Embed Size (px)
Citation preview
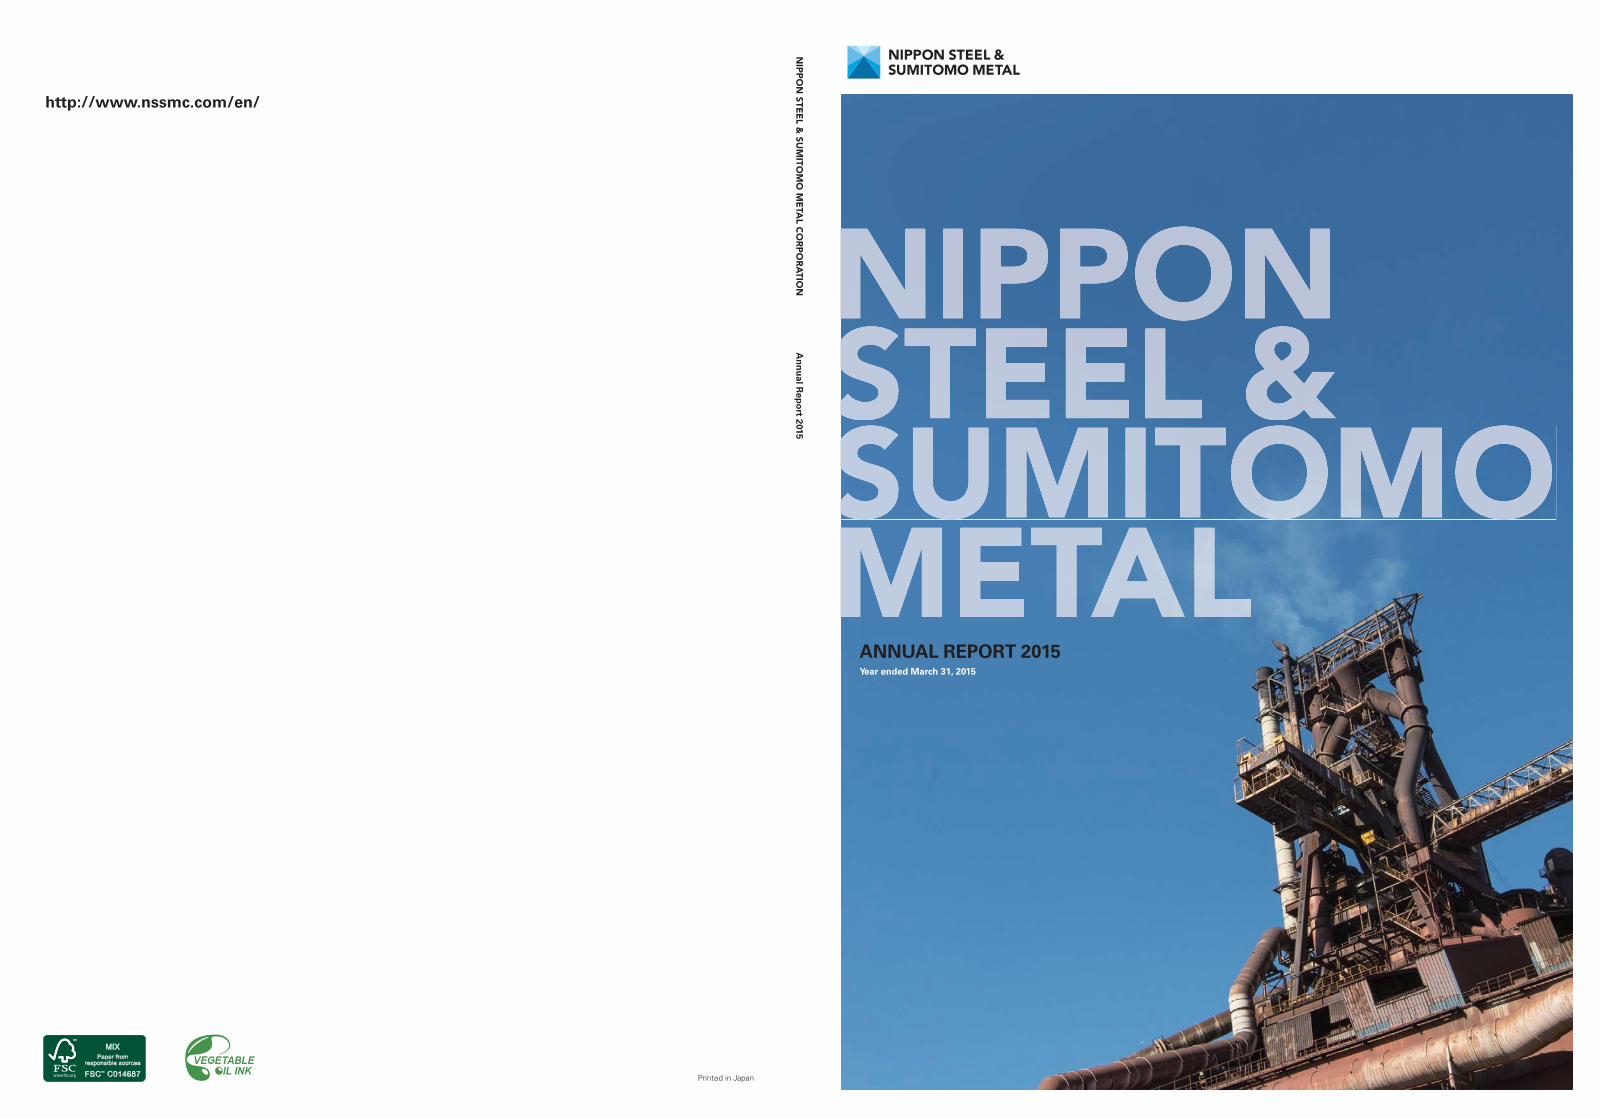
http://www.nssmc.com/en/
Printed in Japan
NSSM
ANNUAL REPORT 2015Year ended March 31, 2015
An
nu
al Rep
ort 2015
NIP
PO
N STE
EL &
SUM
ITOM
O M
ETA
L CO
RP
OR
ATIO
N
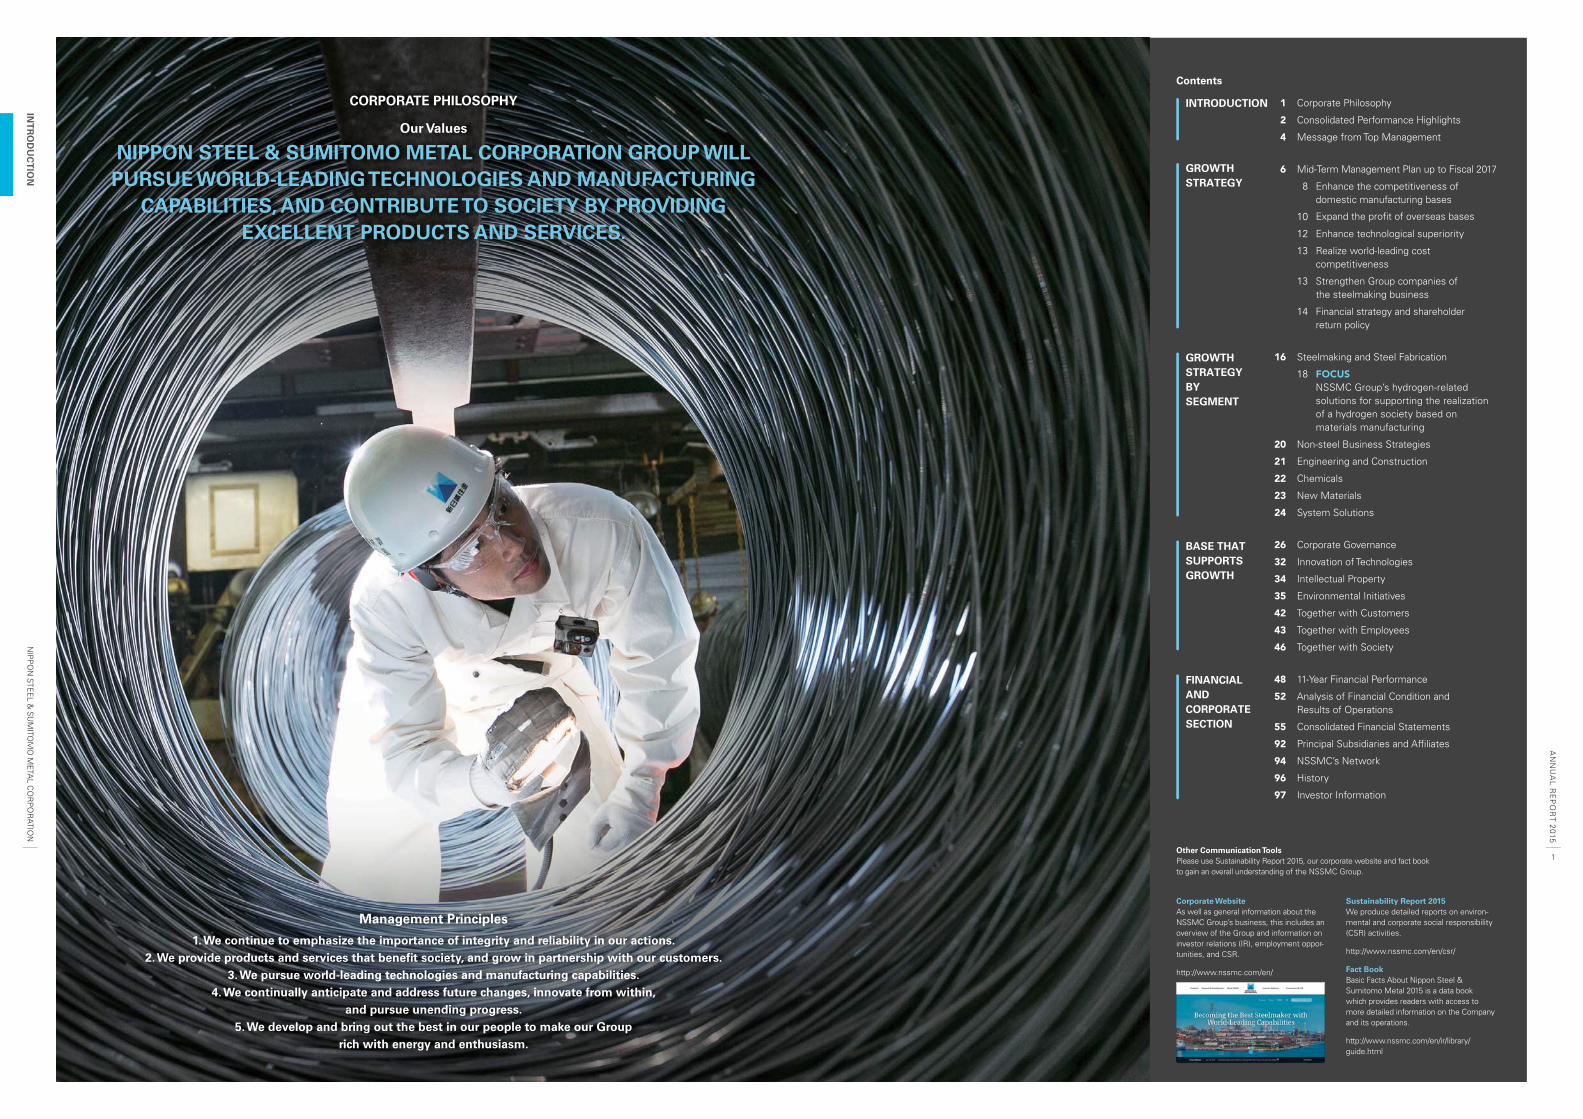
CORPORATE PHILOSOPHY
Our Values
NIPPON STEEL & SUMITOMO METAL CORPORATION GROUP WILL PURSUE WORLD-LEADING TECHNOLOGIES AND MANUFACTURING
CAPABILITIES, AND CONTRIBUTE TO SOCIETY BY PROVIDING EXCELLENT PRODUCTS AND SERVICES.
Management Principles
1. We continue to emphasize the importance of integrity and reliability in our actions.2. We provide products and services that benefi t society, and grow in partnership with our customers.
3. We pursue world-leading technologies and manufacturing capabilities.4. We continually anticipate and address future changes, innovate from within,
and pursue unending progress.5. We develop and bring out the best in our people to make our Group
rich with energy and enthusiasm.
Contents
GROWTH STRATEGY
INTRODUCTION 1 Corporate Philosophy
2 Consolidated Performance Highlights
4 Message from Top Management
6 Mid-Term Management Plan up to Fiscal 2017
8 Enhance the competitiveness of domestic manufacturing bases
10 Expand the profit of overseas bases
12 Enhance technological superiority
13 Realize world-leading cost competitiveness
13 Strengthen Group companies of the steelmaking business
14 Financial strategy and shareholder return policy
16 Steelmaking and Steel Fabrication
18 FOCUSNSSMC Group’s hydrogen-related solutions for supporting the realization of a hydrogen society based on materials manufacturing
20 Non-steel Business Strategies
21 Engineering and Construction
22 Chemicals
23 New Materials
24 System Solutions
26 Corporate Governance
32 Innovation of Technologies
34 Intellectual Property
35 Environmental Initiatives
42 Together with Customers
43 Together with Employees
46 Together with Society
48 11-Year Financial Performance
52 Analysis of Financial Condition and Results of Operations
55 Consolidated Financial Statements
92 Principal Subsidiaries and Affi liates
94 NSSMC’s Network
96 History
97 Investor Information
GROWTH STRATEGY BY SEGMENT
BASE THAT SUPPORTS GROWTH
FINANCIAL AND CORPORATE SECTION
Other Communication ToolsPlease use Sustainability Report 2015, our corporate website and fact bookto gain an overall understanding of the NSSMC Group.
Corporate WebsiteAs well as general information about the NSSMC Group’s business, this includes an overview of the Group and information on investor relations (IR), employment oppor-tunities, and CSR.
http://www.nssmc.com/en/
Sustainability Report 2015We produce detailed reports on environ-mental and corporate social responsibility (CSR) activities.
http://www.nssmc.com/en/csr/
Fact BookBasic Facts About Nippon Steel & Sumitomo Metal 2015 is a data book which provides readers with access to more detailed information on the Company and its operations.
http://www.nssmc.com/en/ir/library/guide.html
1
NIP
PO
N STE
EL &
SU
MITO
MO
META
L CO
RP
OR
ATION
AN
NU
AL R
EP
OR
T 2015
INT
RO
DU
CT
ION
3,000
2,000
1,000
3.00
2.00
1.00
2010 2011 2012 2013 2014
Consolidated Performance Highlights
8,000
6,000
4,000
2,000
2010 2011 2013 20142012*1
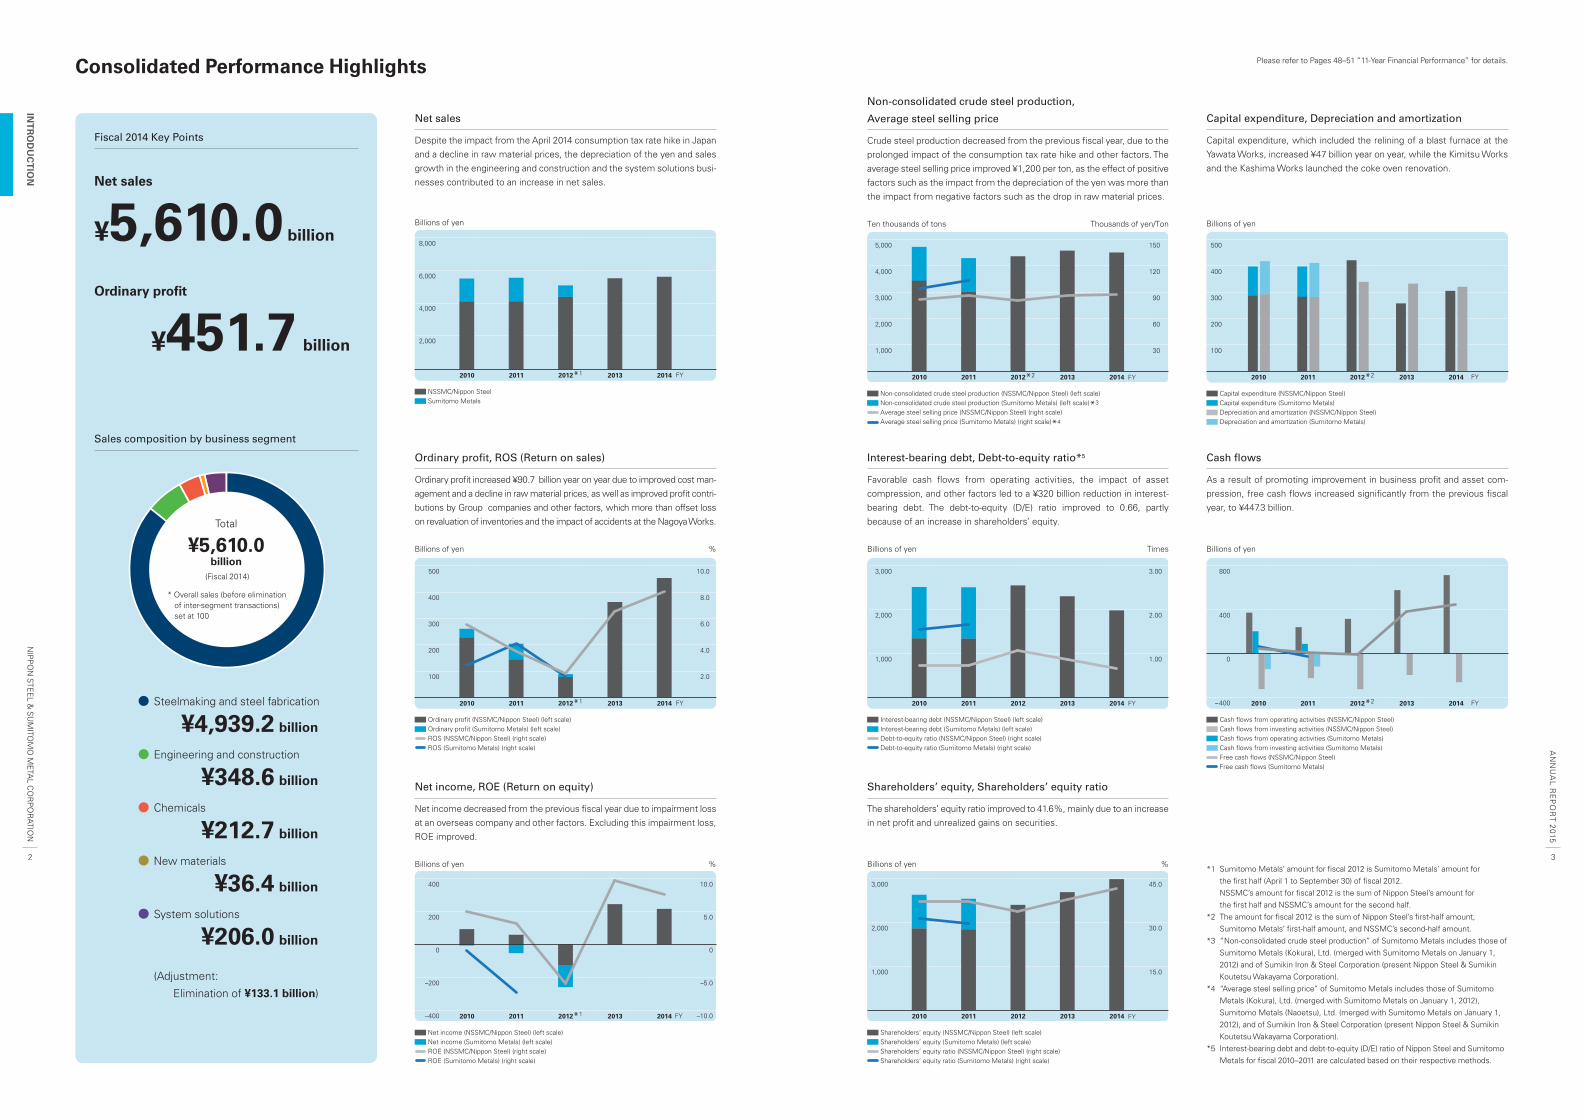
Net sales
Despite the impact from the April 2014 consumption tax rate hike in Japan and a decline in raw material prices, the depreciation of the yen and sales growth in the engineering and construction and the system solutions busi-nesses contributed to an increase in net sales.
Billions of yen
NSSMC/Nippon SteelSumitomo Metals
FY
Shareholders’ equity (NSSMC/Nippon Steel) (left scale)Shareholders’ equity (Sumitomo Metals) (left scale)Shareholders’ equity ratio (NSSMC/Nippon Steel) (right scale)Shareholders’ equity ratio (Sumitomo Metals) (right scale)
3,000 45.0
30.0
15.0
2,000
1,000
2010 2011 2012 2013 2014
Shareholders’ equity, Shareholders’ equity ratio
The shareholders’ equity ratio improved to 41.6%, mainly due to an increase in net profi t and unrealized gains on securities.
Billions of yen %
400
0
–200
–400
10.0
5.0
0
–5.0
–10.02010 2011 2012*1 2013 2014
200
Net income, ROE (Return on equity)
Net income decreased from the previous fi scal year due to impairment loss at an overseas company and other factors. Excluding this impairment loss, ROE improved.
Billions of yen %
Net income (NSSMC/Nippon Steel) (left scale)Net income (Sumitomo Metals) (left scale)ROE (NSSMC/Nippon Steel) (right scale)ROE (Sumitomo Metals) (right scale)
FY
5,000
4,000
3,000
2,000
1,000
150
120
90
60
30
2010 2011 2012*2 2013 2014
Non-consolidated crude steel production,
Average steel selling price
Crude steel production decreased from the previous fi scal year, due to the prolonged impact of the consumption tax rate hike and other factors. The average steel selling price improved ¥1,200 per ton, as the effect of positive factors such as the impact from the depreciation of the yen was more than the impact from negative factors such as the drop in raw material prices.
Ten thousands of tons Thousands of yen/Ton
Non-consolidated crude steel production (NSSMC/Nippon Steel) (left scale)Non-consolidated crude steel production (Sumitomo Metals) (left scale)*3
Average steel selling price (NSSMC/Nippon Steel) (right scale)Average steel selling price (Sumitomo Metals) (right scale)*4
FY
Please refer to Pages 48–51 “11-Year Financial Performance” for details.
Fiscal 2014 Key Points
Net sales
¥5,610.0 billion
Ordinary profi t
¥451.7 billion
Steelmaking and steel fabrication
¥4,939.2 billion
Engineering and construction
¥348.6 billion
Chemicals
¥212.7 billion
New materials
¥36.4 billion
System solutions
¥206.0 billion
(Adjustment:
Elimination of ¥133.1 billion)
Sales composition by business segment
Total
¥5,610.0 billion
(Fiscal 2014)
* Overall sales (before elimination of inter-segment transactions) set at 100
FY
FY
32
NIP
PO
N STE
EL &
SU
MITO
MO
META
L CO
RP
OR
ATION
AN
NU
AL R
EP
OR
T 2015
INT
RO
DU
CT
ION
500
400
300
200
2010 2011 2013 2014
100
2012*2
Capital expenditure, Depreciation and amortization
Capital expenditure, which included the relining of a blast furnace at the Yawata Works, increased ¥47 billion year on year, while the Kimitsu Works and the Kashima Works launched the coke oven renovation.
Billions of yen
Capital expenditure (NSSMC/Nippon Steel)
Depreciation and amortization (Sumitomo Metals)
Capital expenditure (Sumitomo Metals)Depreciation and amortization (NSSMC/Nippon Steel)
FY
Interest-bearing debt, Debt-to-equity ratio*5
Favorable cash fl ows from operating activities, the impact of asset compression, and other factors led to a ¥320 billion reduction in interest-bearing debt. The debt-to-equity (D/E) ratio improved to 0.66, partly because of an increase in shareholders’ equity.
Billions of yen Times
Interest-bearing debt (NSSMC/Nippon Steel) (left scale)Interest-bearing debt (Sumitomo Metals) (left scale)Debt-to-equity ratio (NSSMC/Nippon Steel) (right scale)Debt-to-equity ratio (Sumitomo Metals) (right scale)
500
400
300
200
100
10.0
8.0
6.0
4.0
2.0
2010 2011 2013 20142012*1
Ordinary profit, ROS (Return on sales)
Ordinary profi t increased ¥90.7 billion year on year due to improved cost man-agement and a decline in raw material prices, as well as improved profi t contri-butions by Group companies and other factors, which more than offset loss on revaluation of inventories and the impact of accidents at the Nagoya Works.
Billions of yen %
Ordinary profit (NSSMC/Nippon Steel) (left scale)Ordinary profit (Sumitomo Metals) (left scale)ROS (NSSMC/Nippon Steel) (right scale)ROS (Sumitomo Metals) (right scale)
FY
800
400
0
–400 2010 2011 2013 20142012*2
Cash flows
As a result of promoting improvement in business profi t and asset com-pression, free cash fl ows increased signifi cantly from the previous fi scal year, to ¥447.3 billion.
Billions of yen
Cash flows from operating activities (NSSMC/Nippon Steel)
Cash flows from investing activities (Sumitomo Metals)Cash flows from operating activities (Sumitomo Metals)Cash flows from investing activities (NSSMC/Nippon Steel)
Free cash flows (NSSMC/Nippon Steel) Free cash flows (Sumitomo Metals)
FY
*1 Sumitomo Metals’ amount for fi scal 2012 is Sumitomo Metals’ amount for the fi rst half (April 1 to September 30) of fi scal 2012.
NSSMC’s amount for fi scal 2012 is the sum of Nippon Steel’s amount for the fi rst half and NSSMC’s amount for the second half.
*2 The amount for fi scal 2012 is the sum of Nippon Steel’s fi rst-half amount, Sumitomo Metals’ fi rst-half amount, and NSSMC’s second-half amount.
*3 “Non-consolidated crude steel production” of Sumitomo Metals includes those of Sumitomo Metals (Kokura), Ltd. (merged with Sumitomo Metals on January 1, 2012) and of Sumikin Iron & Steel Corporation (present Nippon Steel & Sumikin Koutetsu Wakayama Corporation).
*4 “Average steel selling price” of Sumitomo Metals includes those of Sumitomo Metals (Kokura), Ltd. (merged with Sumitomo Metals on January 1, 2012), Sumitomo Metals (Naoetsu), Ltd. (merged with Sumitomo Metals on January 1, 2012), and of Sumikin Iron & Steel Corporation (present Nippon Steel & Sumikin Koutetsu Wakayama Corporation).
*5 Interest-bearing debt and debt-to-equity (D/E) ratio of Nippon Steel and Sumitomo Metals for fi scal 2010–2011 are calculated based on their respective methods.
54
NIP
PO
N STE
EL &
SU
MITO
MO
META
L CO
RP
OR
ATION
AN
NU
AL R
EP
OR
T 2015
INT
RO
DU
CT
ION
44
NNIP
PN
IPP
NIP
PIP
PP
PO
NO
N S
ON
SO
NS
ON
SO
NS
ON
SN
SN
STEE
LTE
EL
TEE
LTE
EL
TEE
LTE
EL
TEE
LE
EL
&& S
& S
& S
&S
&S
&S
&SS
UM
IU
MIT
UM
ITU
MIT
UM
ITU
MIT
MMITTO
MO
O
MO
MO
O
MO
O
MO
META
META
META
METTA
L CO
L CO
L CO
CCCCOOO
RP
OR
RP
OR
RP
RP
OR
RP
OR
OR
ATIOATIOATIOAATIOATIOIO
NNNN
Message from Top Management
We announced our fi rst Mid-Term Management Plan in March
2013, after our corporate integration. Since that time, we have
made steady progress in building an optimal production system,
including reorganization of domestic steelworks, developing
overseas businesses, integrating technologies of the two
former companies, and reorganizing Group companies. I am
pleased to say that we have made solid progress in reaching or
even exceeding our numerical fi nancial targets in less than
three years. Nevertheless, I believe it is important that we do
not become complacent, and must now set new objectives to
advance even further. This is why in March 2015 we announced
our new Mid-Term Management Plan, for fi scal 2015–2017, to
fi rmly establish our position as the best steelmaker with world-
leading capabilities.
The new plan has two key imperatives: enhance manufacturing
capabilities in Japan and strengthen overseas manufacturing
bases for growth in sales and profi t. These strategies will be
realized on the basis of our strengths in advanced and propri-
etary technologies. Enhancement of domestic manufacturing
capabilities is particularly important as we strongly believe that
without improving what we do at home, overseas bases cannot
be strengthened.
Specifi cally, to enhance domestic bases we will renovate or
strengthen our manufacturing infrastructure by investing ¥1,350
billion over the next three years. Although we have continually
renovated major facilities in our steelworks, we need to continue
renovating them one by one as they have been in use for many
years. The Oita Works, which is the newest of our domestic
steelworks, was established over 40 years ago. At this time,
however, simple renovation is not what we have in mind. We plan
to invest in renovating and enhancing facilities for the future,
incorporating up-to-date technological advances as well as
applying our entire accumulated manufacturing know-how.
In addition to facilities, human resources will also be reinforced.
We intend to double the number of new hires compared to the
two years prior to the plan beginning, and form a more youthful
base for the important roles of the future. To do so, we intend
to fully transfer existing skills to the next generation and to
smoothly accomplish a change of generations.
Our R&D infrastructure is already one of the most advanced in
the global steel industry, but we will further enhance it to
ensure the continued progress of our technologies.
Accidents and mishaps that occurred at the Nagoya Works in
2014 have made us examine whether our manufacturing capa-
bilities in Japan are truly suffi cient, have alerted us to the need
to renew our efforts at improvement, and have given us some
perspective to refl ect upon. We are determined to get back to
basics; strengthen our facilities, human resources, and technol-
ogies; enhance manufacturing capabilities in Japan at what we
call our “mother mills”; and apply our best practices overseas.
Overseas, we have started many projects in the past several
years and are now entering a stage of stable operation and profi t
expansion. We plan to raise overseas production to 19 million
tons in three years, while aiming to maximize cost effi ciency,
secure profi tability, and increase cash fl ows. At the same time,
¥300 billion has been reserved for business investments in
new projects other than existing joint ventures over the next
three years. This is investment in growth regions and growth
sectors. Specifi cally, we will organize a system that enables
timely investment in the areas of high demand, mainly in the
markets for high-grade steel for the automobile, resource and
energy, and infrastructure-related sectors.
When we look at the world, we fi nd that we are surrounded by
a wide range of uncertainties and many possible changes. Some
of these are the ongoing and signifi cant demand–supply gap in
China, the risk of fl uctuations in the oil, foreign exchange, and
other markets, and higher geopolitical risk in various countries
and regions. On the positive side, along with the economic
development of emerging countries, consumption of steel
materials is defi nitely on a long-term uptrend, and demand
for high-grade steel—our area of strength—is anticipated to
grow steadily on the back of the emerging countries’ economic
advance and rising needs for energy-saving and other environ-
mental measures. Through the previous Mid-Term Management
Plan, we have realized synergy effects and have become ready
to advance further. By implementing the new plan, we will further
enhance the foundation of our manufacturing capabilities and
capture market demand in the long run, even in the midst of a
changing market environment.
“NSSMC will pursue world-leading technologies and manufac-
turing capabilities, and contribute to society by providing excellent
products and services.” This corporate philosophy is what
everyone at NSSMC has in mind and puts into practice every
day. By doing so, we aim to always be relevant to and needed
in society. Your continued support and cooperation in this
regard is sincerely appreciated.
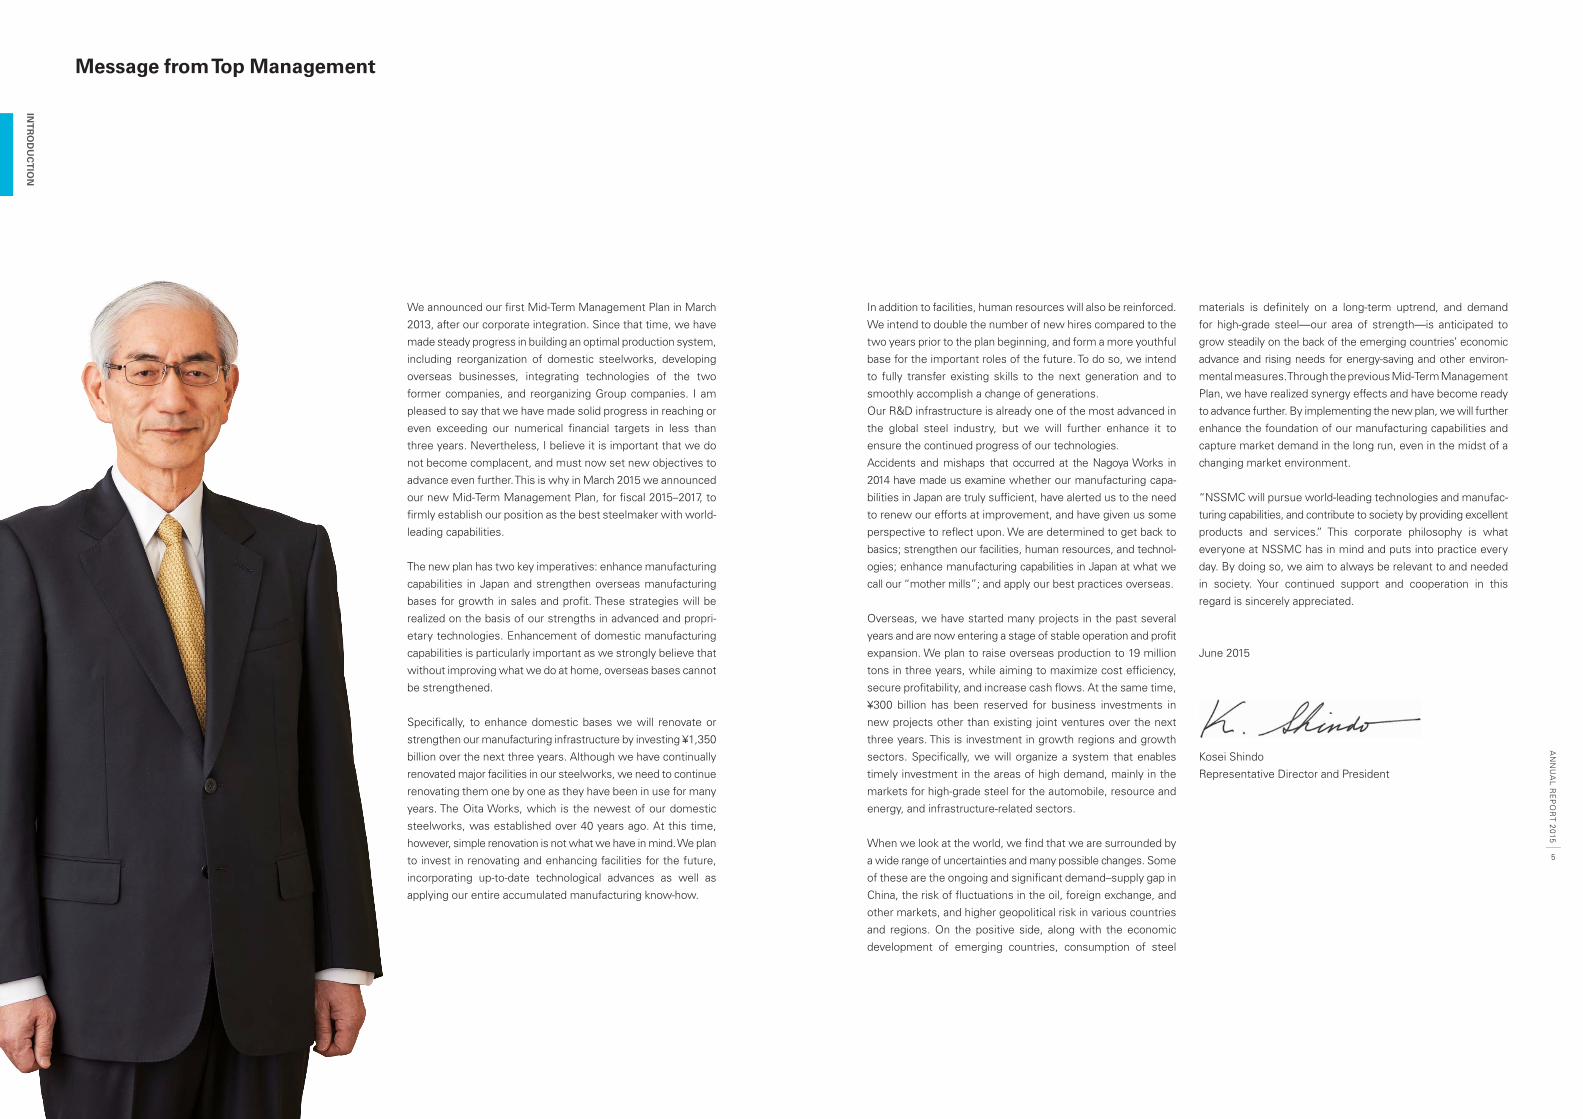
June 2015
Kosei Shindo
Representative Director and President
Manufacturing bases
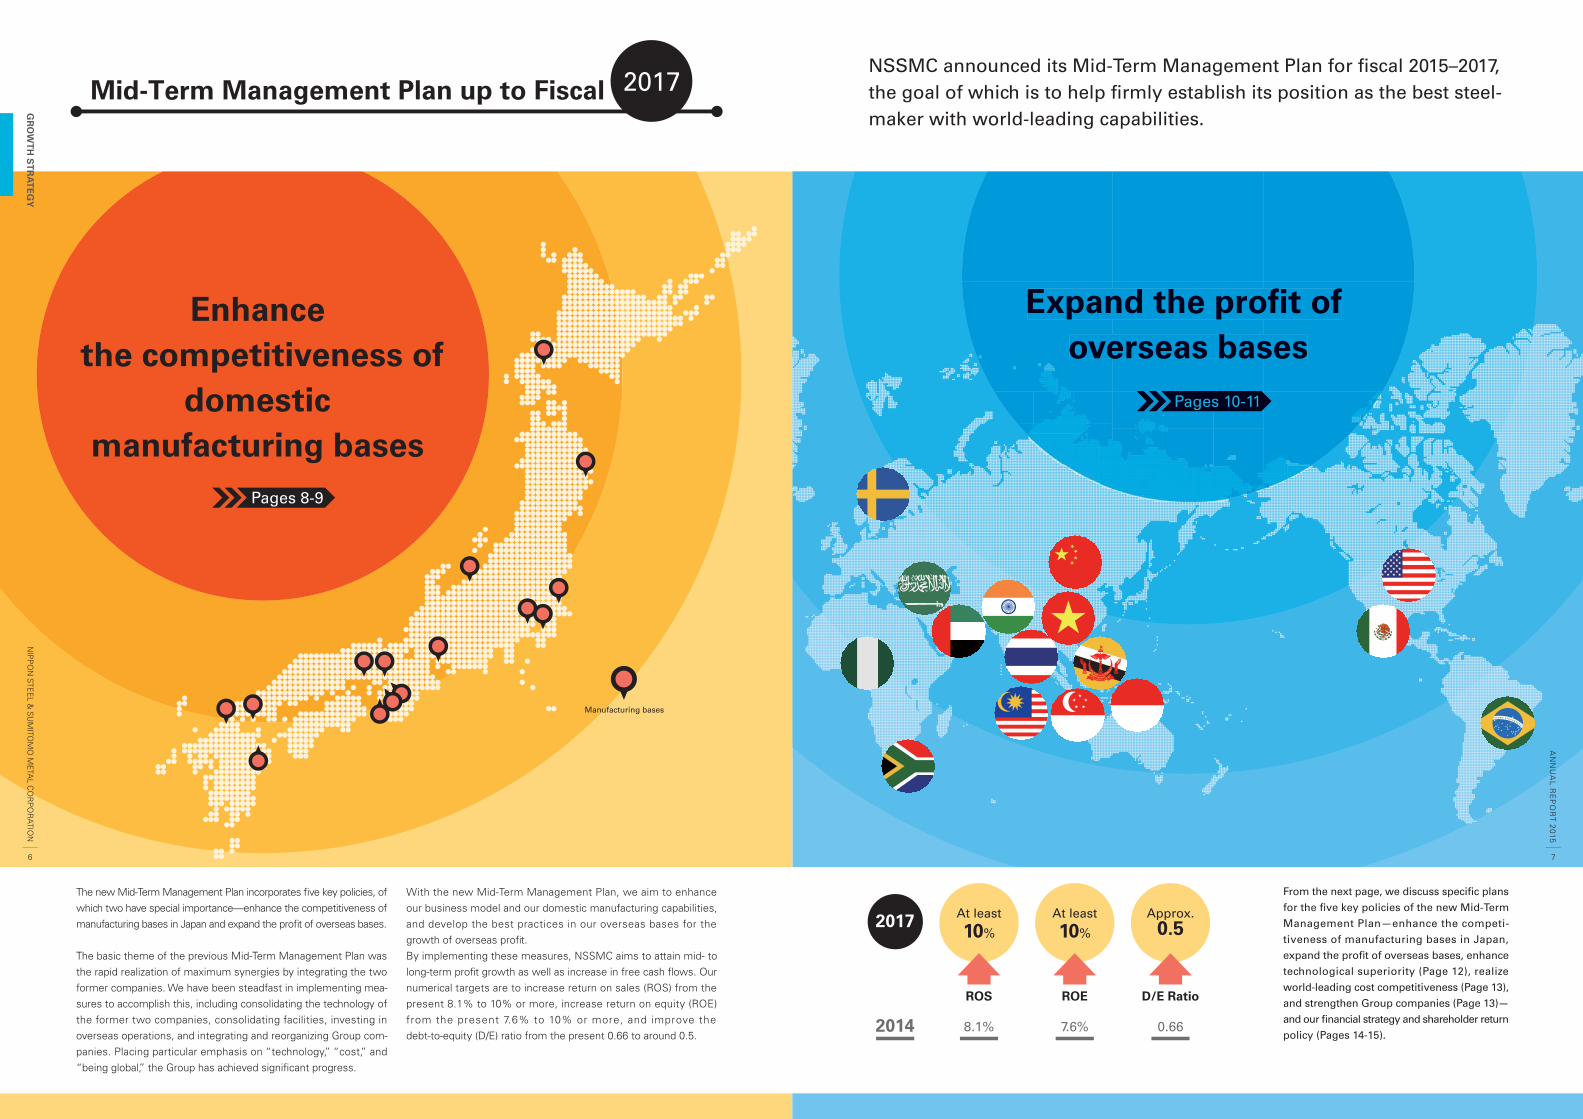
The new Mid-Term Management Plan incorporates five key policies, of which two have special importance—enhance the competitiveness of manufacturing bases in Japan and expand the profit of overseas bases.
The basic theme of the previous Mid-Term Management Plan was the rapid realization of maximum synergies by integrating the two former companies. We have been steadfast in implementing mea-sures to accomplish this, including consolidating the technology of the former two companies, consolidating facilities, investing in overseas operations, and integrating and reorganizing Group com-panies. Placing particular emphasis on “technology,” “cost,” and “being global,” the Group has achieved significant progress.
With the new Mid-Term Management Plan, we aim to enhance our business model and our domestic manufacturing capabilities, and develop the best practices in our overseas bases for the growth of overseas profit.By implementing these measures, NSSMC aims to attain mid- to long-term profit growth as well as increase in free cash flows. Our numerical targets are to increase return on sales (ROS) from the present 8.1% to 10% or more, increase return on equity (ROE) from the present 7.6% to 10% or more, and improve the debt-to-equity (D/E) ratio from the present 0.66 to around 0.5.
From the next page, we discuss specific plans
for the five key policies of the new Mid-Term
Management Plan—enhance the competi-
tiveness of manufacturing bases in Japan,
expand the profit of overseas bases, enhance
technological superiority (Page 12), realize
world-leading cost competitiveness (Page 13),
and strengthen Group companies (Page 13)—
and our financial strategy and shareholder return
policy (Pages 14-15).
At least
10%
2014
2017
8.1%
ROS
At least
10%
7.6%
ROE
Approx.0.5
D/E Ratio
0.66
Pages 10-11
Expand the profit of overseas bases
Pages 10-11
Expand the profit ofoverseas bases
Mid-Term Management Plan up to Fiscal 2017NSSMC announced its Mid-Term Management Plan for fiscal 2015–2017, the goal of which is to help firmly establish its position as the best steel-maker with world-leading capabilities.
Enhance the competitiveness of
domestic manufacturing bases
Pages 8-9
76
NIP
PO
N STE
EL &
SU
MITO
MO
META
L CO
RP
OR
ATION
AN
NU
AL R
EP
OR
T 2015
GR
OW
TH
ST
RA
TE
GY
Tobata
Kokura
Yawata
Dokai Bay
Yawata Area
Kanmon Straits
Yawata Works
Wakayama Works
Tobata Area
Kokura Area
Yawata Works
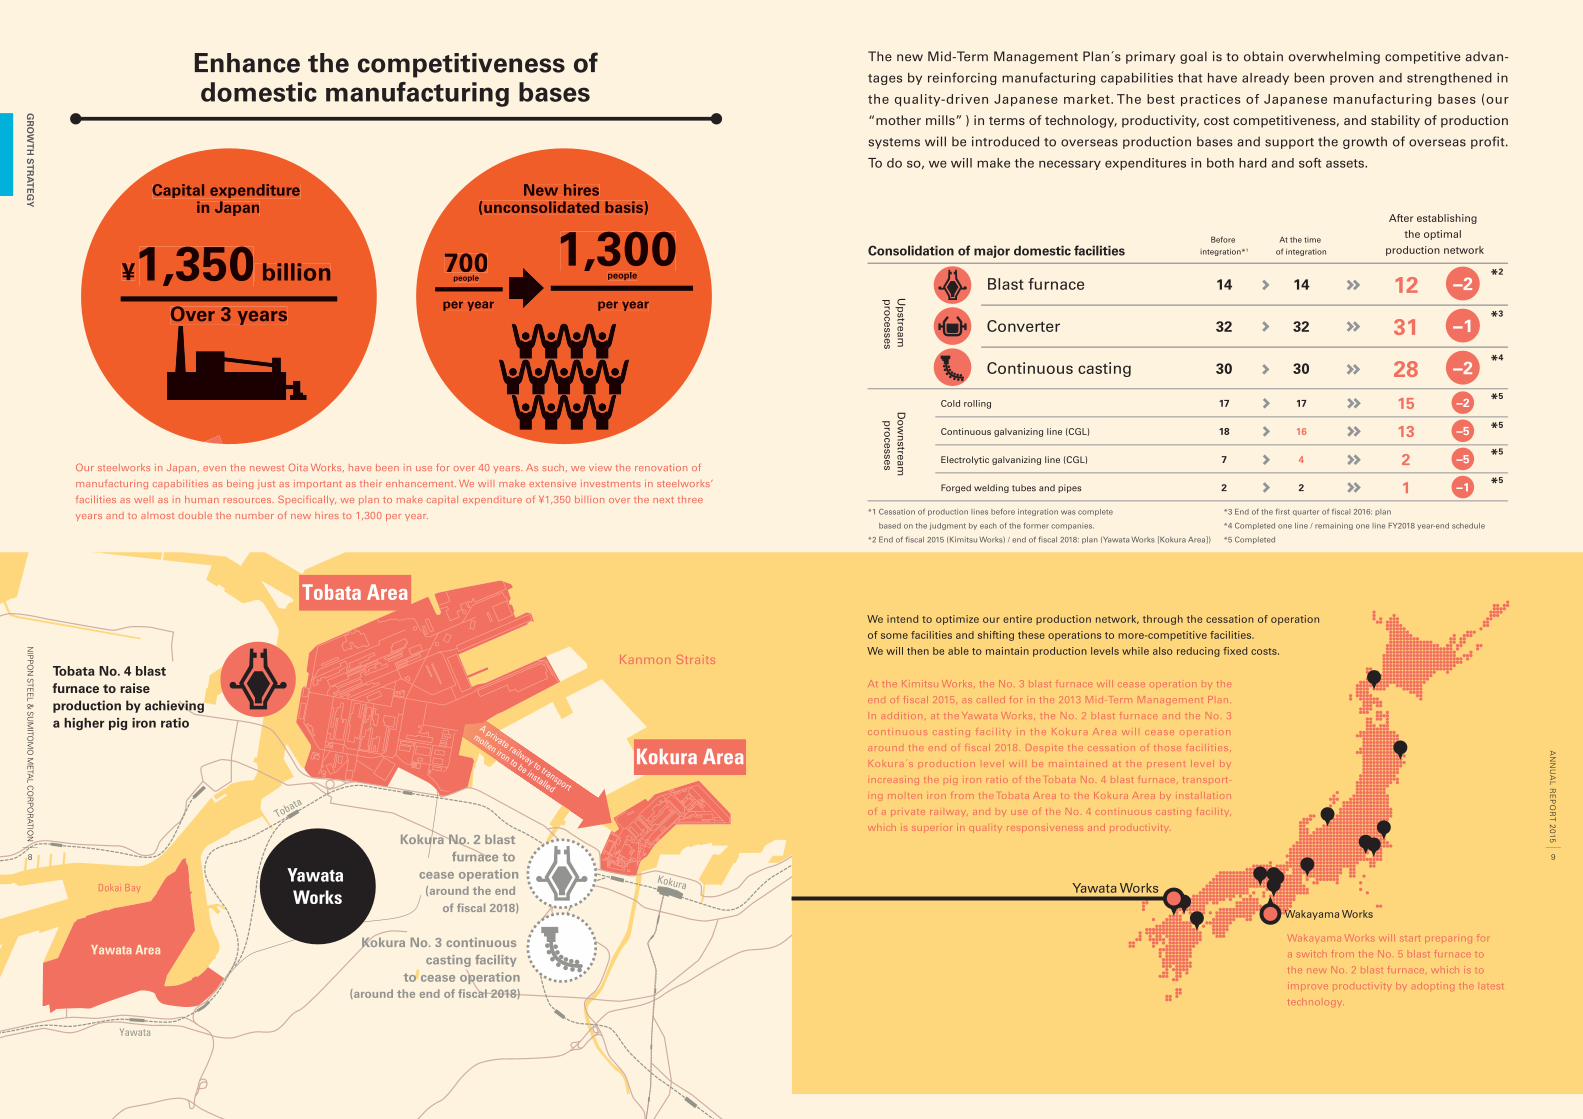
Our steelworks in Japan, even the newest Oita Works, have been in use for over 40 years. As such, we view the renovation of
manufacturing capabilities as being just as important as their enhancement. We will make extensive investments in steelworks’
facilities as well as in human resources. Specifically, we plan to make capital expenditure of ¥1,350 billion over the next three
years and to almost double the number of new hires to 1,300 per year.
We intend to optimize our entire production network, through the cessation of operation
of some facilities and shifting these operations to more-competitive facilities.
We will then be able to maintain production levels while also reducing fixed costs.
At the Kimitsu Works, the No. 3 blast furnace will cease operation by the
end of fiscal 2015, as called for in the 2013 Mid-Term Management Plan.
In addition, at the Yawata Works, the No. 2 blast furnace and the No. 3
continuous casting facility in the Kokura Area will cease operation
around the end of fiscal 2018. Despite the cessation of those facilities,
Kokura´s production level will be maintained at the present level by
increasing the pig iron ratio of the Tobata No. 4 blast furnace, transport-
ing molten iron from the Tobata Area to the Kokura Area by installation
of a private railway, and by use of the No. 4 continuous casting facility,
which is superior in quality responsiveness and productivity.
The new Mid-Term Management Plan´s primary goal is to obtain overwhelming competitive advan-
tages by reinforcing manufacturing capabilities that have already been proven and strengthened in
the quality-driven Japanese market. The best practices of Japanese manufacturing bases (our
“mother mills” ) in terms of technology, productivity, cost competitiveness, and stability of production
systems will be introduced to overseas production bases and support the growth of overseas profit.
To do so, we will make the necessary expenditures in both hard and soft assets.
Up
stream
pro
cessesD
ow
nstream
p
rocesses
Blast furnace
Consolidation of major domestic facilitiesBefore
integration*1
*1 Cessation of production lines before integration was complete
based on the judgment by each of the former companies.
*2 End of fiscal 2015 (Kimitsu Works) / end of fiscal 2018: plan (Yawata Works [Kokura Area])
*3 End of the first quarter of fiscal 2016: plan
*4 Completed one line / remaining one line FY2018 year-end schedule
*5 Completed
After establishing
the optimal
production network
Converter
Continuous casting
Kokura No. 2 blast furnace to
cease operation(around the end
of fiscal 2018)
Kokura No. 3 continuous casting facility
to cease operation(around the end of fiscal 2018)
Cold rolling
Continuous galvanizing line (CGL)
Electrolytic galvanizing line (CGL)
Forged welding tubes and pipes
14
32
30
17
18
7
2
At the time
of integration
14
32
*2
*3
*4
*5
*5
*5
*5
30
17
16
4
2
12
31
2815
13
2
1
−2
−1
−2
−2
−5
−5
−1
¥1,350 billion
Over 3 years
Capital expenditure in Japan
people1,300
per year
New hires (unconsolidated basis)
700people
per year
Enhance the competitiveness ofdomestic manufacturing bases
Wakayama Works will start preparing for
a switch from the No. 5 blast furnace to
the new No. 2 blast furnace, which is to
improve productivity by adopting the latest
technology.
Tobata No. 4 blast furnace to raise production by achieving a higher pig iron ratio A private railway to transport
molten iron to be installed
¥1,350 billion
Over 3 years
Capital expenditure in Japan
people1,300
per year
New hires(unconsolidated basis)
700people
per year
98
NIP
PO
N STE
EL &
SU
MITO
MO
META
L CO
RP
OR
ATION
AN
NU
AL R
EP
OR
T 2015
GR
OW
TH
ST
RA
TE
GY
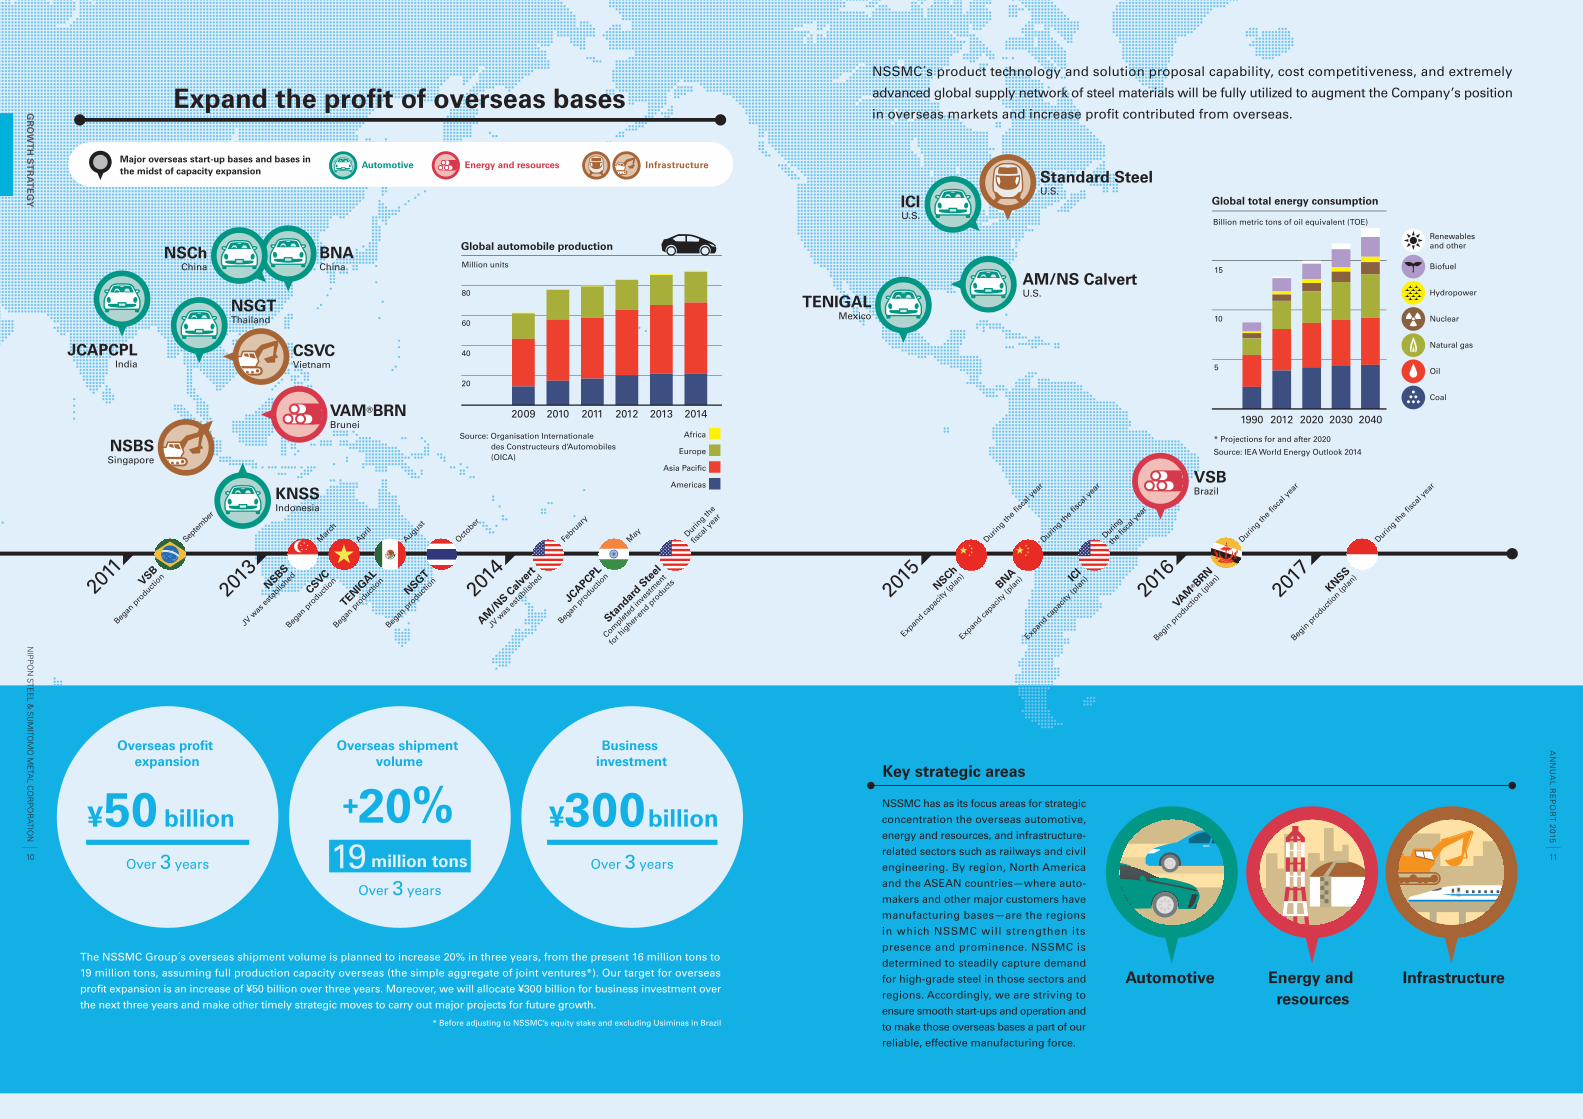
Standard SteelU.S.
AM/NS CalvertU.S.
VSBBrazil
ICIU.S.
NSChChina
JCAPCPLIndia
NSBSSingapore
BNAChina
Major overseas start-up bases and bases in the midst of capacity expansion
CSVCVietnam
NSGTThailand
VAM®BRNBrunei
KNSSIndonesia
TENIGALMexico
2009 2010 2011 2012 2013 2014
20
40
60
80
Million units
Global automobile production
Americas
Asia Pacific
Europe
Africa
1990 2012 2020 2030 2040
* Projections for and after 2020
Source: IEA World Energy Outlook 2014
Global total energy consumption
Coal
5
10
15
Billion metric tons of oil equivalent (TOE)
Oil
Natural gas
Nuclear
Hydropower
Biofuel
Renewables and other
NSSMC´s product technology and solution proposal capability, cost competitiveness, and extremely
advanced global supply network of steel materials will be fully utilized to augment the Company’s position
in overseas markets and increase profit contributed from overseas.
Source: Organisation Internationaledes Constructeurs d’Automobiles (OICA)
NSSMC has as its focus areas for strategic
concentration the overseas automotive,
energy and resources, and infrastructure-
related sectors such as railways and civil
engineering. By region, North America
and the ASEAN countries—where auto-
makers and other major customers have
manufacturing bases—are the regions
in which NSSMC will strengthen its
presence and prominence. NSSMC is
determined to steadily capture demand
for high-grade steel in those sectors and
regions. Accordingly, we are striving to
ensure smooth start-ups and operation and
to make those overseas bases a part of our
reliable, effective manufacturing force.
Key strategic areas
¥300 billion
Over 3 years
Business investment
+20%
Over 3 years
Overseas shipment volume
¥50 billion
Over 3 years
Overseas profit expansion
Energy and resources
Automotive Infrastructure
19 million tons
Expand the profit of overseas bases
NSBS
JV w
as es
tablis
hed
2013
2014
2015
2016
2017
CSVC
Began
pro
duction
April
Mar
ch
VSB
Began
pro
duction
2011
Septem
ber
TENIGAL
Began
pro
duction
August
NSGT
Began
pro
duction
October
JCAPCPL
Began
pro
duction
May
Standar
d Ste
el
Complet
ed in
vestm
ent
for h
igher
-end p
roducts
During th
e
fiscal
year
NSCh
Expan
d capac
ity (p
lan)
During th
e fisc
al ye
ar
BNA
Expan
d capac
ity (p
lan)
During th
e fisc
al ye
ar
VAM® BRN
Begin
pro
duction (p
lan)
During th
e fisc
al ye
ar
KNSS
Begin
pro
duction (p
lan)
During th
e fisc
al ye
ar
ICI
Expan
d capac
ity (p
lan)
During
th
e fisc
al ye
ar
AM/N
S Calv
ert
JV w
as es
tablis
hed
Febru
ary
Energy and resourcesAutomotive Infrastructure
The NSSMC Group´s overseas shipment volume is planned to increase 20% in three years, from the present 16 million tons to
19 million tons, assuming full production capacity overseas (the simple aggregate of joint ventures*). Our target for overseas
profit expansion is an increase of ¥50 billion over three years. Moreover, we will allocate ¥300 billion for business investment over
the next three years and make other timely strategic moves to carry out major projects for future growth.
* Before adjusting to NSSMC’s equity stake and excluding Usiminas in Brazil
1110
NIP
PO
N STE
EL &
SU
MITO
MO
META
L CO
RP
OR
ATION
AN
NU
AL R
EP
OR
T 2015
GR
OW
TH
ST
RA
TE
GY
Technological leadership greatly contributes to enhance NSSMC’s global manufacturing capabilities and supports its business
strategy, by taking the following measures.
1) NSSMC aims to further enhance its world-leading technologies by having the largest team of researchers (about 800) in the
global steel industry. The Company will also strive to lead the global market through its intensive activities including, (i) develop-
ing high-end products with excellent functions (e.g. high-tensile steel sheet, corrosion-resistance high-alloy seamless steel tubes)
in sectors of growing demand such as automotive, energy and resources, and infrastructure-related sectors, (ii) delivering com-
prehensive solutions to its customers, ranging from process design to material selection and processing, and (iii) achieving sig-
nifi cant improvement in productivity through production process innovation.
2) To accelerate technological development, NSSMC plans to expand its R&D spending by about 10% from the current level. NSSMC
will also adequately prepare for the expected future needs of customers and society by engaging in next-generation research on
advanced steel products such as those required for the broad utilization of hydrogen, as well as in research on basic and element
technologies utilizing advanced analytical and mathematical approaches.
The Group companies already integrated during the 2013 Mid-Term Management Plan will seek far greater synergies. At the same time,
NSSMC will seek group-wide synergies, such as those between NSSMC and Group companies, and those among Group companies.
In addition to the above, to optimize group structure, NSSMC will undertake further reorganization within the Group and concen-
tration on core business operations in light of assessment of each Group company’s business domains.
NSSMC aims to realize cost competitiveness equivalent to ¥150 billion a year or more (unconsolidated basis), in approximately
three years. This target will be attained by maximizing the synergy effect from consolidating the production network and other
means and realizing the effects from refurbishment of coke ovens and intensive improvement in operational skills to enable
improvement in yields. Combining the effects of all those measures with those of the earlier measures to strengthen mother mills,
NSSMC will establish world-leading cost competitiveness to win against the global competition.
R&D spending
Billions of yen
NSSMC
Group companyGroup company
80
60
40
20
2010 2011 2012 2013 2014
Realize effects of investments to improve operations
¥90 billionMeasures to refurbish coke ovens;
Improvement in yield; etc.
Maximize synergy effects
¥60 billionOptimal production network (raising capacity
utilization of the entire iron-making, consolidation of downstream processing, etc.); Adoption of
best technological practices of the former two companies; Synergies from integration of Group
companies; Slim-down head offi ce; etc.
Cost reduction (non-consolidated)
¥150 billion or more per year
Maximize synergies among integrated Group companies
Expand group-wide synergies
Concentrate on core Group companies
Approx.+10%
(vs. FY2013–14 average)
Expansion
NSSMC/NSC SMI
Comprehensivesolutions
Production process innovation
Development of high-functioning
products
Next-generation steel and basic technologies
HRX19TM: New stainless
steel for high-pressure
hydrogen environments
Advanced piercer technology
Infrastructure
EneEnergy and resources
AutomotiveDesign
Processing
Material selection
SCOPE21 coke oven
FY
1312
NIP
PO
N STE
EL &
SU
MITO
MO
META
L CO
RP
OR
ATION
AN
NU
AL R
EP
OR
T 2015
GR
OW
TH
ST
RA
TE
GY
Enhance technological superiority
Strengthen Group companies of the steelmaking business
Realize world-leading cost competitiveness
Review of the 2013 Mid-Term Management Plan and fi nancial strategy of the 2017 Mid-Term Management Plan
NSSMC has made steady progress in implementing the 2013 Mid-Term Management Plan (announced in March 2013), with the aim
of achieving sustained growth in profi ts through the early realization of maximum synergies by integration. In the past two years,
the Group promoted cost reduction by consolidating the technology of the two former companies and enhancing effi ciency, consoli-
dating facilities, investing in overseas downstream operations, and integrating and reorganizating Group companies. Specifi cally, we
posted return on sales (ROS) of 8.1% in fi scal 2014 and 9.7% in the second half of fi scal 2014, approaching close to the targeted
ROS of 10% after surpassing the minimum target of 5%. In addition, we proceeded with asset compression of ¥480 billion, which
by far exceeded the targeted compression of ¥300 billion or more. This has led to our debt-to-equity (D/E) ratio going below 1.0 at
an early stage, surpassing the further target of around 0.8, and settling at 0.66 at the end of fi scal 2014. As such, we have almost
achieved or exceeded the 2013 Mid-Term Management Plan’s targets in less than three years. In light of this development, we are
implementing the new Mid-Term Management Plan from fi scal 2015 with the aim of strengthening our competitive base in Japan
and securing increased profi ts and competitiveness in our overseas business. In so doing, NSSMC aims to achieve in the medium-
to long-term an increase in earnings and free cash fl ows, with the targeted ROS of 10% or more and return on equity (ROE) of 10% or
more. NSSMC also targets the achievement of a D/E ratio of around 0.5, which is equivalent to the average level of an international
“A” rating status, by the end of fi scal 2017, and attainment of a robust fi nancial position.
Targets
Financial strategy and shareholder return policy
Shareholder return policy
Regarding return to shareholders, the Company will raise its targeted payout ratio from the present base of approximately 20% to
around 20-30% on a consolidated basis (applying from fi scal 2015).
ROE target and how to improve it
Besides ROS and the D/E ratio, the 2017 Mid-Term Management Plan has added ROE as a fi nancial target, as we believe it is an appropriate indicator to refl ect our aim to raise capital effi ciency by incorporating improvement in ROS, improvement in asset turnover by asset compres-sion and other means, and an increase in the dividend payout ratio.
Capital effi ciency ROE 10% or more
Asset compression Approx. ¥200 billion for 3 years
D/E ratio Approx. 0.5 (Equivalent to avg. level of international “A” rating status)
* 1H: NSC + 2H: NSSMC
Higher ROSHigher asset turnover
Lower D/E ratio
2014 2017 FY
ROE
ROE = ROS × Asset turnover × Financial leverage
2012
Impairment loss on VSB
Higher ROS
Higher asset turnover
Higher dividend payout ratioROE
10% or more
Lower D/E ratio
Cash dividend per share, Dividend payout ratio
Yen %
8.0
6.0
4.0
2.0
2010 2011 2012 2013 2014
40.0
30.0
20.0
10.0
Dividend payout ratio
Around
20–30%
2012
1.7%
−5.2%
9.6%
7.6%6.5%
8.1%
2013 2014 2012 2013 2014
10% or more
¥150 bnor moreper year
10% or more
5% at minimum With upward potential of 10%
2013Mid-Term
ManagementPlan Target
2013Mid-Term
ManagementPlan Target
Target
2017Target
2017
Target
2017
1.06
0.86
0.66
Approx.
0.5
Less than1.0
Quicklytoward 0.8
120
Base
60
ROS
Cost reduction (Billions of yen) D/E ratio
ROE
*1
*2
FY FY
FY FY
2012 2013 2014 2012 2013 2014Target
2017
Impairment loss on domestic facilities
*1 Combined bases of the two former companies *2 1H: NSC + 2H: NSSMC
Cash dividend per share (left scale) Dividend payout ratio (right scale)
–5.2%*
7.6%
FY
1514
NIP
PO
N STE
EL &
SU
MITO
MO
META
L CO
RP
OR
ATION
AN
NU
AL R
EP
OR
T 2015
GR
OW
TH
ST
RA
TE
GY
� PLATE UNIT
NSSMC contributes to enhancing the safety of structures and the development of society by delivering high-performance steel plates for large industrial/social structures such as ships, bridges, and high-rise buildings; marine structures for oil and gas extraction; and high-performance steel plates used for tanks and other energy-related products.
� FLAT PRODUCTS UNIT
NSSMC supports various industries and people’s lives by delivering steel sheet used to make auto-mobiles, electrical appliances, housing, beverage cans, transformers, and other goods. Having pro-duction and processing bases worldwide, this unit provides high-quality, high-performance products and services in Japan and overseas.
� BAR & WIRE ROD UNIT
NSSMC delivers high-quality, high-performance bars and rods to a wide range of industries includ-ing the automotive, construction, and industrial machinery industries. In the automotive business, this unit focuses on high-end products used in important automotive components such as engines, drive trains, and suspensions.
� CONSTRUCTION PRODUCTS UNIT
NSSMC delivers H-beams, steel sheet piles, steel pipe piles, rails, and other steel materials used in the civil engineering and construction sectors in Japan and overseas. By responding to diverse needs, this unit contributes to the development of the infrastructure that supports people’s lives.
� PIPE & TUBE UNIT
NSSMC is a world leader in high-end seamless pipes used in oil and gas development and other energy areas. Large-diameter tubes for pipelines and steel tubes for automobiles and construction/industrial machinery are also areas of strength.
� RAILWAY, AUTOMOTIVE & MACHINERY PARTS UNIT
NSSMC is the only manufacturer of railway steel wheels and axles in Japan. Our major products in this unit are railway rolling stock components and forged crankshafts for automobiles. Global expan-sion is also progressing, and there are now two manufacturing bases for railway wheels and axles, and four bases for crankshafts in the world.
� TITANIUM & SPECIALTY STAINLESS STEEL UNIT
Utilizing titanium’s lighter, high-strength, and corro-sion-resistant properties, NSSMC is a world leader in titanium products for construction, aviation, gen-eral industrial, and consumer-related applications. The unit also provides products with excellent heat resistance, corrosion resistance, and formability made of specialty stainless steel that are used in the automotive, IT, environmental, and energy sectors.
STAINLESS STEEL UNIT
Nippon Steel & Sumikin Stainless Steel Corporation (NSSC) provides a wide range of high-quality stainless steel products that includes steel plates, sheets, bars, and wire rods by leveraging its most advanced technologies in the world. NSSC has developed the world’s fi rst Sn-added low-inter-stitial ferritic steel grade “FW (forward) series” and a new type of duplex stainless steel.
1716
NIP
PO
N STE
EL &
SU
MITO
MO
META
L CO
RP
OR
ATION
AN
NU
AL R
EP
OR
T 2015
GR
OW
TH
ST
RA
TE
GY
BY
SE
GM
EN
T
STEELMAKING andSTEEL FABRICATION
Blast furnace
Converter
Continuous casting
Lightweight welded H-beam
Welded pipe and tube
Hot rolling
Cold rolling & Galvanizing
Steel sheet
�
� �
Bar mill
Bar
Wire rod mill
Wire rod
� � Seamless pipe
Seamless pipe mill
�
Large shape mill
H-beam / Sheet pile / Rail
�
Forging press
Die forged crankshaft
�
Wheel rolling
Assembling
Wheel / Axle
Bogie truck
�
�
Hot strip mill
20-high sendzimir
cold rolling mill
Stainless steel sheet
�
Steel plate rolling
UO pipe
� Steel plate
�
Billets
Blooms
Slabs
5,000
4,000
3,000
2,000
1,000
500
400
300
200
100
20132012 2014
4,877.9
3,790.4
41.5
321.2
401.9
4,939.2
Net sales, Ordinary profit
Billions of yen Billions of yen
Net sales (left scale)Ordinary profit (right scale)FY
NSSMC Group’s hydrogen-related solutions for supporting the realization of a hydrogen society based on materials manufacturing
As of March 31, 2015, a total of 120,000 “Ene-Farm” household fuel cells, which is fi rst launched in 2009, has installed in homes and other locations*1. In addition, commercial sales of fuel cell vehicles (FCVs) began in December 2014, and there are plans for approximately 100*2 hydrogen stations by the end of 2015. In such ways, Japan is making steady progress toward the realization of a hydrogen society that will contribute to a reduction in CO2 emissions and the diversifi cation of energy sources.The NSSMC Group initiated research on hydrogen-related technologies in the second half of the 1970s, embarked on basic research in the 1980s, and com-menced full-fl edged infrastructure research at the start of the 1990s. At the time of the corporate integration in 2012, NSSMC inaugurated the Hydrogen and Energy Materials Research Laboratory in its R&D Laboratories and accelerated materials-related development activities. Moreover, in the 2017 Mid-Term Management Plan, announced in March 2015, NSSMC stated again that it will actively undertake research on next-generation steel materials that meet new social needs, including those of the hydrogen society.The Strategic Road Map for Hydrogen and Fuel Cells, announced by the Council for a Strategy for Hydrogen and Fuel Cells in 2014, divided the development strategy into three phases until around 2040. Phase 1 (until around 2025) is positioned as a period of dramatic expansion in the use of hydrogen (the full-fl edged intro-duction of fuel cells into society). Here, we will explain the Group’s solutions in hydrogen transportation and storage, and their use, which will play the main role in Phase 1. Specifi cally, these solutions are centered on technology related to fuel cells and hydrogen stations, and also their supporting analytical technology.
*1 Announced by the Advanced Cogeneration and Energy Utilization Center Japan*2 Based on the Basic Energy Plan (2014 Cabinet Decision)
Left: Conventional SUS316L stainless steel pipeMiddle and right: HRX19™ stainless steel pipe
Hydrogen station construction business (Nippon Steel & Sumikin P&E)
Nippon Steel & Sumikin Pipeline & Engineering Co., Ltd. has entered the hydro-gen station construction business on a full scale. The company has contributed to the establishment of energy infrastructure such as natural gas pipelines and LNG plants for over 50 years. In the fi eld of hydrogen infrastructure as well, it has experience in constructing a hydrogen station at the 2005 World Exposition in Aichi, Japan, and in constructing the fi rst hydrogen pipelines in Japan for the Kitakyushu Hydrogen Town project. In addition to these advanced engineering achievements, the company formed an alliance with U.S.-based Air Products and Chemicals, Inc.—the world’s leading company in the supply of hydrogen—in February 2014, and will contribute to the realization of a hydrogen society through the construction of hydrogen sta-tions with excellent safety and reliability.
Accumulators (Nippon Steel & Sumikin Kikoh)
For hydro stations, Nippon Steel & Sumikin Kikoh Company, Ltd. man-ufactures and sells accumulators made of SCM435 steel that do not become damaged by embrittlement in a hydrogen environment. In terms of materials, as hydrogen gas embrittlement is a concern at a certain level of pressure and above, embrittlement has been controlled through the optimization of strength. Furthermore, in the case of form-ing and processing both end parts, the spinning method has been adopted to reduce internal unevenness, which tends to become the location of damage (cracks), which helps to realize a smooth surface.
In the hydrogen society, hydrogen is often in a state of high pressure so that it can
be transported and stored effi ciently. High-carbon steel, which is created by adding
carbon to the iron structure, is extremely strong and well-suited to the transporta-
tion of gases in a high-pressure state, whereas hydrogen weakens the bonding of
crystals that penetrate the crystal structure of iron (hydrogen embrittlement). This
phenomenon is known to be pronounced in high-carbon steel, in particular. The
NSSMC Group manufactures various kinds of steel materials with high strength
and high resistance to embrittlement even in hydrogen environments by control-
ling various types of chemical elements that affect the properties of iron and by
introducing component technologies such as the refi ning of the crystal structure.
The Group has a lineup of various kinds of steel materials that suit the pressure
conditions of usage environments, namely, SCM435 for pressures 35MPa and
below, SUS316L for pressures above 35MPa, and HRX19™ and STH™-1, 2 for pres-
sures higher than 70MPa.
NSSMC Group’s lineup of steel materials with high strength and high resistance to hydrogen gas embrittlement
* Identical thickness assumed
–40 20
35
70
105
140
Hydrogen pressure (M
Pa)Temperature (℃ )
SCM435
SUS316L
STHTM-1,2
HRX19TM
Stainless steel for high-pressure hydrogen environments, HRX19™
(Nippon Steel & Sumitomo Metal Corporation / Nippon Steel & Sumikin Stainless Steel
Pipe Co., Ltd.)
HRX19™ is high-performance stainless steel used mainly for pipes, joints, and valves in the high-pressure hydrogen environments of hydrogen stations. Thanks to its three distinctive features—(1) excellent resistance to hydrogen gas embrittlement, (2) high strength, and (3) excellent weldability—this steel can contribute to the reduction of costs and the improvement of maintain-ability and safety in constructing hydrogen stations. It has already been adopted for commercial hydrogen stations, including those constructed by Iwatani Corporation and Tokyo Gas Co., Ltd.(1) Excellent resistance to hydrogen gas embrittlement: Owing to the optimization of component
elements and the manufacturing method, the austenitic stainless steel has the highest level of resistance to hydrogen gas embrittlement, which helps to lengthen piping life in hydrogen stations as well as improve safety.
(2) High strength: HRX19™ guarantees tensile strength of 800MPa under normal temperatures and is approximately 1.5 times stronger than conventional SUS316L stainless steel. Thanks to its superior strength, it enables the design of thinner pipe walls even in high-pressure hydrogen environments (70MPa), and for pipes to be made with greater inside diameters, resulting in larger capacity and shorter hydrogen fi lling times.
(3) Excellent weldability: Even for welded parts, HRX19™ can guarantee tensile strength of more than 800MPa at normal temperatures. Consequently, it can reduce maintenance costs caused by changing from screw construction to weld construction and alleviate the risk of hydrogen leakage from joints.
Transportation and storage of hydrogen (hydrogen station-related)
Station construction
Manufacture of accumulators
Compressor Accumulator
Hydrogen StationNippon Steel & Sumikin P&E
Dispenser
Use of hydrogen (fuel cells for automotive and other applications)
Materials for fuel battery cells such as separators
NSSMC has a lineup comprising two types of separator materi-als made of titanium or stainless steel for fuel cells. Separators, which are important components for fuel battery cells such as household stationary fuel cells and automotive fuel cells, require electrical conductivity as well as high corrosion resistance, as they are located in highly corrosive environments. Moreover, as tens of units to hundreds of units are used in a single fuel cell, they need to be mass produced to lower their cost. For automo-tive applications as well, separators need to be thinned to reduce the weight of vehicle bodies and use materials that do not crack due to vibration.NSSMC has succeeded in providing the necessary properties as components and materials for fuel cells to highly corrosion-resistant
titanium and stainless steel materials that can be mass pro-duced by press molding. This was enabled by newly using tech-nology to control the structure and ingredients of the materials and their surface modifi cation technology. NSSMC’s advanced rolling technology also enables making materials with thinness in units of tens of microns.These materials can also be applied to other parts in fuel battery cells that require the same properties as separators. NSSMC’s special rolled titanium material was incorporated in the Mirai, Toyota Motor Corporation’s FCV that launched in December 2014.
Analysis-related technologies
Evaluation technology used in high-pressure hydrogen gas
(Nippon Steel & Sumikin Technology)
Evaluation tests in high-pressure hydrogen gas environments are essential to the development of materials with high resistance to hydrogen embrittlement. However, as various precautions are required in terms of hard and soft aspects when conducting evaluation tests in high-pressure hydrogen gas environments, there are few testing companies that have this kind of evaluation technology. Nippon Steel & Sumikin Technology Co., Ltd. supports the development of materials with high resistance to hydrogen embrittlement through exposure tests, tensile tests, and fatigue test in high-pressure hydrogen gas environments. Exposure tests can evaluate performance changes caused by hydrogen exposure over a long period while tensile tests can evaluate embrittlement behavior. In addition, fatigue tests can evaluate crack extension tests in hydrogen gas and the degree of fatigue (S-N curve).
Fatigue test
HydrogenManufacturing
Use
Transportation / Storage
Air electrode
Air
Catalytic layer
Polymer fi lm
Metal separators
Metal separators
Gas diffusion layer Gas diffusion layer
Hydrogen
Fuel electrode
Fuel Battery Cells
Source: Agency for Natural Resources and Energy
Fuel Cell Vehicles (FCVs)
Motor
Battery
High-pressure hydrogen tank
Fuel cell stack
(power generator)
Nippon Steel & Sumikin Kikoh
1918
NIP
PO
N STE
EL &
SU
MITO
MO
META
L CO
RP
OR
ATION
AN
NU
AL R
EP
OR
T 2015
GR
OW
TH
ST
RA
TE
GY
BY
SE
GM
EN
T
FOCUS
(Engineering and Construction / Chemicals / New Materials / System Solutions)
Sales by Business Field
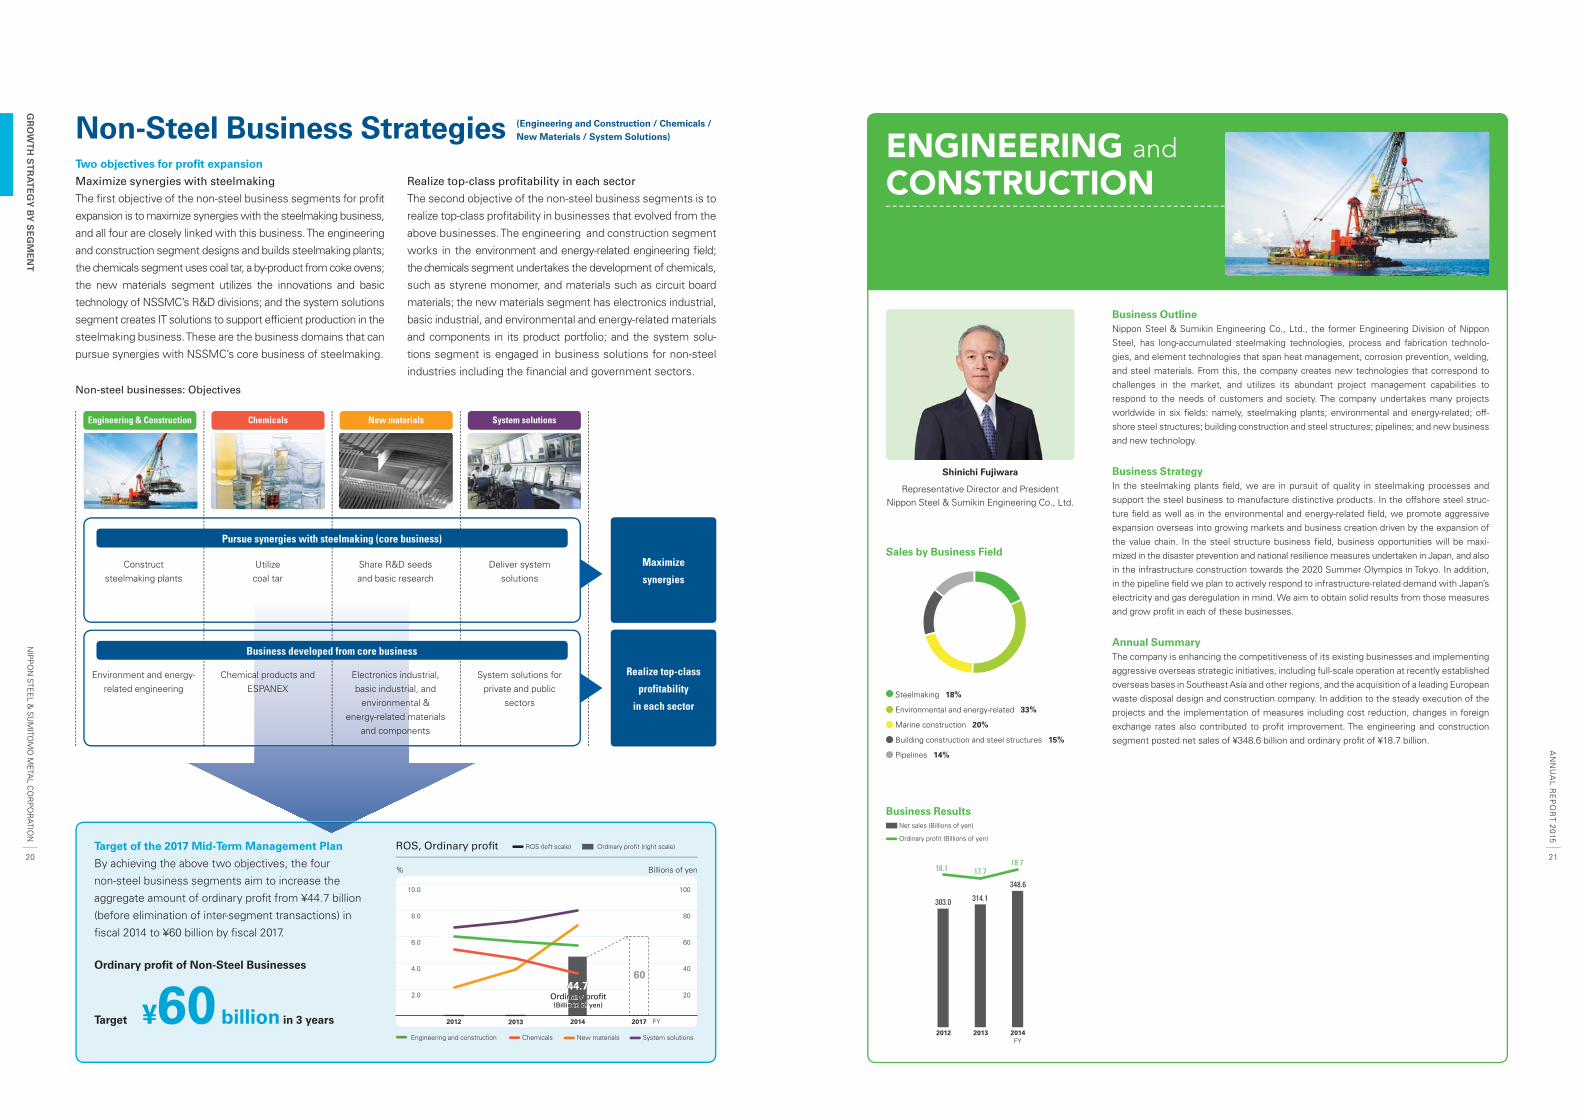
Business ResultsNet sales (Billions of yen)
Ordinary profit (Billions of yen)
Shinichi Fujiwara
Representative Director and PresidentNippon Steel & Sumikin Engineering Co., Ltd.
ENGINEERING and CONSTRUCTION
Realize top-class
profitability
in each sector Steelmaking 18%
Environmental and energy-related 33%
Building construction and steel structures 15%
Pipelines 14%
Marine construction 20%
2120
NIP
PO
N STE
EL &
SU
MITO
MO
META
L CO
RP
OR
ATION
AN
NU
AL R
EP
OR
T 2015
GR
OW
TH
ST
RA
TE
GY
BY
SE
GM
EN
T
10.0
8.0
6.0
4.0
2.0
100
80
60
40
20
20132012 20172014
3,212 3,212
44.744.760
Ordinary profit(Billions of yen)
Ordinary profit(Billions of yen)
ROS, Ordinary profi t
% Billions of yen
Target of the 2017 Mid-Term Management Plan
By achieving the above two objectives, the four
non-steel business segments aim to increase the
aggregate amount of ordinary profi t from ¥44.7 billion
(before elimination of inter-segment transactions) in
fi scal 2014 to ¥60 billion by fi scal 2017.
Ordinary profi t of Non-Steel Businesses
Target ¥60 billion in 3 years FY
Non-Steel Business StrategiesTwo objectives for profi t expansion
Maximize synergies with steelmaking
The fi rst objective of the non-steel business segments for profi t
expansion is to maximize synergies with the steelmaking business,
and all four are closely linked with this business. The engineering
and construction segment designs and builds steelmaking plants;
the chemicals segment uses coal tar, a by-product from coke ovens;
the new materials segment utilizes the innovations and basic
technology of NSSMC’s R&D divisions; and the system solutions
segment creates IT solutions to support effi cient production in the
steelmaking business. These are the business domains that can
pursue synergies with NSSMC’s core business of steelmaking.
Realize top-class profi tability in each sector
The second objective of the non-steel business segments is to
realize top-class profi tability in businesses that evolved from the
above businesses. The engineering and construction segment
works in the environment and energy-related engineering fi eld;
the chemicals segment undertakes the development of chemicals,
such as styrene monomer, and materials such as circuit board
materials; the new materials segment has electronics industrial,
basic industrial, and environmental and energy-related materials
and components in its product portfolio; and the system solu-
tions segment is engaged in business solutions for non-steel
industries including the fi nancial and government sectors.
Non-steel businesses: Objectives
Pursue synergies with steelmaking (core business)
Maximize
synergies
Engineering & Construction Chemicals New materials System solutions
Business developed from core business
Construct steelmaking plants
Environment and energy-related engineering
Utilize coal tar
Chemical products and ESPANEX
Share R&D seeds and basic research
Electronics industrial, basic industrial, and
environmental & energy-related materials
and components
Deliver system solutions
System solutions for private and public
sectors
Business OutlineNippon Steel & Sumikin Engineering Co., Ltd., the former Engineering Division of Nippon Steel, has long-accumulated steelmaking technologies, process and fabrication technolo-gies, and element technologies that span heat management, corrosion prevention, welding, and steel materials. From this, the company creates new technologies that correspond to challenges in the market, and utilizes its abundant project management capabilities to respond to the needs of customers and society. The company undertakes many projects worldwide in six fi elds: namely, steelmaking plants; environmental and energy-related; off-shore steel structures; building construction and steel structures; pipelines; and new business and new technology.
Business StrategyIn the steelmaking plants fi eld, we are in pursuit of quality in steelmaking processes and support the steel business to manufacture distinctive products. In the offshore steel struc-ture fi eld as well as in the environmental and energy-related fi eld, we promote aggressive expansion overseas into growing markets and business creation driven by the expansion of the value chain. In the steel structure business fi eld, business opportunities will be maxi-mized in the disaster prevention and national resilience measures undertaken in Japan, and also in the infrastructure construction towards the 2020 Summer Olympics in Tokyo. In addition, in the pipeline fi eld we plan to actively respond to infrastructure-related demand with Japan’s electricity and gas deregulation in mind. We aim to obtain solid results from those measures and grow profi t in each of these businesses.
Annual SummaryThe company is enhancing the competitiveness of its existing businesses and implementing aggressive overseas strategic initiatives, including full-scale operation at recently established overseas bases in Southeast Asia and other regions, and the acquisition of a leading European waste disposal design and construction company. In addition to the steady execution of the projects and the implementation of measures including cost reduction, changes in foreign exchange rates also contributed to profi t improvement. The engineering and construction segment posted net sales of ¥348.6 billion and ordinary profi t of ¥18.7 billion.
20132012 2014
348.6
314.1303.0
18.1 17.718.7
FYEngineering and construction Chemicals New materials System solutions
ROS (left scale) Ordinary profit (right scale)
Business ResultsSales by Business Field
Business Results
Net sales (Billions of yen)
Ordinary profit (Billions of yen)
Norio Katsuyama
Representative DirectorChief Executive Offi cer
Nippon Steel & Sumikin Chemical Co., Ltd.
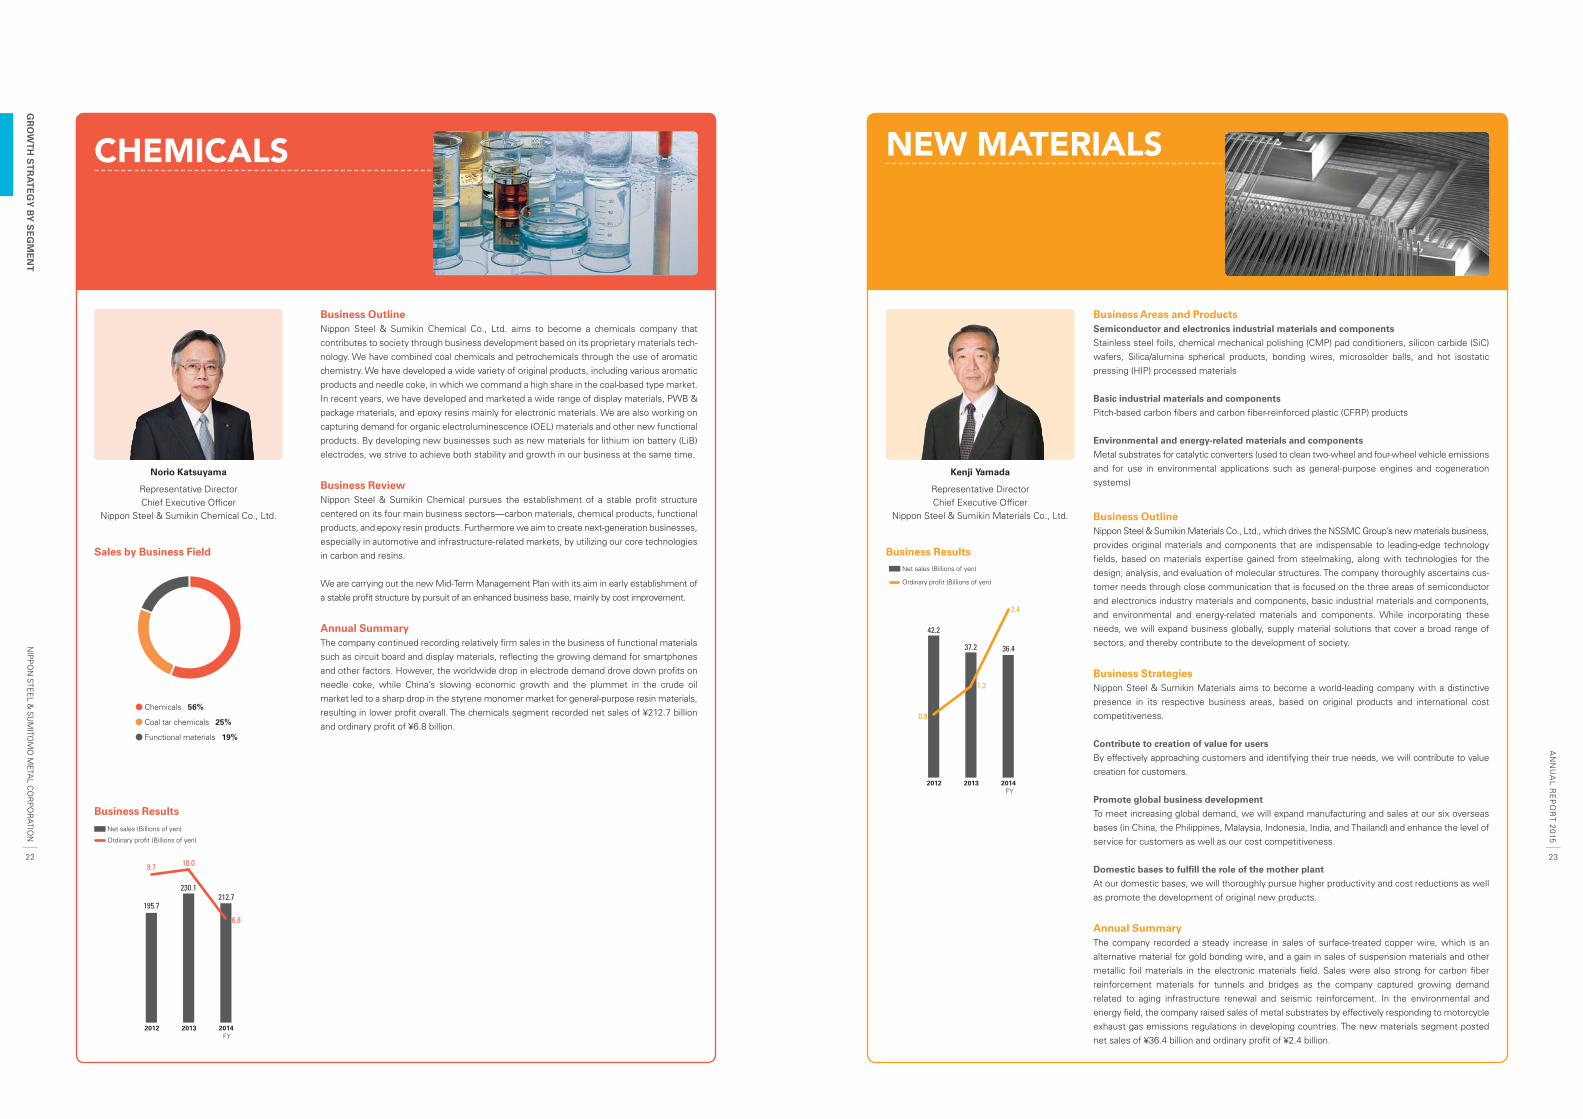
CHEMICALS
Business OutlineNippon Steel & Sumikin Chemical Co., Ltd. aims to become a chemicals company that contributes to society through business development based on its proprietary materials tech-nology. We have combined coal chemicals and petrochemicals through the use of aromatic chemistry. We have developed a wide variety of original products, including various aromatic products and needle coke, in which we command a high share in the coal-based type market. In recent years, we have developed and marketed a wide range of display materials, PWB & package materials, and epoxy resins mainly for electronic materials. We are also working on capturing demand for organic electroluminescence (OEL) materials and other new functional products. By developing new businesses such as new materials for lithium ion battery (LiB) electrodes, we strive to achieve both stability and growth in our business at the same time.
Business ReviewNippon Steel & Sumikin Chemical pursues the establishment of a stable profi t structure centered on its four main business sectors—carbon materials, chemical products, functional products, and epoxy resin products. Furthermore we aim to create next-generation businesses, especially in automotive and infrastructure-related markets, by utilizing our core technologies in carbon and resins.
We are carrying out the new Mid-Term Management Plan with its aim in early establishment of a stable profi t structure by pursuit of an enhanced business base, mainly by cost improvement.
Annual SummaryThe company continued recording relatively fi rm sales in the business of functional materials such as circuit board and display materials, refl ecting the growing demand for smartphones and other factors. However, the worldwide drop in electrode demand drove down profi ts on needle coke, while China’s slowing economic growth and the plummet in the crude oil market led to a sharp drop in the styrene monomer market for general-purpose resin materials, resulting in lower profi t overall. The chemicals segment recorded net sales of ¥212.7 billion and ordinary profi t of ¥6.8 billion.
Chemicals 56%
Coal tar chemicals 25%
Functional materials 19%
Kenji Yamada
Representative DirectorChief Executive Offi cer
Nippon Steel & Sumikin Materials Co., Ltd.
NEW MATERIALS
Business Areas and ProductsSemiconductor and electronics industrial materials and components
Stainless steel foils, chemical mechanical polishing (CMP) pad conditioners, silicon carbide (SiC) wafers, Silica/alumina spherical products, bonding wires, microsolder balls, and hot isostatic pressing (HIP) processed materials
Basic industrial materials and components
Pitch-based carbon fi bers and carbon fi ber-reinforced plastic (CFRP) products
Environmental and energy-related materials and components
Metal substrates for catalytic converters (used to clean two-wheel and four-wheel vehicle emissions and for use in environmental applications such as general-purpose engines and cogeneration systems)
Business Outline Nippon Steel & Sumikin Materials Co., Ltd., which drives the NSSMC Group’s new materials business, provides original materials and components that are indispensable to leading-edge technology fi elds, based on materials expertise gained from steelmaking, along with technologies for the design, analysis, and evaluation of molecular structures. The company thoroughly ascertains cus-tomer needs through close communication that is focused on the three areas of semiconductor and electronics industry materials and components, basic industrial materials and components, and environmental and energy-related materials and components. While incorporating these needs, we will expand business globally, supply material solutions that cover a broad range of sectors, and thereby contribute to the development of society.
Business StrategiesNippon Steel & Sumikin Materials aims to become a world-leading company with a distinctive presence in its respective business areas, based on original products and international cost competitiveness.
Contribute to creation of value for users
By effectively approaching customers and identifying their true needs, we will contribute to value creation for customers.
Promote global business development
To meet increasing global demand, we will expand manufacturing and sales at our six overseas bases (in China, the Philippines, Malaysia, Indonesia, India, and Thailand) and enhance the level of service for customers as well as our cost competitiveness.
Domestic bases to fulfi ll the role of the mother plant
At our domestic bases, we will thoroughly pursue higher productivity and cost reductions as well as promote the development of original new products.
Annual SummaryThe company recorded a steady increase in sales of surface-treated copper wire, which is an alternative material for gold bonding wire, and a gain in sales of suspension materials and other metallic foil materials in the electronic materials fi eld. Sales were also strong for carbon fi ber reinforcement materials for tunnels and bridges as the company captured growing demand related to aging infrastructure renewal and seismic reinforcement. In the environmental and energy fi eld, the company raised sales of metal substrates by effectively responding to motorcycle exhaust gas emissions regulations in developing countries. The new materials segment posted net sales of ¥36.4 billion and ordinary profi t of ¥2.4 billion.
2322
NIP
PO
N STE
EL &
SU
MITO
MO
META
L CO
RP
OR
ATION
AN
NU
AL R
EP
OR
T 2015
GR
OW
TH
ST
RA
TE
GY
BY
SE
GM
EN
T
20132012 2014
36.437.2
42.2
0.9
1.3
2.4
FY
Net sales (Billions of yen)
Ordinary profit (Billions of yen)
20132012 2014
212.7230.1
195.7
9.7 10.0
6.8
FY
Munetaka Shashiki
Representative Director and PresidentNS Solutions Corporation
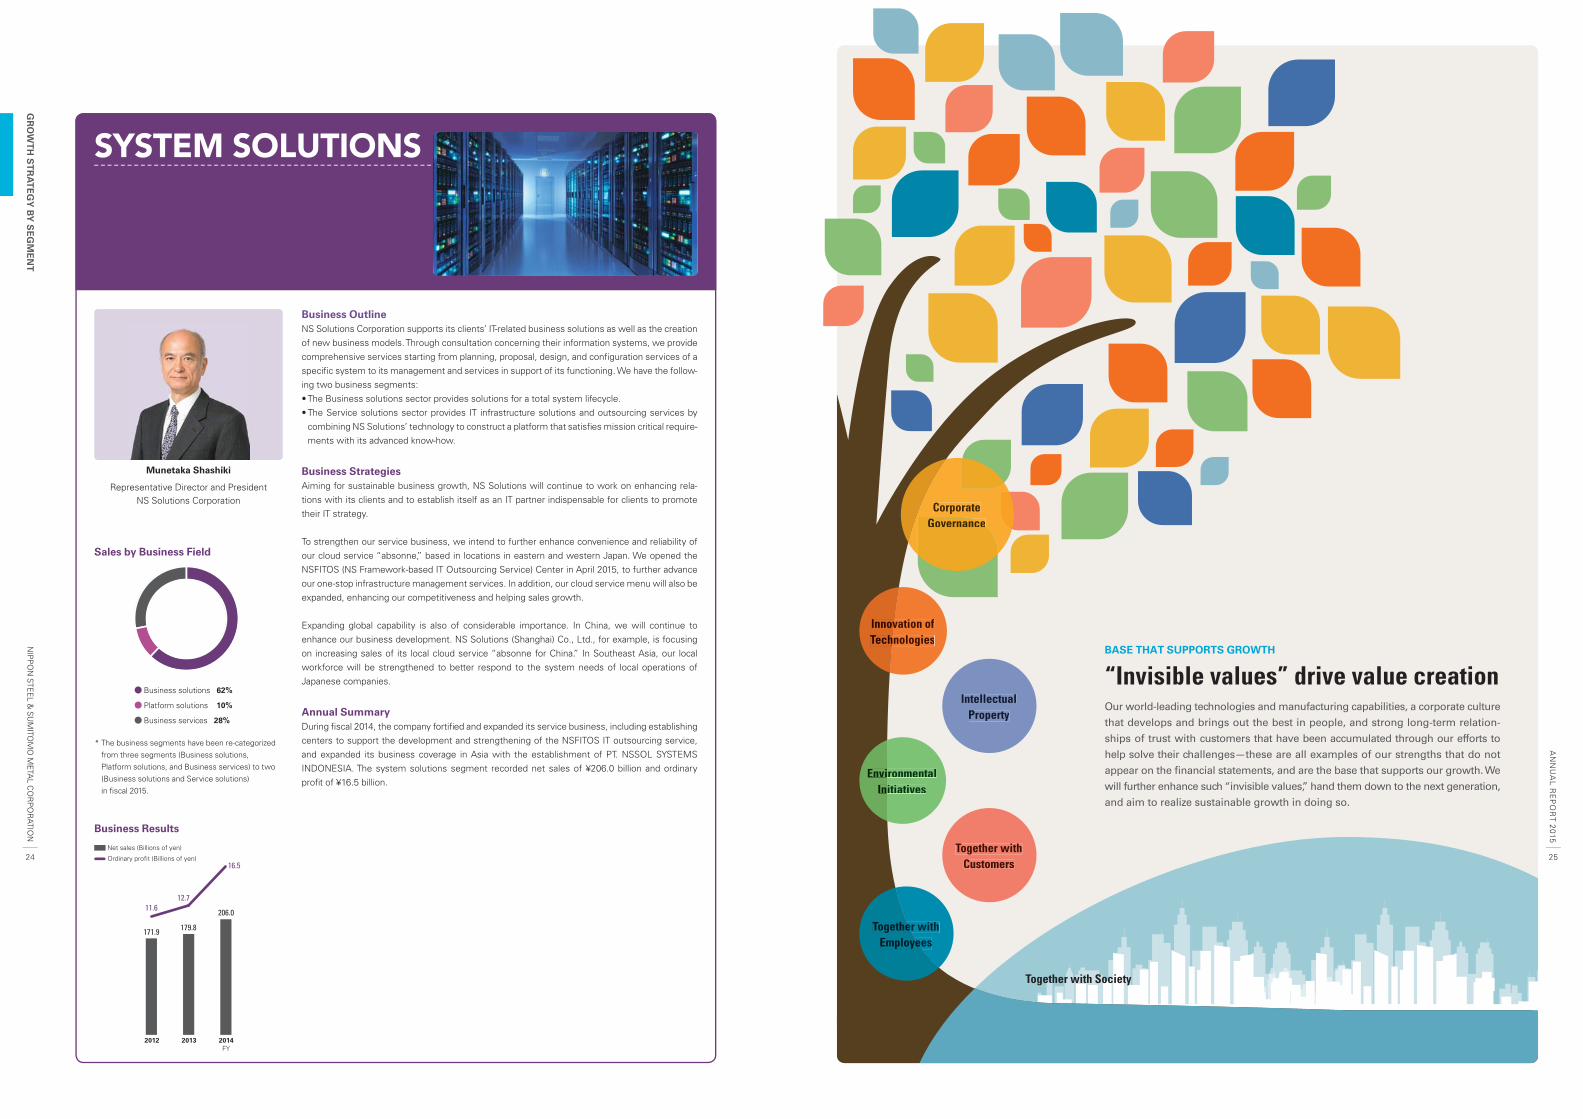
SYSTEM SOLUTIONS
Business Outline NS Solutions Corporation supports its clients’ IT-related business solutions as well as the creation of new business models. Through consultation concerning their information systems, we provide comprehensive services starting from planning, proposal, design, and confi guration services of a specifi c system to its management and services in support of its functioning. We have the follow-ing two business segments: • The Business solutions sector provides solutions for a total system lifecycle. • The Service solutions sector provides IT infrastructure solutions and outsourcing services by
combining NS Solutions’ technology to construct a platform that satisfi es mission critical require-ments with its advanced know-how.
Business StrategiesAiming for sustainable business growth, NS Solutions will continue to work on enhancing rela-tions with its clients and to establish itself as an IT partner indispensable for clients to promote their IT strategy.
To strengthen our service business, we intend to further enhance convenience and reliability of our cloud service “absonne,” based in locations in eastern and western Japan. We opened the NSFITOS (NS Framework-based IT Outsourcing Service) Center in April 2015, to further advance our one-stop infrastructure management services. In addition, our cloud service menu will also be expanded, enhancing our competitiveness and helping sales growth.
Expanding global capability is also of considerable importance. In China, we will continue to enhance our business development. NS Solutions (Shanghai) Co., Ltd., for example, is focusing on increasing sales of its local cloud service “absonne for China.” In Southeast Asia, our local workforce will be strengthened to better respond to the system needs of local operations of Japanese companies.
Annual SummaryDuring fi scal 2014, the company fortifi ed and expanded its service business, including establishing centers to support the development and strengthening of the NSFITOS IT outsourcing service, and expanded its business coverage in Asia with the establishment of PT. NSSOL SYSTEMS INDONESIA. The system solutions segment recorded net sales of ¥206.0 billion and ordinary profi t of ¥16.5 billion.
Sales by Business Field
Business Results
* The business segments have been re-categorized from three segments (Business solutions, Platform solutions, and Business services) to two (Business solutions and Service solutions) in fi scal 2015.
Business solutions 62%
Platform solutions 10%
Business services 28%
2524
NIP
PO
N STE
EL &
SU
MITO
MO
META
L CO
RP
OR
ATION
AN
NU
AL R
EP
OR
T 2015
GR
OW
TH
ST
RA
TE
GY
BY
SE
GM
EN
T
BASE THAT SUPPORTS GROWTH
“Invisible values” drive value creationOur world-leading technologies and manufacturing capabilities, a corporate culture
that develops and brings out the best in people, and strong long-term relation-
ships of trust with customers that have been accumulated through our efforts to
help solve their challenges—these are all examples of our strengths that do not
appear on the fi nancial statements, and are the base that supports our growth. We
will further enhance such “invisible values,” hand them down to the next generation,
and aim to realize sustainable growth in doing so.
ronmentalEnviitiativesIn
Together with Society
CorporatenceGovernance
vation ofInnovhnologiesTech
IntellectualProperty
Together withCustomers
er withTogetheryeesEmployee
20132012 2014
206.0
179.8171.9
11.612.7
16.5
Net sales (Billions of yen)
Ordinary profit (Billions of yen)
FY
2726
NIP
PO
N STE
EL &
SU
MITO
MO
META
L CO
RP
OR
ATION
AN
NU
AL R
EP
OR
T 2015
BA
SE
TH
AT
SU
PP
OR
TS
GR
OW
TH
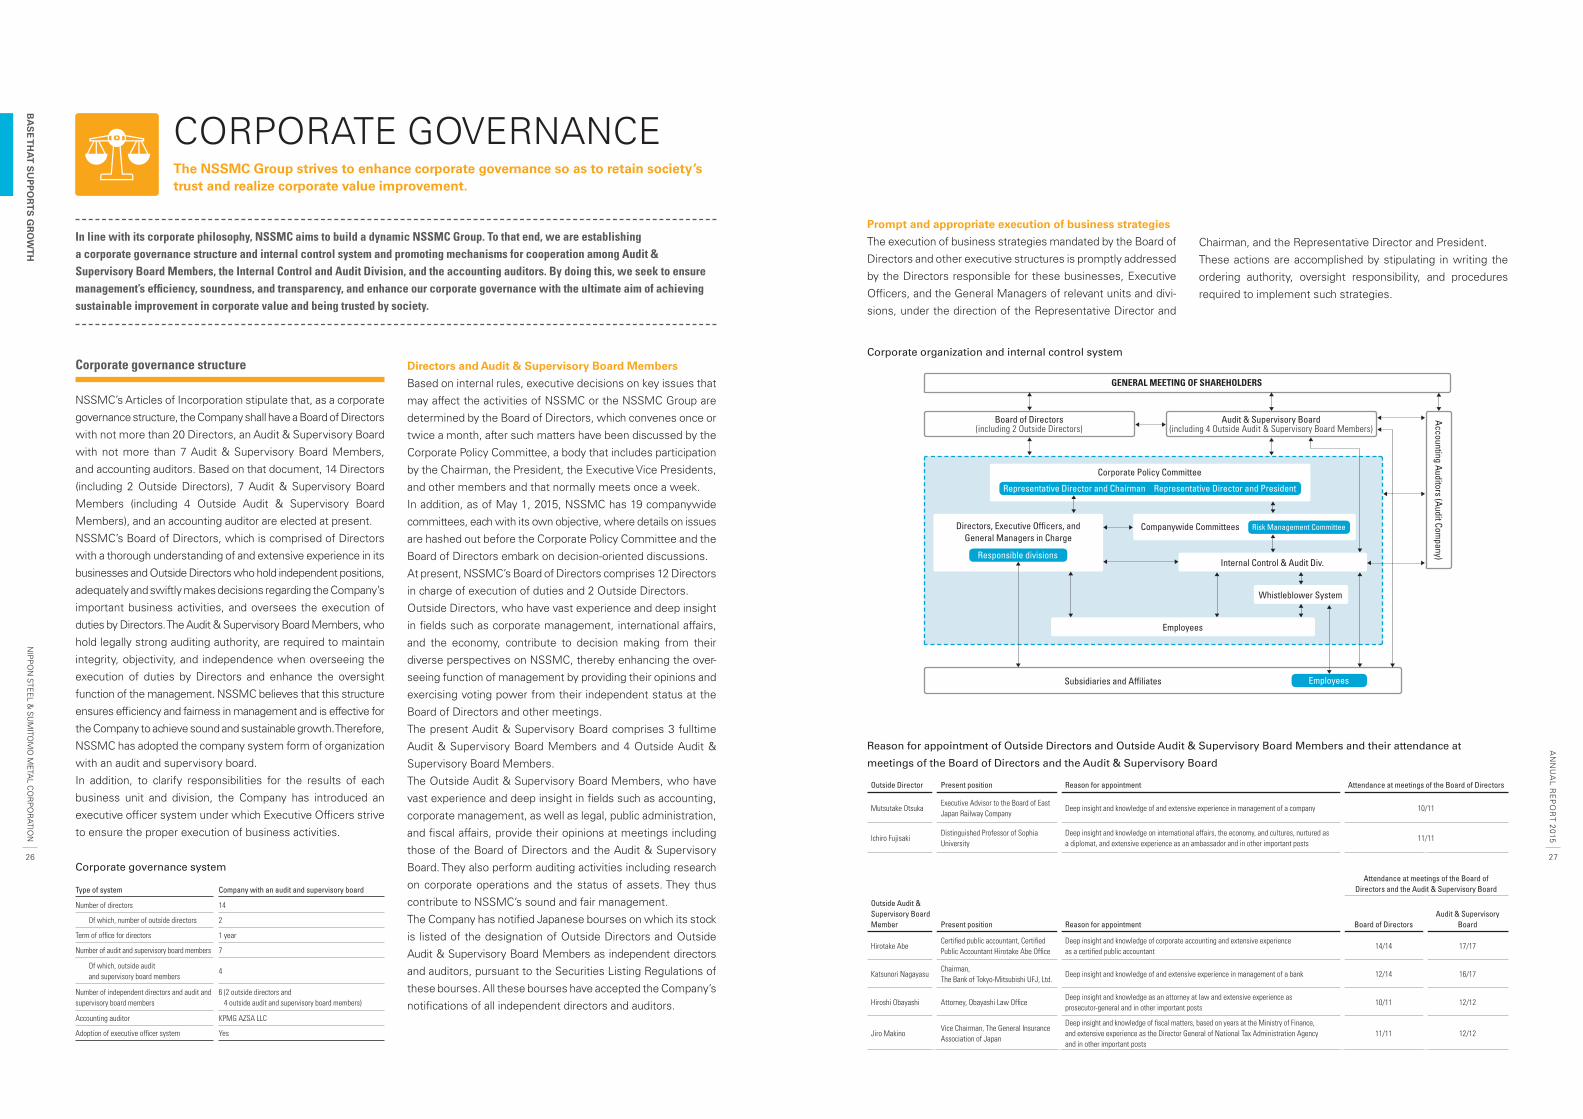
In line with its corporate philosophy, NSSMC aims to build a dynamic NSSMC Group. To that end, we are establishing a corporate governance structure and internal control system and promoting mechanisms for cooperation among Audit & Supervisory Board Members, the Internal Control and Audit Division, and the accounting auditors. By doing this, we seek to ensure management’s effi ciency, soundness, and transparency, and enhance our corporate governance with the ultimate aim of achieving sustainable improvement in corporate value and being trusted by society.
Corporate governance structure
NSSMC’s Articles of Incorporation stipulate that, as a corporate
governance structure, the Company shall have a Board of Directors
with not more than 20 Directors, an Audit & Supervisory Board
with not more than 7 Audit & Supervisory Board Members,
and accounting auditors. Based on that document, 14 Directors
(including 2 Outside Directors), 7 Audit & Supervisory Board
Members (including 4 Outside Audit & Supervisory Board
Members), and an accounting auditor are elected at present.
NSSMC’s Board of Directors, which is comprised of Directors
with a thorough understanding of and extensive experience in its
businesses and Outside Directors who hold independent positions,
adequately and swiftly makes decisions regarding the Company’s
important business activities, and oversees the execution of
duties by Directors. The Audit & Supervisory Board Members, who
hold legally strong auditing authority, are required to maintain
integrity, objectivity, and independence when overseeing the
execution of duties by Directors and enhance the oversight
function of the management. NSSMC believes that this structure
ensures effi ciency and fairness in management and is effective for
the Company to achieve sound and sustainable growth. Therefore,
NSSMC has adopted the company system form of organization
with an audit and supervisory board.
In addition, to clarify responsibilities for the results of each
business unit and division, the Company has introduced an
executive offi cer system under which Executive Offi cers strive
to ensure the proper execution of business activities.
Corporate governance system
Type of system Company with an audit and supervisory board
Number of directors 14
Of which, number of outside directors 2
Term of offi ce for directors 1 year
Number of audit and supervisory board members 7
Of which, outside audit and supervisory board members
4
Number of independent directors and audit and supervisory board members
6 (2 outside directors and 4 outside audit and supervisory board members)
Accounting auditor KPMG AZSA LLC
Adoption of executive offi cer system Yes
Directors and Audit & Supervisory Board Members
Based on internal rules, executive decisions on key issues that
may affect the activities of NSSMC or the NSSMC Group are
determined by the Board of Directors, which convenes once or
twice a month, after such matters have been discussed by the
Corporate Policy Committee, a body that includes participation
by the Chairman, the President, the Executive Vice Presidents,
and other members and that normally meets once a week.
In addition, as of May 1, 2015, NSSMC has 19 companywide
committees, each with its own objective, where details on issues
are hashed out before the Corporate Policy Committee and the
Board of Directors embark on decision-oriented discussions.
At present, NSSMC’s Board of Directors comprises 12 Directors
in charge of execution of duties and 2 Outside Directors.
Outside Directors, who have vast experience and deep insight
in fi elds such as corporate management, international affairs,
and the economy, contribute to decision making from their
diverse perspectives on NSSMC, thereby enhancing the over-
seeing function of management by providing their opinions and
exercising voting power from their independent status at the
Board of Directors and other meetings.
The present Audit & Supervisory Board comprises 3 fulltime
Audit & Supervisory Board Members and 4 Outside Audit &
Supervisory Board Members.
The Outside Audit & Supervisory Board Members, who have
vast experience and deep insight in fi elds such as accounting,
corporate management, as well as legal, public administration,
and fi scal affairs, provide their opinions at meetings including
those of the Board of Directors and the Audit & Supervisory
Board. They also perform auditing activities including research
on corporate operations and the status of assets. They thus
contribute to NSSMC’s sound and fair management.
The Company has notifi ed Japanese bourses on which its stock
is listed of the designation of Outside Directors and Outside
Audit & Supervisory Board Members as independent directors
and auditors, pursuant to the Securities Listing Regulations of
these bourses. All these bourses have accepted the Company’s
notifi cations of all independent directors and auditors.
CORPORATE GOVERNANCEThe NSSMC Group strives to enhance corporate governance so as to retain society’s trust and realize corporate value improvement.
Reason for appointment of Outside Directors and Outside Audit & Supervisory Board Members and their attendance at
meetings of the Board of Directors and the Audit & Supervisory Board
Outside Director Present position Reason for appointment Attendance at meetings of the Board of Directors
Mutsutake Otsuka Executive Advisor to the Board of East Japan Railway Company
Deep insight and knowledge of and extensive experience in management of a company 10/11
Ichiro FujisakiDistinguished Professor of Sophia University
Deep insight and knowledge on international affairs, the economy, and cultures, nurtured as a diplomat, and extensive experience as an ambassador and in other important posts
11/11
Attendance at meetings of the Board of Directors and the Audit & Supervisory Board
Outside Audit & Supervisory Board Member Present position Reason for appointment Board of Directors
Audit & Supervisory Board
Hirotake AbeCertifi ed public accountant, Certifi ed Public Accountant Hirotake Abe Offi ce
Deep insight and knowledge of corporate accounting and extensive experience as a certifi ed public accountant
14/14 17/17
Katsunori NagayasuChairman, The Bank of Tokyo-Mitsubishi UFJ, Ltd.
Deep insight and knowledge of and extensive experience in management of a bank 12/14 16/17
Hiroshi Obayashi Attorney, Obayashi Law Offi ceDeep insight and knowledge as an attorney at law and extensive experience as prosecutor-general and in other important posts
10/11 12/12
Jiro MakinoVice Chairman, The General Insurance Association of Japan
Deep insight and knowledge of fi scal matters, based on years at the Ministry of Finance,and extensive experience as the Director General of National Tax Administration Agency and in other important posts
11/11 12/12
Prompt and appropriate execution of business strategies
The execution of business strategies mandated by the Board of
Directors and other executive structures is promptly addressed
by the Directors responsible for these businesses, Executive
Offi cers, and the General Managers of relevant units and divi-
sions, under the direction of the Representative Director and
Chairman, and the Representative Director and President.
These actions are accomplished by stipulating in writing the
ordering authority, oversight responsibility, and procedures
required to implement such strategies.
Corporate organization and internal control system
Subsidiaries and Affi liates Employees
GENERAL MEETING OF SHAREHOLDERS
Board of Directors (including 2 Outside Directors)
Audit & Supervisory Board (including 4 Outside Audit & Supervisory Board Members)
Accounting Auditors (Audit Company)
Corporate Policy Committee
Companywide Committees Risk Management Committee
Representative Director and Chairman Representative Director and President
Directors, Executive Offi cers, and General Managers in Charge
Internal Control & Audit Div.
Whistleblower System
Employees
Responsible divisions
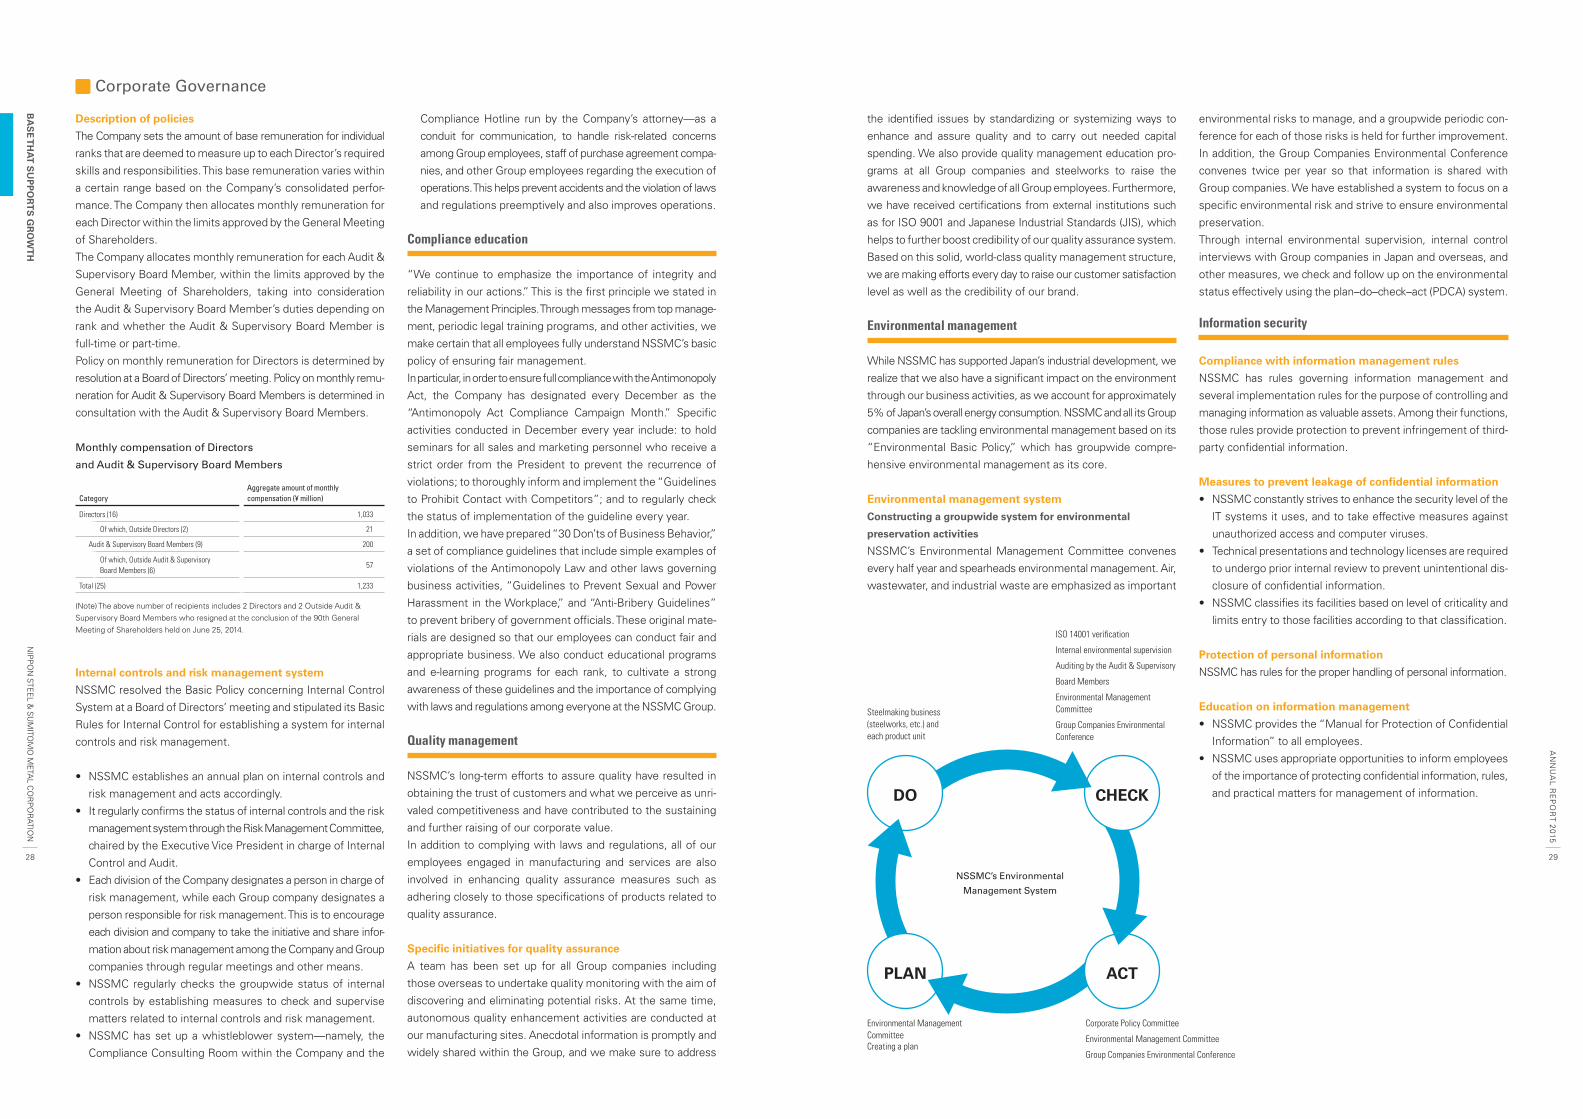
2928
NIP
PO
N STE
EL &
SU
MITO
MO
META
L CO
RP
OR
ATION
AN
NU
AL R
EP
OR
T 2015
BA
SE
TH
AT
SU
PP
OR
TS
GR
OW
TH
Description of policies
The Company sets the amount of base remuneration for individual
ranks that are deemed to measure up to each Director’s required
skills and responsibilities. This base remuneration varies within
a certain range based on the Company’s consolidated perfor-
mance. The Company then allocates monthly remuneration for
each Director within the limits approved by the General Meeting
of Shareholders.
The Company allocates monthly remuneration for each Audit &
Supervisory Board Member, within the limits approved by the
General Meeting of Shareholders, taking into consideration
the Audit & Supervisory Board Member’s duties depending on
rank and whether the Audit & Supervisory Board Member is
full-time or part-time.
Policy on monthly remuneration for Directors is determined by
resolution at a Board of Directors’ meeting. Policy on monthly remu-
neration for Audit & Supervisory Board Members is determined in
consultation with the Audit & Supervisory Board Members.
Monthly compensation of Directors
and Audit & Supervisory Board Members
CategoryAggregate amount of monthly compensation (¥ million)
Directors (16) 1,033
Of which, Outside Directors (2) 21
Audit & Supervisory Board Members (9) 200
Of which, Outside Audit & Supervisory Board Members (6)
57
Total (25) 1,233
(Note) The above number of recipients includes 2 Directors and 2 Outside Audit & Supervisory Board Members who resigned at the conclusion of the 90th General Meeting of Shareholders held on June 25, 2014.
Internal controls and risk management system
NSSMC resolved the Basic Policy concerning Internal Control
System at a Board of Directors’ meeting and stipulated its Basic
Rules for Internal Control for establishing a system for internal
controls and risk management.
• NSSMC establishes an annual plan on internal controls and
risk management and acts accordingly.
• It regularly confi rms the status of internal controls and the risk
management system through the Risk Management Committee,
chaired by the Executive Vice President in charge of Internal
Control and Audit.
• Each division of the Company designates a person in charge of
risk management, while each Group company designates a
person responsible for risk management. This is to encourage
each division and company to take the initiative and share infor-
mation about risk management among the Company and Group
companies through regular meetings and other means.
• NSSMC regularly checks the groupwide status of internal
controls by establishing measures to check and supervise
matters related to internal controls and risk management.
• NSSMC has set up a whistleblower system—namely, the
Compliance Consulting Room within the Company and the
NSSMC’s Environmental
Management System
DO CHECK
ACTPLAN
Steelmaking business (steelworks, etc.) and each product unit
ISO 14001 verifi cation
Internal environmental supervision
Auditing by the Audit & Supervisory
Board Members
Environmental Management Committee
Group Companies Environmental Conference
Corporate Policy Committee
Environmental Management Committee
Group Companies Environmental Conference
Environmental Management CommitteeCreating a plan
Information security
Compliance with information management rules
NSSMC has rules governing information management and
several implementation rules for the purpose of controlling and
managing information as valuable assets. Among their functions,
those rules provide protection to prevent infringement of third-
party confi dential information.
Measures to prevent leakage of confi dential information
• NSSMC constantly strives to enhance the security level of the
IT systems it uses, and to take effective measures against
unauthorized access and computer viruses.
• Technical presentations and technology licenses are required
to undergo prior internal review to prevent unintentional dis-
closure of confi dential information.
• NSSMC classifi es its facilities based on level of criticality and
limits entry to those facilities according to that classifi cation.
Protection of personal information
NSSMC has rules for the proper handling of personal information.
Education on information management
• NSSMC provides the “Manual for Protection of Confi dential
Information” to all employees.
• NSSMC uses appropriate opportunities to inform employees
of the importance of protecting confi dential information, rules,
and practical matters for management of information.
Corporate Governance
Compliance Hotline run by the Company’s attorney—as a
conduit for communication, to handle risk-related concerns
among Group employees, staff of purchase agreement compa-
nies, and other Group employees regarding the execution of
operations. This helps prevent accidents and the violation of laws
and regulations preemptively and also improves operations.
Compliance education
“We continue to emphasize the importance of integrity and
reliability in our actions.” This is the fi rst principle we stated in
the Management Principles. Through messages from top manage-
ment, periodic legal training programs, and other activities, we
make certain that all employees fully understand NSSMC’s basic
policy of ensuring fair management.
In particular, in order to ensure full compliance with the Antimonopoly
Act, the Company has designated every December as the
“Antimonopoly Act Compliance Campaign Month.” Specifi c
activities conducted in December every year include: to hold
seminars for all sales and marketing personnel who receive a
strict order from the President to prevent the recurrence of
violations; to thoroughly inform and implement the “Guidelines
to Prohibit Contact with Competitors”; and to regularly check
the status of implementation of the guideline every year.
In addition, we have prepared “30 Don’ts of Business Behavior,”
a set of compliance guidelines that include simple examples of
violations of the Antimonopoly Law and other laws governing
business activities, “Guidelines to Prevent Sexual and Power
Harassment in the Workplace,” and “Anti-Bribery Guidelines”
to prevent bribery of government offi cials. These original mate-
rials are designed so that our employees can conduct fair and
appropriate business. We also conduct educational programs
and e-learning programs for each rank, to cultivate a strong
awareness of these guidelines and the importance of complying
with laws and regulations among everyone at the NSSMC Group.
Quality management
NSSMC’s long-term efforts to assure quality have resulted in
obtaining the trust of customers and what we perceive as unri-
valed competitiveness and have contributed to the sustaining
and further raising of our corporate value.
In addition to complying with laws and regulations, all of our
employees engaged in manufacturing and services are also
involved in enhancing quality assurance measures such as
adhering closely to those specifi cations of products related to
quality assurance.
Specifi c initiatives for quality assurance
A team has been set up for all Group companies including
those overseas to undertake quality monitoring with the aim of
discovering and eliminating potential risks. At the same time,
autonomous quality enhancement activities are conducted at
our manufacturing sites. Anecdotal information is promptly and
widely shared within the Group, and we make sure to address
the identifi ed issues by standardizing or systemizing ways to
enhance and assure quality and to carry out needed capital
spending. We also provide quality management education pro-
grams at all Group companies and steelworks to raise the
awareness and knowledge of all Group employees. Furthermore,
we have received certifi cations from external institutions such
as for ISO 9001 and Japanese Industrial Standards (JIS), which
helps to further boost credibility of our quality assurance system.
Based on this solid, world-class quality management structure,
we are making efforts every day to raise our customer satisfaction
level as well as the credibility of our brand.
Environmental management
While NSSMC has supported Japan’s industrial development, we
realize that we also have a signifi cant impact on the environment
through our business activities, as we account for approximately
5% of Japan’s overall energy consumption. NSSMC and all its Group
companies are tackling environmental management based on its
“Environmental Basic Policy,” which has groupwide compre-
hensive environmental management as its core.
Environmental management system
Constructing a groupwide system for environmental
preservation activities
NSSMC’s Environmental Management Committee convenes
every half year and spearheads environmental management. Air,
wastewater, and industrial waste are emphasized as important
environmental risks to manage, and a groupwide periodic con-
ference for each of those risks is held for further improvement.
In addition, the Group Companies Environmental Conference
convenes twice per year so that information is shared with
Group companies. We have established a system to focus on a
specifi c environmental risk and strive to ensure environmental
preservation.
Through internal environmental supervision, internal control
interviews with Group companies in Japan and overseas, and
other measures, we check and follow up on the environmental
status effectively using the plan–do–check–act (PDCA) system.
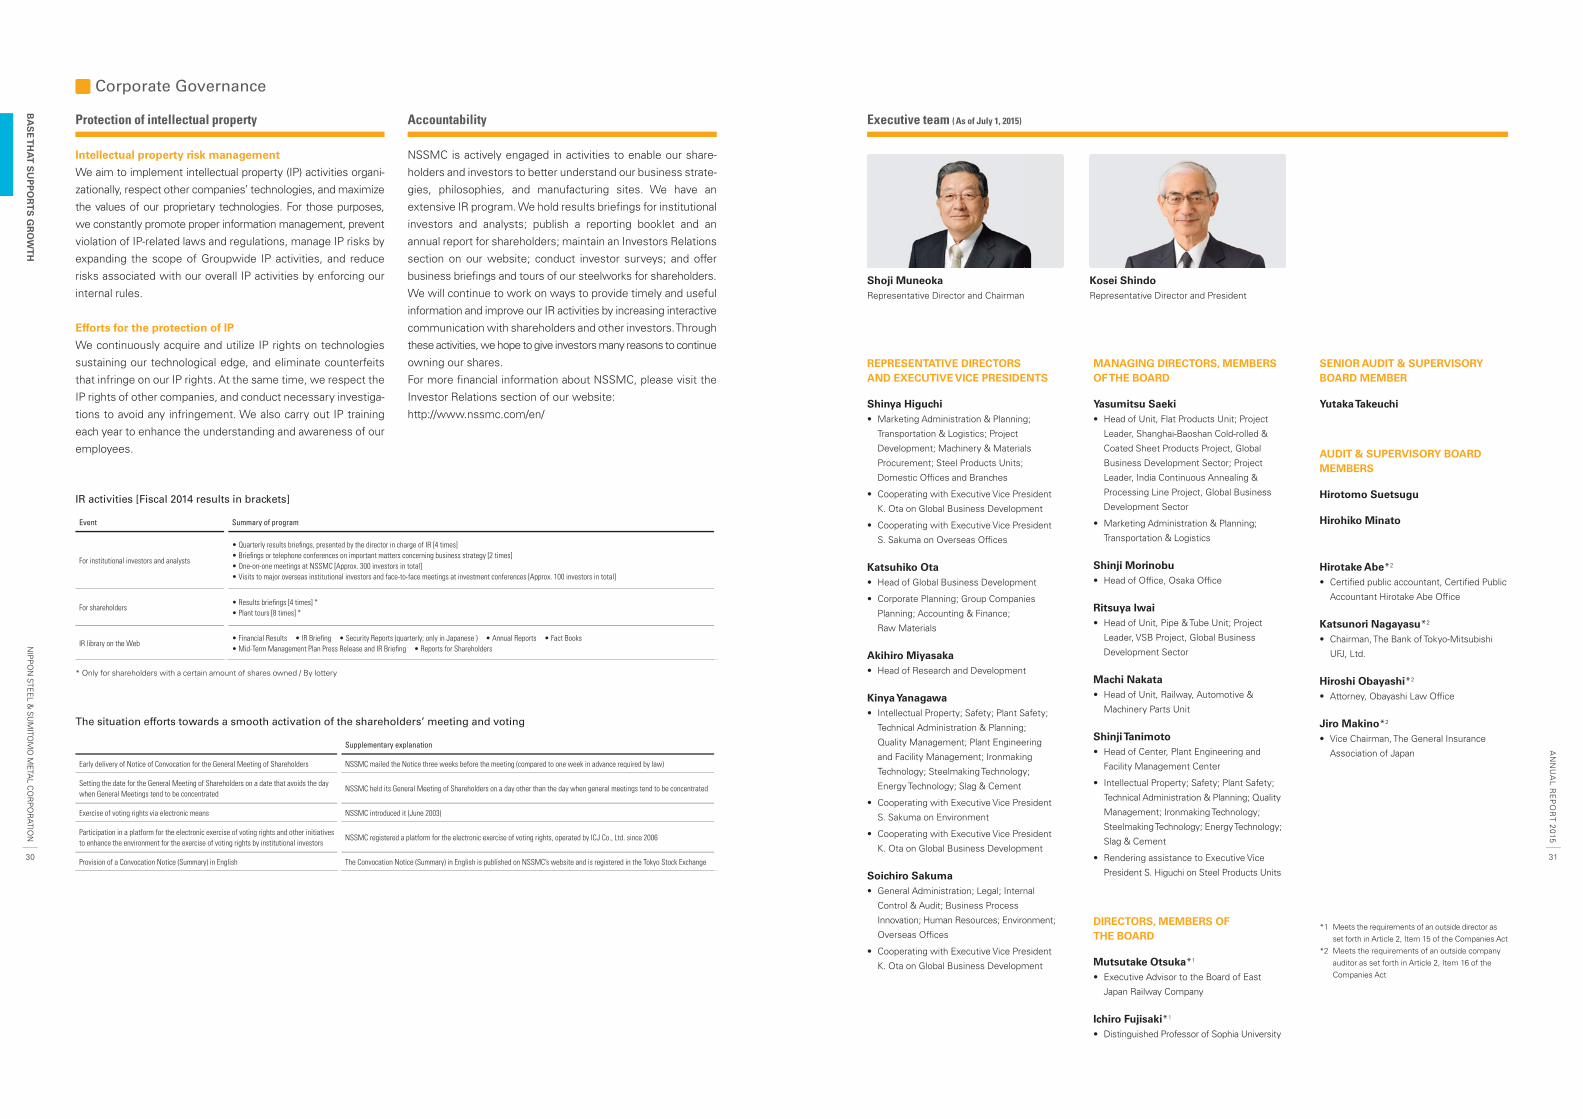
3130
NIP
PO
N STE
EL &
SU
MITO
MO
META
L CO
RP
OR
ATION
AN
NU
AL R
EP
OR
T 2015
BA
SE
TH
AT
SU
PP
OR
TS
GR
OW
TH
Protection of intellectual property
Intellectual property risk management
We aim to implement intellectual property (IP) activities organi-
zationally, respect other companies’ technologies, and maximize
the values of our proprietary technologies. For those purposes,
we constantly promote proper information management, prevent
violation of IP-related laws and regulations, manage IP risks by
expanding the scope of Groupwide IP activities, and reduce
risks associated with our overall IP activities by enforcing our
internal rules.
Efforts for the protection of IP
We continuously acquire and utilize IP rights on technologies
sustaining our technological edge, and eliminate counterfeits
that infringe on our IP rights. At the same time, we respect the
IP rights of other companies, and conduct necessary investiga-
tions to avoid any infringement. We also carry out IP training
each year to enhance the understanding and awareness of our
employees.
Executive team (As of July 1, 2015)
Shoji MuneokaRepresentative Director and Chairman
Kosei ShindoRepresentative Director and President
MANAGING DIRECTORS, MEMBERS OF THE BOARD
Yasumitsu Saeki• Head of Unit, Flat Products Unit; Project
Leader, Shanghai-Baoshan Cold-rolled &
Coated Sheet Products Project, Global
Business Development Sector; Project
Leader, India Continuous Annealing &
Processing Line Project, Global Business
Development Sector
• Marketing Administration & Planning;
Transportation & Logistics
Shinji Morinobu• Head of Offi ce, Osaka Offi ce
Ritsuya Iwai• Head of Unit, Pipe & Tube Unit; Project
Leader, VSB Project, Global Business
Development Sector
Machi Nakata• Head of Unit, Railway, Automotive &
Machinery Parts Unit
Shinji Tanimoto• Head of Center, Plant Engineering and
Facility Management Center
• Intellectual Property; Safety; Plant Safety;
Technical Administration & Planning; Quality
Management; Ironmaking Technology;
Steelmaking Technology; Energy Technology;
Slag & Cement
• Rendering assistance to Executive Vice
President S. Higuchi on Steel Products Units
DIRECTORS, MEMBERS OF THE BOARD
Mutsutake Otsuka*1
• Executive Advisor to the Board of East
Japan Railway Company
Ichiro Fujisaki*1
• Distinguished Professor of Sophia University
SENIOR AUDIT & SUPERVISORY BOARD MEMBER
Yutaka Takeuchi
AUDIT & SUPERVISORY BOARD MEMBERS
Hirotomo Suetsugu
Hirohiko Minato
Hirotake Abe*2
• Certifi ed public accountant, Certifi ed Public
Accountant Hirotake Abe Offi ce
Katsunori Nagayasu*2
• Chairman, The Bank of Tokyo-Mitsubishi
UFJ, Ltd.
Hiroshi Obayashi*2
• Attorney, Obayashi Law Offi ce
Jiro Makino*2
• Vice Chairman, The General Insurance
Association of Japan
REPRESENTATIVE DIRECTORSAND EXECUTIVE VICE PRESIDENTS
Shinya Higuchi• Marketing Administration & Planning;
Transportation & Logistics; Project
Development; Machinery & Materials
Procurement; Steel Products Units;
Domestic Offi ces and Branches
• Cooperating with Executive Vice President
K. Ota on Global Business Development
• Cooperating with Executive Vice President
S. Sakuma on Overseas Offi ces
Katsuhiko Ota• Head of Global Business Development
• Corporate Planning; Group Companies
Planning; Accounting & Finance;
Raw Materials
Akihiro Miyasaka• Head of Research and Development
Kinya Yanagawa• Intellectual Property; Safety; Plant Safety;
Technical Administration & Planning;
Quality Management; Plant Engineering
and Facility Management; Ironmaking
Technology; Steelmaking Technology;
Energy Technology; Slag & Cement
• Cooperating with Executive Vice President
S. Sakuma on Environment
• Cooperating with Executive Vice President
K. Ota on Global Business Development
Soichiro Sakuma• General Administration; Legal; Internal
Control & Audit; Business Process
Innovation; Human Resources; Environment;
Overseas Offi ces
• Cooperating with Executive Vice President
K. Ota on Global Business Development
*1 Meets the requirements of an outside director as set forth in Article 2, Item 15 of the Companies Act
*2 Meets the requirements of an outside company auditor as set forth in Article 2, Item 16 of the Companies Act
IR activities [Fiscal 2014 results in brackets]
Event Summary of program
For institutional investors and analysts
• Quarterly results briefi ngs, presented by the director in charge of IR [4 times]• Briefi ngs or telephone conferences on important matters concerning business strategy [2 times]• One-on-one meetings at NSSMC [Approx. 300 investors in total]• Visits to major overseas institutional investors and face-to-face meetings at investment conferences [Approx. 100 investors in total]
For shareholders• Results briefi ngs [4 times] *• Plant tours [8 times] *
IR library on the Web• Financial Results • IR Briefi ng • Security Reports (quarterly; only in Japanese ) • Annual Reports • Fact Books• Mid-Term Management Plan Press Release and IR Briefi ng • Reports for Shareholders
* Only for shareholders with a certain amount of shares owned / By lottery
The situation efforts towards a smooth activation of the shareholders’ meeting and voting
Supplementary explanation
Early delivery of Notice of Convocation for the General Meeting of Shareholders NSSMC mailed the Notice three weeks before the meeting (compared to one week in advance required by law)
Setting the date for the General Meeting of Shareholders on a date that avoids the day when General Meetings tend to be concentrated
NSSMC held its General Meeting of Shareholders on a day other than the day when general meetings tend to be concentrated
Exercise of voting rights via electronic means NSSMC introduced it (June 2003)
Participation in a platform for the electronic exercise of voting rights and other initiatives to enhance the environment for the exercise of voting rights by institutional investors
NSSMC registered a platform for the electronic exercise of voting rights, operated by ICJ Co., Ltd. since 2006
Provision of a Convocation Notice (Summary) in English The Convocation Notice (Summary) in English is published on NSSMC’s website and is registered in the Tokyo Stock Exchange
Corporate Governance
Accountability
NSSMC is actively engaged in activities to enable our share-
holders and investors to better understand our business strate-
gies, philosophies, and manufacturing sites. We have an
extensive IR program. We hold results briefi ngs for institutional
investors and analysts; publish a reporting booklet and an
annual report for shareholders; maintain an Investors Relations
section on our website; conduct investor surveys; and offer
business briefi ngs and tours of our steelworks for shareholders.
We will continue to work on ways to provide timely and useful
information and improve our IR activities by increasing interactive
communication with shareholders and other investors. Through
these activities, we hope to give investors many reasons to continue
owning our shares.
For more fi nancial information about NSSMC, please visit the
Investor Relations section of our website:
http://www.nssmc.com/en/
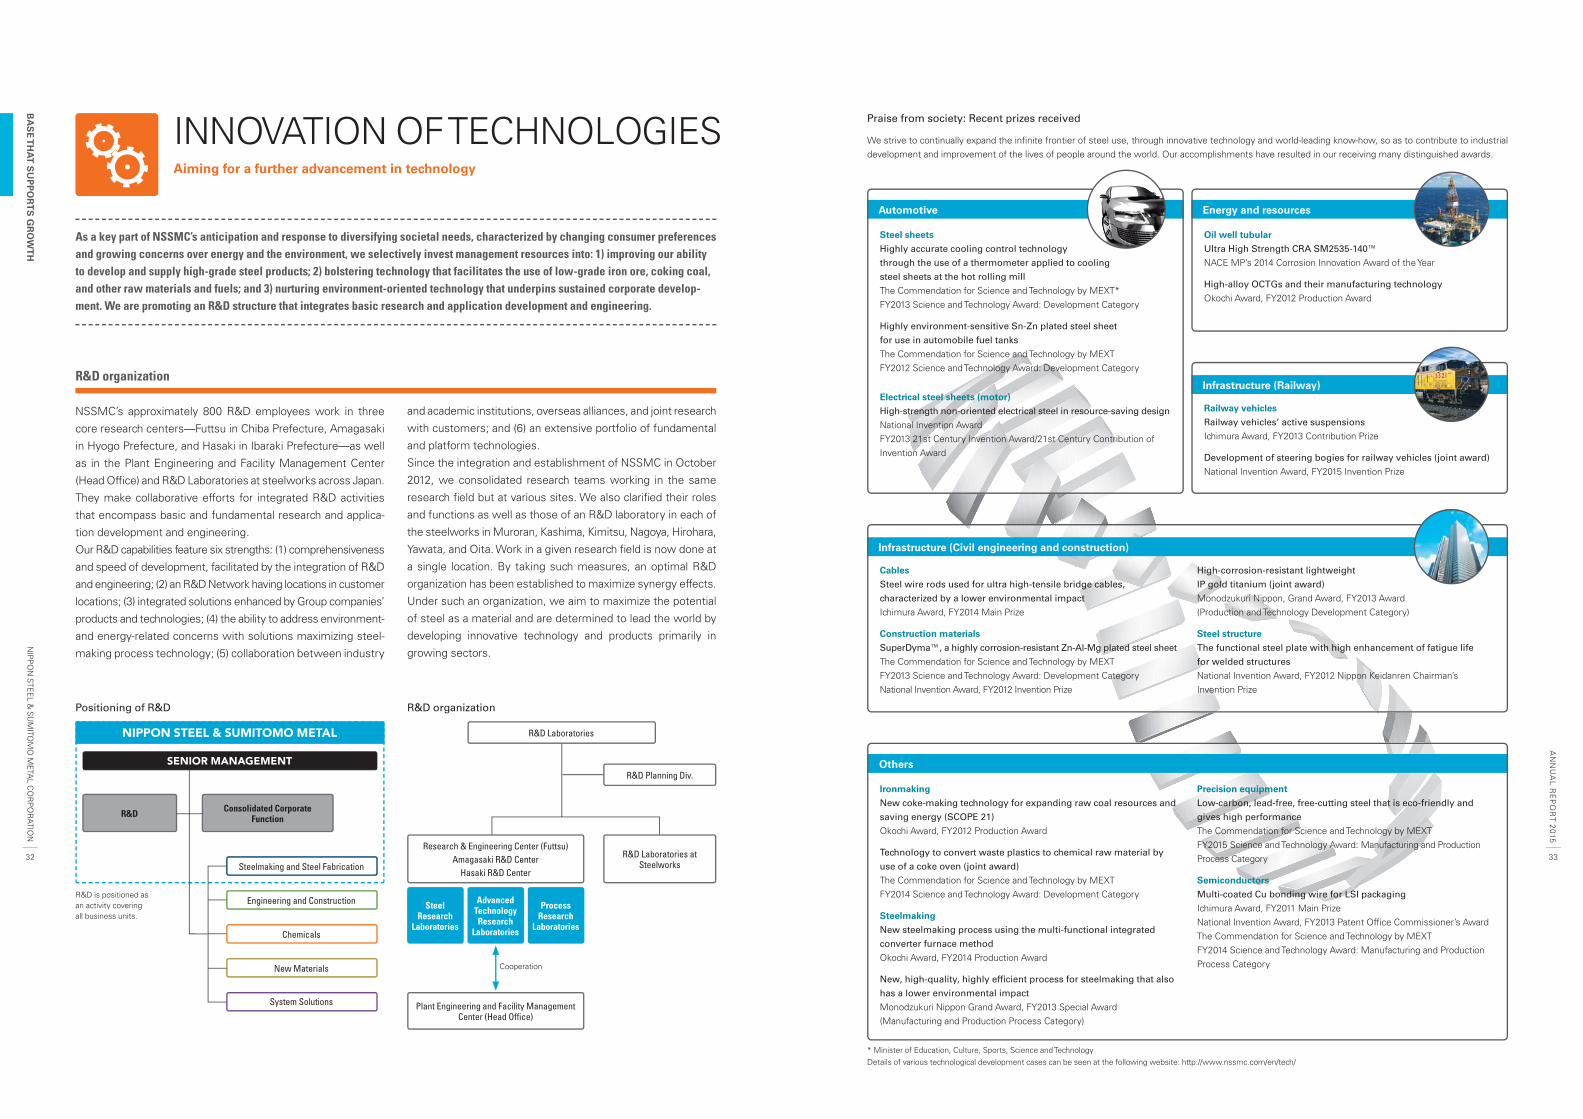
3332
NIP
PO
N STE
EL &
SU
MITO
MO
META
L CO
RP
OR
ATION
AN
NU
AL R
EP
OR
T 2015
BA
SE
TH
AT
SU
PP
OR
TS
GR
OW
TH
As a key part of NSSMC’s anticipation and response to diversifying societal needs, characterized by changing consumer preferences and growing concerns over energy and the environment, we selectively invest management resources into: 1) improving our ability to develop and supply high-grade steel products; 2) bolstering technology that facilitates the use of low-grade iron ore, coking coal, and other raw materials and fuels; and 3) nurturing environment-oriented technology that underpins sustained corporate develop-ment. We are promoting an R&D structure that integrates basic research and application development and engineering.
R&D organization
NSSMC’s approximately 800 R&D employees work in three
core research centers—Futtsu in Chiba Prefecture, Amagasaki
in Hyogo Prefecture, and Hasaki in Ibaraki Prefecture—as well
as in the Plant Engineering and Facility Management Center
(Head Offi ce) and R&D Laboratories at steelworks across Japan.
They make collaborative efforts for integrated R&D activities
that encompass basic and fundamental research and applica-
tion development and engineering.
Our R&D capabilities feature six strengths: (1) comprehensiveness
and speed of development, facilitated by the integration of R&D
and engineering; (2) an R&D Network having locations in customer
locations; (3) integrated solutions enhanced by Group companies’
products and technologies; (4) the ability to address environment-
and energy-related concerns with solutions maximizing steel-
making process technology; (5) collaboration between industry
INNOVATION OF TECHNOLOGIESAiming for a further advancement in technology
and academic institutions, overseas alliances, and joint research
with customers; and (6) an extensive portfolio of fundamental
and platform technologies.
Since the integration and establishment of NSSMC in October
2012, we consolidated research teams working in the same
research fi eld but at various sites. We also clarifi ed their roles
and functions as well as those of an R&D laboratory in each of
the steelworks in Muroran, Kashima, Kimitsu, Nagoya, Hirohara,
Yawata, and Oita. Work in a given research fi eld is now done at
a single location. By taking such measures, an optimal R&D
organization has been established to maximize synergy effects.
Under such an organization, we aim to maximize the potential
of steel as a material and are determined to lead the world by
developing innovative technology and products primarily in
growing sectors.
Praise from society: Recent prizes received
We strive to continually expand the infi nite frontier of steel use, through innovative technology and world-leading know-how, so as to contribute to industrial development and improvement of the lives of people around the world. Our accomplishments have resulted in our receiving many distinguished awards.
Automotive
Steel sheets
Highly accurate cooling control technology
through the use of a thermometer applied to cooling
steel sheets at the hot rolling mill
The Commendation for Science and Technology by MEXT*FY2013 Science and Technology Award: Development Category
Highly environment-sensitive Sn-Zn plated steel sheet
for use in automobile fuel tanks
The Commendation for Science and Technology by MEXTFY2012 Science and Technology Award: Development Category
Electrical steel sheets (motor)
High-strength non-oriented electrical steel in resource-saving design
National Invention AwardFY2013 21st Century Invention Award/21st Century Contribution of Invention Award
Infrastructure (Railway)
Railway vehicles
Railway vehicles’ active suspensions
Ichimura Award, FY2013 Contribution Prize
Development of steering bogies for railway vehicles (joint award)
National Invention Award, FY2015 Invention Prize
Others
Ironmaking
New coke-making technology for expanding raw coal resources and
saving energy (SCOPE 21)
Okochi Award, FY2012 Production Award
Technology to convert waste plastics to chemical raw material by
use of a coke oven (joint award)
The Commendation for Science and Technology by MEXTFY2014 Science and Technology Award: Development Category
Steelmaking
New steelmaking process using the multi-functional integrated
converter furnace method
Okochi Award, FY2014 Production Award
New, high-quality, highly effi cient process for steelmaking that also
has a lower environmental impact
Monodzukuri Nippon Grand Award, FY2013 Special Award (Manufacturing and Production Process Category)
Precision equipment
Low-carbon, lead-free, free-cutting steel that is eco-friendly and
gives high performance
The Commendation for Science and Technology by MEXTFY2015 Science and Technology Award: Manufacturing and Production Process Category
Semiconductors
Multi-coated Cu bonding wire for LSI packaging
Ichimura Award, FY2011 Main PrizeNational Invention Award, FY2013 Patent Offi ce Commissioner’s AwardThe Commendation for Science and Technology by MEXTFY2014 Science and Technology Award: Manufacturing and Production Process Category
Energy and resources
Oil well tubular
Ultra High Strength CRA SM2535-140™
NACE MP’s 2014 Corrosion Innovation Award of the Year
High-alloy OCTGs and their manufacturing technology
Okochi Award, FY2012 Production Award
Infrastructure (Civil engineering and construction)
Cables
Steel wire rods used for ultra high-tensile bridge cables,
characterized by a lower environmental impact
Ichimura Award, FY2014 Main Prize
Construction materials
SuperDyma™, a highly corrosion-resistant Zn-Al-Mg plated steel sheet
The Commendation for Science and Technology by MEXT FY2013 Science and Technology Award: Development CategoryNational Invention Award, FY2012 Invention Prize
High-corrosion-resistant lightweight
IP gold titanium (joint award)
Monodzukuri Nippon, Grand Award, FY2013 Award (Production and Technology Development Category)
Steel structure
The functional steel plate with high enhancement of fatigue life
for welded structures
National Invention Award, FY2012 Nippon Keidanren Chairman’s Invention Prize
Positioning of R&D
R&D is positioned as an activity covering all business units.
NIPPON STEEL & SUMITOMO METAL
SENIOR MANAGEMENT
R&D Consolidated Corporate Function
System Solutions
New Materials
Chemicals
Engineering and Construction
Steelmaking and Steel Fabrication
R&D organization
Cooperation
R&D Laboratories
Steel Research
Laboratories
R&D Planning Div.
Advanced Technology Research
Laboratories
Process Research
Laboratories
Research & Engineering Center (Futtsu)Amagasaki R&D Center
Hasaki R&D Center
R&D Laboratories at Steelworks
Plant Engineering and Facility Management Center (Head Offi ce)
* Minister of Education, Culture, Sports, Science and TechnologyDetails of various technological development cases can be seen at the following website: http://www.nssmc.com/en/tech/
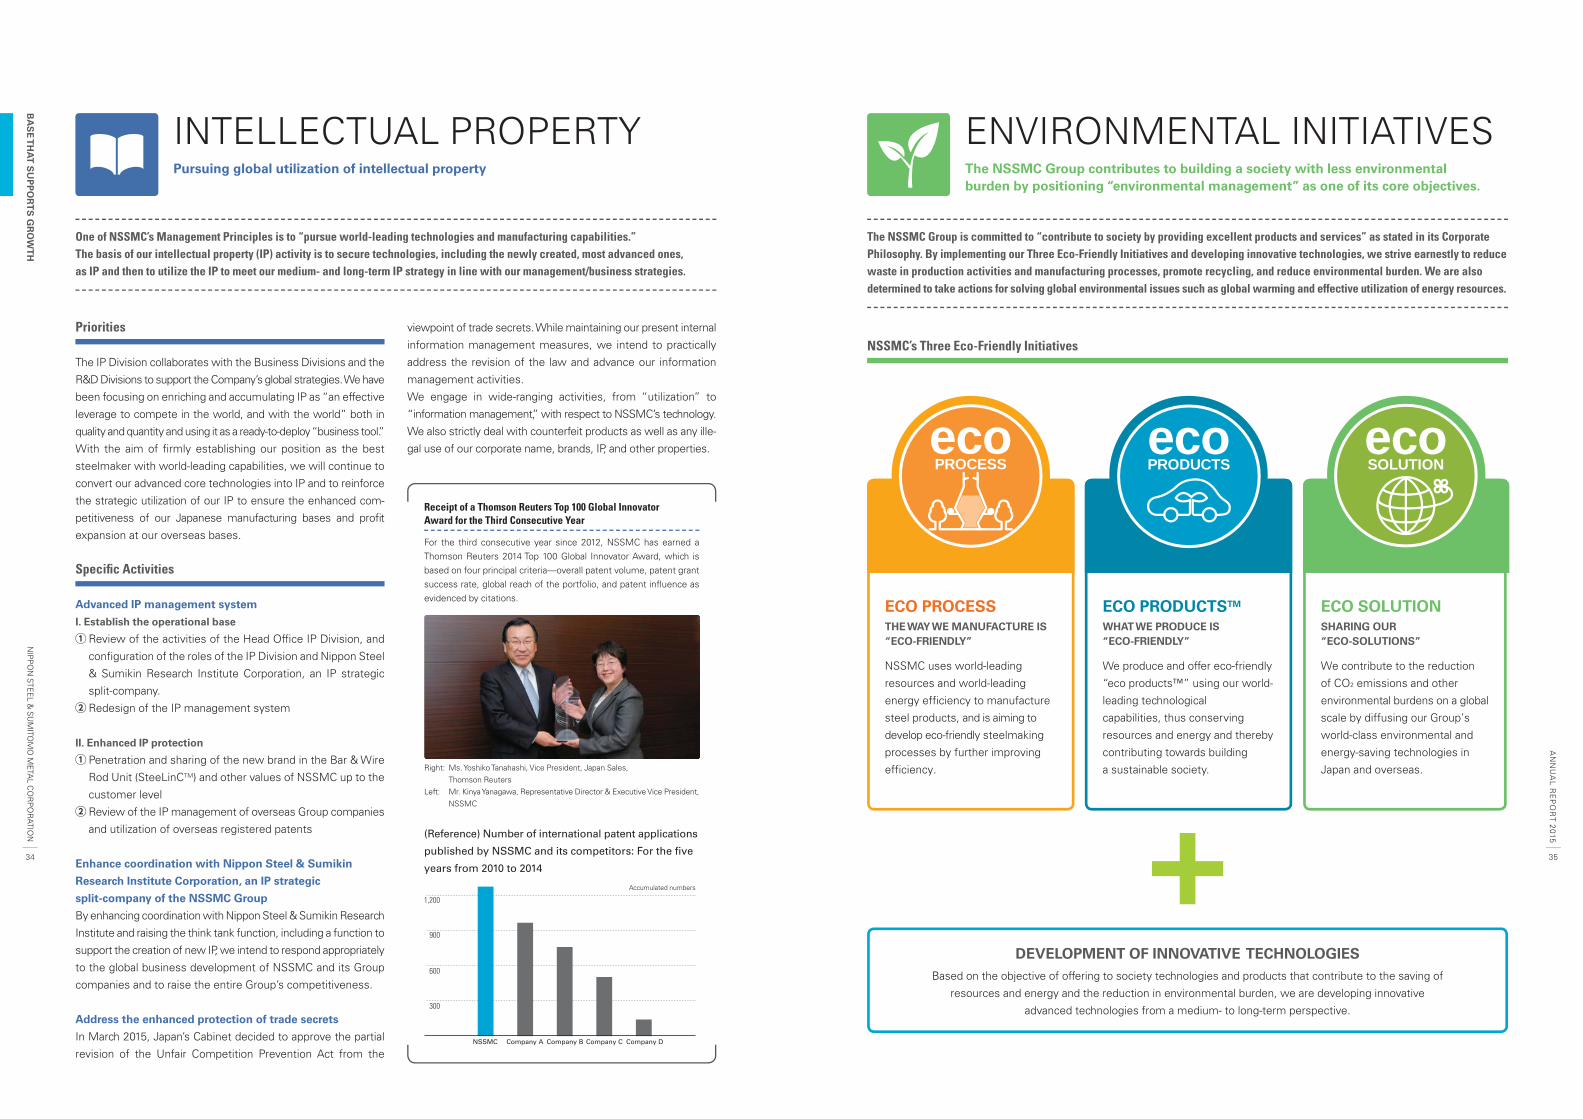
3534
NIP
PO
N STE
EL &
SU
MITO
MO
META
L CO
RP
OR
ATION
AN
NU
AL R
EP
OR
T 2015
BA
SE
TH
AT
SU
PP
OR
TS
GR
OW
TH
The NSSMC Group is committed to “contribute to society by providing excellent products and services” as stated in its Corporate Philosophy. By implementing our Three Eco-Friendly Initiatives and developing innovative technologies, we strive earnestly to reduce waste in production activities and manufacturing processes, promote recycling, and reduce environmental burden. We are also determined to take actions for solving global environmental issues such as global warming and effective utilization of energy resources.
Priorities
The IP Division collaborates with the Business Divisions and the
R&D Divisions to support the Company’s global strategies. We have
been focusing on enriching and accumulating IP as “an effective
leverage to compete in the world, and with the world” both in
quality and quantity and using it as a ready-to-deploy “business tool.”
With the aim of fi rmly establishing our position as the best
steelmaker with world-leading capabilities, we will continue to
convert our advanced core technologies into IP and to reinforce
the strategic utilization of our IP to ensure the enhanced com-
petitiveness of our Japanese manufacturing bases and profi t
expansion at our overseas bases.
Specifi c Activities
Advanced IP management system
I. Establish the operational base
Review of the activities of the Head Offi ce IP Division, and
confi guration of the roles of the IP Division and Nippon Steel
& Sumikin Research Institute Corporation, an IP strategic
split-company.
Redesign of the IP management system
II. Enhanced IP protection
Penetration and sharing of the new brand in the Bar & Wire
Rod Unit (SteeLinCTM) and other values of NSSMC up to the
customer level
Review of the IP management of overseas Group companies
and utilization of overseas registered patents
Enhance coordination with Nippon Steel & Sumikin
Research Institute Corporation, an IP strategic
split-company of the NSSMC Group
By enhancing coordination with Nippon Steel & Sumikin Research
Institute and raising the think tank function, including a function to
support the creation of new IP, we intend to respond appropriately
to the global business development of NSSMC and its Group
companies and to raise the entire Group’s competitiveness.
Address the enhanced protection of trade secrets
In March 2015, Japan’s Cabinet decided to approve the partial
revision of the Unfair Competition Prevention Act from the
viewpoint of trade secrets. While maintaining our present internal
information management measures, we intend to practically
address the revision of the law and advance our information
management activities.
We engage in wide-ranging activities, from “utilization” to
“information management,” with respect to NSSMC’s technology.
We also strictly deal with counterfeit products as well as any ille-
gal use of our corporate name, brands, IP, and other properties.
ENVIRONMENTAL INITIATIVESThe NSSMC Group contributes to building a society with less environmentalburden by positioning “environmental management” as one of its core objectives.
NSSMC’s Three Eco-Friendly Initiatives
DEVELOPMENT OF INNOVATIVE TECHNOLOGIESBased on the objective of offering to society technologies and products that contribute to the saving of
resources and energy and the reduction in environmental burden, we are developing innovative
advanced technologies from a medium- to long-term perspective.
ECO PROCESSTHE WAY WE MANUFACTURE IS “ECO-FRIENDLY”
NSSMC uses world-leading
resources and world-leading
energy efficiency to manufacture
steel products, and is aiming to
develop eco-friendly steelmaking
processes by further improving
efficiency.
ECO PRODUCTSTM
WHAT WE PRODUCE IS “ECO-FRIENDLY”
We produce and offer eco-friendly
“eco products™” using our world-
leading technological
capabilities, thus conserving
resources and energy and thereby
contributing towards building
a sustainable society.
ECO SOLUTIONSHARING OUR “ECO-SOLUTIONS”
We contribute to the reduction
of CO2 emissions and other
environmental burdens on a global
scale by diffusing our Group’s
world-class environmental and
energy-saving technologies in
Japan and overseas.
ecoPROCESS
ecoPRODUCTS
ecoSOLUTION
One of NSSMC’s Management Principles is to “pursue world-leading technologies and manufacturing capabilities.” The basis of our intellectual property (IP) activity is to secure technologies, including the newly created, most advanced ones, as IP and then to utilize the IP to meet our medium- and long-term IP strategy in line with our management/business strategies.
INTELLECTUAL PROPERTYPursuing global utilization of intellectual property
Receipt of a Thomson Reuters Top 100 Global Innovator Award for the Third Consecutive Year
For the third consecutive year since 2012, NSSMC has earned a Thomson Reuters 2014 Top 100 Global Innovator Award, which is based on four principal criteria—overall patent volume, patent grant success rate, global reach of the portfolio, and patent infl uence as evidenced by citations.
Right: Ms. Yoshiko Tanahashi, Vice President, Japan Sales,Thomson Reuters
Left: Mr. Kinya Yanagawa, Representative Director & Executive Vice President,NSSMC
(Reference) Number of international patent applications
published by NSSMC and its competitors: For the fi ve
years from 2010 to 2014
1,200
900
600
300
NSSMC Company A Company B Company C Company D
Accumulated numbers
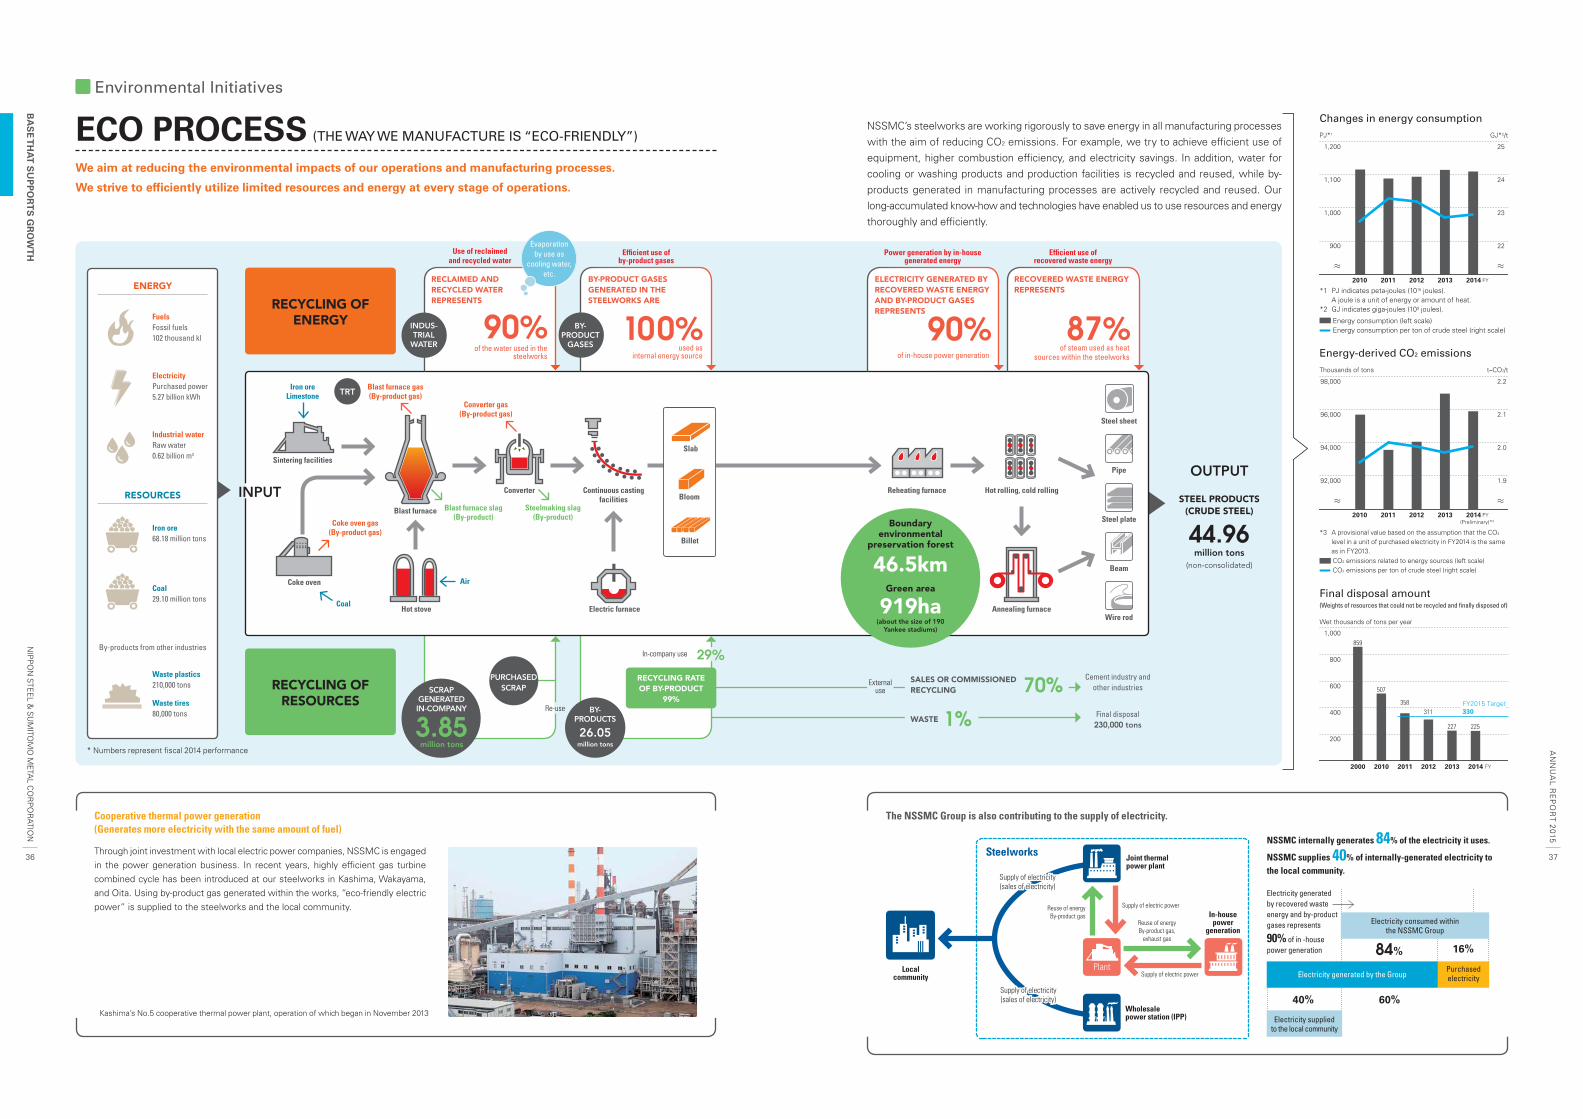
INPUT
ENERGY
RESOURCES
ECO PROCESS (THE WAY WE MANUFACTURE IS “ECO-FRIENDLY”)
We aim at reducing the environmental impacts of our operations and manufacturing processes.
We strive to effi ciently utilize limited resources and energy at every stage of operations.
NSSMC’s steelworks are working rigorously to save energy in all manufacturing processes with the aim of reducing CO2 emissions. For example, we try to achieve effi cient use of equipment, higher combustion effi ciency, and electricity savings. In addition, water for cooling or washing products and production facilities is recycled and reused, while by-products generated in manufacturing processes are actively recycled and reused. Our long-accumulated know-how and technologies have enabled us to use resources and energy thoroughly and effi ciently.
RECYCLING OF ENERGY
RECLAIMED AND RECYCLED WATER REPRESENTS
90%
29%
BY-PRODUCT GASES GENERATED IN THE STEELWORKS ARE
100%
ELECTRICITY GENERATED BY RECOVERED WASTE ENERGY AND BY-PRODUCT GASES REPRESENTS
90%
RECOVERED WASTE ENERGY REPRESENTS
87%
RECYCLING OF RESOURCES
The NSSMC Group is also contributing to the supply of electricity.Cooperative thermal power generation (Generates more electricity with the same amount of fuel)
Through joint investment with local electric power companies, NSSMC is engaged in the power generation business. In recent years, highly effi cient gas turbine combined cycle has been introduced at our steelworks in Kashima, Wakayama, and Oita. Using by-product gas generated within the works, “eco-friendly electric power” is supplied to the steelworks and the local community.
FuelsFossil fuels102 thousand kl
ElectricityPurchased power5.27 billion kWh
Industrial waterRaw water0.62 billion m3
Iron ore68.18 million tons
Coal29.10 million tons
Waste plastics210,000 tons
Waste tires80,000 tons
By-products from other industries
セメント原料他産業
* Numbers represent fi scal 2014 performance
Kashima’s No.5 cooperative thermal power plant, operation of which began in November 2013
40%
84% 16%
60%
Electricity consumed within the NSSMC Group
Final disposal amount(Weights of resources that could not be recycled and fi nally disposed of)
1,000859
507
358
227 225
800
600
400
200
2000 2010 2011 2012 2013 2014
FY2015 Target330311
FY
Wet thousands of tons per year
Supply of electric power
Supply of electric power
Reuse of energyBy-product gas
Local community
Wholesale power station (IPP)
Joint thermal power plant
In-house power
generation
Steelworks
Supply of electricity Supply of electricity (sales of electricity)(sales of electricity)
Supply of electricity Supply of electricity (sales of electricity)(sales of electricity)
Reuse of energyBy-product gas,
exhaust gas
Use of reclaimed and recycled water
Effi cient use of by-product gases
Power generation by in-house generated energy
Effi cient use of recovered waste energy
of the water used in the steelworks
used as internal energy source
External use
of in-house power generationof steam used as heat
sources within the steelworks
Changes in energy consumption
Energy consumption per ton of crude steel (right scale)Energy consumption (left scale)
*1 PJ indicates peta-joules (1015 joules). A joule is a unit of energy or amount of heat.*2 GJ indicates giga-joules (109 joules).
1,200
1,100
1,000
900
25
24
23
22
~~~~
2010 2011 2012 2013 2014 FY
PJ*1 GJ*2/t
CO2 emissions per ton of crude steel (right scale)CO2 emissions related to energy sources (left scale)
*3 A provisional value based on the assumption that the CO2 level in a unit of purchased electricity in FY2014 is the same as in FY2013.
Energy-derived CO2 emissionst–CO2/t
98,000
96,000
94,000
92,000
2.2
2.1
2.0
1.9
~~~~
2010 2011 2012 2013 2014(Preliminary)*3
FY
Thousands of tons
Electricity supplied to the local community
Plant
Sintering facilities
Blast furnace
Converter Continuous casting facilities
Hot stove
Iron oreLimestone
Blast furnace gas(By-product gas)
Converter gas(By-product gas)
Blast furnace slag (By-product)
Steelmaking slag(By-product)
Coke oven gas(By-product gas)
Coal
AirCoke oven
Reheating furnace Hot rolling, cold rolling
Annealing furnace
TRT
Boundary environmental
preservation forest
46.5kmGreen area
919ha(about the size of 190
Yankee stadiums)
Electric furnace
RECYCLING RATE OF BY-PRODUCT
99%
Electricity generated by the GroupPurchased electricity
Billet
Bloom
Slab
Steel plate
Beam
Pipe
Steel sheet
Wire rod
Environmental Initiatives
INDUS-TRIAL
WATER
Evaporation by use as
cooling water, etc.
BY-PRODUCT
GASES
In-company use
Re-use
PURCHASED SCRAPSCRAP
GENERATED IN-COMPANY
3.85million tons
BY-PRODUCTS
26.05million tons
SALES OR COMMISSIONED RECYCLING 70%WASTE 1%
Cement industry and other industries
Final disposal230,000 tons
NSSMC internally generates 84% of the electricity it uses.
NSSMC supplies 40% of internally-generated electricity to the local community.
Electricity generated by recovered waste energy and by-product gases represents
90% of in -house power generation
OUTPUT
STEEL PRODUCTS (CRUDE STEEL)
44.96 million tons
(non-consolidated)
3736
NIP
PO
N STE
EL &
SU
MITO
MO
META
L CO
RP
OR
ATION
AN
NU
AL R
EP
OR
T 2015
BA
SE
TH
AT
SU
PP
OR
TS
GR
OW
TH
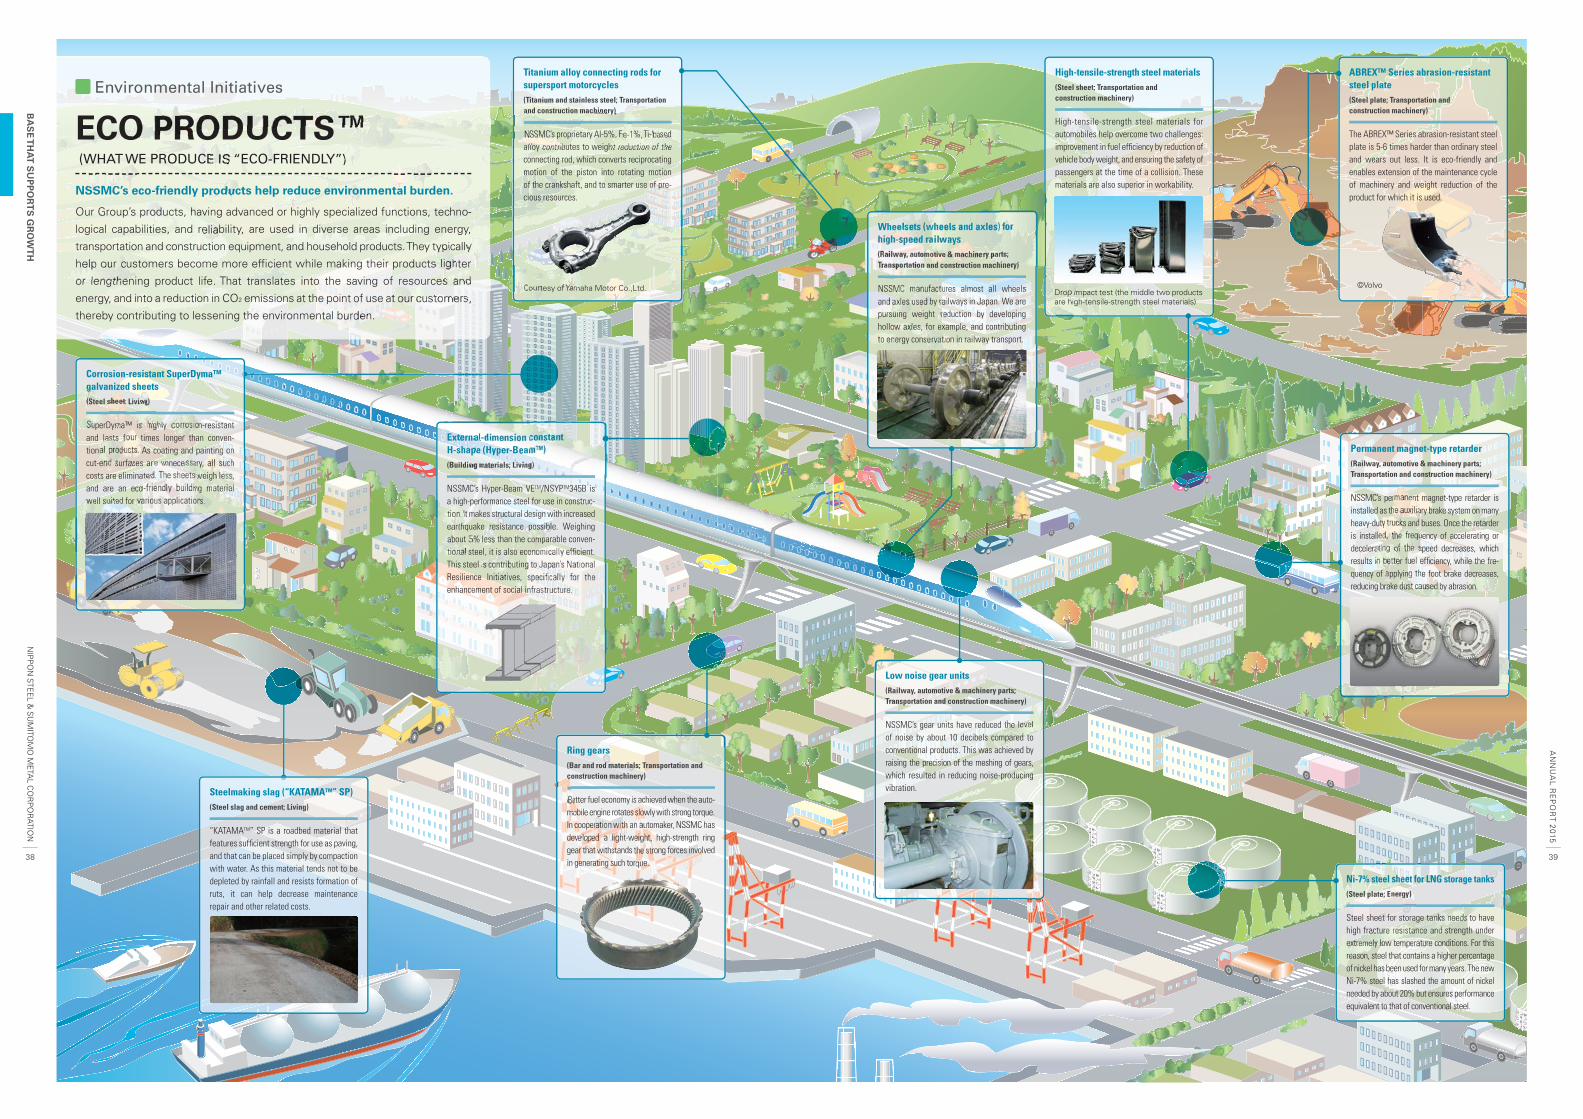
ECO PRODUCTS™ (WHAT WE PRODUCE IS “ECO-FRIENDLY”)
NSSMC’s eco-friendly products help reduce environmental burden.
Our Group’s products, having advanced or highly specialized functions, techno-
logical capabilities, and reliability, are used in diverse areas including energy,
transportation and construction equipment, and household products. They typically
help our customers become more effi cient while making their products lighter
or lengthening product life. That translates into the saving of resources and
energy, and into a reduction in CO2 emissions at the point of use at our customers,
thereby contributing to lessening the environmental burden.
3938
NIP
PO
N STE
EL &
SU
MITO
MO
META
L CO
RP
OR
ATION
AN
NU
AL R
EP
OR
T 2015
BA
SE
TH
AT
SU
PP
OR
TS
GR
OW
TH
Low noise gear units(Railway, automotive & machinery parts; Transportation and construction machinery)
NSSMC’s gear units have reduced the level of noise by about 10 decibels compared to conventional products. This was achieved by raising the precision of the meshing of gears, which resulted in reducing noise-producing vibration.
Permanent magnet-type retarder(Railway, automotive & machinery parts; Transportation and construction machinery)
NSSMC’s permanent magnet-type retarder is installed as the auxiliary brake system on many heavy-duty trucks and buses. Once the retarder is installed, the frequency of accelerating or decelerating of the speed decreases, which results in better fuel effi ciency, while the fre-quency of applying the foot brake decreases, reducing brake dust caused by abrasion.
Titanium alloy connecting rods for supersport motorcycles(Titanium and stainless steel; Transportation and construction machinery)
NSSMC’s proprietary Al-5%, Fe-1%, Ti-based alloy contributes to weight reduction of the connecting rod, which converts reciprocating motion of the piston into rotating motion of the crankshaft, and to smarter use of pre-cious resources.
Ring gears(Bar and rod materials; Transportation and construction machinery)
Better fuel economy is achieved when the auto-mobile engine rotates slowly with strong torque. In cooperation with an automaker, NSSMC has developed a light-weight, high-strength ring gear that withstands the strong forces involved in generating such torque.
External-dimension constant H-shape (Hyper-BeamTM)(Building materials; Living)
NSSMC’s Hyper-Beam VETM/NSYPTM345B is a high-performance steel for use in construc-tion. It makes structural design with increased earthquake resistance possible. Weighing about 5% less than the comparable conven-tional steel, it is also economically effi cient. This steel is contributing to Japan’s National Resilience Initiatives, specifi cally for the enhancement of social infrastructure.
Wheelsets (wheels and axles) for high-speed railways(Railway, automotive & machinery parts; Transportation and construction machinery)
NSSMC manufactures almost all wheels and axles used by railways in Japan. We are pursuing weight reduction by developing hollow axles, for example, and contributing to energy conservation in railway transport.
ABREX™ Series abrasion-resistant steel plate(Steel plate; Transportation and construction machinery)
The ABREX™ Series abrasion-resistant steel plate is 5-6 times harder than ordinary steel and wears out less. It is eco-friendly and enables extension of the maintenance cycle of machinery and weight reduction of the product for which it is used.
Ni-7% steel sheet for LNG storage tanks(Steel plate; Energy)
Steel sheet for storage tanks needs to have high fracture resistance and strength under extremely low temperature conditions. For this reason, steel that contains a higher percentage of nickel has been used for many years. The new Ni-7% steel has slashed the amount of nickel needed by about 20% but ensures performance equivalent to that of conventional steel.
Environmental Initiatives
©VolvoCourtesy of Yamaha Motor Co.,Ltd.
High-tensile-strength steel materials(Steel sheet; Transportation and construction machinery)
High-tensile-strength steel materials for automobiles help overcome two challenges: improvement in fuel effi ciency by reduction of vehicle body weight, and ensuring the safety of passengers at the time of a collision. These materials are also superior in workability.
Drop impact test (the middle two products are high-tensile-strength steel materials)
Corrosion-resistant SuperDyma™ galvanized sheets(Steel sheet; Living)
SuperDyma™ is highly corrosion-resistant and lasts four times longer than conven-tional products. As coating and painting on cut-end surfaces are unnecessary, all such costs are eliminated. The sheets weigh less, and are an eco-friendly building material well suited for various applications.
Steelmaking slag (“KATAMATM” SP)(Steel slag and cement; Living)
“KATAMATM” SP is a roadbed material that features suffi cient strength for use as paving, and that can be placed simply by compaction with water. As this material tends not to be depleted by rainfall and resists formation of ruts, it can help decrease maintenance repair and other related costs.
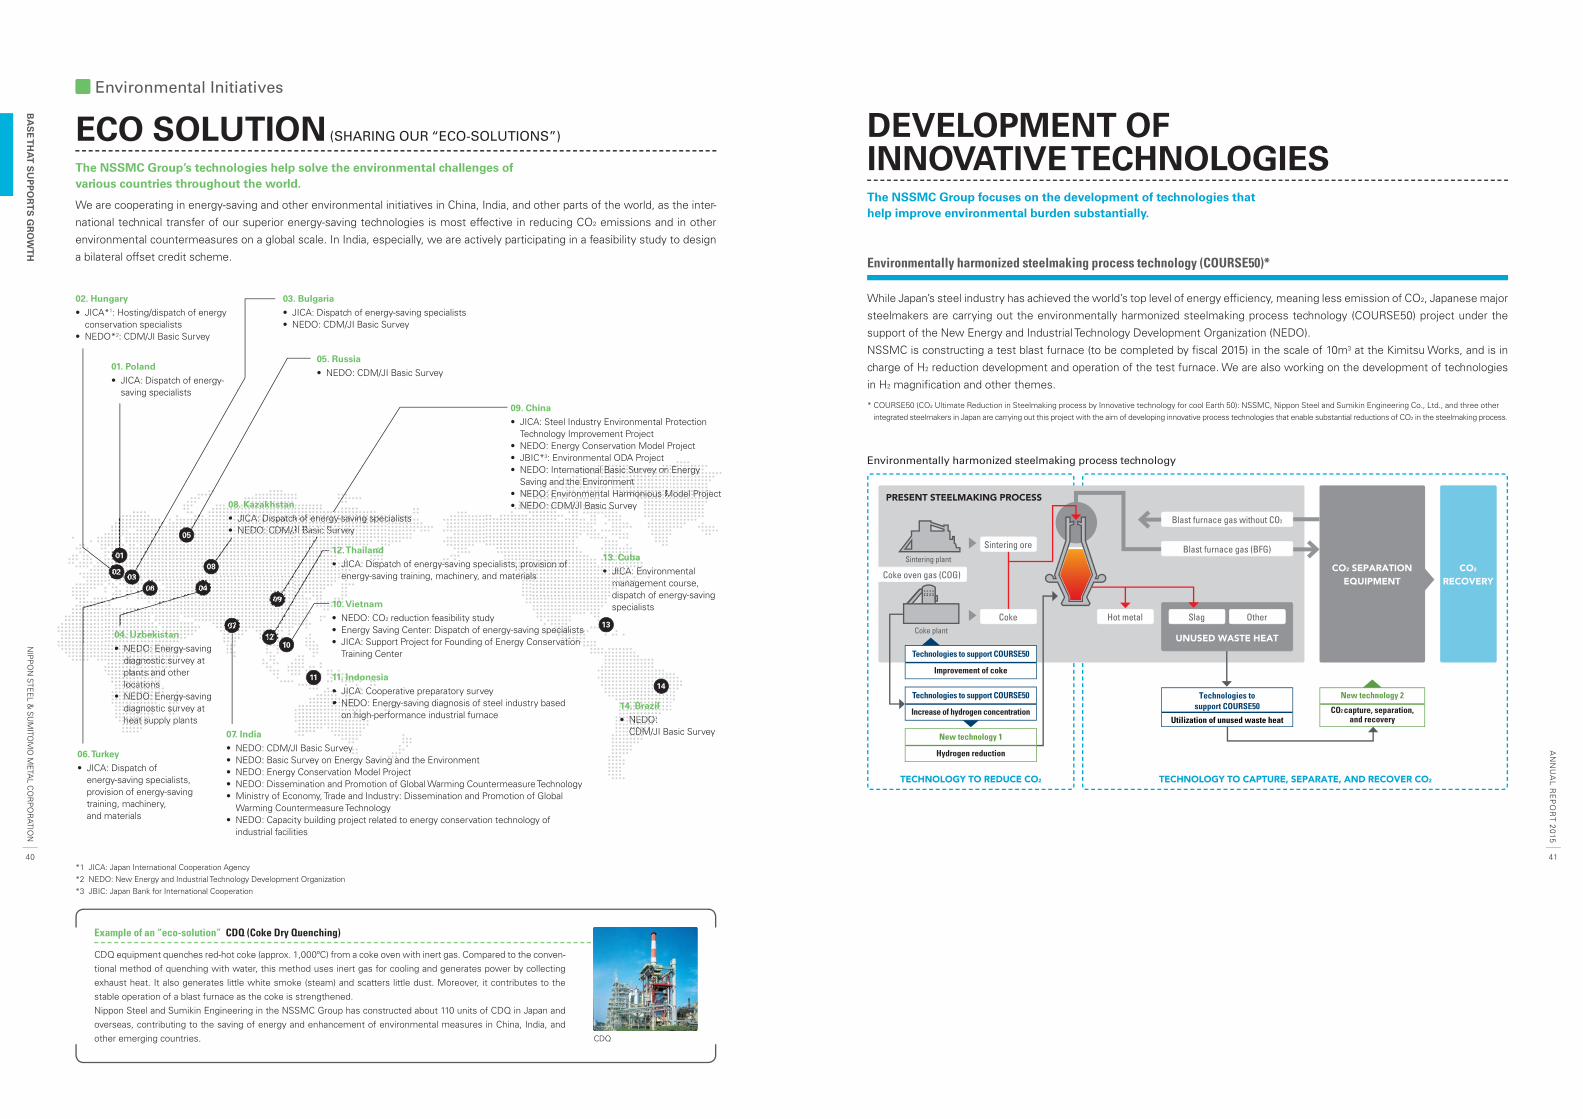
4140
NIP
PO
N STE
EL &
SU
MITO
MO
META
L CO
RP
OR
ATION
AN
NU
AL R
EP
OR
T 2015
BA
SE
TH
AT
SU
PP
OR
TS
GR
OW
TH
ECO SOLUTION (SHARING OUR “ECO-SOLUTIONS”)
The NSSMC Group’s technologies help solve the environmental challenges of various countries throughout the world.
We are cooperating in energy-saving and other environmental initiatives in China, India, and other parts of the world, as the inter-
national technical transfer of our superior energy-saving technologies is most effective in reducing CO2 emissions and in other
environmental countermeasures on a global scale. In India, especially, we are actively participating in a feasibility study to design
a bilateral offset credit scheme.
DEVELOPMENT OF INNOVATIVE TECHNOLOGIESThe NSSMC Group focuses on the development of technologies that help improve environmental burden substantially.
*1 JICA: Japan International Cooperation Agency*2 NEDO: New Energy and Industrial Technology Development Organization*3 JBIC: Japan Bank for International Cooperation
Example of an “eco-solution” CDQ (Coke Dry Quenching)
CDQ equipment quenches red-hot coke (approx. 1,000ºC) from a coke oven with inert gas. Compared to the conven-tional method of quenching with water, this method uses inert gas for cooling and generates power by collecting exhaust heat. It also generates little white smoke (steam) and scatters little dust. Moreover, it contributes to the stable operation of a blast furnace as the coke is strengthened.Nippon Steel and Sumikin Engineering in the NSSMC Group has constructed about 110 units of CDQ in Japan and overseas, contributing to the saving of energy and enhancement of environmental measures in China, India, and other emerging countries. CDQ
Environmentally harmonized steelmaking process technology (COURSE50)*
While Japan’s steel industry has achieved the world’s top level of energy effi ciency, meaning less emission of CO2, Japanese major
steelmakers are carrying out the environmentally harmonized steelmaking process technology (COURSE50) project under the
support of the New Energy and Industrial Technology Development Organization (NEDO).
NSSMC is constructing a test blast furnace (to be completed by fi scal 2015) in the scale of 10m3 at the Kimitsu Works, and is in
charge of H2 reduction development and operation of the test furnace. We are also working on the development of technologies
in H2 magnifi cation and other themes.
* COURSE50 (CO2 Ultimate Reduction in Steelmaking process by Innovative technology for cool Earth 50): NSSMC, Nippon Steel and Sumikin Engineering Co., Ltd., and three other integrated steelmakers in Japan are carrying out this project with the aim of developing innovative process technologies that enable substantial reductions of CO2 in the steelmaking process.
Environmental Initiatives
01
0203
06
05
04
08
09
0712
10
11
13
14
01. Poland
• JICA: Dispatch of energy-saving specialists
02. Hungary
• JICA*1: Hosting/dispatch of energy conservation specialists
• NEDO*2: CDM/JI Basic Survey
03. Bulgaria
• JICA: Dispatch of energy-saving specialists• NEDO: CDM/JI Basic Survey
04. Uzbekistan
• NEDO: Energy-saving diagnostic survey at plants and other locations
• NEDO: Energy-saving diagnostic survey at heat supply plants
06. Turkey
• JICA: Dispatch of energy-saving specialists, provision of energy-saving training, machinery, and materials
07. India
• NEDO: CDM/JI Basic Survey• NEDO: Basic Survey on Energy Saving and the Environment• NEDO: Energy Conservation Model Project• NEDO: Dissemination and Promotion of Global Warming Countermeasure Technology• Ministry of Economy, Trade and Industry: Dissemination and Promotion of Global
Warming Countermeasure Technology• NEDO: Capacity building project related to energy conservation technology of
industrial facilities
09. China
• JICA: Steel Industry Environmental Protection Technology Improvement Project
• NEDO: Energy Conservation Model Project• JBIC*3: Environmental ODA Project• NEDO: International Basic Survey on Energy
Saving and the Environment• NEDO: Environmental Harmonious Model Project• NEDO: CDM/JI Basic Survey
10. Vietnam
• NEDO: CO2 reduction feasibility study• Energy Saving Center: Dispatch of energy-saving specialists• JICA: Support Project for Founding of Energy Conservation
Training Center
11. Indonesia
• JICA: Cooperative preparatory survey• NEDO: Energy-saving diagnosis of steel industry based
on high-performance industrial furnace
13. Cuba
• JICA: Environmental management course, dispatch of energy-saving specialists
14. Brazil
• NEDO: CDM/JI Basic Survey
05. Russia
• NEDO: CDM/JI Basic Survey
08. Kazakhstan
• JICA: Dispatch of energy-saving specialists• NEDO: CDM/JI Basic Survey
12. Thailand
• JICA: Dispatch of energy-saving specialists, provision of energy-saving training, machinery, and materials
Environmentally harmonized steelmaking process technology
CO2 SEPARATION EQUIPMENT
Technologies to support COURSE50
Utilization of unused waste heat
UNUSED WASTE HEAT
OtherSlagHot metal
New technology 1
Hydrogen reduction
CO2 RECOVERY
PRESENT STEELMAKING PROCESS
Sintering plant
Coke plant
TECHNOLOGY TO REDUCE CO2 TECHNOLOGY TO CAPTURE, SEPARATE, AND RECOVER CO2
New technology 2
CO2 capture, separation, and recovery
Technologies to support COURSE50
Improvement of coke
Technologies to support COURSE50
Increase of hydrogen concentration
Blast furnace gas without CO2
Blast furnace gas (BFG)
Coke oven gas (COG)
Coke
Sintering ore
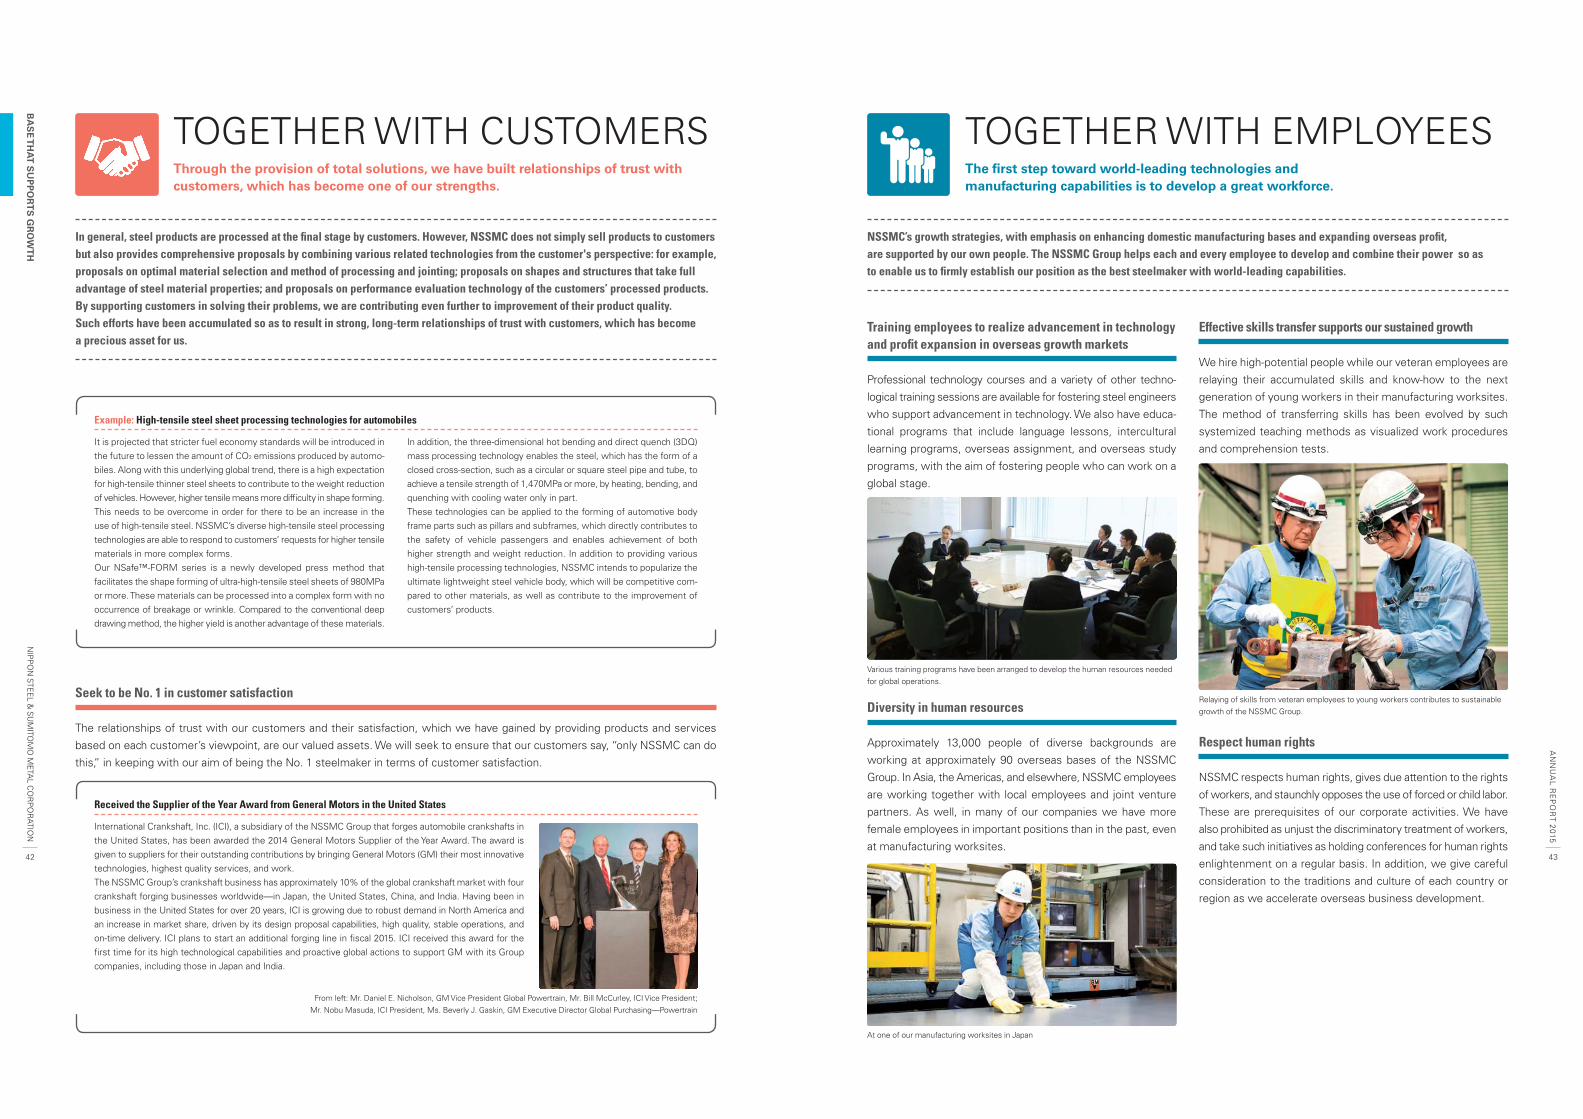
4342
NIP
PO
N STE
EL &
SU
MITO
MO
META
L CO
RP
OR
ATION
AN
NU
AL R
EP
OR
T 2015
BA
SE
TH
AT
SU
PP
OR
TS
GR
OW
TH
In general, steel products are processed at the fi nal stage by customers. However, NSSMC does not simply sell products to customers but also provides comprehensive proposals by combining various related technologies from the customer's perspective: for example, proposals on optimal material selection and method of processing and jointing; proposals on shapes and structures that take full advantage of steel material properties; and proposals on performance evaluation technology of the customers’ processed products. By supporting customers in solving their problems, we are contributing even further to improvement of their product quality. Such efforts have been accumulated so as to result in strong, long-term relationships of trust with customers, which has become a precious asset for us.
NSSMC’s growth strategies, with emphasis on enhancing domestic manufacturing bases and expanding overseas profi t, are supported by our own people. The NSSMC Group helps each and every employee to develop and combine their power so as to enable us to fi rmly establish our position as the best steelmaker with world-leading capabilities.
Training employees to realize advancement in technology and profi t expansion in overseas growth markets
Professional technology courses and a variety of other techno-
logical training sessions are available for fostering steel engineers
who support advancement in technology. We also have educa-
tional programs that include language lessons, intercultural
learning programs, overseas assignment, and overseas study
programs, with the aim of fostering people who can work on a
global stage.
Diversity in human resources
Approximately 13,000 people of diverse backgrounds are
working at approximately 90 overseas bases of the NSSMC
Group. In Asia, the Americas, and elsewhere, NSSMC employees
are working together with local employees and joint venture
partners. As well, in many of our companies we have more
female employees in important positions than in the past, even
at manufacturing worksites.
Effective skills transfer supports our sustained growth
We hire high-potential people while our veteran employees are
relaying their accumulated skills and know-how to the next
generation of young workers in their manufacturing worksites.
The method of transferring skills has been evolved by such
systemized teaching methods as visualized work procedures
and comprehension tests.
Respect human rights
NSSMC respects human rights, gives due attention to the rights
of workers, and staunchly opposes the use of forced or child labor.
These are prerequisites of our corporate activities. We have
also prohibited as unjust the discriminatory treatment of workers,
and take such initiatives as holding conferences for human rights
enlightenment on a regular basis. In addition, we give careful
consideration to the traditions and culture of each country or
region as we accelerate overseas business development.
TOGETHER WITH CUSTOMERS TOGETHER WITH EMPLOYEESThrough the provision of total solutions, we have built relationships of trust with customers, which has become one of our strengths.
The fi rst step toward world-leading technologies and manufacturing capabilities is to develop a great workforce.
Example: High-tensile steel sheet processing technologies for automobiles
It is projected that stricter fuel economy standards will be introduced in the future to lessen the amount of CO2 emissions produced by automo-biles. Along with this underlying global trend, there is a high expectation for high-tensile thinner steel sheets to contribute to the weight reduction of vehicles. However, higher tensile means more diffi culty in shape forming. This needs to be overcome in order for there to be an increase in the use of high-tensile steel. NSSMC’s diverse high-tensile steel processing technologies are able to respond to customers’ requests for higher tensile materials in more complex forms.Our NSafe™-FORM series is a newly developed press method that facilitates the shape forming of ultra-high-tensile steel sheets of 980MPa or more. These materials can be processed into a complex form with no occurrence of breakage or wrinkle. Compared to the conventional deep drawing method, the higher yield is another advantage of these materials.
In addition, the three-dimensional hot bending and direct quench (3DQ) mass processing technology enables the steel, which has the form of a closed cross-section, such as a circular or square steel pipe and tube, to achieve a tensile strength of 1,470MPa or more, by heating, bending, and quenching with cooling water only in part.These technologies can be applied to the forming of automotive body frame parts such as pillars and subframes, which directly contributes to the safety of vehicle passengers and enables achievement of both higher strength and weight reduction. In addition to providing various high-tensile processing technologies, NSSMC intends to popularize the ultimate lightweight steel vehicle body, which will be competitive com-pared to other materials, as well as contribute to the improvement of customers’ products.
Seek to be No. 1 in customer satisfaction
The relationships of trust with our customers and their satisfaction, which we have gained by providing products and services
based on each customer’s viewpoint, are our valued assets. We will seek to ensure that our customers say, “only NSSMC can do
this,” in keeping with our aim of being the No. 1 steelmaker in terms of customer satisfaction.
Received the Supplier of the Year Award from General Motors in the United States
International Crankshaft, Inc. (ICI), a subsidiary of the NSSMC Group that forges automobile crankshafts in the United States, has been awarded the 2014 General Motors Supplier of the Year Award. The award is given to suppliers for their outstanding contributions by bringing General Motors (GM) their most innovative technologies, highest quality services, and work.The NSSMC Group’s crankshaft business has approximately 10% of the global crankshaft market with four crankshaft forging businesses worldwide—in Japan, the United States, China, and India. Having been in business in the United States for over 20 years, ICI is growing due to robust demand in North America and an increase in market share, driven by its design proposal capabilities, high quality, stable operations, and on-time delivery. ICI plans to start an additional forging line in fi scal 2015. ICI received this award for the fi rst time for its high technological capabilities and proactive global actions to support GM with its Group companies, including those in Japan and India.
From left: Mr. Daniel E. Nicholson, GM Vice President Global Powertrain, Mr. Bill McCurley, ICI Vice President; Mr. Nobu Masuda, ICI President, Ms. Beverly J. Gaskin, GM Executive Director Global Purchasing—Powertrain
At one of our manufacturing worksites in Japan
Various training programs have been arranged to develop the human resources needed for global operations.
Relaying of skills from veteran employees to young workers contributes to sustainable growth of the NSSMC Group.
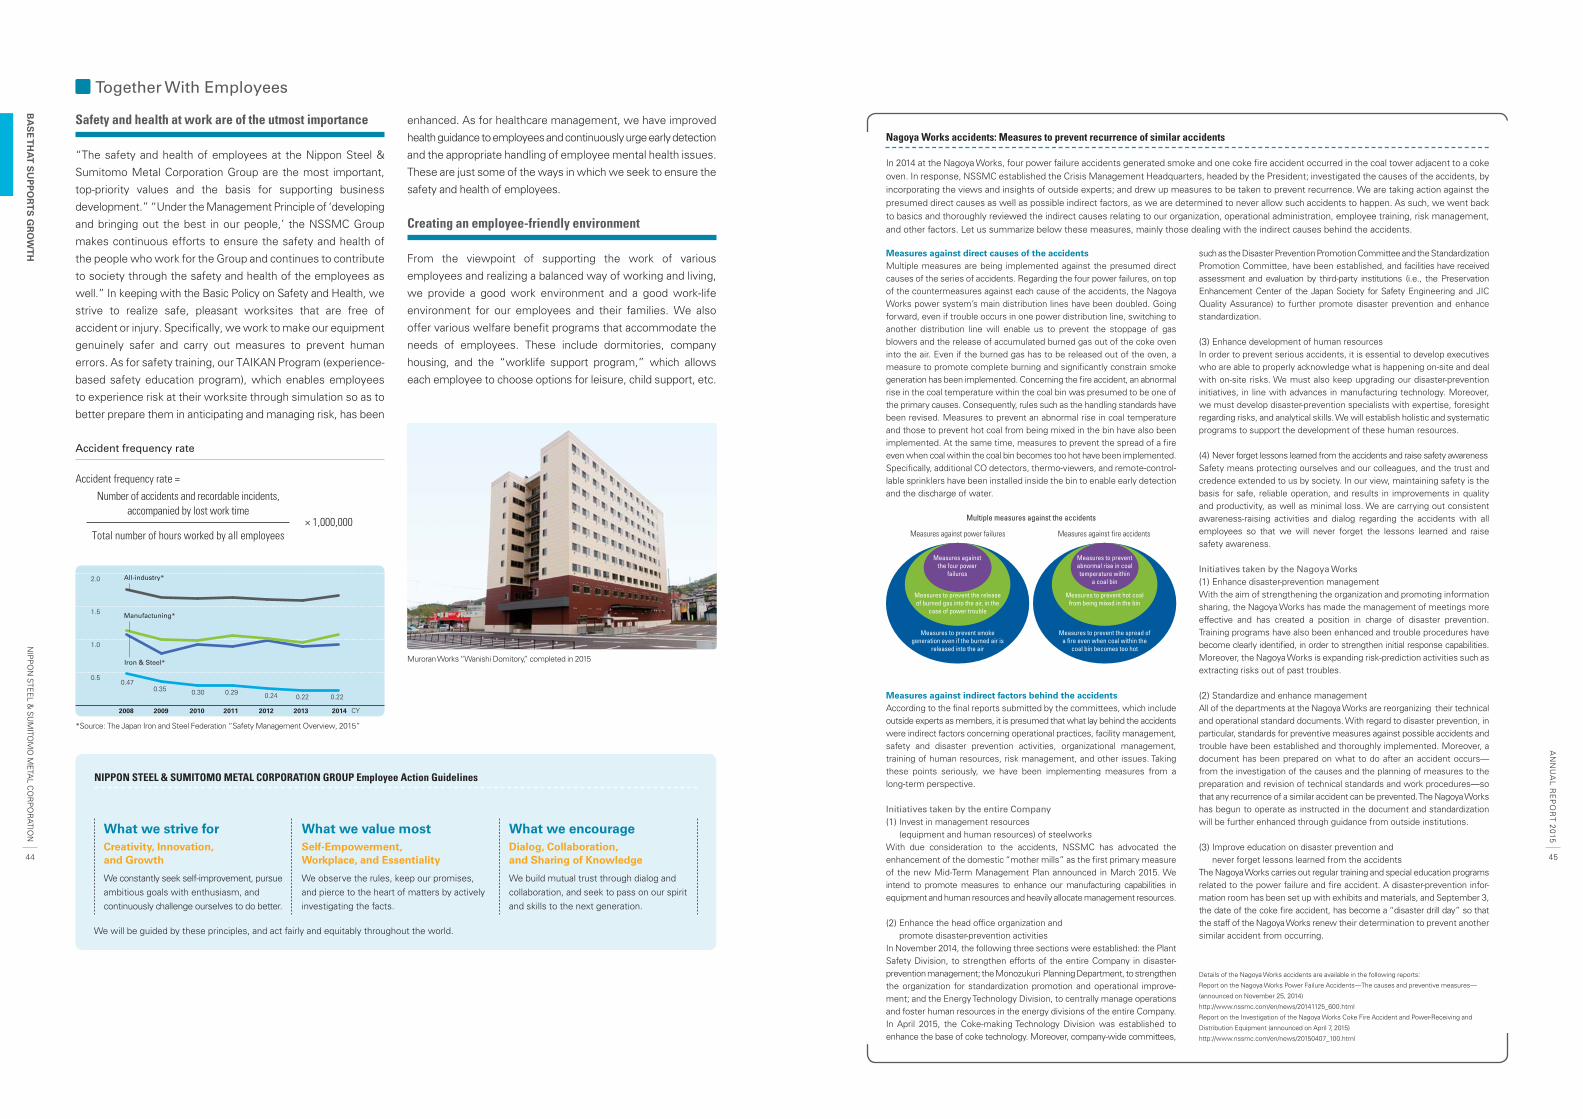
Accident frequency rate
2.0
1.5
1.0
0.5
201020092008 2011 2012 2013 2014 CY
0.470.35 0.30 0.29 0.24 0.22 0.22
Accident frequency rate =
Number of accidents and recordable incidents, accompanied by lost work time
Total number of hours worked by all employees
All-industry*
Manufactuning*
Iron & Steel*
Measures against direct causes of the accidentsMultiple measures are being implemented against the presumed direct causes of the series of accidents. Regarding the four power failures, on top of the countermeasures against each cause of the accidents, the Nagoya Works power system’s main distribution lines have been doubled. Going forward, even if trouble occurs in one power distribution line, switching to another distribution line will enable us to prevent the stoppage of gas blowers and the release of accumulated burned gas out of the coke oven into the air. Even if the burned gas has to be released out of the oven, a measure to promote complete burning and signifi cantly constrain smoke generation has been implemented. Concerning the fi re accident, an abnormal rise in the coal temperature within the coal bin was presumed to be one of the primary causes. Consequently, rules such as the handling standards have been revised. Measures to prevent an abnormal rise in coal temperature and those to prevent hot coal from being mixed in the bin have also been implemented. At the same time, measures to prevent the spread of a fi re even when coal within the coal bin becomes too hot have been implemented. Specifi cally, additional CO detectors, thermo-viewers, and remote-control-lable sprinklers have been installed inside the bin to enable early detection and the discharge of water.
Measures against indirect factors behind the accidentsAccording to the fi nal reports submitted by the committees, which include outside experts as members, it is presumed that what lay behind the accidents were indirect factors concerning operational practices, facility management, safety and disaster prevention activities, organizational management, training of human resources, risk management, and other issues. Taking these points seriously, we have been implementing measures from a long-term perspective.
Initiatives taken by the entire Company(1) Invest in management resources
(equipment and human resources) of steelworksWith due consideration to the accidents, NSSMC has advocated the enhancement of the domestic “mother mills” as the fi rst primary measure of the new Mid-Term Management Plan announced in March 2015. We intend to promote measures to enhance our manufacturing capabilities in equipment and human resources and heavily allocate management resources.
(2) Enhance the head offi ce organization and promote disaster-prevention activities
In November 2014, the following three sections were established: the Plant Safety Division, to strengthen efforts of the entire Company in disaster-prevention management; the Monozukuri Planning Department, to strengthen the organization for standardization promotion and operational improve-ment; and the Energy Technology Division, to centrally manage operations and foster human resources in the energy divisions of the entire Company. In April 2015, the Coke-making Technology Division was established to enhance the base of coke technology. Moreover, company-wide committees,
such as the Disaster Prevention Promotion Committee and the Standardization Promotion Committee, have been established, and facilities have received assessment and evaluation by third-party institutions (i.e., the Preservation Enhancement Center of the Japan Society for Safety Engineering and JIC Quality Assurance) to further promote disaster prevention and enhance standardization.
(3) Enhance development of human resources In order to prevent serious accidents, it is essential to develop executives who are able to properly acknowledge what is happening on-site and deal with on-site risks. We must also keep upgrading our disaster-prevention initiatives, in line with advances in manufacturing technology. Moreover, we must develop disaster-prevention specialists with expertise, foresight regarding risks, and analytical skills. We will establish holistic and systematic programs to support the development of these human resources.
(4) Never forget lessons learned from the accidents and raise safety awareness Safety means protecting ourselves and our colleagues, and the trust and credence extended to us by society. In our view, maintaining safety is the basis for safe, reliable operation, and results in improvements in quality and productivity, as well as minimal loss. We are carrying out consistent awareness-raising activities and dialog regarding the accidents with all employees so that we will never forget the lessons learned and raise safety awareness.
Initiatives taken by the Nagoya Works(1) Enhance disaster-prevention managementWith the aim of strengthening the organization and promoting information sharing, the Nagoya Works has made the management of meetings more effective and has created a position in charge of disaster prevention. Training programs have also been enhanced and trouble procedures have become clearly identifi ed, in order to strengthen initial response capabilities. Moreover, the Nagoya Works is expanding risk-prediction activities such as extracting risks out of past troubles.
(2) Standardize and enhance managementAll of the departments at the Nagoya Works are reorganizing their technical and operational standard documents. With regard to disaster prevention, in particular, standards for preventive measures against possible accidents and trouble have been established and thoroughly implemented. Moreover, a document has been prepared on what to do after an accident occurs—from the investigation of the causes and the planning of measures to the preparation and revision of technical standards and work procedures—so that any recurrence of a similar accident can be prevented. The Nagoya Works has begun to operate as instructed in the document and standardization will be further enhanced through guidance from outside institutions.
(3) Improve education on disaster prevention and never forget lessons learned from the accidents
The Nagoya Works carries out regular training and special education programs related to the power failure and fi re accident. A disaster-prevention infor-mation room has been set up with exhibits and materials, and September 3, the date of the coke fi re accident, has become a “disaster drill day” so that the staff of the Nagoya Works renew their determination to prevent another similar accident from occurring.
Details of the Nagoya Works accidents are available in the following reports:
Report on the Nagoya Works Power Failure Accidents—The causes and preventive measures—
(announced on November 25, 2014)
http://www.nssmc.com/en/news/20141125_600.html
Report on the Investigation of the Nagoya Works Coke Fire Accident and Power-Receiving and
Distribution Equipment (announced on April 7, 2015)
http://www.nssmc.com/en/news/20150407_100.html
In 2014 at the Nagoya Works, four power failure accidents generated smoke and one coke fi re accident occurred in the coal tower adjacent to a coke oven. In response, NSSMC established the Crisis Management Headquarters, headed by the President; investigated the causes of the accidents, by incorporating the views and insights of outside experts; and drew up measures to be taken to prevent recurrence. We are taking action against the presumed direct causes as well as possible indirect factors, as we are determined to never allow such accidents to happen. As such, we went back to basics and thoroughly reviewed the indirect causes relating to our organization, operational administration, employee training, risk management, and other factors. Let us summarize below these measures, mainly those dealing with the indirect causes behind the accidents.
NIPPON STEEL & SUMITOMO METAL CORPORATION GROUP Employee Action Guidelines
What we strive forCreativity, Innovation, and Growth
We constantly seek self-improvement, pursue ambitious goals with enthusiasm, and continuously challenge ourselves to do better.
What we value mostSelf-Empowerment, Workplace, and Essentiality
We observe the rules, keep our promises, and pierce to the heart of matters by actively investigating the facts.
What we encourageDialog, Collaboration, and Sharing of Knowledge
We build mutual trust through dialog and collaboration, and seek to pass on our spirit and skills to the next generation.
Multiple measures against the accidents
Measures against power failures Measures against fire accidents
Measures to prevent smoke generation even if the burned air is
released into the air
Measures to prevent the spread of a fi re even when coal within the
coal bin becomes too hot
Measures to prevent the release of burned gas into the air, in the
case of power trouble
Measures to prevent hot coal from being mixed in the bin
Measures against the four power
failures
Measures to prevent abnormal rise in coal temperature within
a coal bin
× 1,000,000
4544
NIP
PO
N STE
EL &
SU
MITO
MO
META
L CO
RP
OR
ATION
AN
NU
AL R
EP
OR
T 2015
BA
SE
TH
AT
SU
PP
OR
TS
GR
OW
TH
Safety and health at work are of the utmost importance
“The safety and health of employees at the Nippon Steel &
Sumitomo Metal Corporation Group are the most important,
top-priority values and the basis for supporting business
development.” “Under the Management Principle of ‘developing
and bringing out the best in our people,’ the NSSMC Group
makes continuous efforts to ensure the safety and health of
the people who work for the Group and continues to contribute
to society through the safety and health of the employees as
well.” In keeping with the Basic Policy on Safety and Health, we
strive to realize safe, pleasant worksites that are free of
accident or injury. Specifically, we work to make our equipment
genuinely safer and carry out measures to prevent human
errors. As for safety training, our TAIKAN Program (experience-
based safety education program), which enables employees
to experience risk at their worksite through simulation so as to
better prepare them in anticipating and managing risk, has been
*Source: The Japan Iron and Steel Federation “Safety Management Overview, 2015”
Muroran Works “Wanishi Domitory,” completed in 2015
enhanced. As for healthcare management, we have improved
health guidance to employees and continuously urge early detection
and the appropriate handling of employee mental health issues.
These are just some of the ways in which we seek to ensure the
safety and health of employees.
Creating an employee-friendly environment
From the viewpoint of supporting the work of various
employees and realizing a balanced way of working and living,
we provide a good work environment and a good work-life
environment for our employees and their families. We also
offer various welfare benefit programs that accommodate the
needs of employees. These include dormitories, company
housing, and the “worklife support program,” which allows
each employee to choose options for leisure, child support, etc.
Nagoya Works accidents: Measures to prevent recurrence of similar accidents
Together With Employees
We will be guided by these principles, and act fairly and equitably throughout the world.
4746
NIP
PO
N STE
EL &
SU
MITO
MO
META
L CO
RP
OR
ATION
AN
NU
AL R
EP
OR
T 2015
BA
SE
TH
AT
SU
PP
OR
TS
GR
OW
TH
We support people in local communities by engaging in environmental conservation activities and cultural and athletic activities.
TOGETHER WITH SOCIETYNSSMC highly values partnerships with its stakeholders.
Communication with local communities and society
Having a long history of managing steelworks all over Japan,
NSSMC has been rooted in local communities and supported
by local residents. In accordance with our attitude of maintain-
ing harmony with local communities and society, we have
implemented distinctive social contribution programs. These
programs include promoting the “Creation of a Hometown
Forest” by planting trees and plants in communities, activities
to support art and culture with its core base at Kioi Hall, and
contribution to local communities through various sports.
“Creation of a Hometown Forest”
Each of NSSMC’s steelworks
all over Japan has its own
environmental conservation
forest. Taken together, these
silvicultural activities are our
“Creation of a Hometown
Forest” project which has been
carried out under the guid-
ance of Dr. Akira Miyawaki, director of the Japanese Center for
International Studies in Ecology (and professor emeritus at
Yokohama National University). This project seeks to research
the natural vegetation inherent to a certain area, carefully
select suitable trees, grow their saplings in pots, and have
them planted in prepared locations by both local residents and
our employees. The project fi rst began in 1971, when we
planted saplings at Oita Works, and has continued to this day.
At present, our forests in aggregate total around 919 hectares
(about the size of 190 Yankee Stadiums) and have grown to
become home to a diverse range of birds and small animals, as
well as contribute to the prevention of climate change.
Sports-oriented community activities
We support community-based
sports clubs and contribute to
local communities. Through
these clubs, we organize sports
classes for children, provide
guidance to junior teams, and
make our athletic facilities
available to local residents for
games and training. The Kashima Antlers football team, which
began as our corporate team, has become one of the top pro-
fessional J-League teams. Our baseball team participates in
Japan’s Inter-City Baseball Invitation Tournament every year
and has brought many of its players into the professional
leagues. Our men’s volleyball team, the Osaka Blazers Sakai, is
one of the representative teams of V. Premier League, the top-
level volleyball league. Moreover, our Judo team has produced
Olympic medalists and Kamaishi Sea Waves, our former corpo-
rate rugby team, has been the league champion for seven
consecutive years. All of these teams also contribute to their
local community through various activities.
Supporting culture and arts through musical activities
NSSMC has supported artistic
and cultural activities for many
years. A wide variety of activi-
ties are primarily conducted by
the NSSMC Arts Foundation
and include classical concerts
by the Kioi Sinfonietta Tokyo
chamber orchestra, which is
based at Kioi Hall (Chiyoda-ku, Tokyo), Japanese traditional music
concerts in a dedicated Japanese-style music hall within the Hall,
and the ceremony for the presentation of the Nippon Steel &
Sumitomo Metal Music Awards.
The Nippon Steel & Sumitomo Metal Mixed Chorus, formed in
1947, is also committed to making social contributions, notably
by performing charity concerts.
Providing education on manufacturing and the environment
NSSMC hosts a number of
programs nationwide to help
young children and students—
on whose shoulders the future
rests—to better understand
steelmaking and learn about
the importance of manufac-
turing and the wonders of
science and technology. Activities include a hands-on steelmaking
program using the tatara method (a traditional Japanese ironmaking
technique). For elementary and junior high school students, we
help support an energy conservation and environmental protec-
tion class and conduct science experiments and special classroom
lectures. Plant visits for teachers are also conducted.
“Creation of a Hometown Forest” contributes lush greenery to towns
Children’s baseball classroom
Kioi Hall (Chiyoda-ku, Tokyo)
Demonstration of tatara ironmaking method
FINANCIALANDCORPORATESECTION
Contents
48 11-Year Financial Performance
52 Analysis of Financial Condition
and Results of Operations
55 Consolidated Financial Statements
92 Principal Subsidiaries and Affi liates
94 NSSMC’s Network
96 History
97 Investor Information
11-Year Financial Performance (Unaudited; only for reference purposes)
FY 2004 2005 2006 2007 2008 2009 2010 2011 2012*5 2013 2014
Operating Results (Fiscal year) Net sales Unit: Millions of yen
NSSMC/Nippon Steel ¥3,389,356 ¥3,906,301 ¥4,302,145 ¥4,826,974 ¥4,769,821 ¥3,487,714 ¥4,109,774 ¥4,090,936 ¥4,389,922 ¥5,516,180 ¥ 5,610,030 Sumitomo Metals 1,236,920 1,552,765 1,602,720 1,744,572 1,844,422 1,285,845 1,402,454 1,473,367 693,601 — — Operating profi t (loss) NSSMC/Nippon Steel 429,948 576,319 580,097 545,580 342,930 32,005 165,605 79,364 20,110 298,390 349,510 Sumitomo Metals 182,878 305,804 303,774 274,396 226,052 (928) 56,301 76,801 15,759 — — Ordinary profi t (loss) NSSMC/Nippon Steel 371,446 547,400 597,640 564,119 336,140 11,833 226,335 143,006 76,931 361,097 451,747 Sumitomo Metals 173,245 280,733 327,676 298,218 225,736 (36,634) 34,049 60,803 10,815 — — Income (loss) before income taxes and minority interests NSSMC/Nippon Steel 369,485 565,607 621,419 605,485 281,079 11,242 185,377 120,053 (136,970) 399,147 376,188 Sumitomo Metals 169,577 306,183 341,725 281,298 194,459 (39,758) (27,991) (51,251) (134,831) — — Net income (loss) NSSMC/Nippon Steel 220,601 343,903 351,182 354,989 155,077 (11,529) 93,199 58,471 (124,567) 242,753 214,293 Sumitomo Metals 110,864 221,252 226,725 180,547 97,327 (49,772) (7,144) (53,799) (133,849) — —
Capital expenditure NSSMC/Nippon Steel 195,228 203,973 273,440 308,993 305,738 329,356 287,236 281,748 355,873 257,019 304,389 Sumitomo Metals*1 60,374 82,679 135,868 178,887 159,118 136,643 109,934 115,797 N.A — — Depreciation and amortization NSSMC/Nippon Steel 180,571 183,365 192,454 244,038 273,744 284,092 291,587 280,940 288,770 331,801 320,046 Sumitomo Metals*2 79,238 75,255 72,291 102,565 109,854 120,853 126,267 122,937 49,757 — — Research and development costs NSSMC/Nippon Steel 36,352 37,881 41,229 45,329 45,797 46,824 46,663 48,175 60,071 64,437 62,966 Sumitomo Metals 14,732 16,427 18,769 20,102 22,120 22,845 22,783 22,842 N.A — —
Financial Position (End of fi scal year) Total assets Unit: Millions of yen
NSSMC/Nippon Steel ¥3,872,110 ¥4,542,766 ¥5,344,924 ¥5,193,498 ¥4,870,680 ¥5,002,378 ¥5,000,860 ¥4,924,711 ¥7,089,498 ¥7,082,288 ¥7,157,929 Sumitomo Metals 1,923,142 2,113,391 2,301,556 2,418,310 2,452,535 2,403,670 2,440,761 2,386,158 — — — Shareholders’ equity*3
NSSMC/Nippon Steel 1,188,409 1,677,889 1,892,883 1,908,777 1,668,682 1,844,382 1,860,799 1,828,902 2,394,069 2,683,659 2,978,696 Sumitomo Metals 483,237 720,866 880,807 901,946 857,697 829,219 766,777 709,315 — — — Total net assets*3
NSSMC/Nippon Steel 1,279,924 1,782,006 2,369,228 2,413,954 2,174,809 2,335,676 2,380,925 2,347,343 2,938,283 3,237,995 3,547,059 Sumitomo Metals 517,311 762,172 924,798 949,303 904,371 879,209 818,080 761,484 — — — Interest-bearing debt NSSMC/Nippon Steel 1,282,266 1,223,837 1,213,057 1,192,027 1,454,214 1,383,794 1,337,851 1,334,512 2,543,061 2,296,326 1,976,591 Sumitomo Metals*4 885,918 679,778 717,984 883,888 990,010 1,138,353 1,173,382 1,172,120 — — —
Cash Flows (Fiscal year) Cash fl ows from operating activities Unit: Millions of yen
NSSMC/Nippon Steel ¥ 539,445 ¥ 392,996 ¥ 478,460 ¥ 525,777 ¥ 127,540 ¥ 437,668 ¥ 369,500 ¥ 237,414 ¥ 313,317 ¥ 574,767 ¥ 710,998 Sumitomo Metals 277,389 311,943 171,833 230,043 190,582 67,002 202,340 88,065 N.A — — Cash fl ows from investing activities NSSMC/Nippon Steel (174,995) (226,894) (374,669) (438,121) (306,603) (412,827) (325,781) (226,096) (327,336) (196,856) (263,667) Sumitomo Metals (12,013) (63,892) (108,934) (274,316) (214,977) (172,933) (144,009) (120,110) N.A — — Cash fl ows from fi nancing activities NSSMC/Nippon Steel (321,402) (136,110) 19,387 (200,604) 170,209 (79,985) (47,244) (31,785) 33,332 (367,115) (451,843) Sumitomo Metals (297,336) (258,367) (83,456) 48,751 52,623 87,843 (1,325) (32,714) N.A — —
Amounts per Share of Common Stock Net income (loss) per share Unit: Yen
NSSMC/Nippon Steel ¥ 32.73 ¥ 51.07 ¥ 54.28 ¥ 56.33 ¥ 24.60 ¥ (1.83) ¥ 14.81 ¥ 9.29 ¥ (16.23) ¥ 26.67 ¥ 23.48 Sumitomo Metals 23.05 46.03 47.89 39.43 20.98 (10.74) (1.54) (11.61) — — — Cash dividends per share NSSMC/Nippon Steel 5.0 9.0 10.0 11.0 6.0 1.5 3.0 2.5 1.0 5.0 5.5 Sumitomo Metals 5.0 7.0 8.0 10.0 10.0 5.0 3.5 2.0 — — —
NSSMC and its domestic subsidiaries maintain their accounting records in yen. Yen amounts included in the fi nancial statements are stated in millions of yen, and fractions of less than ¥1 million are omitted. Therefore, total or subtotal amounts presented in the fi nancial statements may not equal the exact sum of the individual balances.
*1. Only for “Tangible fi xed assets,” construction base*2. Only for “Tangible fi xed assets”*3. “Shareholders’ equity” described here is the sum of “Shareholders’ equity” as stated in the balance sheet and “Accumulated other comprehensive
income”. The amounts stated for fi scal 2005 and earlier are “Total net assets.” The difference between “Shareholders’ equity” and “Total net assets” is “Minority interests in consolidated subsidiaries.”
*4. The amounts of “Outstanding borrowings” (the sum of “Borrowings,” “Corporate bonds,” and “Commercial paper”) are stated.*5. The amounts stated for “NSSMC/Nippon Steel” for fi scal 2012 are the sum of Nippon Steel’s amounts for the fi rst half (April 1 to September 30) of
fi scal 2012 and NSSMC’s amounts for the second half (October 1 to March 31) of fi scal 2012. The amounts stated for “Sumitomo Metals” for fi scal 2012 are Sumitomo Metals’ amounts for the fi rst half (April 1 to September 30) of fi scal 2012.
NIP
PO
N S
TEE
L & S
UM
ITOM
O M
ETA
L CO
RP
OR
ATIO
NFIN
AN
CIA
L AN
D C
OR
PO
RA
TE
SE
CT
ION
AN
NU
AL R
EP
OR
T 2015
48 49
11-Year Financial Performance (Unaudited; only for reference purposes)
FY 2004 2005 2006 2007 2008 2009 2010 2011 2012*5 2013 2014Financial Index Return on sales ((Ordinary profi t/Net sales) x 100) %
NSSMC/Nippon Steel 11.0% 14.0% 13.9% 11.7% 7.0% 0.3% 5.5% 3.5% 1.8% 6.5% 8.1% Sumitomo Metals 14.0% 18.1% 20.4% 17.1% 12.2% (2.8)% 2.4% 4.1% — — — R eturn on equity ((Net income /Shareholders’ equity
[average for the period]) x 100) NSSMC/Nippon Steel 20.7% 24.0% 19.7% 18.7% 8.7% (0.7)% 5.0% 3.2% (5.9)% 9.6% 7.6% Sumitomo Metals 25.8% 36.7% 28.3% 20.3% 11.1% (5.9)% (0.9)% (7.3)% — — — S hareholders’ equity ratio ((Shareholders’ equity /Total
assets) x 100) NSSMC/Nippon Steel 30.7% 36.9% 35.4% 36.8% 34.3% 36.9% 37.2% 37.1% 33.8% 37.9% 41.6% Sumitomo Metals 25.1% 34.1% 38.3% 37.3% 35.0% 34.5% 31.4% 29.7% — — —
Number of shares issued as of end of period In thousands
NSSMC/Nippon Steel 6,806,980 6,806,980 6,806,980 6,806,980 6,806,980 6,806,980 6,806,980 6,806,980 9,503,214 9,503,214 9,503,214 Sumitomo Metals 4,805,974 4,805,974 4,805,974 4,805,974 4,805,974 4,805,974 4,805,974 4,805,974 — — Share price at end of period Unit: Yen
NSSMC/Nippon Steel ¥ 271 ¥ 456 ¥ 828 ¥ 505 ¥ 263 ¥ 367 ¥ 266 ¥ 227 ¥ 235 ¥ 282 ¥ 302.5 Sumitomo Metals 193 505 609 378 197 283 186 167 — — —
Net Sales by Industry Segment*1 Unit: Millions of yen
Steelmaking and steel fabrication ¥2,620,732 ¥3,057,510 ¥3,482,377 ¥3,994,526 ¥4,038,685 ¥2,823,193 ¥3,473,495 ¥3,476,855 ¥3,790,450 ¥4,877,909 ¥4,939,239 Engineering and construction 279,866 336,179 367,968 359,884 386,643 331,905 254,941 248,934 303,002 314,174 348,699 Urban development 89,275 104,045 94,347 93,839 70,152 80,073 86,556 80,419 — — — Chemicals and non-ferrous materials 331,168 373,072 — — — — — — — — — Chemicals — — 318,755 289,029 212,172 179,412 193,896 197,669 195,719 230,130 212,777 New materials — — 65,601 76,157 59,907 58,799 60,888 54,245 42,211 37,241 36,449 System solutions 146,531 148,339 156,505 165,360 161,541 152,234 159,708 161,582 171,980 179,856 206,032 Other businesses 76,244 69,057 — — — — — — — — — Elimination of inter-segment transactions (154,463) (181,903) (183,410) (151,823) (159,281) (137,904) (119,711) (128,769) (113,442) (123,132) (133,168)
Segment Profi t (Loss)*1
Steelmaking and steel fabrication 376,926 513,977 514,562 475,951 307,047 (20,589) 181,968 98,846 41,522 321,287 401,987 Engineering and construction 6,696 9,517 13,031 21,496 24,674 31,655 14,883 12,775 18,189 17,702 18,758 Urban development 8,503 14,155 14,301 12,602 3,929 2,937 9,273 9,371 — — — Chemicals and non-ferrous materials 26,374 27,037 — — — — — — — — — Chemicals — — 23,645 21,050 894 10,431 13,244 13,598 9,778 10,057 6,898 New materials — — 3,129 559 (2,397) 444 2,111 607 984 1,391 2,482 System solutions 11,384 11,806 13,992 14,756 11,479 10,732 11,332 11,215 11,673 12,760 16,565 Other businesses 384 (1,185) — — — — — — — — — Elimination of inter-segment transactions (321) 1,010 (2,564) (835) (2,696) (3,607) (6,478) (3,408) (5,217) (2,101) 5,053
Non-Financial Performance Crude steel production (Ten thousands of tons) NSSMC/Nippon Steel (Consolidated) 3,279 3,395 3,452 3,623 3,124 2,992 3,492 3,244 4,603 4,816 4,732 NSSMC/Nippon Steel (Non-consolidated) 2,988 3,120 3,160 3,311 2,861 2,750 3,246 3,020 4,355 4,567 4,496 Sumitomo Metals*2 1,287 1,331 1,338 1,362 1,287 1,165 1,290 1,272 — — — S teel products shipments
(Ten thousands of tons, non-consolidated) NSSMC/Nippon Steel 2,951 2,959 3,151 3,290 2,820 2,709 3,135 2,909 4,097 4,202 4,188 Sumitomo Metals*3 1,160 1,195 1,215 1,249 1,144 1,089 1,172 1,124 — — — A verage steel selling price
(Thousands of yen per ton, non-consolidated) NSSMC/Nippon Steel 61.6 74.3 75.3 79.8 104.7 75.4 81.7 86.2 80.1 86.0 87.2 Sumitomo Metals*3 73.6 93.7 100.0 105.7 124.3 88.0 94.2 103.5 — — — Export ratio (Value basis, non-consolidated)*4
NSSMC/Nippon Steel 31.6% 30.9% 32.3% 33.4% 32.5% 38.4% 40.4% 39.2% 44% 46% 47% Sumitomo Metals*3 36.3% 43.8% 46.2% 45.1% 45.2% 42.9% 41.6% 40.9% — — — Number of employees (Consolidated) NSSMC/Nippon Steel 46,451 46,143 47,257 48,757 50,077 52,205 59,183 60,508 83,187 84,361 84,447 Sumitomo Metals 25,201 25,639 24,982 24,926 24,245 23,674 22,597 23,007 — — —
*1 Figures for Nippon Steel. Figures in parentheses indicate either negative fi gures or elimination. “Segment profit (loss)” stated for fiscal 2009 and earlier is “Segment operating profit (loss).” Since July 1, 2006, Nippon Steel has made the following adjustments in its business segments: “the Chemicals and non-ferrous materials segment” has been divided into two segments, “Chemicals” and “New materials.” “Titanium and aluminum operations” within the segment has been transferred to “Steelmaking and steel fabrication.” “Electric power supply, services, and others” has been stated in aggregate as “Other businesses.” Following the business integration of Nippon Steel City Produce, Inc. and Kowa Real Estate Co., Ltd. on October 1, 2012, the business segment classifi cation has been changed to include the results for “Urban development” in “Elimination of inter-segment transac-tions” for “Net sales by segment” and “Profi t (loss) by segment” from fi scal 2012.
*2 “Crude steel production” of Sumitomo Metals includes those of Sumitomo Metals (Kokura), Ltd. (merged with Sumitomo Metals on January 1, 2012) and of Sumikin Iron & Steel Corporation (present Nippon Steel & Sumikin Koutetsu Wakayama Corporation).
*3 “Steel products shipments,” “Average steel selling price,” and “Export ratio” of Sumitomo Metals include those of Sumitomo Metals (Kokura), Ltd. (merged with Sumitomo Metals on January 1, 2012), Sumitomo Metals (Naoetsu), Ltd. (merged with Sumitomo Metals on January 1, 2012), and of Sumikin Iron & Steel Corporation (present Nippon Steel & Sumikin Koutetsu Wakayama Corporation).
*4 “Export ratio” of NSSMC/Nippon Steel indicate the ratios of exports to total steel sales. “Export ratio” of Sumitomo Metals indicate the ratios of exports to total net sales.
*5 The amounts of “Sales,” “Ordinary profi t,” and “Net income” used to calculate “Return on sales (ROS)” and “Return on equity (ROE)” are the sum of Nippon Steel’s amounts for the fi rst half (April 1 to September 30) of fi scal 2012 and NSSMC’s amounts for the second half (October 1 to March 31) of fi scal 2012. “Crude steel production” and “Steel products shipments” for fi scal 2012 are the sum of Nippon Steel’s amount for the fi rst half, Sumitomo Metals’ amount for the fi rst half, and NSSMC’s amount for the second half. At the fi rst half of fi scal 2012, NSSMC’s “Average steel selling price” and “Export ratio” are the weighted average of Nippon Steel and Sumitomo Metals.
NIP
PO
N S
TEE
L & S
UM
ITOM
O M
ETA
L CO
RP
OR
ATIO
NFIN
AN
CIA
L AN
D C
OR
PO
RA
TE
SE
CT
ION
AN
NU
AL R
EP
OR
T 2015
50 51
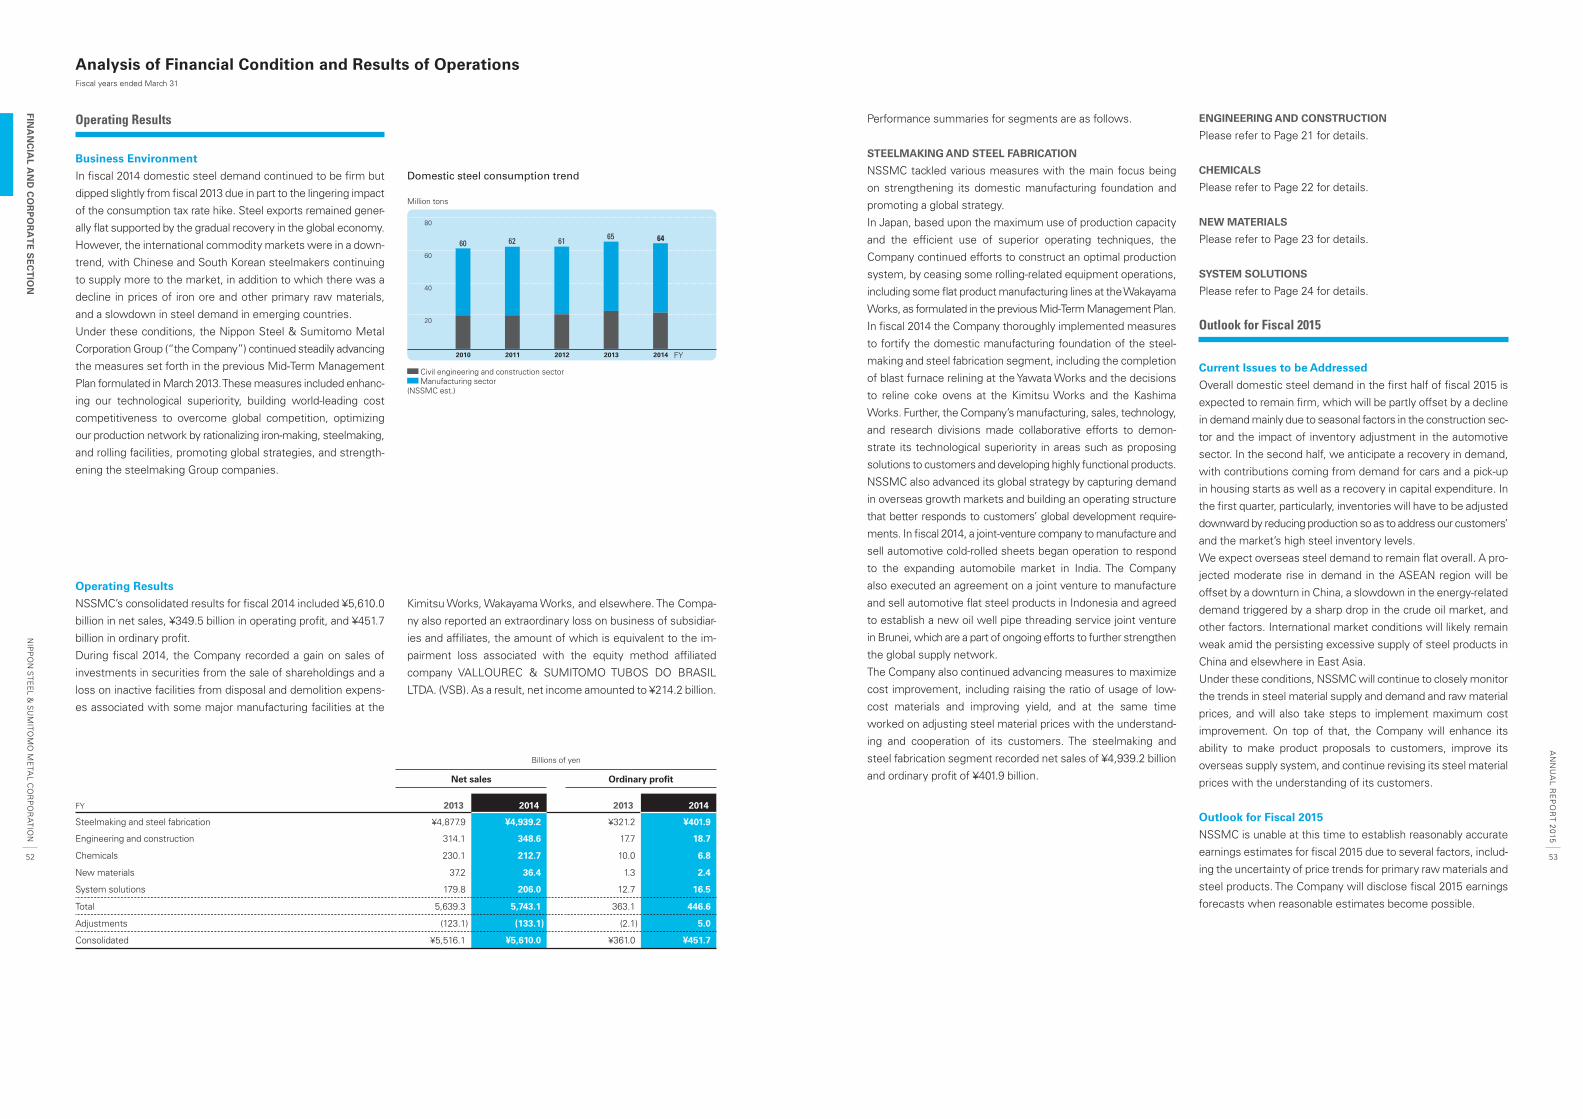
Performance summaries for segments are as follows.
STEELMAKING AND STEEL FABRICATION
NSSMC tackled various measures with the main focus being
on strengthening its domestic manufacturing foundation and
promoting a global strategy.
In Japan, based upon the maximum use of production capacity
and the effi cient use of superior operating techniques, the
Company continued efforts to construct an optimal production
system, by ceasing some rolling-related equipment operations,
including some fl at product manufacturing lines at the Wakayama
Works, as formulated in the previous Mid-Term Management Plan.
In fi scal 2014 the Company thoroughly implemented measures
to fortify the domestic manufacturing foundation of the steel-
making and steel fabrication segment, including the completion
of blast furnace relining at the Yawata Works and the decisions
to reline coke ovens at the Kimitsu Works and the Kashima
Works. Further, the Company’s manufacturing, sales, technology,
and research divisions made collaborative efforts to demon-
strate its technological superiority in areas such as proposing
solutions to customers and developing highly functional products.
NSSMC also advanced its global strategy by capturing demand
in overseas growth markets and building an operating structure
that better responds to customers’ global development require-
ments. In fi scal 2014, a joint-venture company to manufacture and
sell automotive cold-rolled sheets began operation to respond
to the expanding automobile market in India. The Company
also executed an agreement on a joint venture to manufacture
and sell automotive fl at steel products in Indonesia and agreed
to establish a new oil well pipe threading service joint venture
in Brunei, which are a part of ongoing efforts to further strengthen
the global supply network.
The Company also continued advancing measures to maximize
cost improvement, including raising the ratio of usage of low-
cost materials and improving yield, and at the same time
worked on adjusting steel material prices with the understand-
ing and cooperation of its customers. The steelmaking and
steel fabrication segment recorded net sales of ¥4,939.2 billion
and ordinary profi t of ¥401.9 billion.
ENGINEERING AND CONSTRUCTION
Please refer to Page 21 for details.
CHEMICALS
Please refer to Page 22 for details.
NEW MATERIALS
Please refer to Page 23 for details.
SYSTEM SOLUTIONS
Please refer to Page 24 for details.
Outlook for Fiscal 2015
Current Issues to be Addressed
Overall domestic steel demand in the fi rst half of fi scal 2015 is
expected to remain fi rm, which will be partly offset by a decline
in demand mainly due to seasonal factors in the construction sec-
tor and the impact of inventory adjustment in the automotive
sector. In the second half, we anticipate a recovery in demand,
with contributions coming from demand for cars and a pick-up
in housing starts as well as a recovery in capital expenditure. In
the fi rst quarter, particularly, inventories will have to be adjusted
downward by reducing production so as to address our customers’
and the market’s high steel inventory levels.
We expect overseas steel demand to remain fl at overall. A pro-
jected moderate rise in demand in the ASEAN region will be
offset by a downturn in China, a slowdown in the energy-related
demand triggered by a sharp drop in the crude oil market, and
other factors. International market conditions will likely remain
weak amid the persisting excessive supply of steel products in
China and elsewhere in East Asia.
Under these conditions, NSSMC will continue to closely monitor
the trends in steel material supply and demand and raw material
prices, and will also take steps to implement maximum cost
improvement. On top of that, the Company will enhance its
ability to make product proposals to customers, improve its
overseas supply system, and continue revising its steel material
prices with the understanding of its customers.
Outlook for Fiscal 2015
NSSMC is unable at this time to establish reasonably accurate
earnings estimates for fi scal 2015 due to several factors, includ-
ing the uncertainty of price trends for primary raw materials and
steel products. The Company will disclose fi scal 2015 earnings
forecasts when reasonable estimates become possible.
Analysis of Financial Condition and Results of OperationsFiscal years ended March 31
Operating Results
Business Environment
In fi scal 2014 domestic steel demand continued to be fi rm but
dipped slightly from fi scal 2013 due in part to the lingering impact
of the consumption tax rate hike. Steel exports remained gener-
ally fl at supported by the gradual recovery in the global economy.
However, the international commodity markets were in a down-
trend, with Chinese and South Korean steelmakers continuing
to supply more to the market, in addition to which there was a
decline in prices of iron ore and other primary raw materials,
and a slowdown in steel demand in emerging countries.
Under these conditions, the Nippon Steel & Sumitomo Metal
Corporation Group (“the Company”) continued steadily advancing
the measures set forth in the previous Mid-Term Management
Plan formulated in March 2013. These measures included enhanc-
ing our technological superiority, building world-leading cost
competitiveness to overcome global competition, optimizing
our production network by rationalizing iron-making, steelmaking,
and rolling facilities, promoting global strategies, and strength-
ening the steelmaking Group companies.
Operating Results
NSSMC’s consolidated results for fi scal 2014 included ¥5,610.0
billion in net sales, ¥349.5 billion in operating profi t, and ¥451.7
billion in ordinary profi t.
During fi scal 2014, the Company recorded a gain on sales of
investments in securities from the sale of shareholdings and a
loss on inactive facilities from disposal and demolition expens-
es associated with some major manufacturing facilities at the
Kimitsu Works, Wakayama Works, and elsewhere. The Compa-
ny also reported an extraordinary loss on business of subsidiar-
ies and affi liates, the amount of which is equivalent to the im-
pairment loss associated with the equity method affi liated
company VALLOUREC & SUMITOMO TUBOS DO BRASIL
LTDA. (VSB). As a result, net income amounted to ¥214.2 billion.
(NSSMC est.)
80
60
40
20
2010 2011 2012 2013 2014
61626065 64
Civil engineering and construction sectorManufacturing sector
FY
Domestic steel consumption trend
Million tons
Billions of yen
Net sales Ordinary profit
FY 2013 2014 2013 2014
Steelmaking and steel fabrication ¥4,877.9 ¥4,939.2 ¥321.2 ¥401.9
Engineering and construction 314.1 348.6 17.7 18.7
Chemicals 230.1 212.7 10.0 6.8
New materials 37.2 36.4 1.3 2.4
System solutions 179.8 206.0 12.7 16.5
Total 5,639.3 5,743.1 363.1 446.6
Adjustments (123.1) (133.1) (2.1) 5.0
Consolidated ¥5,516.1 ¥5,610.0 ¥361.0 ¥451.7
NIP
PO
N S
TEE
L & S
UM
ITOM
O M
ETA
L CO
RP
OR
ATIO
NFIN
AN
CIA
L AN
D C
OR
PO
RA
TE
SE
CT
ION
AN
NU
AL R
EP
OR
T 2015
52 53
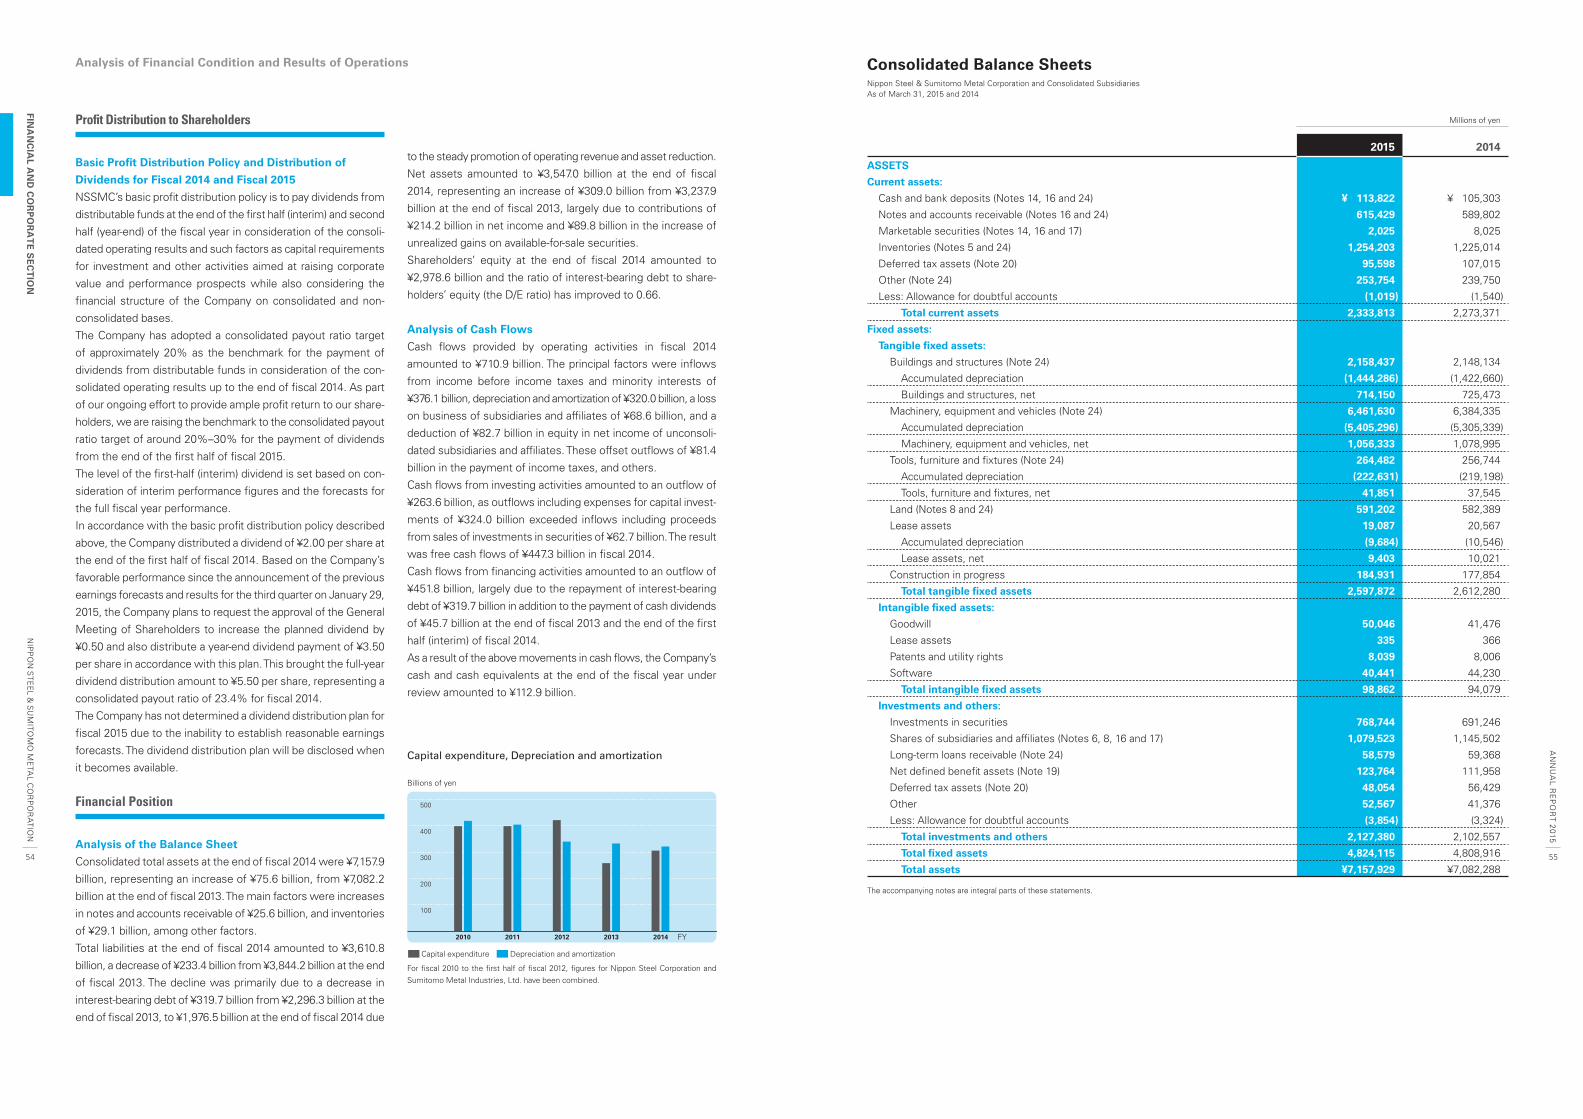
Profi t Distribution to Shareholders
Basic Profi t Distribution Policy and Distribution of
Dividends for Fiscal 2014 and Fiscal 2015
NSSMC’s basic profi t distribution policy is to pay dividends from
distributable funds at the end of the fi rst half (interim) and second
half (year-end) of the fi scal year in consideration of the consoli-
dated operating results and such factors as capital requirements
for investment and other activities aimed at raising corporate
value and performance prospects while also considering the
fi nancial structure of the Company on consolidated and non-
consolidated bases.
The Company has adopted a consolidated payout ratio target
of approximately 20% as the benchmark for the payment of
dividends from distributable funds in consideration of the con-
solidated operating results up to the end of fi scal 2014. As part
of our ongoing effort to provide ample profi t return to our share-
holders, we are raising the benchmark to the consolidated payout
ratio target of around 20%–30% for the payment of dividends
from the end of the fi rst half of fi scal 2015.
The level of the fi rst-half (interim) dividend is set based on con-
sideration of interim performance fi gures and the forecasts for
the full fi scal year performance.
In accordance with the basic profi t distribution policy described
above, the Company distributed a dividend of ¥2.00 per share at
the end of the fi rst half of fi scal 2014. Based on the Company’s
favorable performance since the announcement of the previous
earnings forecasts and results for the third quarter on January 29,
2015, the Company plans to request the approval of the General
Meeting of Shareholders to increase the planned dividend by
¥0.50 and also distribute a year-end dividend payment of ¥3.50
per share in accordance with this plan. This brought the full-year
dividend distribution amount to ¥5.50 per share, representing a
consolidated payout ratio of 23.4% for fi scal 2014.
The Company has not determined a dividend distribution plan for
fi scal 2015 due to the inability to establish reasonable earnings
forecasts. The dividend distribution plan will be disclosed when
it becomes available.
Financial Position
Analysis of the Balance Sheet
Consolidated total assets at the end of fi scal 2014 were ¥7,157.9
billion, representing an increase of ¥75.6 billion, from ¥7,082.2
billion at the end of fi scal 2013. The main factors were increases
in notes and accounts receivable of ¥25.6 billion, and inventories
of ¥29.1 billion, among other factors.
Total liabilities at the end of fi scal 2014 amounted to ¥3,610.8
billion, a decrease of ¥233.4 billion from ¥3,844.2 billion at the end
of fi scal 2013. The decline was primarily due to a decrease in
interest-bearing debt of ¥319.7 billion from ¥2,296.3 billion at the
end of fi scal 2013, to ¥1,976.5 billion at the end of fi scal 2014 due
to the steady promotion of operating revenue and asset reduction.
Net assets amounted to ¥3,547.0 billion at the end of fi scal
2014, representing an increase of ¥309.0 billion from ¥3,237.9
billion at the end of fi scal 2013, largely due to contributions of
¥214.2 billion in net income and ¥89.8 billion in the increase of
unrealized gains on available-for-sale securities.
Shareholders’ equity at the end of fi scal 2014 amounted to
¥2,978.6 billion and the ratio of interest-bearing debt to share-
holders’ equity (the D/E ratio) has improved to 0.66.
Analysis of Cash Flows
Cash fl ows provided by operating activities in fi scal 2014
amounted to ¥710.9 billion. The principal factors were infl ows
from income before income taxes and minority interests of
¥376.1 billion, depreciation and amortization of ¥320.0 billion, a loss
on business of subsidiaries and affi liates of ¥68.6 billion, and a
deduction of ¥82.7 billion in equity in net income of unconsoli-
dated subsidiaries and affi liates. These offset outfl ows of ¥81.4
billion in the payment of income taxes, and others.
Cash fl ows from investing activities amounted to an outfl ow of
¥263.6 billion, as outfl ows including expenses for capital invest-
ments of ¥324.0 billion exceeded infl ows including proceeds
from sales of investments in securities of ¥62.7 billion. The result
was free cash fl ows of ¥447.3 billion in fi scal 2014.
Cash fl ows from fi nancing activities amounted to an outfl ow of
¥451.8 billion, largely due to the repayment of interest-bearing
debt of ¥319.7 billion in addition to the payment of cash dividends
of ¥45.7 billion at the end of fi scal 2013 and the end of the fi rst
half (interim) of fi scal 2014.
As a result of the above movements in cash fl ows, the Company’s
cash and cash equivalents at the end of the fi scal year under
review amounted to ¥112.9 billion.
Capital expenditure Depreciation and amortization
For fi scal 2010 to the fi rst half of fi scal 2012, fi gures for Nippon Steel Corporation and Sumitomo Metal Industries, Ltd. have been combined.
500
400
300
200
100
2010 2011 2012 2013 2014 FY
Capital expenditure, Depreciation and amortization
Billions of yen
Analysis of Financial Condition and Results of Operations Consolidated Balance SheetsNippon Steel & Sumitomo Metal Corporation and Consolidated SubsidiariesAs of March 31, 2015 and 2014
Millions of yen
2015 2014
ASSETS
Current assets:
Cash and bank deposits (Notes 14, 16 and 24) ¥ 113,822 ¥ 105,303
Notes and accounts receivable (Notes 16 and 24) 615,429 589,802
Marketable securities (Notes 14, 16 and 17) 2,025 8,025
Inventories (Notes 5 and 24) 1,254,203 1,225,014
Deferred tax assets (Note 20) 95,598 107,015
Other (Note 24) 253,754 239,750
Less: Allowance for doubtful accounts (1,019) (1,540)
Total current assets 2,333,813 2,273,371
Fixed assets:
Tangible fi xed assets:
Buildings and structures (Note 24) 2,158,437 2,148,134
Accumulated depreciation (1,444,286) (1,422,660)
Buildings and structures, net 714,150 725,473
Machinery, equipment and vehicles (Note 24) 6,461,630 6,384,335
Accumulated depreciation (5,405,296) (5,305,339)
Machinery, equipment and vehicles, net 1,056,333 1,078,995
Tools, furniture and fi xtures (Note 24) 264,482 256,744
Accumulated depreciation (222,631) (219,198)
Tools, furniture and fi xtures, net 41,851 37,545
Land (Notes 8 and 24) 591,202 582,389
Lease assets 19,087 20,567
Accumulated depreciation (9,684) (10,546)
Lease assets, net 9,403 10,021
Construction in progress 184,931 177,854
Total tangible fi xed assets 2,597,872 2,612,280
Intangible fi xed assets:
Goodwill 50,046 41,476
Lease assets 335 366
Patents and utility rights 8,039 8,006
Software 40,441 44,230
Total intangible fi xed assets 98,862 94,079
Investments and others:
Investments in securities 768,744 691,246
Shares of subsidiaries and affi liates (Notes 6, 8, 16 and 17) 1,079,523 1,145,502
Long-term loans receivable (Note 24) 58,579 59,368
Net defi ned benefi t assets (Note 19) 123,764 111,958
Deferred tax assets (Note 20) 48,054 56,429
Other 52,567 41,376
Less: Allowance for doubtful accounts (3,854) (3,324)
Total investments and others 2,127,380 2,102,557
Total fi xed assets 4,824,115 4,808,916
Total assets ¥7,157,929 ¥7,082,288
The accompanying notes are integral parts of these statements.
NIP
PO
N S
TEE
L & S
UM
ITOM
O M
ETA
L CO
RP
OR
ATIO
NFIN
AN
CIA
L AN
D C
OR
PO
RA
TE
SE
CT
ION
AN
NU
AL R
EP
OR
T 2015
54 55
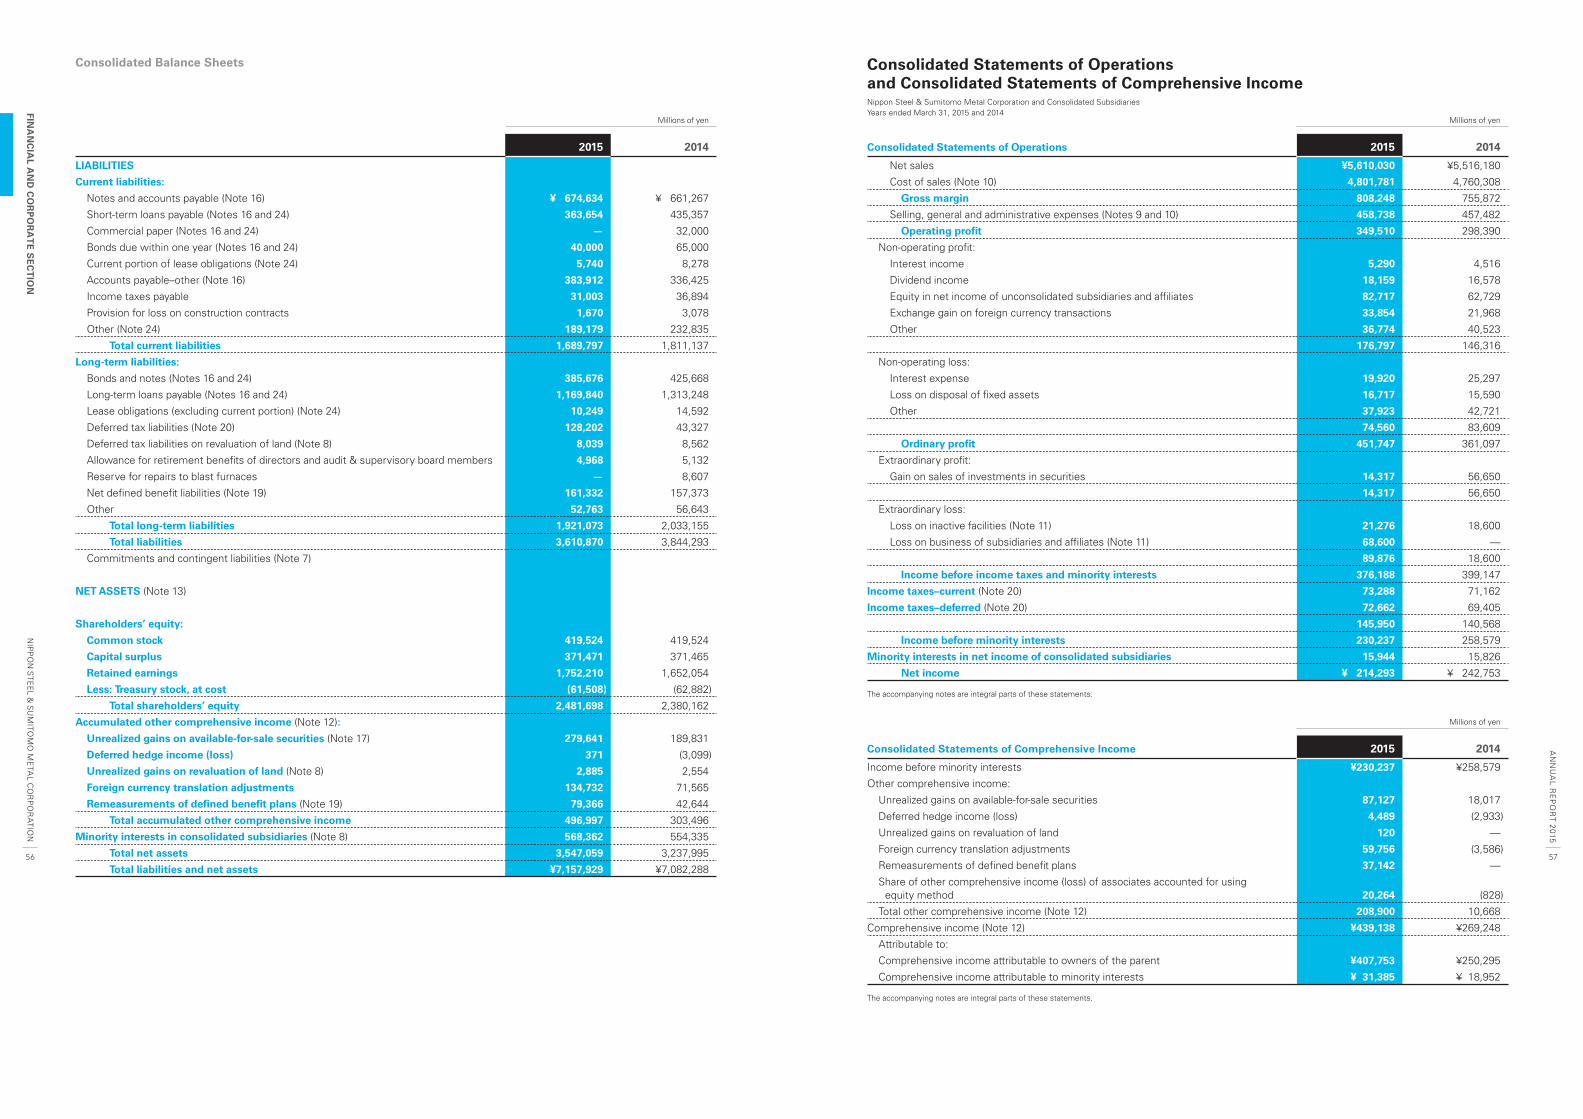
Millions of yen
2015 2014
LIABILITIES
Current liabilities:
Notes and accounts payable (Note 16) ¥ 674,634 ¥ 661,267
Short-term loans payable (Notes 16 and 24) 363,654 435,357
Commercial paper (Notes 16 and 24) — 32,000
Bonds due within one year (Notes 16 and 24) 40,000 65,000
Current portion of lease obligations (Note 24) 5,740 8,278
Accounts payable–other (Note 16) 383,912 336,425
Income taxes payable 31,003 36,894
Provision for loss on construction contracts 1,670 3,078
Other (Note 24) 189,179 232,835
Total current liabilities 1,689,797 1,811,137
Long-term liabilities:
Bonds and notes (Notes 16 and 24) 385,676 425,668
Long-term loans payable (Notes 16 and 24) 1,169,840 1,313,248
Lease obligations (excluding current portion) (Note 24) 10,249 14,592
Deferred tax liabilities (Note 20) 128,202 43,327
Deferred tax liabilities on revaluation of land (Note 8) 8,039 8,562
Allowance for retirement benefi ts of directors and audit & supervisory board members 4,968 5,132
Reserve for repairs to blast furnaces — 8,607
Net defi ned benefi t liabilities (Note 19) 161,332 157,373
Other 52,763 56,643
Total long-term liabilities 1,921,073 2,033,155
Total liabilities 3,610,870 3,844,293
Commitments and contingent liabilities (Note 7)
NET ASSETS (Note 13)
Shareholders’ equity:
Common stock 419,524 419,524
Capital surplus 371,471 371,465
Retained earnings 1,752,210 1,652,054
Less: Treasury stock, at cost (61,508) (62,882)
Total shareholders’ equity 2,481,698 2,380,162
Accumulated other comprehensive income (Note 12):
Unrealized gains on available-for-sale securities (Note 17) 279,641 189,831
Deferred hedge income (loss) 371 (3,099)
Unrealized gains on revaluation of land (Note 8) 2,885 2,554
Foreign currency translation adjustments 134,732 71,565
Remeasurements of defi ned benefi t plans (Note 19) 79,366 42,644
Total accumulated other comprehensive income 496,997 303,496
Minority interests in consolidated subsidiaries (Note 8) 568,362 554,335
Total net assets 3,547,059 3,237,995
Total liabilities and net assets ¥7,157,929 ¥7,082,288
Consolidated Balance Sheets Consolidated Statements of Operations and Consolidated Statements of Comprehensive IncomeNippon Steel & Sumitomo Metal Corporation and Consolidated SubsidiariesYears ended March 31, 2015 and 2014
Millions of yen
Consolidated Statements of Operations 2015 2014
Net sales ¥5,610,030 ¥5,516,180
Cost of sales (Note 10) 4,801,781 4,760,308
Gross margin 808,248 755,872
Selling, general and administrative expenses (Notes 9 and 10) 458,738 457,482
Operating profi t 349,510 298,390
Non-operating profi t:
Interest income 5,290 4,516
Dividend income 18,159 16,578
Equity in net income of unconsolidated subsidiaries and affi liates 82,717 62,729
Exchange gain on foreign currency transactions 33,854 21,968
Other 36,774 40,523
176,797 146,316
Non-operating loss:
Interest expense 19,920 25,297
Loss on disposal of fi xed assets 16,717 15,590
Other 37,923 42,721
74,560 83,609
Ordinary profi t 451,747 361,097
Extraordinary profi t:
Gain on sales of investments in securities 14,317 56,650
14,317 56,650
Extraordinary loss:
Loss on inactive facilities (Note 11) 21,276 18,600
Loss on business of subsidiaries and affi liates (Note 11) 68,600 —
89,876 18,600
Income before income taxes and minority interests 376,188 399,147
Income taxes–current (Note 20) 73,288 71,162
Income taxes–deferred (Note 20) 72,662 69,405
145,950 140,568
Income before minority interests 230,237 258,579
Minority interests in net income of consolidated subsidiaries 15,944 15,826
Net income ¥ 214,293 ¥ 242,753
The accompanying notes are integral parts of these statements.
Millions of yen
Consolidated Statements of Comprehensive Income 2015 2014
Income before minority interests ¥230,237 ¥258,579
Other comprehensive income:
Unrealized gains on available-for-sale securities 87,127 18,017
Deferred hedge income (loss) 4,489 (2,933)
Unrealized gains on revaluation of land 120 —
Foreign currency translation adjustments 59,756 (3,586)
Remeasurements of defi ned benefi t plans 37,142 —
S hare of other comprehensive income (loss) of associates accounted for using equity method 20,264 (828)
Total other comprehensive income (Note 12) 208,900 10,668
Comprehensive income (Note 12) ¥439,138 ¥269,248
Attributable to:
Comprehensive income attributable to owners of the parent ¥407,753 ¥250,295
Comprehensive income attributable to minority interests ¥ 31,385 ¥ 18,952
The accompanying notes are integral parts of these statements.
NIP
PO
N S
TEE
L & S
UM
ITOM
O M
ETA
L CO
RP
OR
ATIO
NFIN
AN
CIA
L AN
D C
OR
PO
RA
TE
SE
CT
ION
AN
NU
AL R
EP
OR
T 2015
56 57
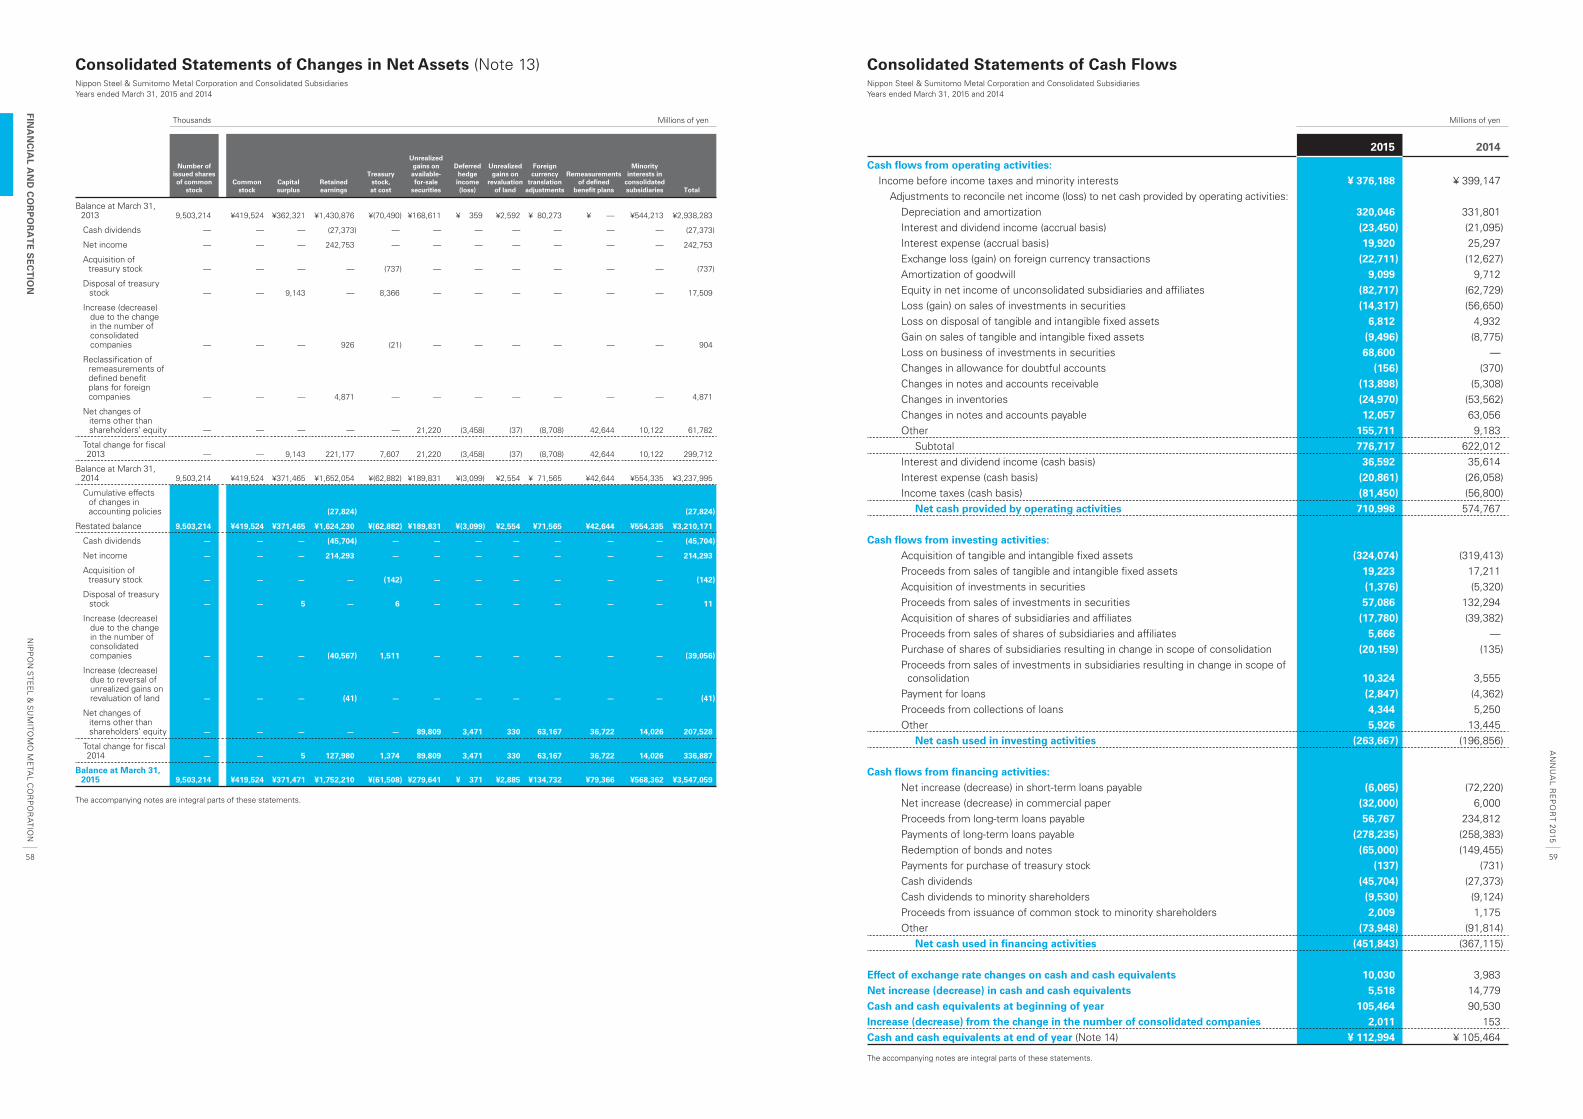
Consolidated Statements of Changes in Net Assets (Note 13)Nippon Steel & Sumitomo Metal Corporation and Consolidated SubsidiariesYears ended March 31, 2015 and 2014
Thousands Millions of yen
Number of issued shares of common
stockCommon
stockCapital surplus
Retained earnings
Treasury stock, at cost
Unrealized gains on available-for-sale
securities
Deferred hedge income (loss)
Unrealized gains on
revaluation of land
Foreign currency
translation adjustments
Remeasurements of defined
benefit plans
Minority interests in
consolidated subsidiaries Total
B alance at March 31, 2013 9,503,214 ¥419,524 ¥362,321 ¥1,430,876 ¥(70,490) ¥168,611 ¥ 359 ¥2,592 ¥ 80,273 ¥ — ¥544,213 ¥2,938,283
Cash dividends — — — (27,373) — — — — — — — (27,373)
Net income — — — 242,753 — — — — — — — 242,753
A cquisition of treasury stock — — — — (737) — — — — — — (737)
D isposal of treasury stock — — 9,143 — 8,366 — — — — — — 17,509
In crease (decrease) due to the change in the number of consolidated companies — — — 926 (21) — — — — — — 904
R eclassifi cation of remeasurements of defi ned benefi t plans for foreign companies — — — 4,871 — — — — — — — 4,871
N et changes of items other than shareholders’ equity — — — — — 21,220 (3,458) (37) (8,708) 42,644 10,122 61,782
T otal change for fi scal 2013 — — 9,143 221,177 7,607 21,220 (3,458) (37) (8,708) 42,644 10,122 299,712
B alance at March 31, 2014 9,503,214 ¥419,524 ¥371,465 ¥1,652,054 ¥(62,882) ¥189,831 ¥(3,099) ¥2,554 ¥ 71,565 ¥42,644 ¥554,335 ¥3,237,995
C umulative effects of changes in accounting policies (27,824) (27,824)
Restated balance 9,503,214 ¥419,524 ¥371,465 ¥1,624,230 ¥(62,882) ¥189,831 ¥(3,099) ¥2,554 ¥71,565 ¥42,644 ¥554,335 ¥3,210,171
Cash dividends — — — (45,704) — — — — — — — (45,704)
Net income — — — 214,293 — — — — — — — 214,293
A cquisition of treasury stock — — — — (142) — — — — — — (142)
D isposal of treasury stock — — 5 — 6 — — — — — — 11
In crease (decrease) due to the change in the number of consolidated companies — — — (40,567) 1,511 — — — — — — (39,056)
In crease (decrease) due to reversal of unrealized gains on revaluation of land — — — (41) — — — — — — — (41)
N et changes of items other than shareholders’ equity — — — — — 89,809 3,471 330 63,167 36,722 14,026 207,528
T otal change for fi scal 2014 — — 5 127,980 1,374 89,809 3,471 330 63,167 36,722 14,026 336,887
B alance at March 31, 2015 9,503,214 ¥419,524 ¥371,471 ¥1,752,210 ¥(61,508) ¥279,641 ¥ 371 ¥2,885 ¥134,732 ¥79,366 ¥568,362 ¥3,547,059
The accompanying notes are integral parts of these statements.
Consolidated Statements of Cash FlowsNippon Steel & Sumitomo Metal Corporation and Consolidated SubsidiariesYears ended March 31, 2015 and 2014
Millions of yen
2015 2014
Cash fl ows from operating activities: Income before income taxes and minority interests ¥ 376,188 ¥ 399,147 Adjustments to reconcile net income (loss) to net cash provided by operating activities: Depreciation and amortization 320,046 331,801 Interest and dividend income (accrual basis) (23,450) (21,095) Interest expense (accrual basis) 19,920 25,297 Exchange loss (gain) on foreign currency transactions (22,711) (12,627) Amortization of goodwill 9,099 9,712 Equity in net income of unconsolidated subsidiaries and affi liates (82,717) (62,729) Loss (gain) on sales of investments in securities (14,317) (56,650) Loss on disposal of tangible and intangible fi xed assets 6,812 4,932 Gain on sales of tangible and intangible fi xed assets (9,496) (8,775) Loss on business of investments in securities 68,600 — Changes in allowance for doubtful accounts (156) (370) Changes in notes and accounts receivable (13,898) (5,308) Changes in inventories (24,970) (53,562) Changes in notes and accounts payable 12,057 63,056 Other 155,711 9,183 Subtotal 776,717 622,012 Interest and dividend income (cash basis) 36,592 35,614 Interest expense (cash basis) (20,861) (26,058) Income taxes (cash basis) (81,450) (56,800) Net cash provided by operating activities 710,998 574,767
Cash fl ows from investing activities: Acquisition of tangible and intangible fi xed assets (324,074) (319,413) Proceeds from sales of tangible and intangible fi xed assets 19,223 17,211 Acquisition of investments in securities (1,376) (5,320) Proceeds from sales of investments in securities 57,086 132,294 Acquisition of shares of subsidiaries and affi liates (17,780) (39,382) Proceeds from sales of shares of subsidiaries and affi liates 5,666 — Purchase of shares of subsidiaries resulting in change in scope of consolidation (20,159) (135) P roceeds from sales of investments in subsidiaries resulting in change in scope of
consolidation 10,324 3,555 Payment for loans (2,847) (4,362) Proceeds from collections of loans 4,344 5,250 Other 5,926 13,445 Net cash used in investing activities (263,667) (196,856)
Cash fl ows from fi nancing activities: Net increase (decrease) in short-term loans payable (6,065) (72,220) Net increase (decrease) in commercial paper (32,000) 6,000 Proceeds from long-term loans payable 56,767 234,812 Payments of long-term loans payable (278,235) (258,383) Redemption of bonds and notes (65,000) (149,455) Payments for purchase of treasury stock (137) (731) Cash dividends (45,704) (27,373) Cash dividends to minority shareholders (9,530) (9,124) Proceeds from issuance of common stock to minority shareholders 2,009 1,175 Other (73,948) (91,814) Net cash used in fi nancing activities (451,843) (367,115)
Effect of exchange rate changes on cash and cash equivalents 10,030 3,983 Net increase (decrease) in cash and cash equivalents 5,518 14,779 Cash and cash equivalents at beginning of year 105,464 90,530 Increase (decrease) from the change in the number of consolidated companies 2,011 153 Cash and cash equivalents at end of year (Note 14) ¥ 112,994 ¥ 105,464
The accompanying notes are integral parts of these statements.
NIP
PO
N S
TEE
L & S
UM
ITOM
O M
ETA
L CO
RP
OR
ATIO
NFIN
AN
CIA
L AN
D C
OR
PO
RA
TE
SE
CT
ION
AN
NU
AL R
EP
OR
T 2015
58 59
01 BASIS OF PRESENTING CONSOLIDATED FINANCIAL STATEMENTS
The accompanying consolidated fi nancial statements of Nippon
Steel & Sumitomo Metal Corporation (NSSMC) and its subsid-
iaries (collectively “the NSSMC Group”) are prepared on the
basis of accounting principles generally accepted in Japan, and
are compiled from the consolidated fi nancial statements pre-
pared by NSSMC as required by the Financial Instruments and
Exchange Act of Japan.
02 NOTES TO THE PRESUMPTION OF GOING CONCERN
None
03 SUMMARY OF SIGNIFICANT ACCOUNTING POLICIES
(1) Scope of consolidation
Number of consolidated subsidiaries: 356 companies
For details of the subsidiaries included in consolidation, refer-
ence should be made to the list of principal subsidiaries and
affi liates of NSSMC on pages 92–93 of this report.
In fi scal 2014, the year ended March 31, 2015, the scope of
consolidation expanded by 13 companies, including newly
established and newly acquired companies. 34 companies—20
merged companies and 8 divestments, etc.—were eliminated
from the scope of consolidation in fi scal 2014.
Non-adoption of the consolidation accounting treatment for the
unconsolidated subsidiaries (6 companies) does not have a
material effect on total assets, net sales, net income or retained
earnings in the consolidated fi nancial statements.
(2) Application of equity method
Affi liates accounted for by the equity method: 105 companies
For details of the affi liates included in consolidation, reference
should be made to the list of principal subsidiaries and affi liates
of NSSMC on pages 92–93 of this report.
During fi scal 2014, 1 company was added as an equity-method affi l-
iate and 5 companies were removed as equity-method affi liates.
Non-adoption of the equity method for the unconsolidated sub-
sidiaries (6 companies) and affi liates (62 companies) has no
material effect on net income or retained earnings in the con-
solidated fi nancial statements.
(3) Adjustments of differences in fi scal year-end
For consolidated subsidiaries listed below using a fi scal year-end
other than March 31, certain adjustments have been made, if
appropriate, in preparing the consolidated fi nancial statements
to refl ect material transactions that have taken place between
their fi scal year-end and March 31.
Consolidatedsubsidiaries
Date of closingaccounting period
2 domestic subsidiaries January 313 domestic subsidiaries December 31133 foreign subsidiaries December 31
Principal foreign subsidiaries using a December 31 fi scal year-end:
NIPPON STEEL AND SUMIKIN TUBOS DO BRASIL LTDA.
The Siam United Steel (1995) Company Limited
National Pipe Company Limited
Standard Steel, LLC
NIPPON STEEL & SUMITOMO METAL U.S.A., Inc.
PT PELAT TIMAH NUSANTARA TBK.
NIPPON STEEL & SUMITOMO METAL (Thailand) Co., Ltd.
NIPPON STEEL & SUMIKIN Steel Processing (Thailand) Co., Ltd.
WESTERN TUBE & CONDUIT CORPORATION
NIPPON STEEL & SUMITOMO METAL Australia Pty. Limited
(4) Securities
• Held-to-maturity debt securities:
Amortized cost method (straight-line method)
• Available-for-sale securities:
Securities with market quotations are stated at market value as
of the balance sheet date. (Net unrealized gains or losses are
comprehensively included in net assets, and the cost of securi-
ties sold is determined by the moving-average method.)
Securities without market quotations are stated at cost deter-
mined by the moving-average method.
(5) Inventories
Inventories are stated principally using the cost accounting
method based on the periodic average method. (Regarding balance
sheet values, this method is designed to reduce book value
when the contribution of inventories to profi tability declines.)
(6) Tangible fi xed assets (excluding leased assets)
Depreciation of tangible fi xed assets is mainly calculated using
the declining-balance method. However, depreciation of buildings
is mainly calculated using the straight-line method.
Useful lives of tangible fi xed assets are generally as follows:
Buildings: Mainly 31 years
Machinery: Mainly 14 years
Notes to Consolidated Financial StatementsNippon Steel & Sumitomo Metal Corporation and Consolidated Subsidiaries
(7) Intangible fi xed assets (excluding leased assets)
Amortization of intangible fi xed assets is calculated using the
straight-line method.
Software products for internal use are amortized mainly over
the estimated useful life of 5 years.
(8) Leased assets
Assets concerning fi nance leases in which ownership is trans-
ferred to the lessee are depreciated using the same method of
depreciation for tangible fi xed assets owned by the NSSMC Group.
Assets concerning fi nance leases in which ownership is not
transferred to the lessee are depreciated to a residual value of
zero based on the straight-line method over a useful life period
corresponding to the lease contract period.
(9) Allowance for doubtful accounts
The allowance for doubtful accounts is computed based on the
historical experienced default ratio for non-specifi c receivables,
as well as the estimated irrecoverable portion of specifi c doubtful
receivables calculated on an individual basis.
(10) Provision for loss on construction contracts
The provision for loss on construction contracts is provided
based on the excess of estimated costs over contract revenue.
(11) Allowance for retirement benefi ts of directors and
audit & supervisory board members
The allowance for retirement benefi ts of directors and audit &
supervisory board members are computed based on internal
rules.
(12) Retirement benefi t accounting policy
The employee retirement benefi t obligations are computed pri-
marily based on the benefi t formula basis using the projected
retirement benefi t obligations at the end of the consolidated
fi scal year under review. Prior service costs are appropriated
using the straight-line method over a specifi ed period (mainly
10 years) within the employees’ average remaining service
period at the time when such costs accrue. Actuarial differ-
ences are principally charged to expenses proportionally using
the straight-line method from the consolidated fi scal year fol-
lowing the year in which such differences accrue over a speci-
fi ed period (mainly 10 years) within the employees’ average
remaining service period at the time when such differences
accrue.
Changes in accounting principles accompanying revisions in
accounting standards
Provisions stated in Section 35 of the “Accounting Standard for
Retirement Benefi ts” (Accounting Standards Board of Japan
(ASBJ) Statement No. 26, hereinafter referred to as the “Retire-
ment Benefi ts Accounting Standard”) and Section 67 of the
“Guidance on the Accounting Standard for Retirement Bene-
fi ts” (ASBJ Guidance No. 25, hereinafter “Guidance on Retire-
ment Benefi ts”) have been applied from the beginning of fi scal
2014. With this application, calculation methods for retirement
benefi t obligations and service costs have been changed.
Under this change, the calculation method for annual allocation
expenses for projected benefi t obligations are changed from
the straight-line attribution basis pro-rated on employees’ years
of service to benefi t formula basis pro-rated on employees’
salaries. The method for determining the time period over
which the discount rate is imputed is changed from the average
remaining years of service for employees to mainly the
expected period length of benefi ts payments and weighted
average discount rate refl ecting the amount to be paid in each
period under the expected length of benefi ts payments for all
employees under the plan.
In accordance with the transitional treatment prescribed in Sec-
tion 37 of the Retirement Benefi ts Accounting Standard, the
Company applied the “Accounting Standard for Retirement
Benefi ts” at the beginning of fi scal 2014, and the effect of the
accounting change in retirement benefi t obligations and service
costs was refl ected in retained earnings.
As a result, net defi ned benefi t assets decreased by ¥27,904
million, net defi ned benefi t liabilities increased by ¥14,506 mil-
lion and retained earnings decreased by ¥27,824 million at the
beginning of fi scal 2014. The effect of this change on consoli-
dated fi nancial results for fi scal 2014 was to increase operating
profi t by ¥2,375 million, and both ordinary profi t and income
before income taxes and minority interests by ¥2,362 million.
Information concerning the effect of this change on a per share
basis is presented in the relevant sections of this report.
(13) Accounting for revenues on construction contracts
Regarding projects for which the outcome of the portion
completed is deemed certain, the NSSMC Group has applied
the percentage-of-completion method (estimating the project
progress percentage based on the percentage of the cost
incurred to the estimated total cost). The completion-of-
contract method is applied to other projects.
(14) Important assets and liabilities in foreign currencies
and foreign currency translation
Monetary assets and liabilities of NSSMC and its domestic
subsidiaries denominated in foreign currencies are translated into
yen at the rate prevailing on the balance sheet date, and the
resulting foreign exchange gains or losses are recognized as
income or expenses. For foreign consolidated subsidiaries, assets
and liabilities are translated into yen at the rate prevailing at each
balance sheet date, revenue and expense accounts are translated
at the average rate of exchange in effect during the fi scal year, and
foreign currency translation adjustments are included in the for-
eign currency translation adjustments and minority interests in
consolidated subsidiaries item under net assets.
NIP
PO
N S
TEE
L & S
UM
ITOM
O M
ETA
L CO
RP
OR
ATIO
NFIN
AN
CIA
L AN
D C
OR
PO
RA
TE
SE
CT
ION
AN
NU
AL R
EP
OR
T 2015
60 61
(15) Hedge accounting
Gains or losses arising from changes in the fair values of derivatives
designated as “hedging instruments” are recorded as deferred
hedge income (loss) in net assets and included in net profi t or
loss in the same period in which the gains or losses on the
underlying hedged items or transactions are recognized.
In principle, the NSSMC Group adopts the deferred hedging
accounting method. In addition, for interest rate swaps whose
amounts, index and period meet the conditions for hedged
items, the “exceptional” method is adopted. Using this method,
the NSSMC Group does not account for gains and losses on
those interest rate swaps on a fair value basis, but recognizes
swap interest on an accrual basis. For foreign exchange forward
contracts and currency swaps whose amounts, currency, and
period meet the conditions of hedged items, the “assigning”
method is adopted. Using this method, the NSSMC Group
does not account for gains and losses on those foreign exchange
forward contracts and currency swaps on a fair value basis, but
converts hedged items using the rates of those foreign
exchange forward contracts and currency swaps at the end of
the year.
Derivatives designated as hedging instruments by the NSSMC
Group are principally foreign exchange forward contracts, interest
swaps, and currency swaps. The related hedged items are
trade accounts receivable and payable, foreign currency future
transactions, long-term bank loans, and debt securities issued
by the NSSMC Group.
The NSSMC Group has a policy that aims to utilize these hedging
instruments in order to reduce its exposure to the risk of fl uctua-
tions in market prices, interest rates, or foreign exchange rates.
Therefore, the NSSMC Group’s purchase of hedging instruments
is limited to the amount of the hedged items.
The NSSMC Group continues to evaluate the effectiveness of
its hedging activities by reference to the accumulated gains or
losses on the hedging instruments and the related hedged
items from the commencement of the hedges.
(16) Goodwill
Goodwill accounted for on an equity basis is amortized over the
period for which the excess cost is expected to contribute to
consolidated net income, where it is possible to estimate such
a period, using the straight-line method. Otherwise, the excess
is amortized proportionately over 5 years.
(17) Cash and cash equivalents
Cash and cash equivalents in the consolidated statements
of cash fl ows include cash in hand, bank deposits able to be
withdrawn on demand, and short-term investments due within
3 months of the date of purchase, and which represent an insig-
nifi cant risk of change in value.
(18) Consumption tax
The accounting treatment used with respect to consumption
tax and local consumption taxes is the tax-excluded method.
Unapplied accounting standards (Year ended March 31, 2015)
“Accounting Standard for Business Combinations”(ASBJ State-
ment No. 21), “Accounting Standard for Consolidated Financial
Statements” (ASBJ Statement No. 22), ”Accounting Standard
for Business Divestitures” (ASBJ Statement No. 7), “Account-
ing Standard for Earnings Per Share” (ASBJ Statement No. 2),
“Guidance on Accounting Standard for Business Combinations
and Accounting Standard for Business Divestitures” (ASBJ
Guidance No. 10), and “Revised Guidance on Accounting Stan-
dard for Earnings Per Share” (ASBJ Guidance No. 4)
1. Summary
The main changes to the accounting standards apply to 1) the
handling of changes in equity holdings of a subsidiary by the
parent company in the event of ongoing control of additional
acquisitions of the subsidiary, 2) the handling of expenses re-
lated to the acquisition, 3) the presentation of net income and
revision from minority interests to non-controlling interests,
and 4) the handling of provisional accounting processes.
2. Planned application
The NSSMC Group plans to apply the changes from the start of
the fi scal year beginning April 1, 2015. The NSSMC Group plans
to apply the handling of provisional accounting processes upon
the corporate integration from April 1, 2015.
3. Effect from application of the accounting standards
The effect on the consolidated fi nancial statements from the
application of the accounting standards is currently under
assessment.
Changes to presentation (Year ended March 31, 2015)
(Consolidated Balance Sheets)
On the Consolidated Balance Sheets, “Shares of subsidiaries
and affi liates”, which had been previously included in “Invest-
ments in securities” and “Other” under “Investments and oth-
ers,” is separately presented as independent accounts from the
consolidated fi scal year under review in order to facilitate better
understanding of the Consolidated Balance Sheets. The fi gure
for the previous fi scal year has been revised in the Consolidated
Financial Statements for the consolidated fi scal year under
review to refl ect the revision in the reporting method.
As a result, in the consolidated balance sheet for the previous
fi scal year, the ¥1,836,196 million amount presented as “In-
vestments in securities” and the ¥41,928 million amount pre-
sented as “Other” under “Investments and others,” were re-
classifi ed as “Investments in securities” of ¥691,246 million,
“Shares of subsidiaries and affi liates” of ¥1,145,502 million,
and “Other” of ¥41,376 million.
(Consolidated Statements of Cash Flows)
In accordance with the revision to the reporting method for
“Shares of subsidiaries and affi liates” under “Investments in
securities” on the Consolidated Balance Sheets, “Acquisition of
shares of subsidiaries and affi liates” is reported as a separate
line item beginning in the consolidated fi scal year under review.
“Acquisition of shares of subsidiaries and affi liates” was previ-
ously reported as part of “Acquisition of investments in securi-
ties” under “Cash fl ows from investing activities.” The fi gure for
the previous fi scal year has been revised in the Consolidated
Financial Statements for the consolidated fi scal year under re-
view to refl ect the revision in the reporting method.
Based on this revision, the ¥(44,702) million reported for “Acqui-
sition of investments in securities” in the Consolidated State-
ments of Cash Flows of the previous fi scal year has been
revised and is reported as ¥(5,320) million for “Acquisition of
investments in securities” and ¥(39,382) million for “Acquisition
of shares of subsidiaries and affi liates.”
“Purchase of shares of subsidiaries resulting in change in scope
of consolidation,” previously reported as part of “Other” under
“Cash fl ows from investing activities,” is reported as a separate
line item beginning in the consolidated fi scal year under review
due to its increased material signifi cance. “Proceeds from pur-
chase of investments in subsidiaries resulting in change in
scope of consolidation,” previously reported as a separate line
item under “Cash fl ows from investing activities,” is reported as
part of “Other” beginning in the consolidated fi scal year under
review due to its decreased material signifi cance. The fi gures
for the previous fi scal year have been revised in the Consoli-
dated Financial Statements for the consolidated fi scal year un-
der review to refl ect the revision in the reporting method.
Based on this revision, the ¥11,436 million reported for “Pro-
ceeds from purchase of investments in subsidiaries resulting in
change in scope of consolidation” and ¥1,874 million reported
for “Other” under “Cash fl ows from investing activities” in the
Consolidated Statements of Cash Flows of the previous fi scal
year, have been revised and are reported as ¥(135) million for
“Purchase of shares of subsidiaries resulting in change in scope
of consolidation” and ¥13,445 million for “Other.”
04 JAPANESE YEN AMOUNTS
NSSMC and its domestic subsidiaries maintain their accounting records in yen. Yen amounts included in the accompanying consoli-
dated fi nancial statements are stated in millions of yen, and fractions of less than ¥1 million are omitted. Therefore, total or subtotal
amounts presented in the accompanying consolidated fi nancial statements may not equal the exact sum of the individual balances.
05 INVENTORIES
Items relevant to inventories are as follows:Millions of yen
2015 2014
Finished and half-fi nished products ¥548,473 ¥544,223
Work in process 62,606 61,136
Raw materials and supplies 643,123 619,654
06 UNCONSOLIDATED SUBSIDIARIES AND AFFILIATES
Items relevant to unconsolidated subsidiaries and affi liates are as follows:Millions of yen
2015 2014
Shares of subsidiaries and affi liates ¥1,079,523 ¥1,145,502
Notes to Consolidated Financial Statements
NIP
PO
N S
TEE
L & S
UM
ITOM
O M
ETA
L CO
RP
OR
ATIO
NFIN
AN
CIA
L AN
D C
OR
PO
RA
TE
SE
CT
ION
AN
NU
AL R
EP
OR
T 2015
62 63
07 CONTINGENT LIABILITIES AND NOTES AND BILLS DISCOUNTED AND ENDORSED
(1) Guarantee liabilities
(Year ended March 31, 2015)Outstanding amounts Substantial amounts
Millions of yen Millions of yen
2015 2015
Contingent liabilities for:
Guarantee of loans
AM/NS Calvert LLC ¥ 69,034 ¥ 69,034
WISCO-NIPPON STEEL Tinplate Co., Ltd. 17,762 17,762
J AMSHEDPUR CONTINUOUS ANNEALING & PROCESSING COMPANY PRIVATE LIMITED 15,254 7,474*
TENIGAL, S. de R.L. de C.V. 11,040 11,040
Japan-Brazil Niobium Corporation 10,389 10,389
UNIGAL Ltda. 2,523 2,523
VALLOUREC & SUMITOMO TUBOS DO BRASIL LTDA. 2,450 2,450
Other 1,835 1,521*
Total ¥130,290 ¥122,197
* These represent substantial amounts excluding that portion which is re-guaranteed by other parties.
Outstanding amounts Substantial amounts
Millions of yen Millions of yen
2015 2015
Contingent liabilities for:
Reserved guarantee of loans ¥1,482 ¥1,111
Maximum repurchase obligation amount associated with the liquidation of receivables 1,429 1,429
(Year ended March 31, 2014)Outstanding amounts Substantial amounts
Millions of yen Millions of yen
2014 2014
Contingent liabilities for:
Guarantee of loans
AM/NS Calvert LLC ¥ 68,187 ¥ 68,187
Japan-Brazil Niobium Corporation 10,878 10,878
TENIGAL, S. de R.L. de C.V. 10,086 10,086
J AMSHEDPUR CONTINUOUS ANNEALING & PROCESSING COMPANY PRIVATE LIMITED 8,843 4,333*
WISCO-NIPPON STEEL Tinplate Co., Ltd. 8,087 8,087
VALLOUREC & SUMITOMO TUBOS DO BRASIL LTDA. 4,024 4,024
Automotive Steel Pipe India Private Limited 3,747 1,669*
UNIGAL Ltda. 2,778 2,778
Other 3,233 2,882*
Total ¥119,867 ¥112,928
* These represent substantial amounts excluding that portion which is re-guaranteed by other parties.
Outstanding amounts Substantial amounts
Millions of yen Millions of yen
2014 2014
Contingent liabilities for:
Reserved guarantee of loans ¥1,267 ¥ 986
Maximum repurchase obligation amount associated with the liquidation of receivables 2,180 2,180
(2) Notes and bills endorsedMillions of yen
2015 2014
Notes and bills endorsed ¥3 ¥19
* These bills have a recourse clause which is in fact the contingent liability.
08 REVALUATION OF LAND
Revaluation of land used for business purposes was carried out
in accordance with the “Law concerning Revaluation of Land”
and related amendments for certain of NSSMC’s domestic con-
solidated subsidiaries and affi liates to which the equity method
is applied.
Revaluation differences computed by consolidated subsidiaries,
net of tax and minority interests, which were charged to
“Deferred tax liabilities on revaluation of land” and “Minority
interests in consolidated subsidiaries,” respectively, were
recorded as a separate component of net assets as “Unrealized
gains on revaluation of land.”
Additionally, revaluation differences accounted for by affi liates
were recorded as a separate component of net assets as
“Unrealized gains on revaluation of land” in proportion to the
equity rate.
• Method of revaluation
Calculations were made in accordance with the “Law con-
cerning Revaluation of Land.”
(Year ended March 31, 2015)
(Revaluation done on March 31, 2002)
• The excess of the carrying amounts of the revalued
land over its fair value at the end of March 31, 2015 was
¥2,507 million.
(Revaluation done on March 31, 2001)
• The excess of the carrying amounts of the revalued land
over its fair value at the end of March 31, 2015 was ¥12,424
million.
(Revaluation done on March 31, 2000)
• The excess of the carrying amounts of the revalued land
over its fair value at the end of March 31, 2015 was ¥1,905
million.
(Year ended March 31, 2014)
(Revaluation done on March 31, 2002)
• The excess of the carrying amounts of the revalued land
over its fair value at the end of March 31, 2014 was ¥2,468
million.
(Revaluation done on March 31, 2001)
• The excess of the carrying amounts of the revalued land
over its fair value at the end of March 31, 2014 was ¥12,306
million.
(Revaluation done on March 31, 2000)
• The excess of the carrying amounts of the revalued
land over its fair value at the end of March 31, 2014 was
¥1,889 million.
Notes to Consolidated Financial Statements
NIP
PO
N S
TEE
L & S
UM
ITOM
O M
ETA
L CO
RP
OR
ATIO
NFIN
AN
CIA
L AN
D C
OR
PO
RA
TE
SE
CT
ION
AN
NU
AL R
EP
OR
T 2015
64 65
09 SELLING, GENERAL AND ADMINISTRATIVE EXPENSES
The main components of selling, general and administrative expenses for the years ended March 31, 2015 and 2014 are as follows:
Millions of yen
2015 2014
Transportation and storage ¥116,146 ¥125,022
Salaries 119,825 120,622
Retirement benefi t expenses 4,274 5,393
Depreciation and amortization 6,791 6,636
Research and development expenses 49,674 52,121
Amortization of goodwill 9,304 11,430
10 RESEARCH AND DEVELOPMENT COSTS
Research and development costs charged to income for the years ended March 31, 2015 and 2014 are ¥62,966 million and ¥64,437
million, respectively.
11 EXPLANATORY NOTES ON EXTRAORDINARY PROFIT AND LOSS
(Year ended March 31, 2015)
Extraordinary loss
(1) Loss on inactive facilities
Expenses that were incurred mainly due to retirement or disassem-
bly based on decision to phase out major production equipment.
(2) Loss on business of subsidiaries and affi liates
Due to the signifi cant change in the business environment for
equity-method affi liate VALLOUREC & SUMITOMO TUBOS DO
BRASIL LTDA., an amount equivalent to an impairment loss is
reported as “loss on business of subsidiaries and affi liates”.
(Year ended March 31, 2014)
Extraordinary loss
(1) Loss on inactive facilities
Expenses that were incurred mainly due to retirement or disassem-
bly based on decision to phase out major production equipment.
12 NOTES ON CONSOLIDATED STATEMENTS OF COMPREHENSIVE INCOME
Reclassifi cation adjustments and deferred tax accounting related to other comprehensive income for the years ended March 31,
2015 and 2014 are as follows:Millions of yen
2015 2014
Unrealized gains on available-for-sale securities:
Amount for the current term ¥132,864 ¥ 84,437
Amount due to reclassifi cation adjustments (17,855) (56,149)
Amount before adjustments in deferred tax accounting 115,009 28,287
Amount due to deferred tax accounting (27,882) (10,270)
Unrealized gains on available-for-sale securities 87,127 18,017
Deferred hedge income (loss):
Amount for the current term ¥ 6,055 ¥ 871
Amount due to reclassifi cation adjustments 682 (5,748)
Amount before adjustments in deferred tax accounting 6,738 (4,876)
Amount due to deferred tax accounting (2,249) 1,942
Deferred hedge income (loss) 4,489 (2,933)
Unrealized gains on revaluation of land:
Amount for the current term ¥ — ¥ —
Amount before adjustments in deferred tax accounting — —
Amount due to deferred tax accounting 120 —
Unrealized gains on revaluation of land 120 —
Foreign currency translation adjustments:
Amount for the current term ¥ 59,155 ¥ (3,626)
Amount due to reclassifi cation adjustments 601 40
Amount before adjustments in deferred tax accounting 59,756 (3,586)
Amount due to deferred tax accounting — —
Foreign currency translation adjustments 59,756 (3,586)
Remeasurements of defi ned benefi t plans:
Amount for the current term ¥ 59,779 ¥ —
Amount due to reclassifi cation adjustments (8,329) —
Amount before adjustments in deferred tax accounting 51,450 —
Amount due to deferred tax accounting (14,307) —
Remeasurements of defi ned benefi t plans 37,142 —
Share of other comprehensive income (loss) of associates accounted for using equity method:
Amount for the current term ¥ 18,842 ¥ 2,684
Amount due to reclassifi cation adjustments 1,422 (3,512)
Share of other comprehensive income (loss) of associates accounted for using equity method 20,264 (828)
Total other comprehensive income ¥208,900 ¥ 10,668
Notes to Consolidated Financial Statements
NIP
PO
N S
TEE
L & S
UM
ITOM
O M
ETA
L CO
RP
OR
ATIO
NFIN
AN
CIA
L AN
D C
OR
PO
RA
TE
SE
CT
ION
AN
NU
AL R
EP
OR
T 2015
66 67
13 CHANGES IN NET ASSETS AND SHAREHOLDERS’ EQUITY
Notes on the consolidated statements of changes in net assets for the years ended March 31, 2015 and 2014 are as follows:
(Year ended March 31,2015)
(1) Information on issued shares
Type of stock March 31, 2014 Increase Decrease March 31, 2015
Common stock (Thousands) 9,503,214 — — 9,503,214
(2) Information on treasury stock
Type of stock March 31, 2014 Increase Decrease March 31, 2015
Common stock (Thousands) 378,513 646 4,559 374,600
(Reason for increase or decrease of treasury stock)
• Increase (Thousands)
1. Odd-lot stock purchases 453
2. Purchased by affi liates 192
• Decrease (Thousands)
1. Change in scope of consolidation 4,520
2. Odd-lot stock sold 39
(3) Information on dividends
Amount of dividend payments
Decision Type of stockTotal payments (Millions of yen)
Cash dividends per share (Yen) Record date Effective date
A t the Ordinary General Meeting of Shareholders held on June 25, 2014
Common stock ¥27,422 ¥3.0
March 31, 2014
June 26, 2014
A t the Meeting of the Board of Directors held on October 30, 2014
Common stock ¥18,281 ¥2.0
September 30, 2014
December 1, 2014
Dividends of which record date belong to the year ended March 31, 2015, and the effective date belong to the year ending March
31, 2016 are as follows:
Decision Type of stockSource of dividends
Total payments (Millions of yen)
Cash dividends per share (Yen) Record date Effective date
A t the Ordinary General Meeting of Shareholders held on June 24, 2015
Common stock
Retained earnings ¥31,991 ¥3.5
March 31, 2015
June 25, 2015
(Year ended March 31, 2014)
(1) Information on issued shares
Type of stock March 31, 2013 Increase Decrease March 31, 2014
Common stock (Thousands) 9,503,214 — — 9,503,214
(2) Information on treasury stock
Type of stock March 31, 2013 Increase Decrease March 31, 2014
Common stock (Thousands) 428,564 2,557 52,609 378,513
(Reason for increase or decrease of treasury stock)
• Increase (Thousands)
1. Purchase from opposing shareholders in accordance with the Companies Act 1,601
2. Odd-lot stock purchases 870
3. Purchased by affi liates 86
• Decrease (Thousands)
1. Share exchange 52,481
2. Odd-lot stock sold 127
(3) Information on dividends
Amount of dividend payments
Decision Type of stockTotal payments(Millions of yen)
Cash dividends per share (Yen) Record date Effective date
A t the Ordinary General Meeting of Shareholders held on June 25, 2013
Common stock ¥9,090 ¥1.0
March 31, 2013
June 26, 2013
A t the Meeting of the Board of Directors held on October 30, 2013
Common stock ¥18,282 ¥2.0
September 30, 2013
December 2, 2013
Dividends of which record date belong to the year ended March 31, 2014, and the effective date belong to the year ended March
31, 2015 are as follows:
Decision Type of stockSource of dividends
Total payments(Millions of yen)
Cash dividends per share (Yen) Record date Effective date
A t the Ordinary General Meeting of Shareholders held on June 25, 2014
Common stock
Retained earnings ¥27,422 ¥3.0
March 31, 2014
June 26, 2014
14 NOTES ON CONSOLIDATED STATEMENTS OF CASH FLOWS
Cash and cash equivalentsMillions of yen
2015 2014
Cash and bank deposits ¥113,822 ¥105,303
Less: Time deposits with original maturity over 3 months (827) (839)
Securities due within 3 months — 1,000
Cash and cash equivalents ¥112,994 ¥105,464
15 LEASE COMMITMENTS
(1) Finance leases
(Years ended March 31, 2015 and 2014)
Finance lease contracts under which the ownership of the leased assets are to be transferred to lessees
Outline of leased assets
Tangible fi xed assets
Mainly machinery in the steel business
Accounting for the depreciation and amortization of leased assets
Included in Note 03, “Summary of Signifi cant Accounting Policies”
Finance lease contracts other than those under which the ownership of the leased assets are to be transferred to lessees
Outline of leased assets
Tangible fi xed assets
Mainly buildings in the steel business
Intangible fi xed assets
Software
Accounting for the depreciation and amortization of leased assets
Included in Note 03, “Summary of Signifi cant Accounting Policies”
Notes to Consolidated Financial Statements
NIP
PO
N S
TEE
L & S
UM
ITOM
O M
ETA
L CO
RP
OR
ATIO
NFIN
AN
CIA
L AN
D C
OR
PO
RA
TE
SE
CT
ION
AN
NU
AL R
EP
OR
T 2015
68 69
(2) Operating leases (non-cancelable)
The amount of outstanding future lease payments due at March 31, 2015 and 2014 are summarized as follows:
Millions of yen
2015 2014
Future lease payments:
Within one year ¥ 4,831 ¥ 4,465
Over one year 12,590 13,658
¥17,421 ¥18,123
The amount of outstanding future lease income due at March 31, 2015 and 2014 are summarized as follows:
Millions of yen
2015 2014
Future lease income:
Within one year ¥1,263 ¥1,181
Over one year 5,970 5,177
¥7,234 ¥6,359
16 FINANCIAL INSTRUMENTS
1. Current status of fi nancial instruments
(1) Policy regarding fi nancial instruments
NSSMC considers its business plan as it undertakes the pro-
curement of necessary funds (mainly through the arrangement
of loans and the issuance of commercial paper and bonds), and its
fund procurement methods are chosen based on consideration
of the short- or long-term nature of funding requirements and
other special characteristics of funding requirements. Surplus
fund management is restricted to management methods that
emphasize safety and capabilities for conversion into cash when
necessary. In addition, in cases when NSSMC undertakes
transactions in derivatives, such transactions are limited to
transactions (including future transactions) undertaken as a part
of business activities (for the purpose of hedging risks associated
with hedged items actually executed in the course of NSSMC’s
business activities), and NSSMC has a policy of not engaging in
derivative transactions for trading purposes (transactions with
the purpose of obtaining profi t through the trading of deriva-
tives themselves).
(2) Types of fi nancial instruments and related risks
NSSMC is exposed to credit risks arising from trade receivables
such as notes and accounts receivable, but NSSMC limits its
transactions to principal suppliers with respect to which it can
offset receivables against trade payables and loans and to com-
panies with high credit ratings, and NSSMC, therefore, judges
that it is exposed to almost no contractual default credit risks.
In addition, accompanying NSSMC’s exports of products,
NSSMC is exposed to foreign currency exchange risks associated
with receivables denominated in foreign currencies. NSSMC
holds marketable and investment securities, mainly stocks of
customers and other business collaborators, and NSSMC is
exposed to market price risks owing to these stockholdings. In
addition, NSSMC extends long-term loans payable to its affi liates.
NSSMC incurs trade payables such as notes and accounts pay-
able that are, in principle, payable within one year. NSSMC is
exposed to foreign currency exchange risks arising from a por-
tion of trade payables associated with imports of raw materials
that are denominated in foreign currencies. NSSMC’s fund pro-
curement are as described in (1) above. In addition, a portion of
funds procured by means of long-term loans and bonds is asso-
ciated with variable interest rates, and the related payment
burden changes due to trends in market interest rates.
Regarding derivative transactions associated with marketable
securities, interest rates, or currency exchange rates, NSSMC
limits its execution of such transactions to (a) hedge transactions
with the objective of avoiding value fl uctuation risks on market-
able securities that NSSMC holds, (b) hedge transactions with
the objective of hedging market risks accompanying movements
in interest rates associated with assets/liabilities or with the
objective of maintaining the proportion of assets/liabilities associ-
ated with fi xed or variable interest rates, and (c) hedge transac-
tions with the objective of avoiding currency exchange risks
accompanying transactions undertaken as a part of business
activities, such as trading, funding, and investment. The derivative
transactions executed by NSSMC are exposed to the risks of
securities price fl uctuation, future changes in interest rates, and
currency exchange rates, but because those transactions are
limited to those with the objectives described in (a), (b), and
(c) above, NSSMC judges that the risks from those transactions
are limited.
(3) Systems for management of fi nancial instrument risks
(a) Management of credit risks (the risks that customers may
default on their obligations)
In accordance with NSSMC’s credit management regulations,
information related to the credit management situation of
customers is shared, and asset preservation measures are
considered and implemented when necessary.
(b) Management of market risks (the risks arising from fl uctua-
tions in exchange rates, interest rates, and other indicators)
1) Market price risks
Regarding marketable and investment securities, NSSMC
maintains a grasp of fair value situations when necessary and
undertakes deliberations regarding whether such securities are
necessary for business purposes.
2) Interest rate risks
To control risks from interest rate changes associated with interest
payments on loans and bonds, interest rate swaps are used.
3) Currency exchange risks
Regarding foreign currency-denominated trade assets and
liabilities, to avoid currency exchange risks accompanying trans-
actions undertaken as a part of business activities such as trading,
funding, and investment, exchange contracts, and currency swaps
are used to hedge such risks.
In addition, derivative transactions are executed in accordance
with internal derivative transaction management regulations.
These regulations require that prospective transactions in fi nancial
instrument-related derivatives be discussed by the Funding
Management Committee with respect to the transaction policy,
then discussed by or reported to the Management Conference/
Board of Directors, and fi nally approved individually by the General
Manager of the Accounting & Finance Division within the
pre-authorized scope of transactions before being executed. In
conjunction with this, reports on the balance and profi tability
situation of such transactions must be regularly submitted to
the Funding Management Committee. In addition, during each
six-month semiannual fi scal period, an evaluation is undertaken
of the effectiveness of hedging activities.
(c) Management of fund procurement liquidity-related risks
(the risks that NSSMC may not be able to meet its payment
obligations on the scheduled date)
Based on reports from each of NSSMC’s departments, the
Accounting & Finance Division prepares and updates cash fl ow
plans when necessary to manage liquidity-related risks. To pre-
pare for unexpected events, NSSMC arranges commitment
line contracts.
The systems of consolidated subsidiaries are generally the
same as those of NSSMC that are described in items (1)
through (3) above.
(4) Supplementary explanation of the fair value of
fi nancial instruments and related matters
The contract (notional) amount of derivative transactions in
Note 18, “Information on Derivatives,” is not an indicator of the
actual risks involved in derivative transactions.
2. Fair value and other matters related to
fi nancial instruments
Book value and fair value as of the balance sheet date and
differences are shown in the following tables.
(Year ended March 31, 2015)Millions of yen
Book value* Fair value* Differences
(1) Cash and bank deposits ¥ 113,822 ¥ 113,822 ¥ —
(2) Notes and accounts receivable 615,429 615,429 —
(3) Marketable and investment securities
Held-to-maturity debt securities 3,000 2,988 (11)
Available-for-sale securities 737,446 737,446 —
(4) Notes and accounts payable (674,634) (674,634) —
(5) Short-term loans payable (363,654) (363,654) —
(6) Bonds due within one year (40,000) (40,000) —
(7) Accounts payable–other (383,912) (383,912) —
(8) Bonds and notes (385,676) (400,762) (15,085)
(9) Long-term loans payable (1,169,840) (1,195,835) (25,995)
(10) Derivative transactions 7,667 7,667 —
* Figures shown in parentheses are liability items.
Notes to Consolidated Financial Statements
NIP
PO
N S
TEE
L & S
UM
ITOM
O M
ETA
L CO
RP
OR
ATIO
NFIN
AN
CIA
L AN
D C
OR
PO
RA
TE
SE
CT
ION
AN
NU
AL R
EP
OR
T 2015
70 71
(Year ended March 31, 2014)Millions of yen
Book value* Fair value* Differences
(1) Cash and bank deposits ¥ 105,303 ¥ 105,303 ¥ —
(2) Notes and accounts receivable 589,802 589,802 —
(3) Marketable and investment securities
Held-to-maturity debt securities 8,300 8,299 (0)
Available-for-sale securities 647,251 647,251 —
(4) Notes and accounts payable (661,267) (661,267) —
(5) Short-term loans payable (435,357) (435,357) —
(6) Bonds due within one year (65,000) (65,000) —
(7) Accounts payable–other (336,425) (336,425) —
(8) Bonds and notes (425,668) (440,228) (14,560)
(9) Long-term loans payable (1,313,248) (1,333,836) (20,587)
(10) Derivative transactions 2,697 2,697 —
* Figures shown in parentheses are liability items.
Notice 1: Methods for computing the fair value of
fi nancial instruments and information on
securities and derivative transactions
Assets
(1) Cash and bank deposits and (2) Notes and accounts receivable
Since these items are settled in a short period of time and have
fair values that are virtually the same as the book values, the
latter has been used.
(3) Marketable and investment securities
The fair values of these items are mainly valued at the exchange
trading price. Information on securities classifi ed by purpose of
holding are shown in Note 17, “Securities.”
Liabilities
(4) Notes and accounts payable, (5) Short-term loans payable,
(6) Bonds due within one year, and (7) Accounts payable–other
Since these items are settled in a short period of time and have
fair values that are virtually the same as the book values, the
latter has been used.
(8) Bonds and notes and (9) Long-term loans payable
The fair value of bonds is valued at the market price. In addition,
the fair value of long-term loans payable is calculated by dis-
counting total principal and interest payments to present value
using a discount rate equal to the rate that would be charged if
the loan was newly borrowed. Floating rate bonds and loans are
subject to exceptional method for interest rate swaps. Such
interest rate swaps are handled together with total principal
and interest payments and are calculated as the present value
using a reasonable estimate of the discount rate that would be
applied for the same kind of bonds or loans.
Derivative transactions
These transactions are handled as described in Note 18, “Infor-
mation on Derivatives.”
Notice 2: Items for which obtaining fair value is deemed to be extremely diffi cult
(Year ended March 31, 2015)Millions of yen
Item Book value
Unlisted stocks ¥30,322
(Year ended March 31, 2014)Millions of yen
Item Book value
Unlisted stocks ¥43,710
The items in the preceding tables do not have market values, and estimating their future cash fl ow is deemed to be practically impos-
sible. Therefore, determining the fair value of these items is deemed to be extremely diffi cult, and consequently fair value is not
disclosed or included in “Available-for-sale securities” under “(3) Marketable and investment securities.”
Notice 3: Scheduled redemption amounts, subsequent to the balance sheet date, for monetary assets and
securities with maturity dates
(Year ended March 31, 2015)Millions of yen
Due within 1 year
Due in 1 to 5 years
Due in 5 to 10 years
Due after 10 years
Cash and bank deposits ¥113,822 ¥ — ¥— ¥—
Notes and accounts receivable 615,429 — — —
Marketable and investment securities
Held-to-maturity debt securities
Corporate bonds 2,000 1,000 — —
Negotiable certifi cates of deposit — — — —
Available-for-sale securities with maturity dates 25 113 — —
Total ¥731,276 ¥1,113 ¥— ¥—
(Year ended March 31, 2014)Millions of yen
Due within 1 year
Due in 1 to 5 years
Due in 5 to 10 years
Due after 10 years
Cash and bank deposits ¥105,303 ¥ — ¥— ¥—
Notes and accounts receivable 589,802 — — —
Marketable and investment securities
Held-to-maturity debt securities
Corporate bonds 7,000 300 — —
Negotiable certifi cates of deposit 1,000 — — —
Available-for-sale securities with maturity dates 25 431 9 —
Total ¥703,132 ¥731 ¥ 9 ¥—
Notice 4: Estimated amount of bonds, long-term loans payable, and other interest-bearing debt subsequent
to the balance sheet date
(Year ended March 31, 2015) Millions of yen
Due within 1 year
Due in 1 to 2 years
Due in 2 to 3 years
Due in 3 to 4 years
Due in 4 to 5 years
Due after5 years
Short-term loans payable ¥161,617 ¥ — ¥ — ¥ — ¥ — ¥ —
Commercial paper — — — — — —
Bonds 40,000 50,000 120,000 65,700 60,000 90,000
Long-term loans payable 202,037 279,314 177,708 130,559 74,415 507,842
Lease obligations 5,740 3,258 2,185 855 603 3,345
Total ¥409,395 ¥332,573 ¥299,894 ¥197,114 ¥135,019 ¥601,188
(Year ended March 31, 2014) Millions of yen
Due within 1 year
Due in 1 to 2 years
Due in 2 to 3 years
Due in 3 to 4 years
Due in 4 to 5 years
Due after5 years
Short-term loans payable ¥164,316 ¥ — ¥ — ¥ — ¥ — ¥ —
Commercial paper 32,000 — — — — —
Bonds 65,000 40,000 50,000 120,000 65,700 150,000
Long-term loans payable 271,040 206,829 272,358 172,689 109,281 552,090
Lease obligations 8,278 5,622 2,946 1,666 661 3,694
Total ¥540,636 ¥252,452 ¥325,304 ¥294,355 ¥175,642 ¥705,785
Notes to Consolidated Financial Statements
NIP
PO
N S
TEE
L & S
UM
ITOM
O M
ETA
L CO
RP
OR
ATIO
NFIN
AN
CIA
L AN
D C
OR
PO
RA
TE
SE
CT
ION
AN
NU
AL R
EP
OR
T 2015
72 73
17 SECURITIES
(Year ended March 31, 2015)
Information regarding marketable and investment securities at March 31, 2015 is as follows:
(1) Held-to-maturity debt securitiesMillions of yen
2015
Book value Fair value Differences
H eld-to-maturity debt securities whose fair value is less than the book value on the balance sheet:
Corporate bonds ¥3,000 ¥2,988 ¥(11)
Negotiable certifi cates of deposit — — —
Total ¥3,000 ¥2,988 ¥(11)
(2) Available-for-sale securitiesMillions of yen
2015
Book value Acquisition cost Differences
A vailable-for-sale securities whose book value on the balance sheet is in excess of the related cost:
Corporate shares ¥606,950 ¥244,893 ¥362,057
Other 115,466 80,047 35,418
Subtotal ¥722,417 ¥324,941 ¥397,476
A vailable-for-sale securities whose book value on the balance sheet is less than the related cost:
Corporate shares ¥ 15,029 ¥ 17,075 ¥ (2,045)
Other — — —
Subtotal ¥ 15,029 ¥ 17,075 ¥ (2,045)
Total ¥737,446 ¥342,016 ¥395,430
(3) Available-for-sale securities sold in the year ended March 31, 2015Millions of yen
2015
Amount of sales Gain on sales Loss on sales
Corporate shares ¥46,492 ¥19,019 ¥399
Bonds — — —
Other 57 — 377
Total ¥46,550 ¥19,019 ¥777
(4) Financial assets with the right of free disposal
The NSSMC Group holds pledged fi nancial assets (mainly securities) with the right of free disposal whose current fair value is
¥4,061 million at March 31, 2015.
(Year ended March 31, 2014)
Information regarding marketable and investment securities at March 31, 2014 is as follows:
(1) Held-to-maturity debt securitiesMillions of yen
2014
Book value Fair value Differences
H eld-to-maturity debt securities whose fair value is less than the book value on the balance sheet:
Corporate bonds ¥7,300 ¥7,299 ¥(0)
Negotiable certifi cates of deposit 1,000 1,000 —
Total ¥8,300 ¥8,299 ¥(0)
(2) Available-for-sale securitiesMillions of yen
2014
Book value Acquisition cost Differences
A vailable-for-sale securities whose book value on the balance sheet is in excess of the related cost:
Corporate shares ¥495,729 ¥256,594 ¥239,134
Other 125,577 80,047 45,529
Subtotal ¥621,307 ¥336,642 ¥284,664
A vailable-for-sale securities whose book value on the balance sheet is less than the related cost:
Corporate shares ¥ 25,587 ¥ 29,033 ¥ (3,445)
Other 356 435 (79)
Subtotal ¥ 25,944 ¥ 29,469 ¥ (3,525)
Total ¥647,251 ¥366,111 ¥281,139
(3) Available-for-sale securities sold in the year ended March 31, 2014Millions of yen
2014
Amount of sales Gain on sales Loss on sales
Corporate shares ¥114,694 ¥56,621 ¥104
Bonds 1 — —
Other 46 2 2
Total ¥114,741 ¥56,624 ¥107
(4) Financial assets with the right of free disposal
The NSSMC Group holds pledged fi nancial assets (mainly securities) with the right of free disposal whose current fair value is
¥3,466 million at March 31, 2014.
Notes to Consolidated Financial Statements
NIP
PO
N S
TEE
L & S
UM
ITOM
O M
ETA
L CO
RP
OR
ATIO
NFIN
AN
CIA
L AN
D C
OR
PO
RA
TE
SE
CT
ION
AN
NU
AL R
EP
OR
T 2015
74 75
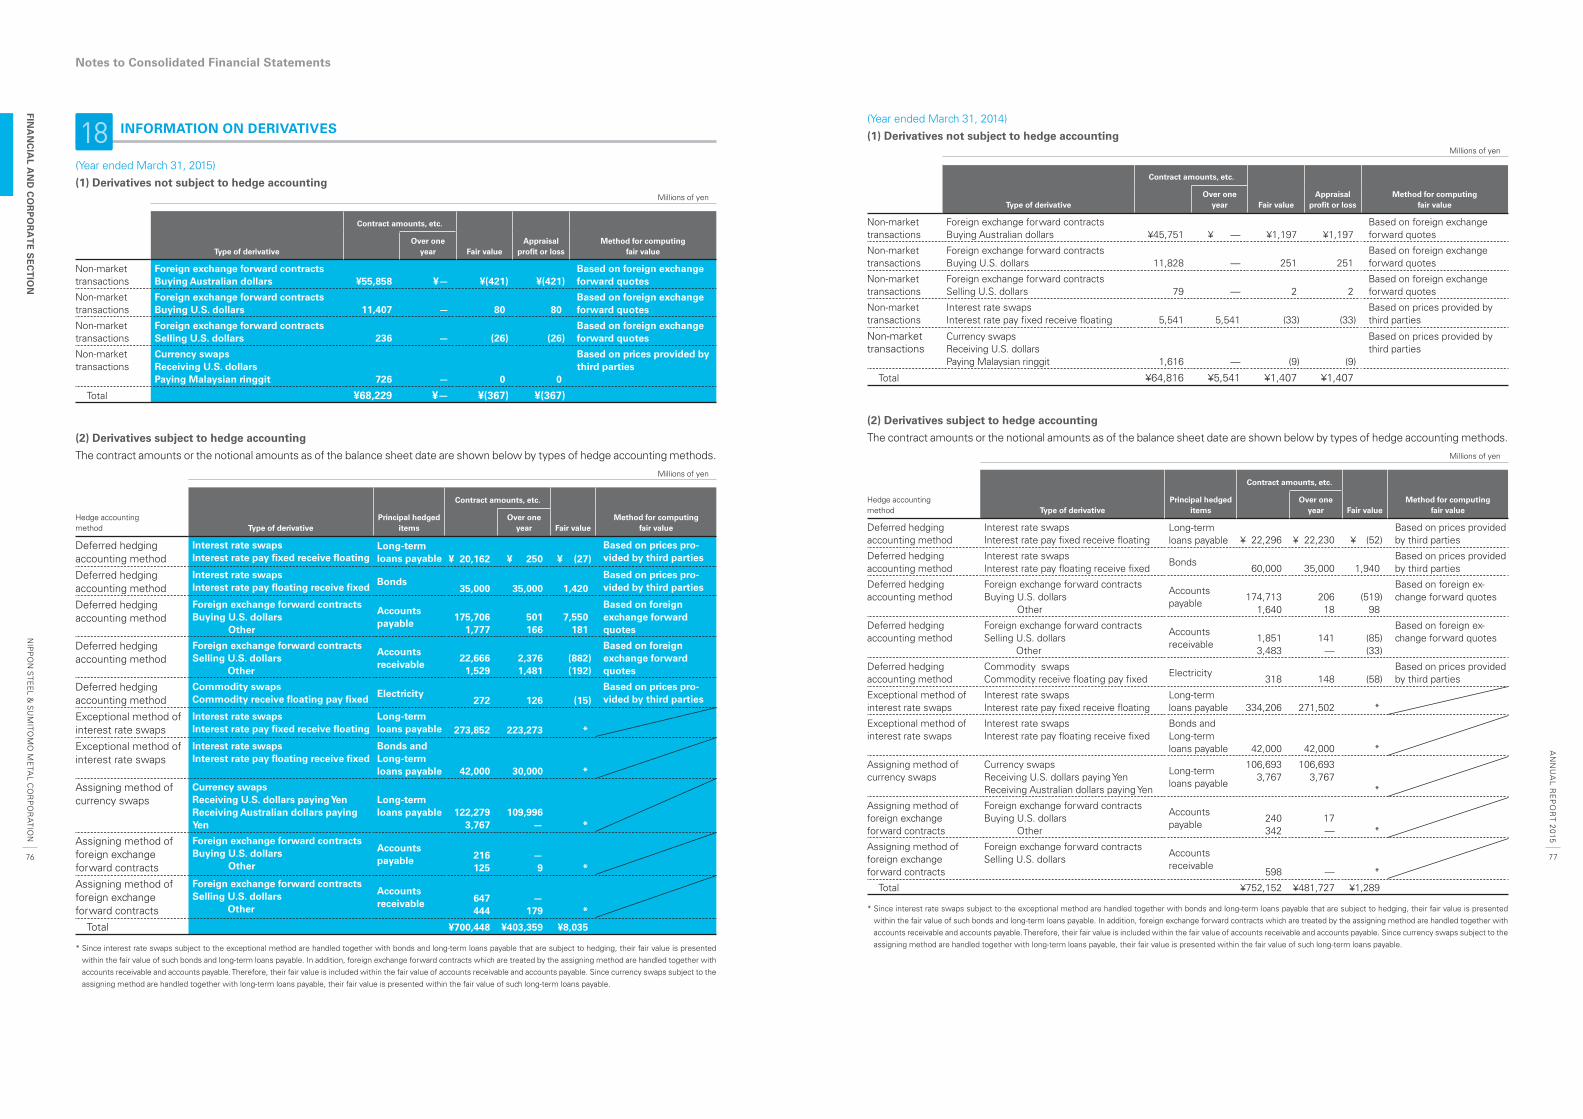
18 INFORMATION ON DERIVATIVES
(Year ended March 31, 2015)
(1) Derivatives not subject to hedge accountingMillions of yen
Type of derivative
Contract amounts, etc.
Fair valueAppraisal
profi t or lossMethod for computing
fair valueOver one
year
Non-market transactions
Foreign exchange forward contractsBuying Australian dollars ¥55,858 ¥— ¥(421) ¥(421)
Based on foreign exchange forward quotes
Non-market transactions
Foreign exchange forward contractsBuying U.S. dollars 11,407 — 80 80
Based on foreign exchange forward quotes
Non-market transactions
Foreign exchange forward contractsSelling U.S. dollars 236 — (26) (26)
Based on foreign exchange forward quotes
Non-market transactions
Currency swapsReceiving U.S. dollars Paying Malaysian ringgit 726 — 0 0
Based on prices provided by third parties
Total ¥68,229 ¥— ¥(367) ¥(367)
(2) Derivatives subject to hedge accounting
The contract amounts or the notional amounts as of the balance sheet date are shown below by types of hedge accounting methods.
Millions of yen
Hedge accounting method Type of derivative
Principal hedged items
Contract amounts, etc.
Fair valueMethod for computing
fair valueOver one
year
Deferred hedging accounting method
Interest rate swapsInterest rate pay fi xed receive fl oating
Long-term loans payable ¥ 20,162 ¥ 250 ¥ (27)
Based on prices pro-vided by third parties
Deferred hedging accounting method
Interest rate swapsInterest rate pay fl oating receive fi xed Bonds
35,000 35,000 1,420Based on prices pro-vided by third parties
Deferred hedging accounting method
Foreign exchange forward contractsBuying U.S. dollars
Other
Accounts payable
175,7061,777
501166
7,550181
Based on foreign exchange forward quotes
Deferred hedging accounting method
Foreign exchange forward contractsSelling U.S. dollars
Other
Accounts receivable
22,6661,529
2,3761,481
(882)(192)
Based on foreign exchange forward quotes
Deferred hedging accounting method
Commodity swaps Commodity receive fl oating pay fi xed Electricity
272 126 (15)Based on prices pro-vided by third parties
Exceptional method of interest rate swaps
Interest rate swapsInterest rate pay fi xed receive fl oating
Long-term loans payable 273,852 223,273 *
Exceptional method of interest rate swaps
Interest rate swapsInterest rate pay fl oating receive fi xed
Bonds and Long-term loans payable 42,000 30,000 *
Assigning method of currency swaps
Currency swapsReceiving U.S. dollars paying YenReceiving Australian dollars paying Yen
Long-term loans payable 122,279
3,767109,996
— *
Assigning method of foreign exchange forward contracts
Foreign exchange forward contractsBuying U.S. dollars
Other
Accounts payable 216
125—9 *
Assigning method of foreign exchange forward contracts
Foreign exchange forward contractsSelling U.S. dollars
Other
Accounts receivable 647
444—
179 *
Total ¥700,448 ¥403,359 ¥8,035
* Since interest rate swaps subject to the exceptional method are handled together with bonds and long-term loans payable that are subject to hedging, their fair value is presented within the fair value of such bonds and long-term loans payable. In addition, foreign exchange forward contracts which are treated by the assigning method are handled together with accounts receivable and accounts payable. Therefore, their fair value is included within the fair value of accounts receivable and accounts payable. Since currency swaps subject to the assigning method are handled together with long-term loans payable, their fair value is presented within the fair value of such long-term loans payable.
(Year ended March 31, 2014)
(1) Derivatives not subject to hedge accountingMillions of yen
Type of derivative
Contract amounts, etc.
Fair valueAppraisal
profi t or lossMethod for computing
fair valueOver one
year
Non-market transactions
Foreign exchange forward contractsBuying Australian dollars ¥45,751 ¥ — ¥1,197 ¥1,197
Based on foreign exchange forward quotes
Non-market transactions
Foreign exchange forward contractsBuying U.S. dollars 11,828 — 251 251
Based on foreign exchange forward quotes
Non-market transactions
Foreign exchange forward contractsSelling U.S. dollars 79 — 2 2
Based on foreign exchange forward quotes
Non-market transactions
Interest rate swapsInterest rate pay fi xed receive fl oating 5,541 5,541 (33) (33)
Based on prices provided by third parties
Non-market transactions
Currency swapsReceiving U.S. dollars Paying Malaysian ringgit 1,616 — (9) (9)
Based on prices provided by third parties
Total ¥64,816 ¥5,541 ¥1,407 ¥1,407
(2) Derivatives subject to hedge accounting
The contract amounts or the notional amounts as of the balance sheet date are shown below by types of hedge accounting methods.
Millions of yen
Hedge accounting method Type of derivative
Principal hedged items
Contract amounts, etc.
Fair valueMethod for computing
fair valueOver one
year
Deferred hedging accounting method
Interest rate swapsInterest rate pay fi xed receive fl oating
Long-term loans payable ¥ 22,296 ¥ 22,230 ¥ (52)
Based on prices provided by third parties
Deferred hedging accounting method
Interest rate swapsInterest rate pay fl oating receive fi xed
Bonds60,000 35,000 1,940
Based on prices provided by third parties
Deferred hedging accounting method
Foreign exchange forward contractsBuying U.S. dollars
Other
Accounts payable
174,7131,640
20618
(519)98
Based on foreign ex-change forward quotes
Deferred hedging accounting method
Foreign exchange forward contracts Selling U.S. dollars
Other
Accounts receivable
1,8513,483
141—
(85)(33)
Based on foreign ex-change forward quotes
Deferred hedging accounting method
Commodity swaps Commodity receive fl oating pay fi xed
Electricity318 148 (58)
Based on prices provided by third parties
Exceptional method of interest rate swaps
Interest rate swapsInterest rate pay fi xed receive fl oating
Long-term loans payable 334,206 271,502 *
Exceptional method of interest rate swaps
Interest rate swapsInterest rate pay fl oating receive fi xed
Bonds and Long-term loans payable 42,000 42,000 *
Assigning method of currency swaps
Currency swapsReceiving U.S. dollars paying YenReceiving Australian dollars paying Yen
Long-term loans payable
106,6933,767
106,6933,767
*
Assigning method of foreign exchange forward contracts
Foreign exchange forward contractsBuying U.S. dollars
Other
Accounts payable
240342
17— *
Assigning method of foreign exchange forward contracts
Foreign exchange forward contractsSelling U.S. dollars
Accounts receivable
598 — *
Total ¥752,152 ¥481,727 ¥1,289
* Since interest rate swaps subject to the exceptional method are handled together with bonds and long-term loans payable that are subject to hedging, their fair value is presented within the fair value of such bonds and long-term loans payable. In addition, foreign exchange forward contracts which are treated by the assigning method are handled together with accounts receivable and accounts payable. Therefore, their fair value is included within the fair value of accounts receivable and accounts payable. Since currency swaps subject to the assigning method are handled together with long-term loans payable, their fair value is presented within the fair value of such long-term loans payable.
Notes to Consolidated Financial Statements
NIP
PO
N S
TEE
L & S
UM
ITOM
O M
ETA
L CO
RP
OR
ATIO
NFIN
AN
CIA
L AN
D C
OR
PO
RA
TE
SE
CT
ION
AN
NU
AL R
EP
OR
T 2015
76 77
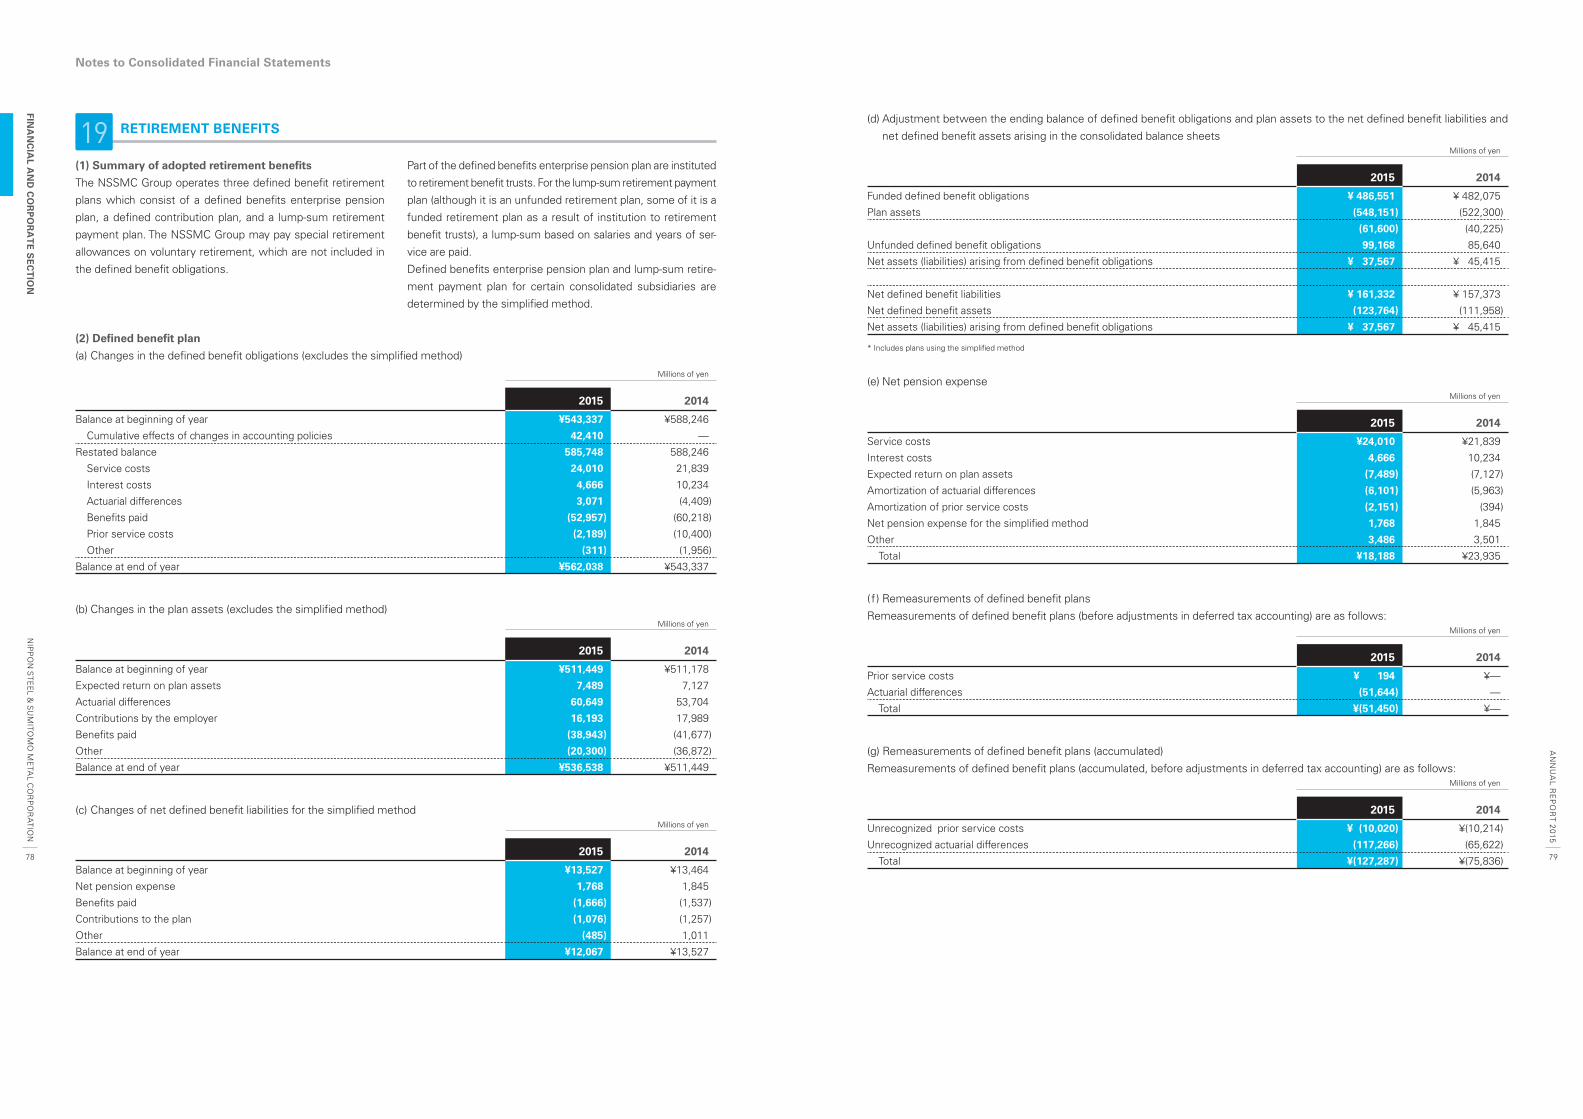
19 RETIREMENT BENEFITS
(1) Summary of adopted retirement benefi ts
The NSSMC Group operates three defi ned benefi t retirement
plans which consist of a defi ned benefi ts enterprise pension
plan, a defi ned contribution plan, and a lump-sum retirement
payment plan. The NSSMC Group may pay special retirement
allowances on voluntary retirement, which are not included in
the defi ned benefi t obligations.
Part of the defi ned benefi ts enterprise pension plan are instituted
to retirement benefi t trusts. For the lump-sum retirement payment
plan (although it is an unfunded retirement plan, some of it is a
funded retirement plan as a result of institution to retirement
benefi t trusts), a lump-sum based on salaries and years of ser-
vice are paid.
Defi ned benefi ts enterprise pension plan and lump-sum retire-
ment payment plan for certain consolidated subsidiaries are
determined by the simplifi ed method.
(2) Defi ned benefi t plan
(a) Changes in the defi ned benefi t obligations (excludes the simplifi ed method)
Millions of yen
2015 2014
Balance at beginning of year ¥543,337 ¥588,246
Cumulative effects of changes in accounting policies 42,410 —
Restated balance 585,748 588,246
Service costs 24,010 21,839
Interest costs 4,666 10,234
Actuarial differences 3,071 (4,409)
Benefi ts paid (52,957) (60,218)
Prior service costs (2,189) (10,400)
Other (311) (1,956)
Balance at end of year ¥562,038 ¥543,337
(b) Changes in the plan assets (excludes the simplifi ed method)Millions of yen
2015 2014
Balance at beginning of year ¥511,449 ¥511,178
Expected return on plan assets 7,489 7,127
Actuarial differences 60,649 53,704
Contributions by the employer 16,193 17,989
Benefi ts paid (38,943) (41,677)
Other (20,300) (36,872)
Balance at end of year ¥536,538 ¥511,449
(c) Changes of net defi ned benefi t liabilities for the simplifi ed methodMillions of yen
2015 2014
Balance at beginning of year ¥13,527 ¥13,464
Net pension expense 1,768 1,845
Benefi ts paid (1,666) (1,537)
Contributions to the plan (1,076) (1,257)
Other (485) 1,011
Balance at end of year ¥12,067 ¥13,527
(d) Adjustment between the ending balance of defi ned benefi t obligations and plan assets to the net defi ned benefi t liabilities and
net defi ned benefi t assets arising in the consolidated balance sheetsMillions of yen
2015 2014
Funded defi ned benefi t obligations ¥ 486,551 ¥ 482,075
Plan assets (548,151) (522,300)
(61,600) (40,225)
Unfunded defi ned benefi t obligations 99,168 85,640
Net assets (liabilities) arising from defi ned benefi t obligations ¥ 37,567 ¥ 45,415
Net defi ned benefi t liabilities ¥ 161,332 ¥ 157,373
Net defi ned benefi t assets (123,764) (111,958)
Net assets (liabilities) arising from defi ned benefi t obligations ¥ 37,567 ¥ 45,415
* Includes plans using the simplifi ed method
(e) Net pension expenseMillions of yen
2015 2014
Service costs ¥24,010 ¥21,839
Interest costs 4,666 10,234
Expected return on plan assets (7,489) (7,127)
Amortization of actuarial differences (6,101) (5,963)
Amortization of prior service costs (2,151) (394)
Net pension expense for the simplifi ed method 1,768 1,845
Other 3,486 3,501
Total ¥18,188 ¥23,935
(f ) Remeasurements of defi ned benefi t plans
Remeasurements of defi ned benefi t plans (before adjustments in deferred tax accounting) are as follows:Millions of yen
2015 2014
Prior service costs ¥ 194 ¥—
Actuarial differences (51,644) —
Total ¥(51,450) ¥—
(g) Remeasurements of defi ned benefi t plans (accumulated)
Remeasurements of defi ned benefi t plans (accumulated, before adjustments in deferred tax accounting) are as follows:Millions of yen
2015 2014
Unrecognized prior service costs ¥ (10,020) ¥(10,214)
Unrecognized actuarial differences (117,266) (65,622)
Total ¥(127,287) ¥(75,836)
Notes to Consolidated Financial Statements
NIP
PO
N S
TEE
L & S
UM
ITOM
O M
ETA
L CO
RP
OR
ATIO
NFIN
AN
CIA
L AN
D C
OR
PO
RA
TE
SE
CT
ION
AN
NU
AL R
EP
OR
T 2015
78 79
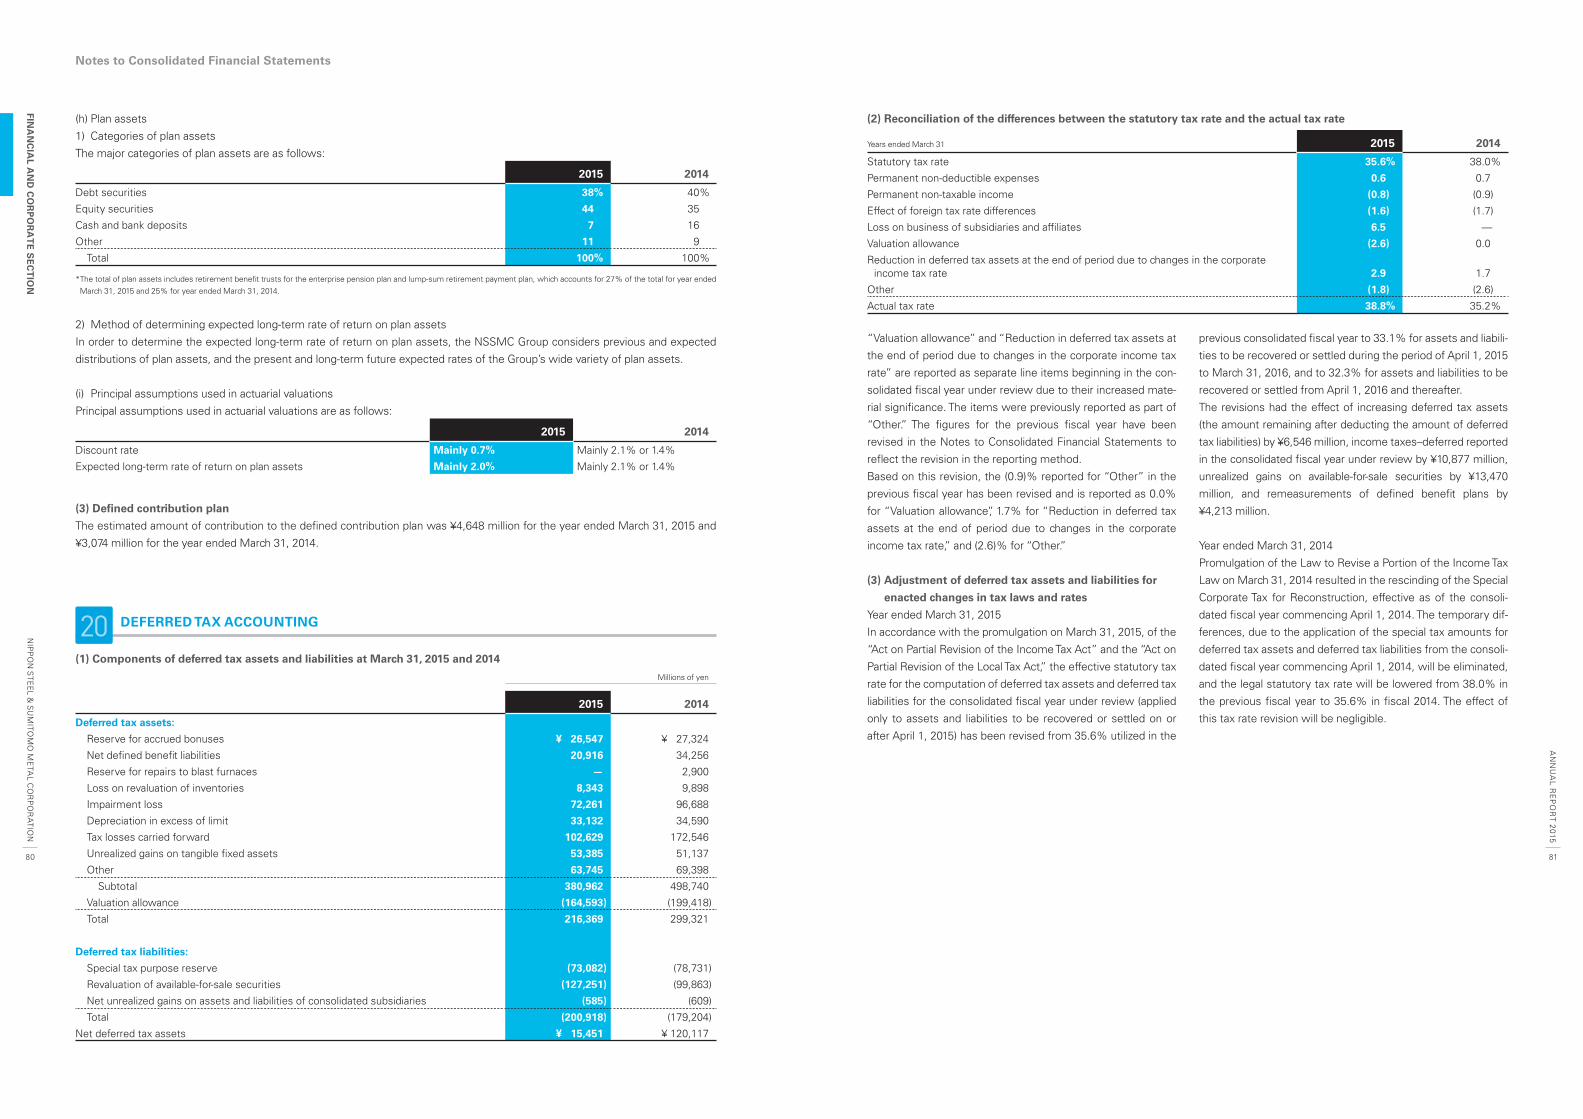
(h) Plan assets
1) Categories of plan assets
The major categories of plan assets are as follows:
2015 2014
Debt securities 38% 40%
Equity securities 44 35
Cash and bank deposits 7 16
Other 11 9
Total 100% 100%
* The total of plan assets includes retirement benefi t trusts for the enterprise pension plan and lump-sum retirement payment plan, which accounts for 27% of the total for year ended March 31, 2015 and 25% for year ended March 31, 2014.
2) Method of determining expected long-term rate of return on plan assets
In order to determine the expected long-term rate of return on plan assets, the NSSMC Group considers previous and expected
distributions of plan assets, and the present and long-term future expected rates of the Group’s wide variety of plan assets.
(i) Principal assumptions used in actuarial valuations
Principal assumptions used in actuarial valuations are as follows:
2015 2014
Discount rate Mainly 0.7% Mainly 2.1% or 1.4%
Expected long-term rate of return on plan assets Mainly 2.0% Mainly 2.1% or 1.4%
(3) Defi ned contribution plan
The estimated amount of contribution to the defi ned contribution plan was ¥4,648 million for the year ended March 31, 2015 and
¥3,074 million for the year ended March 31, 2014.
20 DEFERRED TAX ACCOUNTING
(1) Components of deferred tax assets and liabilities at March 31, 2015 and 2014
Millions of yen
2015 2014
Deferred tax assets:
Reserve for accrued bonuses ¥ 26,547 ¥ 27,324
Net defi ned benefi t liabilities 20,916 34,256
Reserve for repairs to blast furnaces — 2,900
Loss on revaluation of inventories 8,343 9,898
Impairment loss 72,261 96,688
Depreciation in excess of limit 33,132 34,590
Tax losses carried forward 102,629 172,546
Unrealized gains on tangible fi xed assets 53,385 51,137
Other 63,745 69,398
Subtotal 380,962 498,740
Valuation allowance (164,593) (199,418)
Total 216,369 299,321
Deferred tax liabilities:
Special tax purpose reserve (73,082) (78,731)
Revaluation of available-for-sale securities (127,251) (99,863)
Net unrealized gains on assets and liabilities of consolidated subsidiaries (585) (609)
Total (200,918) (179,204)
Net deferred tax assets ¥ 15,451 ¥ 120,117
(2) Reconciliation of the differences between the statutory tax rate and the actual tax rate
Years ended March 31 2015 2014
Statutory tax rate 35.6% 38.0%
Permanent non-deductible expenses 0.6 0.7
Permanent non-taxable income (0.8) (0.9)
Effect of foreign tax rate differences (1.6) (1.7)
Loss on business of subsidiaries and affi liates 6.5 —
Valuation allowance (2.6) 0.0
R eduction in deferred tax assets at the end of period due to changes in the corporate income tax rate 2.9 1.7
Other (1.8) (2.6)
Actual tax rate 38.8% 35.2%
“Valuation allowance” and “Reduction in deferred tax assets at
the end of period due to changes in the corporate income tax
rate” are reported as separate line items beginning in the con-
solidated fi scal year under review due to their increased mate-
rial signifi cance. The items were previously reported as part of
“Other.” The fi gures for the previous fi scal year have been
revised in the Notes to Consolidated Financial Statements to
refl ect the revision in the reporting method.
Based on this revision, the (0.9)% reported for “Other” in the
previous fi scal year has been revised and is reported as 0.0%
for “Valuation allowance”, 1.7% for “Reduction in deferred tax
assets at the end of period due to changes in the corporate
income tax rate,” and (2.6)% for “Other.”
(3) Adjustment of deferred tax assets and liabilities for
enacted changes in tax laws and rates
Year ended March 31, 2015
In accordance with the promulgation on March 31, 2015, of the
“Act on Partial Revision of the Income Tax Act” and the “Act on
Partial Revision of the Local Tax Act,” the effective statutory tax
rate for the computation of deferred tax assets and deferred tax
liabilities for the consolidated fi scal year under review (applied
only to assets and liabilities to be recovered or settled on or
after April 1, 2015) has been revised from 35.6% utilized in the
previous consolidated fi scal year to 33.1% for assets and liabili-
ties to be recovered or settled during the period of April 1, 2015
to March 31, 2016, and to 32.3% for assets and liabilities to be
recovered or settled from April 1, 2016 and thereafter.
The revisions had the effect of increasing deferred tax assets
(the amount remaining after deducting the amount of deferred
tax liabilities) by ¥6,546 million, income taxes–deferred reported
in the consolidated fi scal year under review by ¥10,877 million,
unrealized gains on available-for-sale securities by ¥13,470
million, and remeasurements of defi ned benefi t plans by
¥4,213 million.
Year ended March 31, 2014
Promulgation of the Law to Revise a Portion of the Income Tax
Law on March 31, 2014 resulted in the rescinding of the Special
Corporate Tax for Reconstruction, effective as of the consoli-
dated fi scal year commencing April 1, 2014. The temporary dif-
ferences, due to the application of the special tax amounts for
deferred tax assets and deferred tax liabilities from the consoli-
dated fi scal year commencing April 1, 2014, will be eliminated,
and the legal statutory tax rate will be lowered from 38.0% in
the previous fi scal year to 35.6% in fi scal 2014. The effect of
this tax rate revision will be negligible.
Notes to Consolidated Financial Statements
NIP
PO
N S
TEE
L & S
UM
ITOM
O M
ETA
L CO
RP
OR
ATIO
NFIN
AN
CIA
L AN
D C
OR
PO
RA
TE
SE
CT
ION
AN
NU
AL R
EP
OR
T 2015
80 81
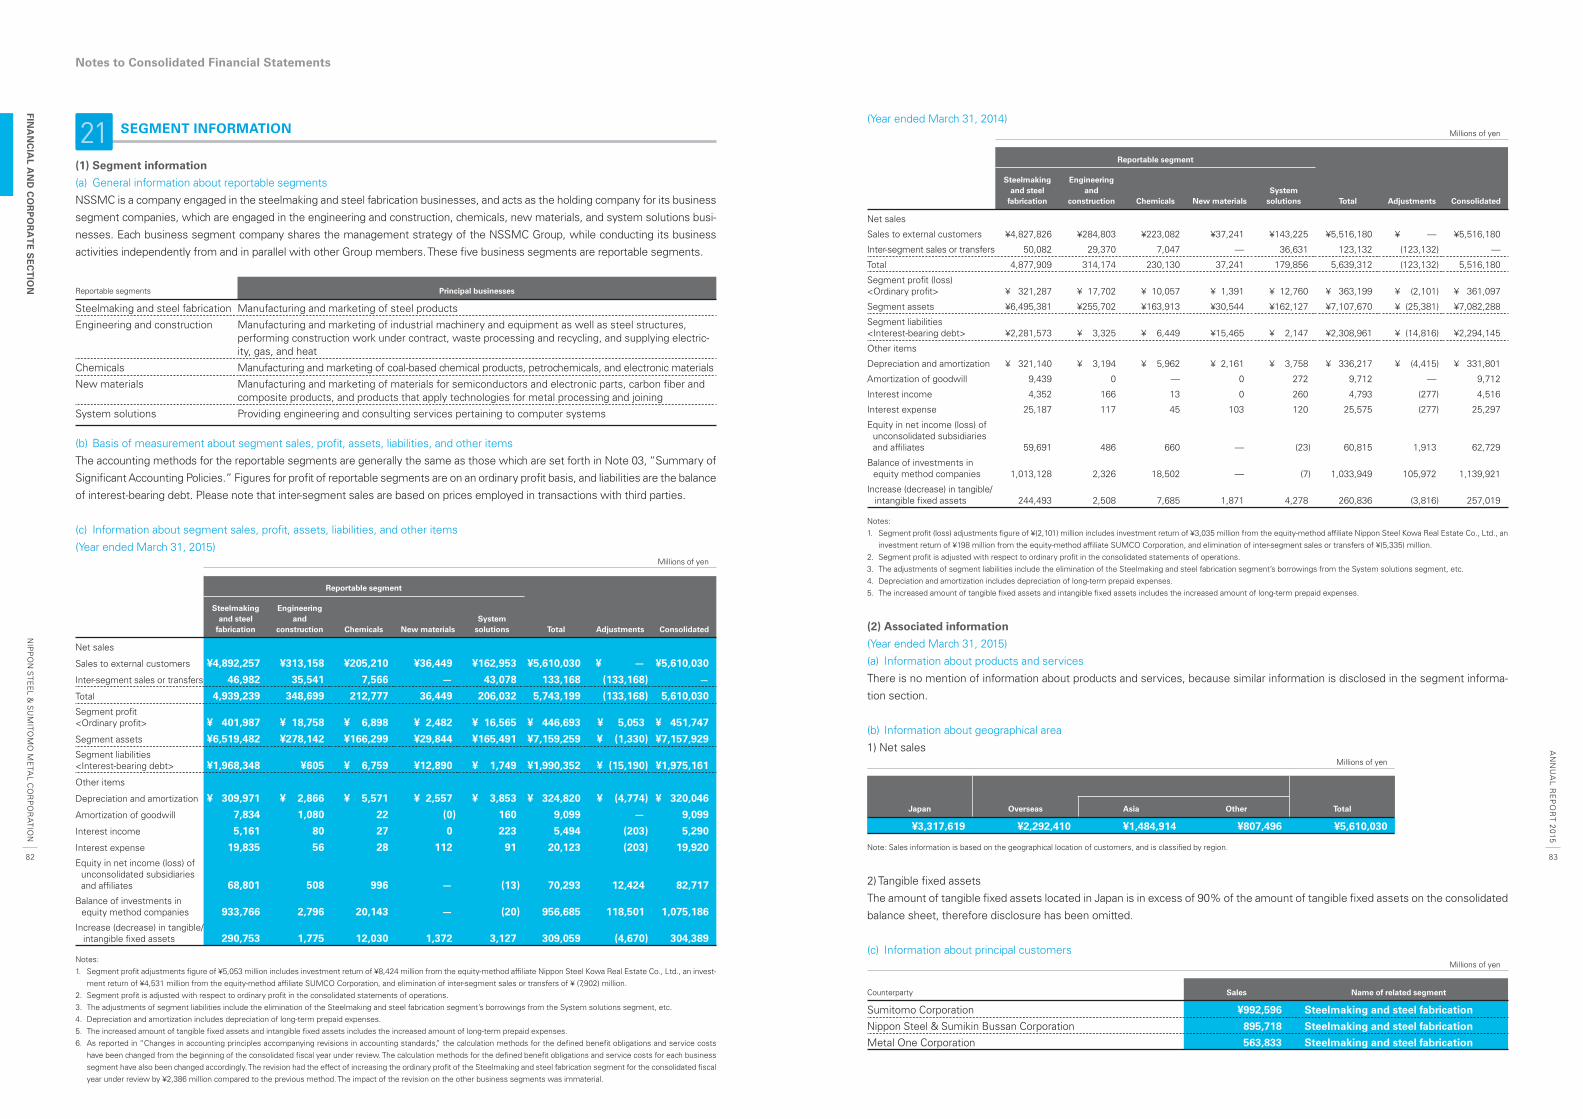
21 SEGMENT INFORMATION
(1) Segment information
(a) General information about reportable segments
NSSMC is a company engaged in the steelmaking and steel fabrication businesses, and acts as the holding company for its business
segment companies, which are engaged in the engineering and construction, chemicals, new materials, and system solutions busi-
nesses. Each business segment company shares the management strategy of the NSSMC Group, while conducting its business
activities independently from and in parallel with other Group members. These fi ve business segments are reportable segments.
Reportable segments Principal businesses
Steelmaking and steel fabrication Manufacturing and marketing of steel products
Engineering and construction Manufacturing and marketing of industrial machinery and equipment as well as steel structures, performing construction work under contract, waste processing and recycling, and supplying electric-ity, gas, and heat
Chemicals Manufacturing and marketing of coal-based chemical products, petrochemicals, and electronic materials
New materials Manufacturing and marketing of materials for semiconductors and electronic parts, carbon fi ber and composite products, and products that apply technologies for metal processing and joining
System solutions Providing engineering and consulting services pertaining to computer systems
(b) Basis of measurement about segment sales, profi t, assets, liabilities, and other items
The accounting methods for the reportable segments are generally the same as those which are set forth in Note 03, “Summary of
Signifi cant Accounting Policies.” Figures for profi t of reportable segments are on an ordinary profi t basis, and liabilities are the balance
of interest-bearing debt. Please note that inter-segment sales are based on prices employed in transactions with third parties.
(c) Information about segment sales, profi t, assets, liabilities, and other items
(Year ended March 31, 2015)Millions of yen
Reportable segment
Total Adjustments Consolidated
Steelmaking and steel
fabrication
Engineering and
construction Chemicals New materialsSystem
solutions
Net sales
Sales to external customers ¥4,892,257 ¥313,158 ¥205,210 ¥36,449 ¥162,953 ¥5,610,030 ¥ — ¥5,610,030
In ter-segment sales or transfers 46,982 35,541 7,566 — 43,078 133,168 (133,168) —
Total 4,939,239 348,699 212,777 36,449 206,032 5,743,199 (133,168) 5,610,030Segment profi t<Ordinary profi t> ¥ 401,987 ¥ 18,758 ¥ 6,898 ¥ 2,482 ¥ 16,565 ¥ 446,693 ¥ 5,053 ¥ 451,747
Segment assets ¥6,519,482 ¥278,142 ¥166,299 ¥29,844 ¥165,491 ¥7,159,259 ¥ (1,330) ¥7,157,929Segment liabilities<Interest-bearing debt> ¥1,968,348 ¥605 ¥ 6,759 ¥12,890 ¥ 1,749 ¥1,990,352 ¥ (15,190) ¥1,975,161
Other items
Depreciation and amortization ¥ 309,971 ¥ 2,866 ¥ 5,571 ¥ 2,557 ¥ 3,853 ¥ 324,820 ¥ (4,774) ¥ 320,046
Amortization of goodwill 7,834 1,080 22 (0) 160 9,099 — 9,099
Interest income 5,161 80 27 0 223 5,494 (203) 5,290
Interest expense 19,835 56 28 112 91 20,123 (203) 19,920E quity in net income (loss) of
unconsolidated subsidiaries and affi liates 68,801 508 996 — (13) 70,293 12,424 82,717
B alance of investments in equity method companies 933,766 2,796 20,143 — (20) 956,685 118,501 1,075,186
In crease (decrease) in tangible/intangible fi xed assets 290,753 1,775 12,030 1,372 3,127 309,059 (4,670) 304,389
Notes:1. Segment profi t adjustments fi gure of ¥5,053 million includes investment return of ¥8,424 million from the equity-method affi liate Nippon Steel Kowa Real Estate Co., Ltd., an invest-
ment return of ¥4,531 million from the equity-method affi liate SUMCO Corporation, and elimination of inter-segment sales or transfers of ¥ (7,902) million.2. Segment profi t is adjusted with respect to ordinary profi t in the consolidated statements of operations.3. The adjustments of segment liabilities include the elimination of the Steelmaking and steel fabrication segment’s borrowings from the System solutions segment, etc. 4. Depreciation and amortization includes depreciation of long-term prepaid expenses.5. The increased amount of tangible fi xed assets and intangible fi xed assets includes the increased amount of long-term prepaid expenses.6. As reported in “Changes in accounting principles accompanying revisions in accounting standards,” the calculation methods for the defi ned benefi t obligations and service costs
have been changed from the beginning of the consolidated fi scal year under review. The calculation methods for the defi ned benefi t obligations and service costs for each business segment have also been changed accordingly. The revision had the effect of increasing the ordinary profi t of the Steelmaking and steel fabrication segment for the consolidated fi scal year under review by ¥2,386 million compared to the previous method. The impact of the revision on the other business segments was immaterial.
(Year ended March 31, 2014) Millions of yen
Reportable segment
Total Adjustments Consolidated
Steelmaking and steel
fabrication
Engineering and
construction Chemicals New materialsSystem
solutions
Net sales
Sales to external customers ¥4,827,826 ¥284,803 ¥223,082 ¥37,241 ¥143,225 ¥5,516,180 ¥ — ¥5,516,180
In ter-segment sales or transfers 50,082 29,370 7,047 — 36,631 123,132 (123,132) —
Total 4,877,909 314,174 230,130 37,241 179,856 5,639,312 (123,132) 5,516,180
Segment profi t (loss) <Ordinary profi t> ¥ 321,287 ¥ 17,702 ¥ 10,057 ¥ 1,391 ¥ 12,760 ¥ 363,199 ¥ (2,101) ¥ 361,097
Segment assets ¥6,495,381 ¥255,702 ¥163,913 ¥30,544 ¥162,127 ¥7,107,670 ¥ (25,381) ¥7,082,288
Segment liabilities<Interest-bearing debt> ¥2,281,573 ¥ 3,325 ¥ 6,449 ¥15,465 ¥ 2,147 ¥2,308,961 ¥ (14,816) ¥2,294,145
Other items
Depreciation and amortization ¥ 321,140 ¥ 3,194 ¥ 5,962 ¥ 2,161 ¥ 3,758 ¥ 336,217 ¥ (4,415) ¥ 331,801
Amortization of goodwill 9,439 0 — 0 272 9,712 — 9,712
Interest income 4,352 166 13 0 260 4,793 (277) 4,516
Interest expense 25,187 117 45 103 120 25,575 (277) 25,297
E quity in net income (loss) of unconsolidated subsidiaries and affi liates 59,691 486 660 — (23) 60,815 1,913 62,729
B alance of investments in equity method companies 1,013,128 2,326 18,502 — (7) 1,033,949 105,972 1,139,921
In crease (decrease) in tangible/intangible fi xed assets 244,493 2,508 7,685 1,871 4,278 260,836 (3,816) 257,019
Notes:1. Segment profi t (loss) adjustments fi gure of ¥(2,101) million includes investment return of ¥3,035 million from the equity-method affi liate Nippon Steel Kowa Real Estate Co., Ltd., an
investment return of ¥198 million from the equity-method affi liate SUMCO Corporation, and elimination of inter-segment sales or transfers of ¥(5,335) million.2. Segment profi t is adjusted with respect to ordinary profi t in the consolidated statements of operations.3. The adjustments of segment liabilities include the elimination of the Steelmaking and steel fabrication segment’s borrowings from the System solutions segment, etc. 4. Depreciation and amortization includes depreciation of long-term prepaid expenses.5. The increased amount of tangible fi xed assets and intangible fi xed assets includes the increased amount of long-term prepaid expenses.
(2) Associated information
(Year ended March 31, 2015)
(a) Information about products and services
There is no mention of information about products and services, because similar information is disclosed in the segment informa-
tion section.
(b) Information about geographical area
1) Net salesMillions of yen
Japan Overseas TotalAsia Other
¥3,317,619 ¥2,292,410 ¥1,484,914 ¥807,496 ¥5,610,030
Note: Sales information is based on the geographical location of customers, and is classifi ed by region.
2) Tangible fi xed assets
The amount of tangible fi xed assets located in Japan is in excess of 90% of the amount of tangible fi xed assets on the consolidated
balance sheet, therefore disclosure has been omitted.
(c) Information about principal customersMillions of yen
Counterparty Sales Name of related segment
Sumitomo Corporation ¥992,596 Steelmaking and steel fabrication
Nippon Steel & Sumikin Bussan Corporation 895,718 Steelmaking and steel fabrication
Metal One Corporation 563,833 Steelmaking and steel fabrication
Notes to Consolidated Financial Statements
NIP
PO
N S
TEE
L & S
UM
ITOM
O M
ETA
L CO
RP
OR
ATIO
NFIN
AN
CIA
L AN
D C
OR
PO
RA
TE
SE
CT
ION
AN
NU
AL R
EP
OR
T 2015
82 83
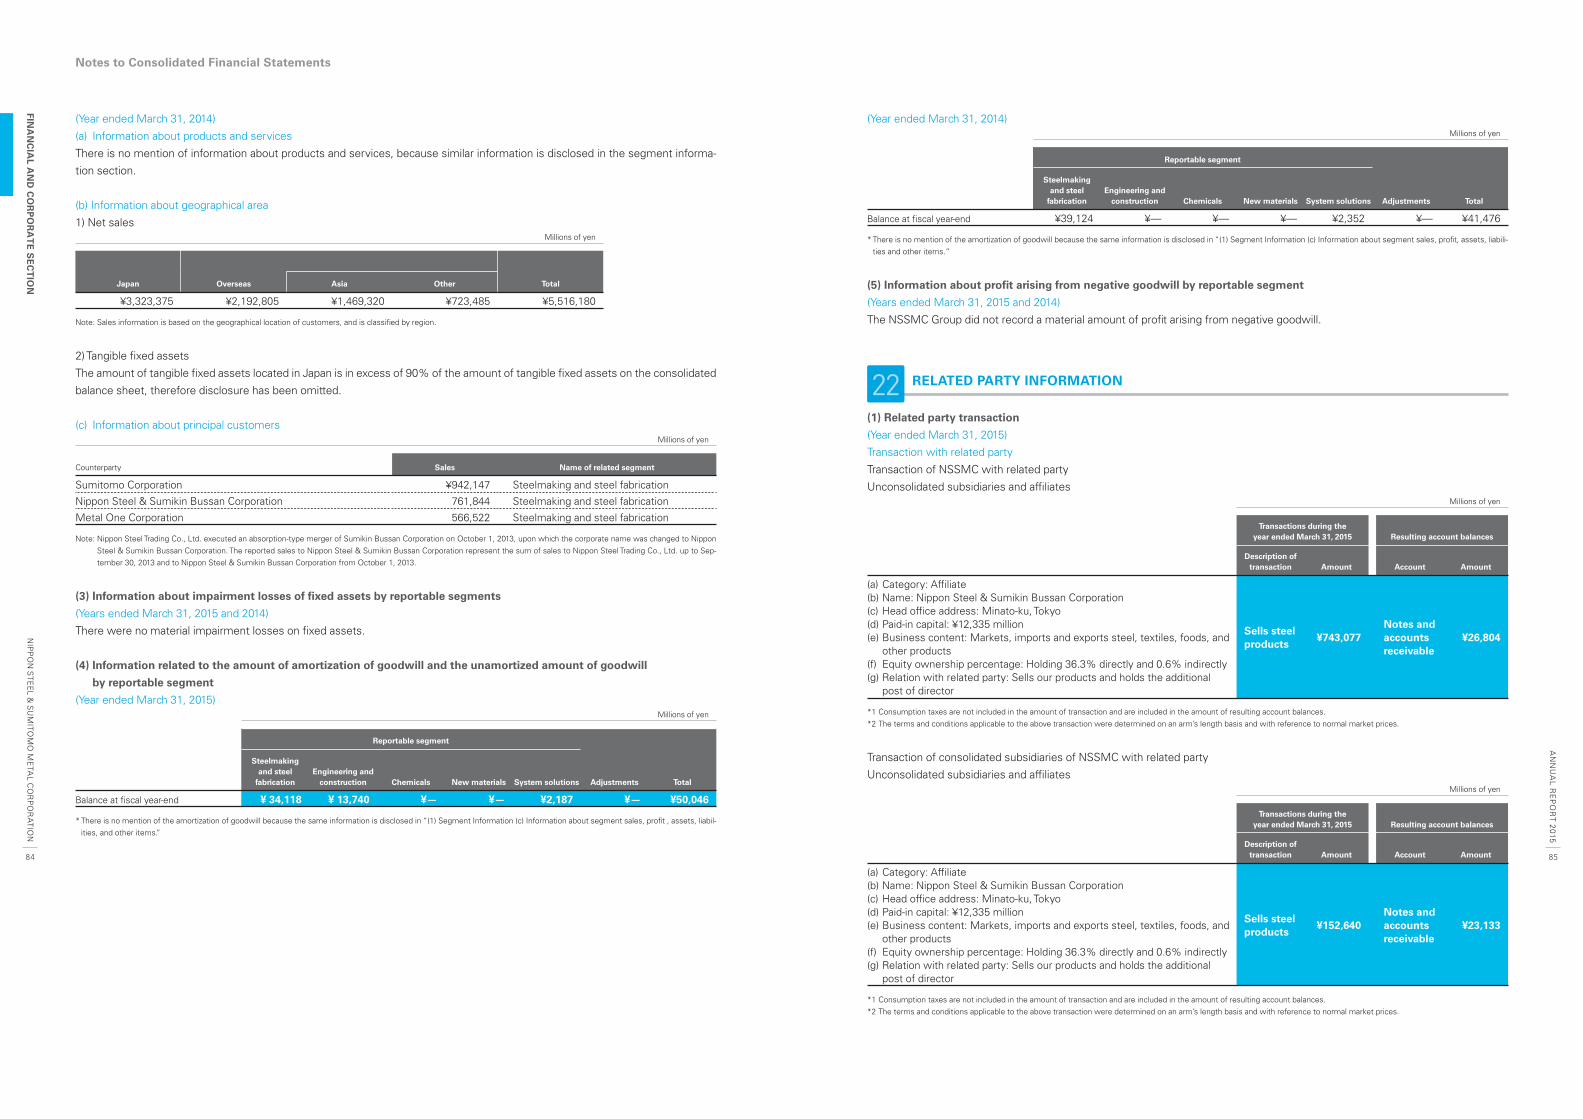
(Year ended March 31, 2014)
(a) Information about products and services
There is no mention of information about products and services, because similar information is disclosed in the segment informa-
tion section.
(b) Information about geographical area
1) Net salesMillions of yen
Japan Overseas TotalAsia Other
¥3,323,375 ¥2,192,805 ¥1,469,320 ¥723,485 ¥5,516,180
Note: Sales information is based on the geographical location of customers, and is classifi ed by region.
2) Tangible fi xed assets
The amount of tangible fi xed assets located in Japan is in excess of 90% of the amount of tangible fi xed assets on the consolidated
balance sheet, therefore disclosure has been omitted.
(c) Information about principal customersMillions of yen
Counterparty Sales Name of related segment
Sumitomo Corporation ¥942,147 Steelmaking and steel fabrication
Nippon Steel & Sumikin Bussan Corporation 761,844 Steelmaking and steel fabrication
Metal One Corporation 566,522 Steelmaking and steel fabrication
Note: Nippon Steel Trading Co., Ltd. executed an absorption-type merger of Sumikin Bussan Corporation on October 1, 2013, upon which the corporate name was changed to Nippon Steel & Sumikin Bussan Corporation. The reported sales to Nippon Steel & Sumikin Bussan Corporation represent the sum of sales to Nippon Steel Trading Co., Ltd. up to Sep-tember 30, 2013 and to Nippon Steel & Sumikin Bussan Corporation from October 1, 2013.
(3) Information about impairment losses of fi xed assets by reportable segments
(Years ended March 31, 2015 and 2014)
There were no material impairment losses on fi xed assets.
(4) Information related to the amount of amortization of goodwill and the unamortized amount of goodwill
by reportable segment
(Year ended March 31, 2015)Millions of yen
Reportable segment
Adjustments Total
Steelmaking and steel
fabricationEngineering and
construction Chemicals New materials System solutions
Balance at fi scal year-end ¥ 34,118 ¥ 13,740 ¥— ¥— ¥2,187 ¥— ¥50,046
* There is no mention of the amortization of goodwill because the same information is disclosed in “(1) Segment Information (c) Information about segment sales, profi t , assets, liabil-ities, and other items.”
(Year ended March 31, 2014)Millions of yen
Reportable segment
Adjustments Total
Steelmaking and steel
fabricationEngineering and
construction Chemicals New materials System solutions
Balance at fi scal year-end ¥39,124 ¥— ¥— ¥— ¥2,352 ¥— ¥41,476
* There is no mention of the amortization of goodwill because the same information is disclosed in “(1) Segment Information (c) Information about segment sales, profi t, assets, liabili-ties and other items.”
(5) Information about profi t arising from negative goodwill by reportable segment
(Years ended March 31, 2015 and 2014)
The NSSMC Group did not record a material amount of profi t arising from negative goodwill.
22 RELATED PARTY INFORMATION
(1) Related party transaction
(Year ended March 31, 2015)
Transaction with related party
Transaction of NSSMC with related party
Unconsolidated subsidiaries and affi liatesMillions of yen
Transactions during the year ended March 31, 2015 Resulting account balances
Description of transaction Amount Account Amount
(a) Category: Affi liate(b) Name: Nippon Steel & Sumikin Bussan Corporation(c) Head offi ce address: Minato-ku, Tokyo(d) Paid-in capital: ¥12,335 million(e) Business content: Markets, imports and exports steel, textiles, foods, and
other products(f) Equity ownership percentage: Holding 36.3% directly and 0.6% indirectly(g) Relation with related party: Sells our products and holds the additional
post of director
Sells steel products
¥743,077Notes and accounts receivable
¥26,804
*1 Consumption taxes are not included in the amount of transaction and are included in the amount of resulting account balances.*2 The terms and conditions applicable to the above transaction were determined on an arm’s length basis and with reference to normal market prices.
Transaction of consolidated subsidiaries of NSSMC with related party
Unconsolidated subsidiaries and affi liatesMillions of yen
Transactions during the year ended March 31, 2015 Resulting account balances
Description of transaction Amount Account Amount
(a) Category: Affi liate(b) Name: Nippon Steel & Sumikin Bussan Corporation(c) Head offi ce address: Minato-ku, Tokyo(d) Paid-in capital: ¥12,335 million(e) Business content: Markets, imports and exports steel, textiles, foods, and
other products(f) Equity ownership percentage: Holding 36.3% directly and 0.6% indirectly(g) Relation with related party: Sells our products and holds the additional
post of director
Sells steel products
¥152,640Notes and accounts receivable
¥23,133
*1 Consumption taxes are not included in the amount of transaction and are included in the amount of resulting account balances.*2 The terms and conditions applicable to the above transaction were determined on an arm’s length basis and with reference to normal market prices.
Notes to Consolidated Financial Statements
NIP
PO
N S
TEE
L & S
UM
ITOM
O M
ETA
L CO
RP
OR
ATIO
NFIN
AN
CIA
L AN
D C
OR
PO
RA
TE
SE
CT
ION
AN
NU
AL R
EP
OR
T 2015
84 85
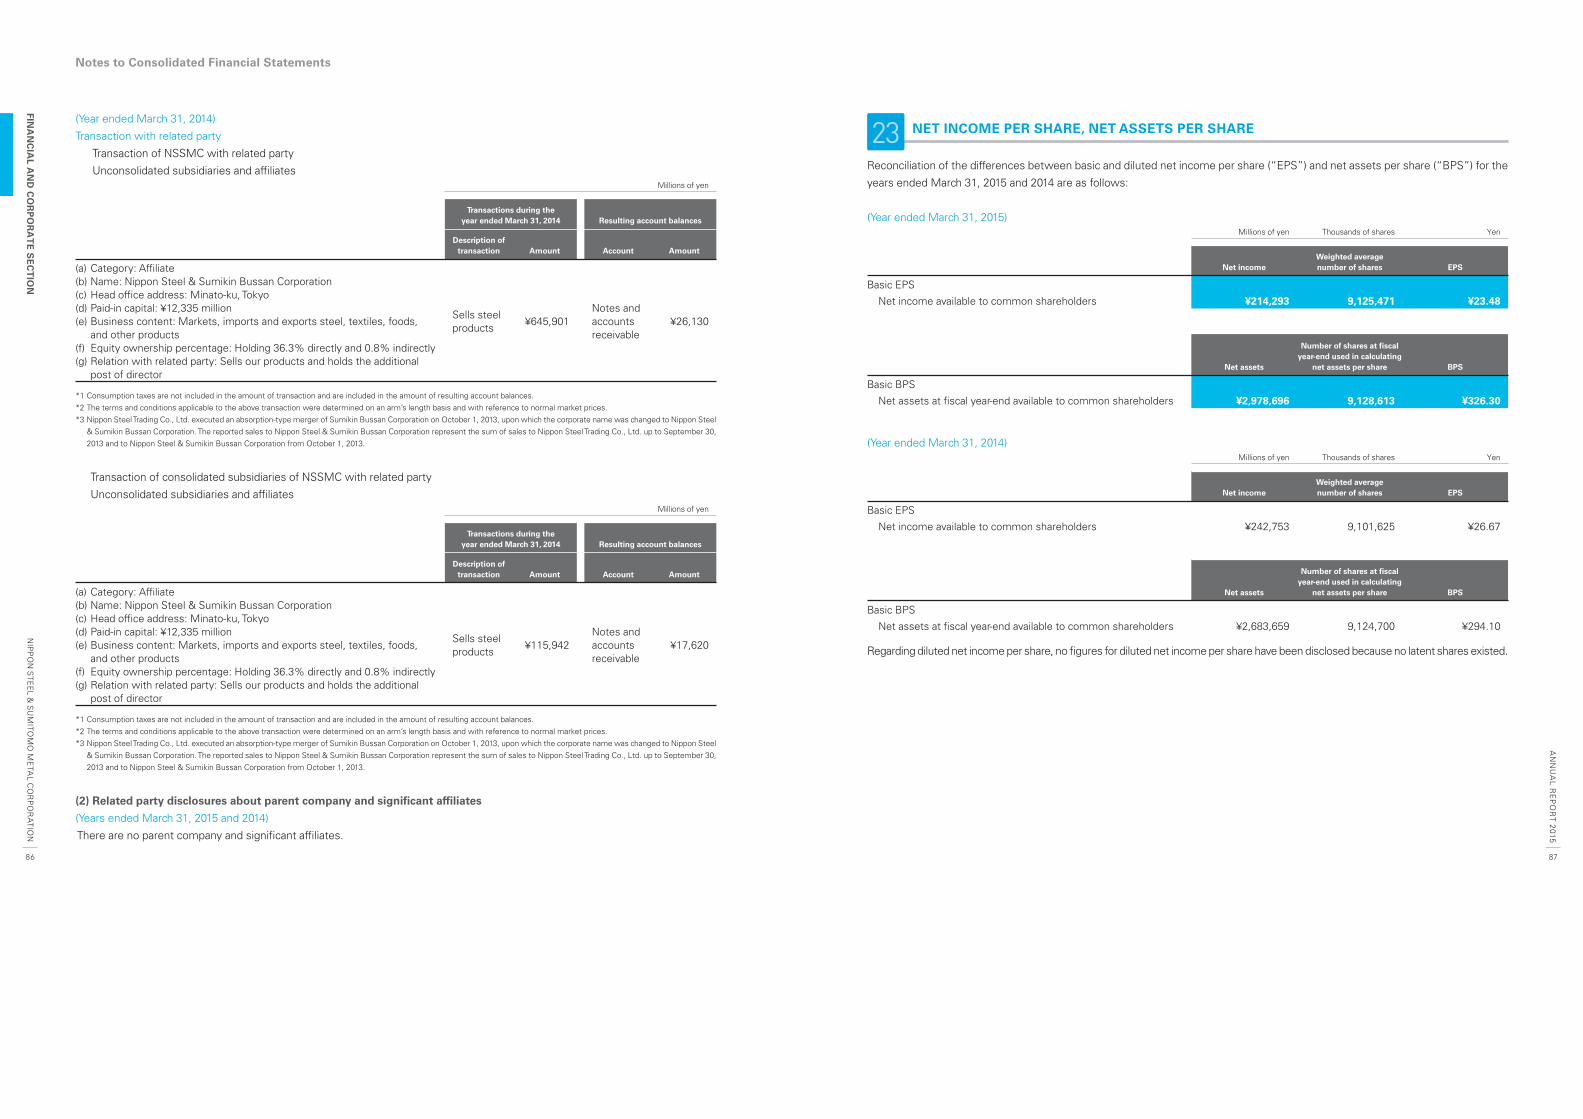
(Year ended March 31, 2014)
Transaction with related party
Transaction of NSSMC with related party
Unconsolidated subsidiaries and affi liatesMillions of yen
Transactions during the year ended March 31, 2014 Resulting account balances
Description of transaction Amount Account Amount
(a) Category: Affi liate(b) Name: Nippon Steel & Sumikin Bussan Corporation(c) Head offi ce address: Minato-ku, Tokyo(d) Paid-in capital: ¥12,335 million(e) Business content: Markets, imports and exports steel, textiles, foods,
and other products(f) Equity ownership percentage: Holding 36.3% directly and 0.8% indirectly(g) Relation with related party: Sells our products and holds the additional
post of director
Sells steel products
¥645,901Notes and accounts receivable
¥26,130
*1 Consumption taxes are not included in the amount of transaction and are included in the amount of resulting account balances.*2 The terms and conditions applicable to the above transaction were determined on an arm’s length basis and with reference to normal market prices.*3 Nippon Steel Trading Co., Ltd. executed an absorption-type merger of Sumikin Bussan Corporation on October 1, 2013, upon which the corporate name was changed to Nippon Steel
& Sumikin Bussan Corporation. The reported sales to Nippon Steel & Sumikin Bussan Corporation represent the sum of sales to Nippon Steel Trading Co., Ltd. up to September 30, 2013 and to Nippon Steel & Sumikin Bussan Corporation from October 1, 2013.
Transaction of consolidated subsidiaries of NSSMC with related party
Unconsolidated subsidiaries and affi liatesMillions of yen
Transactions during the year ended March 31, 2014 Resulting account balances
Description of transaction Amount Account Amount
(a) Category: Affi liate(b) Name: Nippon Steel & Sumikin Bussan Corporation(c) Head offi ce address: Minato-ku, Tokyo(d) Paid-in capital: ¥12,335 million(e) Business content: Markets, imports and exports steel, textiles, foods,
and other products(f) Equity ownership percentage: Holding 36.3% directly and 0.8% indirectly(g) Relation with related party: Sells our products and holds the additional
post of director
Sells steel products
¥115,942Notes and accounts receivable
¥17,620
*1 Consumption taxes are not included in the amount of transaction and are included in the amount of resulting account balances.*2 The terms and conditions applicable to the above transaction were determined on an arm’s length basis and with reference to normal market prices.*3 Nippon Steel Trading Co., Ltd. executed an absorption-type merger of Sumikin Bussan Corporation on October 1, 2013, upon which the corporate name was changed to Nippon Steel
& Sumikin Bussan Corporation. The reported sales to Nippon Steel & Sumikin Bussan Corporation represent the sum of sales to Nippon Steel Trading Co., Ltd. up to September 30, 2013 and to Nippon Steel & Sumikin Bussan Corporation from October 1, 2013.
(2) Related party disclosures about parent company and signifi cant affi liates
(Years ended March 31, 2015 and 2014)
There are no parent company and signifi cant affi liates.
23 NET INCOME PER SHARE, NET ASSETS PER SHARE
Reconciliation of the differences between basic and diluted net income per share (“EPS”) and net assets per share (“BPS”) for the
years ended March 31, 2015 and 2014 are as follows:
(Year ended March 31, 2015)Millions of yen Thousands of shares Yen
Net incomeWeighted average number of shares EPS
Basic EPS
Net income available to common shareholders ¥214,293 9,125,471 ¥23.48
Net assets
Number of shares at fi scal year-end used in calculating
net assets per share BPS
Basic BPS
Net assets at fi scal year-end available to common shareholders ¥2,978,696 9,128,613 ¥326.30
(Year ended March 31, 2014)Millions of yen Thousands of shares Yen
Net incomeWeighted average number of shares EPS
Basic EPS
Net income available to common shareholders ¥242,753 9,101,625 ¥26.67
Net assets
Number of shares at fi scal year-end used in calculating
net assets per share BPS
Basic BPS
Net assets at fi scal year-end available to common shareholders ¥2,683,659 9,124,700 ¥294.10
Regarding diluted net income per share, no fi gures for diluted net income per share have been disclosed because no latent shares existed.
Notes to Consolidated Financial Statements
NIP
PO
N S
TEE
L & S
UM
ITOM
O M
ETA
L CO
RP
OR
ATIO
NFIN
AN
CIA
L AN
D C
OR
PO
RA
TE
SE
CT
ION
AN
NU
AL R
EP
OR
T 2015
86 87
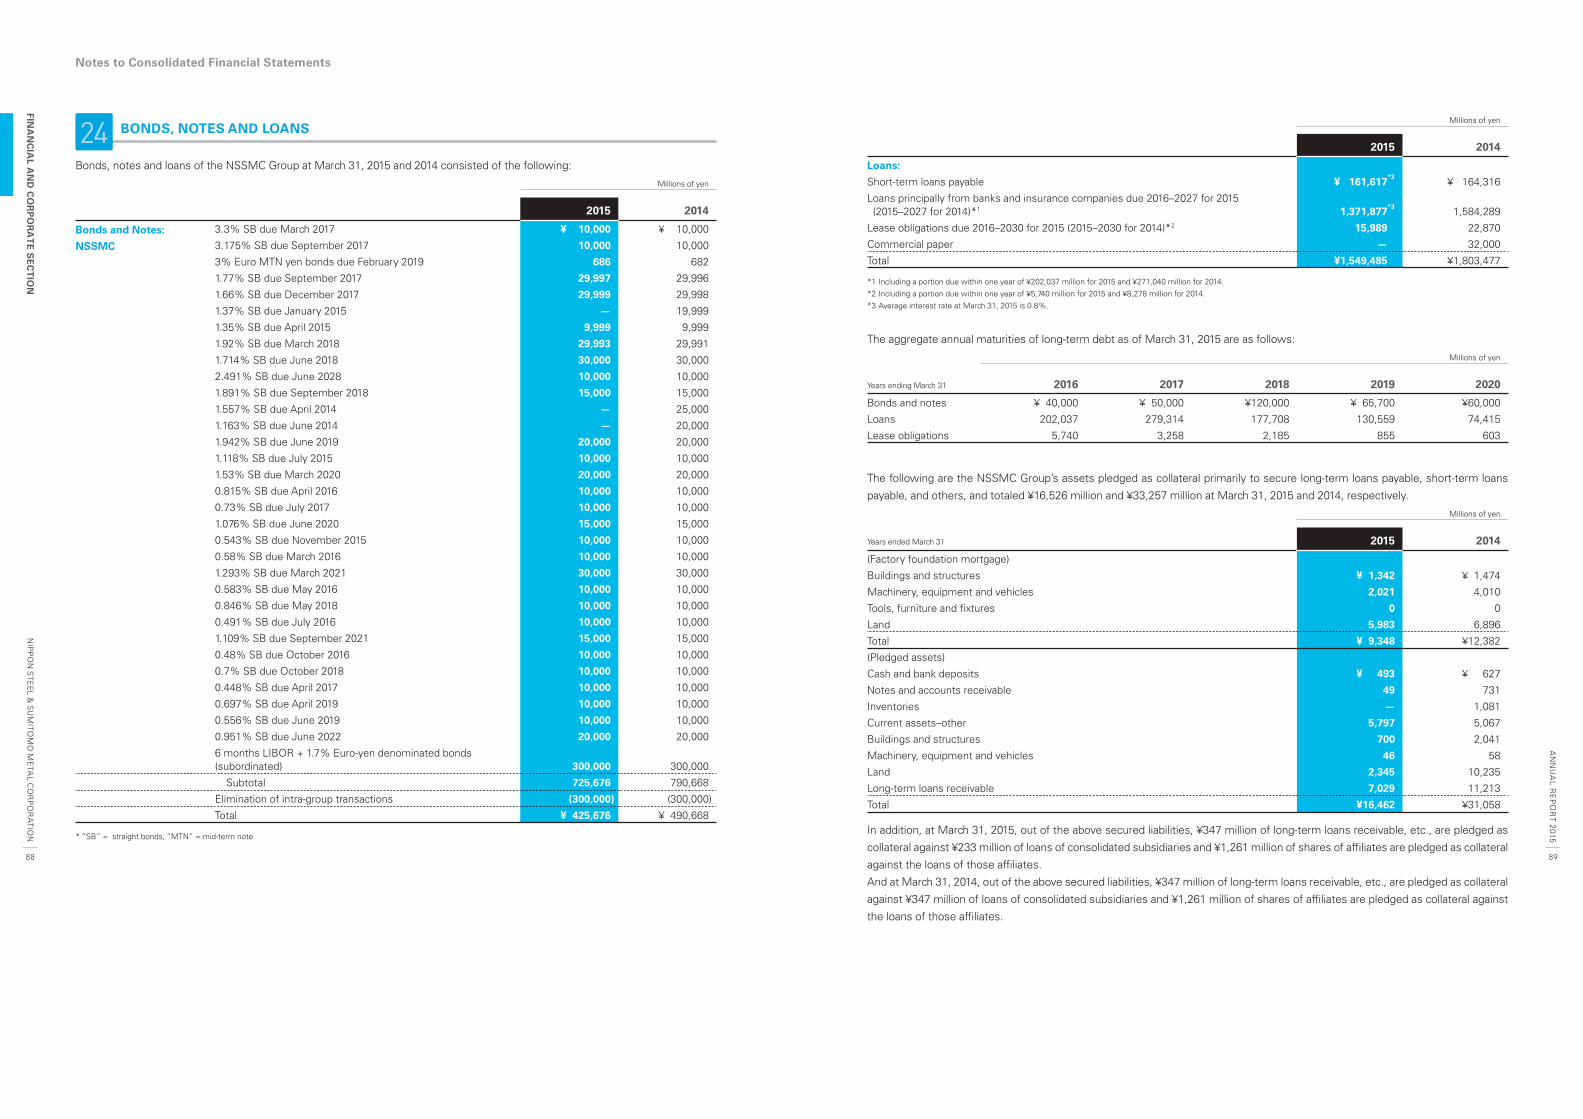
24 BONDS, NOTES AND LOANS
Bonds, notes and loans of the NSSMC Group at March 31, 2015 and 2014 consisted of the following:
Millions of yen
2015 2014
Bonds and Notes: 3.3% SB due March 2017 ¥ 10,000 ¥ 10,000
NSSMC 3.175% SB due September 2017 10,000 10,000
3% Euro MTN yen bonds due February 2019 686 682
1.77% SB due September 2017 29,997 29,996
1.66% SB due December 2017 29,999 29,998
1.37% SB due January 2015 — 19,999
1.35% SB due April 2015 9,999 9,999
1.92% SB due March 2018 29,993 29,991
1.714% SB due June 2018 30,000 30,000
2.491% SB due June 2028 10,000 10,000
1.891% SB due September 2018 15,000 15,000
1.557% SB due April 2014 — 25,000
1.163% SB due June 2014 — 20,000
1.942% SB due June 2019 20,000 20,000
1.118% SB due July 2015 10,000 10,000
1.53% SB due March 2020 20,000 20,000
0.815% SB due April 2016 10,000 10,000
0.73% SB due July 2017 10,000 10,000
1.076% SB due June 2020 15,000 15,000
0.543% SB due November 2015 10,000 10,000
0.58% SB due March 2016 10,000 10,000
1.293% SB due March 2021 30,000 30,000
0.583% SB due May 2016 10,000 10,000
0.846% SB due May 2018 10,000 10,000
0.491% SB due July 2016 10,000 10,000
1.109% SB due September 2021 15,000 15,000
0.48% SB due October 2016 10,000 10,000
0.7% SB due October 2018 10,000 10,000
0.448% SB due April 2017 10,000 10,000
0.697% SB due April 2019 10,000 10,000
0.556% SB due June 2019 10,000 10,000
0.951% SB due June 2022 20,000 20,000
6 months LIBOR + 1.7% Euro-yen denominated bonds (subordinated) 300,000 300,000
Subtotal 725,676 790,668
Elimination of intra-group transactions (300,000) (300,000)
Total ¥ 425,676 ¥ 490,668
* “SB” = straight bonds, “MTN” = mid-term note
Millions of yen
2015 2014
Loans:
Short-term loans payable ¥ 161,617*3 ¥ 164,316
L oans principally from banks and insurance companies due 2016–2027 for 2015 (2015–2027 for 2014)*1 1,371,877
*3 1,584,289
Lease obligations due 2016–2030 for 2015 (2015–2030 for 2014)*2 15,989 22,870
Commercial paper — 32,000
Total ¥1,549,485 ¥1,803,477
*1 Including a portion due within one year of ¥202,037 million for 2015 and ¥271,040 million for 2014.*2 Including a portion due within one year of ¥5,740 million for 2015 and ¥8,278 million for 2014.*3 Average interest rate at March 31, 2015 is 0.8%.
The aggregate annual maturities of long-term debt as of March 31, 2015 are as follows:
Millions of yen
Years ending March 31 2016 2017 2018 2019 2020
Bonds and notes ¥ 40,000 ¥ 50,000 ¥120,000 ¥ 65,700 ¥60,000
Loans 202,037 279,314 177,708 130,559 74,415
Lease obligations 5,740 3,258 2,185 855 603
The following are the NSSMC Group’s assets pledged as collateral primarily to secure long-term loans payable, short-term loans
payable, and others, and totaled ¥16,526 million and ¥33,257 million at March 31, 2015 and 2014, respectively.
Millions of yen
Years ended March 31 2015 2014
(Factory foundation mortgage)
Buildings and structures ¥ 1,342 ¥ 1,474
Machinery, equipment and vehicles 2,021 4,010
Tools, furniture and fi xtures 0 0
Land 5,983 6,896
Total ¥ 9,348 ¥12,382
(Pledged assets)
Cash and bank deposits ¥ 493 ¥ 627
Notes and accounts receivable 49 731
Inventories — 1,081
Current assets–other 5,797 5,067
Buildings and structures 700 2,041
Machinery, equipment and vehicles 46 58
Land 2,345 10,235
Long-term loans receivable 7,029 11,213
Total ¥16,462 ¥31,058
In addition, at March 31, 2015, out of the above secured liabilities, ¥347 million of long-term loans receivable, etc., are pledged as
collateral against ¥233 million of loans of consolidated subsidiaries and ¥1,261 million of shares of affi liates are pledged as collateral
against the loans of those affi liates.
And at March 31, 2014, out of the above secured liabilities, ¥347 million of long-term loans receivable, etc., are pledged as collateral
against ¥347 million of loans of consolidated subsidiaries and ¥1,261 million of shares of affi liates are pledged as collateral against
the loans of those affi liates.
Notes to Consolidated Financial Statements
NIP
PO
N S
TEE
L & S
UM
ITOM
O M
ETA
L CO
RP
OR
ATIO
NFIN
AN
CIA
L AN
D C
OR
PO
RA
TE
SE
CT
ION
AN
NU
AL R
EP
OR
T 2015
88 89
25 SUBSEQUENT EVENTS
(Year ended March 31, 2015 )
1. Share consolidation
NSSMC resolved at the Meeting of the Board of Directors held
on April 28, 2015 to approve a partial amendment to the Articles
of Incorporation associated with change of the number of
shares in a unit of shares of the Company (from 1,000 shares to
100 shares) and received approval at the Ordinary General
Meeting of Shareholders held on June 24, 2015 for a share con-
solidation of 10 shares becoming 1 share and the total number
of authorized shares from 20 billion shares to 2 billion shares.
The approved partial amendment to the Articles of Incorpora-
tion and share consolidation will be effective on October 1,
2015.
2. Redemption of Euro-yen denominated bonds (subordi-
nated) and Euro-yen denominated preferred securities
issued by the overseas subsidiary, and fi nancing by
subordinated loans
NSSMC resolved at the Meeting of the Board of Directors held
on May 15, 2015 to exercise the right of redemption in full for
the securities presented below, the two securities as described
in (1) and (2) (collectively, the “Existing Hybrid Securities”) , and
to raise ¥300 billion, as of the same date and by means of sub-
ordinated loans (the “Loans”), to be used for funding this
redemption (the redemption of the Existing Hybrid Securities
and the procurement of ¥300 billion through the Loans are
hereinafter referred to, collectively, as the “Refi nancing”). The
Existing Hybrid Securities were issued in November 2006 for
raising ¥300 billion. Details are as follows.
(1) Euro-yen denominated bonds (subordinated) issued
by the Company through allocation to NS
Preferred Capital Limited (the “Overseas SPC”), the Company’s
wholly-owned subsidiary in British Overseas Territory Cayman
Islands
(2) Euro-yen denominated preferred securities issued by
the Overseas SPC through allocation to the Compa-
ny’s three main banks
(a) Summary of the Loans
(1) Aggregate loan amount: ¥300 billion
(2) Use of proceeds: Redemption of the Existing Hybrid
Securities
(3) Drawdown date: July 21, 2015
(4) Maturity date: July 19, 2075
Provided, however, that optional prepayment is permitted after
the expiration of fi ve years from the drawdown date
(5) Lenders: Four main banks
(6) Subordination conditions:
In the event liquidation proceedings are commenced, or the
decision to commence bankruptcy proceedings, corporate
reorganization, civil rehabilitation, or any other similar proceed-
ings is made with regard to the Company, the principals and
interests of the Loans may be paid to the lenders of the Loans
after the payment of all receivables in full excluding the Loans
and other subordinated receivables which rank equal in point of
subordination as the Loans.
(7) Optional deferral of interest payments:
Except where dividends are distributed to its common stock,
etc., the Company may, at its discretion, defer payment of all or
a portion of the interests on the Loans.
(8) Restrictions on amendments to the terms of the
Loans:
No amendment shall be made to the terms and conditions of
the Loans that is prejudicial to the creditors of the Company
other than the creditors of the subordinated receivables which
rank equal in point of subordination as the Loans.
(9) Replacement Restrictions Clause*: None* A provision under which the Company states its intention to prepay the Loans to the
extent that the Company has raised funds, preceding such prepayment, which have been approved by the rating agencies as having the same or higher equity credit as the Loans.
(10) Equity credit acknowledgment:
(First fi ve years) Moody’s 50%, S&P 50%, R&I 30%, JCR 50%
(After the expiry of fi ve years) Moody’s 50%, R&I 30%, JCR
25%
(b) Impact on the fi nancial and operating results
The impact of the Refi nancing is immaterial with regard to the
consolidated fi nancial and operating results of the Company.
The preferred securities issued by the Overseas SPC in the
amount of ¥300 billion were recorded as“minority interest in
consolidated subsidiaries” (in the section of “Net Assets”) on
the Company’s consolidated balance sheet. In contrast, after
the completion of the Refi nancing, the Loans in the amount of
¥300 billion will be recorded as “Long-term loans payable” (in
the section of Liabilities).
Independent Auditor’s ReportNotes to Consolidated Financial Statements
NIP
PO
N S
TEE
L & S
UM
ITOM
O M
ETA
L CO
RP
OR
ATIO
NFIN
AN
CIA
L AN
D C
OR
PO
RA
TE
SE
CT
ION
AN
NU
AL R
EP
OR
T 2015
90 91
Principal Subsidiaries and Affi liates(As of March 31, 2015)
CompanyPaid-in Capital (Millions of yen)
Voting Rights (%)
Business Content
Steelmaking and Steel Fabrication (367 companies)
Consolidated Subsidiaries (276 companies)
East Asia United Steel Corporation17,217 64.6%
Holding company of Nippon Steel & Sumikin Koutetsu Wakayama Corporation
Nippon Steel & Sumikin Koutetsu Wakayama Corporation 17,217 100.0% Manufactures and markets semi-fi nished steel products
Nippon Steel & Sumikin Coated Sheet Corporation12,588 100.0%
Manufactures and markets galvanized sheets, prepainted galvanized sheets, coated sheets, and construction materials
Osaka Steel Co., Ltd.8,769 66.3%
Manufactures and markets billets, shapes, deformed bars, and fabricated products
Nippon Steel & Sumikin Metal Products Co., Ltd.
5,912 100.0%
Manufactures and markets structural materials for buildings and civil engineering work, prepainted galvanized sheets and steelmaking fl uxes, and CC powders
Nippon Steel & Sumikin Pipe Co., Ltd. 5,831 100.0% Manufactures and markets steel pipes and tubes
Nippon Steel & Sumikin Texeng Co., Ltd.
5,468 72.3%
Provides engineering, maintenance, and operational services pertaining to machines, electrical instrumentation, systems, and the construction of steel production equipment
Nippon Steel & Sumikin Stainless Steel Corporation 5,000 100.0% Manufactures and markets stainless steel
Nippon Steel & Sumikin Logistics Co., Ltd. 4,000 100.0% Undertakes ocean and land transportation and warehousing
Suzuki Metal Industry Co., Ltd. 3,634 66.6% Manufactures and markets wire products
Geostr Corporation3,352 42.3%
Manufactures and markets concrete products for civil engineering, along with metal products
Nippon Steel & Sumikin Shapes Corporation 3,000 100.0% Manufactures and markets H-shapes and steel sheet piles
Nippon Steel & Sumikin Welding Co., Ltd. 2,100 100.0% Manufactures and markets welding materials and apparatus
Nippon Steel & Sumikin Drum Co., Ltd. 1,654 100.0% Manufactures and markets drums
Nippon Steel & Sumikin Blast Furnace Slag Cement Co., Ltd. 1,500 100.0%
Manufactures and markets cement, steelmaking slag, and calcined lime products
Nippon Steel & Sumikin Cement Co., Ltd. 1,500 85.0% Manufactures and markets cement
Nippon Steel & Sumikin Finance Co., Ltd. 1,000 100.0% Engages in fi nancing and lending operations
Nippon Steel & Sumikin Stainless Steel Pipe Co., Ltd. 916 100.0% Manufactures and markets stainless steel pipes and tubes
Nippon Steel & Sumikin Steel Wire Co., Ltd. 897 51.0% Manufactures and markets secondary products using bars and wire rods
Nippon Steel & Sumikin Bolten Corporation 550 85.0% Manufactures and markets high-tension bolts, etc.
Nippon Steel & Sumikin Eco-Tech Corporation
500 85.1%
Designs, constructs, operates, and maintains water treatment facilities; designs and constructs civil engineering projects; and undertakes environmental / chemical analyses
NS Preferred Capital Limited 300,000 100.0% Issues preferred securities
Nippon Steel & Sumikin Tubos do Brasil Ltda. R2,002 million 100.0% Markets seamless pipes
The Siam United Steel (1995) Co., Ltd. THB9,000 million 71.0% Manufactures and markets cold-rolled sheets
National Pipe Co., Ltd. SAR200million 51.0% Manufactures and markets primarily steel line pipes
Standard Steel, LLC US$47 million 100.0% Manufactures and markets wheels and axles for railways
Nippon Steel & Sumitomo Metal U.S.A., Inc. US$40 million 100.0% Invests mainly in U.S. companies and gathers information
PT Pelat Timah Nusantara Tbk. US$26 million 35.0% Manufactures and markets tinplates
Nippon Steel & Sumitomo Metal (Thailand) Co., Ltd. THB718 million 100.0% Gathers information in Asian region focusing on Thailand
Nippon Steel & Sumikin Steel Processing (Thailand) Co., Ltd. THB571 million 66.5% Manufactures and markets cold-heading wire and cold-fi nished bars
Western Tube & Conduit Corporation US$17 million 96.7% Manufactures and markets steel conduit tubes and mechanical tubes
Nippon Steel & Sumitomo Metal Australia Pty. Limited A$21 million 100.0% Participates in mine development in Australia and gathers information
244 other companies
Affi liates Accounted for by the Equity Method (91 companies)
Godo Steel, Ltd. 34,896 16.6% Manufactures and markets shapes, rails, bars, and wires
Topy Industries, Ltd.20,983 20.5%
Manufactures and markets shapes, deformed steel bars, and automotive and industrial components
Sanyo Special Steel Co., Ltd. 20,182 15.3% Manufactures and markets special steel products
Kyoei Steel Ltd.18,515 26.7%
Manufactures and markets steel bars, shapes and billets; processes and markets steel products
Nippon Steel & Sumikin Bussan Corporation 12,335 36.9% Imports, exports, and markets steel, textiles, foodstuffs, and other products
Nippon Denko Co., Ltd.11,026 21.0%
Manufactures and markets ferro-alloys, advanced materials, chemicals, and environmental recycling systems
Affi liates Accounted for by the Equity Method
Nichia Steel Works, Ltd.10,720 24.3%
Manufactures and markets bolts, wire products, and prepainted galvanized sheets
Sumitomo Precision Products Co., Ltd.10,311 40.7%
Manufactures and markets aerospace hydraulic equipment, heat exchangers, and industrial / environmental equipment
NS United Kaiun Kaisha, Ltd. 10,300 34.1% Undertakes ocean and land transportation
Osaka Titanium Technologies Co., Ltd.8,739 23.9%
Manufactures and markets titanium metal, polysilicon, and high-function materials made from titanium and silicon developed for new applications
Nippon Coke & Engineering Co., Ltd. 7,000 21.8% Markets coal and manufactures and markets coke
Japan Casting & Forging Corporation 6,000 42.0% Manufactures and markets castings, forgings, ingots, and billets
Krosaki Harima Corporation 5,537 47.1% Manufactures, markets, and constructs refractories
Sanko Metal Industrial Co., Ltd.1,980 16.5%
Manufactures, processes, installs, and sells metal roofs and building materials
Sanyu Co., Ltd. 1,513 35.1% Manufactures and markets cold-fi nished bars and cold-heading wire
Usinas Siderúrgicas de Minas Gerais S.A.-USIMINAS R12,150 million 29.2% Manufactures and markets steel products
Vallourec & Sumitomo Tubos do Brasil Ltda. R5,376 million 40.4% Manufactures seamless pipes
Baosteel-NSC Automotive Steel Sheets Co., Ltd. RMB3,000 million 50.0% Manufactures and markets automotive steel sheets
UNIGAL Ltda. R584 million 30.0% Manufactures and markets galvanized sheets
Companhia Nipo-Brasileira de Pelotizacao R432 million 31.4% Maintains and leases pellet production facilities
Guangzhou Pacifi c Tinplate Co., Ltd. US$36 million 27.3% Manufactures and markets tinplate
70 other companies
Engineering and Construction (37 companies)
Consolidated Subsidiaries (34 companies) Affi liates Accounted for by the Equity Method (3 companies)
Nippon Steel & Sumikin Engineering Co., Ltd.
15,000 100.0%
Manufactures and markets industrial machinery and equipment and steel structures; undertakes civil engineering and building construction work; operates waste and regeneration treatment business; operates electricity, gas, and heat supply business
36 other companies
Chemicals (21 companies)
Consolidated Subsidiaries (14 companies) Affi liates Accounted for by the Equity Method (7 companies)
Nippon Steel & Sumikin Chemical Co., Ltd.5,000 100.0%
Manufactures and markets coal chemicals, petrochemicals, and electronic materials
20 other companies
New Materials (12 companies)
Consolidated Subsidiaries (12 companies)
Nippon Steel & Sumikin Materials Co., Ltd.
3,000 100.0%
Manufactures and markets semiconductor components and materials, electronic components and materials, carbon-fi ber composite products, and metal-processed products
11 other companies
System Solutions (22 companies)
Consolidated Subsidiaries (20 companies) Affi liates Accounted for by the Equity Method (2 companies)
NS Solutions Corporation12,952 62.4%
Provides engineering and consulting services pertaining to computer systems
21 other companies
Other (2 companies)
Affi liates Accounted for by the Equity Method (2 companies)
SUMCO Corporation 136,607 27.8% Manufactures and markets semiconductor silicon wafers
1 other company
Total consolidated subsidiaries: 356 companies Total affi liates accounted for by the equity method: 105 companies
NIP
PO
N S
TEE
L & S
UM
ITOM
O M
ETA
L CO
RP
OR
ATIO
NFIN
AN
CIA
L AN
D C
OR
PO
RA
TE
SE
CT
ION
AN
NU
AL R
EP
OR
T 2015
92 93
NSSMC’s Network
Domestic Steelworks and Research Laboratories (Non-consolidated)
01. Kashima Works (Ibaraki Pref.)
Crude steel production: 757Employees: 2,726Main products: Sheets, plates, shapes, pipes and tubes
02. Kimitsu Works (Kimitsu Area, Chiba Pref.) (Tokyo Area, Tokyo)
Crude steel production: 963Employees: 3,550Main products: Sheets, plates, wire rods, shapes, pipes and tubes
03. Nagoya Works (Aichi Pref.)
Crude steel production: 621Employees: 3,010Main products: Sheets, plates, pipes and tubes
04. Wakayama Works (Wakayama Area and Kainan Area, Wakayama Pref.), (Sakai Area, Osaka)
Crude steel production: 473*Employees: 1,377Main products: Pipes and tubes, shapes, sheets
05. Hirohata Works (Hyogo Pref.)
Crude steel production: 78Employees: 1,224Main product: Sheets
06. Yawata Works (Tobata Area, Kokura Area, and Yawata Area, Fukuoka Pref.)
Crude steel production: 472Employees: 3,659Main products: Sheets, shapes, rails, pipes and tubes, bars and wire rods
07. Oita Works (Oita Area, Oita Pref.) (Hikari Area, Yamaguchi Pref.)
Crude steel production: 981Employees: 1,963Main products: Sheets, plates, pipes and tubes, titanium
08. Muroran Works (Hokkaido Pref.)
Crude steel production: 146Employees: 601Main products: Bars and wire rods
09. Kamaishi Works (Iwate Pref.)
Employees: 228Main product: Wire rods
10. Amagasaki Works (Hyogo Pref.)
Employees: 645Main products: Pipes and tubes
11. Osaka Steel Works (Osaka)
Crude steel production: 5Employees: 1,072Main products: Wheels and axles, crankshafts
12. Naoetsu Works (Niigata Pref.)
Employees: 167Main products: Stainless steel, titanium
Research & Engineering Center
(Futtsu, Chiba Pref.)
Amagasaki R&D Center
(Hyogo Pref.)
Hasaki R&D Center (Ibaraki Pref.)
08
09
12
0305 11
10
040706
07
02
01
Blast furnace
Cold ferrous materials melting furnace
Head Office and Domestic Offices and Branches
Overseas Offices (including locally incorporated companies)
Head Offi ce
2-6-1, Marunouchi, Chiyoda-ku, Tokyo 100-8071, JapanPhone: +81-3-6867-4111Fax: +81-3-6867-5607
Sales Offi ces
Osaka Offi ce
Hokkaido Marketing Branch
Muroran Marketing SiteTohoku Marketing Branch
Aomori Marketing Site Akita Marketing Site Morioka Marketing Site Kamaishi Marketing Site Kitakami Marketing Site Fukushima Marketing SiteNiigata Marketing Branch
Hokuriku Marketing Branch
Ibaraki Marketing Branch
Nagoya Marketing Branch
Shizuoka Marketing Site Hamamatsu Marketing Site
Chugoku Marketing Branch
Shikoku Marketing Branch
Kyushu Marketing Branch
Nagasaki Marketing Site Oita Marketing Site Minami-Kyushu Marketing Site Okinawa Marketing Site
Chiba Marketing Site Yokohama Marketing Site Nagano Marketing Site
Nippon Steel & Sumitomo Metal U.S.A., Inc.
(New York, Chicago, Houston)
Mexico Representative Offi ce (Mexico City)
Nippon Steel & Sumitomo Metal Empreendimentos
Siderúrgicos Ltda.
(São Paulo, Belo Horizonte)
Nippon Steel & Sumitomo Metal Corporation
European Offi ce
(Düsseldorf)
Nippon Steel & Sumitomo Metal Australia Pty. Limited
(Sydney)
Nippon Steel & Sumitomo Metal Consulting
(Beijing) Co., Ltd.
(Beijing, Shanghai, Guangzhou)
PT. Nippon Steel and Sumitomo Metal Indonesia
(Jakarta)
Nippon Steel & Sumitomo Metal Southeast Asia Pte. Ltd.
(Singapore)
Nippon Steel & Sumitomo Metal (Thailand) Co., Ltd.
(Bangkok)
Vietnam Representative Offi ce (Ho Chi Minh City)
Nippon Steel & Sumitomo Metal India Private Limited
(New Delhi)
Nippon Steel & Sumitomo Metal Corporation
Dubai Offi ce
Notes:1 Crude steel production unit: Ten thousands of metric tons; Employees: Persons2 Crude steel production fi gures are for the year ended March 31, 2015; Employee fi gures are as of March 31, 2015.
* Nippon Steel & Sumikin Koutetsu Wakayama Corporation
NIP
PO
N S
TEE
L & S
UM
ITOM
O M
ETA
L CO
RP
OR
ATIO
NFIN
AN
CIA
L AN
D C
OR
PO
RA
TE
SE
CT
ION
AN
NU
AL R
EP
OR
T 2015
94 95
History
NIPPON STEEL CORPORATION
2011 Agreed to commence consideration of business integration with Sumitomo Metal Industries, Ltd.
2006 Engineering and Construction business was spun off to Nippon Steel Engineering Co., Ltd.New Materials business was spun off to Nippon Steel Materials Co., Ltd.
2003 Stainless Steel business was spun off to Nippon Steel & Sumikin Stainless Steel Corporation.
2002 Announced alliance with Sumitomo Metal Industries, Ltd. and Kobe Steel, Ltd.All operations of Nippon Steel’s Urban Development Division were integrated into Nippon Steel City Produce, Inc.
2001 Operations of Nippon Steel’s Electronics & Information Systems Division and its subsidiary Nippon Steel Information & Communication Systems Inc. were integrated to organize NS Solutions Corporation.
2000 Divisionally integrated operational system within the Group based on product item or business area was introduced in the steelmaking and steel fabrication business.
1997 Silicon Wafer Division was organized (abolished in April 2004).
1993 Semiconductor Division was organized (abolished in April 1999).
1991 Technical Development Bureau was organized by integrating Central R&D Bureau and Plant Engineering & Technology Bureau, and Research & Engineering Center began operation.
1987 Electronics & Information Systems Division, New Materials Division, and Service Business Division (integrated into Urban Development Division in June 1992) were organized.
1986 Electronics Division was organized.
1984 Nippon Steel Chemical Co., Ltd. was inaugurated through the merger of Nippon Steel Chemical Co., Ltd. and Nittetsu Chemical Industrial Co., Ltd.New Materials Projects Bureau was organized.
1974 Engineering Divisions Group was organized.
1971 Nippon Steel absorbed Fuji Sanki Pipe & Tube Co., Ltd. Oita Works began operation.
1970 Yawata Iron & Steel and Fuji Iron & Steel merged to form Nippon Steel Corporation.
1968 Yawata Iron & Steel absorbed Yawata Steel Tube Co., Ltd.
1967 Tokai Iron & Steel became Nagoya Works of Fuji Iron & Steel.
1965 Kimitsu Works of Yawata Iron & Steel began operation.
1961 Sakai Works of Yawata Iron & Steel began operation.
1958 Tokai Iron & Steel Co., Ltd. was established.Yawata Iron & Steel inaugurated the Tobata Area of Yawata Works.
1955 Hikari Works of Yawata Iron & Steel began operation.
1950 Yawata Iron & Steel Co., Ltd. and Fuji Iron & Steel Co., Ltd. were established. <Company’s founding>
SUMITOMO METAL INDUSTRIES, LTD.
2012 Merged with Sumitomo Metals (Kokura), Ltd. and Sumitomo Metals (Naoetsu), Ltd.
2011 Agreed to commence consideration of business integration with Nippon Steel Corporation.
2008 Implemented corporate split of Titanium business and succeeded to Sumitomo Metals (Naoetsu), Ltd.
2003 Nippon Steel & Sumikin Stainless Steel Corporation was established. Sumikin Iron & Steel Corporation (present Nippon Steel & Sumikin Kotetsu Wakayama Corp.) was established.Wakayama Works’ upstream operation was split to establish a new company.
2002 Announced alliance with Nippon Steel Corporation and Kobe Steel, Ltd.Silicon wafer business was transferred to Silicon United Manufacturing Corporation (present SUMCO Corporation).
2000 Sumitomo Metals (Kokura), Ltd. was established (former Kokura Works).Sumitomo Metals (Naoetsu), Ltd. was established (former Naoetsu Works).
1998 Merged with Sumitomo Sitix Corporation.
1994 Kashima Stainless Steel Works was integrated into Kashima Works.
1992 Merged with Nippon Stainless Co., Ltd. (Naoetsu Works and Kashima Stainless Steel Works were established.)
1990 Electronics Division was established.
1988 Kainan Steel Tube Works was integrated into Wakayama Works.
1980 Merged with Kainan Steel Tube Co., Ltd. (Kainan Steel Tube Works was established.)
1977 Engineering Division was established. (Entered into engineering business.)
1974 Hasaki Research Center, present Hasaki R&D Center, was established.
1968 Kashima Works was established.
1966 Kainan Steel Tube Co., Ltd. was established.
1963 Sumitomo Special Metals Co., Ltd. (former Magnetic Steel and Electronic Parts Manufacturing Departments) was established.
1961 Sumitomo Precision Products Co., Ltd. (former Aircraft Instruments Department) was established.
1959 Sumitomo Light Metal Industries, Ltd. (former Copper Rolling and Aluminum Rolling Department) was established.Central Research Laboratories, present Amagasaki R&D Center, was established.
1953 Merged with Kokura Steel Manufacturing Co. and established Kokura Works, an integrated steelmaker.
1952 Shin-Fuso Metal Industries, Ltd. was renamed to Sumitomo Metal Industries, Ltd.
1950 Narumi China Corporation (former China Manufacturing Department) was established.
1949 Shin-Fuso Metal Industries, Ltd. was established. <Company’s founding>
2014 Yawata Works and Kokura Works were integrated to become Yawata Works.Wakayama Works and Sakai Works were integrated to become Wakayama Works.Kimitsu Works and Tokyo Works were integrated to become Kimitsu Works.
2012 Nippon Steel & Sumitomo Metal Corporation was incorporated on October 1.
Investor Information (As of March 31, 2015)
Shareholders Benefi ts
Benefi ts DescriptionPeriod of
implementation
Applicable shareholders
As of the end of March 2015
As of the end of September 2015 (*6)
"After the share consolidation (*7)
Company calendarNSSMC’s calendar is distributed to shareholders
Once a year(Late November to early December)
Shareholders who own 5,000 or
more shares
Shareholders who own 500 or more shares as of
the end of September
Invitation to plant tours (by lottery)
Shareholders are invited to plant toursTwice a year(March-April and October-November)
Shareholders who own 10,000 or more shares
Shareholders who own 10,000 or more shares
Shareholders who own 1,000 or more
shares as of the end of March or September
Invitation to business briefi ngs (by lottery)
Shareholders are invited to business briefi ngs conducted in Tokyo, Osaka, and other locations
Twice a year(July-September and February-March)
Invitation to football games of Kashima Antlers (by lottery)
Shareholders are invited to J1-League football games (home and away)
Twice a year(April-August and August- December)
Shareholders who own 5,000 or more shares Shareholders
who own 50,000 or more shares
Shareholders who own 5,000 or more
shares as of the end of March or September
Invitation to concerts at Kioi Hall (by lottery)
Shareholders are invited to periodic Kioi Sinfonietta Tokyo concerts and other concerts
Twice a year(March-July and September- February)
Shareholders who own 50,000 or more shares
*6 Effective from the end of September 2015, our shareholders benefi t program will be partly revised. For more information, please refer to our Website.*7 The request of share consolidation has been approved by the General Meeting of Shareholders (June 24, 2015) and every 10 shares will be consolidated into 1 share. This consoli-
dation will become effective on October 1, 2015.
Principal Shareholders
Name Shares owned (Thousands) Shareholding ratio (%)*5
Japan Trustee Services Bank, Ltd. (Trust Account) 391,189 4.1
The Master Trust Bank of Japan, Ltd. (Trust Account) 311,468 3.3
Nippon Life Insurance Company 245,182 2.6
Sumitomo Corporation 182,690 1.9
Mizuho Bank, Ltd.*3 162,600 1.7
Sumitomo Mitsui Banking Corporation*4 146,470 1.5
Meiji Yasuda Life Insurance Company 138,977 1.5
The Bank of Tokyo-Mitsubishi UFJ, Ltd. 136,356 1.4
THE BANK OF NEW YORK MELLON SA/NV 10 122,706 1.3
STATE STREET BANK WEST CLIENT-TREATY 505234 103,887 1.1
*3 Apart from those shares listed above, Mizuho Bank, Ltd. has 22,350 thousand shares (0.2% shareholding ratio) as retirement benefi t trust.*4 Apart from those shares listed above, Sumitomo Mitsui Banking Corporation has 66,381 thousand shares (0.7% shareholding ratio) as retirement benefi t trust.*5 Treasury stock owned by Nippon Steel & Sumitomo Metal Corporation, a total of 362,659 thousand shares (3.8% shareholding ratio), is included in calculation of the shareholding ratio.
*1 At the 91st General Meeting of Shareholders, held on June 24, 2015, Proposal Item 3 on Share Consolidation (every 10 shares in the Company will be consolidated into one share) was approved. As a result, the number of common shares (issued) will be 950,321,402 and the number of common shares (authorized) will be 2,000,000,000, effective October 1, 2015.
*2 The Board of Directors’ meeting held on April 28, 2015 resolved to change the number of shares in a trading unit from 1,000 shares to 100 shares, effective October 1, 2015.
Number of Shares per Trading Unit*2
1,000 shares
Share Ownership by Category(Ratio of shares held to the total number of common shares (issued))
Financial institutions 34.2%
Individuals and others in Japan 21.0%
Overseas investors 28.7%
Other companies 12.3%
Treasury stock 3.8%
Head Offi ce
2-6-1, Marunouchi, Chiyoda-ku,Tokyo 100-8071, JapanPhone: +81-3-6867-4111URL: http://www.nssmc.com/en/
Date of Establishment
March 31, 1970
Common Stock
¥419,524 million
Stock Code
5401
Common Shares (Issued)*1
9,503,214,022 shares
Common Shares (Authorized)*1
20,000,000,000 shares
Number of Shareholders
517,918
Listings
Tokyo Stock ExchangeNagoya Stock ExchangeFukuoka Stock ExchangeSapporo Securities Exchange
Registration Agent
Sumitomo Mitsui Trust Bank, Limited1-4-1, Marunouchi, Chiyoda-ku,Tokyo 100-0005, Japan
Phone inquiries0120-785-401(Toll-free for domestic phone calls only)+81-3-3323-7111 (Outside Japan)
ADR Information
Trading market: OTC (Over-the-counter)ADR ratio: 1 ADR:10 Shares of common stockTicker symbol: NSSMYOUSIP number: 65461T101Depositary bank: JPMorgan Chase Bank, N.A.
Contact for inquiries regarding our ADR program:JPMorgan Service CenterP.O. Box 64504St. Paul, MN 55164-0504, U.S.A.Phone: 1-800-990-1135 (Toll-free within the U.S.A.)
+1-651-453-2128 (Outside the U.S.A.)E-mail: [email protected]
NIP
PO
N S
TEE
L & S
UM
ITOM
O M
ETA
L CO
RP
OR
ATIO
NFIN
AN
CIA
L AN
D C
OR
PO
RA
TE
SE
CT
ION
AN
NU
AL R
EP
OR
T 2015
96 97