Embed Size (px)
Citation preview
1508SD249-6-10001408SD249-5-23001008SD249-1-1000
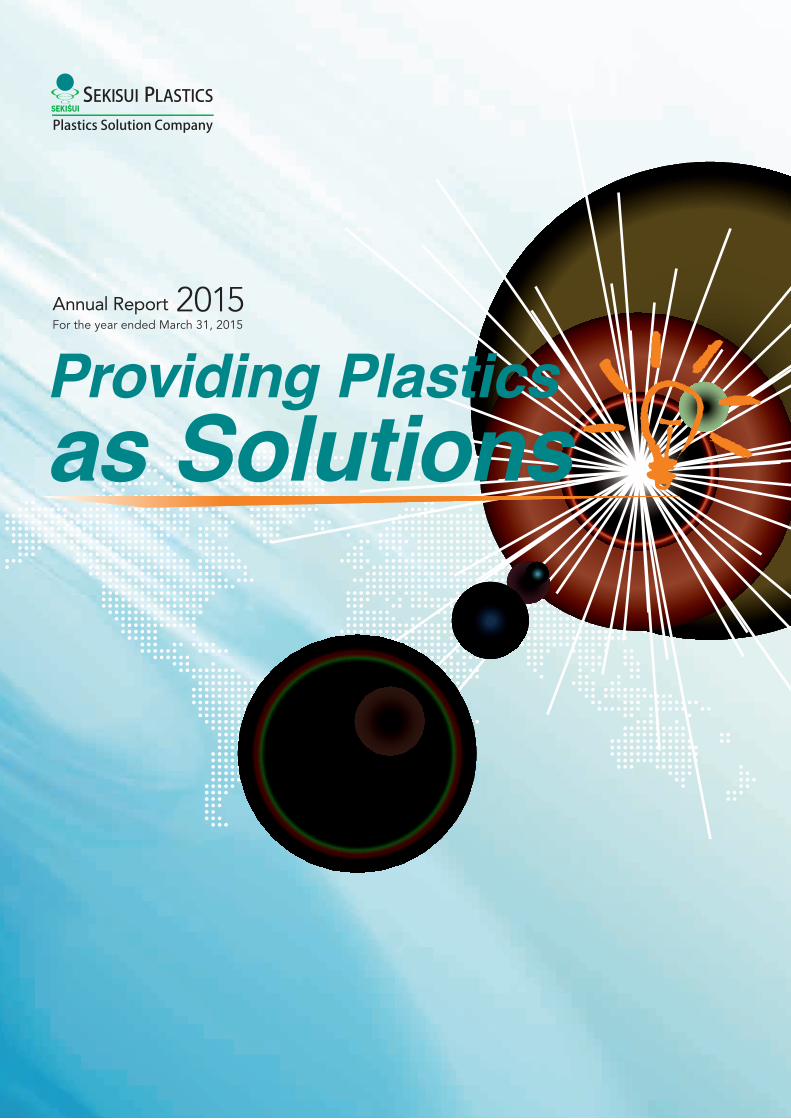
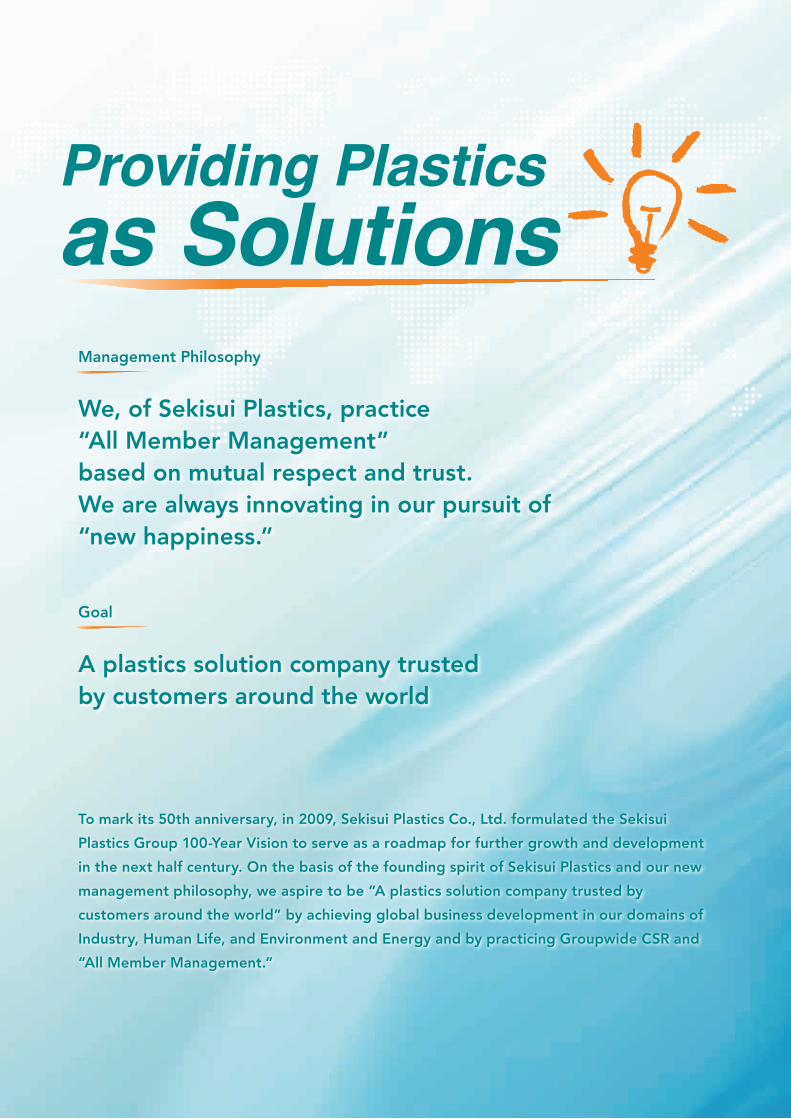
Providing Plastics as Solutions
Annual Report 2015For the year ended March 31, 2015
Sekisui Plastics Co., Ltd.http://www.sekisuiplastics.com
Providing Plastics as Solutions
Management Philosophy
We, of Sekisui Plastics, practice “All Member Management”based on mutual respect and trust.We are always innovating in our pursuit of “new happiness.”
Goal
A plastics solution company trustedby customers around the world
To mark its 50th anniversary, in 2009, Sekisui Plastics Co., Ltd. formulated the Sekisui
Plastics Group 100-Year Vision to serve as a roadmap for further growth and development
in the next half century. On the basis of the founding spirit of Sekisui Plastics and our new
management philosophy, we aspire to be “A plastics solution company trusted by
customers around the world” by achieving global business development in our domains of
Industry, Human Life, and Environment and Energy and by practicing Groupwide CSR and
“All Member Management.”
Contents
2
4
8
10
12
Our Plastics Solutions Global Bases
Providing Plastics as SolutionsPlastics Solutions that Add Value to Customers and Society
Sekisui Plastics Group at a GlanceThe Sekisui Plastics Group is pursuing transformation to solutions-driven businesses built around world-class foam technologies and focused on plastics as a key material.
100-Year VisionThis section explains “A plastics solution company trusted by customers around the world,” the corporate vision to which the Group aspires in the years culminating with 2059, its centennial anniversary.
Mid-Term Management Plan ENS2000-Challenge
14
18
20
22
23
24
46
48
A Message from the President
Overview by Business SegmentThe Sekisui Plastics Group is active across two broad business domains: Human Life, which encompasses food and distribution, housing and civil engineering and related fields; and Industry, which includes electric home appliances, IT, transportation, and related fields.
CSR Initiatives
Corporate Governance
Compliance and Risk Management
Consolidated Financial Highlights
Sekisui Plastics Group’s Network
Corporate Data/Investor Information
1Sekisui Plastics Co., Ltd.
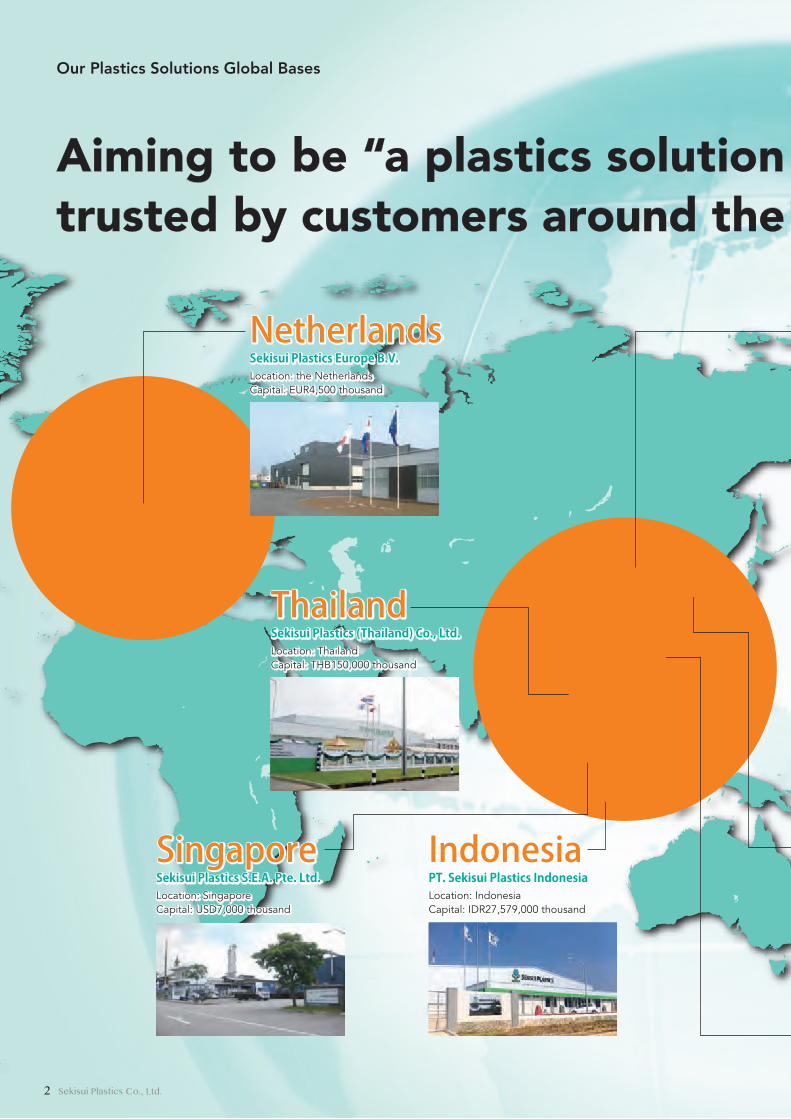
South Korea Sekisui Plastics Korea Co., Ltd.Location: South KoreaCapital: KRW125,000 thousand
TaiwanSekisui Plastics Taiwan Co., Ltd.Location: TaiwanCapital: TWD250,000 thousand
United StatesSekisui Plastics U.S.A., Inc.Location: the United StatesCapital: USD4,500 thousand
IndonesiaPT. Sekisui Plastics IndonesiaLocation: IndonesiaCapital: IDR27,579,000 thousand
ThailandSekisui Plastics (Thailand) Co., Ltd.Location: ThailandCapital: THB150,000 thousand
NetherlandsSekisui Plastics Europe B.V. Location: the NetherlandsCapital: EUR4,500 thousand
SingaporeSekisui Plastics S.E.A. Pte. Ltd.Location: SingaporeCapital: USD7,000 thousand
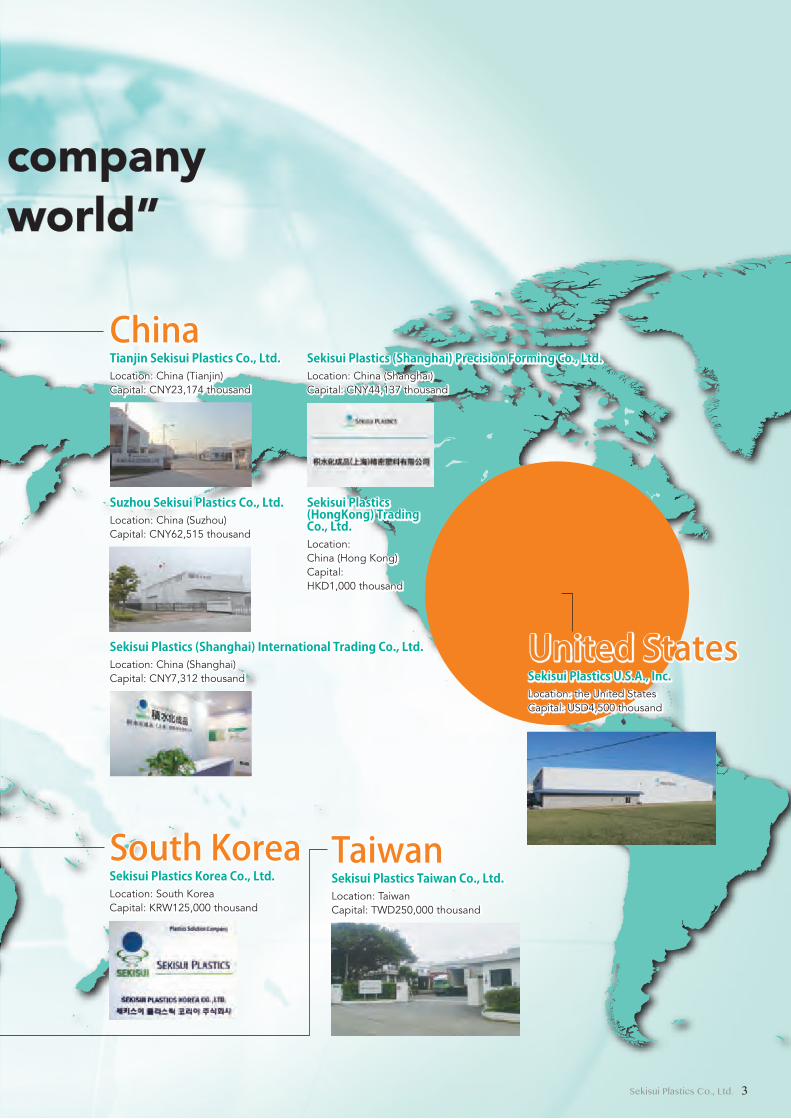
ChinaTianjin Sekisui Plastics Co., Ltd.Location: China (Tianjin)Capital: CNY23,174 thousand
Suzhou Sekisui Plastics Co., Ltd.Location: China (Suzhou)Capital: CNY62,515 thousand
Sekisui Plastics (Shanghai) International Trading Co., Ltd.Location: China (Shanghai)Capital: CNY7,312 thousand
Sekisui Plastics (Shanghai) Precision Forming Co., Ltd.Location: China (Shanghai)Capital: CNY44,137 thousand
Sekisui Plastics(HongKong) TradingCo., Ltd.Location: China (Hong Kong)Capital: CNY1,000 thousand
South Korea Sekisui Plastics Korea Co., Ltd.Location: South KoreaCapital: KRW125,000 thousand
TaiwanSekisui Plastics Taiwan Co., Ltd.Location: TaiwanCapital: TWD250,000 thousand
United StatesSekisui Plastics U.S.A., Inc.Location: the United StatesCapital: USD4,500 thousand
IndonesiaPT. Sekisui Plastics IndonesiaLocation: IndonesiaCapital: IDR27,579,000 thousand
ThailandSekisui Plastics (Thailand) Co., Ltd.Location: ThailandCapital: THB150,000 thousand
NetherlandsSekisui Plastics Europe B.V. Location: the NetherlandsCapital: EUR4,500 thousand
SingaporeSekisui Plastics S.E.A. Pte. Ltd.Location: SingaporeCapital: USD7,000 thousand
ChinaTianjin Sekisui Plastics Co., Ltd.Location: China (Tianjin)Capital: CNY23,174 thousand
Suzhou Sekisui Plastics Co., Ltd.Location: China (Suzhou)Capital: CNY62,515 thousand
Sekisui Plastics (Shanghai) International Trading Co., Ltd.Location: China (Shanghai)Capital: CNY7,312 thousand
Sekisui Plastics (Shanghai) Precision Forming Co., Ltd.Location: China (Shanghai)Capital: CNY44,137 thousand
Sekisui Plastics(HongKong) TradingCo., Ltd.Location: China (Hong Kong)Capital: HKD1,000 thousand
Aiming to be “a plastics solution company trusted by customers around the world”
Our Plastics Solutions Global Bases
2 Sekisui Plastics Co., Ltd.
South Korea Sekisui Plastics Korea Co., Ltd.Location: South KoreaCapital: KRW125,000 thousand
TaiwanSekisui Plastics Taiwan Co., Ltd.Location: TaiwanCapital: TWD250,000 thousand
United StatesSekisui Plastics U.S.A., Inc.Location: the United StatesCapital: USD4,500 thousand
IndonesiaPT. Sekisui Plastics IndonesiaLocation: IndonesiaCapital: IDR27,579,000 thousand
ThailandSekisui Plastics (Thailand) Co., Ltd.Location: ThailandCapital: THB150,000 thousand
NetherlandsSekisui Plastics Europe B.V. Location: the NetherlandsCapital: EUR4,500 thousand
SingaporeSekisui Plastics S.E.A. Pte. Ltd.Location: SingaporeCapital: USD7,000 thousand
ChinaTianjin Sekisui Plastics Co., Ltd.Location: China (Tianjin)Capital: CNY23,174 thousand
Suzhou Sekisui Plastics Co., Ltd.Location: China (Suzhou)Capital: CNY62,515 thousand
Sekisui Plastics (Shanghai) International Trading Co., Ltd.Location: China (Shanghai)Capital: CNY7,312 thousand
Sekisui Plastics (Shanghai) Precision Forming Co., Ltd.Location: China (Shanghai)Capital: CNY44,137 thousand
Sekisui Plastics(HongKong) TradingCo., Ltd.Location: China (Hong Kong)Capital: CNY1,000 thousand
South Korea Sekisui Plastics Korea Co., Ltd.Location: South KoreaCapital: KRW125,000 thousand
TaiwanSekisui Plastics Taiwan Co., Ltd.Location: TaiwanCapital: TWD250,000 thousand
United StatesSekisui Plastics U.S.A., Inc.Location: the United StatesCapital: USD4,500 thousand
IndonesiaPT. Sekisui Plastics IndonesiaLocation: IndonesiaCapital: IDR27,579,000 thousand
ThailandSekisui Plastics (Thailand) Co., Ltd.Location: ThailandCapital: THB150,000 thousand
NetherlandsSekisui Plastics Europe B.V. Location: the NetherlandsCapital: EUR4,500 thousand
SingaporeSekisui Plastics S.E.A. Pte. Ltd.Location: SingaporeCapital: USD7,000 thousand
ChinaTianjin Sekisui Plastics Co., Ltd.Location: China (Tianjin)Capital: CNY23,174 thousand
Suzhou Sekisui Plastics Co., Ltd.Location: China (Suzhou)Capital: CNY62,515 thousand
Sekisui Plastics (Shanghai) International Trading Co., Ltd.Location: China (Shanghai)Capital: CNY7,312 thousand
Sekisui Plastics (Shanghai) Precision Forming Co., Ltd.Location: China (Shanghai)Capital: CNY44,137 thousand
Sekisui Plastics(HongKong) TradingCo., Ltd.Location: China (Hong Kong)Capital: HKD1,000 thousand
Aiming to be “a plastics solution company trusted by customers around the world”
Our Plastics Solutions Global Bases
3Sekisui Plastics Co., Ltd.
The Sekisui Plastics Group has won recognition for the value it provides
by proposing business solutions to corporate customers in areas such as
business processes, operational and ef�ciency improvements and social
infrastructure development based on technologies that create added
value through the foaming, polymerization, extrusion, and molding of
plastics. To develop and evolve business solutions at the global level, the
Sekisui Plastics Group will form teams that work across organizational and
regional boundaries. Furthermore, we will take maximum advantage of
Groupwide resources, technologies, expertise, products, and customer
networks to further innovate our development proposal activities in order
to propose solutions utilizing the Sekisui Plastics Group’ s full range of
products and services.
Providing Plastics as Solutions
Plastics Solutions that Add Value to Customers and Society
4 Sekisui Plastics Co., Ltd.
The Sekisui Plastics Group has won recognition for the value it provides
by proposing business solutions to corporate customers in areas such as
business processes, operational and ef�ciency improvements and social
infrastructure development based on technologies that create added
value through the foaming, polymerization, extrusion, and molding of
plastics. To develop and evolve business solutions at the global level, the
Sekisui Plastics Group will form teams that work across organizational and
regional boundaries. Furthermore, we will take maximum advantage of
Groupwide resources, technologies, expertise, products, and customer
networks to further innovate our development proposal activities in order
to propose solutions utilizing the Sekisui Plastics Group’ s full range of
products and services.
Providing Plastics as Solutions
Plastics Solutions that Add Value to Customers and Society
Our Businessand Strengths
5Sekisui Plastics Co., Ltd.
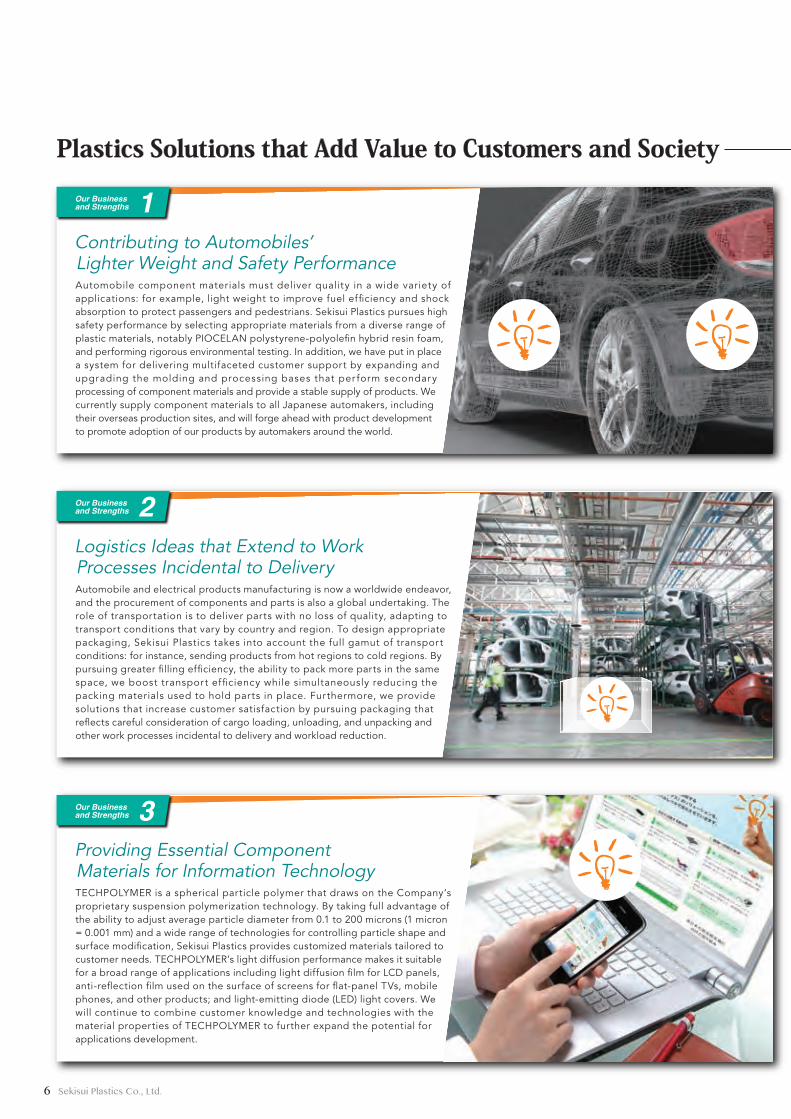
Contributing to Automobiles’ Lighter Weight and Safety Performance
Providing Essential Component Materials for Information Technology
Logistics Ideas that Extend to Work Processes Incidental to Delivery
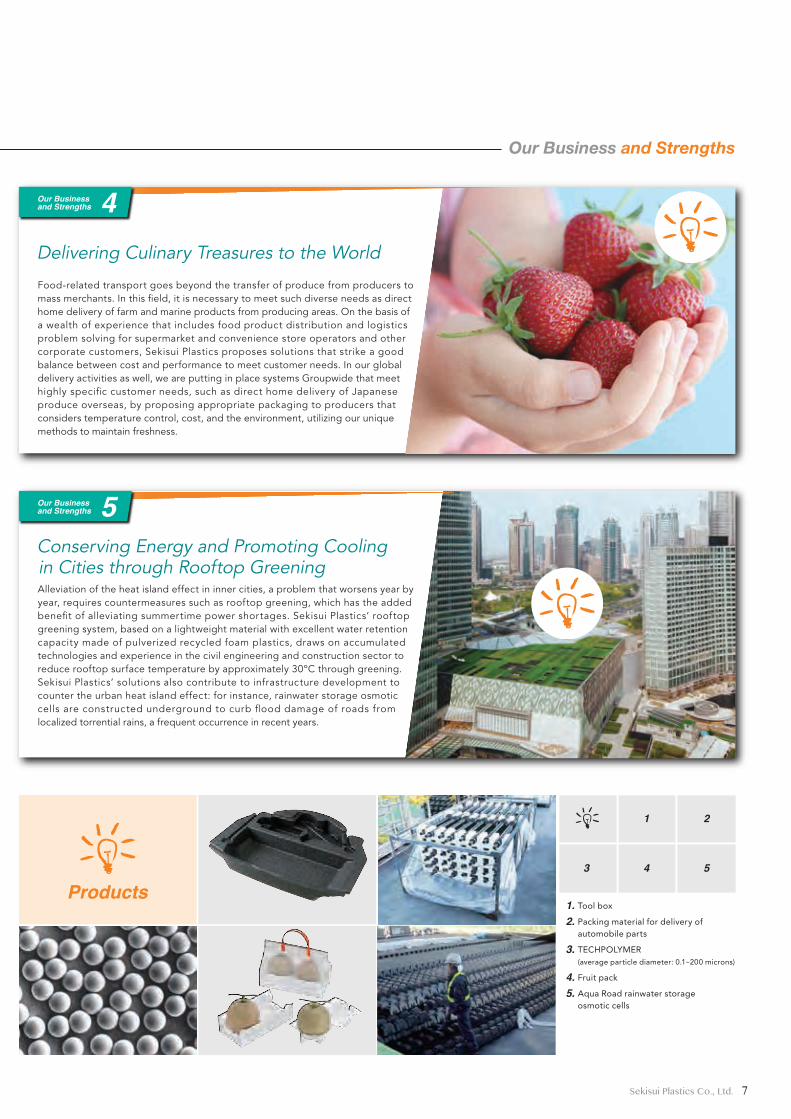
Conserving Energy and Promoting Cooling in Cities through Rooftop Greening
Delivering Culinary Treasures to the World
Automobile component materials must deliver quality in a wide variety of applications: for example, light weight to improve fuel ef�ciency and shock absorption to protect passengers and pedestrians. Sekisui Plastics pursues high safety performance by selecting appropriate materials from a diverse range of plastic materials, notably PIOCELAN polystyrene-polyole�n hybrid resin foam, and performing rigorous environmental testing. In addition, we have put in place a system for delivering multifaceted customer support by expanding and upgrading the molding and processing bases that per form secondary processing of component materials and provide a stable supply of products. We currently supply component materials to all Japanese automakers, including their overseas production sites, and will forge ahead with product development to promote adoption of our products by automakers around the world.
Automobile and electrical products manufacturing is now a worldwide endeavor, and the procurement of components and parts is also a global undertaking. The role of transportation is to deliver parts with no loss of quality, adapting to transport conditions that vary by country and region. To design appropriate packaging, Sekisui Plastics takes into account the full gamut of transport conditions: for instance, sending products from hot regions to cold regions. By pursuing greater �lling ef�ciency, the ability to pack more parts in the same space, we boost transpor t ef�ciency while simultaneously reducing the packing materials used to hold par ts in place. Fur thermore, we provide solutions that increase customer satisfaction by pursuing packaging that re�ects careful consideration of cargo loading, unloading, and unpacking and other work processes incidental to delivery and workload reduction.
Food-related transport goes beyond the transfer of produce from producers to mass merchants. In this �eld, it is necessary to meet such diverse needs as direct home delivery of farm and marine products from producing areas. On the basis of a wealth of experience that includes food product distribution and logistics problem solving for supermarket and convenience store operators and other corporate customers, Sekisui Plastics proposes solutions that strike a good balance between cost and performance to meet customer needs. In our global delivery activities as well, we are putting in place systems Groupwide that meet highly speci�c customer needs, such as direct home delivery of Japanese produce overseas, by proposing appropriate packaging to producers that considers temperature control, cost, and the environment, utilizing our unique methods to maintain freshness.
TECHPOLYMER is a spherical particle polymer that draws on the Company’s proprietary suspension polymerization technology. By taking full advantage of the ability to adjust average particle diameter from 0.1 to 200 microns (1 micron = 0.001 mm) and a wide range of technologies for controlling particle shape and surface modi�cation, Sekisui Plastics provides customized materials tailored to customer needs. TECHPOLYMER’s light diffusion performance makes it suitable for a broad range of applications including light diffusion �lm for LCD panels, anti-re�ection �lm used on the surface of screens for �at-panel TVs, mobile phones, and other products; and light-emitting diode (LED) light covers. We will continue to combine customer knowledge and technologies with the material properties of TECHPOLYMER to further expand the potential for applications development.
Alleviation of the heat island effect in inner cities, a problem that worsens year by year, requires countermeasures such as rooftop greening, which has the added bene�t of alleviating summertime power shortages. Sekisui Plastics’ rooftop greening system, based on a lightweight material with excellent water retention capacity made of pulverized recycled foam plastics, draws on accumulated technologies and experience in the civil engineering and construction sector to reduce rooftop surface temperature by approximately 30ºC through greening. Sekisui Plastics’ solutions also contribute to infrastructure development to counter the urban heat island effect: for instance, rainwater storage osmotic cells are constructed underground to curb �ood damage of roads from localized torrential rains, a frequent occurrence in recent years.
54
21
3
1.2.
3.
4.5.
Our Businessand Strengths 1
Our Businessand Strengths 2
Our Businessand Strengths 3
Our Businessand Strengths 4
Our Businessand Strengths 5
Tool box
Packing material for delivery of automobile parts
TECHPOLYMER(average particle diameter: 0.1~200 microns)
Fruit pack
Aqua Road rainwater storage osmotic cells
Products
Plastics Solutions that Add Value to Customers and Society
6 Sekisui Plastics Co., Ltd.
Contributing to Automobiles’ Lighter Weight and Safety Performance
Providing Essential Component Materials for Information Technology
Logistics Ideas that Extend to Work Processes Incidental to Delivery
Conserving Energy and Promoting Cooling in Cities through Rooftop Greening
Delivering Culinary Treasures to the World
Automobile component materials must deliver quality in a wide variety of applications: for example, light weight to improve fuel ef�ciency and shock absorption to protect passengers and pedestrians. Sekisui Plastics pursues high safety performance by selecting appropriate materials from a diverse range of plastic materials, notably PIOCELAN polystyrene-polyole�n hybrid resin foam, and performing rigorous environmental testing. In addition, we have put in place a system for delivering multifaceted customer support by expanding and upgrading the molding and processing bases that per form secondary processing of component materials and provide a stable supply of products. We currently supply component materials to all Japanese automakers, including their overseas production sites, and will forge ahead with product development to promote adoption of our products by automakers around the world.
Automobile and electrical products manufacturing is now a worldwide endeavor, and the procurement of components and parts is also a global undertaking. The role of transportation is to deliver parts with no loss of quality, adapting to transport conditions that vary by country and region. To design appropriate packaging, Sekisui Plastics takes into account the full gamut of transport conditions: for instance, sending products from hot regions to cold regions. By pursuing greater �lling ef�ciency, the ability to pack more parts in the same space, we boost transpor t ef�ciency while simultaneously reducing the packing materials used to hold par ts in place. Fur thermore, we provide solutions that increase customer satisfaction by pursuing packaging that re�ects careful consideration of cargo loading, unloading, and unpacking and other work processes incidental to delivery and workload reduction.
Food-related transport goes beyond the transfer of produce from producers to mass merchants. In this �eld, it is necessary to meet such diverse needs as direct home delivery of farm and marine products from producing areas. On the basis of a wealth of experience that includes food product distribution and logistics problem solving for supermarket and convenience store operators and other corporate customers, Sekisui Plastics proposes solutions that strike a good balance between cost and performance to meet customer needs. In our global delivery activities as well, we are putting in place systems Groupwide that meet highly speci�c customer needs, such as direct home delivery of Japanese produce overseas, by proposing appropriate packaging to producers that considers temperature control, cost, and the environment, utilizing our unique methods to maintain freshness.
TECHPOLYMER is a spherical particle polymer that draws on the Company’s proprietary suspension polymerization technology. By taking full advantage of the ability to adjust average particle diameter from 0.1 to 200 microns (1 micron = 0.001 mm) and a wide range of technologies for controlling particle shape and surface modi�cation, Sekisui Plastics provides customized materials tailored to customer needs. TECHPOLYMER’s light diffusion performance makes it suitable for a broad range of applications including light diffusion �lm for LCD panels, anti-re�ection �lm used on the surface of screens for �at-panel TVs, mobile phones, and other products; and light-emitting diode (LED) light covers. We will continue to combine customer knowledge and technologies with the material properties of TECHPOLYMER to further expand the potential for applications development.
Alleviation of the heat island effect in inner cities, a problem that worsens year by year, requires countermeasures such as rooftop greening, which has the added bene�t of alleviating summertime power shortages. Sekisui Plastics’ rooftop greening system, based on a lightweight material with excellent water retention capacity made of pulverized recycled foam plastics, draws on accumulated technologies and experience in the civil engineering and construction sector to reduce rooftop surface temperature by approximately 30ºC through greening. Sekisui Plastics’ solutions also contribute to infrastructure development to counter the urban heat island effect: for instance, rainwater storage osmotic cells are constructed underground to curb �ood damage of roads from localized torrential rains, a frequent occurrence in recent years.
54
21
3
1.2.
3.
4.5.
Our Businessand Strengths 1
Our Businessand Strengths 2
Our Businessand Strengths 3
Our Businessand Strengths 4
Our Businessand Strengths 5
Tool box
Packing material for delivery of automobile parts
TECHPOLYMER(average particle diameter: 0.1~200 microns)
Fruit pack
Aqua Road rainwater storage osmotic cells
Products
Plastics Solutions that Add Value to Customers and Society Our Business and Strengths
7Sekisui Plastics Co., Ltd.
Fiscal 2014 9
Americas
Europe
Rest ofAsia
China
20.92.2
Americas Europe
1.2Rest of Asia 9.1 China 8.4
0 5 10 15 20 25
countries and regions
PIOCELANTECHPOLYMERST-GEL
CELPETNEO-MICROLENLIGHTLON
EPSREM ERX BIOCELLULAR
Major Products
●Human LifeESLEN SHEET
Plant-derivedfoam plastics
Expandable polystyrene beads using recycled materials
Packaging materialsFood containers
Civil engineeringmaterials
Building andhousing materials
Agricultural and marineproduct packaging materials
Food containers
Medical materialsVehicle parts packing materials
Cosmetic materialsElectronic products and parts packaging materials
LCD component materials
Automobile component materials
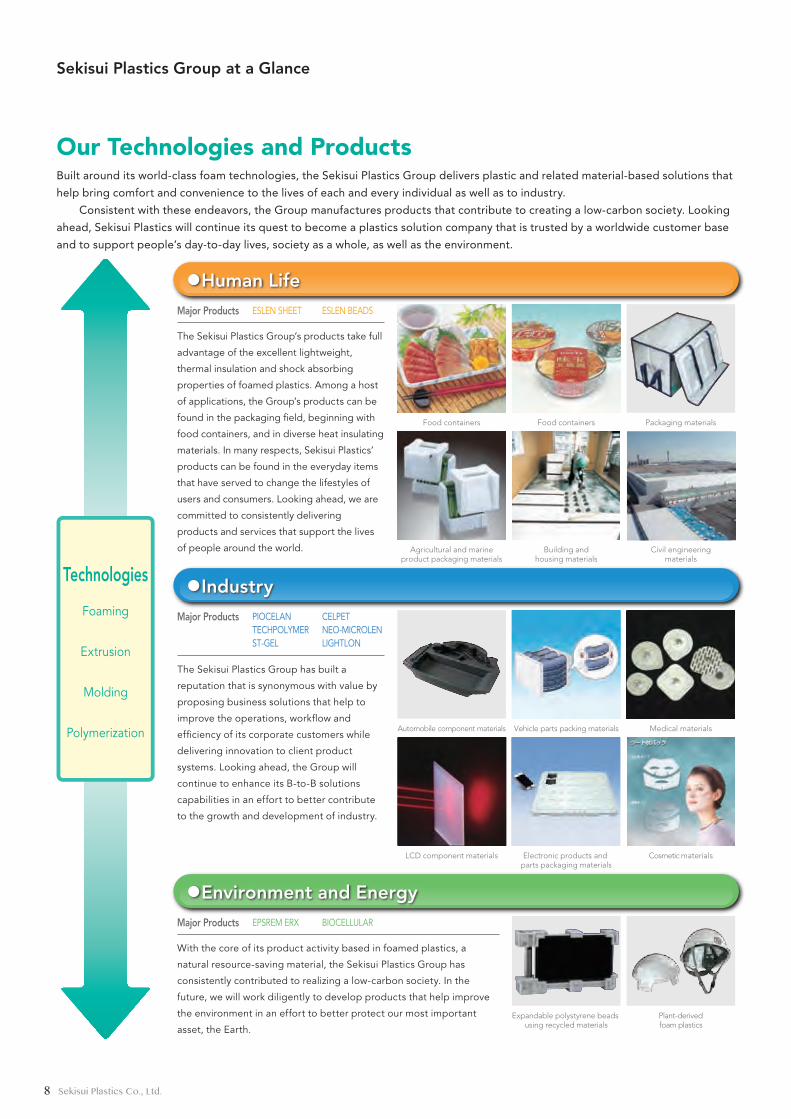
The Sekisui Plastics Group’s products take full
advantage of the excellent lightweight,
thermal insulation and shock absorbing
properties of foamed plastics. Among a host
of applications, the Group’s products can be
found in the packaging �eld, beginning with
food containers, and in diverse heat insulating
materials. In many respects, Sekisui Plastics’
products can be found in the everyday items
that have served to change the lifestyles of
users and consumers. Looking ahead, we are
committed to consistently delivering
products and services that support the lives
of people around the world.
ESLEN BEADS
Major Products
●Industry
The Sekisui Plastics Group has built a
reputation that is synonymous with value by
proposing business solutions that help to
improve the operations, work�ow and
ef�ciency of its corporate customers while
delivering innovation to client product
systems. Looking ahead, the Group will
continue to enhance its B-to-B solutions
capabilities in an effort to better contribute
to the growth and development of industry.
Major Products
●Environment and Energy
With the core of its product activity based in foamed plastics, a
natural resource-saving material, the Sekisui Plastics Group has
consistently contributed to realizing a low-carbon society. In the
future, we will work diligently to develop products that help improve
the environment in an effort to better protect our most important
asset, the Earth.
Technologies
Foaming
Molding
Polymerization
Extrusion
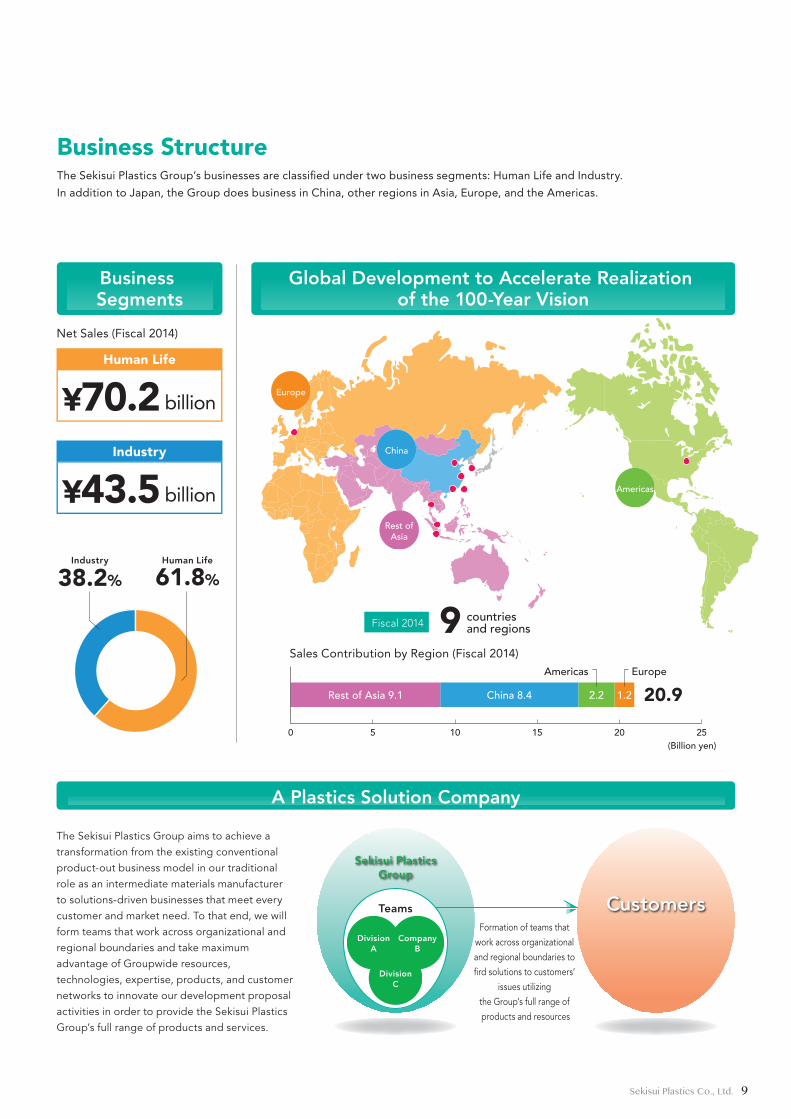
The Sekisui Plastics Group aims to achieve a transformation from the existing conventional product-out business model in our traditional role as an intermediate materials manufacturer to solutions-driven businesses that meet every customer and market need. To that end, we will form teams that work across organizational and regional boundaries and take maximum advantage of Groupwide resources, technologies, expertise, products, and customer networks to innovate our development proposal activities in order to provide the Sekisui Plastics Group’s full range of products and services.
Our Technologies and ProductsBuilt around its world-class foam technologies, the Sekisui Plastics Group delivers plastic and related material-based solutions that
help bring comfort and convenience to the lives of each and every individual as well as to industry.
Consistent with these endeavors, the Group manufactures products that contribute to creating a low-carbon society. Looking
ahead, Sekisui Plastics will continue its quest to become a plastics solution company that is trusted by a worldwide customer base
and to support people’s day-to-day lives, society as a whole, as well as the environment.
Business StructureThe Sekisui Plastics Group’s businesses are classi�ed under two business segments: Human Life and Industry.
In addition to Japan, the Group does business in China, other regions in Asia, Europe, and the Americas.
Human Life
61.8%
¥70.2 billion
Industry
38.2%
Net Sales (Fiscal 2014)
Sales Contribution by Region (Fiscal 2014)
(Billion yen)
Human Life
¥43.5 billion
Industry
Customers
DivisionA
CompanyB
DivisionC
Sekisui PlasticsGroup
Teams
Formation of teams that work across organizational and regional boundaries to �rd solutions to customers’
issues utilizing the Group’s full range of products and resources
Business Segments
A Plastics Solution Company
Global Development to Accelerate Realization of the 100-Year Vision
Sekisui Plastics Group at a Glance
8 Sekisui Plastics Co., Ltd.
Fiscal 2014 9
Americas
Europe
Rest ofAsia
China
20.92.2
Americas Europe
1.2Rest of Asia 9.1 China 8.4
0 5 10 15 20 25
countries and regions
PIOCELANTECHPOLYMERST-GEL
CELPETNEO-MICROLENLIGHTLON
EPSREM ERX BIOCELLULAR
Major Products
●Human LifeESLEN SHEET
Plant-derivedfoam plastics
Expandable polystyrene beads using recycled materials
Packaging materialsFood containers
Civil engineeringmaterials
Building andhousing materials
Agricultural and marineproduct packaging materials
Food containers
Medical materialsVehicle parts packing materials
Cosmetic materialsElectronic products and parts packaging materials
LCD component materials
Automobile component materials
The Sekisui Plastics Group’s products take full
advantage of the excellent lightweight,
thermal insulation and shock absorbing
properties of foamed plastics. Among a host
of applications, the Group’s products can be
found in the packaging �eld, beginning with
food containers, and in diverse heat insulating
materials. In many respects, Sekisui Plastics’
products can be found in the everyday items
that have served to change the lifestyles of
users and consumers. Looking ahead, we are
committed to consistently delivering
products and services that support the lives
of people around the world.
ESLEN BEADS
Major Products
●Industry
The Sekisui Plastics Group has built a
reputation that is synonymous with value by
proposing business solutions that help to
improve the operations, work�ow and
ef�ciency of its corporate customers while
delivering innovation to client product
systems. Looking ahead, the Group will
continue to enhance its B-to-B solutions
capabilities in an effort to better contribute
to the growth and development of industry.
Major Products
●Environment and Energy
With the core of its product activity based in foamed plastics, a
natural resource-saving material, the Sekisui Plastics Group has
consistently contributed to realizing a low-carbon society. In the
future, we will work diligently to develop products that help improve
the environment in an effort to better protect our most important
asset, the Earth.
Technologies
Foaming
Molding
Polymerization
Extrusion
The Sekisui Plastics Group aims to achieve a transformation from the existing conventional product-out business model in our traditional role as an intermediate materials manufacturer to solutions-driven businesses that meet every customer and market need. To that end, we will form teams that work across organizational and regional boundaries and take maximum advantage of Groupwide resources, technologies, expertise, products, and customer networks to innovate our development proposal activities in order to provide the Sekisui Plastics Group’s full range of products and services.
Our Technologies and ProductsBuilt around its world-class foam technologies, the Sekisui Plastics Group delivers plastic and related material-based solutions that
help bring comfort and convenience to the lives of each and every individual as well as to industry.
Consistent with these endeavors, the Group manufactures products that contribute to creating a low-carbon society. Looking
ahead, Sekisui Plastics will continue its quest to become a plastics solution company that is trusted by a worldwide customer base
and to support people’s day-to-day lives, society as a whole, as well as the environment.
Business StructureThe Sekisui Plastics Group’s businesses are classi�ed under two business segments: Human Life and Industry.
In addition to Japan, the Group does business in China, other regions in Asia, Europe, and the Americas.
Human Life
61.8%
¥70.2 billion
Industry
38.2%
Net Sales (Fiscal 2014)
Sales Contribution by Region (Fiscal 2014)
(Billion yen)
Human Life
¥43.5 billion
Industry
Customers
DivisionA
CompanyB
DivisionC
Sekisui PlasticsGroup
Teams
Formation of teams that work across organizational and regional boundaries to �rd solutions to customers’
issues utilizing the Group’s full range of products and resources
Business Segments
A Plastics Solution Company
Global Development to Accelerate Realization of the 100-Year Vision
Sekisui Plastics Group at a Glance
9Sekisui Plastics Co., Ltd.
100-Year Vision
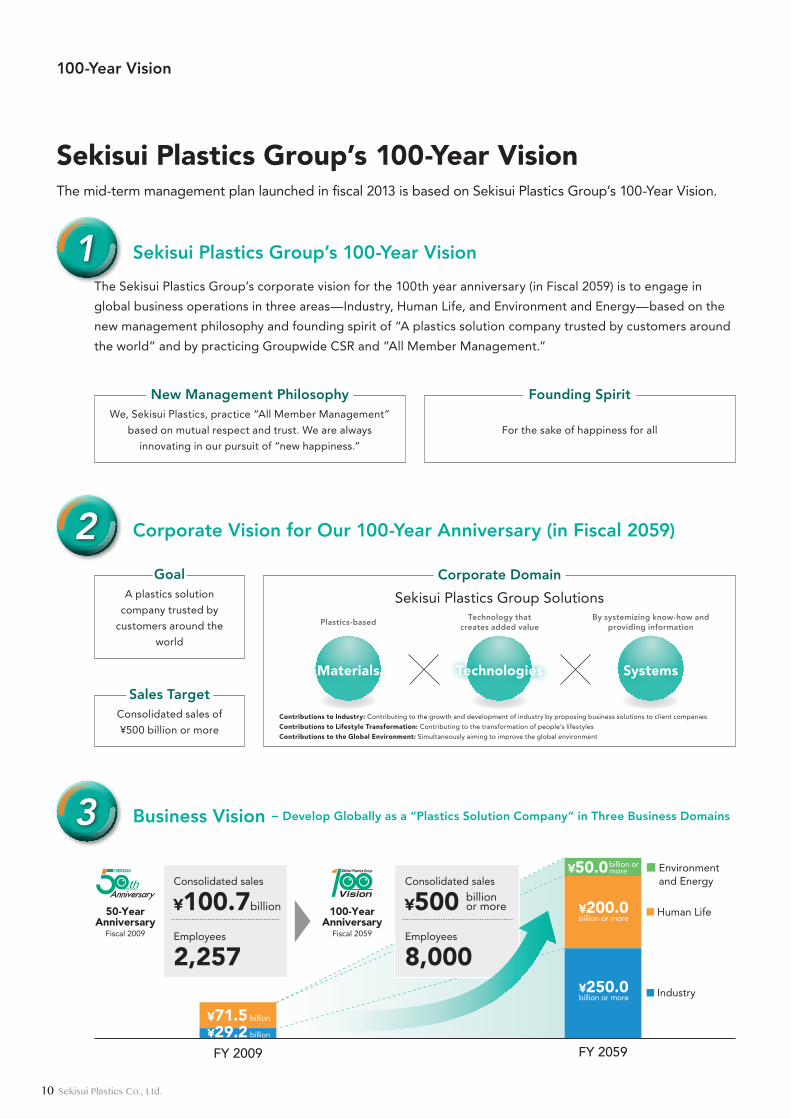
The mid-term management plan launched in fiscal 2013 is based on Sekisui Plastics Group’s 100-Year Vision.
Sekisui Plastics Group’s 100-Year Vision
The Sekisui Plastics Group’s corporate vision for the 100th year anniversary (in Fiscal 2059) is to engage in
global business operations in three areas—Industry, Human Life, and Environment and Energy—based on the
new management philosophy and founding spirit of “A plastics solution company trusted by customers around
the world” and by practicing Groupwide CSR and ”All Member Management.”
Corporate Vision for Our 100-Year Anniversary (in Fiscal 2059)
Business Vision − Develop Globally as a “Plastics Solution Company” in Three Business Domains
Sekisui Plastics Group Solutions
Materials
Plastics-based
Technologies
Technology thatcreates added value
Systems
By systemizing know-how andproviding information
Contributions to Industry: Contributing to the growth and development of industry by proposing business solutions to client companies
Contributions to Lifestyle Transformation: Contributing to the transformation of people’s lifestyles
Contributions to the Global Environment: Simultaneously aiming to improve the global environment
Corporate Domain
50-YearAnniversary
Fiscal 2009
Consolidated sales
¥100.7billion
Employees
2,257
100-YearAnniversary
Fiscal 2059
FY 2009 FY 2059
Employees
8,000
Consolidated sales
¥500 billion or more
¥71.5 billion
¥29.2 billion
¥250.0billion or more
¥200.0billion or more
¥50.0 billion or more ■ Environment
and Energy
■ Human Life
■ Industry
Sekisui Plastics Group’s 100-Year Vision
New Management PhilosophyWe, Sekisui Plastics, practice “All Member Management”
based on mutual respect and trust. We are always
innovating in our pursuit of “new happiness.”
Founding Spirit
For the sake of happiness for all
GoalA plastics solution
company trusted by
customers around the
world
Sales TargetConsolidated sales of
¥500 billion or more
1
2
3
10 Sekisui Plastics Co., Ltd.
100-Year Vision
Corporate Culture Vision—“All Member Management”
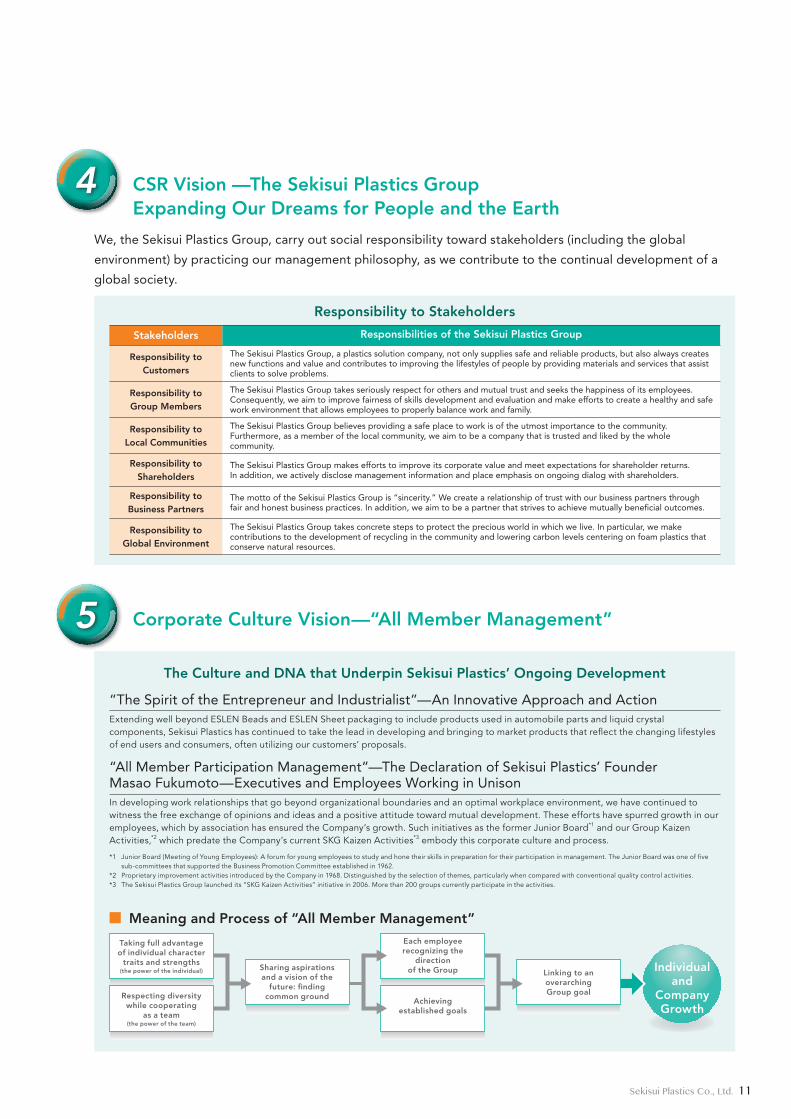
CSR Vision —The Sekisui Plastics Group Expanding Our Dreams for People and the Earth
We, the Sekisui Plastics Group, carry out social responsibility toward stakeholders (including the global
environment) by practicing our management philosophy, as we contribute to the continual development of a
global society.
Responsibility to Stakeholders
Stakeholders Responsibilities of the Sekisui Plastics Group
Responsibility to Customers
The Sekisui Plastics Group, a plastics solution company, not only supplies safe and reliable products, but also always creates new functions and value and contributes to improving the lifestyles of people by providing materials and services that assist clients to solve problems.
Responsibility to Group Members
The Sekisui Plastics Group takes seriously respect for others and mutual trust and seeks the happiness of its employees. Consequently, we aim to improve fairness of skills development and evaluation and make efforts to create a healthy and safe work environment that allows employees to properly balance work and family.
Responsibility toLocal Communities
The Sekisui Plastics Group believes providing a safe place to work is of the utmost importance to the community.Furthermore, as a member of the local community, we aim to be a company that is trusted and liked by the whole community.
Responsibility to Shareholders
The Sekisui Plastics Group makes efforts to improve its corporate value and meet expectations for shareholder returns.In addition, we actively disclose management information and place emphasis on ongoing dialog with shareholders.
Responsibility to Business Partners
The motto of the Sekisui Plastics Group is “sincerity.” We create a relationship of trust with our business partners through fair and honest business practices. In addition, we aim to be a partner that strives to achieve mutually beneficial outcomes.
Responsibility to Global Environment
The Sekisui Plastics Group takes concrete steps to protect the precious world in which we live. In particular, we make contributions to the development of recycling in the community and lowering carbon levels centering on foam plastics that conserve natural resources.
The Culture and DNA that Underpin Sekisui Plastics’ Ongoing Development
“The Spirit of the Entrepreneur and Industrialist”—An Innovative Approach and ActionExtending well beyond ESLEN Beads and ESLEN Sheet packaging to include products used in automobile parts and liquid crystal components, Sekisui Plastics has continued to take the lead in developing and bringing to market products that reflect the changing lifestyles of end users and consumers, often utilizing our customers’ proposals.
“All Member Participation Management”—The Declaration of Sekisui Plastics’ Founder Masao Fukumoto—Executives and Employees Working in UnisonIn developing work relationships that go beyond organizational boundaries and an optimal workplace environment, we have continued to witness the free exchange of opinions and ideas and a positive attitude toward mutual development. These efforts have spurred growth in our employees, which by association has ensured the Company’s growth. Such initiatives as the former Junior Board*1 and our Group Kaizen Activities,*2 which predate the Company’s current SKG Kaizen Activities*3 embody this corporate culture and process.
*1 Junior Board (Meeting of Young Employees): A forum for young employees to study and hone their skills in preparation for their participation in management. The Junior Board was one of five sub-committees that supported the Business Promotion Committee established in 1962.
*2 Proprietary improvement activities introduced by the Company in 1968. Distinguished by the selection of themes, particularly when compared with conventional quality control activities.*3 The Sekisui Plastics Group launched its “SKG Kaizen Activities” initiative in 2006. More than 200 groups currently participate in the activities.
Individualand
CompanyGrowth
Linking to an overarchingGroup goal
Each employee recognizing the
directionof the Group
Achievingestablished goals
Sharing aspirations and a vision of the
future: �nding common ground
Taking full advantage of individual character
traits and strengths(the power of the individual)
Respecting diversity while cooperating
as a team(the power of the team)
■ Meaning and Process of “All Member Management”
5
4
11Sekisui Plastics Co., Ltd.
Mid-Term Management Plan, ENS2000-Challenge
■ Challenges of the Mid-Term Management Plan
Transformation from businesses focused on existing customers based on a conventional product-out business model to solutions-driven businesses that meet all customer needs
Discovery and satisfaction of customers’ total needs by means including team activities that work across organizational and regional boundaries leading to a rise in new customers and markets
At businesses in Japan, production structure optimization, transition to a sales structure based on and proximity to customers, and control of Group workforce growth through multi-skills training of current personnel
In the global market, acceleration of earnings growth through the exchange of overseas personnel hired during the previous mid-term management plan and sales and development personnel from Japan
Business Model Transformation Earnings Structure Reform
CONCEPT
Quantitative Targets (¥ billion)
Proceed with initiatives focused on sales expansion (original target of ¥120.0 billion) and operating income ratio improvement (operating income ratio of 4%/ROE of 5% or higher)
Fiscal 2013 results Fiscal 2014 results Fiscal 2015 plan
Sales 1,099.2 1,136.6 1,200.0
Overseas sales (142.2) (208.7) (250.0)
(Overseas sales ratio) (12.9%) (18.4%) (20.8%)
Operating income 21.2 39.3 50.0
(Operating income ratio) (1.9%) (3.5%) (4.2%)
Recurring income 22.1 41.8 47.0
Net income 12.6 25.3 30.0
ROE (2.5%) (4.6%) (5.1%)
To synchronize the accounting period of overseas Group companies with the accounting period in Japan beginning in fiscal 2014, the fiscal 2014 results for overseas Group companies are for a 15-month accounting period.
Overview of the Final Year of the Mid-Term Management Plan (Fiscal 2015)
ENS2000-Challenge
Completing the Transformation of the Business Model and Reforming
the Earnings Structure
The continuing quest to secure a growth path to achieve the sales target of ¥200.0 billion in fiscal 2019 set forth in the previous mid-term management plan
12 Sekisui Plastics Co., Ltd.
Mid-Term Management Plan, ENS2000-Challenge
High-Priority Policies
Investment Policy (¥ billion)
Fiscal 2013 results Fiscal 2014 results Fiscal 2015 planThree-year plan
(cumulative)
Capital expenditures 34.4 59.1 41.5 135.0
■ Fiscal 2014 Capital Expenditures ◦Principal Facilities Completed PSP warehouse and distribution facility (Japan) TECHPOLYMER capacity expansion (Japan) Construction of a new molding and processing
plant (Taiwan) Expansion of a molding and processing plant
(Thailand) Warehouse expansion at the Tennessee plant
(USA)
■ Fiscal 2015 Capital Expenditures ◦Principal Facilities Completed Construction of a new molding and processing
plant (Indonesia) Construction of a new plant in Ohio (USA)
■ Three-Year Investment Breakdown (¥ billion)Overseas
(capacity expansion)49
Japan(capacity expansion)
12
Japan(streamlining
and distribution)17
Shared investments57
Mergers and acquisitions are strategically implemented and considered separately from ordinary investments.
Dividend Plan (yen)
Fiscal 2013 results Fiscal 2014 results Fiscal 2015 plan
Dividend per share 7.09.0
10.0(Ordinary dividend 8.5)(Commemorative dividend 0.5)
Consolidated payout ratio 51.9% 33.2% 31.2%
■ Shareholder Returns Policy ◦ Although the Company has set a target of a dividend payout ratio of 30% to 40% on a consolidated basis, dividends are
decided on the basis of a comprehensive consideration of trends in the stock market and business performance. ◦ The Company implements treasury stock acquisitions with flexibility and acumen, taking into consideration the stock market
environment and its capital position.
*CS (Cross-functional Solution) TeamsThe purpose of CS teams is to develop business models by forming teams that work across organizational and regional boundaries for specific customers and on specific projects.
Completion of transformation to a business based on customers’ total needs・ Expansion of the customer base and sales through fusion of the new divisional system and CS teams*・ Business transformation and earnings reform at domestic and overseas Group companies
1
Strategic utilization of resources and fostering of human resources in preparation for global business expansion・ Full utilization of new production sites, additional input of human resources from Japan and early development of human
resources in overseas countries
2
Rapid cultivation of new products and new businesses and acceleration of earnings contribution・ Rapid cultivation of next-generation strategic products, such as composite structural component materials that combine
carbon fiber-reinforced plastic (CFRP) and Sekisui Plastics foam
3
Control of fixed costs through cost-reduction activities and continued rigorous selection of capital expenditures4
Fostering assertive and dynamic human resources5
13Sekisui Plastics Co., Ltd.
A Message from the President
Conditions in the global economy in fiscal 2014 were mixed. Whereas the U.S. economy enjoyed a recovery, the European economy was stagnant and the rate of economical growth in China and developing countries was slowing. In addition, crude oil prices declined from the second half onward, with the economic impact differing from region to region. Although the Japanese economy showed a modest recovery trend, the consumption tax increase has affected personal consumption leading to sluggish economic growth. In the second half of the fiscal year, weakening of the yen brought improvement in the business environment, mainly for export industries. Although Japan’s foamed plastics industry benefited from the easing of pressure on profits as petrochemical raw material prices shifted into a downward phase due to the decline in crude oil prices, electric power costs and other costs remained high. The industry faced a difficult demand environment owing to the impact of stagnant consumption, among other factors.
In such a management environment, the Sekisui Plastics Group entered the second year of the ENS2000–Challenge mid-term management plan. We made an organizational change to our market-responsive divisional system consisting of two business headquarters and are speeding up implementation of key measures in the management plan, such as strengthening the earnings capability of domestic and overseas Group companies. Although demand in the Human Life segment was weak in fiscal 2014, income improved as a result of flexible pricing policies adapted to raw materials price trends and cost reductions. In the Industry segment, overseas demand in the electric home appliance and IT fields and automobile-related fields was strong. As a result, we achieved increases in sales and profits on a year-on-year basis in fiscal 2014, recording net sales of ¥113.66 billion, operating income of ¥3.93 billion, recurring income of ¥4.18 billion, and net income of ¥2.53 billion.
Fiscal 2014 Business Report
President Masato Kashiwabara
14 Sekisui Plastics Co., Ltd.
A Message from the President
Although the modest recovery trend is expected to continue in the global economy and the Japanese economy in fiscal 2015, the business environment for the Sekisui Plastics Group is expected to be uncertain due to the hard-to-predict trend in raw materials and fuel prices, which fell in the second half of fiscal 2014, and sharp fluctuations in LCD panel-related demand, which was robust in fiscal 2014.
In the final year of the ENS2000-Challenge management plan, in order to secure a return to the growth path, the mid-term management plan’s objective, the Sekisui Plastics Group will complete the implementation of the key measures in the plan and promote activities focusing on sales expansion and on profit margin improvement.
Specifically, by fusing the reorganized divisional system and the teams that work across organizational and regional boundaries, we will find new customers and open up new markets through implementation of transformation of our
business based on customers’ total needs.In our global business operations, which are key to
increasing sales, we will fully utilize our expanded and upgraded molding and processing bases and accelerate business expansion by further shifting the investment of resources from Japan and by the early development of human resources in each country. In addition, we will expedite the development of new products and new businesses, such as composite materials of carbon-fiber-reinforced plastics and our foamed core materials, and also consider mergers and acquisitions that would contribute to strengthening our businesses. At the same time, we will strive to improve earnings by continuing cost-reduction activities such as energy-savings, as a means of dealing with volatile raw materials and fuel prices and by continuing the rigorous selection of capital investments.
Key Measures for Fiscal 2015
Items made of composite materials of carbon-fiber-reinforced plastics and our foamed core material were displayed at the NPE2015 exhibition in the U.S.A.
15Sekisui Plastics Co., Ltd.
A Message from the President
Sekisui PlasticsHokkaido
Nationwidenetworkcompleted
Sekisui PlasticsTohoku
Sekisui PlasticsChubu
SekisuiGiken
Sekisui PlasticsYamaguchi
Sekisui PlasticsKyushu
Sekisui PlasticsShikoku
Sekisui Plastics Okinawa
Sekisui PlasticsTobu
(Established inOctober 2014)
Regional RepresentativeGroup Companies
Life Materials &Systems Business
Division
Agricultural productpackaging materials
Food containers
Construction materials
Civil engineeringmaterials
Marine productpackaging materials
Distribution materials
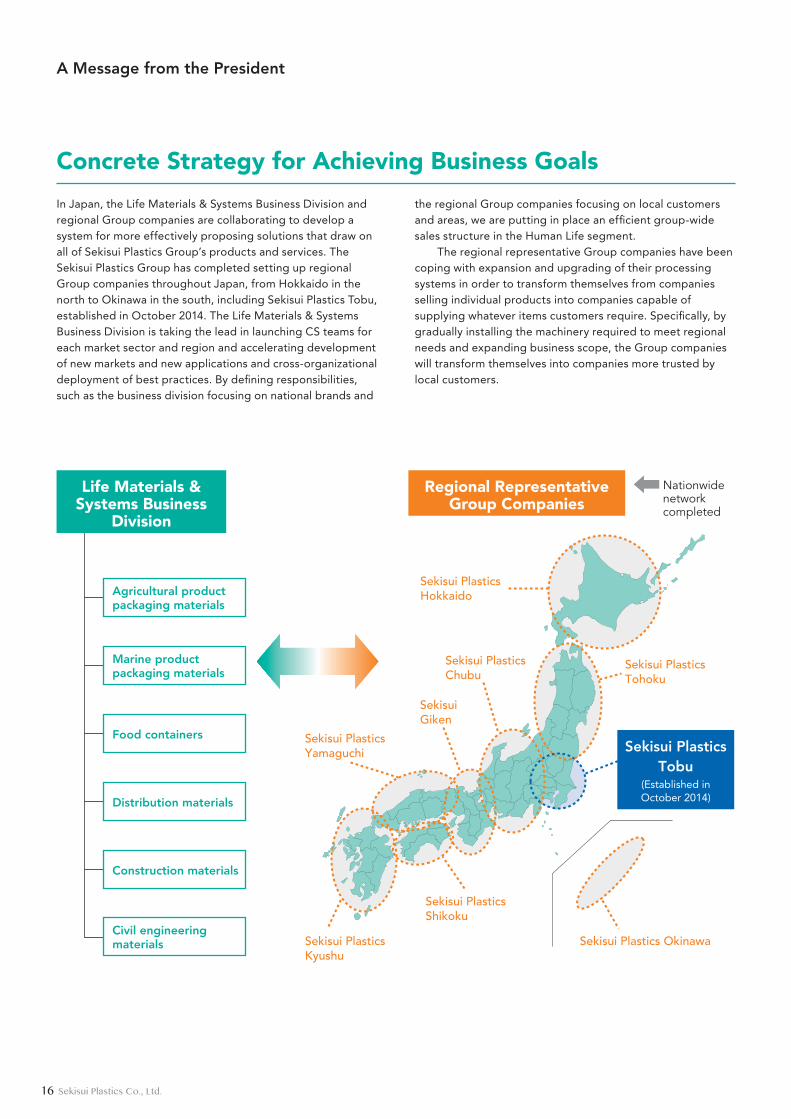
In Japan, the Life Materials & Systems Business Division and regional Group companies are collaborating to develop a system for more effectively proposing solutions that draw on all of Sekisui Plastics Group’s products and services. The Sekisui Plastics Group has completed setting up regional Group companies throughout Japan, from Hokkaido in the north to Okinawa in the south, including Sekisui Plastics Tobu, established in October 2014. The Life Materials & Systems Business Division is taking the lead in launching CS teams for each market sector and region and accelerating development of new markets and new applications and cross-organizational deployment of best practices. By defining responsibilities, such as the business division focusing on national brands and
the regional Group companies focusing on local customers and areas, we are putting in place an efficient group-wide sales structure in the Human Life segment.
The regional representative Group companies have been coping with expansion and upgrading of their processing systems in order to transform themselves from companies selling individual products into companies capable of supplying whatever items customers require. Specifically, by gradually installing the machinery required to meet regional needs and expanding business scope, the Group companies will transform themselves into companies more trusted by local customers.
Concrete Strategy for Achieving Business Goals
16 Sekisui Plastics Co., Ltd.
A Message from the President
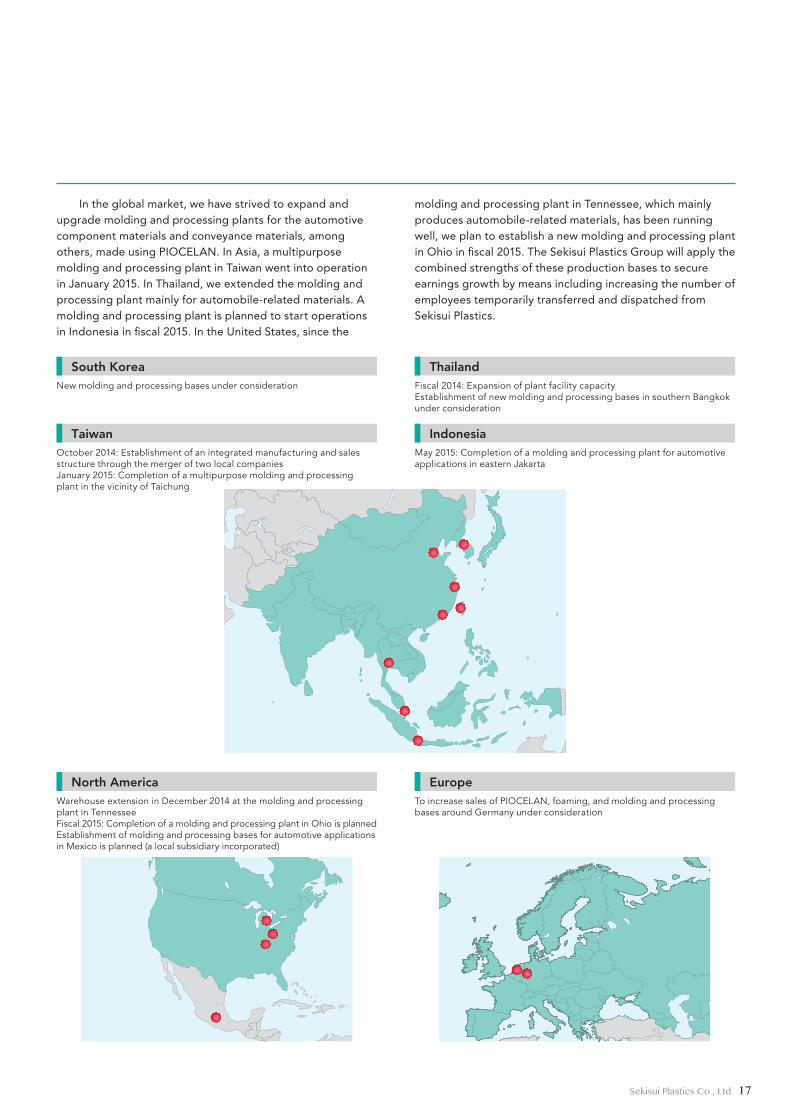
South KoreaNew molding and processing bases under consideration
TaiwanOctober 2014: Establishment of an integrated manufacturing and sales structure through the merger of two local companiesJanuary 2015: Completion of a multipurpose molding and processing plant in the vicinity of Taichung
ThailandFiscal 2014: Expansion of plant facility capacityEstablishment of new molding and processing bases in southern Bangkok under consideration
IndonesiaMay 2015: Completion of a molding and processing plant for automotive applications in eastern Jakarta
North AmericaWarehouse extension in December 2014 at the molding and processing plant in TennesseeFiscal 2015: Completion of a molding and processing plant in Ohio is plannedEstablishment of molding and processing bases for automotive applications in Mexico is planned (a local subsidiary incorporated)
EuropeTo increase sales of PIOCELAN, foaming, and molding and processing bases around Germany under consideration
In the global market, we have strived to expand and upgrade molding and processing plants for the automotive component materials and conveyance materials, among others, made using PIOCELAN. In Asia, a multipurpose molding and processing plant in Taiwan went into operation in January 2015. In Thailand, we extended the molding and processing plant mainly for automobile-related materials. A molding and processing plant is planned to start operations in Indonesia in fiscal 2015. In the United States, since the
molding and processing plant in Tennessee, which mainly produces automobile-related materials, has been running well, we plan to establish a new molding and processing plant in Ohio in fiscal 2015. The Sekisui Plastics Group will apply the combined strengths of these production bases to secure earnings growth by means including increasing the number of employees temporarily transferred and dispatched from Sekisui Plastics.
17Sekisui Plastics Co., Ltd.
Overview by Business Segment
Total solutions proposals support the globalization of marine products companies.
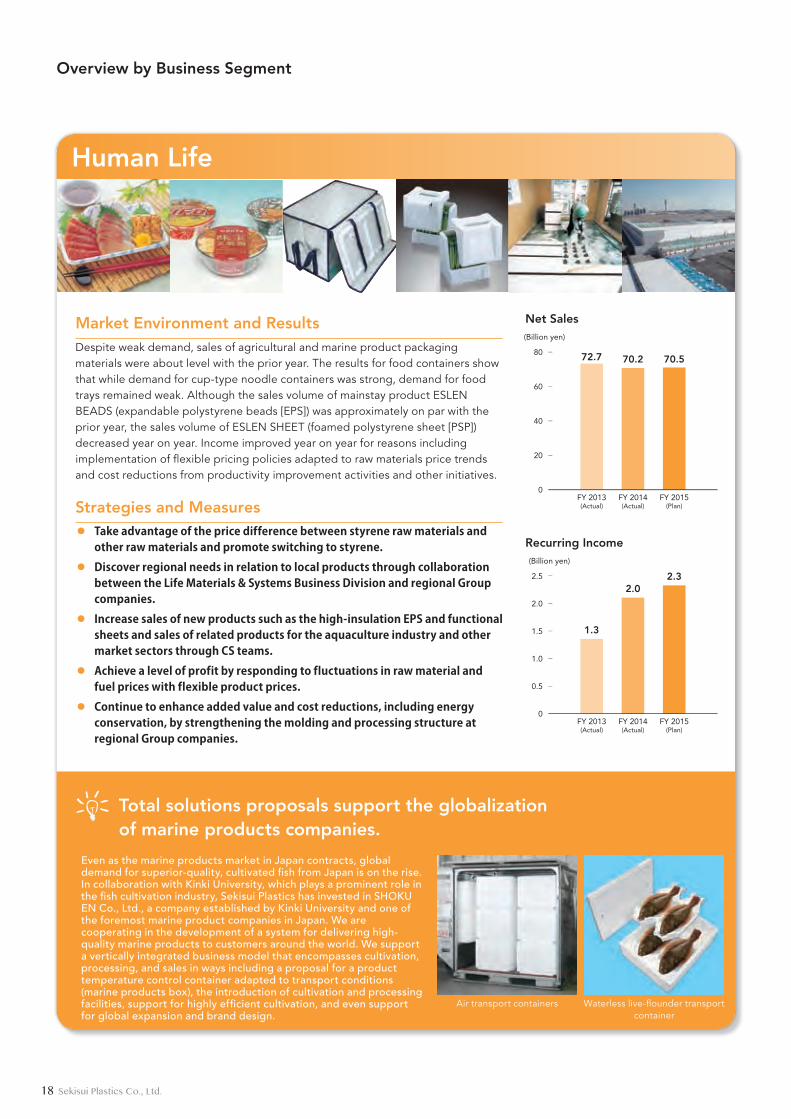
Even as the marine products market in Japan contracts, global demand for superior-quality, cultivated fish from Japan is on the rise. In collaboration with Kinki University, which plays a prominent role in the fish cultivation industry, Sekisui Plastics has invested in SHOKU EN Co., Ltd., a company established by Kinki University and one of the foremost marine product companies in Japan. We are cooperating in the development of a system for delivering high-quality marine products to customers around the world. We support a vertically integrated business model that encompasses cultivation, processing, and sales in ways including a proposal for a product temperature control container adapted to transport conditions (marine products box), the introduction of cultivation and processing facilities, support for highly efficient cultivation, and even support for global expansion and brand design.
Market Environment and ResultsDespite weak demand, sales of agricultural and marine product packaging materials were about level with the prior year. The results for food containers show that while demand for cup-type noodle containers was strong, demand for food trays remained weak. Although the sales volume of mainstay product ESLEN BEADS (expandable polystyrene beads [EPS]) was approximately on par with the prior year, the sales volume of ESLEN SHEET (foamed polystyrene sheet [PSP]) decreased year on year. Income improved year on year for reasons including implementation of flexible pricing policies adapted to raw materials price trends and cost reductions from productivity improvement activities and other initiatives.
Strategies and Measures◦ Takeadvantageofthepricedifferencebetweenstyrenerawmaterialsandotherrawmaterialsandpromoteswitchingtostyrene.
◦ DiscoverregionalneedsinrelationtolocalproductsthroughcollaborationbetweentheLifeMaterials&SystemsBusinessDivisionandregionalGroupcompanies.
◦ Increasesalesofnewproductssuchasthehigh-insulationEPSandfunctionalsheetsandsalesofrelatedproductsfortheaquacultureindustryandothermarketsectorsthroughCSteams.
◦ Achievealevelofprofitbyrespondingtofluctuationsinrawmaterialandfuelpriceswithflexibleproductprices.
◦ Continuetoenhanceaddedvalueandcostreductions,includingenergyconservation,bystrengtheningthemoldingandprocessingstructureatregionalGroupcompanies.
72.7
1.3
70.2
2.0
70.5
2.3
(Billion yen)
0
20
40
60
80
FY 2013(Actual)
FY 2014(Actual)
FY 2015(Plan)
FY 2013(Actual)
FY 2014(Actual)
FY 2015(Plan)
Net Sales
(Billion yen)
0
0.5
2.0
1.5
1.0
2.5
Recurring Income
Human Life
18 Sekisui Plastics Co., Ltd.
Waterless live-flounder transport container
Air transport containers
Overview by Business Segment
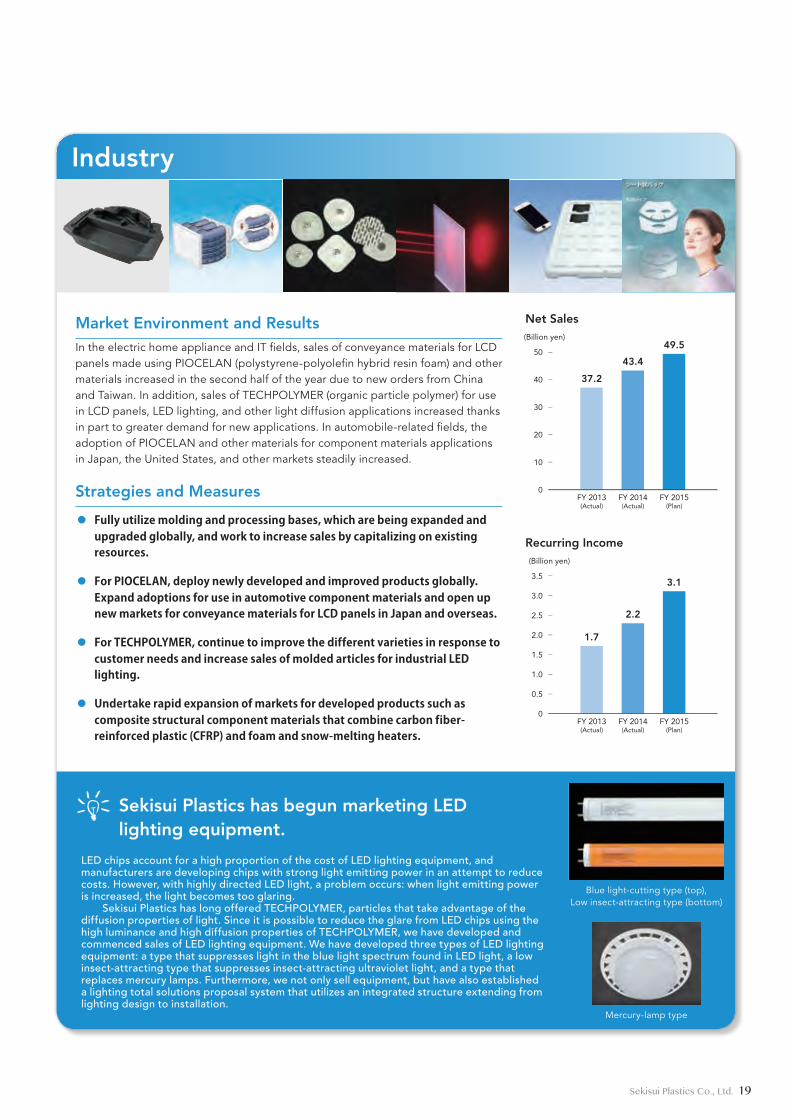
Sekisui Plastics has begun marketing LED lighting equipment.
LED chips account for a high proportion of the cost of LED lighting equipment, and manufacturers are developing chips with strong light emitting power in an attempt to reduce costs. However, with highly directed LED light, a problem occurs: when light emitting power is increased, the light becomes too glaring.
Sekisui Plastics has long offered TECHPOLYMER, particles that take advantage of the diffusion properties of light. Since it is possible to reduce the glare from LED chips using the high luminance and high diffusion properties of TECHPOLYMER, we have developed and commenced sales of LED lighting equipment. We have developed three types of LED lighting equipment: a type that suppresses light in the blue light spectrum found in LED light, a low insect-attracting type that suppresses insect-attracting ultraviolet light, and a type that replaces mercury lamps. Furthermore, we not only sell equipment, but have also established a lighting total solutions proposal system that utilizes an integrated structure extending from lighting design to installation.
Market Environment and ResultsIn the electric home appliance and IT fields, sales of conveyance materials for LCD panels made using PIOCELAN (polystyrene-polyolefin hybrid resin foam) and other materials increased in the second half of the year due to new orders from China and Taiwan. In addition, sales of TECHPOLYMER (organic particle polymer) for use in LCD panels, LED lighting, and other light diffusion applications increased thanks in part to greater demand for new applications. In automobile-related fields, the adoption of PIOCELAN and other materials for component materials applications in Japan, the United States, and other markets steadily increased.
Strategies and Measures
◦ Fullyutilizemoldingandprocessingbases,whicharebeingexpandedandupgradedglobally,andworktoincreasesalesbycapitalizingonexistingresources.
◦ ForPIOCELAN,deploynewlydevelopedandimprovedproductsglobally.ExpandadoptionsforuseinautomotivecomponentmaterialsandopenupnewmarketsforconveyancematerialsforLCDpanelsinJapanandoverseas.
◦ ForTECHPOLYMER,continuetoimprovethedifferentvarietiesinresponsetocustomerneedsandincreasesalesofmoldedarticlesforindustrialLEDlighting.
◦ Undertakerapidexpansionofmarketsfordevelopedproductssuchascompositestructuralcomponentmaterialsthatcombinecarbonfiber-reinforcedplastic(CFRP)andfoamandsnow-meltingheaters.
37.2
1.7
43.4
2.2
49.5
3.1
Net Sales
Recurring Income
(Billion yen)
FY 2013(Actual)
FY 2014(Actual)
FY 2015(Plan)
(Billion yen)
FY 2013(Actual)
FY 2014(Actual)
FY 2015(Plan)
0
20
10
30
50
40
0
1.0
0.5
1.5
3.5
2.5
2.0
3.0
Industry
19Sekisui Plastics Co., Ltd.
Blue light-cutting type (top),Low insect-attracting type (bottom)
Mercury-lamp type
CSR Initiatives
In the 100-Year Vision formulated in October 2009, the Group included the CSR declaration, “The Sekisui Plastics Group, expanding our dreams for people and the Earth.” The Group is endeavoring to carry out its social responsibility toward all stakeholders, including the global environment, and to contribute to the sustainable development of societies worldwide.
Green Wall Activities and Green Wave Activities
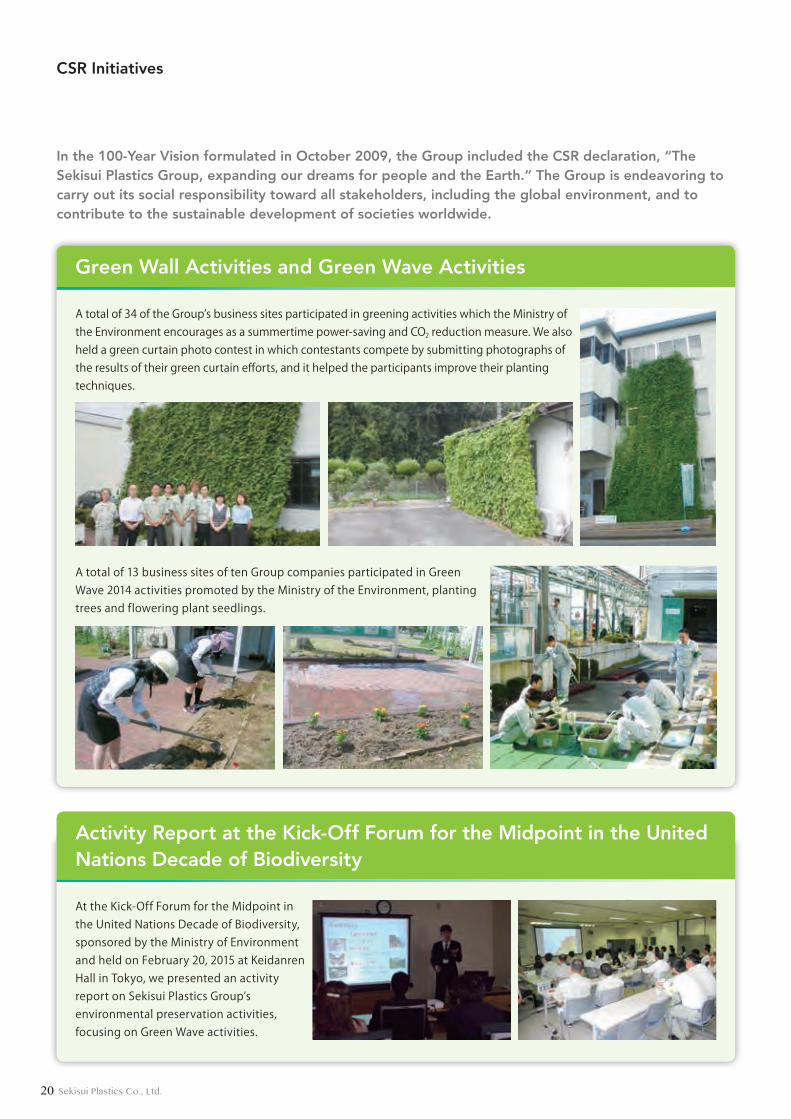
A total of 34 of the Group’s business sites participated in greening activities which the Ministry of the Environment encourages as a summertime power-saving and CO2 reduction measure. We also held a green curtain photo contest in which contestants compete by submitting photographs of the results of their green curtain efforts, and it helped the participants improve their planting techniques.
A total of 13 business sites of ten Group companies participated in Green Wave 2014 activities promoted by the Ministry of the Environment, planting trees and flowering plant seedlings.
Activity Report at the Kick-Off Forum for the Midpoint in the United Nations Decade of Biodiversity
At the Kick-Off Forum for the Midpoint in the United Nations Decade of Biodiversity, sponsored by the Ministry of Environment and held on February 20, 2015 at Keidanren Hall in Tokyo, we presented an activity report on Sekisui Plastics Group’s environmental preservation activities, focusing on Green Wave activities.
20 Sekisui Plastics Co., Ltd.
CSR Initiatives
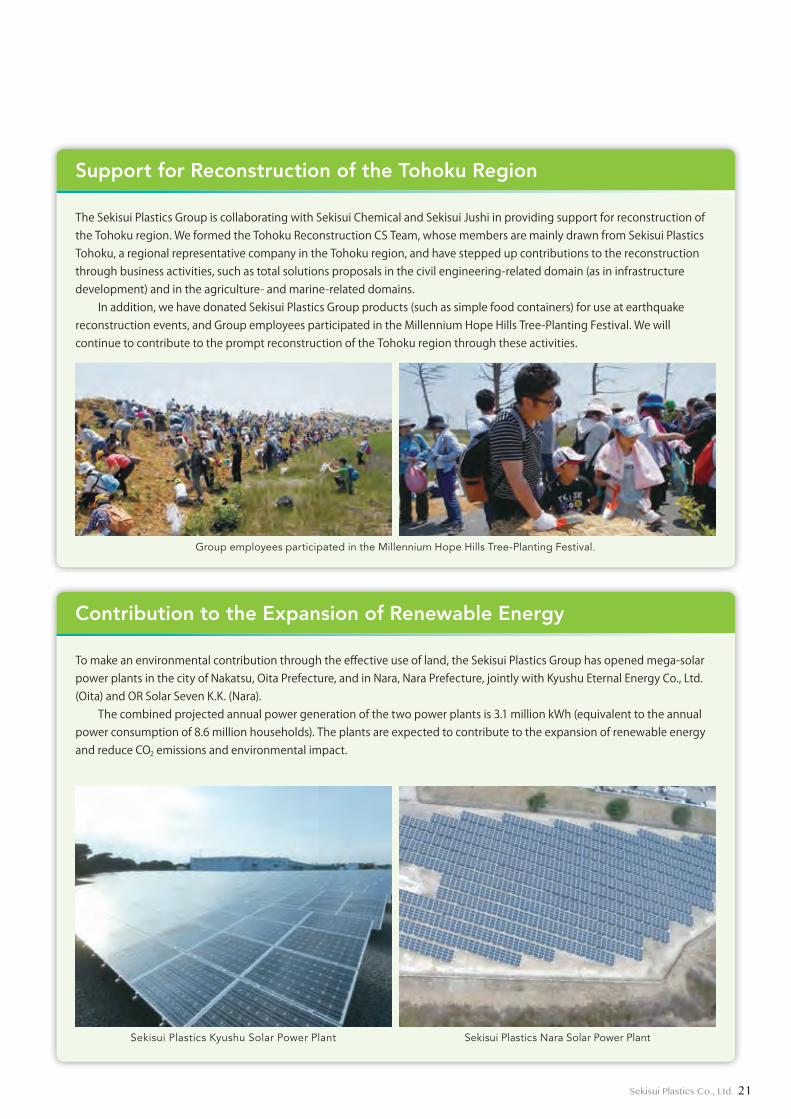
Support for Reconstruction of the Tohoku Region
The Sekisui Plastics Group is collaborating with Sekisui Chemical and Sekisui Jushi in providing support for reconstruction of the Tohoku region. We formed the Tohoku Reconstruction CS Team, whose members are mainly drawn from Sekisui Plastics Tohoku, a regional representative company in the Tohoku region, and have stepped up contributions to the reconstruction through business activities, such as total solutions proposals in the civil engineering-related domain (as in infrastructure development) and in the agriculture- and marine-related domains.
In addition, we have donated Sekisui Plastics Group products (such as simple food containers) for use at earthquake reconstruction events, and Group employees participated in the Millennium Hope Hills Tree-Planting Festival. We will continue to contribute to the prompt reconstruction of the Tohoku region through these activities.
Contribution to the Expansion of Renewable Energy
To make an environmental contribution through the effective use of land, the Sekisui Plastics Group has opened mega-solar power plants in the city of Nakatsu, Oita Prefecture, and in Nara, Nara Prefecture, jointly with Kyushu Eternal Energy Co., Ltd. (Oita) and OR Solar Seven K.K. (Nara).
The combined projected annual power generation of the two power plants is 3.1 million kWh (equivalent to the annual power consumption of 8.6 million households). The plants are expected to contribute to the expansion of renewable energy and reduce CO2 emissions and environmental impact.
Sekisui Plastics Kyushu Solar Power Plant Sekisui Plastics Nara Solar Power Plant
Group employees participated in the Millennium Hope Hills Tree-Planting Festival.
21Sekisui Plastics Co., Ltd.
Compliance and Risk ManagementCorporate Governance
Sekisui Plastics aspires to be “a plastics solution company trusted by customers around the world.” The most important management task in the realization of this aspiration is to create a management structure that ensures effective corporate governance and management transparency and soundness, and is capable of rapidly responding to changes in the operating environment.
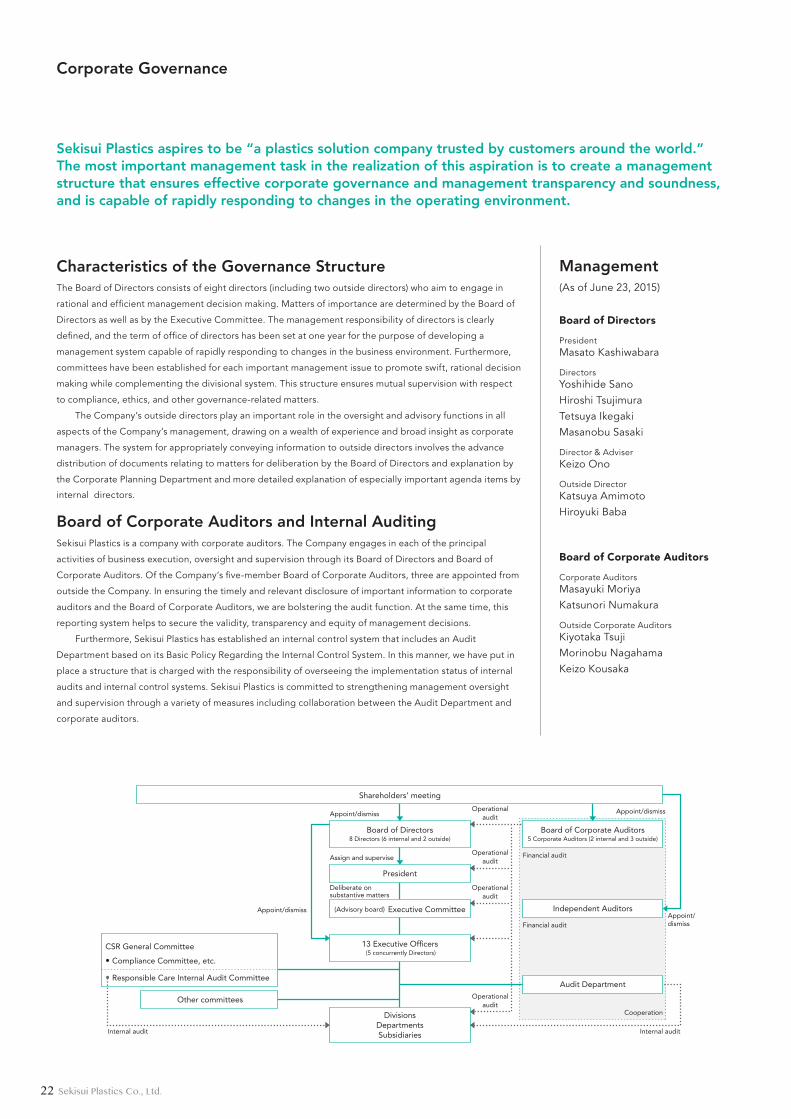
Characteristics of the Governance StructureThe Board of Directors consists of eight directors (including two outside directors) who aim to engage in
rational and efficient management decision making. Matters of importance are determined by the Board of
Directors as well as by the Executive Committee. The management responsibility of directors is clearly
defined, and the term of office of directors has been set at one year for the purpose of developing a
management system capable of rapidly responding to changes in the business environment. Furthermore,
committees have been established for each important management issue to promote swift, rational decision
making while complementing the divisional system. This structure ensures mutual supervision with respect
to compliance, ethics, and other governance-related matters.
The Company’s outside directors play an important role in the oversight and advisory functions in all
aspects of the Company’s management, drawing on a wealth of experience and broad insight as corporate
managers. The system for appropriately conveying information to outside directors involves the advance
distribution of documents relating to matters for deliberation by the Board of Directors and explanation by
the Corporate Planning Department and more detailed explanation of especially important agenda items by
internal directors.
Board of Corporate Auditors and Internal AuditingSekisui Plastics is a company with corporate auditors. The Company engages in each of the principal
activities of business execution, oversight and supervision through its Board of Directors and Board of
Corporate Auditors. Of the Company’s five-member Board of Corporate Auditors, three are appointed from
outside the Company. In ensuring the timely and relevant disclosure of important information to corporate
auditors and the Board of Corporate Auditors, we are bolstering the audit function. At the same time, this
reporting system helps to secure the validity, transparency and equity of management decisions.
Furthermore, Sekisui Plastics has established an internal control system that includes an Audit
Department based on its Basic Policy Regarding the Internal Control System. In this manner, we have put in
place a structure that is charged with the responsibility of overseeing the implementation status of internal
audits and internal control systems. Sekisui Plastics is committed to strengthening management oversight
and supervision through a variety of measures including collaboration between the Audit Department and
corporate auditors.
Management (As of June 23, 2015)
Board of Directors
PresidentMasato Kashiwabara
DirectorsYoshihide SanoHiroshi TsujimuraTetsuya IkegakiMasanobu Sasaki
Director & AdviserKeizo Ono
Outside DirectorKatsuya AmimotoHiroyuki Baba
Board of Corporate Auditors
Corporate AuditorsMasayuki MoriyaKatsunori Numakura
Outside Corporate AuditorsKiyotaka TsujiMorinobu NagahamaKeizo Kousaka
Shareholders’ meeting
Board of Directors8 Directors (6 internal and 2 outside)
13 Executive Of�cers (5 concurrently Directors)
Appoint/dismiss
Appoint/dismiss
Assign and supervise
President
Deliberate on substantive matters
(Advisory board) Executive Committee
CSR General Committee
• Compliance Committee, etc.
• Responsible Care Internal Audit Committee
Other committees
Internal audit
DivisionsDepartmentsSubsidiaries
Appoint/dismiss
Board of Corporate Auditors5 Corporate Auditors (2 internal and 3 outside)
Operationalaudit
Operationalaudit
Operationalaudit
Operationalaudit
Independent Auditors
Financial audit
Financial audit
Appoint/dismiss
Audit Department
Cooperation
Internal audit
22 Sekisui Plastics Co., Ltd.

Compliance and Risk ManagementCorporate Governance
Sekisui Plastics continues to promote increased awareness, acceptance and understanding of corporate ethics, to prevent any breach of laws and regulations and to strengthen compliance. In addition, the Company is implementing a variety of measures aimed at addressing business risks. These include efforts to enhance its management structure and systems as well as education and training initiatives.
ComplianceSekisui Plastics established the Compliance Committee and has put together a
structure to ensure that the Group adheres strictly to all relevant laws and
regulations. The Compliance Committee meets on a regular, twice-yearly basis to
deliberate on important issues as they relate to the Group. At the same time, the
Committee coordinates with officers who have been appointed to each Group
company to oversee and promote the compliance function. Moreover, compliance
committees of a comparable scale and nature as the Company’s are established
at Group companies of a certain scale and size. In an effort to better fulfill its
corporate social responsibility and enhance both internal communication and
reporting, the Company set up a hotline with direct links to the Compliance
Committee Secretariat and legal counsel. Through these and other means, Sekisui
Plastics is steadily building an equitable and vibrant compliance structure and
systems. In addition, the Company has executed an advisory agreement with an
established legal firm. Under the agreement, the Company receives guidance and
advice as and when required, which forms a part of the overall decision-making
process with respect to corporate management as well as day-to-day operations.
Risk ManagementSekisui Plastics has formulated a variety of specific rules and
regulations, which cover such issues as quality, safety, the
environment and information security. In its efforts to address the
wide range of risks inherent in its ongoing business activities, the
Company has established individual committees to address each of
the aforementioned issues, while calling on general managers of
each division to independently manage miscellaneous risks.
At the same time, Sekisui Plastics has produced a “Crisis
Management Manual.” In taking steps to ensure that directors and
employees are familiar with and conversant in this Manual, the
Company is endeavoring to prevent the occurrence of risk. In the
event of an emergency situation, Sekisui Plastics has established
emergency response measure procedures that include the
immediate launch of an emergency task force. Under the direction
of the president, this task force is charged with the responsibility of
crisis management.
Sekisui Plastics Group places the highest priority on the health and safety of its employees and local community residents and organizes activities on prevention of accidents and injuries.
Security, Safety, and Health Initiatives
In addition to safety patrols of the workplace and tours of the premises by business site managers, we implement the following safety-related activities.
1 Safety briefings with managers
Managers conduct safety-related briefings with all employees. (Some business sites utilize the results of a safety response survey conducted by the Japan Industrial Safety and Health Association.)
2 Designation of daily safety managers
All Group companies designate daily safety managers with the aim of increasing safety awareness and the sense of responsibility for a safe workplace among employees and identifying and correcting unsafe conditions.
3 Production section safety meetings
Group companies that have similar production facilities and production operations get together to devise and carry out safety measures pertaining to shared issues.
Taiwan Sekisui Yunchu Co., Ltd.’s Miaoli Plant and PT. Sekisui Plastics Indonesia, which began operations in fiscal 2015, engage in safety-related activities using a safety calendar, safety education videos, and other tools.
We conduct periodic training and safety education and emergency response drills to hone employee abilities and skills and maintain and improve safety and health.
First-aid training
We engage outside instructors to periodically conduct first-aid training at Group companies.
Safety-Related Activities Safety-Related Activities at Overseas Business Sites
Safety-Related and Health Activities
Sekisui Giken Meihan Ogura Plant
23Sekisui Plastics Co., Ltd.
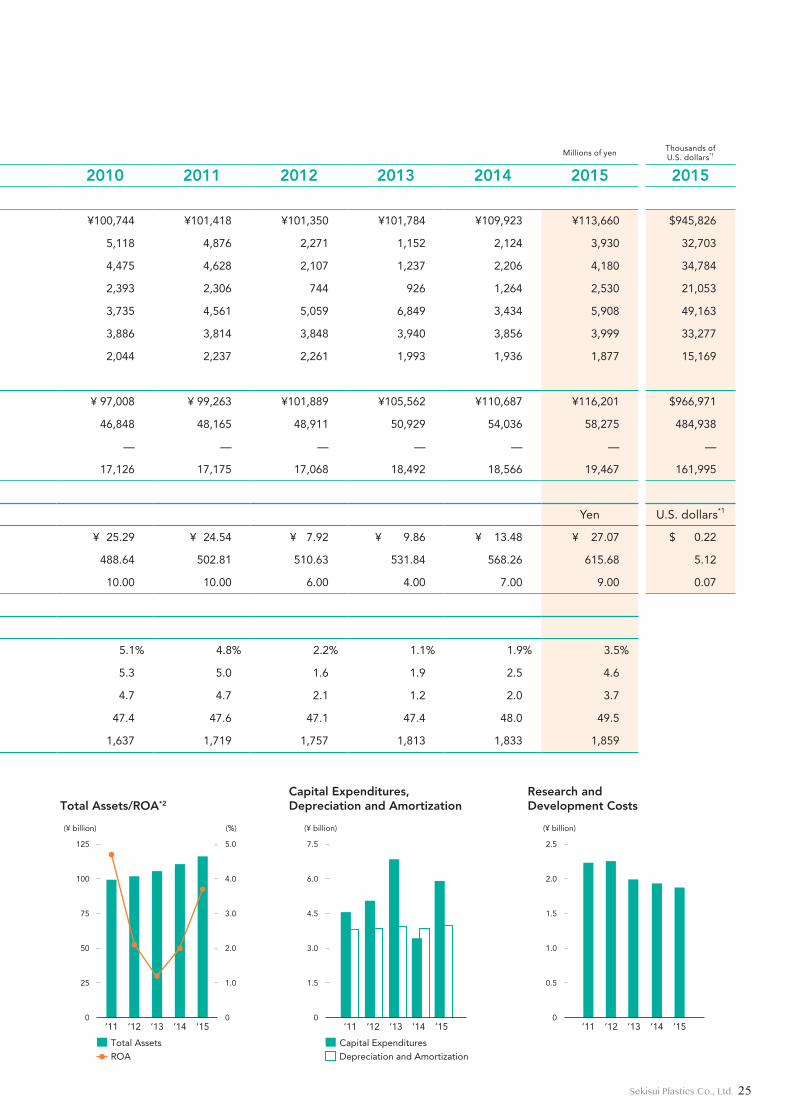
Consolidated Financial Highlights
Sekisui Plastics Co., Ltd. and Consolidated SubsidiariesYears ended March 31
Millions of yen Thousands ofU.S. dollars*1
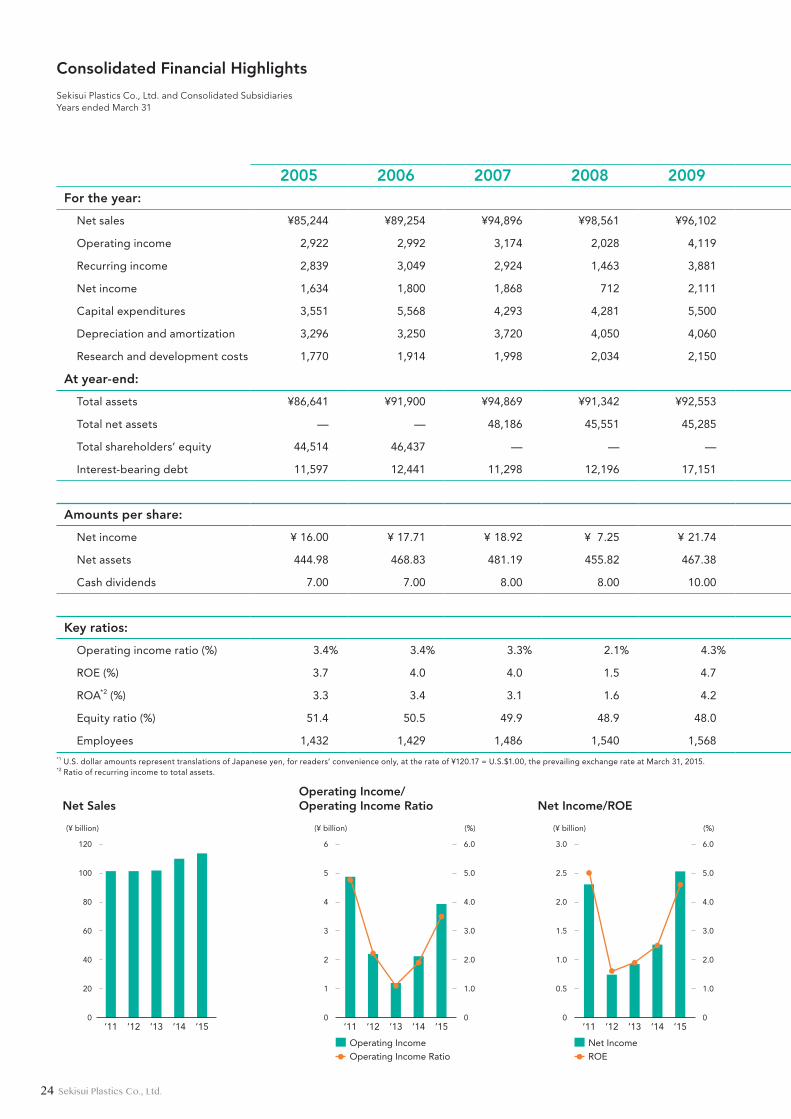
2005 2006 2007 2008 2009 2010 2011 2012 2013 2014 2015 2015For the year:
Net sales ¥85,244 ¥89,254 ¥94,896 ¥98,561 ¥96,102 ¥100,744 ¥101,418 ¥101,350 ¥101,784 ¥109,923 ¥113,660 $945,826
Operating income 2,922 2,992 3,174 2,028 4,119 5,118 4,876 2,271 1,152 2,124 3,930 32,703
Recurring income 2,839 3,049 2,924 1,463 3,881 4,475 4,628 2,107 1,237 2,206 4,180 34,784
Net income 1,634 1,800 1,868 712 2,111 2,393 2,306 744 926 1,264 2,530 21,053
Capital expenditures 3,551 5,568 4,293 4,281 5,500 3,735 4,561 5,059 6,849 3,434 5,908 49,163
Depreciation and amortization 3,296 3,250 3,720 4,050 4,060 3,886 3,814 3,848 3,940 3,856 3,999 33,277
Research and development costs 1,770 1,914 1,998 2,034 2,150 2,044 2,237 2,261 1,993 1,936 1,877 15,169
At year-end:
Total assets ¥86,641 ¥91,900 ¥94,869 ¥91,342 ¥92,553 ¥ 97,008 ¥ 99,263 ¥101,889 ¥105,562 ¥110,687 ¥116,201 $966,971
Total net assets — — 48,186 45,551 45,285 46,848 48,165 48,911 50,929 54,036 58,275 484,938
Total shareholders’ equity 44,514 46,437 — — — — — — — — — —
Interest-bearing debt 11,597 12,441 11,298 12,196 17,151 17,126 17,175 17,068 18,492 18,566 19,467 161,995
Amounts per share: Yen U.S. dollars*1
Net income ¥ 16.00 ¥ 17.71 ¥ 18.92 ¥ 7.25 ¥ 21.74 ¥ 25.29 ¥ 24.54 ¥ 7.92 ¥ 9.86 ¥ 13.48 ¥ 27.07 $ 0.22
Net assets 444.98 468.83 481.19 455.82 467.38 488.64 502.81 510.63 531.84 568.26 615.68 5.12
Cash dividends 7.00 7.00 8.00 8.00 10.00 10.00 10.00 6.00 4.00 7.00 9.00 0.07
Key ratios:
Operating income ratio (%) 3.4% 3.4% 3.3% 2.1% 4.3% 5.1% 4.8% 2.2% 1.1% 1.9% 3.5%
ROE (%) 3.7 4.0 4.0 1.5 4.7 5.3 5.0 1.6 1.9 2.5 4.6
ROA*2 (%) 3.3 3.4 3.1 1.6 4.2 4.7 4.7 2.1 1.2 2.0 3.7
Equity ratio (%) 51.4 50.5 49.9 48.9 48.0 47.4 47.6 47.1 47.4 48.0 49.5
Employees 1,432 1,429 1,486 1,540 1,568 1,637 1,719 1,757 1,813 1,833 1,859*1 U.S. dollar amounts represent translations of Japanese yen, for readers’ convenience only, at the rate of ¥120.17 = U.S.$1.00, the prevailing exchange rate at March 31, 2015.*2 Ratio of recurring income to total assets.
Net Sales
0
20
40
60
80
120
100
(¥ billion)
’11 ’12 ’13 ’14 ’15
Operating IncomeOperating Income Ratio
’11 ’12 ’13 ’14 ’15
(¥ billion)
0 0
1
2
3
5
4
6
1.0
2.0
3.0
4.0
6.0
5.0
Operating Income/Operating Income Ratio
Net IncomeROE
’11 ’12 ’13 ’14 ’15
(%) (¥ billion)
0 0
1.0
2.0
3.0
6.0
5.0
4.0
Net Income/ROE
(%)
0
Total AssetsROA
’11 ’12 ’13 ’14 ’15
(¥ billion)
0
25
50
75
100
125
1.0
2.0
3.0
5.0
4.0
Total Assets/ROA*2
(%)
Capital ExpendituresDepreciation and Amortization
’11 ’12 ’13 ’14 ’150
1.5
3.0
4.5
7.5
6.0
(¥ billion)
Capital Expenditures, Depreciation and Amortization
’11 ’12 ’13 ’14 ’15
(¥ billion)
0
0.5
1.0
1.5
2.0
2.5
Research andDevelopment Costs
0.5
1.0
1.5
2.0
3.0
2.5
24 Sekisui Plastics Co., Ltd.
Consolidated Financial Highlights
Sekisui Plastics Co., Ltd. and Consolidated SubsidiariesYears ended March 31
Millions of yen Thousands ofU.S. dollars*1
2005 2006 2007 2008 2009 2010 2011 2012 2013 2014 2015 2015For the year:
Net sales ¥85,244 ¥89,254 ¥94,896 ¥98,561 ¥96,102 ¥100,744 ¥101,418 ¥101,350 ¥101,784 ¥109,923 ¥113,660 $945,826
Operating income 2,922 2,992 3,174 2,028 4,119 5,118 4,876 2,271 1,152 2,124 3,930 32,703
Recurring income 2,839 3,049 2,924 1,463 3,881 4,475 4,628 2,107 1,237 2,206 4,180 34,784
Net income 1,634 1,800 1,868 712 2,111 2,393 2,306 744 926 1,264 2,530 21,053
Capital expenditures 3,551 5,568 4,293 4,281 5,500 3,735 4,561 5,059 6,849 3,434 5,908 49,163
Depreciation and amortization 3,296 3,250 3,720 4,050 4,060 3,886 3,814 3,848 3,940 3,856 3,999 33,277
Research and development costs 1,770 1,914 1,998 2,034 2,150 2,044 2,237 2,261 1,993 1,936 1,877 15,169
At year-end:
Total assets ¥86,641 ¥91,900 ¥94,869 ¥91,342 ¥92,553 ¥ 97,008 ¥ 99,263 ¥101,889 ¥105,562 ¥110,687 ¥116,201 $966,971
Total net assets — — 48,186 45,551 45,285 46,848 48,165 48,911 50,929 54,036 58,275 484,938
Total shareholders’ equity 44,514 46,437 — — — — — — — — — —
Interest-bearing debt 11,597 12,441 11,298 12,196 17,151 17,126 17,175 17,068 18,492 18,566 19,467 161,995
Amounts per share: Yen U.S. dollars*1
Net income ¥ 16.00 ¥ 17.71 ¥ 18.92 ¥ 7.25 ¥ 21.74 ¥ 25.29 ¥ 24.54 ¥ 7.92 ¥ 9.86 ¥ 13.48 ¥ 27.07 $ 0.22
Net assets 444.98 468.83 481.19 455.82 467.38 488.64 502.81 510.63 531.84 568.26 615.68 5.12
Cash dividends 7.00 7.00 8.00 8.00 10.00 10.00 10.00 6.00 4.00 7.00 9.00 0.07
Key ratios:
Operating income ratio (%) 3.4% 3.4% 3.3% 2.1% 4.3% 5.1% 4.8% 2.2% 1.1% 1.9% 3.5%
ROE (%) 3.7 4.0 4.0 1.5 4.7 5.3 5.0 1.6 1.9 2.5 4.6
ROA*2 (%) 3.3 3.4 3.1 1.6 4.2 4.7 4.7 2.1 1.2 2.0 3.7
Equity ratio (%) 51.4 50.5 49.9 48.9 48.0 47.4 47.6 47.1 47.4 48.0 49.5
Employees 1,432 1,429 1,486 1,540 1,568 1,637 1,719 1,757 1,813 1,833 1,859*1 U.S. dollar amounts represent translations of Japanese yen, for readers’ convenience only, at the rate of ¥120.17 = U.S.$1.00, the prevailing exchange rate at March 31, 2015.*2 Ratio of recurring income to total assets.
Net Sales
0
20
40
60
80
120
100
(¥ billion)
’11 ’12 ’13 ’14 ’15
Operating IncomeOperating Income Ratio
’11 ’12 ’13 ’14 ’15
(¥ billion)
0 0
1
2
3
5
4
6
1.0
2.0
3.0
4.0
6.0
5.0
Operating Income/Operating Income Ratio
Net IncomeROE
’11 ’12 ’13 ’14 ’15
(%) (¥ billion)
0 0
1.0
2.0
3.0
6.0
5.0
4.0
Net Income/ROE
(%)
0
Total AssetsROA
’11 ’12 ’13 ’14 ’15
(¥ billion)
0
25
50
75
100
125
1.0
2.0
3.0
5.0
4.0
Total Assets/ROA*2
(%)
Capital ExpendituresDepreciation and Amortization
’11 ’12 ’13 ’14 ’150
1.5
3.0
4.5
7.5
6.0
(¥ billion)
Capital Expenditures, Depreciation and Amortization
’11 ’12 ’13 ’14 ’15
(¥ billion)
0
0.5
1.0
1.5
2.0
2.5
Research andDevelopment Costs
0.5
1.0
1.5
2.0
3.0
2.5
25Sekisui Plastics Co., Ltd.
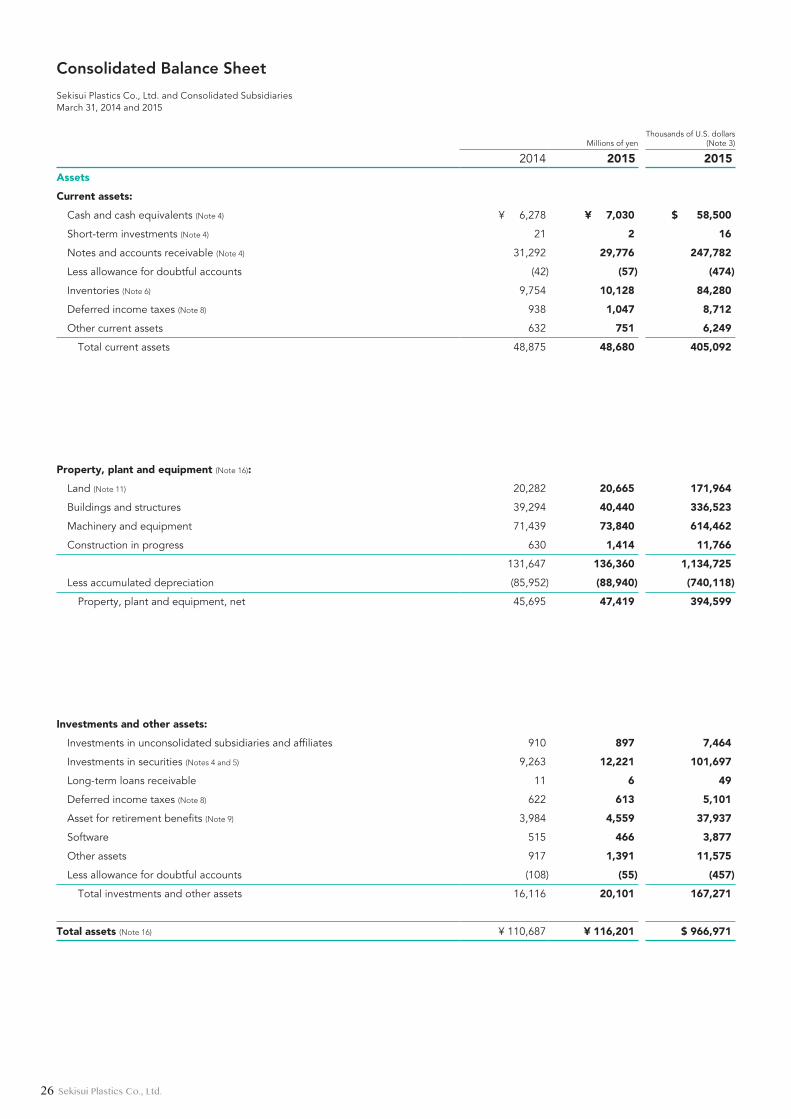
Consolidated Balance Sheet
Sekisui Plastics Co., Ltd. and Consolidated SubsidiariesMarch 31, 2014 and 2015
Millions of yenThousands of U.S. dollars
(Note 3)
2014 2015 2015
Assets
Current assets:
Cash and cash equivalents (Note 4) ¥ 6,278 ¥ 7,030 $ 58,500
Short-term investments (Note 4) 21 2 16
Notes and accounts receivable (Note 4) 31,292 29,776 247,782
Less allowance for doubtful accounts (42) (57) (474)
Inventories (Note 6) 9,754 10,128 84,280
Deferred income taxes (Note 8) 938 1,047 8,712
Other current assets 632 751 6,249
Total current assets 48,875 48,680 405,092
Property, plant and equipment (Note 16):
Land (Note 11) 20,282 20,665 171,964
Buildings and structures 39,294 40,440 336,523
Machinery and equipment 71,439 73,840 614,462
Construction in progress 630 1,414 11,766
131,647 136,360 1,134,725
Less accumulated depreciation (85,952) (88,940) (740,118)
Property, plant and equipment, net 45,695 47,419 394,599
Investments and other assets:
Investments in unconsolidated subsidiaries and affiliates 910 897 7,464
Investments in securities (Notes 4 and 5) 9,263 12,221 101,697
Long-term loans receivable 11 6 49
Deferred income taxes (Note 8) 622 613 5,101
Asset for retirement benefits (Note 9) 3,984 4,559 37,937
Software 515 466 3,877
Other assets 917 1,391 11,575
Less allowance for doubtful accounts (108) (55) (457)
Total investments and other assets 16,116 20,101 167,271
Total assets (Note 16) ¥ 110,687 ¥ 116,201 $ 966,971
26 Sekisui Plastics Co., Ltd.
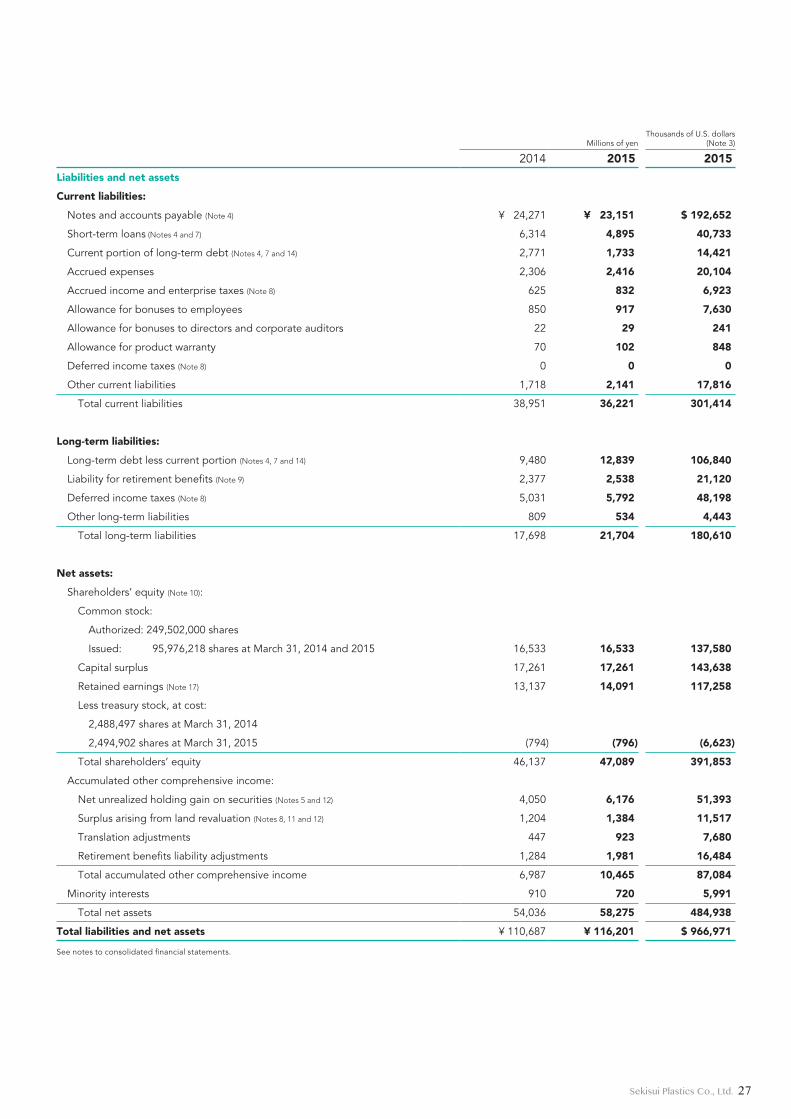
Consolidated Balance Sheet
Sekisui Plastics Co., Ltd. and Consolidated SubsidiariesMarch 31, 2014 and 2015
Millions of yenThousands of U.S. dollars
(Note 3)
2014 2015 2015
Liabilities and net assets
Current liabilities:
Notes and accounts payable (Note 4) ¥ 24,271 ¥ 23,151 $ 192,652
Short-term loans (Notes 4 and 7) 6,314 4,895 40,733
Current portion of long-term debt (Notes 4, 7 and 14) 2,771 1,733 14,421
Accrued expenses 2,306 2,416 20,104
Accrued income and enterprise taxes (Note 8) 625 832 6,923
Allowance for bonuses to employees 850 917 7,630
Allowance for bonuses to directors and corporate auditors 22 29 241
Allowance for product warranty 70 102 848
Deferred income taxes (Note 8) 0 0 0
Other current liabilities 1,718 2,141 17,816
Total current liabilities 38,951 36,221 301,414
Long-term liabilities:
Long-term debt less current portion (Notes 4, 7 and 14) 9,480 12,839 106,840
Liability for retirement benefits (Note 9) 2,377 2,538 21,120
Deferred income taxes (Note 8) 5,031 5,792 48,198
Other long-term liabilities 809 534 4,443
Total long-term liabilities 17,698 21,704 180,610
Net assets:
Shareholders’ equity (Note 10):
Common stock:
Authorized: 249,502,000 shares
Issued: 95,976,218 shares at March 31, 2014 and 2015 16,533 16,533 137,580
Capital surplus 17,261 17,261 143,638
Retained earnings (Note 17) 13,137 14,091 117,258
Less treasury stock, at cost:
2,488,497 shares at March 31, 2014
2,494,902 shares at March 31, 2015 (794) (796) (6,623)
Total shareholders’ equity 46,137 47,089 391,853
Accumulated other comprehensive income:
Net unrealized holding gain on securities (Notes 5 and 12) 4,050 6,176 51,393
Surplus arising from land revaluation (Notes 8, 11 and 12) 1,204 1,384 11,517
Translation adjustments 447 923 7,680
Retirement benefits liability adjustments 1,284 1,981 16,484
Total accumulated other comprehensive income 6,987 10,465 87,084
Minority interests 910 720 5,991
Total net assets 54,036 58,275 484,938
Total liabilities and net assets ¥ 110,687 ¥ 116,201 $ 966,971
See notes to consolidated financial statements.
27Sekisui Plastics Co., Ltd.
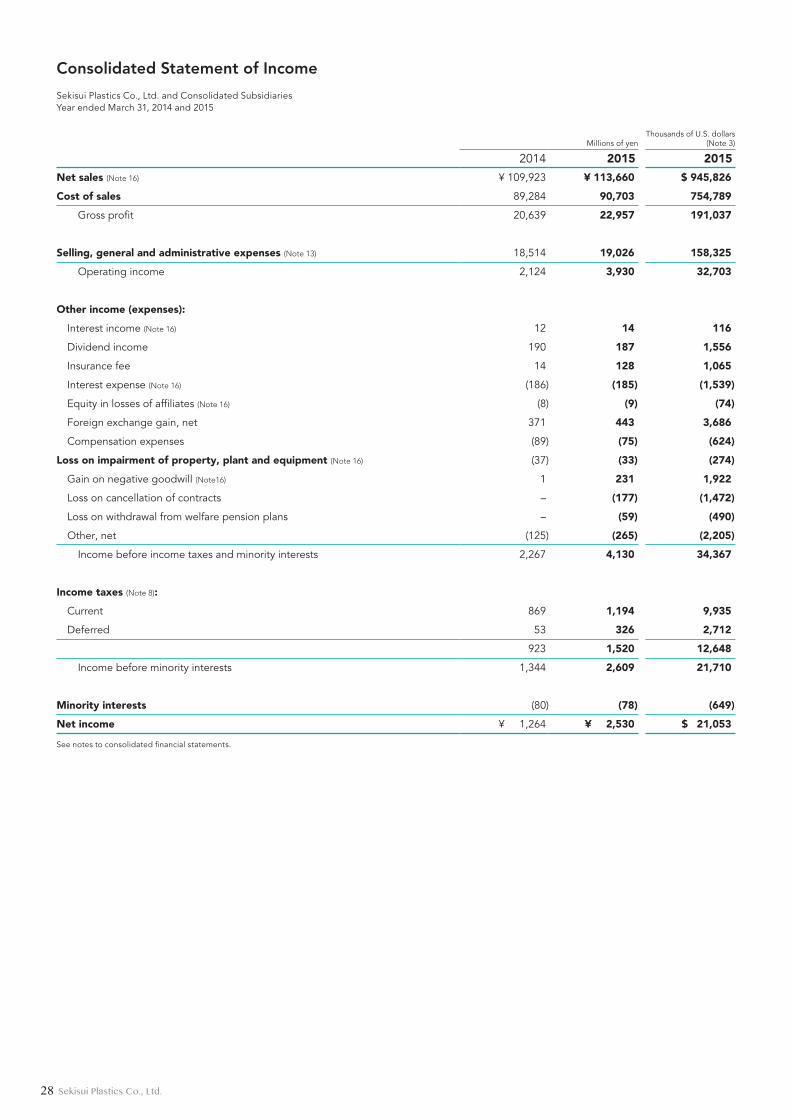
Consolidated Statement of Income
Sekisui Plastics Co., Ltd. and Consolidated SubsidiariesYear ended March 31, 2014 and 2015
Consolidated Statement of Comprehensive Income
Sekisui Plastics Co., Ltd. and Consolidated SubsidiariesYear ended March 31, 2014 and 2015
Millions of yenThousands of U.S. dollars
(Note 3)
2014 2015 2015
Net sales (Note 16) ¥ 109,923 ¥ 113,660 $ 945,826
Cost of sales 89,284 90,703 754,789
Gross profit 20,639 22,957 191,037
Selling, general and administrative expenses (Note 13) 18,514 19,026 158,325
Operating income 2,124 3,930 32,703
Other income (expenses):
Interest income (Note 16) 12 14 116
Dividend income 190 187 1,556
Insurance fee 14 128 1,065
Interest expense (Note 16) (186) (185) (1,539)
Equity in losses of affiliates (Note 16) (8) (9) (74)
Foreign exchange gain, net 371 443 3,686
Compensation expenses (89) (75) (624)
Loss on impairment of property, plant and equipment (Note 16) (37) (33) (274)
Gain on negative goodwill (Note16) 1 231 1,922
Loss on cancellation of contracts – (177) (1,472)
Loss on withdrawal from welfare pension plans – (59) (490)
Other, net (125) (265) (2,205)
Income before income taxes and minority interests 2,267 4,130 34,367
Income taxes (Note 8):
Current 869 1,194 9,935
Deferred 53 326 2,712
923 1,520 12,648
Income before minority interests 1,344 2,609 21,710
Minority interests (80) (78) (649)
Net income ¥ 1,264 ¥ 2,530 $ 21,053
See notes to consolidated financial statements.
28 Sekisui Plastics Co., Ltd.
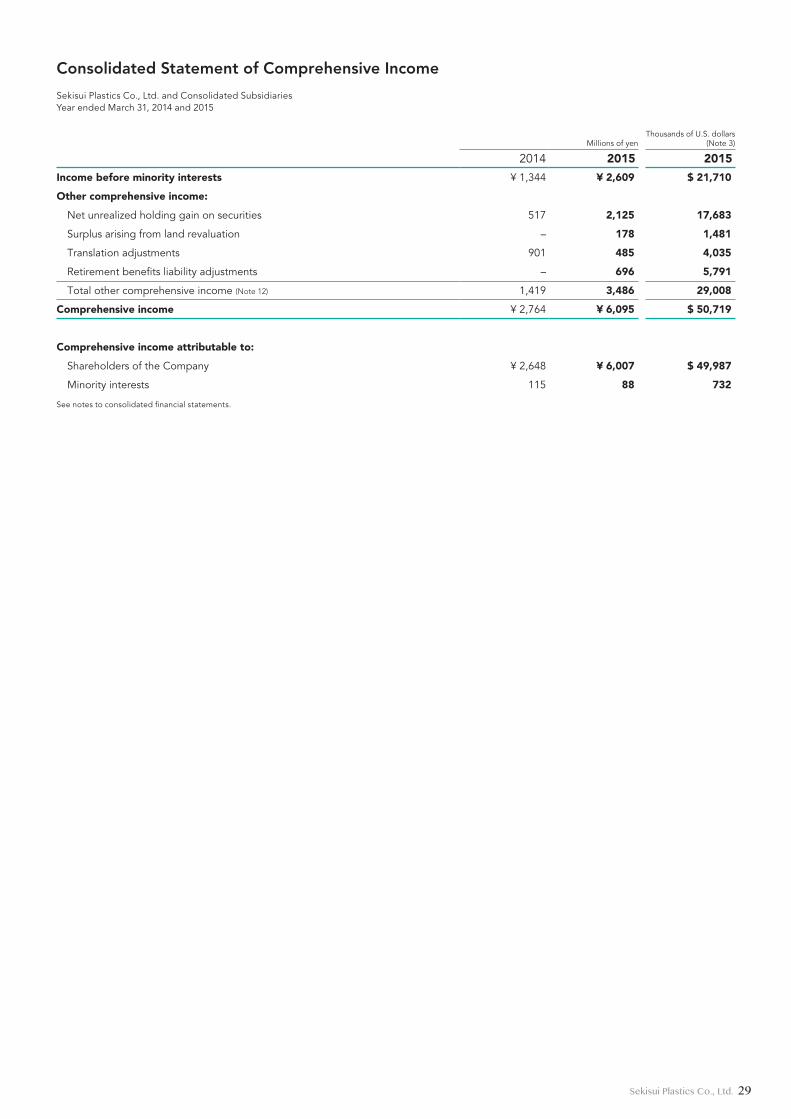
Consolidated Statement of Income
Sekisui Plastics Co., Ltd. and Consolidated SubsidiariesYear ended March 31, 2014 and 2015
Consolidated Statement of Comprehensive Income
Sekisui Plastics Co., Ltd. and Consolidated SubsidiariesYear ended March 31, 2014 and 2015
Millions of yenThousands of U.S. dollars
(Note 3)
2014 2015 2015
Income before minority interests ¥ 1,344 ¥ 2,609 $ 21,710
Other comprehensive income:
Net unrealized holding gain on securities 517 2,125 17,683
Surplus arising from land revaluation – 178 1,481
Translation adjustments 901 485 4,035
Retirement benefits liability adjustments – 696 5,791
Total other comprehensive income (Note 12) 1,419 3,486 29,008
Comprehensive income ¥ 2,764 ¥ 6,095 $ 50,719
Comprehensive income attributable to:
Shareholders of the Company ¥ 2,648 ¥ 6,007 $ 49,987
Minority interests 115 88 732
See notes to consolidated financial statements.
29Sekisui Plastics Co., Ltd.
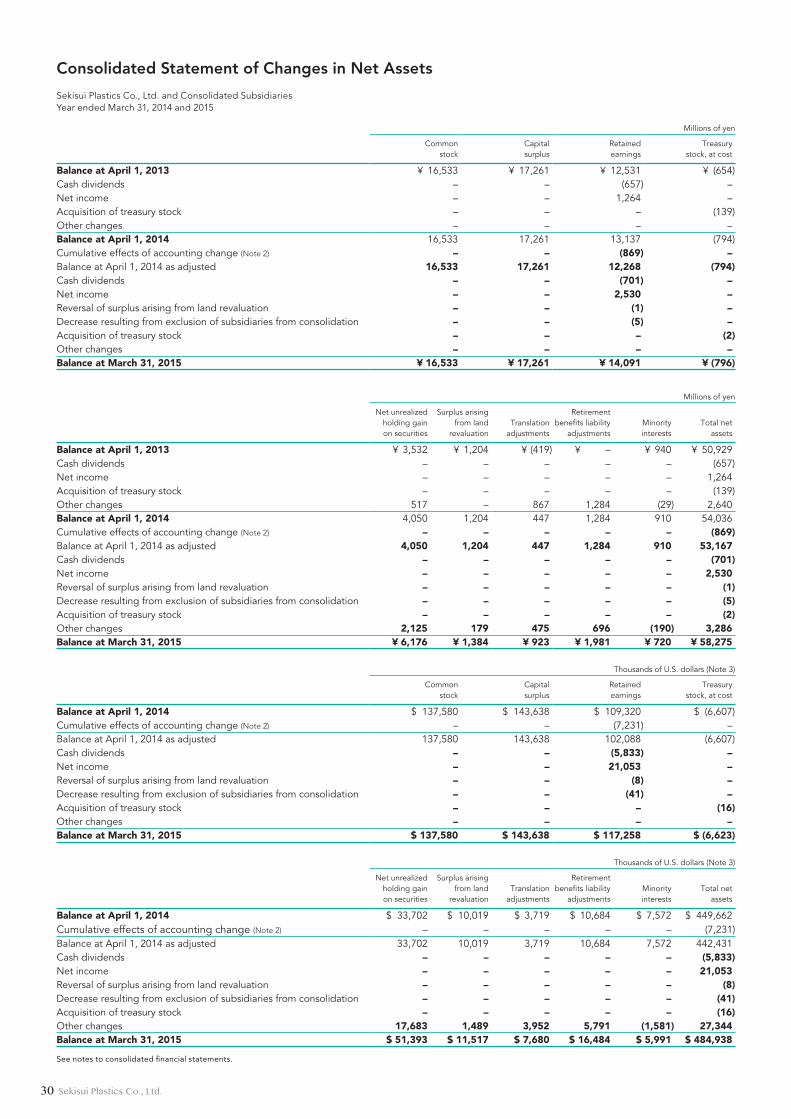
Consolidated Statement of Changes in Net Assets
Sekisui Plastics Co., Ltd. and Consolidated SubsidiariesYear ended March 31, 2014 and 2015
Consolidated Statement of Cash Flows
Sekisui Plastics Co., Ltd. and Consolidated SubsidiariesYear ended March 31, 2014 and 2015
Millions of yen
Commonstock
Capitalsurplus
Retainedearnings
Treasurystock, at cost
Balance at April 1, 2013 ¥ 16,533 ¥ 17,261 ¥ 12,531 ¥ (654)Cash dividends – – (657) –Net income – – 1,264 –Acquisition of treasury stock – – – (139)Other changes – – – –Balance at April 1, 2014 16,533 17,261 13,137 (794)Cumulative effects of accounting change (Note 2) – – (869) –Balance at April 1, 2014 as adjusted 16,533 17,261 12,268 (794)Cash dividends – – (701) –Net income – – 2,530 –Reversal of surplus arising from land revaluation – – (1) –Decrease resulting from exclusion of subsidiaries from consolidation – – (5) –Acquisition of treasury stock – – – (2)Other changes – – – –Balance at March 31, 2015 ¥ 16,533 ¥ 17,261 ¥ 14,091 ¥ (796)
Millions of yen
Net unrealized holding gain on securities
Surplus arising from land
revaluationTranslation
adjustments
Retirement benefits liability
adjustmentsMinorityinterests
Total netassets
Balance at April 1, 2013 ¥ 3,532 ¥ 1,204 ¥ (419) ¥ – ¥ 940 ¥ 50,929Cash dividends – – – – – (657)Net income – – – – – 1,264Acquisition of treasury stock – – – – – (139)Other changes 517 – 867 1,284 (29) 2,640Balance at April 1, 2014 4,050 1,204 447 1,284 910 54,036Cumulative effects of accounting change (Note 2) – – – – – (869)Balance at April 1, 2014 as adjusted 4,050 1,204 447 1,284 910 53,167Cash dividends – – – – – (701)Net income – – – – – 2,530Reversal of surplus arising from land revaluation – – – – – (1)Decrease resulting from exclusion of subsidiaries from consolidation – – – – – (5)Acquisition of treasury stock – – – – – (2)Other changes 2,125 179 475 696 (190) 3,286Balance at March 31, 2015 ¥ 6,176 ¥ 1,384 ¥ 923 ¥ 1,981 ¥ 720 ¥ 58,275
Thousands of U.S. dollars (Note 3)
Commonstock
Capitalsurplus
Retainedearnings
Treasurystock, at cost
Balance at April 1, 2014 $ 137,580 $ 143,638 $ 109,320 $ (6,607)Cumulative effects of accounting change (Note 2) – – (7,231) –Balance at April 1, 2014 as adjusted 137,580 143,638 102,088 (6,607)Cash dividends – – (5,833) –Net income – – 21,053 –Reversal of surplus arising from land revaluation – – (8) –Decrease resulting from exclusion of subsidiaries from consolidation – – (41) –Acquisition of treasury stock – – – (16)Other changes – – – –Balance at March 31, 2015 $ 137,580 $ 143,638 $ 117,258 $ (6,623)
Thousands of U.S. dollars (Note 3)
Net unrealized holding gainon securities
Surplus arising from land
revaluationTranslation
adjustments
Retirement benefits liability
adjustmentsMinorityinterests
Total netassets
Balance at April 1, 2014 $ 33,702 $ 10,019 $ 3,719 $ 10,684 $ 7,572 $ 449,662Cumulative effects of accounting change (Note 2) – – – – – (7,231)Balance at April 1, 2014 as adjusted 33,702 10,019 3,719 10,684 7,572 442,431Cash dividends – – – – – (5,833)Net income – – – – – 21,053Reversal of surplus arising from land revaluation – – – – – (8)Decrease resulting from exclusion of subsidiaries from consolidation – – – – – (41)Acquisition of treasury stock – – – – – (16)Other changes 17,683 1,489 3,952 5,791 (1,581) 27,344Balance at March 31, 2015 $ 51,393 $ 11,517 $ 7,680 $ 16,484 $ 5,991 $ 484,938
See notes to consolidated financial statements.
30 Sekisui Plastics Co., Ltd.
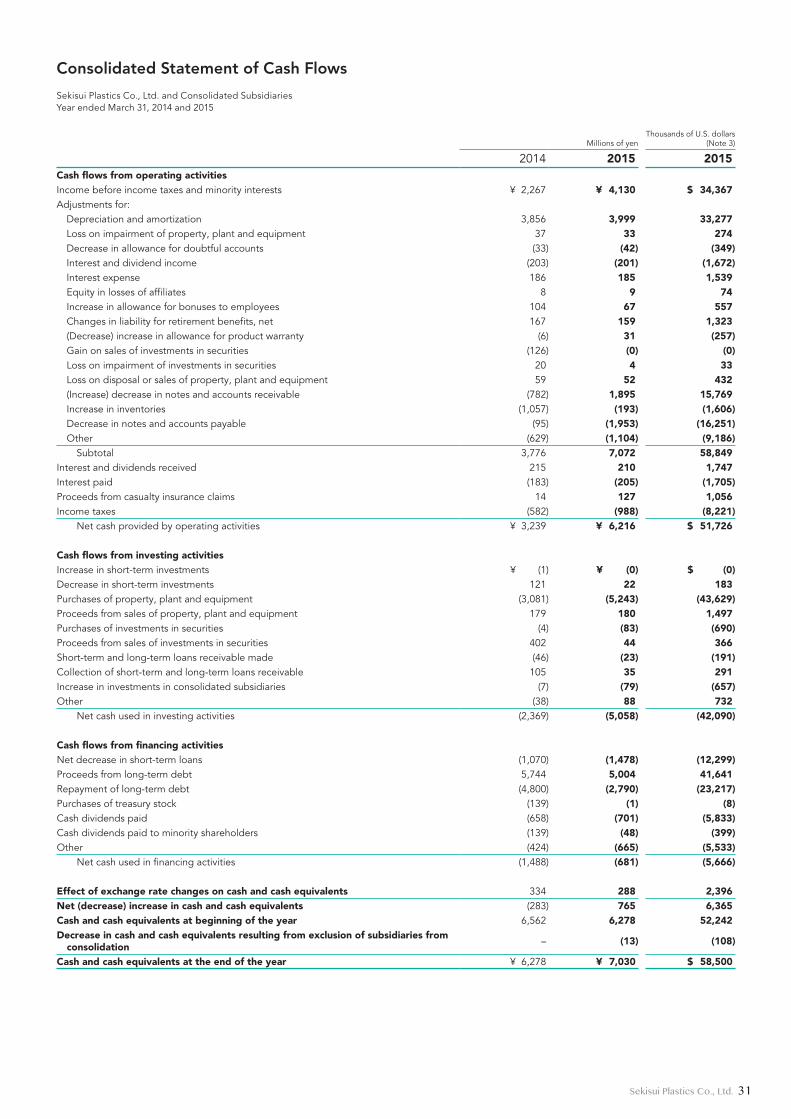
Consolidated Statement of Changes in Net Assets
Sekisui Plastics Co., Ltd. and Consolidated SubsidiariesYear ended March 31, 2014 and 2015
Consolidated Statement of Cash Flows
Sekisui Plastics Co., Ltd. and Consolidated SubsidiariesYear ended March 31, 2014 and 2015
Millions of yenThousands of U.S. dollars
(Note 3)
2014 2015 2015Cash flows from operating activitiesIncome before income taxes and minority interests ¥ 2,267 ¥ 4,130 $ 34,367Adjustments for:
Depreciation and amortization 3,856 3,999 33,277Loss on impairment of property, plant and equipment 37 33 274Decrease in allowance for doubtful accounts (33) (42) (349)Interest and dividend income (203) (201) (1,672)Interest expense 186 185 1,539Equity in losses of affiliates 8 9 74Increase in allowance for bonuses to employees 104 67 557Changes in liability for retirement benefits, net 167 159 1,323(Decrease) increase in allowance for product warranty (6) 31 (257)Gain on sales of investments in securities (126) (0) (0)Loss on impairment of investments in securities 20 4 33Loss on disposal or sales of property, plant and equipment 59 52 432(Increase) decrease in notes and accounts receivable (782) 1,895 15,769Increase in inventories (1,057) (193) (1,606)Decrease in notes and accounts payable (95) (1,953) (16,251)Other (629) (1,104) (9,186)
Subtotal 3,776 7,072 58,849Interest and dividends received 215 210 1,747Interest paid (183) (205) (1,705)Proceeds from casualty insurance claims 14 127 1,056Income taxes (582) (988) (8,221)
Net cash provided by operating activities ¥ 3,239 ¥ 6,216 $ 51,726
Cash flows from investing activitiesIncrease in short-term investments ¥ (1) ¥ (0) $ (0)Decrease in short-term investments 121 22 183Purchases of property, plant and equipment (3,081) (5,243) (43,629)Proceeds from sales of property, plant and equipment 179 180 1,497Purchases of investments in securities (4) (83) (690)Proceeds from sales of investments in securities 402 44 366Short-term and long-term loans receivable made (46) (23) (191)Collection of short-term and long-term loans receivable 105 35 291Increase in investments in consolidated subsidiaries (7) (79) (657)Other (38) 88 732
Net cash used in investing activities (2,369) (5,058) (42,090)
Cash flows from financing activitiesNet decrease in short-term loans (1,070) (1,478) (12,299)Proceeds from long-term debt 5,744 5,004 41,641Repayment of long-term debt (4,800) (2,790) (23,217)Purchases of treasury stock (139) (1) (8)Cash dividends paid (658) (701) (5,833)Cash dividends paid to minority shareholders (139) (48) (399)Other (424) (665) (5,533)
Net cash used in financing activities (1,488) (681) (5,666)
Effect of exchange rate changes on cash and cash equivalents 334 288 2,396Net (decrease) increase in cash and cash equivalents (283) 765 6,365Cash and cash equivalents at beginning of the year 6,562 6,278 52,242Decrease in cash and cash equivalents resulting from exclusion of subsidiaries from
consolidation – (13) (108)
Cash and cash equivalents at the end of the year ¥ 6,278 ¥ 7,030 $ 58,500
31Sekisui Plastics Co., Ltd.
Notes to Consolidated Financial Statements
Sekisui Plastics Co., Ltd. and Consolidated SubsidiariesMarch 31, 2015
(a) Basis of PreparationThe consolidated financial statements of Sekisui Plastics Co., Ltd. (the “Company”) and its consolidated subsidiaries are prepared on the basis of accounting principles generally accepted in Japan, which are different in certain respects as to the application and disclosure requirements of International Financial Reportable Standards, and have been compiled from the consolidated financial statements prepared by the Company as required by the Financial Instruments and Exchange Act of Japan.
In preparing the consolidated financial statements, certain reclassifications and rearrangements have been made to the consolidated financial statements issued domestically in order to present them in a format which is more familiar to readers outside Japan.
Certain reclassifications of previously reported amounts have been made to conform the consolidated financial statements for the year ended March 31, 2014 to the 2015 presentation. Such reclassifications had no effect on consolidated net income.
As permitted by the Financial Instruments and Exchange Act of Japan, amounts of less than one million yen have been omitted. Consequently, the totals shown in the consolidated financial statements do not necessarily agree with the sum of the individual yen and U.S. dollar amounts.
(b) Principles of Consolidation and Accounting for Investments in Unconsolidated Subsidiaries' Affiliates
The consolidated financial statements include the accounts of the Company and its 36 and 32 significant consolidated subsidiaries (collectively, the “Group”) for the years ended March 31, 2014 and 2015, respectively. The Company has applied the equity method to its investment in a significant affiliate for the purpose of the consolidated financial statements for the years ended March 31, 2014 and 2015.
The principles of consolidation are to include significant subsidiaries over which substantial control is exerted either through majority ownership of voting stock and/or by other means. In addition, significant affiliates, over which the Group exercises substantial control in various ways, are accounted for by the equity method.
Other subsidiaries and affiliates are not significant in terms of their total assets, net income or loss, and retained earnings. Accordingly, these other subsidiaries and affiliates have not been consolidated nor are they accounted for by the equity method. Investments in such subsidiaries and affiliates are stated at cost or less. Where there has been a permanent decline in the value of such investments, the Company has written down the investments.
All significant intercompany balances and transactions have been eliminated in the consolidated financial statements.
Goodwill arising from the difference between the purchase cost and the underlying equity in net assets at the respective dates of acquisition is amortized by straight-line method over a period of 5 years. Goodwill is included in other assets.
Effective the year ended March 31, 2015, Sekisui Plastics (Shanghai) Precision Forming Co., Ltd., whose shares were additionally acquired by the Company's subsidiary, has been newly included in consolidation. Its fiscal year end is December 31, and it has been consolidated using provisional financial statements at March 31, 2015.
Effective the year ended March 31, 2015, Sekisui Plastics Tochigi Co., Ltd., Sekisui Plastics Sakura Co., Ltd., and Sekisui Plastics Package Co., Ltd., whose shares were additionally acquired by Sekisui Plastics Ibaraki Co., Ltd., have been eliminated from consolidation. Sekisui Plastics Ibaraki Co., Ltd. changed its company name to Sekisui Plastics Toubu Co., Ltd.
Effective the year ended March 31, 2015, Taiwan Sekisui Centex Co., Ltd., whose shares were additionally acquired by Taiwan Sekisui Yunchu Co., Ltd., has been eliminated from consolidation. Taiwan Sekisui Yunchu Co., Ltd. changed its company name to Sekisui Plastics Taiwan Co., Ltd.
Until the year ended March 31, 2014, 13 overseas consolidated subsidiaries were consolidated on the basis of fiscal year ending December 31, which differs from the balance sheet date of the Company. Accordingly, adjustments had been made for any significant intercompany transactions which took place during the period between the year-end of these overseas consolidated subsidiaries and the year-end of the Company.
Effective from the year ended March 31, 2015, however, the fiscal year-end of certain overseas consolidated subsidiaries has been changed. The fiscal year end of 8 overseas consolidated subsidiaries has been changed to March 31, 2015. The fiscal year-end of 3 overseas consolidated subsidiaries has not been changed, but these consolidated subsidiaries have been consolidated using provisional financial statements at March 31, 2015. The fiscal year-end of 2 overseas consolidated subsidiaries has not been changed and necessary adjustments have been made, the same as in previous fiscal years.
As a result, the consolidated financial statements have been prepared based on financial statements for a 15-month period from January 1, 2014 to March 31, 2015. Net sales, operating income and loss before income taxes and minority interests of these overseas consolidated subsidiaries for the 3 months from January 1, 2014 to March 31, 2014 were ¥3,174 million ($26,412 thousand), ¥27 million ($224 thousand) and ¥5 million ($41 thousand), respectively.
(c) Foreign Currency TranslationThe financial statements of the overseas consolidated subsidiaries are translated into yen at the rates of exchange in effect at the balance sheet date except that the components of net assets excluding minority interests are translated at their historical exchange rates. Differences resulting from translating the financial statements of the overseas consolidated subsidiaries are not included in the determination of net income but are reported as translation adjustments and minority interests in net assets in the consolidated balance sheet.
Revenue and expense items arising from transactions denominated in foreign currencies are generally translated into yen at the rates of exchange in effect at the respective transaction dates.
All monetary assets and liabilities denominated in foreign currencies are translated into yen at the rates of exchange in effect at the balance sheet date and gain or loss on each translation is credited or charged to income.
(d) Cash and Cash EquivalentsCash and cash equivalents include cash on hand and in banks and other highly liquid investments with a maturity of 3 months or less when purchased.
(e) Allowance for Doubtful AccountsThe Group provides an allowance for doubtful accounts at an amount calculated based on their historical experience of bad debts on ordinary receivables plus an additional estimate of probable specific bad debts from customers experiencing financial difficulties.
(f) InventoriesInventories are stated at lower of cost or net selling value, cost being determined by the moving average method.
(g) SecuritiesSecurities are classified into three categories: trading securities, held-to-maturity debt securities and other securities. Trading securities, consisting of debt and marketable equity securities are stated at fair value. Gain or loss, both realized and unrealized, is credited or charged to income. Held-to-maturity debt securities are stated at amortized cost. Marketable securities classified as other securities are carried at fair value with any changes in unrealized holding gain or loss, net of the applicable income taxes, reported as a separate component of accumulated other comprehensive income (loss). Non-marketable securities classified as other securities are carried at cost determined by the moving average method.
(h) Property, Plant and Equipment (except for leased assets)Property, plant and equipment are stated at cost.
Depreciation of buildings (other than structures attached to the buildings) is principally calculated by the straight-line method over the estimated useful lives of the respective assets. Depreciation of other property, plant and equipment is computed by the declining-balance method, except for certain subsidiaries which compute depreciation by the straight-line method over the estimated useful lives of the respective assets.
1. Significant Accounting Policies
32 Sekisui Plastics Co., Ltd.
Notes to Consolidated Financial Statements
Sekisui Plastics Co., Ltd. and Consolidated SubsidiariesMarch 31, 2015
The estimated useful lives of major property, plant and equipment are summarized as follows:
Buildings principally 31 to 38 yearsMachinery principally 8 years
Significant renewals and additions are capitalized at cost. Maintenance and repairs are charged to income as incurred.
(i) Leased AssetsLeased assets under finance lease contracts that do not transfer ownership to the lessee are depreciated to a residual value of zero by the straight-line method using the term of the contract as the useful life.
(j) Income TaxesIncome taxes are calculated on taxable income and charged to income on an accrual basis. Certain temporary differences exist between taxable income and income reported for financial statement purposes which enter into the determination of taxable income in a different period. The Group has recognized the tax effect of such temporary differences in the consolidated financial statements.
The Company and certain domestic consolidated subsidiaries have applied the consolidated taxation system, which allows companies to file tax returns based on the combined profits or losses of the parent company and wholly owned domestic subsidiaries.
(k) Allowance for Bonuses to EmployeesAllowance for bonuses to employees is provided at the estimated amount of bonuses to be paid to the employees in the following year which has been allocated to the current fiscal year.
(l) Allowance for Bonuses to Directors and Corporate AuditorsAllowance for bonuses to directors and corporate auditors is calculated based on the estimated amount of bonuses to be paid to directors and corporate auditors.
(m) Allowance for Product WarrantyAllowance for product warranty is provided based on an estimated amount which is expected to be incurred subsequent to the balance sheet date.
(n) Retirement Benefit Plansi) Method of attributing expected benefits to each period
The retirement benefit obligation for employees is attributed to each period by the benefit formula method over the estimated years of service of the eligible employees.
ii) Amortization method of prior service or service cost and actuarial gain or lossPrior service cost is amortized by the straight-line method over a period of 5 years, which is within the estimated average remaining years of service of
the eligible employees.Actuarial gain or loss is amortized from the year following the year in
which the gain or loss is recognized by the straight-line method over a period of 5 years, which is within the estimated average remaining years of service of the eligible employees.
(o) SoftwareExpenditures relating to computer software developed for internal use are charged to income when incurred, except if these are deemed to contribute to the generation of future income or cost savings. Such expenditures are capitalized as assets and amortized by the straight-line method over their respective estimated useful lives, generally a period of 5 years.
(p) Research and Development Costs Research and development costs are charged to income when incurred.
(q) Hedge AccountingDerivative financial instruments consist principally of interest-rate currency swaps, which are entered into in order to reduce the risk of interest rate and foreign currency exchange rate fluctuations on long-term debt denominated in foreign currencies.
(a) Hedge accounting methodInterest-rate currency swaps that meet special matching criteria are not remeasured at market value, but the differential paid or received under the swap agreements is recognized and included in interest expense or income, and the long-term debt hedged by the swap agreements is translated at the swap contract rate (“integral hedge accounting”).
(b) Hedging instruments and hedged itemsHedging instruments: Interest-rate currency swapsHedged items: Long-term debt denominated in foreign currencies
(c) Hedging policyRules with respect to granting authority to enter into derivative transactions are defined in the Company’s internal regulations. The exposure to interest-rate risk and foreign currency exchange risk is hedged in compliance with these regulations.
(d) Assessing hedge effectivenessWith regard to interest-rate currency swaps accounted for by integral hedge accounting, the evaluation of hedge effectiveness is omitted.
(r) Distribution of Retained EarningsUnder the Corporation Law of Japan, the distribution of retained earnings with respect to a given financial period is made by resolution of the shareholders at a general meeting held subsequent to the close of the financial period. The accounts for that period do not, therefore, reflect such distributions (see Note 17).
The Company and its domestic subsidiaries adopted Section 35 of “Accounting Standard for Retirement Benefits” (ASBJ Statement No. 26 of May 17, 2012) and the main clause of Section 67 of “Guidance on Accounting Standard for Retirement Benefits” (ASBJ Guidance No. 25 of May 17, 2012) effective from April 1, 2014. As a result, the methods for calculating the retirement benefit obligation and service cost have been revised in the following respects: the method for attributing projected benefits to each period has been changed from the straight-line method to the benefit formula method, and the method for determining the discount rate has been changed to use a single weight-average discount rate reflecting the expected timing and amount of benefit payments.
The cumulative effect of changing the methods for calculating the retirement benefit obligation and service cost was recognized by adjusting retained earnings at April 1, 2014, in accordance with the transitional treatment provided in Paragraph 37 of Accounting Standard for Retirement Benefits.
As a result, the asset for retirement benefits decreased by ¥1,349 million ($11,225 thousand), liabilities for retirement benefits increased by ¥0 million ($0 thousand), and retained earnings decreased by ¥869 million ($7,231 thousand) at April 1, 2014, and operating income and income before income taxes and minority interests for the year ended March 31, 2015 increased by ¥52 million ($432 thousand). Further information regarding the impact of the accounting change on amounts per share can be found in Note 15.
The U.S. dollar amounts in the consolidated financial statements have been translated from yen solely for convenience and, as a matter of arithmetic computation only, at ¥120.17 = U.S.$1.00, the exchange rate prevailing on March 31,
2015. This translation should not be construed as a representation that the yen amounts have been, could have been, or could in the future be, converted into U.S. dollars at the above or any other rate.
2. Accounting Change
3. U.S. Dollar Amounts
33Sekisui Plastics Co., Ltd.
(a) Status of Financial InstrumentsThe Group manages fund surpluses only through short-term financial assets. In addition, the Group currently raises capital through bank borrowings. Derivative transactions are not used for speculation, but only used to hedge various risks.
In accordance with the internal business management rules of the Company for managing credit risk arising from notes and accounts receivable, each business section and the sales supervisory department monitor credit worthiness of their customers periodically, and monitor due dates and outstanding balances. Subsidiaries of the Company also manage credit risk in accordance with the Company’s business management rules.
Investments in securities are exposed to market risk. Those securities are composed of mainly the shares of common stock of other companies with which the Group has business relationships. The accounting department, on a quarterly basis, reviews the fair value of such financial instruments.
All notes and accounts payable have payment due dates within one year. Short-term loans are raised mainly in connection with operating activities,
and long-term debt is taken out principally for the purpose of making capital investments. Long-term debt with variable interest rates is exposed to
interest-rate fluctuation risk. Interest-rate currency swaps are used to hedge the risk of interest rate
and foreign currency exchange rate fluctuations on the Group’s long-term debt denominated in foreign currencies.
Derivative transactions are not used for speculation, but only used to manage various market risks and to reduce those risks.
Further information regarding the method of hedge accounting can be found in Note 1(q).
Trade payables, short-term loans and long-term debt are exposed to liquidity risk. The Company has established a commitment line, and makes efforts to ensure diverse sources of financing. Each component of the Group also prepares monthly cash flow plans to manage liquidity risk.
(b) Estimated Fair Value of Financial InstrumentsCarrying amount, estimated fair value and the difference between them for financial instruments on the consolidated balance sheet as of March 31, 2014 and 2015 are shown in the following table. The following table does not include financial instruments for which it is extremely difficult to determine the fair value.
4. Financial Instruments
Methods to determine the estimated fair value of financial instruments and other matters related to securities are as follows:Assets:
Cash and cash equivalents, short-term investments and notes and accounts receivable:Since cash and cash equivalents, short-term investments and notes and accounts receivable are settled in a short period of time, their carrying amounts approximate the fair value.
Investments in securities:The fair values of other investments in securities are based on quoted market prices. For information on securities classified by purpose of holding, please refer to Note 5.
Liabilities:Notes and accounts payable and short-term loans:Since notes and accounts payable and short-term loans are settled in a short period of time, their carrying amounts approximate the fair value.
Long-term debt:The fair value of long-term debt is based on the present value of the total of principal and interest discounted by the interest rate to be applied if similar new borrowings were entered into. The fair value of long-term debt with variable interest rates hedged with interest-rate swaps which qualify for hedge accounting and meet special matching criteria is calculated by discounting the sum of principal and interest, including the difference paid or received under the swap agreements, with the rate which would be applied if a similar new borrowing were entered into.
Unlisted equity securities in the amount of ¥1,081 million and ¥1,072 million ($8,920 thousand) at March 31, 2014 and 2015 are not included in investments in securities in the preceding table since it is extremely difficult to determine their fair value at March 31, 2014 and 2015.
Millions of yen
2014 2015
Carrying amount
Estimated fair value Difference
Carrying amount
Estimated fair value Difference
Cash and cash equivalents ¥ 6,278 ¥ 6,278 ¥ – ¥ 7,030 ¥ 7,030 ¥ –Short-term investments 21 21 – 2 2 –Notes and accounts receivable 31,292 31,292 – 29,776 29,776 –Investments in securities 9,092 9,092 – 12,046 12,046 –Total assets ¥ 46,685 ¥ 46,685 ¥ – ¥ 48,856 ¥ 48,856 ¥ –
Notes and accounts payable ¥ 24,271 ¥ 24,271 ¥ – ¥ 23,151 ¥ 23,151 ¥ –Short-term loans 6,314 6,314 – 4,895 4,895 –Long-term debt* 12,251 12,326 74 14,572 14,658 86Total liabilities ¥ 42,837 ¥ 42,911 ¥ 74 ¥ 42,619 ¥ 42,705 ¥ 86
Thousands of U.S. dollars
2015
Carrying amount
Estimated fair value Difference
Cash and cash equivalents $ 58,500 $ 58,500 $ –Short-term investments 16 16 –Notes and accounts receivable 247,782 247,782 –Investments in securities 100,241 100,241 –Total assets $ 406,557 $ 406,557 $ –
Notes and accounts payable $ 192,652 $ 192,652 $ –Short-term loans 40,733 40,733 –Long-term debt* 121,261 121,977 715Total liabilities $ 354,655 $ 355,371 $ 715
*Includes current portion of long-term debt of ¥2,771 million and ¥1,733 million ($14,421 thousand) at March 31, 2014 and 2015, respectively.
34 Sekisui Plastics Co., Ltd.
Unlisted equity securities in the amount of ¥170 million and ¥174 million ($1,447 thousand) at March 31, 2014 and 2015 are not included in equity
securities in the above table since it is extremely difficult to determine their fair value at March 31, 2014 and 2015.
The redemption schedule at March 31, 2015 for deposits and notes and accounts receivable with maturity dates is summarized as follows:
The redemption schedule for long-term debt is disclosed in Note 7.
Millions of yen Thousands of U.S. dollars
2015 2015Within 1 year Within 1 year
Deposits ¥ 6,999 $ 58,242Notes and accounts receivable 29,776 247,782Total ¥ 36,776 $ 306,033
Millions of yen
2014 2015
Acquisition cost
Carrying value
Unrealized holding gain (loss)
Acquisition cost
Carrying value
Unrealized holding gain (loss)
Securities whose carrying value exceeds their acquisition cost:Equity securities ¥ 2,933 ¥ 8,663 ¥ 5,729 ¥ 3,438 ¥ 12,046 ¥ 8,608
Securities whose acquisition cost exceeds their carrying value:Equity securities 438 428 (9) – – –
Total ¥ 3,372 ¥ 9,092 ¥ 5,720 ¥ 3,438 ¥ 12,046 ¥ 8,608
Thousands of U.S. dollars
2015
Acquisition cost
Carrying value
Unrealized holding gain (loss)
Securities whose carrying value exceeds their acquisition cost:Equity securities $ 28,609 $ 100,241 $ 71,631
Securities whose acquisition cost exceeds their carrying value:Equity securities – – –
Total $ 28,609 $ 100,241 $ 71,631
Millions of yen Thousands of U.S. dollars
2014 2015 2015Proceeds from sales ¥ 402 ¥ 44 $ 366Gross realized gain 126 0 0
Marketable securities classified as other securities at March 31, 2014 and 2015 were as follows:
The proceeds from sales of, and gross realized gain or loss on, investments in securities for the years ended March 31, 2014 and 2015 are summarized as follows:
5. Investments in Securities
35Sekisui Plastics Co., Ltd.
Short-term loans at March 31, 2014 and 2015 represented loans in the form of deeds and overdrafts at interest rates ranging from 0.36% to 3.82% and from
0.34% to 3.20% per annum, respectively.
7. Short-Term Loans and Long-Term Debt
Millions of yenThousands of
U.S. dollars
2014 2015 2015Unsecured loans from banks and insurance companies, payable in Japanese yen, at rates ranging from 0.15% to 1.93% ¥ 8,460 ¥ 12,900 $ 107,347Unsecured loans from banks, payable in U.S. dollars, at rates ranging from 0.73% to 2.48% 3,253 706 5,875Unsecured loans from banks, payable in Euro, at a rate of 1.33% 322 222 1,847Unsecured loans from banks, payable in Taiwan dollars, at a rate of 4.25% – 576 4,793Unsecured loans from banks, payable in Thai baht, at a rate of 4.25% 216 166 1,381Total 12,251 14,572 121,261Less current portion (2,771) (1,733) (14,421)
¥ 9,480 ¥ 12,839 $ 106,840
Long-term debt at March 31, 2014 and 2015 was composed of the following:
Millions of yen Thousands of U.S. dollars
Years ending March 31, 2015 20152016 ¥ 1,733 $ 14,4212017 2,735 22,7592018 2,524 21,0032019 5,509 45,8432020 and thereafter 2,069 17,217Total ¥ 14,572 $ 121,261
The aggregate annual maturities of long-term debt subsequent to March 31, 2015 are summarized as follows:
Millions of yen Thousands of U.S. dollars
2014 2015 2015Merchandise, finished goods semi-finished goods ¥ 6,987 ¥ 7,646 $ 63,626Work in process goods 174 96 798Raw materials and supplies 2,591 2,385 19,846Total ¥ 9,754 ¥ 10,128 $ 84,280
Inventories at March 31, 2014 and 2015 were composed of the following:
6. Inventories
36 Sekisui Plastics Co., Ltd.
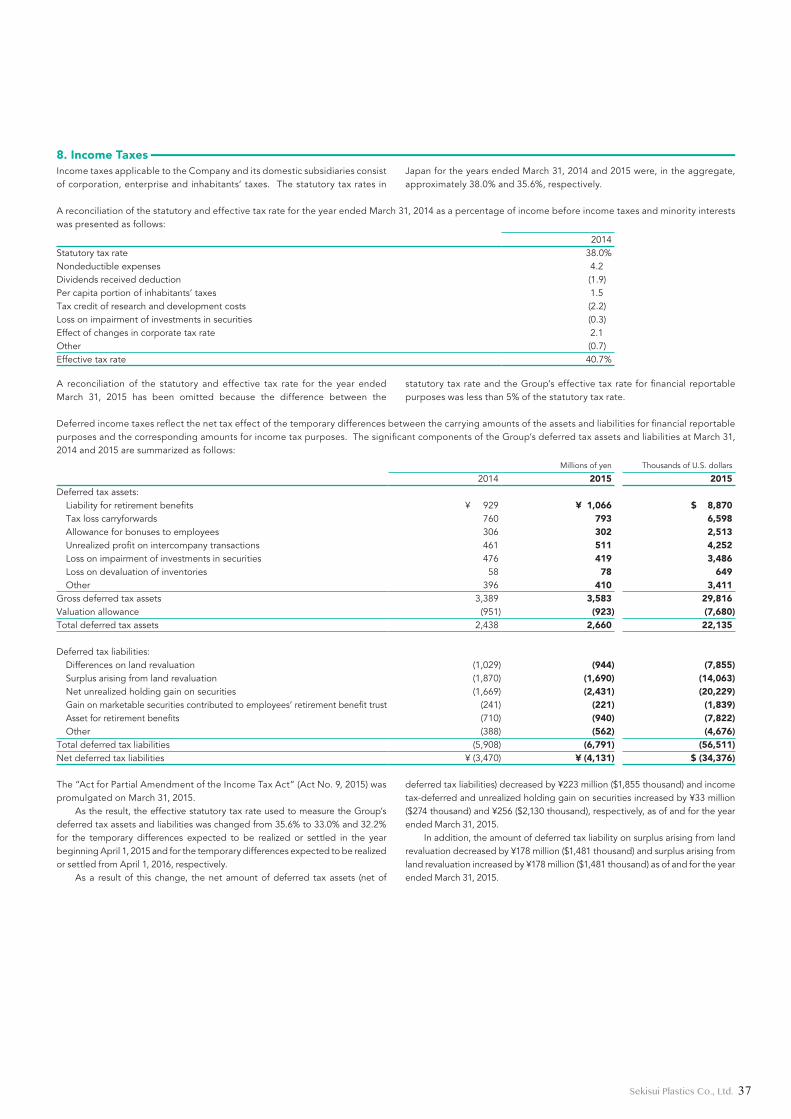
Millions of yen Thousands of U.S. dollars
2014 2015 2015Deferred tax assets:
Liability for retirement benefits ¥ 929 ¥ 1,066 $ 8,870Tax loss carryforwards 760 793 6,598Allowance for bonuses to employees 306 302 2,513Unrealized profit on intercompany transactions 461 511 4,252Loss on impairment of investments in securities 476 419 3,486Loss on devaluation of inventories 58 78 649Other 396 410 3,411
Gross deferred tax assets 3,389 3,583 29,816Valuation allowance (951) (923) (7,680)Total deferred tax assets 2,438 2,660 22,135
Deferred tax liabilities:Differences on land revaluation (1,029) (944) (7,855)Surplus arising from land revaluation (1,870) (1,690) (14,063)Net unrealized holding gain on securities (1,669) (2,431) (20,229)Gain on marketable securities contributed to employees’ retirement benefit trust (241) (221) (1,839)Asset for retirement benefits (710) (940) (7,822)Other (388) (562) (4,676)
Total deferred tax liabilities (5,908) (6,791) (56,511)Net deferred tax liabilities ¥ (3,470) ¥ (4,131) $ (34,376)
2014Statutory tax rate 38.0%Nondeductible expenses 4.2Dividends received deduction (1.9)Per capita portion of inhabitants’ taxes 1.5Tax credit of research and development costs (2.2)Loss on impairment of investments in securities (0.3)Effect of changes in corporate tax rate 2.1Other (0.7)Effective tax rate 40.7%
Deferred income taxes reflect the net tax effect of the temporary differences between the carrying amounts of the assets and liabilities for financial reportable purposes and the corresponding amounts for income tax purposes. The significant components of the Group’s deferred tax assets and liabilities at March 31, 2014 and 2015 are summarized as follows:
Income taxes applicable to the Company and its domestic subsidiaries consist of corporation, enterprise and inhabitants’ taxes. The statutory tax rates in
Japan for the years ended March 31, 2014 and 2015 were, in the aggregate, approximately 38.0% and 35.6%, respectively.
A reconciliation of the statutory and effective tax rate for the year ended March 31, 2015 has been omitted because the difference between the
statutory tax rate and the Group’s effective tax rate for financial reportable purposes was less than 5% of the statutory tax rate.
The “Act for Partial Amendment of the Income Tax Act” (Act No. 9, 2015) was promulgated on March 31, 2015.
As the result, the effective statutory tax rate used to measure the Group’s deferred tax assets and liabilities was changed from 35.6% to 33.0% and 32.2% for the temporary differences expected to be realized or settled in the year beginning April 1, 2015 and for the temporary differences expected to be realized or settled from April 1, 2016, respectively.
As a result of this change, the net amount of deferred tax assets (net of
deferred tax liabilities) decreased by ¥223 million ($1,855 thousand) and income tax-deferred and unrealized holding gain on securities increased by ¥33 million ($274 thousand) and ¥256 ($2,130 thousand), respectively, as of and for the year ended March 31, 2015.
In addition, the amount of deferred tax liability on surplus arising from land revaluation decreased by ¥178 million ($1,481 thousand) and surplus arising from land revaluation increased by ¥178 million ($1,481 thousand) as of and for the year ended March 31, 2015.
A reconciliation of the statutory and effective tax rate for the year ended March 31, 2014 as a percentage of income before income taxes and minority interests was presented as follows:
8. Income Taxes
37Sekisui Plastics Co., Ltd.
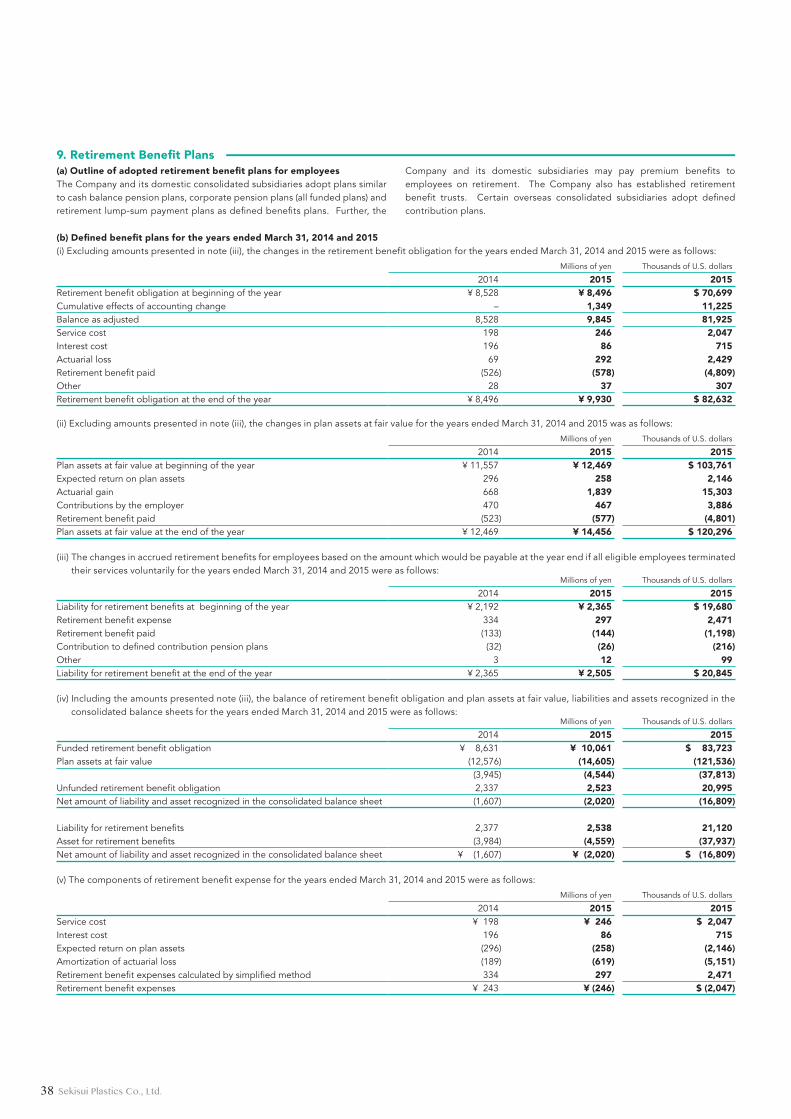
9. Retirement Benefit Plans
(b) Defined benefit plans for the years ended March 31, 2014 and 2015
(a) Outline of adopted retirement benefit plans for employeesThe Company and its domestic consolidated subsidiaries adopt plans similar to cash balance pension plans, corporate pension plans (all funded plans) and retirement lump-sum payment plans as defined benefits plans. Further, the
Company and its domestic subsidiaries may pay premium benefits to employees on retirement. The Company also has established retirement benefit trusts. Certain overseas consolidated subsidiaries adopt defined contribution plans.
(ii) Excluding amounts presented in note (iii), the changes in plan assets at fair value for the years ended March 31, 2014 and 2015 was as follows:
(iii) The changes in accrued retirement benefits for employees based on the amount which would be payable at the year end if all eligible employees terminated their services voluntarily for the years ended March 31, 2014 and 2015 were as follows:
(iv) Including the amounts presented note (iii), the balance of retirement benefit obligation and plan assets at fair value, liabilities and assets recognized in the consolidated balance sheets for the years ended March 31, 2014 and 2015 were as follows:
(v) The components of retirement benefit expense for the years ended March 31, 2014 and 2015 were as follows:
(i) Excluding amounts presented in note (iii), the changes in the retirement benefit obligation for the years ended March 31, 2014 and 2015 were as follows:
Millions of yen Thousands of U.S. dollars
2014 2015 2015Retirement benefit obligation at beginning of the year ¥ 8,528 ¥ 8,496 $ 70,699Cumulative effects of accounting change – 1,349 11,225Balance as adjusted 8,528 9,845 81,925Service cost 198 246 2,047Interest cost 196 86 715Actuarial loss 69 292 2,429Retirement benefit paid (526) (578) (4,809)Other 28 37 307Retirement benefit obligation at the end of the year ¥ 8,496 ¥ 9,930 $ 82,632
Millions of yen Thousands of U.S. dollars
2014 2015 2015Plan assets at fair value at beginning of the year ¥ 11,557 ¥ 12,469 $ 103,761Expected return on plan assets 296 258 2,146Actuarial gain 668 1,839 15,303Contributions by the employer 470 467 3,886Retirement benefit paid (523) (577) (4,801)Plan assets at fair value at the end of the year ¥ 12,469 ¥ 14,456 $ 120,296
Millions of yen Thousands of U.S. dollars
2014 2015 2015Liability for retirement benefits at beginning of the year ¥ 2,192 ¥ 2,365 $ 19,680Retirement benefit expense 334 297 2,471Retirement benefit paid (133) (144) (1,198)Contribution to defined contribution pension plans (32) (26) (216)Other 3 12 99Liability for retirement benefit at the end of the year ¥ 2,365 ¥ 2,505 $ 20,845
Millions of yen Thousands of U.S. dollars
2014 2015 2015Service cost ¥ 198 ¥ 246 $ 2,047Interest cost 196 86 715Expected return on plan assets (296) (258) (2,146)Amortization of actuarial loss (189) (619) (5,151)Retirement benefit expenses calculated by simplified method 334 297 2,471Retirement benefit expenses ¥ 243 ¥ (246) $ (2,047)
Millions of yen Thousands of U.S. dollars
2014 2015 2015Funded retirement benefit obligation ¥ 8,631 ¥ 10,061 $ 83,723Plan assets at fair value (12,576) (14,605) (121,536)
(3,945) (4,544) (37,813)Unfunded retirement benefit obligation 2,337 2,523 20,995Net amount of liability and asset recognized in the consolidated balance sheet (1,607) (2,020) (16,809)
Liability for retirement benefits 2,377 2,538 21,120Asset for retirement benefits (3,984) (4,559) (37,937)Net amount of liability and asset recognized in the consolidated balance sheet ¥ (1,607) ¥ (2,020) $ (16,809)
38 Sekisui Plastics Co., Ltd.
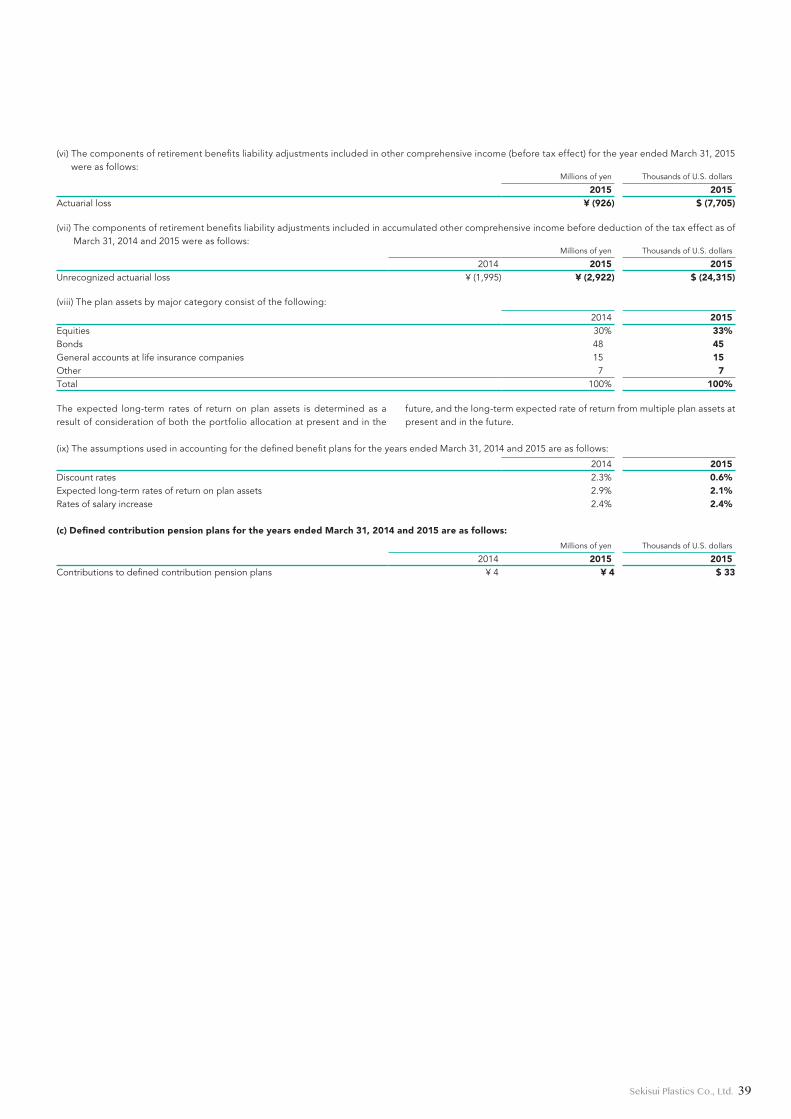
(vi) The components of retirement benefits liability adjustments included in other comprehensive income (before tax effect) for the year ended March 31, 2015 were as follows:
The expected long-term rates of return on plan assets is determined as a result of consideration of both the portfolio allocation at present and in the
future, and the long-term expected rate of return from multiple plan assets at present and in the future.
Millions of yen Thousands of U.S. dollars
2015 2015Actuarial loss ¥ (926) $ (7,705)
2014 2015Equities 30% 33%Bonds 48 45General accounts at life insurance companies 15 15Other 7 7Total 100% 100%
2014 2015Discount rates 2.3% 0.6%Expected long-term rates of return on plan assets 2.9% 2.1%Rates of salary increase 2.4% 2.4%
(vii) The components of retirement benefits liability adjustments included in accumulated other comprehensive income before deduction of the tax effect as of March 31, 2014 and 2015 were as follows:
(viii) The plan assets by major category consist of the following:
(ix) The assumptions used in accounting for the defined benefit plans for the years ended March 31, 2014 and 2015 are as follows:
(c) Defined contribution pension plans for the years ended March 31, 2014 and 2015 are as follows:
Millions of yen Thousands of U.S. dollars
2014 2015 2015Unrecognized actuarial loss ¥ (1,995) ¥ (2,922) $ (24,315)
Millions of yen Thousands of U.S. dollars
2014 2015 2015Contributions to defined contribution pension plans ¥ 4 ¥ 4 $ 33
39Sekisui Plastics Co., Ltd.
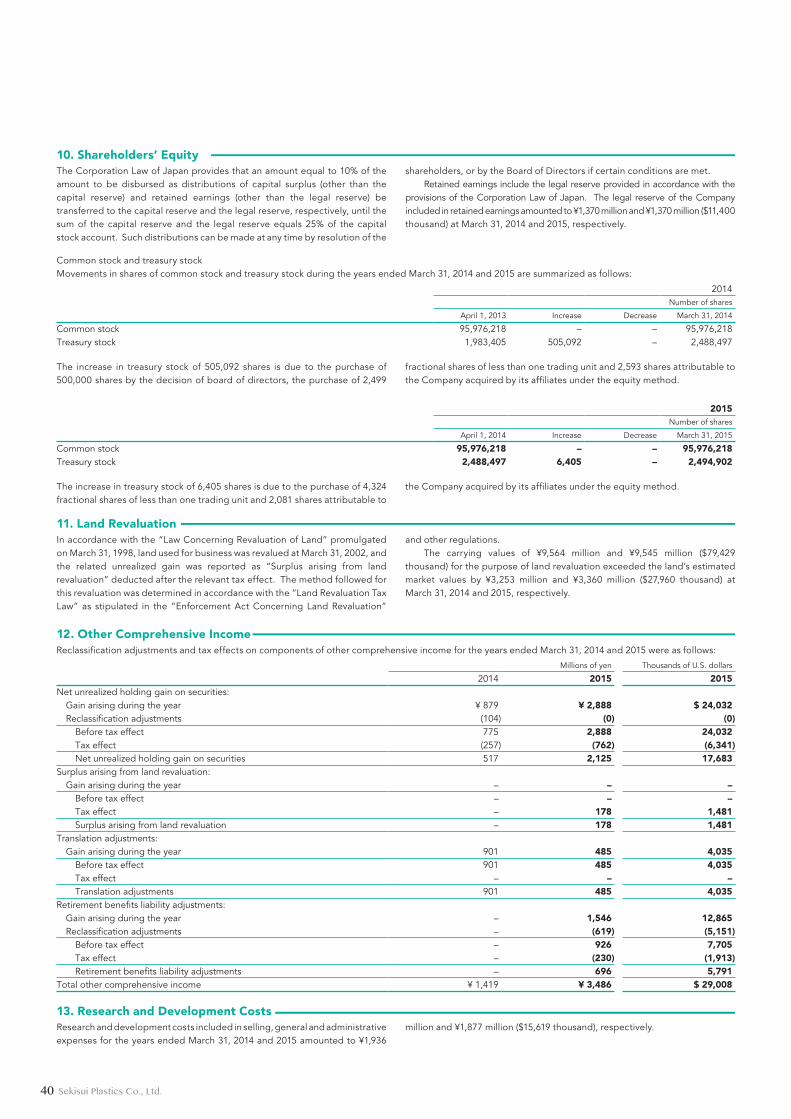
2014Number of shares
April 1, 2013 Increase Decrease March 31, 2014
Common stock 95,976,218 – – 95,976,218Treasury stock 1,983,405 505,092 – 2,488,497
2015Number of shares
April 1, 2014 Increase Decrease March 31, 2015
Common stock 95,976,218 – – 95,976,218Treasury stock 2,488,497 6,405 – 2,494,902
Common stock and treasury stockMovements in shares of common stock and treasury stock during the years ended March 31, 2014 and 2015 are summarized as follows:
The increase in treasury stock of 505,092 shares is due to the purchase of 500,000 shares by the decision of board of directors, the purchase of 2,499
fractional shares of less than one trading unit and 2,593 shares attributable to the Company acquired by its affiliates under the equity method.
The increase in treasury stock of 6,405 shares is due to the purchase of 4,324 fractional shares of less than one trading unit and 2,081 shares attributable to
the Company acquired by its affiliates under the equity method.
In accordance with the “Law Concerning Revaluation of Land” promulgated on March 31, 1998, land used for business was revalued at March 31, 2002, and the related unrealized gain was reported as “Surplus arising from land revaluation” deducted after the relevant tax effect. The method followed for this revaluation was determined in accordance with the “Land Revaluation Tax Law” as stipulated in the “Enforcement Act Concerning Land Revaluation”
and other regulations.The carrying values of ¥9,564 million and ¥9,545 million ($79,429
thousand) for the purpose of land revaluation exceeded the land’s estimated market values by ¥3,253 million and ¥3,360 million ($27,960 thousand) at March 31, 2014 and 2015, respectively.
11. Land Revaluation
Millions of yen Thousands of U.S. dollars
2014 2015 2015Net unrealized holding gain on securities:
Gain arising during the year ¥ 879 ¥ 2,888 $ 24,032Reclassification adjustments (104) (0) (0)
Before tax effect 775 2,888 24,032Tax effect (257) (762) (6,341)Net unrealized holding gain on securities 517 2,125 17,683
Surplus arising from land revaluation:Gain arising during the year – – –
Before tax effect – – –Tax effect – 178 1,481Surplus arising from land revaluation – 178 1,481
Translation adjustments:Gain arising during the year 901 485 4,035
Before tax effect 901 485 4,035Tax effect – – –Translation adjustments 901 485 4,035
Retirement benefits liability adjustments:Gain arising during the year – 1,546 12,865Reclassification adjustments – (619) (5,151)
Before tax effect – 926 7,705Tax effect – (230) (1,913)Retirement benefits liability adjustments – 696 5,791
Total other comprehensive income ¥ 1,419 ¥ 3,486 $ 29,008
Reclassification adjustments and tax effects on components of other comprehensive income for the years ended March 31, 2014 and 2015 were as follows:
12. Other Comprehensive Income
Research and development costs included in selling, general and administrative expenses for the years ended March 31, 2014 and 2015 amounted to ¥1,936
million and ¥1,877 million ($15,619 thousand), respectively.
13. Research and Development Costs
10. Shareholders’ EquityThe Corporation Law of Japan provides that an amount equal to 10% of the amount to be disbursed as distributions of capital surplus (other than the capital reserve) and retained earnings (other than the legal reserve) be transferred to the capital reserve and the legal reserve, respectively, until the sum of the capital reserve and the legal reserve equals 25% of the capital stock account. Such distributions can be made at any time by resolution of the
shareholders, or by the Board of Directors if certain conditions are met.Retained earnings include the legal reserve provided in accordance with the
provisions of the Corporation Law of Japan. The legal reserve of the Company included in retained earnings amounted to ¥1,370 million and ¥1,370 million ($11,400 thousand) at March 31, 2014 and 2015, respectively.
40 Sekisui Plastics Co., Ltd.
Yen U.S. dollars
2014 2015 2015Basic net income ¥ 13.48 ¥ 27.07 $ 0.22Net assets 568.26 615.68 5.12Cash dividends 7.00 9.00 0.07
Millions of yen Thousands of U.S. dollars
2014 2015 2015Net income ¥ 1,264 ¥ 2,530 $ 21,053Adjusted net income available for distribution to common stockholders ¥ 1,264 ¥ 2,530 $ 21,053
Thousands of shares
2014 2015Weighted-average number of shares of common stock outstanding 93,798 93,484
Millions of yen Thousands of U.S. dollars
2014 2015 2015Total net assets ¥ 54,036 ¥ 58,275 $ 484,938Deductions from total net assets:
Minority interests 910 720 5,991Total net assets available to common stockholders ¥ 53,125 ¥ 57,554 $ 478,938
Thousands of shares
2014 2015Number of shares of common stock used in the calculation of net assets per share 93,487 93,481
Basic net income per share has been computed based on net income available for distribution to shareholders of common stock and the weighted-average number of shares of common stock outstanding during the year. Diluted net income per share has not been presented for the years ended March 31, 2014 and 2015 since neither the Company nor any of the consolidated subsidiaries had any potentially dilutive shares at March 31, 2014 and 2015.
The amounts per share of net assets have been computed based on the number of shares of common stock outstanding at the year end.
Cash dividends per share represent the cash dividends proposed by the Board of Directors as applicable to the respective years together with the interim cash dividends paid.
As described in Note 1(n) concerning the application of the Accounting Standard for Retirement Benefits, based on the provisional treatment set out in Section 37 of the standard, the effects of such changes in the year ended March 31, 2015 have been recorded in retirement benefits liability adjustments
through accumulated other comprehensive income. As a result, net assets per share decreased by ¥9.30 ($0.07) and net income per share increased ¥0.56 ($0.00) as of and for the year ended March 31, 2015.
The financial data used in the computation of basic net income per share based on the above method for the years ended March 31, 2014 and 2015 is summarized as follows:
The financial data used in the computation of net assets per share based on the above method at March 31, 2014 and 2015 is summarized as follows:
15. Amounts per Share
The estimated fair value of derivative instruments outstanding at March 31, 2015 for which hedge accounting has been applied is summarized as follows:
14. Derivatives and Hedge Accounting
Millions of yen
2015Notional amount
TotalMaturing after
one year Fair value
Interest-rate currency swaps hedging long-term debt, accounted for by integral hedge accounting:Receivable/floating and U.S. dollar ¥ 3,000 ¥ 3,000 (*)Payable/fixed and Japanese yen
Thousands of U.S. dollars
2015Notional amount
TotalMaturing after
one year Fair value
Interest-rate currency swaps hedging long-term debt, accounted for by integral hedge accounting:Receivable/floating and U.S. dollar $ 24,964 $ 24,964 (*)Payable/fixed and Japanese yen
(*) Fair value of interest-rate currency swaps accounted for by integral hedge accounting is included in the estimated fair value of the underlying long-term debt in Note 4.
41Sekisui Plastics Co., Ltd.
Millions of yen
2014Reportable segments
Adjustments and eliminations (*1) ConsolidatedHuman Life Industry Total
Sales, income and assets by reportable segments:Sales to third parties ¥ 72,703 ¥ 37,219 ¥ 109,923 ¥ – ¥ 109,923Inter-segment sales and transfers 2,437 1,614 4,052 (4,052) –Total ¥ 75,141 ¥ 38,834 ¥ 113,975 ¥ (4,052) ¥ 109,923Segment income (*2) ¥ 1,339 ¥ 1,705 ¥ 3,044 ¥ (837) ¥ 2,206Segment assets 68,107 30,018 98,126 12,561 110,687
Other items:Depreciation and amortization ¥ 2,075 ¥ 1,300 ¥ 3,376 ¥ 479 ¥ 3,856Amortization of goodwill (1) – (1) – (1)Interest income 0 9 9 3 12Interest expense 793 227 1,021 (835) 186Equity in losses of affiliates 8 – 8 – 8Gain on negative goodwill – 1 1 – 1Loss on impairment of fixed assets 37 – 37 – 37Investments in affiliates accounted for by the equity method 375 – 375 – 375Increase in property, plant and equipment and intangible assets 1,665 1,537 3,203 231 3,434
Millions of yen
2015Reportable segments
Adjustments and eliminations (*1) ConsolidatedHuman Life Industry Total
Sales, income and assets by reportable segments:Sales to third parties ¥ 70,201 ¥ 43,458 ¥ 113,660 ¥ – ¥ 113,660Inter-segment sales and transfers 3,078 2,196 5,275 (5,275) –Total ¥ 73,280 ¥ 45,655 ¥ 118,935 ¥ (5,275) ¥ 113,660Segment income (*2) ¥ 2,083 ¥ 2,289 ¥ 4,373 ¥ (192) ¥ 4,180Segment assets 66,411 37,010 103,422 12,778 116,201
Other items:Depreciation and amortization ¥ 1,914 ¥ 1,669 ¥ 3,584 ¥ 415 ¥ 3,999Amortization of goodwill (1) – (1) – (1)Interest income 0 12 12 1 14Interest expense 785 221 1,007 (821) 185Equity in losses of affiliates 9 – 9 – 9Gain on negative goodwill – 231 231 – 231Loss on impairment of fixed assets – 11 11 22 33Investments in affiliates accounted for by the equity method 365 – 365 – 365Increase in property, plant and equipment and intangible assets 1,854 3,761 5,615 293 5,908
Information by reportable segment for the years ended March 31, 2014 and 2015 is as follows:(c) Information on sales, income, assets and other items of each reportable segment
16. Segment Information(a) Outline of segment informationThe Group’s business mainly involves the manufacturing and sales of plastic products. The Company has established departments based on product markets or product function for global development in the two fields of “Human Life” and “Industry.” Each department has works closely with subsidiaries to plan overall strategies and operate its business.
Accordingly, the Group’s reportable segments are “Human Life” and “Industry.”
These reportable segments of the Group are components for which discrete financial information is available and whose operating results are regularly reviewed by the Board of Directors to make decisions about resource allocation and to assess performance.
The main products in the Human Life segment are boxes/trays for agricultural/fishery products, food containers, housing and civil engineering
materials, etc., while the main products in the Industry segment are automobile components, digital consumer electronics components, packaging materials, and other related products.
(b) Calculation methods used for sales, income, assets and other items of each reportable segment
The accounting policies of the segments are substantially the same as those described in significant accounting policies in Note 1.
Segment income represents ordinary income, which consists of operating income and nonoperating income/expenses. Nonoperating income/expenses mainly include interest income, dividend income, interest expense, equity in net income (loss) of affiliates. Intersegment sales are recorded at the same price used in transactions with third parties.
42 Sekisui Plastics Co., Ltd.
Thousands of U.S. dollars
2015Reportable segments
Adjustments and eliminations (*1) ConsolidatedHuman Life Industry Total
Sales, income and assets by reportable segments:Sales to third parties $ 584,180 $ 361,637 $ 945,826 $ – $ 945,826Inter-segment sales and transfers 25,613 18,274 43,896 (43,896) –Total $ 609,802 $ 379,920 $ 989,722 $ (43,896) $ 945,826Segment income (*2) $ 17,333 $ 19,048 $ 36,390 $ (1,597) $ 34,784Segment assets 552,642 307,980 860,630 106,332 966,971
Other items:Depreciation and amortization $ 15,927 $ 13,888 $ 29,824 $ 3,453 $ 33,277Amortization of goodwill (8) – (8) – (8)Interest income 0 99 99 8 116Interest expense 6,532 1,839 8,379 (6,831) 1,539Equity in losses of affiliates 74 – 74 – 74Gain on negative goodwill – 1,922 1,922 – 1,922Loss on impairment of fixed assets – 91 91 183 274Investments in affiliates accounted for by the equity method 3,037 – 3,037 – 3,037Increase in property, plant and equipment and intangible assets 15,428 31,297 46,725 2,438 49,163
(*1) Adjustments and eliminations in the preceding tables were as follows:(i) Segment income in the amounts of ¥837 million and ¥192 million ($1,597 thousand) for the years ended March 31, 2014 and 2015 consist of elimination
of inter-segment transactions in the amounts of ¥0 million and ¥0 million ($0 thousand), unallocable expenses in the amounts of ¥838 million and ¥192 million ($1,597 thousand) and unrealized gain on property, plant and equipment in the amounts of ¥0 million and ¥(0) million ($(0) thousand), respectively.
(ii) Segment assets in the amounts of ¥12,561 million and ¥12,778 million ($106,332 thousand) for the years ended March 31, 2014 and 2015, respectively, mainly consisted of investments in securities and assets related to administrative departments and the Central R&D Laboratory owned by the Company.
(iii) Depreciation and amortization in the amounts of ¥479 million and ¥415 million ($3,453 thousand) for the years ended March 31, 2014 and 2015, respectively, include amortization of long-term prepaid expenses. In addition, these amounts mainly consisted of depreciation of assets related to administrative departments and the Central R&D Laboratory owned by the Company.
(iv) Interest expenses were the difference between allocated internal interest expenses and actual interest expenses.(v) Increase in property, plant and equipment and intangible assets in the amounts of ¥231 million and ¥293 million ($2,438 thousand) for the years ended
March 31, 2014 and 2015, respectively, mainly consisted of assets related to the Central R&D Laboratory owned by the Company.
(*2) Segment income was adjusted for the ordinary income as described in “(b) Calculation methods used for sales, income, assets and other items of each reportable segment.”
(*3) Items related to Reporting Segment ChangeAs disclosed in Note 1 (b), effective from the year ended March 31, 2015, the fiscal year end of certain overseas consolidated subsidiaries has been changed.
As a result, the financial statements of these overseas consolidated subsidiaries are prepared for a 15-month period from January 1, 2014 to March 31, 2015. In the Industry segment, net sales and segment loss of these overseas consolidated subsidiaries for the 3 months from January 1, 2014 to March 31, 2014 were ¥3,174 million ($26,412 thousand) and ¥5 million ($41 thousand), respectively.
Millions of yen Thousands of U.S. dollars
2014 2015 2015Japan ¥ 95,701 ¥ 92,790 $ 772,156Asia 11,940 17,495 145,585Other 2,281 3,374 28,076Total ¥ 109,923 ¥ 113,660 $ 945,826
Millions of yen Thousands of U.S. dollars
2014 2015 2015Japan ¥ 40,466 ¥ 40,333 $ 335,632Asia 3,569 4,672 38,878Other 1,659 2,413 20,079Total ¥ 45,695 ¥ 47,419 $ 394,599
Millions of yen Thousands of U.S. dollars
Customer Related segment 2014 2015 2015FP Corporation Human Life ¥ 13,257 ¥ 14,270 $ 118,748
Sales to third parties by countries or areas grouped according to geographical classification for the years ended March 31, 2014 and 2015 were summarized as follows:
Property, plant and equipment by countries or areas grouped according to geographical classification at March 31, 2014 and 2015 were summarized as follows:
Information by major customer for the years ended March 31, 2014 and 2015 was summarized as follows:
(d) Geographical information
43Sekisui Plastics Co., Ltd.
Independent Auditor’s Report
Millions of yen
2014Human Life Industry Adjustments and eliminations Consolidated
¥ 37 ¥ – ¥ – ¥ 37
Millions of yen
2015Human Life Industry Adjustments and eliminations Consolidated
¥ – ¥ 11 ¥ 22 ¥ 33
Thousands of U.S. dollars
2015Human Life Industry Adjustments and eliminations Consolidated
$ – $ 91 $ 183 $ 274
Millions of yen
2014Human Life Industry Adjustments and eliminations Consolidated
Amortization ¥ (1) – – ¥ (1)Balance at end of year ¥ (1) – – ¥ (1)
Millions of yen
2015Human Life Industry Adjustments and eliminations Consolidated
Amortization ¥ (1) – – ¥ (1)Balance at end of year – – – –
Thousands of U.S. dollars
2015Human Life Industry Adjustments and eliminations Consolidated
Amortization $ (8) – – $ (8)Balance at end of year – – – –
Millions of yen Thousands of U.S. dollars
Cash dividends (¥5.50 (U.S.$0.04) per share) ¥ 514 $ 4,277
Gain on negative goodwill in the Human Life segment in the amount of ¥1 million for the year ended March 31, 2014 incurred from the additional acquisition of shares of consolidated subsidiaries.
Gain on negative goodwill in the Industry segment in the amount of ¥231 million ($1,922 thousand), for the year ended March 31, 2015 resulted from the additional acquisition of shares of consolidated subsidiaries.
The following distribution of retained earnings of the Company, which has not been reflected in the consolidated financial statements for the year ended March 31, 2015, was approved at a shareholders’ meeting held on June 23, 2015:
17. Subsequent Event
(e) Loss on impairment of property, plant and equipment for the years ended March 31, 2014 and 2015.
(f) Information on goodwill included in other assets per reportable segment
44 Sekisui Plastics Co., Ltd.
Independent Auditor’s Report
45Sekisui Plastics Co., Ltd.
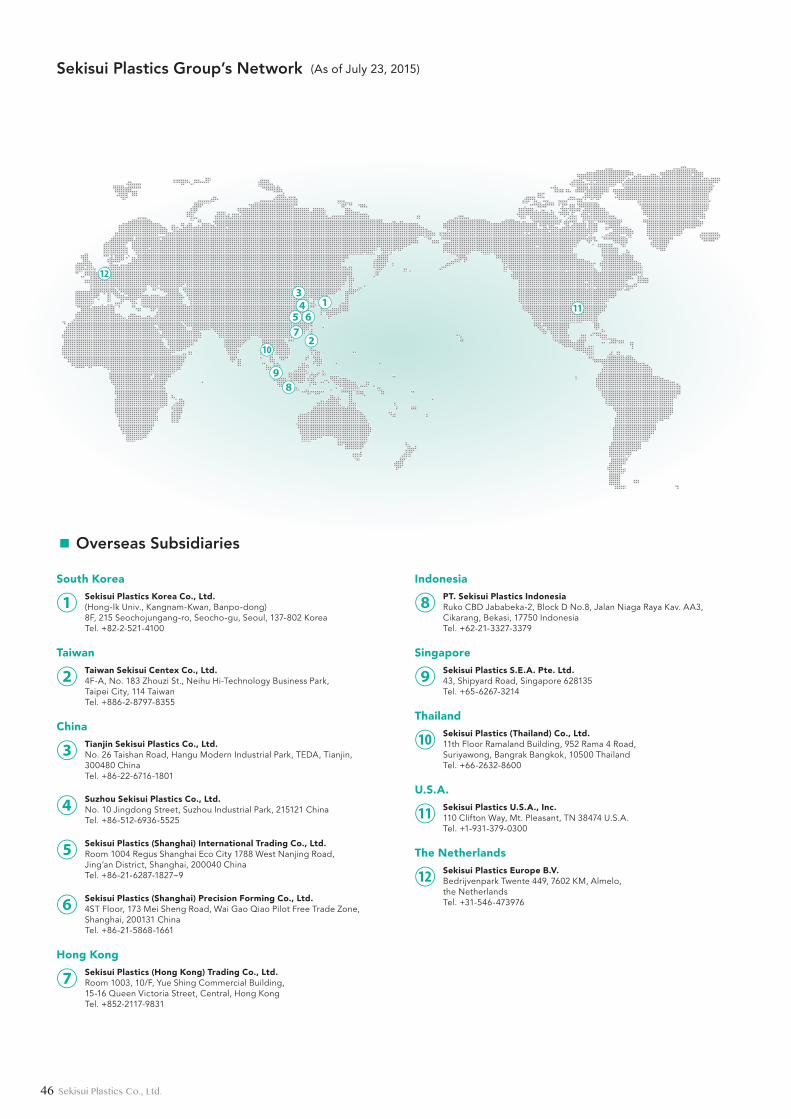
Sekisui Plastics Group’s Network (As of July 23, 2015)
●④
●①
●⑥
●⑫●⑭●⑩●⑪●●⑨
●⑧●⑦●⑤ ●③
●⑫
●④
●②
●③
●⑦●⑩●⑨●⑧
●① ●⑪
●⑱
●②
●❷●❶●❸
●⑤●⑥
●⑰●⑮●⑯
●⑬
South Korea
① Sekisui Plastics Korea Co., Ltd.(Hong-Ik Univ., Kangnam-Kwan, Banpo-dong)8F, 215 Seochojungang-ro, Seocho-gu, Seoul, 137-802 KoreaTel. +82-2-521-4100
Taiwan
② Taiwan Sekisui Centex Co., Ltd.4F-A, No. 183 Zhouzi St., Neihu Hi-Technology Business Park,Taipei City, 114 TaiwanTel. +886-2-8797-8355
China
③ Tianjin Sekisui Plastics Co., Ltd.No. 26 Taishan Road, Hangu Modern Industrial Park, TEDA, Tianjin,300480 ChinaTel. +86-22-6716-1801
④ Suzhou Sekisui Plastics Co., Ltd.No. 10 Jingdong Street, Suzhou Industrial Park, 215121 ChinaTel. +86-512-6936-5525
⑤ Sekisui Plastics (Shanghai) International Trading Co., Ltd.Room 1004 Regus Shanghai Eco City 1788 West Nanjing Road, Jing’an District, Shanghai, 200040 ChinaTel. +86-21-6287-1827~9
⑥ Sekisui Plastics (Shanghai) Precision Forming Co., Ltd.4ST Floor, 173 Mei Sheng Road, Wai Gao Qiao Pilot Free Trade Zone, Shanghai, 200131 ChinaTel. +86-21-5868-1661
Hong Kong
⑦ Sekisui Plastics (Hong Kong) Trading Co., Ltd.Room 1003, 10/F, Yue Shing Commercial Building, 15-16 Queen Victoria Street, Central, Hong KongTel. +852-2117-9831
Indonesia
⑧ PT. Sekisui Plastics IndonesiaRuko CBD Jababeka-2, Block D No.8, Jalan Niaga Raya Kav. AA3,Cikarang, Bekasi, 17750 IndonesiaTel. +62-21-3327-3379
Singapore
⑨ Sekisui Plastics S.E.A. Pte. Ltd.43, Shipyard Road, Singapore 628135Tel. +65-6267-3214
Thailand
⑩ Sekisui Plastics (Thailand) Co., Ltd.11th Floor Ramaland Building, 952 Rama 4 Road, Suriyawong, Bangrak Bangkok, 10500 ThailandTel. +66-2632-8600
U.S.A.
⑪ Sekisui Plastics U.S.A., Inc.110 Clifton Way, Mt. Pleasant, TN 38474 U.S.A.Tel. +1-931-379-0300
The Netherlands
⑫ Sekisui Plastics Europe B.V.Bedrijvenpark Twente 449, 7602 KM, Almelo, the NetherlandsTel. +31-546-473976
▪ Overseas Subsidiaries
46 Sekisui Plastics Co., Ltd.
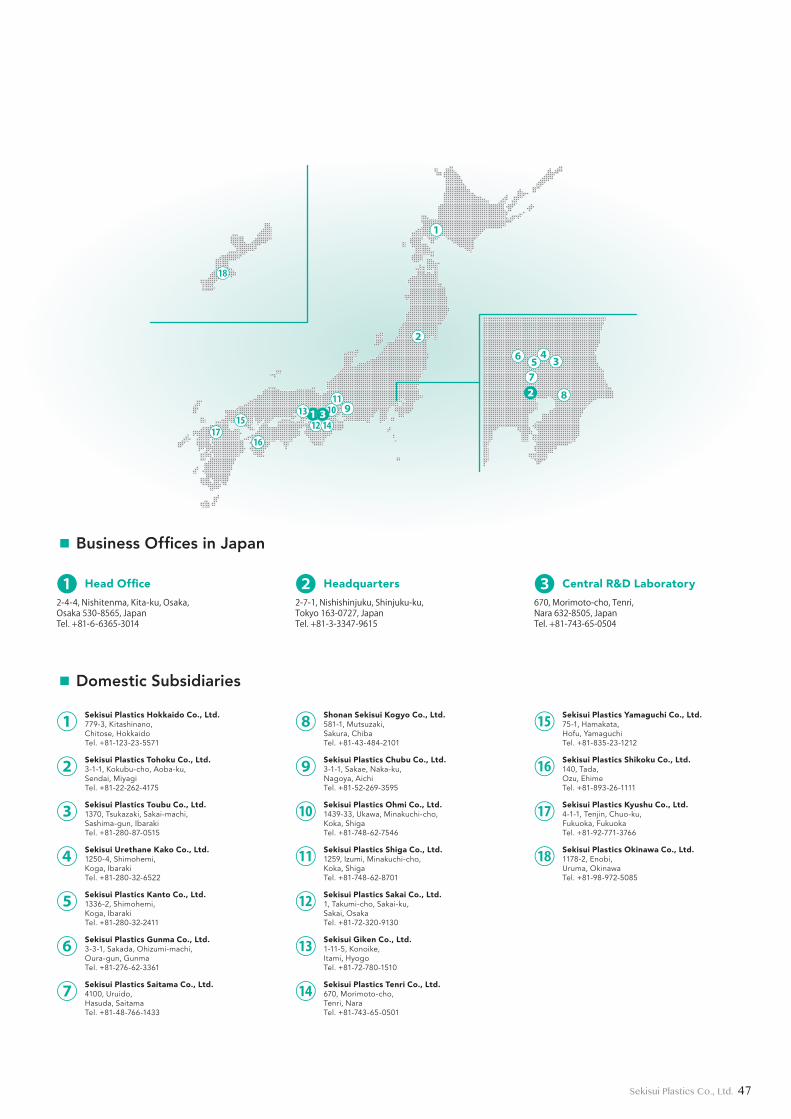
Sekisui Plastics Group’s Network (As of July 23, 2015)
●④
●①
●⑥
●⑫●⑭●⑩●⑪●●⑨
●⑧●⑦●⑤ ●③
●⑫
●④
●②
●③
●⑦●⑩●⑨●⑧
●① ●⑪
●⑱
●②
●❷●❶●❸
●⑤●⑥
●⑰●⑮●⑯
●⑬
❶ Head Office
2-4-4, Nishitenma, Kita-ku, Osaka,Osaka 530-8565, JapanTel. +81-6-6365-3014
❷ Headquarters
2-7-1, Nishishinjuku, Shinjuku-ku,Tokyo 163-0727, JapanTel. +81-3-3347-9615
❸ Central R&D Laboratory
670, Morimoto-cho, Tenri, Nara 632-8505, JapanTel. +81-743-65-0504
① Sekisui Plastics Hokkaido Co., Ltd.779-3, Kitashinano,Chitose, HokkaidoTel. +81-123-23-5571
② Sekisui Plastics Tohoku Co., Ltd.3-1-1, Kokubu-cho, Aoba-ku,Sendai, MiyagiTel. +81-22-262-4175
③ Sekisui Plastics Toubu Co., Ltd.1370, Tsukazaki, Sakai-machi,Sashima-gun, IbarakiTel. +81-280-87-0515
④ Sekisui Urethane Kako Co., Ltd.1250-4, Shimohemi,Koga, IbarakiTel. +81-280-32-6522
⑤ Sekisui Plastics Kanto Co., Ltd.1336-2, Shimohemi,Koga, IbarakiTel. +81-280-32-2411
⑥ Sekisui Plastics Gunma Co., Ltd.3-3-1, Sakada, Ohizumi-machi,Oura-gun, GunmaTel. +81-276-62-3361
⑦ Sekisui Plastics Saitama Co., Ltd.4100, Uruido, Hasuda, SaitamaTel. +81-48-766-1433
⑧ Shonan Sekisui Kogyo Co., Ltd.581-1, Mutsuzaki, Sakura, ChibaTel. +81-43-484-2101
⑨ Sekisui Plastics Chubu Co., Ltd.3-1-1, Sakae, Naka-ku,Nagoya, AichiTel. +81-52-269-3595
⑩ Sekisui Plastics Ohmi Co., Ltd.1439-33, Ukawa, Minakuchi-cho,Koka, ShigaTel. +81-748-62-7546
⑪ Sekisui Plastics Shiga Co., Ltd.1259, Izumi, Minakuchi-cho,Koka, ShigaTel. +81-748-62-8701
⑫ Sekisui Plastics Sakai Co., Ltd.1, Takumi-cho, Sakai-ku,Sakai, OsakaTel. +81-72-320-9130
⑬ Sekisui Giken Co., Ltd.1-11-5, Konoike,Itami, HyogoTel. +81-72-780-1510
⑭ Sekisui Plastics Tenri Co., Ltd.670, Morimoto-cho,Tenri, NaraTel. +81-743-65-0501
⑮ Sekisui Plastics Yamaguchi Co., Ltd.75-1, Hamakata,Hofu, YamaguchiTel. +81-835-23-1212
⑯ Sekisui Plastics Shikoku Co., Ltd.140, Tada,Ozu, EhimeTel. +81-893-26-1111
⑰ Sekisui Plastics Kyushu Co., Ltd.4-1-1, Tenjin, Chuo-ku,Fukuoka, FukuokaTel. +81-92-771-3766
⑱ Sekisui Plastics Okinawa Co., Ltd.1178-2, Enobi,Uruma, OkinawaTel. +81-98-972-5085
▪ Business Offices in Japan
▪ Domestic Subsidiaries
47Sekisui Plastics Co., Ltd.
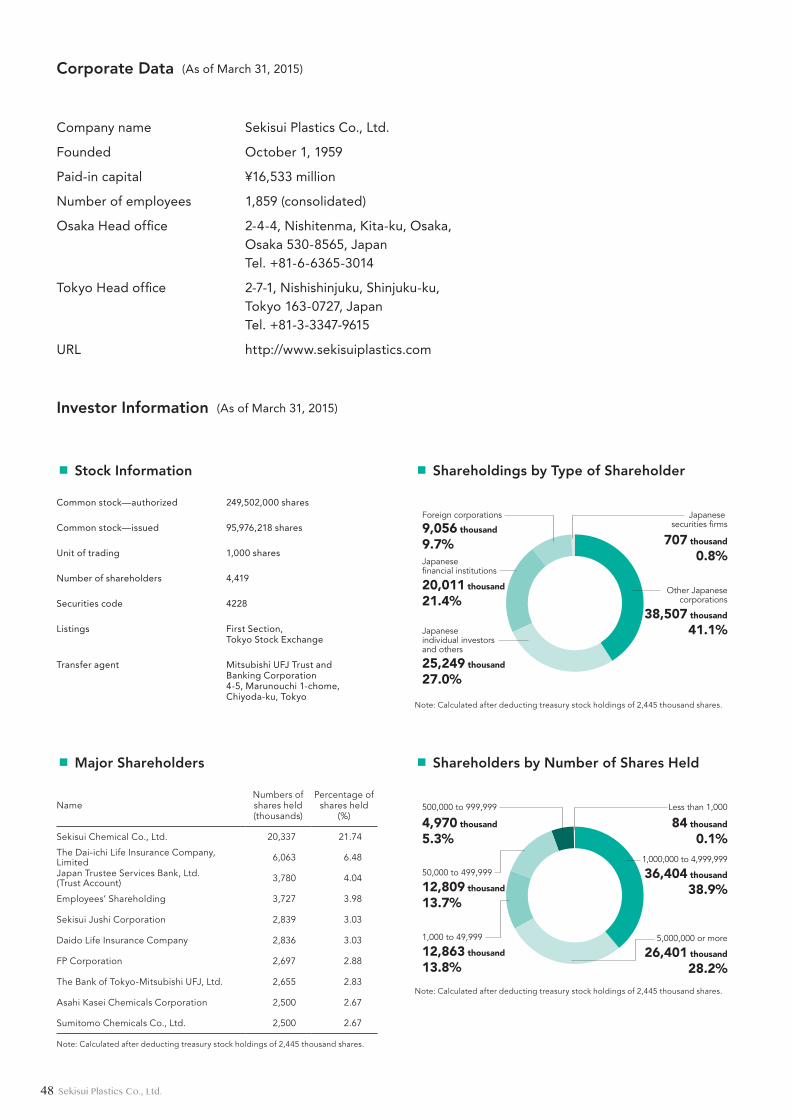
Sekisui Plastics: Fostering Communication
Investor Information (As of March 31, 2015)
Corporate Data (As of March 31, 2015)
707千株0.8%
外国法人等 金融商品取引業者
その他の法人38,507千株
41.1%
個人・その他20,011千株21.4%
金融機関25,249千株27.0%
9,056千株9.7%
Foreign corporations
Japanese �nancial institutions
20,011 thousand
21.4%
Japanese individual investors and others
25,249 thousand
27.0%
9,056 thousand
9.7% 707 thousand
0.8%
Japanese securities �rms
Other Japanesecorporations
38,507 thousand
41.1%
91千株0.1%
50万株以上 1千株未満
500万株以上26,401千株
28.1%
5万株以上15,985千株17.0%
1千株以上14,470千株15.4%
2,995千株3.2%
100万株以上34,095千株
36.2%
84 thousand
0.1%
Less than 1,000
1,000,000 to 4,999,999
36,404 thousand
38.9%
5,000,000 or more
26,401 thousand
28.2%
500,000 to 999,999
50,000 to 499,999
12,809 thousand
13.7%
1,000 to 49,999
12,863 thousand
13.8%
4,970 thousand
5.3%
Company name Sekisui Plastics Co., Ltd.
Founded October 1, 1959
Paid-in capital ¥16,533 million
Number of employees 1,859 (consolidated)
Osaka Head office 2-4-4, Nishitenma, Kita-ku, Osaka, Osaka 530-8565, JapanTel. +81-6-6365-3014
Tokyo Head office 2-7-1, Nishishinjuku, Shinjuku-ku, Tokyo 163-0727, JapanTel. +81-3-3347-9615
URL http://www.sekisuiplastics.com
Common stock—authorized 249,502,000 shares
Common stock—issued 95,976,218 shares
Unit of trading 1,000 shares
Number of shareholders 4,419
Securities code 4228
Listings First Section,Tokyo Stock Exchange
Transfer agent Mitsubishi UFJ Trust andBanking Corporation4-5, Marunouchi 1-chome,Chiyoda-ku, Tokyo
NameNumbers of shares held(thousands)
Percentage of shares held
(%)
Sekisui Chemical Co., Ltd. 20,337 21.74
The Dai-ichi Life Insurance Company, Limited 6,063 6.48
Japan Trustee Services Bank, Ltd. (Trust Account) 3,780 4.04
Employees’ Shareholding 3,727 3.98
Sekisui Jushi Corporation 2,839 3.03
Daido Life Insurance Company 2,836 3.03
FP Corporation 2,697 2.88
The Bank of Tokyo-Mitsubishi UFJ, Ltd. 2,655 2.83
Asahi Kasei Chemicals Corporation 2,500 2.67
Sumitomo Chemicals Co., Ltd. 2,500 2.67
Note: Calculated after deducting treasury stock holdings of 2,445 thousand shares.
Note: Calculated after deducting treasury stock holdings of 2,445 thousand shares.
Note: Calculated after deducting treasury stock holdings of 2,445 thousand shares.
▪ Stock Information
▪ Major Shareholders
▪ Shareholdings by Type of Shareholder
▪ Shareholders by Number of Shares Held
48 Sekisui Plastics Co., Ltd.
Sekisui Plastics: Fostering Communication
Investor Information (As of March 31, 2015)
Corporate Data (As of March 31, 2015)
Results forecasts, plans, business strategies, awareness and assessments of facts, and other forward-looking statements concerning the Company or the Group are assumptions that the Company’s management believes to be reasonable based on currently available information. Actual outcomes may differ materially from those expressed in these forward-looking statements due to various factors. The Company undertakes no obligation to publish revised forward-looking statements to reflect new events, conditions, or circumstances.
Sekisui Plastics posts a wide and diverse range of information on its website, including corporate, shareholder and investor relations information, details of its products and activities aimed at improving the environment, as well as the latest information. In order to gain a deeper understanding of the Group’s activities, all stakeholders are directed to the Group’s CSR Report.
Sekisui Plastics Corporate Website
http://www.sekisuiplastics.com
Investor Relations Website
http://www.sekisuiplastics.com/ir/index/
CSR Report
http://www.sekisuiplastics.com/ir/csr/index.html
CSR Report 2015The Sekisui Plastics GroupExpanding Our Dreams for People and the EarthThe Sekisui Plastics GroupExpanding Our Dreams for People and the Earth
1508SD249-6-10001408SD249-5-23001008SD249-1-1000
Providing Plastics as Solutions
Annual Report 2015For the year ended March 31, 2015
Sekisui Plastics Co., Ltd.http://www.sekisuiplastics.com


![[TECH]Honeywell Plastics Design Solutions Guide](https://img.pdfslide.net/doc/110x75/5695d2d21a28ab9b029bd6bc/techhoneywell-plastics-design-solutions-guide.jpg)