Embed Size (px)
Citation preview
ANNUAL REPORT
2015
Sirtex 2015 AR 1
2001 2002 2003 2004 2005 2006 2007 2008 2009 2010 2011 2012
11,000
2013 20152014
10,000
6,000
5,000
4,000
9,000
8,000
7,000
3,000
2,000
1,000
Sirtex Medical Limited is an Australian-based global healthcare business working to improve outcomes for people with cancer.
Our leading product is a targeted radiation therapy known as SIR-Spheres Y-90 resin microspheres. It is available in more than 40 countries and over 900 hospitals where we work together with medical professionals to help improve outcomes for people with liver cancer.
We are challenging established practices and developing innovative new therapies that promise to improve the health and lives of many people.
Our ongoing success is based on a commitment to serving our customers, professionalism, continuous improvement and innovation.
Our vision is that liver cancer will one day be a chronic disease that patients can successfully live with.
Our business revolves around helping medical professionals understand and use our product to improve clinical outcomes and the quality of life for people with liver cancer.
We are also focused on bringing a number of new treatments and innovations to global markets that will transform quality of life and standards of medical care.
Our head office is in Australia and we have substantial manufacturing and operations in the United States, Germany and Singapore.
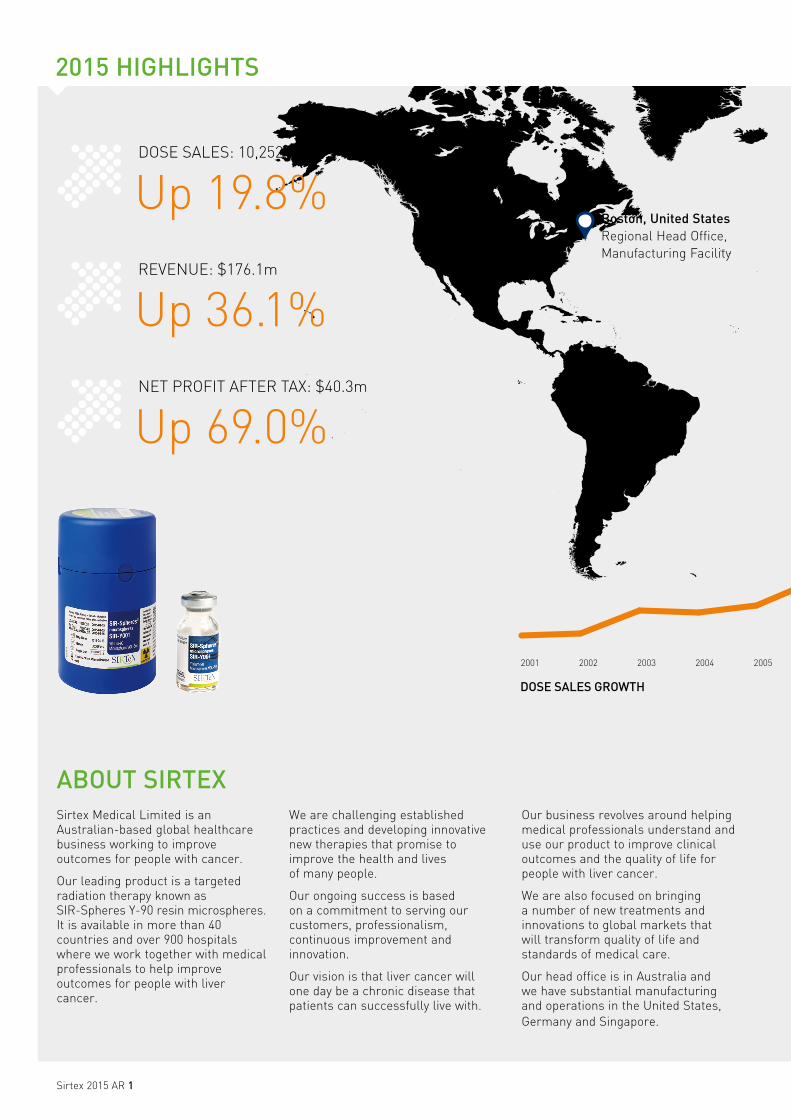
Boston, United StatesRegional Head Office, Manufacturing Facility
ABOUT SIRTEX
DOSE SALES: 10,252
Up 19.8%REVENUE: $176.1m
Up 36.1%NET PROFIT AFTER TAX: $40.3m
Up 69.0%
DOSE SALES GROWTH
2015 HIGHLIGHTS
Sirtex 2015 AR 2
2001 2002 2003 2004 2005 2006 2007 2008 2009 2010 2011 2012
11,000
2013 20152014
10,000
6,000
5,000
4,000
9,000
8,000
7,000
3,000
2,000
1,000
CONTENTS
3 2015 FINANCIAL SUMMARY5 REGIONAL UPDATE7 SIRFLOX RESULTS & OTHER CLINICAL PROGRAMS
11 MANUFACTURING & OPERATIONS RESEARCH & DEVELOPMENT12 MARKETING & COMMUNICATIONS13 PEOPLE, COMMUNITIES & SOCIAL RESPONSIBILITY15 CHAIRMAN’S REPORT18 CHIEF EXECUTIVE OFFICER’S REPORT22 BOARD OF DIRECTORS23 KEY MANAGEMENT PERSONNEL 24 CORPORATE GOVERNANCE STATEMENT26 FINANCIAL REPORT
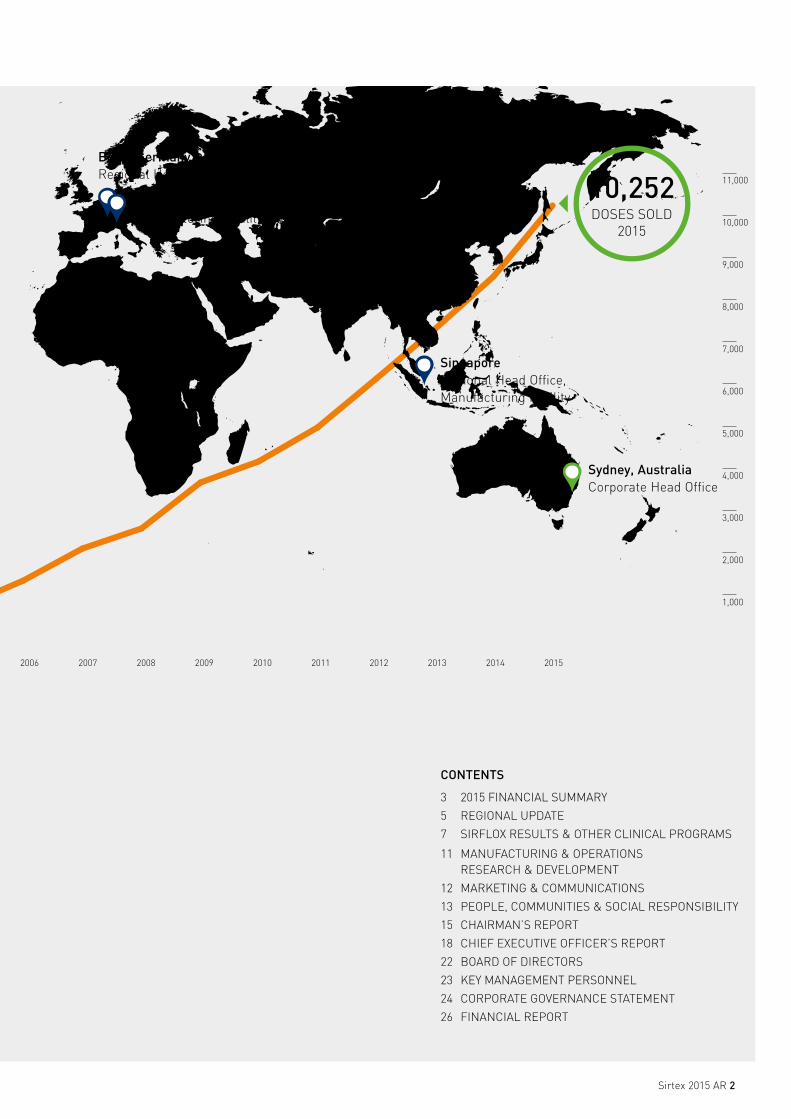
Singapore Regional Head Office, Manufacturing Facility
Bonn, Germany Regional Head Office
Frankfurt, Germany Manufacturing Facility
Sydney, AustraliaCorporate Head Office
10,252DOSES SOLD
2015
Sirtex 2015 AR 3
2015 FINANCIAL SUMMARY
DIVIDENDS PER SHARECENTS
PROFIT AFTER TAX$’000
SHARE PRICE $ (AT 30 JUNE)
OPERATING CASH FLOW$’000
CASH ON HAND $’000 (AT 30 JUNE)
EARNINGS PER SHARECENTS
0
2
4
6
8
10
12
14
16
18
77 10 12
2010
7
2009 2011 2012 2013 2014
14 20
2015
0.0
4034.5
8069.0
12103.5
16138.0
20172.5
24207.0
28241.5
32276.0
36310.5
40345.0
16,080
11,479
23,868
18,270
2010 2011 2012 2014
40,345
2015
17,103
2013
2010 2011 2014 201520132012
$4.90 $4.90$6.09
$11.98
$16.88
$29.05
4.90
9.73
14.56
19.39
24.22
29.05
0.0
5197.4
10394.8
15592.2
20789.6
25987.0
31184.4
36381.8
41579.2
46776.6
51974.0
20,231
15,286
19,987
24,327
2010 2011 2012 2013
32,171
2014
51,974
2015
0.000000
7394.097746
14788.195493
22182.293239
29576.390985
36970.488732
44364.586478
51758.684224
59152.781971
66546.879717
73940.977463
41,421
42,915
49,447
2010 2011 2012 2013
52,094
52,495
2014
73,941
2015
0.000000
7.933296
15.866592
23.799888
31.733184
39.666480
47.599776
55.533072
63.466368
71.399664
28.8
30.7
20.6
2010 2011 2012 2013
32.8
42.5
2014
71.4
2015
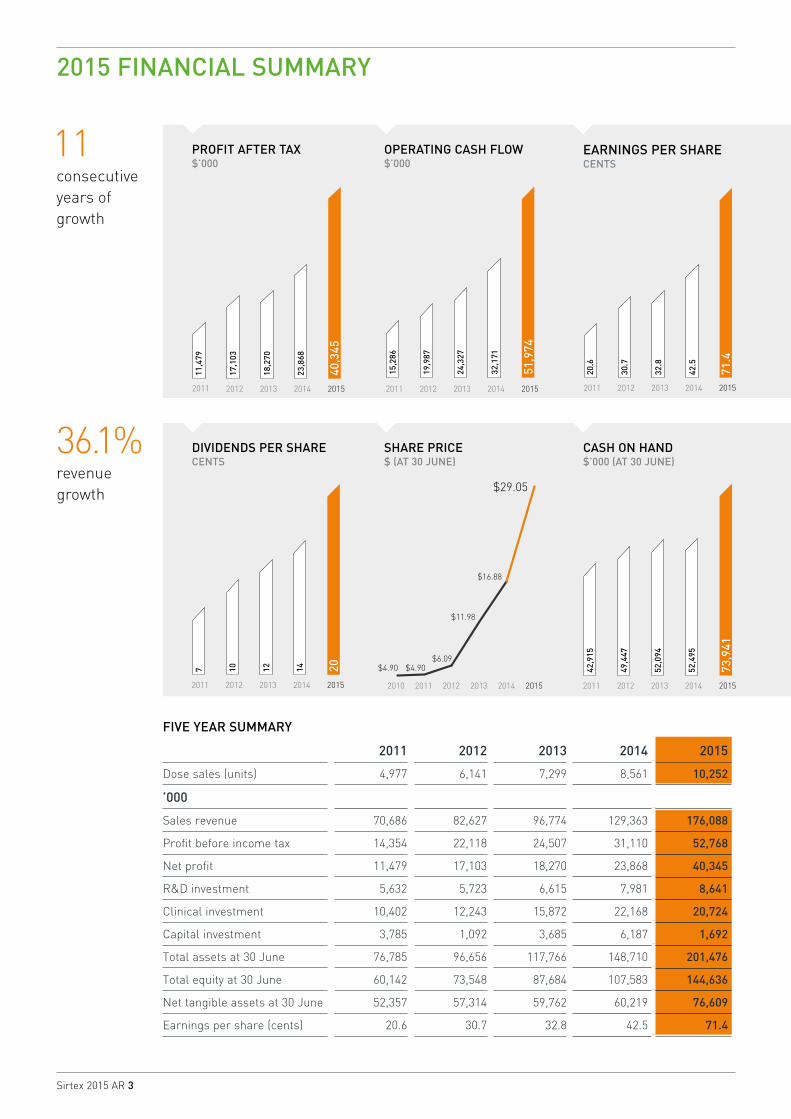
FIVE YEAR SUMMARY
2011 2012 2013 2014 2015
Dose sales (units) 4,977 6,141 7,299 8,561 10,252
’000
Sales revenue 70,686 82,627 96,774 129,363 176,088
Profit before income tax 14,354 22,118 24,507 31,110 52,768
Net profit 11,479 17,103 18,270 23,868 40,345
R&D investment 5,632 5,723 6,615 7,981 8,641
Clinical investment 10,402 12,243 15,872 22,168 20,724
Capital investment 3,785 1,092 3,685 6,187 1,692
Total assets at 30 June 76,785 96,656 117,766 148,710 201,476
Total equity at 30 June 60,142 73,548 87,684 107,583 144,636
Net tangible assets at 30 June 52,357 57,314 59,762 60,219 76,609
Earnings per share (cents) 20.6 30.7 32.8 42.5 71.4
11consecutive years of growth
36.1%revenue growth
Sirtex 2015 AR 4
3,6584,171
4,977
7,299
2009 2010 2011 2013
8,561
2014
10,252
2015
6,141
20120.000000
1139.111175
2278.222351
3417.333526
4556.444702
5695.555877
6834.667053
7973.778228
9112.889404
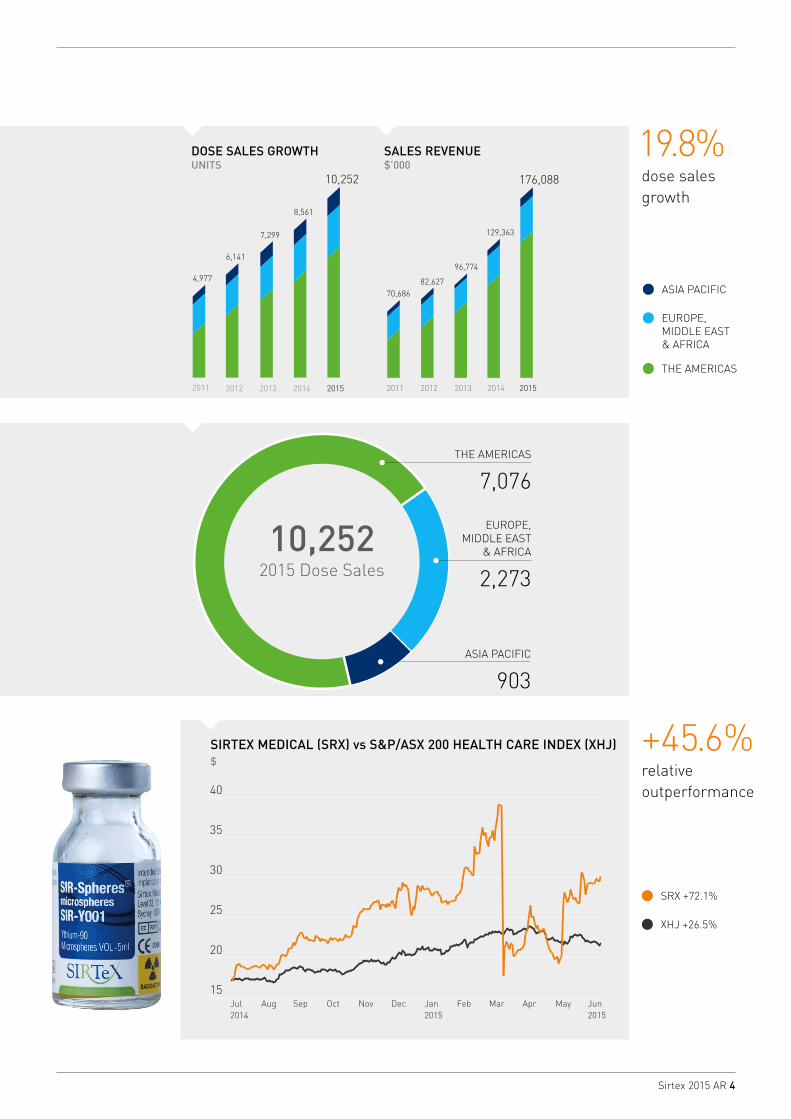
DOSE SALES GROWTH UNITS
SALES REVENUE $’000
65,559 64,33370,686
82,627
2009 2010 2011 2012
96,774
2013
129,363
176,088
2014 20150.000000
17608.798639
35217.597278
52826.395916
70435.194555
88043.993194
105652.791833
123261.590472
140870.389110
158479.187749
176087.986388
2008
38,125
65,559 64,333
70,290
82,627
2009 2010 2011 2012
THE AMERICAS
7,076
EUROPE,MIDDLE EAST
& AFRICA
2,273
ASIA PACIFIC
903
10,2522015 Dose Sales
ASIA PACIFIC
EUROPE, MIDDLE EAST & AFRICA
THE AMERICAS
19.8%dose sales growth
+45.6%relative outperformance40
15
2014 20152015Jun Jul Aug Sep Oct Nov Dec Jan Feb Mar Apr May
20
25
30
35
SIRTEX MEDICAL (SRX) vs S&P/ASX 200 HEALTH CARE INDEX (XHJ) $
SRX +72.1%
XHJ +26.5%
Sirtex 2015 AR 5
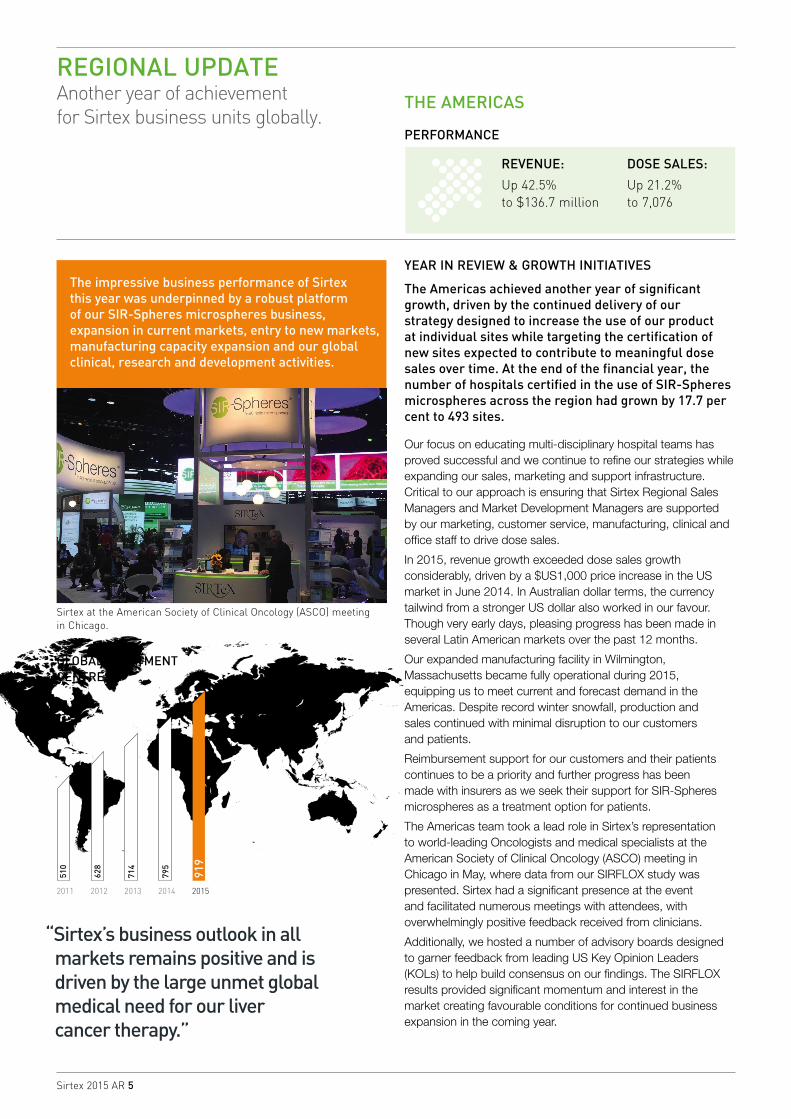
REGIONAL UPDATEAnother year of achievement for Sirtex business units globally.
THE AMERICAS
PERFORMANCE
YEAR IN REVIEW & GROWTH INITIATIVES
The Americas achieved another year of significant growth, driven by the continued delivery of our strategy designed to increase the use of our product at individual sites while targeting the certification of new sites expected to contribute to meaningful dose sales over time. At the end of the financial year, the number of hospitals certified in the use of SIR-Spheres microspheres across the region had grown by 17.7 per cent to 493 sites.
Our focus on educating multi-disciplinary hospital teams has proved successful and we continue to refine our strategies while expanding our sales, marketing and support infrastructure. Critical to our approach is ensuring that Sirtex Regional Sales Managers and Market Development Managers are supported by our marketing, customer service, manufacturing, clinical and office staff to drive dose sales.
In 2015, revenue growth exceeded dose sales growth considerably, driven by a $US1,000 price increase in the US market in June 2014. In Australian dollar terms, the currency tailwind from a stronger US dollar also worked in our favour. Though very early days, pleasing progress has been made in several Latin American markets over the past 12 months.
Our expanded manufacturing facility in Wilmington, Massachusetts became fully operational during 2015, equipping us to meet current and forecast demand in the Americas. Despite record winter snowfall, production and sales continued with minimal disruption to our customers and patients.
Reimbursement support for our customers and their patients continues to be a priority and further progress has been made with insurers as we seek their support for SIR-Spheres microspheres as a treatment option for patients.
The Americas team took a lead role in Sirtex’s representation to world-leading Oncologists and medical specialists at the American Society of Clinical Oncology (ASCO) meeting in Chicago in May, where data from our SIRFLOX study was presented. Sirtex had a significant presence at the event and facilitated numerous meetings with attendees, with overwhelmingly positive feedback received from clinicians.
Additionally, we hosted a number of advisory boards designed to garner feedback from leading US Key Opinion Leaders (KOLs) to help build consensus on our findings. The SIRFLOX results provided significant momentum and interest in the market creating favourable conditions for continued business expansion in the coming year.
“Sirtex’s business outlook in all markets remains positive and is driven by the large unmet global medical need for our liver cancer therapy.”
REVENUE:
Up 42.5% to $136.7 million
DOSE SALES:
Up 21.2% to 7,076
The impressive business performance of Sirtex this year was underpinned by a robust platform of our SIR-Spheres microspheres business, expansion in current markets, entry to new markets, manufacturing capacity expansion and our global clinical, research and development activities.
0.000000
102.111111
204.222222
306.333333
408.444444
510.555556
612.666667
714.777778
816.888889
919.000000
628
510
2011 2012 2013
714
795
2014
919
2015
GLOBAL TREATMENT CENTRES
Sirtex at the American Society of Clinical Oncology (ASCO) meeting in Chicago.
Sirtex 2015 AR 6
EUROPE, MIDDLE EAST, AFRICA
PERFORMANCE
YEAR IN REVIEW & GROWTH INITIATIVES
Growth this year was driven by the solid contribution from several well established European markets and the UK. Several Middle Eastern markets also delivered sound results and we achieved reimbursement in Israel, leading to increased sales in that market. At the end of the financial year, the number of hospitals certified in the use of SIR-Spheres microspheres across the region had grown by 11.5 per cent to 291 sites.
The EMEA sales and marketing teams continued to focus on professional education programs and a range of initiatives to create awareness among patient support groups.
A dedicated UK support website called MySIRTStory for patients treated with Selective Internal Radiation Therapy (SIRT) was launched during the year. This initiative was in response to the National Health Service (NHS) in Wales approving funding for SIR-Spheres microspheres under the Commissioning through Evaluation (CtE) process, making the treatment available for funding for all eligible patients throughout the UK.
SIR-Spheres microspheres also received endorsement from the European Society of Medical Oncology (ESMO) in its Clinical Guidelines for treating metastatic colorectal cancer (mCRC) during 2015. The new guidelines for the treatment of mCRC recommended radioembolisation and SIR-Spheres microspheres as a ‘clinically proven technology to prolong time to liver tumour progression’ in patients who have failed to respond to available chemotherapy options. This has significantly improved awareness and interest among European clinicians.
The European clinical program made excellent progress this year. In France, the recruitment of 460 patients in the SARAH study was completed in March 2015, while a second major European study, SORAMIC, reached the 85 per cent patient recruitment level at the end of the financial year.
Our sales team focused heavily on educating referring Medical Oncologists, Liver Surgeons and Hepatologists and representing Sirtex at European and national industry events. This culminated in the EMEA team having a major presence at ASCO following the release of the SIRFLOX results. A number of European centres and KOLs were part of the study and publicly stated their support for the results delivered in the liver. The very positive reception at ASCO, and subsequent presentations of additional SIRFLOX data, coupled with a number of regional opportunities, will ensure EMEA continues its positive growth trajectory.
ASIA PACIFIC
PERFORMANCE
YEAR IN REVIEW & GROWTH INITIATIVES
A year of sound growth saw the number of hospitals certified in the use of SIR-Spheres microspheres across the region grow by 17.4 per cent to 135 sites. APAC revenue growth outpaced dose sales growth, reflecting increases in the selling price of SIR-Spheres microspheres in several markets and new direct market entries.
The APAC team continued to execute its market development strategy centred on educating and informing Oncologists and medical professionals about the benefits of SIR-Spheres microspheres.
Recognising the region’s growth potential, Sirtex hosted a series of educational presentations to Interventional Radiologists and Medical Oncologists in Vietnam, The Philippines, India and Malaysia. Additionally, we facilitated the 2nd Asia Pacific Symposium on Liver Directed Y-90 Microspheres Therapy together with the Academy of Medicine, Singapore. This two-day event included a host of APAC KOLs presenting on the benefits of SIRT in primary and metastatic liver cancer.
Our strategy is having a positive impact on sales, with Singapore and Vietnam recording strong growth. Australia continues to be an important market with high single digit growth recorded, reflecting increasing awareness among the medical community. A key event was Sirtex sponsorship of the 5th Asia-Pacific Primary Liver Cancer Expert Meeting (APPLE) in Taipei, Taiwan. This investment brought together a diverse group of participants from around the world to discuss new initiatives and develop a consensus in radiotherapy for the treatment of primary liver cancer. As a result, SIRT treatment was included in the Primary Liver Cancer Management Consensus Guidelines in Taiwan in April 2015.
APAC-oriented clinical studies made good progress with recruitment in the SIRveNIB 360 patient multi-centre randomised controlled study in locally advanced hepatocellular carcinoma (HCC) reaching 85 per cent at the end of the financial year.
To capitalise on the growing interest in our product, Sirtex initiated a small clinical study on cholangiocarcinoma, a form of cancer that originates in the bile ducts. The study will evaluate SIR-Spheres microspheres in combination with a standard chemotherapy regimen. This will be compared to the outcome of prescribing chemotherapy alone in the first-line treatment of nonresectable liver-only or liver-dominant disease in Hong Kong and Singapore.
With such promising inroads being made with our market development strategy across the region, APAC is well positioned for continued growth in all markets.
REVENUE:
Up 17.3% to $32.4 million
DOSE SALES:
Up 18.6% to 2,273
REVENUE:
Up 20.5% to $6.9 million
DOSE SALES:
Up 11.6% to 903
Sirtex 2015 AR 7
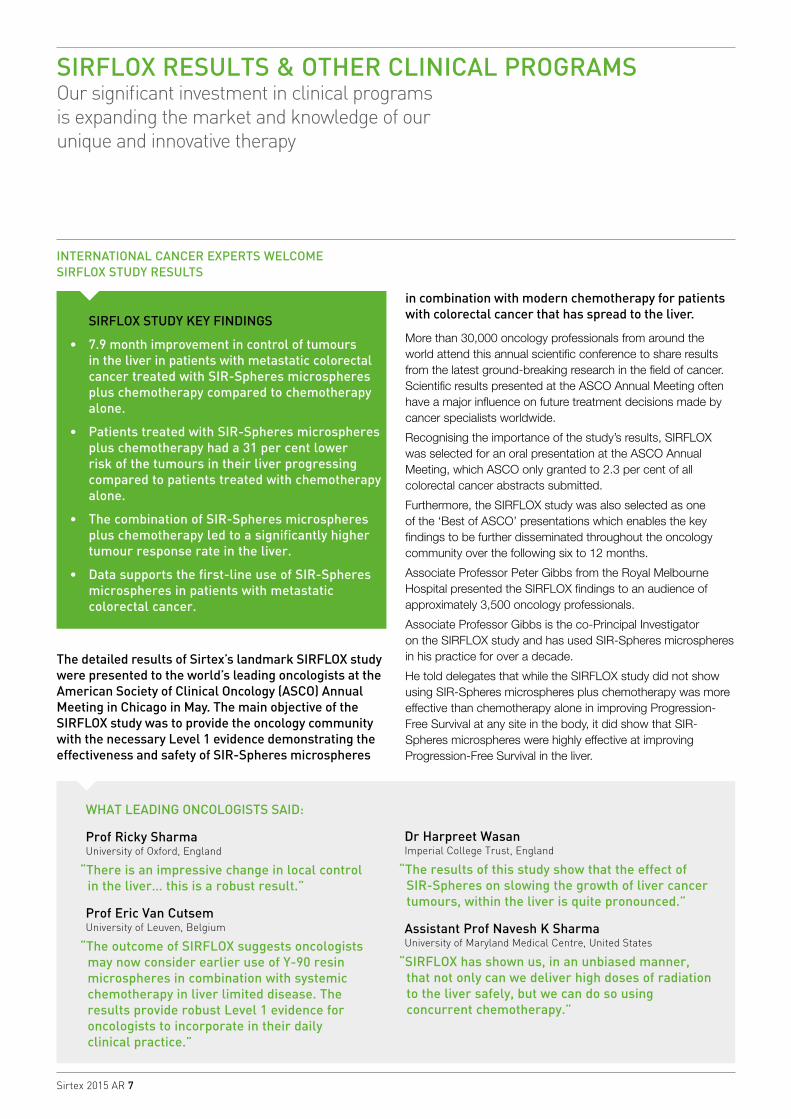
SIRFLOX STUDY KEY FINDINGS
• 7.9 month improvement in control of tumours in the liver in patients with metastatic colorectal cancer treated with SIR-Spheres microspheres plus chemotherapy compared to chemotherapy alone.
• Patients treated with SIR-Spheres microspheres plus chemotherapy had a 31 per cent lower risk of the tumours in their liver progressing compared to patients treated with chemotherapy alone.
• The combination of SIR-Spheres microspheres plus chemotherapy led to a significantly higher tumour response rate in the liver.
• Data supports the first-line use of SIR-Spheres microspheres in patients with metastatic colorectal cancer.
SIRFLOX RESULTS & OTHER CLINICAL PROGRAMS Our significant investment in clinical programs is expanding the market and knowledge of our unique and innovative therapy
The detailed results of Sirtex’s landmark SIRFLOX study were presented to the world’s leading oncologists at the American Society of Clinical Oncology (ASCO) Annual Meeting in Chicago in May. The main objective of the SIRFLOX study was to provide the oncology community with the necessary Level 1 evidence demonstrating the effectiveness and safety of SIR-Spheres microspheres
in combination with modern chemotherapy for patients with colorectal cancer that has spread to the liver.
More than 30,000 oncology professionals from around the world attend this annual scientific conference to share results from the latest ground-breaking research in the field of cancer. Scientific results presented at the ASCO Annual Meeting often have a major influence on future treatment decisions made by cancer specialists worldwide.
Recognising the importance of the study’s results, SIRFLOX was selected for an oral presentation at the ASCO Annual Meeting, which ASCO only granted to 2.3 per cent of all colorectal cancer abstracts submitted.
Furthermore, the SIRFLOX study was also selected as one of the ‘Best of ASCO’ presentations which enables the key findings to be further disseminated throughout the oncology community over the following six to 12 months.
Associate Professor Peter Gibbs from the Royal Melbourne Hospital presented the SIRFLOX findings to an audience of approximately 3,500 oncology professionals.
Associate Professor Gibbs is the co-Principal Investigator on the SIRFLOX study and has used SIR-Spheres microspheres in his practice for over a decade.
He told delegates that while the SIRFLOX study did not show using SIR-Spheres microspheres plus chemotherapy was more effective than chemotherapy alone in improving Progression-Free Survival at any site in the body, it did show that SIR-Spheres microspheres were highly effective at improving Progression-Free Survival in the liver.
INTERNATIONAL CANCER EXPERTS WELCOME SIRFLOX STUDY RESULTS
WHAT LEADING ONCOLOGISTS SAID:
Prof Ricky Sharma University of Oxford, England
“There is an impressive change in local control in the liver… this is a robust result.”
Prof Eric Van Cutsem University of Leuven, Belgium
“The outcome of SIRFLOX suggests oncologists may now consider earlier use of Y-90 resin microspheres in combination with systemic chemotherapy in liver limited disease. The results provide robust Level 1 evidence for oncologists to incorporate in their daily clinical practice.”
Dr Harpreet Wasan Imperial College Trust, England
“The results of this study show that the effect of SIR-Spheres on slowing the growth of liver cancer tumours, within the liver is quite pronounced.”
Assistant Prof Navesh K Sharma University of Maryland Medical Centre, United States
“SIRFLOX has shown us, in an unbiased manner, that not only can we deliver high doses of radiation to the liver safely, but we can do so using concurrent chemotherapy.”
Sirtex 2015 AR 8
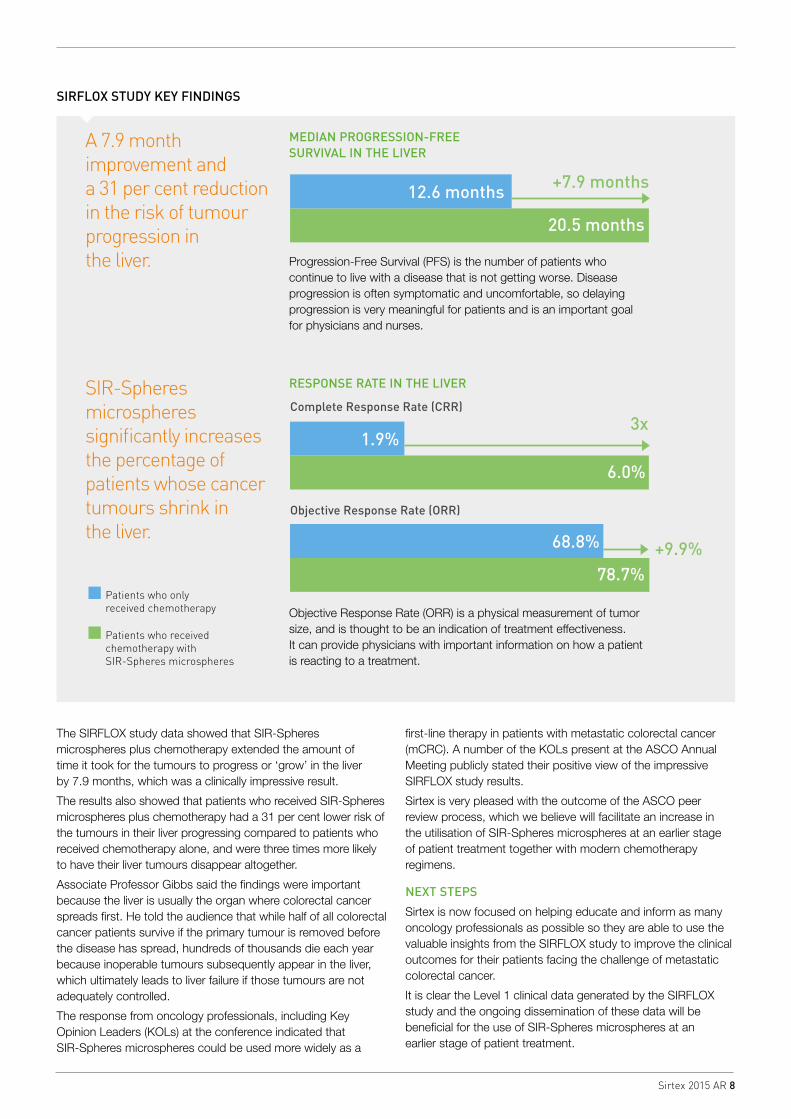
A 7.9 month improvement and a 31 per cent reduction in the risk of tumour progression in the liver. Progression-Free Survival (PFS) is the number of patients who
continue to live with a disease that is not getting worse. Disease progression is often symptomatic and uncomfortable, so delaying progression is very meaningful for patients and is an important goal for physicians and nurses.
68.8%
78.7%
1.9%
6.0%
+9.9%
+XX%
Patients who only received chemotherapy
Complete Response Rate (CRR)
Objective Response Rate (ORR)
Patients who received chemotherapy with SIR-Spheres microspheres
12.6 months
20.5 months
+7.9 months
20.5 months
68.8%
78.7%
1.9%
6.0%
+7.9 months
+9.9%
3x
Patients who only received chemotherapy
Complete Response Rate (CRR)
Objective Response Rate (ORR)
Patients who received chemotherapy with SIR-Spheres microspheres
12.6 months
MEDIAN PROGRESSION-FREE SURVIVAL IN THE LIVER
SIR-Spheres microspheres significantly increases the percentage of patients whose cancer tumours shrink in the liver.
Objective Response Rate (ORR) is a physical measurement of tumor size, and is thought to be an indication of treatment effectiveness. It can provide physicians with important information on how a patient is reacting to a treatment.
20.5 months
68.8%
78.7%
1.9%
6.0%
+7.9 months
+9.9%
3x
Patients who only received chemotherapy
Complete Response Rate (CRR)
Objective Response Rate (ORR)
Patients who received chemotherapy with SIR-Spheres microspheres
12.6 months
RESPONSE RATE IN THE LIVER
The SIRFLOX study data showed that SIR-Spheres microspheres plus chemotherapy extended the amount of time it took for the tumours to progress or ‘grow’ in the liver by 7.9 months, which was a clinically impressive result.
The results also showed that patients who received SIR-Spheres microspheres plus chemotherapy had a 31 per cent lower risk of the tumours in their liver progressing compared to patients who received chemotherapy alone, and were three times more likely to have their liver tumours disappear altogether.
Associate Professor Gibbs said the findings were important because the liver is usually the organ where colorectal cancer spreads first. He told the audience that while half of all colorectal cancer patients survive if the primary tumour is removed before the disease has spread, hundreds of thousands die each year because inoperable tumours subsequently appear in the liver, which ultimately leads to liver failure if those tumours are not adequately controlled.
The response from oncology professionals, including Key Opinion Leaders (KOLs) at the conference indicated that SIR-Spheres microspheres could be used more widely as a
first-line therapy in patients with metastatic colorectal cancer (mCRC). A number of the KOLs present at the ASCO Annual Meeting publicly stated their positive view of the impressive SIRFLOX study results.
Sirtex is very pleased with the outcome of the ASCO peer review process, which we believe will facilitate an increase in the utilisation of SIR-Spheres microspheres at an earlier stage of patient treatment together with modern chemotherapy regimens.
NEXT STEPS
Sirtex is now focused on helping educate and inform as many oncology professionals as possible so they are able to use the valuable insights from the SIRFLOX study to improve the clinical outcomes for their patients facing the challenge of metastatic colorectal cancer.
It is clear the Level 1 clinical data generated by the SIRFLOX study and the ongoing dissemination of these data will be beneficial for the use of SIR-Spheres microspheres at an earlier stage of patient treatment.
SIRFLOX STUDY KEY FINDINGS
Sirtex 2015 AR 9
SIRFLOX RESULTS & OTHER CLINICAL PROGRAMS
We remain focused on implementing our comprehensive regulatory and reimbursement strategies and progressing discussions with clinical guideline panels around the world on the importance of the SIRLFOX study findings.
Alongside these initiatives, the SIRFLOX results will continue to be presented over the next six to 12 months as part of the Best of ASCO series, which will help further the awareness and understanding of the SIRFLOX study among the international oncology community and its importance for clinical practice.
SIGNIFICANT PROGRESS ACHIEVED IN OTHER MAJOR STUDIES
During the reporting period we announced the achievement of key milestones in a number of other important studies aimed at generating further Level 1 evidence demonstrating the effectiveness and safety of SIR-Spheres microspheres.
In January, we announced the completion of patient recruitment in the FOXFIRE and FOXFIRE Global studies. These studies, like SIRFLOX, are examining the first-line use of SIR-Spheres microspheres in combination with chemotherapy in metastatic colorectal cancer (mCRC). The FOXFIRE and FOXFIRE Global studies have been designed from the outset to be combined with the SIRFLOX study to generate Level 1 evidence on Overall Survival. Overall Survival is considered the most robust measure of benefit for cancer therapies in general. The combination of the three clinical studies, that cumulatively recruited over 1,100 patients, has sufficient statistical power to clearly determine whether SIR-Spheres microspheres in combination with first-line chemotherapy can increase Overall Survival in a clinically significant manner in patients with metastatic colorectal cancer.
The SIRFLOX, FOXFIRE and FOXFIRE Global clinical studies are expected to have their Overall Survival data available in calendar year 2017.
In March we announced the completion of recruitment in the SARAH randomised controlled clinical study conducted throughout France.
The SARAH study directly compares SIR-Spheres microspheres against the current standard of care systemic therapy sorafenib (Nexavar®, Bayer Healthcare Pharmaceuticals) in patients with non-resectable advanced hepatocellular carcinoma (HCC), as the main form of primary liver cancer.
SARAH is a landmark study that exceeded its initial recruitment target with 460 patients enrolled in more than 25 institutions across France within a rapid timeframe. We believe if the results from the SARAH study are positive they could help elevate the use of SIR-Spheres microspheres to a standard treatment for patients with advanced primary hepatocellular carcinoma.
The primary endpoint of the SARAH study is Overall Survival with secondary endpoints being safety and tolerability, Progression-Free Survival, tumour response rates, quality-of-life scores and overall healthcare costs between the two arms of
the study. It is the largest randomised study ever to compare SIRT or any liver-directed therapy against the standard of care systemic therapy in the treatment of primary hepatocellular carcinoma. The SARAH study is expected to have its Overall Survival data available in late calendar year 2016.
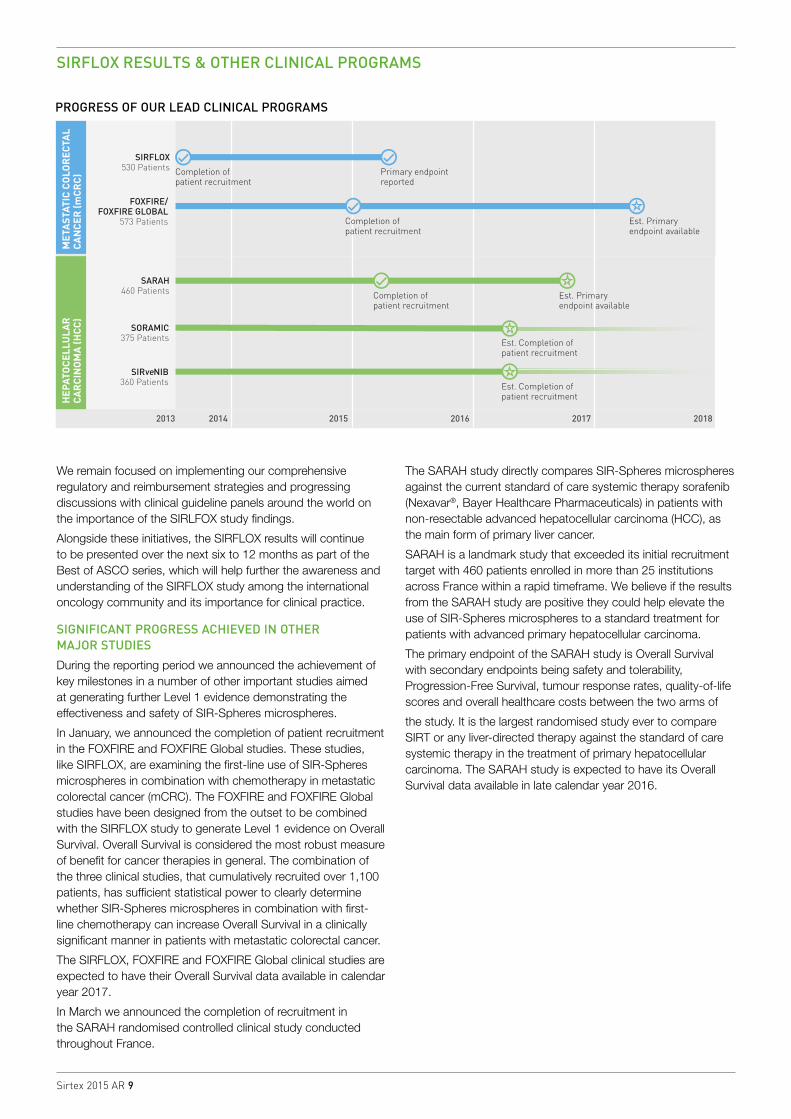
2013 2014 2015 2016 2017 2018
Completion of patient recruitment
Est. Primary endpoint available
SARAH460 Patients
SORAMIC375 Patients
SIR NIB360 Patients
ve
Completion of patient recruitment
SIRFLOX530 Patients
FOXFIRE/FOXFIRE GLOBAL
573 Patients Completion of patient recruitment
MET
AST
ATIC
CO
LOR
ECTA
L CA
NC
ER (m
CR
C)
HEP
ATO
CEL
LULA
R
CAR
CIN
OM
A (H
CC
)
Primary endpoint reported
Est. Primary endpoint available
Est. Completion of patient recruitment
Est. Completion of patient recruitment
PROGRESS OF OUR LEAD CLINICAL PROGRAMS
Sirtex 2015 AR 10
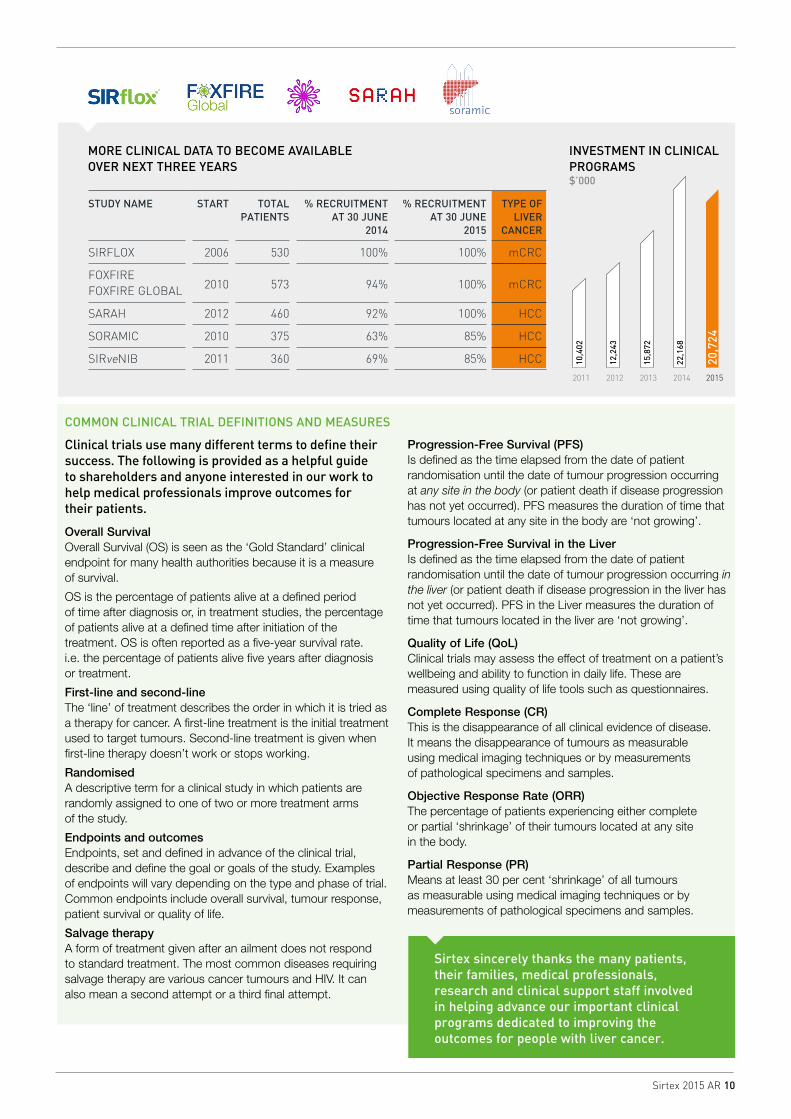
STUDY NAME
START
TOTAL PATIENTS
% RECRUITMENT AT 30 JUNE
2014
% RECRUITMENT AT 30 JUNE
2015
TYPE OF LIVER
CANCER
SIRFLOX 2006 530 100% 100% mCRC
FOXFIRE FOXFIRE GLOBAL 2010 573 94% 100% mCRC
SARAH 2012 460 92% 100% HCC
SORAMIC 2010 375 63% 85% HCC
SIRveNIB 2011 360 69% 85% HCC
COMMON CLINICAL TRIAL DEFINITIONS AND MEASURES
Clinical trials use many different terms to define their success. The following is provided as a helpful guide to shareholders and anyone interested in our work to help medical professionals improve outcomes for their patients.
Overall SurvivalOverall Survival (OS) is seen as the ‘Gold Standard’ clinical endpoint for many health authorities because it is a measure of survival.
OS is the percentage of patients alive at a defined period of time after diagnosis or, in treatment studies, the percentage of patients alive at a defined time after initiation of the treatment. OS is often reported as a five-year survival rate. i.e. the percentage of patients alive five years after diagnosis or treatment.
First-line and second-lineThe ‘line’ of treatment describes the order in which it is tried as a therapy for cancer. A first-line treatment is the initial treatment used to target tumours. Second-line treatment is given when first-line therapy doesn’t work or stops working.
RandomisedA descriptive term for a clinical study in which patients are randomly assigned to one of two or more treatment arms of the study.
Endpoints and outcomesEndpoints, set and defined in advance of the clinical trial, describe and define the goal or goals of the study. Examples of endpoints will vary depending on the type and phase of trial. Common endpoints include overall survival, tumour response, patient survival or quality of life.
Salvage therapyA form of treatment given after an ailment does not respond to standard treatment. The most common diseases requiring salvage therapy are various cancer tumours and HIV. It can also mean a second attempt or a third final attempt.
Progression-Free Survival (PFS) Is defined as the time elapsed from the date of patient randomisation until the date of tumour progression occurring at any site in the body (or patient death if disease progression has not yet occurred). PFS measures the duration of time that tumours located at any site in the body are ‘not growing’.
Progression-Free Survival in the Liver Is defined as the time elapsed from the date of patient randomisation until the date of tumour progression occurring in the liver (or patient death if disease progression in the liver has not yet occurred). PFS in the Liver measures the duration of time that tumours located in the liver are ‘not growing’.
Quality of Life (QoL) Clinical trials may assess the effect of treatment on a patient’s wellbeing and ability to function in daily life. These are measured using quality of life tools such as questionnaires.
Complete Response (CR) This is the disappearance of all clinical evidence of disease. It means the disappearance of tumours as measurable using medical imaging techniques or by measurements of pathological specimens and samples.
Objective Response Rate (ORR) The percentage of patients experiencing either complete or partial ‘shrinkage’ of their tumours located at any site in the body.
Partial Response (PR) Means at least 30 per cent ‘shrinkage’ of all tumours as measurable using medical imaging techniques or by measurements of pathological specimens and samples.
MORE CLINICAL DATA TO BECOME AVAILABLE OVER NEXT THREE YEARS
INVESTMENT IN CLINICAL PROGRAMS$’000
0.0
2216.8
4433.6
6650.4
8867.2
11084.0
13300.8
15517.6
17734.4
19951.2
22168.0
12,2
43
10,4
02
15,8
72
22,1
68
20,7
24
2011
3,06
2
2010 2012 2013 2014 2015
Sirtex sincerely thanks the many patients, their families, medical professionals, research and clinical support staff involved in helping advance our important clinical programs dedicated to improving the outcomes for people with liver cancer.
Sirtex 2015 AR 11
MANUFACTURING & OPERATIONSRESEARCH & DEVELOPMENT Our commitment to creating long-term value and growth has seen significant investments in manufacturing and operations, and R&D.
MANUFACTURING & OPERATIONS
The manufacture and supply of the highest possible quality product is of paramount importance to Sirtex, the medical teams who administer our product and the patients who receive our therapy. Our manufacturing and operations teams continued to ensure the safe and timely delivery of our product to customers at more than 900 treatment sites, across over 40 countries around the world. During the year, an average of 98 per cent of all SIR-Spheres microspheres deliveries were made globally within 30 minutes of the scheduled delivery time from our current manufacturing facilities in the US and Singapore.
During the 2015 financial year, our expanded manufacturing facility in the US became operational and is expected to meet future demand across the Americas. In Europe, work continued to progress on our state-of-the-art manufacturing plant in Frankfurt, Germany. This facility is anticipated to commence commercial supply into the EMEA region during the 2016 financial year.
The robustness of our manufacturing and logistical infrastructure was highlighted during February and March, where despite the heaviest winter snowfall in history across Boston (108.6 inches), our Wilmington manufacturing facility continued to operate irrespective of the significant logistical challenges the snow presented. All intended deliveries of SIR-Spheres microspheres were made which enabled the patients to receive their scheduled treatments. The highly efficient global distribution network that allows Sirtex to manufacture and deliver such an important cancer therapy is one of our most valuable assets.
However, we consistently aim to improve the way we structure our manufacturing and operations. To manage our supply chain more effectively, a new integrated software system is helping our manufacturing teams streamline administrative procedures
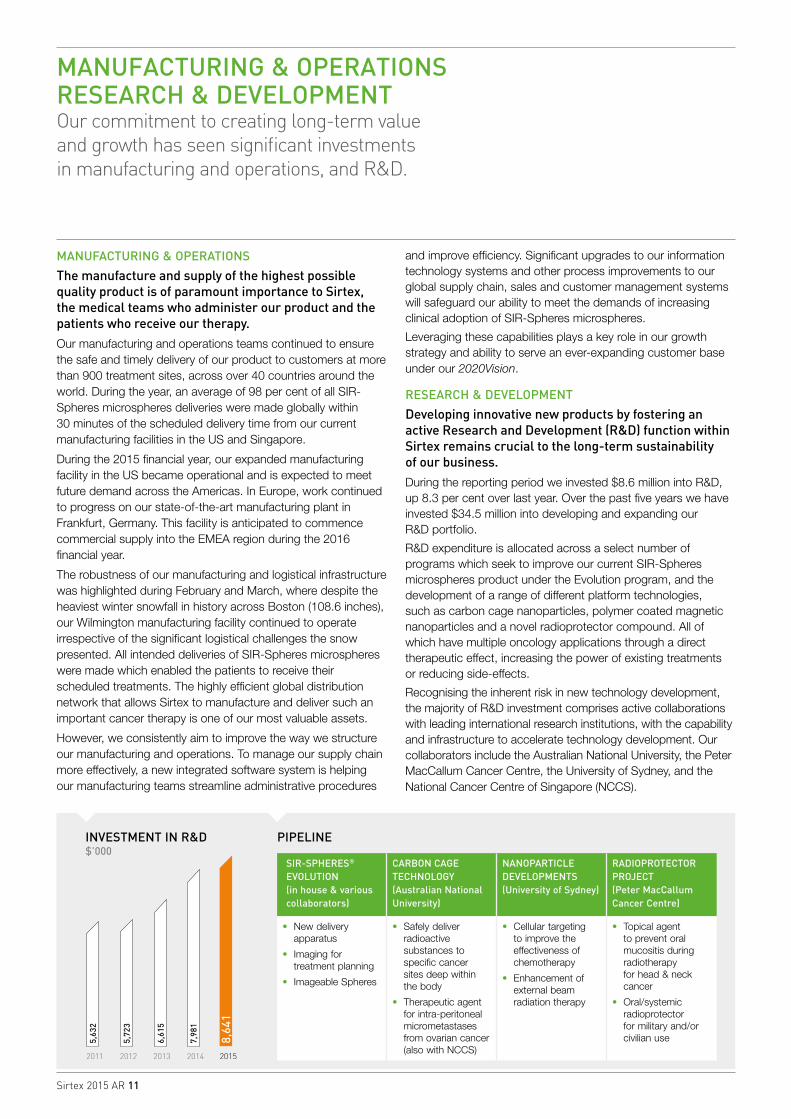
INVESTMENT IN R&D$’000
PIPELINE
0.0
864.1
1728.2
2592.3
3456.4
4320.5
5184.6
6048.7
6912.8
7776.9
8641.0
5,72
3
5,63
2
6,61
5
7,98
1
8,64
1
2011
3,06
2
2010 2012 2013 2014 2015
SIR-SPHERES® EVOLUTION (in house & various collaborators)
CARBON CAGE TECHNOLOGY (Australian National University)
NANOPARTICLE DEVELOPMENTS (University of Sydney)
RADIOPROTECTOR PROJECT (Peter MacCallum Cancer Centre)
• New delivery apparatus
• Imaging for treatment planning
• Imageable Spheres
• Safely deliver radioactive substances to specific cancer sites deep within the body
• Therapeutic agent for intra-peritoneal micrometastases from ovarian cancer (also with NCCS)
• Cellular targeting to improve the effectiveness of chemotherapy
• Enhancement of external beam radiation therapy
• Topical agent to prevent oral mucositis during radiotherapy for head & neck cancer
• Oral/systemic radioprotector for military and/or civilian use
and improve efficiency. Significant upgrades to our information technology systems and other process improvements to our global supply chain, sales and customer management systems will safeguard our ability to meet the demands of increasing clinical adoption of SIR-Spheres microspheres.
Leveraging these capabilities plays a key role in our growth strategy and ability to serve an ever-expanding customer base under our 2020Vision.
RESEARCH & DEVELOPMENT
Developing innovative new products by fostering an active Research and Development (R&D) function within Sirtex remains crucial to the long-term sustainability of our business. During the reporting period we invested $8.6 million into R&D, up 8.3 per cent over last year. Over the past five years we have invested $34.5 million into developing and expanding our R&D portfolio.
R&D expenditure is allocated across a select number of programs which seek to improve our current SIR-Spheres microspheres product under the Evolution program, and the development of a range of different platform technologies, such as carbon cage nanoparticles, polymer coated magnetic nanoparticles and a novel radioprotector compound. All of which have multiple oncology applications through a direct therapeutic effect, increasing the power of existing treatments or reducing side-effects.
Recognising the inherent risk in new technology development, the majority of R&D investment comprises active collaborations with leading international research institutions, with the capability and infrastructure to accelerate technology development. Our collaborators include the Australian National University, the Peter MacCallum Cancer Centre, the University of Sydney, and the National Cancer Centre of Singapore (NCCS).
Sirtex 2015 AR 12
MARKETING & COMMUNICATIONS Our marketing investment creates greater awareness of our unique therapy among healthcare professionals worldwide.
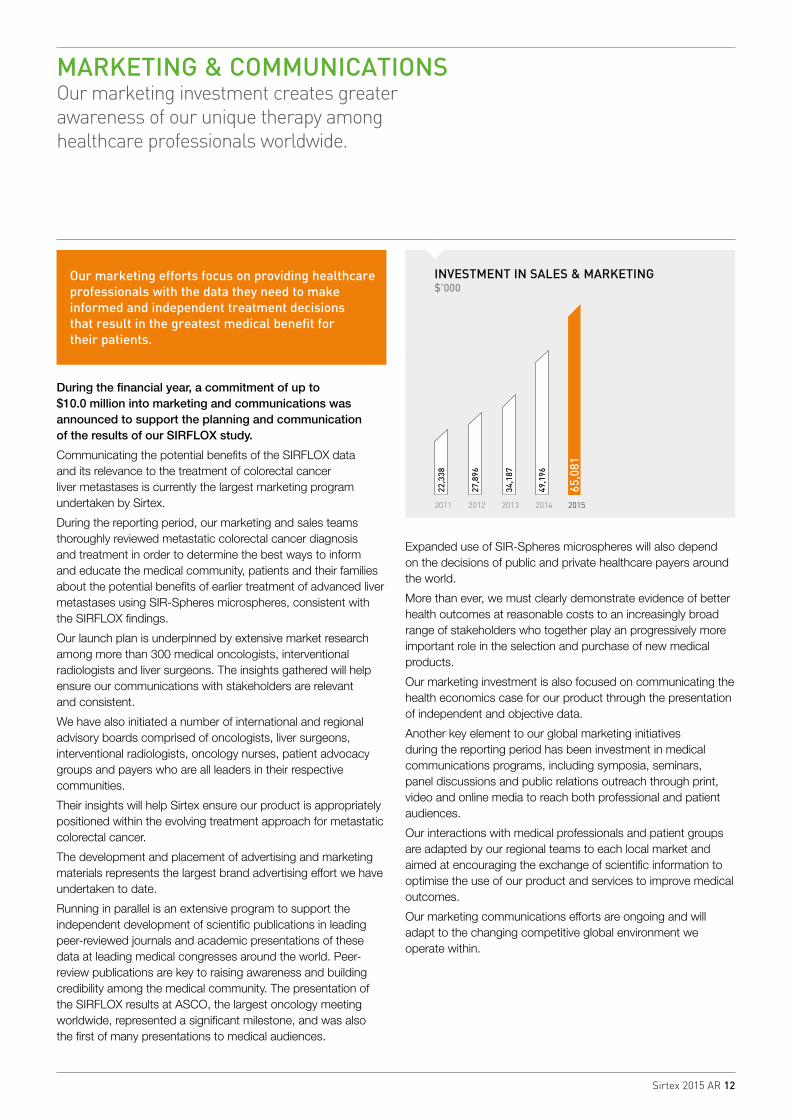
During the financial year, a commitment of up to $10.0 million into marketing and communications was announced to support the planning and communication of the results of our SIRFLOX study.
Communicating the potential benefits of the SIRFLOX data and its relevance to the treatment of colorectal cancer liver metastases is currently the largest marketing program undertaken by Sirtex.
During the reporting period, our marketing and sales teams thoroughly reviewed metastatic colorectal cancer diagnosis and treatment in order to determine the best ways to inform and educate the medical community, patients and their families about the potential benefits of earlier treatment of advanced liver metastases using SIR-Spheres microspheres, consistent with the SIRFLOX findings.
Our launch plan is underpinned by extensive market research among more than 300 medical oncologists, interventional radiologists and liver surgeons. The insights gathered will help ensure our communications with stakeholders are relevant and consistent.
We have also initiated a number of international and regional advisory boards comprised of oncologists, liver surgeons, interventional radiologists, oncology nurses, patient advocacy groups and payers who are all leaders in their respective communities.
Their insights will help Sirtex ensure our product is appropriately positioned within the evolving treatment approach for metastatic colorectal cancer.
The development and placement of advertising and marketing materials represents the largest brand advertising effort we have undertaken to date.
Running in parallel is an extensive program to support the independent development of scientific publications in leading peer-reviewed journals and academic presentations of these data at leading medical congresses around the world. Peer-review publications are key to raising awareness and building credibility among the medical community. The presentation of the SIRFLOX results at ASCO, the largest oncology meeting worldwide, represented a significant milestone, and was also the first of many presentations to medical audiences.
INVESTMENT IN SALES & MARKETING$’000
0.0
6508.1
13016.2
19524.3
26032.4
32540.5
39048.6
45556.7
52064.8
58572.9
65081.0
27,8
96
22,3
38
34,1
87
49,1
96
65,0
81
2011
3,06
2
2010 2012 2013 2014 2015
Expanded use of SIR-Spheres microspheres will also depend on the decisions of public and private healthcare payers around the world.
More than ever, we must clearly demonstrate evidence of better health outcomes at reasonable costs to an increasingly broad range of stakeholders who together play an progressively more important role in the selection and purchase of new medical products.
Our marketing investment is also focused on communicating the health economics case for our product through the presentation of independent and objective data.
Another key element to our global marketing initiatives during the reporting period has been investment in medical communications programs, including symposia, seminars, panel discussions and public relations outreach through print, video and online media to reach both professional and patient audiences.
Our interactions with medical professionals and patient groups are adapted by our regional teams to each local market and aimed at encouraging the exchange of scientific information to optimise the use of our product and services to improve medical outcomes.
Our marketing communications efforts are ongoing and will adapt to the changing competitive global environment we operate within.
Our marketing efforts focus on providing healthcare professionals with the data they need to make informed and independent treatment decisions that result in the greatest medical benefit for their patients.
Sirtex 2015 AR 13
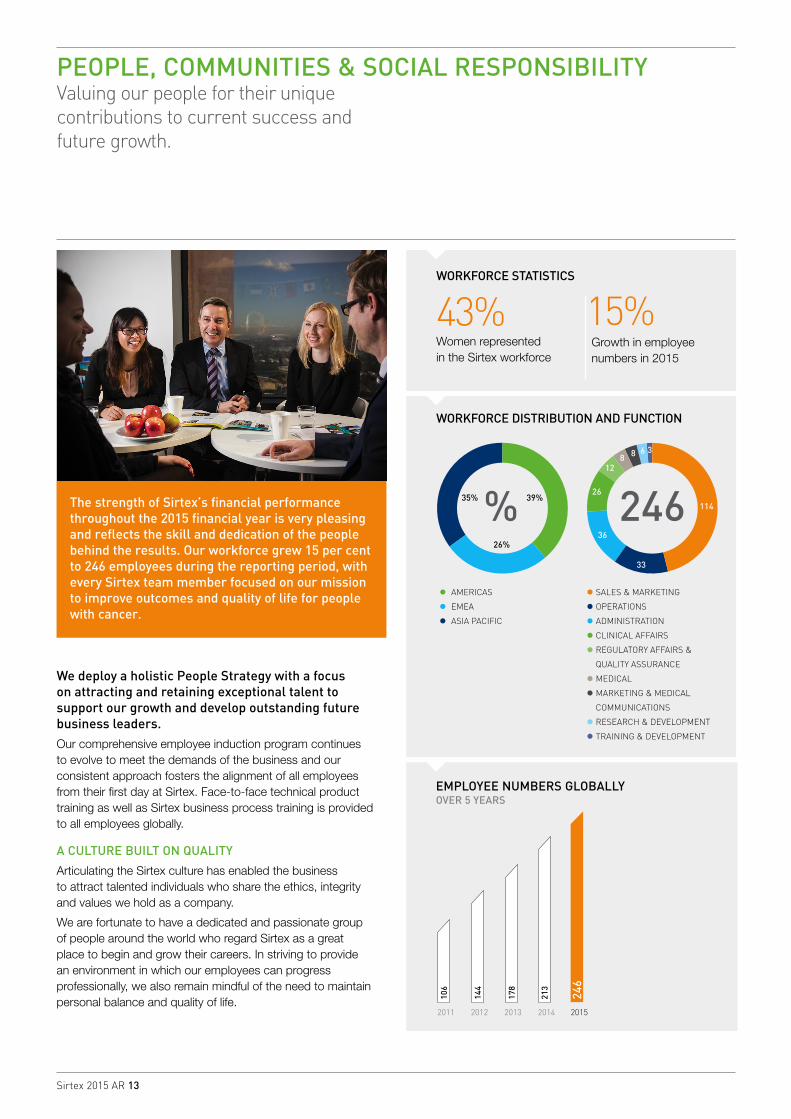
PEOPLE, COMMUNITIES & SOCIAL RESPONSIBILITY Valuing our people for their unique contributions to current success and future growth.
The strength of Sirtex’s financial performance throughout the 2015 financial year is very pleasing and reflects the skill and dedication of the people behind the results. Our workforce grew 15 per cent to 246 employees during the reporting period, with every Sirtex team member focused on our mission to improve outcomes and quality of life for people with cancer.
We deploy a holistic People Strategy with a focus on attracting and retaining exceptional talent to support our growth and develop outstanding future business leaders. Our comprehensive employee induction program continues to evolve to meet the demands of the business and our consistent approach fosters the alignment of all employees from their first day at Sirtex. Face-to-face technical product training as well as Sirtex business process training is provided to all employees globally.
A CULTURE BUILT ON QUALITY
Articulating the Sirtex culture has enabled the business to attract talented individuals who share the ethics, integrity and values we hold as a company.
We are fortunate to have a dedicated and passionate group of people around the world who regard Sirtex as a great place to begin and grow their careers. In striving to provide an environment in which our employees can progress professionally, we also remain mindful of the need to maintain personal balance and quality of life.
EMPLOYEE NUMBERS GLOBALLY OVER 5 YEARS
0.0
24.6
49.2
73.8
98.4
123.0
147.6
172.2
196.8
221.4
246.0
144
106
178
213
246
2011 2012 2013 2014 2015
WORKFORCE DISTRIBUTION AND FUNCTION
WORKFORCE STATISTICS
• AMERICAS
• EMEA
• ASIA PACIFIC
• SALES & MARKETING
• OPERATIONS
• ADMINISTRATION
• CLINICAL AFFAIRS
• REGULATORY AFFAIRS &
QUALITY ASSURANCE
• MEDICAL
• MARKETING & MEDICAL
COMMUNICATIONS
• RESEARCH & DEVELOPMENT
• TRAINING & DEVELOPMENT
68 3
33
36
128
26
11435%
26%
39%% 246
Growth in employee numbers in 2015
43%Women represented in the Sirtex workforce
15%
Sirtex 2015 AR 14
With a dedicated global team of Human Resources professionals now in place, we are equipped to actively support our growing workforce and their unique requirements in all markets.
CARING FOR OUR PEOPLE AND BUILDING A GLOBAL WORKFORCE
Sirtex has a diverse and inclusive working environment that empowers employees and supports the achievement of our long-term business goals. The Sirtex Diversity Program will continue to foster equality, flexible work practices and promote further opportunities for women to participate at all levels of the organisation.
An inclusive environment cultivates different knowledge, experiences and working styles that foster innovation and creative thinking, providing scope to build a diverse group of decision-makers and integrate a range of perspectives into our business. By embracing this powerful formula, Sirtex is in a strong position to capitalise on opportunities in all markets, particularly emerging markets that could provide solid business growth in the coming decade.
Key to the long-term, sustainable growth and success of Sirtex will be our ability to continually attract, shape and motivate a highly skilled workforce. A broad program of engagement has been created, combining traditional hiring processes with more modern recruitment solutions that harness the power of social media. This has seen an increase in employees hired via direct referrals during the reporting period.
With these sound strategic engagement plans in place, we are well positioned to manage the expansion of our workforce as we move towards the fulfillment of the Sirtex 2020Vision.
GROWING WITH SIRTEX
Growing with Sirtex is an internal initiative aimed at supporting the development of our global team by enhancing the skills they will need as our business evolves.
The goal is to continue to build a team of highly skilled and capable individuals who can enjoy career progression within Sirtex while making a significant, efficient and considered contribution to the business.
HEALTH, SAFETY AND ENVIRONMENT
Our commitment to building a safe and healthy workplace and reducing our environmental footprint is approached with the same level of focus given to all other areas of the Sirtex business.
We recently appointed a dedicated global Health and Safety Manager to oversee the implementation of a comprehensive program to build on our good record in this area. World Safety Day 2015 served as an ideal occasion to launch our inaugural Health, Safety and Environment Policy via a video message from our CEO to all employees.
With employees in 20 countries and extensive research, distribution and manufacturing operations, we are exposed to a number of potential risks. As part of our steadfast commitment to preventing work-related accidents and illnesses, a new company-wide awareness and training program has been designed to minimise these risks and equip our teams with the tools and insights needed to perform at the highest levels with zero harm.
Sirtex recognises the importance of conducting its business in a manner that acknowledges our long-term responsibility to the environment. During the reporting period we maintained compliance with all applicable environmental laws and regulations in every market.
Our performance in safety, health and environment is reviewed regularly and all employees are encouraged to contribute and identify areas for improvement.
IN THE COMMUNITY
Sirtex is committed to playing an active role in the medical, scientific, patient and research communities we collaborate with worldwide.
Helping where we can to empower researchers, medical practitioners, patient advocacy and support groups and the local communities where our employees live and work is part of our corporate and social responsibility. Sirtex provides support to these stakeholders through product or monetary donations, sponsorships, research and education grants and scholarships.
By facilitating and contributing to the work of others who support and share our goals, we are moving closer to our vision of transforming cancer into a condition people can live with.
OUR COMMUNITY SUPPORT IS FOCUSED ON FOUR AREAS
PATIENTS Improve access and awareness
of our therapy
Enhance the quality of life for liver cancer patients and their families
RESEARCH
Enhance and expand the knowledge of researchers in microsphere and
related technologies
Expand knowledge of our technology platform to support the next generation
of biomedical researchers
MEDICAL
Improve the skills and knowledge of medical professionals who use
our product
Foster the next generation of medical specialists who will use our product
LOCAL
Support community efforts where our staff work and live
Support initiatives that contribute to our goal of making cancer a
chronic disease
1234
Sirtex 2015 AR 15
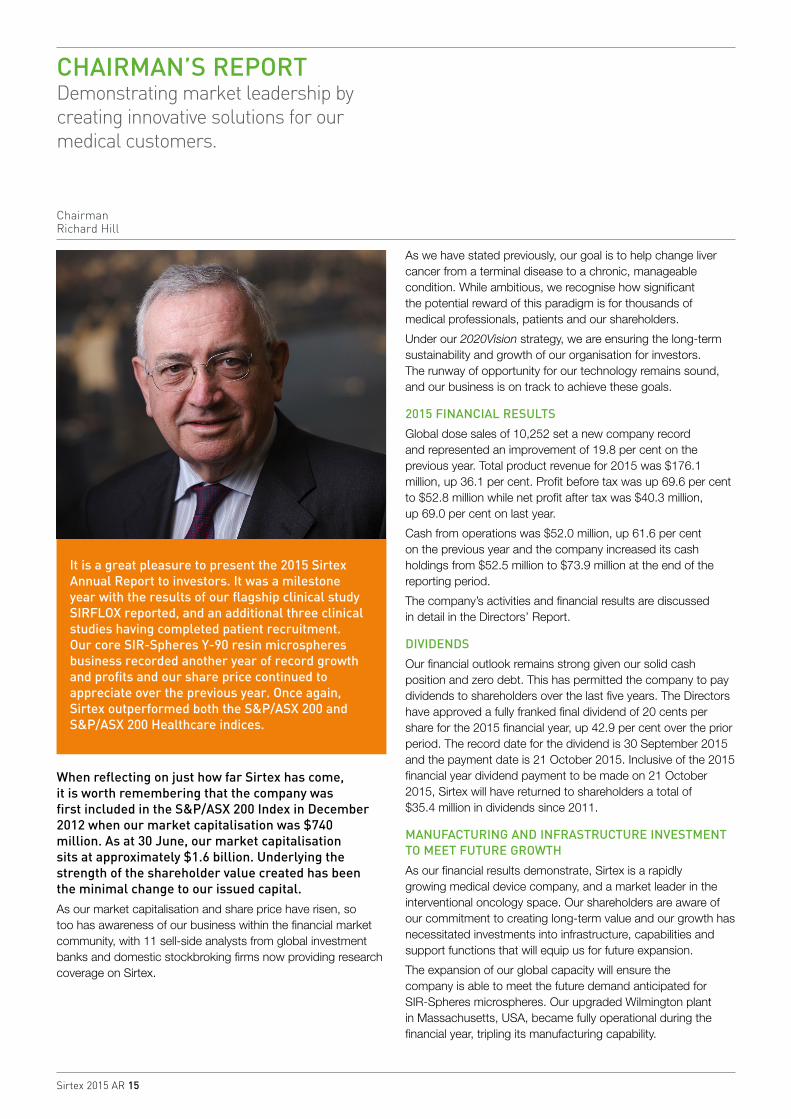
CHAIRMAN’S REPORTDemonstrating market leadership by creating innovative solutions for our medical customers.
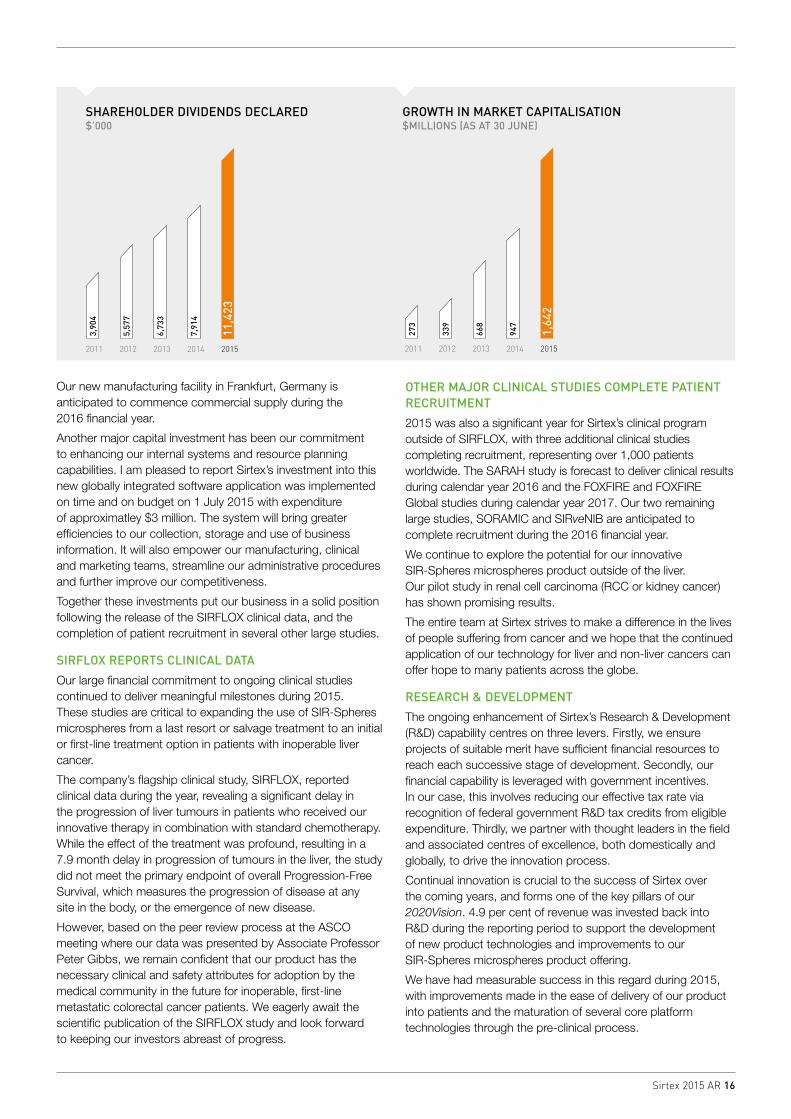
When reflecting on just how far Sirtex has come, it is worth remembering that the company was first included in the S&P/ASX 200 Index in December 2012 when our market capitalisation was $740 million. As at 30 June, our market capitalisation sits at approximately $1.6 billion. Underlying the strength of the shareholder value created has been the minimal change to our issued capital. As our market capitalisation and share price have risen, so too has awareness of our business within the financial market community, with 11 sell-side analysts from global investment banks and domestic stockbroking firms now providing research coverage on Sirtex.
As we have stated previously, our goal is to help change liver cancer from a terminal disease to a chronic, manageable condition. While ambitious, we recognise how significant the potential reward of this paradigm is for thousands of medical professionals, patients and our shareholders.
Under our 2020Vision strategy, we are ensuring the long-term sustainability and growth of our organisation for investors. The runway of opportunity for our technology remains sound, and our business is on track to achieve these goals.
2015 FINANCIAL RESULTS
Global dose sales of 10,252 set a new company record and represented an improvement of 19.8 per cent on the previous year. Total product revenue for 2015 was $176.1 million, up 36.1 per cent. Profit before tax was up 69.6 per cent to $52.8 million while net profit after tax was $40.3 million, up 69.0 per cent on last year.
Cash from operations was $52.0 million, up 61.6 per cent on the previous year and the company increased its cash holdings from $52.5 million to $73.9 million at the end of the reporting period.
The company’s activities and financial results are discussed in detail in the Directors’ Report.
DIVIDENDS
Our financial outlook remains strong given our solid cash position and zero debt. This has permitted the company to pay dividends to shareholders over the last five years. The Directors have approved a fully franked final dividend of 20 cents per share for the 2015 financial year, up 42.9 per cent over the prior period. The record date for the dividend is 30 September 2015 and the payment date is 21 October 2015. Inclusive of the 2015 financial year dividend payment to be made on 21 October 2015, Sirtex will have returned to shareholders a total of $35.4 million in dividends since 2011.
MANUFACTURING AND INFRASTRUCTURE INVESTMENT TO MEET FUTURE GROWTH
As our financial results demonstrate, Sirtex is a rapidly growing medical device company, and a market leader in the interventional oncology space. Our shareholders are aware of our commitment to creating long-term value and our growth has necessitated investments into infrastructure, capabilities and support functions that will equip us for future expansion.
The expansion of our global capacity will ensure the company is able to meet the future demand anticipated for SIR-Spheres microspheres. Our upgraded Wilmington plant in Massachusetts, USA, became fully operational during the financial year, tripling its manufacturing capability.
Chairman Richard Hill
It is a great pleasure to present the 2015 Sirtex Annual Report to investors. It was a milestone year with the results of our flagship clinical study SIRFLOX reported, and an additional three clinical studies having completed patient recruitment. Our core SIR-Spheres Y-90 resin microspheres business recorded another year of record growth and profits and our share price continued to appreciate over the previous year. Once again, Sirtex outperformed both the S&P/ASX 200 and S&P/ASX 200 Healthcare indices.
Sirtex 2015 AR 16
Our new manufacturing facility in Frankfurt, Germany is anticipated to commence commercial supply during the 2016 financial year.
Another major capital investment has been our commitment to enhancing our internal systems and resource planning capabilities. I am pleased to report Sirtex’s investment into this new globally integrated software application was implemented on time and on budget on 1 July 2015 with expenditure of approximatley $3 million. The system will bring greater efficiencies to our collection, storage and use of business information. It will also empower our manufacturing, clinical and marketing teams, streamline our administrative procedures and further improve our competitiveness.
Together these investments put our business in a solid position following the release of the SIRFLOX clinical data, and the completion of patient recruitment in several other large studies.
SIRFLOX REPORTS CLINICAL DATA
Our large financial commitment to ongoing clinical studies continued to deliver meaningful milestones during 2015. These studies are critical to expanding the use of SIR-Spheres microspheres from a last resort or salvage treatment to an initial or first-line treatment option in patients with inoperable liver cancer.
The company’s flagship clinical study, SIRFLOX, reported clinical data during the year, revealing a significant delay in the progression of liver tumours in patients who received our innovative therapy in combination with standard chemotherapy. While the effect of the treatment was profound, resulting in a 7.9 month delay in progression of tumours in the liver, the study did not meet the primary endpoint of overall Progression-Free Survival, which measures the progression of disease at any site in the body, or the emergence of new disease.
However, based on the peer review process at the ASCO meeting where our data was presented by Associate Professor Peter Gibbs, we remain confident that our product has the necessary clinical and safety attributes for adoption by the medical community in the future for inoperable, first-line metastatic colorectal cancer patients. We eagerly await the scientific publication of the SIRFLOX study and look forward to keeping our investors abreast of progress.
OTHER MAJOR CLINICAL STUDIES COMPLETE PATIENT RECRUITMENT
2015 was also a significant year for Sirtex’s clinical program outside of SIRFLOX, with three additional clinical studies completing recruitment, representing over 1,000 patients worldwide. The SARAH study is forecast to deliver clinical results during calendar year 2016 and the FOXFIRE and FOXFIRE Global studies during calendar year 2017. Our two remaining large studies, SORAMIC and SIRveNIB are anticipated to complete recruitment during the 2016 financial year.
We continue to explore the potential for our innovative SIR-Spheres microspheres product outside of the liver. Our pilot study in renal cell carcinoma (RCC or kidney cancer) has shown promising results.
The entire team at Sirtex strives to make a difference in the lives of people suffering from cancer and we hope that the continued application of our technology for liver and non-liver cancers can offer hope to many patients across the globe.
RESEARCH & DEVELOPMENT
The ongoing enhancement of Sirtex’s Research & Development (R&D) capability centres on three levers. Firstly, we ensure projects of suitable merit have sufficient financial resources to reach each successive stage of development. Secondly, our financial capability is leveraged with government incentives. In our case, this involves reducing our effective tax rate via recognition of federal government R&D tax credits from eligible expenditure. Thirdly, we partner with thought leaders in the field and associated centres of excellence, both domestically and globally, to drive the innovation process.
Continual innovation is crucial to the success of Sirtex over the coming years, and forms one of the key pillars of our 2020Vision. 4.9 per cent of revenue was invested back into R&D during the reporting period to support the development of new product technologies and improvements to our SIR-Spheres microspheres product offering.
We have had measurable success in this regard during 2015, with improvements made in the ease of delivery of our product into patients and the maturation of several core platform technologies through the pre-clinical process.
SHAREHOLDER DIVIDENDS DECLARED$’000
GROWTH IN MARKET CAPITALISATION $MILLIONS (AS AT 30 JUNE)
0.0
1142.3
2284.6
3426.9
4569.2
5711.5
6853.8
7996.1
9138.4
10280.7
3,90
4
5,57
7
6,73
3
2011
3,90
4
2010 2012 2013 2014
7,91
4
11,4
23
20150.0
164.2
328.4
492.6
656.8
821.0
985.2
1149.4
1313.6
1477.8
273
339
668
2011 2012 2013 2014
947
1,64
2
2015
Sirtex 2015 AR 17
DIRECTOR AND BOARD ACTIVITIES
Stability at Board level is one measure of strength of the company. The Sirtex Board has worked cohesively and constructively over a number of years, and this approach continued in 2015 with Board membership remaining unchanged.
The Board works diligently to ensure the Sirtex global management team has the expertise, capability and resources to execute on their global growth initiatives both now and into the future.
Under the leadership of our Chief Executive Officer, Gilman Wong, the company has continued to deliver exceptional returns to shareholders over a number of years. Our staff numbers continue to rise, commensurate with the growth in our business, all within the stated objectives of the 2020Vision.
OUR DEDICATED EMPLOYEES WORLDWIDE
Our employees are highly motivated individuals who share our common corporate vision for the business. Approximately 46 per cent of our workforce operates in a sales and marketing capacity. At the end of the 2015 financial year, women represented 43 per cent of the total number of employees globally.
Our people are talented and united in their focus to deliver on our 2020Vision to create market leadership by delivering solutions to the problems faced by our medical customers. They are also committed to deploying our resources wisely and delivering financial performance to create long-term shareholder value.
DIVERSITY
We benefit from a diverse workforce which reflects the multiple and varied communities in which we seek to do business. Our diverse workforce also provides the necessary insights and innovation required to remain successful in a global environment.
The Board acknowledges the tireless work and commitment of Sirtex employees in realising this vision, which has enhanced Sirtex’s reputation among its customers, the medical and scientific community and its key stakeholders, both domestically and across the globe in over 40 countries.
A RESPONSIBLE COMMUNITY MEMBER
Sirtex is committed to conducting business ethically and contributing to the social, environmental and economic wellbeing of the many communities in which we operate.
Our report this year details our commitment and support for a range of stakeholders in the medical, patient research and local communities worldwide.
OUTLOOK
Minimally invasive interventional oncology products like SIR-Spheres microspheres continue to generate higher levels of clinician interest with each passing year. Now, with the reporting of the SIRFLOX data which was the largest such study ever undertaken, the Board believes such a solid foundation of evidence and benefit will see this segment of the oncology market continue to grow over the coming years.
Patients will continue to seek out treatments that offer greater precision with better clinical outcomes and lower side-effects. On the other hand, Governments globally are looking to reduce healthcare expenditures by providing their citizens with cost-effective medical solutions. We believe SIR-Spheres microspheres are uniquely positioned in this regard.
The Board is pleased with the progress made on all fronts and the performance of the Sirtex team. 2016 is shaping up to be another year of growth and prosperity for Sirtex as we pursue our goal of making a meaningful difference in the lives of people with cancer.
RICHARD HILL CHAIRMAN
CHAIRMAN’S REPORT
Sirtex 2015 AR 18
The SIRFLOX study provided for the first time the necessary Level 1 clinical evidence required by clinicians when making informed treatment decisions for their liver cancer patients. SIRFLOX highlighted the significant benefits of SIR-Spheres microspheres in patients suffering from metastatic colorectal cancer where the cancer had spread to the liver. Importantly, through the peer review process at the American Society for Clinical Oncology (ASCO) Annual Meeting in Chicago in late May, our study results were deemed to be both clinically meaningful and significant in the liver. In short, we are delighted by the results, which now provide us with an opportunity to generate sales at an earlier stage of treatment for patients with metastatic colorectal cancer than is currently the case with our salvage business. In addition to the exciting potential resulting from the SIRFLOX study results, our current business delivered another outstanding year of growth. We remain focused in our determination to see as many patients as possible with inoperable liver cancer benefit from our treatment. Our addressable global market is large, and our 2015 dose sales imply we have less than a two per cent share. Our runway of opportunity is therefore significant.
We must work in a proactive manner with the medical community, patients, insurance companies, government regulators and hospital administrators to achieve our long- term growth objectives.
Behind every treatment we sell is a patient living with liver cancer. Despite recent advances in the field, the five-year survival rate for patients with inoperable liver cancer remains very low. Like all medical paradigms, changing the basic three tenets of cancer care, namely surgery, external radiotherapy and drug therapy (chemotherapy) to include a fourth option of ‘loco-regional’ or organ-specific treatments such as SIR-Spheres microspheres will require education and time. At Sirtex, we are committed to ensuring the relatively new specialty of interventional oncology gains wider acceptance by the general medical community.
We have an ambitious aim of increasing the number of patients who are effectively able to live with their cancer by controlling the burden of their disease in the liver. It is these patients who motivate and inspire us at Sirtex to ensure every patient who is eligible for our treatment has the potential to receive it.
Much of what we aim to achieve in the longer term is embodied in our core strategy, the 2020Vision.
CHIEF EXECUTIVE OFFICER’S REPORTAnother year of strong progress and major milestones delivered.
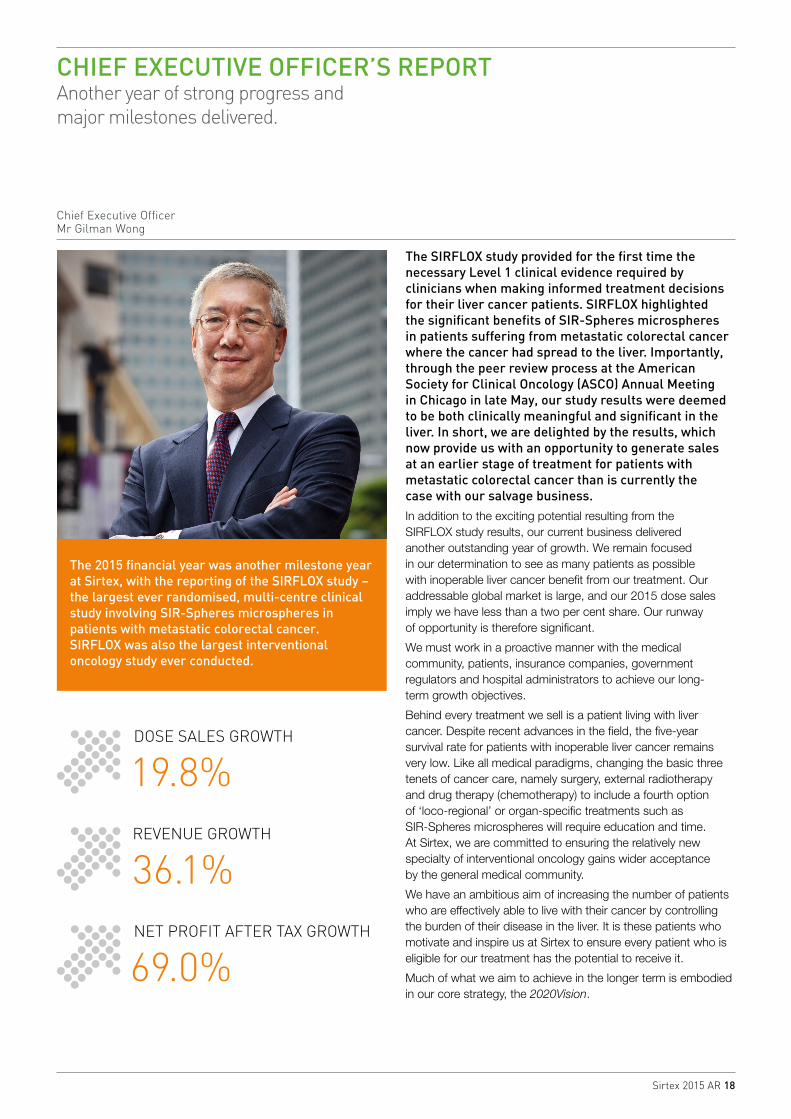
Chief Executive Officer Mr Gilman Wong
The 2015 financial year was another milestone year at Sirtex, with the reporting of the SIRFLOX study – the largest ever randomised, multi-centre clinical study involving SIR-Spheres microspheres in patients with metastatic colorectal cancer. SIRFLOX was also the largest interventional oncology study ever conducted.
NET PROFIT AFTER TAX GROWTH
69.0%
REVENUE GROWTH
36.1%
DOSE SALES GROWTH
19.8%
Sirtex 2015 AR 19
CHIEF EXECUTIVE OFFICER’S REPORT
2020VISION STRATEGY
Our 2020Vision which aims to define where Sirtex could be in the year 2020 is now well into its third year of implementation. It continues to shape our near and long-term decision-making across three core pillars.
The first pillar involves fully exploiting the SIR-Spheres microspheres technology platform by significantly expanding the current ‘salvage’ market opportunity by investing into sales and marketing to build awareness and increase adoption, while at the same time investing in clinical studies that will expand its use in existing primary and secondary liver cancer markets. We are also examining its use in other cancers outside the liver, such as the kidneys. We are very pleased with our progress under this pillar, with three of our six major clinical studies completing recruitment during 2015 and in the case of SIRFLOX, reporting results.
The second pillar is aimed at evolving the current SIR-Spheres microspheres platform and related technologies, which include developments in carbon cage nanoparticles, coated nanoparticles, radioprotector and other technologies. We continue to make good progress across all programs and are moving closer to commencing human clinical studies.
The third pillar is focused on potential merger and acquisition activities. While the opportunities for SIR-Spheres microspheres are substantial, it is important for the company to leverage its key capabilities and infrastructure in seeking appropriate products or technologies that may facilitate additional growth.
The 2020Vision is a pragmatic approach to managing strategic risk while increasing shareholder value and returns over the long-term. We look forward to updating shareholders as further key milestones are met.
SIRFLOX CLINICAL STUDY RESULTS
In 2015 Sirtex reported the results of its flagship clinical study SIRFLOX, which examined the combination of SIR-Spheres microspheres with standard chemotherapy versus chemotherapy alone. While the study did not meet the primary endpoint of overall Progression-Free Survival (PFS), the study did meet the key secondary endpoint of PFS in the liver. The addition of SIR-Spheres microspheres to standard chemotherapy resulted in a 7.9 month improvement in PFS in the liver from 12.6 months to 20.5 months with a 31 per cent
lower risk of the patient’s tumours progressing at any time during the study, with strong statistical significance.
The SIRFLOX results presented at ASCO were considered clinically meaningful in the liver and received strong endorsement by a number of Key Opinion Leaders who commented on the findings publicly. This is a remarkable achievement, and we extend our thanks to the study investigators, hospitals and patients who participated in this important clinical study.
In recognition of the quality of both the study and its findings, ASCO selected SIRFLOX as one of the ‘Best of ASCO’ presentations, which facilitates a greater dissemination of the results by national oncology leaders to Medical Oncologists in their home countries.
Study data continues to be generated beyond what was presented at the ASCO meeting. In July, Professor Guy van Hazel, Co-Principal Investigator on the SIRFLOX study from the University of Western Australia presented further sub-set analyses at the World Congress on Gastrointestinal Cancer (WCGIC). This data once again highlighted the positive clinical benefits of SIR-Spheres microspheres in patients with liver-only and liver-dominant disease. Importantly, from a clinical practice perspective, the significant effect of SIR-Spheres microspheres was independent of whether a patient was intended to be treated with the biologic drug bevacizumab or not and there was no impact on the duration of systemic therapy given to patients.
We anticipate the use of our unique product in earlier treatment lines, including first-line, for metastatic colorectal cancer, will gain momentum over time.
OTHER MAJOR CLINICAL STUDIES CONTINUE TO PROGRESS STRONGLY
Our $60.0 million investment over five years into five major clinical studies additional to SIRFLOX was designed to significantly expand the use of SIR-Spheres microspheres beyond the current salvage treatment market segment. This is a key tenet of our 2020Vision. As mentioned, 2015 was a year of significant progress in these clinical programs with three of them completing recruitment and the final two studies now having recruited 85 per cent of the total patients required by the end of the 2015 financial year.
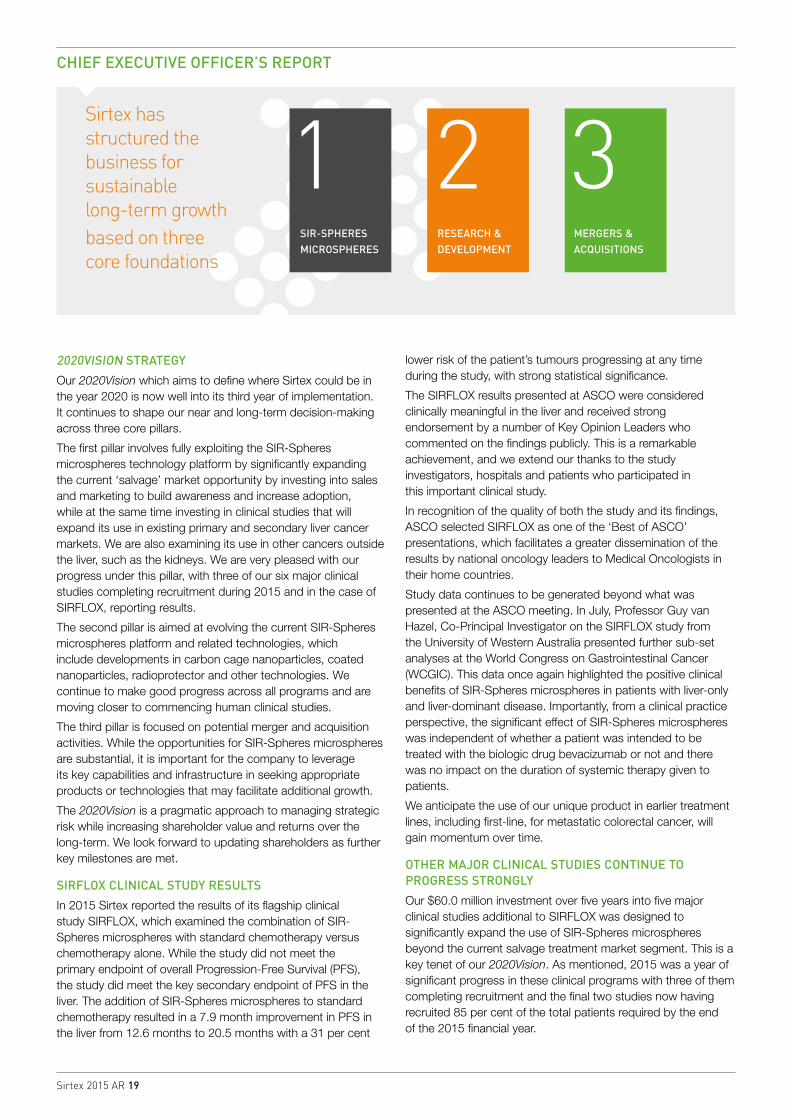
Sirtex has structured the business for sustainable long-term growth based on three core foundations
SIR-SPHERES MICROSPHERES
RESEARCH & DEVELOPMENT
MERGERS & ACQUISITIONS
1 2 3
Sirtex 2015 AR 20
In January, we announced the completion of the FOXFIRE and FOXFIRE Global studies, which recruited over 360 and over 200 patients, respectively. The primary endpoint of these studies is Overall Survival (OS). When combined with the SIRFLOX OS data it will provide the necessary statistical power in over 1,100 patients to see if there is a clinically meaningful difference in survival between the chemotherapy arm and the chemotherapy plus SIR-Spheres microspheres arm of the study. We anticipate the results will be available during calendar year 2017.
In March, the SARAH study completed recruitment of 460 patients, across 25 specialist sites in France. This landmark study is the largest randomised study to compare SIR-Spheres microspheres, or any liver-directed therapy, against the standard systemic therapy sorafenib (Nexavar® – Bayer Healthcare Pharmaceuticals). We believe if the SARAH study results are positive, it could elevate the use of SIR-Spheres microspheres to a standard treatment for patients with advanced primary liver cancer, also known as hepatocellular carcinoma (HCC). Results from the SARAH study are anticipated in late calendar year 2016.
The remaining two studies, SORAMIC (pan European) and SIRveNIB (Asia Pacific) are anticipated to complete recruitment during the 2016 financial year. The target recruitment for SORAMIC is 375 patients and for SIRveNIB 360 patients. As our large studies move closer to completion, we are directing our resources and skills towards providing therapies for a range of other potential indications.
Our RESIRT kidney cancer pilot study has continued to show great promise with minimal side-effects in patients treated with high doses of SIR-Spheres microspheres. To date, we have treated 18 patients, with promising results delivered. Patient recruitment is expected to be complete by early calendar year 2016.
RESEARCH & DEVELOPMENT
Research & Development (R&D) is a crucial component of our long-term 2020Vision. We continually seek to improve our core product offering while simultaneously investing in new technologies that leverage our in-house scientific expertise and collaborations with world-leading universities and institutes. During the reporting period our R&D investment was $8.6 million or 4.9 per cent of total revenue.
Under our SIR-Spheres microspheres evolution program our advanced patient treatment planning system and new delivery apparatus continued to make good progress.
Our collaborations with The Australian National University, Peter MacCallum Institute and National Cancer Centre of Singapore all achieved developmental milestones during the year. We believe our R&D activities are sufficiently diversified to manage the inherent risks associated with new technology development. Several of our programs are moving closer to human clinical trials, which it is hoped will commence during the 2016 financial year.
RECORD DOSE SALES AND PROFIT
We continue to make strong inroads with our ‘deep and wide’ strategy. This approach seeks to increase the use of SIR-Spheres microspheres on a per site basis (‘deep’) and commensurately increase the number of accredited treatment
sites able to use our innovative treatment (‘wide’). In 2015 we saw dose sales accelerate, up 19.8 per cent over the prior year. Revenue growth of 36.1 per cent to $176.1 million outpaced dose sales growth reflecting the material benefit of a price rise in the key US market and the translation effect of a weaker Australian dollar versus the US dollar over the period. With tight cost control, our net profit after tax rose 69.0 per cent to $40.3 million.
Key milestones achieved by the Sirtex team during the reporting period include:
• Record dose sales of 10,252, up 19.8 per cent on 2014
• Record revenues of $176.1 million, up 36.1 per cent on 2014
• Earnings per share of 71.4 cents, up 67.8 per cent
• Dividend per share of 20.0 cents, up 42.9 per cent on the previous year
• Operating cash flow of $52.0 million, up 61.6 per cent on 2014
• Cash balance of $73.9 million and no debt
• Reporting of SIRFLOX clinical study results and presentations at ASCO and WCGIC annual meetings
• Completion of patient recruitment in the SARAH clinical study
• Completion of patient recruitment in the FOXFIRE and FOXFIRE Global clinical studies
• Strong investor interest in Sirtex’s ‘Lunch and Learn’ seminars in Melbourne and Sydney with a Key Opinion Leader presentation.
SALES & MARKETING
Sales and marketing expenditure was up 32.3 per cent on the prior year to $65.1 million, or 37.0 per cent of sales. Our major focus was on expanding our sales and marketing infrastructure in readiness for presentation of the SIRFLOX study results at ASCO.
In 2015 we allocated an additional $10.0 million in sales and marketing expenditure. This was specifically targeted at educating and building awareness within the medical oncology and interventional radiology community both prior to and immediately following the release of the SIRFLOX study results.
Our SIRFLOX sales and marketing initiative culminated with our significant exposure at ASCO where over 30,000 people attended the Annual Meeting and approximately 3,500 attended the presentation of the SIRFLOX study results by Associate Professor Peter Gibbs. We believe most in the audience were relatively unfamiliar with our product.
Our sales and marketing teams globally are now armed with the necessary knowledge and expertise to position SIR-Spheres microspheres as a first-line treatment option for clinicians considering a liver-directed therapy to complement their use of systemic chemotherapy when treating liver-only or liver-dominant metastatic colorectal cancer.
Sirtex now has a global team of 246 people across 20 countries, representing growth of 15 per cent over the prior period. Reflecting our innovative, supportive and inclusive culture at Sirtex is our high participation rate, with 30 per cent of our global workforce having achieved five years’ service. Our staff turnover rates remain low as a direct result of
Sirtex 2015 AR 21
initiatives aimed at attracting, developing and promoting high performers.
Sirtex is committed to providing a healthy and safe workplace for all employees. To achieve this we appointed a dedicated Global Health and Safety Manager to oversee the implementation of a comprehensive program to build on our solid track record in this area. We also used the occasion of World Safety Day 2015 to launch our inaugural Health, Safety and Environment Policy via a video message to all employees.
MANUFACTURING AND SUPPLY CHAIN
Sirtex has manufacturing capabilities in Singapore as well as Wilmington, Massachusetts, USA and more recently in Frankfurt, Germany. These facilities are close to major transport hubs, allowing our product to be efficiently dispatched across the Americas, EMEA and Asia Pacific. We operate a highly efficient but complex logistical supply chain to ensure our products are delivered on time to over 900 hospitals globally and the thousands of patients they treat each year. The complexity of our global manufacturing and supply chains is one of our most valuable assets, particularly when managing a product with a short half-life of only 64.1 hours. The infrastructure we have in place allows for expanded production volumes in the coming years while ensuring tight cost control and margin stability.
Our expanded manufacturing facility in Wilmington was completed during the year, with commercial doses now being supplied throughout the Americas from this facility. We anticipate our Frankfurt facility will be supplying commercial doses across the EMEA region during the 2016 financial year. Sirtex has mitigated the risk of unexpected shut downs at any site, by ensuring each facility is certified to supply any one of our three regions, should the need arise.
The major upgrade of our global information technology systems in the 2015 financial year will allow us to more effectively manage our supply chain, streamline administrative procedures, enhance both sales and customer management and increase the overall enterprise-wide efficiency. This will enable Sirtex to manage future growth more readily.
OUTLOOK
The 2015 financial year was a watershed year for Sirtex with the strong clinical results delivered from the SIRFLOX study. Such large-scale clinical studies not only seek to educate the broader medical community on the benefits of our treatment, but provide us with a robust platform to pursue growth opportunities in both existing and new markets for SIR-Spheres microspheres.
With such a large addressable market for SIR-Spheres microspheres in patients with inoperable liver cancer, the reporting of important clinical information from the SIRFLOX study and additionally from our other major studies from 2016 onwards will provide us with the necessary evidence to materially penetrate this market in the coming years.
With governments worldwide seeking to limit the growth in their healthcare expenditures, it is important for us to demonstrate to governments and private insurers that innovative treatments like ours offer the patient an improved survival outlook at a price that is deemed cost-effective.
We believe our multi-faceted approach ensures that we will continue to build upon our strong leadership position in the rapidly growing field of interventional oncology in the years ahead.
We remain equally excited by our new technologies under development, which made good progress during 2015. Such technologies have the potential to become meaningful contributors to sales growth in the coming years.
Our strong financial and market leading position also affords us the opportunity to take advantage of any potential product or company acquisition targets that may arise in the future. On all fronts, we are particularly pleased with our progress under the 2020Vision.
The operational excellence of our global business is built on a working culture of cooperation and mutual respect. This ensures that every talented Sirtex team is able to meet our ongoing commitment to the medical professionals and their patients who depend on our product for their quality of life.
We remain very confident in our long-term growth prospects and look forward to another successful year in 2016.
GILMAN E WONG CHIEF EXECUTIVE OFFICER
CHIEF EXECUTIVE OFFICER’S REPORT
Sirtex 2015 AR 22
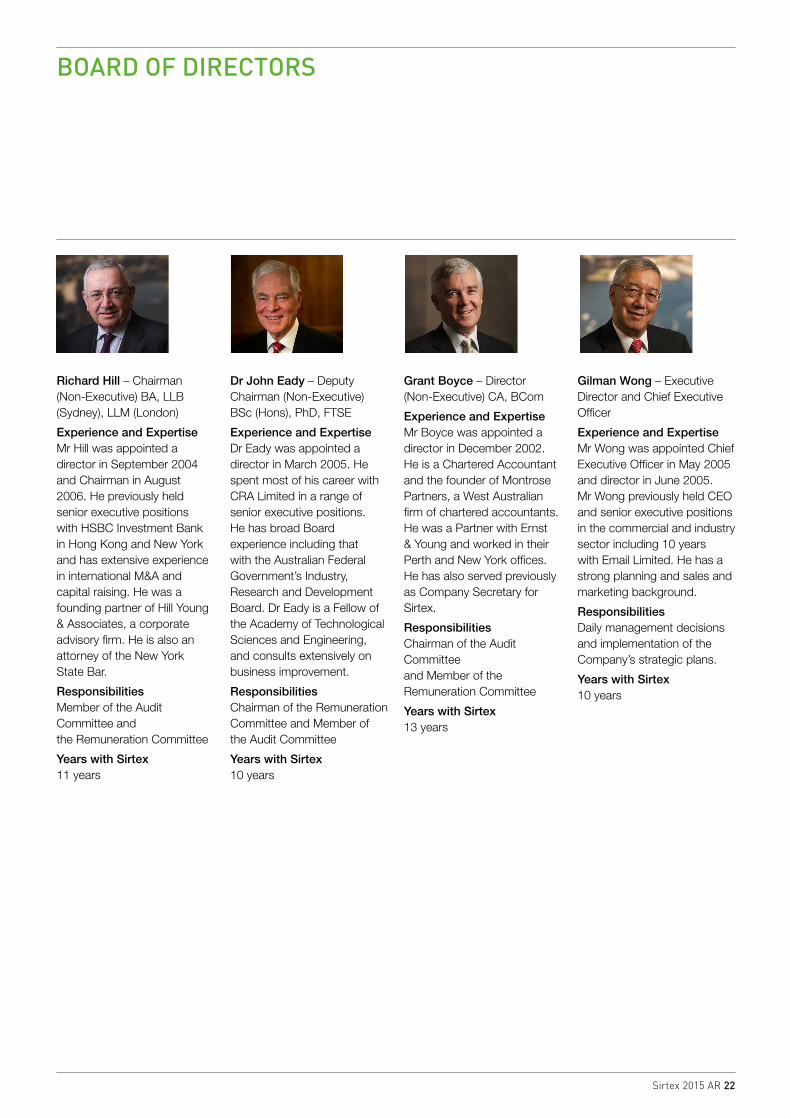
BOARD OF DIRECTORS
Richard Hill – Chairman (Non-Executive) BA, LLB (Sydney), LLM (London)
Experience and ExpertiseMr Hill was appointed a director in September 2004 and Chairman in August 2006. He previously held senior executive positions with HSBC Investment Bank in Hong Kong and New York and has extensive experience in international M&A and capital raising. He was a founding partner of Hill Young & Associates, a corporate advisory firm. He is also an attorney of the New York State Bar.
ResponsibilitiesMember of the Audit Committee and the Remuneration Committee
Years with Sirtex11 years
Dr John Eady – Deputy Chairman (Non-Executive) BSc (Hons), PhD, FTSE
Experience and ExpertiseDr Eady was appointed a director in March 2005. He spent most of his career with CRA Limited in a range of senior executive positions. He has broad Board experience including that with the Australian Federal Government’s Industry, Research and Development Board. Dr Eady is a Fellow of the Academy of Technological Sciences and Engineering, and consults extensively on business improvement.
ResponsibilitiesChairman of the Remuneration Committee and Member of the Audit Committee
Years with Sirtex10 years
Grant Boyce – Director (Non-Executive) CA, BCom
Experience and ExpertiseMr Boyce was appointed a director in December 2002. He is a Chartered Accountant and the founder of Montrose Partners, a West Australian firm of chartered accountants. He was a Partner with Ernst & Young and worked in their Perth and New York offices. He has also served previously as Company Secretary for Sirtex.
ResponsibilitiesChairman of the Audit Committee and Member of the Remuneration Committee
Years with Sirtex13 years
Gilman Wong – Executive Director and Chief Executive Officer
Experience and ExpertiseMr Wong was appointed Chief Executive Officer in May 2005 and director in June 2005. Mr Wong previously held CEO and senior executive positions in the commercial and industry sector including 10 years with Email Limited. He has a strong planning and sales and marketing background.
ResponsibilitiesDaily management decisions and implementation of the Company’s strategic plans.
Years with Sirtex10 years
Sirtex 2015 AR 23
KEY MANAGEMENT PERSONNEL
Darren Smith – Chief Financial Officer and Company Secretary
Experience and ExpertiseMr Smith was appointed Company Secretary in July 2008 and Chief Financial Officer in February 2009. Mr Smith previously held CFO and senior executive finance and general management positions in a number of international, Australian listed and private companies. Mr Smith holds an MBA from the Australian Graduate School of Management (AGSM), the University of New South Wales, a Bachelor of Business from the University of Western Sydney, is a Fellow of CPA Australia having been a member for over 20 years and is a member of the Australian Institute of Company Directors.
ResponsibilitiesMr Smith has overall responsibility for the Finance, IT and Human Resources function of the Group.
Years with Sirtex7 years
Dr Burwood Chew – CEO Asia Pacific
Experience and ExpertiseDr Chew joined Sirtex in January 2011 as Head of the Asia Pacific region. Dr Chew has extensive experience in oncology and for many years has held senior regional positions with Bayer Healthcare, Sanofi-Aventis, and with Wellcome (now GSK). Dr Chew is a medical graduate from the University of New South Wales.
ResponsibilitiesDr Chew is based in our regional office in Singapore with responsibility for the development and execution of the strategic direction of Sales and Marketing in Australia, New Zealand and Asia Pacific. This large region comprises heterogeneous markets with direct sales, distributors and licensing partners.
Years with Sirtex4 years
Michael Mangano – President US
Experience and ExpertiseMr Mangano joined Sirtex in January 2010, after 15 years of experience in the medical device industry with Boston Scientific where he had numerous management positions both within the US and internationally.
ResponsibilitiesMr Mangano is based in our regional office in the greater Boston area and responsible for the development and execution of the strategic direction of Sales and Marketing in North, Central and Latin America.
Years with Sirtex5 years
Nigel Lange – CEO Europe
Experience and Expertise Mr Lange joined Sirtex US in 2002, then set up Sirtex operations in Europe. Before joining Sirtex, Mr Lange held senior roles at Nordion Inc (NYSE:NDZ) and has over 20 years of experience in the healthcare industry.
ResponsibilitiesMr Lange is based in our regional office in Bonn, Germany, where he is responsible for the development and execution of the strategic direction of Sales and Marketing in Europe as well as the Middle East and Africa, a region which for Sirtex comprises a total of 20 countries with direct sales and distributor sales models.
Years with Sirtex13 years
Dr David N Cade – Chief Medical Officer
Experience and ExpertiseDr Cade joined Sirtex in 2003 and has served as the Chief Medical Officer since 2007. He previously held the positions of U.S. Medical Director based in New York, USA, from 2005 to 2007, and European Medical Director based in Bonn, Germany, from 2003 to 2005.
Dr Cade is a medical graduate of Monash University and holds an MBA from the Melbourne Business School and the ESADE Business School in Barcelona, Spain. He is a Graduate of the Australian Institute of Company Directors. Prior to joining Sirtex, Dr Cade worked at management consultancy Booz & Company.
ResponsibilitiesDr Cade has responsibility for all medical affairs of the group, and is based in the Sydney head office.
Years with Sirtex12 years
Robert Hardie – Global Head of Operations
Experience and ExpertiseMr Hardie joined Sirtex in June 2006 and was appointed Global Head of Operations in October 2006. Mr Hardie previously held senior engineering and management positions in various industry sectors, and has a strong engineering, manufacturing, production planning and logistics background.
ResponsibilitiesMr Hardie has overall responsibility for global operations including manufacturing, supply chain management and logistics. Mr Hardie is based in the Sydney head office.
Years with Sirtex9 years
Sirtex 2015 AR 24
The Board is committed to achieving and demonstrating the highest standards of corporate governance. As such, Sirtex Medical Limited and its Controlled Entities (the ‘Group’) have adopted the third edition of the Corporate Governance Principles and Recommendations which was released by the ASX Corporate Governance Council on 27 March 2014 and became effective for financial years beginning on or after 1 July 2014.
The Group’s Corporate Governance Statement for the financial year ending 30 June 2015 is dated as at 30 June 2015 and was approved by the Board on 13 August 2015. The Corporate Governance Statement is available on Sirtex Medical Limited’s website at www.sirtex.com/au/investors/investor-resources/corporate-governance-and-policies/
CORPORATE GOVERNANCE

Sirtex 2015 AR 25
Sirtex 2014 AR 26
CONTENTS
27 DIRECTORS’ REPORT47 AUDITOR’S INDEPENDENCE DECLARATION48 DIRECTORS’ DECLARATION49 INDEPENDENT AUDITOR’S REPORT52 CONSOLIDATED STATEMENT OF PROFIT OR LOSS
AND OTHER COMPREHENSIVE INCOME53 CONSOLIDATED STATEMENT OF FINANCIAL POSITION54 STATEMENT OF CHANGES IN EQUITY55 CONSOLIDATED STATEMENT OF CASH FLOWS56 NOTES TO THE FINANCIAL STATEMENTS84 ADDITIONAL STOCK EXCHANGE INFORMATION 85 COMPANY INFORMATION
SIRTEX MEDICAL LIMITEDCONSOLIDATED ENTITYABN 35 078 166 122
FINANCIAL REPORT FOR THE YEAR ENDED 30 JUNE 2015
Sirtex 2015 AR 27
DIRECTORS’ REPORTFOR THE YEAR ENDED 30 JUNE 2015
The Directors of Sirtex Medical Ltd present their report, together with the financial statements of the consolidated entity, being Sirtex Medical Ltd and its controlled entities (‘the Group’) for the year ended 30 June 2015.
DIRECTORSThe Directors of Sirtex Medical Ltd during the financial year and until the date of this report are Mr R Hill, Dr J Eady, Mr G Boyce, and Mr G Wong. Details of the Directors, including their skills, experience, and expertise, are set out below.
Richard Hill – Chairman (Non-Executive)BA, LLB (Sydney), LLM (London)
Experience and ExpertiseMr Hill was appointed a director in September 2004 and Chairman in August 2006. He previously held senior executive positions with HSBC Investment Bank in Hong Kong and New York and has extensive experience in international M&A and capital raising. He was a founding partner of Hill Young & Associates, a corporate advisory firm. He is also an attorney of the New York State Bar.
Directorships held in other listed entities during the last three yearsCalliden Group Limited – Chairman (appointed April 2000)Biota Holdings Limited (appointed November 2008, delisted November 2012)BlackWall Property Funds – Chairman (appointed July 2008)
Special ResponsibilitiesMember of the Audit Committee and the Remuneration Committee
Interest in Shares and Options1,974 ordinary shares in Sirtex Medical Limited 2,959 share rights
Dr John Eady – Deputy Chairman (Non-Executive)BSc (Hons), PhD, FTSE
Experience and ExpertiseDr Eady was appointed director in March 2005. He spent most of his career with CRA Limited in a range of senior executive positions. He has broad Board experience including that with the Australian Federal Government’s Industry, Research and Development Board. Dr Eady is a Fellow of the Academy of Technological Sciences and Engineering, and consults extensively on business improvement.
Directorships held in other listed entities during the last three yearsNil
Special ResponsibilitiesChairman of the Remuneration Committee and Member of the Audit Committee
Interest in Shares and Options6,234 ordinary shares in Sirtex Medical Limited1,850 share rights
Grant Boyce – Director (Non-Executive)CA, BCom
Experience and ExpertiseMr Boyce was appointed director in December 2002. He is a Chartered Accountant and the founder of Montrose Partners, a West Australian firm of chartered accountants. He was a Partner with Ernst & Young and worked in their Perth and New York offices. He has also served previously as Company Secretary for Sirtex.
Directorships held in other listed entities during the last three yearsNil
Special ResponsibilitiesChairman of the Audit Committee and Member of the Remuneration Committee
Interest in Shares and Options5,987 ordinary shares in Sirtex Medical Limited1,480 share rights
Gilman Wong – Executive Director and Chief Executive Officer
Experience and ExpertiseMr Wong was appointed Chief Executive Officer in May 2005 and director in June 2005. Mr Wong previously held CEO and senior executive positions in various industries. He has a strong planning, and sales and marketing background.
Directorships held in other listed entities during the last three yearsNil
Interest in Shares and Options100,000 ordinary shares in Sirtex Medical Limited328,000 Executive Performance Rights
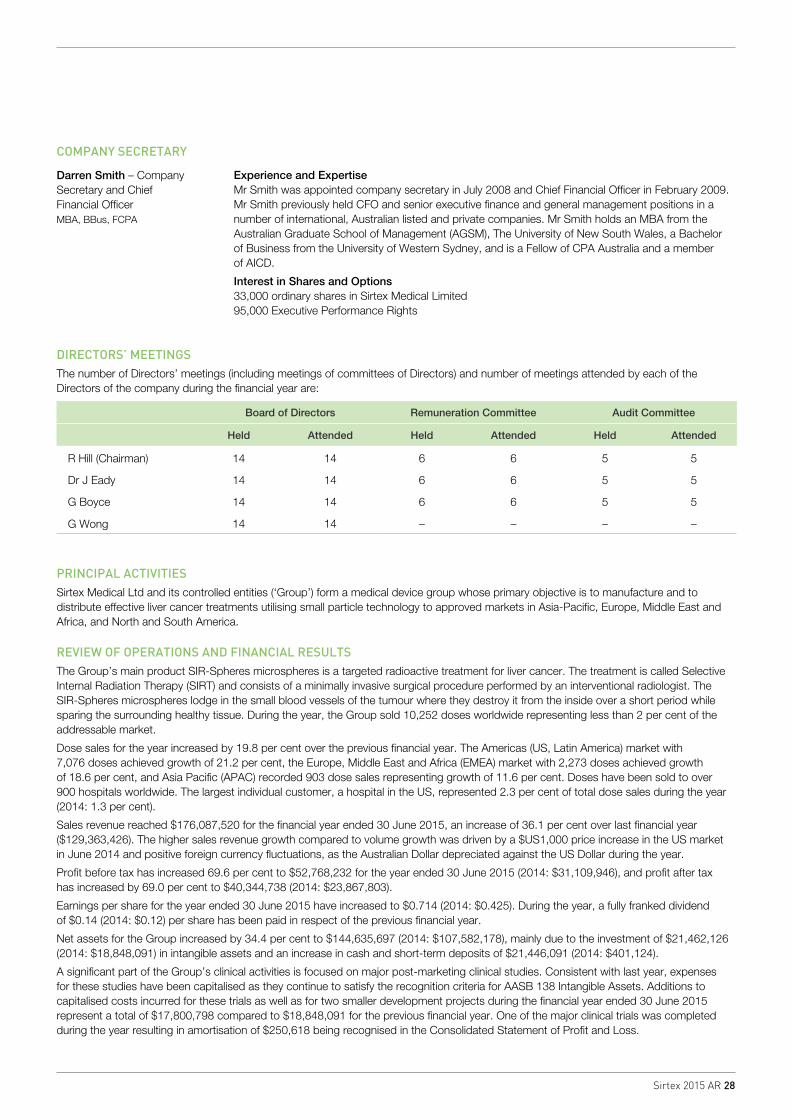
Sirtex 2015 AR 28
COMPANY SECRETARY
Darren Smith – Company Secretary and Chief Financial OfficerMBA, BBus, FCPA
Experience and ExpertiseMr Smith was appointed company secretary in July 2008 and Chief Financial Officer in February 2009. Mr Smith previously held CFO and senior executive finance and general management positions in a number of international, Australian listed and private companies. Mr Smith holds an MBA from the Australian Graduate School of Management (AGSM), The University of New South Wales, a Bachelor of Business from the University of Western Sydney, and is a Fellow of CPA Australia and a member of AICD.
Interest in Shares and Options33,000 ordinary shares in Sirtex Medical Limited95,000 Executive Performance Rights
DIRECTORS’ MEETINGSThe number of Directors’ meetings (including meetings of committees of Directors) and number of meetings attended by each of the Directors of the company during the financial year are:
Board of Directors Remuneration Committee Audit Committee
Held Attended Held Attended Held Attended
R Hill (Chairman) 14 14 6 6 5 5
Dr J Eady 14 14 6 6 5 5
G Boyce 14 14 6 6 5 5
G Wong 14 14 – – – –
PRINCIPAL ACTIVITIESSirtex Medical Ltd and its controlled entities (‘Group’) form a medical device group whose primary objective is to manufacture and to distribute effective liver cancer treatments utilising small particle technology to approved markets in Asia-Pacific, Europe, Middle East and Africa, and North and South America.
REVIEW OF OPERATIONS AND FINANCIAL RESULTSThe Group’s main product SIR-Spheres microspheres is a targeted radioactive treatment for liver cancer. The treatment is called Selective Internal Radiation Therapy (SIRT) and consists of a minimally invasive surgical procedure performed by an interventional radiologist. The SIR-Spheres microspheres lodge in the small blood vessels of the tumour where they destroy it from the inside over a short period while sparing the surrounding healthy tissue. During the year, the Group sold 10,252 doses worldwide representing less than 2 per cent of the addressable market.
Dose sales for the year increased by 19.8 per cent over the previous financial year. The Americas (US, Latin America) market with 7,076 doses achieved growth of 21.2 per cent, the Europe, Middle East and Africa (EMEA) market with 2,273 doses achieved growth of 18.6 per cent, and Asia Pacific (APAC) recorded 903 dose sales representing growth of 11.6 per cent. Doses have been sold to over 900 hospitals worldwide. The largest individual customer, a hospital in the US, represented 2.3 per cent of total dose sales during the year (2014: 1.3 per cent).
Sales revenue reached $176,087,520 for the financial year ended 30 June 2015, an increase of 36.1 per cent over last financial year ($129,363,426). The higher sales revenue growth compared to volume growth was driven by a $US1,000 price increase in the US market in June 2014 and positive foreign currency fluctuations, as the Australian Dollar depreciated against the US Dollar during the year.
Profit before tax has increased 69.6 per cent to $52,768,232 for the year ended 30 June 2015 (2014: $31,109,946), and profit after tax has increased by 69.0 per cent to $40,344,738 (2014: $23,867,803).
Earnings per share for the year ended 30 June 2015 have increased to $0.714 (2014: $0.425). During the year, a fully franked dividend of $0.14 (2014: $0.12) per share has been paid in respect of the previous financial year.
Net assets for the Group increased by 34.4 per cent to $144,635,697 (2014: $107,582,178), mainly due to the investment of $21,462,126 (2014: $18,848,091) in intangible assets and an increase in cash and short-term deposits of $21,446,091 (2014: $401,124).
A significant part of the Group’s clinical activities is focused on major post-marketing clinical studies. Consistent with last year, expenses for these studies have been capitalised as they continue to satisfy the recognition criteria for AASB 138 Intangible Assets. Additions to capitalised costs incurred for these trials as well as for two smaller development projects during the financial year ended 30 June 2015 represent a total of $17,800,798 compared to $18,848,091 for the previous financial year. One of the major clinical trials was completed during the year resulting in amortisation of $250,618 being recognised in the Consolidated Statement of Profit and Loss.
Sirtex 2015 AR 29
DIRECTORS’ REPORTFOR THE YEAR ENDED 30 JUNE 2015
DIVIDENDSAn ordinary dividend of 14 cents per share was declared for the financial year ended 30 June 2014 and paid during the financial year ended 30 June 2015 (2014: 12 cents).
SIGNIFICANT CHANGES IN STATE OF AFFAIRSDuring the financial year there were no significant changes in the state of affairs of the Group other than that referred to in the financial statements or notes thereto.
LIKELY DEVELOPMENTS, PROSPECTS AND BUSINESS STRATEGIES The Group’s strategy focuses on promoting and developing SIR-Spheres microspheres to become a worldwide standard of care for patients with liver cancer, representing a market estimated at over 480,000 patients per year.
To achieve this objective, Sirtex continues to invest in major randomised controlled studies. With a Clinical Operations team comprising in excess of 25 employees in the US, Europe, and Asia Pacific, together with contract research organisations and other service providers, the Group possesses the project management and patient recruitment capabilities that are required to successfully manage and complete these large studies.
During the financial year ended 30 June 2015, the Group released the results of one of its five clinical studies. To prepare for future demand for SIR-Spheres microspheres following the release of the results, the Group has expanded its manufacturing capabilities. The additional manufacturing capabilities at our plant in Wilmington, USA became operational during the financial year and the new manufacturing facility in Frankfurt, Germany is anticipated to commence manufacturing commercial doses during the financial year ended 30 June 2016.
The Group has been successful in gaining regulatory approval for SIR-Spheres microspheres in key global markets. They include US, Argentina, Brazil, the European Union, Israel and various Middle East and African markets, Australia, New Zealand, Singapore, Hong Kong, Taiwan and various other Asian markets. Sirtex is working towards gaining regulatory approvals in other major markets such as Japan and China for its SIR-Spheres microspheres product to continue its geographic growth.
The Group has invested $3,087,421 in a new integrated software application in order to bring greater efficiencies to our collection, storage and use of business information to empower our manufacturing, clinical and marketing teams, streamline our administrative procedures and further improve our competitiveness. In addition, significant investments have been made in human resources, with a further increase in staff numbers from 213 at the end of last financial year to 246 at the end of this financial year.
ENVIRONMENTAL REGULATIONSThe Group is not subject to significant environmental regulation under the law of any of the jurisdictions the Group is operating in.
UNISSUED SHARESExecutive Performance rights on issue at year endAs at 30 June 2015, the unissued shares of Sirtex Medical Limited under Executive Performance Rights are as follows:
Grant date Date of Vesting Exercise Price $ Number under Rights22 February 2011 3 July 2013 nil 33,00023 August 2011 7 July 2014 nil 33,00028 August 2012 30 June 2015 nil 678,50026 November 2013 30 June 2016 nil 443,00023 September 2014 30 June 2017 nil 281,320
Rights holders do not have any rights to participate in any issue of shares or other interests in the Company or any other entity. For further details on rights issued as remuneration, refer to the Remuneration Report.
Directors’ rights on issue at year endAs at 30 June 2015, the unissued shares of Sirtex Medical Limited under Non-Executive Directors Rights are as follows:
Grant date Date of Vesting Exercise Price $ Number under Rights22 July 2014 22 July 2015 nil 6,289
Share options on issue at year end or exercised during the yearDuring the year ended 30 June 2015, there were no ordinary shares of Sirtex Medical Ltd issued on the exercise of options. No share options have been issued during the year, and no share options are outstanding at 30 June 2015.
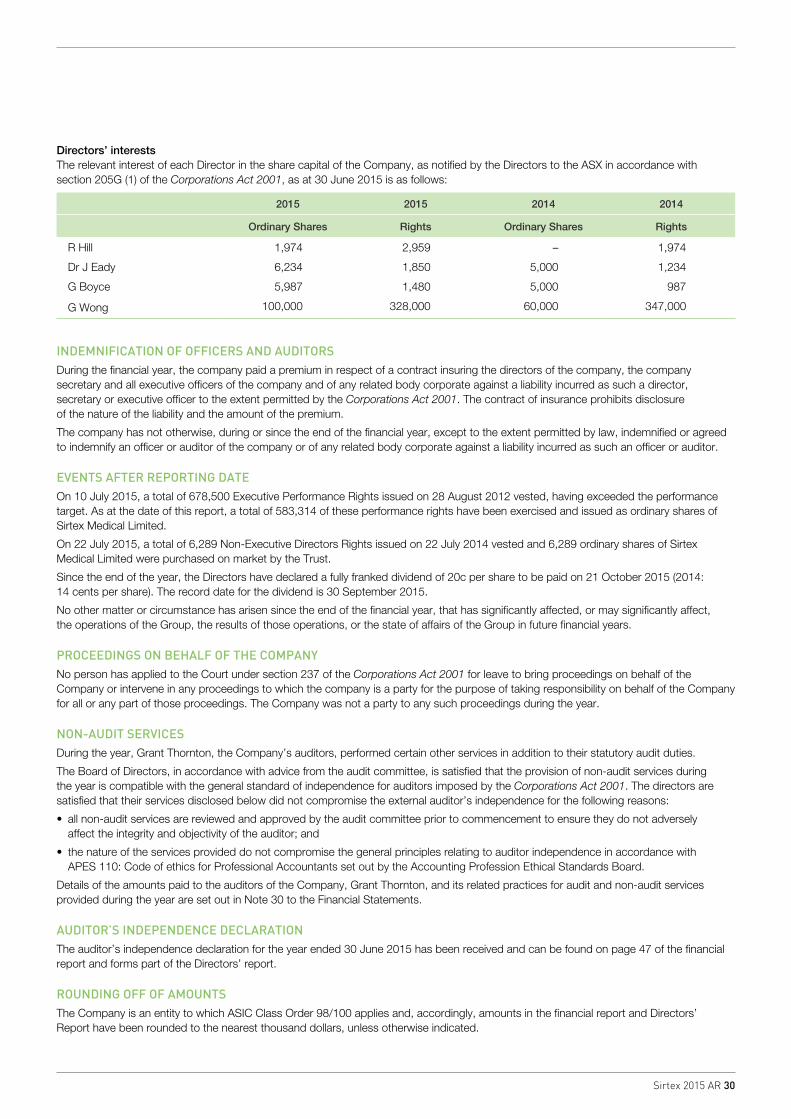
Sirtex 2015 AR 30
Directors’ interestsThe relevant interest of each Director in the share capital of the Company, as notified by the Directors to the ASX in accordance with section 205G (1) of the Corporations Act 2001, as at 30 June 2015 is as follows:
2015 2015 2014 2014
Ordinary Shares Rights Ordinary Shares Rights
R Hill 1,974 2,959 – 1,974
Dr J Eady 6,234 1,850 5,000 1,234
G Boyce 5,987 1,480 5,000 987
G Wong 100,000 328,000 60,000 347,000
INDEMNIFICATION OF OFFICERS AND AUDITORSDuring the financial year, the company paid a premium in respect of a contract insuring the directors of the company, the company secretary and all executive officers of the company and of any related body corporate against a liability incurred as such a director, secretary or executive officer to the extent permitted by the Corporations Act 2001. The contract of insurance prohibits disclosure of the nature of the liability and the amount of the premium.
The company has not otherwise, during or since the end of the financial year, except to the extent permitted by law, indemnified or agreed to indemnify an officer or auditor of the company or of any related body corporate against a liability incurred as such an officer or auditor.
EVENTS AFTER REPORTING DATEOn 10 July 2015, a total of 678,500 Executive Performance Rights issued on 28 August 2012 vested, having exceeded the performance target. As at the date of this report, a total of 583,314 of these performance rights have been exercised and issued as ordinary shares of Sirtex Medical Limited.
On 22 July 2015, a total of 6,289 Non-Executive Directors Rights issued on 22 July 2014 vested and 6,289 ordinary shares of Sirtex Medical Limited were purchased on market by the Trust.
Since the end of the year, the Directors have declared a fully franked dividend of 20c per share to be paid on 21 October 2015 (2014: 14 cents per share). The record date for the dividend is 30 September 2015.
No other matter or circumstance has arisen since the end of the financial year, that has significantly affected, or may significantly affect, the operations of the Group, the results of those operations, or the state of affairs of the Group in future financial years.
PROCEEDINGS ON BEHALF OF THE COMPANYNo person has applied to the Court under section 237 of the Corporations Act 2001 for leave to bring proceedings on behalf of the Company or intervene in any proceedings to which the company is a party for the purpose of taking responsibility on behalf of the Company for all or any part of those proceedings. The Company was not a party to any such proceedings during the year.
NON-AUDIT SERVICESDuring the year, Grant Thornton, the Company’s auditors, performed certain other services in addition to their statutory audit duties.
The Board of Directors, in accordance with advice from the audit committee, is satisfied that the provision of non-audit services during the year is compatible with the general standard of independence for auditors imposed by the Corporations Act 2001. The directors are satisfied that their services disclosed below did not compromise the external auditor’s independence for the following reasons:
• all non-audit services are reviewed and approved by the audit committee prior to commencement to ensure they do not adversely affect the integrity and objectivity of the auditor; and
• the nature of the services provided do not compromise the general principles relating to auditor independence in accordance with APES 110: Code of ethics for Professional Accountants set out by the Accounting Profession Ethical Standards Board.
Details of the amounts paid to the auditors of the Company, Grant Thornton, and its related practices for audit and non-audit services provided during the year are set out in Note 30 to the Financial Statements.
AUDITOR’S INDEPENDENCE DECLARATIONThe auditor’s independence declaration for the year ended 30 June 2015 has been received and can be found on page 47 of the financial report and forms part of the Directors’ report.
ROUNDING OFF OF AMOUNTSThe Company is an entity to which ASIC Class Order 98/100 applies and, accordingly, amounts in the financial report and Directors’ Report have been rounded to the nearest thousand dollars, unless otherwise indicated.
Sirtex 2015 AR 31
DIRECTORS’ REPORTFOR THE YEAR ENDED 30 JUNE 2015
Remuneration Report (audited)
LETTER FROM THE CHAIRMAN OF THE REMUNERATION COMMITTEE
Dear Shareholder,
I am pleased to present the remuneration report for the financial year ended 30 June 2015, outlining the nature and amount of remuneration for Sirtex’s non-executive directors and other Key Management Personnel (KMP), as defined under section 300A of the Corporations Act, 2001 and its associated regulations.
Sirtex’s remuneration levels and structure are critical to the Group’s ability to recruit and retain the calibre of people necessary if it is to grow and reach its full potential. It must be market-competitive, and at the same time fair to staff and responsible from a shareholder perspective. The Group’s remuneration for the financial year ended 30 June 2015 sought to achieve these goals.
Remuneration continues to comprise a fixed salary and a significant at-risk component. In this way, reward reflects performance and is higher when shareholder rewards are higher and lower when they are not.
It is currently the Group’s policy to set fixed salary at the median (middle of market) for the role in the relevant country (P50) and for the at-risk component to be structured so that remuneration equal to half-way between the median and top levels (P75) can be achieved if demanding targets are met.
It is also Sirtex’s policy to emphasise the long-term incentive (LTI) element of the at-risk component. While some cash short-term incentive (STI) bonus, reflecting individual and Group performance, is considered necessary to be fair to executives, the Board believes that this LTI emphasis encourages the longer term commitment favoured by Sirtex and shareholder groups. As a result, we have continued this emphasis and at this stage prefer this approach rather than introducing a two-part STI reward and its additional complexity.
At the same time the Board is considering improvements to the Executive Performance Rights Plan. For the financial year ended 30 June 2016, we intend to replace the current absolute Total Shareholder Return (TSR) measure with a market-adjusted TSR. This change is in response to concerns expressed as to the possibility of vesting being driven by broad market movement rather than company performance, although this has not occurred since the LTI plan was introduced. We are also considering whether changes are warranted in order to encourage executive KMP to retain significant portions of vested LTI shares.
For the financial year ended 30 June 2015, KMP and other senior executive remuneration continued to be based on thorough data collection and market analysis for equivalent roles in similar companies in the countries in which Sirtex operates. The data were collected and analysed by the Group’s independent, expert remuneration consultant (Godfrey Remuneration Group), augmented where appropriate through other sources and considered by the Remuneration Committee, given prevailing circumstances.
Where possible, the comparator companies included organisations in the healthcare/biotechnology/medical device industries, but it is evident that the most relevant comparison characteristic is size. Extensive research has shown a strong correlation between the remuneration levels of senior executives and market capitalisation, globally across all industries. The higher the capitalisation, the higher the remuneration levels, reflecting the significantly greater complexity, responsibility and impact the executive’s role has in the larger organisations.
For this reason, the determination of the appropriate market capitalisation to be used as a basis for the comparison of remuneration levels is a critical step, particularly given the significant share price growth and volatility experienced by Sirtex in recent times.
For the financial year ended 30 June 2015 analysis, the Remuneration Committee opted to take a conservative approach and used an underlying share value that reflects factors such as typical Price Earnings (PE) ratios, rather than the latest share price. Even so, because of the Group’s strong growth, remuneration for senior executives has needed to grow significantly more than would have been the case for a company with a relatively stable market capitalisation.
This has also been the case for the Group’s non-executive directors (NEDs). Sirtex believes that the same P75 positioning is necessary if it is to have the NEDs it needs to guide such a strategically exciting company. Accordingly, NED remuneration is based on fixed fees set at P50 for NEDs in similar companies and equities purchased through a salary sacrifice mechanism so that total remuneration approaches the P75 level.
Market comparisons have shown that NED remuneration also increases with company size. This has meant increases in total NED remuneration for financial year ended 30 June 2015. It should be noted, however, that when determining the 2015 NED remuneration components, it was decided to limit the indicated increases in fixed fees and use more of the market capitalisation-driven increases to salary sacrifice into equities. The objective was to accelerate NED shareholding growth.
These equities vest after only one year but have dealing restrictions while the NED remains on the Board, or for six years after vesting. This is a simple tax-effective mechanism to encourage NEDs to retain and build their shareholding in the Group.
Sirtex strives to have remuneration structures and levels that are data-driven and based on objective, simple and transparent policies. A fundamental requirement is that we continue to match market practice. We are committed to improving healthcare outcomes for patients worldwide, and to do that in a way that is responsible to all stakeholders.
As Chair of the Remuneration Committee, I would like to thank shareholders for their support and to invite feedback regarding the changes made during the financial year ended 30 June 2015. I hope you will continue to support us by voting to adopt this remuneration report at the upcoming Annual General Meeting.
Regards,
Dr John EadyChair of the Remuneration Committee
Sirtex 2015 AR 32
CONTENT:The Remuneration Report, which forms part of the Directors’ Report, provides information about the remuneration of the directors of Sirtex Medical Limited (Sirtex) and its other KMP for the year ended 30 June 2015. The remuneration report is set out under the following headings:
1. Persons covered by this report
2. Principles used to determine the nature and amount of remuneration
3. Service agreements
4. Performance outcomes and impact on shareholder wealth for the financial year ended 30 June 2015
5. Details of remuneration
6. Additional information
1. PERSONS COVERED BY THIS REPORTThis report covers remuneration arrangements and outcomes for the following KMP:
Non-executive Directors
• Mr Richard Hill, Independent Non-executive Chairman
• Dr John Eady, Independent Non-executive Director and Deputy Chairman – Chair of Remuneration Committee
• Mr Grant Boyce, Independent Non-executive Director – Chair of the Audit Committee
Executives
• Mr Gilman Wong, Managing Director & CEO
• Mr Darren Smith, CFO and Company Secretary
• Mr Michael Mangano, President Americas
• Mr Nigel Lange, Chief Executive EMEA
• Dr Burwood Chew, Chief Executive Asia Pacific
• Mr Robert Hardie, Global Head of Operations
• Dr David Cade, Chief Medical Officer
All KMP held their positions throughout the financial year ended 30 June 2015.
2. PRINCIPLES USED TO DETERMINE THE NATURE AND AMOUNT OF REMUNERATION2.1 Remuneration Governance Framework
In order to base its decisions on broadly-based information and views, the Group seeks input from a wide range of sources:
• Remuneration Committee members;
• External remuneration consultants (ERCs);
• Group management;
• Stakeholder groups and shareholders;
• Other experts and professionals such as tax advisors and lawyers; and
• Individual KMP to understand roles and complexities.
Interactions between various parties on remuneration matters are overseen by the Remuneration Committee to ensure that there is appropriate independence and controls in place. The Remuneration Committee uses the input provided to inform its views on KMP remuneration issues, appropriate to the Group’s specific circumstances.
Sirtex 2015 AR 33
DIRECTORS’ REPORTFOR THE YEAR ENDED 30 JUNE 2015
2.2 Executive KMP Remuneration Policy and Procedure
The Executive KMP Remuneration Policy and Procedure applies to executives defined as:
• Managing Director – accountable to the Board for the Group’s performance and long term planning; and
• Top Strata Direct Reports to the Managing Director – roles that are business unit, functional, or expertise heads regarded as KMP.
This policy outlines the Group’s intentions regarding executive remuneration, as well as how remuneration is intended to be structured, benchmarked and adjusted in response to changes in the circumstances of the Group, and in line with good governance.
Broadly the policy states that for executive KMP:
• Remuneration should be composed of:
– Fixed Remuneration (inclusive of superannuation, allowances, benefits and any applicable fringe benefits tax (FBT),
– STI which provides a reward for performance against annual objectives and personal effectiveness,
– LTI which provides a securities-based reward for performance against indicators of shareholder benefit or value creation, over a three year period.
• In total, the sum of the three elements will constitute total targeted remuneration (TTR).
• Internal relativities should be considered to recognise Sirtex’s particular organisation design, using ‘strata’ to map the relationships between roles.
• External market factors should be considered and used to benchmark practices.
• TTR should be structured with reference to local market practice.
• Remuneration will be managed within a range so as to allow for the recognition of individual differences such as the calibre of incumbents and the competency with which they fulfil roles.
• Termination benefits will be in line with local regulation, and in Australia limited to the default amount allowed for under the Corporations Act.
Executive KMP remuneration is linked closely to Group performance.
Policy Area Relationship to Company Performance
Fixed Remuneration Fixed remuneration is based on market practice where levels vary with market capitalisation which reflects Group performance through its share price.
At-risk components (STI and LTI)
The at-risk components are linked to business levers that drive strategic initiatives or indicators that reflect shareholder experience.
STI payments depend on the influence an individual senior executive has on Group performance, as compared to target, and are measured via key performance indicators (KPIs) reflecting the business levers necessary to implement Group strategy. While many influencing factors are quantitative, some are more subjective, aimed at assessing personal effectiveness, in the context of the prevailing circumstances.
STI KPIs generally focus on internal perspectives, such as dose sales, that can be considered as leading indicators for the external measures used for LTI awards.
LTI awards are based on direct measures of Group performance, as reflected in share price growth and the growth in earnings per share.
In this way, remuneration policies seek to link overall executive remuneration with longer-term strategies and the experience of shareholders, it being higher when longer term issues are being addressed effectively and the Group is doing well.
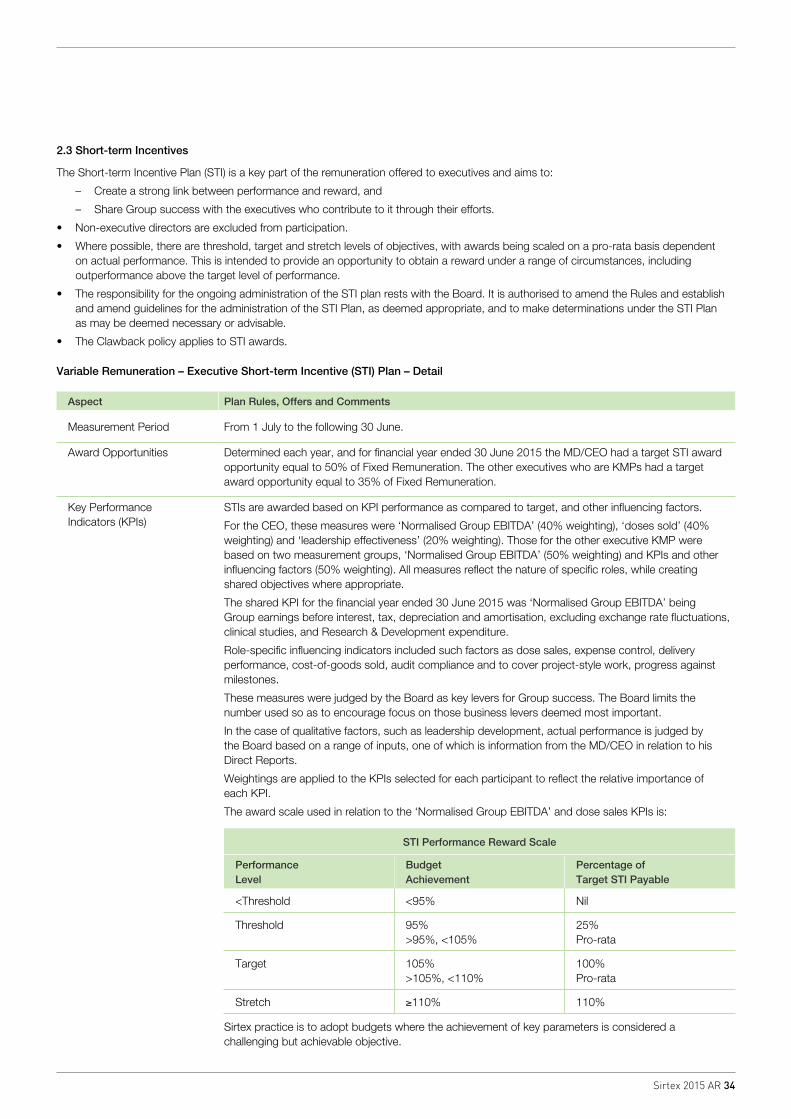
Sirtex 2015 AR 34
2.3 Short-term Incentives
The Short-term Incentive Plan (STI) is a key part of the remuneration offered to executives and aims to:
– Create a strong link between performance and reward, and
– Share Group success with the executives who contribute to it through their efforts.
• Non-executive directors are excluded from participation.
• Where possible, there are threshold, target and stretch levels of objectives, with awards being scaled on a pro-rata basis dependent on actual performance. This is intended to provide an opportunity to obtain a reward under a range of circumstances, including outperformance above the target level of performance.
• The responsibility for the ongoing administration of the STI plan rests with the Board. It is authorised to amend the Rules and establish and amend guidelines for the administration of the STI Plan, as deemed appropriate, and to make determinations under the STI Plan as may be deemed necessary or advisable.
• The Clawback policy applies to STI awards.
Variable Remuneration – Executive Short-term Incentive (STI) Plan – Detail
Aspect Plan Rules, Offers and Comments
Measurement Period From 1 July to the following 30 June.
Award Opportunities Determined each year, and for financial year ended 30 June 2015 the MD/CEO had a target STI award opportunity equal to 50% of Fixed Remuneration. The other executives who are KMPs had a target award opportunity equal to 35% of Fixed Remuneration.
Key Performance Indicators (KPIs)
STIs are awarded based on KPI performance as compared to target, and other influencing factors.
For the CEO, these measures were ‘Normalised Group EBITDA’ (40% weighting), ‘doses sold’ (40% weighting) and ‘leadership effectiveness’ (20% weighting). Those for the other executive KMP were based on two measurement groups, ‘Normalised Group EBITDA’ (50% weighting) and KPIs and other influencing factors (50% weighting). All measures reflect the nature of specific roles, while creating shared objectives where appropriate.
The shared KPI for the financial year ended 30 June 2015 was ‘Normalised Group EBITDA’ being Group earnings before interest, tax, depreciation and amortisation, excluding exchange rate fluctuations, clinical studies, and Research & Development expenditure.
Role-specific influencing indicators included such factors as dose sales, expense control, delivery performance, cost-of-goods sold, audit compliance and to cover project-style work, progress against milestones.
These measures were judged by the Board as key levers for Group success. The Board limits the number used so as to encourage focus on those business levers deemed most important.
In the case of qualitative factors, such as leadership development, actual performance is judged by the Board based on a range of inputs, one of which is information from the MD/CEO in relation to his Direct Reports.
Weightings are applied to the KPIs selected for each participant to reflect the relative importance of each KPI.
The award scale used in relation to the ‘Normalised Group EBITDA’ and dose sales KPIs is:
STI Performance Reward Scale
Performance Level
Budget Achievement
Percentage of Target STI Payable
<Threshold <95% Nil
Threshold 95% >95%, <105%
25% Pro-rata
Target 105% >105%, <110%
100% Pro-rata
Stretch ≥110% 110%
Sirtex practice is to adopt budgets where the achievement of key parameters is considered a challenging but achievable objective.
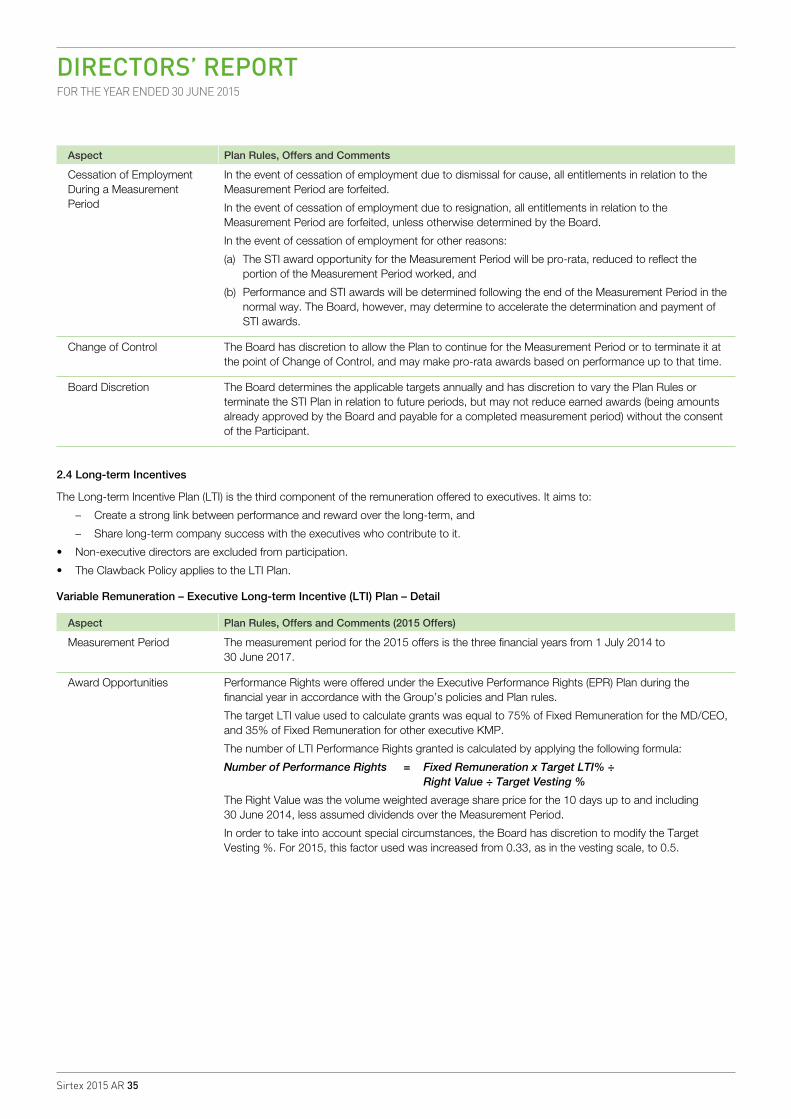
Sirtex 2015 AR 35
DIRECTORS’ REPORTFOR THE YEAR ENDED 30 JUNE 2015
Aspect Plan Rules, Offers and Comments
Cessation of Employment During a Measurement Period
In the event of cessation of employment due to dismissal for cause, all entitlements in relation to the Measurement Period are forfeited.
In the event of cessation of employment due to resignation, all entitlements in relation to the Measurement Period are forfeited, unless otherwise determined by the Board.
In the event of cessation of employment for other reasons:
(a) The STI award opportunity for the Measurement Period will be pro-rata, reduced to reflect the portion of the Measurement Period worked, and
(b) Performance and STI awards will be determined following the end of the Measurement Period in the normal way. The Board, however, may determine to accelerate the determination and payment of STI awards.
Change of Control The Board has discretion to allow the Plan to continue for the Measurement Period or to terminate it at the point of Change of Control, and may make pro-rata awards based on performance up to that time.
Board Discretion The Board determines the applicable targets annually and has discretion to vary the Plan Rules or terminate the STI Plan in relation to future periods, but may not reduce earned awards (being amounts already approved by the Board and payable for a completed measurement period) without the consent of the Participant.
2.4 Long-term Incentives
The Long-term Incentive Plan (LTI) is the third component of the remuneration offered to executives. It aims to:
– Create a strong link between performance and reward over the long-term, and
– Share long-term company success with the executives who contribute to it.
• Non-executive directors are excluded from participation.
• The Clawback Policy applies to the LTI Plan.
Variable Remuneration – Executive Long-term Incentive (LTI) Plan – Detail
Aspect Plan Rules, Offers and Comments (2015 Offers)
Measurement Period The measurement period for the 2015 offers is the three financial years from 1 July 2014 to 30 June 2017.
Award Opportunities Performance Rights were offered under the Executive Performance Rights (EPR) Plan during the financial year in accordance with the Group’s policies and Plan rules.
The target LTI value used to calculate grants was equal to 75% of Fixed Remuneration for the MD/CEO, and 35% of Fixed Remuneration for other executive KMP.
The number of LTI Performance Rights granted is calculated by applying the following formula:
Number of Performance Rights = Fixed Remuneration x Target LTI% ÷ Right Value ÷ Target Vesting %
The Right Value was the volume weighted average share price for the 10 days up to and including 30 June 2014, less assumed dividends over the Measurement Period.
In order to take into account special circumstances, the Board has discretion to modify the Target Vesting %. For 2015, this factor used was increased from 0.33, as in the vesting scale, to 0.5.
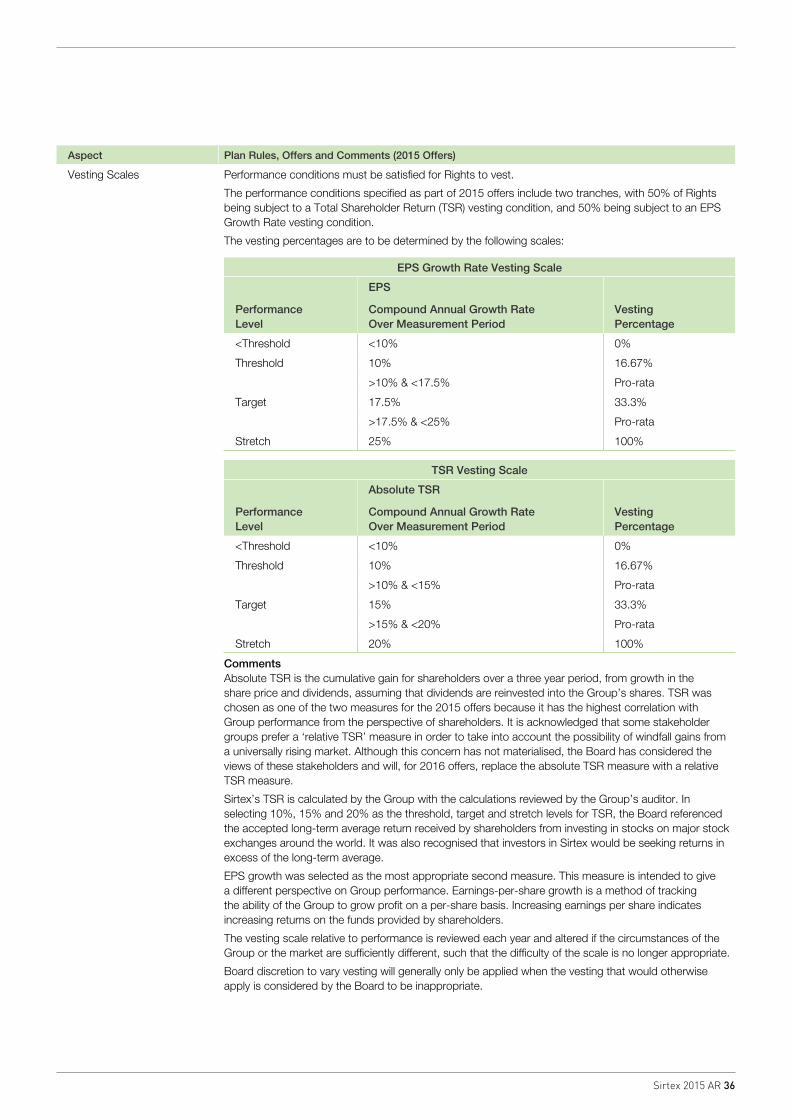
Sirtex 2015 AR 36
Aspect Plan Rules, Offers and Comments (2015 Offers)
Vesting Scales Performance conditions must be satisfied for Rights to vest.
The performance conditions specified as part of 2015 offers include two tranches, with 50% of Rights being subject to a Total Shareholder Return (TSR) vesting condition, and 50% being subject to an EPS Growth Rate vesting condition.
The vesting percentages are to be determined by the following scales:
EPS Growth Rate Vesting Scale
Performance Level
EPS
Compound Annual Growth Rate Over Measurement Period
Vesting Percentage
<Threshold <10% 0%
Threshold 10% 16.67%
>10% & <17.5% Pro-rata
Target 17.5% 33.3%
>17.5% & <25% Pro-rata
Stretch 25% 100%
TSR Vesting Scale
Performance Level
Absolute TSR
Compound Annual Growth Rate Over Measurement Period
Vesting Percentage
<Threshold <10% 0%
Threshold 10% 16.67%
>10% & <15% Pro-rata
Target 15% 33.3%
>15% & <20% Pro-rata
Stretch 20% 100%
CommentsAbsolute TSR is the cumulative gain for shareholders over a three year period, from growth in the share price and dividends, assuming that dividends are reinvested into the Group’s shares. TSR was chosen as one of the two measures for the 2015 offers because it has the highest correlation with Group performance from the perspective of shareholders. It is acknowledged that some stakeholder groups prefer a ‘relative TSR’ measure in order to take into account the possibility of windfall gains from a universally rising market. Although this concern has not materialised, the Board has considered the views of these stakeholders and will, for 2016 offers, replace the absolute TSR measure with a relative TSR measure.
Sirtex’s TSR is calculated by the Group with the calculations reviewed by the Group’s auditor. In selecting 10%, 15% and 20% as the threshold, target and stretch levels for TSR, the Board referenced the accepted long-term average return received by shareholders from investing in stocks on major stock exchanges around the world. It was also recognised that investors in Sirtex would be seeking returns in excess of the long-term average.
EPS growth was selected as the most appropriate second measure. This measure is intended to give a different perspective on Group performance. Earnings-per-share growth is a method of tracking the ability of the Group to grow profit on a per-share basis. Increasing earnings per share indicates increasing returns on the funds provided by shareholders.
The vesting scale relative to performance is reviewed each year and altered if the circumstances of the Group or the market are sufficiently different, such that the difficulty of the scale is no longer appropriate.
Board discretion to vary vesting will generally only be applied when the vesting that would otherwise apply is considered by the Board to be inappropriate.
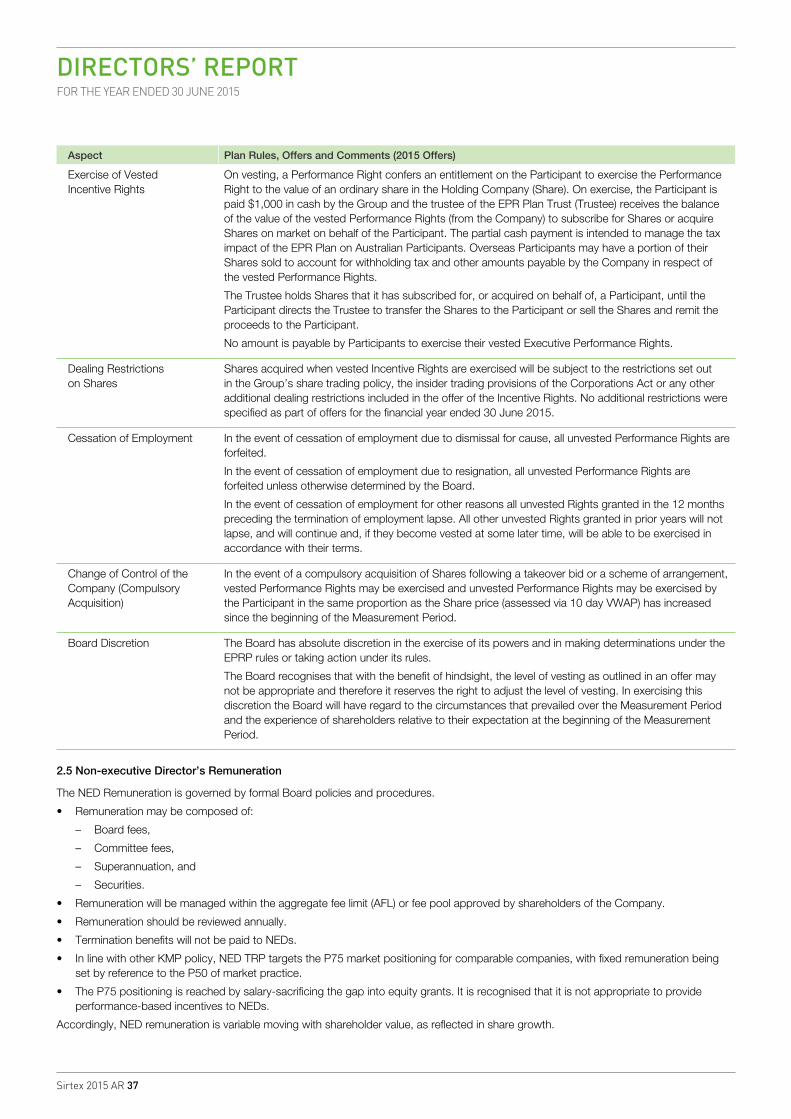
Sirtex 2015 AR 37
DIRECTORS’ REPORTFOR THE YEAR ENDED 30 JUNE 2015
Aspect Plan Rules, Offers and Comments (2015 Offers)
Exercise of Vested Incentive Rights
On vesting, a Performance Right confers an entitlement on the Participant to exercise the Performance Right to the value of an ordinary share in the Holding Company (Share). On exercise, the Participant is paid $1,000 in cash by the Group and the trustee of the EPR Plan Trust (Trustee) receives the balance of the value of the vested Performance Rights (from the Company) to subscribe for Shares or acquire Shares on market on behalf of the Participant. The partial cash payment is intended to manage the tax impact of the EPR Plan on Australian Participants. Overseas Participants may have a portion of their Shares sold to account for withholding tax and other amounts payable by the Company in respect of the vested Performance Rights.
The Trustee holds Shares that it has subscribed for, or acquired on behalf of, a Participant, until the Participant directs the Trustee to transfer the Shares to the Participant or sell the Shares and remit the proceeds to the Participant.
No amount is payable by Participants to exercise their vested Executive Performance Rights.
Dealing Restrictions on Shares
Shares acquired when vested Incentive Rights are exercised will be subject to the restrictions set out in the Group’s share trading policy, the insider trading provisions of the Corporations Act or any other additional dealing restrictions included in the offer of the Incentive Rights. No additional restrictions were specified as part of offers for the financial year ended 30 June 2015.
Cessation of Employment In the event of cessation of employment due to dismissal for cause, all unvested Performance Rights are forfeited.
In the event of cessation of employment due to resignation, all unvested Performance Rights are forfeited unless otherwise determined by the Board.
In the event of cessation of employment for other reasons all unvested Rights granted in the 12 months preceding the termination of employment lapse. All other unvested Rights granted in prior years will not lapse, and will continue and, if they become vested at some later time, will be able to be exercised in accordance with their terms.
Change of Control of the Company (Compulsory Acquisition)
In the event of a compulsory acquisition of Shares following a takeover bid or a scheme of arrangement, vested Performance Rights may be exercised and unvested Performance Rights may be exercised by the Participant in the same proportion as the Share price (assessed via 10 day VWAP) has increased since the beginning of the Measurement Period.
Board Discretion The Board has absolute discretion in the exercise of its powers and in making determinations under the EPRP rules or taking action under its rules.
The Board recognises that with the benefit of hindsight, the level of vesting as outlined in an offer may not be appropriate and therefore it reserves the right to adjust the level of vesting. In exercising this discretion the Board will have regard to the circumstances that prevailed over the Measurement Period and the experience of shareholders relative to their expectation at the beginning of the Measurement Period.
2.5 Non-executive Director’s Remuneration
The NED Remuneration is governed by formal Board policies and procedures.
• Remuneration may be composed of:
– Board fees,
– Committee fees,
– Superannuation, and
– Securities.
• Remuneration will be managed within the aggregate fee limit (AFL) or fee pool approved by shareholders of the Company.
• Remuneration should be reviewed annually.
• Termination benefits will not be paid to NEDs.
• In line with other KMP policy, NED TRP targets the P75 market positioning for comparable companies, with fixed remuneration being set by reference to the P50 of market practice.
• The P75 positioning is reached by salary-sacrificing the gap into equity grants. It is recognised that it is not appropriate to provide performance-based incentives to NEDs.
Accordingly, NED remuneration is variable moving with shareholder value, as reflected in share growth.
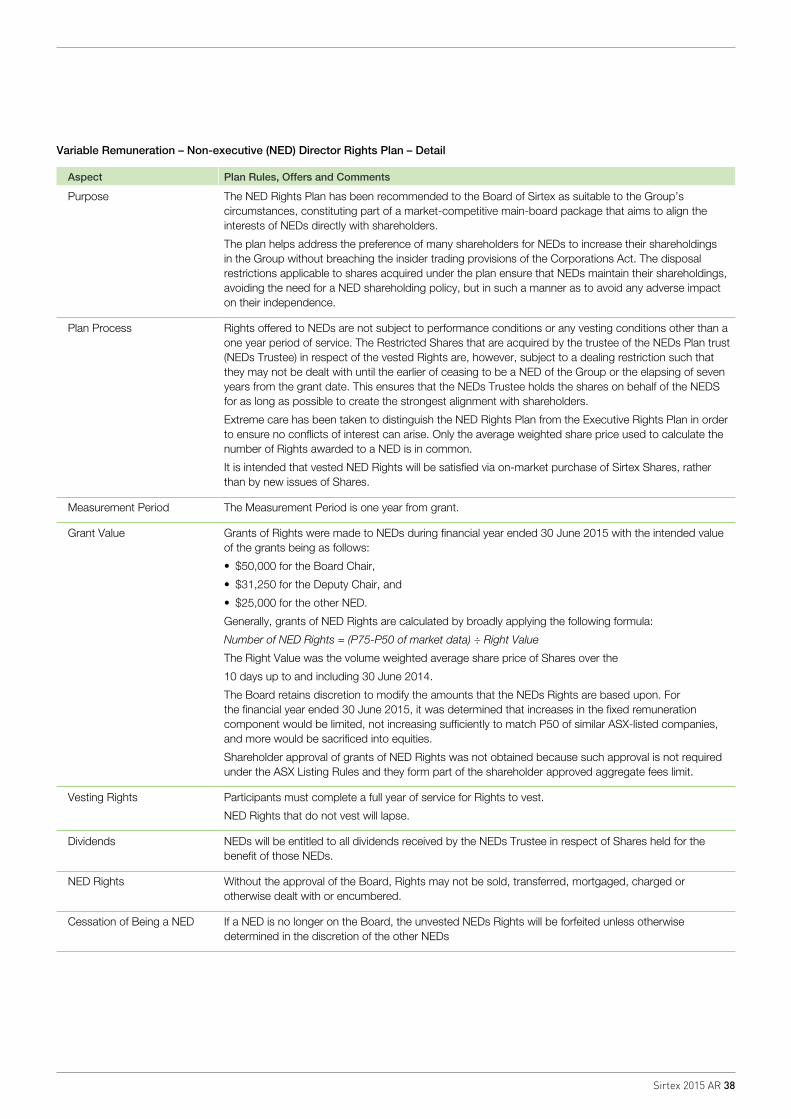
Sirtex 2015 AR 38
Variable Remuneration – Non-executive (NED) Director Rights Plan – Detail
Aspect Plan Rules, Offers and Comments
Purpose The NED Rights Plan has been recommended to the Board of Sirtex as suitable to the Group’s circumstances, constituting part of a market-competitive main-board package that aims to align the interests of NEDs directly with shareholders.
The plan helps address the preference of many shareholders for NEDs to increase their shareholdings in the Group without breaching the insider trading provisions of the Corporations Act. The disposal restrictions applicable to shares acquired under the plan ensure that NEDs maintain their shareholdings, avoiding the need for a NED shareholding policy, but in such a manner as to avoid any adverse impact on their independence.
Plan Process Rights offered to NEDs are not subject to performance conditions or any vesting conditions other than a one year period of service. The Restricted Shares that are acquired by the trustee of the NEDs Plan trust (NEDs Trustee) in respect of the vested Rights are, however, subject to a dealing restriction such that they may not be dealt with until the earlier of ceasing to be a NED of the Group or the elapsing of seven years from the grant date. This ensures that the NEDs Trustee holds the shares on behalf of the NEDS for as long as possible to create the strongest alignment with shareholders.
Extreme care has been taken to distinguish the NED Rights Plan from the Executive Rights Plan in order to ensure no conflicts of interest can arise. Only the average weighted share price used to calculate the number of Rights awarded to a NED is in common.
It is intended that vested NED Rights will be satisfied via on-market purchase of Sirtex Shares, rather than by new issues of Shares.
Measurement Period The Measurement Period is one year from grant.
Grant Value Grants of Rights were made to NEDs during financial year ended 30 June 2015 with the intended value of the grants being as follows:
• $50,000 for the Board Chair,
• $31,250 for the Deputy Chair, and
• $25,000 for the other NED.
Generally, grants of NED Rights are calculated by broadly applying the following formula:
Number of NED Rights = (P75-P50 of market data) ÷ Right Value
The Right Value was the volume weighted average share price of Shares over the
10 days up to and including 30 June 2014.
The Board retains discretion to modify the amounts that the NEDs Rights are based upon. For the financial year ended 30 June 2015, it was determined that increases in the fixed remuneration component would be limited, not increasing sufficiently to match P50 of similar ASX-listed companies, and more would be sacrificed into equities.
Shareholder approval of grants of NED Rights was not obtained because such approval is not required under the ASX Listing Rules and they form part of the shareholder approved aggregate fees limit.
Vesting Rights Participants must complete a full year of service for Rights to vest.
NED Rights that do not vest will lapse.
Dividends NEDs will be entitled to all dividends received by the NEDs Trustee in respect of Shares held for the benefit of those NEDs.
NED Rights Without the approval of the Board, Rights may not be sold, transferred, mortgaged, charged or otherwise dealt with or encumbered.
Cessation of Being a NED If a NED is no longer on the Board, the unvested NEDs Rights will be forfeited unless otherwise determined in the discretion of the other NEDs
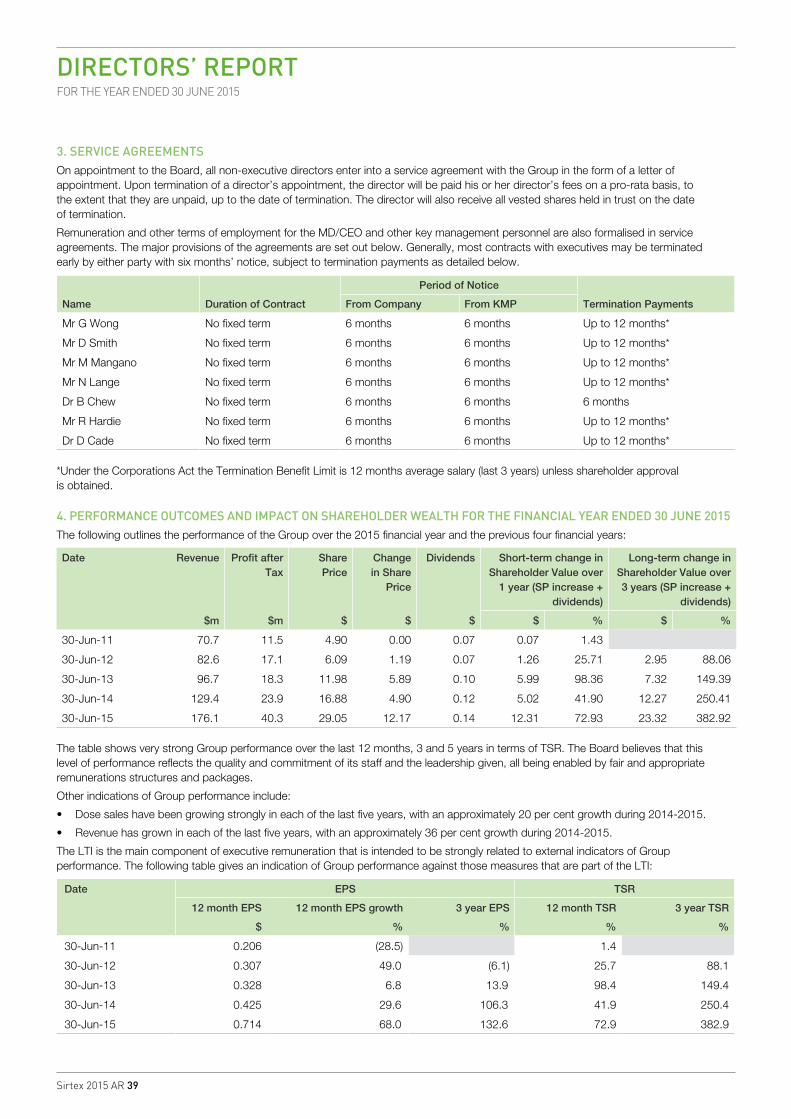
Sirtex 2015 AR 39
DIRECTORS’ REPORTFOR THE YEAR ENDED 30 JUNE 2015
3. SERVICE AGREEMENTSOn appointment to the Board, all non-executive directors enter into a service agreement with the Group in the form of a letter of appointment. Upon termination of a director’s appointment, the director will be paid his or her director’s fees on a pro-rata basis, to the extent that they are unpaid, up to the date of termination. The director will also receive all vested shares held in trust on the date of termination.
Remuneration and other terms of employment for the MD/CEO and other key management personnel are also formalised in service agreements. The major provisions of the agreements are set out below. Generally, most contracts with executives may be terminated early by either party with six months’ notice, subject to termination payments as detailed below.
Name Duration of Contract
Period of Notice
Termination PaymentsFrom Company From KMP
Mr G Wong No fixed term 6 months 6 months Up to 12 months*
Mr D Smith No fixed term 6 months 6 months Up to 12 months*
Mr M Mangano No fixed term 6 months 6 months Up to 12 months*
Mr N Lange No fixed term 6 months 6 months Up to 12 months*
Dr B Chew No fixed term 6 months 6 months 6 months
Mr R Hardie No fixed term 6 months 6 months Up to 12 months*
Dr D Cade No fixed term 6 months 6 months Up to 12 months*
*Under the Corporations Act the Termination Benefit Limit is 12 months average salary (last 3 years) unless shareholder approval is obtained.
4. PERFORMANCE OUTCOMES AND IMPACT ON SHAREHOLDER WEALTH FOR THE FINANCIAL YEAR ENDED 30 JUNE 2015The following outlines the performance of the Group over the 2015 financial year and the previous four financial years:
Date Revenue Profit after Tax
Share Price
Change in Share
Price
Dividends Short-term change in Shareholder Value over
1 year (SP increase + dividends)
Long-term change in Shareholder Value over 3 years (SP increase +
dividends)
$m $m $ $ $ $ % $ %
30-Jun-11 70.7 11.5 4.90 0.00 0.07 0.07 1.43
30-Jun-12 82.6 17.1 6.09 1.19 0.07 1.26 25.71 2.95 88.06
30-Jun-13 96.7 18.3 11.98 5.89 0.10 5.99 98.36 7.32 149.39
30-Jun-14 129.4 23.9 16.88 4.90 0.12 5.02 41.90 12.27 250.41
30-Jun-15 176.1 40.3 29.05 12.17 0.14 12.31 72.93 23.32 382.92
The table shows very strong Group performance over the last 12 months, 3 and 5 years in terms of TSR. The Board believes that this level of performance reflects the quality and commitment of its staff and the leadership given, all being enabled by fair and appropriate remunerations structures and packages.
Other indications of Group performance include:
• Dose sales have been growing strongly in each of the last five years, with an approximately 20 per cent growth during 2014-2015.
• Revenue has grown in each of the last five years, with an approximately 36 per cent growth during 2014-2015.
The LTI is the main component of executive remuneration that is intended to be strongly related to external indicators of Group performance. The following table gives an indication of Group performance against those measures that are part of the LTI:
Date EPS TSR
12 month EPS 12 month EPS growth 3 year EPS 12 month TSR 3 year TSR
$ % % % %
30-Jun-11 0.206 (28.5) 1.4
30-Jun-12 0.307 49.0 (6.1) 25.7 88.1
30-Jun-13 0.328 6.8 13.9 98.4 149.4
30-Jun-14 0.425 29.6 106.3 41.9 250.4
30-Jun-15 0.714 68.0 132.6 72.9 382.9
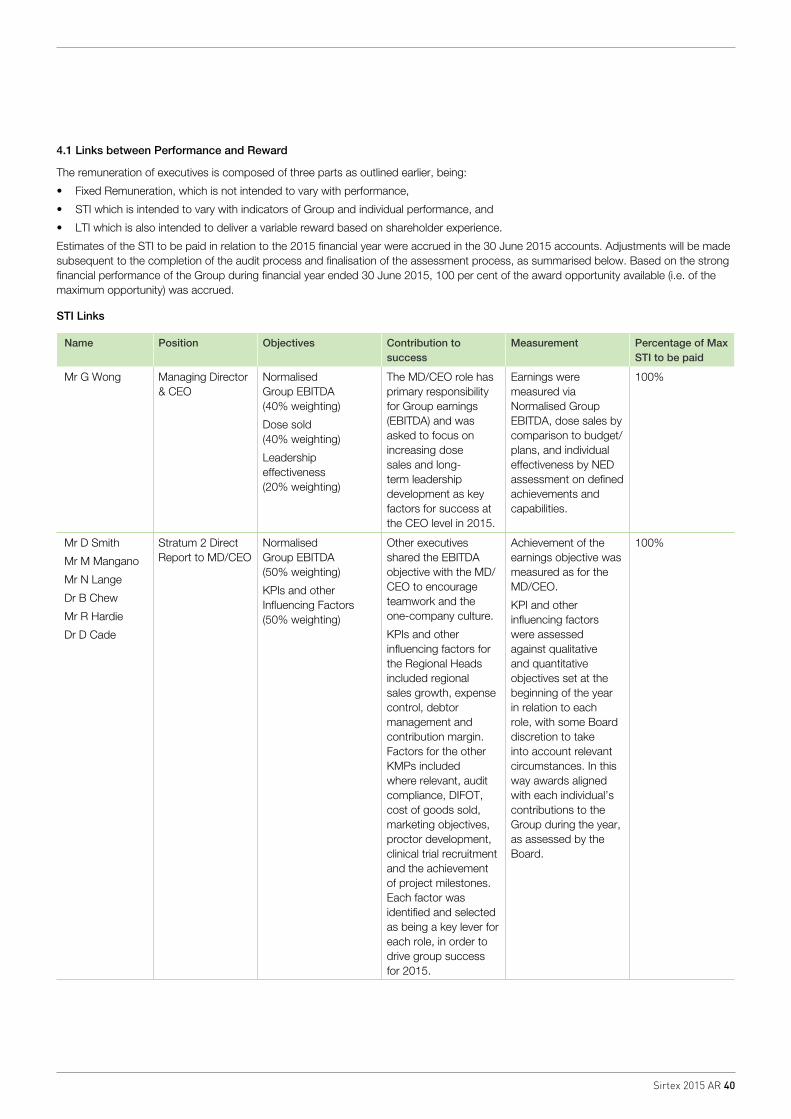
Sirtex 2015 AR 40
4.1 Links between Performance and Reward
The remuneration of executives is composed of three parts as outlined earlier, being:
• Fixed Remuneration, which is not intended to vary with performance,
• STI which is intended to vary with indicators of Group and individual performance, and
• LTI which is also intended to deliver a variable reward based on shareholder experience.
Estimates of the STI to be paid in relation to the 2015 financial year were accrued in the 30 June 2015 accounts. Adjustments will be made subsequent to the completion of the audit process and finalisation of the assessment process, as summarised below. Based on the strong financial performance of the Group during financial year ended 30 June 2015, 100 per cent of the award opportunity available (i.e. of the maximum opportunity) was accrued.
STI Links
Name Position Objectives Contribution to success
Measurement Percentage of Max STI to be paid
Mr G Wong Managing Director & CEO
Normalised Group EBITDA (40% weighting)
Dose sold (40% weighting)
Leadership effectiveness (20% weighting)
The MD/CEO role has primary responsibility for Group earnings (EBITDA) and was asked to focus on increasing dose sales and long-term leadership development as key factors for success at the CEO level in 2015.
Earnings were measured via Normalised Group EBITDA, dose sales by comparison to budget/plans, and individual effectiveness by NED assessment on defined achievements and capabilities.
100%
Mr D Smith
Mr M Mangano
Mr N Lange
Dr B Chew
Mr R Hardie
Dr D Cade
Stratum 2 Direct Report to MD/CEO
Normalised Group EBITDA (50% weighting)
KPIs and other Influencing Factors (50% weighting)
Other executives shared the EBITDA objective with the MD/CEO to encourage teamwork and the one-company culture.
KPIs and other influencing factors for the Regional Heads included regional sales growth, expense control, debtor management and contribution margin. Factors for the other KMPs included where relevant, audit compliance, DIFOT, cost of goods sold, marketing objectives, proctor development, clinical trial recruitment and the achievement of project milestones. Each factor was identified and selected as being a key lever for each role, in order to drive group success for 2015.
Achievement of the earnings objective was measured as for the MD/CEO.
KPI and other influencing factors were assessed against qualitative and quantitative objectives set at the beginning of the year in relation to each role, with some Board discretion to take into account relevant circumstances. In this way awards aligned with each individual’s contributions to the Group during the year, as assessed by the Board.
100%
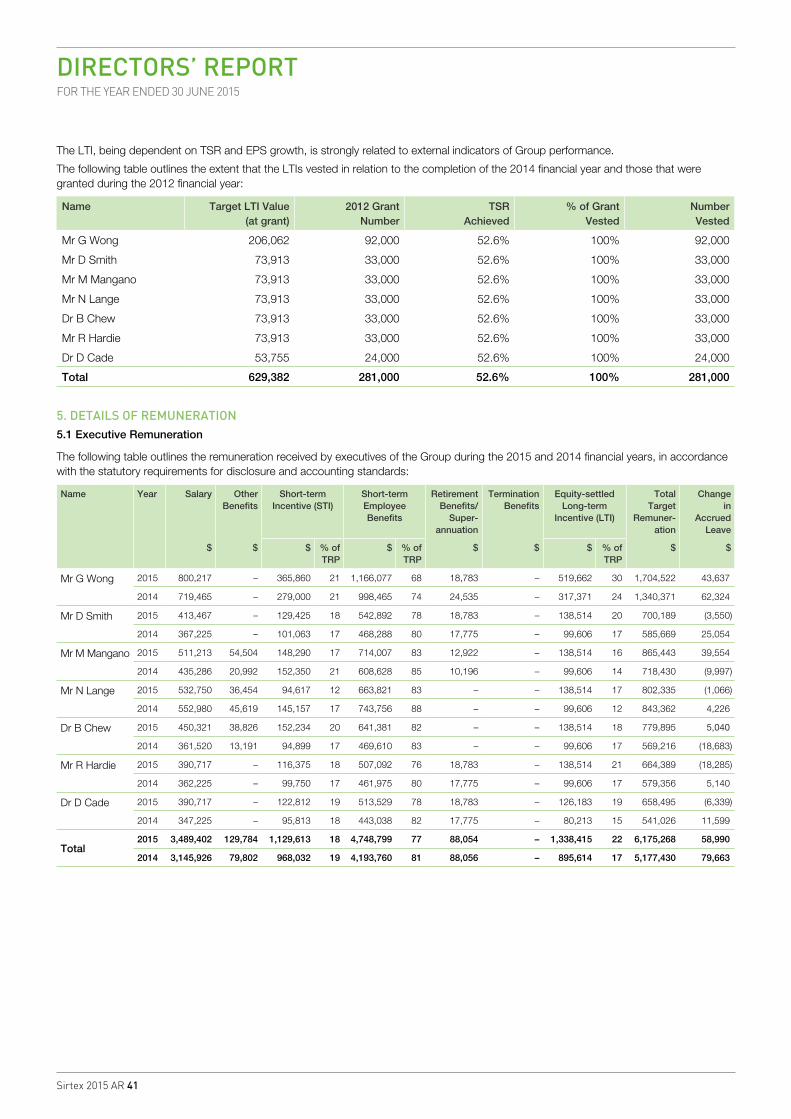
Sirtex 2015 AR 41
DIRECTORS’ REPORTFOR THE YEAR ENDED 30 JUNE 2015
The LTI, being dependent on TSR and EPS growth, is strongly related to external indicators of Group performance.
The following table outlines the extent that the LTIs vested in relation to the completion of the 2014 financial year and those that were granted during the 2012 financial year:
Name Target LTI Value (at grant)
2012 Grant Number
TSR Achieved
% of Grant Vested
Number Vested
Mr G Wong 206,062 92,000 52.6% 100% 92,000
Mr D Smith 73,913 33,000 52.6% 100% 33,000
Mr M Mangano 73,913 33,000 52.6% 100% 33,000
Mr N Lange 73,913 33,000 52.6% 100% 33,000
Dr B Chew 73,913 33,000 52.6% 100% 33,000
Mr R Hardie 73,913 33,000 52.6% 100% 33,000
Dr D Cade 53,755 24,000 52.6% 100% 24,000
Total 629,382 281,000 52.6% 100% 281,000
5. DETAILS OF REMUNERATION5.1 Executive Remuneration
The following table outlines the remuneration received by executives of the Group during the 2015 and 2014 financial years, in accordance with the statutory requirements for disclosure and accounting standards:
Name Year Salary Other Benefits
Short-term Incentive (STI)
Short-term Employee Benefits
Retirement Benefits/
Super- annuation
Termination Benefits
Equity-settled Long-term
Incentive (LTI)
Total Target
Remuner-ation
Change in
Accrued Leave
$ $ $ % of TRP
$ % of TRP
$ $ $ % of TRP
$ $
Mr G Wong 2015 800,217 – 365,860 21 1,166,077 68 18,783 – 519,662 30 1,704,522 43,637
2014 719,465 – 279,000 21 998,465 74 24,535 – 317,371 24 1,340,371 62,324
Mr D Smith 2015 413,467 – 129,425 18 542,892 78 18,783 – 138,514 20 700,189 (3,550)
2014 367,225 – 101,063 17 468,288 80 17,775 – 99,606 17 585,669 25,054
Mr M Mangano 2015 511,213 54,504 148,290 17 714,007 83 12,922 – 138,514 16 865,443 39,554
2014 435,286 20,992 152,350 21 608,628 85 10,196 – 99,606 14 718,430 (9,997)
Mr N Lange 2015 532,750 36,454 94,617 12 663,821 83 – – 138,514 17 802,335 (1,066)
2014 552,980 45,619 145,157 17 743,756 88 – – 99,606 12 843,362 4,226
Dr B Chew 2015 450,321 38,826 152,234 20 641,381 82 – – 138,514 18 779,895 5,040
2014 361,520 13,191 94,899 17 469,610 83 – – 99,606 17 569,216 (18,683)
Mr R Hardie 2015 390,717 – 116,375 18 507,092 76 18,783 – 138,514 21 664,389 (18,285)
2014 362,225 – 99,750 17 461,975 80 17,775 – 99,606 17 579,356 5,140
Dr D Cade 2015 390,717 – 122,812 19 513,529 78 18,783 – 126,183 19 658,495 (6,339)
2014 347,225 – 95,813 18 443,038 82 17,775 – 80,213 15 541,026 11,599
Total2015 3,489,402 129,784 1,129,613 18 4,748,799 77 88,054 – 1,338,415 22 6,175,268 58,990
2014 3,145,926 79,802 968,032 19 4,193,760 81 88,056 – 895,614 17 5,177,430 79,663
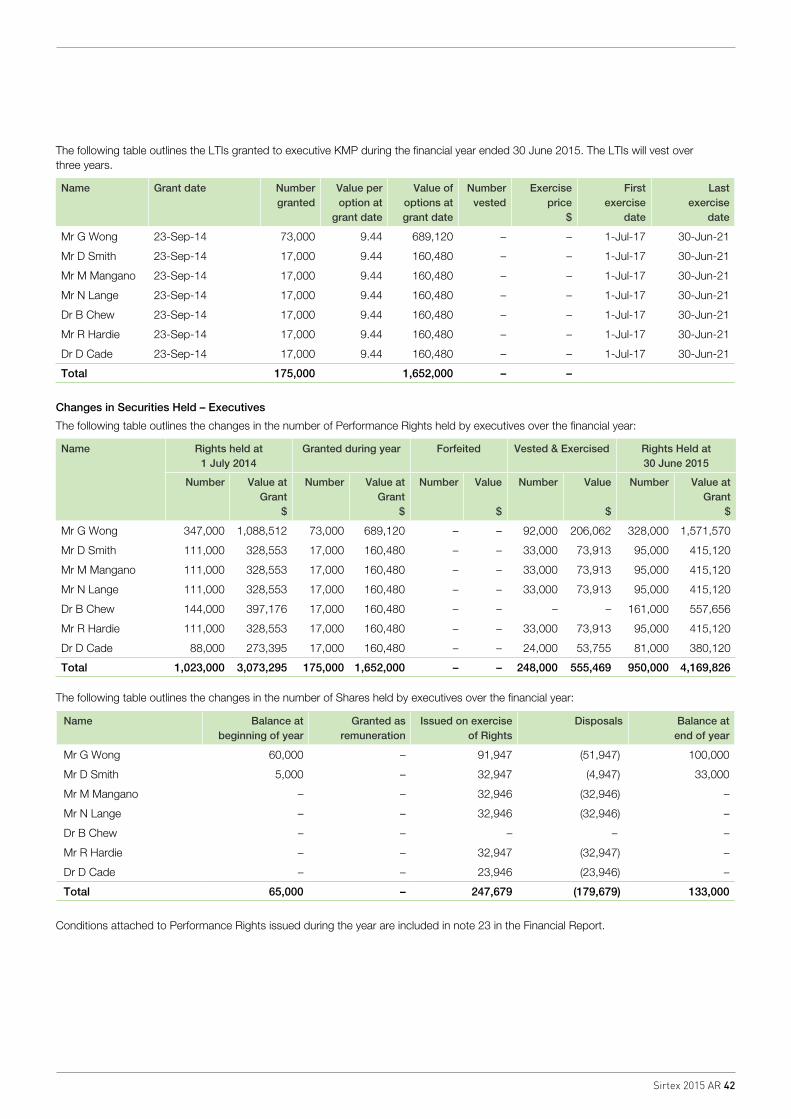
Sirtex 2015 AR 42
The following table outlines the LTIs granted to executive KMP during the financial year ended 30 June 2015. The LTIs will vest over three years.
Name Grant date Number granted
Value per option at
grant date
Value of options at grant date
Number vested
Exercise price
$
First exercise
date
Last exercise
date
Mr G Wong 23-Sep-14 73,000 9.44 689,120 – – 1-Jul-17 30-Jun-21
Mr D Smith 23-Sep-14 17,000 9.44 160,480 – – 1-Jul-17 30-Jun-21
Mr M Mangano 23-Sep-14 17,000 9.44 160,480 – – 1-Jul-17 30-Jun-21
Mr N Lange 23-Sep-14 17,000 9.44 160,480 – – 1-Jul-17 30-Jun-21
Dr B Chew 23-Sep-14 17,000 9.44 160,480 – – 1-Jul-17 30-Jun-21
Mr R Hardie 23-Sep-14 17,000 9.44 160,480 – – 1-Jul-17 30-Jun-21
Dr D Cade 23-Sep-14 17,000 9.44 160,480 – – 1-Jul-17 30-Jun-21
Total 175,000 1,652,000 – –
Changes in Securities Held – Executives
The following table outlines the changes in the number of Performance Rights held by executives over the financial year:
Name Rights held at 1 July 2014
Granted during year Forfeited Vested & Exercised Rights Held at 30 June 2015
Number Value at Grant
$
Number Value at Grant
$
Number Value $
Number Value $
Number Value at Grant
$
Mr G Wong 347,000 1,088,512 73,000 689,120 – – 92,000 206,062 328,000 1,571,570
Mr D Smith 111,000 328,553 17,000 160,480 – – 33,000 73,913 95,000 415,120
Mr M Mangano 111,000 328,553 17,000 160,480 – – 33,000 73,913 95,000 415,120
Mr N Lange 111,000 328,553 17,000 160,480 – – 33,000 73,913 95,000 415,120
Dr B Chew 144,000 397,176 17,000 160,480 – – – – 161,000 557,656
Mr R Hardie 111,000 328,553 17,000 160,480 – – 33,000 73,913 95,000 415,120
Dr D Cade 88,000 273,395 17,000 160,480 – – 24,000 53,755 81,000 380,120
Total 1,023,000 3,073,295 175,000 1,652,000 – – 248,000 555,469 950,000 4,169,826
The following table outlines the changes in the number of Shares held by executives over the financial year:
Name Balance at beginning of year
Granted as remuneration
Issued on exercise of Rights
Disposals Balance at end of year
Mr G Wong 60,000 – 91,947 (51,947) 100,000
Mr D Smith 5,000 – 32,947 (4,947) 33,000
Mr M Mangano – – 32,946 (32,946) –
Mr N Lange – – 32,946 (32,946) –
Dr B Chew – – – – –
Mr R Hardie – – 32,947 (32,947) –
Dr D Cade – – 23,946 (23,946) –
Total 65,000 – 247,679 (179,679) 133,000
Conditions attached to Performance Rights issued during the year are included in note 23 in the Financial Report.
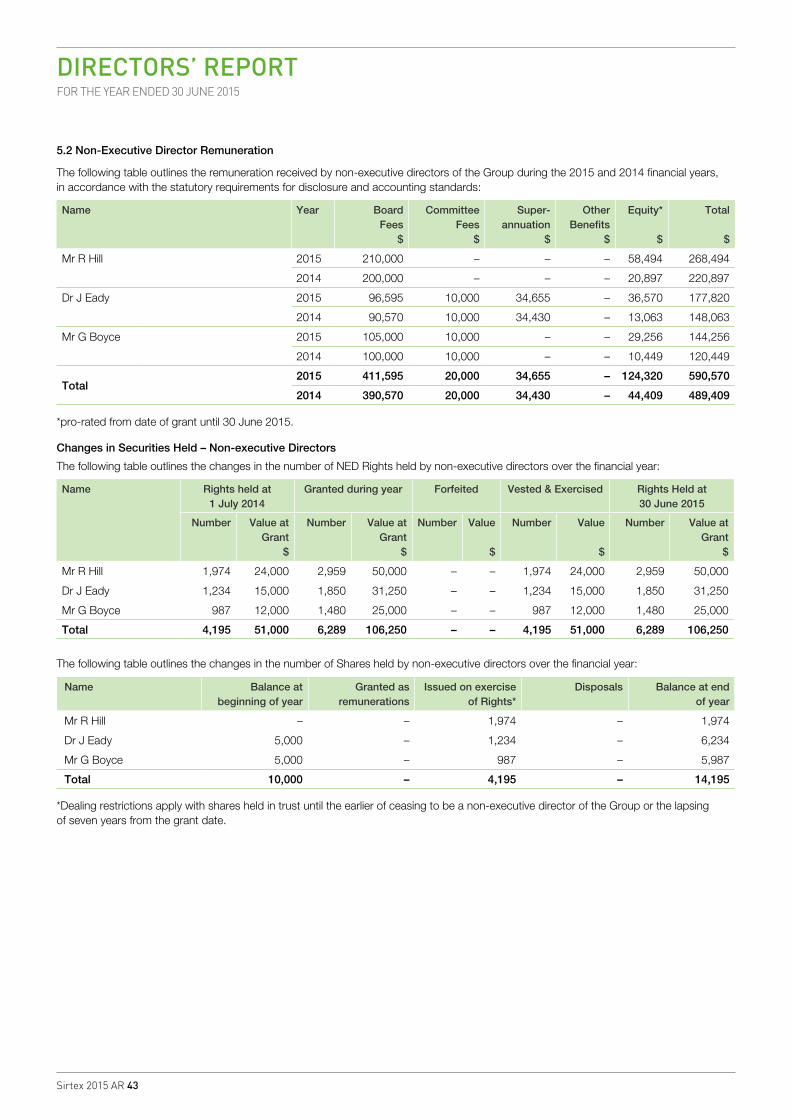
Sirtex 2015 AR 43
DIRECTORS’ REPORTFOR THE YEAR ENDED 30 JUNE 2015
5.2 Non-Executive Director Remuneration
The following table outlines the remuneration received by non-executive directors of the Group during the 2015 and 2014 financial years, in accordance with the statutory requirements for disclosure and accounting standards:
Name Year Board Fees
$
Committee Fees
$
Super-annuation
$
Other Benefits
$
Equity* $
Total $
Mr R Hill 2015 210,000 – – – 58,494 268,494
2014 200,000 – – – 20,897 220,897
Dr J Eady 2015 96,595 10,000 34,655 – 36,570 177,820
2014 90,570 10,000 34,430 – 13,063 148,063
Mr G Boyce 2015 105,000 10,000 – – 29,256 144,256
2014 100,000 10,000 – – 10,449 120,449
Total2015 411,595 20,000 34,655 – 124,320 590,570
2014 390,570 20,000 34,430 – 44,409 489,409
*pro-rated from date of grant until 30 June 2015.
Changes in Securities Held – Non-executive Directors
The following table outlines the changes in the number of NED Rights held by non-executive directors over the financial year:
Name Rights held at 1 July 2014
Granted during year Forfeited Vested & Exercised Rights Held at 30 June 2015
Number Value at Grant
$
Number Value at Grant
$
Number Value $
Number Value $
Number Value at Grant
$
Mr R Hill 1,974 24,000 2,959 50,000 – – 1,974 24,000 2,959 50,000
Dr J Eady 1,234 15,000 1,850 31,250 – – 1,234 15,000 1,850 31,250
Mr G Boyce 987 12,000 1,480 25,000 – – 987 12,000 1,480 25,000
Total 4,195 51,000 6,289 106,250 – – 4,195 51,000 6,289 106,250
The following table outlines the changes in the number of Shares held by non-executive directors over the financial year:
Name Balance at beginning of year
Granted as remunerations
Issued on exercise of Rights*
Disposals Balance at end of year
Mr R Hill – – 1,974 – 1,974
Dr J Eady 5,000 – 1,234 – 6,234
Mr G Boyce 5,000 – 987 – 5,987
Total 10,000 – 4,195 – 14,195
*Dealing restrictions apply with shares held in trust until the earlier of ceasing to be a non-executive director of the Group or the lapsing of seven years from the grant date.
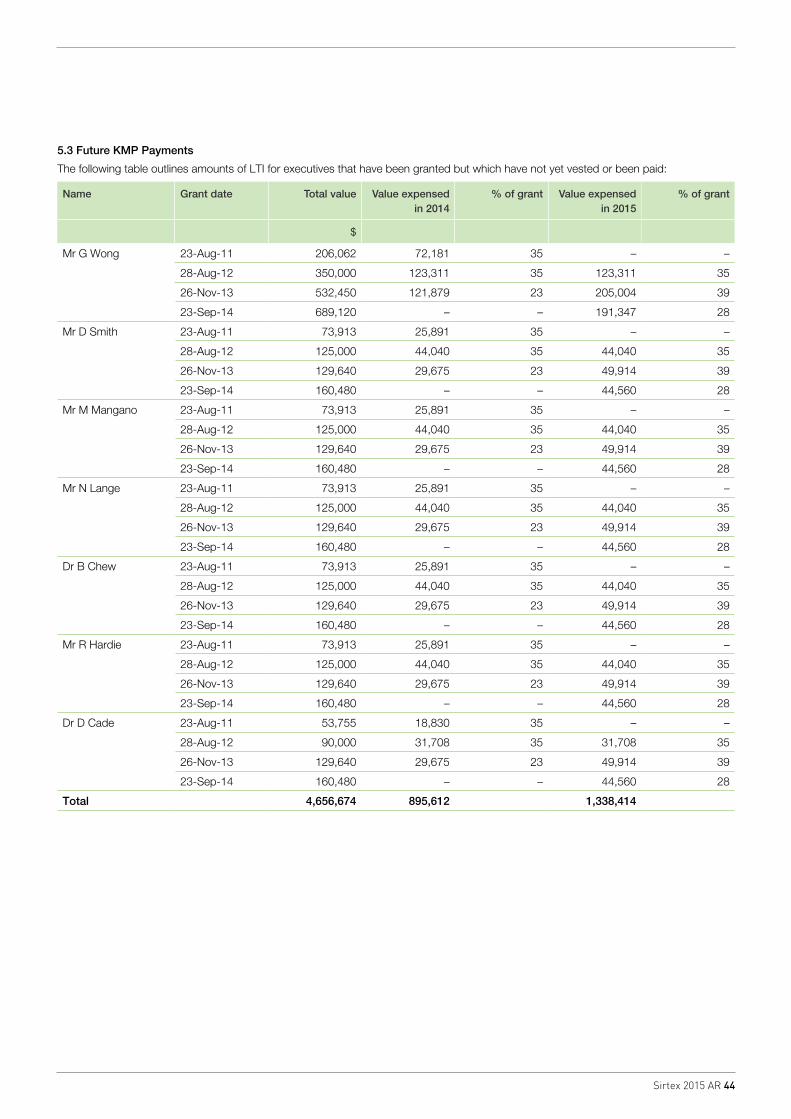
Sirtex 2015 AR 44
5.3 Future KMP Payments
The following table outlines amounts of LTI for executives that have been granted but which have not yet vested or been paid:
Name Grant date Total value Value expensed in 2014
% of grant Value expensed in 2015
% of grant
$
Mr G Wong 23-Aug-11 206,062 72,181 35 – –
28-Aug-12 350,000 123,311 35 123,311 35
26-Nov-13 532,450 121,879 23 205,004 39
23-Sep-14 689,120 – – 191,347 28
Mr D Smith 23-Aug-11 73,913 25,891 35 – –
28-Aug-12 125,000 44,040 35 44,040 35
26-Nov-13 129,640 29,675 23 49,914 39
23-Sep-14 160,480 – – 44,560 28
Mr M Mangano 23-Aug-11 73,913 25,891 35 – –
28-Aug-12 125,000 44,040 35 44,040 35
26-Nov-13 129,640 29,675 23 49,914 39
23-Sep-14 160,480 – – 44,560 28
Mr N Lange 23-Aug-11 73,913 25,891 35 – –
28-Aug-12 125,000 44,040 35 44,040 35
26-Nov-13 129,640 29,675 23 49,914 39
23-Sep-14 160,480 – – 44,560 28
Dr B Chew 23-Aug-11 73,913 25,891 35 – –
28-Aug-12 125,000 44,040 35 44,040 35
26-Nov-13 129,640 29,675 23 49,914 39
23-Sep-14 160,480 – – 44,560 28
Mr R Hardie 23-Aug-11 73,913 25,891 35 – –
28-Aug-12 125,000 44,040 35 44,040 35
26-Nov-13 129,640 29,675 23 49,914 39
23-Sep-14 160,480 – – 44,560 28
Dr D Cade 23-Aug-11 53,755 18,830 35 – –
28-Aug-12 90,000 31,708 35 31,708 35
26-Nov-13 129,640 29,675 23 49,914 39
23-Sep-14 160,480 – – 44,560 28
Total 4,656,674 895,612 1,338,414
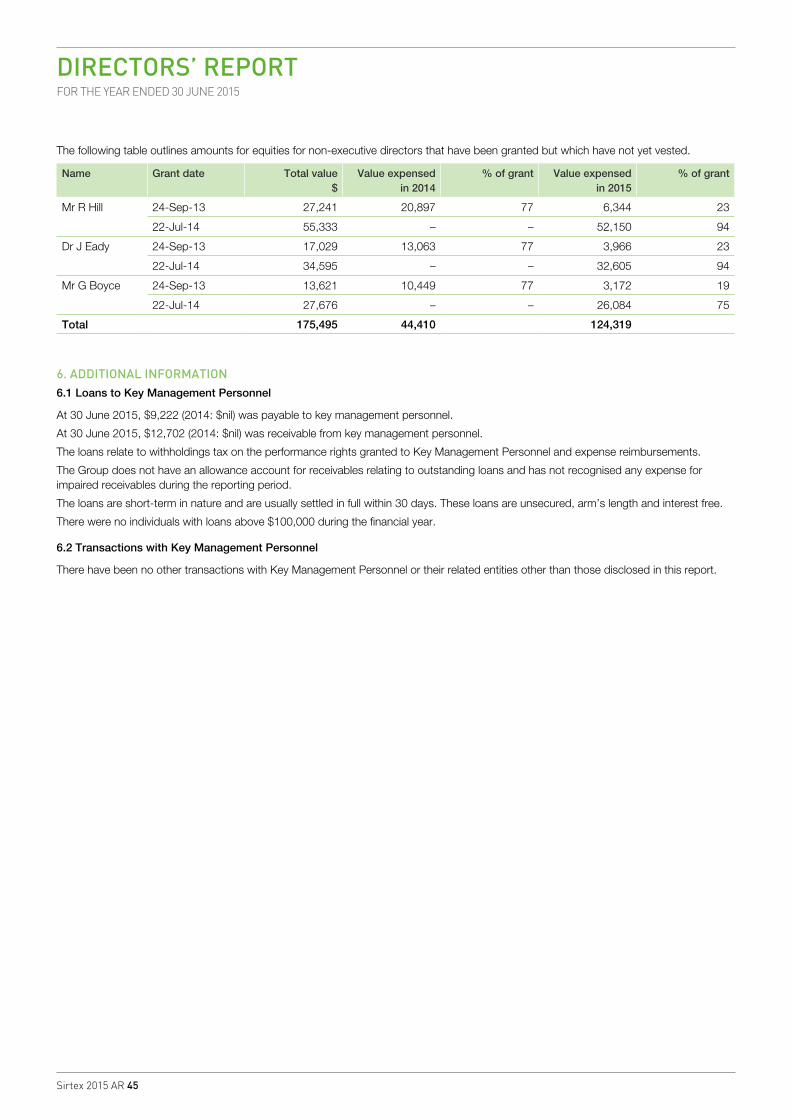
Sirtex 2015 AR 45
DIRECTORS’ REPORTFOR THE YEAR ENDED 30 JUNE 2015
The following table outlines amounts for equities for non-executive directors that have been granted but which have not yet vested.
Name Grant date Total value $
Value expensed in 2014
% of grant Value expensed in 2015
% of grant
Mr R Hill 24-Sep-13 27,241 20,897 77 6,344 23
22-Jul-14 55,333 – – 52,150 94
Dr J Eady 24-Sep-13 17,029 13,063 77 3,966 23
22-Jul-14 34,595 – – 32,605 94
Mr G Boyce 24-Sep-13 13,621 10,449 77 3,172 19
22-Jul-14 27,676 – – 26,084 75
Total 175,495 44,410 124,319
6. ADDITIONAL INFORMATION6.1 Loans to Key Management Personnel
At 30 June 2015, $9,222 (2014: $nil) was payable to key management personnel.
At 30 June 2015, $12,702 (2014: $nil) was receivable from key management personnel.
The loans relate to withholdings tax on the performance rights granted to Key Management Personnel and expense reimbursements.
The Group does not have an allowance account for receivables relating to outstanding loans and has not recognised any expense for impaired receivables during the reporting period.
The loans are short-term in nature and are usually settled in full within 30 days. These loans are unsecured, arm’s length and interest free.
There were no individuals with loans above $100,000 during the financial year.
6.2 Transactions with Key Management Personnel
There have been no other transactions with Key Management Personnel or their related entities other than those disclosed in this report.
Sirtex 2015 AR 46
6.3 External Remuneration Consultant Advice
During the year KMP remuneration recommendations and data were received from external remuneration consultant(s). The consultants and the amount payable for the information and work that led to their recommendations are listed below:
Godfrey Remuneration Group Pty Limited $16,000
Hay Group Limited $60,375
The consultant(s) also provided other advice during the year and the kinds of advice and remuneration payable for such advice is summarised below:
Godfrey Remuneration Group Pty Limited Assistance drafting new and up-dating existing remuneration policies and documents related to the independent development of the Remuneration Governance Framework, Remuneration Report drafting and Notice of Meeting drafting.
$74,000
So as to ensure that KMP remuneration recommendations were free from undue influence from the KMP to whom they relate, the Company has policies and procedures governing engagements with external remuneration consultants. The key aspects include:
(a) KMP remuneration recommendations may only be received from consultants who have been approved by the Board. This is a legal requirement. Before such approval is given and before each engagement the Board ensures that the consultant is independent of KMP.
(b) As required by law, KMP remuneration recommendations are only received by non-executive directors, mainly the Chair of the Remuneration Committee.
(c) The policy seeks to ensure that the Board controls any contact by management of Board-approved remuneration consultants and any interactions between management and external remuneration consultants when undertaking work leading to KMP remuneration recommendations.
The Board is satisfied that the KMP remuneration recommendations received were free from undue influence from KMP to whom the recommendations related. The reasons the Board is so satisfied include that it is confident that the policy for engaging external remuneration consultants is being adhered to and is operating as intended, the Board has been closely involved in all dealings with the external remuneration consultants and each KMP remuneration recommendation received during the year was accompanied by a legal declaration from the consultants to the effect that their advice was provided free from undue influence from the KMP to whom the recommendations related.
Gilman WongDirector
13 August 2015
Sirtex 2015 AR 47
AUDITOR’S INDEPENDENCE DECLARATION

Sirtex 2015 AR 48
DIRECTORS’ DECLARATION
The Directors of the Company declare that:
1. the financial statements and notes, as set out on pages 52 to 83, are in accordance with the Corporations Act 2001 and
(a) comply with Australian Accounting Standards (including the Australian Accounting Interpretations) and the Corporations Regulations 2001, which, as stated in accounting policy Note 1 to the financial statements, constitutes explicit and unreserved compliance with International Financial Reporting Standards (IFRS), and
(b) give a true and fair view of the financial position as at 30 June 2015 and of the performance for the year ended on that date of the company and consolidated group
2. the Chief Executive Officer and Chief Financial Officer have each declared, as required by section 295A of the Corporations Act 2001, that:
(a) the financial records of the company for the financial year have been properly maintained in accordance with s 286 of the Corporations Act 2001
(b) the financial statements and notes for the financial year comply with Accounting Standards, and
(c) the financial statements and notes for the financial year give a true and fair view
3. in the directors’ opinion, there are reasonable grounds to believe that the Group will be able to pay its debts as and when they become due and payable.
This declaration is made in accordance with a resolution of the Board of Directors.
Gilman WongDirector
Sydney, 13 August 2015
Sirtex 2015 AR 49
INDEPENDENT AUDITOR’S REPORT
Sirtex 2015 AR 50
INDEPENDENT AUDITOR’S REPORT
Sirtex 2015 AR 51
INDEPENDENT AUDITOR’S REPORT
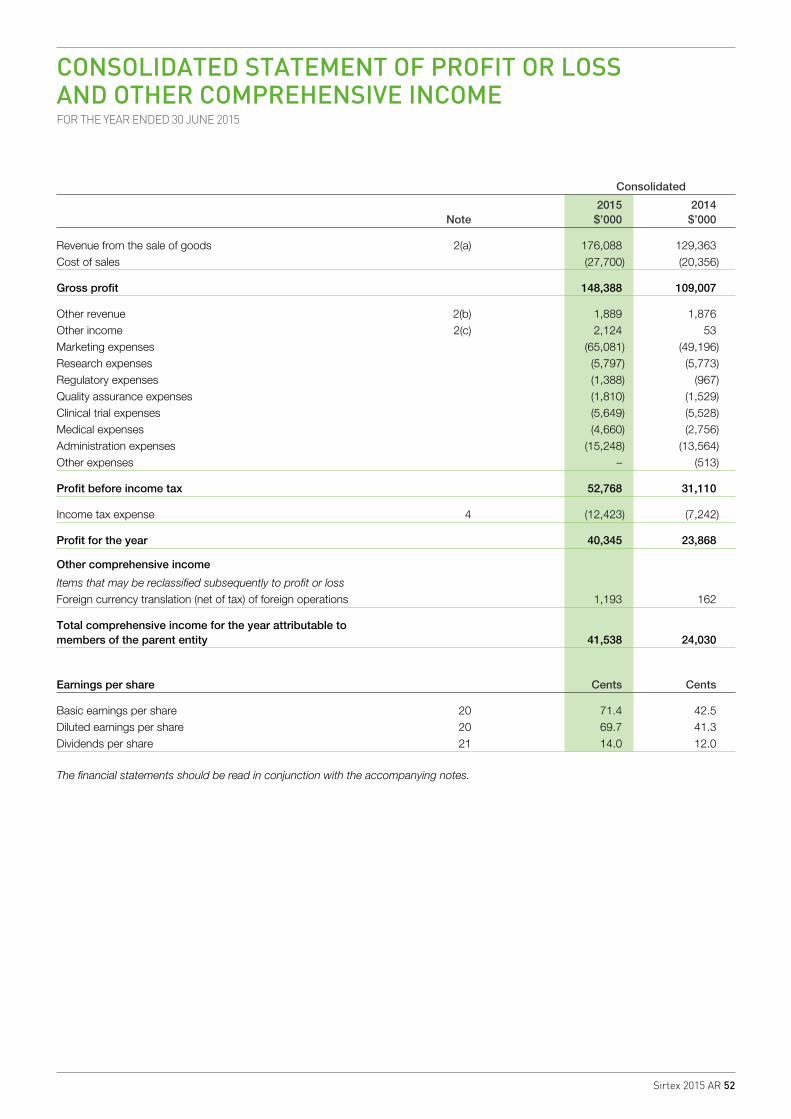
Sirtex 2015 AR 52
CONSOLIDATED STATEMENT OF PROFIT OR LOSS AND OTHER COMPREHENSIVE INCOMEFOR THE YEAR ENDED 30 JUNE 2015
Consolidated
2015 2014 Note $’000 $’000
Revenue from the sale of goods 2(a) 176,088 129,363Cost of sales (27,700) (20,356)
Gross profit 148,388 109,007
Other revenue 2(b) 1,889 1,876Other income 2(c) 2,124 53Marketing expenses (65,081) (49,196)Research expenses (5,797) (5,773)Regulatory expenses (1,388) (967)Quality assurance expenses (1,810) (1,529)Clinical trial expenses (5,649) (5,528)Medical expenses (4,660) (2,756)Administration expenses (15,248) (13,564)Other expenses – (513)
Profit before income tax 52,768 31,110
Income tax expense 4 (12,423) (7,242)
Profit for the year 40,345 23,868
Other comprehensive income
Items that may be reclassified subsequently to profit or loss
Foreign currency translation (net of tax) of foreign operations 1,193 162
Total comprehensive income for the year attributable to members of the parent entity 41,538 24,030
Earnings per share Cents Cents
Basic earnings per share 20 71.4 42.5Diluted earnings per share 20 69.7 41.3Dividends per share 21 14.0 12.0
The financial statements should be read in conjunction with the accompanying notes.
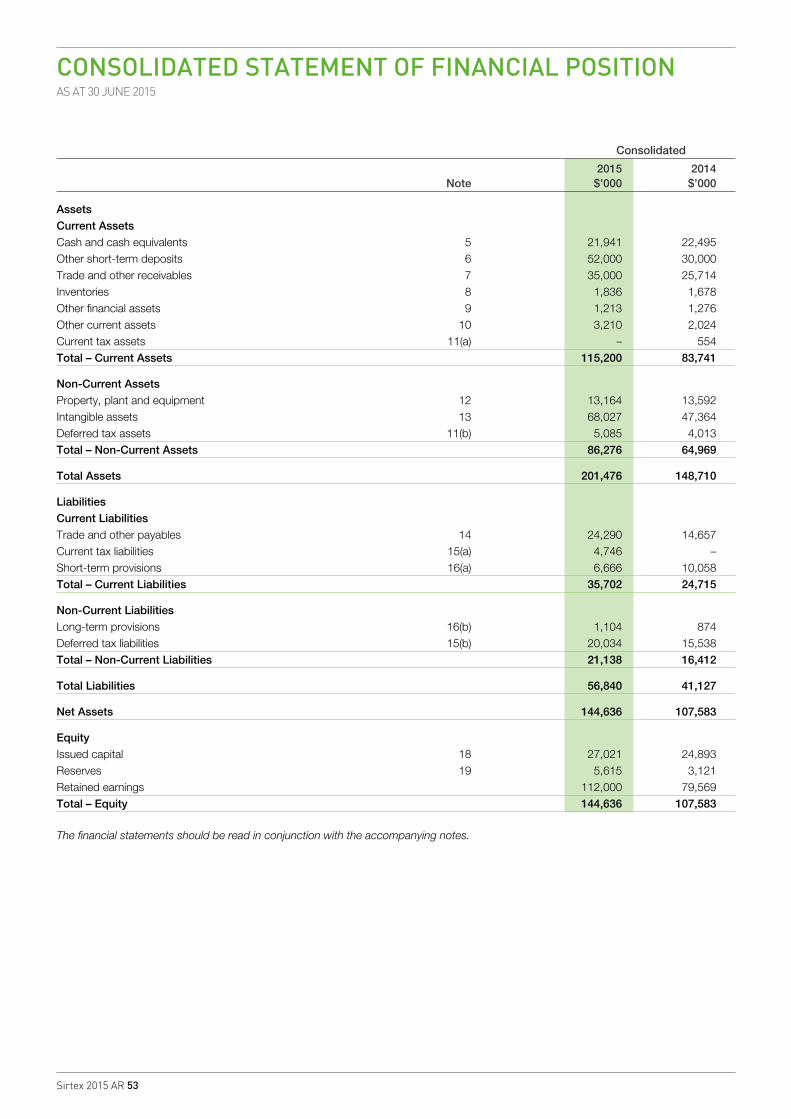
Sirtex 2015 AR 53
CONSOLIDATED STATEMENT OF FINANCIAL POSITIONAS AT 30 JUNE 2015
Consolidated
2015 2014 Note $’000 $’000
Assets Current Assets Cash and cash equivalents 5 21,941 22,495Other short-term deposits 6 52,000 30,000Trade and other receivables 7 35,000 25,714Inventories 8 1,836 1,678Other financial assets 9 1,213 1,276Other current assets 10 3,210 2,024Current tax assets 11(a) – 554Total – Current Assets 115,200 83,741
Non-Current Assets Property, plant and equipment 12 13,164 13,592Intangible assets 13 68,027 47,364Deferred tax assets 11(b) 5,085 4,013Total – Non-Current Assets 86,276 64,969
Total Assets 201,476 148,710
Liabilities Current Liabilities Trade and other payables 14 24,290 14,657Current tax liabilities 15(a) 4,746 –Short-term provisions 16(a) 6,666 10,058Total – Current Liabilities 35,702 24,715
Non-Current Liabilities Long-term provisions 16(b) 1,104 874Deferred tax liabilities 15(b) 20,034 15,538Total – Non-Current Liabilities 21,138 16,412
Total Liabilities 56,840 41,127
Net Assets 144,636 107,583
Equity Issued capital 18 27,021 24,893Reserves 19 5,615 3,121Retained earnings 112,000 79,569Total – Equity 144,636 107,583
The financial statements should be read in conjunction with the accompanying notes.
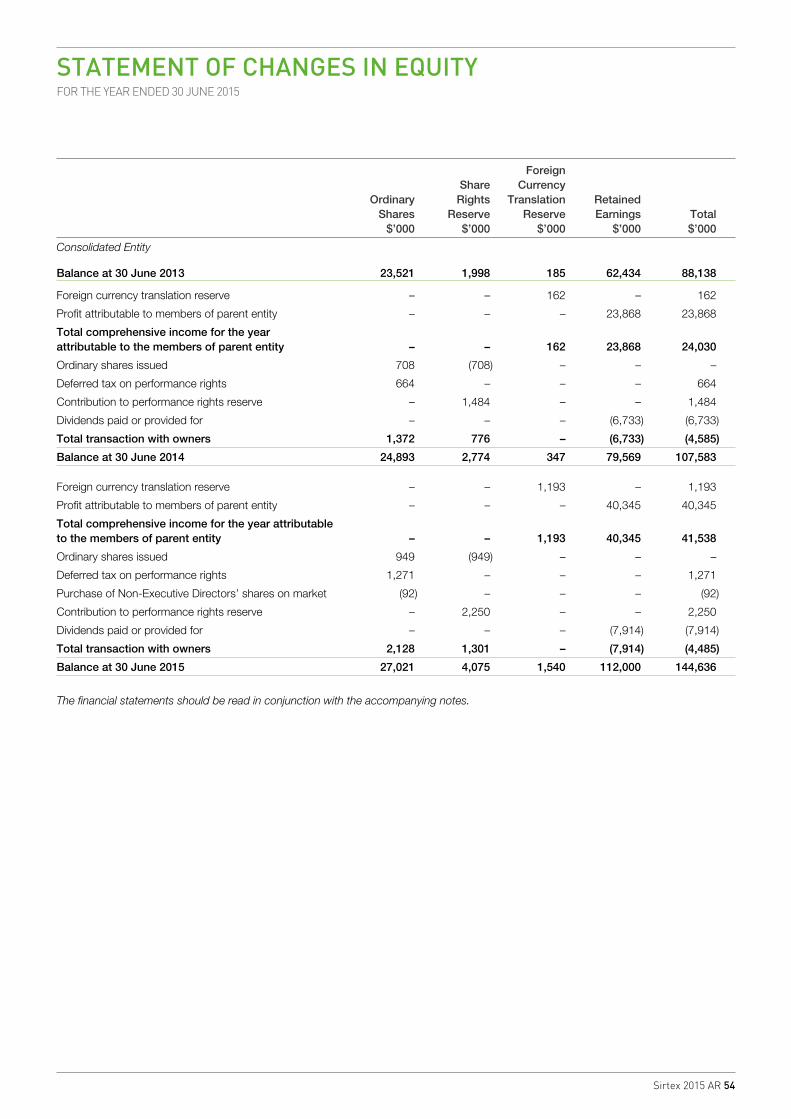
Sirtex 2015 AR 54
STATEMENT OF CHANGES IN EQUITYFOR THE YEAR ENDED 30 JUNE 2015
Foreign Share Currency Ordinary Rights Translation Retained Shares Reserve Reserve Earnings Total $’000 $’000 $’000 $’000 $’000
Consolidated Entity
Balance at 30 June 2013 23,521 1,998 185 62,434 88,138
Foreign currency translation reserve – – 162 – 162
Profit attributable to members of parent entity – – – 23,868 23,868
Total comprehensive income for the year attributable to the members of parent entity – – 162 23,868 24,030
Ordinary shares issued 708 (708) – – –
Deferred tax on performance rights 664 – – – 664
Contribution to performance rights reserve – 1,484 – – 1,484
Dividends paid or provided for – – – (6,733) (6,733)
Total transaction with owners 1,372 776 – (6,733) (4,585)
Balance at 30 June 2014 24,893 2,774 347 79,569 107,583
Foreign currency translation reserve – – 1,193 – 1,193
Profit attributable to members of parent entity – – – 40,345 40,345
Total comprehensive income for the year attributable to the members of parent entity – – 1,193 40,345 41,538
Ordinary shares issued 949 (949) – – –
Deferred tax on performance rights 1,271 – – – 1,271
Purchase of Non-Executive Directors’ shares on market (92) – – – (92)
Contribution to performance rights reserve – 2,250 – – 2,250
Dividends paid or provided for – – – (7,914) (7,914)
Total transaction with owners 2,128 1,301 – (7,914) (4,485)
Balance at 30 June 2015 27,021 4,075 1,540 112,000 144,636
The financial statements should be read in conjunction with the accompanying notes.
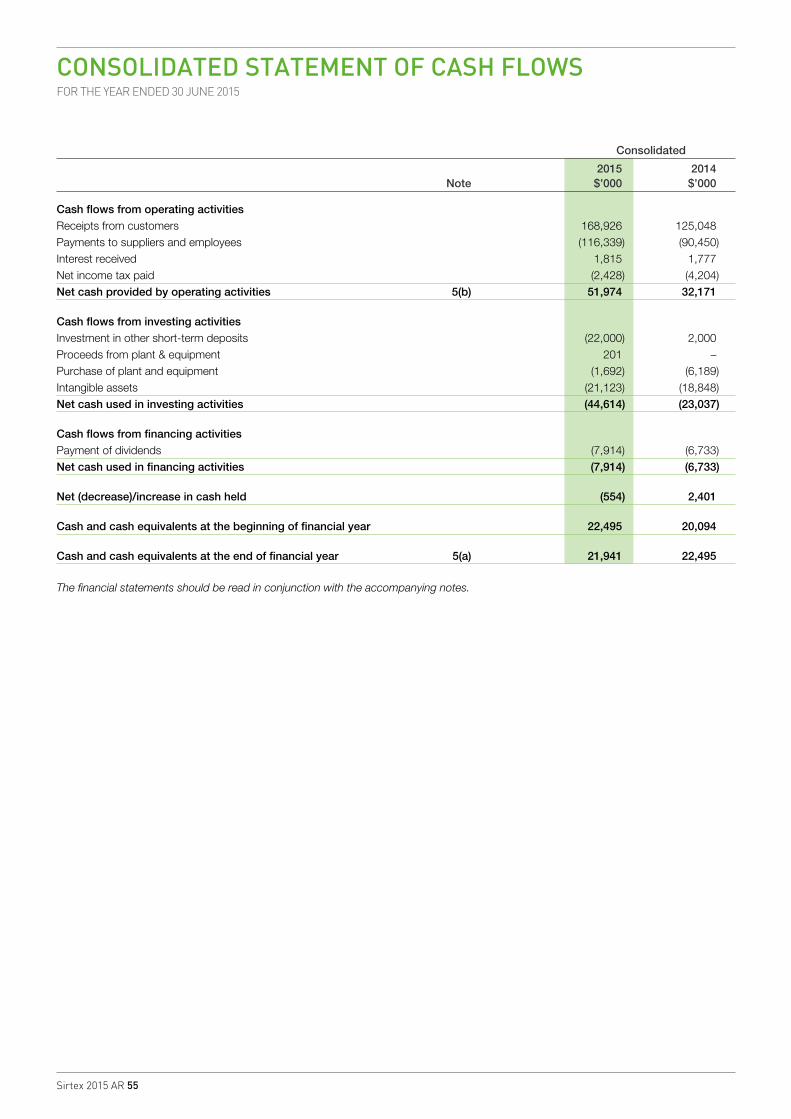
Sirtex 2015 AR 55
CONSOLIDATED STATEMENT OF CASH FLOWSFOR THE YEAR ENDED 30 JUNE 2015
Consolidated
2015 2014 Note $’000 $’000
Cash flows from operating activities Receipts from customers 168,926 125,048Payments to suppliers and employees (116,339) (90,450)Interest received 1,815 1,777Net income tax paid (2,428) (4,204)Net cash provided by operating activities 5(b) 51,974 32,171
Cash flows from investing activities Investment in other short-term deposits (22,000) 2,000Proceeds from plant & equipment 201 –Purchase of plant and equipment (1,692) (6,189)Intangible assets (21,123) (18,848)Net cash used in investing activities (44,614) (23,037)
Cash flows from financing activities Payment of dividends (7,914) (6,733)Net cash used in financing activities (7,914) (6,733)
Net (decrease)/increase in cash held (554) 2,401
Cash and cash equivalents at the beginning of financial year 22,495 20,094
Cash and cash equivalents at the end of financial year 5(a) 21,941 22,495
The financial statements should be read in conjunction with the accompanying notes.
Sirtex 2015 AR 56
NOTES TO THE FINANCIAL STATEMENTSFOR THE YEAR ENDED 30 JUNE 2015
1. STATEMENT OF SIGNIFICANT ACCOUNTING POLICIESThe financial report is a general purpose financial report which has been prepared in accordance with Australian Accounting Standards, Australian Accounting Interpretations, other authoritative pronouncements of the Australian Accounting Standards Board (AASB) and the Corporations Act 2001. The report includes the consolidated financial statements and notes of Sirtex Medical Limited and controlled entities. Sirtex Medical Limited is a for-profit entity for the purpose of preparing the financial statements.
Compliance with Australian Accounting Standards ensures that the financial report of the Group complies with International Financial Reporting Standards (IFRS) in their entirety. Material accounting policies adopted in the preparation of this financial report are presented below and have been consistently applied unless otherwise stated.
Sirtex Medical Limited is the Group’s Ultimate Parent Company. Sirtex Medical Limited is a Public Company incorporated and domiciled in Australia.
The consolidated financial statements were approved and authorised for issue by the directors on 13 August 2015.
This financial report has been prepared on an accruals basis and is based on historical costs, modified, where applicable, by the measurement at fair value of selected non-current assets, financial assets and financial liabilities.
(a) Basis of consolidation
The Group financial statements consolidate those of the Parent Company and all of its subsidiaries as of 30 June 2015. The Parent controls a subsidiary if it is exposed, or has rights, to variable returns from its involvement with the subsidiary and has the ability to affect those returns through its power over the subsidiary. All subsidiaries have a reporting date of 30 June.
All transactions and balances between Group companies are eliminated on consolidation, including unrealised gains and losses on transactions between Group companies. Where unrealised losses on intra-group asset sales are reversed on consolidation, the underlying asset is also tested for impairment from a group perspective. Amounts reported in the financial statements of subsidiaries have been adjusted where necessary to ensure consistency with the accounting policies adopted by the Group.
Profit or loss and other comprehensive income of subsidiaries acquired or disposed of during the year are recognised from the effective date of acquisition, or up to the effective date of disposal, as applicable.
(b) Revenue recognition
Revenue is measured at the fair value of the consideration received or receivable after taking into account any trade discounts and volume rebates allowed. All revenue is stated net of the amount of GST.
Revenue from the sale of goods is recognised when the Group has transferred the significant risks and rewards of ownership to the buyer. Due to different legislative and market environments in the regions where the Group is operating, the date of transfer of risks and rewards is different by region. In the US, this date is on the delivery of goods to the customer, and in all other regions this date is the treatment day of the patient which usually occurs one to two days after the delivery day.
Interest revenue is recognised on an accrual basis using the effective interest method.
(c) Operating expenses
Operating expenses are recognised in profit or loss upon utilisation of the service or at the date of their origin.
(d) Goods and services tax (GST)
Revenues, expenses and assets are recognised net of the amount of GST, except where the amount of GST incurred is not recoverable from the relevant revenue authorities. In these circumstances, the GST is recognised as part of the cost of acquisition of the asset or as part of an item of the expense.
Receivables and payables are shown inclusive of GST. The net amount of GST recoverable from, or payable to the relevant revenue authorities is included as a current asset or liability in the Consolidated Statement of Financial Position.
Cash flows are presented in the Consolidated Statement of Cash Flows on a gross basis, except for the GST component of investing and financing activities, which are disclosed as operating cash flows.
(e) Inventories
Inventories are measured at the lower of cost and net realisable value. The cost of manufactured products includes direct materials, direct labour and an appropriate portion of variable and fixed overheads. Costs are assigned on the basis of weighted average costs.
(f) Plant and equipment
All assets acquired are initially recorded at their cost of acquisition, being fair value of the consideration provided plus incidental costs directly attributable to the acquisition. Depreciation and amortisation is recognised in accordance with (h) below.
The cost of plant and equipment constructed by the Group includes the cost of material and direct labour, an appropriate proportion of fixed and variable overheads and capitalised interest. Subsequent costs are included in the asset’s carrying amount or recognised as a separate asset, only when it is probable that future economic benefits associated with the item will flow to the Group and the cost of the item can be measured reliably.
All items of plant and equipment are carried at the lower of cost less accumulated depreciation, amortisation and impairment losses and their recoverable amount.
(g) Intangibles
Intellectual property
The fair value of intellectual property contributed by an equity interest holder to Sirtex Medical Ltd, has been capitalised and recorded at fair value at the time of the contribution. Amortisation is recognised in accordance with (h) below.
Internally generated intangible assets
Expenditure on the research phase of projects are recognised as an expense as incurred.
Development costs and certain clinical trial costs have been capitalised to the extent they satisfy the recognition criteria for internally generated intangible assets.
Sirtex 2015 AR 57
NOTES TO THE FINANCIAL STATEMENTSFOR THE YEAR ENDED 30 JUNE 2015
Following the initial recognition of the capitalised development expenditure, the cost model is applied requiring the assets to be carried at cost less accumulated impairment losses. Amortisation is recognised in accordance with (h) below.
The Group uses its judgment in continually assessing whether development expenditure meet the recognition criteria of an intangible asset.
The carrying value of an intangible asset arising from development costs is tested for impairment annually when the asset is not yet available for use or more frequently when an indicator of impairment arises during the reporting period.
(h) Depreciation and amortisation
Items of plant and equipment, including leasehold assets, and intangible assets are depreciated or amortised on a straight line basis so as to write off the net cost of each asset over its expected useful life.
Plant and equipment and intangible assets other than capitalised development costs are depreciated from the date of acquisition. Capitalised development costs are amortised from the date they are ready for use.
Depreciation and amortisation rates are reviewed annually for appropriateness. When changes are made, adjustments are reflected prospectively in current and future financial periods only.
The depreciation and amortisation rates used for each class of asset are:
Plant and Equipment Buildings and Leasehold improvements 5% – 10%Plant & Equipment 10% – 33.33%Assets work in progress 0%
Intangible Assets Intellectual Property 5% – 12.5%Internally Generated Intangible Assets 12.5%
(i) Impairment of plant and equipment and intangible assets
For impairment assessment purposes, assets are grouped at the lowest levels for which there are largely independent cash inflows (cash-generating units). As a result, some assets are tested individually for impairment and some are tested at cash-generating unit level.
Individual assets or cash-generating units are tested for impairment whenever events or changes in circumstances indicate that the carrying amount may not be recoverable.
An impairment loss is recognised for the amount by which the asset’s or cash-generating unit’s carrying amount exceeds its recoverable amount, which is the higher of fair value less costs to sell and value-in-use. To determine the value-in-use, management estimates expected future cash flows from each cash-generating unit and determines a suitable interest rate in order to calculate the present value of those cash flows. The data used for impairment testing procedures are directly linked to the Group’s latest approved budget, adjusted as necessary to exclude the effects of future reorganisations and asset enhancements. Discount factors are determined individually for each cash-generating unit and reflect management’s assessment of respective risk profiles, such as market and asset-specific risks factors.
(j) Cash and cash equivalents
Cash and cash equivalents include cash on hand, deposits held at call with banks and other short-term, highly liquid instruments with original maturity of three months or less. Restricted cash assets are shown within other current financial assets.
(k) Financial instruments
Financial instruments are initially measured at fair value on trade date, which includes transaction costs, when the related contractual rights or obligations exist. Subsequent to initial recognition these instruments are measured as set out below.
Loans and receivables are non-derivative financial assets with fixed or determinable payments that are not quoted in an active market and are stated at amortised cost using the effective interest rate method. Non-derivative financial liabilities are recognised at amortised cost, comprising original debt less principal payments and amortisation.
Foreign currency options entered into to hedge highly probable forecast transactions are accounted for as a derivative. Changes in the fair value of derivatives are recorded in the Consolidated Statement of Profit or Loss and Other Comprehensive Income, together with any changes in the fair value of hedged assets or liabilities that are attributable to the hedged risk.
At each reporting date, the Group assesses whether there is objective evidence that a financial instrument has been impaired. Impairment losses are recognised in the Consolidated Statement of Profit or Loss and Other Comprehensive Income.
Financial assets are derecognised when the contractual rights to receipt of cash flows expire or the asset is transferred to another party. Financial liabilities are derecognised where the related obligations are discharged, cancelled or expired.
(l) Employee benefits
Wages, salaries and annual leave
Liabilities for employee benefits for wages, salaries and annual leave expected to settle wholly within 12 months of the year end represent present obligations resulting from employees’ services provided up to reporting date, calculated as undiscounted amounts based on remuneration wage and salary rates that the Group expects to pay as at reporting date including related on costs, such as workers’ compensation insurance and payroll tax. Employee benefits expected to be settled beyond 12 months are carried at the present value of the estimated future cash flows.
Long service leave
The provision for employee benefits to long service leave represents the present value of estimated future cash outflows to be made by the employer resulting from employees’ services provided up to reporting date. The provision is calculated using expected future increases in remuneration rates, including related costs, and expected settlement dates based on turnover history, and is discounted using the rates attaching to high quality corporate bonds at reporting date, which most closely match the terms of maturity of the related liabilities.
1. STATEMENT OF SIGNIFICANT ACCOUNTING POLICIES (CONTINUED)
Sirtex 2015 AR 58
NOTES TO THE FINANCIAL STATEMENTSFOR THE YEAR ENDED 30 JUNE 2015
Post-employment benefit plans
The Group contributes to various employee superannuation plans. The Group has no legal or constructive obligations to pay contributions in addition to its fixed contributions. Contributions are recongised as an in the period that relevant employee services are rendered.
Share-based payments
The Group provides benefits to certain employees in the form of share-based payment transactions, whereby employees render services in exchange for rights over shares (equity-settled transactions). For this purpose, the Group has an Executive Performance Rights Plan in place.
The cost of these equity-settled transactions is measured by reference to the fair value at the date at which they are granted. The fair value of the rights is determined using a Monte Carlo simulation and the binomial option valuation models.
The cost of the equity-settled transactions is recognised, together with a corresponding increase in equity, over the period in which the vesting conditions are fulfilled, ending on the date on which the relevant employees become fully entitled to the award.
All share-based remuneration is ultimately recognised as an expense in profit or loss with a corresponding credit to the share rights reserve. The expense is allocated over the vesting period, based on the best available estimate of the number of share rights expected to vest.
Upon exercise of performance rights, the proceeds received net of any directly attributable transaction costs are allocated to share capital.
Further information can be found in Note 23 to the financial statements.
(m) Leases
Lease payments for operating leases, where substantially all the risks and benefits remain with the lessor, are charged as expenses in the periods in which they are incurred.
Lease incentives under operating leases are recognised as a liability and amortised on a straight-line basis over the life of the lease term.
(n) Provisions, contingent liabilities and contingent assets
Provisions are recognised when the group has a legal or constructive obligation, as a result of past events, for which it is probable that an outflow of economic benefits will result and that outflow of economic resources will be required and amounts can be estimated reliably. Timing or amount of the outflow may still be uncertain.
Provisions are measured at the estimated expenditure required to settle the present obligation, based on the most reliable evidence available at reporting date. Provisions are discounted to their present value, where the time value of money is material.
No liability is recognised if an outflow of economic resources as a result of a present obligation is not probable. Such situations are disclosed as contingent liabilities, unless the outflow of resources is remote in which case no liability is recognised.
(o) Segment reporting
The Group has identified its operating segments based on internal reports that are reviewed and used by the Board of Directors in assessing performance and determining the allocation of resources.
The Group is managed primarily on the basis of regional markets which have different structures and performance assessment criteria. Operating segments are therefore determined on the same basis. The three regional markets currently serviced by the Group are Asia Pacific, The Americas, and Europe, Middle East and Africa (EMEA).
As the Group manufactures and distributes only one product, identical for each of the three regional markets, no further segmentation across products or services is made.
(p) Equity, reserves and dividend payments
Share capital represents the fair value of shares that have been issued. Any transaction costs associated with the issuing of shares are deducted from share capital, net of any related income tax benefits. Equity also includes the Foreign currency translation reserve which comprises foreign currency translation differences arising on the translation of financial statements of the Group’s foreign entities into AUD.
Retained earnings include all current and prior period retained profits.
Dividend distributions payable to equity shareholders are included in other liabilities when the dividends have been approved prior to the reporting date.
All transactions with owners of the parent entity are recorded separately within equity.
(q) Income tax
The charge for current income tax expense is based on the profit for the year adjusted for any non-assessable or disallowed items. It is calculated using the tax rates that have been enacted or are substantially enacted by the reporting date.
Deferred tax is accounted for using the balance sheet liability method in respect of temporary differences arising between the tax bases of assets and liabilities and their carrying amounts in the financial statements. No deferred income tax will be recognised from the initial recognition of an asset or liability, excluding a business combination, where there is no effect on accounting or taxable profit or loss.
Deferred tax is calculated at the tax rates that are expected to apply to the period when the asset is realised or liability is settled. Deferred tax is credited in the statement of profit or loss and other comprehensive income except where it relates to items that may be credited directly to equity, in which case the deferred tax is adjusted directly against equity.
Deferred income tax assets are recognised to the extent that it is probable that future tax profits will be available against which deductible temporary differences can be utilised.
The amount of benefits brought to account or which may be realised in the future is based on the assumption that no adverse change will occur in income taxation legislation and the anticipation that the consolidated entity will derive sufficient future assessable income to enable the benefit to be realised and comply with the conditions of deductibility imposed by the law.
Sirtex 2015 AR 59
NOTES TO THE FINANCIAL STATEMENTSFOR THE YEAR ENDED 30 JUNE 2015
Sirtex Medical Ltd and its wholly-owned Australian subsidiaries have formed an income tax consolidated group under the tax consolidation regime. Each entity in the group recognises its own current and deferred tax liabilities, except for any deferred tax liabilities resulting from unused tax losses and tax credits, which are immediately assumed by the parent entity. The current tax liability of each group entity is then subsequently assumed by the parent entity. The group notified the Australian Tax Office that it had formed an income tax consolidated group to apply from 1 July 2004. The tax consolidated group has entered a tax sharing agreement whereby each company in the group contributes to the income tax payable in proportion to their contribution to the net profit before tax of the consolidated group.
R&D tax credits arising from the recognition of eligible R&D expenditure under the Federal Government’s R&D Tax Incentive Scheme are offset against any income tax payable.
(r) Foreign Currency Transactions and Balances
All foreign currency transactions are brought to account using the exchange rate in effect at the date of the transaction. Foreign currency monetary items at reporting date are translated at the exchange rate at that date.
Exchange differences arising on the translation of monetary items are recognised in the Consolidated Statement of Profit or Loss. Exchange differences arising on the translation of non-monetary items are recognised directly in equity to the extent that the gain or loss is directly recognised in equity, otherwise the exchange difference is recognised in the Consolidated Statement of Profit or Loss and Other Comprehensive Income.
The financial results and position of foreign operations whose functional currency is different from the Group’s presentation currency are translated as follows:
• assets and liabilities are translated at year-end exchange rates prevailing at that reporting date
• income and expenses are translated at average exchange rates for the period, and
• retained earnings are translated at the exchange rate prevailing at the date of the transaction
Exchange differences arising on translation of foreign operations are transferred directly to the foreign currency translation reserve in the Consolidated Statement of Profit or Loss and Other Comprehensive Income. These differences are recognised in the statement of profit or loss and other comprehensive income in the period in which the operation is disposed.
(s) Comparative figures
When required by accounting standards, comparative figures have been adjusted to conform to changes in the presentation for the current financial year.
(t) Key estimates
Impairment
The Group assesses impairment at each reporting date by evaluating conditions specific to the group that may lead to impairment of assets. Where impairment exists, the recoverable amount of the asset is determined. Value-in-use calculations performed in assessing recoverable amounts incorporate a number of key estimates.
Impairment assessment of internally generated intangible assets is performed in accordance with AASB 136 Impairment of Assets. For the year ended 30 June 2015, no impairment has been recognised for the clinical trials and development projects which meet the recognition criteria for internally generated intangible assets.
Research and development tax incentive
The Group estimates the research and development tax incentive by reference to the percentage of research and development expenditure that contributed to the prior year research and development tax incentive.
Share-based payment transactions
The Group measures the cost of equity-settled transactions with employees by reference to their fair value of the equity instruments at the date at which they are granted. The fair value is determined with a Monte Carlo simulation and binomial option valuation models using the assumptions detailed in Note 23.
Long service leave provision
The liability for long service leave is recognised and measured at the present value of the estimated future cash flows to be made in respect of all employees at the reporting date. In determining the present value of the liability, estimates of attrition rates and pay increases through promotion and inflation have been taken into account.
Lease make good provision
A provision is made for the present value of anticipated costs for future restoration of leased premises. The provision includes future cost estimates associated with closure of the premises. The calculation of this provision requires assumptions such as application of closure dates and cost estimates. The provision recognised for each site is periodically reviewed and updated based on the facts and circumstances available at the time. Changes to the estimated future costs for sites are recognised in the statement of financial position by adjusting the expenses or asset, if applicable, and provision.
(u) Rounding of amounts
The Parent Entity has applied the relief available to it under ASIC Class Order 98/100 and accordingly, amounts in the financial statements and directors’ report have been rounded off to the nearest $1,000, or in cases, the nearest dollar.
(v) Adoption of new and revised accounting standards
A number of new and revised standards and an interpretation became effective for the first time to annual periods beginning on or after 1 July 2014. Information on these new standards is presented below.
AASB 2012-3 Amendments to Australian Accounting Standards – Offsetting Financial Assets and Financial Liabilities
AASB 2012-3 adds application guidance to AASB 132 to address inconsistencies identified in applying some of the offsetting criteria of AASB 132, including clarifying the meaning of ‘currently has a legally enforceable right of set-off’ and that some gross settlement systems may be considered equivalent to net settlement.
AASB 2012-3 is applicable to annual reporting periods beginning on or after 1 January 2014.
1. STATEMENT OF SIGNIFICANT ACCOUNTING POLICIES (CONTINUED)
Sirtex 2015 AR 60
NOTES TO THE FINANCIAL STATEMENTSFOR THE YEAR ENDED 30 JUNE 2015
The adoption of these amendments has not had a material impact on the Group as the amendments merely clarify the existing requirements in AASB 132.
AASB 2013-3 Amendments to AASB 136 – Recoverable Amount Disclosures for Non-Financial Assets
These narrow-scope amendments address disclosure of information about the recoverable amount of impaired assets if that amount is based on fair value less costs of disposal.
When developing IFRS 13 Fair Value Measurement, the IASB decided to amend IAS 36 Impairment of Assets to require disclosures about the recoverable amount of impaired assets. The IASB noticed however that some of the amendments made in introducing those requirements resulted in the requirement being more broadly applicable than the IASB had intended. These amendments to IAS 36 therefore clarify the IASB’s original intention that the scope of those disclosures is limited to the recoverable amount of impaired assets that is based on fair value less costs of disposal.
AASB 2013-3 makes the equivalent amendments to AASB 136 Impairment of Assets and is applicable to annual reporting periods beginning on or after 1 January 2014.
The adoption of these amendments has not had a material impact on the Group as they are largely of the nature of clarification of existing requirements.
AASB 2014-1 Amendments to Australian Accounting Standards (Part A: Annual Improvements 2010-2012 and 2011-2013 Cycles)
Part A of AASB 2014-1 makes amendments to various Australian Accounting Standards arising from the issuance by the IASB of International Financial Reporting Standards Annual Improvements to IFRSs 2010-2012 Cycle and Annual Improvements to IFRSs 2011-2013 Cycle.
Among other improvements, the amendments arising from Annual Improvements to IFRSs 2010-2012 Cycle:
• clarify that the definition of a ‘related party’ includes a management entity that provides key management personnel services to the reporting entity (either directly or through a group entity)
• amend AASB 8 Operating Segments to explicitly require the disclosure of judgements made by management in applying the aggregation criteria
Among other improvements, the amendments arising from Annual Improvements to IFRSs 2011-2013 Cycle clarify that an entity should assess whether an acquired property is an investment property under AASB 140 Investment Property and perform a separate assessment under AASB 3 Business Combinations to determine whether the acquisition of the investment property constitutes a business combination.
Part A of AASB 2014-1 is applicable to annual reporting periods beginning on or after 1 July 2014.
The adoption of these amendments has not had a material impact on the Group as they are largely of the nature of clarification of existing requirements.
(w) New Accounting Standards for Application in Future Periods
The AASB has issued new and amended accounting standards and interpretations that have mandatory application dates for future reporting periods. The Group has decided
against early adoption of these standards. A discussion of those future requirements and their impact on the Group follows:
AASB 9 Financial Instruments (applicable for annual reporting periods beginning on or after 1 January 2018:
The standard introduces new requirements for the classification and measurement of financial assets and liabilities. These requirements improve and simplify the approach for classification and measurement of financial assets compared with the requirements of AASB 139. The main changes are:
(a) Financial assets that are debt instruments will be classified based on
i. the objective of the entity’s business model for managing the financial assets; and
ii. the characteristics of the contractual cash flows.
(b) Allows an irrevocable election on initial recognition to present gains and losses on investments in equity instruments that are not held for trading in other comprehensive income (instead of in profit or loss). Dividends in respect of these investments that are a return on investment can be recognised in profit or loss and there is no impairment or recycling on disposal of the instrument.
(c) Financial assets can be designated and measured at fair value through profit or loss at initial recognition if doing so eliminates or significantly reduces a measurement or recognition inconsistency that would arise from measuring assets or liabilities, or recognising the gains and losses on them, on different bases.
(d) Where the fair value option is used for financial liabilities the change in fair value is to be accounted for as follows:
i. the change attributable to changes in credit risk are presented in other comprehensive income (OCI); and
ii. the remaining change is presented in profit or loss.
If this approach creates or enlarges an accounting mismatch in the profit or loss, the effect of the changes in credit risk are also presented in profit or loss.
Otherwise, the following requirements have been carried forward unchanged from AASB 139 into AASB 9:
i. classification and measurement of financial liabilities; and
ii. de-recognition requirements for financial assets and liabilities.
AASB 9 requirements regarding hedge accounting represent a substantial overhaul of hedge accounting that will enable entities to better reflect their risk management activities in the financial statements.
Furthermore, AASB 9 introduces a new impairment model based on expected credit losses. This model makes use of more forward-looking information and applies to all financial instruments that are subject to impairment accounting.
The entity is yet to undertake a detailed assessment of the impact of AASB 9. However, based on the entity’s preliminary assessment, the Standard is not expected to have a material impact on the transactions and balances recognised in the financial statements when it is first adopted for the year ending 30 June 2019.
Sirtex 2015 AR 61
NOTES TO THE FINANCIAL STATEMENTSFOR THE YEAR ENDED 30 JUNE 2015
AASB 15 Revenue from Contracts with Customers
AASB 15:
• replaces AASB 118 Revenue, AASB 111 Construction Contracts and some revenue-related Interpretations:
• establishes a new revenue recognition model
• changes the basis for deciding whether revenue is to be recognised over time or at a point in time
• provides new and more detailed guidance on specific topics (e.g., multiple element arrangements, variable pricing, rights of return, warranties and licensing)
• expands and improves disclosures about revenue
The entity is yet to undertake a detailed assessment of the impact of AASB 15. However, based on the entity’s preliminary assessment, the Standard is not expected to have a material impact on the transactions and balances recognised in the financial statements when it is first adopted for the year ending 30 June 2018.
AASB 2014-1 Amendments to Australian Accounting Standards (Part E: Financial Instruments)
Part E of AASB 2014-1 makes amendments to Australian Accounting Standards to reflect the AASB’s decision to defer the mandatory application date of AASB 9 Financial Instruments to annual reporting periods beginning on or after 1 January 2018. Part E also makes amendments to numerous Australian Accounting Standards as a consequence of the introduction of Chapter 6 Hedge Accounting into AASB 9 and to amend reduced disclosure requirements for AASB 7 Financial Instruments: Disclosures and AASB 101 Presentation of Financial Statements.
When these amendments are first adopted for the year ending 30 June 2016, there will be no material impact on the Group.
AASB 2014-4 Amendments to Australian Accounting Standards – Clarification of Acceptable Methods of Depreciation and Amortisation
The amendments to AASB 116 prohibit the use of a revenue-based depreciation method for property, plant and equipment. Additionally, the amendments provide guidance in the application of the diminishing balance method for property, plant and equipment.
The amendments to AASB 138 present a rebuttable presumption that a revenue-based amortisation method for intangible assets is inappropriate. This rebuttable presumption can be overcome (i.e., a revenue-based amortisation method might be appropriate) only in two (2) limited circumstances:
• The intangible asset is expressed as a measure of revenue, for example when the predominant limiting factor inherent in an intangible asset is the achievement of a revenue threshold (for instance, the right to operate a toll road could be based on a fixed total amount of revenue to be generated from cumulative tolls charged); or
• When it can be demonstrated that revenue and the consumption of the economic benefits of the intangible asset are highly correlated.
AASB 2015-2 Amendments to Australian Accounting Standards – Disclosure Initiative: Amendments to AASB 101
The amendments:
• clarify the materiality requirements in AASB 101, including an emphasis on the potentially detrimental effect of obscuring useful information with immaterial information
• clarify that AASB 101’s specified line items in the statement(s) of profit or loss and other comprehensive income and the statement of financial position can be disaggregated
• add requirements for how an entity should present subtotals in the statement(s) of profit and loss and other comprehensive income and the statement of financial position
• clarify that entities have flexibility as to the order in which they present the notes, but also emphasise that understandability and comparability should be considered by an entity when deciding that order
• remove potentially unhelpful guidance in IAS 1 for identifying a significant accounting policy.
When these amendments are first adopted for the year ending 30 June 2017, there will be no material impact on the financial statements.
AASB 2015-3 Amendments to Australian Accounting Standards arising from the Withdrawal of AASB 1031 Materiality
The Standard completes the AASB’s project to remove Australian guidance on materiality from Australian Accounting Standards.
When this Standard is first adopted for the year ending 30 June 2016, there will be no impact on the financial statements.
The Group does not anticipate the early adoption of any of the above Australian Accounting Standards.
1. STATEMENT OF SIGNIFICANT ACCOUNTING POLICIES (CONTINUED)
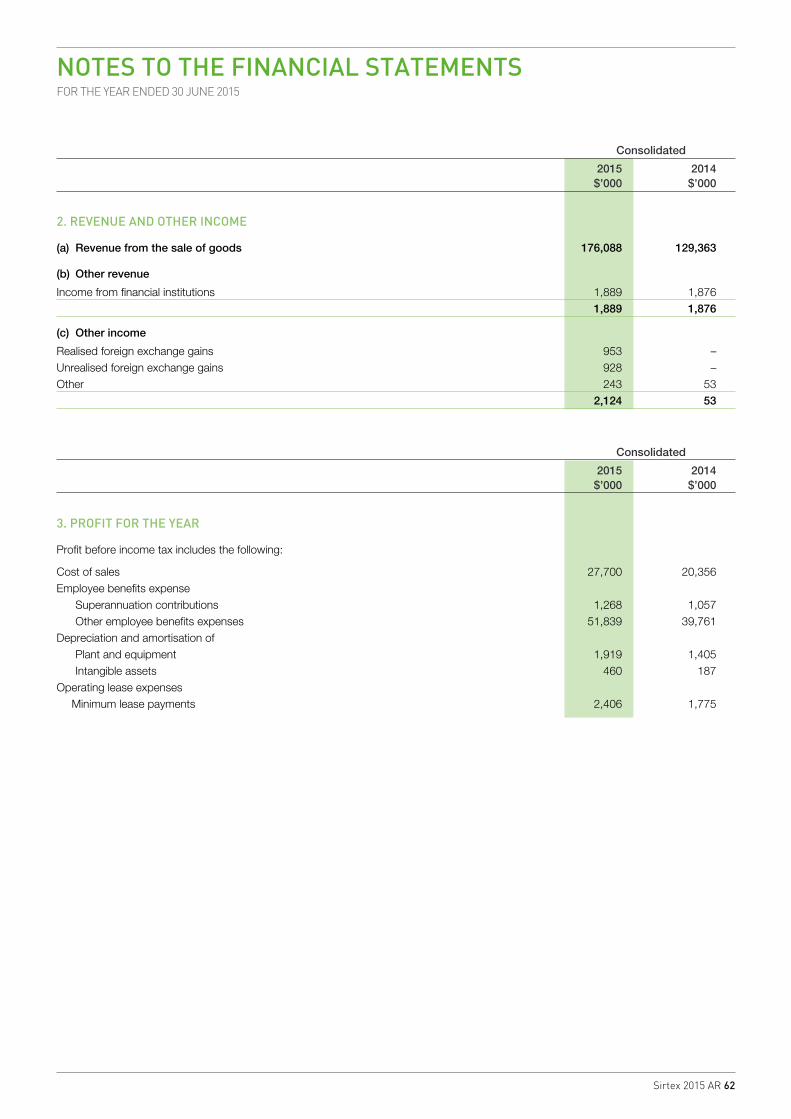
Sirtex 2015 AR 62
NOTES TO THE FINANCIAL STATEMENTSFOR THE YEAR ENDED 30 JUNE 2015
Consolidated
2015 2014 $’000 $’000
2. REVENUE AND OTHER INCOME
(a) Revenue from the sale of goods 176,088 129,363
(b) Other revenue
Income from financial institutions 1,889 1,876 1,889 1,876
(c) Other income
Realised foreign exchange gains 953 –Unrealised foreign exchange gains 928 –Other 243 53 2,124 53
Consolidated
2015 2014 $’000 $’000
3. PROFIT FOR THE YEAR
Profit before income tax includes the following:
Cost of sales 27,700 20,356Employee benefits expense
Superannuation contributions 1,268 1,057Other employee benefits expenses 51,839 39,761
Depreciation and amortisation of Plant and equipment 1,919 1,405 Intangible assets 460 187
Operating lease expenses Minimum lease payments 2,406 1,775
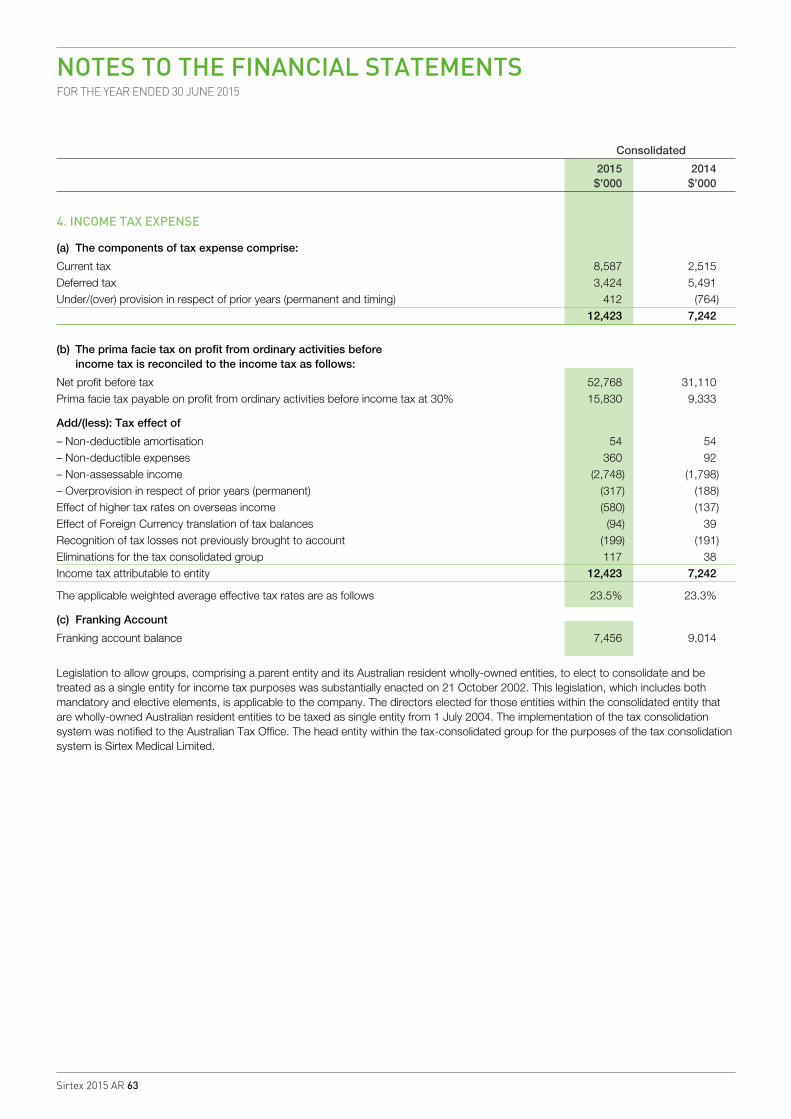
Sirtex 2015 AR 63
NOTES TO THE FINANCIAL STATEMENTSFOR THE YEAR ENDED 30 JUNE 2015
Consolidated
2015 2014 $’000 $’000
4. INCOME TAX EXPENSE
(a) The components of tax expense comprise:
Current tax 8,587 2,515 Deferred tax 3,424 5,491Under/(over) provision in respect of prior years (permanent and timing) 412 (764) 12,423 7,242
(b) The prima facie tax on profit from ordinary activities before income tax is reconciled to the income tax as follows:
Net profit before tax 52,768 31,110 Prima facie tax payable on profit from ordinary activities before income tax at 30% 15,830 9,333
Add/(less): Tax effect of
– Non-deductible amortisation 54 54– Non-deductible expenses 360 92 – Non-assessable income (2,748) (1,798)– Overprovision in respect of prior years (permanent) (317) (188)Effect of higher tax rates on overseas income (580) (137)Effect of Foreign Currency translation of tax balances (94) 39Recognition of tax losses not previously brought to account (199) (191)Eliminations for the tax consolidated group 117 38 Income tax attributable to entity 12,423 7,242
The applicable weighted average effective tax rates are as follows 23.5% 23.3%
(c) Franking Account
Franking account balance 7,456 9,014
Legislation to allow groups, comprising a parent entity and its Australian resident wholly-owned entities, to elect to consolidate and be treated as a single entity for income tax purposes was substantially enacted on 21 October 2002. This legislation, which includes both mandatory and elective elements, is applicable to the company. The directors elected for those entities within the consolidated entity that are wholly-owned Australian resident entities to be taxed as single entity from 1 July 2004. The implementation of the tax consolidation system was notified to the Australian Tax Office. The head entity within the tax-consolidated group for the purposes of the tax consolidation system is Sirtex Medical Limited.
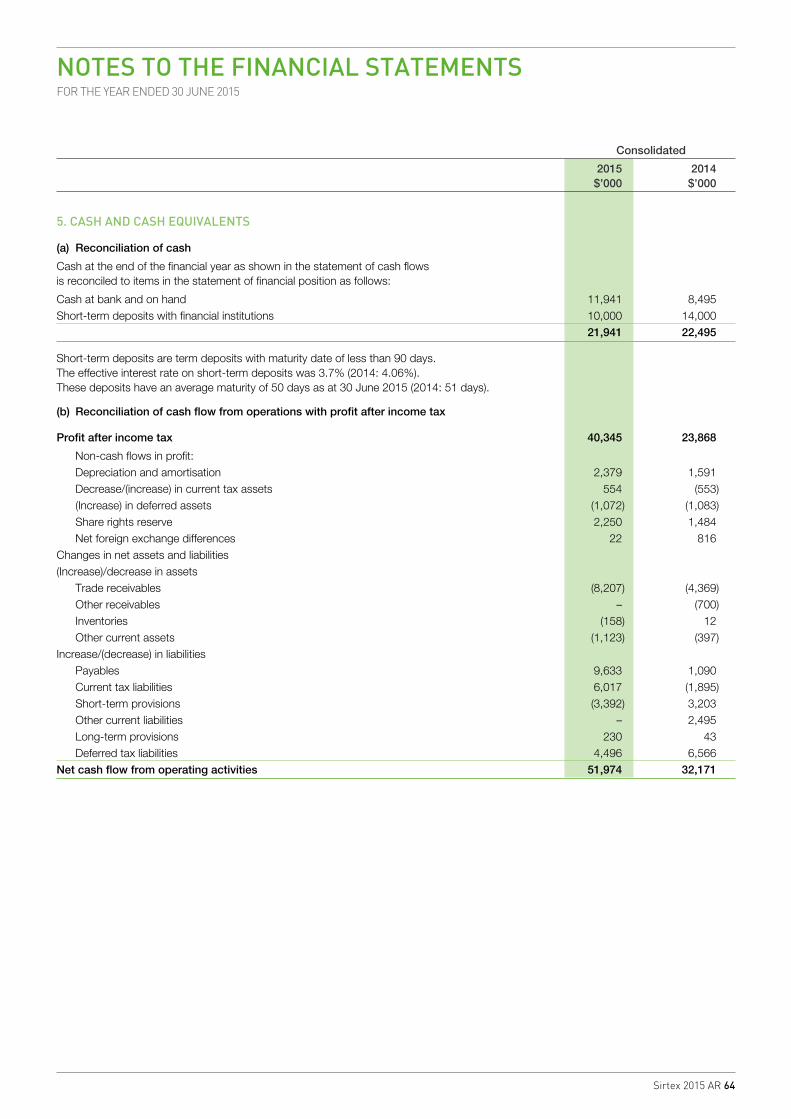
Sirtex 2015 AR 64
NOTES TO THE FINANCIAL STATEMENTSFOR THE YEAR ENDED 30 JUNE 2015
Consolidated
2015 2014 $’000 $’000
5. CASH AND CASH EQUIVALENTS
(a) Reconciliation of cash
Cash at the end of the financial year as shown in the statement of cash flows is reconciled to items in the statement of financial position as follows:
Cash at bank and on hand 11,941 8,495Short-term deposits with financial institutions 10,000 14,000 21,941 22,495
Short-term deposits are term deposits with maturity date of less than 90 days. The effective interest rate on short-term deposits was 3.7% (2014: 4.06%). These deposits have an average maturity of 50 days as at 30 June 2015 (2014: 51 days).
(b) Reconciliation of cash flow from operations with profit after income tax
Profit after income tax 40,345 23,868
Non-cash flows in profit:Depreciation and amortisation 2,379 1,591Decrease/(increase) in current tax assets 554 (553)(Increase) in deferred assets (1,072) (1,083)Share rights reserve 2,250 1,484Net foreign exchange differences 22 816
Changes in net assets and liabilities (Increase)/decrease in assets
Trade receivables (8,207) (4,369)Other receivables – (700)Inventories (158) 12Other current assets (1,123) (397)
Increase/(decrease) in liabilities Payables 9,633 1,090Current tax liabilities 6,017 (1,895)Short-term provisions (3,392) 3,203Other current liabilities – 2,495Long-term provisions 230 43Deferred tax liabilities 4,496 6,566
Net cash flow from operating activities 51,974 32,171
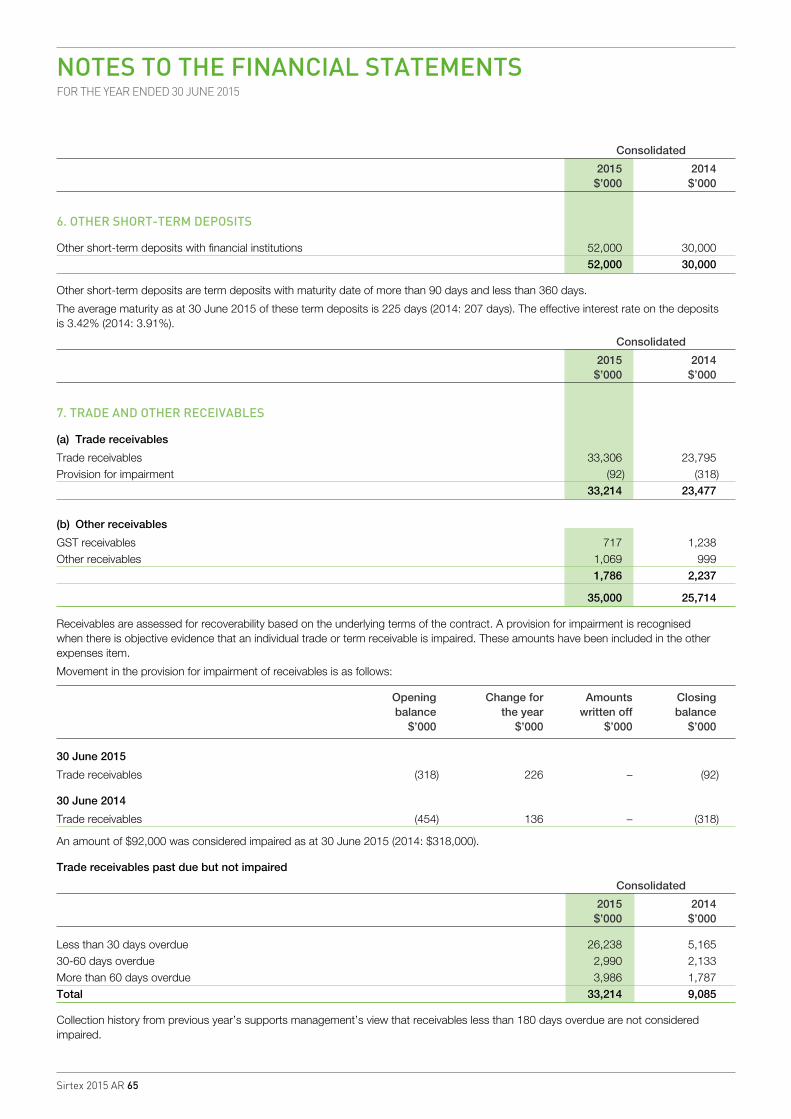
Sirtex 2015 AR 65
NOTES TO THE FINANCIAL STATEMENTSFOR THE YEAR ENDED 30 JUNE 2015
Consolidated
2015 2014 $’000 $’000
6. OTHER SHORT-TERM DEPOSITS
Other short-term deposits with financial institutions 52,000 30,000 52,000 30,000
Other short-term deposits are term deposits with maturity date of more than 90 days and less than 360 days.
The average maturity as at 30 June 2015 of these term deposits is 225 days (2014: 207 days). The effective interest rate on the deposits is 3.42% (2014: 3.91%).
Consolidated
2015 2014 $’000 $’000
7. TRADE AND OTHER RECEIVABLES
(a) Trade receivables
Trade receivables 33,306 23,795Provision for impairment (92) (318) 33,214 23,477
(b) Other receivables
GST receivables 717 1,238Other receivables 1,069 999 1,786 2,237
35,000 25,714
Receivables are assessed for recoverability based on the underlying terms of the contract. A provision for impairment is recognised when there is objective evidence that an individual trade or term receivable is impaired. These amounts have been included in the other expenses item.
Movement in the provision for impairment of receivables is as follows:
Opening Change for Amounts Closing balance the year written off balance $’000 $’000 $’000 $’000
30 June 2015
Trade receivables (318) 226 – (92)
30 June 2014
Trade receivables (454) 136 – (318)
An amount of $92,000 was considered impaired as at 30 June 2015 (2014: $318,000).
Trade receivables past due but not impaired
Consolidated
2015 2014 $’000 $’000
Less than 30 days overdue 26,238 5,16530-60 days overdue 2,990 2,133More than 60 days overdue 3,986 1,787Total 33,214 9,085
Collection history from previous year’s supports management’s view that receivables less than 180 days overdue are not considered impaired.
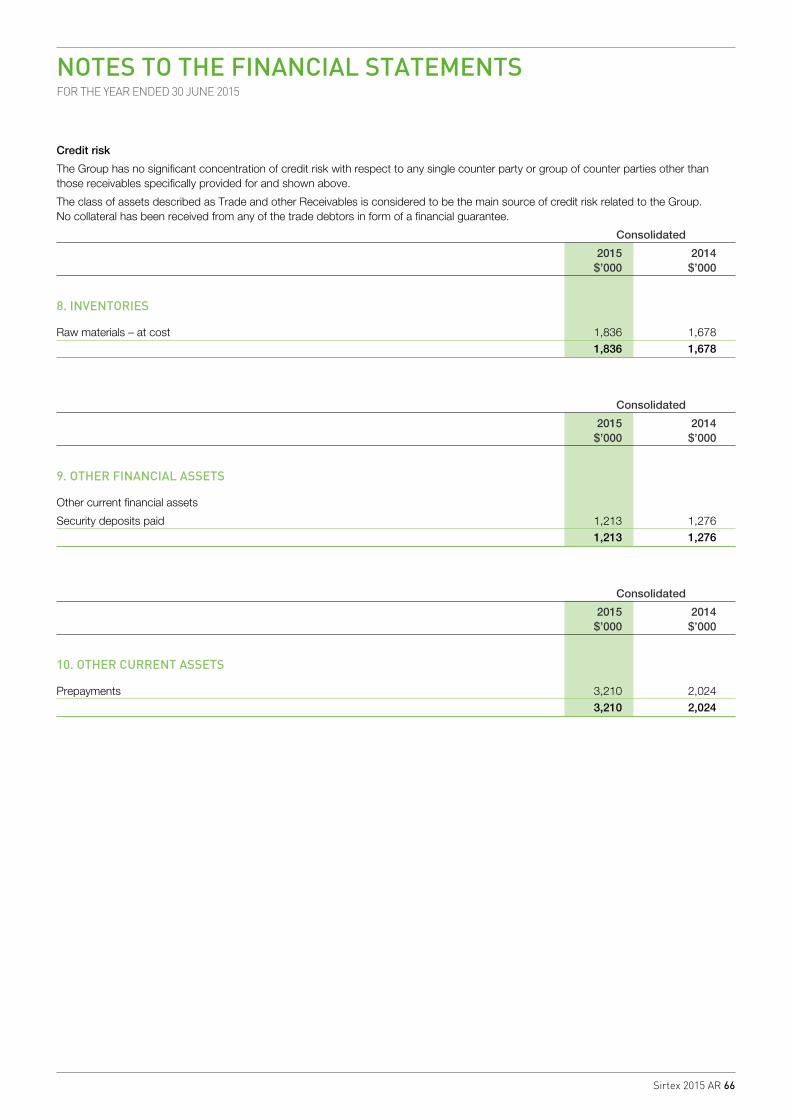
Sirtex 2015 AR 66
NOTES TO THE FINANCIAL STATEMENTSFOR THE YEAR ENDED 30 JUNE 2015
Credit risk
The Group has no significant concentration of credit risk with respect to any single counter party or group of counter parties other than those receivables specifically provided for and shown above.
The class of assets described as Trade and other Receivables is considered to be the main source of credit risk related to the Group. No collateral has been received from any of the trade debtors in form of a financial guarantee.
Consolidated
2015 2014 $’000 $’000
8. INVENTORIES
Raw materials – at cost 1,836 1,678 1,836 1,678
Consolidated
2015 2014 $’000 $’000
9. OTHER FINANCIAL ASSETS
Other current financial assets
Security deposits paid 1,213 1,276 1,213 1,276
Consolidated
2015 2014 $’000 $’000
10. OTHER CURRENT ASSETS
Prepayments 3,210 2,024 3,210 2,024
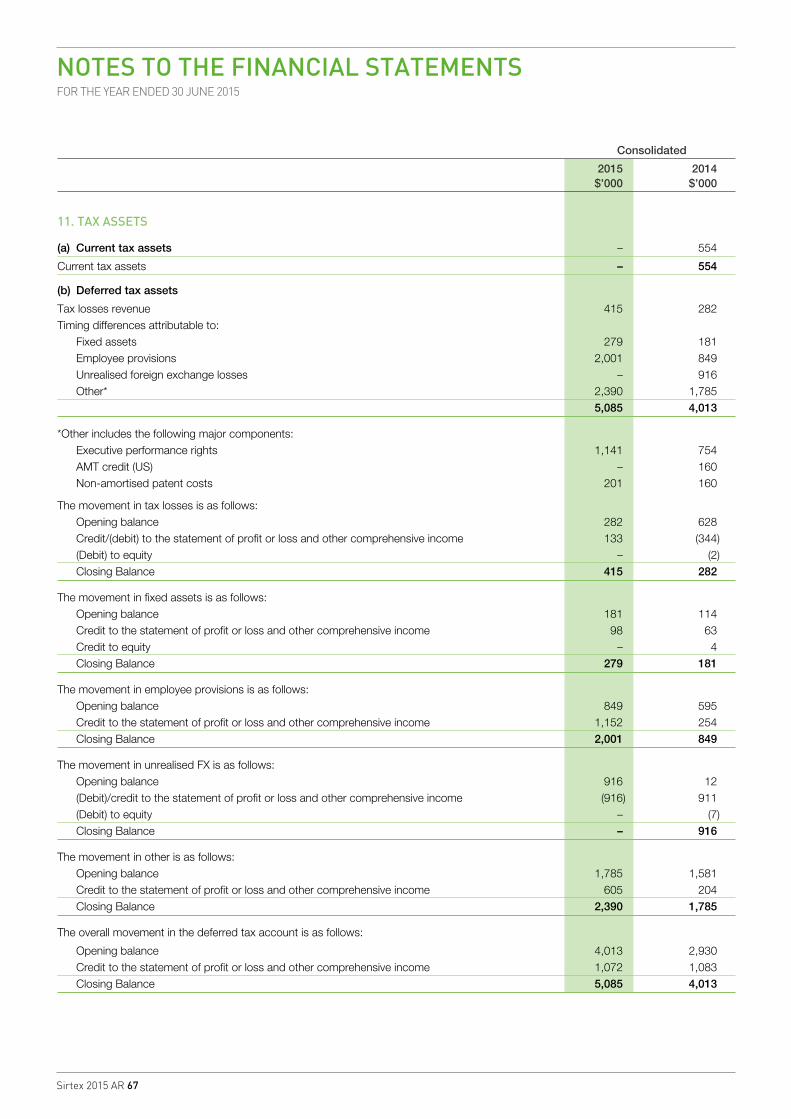
Sirtex 2015 AR 67
NOTES TO THE FINANCIAL STATEMENTSFOR THE YEAR ENDED 30 JUNE 2015
Consolidated
2015 2014 $’000 $’000
11. TAX ASSETS
(a) Current tax assets – 554
Current tax assets – 554
(b) Deferred tax assets
Tax losses revenue 415 282Timing differences attributable to:
Fixed assets 279 181Employee provisions 2,001 849Unrealised foreign exchange losses – 916Other* 2,390 1,785
5,085 4,013
*Other includes the following major components: Executive performance rights 1,141 754AMT credit (US) – 160Non-amortised patent costs 201 160
The movement in tax losses is as follows: Opening balance 282 628Credit/(debit) to the statement of profit or loss and other comprehensive income 133 (344)(Debit) to equity – (2)Closing Balance 415 282
The movement in fixed assets is as follows: Opening balance 181 114Credit to the statement of profit or loss and other comprehensive income 98 63Credit to equity – 4Closing Balance 279 181
The movement in employee provisions is as follows: Opening balance 849 595Credit to the statement of profit or loss and other comprehensive income 1,152 254Closing Balance 2,001 849
The movement in unrealised FX is as follows:Opening balance 916 12(Debit)/credit to the statement of profit or loss and other comprehensive income (916) 911(Debit) to equity – (7)Closing Balance – 916
The movement in other is as follows: Opening balance 1,785 1,581Credit to the statement of profit or loss and other comprehensive income 605 204Closing Balance 2,390 1,785
The overall movement in the deferred tax account is as follows:
Opening balance 4,013 2,930Credit to the statement of profit or loss and other comprehensive income 1,072 1,083Closing Balance 5,085 4,013
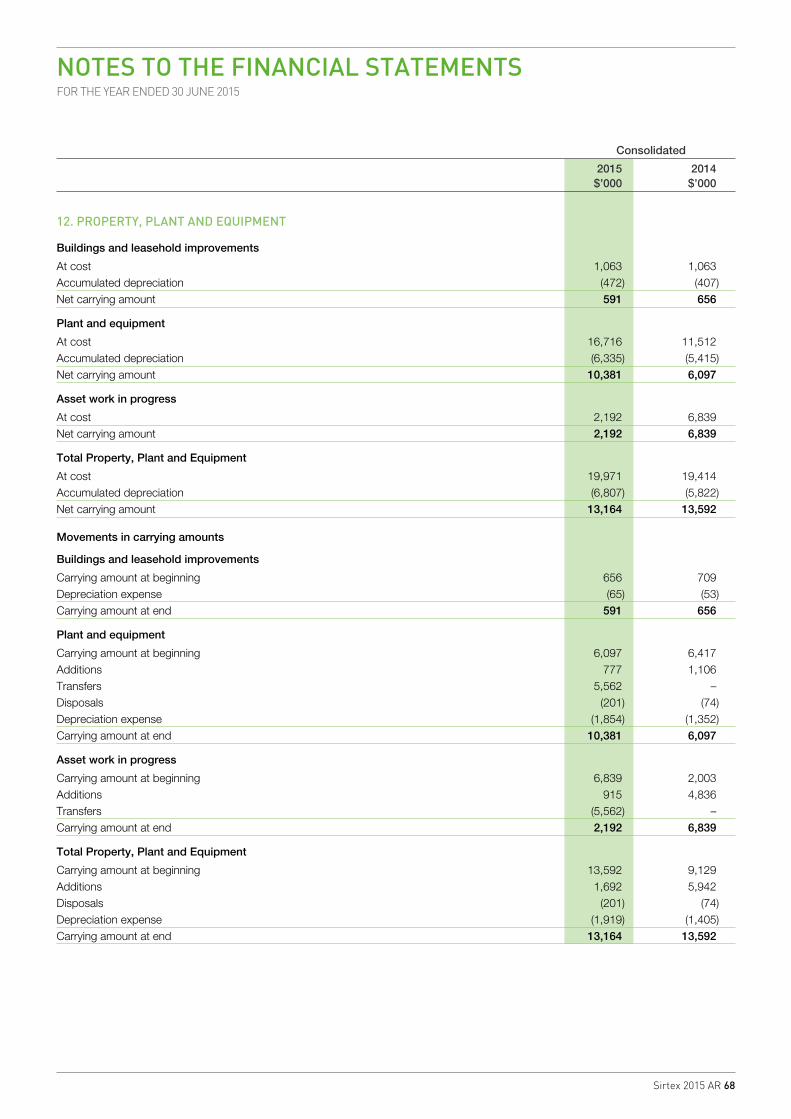
Sirtex 2015 AR 68
NOTES TO THE FINANCIAL STATEMENTSFOR THE YEAR ENDED 30 JUNE 2015
Consolidated
2015 2014 $’000 $’000
12. PROPERTY, PLANT AND EQUIPMENT
Buildings and leasehold improvements
At cost 1,063 1,063Accumulated depreciation (472) (407)Net carrying amount 591 656
Plant and equipment
At cost 16,716 11,512Accumulated depreciation (6,335) (5,415)Net carrying amount 10,381 6,097
Asset work in progress
At cost 2,192 6,839Net carrying amount 2,192 6,839
Total Property, Plant and Equipment
At cost 19,971 19,414Accumulated depreciation (6,807) (5,822)Net carrying amount 13,164 13,592
Movements in carrying amounts
Buildings and leasehold improvements
Carrying amount at beginning 656 709Depreciation expense (65) (53)Carrying amount at end 591 656
Plant and equipment
Carrying amount at beginning 6,097 6,417Additions 777 1,106Transfers 5,562 –Disposals (201) (74)Depreciation expense (1,854) (1,352)Carrying amount at end 10,381 6,097
Asset work in progress
Carrying amount at beginning 6,839 2,003Additions 915 4,836Transfers (5,562) –Carrying amount at end 2,192 6,839
Total Property, Plant and Equipment
Carrying amount at beginning 13,592 9,129Additions 1,692 5,942Disposals (201) (74)Depreciation expense (1,919) (1,405)Carrying amount at end 13,164 13,592
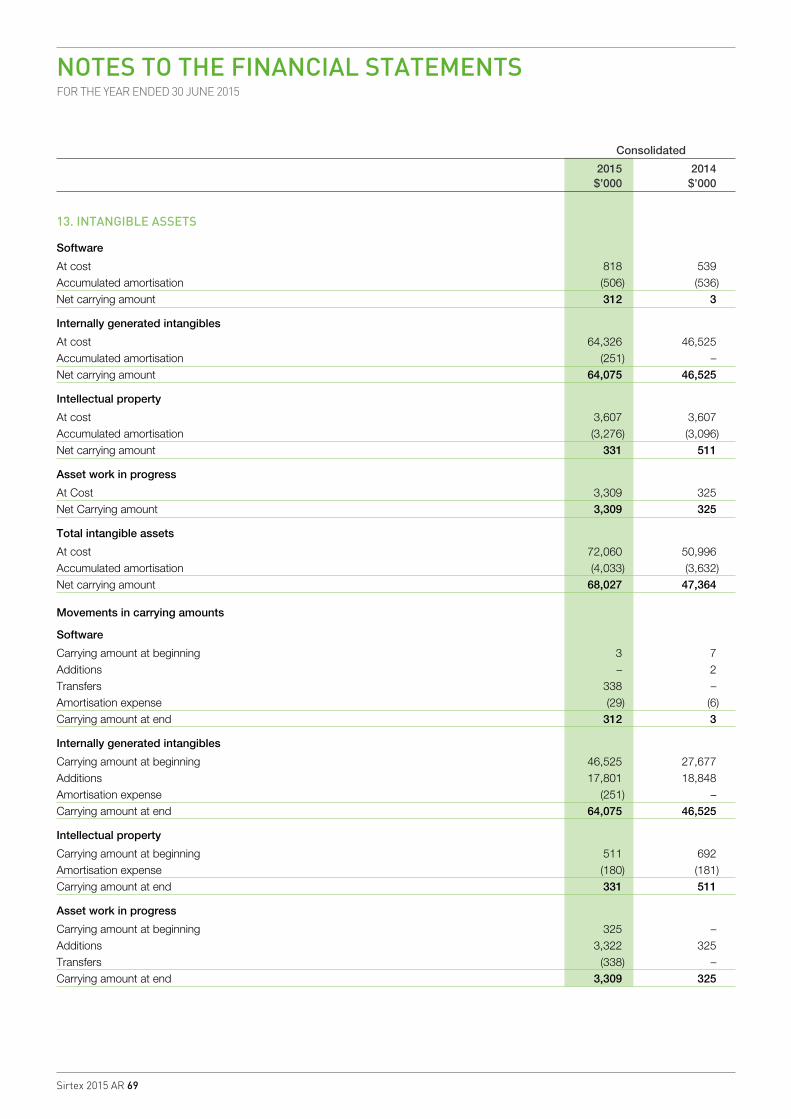
Sirtex 2015 AR 69
NOTES TO THE FINANCIAL STATEMENTSFOR THE YEAR ENDED 30 JUNE 2015
Consolidated
2015 2014 $’000 $’000
13. INTANGIBLE ASSETS
Software
At cost 818 539Accumulated amortisation (506) (536)Net carrying amount 312 3
Internally generated intangibles
At cost 64,326 46,525Accumulated amortisation (251) –Net carrying amount 64,075 46,525
Intellectual property
At cost 3,607 3,607Accumulated amortisation (3,276) (3,096)Net carrying amount 331 511
Asset work in progress
At Cost 3,309 325Net Carrying amount 3,309 325
Total intangible assets
At cost 72,060 50,996Accumulated amortisation (4,033) (3,632)Net carrying amount 68,027 47,364
Movements in carrying amounts
Software
Carrying amount at beginning 3 7Additions – 2Transfers 338 –Amortisation expense (29) (6)Carrying amount at end 312 3
Internally generated intangibles
Carrying amount at beginning 46,525 27,677Additions 17,801 18,848Amortisation expense (251) –Carrying amount at end 64,075 46,525
Intellectual property
Carrying amount at beginning 511 692Amortisation expense (180) (181)Carrying amount at end 331 511
Asset work in progress
Carrying amount at beginning 325 –Additions 3,322 325Transfers (338) –Carrying amount at end 3,309 325
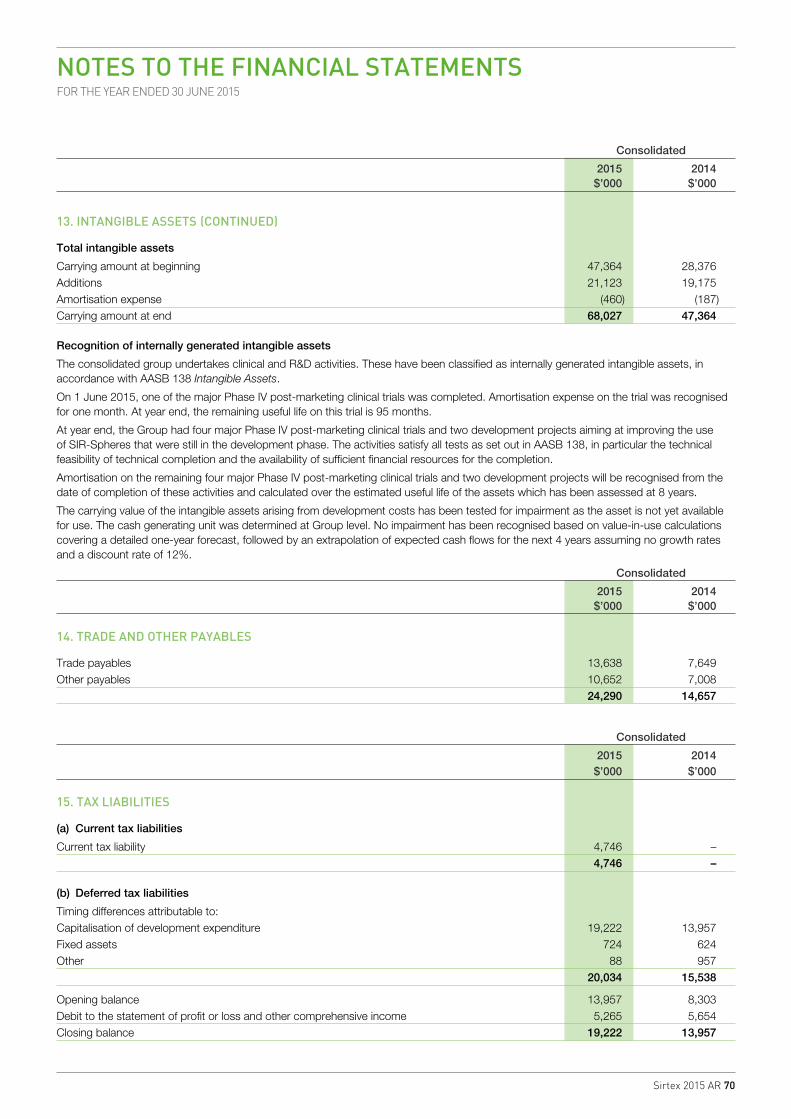
Sirtex 2015 AR 70
NOTES TO THE FINANCIAL STATEMENTSFOR THE YEAR ENDED 30 JUNE 2015
Consolidated
2015 2014 $’000 $’000
13. INTANGIBLE ASSETS (CONTINUED)
Total intangible assets
Carrying amount at beginning 47,364 28,376Additions 21,123 19,175Amortisation expense (460) (187)Carrying amount at end 68,027 47,364
Recognition of internally generated intangible assets
The consolidated group undertakes clinical and R&D activities. These have been classified as internally generated intangible assets, in accordance with AASB 138 Intangible Assets.
On 1 June 2015, one of the major Phase IV post-marketing clinical trials was completed. Amortisation expense on the trial was recognised for one month. At year end, the remaining useful life on this trial is 95 months.
At year end, the Group had four major Phase IV post-marketing clinical trials and two development projects aiming at improving the use of SIR-Spheres that were still in the development phase. The activities satisfy all tests as set out in AASB 138, in particular the technical feasibility of technical completion and the availability of sufficient financial resources for the completion.
Amortisation on the remaining four major Phase IV post-marketing clinical trials and two development projects will be recognised from the date of completion of these activities and calculated over the estimated useful life of the assets which has been assessed at 8 years.
The carrying value of the intangible assets arising from development costs has been tested for impairment as the asset is not yet available for use. The cash generating unit was determined at Group level. No impairment has been recognised based on value-in-use calculations covering a detailed one-year forecast, followed by an extrapolation of expected cash flows for the next 4 years assuming no growth rates and a discount rate of 12%.
Consolidated
2015 2014 $’000 $’000
14. TRADE AND OTHER PAYABLES
Trade payables 13,638 7,649Other payables 10,652 7,008 24,290 14,657
Consolidated
2015 2014 $’000 $’000
15. TAX LIABILITIES
(a) Current tax liabilities
Current tax liability 4,746 – 4,746 –
(b) Deferred tax liabilities
Timing differences attributable to: Capitalisation of development expenditure 19,222 13,957Fixed assets 724 624Other 88 957 20,034 15,538
Opening balance 13,957 8,303Debit to the statement of profit or loss and other comprehensive income 5,265 5,654Closing balance 19,222 13,957
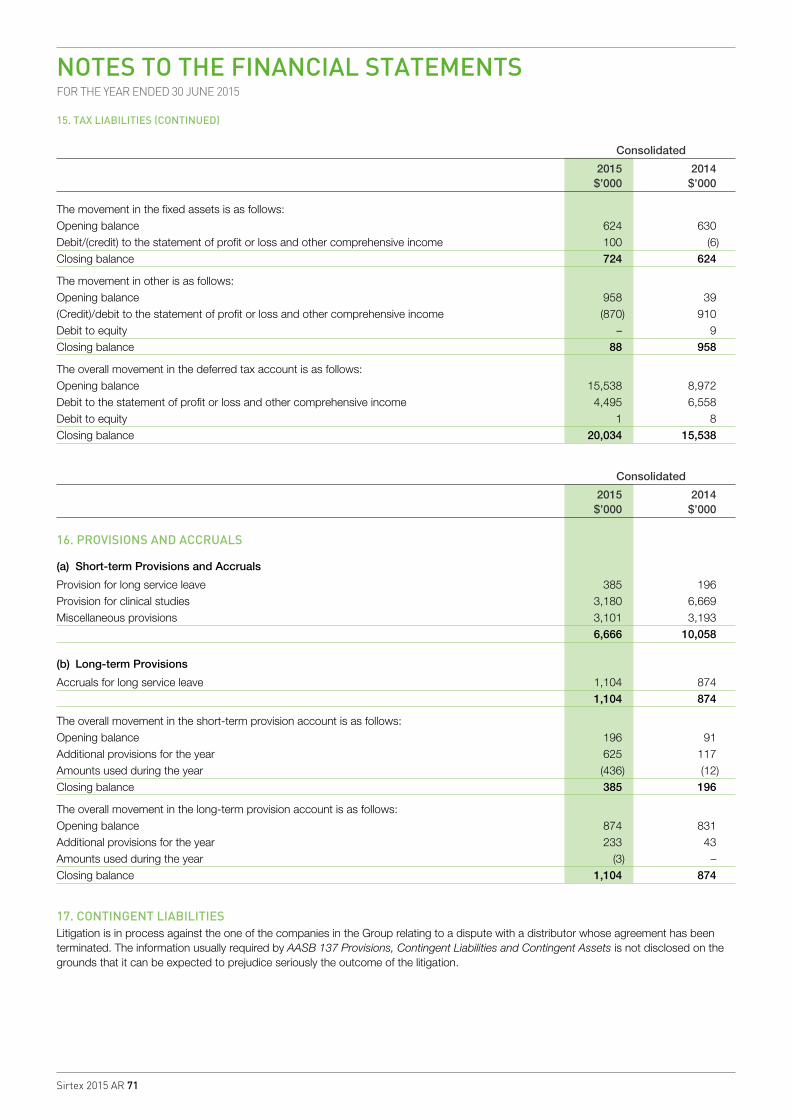
Sirtex 2015 AR 71
NOTES TO THE FINANCIAL STATEMENTSFOR THE YEAR ENDED 30 JUNE 2015
Consolidated
2015 2014 $’000 $’000
The movement in the fixed assets is as follows: Opening balance 624 630Debit/(credit) to the statement of profit or loss and other comprehensive income 100 (6)Closing balance 724 624
The movement in other is as follows: Opening balance 958 39(Credit)/debit to the statement of profit or loss and other comprehensive income (870) 910Debit to equity – 9Closing balance 88 958
The overall movement in the deferred tax account is as follows: Opening balance 15,538 8,972Debit to the statement of profit or loss and other comprehensive income 4,495 6,558Debit to equity 1 8Closing balance 20,034 15,538
Consolidated
2015 2014 $’000 $’000
16. PROVISIONS AND ACCRUALS
(a) Short-term Provisions and Accruals
Provision for long service leave 385 196Provision for clinical studies 3,180 6,669Miscellaneous provisions 3,101 3,193 6,666 10,058
(b) Long-term Provisions
Accruals for long service leave 1,104 874 1,104 874
The overall movement in the short-term provision account is as follows: Opening balance 196 91Additional provisions for the year 625 117Amounts used during the year (436) (12)Closing balance 385 196
The overall movement in the long-term provision account is as follows: Opening balance 874 831Additional provisions for the year 233 43Amounts used during the year (3) –Closing balance 1,104 874
17. CONTINGENT LIABILITIESLitigation is in process against the one of the companies in the Group relating to a dispute with a distributor whose agreement has been terminated. The information usually required by AASB 137 Provisions, Contingent Liabilities and Contingent Assets is not disclosed on the grounds that it can be expected to prejudice seriously the outcome of the litigation.
15. TAX LIABILITIES (CONTINUED)
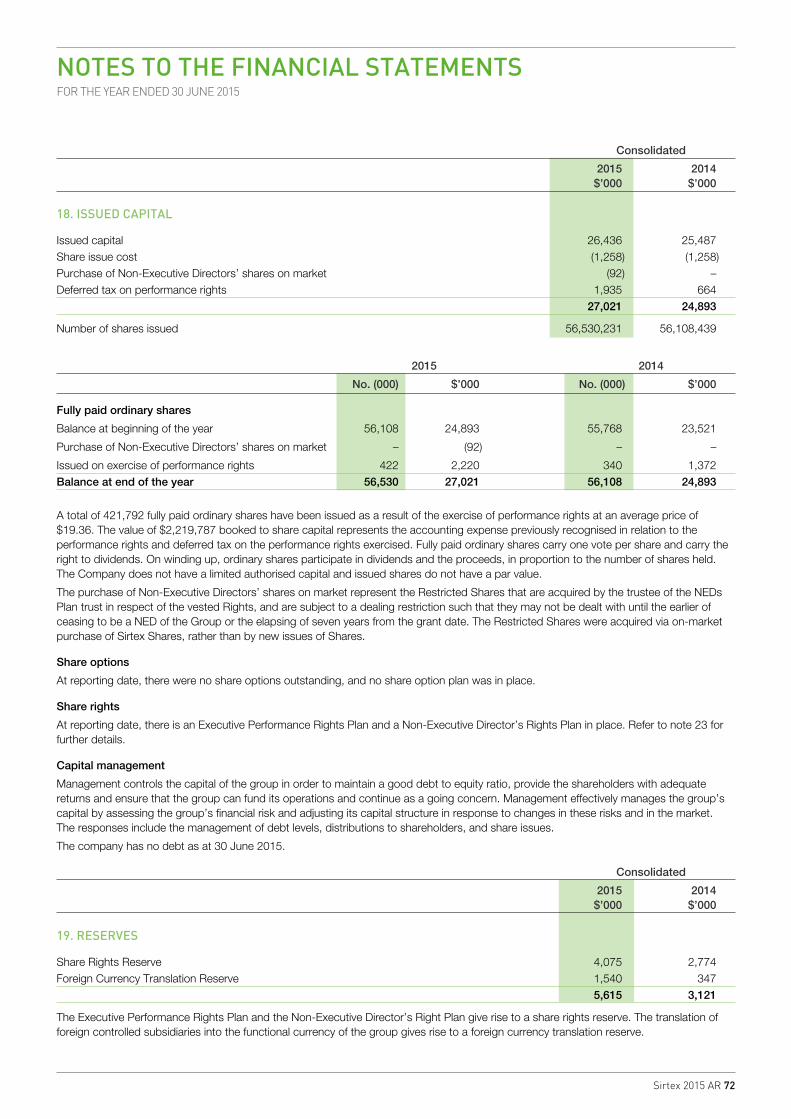
Sirtex 2015 AR 72
NOTES TO THE FINANCIAL STATEMENTSFOR THE YEAR ENDED 30 JUNE 2015
Consolidated
2015 2014 $’000 $’000
18. ISSUED CAPITAL
Issued capital 26,436 25,487Share issue cost (1,258) (1,258)Purchase of Non-Executive Directors’ shares on market (92) –Deferred tax on performance rights 1,935 664 27,021 24,893
Number of shares issued 56,530,231 56,108,439
2015 2014
No. (000) $’000 No. (000) $’000
Fully paid ordinary shares
Balance at beginning of the year 56,108 24,893 55,768 23,521
Purchase of Non-Executive Directors’ shares on market – (92) – –
Issued on exercise of performance rights 422 2,220 340 1,372Balance at end of the year 56,530 27,021 56,108 24,893
A total of 421,792 fully paid ordinary shares have been issued as a result of the exercise of performance rights at an average price of $19.36. The value of $2,219,787 booked to share capital represents the accounting expense previously recognised in relation to the performance rights and deferred tax on the performance rights exercised. Fully paid ordinary shares carry one vote per share and carry the right to dividends. On winding up, ordinary shares participate in dividends and the proceeds, in proportion to the number of shares held. The Company does not have a limited authorised capital and issued shares do not have a par value.
The purchase of Non-Executive Directors’ shares on market represent the Restricted Shares that are acquired by the trustee of the NEDs Plan trust in respect of the vested Rights, and are subject to a dealing restriction such that they may not be dealt with until the earlier of ceasing to be a NED of the Group or the elapsing of seven years from the grant date. The Restricted Shares were acquired via on-market purchase of Sirtex Shares, rather than by new issues of Shares.
Share options
At reporting date, there were no share options outstanding, and no share option plan was in place.
Share rights
At reporting date, there is an Executive Performance Rights Plan and a Non-Executive Director’s Rights Plan in place. Refer to note 23 for further details.
Capital management
Management controls the capital of the group in order to maintain a good debt to equity ratio, provide the shareholders with adequate returns and ensure that the group can fund its operations and continue as a going concern. Management effectively manages the group’s capital by assessing the group’s financial risk and adjusting its capital structure in response to changes in these risks and in the market. The responses include the management of debt levels, distributions to shareholders, and share issues.
The company has no debt as at 30 June 2015.
Consolidated
2015 2014 $’000 $’000
19. RESERVES
Share Rights Reserve 4,075 2,774Foreign Currency Translation Reserve 1,540 347 5,615 3,121
The Executive Performance Rights Plan and the Non-Executive Director’s Right Plan give rise to a share rights reserve. The translation of foreign controlled subsidiaries into the functional currency of the group gives rise to a foreign currency translation reserve.
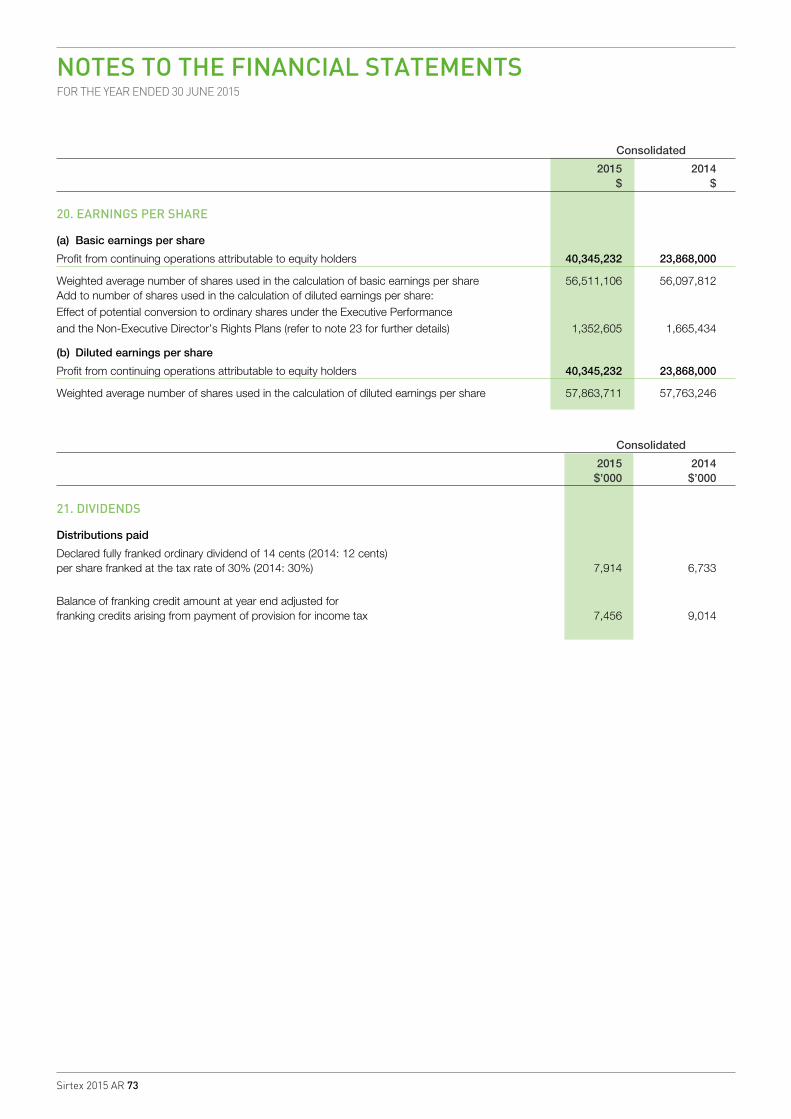
Sirtex 2015 AR 73
NOTES TO THE FINANCIAL STATEMENTSFOR THE YEAR ENDED 30 JUNE 2015
Consolidated
2015 2014 $ $
20. EARNINGS PER SHARE
(a) Basic earnings per share
Profit from continuing operations attributable to equity holders 40,345,232 23,868,000
Weighted average number of shares used in the calculation of basic earnings per share 56,511,106 56,097,812 Add to number of shares used in the calculation of diluted earnings per share:Effect of potential conversion to ordinary shares under the Executive Performanceand the Non-Executive Director’s Rights Plans (refer to note 23 for further details) 1,352,605 1,665,434
(b) Diluted earnings per share
Profit from continuing operations attributable to equity holders 40,345,232 23,868,000
Weighted average number of shares used in the calculation of diluted earnings per share 57,863,711 57,763,246
Consolidated
2015 2014 $’000 $’000
21. DIVIDENDS
Distributions paid
Declared fully franked ordinary dividend of 14 cents (2014: 12 cents) per share franked at the tax rate of 30% (2014: 30%) 7,914 6,733 Balance of franking credit amount at year end adjusted for franking credits arising from payment of provision for income tax 7,456 9,014
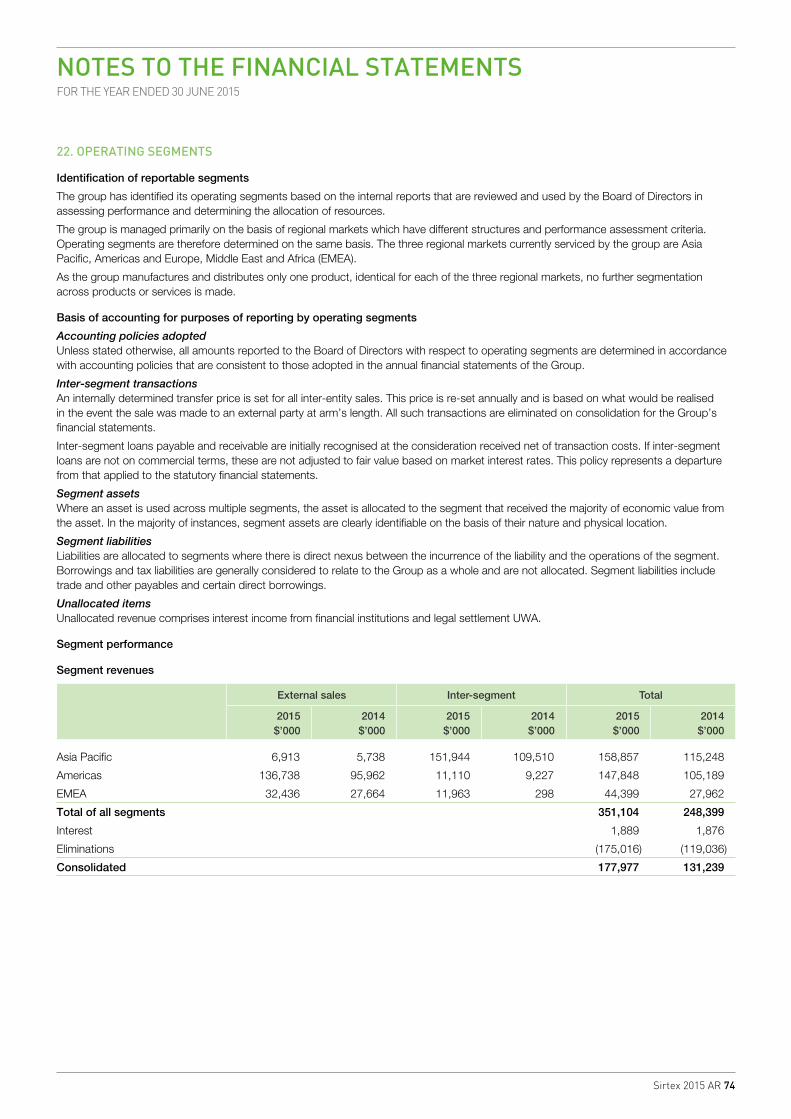
Sirtex 2015 AR 74
NOTES TO THE FINANCIAL STATEMENTSFOR THE YEAR ENDED 30 JUNE 2015
22. OPERATING SEGMENTS
Identification of reportable segments
The group has identified its operating segments based on the internal reports that are reviewed and used by the Board of Directors in assessing performance and determining the allocation of resources.
The group is managed primarily on the basis of regional markets which have different structures and performance assessment criteria. Operating segments are therefore determined on the same basis. The three regional markets currently serviced by the group are Asia Pacific, Americas and Europe, Middle East and Africa (EMEA).
As the group manufactures and distributes only one product, identical for each of the three regional markets, no further segmentation across products or services is made.
Basis of accounting for purposes of reporting by operating segments
Accounting policies adoptedUnless stated otherwise, all amounts reported to the Board of Directors with respect to operating segments are determined in accordance with accounting policies that are consistent to those adopted in the annual financial statements of the Group.
Inter-segment transactionsAn internally determined transfer price is set for all inter-entity sales. This price is re-set annually and is based on what would be realised in the event the sale was made to an external party at arm’s length. All such transactions are eliminated on consolidation for the Group’s financial statements.
Inter-segment loans payable and receivable are initially recognised at the consideration received net of transaction costs. If inter-segment loans are not on commercial terms, these are not adjusted to fair value based on market interest rates. This policy represents a departure from that applied to the statutory financial statements.
Segment assetsWhere an asset is used across multiple segments, the asset is allocated to the segment that received the majority of economic value from the asset. In the majority of instances, segment assets are clearly identifiable on the basis of their nature and physical location.
Segment liabilitiesLiabilities are allocated to segments where there is direct nexus between the incurrence of the liability and the operations of the segment. Borrowings and tax liabilities are generally considered to relate to the Group as a whole and are not allocated. Segment liabilities include trade and other payables and certain direct borrowings.
Unallocated itemsUnallocated revenue comprises interest income from financial institutions and legal settlement UWA.
Segment performance
Segment revenues
External sales Inter-segment Total
2015$’000
2014$’000
2015$’000
2014$’000
2015$’000
2014$’000
Asia Pacific 6,913 5,738 151,944 109,510 158,857 115,248
Americas 136,738 95,962 11,110 9,227 147,848 105,189
EMEA 32,436 27,664 11,963 298 44,399 27,962
Total of all segments 351,104 248,399
Interest 1,889 1,876
Eliminations (175,016) (119,036)
Consolidated 177,977 131,239
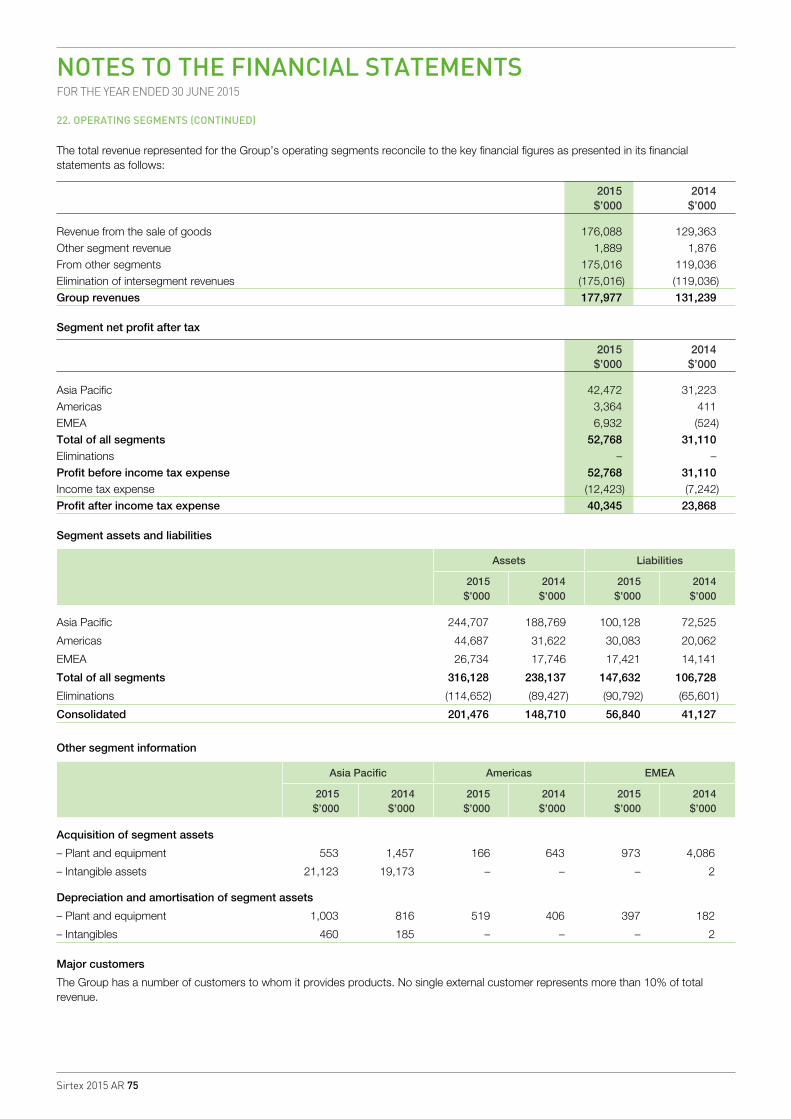
Sirtex 2015 AR 75
NOTES TO THE FINANCIAL STATEMENTSFOR THE YEAR ENDED 30 JUNE 2015
The total revenue represented for the Group’s operating segments reconcile to the key financial figures as presented in its financial statements as follows:
2015 2014 $’000 $’000
Revenue from the sale of goods 176,088 129,363Other segment revenue 1,889 1,876From other segments 175,016 119,036Elimination of intersegment revenues (175,016) (119,036)Group revenues 177,977 131,239
Segment net profit after tax
2015 2014 $’000 $’000
Asia Pacific 42,472 31,223Americas 3,364 411EMEA 6,932 (524)Total of all segments 52,768 31,110Eliminations – –Profit before income tax expense 52,768 31,110Income tax expense (12,423) (7,242)Profit after income tax expense 40,345 23,868
Segment assets and liabilities
Assets Liabilities
2015$’000
2014$’000
2015$’000
2014$’000
Asia Pacific 244,707 188,769 100,128 72,525
Americas 44,687 31,622 30,083 20,062
EMEA 26,734 17,746 17,421 14,141
Total of all segments 316,128 238,137 147,632 106,728
Eliminations (114,652) (89,427) (90,792) (65,601)
Consolidated 201,476 148,710 56,840 41,127
Other segment information
Asia Pacific Americas EMEA
2015$’000
2014$’000
2015$’000
2014$’000
2015$’000
2014$’000
Acquisition of segment assets
– Plant and equipment 553 1,457 166 643 973 4,086
– Intangible assets 21,123 19,173 – – – 2
Depreciation and amortisation of segment assets
– Plant and equipment 1,003 816 519 406 397 182
– Intangibles 460 185 – – – 2
Major customers
The Group has a number of customers to whom it provides products. No single external customer represents more than 10% of total revenue.
22. OPERATING SEGMENTS (CONTINUED)
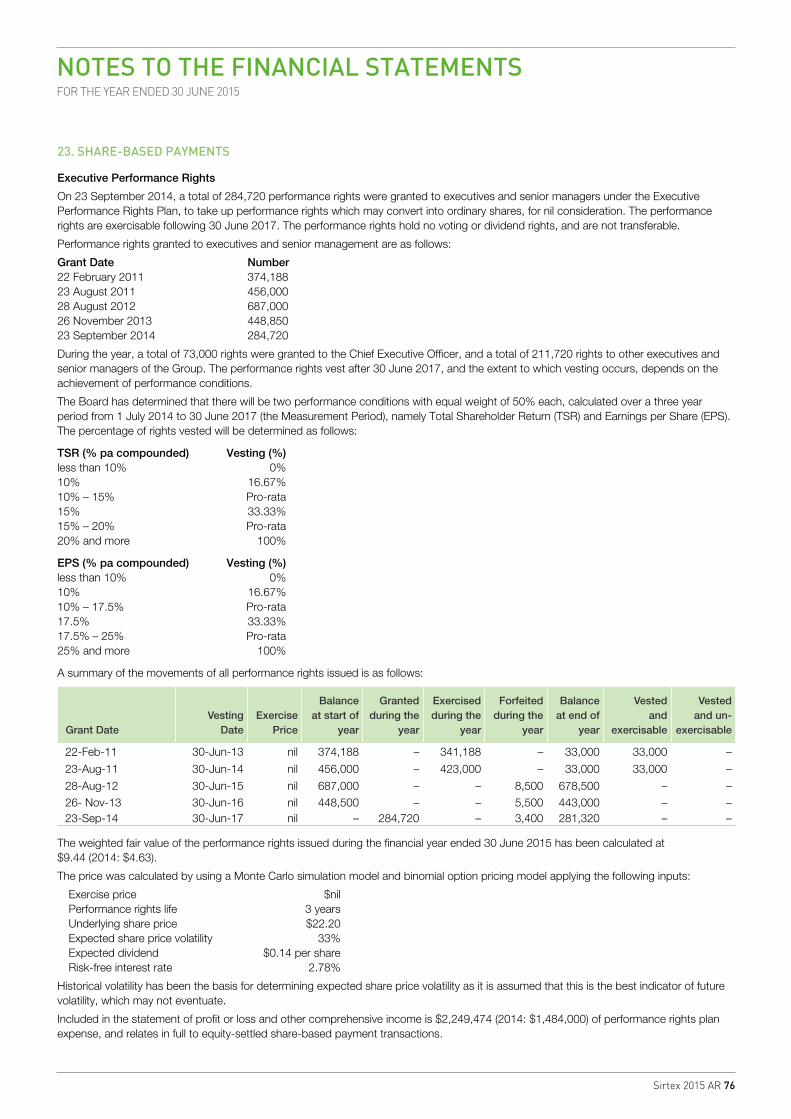
Sirtex 2015 AR 76
NOTES TO THE FINANCIAL STATEMENTSFOR THE YEAR ENDED 30 JUNE 2015
23. SHARE-BASED PAYMENTS
Executive Performance Rights
On 23 September 2014, a total of 284,720 performance rights were granted to executives and senior managers under the Executive Performance Rights Plan, to take up performance rights which may convert into ordinary shares, for nil consideration. The performance rights are exercisable following 30 June 2017. The performance rights hold no voting or dividend rights, and are not transferable.
Performance rights granted to executives and senior management are as follows:
Grant Date Number22 February 2011 374,18823 August 2011 456,00028 August 2012 687,00026 November 2013 448,85023 September 2014 284,720
During the year, a total of 73,000 rights were granted to the Chief Executive Officer, and a total of 211,720 rights to other executives and senior managers of the Group. The performance rights vest after 30 June 2017, and the extent to which vesting occurs, depends on the achievement of performance conditions.
The Board has determined that there will be two performance conditions with equal weight of 50% each, calculated over a three year period from 1 July 2014 to 30 June 2017 (the Measurement Period), namely Total Shareholder Return (TSR) and Earnings per Share (EPS). The percentage of rights vested will be determined as follows:
TSR (% pa compounded) Vesting (%)less than 10% 0%10% 16.67%10% – 15% Pro-rata15% 33.33%15% – 20% Pro-rata20% and more 100%
EPS (% pa compounded) Vesting (%)less than 10% 0%10% 16.67%10% – 17.5% Pro-rata17.5% 33.33%17.5% – 25% Pro-rata25% and more 100%
A summary of the movements of all performance rights issued is as follows:
Grant DateVesting
DateExercise
Price
Balance at start of
year
Granted during the
year
Exercised during the
year
Forfeited during the
year
Balance at end of
year
Vested and
exercisable
Vested and un-
exercisable
22-Feb-11 30-Jun-13 nil 374,188 – 341,188 – 33,000 33,000 –
23-Aug-11 30-Jun-14 nil 456,000 – 423,000 – 33,000 33,000 –
28-Aug-12 30-Jun-15 nil 687,000 – – 8,500 678,500 – –
26- Nov-13 30-Jun-16 nil 448,500 – – 5,500 443,000 – –23-Sep-14 30-Jun-17 nil – 284,720 – 3,400 281,320 – –
The weighted fair value of the performance rights issued during the financial year ended 30 June 2015 has been calculated at $9.44 (2014: $4.63).
The price was calculated by using a Monte Carlo simulation model and binomial option pricing model applying the following inputs:
Exercise price $nil Performance rights life 3 years Underlying share price $22.20 Expected share price volatility 33% Expected dividend $0.14 per shareRisk-free interest rate 2.78%
Historical volatility has been the basis for determining expected share price volatility as it is assumed that this is the best indicator of future volatility, which may not eventuate.
Included in the statement of profit or loss and other comprehensive income is $2,249,474 (2014: $1,484,000) of performance rights plan expense, and relates in full to equity-settled share-based payment transactions.
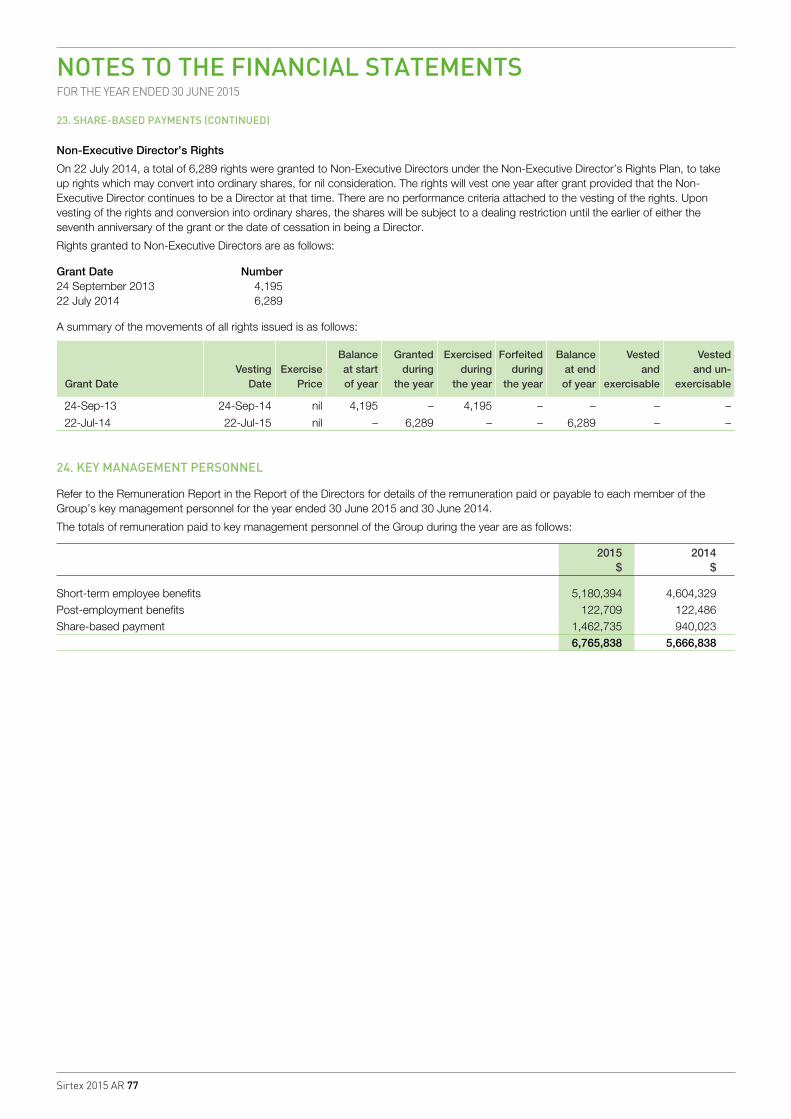
Sirtex 2015 AR 77
NOTES TO THE FINANCIAL STATEMENTSFOR THE YEAR ENDED 30 JUNE 2015
Non-Executive Director’s Rights
On 22 July 2014, a total of 6,289 rights were granted to Non-Executive Directors under the Non-Executive Director’s Rights Plan, to take up rights which may convert into ordinary shares, for nil consideration. The rights will vest one year after grant provided that the Non-Executive Director continues to be a Director at that time. There are no performance criteria attached to the vesting of the rights. Upon vesting of the rights and conversion into ordinary shares, the shares will be subject to a dealing restriction until the earlier of either the seventh anniversary of the grant or the date of cessation in being a Director.
Rights granted to Non-Executive Directors are as follows:
Grant Date Number24 September 2013 4,19522 July 2014 6,289
A summary of the movements of all rights issued is as follows:
Grant DateVesting
DateExercise
Price
Balance at start of year
Granted during
the year
Exercised during
the year
Forfeited during
the year
Balance at end of year
Vested and
exercisable
Vested and un-
exercisable
24-Sep-13 24-Sep-14 nil 4,195 – 4,195 – – – –
22-Jul-14 22-Jul-15 nil – 6,289 – – 6,289 – –
24. KEY MANAGEMENT PERSONNEL
Refer to the Remuneration Report in the Report of the Directors for details of the remuneration paid or payable to each member of the Group’s key management personnel for the year ended 30 June 2015 and 30 June 2014.
The totals of remuneration paid to key management personnel of the Group during the year are as follows:
2015 2014 $ $
Short-term employee benefits 5,180,394 4,604,329Post-employment benefits 122,709 122,486Share-based payment 1,462,735 940,023 6,765,838 5,666,838
23. SHARE-BASED PAYMENTS (CONTINUED)
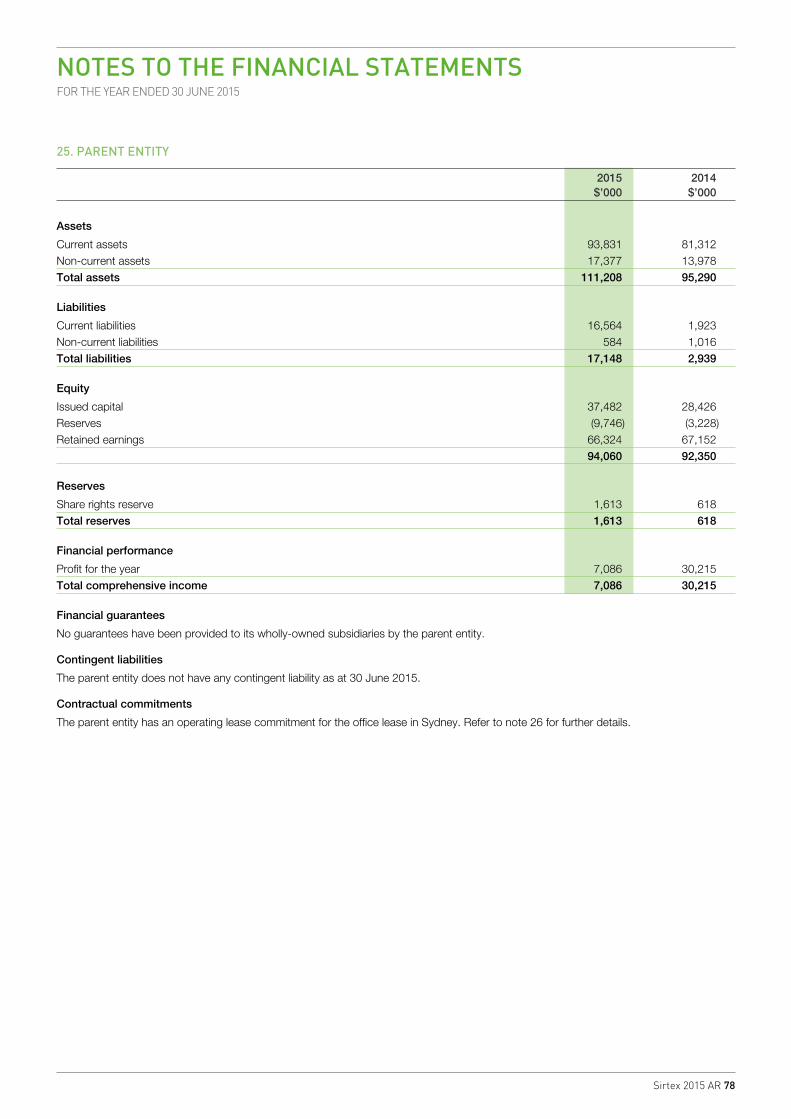
Sirtex 2015 AR 78
NOTES TO THE FINANCIAL STATEMENTSFOR THE YEAR ENDED 30 JUNE 2015
25. PARENT ENTITY
2015 2014 $’000 $’000
Assets
Current assets 93,831 81,312Non-current assets 17,377 13,978Total assets 111,208 95,290
Liabilities
Current liabilities 16,564 1,923Non-current liabilities 584 1,016Total liabilities 17,148 2,939
Equity
Issued capital 37,482 28,426Reserves (9,746) (3,228)Retained earnings 66,324 67,152 94,060 92,350
Reserves
Share rights reserve 1,613 618Total reserves 1,613 618
Financial performance
Profit for the year 7,086 30,215Total comprehensive income 7,086 30,215
Financial guarantees
No guarantees have been provided to its wholly-owned subsidiaries by the parent entity.
Contingent liabilities
The parent entity does not have any contingent liability as at 30 June 2015.
Contractual commitments
The parent entity has an operating lease commitment for the office lease in Sydney. Refer to note 26 for further details.
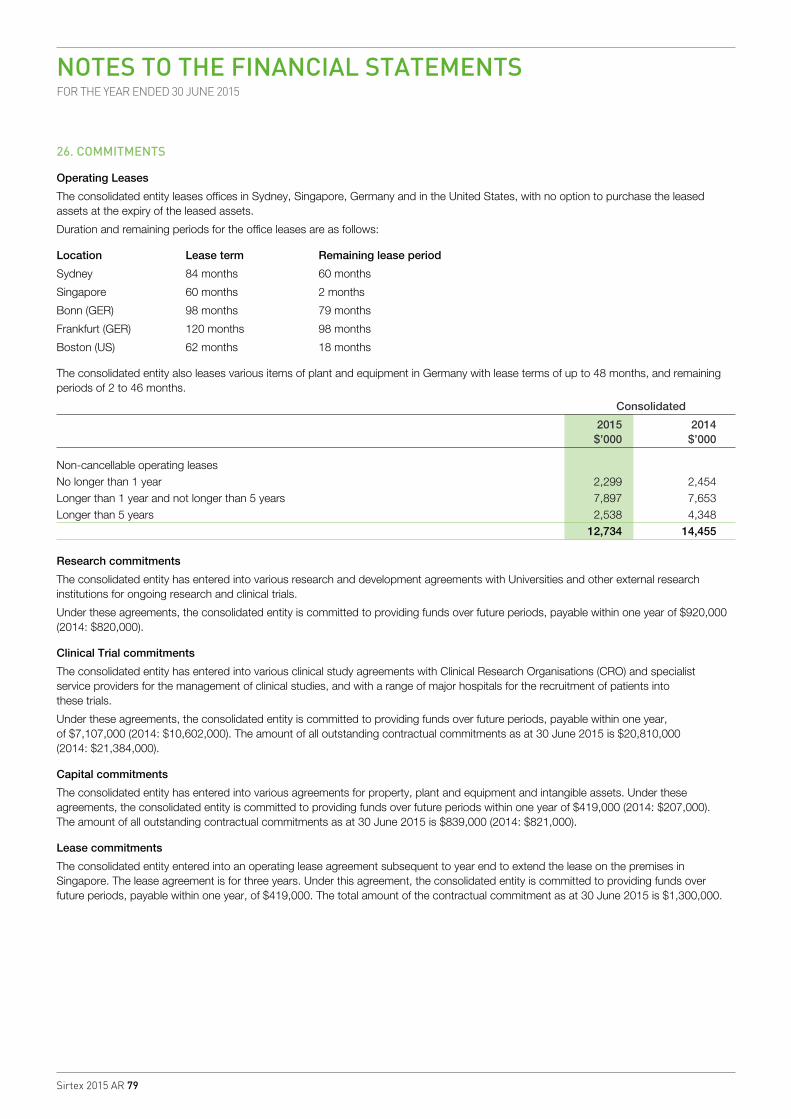
Sirtex 2015 AR 79
NOTES TO THE FINANCIAL STATEMENTSFOR THE YEAR ENDED 30 JUNE 2015
26. COMMITMENTS
Operating Leases
The consolidated entity leases offices in Sydney, Singapore, Germany and in the United States, with no option to purchase the leased assets at the expiry of the leased assets.
Duration and remaining periods for the office leases are as follows:
Location Lease term Remaining lease period
Sydney 84 months 60 months
Singapore 60 months 2 months
Bonn (GER) 98 months 79 months
Frankfurt (GER) 120 months 98 months
Boston (US) 62 months 18 months
The consolidated entity also leases various items of plant and equipment in Germany with lease terms of up to 48 months, and remaining periods of 2 to 46 months.
Consolidated
2015 2014 $’000 $’000
Non-cancellable operating leases No longer than 1 year 2,299 2,454Longer than 1 year and not longer than 5 years 7,897 7,653Longer than 5 years 2,538 4,348 12,734 14,455
Research commitments
The consolidated entity has entered into various research and development agreements with Universities and other external research institutions for ongoing research and clinical trials.
Under these agreements, the consolidated entity is committed to providing funds over future periods, payable within one year of $920,000 (2014: $820,000).
Clinical Trial commitments
The consolidated entity has entered into various clinical study agreements with Clinical Research Organisations (CRO) and specialist service providers for the management of clinical studies, and with a range of major hospitals for the recruitment of patients into these trials.
Under these agreements, the consolidated entity is committed to providing funds over future periods, payable within one year, of $7,107,000 (2014: $10,602,000). The amount of all outstanding contractual commitments as at 30 June 2015 is $20,810,000 (2014: $21,384,000).
Capital commitments
The consolidated entity has entered into various agreements for property, plant and equipment and intangible assets. Under these agreements, the consolidated entity is committed to providing funds over future periods within one year of $419,000 (2014: $207,000). The amount of all outstanding contractual commitments as at 30 June 2015 is $839,000 (2014: $821,000).
Lease commitments
The consolidated entity entered into an operating lease agreement subsequent to year end to extend the lease on the premises in Singapore. The lease agreement is for three years. Under this agreement, the consolidated entity is committed to providing funds over future periods, payable within one year, of $419,000. The total amount of the contractual commitment as at 30 June 2015 is $1,300,000.
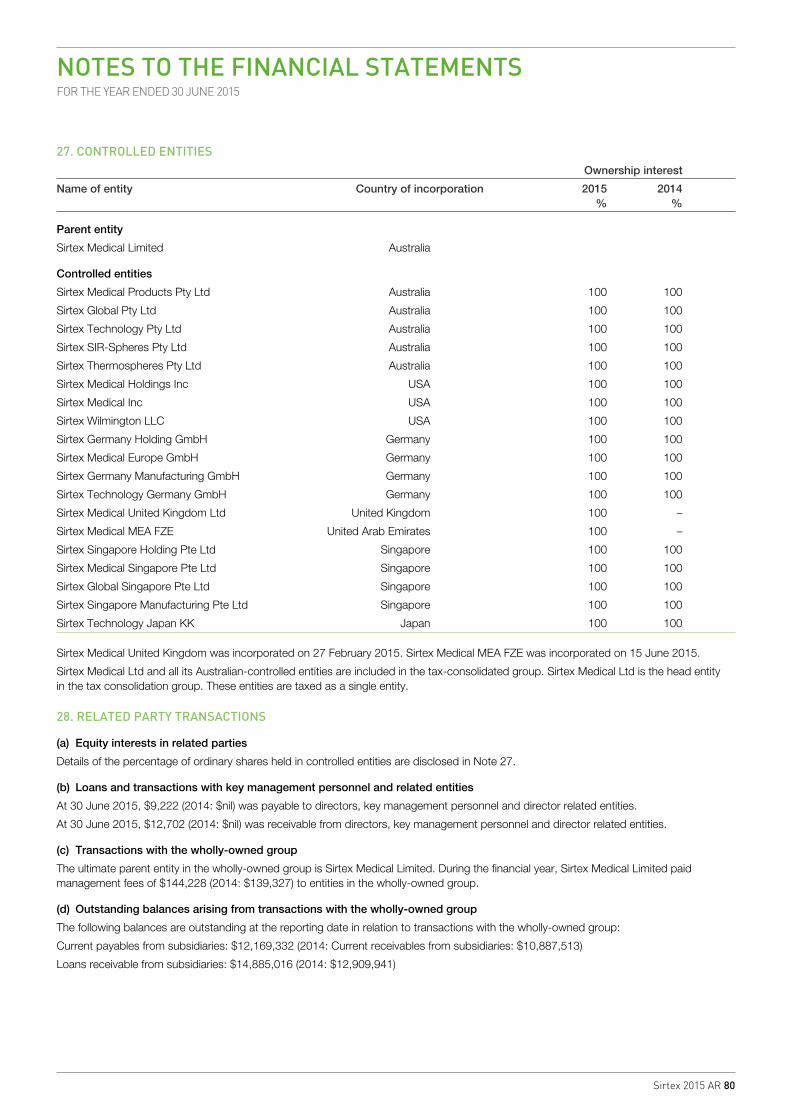
Sirtex 2015 AR 80
NOTES TO THE FINANCIAL STATEMENTSFOR THE YEAR ENDED 30 JUNE 2015
27. CONTROLLED ENTITIES Ownership interest
Name of entity Country of incorporation 2015 2014 % %
Parent entity
Sirtex Medical Limited Australia
Controlled entities
Sirtex Medical Products Pty Ltd Australia 100 100
Sirtex Global Pty Ltd Australia 100 100
Sirtex Technology Pty Ltd Australia 100 100
Sirtex SIR-Spheres Pty Ltd Australia 100 100
Sirtex Thermospheres Pty Ltd Australia 100 100
Sirtex Medical Holdings Inc USA 100 100
Sirtex Medical Inc USA 100 100
Sirtex Wilmington LLC USA 100 100
Sirtex Germany Holding GmbH Germany 100 100
Sirtex Medical Europe GmbH Germany 100 100
Sirtex Germany Manufacturing GmbH Germany 100 100
Sirtex Technology Germany GmbH Germany 100 100
Sirtex Medical United Kingdom Ltd United Kingdom 100 –
Sirtex Medical MEA FZE United Arab Emirates 100 –
Sirtex Singapore Holding Pte Ltd Singapore 100 100
Sirtex Medical Singapore Pte Ltd Singapore 100 100
Sirtex Global Singapore Pte Ltd Singapore 100 100
Sirtex Singapore Manufacturing Pte Ltd Singapore 100 100
Sirtex Technology Japan KK Japan 100 100
Sirtex Medical United Kingdom was incorporated on 27 February 2015. Sirtex Medical MEA FZE was incorporated on 15 June 2015.
Sirtex Medical Ltd and all its Australian-controlled entities are included in the tax-consolidated group. Sirtex Medical Ltd is the head entity in the tax consolidation group. These entities are taxed as a single entity.
28. RELATED PARTY TRANSACTIONS
(a) Equity interests in related parties
Details of the percentage of ordinary shares held in controlled entities are disclosed in Note 27.
(b) Loans and transactions with key management personnel and related entities
At 30 June 2015, $9,222 (2014: $nil) was payable to directors, key management personnel and director related entities.
At 30 June 2015, $12,702 (2014: $nil) was receivable from directors, key management personnel and director related entities.
(c) Transactions with the wholly-owned group
The ultimate parent entity in the wholly-owned group is Sirtex Medical Limited. During the financial year, Sirtex Medical Limited paid management fees of $144,228 (2014: $139,327) to entities in the wholly-owned group.
(d) Outstanding balances arising from transactions with the wholly-owned group
The following balances are outstanding at the reporting date in relation to transactions with the wholly-owned group:
Current payables from subsidiaries: $12,169,332 (2014: Current receivables from subsidiaries: $10,887,513)
Loans receivable from subsidiaries: $14,885,016 (2014: $12,909,941)
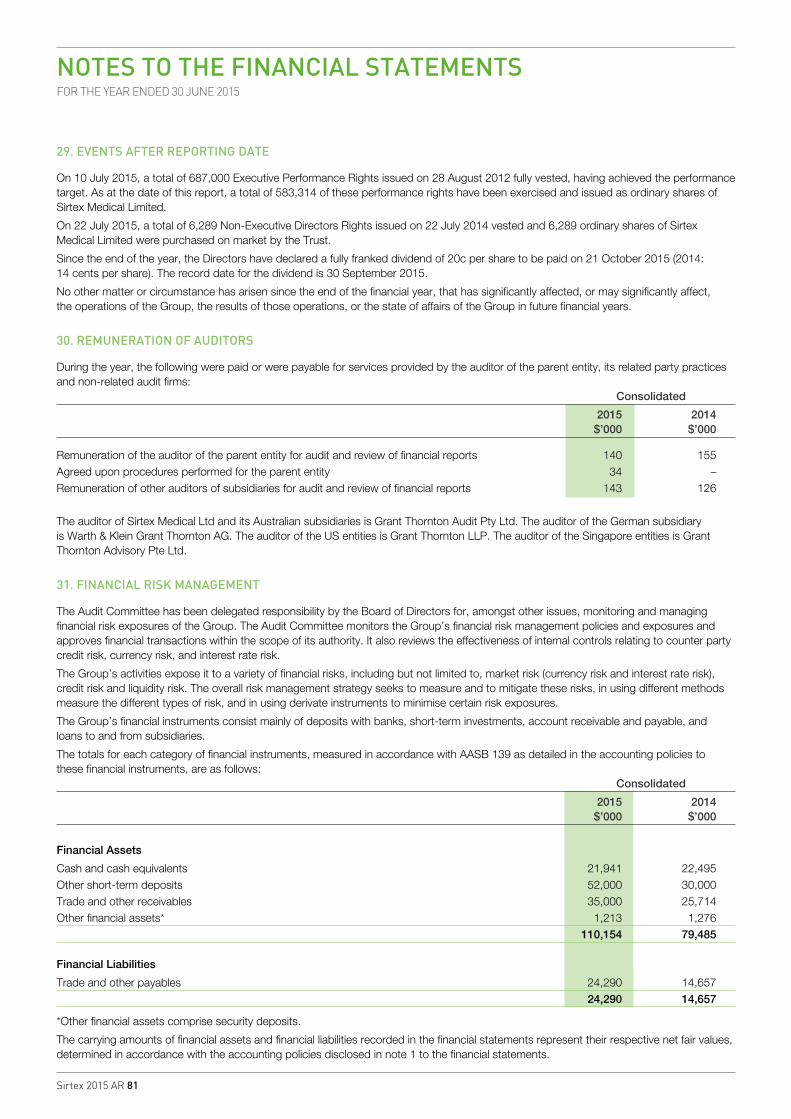
Sirtex 2015 AR 81
NOTES TO THE FINANCIAL STATEMENTSFOR THE YEAR ENDED 30 JUNE 2015
29. EVENTS AFTER REPORTING DATE
On 10 July 2015, a total of 687,000 Executive Performance Rights issued on 28 August 2012 fully vested, having achieved the performance target. As at the date of this report, a total of 583,314 of these performance rights have been exercised and issued as ordinary shares of Sirtex Medical Limited.
On 22 July 2015, a total of 6,289 Non-Executive Directors Rights issued on 22 July 2014 vested and 6,289 ordinary shares of Sirtex Medical Limited were purchased on market by the Trust.
Since the end of the year, the Directors have declared a fully franked dividend of 20c per share to be paid on 21 October 2015 (2014: 14 cents per share). The record date for the dividend is 30 September 2015.
No other matter or circumstance has arisen since the end of the financial year, that has significantly affected, or may significantly affect, the operations of the Group, the results of those operations, or the state of affairs of the Group in future financial years.
30. REMUNERATION OF AUDITORS
During the year, the following were paid or were payable for services provided by the auditor of the parent entity, its related party practices and non-related audit firms: Consolidated
2015 2014 $’000 $’000
Remuneration of the auditor of the parent entity for audit and review of financial reports 140 155 Agreed upon procedures performed for the parent entity 34 –Remuneration of other auditors of subsidiaries for audit and review of financial reports 143 126
The auditor of Sirtex Medical Ltd and its Australian subsidiaries is Grant Thornton Audit Pty Ltd. The auditor of the German subsidiary is Warth & Klein Grant Thornton AG. The auditor of the US entities is Grant Thornton LLP. The auditor of the Singapore entities is Grant Thornton Advisory Pte Ltd.
31. FINANCIAL RISK MANAGEMENT
The Audit Committee has been delegated responsibility by the Board of Directors for, amongst other issues, monitoring and managing financial risk exposures of the Group. The Audit Committee monitors the Group’s financial risk management policies and exposures and approves financial transactions within the scope of its authority. It also reviews the effectiveness of internal controls relating to counter party credit risk, currency risk, and interest rate risk.
The Group’s activities expose it to a variety of financial risks, including but not limited to, market risk (currency risk and interest rate risk), credit risk and liquidity risk. The overall risk management strategy seeks to measure and to mitigate these risks, in using different methods measure the different types of risk, and in using derivate instruments to minimise certain risk exposures.
The Group’s financial instruments consist mainly of deposits with banks, short-term investments, account receivable and payable, and loans to and from subsidiaries.
The totals for each category of financial instruments, measured in accordance with AASB 139 as detailed in the accounting policies to these financial instruments, are as follows: Consolidated
2015 2014 $’000 $’000
Financial Assets
Cash and cash equivalents 21,941 22,495Other short-term deposits 52,000 30,000Trade and other receivables 35,000 25,714Other financial assets* 1,213 1,276 110,154 79,485
Financial Liabilities
Trade and other payables 24,290 14,657 24,290 14,657
*Other financial assets comprise security deposits.
The carrying amounts of financial assets and financial liabilities recorded in the financial statements represent their respective net fair values, determined in accordance with the accounting policies disclosed in note 1 to the financial statements.
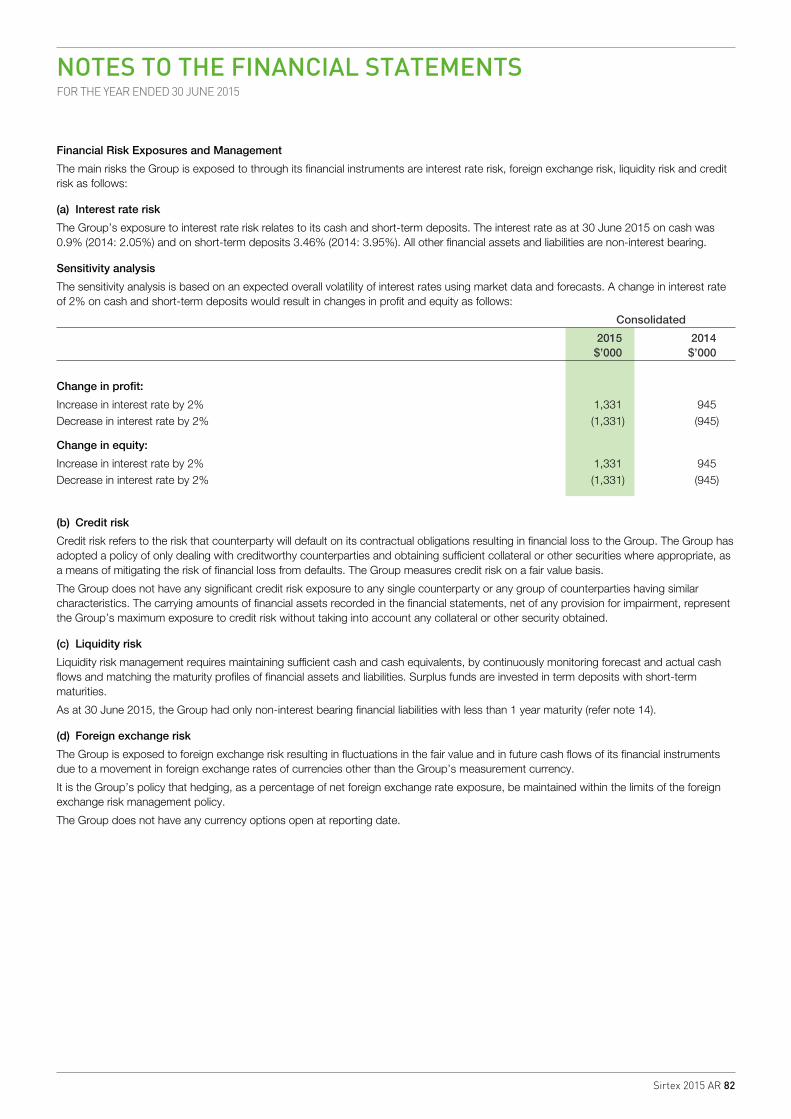
Sirtex 2015 AR 82
NOTES TO THE FINANCIAL STATEMENTSFOR THE YEAR ENDED 30 JUNE 2015
Financial Risk Exposures and Management
The main risks the Group is exposed to through its financial instruments are interest rate risk, foreign exchange risk, liquidity risk and credit risk as follows:
(a) Interest rate risk
The Group’s exposure to interest rate risk relates to its cash and short-term deposits. The interest rate as at 30 June 2015 on cash was 0.9% (2014: 2.05%) and on short-term deposits 3.46% (2014: 3.95%). All other financial assets and liabilities are non-interest bearing.
Sensitivity analysis
The sensitivity analysis is based on an expected overall volatility of interest rates using market data and forecasts. A change in interest rate of 2% on cash and short-term deposits would result in changes in profit and equity as follows:
Consolidated
2015 2014 $’000 $’000
Change in profit:
Increase in interest rate by 2% 1,331 945Decrease in interest rate by 2% (1,331) (945)
Change in equity:
Increase in interest rate by 2% 1,331 945Decrease in interest rate by 2% (1,331) (945)
(b) Credit risk
Credit risk refers to the risk that counterparty will default on its contractual obligations resulting in financial loss to the Group. The Group has adopted a policy of only dealing with creditworthy counterparties and obtaining sufficient collateral or other securities where appropriate, as a means of mitigating the risk of financial loss from defaults. The Group measures credit risk on a fair value basis.
The Group does not have any significant credit risk exposure to any single counterparty or any group of counterparties having similar characteristics. The carrying amounts of financial assets recorded in the financial statements, net of any provision for impairment, represent the Group’s maximum exposure to credit risk without taking into account any collateral or other security obtained.
(c) Liquidity risk
Liquidity risk management requires maintaining sufficient cash and cash equivalents, by continuously monitoring forecast and actual cash flows and matching the maturity profiles of financial assets and liabilities. Surplus funds are invested in term deposits with short-term maturities.
As at 30 June 2015, the Group had only non-interest bearing financial liabilities with less than 1 year maturity (refer note 14).
(d) Foreign exchange risk
The Group is exposed to foreign exchange risk resulting in fluctuations in the fair value and in future cash flows of its financial instruments due to a movement in foreign exchange rates of currencies other than the Group’s measurement currency.
It is the Group’s policy that hedging, as a percentage of net foreign exchange rate exposure, be maintained within the limits of the foreign exchange risk management policy.
The Group does not have any currency options open at reporting date.
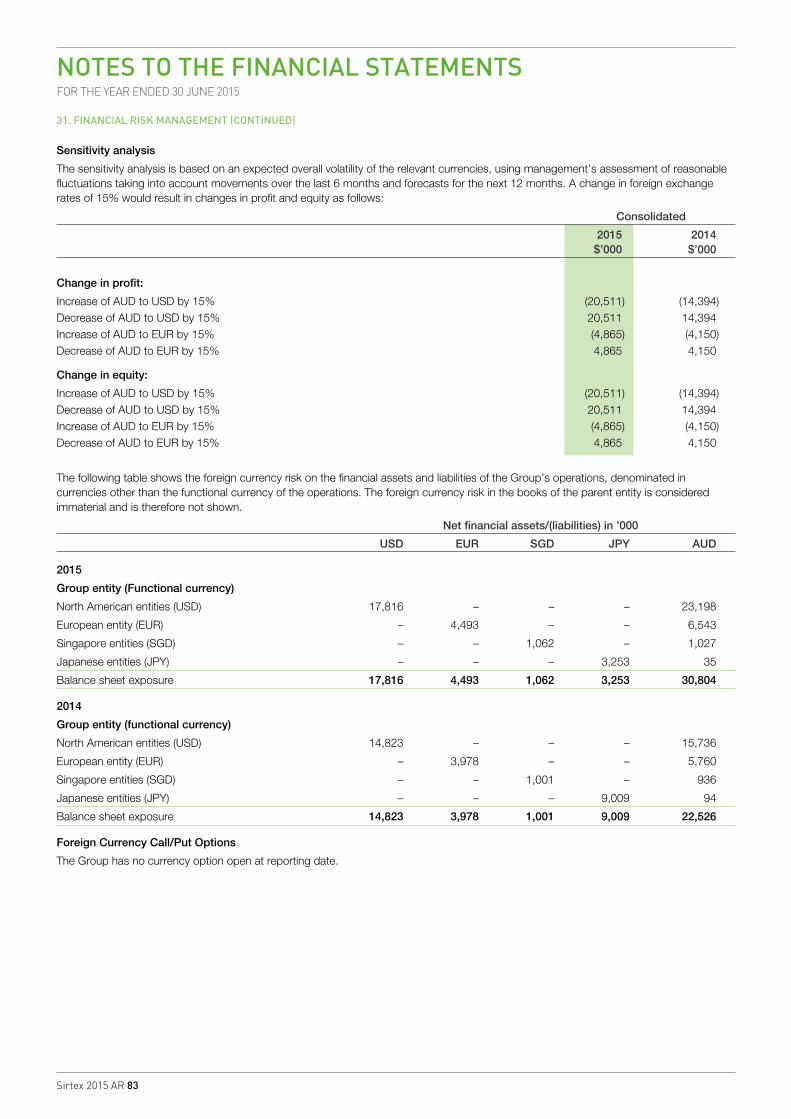
Sirtex 2015 AR 83
NOTES TO THE FINANCIAL STATEMENTSFOR THE YEAR ENDED 30 JUNE 2015
Sensitivity analysis
The sensitivity analysis is based on an expected overall volatility of the relevant currencies, using management’s assessment of reasonable fluctuations taking into account movements over the last 6 months and forecasts for the next 12 months. A change in foreign exchange rates of 15% would result in changes in profit and equity as follows:
Consolidated
2015 2014 $’000 $’000
Change in profit:
Increase of AUD to USD by 15% (20,511) (14,394)Decrease of AUD to USD by 15% 20,511 14,394Increase of AUD to EUR by 15% (4,865) (4,150)Decrease of AUD to EUR by 15% 4,865 4,150
Change in equity:
Increase of AUD to USD by 15% (20,511) (14,394)Decrease of AUD to USD by 15% 20,511 14,394Increase of AUD to EUR by 15% (4,865) (4,150)Decrease of AUD to EUR by 15% 4,865 4,150
The following table shows the foreign currency risk on the financial assets and liabilities of the Group’s operations, denominated in currencies other than the functional currency of the operations. The foreign currency risk in the books of the parent entity is considered immaterial and is therefore not shown.
Net financial assets/(liabilities) in ’000
USD EUR SGD JPY AUD
2015
Group entity (Functional currency)
North American entities (USD) 17,816 – – – 23,198
European entity (EUR) – 4,493 – – 6,543
Singapore entities (SGD) – – 1,062 – 1,027
Japanese entities (JPY) – – – 3,253 35
Balance sheet exposure 17,816 4,493 1,062 3,253 30,804
2014
Group entity (functional currency)
North American entities (USD) 14,823 – – – 15,736
European entity (EUR) – 3,978 – – 5,760
Singapore entities (SGD) – – 1,001 – 936
Japanese entities (JPY) – – – 9,009 94
Balance sheet exposure 14,823 3,978 1,001 9,009 22,526
Foreign Currency Call/Put Options
The Group has no currency option open at reporting date.
31. FINANCIAL RISK MANAGEMENT (CONTINUED)
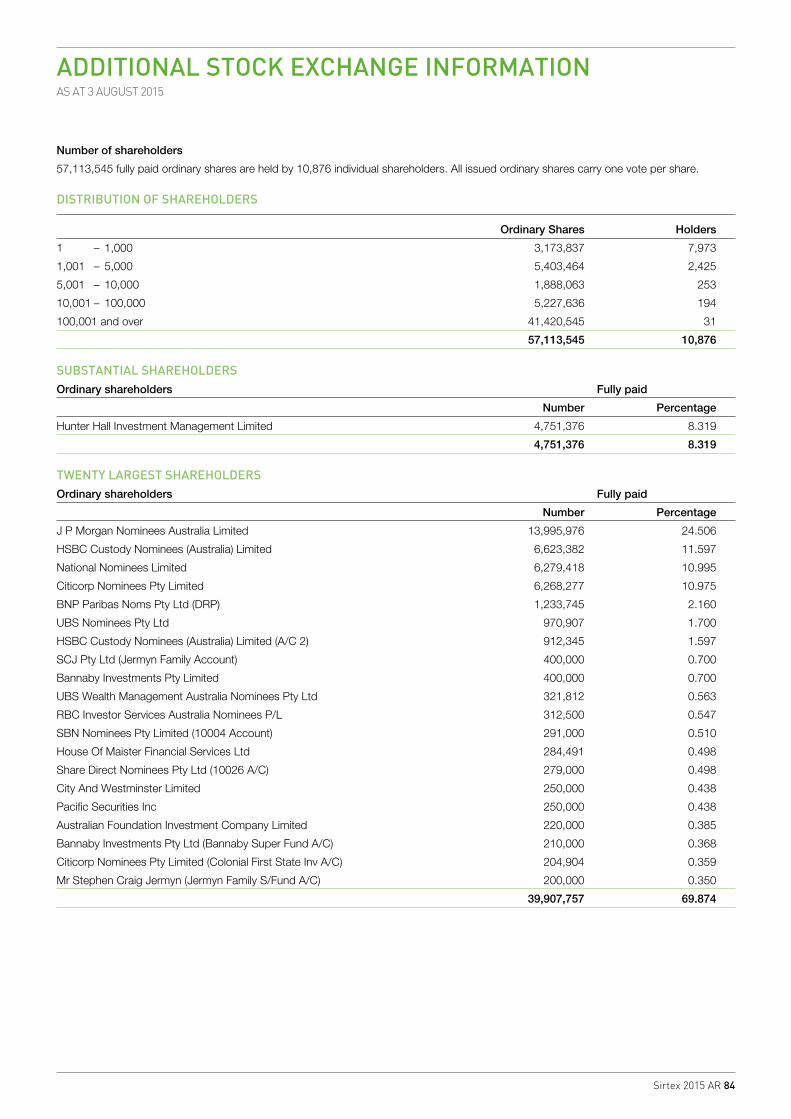
Sirtex 2015 AR 84
ADDITIONAL STOCK EXCHANGE INFORMATIONAS AT 3 AUGUST 2015
Number of shareholders
57,113,545 fully paid ordinary shares are held by 10,876 individual shareholders. All issued ordinary shares carry one vote per share.
DISTRIBUTION OF SHAREHOLDERS
Ordinary Shares Holders
1 – 1,000 3,173,837 7,973
1,001 – 5,000 5,403,464 2,425
5,001 – 10,000 1,888,063 253
10,001 – 100,000 5,227,636 194
100,001 and over 41,420,545 31
57,113,545 10,876
SUBSTANTIAL SHAREHOLDERSOrdinary shareholders Fully paid
Number Percentage
Hunter Hall Investment Management Limited 4,751,376 8.319
4,751,376 8.319
TWENTY LARGEST SHAREHOLDERSOrdinary shareholders Fully paid
Number Percentage
J P Morgan Nominees Australia Limited 13,995,976 24.506
HSBC Custody Nominees (Australia) Limited 6,623,382 11.597
National Nominees Limited 6,279,418 10.995
Citicorp Nominees Pty Limited 6,268,277 10.975
BNP Paribas Noms Pty Ltd (DRP) 1,233,745 2.160
UBS Nominees Pty Ltd 970,907 1.700
HSBC Custody Nominees (Australia) Limited (A/C 2) 912,345 1.597
SCJ Pty Ltd (Jermyn Family Account) 400,000 0.700
Bannaby Investments Pty Limited 400,000 0.700
UBS Wealth Management Australia Nominees Pty Ltd 321,812 0.563
RBC Investor Services Australia Nominees P/L 312,500 0.547
SBN Nominees Pty Limited (10004 Account) 291,000 0.510
House Of Maister Financial Services Ltd 284,491 0.498
Share Direct Nominees Pty Ltd (10026 A/C) 279,000 0.498
City And Westminster Limited 250,000 0.438
Pacific Securities Inc 250,000 0.438
Australian Foundation Investment Company Limited 220,000 0.385
Bannaby Investments Pty Ltd (Bannaby Super Fund A/C) 210,000 0.368
Citicorp Nominees Pty Limited (Colonial First State Inv A/C) 204,904 0.359
Mr Stephen Craig Jermyn (Jermyn Family S/Fund A/C) 200,000 0.350
39,907,757 69.874
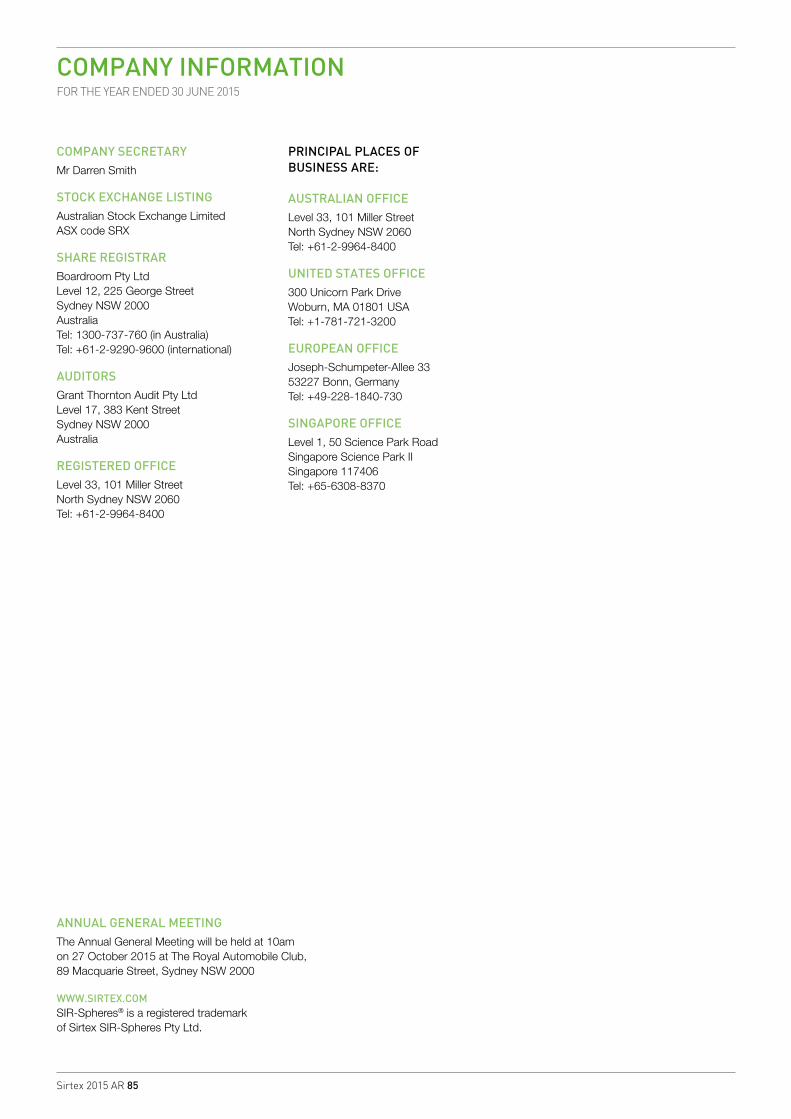
Sirtex 2015 AR 85
COMPANY INFORMATIONFOR THE YEAR ENDED 30 JUNE 2015
COMPANY SECRETARYMr Darren Smith
STOCK EXCHANGE LISTINGAustralian Stock Exchange LimitedASX code SRX
SHARE REGISTRARBoardroom Pty LtdLevel 12, 225 George Street Sydney NSW 2000 AustraliaTel: 1300-737-760 (in Australia)Tel: +61-2-9290-9600 (international)
AUDITORSGrant Thornton Audit Pty LtdLevel 17, 383 Kent StreetSydney NSW 2000 Australia
REGISTERED OFFICELevel 33, 101 Miller StreetNorth Sydney NSW 2060Tel: +61-2-9964-8400
PRINCIPAL PLACES OF BUSINESS ARE:
AUSTRALIAN OFFICELevel 33, 101 Miller StreetNorth Sydney NSW 2060Tel: +61-2-9964-8400
UNITED STATES OFFICE 300 Unicorn Park Drive Woburn, MA 01801 USA Tel: +1-781-721-3200
EUROPEAN OFFICE Joseph-Schumpeter-Allee 3353227 Bonn, GermanyTel: +49-228-1840-730
SINGAPORE OFFICE Level 1, 50 Science Park Road Singapore Science Park II Singapore 117406 Tel: +65-6308-8370
ANNUAL GENERAL MEETINGThe Annual General Meeting will be held at 10am on 27 October 2015 at The Royal Automobile Club, 89 Macquarie Street, Sydney NSW 2000
WWW.SIRTEX.COMSIR-Spheres® is a registered trademark of Sirtex SIR-Spheres Pty Ltd.

www.sirtex.com