Embed Size (px)
Citation preview
Columbus, Lautrupvang 6, DK-2750 Ballerup Phone: +45 70 20 50 00, Fax: +45 70 25 07 01 www.columbusglobal.com, CVR.: 13 22 83 45
Annual Report 2016 Columbus A/S CVR.: 13 22 83 45

Management’s review Columbus Annual Report 2016
2
Columbus is a leading global services company focused on the manufacturing, food processing and retail industries. We help organizations digitally transforming their business and improving the value realization of ERP.
About Columbus
Listed on Nasdaq in 1998
1,200 employees
Global services company with
24/7 global support with ColumbusCare
We help our customersdigitally transform their business
development and sale of industry specific software and services
Local offices in 12 countries with
customers in 45 countries
We focus on 3 industries: Manufacturing, food, retail
Every month we ask our customers to rate their

Columbus Annual Report 2016 Management’s review
3
Highlights
Revenue
DKK 1,193m corresponding to a growth of 6%.
EBITDA1
DKK 144m corresponding to a growth of 37%. 1 EBITDA before share-based payment
Service EBITDA
DKK 91m corresponding to a growth of 131%.
Columbus Software sales
DKK 91m corresponding to a decline of 6%.
Net result
DKK 81.5m corresponding to an increase of 25%.
Recurring revenue and cloud revenue
DKK 302m corresponding to an increase of 11%. The proportion of recurring revenue constitutes 25% of the total revenue.

Management’s review Columbus Annual Report 2016
4
Contents Columbus
About Columbus 2
Highlights 3
Seizing the wind 5
Management’s review
Columbus2020 – strategy update 8
2016 outlined 12
2016: Solid start of Columbus2020 strategy 14
Expectations for 2017 17
Long-term targets for 2019 19
Risk issues 20
Corporate governance 24
Corporate social responsibility 28
Notifications to NASDAQ Copenhagen 30
Group overview 31
The Board of Directors and Executive Board 32
Shareholder information 34
Statement by management on the Annual Report 36
Independent Auditors Reports 37
Financial Statements
Statement of comprehensive income 43
Balance sheet 44
Statement of changes in equity - Group 46
Cash flow 48
Notes 49

Columbus Annual Report 2016 Management’s review
5
In the beginning of 2016, Columbus set sail for a new five-year strategic journey. The strategy is called Columbus2020, and the aim is to lead our customers successfully in the digital transformation. Digitalizing business is becoming increasingly important for companies around the world, and there is a very high correlation between the level of digitalization in a business and achieving business results. The more digitalized the business is, the higher return for customers and shareholders because digitalization creates the opportunity for developing, optimizing, automating and streamlining the business. Our customers’ request for smarter and faster digitalization is hence the underlying foundation of Columbus2020. Columbus2020 has already made important progress for our business. One example is Columbus Pulse: a global customer loyalty program which measures customer satisfaction and loyalty regularly in order to improve the value that we realize for our customers. The goal is to improve customer satisfaction across our business and keep our customers for life. Another important element of Columbus2020 is our objective to constantly improve the quality in our business. In the strategic element called Process Excellence we strive to improve quality and maturity across our sales, delivery and support organization. Improving quality makes our customers more satisfied and at the same time yields higher profitability for Columbus, because
higher quality means less waste and inefficiency. Columbus is fundamentally a people business, and taking care of our people is crucial to our success. To us, taking care of our people means investing in education, offering attractive working conditions and providing a career and training path for all our employees - from junior to senior and across all roles in the company. We want to attract, develop and retain the best people in our market. I am sure that Columbus2020 will generate significant value to shareholders, and I am encouraged by the progress we have made so far. 2016 was a very good year for Columbus as we improved both revenue and earnings ahead of our plan. I am particularly satisfied with the strong growth in our services business and the overall increased profitability of Columbus. I am also happy to welcome the employees from the three acquisitions SystemHosting A/S, Client Strategy Group LLC and Cambridge Online Systems Ltd, which we completed in 2016, and from Tridea Partners LLC, which we acquired in January 2017. We are now integrating these businesses into Columbus. During the second half of 2016 we began to see the impact of the cloud in our business as customers are investing and using business applications on subscription terms rather than on transactional terms. In the long term this market transformation is a significant advantage to Columbus because our
revenue and earnings will become more recurring, and thus more predictive and stable. However, short term it will have a negative impact on software revenue and profitability. The cloud transformation is affecting many parts of our business from how we develop solutions, how we go to market to how we deliver projects and take care of our customers. Columbus welcomes the change because we are prepared to anticipate the changing customer demands and technology trends. We will seize the shifting winds and continue our growth journey, and I am convinced that Columbus will leverage the market transformation to build an even stronger, more reliable and profitable business over the next years. Ib Kunøe Chairman of the Board
Seizing the wind

Management’s review Columbus Annual Report 2016
6
Columbus’ mission
Columbus’ core purpose is to help organizations digitally transform their business and maximize productivity by offering innovative and leading business solutions.
Columbus’ vision
Columbus aims to be a leading value provider of digital business solutions in selected industries.
We aspire to keep our customers for life.
We will attract, develop and retain the best people in the industry.

Columbus Annual Report 2016 Management’s review
7
Management’s review

Management’s review Columbus Annual Report 2016
8
Columbus’ business model is built on the company’s highly skilled employees, unique solutions, strong innovation platform, a global and scalable delivery model, and strong customer relations. Columbus holds a leadership position within digital transformation within our three focus industries, supported by a number of global trends that offer attractive growth opportunities. Digital transformation is driving business growth Digital transformation is having a significant impact on enterprises worldwide. Digital transformation reshapes many aspects of a business, and today digital transformation is a central component of modern business strategy. The globalization and new disruptive players entering the markets make competition much more fierce. Customer experience is therefore becoming crucial in the increasing competitive business environment. Customers are more cautious than ever and demand an ultimate customer experience in every touch-point with the business. Furthermore, companies across all industries are navigating a global proliferation of diverse regulatory requirements, stakeholder expectations,
digitalization disrupters and business model changes, where compliance and risk management are becoming crucial to the business. These global trends are the primary growth drivers for Columbus’ business. Businesses will increasingly need to invest in business applications and services in order to adapt to these trends. Columbus launched its new strategy Columbus2020 in March 2016, with the goal of being a leading global value provider of digital business solutions in selected industries. Columbus2020 - seizing the digital economy Columbus’ five-year strategy is based on four interconnected elements that lead customers in the digital transformation of their business. In the following, we explain Columbus2020, and how we progressed in the first year of the execution of the strategy. Customer Success Taking care of customers for life Satisfied and loyal customers are crucial to us. Columbus therefore aims to be widely recognized as a business partner that enhances our customers’ success by improving the value realization of their ERP investments.
In order to reach that goal, we focus on creating a unique customer experience in all aspects of our business. This includes extensive focus on the entire value chain in Columbus - from an improved and standardized sales process, better quality in project delivery to strong service delivery management and lifetime support. In 2016, we introduced Columbus Pulse, which is a global loyalty and satisfaction program that measure our customers’ loyalty on a monthly basis. Columbus aims to have the most satisfied customers in the industry, and by measuring it continuously we set the direction of improvement. In order to take care of our customers for life, we continuously improve our foundation for lifetime support; ColumbusCare, which ensures our customers high quality support around the clock. Our goal is to extend the current ColumbusCare with new services in order to take care of our customers – for life. Digital Leadership Accelerate business innovation Columbus helps our customers maximize the value realization of ERP and lead them in the digital business transformation. Digital Leadership comprises two different, yet closely connected types of digital innovation. Columbus continues to strengthen our leadership position within ERP. This means that we invest in new business applications, new methodologies, and new business processes to make the experience of buying and implementing ERP and other business applications from
Columbus2020 – strategy update
Columbus had a solid start to the company’s new strategic journey Columbus2020, with the goal of leading our customers in the digital transformation.

Columbus Annual Report 2016 Management’s review
9
Columbus faster, better and less risky and with high returns. The other type of innovation within Digital Leadership reaches beyond ERP, thus investing in the development of solutions and services that help our customers in the digital transformation of their business. By using cloud, social, analytics and IoT technologies, Columbus enables customers to take advantage of the digital opportunities. The shift towards cloud-based solutions started some years ago, however in 2016 the cloud transition emerged with full speed. Microsoft introduced Dynamics 365, which is Microsoft’s new cloud-based business application framework, moving Microsoft into a market leading position. Already in 2016, Microsoft Dynamics 365 meant significant business opportunities for Columbus, and Columbus completed the first Dynamics 365 implementation in Denmark. During 2016, Columbus converted most of our software portfolio into cloud, which means that customers can buy total cloud solutions based on Columbus Software products in the cloud. Furthermore, Columbus launched our first IoT solution, innius®, which is a cloud-based business application developed for manufacturing companies delivering real-time intelligence about machine performance. Process Excellence Quality in everything we do In Columbus, we constantly strive to optimize and streamline the business operations in order to achieve global sales excellence and deliver high quality services to our customers. Our goal is to create the best customer experience when engaging with Columbus.
The focal point is quality in everything we do – from the initial contact with customers, over sales and design of the business solution to the implementation process and lifetime support engagement. We want to be best in class in ensuring the value realization of the project and manage the inherent risks in the implementation. In order to reach that goal, we optimize our sales, services and support delivery capabilities – always striving to improve the quality. In 2016, Columbus modernized our brand including launching a new modern website addressing the demands for responsiveness and today’s buying behavior. Furthermore, we implemented common sales and marketing processes globally. In Services, Columbus implemented the company’s global services excellence program (GSE) insuring high quality in project delivery. Our People Attract, develop and retain the best people Columbus is a people business. Our greatest asset is our people and therefore it is crucial for our success that we attract and retain the best people in the industry. We want Columbus to be a company highly skilled people join, because it is the best place for gaining competence development, career opportunities and attractive working conditions. Furthermore, we want to create a customer culture, where meeting the customers’ expectations sets the direction in everything we do. This means that Columbus always strives to deliver projects on time, within budget and at the highest quality.
In 2016, Columbus continued the investment in career and skills development across the Group, including an upgraded Columbus’ Competencies & Career Framework (CCF), which means that Columbus today has a unified business objective setup in all subsidiaries.
Management’s review Columbus Annual Report 2016
10
Columbus2020 – embracing the digital economy Columbus’ five-year strategy, Columbus2020, was born with the ambition of being a leading global value provider of digital business solutions in selected industries. Columbus continues to invest in new innovative business solutions, while at the
same time optimizing and streamlining our services business. Ensuring satisfied and successful customers is an essential focus area for Columbus, as well as engaged and motivated employees. The strategy is based on four strategic interconnected elements that lead our
customers in the digital transformation of their business. In the following, we take a closer look at Columbus’ ambitions within our strategic focus areas.
Columbus’ strategy is built around three value drivers:
Improve profitability in the services business Today, the services business is our largest revenue contributor, and we expect the service revenue to continue to be the major revenue stream in the future. We aim to deliver higher productivity and quality in our services business to optimize delivery, minimize risk and control cost.
Scaling of own software sales Columbus Software generates high earnings while creating high value for customers. We aim to grow our software sales within Columbus Software subscriptions and cloud revenue.
Recurring service revenue and cloud revenue We expect to grow the recurring service revenue in order to improve predictability and profitability. The recurring revenue consists of Columbus Software and third party software subscriptions, cloud revenue and ColumbusCare revenue. All revenue categories are based on a long co-operation with customers where Columbus becomes the strategic business partner.
Columbus Annual Report 2016 Management’s review
11
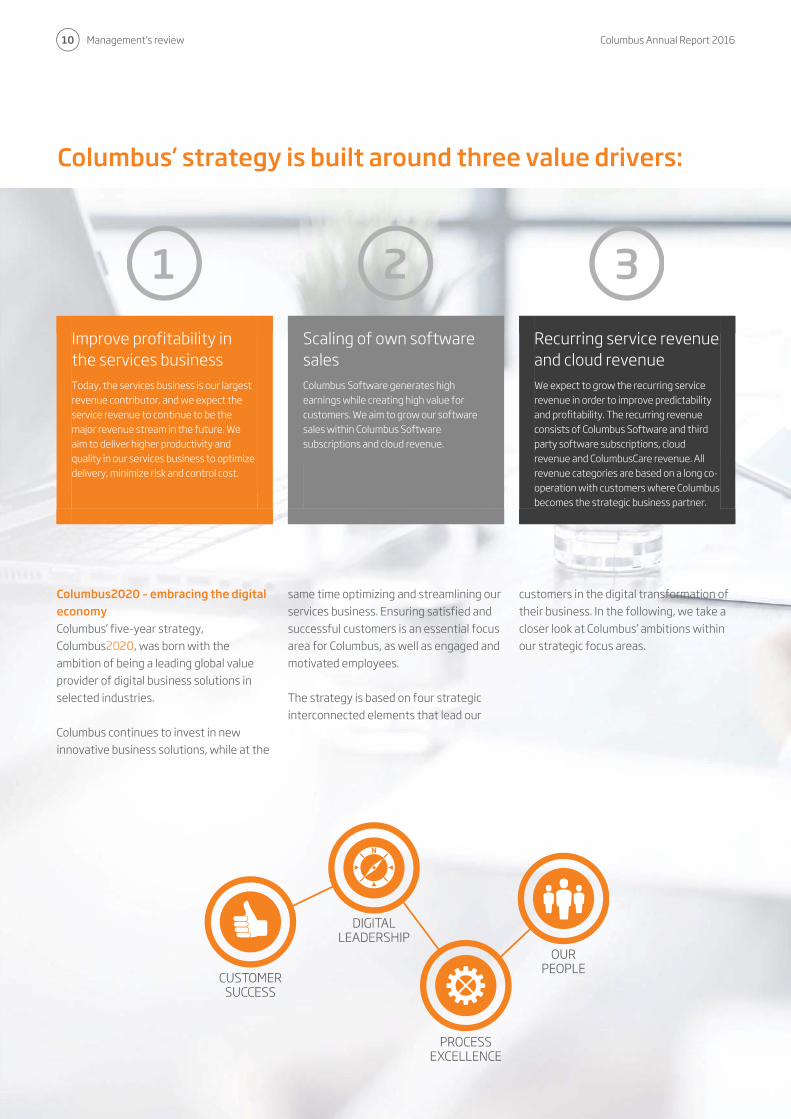
Customer Success – Taking care of our customers for life
Columbus aims to be widely recognized as a business partner that enhances our customers’ success by improving the value realization of their ERP investments. Therefore, we will intensify our focus on creating a unique customer experience, including an extensive focus on better quality and project delivery throughout our business.
Taking care of our customers is a fundamental goal for Columbus. An important foundation for reaching that goal is our lifetime support offering, ColumbusCare, which ensures our customers high quality support around the clock. We will extend the ColumbusCare offering with new services towards a total service concept that takes care of our customers – for life.
Digital Leadership – Accelerate business innovation
Columbus helps our customers accelerate business innovation by maximizing the value realization of ERP and by leading them in the digital business transformation. Digital Leadership comprises two different, yet closely connected types of innovation: Columbus will continue to strengthen our leadership position within ERP. This means that we will invest in new business applications, new methodologies and new business processes to make the experience of buying and implementing ERP and other business applications from Columbus faster, better, less risky and with high returns.
Columbus will extend our business and build a new leadership position in digital business transformation. Our customers are seeking a business partner that is able to lead them in the digital transformation of their business. Columbus wants to be that partner. We will build a leadership position using cloud, social, analytics and IoT (Internet of Things) technologies and business models, to enable our customers to take advantage of the digital opportunities.
Process Excellence – Quality in everything we do
In Columbus, we constantly strive to optimize and streamline the business operations in order to achieve global sales excellence and deliver high quality services to our customer. Our goal is to create the best customer experience for our customers, when engaging with Columbus. The focal point is quality in everything we do – from the initial contact with customers, over sales and design of
the business solution to the implementation process and lifetime support engagement. We want to be best in class in ensuring the value realization of the project and manage the inherent risks in the implementation. In order to reach that goal, we will optimize our sales, services and support delivery capabilities – always striving to improve the quality.
Our People – Attract, develop and retain the best people
Columbus is a people business. Our greatest asset is our people and therefore it is crucial for our success that we attract and retain the best people in the industry. We want Columbus to be a company attracting highly skilled people to join, because it is the best place for competence development. We will achieve this goal by providing challenging career opportunities, attractive working conditions and professional and personal growth.
Furthermore, we want to create a customer success culture, where meeting the customers’ expectation for high quality sets the direction in everything we do. This means that we always strive to deliver projects on time, within budget and at the highest quality.
Management’s review Columbus Annual Report 2016
12
Specific targets for 2016 Expectations announced in Annual Report 2015: • Revenue in the level of DKK 1.2bn • EBITDA1 in the level of DKK 120m • Service EBITDA of DKK 80m • Columbus Software in the level of DKK
105m. • 10% dividend on nominal share capital In connection with the acquisition of Client Strategy Group LLC in July 2016, Columbus increased the expectations to EBITDA1 from the level of DKK 120m to the level of DKK 124m, and Service EBITDA from DKK 80m to DKK 84m. On 2 November 2016, the expectations to Columbus Software were reduced from DKK 105m to the level of DKK 95m, due to a faster cloud conversion than expected. On 16 January 2017, the EBITDA1 guidance was adjusted to the level of DKK 144m. Management initiatives • Launch of the Columbus2020 strategy • Acquisitions:
• SystemHosting A/S • Client Strategy Group LLC (CSG) • Cambridge Online Systems Ltd.
• Cloud conversion Cloud conversion The shift towards cloud-based solutions emerged faster than expected in 2016.
1 EBITDA before share-based payment
Microsoft introduced Microsoft Dynamics 365, which is Microsoft’s new cloud-based business application framework. This move to the cloud affects Columbus, as more customers have been and will continue to move in part or in full to the cloud, and thus when customers subscribe to Microsoft Software, they also wish to subscribe to Columbus Software instead of buying licenses. The faster cloud conversion lead to a decrease in the sale of Columbus Software license, as customers were initially being reluctant to replace or upgrade the business applications. At the same time the new license terms result in a lower revenue from sale of software, as sale of cloud subscriptions is recognized on an ongoing basis instead of upfront at the time of sale and delivery. During 2016, Columbus converted most of the software portfolio into cloud. Financial statements for 2016 The revenue amounted to DKK 1.2bn, an increase of 6%. In local currency revenue increased by 9%. EBITDA1 amounted to DKK 144m, an increase of 37%. Revenue and EBITDA1 are in line with the latest announced expectations. EBITDA1 is impacted by a net non- recurring extraordinary income of DKK 5.6m.
The revenue from Columbus’ services business increased by 11%. The Service EBITDA increased from DKK 40m to DKK 91m, an increase of 131%, which exceeded our expectations. The increase is due to improvements in efficiency, especially in Columbus Norway and Columbus US. Overall efficiency increased from 55% to 58%. Further, Service EBITDA is impacted by acquisitions. The revenue from Columbus Software decreased by 6% to DKK 91m (2015: DKK 97m). The decrease is primarily due to the cloud conversion, and secondly due to a very strong software sale in 2015. The cloud development was expected, however it has taken place faster than anticipated. The result is below our expectations and in the lower end of the announced expectations. Recurring revenue increased from 24% of total revenue to 25%, an increase of 11%, primarily affected by the acquisition of the cloud and hosting company System-Hosting. The development is in line with our expectations. EBITDA after share-based payment increased by 33% to DKK 139m compared to 2015 (2015 DKK 104m). Net result after tax is DKK 81.5m (2015 DKK 65.3), an increase of 25%, and is considered satisfactory. Dividend In line with Columbus’ dividend policy, the Board of Directors proposes a dividend of 10% of the nominal share capital, corresponding to DKK 0.125 per share, to be adopted at the General Meeting.
2016 outlined
A solid start to Columbus’ new strategy Columbus2020 with a revenue of DKK 1.193m, a growth of 6%, and EBITDA1 of DKK 144m, corresponding to a growth of 37%.

Columbus Annual Report 2016 Management’s review
13
The key figures and financial ratios above have been calculated in accordance with the Danish Society of Financial Analysts’ “Recommendations and Key Figures 2015”.
Key figures and ratios DKK ´000 2016 2015 2014 2013 2012
Income related figures
Columbus licenses 44.187 52.251 28.782 31.052 34.434
Columbus subscriptions 46.876 44.530 33.059 29.102 25.950
Columbus Software 91.063 96.781 61.841 60.154 60.384 External licenses 86.495 107.525 73.891 88.270 130.550
External subscriptions 195.164 184.524 124.350 140.258 140.572
Service 796.401 715.545 596.942 567.614 531.711
Other 23.584 19.068 21.267 23.509 17.968
Net revenue 1.192.707 1.123.443 878.291 879.805 881.185
Recurring revenue % of total revenue 25,3% 24,3% N/A N/A N/A
Service EBITDA 91.341 39.504 N/A N/A N/A
EBITDA before share-based payment 144.070 105.225 81.591 72.084 58.152
EBITDA 138.546 103.863 78.704 70.124 56.952
EBIT 105.271 74.843 52.893 44.772 29.028
Profit before tax 107.303 83.400 58.700 36.730 23.258
Profit after tax 81.479 65.339 52.697 21.734 145 Balance sheet
Non-current assets 547.771 431.496 277.441 245.104 258.221
Current assets 289.735 266.285 272.777 238.600 241.837
Total assets 837.506 697.781 550.218 483.704 500.058 Group shareholder equity 469.813 386.179 325.901 280.332 273.026
Minority interests 1.774 2.573 4.233 3.646 7.507
Total liabilities 365.919 309.029 220.084 199.726 219.525
Total equity and liabilities 837.506 697.781 550.218 483.704 500.058
Investments in tangible assets 8.799 6.276 3.819 3.817 7.485 Cash flow
Cash flow from operating activities 124.708 109.147 75.023 72.665 46.496
Cash flow from discontinued operations 0 0 0 -3.047 -4.874
Cash flow from investing activities -130.546 -109.124 -36.285 -29.579 -39.776
Cash flow from financing activities 19.981 -15.450 -9.625 -905 -10.346
Total cash flow 14.143 -15.427 29.113 39.134 -8.500 Key ratios
EBITDA-margin 11,6% 9,2% 9,0% 8,0% 6,5%
Operating profit margin (EBIT-margin) 8,8% 6,7% 6,0% 5,1% 3,3%
Equity ratio 56,1% 55,3% 59,2% 58,0% 54,6%
Return on equity 17,2% 16,8% 15,6% 6,6% -1,4%
Return on invested capital including goodwill (ROIC) 25,1% 24,1% 23,9% 22,6% 12,7%
Number of shares, in thousands 116.198 113.699 110.264 106.234 105.739
Average number of shares, in thousands 115.628 112.930 109.343 106.108 105.739
Book value of equity per share (BVPS) 4,04 3,40 2,96 2,64 2,58
Earnings per share (EPS) 0,70 0,57 0,46 0,18 -0,04
Cash flow per share 1,04 0,95 0,66 0,67 0,44
Share price, end of period 10,70 6,70 4,70 3,80 1,69
Average full time employees for the period 1.105 1.080 889 842 845
Management’s review Columbus Annual Report 2016
14
Services business and acquisitions are driving growth Total revenue increased by 6% to DKK 1,193m, while increasing EBITDA2 by 37%, amounting to DKK 144m. In local currencies, the revenue increased by 9%. The revenue was mainly affected by the negative development in GBP compared to 2015. The revenue growth was primarily driven by a solid growth in the services business and acquisitions made in 2015 and 2016. The increase in EBITDA2 was primarily due to a significant growth in profitability in the services business and secondly due to the effect of the acquisitions made in 2015 and 2016. EBITDA2 was also impacted by a non-recurring extraordinary income of DKK 5,6m. 2016: A solid start of Columbus2020 In March 2016, Columbus announced the company’s new five-year strategy Columbus2020. The ambition is to be a leading global value provider of digital business solutions in selected industries.
2 EBITDA before share-based payment
Columbus continues the optimizing and streamlining of the business to improve customer success and to improve profitability. At the same time, Columbus continues to invest in new innovative business applications and services that will drive growth and further strengthen the company’s market position. Ensuring satisfied customers is an essential focus area for Columbus, as well as dedicated and motivated employees. In connection with the new strategy, Columbus has identified three value drivers, which reflect the new strategic direction. The value drivers measure the development in relation to significant success criteria for future growth and value creation. Value drivers 1. Improve profitability in the services business Columbus’ services business is the largest revenue contributor in the Group. Columbus aims to expand the services business and continuously improve productivity and quality.
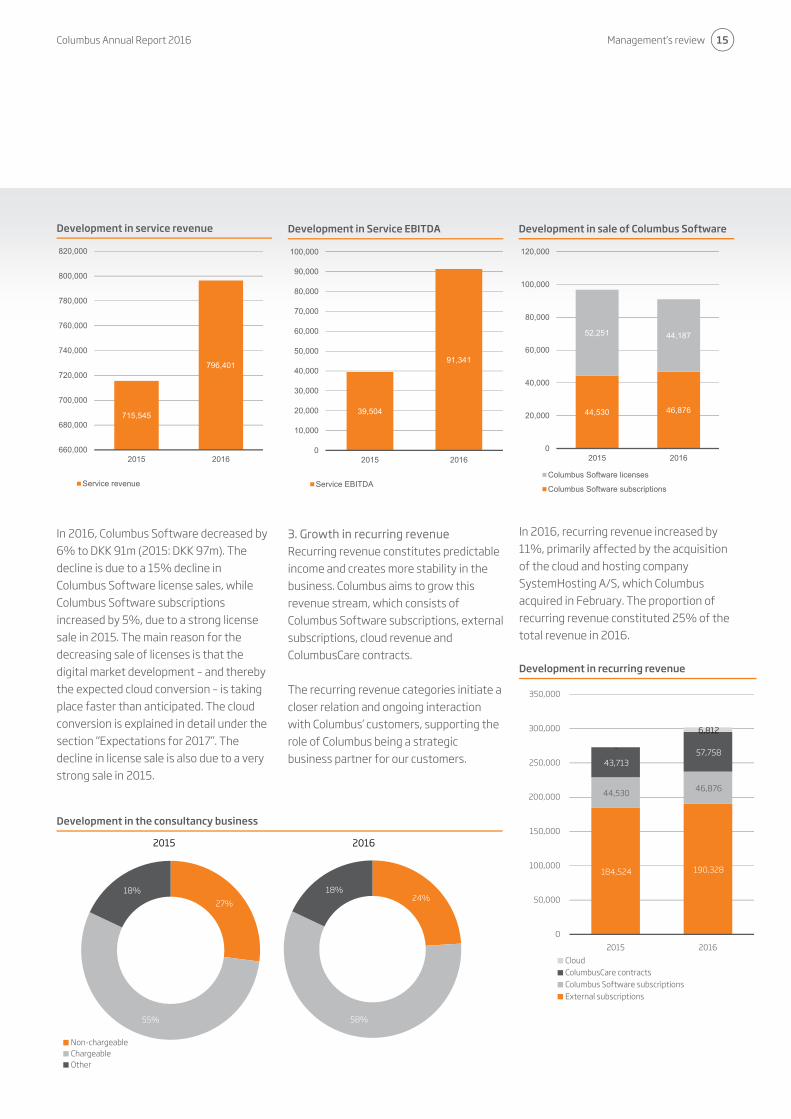
The value driver “Service EBITDA” reflects the achievement of this target. In 2016 Service Revenue increased by 11% and the Service EBITDA increased from DKK 40m to DKK 91m, an increase of 131%. The main reason for this improvement was an increase in chargeable hours from 55% to 58%, with the greatest progress coming from Columbus Norway and Columbus US. Acquisitions are also an important contributor to the improved Service EBITDA. Columbus’ services business delivered significant progress during 2016. With a successful implementation of the company’s global quality program (GSE), Columbus has improved and streamlined project deliveries across the business ensuring customers high quality implementations. Columbus’ Global Delivery Center has expanded further in 2016 to 120 skilled consultants. The center ensures high scalability and improved productivity in the services business. 2. Scaling of own software sales Columbus Software is of strategic importance to Columbus, since this is a key differentiator in the market and generates high marginal earnings. Columbus aims to grow software licenses, subscriptions and cloud solutions.
2016: Solid start of Columbus2020strategy
Columbus increased EBITDA2 by 37% to DKK 144m. Revenue grew by 6%. Columbus’ services business and acquisitions are driving the revenue and EBITDA increase.
Columbus Annual Report 2016 Management’s review
15
In 2016, Columbus Software decreased by 6% to DKK 91m (2015: DKK 97m). The decline is due to a 15% decline in Columbus Software license sales, while Columbus Software subscriptions increased by 5%, due to a strong license sale in 2015. The main reason for the decreasing sale of licenses is that the digital market development – and thereby the expected cloud conversion – is taking place faster than anticipated. The cloud conversion is explained in detail under the section “Expectations for 2017”. The decline in license sale is also due to a very strong sale in 2015.
Development in Service EBITDA
3. Growth in recurring revenue Recurring revenue constitutes predictable income and creates more stability in the business. Columbus aims to grow this revenue stream, which consists of Columbus Software subscriptions, external subscriptions, cloud revenue and ColumbusCare contracts. The recurring revenue categories initiate a closer relation and ongoing interaction with Columbus’ customers, supporting the role of Columbus being a strategic business partner for our customers.
In 2016, recurring revenue increased by 11%, primarily affected by the acquisition of the cloud and hosting company SystemHosting A/S, which Columbus acquired in February. The proportion of recurring revenue constituted 25% of the total revenue in 2016. Development in recurring revenue
39,504
91,341
0
10,000
20,000
30,000
40,000
50,000
60,000
70,000
80,000
90,000
100,000
2015 2016
Service EBITDA
Development in service revenue
Development in the consultancy business
Development in sale of Columbus Software
715,545
796,401
660,000
680,000
700,000
720,000
740,000
760,000
780,000
800,000
820,000
2015 2016
Service revenue
44,530 46,876
52,251 44,187
0
20,000
40,000
60,000
80,000
100,000
120,000
2015 2016
Columbus Software licenses
Columbus Software subscriptions
184,524 190,328
44,530 46,876
43,713 57,758 -
6,812
0
50,000
100,000
150,000
200,000
250,000
300,000
350,000
2015 2016
CloudColumbusCare contractsColumbus Software subscriptionsExternal subscriptions
2015 2016
24%
58%
18%
27%
55%
18%
Non-chargeableChargeableOther
Management’s review Columbus Annual Report 2016
16
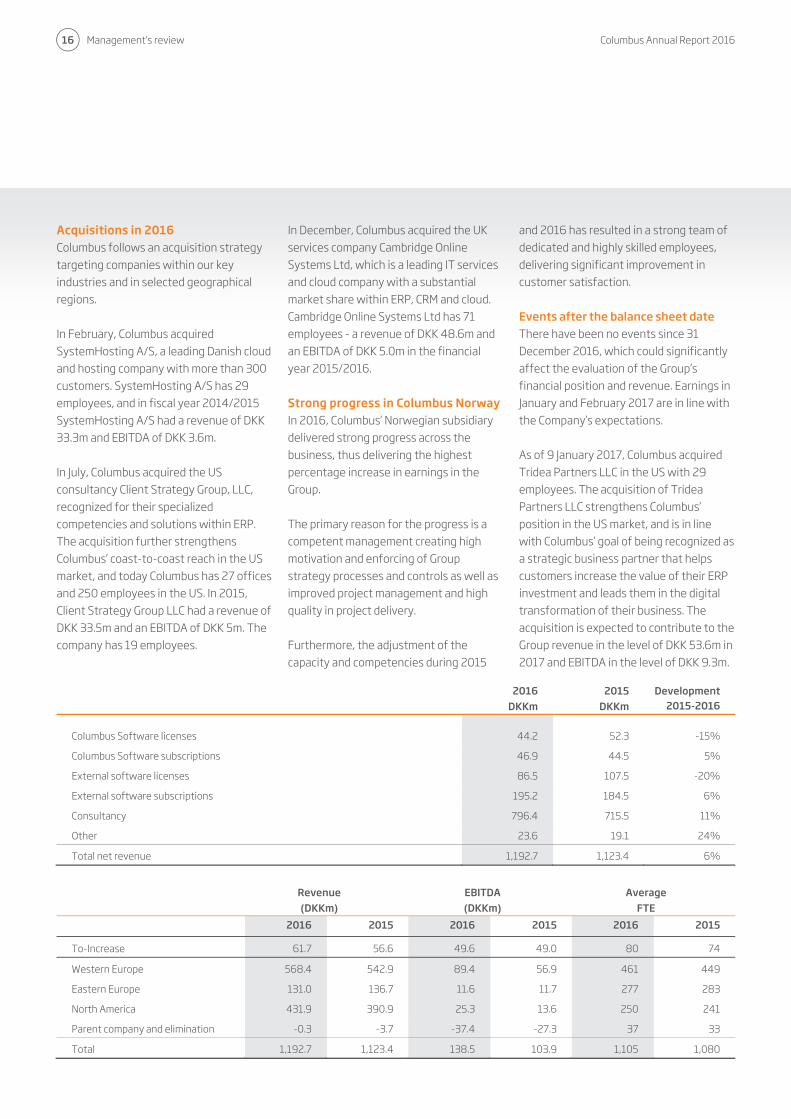
Acquisitions in 2016 Columbus follows an acquisition strategy targeting companies within our key industries and in selected geographical regions. In February, Columbus acquired SystemHosting A/S, a leading Danish cloud and hosting company with more than 300 customers. SystemHosting A/S has 29 employees, and in fiscal year 2014/2015 SystemHosting A/S had a revenue of DKK 33.3m and EBITDA of DKK 3.6m. In July, Columbus acquired the US consultancy Client Strategy Group, LLC, recognized for their specialized competencies and solutions within ERP. The acquisition further strengthens Columbus’ coast-to-coast reach in the US market, and today Columbus has 27 offices and 250 employees in the US. In 2015, Client Strategy Group LLC had a revenue of DKK 33.5m and an EBITDA of DKK 5m. The company has 19 employees.
In December, Columbus acquired the UK services company Cambridge Online Systems Ltd, which is a leading IT services and cloud company with a substantial market share within ERP, CRM and cloud. Cambridge Online Systems Ltd has 71 employees - a revenue of DKK 48.6m and an EBITDA of DKK 5.0m in the financial year 2015/2016. Strong progress in Columbus Norway In 2016, Columbus’ Norwegian subsidiary delivered strong progress across the business, thus delivering the highest percentage increase in earnings in the Group. The primary reason for the progress is a competent management creating high motivation and enforcing of Group strategy processes and controls as well as improved project management and high quality in project delivery. Furthermore, the adjustment of the capacity and competencies during 2015
and 2016 has resulted in a strong team of dedicated and highly skilled employees, delivering significant improvement in customer satisfaction. Events after the balance sheet date There have been no events since 31 December 2016, which could significantly affect the evaluation of the Group’s financial position and revenue. Earnings in January and February 2017 are in line with the Company’s expectations. As of 9 January 2017, Columbus acquired Tridea Partners LLC in the US with 29 employees. The acquisition of Tridea Partners LLC strengthens Columbus’ position in the US market, and is in line with Columbus’ goal of being recognized as a strategic business partner that helps customers increase the value of their ERP investment and leads them in the digital transformation of their business. The acquisition is expected to contribute to the Group revenue in the level of DKK 53.6m in 2017 and EBITDA in the level of DKK 9.3m.
Revenue (DKKm)
EBITDA (DKKm)
Average FTE
2016 2015 2016 2015 2016 2015
To-Increase 61.7 56.6 49.6 49.0 80 74
Western Europe 568.4 542.9 89.4 56.9 461 449
Eastern Europe 131.0 136.7 11.6 11.7 277 283
North America 431.9 390.9 25.3 13.6 250 241
Parent company and elimination -0.3 -3.7 -37.4 -27.3 37 33
Total 1,192.7 1,123.4 138.5 103.9 1,105 1,080
2016 DKKm
2015 DKKm
Development 2015-2016
Columbus Software licenses 44.2 52.3 -15%
Columbus Software subscriptions 46.9 44.5 5%
External software licenses 86.5 107.5 -20%
External software subscriptions 195.2 184.5 6%
Consultancy 796.4 715.5 11%
Other 23.6 19.1 24%
Total net revenue 1,192.7 1,123.4 6%
Columbus Annual Report 2016 Management’s review
17
Expectations for growth The use of ERP systems has seen a shift in recent years. ERP and business applications in general are increasingly becoming key in companies’ ability to compete in the intensified global competition. The need for better understanding customer trends, product requirements and improve customer service creates a higher demand for ERP and other business applications that help companies compete in the digital economy. Columbus holds a market leading position within the market for digital transformation, and with the emerging demand for cloud-based business applications, Columbus has positive expectations for 2017. Cloud Conversion - a business opportunity for Columbus One of the significant computing trends these years is the shift towards cloud-based solutions. This trend is arisen from customers’ demands for more agile and flexible business applications where implementation efforts and investment requirements are decreasing. Industry leaders such as Salesforce, Oracle, SAP and Microsoft are also pushing the cloud based solutions because they create new business opportunities and change the competitive landscape. The transition to cloud computing started some years ago with IaaS (Infrastructure
as a Service) and subsequently PaaS (Platform as a Service). Now customers are ready to move more advanced business applications such as ERP and CRM to the cloud (Software as a Service). In October 2016, Microsoft introduced Microsoft Dynamics 365, which is Microsoft’s new cloud-based business application framework. It uses Microsoft Azure as the underlying foundation and it is a very efficient framework for business applications. Microsoft is clearly moving into a market leading position with Dynamics 365 and this creates significant business opportunities for Columbus as we together with Microsoft can offer complete and compelling industry-based business applications running in the Microsoft Azure cloud. In connection with the introduction of Microsoft Dynamics 365, Microsoft announced a cloud-based pricing, which shifts the payment from an up-front payment to an ongoing payment.
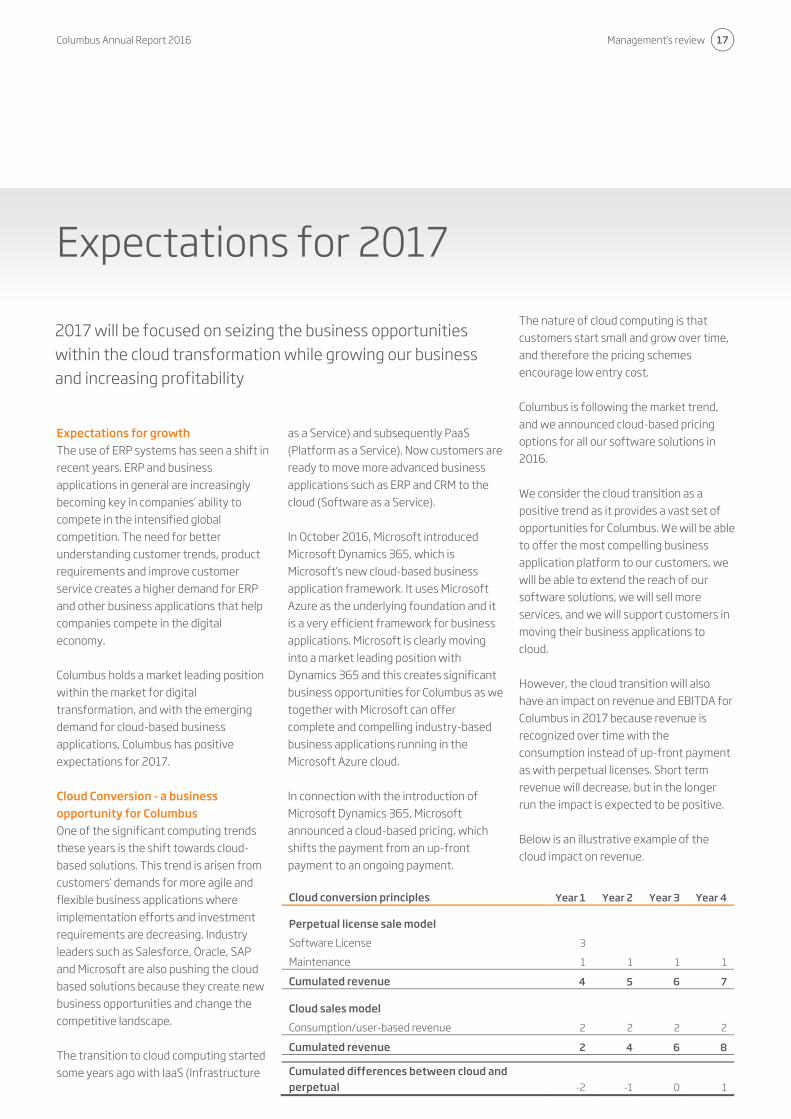
The nature of cloud computing is that customers start small and grow over time, and therefore the pricing schemes encourage low entry cost. Columbus is following the market trend, and we announced cloud-based pricing options for all our software solutions in 2016. We consider the cloud transition as a positive trend as it provides a vast set of opportunities for Columbus. We will be able to offer the most compelling business application platform to our customers, we will be able to extend the reach of our software solutions, we will sell more services, and we will support customers in moving their business applications to cloud. However, the cloud transition will also have an impact on revenue and EBITDA for Columbus in 2017 because revenue is recognized over time with the consumption instead of up-front payment as with perpetual licenses. Short term revenue will decrease, but in the longer run the impact is expected to be positive. Below is an illustrative example of the cloud impact on revenue.
Expectations for 2017
2017 will be focused on seizing the business opportunities within the cloud transformation while growing our business and increasing profitability
Cloud conversion principles Year 1 Year 2 Year 3 Year 4
Perpetual license sale model Software License 3 Maintenance 1 1 1 1
Cumulated revenue 4 5 6 7
Cloud sales model Consumption/user-based revenue 2 2 2 2
Cumulated revenue 2 4 6 8
Cumulated differences between cloud and perpetual -2 -1 0 1

Management’s review Columbus Annual Report 2016
18
Columbus expects that the total impact on revenue in 2017 will be in the level of DKK -40m. The impact on EBITDA is expected to be in the level of DKK -25m. Management priorities for 2017 • Execute the Columbus2020 strategy • Improve customer satisfaction NPS
results • Synchronize processes in both the
sales and the services business • Develop Columbus Competencies &
Career Framework for employees further
• Develop products and services to ensure digital leadership, including launch of cloud solution portfolio and ColumbusCare offerings
• Execution of Cloud Execution Plan • Acquire additional businesses that
complement Columbus’ services or offering portfolio
3 EBITDA before share-based payment
Specific targets for 2017 The expectations for 2017 are summarized below: • Revenue in the level of DKK 1.35bn • EBITDA3 in the level of DKK 150m • Columbus Software revenue in the
level of DKK 80m • Service EBITDA of DKK 140m • 10% dividend on nominal share capital
Columbus Annual Report 2016 Management’s review
19
Columbus has updated the long-term guidance for the next three years. The emerging cloud conversion leads to a changing revenue mix between services and products. This means a relatively lower growth in revenue, however a relatively higher growth in EBITDA4. Consequently, Columbus adjusts the revenue and EBITDA targets for 2019. Average revenue growth of 10% per year Columbus maintains the long-term revenue growth at a compounded average growth of 10% each year. Growth is continuously expected to derive both from acquisitions and organically. EBITDA margin of 11% Columbus adjusts long term EBITDA margin from 10% to 11% EBITDA margin each year. Due to the cloud conversion and business focus, services constitute a larger proportion of the business, thus leading to increased EBITDA1 margins. Recurring revenue Recurring revenue is expected to grow in order to improve predictability and profitability. We expect to increase recurring revenue from 25% in 2016 to 30% of total revenue in 2019.
4 EBITDA before share-based payment
Dividend 10% payout Columbus dividend policy is to pay out 10% dividend of nominal value each year. Services business performance Columbus’ goal is to continue to grow our services business with a wider portfolio of services and with an objective of delivering increased EBITDA from the services business. Increase revenue from Columbus Software We intend to continue the progress with Columbus Software. We will increase the revenue from Columbus Software through our own product development and by acquiring software that supports our strategy. However, the growth of Columbus Software will be subject to higher uncertainties due to the cloud conversion in the coming years.
Long-term targets for 2019

Management’s review Columbus Annual Report 2016
20
Strategic and operational risks Columbus’ potential to realize the Company’s strategic and operational objectives is subject to a number of commercial and financial risks. Columbus is continuously working on identifying and meeting risks that can negatively impact the Company’s future growth, activities, financial position and results. Key risks are considered and reviewed by the Executive Board and presented to the Board of Directors annually or more often if considered relevant. On page 22 some of the risk factors management considers as being of special importance to the Group are described in no specific order. All companies in the Columbus Group report financial and operational data to the head office on a monthly basis. The reporting includes comments to the financial and business development. Based on this reporting the Group’s financial statements are consolidated and reported to the Group management. As part of this process, monthly business reviews and
control meetings are held, and control visits to all operational companies in the Group are performed on an ongoing basis in order to ensure that material errors in the financial reporting are discouraged, discovered and corrected should they arise. Financial risks Columbus’ international activities entail that the Company’s earnings and equity are affected by a number of financial risks and it is the Company’s policy to identify and cover these risks pursuant to the guidelines set by the Board of Directors and the Executive Board. The finance policy sets up guidelines for the Group’s currency, investments, financing and credit risks in relation to financial counterparts. The overall goal with financial risk management is to reduce the sensitivity of earnings to fluctuations in economic trends. The overall guidelines for the management of the financial and commercial risks are outlined by the Board of Directors annually with the basis in a low risk profile so that currency and interest risks only emerge in commercial conditions.
As a result of our operation, investments and financing, the Group is exposed to changes in currency rates and interest level. The Parent Company controls the financial risks in the Group centrally and coordinates the Group’s liquidity management, including provision of capital and placement of excess liquidity.
Risk issues
Columbus attaches significance to conducting ongoing risk monitoring and management. The overall goal of risk management is to ensure that the Company is operated with a level of risk, which is in a sensible ratio to the activity level, the nature of business, and the Company’s expected earnings and equity.

Columbus Annual Report 2016 Management’s review
21
Columbus attaches significance to conducting ongoing risk monitoring and management. The overall goal of risk management is to ensure that the Company is operated with a level of risk, which is in a sensible ratio to the activity level, the nature of business, and the Company’s expected earnings and equity.

Management’s review Columbus Annual Report 2016
22
Risk issues and actions
Access to Microsoft’s products
Columbus’ business foundation is to a wide extent based on the development and implementation of customer solutions based on Microsoft Dynamics. Access to the onward sale of Microsoft Dynamics is therefore of crucial importance to the implementation of Columbus’ business strategy and Columbus works with focus on retaining the good relationship and the high partner status with Microsoft.
Software development and product innovation
The Company’s future success, including the opportunities to ensure growth, depends on the ability to continue improving existing solutions, as well as developing new solutions and products adapted to the latest technology and the clients’ needs. Columbus has many years of experience developing industry-related solutions and has chosen to separate development activities into a separate company, To-Increase. This will focus resources and make a broader sale of these products possible.
Project and contract risks It is crucial to Columbus’ services projects to be able to execute high quality at the agreed time and price. Risks are attached to the Sale, Analysis and Design, Development, Implementation and Commissioning phases. Columbus has carefully defined the individual phases, activities, and tools contained therein, with a view to active risk management and effective implementation. By focusing on the sales phase, we are striving towards a majority of repetition in solving the customer problems and the procedures by which these problems are managed. Through project reviews and ongoing analyses before, during, and after initiation, Columbus tries to ensure that fixed price contracts are entered into with the correct pricing.
Insurance The Company’s insurance policy sets the overall guidelines for the scope and management of the Company’s risks in terms of insurance. Columbus has taken policies for the compulsory and relevant insurance, which arise ordinarily purchased by comparable companies. Included is insurance for operating material and inventory. Management assessments indicate that the necessary and relevant precautions have been taken to thoroughly cover insurance issues. Columbus’ insurance policy is revised annually in consultation with the Board of Directors.
Customer dependency Columbus is dependent on constant customer intake and on maintaining customer relations. The market is generally characterized by strong prize competition. Columbus is mitigating the risk by executing the Columbus2020 strategy with continuous improvement of customer success, digital leadership and constant development of skilled employees to ensure high quality in delivery of projects and services.
Employee dependency Columbus is a knowledge-intensive company and in order to continuously offer optimal solutions, develop innovative products, and ensure satisfactory financial results, it is necessary to attract, retain and develop the right employees. Columbus has the goal of being an attractive workplace and achieves this through incentive programs, attractive working conditions, employee and manager development, and placing great importance on the company culture.
Columbus Annual Report 2016 Management’s review
23
Foreign exchange rate risk
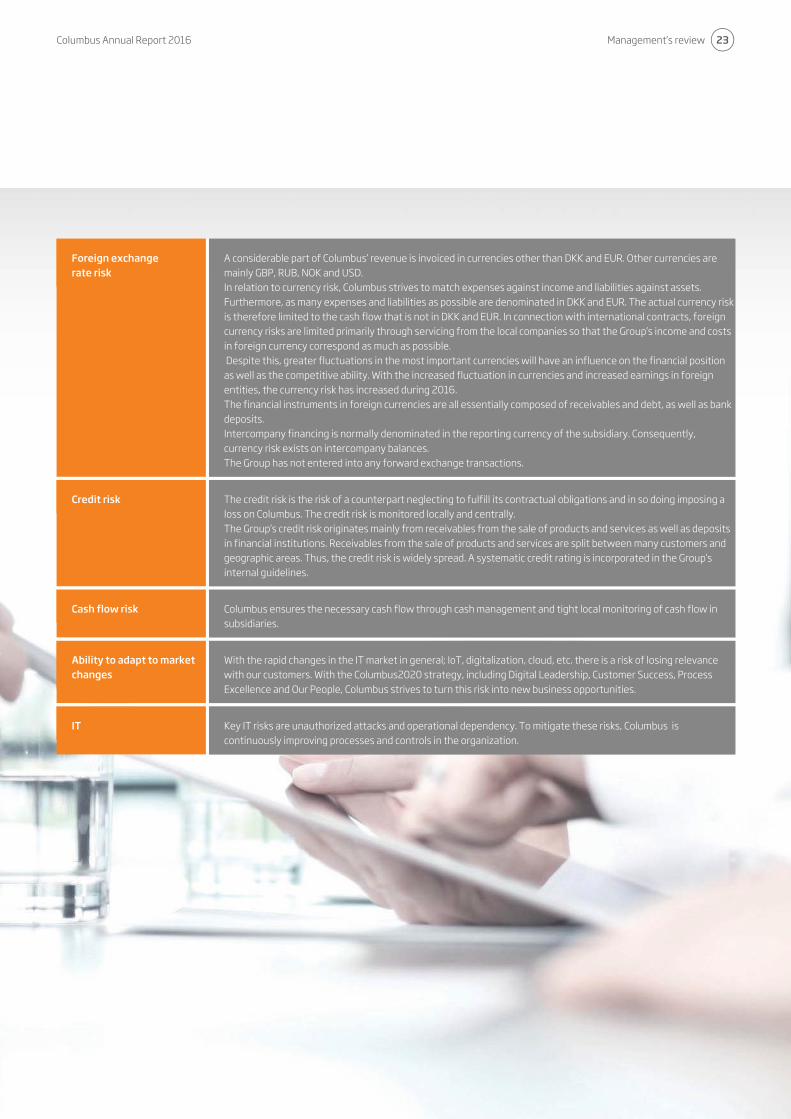
A considerable part of Columbus’ revenue is invoiced in currencies other than DKK and EUR. Other currencies are mainly GBP, RUB, NOK and USD. In relation to currency risk, Columbus strives to match expenses against income and liabilities against assets. Furthermore, as many expenses and liabilities as possible are denominated in DKK and EUR. The actual currency risk is therefore limited to the cash flow that is not in DKK and EUR. In connection with international contracts, foreign currency risks are limited primarily through servicing from the local companies so that the Group’s income and costs in foreign currency correspond as much as possible. Despite this, greater fluctuations in the most important currencies will have an influence on the financial position as well as the competitive ability. With the increased fluctuation in currencies and increased earnings in foreign entities, the currency risk has increased during 2016. The financial instruments in foreign currencies are all essentially composed of receivables and debt, as well as bank deposits. Intercompany financing is normally denominated in the reporting currency of the subsidiary. Consequently, currency risk exists on intercompany balances. The Group has not entered into any forward exchange transactions.
Credit risk The credit risk is the risk of a counterpart neglecting to fulfill its contractual obligations and in so doing imposing a loss on Columbus. The credit risk is monitored locally and centrally. The Group’s credit risk originates mainly from receivables from the sale of products and services as well as deposits in financial institutions. Receivables from the sale of products and services are split between many customers and geographic areas. Thus, the credit risk is widely spread. A systematic credit rating is incorporated in the Group’s internal guidelines.
Cash flow risk Columbus ensures the necessary cash flow through cash management and tight local monitoring of cash flow in subsidiaries.
Ability to adapt to market changes
With the rapid changes in the IT market in general; IoT, digitalization, cloud, etc. there is a risk of losing relevance with our customers. With the Columbus2020 strategy, including Digital Leadership, Customer Success, Process Excellence and Our People, Columbus strives to turn this risk into new business opportunities.
IT Key IT risks are unauthorized attacks and operational dependency. To mitigate these risks, Columbus is continuously improving processes and controls in the organization.

Management’s review Columbus Annual Report 2016
24
Columbus is committed to follow the Danish Recommendations for Corporate Governance as implemented on 1 June 2013 by NASDAQ Copenhagen in its Rules for Issuers of Shares. Accordingly, the Board of Directors has reviewed and discussed each of the recommendations in order to determine which of the recommendations are relevant for Columbus, considering the size, ownership structure and nature of the Company. Fundamentally, the Company is in compliance with the recommendations which support the Company’s business model and create value for the Company’s interested parties. Each year, in connection with the Annual Report, Columbus A/S publishes a statutory report on Corporate Governance, cf. Section 107b of the Danish Financial Statements Act, using the comply or explain approach. Management and Board Committees Columbus has a unified management structure consisting of a Board of Directors and an Executive Board. The two bodies are separate and no one serves as members of both. Board of Directors The Board of Directors in Columbus A/S consists of four members: Ib Kunøe, Jørgen Cadovius, Sven Madsen and Peter Skov Hansen. The Board members are elected for one year at a time with the option for re-election.
The number of board members is considered adequate by the Board of Directors, and likewise the composition of the Board is considered appropriate in terms of professional experience and relevant special competences to perform the tasks of the Board of Directors. Half of the members elected by the General Meeting are independent members, and none of the Board members participates in the day-to-day operation of the Company. The Board of Directors holds at least nine meetings a year according to a meeting schedule planned one year in advance on the Board meeting in December. Extraordinary Board meetings are held according to need. In 2016, 11 Board meetings were held. The Executive Board participates in Board meetings in order to ensure a direct dialogue and that the Board of Directors is well informed about the operation of the Company. The Board of Directors is responsible for the overall management of the Company on behalf of the shareholders and supervises the Company and ensures adequate management of the Company in compliance with legislation and Articles of Association. Together with the Executive Board, the Board of Directors determines goals and strategies, and approves budgets and action plans. For more details about the members of the Board of Directors and the members of the Audit Committee, see “Board of Directors and Executive Board” on page 32.
Executive Board The Board of Directors appoints the Executive Board and determines the terms of employment. The Executive Board is responsible for the day-to-day operation of Columbus, including strategy, budgets and targets for the Company. In October 2016 the Board of Directors extended the Executive Board of Columbus A/S by one member; CFO Hans Henrik Thrane. Hans Henrik Thrane has been employed as CFO in Columbus since 2010. Thus, the Executive Board now consists of two members: CEO, Thomas Honoré and CFO Hans Henrik Thrane. The Board of Directors has adopted Rules of Procedure for the Executive Board, which describes the overall tasks and responsibilities of the Executive Board, reporting to the Board of Directors and authorities of the Executive Board. The Rules of Procedure for the Executive Board are reviewed and approved annually. Audit Committee In April 2009, the Company appointed an Audit Committee, the purpose of which is to consider accounting, audit, risk and controlling issues. The Audit Committee consists of Peter Skov Hansen (Chairman) and Sven Madsen. The tasks of the Audit Committee have been determined in a Terms of Reference, which has been approved by the Board of Directors. The Terms of Reference are available on the Company’s website. The Committee determines the meeting frequency. In 2016, four meetings were held.
Corporate governance
Columbus Annual Report 2016 Management’s review
25
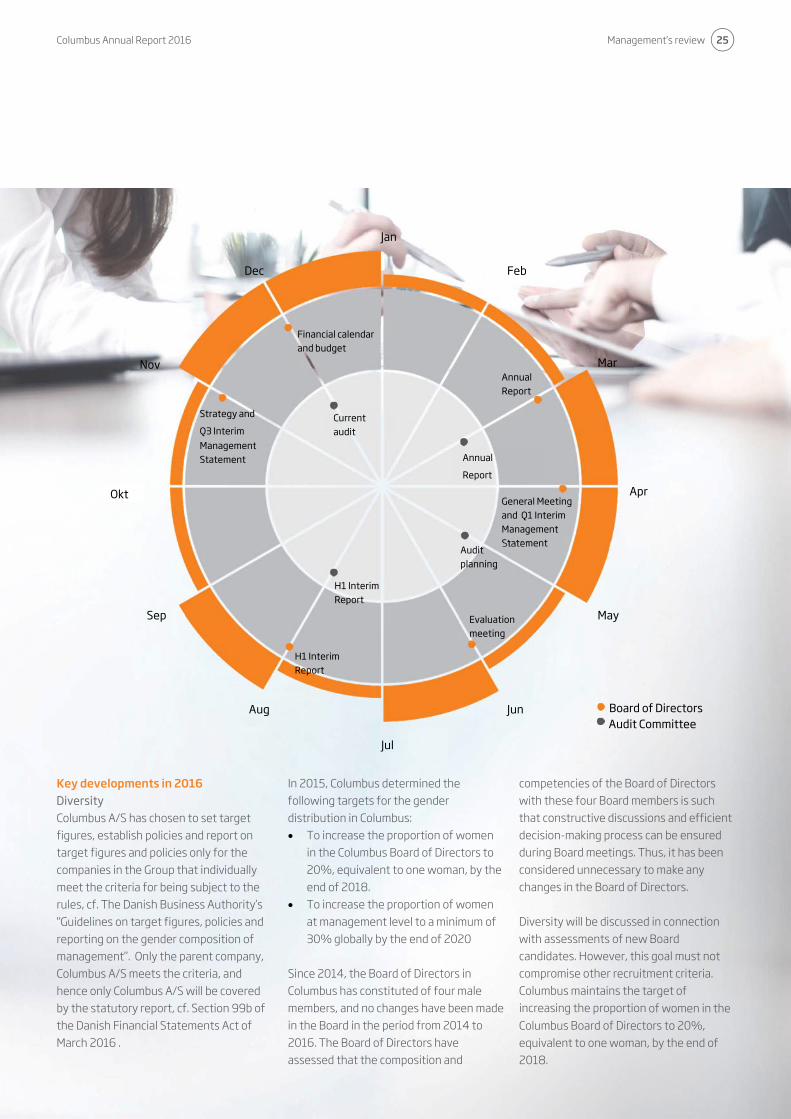
Key developments in 2016 Diversity Columbus A/S has chosen to set target figures, establish policies and report on target figures and policies only for the companies in the Group that individually meet the criteria for being subject to the rules, cf. The Danish Business Authority’s “Guidelines on target figures, policies and reporting on the gender composition of management”. Only the parent company, Columbus A/S meets the criteria, and hence only Columbus A/S will be covered by the statutory report, cf. Section 99b of the Danish Financial Statements Act of March 2016 .
In 2015, Columbus determined the following targets for the gender distribution in Columbus: • To increase the proportion of women
in the Columbus Board of Directors to 20%, equivalent to one woman, by the end of 2018.
• To increase the proportion of women at management level to a minimum of 30% globally by the end of 2020
Since 2014, the Board of Directors in Columbus has constituted of four male members, and no changes have been made in the Board in the period from 2014 to 2016. The Board of Directors have assessed that the composition and
competencies of the Board of Directors with these four Board members is such that constructive discussions and efficient decision-making process can be ensured during Board meetings. Thus, it has been considered unnecessary to make any changes in the Board of Directors. Diversity will be discussed in connection with assessments of new Board candidates. However, this goal must not compromise other recruitment criteria. Columbus maintains the target of increasing the proportion of women in the Columbus Board of Directors to 20%, equivalent to one woman, by the end of 2018.
Jan
Mar
Feb
Apr
May
Jun
Jul
Aug
Sep
Okt
Nov
Dec
Board of DirectorsAudit Committee
Annual Report
General Meeting and Q1 Interim Management Statement
Evaluation meeting
H1 Interim Report
Financial calendar and budget
Strategy and Q3 Interim Management Statement Annual
Report
H1 Interim Report
Audit planning
Current audit
Management’s review Columbus Annual Report 2016
26
In 2015, the gender distribution at Group management level in Columbus globally constituted 26% women and 74% men. At the end of 2016, the percentage of women at Group management level had increased to 27.5%. However, as stated above, Columbus has decided to set target figures and report on target figures and policies only for Columbus A/S, and therefore only the progress in Columbus A/S will be described in detail below. In 2015, the gender distribution at management level in Columbus A/S constituted 9.5% women and 90.5% men. At the end of 2016, the percentage of women at management level had increased to 12.5%. When searching for external candidates for the open management positions in 2016, recruitment agencies were asked specifically to identify relevant female candidates. With the Columbus Competence and Career Framework (CCF), it is possible to monitor and report performance of all employees. This framework ensures equal opportunities for all employees, regardless of gender. The framework was used, when internal candidates were considered for open management positions in Columbus A/S in 2016. In connection with appointments at management level, a careful assessment is conducted of which knowledge and professional experience are needed with a view to ensuring the presence of the necessary competences on all management levels. It is important that the greatest management talents, irrespective of gender, achieve the highest management positions. Columbus A/S believes that the Company has appointed the best candidates for all open positions in Columbus A/S in 2016.
The future target set by the Board of Directors is to obtain a minimum of 20% female managers in Columbus A/S by the end of 2020. Although Columbus has decided only to report progress on target figures and policies for the parent company, Columbus also focuses on increasing the proportion of women at management level in its subsidiaries, and is continuously following up on the progress. Business ethics – whistle-blower scheme In 2015, the Board of Directors decided to establish a whistle-blower scheme for expedient and confidential notification of possible or suspected wrongdoing. The whistle-blower scheme was implemented globally on 1 March 2016. Evaluation of performance The Chairman of the Board is responsible for conducting an annual evaluation of the performance of the Board of Directors and the Executive Board. In June 2016, Columbus’ Board of Directors performed an evaluation of the competencies of the Board of Directors, the cooperation between the Board of Directors and the Executive Board and the work and results of the Board of Directors and the Executive Board, including the areas operation, finance, strategy, organization and management. The Board discussed the results of the evaluation. Based on the evaluation, it was concluded that the work of the Board of Directors and Executive Board is efficient, and that the composition of the Board of Directors is appropriate in terms of professional experience and relevant special competences to perform the tasks of the Board of Directors.
Remuneration The Company has prepared guidelines for incentive programs for members of the Board of Directors and the Executive Board. The principles of the guidelines reflect a lasting and long-term value creation for the Group’s shareholders. The guidelines were adopted by the General Meeting in October 2016. Board of Directors Members of the Board of Directors receive a fixed annual fee, which is approved at the Annual General Meeting for the previous year, when approving the Annual Report. It is ensured that the remuneration of the members of the Board of Directors is in accordance with the general practice in the market and reflects the efforts required. The guidelines for incentive programs include share-based incentive programs for the Board of Directors, and the Board of Directors were granted a warrant program in July 2016. Executive Board Members of the Executive Board receive an agreed annual base salary, as well as incentive programs consisting of performance and result related bonus schemes, share-based payment and other benefits. According to the guidelines, incentive programs may also include retention bonus, loyalty bonus or the like. The Company does not pay termination payments which amount to more than two years’ annual remuneration. The Board of Directors approves the remuneration of the Executive Board. The total remuneration paid to the Board of Directors and Executive Board appears

Columbus Annual Report 2016 Management’s review
27
from note 5 in the Annual Report 2016. Incentive programs are announced in accordance with NASDAQ’s disclosure requirements. Internal controls and risk management related to financial reporting The intention of Columbus A/S’ internal control system is to eliminate or mitigate significant risks identified in the financial reporting, and that material errors and inconsistencies in the financial reporting process are identified and corrected. Overall control environment The Board of Directors has the overall responsibility for Columbus A/S’ internal controls and has approved Group policies related to internal controls, standards and procedures for financial reporting. The Board of Directors has appointed the Audit Committee to assist the Board of Directors with supervising the financial reporting process and monitoring the effectiveness of the internal controls and risk management system. The responsibility for maintaining efficient internal controls and a risk management system in connection with the financial reporting lies with the Executive Board which in cooperation with the Board of Directors evaluate the control system of the Group annually. Responsibilities, authorities and procedures relating to essential areas are defined in a Group policy which is approved by the Executive Board. Risk assessment The Board of Directors and the Executive Board assess the risks that Columbus A/S is exposed to, including risks related to the financial reporting process annually. On an ongoing basis, the Audit Committee monitors the effectiveness of the internal controls for financial reporting and reviews
and discusses material and relevant changes to accounting principles, including implementation of these. Control activities and monitoring All companies in the Columbus Group report financial and operational data to the head office on a monthly basis. The reporting includes comments to the financial and business development. Based on this reporting the Group’s financial statements are consolidated and reported to the Group management. As part of this process, monthly business reviews and controlling meetings are held, and control visits to all operational companies in the Group are performed on an ongoing basis in order to ensure that material errors in the financial reporting are discouraged, discovered and corrected. The need for an internal audit is considered annually by the Audit Committee. However, due to the size of the Company and the established control activities the Audit Committee so far considers it unnecessary to establish an independent internal executive audit board. As part of the risk management, Columbus has established a whistle-blower function for expedient and confidential notification of possible or suspected wrongdoing. Information and communication Columbus has implemented a formalized reporting process for monthly, quarterly and annual reporting as well as for budgeting and forecasting. Columbus’s reporting manual and other reporting instructions are updated on an ongoing basis. All updates are communicated to the global finance organization. All employees have access to reporting manuals and instructions.
Further information The statutory report on Corporate Governance for 2016, cf. section 107b of the Danish Financial Statement Act is available at: www.columbusglobal.com/Investor/Governance and CSR/Statutory reports on Corporate Governance The statutory report on gender distribution, cf., section 99b of the Financial Statements Act is available at: www.columbusglobal.com/Investor/Governance and CSR/Diversity Guidelines for incentive programs are available at: www.columbusglobal.com/Investor/Governance and CSR/Guidelines for Incentive Programs
Management’s review Columbus Annual Report 2016
28
Corporate social responsibility
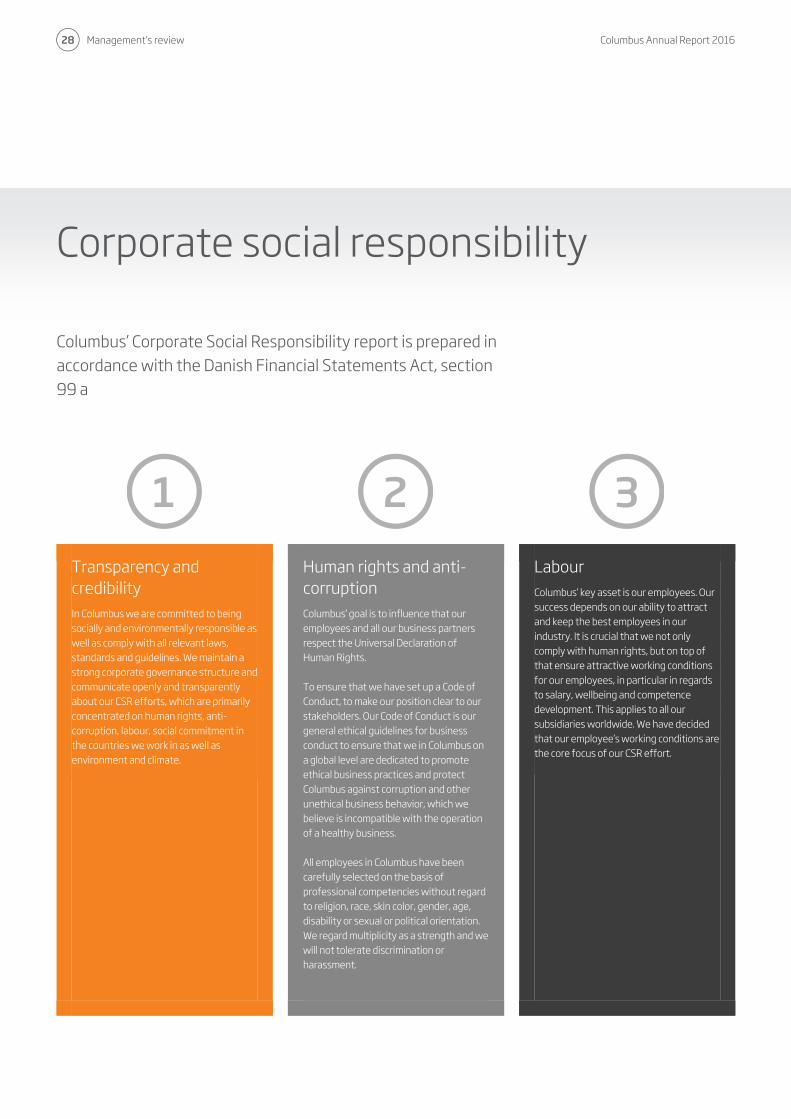
Columbus’ Corporate Social Responsibility report is prepared in accordance with the Danish Financial Statements Act, section 99 a
Transparency and credibility In Columbus we are committed to being socially and environmentally responsible as well as comply with all relevant laws, standards and guidelines. We maintain a strong corporate governance structure and communicate openly and transparently about our CSR efforts, which are primarily concentrated on human rights, anti-corruption, labour, social commitment in the countries we work in as well as environment and climate.
Human rights and anti-corruption Columbus’ goal is to influence that our employees and all our business partners respect the Universal Declaration of Human Rights. To ensure that we have set up a Code of Conduct, to make our position clear to our stakeholders. Our Code of Conduct is our general ethical guidelines for business conduct to ensure that we in Columbus on a global level are dedicated to promote ethical business practices and protect Columbus against corruption and other unethical business behavior, which we believe is incompatible with the operation of a healthy business. All employees in Columbus have been carefully selected on the basis of professional competencies without regard to religion, race, skin color, gender, age, disability or sexual or political orientation. We regard multiplicity as a strength and we will not tolerate discrimination or harassment.
Labour Columbus’ key asset is our employees. Our success depends on our ability to attract and keep the best employees in our industry. It is crucial that we not only comply with human rights, but on top of that ensure attractive working conditions for our employees, in particular in regards to salary, wellbeing and competence development. This applies to all our subsidiaries worldwide. We have decided that our employee’s working conditions are the core focus of our CSR effort.

Columbus Annual Report 2016 Management’s review
29
In 2012, Columbus joined the United Nations Global Compact to show internally and externally that Columbus supports and enacts ten general principles of corporate social responsibility.
These principles are based on internationally recognized conventions on human rights, labour standards, environment and anti corruption.
The CSR report is available at our website: www.columbusglobal.com/Investor/Governance and CSR/CSR
Social commitment Columbus is a global business that operates locally and in close proximity with our customers. We believe it is essential that we are involved in community and charitable activities and therefore we have decided to emphasize these initiatives in our CSR report. Columbus is committed to giving back to our communities. We encourage and support our employees’ desire to use their time and talent for charity work. Most of Columbus’ subsidiaries engage in local charity.
Environment and climate impact Columbus is a people business. Being mostly office based means that our business’ impact on the environment is relatively small. However, Columbus continuously optimizes our offices in order to be energy-efficient and healthy working environments for our employees. Furthermore, we aim to minimize unnecessary travel by plane and instead promote and develop virtual meetings, which also improves the efficiently in our business.
Our CSR focus in 2016 In 2016, we launched our new strategy Columbus2020 with the strategic element Our People as one of the four strategic focus areas. Employee well-being and development is the key focus in Columbus’ CSR effort, and with the strategic initiative Our People, we emphasize the focus on satisfied and engaged employees. In 2016, we had extensive focus on performance and skills development with further investments in career and skills development across Columbus.
Management’s review Columbus Annual Report 2016
30
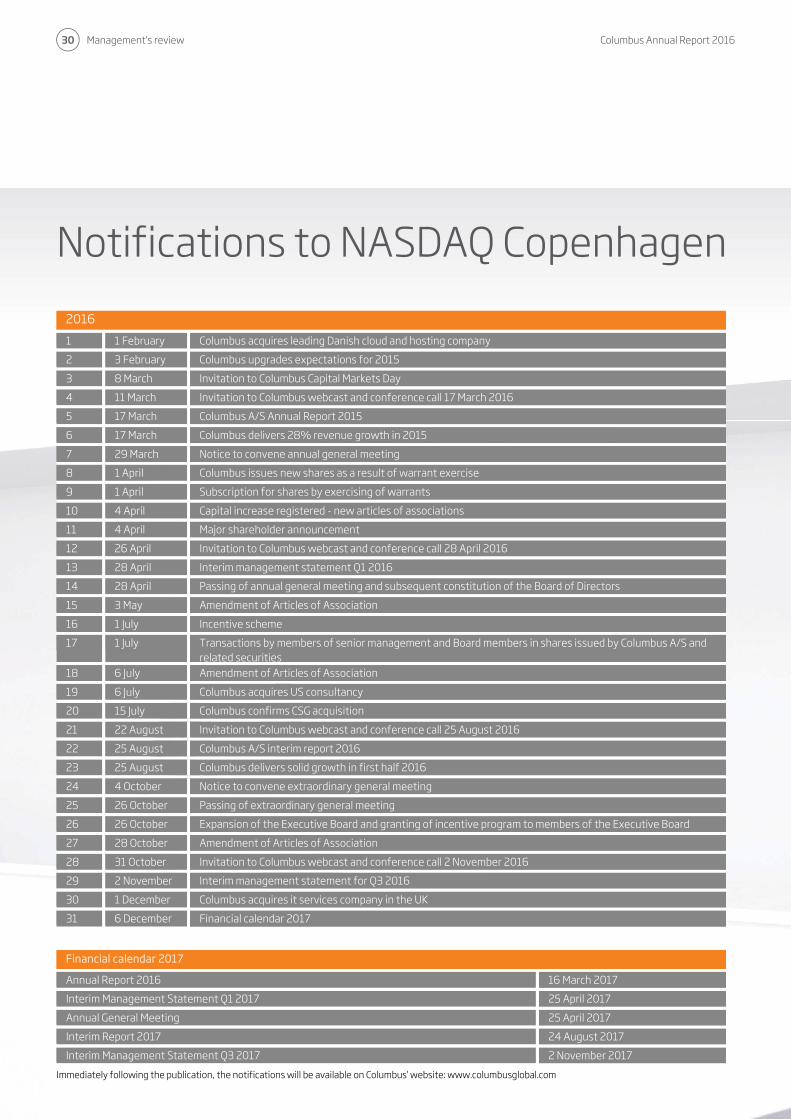
Notifications to NASDAQ Copenhagen
2016
1 1 February Columbus acquires leading Danish cloud and hosting company
2 3 February Columbus upgrades expectations for 2015
3 8 March Invitation to Columbus Capital Markets Day
4 11 March Invitation to Columbus webcast and conference call 17 March 2016
5 17 March Columbus A/S Annual Report 2015
6 17 March Columbus delivers 28% revenue growth in 2015
7 29 March Notice to convene annual general meeting
8 1 April Columbus issues new shares as a result of warrant exercise
9 1 April Subscription for shares by exercising of warrants
10 4 April Capital increase registered - new articles of associations
11 4 April Major shareholder announcement
12 26 April Invitation to Columbus webcast and conference call 28 April 2016
13 28 April Interim management statement Q1 2016
14 28 April Passing of annual general meeting and subsequent constitution of the Board of Directors
15 3 May Amendment of Articles of Association
16 1 July Incentive scheme
17 1 July Transactions by members of senior management and Board members in shares issued by Columbus A/S and related securities
18 6 July Amendment of Articles of Association
19 6 July Columbus acquires US consultancy
20 15 July Columbus confirms CSG acquisition
21 22 August Invitation to Columbus webcast and conference call 25 August 2016
22 25 August Columbus A/S interim report 2016
23 25 August Columbus delivers solid growth in first half 2016
24 4 October Notice to convene extraordinary general meeting
25 26 October Passing of extraordinary general meeting
26 26 October Expansion of the Executive Board and granting of incentive program to members of the Executive Board
27 28 October Amendment of Articles of Association
28 31 October Invitation to Columbus webcast and conference call 2 November 2016
29 2 November Interim management statement for Q3 2016
30 1 December Columbus acquires it services company in the UK
31 6 December Financial calendar 2017
Financial calendar 2017
Annual Report 2016 16 March 2017
Interim Management Statement Q1 2017 25 April 2017
Annual General Meeting 25 April 2017
Interim Report 2017 24 August 2017
Interim Management Statement Q3 2017 2 November 2017
Immediately following the publication, the notifications will be available on Columbus’ website: www.columbusglobal.com

Columbus Annual Report 2016 Management’s review
31
Note: The overview only contains the Group’s operative companies.
* The average no. of employees is based on the full year. Cambridge Online Systems Ltd. was acquired 1 December 2016, and the actual no. of employees in the
company on 31 December 2016 was 65.
** Columbus Eesti AS owns 64% of Columbus IT Partner SIA. Columbus A/S is controlling shareholder in Columbus IT Partner SIA by indirect disposal of the voting
right through control of the majority of the ownership of Columbus Eesti AS.
*** 91 employees in Columbus Global Services India Pvt. Ltd. are allocated to the other individual subsidiaries.
Group overview
Company Country Ownership by Columbus A/S, %
Columbus A/S’ share of voting right, %
Average no. of employees
Columbus A/S Denmark 213
Subsidiaries
Western Europe
Columbus NSC A/S Denmark 100 100 27
SystemHosting A/S Denmark 100 100 23
MW data A/S Denmark 100 100 22
Columbus Norway AS Norway 100 100 58
Columbus Global (UK) Ltd. England 100 100 135
Omnica Ltd. England 100 100 0
Cambridge Online Systems Ltd England 100 100 5*
To-Increase B.V. Netherlands 100 100 80
To-Increase Holding Netherlands 100 100 0
Eastern Europe
AO Columbus Russia 100 100 133
000 Columbus Global Russia 100 100 4
Columbus Global Ukraine Ukraine 100 100 1
Columbus Global Kazakhstan Kazakhstan 100 100 2
Columbus IT Partner (Russia) Ltd. Cyprus 100 100 0
UAB Columbus Lietuva Lithuania 100 100 52
Columbus Eesti AS Estonia 51 51 60
Columbus IT Partner SIA** Latvia 33 33 25
North America
Columbus US Inc. USA 100 100 100
Business Microvar Inc. USA 100 100 150
Asia
Columbus Global Services India Pvt. Ltd. India 100 100 15***
Management’s review Columbus Annual Report 2016
32
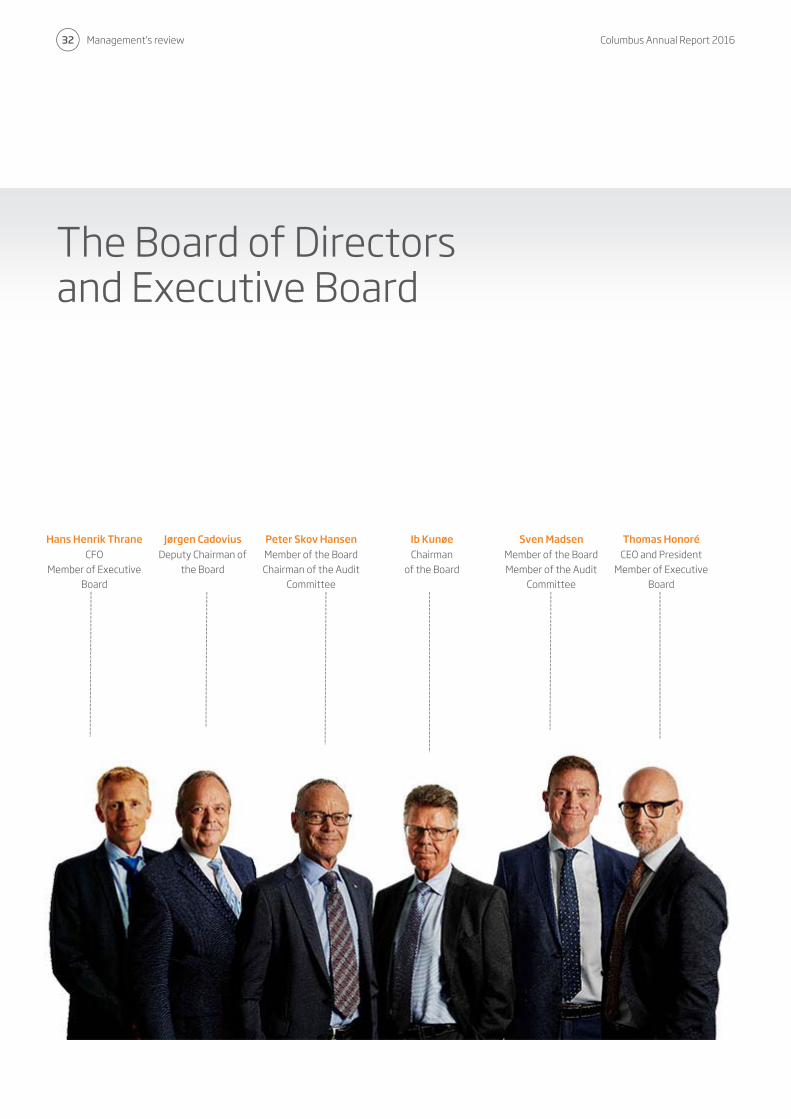
Hans Henrik Thrane Jørgen Cadovius Peter Skov Hansen Ib Kunøe Sven Madsen Thomas Honoré CFO
Member of Executive Board
Deputy Chairman of the Board
Member of the BoardChairman of the Audit
Committee
Chairmanof the Board
Member of the Board Member of the Audit
Committee
CEO and PresidentMember of Executive
Board
The Board of Directors and Executive Board

Columbus Annual Report 2016 Management’s review
33
Ib Kunøe Born 1943 Chairman of the Board Member of the Board since 2004, re-elected in 2016, term expires 2017 Does not fulfill the Committee of Corporate Governance definition of independency Chairman of the Board for: Atea ASA, Consolidated Holdings A/S, Netop Solutions A/S, X-Yacht A/S, X-Yacht Holding A/S, Calum Bagsværdlund K/S, Sparresholm Jagtselskab ApS and Freemantle Ltd. Member of the Board for: Atrium Partner A/S Special competencies: Company management, including management of IT companies, development of and dealing with companies.
Jørgen Cadovius Born 1945 Deputy Chairman of the Board Member of the Board since 2005, re-elected in 2016, term expires 2017 Solicitor Fulfills the Committee of Corporate Governance definition of independency Chairman of the Board for: Frese Holding ApS and its three subsidiaries, Fil de Fer A/S, Inter Express Transport A/S, Rosenkæret ApS and J. K. C. Trading & Invest ApS. Member of the Board for: Jørgen Schultz Holding A/S, Theodor Lund & Petersen Holding A/S, Carliis ApS and Monark Automotive GmbH. Special competencies: General management, legal and company law.
Sven MadsenBorn 1964 Member of the Board since 2007, re-elected in 2016, term expires 2017 CFO in Consolidated Holdings A/S Member of the Audit Committee Does not fulfill the Committee of Corporate Governance definition of independency Chairman of the Board for: CHV III ApS Member of the Board for: Atea ASA, Consolidated Holdings A/S, core:workers AB, core:workers Holding A/S, X-Yachts A/S, X-Yachts Holding ApS, Netop Solutions A/S, Ejendomsaktieselskabet af 1920 A/S, DAN-Palletiser Holding A/S, DAN-Palletiser A/S, DAN-Palletiser Finans A/S and Northern Link PR ApS. Special competencies: General management, M&A, business development, economic and financial issues.
Peter Skov HansenBorn 1951 Member of the Board since 2012, re-elected in 2016, term expires 2017 Completed State Authorized Public Accountant education in 1980, registered as non-practicing Chairman of the Audit Committee Fulfills the Committee of Corporate Governance definition of independency Member of the Board for: X-Yachts Holding ApS, X-Yachts A/S, Netop Solutions A/S and Robotek Gruppen A/S Special competencies: Business development and financial, accounting and tax related issues.
Executive Board
Thomas Honoré Born 1969 Joined as CEO & President in May 2011
Hans Henrik Thrane Born 1968 Joined as CFO in July 2010
Direct and indirect ownership in Columbus A/S
Number of shares
Changes in fiscal years,
shares
Total number of warrants 1 January 2016
Number of warrants
exercised in 2016
Number of warrants
granted in 2016
Total number of warrants 31
December 2016
Consolidated Holdings A/S 56,538,055 0
Board of Directors
Ib Kunøe 180,000 0 0 0 180,000 180,000
Jørgen Cadovius 470,000 0 0 0 180,000 180,000
Sven Madsen 588,529 0 0 0 180,000 180,000
Peter Skov Hansen 220,000 0 0 0 180,000 180,000
Executive Board
Thomas Honoré 1,580,997 0 1,185,200 0 270,000 1,455,200
Hans Henrik Thrane 553,800 140,000 490,000 140,000 270,000 620,000
Board of Directors

Management’s review Columbus Annual Report 2016
34
Shareholder information Columbus A/S’s shares have been listed on NASDAQ Copenhagen since May 1998 and have ID code DK0010268366 and abbreviated name COLUM. Columbus A/S is included in the Small Cap index. At the end of 2016, the price of the Columbus A/S share was DKK 10.70, while at the end of 2015 it was DKK 6.70 – an increase of 59.70% (2015: 42.55%)5. In 2016, a total of 65.1m shares were sold corresponding to 56.00% of the total number of shares at the end of 2016 (2015: 34.60%). The average revenue per business day in 2016 was DKK 2.35m (2015: DKK 0.87m)3. The Company’s market value amounted to DKK 1,243m at the end of 2016 against DKK 761.8m at the end of 2015. Share price development in 20163:
Share capital At the end of 2016 the share capital in Columbus A/S comprised of 116,197,772 shares at DKK 1.25 corresponding to nominal share capital of DKK 145,247,215 (2015: 113,698,572 shares at DKK 1, 25, corresponding to nominal share capital of DKK 142,123,215). Each share provides one vote. The shares are marketable securities and no restrictions have been set for the shares’ negotiability. The shares must be named and noted in the Company’s share register. Ownership At the end of 2016 Columbus A/S had 5,969 registered shareholders, who together owned 97.03% of the total share capital. Members of Columbus A/S’ Board of Directors and Executive Board owned in total 51.71% of the share capital at the end of 2016.
Dividend The Company’s dividend policy is to distribute dividend of minimum 10% of the nominal share capital each year, corresponding to DKK 0.125 per share. Besides, the Board of Directors may decide to propose to the General Meeting that this dividend be supplemented with an extraordinary dividend for a specific fiscal year. However, it is decisive for Columbus to reduce debts and improve financial resources in order to be able to seize any positive development opportunities for continued strengthening of the long-term value creation for the Company. The Board of Directors may therefore decide to deviate from the dividend policy and propose at the General Meeting that dividends are not distributed for a specific fiscal year.
5 Source: NASDAQ Copenhagen A/S
Shareholder information
The following shareholders have informed Columbus A/S of possession of 5% or above of the share capital:
No. of shares %Consolidated Holdings A/S 56,538,055 48.66Ib Kunøe 180,000 0.15Total 56,718,055 48.81 ** Due to shareholder voting agreements, Consolidated Holdings A/S holds 49.67% of the voting rights.
Share price Volume

Columbus Annual Report 2016 Management’s review
35
The Board of Director proposes that the Annual General Meeting adopts ordinary dividends to shareholders of 10% of the nominal value in line with the dividend policy. Investor Relations Columbus endeavors to provide a high and consistent level of information to our shareholders and other interested parties. A company goal is to have an open and active dialogue with shareholders, share analysts, the press and the public in order to ensure the necessary insight and thereby the best possibility to evaluate the Company. This will be obtained in accordance with rules and legislation for companies listed on NASDAQ Copenhagen and in accordance with Columbus’ Investor Relations policy. Communication with interested parties takes place via the ongoing publication of notifications,
investor presentations and individual meetings. The website www.columbusglobal.com is the primary source of information for interested parties. It is updated constantly with new information about Columbus’ results, activities and strategy. Columbus hosts a conference call after publication of financial statements. The call and presentations can be followed directly via the Company’s website. Analysts The Danish share analysts, Aktieinfo and ABG Sundal Collier cover Columbus, and four times a year they publish a share analysis with recommendations about the Columbus share based on the Company’s results and factors that may influence the
Company’s business and future share price development. Contact The CFO handles the daily contact with investors and analysts: Columbus Lautrupvang 6 2750 Ballerup Tel: +45 7020 5000 Contact person: CFO, Hans Henrik Thrane Email: [email protected] General Meeting The Company’s Annual General Meeting will be held on 25 April 2017 at 10.00 a.m. on the Company’s address at: Lautrupvang 6, 2750 Ballerup.
Development in share capital
Development in share capital in Columbus A/S since 1 January 2016
Capital increase(DKK nom.)
Total share capital
(DKK nom.)
No. of shares of DKK 1.25 (nom.)
Capital increase 1 April* 3,124,000 145,247,215 116,197,772* Capital increase as a consequence of the exercise of warrants by members of the Executive Board and a number of senior executives. The warrants were granted
as part of the Company’s warrant program. The subscription price for the new shares is DKK 2.14 for 1,625,000 shares, DKK 3.93 for 700,800 shares and DKK 5.60
for 173,400 shares

Management’s review Columbus Annual Report 2016
36
The Board of Directors and the Executive Board have today considered and approved the annual report of Columbus A/S for the financial year 01.01.2016 - 31.12.2016. The annual report is prepared in accordance with International Financial Reporting Standards as adopted by the EU and Danish disclosure requirements for listed companies.
In our opinion, the consolidated financial statements and the parent financial statements give a true and fair view of the Group’s and the Parent’s financial position at 31.12.2016 and of the results of their operations and cash flows for the financial year 2016. In our opinion, the management commentary contains a fair review of the development of the Group's and the
Parent’s business and financial matters, the results for the year and of the Parent’s financial position and the financial position as a whole of the entities included in the consolidated financial statements, together with a description of the principal risks and uncertainties that the Group and the Parent face. We recommend the annual report for adoption at the Annual General Meeting.
Statement by management on the Annual Report
Ballerup, 16 March 2017
Executive Board
Thomas Honoré CEO & President
Hans Henrik Thrane CFO
Board of Directors
Ib Kunøe Chairman
Jørgen Cadovius Deputy Chairman
Peter Skov Hansen Sven Madsen
Columbus Annual Report 2016 Management’s review
37
To the shareholders of Columbus A/S Opinion We have audited the consolidated financial statements and the parent financial statements of Columbus A/S for the financial year 01.01.2016 - 31.12.2016, which comprise the statement of comprehensive income, balance sheet, statement of changes in equity, cash flow statement and notes, including a summary of significant accounting policies, for the Group as well as for the Parent. The consolidated financial statements and the parent financial statements are prepared in accordance with International Financial Reporting Standards as adopted by the EU and additional requirements of the Danish Financial Statements Act. In our opinion, the consolidated financial statements and the parent financial statements give a true and fair view of the Group’s and the Parent’s financial position at 31.12.2016, and of the results of their operations and cash flows for the financial year 01.01.2016 - 31.12.2016 in accordance with International Financial Reporting Standards as adopted by the EU and additional requirements of the Danish Financial Statements Act. Basis for opinion We conducted our audit in accordance with International Standards on Auditing (ISAs) and the additional requirements applicable in Denmark. Our responsibilities under those standards and requirements are further described in the Auditor’s responsibilities for the audit of the consolidated financial statements and the parent financial statements section of this auditor’s report. We are independent of the Group in accordance with the International Ethics Standards Board of Accountants' Code of Ethics for Professional Accountants (IESBA Code) and the additional requirements applicable in Denmark, and we have fulfilled our other ethical responsibilities in accordance with these requirements. We believe that the audit evidence we have obtained is sufficient and appropriate to provide a basis for our opinion. Key audit matters Key audit matters are those matters that, in our professional judgement, were of most significance in our audit of the consolidated financial statements and the parent financial statements for the financial year 01.01.2016 – 31.12.2016. These matters were addressed in the context of our audit of the consolidated financial statements and the parent financial statements as a whole, and in forming our opinion thereon, and we do not provide a separate opinion on these matters.
Independent Auditors Reports

Management’s review Columbus Annual Report 2016
38
Carrying value of goodwill and other intangible assets How the matter was addressed in our audit Refer to Note 10 in the consolidated financial statements. At 31 December 2016 the carrying value of the Group’s goodwill was DKK 415.2 million and other intangible assets was DKK 30.6 million. Annually, an impairment test is performed in relation to goodwill and other intangible assets with indefinite useful economic lives. At 31 December 2016, the CGU “Value Added Reseller (VAR)” and “Independent Software Vendor (ISV)” had a carrying value of DKK 415.2 million of which DKK 375.0 million related to VAR and DKK 40.2 million related to ISV. The determination of the recoverable amount was based on the individual CGU and the Capital Asset Pricing Model (CAPM model). Significant judgement is required by Management in determining value-in-use including cash flow projections based on financial budgets for 2017 and financial forecasts for 2018-2020, discount rate and growth rate in the terminal period. Intangible assets are considered to be a key audit matter due to the judgement associated with determining the recoverable amount combined with the significance of the balance of goodwill and other intangible assets to the financial statements.
In assessing the valuation of goodwill and other intangible assets, we obtained and evaluated Management’s future cash flow forecasts for each Cash Generating Unit (“CGU”), and the underlying process by which they were drawn up including the mathematical accuracy of the cash flow models, and reconciled future growth, investment and margin assumptions to the latest Board approved budgets and financial forecasts. For each CGU, we evaluated the appropriateness of key market related assumptions in Management’s valuation models including discount rates and terminal growth rates. We assessed the reasonableness of Management’s future forecasts of growth, investment and margin included in the cash flow forecasts in light of the historical accuracy of such forecasts and the current operational results. We independently calculated a weighted average cost of capital by making reference to market data and verified the long term growth rate to market data. In assessing the level of headroom in respect of these CGUs, we performed a downside sensitivity analysis around the key assumptions, using a range of higher WACC and lower cash flows, and we concluded that headroom was maintained under these scenarios.
Revenue recognition, including the valuation and recognition of work in progress
How the matter was addressed in our audit
Refer to Notes 3, 4 and 14 in the consolidated financial statements. At 31 December 2016 the carrying value of the Group’s work in progress amounted to a net asset of DKK -0.9 million or recognised assets of DKK 59.3 million and liabilities of DKK 60.2 million corresponding to the contract value of work in progress of DKK 9.0 million and progress billing of DKK 9.9 million. Recognised consultancy revenue based on the stage of completion method amounted to DKK 818.7 million in 2016. Significant judgements are required by Management in determining the stage of completion and estimated profit on each project including assessment of provisions for specific project risks.
We tested the relevant internal controls for work in progress primarily relating to contract acceptance and terms, change orders, monitoring of project development, costs incurred, estimated costs to completion and assessment of provisions for specific project risks. From management we obtained an overview of the Group’s consultancy contracts in progress at 31 December 2016 as well as completed contracts during the year. Based on project risk and materiality, we selected a sample of projects for which we obtained the underlying contracts including change orders, original budget, project reports including estimates of costs to completion and overview of the risk and corresponding risk provision per contract. For the selected contracts, we tested and challenged Management’s assumptions for determining stage of completion including their assessment of risk provisions and estimated profits. The testing involved interviews
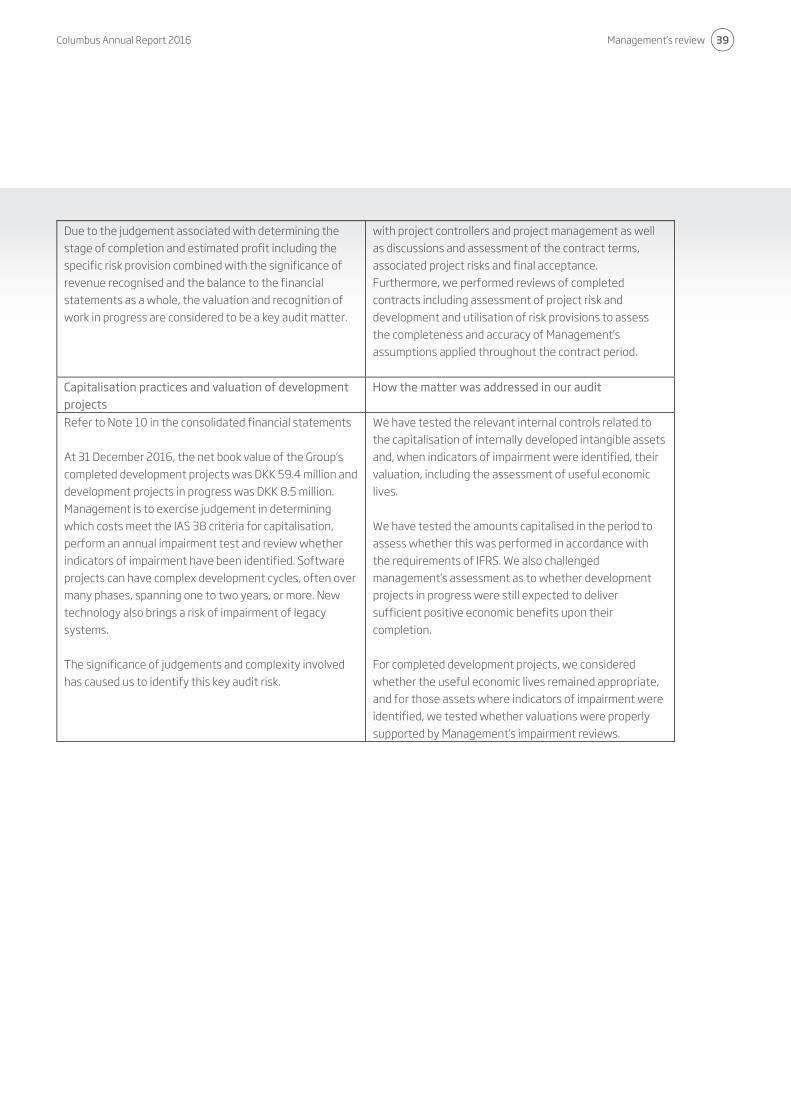
Columbus Annual Report 2016 Management’s review
39
Due to the judgement associated with determining the stage of completion and estimated profit including the specific risk provision combined with the significance of revenue recognised and the balance to the financial statements as a whole, the valuation and recognition of work in progress are considered to be a key audit matter.
with project controllers and project management as well as discussions and assessment of the contract terms, associated project risks and final acceptance. Furthermore, we performed reviews of completed contracts including assessment of project risk and development and utilisation of risk provisions to assess the completeness and accuracy of Management’s assumptions applied throughout the contract period.
Capitalisation practices and valuation of development projects
How the matter was addressed in our audit
Refer to Note 10 in the consolidated financial statements At 31 December 2016, the net book value of the Group’s completed development projects was DKK 59.4 million and development projects in progress was DKK 8.5 million. Management is to exercise judgement in determining which costs meet the IAS 38 criteria for capitalisation, perform an annual impairment test and review whether indicators of impairment have been identified. Software projects can have complex development cycles, often over many phases, spanning one to two years, or more. New technology also brings a risk of impairment of legacy systems. The significance of judgements and complexity involved has caused us to identify this key audit risk.
We have tested the relevant internal controls related to the capitalisation of internally developed intangible assets and, when indicators of impairment were identified, their valuation, including the assessment of useful economic lives. We have tested the amounts capitalised in the period to assess whether this was performed in accordance with the requirements of IFRS. We also challenged management’s assessment as to whether development projects in progress were still expected to deliver sufficient positive economic benefits upon their completion. For completed development projects, we considered whether the useful economic lives remained appropriate, and for those assets where indicators of impairment were identified, we tested whether valuations were properly supported by Management’s impairment reviews.
Management’s review Columbus Annual Report 2016
40
Statement on the management commentary Management is responsible for the management commentary. Our opinion on the consolidated financial statements and the parent financial statements does not cover the management commentary, and we do not express any form of assurance conclusion thereon. In connection with our audit of the consolidated financial statements and the parent financial statements, our responsibility is to read the management commentary and, in doing so, consider whether the management commentary is materially inconsistent with the consolidated financial statements and the parent financial statements or our knowledge obtained in the audit or otherwise appears to be materially misstated. Moreover, it is our responsibility to consider whether the management commentary provides the information required under the Danish Financial Statements Act. Based on the work we have performed, we conclude that the management commentary is in accordance with the consolidated financial statements and the parent financial statements and has been prepared in accordance with the requirements of the Danish Financial Statements Act. We did not identify any material misstatement of the management commentary.
Management's responsibilities for the consolidated financial statements and the parent financial statements Management is responsible for the preparation of consolidated financial statements and parent financial statements that give a true and fair view in accordance with International Financial Reporting Standards as adopted by the EU and additional requirements of the Danish Financial Statements Act, and for such internal control as Management determines is necessary to enable the preparation of consolidated financial statements and parent financial statements that are free from material misstatement, whether due to fraud or error. In preparing the consolidated financial statements and the parent financial statements, Management is responsible for assessing the Group’s and the Parent’s ability to continue as a going concern, for disclosing, as applicable, matters related to going concern, and for using the going concern basis of accounting in preparing the consolidated financial statements and the parent financial statements unless Management either intends to liquidate the Group or the Entity or to cease operations, or has no realistic alternative but to do so.
Auditor's responsibilities for the audit of the consolidated financial statements and the parent financial statements Our objectives are to obtain reasonable assurance about whether the consolidated financial statements and the parent financial statements as a whole are free from material misstatement, whether due to fraud or error, and to issue an auditor’s report that includes our opinion. Reasonable assurance is a high level of assurance, but is not a guarantee that an audit conducted in accordance with ISAs and the additional requirements applicable in Denmark will always detect a material misstatement when it exists. Misstatements can arise from fraud or error and are considered material if, individually or in the aggregate, they could reasonably be expected to influence the economic decisions of users taken on the basis of these consolidated financial statements and the parent financial statements. As part of an audit conducted in accordance with ISAs and the additional requirements applicable in Denmark, we exercise professional judgement and maintain professional scepticism throughout the audit. We also: • Identify and assess the risks of material misstatement of the consolidated financial statements and the parent financial
statements, whether due to fraud or error, design and perform audit procedures responsive to those risks, and obtain audit evidence that is sufficient and appropriate to provide a basis for our opinion. The risk of not detecting a material misstatement resulting from fraud is higher than for one resulting from error, as fraud may involve collusion, forgery, intentional omissions, misrepresentations, or the override of internal control.

Columbus Annual Report 2016 Management’s review
41
• Obtain an understanding of internal control relevant to the audit in order to design audit procedures that are appropriate in the circumstances, but not for the purpose of expressing an opinion on the effectiveness of the Group’s and the Parent’s internal control.
• Evaluate the appropriateness of accounting policies used and the reasonableness of accounting estimates and related disclosures made by Management.
• Conclude on the appropriateness of Management’s use of the going concern basis of accounting in preparing the consolidated financial statements and the parent financial statements, and, based on the audit evidence obtained, whether a material uncertainty exists related to events or conditions that may cast significant doubt on the Group's and the Parent’s ability to continue as a going concern. If we conclude that a material uncertainty exists, we are required to draw attention in our auditor’s report to the related disclosures in the consolidated financial statements and the parent financial statements or, if such disclosures are inadequate, to modify our opinion. Our conclusions are based on the audit evidence obtained up to the date of our auditor’s report. However, future events or conditions may cause the Group and the Entity to cease to continue as a going concern.
• Evaluate the overall presentation, structure and content of the consolidated financial statements and the parent financial statements, including the disclosures in the notes, and whether the consolidated financial statements and the parent financial statements represent the underlying transactions and events in a manner that gives a true and fair view.
We communicate with those charged with governance regarding, among other matters, the planned scope and timing of the audit and significant audit findings, including any significant deficiencies in internal control that we identify during our audit. We also provide those charged with governance with a statement that we have complied with relevant ethical requirements regarding independence, and to communicate with them all relationships and other matters that may reasonably be thought to bear on our independence, and where applicable, related safeguards. From the matters communicated with those charged with governance, we determine those matters that were of most significance in the audit of the consolidated financial statements and the parent financial statements of the current period and are therefore the key audit matters. We describe these matters in our auditor’s report unless law or regulation precludes public disclosure about the matter or when, in extremely rare circumstances, we determine that a matter should not be communicated in our report because the adverse consequences of doing so would reasonably be expected to outweigh the public interest benefits of such communication. Copenhagen, 16.03.2017 Deloitte Statsautoriseret Revisionspartnerselskab Business Registration No 33 96 35 56 Anders Oldau Gjelstrup Christian Sanderhage State-Authorised State-Authorised Public Accountant Public Accountant

Financial Statements Columbus Annual Report 2016
42
Financial Statements 2016
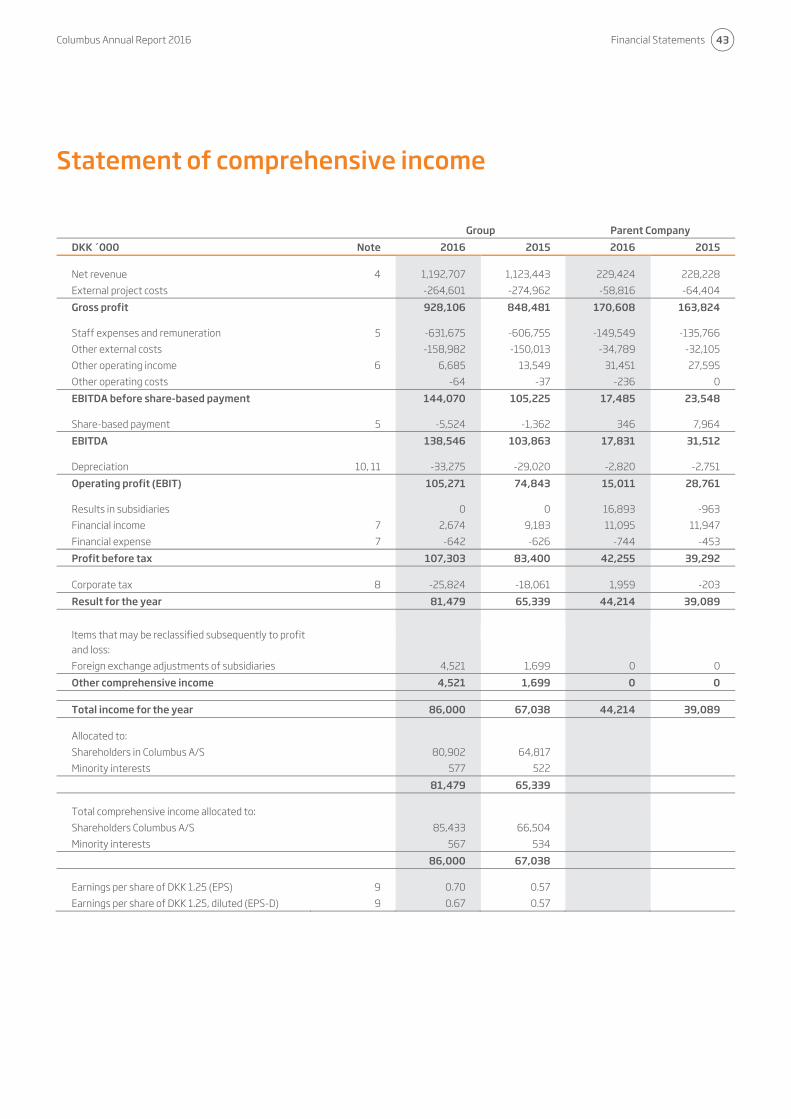
Columbus Annual Report 2016 Financial Statements
43
Group Parent Company
DKK ´000 Note 2016 2015 2016 2015 Net revenue 4 1,192,707 1,123,443 229,424 228,228
External project costs -264,601 -274,962 -58,816 -64,404
Gross profit 928,106 848,481 170,608 163,824 Staff expenses and remuneration 5 -631,675 -606,755 -149,549 -135,766
Other external costs -158,982 -150,013 -34,789 -32,105
Other operating income 6 6,685 13,549 31,451 27,595
Other operating costs -64 -37 -236 0
EBITDA before share-based payment 144,070 105,225 17,485 23,548 Share-based payment 5 -5,524 -1,362 346 7,964
EBITDA 138,546 103,863 17,831 31,512 Depreciation 10, 11 -33,275 -29,020 -2,820 -2,751
Operating profit (EBIT) 105,271 74,843 15,011 28,761 Results in subsidiaries 0 0 16,893 -963
Financial income 7 2,674 9,183 11,095 11,947
Financial expense 7 -642 -626 -744 -453
Profit before tax 107,303 83,400 42,255 39,292 Corporate tax 8 -25,824 -18,061 1,959 -203
Result for the year 81,479 65,339 44,214 39,089
Items that may be reclassified subsequently to profit and loss:
Foreign exchange adjustments of subsidiaries 4,521 1,699 0 0
Other comprehensive income 4,521 1,699 0 0 Total income for the year 86,000 67,038 44,214 39,089 Allocated to:
Shareholders in Columbus A/S 80,902 64,817
Minority interests 577 522
81,479 65,339 Total comprehensive income allocated to:
Shareholders Columbus A/S 85,433 66,504
Minority interests 567 534
86,000 67,038 Earnings per share of DKK 1.25 (EPS) 9 0.70 0.57
Earnings per share of DKK 1.25, diluted (EPS-D) 9 0.67 0.57
Statement of comprehensive income
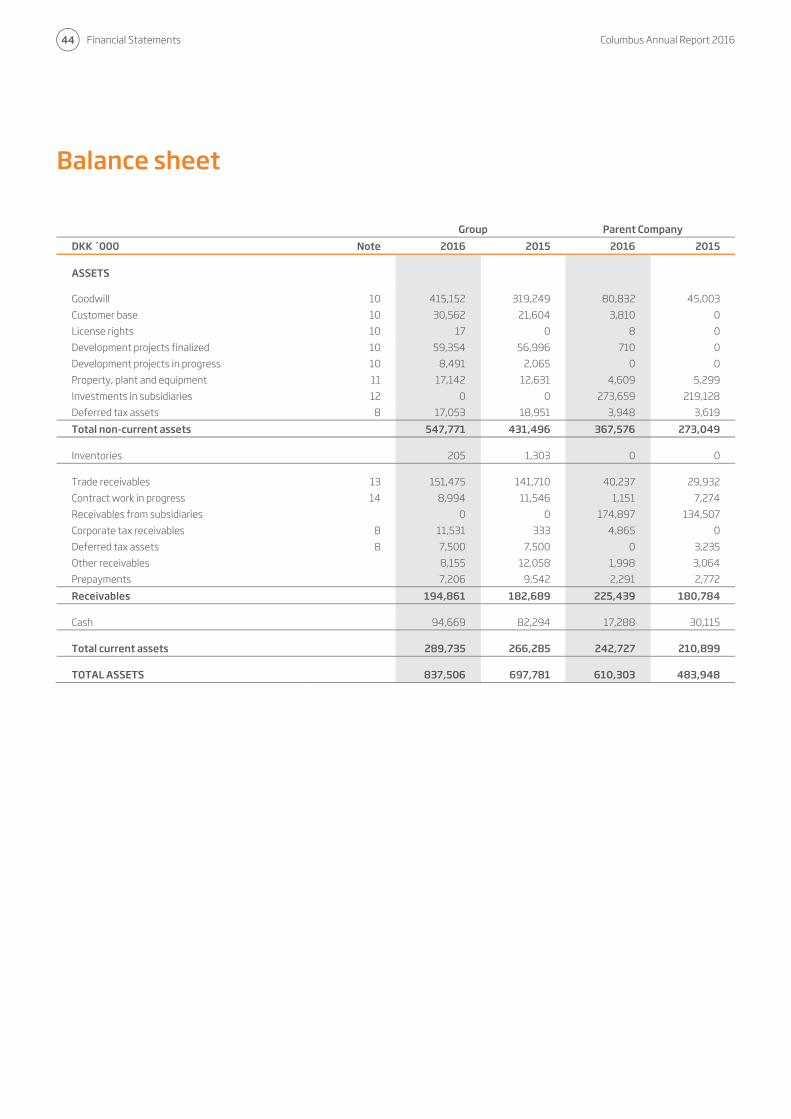
Financial Statements Columbus Annual Report 2016
44
Group Parent Company
DKK ´000 Note 2016 2015 2016 2015 ASSETS Goodwill 10 415,152 319,249 80,832 45,003
Customer base 10 30,562 21,604 3,810 0
License rights 10 17 0 8 0
Development projects finalized 10 59,354 56,996 710 0
Development projects in progress 10 8,491 2,065 0 0
Property, plant and equipment 11 17,142 12,631 4,609 5,299
Investments in subsidiaries 12 0 0 273,659 219,128
Deferred tax assets 8 17,053 18,951 3,948 3,619
Total non-current assets 547,771 431,496 367,576 273,049 Inventories 205 1,303 0 0 Trade receivables 13 151,475 141,710 40,237 29,932
Contract work in progress 14 8,994 11,546 1,151 7,274
Receivables from subsidiaries 0 0 174,897 134,507
Corporate tax receivables 8 11,531 333 4,865 0
Deferred tax assets 8 7,500 7,500 0 3,235
Other receivables 8,155 12,058 1,998 3,064
Prepayments 7,206 9,542 2,291 2,772
Receivables 194,861 182,689 225,439 180,784 Cash 94,669 82,294 17,288 30,115 Total current assets 289,735 266,285 242,727 210,899 TOTAL ASSETS 837,506 697,781 610,303 483,948
Balance sheet

Columbus Annual Report 2016 Financial Statements
45
Group Parent Company
DKK ´000 Note 2016 2015 2016 2015 EQUITY AND LIABILITIES Share capital 15 145,247 142,123 145,247 142,123
Reserves on foreign currency translation -6,475 -11,006 0 0
Retained profit 331,041 255,062 279,058 238,785
Group shareholders’ equity 469,813 386,179 424,305 380,908 Minority interests 1,774 2,573 0 0
Equity 471,587 388,752 424,305 380,908 Deferred tax 8 10,614 6,454 0 0
Provisions 16 11,532 13,876 4,286 4,434
Non-current liabilities 22,146 20,330 4,286 4,434 Debt to credit institutions 29,091 420 23,117 0
Debt to subsidiaries 0 0 92,373 33,413
Client prepayments 33,645 43,374 1,418 5,376
Trade payables 66,211 68,270 12,997 16,603
Corporate tax payables 8 24,177 10,601 0 0
Other liabilities 17 157,228 138,723 48,243 40,788
Accruals 33,421 27,311 3,564 2,426
Current liabilities 343,773 288,699 181,712 98,606 Total liabilities 365,919 309,029 185,998 103,040 TOTAL EQUITY AND LIABILITIES 837,506 697,781 610,303 483,948
Balance sheet

Financial Statements Columbus Annual Report 2016
46
Shareholders in Columbus A/S
DKK ´000 Share capital
Reserves on foreign
currency translation
Retained profits
Minority interests Equity
Group 2016 Balance at 1 January 2016 142,123 -11,006 255,062 2,573 388,752
Profit after tax 0 0 80,902 577 81,479
Currency adjustments of investments in subsidiaries 0 4,531 0 -10 4,521
Total comprehensive income 0 4,531 80,902 567 86,000 Capital increase, cf. note 15 3,124 0 4,079 0 7,203
Share-based payment cf. note 5 0 0 5,524 0 5,524
Payment of dividend 0 0 -14,526 -1,366 -15,892
Balance at 31 December 2016 145,247 -6,475 331,041 1,774 471,587 Group 2015 Balance at 1 January 2015 137,831 -12,693 200,763 4,233 330,134
Profit after tax 0 0 64,817 522 65,339
Currency adjustments of investments in subsidiaries 0 1,687 0 12 1,699
Total comprehensive income 0 1,687 64,817 534 67,038 Capital increase, cf. note 15 4,292 0 2,332 0 6,624
Share-based payment, cf. note 5 0 0 1,362 0 1,362
Payment of dividend 0 0 -14,212 -2,194 -16,406
Balance at 31 December 2015 142,123 -11,006 255,062 2,573 388,752
Statement of changes in equity - Group
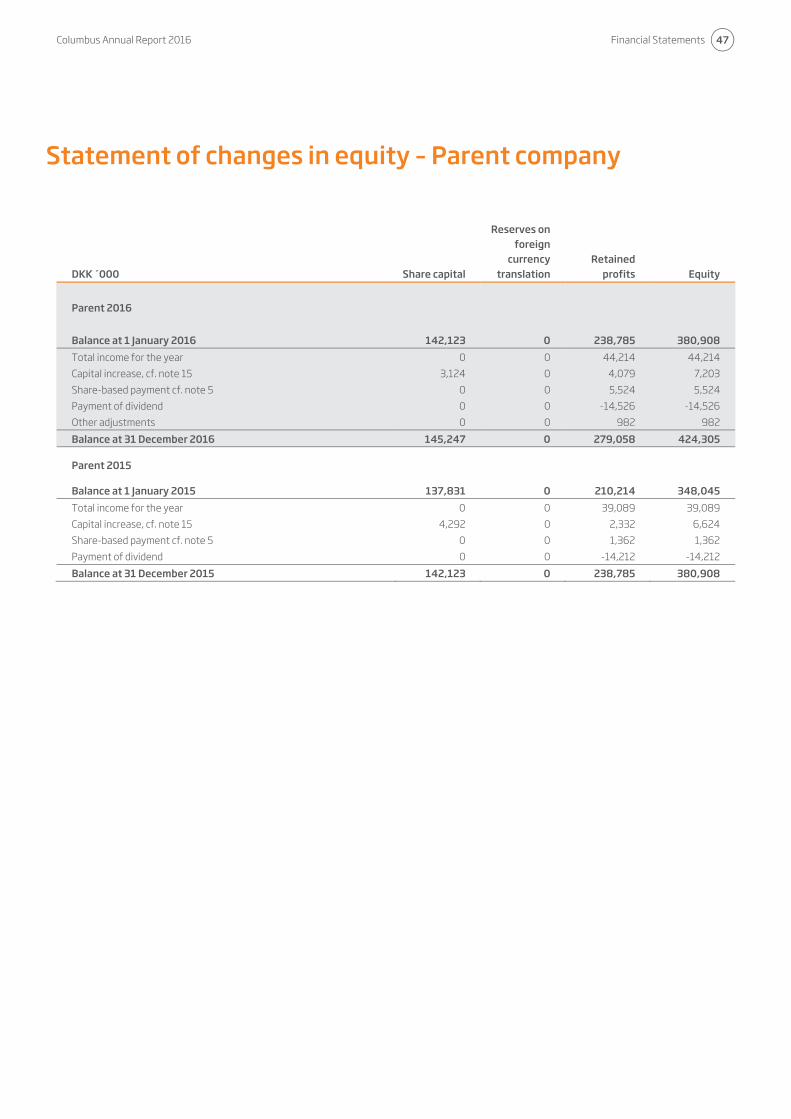
Columbus Annual Report 2016 Financial Statements
47
DKK ´000 Share capital
Reserves on foreign
currency translation
Retained profits Equity
Parent 2016
Balance at 1 January 2016 142,123 0 238,785 380,908
Total income for the year 0 0 44,214 44,214
Capital increase, cf. note 15 3,124 0 4,079 7,203
Share-based payment cf. note 5 0 0 5,524 5,524
Payment of dividend 0 0 -14,526 -14,526
Other adjustments 0 0 982 982
Balance at 31 December 2016 145,247 0 279,058 424,305 Parent 2015 Balance at 1 January 2015 137,831 0 210,214 348,045
Total income for the year 0 0 39,089 39,089
Capital increase, cf. note 15 4,292 0 2,332 6,624
Share-based payment cf. note 5 0 0 1,362 1,362
Payment of dividend 0 0 -14,212 -14,212
Balance at 31 December 2015 142,123 0 238,785 380,908
Statement of changes in equity – Parent company

Financial Statements Columbus Annual Report 2016
48
Group Parent Company
DKK ´000 Note 2016 2015 2016 2015 Operating profit (EBIT) 105,271 74,843 15,011 28,761
Non-recurring income and expenses from acquisitions -5,594 -12,086 236 -827
Depreciations and amortizations 10, 11 33,275 29,020 2,820 2,751
Cost of incentive scheme 5 5,524 1,362 5,524 1,362
Changes in net working capital 23 3,415 24,415 -21,808 891
Cash flow from primary activities 141,891 117,554 1,783 32,938 Interest received, etc. 1,904 2,617 6,603 5,381
Interest paid, etc. -642 -626 -744 -453
Corporate tax paid -18,445 -10,398 0 0
Cash flow from operating activities 124,708 109,147 7,642 37,866 Net increase in development projects 10 -28,260 -24,951 -731 0
Acquisition of tangible assets 11 -8,799 -6,276 -1,903 -3,330
Acquisition of intangible assets 10 -166 -36 0 0
Disposal of tangible assets 11 335 276 0 0
Disposal of intangible assets 10 388 0 0 0
Acquisition of subsidiaries and activities -94,044 -78,137 -36,591 -39,543
Capital increase in affiliated companies 0 0 -22,030 -19,580
Dividends received from subsidiaries 0 0 24,993 33,482
Cash flow from investing activities -130,546 -109,124 -36,262 -28,971 Proceeds from capital increase/warrants exercised 7,203 6,624 7,203 6,624
Overdraft facilities 28,670 -5,668 23,117 0
Dividends paid -15,892 -16,406 -14,526 -14,212
Cash flow from financing activities 19,981 -15,450 15,794 -7,588 Total cash flow 14,143 -15,427 -12,826 1,307
Cash funds at the beginning of the year 82,294 99,018 30,115 28,808
Exchange rate adjustments -1,768 -1,297 0 0
Cash funds at the end of the period 94,669 82,294 17,288 30,115
Cash flow
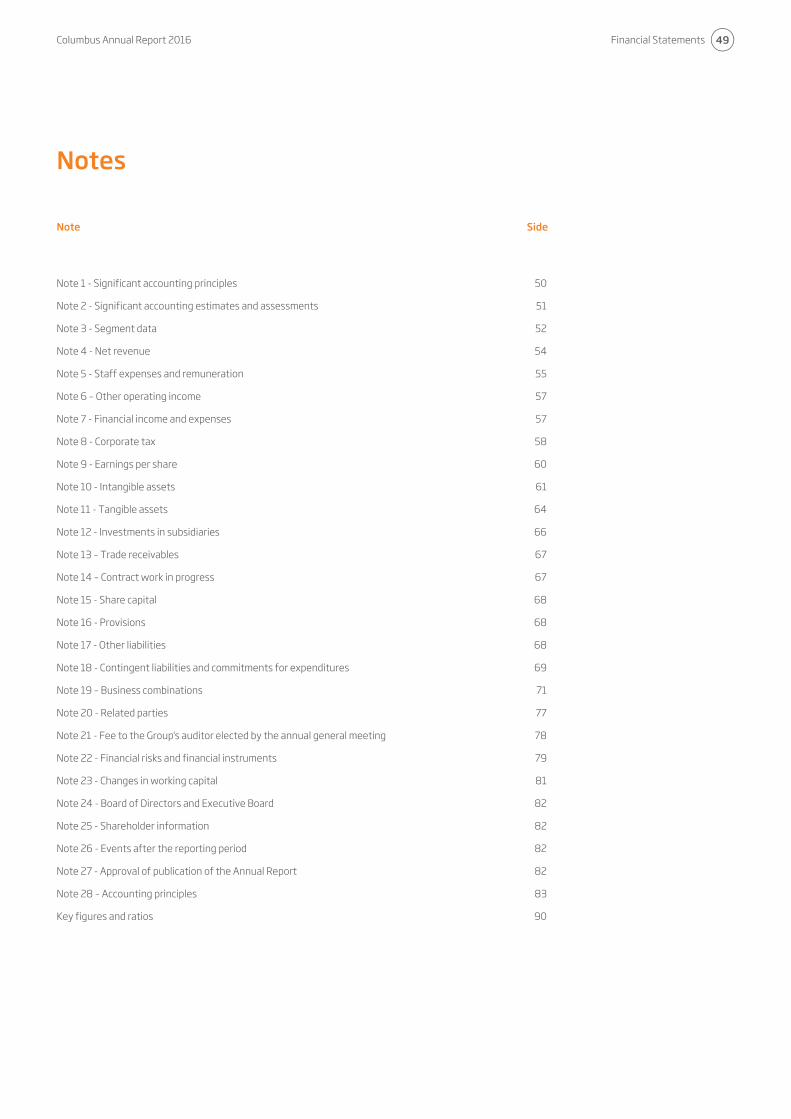
Columbus Annual Report 2016 Financial Statements
49
Note Side
Note 1 - Significant accounting principles 50 Note 2 - Significant accounting estimates and assessments 51 Note 3 - Segment data 52 Note 4 - Net revenue 54 Note 5 - Staff expenses and remuneration 55 Note 6 – Other operating income 57 Note 7 - Financial income and expenses 57 Note 8 - Corporate tax 58 Note 9 - Earnings per share 60 Note 10 - Intangible assets 61 Note 11 - Tangible assets 64 Note 12 - Investments in subsidiaries 66 Note 13 – Trade receivables 67 Note 14 – Contract work in progress 67 Note 15 - Share capital 68 Note 16 - Provisions 68 Note 17 - Other liabilities 68 Note 18 - Contingent liabilities and commitments for expenditures 69 Note 19 – Business combinations 71 Note 20 - Related parties 77 Note 21 - Fee to the Group's auditor elected by the annual general meeting 78 Note 22 - Financial risks and financial instruments 79 Note 23 - Changes in working capital 81 Note 24 - Board of Directors and Executive Board 82 Note 25 - Shareholder information 82 Note 26 - Events after the reporting period 82 Note 27 - Approval of publication of the Annual Report 82 Note 28 – Accounting principles 83 Key figures and ratios 90
Notes
Financial Statements Columbus Annual Report 2016
Notes
50
The financial statements for 2016 for Columbus, which include financial statements for the Parent Company Columbus A/S and consolidated financial statements for the Columbus Group have been prepared in compliance with International Financial Reporting Standards (IFRS) as adopted by the EU and Danish disclosure requirements for annual reports prepared after reporting class D (listed), cf. IFRS Executive Order issued pursuant to the Financial Statements Act. Columbus is a public limited company seated in Denmark. The consolidated and Parent Company’s financial statements are presented in Danish Kroner (DKK), which is the presentation currency for the Group's activities and the functional currency of the parent. The consolidated and Parent Company’s financial statements have been prepared based on historical cost. The main elements of the accounting policies and changes compared to last year due to new and amended standards are described below. The accounting principles are also disclosed in note 28. The effect of new accounting standards All new and revised standards, which entered into force with effect from fiscal periods beginning at January 1st 2016, and interpretations that are relevant to the Columbus Group are used in preparing the financial statements. Adoption of new and revised standards and interpretation contributions have not resulted in changes in the financial statements 2016 or previous years, and the Groups accounting principles are unchanged compared to 2015.
A number of new or amended standards and interpretations are at the time of publication of the consolidated and Parent Company’s financial statements not yet in force. It is management’s assessment that these standards and interpretations will not have a significant impact on the financial statements for the years going forward. In preparing the consolidated and Parent Company’s financial statements, the management makes various accounting assessments that form the basis of presentation, recognition and measurement of the Parent Company and the Group’s assets and liabilities. The most significant estimates and assessments are presented in note 2. Due to the Group internal asset purchase of MW Data A/S to Columbus A/S as of 31.12.2016, no historical figures have been changed in the Parent Company. The book value method has been applied to account for the Group internal transaction.
Note 1 - Significant accounting principles
Columbus Annual Report 2016 Financial Statements
Notes
51
By applying the Group's accounting principles as described in note 28, it is necessary that the management perform assessments, estimates and assumptions about the carrying amounts of assets and liabilities that are not readily apparent from other sources. The performed estimates and assumptions are based on historical experience and other factors that management considers reasonable under the circumstances, but which are inherently uncertain and unpredictable. The assumptions may be incomplete or inaccurate, and unexpected events or circumstances may occur. The Company is also subject to risks and uncertainties that may cause actual results to differ from these estimates. Specific risks for the Columbus Group are described in the "Risk Issues", cf. page 20. The estimates and underlying assumptions are reviewed regularly. Changes to accounting estimates are recognized in the accounting period in which the change occurs and in future periods if the change affects both the period, in which the change occurs and subsequent accounting periods. Recoverability and intangible assets generated internally in the Group The management’s assessment regarding completed development projects that are amortized over a 3 to 5-year useful life, is that no impairment indicators in excess of the amortization made exist. At the annual impairment test of ongoing development projects, or when there is indication of impairment, an estimate is made of how the parts of the business (cash-generating units) that ongoing development projects are related to will be able to generate sufficient cash flows in the future to support the value of ongoing
development projects and other net assets in the relevant part of the business. Management closely monitors developments in the ongoing development projects, and will make adjustments to the carrying amounts if required as a result of the development. Recoverable amount of goodwill The determination of impairment of recognized goodwill requires determination of the value of the cash-generating units to which the goodwill is allocated. Determination of the value requires an estimate of expected future cash flows of each cash-generating unit and a reasonable discount rate. At 31 December 2016, the carrying value of goodwill is DKK 415,152k. For a detailed description of discount factors, etc. see note 10. Evaluation of revenue recognition of contracts The stage of completion, forming the basis for the current recognition of revenue at the Company's use of the production method of contracts, is determined on the basis of the relationship between the entity's resources in relation to recent total estimate of resource consumption. The degree of completion is assessed regularly by the responsible employees and the area is closely monitored by management, and further adjustments are made to the stage of completion, etc., if deemed necessary. Utilization of deferred tax assets Deferred tax assets are recognized for all unused tax losses and difference values to the extent it is deemed likely that within the foreseeable future taxable profits will be realized in which the losses and the difference values can be utilized. Determining the size of the amount that can be recognized for deferred tax assets is based on management’s estimate of the
likely time and amount of future taxable profits. At 31 December 2016, the carrying value of recognized tax was DKK 24,553k, which is estimated to be realized in a foreseeable future (5 years or less).
Note 2 - Significant accounting estimates and assessments

Financial Statements Columbus Annual Report 2016
Notes
52
In order to support decisions about allocation of resources and assessment of performance of the segments, the Group’s internal reporting to the Board of Directors of the Parent Company is based on the following grouping of operating segments:
Strategic business areas Description Geographical segment
ISV (Independent Software Vendor)
Development and sale of industry-specific software within Columbus' three focus industries: Retail, food and manufacturing No specific area
Consultancy Sale, implementation and service of standard business systems
Western Europe Eastern Europe North America
Information about the Group’s segments is stated below.
Consultancy
DKK ´000 ISV Western
Europe Eastern Europe
North America
HQ, GDC and Eliminations Total
2016 Columbus Software licenses 37,141 14,847 2,541 3,319 -13,661 44,187
Columbus Software subscriptions 40,961 14,407 1,350 6,182 -16,024 46,876
External licenses 0 24,875 11,825 50,269 -474 86,495
External subscriptions 0 70,018 23,179 103,288 -1,321 195,164
Services 14,215 452,383 92,833 261,584 -24,614 796,401
Other 1,156 10,504 1,697 9,967 260 23,584
Total net revenue 93,473 587,034 133,425 434,609 -55,834 1,192,707 Gross profit 82,560 438,489 100,383 286,782 19,892 928,106
EBITDA 49,604 89,395 11,560 25,263 -37,276 138,546
Operating profit (EBIT) 25,851 59,351 6,074 15,929 -1,934 105,271
Profit before tax 26,529 59,983 5,325 10,521 4,945 107,303
Profit after tax 20,809 42,621 3,178 8,744 6,127 81,479 Segment assets 132,040 373,474 81,357 334,100 -83,465 837,506
Segment liabilities 44,492 155,787 32,101 77,655 55,884 365,919
Non-current assets 107,089 228,740 37,067 269,431 -94,556 547,771
Asset investments 27,959 6,081 402 1,755 1,028 37,225
Depreciation -19,586 -8,112 -481 -4,757 -339 -33,275 Average number of employees 80 461 277 250 37 1,105
In order to be able to estimate the results of the segments and allocate resources between these, the Board of Directors also monitors the tangible, intangible and financial assets related to each segment.
Note 3 - Segment data

Columbus Annual Report 2016 Financial Statements
Notes
53
Consultancy
DKK ´000 ISV Western
Europe Eastern Europe
North America
HQ, GDC and Eliminations Total
2015 Columbus Software licenses 38,715 20,417 4,719 6,829 -18,429 52,251
Columbus Software subscriptions 35,505 14,870 1,480 5,580 -12,905 44,530
External licenses 0 39,390 16,489 51,937 -291 107,525
External subscriptions -128 70,420 23,792 90,674 -234 184,524
Services 17,453 398,707 91,285 228,952 -20,852 715,545
Other 1,287 8,103 2,033 7,738 -93 19,068
Total net revenue 92,832 551,907 139,798 391,710 -52,804 1,123,443 Gross profit 82,260 412,662 101,458 247,441 4,660 848,481
EBITDA 49,034 56,882 11,697 13,605 -27,355 103,863
Operating profit (EBIT) 30,277 29,669 5,785 -1,502 10,614 74,843
Profit before tax 31,820 27,852 7,702 -5,918 21,944 83,400
Profit after tax 25,741 16,885 4,247 -1,935 20,401 65,339 Segment assets 115,183 285,906 82,318 271,782 -57,408 697,781
Segment liabilities 37,644 117,417 33,144 70,025 50,799 309,029
Non-current assets 98,958 123,565 37,161 224,810 -52,999 431,496
Asset investments 29,405 9,646 367 2,007 -4,752 36,673
Depreciation -18,640 -5,089 -506 -4,447 -338 -29,020 Average number of employees 74 449 283 241 33 1,080
In order to be able to estimate the results of the segments and allocate resources between these, the Board of Directors also monitors the tangible, intangible and financial assets related to each segment. Revenue and non-current assets distributed in geographic areas The Group’s revenue from external customers and non-current assets distribution in geographical areas are specified below. Revenue is distributed according to the registered address of the customers, and the non-current assets are distributed according to location and legal relation.
Net revenue from external
customers Non-current assetsDKK ´000 2016 2015 2016 2015 Denmark 333,592 291,027 103,218 105,814
Norway 58,363 57,021 8,398 6,956
United Kingdom 176,136 191,171 87,380 22,822
USA 431,939 390,924 261,899 217,279
Russia 61,739 72,224 366 33
The rest of the world 130,938 121,076 86,510 78,592
Total 1,192,707 1,123,443 547,771 431,496
Note 3 - Segment data continued

Financial Statements Columbus Annual Report 2016
Notes
54
Group Parent Company
DKK ´000 2016 2015 2016 2015 Sale of products Columbus Software licenses 44,187 52,251 6,631 11,671
Columbus Software subscriptions 46,876 44,530 4,242 4,785
External licenses 86,495 107,525 8,481 17,702
External subscriptions 195,164 184,524 31,902 33,954
Other 1,285 1,213 63 0
Total sale of products 374,007 390,043 51,319 68,112 Sale of services Sales value of finished projects 789,496 702,881 175,994 138,431
Change in contract work in progress 6,905 12,664 -938 18,763
Other services 22,299 17,855 3,049 2,922
Total sale of services 818,700 733,400 178,105 160,116 Total net revenue 1,192,707 1,123,443 229,424 228,228 Contract work in progress, beginning of period -52,475 -39,811 -38,651 -19,888
Contract work in progress, end of period 59,380 52,475 37,713 38,651
Total change in contract work in progress 6,905 12,664 -938 18,763
Note 4 - Net revenue
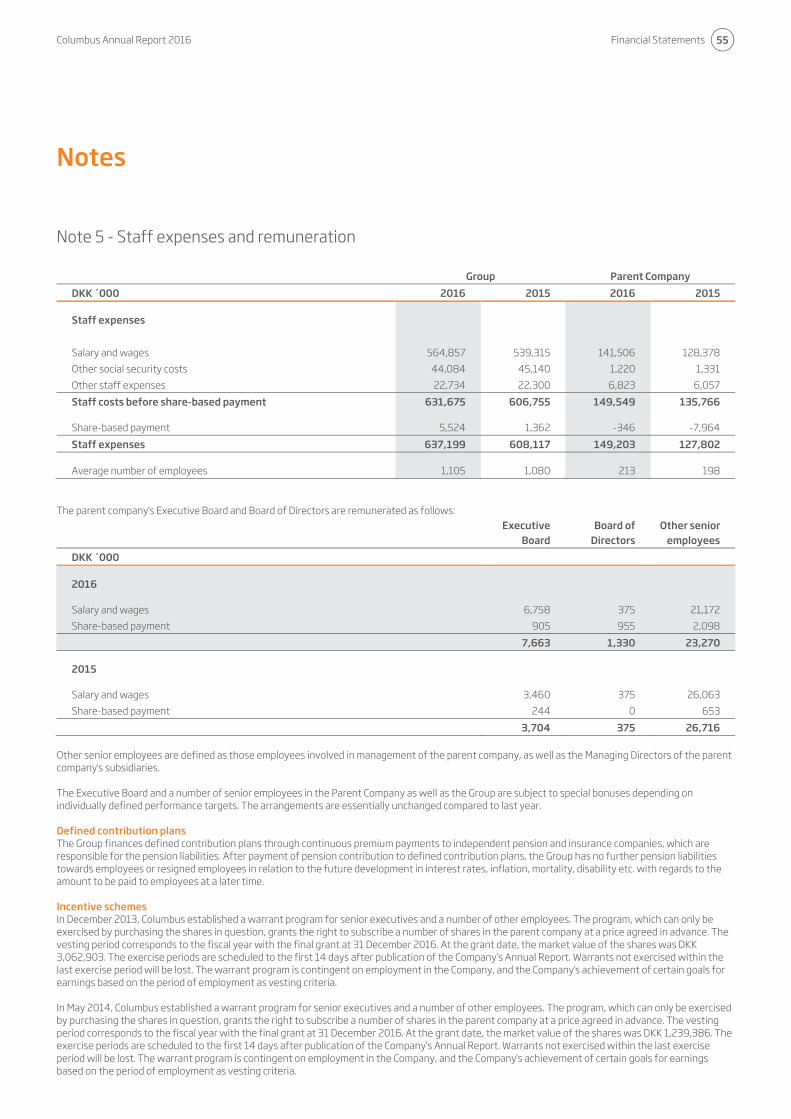
Columbus Annual Report 2016 Financial Statements
Notes
55
Group Parent Company
DKK ´000 2016 2015 2016 2015 Staff expenses
Salary and wages 564,857 539,315 141,506 128,378
Other social security costs 44,084 45,140 1,220 1,331
Other staff expenses 22,734 22,300 6,823 6,057
Staff costs before share-based payment 631,675 606,755 149,549 135,766 Share-based payment 5,524 1,362 -346 -7,964
Staff expenses 637,199 608,117 149,203 127,802 Average number of employees 1,105 1,080 213 198
The parent company's Executive Board and Board of Directors are remunerated as follows:
Executive
Board Board of
Directors Other senior
employees
DKK ´000 2016 Salary and wages 6,758 375 21,172
Share-based payment 905 955 2,098
7,663 1,330 23,270 2015 Salary and wages 3,460 375 26,063
Share-based payment 244 0 653
3,704 375 26,716 Other senior employees are defined as those employees involved in management of the parent company, as well as the Managing Directors of the parent company's subsidiaries. The Executive Board and a number of senior employees in the Parent Company as well as the Group are subject to special bonuses depending on individually defined performance targets. The arrangements are essentially unchanged compared to last year. Defined contribution plans The Group finances defined contribution plans through continuous premium payments to independent pension and insurance companies, which are responsible for the pension liabilities. After payment of pension contribution to defined contribution plans, the Group has no further pension liabilities towards employees or resigned employees in relation to the future development in interest rates, inflation, mortality, disability etc. with regards to the amount to be paid to employees at a later time. Incentive schemes In December 2013, Columbus established a warrant program for senior executives and a number of other employees. The program, which can only be exercised by purchasing the shares in question, grants the right to subscribe a number of shares in the parent company at a price agreed in advance. The vesting period corresponds to the fiscal year with the final grant at 31 December 2016. At the grant date, the market value of the shares was DKK 3,062,903. The exercise periods are scheduled to the first 14 days after publication of the Company’s Annual Report. Warrants not exercised within the last exercise period will be lost. The warrant program is contingent on employment in the Company, and the Company's achievement of certain goals for earnings based on the period of employment as vesting criteria. In May 2014, Columbus established a warrant program for senior executives and a number of other employees. The program, which can only be exercised by purchasing the shares in question, grants the right to subscribe a number of shares in the parent company at a price agreed in advance. The vesting period corresponds to the fiscal year with the final grant at 31 December 2016. At the grant date, the market value of the shares was DKK 1,239,386. The exercise periods are scheduled to the first 14 days after publication of the Company’s Annual Report. Warrants not exercised within the last exercise period will be lost. The warrant program is contingent on employment in the Company, and the Company's achievement of certain goals for earnings based on the period of employment as vesting criteria.
Note 5 - Staff expenses and remuneration
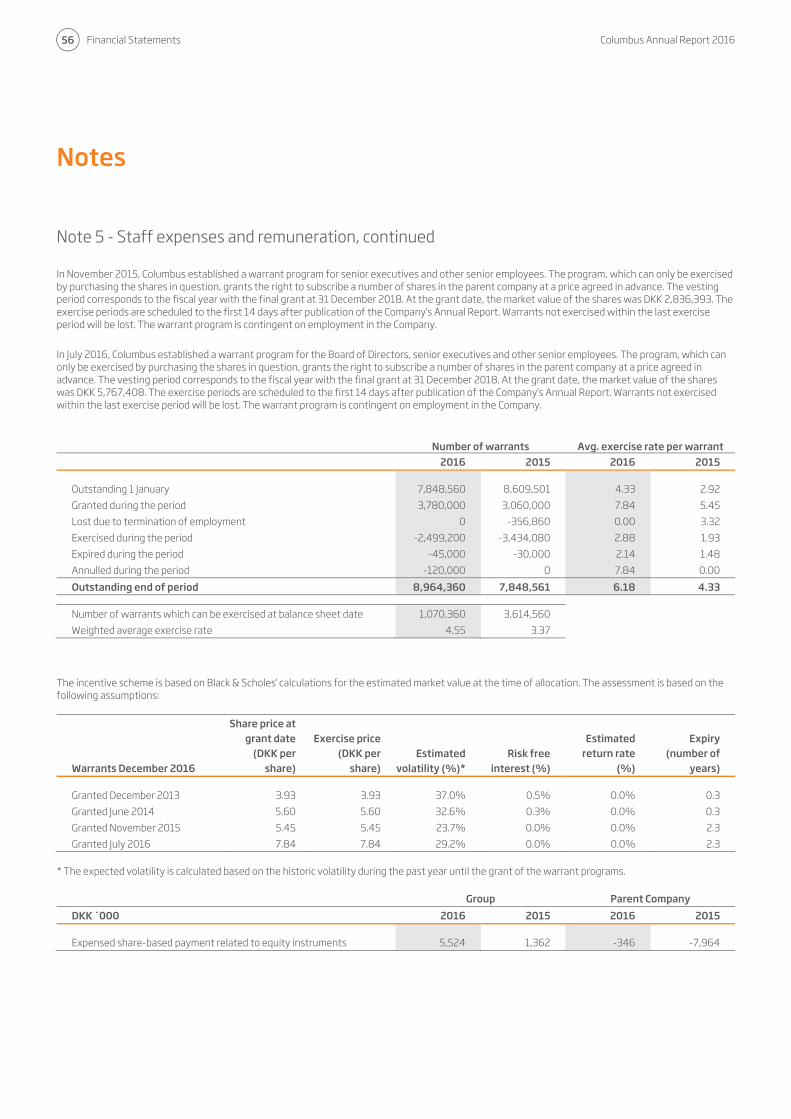
Financial Statements Columbus Annual Report 2016
Notes
56
In November 2015, Columbus established a warrant program for senior executives and other senior employees. The program, which can only be exercised by purchasing the shares in question, grants the right to subscribe a number of shares in the parent company at a price agreed in advance. The vesting period corresponds to the fiscal year with the final grant at 31 December 2018. At the grant date, the market value of the shares was DKK 2,836,393. The exercise periods are scheduled to the first 14 days after publication of the Company’s Annual Report. Warrants not exercised within the last exercise period will be lost. The warrant program is contingent on employment in the Company.
In July 2016, Columbus established a warrant program for the Board of Directors, senior executives and other senior employees. The program, which can only be exercised by purchasing the shares in question, grants the right to subscribe a number of shares in the parent company at a price agreed in advance. The vesting period corresponds to the fiscal year with the final grant at 31 December 2018. At the grant date, the market value of the shares was DKK 5,767,408. The exercise periods are scheduled to the first 14 days after publication of the Company’s Annual Report. Warrants not exercised within the last exercise period will be lost. The warrant program is contingent on employment in the Company.
Number of warrants Avg. exercise rate per warrant 2016 2015 2016 2015 Outstanding 1 January 7,848,560 8,609,501 4.33 2.92
Granted during the period 3,780,000 3,060,000 7.84 5.45
Lost due to termination of employment 0 -356,860 0.00 3.32
Exercised during the period -2,499,200 -3,434,080 2.88 1.93
Expired during the period -45,000 -30,000 2.14 1.48
Annulled during the period -120,000 0 7.84 0.00
Outstanding end of period 8,964,360 7,848,561 6.18 4.33 Number of warrants which can be exercised at balance sheet date 1,070,360 3,614,560
Weighted average exercise rate 4.55 3.37 The incentive scheme is based on Black & Scholes' calculations for the estimated market value at the time of allocation. The assessment is based on the following assumptions:
Warrants December 2016
Share price at grant date
(DKK per share)
Exercise price (DKK per
share) Estimated
volatility (%)* Risk free
interest (%)
Estimated return rate
(%)
Expiry (number of
years) Granted December 2013 3.93 3.93 37.0% 0.5% 0.0% 0.3
Granted June 2014 5.60 5.60 32.6% 0.3% 0.0% 0.3
Granted November 2015 5.45 5.45 23.7% 0.0% 0.0% 2.3
Granted July 2016 7.84 7.84 29.2% 0.0% 0.0% 2.3 * The expected volatility is calculated based on the historic volatility during the past year until the grant of the warrant programs.
Group Parent Company
DKK ´000 2016 2015 2016 2015 Expensed share-based payment related to equity instruments 5,524 1,362 -346 -7,964
Note 5 - Staff expenses and remuneration, continued

Columbus Annual Report 2016 Financial Statements
Notes
57
Group Parent CompanyDKK ´000 2016 2015 2016 2015 Other operating income Non-recurring income from acquisitions 5,594 12,086 0 827
Central cost allocation Columbus Group 0 0 27,502 22,559
Other services 1,091 1,463 3,949 4,209
Total other operating income 6,685 13,549 31,451 27,595
Note 7 - Financial income and expenses
Group Parent CompanyDKK ´000 2016 2015 2016 2015 Financial income Interest income from subsidiaries 0 0 5,319 4,757
Interest income on bank deposits, etc. 42 92 0 0
Other interest income 96 145 0 0
Interest income on financial assets not measured at fair value in the result 138 237 5,319 4,757 Foreign exchange gains 2,536 8,946 5,776 7,190 Total financial income 2,674 9,183 11,095 11,947 Financial expenses Interests expense to subsidiaries 0 0 301 14
Interest expense on bank loans 602 384 443 292
Other interest expense 40 242 0 147
Total financial expenses 642 626 744 453
Note 6 – Other operating income

Financial Statements Columbus Annual Report 2016
Notes
58
Group Parent CompanyDKK ´000 2016 2015 2016 2015 Tax on result for the year
Current tax 17,854 15,082 -4,865 0
Change in deferred tax 6,588 7,603 2,169 203
Adjustment to previous years 1,382 -4,624 737 0
25,824 18,061 -1,959 203 Tax on result for the year explained as follows
Calculated 22% on pre-tax earnings on continuing operations 23,607 19,599 9,297 9,234
Tax effect of
Adjustment to tax concerning previous years 1,382 1,512 737 0
Adjustment to tax rates in foreign subsidiaries
relative to 22% 975 -3,176 0 0
Non-capitalized tax value of losses -1,070 10,214 0 0
Impairment on tax due to changed rules on loss carry forwards 0 -5,495 0 -5,495
Effect of reduced corporate tax rate 0 249 0 248
Not taxable income -3,377 -5,136 -6,179 -10,734
Not taxable expenses 3,329 925 1,791 8,095
Other temporary differences 268 -631 277 -1,145
Other permanent differences 710 0 -7,882 0
25,824 18,061 -1,959 203 Effective tax rate (%) 24.07 21.66 -4.64 0.52 Corporate tax payable (net)
Balance at 1 January 10,267 3,325 0 0
Currency adjustment 2,215 -152 0 0
Adjustment to previous years -300 -152 0 0
Current tax for the year 17,854 15,082 -4,865 0
Tax paid on account for the year -7,555 -5,961 0 0
Corporate tax paid during the year -9,834 -1,875 0 0
Balance at 31 December 12,647 10,267 -4,865 0 Corporate tax receivable -11,531 -333 -4,865 0
Corporate tax payable 24,177 10,601 0 0
12,647 10,267 -4,865 0
Note 8 - Corporate tax

Columbus Annual Report 2016 Financial Statements
Notes
59
Group Parent CompanyDKK ´000 2016 2015 2016 2015 Deferred tax assets
Balance at 1 January 26,451 19,400 6,854 7,057
Deferred tax assets 1 January 26,451 19,400 6,854 7,057 Currency adjustments 3,975 211 0 0
Additions due to acquisitions during the year 2,202 2,350 0 0
Adjustment to previous years 640 0 0 0
This year's change in deferred tax -8,715 4,489 -2,906 -203
Balance at 31 December 24,553 26,451 3,948 6,854 Deferred tax assets relate to
Intangible assets -6,432 -9,598 -1,037 223
Tangible assets 3,436 5,166 2,872 3,397
Current assets 4,924 20,215 -385 -1
Loss carry forward 22,625 10,668 2,498 3,235
24,553 26,451 3,948 6,854 Based on the management’s assessment of future income short-term tax assets are expected to be DKK 7.5m and the total tax assets are expected to be utilized within a 5-year period.
Group Parent CompanyDKK ´000 2016 2015 2016 2015 Deferred tax liabilities
Balance at 1 January 6,454 281 0 0
Effect of reduced corporate tax rate 0 76 0 0
Adjusted deferred tax liabilities 1 January 6,454 357 0 0
Currency adjustment -110 19 0 0
Additions due to acquisitions during the year 607 123 0 0
This year's change in deferred tax 3,663 5,955 0 0
Balance 31 December 10,614 6,454 0 0 Deferred tax liabilities relates to
Intangible assets 10,614 6,421 0 0
Tangible assets 0 83 0 0
Current assets 0 -50 0 0
10,614 6,454 0 0 The Group's non-capitalized tax assets amount to DKK 58m (2015: DKK 60m).
Note 8 - Corporate tax, continued
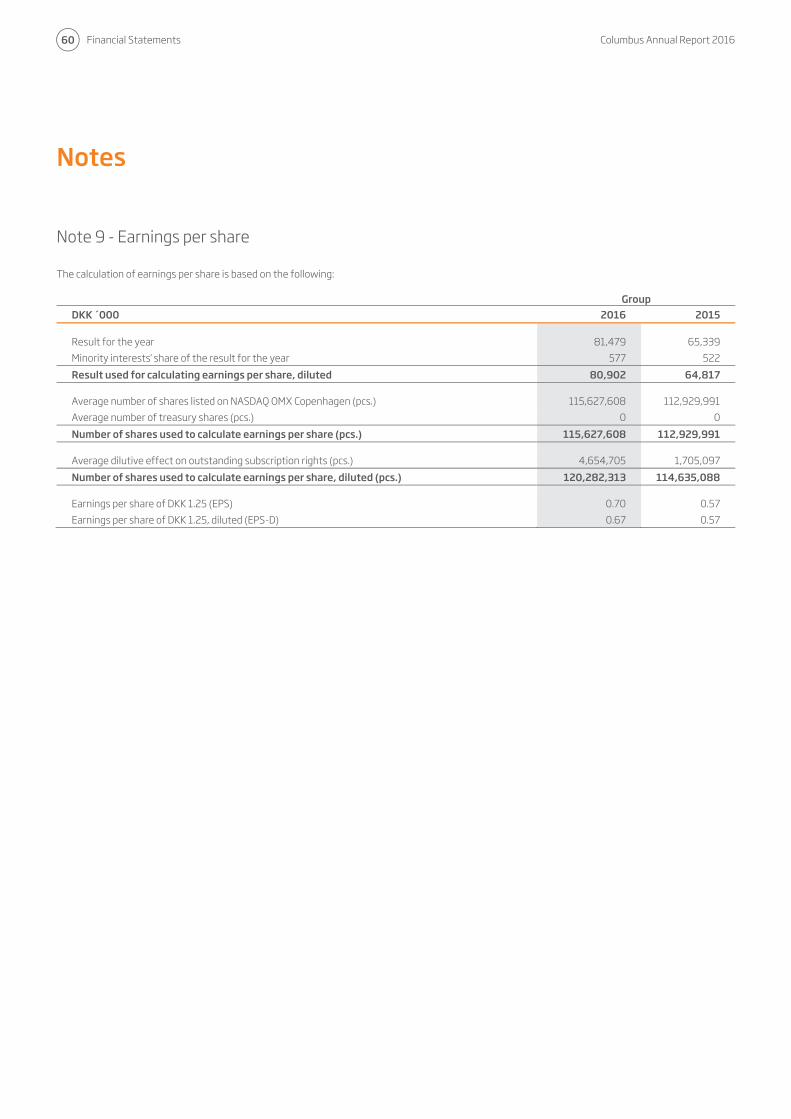
Financial Statements Columbus Annual Report 2016
Notes
60
The calculation of earnings per share is based on the following:
Group DKK ´000 2016 2015 Result for the year 81,479 65,339
Minority interests' share of the result for the year 577 522
Result used for calculating earnings per share, diluted 80,902 64,817 Average number of shares listed on NASDAQ OMX Copenhagen (pcs.) 115,627,608 112,929,991
Average number of treasury shares (pcs.) 0 0
Number of shares used to calculate earnings per share (pcs.) 115,627,608 112,929,991 Average dilutive effect on outstanding subscription rights (pcs.) 4,654,705 1,705,097
Number of shares used to calculate earnings per share, diluted (pcs.) 120,282,313 114,635,088 Earnings per share of DKK 1.25 (EPS) 0.70 0.57
Earnings per share of DKK 1.25, diluted (EPS-D) 0.67 0.57
Note 9 - Earnings per share
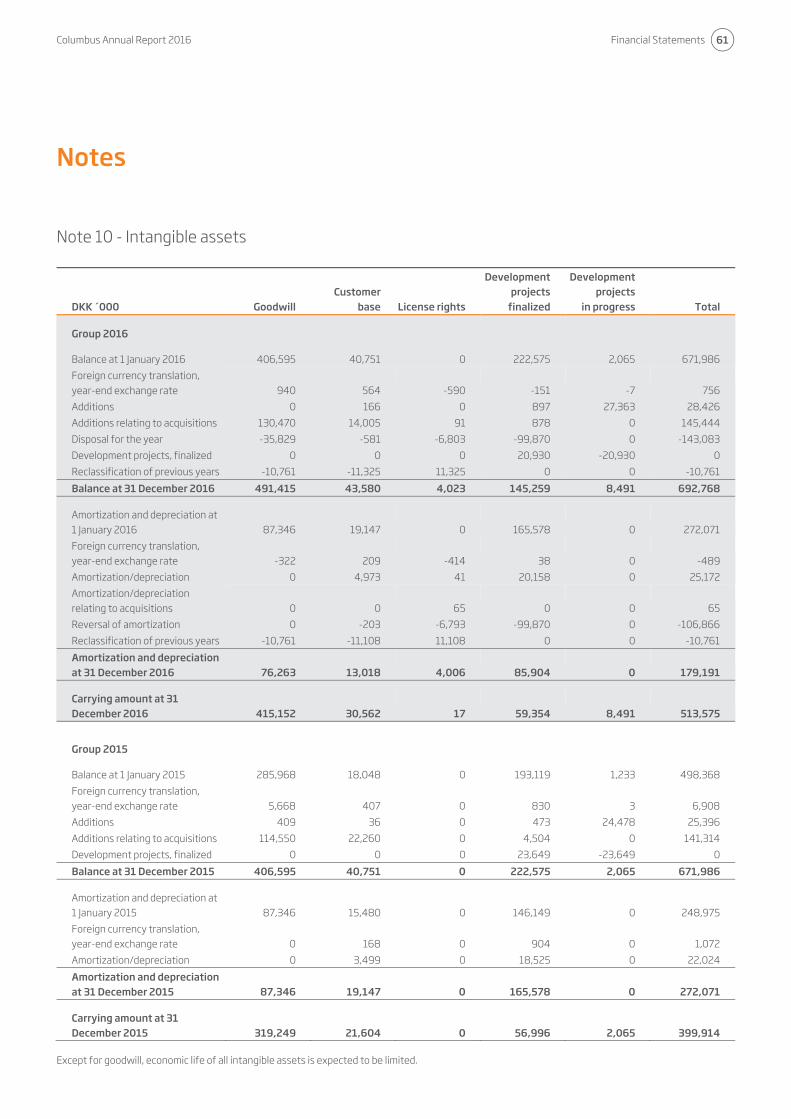
Columbus Annual Report 2016 Financial Statements
Notes
61
DKK ´000 Goodwill Customer
base License rights
Development projects
finalized
Development projects
in progress Total Group 2016 Balance at 1 January 2016 406,595 40,751 0 222,575 2,065 671,986
Foreign currency translation, year-end exchange rate 940 564 -590 -151 -7 756
Additions 0 166 0 897 27,363 28,426
Additions relating to acquisitions 130,470 14,005 91 878 0 145,444
Disposal for the year -35,829 -581 -6,803 -99,870 0 -143,083
Development projects, finalized 0 0 0 20,930 -20,930 0
Reclassification of previous years -10,761 -11,325 11,325 0 0 -10,761
Balance at 31 December 2016 491,415 43,580 4,023 145,259 8,491 692,768 Amortization and depreciation at 1 January 2016 87,346 19,147 0 165,578 0 272,071
Foreign currency translation, year-end exchange rate -322 209 -414 38 0 -489
Amortization/depreciation 0 4,973 41 20,158 0 25,172
Amortization/depreciation relating to acquisitions 0 0 65 0 0 65
Reversal of amortization 0 -203 -6,793 -99,870 0 -106,866
Reclassification of previous years -10,761 -11,108 11,108 0 0 -10,761
Amortization and depreciation at 31 December 2016 76,263 13,018 4,006 85,904 0 179,191 Carrying amount at 31 December 2016 415,152 30,562 17 59,354 8,491 513,575 Group 2015 Balance at 1 January 2015 285,968 18,048 0 193,119 1,233 498,368
Foreign currency translation, year-end exchange rate 5,668 407 0 830 3 6,908
Additions 409 36 0 473 24,478 25,396
Additions relating to acquisitions 114,550 22,260 0 4,504 0 141,314
Development projects, finalized 0 0 0 23,649 -23,649 0
Balance at 31 December 2015 406,595 40,751 0 222,575 2,065 671,986 Amortization and depreciation at 1 January 2015 87,346 15,480 0 146,149 0 248,975
Foreign currency translation, year-end exchange rate 0 168 0 904 0 1,072
Amortization/depreciation 0 3,499 0 18,525 0 22,024
Amortization and depreciation at 31 December 2015 87,346 19,147 0 165,578 0 272,071 Carrying amount at 31 December 2015 319,249 21,604 0 56,996 2,065 399,914
Except for goodwill, economic life of all intangible assets is expected to be limited.
Note 10 - Intangible assets

Financial Statements Columbus Annual Report 2016
Notes
62
Goodwill The carrying amount of goodwill is distributed on cash-generating units as shown below:
DKK ´000 Country Segment 31 December
2016 31 December
2015 Columbus A/S DK VAR 80,832 45,003
MW data A/S DK VAR 0 35,829
Columbus NSC A/S DK VAR 29,407 0
ZAO Columbus RU VAR 30,944 30,945
Columbus US Inc. US VAR 94,902 52,529
Business Microvar Inc. US VAR 80,508 77,964
Columbus Norway AS NO VAR 7,857 7,684
UAB Columbus Lietuva LT VAR 4,691 4,709
Columbus Global (UK) Ltd. UK VAR 17,357 20,213
Cambridge Online Systems Ltd. UK VAR 24,330 0
Columbus Eesti AS EE VAR 54 54
Columbus CoMakeIt India Pvt Ltd. IN VAR 4,130 4,130
Total consultancy 375,012 279,060 To-Increase B.V. NL ISV 40,140 40,189
Total ISV segment 40,140 40,189
415,152 319,249
The management performs an impairment test of the carrying amount of goodwill, development projects and other non-current assets at least annually and more frequently if there are indicators of impairment. The annual impairment test is performed on 31 December 2016. The recoverable amount of goodwill related to the individual cash generating units are calculated based on the Capital Asset Pricing Model (CAPM model)
The main changes in the goodwill from 2015 to 2016 relates to acquisitions of SystemHosting A/S, Client Strategy Group LLC and Cambridge Online Systems Ltd. However, also minor impact from exchange rate adjustments primarily linked to the US and UK operations.
Future cash flows The recoverable amount of the individual cash-generating units to which the goodwill amounts to, is calculated based on the calculations of capital value. The most significant uncertainties are connected to the determination of discount rates, growth rates and expected changes in costs in the budget and terminal periods. Budget for the individual cash generating units is based on a bottom up process. The key assumptions for the budget are expected development in efficiency (number of chargeable hours compared to total hours) in the consultancy business and expected revenue and gross profits from sale of software and general development in cost. The budget process takes place in October through November and takes into consideration the historical performance and current condition and performance of the cash generating unit in terms of pipeline, order book and current capacity in terms of consultants. The 3-year projection period is based on individual and conservative assumptions for the three main revenue streams in Columbus i.e. Consultancy, external software and Columbus Software. In generating a terminal value, a conservative real growth in revenue and cost of 1% is applied. With regards to staff, cost a real growth of 2% is expected in both the 3-year interim period and in generating the terminal value. Columbus is operating in a market where the development has low sensitivity to market development in general and to the development in general IT spending by companies. The management believes that likely changes in the key assumptions will not cause the carrying amount of goodwill to exceed the recoverable amounts. Group management has performed a sensitivity analysis of goodwill impairment tests to show the headroom between carrying amount and the recoverable amounts. The sensitivity analysis is focusing on changes in free cash flow in terminal period with 5%, growth in terminal period with 1% and changes in discount rate with 1%. The analysis did not identify any indication of impairment.
Note 10 - Intangible assets, continued

Columbus Annual Report 2016 Financial Statements
Notes
63
Discount rate The determined discount factors reflect the market assessment of the time value of money in the countries where the cash generating units operate expressed as a risk-free rate and the specific risks associated with each cash-generating unit. The discount rate is determined on an "after tax" basis on the assessed Weighted Average Costs of Capital (WACC).
The discount rate used to calculate the present value of expected future cash flow is between 6.7% and 9.7% after tax, representing 6.7% and 9.6% pretax. The reason for the insignificant difference between after tax and pre-tax discount rates is due to a very low debt to equity ratio and due to the fact that Columbus has, significant tax losses carry forwards to offset tax payments. The discount rate has been determined based on the Capital Asset Pricing Model and comprise a risk-free interest rate, the market risk premium and a beta factor, covering systematic market risk and also a company premium. The values for the risk-free interest rate, the market risk premium and the beta factor are determined using external sources. The group applies the same discount rates for all cash generating units, as the risk of the individual cash generating units are reflected in their estimated cash flows. However, to accommodate for higher assessed risk in the future, cash flows in Eastern Europe and UK a 3% higher discount factor has been applied for these markets. Most important assumptions for the impairment test With the applied method for the annual impairment test, the growth rate applied in the terminal value and the WACC becomes the most important assumptions for the net present value of the future cash flows.
Overall, the impairment based on the above assumptions demonstrates that the present value of the future cash flows from the cash generating units comfortably exceeds the carrying amount of goodwill. The management has applied conservative growth rates for the projection period and for the period following the projection period developed for the purpose of the impairment test.
DKK ´000 Goodwill Customer
base License rights
Development projects
finalized Total Parent 2016
Balance at 1 January 2016 45.987 9.513 0 21.764 77.264
Additions 0 0 0 731 731
Additions relating to acquisitions 35.829 5.000 46 0 40.875
Disposal for the year 0 -1.914 -2.879 -439 -5.232
Reclassification of previous years 0 -3.620 3.620 0 0
Balance at 31 December 2016 81.816 8.979 787 22.056 113.638 Amortization and depreciation at 1 January 2016 984 9.513 0 21.764 32.261
Amortization/depreciation 0 0 0 21 21
Amortization/depreciation relating to acquisitions 0 1.190 38 0 1.228
Reversal of depreciation 0 -1.914 -2.879 -439 -5.232
Reclassification of previous years 0 -3.620 3.620 0 0
Amortization and depreciation at 31 December 2016 984 5.169 779 21.346 28.278 Carrying amount at 31 December 2016 80.832 3.810 8 710 85.360 Parent 2015
Balance at 1 January 2015 45.987 9.513 0 21.764 77.264
Balance at 31 December 2015 45.987 9.513 0 21.764 77.264 Amortization and depreciation at 1 January 2015 984 9.513 0 21.694 32.191
Amortization /depreciation 0 0 0 70 70
Amortization and depreciation at 31 December 2015 984 9.513 0 21.764 32.261 Carrying amount at 31 December 2015 45.003 0 0 0 45.003
Note 10 - Intangible assets, continued

Financial Statements Columbus Annual Report 2016
Notes
64
DKK ´000 Land and buildings
Leasehold improvements
Fixtures and equipment Total
Group 2016 Balance at 1 January 2016 0 2,617 82,704 85,321
Foreign currency translation, year-end exchange rate 0 -3 164 161
Additions 2,202 350 6,247 8,799
Additions related to acquisitions 71 681 6,278 7,030
Disposals 0 -1,819 -37,288 -39,107
Disposals relating to divestments 0 -101 -2,925 -3,026
Balance at 31 December 2016 2,273 1,725 55,180 59,178
Depreciation and write-downs at 1 January 2016 0 2,522 70,169 72,691
Foreign currency translation, year-end exchange rate -1 -2 252 249
Depreciation 35 216 7,852 8,103
Additions related to acquisitions 0 178 2,614 2,792
Reversed depreciation on disposals 0 -1,819 -37,122 -38,941
Reversed depreciation on disposals relating to divestments 0 -88 -2,769 -2,857
Depreciation at 31 December 2016 34 1,007 40,996 42,037
Carrying amount at 31 December 2016 2,239 719 14,184 17,142 Group 2015 Balance at 1 January 2015 0 2,615 62,693 65,308
Foreign currency translation, year-end exchange rate 0 2 2,057 2,059
Additions 0 0 6,276 6,276
Additions relating to acquisitions 0 0 12,064 12,064
Disposals 0 0 -372 -372
Disposals relating to divestments 0 0 -14 -14
Balance at 31 December 2015 0 2,617 82,704 85,321 Depreciation and write-downs at 1 January 2015 0 2,467 54,193 56,660
Foreign currency translation, year-end exchange rate 0 2 1,298 1,300
Depreciation 0 53 6,943 6,996
Additions relating to acquisitions 0 0 7,844 7,844
Reversed depreciation on disposals 0 0 -97 -97
Reversed depreciation on disposals relating to divestments 0 0 -12 -12
Depreciation at 31 December 2015 0 2,522 70,169 72,691
Carrying amount at 31 December 2015 0 96 12,535 12,631
Note 11 - Tangible assets
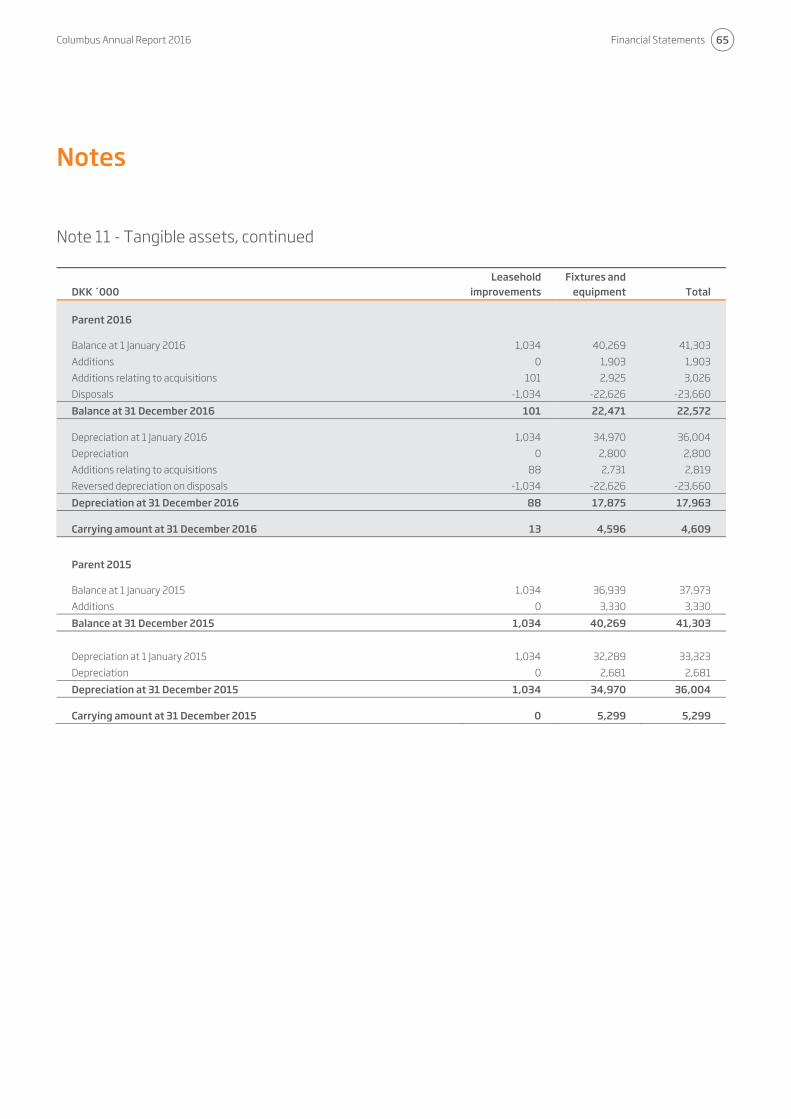
Columbus Annual Report 2016 Financial Statements
Notes
65
DKK ´000 Leasehold
improvements Fixtures and
equipment Total Parent 2016 Balance at 1 January 2016 1,034 40,269 41,303
Additions 0 1,903 1,903
Additions relating to acquisitions 101 2,925 3,026
Disposals -1,034 -22,626 -23,660
Balance at 31 December 2016 101 22,471 22,572 Depreciation at 1 January 2016 1,034 34,970 36,004
Depreciation 0 2,800 2,800
Additions relating to acquisitions 88 2,731 2,819
Reversed depreciation on disposals -1,034 -22,626 -23,660
Depreciation at 31 December 2016 88 17,875 17,963 Carrying amount at 31 December 2016 13 4,596 4,609 Parent 2015 Balance at 1 January 2015 1,034 36,939 37,973
Additions 0 3,330 3,330
Balance at 31 December 2015 1,034 40,269 41,303
Depreciation at 1 January 2015 1,034 32,289 33,323
Depreciation 0 2,681 2,681
Depreciation at 31 December 2015 1,034 34,970 36,004 Carrying amount at 31 December 2015 0 5,299 5,299
Note 11 - Tangible assets, continued

Financial Statements Columbus Annual Report 2016
Notes
66
Parent CompanyDKK ´000 2016 2015 Balance at 1 January 305,009 231,742
Adjustments 0 409
Additions 62,631 72,858
Disposal -8,100 0
Balance at 31 December 359,540 305,009 Amortization at 1 January -85,881 -51,435
Write-down 0 -34,446
Amortization at 31 December -85,881 -85,881 Carrying amount 31 December 273,659 219,128
Additions of investments in subsidiaries in 2016 relate to the acquisition of SystemHosting A/S and share capital increase in Columbus Norway AS. Disposal in 2016 relate to liquidation of MW Solutions A/S.
Additions of investments in subsidiaries in 2015 relate to the acquisition of MW data A/S, MW Solutions A/S and share capital increase in Columbus Norway AS. Write-down of investments in 2015 relates to impairment test on the Norwegian investment.
Note 12 - Investments in subsidiaries

Columbus Annual Report 2016 Financial Statements
Notes
67
Group Parent Company
DKK ´000 2016 2015 2016 2015 Receivables (gross) at 31 December 167,941 148,701 41,987 29,937 Provisions for bad debt at 1 January 6,991 4,938 5 38
Change in provisions for bad debt during the period 15,151 13,516 1,745 24
Loss realized during the period -5,676 -11,463 0 -57
Provisions for bad debt 31 December 16,466 6,991 1,750 5 Carrying amount at 31 December 151,475 141,710 40,237 29,932
Provisions for bad debt are made if it is assessed that the individual debtors ability to pay is reduced, e.g. in the event of administrative orders, insolvency, etc.
Note 14 – Contract work in progress Group Parent Company
DKK ´000 2016 2015 2016 2015 Contract work in progress 59,380 52,475 37,713 38,651
On account billing and prepayments -60,232 -57,519 -37,980 -36,753
-852 -5,044 -267 1,898 The net value is included in the balance as follows:
Contract work in progress (assets) 8,994 11,546 1,151 7,274
Client prepayments (liabilities) -9,846 -16,590 -1,418 -5,376
-852 -5,044 -267 1,898
Note 13 – Trade receivables

Financial Statements Columbus Annual Report 2016
Notes
68
The share capital consists of 116,197,772 shares of DKK 1.25, corresponding to DKK 145,247k (nom.). The shares are not divided into classes, and no shares have any special rights. The share capital is fully paid up. In 2016, the Company increased the capital by 2,499,200 shares of DKK 1.25, corresponding to DKK 3,124k (nom.) as a result of exercised warrant programs. In 2015, the Company increased the capital by 3,434,080 shares of DKK 1.25, corresponding to DKK 4,293k (nom.) as a result of exercised warrant programs.
Parent Company 2016 2015 Number of shares at the beginning of the year 113,698,572 110,264,492
Capital increase 2,499,200 3,434,080
Number of shares at the end of the year 116,197,772 113,698,572
Note 16 - Provisions
Group Parent CompanyDKK ´000 2016 2015 2016 2015 Contingent consideration 11,049 13,514 3,803 4,072
Other provisions 483 362 483 362
11,532 13,876 4,286 4,434
Note 17 - Other liabilities
Group Parent CompanyDKK ´000 2016 2015 2016 2015 Payroll cost, payroll tax, retirement benefit obligations etc. 41,521 43,550 8,582 7,450
Holiday pay etc. 42,780 35,633 20,064 16,151
VAT payable 17,036 19,547 4,680 3,062
Other liabilities 31,837 30,852 5,105 4,984
Contingent consideration 24,054 9,141 9,812 9,141
157,228 138,723 48,243 40,788 The carrying amount of other liabilities matches the fair value of the liabilities. The holiday pay obligation represents the Groups obligation to pay salary during employees' holiday in the following financial year.
Note 15 - Share capital

Columbus Annual Report 2016 Financial Statements
Notes
69
Group
Contractual obligations Group companies have entered into various housing lease agreements, and the total lease obligation in the interminable part of the lease period amounts to DKK 55.1m (2015: DKK 59.7m).
Further, various leasing agreements (primarily cars) have been entered into in relation to operating equipment, and total liabilities amount to DKK 10.6m (2015: DKK 7.0).
Parent Company
Contractual obligations Parent company have entered into various housing lease agreements, and the total lease obligation in the interminable part of the lease period amounts to DKK 12.1m (2015: DKK 12.5m).
Further, various leasing agreements (primarily cars) have been entered into in relation to operating equipment, and total liabilities amount to DKK 1.4m (2015: DKK 1.2m). Contingent liabilities The Company is jointly VAT registered with Columbus NSC A/S and is jointly and severally liable for VAT. The Danish jointly taxed companies are jointly and severally liable for tax on joint taxation income. The Company is included in Danish jointly taxation with Consolidated Holdings A/S as controlling company. Thus, the Company is, in accordance with the Danish Corporation Tax Act, from financial year 2013 liable for income tax etc. for the jointly taxed companies and from 1 July 2012 also for potential liabilities, including withholding tax on interest, royalties and profits for these companies. Commitments for expenditures The Company has guaranteed payment of banking arrangements in Nordea for subsidiaries. As at 31 December 2016 the maximum liability is DKK 5.974k (2015: DKK 420k). The Company's shares in subsidiaries are provided as security for the parent company's arrangement with the main bank, total amount DKK 21.0m. (2015: DKK 21.0m)
Note 18 - Contingent liabilities and commitments for expenditures

Financial Statements Columbus Annual Report 2016
Notes
70
Rental and lease commitments Future rental and lease commitments are as follows:
DKK ´000 2016 2015
Group Buildings
Fixtures and operating
equipment Total Buildings
Fixtures and operating
equipment Total
Less than 1 year 20,192 4,692 24,884 17,597 3,114 20,711
Between 1 and 5 years 45,459 5,850 51,309 46,061 3,947 50,008
More than 5 years 6,644 0 6,644 27,951 0 27,951
72,295 10,542 82,837 91,609 7,061 98,670 The Group leases operating equipment and inventory on operational lease agreements. The lease period is usually between 2 and 7 years with the possibility of renewal on expiry.
DKK ´000 2016 2015
Parent Company Buildings
Fixtures and operating
equipment Total Buildings
Fixtures and operating
equipment Total
Less than 1 year 3,722 737 4,459 3,296 832 4,128
Between 1 and 5 years 13,444 665 14,109 13,370 321 13,691
More than 5 years 4,928 0 4,928 8,265 0 8,265
22,094 1,402 23,496 24,931 1,153 26,084 The Parent company leases operating equipment and inventory on operational lease agreements. The lease period is usually between 2 and 7 years with the possibility of renewal on expiry.
Note 18 - Contingent liabilities and commitments for expenditures, continued

Columbus Annual Report 2016 Financial Statements
Notes
71
Acquisition of companies in 2017 As of 9 January 2017, the Group acquired 100% of the shares in Tridea Partners LLC.
Name Primary activity
Date of control gained
Acquired ownership
Acquired voting rights
Total consideration
DKK ’000
Tridea Partners LLC Distribution and implementation of standardised business solutions. 9th January 100% 100% 60.381
Total 60.381
The acquisition of Tridea Partners LLC will strengthen Columbus' coast-to-coast reach in US market and underlines the goal of being recognized as a strategic business partner that leads customers in the digital business transformation.
DKK ´000 Tridea
Partners LLC Total Other intangible assets 5,532 5,532
Total non-current assets 5,532 5,532 Trade receivables 3,727 3,727
Other receivables 655 655
Cash 4,543 4,543
Total current assets 8,925 8,925 Trade payables -1,425 -1,425
Other debt -3,824 -3,824
Total current debt -5,249 -5,249
Net assets acquired 9,209 9,209 Goodwill 51,172 51,172
Total consideration 60,381 60,381 Acquired cash funds -4,543 -4,543
Contingent consideration -13,837 -13,837
Cash consideration on acquisition date 42,001 42,001 After recognition of identifiable assets, liabilities and contingent liabilities at fair value, goodwill in relation to the acquisition was assessed to DKK 51.1m. Estimated tax deductibility on goodwill for the Tridea Partners LLC acquisition is DKK 42.9m. Goodwill is for tax purposes amortized over 15 years. Contingent consideration for Tridea Partners LLC is DKK 13.8m. The contingent consideration is determined by certain contribution thresholds in 2017 and 2018 for the combined business. The consideration is recognized as if these thresholds will be met.
Note 19 – Business combinations
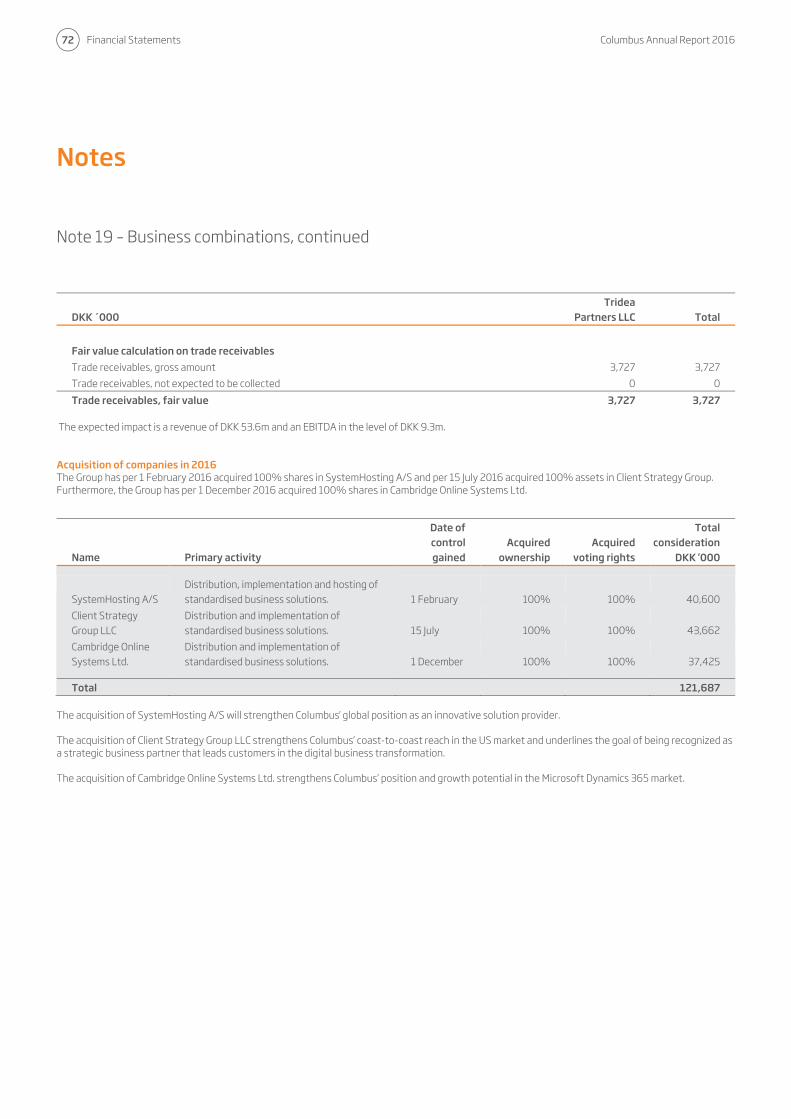
Financial Statements Columbus Annual Report 2016
Notes
72
DKK ´000 Tridea
Partners LLC Total
Fair value calculation on trade receivables
Trade receivables, gross amount 3,727 3,727
Trade receivables, not expected to be collected 0 0
Trade receivables, fair value 3,727 3,727 The expected impact is a revenue of DKK 53.6m and an EBITDA in the level of DKK 9.3m. Acquisition of companies in 2016 The Group has per 1 February 2016 acquired 100% shares in SystemHosting A/S and per 15 July 2016 acquired 100% assets in Client Strategy Group. Furthermore, the Group has per 1 December 2016 acquired 100% shares in Cambridge Online Systems Ltd.
Name Primary activity
Date of control gained
Acquired ownership
Acquired voting rights
Total consideration
DKK ’000
SystemHosting A/S Distribution, implementation and hosting of standardised business solutions. 1 February 100% 100% 40,600
Client Strategy Group LLC
Distribution and implementation of standardised business solutions. 15 July 100% 100% 43,662
Cambridge Online Systems Ltd.
Distribution and implementation of standardised business solutions. 1 December 100% 100% 37,425
Total 121,687
The acquisition of SystemHosting A/S will strengthen Columbus' global position as an innovative solution provider. The acquisition of Client Strategy Group LLC strengthens Columbus’ coast-to-coast reach in the US market and underlines the goal of being recognized as a strategic business partner that leads customers in the digital business transformation. The acquisition of Cambridge Online Systems Ltd. strengthens Columbus’ position and growth potential in the Microsoft Dynamics 365 market.
Note 19 – Business combinations, continued
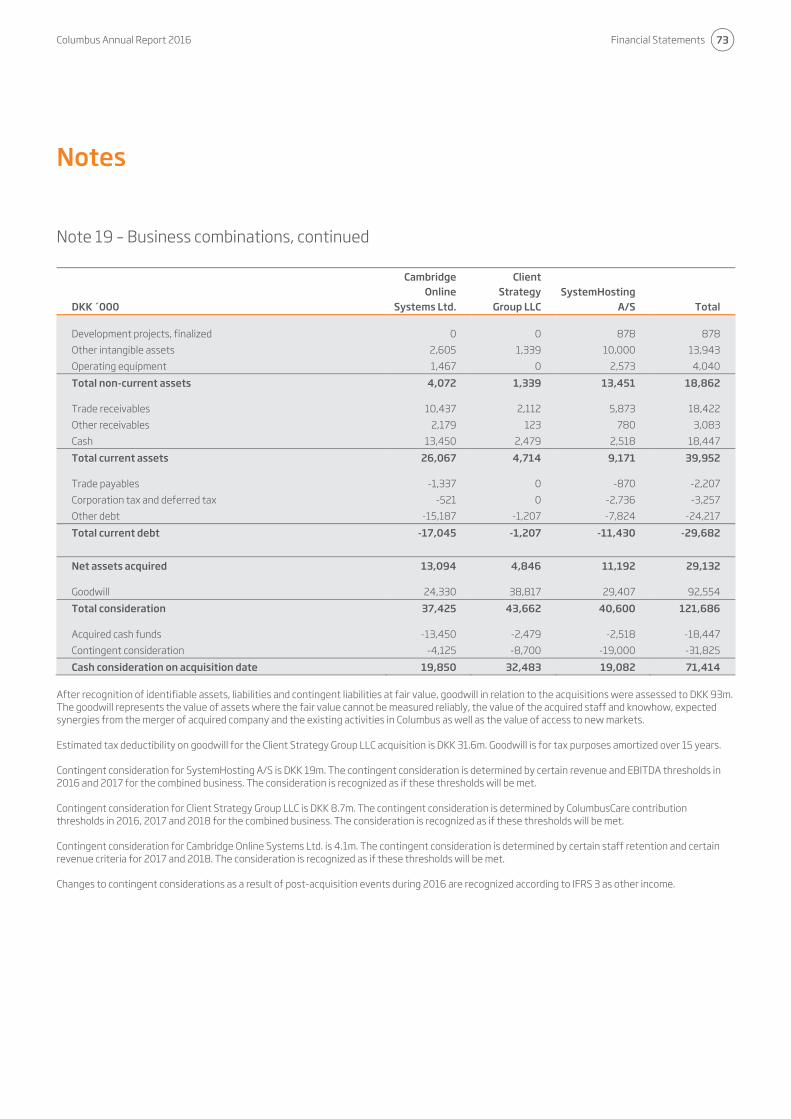
Columbus Annual Report 2016 Financial Statements
Notes
73
DKK ´000
Cambridge Online
Systems Ltd.
Client Strategy
Group LLC SystemHosting
A/S Total Development projects, finalized 0 0 878 878
Other intangible assets 2,605 1,339 10,000 13,943
Operating equipment 1,467 0 2,573 4,040
Total non-current assets 4,072 1,339 13,451 18,862 Trade receivables 10,437 2,112 5,873 18,422
Other receivables 2,179 123 780 3,083
Cash 13,450 2,479 2,518 18,447
Total current assets 26,067 4,714 9,171 39,952 Trade payables -1,337 0 -870 -2,207
Corporation tax and deferred tax -521 0 -2,736 -3,257
Other debt -15,187 -1,207 -7,824 -24,217
Total current debt -17,045 -1,207 -11,430 -29,682
Net assets acquired 13,094 4,846 11,192 29,132 Goodwill 24,330 38,817 29,407 92,554
Total consideration 37,425 43,662 40,600 121,686 Acquired cash funds -13,450 -2,479 -2,518 -18,447
Contingent consideration -4,125 -8,700 -19,000 -31,825
Cash consideration on acquisition date 19,850 32,483 19,082 71,414 After recognition of identifiable assets, liabilities and contingent liabilities at fair value, goodwill in relation to the acquisitions were assessed to DKK 93m. The goodwill represents the value of assets where the fair value cannot be measured reliably, the value of the acquired staff and knowhow, expected synergies from the merger of acquired company and the existing activities in Columbus as well as the value of access to new markets. Estimated tax deductibility on goodwill for the Client Strategy Group LLC acquisition is DKK 31.6m. Goodwill is for tax purposes amortized over 15 years. Contingent consideration for SystemHosting A/S is DKK 19m. The contingent consideration is determined by certain revenue and EBITDA thresholds in 2016 and 2017 for the combined business. The consideration is recognized as if these thresholds will be met. Contingent consideration for Client Strategy Group LLC is DKK 8.7m. The contingent consideration is determined by ColumbusCare contribution thresholds in 2016, 2017 and 2018 for the combined business. The consideration is recognized as if these thresholds will be met. Contingent consideration for Cambridge Online Systems Ltd. is 4.1m. The contingent consideration is determined by certain staff retention and certain revenue criteria for 2017 and 2018. The consideration is recognized as if these thresholds will be met. Changes to contingent considerations as a result of post-acquisition events during 2016 are recognized according to IFRS 3 as other income.
Note 19 – Business combinations, continued

Financial Statements Columbus Annual Report 2016
Notes
74
DKK ´000
Cambridge Online
Systems Ltd.
Client Strategy
Group LLC SystemHosting
A/S Total
Fair value assessment of trade receivables
Trade receivables, gross amount 11,471 2,112 5,873 19,456
Trade receivables, not expected to be collected -1,033 0 0 -1,033
Trade receivables, fair value 10,437 2,112 5,873 18,422
SystemHosting A/S, Client Strategy Group LLC and Cambridge Online Systems Ltd. have been implemented completely in the business and in the books and a separation of the business is impracticable. The amount of revenue and profit or loss, for the period from the acquisition date as well as proforma figures for the year 2016 has consequently not been stated. Acquisition of companies in 2015 As of 1 February 2015, the Group acquired 100% of the shares in Business Microvar Inc. and as of 4 May 2015 the Group acquired 100% of the shares in MW data A/S and MW Solutions A/S. Furthermore, as of 1 July 2015 the Group acquired 100% of the assets in Sherwood Systems.
Name Primary activity
Date of control gained
Acquired ownership
Acquired voting rights
Total consideration
DKK ’000 Business Microvar Inc.
Distribution and implementation of standardised business solutions. 1st February 100% 100% 62,225
MW data A/S and MW Solutions A/S
Distribution and implementation of standardised business solutions. 4th May 100% 100% 53,278
Sherwood Systems Distribution and implementation of standardised business solutions. 1st July 100% 100% 6,595
Total 122,098
The acquisition of Business Microvar Inc. and Sherwood Systems has strengthened the position as a value provider of industry specific consultancy and business solutions to companies within the retail, manufacturing and food industries. The acquisition of MW data A/S has strengthened the focus within the company’s key industries, and thereby the global position as an innovative solution provider.
Note 19 – Business combinations, continued
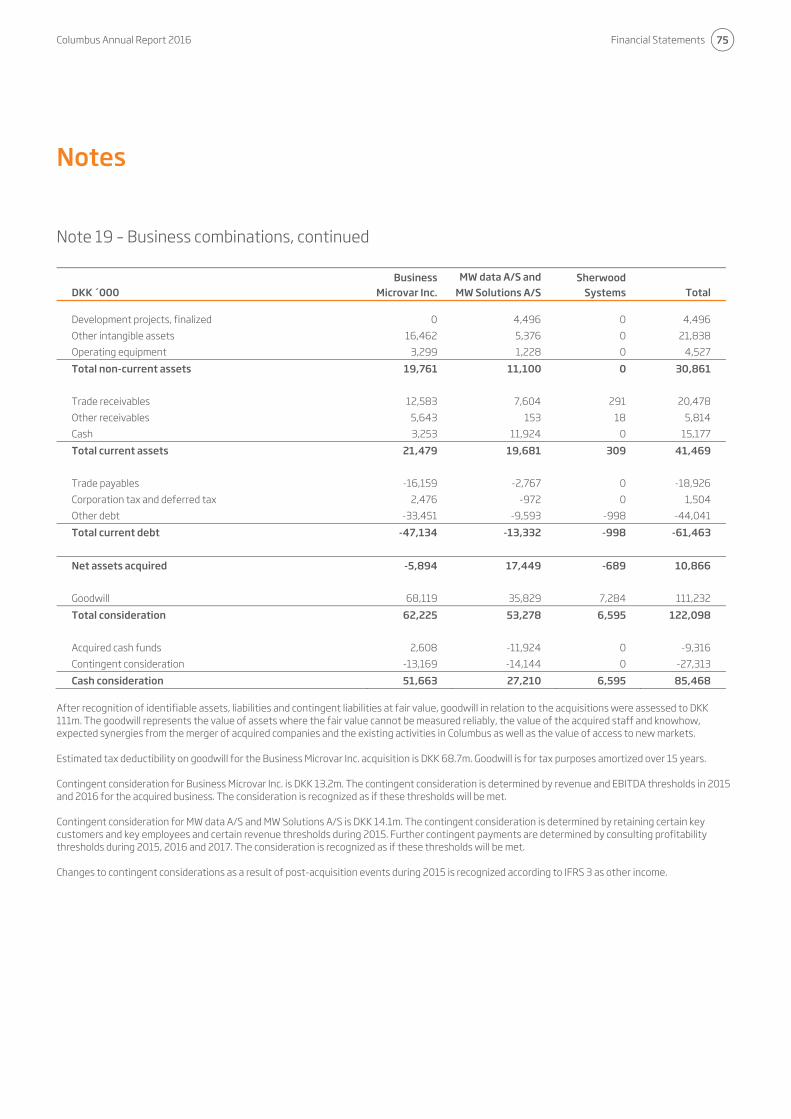
Columbus Annual Report 2016 Financial Statements
Notes
75
DKK ´000 Business
Microvar Inc. MW data A/S and
MW Solutions A/S Sherwood
Systems Total Development projects, finalized 0 4,496 0 4,496
Other intangible assets 16,462 5,376 0 21,838
Operating equipment 3,299 1,228 0 4,527
Total non-current assets 19,761 11,100 0 30,861 Trade receivables 12,583 7,604 291 20,478
Other receivables 5,643 153 18 5,814
Cash 3,253 11,924 0 15,177
Total current assets 21,479 19,681 309 41,469
Trade payables -16,159 -2,767 0 -18,926
Corporation tax and deferred tax 2,476 -972 0 1,504
Other debt -33,451 -9,593 -998 -44,041
Total current debt -47,134 -13,332 -998 -61,463 Net assets acquired -5,894 17,449 -689 10,866 Goodwill 68,119 35,829 7,284 111,232
Total consideration 62,225 53,278 6,595 122,098 Acquired cash funds 2,608 -11,924 0 -9,316
Contingent consideration -13,169 -14,144 0 -27,313
Cash consideration 51,663 27,210 6,595 85,468 After recognition of identifiable assets, liabilities and contingent liabilities at fair value, goodwill in relation to the acquisitions were assessed to DKK 111m. The goodwill represents the value of assets where the fair value cannot be measured reliably, the value of the acquired staff and knowhow, expected synergies from the merger of acquired companies and the existing activities in Columbus as well as the value of access to new markets. Estimated tax deductibility on goodwill for the Business Microvar Inc. acquisition is DKK 68.7m. Goodwill is for tax purposes amortized over 15 years. Contingent consideration for Business Microvar Inc. is DKK 13.2m. The contingent consideration is determined by revenue and EBITDA thresholds in 2015 and 2016 for the acquired business. The consideration is recognized as if these thresholds will be met. Contingent consideration for MW data A/S and MW Solutions A/S is DKK 14.1m. The contingent consideration is determined by retaining certain key customers and key employees and certain revenue thresholds during 2015. Further contingent payments are determined by consulting profitability thresholds during 2015, 2016 and 2017. The consideration is recognized as if these thresholds will be met. Changes to contingent considerations as a result of post-acquisition events during 2015 is recognized according to IFRS 3 as other income.
Note 19 – Business combinations, continued

Financial Statements Columbus Annual Report 2016
Notes
76
DKK ´000 Business
Microvar Inc. MW data A/S and
MW Solutions A/S Sherwood
Systems Total
Fair value assessment of trade receivables
Trade receivables, gross amount 15,039 7,718 350 23,108
Trade receivables, not expected to be collected -2,456 -114 -59 -2,629
Trade receivables, fair value 12,583 7,604 291 20,478 Business Microvar Inc., MW data A/S, MW Solutions A/S and Sherwood Systems have been implemented completely in business and in the books and a separation of the businesses is impracticable. The amount of revenue and profit or loss, for the period from the acquisition date as well as proforma figures for the year 2015 has consequently not been stated.
Note 19 – Business combinations, continued

Columbus Annual Report 2016 Financial Statements
Notes
77
Consolidated Holdings A/S has a controlling interest in the Columbus Group, including Columbus A/S.
Other related parties with significant influence in the Columbus Group are the Company’s Board of Directors, Executive Board and certain executives and their related parties. Furthermore, related parties are companies in which the above persons have significant interests.
Related parties with controlling interest Consolidated Holdings A/S (Fredheimvej 9, 2950 Vedbæk) Consolidated Holdings A/S owns 48.66% of the shares in Columbus A/S. Consolidated Holdings A/S has a controlling interest in Columbus A/S, as Consolidated Holdings A/S, through its shareholding and its shareholder voting agreements, controls the majority (49,67 %) of the votes at the annual general meeting. Transactions with the company takes are made on an arm's length basis. Ib Kunøe is the majority shareholder in Consolidated Holdings A/S. Dividend to Consolidated Holdings A/S is paid on equal principals as with other shareholders. Furthermore, Consolidated Holdings A/S is in a joint taxation with the Danish entities in the Columbus Group, with Consolidated Holdings A/S as management company. In 2016 tax paid by Columbus to Consolidated Holdings A/S amounted to 2.7m DKK (2015: DKK 0). Related parties with significant influence ATEA (Lautrupvang 6, 2750 Ballerup) Transactions with the company are made on an arm's length basis. In 2016 Columbus bought products and services from ATEA for 2.3m DKK (2015: DKK 1.6m). Consolidated Holdings A/S has significant influence in ATEA, and certain dual roles in the management are filled by the same persons in ATEA and the Columbus Group.
Netop Solutions A/S (Netop, Bregnerødvej 127, 3460 Birkerød) Transactions with the company are made on an arm's length basis. In 2016 the Columbus Group has sold licenses and services to the company for DKK 31k (2015: DKK 31k), Consolidated Holdings A/S has controlling interest in Netop Solutions A/S, and certain dual roles in the management are filled by the same persons in Netop Solutions A/S and the Columbus Group.
Dan-Palletiser A/S (Borgergade 17, 4241 Vemmelev) Transactions with the company are made on an arm's length basis. In 2016 the Columbus Group has sold licenses and services to the company for DKK 0.9m (2015: 0.6m). Consolidated Holdings A/S has controlling interest in Dan-Palletiser A/S, and certain dual roles in the management are filled by the same persons in Dan-Palletiser A/S and the Columbus Group.
Other related parties Maatschap de Baksteen (T.a.v. de heer R. Hardeman, Utrechtseweg 28, 3927AV Renswoude, Holland) Transactions with the company are made on an arm's length basis. In 2016 the Columbus Group bought services related to office rent for DKK 1.0m (2015: DKK 0.9m). The company is a related party to the Columbus Group as an executive in the Columbus Group is a part owner of the company.
Related parties in Columbus also comprise the subsidiaries in which the Company has controlling interest, cf. the Group overview.
Note 20 - Related parties
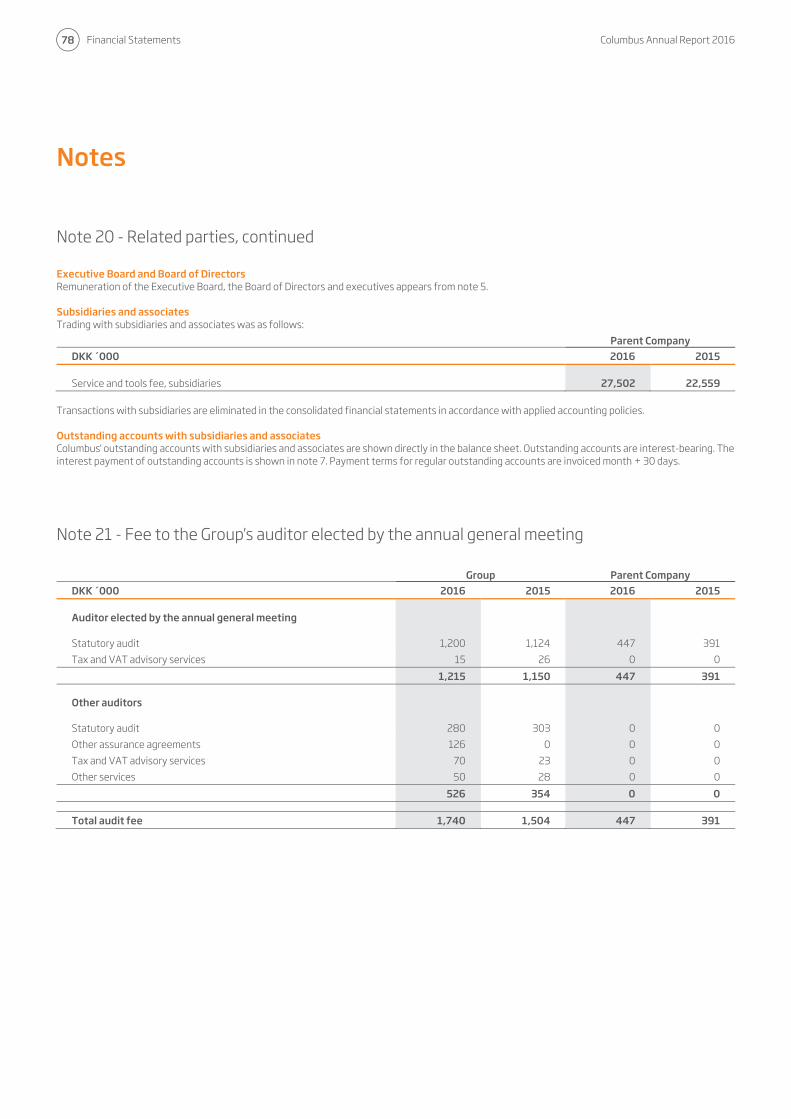
Financial Statements Columbus Annual Report 2016
Notes
78
Executive Board and Board of Directors Remuneration of the Executive Board, the Board of Directors and executives appears from note 5. Subsidiaries and associates Trading with subsidiaries and associates was as follows:
Parent CompanyDKK ´000 2016 2015 Service and tools fee, subsidiaries 27,502 22,559
Transactions with subsidiaries are eliminated in the consolidated financial statements in accordance with applied accounting policies. Outstanding accounts with subsidiaries and associates Columbus' outstanding accounts with subsidiaries and associates are shown directly in the balance sheet. Outstanding accounts are interest-bearing. The interest payment of outstanding accounts is shown in note 7. Payment terms for regular outstanding accounts are invoiced month + 30 days.
Note 21 - Fee to the Group's auditor elected by the annual general meeting
Group Parent CompanyDKK ´000 2016 2015 2016 2015 Auditor elected by the annual general meeting Statutory audit 1,200 1,124 447 391
Tax and VAT advisory services 15 26 0 0
1,215 1,150 447 391 Other auditors Statutory audit 280 303 0 0
Other assurance agreements 126 0 0 0
Tax and VAT advisory services 70 23 0 0
Other services 50 28 0 0
526 354 0 0 Total audit fee 1,740 1,504 447 391
Note 20 - Related parties, continued
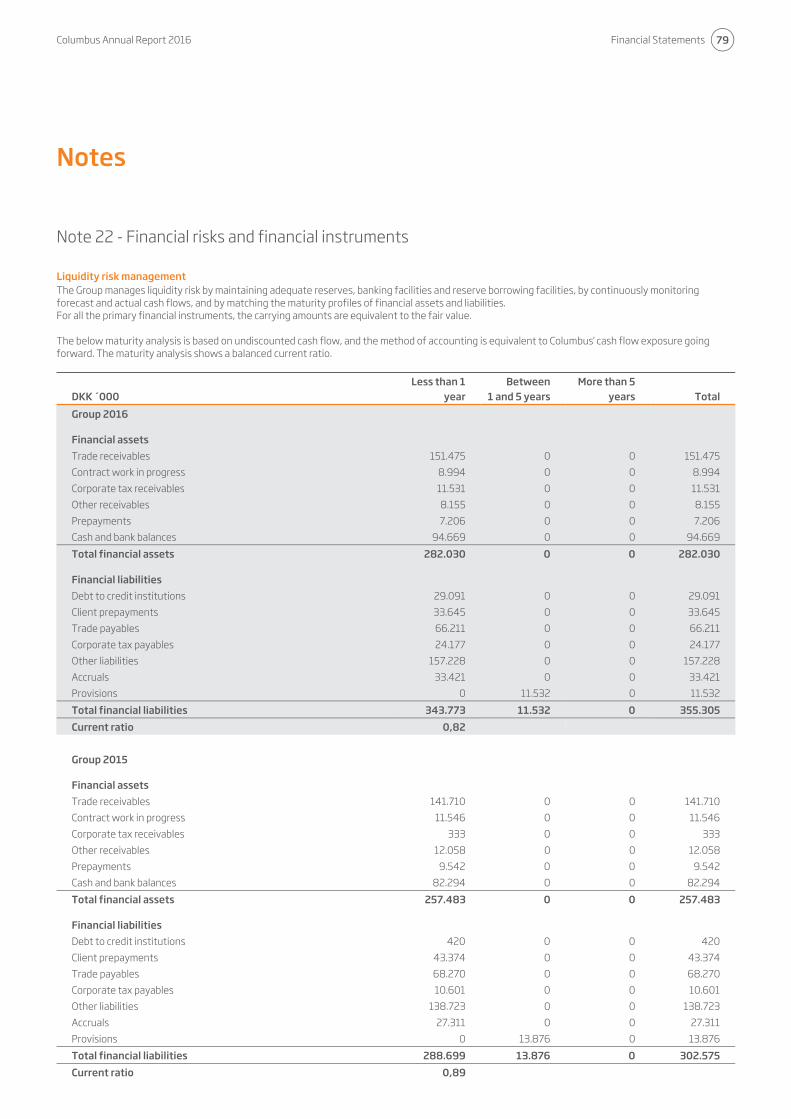
Columbus Annual Report 2016 Financial Statements
Notes
79
Liquidity risk management The Group manages liquidity risk by maintaining adequate reserves, banking facilities and reserve borrowing facilities, by continuously monitoring forecast and actual cash flows, and by matching the maturity profiles of financial assets and liabilities. For all the primary financial instruments, the carrying amounts are equivalent to the fair value. The below maturity analysis is based on undiscounted cash flow, and the method of accounting is equivalent to Columbus' cash flow exposure going forward. The maturity analysis shows a balanced current ratio.
DKK ´000 Less than 1
year Between
1 and 5 years More than 5
years Total
Group 2016 Financial assets
Trade receivables 151.475 0 0 151.475
Contract work in progress 8.994 0 0 8.994
Corporate tax receivables 11.531 0 0 11.531
Other receivables 8.155 0 0 8.155
Prepayments 7.206 0 0 7.206
Cash and bank balances 94.669 0 0 94.669
Total financial assets 282.030 0 0 282.030 Financial liabilities
Debt to credit institutions 29.091 0 0 29.091
Client prepayments 33.645 0 0 33.645
Trade payables 66.211 0 0 66.211
Corporate tax payables 24.177 0 0 24.177
Other liabilities 157.228 0 0 157.228
Accruals 33.421 0 0 33.421
Provisions 0 11.532 0 11.532
Total financial liabilities 343.773 11.532 0 355.305
Current ratio 0,82
Group 2015 Financial assets
Trade receivables 141.710 0 0 141.710
Contract work in progress 11.546 0 0 11.546
Corporate tax receivables 333 0 0 333
Other receivables 12.058 0 0 12.058
Prepayments 9.542 0 0 9.542
Cash and bank balances 82.294 0 0 82.294
Total financial assets 257.483 0 0 257.483 Financial liabilities
Debt to credit institutions 420 0 0 420
Client prepayments 43.374 0 0 43.374
Trade payables 68.270 0 0 68.270
Corporate tax payables 10.601 0 0 10.601
Other liabilities 138.723 0 0 138.723
Accruals 27.311 0 0 27.311
Provisions 0 13.876 0 13.876
Total financial liabilities 288.699 13.876 0 302.575
Current ratio 0,89
Note 22 - Financial risks and financial instruments

Financial Statements Columbus Annual Report 2016
Notes
80
Financing facilities Group
DKK ´000 2016 2015 Cash and bank balances 94,669 82,294
Unused credits 79,741 100,490
174,410 182,784
The Group's cash reserves consist of cash and unused credits.
Foreign exchange rate risk, interest rate risk and use of financial instruments As a consequence of the operation, investments and financing, the Group is exposed to changes in foreign exchange rates and interest rates. The Parent Company controls the financial risks in the Group centrally and coordinates the cash management, including cash generation and excess liquidity. The Group follows a finance policy approved by the Board of Directors, and operates with a balanced risk profile, in order to ensure that foreign exchange rate risks and interest risks only occur in commercial situations. Fluctuations in foreign exchange rates have an effect on the Group's equity, results and revenue. As approx. 61% of the revenue comes from NOK, GBP, USD and RUB the Group has performed a sensitive analysis on the relevant foreign exchange rates. The foreign exchange rate risk for EUR is considered to be minimal. Equity exchange rates sensitivity
GroupDKK ´000 2016 2015 Affect of 10% decrease in USD -12.518 -11.239
Affect of 10% decrease in GBP -3.454 -2.039
Affect of 10% decrease in NOK -1.238 1.192
Affect of 10% decrease in RUB -1.062 -1.157 Net result after tax exchange rates sensitivity
GroupDKK ´000 2016 2015 Affect of 10% decrease in USD -874 194
Affect of 10% decrease in GBP -2.849 -3.336
Affect of 10% decrease in NOK -211 3.783
Affect of 10% decrease in RUB -39 -178 Revenue exchange rates sensitivity
GroupDKK ´000 2016 2015 Affect of 10% decrease in USD -43.194 -39.092
Affect of 10% decrease in GBP -17.614 -19.117
Affect of 10% decrease in NOK -5.836 -5.702
Affect of 10% decrease in RUB -6.174 -7.222 Interest rates Fluctuations in interest rates have a limited effect on the Group's financial instruments. By the end of 2016 an increase in interest rates of half a percentage point would increase the Group's financial liabilities by DKK 59k (2015: DKK 2k). The financial liabilities included in the sensitivity analysis include long-term and short-term debt to credit institutions. The Group uses no derivative financial instruments.
Note 22 - Financial risks and financial instruments, continued
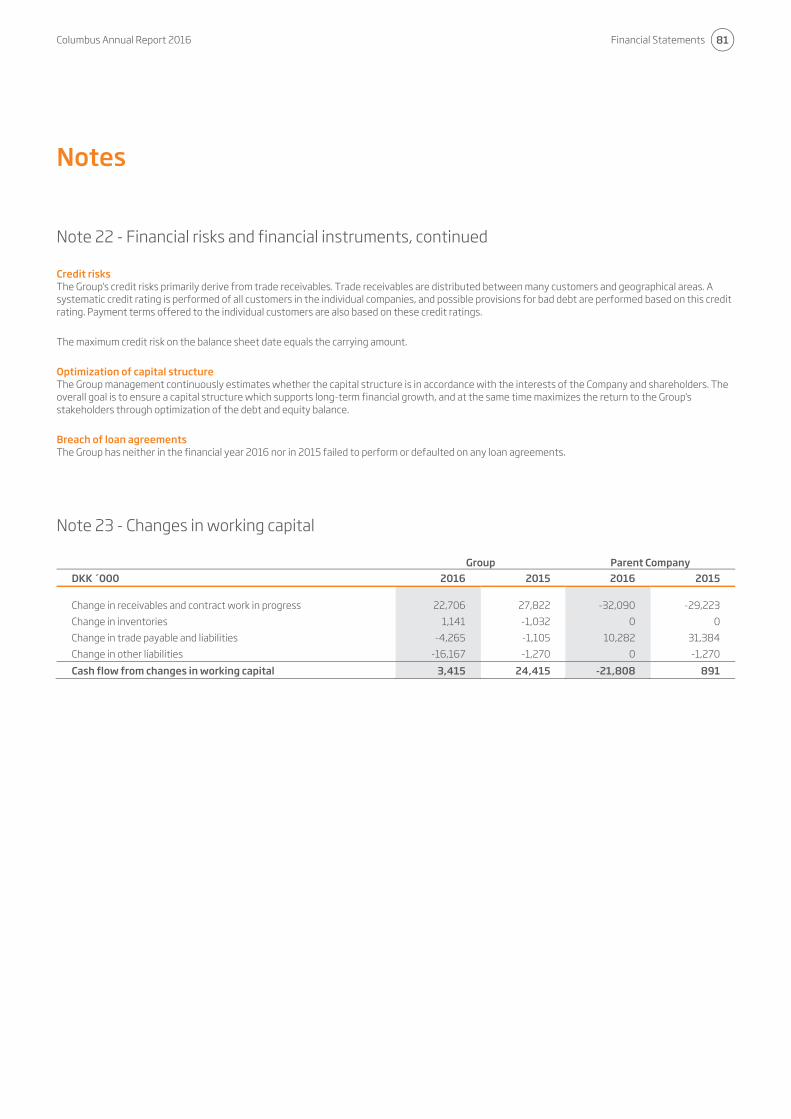
Columbus Annual Report 2016 Financial Statements
Notes
81
Credit risks The Group's credit risks primarily derive from trade receivables. Trade receivables are distributed between many customers and geographical areas. A systematic credit rating is performed of all customers in the individual companies, and possible provisions for bad debt are performed based on this credit rating. Payment terms offered to the individual customers are also based on these credit ratings.
The maximum credit risk on the balance sheet date equals the carrying amount.
Optimization of capital structure The Group management continuously estimates whether the capital structure is in accordance with the interests of the Company and shareholders. The overall goal is to ensure a capital structure which supports long-term financial growth, and at the same time maximizes the return to the Group's stakeholders through optimization of the debt and equity balance.
Breach of loan agreements The Group has neither in the financial year 2016 nor in 2015 failed to perform or defaulted on any loan agreements.
Note 23 - Changes in working capital
Group Parent CompanyDKK ´000 2016 2015 2016 2015 Change in receivables and contract work in progress 22,706 27,822 -32,090 -29,223
Change in inventories 1,141 -1,032 0 0
Change in trade payable and liabilities -4,265 -1,105 10,282 31,384
Change in other liabilities -16,167 -1,270 0 -1,270
Cash flow from changes in working capital 3,415 24,415 -21,808 891
Note 22 - Financial risks and financial instruments, continued
Financial Statements Columbus Annual Report 2016
Notes
82
See section "The Board of Directors and Executive Board" in the Management's Report, page 32.
Note 25 - Shareholder information
See section "Shareholder information" in the Management's Report, page 34.
Note 26 - Events after the reporting period
The Board of Directors have after preparing this Annual Report proposed an ordinary dividend to the shareholders of DKK 0.125 per share of DKK 1.25
(nom) to be approved at the Annual General Meeting on 25 April 2017. The dividend has not been included as a liability in these consolidated financial
statements.
There have been no other events since 31 December 2016 which could significantly affect the evaluation of the Group’s financial position and revenues
at 31 December 2016. Earnings in January and February 2017 are in line with the Company’s expectations.
Note 27 - Approval of publication of the Annual Report
On the Board meeting on 16 March 2017 the Board of Directors approved publication of the Annual Report 2016. The Annual Report 2016 will be submitted for approval by the shareholders of Columbus A/S on the Annual General Meeting on 25 April 2017.
Note 24 - Board of Directors and Executive Board
Columbus Annual Report 2016 Financial Statements
Notes
83
In addition to the description in Note 1, the accounting principles are as described below.
The consolidated financial statements The consolidated financial statements include Columbus A/S and the companies in which the Group holds more than 50% of the voting rights, or otherwise has the power to govern the financial and operating policies for achieving returns or other benefits from its activities. Principles of consolidation The consolidated financial statements are prepared based on financial reporting for Columbus A/S and its subsidiaries. The consolidated financial statements are prepared by combining financial statements uniform items. The financial reporting that is used for the consolidation is prepared in accordance with the Group's accounting policies. On consolidation, intercompany income and expenses, intercompany accounts and dividends, and gains and losses on transactions between the consolidated companies are eliminated. In the consolidated financial statements items of subsidiaries are included 100%. Minority interests On initial recognition, minority interests are measured at fair value or at their proportionate share of the fair value of the acquiree's identifiable assets, liabilities and contingent liabilities. The adopted method is selected for each transaction. Minority interests are subsequently adjusted for their proportionate share of changes in equity of the subsidiaries. Comprehensive income is allocated to minority interests regardless of whether the minority interest thus may be negative.
Purchase and sale of minority shares in a subsidiary that do not result in a loss of control are treated in the consolidated financial statements as an equity transaction, and the difference between the consideration and the carrying amount is allocated to the Parent Company's share of equity. Business combinations Newly acquired or newly established subsidiaries are consolidated from the date of acquisition or formation. The acquisition date is the date on which the Columbus Group obtains control of the acquiree. Divested companies are included in the consolidated financial statements until the date of disposal or winding up. Disposal is the date when control is actually transferred to third parties. Acquisition of new companies or activities in which the Group obtains control of the acquisition decision acquired business will be accounted for under the purchase method, so that the identified assets, liabilities and contingent liabilities are measured at fair value at the acquisition date. Identified intangible assets are recognized separately from goodwill if they are separable or arise from a contractual right and the fair value can be measured reliably. Non-current assets which are held for sale are measured at fair value less estimated selling costs. Restructuring liabilities are only recognized in the acquisition balance sheet if they represent a liability to the acquired company. Account is taken for the tax effect of the restatements. The purchase consideration for a company is the fair value of the consideration paid for the acquired company. If the final determination is subject to one or more future events, these fair values are
recognized at the acquisition date. Costs directly attributable to the acquisition are recognized directly in the statement of comprehensive income as incurred. Positive differences (goodwill) between, on one hand, the purchase price of an acquired company, the value of non-controlling interests in the acquiree and the fair value of previously held equity interests, and on the other hand, the fair value of the identifiable assets, liabilities and contingent liabilities is recognized as goodwill under intangible fixed assets. Goodwill is not amortized but is tested annually for impairment. The first impairment test is performed before the end of the year of acquisition. Upon acquisition, goodwill is allocated to the cash-generating units, which subsequently form the basis of the impairment test. The determination of cash-generating units follows the management structure and internal financial control and reporting of the Group. If the carrying amount of an asset exceeds its recoverable amount it is written down to its recoverable amount. In case of negative differences (negative goodwill), the calculated fair values, the calculated purchase consideration for the company, the value of non-controlling interests in the acquiree and the fair value of previously held equity interests is reassessed. If the difference is still negative, the difference is recognized as income in the statement of comprehensive income. If at the time of acquisition there is an uncertainty about the identification or measurement of acquired assets, liabilities or contingent liabilities or the determination of the consideration, initial recognition is based on preliminary fair
Note 28 – Accounting principles

Financial Statements Columbus Annual Report 2016
Notes
84
values. The preliminary calculated amounts can be adjusted, or additional assets or liabilities can be recognized until one year after the purchase date, if new information on conditions that existed at the acquisition date is obtained, which would have affected the calculation of values at the acquisition date, had the information been known. Changes in estimates of contingent consideration are generally recognized directly in income statement (EBITDA). Gains and losses on divestments or dissolvement of subsidiaries or associates Gains or losses on divestments or dissolvements of subsidiaries and associates are stated as the difference between the sales price or settlement price and the fair value of any remaining equity and the book value of net assets on the time of sale or winding up, including goodwill, less any minority interests. Gains or losses are recognized in the statement of comprehensive income as well as accumulated foreign currency translation adjustments previously recognized in other comprehensive income. Foreign currency translation Transactions in currencies other than the Group's functional currency are translated initially at the transaction date. Receivables and payables and other monetary items denominated in foreign currencies that have not been settled at the balance sheet date are translated at the closing rate. Gains and losses arising from the difference between the exchange and the transaction date are recognized in the statement of comprehensive income as financial items. Tangible and intangible assets, inventories and other non-monetary assets acquired in foreign currency and measured at historical cost are translated at the transaction date. Non-monetary items
revalued at fair value are translated using the exchange rate at the date of revaluation. Translation of foreign subsidiaries On recognition in the consolidated financial statements of foreign subsidiaries with a functional currency other than Danish kroner (DKK), income statements are translated at average exchange rates for the months unless these deviate significantly from the actual exchange rates at the transaction dates. In the latter case, the actual exchange rates are used. Balance sheet items are translated at the closing exchange rates. Goodwill is considered to belong to the acquired entity and is translated at the closing rate. Foreign exchange differences arising from the translation of foreign company balance sheet items at the beginning of the closing exchange rates, and on translation of foreign entities' income statements from average rates to closing rates are recognized in other comprehensive income. Similarly, exchange differences arising as a result of changes made directly in the foreign enterprise's equity, are also recognized in other comprehensive income. Adjustment of receivables or debt to subsidiaries which are considered part of the Parent Company's overall investment in the subsidiary in question are recognized in other comprehensive income in the consolidated financial statements, whereas they are recognized in the statement of comprehensive income of the Parent Company. Translation of foreign associates On recognition in the consolidated financial statements of associates with a functional currency other than DKK, the share of the profit at average exchange rates is translated, and the share of equity
including goodwill is translated at closing rates. Consolidated statement of comprehensive income Revenue Revenue is recognized in the income statement when delivery and transfer of ownership has taken place before year-end, if the income can be reliably measured and payment is expected to be received. Revenue is recognized net of VAT, taxes etc. collected on behalf of third parties and discounts. Income from subscription agreements, where the Group must fulfill a service is recognized on a straight line basis over the subscription period, while other subscriptions (upgrades etc.) are recognized at the time of invoicing. Contract work in progress is recognized as the production of each project carried out, whereby revenue corresponds to the sales value of the work in progress (stage of completion method). Revenue is recognized when total income and expenses of the projects and completion at the balance sheet date can be measured reliably and it is probable that the economic benefits including payments will flow to the Group. Compound contracts Columbus typically enters into contracts that include a combination of software licenses and consulting services. These contracts are classified either as multiple element contracts or compound contracts. Multiple element contracts are contracts where price and other significant issues in the contract are negotiated independently. In this group of contracts each element is recognized individually, so that the sale of software and consulting services are recognized separately in accordance with the above practices.
Columbus Annual Report 2016 Financial Statements
Notes
85
Compound contracts are contracts where price and other essential items are negotiated together and cannot be disassembled. These types of contracts are recognized jointly by the practices that are applicable to the main element of the contract, which is typically the consultancy. Royalty Royalty is recognized on a straight line basis over the period during which the royalty agreement covers. External project costs External projects costs include the expenses excluding wages and salaries that are directly incurred to achieve revenue for the year and include the cost of licenses, subcontractors, etc. External project costs are recognized as the project progresses. Other external costs Other external costs include expenses of premises, sale and distribution, office expenses, etc. Other operating income and expenses Other operating income and expenses includes income and expenses of a secondary nature to the Group's primary activities, including adjustments of contingent liabilities related to acquisitions, gains and losses on disposal of intangible and tangible assets. Gains and losses on disposal of intangible and tangible assets are calculated as the selling price less selling costs and the carrying amount at the time of sale. Dividends from subsidiaries and associates Dividends from investments are recognized in the Parent Company’s profit in the accounting period, where the right for the dividend is earned.
Financial items Financial items include interest income and expenses, the interest portion of finance lease payments, gains and losses on foreign currency transactions and surcharges and allowances under the account tax scheme. Tax Income tax for the year, comprising current tax and movements in deferred tax, is recognized in the statement of comprehensive income by the portion attributable to the profit and directly in equity or in other comprehensive income to the extent that it relates to items recognized directly in equity and in other comprehensive income. Exchange adjustments of deferred tax is recognized as part of the adjustment of deferred tax. Current tax liabilities and receivables are recognized in the balance sheet as estimated tax on the taxable income, adjusted for prepaid tax. When calculating the current tax, the applicable tax rates and rules on the balance sheet date is used. Deferred tax is recognized using the balance sheet liability method on all temporary differences between accounting and tax values of assets and liabilities, except for deferred taxes on temporary differences arising on the initial recognition of goodwill or from the initial recognition of a transaction that is not a business combination, and where the temporary difference identified by the initial recognition affects neither the accounting profit nor the taxable income. Deferred income tax is provided on temporary differences arising on investments in subsidiaries and associates, unless the parent is able to control when the deferred tax is realized, and it is
probable that the deferred tax will not crystalize as current tax in the foreseeable future. Deferred tax is calculated based on the planned use of each asset and settlement of each liability. Deferred tax is measured based on the tax rules and rates in the respective countries, based on enacted or in reality enacted laws at the balance sheet dates that are expected to apply when the deferred tax is expected to crystallize as current tax. Changes in deferred tax due to changes in tax rates or rules are recognized in the statement of comprehensive income unless the deferred tax is attributable to transactions previously recognized directly in equity or in other comprehensive income. In the latter case, the change is also recognized in equity, respectively, in other comprehensive income. Deferred tax assets, including the tax value of tax loss carry forwards, are recognized at the value at which they are expected to be realized, either as net assets to offset against future taxable income or against deferred tax liabilities in the same legal tax entity and jurisdiction. It is assessed at each reporting date whether it is likely that in the future there will be sufficient taxable profits against which the deferred tax asset can be utilized. The Parent Company is part of a mandatory Danish joint taxation with all Danish companies controlled by Consolidated Holdings A/S. The calculated Danish tax on the joint taxable income is distributed among the jointly taxed companies in proportion to their taxable income (full allocation with credit for tax losses).
Financial Statements Columbus Annual Report 2016
Notes
86
Balance sheet Intangible assets Goodwill Goodwill is recognized and measured at initial recognition as the difference between the cost and the net assets of the acquired company. The net assets of the acquired company based on the fair value of assets and liabilities at the acquisition date. On recognition of goodwill, the goodwill is allocated to each of the Group's activities that generate separate cash flows (cash generating units). The determination of cash-generating units follows the management structure and internal financial management and reporting of the Group. Goodwill is not amortized, but is tested annually for impairment. Customer base Other intangible assets are primarily capitalized to the fair value of the customer base in acquired companies, recognized during the purchase price allocation. Customer base is amortized over 7 years. Licensing rights Acquired license rights comprise software. These are measured at cost less accumulated depreciation and impairment losses. License rights are amortized over the expected life or expiry of the contract, whichever is shortest. The amortization period is usually 5 years. Acquired license rights are impaired to the recoverable amount if this is lower than the carrying value. Development projects Development projects are projects that are clearly defined and identifiable, where the
technical feasibility, adequate resources and a potential future market or application in the group can be demonstrated and where the intention is to produce, promote or use the project. Development projects are recognized as intangible assets if the cost can be measured reliably and there is sufficient assurance that future earnings or the net selling price will cover production, sales, administration and development costs. Other development costs are recognized in the statement of comprehensive income as incurred. Development costs are measured at cost less accumulated depreciation and impairment losses. The cost includes wages, salaries, services, depreciation and other costs directly attributable to the Group's development and which are necessary to complete the project, from the time when the development project first qualifies for recognition as an asset. After completion of the development project development costs are amortized straight-line basis over the estimated useful life. The amortization period is usually 3-5 years. Development projects are reviewed annually to determine whether there are indications of impairment. If such an indication exists, the asset's recoverable amount is calculated. If the recoverable amount is lower than the carrying value, the development projects are impaired to this value. Development projects in progress are tested at least annually for impairment. Tangible assets Property plant and equipment These are measured at cost less accumulated depreciation and impairment losses. Cost comprises the purchase price and any costs directly attributable to the
acquisition until the date the asset is ready for use. For financial leased assets, cost is the lower of the fair value or the present value of the future minimum lease payments. In calculating the present value of leases the internal interest rate of the leasing agreement or the incremental borrowing rate is applied as the discount rate. Fixtures and equipment are depreciated over 3 to 5 years, equal to the assets' estimated useful life. Leasehold improvements are amortized over the lease period not exceeding 5 years. The basis for depreciation is determined taking into account the residual value less impairment losses. The value is impaired to the recoverable amount if this is lower than the carrying value. The residual value is determined at the acquisition date and reassessed annually. Depreciation is discontinued if the residual value exceeds the carrying amount. In amendment of the depreciation period or the residual value the effect is recognized prospectively as a change in accounting estimates. Financial assets Investments in subsidiaries and associates in the Parent Company’s financial statement Investments in subsidiaries and associates are measured in the Parent Company’s financial statements at historical cost. If the historical cost exceeds the recoverable amount the costs are impaired to the lower value. When dividend distributed exceeds the accumulated earnings after the acquisition date this is considered as an indication of impairment. If the Parent Company has a legal or

Columbus Annual Report 2016 Financial Statements
Notes
87
constructive obligation to cover a subsidiary's deficit, a provision is recognized to the extent that it exceeds amounts owed by the subsidiary. Gains and losses on disposal of subsidiaries are calculated as the difference between the sale or liquidation amount and the carrying amount at the time of sale less costs to sell. Gains or losses are recognized in the statement of comprehensive income under "Other operating income" and "Other operating expenses". Impairment of tangible and intangible assets as well as investments in subsidiaries The carrying values of tangible and intangible assets of definite useful lives as well as investments in subsidiaries are reviewed at each balance sheet date to determine any indications of impairment. If this is the case, the asset's recoverable value is determined to identify any need for impairment and the extent thereof. If the asset does not generate cash flow independent of other assets, the recoverable amount of the smallest cash-generating unit to which the asset belongs is determined. The recoverable amount of an asset is the higher of net selling price and capital value. For cash-generating units, the impairment is firstly distributed on goodwill, and then any remaining impairment is distributed to other assets in the unit. Impairment losses are recognized in the statement of comprehensive income. On any subsequent reversal of impairment losses resulting from changes in the assumptions used to determine the recoverable amount, the asset and the cash-generating unit's carrying amount is increased to the adjusted recoverable amount, however not exceeding the carrying value of the asset or cash-
generating excluding impairment. Impairment of goodwill is not reversed. Deferred tax assets are reviewed annually and recognized only to the extent that it is probable for utilization within a five-year period. Inventories Finished goods, consisting primarily of software are measured at cost using the FIFO method or net realizable value, whichever is lower. The cost of goods comprises the purchase price. The net realizable value of inventories is calculated as the selling price less costs incurred to execute the sale and is determined taking into account marketability, obsolescence and expected selling price development. Receivables Receivables consist of receivables from sales of products and services and other receivables. Receivables are measured at initial recognition at fair value and subsequently at amortized cost, which usually corresponds to nominal value less provisions for bad debts. Impairment losses are calculated based on an individual assessment of each receivable. Contract work in progress Contract work in progress is measured at the sales value of the work performed less progress billings and expected losses. Market value is measured based on completion at the balance sheet date and the total expected income from the contract. The stage of completion is determined as the ratio between the resources spent and the total estimated
resource for the project. For some projects where the consumption of resources cannot be used as a base the measurement is instead based on the ratio between completed sub activities and the total project. When it is probable that total costs will exceed total revenue on a contract work in progress, the expected loss on the contract is taken immediately as an expense and a provision. When the outcome of a contract cannot be estimated reliably, the selling price is only recognized at cost, to the extent that it is probable, they will be recovered. Contract work in progress is recognized in the balance sheet under current assets or liabilities, depending on whether net value is a receivable or liability. Costs of sales work and securing contracts are recognized in statement of comprehensive income as incurred. Prepayments Prepayments recognized under assets include expenses paid concerning subsequent financial years and are measured at cost. Dividend Proposed dividends are recognized as a liability at the time of approval by the general meeting (time of declaration). Treasury shares Acquisition, disposal and dividends on treasury shares are recognized directly in retained earnings in equity. Translation reserve The translation reserve comprises foreign exchange differences arising from translation of the financial report for entities with a different functional currency than Danish kroner.

Financial Statements Columbus Annual Report 2016
Notes
88
Provisions Provisions for liabilities are recognized as a result of events occurring before or at the balance sheet date that has a legal or constructive obligation and it is probable that settlement of the obligation will result in an outflow of economic resources. Provisions are measured at management's best estimate of the amount required to settle the obligation. Provisions with an expected maturity more than one year from the balance sheet date are measured at present value. Pensions Contributions to defined contribution plans are recognized in the statement of comprehensive income in the period to which they relate and any contributions payable are recognized in the balance sheet under other payables. Share option schemes Equity-settled share options are measured at fair value at allotment date and recognized in the income statement under share-based payment over the period in which the final right of the options vest. The balancing item is recognized directly in equity. On initial recognition of share options, the number of options expected to vest at expiry is estimated. Subsequently revised for changes in the estimated number of vested options, so that the total recognition is based on the actual number of vested options. The fair value of the options granted is estimated using the Black-Scholes model with the parameters stated in Note 5. Current liabilities Current liabilities include bank loans, trade payables and other liabilities to public authorities, etc. Current liabilities are initially measured at fair value, less any
transaction costs. In subsequent periods, current liabilities are measured at amortized cost using the "effective interest method" so that the difference between the proceeds and the nominal value is recognized in the income statement under financial expenses over the loan period. Other liabilities are measured at amortized cost. Leasing Lease obligations are operating leases. Lease payments under operating leases are recognized in the statement of comprehensive income over the lease term Deferred income Deferred income recognized under liabilities comprises payments received concerning income in subsequent years measured at cost. The cash flow statement The cash flow statement is presented using the indirect method based on net operating profit. The cash flow statement shows cash flows for the year, the change in cash, as well as the balance of cash at the beginning and end of the year. Cash flow from operating activities Cash flow from operating activities is calculated as profit before tax adjusted for noncash operating items, changes in working capital, interests received and paid, and corporation tax paid. Cash flow from investment activities Cash flows from investment activities comprise payments relating to purchase and divestment of businesses and activities, purchase and divestment of intangible and other long-term assets as well as purchase and divestment of securities not recognized as cash and
dividends received. Cash flow from acquired companies is included from the date of acquisition, while cash flow from divestments is recognized until the time of sale. Cash flow from financing activities Cash flows from financing activities comprise changes in size or composition of share capital and related costs as well as raising and repayment of loans repayment of interest-bearing debt, purchase and divestment of treasury shares and payment of dividend to minority shareholders. Inception of financial leases are treated as non-cash transactions. Cash flows realign to financial leases are recognized as payments of interest and repayment of debt. Cash Cash comprise cash less any overdraft facilities that are an integral part of cash management. Cash flows in currencies other than the functional currency are translated using average exchange rates unless these deviate significantly from the transaction date. Segment data Segment data are prepared in accordance with the Group's accounting policies and the Group's internal management reporting. Segment income and expenses and segment assets and liabilities include items directly attributable to a segment and items that can be allocated to the individual segments on a reliable basis. Assets in the segments comprise assets used directly in segment operations, including intangible and tangible fixed assets, investments in associates,

Columbus Annual Report 2016 Financial Statements
Notes
89
inventories, receivables from sales of goods and services, other receivables, prepayments and cash. Liabilities related to the segments comprise liabilities derived from segment operations, including debts to suppliers of goods and services, provisions and other payables.

Financial Statements Columbus Annual Report 2016
Notes
90
Key figures and ratios
Earnings per share (EPS) and diluted earnings per share (EPS-D) are calculated in accordance with IAS 33. Other ratios are calculated in accordance with the Danish Society of Financial Analysts Recommendations & Financial Ratios 2015. The financial ratios stated are calculated as follows:
EBITDA-margin Earnings before interest, tax, depreciations and amortizations (EBITDA) Net revenue
Operating margin Operating profit (EBIT) Net revenue
Return of equity Result after tax and excl. minority interests Equity excl. minority interests
Return on invested capital (ROIC) EBITA Average invested capital including goodwill
Equity ratio Equity excl. minority interests Total liabilities
Earnings per share (EPS) Result after tax and excl. minority interests
x f Average number of shares
Book value per share (BVPS) Equity excl. minority interests end of year x 100
x fNumber of shares end of year
Cash flow per share Cash flow from operations
x f Average number of diluted shares
Adjustment factor (f) Theoretical rate Listed price of stock the day before the subscription and/or stock right cease

For more information on Columbus, visit www.columbusglobal.com