Embed Size (px)
Citation preview
ANNUALREPORT2016
2016 Annual ReportM
eritage Homes
Life. Built. Better.
Life is game nights, quiet nights, date
nights and movie nights. It’s early risers
drinking coffee in the kitchen and night
owls reading a page-turner in the living
room. It’s setting up the tent in the
bedroom for an epic indoor campout
and making s’mores in the fireplace.
In our 30+ years as a homebuilder,
we’ve invested millions of dollars in
a relentless pursuit of building better,
smarter, healthier homes. In game-
changing innovations, thoughtful features
and unparalleled building standards.Not
because we have to. Because we want to.
We hold ourselves to a higher standard
because we believe our homeowners
deserve the very best. Since when did
compromise become acceptable when
searching for a place to call home? We
build better from the ground up because
that’s the way it should be done.
LIFE. BUILT. BETTER.
Franklin | Charlotte Metro, NCOn the Cover: Miramesa Snapdragon | Houston Metro, TX
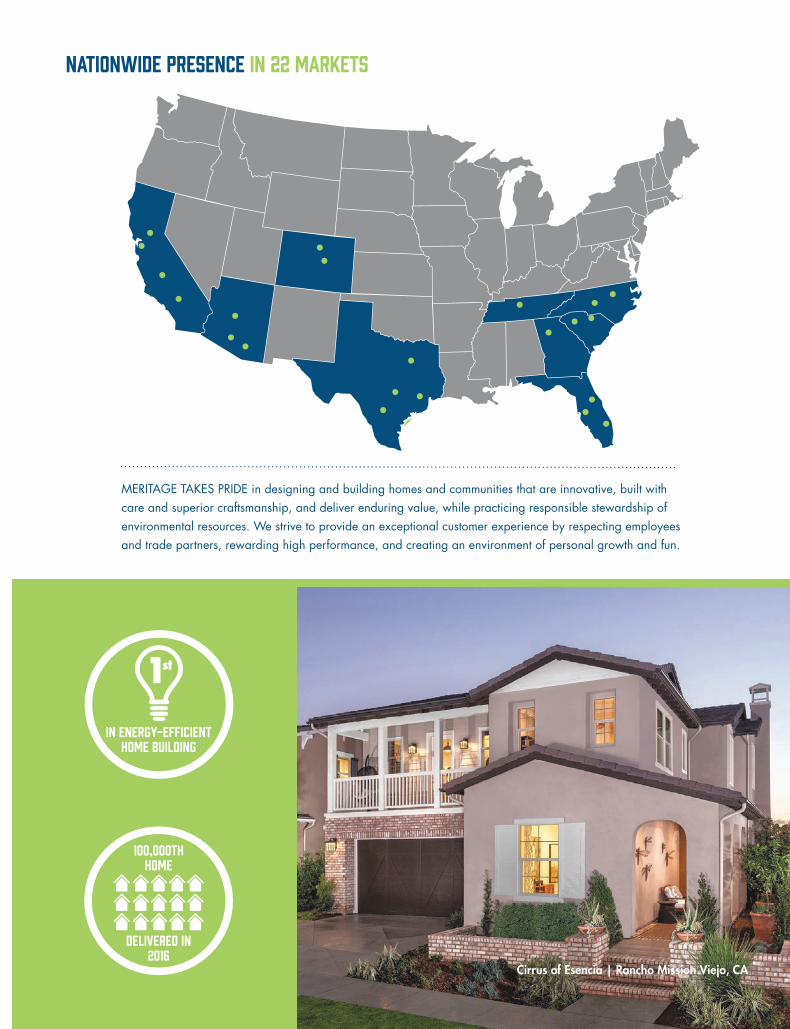
MERITAGE TAKES PRIDE in designing and building homes and communities that are innovative, built with care and superior craftsmanship, and deliver enduring value, while practicing responsible stewardship of environmental resources. We strive to provide an exceptional customer experience by respecting employees and trade partners, rewarding high performance, and creating an environment of personal growth and fun.
Nationwide Presence in 22 Markets
100,000THHOME
DELIVERED IN2016
IN ENERGY-EFFICIENTHOME BUILDING
Cirrus of Esencia | Rancho Mission Viejo, CA
MERITAGE HOMES | 2016 ANNUAL REPORT2
Letter to shareholders
Meritage Homes posted strong results in 2016 by delivering double-digit earnings growth, while also expanding our presence in the fast-growing first-time home buyer segment and maintaining our leadership position in energy-efficient homes. The $3 billion in revenue we generated during the year represents the highest revenue earned since the peak of the last housing cycle in 2006, and our net debt to capital ratio of 41% provides us with financial flexibility for future opportunities.
While we are proud of our accomplishments in 2016, we also believe that we have the potential for even better results thanks to the continued strength of the markets in which we build, our positions within those markets, and the operating progress we’re making in our newer markets.
The housing market continues to evolve as it recovers. The level of new home construction on a national basis remains below historical averages, despite significant population, household formation and job growth over the last several years. That dynamic, coupled with low levels of existing home inventory, favorable employment levels and a reasonable interest rate environment means that there is plenty of opportunity for growth in our business for the next several years.
Builders who are situated in the right markets with homes that cater to the wants and needs of today’s home buying
population are best positioned to capitalize on growth opportunities. We believe Meritage is one of those builders.
In homebuilding, location is everything. That is why Meritage has carefully executed a strategic geographic expansion plan over the last several years, establishing a presence in some of the top homebuilding markets in the country. In general, these markets are characterized by a steady inflow of new residents and strong local economies that support future employment growth. Our operations now span markets throughout California, the Southwest, Texas and the Southeast — regions that we believe will see above-average job and population growth, and therefore, an increased need for new housing.
In order to be successful, a homebuilder must also be able to identify emerging trends within the industry and offer homes that appeal to a constantly evolving customer base in each of its markets. Meritage prides itself on being a well-diversified builder catering to a number of different market segments, and we believe that there is a real opportunity to grow our business within the first-time buyer segment. This demographic has not fully participated in the housing recovery until recently, a trend that has begun to reverse as more Millennials enter their prime home buying years.
To capitalize on this trend, we debuted Meritage’s LiVE.NOW.™ homes in 2016, as part of our entry-level market strategy. Our
The $3 billion in revenue we generated during the year represents the highest revenue earned since the peak of the last housing cycle in 2006.
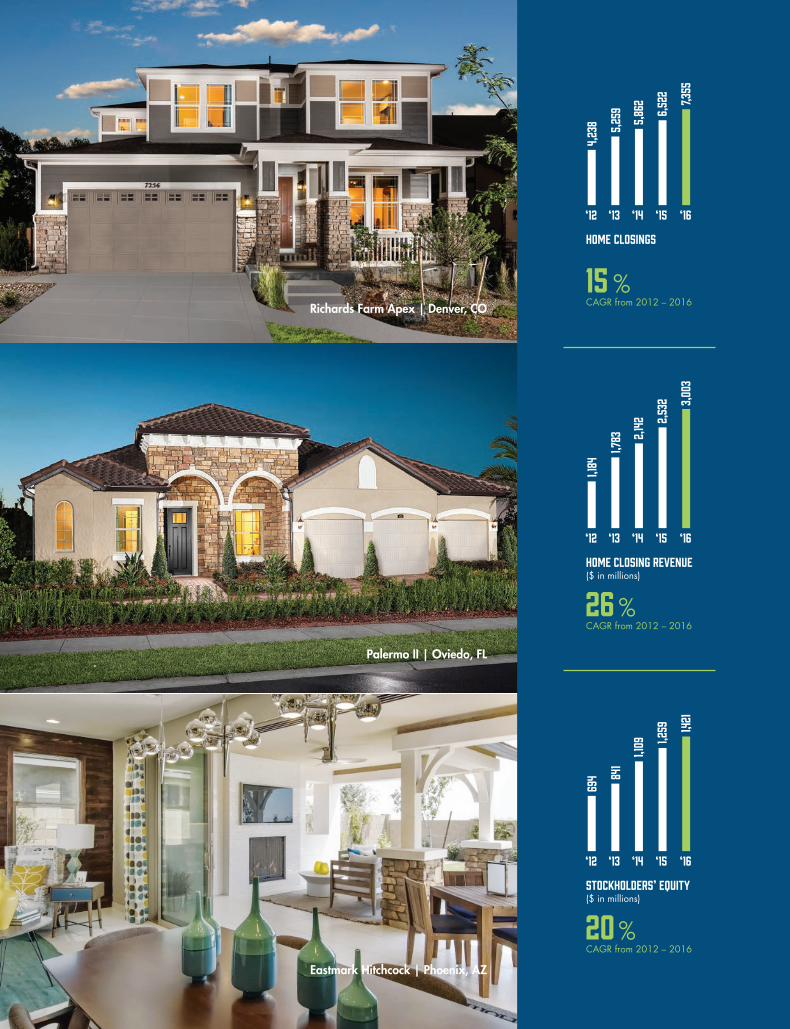
HOME CLOSINGS
‘12 ‘13 ‘14 ‘15 ‘16
4,23
8 5,25
9
5,86
2
6,52
2
7,355
CAGR from 2012 – 201615 %
HOME CLOSING REVENUE($ in millions)
‘12 ‘13 ‘14 ‘15 ‘16
1,184
1,783 2,
142 2,
532 3,
003
STOCKHOLDERS’ EQUITY($ in millions)
‘12 ‘13 ‘14 ‘15 ‘16
694 84
1
1,109 1,2
59 1,421
Richards Farm Apex | Denver, CO
Palermo II | Oviedo, FL
Eastmark Hitchcock | Phoenix, AZ
CAGR from 2012 – 201626 %
CAGR from 2012 – 201620 %
MERITAGE HOMES | 2016 ANNUAL REPORT4
entry-level homes, including LiVE.NOW., are designed for first-time homebuyers who are looking to make the transition to home ownership. They are affordably priced, but still incorporate Meritage’s standard energy-efficient construction, along with features or amenities that enhance a homeowner’s lifestyle, such as kitchen islands with granite countertops, upgraded cabinetry and premium fixtures, which are not typically available in a starter home.
We have been very pleased with the initial success of this new product offering and look forward to rolling it out to more markets in the future. We believe that 35–40% of our communities will be targeting first-time buyers by the end of 2018, compared to 23% in 2016. We believe these LiVE.NOW. homes will be a large contributor to our growth.
Meritage remains committed to being a leader and innovator in advanced homebuilding practices. In 2016, the
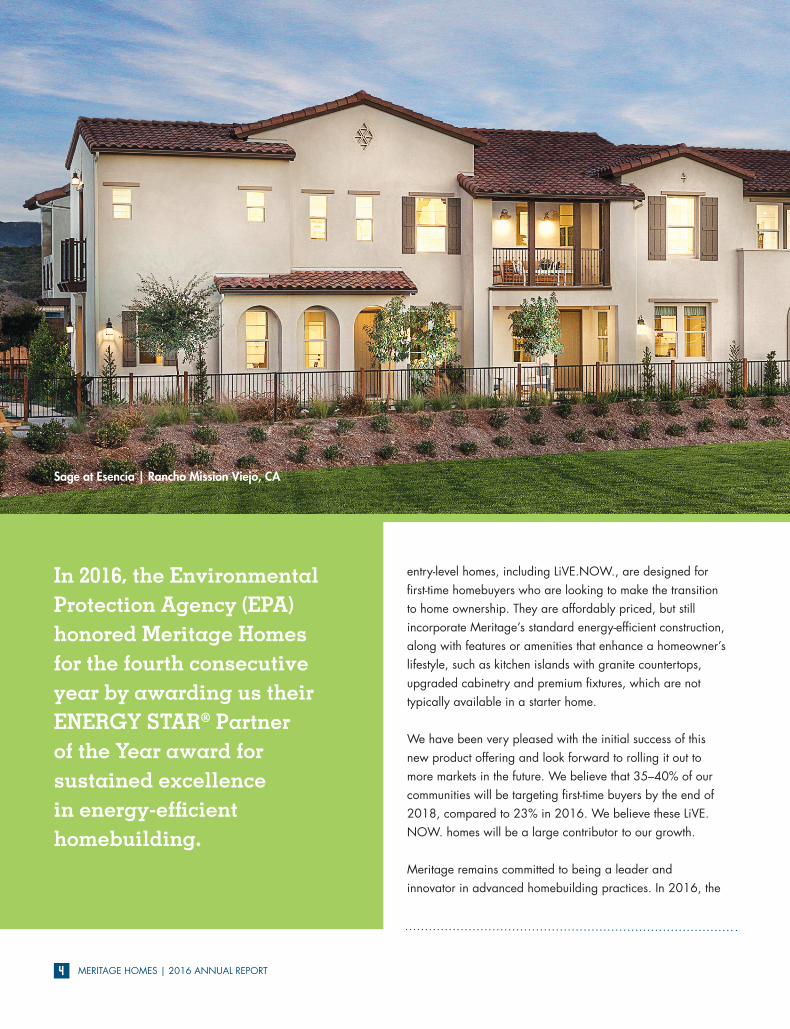
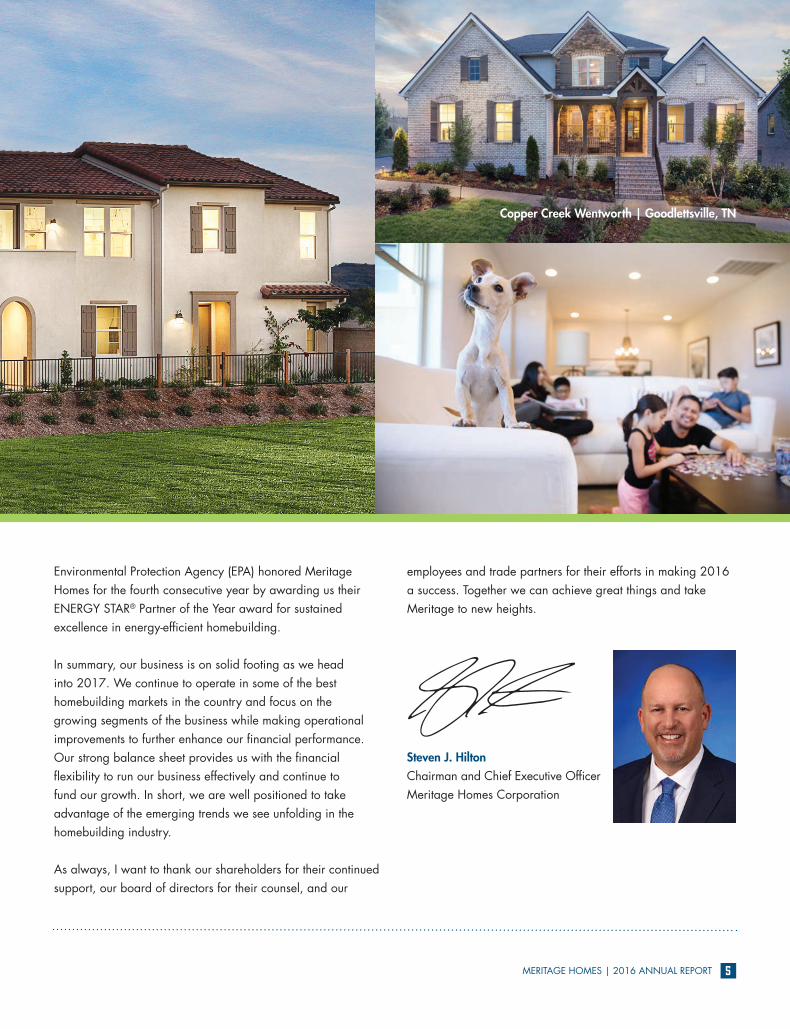
In 2016, the Environmental Protection Agency (EPA) honored Meritage Homes for the fourth consecutive year by awarding us their ENERGY STAR® Partner of the Year award for sustained excellence in energy-efficient homebuilding.
Sage at Esencia | Rancho Mission Viejo, CA
MERITAGE HOMES | 2016 ANNUAL REPORT 5
Environmental Protection Agency (EPA) honored Meritage Homes for the fourth consecutive year by awarding us their ENERGY STAR® Partner of the Year award for sustained excellence in energy-efficient homebuilding.
In summary, our business is on solid footing as we head into 2017. We continue to operate in some of the best homebuilding markets in the country and focus on the growing segments of the business while making operational improvements to further enhance our financial performance. Our strong balance sheet provides us with the financial flexibility to run our business effectively and continue tofund our growth. In short, we are well positioned to take advantage of the emerging trends we see unfolding in the homebuilding industry.
As always, I want to thank our shareholders for their continued support, our board of directors for their counsel, and our
employees and trade partners for their efforts in making 2016 a success. Together we can achieve great things and take Meritage to new heights.
Steven J. HiltonChairman and Chief Executive OfficerMeritage Homes Corporation
Copper Creek Wentworth | Goodlettsville, TN
MERITAGE HOMES | 2016 ANNUAL REPORT6
Financial Highlights
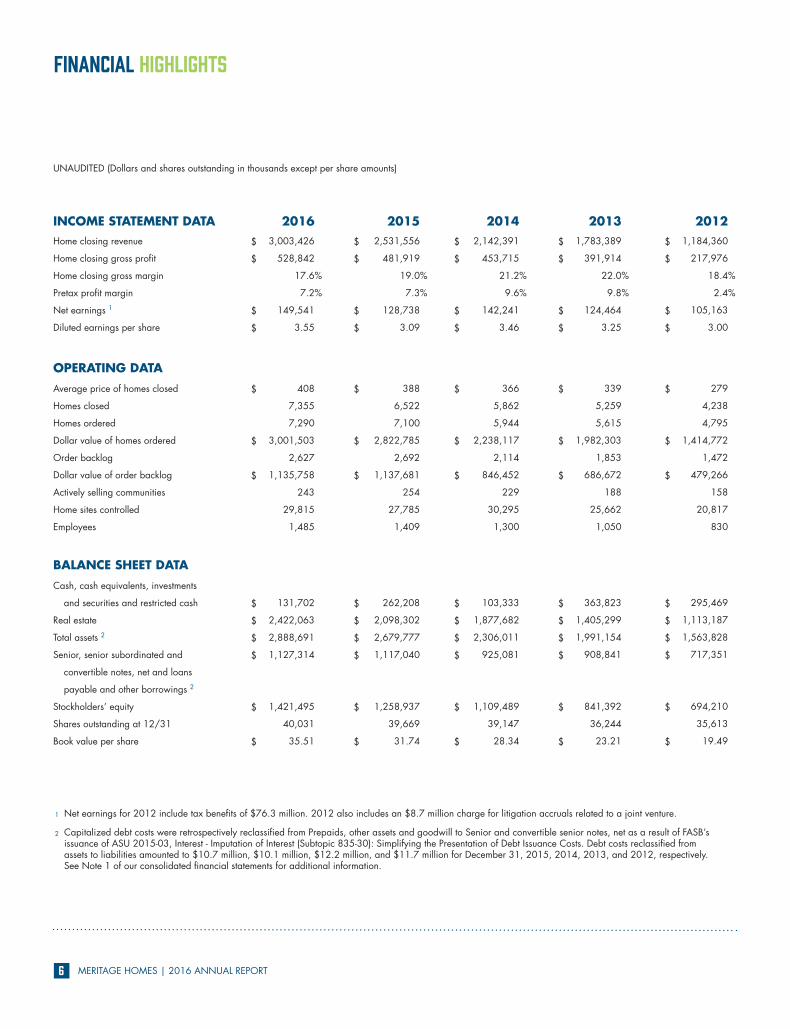
UNAUDITED (Dollars and shares outstanding in thousands except per share amounts)
1 Net earnings for 2012 include tax benefits of $76.3 million. 2012 also includes an $8.7 million charge for litigation accruals related to a joint venture.
2 Capitalized debt costs were retrospectively reclassified from Prepaids, other assets and goodwill to Senior and convertible senior notes, net as a result of FASB’s issuance of ASU 2015-03, Interest - Imputation of Interest (Subtopic 835-30): Simplifying the Presentation of Debt Issuance Costs. Debt costs reclassified fromassets to liabilities amounted to $10.7 million, $10.1 million, $12.2 million, and $11.7 million for December 31, 2015, 2014, 2013, and 2012, respectively.See Note 1 of our consolidated financial statements for additional information.
INCOME STATEMENT DATA 2016 2015 2014 2013 2012Home closing revenue
Home closing gross profit
Home closing gross margin
Pretax profit margin
Net earnings 1
Diluted earnings per share
$
$
$
$
3,003,426
528,842
17.6
7.2
149,541
3.55
%
%
$
$
$
$
2,531,556
481,919
19.0
7.3
128,738
3.09
%
%
$
$
$
$
2,142,391
453,715
21.2
9.6
142,241
3.46
%
%
$
$
$
$
1,783,389
391,914
22.0
9.8
124,464
3.25
%
%
$
$
$
$
1,184,360
217,976
18.4
2.4
105,163
3.00
%
%
OPERATING DATA
Average price of homes closed
Homes closed
Homes ordered
Dollar value of homes ordered
Order backlog
Dollar value of order backlog
Actively selling communities
Home sites controlled
Employees
$
$
$
408
7,355
7,290
3,001,503
2,627
1,135,758
243
29,815
1,485
$
$
$
388
6,522
7,100
2,822,785
2,692
1,137,681
254
27,785
1,409
$
$
$
366
5,862
5,944
2,238,117
2,114
846,452
229
30,295
1,300
$
$
$
339
5,259
5,615
1,982,303
1,853
686,672
188
25,662
1,050
$
$
$
279
4,238
4,795
1,414,772
1,472
479,266
158
20,817
830
BALANCE SHEET DATA
Cash, cash equivalents, investments
and securities and restricted cash
Real estate
Total assets 2
Senior, senior subordinated and
convertible notes, net and loans
payable and other borrowings 2
Stockholders’ equity
Shares outstanding at 12/31
Book value per share
$
$
$
$
$
$
131,702
2,422,063
2,888,691
1,127,314
1,421,495
40,031
35.51
$
$
$
$
$
$
262,208
2,098,302
2,679,777
1,117,040
1,258,937
39,669
31.74
$
$
$
$
$
$
103,333
1,877,682
2,306,011
925,081
1,109,489
39,147
28.34
$
$
$
$
$
$
363,823
1,405,299
1,991,154
908,841
841,392
36,244
23.21
$
$
$
$
$
$
295,469
1,113,187
1,563,828
717,351
694,210
35,613
19.49
Form 10-K2016

UNITED STATESSECURITIES AND EXCHANGE COMMISSION
Washington, D.C. 20549
FORM 10-K (Mark One)
ANNUAL REPORT PURSUANT TO SECTION 13 OR 15(d) OF THE SECURITIESEXCHANGE ACT OF 1934
For the fiscal year ended December 31, 2016
OR
TRANSITION REPORT PURSUANT TO SECTION 13 OR 15(d) OF THE SECURITIESEXCHANGE ACT OF 1934
For the transition period from to
Commission File Number 1-9977
(Exact Name of Registrant as Specified in its Charter)
Maryland 86-0611231(State or Other Jurisdiction of
Incorporation or Organization) (IRS Employer
Identification No.)
8800 E. Raintree Drive, Suite 300,Scottsdale, Arizona 85260
(Address of Principal Executive Offices) (Zip Code)
(480) 515-8100(Registrant’s telephone number, including area code)
Securities registered pursuant to Section 12(b) of the Act:
Title of Each Class Name of Each Exchange on which Registered
Common Stock, $.01 par value New York Stock Exchange
Securities registered pursuant to Section 12(g) of the Act: None
Indicate by check mark if the registrant is a well-known seasoned issuer, as defined in Rule 405 of theSecurities Act.
Yes No
Indicate by check mark if the registrant is not required to file reports pursuant to Section 13 or Section 15(d) of the Act.
Yes No
Indicate by check mark whether the registrant (1) has filed all reports required to be filed by Section 13 or15(d) of the Securities Exchange Act of 1934 during the preceding 12 months (or for such shorter periodthat the registrant was required to file such reports), and (2) has been subject to such filing requirementsfor the past 90 days.
Yes No
Indicate by check mark whether the registrant has submitted electronically and posted on its corporateWeb site, if any, every Interactive Data File required to be submitted and posted pursuant to Rule 405 ofRegulation S-T (§ 232.405 of this chapter) during the preceding 12 months (or for such shorter period thatthe registrant was required to submit and post such files).
Yes No
Indicate by check mark if disclosure of delinquent filers pursuant to Item 405 of Regulation S-K (§229.405) is not contained herein, and will not be contained, to the best of registrant’s knowledge, indefinitive proxy or information statements incorporated by reference in Part III of this Form 10-K or anyamendment to this Form 10-K.
Indicate by check mark whether the registrant is a large accelerated filer, an accelerated filer, a non-accelerated filer, or a smaller reporting company. See the definitions of “large accelerated filer”,“accelerated filer” and “smaller reporting company” in Rule 12b-2 of the Exchange Act. (Check one):
Large accelerated filer Accelerated Filer
Non-accelerated filer (Do not check if a smaller reporting company) Smaller reporting company
Indicate by checkmark whether the registrant is a shell company (as defined in Rule 12b-2 of theExchange Act).
Yes No
The aggregate market value of common stock held by non-affiliates of the registrant (37,915,078 shares) as of June 30, 2016, was $1.4 billion based on the closing sales price per share as reported by the New York Stock Exchange on such date.
The number of shares outstanding of the registrant’s common stock on February 15, 2017 was 40,119,338.
DOCUMENTS INCORPORATED BY REFERENCE
Portions from the registrant’s Proxy Statement relating to the 2017 Annual Meeting of Stockholders have been incorporated by reference into Part III, Items 10, 11, 12, 13 and 14.
3
MERITAGE HOMES CORPORATIONFORM 10-K
TABLE OF CONTENTS
PART I
Item 1. Business
Item 1A. Risk Factors
Item 1B. Unresolved Staff Comments
Item 2. Properties
Item 3. Legal Proceedings
Item 4. Mine Safety Disclosures
PART II
Item 5. Market For Registrant’s Common Equity, Related Stockholder Matters and Issuer Purchases of Equity Securities
Item 6. Selected Financial Data
Item 7. Management’s Discussion and Analysis of Financial Condition and Results of Operations
Item 7A. Quantitative and Qualitative Disclosures About Market Risk
Item 8. Financial Statements and Supplementary Data
Item 9. Changes in and Disagreements With Accountants on Accounting and Financial Disclosure
Item 9A. Controls and Procedures
Item 9B. Other Information
PART III
Item 10. Directors, Executive Officers and Corporate Governance
Item 11. Executive Compensation
Item 12. Security Ownership of Certain Beneficial Owners and Management and Related Stockholder Matters
Item 13. Certain Relationships and Related Transactions, and Director Independence
Item 14. Principal Accountant Fees and Services
PART IV
Item 15. Exhibits and Financial Statement Schedules
Item 16. Form 10-K Summary
SIGNATURES
4
4
16
23
23
23
23
24
24
26
27
49
49
75
75
78
78
78
78
78
78
78
79
79
84
84
4
PART I
Item 1. Business
The Company
Meritage Homes is a leading designer and builder of single-family homes. We primarily build in historically high-growth regions of the United States and offer a variety of homes that are designed to appeal to a wide range of homebuyers, including first-time, move-up, active adult and luxury. We have homebuilding operations in three regions: West, Central and East, which are comprised of nine states: Arizona, California, Colorado, Texas, Florida, Georgia, North Carolina, South Carolina and Tennessee. These three regions are our principal homebuilding reporting segments. We also operate a wholly-owned title company, Carefree Title Agency, Inc. ("Carefree Title"). Carefree Title's core business includes title insurance and closing/settlement services we offer to our homebuyers. Refer to Note 14 of the consolidated financial statements for information regarding our operating and reporting segments.
Our homebuilding and marketing activities are conducted under the name of Meritage Homes in each of our homebuilding markets. We also offer luxury homes in some markets under the name of Monterey Homes. At December 31, 2016, we were actively selling homes in 243 communities, with base prices ranging from approximately $162,000 to $1,440,000. Our average sales price on closings and orders were $408,400 and $411,700, respectively for the year ended December 31, 2016.
In the latter half of 2012, we commenced operations of our wholly-owned title company, Carefree Title. Carefree Title's core business lines include title insurance and closing/settlement services for our homebuyers in most of our markets. Managing our own title operations allows us greater control over the entire escrow and closing cycles in addition to generating additional revenue. In addition, we believe homebuyers that utilize Carefree Title's services for their home closings benefit from a more convenient closing experience as Carefree Title's processes are streamlined with those of our homebuilding operations, creating a more efficient work-flow that is seamless to our homebuyers. Revenue and expense from Carefree Title are included in our Financial Services segment in the accompanying consolidated financial statements.
Available Information; Corporate Governance
Meritage Homes Corporation was incorporated in 1988 as a real estate investment trust in the State of Maryland. On December 31, 1996, through a merger, we acquired the homebuilding operations of our predecessor company. We currently focus on homebuilding and related activities and no longer operate as a real estate investment trust. Meritage Homes Corporation operates as a holding company and has no independent assets or operations. Its homebuilding construction, development and sales activities are conducted through its subsidiaries.
Information about our company and communities is provided on our Internet website at www.meritagehomes.com. The information contained on our website is not considered part of this Annual Report on Form 10-K. Our periodic and current reports, including any amendments, filed or furnished pursuant to section 13(a) or 15(d) of the Securities Exchange Act of 1934 (the “Exchange Act”) are available, free of charge, on our website as soon as reasonably practicable after they are electronically filed with or furnished to the Securities and Exchange Commission (“SEC”).
Meritage operates within a comprehensive plan of corporate governance for the purpose of defining responsibilities and setting high standards for ethical conduct. Our Board of Directors has established an audit committee, executive compensation committee, nominating/governance committee and land committee. The charters for each of these committees are available on our website, along with our Code of Ethics, Corporate Governance Principles and Practices, Conflict of Interest Policy and Securities Trading Policy. All of our employees, officers and directors, are required to comply with our Code of Ethics and to immediately report through the appropriate channels, any known instances of non-compliance. Our committee charters, Code of Ethics, Corporate Governance Principles and Practices, Conflict of Interest Policy and Securities Trading Policy are also available in print, free of charge, to any stockholder who requests any of them by calling us or by writing to us at our principal executive offices at the following address: Meritage Homes Corporation, 8800 East Raintree Drive, Suite 300, Scottsdale, Arizona 85260, Attention: General Counsel. Our telephone number is (480) 515-8100.
Strategy
All facets of our operations are governed by our core values that define Meritage's culture and operational parameters, ensuring that our actions are aligned around the achievement of our core purpose of enriching lives by building the American dream and delivering to each of our customers a LIFE. BUILT. BETTER.™. These values combine our entrepreneurial spirit, cutting-edge innovation and organizational agility to strive for industry-leading results in all of our functional areas, including:
5
management, land acquisition and development, finance, marketing, sales, purchasing, construction and customer care. The main tenets of our core values are to:
• Continuously and purposefully renew, rethink and innovate to align our pricing, product and community offerings with homebuyers’ changing demands;
• Be relentless in our pursuit of excellence by continuously improving our construction process; working with our vendors to find mutual efficiencies in order to construct high-quality homes at the lowest possible cost, while incorporating our energy-efficiency technologies and other innovative concepts into routine construction practices;
• Provide the highest level of customer service and care by bringing passion and care to every customer interaction throughout the sales and construction process and after delivery of their homes; and
• Ensure that we have the best team available through investing in our people and fostering an environment that embraces continual growth and learning and expecting top level performance.
These core values are evident in the operational decisions we make in each of our divisions and communities, all of which contribute to the successes we have achieved with our customers, within the marketplace and within our homebuilder peer group.
With our focus on innovation, we employ industry-leading building techniques and technologies throughout Meritage aimed at setting the standard for energy-efficient homebuilding. Accordingly, at a minimum, every new home we construct (except those we construct in markets in which we enter through acquisition and are in the process of converting existing product), meets ENERGY STAR® standards, with many of our communities greatly surpassing those levels, offering our customers homes that utilize, on average, half of the energy of the standard US home. Our commitment to incorporate these energy standards into all of our homes has resulted in our achievement of design, purchasing and production efficiencies that have allowed us to offer these as standard features to our home buyers for nominal additional cost. As a result of our innovative building practices, we have benefited from energy tax credits over the past several years of approximately $41.4 million through December 31, 2016.
Year after year, the homes we build help deliver short- and long-term savings to our homeowners. As a result, for the fourth consecutive year, we have earned the EPA's highest ENERGY STAR award, "Partner of the Year - Sustained Excellence". Because of our recognized industry leadership, utility companies and the US Department of Energy periodically partner with us to introduce advanced building technologies into the homes we build that further differentiate our product in the marketplace when compared against both new and resale homes. This financial backing provides us with a competitive advantage while allowing our buyers to live in more comfortable, healthy and cost-effective homes.
In 2014, we proudly issued our first Corporate Sustainability Report ("Sustainability Report"), voluntarily reporting our 2013 sustainability practices in compliance with the standards of the Global Reporting Initiative Guidelines. A copy of our Sustainability Report is available on our website and we are currently working on our 2016 Sustainability Report which we plan to issue later in 2017.
6
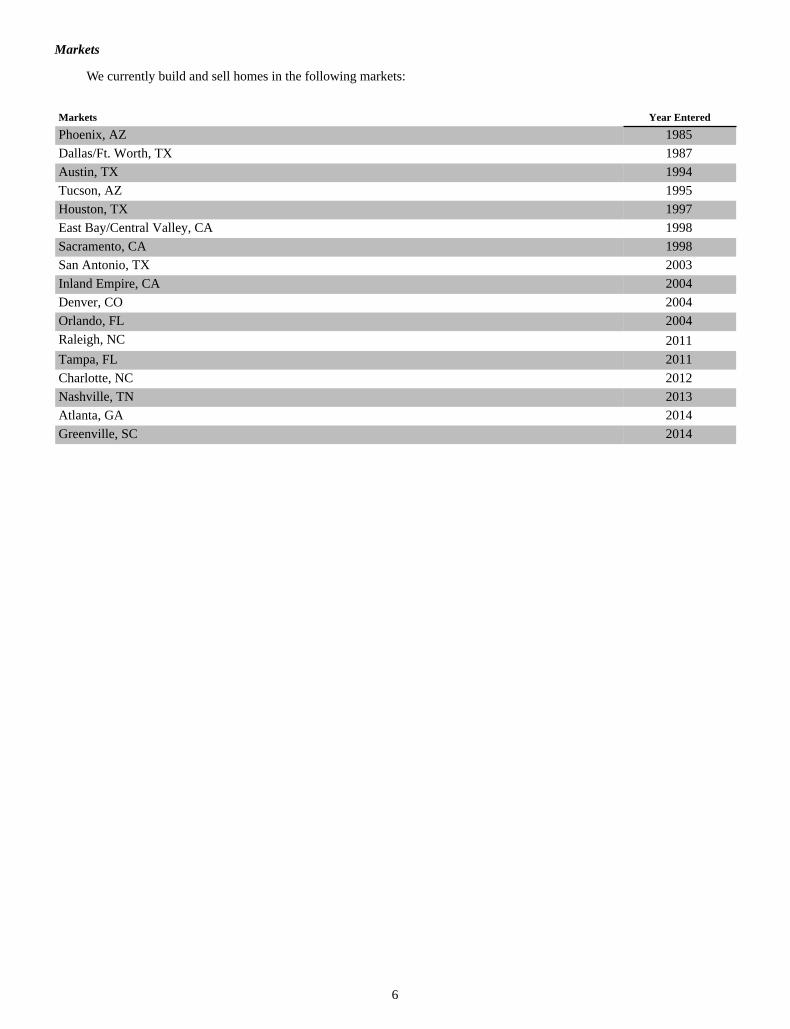
Markets
We currently build and sell homes in the following markets:
Markets Year Entered
Phoenix, AZ 1985Dallas/Ft. Worth, TX 1987Austin, TX 1994Tucson, AZ 1995Houston, TX 1997East Bay/Central Valley, CA 1998Sacramento, CA 1998San Antonio, TX 2003Inland Empire, CA 2004Denver, CO 2004Orlando, FL 2004Raleigh, NC 2011Tampa, FL 2011Charlotte, NC 2012Nashville, TN 2013Atlanta, GA 2014Greenville, SC 2014
7
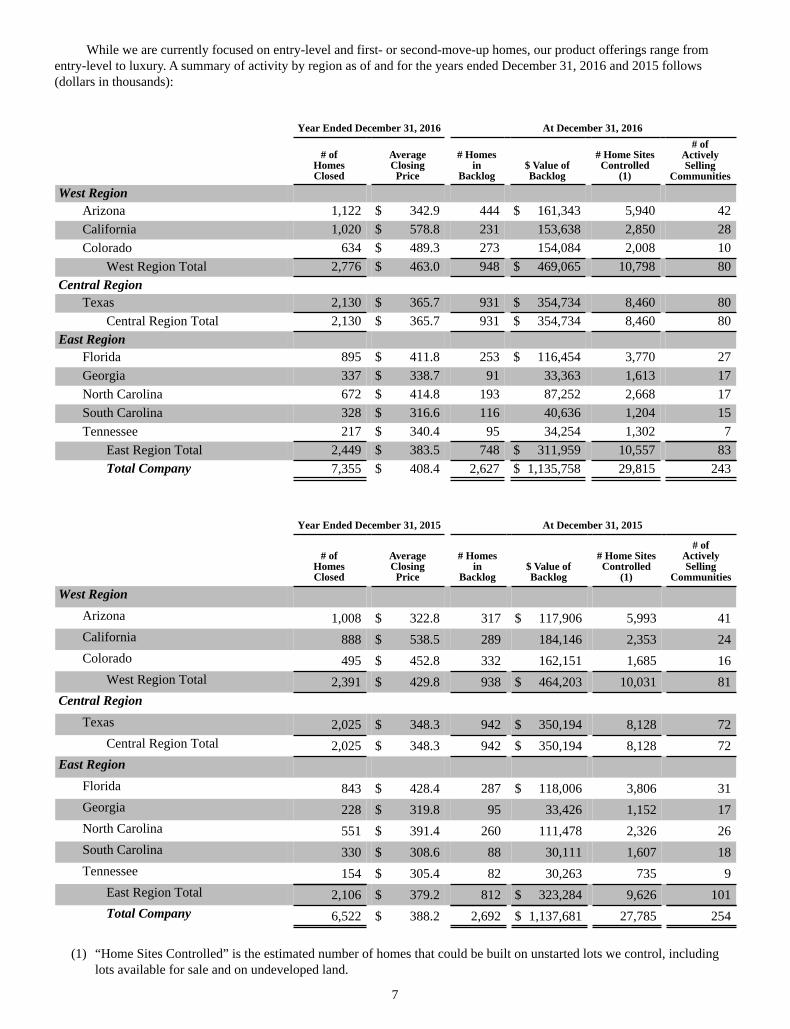
While we are currently focused on entry-level and first- or second-move-up homes, our product offerings range from entry-level to luxury. A summary of activity by region as of and for the years ended December 31, 2016 and 2015 follows (dollars in thousands):
Year Ended December 31, 2016 At December 31, 2016
# ofHomesClosed
AverageClosingPrice
# Homesin
Backlog$ Value ofBacklog
# Home SitesControlled
(1)
# ofActivelySelling
Communities
West RegionArizona 1,122 $ 342.9 444 $ 161,343 5,940 42California 1,020 $ 578.8 231 153,638 2,850 28Colorado 634 $ 489.3 273 154,084 2,008 10
West Region Total 2,776 $ 463.0 948 $ 469,065 10,798 80Central Region
Texas 2,130 $ 365.7 931 $ 354,734 8,460 80Central Region Total 2,130 $ 365.7 931 $ 354,734 8,460 80
East RegionFlorida 895 $ 411.8 253 $ 116,454 3,770 27Georgia 337 $ 338.7 91 33,363 1,613 17North Carolina 672 $ 414.8 193 87,252 2,668 17South Carolina 328 $ 316.6 116 40,636 1,204 15Tennessee 217 $ 340.4 95 34,254 1,302 7
East Region Total 2,449 $ 383.5 748 $ 311,959 10,557 83Total Company 7,355 $ 408.4 2,627 $ 1,135,758 29,815 243
Year Ended December 31, 2015 At December 31, 2015
# ofHomesClosed
AverageClosingPrice
# Homesin
Backlog$ Value ofBacklog
# Home SitesControlled
(1)
# ofActivelySelling
Communities
West RegionArizona 1,008 $ 322.8 317 $ 117,906 5,993 41California 888 $ 538.5 289 184,146 2,353 24Colorado 495 $ 452.8 332 162,151 1,685 16
West Region Total 2,391 $ 429.8 938 $ 464,203 10,031 81Central Region
Texas 2,025 $ 348.3 942 $ 350,194 8,128 72Central Region Total 2,025 $ 348.3 942 $ 350,194 8,128 72
East RegionFlorida 843 $ 428.4 287 $ 118,006 3,806 31Georgia 228 $ 319.8 95 33,426 1,152 17North Carolina 551 $ 391.4 260 111,478 2,326 26South Carolina 330 $ 308.6 88 30,111 1,607 18Tennessee 154 $ 305.4 82 30,263 735 9
East Region Total 2,106 $ 379.2 812 $ 323,284 9,626 101Total Company 6,522 $ 388.2 2,692 $ 1,137,681 27,785 254
(1) “Home Sites Controlled” is the estimated number of homes that could be built on unstarted lots we control, including
lots available for sale and on undeveloped land.
8
Higher closing volume along with higher average sales prices contributed to a strong year of revenue growth in 2016, generating 18.6% higher home closing revenue for the year ended December 31, 2016 compared to 2015. Delays in community openings during the year combined with faster-than-anticipated sellout of communities led to tempered orders in the latter part of the year and contributed to the slightly lower number of units in backlog at December 31, 2016. Land spending was lower in 2015 as we assessed uncertainties in specific markets, which contributed to opening delays and lower overall ending community count in 2016. We are strategically focused on land acquisition to grow community count and to that end we ended 2016 with 29,815 home sites controlled, a 7.3% increase compared to 2015. We believe our land positioning is poised to help us achieve further growth and profitability.
Recent Industry and Company Developments
The 2016 housing market generally experienced a steady level of growth, thanks in part to the continued low cost of home ownership and improving consumer confidence, contributing to a favorable demand environment, particularly in the first-time buyer segment. Despite the modest rise in interest rates in the last quarter of the year, rates are still historically low, and their impact has not yet been observed in the homebuilding industry.
In line with historical trends in the homebuilding industry, the performance of individual housing markets vary. Accordingly, we experienced healthy orders and average sales price growth in some markets and more tempered growth or slight declines in our year-over-year results in other markets. We remain focused on positioning ourselves in well-located and highly-desired communities in many of the top residential real-estate markets in the United States to continue to tap into the demand of today's homebuyers. We believe we successfully differentiate ourselves from our competition by offering a lineup of extremely livable and efficient plans that highlight the benefits of our industry-leading energy-efficient homes. In addition, we also offer our buyers the ability to personalize their homes and we provide a home warranty, further setting us apart from the competition we face with resale homes.
We carefully manage our goals of maintaining adequate liquidity and a strong balance sheet. During 2016, we exercised the accordion feature on our unsecured revolving credit facility and increased the total commitments to $540.0 million and extended the maturity date whereby $60.0 million matures in 2019 with the remainder maturing in 2020. We ended the year with cash and cash equivalents totaling $131.7 million as compared to $262.2 million at December 31, 2015, a year-over-year decline due mainly to increased real estate spending. Our net debt-to-capital ratio remained within our target of the low-to-mid 40% range at 41.2% at December 31, 2016, compared to 40.4% at December 31, 2015. As a means of managing our cash outlays, we seek to acquire lot positions through option contracts that allow us to leverage our balance sheet when both available and financially feasible (see Note 3 for additional information related to option contracts). We continue to reinforce our lot positions with well-located lots in our existing markets and are continually evaluating opportunities for expansion into new markets. We have entered six new markets since 2011 and most recently we entered the Atlanta, Georgia and Greenville, South Carolina markets in 2014 through acquisition of the assets of a regional homebuilder.
Our active community count declined to 243 at year end versus 254 a year ago. Our orders per average active community during 2016 was relatively flat at 29.3 as compared to 29.4 in 2015. Our unsold inventory consisted of 1,692 homes as of December 31, 2016, approximately 28.9% of which were completed, as compared to prior year unsold inventory of 1,270 homes. The increase in unsold inventory primarily relates to our strategy to increase the availability of quick move-in home opportunities in our entry-level segment.
Land Acquisition and Development
Our current land pipeline goal is to maintain an approximate four-to-five year supply of lots, which we believe provides an appropriate planning horizon to address regulatory matters and land development and manage to our business plan for future closings. To grow our business and to better leverage our existing overhead, we are currently focused on adding to our current lot positions and expanding our market share in our key markets and their surrounding submarkets while also exploring opportunities outside of our existing markets, when available. As of December 31, 2016 we have a 4.1-year supply of lots, based on 2016 closings. We continually evaluate our markets, monitoring and adjusting our lot supplies through lot and land acquisitions to ensure we have a sufficient pipeline that is in sync with local market dynamics as well as our goals for growth in those markets.
We are currently purchasing primarily partially-developed or undeveloped lots. The opportunity to purchase substantially finished lots in desired locations is becoming increasingly more limited and competitive than in prior years. Finished lots are those on which the development has already been completed by a third party, and which are ready for immediate home construction. Undeveloped land and partially finished lots require a longer lead time to allow for development activities before our new communities are able to open for sales. However, we are typically purchasing undeveloped and partially finished lots at a lower cost as we are responsible for improvements on the land, rather than paying a mark-up on improvements from a prior developer. When evaluating any land acquisition, our selection is based upon a variety of factors, including:
9
• financial feasibility of the proposed project, including projected profit margins, return on capital invested, and the capital payback period;
• management’s judgment as to the local real estate market and economic trends, and our experience in particular markets;
• suitability of the land to achieve desired shift in product mix toward entry-level product;• existing concentration of owned and contracted lots in surrounding markets, including nearby Meritage communities;• timeline for development, generally within a three to five-year time period from the beginning of the development
process to the delivery of the last home;• surrounding demographics based on extensive marketing studies, including surveys of both new and resale homebuyers;• the ability to secure governmental approvals and entitlements, if required;• results of environmental and legal due diligence;• proximity to local traffic and employment corridors and amenities;• entitlement and development risks and timelines; and• availability of seller-provided purchase options or agreements that allow us to defer lot purchases until needed for
production
When purchasing undeveloped or partially developed land, we prefer to acquire land only after most necessary entitlements have been obtained so that development or construction may begin as market conditions dictate. The term “entitlements” refers to appropriate zoning, development agreements and preliminary or tentative maps and recorded plats, depending on the jurisdiction within which the land is located. Entitlements generally give the developer the right to obtain building permits upon compliance with conditions that are ordinarily within the developer’s control. Even though entitlements are usually obtained before land is purchased, we are typically still required to secure a variety of other governmental approvals and permits prior to and during development, and the process of obtaining such approvals and permits can be lengthy. We may consider the purchase of unentitled property when we can do so in a manner consistent with our business strategy. Currently, we are purchasing and developing parcels that on average range from 50 to 200 lots.
Once we secure undeveloped land, we generally supervise and control the development of the land through contractual agreements with subcontractors. These activities include site planning and engineering, as well as constructing road, sewer, water, utilities, drainage, landscaping improvements, and recreation facilities and other improvements and refinements. We may build homes in master-planned communities with home sites that are along or near major amenities, such as golf courses or recreation facilities.
The factors used to evaluate finished lot purchases are similar to those for land we intend to develop ourselves, although the development risks associated with the undeveloped land—financial, environmental, legal and governmental—have been borne by others. Therefore, these finished lots may be more attractive to us, despite their higher price, as we can immediately bring the community to market and begin home construction as well as mitigate potential cost and time risks that can occur during the land development cycle.
We develop a design and marketing concept tailored to each community, which includes the determination of size, style and price range of homes. We may also determine street layout, individual lot size and layout, and overall community design for each project we develop. The product lines offered depend upon many factors, including the guidelines, if any, of the existing community, housing generally available in the area, the needs and desired housing product for a particular market, and our lot sizes, though we are increasingly able to use standardized design plans across most of our communities.
As a means of accessing parcels of land with minimal cash outlay, we may use rolling option contracts. Acquiring our land through option contracts, when available, allows us to leverage our balance sheet by controlling the timing and volume of lot and land purchases from third parties. These contracts provide us the right, but generally not the obligation, to buy lots and are usually structured to approximate our projected absorption rate at the time the contract is negotiated. Lot option contracts are generally non-recourse and typically require the payment of non-refundable deposits of 5% to 20% of the total land purchase price. We believe the use of option contracts limits the market risks associated with land ownership by allowing us to re-negotiate option terms or terminate options in the event of declines in land value and/or market downturns. In the event we elect to cancel an option contract, our losses are typically limited to the forfeiture of our option deposits and any associated capitalized pre-acquisition costs. The cost of obtaining land through such option contracts is generally higher than if we were to purchase land in bulk, although historically the financial leverage they can provide has frequently outweighed the financing costs associated with them. However, during a period of gross margin contraction, we diligently analyze each option contract to ensure financial feasibility and will generally only contract for lots in this manner if we are still able to achieve desired margins. During 2016 we were successful in securing approximately 1,900 lots through such options. Land purchases are generally financed through our working capital, including corporate borrowings.
10
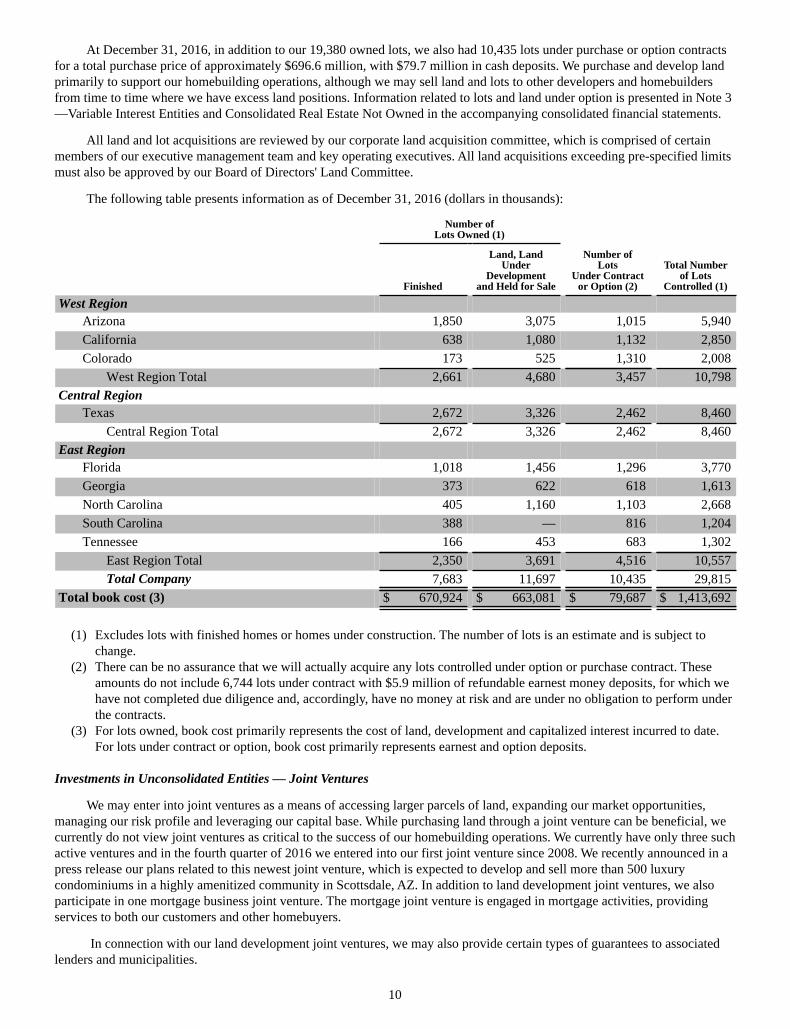
At December 31, 2016, in addition to our 19,380 owned lots, we also had 10,435 lots under purchase or option contracts for a total purchase price of approximately $696.6 million, with $79.7 million in cash deposits. We purchase and develop land primarily to support our homebuilding operations, although we may sell land and lots to other developers and homebuilders from time to time where we have excess land positions. Information related to lots and land under option is presented in Note 3—Variable Interest Entities and Consolidated Real Estate Not Owned in the accompanying consolidated financial statements.
All land and lot acquisitions are reviewed by our corporate land acquisition committee, which is comprised of certain members of our executive management team and key operating executives. All land acquisitions exceeding pre-specified limits must also be approved by our Board of Directors' Land Committee.
The following table presents information as of December 31, 2016 (dollars in thousands):
Number of
Lots Owned (1)
Number ofLots
Under Contractor Option (2)
Total Numberof Lots
Controlled (1) Finished
Land, Land Under
Developmentand Held for Sale
West RegionArizona 1,850 3,075 1,015 5,940California 638 1,080 1,132 2,850Colorado 173 525 1,310 2,008
West Region Total 2,661 4,680 3,457 10,798Central Region
Texas 2,672 3,326 2,462 8,460Central Region Total 2,672 3,326 2,462 8,460
East RegionFlorida 1,018 1,456 1,296 3,770Georgia 373 622 618 1,613North Carolina 405 1,160 1,103 2,668South Carolina 388 — 816 1,204Tennessee 166 453 683 1,302
East Region Total 2,350 3,691 4,516 10,557Total Company 7,683 11,697 10,435 29,815
Total book cost (3) $ 670,924 $ 663,081 $ 79,687 $ 1,413,692
(1) Excludes lots with finished homes or homes under construction. The number of lots is an estimate and is subject to change.
(2) There can be no assurance that we will actually acquire any lots controlled under option or purchase contract. These amounts do not include 6,744 lots under contract with $5.9 million of refundable earnest money deposits, for which we have not completed due diligence and, accordingly, have no money at risk and are under no obligation to perform under the contracts.
(3) For lots owned, book cost primarily represents the cost of land, development and capitalized interest incurred to date. For lots under contract or option, book cost primarily represents earnest and option deposits.
Investments in Unconsolidated Entities — Joint Ventures
We may enter into joint ventures as a means of accessing larger parcels of land, expanding our market opportunities, managing our risk profile and leveraging our capital base. While purchasing land through a joint venture can be beneficial, we currently do not view joint ventures as critical to the success of our homebuilding operations. We currently have only three such active ventures and in the fourth quarter of 2016 we entered into our first joint venture since 2008. We recently announced in a press release our plans related to this newest joint venture, which is expected to develop and sell more than 500 luxury condominiums in a highly amenitized community in Scottsdale, AZ. In addition to land development joint ventures, we also participate in one mortgage business joint venture. The mortgage joint venture is engaged in mortgage activities, providing services to both our customers and other homebuyers.
In connection with our land development joint ventures, we may also provide certain types of guarantees to associated lenders and municipalities.
11
Construction Operations
We typically act as the general contractor for our projects and hire experienced subcontractors on a geographic basis to complete construction at a fixed price. We usually enter into agreements with subcontractors and materials suppliers on an individual basis after receiving competitive bids. We also enter into longer-term and national or regional contracts with subcontractors and suppliers, where possible, to obtain more favorable terms, minimize construction costs and to control product consistency and availability. Our contracts require that our subcontractors comply with all laws and labor practices pertaining to their work, follow local building codes and permits, and meet performance, warranty and insurance requirements. Our purchasing and construction managers coordinate and monitor the activities of subcontractors and suppliers, and monitor compliance with zoning, building and safety codes. At December 31, 2016, we employed 700 full-time construction and warranty managers.
We specify that quality durable materials be used in the construction of our homes and we do not maintain significant inventories of construction materials, except for work in process materials for homes under construction. When possible, we negotiate price and volume discounts and rebates with manufacturers and suppliers on behalf of our subcontractors so we can take advantage of production volume. Our raw materials consist primarily of lumber, concrete, drywall and similar construction materials and are frequently purchased on a national or regional level. Such materials have historically been available from multiple suppliers and therefore we do not believe there is a supplier risk concentration. However, because such materials are substantially comprised of natural resource commodities, their cost and availability is subject to national and worldwide price fluctuations and inflation, each of which could be impacted by legislation or regulation relating to energy and climate change.
We generally build and sell homes in phases within our larger projects, which we believe creates efficiencies in land development, home construction operations and cash management. We also believe it improves customer satisfaction by reducing the number of vacant lots and construction activity surrounding completed homes. Our homes are typically completed within three to five months from the start of construction, depending upon the geographic location and the size and complexity of the home. Construction schedules may vary depending on the size of the home, availability of labor, materials and supplies, product type, location, municipal requirements and weather. Our homes are usually designed to promote efficient use of space and materials, and to minimize construction costs and time. We typically do not enter into any derivative contracts to hedge against weather or materials fluctuations as we do not believe they are particularly advantageous to our operations, although we do lock in short and mid-term pricing with our vendors for certain key construction commodities.
Marketing and Sales
We believe that we have an established reputation for building a diversified line of attractive, high quality and efficient homes, which helps generate demand in each project. Our communication and marketing plans are tailored to target and reach our different customer segments. Part of these plans involve reaching new customers through a combination of advertising and other promotional activities, including our website at www.meritagehomes.com, social media outlets, magazine and newspaper advertisements, radio, brochures, direct mailings and the placement of strategically located signs in the vicinities near our developments to drive traffic to our communities. Our marketing strategy is aimed at differentiating us from other new homebuilders, and resale homes. We solidify this differentiation across all of our marketing and sales efforts to explain how we have thoughtfully selected and incorporated every home's energy-efficient features and benefits as part of a larger, integrated system that enables us to truly deliver on our LIFE. BUILT. BETTER. brand promise to our customers, which means having a home that is quieter, cleaner, healthier, smarter and safer.
We sell our homes using furnished model homes as a marketing tool to demonstrate to prospective homebuyers the advantages of the designs and features of our homes. At December 31, 2016, we owned 341 completed model homes and 29 models under construction and we leased back an additional 16 model homes. We generally employ or contract with interior and landscape designers who enhance the appeal of our model homes, which highlight the features and options available for the product line within a project. We typically build between one and three model homes for each actively selling community, depending upon the number of homes to be built in the project and the products to be offered. We strive to implement marketing strategies that will educate our buyers on how our unique building techniques and the energy efficient features in our homes differentiate them from other homes. In our communities, we have built "learning centers" or in-home displays in order to inform our buyers about energy-efficient features and help them understand how and to what extent a Meritage home can help them enjoy more savings through reduced energy bills, better health, improved comfort and peace of mind.
Our homes generally are sold by our commissioned sales associate employees who work from a sales office typically located in a converted garage of one of the model homes for each project. We also employ a team of online sales associates who offer assistance to potential buyers viewing our communities and products over the Internet. At December 31, 2016, we had 475 full-time sales and marketing personnel. Our goal is to ensure that our sales force has extensive knowledge of our housing product, our energy efficient and innovative features, our sales strategies, mortgage options, and community dynamics, in order to fully execute our marketing message. To achieve this goal, we train our sales associates and conduct regular
12
meetings to update them on our product, communities, sales techniques, competition in the area, financing availability, construction schedules, marketing and advertising plans, available product lines, pricing, options and warranties offered, as well as the numerous benefits and savings our energy efficient product provides. Our sales associates are licensed real estate agents where required by law. Our sales associates may also assist our customers to make standard selections and to select from available options and upgrades that may be available on a community by community basis, which we design to appeal to local consumer demands. In some divisions, we contract with third-party design studios that specialize in assisting our homebuyers with those selections to personalize their homes. Utilizing such third-party design studios typically allows us to manage our overhead costs more efficiently. We may offer various sales incentives, including price concessions, assistance with closing costs, and landscaping or interior upgrades, to attract buyers. The use, type and amount of incentives depends largely on economic and local competitive market conditions. Third-party brokers may also sell our homes, and are usually paid a sales commission based on the price of the home. Frequently, outside brokers bring prospective buyers to our communities. We have a robust loyalty program for these brokers and we aim to regularly educate them on the benefits of owning a Meritage home and our community offerings, which we believe helps enhance the impact of our marketing message.
We differentiate ourselves from our competitors through the superior design and value of our communities and homes, our energy-efficiency and other technologies, and our offerings and enhancements made pursuant to the results of ongoing surveying and product research efforts. We believe our commitment to design and build energy-efficient homes is aligned with buyer sensitivities about how eco-friendly designs, features and materials help impact the environment and the livability of homes, as well as their pocketbooks. We are continually evaluating buyer preferences and make adjustments to the homes we offer and the targeted price points in accordance with buyer demand. Most recently we introduced LiVE. NOW., our newest "entry-level plus" collection of product offerings targeted to the growing number of first-time homebuyers who are looking for an affordable home with features beyond a typical entry-level home and who appreciate a streamlined and expedited home purchasing process.
Backlog
Our sales contracts require cash deposits and are subject to certain contingencies such as the buyer’s ability to qualify for financing. Additional deposits are usually collected upon the selection of options and upgrades. Homes covered by such sales contracts but which are not yet closed are considered “backlog” and are representative of potential future revenues. Started homes are excluded from backlog until a sales contract is signed and are referred to as unsold or “spec” inventory. A contract contingent upon the sale of a customer’s existing home is not considered a sale and not included in backlog until the contingency is removed. We generally require a signed sales contract to release a lot to start construction, although on a regular basis we also start a certain number of homes for speculative sales inventory, as we have had a high level of success with these quick move-in opportunities, particularly in communities that appeal to the renter and first-time buyer demographic. As a result of our strategic shift to expand our entry-level home products, we expect to grow our number of spec homes. We may also start construction on such homes to accelerate or facilitate the close-out of a community. At December 31, 2016, 77.0% of our 2,627 homes in backlog were under construction.
We do not recognize any revenue from a home sale until a finished home is delivered to the homebuyer, payment is collected and other criteria for sale and profit recognition are met. At December 31, 2016, of our total homes in inventory excluding completed model homes, 32.1% were under construction without sales contracts and 13.1% were completed homes without sales contracts. A portion of the unsold homes resulted from homesites that began construction with valid sales contracts that were subsequently canceled. We believe that during 2017 we will deliver to customers substantially all homes in backlog at December 31, 2016 under existing or, in the case of cancellations, replacement sales contracts.
The number of units in backlog decreased 2.4% to 2,627 units at December 31, 2016 from 2,692 units December 31, 2015; however, due to higher average sales prices, the value of backlog year-over-year was flat at $1.1 billion. The larger volume of closings in 2016, combined with the tempering of orders in the latter part of 2016 from fewer actively selling communities contributed to the slight decline in backlog units from prior year.
Customer Financing
Most of our homebuyers require financing. Accordingly, we refer them to mortgage lenders that offer a variety of financing options. While our homebuyers may obtain financing from any mortgage provider of their choice, we have a joint venture arrangement with an established mortgage broker that allows it to act as a preferred mortgage broker to our buyers in most of our markets to help facilitate the sale and closing process as well as generate additional revenue for us through our interest in the joint venture (See Note 4 for additional information on joint venture financial results). In some markets we also use unaffiliated preferred mortgage lenders. We may pay a portion of the closing costs to assist homebuyers who obtain financing from our preferred lenders.
13
Customer Relations, Quality Control and Warranty Programs
We believe that positive customer relations and an adherence to stringent quality control standards are fundamental to our continued success, and that our commitment to buyer satisfaction and quality control has significantly contributed to our reputation as a high-quality builder.
In accordance with our company-wide standards, one or more Meritage project manager or superintendent generally monitors compliance with quality control standards for each community through the building phase of our homes. These employees perform the following tasks:
• oversee home construction;• monitor subcontractor and supplier performance;• manage scheduling and construction completion deadlines; and• conduct formal inspections as specific stages of construction are completed.
At the time a home is completed and delivered to a buyer, we typically hand off the process to a customer relations employee who manages the warranty and customer care efforts.
We generally provide a one-to-two-year limited warranty on workmanship and building materials and a ten-year warranty for the structural integrity on the homes we build. We require our subcontractors to provide a warranty and indemnity to us as well as evidence of insurance before beginning work, and therefore any claims relating to workmanship and materials are generally the subcontractors’ responsibility. Although our subcontractors are generally required to repair and replace any product or labor defects, we are, during applicable warranty periods, ultimately responsible to the homeowner for making such repairs. Accordingly, with the assistance of an actuary, we have estimated and established reserves for future structural warranty costs based on the number of home closings and historical data trends for warranty work within our communities. Warranty reserves generally range between 0.1% to 0.6% of a home’s sale price. Those projections are subject to variability due to uncertainties regarding structural defect claims for the products and labor we use in the construction of our homes, the markets in which we build, claim settlement history, and insurance and legal interpretations, among other factors and we are, therefore, constantly monitoring such reserves. Historically, these reserves have been sufficient to cover net out-of-pocket warranty costs.
Competition and Market Factors
The construction and sale of homes is a highly-competitive industry. We compete for sales in each of our markets with national, regional and local developers and homebuilders, as well as existing resale homes, and to a lesser extent, condominiums and rental housing. Some of our competitors have significantly greater financial resources and may have lower costs than we do. Competition among residential homebuilders of all sizes is based on a number of interrelated factors, including location, reputation, product type, amenities, design, innovation, quality and price. We believe that we compare favorably to other homebuilders in the markets in which we operate due to our:
• experience within our geographic markets which allows us to develop and offer products that provide superior design and quality in line with the needs and desires of the targeted demographic;
• streamlined construction processes that allow us to save on materials, labor and time and pass those savings to our customers in the form of lower prices;
• ENERGY STAR® standards in all of our communities (except those we construct in markets in which we enter through acquisition and are in the process of converting existing product) and incremental energy-efficient features that create a variety of benefits to our customers and differentiate our product from competing new and existing home inventories;
• ability to recognize and adapt to changing market conditions, from both a capital and human resource perspective;• ability to capitalize on opportunities to acquire land on favorable terms; and• reputation for outstanding service and quality products and our exceptional customer and warranty service.
Our product offerings and strategic locations are successfully competing with both existing homes inventory and surrounding new-home communities as evidenced by our relative orders volume and market share in most of our divisions. We expect that the strengths noted above will continue to provide us with long-term competitive advantages.
We have an extensive market research department that assists our operating divisions in each of our markets to better compete with other homebuilders, and the inventory of re-sale homes in surrounding neighborhoods. Our strategic operations team conducts in-depth community-level reviews in each of our markets, including a detailed analysis of existing inventory, pricing, buyer demographics and the identification of each location’s key buyer metrics. This analysis and resulting analytical tools assist in decision making regarding product designs, positioning, and pricing and underwriting standards for land purchases and land development. Additionally, our market research department is focused on evaluating and identifying new market opportunities.
14
Government Regulation and Environmental Matters
To the extent that we acquire undeveloped land, we prefer to acquire land after all or most entitlements have been obtained. Construction may begin almost immediately on such entitled land upon compliance with and receipt of specified permits, approvals and other conditions, which generally are within our control. The time needed to obtain such approvals and permits affects the carrying costs of unimproved property acquired for development and construction. The continued effectiveness of permits already granted is subject to factors such as changes in government policies, rules and regulations, and their interpretation and application. To date, the government approval processes discussed above have caused some timing delays but have not had a material adverse effect on our development activities, although there is no assurance that these and other restrictions will not adversely affect future operations as, among other things, sunset clauses may exist on some of our entitlements and they could lapse.
Local and state governments have broad discretion regarding the imposition of development fees for projects under their jurisdictions. These fees are normally established when we receive recorded maps or plats and building permits. Governing agencies may also require concessions or may require the builder to construct certain improvements to public places such as parks and streets. In addition, governing agencies may impose construction moratoriums. Because most of our land is entitled, construction moratoriums typically would not affect us in the near term unless they arise from health, safety or welfare issues, such as insufficient water, electric or sewage facilities. In the long term, we could become subject to delays or may be precluded entirely from developing communities due to building moratoriums, “no growth” or “slow growth” initiatives or building permit allocation ordinances, which could be implemented in the future.
In addition, there is a variety of new legislation being enacted, or considered for enactment at the federal, state and local level relating to energy and climate change. This legislation relates to items such as carbon dioxide emissions control and building codes that impose energy efficiency standards. New building code requirements that impose stricter energy efficiency standards could significantly increase the cost to construct homes, although our energy-efficiency technologies and offerings meet, and in many instances exceed, current and expected energy efficiency thresholds. As climate change concerns continue to grow, legislation and regulations of this nature are expected to continue and may result in increased costs and longer approval and development timelines. Similarly, energy-related initiatives affect a wide variety of companies throughout the United States and the world, and because our operations are heavily dependent on significant amounts of raw materials, such as lumber, steel, and concrete, such initiatives could have an indirect adverse impact on our operations and profitability to the extent the manufacturers and suppliers of our materials are burdened with expensive carbon dioxide emissions control and energy-related regulations.
We are also subject to a variety of local, state, and federal statutes, ordinances, rules and regulations concerning the protection of health and the environment. In some markets, we are subject to environmentally sensitive land ordinances that mandate open space areas with public elements in housing developments, and prevent development on hillsides, wetlands and other protected areas. We must also comply with flood plain restrictions, desert wash area restrictions, native plant regulations, endangered species acts and view restrictions. These and similar laws and regulations may result in delays, cause substantial compliance and other costs, and prohibit or severely restrict development in certain environmentally sensitive regions or areas. To date, compliance with such laws and regulations has not materially affected our operations, although it may do so in the future.
We usually will condition our obligation to acquire property on, among other things, an environmental review of the land. To date, we have not incurred any material unanticipated liabilities relating to the removal or remediation of unknown toxic wastes or other environmental conditions. However, there is no assurance that we will not incur material liabilities in the future relating to toxic waste removal or other environmental conditions affecting land currently or previously owned.
In order for our homebuyers to finance their home purchases with FHA-insured or VA-guaranteed or USDA-guaranteed mortgages, we are required to build such homes in accordance with the regulatory requirements of those agencies.
Some states have statutory disclosure requirements governing the marketing and sale of new homes. These requirements vary widely from state to state.
Some states require us to be registered as a licensed contractor, a licensed real estate broker and in some markets our sales agents are required to be registered as licensed real estate agents.
15
Employees, Subcontractors and Consultants
At December 31, 2016, we had 1,485 full-time employees, including 276 in management and administration, 34 in our title company, 475 in sales and marketing, and 700 in construction operations. Our operations are carried out through both local and centralized corporate management. Local operations are made up of our division employees, led by management with significant homebuilding experience and who typically possess a depth of knowledge in their particular markets. Our centralized corporate management sets our strategy and leads decisions related to the Company's land acquisition, risk management, finance, cash management and information systems. Our employees are not unionized, and we believe that we have good employee relationships. We pay for a substantial portion of our employees’ insurance costs, with the balance contributed by the employees. We also have a 401(k) savings plan, which is available to all employees who meet the plan’s participation requirements.
We act solely as a general contractor, and all construction operations are coordinated by our project managers and field superintendents who schedule and monitor third party independent subcontractors. We use independent consultants and contractors for architectural, engineering, advertising and some legal services, and we strive to maintain good relationships with our subcontractors and independent consultants and contractors.
Seasonality
Historically, we experienced seasonal variations in our quarterly operating results and capital requirements. We typically sell more homes in the first half of the fiscal year than in the second half, which creates additional working capital requirements in the second and third quarters to build our inventories to satisfy the deliveries in the second half of the year. We typically benefit from the cash generated from home closings more in the third and fourth quarters than in the first and second quarters. We expect this seasonal pattern to continue over the long term, although it has been and may continue to be affected by volatility in the homebuilding industry.
Executive Officers of the Registrant
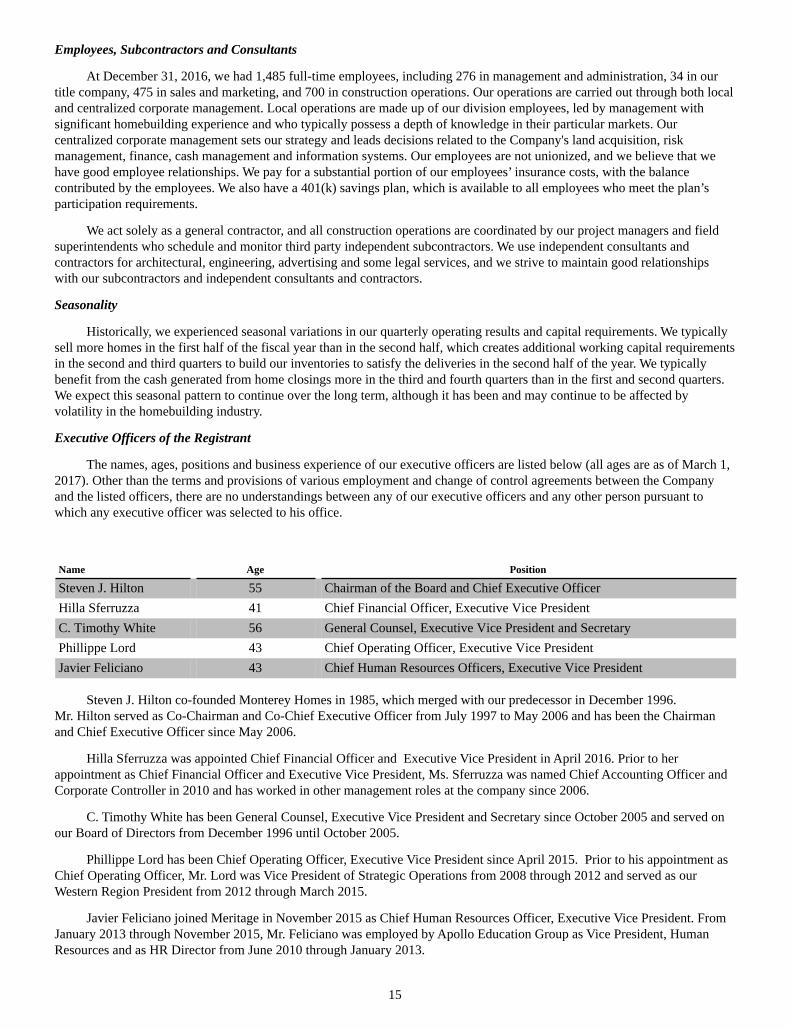
The names, ages, positions and business experience of our executive officers are listed below (all ages are as of March 1, 2017). Other than the terms and provisions of various employment and change of control agreements between the Company and the listed officers, there are no understandings between any of our executive officers and any other person pursuant to which any executive officer was selected to his office.
Name Age Position
Steven J. Hilton 55 Chairman of the Board and Chief Executive OfficerHilla Sferruzza 41 Chief Financial Officer, Executive Vice PresidentC. Timothy White 56 General Counsel, Executive Vice President and SecretaryPhillippe Lord 43 Chief Operating Officer, Executive Vice PresidentJavier Feliciano 43 Chief Human Resources Officers, Executive Vice President
Steven J. Hilton co-founded Monterey Homes in 1985, which merged with our predecessor in December 1996. Mr. Hilton served as Co-Chairman and Co-Chief Executive Officer from July 1997 to May 2006 and has been the Chairman and Chief Executive Officer since May 2006.
Hilla Sferruzza was appointed Chief Financial Officer and Executive Vice President in April 2016. Prior to her appointment as Chief Financial Officer and Executive Vice President, Ms. Sferruzza was named Chief Accounting Officer and Corporate Controller in 2010 and has worked in other management roles at the company since 2006.
C. Timothy White has been General Counsel, Executive Vice President and Secretary since October 2005 and served on our Board of Directors from December 1996 until October 2005.
Phillippe Lord has been Chief Operating Officer, Executive Vice President since April 2015. Prior to his appointment as Chief Operating Officer, Mr. Lord was Vice President of Strategic Operations from 2008 through 2012 and served as our Western Region President from 2012 through March 2015.
Javier Feliciano joined Meritage in November 2015 as Chief Human Resources Officer, Executive Vice President. From January 2013 through November 2015, Mr. Feliciano was employed by Apollo Education Group as Vice President, Human Resources and as HR Director from June 2010 through January 2013.
16
Item 1A. Risk Factors
The risk factors discussed below are factors that we believe could significantly impact our business, if they occur. These factors could cause results to differ materially from our historical results or our future expectations.
Risk Factors Related to our Business
Our long-term success depends on the availability of lots and land that meet our land investment criteria.
The availability of lots and land that meet our investment and marketing standards depends on a number of factors outside of our control, including land availability in general, competition with other homebuilders and land buyers, credit market conditions, legal and government agency processes and regulations, inflation in land prices, zoning, our ability and the costs to obtain building permits, the amount of impact fees, property tax rates and other regulatory requirements. If suitable lots or land becomes less available, or the cost of attractive land increases, it could reduce the number of homes that we may be able to build and sell, each of which could adversely impact our financial results. The availability of suitable land assets could also affect the success of our strategic land acquisition strategy, which may impact our ability to increase the number of actively selling communities and to maintain profitability.
Decreases in mortgage availability and increases in interest rates may make purchasing a home more difficult and may negatively impact the ability to sell new and existing homes.
In general, housing demand is adversely affected by a lack of availability of mortgage financing and increases in interest rates. Most of our buyers finance their home purchases through our mortgage joint venture or third-party lenders providing mortgage financing. If mortgage interest rates increase and, consequently, the ability of prospective buyers to finance home purchases is adversely affected, our home sales and cash flow may be adversely affected and the impact may be material. These risks can also indirectly impact us to the extent our customers need to sell their existing home to purchase a new home from us if the potential buyers of our customer's homes are unable to obtain mortgage financing. Although long-term interest rates currently remain near historically low levels, it is impossible to predict future increases or decreases in market interest rates.
Mortgage lenders are subject to underwriting standards by the regulatory authorities which oversee them. Regulations, standards, rules and requirements, as and when implemented, could restrict the availability of loans and/or increase the costs to borrowers to obtain such loans. While lending requirements have loosened in the past couple of years, mortgage lending underwriting standards are more restrictive than in the previous homebuilding cycle; potentially limiting the number of buyers able to obtain a mortgage. The FHA insures mortgage loans that generally have lower credit requirements and is an important source for financing some of our home sales. Changes or restrictions in FHA programs may negatively affect the availability or affordability of FHA financing. Financing through programs offered by the VA, USDA and other certain housing finance agencies are subject to changes in regulations, lending standards and government funding levels. There can be no assurance that these programs will continue to be available or that they will be as attractive as they currently are. Continued legislative and regulatory actions and more stringent underwriting standards could have a material adverse effect on our business if certain buyers are unable to obtain mortgage financing. A prolonged tightening of the financial markets could also negatively impact our business.
Shortages in the availability of subcontract labor may delay construction schedules and increase our costs.
We conduct our construction operations only as a general contractor. Virtually all design, architectural, construction and development work is performed by unaffiliated third-party consultants and subcontractors. As a consequence, we depend on the continued availability of and satisfactory performance by these consultants and subcontractors for the design and construction of our communities and homes and to provide related materials. The cost of labor may also be adversely affected by shortages of qualified trades people, changes in laws and regulations relating to union activity and changes in immigration laws and trends in labor migration. Throughout the homebuilding cycle, we have experienced shortages of skilled labor in certain markets, which led to increased labor costs. We cannot be assured that in the future there will be a sufficient supply or satisfactory performance by these unaffiliated third-party consultants and subcontractors, which could have a material adverse effect on our business.
17
Expirations, amendments or changes to tax laws, incentives or credits currently available to us and our homebuyers may negatively impact our business.
Significant changes to existing tax laws that currently benefit our homebuyers may result in an increase in the total cost of home ownership and may make the purchase of a home less attractive to our buyers. Many homeowners receive substantial tax benefits in the form of tax deductions against their personal taxable income for mortgage interest and property tax payments and the loss or reduction of these deductions would affect most homeowners' net cost of owning a home. If federal or state governments further change income tax laws by eliminating, limiting or substantially reducing these or other associated income tax benefits or by altering tax rates, the after-tax cost of owning a home could increase substantially, which could adversely impact demand for and/or selling prices of our homes, and the effect on our consolidated financial statements could be material. Also, federal or state governments have in the past provided for substantial benefits in the form of tax credits for buyers of new or used homes.
Currently, under the American Taxpayer Relief Act of 2012, the federal government enacted higher income tax rates and limits on the value of tax deductions for certain high-income individuals and households which may have an indirect impact on our operations. On December 16, 2014, Congress passed the Tax Increase Prevention Act of 2014 (the "Extenders Act"), which the President signed into law on December 19, 2014. The Extenders Act extended the availability of the IRC §45L new energy efficient homes credit to the end of 2014. On December 18, 2015, Congress passed the Protecting Americans from Tax Hikes ("PATH") Act of 2015. The PATH Act further extended the availability of the IRC §45L new energy efficient homes credit through the end of 2016. Legislation to extend this tax credit for 2017 and beyond has not been adopted and it is uncertain whether an extension or similar tax credit will be adopted, particularly in light of the new Presidential administration that began in January 2017. The energy tax credits provided us a significant benefit and reduced our effective income tax rate in 2015 and 2016. If such legislation to extend these tax credits is not adopted, it would increase our effective tax rate and the amount of Federal income taxes we are required to remit to the United States Treasury.
If our current strategic initiatives are not successful, it could have negative consequences on our operations, financial position and cash flows.
We have traditionally focused our marketing, community and home designs, and product offerings on the first- or second-move-up buyer. As a result of changing demographics and trends, we have shifted our strategy and have undertaken actions to align our pricing, product and community offerings to include a focus on entry-level homes based on our belief that there will be a resurgence of first time buyers. We have invested significant efforts to align our community layouts, lot sizes and product designs to include more homes targeted to first time buyers. If there is not a resurgence of first time buyers or our entry-level home offerings are not attractive to our customers it could have negative consequences on our operations, financial position and cash flows.
If home prices decline, potential buyers may not be able to sell their existing homes, which may negatively impact our sales.
As a homebuilder, we are subject to market forces beyond our control. In general, housing demand is impacted by the affordability of housing. Many homebuyers need to sell their existing homes in order to purchase a new home from us, and a weakness in the home resale market could adversely affect that ability. Declines in home prices could have an adverse effect on our homebuilding business margins and cash flows.
High cancellation rates may negatively impact our business; some home cancellations are with homebuyers that have refundable deposits.
Our backlog reflects the number and value of homes for which we have entered into non-contingent sales contracts with customers but have not yet delivered those homes. While we may accept sales contracts on a contingent basis in limited circumstances, they are not included in our backlog until the contingency is removed. In connection with the purchase of a home, our policy is to generally collect a deposit from our customers, although typically, this deposit reflects a small percentage of the total purchase price, and due to local regulations, the deposit may, in certain circumstances, be fully or partially refundable prior to closing. If the prices for our homes in a given community decline, our neighboring competitors reduce their sales prices (or increase their sales incentives), interest rates increase, the availability of mortgage financing tightens or there is a downturn in local, regional or national economies, homebuyers may elect to cancel their home purchase contracts with us. Significant cancellations have previously had, and could in the future have, a material adverse effect on our business as a result of lost sales revenue and the accumulation of unsold housing inventory.
18
Our future operations may be adversely impacted by high inflation.
We, like other homebuilders, may be adversely affected during periods of high inflation, mainly from higher land, construction, labor and materials costs. Also, higher mortgage interest rates may significantly affect the affordability of mortgage financing to prospective buyers. Inflation could increase our cost of financing, materials and labor and could cause our financial results or profitability to decline. Traditionally, we have attempted to pass cost increases on to our customers through higher sales prices. Although inflation has not historically had a material adverse effect on our business, sustained increases in material costs have recently had and may continue to have a material adverse effect on our business if we are unable to correspondingly increase home sale prices.
A reduction in our sales absorption levels may force us to incur and absorb additional community-level costs.
We incur certain overhead costs associated with our communities, such as marketing expenses and costs associated with the upkeep and maintenance of our model and sales complexes. If our sales absorptions pace decreases and the time required to close out our communities is extended, we would likely incur additional overhead costs, which would negatively impact our financial results. Additionally, we incur various land development improvement costs for a community prior to the commencement of home construction. Such costs include infrastructure, utilities, taxes and other related expenses. Reduction in home absorption rates increases the associated holding costs and extends our time to recover such costs. Declines in the homebuilding market may also require us to evaluate the recoverability of costs relating to land acquired more recently.
The value of our real estate inventory may decline, leading to impairments and reduced profitability.
During the last homebuilding cycle downturn, and in certain isolated circumstances afterward, we had to impair many of our real-estate assets to fair-value, incurring large impairment charges which negatively impacted our financial results. Another decline in the homebuilding market may require us to re-evaluate the value of our land holdings and we could incur additional impairment charges, which would decrease both the book value of our assets and stockholders’ equity.
Reduced levels of sales may cause us to re-evaluate the viability of existing option contracts, resulting in a potential termination of these contracts which may lead to impairment charges.
In the prior homebuilding cycle, a significant portion of our lots were controlled under option contracts. Such options generally require a cash deposit that will be forfeited if we do not exercise the option or proceed with the purchase(s). During the prior downturn, we forfeited significant amounts of deposits and wrote off significant amounts of related pre-acquisition costs related to projects we no longer deemed feasible, as they were not projected to generate acceptable returns. Another downturn in the homebuilding market may cause us to re-evaluate the feasibility of our optioned projects, which may result in writedowns that would reduce our assets and stockholders’ equity.
Our business may be negatively impacted by natural disasters or extensive weather.
Our homebuilding operations include operations in Texas, California, North Carolina, South Carolina, Tennessee, Georgia and Florida. These markets occasionally experience extreme weather conditions such as tornadoes and/or hurricanes, earthquakes, wildfires, flooding, landslides, prolonged periods of precipitation, sinkholes and other natural disasters. We do not insure against some of these risks. These occurrences could damage or destroy some of our homes under construction or our building lots, which may result in uninsured or underinsured losses. We could also suffer significant construction delays or substantial fluctuations in the pricing or availability of building materials due to such disasters. Any of these events could cause a decrease in our revenue, cash flows and earnings.
If we are unable to successfully compete in the highly competitive housing industry, our financial results and growth may suffer.
The housing industry is highly competitive. We compete for sales in each of our markets with national, regional and local developers and homebuilders, existing home resales (including foreclosures) and, to a lesser extent, condominiums and available rental housing. Some of our competitors have significantly greater financial resources and some may have lower costs than we do. Competition among homebuilders of all sizes is based on a number of interrelated factors, including location, reputation, amenities, design, innovation, quality and price. Competition is expected to continue and may become more intense, and there may be new entrants in the markets in which we currently operate and in markets we may enter in the future and our industry may also experience some consolidations. If we are unable to successfully compete, our financial results and growth could suffer.
19
We are subject to home warranty and construction defect claims arising in the ordinary course of business, which may lead to additional reserves or expenses.
Home warranty and construction defect claims are common in the homebuilding industry and can be costly. Therefore, in order to account for future potential obligations, we establish a warranty reserve in connection with every home closing. Additionally, we maintain general liability insurance and generally require our subcontractors to provide a warranty and indemnity to us and insurance coverage for liabilities arising from their work; however, we cannot be assured that our warranty reserves and insurance and those subcontractors warranties, insurance and indemnities will be adequate to cover all warranty and construction defect claims for which we may be held responsible. For example, we may be responsible for applicable self-insured retentions, and certain claims may not be covered by insurance or may exceed applicable coverage limits.
A major safety incident relating to our operations could be costly in terms of potential liabilities and reputational damage.
Building sites are inherently dangerous, and operating in the homebuilding industry poses certain inherent health and safety risks. Due to health and safety regulatory requirements and the number of projects we work on, health and safety performance is important to the success of our development and construction activities. Any failure in health and safety performance may result in penalties for non-compliance with relevant regulatory requirements, and a failure that results in a major or significant health and safety incident is likely to be costly and could expose us to claims resulting from personal injury. Such a failure could generate significant negative publicity and have a corresponding impact on our reputation, our relationships with relevant regulatory agencies or governmental authorities, and our ability to attract customers and employees, which in turn could have a material adverse effect on our business, financial condition and operating results. We and our subcontractors carry insurance that covers some of these risks.
Our income tax provision and other tax liabilities may be insufficient if taxing authorities initiate and are successful in asserting tax positions that are contrary to our position.
In the normal course of business, we are audited by various federal, state and local authorities regarding income tax matters. Significant judgment is required to determine our provision for income taxes and our liabilities for federal, state, local and other taxes. We have one state tax audit unresolved at this time. Although we believe our approach to determining the appropriate tax treatment is supportable and in accordance with tax laws and regulations and relevant accounting literature, it is possible that the final tax authority will take a tax position that is materially different than ours. As each audit is conducted, adjustments, if any, are recorded in our consolidated financial statements in the period determined. Such differences could have a material adverse effect on our income tax provision or benefit, or other tax reserves, in the reporting period in which such determination is made and, consequently, on our results of operations, financial position and/or cash flows for such period.
Our ability to acquire and develop raw or partially finished lots may be negatively impacted if we are unable to secure performance bonds.
In connection with land development work on our raw or partially finished land, we are oftentimes required to provide performance bonds or other assurances for the benefit of the respective municipalities or governmental authorities. These performance bonds provide assurance to the beneficiaries that the development will be completed, or that in case we do not perform, that funds from the bonds are available for the municipality or governmental agency to finish such work. In the future, additional performance bonds may be difficult to obtain, or may become difficult to obtain on terms that are acceptable to us. If we are unable to secure such required bonds, progress on affected projects may be delayed or halted or we may be required to expend additional cash to secure other forms of sureties which may adversely affect our financial position and ability to grow our operations.
The loss of key personnel may negatively impact us.
Our success largely depends on the continuing services of certain key employees and our ability to attract and retain qualified personnel. We have employment agreements with certain key employees who we believe possess valuable industry knowledge, experience and leadership abilities that would be difficult in the short term to replicate. The loss of the services of such key employees could harm our operations and business plans.
Failure to comply with laws and regulations by our employees or representatives may harm us.
We are required to comply with applicable laws and regulations that govern all aspects of our business including land acquisition, development, home construction, mortgage origination, title and escrow operations, sales and warranty. It is possible that individuals acting on our behalf could intentionally or unintentionally violate some of these laws and regulations. Although we endeavor to take immediate action if we become aware of such violations, we may incur fines or penalties as a
20
result of these actions and our reputation with governmental agencies and our customers may be damaged. Further, other acts of bad judgment may also result in negative publicity and/or financial consequences.
Our lack of geographic diversification could adversely affect us if the homebuilding industry in our market declines.
We have operations in Texas, Arizona, California, Colorado, Florida, North Carolina, South Carolina, Georgia and Tennessee. Although we have recently expanded our operations to new markets, our geographic diversification is still limited and could adversely impact us if the homebuilding business in our current markets should decline, since we may not have a balancing opportunity in other geographic regions. For example, oil prices declined significantly in the latter part of 2014 and 2015 which had an impact on our operations in the Houston market which are sensitive to declining oil prices as energy is an important employment sector in this market.
We experience fluctuations and variability in our operating results on a quarterly basis and, as a result, our historical performance may not be a meaningful indicator of future results.
We historically have experienced, and expect to continue to experience, variability in home sales and results of operations on a quarterly basis. As a result of such variability, our historical performance may not be a meaningful indicator of future results. Factors that contribute to this variability include:
• timing of home deliveries and land sales;• the changing composition and mix of our asset portfolio;• delays in construction schedules due to adverse weather, acts of God, reduced subcontractor availability and
governmental requirements and restrictions;• conditions of the real estate market in areas where we operate and of the general economy;• the cyclical nature of the homebuilding industry; and• costs and availability of materials and labor.
Our level of indebtedness may adversely affect our financial position and prevent us from fulfilling our debt obligations.
The homebuilding industry is capital intensive and requires significant up-front expenditures to secure land and pursue development and construction on such land. Accordingly, we incur substantial indebtedness to finance our homebuilding activities. At December 31, 2016, we had approximately $1.1 billion of indebtedness and $131.7 million of cash and cash equivalents. If we require working capital greater than that provided by operations, our current liquidity position, and our current $481.2 million available to be drawn under our credit facility, we may be required to seek additional capital in the form of equity or debt financing from a variety of potential sources, including bank financing and securities offerings. There can be no assurance we would be able to obtain such additional capital on terms acceptable to us, if at all. The level of our indebtedness could have important consequences to our stockholders, including the following:
• our ability to obtain additional financing for working capital, capital expenditures, acquisitions or general corporate purposes could be impaired;
• we could have to use a substantial portion of our cash flow from operations to pay interest and principal on our indebtedness, which would reduce the funds available to us for other purposes such as land and lot acquisition, development and construction activities;
• we have a moderate level of indebtedness and a lower volume of cash and cash equivalents than some of our competitors, which may put us at a competitive disadvantage and reduce our flexibility in planning for, or responding to, changing conditions in our industry, including increased competition; and
• we may be more vulnerable to economic downturns and adverse developments in our business than some of our competitors.
We expect to generate cash flow to pay our expenses and to pay the principal and interest on our indebtedness with cash flow from operations or from existing working capital. Our ability to meet our expenses thus depends, to a large extent, on our future performance, which will be affected by financial, business, economic and other factors. We will not be able to control many of these factors, such as economic conditions in the markets where we operate and pressure from competitors. If we do not have sufficient funds, we may be required to refinance all or part of our existing debt, sell assets or borrow additional funds. We cannot guarantee that we will be able to do so on terms acceptable to us, if at all. In addition, the terms of existing or future debt agreements may restrict us from pursuing any of these alternatives.
21
Our ability to obtain third-party financing may be negatively affected by any downgrade of our credit rating from a rating agency
We consider the availability of third-party financing to be a key component of our long-term strategy to grow our business either through acquisitions or through internal expansion. As of December 31, 2016, our credit ratings were BB-, Ba2, and BB- by Standard and Poor’s Financial Services, Moody’s Investor Services and Fitch Ratings, respectively, the three primary rating agencies. Any downgrades from these ratings may impact our ability to obtain future additional financing, or to obtain such financing at terms that are favorable to us and therefore, may adversely impact our future operations.
We may not be successful in future expansion and integrating acquisitions.
We may consider growth or expansion of our operations in our current markets or in other areas of the country. We may not be successful in future expansion and integrating future acquisitions. Our expansion into new or existing markets could have a material adverse effect on our cash flows and/or profitability as we may incur costs to integrate new markets into our operations in advance of those operations providing a right-sized impact to our bottom line. The magnitude, timing and nature of any future expansion will depend on a number of factors, including suitable additional markets and/or acquisition candidates, the negotiation of acceptable terms, our financial capabilities, the size of the new business, and general economic and business conditions. New acquisitions may result in the incurrence of additional debt. Acquisitions also involve numerous risks, including difficulties and/or delays in the assimilation and integration of the acquired company’s operations, the incurrence of unanticipated liabilities or expenses, the diversion of management’s attention from other business concerns, risks of entering markets in which we have limited or no direct experience and the potential loss of key employees of the acquired company. In our recent acquisitions in Nashville, Atlanta and Greenville, the integration of the operations was slower than originally anticipated, although we believe we have now worked through most of the delays. However, it cannot be assured that integration delays for future acquisitions will not occur, which could have an impact on our operations and our financial results.
We are subject to extensive government regulations that could cause us to incur significant liabilities or restrict our business activities.
Regulatory requirements could cause us to incur significant liabilities and costs and could restrict our business activities. We are subject to local, state and federal statutes and rules regulating certain developmental matters, as well as building and site design. We are subject to various fees and charges of government authorities designed to defray the cost of providing certain governmental services and improvements. We may be subject to additional costs and delays or may be precluded entirely from building projects because of “no-growth” or “slow-growth” initiatives, building permit ordinances, building moratoriums, or similar government regulations that could be imposed in the future due to health, safety, climate, welfare or environmental concerns. We must also obtain licenses, permits and approvals from government agencies to engage in certain activities, the granting or receipt of which are beyond our control and could cause delays in our homebuilding projects.
We are also subject to a variety of local, state and federal statutes, ordinances, rules and regulations concerning the protection of health and the environment. Environmental laws or permit restrictions may result in project delays, may cause substantial compliance and other costs and may prohibit or severely restrict development in certain environmentally sensitive regions or geographic areas. Environmental regulations can also have an adverse impact on the availability and price of certain raw materials, such as lumber.
Our wholly-owned title company, Carefree Title Agency, provides title insurance and closing settlement services for our homebuyers. The title and settlement services provided by Carefree Title Agency are subject to various regulations, including regulation by state banking and insurance regulations. Potential changes to federal and state laws and regulations could have the effect of limiting our activities or how our joint venture conducts its operations and this could have an adverse effect on our results of operations.
Our mortgage joint venture is engaged in mortgage broker activities and provides services both to our customers and other homebuyers. The mortgage industry remains under intense scrutiny and continues to face increasing regulation at the federal, state and local level. Although we do not originate mortgages, we are directly or indirectly subject to certain of these regulations. In addition, if we are determined to have violated federal or state regulations, we face the loss of our licenses or other required approvals or we could be subject to fines, penalties, civil actions or we could be required to suspend our activities, each of which could have an adverse effect on our reputation, results and operations.
Legislation relating to energy and climate change could increase our costs to construct homes.
There is a variety of new legislation being enacted, or considered for enactment at the federal, state and local level relating to energy and climate change. This legislation relates to items such as carbon dioxide emissions control and building codes that impose energy efficiency standards. New building code requirements that impose stricter energy efficiency standards could significantly increase our cost to construct homes. As climate change concerns continue to grow, legislation and
22
regulations of this nature are expected to continue and become more costly to comply with. Similarly, energy-related initiatives affect a wide variety of companies throughout the United States and the world and because our operations are heavily dependent on significant amounts of raw materials, such as lumber, steel, and concrete, they could have an indirect adverse impact on our operations and profitability to the extent the manufacturers and suppliers of our materials are burdened with expensive cap and trade and similar energy-related regulations.
Our ability to build energy-efficient technologies at a profitable price point may be replicated by other builders in the future, which could reduce our competitive advantage.
We believe we currently have a competitive advantage over many of the other production homebuilders by virtue of our energy efficiency technologies. Our communities offer a high level of energy-saving features included in the base price of our homes, and most of our communities are engineered to add on optional solar features to further optimize energy savings. If other builders are able to replicate our energy efficient technologies and offer them at a similar price point, it could diminish our competitive advantage in the marketplace.
Information technology failures and data security breaches could harm our business.
We use information technology and other computer resources to carry out important operational and marketing activities as well as maintain our business records. Many of these resources are provided to us and/or maintained on our behalf by third-party service providers pursuant to agreements that specify certain security and service level standards. Although we and our service providers employ what we believe are adequate security, disaster recovery and other preventative and corrective measures, our ability to conduct our business may be impaired if these resources are compromised, degraded, damaged or fail, whether due to a virus or other harmful circumstance, intentional penetration or disruption of our information technology resources by a third party, natural disaster, hardware or software corruption or failure or error (including a failure of security controls incorporated into or applied to such hardware or software), telecommunications system failure, service provider error or failure, intentional or unintentional personnel actions (including the failure to follow our security protocols), or lost connectivity to our networked resources.
A significant and extended disruption in the functioning of these resources could damage our reputation and cause us to lose customers, sales, result in the unintended public disclosure or the misappropriation of proprietary, personal and confidential information (including information about our homebuyers and business partners), and require us to incur significant expense to address and resolve these kinds of issues. The release of confidential information may also lead to litigation or other proceedings against us by affected individuals and/or business partners and/or by regulators, and the outcome of such proceedings, which could include penalties or fines, could have a material and adverse effect on our consolidated financial statements. In addition, the costs of maintaining adequate protection against such threats, depending on their evolution, pervasiveness and frequency and/or government-mandated standards or obligations regarding protective efforts, could continue to increase and could be material to our consolidated financial statements.
Any of the above risk factors could have a material adverse effect on your investment in our bonds and common stock. As a result, you could lose some or all of your investment.
Special Note of Caution Regarding Forward-Looking Statements
In passing the Private Securities Litigation Reform Act of 1995 (“PSLRA”), Congress encouraged public companies to make “forward-looking statements” by creating a safe-harbor to protect companies from securities law liability in connection with forward-looking statements. We intend to qualify both our written and oral forward-looking statements for protection under the PSLRA.
The words “believe,” “expect,” “anticipate,” “forecast,” “plan,” “intend,” “may,” “will,” “should,” “could,” “estimate,” and “project” and similar expressions identify forward-looking statements, which speak only as of the date the statement was made. All statements we make other than statements of historical fact are forward-looking statements within the meaning of that term in Section 27A of the Securities Act of 1933, as amended, and Section 21E of the Exchange Act. Forward-looking statements in this Annual Report include statements concerning our belief that we have ample liquidity; our intentions and the expected benefits and advantages of our strategic model and energy efficiency initiatives as well as our product and land positioning strategies; the benefits of and our intentions to use options to acquire land; our exposure to supplier concentration risk; our delivery of substantially all of our backlog existing as of year end; management estimates regarding future joint venture exposure; our positions and our expected outcome relating to litigation in general; our intentions to not pay dividends; growth in the first-time buyer segment that are seeking entry-level homes; the timing and extent of new community openings in 2017; that our spec home inventory will increase; that we may repurchase our debt and equity securities; that we plan to issue a sustainability report in 2017; our use of derivative financial instruments; expectations regarding our industry and our business into 2017 and beyond, and that we expect our cash expenditures will exceed our cash generated by operations as we continue to
23
expand our business; the demand for and the pricing of our homes; our land and lot acquisition strategy (including that we will redeploy cash to acquire well-positioned finished lots and that we may participate in joint ventures or opportunities outside of our existing markets if opportunities arise and the benefits relating thereto); that we may expand into new markets; the availability of suppliers; that we may seek additional debt or equity capital; our expectation that existing guarantees, letters of credit and performance and surety bonds will not be drawn on; the sufficiency of our insurance coverage and warranty reserves; the sufficiency of our capital resources to support our business strategy; the impact of new accounting standards and changes in accounting estimates; trends and expectations concerning sales prices, sales orders, cancellations, construction costs, gross margins, land costs and profitability and future home inventories; our future cash needs; the impact of seasonality; and our future compliance with debt covenants and actions we may take with respect thereto.
Important factors currently known to management that could cause actual results to differ materially from those in forward-looking statements, and that could negatively affect our business are discussed above in this report under the heading “Risk Factors.”
Forward-looking statements express expectations of future events. All forward-looking statements are inherently uncertain as they are based on various expectations and assumptions concerning future events and they are subject to numerous known and unknown risks and uncertainties that could cause actual events or results to differ materially from those projected. Due to these inherent uncertainties, the investment community is urged not to place undue reliance on forward-looking statements. In addition, we undertake no obligations to update or revise forward-looking statements to reflect changed assumptions, the occurrence of unanticipated events or changes to projections over time, except as required by law.
Item 1B. Unresolved Staff Comments
None.
Item 2. Properties
Our corporate office is in a leased building located in Scottsdale, Arizona with 66,209 square feet and a September 30, 2023 lease expiration.
We lease an aggregate of approximately 306,000 square feet of office space (of which approximately 15,000 square feet is currently subleased by us to third parties) in our markets for our operating divisions, corporate and executive offices.
Item 3. Legal Proceedings
We are involved in various routine legal and regulatory proceedings, including, without limitation, claims and litigation alleging construction defects. In general, the proceedings are incidental to our business, and most exposure is subject to and should be covered by warranty and indemnity obligations of our consultants and subcontractors. Additionally, some such claims are also covered by insurance. With respect to the majority of pending litigation matters, our ultimate legal and financial responsibility, if any, cannot be estimated with certainty and, in most cases, any potential losses related to these matters are not considered probable. Historically, most disputes regarding warranty claims are resolved prior to litigation. We believe there are no pending legal or warranty matters that could have a material adverse impact upon our consolidated financial condition, results of operations or cash flows that have not been sufficiently reserved. Information related to pending legal proceedings is presented in Note 15 - Commitments and Contingencies, in the accompanying consolidated financial statements and is incorporated by reference herein.
Item 4. Mine Safety Disclosures
Not applicable.
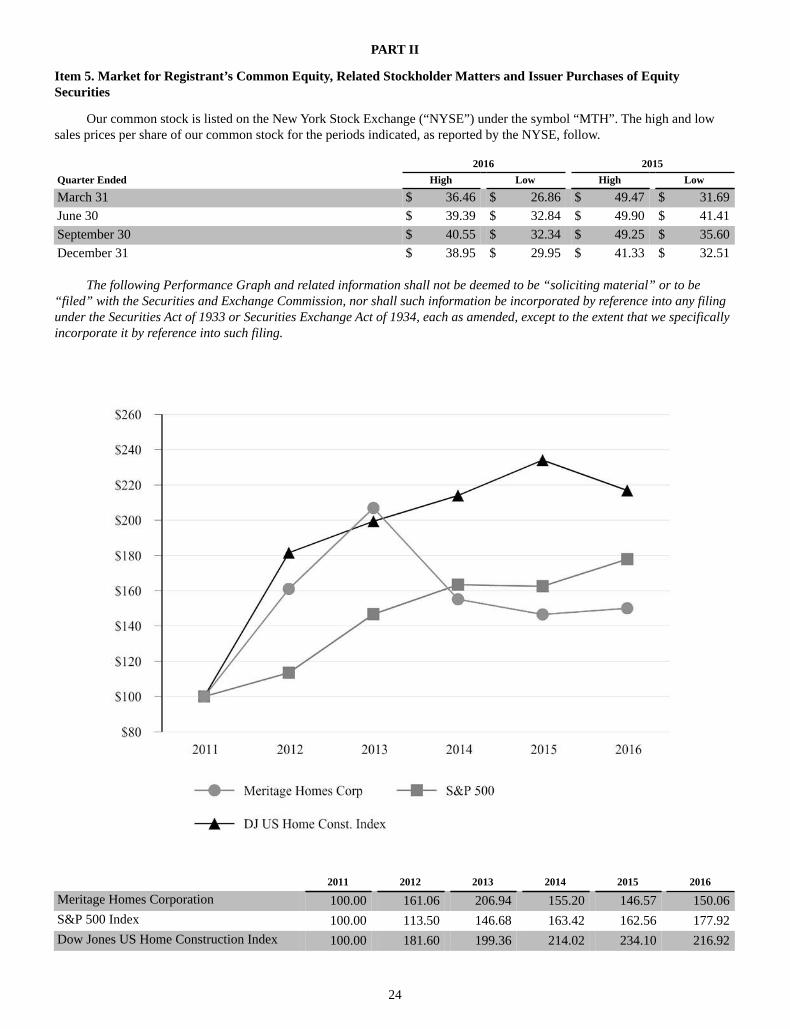
24
PART II
Item 5. Market for Registrant’s Common Equity, Related Stockholder Matters and Issuer Purchases of Equity Securities
Our common stock is listed on the New York Stock Exchange (“NYSE”) under the symbol “MTH”. The high and low sales prices per share of our common stock for the periods indicated, as reported by the NYSE, follow.
2016 2015Quarter Ended High Low High Low
March 31 $ 36.46 $ 26.86 $ 49.47 $ 31.69June 30 $ 39.39 $ 32.84 $ 49.90 $ 41.41September 30 $ 40.55 $ 32.34 $ 49.25 $ 35.60December 31 $ 38.95 $ 29.95 $ 41.33 $ 32.51
The following Performance Graph and related information shall not be deemed to be “soliciting material” or to be “filed” with the Securities and Exchange Commission, nor shall such information be incorporated by reference into any filing under the Securities Act of 1933 or Securities Exchange Act of 1934, each as amended, except to the extent that we specifically incorporate it by reference into such filing.
2011 2012 2013 2014 2015 2016
Meritage Homes Corporation 100.00 161.06 206.94 155.20 146.57 150.06S&P 500 Index 100.00 113.50 146.68 163.42 162.56 177.92Dow Jones US Home Construction Index 100.00 181.60 199.36 214.02 234.10 216.92
25
The preceding graph compares the five-year total return of our common stock with the S&P 500 Index and the Dow Jones US Home Construction Index. The graph assumes $100 invested as of December 31, 2011 in Meritage Common Stock the S&P 500 Index and the Dow Jones US Home Construction Index, and the re-investment of all dividends. The performance of our common stock depicted in the graphs is not indicative of future performance.
On February 1, 2017 there were approximately 203 owners of record and approximately 11,500 beneficial owners of common stock.
The transfer agent for our common stock is Computershare Investor Services, LLC, 480 Washington Blvd., Jersey City, NJ 07310 (www.cpushareownerservices.com).
Historically, we have not declared cash dividends, nor do we intend to declare cash dividends in the foreseeable future. We plan to retain our earnings to finance the continuing development of the business. Future cash dividends, if any, will depend upon our financial condition, results of operations, capital requirements, statutory requirements, as well as other factors considered relevant by our Board of Directors. See “Management’s Discussion and Analysis of Financial Condition and Results of Operations — Liquidity and Capital Resources”.
Reference is made to Note 10 in the accompanying consolidated financial statements for a description of our stock-based compensation plans.
Issuer Purchases of Equity Securities
We did not acquire any shares of our common stock during the twelve months ended December 31, 2016. On February 21, 2006, we announced that our Board of Directors approved a stock repurchase program, authorizing the expenditure of up to $100 million to repurchase shares of our common stock, subject to certain price parameters. In August 2006, the Board of Directors authorized an additional $100 million under this program. There is no stated expiration date for this program. As of December 31, 2016, we had approximately $130.2 million of the authorized amount available to repurchase shares under this program.
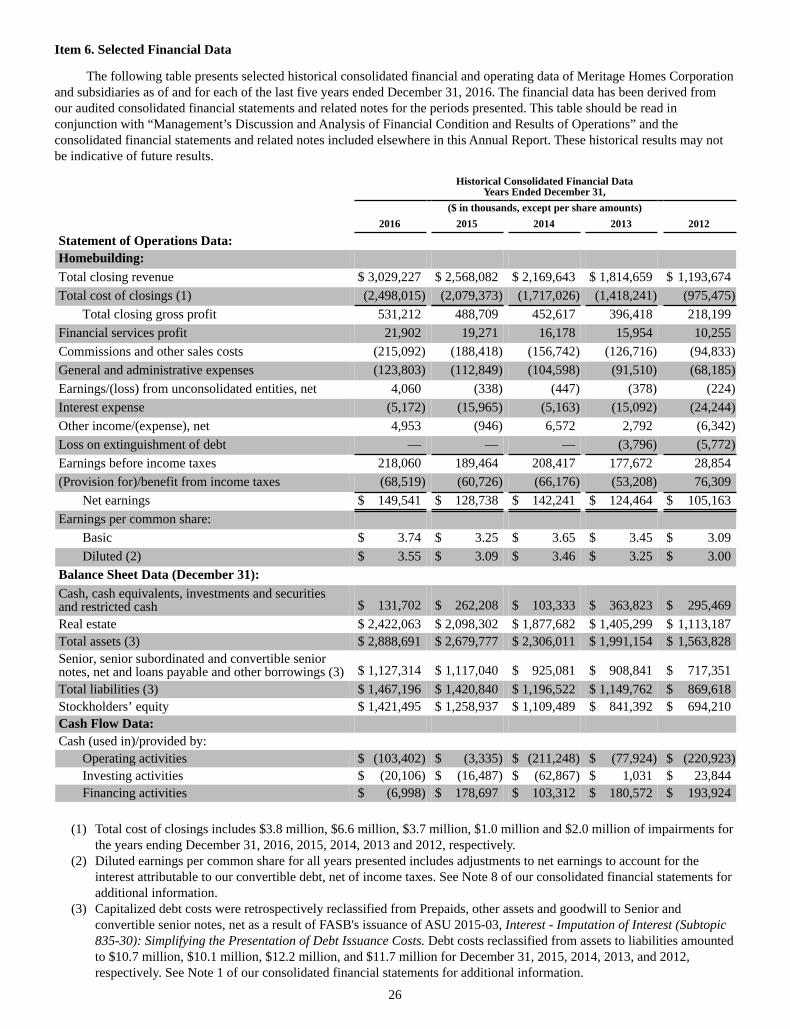
26
Item 6. Selected Financial Data
The following table presents selected historical consolidated financial and operating data of Meritage Homes Corporation and subsidiaries as of and for each of the last five years ended December 31, 2016. The financial data has been derived from our audited consolidated financial statements and related notes for the periods presented. This table should be read in conjunction with “Management’s Discussion and Analysis of Financial Condition and Results of Operations” and the consolidated financial statements and related notes included elsewhere in this Annual Report. These historical results may not be indicative of future results.
Historical Consolidated Financial Data
Years Ended December 31, ($ in thousands, except per share amounts) 2016 2015 2014 2013 2012
Statement of Operations Data:Homebuilding:Total closing revenue $ 3,029,227 $ 2,568,082 $ 2,169,643 $ 1,814,659 $ 1,193,674Total cost of closings (1) (2,498,015) (2,079,373) (1,717,026) (1,418,241) (975,475)
Total closing gross profit 531,212 488,709 452,617 396,418 218,199Financial services profit 21,902 19,271 16,178 15,954 10,255Commissions and other sales costs (215,092) (188,418) (156,742) (126,716) (94,833)General and administrative expenses (123,803) (112,849) (104,598) (91,510) (68,185)Earnings/(loss) from unconsolidated entities, net 4,060 (338) (447) (378) (224)Interest expense (5,172) (15,965) (5,163) (15,092) (24,244)Other income/(expense), net 4,953 (946) 6,572 2,792 (6,342)Loss on extinguishment of debt — — — (3,796) (5,772)Earnings before income taxes 218,060 189,464 208,417 177,672 28,854(Provision for)/benefit from income taxes (68,519) (60,726) (66,176) (53,208) 76,309
Net earnings $ 149,541 $ 128,738 $ 142,241 $ 124,464 $ 105,163Earnings per common share:
Basic $ 3.74 $ 3.25 $ 3.65 $ 3.45 $ 3.09Diluted (2) $ 3.55 $ 3.09 $ 3.46 $ 3.25 $ 3.00
Balance Sheet Data (December 31):Cash, cash equivalents, investments and securitiesand restricted cash $ 131,702 $ 262,208 $ 103,333 $ 363,823 $ 295,469Real estate $ 2,422,063 $ 2,098,302 $ 1,877,682 $ 1,405,299 $ 1,113,187Total assets (3) $ 2,888,691 $ 2,679,777 $ 2,306,011 $ 1,991,154 $ 1,563,828Senior, senior subordinated and convertible seniornotes, net and loans payable and other borrowings (3) $ 1,127,314 $ 1,117,040 $ 925,081 $ 908,841 $ 717,351Total liabilities (3) $ 1,467,196 $ 1,420,840 $ 1,196,522 $ 1,149,762 $ 869,618Stockholders’ equity $ 1,421,495 $ 1,258,937 $ 1,109,489 $ 841,392 $ 694,210Cash Flow Data:Cash (used in)/provided by:
Operating activities $ (103,402) $ (3,335) $ (211,248) $ (77,924) $ (220,923)Investing activities $ (20,106) $ (16,487) $ (62,867) $ 1,031 $ 23,844Financing activities $ (6,998) $ 178,697 $ 103,312 $ 180,572 $ 193,924
(1) Total cost of closings includes $3.8 million, $6.6 million, $3.7 million, $1.0 million and $2.0 million of impairments for
the years ending December 31, 2016, 2015, 2014, 2013 and 2012, respectively.(2) Diluted earnings per common share for all years presented includes adjustments to net earnings to account for the
interest attributable to our convertible debt, net of income taxes. See Note 8 of our consolidated financial statements for additional information.
(3) Capitalized debt costs were retrospectively reclassified from Prepaids, other assets and goodwill to Senior and convertible senior notes, net as a result of FASB's issuance of ASU 2015-03, Interest - Imputation of Interest (Subtopic 835-30): Simplifying the Presentation of Debt Issuance Costs. Debt costs reclassified from assets to liabilities amounted to $10.7 million, $10.1 million, $12.2 million, and $11.7 million for December 31, 2015, 2014, 2013, and 2012, respectively. See Note 1 of our consolidated financial statements for additional information.
27
Item 7. Management’s Discussion and Analysis of Financial Condition and Results of Operations
Overview and Outlook
Industry Conditions
Continued housing affordability and increasing demand in most markets due to improved consumer confidence and a strengthening economy resulted in a steady level of growth for the housing market during 2016. We believe that recent job growth and increased household formations support generally steady growth for our sector over the next several years, particularly among the first-time homebuyer segment. The demand for new homes and the continuing financial recovery have also resulted in rising land, construction and labor costs which translated into tighter gross margins for our company and the homebuilding industry in general.
We are committed to our plan of strategically positioning ourselves in many of the top housing markets in the country and continue to actively source land for well-located communities within those locations. We offer our buyers energy efficient features coupled with the ability to personalize their homes and we provide a home warranty, successfully setting us apart from the competition we face with resale homes. Currently, we are actively pursuing land opportunities and opening new communities that appeal to and target the growing first-time home buyer segment.
Summary Company Results
Total home closing revenue was $3.0 billion for the year ended December 31, 2016, increasing 18.6% from $2.5 billion in 2015. Total home closing revenue for the year ended December 31, 2015 was 18.2% higher than the $2.1 billion recorded for the year ended December 31, 2014. Improved revenue from higher closing volume resulted in net earnings of $149.5 million in 2016 as compared to $128.7 million in 2015 and $142.2 million in 2014. Tight labor supplies and rising construction costs, coupled with the limited ability to increase prices in most markets, put pressure on margins resulting in gross margins in 2016 of 17.6% versus 19.0% in 2015 and 21.2% in 2014. Our 2016 results include $68.5 million of income taxes, representing a 31.4% effective tax rate as compared to a 32.1% effective tax rate in 2015 and a 31.8% effective tax rate in 2014.
Companywide, both units and average sales prices on closings and orders experienced year-over-year increases in 2016. At December 31, 2016, our backlog of $1.1 billion was relatively flat with December 31, 2015, and was up 34.2% from $846.5 million at December 31, 2014. The nominally lower year-over-year ending backlog at December 31, 2016 was primarily the result of a decline in fourth quarter orders resulting from fewer communities open for sale primarily due to delays in community openings following the quick sell-out of certain communities in the prior several quarters. The unit decline in backlog was nearly offset by higher average sales prices in the majority of our markets. Our average sales price for homes in backlog increased 2.3% to $432,300 from $422,600 at December 31, 2015 and increased 8.0% from $400,400 at December 31, 2014. Our cancellation rate on sales orders as a percentage of gross sales in 2016 remained low at 13.1% as compared to 12.1% and 14.0% for the years ended December 31, 2015 and 2014, respectively, reflecting a high quality backlog.
Company Positioning
We remain focused on our main goals of growing our orders, revenue and profit and maintaining a strong balance sheet. To help meet these goals, we continue to focus on the following initiatives:
• Continuing to actively acquire and develop land in key markets in order to maintain and grow our lot supply and active community count;
• Introducing LiVE.NOW, our newest "entry-level plus" collection of product offerings that targets the growing first-time homebuyer segment;
• Expanding market share in our smaller markets;• Managing construction efficiencies and cost increases through national and regional vendor relationships with a
focus on quality construction and warranty management;• Growing revenue while managing costs, allowing us to improve overhead operating leverage in all of our
markets;• Generating additional working capital and maintaining adequate liquidity; • Increasing orders pace through the use of our consumer and market research to build homes that offer our buyers
their desired features and amenities;• Continuing to innovate and promote our energy efficiency program to drive sales;
28
• Adapting sales and marketing efforts to increase traffic and allow us to favorably compete with both resale and new homes;
• Actively monitoring and adjusting our sales, construction and closing processes through customer satisfaction surveys; and
• Promoting a positive environment for our employees in order to retain our employees and minimize turnover.
To assist in meeting our company goals, we are pleased to report the following 2016 successes:• Successfully opened our first LiVE.NOW communities targeted to the growing number of first-time buyers
looking for affordable home ownership that offers a product beyond the typical entry-level home.• Surpassed a historic milestone with the closing of our 100,000th home; and• Increased our lots under control by 7.3% to 29,815 lots at December 31, 2016 from prior year.
We believe that the investments in our new communities, new markets and industry leading energy efficient product offerings create a differentiated strategy that has aided us in our growth. Throughout 2016, we opened 75 new communities while closing out 83 communities. We expect that the first half of 2017 will be a growth period for us in terms of new community openings as we work through some of the community opening delays experienced in the second half of 2016.
Critical Accounting Policies
We have established various accounting policies that govern the application of United States generally accepted accounting principles (“GAAP”) in the preparation and presentation of our consolidated financial statements. Our significant accounting policies are described in Note 1 of the consolidated financial statements included in this Form 10-K. Certain of these policies involve significant judgments, assumptions and estimates by management that may have a material impact on the carrying value of certain assets and liabilities, and revenue and costs. We are subject to uncertainties such as the impact of future events, economic, environmental and political factors and changes in our business environment; therefore, actual results could differ from these estimates. Accordingly, the accounting estimates used in the preparation of our financial statements may change as new events occur, as more experience is acquired, as additional information is obtained and as our operating environment changes. Changes in estimates are revised when circumstances warrant. Such changes in estimates and refinements in methodologies are reflected in our reported results of operations and, if material, the effects of changes in estimates are disclosed in the notes to our consolidated financial statements. The judgments, assumptions and estimates we use and believe to be critical to our business are based on historical experience, knowledge of the accounts, industry practices, and other factors, which we believe to be reasonable under the circumstances. Because of the nature of the judgments and assumptions we have made, actual results may differ from these judgments and estimates and could have a material impact on the carrying values of assets and liabilities and the results of our operations.
The accounting policies that we deem most critical to us and involve the most difficult, subjective or complex judgments are as follows:
Revenue Recognition
We recognize revenue from a home sale when title passes to the homeowner, the homeowner’s initial and continuing investment is adequate to demonstrate a commitment to pay for the home, the receivable, if any, from the homeowner is not subject to future subordination and we do not have a substantial continuing involvement with the sold home. These conditions are typically achieved when a home closes.
Revenue from land sales is recognized when a significant down payment is received, the earnings process is relatively complete, title passes and collectability of the receivable is reasonably assured. Although there is limited subjectivity in this accounting policy, we have designated revenue recognition as a critical accounting policy due to the significance of this balance in our statements of operations.
29
Real Estate
Real estate is stated at cost unless the community or land is determined to be impaired, at which point the inventory is written down to fair value as required by Financial Accounting Standards Board (“FASB”) Accounting Standards Codification (“ASC”) 360-10, Property, Plant and Equipment. Inventory includes the costs of land acquisition, land development and home construction, capitalized interest, real estate taxes, direct overhead costs incurred during development and home construction that benefit the entire community, less impairments, if any. Land and development costs are typically allocated and transferred to homes under construction when home construction begins. Home construction costs are accumulated on a per-home basis. Cost of home closings includes the specific construction costs of the home and all related allocated land acquisition, land development and other common costs (both incurred and estimated to be incurred) based upon the total number of homes expected to be closed in each community or phase. Any changes to the estimated total development costs of a community or phase are allocated to the remaining homes in the community or phase. When a home closes, we may have incurred costs for goods and services that have not yet been paid. Therefore, an accrual to capture such obligations is recorded in connection with the home closing and charged directly to cost of sales.
We rely on certain estimates to determine our construction and land development costs. Construction and land costs are comprised of direct and allocated costs, including estimated future costs. In determining these costs, we compile project budgets that are based on a variety of assumptions, including future construction schedules and costs to be incurred. Actual results can differ from these budgeted amounts for various reasons, including construction delays, labor or material shortages, slower absorptions, increases in costs that have not yet been committed, changes in governmental requirements, or other unanticipated issues encountered during construction and development and other factors beyond our control. To address uncertainty in these budgets, we assess, update and revise project budgets on a regular basis, utilizing the most current information available to estimate construction and land costs.
Typically, an entitled community’s life cycle ranges from three to five years, commencing with the acquisition of the land, continuing through the land development phase and concluding with the sale, construction and closing of the homes. Actual community lives will vary based on the size of the community, the absorption rates and whether the land purchased was raw land or finished lots. Master-planned communities encompassing several phases and super-block land parcels may have significantly longer lives and projects involving smaller finished lot purchases may be significantly shorter.
All of our land inventory and related real estate assets are reviewed for recoverability, as our inventory is considered “long-lived” in accordance with GAAP. Impairment charges are recorded to write down an asset to its estimated fair value if the undiscounted cash flows expected to be generated by the asset are lower than its carrying amount. Our determination of fair value is based on projections and estimates. Changes in these expectations may lead to a change in the outcome of our impairment analysis, and actual results may also differ from our assumptions. Our analysis is conducted if indicators of a decline in value of our land and real estate assets exist. If an asset is deemed to be impaired, the impairment recognized is measured as the amount by which the assets’ carrying amount exceeds their fair value. The impairment of a community is allocated to each lot on a straight-line basis.
Goodwill
Goodwill represents the excess of the purchase price paid over the fair value of the net assets acquired in business combinations. Goodwill was $33.0 million as of December 31, 2016 and December 31, 2015. In accordance with ASC 350, Intangibles, Goodwill and Other ("ASC 350"), we analyze goodwill on an annual basis (or whenever indicators of impairment exist) through a qualitative assessment to determine whether it is necessary to perform a two-step goodwill impairment test. ASC 350 states that an entity may assess qualitative factors to determine whether it is more likely than not that the fair value of a reporting unit is less than its carrying amount, including goodwill. Such qualitative factors include: (1) macroeconomic conditions, such as a deterioration in general economic conditions, (2) industry and market considerations such as deterioration in the environment in which the entity operates, (3) cost factors such as increases in raw materials, labor costs, etc., and (4) overall financial performance such as negative or declining cash flows or a decline in actual or planned revenue or earnings. If the qualitative analysis determines that additional impairment testing is required, the two-step impairment testing in accordance with ASC 350 would be initiated. We continually evaluate our qualitative inputs to assess whether events and circumstances have occurred that indicate the goodwill balance may not be recoverable.
30
Warranty Reserves
We use subcontractors for nearly all aspects of home construction. Although our subcontractors are generally required to repair and replace any product or labor defects, we are, during applicable warranty periods, ultimately responsible to the homeowner for making such repairs. As such, warranty reserves are recorded to cover our exposure to absorb the costs for materials and labor not expected to be covered by our subcontractors to the extent they relate to warranty-type claims subsequent to the delivery of a home to the homeowner. Reserves are reviewed on a regular basis and, with the assistance of an actuary for the structural warranty, we determine their sufficiency based on our and industry-wide historical data and trends. These reserves are subject to variability due to uncertainties regarding structural defect claims for the products we build, the markets in which we build, claim settlement history, insurance and legal interpretations and expected recoveries, among other factors.
At December 31, 2016, our warranty reserve was $22.7 million, reflecting an accrual of 0.1% to 0.6% of a home’s sale price depending on our loss history in the geographic area in which the home was built. A 10% increase in our warranty reserve rate would have increased our accrual and corresponding cost of sales by approximately $1.7 million in 2016. We recorded $1.0 million in favorable adjustments to our reserve in 2016 and $1.1 million in unfavorable adjustments in 2015. These adjustments were based on historical trends of actual claims paid combined with our success in recovery of expended amounts and the composition of the homes covered under warranty. While we believe that the warranty reserve is sufficient to cover our projected costs, there can be no assurances that historical data and trends will accurately predict our actual warranty costs. Furthermore, there can be no assurances that future economic or financial developments might not lead to a significant change in the reserve.
Valuation of Deferred Tax Assets
We account for income taxes using the asset and liability method, which requires that deferred tax assets and liabilities be recognized based on future tax consequences of both temporary differences between the financial statement carrying amounts of existing assets and liabilities and their respective tax bases. Deferred tax assets and liabilities are measured using enacted tax rates expected to apply in the years in which the temporary differences are expected to be recovered or settled. The effect on deferred tax assets and liabilities of a change in tax rates is recognized in earnings in the period when the changes are enacted.
In accordance with ASC 740-10, Income Taxes, we evaluate our deferred tax assets by tax jurisdiction, including the benefit from NOLs by tax jurisdiction, to determine if a valuation allowance is required. Companies must assess, using significant judgments, whether a valuation allowance should be established based on the consideration of all available evidence using a “more likely than not” standard with significant weight being given to evidence that can be objectively verified. This assessment considers, among other matters, the nature, frequency and severity of current and cumulative losses, forecasts of future profitability, the length of statutory carryforward periods, experience with operating losses and experience of utilizing tax credit carryforwards and tax planning alternatives.
We have no valuation allowance on our deferred tax assets and NOL carryovers at December 31, 2016.
Share-Based Payments
We have both time-based restricted stock awards and units ("time-based awards") and performance-based restricted stock awards ("performance awards") outstanding under our stock compensation plan. Compensation cost related to time-based restricted stock awards is measured as of the closing price on the date of grant and is expensed on a straight-line basis over the vesting period of the award. Compensation cost related to the performance awards is also measured as of the closing price on the date of grant but is expensed in accordance with ASC 718-10-25-20, Compensation – Stock Compensation ("ASC 718"), which requires an assessment of probability of attainment of the performance target. As our performance targets are dependent on performance over a specified measurement period, once we determine that the performance target outcome is probable, the cumulative expense is recorded immediately with the remaining expense and recorded on a straight-line basis through the end of the vesting periods of the awards. Within our performance-based restricted stock awards, we have grants that contain market conditions as defined by ASC 718. In accordance with ASC 718, compensation cost related to these market awards is based on a derived fair value analysis and is expensed straight line over the service period of the awards. Our time based awards generally vest on a pro-rata basis over either three or five years, and our performance awards cliff vest at the end of the third year.
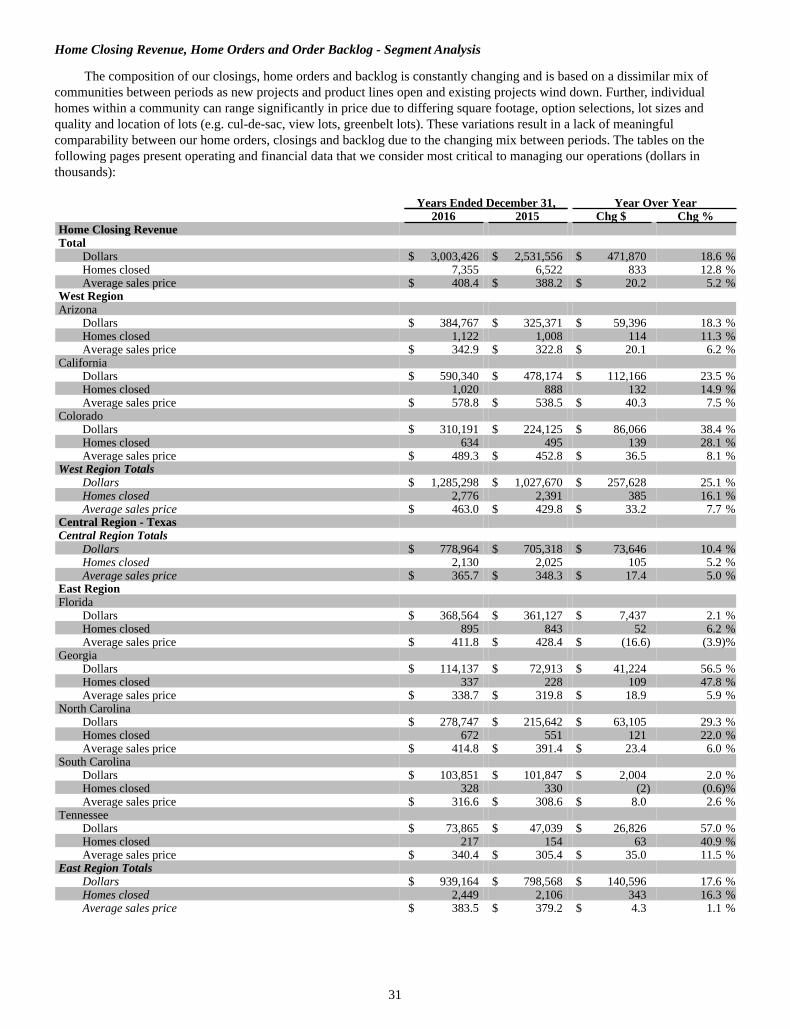
31
Home Closing Revenue, Home Orders and Order Backlog - Segment Analysis
The composition of our closings, home orders and backlog is constantly changing and is based on a dissimilar mix of communities between periods as new projects and product lines open and existing projects wind down. Further, individual homes within a community can range significantly in price due to differing square footage, option selections, lot sizes and quality and location of lots (e.g. cul-de-sac, view lots, greenbelt lots). These variations result in a lack of meaningful comparability between our home orders, closings and backlog due to the changing mix between periods. The tables on the following pages present operating and financial data that we consider most critical to managing our operations (dollars in thousands):
Years Ended December 31, Year Over Year2016 2015 Chg $ Chg %
Home Closing RevenueTotal
Dollars $ 3,003,426 $ 2,531,556 $ 471,870 18.6 %Homes closed 7,355 6,522 833 12.8 %Average sales price $ 408.4 $ 388.2 $ 20.2 5.2 %
West RegionArizona
Dollars $ 384,767 $ 325,371 $ 59,396 18.3 %Homes closed 1,122 1,008 114 11.3 %Average sales price $ 342.9 $ 322.8 $ 20.1 6.2 %
CaliforniaDollars $ 590,340 $ 478,174 $ 112,166 23.5 %Homes closed 1,020 888 132 14.9 %Average sales price $ 578.8 $ 538.5 $ 40.3 7.5 %
ColoradoDollars $ 310,191 $ 224,125 $ 86,066 38.4 %Homes closed 634 495 139 28.1 %Average sales price $ 489.3 $ 452.8 $ 36.5 8.1 %
West Region TotalsDollars $ 1,285,298 $ 1,027,670 $ 257,628 25.1 %Homes closed 2,776 2,391 385 16.1 %Average sales price $ 463.0 $ 429.8 $ 33.2 7.7 %
Central Region - TexasCentral Region Totals
Dollars $ 778,964 $ 705,318 $ 73,646 10.4 %Homes closed 2,130 2,025 105 5.2 %Average sales price $ 365.7 $ 348.3 $ 17.4 5.0 %
East RegionFlorida
Dollars $ 368,564 $ 361,127 $ 7,437 2.1 %Homes closed 895 843 52 6.2 %Average sales price $ 411.8 $ 428.4 $ (16.6) (3.9)%
GeorgiaDollars $ 114,137 $ 72,913 $ 41,224 56.5 %Homes closed 337 228 109 47.8 %Average sales price $ 338.7 $ 319.8 $ 18.9 5.9 %
North CarolinaDollars $ 278,747 $ 215,642 $ 63,105 29.3 %Homes closed 672 551 121 22.0 %Average sales price $ 414.8 $ 391.4 $ 23.4 6.0 %
South CarolinaDollars $ 103,851 $ 101,847 $ 2,004 2.0 %Homes closed 328 330 (2) (0.6)%Average sales price $ 316.6 $ 308.6 $ 8.0 2.6 %
TennesseeDollars $ 73,865 $ 47,039 $ 26,826 57.0 %Homes closed 217 154 63 40.9 %Average sales price $ 340.4 $ 305.4 $ 35.0 11.5 %
East Region TotalsDollars $ 939,164 $ 798,568 $ 140,596 17.6 %Homes closed 2,449 2,106 343 16.3 %Average sales price $ 383.5 $ 379.2 $ 4.3 1.1 %
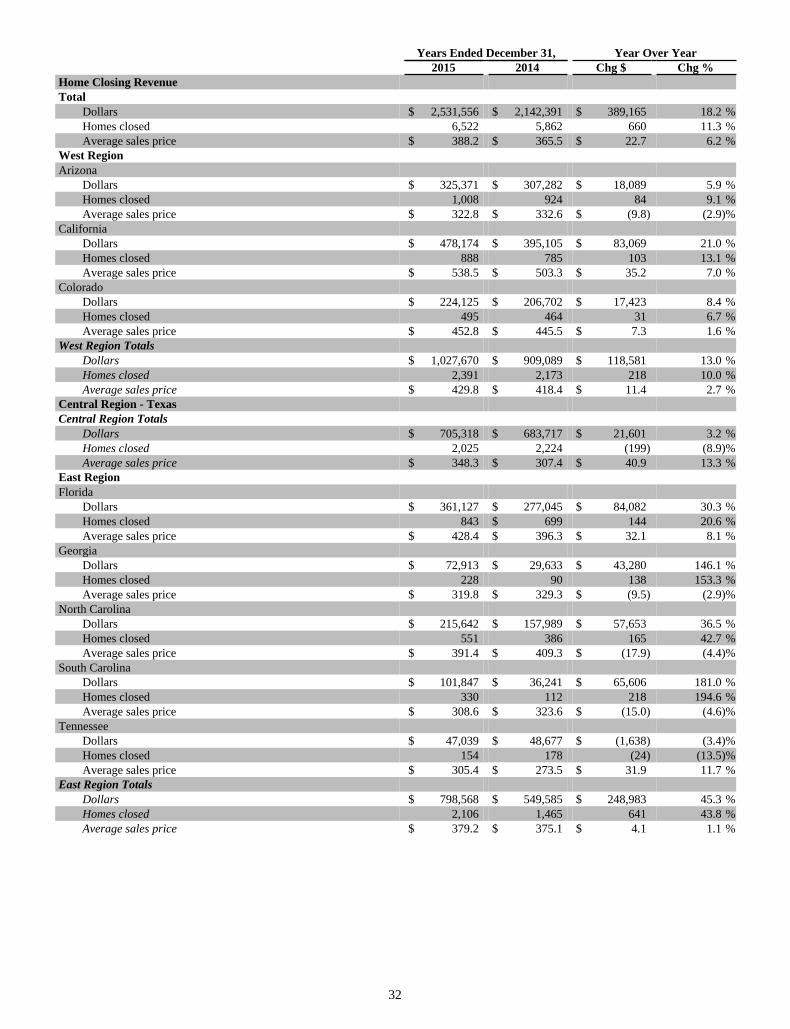
32
Years Ended December 31, Year Over Year2015 2014 Chg $ Chg %
Home Closing RevenueTotal
Dollars $ 2,531,556 $ 2,142,391 $ 389,165 18.2 %Homes closed 6,522 5,862 660 11.3 %Average sales price $ 388.2 $ 365.5 $ 22.7 6.2 %
West RegionArizona
Dollars $ 325,371 $ 307,282 $ 18,089 5.9 %Homes closed 1,008 924 84 9.1 %Average sales price $ 322.8 $ 332.6 $ (9.8) (2.9)%
CaliforniaDollars $ 478,174 $ 395,105 $ 83,069 21.0 %Homes closed 888 785 103 13.1 %Average sales price $ 538.5 $ 503.3 $ 35.2 7.0 %
ColoradoDollars $ 224,125 $ 206,702 $ 17,423 8.4 %Homes closed 495 464 31 6.7 %Average sales price $ 452.8 $ 445.5 $ 7.3 1.6 %
West Region TotalsDollars $ 1,027,670 $ 909,089 $ 118,581 13.0 %Homes closed 2,391 2,173 218 10.0 %Average sales price $ 429.8 $ 418.4 $ 11.4 2.7 %
Central Region - TexasCentral Region Totals
Dollars $ 705,318 $ 683,717 $ 21,601 3.2 %Homes closed 2,025 2,224 (199) (8.9)%Average sales price $ 348.3 $ 307.4 $ 40.9 13.3 %
East RegionFlorida
Dollars $ 361,127 $ 277,045 $ 84,082 30.3 %Homes closed 843 $ 699 144 20.6 %Average sales price $ 428.4 $ 396.3 $ 32.1 8.1 %
GeorgiaDollars $ 72,913 $ 29,633 $ 43,280 146.1 %Homes closed 228 90 138 153.3 %Average sales price $ 319.8 $ 329.3 $ (9.5) (2.9)%
North CarolinaDollars $ 215,642 $ 157,989 $ 57,653 36.5 %Homes closed 551 386 165 42.7 %Average sales price $ 391.4 $ 409.3 $ (17.9) (4.4)%
South CarolinaDollars $ 101,847 $ 36,241 $ 65,606 181.0 %Homes closed 330 112 218 194.6 %Average sales price $ 308.6 $ 323.6 $ (15.0) (4.6)%
TennesseeDollars $ 47,039 $ 48,677 $ (1,638) (3.4)%Homes closed 154 178 (24) (13.5)%Average sales price $ 305.4 $ 273.5 $ 31.9 11.7 %
East Region TotalsDollars $ 798,568 $ 549,585 $ 248,983 45.3 %Homes closed 2,106 1,465 641 43.8 %Average sales price $ 379.2 $ 375.1 $ 4.1 1.1 %
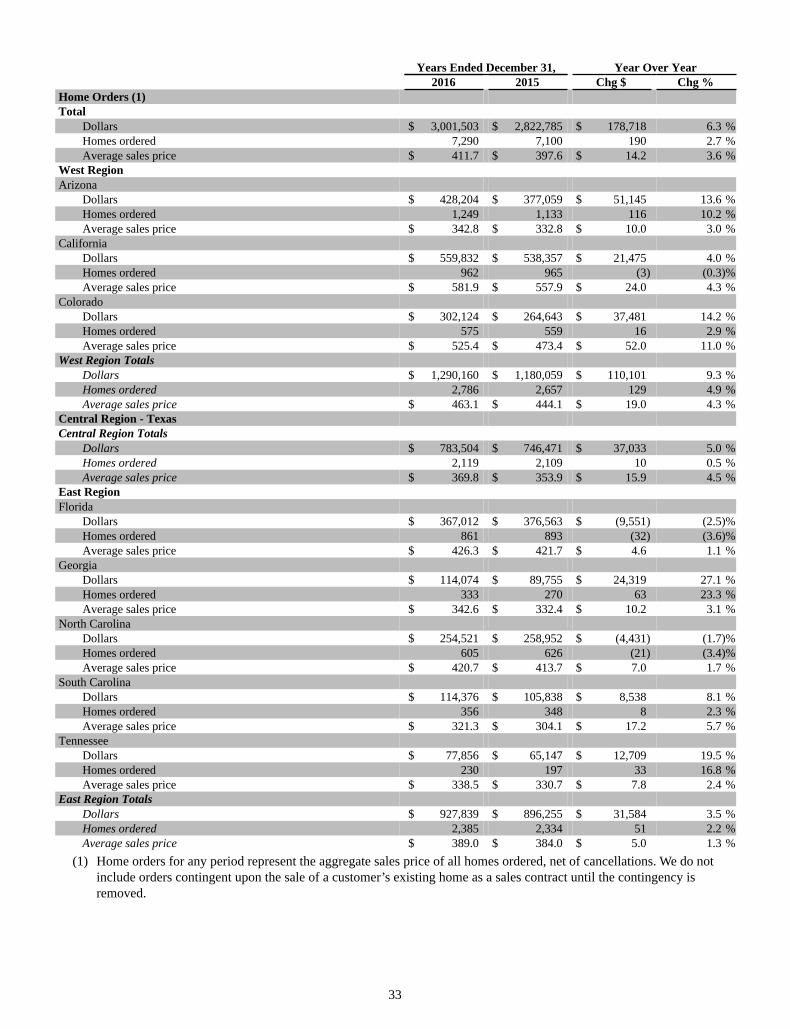
33
Years Ended December 31, Year Over Year2016 2015 Chg $ Chg %
Home Orders (1)Total
Dollars $ 3,001,503 $ 2,822,785 $ 178,718 6.3 %Homes ordered 7,290 7,100 190 2.7 %Average sales price $ 411.7 $ 397.6 $ 14.2 3.6 %
West RegionArizona
Dollars $ 428,204 $ 377,059 $ 51,145 13.6 %Homes ordered 1,249 1,133 116 10.2 %Average sales price $ 342.8 $ 332.8 $ 10.0 3.0 %
CaliforniaDollars $ 559,832 $ 538,357 $ 21,475 4.0 %Homes ordered 962 965 (3) (0.3)%Average sales price $ 581.9 $ 557.9 $ 24.0 4.3 %
ColoradoDollars $ 302,124 $ 264,643 $ 37,481 14.2 %Homes ordered 575 559 16 2.9 %Average sales price $ 525.4 $ 473.4 $ 52.0 11.0 %
West Region TotalsDollars $ 1,290,160 $ 1,180,059 $ 110,101 9.3 %Homes ordered 2,786 2,657 129 4.9 %Average sales price $ 463.1 $ 444.1 $ 19.0 4.3 %
Central Region - TexasCentral Region Totals
Dollars $ 783,504 $ 746,471 $ 37,033 5.0 %Homes ordered 2,119 2,109 10 0.5 %Average sales price $ 369.8 $ 353.9 $ 15.9 4.5 %
East RegionFlorida
Dollars $ 367,012 $ 376,563 $ (9,551) (2.5)%Homes ordered 861 893 (32) (3.6)%Average sales price $ 426.3 $ 421.7 $ 4.6 1.1 %
GeorgiaDollars $ 114,074 $ 89,755 $ 24,319 27.1 %Homes ordered 333 270 63 23.3 %Average sales price $ 342.6 $ 332.4 $ 10.2 3.1 %
North CarolinaDollars $ 254,521 $ 258,952 $ (4,431) (1.7)%Homes ordered 605 626 (21) (3.4)%Average sales price $ 420.7 $ 413.7 $ 7.0 1.7 %
South CarolinaDollars $ 114,376 $ 105,838 $ 8,538 8.1 %Homes ordered 356 348 8 2.3 %Average sales price $ 321.3 $ 304.1 $ 17.2 5.7 %
TennesseeDollars $ 77,856 $ 65,147 $ 12,709 19.5 %Homes ordered 230 197 33 16.8 %Average sales price $ 338.5 $ 330.7 $ 7.8 2.4 %
East Region TotalsDollars $ 927,839 $ 896,255 $ 31,584 3.5 %Homes ordered 2,385 2,334 51 2.2 %Average sales price $ 389.0 $ 384.0 $ 5.0 1.3 %
(1) Home orders for any period represent the aggregate sales price of all homes ordered, net of cancellations. We do not include orders contingent upon the sale of a customer’s existing home as a sales contract until the contingency is removed.
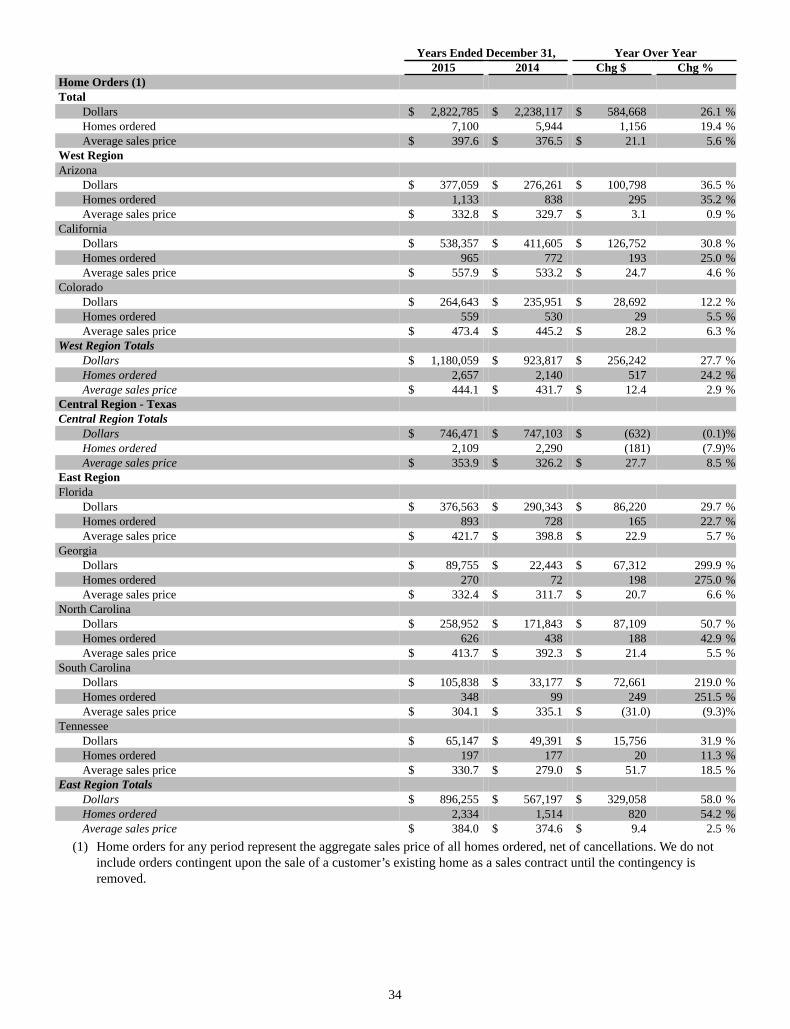
34
Years Ended December 31, Year Over Year2015 2014 Chg $ Chg %
Home Orders (1)Total
Dollars $ 2,822,785 $ 2,238,117 $ 584,668 26.1 %Homes ordered 7,100 5,944 1,156 19.4 %Average sales price $ 397.6 $ 376.5 $ 21.1 5.6 %
West RegionArizona
Dollars $ 377,059 $ 276,261 $ 100,798 36.5 %Homes ordered 1,133 838 295 35.2 %Average sales price $ 332.8 $ 329.7 $ 3.1 0.9 %
CaliforniaDollars $ 538,357 $ 411,605 $ 126,752 30.8 %Homes ordered 965 772 193 25.0 %Average sales price $ 557.9 $ 533.2 $ 24.7 4.6 %
ColoradoDollars $ 264,643 $ 235,951 $ 28,692 12.2 %Homes ordered 559 530 29 5.5 %Average sales price $ 473.4 $ 445.2 $ 28.2 6.3 %
West Region TotalsDollars $ 1,180,059 $ 923,817 $ 256,242 27.7 %Homes ordered 2,657 2,140 517 24.2 %Average sales price $ 444.1 $ 431.7 $ 12.4 2.9 %
Central Region - TexasCentral Region Totals
Dollars $ 746,471 $ 747,103 $ (632) (0.1)%Homes ordered 2,109 2,290 (181) (7.9)%Average sales price $ 353.9 $ 326.2 $ 27.7 8.5 %
East RegionFlorida
Dollars $ 376,563 $ 290,343 $ 86,220 29.7 %Homes ordered 893 728 165 22.7 %Average sales price $ 421.7 $ 398.8 $ 22.9 5.7 %
GeorgiaDollars $ 89,755 $ 22,443 $ 67,312 299.9 %Homes ordered 270 72 198 275.0 %Average sales price $ 332.4 $ 311.7 $ 20.7 6.6 %
North CarolinaDollars $ 258,952 $ 171,843 $ 87,109 50.7 %Homes ordered 626 438 188 42.9 %Average sales price $ 413.7 $ 392.3 $ 21.4 5.5 %
South CarolinaDollars $ 105,838 $ 33,177 $ 72,661 219.0 %Homes ordered 348 99 249 251.5 %Average sales price $ 304.1 $ 335.1 $ (31.0) (9.3)%
TennesseeDollars $ 65,147 $ 49,391 $ 15,756 31.9 %Homes ordered 197 177 20 11.3 %Average sales price $ 330.7 $ 279.0 $ 51.7 18.5 %
East Region TotalsDollars $ 896,255 $ 567,197 $ 329,058 58.0 %Homes ordered 2,334 1,514 820 54.2 %Average sales price $ 384.0 $ 374.6 $ 9.4 2.5 %
(1) Home orders for any period represent the aggregate sales price of all homes ordered, net of cancellations. We do not include orders contingent upon the sale of a customer’s existing home as a sales contract until the contingency is removed.
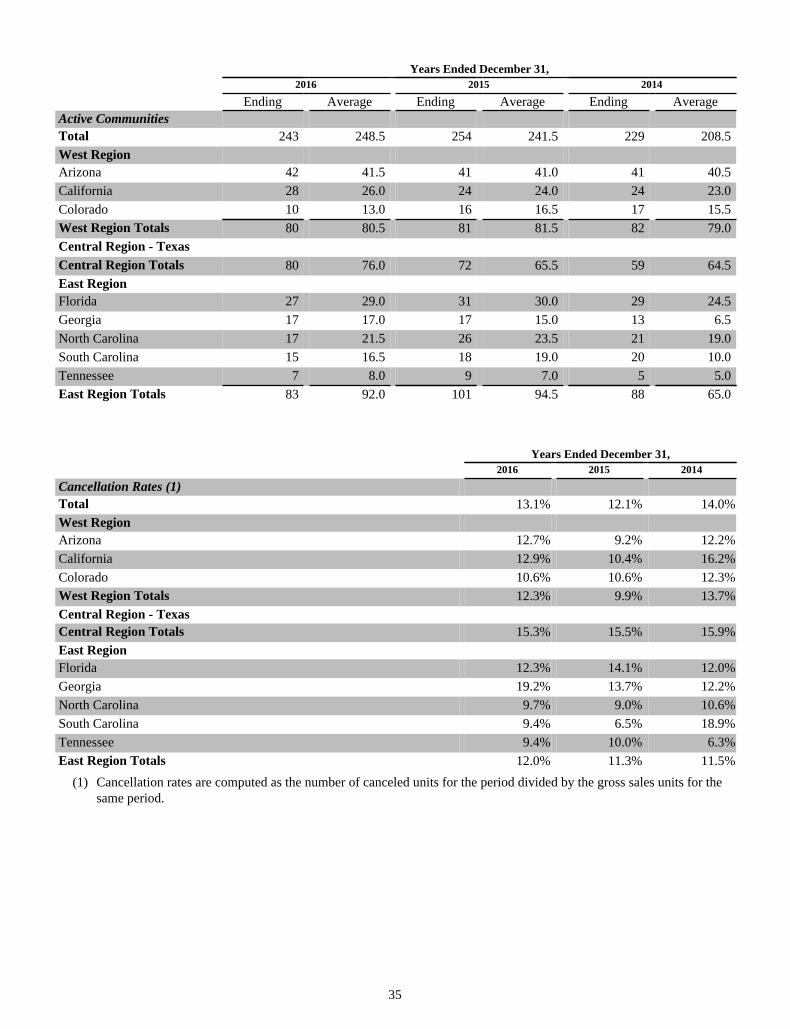
35
Years Ended December 31, 2016 2015 2014
Ending Average Ending Average Ending AverageActive CommunitiesTotal 243 248.5 254 241.5 229 208.5West RegionArizona 42 41.5 41 41.0 41 40.5California 28 26.0 24 24.0 24 23.0Colorado 10 13.0 16 16.5 17 15.5West Region Totals 80 80.5 81 81.5 82 79.0Central Region - TexasCentral Region Totals 80 76.0 72 65.5 59 64.5East RegionFlorida 27 29.0 31 30.0 29 24.5Georgia 17 17.0 17 15.0 13 6.5North Carolina 17 21.5 26 23.5 21 19.0South Carolina 15 16.5 18 19.0 20 10.0Tennessee 7 8.0 9 7.0 5 5.0East Region Totals 83 92.0 101 94.5 88 65.0
Years Ended December 31, 2016 2015 2014
Cancellation Rates (1)Total 13.1% 12.1% 14.0%West RegionArizona 12.7% 9.2% 12.2%California 12.9% 10.4% 16.2%Colorado 10.6% 10.6% 12.3%West Region Totals 12.3% 9.9% 13.7%Central Region - TexasCentral Region Totals 15.3% 15.5% 15.9%East RegionFlorida 12.3% 14.1% 12.0%Georgia 19.2% 13.7% 12.2%North Carolina 9.7% 9.0% 10.6%South Carolina 9.4% 6.5% 18.9%Tennessee 9.4% 10.0% 6.3%East Region Totals 12.0% 11.3% 11.5%
(1) Cancellation rates are computed as the number of canceled units for the period divided by the gross sales units for the same period.
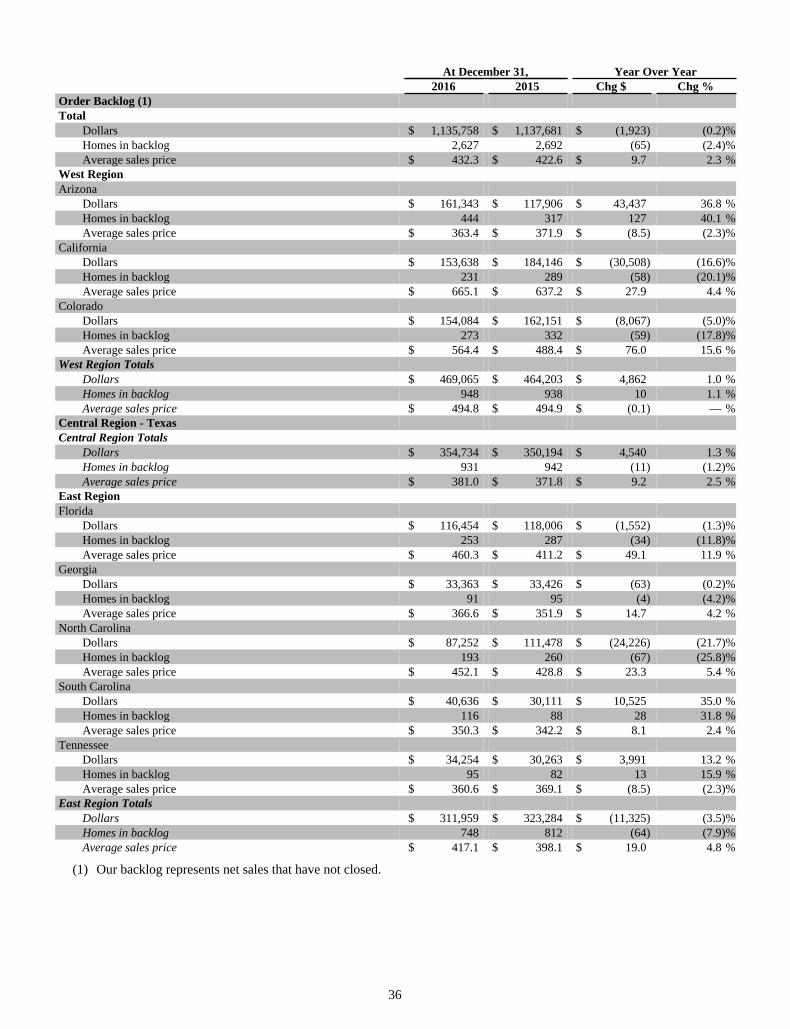
36
At December 31, Year Over Year2016 2015 Chg $ Chg %
Order Backlog (1)Total
Dollars $ 1,135,758 $ 1,137,681 $ (1,923) (0.2)%Homes in backlog 2,627 2,692 (65) (2.4)%Average sales price $ 432.3 $ 422.6 $ 9.7 2.3 %
West RegionArizona
Dollars $ 161,343 $ 117,906 $ 43,437 36.8 %Homes in backlog 444 317 127 40.1 %Average sales price $ 363.4 $ 371.9 $ (8.5) (2.3)%
CaliforniaDollars $ 153,638 $ 184,146 $ (30,508) (16.6)%Homes in backlog 231 289 (58) (20.1)%Average sales price $ 665.1 $ 637.2 $ 27.9 4.4 %
ColoradoDollars $ 154,084 $ 162,151 $ (8,067) (5.0)%Homes in backlog 273 332 (59) (17.8)%Average sales price $ 564.4 $ 488.4 $ 76.0 15.6 %
West Region TotalsDollars $ 469,065 $ 464,203 $ 4,862 1.0 %Homes in backlog 948 938 10 1.1 %Average sales price $ 494.8 $ 494.9 $ (0.1) — %
Central Region - TexasCentral Region Totals
Dollars $ 354,734 $ 350,194 $ 4,540 1.3 %Homes in backlog 931 942 (11) (1.2)%Average sales price $ 381.0 $ 371.8 $ 9.2 2.5 %
East RegionFlorida
Dollars $ 116,454 $ 118,006 $ (1,552) (1.3)%Homes in backlog 253 287 (34) (11.8)%Average sales price $ 460.3 $ 411.2 $ 49.1 11.9 %
GeorgiaDollars $ 33,363 $ 33,426 $ (63) (0.2)%Homes in backlog 91 95 (4) (4.2)%Average sales price $ 366.6 $ 351.9 $ 14.7 4.2 %
North CarolinaDollars $ 87,252 $ 111,478 $ (24,226) (21.7)%Homes in backlog 193 260 (67) (25.8)%Average sales price $ 452.1 $ 428.8 $ 23.3 5.4 %
South CarolinaDollars $ 40,636 $ 30,111 $ 10,525 35.0 %Homes in backlog 116 88 28 31.8 %Average sales price $ 350.3 $ 342.2 $ 8.1 2.4 %
TennesseeDollars $ 34,254 $ 30,263 $ 3,991 13.2 %Homes in backlog 95 82 13 15.9 %Average sales price $ 360.6 $ 369.1 $ (8.5) (2.3)%
East Region TotalsDollars $ 311,959 $ 323,284 $ (11,325) (3.5)%Homes in backlog 748 812 (64) (7.9)%Average sales price $ 417.1 $ 398.1 $ 19.0 4.8 %
(1) Our backlog represents net sales that have not closed.
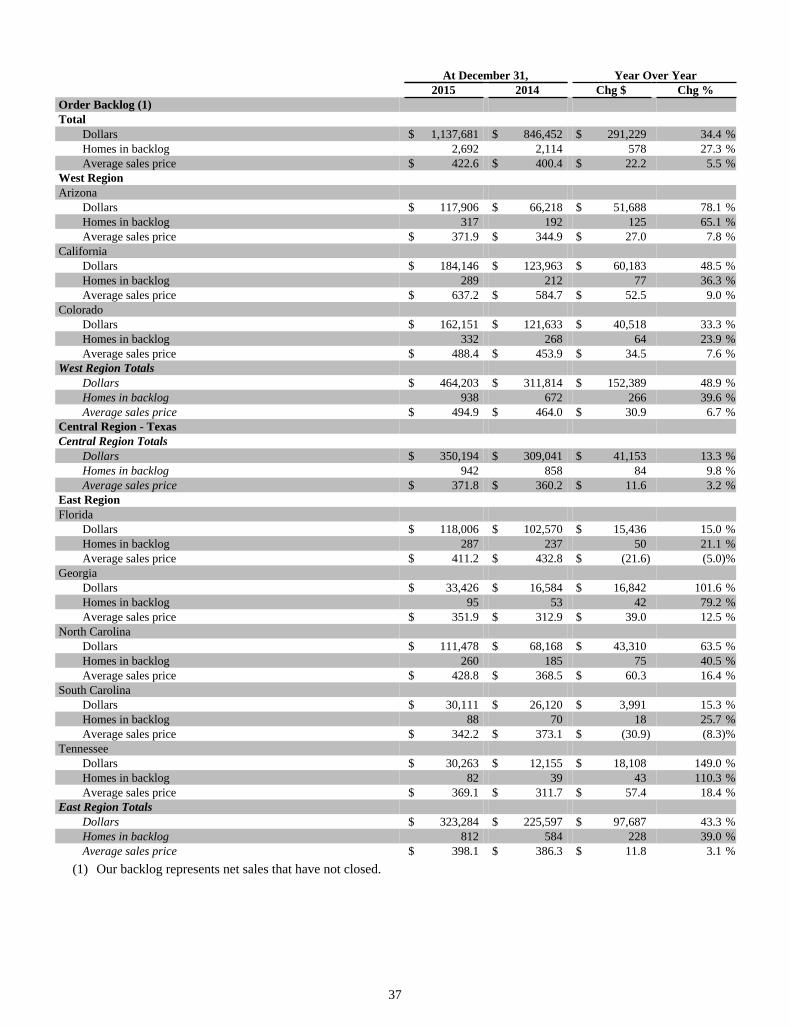
37
At December 31, Year Over Year2015 2014 Chg $ Chg %
Order Backlog (1)Total
Dollars $ 1,137,681 $ 846,452 $ 291,229 34.4 %Homes in backlog 2,692 2,114 578 27.3 %Average sales price $ 422.6 $ 400.4 $ 22.2 5.5 %
West RegionArizona
Dollars $ 117,906 $ 66,218 $ 51,688 78.1 %Homes in backlog 317 192 125 65.1 %Average sales price $ 371.9 $ 344.9 $ 27.0 7.8 %
CaliforniaDollars $ 184,146 $ 123,963 $ 60,183 48.5 %Homes in backlog 289 212 77 36.3 %Average sales price $ 637.2 $ 584.7 $ 52.5 9.0 %
ColoradoDollars $ 162,151 $ 121,633 $ 40,518 33.3 %Homes in backlog 332 268 64 23.9 %Average sales price $ 488.4 $ 453.9 $ 34.5 7.6 %
West Region TotalsDollars $ 464,203 $ 311,814 $ 152,389 48.9 %Homes in backlog 938 672 266 39.6 %Average sales price $ 494.9 $ 464.0 $ 30.9 6.7 %
Central Region - TexasCentral Region Totals
Dollars $ 350,194 $ 309,041 $ 41,153 13.3 %Homes in backlog 942 858 84 9.8 %Average sales price $ 371.8 $ 360.2 $ 11.6 3.2 %
East RegionFlorida
Dollars $ 118,006 $ 102,570 $ 15,436 15.0 %Homes in backlog 287 237 50 21.1 %Average sales price $ 411.2 $ 432.8 $ (21.6) (5.0)%
GeorgiaDollars $ 33,426 $ 16,584 $ 16,842 101.6 %Homes in backlog 95 53 42 79.2 %Average sales price $ 351.9 $ 312.9 $ 39.0 12.5 %
North CarolinaDollars $ 111,478 $ 68,168 $ 43,310 63.5 %Homes in backlog 260 185 75 40.5 %Average sales price $ 428.8 $ 368.5 $ 60.3 16.4 %
South CarolinaDollars $ 30,111 $ 26,120 $ 3,991 15.3 %Homes in backlog 88 70 18 25.7 %Average sales price $ 342.2 $ 373.1 $ (30.9) (8.3)%
TennesseeDollars $ 30,263 $ 12,155 $ 18,108 149.0 %Homes in backlog 82 39 43 110.3 %Average sales price $ 369.1 $ 311.7 $ 57.4 18.4 %
East Region TotalsDollars $ 323,284 $ 225,597 $ 97,687 43.3 %Homes in backlog 812 584 228 39.0 %Average sales price $ 398.1 $ 386.3 $ 11.8 3.1 %
(1) Our backlog represents net sales that have not closed.
38
Fiscal 2016 Compared to Fiscal 2015
Companywide. Home closing revenue for the year ended December 31, 2016 increased 18.6% to $3.0 billion when compared to the prior year due to 833 additional units closed and a $20,200 increase in average sales price. Home order growth improved 6.3% to $3.0 billion on 7,290 units in 2016 as compared to $2.8 billion on 7,100 units in 2015. In addition, the value on orders was assisted by an average sales price increase of $14,200. The average sales prices on orders rose in all of our markets year over year, mainly as a result of community location and product mix, with some pricing appreciation in certain markets. A decline in community count contributed to a 65-unit or 2.4% decrease in our year-end backlog as fourth quarter orders slowed, ending 2016 with 2,627 homes in backlog compared to 2,692 homes in the prior year. Backlog value at December 31, 2016 was flat at $1.1 billion year over year due to a 2.3% increase in average sales price. A strategic shift in product to appeal to the first-time homebuyer segment combined with delays in some community openings drove the 4.3% decline in ending community count.
West. In 2016, home closing units in our West Region increased 16.1%, coupled with a $33,200 increase in average sales price, generating $1.3 billion in home closing revenue for the year ended December 31, 2016, a 25.1% improvement compared to $1.0 billion in 2015. Similarly, the Region reported a $110.1 million increase in order value to $1.3 billion on 2,786 units compared to $1.2 billion on 2,657 units in the prior year. Demand in the West Region remains strong as evidenced by the 6.1% improvement in orders pace of 34.6 units per average community for the year ended December 31, 2016 as compared to 32.6 in 2015. These results led to ending backlog in the Region of $469.1 million on 948 units versus $464.2 million on 938 units in 2015, 1.0% and 1.1% increases over the prior year, respectively.
The California market delivered the highest home closing revenue in the region, ending the year with $590.3 million on 1,020 closings, 23.5% and 14.9% improvements over 2015, respectively. This improvement was largely the benefit of strong orders in 2015 when California led the company in orders pace and led to the quick sell out of several communities. Accordingly, we opened 12 new communities during 2016, ending the year with 28 active communities, a 16.7% increase over prior year. An 8.0% decline in orders pace contributed to flat orders year over year, but our California results benefited from a $24,000 increase to average sales prices on homes ordered that led to a 4.0% increase in order value. The 2016 pace of 37.0 orders per average community in California remains the second highest in the company and represents strong demand.
Arizona contributed $384.8 million in home closing revenue in 2016 on 1,122 units, increases of 18.3% and 11.3% over prior year, respectively. Arizona also reported order improvement and was the largest growth contributor for the Region in order units and value, with an increase of $51.1 million on 116 additional units in 2016 compared to 2015. As evidenced by the 9.1% higher orders pace, demand is strengthening in the Arizona market, particularly in our newly opened LiVE.NOW communities offering our new product line, which provide all of the standard Meritage energy-efficient features and benefits, but at an affordable price point for the first-time buyer.
The Colorado market continues to provide year-over-year growth in both closings and orders. Colorado ended the year with $310.2 million in home closing revenue on 634 units, 38.4% and 28.1% improvements over prior year, respectively. The growth in orders was more tempered, at 2.9% more units, and is entirely attributable to the 21.2% decline in average active communities. The tremendous demand in this market is evidenced in the rising average sales prices on both closings and orders and the 30.4% improvement in orders pace over the prior year. Colorado led the company in 2016 with 44.2 homes ordered per average community, resulting in the fast sell out of high-demand communities. We are aggressively reloading our lot supply here, and anticipate several community openings throughout 2017. We expect the rising sales prices to slow as we introduce more communities targeted to first-time homebuyers in the first half of 2017.
Central. The Central Region, made up of our Texas markets, closed 2,130 units totaling $779.0 million in home closing revenue. The 5.2% increase in closing units combined with a 5.0%, or $17,400, increase in average sales prices, resulted in a $73.6 million higher home closing revenue than in 2015. Orders improved slightly compared to prior year, and average sales prices increased by $15,900, resulting in a $37.0 million increase in order value. The Region reported an orders pace decline of 13.4% year over year, as the majority of new community openings occurred in the second half of 2016. Community count is expected to continue to grow throughout 2017 which we expect to result in continued order and revenue growth in 2017. Although the Houston division continues to perform below recent years, demand there is starting to stabilize and we have begun to re-invest in that market. Dallas continues to be one of our best homebuilding markets and closings increased significantly over prior year, partially due to homes impacted by the weather-related delays in 2015 closing in early 2016. The Region ended 2016 with relatively flat backlog of 931 units valued at $354.7 million compared to 942 units valued at $350.2 million at December 31, 2015.
East. Our East Region generated 2,449 closings with $939.2 million of home closing revenue in 2016, 16.3% and 17.6% increases, respectively, from the same period in 2015. The Region also reported an increase in orders year over year, providing $31.6 million of additional order dollars, due to 51 additional units, aided by a $5,000 increase in average sales prices from 2015. The orders growth was hindered by the 2.6% decline in average active communities during 2016 although the Region
39
experienced a 4.9% increase in orders pace over 2015. To meet the demand in these markets, we are focused on community openings planned throughout the East region in the first half of 2017, many of which will open with our new product offering, and we expect orders growth as a result.
The Florida market is the largest contributor to the Region's results reporting $368.6 million in home closing revenue on 895 units. Home closing units increased by 6.2% over prior year but were partially offset by a $16,600 decline in average sales price netting a 2.1% increase in closing revenue over prior year. A shift in product mix directly contributed to the decline in average sales price as several luxury communities with above average sales prices contributed to a large percentage of 2015 closings. Florida generated 861 orders during 2016 valued at $367.0 million, reflecting declines of 3.6% and 2.5%, respectively, compared to prior year. The decline in orders was the result of a 3.3% decline in average community count.
Operations in North Carolina delivered 672 units and $278.7 million in home closing revenue during 2016. These results represent a 29.3% or $63.1 million increase in closing revenue and a 22.0% or 121-unit improvement in closings over prior year. The state generated 605 orders with $254.5 million in order revenue, representing declines of 3.4% and 1.7% compared to prior year, respectively. This order decline is largely attributable to the 8.5% decrease in the average number of actively-selling communities, partially offset by a 5.6% increase in orders pace. We are working diligently to open new communities with our new product offerings to meet the demand reflected by the improved orders pace.
Tennessee increased its contribution to home closings and revenue in 2016, ending the year with 217 closings valued at $73.9 million. These results represent 40.9% and 57.0% increases over prior year, respectively, in addition to a $35,000 increase in average sales price. Orders and order value also improved in 2016, ending the year with 230 orders valued at $77.9 million, 16.8% and 19.5% increases over 2015, respectively. The largest driver for this improvement resulted from a 14.3% increase in average active communities in 2016 versus 2015 combined with a 2.5% improvement in orders pace.
Growth in Georgia continues to be a strategic focus for us, as this market demonstrates solid buyer demand and is one of the strongest homebuilding markets in the country. During 2016, we increased average active community count by 13.3% over prior year and anticipate opening several new communities in the first half of 2017. We ended the year with 337 closings that provided $114.1 million in home closing revenue, 47.8% and 56.5% increases over 2015. Orders in Georgia grew by 23.3% or 63 units, largely attributable to a 8.9% increase in the orders pace during the year combined with the higher average community count. Total order value improved by $24.3 million or 27.1% year over year.
The South Carolina market provided 328 closings and $103.9 million in home closing revenue during 2016. Closings were flat with prior year but revenue improved by $2.0 million due to a $8,000 increase in average sales price. Orders and order value improved by 2.3% and 8.1%, respectively, ending the year with 356 orders valued at $114.4 million. Improvement in orders was the result of a 18.0% improvement in orders pace despite a 13.2% decline in average communities.
The region ended 2016 with 64-unit and $11.3 million decreases in ending backlog and backlog value, respectively, over the prior year, with 748 units valued at $312.0 million at December 31, 2016.
Land Closing Revenue and Gross Profit
From time to time, we may sell certain land parcels to other homebuilders, developers or investors if we feel the sale will provide a greater economic benefit to us than continuing home construction or where we are looking to diversify our land positions in the specific geography. As a result of such sales, we recognized land closing revenue of $25.8 million and $36.5 million for the years ending December 31, 2016 and 2015, respectively. For both years, modest profits were achieved on these land sales, $2.4 million in 2016 and $6.8 million in 2015.
Fiscal 2015 Compared to Fiscal 2014
Companywide. Home closing revenue for the year ended December 31, 2015 increased 18.2% to $2.5 billion when compared to the prior year due to the 660 additional units closed and a $22,700 increase in average closing price. Home orders also improved to $2.8 billion on 7,100 units in 2015 as compared to $2.2 billion on 5,944 units in 2014. In addition to the higher units, the value on orders was assisted by an average sales price increase of $21,100. Buyer confidence helped to maintain a low cancellation rate of 12.1% in 2015 as compared to 14.0% in 2014, contributing to a 578-unit or 27.3% increase in our year-end backlog, ending 2015 with 2,692 homes valued at $1.1 billion as compared to 2,114 homes valued at $846.5 million in 2014. The largest year-over-year revenue and order growth came from our East Region, reflecting the results of markets from our 2014 acquisition of Legendary Communities, combined with organic growth from our existing East Region markets. Consistent with our revenue and orders growth, community count expansion in 2015 was also led by our East Region, which reported a 45.4% year-over-year increase in the average number of actively-selling communities. We ended 2015 with 254 actively-selling communities as compared to 229 at the end of 2014.
40
West. In 2015, home closing units in our West Region increased 10.0% coupled with an $11,400 increase in average sales price that generated $1.0 billion in home closing revenue for the year ended December 31, 2015, a 13.0% improvement compared to $909.1 million in 2014. Similarly, the Region reported a $256.2 million increase in order value to $1.2 billion on 2,657 units. These results led to ending backlog in the Region of $464.2 million on 938 units at December 31, 2015 versus $311.8 million on 672 units at December 31, 2014.
Demand in the West Region continued to rise as evidenced by the 20.3% improvement in annual per-community orders pace of 32.6 for the year ended December 31, 2015 as compared to 27.1 in 2014. Arizona was the largest growth contributor in 2015 for the Region in order units and value, with 35.2% and 36.5% improvements, respectively. The California market was the company leader for orders pace with 40.2 orders per average community in 2015, 19.6% higher than 2014. The combination of these factors contributed to the 25.0% and 30.8% increases in orders and order value, respectively, over 2014. Challenged with spring weather delays in 2015, which pushed out closing dates, Colorado experienced only a modest 6.7% increase in closing units, contributing 495 units with $224.1 million in closing revenue over the 464 units for the year ended December 31, 2014. Similarly, weather played a part in the slight increase in orders that was achieved in Colorado, with 559 units versus 530 in the prior year, up 5.5% from the prior year. Community location and product mix on orders largely drove the average sales price improvements in 2015 versus 2014. While each state in the Region varied with respect to prior year comparisons, all three states in the Region generated improvements for the year ending December 31, 2015, which directly led to an increase in backlog in 2015 of 266 units, or $152.4 million, compared to 2014, ending 2015 with 938 units valued at $464.2 million.
Central. The Central Region closed 2,025 units totaling $705.3 million in home closing revenue. The 8.9% decline in closing units was more than offset by the 13.3% or $40,900 increase in average sales prices, resulting in a $21.6 million improvement in home closing revenue versus 2014. Texas also experienced a 7.9% decrease in orders to 2,109 units in 2015 as compared to 2,290 units in 2014. The decrease in orders was partially offset by a $27,700 increase in average sales prices. The order and closing decline was largely impacted by the lower consumer confidence levels from lower oil prices in the Houston market. The Austin market experienced declines in orders and closings in 2015, as demand in that market has shifted to lower-priced homes. The San Antonio division was our only Texas market that delivered improved results in both orders and closings in 2015 versus 2014. The Region reported an orders pace decline of 9.3% year over year, a combined result of the reduced orders discussed above coupled with the relatively flat number of average selling communities. The combination of all these results translated to moderately higher backlog at December 31, 2015, with 942 units valued at $350.2 million, 9.8% and 13.3% increases, respectively, over 2014.
East. Our East Region generated 2,106 closings with $798.6 million of home closing revenue in 2015, 43.8% and 45.3% increases, respectively, from the same period in 2014. The Region also reported higher orders year over year, generating $329.1 million of additional order dollars, due to a 54.2% increase in units, aided by a $9,400 increase in average sales prices from 2014. The increases were primarily driven by 2015 representing full-year operations in our newer markets from the 2014 acquisition of Legendary Communities. Operations in Tennessee, Georgia and South Carolina reported average sales prices ranging from approximately $50,000-$110,000 less than the average of the other markets in our East Region in 2015. The Region ended 2015 with 101 actively-selling communities as compared to 88 at the end of 2014. Ending 2015 with 228-unit and $97.7 million increases in ending backlog and backlog value over the prior year, the Region has 812 units valued at $323.3 million at December 31, 2015.
The Florida market reported $361.1 million in closing revenue on 843 units and generated $376.6 million on 893 new orders for the year ended December 31, 2015. The Florida growth was largely attributable to the 22.4% increase in actively-selling communities in 2015 over 2014. Florida's closing revenue for the year ended December 31, 2015 increased compared to prior year by $84.1 million, largely driven by the 144 additional units closed, coupled with a $32,100 increase in average sales price. Operations in North Carolina contributed 551 units or $215.6 million in closings and 626 units, or $259.0 million in order volume. These results represented a 36.5% or $57.7 million increase in closing revenues and a 50.7% or $87.1 million improvement in order value. This order growth was largely attributable to the 23.7% increase in the average number of actively-selling communities in 2015 combined with higher average sales prices, mainly from offering larger product than in 2014. Tennessee reported reduced home closing revenue in 2015 of $1.6 million on 24 fewer units versus 2014. The largest driver for this decline was from the temporary reduction of actively-selling communities in the first half of 2015. The newest markets from the acquisition in Georgia and South Carolina had only partial 2014 results and contributed 228 and 330 closings valued at $72.9 million and $101.8 million, respectively, during 2015. Georgia and South Carolina also provided 270 and 348 orders in 2015, respectively, which resulted in ending backlog of 95 homes valued at $33.4 million in Georgia and 88 homes valued at $30.1 million in South Carolina at December 31, 2015 as compared to 53 units valued at $16.6 million in Georgia and 70 units valued at $26.1 million in South Carolina at December 31, 2014.
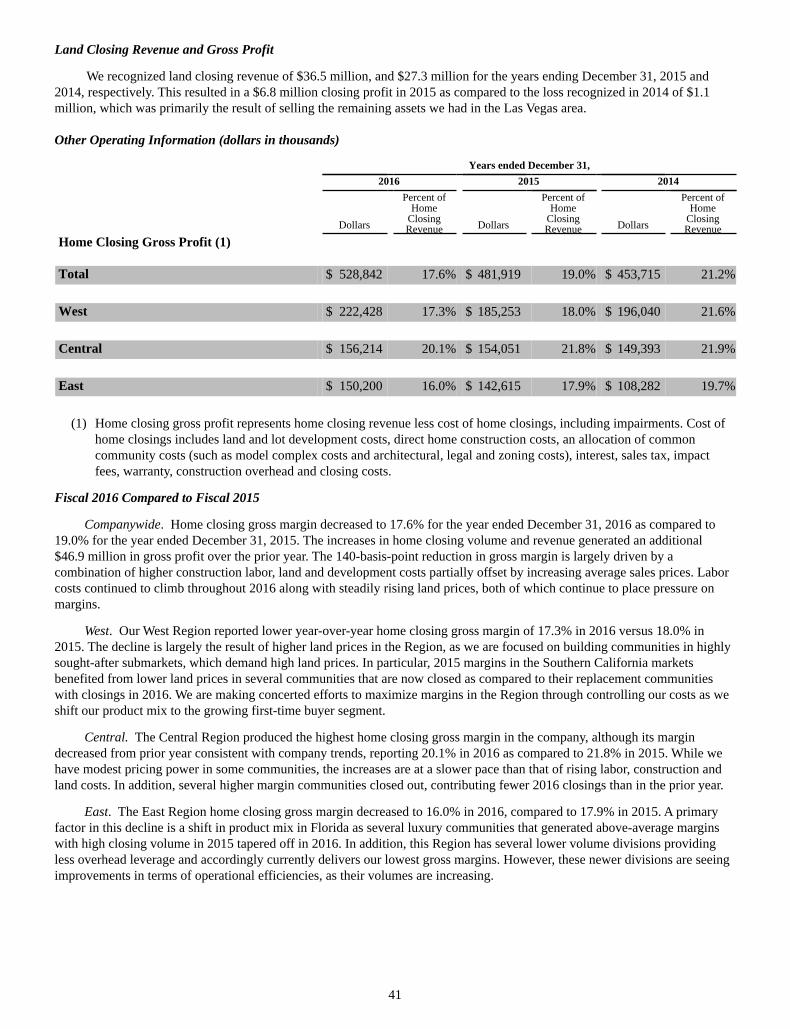
41
Land Closing Revenue and Gross Profit
We recognized land closing revenue of $36.5 million, and $27.3 million for the years ending December 31, 2015 and 2014, respectively. This resulted in a $6.8 million closing profit in 2015 as compared to the loss recognized in 2014 of $1.1 million, which was primarily the result of selling the remaining assets we had in the Las Vegas area.
Other Operating Information (dollars in thousands)
Years ended December 31, 2016 2015 2014
Dollars
Percent ofHome
ClosingRevenue Dollars
Percent ofHome
ClosingRevenue Dollars
Percent ofHome
ClosingRevenue
Home Closing Gross Profit (1)
Total $ 528,842 17.6% $ 481,919 19.0% $ 453,715 21.2%
West $ 222,428 17.3% $ 185,253 18.0% $ 196,040 21.6%
Central $ 156,214 20.1% $ 154,051 21.8% $ 149,393 21.9%
East $ 150,200 16.0% $ 142,615 17.9% $ 108,282 19.7%
(1) Home closing gross profit represents home closing revenue less cost of home closings, including impairments. Cost of home closings includes land and lot development costs, direct home construction costs, an allocation of common community costs (such as model complex costs and architectural, legal and zoning costs), interest, sales tax, impact fees, warranty, construction overhead and closing costs.
Fiscal 2016 Compared to Fiscal 2015
Companywide. Home closing gross margin decreased to 17.6% for the year ended December 31, 2016 as compared to 19.0% for the year ended December 31, 2015. The increases in home closing volume and revenue generated an additional $46.9 million in gross profit over the prior year. The 140-basis-point reduction in gross margin is largely driven by a combination of higher construction labor, land and development costs partially offset by increasing average sales prices. Labor costs continued to climb throughout 2016 along with steadily rising land prices, both of which continue to place pressure on margins.
West. Our West Region reported lower year-over-year home closing gross margin of 17.3% in 2016 versus 18.0% in 2015. The decline is largely the result of higher land prices in the Region, as we are focused on building communities in highly sought-after submarkets, which demand high land prices. In particular, 2015 margins in the Southern California markets benefited from lower land prices in several communities that are now closed as compared to their replacement communities with closings in 2016. We are making concerted efforts to maximize margins in the Region through controlling our costs as we shift our product mix to the growing first-time buyer segment.
Central. The Central Region produced the highest home closing gross margin in the company, although its margin decreased from prior year consistent with company trends, reporting 20.1% in 2016 as compared to 21.8% in 2015. While we have modest pricing power in some communities, the increases are at a slower pace than that of rising labor, construction and land costs. In addition, several higher margin communities closed out, contributing fewer 2016 closings than in the prior year.
East. The East Region home closing gross margin decreased to 16.0% in 2016, compared to 17.9% in 2015. A primary factor in this decline is a shift in product mix in Florida as several luxury communities that generated above-average margins with high closing volume in 2015 tapered off in 2016. In addition, this Region has several lower volume divisions providing less overhead leverage and accordingly currently delivers our lowest gross margins. However, these newer divisions are seeing improvements in terms of operational efficiencies, as their volumes are increasing.
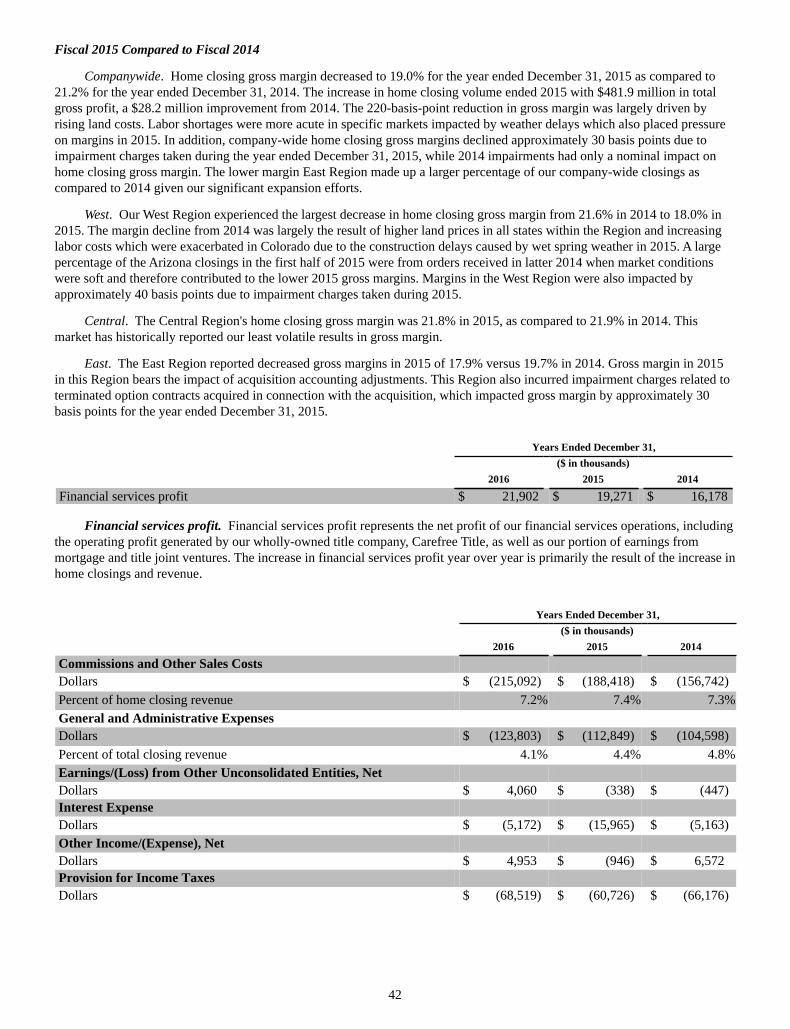
42
Fiscal 2015 Compared to Fiscal 2014
Companywide. Home closing gross margin decreased to 19.0% for the year ended December 31, 2015 as compared to 21.2% for the year ended December 31, 2014. The increase in home closing volume ended 2015 with $481.9 million in total gross profit, a $28.2 million improvement from 2014. The 220-basis-point reduction in gross margin was largely driven by rising land costs. Labor shortages were more acute in specific markets impacted by weather delays which also placed pressure on margins in 2015. In addition, company-wide home closing gross margins declined approximately 30 basis points due to impairment charges taken during the year ended December 31, 2015, while 2014 impairments had only a nominal impact on home closing gross margin. The lower margin East Region made up a larger percentage of our company-wide closings as compared to 2014 given our significant expansion efforts.
West. Our West Region experienced the largest decrease in home closing gross margin from 21.6% in 2014 to 18.0% in 2015. The margin decline from 2014 was largely the result of higher land prices in all states within the Region and increasing labor costs which were exacerbated in Colorado due to the construction delays caused by wet spring weather in 2015. A large percentage of the Arizona closings in the first half of 2015 were from orders received in latter 2014 when market conditions were soft and therefore contributed to the lower 2015 gross margins. Margins in the West Region were also impacted by approximately 40 basis points due to impairment charges taken during 2015.
Central. The Central Region's home closing gross margin was 21.8% in 2015, as compared to 21.9% in 2014. This market has historically reported our least volatile results in gross margin.
East. The East Region reported decreased gross margins in 2015 of 17.9% versus 19.7% in 2014. Gross margin in 2015 in this Region bears the impact of acquisition accounting adjustments. This Region also incurred impairment charges related to terminated option contracts acquired in connection with the acquisition, which impacted gross margin by approximately 30 basis points for the year ended December 31, 2015.
Years Ended December 31,($ in thousands)
2016 2015 2014
Financial services profit $ 21,902 $ 19,271 $ 16,178
Financial services profit. Financial services profit represents the net profit of our financial services operations, including the operating profit generated by our wholly-owned title company, Carefree Title, as well as our portion of earnings from mortgage and title joint ventures. The increase in financial services profit year over year is primarily the result of the increase in home closings and revenue.
Years Ended December 31, ($ in thousands) 2016 2015 2014
Commissions and Other Sales CostsDollars $ (215,092) $ (188,418) $ (156,742)Percent of home closing revenue 7.2% 7.4% 7.3%General and Administrative ExpensesDollars $ (123,803) $ (112,849) $ (104,598)Percent of total closing revenue 4.1% 4.4% 4.8%Earnings/(Loss) from Other Unconsolidated Entities, NetDollars $ 4,060 $ (338) $ (447)Interest ExpenseDollars $ (5,172) $ (15,965) $ (5,163)Other Income/(Expense), NetDollars $ 4,953 $ (946) $ 6,572Provision for Income TaxesDollars $ (68,519) $ (60,726) $ (66,176)
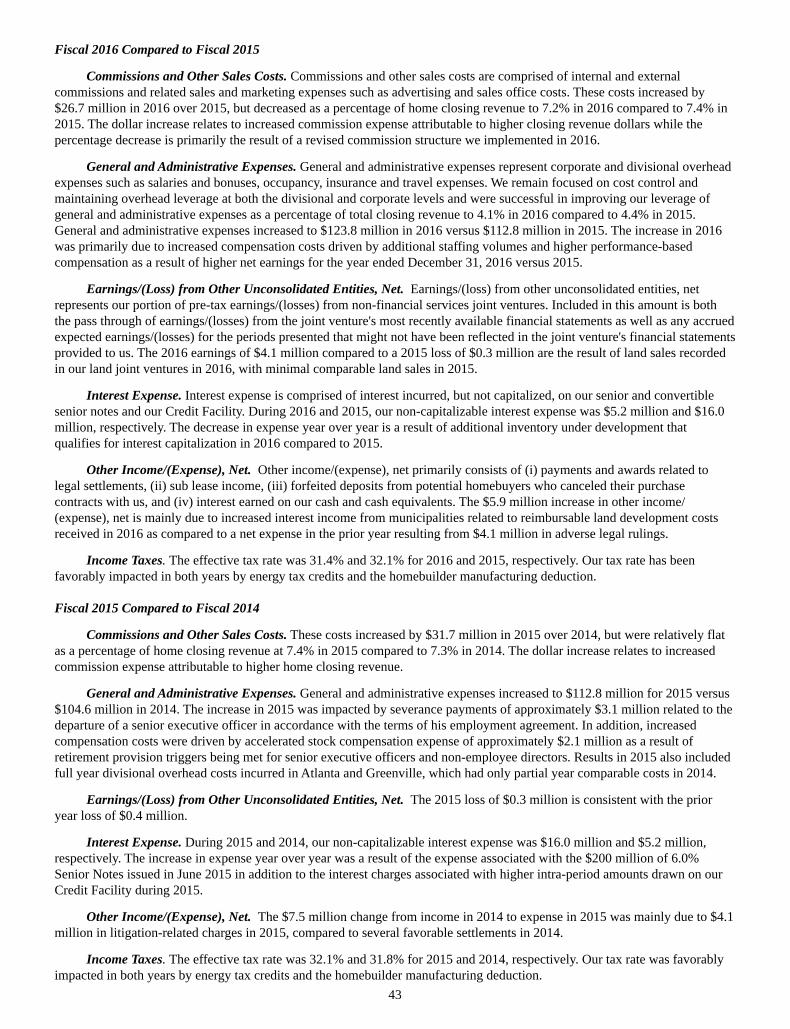
43
Fiscal 2016 Compared to Fiscal 2015
Commissions and Other Sales Costs. Commissions and other sales costs are comprised of internal and external commissions and related sales and marketing expenses such as advertising and sales office costs. These costs increased by $26.7 million in 2016 over 2015, but decreased as a percentage of home closing revenue to 7.2% in 2016 compared to 7.4% in 2015. The dollar increase relates to increased commission expense attributable to higher closing revenue dollars while the percentage decrease is primarily the result of a revised commission structure we implemented in 2016.
General and Administrative Expenses. General and administrative expenses represent corporate and divisional overhead expenses such as salaries and bonuses, occupancy, insurance and travel expenses. We remain focused on cost control and maintaining overhead leverage at both the divisional and corporate levels and were successful in improving our leverage of general and administrative expenses as a percentage of total closing revenue to 4.1% in 2016 compared to 4.4% in 2015. General and administrative expenses increased to $123.8 million in 2016 versus $112.8 million in 2015. The increase in 2016 was primarily due to increased compensation costs driven by additional staffing volumes and higher performance-based compensation as a result of higher net earnings for the year ended December 31, 2016 versus 2015.
Earnings/(Loss) from Other Unconsolidated Entities, Net. Earnings/(loss) from other unconsolidated entities, net represents our portion of pre-tax earnings/(losses) from non-financial services joint ventures. Included in this amount is both the pass through of earnings/(losses) from the joint venture's most recently available financial statements as well as any accrued expected earnings/(losses) for the periods presented that might not have been reflected in the joint venture's financial statements provided to us. The 2016 earnings of $4.1 million compared to a 2015 loss of $0.3 million are the result of land sales recorded in our land joint ventures in 2016, with minimal comparable land sales in 2015.
Interest Expense. Interest expense is comprised of interest incurred, but not capitalized, on our senior and convertible senior notes and our Credit Facility. During 2016 and 2015, our non-capitalizable interest expense was $5.2 million and $16.0 million, respectively. The decrease in expense year over year is a result of additional inventory under development that qualifies for interest capitalization in 2016 compared to 2015.
Other Income/(Expense), Net. Other income/(expense), net primarily consists of (i) payments and awards related to legal settlements, (ii) sub lease income, (iii) forfeited deposits from potential homebuyers who canceled their purchase contracts with us, and (iv) interest earned on our cash and cash equivalents. The $5.9 million increase in other income/(expense), net is mainly due to increased interest income from municipalities related to reimbursable land development costs received in 2016 as compared to a net expense in the prior year resulting from $4.1 million in adverse legal rulings.
Income Taxes. The effective tax rate was 31.4% and 32.1% for 2016 and 2015, respectively. Our tax rate has been favorably impacted in both years by energy tax credits and the homebuilder manufacturing deduction.
Fiscal 2015 Compared to Fiscal 2014
Commissions and Other Sales Costs. These costs increased by $31.7 million in 2015 over 2014, but were relatively flat as a percentage of home closing revenue at 7.4% in 2015 compared to 7.3% in 2014. The dollar increase relates to increased commission expense attributable to higher home closing revenue.
General and Administrative Expenses. General and administrative expenses increased to $112.8 million for 2015 versus $104.6 million in 2014. The increase in 2015 was impacted by severance payments of approximately $3.1 million related to the departure of a senior executive officer in accordance with the terms of his employment agreement. In addition, increased compensation costs were driven by accelerated stock compensation expense of approximately $2.1 million as a result of retirement provision triggers being met for senior executive officers and non-employee directors. Results in 2015 also included full year divisional overhead costs incurred in Atlanta and Greenville, which had only partial year comparable costs in 2014.
Earnings/(Loss) from Other Unconsolidated Entities, Net. The 2015 loss of $0.3 million is consistent with the prior year loss of $0.4 million.
Interest Expense. During 2015 and 2014, our non-capitalizable interest expense was $16.0 million and $5.2 million, respectively. The increase in expense year over year was a result of the expense associated with the $200 million of 6.0% Senior Notes issued in June 2015 in addition to the interest charges associated with higher intra-period amounts drawn on our Credit Facility during 2015.
Other Income/(Expense), Net. The $7.5 million change from income in 2014 to expense in 2015 was mainly due to $4.1 million in litigation-related charges in 2015, compared to several favorable settlements in 2014.
Income Taxes. The effective tax rate was 32.1% and 31.8% for 2015 and 2014, respectively. Our tax rate was favorably impacted in both years by energy tax credits and the homebuilder manufacturing deduction.
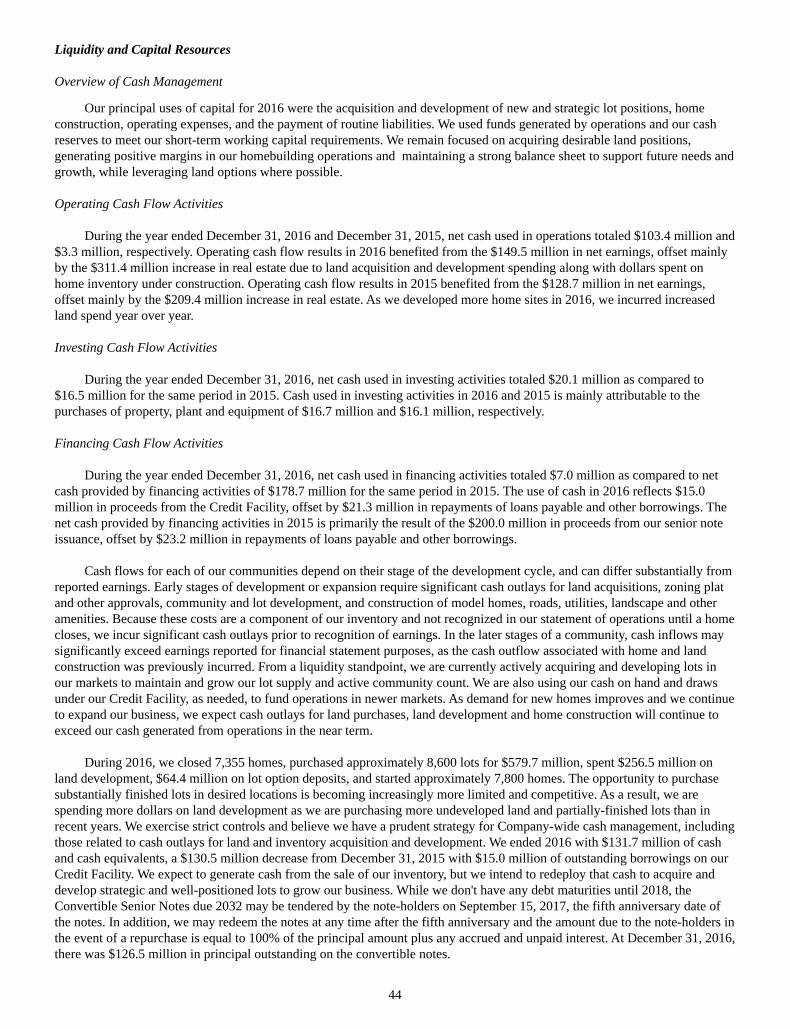
44
Liquidity and Capital Resources
Overview of Cash Management
Our principal uses of capital for 2016 were the acquisition and development of new and strategic lot positions, home construction, operating expenses, and the payment of routine liabilities. We used funds generated by operations and our cash reserves to meet our short-term working capital requirements. We remain focused on acquiring desirable land positions, generating positive margins in our homebuilding operations and maintaining a strong balance sheet to support future needs and growth, while leveraging land options where possible.
Operating Cash Flow Activities
During the year ended December 31, 2016 and December 31, 2015, net cash used in operations totaled $103.4 million and $3.3 million, respectively. Operating cash flow results in 2016 benefited from the $149.5 million in net earnings, offset mainly by the $311.4 million increase in real estate due to land acquisition and development spending along with dollars spent on home inventory under construction. Operating cash flow results in 2015 benefited from the $128.7 million in net earnings, offset mainly by the $209.4 million increase in real estate. As we developed more home sites in 2016, we incurred increased land spend year over year.
Investing Cash Flow Activities
During the year ended December 31, 2016, net cash used in investing activities totaled $20.1 million as compared to $16.5 million for the same period in 2015. Cash used in investing activities in 2016 and 2015 is mainly attributable to the purchases of property, plant and equipment of $16.7 million and $16.1 million, respectively.
Financing Cash Flow Activities
During the year ended December 31, 2016, net cash used in financing activities totaled $7.0 million as compared to net cash provided by financing activities of $178.7 million for the same period in 2015. The use of cash in 2016 reflects $15.0 million in proceeds from the Credit Facility, offset by $21.3 million in repayments of loans payable and other borrowings. The net cash provided by financing activities in 2015 is primarily the result of the $200.0 million in proceeds from our senior note issuance, offset by $23.2 million in repayments of loans payable and other borrowings.
Cash flows for each of our communities depend on their stage of the development cycle, and can differ substantially from reported earnings. Early stages of development or expansion require significant cash outlays for land acquisitions, zoning plat and other approvals, community and lot development, and construction of model homes, roads, utilities, landscape and other amenities. Because these costs are a component of our inventory and not recognized in our statement of operations until a home closes, we incur significant cash outlays prior to recognition of earnings. In the later stages of a community, cash inflows may significantly exceed earnings reported for financial statement purposes, as the cash outflow associated with home and land construction was previously incurred. From a liquidity standpoint, we are currently actively acquiring and developing lots in our markets to maintain and grow our lot supply and active community count. We are also using our cash on hand and draws under our Credit Facility, as needed, to fund operations in newer markets. As demand for new homes improves and we continue to expand our business, we expect cash outlays for land purchases, land development and home construction will continue to exceed our cash generated from operations in the near term.
During 2016, we closed 7,355 homes, purchased approximately 8,600 lots for $579.7 million, spent $256.5 million on land development, $64.4 million on lot option deposits, and started approximately 7,800 homes. The opportunity to purchase substantially finished lots in desired locations is becoming increasingly more limited and competitive. As a result, we are spending more dollars on land development as we are purchasing more undeveloped land and partially-finished lots than in recent years. We exercise strict controls and believe we have a prudent strategy for Company-wide cash management, including those related to cash outlays for land and inventory acquisition and development. We ended 2016 with $131.7 million of cash and cash equivalents, a $130.5 million decrease from December 31, 2015 with $15.0 million of outstanding borrowings on our Credit Facility. We expect to generate cash from the sale of our inventory, but we intend to redeploy that cash to acquire and develop strategic and well-positioned lots to grow our business. While we don't have any debt maturities until 2018, the Convertible Senior Notes due 2032 may be tendered by the note-holders on September 15, 2017, the fifth anniversary date of the notes. In addition, we may redeem the notes at any time after the fifth anniversary and the amount due to the note-holders in the event of a repurchase is equal to 100% of the principal amount plus any accrued and unpaid interest. At December 31, 2016, there was $126.5 million in principal outstanding on the convertible notes.
45
In addition to expanding our business in existing markets, we may opportunistically increase our geographic footprint through acquisitions. Consistent with our efforts, in August 2013, we completed our first acquisition since 2005, entering the Nashville, Tennessee market through the purchase of a local homebuilder. In August 2014, we entered the Atlanta, Georgia and Greenville, South Carolina markets and expanded our presence in Charlotte, North Carolina through the acquisition of a regional homebuilder.
Additionally, we continue to evaluate our capital needs in light of the improving homebuilding markets and our existing capital structure. In 2016, we exercised the accordion feature of our unsecured revolving credit facility to increase the total commitments to $540.0 million and extended the maturity date whereby $60.0 million matures in July 2019 with the remainder maturing in July 2020.
We believe that we currently have strong liquidity. Nevertheless, we may seek additional capital to strengthen our liquidity position, enable us to opportunistically acquire additional land inventory in anticipation of improving market conditions, and/or strengthen our long-term capital structure. Such additional capital may be in the form of equity or debt financing and may be from a variety of sources. There can be no assurances that we would be able to obtain such additional capital on terms acceptable to us, if at all, and such additional equity or debt financing could dilute the interests of our existing stockholders or increase our interest costs. Reference is made to Notes 5 and 6 in the accompanying consolidated financial statements.
We believe that our leverage ratios provide useful information to the users of our financial statements regarding our financial position and cash and debt management. Debt-to-capital and net debt-to-capital are calculated as follows (dollars in thousands):
At December 31,2016
At December 31,2015
Notes payable and other borrowings $ 1,127,314 $ 1,117,040Stockholders’ equity 1,421,495 1,258,937Total capital $ 2,548,809 $ 2,375,977Debt-to-capital (1) 44.2% 47.0%Notes payable and other borrowings $ 1,127,314 $ 1,117,040Less: cash and cash equivalents (131,702) (262,208)Net debt 995,612 854,832Stockholders’ equity 1,421,495 1,258,937Total net capital $ 2,417,107 $ 2,113,769Net debt-to-capital (2) 41.2% 40.4%
(1) Debt-to-capital is computed as senior and convertible senior notes, net and loans payable and other borrowings divided
by the aggregate of total senior and convertible senior notes, net and loans payable and other borrowings and stockholders' equity.
(2) Net debt-to-capital is computed as net debt divided by the aggregate of net debt and stockholders' equity. Net debt is total senior and convertible senior notes, net and loans payable and other borrowings, less cash and cash equivalents. The most directly comparable GAAP financial measure is the ratio of debt to total capital. We believe the ratio of net debt-to-capital is a relevant financial measure for investors to understand the leverage employed in our operations and as an indicator of our ability to obtain financing.
Senior and Convertible Senior Notes
7.15% Senior Notes
During the second quarter of 2010, we completed an offering of $200 million aggregate principal amount of 7.15% senior notes due 2020. The notes were issued at 97.567% of par value to yield 7.50%. In the fourth quarter of 2013, we completed a $100 million add-on offering to these notes at 106.699% of par value to yield 5.875%.
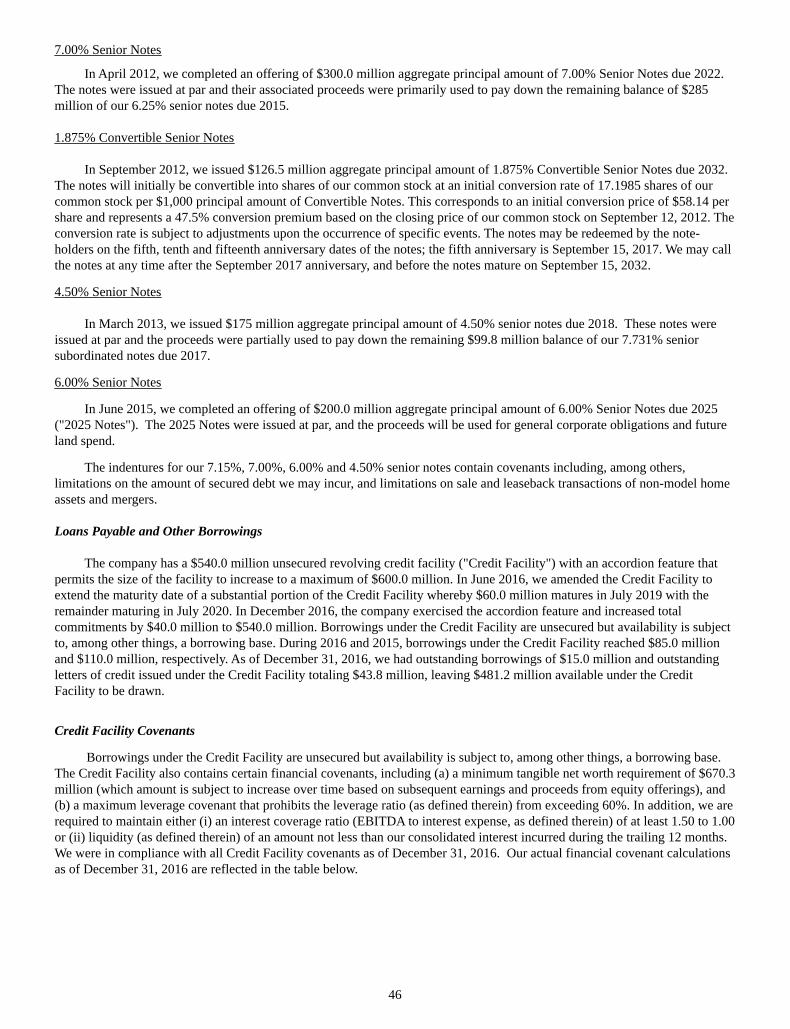
46
7.00% Senior Notes
In April 2012, we completed an offering of $300.0 million aggregate principal amount of 7.00% Senior Notes due 2022. The notes were issued at par and their associated proceeds were primarily used to pay down the remaining balance of $285 million of our 6.25% senior notes due 2015.
1.875% Convertible Senior Notes
In September 2012, we issued $126.5 million aggregate principal amount of 1.875% Convertible Senior Notes due 2032. The notes will initially be convertible into shares of our common stock at an initial conversion rate of 17.1985 shares of our common stock per $1,000 principal amount of Convertible Notes. This corresponds to an initial conversion price of $58.14 per share and represents a 47.5% conversion premium based on the closing price of our common stock on September 12, 2012. The conversion rate is subject to adjustments upon the occurrence of specific events. The notes may be redeemed by the note-holders on the fifth, tenth and fifteenth anniversary dates of the notes; the fifth anniversary is September 15, 2017. We may call the notes at any time after the September 2017 anniversary, and before the notes mature on September 15, 2032.
4.50% Senior Notes
In March 2013, we issued $175 million aggregate principal amount of 4.50% senior notes due 2018. These notes were issued at par and the proceeds were partially used to pay down the remaining $99.8 million balance of our 7.731% senior subordinated notes due 2017.
6.00% Senior Notes
In June 2015, we completed an offering of $200.0 million aggregate principal amount of 6.00% Senior Notes due 2025 ("2025 Notes"). The 2025 Notes were issued at par, and the proceeds will be used for general corporate obligations and future land spend.
The indentures for our 7.15%, 7.00%, 6.00% and 4.50% senior notes contain covenants including, among others, limitations on the amount of secured debt we may incur, and limitations on sale and leaseback transactions of non-model home assets and mergers.
Loans Payable and Other Borrowings
The company has a $540.0 million unsecured revolving credit facility ("Credit Facility") with an accordion feature that permits the size of the facility to increase to a maximum of $600.0 million. In June 2016, we amended the Credit Facility to extend the maturity date of a substantial portion of the Credit Facility whereby $60.0 million matures in July 2019 with the remainder maturing in July 2020. In December 2016, the company exercised the accordion feature and increased total commitments by $40.0 million to $540.0 million. Borrowings under the Credit Facility are unsecured but availability is subject to, among other things, a borrowing base. During 2016 and 2015, borrowings under the Credit Facility reached $85.0 million and $110.0 million, respectively. As of December 31, 2016, we had outstanding borrowings of $15.0 million and outstanding letters of credit issued under the Credit Facility totaling $43.8 million, leaving $481.2 million available under the Credit Facility to be drawn.
Credit Facility Covenants
Borrowings under the Credit Facility are unsecured but availability is subject to, among other things, a borrowing base. The Credit Facility also contains certain financial covenants, including (a) a minimum tangible net worth requirement of $670.3 million (which amount is subject to increase over time based on subsequent earnings and proceeds from equity offerings), and (b) a maximum leverage covenant that prohibits the leverage ratio (as defined therein) from exceeding 60%. In addition, we are required to maintain either (i) an interest coverage ratio (EBITDA to interest expense, as defined therein) of at least 1.50 to 1.00 or (ii) liquidity (as defined therein) of an amount not less than our consolidated interest incurred during the trailing 12 months. We were in compliance with all Credit Facility covenants as of December 31, 2016. Our actual financial covenant calculations as of December 31, 2016 are reflected in the table below.
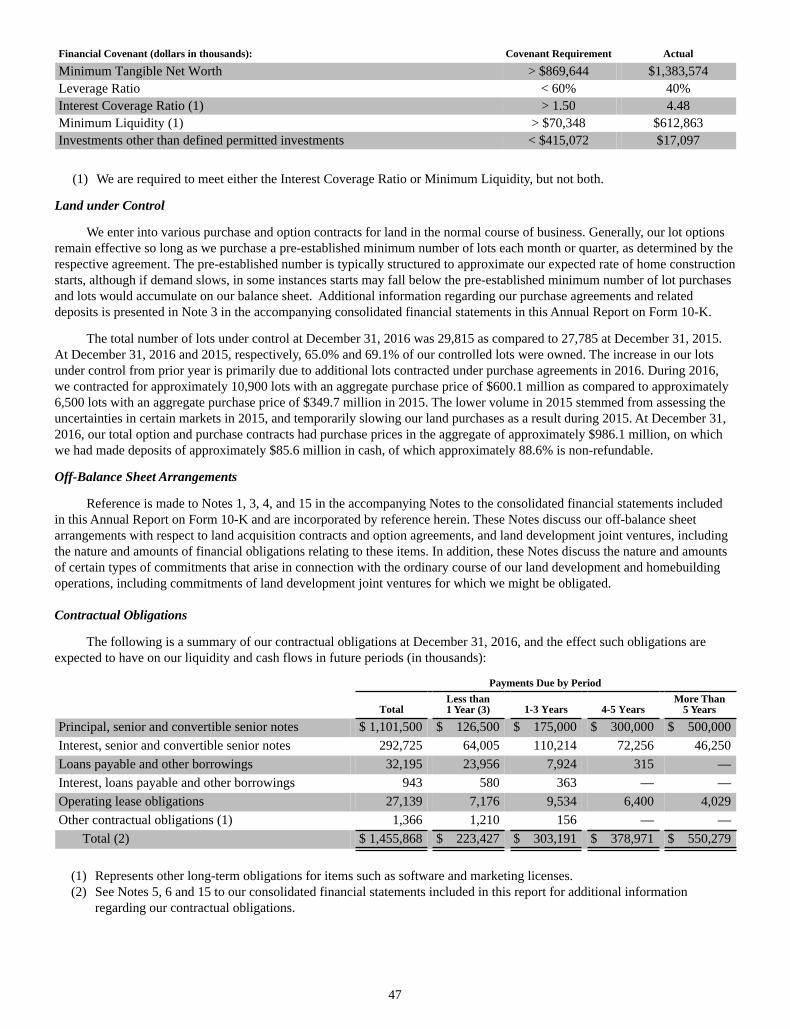
47
Financial Covenant (dollars in thousands): Covenant Requirement Actual
Minimum Tangible Net Worth > $869,644 $1,383,574Leverage Ratio < 60% 40%Interest Coverage Ratio (1) > 1.50 4.48Minimum Liquidity (1) > $70,348 $612,863Investments other than defined permitted investments < $415,072 $17,097
(1) We are required to meet either the Interest Coverage Ratio or Minimum Liquidity, but not both.
Land under Control
We enter into various purchase and option contracts for land in the normal course of business. Generally, our lot options remain effective so long as we purchase a pre-established minimum number of lots each month or quarter, as determined by the respective agreement. The pre-established number is typically structured to approximate our expected rate of home construction starts, although if demand slows, in some instances starts may fall below the pre-established minimum number of lot purchases and lots would accumulate on our balance sheet. Additional information regarding our purchase agreements and related deposits is presented in Note 3 in the accompanying consolidated financial statements in this Annual Report on Form 10-K.
The total number of lots under control at December 31, 2016 was 29,815 as compared to 27,785 at December 31, 2015. At December 31, 2016 and 2015, respectively, 65.0% and 69.1% of our controlled lots were owned. The increase in our lots under control from prior year is primarily due to additional lots contracted under purchase agreements in 2016. During 2016, we contracted for approximately 10,900 lots with an aggregate purchase price of $600.1 million as compared to approximately 6,500 lots with an aggregate purchase price of $349.7 million in 2015. The lower volume in 2015 stemmed from assessing the uncertainties in certain markets in 2015, and temporarily slowing our land purchases as a result during 2015. At December 31, 2016, our total option and purchase contracts had purchase prices in the aggregate of approximately $986.1 million, on which we had made deposits of approximately $85.6 million in cash, of which approximately 88.6% is non-refundable.
Off-Balance Sheet Arrangements
Reference is made to Notes 1, 3, 4, and 15 in the accompanying Notes to the consolidated financial statements included in this Annual Report on Form 10-K and are incorporated by reference herein. These Notes discuss our off-balance sheet arrangements with respect to land acquisition contracts and option agreements, and land development joint ventures, including the nature and amounts of financial obligations relating to these items. In addition, these Notes discuss the nature and amounts of certain types of commitments that arise in connection with the ordinary course of our land development and homebuilding operations, including commitments of land development joint ventures for which we might be obligated.
Contractual Obligations
The following is a summary of our contractual obligations at December 31, 2016, and the effect such obligations are expected to have on our liquidity and cash flows in future periods (in thousands):
Payments Due by Period
TotalLess than1 Year (3) 1-3 Years 4-5 Years
More Than5 Years
Principal, senior and convertible senior notes $ 1,101,500 $ 126,500 $ 175,000 $ 300,000 $ 500,000Interest, senior and convertible senior notes 292,725 64,005 110,214 72,256 46,250Loans payable and other borrowings 32,195 23,956 7,924 315 —Interest, loans payable and other borrowings 943 580 363 — —Operating lease obligations 27,139 7,176 9,534 6,400 4,029Other contractual obligations (1) 1,366 1,210 156 — —
Total (2) $ 1,455,868 $ 223,427 $ 303,191 $ 378,971 $ 550,279
(1) Represents other long-term obligations for items such as software and marketing licenses. (2) See Notes 5, 6 and 15 to our consolidated financial statements included in this report for additional information
regarding our contractual obligations.

48
(3) The Convertible Notes may be redeemed by the note-holders on the fifth, tenth and fifteenth anniversary dates of the Convertible Notes. On such dates, the note-holders may require a repurchase for any portion or all of their outstanding notes. The fifth anniversary of the Convertible Notes is September 15, 2017. The amount due to the note-holders in the event of a repurchase is equal to 100% of the principal amount plus any accrued and unpaid interest. We may call the Convertible Notes at any time after the September 15, 2017 anniversary.
We do not engage in commodity trading or other similar activities. We had no derivative financial instruments at December 31, 2016 or 2015.
Recent Accounting Standards
See Note 1 to our consolidated financial statements included in this report for discussion of recently-issued accounting standards.
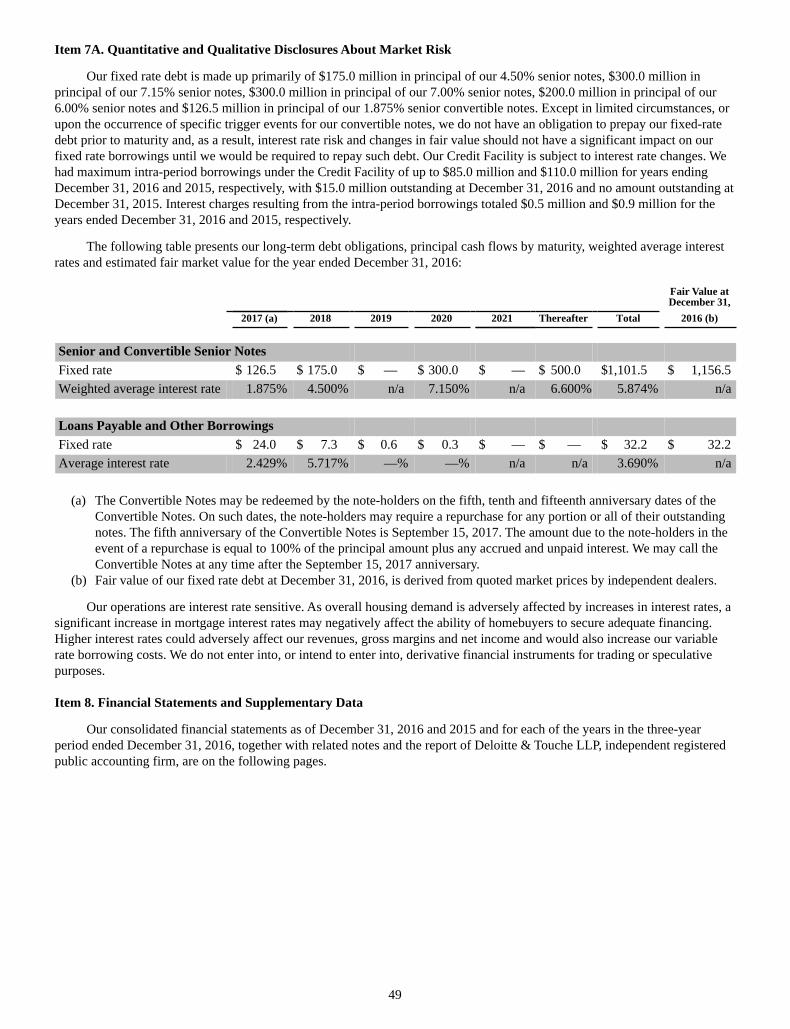
49
Item 7A. Quantitative and Qualitative Disclosures About Market Risk
Our fixed rate debt is made up primarily of $175.0 million in principal of our 4.50% senior notes, $300.0 million in principal of our 7.15% senior notes, $300.0 million in principal of our 7.00% senior notes, $200.0 million in principal of our 6.00% senior notes and $126.5 million in principal of our 1.875% senior convertible notes. Except in limited circumstances, or upon the occurrence of specific trigger events for our convertible notes, we do not have an obligation to prepay our fixed-rate debt prior to maturity and, as a result, interest rate risk and changes in fair value should not have a significant impact on our fixed rate borrowings until we would be required to repay such debt. Our Credit Facility is subject to interest rate changes. We had maximum intra-period borrowings under the Credit Facility of up to $85.0 million and $110.0 million for years ending December 31, 2016 and 2015, respectively, with $15.0 million outstanding at December 31, 2016 and no amount outstanding at December 31, 2015. Interest charges resulting from the intra-period borrowings totaled $0.5 million and $0.9 million for the years ended December 31, 2016 and 2015, respectively.
The following table presents our long-term debt obligations, principal cash flows by maturity, weighted average interest rates and estimated fair market value for the year ended December 31, 2016:
Fair Value atDecember 31,
2017 (a) 2018 2019 2020 2021 Thereafter Total 2016 (b)
Senior and Convertible Senior NotesFixed rate $ 126.5 $ 175.0 $ — $ 300.0 $ — $ 500.0 $1,101.5 $ 1,156.5Weighted average interest rate 1.875% 4.500% n/a 7.150% n/a 6.600% 5.874% n/a
Loans Payable and Other BorrowingsFixed rate $ 24.0 $ 7.3 $ 0.6 $ 0.3 $ — $ — $ 32.2 $ 32.2Average interest rate 2.429% 5.717% —% —% n/a n/a 3.690% n/a
(a) The Convertible Notes may be redeemed by the note-holders on the fifth, tenth and fifteenth anniversary dates of the Convertible Notes. On such dates, the note-holders may require a repurchase for any portion or all of their outstanding notes. The fifth anniversary of the Convertible Notes is September 15, 2017. The amount due to the note-holders in the event of a repurchase is equal to 100% of the principal amount plus any accrued and unpaid interest. We may call the Convertible Notes at any time after the September 15, 2017 anniversary.
(b) Fair value of our fixed rate debt at December 31, 2016, is derived from quoted market prices by independent dealers.
Our operations are interest rate sensitive. As overall housing demand is adversely affected by increases in interest rates, a significant increase in mortgage interest rates may negatively affect the ability of homebuyers to secure adequate financing. Higher interest rates could adversely affect our revenues, gross margins and net income and would also increase our variable rate borrowing costs. We do not enter into, or intend to enter into, derivative financial instruments for trading or speculative purposes.
Item 8. Financial Statements and Supplementary Data
Our consolidated financial statements as of December 31, 2016 and 2015 and for each of the years in the three-year period ended December 31, 2016, together with related notes and the report of Deloitte & Touche LLP, independent registered public accounting firm, are on the following pages.
50
REPORT OF INDEPENDENT REGISTERED PUBLIC ACCOUNTING FIRM
To the Board of Directors and Stockholders of
Meritage Homes Corporation
Scottsdale, Arizona
We have audited the accompanying consolidated balance sheets of Meritage Homes Corporation and subsidiaries (the "Company") as of December 31, 2016 and 2015, and the related consolidated statements of operations, stockholders' equity, and cash flows for each of the three years in the period ended December 31, 2016. These financial statements are the responsibility of the Company's management. Our responsibility is to express an opinion on these financial statements based on our audits.
We conducted our audits in accordance with the standards of the Public Company Accounting Oversight Board (United States). Those standards require that we plan and perform the audit to obtain reasonable assurance about whether the financial statements are free of material misstatement. An audit includes examining, on a test basis, evidence supporting the amounts and disclosures in the financial statements. An audit also includes assessing the accounting principles used and significant estimates made by management, as well as evaluating the overall financial statement presentation. We believe that our audits provide a reasonable basis for our opinion.
In our opinion, such consolidated financial statements present fairly, in all material respects, the financial position of Meritage Homes Corporation and subsidiaries as of December 31, 2016 and 2015, and the results of their operations and their cash flows for each of the three years in the period ended December 31, 2016, in conformity with accounting principles generally accepted in the United States of America.
We have also audited, in accordance with the standards of the Public Company Accounting Oversight Board (United States), the Company's internal control over financial reporting as of December 31, 2016, based on the criteria established in Internal Control - Integrated Framework (2013) issued by the Committee of Sponsoring Organizations of the Treadway Commission and our report dated February 17, 2017 expressed an unqualified opinion on the Company's internal control over financial reporting.
/s/ DELOITTE & TOUCHE LLP
Phoenix, Arizona
February 17, 2017
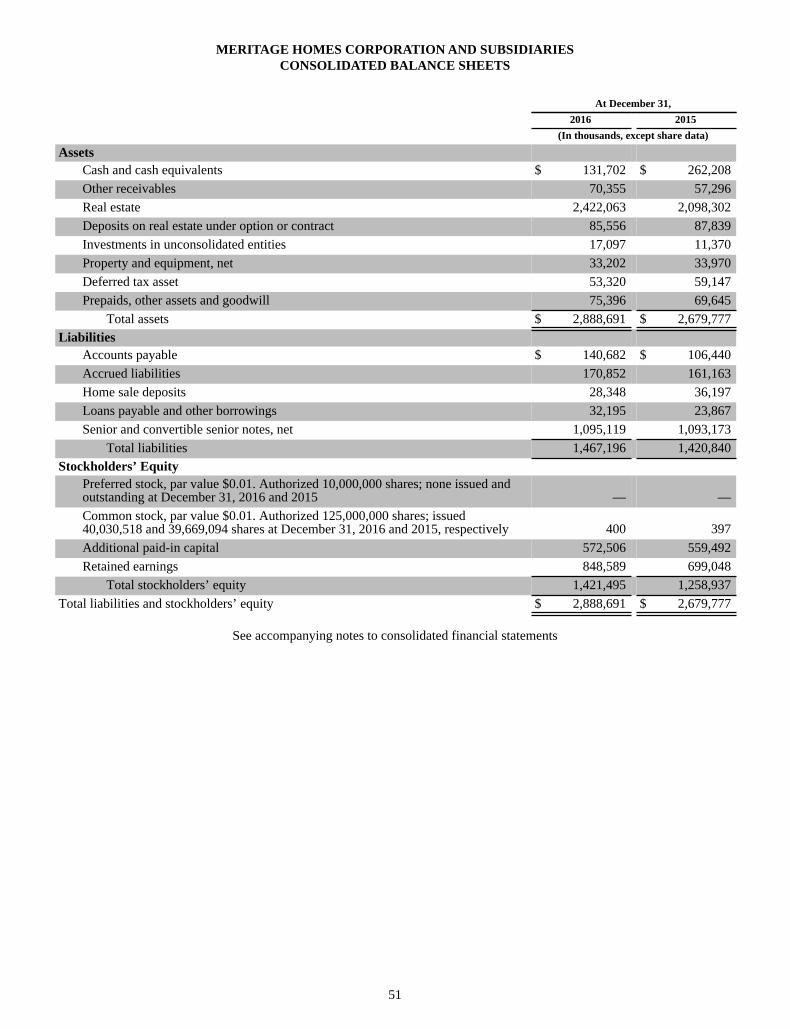
51
MERITAGE HOMES CORPORATION AND SUBSIDIARIESCONSOLIDATED BALANCE SHEETS
At December 31, 2016 2015 (In thousands, except share data)
AssetsCash and cash equivalents $ 131,702 $ 262,208Other receivables 70,355 57,296Real estate 2,422,063 2,098,302Deposits on real estate under option or contract 85,556 87,839Investments in unconsolidated entities 17,097 11,370Property and equipment, net 33,202 33,970Deferred tax asset 53,320 59,147Prepaids, other assets and goodwill 75,396 69,645
Total assets $ 2,888,691 $ 2,679,777Liabilities
Accounts payable $ 140,682 $ 106,440Accrued liabilities 170,852 161,163Home sale deposits 28,348 36,197Loans payable and other borrowings 32,195 23,867Senior and convertible senior notes, net 1,095,119 1,093,173
Total liabilities 1,467,196 1,420,840Stockholders’ Equity
Preferred stock, par value $0.01. Authorized 10,000,000 shares; none issued andoutstanding at December 31, 2016 and 2015 — —Common stock, par value $0.01. Authorized 125,000,000 shares; issued40,030,518 and 39,669,094 shares at December 31, 2016 and 2015, respectively 400 397Additional paid-in capital 572,506 559,492Retained earnings 848,589 699,048
Total stockholders’ equity 1,421,495 1,258,937Total liabilities and stockholders’ equity $ 2,888,691 $ 2,679,777
See accompanying notes to consolidated financial statements
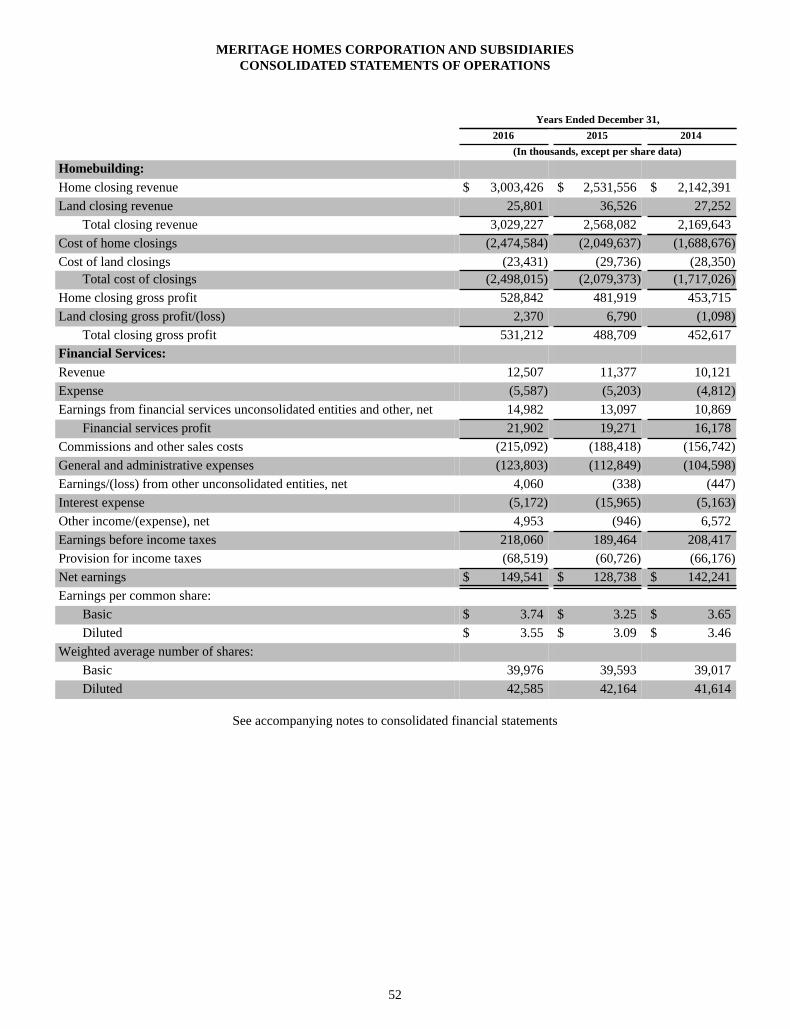
52
MERITAGE HOMES CORPORATION AND SUBSIDIARIESCONSOLIDATED STATEMENTS OF OPERATIONS
Years Ended December 31, 2016 2015 2014 (In thousands, except per share data)
Homebuilding:Home closing revenue $ 3,003,426 $ 2,531,556 $ 2,142,391Land closing revenue 25,801 36,526 27,252
Total closing revenue 3,029,227 2,568,082 2,169,643Cost of home closings (2,474,584) (2,049,637) (1,688,676)Cost of land closings (23,431) (29,736) (28,350)
Total cost of closings (2,498,015) (2,079,373) (1,717,026)Home closing gross profit 528,842 481,919 453,715Land closing gross profit/(loss) 2,370 6,790 (1,098)
Total closing gross profit 531,212 488,709 452,617Financial Services:Revenue 12,507 11,377 10,121Expense (5,587) (5,203) (4,812)Earnings from financial services unconsolidated entities and other, net 14,982 13,097 10,869
Financial services profit 21,902 19,271 16,178Commissions and other sales costs (215,092) (188,418) (156,742)General and administrative expenses (123,803) (112,849) (104,598)Earnings/(loss) from other unconsolidated entities, net 4,060 (338) (447)Interest expense (5,172) (15,965) (5,163)Other income/(expense), net 4,953 (946) 6,572Earnings before income taxes 218,060 189,464 208,417Provision for income taxes (68,519) (60,726) (66,176)Net earnings $ 149,541 $ 128,738 $ 142,241Earnings per common share:
Basic $ 3.74 $ 3.25 $ 3.65Diluted $ 3.55 $ 3.09 $ 3.46
Weighted average number of shares:Basic 39,976 39,593 39,017Diluted 42,585 42,164 41,614
See accompanying notes to consolidated financial statements
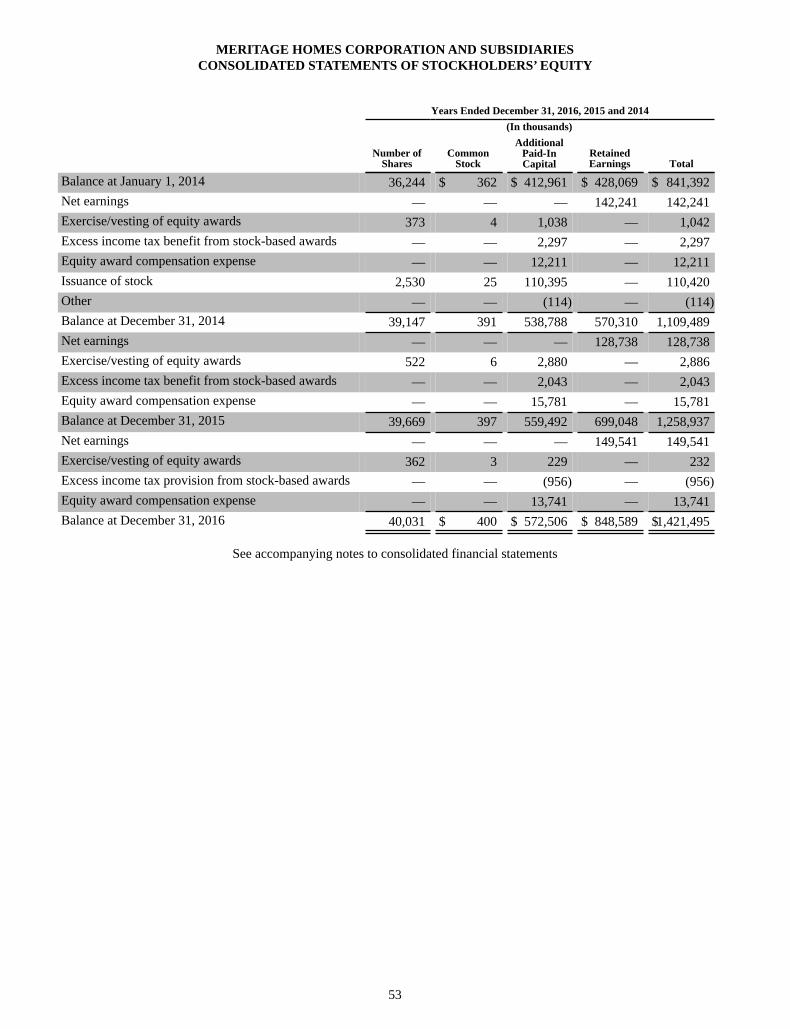
53
MERITAGE HOMES CORPORATION AND SUBSIDIARIESCONSOLIDATED STATEMENTS OF STOCKHOLDERS’ EQUITY
Years Ended December 31, 2016, 2015 and 2014 (In thousands)
Number of
SharesCommon
Stock
AdditionalPaid-InCapital
RetainedEarnings Total
Balance at January 1, 2014 36,244 $ 362 $ 412,961 $ 428,069 $ 841,392Net earnings — — — 142,241 142,241Exercise/vesting of equity awards 373 4 1,038 — 1,042Excess income tax benefit from stock-based awards — — 2,297 — 2,297Equity award compensation expense — — 12,211 — 12,211Issuance of stock 2,530 25 110,395 — 110,420Other — — (114) — (114)Balance at December 31, 2014 39,147 391 538,788 570,310 1,109,489Net earnings — — — 128,738 128,738Exercise/vesting of equity awards 522 6 2,880 — 2,886Excess income tax benefit from stock-based awards — — 2,043 — 2,043Equity award compensation expense — — 15,781 — 15,781Balance at December 31, 2015 39,669 397 559,492 699,048 1,258,937Net earnings — — — 149,541 149,541Exercise/vesting of equity awards 362 3 229 — 232Excess income tax provision from stock-based awards — — (956) — (956)Equity award compensation expense — — 13,741 — 13,741Balance at December 31, 2016 40,031 $ 400 $ 572,506 $ 848,589 $1,421,495
See accompanying notes to consolidated financial statements
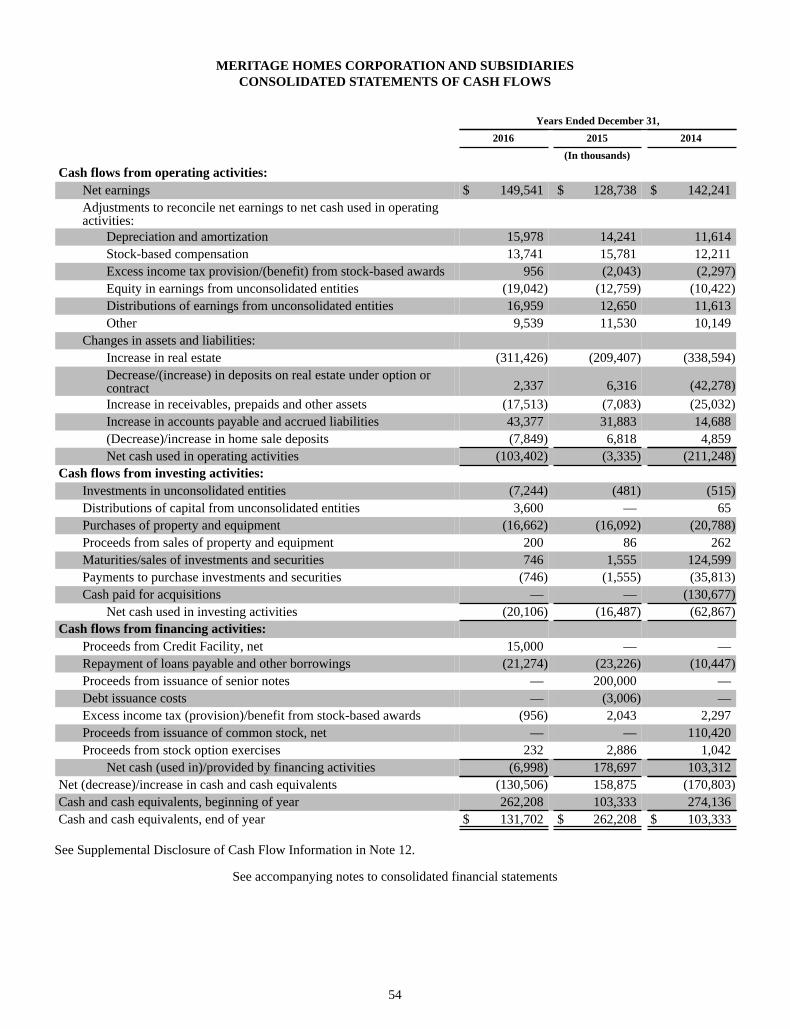
54
MERITAGE HOMES CORPORATION AND SUBSIDIARIESCONSOLIDATED STATEMENTS OF CASH FLOWS
Years Ended December 31, 2016 2015 2014 (In thousands)
Cash flows from operating activities:Net earnings $ 149,541 $ 128,738 $ 142,241Adjustments to reconcile net earnings to net cash used in operatingactivities:
Depreciation and amortization 15,978 14,241 11,614Stock-based compensation 13,741 15,781 12,211Excess income tax provision/(benefit) from stock-based awards 956 (2,043) (2,297)Equity in earnings from unconsolidated entities (19,042) (12,759) (10,422)Distributions of earnings from unconsolidated entities 16,959 12,650 11,613Other 9,539 11,530 10,149
Changes in assets and liabilities:Increase in real estate (311,426) (209,407) (338,594)Decrease/(increase) in deposits on real estate under option orcontract 2,337 6,316 (42,278)Increase in receivables, prepaids and other assets (17,513) (7,083) (25,032)Increase in accounts payable and accrued liabilities 43,377 31,883 14,688(Decrease)/increase in home sale deposits (7,849) 6,818 4,859Net cash used in operating activities (103,402) (3,335) (211,248)
Cash flows from investing activities:Investments in unconsolidated entities (7,244) (481) (515)Distributions of capital from unconsolidated entities 3,600 — 65Purchases of property and equipment (16,662) (16,092) (20,788)Proceeds from sales of property and equipment 200 86 262Maturities/sales of investments and securities 746 1,555 124,599Payments to purchase investments and securities (746) (1,555) (35,813)Cash paid for acquisitions — — (130,677)
Net cash used in investing activities (20,106) (16,487) (62,867)Cash flows from financing activities:
Proceeds from Credit Facility, net 15,000 — —Repayment of loans payable and other borrowings (21,274) (23,226) (10,447)Proceeds from issuance of senior notes — 200,000 —Debt issuance costs — (3,006) —Excess income tax (provision)/benefit from stock-based awards (956) 2,043 2,297Proceeds from issuance of common stock, net — — 110,420Proceeds from stock option exercises 232 2,886 1,042
Net cash (used in)/provided by financing activities (6,998) 178,697 103,312Net (decrease)/increase in cash and cash equivalents (130,506) 158,875 (170,803)Cash and cash equivalents, beginning of year 262,208 103,333 274,136Cash and cash equivalents, end of year $ 131,702 $ 262,208 $ 103,333
See Supplemental Disclosure of Cash Flow Information in Note 12.
See accompanying notes to consolidated financial statements
55
MERITAGE HOMES CORPORATION AND SUBSIDIARIESNOTES TO CONSOLIDATED FINANCIAL STATEMENTS
December 31, 2016, 2015 and 2014
NOTE 1 — BUSINESS AND SUMMARY OF SIGNIFICANT ACCOUNTING POLICIES
Organization. Meritage Homes is a leading designer and builder of single-family homes. We primarily build in historically high-growth regions of the United States and offer a variety of homes that are designed to appeal to a wide range of homebuyers, including first-time, move-up, active adult and luxury. We have homebuilding operations in three regions: West, Central and East, which are comprised of nine states: Arizona, California, Colorado, Texas, Florida, Georgia, North Carolina, South Carolina and Tennessee. We also operate a wholly-owned title company, Carefree Title Agency, Inc. ("Carefree Title"). Carefree Title's core business includes title insurance and closing/settlement services we offer to our homebuyers. Through our successors, we commenced our homebuilding operations in 1985. Meritage Homes Corporation was incorporated in 1988 in the state of Maryland.
Our homebuilding and marketing activities are conducted under the name of Meritage Homes in each of our homebuilding markets. We also operate under the name Monterey Homes in some markets. At December 31, 2016, we were actively selling homes in 243 communities, with base prices ranging from approximately $162,000 to $1,440,000.
Basis of Presentation. The accompanying consolidated financial statements have been prepared in accordance with accounting principles generally accepted in the United States (“GAAP”) and include the accounts of Meritage Homes Corporation and those of our consolidated subsidiaries, partnerships and other entities in which we have a controlling financial interest, and of variable interest entities (see Note 3) in which we are deemed the primary beneficiary (collectively, “us”, “we”, “our” and the “Company”). Intercompany balances and transactions have been eliminated in consolidation.
Cash and Cash Equivalents. Liquid investments with an initial maturity of three months or less are classified as cash equivalents. Amounts in transit from title companies for home closings of approximately $75.3 million and $74.5 million are included in cash and cash equivalents at December 31, 2016 and 2015, respectively. Included in our balance as of December 31, 2016 and December 31, 2015 is $0.1 million and $20.0 million, respectively, of money market funds that are invested in short term (three months or less) government securities.
Real Estate. Real estate is stated at cost unless the asset is determined to be impaired, at which point the inventory is written down to fair value as required by Accounting Standards Codification (“ASC”) 360-10, Property, Plant and Equipment (“ASC 360-10”). Inventory includes the costs of land acquisition, land development, home construction, capitalized interest, real estate taxes, capitalized direct overhead costs incurred during development and home construction that benefit the entire community, less impairments, if any. Land and development costs are typically allocated and transferred to homes under construction when construction begins. Home construction costs are accumulated on a per-home basis, while selling costs are expensed as incurred. Cost of home closings includes the specific construction costs of the home and all related allocated land acquisition, land development and other common costs (both incurred and estimated to be incurred) that are allocated based upon the total number of homes expected to be closed in each community or phase. Any changes to the estimated total development costs of a community or phase are allocated to the remaining homes in the community or phase. When a home closes, we may have incurred costs for goods and services that have not yet been paid. An accrued liability to capture such obligations is recorded in connection with the home closing and charged directly to cost of sales.
We rely on certain estimates to determine our construction and land development costs. Construction and land costs are comprised of direct and allocated costs, including estimated future costs. In determining these costs, we compile project budgets that are based on a variety of assumptions, including future construction schedules and costs to be incurred. Actual results can differ from budgeted amounts for various reasons, including construction delays, labor or material shortages, increases in costs that have not yet been committed, changes in governmental requirements, or other unanticipated issues encountered during construction and development and other factors beyond our control. To address uncertainty in these budgets, we assess, update and revise project budgets on a regular basis, utilizing the most current information available to estimate construction and land costs.
Typically, a community's life cycle ranges from three to five years, commencing with the acquisition of the land, continuing through the land development phase, if applicable, and concluding with the sale, construction and closing of the homes. Actual community lives will vary based on the size of the community, the sales absorption rate and whether the land purchased was raw, partially-developed or in finished status. Master-planned communities encompassing several phases and
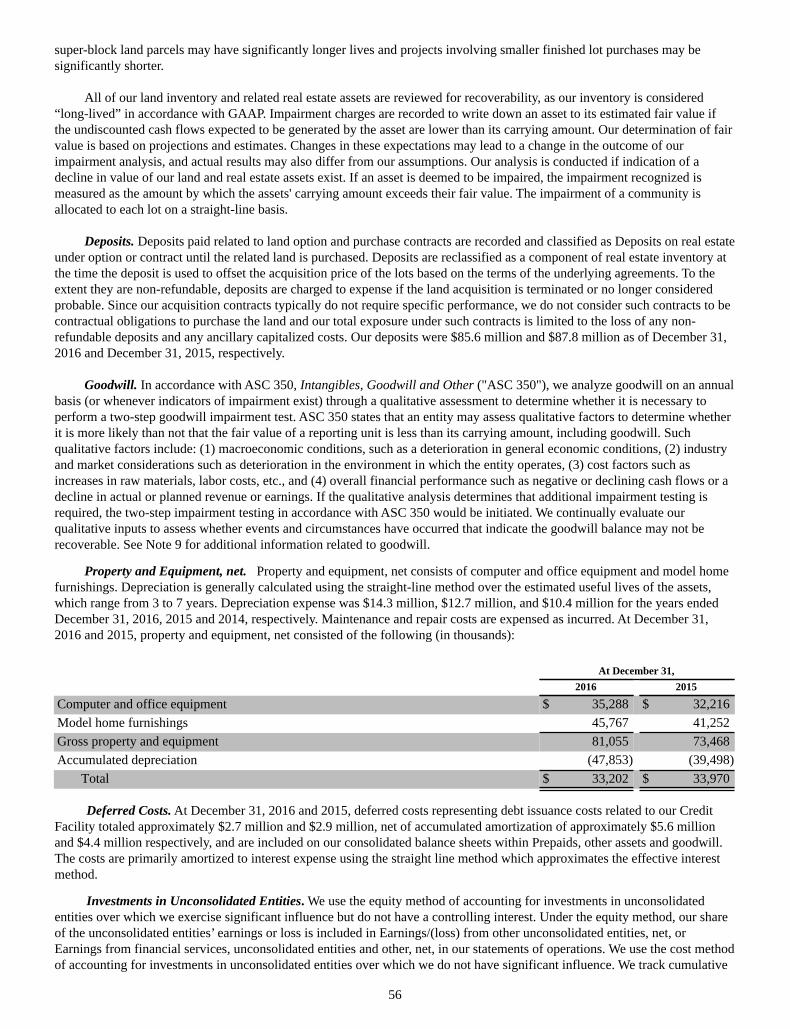
56
super-block land parcels may have significantly longer lives and projects involving smaller finished lot purchases may be significantly shorter.
All of our land inventory and related real estate assets are reviewed for recoverability, as our inventory is considered “long-lived” in accordance with GAAP. Impairment charges are recorded to write down an asset to its estimated fair value if the undiscounted cash flows expected to be generated by the asset are lower than its carrying amount. Our determination of fair value is based on projections and estimates. Changes in these expectations may lead to a change in the outcome of our impairment analysis, and actual results may also differ from our assumptions. Our analysis is conducted if indication of a decline in value of our land and real estate assets exist. If an asset is deemed to be impaired, the impairment recognized is measured as the amount by which the assets' carrying amount exceeds their fair value. The impairment of a community is allocated to each lot on a straight-line basis.
Deposits. Deposits paid related to land option and purchase contracts are recorded and classified as Deposits on real estate under option or contract until the related land is purchased. Deposits are reclassified as a component of real estate inventory at the time the deposit is used to offset the acquisition price of the lots based on the terms of the underlying agreements. To the extent they are non-refundable, deposits are charged to expense if the land acquisition is terminated or no longer considered probable. Since our acquisition contracts typically do not require specific performance, we do not consider such contracts to be contractual obligations to purchase the land and our total exposure under such contracts is limited to the loss of any non-refundable deposits and any ancillary capitalized costs. Our deposits were $85.6 million and $87.8 million as of December 31, 2016 and December 31, 2015, respectively.
Goodwill. In accordance with ASC 350, Intangibles, Goodwill and Other ("ASC 350"), we analyze goodwill on an annual basis (or whenever indicators of impairment exist) through a qualitative assessment to determine whether it is necessary to perform a two-step goodwill impairment test. ASC 350 states that an entity may assess qualitative factors to determine whether it is more likely than not that the fair value of a reporting unit is less than its carrying amount, including goodwill. Such qualitative factors include: (1) macroeconomic conditions, such as a deterioration in general economic conditions, (2) industry and market considerations such as deterioration in the environment in which the entity operates, (3) cost factors such as increases in raw materials, labor costs, etc., and (4) overall financial performance such as negative or declining cash flows or a decline in actual or planned revenue or earnings. If the qualitative analysis determines that additional impairment testing is required, the two-step impairment testing in accordance with ASC 350 would be initiated. We continually evaluate our qualitative inputs to assess whether events and circumstances have occurred that indicate the goodwill balance may not be recoverable. See Note 9 for additional information related to goodwill.
Property and Equipment, net. Property and equipment, net consists of computer and office equipment and model home furnishings. Depreciation is generally calculated using the straight-line method over the estimated useful lives of the assets, which range from 3 to 7 years. Depreciation expense was $14.3 million, $12.7 million, and $10.4 million for the years ended December 31, 2016, 2015 and 2014, respectively. Maintenance and repair costs are expensed as incurred. At December 31, 2016 and 2015, property and equipment, net consisted of the following (in thousands):
At December 31, 2016 2015
Computer and office equipment $ 35,288 $ 32,216Model home furnishings 45,767 41,252Gross property and equipment 81,055 73,468Accumulated depreciation (47,853) (39,498)
Total $ 33,202 $ 33,970
Deferred Costs. At December 31, 2016 and 2015, deferred costs representing debt issuance costs related to our Credit Facility totaled approximately $2.7 million and $2.9 million, net of accumulated amortization of approximately $5.6 million and $4.4 million respectively, and are included on our consolidated balance sheets within Prepaids, other assets and goodwill. The costs are primarily amortized to interest expense using the straight line method which approximates the effective interest method.
Investments in Unconsolidated Entities. We use the equity method of accounting for investments in unconsolidated entities over which we exercise significant influence but do not have a controlling interest. Under the equity method, our share of the unconsolidated entities’ earnings or loss is included in Earnings/(loss) from other unconsolidated entities, net, or Earnings from financial services, unconsolidated entities and other, net, in our statements of operations. We use the cost method of accounting for investments in unconsolidated entities over which we do not have significant influence. We track cumulative
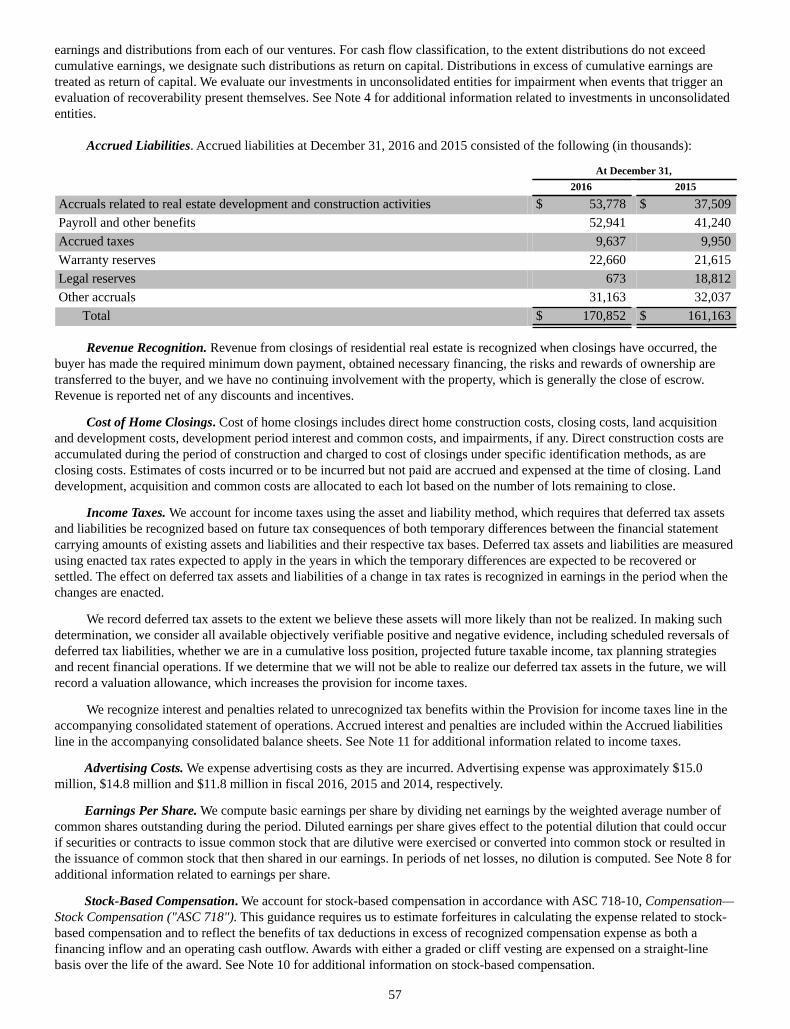
57
earnings and distributions from each of our ventures. For cash flow classification, to the extent distributions do not exceed cumulative earnings, we designate such distributions as return on capital. Distributions in excess of cumulative earnings are treated as return of capital. We evaluate our investments in unconsolidated entities for impairment when events that trigger an evaluation of recoverability present themselves. See Note 4 for additional information related to investments in unconsolidated entities.
Accrued Liabilities. Accrued liabilities at December 31, 2016 and 2015 consisted of the following (in thousands):
At December 31, 2016 2015
Accruals related to real estate development and construction activities $ 53,778 $ 37,509Payroll and other benefits 52,941 41,240Accrued taxes 9,637 9,950Warranty reserves 22,660 21,615Legal reserves 673 18,812Other accruals 31,163 32,037
Total $ 170,852 $ 161,163
Revenue Recognition. Revenue from closings of residential real estate is recognized when closings have occurred, the buyer has made the required minimum down payment, obtained necessary financing, the risks and rewards of ownership are transferred to the buyer, and we have no continuing involvement with the property, which is generally the close of escrow. Revenue is reported net of any discounts and incentives.
Cost of Home Closings. Cost of home closings includes direct home construction costs, closing costs, land acquisition and development costs, development period interest and common costs, and impairments, if any. Direct construction costs are accumulated during the period of construction and charged to cost of closings under specific identification methods, as are closing costs. Estimates of costs incurred or to be incurred but not paid are accrued and expensed at the time of closing. Land development, acquisition and common costs are allocated to each lot based on the number of lots remaining to close.
Income Taxes. We account for income taxes using the asset and liability method, which requires that deferred tax assets and liabilities be recognized based on future tax consequences of both temporary differences between the financial statement carrying amounts of existing assets and liabilities and their respective tax bases. Deferred tax assets and liabilities are measured using enacted tax rates expected to apply in the years in which the temporary differences are expected to be recovered or settled. The effect on deferred tax assets and liabilities of a change in tax rates is recognized in earnings in the period when the changes are enacted.
We record deferred tax assets to the extent we believe these assets will more likely than not be realized. In making such determination, we consider all available objectively verifiable positive and negative evidence, including scheduled reversals of deferred tax liabilities, whether we are in a cumulative loss position, projected future taxable income, tax planning strategies and recent financial operations. If we determine that we will not be able to realize our deferred tax assets in the future, we will record a valuation allowance, which increases the provision for income taxes.
We recognize interest and penalties related to unrecognized tax benefits within the Provision for income taxes line in the accompanying consolidated statement of operations. Accrued interest and penalties are included within the Accrued liabilities line in the accompanying consolidated balance sheets. See Note 11 for additional information related to income taxes.
Advertising Costs. We expense advertising costs as they are incurred. Advertising expense was approximately $15.0 million, $14.8 million and $11.8 million in fiscal 2016, 2015 and 2014, respectively.
Earnings Per Share. We compute basic earnings per share by dividing net earnings by the weighted average number of common shares outstanding during the period. Diluted earnings per share gives effect to the potential dilution that could occur if securities or contracts to issue common stock that are dilutive were exercised or converted into common stock or resulted in the issuance of common stock that then shared in our earnings. In periods of net losses, no dilution is computed. See Note 8 for additional information related to earnings per share.
Stock-Based Compensation. We account for stock-based compensation in accordance with ASC 718-10, Compensation—Stock Compensation ("ASC 718"). This guidance requires us to estimate forfeitures in calculating the expense related to stock-based compensation and to reflect the benefits of tax deductions in excess of recognized compensation expense as both a financing inflow and an operating cash outflow. Awards with either a graded or cliff vesting are expensed on a straight-line basis over the life of the award. See Note 10 for additional information on stock-based compensation.
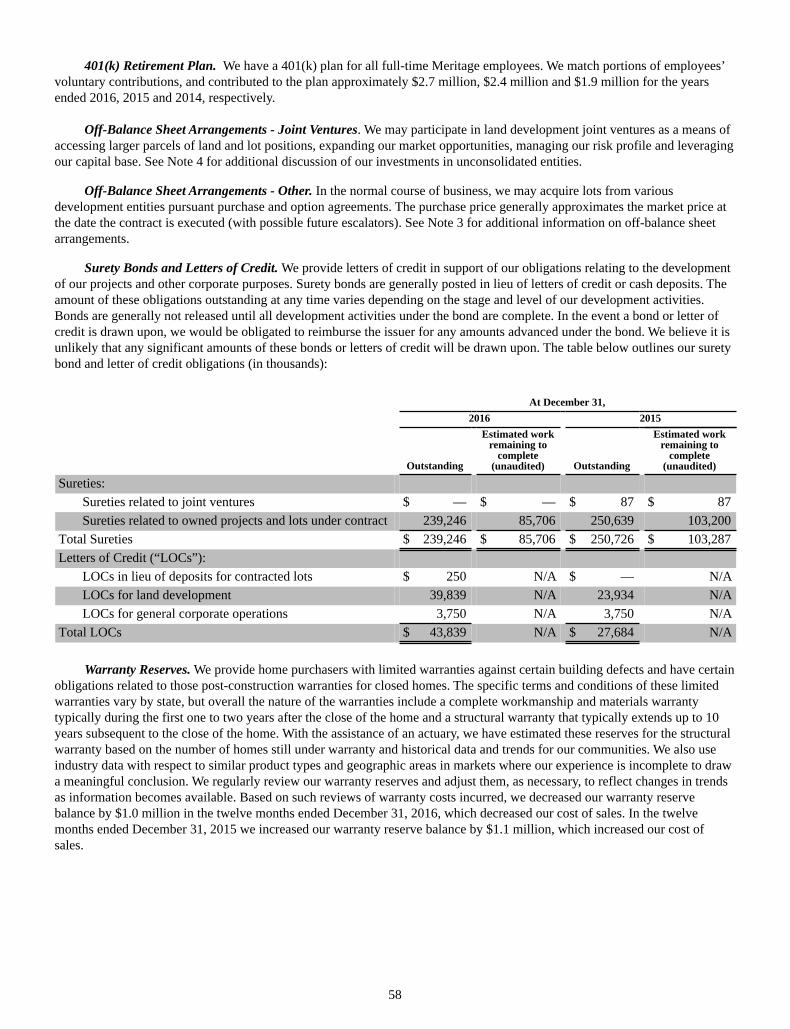
58
401(k) Retirement Plan. We have a 401(k) plan for all full-time Meritage employees. We match portions of employees’ voluntary contributions, and contributed to the plan approximately $2.7 million, $2.4 million and $1.9 million for the years ended 2016, 2015 and 2014, respectively.
Off-Balance Sheet Arrangements - Joint Ventures. We may participate in land development joint ventures as a means of accessing larger parcels of land and lot positions, expanding our market opportunities, managing our risk profile and leveraging our capital base. See Note 4 for additional discussion of our investments in unconsolidated entities.
Off-Balance Sheet Arrangements - Other. In the normal course of business, we may acquire lots from various development entities pursuant purchase and option agreements. The purchase price generally approximates the market price at the date the contract is executed (with possible future escalators). See Note 3 for additional information on off-balance sheet arrangements.
Surety Bonds and Letters of Credit. We provide letters of credit in support of our obligations relating to the development of our projects and other corporate purposes. Surety bonds are generally posted in lieu of letters of credit or cash deposits. The amount of these obligations outstanding at any time varies depending on the stage and level of our development activities. Bonds are generally not released until all development activities under the bond are complete. In the event a bond or letter of credit is drawn upon, we would be obligated to reimburse the issuer for any amounts advanced under the bond. We believe it is unlikely that any significant amounts of these bonds or letters of credit will be drawn upon. The table below outlines our surety bond and letter of credit obligations (in thousands):
At December 31, 2016 2015
Outstanding
Estimated workremaining to
complete (unaudited) Outstanding
Estimated workremaining to
complete (unaudited)
Sureties:Sureties related to joint ventures $ — $ — $ 87 $ 87Sureties related to owned projects and lots under contract 239,246 85,706 250,639 103,200
Total Sureties $ 239,246 $ 85,706 $ 250,726 $ 103,287Letters of Credit (“LOCs”):
LOCs in lieu of deposits for contracted lots $ 250 N/A $ — N/ALOCs for land development 39,839 N/A 23,934 N/ALOCs for general corporate operations 3,750 N/A 3,750 N/A
Total LOCs $ 43,839 N/A $ 27,684 N/A
Warranty Reserves. We provide home purchasers with limited warranties against certain building defects and have certain obligations related to those post-construction warranties for closed homes. The specific terms and conditions of these limited warranties vary by state, but overall the nature of the warranties include a complete workmanship and materials warranty typically during the first one to two years after the close of the home and a structural warranty that typically extends up to 10 years subsequent to the close of the home. With the assistance of an actuary, we have estimated these reserves for the structural warranty based on the number of homes still under warranty and historical data and trends for our communities. We also use industry data with respect to similar product types and geographic areas in markets where our experience is incomplete to draw a meaningful conclusion. We regularly review our warranty reserves and adjust them, as necessary, to reflect changes in trends as information becomes available. Based on such reviews of warranty costs incurred, we decreased our warranty reserve balance by $1.0 million in the twelve months ended December 31, 2016, which decreased our cost of sales. In the twelve months ended December 31, 2015 we increased our warranty reserve balance by $1.1 million, which increased our cost of sales.
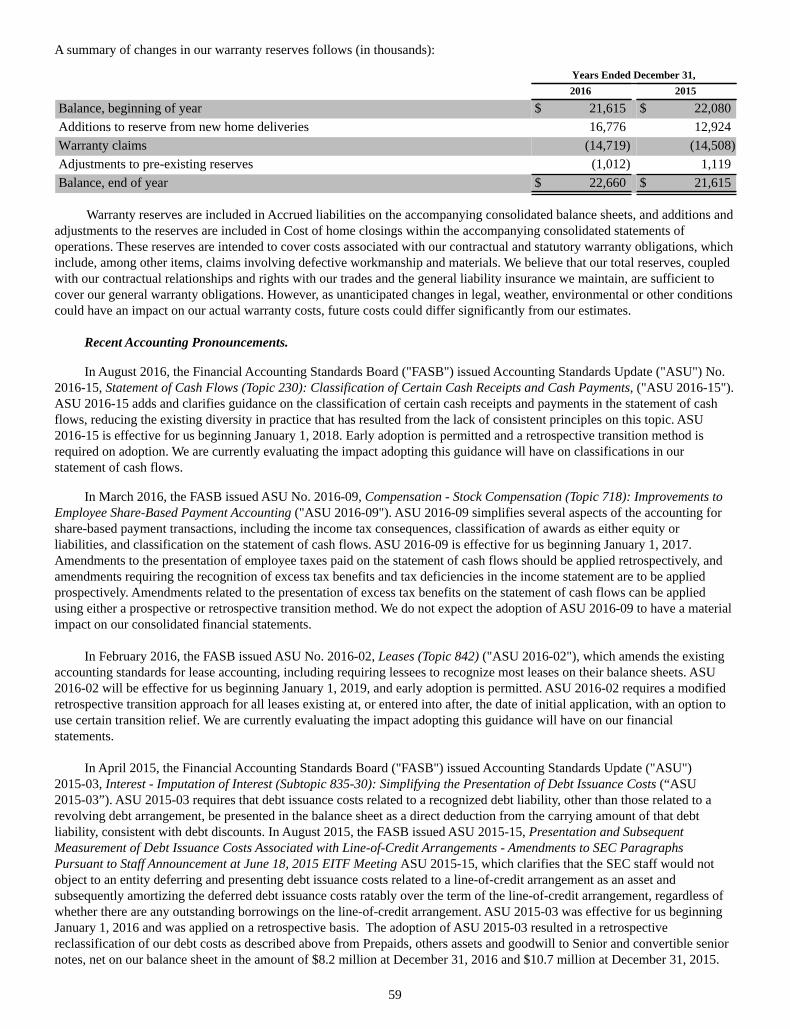
59
A summary of changes in our warranty reserves follows (in thousands):
Years Ended December 31, 2016 2015
Balance, beginning of year $ 21,615 $ 22,080Additions to reserve from new home deliveries 16,776 12,924Warranty claims (14,719) (14,508)Adjustments to pre-existing reserves (1,012) 1,119Balance, end of year $ 22,660 $ 21,615
Warranty reserves are included in Accrued liabilities on the accompanying consolidated balance sheets, and additions and adjustments to the reserves are included in Cost of home closings within the accompanying consolidated statements of operations. These reserves are intended to cover costs associated with our contractual and statutory warranty obligations, which include, among other items, claims involving defective workmanship and materials. We believe that our total reserves, coupled with our contractual relationships and rights with our trades and the general liability insurance we maintain, are sufficient to cover our general warranty obligations. However, as unanticipated changes in legal, weather, environmental or other conditions could have an impact on our actual warranty costs, future costs could differ significantly from our estimates.
Recent Accounting Pronouncements.
In August 2016, the Financial Accounting Standards Board ("FASB") issued Accounting Standards Update ("ASU") No. 2016-15, Statement of Cash Flows (Topic 230): Classification of Certain Cash Receipts and Cash Payments, ("ASU 2016-15"). ASU 2016-15 adds and clarifies guidance on the classification of certain cash receipts and payments in the statement of cash flows, reducing the existing diversity in practice that has resulted from the lack of consistent principles on this topic. ASU 2016-15 is effective for us beginning January 1, 2018. Early adoption is permitted and a retrospective transition method is required on adoption. We are currently evaluating the impact adopting this guidance will have on classifications in our statement of cash flows.
In March 2016, the FASB issued ASU No. 2016-09, Compensation - Stock Compensation (Topic 718): Improvements to Employee Share-Based Payment Accounting ("ASU 2016-09"). ASU 2016-09 simplifies several aspects of the accounting for share-based payment transactions, including the income tax consequences, classification of awards as either equity or liabilities, and classification on the statement of cash flows. ASU 2016-09 is effective for us beginning January 1, 2017. Amendments to the presentation of employee taxes paid on the statement of cash flows should be applied retrospectively, and amendments requiring the recognition of excess tax benefits and tax deficiencies in the income statement are to be applied prospectively. Amendments related to the presentation of excess tax benefits on the statement of cash flows can be applied using either a prospective or retrospective transition method. We do not expect the adoption of ASU 2016-09 to have a material impact on our consolidated financial statements.
In February 2016, the FASB issued ASU No. 2016-02, Leases (Topic 842) ("ASU 2016-02"), which amends the existing accounting standards for lease accounting, including requiring lessees to recognize most leases on their balance sheets. ASU 2016-02 will be effective for us beginning January 1, 2019, and early adoption is permitted. ASU 2016-02 requires a modified retrospective transition approach for all leases existing at, or entered into after, the date of initial application, with an option to use certain transition relief. We are currently evaluating the impact adopting this guidance will have on our financial statements.
In April 2015, the Financial Accounting Standards Board ("FASB") issued Accounting Standards Update ("ASU") 2015-03, Interest - Imputation of Interest (Subtopic 835-30): Simplifying the Presentation of Debt Issuance Costs (“ASU 2015-03”). ASU 2015-03 requires that debt issuance costs related to a recognized debt liability, other than those related to a revolving debt arrangement, be presented in the balance sheet as a direct deduction from the carrying amount of that debt liability, consistent with debt discounts. In August 2015, the FASB issued ASU 2015-15, Presentation and Subsequent Measurement of Debt Issuance Costs Associated with Line-of-Credit Arrangements - Amendments to SEC Paragraphs Pursuant to Staff Announcement at June 18, 2015 EITF Meeting ASU 2015-15, which clarifies that the SEC staff would not object to an entity deferring and presenting debt issuance costs related to a line-of-credit arrangement as an asset and subsequently amortizing the deferred debt issuance costs ratably over the term of the line-of-credit arrangement, regardless of whether there are any outstanding borrowings on the line-of-credit arrangement. ASU 2015-03 was effective for us beginning January 1, 2016 and was applied on a retrospective basis. The adoption of ASU 2015-03 resulted in a retrospective reclassification of our debt costs as described above from Prepaids, others assets and goodwill to Senior and convertible senior notes, net on our balance sheet in the amount of $8.2 million at December 31, 2016 and $10.7 million at December 31, 2015.
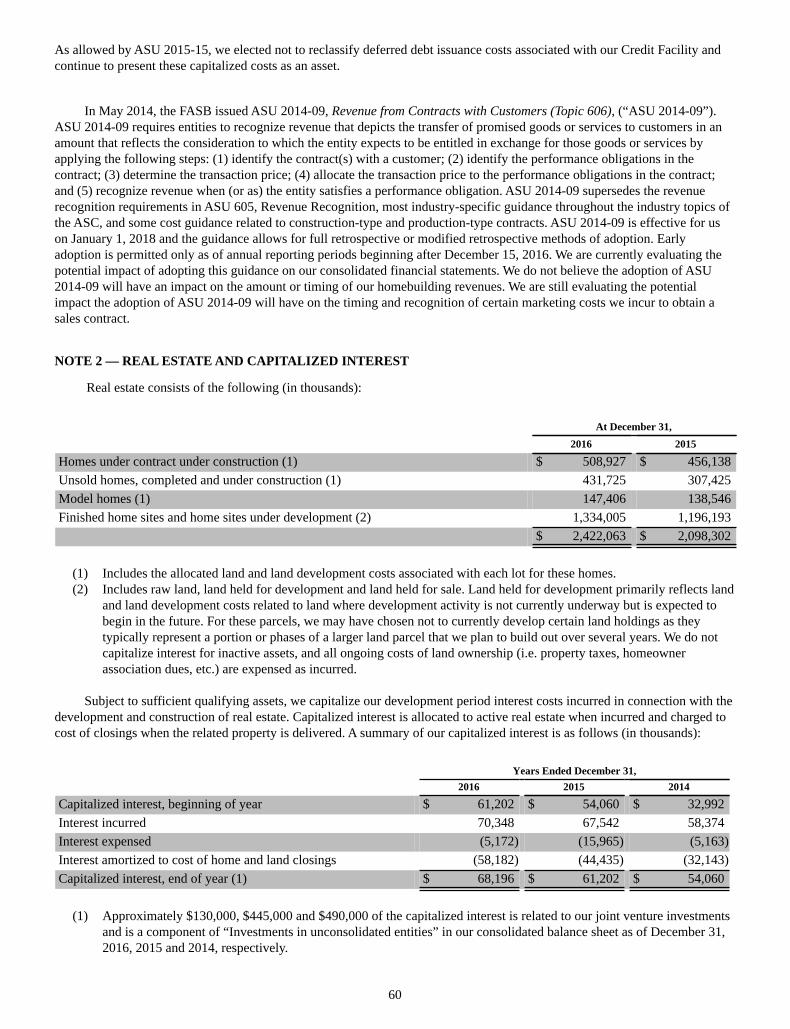
60
As allowed by ASU 2015-15, we elected not to reclassify deferred debt issuance costs associated with our Credit Facility and continue to present these capitalized costs as an asset.
In May 2014, the FASB issued ASU 2014-09, Revenue from Contracts with Customers (Topic 606), (“ASU 2014-09”). ASU 2014-09 requires entities to recognize revenue that depicts the transfer of promised goods or services to customers in an amount that reflects the consideration to which the entity expects to be entitled in exchange for those goods or services by applying the following steps: (1) identify the contract(s) with a customer; (2) identify the performance obligations in the contract; (3) determine the transaction price; (4) allocate the transaction price to the performance obligations in the contract; and (5) recognize revenue when (or as) the entity satisfies a performance obligation. ASU 2014-09 supersedes the revenue recognition requirements in ASU 605, Revenue Recognition, most industry-specific guidance throughout the industry topics of the ASC, and some cost guidance related to construction-type and production-type contracts. ASU 2014-09 is effective for us on January 1, 2018 and the guidance allows for full retrospective or modified retrospective methods of adoption. Early adoption is permitted only as of annual reporting periods beginning after December 15, 2016. We are currently evaluating the potential impact of adopting this guidance on our consolidated financial statements. We do not believe the adoption of ASU 2014-09 will have an impact on the amount or timing of our homebuilding revenues. We are still evaluating the potential impact the adoption of ASU 2014-09 will have on the timing and recognition of certain marketing costs we incur to obtain a sales contract.
NOTE 2 — REAL ESTATE AND CAPITALIZED INTEREST
Real estate consists of the following (in thousands):
At December 31,2016 2015
Homes under contract under construction (1) $ 508,927 $ 456,138Unsold homes, completed and under construction (1) 431,725 307,425Model homes (1) 147,406 138,546Finished home sites and home sites under development (2) 1,334,005 1,196,193
$ 2,422,063 $ 2,098,302
(1) Includes the allocated land and land development costs associated with each lot for these homes.(2) Includes raw land, land held for development and land held for sale. Land held for development primarily reflects land
and land development costs related to land where development activity is not currently underway but is expected to begin in the future. For these parcels, we may have chosen not to currently develop certain land holdings as they typically represent a portion or phases of a larger land parcel that we plan to build out over several years. We do not capitalize interest for inactive assets, and all ongoing costs of land ownership (i.e. property taxes, homeowner association dues, etc.) are expensed as incurred.
Subject to sufficient qualifying assets, we capitalize our development period interest costs incurred in connection with the development and construction of real estate. Capitalized interest is allocated to active real estate when incurred and charged to cost of closings when the related property is delivered. A summary of our capitalized interest is as follows (in thousands):
Years Ended December 31, 2016 2015 2014
Capitalized interest, beginning of year $ 61,202 $ 54,060 $ 32,992Interest incurred 70,348 67,542 58,374Interest expensed (5,172) (15,965) (5,163)Interest amortized to cost of home and land closings (58,182) (44,435) (32,143)Capitalized interest, end of year (1) $ 68,196 $ 61,202 $ 54,060
(1) Approximately $130,000, $445,000 and $490,000 of the capitalized interest is related to our joint venture investments
and is a component of “Investments in unconsolidated entities” in our consolidated balance sheet as of December 31, 2016, 2015 and 2014, respectively.
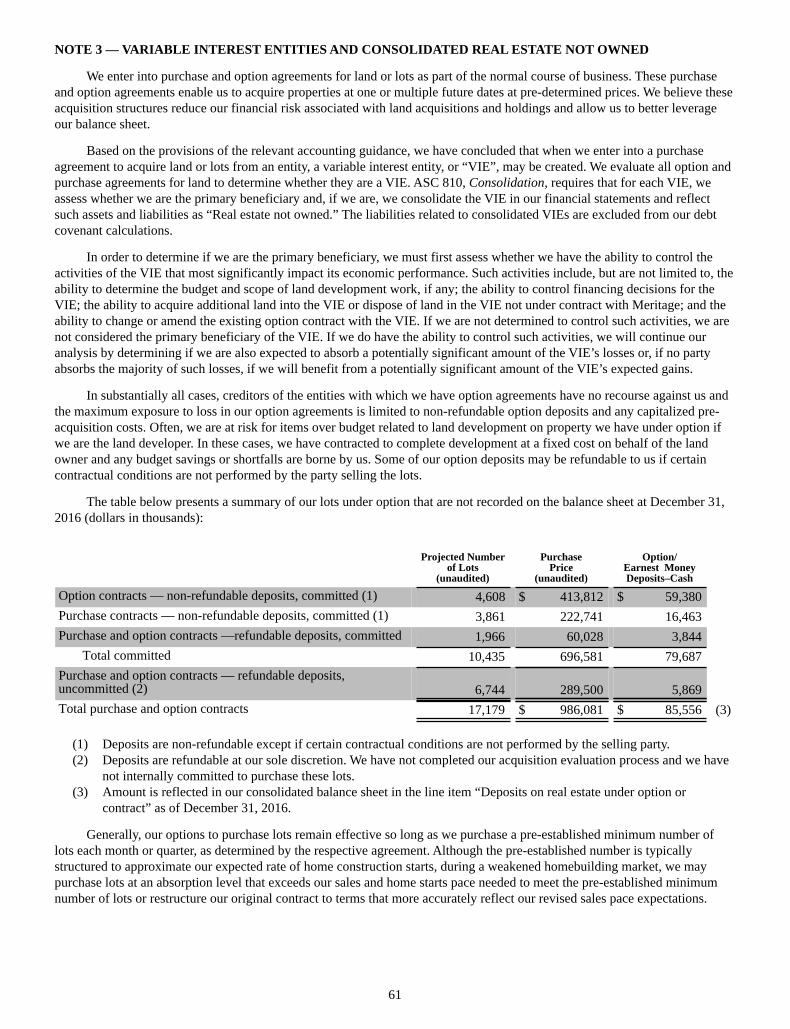
61
NOTE 3 — VARIABLE INTEREST ENTITIES AND CONSOLIDATED REAL ESTATE NOT OWNED
We enter into purchase and option agreements for land or lots as part of the normal course of business. These purchase and option agreements enable us to acquire properties at one or multiple future dates at pre-determined prices. We believe these acquisition structures reduce our financial risk associated with land acquisitions and holdings and allow us to better leverage our balance sheet.
Based on the provisions of the relevant accounting guidance, we have concluded that when we enter into a purchase agreement to acquire land or lots from an entity, a variable interest entity, or “VIE”, may be created. We evaluate all option and purchase agreements for land to determine whether they are a VIE. ASC 810, Consolidation, requires that for each VIE, we assess whether we are the primary beneficiary and, if we are, we consolidate the VIE in our financial statements and reflect such assets and liabilities as “Real estate not owned.” The liabilities related to consolidated VIEs are excluded from our debt covenant calculations.
In order to determine if we are the primary beneficiary, we must first assess whether we have the ability to control the activities of the VIE that most significantly impact its economic performance. Such activities include, but are not limited to, the ability to determine the budget and scope of land development work, if any; the ability to control financing decisions for the VIE; the ability to acquire additional land into the VIE or dispose of land in the VIE not under contract with Meritage; and the ability to change or amend the existing option contract with the VIE. If we are not determined to control such activities, we are not considered the primary beneficiary of the VIE. If we do have the ability to control such activities, we will continue our analysis by determining if we are also expected to absorb a potentially significant amount of the VIE’s losses or, if no party absorbs the majority of such losses, if we will benefit from a potentially significant amount of the VIE’s expected gains.
In substantially all cases, creditors of the entities with which we have option agreements have no recourse against us and the maximum exposure to loss in our option agreements is limited to non-refundable option deposits and any capitalized pre-acquisition costs. Often, we are at risk for items over budget related to land development on property we have under option if we are the land developer. In these cases, we have contracted to complete development at a fixed cost on behalf of the land owner and any budget savings or shortfalls are borne by us. Some of our option deposits may be refundable to us if certain contractual conditions are not performed by the party selling the lots.
The table below presents a summary of our lots under option that are not recorded on the balance sheet at December 31, 2016 (dollars in thousands):
Projected Numberof Lots
(unaudited)
PurchasePrice
(unaudited)
Option/Earnest MoneyDeposits–Cash
Option contracts — non-refundable deposits, committed (1) 4,608 $ 413,812 $ 59,380Purchase contracts — non-refundable deposits, committed (1) 3,861 222,741 16,463Purchase and option contracts —refundable deposits, committed 1,966 60,028 3,844
Total committed 10,435 696,581 79,687Purchase and option contracts — refundable deposits,uncommitted (2) 6,744 289,500 5,869Total purchase and option contracts 17,179 $ 986,081 $ 85,556 (3)
(1) Deposits are non-refundable except if certain contractual conditions are not performed by the selling party.(2) Deposits are refundable at our sole discretion. We have not completed our acquisition evaluation process and we have
not internally committed to purchase these lots.(3) Amount is reflected in our consolidated balance sheet in the line item “Deposits on real estate under option or
contract” as of December 31, 2016.
Generally, our options to purchase lots remain effective so long as we purchase a pre-established minimum number of lots each month or quarter, as determined by the respective agreement. Although the pre-established number is typically structured to approximate our expected rate of home construction starts, during a weakened homebuilding market, we may purchase lots at an absorption level that exceeds our sales and home starts pace needed to meet the pre-established minimum number of lots or restructure our original contract to terms that more accurately reflect our revised sales pace expectations.
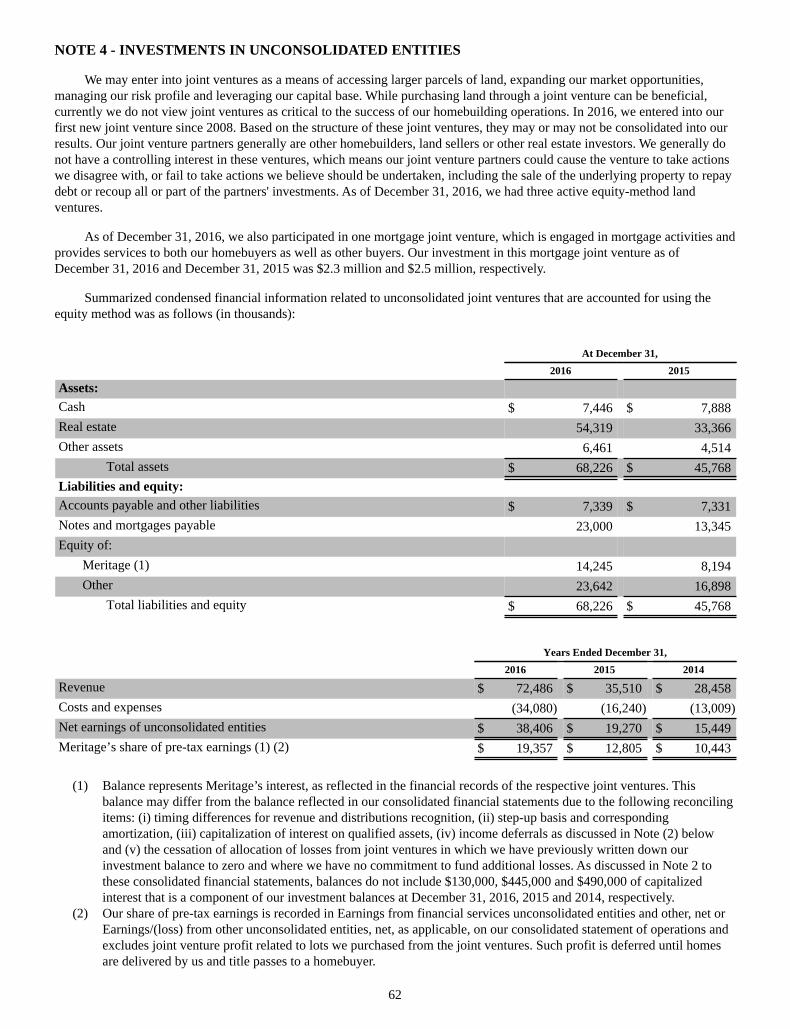
62
NOTE 4 - INVESTMENTS IN UNCONSOLIDATED ENTITIES
We may enter into joint ventures as a means of accessing larger parcels of land, expanding our market opportunities, managing our risk profile and leveraging our capital base. While purchasing land through a joint venture can be beneficial, currently we do not view joint ventures as critical to the success of our homebuilding operations. In 2016, we entered into our first new joint venture since 2008. Based on the structure of these joint ventures, they may or may not be consolidated into our results. Our joint venture partners generally are other homebuilders, land sellers or other real estate investors. We generally do not have a controlling interest in these ventures, which means our joint venture partners could cause the venture to take actions we disagree with, or fail to take actions we believe should be undertaken, including the sale of the underlying property to repay debt or recoup all or part of the partners' investments. As of December 31, 2016, we had three active equity-method land ventures.
As of December 31, 2016, we also participated in one mortgage joint venture, which is engaged in mortgage activities and provides services to both our homebuyers as well as other buyers. Our investment in this mortgage joint venture as of December 31, 2016 and December 31, 2015 was $2.3 million and $2.5 million, respectively.
Summarized condensed financial information related to unconsolidated joint ventures that are accounted for using the equity method was as follows (in thousands):
At December 31,2016 2015
Assets:Cash $ 7,446 $ 7,888Real estate 54,319 33,366Other assets 6,461 4,514
Total assets $ 68,226 $ 45,768Liabilities and equity:Accounts payable and other liabilities $ 7,339 $ 7,331Notes and mortgages payable 23,000 13,345Equity of:
Meritage (1) 14,245 8,194Other 23,642 16,898
Total liabilities and equity $ 68,226 $ 45,768
Years Ended December 31, 2016 2015 2014
Revenue $ 72,486 $ 35,510 $ 28,458Costs and expenses (34,080) (16,240) (13,009)Net earnings of unconsolidated entities $ 38,406 $ 19,270 $ 15,449Meritage’s share of pre-tax earnings (1) (2) $ 19,357 $ 12,805 $ 10,443
(1) Balance represents Meritage’s interest, as reflected in the financial records of the respective joint ventures. This balance may differ from the balance reflected in our consolidated financial statements due to the following reconciling items: (i) timing differences for revenue and distributions recognition, (ii) step-up basis and corresponding amortization, (iii) capitalization of interest on qualified assets, (iv) income deferrals as discussed in Note (2) below and (v) the cessation of allocation of losses from joint ventures in which we have previously written down our investment balance to zero and where we have no commitment to fund additional losses. As discussed in Note 2 to these consolidated financial statements, balances do not include $130,000, $445,000 and $490,000 of capitalized interest that is a component of our investment balances at December 31, 2016, 2015 and 2014, respectively.
(2) Our share of pre-tax earnings is recorded in Earnings from financial services unconsolidated entities and other, net or Earnings/(loss) from other unconsolidated entities, net, as applicable, on our consolidated statement of operations and excludes joint venture profit related to lots we purchased from the joint ventures. Such profit is deferred until homes are delivered by us and title passes to a homebuyer.
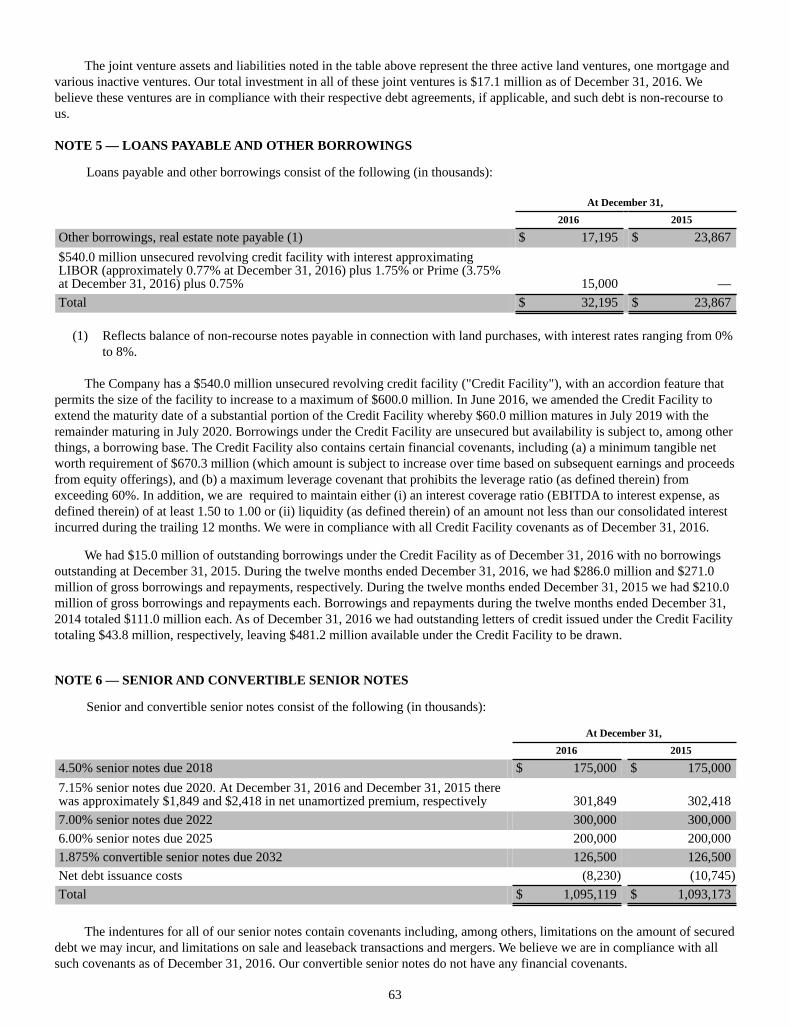
63
The joint venture assets and liabilities noted in the table above represent the three active land ventures, one mortgage and various inactive ventures. Our total investment in all of these joint ventures is $17.1 million as of December 31, 2016. We believe these ventures are in compliance with their respective debt agreements, if applicable, and such debt is non-recourse to us.
NOTE 5 — LOANS PAYABLE AND OTHER BORROWINGS
Loans payable and other borrowings consist of the following (in thousands):
At December 31,2016 2015
Other borrowings, real estate note payable (1) $ 17,195 $ 23,867$540.0 million unsecured revolving credit facility with interest approximatingLIBOR (approximately 0.77% at December 31, 2016) plus 1.75% or Prime (3.75%at December 31, 2016) plus 0.75% 15,000 —Total $ 32,195 $ 23,867
(1) Reflects balance of non-recourse notes payable in connection with land purchases, with interest rates ranging from 0% to 8%.
The Company has a $540.0 million unsecured revolving credit facility ("Credit Facility"), with an accordion feature that permits the size of the facility to increase to a maximum of $600.0 million. In June 2016, we amended the Credit Facility to extend the maturity date of a substantial portion of the Credit Facility whereby $60.0 million matures in July 2019 with the remainder maturing in July 2020. Borrowings under the Credit Facility are unsecured but availability is subject to, among other things, a borrowing base. The Credit Facility also contains certain financial covenants, including (a) a minimum tangible net worth requirement of $670.3 million (which amount is subject to increase over time based on subsequent earnings and proceeds from equity offerings), and (b) a maximum leverage covenant that prohibits the leverage ratio (as defined therein) from exceeding 60%. In addition, we are required to maintain either (i) an interest coverage ratio (EBITDA to interest expense, as defined therein) of at least 1.50 to 1.00 or (ii) liquidity (as defined therein) of an amount not less than our consolidated interest incurred during the trailing 12 months. We were in compliance with all Credit Facility covenants as of December 31, 2016.
We had $15.0 million of outstanding borrowings under the Credit Facility as of December 31, 2016 with no borrowings outstanding at December 31, 2015. During the twelve months ended December 31, 2016, we had $286.0 million and $271.0 million of gross borrowings and repayments, respectively. During the twelve months ended December 31, 2015 we had $210.0 million of gross borrowings and repayments each. Borrowings and repayments during the twelve months ended December 31, 2014 totaled $111.0 million each. As of December 31, 2016 we had outstanding letters of credit issued under the Credit Facility totaling $43.8 million, respectively, leaving $481.2 million available under the Credit Facility to be drawn.
NOTE 6 — SENIOR AND CONVERTIBLE SENIOR NOTES
Senior and convertible senior notes consist of the following (in thousands):
At December 31,2016 2015
4.50% senior notes due 2018 $ 175,000 $ 175,0007.15% senior notes due 2020. At December 31, 2016 and December 31, 2015 therewas approximately $1,849 and $2,418 in net unamortized premium, respectively 301,849 302,4187.00% senior notes due 2022 300,000 300,0006.00% senior notes due 2025 200,000 200,0001.875% convertible senior notes due 2032 126,500 126,500Net debt issuance costs (8,230) (10,745)Total $ 1,095,119 $ 1,093,173
The indentures for all of our senior notes contain covenants including, among others, limitations on the amount of secured debt we may incur, and limitations on sale and leaseback transactions and mergers. We believe we are in compliance with all such covenants as of December 31, 2016. Our convertible senior notes do not have any financial covenants.
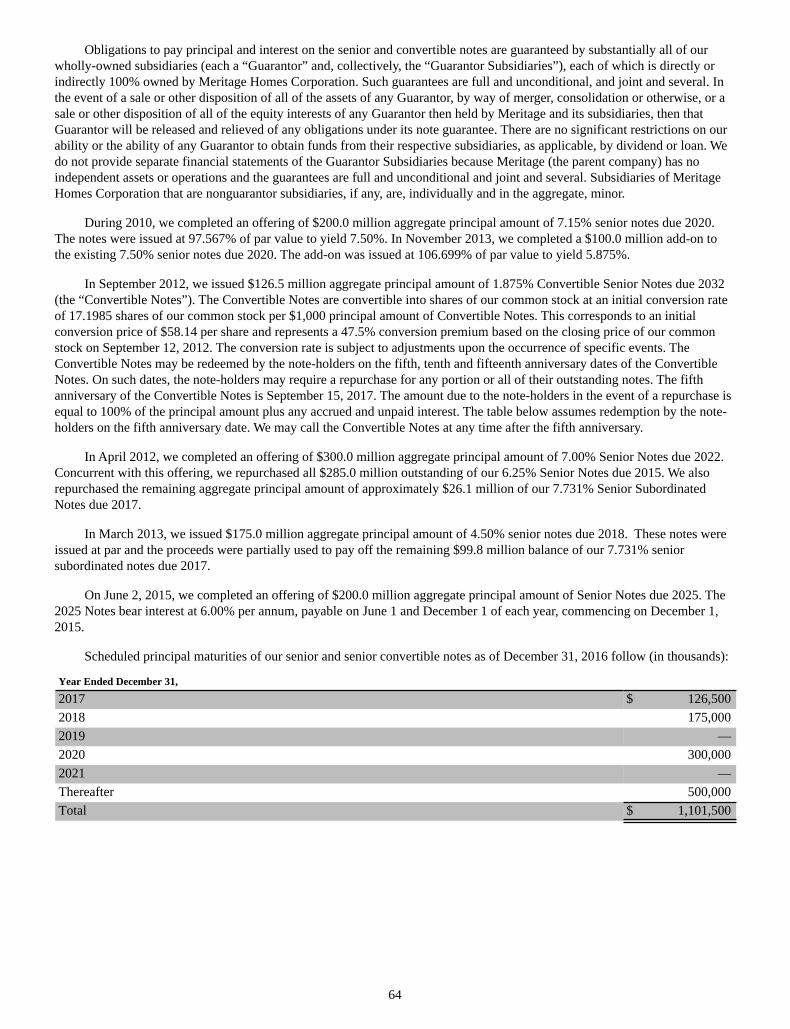
64
Obligations to pay principal and interest on the senior and convertible notes are guaranteed by substantially all of our wholly-owned subsidiaries (each a “Guarantor” and, collectively, the “Guarantor Subsidiaries”), each of which is directly or indirectly 100% owned by Meritage Homes Corporation. Such guarantees are full and unconditional, and joint and several. In the event of a sale or other disposition of all of the assets of any Guarantor, by way of merger, consolidation or otherwise, or a sale or other disposition of all of the equity interests of any Guarantor then held by Meritage and its subsidiaries, then that Guarantor will be released and relieved of any obligations under its note guarantee. There are no significant restrictions on our ability or the ability of any Guarantor to obtain funds from their respective subsidiaries, as applicable, by dividend or loan. We do not provide separate financial statements of the Guarantor Subsidiaries because Meritage (the parent company) has no independent assets or operations and the guarantees are full and unconditional and joint and several. Subsidiaries of Meritage Homes Corporation that are nonguarantor subsidiaries, if any, are, individually and in the aggregate, minor.
During 2010, we completed an offering of $200.0 million aggregate principal amount of 7.15% senior notes due 2020. The notes were issued at 97.567% of par value to yield 7.50%. In November 2013, we completed a $100.0 million add-on to the existing 7.50% senior notes due 2020. The add-on was issued at 106.699% of par value to yield 5.875%.
In September 2012, we issued $126.5 million aggregate principal amount of 1.875% Convertible Senior Notes due 2032 (the “Convertible Notes”). The Convertible Notes are convertible into shares of our common stock at an initial conversion rate of 17.1985 shares of our common stock per $1,000 principal amount of Convertible Notes. This corresponds to an initial conversion price of $58.14 per share and represents a 47.5% conversion premium based on the closing price of our common stock on September 12, 2012. The conversion rate is subject to adjustments upon the occurrence of specific events. The Convertible Notes may be redeemed by the note-holders on the fifth, tenth and fifteenth anniversary dates of the Convertible Notes. On such dates, the note-holders may require a repurchase for any portion or all of their outstanding notes. The fifth anniversary of the Convertible Notes is September 15, 2017. The amount due to the note-holders in the event of a repurchase is equal to 100% of the principal amount plus any accrued and unpaid interest. The table below assumes redemption by the note-holders on the fifth anniversary date. We may call the Convertible Notes at any time after the fifth anniversary.
In April 2012, we completed an offering of $300.0 million aggregate principal amount of 7.00% Senior Notes due 2022. Concurrent with this offering, we repurchased all $285.0 million outstanding of our 6.25% Senior Notes due 2015. We also repurchased the remaining aggregate principal amount of approximately $26.1 million of our 7.731% Senior Subordinated Notes due 2017.
In March 2013, we issued $175.0 million aggregate principal amount of 4.50% senior notes due 2018. These notes were issued at par and the proceeds were partially used to pay off the remaining $99.8 million balance of our 7.731% senior subordinated notes due 2017.
On June 2, 2015, we completed an offering of $200.0 million aggregate principal amount of Senior Notes due 2025. The 2025 Notes bear interest at 6.00% per annum, payable on June 1 and December 1 of each year, commencing on December 1, 2015.
Scheduled principal maturities of our senior and senior convertible notes as of December 31, 2016 follow (in thousands):
Year Ended December 31,
2017 $ 126,5002018 175,0002019 —2020 300,0002021 —Thereafter 500,000Total $ 1,101,500
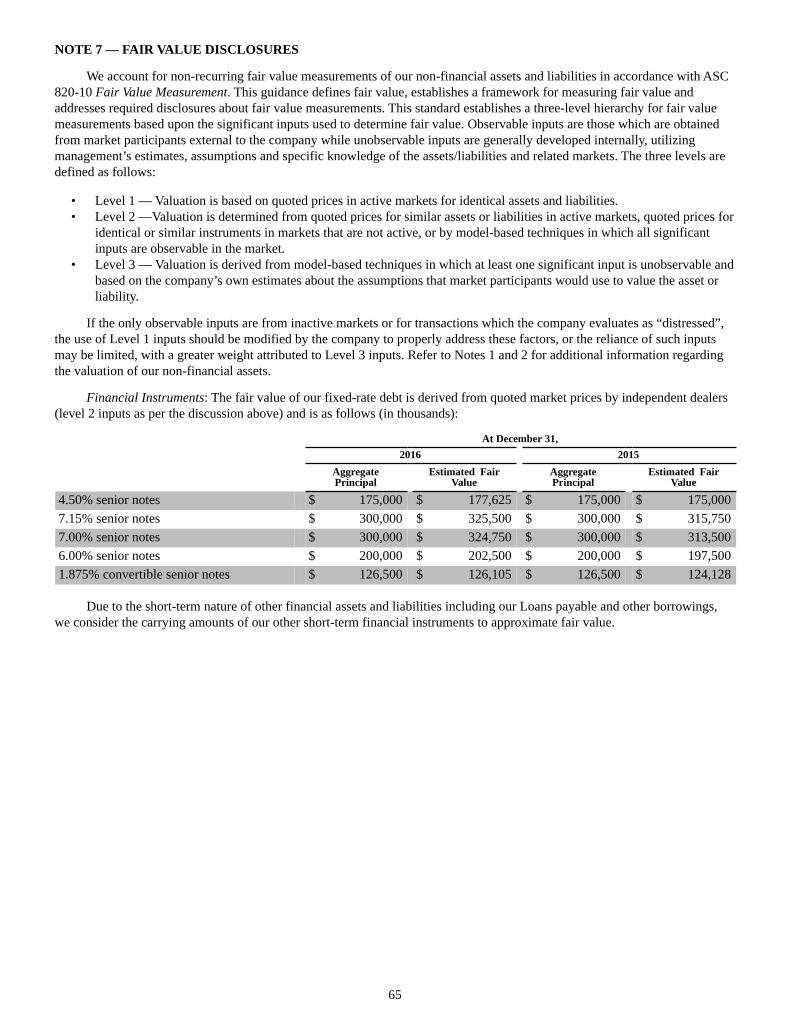
65
NOTE 7 — FAIR VALUE DISCLOSURES
We account for non-recurring fair value measurements of our non-financial assets and liabilities in accordance with ASC 820-10 Fair Value Measurement. This guidance defines fair value, establishes a framework for measuring fair value and addresses required disclosures about fair value measurements. This standard establishes a three-level hierarchy for fair value measurements based upon the significant inputs used to determine fair value. Observable inputs are those which are obtained from market participants external to the company while unobservable inputs are generally developed internally, utilizing management’s estimates, assumptions and specific knowledge of the assets/liabilities and related markets. The three levels are defined as follows:
• Level 1 — Valuation is based on quoted prices in active markets for identical assets and liabilities.• Level 2 —Valuation is determined from quoted prices for similar assets or liabilities in active markets, quoted prices for
identical or similar instruments in markets that are not active, or by model-based techniques in which all significant inputs are observable in the market.
• Level 3 — Valuation is derived from model-based techniques in which at least one significant input is unobservable and based on the company’s own estimates about the assumptions that market participants would use to value the asset or liability.
If the only observable inputs are from inactive markets or for transactions which the company evaluates as “distressed”, the use of Level 1 inputs should be modified by the company to properly address these factors, or the reliance of such inputs may be limited, with a greater weight attributed to Level 3 inputs. Refer to Notes 1 and 2 for additional information regarding the valuation of our non-financial assets.
Financial Instruments: The fair value of our fixed-rate debt is derived from quoted market prices by independent dealers (level 2 inputs as per the discussion above) and is as follows (in thousands):
At December 31, 2016 2015
AggregatePrincipal
Estimated FairValue
AggregatePrincipal
Estimated FairValue
4.50% senior notes $ 175,000 $ 177,625 $ 175,000 $ 175,0007.15% senior notes $ 300,000 $ 325,500 $ 300,000 $ 315,7507.00% senior notes $ 300,000 $ 324,750 $ 300,000 $ 313,5006.00% senior notes $ 200,000 $ 202,500 $ 200,000 $ 197,5001.875% convertible senior notes $ 126,500 $ 126,105 $ 126,500 $ 124,128
Due to the short-term nature of other financial assets and liabilities including our Loans payable and other borrowings, we consider the carrying amounts of our other short-term financial instruments to approximate fair value.
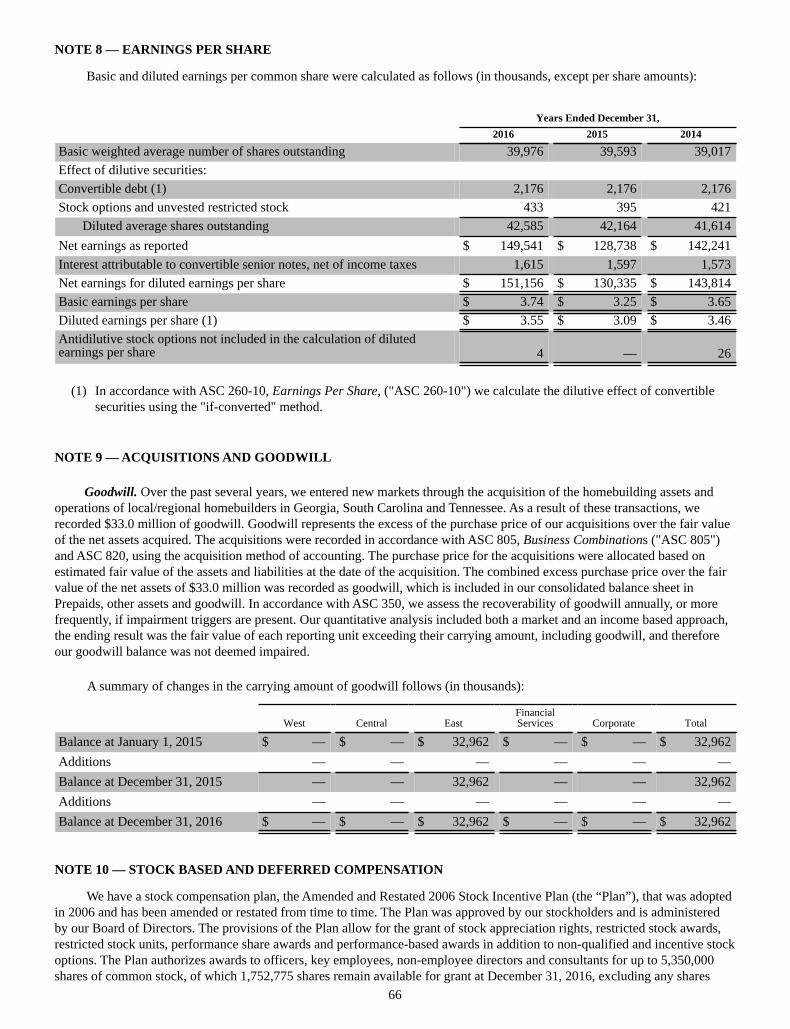
66
NOTE 8 — EARNINGS PER SHARE
Basic and diluted earnings per common share were calculated as follows (in thousands, except per share amounts):
Years Ended December 31,2016 2015 2014
Basic weighted average number of shares outstanding 39,976 39,593 39,017Effect of dilutive securities:Convertible debt (1) 2,176 2,176 2,176Stock options and unvested restricted stock 433 395 421
Diluted average shares outstanding 42,585 42,164 41,614Net earnings as reported $ 149,541 $ 128,738 $ 142,241Interest attributable to convertible senior notes, net of income taxes 1,615 1,597 1,573Net earnings for diluted earnings per share $ 151,156 $ 130,335 $ 143,814Basic earnings per share $ 3.74 $ 3.25 $ 3.65Diluted earnings per share (1) $ 3.55 $ 3.09 $ 3.46Antidilutive stock options not included in the calculation of dilutedearnings per share 4 — 26
(1) In accordance with ASC 260-10, Earnings Per Share, ("ASC 260-10") we calculate the dilutive effect of convertible
securities using the "if-converted" method.
NOTE 9 — ACQUISITIONS AND GOODWILL
Goodwill. Over the past several years, we entered new markets through the acquisition of the homebuilding assets and operations of local/regional homebuilders in Georgia, South Carolina and Tennessee. As a result of these transactions, we recorded $33.0 million of goodwill. Goodwill represents the excess of the purchase price of our acquisitions over the fair value of the net assets acquired. The acquisitions were recorded in accordance with ASC 805, Business Combinations ("ASC 805") and ASC 820, using the acquisition method of accounting. The purchase price for the acquisitions were allocated based on estimated fair value of the assets and liabilities at the date of the acquisition. The combined excess purchase price over the fair value of the net assets of $33.0 million was recorded as goodwill, which is included in our consolidated balance sheet in Prepaids, other assets and goodwill. In accordance with ASC 350, we assess the recoverability of goodwill annually, or more frequently, if impairment triggers are present. Our quantitative analysis included both a market and an income based approach, the ending result was the fair value of each reporting unit exceeding their carrying amount, including goodwill, and therefore our goodwill balance was not deemed impaired.
A summary of changes in the carrying amount of goodwill follows (in thousands):
West Central EastFinancialServices Corporate Total
Balance at January 1, 2015 $ — $ — $ 32,962 $ — $ — $ 32,962Additions — — — — — —Balance at December 31, 2015 — — 32,962 — — 32,962Additions — — — — — —Balance at December 31, 2016 $ — $ — $ 32,962 $ — $ — $ 32,962
NOTE 10 — STOCK BASED AND DEFERRED COMPENSATION
We have a stock compensation plan, the Amended and Restated 2006 Stock Incentive Plan (the “Plan”), that was adopted in 2006 and has been amended or restated from time to time. The Plan was approved by our stockholders and is administered by our Board of Directors. The provisions of the Plan allow for the grant of stock appreciation rights, restricted stock awards, restricted stock units, performance share awards and performance-based awards in addition to non-qualified and incentive stock options. The Plan authorizes awards to officers, key employees, non-employee directors and consultants for up to 5,350,000 shares of common stock, of which 1,752,775 shares remain available for grant at December 31, 2016, excluding any shares
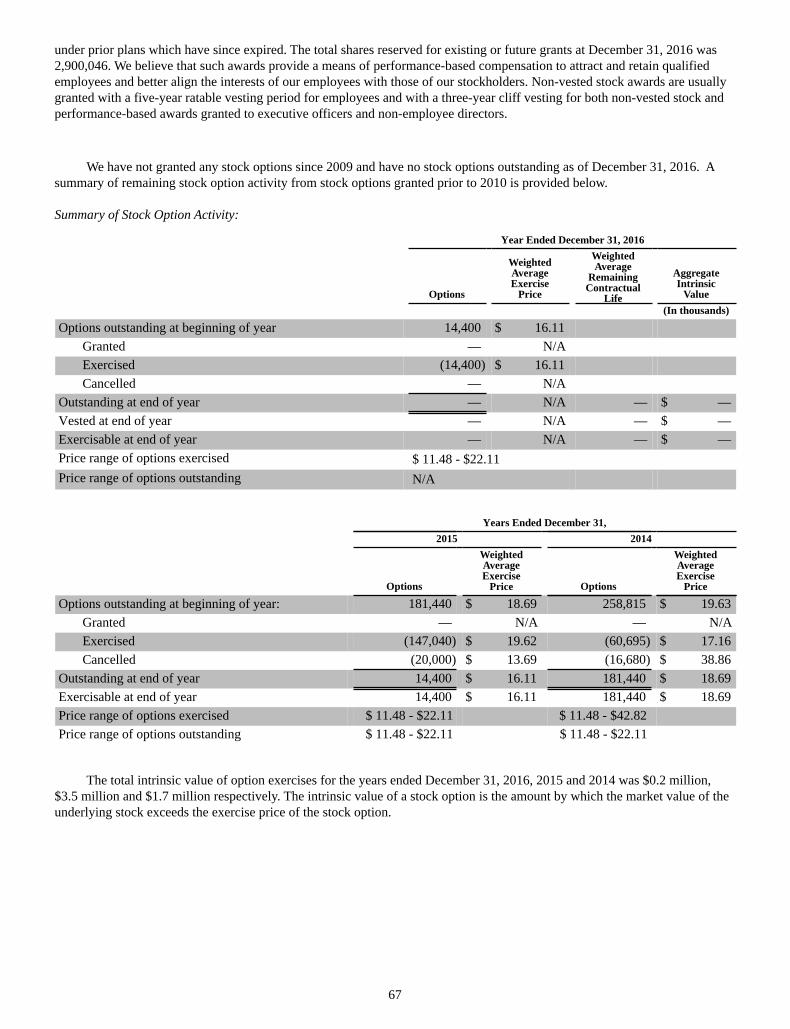
67
under prior plans which have since expired. The total shares reserved for existing or future grants at December 31, 2016 was 2,900,046. We believe that such awards provide a means of performance-based compensation to attract and retain qualified employees and better align the interests of our employees with those of our stockholders. Non-vested stock awards are usually granted with a five-year ratable vesting period for employees and with a three-year cliff vesting for both non-vested stock and performance-based awards granted to executive officers and non-employee directors.
We have not granted any stock options since 2009 and have no stock options outstanding as of December 31, 2016. A summary of remaining stock option activity from stock options granted prior to 2010 is provided below.
Summary of Stock Option Activity:
Year Ended December 31, 2016
Options
WeightedAverageExercise
Price
WeightedAverage
RemainingContractual
Life
AggregateIntrinsic
Value(In thousands)
Options outstanding at beginning of year 14,400 $ 16.11Granted — N/AExercised (14,400) $ 16.11Cancelled — N/A
Outstanding at end of year — N/A — $ —Vested at end of year — N/A — $ —Exercisable at end of year — N/A — $ —Price range of options exercised $ 11.48 - $22.11Price range of options outstanding N/A
Years Ended December 31, 2015 2014
Options
WeightedAverageExercise
Price Options
WeightedAverageExercise
Price
Options outstanding at beginning of year: 181,440 $ 18.69 258,815 $ 19.63Granted — N/A — N/AExercised (147,040) $ 19.62 (60,695) $ 17.16Cancelled (20,000) $ 13.69 (16,680) $ 38.86
Outstanding at end of year 14,400 $ 16.11 181,440 $ 18.69Exercisable at end of year 14,400 $ 16.11 181,440 $ 18.69Price range of options exercised $ 11.48 - $22.11 $ 11.48 - $42.82Price range of options outstanding $ 11.48 - $22.11 $ 11.48 - $22.11
The total intrinsic value of option exercises for the years ended December 31, 2016, 2015 and 2014 was $0.2 million, $3.5 million and $1.7 million respectively. The intrinsic value of a stock option is the amount by which the market value of the underlying stock exceeds the exercise price of the stock option.
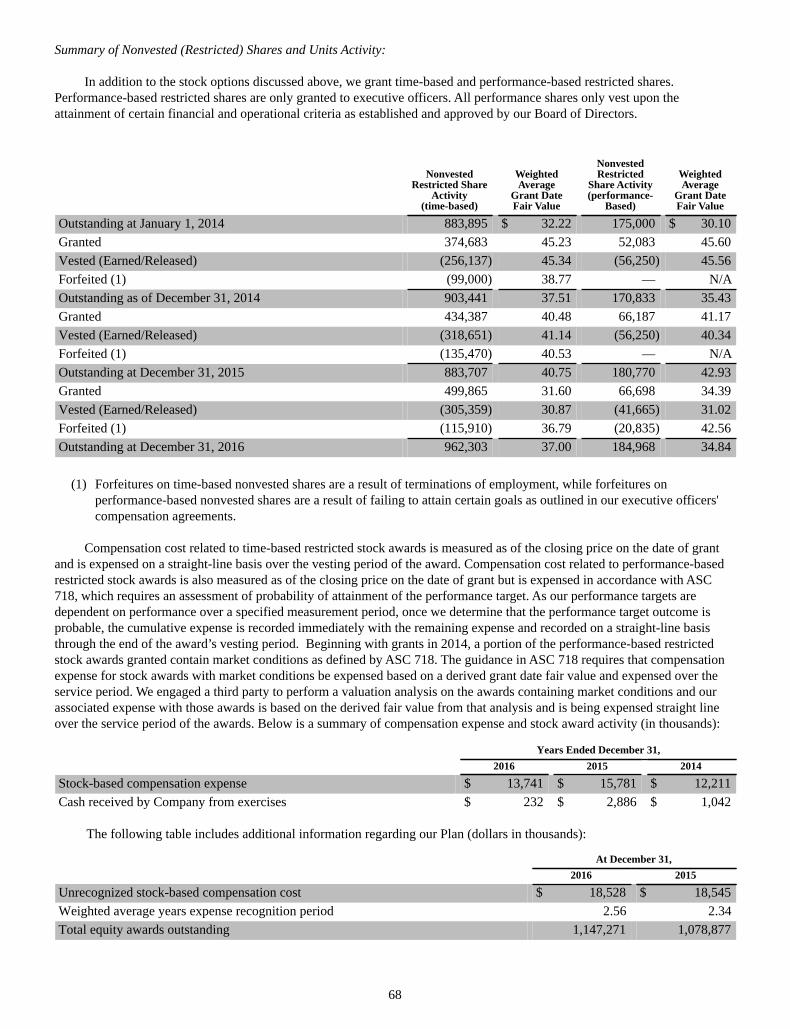
68
Summary of Nonvested (Restricted) Shares and Units Activity:
In addition to the stock options discussed above, we grant time-based and performance-based restricted shares. Performance-based restricted shares are only granted to executive officers. All performance shares only vest upon the attainment of certain financial and operational criteria as established and approved by our Board of Directors.
NonvestedRestricted Share
Activity(time-based)
WeightedAverage
Grant DateFair Value
NonvestedRestricted
Share Activity(performance-
Based)
WeightedAverage
Grant DateFair Value
Outstanding at January 1, 2014 883,895 $ 32.22 175,000 $ 30.10Granted 374,683 45.23 52,083 45.60Vested (Earned/Released) (256,137) 45.34 (56,250) 45.56Forfeited (1) (99,000) 38.77 — N/AOutstanding as of December 31, 2014 903,441 37.51 170,833 35.43Granted 434,387 40.48 66,187 41.17Vested (Earned/Released) (318,651) 41.14 (56,250) 40.34Forfeited (1) (135,470) 40.53 — N/AOutstanding at December 31, 2015 883,707 40.75 180,770 42.93Granted 499,865 31.60 66,698 34.39Vested (Earned/Released) (305,359) 30.87 (41,665) 31.02Forfeited (1) (115,910) 36.79 (20,835) 42.56Outstanding at December 31, 2016 962,303 37.00 184,968 34.84
(1) Forfeitures on time-based nonvested shares are a result of terminations of employment, while forfeitures on
performance-based nonvested shares are a result of failing to attain certain goals as outlined in our executive officers' compensation agreements.
Compensation cost related to time-based restricted stock awards is measured as of the closing price on the date of grant and is expensed on a straight-line basis over the vesting period of the award. Compensation cost related to performance-based restricted stock awards is also measured as of the closing price on the date of grant but is expensed in accordance with ASC 718, which requires an assessment of probability of attainment of the performance target. As our performance targets are dependent on performance over a specified measurement period, once we determine that the performance target outcome is probable, the cumulative expense is recorded immediately with the remaining expense and recorded on a straight-line basis through the end of the award’s vesting period. Beginning with grants in 2014, a portion of the performance-based restricted stock awards granted contain market conditions as defined by ASC 718. The guidance in ASC 718 requires that compensation expense for stock awards with market conditions be expensed based on a derived grant date fair value and expensed over the service period. We engaged a third party to perform a valuation analysis on the awards containing market conditions and our associated expense with those awards is based on the derived fair value from that analysis and is being expensed straight line over the service period of the awards. Below is a summary of compensation expense and stock award activity (in thousands):
Years Ended December 31, 2016 2015 2014
Stock-based compensation expense $ 13,741 $ 15,781 $ 12,211Cash received by Company from exercises $ 232 $ 2,886 $ 1,042
The following table includes additional information regarding our Plan (dollars in thousands):
At December 31, 2016 2015
Unrecognized stock-based compensation cost $ 18,528 $ 18,545Weighted average years expense recognition period 2.56 2.34Total equity awards outstanding 1,147,271 1,078,877
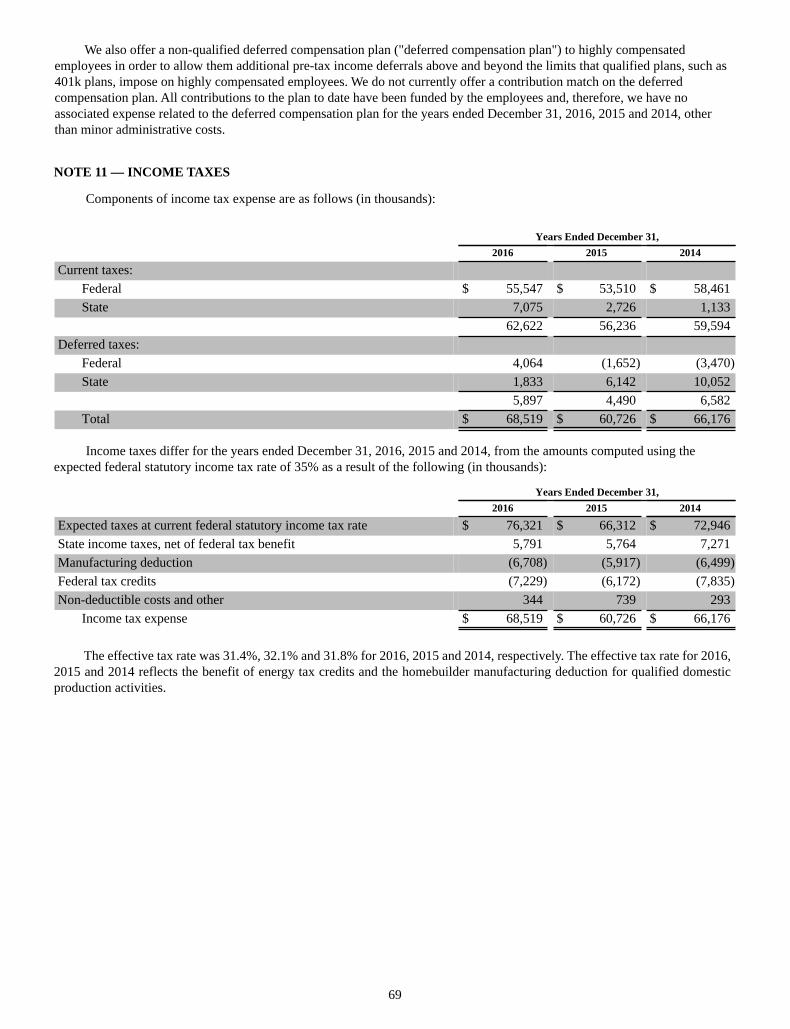
69
We also offer a non-qualified deferred compensation plan ("deferred compensation plan") to highly compensated employees in order to allow them additional pre-tax income deferrals above and beyond the limits that qualified plans, such as 401k plans, impose on highly compensated employees. We do not currently offer a contribution match on the deferred compensation plan. All contributions to the plan to date have been funded by the employees and, therefore, we have no associated expense related to the deferred compensation plan for the years ended December 31, 2016, 2015 and 2014, other than minor administrative costs.
NOTE 11 — INCOME TAXES
Components of income tax expense are as follows (in thousands):
Years Ended December 31, 2016 2015 2014
Current taxes:Federal $ 55,547 $ 53,510 $ 58,461State 7,075 2,726 1,133
62,622 56,236 59,594Deferred taxes:
Federal 4,064 (1,652) (3,470)State 1,833 6,142 10,052
5,897 4,490 6,582Total $ 68,519 $ 60,726 $ 66,176
Income taxes differ for the years ended December 31, 2016, 2015 and 2014, from the amounts computed using the expected federal statutory income tax rate of 35% as a result of the following (in thousands):
Years Ended December 31, 2016 2015 2014
Expected taxes at current federal statutory income tax rate $ 76,321 $ 66,312 $ 72,946State income taxes, net of federal tax benefit 5,791 5,764 7,271Manufacturing deduction (6,708) (5,917) (6,499)Federal tax credits (7,229) (6,172) (7,835)Non-deductible costs and other 344 739 293
Income tax expense $ 68,519 $ 60,726 $ 66,176
The effective tax rate was 31.4%, 32.1% and 31.8% for 2016, 2015 and 2014, respectively. The effective tax rate for 2016, 2015 and 2014 reflects the benefit of energy tax credits and the homebuilder manufacturing deduction for qualified domestic production activities.
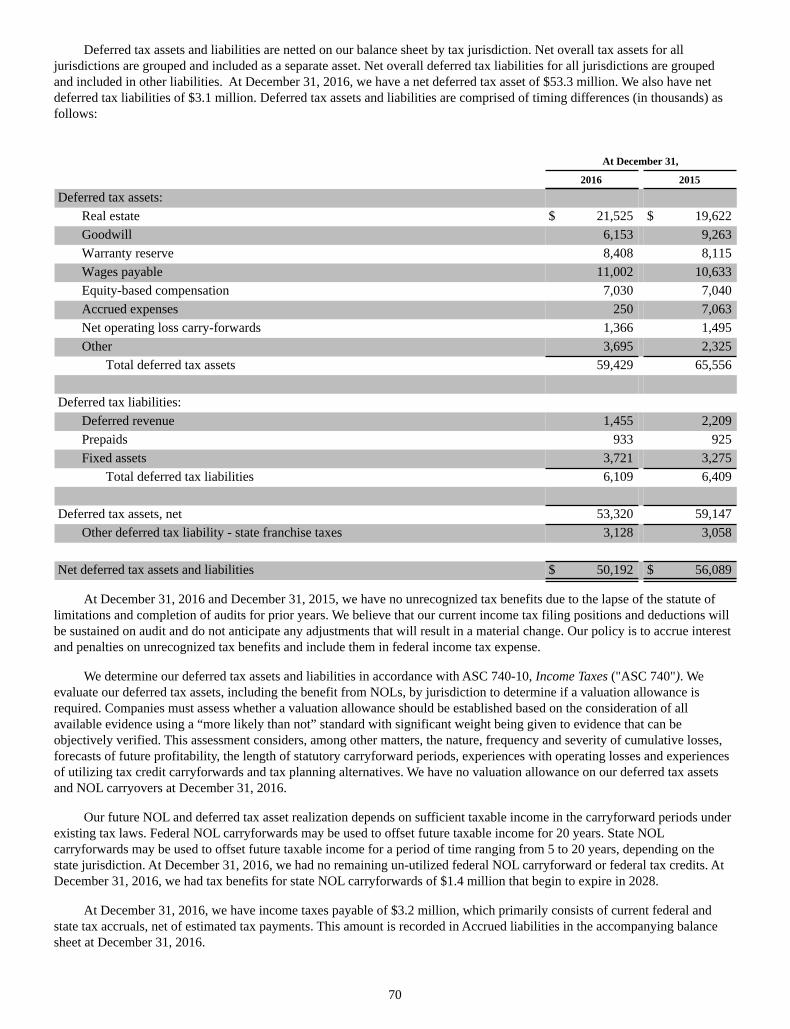
70
Deferred tax assets and liabilities are netted on our balance sheet by tax jurisdiction. Net overall tax assets for all jurisdictions are grouped and included as a separate asset. Net overall deferred tax liabilities for all jurisdictions are grouped and included in other liabilities. At December 31, 2016, we have a net deferred tax asset of $53.3 million. We also have net deferred tax liabilities of $3.1 million. Deferred tax assets and liabilities are comprised of timing differences (in thousands) as follows:
At December 31,
2016 2015
Deferred tax assets:Real estate $ 21,525 $ 19,622Goodwill 6,153 9,263Warranty reserve 8,408 8,115Wages payable 11,002 10,633Equity-based compensation 7,030 7,040Accrued expenses 250 7,063Net operating loss carry-forwards 1,366 1,495Other 3,695 2,325
Total deferred tax assets 59,429 65,556
Deferred tax liabilities:Deferred revenue 1,455 2,209Prepaids 933 925Fixed assets 3,721 3,275
Total deferred tax liabilities 6,109 6,409
Deferred tax assets, net 53,320 59,147Other deferred tax liability - state franchise taxes 3,128 3,058
Net deferred tax assets and liabilities $ 50,192 $ 56,089
At December 31, 2016 and December 31, 2015, we have no unrecognized tax benefits due to the lapse of the statute of limitations and completion of audits for prior years. We believe that our current income tax filing positions and deductions will be sustained on audit and do not anticipate any adjustments that will result in a material change. Our policy is to accrue interest and penalties on unrecognized tax benefits and include them in federal income tax expense.
We determine our deferred tax assets and liabilities in accordance with ASC 740-10, Income Taxes ("ASC 740"). We evaluate our deferred tax assets, including the benefit from NOLs, by jurisdiction to determine if a valuation allowance is required. Companies must assess whether a valuation allowance should be established based on the consideration of all available evidence using a “more likely than not” standard with significant weight being given to evidence that can be objectively verified. This assessment considers, among other matters, the nature, frequency and severity of cumulative losses, forecasts of future profitability, the length of statutory carryforward periods, experiences with operating losses and experiences of utilizing tax credit carryforwards and tax planning alternatives. We have no valuation allowance on our deferred tax assets and NOL carryovers at December 31, 2016.
Our future NOL and deferred tax asset realization depends on sufficient taxable income in the carryforward periods under existing tax laws. Federal NOL carryforwards may be used to offset future taxable income for 20 years. State NOL carryforwards may be used to offset future taxable income for a period of time ranging from 5 to 20 years, depending on the state jurisdiction. At December 31, 2016, we had no remaining un-utilized federal NOL carryforward or federal tax credits. At December 31, 2016, we had tax benefits for state NOL carryforwards of $1.4 million that begin to expire in 2028.
At December 31, 2016, we have income taxes payable of $3.2 million, which primarily consists of current federal and state tax accruals, net of estimated tax payments. This amount is recorded in Accrued liabilities in the accompanying balance sheet at December 31, 2016.
71
We conduct business and are subject to tax in the U.S. and several states. With few exceptions, we are no longer subject to U.S. federal, state, or local income tax examinations by taxing authorities for years prior to 2012. We have one state income tax examination covering various years pending resolution at this time.
The tax benefits from NOLs, built-in losses, and tax credits would be materially reduced or potentially eliminated if we experience an “ownership change” as defined under Internal Revenue Code (“IRC”) §382. Based on our analysis performed as of December 31, 2016 we do not believe that we have experienced an ownership change. As a protective measure, our stockholders held a Special Meeting of Stockholders on February 16, 2009 and approved an amendment to our Articles of Incorporation that restricts certain transfers of our common stock. The amendment is intended to help us avoid an unintended ownership change and thereby preserve the value of any tax benefit for future utilization.
On December 16, 2014, Congress passed the Tax Increase Prevention Act of 2014 (the "Extenders Act"), which the President signed into law on December 19, 2014. The Extenders Act extended the availability of the IRC §45L new energy efficient homes credit to the end of 2014. On December 18, 2015, Congress passed the Protecting Americans from Tax Hikes ("PATH") Act of 2015. The PATH Act further extended the availability of the IRC §45L new energy efficient homes credit through the end of 2016. Under ASC 740, the effects of new legislation are recognized in the period that includes the date of enactment, regardless of the retroactive benefit. In accordance with this guidance, we recorded tax effected benefits based on estimates for qualifying new energy efficient homes that we closed in 2014, 2015 and 2016. The estimated tax effected benefits as adjusted for actual experience are reflected in our effective tax rate reconciliation as the benefit from federal tax credits.
NOTE 12 — SUPPLEMENTAL DISCLOSURE OF CASH FLOW INFORMATION
The following table presents certain supplemental cash flow information (in thousands):
Years Ended December 31,
2016 2015 2014
Cash paid during the year for:Interest, net of interest capitalized $ 1,760 $ 9,915 $ 830Income taxes $ 65,020 $ 56,186 $ 71,321
Non-cash operating activities decrease:Real estate not owned $ — $ 4,999 $ 4,710Real estate acquired through notes payable $ 14,199 $ 16,371 $ 25,176
NOTE 13 — RELATED PARTY TRANSACTIONS
From time to time, in the normal course of business, we have transacted with related or affiliated companies and with certain of our officers and directors. We believe that the terms and fees negotiated for all transactions listed below are no less favorable than those that could be negotiated in arm’s length transactions.
We charter aircraft services from companies that use the private plane of Steven Hilton, our Chairman and CEO, although Mr. Hilton does not have an ownership interest in the companies. Payments made to these companies were approximately $711,000, $695,000 and $598,000 for the years ended December 31, 2016, 2015 and 2014, respectively. In addition, in 2016 we chartered aircraft services from a company that uses the private plane of Robert Sarver, a Meritage director. During the year ended December 31, 2016, these payments totaled $43,000 with no prior year activity.
In 2012, we entered into an FDIC insured bank deposit account agreement with Alliance Bank of Arizona (“Alliance Bank”) through the Insured Cash Sweep Service ("ICS"). ICS is an accepted and recognized service through which participating banks may accept and provide FDIC insurance coverage for large deposits that would otherwise exceed FDIC insurance limits (currently $250,000) by placing, as custodian for the deposit customer (Meritage), that portion of the deposit exceeding FDIC insurance limits with other ICS banks participating in the program such that for FDIC insurance purposes, the deposit is divided into insured amounts and deposited with other network banks to allow for full FDIC coverage. We had no cash deposits at December 31, 2016 and cash deposits in the aggregate amount of $100.1 million at December 31, 2015, through Alliance Bank as the ICS custodian or relationship bank. Alliance Bank had divided these amounts into FDIC insured amounts deposited with other ICS participating FDIC insured institutions. We do not pay any separate fees to Alliance Bank for these programs. Rather, Alliance Bank receives a small fee from the other ICS institutions for certain funds placed. Robert Sarver, a Meritage director, is a director and the chief executive officer of Western Alliance Bancorporation ("Western Alliance"), the parent company of Alliance Bank. In addition, Steven Hilton, our Chairman and CEO is also a director of
72
Western Alliance. We earned market-rate interest on deposits placed with Western Alliance pursuant to the ICS program of $48,000, $137,000 and $430,000 in 2016, 2015, and 2014, respectively. We had no cash deposits at an Alliance Bank checking account as of December 31, 2016 and a nominal amount of $9,678 of cash deposits as of December 31, 2015.
NOTE 14 — OPERATING AND REPORTING SEGMENTS
We operate with two principal business segments: homebuilding and financial services. As defined in ASC 280-10, Segment Reporting, we have nine homebuilding operating segments. The homebuilding segments are engaged in the business of acquiring and developing land, constructing homes, marketing and selling those homes and providing warranty and customer services. We aggregate our homebuilding operating segments into reporting segments based on similar long-term economic characteristics and geographical proximity. Our current reportable homebuilding segments are as follows:
West: Arizona, California and Colorado (1)Central: TexasEast: Florida, Georgia, North Carolina, South Carolina and Tennessee
(1) Activity for our wind-down Nevada operations is reflected in the West Region's results.
Management’s evaluation of segment performance is based on segment operating income, which we define as homebuilding and land revenues less cost of home construction, commissions and other sales costs, land development and other land sales costs and other costs incurred by or allocated to each segment, including impairments. Each reportable segment follows the same accounting policies described in Note 1, “Business and Summary of Significant Accounting Policies.” Operating results for each segment may not be indicative of the results for such segment had it been an independent, stand-alone entity for the periods presented. The following segment information is in thousands:
Years Ended December 31, 2016 2015 2014
Homebuilding revenue (1):West $ 1,300,906 $ 1,029,801 $ 920,244Central 787,849 731,766 692,320East 940,472 806,515 557,079
Consolidated total 3,029,227 2,568,082 2,169,643Homebuilding segment operating income:
West 103,801 85,760 102,640Central 74,253 80,444 75,372East 48,126 56,141 46,510
Total homebuilding segment operating income 226,180 222,345 224,522Financial services segment profit 21,902 19,271 16,178Corporate and unallocated costs (2) (33,863) (34,903) (33,245)Earnings/(loss) from other unconsolidated entities, net 4,060 (338) (447)Interest expense (5,172) (15,965) (5,163)Other income/(expense), net 4,953 (946) 6,572
Net earnings before income taxes $ 218,060 $ 189,464 $ 208,417
(1) Homebuilding revenue includes the following land closing revenue, by segment:
Years Ended December 31,
Land closing revenue: 2016 2015 2014
West $ 15,608 $ 2,131 $ 11,155Central 8,885 26,448 8,603East 1,308 7,947 7,494
Total $ 25,801 $ 36,526 $ 27,252
73
(2) Balance consists primarily of corporate costs and numerous shared service functions such as finance and treasury that are not allocated to the homebuilding or financial reporting segments.
At December 31, 2016
West Central EastFinancialServices
Corporate andUnallocated Total
Deposits on real estate underoption or contract $ 25,863 $ 27,669 $ 32,024 $ — $ — $ 85,556Real estate 1,120,038 595,485 706,540 — — 2,422,063Investments in unconsolidatedentities 7,362 7,450 — — 2,285 17,097Other assets 45,624 94,299 (1) 93,245 (2) 812 129,995 (3) 363,975Total assets $ 1,198,887 $ 724,903 $ 831,809 $ 812 $ 132,280 $ 2,888,691
At December 31, 2015
West Central EastFinancialServices
Corporate and
Unallocated Total
Deposits on real estate underoption or contract $ 28,488 $ 30,241 $ 29,110 $ — $ — $ 87,839Real estate 1,008,457 505,954 583,891 — — 2,098,302Investments in unconsolidatedentities 204 8,704 — — 2,462 11,370Other assets 55,112 87,313 (1) 77,548 (2) 898 261,395 (3) 482,266Total assets $ 1,092,261 $ 632,212 $ 690,549 $ 898 $ 263,857 $ 2,679,777
(1) Balance consists primarily of development reimbursements from local municipalities and cash.(2) Balance consists primarily of goodwill (see Note 9), prepaid permits and fees to local municipalities and cash.(3) Balance consists primarily of cash and our deferred tax asset.
NOTE 15 — COMMITMENTS AND CONTINGENCIES
We are involved in various routine legal and regulatory proceedings, including, without limitation, claims and litigation alleging construction defects. In general, the proceedings are incidental to our business, and most exposure is subject to and should be covered by warranty and indemnity obligations of our consultants and subcontractors. Additionally, some such claims are also covered by insurance. With respect to the majority of pending litigation matters, our ultimate legal and financial responsibility, if any, cannot be estimated with certainty and, in most cases, any potential losses related to these matters are not considered probable. Historically, most disputes regarding warranty claims are resolved prior to litigation. We believe there are not any pending legal or warranty matters that could have a material adverse impact upon our consolidated financial condition, results of operations or cash flows that have not been sufficiently reserved.
Joint Venture Litigation
From 2008 through January 2016, we were involved in litigation initiated by the lender group for a large Nevada-based land acquisition and development joint venture in which we held a 3.53% interest. We were the only builder joint venture partner to have fully performed its obligations with respect to takedowns of lots from the joint venture, having completed our first takedown in April 2007 and having tendered full performance of our second and final takedown in April 2008. The joint venture and the lender group rejected our tender of performance for our second and final takedown, and we contended, among other things, that the rejection by the joint venture and the lender group of our tender of full performance was wrongful and constituted a breach of contract and should release us of liability with respect to the takedown and extinguish or greatly reduce our exposure under all guarantees. On December 9, 2010, three of the lenders filed a petition seeking to place the venture into an involuntary bankruptcy (JP Morgan Chase Bank, N.A. v. South Edge, LLC (Case No. 10-32968-bam)). On June 6, 2011, we received a demand letter from the lenders requesting full payment of $13.2 million the lenders claimed to be owed under the springing repayment guarantee, including past-due interest and penalties. The lenders claimed that the involuntary bankruptcy filed by three of the co-lenders triggered the springing repayment guarantee. We contested the Lenders’ claim on the basis that the lenders breached their contract with us by refusing to accept the April 2008 tender of our performance, by refusing to release their lien in connection with our second and final takedown in this project, and the repayment guarantee was not properly triggered by the lenders’ filing of the involuntary bankruptcy. On August 25, 2011, the US District Court of Nevada
74
entered judgments in favor of JP Morgan in a combined amount of $16.6 million, which included prejudgment interest and attorneys' fees. We appealed that ruling and on October 26, 2015, the Ninth Circuit Court of Appeals issued an unpublished Memorandum Opinion affirming the trial court's ruling in favor of JP Morgan. We incurred an incremental $4.1 million in charges in the third quarter of 2015 for litigation reserves related to this matter to fully reserve the entire judgment and we subsequently paid the entire judgment amount in 2016, thus concluding the litigation with the lender group.
We believe that four of our co-venturers in the South Edge entity (KB Home, Toll Brothers, Pardee Homes and Beazer Homes) are liable to Meritage for certain amounts that Meritage has paid or may hereafter pay pursuant to or related to the above-mentioned litigation with the lender group and we have filed an arbitration claim against those builders to recover such amounts from them based on breach of contract, breach of the implied covenant of good faith and fair dealing, unjust enrichment, indemnity, and other claims.
Lease Agreements
We lease office facilities, model homes and equipment under various operating lease agreements. Approximate future minimum lease payments for non-cancellable operating leases as of December 31, 2016, are as follows (in thousands):
Years Ended December 31,
2017 $ 7,1762018 5,4102019 4,1242020 3,6592021 2,741Thereafter 4,029
$ 27,139
Rent expense was $7.8 million, $6.6 million and $6.5 million in 2016, 2015 and 2014, respectively, and is included within general and administrative expense or in commissions and other sales costs on our consolidated statements of operations. Sublease income was $0.6 million, $0.5 million and $0.6 million in 2016, 2015 and 2014, respectively. Sublease income is included within other income/(expense), net on our consolidated statements of operations.
See Note 1 for information related to our warranty obligations.
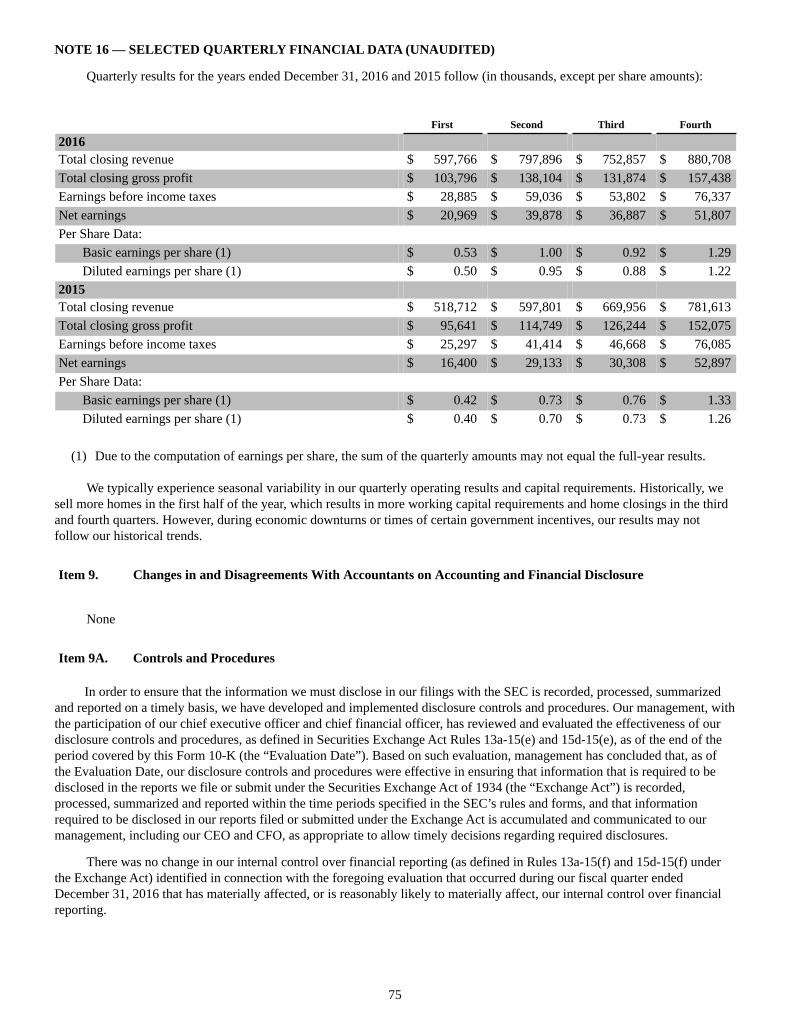
75
NOTE 16 — SELECTED QUARTERLY FINANCIAL DATA (UNAUDITED)
Quarterly results for the years ended December 31, 2016 and 2015 follow (in thousands, except per share amounts):
First Second Third Fourth
2016Total closing revenue $ 597,766 $ 797,896 $ 752,857 $ 880,708Total closing gross profit $ 103,796 $ 138,104 $ 131,874 $ 157,438Earnings before income taxes $ 28,885 $ 59,036 $ 53,802 $ 76,337Net earnings $ 20,969 $ 39,878 $ 36,887 $ 51,807Per Share Data:
Basic earnings per share (1) $ 0.53 $ 1.00 $ 0.92 $ 1.29Diluted earnings per share (1) $ 0.50 $ 0.95 $ 0.88 $ 1.22
2015Total closing revenue $ 518,712 $ 597,801 $ 669,956 $ 781,613Total closing gross profit $ 95,641 $ 114,749 $ 126,244 $ 152,075Earnings before income taxes $ 25,297 $ 41,414 $ 46,668 $ 76,085Net earnings $ 16,400 $ 29,133 $ 30,308 $ 52,897Per Share Data:
Basic earnings per share (1) $ 0.42 $ 0.73 $ 0.76 $ 1.33Diluted earnings per share (1) $ 0.40 $ 0.70 $ 0.73 $ 1.26
(1) Due to the computation of earnings per share, the sum of the quarterly amounts may not equal the full-year results.
We typically experience seasonal variability in our quarterly operating results and capital requirements. Historically, we sell more homes in the first half of the year, which results in more working capital requirements and home closings in the third and fourth quarters. However, during economic downturns or times of certain government incentives, our results may not follow our historical trends.
Item 9. Changes in and Disagreements With Accountants on Accounting and Financial Disclosure
None
Item 9A. Controls and Procedures
In order to ensure that the information we must disclose in our filings with the SEC is recorded, processed, summarized and reported on a timely basis, we have developed and implemented disclosure controls and procedures. Our management, with the participation of our chief executive officer and chief financial officer, has reviewed and evaluated the effectiveness of our disclosure controls and procedures, as defined in Securities Exchange Act Rules 13a-15(e) and 15d-15(e), as of the end of the period covered by this Form 10-K (the “Evaluation Date”). Based on such evaluation, management has concluded that, as of the Evaluation Date, our disclosure controls and procedures were effective in ensuring that information that is required to be disclosed in the reports we file or submit under the Securities Exchange Act of 1934 (the “Exchange Act”) is recorded, processed, summarized and reported within the time periods specified in the SEC’s rules and forms, and that information required to be disclosed in our reports filed or submitted under the Exchange Act is accumulated and communicated to our management, including our CEO and CFO, as appropriate to allow timely decisions regarding required disclosures.
There was no change in our internal control over financial reporting (as defined in Rules 13a-15(f) and 15d-15(f) under the Exchange Act) identified in connection with the foregoing evaluation that occurred during our fiscal quarter ended December 31, 2016 that has materially affected, or is reasonably likely to materially affect, our internal control over financial reporting.
76
Management’s Annual Report on Internal Control over Financial Reporting
Our management is responsible for establishing and maintaining adequate internal control over financial reporting, as such term is defined in Exchange Act Rule 13a-15(f). Internal control over financial reporting is a process to provide reasonable assurance regarding the reliability of our financial reporting and the preparation of financial statements for external purposes in accordance with accounting principles generally accepted in the United States. Because of its inherent limitations, internal control over financial reporting is not intended to provide absolute assurance that a misstatement of our financial statements would be prevented or detected. Also, projections of any evaluation of internal control effectiveness to future periods are subject to the risk that controls may become inadequate because of changes in conditions, or that the degree of compliance with internal control policies or procedures may deteriorate. Under the supervision and with the participation of our management, including our CEO and CFO, we conducted an evaluation of the effectiveness of our internal control over financial reporting based on the framework in Internal Control—Integrated Framework (2013) issued by the Committee of Sponsoring Organizations of the Treadway Commission. Based on this evaluation, our management concluded that our internal control over financial reporting was effective as of December 31, 2016. The effectiveness of our internal control over financial reporting as of December 31, 2016 has been audited by Deloitte & Touche LLP, an independent registered accounting firm, as stated in their attestation report, which is included herein.
77
REPORT OF INDEPENDENT REGISTERED PUBLIC ACCOUNTING FIRM
To the Board of Directors and Stockholders ofMeritage Homes CorporationScottsdale, Arizona
We have audited the internal control over financial reporting of Meritage Homes Corporation and subsidiaries (the "Company") as of December 31, 2016, based on criteria established in Internal Control - Integrated Framework (2013) issued by the Committee of Sponsoring Organizations of the Treadway Commission. The Company's management is responsible for maintaining effective internal control over financial reporting and for its assessment of the effectiveness of internal control over financial reporting, included in the accompanying Management’s Annual Report on Internal Control over Financial Reporting. Our responsibility is to express an opinion on the Company's internal control over financial reporting based on our audit.
We conducted our audit in accordance with the standards of the Public Company Accounting Oversight Board (United States). Those standards require that we plan and perform the audit to obtain reasonable assurance about whether effective internal control over financial reporting was maintained in all material respects. Our audit included obtaining an understanding of internal control over financial reporting, assessing the risk that a material weakness exists, testing and evaluating the design and operating effectiveness of internal control based on the assessed risk, and performing such other procedures as we considered necessary in the circumstances. We believe that our audit provides a reasonable basis for our opinion.
A company's internal control over financial reporting is a process designed by, or under the supervision of, the company's principal executive and principal financial officers, or persons performing similar functions, and effected by the company's board of directors, management, and other personnel to provide reasonable assurance regarding the reliability of financial reporting and the preparation of financial statements for external purposes in accordance with generally accepted accounting principles. A company's internal control over financial reporting includes those policies and procedures that (1) pertain to the maintenance of records that, in reasonable detail, accurately and fairly reflect the transactions and dispositions of the assets of the company; (2) provide reasonable assurance that transactions are recorded as necessary to permit preparation of financial statements in accordance with generally accepted accounting principles, and that receipts and expenditures of the company are being made only in accordance with authorizations of management and directors of the company; and (3) provide reasonable assurance regarding prevention or timely detection of unauthorized acquisition, use, or disposition of the company's assets that could have a material effect on the financial statements.
Because of the inherent limitations of internal control over financial reporting, including the possibility of collusion or improper management override of controls, material misstatements due to error or fraud may not be prevented or detected on a timely basis. Also, projections of any evaluation of the effectiveness of the internal control over financial reporting to future periods are subject to the risk that the controls may become inadequate because of changes in conditions, or that the degree of compliance with the policies or procedures may deteriorate.
In our opinion, the Company maintained, in all material respects, effective internal control over financial reporting as of December 31, 2016, based on the criteria established in Internal Control - Integrated Framework (2013) issued by the Committee of Sponsoring Organizations of the Treadway Commission.
We have also audited, in accordance with the standards of the Public Company Accounting Oversight Board (United States), the consolidated financial statements as of and for the year ended December 31, 2016 of the Company and our report dated February 17, 2017 expressed an unqualified opinion on those financial statements.
/s/ DELOITTE & TOUCHE LLP
Phoenix, Arizona
February 17, 2017
78
Item 9B. Other Information
None
PART III
Item 10. Directors, Executive Officers and Corporate Governance
Except as set forth herein, information required in response to this item is incorporated by reference from the information contained in our 2017 Proxy Statement (which will be filed with the Securities and Exchange Commission no later than 120 days following the Company’s fiscal year end (the "2017 Proxy Statement")). The information required by Item 10 regarding our executive officers appears in Part I, Item 1 of this Annual Report as permitted by General Instruction G(3).
Item 11. Executive Compensation
Information required in response to this item is incorporated by reference to our 2017 Proxy Statement.
Item 12. Security Ownership of Certain Beneficial Owners and Management and Related Stockholder Matters
Information required in response to this item is incorporated by reference to our 2017 Proxy Statement.
Item 13. Certain Relationships and Related Transactions, and Director Independence
Information required in response to this item is incorporated by reference to our 2017 Proxy Statement.
Item 14. Principal Accountant Fees and Services
Information required in response to this item is incorporated by reference to our 2017 Proxy Statement.
79
PART IV
Item 15. Exhibits and Financial Statement Schedules
(a) Financial Statements and Schedules
(i) Financial Statements:
The consolidated financial statements are included under Part II, Item 8 in this Annual Report on Form 10-K.
(ii) Financial Statement Schedules:
Schedules have been omitted because of the absence of conditions under which they are required or because the required information is included in the Consolidated Financial Statements or Notes thereto.
80
(b) Exhibits
ExhibitNumber Description Page or Method of Filing
2.1 Agreement and Plan of Reorganization, dated as ofSeptember 13, 1996, by and among Homeplex, theMonterey Merging Companies and the MontereyStockholders
Incorporated by reference to Appendix A ofForm S-4 Registration Statement No. 333-15937.
3.1 Restated Articles of Incorporation of Meritage HomesCorporation
Incorporated by reference to Exhibit 3 of Form8-K dated June 20, 2002.
3.1.1 Amendment to Articles of Incorporation of Meritage HomesCorporation
Incorporated by reference to Exhibit 3.1 of Form8-K dated September 15, 2004.
3.1.2 Amendment to Articles of Incorporation of Meritage HomesCorporation
Incorporated by reference to Appendix A of theProxy Statement for the 2006 Annual Meeting ofStockholders.
3.1.3 Amendment to Articles of Incorporation of Meritage HomesCorporation
Incorporated by reference to Appendix B ofProxy Statement for the 2008 Annual Meeting ofStockholders.
3.1.4 Amendment to Articles of Incorporation of Meritage HomesCorporation
Incorporated by reference to Appendix A of theDefinitive Proxy Statement filed with theSecurities and Exchange Commission on January9, 2009.
3.2 Amended and Restated Bylaws of Meritage HomesCorporation
Incorporated by reference to Exhibit 3.1 of Form8-K filed on February 15, 2017.
4.1 Form of Specimen of Common Stock Certificate Incorporated by reference to Exhibit 4.1 of Form10-K for the year ended December 31, 2007.
4.2 Indenture, dated April 13, 2010 (re 7.15% Senior Notes due2020)
Incorporated by reference to Exhibit 4.1 of Form8-K filed on April 14, 2010
4.2.1 First Supplemental Indenture (re 7.15% Senior Notes due2020)
Incorporated by reference to Exhibit 4.2 of Form10-Q for the quarter ended March 31, 2011).
4.2.2 Second Supplemental Indenture (re 7.15% Senior Notes due2020)
Incorporated by reference to Exhibit 4.4.2 ofForm 10-K for the year ended December 31,2011.
4.2.3 Third Supplemental Indenture (re 7.15% Senior Notes due2020)
Incorporated by reference to Exhibit 4.5 of Form10-Q for the quarterly period ended March 31,2012
4.2.4 Agreement of Resignation, Appointment and Acceptance,dated as of September 27, 2012, by and among MeritageHomes Corporation, Wells Fargo Bank, NationalAssociation and HSBC Bank USA, National Association (re7.15% Senior Notes due 2020)
Incorporated by reference to Exhibit 4.1 of Form8-K filed on October 1, 2012
4.2.5 Fourth Supplemental Indenture (re 7.15% Senior Notes due2020)
Incorporated by reference to Exhibit 4.3.4 ofForm S-4 Registration Statement No.333-187457
4.2.6 Fifth Supplemental Indenture (re 7.15% Senior Notes due2020)
Incorporated by reference to Exhibit 4.4 of Form10-Q for the quarter ended September 30, 2013
81
ExhibitNumber Description Page or Method of Filing
4.2.7 Sixth Supplemental Indenture (re 7.15% Senior Notes due2020)
Incorporated by reference to Exhibit 4.2.7 ofForm S-4 Registration Statement No.333-192730
4.2.8 Sixth Supplemental Indenture (re 7.15% Senior Notes due2020)
Incorporated by reference to Exhibit 4.3 of Form10-Q for the quarter ended June 30, 2014
4.2.9 Seventh Supplemental Indenture (re 7.15% Senior Notesdue 2020)
Incorporated by reference to Exhibit 4.4 of Form10-Q for the quarter ended June 30, 2014
4.2.10 Eighth Supplemental Indenture (re 7.15% Senior Notes due2020)
Incorporated by reference to Exhibit 4.2.10 ofForm 10-K for the year ended December 31,2014
4.3 Indenture dated April 10, 2012 (re 7.00% Senior Notes due2022)
Incorporated by reference to Exhibit 4.1 of Form8-K filed on April 10, 2012
4.3.1 First Supplemental Indenture (re 7.00% Senior Notes due2022)
Incorporated by reference to Exhibit 4.4.1 ofForm S-4 Registration Statement No.333-187457
4.3.2 Second Supplemental Indenture (re 7.00% Senior Notesdue 2022)
Incorporated by reference to Exhibit 4.2 of Form10-Q for the quarter ended September 30, 2013
4.3.3 Third Supplemental Indenture (re 7.00% Senior Notes due2022)
Incorporated by reference to Exhibit 4.5 of Form10-Q for the quarter ended June 30, 2014
4.3.4 Fourth Supplemental Indenture (re 7.00% Senior Notes due2022)
Incorporated by reference to Exhibit 4.6 of Form10-Q for the quarter ended June 30, 2014
4.3.5 Fifth Supplemental Indenture (re 7.00% Senior Notes due2022)
Incorporated by reference to Exhibit 4.3.5 ofForm 10-K for the year ended December 31,2014
4.4 Indenture, dated as of September 18, 2012 Incorporated by reference to Exhibit 4.1 of Form8-K filed on September 18, 2012
4.4.1 Supplemental Indenture No. 1, dated as of September 18,2012 (re 1.875% Convertible Senior Notes due 2032) andform of 1.875% Convertible Senior Notes due 2032
Incorporated by reference to Exhibit 4.2 of Form8-K filed on September 18, 2012
4.4.2 Supplemental Indenture No. 2 (re 1.875% ConvertibleSenior Notes due 2032)
Incorporated by reference to Exhibit 4.3 of Form10-Q for the quarter ended September 30, 2013
4.4.3 Supplemental Indenture No. 3 (re 1.875% ConvertibleSenior Notes due 2032)
Incorporated by reference to Exhibit 4.7 of Form10-Q for the quarter ended June 30, 2014
4.4.4 Supplemental Indenture No. 4 (re 1.875% ConvertibleSenior Notes due 2032)
Incorporated by reference to Exhibit 4.8 of Form10-Q for the quarter ended June 30, 2014
4.4.5 Supplemental Indenture No. 5 (re 1.875% ConvertibleSenior Notes due 2032)
Incorporated by reference to Exhibit 4.4.5 ofForm 10-K for the year ended December 31,2014
4.5 Indenture, dated March 13, 2013 re 4.50% Senior Notesdue 2018, and Form of 4.50% Senior Note
Incorporated by reference to Exhibit 4.1 of Form8-K dated March 13, 2013
4.5.1 First Supplemental Indenture (re 4.50% Senior Notes due2018)
Incorporated by reference to Exhibit 4.1 of Form10-Q for the quarter ended September 30, 2013
4.5.2 Second Supplemental Indenture (re 4.50% Senior Notesdue 2018)
Incorporated by reference to Exhibit 4.1 of Form10-Q for the quarter ended June 30, 2014
82
ExhibitNumber Description Page or Method of Filing
4.5.3 Third Supplemental Indenture (re 4.50% Senior Notes due2018)
Incorporated by reference to Exhibit 4.2 of Form10-Q for the quarter ended June 30, 2014
4.5.4 Fourth Supplemental Indenture (re 4.50% Senior Notes due2018)
Incorporated by reference to Exhibit 4.5.4 ofForm 10-K for the year ended December 31,2014
4.6 Indenture dated June 2, 2015 (re 6.00% Senior Notes due2025)
Incorporated by reference to Exhibit 4.1 of Form8-K dated June 2, 2015
10.1 2006 Executive Management Incentive Plan * Incorporated by reference to Appendix B of theProxy Statement for the 2014 Annual Meeting ofStockholders
10.2 Meritage Homes Corporation Amended and Restated 2006Stock Incentive Plan, as amended *
Incorporated by reference to Appendix A of theProxy Statement for the 2014 Annual Meeting ofStockholders
10.2.1 Amendment to the Meritage Homes Corporation Amendedand Restated 2006 Stock Incentive Plan *
Incorporated by reference to Appendix of theProxy Statement for the 2016 Annual Meeting ofStockholders
10.2.2 Representative Form of Restricted Stock Agreement * Incorporated by reference to Exhibit 4.9 of FormS-8 Registration Statement No. 333-166991
10.2.3 Representative Form of Restricted Stock Agreement (2006Plan; Executive Officer) *
Incorporated by reference to Exhibit 4.9.1 ofForm S-8 Registration Statement No.333-166991
10.2.4 Representative Form of Restricted Stock Agreement (2006Plan; Non-Employee Director) *
Incorporated by reference to Exhibit 4.9.2 ofForm S-8 Registration Statement No.333-166991
10.2.5 Representative Form of Non-Qualified Stock OptionAgreement (2006 Plan) *
Incorporated by reference to Exhibit 4.10 ofForm S-8 Registration Statement No.333-166991
10.2.6 Representative Form of Incentive Stock Option Agreement(2006 Plan) *
Incorporated by reference to Exhibit 4.4 of FormS-8 Registration Statement No. 333-134637
10.2.7 Representative Form of Stock Appreciation RightsAgreement (2006 Plan) *
Incorporated by reference to Exhibit 4.5 of FormS-8 Registration Statement No. 333-134637
10.2.8 Representative Form of Performance Share AwardAgreement *
Incorporated by reference to Exhibit 10.9 ofForm 8-K dated March 28, 2014
10.2.9 Representative Form of Restricted Stock Unit Agreement * Incorporated by reference to Exhibit 10.10 ofForm 8-K dated March 28, 2014
10.3 Fifth Amendment and Restated Employment Agreementbetween the Company and Steven J. Hilton *
Incorporated by reference to Exhibit 10.1 ofForm 8-K dated February 16, 2017
10.3.1 Fourth Amended and Restated Employment Agreementbetween the Company and Steven J. Hilton *
Incorporated by reference to Exhibit 10.1 ofForm 8-K dated March 28, 2014
10.3.2 Third Amended and Restated Change of Control Agreementbetween the Company and Steven J. Hilton *
Incorporated by reference to Exhibit 10.5 ofForm 8-K dated January 19, 2010.
10.3.3 Second Amendment to Third Amended and RestatedChange of Control Agreement for Steven J. Hilton *
Incorporated by reference to Exhibit 10.5 ofForm 8-K dated March 28, 2014
10.4 Fourth Amended and Restated Employment Agreementbetween the Company and Larry W. Seay *
Incorporated by reference to Exhibit 10.2 ofForm 8-K dated March 28, 2014
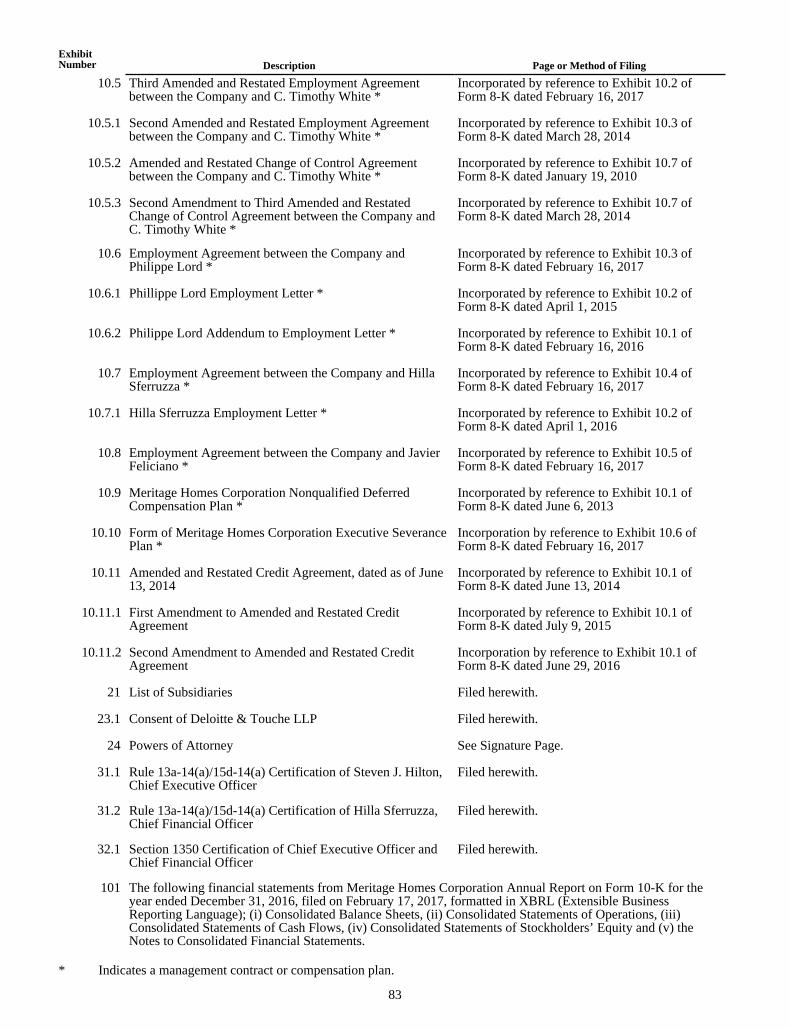
83
ExhibitNumber Description Page or Method of Filing
10.5 Third Amended and Restated Employment Agreementbetween the Company and C. Timothy White *
Incorporated by reference to Exhibit 10.2 ofForm 8-K dated February 16, 2017
10.5.1 Second Amended and Restated Employment Agreementbetween the Company and C. Timothy White *
Incorporated by reference to Exhibit 10.3 ofForm 8-K dated March 28, 2014
10.5.2 Amended and Restated Change of Control Agreementbetween the Company and C. Timothy White *
Incorporated by reference to Exhibit 10.7 ofForm 8-K dated January 19, 2010
10.5.3 Second Amendment to Third Amended and RestatedChange of Control Agreement between the Company andC. Timothy White *
Incorporated by reference to Exhibit 10.7 ofForm 8-K dated March 28, 2014
10.6 Employment Agreement between the Company andPhilippe Lord *
Incorporated by reference to Exhibit 10.3 ofForm 8-K dated February 16, 2017
10.6.1 Phillippe Lord Employment Letter * Incorporated by reference to Exhibit 10.2 ofForm 8-K dated April 1, 2015
10.6.2 Philippe Lord Addendum to Employment Letter * Incorporated by reference to Exhibit 10.1 ofForm 8-K dated February 16, 2016
10.7 Employment Agreement between the Company and HillaSferruzza *
Incorporated by reference to Exhibit 10.4 ofForm 8-K dated February 16, 2017
10.7.1 Hilla Sferruzza Employment Letter * Incorporated by reference to Exhibit 10.2 ofForm 8-K dated April 1, 2016
10.8 Employment Agreement between the Company and JavierFeliciano *
Incorporated by reference to Exhibit 10.5 ofForm 8-K dated February 16, 2017
10.9 Meritage Homes Corporation Nonqualified DeferredCompensation Plan *
Incorporated by reference to Exhibit 10.1 ofForm 8-K dated June 6, 2013
10.10 Form of Meritage Homes Corporation Executive SeverancePlan *
Incorporation by reference to Exhibit 10.6 ofForm 8-K dated February 16, 2017
10.11 Amended and Restated Credit Agreement, dated as of June13, 2014
Incorporated by reference to Exhibit 10.1 ofForm 8-K dated June 13, 2014
10.11.1 First Amendment to Amended and Restated CreditAgreement
Incorporated by reference to Exhibit 10.1 ofForm 8-K dated July 9, 2015
10.11.2 Second Amendment to Amended and Restated CreditAgreement
Incorporation by reference to Exhibit 10.1 ofForm 8-K dated June 29, 2016
21 List of Subsidiaries Filed herewith.
23.1 Consent of Deloitte & Touche LLP Filed herewith.
24 Powers of Attorney See Signature Page.
31.1 Rule 13a-14(a)/15d-14(a) Certification of Steven J. Hilton,Chief Executive Officer
Filed herewith.
31.2 Rule 13a-14(a)/15d-14(a) Certification of Hilla Sferruzza,Chief Financial Officer
Filed herewith.
32.1 Section 1350 Certification of Chief Executive Officer andChief Financial Officer
Filed herewith.
101 The following financial statements from Meritage Homes Corporation Annual Report on Form 10-K for theyear ended December 31, 2016, filed on February 17, 2017, formatted in XBRL (Extensible BusinessReporting Language); (i) Consolidated Balance Sheets, (ii) Consolidated Statements of Operations, (iii)Consolidated Statements of Cash Flows, (iv) Consolidated Statements of Stockholders’ Equity and (v) theNotes to Consolidated Financial Statements.
* Indicates a management contract or compensation plan.
84
Item 16. Form 10-K Summary
Not applicable.
SIGNATURES
Pursuant to the requirements of Section 13 or 15(d) of the Securities Exchange Act of 1934, the registrant has duly caused this report to be signed on its behalf by the undersigned, thereunto duly authorized, this 17th day of February 2017.
MERITAGE HOMES CORPORATION,a Maryland Corporation
By /s/ STEVEN J. HILTONSteven J. HiltonChairman and Chief Executive Officer
By /s/ HILLA SFERRUZZA
Hilla SferruzzaChief Financial Officer and Chief Accounting Officer(Duly Authorized Officer and Principal Financial Officer)
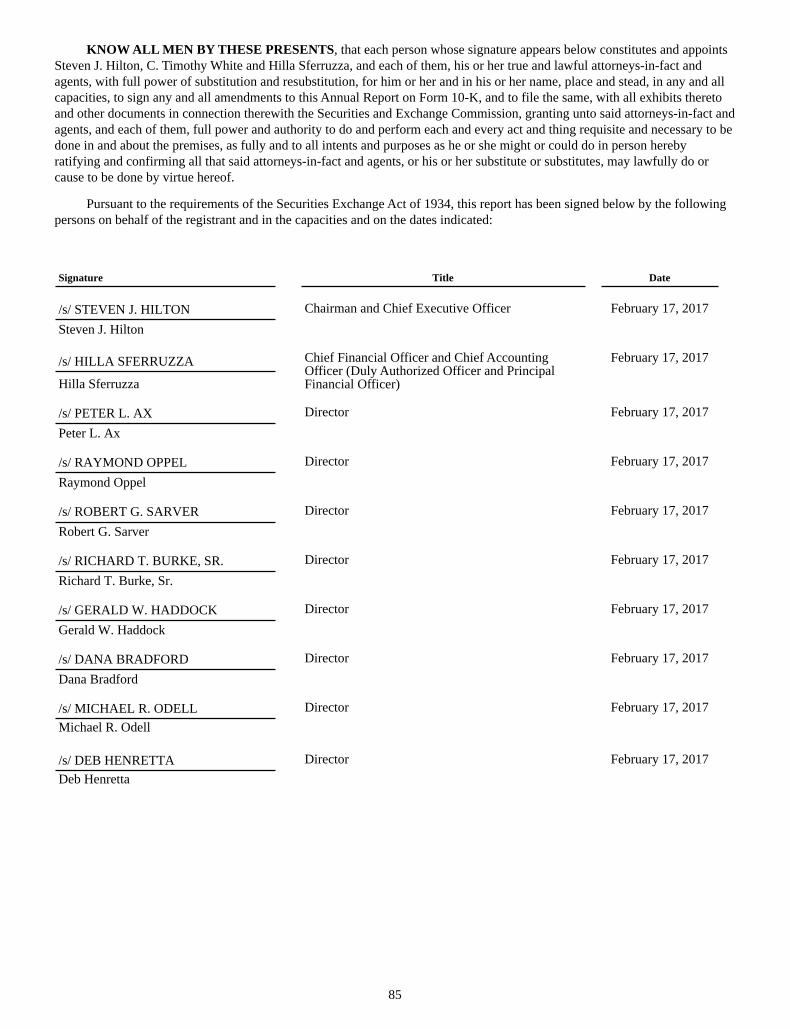
85
KNOW ALL MEN BY THESE PRESENTS, that each person whose signature appears below constitutes and appoints Steven J. Hilton, C. Timothy White and Hilla Sferruzza, and each of them, his or her true and lawful attorneys-in-fact and agents, with full power of substitution and resubstitution, for him or her and in his or her name, place and stead, in any and all capacities, to sign any and all amendments to this Annual Report on Form 10-K, and to file the same, with all exhibits thereto and other documents in connection therewith the Securities and Exchange Commission, granting unto said attorneys-in-fact and agents, and each of them, full power and authority to do and perform each and every act and thing requisite and necessary to be done in and about the premises, as fully and to all intents and purposes as he or she might or could do in person hereby ratifying and confirming all that said attorneys-in-fact and agents, or his or her substitute or substitutes, may lawfully do or cause to be done by virtue hereof.
Pursuant to the requirements of the Securities Exchange Act of 1934, this report has been signed below by the following persons on behalf of the registrant and in the capacities and on the dates indicated:
Signature Title Date
/s/ STEVEN J. HILTON Chairman and Chief Executive Officer February 17, 2017Steven J. Hilton
/s/ HILLA SFERRUZZA Chief Financial Officer and Chief Accounting Officer (Duly Authorized Officer and Principal Financial Officer)
February 17, 2017
Hilla Sferruzza
/s/ PETER L. AX Director February 17, 2017Peter L. Ax
/s/ RAYMOND OPPEL Director February 17, 2017Raymond Oppel
/s/ ROBERT G. SARVER Director February 17, 2017Robert G. Sarver
/s/ RICHARD T. BURKE, SR. Director February 17, 2017Richard T. Burke, Sr.
/s/ GERALD W. HADDOCK Director February 17, 2017Gerald W. Haddock
/s/ DANA BRADFORD Director February 17, 2017Dana Bradford
/s/ MICHAEL R. ODELL Director February 17, 2017Michael R. Odell
/s/ DEB HENRETTA Director February 17, 2017Deb Henretta

[THIS PAGE INTENTIONALLY LEFT BLANK]
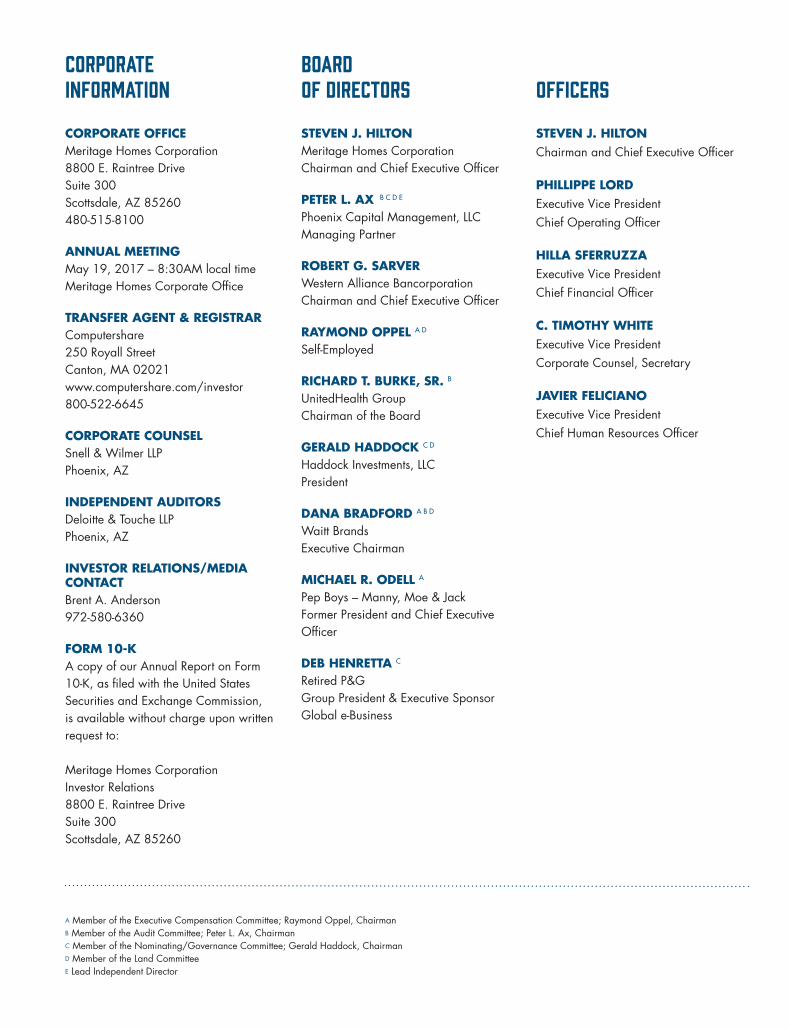
A Member of the Executive Compensation Committee; Raymond Oppel, ChairmanB Member of the Audit Committee; Peter L. Ax, ChairmanC Member of the Nominating/Governance Committee; Gerald Haddock, ChairmanD Member of the Land CommitteeE Lead Independent Director
CORPORATEINFORMATION
CORPORATE OFFICEMeritage Homes Corporation8800 E. Raintree DriveSuite 300Scottsdale, AZ 85260480-515-8100
ANNUAL MEETINGMay 19, 2017 – 8:30AM local timeMeritage Homes Corporate Office
TRANSFER AGENT & REGISTRARComputershare250 Royall StreetCanton, MA 02021www.computershare.com/investor800-522-6645
CORPORATE COUNSELSnell & Wilmer LLPPhoenix, AZ
INDEPENDENT AUDITORSDeloitte & Touche LLPPhoenix, AZ
INVESTOR RELATIONS/MEDIA CONTACTBrent A. Anderson972-580-6360
FORM 10-KA copy of our Annual Report on Form 10-K, as filed with the United States Securities and Exchange Commission, is available without charge upon written request to:
Meritage Homes CorporationInvestor Relations8800 E. Raintree DriveSuite 300Scottsdale, AZ 85260
BOARDOF DIRECTORS
STEVEN J. HILTONMeritage Homes CorporationChairman and Chief Executive Officer
PETER L. AX B C D E
Phoenix Capital Management, LLCManaging Partner
ROBERT G. SARVERWestern Alliance BancorporationChairman and Chief Executive Officer
RAYMOND OPPEL A D
Self-Employed
RICHARD T. BURKE, SR. B
UnitedHealth GroupChairman of the Board
GERALD HADDOCK C D
Haddock Investments, LLCPresident
DANA BRADFORD A B D
Waitt BrandsExecutive Chairman
MICHAEL R. ODELL A
Pep Boys – Manny, Moe & JackFormer President and Chief Executive Officer
DEB HENRETTA C
Retired P&GGroup President & Executive SponsorGlobal e-Business
OFFICERS
STEVEN J. HILTONChairman and Chief Executive Officer
PHILLIPPE LORDExecutive Vice PresidentChief Operating Officer
HILLA SFERRUZZAExecutive Vice PresidentChief Financial Officer
C. TIMOTHY WHITEExecutive Vice PresidentCorporate Counsel, Secretary
JAVIER FELICIANOExecutive Vice PresidentChief Human Resources Officer

meritagehomes.comNYSE: MTH ©2017 Meritage Homes Corporation
2016 Annual ReportM
eritage Homes
Life. Built. Better.