Embed Size (px)
Citation preview

Brands for PeopleAnnual Report 2016

02 STADA Key Figures
STADA KEY FIGURES
Key figures for the Group in € million 2016 Previous year ± %
Group sales 2,139.2 2,115.1 +1%
• Generics1) 1,280.7 1,261.4 +2%
• Branded Products 858.5 853.6 +1%
Group sales adjusted for currency and portfolio effects 2,167.2 2,100.4 2) +3%
• Generics 1) 1,287.4 1,253.2 2) +3%
• Branded Products 879.8 847.1 2) +4%
Operating profit 178.1 223.7 -20%
• Operating segment result Generics1) 195.2 177.7 +10%
• Operating segment result Branded Products 81.4 130.0 -37%
Operating profit, adjusted 3) 4) 294.4 283.8 +4%
• Operating segment result Generics 1), adjusted 3) 4) 214.2 182.7 +17%
• Operating segment result Branded Products, adjusted 3) 4) 152.8 173.2 -12%
EBITDA (Earnings before interest, taxes, depreciation and amortization) 361.5 377.1 -4%
• EBITDA Generics1) 255.8 233.2 +10%
• EBITDA Branded Products 186.2 211.8 -12%
EBITDA (Earnings before interest, taxes, depreciation and amortization), adjusted 3) 4) 398.0 389.4 +2%
• EBITDA Generics 1), adjusted 3) 4) 264.9 232.0 +14%
• EBITDA Branded Products, adjusted 3) 4) 200.7 220.1 -9%
EBIT (Earnings before interest and taxes) 178.9 225.3 -21%
EBIT (Earnings before interest and taxes), adjusted 3) 4) 295.1 285.3 +3%
EBT (Earnings before taxes) 127.4 157.8 -19%
EBT (Earnings before taxes), adjusted 3) 4) 244.2 220.9 +11%
Net income 85.9 110.4 -22%
Net income, adjusted 3) 4) 177.3 165.8 +7%
Cash flow from operating activities 333.5 311.7 +7%
Capital expenditure 189.7 177.0 +7%
Depreciation and amortization (net of write-ups) 182.7 151.8 +20%
Employees (average number calculated on the basis of full-time employees)5) 10,839 10,441 +4%
Employees (as of the balance sheet date calculated on the basis of full-time employees)
10,923
10,532
+4%
Key share figures 2016 Previous year ± %
Market capitalization (year-end) in € million 3,066.3 2,327.9 +32%
Year-end closing price (XETRA®) in € 49.19 37.34 +32%
Number of shares (year-end) 62,342,440 62,342,440 –
Average number of shares (without treasury shares) 62,256,532 61,637,621 +1%
Earnings per share in € 1.38 1.79 -23%
Earnings per share in €, adjusted 3) 4) 2.85 2.69 +6%
Diluted earnings per share in € – 1.79 –
Diluted earnings per share in €, adjusted 3) 4) 6) – 2.69 –
Dividend per share in € 0.727) 0.70 +3%
Total dividend payments in € million 44.87) 43.6 +3%
Distribution ratio as a percentage 52%7) 39% +32%
1) Figures for the reporting year and the previous year include the non-core activity “Commercial Business”, which was previously disclosed separately.2) Sales of the previous year adjusted for currency and portfolio effects represent the comparable basis which is relevant for the key figure of the current reporting year.3) The deduction of such effects which have an impact on the presentation of STADA’s earnings situation and the derived key figures aims at improving the comparability of key figures with previous years. To achieve this, STADA uses adjusted key figures, which, as so-called pro forma figures, are not governed by the accounting requirements in accordance with IFRS. As other companies may not calculate the pro forma figures presented by STADA in the same way, STADA’s pro forma figures are only comparable with similarly designated disclosures by other companies to a limited extent.
4) Within the context of this annual report, adjustments in connection with the key earnings figures generally relate to special items.5) This average number includes changes in the scope of consolidation on a pro-rata basis.6) Earnings per share will not be diluted in financial year 2016, because the share options from the STADA warrants in connection with the Conditional Capital Increase 2004/I expired on June 26, 2015.7) Recommendation.

03STADA at a Glance
STADA AT A GLANCE
STADA BUSINESS MODEL• Focus on products with off-patent active pharmaceutical ingredients in the health care and pharmaceutical market
• Segments
– Generics (59% share in adjusted Group sales)
– Branded Products (41% share in adjusted Group sales)
• Strategic success factors
– Orientation on long-term growth markets
– Comprehensive portfolio of generics including selected biosimilars
– Attractive-margin branded product portfolio with increased internationalization of successful brands
– Strong product development including well-filled pipeline
– Global sales structure with further internationalization potential
– A focused acquisition policy
– A functional organizational structure with close-to-market sales companies
– Continuous cost optimization and efficient cost management
– Excellent and committed employees
STADA FINANCIAL YEAR 2016• Reported Group sales increase by 1% to € 2.14 billion – Group sales adjusted for currency and portfolio effects
increase by 3% to € 2.17 billion
• Adjusted sales in the Generics segment increase by 3% to € 1,287.4 million
• Adjusted sales in the Branded Products segment record growth of 4% to € 879.8 million – further expansion of the
self-pay portfolio
• Reported key earnings figures
– Reported EBITDA records a decrease of 4% to € 361.5 million
– Reported net income decreases by 22% to € 85.9 million
• Adjusted key earnings figures
– Adjusted EBITDA shows an increase of 2% to € 398.0 million
– Adjusted net income grows by 7% to € 177.3 million
• Strategic further development with numerous initiatives introduced to improve performance
• Fundamental change to reporting structures carried out – management by operating segments
• Successful product development with a total of 665 product launches
• Selected value-enhancing acquisitions to strengthen the Branded Products and Generics segments
• Significant growth in the STADA share price of 32%
• Proposal to increase the dividend by 3% to € 0.72 per STADA share
STADA OUTLOOK• Guidance for 2017
– Group sales adjusted for currency and portfolio effects between € 2.280 billion and € 2.350 billion
– Adjusted EBITDA between € 430 million and € 450 million
– Adjusted net income between € 195 million and € 205 million
– Ratio of net debt, excluding further acquisitions, to adjusted EBITDA at a level of nearly 3
• Strategic outlook for 2019
– Adjusted Group sales between € 2.650 billion and € 2.700 billion
– Adjusted EBITDA between € 570 million and € 590 million
– Adjusted net income between € 250 million and € 270 million

Hedrin® – Taking the drama out of head lice.
STADA ANNUAL REPORT 2016
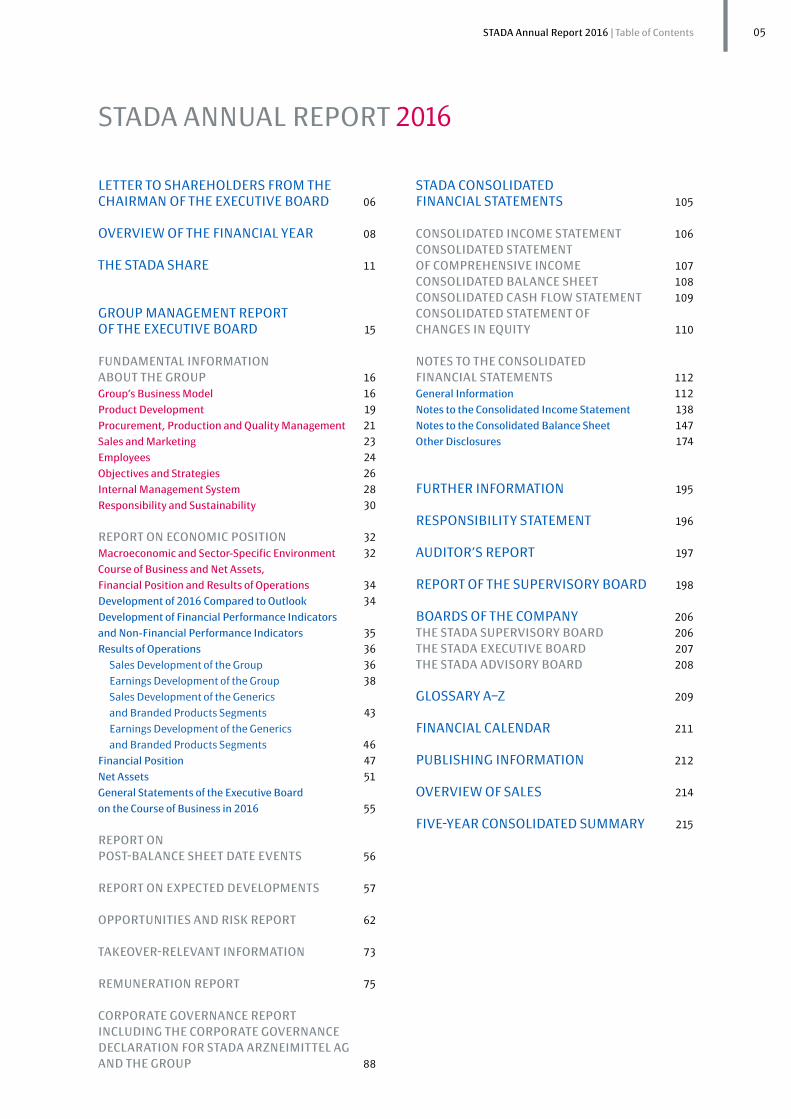
05STADA Annual Report 2016 | Table of Contents
LETTER TO SHAREHOLDERS FROM THE CHAIRMAN OF THE EXECUTIVE BOARD 06
OVERVIEW OF THE FINANCIAL YEAR 08
THE STADA SHARE 11
GROUP MANAGEMENT REPORT OF THE EXECUTIVE BOARD 15
FUNDAMENTAL INFORMATION ABOUT THE GROUP 16
Group’s Business Model 16
Product Development 19
Procurement, Production and Quality Management 21
Sales and Marketing 23
Employees 24
Objectives and Strategies 26
Internal Management System 28
Responsibility and Sustainability 30
REPORT ON ECONOMIC POSITION 32
Macroeconomic and Sector-Specific Environment 32
Course of Business and Net Assets,
Financial Position and Results of Operations 34
Development of 2016 Compared to Outlook 34
Development of Financial Performance Indicators
and Non-Financial Performance Indicators 35
Results of Operations 36
Sales Development of the Group 36
Earnings Development of the Group 38
Sales Development of the Generics
and Branded Products Segments 43
Earnings Development of the Generics
and Branded Products Segments 46
Financial Position 47
Net Assets 51
General Statements of the Executive Board
on the Course of Business in 2016 55
REPORT ON POST-BALANCE SHEET DATE EVENTS 56
REPORT ON EXPECTED DEVELOPMENTS 57
OPPORTUNITIES AND RISK REPORT 62
TAKEOVER-RELEVANT INFORMATION 73
REMUNERATION REPORT 75
CORPORATE GOVERNANCE REPORT INCLUDING THE CORPORATE GOVERNANCE DECLARATION FOR STADA ARZNEIMITTEL AG AND THE GROUP 88
STADA CONSOLIDATED FINANCIAL STATEMENTS 105
CONSOLIDATED INCOME STATEMENT 106
CONSOLIDATED STATEMENT OF COMPREHENSIVE INCOME 107
CONSOLIDATED BALANCE SHEET 108
CONSOLIDATED CASH FLOW STATEMENT 109
CONSOLIDATED STATEMENT OF CHANGES IN EQUITY 110
NOTES TO THE CONSOLIDATED FINANCIAL STATEMENTS 112
General Information 112
Notes to the Consolidated Income Statement 138
Notes to the Consolidated Balance Sheet 147
Other Disclosures 174
FURTHER INFORMATION 195
RESPONSIBILITY STATEMENT 196
AUDITOR’S REPORT 197
REPORT OF THE SUPERVISORY BOARD 198
BOARDS OF THE COMPANY 206
THE STADA SUPERVISORY BOARD 206
THE STADA EXECUTIVE BOARD 207
THE STADA ADVISORY BOARD 208
GLOSSARY A–Z 209
FINANCIAL CALENDAR 211
PUBLISHING INFORMATION 212
OVERVIEW OF SALES 214
FIVE-YEAR CONSOLIDATED SUMMARY 215

06 Letter to Shareholders from the Chairman of the Executive Board
LETTER TO SHAREHOLDERS FROM THE CHAIRMAN OF THE EXECUTIVE BOARD
Dear Shareholders, Ladies and Gentlemen,
2016 was, in many ways, a year of transformation for STADA. You, the company’s shareholders, elected a new Supervisory Board
at what was, for all intents and purposes, a contentious Annual General Meeting. At the same time, you expressed confidence
in the Executive Board’s ability to initiate a comprehensive strategic development of the company – the fundamental principles
of which we were able to introduce to you at the Annual General Meeting.
In an economic and political environment that remains challenging, we took significant steps forward in the second half of 2016
in terms of the implementation of our future program that we have named “STADA Plus”:
• We have optimized the Group structure and since the third quarter of 2016 have been managing STADA under the
two core segments Generics and Branded Products.
• We have increased transparency with the new reporting standards and comprehensive internal and external bench-
marking. We have taken steps to ensure that we have an improved overview, greater accountability and, as a result,
successful management of the business.
• We have begun to consistently rid our portfolio of projects and products that, according to cost-benefit analyses, do
not make a sufficient contribution to operating profitability. This includes both changes to our sales structures in various
markets as well as the disposal of those businesses or products that are no longer in line with our strategic focus. Although
these measures had a negative impact on our net profit in 2016, they were nonetheless a necessary step toward consistent
and sustainable performance improvement.
• The focused internationalization of attractive branded products is another key measure that we introduced in 2016.
We have now identified seven branded products that we intend to roll out internationally in the coming years.
• We are taking a targeted approach to tapping into further growth markets. This includes intensifying our activities in the
attractive market for nutritional supplements which we succeeded in moving forward with the announced acquisition of
British branded product company Natures Aid in December 2016. In the Generics segment, we are pursuing a risk-averse
biosimilar strategy with which we are laying the groundwork for the market launch of four biosimilars for 2019.
• As part of our future program, we have streamlined our M&A strategy and applied a clear set of investment criteria.
• And, last but not least, we have initiated a cultural transformation in the company with which we will demand entre-
preneurship, knowledge sharing and an open dialogue while fostering performance and innovation in the company.
In the past financial year, STADA thus laid the cornerstones for a sustainably successful future. The already ambitions
medium-term goals for the year 2019 that we introduced in the summer of 2016 and for which we provided further details at
our Capital Market Day in October were an expression of the tremendous potential that can be found within your company.
STADA showed very sound development in this environment in the past financial year, even slightly exceeding all of the goals
for the year. We were able to increase both adjusted Group sales and EBITDA by 3% to € 2.167 billion and by 2% to € 398.0 mil-
lion respectively, adjusted net income increased by an even more impressive 7% to € 177.3 million. Both core segments, the
business with generics and the business with branded products, contributed to the strong result.
The business results show that we are on the right path with the further development of the corporate strategy and our future
program “STADA Plus”. In this year of transformation, we proved our ability to perform in a difficult environment and have already
been able to significantly improve our performance in key areas. STADA is moving forward – and taking giant steps on the path
to a sustainably successful future.
We would also like to make sure that you, dear shareholders, again participate to an appropriate degree in the good annual
result. We therefore recommend that the Annual General Meeting on June 8, 2017 propose a three percent increase in
the dividend to € 0.72 per share. This represents a distribution ratio of around 52% of reported net income, a continuation of a
dividend policy that has remained constant for decades.

07Letter to Shareholders from the Chairman of the Executive Board
I would like to take this opportunity to thank all of the customers and patients around the world who have put their trust in
STADA’s products and brands. You motivate us to do our best every day. But the foundation that allows us to make this per-
formance commitment are the employees of the STADA Group. The success of this company would not be possible without them.
I thank you all for your tremendous commitment and for the contribution you make to the strong development of our business.
My thanks also go out to our new and former members of the Supervisory Board for their helpful and constructive cooperation.
STADA is on the right path, but we still have a long way to go. 2017 will be another year of transition for your company – but it
will also be a year of enhanced growth. To achieve this, we have intensified the work we are doing on our future program “STADA
Plus” and have defined further necessary measures to take advantage of additional potentials. We are concentrating on three
key levers:
• Further strengthening of the generics business: We are harmonizing the product and dosage portfolio and intensifying
our sales efforts in selected European markets with substantial growth potential.
• Further expansion of the branded products business: We are consistently aligning the organizational structure on
the branded products area toward a central management of our internationalization projects. Today, we have already
identified additional attractive branded products that to date have been mainly local champions and which we believe
can achieve major international success.
• Consistent cost management: We are optimizing our supply chain management as well as the procurement process and
organization. In addition, we have introduced a number of long term improvement measures with the goal of reducing
internal production costs. General and administrative expenses will also be reduced.
Together with the measures we already introduced in the summer of 2016, we have now, in this second step of our future
project, developed additional value enhancement potentials with which we want to achieve an even greater improvement in
profitability in the medium term than originally planned. We are thus making STADA fit for the future – irrespective of the current
structured bidding process that your company finds itself in.
Although there will be one-time burdens in the current and in the coming financial year from restructuring expenses for the
measures that have been outlined here, we are confident that we will also be able to deliver a further improved result in 2017.
We in the Executive Board anticipate a figure of between € 2.280 billion and € 2.350 billion for Group sales adjusted for currency
and portfolio effects, an adjusted EBITDA of between € 430 million and € 450 million and an adjusted net income between
€ 195 million and € 205 million. From a medium-term perspective, the Executive Board is also determined to increase STADA’s
profitability, expressed in terms of the adjusted EBITDA margin, to around 23%.
Our future program “STADA Plus” is geared not only toward short and medium-term successes. The potential of our program
reaches well beyond the achievement of our growth and profit goals for 2019. Together we are working on a long term and
sustainably successful future for your company – on a new and even better STADA. The 125th anniversary of your company in
2020 is not only a symbolically decisive milestone for us. This welcome anniversary is a clear mission to define a viable vision for
the future of STADA and to determinedly develop the company in this direction – for the benefit of customers, employees and
shareholders.
We hope that you will remain loyal as we continue on this path!
On behalf of the Executive Board
Dr. Matthias Wiedenfels
Chairman of the Executive Board

08 Overview of the Financial Year
OVERVIEW OF THE FINANCIAL YEAR
Five-year comparison in € million 2016 2015 2014 2013 2012
Group sales 2,139.2 2,115.1 2,062.2 2,003.9 1,837.5
Operating profit 178.1 223.7 188.5 248.3 202.1
Operating profit, adjusted 294.4 283.8 320.7 303.1 266.2
EBITDA1) 361.5 377.1 418.8 382.6 323.7
EBITDA, adjusted 398.0 389.4 431.9 414.3 367.4
EBIT2) 178.9 225.3 190.3 252.4 205.9
EBIT, adjusted 295.1 285.3 322.4 307.1 270.0
EBT3) 127.4 157.8 124.7 189.3 135.6
EBT, adjusted 244.2 220.9 253.3 240.7 200.5
Net income 85.9 110.4 64.6 121.4 86.5
Net income, adjusted 177.3 165.8 186.2 160.6 147.9
Financial year 2016 characterized by significant changes
The Group was able to drive forward significant changes in financial year 2016 in the context of the revised corporate strategy.
Reported Group sales increased by 1% to € 2,139.2 million in the reporting year (previous year: € 2,115.1 million). When effects
on sales resulting from changes in the Group portfolio and currency effects are deducted, adjusted Group sales increased by
3% to € 2,167.2 million (previous year: € 2,100.4 million).
Overall, the earnings situation in 2016 was characterized by high special items, particularly through expenses in connection
with restructuring decisions. The changes to the corporate structure and resulting changes to reporting structures in July 2016
with which the company is moving away from regional responsibilities and towards central management of the Generics and
Branded Products segments, led to a series of structural measures, particularly in relation to personnel decisions, as well as the
revaluation of portfolio activities. As a consequence, the development of the reported earnings situation differed from
the development of the adjusted key earnings figures. Furthermore, the development of reported operating profit was signifi-
cantly influenced by negative translation effects that were attributable to a weaker Russian ruble and the increasing weakness
of the British pound sterling since the EU referendum.
Reported EBITDA decreased by 4% to € 361.5 million (previous year: € 377.1 million). Reported net income increased by 22%
to € 85.9 million (previous year: € 110.4 million). After adjusting the key earnings figures for influences distorting the year-
on-year comparison resulting from special items, adjusted EBITDA increased by 2% to € 398.0 million (previous year: € 389.4 mil-
lion). Adjusted net income grew by 7% to € 177.3 million (previous year: € 165.8 million).
The reported tax rate improved in financial year 2016 to 25.1% (previous year: 25.8%) The adjusted tax rate of 23.9% in the
same period was above the level of the previous year (previous year: 22.0%).
Positive development of the financial situation
The financial situation of the STADA Group recorded positive development in the reporting year.
As of December 31, 2016, the equity-to-assets ratio was 30.4% (December 31, 2015: 31.0%) and was satisfactory in the
opinion of the Executive Board. Net debt was reduced to € 1,118.2 million as of the reporting date (December 31, 2015:
€ 1,215.7 million).
The net debt to adjusted EBITDA ratio improved to 2.8 in financial year 2016 (previous year: 3.1).
1) Earnings before interest, taxes, depreciation and amortization.2) Earnings before interest and taxes.3) Earnings before taxes.
09Overview of the Financial Year
1) See the Company’s ad hoc release of August 15, 2016.2) See the Company’s ad hoc release of June 5, 2016.3) See the Company’s press release of August 27, 2016.
The long-term refinancing of the Group as of December 31, 2016 was provided for by a five-year bond that was placed in the
second quarter of 2013 in the amount of € 350.0 million with an interest rate of 2.25% p.a. as well as a seven-year corporate
bond placed in the first quarter of 2015 in the amount of € 300.0 million with an interest rate of 1.75% p.a. Furthermore, as of
December 31, 2016, there were promissory note loans with maturities in the area of the beginning of 2017 until 2023 with a
total nominal value in the amount of € 709.0 million. In order to ensure a balanced financing structure, promissory note loans
are staggered in terms of their volume and duration.
Cash flow from operating activities improved to € 333.5 million in the reporting year (previous year: € 311.7 million). Free cash
flow increased to € 160.9 million (previous year: € 133.5 million). Free cash flow adjusted for payments for significant investments
or acquisitions and proceeds from significant disposals increased to € 243.0 million (previous year: € 212.4 million).
Changes in the Executive Board and Supervisory Board
On August 15, 2016, the long-standing Chairman of the Executive Board Hartmut Retzlaff resigned from his office as member
of the Executive Board with immediate effect. The employment relationship between him and STADA Arzneimittel AG was
ended with effect from December 31, 2016 by mutual agreement due to personal circumstances.1) The STADA Supervisory Board
had already decided on a change at the company’s helm at an extraordinary meeting held on June 5, 2016, due to the serious
and likely long-term illness of Mr. Retzlaff.2) As a result, Dr. Matthias Wiedenfels was appointed as Chairman of the Executive
Board.
In addition, the process of reshaping the Supervisory Board ahead of schedule was completed in the reporting year.3) Dr. Martin
Abend, Dr. Eckhard Brüggemann, Dr. K. F. Arnold Hertzsch, Dieter Koch and Constantin Meyer were succeeded by Dr. Eric Cornut,
Rolf Hoffmann, Dr. Birgit Kudlek, Tina Müller and Dr. Gunnar Riemann as new shareholder representatives on the Supervisory
Board. Following the Annual General Meeting, the Supervisory Board elected Carl Ferdinand Oetker as its Chairman and
Jens Steegers as Vice-Chairman.
Revised corporate strategy to improve performance for the fundamental changing of the reporting structure
In the reporting year, the Executive Board agreed a revised corporate strategy and introduced numerous initiatives to improve
the performance of the Group and to increase the enterprise value in the long-term. As part of the program, untapped sales
potential will be leveraged, marketing expenses will be optimized, sales efficiency will be enhanced and cost of sales will be
reduced. The initiatives will also contribute towards meeting the goals for 2019, set in 2016.
In order to accommodate the growth strategy including central management of the segments, an increased internationalization
of the branded product portfolio and stricter cost controls, the Executive Board agreed a fundamental change to reporting
structures in financial year 2016. STADA had previously reported according to operating segment and market region. In accor-
dance with the changed reporting structure, the Group is now managed by the two segments Generics and Branded Products.
In the course of the change, the non-core activity Commercial Business was integrated into the Generics segment. As a result
the figures reported for the Generics segment for financial year 2016, as well as those for the previous year, include the non-core
activity Commercial Business, which was previously disclosed separately.
In the course of the strategic development, the organizational and sales structures are to be examined. The German business
activities, for example, are to be bundled and made more competitive to improve perception on the market and achieve sales
and cost advantages. In this context, STADA GmbH and STADAvita as well as STADApharm and cell pharm are to be merged. At
the beginning of the fourth quarter of 2016, the executive management of STADA GmbH and STADAvita as well as STADApharm
and cell pharm started negotiations with the Works Council on the details for a merger as well as negotiations on a balancing of
interests and a social compensation plan.
Strong product development with a well-filled pipeline
The STADA Group has strong product development and a well-filled pipeline. With the further expansion of the product
portfolio and the launch of 665 individual products worldwide in the reporting year (previous year: 578 product launches),
STADA once again proved the success of its development and approval activities.

10 Overview of the Financial Year
In addition, the Group also made further progress in the area of biosimilars. In 2016, STADA was able to sign a contract with
mAbxience for the in-licensing of the monoclonal antibody Bevacizumab. STADA and its cooperation partner also received a
so-called “positive opinion” from the responsible European approval authority EMA for teriparatide at the end of 2016, before
approval was granted by the EU commission in the current financial year 2017.
In light of the well-filled product pipeline, the Executive Board expects to be able to continuously introduce new products to
the market in future. The focus here remains on generics in the EU. In the area of biosimilars, STADA will continue to pursue its
in-licensing strategy in order to further supplement its portfolio with seleted biosimilars.
Continuation of STADA’s focused acquisition policy
In financial year 2016, the Group continued its focused acquisition policy of targeting organic growth through selected external
acquisitions. The focus remains on both the regional expansion of business activities as well as on the expansion and inter-
nationalization of branded products in particular.
In order to strengthen the Generics segment, STADA and the STADA subsidiary BEPHA Beteiligungsgesellschaft für Pharmawerte
mbH signed a contract for the purchase of the Argentinean generics producer Laboratorio Vannier in the fourth quarter of 20151),
with the purchase completed in the first quarter of 2016.
In addition, in the third quarter of 2016, the Serbian STADA subsidiary Hemofarm A.D. acquired a local product portfolio
primarily focusing on medication for the treatment of gastrointestinal disorders, to strengthen their position in the area of
consumer health.
Furthermore, STADA UK Holdings Ltd. also took over British branded products company Natures Aid Limited, a well-known
manufacturer of vitamins, minerals, food supplements and herbal products, in the fourth quarter of 2016.2)
Proposal to increase the dividend
Despite the decrease in reported net income, in light of STADA’s dividend policy, which has been consistent for decades, the
Executive Board is recommending to the Supervisory Board that a dividend in the amount of € 0.72 per STADA share is proposed
for financial year 2016 at the next Annual General Meeting on June 8, 2017 (previous year: € 0.70).3) This would represent a
dividend increase of 3% compared with the previous year, a total dividend payment of € 44.8 million (previous year: € 43.6 mil-
lion) and a distribution ratio of around 52% of the reported net income.
Guidance/Strategic outlook
In general, the Group’s future sales and earnings development will be characterized by both growth-stimulating and
challenging conditions. In light of the changed corporate structure and repositioned corporate culture, the implementation of
the numerous initiatives as part of the revised corporate strategy and the strategic success factors, the positive prospects are
however expected to prevail.
For financial year 2017, the Executive Board expects further growth. Group sales adjusted for currency and portfolio effects are
to be between € 2.280 billion and € 2.350 billion, adjusted EBITDA between € 430 million and € 450 million and adjusted
net income between € 195 million and € 205 million. The Executive Board anticipates the ratio of net debt, excluding further
acquisitions, to adjusted EBITDA to be at a level of nearly 3. Detailed information on the guidance is included in the Group
Management Report of this Annual Report in the chapter “Report on Expected Developments”.
In the reporting year, the Executive Board approved medium-term growth targets.4) In the current first quarter of 2017, the
Executive Board increased the strategic outlook for 2019.5) In accordance with this outlook, adjusted Group sales of between
€ 2.650 billion and € 2.700 billion are to be achieved in financial year 2019 (previously around € 2.6 billion). In terms of adjusted
EBITDA, the Executive Board expects a range between € 570 million and € 590 million (previously around € 510 million).
Adjusted net income is to increase to between € 250 million and € 270 million (previously around € 250 million). The adjusted
EBITDA margin is to be nearly 22%. Cash flow from operating activities is to improve to between € 560 million and € 580 million.
1) See the Company’s press release of December 10, 2015.2) See the Company’s investor news of November 21, 2016.3) See the Company’s investor news of March 1, 2017.4) See the Company’s ad hoc release of July 11, 2016.5) See the Company’s ad hoc release of March 17, 2017.

11The STADA Share
THE STADA SHARE
STADA share codes
STADA share codes
Identification numbers ISIN: DE0007251803, WKN: 725180
Ticker symbols Reuters: STAGn.DE, Bloomberg: SAZ:GR
Capital structure
As of December 31, 2016, the subscribed share capital of STADA Arzneimittel AG amounted to € 162,090,344.00 (December
31, 2015: € 162,090,344.00) consisting of 62,342,440 registered shares (December 31, 2015: 62,342,440 registered shares1)
with restricted transferability), each with an arithmetical share in share capital of € 2.60.
Capital structure of STADA Arzneimittel AG Dec. 31, 2016 Dec. 31, 2015
Issued shares 62,342,440 62,342,440
Significant increase in the STADA share price
In 2016, the STADA share price recorded very pleasing development with an increase of 32%. Although the share price closed
2015 at € 37.34, it amounted to € 49.19 at the end of 2016.
The relevant national comparative indices for STADA showed differing share price development during the course of 2016.
Whilst the German benchmark index DAX® 2) and the MDAX® 3) (that the STADA share belongs to) increased by 7%4) compared
with the previous year, the price of the Bloomberg Pharmaceutical Index5) fell by 12%.
At the end of 2016, the market capitalization of STADA amounted to € 3.066 billion. At the end of 2015, it was € 2.328 billion.
Based on Deutsche Börse AG’s index system, which only considers free float, STADA, in terms of market capitalization, took
place 20 in the MDAX® in 2016. In the previous year STADA had occupied position 21.
The average daily volume of the STADA share in terms of the trading volume at the XETRA® trading and the Frankfurt Stock
Exchange amounted to a total of € 13.0 million in 2016. In 2015, the average trading volume per day of the STADA share was
€ 11.6 million. Based on Deutsche Börse AG’s index system, STADA occupied place 18 in terms of trading volume in 2016.
STADA had been at place 21 in this category in the previous year.
1) On August 26, 2016, the STADA Annual General Meeting resolved to eliminate restrictions on the transferability of registered shares by means of a change to the Articles of Incorpo- ration. The change to the Articles of Incorporation was registered in the commercial register and thereby became effective on December 9, 2016.2) DAX® is the index of Deutsche Börse AG, largely consisting of the 30 biggest companies by market capitalization and order book volume. 3) MDAX® is the index of Deutsche Börse AG for midcap companies, largely consisting of the 50 next-biggest companies by market capitalization and order book volume below the DAX®, thus also including the STADA share.
4) Both developments relate to their XETRA® closing prices. XETRA® is the electronic trading system of Deutsche Börse AG.5) The Bloomberg Pharmaceutical Index is a market capitalization-weighted index of all companies involved in the pharmaceutical sector of the Bloomberg Europe 500 Index. STADA is currently not part of the index.

12 The STADA Share
1) Recommendation.2) Source: Orient Capital Pty Ltd.
STADA key share data 2016 2015
Number of shares (year-end) 62,342,440 62,342,440
Number of treasury shares (year-end) 85,043 87,259
Average number of shares (without treasury shares) 62,256,532 61,637,621
Year-end closing price (XETRA®) in € 49.19 37.34
High (XETRA® closing price) in € 50.42 37.42
Low (XETRA® closing price) in € 28.67 25.10
Market capitalization (XETRA®) in € million (year-end) 3,066.3 2,327.9
Earnings per share in € 1.38 1.79
Earnings per share in €, adjusted 2.85 2.69
Diluted earnings per share in € – 1.79
Adjusted diluted earnings per share in € – 2.69
Dividend per share in € 0.721) 0.70
100% free float with broadly based shareholder structure
As of December 31, 2016, approx. 34,000 shareholders held share capital of STADA Arzneimittel AG. Based on results of regu-
larly carried out analyses of the Company’s shareholder structure, STADA assumes that approx. 67% of STADA’s shares are held
by institutional investors. The geographical distribution is as follows: Germany 48%, North America 22%, Europe
(excluding the United Kingdom and Germany) 18%, United Kingdom 9%, Unknown/Shareholders below threshold 3% and
Rest of World 2%.
As of December 31, 2016, STADA held 85,043 treasury shares, compared to 87,259 shares which were held by the Company on
the reporting date of the previous year. As part of an employee share ownership program, STADA sold 2,216 of its own shares
in the reporting year at an average price of € 36.31.
In financial year 2016, the Group published all 27 of the received voting rights notices according to Section 26 of the German
Securities Trading Act (WpHG). The voting rights notices received by STADA can be viewed on the website at www.stada.de or
www.stada.com.
Geographical shareholder structure (institutional investors)2)
Unknown/Shareholdings below threshold 3% — — Rest of World 2% United Kingdom 9% —
Europe (excl. UK, Germany) 18% —
North America 22% —
— Germany 48%Dec. 31, 2016

13The STADA Share
Directors’ Dealings
In financial year 2016 according to information available to the Company, STADA reported a total of five Directors’ Dealings in
the form of two sales and three purchases. On June 24, 2016, Luis Paul Retzlaff and Eliza Marie Retzlaff, son and daughter of
the then exempted from duty Chairman of the Executive Board Hartmut Retzlaff, each sold 3,000 STADA shares at a price of
€ 44.207 per STADA share, amounting to a total of € 265,242. In addition, Dr. Kudlek, Member of the Supervisory Board of
STADA Arzneimittel AG, purchased STADA shares at € 50.105 per share and a total value of € 10,021, on September 29, 2016
and on November 10, 2016 at a price of € 42.65 per share and a total value of € 8,103.50 and on November 11, 2016 at a price
of € 42.274468 per share with a total value of € 9,934.50.
Key results of the Annual General Meeting
On August 26, 2016, the Annual General Meeting formally approved the activities of the Executive Board and Supervisory Board.
During their votes, shareholders followed most of the proposals made by the company’s management.1) As part of the share-
holders’ decisions, the dividend for financial year 2015 was raised by 6% to € 0.70 per share and the elimination of restrictions
on the transferability of registered shares was approved by means of a change to the Articles of Incorporation.2) In addition, the
process of reshaping the Supervisory Board ahead of schedule was completed. Dr. Martin Abend, Dr. Eckhard Brüggemann,
Dr. K. F. Arnold Hertzsch, Dieter Koch and Constantin Meyer were succeeded by Dr. Eric Cornut, Rolf Hoffmann, Dr. Birgit Kudlek,
Tina Müller and Dr. Gunnar Riemann as new shareholder representatives on the Supervisory Board. Following the Annual
General Meeting, the Supervisory Board elected Carl Ferdinand Oetker as its Chairman and Jens Steegers as Vice-Chairman.
1) See the Company’s press release of August 27, 2016. 2) The change to the Articles of Incorporation was registered in the commercial register and became effective on December 9, 2016.

Ladival® – Be even safer in the sun.

GROUP MANAGEMENT REPORT OF THE EXECUTIVE BOARD 2016
15Group Management Report of the Executive Board | Table of Contents
FUNDAMENTAL INFORMATION ABOUT THE GROUP 16
Group’s Business Model 16
Product Development 19
Procurement, Production and Quality Management 21
Sales and Marketing 23
Employees 24
Objectives and Strategies 26
Internal Management System 28
Responsibility and Sustainability 30
REPORT ON ECONOMIC POSITION 32
Macroeconomic and Sector-Specific Environment 32
Course of Business and Net Assets,
Financial Position and Results of Operations 34
Development of 2016 Compared to Outlook 34
Development of Financial Performance Indicators
and Non-Financial Performance Indicators 35
Results of Operations 36
Sales Development of the Group 36
Earnings Development of the Group 38
Sales Development of the Generics
and Branded Products Segments 43
Earnings Development of the Generics
and Branded Products Segments 46
Financial Position 47
Net Assets 51
General Statements of the Executive Board
on the Course of Business in 2016 55
REPORT ON POST-BALANCE SHEET DATE EVENTS 56
REPORT ON EXPECTED DEVELOPMENTS 57
OPPORTUNITIES AND RISK REPORT 62
TAKEOVER-RELEVANT INFORMATION 73
REMUNERATION REPORT 75
CORPORATE GOVERNANCE REPORT INCLUDING THE CORPORATE GOVERNANCE DECLARATION FOR STADA ARZNEIMITTEL AG AND THE GROUP 88

16 Group Management Report of the Executive Board
FUNDAMENTAL INFORMATION ABOUT THE GROUPGroup’s Business Model
Focus on the health care growth market with emphasis on the pharmaceutical market
STADA is an internationally active health care company organized as a stock corporation. The business model of STADA focuses
on the health care market and particularly the pharmaceutical market and is oriented towards one of the global growth
industries as a result. In the context of general growth drivers such as the global population increase, an aging society in
industrialized nations and further medical progress, numerous health care and pharmaceutical markets will continue to offer
high growth oppportunities, which are relatively independent from the market in future. With regard to costs and risks, STADA
deliberately does not conduct any in-house research on, or marketing of, new active pharmaceutical ingredients, but rather
focuses on the development and marketing of products with active ingredients free from commercial property rights, particu-
larly patents.
As part of the implementation of the revised corporate strategy, in financial year 2016 the Executive Board also agreed a change
to the corporate structure, creating clear areas of responsibility and greater transparency. In order to accommodate the growth
strategy including central management of the segments, an increased internationalization of the branded product portfolio
and stricter cost controls, management by business segments as well as a fundamental change to reporting structures were
agreed. The Group is now managed by the two segments Generics and Branded Products. STADA had previously reported
according to operating segment and market region. In the reporting year, Generics contributed around 60% and Branded
Products around 40% to Group sales. In light of the fact that Branded Products are subject to less regulatory intervention and
are characterized by more attractive margins than Generics, STADA intends to reverse these shares in future.
However, Generics will also continue to see growth opportunities in the pharmaceutical market. They represent a lower cost
alternative to the often significantly more expensive original products and consequently contribute to counteracting the sig-
nificant price pressure in individual health care markets. Furthermore, additional growth potentials result from the continuous
expiration of patents and other commercial property rights. Within Generics, biosimilars have further growth opportunities as
they can make a significant contribution towards cost reduction as a result of the cost intensity of biopharmaceuticals. As part
of the implementation of the revised corporate strategy, the Group will continue to expand in the Generics segment in markets
with relatively low penetration rates and to supplement the portfolio with selected biosimilars. STADA will in-license certain
biosimilars from highly specialized suppliers, as this is a lower-risk and lower-cost path (see “Product Development”).
1) The figures in the reporting year and in the previous year include the non-core activity Commercial Business, which was previously reported separately.
Share of Generics and Branded Products segments in STADA Group sales
— Generics 59.9%1)
— Branded Products 40.1%
2016
— Generics 59.7%1)
— Branded Products 40.3%
2015

17Group Management Report of the Executive Board | Fundamental Information about the Group
Within Branded Products, which for STADA primarily comprises non-prescription products (OTC), prescription products (RX)
and discretionary prescription products (OTX), the Group is accelerating not only the expansion of the portfolio, but also the
increasing internationalization of successful brands. Overall, STADA relies on the advantages of a centralized portfolio manage-
ment structure.
Whereas generics sales focus on low pricing, branded product marketing focuses on specific product characteristics and, in
particular, the brand name.
Apart from the sales positioning, the two segments differ from one another in other areas such as the demand structure, growth
and margin expectations as well as the requirements of portfolio expansion and development strategies.
In the Generics segment, the requirements of the product portfolio are strongly oriented towards the regulatory structure in
the individual markets in which generics are sold. The product portfolio generally includes numerous dosage forms and
dosages for most relevant active pharmaceutical ingredients. The top five generics active ingredients in terms of sales in
financial year 2016 were Tilidin Naloxon, Atorvastatin, Pantoprazol, Epoetin zeta and Diclofenac. The eight largest markets in
this segment in terms of sales were Germany, Italy, Spain, Russia, Belgium, France, Vietnam and Serbia.
Top 5 Generics active ingredients
Active ingredient
Indication group
Sales 2016 in € million
Change from previous year
Tilidin Naloxon Pain 43.6 +36%
Atorvastatin Elevated cholesterol level 24.4 +1%
Pantoprazol Gastric ulcer/reflux 22.4 +3%
Epoetin zeta Anemia 22.4 +11%
Diclofenac Pain/inflamation 20.6 0%
Total 133.4 +12%
The eight largest markets in the Generics segment in terms of sales
in € 000s
Sales 2016 in € million
Change from previous year
Germany 308.0 0%
Italy 157.7 +6%
Spain 105.4 -1%
Russia 92.5 +11%
Belgium 90.7 -5%
France 81.9 +2%
Vietnam 69.1 +9%
Serbia 55.8 -24%
Total 961.1 0%

18 Group Management Report of the Executive Board
In the Branded Products segment, the Group pursues the concept of the so-called “strong brands”, relying on high brand
awareness. In general, STADA covers all key indications in this area. In the reporting year, the top five branded products were
APO-Go®, Grippostad®, Snup®, Fultium®, and Vitaprost®. The five largest markets in this segment in terms of sales were
Germany, the United Kingdom, Russia, Italy and Vietnam.
Top 5 branded products
Branded product
Indication group
Sales 2016 in € million
Change from previous year
APO-Go® Parkinson’s 66.6 +6%
Grippostad® Cold 43.7 +4%
Snup® Rhinitis 24.2 -19%
Fultium® Vitamin D deficiency 22.6 +10%
Vitaprost® Prostate disease 20.0 -8%
Total 177.1 0%
The five largest markets in the Branded Products segment in terms of sales
in € 000s
Sales 2016 in € million
Change from previous year
Germany 177.4 +38%
United Kingdom 175.4 +4%
Russia 150.1 -29%
Italy 43.9 +9%
Vietnam 36.7 +19%
Total 583.5 +1%
STADA is not equally represented with Generics and Branded Products in all countries in which it does business. Depending on
the sales focus, the Group is more active in regulated markets or in self-pay markets.
The key customer groups in the Group include patients and consumers, doctors, pharmacies and pharmacy chains, hospitals,
mail-order companies, buying groups, wholesales and other service providers in the health care market as well as cost bearers
in the form of public or private health insurance organizations. The sales focus is on different target groups, depending on the
individual market.
Operative positioning
In the course of the implementation of the revised corporate strategy, a change to the corporate structure including the afore-
mentioned new reporting structure was carried out in 2016. In accordance with the changed operative alignment, in addition
to the areas of product development, procurement, purchasing, production, quality management, finance, risk management,
compliance and corporate governance, sales and earnings responsibility in the individual countries as well as the correspond-
ing product portfolio are now subject to central management. With the fundamental reorganization, the Group aims to
optimally meet the requirements of the growth strategy.

19Group Management Report of the Executive Board | Product Development
Product Development
Strategic and organizational orientation of development activities
In view of the business model and strategic positioning, the STADA Group deliberately does not conduct any in-house research
for active pharmaceutical ingredients, but rather focuses on the development of products with active ingredients – generally
pharmaceutical active ingredients – that are no longer subject to any commercial property rights, particularly patents. One
focus of the Group-wide development activities is the development of Generics. In the area of innovative branded products,
particularly non-prescription drugs, such as nutritional supplements, STADA is continuously expanding its development
activities as a result of the increasing importance of this segment in the Group. In addition, within the branded products area,
STADA is targeting the increasing internationalization of successful brands. Additional growth opportunities existing in niche
markets and unregulated markets are to be taken advantage of through the introduction of innovative products.
In financial year 2016, STADA began a detailed analysis of its Generics portfolio. The objective is to reduce the complexity of the
existing portfolio, which is currently made up of around 18,000 product presentations, in order to reduce manufacturing and
marketing expenses. Marketing expenditure is also to be more strongly focused on profitable products.
Market readiness is at the center of development activities for new products. In the case of pharmaceuticals this usually involves
obtaining national approval from the responsible approval authorities in the context of differentiated, largely supranational
approval processes. In the majority of cases, STADA Arzneimittel AG, as the central development unit, prefers supranational – in
particular EU-wide – approval processes in order to achieve numerous national approvals of a product in different countries
nearly simultaneously. Approval procedures outside of the EU are carried out, if possible, on the basis of the EU dossier of the
individual products that are based on a standardized formulation. The international orientation of the development activities
also allows economy of scale effects to be achieved as a result of optimized batch sizes.
In the course of the long-term oriented Group-wide development activities, the Group is already working on the development
of generic products with potential launch dates beyond 2025. STADA generally pursues a “time and cheap to market” strategy
with the objective of launching new products not only at the earliest point in time, but also at the best possible cost of sales.
For the management of Group-wide development projects, STADA has central
project management with interface management which ensures the transparent
management of product development in the Group. Group-owned development
centers for internationally oriented projects are located in Bad Vilbel, Germany,
and Vrsac, Serbia. In order to optimally manage development resources and close
technological gaps, STADA also cooperates with external third-party developers
from Europe and Asia. In addition to in-house and third-party development, the
Group generally takes advantage of a global network of external development
partners, through which dossiers or approvals are acquired.
Development and approval strength
The high number of annual product launches shows the development and
approval strength of STADA. With the introduction of 665 individual products
worldwide (previous year: 578) the Group was able to prove this strength once
again in 2016.
The great importance of successful product development can be seen from the
4% share in sales (previous year: 5%) generated with products the Group intro-
duced in the last two years1) 2).
STADA has a well-filled product pipeline. This is also shown by the high number
of ongoing approval procedures as of December 31, 2016 totaling over
1,400 for more than 160 active pharmaceutical ingredients and active ingredient
1) Reporting year and previous year.2) Without products and sales from acquisitions.
2012 2013 2014 2015 2016
71
7
70
6
62
6
57
85-year development: Number of product launches
66
5

20 Group Management Report of the Executive Board
combinations for over 55 countries. This applies in particular to Generics in the EU. In addition, the Group conducts approval
activities also in markets outside of the EU where it has its own subsidiaries or is active in the export business.
STADA is also active in the area of biosimilars. The Group currently has two biosimilars on the market: SILAPO®, an epoetin
biosimilar, and Grastofil®, a filgrastim product. In addition, STADA has also in-licensed five further biosimilars – pegfilgrastim,
rituximab, teriparatide, adalimumab and bevacicumab – the latter in the reporting year. STADA and its cooperation partner also
received a so-called “positive opinion” from the responsible European approval authority EMA for teriparatide at the end of
2016, before approval was granted by the EU commission in the current financial year 2017. A significant delay is expected in
the approval for pegfilgrastim, as the European approval authority EMA had a different interpretation of one aspect of the results
from clinical data and has requested further clinical data. In light of the fact that this was no longer possible in the previously
ongoing approval procedure, the license partner Gedeon Richter and STADA agreed in November 2016 to withdraw the
approval application for pegfilgrastim. Following successful completion of the data collected, Gedeon Richter and STADA
will resubmit the approval application.
Expenses for research and development costs
The research and development costs amounted to € 65.1 million in financial year 2016 (previous year: € 65.0 million) (see “Eco-
nomic Report – Course of Business and Net Assets, Financial Position and Results of Operations – Results of Operations –
Earnings Development of the Group”). Since STADA is not active in research for new active pharmaceutical ingredients due to
its business model, it is only a matter of development costs. In addition, the Group capitalized development costs for new
products in the amount of € 28.4 million in the reporting year (previous year: € 26.1 million) This corresponds to a capitalization
rate of 30.4% (previous year: 28.6%). Amortization of capitalized development costs in 2016 amounted to approx. € 8 million
(previous year: approx. € 8 million).

21Group Management Report of the Executive Board | Procurement, Production and Quality Management
Procurement, Production and Quality Management
Centralized needs planning as well as high flexibility and continuous cost optimization within the supply chain and pharmaceutical production
Overall, there are three so-called supply chain hubs in the Group at the locations in Bad Vilbel, Germany, Vrsac, Serbia, and
Moscow, Russia. These are managed through STADA Arzneimittel AG and are where the centralized needs planning is carried
out for selected top products in the Group.
The Group principally has a high level of flexibility and pays attention to continous cost optimization in the supply chain and
pharmaceutical production. As a result of the comprehensive product portfolio of more than 800 active pharmaceutical
ingredients and approximately 18,000 product packagings sold by the Group, each different in terms of its active ingredients
and/or quantity of the active ingredients and/or dosage forms and/or package sizes, STADA makes use of an international
network of internal and external resources for the supply chain and pharmaceutical production.
As a result, the Group generally does not produce any raw and auxiliary materials necessary for pharmaceutical production
itself, but instead sources them primarily from low-cost suppliers from low-cost countries, particularly in Asia. In financial year
2016, STADA had procurement offices in Shanghai, China, and in Mumbai, India.
Where STADA has products produced in the context of contract manufacturing, the company is dependent not only on the
global development of the purchase prices for the necessary raw and auxiliary materials, but also on the supply prices to be
negotiated with the contract manufacturers. The Group involves suppliers in the risk of margin losses due to falling selling
prices as much as possible. This occurs, for example, by using price escalation clauses in which procurement prices are linked
to selling prices, subsequent negotiations or the agreement of special procurement prices for special sales volumes, such as
volumes that are put out to tender by public health insurance organizations in the context of discount agreements.
In terms of the production processes, in financial year 2016 the Group continued to concentrate on its own locations, in line
with the policy started several years ago. As a result of the gradual assumption of production volumes from contract manu-
facturing and the shift of production volumes within Group-owned production facilities, around 75% of the Group-wide
production volume is now manufactured in low-cost countries. Overall, as part of the concentration process and the flexible
“make or buy” approach, the Group benefits from both structural cost advantages resulting from the use of locations in low-cost
countries, and the higher capacity utilization and associated decline in unit prices.
In the reporting year, the STADA Group had 16 production locations, of which those in Germany, the United Kingdom, Russia
and Serbia were the most important.
Adequate annual investments are made to ensure that all Group-owned production facilities and test laboratories are maintained
at the level required by legal stipulations and technical production considerations. In the reporting year, investments in the
expansion and renewal of production facilities and plants as well as test laboratories amounted to € 22.6 million (previous year:
€ 32.2 million).
Highest quality and safety standards
As an international health care company, STADA always has high requirements for the quality and safety of its products. These
requirements apply to the quality of raw materials, products, services and working conditions. The Group-wide control
management is carried out centrally through STADA Arzneimittel AG.
In the context of regular and comprehensive audits, the Group-wide quality management reviews the quality standards set by
the Group, some of which far exceed the legal requirements, not only at its own production sites, but also in the facilities of
suppliers and contract manufacturers.

22 Group Management Report of the Executive Board
The responsible national regulatory authorities also carry out regular external inspections. Within the EU, these inspections
take place every two to three years. In addition to inspection by national authorities outside the EU, STADA also orders EU Good
Manufacturing Practice Compliance inspections (EU GMP compliance inspections) in order to receive three-year extensions of
the required EU import authorizations. In this context, the authorities responsible for the Group review whether the inspected
production facilities meet the EU GMP standards.
Since the Group also aims to guarantee EU quality standards for drugs in countries outside of the EU, standards that often go
beyond local requirements, the Group-owned production facilities not located in the EU in Banja Luka, Nizhny Novgorod,
Obninsk, Podgorica, Sabac, Tuy Hoa and Vrsac are set up for the production of certain pharmaceutical dosage forms for EU
countries, meaning they are authorized by the responsible EU regulatory authorities for delivery to the EU according to the
previously mentioned inspections.
In addition to legal provisions, STADA holds international certifications in accordance with external quality management
systems. Accordingly, at numerous production sites, the Group not only focuses on GMP standards but also on the relevant
ISO standards.

23Group Management Report of the Executive Board | Sales and Marketing
Sales and Marketing
Functionally organized Group with local and close to market sales companies
The STADA Group has an international sales structure made up of nationally focused sales companies. In accordance with the
operative alignment, the subsidiaries, which are active in sales, are centrally organized but still have a high degree of market
proximity and therefore extraordinary sales strength. Globally, the Group markets its products in around 125 countries
including the export business, of which around 30 countries have their own sales companies.
The sales activities are generally coordinated at an international level in the Group. This includes, for example, the structuring
of the portfolio in line with the further internationalization of individual products or certain sales activities such as wholesaling
cooperations.
As part of its focused acquisition policy, the Group will continue to expand the existing sales network. Alongside the use of
growth potentials, the expansion is also designed to reduce the share of sales activities in the countries which, for example,
represent difficult regulatory conditions for generics, in order to reduce the dependency on state regulated and therefore price
regulated health care systems.
More information on the development of Group’s sales activities in the individual markets carried out in the reporting year is
provided under “Economic Report – Course of Business and Net Assets, Financial Position and Results of Operations – Results
of Operations – Sales Development of the Generics and Branded Products Segments”.

24 Group Management Report of the Executive Board
Employees
Long-term personnel policy
Through their extensive expertise and strong commitment, STADA´s employees make a substantial contribution to the lasting
success of the Group. For this reason, STADA pursues a personnel policy focused on the long-term and geared toward the
sustainable development of all employees. “Training and development”, “knowledge management”, “succession planning for
management” and “employee dialog” are all topics that play an important role in this regard. In terms of training, the company
offers measures such as language skills support, specialist workshops, seminars and extra- occupational study programs.
In addition, the Group offers targeted development and support programs designed for different professional phases and
individual career path planning. Examples of this include exchange programs between German and foreign subsidiaries, as well
as management programs. All personal development measures aim to continuously provide the skills needed both now and in
the future, and to fill management and expert positions from within STADA’s own ranks as much as possible.
Employee participation and employee dialog
Employee participation is also an important part of personnel policy at STADA. In order to allow employees to participate to an
even greater extent in the company’s success, incentives are offered for the purchase of STADA shares in Germany. This invest-
ment strengthens employee loyalty which in turn promotes identification with STADA and increases the sense of responsibility
to the company and its success.
In order to increase STADA’s competitiveness, great importance is attached to employees’ creative potential and imagination.
STADA recognizes active and systematic participation in the form of an idea management system. Every employee is encouraged
to submit their ideas and suggestions using a company suggestion scheme in order to enable this ongoing improvement process.
Another measure is institutionalized employee dialog, which includes direct communication between the workforce and
management bodies and exchanges among employees. Furthermore, as part of the implementation of the revised strategy and
the corresponding development of the corporate culture, there are further activities that aim to promote communication and
cooperation within the Group and to strengthen team spirit further.
Influence of personnel management
STADA’s personnel management is decentralized so that the varying needs of employees in the countries the Group operates
can be met. In line with company guidelines – particularly compliance guidelines – international subsidiaries are largely
independent in many areas of personnel management including recruitment, training and remuneration.
Development of the number of employees
In the reporting year, the number of employees grew both in terms of the average number and the number at the reporting date.
In 2016, the average number of employees increased to 10,839 (previous year: 10,441). As of the December 31, 2016 reporting
date, the number of employees increased to 10,923 (December 31, 2015: 10,532).
The increase in the number of employees was primarily attributable to the acquisitions of the British BSMW Limited, Argentinean
Laboratorio Vannier S.A. and British Natures Aid Limited as well as a local product portfolio of the Serbian IVANCIC I SINOVI
DOO with a total of 218 employees.

25Group Management Report of the Executive Board | Employees
The regional breakdown of the employees Group-wide shows that in financial year 2016 an average of 1,164 employees were
under contract in Germany (previous year: 1,207 employees). The average number of employees located at Group headquarters
in Bad Vilbel, Germany amounted to 908 (previous year: 938). The average number of employees at international Group locations
amounted to 9,675 (previous year: 9,234).
The Group-wide share of women in management positions in 2016 amounted to approx. 49% (previous year: approx. 48%).
Further information on the statutorily prescribed targets for Germany’s Law on Equal Participation of Men and Women in
Management Positions can be found in the chapter “Corporate Governance Report including the Corporate Governance
Declaration for STADA Arzneimittel AG and the Group”.
Personnel expenses
Personnel expenses increased in 2016 to € 365.7 million (previous year: € 342.7 million). The ratio of personnel expenses to
sales amounted to 17.1% (previous year: 16.2%).

26 Group Management Report of the Executive Board
Objectives and Strategies
Sustainable profitable growth and long-term value increase
With its business model STADA aims to generate sustainable profitable growth and to increase the value of the company in the
long-term.
To reach these targets, in financial year 2016 the Executive Board agreed a revised corporate strategy. With an unchanged
strategic orientation, numerous initiatives were introduced to improve the performance of the Group with which competitive-
ness and innovation is to be increased and added value is to be achieved in the long-term. As part of the implementation of the
initiatives, untapped sales potential will be leveraged, marketing expenses will be optimized, sales efficiency will be
enhanced and cost of sales will be reduced . For example, promising products are to be introduced into more countries in order
to take advantage of previously untapped sales opportunities in the Branded Products segment. Within the Generics segment,
STADA will benefit from the expiration of further patents and will also supplement the portfolio with selected biosimilars.
Furthermore, the number of Group companies and product presentations is to be minimized, the number of suppliers reduced
and production processes further optimized. A changed corporate structure with clear areas of responsibility and greater
transparency as well as a re-positioned corporate culture with an increased focus on entrepreneurship, extensive knowledge
sharing and an open dialog are to contribute towards reaching the objectives. In general, the revised strategy will also make a
significant contribution towards reaching the objectives for 2019, presented in 2016 (see “Report on Expected Developments”).
Generics segment remains part of the core business – expansion of the attractive-margin Branded Products area
In order to grow further, STADA is relying on both organic growth and value-adding acquisitions. Generics will remain part of
STADA’s core business, and within it growth potentials particularly exist in the expansion in markets with relatively low pene-
tration rates and in the supplementation of the existing portfolio with selected biosimilars. In the Generics markets, in which
the Group is already active with subsidiaries, STADA aims to maintain or take leading positions. With the help of continuous
growth in the Generics segment, the Group intends to generate financial means, to further expand the often more attractive-
margin Branded Products area and gradually increase the share of this segment in Group sales as a result. Within Branded
Products, STADA is aiming for both further expansion and the increasing internationalization of successful brands. Innovative
marketing concepts are to be used in this context. Alongside the strengthening of the Generics and Branded Products segments,
STADA intends to take advantage of additional growth opportunities in niche and non-regulated markets through the intro-
duction of innovative products.
As part of the strategic development, the organizational and sales structures were reviewed. German business activities,
for example, are to be bundled and made more competitive to improve perception on the market and achieve sales and cost
advantages. In this context, STADA GmbH and STADAvita as well as STADApharm and cell pharm are to be merged. At the
beginning of the fourth quarter of 2016, the management of STADA GmbH and STADAvita as well as STADApharm and cell pharm
started negotations with the Works Council about the details of a merger as well as the balancing of interests and a social plan.

27Group Management Report of the Executive Board | Objectives and Strategies
Revised Strategy Build on generics, expand branded product business and strive for additional growth opportunities
Above average growth,above average margins
Solid growth,cash flow generating
Higher growth and higher margins
2015 2019
Internationalization of brands/biosimilars/niche areas/ special therapy areas Additional growth opportunities – Niche markets, non-regulated markets, driven by innovative products
Branded Products Expand branded base business – Prioritize attractive brands – Internationalize selected products – Make use of innovative marketing concepts – Further expansion in non-regulated markets
Generics Expand generics base business – Core business – Offers solid reliable growth basis – Cost leadership and strong market position in selected regions,
benefiting from still low penetration rates

28 Group Management Report of the Executive Board
Internal Management System
In the STADA Group, the corporate areas are managed using the following financial performance indicators: Adjusted Group
sales, adjusted net income, adjusted EBITDA and the net debt to adjusted EBITDA ratio. These key figures are used for
operational Group management. While Group sales are managed at segment level, adjusted EBITDA, adjusted net income and
the net debt to adjusted EBITDA ratio are managed at Group level.
Despite the fact that STADA is targeting both organic and acquisition-related growth in the implementation of its growth
strategy, the essential key figure is Group sales adjusted for currency and portfolio effects, which plays a key role in terms of
ensuring sustainable Group success.
Adjusted EBITDA1) in the STADA Group represents EBITDA adjusted for special items within operating profit with the exception
of special items that relate to impairments and write-ups of non-current assets. STADA utilizes adjusted EBITDA to measure
its operational performance and the success of the individual segments adjusted for influences distorting the year-on-year
comparison resulting from special items. Results from associates and investment income are included.
STADA’s adjusted net income1) represents the net income adjusted for special items. Adjusted net income is used as a key figure
for the measurement of the overall success.
The net debt to adjusted EBITDA ratio serves as a measure for the debt-to-equity ratio and as a result is an indication of the
financial stability, among other things for the borrowing of funds.
1) The deduction of such effects which have an impact on the presentation of STADA’s results of operations and the derived key figures aims at improving the comparability of key figures with previous years. To achieve this, STADA uses adjusted key figures, which, as so-called pro forma figures, are not governed by the accounting requirements in accordance with IFRS. As other companies may not calculate the pro forma figures presented by STADA in the same way, STADA’s pro forma figures are only comparable with similarly designated disclosures by other companies to a limited extent.

29Group Management Report of the Executive Board | Internal Management System
The financial performance indicators of Group sales adjusted for currency and portfolio effects, adjusted EBITDA, adjusted net
income and net debt to adjusted EBITDA ratio are derived as follows in the STADA Group:
Financial performance indicators
Determination based on the consolidated income statement and the consolidated balance sheet in accordance with IFRS
Group sales adjusted for currency and
portfolio effects
Group sales
± Portfolio effects
± Currency effects
= Group sales adjusted for currency and portfolio effects
EBITDA, adjusted
Earnings before interest and taxes (EBIT)
± Balance from depreciation/amortization and impairments/write-ups on intangible assets (including goodwill), property, plant and equipment and financial assets
= Earnings before interest, taxes, depreciation and amortization (EBITDA)
± Special items within operating profit excluding one-time special items that relate to impairments and write-ups of fixed assets
= Adjusted EBITDA (adjusted earnings before interest, taxes, depreciation and amortization)
Net income, adjusted
Result distributable to shareholders of STADA Arzneimittel AG (net income)
± Special items
= Adjusted net income
Net debt to adjusted EBITDA ratio
Non-current financial liabilities
+ Current financial liabilities
= Gross debt
– Cash, cash equivalents and “available-for-sale” securities
= Net debt
÷ EBITDA, adjusted
Net debt to adjusted EBITDA ratio

30 Group Management Report of the Executive Board
Responsibility and Sustainability
Corporate responsibility for over 120 years
As a globally active pharmaceutical and health care company, STADA has been committed to taking responsibility for over
120 years. This is also expressed in its “All the Best” mission statement. Alongside care for people’s health and well-being, it
includes sustainable and responsible economic activity. With the founding of the Professional Community of German
Pharmacists (STADA) in 1895, certain products were prepared in accordance with standardized guidelines for the benefit of
patients. STADA continues to take its social responsibility very seriously today. Both segments, Generics and Branded Products,
contribute towards this. Through a lower price, Generics contribute towards efficient and affordable health care. Branded
Products relieve pressure on health care systems because they are, with only a few exceptions, not reimbursable. STADA
will reinforce its commitment to the safety and health of patients, environmental protection, fair working conditions and
sustainable and responsible corporate governance with the planned joining of the UN Global Compact.
Value-based corporate governance
Good corporate governance is an important component of business success. Alongside comprehensive opportunities and risk
management, this also includes Group-wide binding behavioral guidelines – set out in the Code of Conduct – and topic-oriented
corporate policies. Compliance, i.e. the adherence to laws and internal rules, is firmly anchored in the STADA Group. As part of
the ongoing optimization of the Compliance Management System, in financial year 2016 a review of the Compliance Management
System in the STADA Group (readiness assessment) was started by external experts as planned and will be continued in the
current financial year. The subject of compliance is described in detail in the Group Management Report of this Annual Report
in the “Corporate Governance Report”. Central purchasing and supplier management as well as comprehensive corporate
responsibility management (CR management) and environmental social governance management (ESG management) are further
elements of value-oriented corporate governance at STADA. In 2016, for example, an extensive self-disclosure survey
of suppliers and service providers on diverse corporate governance related issues was carried out. This information was up-
loaded into the electronic system for corporate governance supplier assessment. The STADA Steering Group CR ensures the
strategic management of CR across all areas and has engaged the CR project group within the organization with the operat ional
implementation.
Global medicine safety system
Medicines are products that have a direct impact on people’s health. As a result of this responsibility towards patients, safe and
high quality medicine are the most important goal at STADA. In order to achieve this, quality assurance and quality control in
the STADA Group are designed in accordance with the guidelines of the European Good Manufacturing Practice Standard
(EU-GMP standard). These GMP standards also apply to all suppliers of the STADA Group. The worldwide STADA subsidiaries are
also subject to a central management of quality assurance and quality control, supported by regional quality assurance officers.
As part of the global medicine safety system, all subsidiaries also report directly to the central “medicine safety” department.
At STADA, the topic of product safety includes safe medicine packaging, the observance of all legal requirements and guidelines,
the regular auditing of the global medicine safety system as well as the orientation of development activities in accordance with
EU guidelines and national requirements for local in-house developments. Furthermore, in 2013 STADA was the first pharma-
ceutical company in Germany to introduce 2D bar code labeling on products on a large scale. This simplified product management
and increased customer safety, for example in the case of a product recall. In doing so the STADA Group established first measures
on the market resulting from the EU directive on falsified medicinal products at an early stage. These must be legally implemented
across the EU by February 9, 2019.

31Group Management Report of the Executive Board | Responsibility and Sustainability
Environmental protection at STADA
Environmental protection at STADA is not limited to compliance with applicable laws. In fact, the company is constantly
working to optimize procedures and processes to conserve resources and minimize the impact on the environment. Alongside
regular GMP certification of the production sites and suppliers, environmental management is supported by Group-wide best
practice transfer. Local standards, laws and measures are taken into account through decentralized organization in this area.
Furthermore, as a result of its business model (not including the production of active ingredients) STADA does not present
any significant emission risks. The Group is currently working on an integrated Corporate Governance report, which is to include
Corporate Governance key figures, applicable across the Group.
“All the best” initiative
In order to fully satisfy its “All the best” mission statement, STADA is also involved in numerous social sponsoring projects. The
Group is particularly active in the areas of information, education and research, culture and sport. In the case of a disaster,
STADA also offers fast support with medication or financial donations.
The “All the best” initiative, founded by STADA in 2014, contributes towards, for example, not only providing people with useful
health care information, but also explaining gaps in knowledge or incorrect knowledge. The latest STADA Health Report,
published in financial year 2016, looked at the interactions between the body and the mind. In addition, since 2007 STADA has
been the main sponsor of dolphin aid e.V., a non-profit organization that offers alternative therapies for ill and disabled children.
The company has been supporting Nepal since the severe earthquake in April 2015. Initially, emergency aid took the form of
medication and financial donations, and has since been replaced with the means for rebuilding homes and schools. Within the
area of “education and research”, STADA has been supporting the Hochschule Fresenius since 2003 in the form of a
foundation professorship. Furthermore, Group is involved in the so-called “Deutschlandstipendium” (Scholarship of Germany),
in cooperation with Charité – Universitätsmedizin Berlin. Within the area of culture, STADA has supported the the Burgfestspiele
(castle festival) in Bad Vilbel for the past 29 years. Sport is also important for health. For this reason, STADA is also committed
in this area to numerous projects in amateur, disabled and professional sport. These are just some of the numerous examples
of the social commitment of the STADA Group.
Digitalization in the health care industry
Like many other companies, STADA is also working intensively in the area of digitalization. As a result, in financial year 2015
STADA joined the Bundesverband Informationswirtschaft, Telekommunikation und neue Medien e.V. (Bitkom, Germany’s
digital association). In this way, the Group would like to become involved in the dialog about important aspects of digitalization
of the health care industry, such as the subject of “data protection in the health care system” and the e-health law. Digitalization
is also a factor for employer attractiveness. Digital networking and digital knowledge management will become ever more
important for STADA in the future in order to offer employees a diverse working environment. In previous years STADA had
introduced comprehensive digitalization in the company, among others through the increased use of digital media to provide
information about health topics and through the establishment of an IT shared service center, which supports and advises the
entire Group with IT services. This development will be further expanded in future. Within Human Resources, the gradual
implementation of a new HR IT system is currently ongoing. Linking the individual modules is to increase efficiency, effectiveness
and competitiveness.

32 Group Management Report of the Executive Board
REPORT ON ECONOMIC POSITIONMacroeconomic and Sector-Specific Environment
Overall economic development
According to information from the International Monetary Fund (IMF), global economic output in 2016 increased moderately
by 3.1%.1) The decision of the United Kingdom to leave the European Union and the long-standing uncertainty regarding the
outcome of the US elections as well as the repositioning of China to focus on domestic consumption had a noticeable effect.
Commodity prices increased significantly from the beginning of the year, however they generally remained below the average
prices of 2015. The economic situation of commodity-exporting countries such as Russia consequently remained difficult.
The following table shows the development of the most important markets for STADA. The countries are sorted in descending
order of sales achieved by STADA in 2016.
Growth rate (GDP) 2016 in %
Germany1) 1.7
Russia1) -0.6
Italy1) 0.9
United Kingdom1) 2.0
Spain1) 3.2
Vietnam2) 6.1
Belgium2) 1.4
France1) 1.3
Serbia2) 2.5
In Germany, the strong economic development continued at 1.7%. Russia continued to suffer from the low raw material prices.
However, its economic output improved from -3.7% to -0.6%. The potential negative consequences of Brexit for the United
Kingdom have not yet been reflected in growth figures of 2.0%, although the British pound sterling lost significant value. In
Italy, France and Belgium growth rates stabilized at 0.9%, 1.3% and 1.4%. Spain once again benefited from an expansive
financial policy and strong growth in tourism, meaning economic ouput remained at the previous year’s level of 3.2%. Vietnam
was able to maintain the high growth rate of the previous year with 6.1%. In Serbia, growth increased from 0.5% in the previous
year to 2.5%.
Sector-specific development
In 2016, sales in the international generics market increased by approx. 7.8%3) to approx. € 185.3 billion3) as compared to the
previous year. The market share of generics in the global pharmaceutical market amounted to approx. 15.2%3). The sales devel-
opment of generics in the eight largest countries for STADA in terms of sales were as follows in the reporting year: Germany
approx. +4.0% 4) to approx. € 6.7 billion4), Italy approx. +6.6%4) to approx. € 3.6 billion4), Spain approx. +6.8%4) to approx.
€ 3.1 billion4), Russia approx. +9.5%4) to approx. € 2.5 billion4), France approx. +5.1%4) to approx. € 5.9 billion4), Belgium approx.
+3.8%4) to approx. € 0.6 billion4), Vietnam approx. +5.5%4) to approx. € 0.6 billion4) and Serbia approx. +4.8%4) to approx.
€ 0.3 billion5).
Sales in the international OTC market increased by approx. 11.7%4) to approx. € 79.4 billion4) in 2016 as compared to the
pre vious year. The market share of OTC products in the global pharmaceutical market amounted to approx. 7.7%4). The sales
development in OTC products in the five largest countries for STADA in terms of sales developed as follows in 2016: Germany
approx. +1.8%4) to approx. € 5.3 billion4), United Kingdom approx. +1.8%4) to approx. € 1.7 billion4), Russia approx. +5.0%4) to
approx. € 3.8 billion4), Italy approx. +2.4%4) to approx. € 1.6 billion4) and Vietnam approx. +20.1%4) to approx. € 1.3 billion4).
1) Source: International Monetary Fund: World Economic Outlook January 2017.2) Source: International Monetary Fund: World Economic Outlook October 2016.3) QuintilesIMS Syndicated Analytics Service; prepared for STADA February 2017.4) QuintilesIMS MIDAS 2016.5) QuintilesIMS National / Sell-Out.

33Group Management Report of the Executive Board | Report on Economic Position
Effects of macroeconomic and sector-specific environment
With its business model, the STADA Group is oriented toward the health care market, a market that is characterized by a demand
that is relatively independent of the economy. In light of this, the global economic conditions generally have fewer direct impacts
on the business development of the Group than the respective regulatory environment. There were no signficiant changes,
which impacted the development of the Group in the reporting year in terms of the regulatory conditions in the countries where
STADA is active.
Economic influences in the markets of the Group have a stronger influence on the self-pay market, as the demand there is to a
certain – at times significant – extent, dependent on the financial situation of the population. In 2016, for example, STADA’s
Branded Products segment in Russia was influenced by continued reluctance to buy among Russian consumers, as this market
has a high proportion of self-pay patients, at 94%.
The economic conditions impact the Group development in the form of currency and interest fluctuation. Against this backdrop,
STADA takes suitable measures to be able to react appropriately to strong volatility in interest rates and Group-relevant curren-
cy relationships. However, this is only possible to a limited extent (see “Opportunities and Risk Report”). The currency influence
was particularly noticeable in the reporting year in the development of the reported operating profit. This was strongly affected
by negative translation effects due to the weak Russian ruble and the pound sterling, a currency that had become increasingly
weaker since the EU referendum (see “Course of Business and Net Assets, Financial Position and Results of Operations – Results
of Operations – Earnings Development of the Group”).
In terms of the translation of sales and earnings in the most important national currencies for STADA, the Russian ruble, Serbian
dinar and British pound sterling, it was observed that these currencies recorded weaker development in 2016 in relation to the
Group currency, the euro, and influenced earnings development as a result. Whilst the Russian ruble recorded weaker devel-
opment and the British pound sterling recorded increasingly weaker development following the EU referendum, the Serbian
dinar was only slightly negative in relation to the euro. The Ukrainian hryvnia and Kazakhstani tenge recorded significantly
weaker development than the euro, the Vietnamese dong and the Swiss franc recorded weaker development. The currency
relations in other countries relevant for STADA only had a minor impact on the translation of sales and earnings in local
currencies into the Group currency euro (see “Course of Business and Net Assets, Financial Position and Results of Operations
– Results of Operations – Sales Development of the Group”).
The development of the British pound and the Russisan ruble in relation to the Group currency, euro, was as follows in 2016
compared with the previous year:
Significant currency relations in local currency to € 1
Closing rate on Dec. 31 in local currency
Average rate for the reporting period
2016 2015 ± % 2016 2015 ± %
Pound sterling 0.85620 0.73390 +17% 0.81886 0.72604 +13%
Russian ruble 64.30000 80.67360 -20% 74.22592 68.01339 +9%

34 Group Management Report of the Executive Board
Course of Business and Net Assets, Financial Position and Results of Operations | Development of 2016 Compared to Outlook
For financial year 2016, the STADA Executive Board had forecast slight growth in Group sales adjusted for currency and port folio
effects, adjusted EBITDA and adjusted net income in the report on expected developments of the Annual Report 2015. The
Executive Board had expected the ratio of net debt excluding further acquisitions to adjusted EBITDA to be at a level of nearly 3.
Group sales adjusted for currency and portfolio effects increased by 3% to € 2,167.2 million in the reporting year (see “Report
on Economic Position – Course of Business and Net Assets, Financial Position and Results of Operations – Results of Operations
– Sales Development of the Group). Adjusted EBITDA increased by 2% to € 398.0 million (see “Report on Economic Position –
Course of Business and Net Assets, Financial Position and Results of Operations – Results of Operations – Earnings Development
of the Group”). Adjusted net income recorded an increase of 7% to € 177.3 million (see “Report on Economic Position – Course
of Business and Net Assets, Financial Position and Results of Operations – Earnings Development of the Group – Results of
Operations”). The net debt excluding further acquisitions to adjusted EBITDA ratio was 2.8 (see “Report on Economic Position
– Course of Business and Net Assets, Financial Position and Results of Operations – Net Assets”).
With this development, Group sales adjusted for currency and portfolio effects, adjusted EBITDA and adjusted net income in
financial year 2016 were slightly above the statements on expected developments in the 2015 Annual Report.
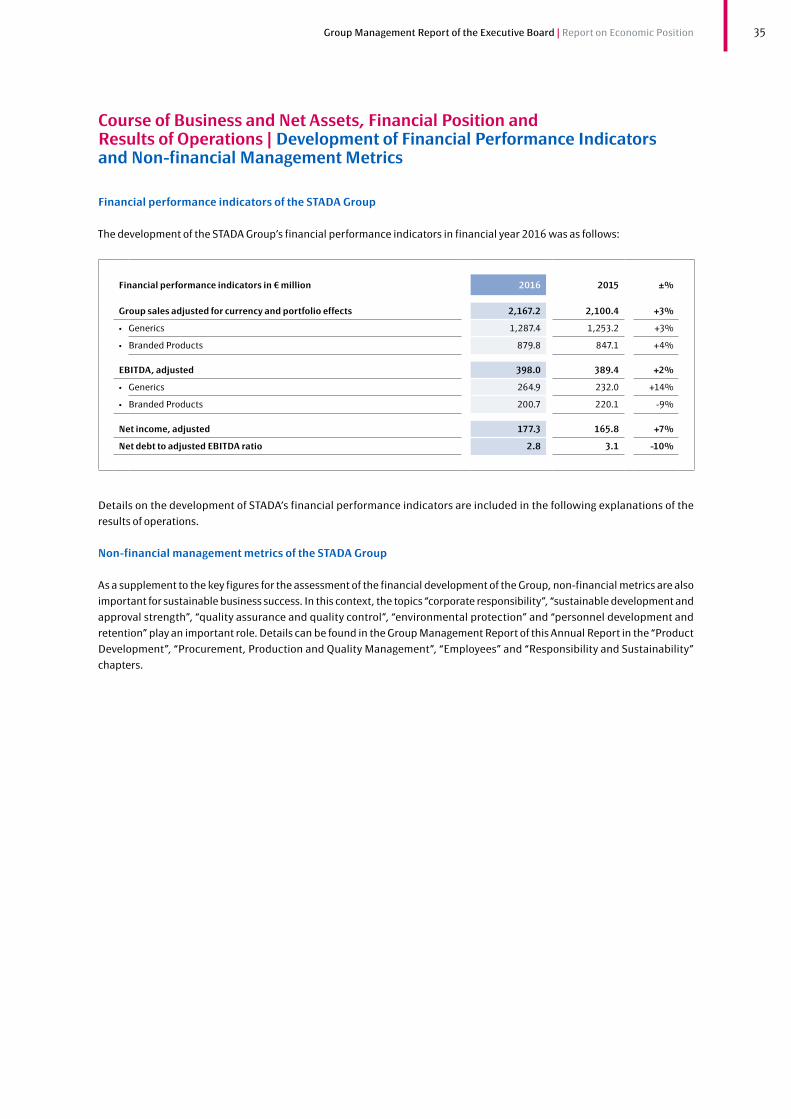
35Group Management Report of the Executive Board | Report on Economic Position
Course of Business and Net Assets, Financial Position and Results of Operations | Development of Financial Performance Indicators and Non-financial Management Metrics
Financial performance indicators of the STADA Group
The development of the STADA Group’s financial performance indicators in financial year 2016 was as follows:
Financial performance indicators in € million 2016 2015 ±%
Group sales adjusted for currency and portfolio effects 2,167.2 2,100.4 +3%
• Generics 1,287.4 1,253.2 +3%
• Branded Products 879.8 847.1 +4%
EBITDA, adjusted 398.0 389.4 +2%
• Generics 264.9 232.0 +14%
• Branded Products 200.7 220.1 -9%
Net income, adjusted 177.3 165.8 +7%
Net debt to adjusted EBITDA ratio 2.8 3.1 -10%
Details on the development of STADA’s financial performance indicators are included in the following explanations of the
results of operations.
Non-financial management metrics of the STADA Group
As a supplement to the key figures for the assessment of the financial development of the Group, non-financial metrics are also
important for sustainable business success. In this context, the topics “corporate responsibility”, “sustainable development and
approval strength”, “quality assurance and quality control”, “environmental protection” and “personnel development and
retention” play an important role. Details can be found in the Group Management Report of this Annual Report in the “Product
Development”, “Procurement, Production and Quality Management”, “Employees” and “Responsibility and Sustainability”
chapters.

36 Group Management Report of the Executive Board
Course of Business and Net Assets, Financial Position and Results of Operations | Results of Operations Sales Development of the Group
Increase in Group sales under difficult conditions
in € million 2016 2015
Group sales 2,139.2 2,115.1
Group sales adjusted for currency and portfolio effects 2,167.2 2,100.4
Reported Group sales recorded an increase of 1% to € 2,139.2 million in financial year 2016 (previous year: € 2,115.1 million).
When effects on sales based on changes in the Group portfolio and currency effects are deducted, adjusted Group sales
increased by 3% to € 2,167.2 million in the reporting year (previous year: € 2,100.4 million).
The reconciliation of reported Group sales to Group sales adjusted for currency and portfolio effects is as follows:
in € million
2016
Comparable period for
2016
±%
2015
Comparable period for
2015
±%
Reported Group sales 2,139.2 2,115.1 +1% 2,115.1 2,062.2 +3%
• Generics 1,280.7 1,261.4 +2% 1,261.4 1,261.7 -0%
• Branded Products 858.5 853.6 +1% 853.6 800.5 +7%
Currency effects 69.6 – – 64.6 – –
• Generics 17.9 – – 13.2 – –
• Branded Products 51.7 – – 51.5 – –
Portfolio changes 41.6 14.7 – 45.9 10.0 –
• Generics 11.2 8.2 – 6.6 6.3 –
• Branded Products 30.4 6.5 – 39.3 3.7 –
Group sales adjusted for currency and portfolio effects
2,167.2
2,100.4
+3%
2,133.8
2,052.2
+4%
• Generics 1,287.4 1,253.2 +3% 1,268.0 1,255.4 +1%
• Branded Products 879.8 847.1 +4% 865.8 796.8 +9%

37Group Management Report of the Executive Board | Report on Economic Position
In detail, these effects on sales which can be attributed to changes in the Group portfolio and currency effects were as follows:
Portfolio changes totaled € 41.6 million in 2016, primarily due to the acquisition of the Socialites group and Laboratorio
Vannier, and € 14.7 million in the previous year, including the retrospective adjustment, which was particularly attributable to
the disposal of Laboratoires d’études et de recherches en oligo éléments thérapie SA and the suspension of the commercial
business within STADA Nordic. This represents 1.2 percentage points.
As a result of applying foreign exchange rates from the reporting year compared with the previous year for the translation of
local sales contributions into the Group currency euro, STADA recorded a negative currency effect for Group sales in the amount
of € 69.6 million or -3.3 percentage points because the development of all three of the most important national currencies for
STADA was weaker compared to the Group currency euro. Whilst the Russian ruble recorded weaker development and the
British pound sterling recorded increasingly weaker development following the EU referendum, the Serbian dinar was only
slightly negative in relation to the euro. The Ukrainian hryvnia and Kazakhstani tenge recorded significantly weaker development
than the euro, the Vietnamese dong and the Swiss franc recorded weaker development. The currency relations in other countries
relevant for STADA only had a minor impact on the translation of sales and earnings in local currencies into the Group currency
euro.
To the extent that adjusted sales figures are reported in this annual report, this refers to sales adjusted for these portfolio effects
and currency fluctuations in each case.
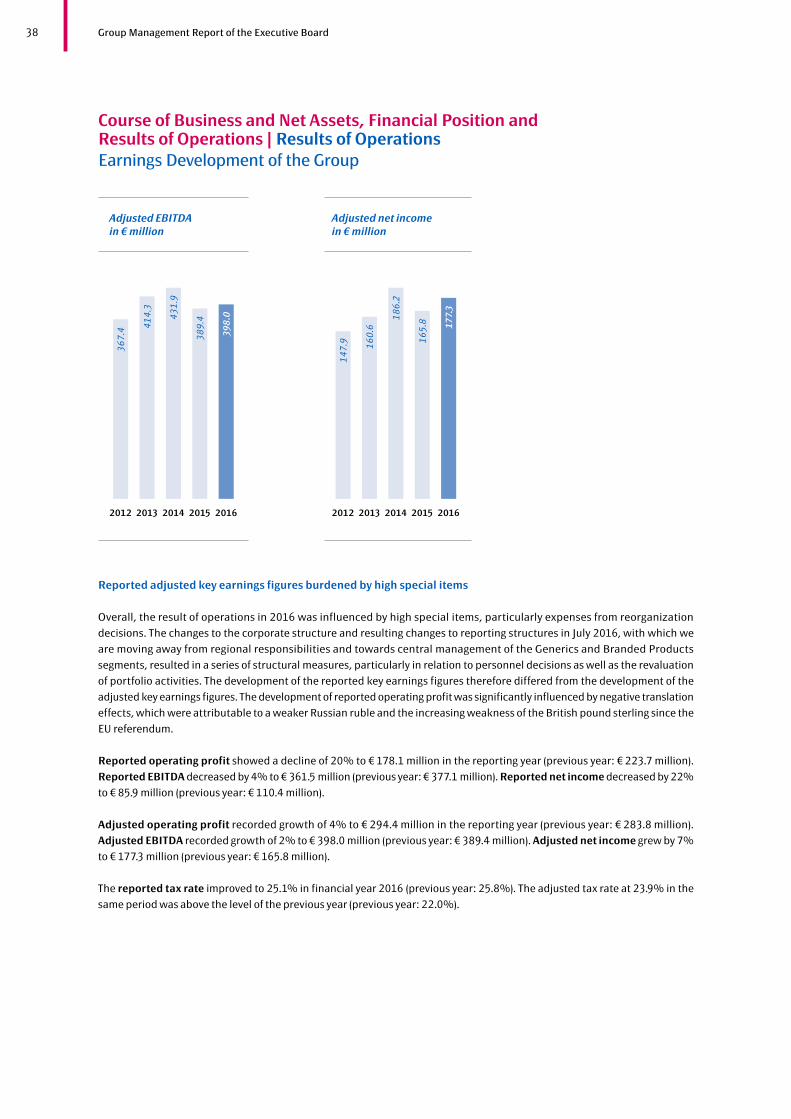
38 Group Management Report of the Executive Board
Course of Business and Net Assets, Financial Position and Results of Operations | Results of Operations Earnings Development of the Group
Reported adjusted key earnings figures burdened by high special items Overall, the result of operations in 2016 was influenced by high special items, particularly expenses from reorganization
decisions. The changes to the corporate structure and resulting changes to reporting structures in July 2016, with which we
are moving away from regional responsibilities and towards central management of the Generics and Branded Products
segments, resulted in a series of structural measures, particularly in relation to personnel decisions as well as the revaluation
of portfolio activities. The development of the reported key earnings figures therefore differed from the development of the
adjusted key earnings figures. The development of reported operating profit was significantly influenced by negative translation
effects, which were attributable to a weaker Russian ruble and the increasing weakness of the British pound sterling since the
EU referendum.
Reported operating profit showed a decline of 20% to € 178.1 million in the reporting year (previous year: € 223.7 million).
Reported EBITDA decreased by 4% to € 361.5 million (previous year: € 377.1 million). Reported net income decreased by 22%
to € 85.9 million (previous year: € 110.4 million).
Adjusted operating profit recorded growth of 4% to € 294.4 million in the reporting year (previous year: € 283.8 million).
Adjusted EBITDA recorded growth of 2% to € 398.0 million (previous year: € 389.4 million). Adjusted net income grew by 7%
to € 177.3 million (previous year: € 165.8 million).
The reported tax rate improved to 25.1% in financial year 2016 (previous year: 25.8%). The adjusted tax rate at 23.9% in the
same period was above the level of the previous year (previous year: 22.0%).
2012 2013 2014 2015 2016
14
7.9 16
0.6
18
6.2
16
5.8
Adjusted net income in € million
177.
3
2012 2013 2014 2015 2016
36
7.4
41
4.3
43
1.9
38
9.4
Adjusted EBITDA in € million
39
8.0

39Group Management Report of the Executive Board | Report on Economic Position
1) As a result of the presentation in € million, deviations due to rounding may occur in the tables.2) Relates to additional scheduled depreciation and other measurement effects due to purchase price allocations as well as significant product acquisitions taking financial year 2013 as basis.3) Relates to currency translation effects recorded in the income statement resulting from the fluctuation of the Russian ruble as well as other significant currencies of the region CIS/Eastern Europe.
4) Relates to miscellaneous extraordinary expenses, among other things, for the restructuring of the German business, the termination of further parts of the aesthetics business, expenses related to the deconsolidation of the Egyptian subsidiary as well as the termination of a distribution contract in Belgium.5) Relates to miscellaneous extraordinary income and expenses, among other things, from a received milestone payment in the United Kingdom, tax rate changes in the United Kingdom and a severance payment for the previous Chairman of the Executive Board.
Influence on earnings due to special items
Special items amounted to a net burden on earnings of € 116.7 million before or € 91.4 million after taxes in 2016. The
re conciliation of the reported financial key performance indicators and further essential key earnings figures of the STADA
Group to those adjusted for special items is as follows:
in € million1)
2016 reported
Impair-ments/
write-ups on fixed
assets
Effects from
purchase price
allocations and
product acquisi-
tions2)
Currency effects
CIS/Eastern
Europe3)
Measure-ment of
derivative financial
instru-ments
Portfolio adjust-ments/
restruc-turing
expenses4)
Other5)
2016 adjusted
Operating profit 178.1 65.5 11.4 9.1 – 28.2 2.0 294.4
Result from investments measured at equity
0.7
–
–
–
–
–
–
0.7
Investment income 0.0 – – – – – – 0.0
Earnings before interest and taxes (EBIT)
178.9
65.5
11.4
9.1
–
28.2
2.0
295.1
Financial income and expenses
51.4
–
–
–
-0.5
–
–
50.9
Earnings before taxes (EBT)
127.4
65.5
11.4
9.1
0.5
28.2
2.0
244.2
Income taxes 31.9 12.8 3.1 1.1 0.1 5.3 4.0 58.4
Result distributable to non-controlling shareholders
9.6
0.5
-1.6
–
–
–
–
8.5
Result distributable to share holders of STADA Arzneimittel AG (net income)
85.9
52.2
9.9
8.0
0.4
22.9
-2.0
177.3
Earnings before interest and taxes (EBIT)
178.9
65.5
11.4
9.1
–
28.2
2.0
295.1
Balance from depreciation/amortization and impairments/write-ups of intangible assets (including goodwill), property, plant and equipment and financial assets
182.7
-65.5
-14.3
–
–
–
–
102.9
Earnings before interest, taxes, depreciation and amortization (EBITDA)
361.5
–
-2.9
9.1
–
28.2
2.0
398.0
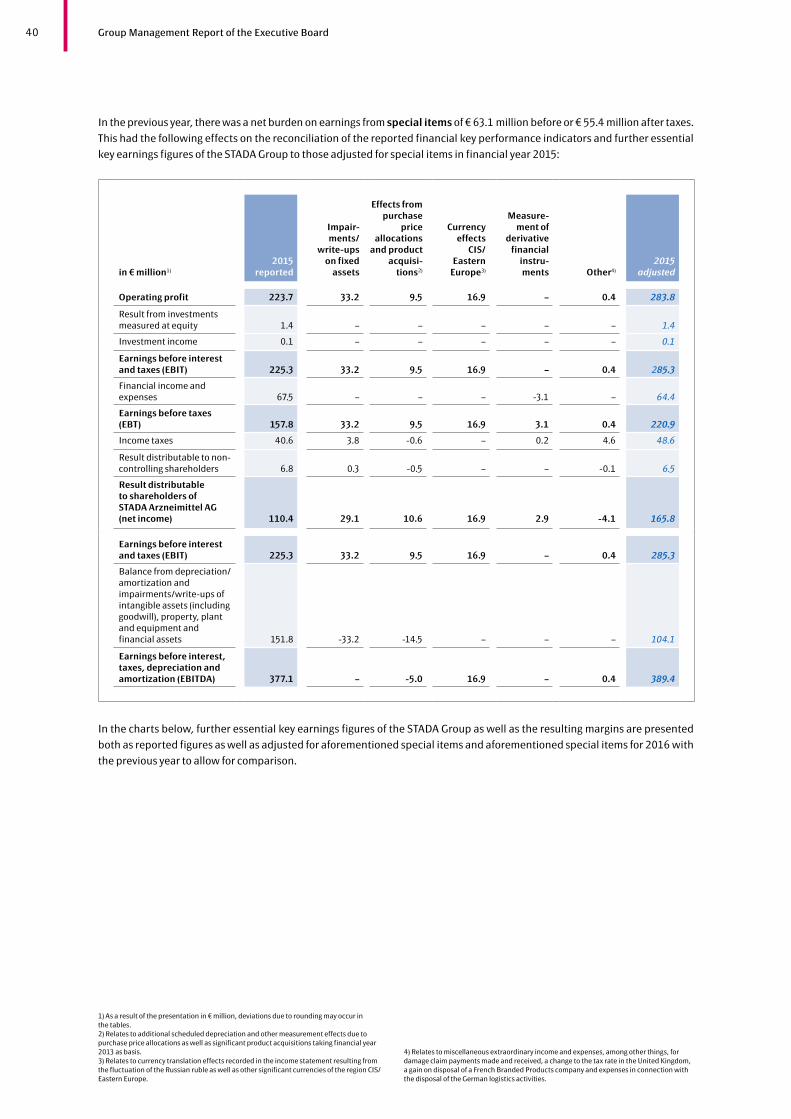
40 Group Management Report of the Executive Board
In the previous year, there was a net burden on earnings from special items of € 63.1 million before or € 55.4 million after taxes.
This had the following effects on the reconciliation of the reported financial key performance indicators and further essential
key earnings figures of the STADA Group to those adjusted for special items in financial year 2015:
in € million1)
2015 reported
Impair-ments/
write-ups on fixed
assets
Effects from purchase
price allocations
and product acquisi-
tions2)
Currency effects
CIS/Eastern
Europe3)
Measure-
ment of derivative
financial instru-ments
Other4)
2015 adjusted
Operating profit 223.7 33.2 9.5 16.9 – 0.4 283.8
Result from investments measured at equity
1.4
–
–
–
–
–
1.4
Investment income 0.1 – – – – – 0.1
Earnings before interest and taxes (EBIT)
225.3
33.2
9.5
16.9
–
0.4
285.3
Financial income and expenses
67.5
–
–
–
-3.1
–
64.4
Earnings before taxes (EBT)
157.8
33.2
9.5
16.9
3.1
0.4
220.9
Income taxes 40.6 3.8 -0.6 – 0.2 4.6 48.6
Result distributable to non- controlling shareholders
6.8
0.3
-0.5
–
–
-0.1
6.5
Result distributable to share holders of STADA Arzneimittel AG (net income)
110.4
29.1
10.6
16.9
2.9
-4.1
165.8
Earnings before interest and taxes (EBIT)
225.3
33.2
9.5
16.9
–
0.4
285.3
Balance from depreciation/amortization and impairments/write-ups of intangible assets (including goodwill), property, plant and equipment and financial assets
151.8
-33.2
-14.5
–
–
–
104.1
Earnings before interest, taxes, depreciation and amortization (EBITDA)
377.1
–
-5.0
16.9
–
0.4
389.4
In the charts below, further essential key earnings figures of the STADA Group as well as the resulting margins are presented
both as reported figures as well as adjusted for aforementioned special items and aforementioned special items for 2016 with
the previous year to allow for comparison.
1) As a result of the presentation in € million, deviations due to rounding may occur in the tables.2) Relates to additional scheduled depreciation and other measurement effects due to purchase price allocations as well as significant product acquisitions taking financial year 2013 as basis.3) Relates to currency translation effects recorded in the income statement resulting from the fluctuation of the Russian ruble as well as other significant currencies of the region CIS/Eastern Europe.
4) Relates to miscellaneous extraordinary income and expenses, among other things, for damage claim payments made and received, a change to the tax rate in the United Kingdom, a gain on disposal of a French Branded Products company and expenses in connection with the disposal of the German logistics activities.

41Group Management Report of the Executive Board | Report on Economic Position
1) Related to relevant Group sales.2) Earnings before interest, taxes, depreciation and amortization.3) Earnings before interest and taxes.4) Earnings before taxes.
5) Earnings per share will not be diluted in financial year 2016, because the share options from the STADA warrants in connection with the Conditional Capital Increase 2004/I expired on June 26, 2015.6) Adjusted for special items.
Development of the STADA Group’s reported key earnings figures
in € million 2016 2015 ±% Margin1) 2016 Margin1) 2015
Operating profit 178.1 223.7 -20% 8.3% 10.6%
• Operating segment result Generics 195.2 177.7 +10% 15.2% 14.1%
• Operating segment result Branded Products 81.4 130.0 -37% 9.5% 15.2%
EBITDA2) 361.5 377.1 -4% 16.9% 17.8%
• EBITDA Generics 255.8 233.2 +10% 20.0% 18.5%
• EBITDA Branded Products 186.2 211.8 -12% 21.7% 24.8%
EBIT3) 178.9 225.3 -21% 8.4% 10.7%
EBT4) 127.4 157.8 -19% 6.0% 7.5%
Net income 85.9 110.4 -22% 4.0% 5.2%
Earnings per share in € 1.38 1.79 -23%
Diluted earnings per share in €5) – 1.79 –
Development of the STADA Group’s adjusted 6) key earnings figures
in € million 2016 2015 ±% Margin 1) 2016 Margin 1) 2015
Operating profit, adjusted 294.4 283.8 +4% 13.8% 13.4%
• Operating segment result Generics, adjusted 214.2 182.7 +17% 16.7% 14.5%
• Operating segment result Branded Products, adjusted
152.8
173.2
-12%
17.8%
20.3%
EBITDA 2), adjusted 398.0 389.4 +2% 18.6% 18.4%
• EBITDA Generics, adjusted 264.9 232.0 +14% 20.7% 18.4%
• EBITDA Branded Products, adjusted 200.7 220.1 -9% 23.4% 25.8%
EBIT 3), adjusted 295.1 285.3 +3% 13.8% 13.5%
EBT 4), adjusted 244.2 220.9 +11% 11.4% 10.4%
Net income, adjusted 177.3 165.8 +7% 8.3% 7.8%
Earnings per share in €, adjusted 2.85 2.69 +6%
Diluted earnings per share in €5), adjusted – 2.69 –
Income statement and development
In 2016, cost of sales increased to € 1,105.3 million (previous year: € 1,101.7 million), in line with increased sales revenues.
Group profit amounted to € 1,033.9 million (previous year: € 1,013.4 million).
Overall, cost of sales in the reporting year include impairment, depreciation and amortization in the amount of € 101.0 million
(previous year: € 101.5 million). These primarily resulted from amortization on such intangible assets, representing a necessary
condition for the marketing of the products manufactured – in particular drug approvals.
The cost of sales ratio in financial year 2016 amounted to 51.7% (previous year: 52.1%). The gross margin improved to 48.3%
(previous year: 47.9%). This development was primarily attributable to a lower rate of sales reductions in the German Generics
segment (see “Results of Operations – Sales Development of the Generics and Branded Products Segments – Generics –
Germany”) as well as a continued improvement in cost of sales ratio.
Selling expenses in the reporting year increased to € 488.3 million (previous year: € 482.6 million). This development was
primarily based on increased marketing expenses in the Branded Products segment, particularly in Italy, Germany and Belgium.
Selling expenses as a percentage of sales amounted to 22.8% (previous year: 22.8%).

42 Group Management Report of the Executive Board
General and administrative expenses increased to € 182.7 million in 2016 (previous year: € 178.4 million). Their share of
Group sales amounted to 8.5% (previous year: 8.4%). This increase was mainly based on the inclusion of subsidiaries first
consolidated in the reporting year or at the end of the previous year.
Research and development costs were € 65.1 million in financial year 2016 (previous year: € 65.0 million). The sales-related
ratio of research and development expenses amounted to 3.0% (previous year: 3.1%).
STADA’s reported development costs include the non-capitalizable development costs. These are primarily made up of costs
associated with regulatory requirements and the optimization of existing products. This cost item does not include payments
for the development of new products, as they are usually capitalized by STADA.1)
Other expenses increased to € 138.9 million in 2016 (previous year: € 83.7 million). This development was primarily attributable
to increased impairments on intangible assets, the termination of significant areas of the aesthetics business, the termination
of a distribution contract in Belgium, the restructuring of the German business as well as a severance payment for the previous
Chairman of the Executive Board. Lower currency translation expenses, in particular in the Russian subgroup STADA CIS, had
an opposite effect.
Within remaining other expenses, personnel expenses are recognized in the amount of € 24.8 million (previous year: € 4.4 mil-
lion).
The financial result, which is primarily made up of financial income and financial expenses, was € -50.7 million in the reporting
year (previous year: € -65.9 million). The interest expense in the amount of € 52.9 million (previous year: € 65.6 million) re presented
the largest single operational item. Furthermore, the financial result also included effects from the measurement of derivative
financial instruments that amounted to a net expenses of € 0.5 million (previous year: burden on earnings of € 3.1 million).
In financial year 2016, the Group refinanced itself at interest rates of between 0.7% p.a. and 26.0% p.a. (previous year: between
0.7% p.a. and 16.6% p.a.). On the reporting date of December 31, 2016, the weighted average interest rate for non-current
financial liabilities was approx. 1.7% p.a. (December 31, 2015: approx. 2.0% p.a.) and for current financial liabilities approx.
3.1% p.a. (December 31, 2015: approx. 5.1% p.a.). For all of the Group’s financial liabilities the weighted average interest
amounted to approx. 1.8% p.a. (December 31, 2015: approx. 2.6% p.a.).
Income tax expenses decreased to € 31.9 million in 2016 (previous year: € 40.6 million). The reported tax rate improved to 25.1%
(previous year: 25.8%), in particular due to a tax rate change in the United Kingdom and the continued utilization of tax loss
carryforwards in Germany. The adjusted tax rate at 23.9% in the same period was above the level of the previous year
(pre vious year: 22.0%).
1) In the reporting year, development expenses for new products in the amount of € 28.4 million (previous year: € 26.1 million) were capitalized.

43Group Management Report of the Executive Board | Report on Economic Position
Course of Business and Net Assets, Financial Position and Results of Operations | Results of Operations Sales Development of the Generics and Branded Products Segments
In accordance with the fundamental change to reporting structures in 2016, agreed by the Executive Board and briefly described
in the “Overview of the Financial Year” chapter, the STADA Group now reports exclusively by the two segments Generics and
Branded Products. In the presentation of the two segments, STADA also describes how the largest countries in terms of sales
within these two segments have developed.
Reported sales of the Generics segment increased by 2% to € 1,280.7 million in financial year 2016 (previous year: € 1,261.4 mil-
lion). This development was primarily attributable to sales growth in Italy, Russia and Vietnam. Sales of the Generics segment
adjusted for portfolio effects and currency influences increased by 3% compared with the previous year to € 1,287.4 million
(previous year: € 1,253.2 million) – particularly due to the negative development of currency effects in this segment. Generics
contributed 59.9% to Group sales (previous year: 59.7%).
Within the Generics segment, the eight largest countries according to sales developed as follows in 2016:
Sales of generics in Germany of € 308.0 million (previous year: € 308.3 million) were at the level of the previous year. Sales
generated in the German market with generics had a share of 63% in the overall sales achieved in the German market (previous
year: 71%). The market share of generics sold in German pharmacies in the reporting year was approx. 11.5%1) (previous year:
approx. 12.4%1)). As a result, the STADA Group continues to be the clear number 3 in the German generics market.1)
Sales of generics in Italy increased by 6% to € 157.7 million (previous year: € 149.0 million), in particular as a result of positive
volume effects. Generics contributed 78% to local sales (previous year: 79%). With a market share of approx. 14.6% (previous
year: approx. 14.8%), STADA occupied position 4 in the Italian generics market in financial year 2016.2)
In Spain, sales with generics decreased by 1% to € 105.4 million (previous year: € 107.0 million). This development was
particularly attributable to a high comparable basis in the previous year as a result of numerous product launches and the legal
approval of discounts in the reporting year, which led to a higher rate of sales reductions. Generics contributed 87% to local
sales on the Spanish market (previous year: 89%). With a market share of approx. 9.8% (previous year: approx. 9.7%), STADA
occupied position 3 in the Spanish generics market in 2016.2)
Sales generated with generics in Russia increased by 18%, applying the exchange rates of the previous year. Despite a clearly
negative currency effect of the Russian ruble, sales in euro grew by 11% to € 92.5 million (previous year: € 83.6 million).
Generics contributed 38% to local sales (previous year: 28%). With a market share of approx. 4.7% (previous year: approx. 4.5%),
STADA occupied position 1 in the Russian generics market in the reporting year.2)
In Belgium, sales generated with generics decreased by 5% to € 90.7 million, particularly due to a still-hesitant purchasing and
sales strategy of the Belgian sales partner (previous year: € 95.0 million) – where positive sales development was observed in
the second half of 2016. Whilst sales in the first six months of 2016 decreased by 37%, an increase of 66% was achieved in the
second half of 2016. Generics contributed 89% to local sales (previous year: 91%). With a market share of approx. 44.6% (pre-
vious year: approx 43.9%), STADA remained the clear market leader in the Belgian generics market in 2016.2) In the current fi-
nancial year, STADA expects continued positive development in sales generated with generics in Belgium, as STADA ended an
existing sales cooperation in December 2016 and now manages the logistics and sales area on its own.
Sales achieved with generics in France recorded an increase of 2% to € 81.9 million (previous year: € 80.1 million), which was
primarily a result of volume effects, despite continued strong price and discount competition. Generics contributed 96% to
local sales (previous year: 89%). With a market share of approx. 3.7% (previous year: approx. 3.6%), STADA occupied position 7
in the French generics market in financial year 2016.2)
1) Data from QuintilesIMS Health based on pharmacy sales to customers (source: QuintilesIMS/Pharmascope rational).2) STADA estimate based on QuintilesIMS data at ex-factory prices.

44 Group Management Report of the Executive Board
1) STADA estimate based on QuintilesIMS data at ex-factory prices.
Despite increased price pressure, sales generated with generics in Vietnam grew by 11%, applying the exchange rates of the
previous year. As a result of a weaker Vietnamese dong, sales in euro increased by 9% to € 69.1 million (previous year: € 63.2 mil-
lion). This development resulted, in particular, from local hospital tender processes that were won. Generics contributed 65%
to local sales (previous year: 67%).
The sales generated in Serbia with generics declined by 23%, applying the exchange rates In euro, sales declined by 24% to
€ 55.8 million (previous year: € 73.7 million) as a result of a slightly negative currency effect of the Serbian dinar. This development
was, among other things, attributable to the decision on declining reimbursement prices. Additionally, wholesalers continued
to have high inventories. Generics contributed 76% to Serbian sales (previous year: 79%). Overall, an unchanged general shift
from generics to branded products can be observed in the sales mix of the Serbian market. With a market share of approx. 29.7%
(previous year: approx. 33.3%), STADA remained the market leader in Serbia in 2016.1)
With products containing the Group’s top five pharmaceutical active ingredients in terms of sales, STADA achieved sales in the
amount of € 133.4 million in 2016 (previous year: € 117.9 million). These products thus had a share of 10.4% of sales in the
Generics segment (previous year: 9.3%). With sales of € 43.6 million in the reporting year (previous year: € 32.0 million), tilidin
naloxon was the strongest selling active pharmaceutical ingredient in the Generics segment.
Reported sales of the Branded Products segment increased slightly by 1% to € 858.5 million in financial year 2016 (previous
year: € 853.6 million). Despite strong development in Germany and sales growth due to acquisitions in the United Kingdom, this
development was particularly attributable to a decline in sales in Russia. Sales of the core segment Branded Products adjusted
for portfolio effects and currency influences increased by 4% compared with the previous year to € 879.8 million (previous year:
€ 847.1 million) — particularly as a result of the negative development of currency effects in this segment. Branded products
contributed 40.1% to Group sales (previous year: 40.3%).
Within the Branded Products segment, development of the five largest countries according to sales was as follows in the
reporting year:
Sales generated with branded products in Germany recorded growth of 38% to € 177.4 million (previous year: € 128.3 million).
This development was attributable to optimizations in the product portfolio, strong growth of core products and new product
launches. Overall, branded products contributed 37% to sales achieved in the German market (previous year: 29%).
In the United Kingdom, sales generated with branded products increased by 17%, applying the exchange rates of the previous
year. Despite the negative currency effect as a consequence of the referendum decision in favor of the United Kingdom leaving
the European Union, sales in euro increased by 4% to € 175.4 million (previous year: € 168.0 million). The acquisition of the
Socialites Group in December 2015 and of BSMW Limited in February 2016 contributed to this growth in sales. However, a weak
cough and cold season at the beginning of the year and poor weather in June and July which reduced sales of suncream products
had a dampening effect on sales. Branded products accounted for 88% of total sales in the UK market (previous year: 86%).
The outlook for the development of the British pound sterling continues to be negative as a result of the United Kingdom’s
referendum decision in the second quarter of 2016 to leave the European Union and the associated uncertainties. Overall, such
a devaluation of the British pound sterling will result in negative translation effects on sales reported in euro for STADA.
In view of the continued difficult conditions, in particular in the self-pay market, sales generated with branded products in
Russia decreased by 25%, applying the exchange rates of the previous year. As a result of a clearly negative currency effect of
the Russian ruble, sales decreased in euro by 29% to € 150.1 million (previous year: € 212.2 million). This development was
primarily driven by growing consolidation on the demand side and consequently higher discount burdens. In addition, price
increases in the so-called Vital and Essential Drugs List (EDL) could not compensate for the high inflation rate. Branded products
had a share in sales of 62% in the Russian market (previous year: 72%). The sales and earnings contributions of Russian STADA
business activities will also continue to be primarily affected by the development of the currency relation of the Russian ruble
to the euro in the future. In addition, the unchanged bleak prospects for the Russian economy and the strong devaluation of the
Russian ruble present an increased risk in terms of consumer sentiment and consumer spending.

45Group Management Report of the Executive Board | Report on Economic Position
Sales generated in Italy with branded products recorded an increase of 9% to € 43.9 million, in particular due to acquisitions
(previous year: € 40.4 million). Branded products contributed 22% to sales in Italy (previous year: 21%).
Sales generated in Vietnam with branded products increased by 21%, applying the exchange rates of the previous year. In euro,
sales increased by 19% to € 36.7 million (previous year: € 30.8 million) as a result of a slightly negative currency effect of the
Vietnamese dong. Branded Products contributed 35% to Vietnamese sales (previous year: 33%).
With the top five branded products in the Group in term of sales, STADA achieved sales in the amount of € 177.1 million in the
reporting year (previous year: € 199.7 million). These products thus had a share of 20.6% of sales in the Branded Products
segment (previous year: 23.4%).

46 Group Management Report of the Executive Board
Course of Business and Net Assets, Financial Position and Results of Operations | Results of Operations Earnings development of the Generics and Branded Products segments
The reported operating profit in the Generics segment increased by 10% to € 195.2 million in financial year 2016 (previous
year: € 177.7 million). This development resulted from significant growth in the operating result of the German sales companies
primarily due to more limited revenue reductions. In addition, the good sales performance in Italy, Switzerland and Vietnam
had a positive effect on the key earnings figures. An opposing development occurred in Belgium due to a hesitant purchasing
and sales strategy of the Belgian sales partner until the end of 2016. The resulting sales development at the level of the previous
year could not be compensated with corresponding cost savings and led to the termination of the distribution agreement with
the Belgian partner. The reported EBITDA in Generics increased by 10% to € 255.8 million (previous year: € 233.2 million ). This
development was solely attributable to the aforementioned developments in the reported operating profit in the segment. The
reported operating profit margin of Generics amounted to 15.2% (pre vious year: 14.1%). The reported EBITDA margin in
Generics was 20.0% (previous year: 18.5%).
Adjusted operating profit in the Generics segment increased in the reporting year by 17% to € 214.2 million (previous year:
€ 182.7 million). Adjusted EBITDA of Generics showed an increase of 14% to € 264.9 million (previous year: € 232.0 million).
Both developments were primarily attributable to the aforementioned developments in Germany, Italy, Switzerland and Viet-
nam. The significantly more positive development of adjusted operating profit as compared to reported operating profit result-
ed from higher adjustments than in the previous year, which mainly relate to expenses in connection with the termination of
the distribution agreement with the Belgian sales partner and with the merging of German sales companies. The adjusted
operating profit margin of Generics was 16.7% (previous year: 14.5%). The adjusted EBITDA margin of Generics was at 20.7%
(previous year: 18.4%).
The reported operating profit in the Branded Products segment decreased by 37% to € 81.4 million in financial year 2016
(previous year: € 130.0 million). This development mainly resulted from various effects in the Russian market. On the one hand,
high inflation affected consumer sentiment and purchasing power of end consumers. On the other hand, increased discount
burdens and sales measures in connection with a clearly negative currency effect of the Russian ruble had a negative impact
on the operating segment profit of Branded Products. In addition, despite a positive sales performance, negative translation
effects resulting from the EU referendum as well as increased expenses in sales and marketing led to a burden on the key
earnings figures of the British subgroup Thornton & Ross. Furthermore, a significant increase in segment operating performance
in German Branded Products was countered by expenses from portfolio adjustments and restructuring measures. The
reported EBITDA of Branded Products decreased by 12% to € 186.2 million (previous year: € 211.8 million). This development
was primarily attributable to the aforementioned developments in the segment operating profit. Reported operating profit
margin of Branded Products was at 9.5% (previous year: 15.2%). The reported EBITDA margin of Branded Products was
21.7% (previous year: 24.8%).
Adjusted operating segment profit of Branded Products recorded a decrease of 12% to € 152.8 million in 2016 (previous
year: € 173.2 million). Adjusted EBITDA of Branded Products decreased by 9% to € 200.7 million (previous year: € 220.1 million).
Both developments were based on the reasons relating to the markets of Russia and the United Kingdom already mentioned
under reported operating profit of Branded Products. There was higher decrease in reported operating profit than in the
adjusted key figure as compared to the previous year due to higher special items, which are primarily attributable to the afore-
mentioned portfolio adjustments and restructuing measures as well as currency translation expenses in the CIS subgroup,
recognized in income. The adjusted operating profit margin of Branded Products amounted to 17.8% (previous year: 20.3%).
The adjusted EBITDA margin of Branded Products was 23.4% (previous year: 25.8%).

47Group Management Report of the Executive Board | Report on Economic Position
Course of Business and Net Assets, Financial Position and Results of Operations | Financial Position
Stable financial position
The STADA Group had a stable financial position in financial year 2016. As a supplement to some of the individual items
reported in the cash flow statement, these can be observed in various key figures taken from, among other things, the liquidity
analysis contained in this chapter.
Basic principles and objectives of financial management at STADA
As part of its financing strategy, STADA aims to both secure its financial flexibility and to optimize the weighted average costs
of capital. In terms of high financial flexibility, the Group relies on different financial instruments as well as a diversified
investor structure. Overall, STADA’s maturity profile reflects a broad distribution with a high share of middle and long-term
financial instruments. The Group covers its need for financing through a combination of cash flow from operating activities and
the borrowing of funds on the short, middle and long-term, as well as factoring programs. STADA also has a liquidity reserve
through certain credit lines.
The Group has defined the net debt to adjusted EBITDA ratio as a dynamic debt figure. In principle, this key figure must not
exceed three, excluding further acquisitions. If this target is exceeded in the short-term, STADA aims to reverse this within
12 to 18 months.
Existing financial risks in the Group are reduced to a minimum through natural hedges or derivative financial instruments.
Derivative financial instruments are principally neither held nor issued for speculation purposes. Financial risks are hedged
only if they have significant consequences on the Group’s cash flow. Details on the management of individual financial risks
can be found in the Group Management Report of this Annual Report in the chapter “Opportunities and Risk Report”.
Long-term refinancing secured
The long-term refinancing of the Group as of December 31, 2016 was provided for by a five-year bond that was placed in the
second quarter of 2013 in the amount of € 350.0 million with an interest rate of 2.25% p.a. as well as a seven-year corporate
bond placed in the first quarter of 2015 in the amount of € 300.0 million with an interest rate of 1.75% p.a. Furthermore, as of
December 31, 2016, there were promissory note loans with maturities in the area of the beginning of 2017 until 2023 with a
total nominal value in the amount of € 709.0 million. In order to ensure a balanced financing structure, promissory note loans
are staggered in terms of their volume and duration.
Financing mix of the STADA Group as of December 31, 2016
Bonds 44% — — Promissory note loans 48%
— Other financial liabilities 8%
€ 1,470.8 million

48 Group Management Report of the Executive Board
Financial liabilities in a currency other than the Group’s functional currency primarily exist at one Group company within the
region CIS/Eastern Europe.
In financial year 2016, the Group refinanced itself at interest rates of between 0.7% p.a. and 26.0% p.a. (previous year: between
0.7% p.a. and 16.6% p.a.). On the reporting date of December 31, 2016, the weighted average interest rate for non-current
financial liabilities was approx. 1.7% p.a. (December 31, 2015: approx. 2.0% p.a.) and for current financial liabilities approx.
3.1% p.a. (December 31, 2015: approx. 5.1% p.a.). For all of the Group’s financial liabilities the weighted average interest
amounted to approx. 1.8% p.a. (December 31, 2015: approx. 2.6% p.a.).
The following table gives an overview of the structuring of financial liabilities in the STADA Group:
Remaining maturities of financial liabilities due to banks as of Dec. 31, 2016 in € 000s
< 1 year
1 – 3 years
3 – 5 years
> 5 years
Total
thereof as of Dec. 31, 2016
> 1 year in %
Promissory note loans 43,993 294,487 307,665 61,314 707,459 94%
Bonds – 348,912 – 297,918 646,830 100%
Liabilities to banks 90,351 25,575 542 – 116,468 22%
Total 134,343 668,974 308,207 359,232 1,470,757 91%
Liquidity analysis
The Group’s liquidity was guaranteed at all times in the reporting year. In 2016, significant sources of liquidity included cash
inflows from operating activities as well as financing activity, i.e. the borrowing of funds on the short, middle and long-term.
STADA also received cash inflow from factoring programs. Cash inflows from operating activities are influenced by the profit-
ability of business activities and by net working capital, in particular by receivables. In addition to the existing financing through
two corporate bonds, long-term credit lines and various promissory note loans, STADA maintains a liquidity reserve in the form
of cash and short-term credit lines.
Cash flow analysis
Cash flow statement (abridged) in € 000s 2016 2015
Cash flow from operating activities 333,522 311,748
Cash flow from investing activities -172,666 -178,217
Free cash flow 160,856 133,531
Cash flow from financing activities 55,237 -155,089
Non-cash changes in cash and cash equivalents -6,691 527
Cash flow 209,402 -21,031
Cash flow from operating activities consists of changes in items not covered by capital expenditure, financing, exchange
differences on the conversion of foreign financial statements and transactions in foreign currencies or through changes in the
scope of consolidation and measurement. Cash flow from operating activities improved to € 333.5 million in the reporting year
(previous year: € 311.7 million). The cash flow increase from operating activities by € 21.8 million from the previous year
mainly resulted from decreased payments for interest and income taxes as well as a significantly lower cash-effective increase
in inventories and a cash-effective increase in trade accounts payable, although in the previous year the latter recorded a
significantly decreased cash-effective decrease. The resulting positive effects on cash flow from operating activities were
partly compensated by cash outflows from other net assets that were significantly higher than the previous year.
49Group Management Report of the Executive Board | Report on Economic Position
Cash flow from investing activities reflects the cash outflows for investments reduced by the inflows from disposals and
amounted to € -172.7 million in the reporting year (previous year: € -178.2 million). The cash flow from investing activities was
particularly influenced by payments for investments in intangible assets in financial year 2016, which primarily relate to advance
payments made for the development of approvals and trademarks as well as licenses in Germany and the United
Kingdom. Furthermore, expenses were also incurred for company mergers, particularly from the acquisition of a product port-
folio in Serbia and the purchase of the British Natures Aid and the Argentinean Laboratorio Vannier.
For acquisitions as well as business combinations in accordance with IFRS 3 as well as for significant investments in intangible
assets for the short-term expansion of the product portfolio (generally in the reporting year) – STADA spent a total of € 86.3 mil-
lion in 2016 (previous year: € 89.0 million).
As a result of disposals, cash flow from investing activities recorded an inflow of cash and cash equivalents in the total amount
of € 11.0 million in the reporting year (previous year: € 11.8 million).
Investments in other intangible assets, i.e. investments in intangible assets in the context of the ongoing operating business
and thus without consideration of significant investments or acquisitions for the short-term expansion of the product portfolio,
amounted to € 42.7 million in financial year 2016 (previous year: € 49.2 million) and primarily comprised individual insignificant
payments for the development and acquisition of approvals and approval dossiers in the reporting year.
Payments for investments in property, plant and equipment amounted to € 49.8 million in 2016 (previous year: € 51.2 million).
Investments in property plant and equipment included investments in production facilities, production sites and test labora-
tories in the total amount of € 22.6 million (previous year: € 32.2 million).
Payments for investments in financial assets were € 4.9 million in 2016 (previous year: € 0.6 million).
Cash flow from financing activities amounted to € 55.2 million in financial year 2016 (previous year: € -155.1 million) and
encompasses payments from changes in financial liabilities, dividend distribution payments and payments for treasury shares
as well as additions to shareholders’ equity. This development was primarily attributable to the securing of additional
promissory note loans in the total amount of € 350.0 million, which will be used for the refinancing of the promissory note loans
expiring in financial year 2016 in the total amount of € 188.0 million. In addition, significantly fewer financial liabilities were
repaid in the reporting year than in the previous year.
Free cash flow, i.e. cash flow from operating activities plus cash flow from investing activities, increased to € 160.9 million in
2016 (previous year: € 133.5 million). Free cash flow adjusted for payments for significant investments or acquisitions and
proceeds from significant disposals increased to € 243.0 million (previous year: € 212.4 million).
Cash flow for financial year 2016, net of all inflows and outflows of cash and cash equivalents, amounted to € 209.4 million in
2016 (previous year: € -21.0 million).
Investments
The Group’s investments totaled € 189.7 million in the reporting year (previous year: € 177.0 million). Investments in property
plant and equipment were € 54.3 million (previous year: € 53.5 million), of which € 4.2 million was attributable to business
combinations in accordance with IFRS 3 (previous year: € 0.6 million). In relation to Group sales, the share of investments in
property, plant and equipment was 2.5% (previous year: 2.5% of Group sales). Investments in intangible assets amounted to
€ 130.5 million (previous year: € 122.9 million), of which € 49.0 million was due to business combinations according to IFRS 3
(previous year: € 51.5 million). In financial year 2016, 29% of the total investment volume was used for property, plant and
equipment (previous year: 30%) and 69% for intangible assets (previous year: 69%).

50 Group Management Report of the Executive Board
1) See the Company’s press release of December 10, 2015.2) See the Company’s press release of November 21, 2016.
Focused acquisition policy with selected purchases
In financial year 2016, the Group continued its focused acquisition policy, targeting continued organic growth through
selected external acquisitions. The Group continues to concentrate on both the regional expansion of business activities as well
as the expansion and internationalization of branded products in particular. These are subject to less regulatory intervention
and are often characterized by more attractive margins than generics.
Regardless of this focused purchasing policy, acquisition projects are principally subject to a strict selection process with uniform
criteria and must, in particular, meet defined return specifications in addition to strategic criteria. For larger acquisitions or
cooperations with capital investments, appropriate capital measures continue to be imaginable if the burden on the
equity-to-assets ratio from such acquisitions or cooperations is too high.
STADA made the following value-enhancing purchases in the context of its focussed acquisition policy in the reporting year:
In order to strengthen the Generics segment, STADA and the STADA subsidiary BEPHA Beteiligungsgesellschaft für Pharmawerte
mbH signed a contract for the purchase of the Argentinian generics producer Laboratorio Vannier in the fourth quarter of 2015.1)
The purchase price amounted to a maximum of USD 13.0 million (according to the exchange rate at the date of acquisition approx.
€ 11.9 million) and will be or has already been paid in cash or cash equivalents. The purchase was completed in the first quarter
of 2016. Through the acquisition, STADA also expanded its international sales network in a country that the Group had not yet
been represented with its own sales company.
STADA acquired the British BSMW, based in Stockport, in the first quarter of 2016 to expand the presence and sale activities
in the British market and in the Branded Products segment. STADA achieved control upon conclusion of the contract on
February 5, 2016. The purchase price amount to GBP 3.4 million and was paid completely in cash or cash equivalents.
In the third quarter of 2016, the Serbian STADA subsidiary Hemofarm A.D. acquired a local product portfolio primarily com-
prising medication for the treatment of gastrointestinal disorders in order to strengthen its position in the area of consumer
health. The purchase price for the acquisition of the product portfolio including the associated sales structures amounted to a
total of € 21.6 million and will be or has already been completely paid in cash or cash equivalents. The acquired business has
been consolidated in the STADA Group since August 1, 2016.
Furthermore, STADA UK Holdings also took over British branded products company Natures Aid Limited, based in Preston, a
well-known manufacturer of vitamins, minerals, food supplements and herbal products, in the fourth quarter of 2016.2) The
purchase price amounted to GBP 16.8 million and was completely paid in cash or cash equivalents. As part of the negotiations
with the seller of the company, at the same time as the agreed company merger, Natures Aid acquired the building belonging
to the production location as well as the associated site for a purchase price of GBP 1.7 million. The purchase price was paid by
the company in full in cash. STADA achieved control upon conclusion of the contract on November 21, 2016, and consolidated
Natures Aid Limited in the consolidated financial statements at this time.
Continuation of STADA’s focused acquisition policy
In the current financial year 2017, the Group intends to continue its focused acquisition policy.

51Group Management Report of the Executive Board | Report on Economic Position
Course of Business and Net Assets, Financial Position and Results of Operations | Net Assets
Development of the Balance Sheet
Balance sheet (abridged) Assets
Dec. 31, 2016 in € 000s
Dec. 31, 2016 in %
Dec. 31, 2015 in € 000s
Dec. 31, 2015 in %
Non-current assets 1,949,543 56.7% 2,032,309 61.8%
Intangible assets 1,582,361 46.0% 1,649,020 50.2%
Property, plant and equipment 322,715 9.4% 321,617 9.8%
Remaining assets 44,467 1.3% 61,672 1.8%
Current assets 1,490,901 43.3% 1,255,106 38.2%
Inventories 484,904 14.1% 501,520 15.2%
Trade accounts receivable 489,071 14.2% 485,901 14.8%
Remaining assets 81,386 2.4% 124,507 3.8%
Cash and cash equivalents 352,580 10.2% 143,178 4.4%
Non-current assets and disposal groups held for sale 82,960 2.4% – –
Total assets 3,440,444 100% 3,287,415 100%
Equity and liabilities
Dec. 31, 2016 in € 000s
Dec. 31, 2016 in %
Dec. 31, 2015 in € 000s
Dec. 31, 2015 in %
Equity 1,047,105 30.4% 1,018,530 31.0%
Non-current borrowed capital 1,493,712 43.4% 1,282,577 39.0%
Other non-current provisions 35,997 1.0% 28,869 0.9%
Financial liabilities 1,336,414 38.9% 1,084,213 33.0%
Other liabilities 121,301 3.5% 169,495 5.1%
Current borrowed capital 899,627 26.2% 986,308 30.0%
Other provisions 20,273 0.6% 22,532 0.7%
Financial liabilities 134,343 3.9% 274,672 8.4%
Trade payables 336,844 9.8% 328,487 10.0%
Other liabilities 393,589 11.5% 360,617 10.9%
Non-current liabilities and associated liabilities of disposal groups held for sale
14,578
0.4%
–
–
Total assets 3,440,444 100% 3,287,415 100%
The net assets of the STADA Group recorded positive development in the financial year 2016. This was reflected in particular in
various derived key figures.
Net debt reduced to € 1,118.2 million as of December 31, 2016 (December 31, 2015: € 1,215.7 million).
The net debt to adjusted EBITDA ratio improved to 2.8 in the reporting year (previous year: 3.1).
As of the reporting date, the equity-to-assets ratio was 30.4% (December 31, 2015: 31.0%) and was satisfactory in the opinion
of the Executive Board as a result.
Total assets increased as of December 31, 2016 to € 3,440.4 million (December 31, 2015: € 3,287.4 million). The increase was
attributable, among other things, to the assumption of further promissary note loans in the total amount of € 350 million.

52 Group Management Report of the Executive Board
Intangible assets decreased by € 66.6 million to € 1,582.4 million as of December 31, 2016 (December 31, 2015: € 1,649.0 mil-
lion). The decrease primarily resulted from amortization, impairments and reclassifications to non-current assets and disposal
groups held for sale in accordance with IFRS 5. In addition, there were high currency effects resulting from the appreciation of
the Russian ruble and the depreciation of the British pound.
As of December 31, 2016, intangible assets included goodwill in the amount of € 404.6 million (December 31, 2015: € 391.6 mil-
lion). There were additions to intangible assets from business combinations in accordance to IFRS 3 – without considering
amortization – in the amount of € 49.0 million. Of this, € 18.8 million was attributable to the acquisition of Serbian product
portfolio to strengthen the position in the consumer health area, € 11.5 million to the purchase of the Argentinean Laboratorio
Vannier S.A. as well as € 3.5 million and € 17.4 million from the purchase of the British BSMW Limited and Natures Aid Limited.
In addition, in financial year 2016 development costs in the amount of € 31.0 million were capitalized as internally created
intangible assets (December 31, 2015: € 27.5 million). In 2016, STADA recognized impairments on intangible assets in the total
amount of € 61.8 million (previous year: € 32.9 million).
Property, plant and equipment increased to € 322.7 million as of December 31, 2016 (December 31, 2015: € 321.6 million).
This increase mainly resulted from investments in production facilities in the Serbian subgroup.
Inventories decreased as of December 31, 2016 by € 16.6 million to € 484.9 million (December 31, 2015: € 501.5 million). This
development was primarily based on reclassifications to non-current assets and disposal groups held for sale in accordance
with IFRS 5 related to two subsidiaries in Asia.
In specific situations STADA puts – following the principle of market proximity – certain range considerations deliberately aside
in favor of possible operating opportunities. In individual cases this – if the utilization of opportunities cannot be realized as
expected – can lead to value allowances for inventories which burden earnings. Total burdens in the amount of € 28.2 million
as of December 31, 2016 were incurred due to value allowances in inventories offset with reversals (December 31, 2015:
€ 36.5 million).
Trade accounts receivable increased to € 489.1 million as of the reporting date (December 31, 2015: € 485.9 million). Alongside
gains in the context of business combinations, this development resulted, among other things, from reporting date effects as
well as translation effects in the context of converting financial statements of foreign subsidiaries with a reporting currency
other than the Group currency euro, particularly for companies accounting in Russian ruble, which also recorded an increase
in this item. In contrast, trade accounts receivable decreased as a result of the reclassification to non-current assets and disposal
groups held for sale in accordance with IFRS 5 related to two subsidiaries in Asia.
In certain market situations, the Group accepts, if necessary, higher current trade receivables, if this leads to opportunities for
a better market position. In terms of its receivables management, STADA pays thorough attention to the liquidity of customers
as a rule. However, defaults can never be entirely ruled out (see “Opportunities and Risk Report”).
Remaining assets contain various items including, among other things, financial assets, shares in associates, deferred tax
assets and other financial assets.
Financial assets increased as of December 31, 2016 to € 2.2 million (December 31, 2015: € 1.3 million). This development was
primarily based on a capital increases in non-consolidated Group companies in connection with the purchase of two sub-
sidiaries.
Investments measured at equity increased as of the reporting date to € 13.9 million (December 31, 2015: € 13.2 million). The
increase of this balance sheet item was mainly based on the contribution to earnings of associates in financial year 2016.
Deferred tax assets decreased as of December 31, 2016 by € 13.3 million to € 20.8 million (December 31, 2015: € 34.1 million).
The decrease primarily resulted from netting with deferred tax liabilities as well as the utilization of tax loss carryforwards for
which deferred active tax assets were accounted for in the past.

53Group Management Report of the Executive Board | Report on Economic Position
Other financial assets in the amount of € 44.3 million (December 31, 2015: € 83.0 million) include purchase price receivables.
This item also comprises the positive market values from derivative financial instruments amounting to € 9.9 million as of the
reporting date (December 31, 2015: € 27.5 million) and mainly resulted from cross-currency swaps.
The reduction of income tax receivables as of December 31, 2016 to € 12.8 million (December 31, 2015: € 21.2 million) was
primarily a result of payments received from the reimbursement of tax prepayments in Germany.
Cash and cash equivalents, including cash and call deposits as well as current financial investments, increased as of December
31, 2016 to € 352.6 million (December 31, 2015: € 143.2 million). This development was based on both positive cash flow
devel opment and on effects related to the reporting date. Further details on the development of cash and cash equivalents can
be found in the consolidated cash flow statement.
As of December 31, 2016, € 83.0 million in assets held for sale as part of a disposal group and € 14.6 million in related
liabilities were reported in separate line items in the balance sheet of the STADA Group. The disposal group comprises two
Asian subsidiaries expected to be sold in financial year 2017. As the carrying amount of the disposal group was below fair value
less costs to sell on December 31, 2016, no impairment loss was recorded.
As of December 31, 2016, equity recorded an increase of € 1,047.1 million (December 31, 2015: € 1,018.5 million). In the
previous year, the Group had recorded proceeds from capital increases from the conversion of STADA warrants in the first half
of 2015 in the amount of € 28.2 million, the exercise period of which expired at the end of June 26, 2015.
Retained earnings including net income comprise net income for the financial year as well as earnings generated in previous
periods, provided these were not distributed, including amounts transferred to retained earnings. In addition, revaluations of
net debt from defined benefit plans that were recognized directly in equity are reported under this item, taking deferred tax
liabilities into account. In the context of the measurement of defined benefit obligations as of December 31, 2016, excluding
amounts attributable to minority interest, a net expense in the amount of € 4.8 million recognized in other comprehensive
income after deferred taxes resulted from the remeasurement. This was primarily due to the reduction in the discount rate
applied to the measurement for various defined benefit plans in the STADA Group as of December 31, 2016 compared with
December 31, 2015.
Other reserves include results recognized directly in equity. This relates, among other things, to foreign exchange gains and
losses resulting from the currency translation with no effect on the income of financial statements of companies included in
the Group that are reported in the statement of changes in equity under the currency translation reserve.
The reduction of other reserves compared with the previous year is primarily composed of the following effects: On the one
hand, the devaluation of the British pound sterling since December 31, 2015 led to expenses recognized directly in equity from
the currency translation of financial statements of companies reporting in British pound sterling. On the other hand, the appre-
ciation of the Russian ruble since December 31, 2015 has resulted in income recognized in equity from the currency translations
of financial statements of companies reporting in the respective currency, which only partially compensated for the previously
described expenses.
Financial liabilities were at € 1,470.8 million as of December 31, 2016 (December 31, 2015: € 1,358.9 million). The item includes,
in particular, promissory note loans with a nominal value in the amount of € 709.0 million (December 31, 2015: € 547.0 million),
a bond with a nominal value in the amount of € 350.0 million and a bond with a nominal value of € 300.0 million (December 31,
2015: a bond with a nominal value in the amount of € 350.0 million and a bond with nominal value of € 300.0 million). The
increase in financial liabilities was based on the securing of additional promissory note loans in the total amount of € 350.0 mil-
lion to be used for the refinancing of the promissory note loans that expired in financial year 2016 in the total amount of
€ 188.0 million.
Trade payables increased as of the reporting date of December 31, 2016 by € 8.3 million to € 336.8 million (December 31, 2015:
€ 328.5 million). This development was primarily a result of effects relating to the balance sheet date, in particular those in
connection with accruals for outstanding invoices. In addition, there was an increase in comparison to the previous year result-
ing from business combinations recorded in financial year 2016 in accordance to IFRS 3.

54 Group Management Report of the Executive Board
Remaining liabilities include deferred tax liabilities, other financial liabilities, other liabilities and income tax liabilities.
Deferred tax liabilities decreased as of December 31, 2016 to € 116.4 million (December 31, 2015: € 160.2 million). This devel-
opment was a result, in particular, of a change in the tax rate in the United Kingdom as well as impairments to assets from
business combinations, leading to a reduction in temporary differences.
Other financial liabilities in the amount of € 217.9 million (December 31, 2015: € 226.0 million) include, among other things,
finance lease liabilities and liabilities from derivative financial instruments. The finance lease liabilities amounted to € 3.3 mil-
lion as of December 31, 2016 (December 31, 2015: € 2.2 million). The liabilities from derivative financial instruments amounted
to € 11.9 million on the reporting date (December 31, 2015: € 4.6 million), and resulted from the negative market values of
derivatives measured at fair value through profit or loss. Other financial liabilities decreased in comparison to the previous year
mainly due to decreased liabilities from discount agreements of German STADA companies.
Other financial liabilities as of December 31, 2016 showed an increase of € 119.9 million (December 31, 2015: € 104.4 million),
which was mainly attributable to increased personnel-related liabilities.
Income tax liabilities increased as of the reporting date by € 21.2 million to € 60.6 million (previous year: € 39.4 million). This
development was primarily due to the fact that no final assessments exist for previous financial years.

55Group Management Report of the Executive Board | Report on Economic Position
Course of Business and Net Assets, Financial Position and Results of Operations | General Statements of the Executive Board on the Course of Business in 2016
In the context of the revised corporate strategy, the Group was able to drive forward significant changes in financial year 2016.
Overall, the outlook published at the beginning of the year was slightly exceeded.
Group sales adjusted for currency and portfolio effects increased by 3% to € 2,167.2 million (previous year: € 2,100.4 million)
(see “Report on Economic Position – Course of Business and Net Assets, Financial Position and Results of Operations – Results
of Operations – Sales Development of the Group”).
EBITDA adjusted for influences distorting the year-on-year comparison from special items increased by 2% to € 398.0 million
(previous year: € 389.4 million) (see “Report on Economic Position – Course of Business and Net Assets, Financial Position and
Results of Operations – Results of Operations – Earnings Development of the Group”).
Net income adjusted for influences distorting the year-on-year comparison from special items recorded growth of 7% to
€ 177.3 million (previous year: € 165.8 million) (see “Report on Economic Position – Course of Business and Net Assets, Financial
Position and Results of Operations – Results of Operations – Earnings Development of the Group”).
The net debt to adjusted EBITDA ratio improved to 2.8 (previous year: 3.1) (see “Report on Economic Position – Course of
Business and Net Assets, Financial Position and Results of Operations – Net Assets”).

56 Group Management Report of the Executive Board
REPORT ON POST-BALANCE SHEET EVENTS
This report on post-balance sheet date events includes events that occurred between the end of financial year 2016 and the
date of the signing of the Group Management Report and the Consolidated Financial Statements for 2016 and which have a
significant, or possibly significant effect on the net assets, financial position and results of operations of the STADA Group.
These were as follows:
• On January 23, 2017, the Supervisory Board announced the appointment of Dr. Barthold Piening as a full Member of
the STADA Executive Board with effect from April 1, 2017.1) He will assume Executive Board responsibility for Production,
Research and Development, Biotechnology as well as Quality Assurance and Control.
1) See the Company’s Investor News of January 23, 2017.

57Group Management Report of the Executive Board | Report on Post-balance Sheet Date Events | Report on Expected Developments
REPORT ON EXPECTED DEVELOPMENTS
Business model with long-term growth potential
The business model of STADA will continue to be oriented towards the health care and pharmaceutical market, i.e. towards one
of the global growth industries. The Group will continue to concentrate on the development and marketing of products with
active ingredients that are free of commercial property rights, particularly patents.
Despite the further orientation towards areas with long-term growth potential, sales and earnings development in financial
year 2017 will be subject to different and partially opposing influence factors, as the economic, regulatory and competitive
conditions can vary from year to year in the different countries. In terms of opportunities management, the Executive Board
expects to be able to generate further growth in the future.
Comprehensive opportunities management for the use of existing growth opportunities
With its comprehensive opportunities management, considered by the STADA Group as an ongoing entrepreneurial task, the
Group secures and improves existing opportunities and creates new possibilities. STADA management intensively monitors the
markets and competitors at all levels and as a result can not only identify and analyze trends, requirements and opportunities
in the often fragmented markets, but can also plan its actions accordingly. Furthermore, the individual corporate areas
purposefully share their knowledge and experience in order to identify and use additional opportunities and synergies.
On the basis of the continuous implementation of the revised corporate strategy and the strategic success factors of the Group,
the management takes advantage of opportunities for the optimum use of existing growth potentials.
As part of its successful product development and active acquisition policy, STADA will continuously expand the Group port-
folio in both the Generics and Branded Products segments with value-adding acquisitions. Within Generics, a segment that
will remain part of STADA’s core business in the future, promising growth opportunities exist in the expansion in markets with
relatively low penetration rates in particular. In addition, STADA is also investing in selected biosimilars together with cooper-
ation partners in order to supplement the portfolio. In the Branded Products segment, alongside expansion, the Group is
targeting the increasing internationalization of successful brands. Innovative marketing concepts are to be used in this context.
STADA also intends to take advantage of additional growth opportunities in niche and non-regulated markets through the
introduction of innovative products.
In order to be able to optimally sell the products from the Group portfolio, adapted to the different regulatory and competitive
conditions in the individual markets, STADA will gradually expand its international sales network.
With a view to further growth, the functional reporting structures with short decision making channels and, at the same time,
strong regional market presence will remain a high priority. A changed corporate structure with clear areas of responsibility and
greater transparency as well as a re-positioned corporate culture with an increased focus on entrepreneurship, extensive
knowledge sharing and an open dialog will be particularly important.
Employees represent another key opportunity, since they will continue to have a significant share in the sustainable success of
the Group in the future with their extensive expertise and their strong commitment.
Numerous initiatives to improve performance will also play a key role in making use of existing growth opportunities. Alongside
the leveraging of untapped sales potentials, this also includes the optimization of marketing costs, the increasing of sales
efficiency and the reduction of cost of sales.

58 Group Management Report of the Executive Board
1) Source: International Monetary Fund: World Economic Outlook January 2017.
Challenges and risks
In addition to the challenges and risks already presented, the Group also faces operating challenges and risks that, from the
Executive Board’s perspective, result from structures and mechanisms of the market segments and are relevant for the
development of the Group (see “Report on Economic Position – Course of Business and Net Assets, Financial Position and
Results of Operations – Results of Operations – Sales Development of the Generics and Branded Products Segments” as well as
“Opportunities and Risk Report”). As they are, to a large extent, inextricably associated with structural growth opportunities,
they will however continue to be unavoidable in the future in order to optimally use these growth potentials.
In addition, STADA will continue to be faced with non-operational challenges and risks. Despite the fact that STADA is active in
the health care market and this is relatively independent of the economy, in future the Group will continue to be faced with
specific impacts of global economic conditions. A key issue here is the development of the currency relations relevant for the
Group – particularly those of the Russian ruble, the Ukrainian hryvnia, the Kazakhstani tenge and the British pound sterling to
the euro. Furthermore, STADA will continue to be exposed to the effects of the ongoing CIS crisis. The Group certainly continues
to prepare itself, within the realms of possibility, for potential risks in this regard, such as a significantly increased default risk
of business partners, subsidies to crisis-prone competitors that distort competition or strong volatility in interest rate levels and
currency relations that are relevant for the Group. However, in view of the effects of the CIS crisis and the resulting burdens such
as special items from impairment losses on intangible assets and property, plant and equipment, payment defaults, non-
operational burdens on earnings from currency influences – in particular from the devaluation of the Russian ruble, the Ukrainian
hryvnia and the Kazakhstani tenge – as well as curbed or further decreasing demand in the Russian pharmaceuticals market
cannot be ruled out. With regard to the current sanctions against Russia, however, STADA does not see any significant direct
effects on the Group’s business activities from today’s perspective.
The outlook for the development of the British pound sterling is negative as a result of the United Kingdom’s referendum decision
in the second quarter of 2016 to leave the European Union and the associated uncertainties. Overall, such a devaluation of the
British pound sterling compared with the euro will result in negative translation effects for STADA. The British companies are
fully integrated subsidiaries, whose transactions are primarily made in local currency. Overall, the assets of these companies,
whose transaction currency is not the pound sterling, currently exceed the corresponding liabilities, meaning that STADA
presently does not expect any significant negative translation effects from the devaluation of the pound sterling. From today’s
perspective, STADA does not anticipate any substantial currency effects for the income statement as a result of this possible
currency development. It is very difficult to provide a prognosis on the possible macroeconomic effects of Brexit since this is an
unprecedented event. In general, a decrease in investments and corresponding slower growth is to be expected. The develop-
ments and potential effects on the business model of STADA in the United Kingdom will be monitored continuously as a result.
Overall, the Executive Board does not currently see any challenges or risks that would jeopardize the existence of the Group.
Overall economic outlook
For 2017, the IMF expects a moderate increase in economic activity with a rise in global economic growth to 3.4%.1)

59Group Management Report of the Executive Board | Report on Expected Developments
The following table shows the economic forecast for the most important markets for STADA. The countries are sorted in
descending order of sales achieved by STADA in 2016.
Prognosis growth rates (GDP)
2017 in %
Germany1) 1.5
Russia1) 1.1
Italy1) 0.7
United Kingdom1) 1.5
Spain1) 2.3
Vietnam2) 6.2
Belgium2) 1.4
France1) 1.3
Serbia2) 2.8
For Germany, the IMF expects growth for 2017, albeit slightly weaker growth than the previous year. Russia may have reached
its lowest point and may return to moderate growth. The outlook for the United Kingdom indicates a weakening of the economy.
The possible consequences of Brexit remain difficult to estimate, as both the final date and details regarding concrete
implementation of the exit from the European Union are under dicussion. Italy, Belgium and France are expected to remain at
a low level of growth. The outlook for Spain has been weakened, although the growth forecast is still very good in comparison
with the rest of Europe. The outlook for Vietnam remains high and a continuation of the positive growth trend is also expected
in Serbia.
Sector-specific outlook
In the context of general growth drivers such as the global population increase, an aging society in industrialized nations and
further medical progress, numerous health care and pharmaceutical markets will continue to offer high and relatively
market-independent growth opportunities in future. Within the pharmaceutical market, generics in particular is characterized
by further growth potentials, as generics represents a lower-cost alternative to the usually significantly more expensive original
products and as a result counteract the significant price pressure in the individual health care markets. Furthermore, additional
growth opportunities result from the continuous expiration of patents and other commercial property rights. Within generics,
biosimilars, among other things, have increasing growth opportunities, as they can make a significant contribution towards
cost reduction as a result of the cost intensity of biopharmaceuticals.
In light of these potentials, according to forecasts, sales in the global pharmaceutical market will increase by 5% to 7% per year
until 2021.3)
For the international generics market, QuintilesIMS forecasts annual growth of up to 8.0%3) up to 2021. It should, however, be
taken into account that the actual growth rates of reported sales in markets where significant discounts must be granted will
be substantially below gross sales generally recorded by the market research institutions before discounts.
In terms of the sales volume for active pharmaceutical ingredients becoming available for generics competition between 2017
and 2020 in the largest pharmaceutical markets by sales in Europe – Germany, France, Italy, the United Kingdom and Spain –
which, according to market research figures, amounts to more than € 11.9 billion, the STADA Executive Board continues to expect
further growth potentials in the EU generics market.4)
1) Source: International Monetary Fund: World Economic Outlook January 2017.2) Source: International Monetary Fund: World Economic Outlook October 2016.3) QuintilesIMS Syndicated Analytics Service; prepared for STADA February 2017.
4) STADA estimate of sales volumes in 2016 at ex-factory prices for active pharmaceutical ingredients for which STADA from today’s perspective expects the patents or other commercial property rights relevant for generics competition to expire by 2020, based on data provided by various international market research institutes. STADA’s expectations as to the date of availability of active pharmaceutical ingredients for generics competition are continuously being reviewed from a legal perspective and may in the future significantly differ from today’s expectations (as of March 1, 2017) as expressed in this data. The actual sales volumes becoming available for generics competition at the respective dates are subject to fluctuations as a result of changing market success, legal circumstances or market structures, among other factors.
60 Group Management Report of the Executive Board
1) QuintilesIMS Syndicated Analytics Service; prepared for STADA February 2017.2) Russia, Serbia, Ukraine, Kazakhstan, Bosnia-Herzegovina.3) Source: Pharmazeutische Zeitung, Online Issue 21/2016.
This assumption is supported by estimates from QuintilesIMS as well, according to which annual generics growth in the EU
(EU 28) amounts to an average of 3.9%1) from 2017 to 2019. For selected markets in Eastern Europe2), QuintilesIMS expects
annual average generics growth of 6.8%1) from 2017 until 2021. The Russian generics market as a result is to grow by an average
of 6.0%1) annually between 2017 and 2021.
In the context of regulatory conditions, STADA does not expect any significant changes in financial year 2017 that could have a
considerable impact on the business development of the Group in the markets in which the Company is active.
In light of the previously discussed significant potential contribution towards containing costs, analysts estimate the share of
biosimilars on the global biologics market to be between 4% and 10% in 2020. This would represent a market value of USD 5 bil-
lion to 19 billion.3)
According to data from QuintilesIMS, annual growth rates of the global OTC market will be up to 6.3% by 2021.1) The forecast
for the European OTC market are at up to 3.0%1) according to experts.
Basis of the prognosis
The outlook for financial year 2017 was made taking into account the events known when this annual report was prepared. It
is also based on the details of the overall economic outlook and the industry-specific outlook.
Additionally, it uses the following assumptions:
• Predominantly unchanged regulatory conditions in the markets most relevant for STADA, not including the regulatory
changes and market assessments known at the time the forecast was prepared
• Optimization of procurement prices for primary materials
• The continued possibility of immediately launching new products upon patent expiration
• Largely unchanged tax situation in the countries where STADA is active with Group companies
• Application of forward rates at the time the forecast was prepared for the conversion of currencies other than the
Group currency euro
Summarizing outlook
In view of the general and generics-specific growth drivers in the health care and pharmaceutical industry, STADA’s business
model is principally oriented towards markets with long-term growth potentials.
Inseparably linked to this, however, are operating risks and challenges based in particular on changed or additional state
regulation and/or intensive competition. In addition, in the future the Group will continue to be faced with non-operational
influence factors such as negative Group-relevant currency relations, the effects of the ongoing CIS crisis or the potentially
negative macroeconomic consequences of the decision of the United Kingdom to leave the European Union.
In general, the Group’s future sales and earnings development will be characterized by growth-stimulating and challenging
conditions.
In light of the changed corporate structure and repositioned corporate culture, the implementation of the numerous initiatives
as part of the revised corporate strategy as well as the strategic success factors, however the positive prospects are expected
to prevail.
61Group Management Report of the Executive Board | Report on Expected Developments
For financial year 2017, the Executive Board expects Group sales of between € 2.280 billion and € 2.350 billion, adjusted for
currency and portfolio effects with an adjusted EBITDA between € 430 million and € 450 million and adjusted net income
between € 195 and € 205 million. It expects the ratio of net debt excluding further acquisitions to adjusted EBITDA to be at a
level of nearly 3.
In the reporting year, the Executive Board approved medium-term growth targets.1) In the current first quarter of 2017, the
Executive Board increased the strategic outlook for 2019.2) In accordance with this outlook, adjusted Group sales of between
€ 2.650 billion and € 2.700 billion are to be achieved in financial year 2019 (previously around € 2.6 billion). In terms of adjusted
EBITDA, the Executive Board expects a range between € 570 million and € 590 million (previously around € 510 million). Ad-
justed net income is to increase to between € 250 million and € 270 million (previously around € 250 million). The adjusted
EBITDA margin is to be nearly 22%. Cash flow from operating activities is to improve to between € 560 million and € 580 million.
The increase in the medium-term growth targets for 2019 is a reflection of the interim results from the “STADA Plus” program
to improve performance that was introduced in the summer of 2016. Additional value enhancement potentials have also been
identified as part of the strategy project that was launched at the beginning of the year. An expanded package of measures has
been defined to leverage these.
On the sales side, STADA anticipates additional growth through a generally stronger base business in both the generics and
brands segments. On the cost side, additional savings potentials have been identified in areas including purchasing, through
further optimization in production, as well as in the supply chain area. This is on top of the fact that it has been possible to
implement the measures more quickly, which means that they will likely contribute to improved profitability earlier than
previously assumed. The medium-term growth targets are also based on the following assumptions:
• Organic sales growth in the core segments of Generics and Branded Products
• No significant disposals that would impact sales and earnings
• Forward projection of current currency relations, the current interest rate levels and largely unchanged tax framework
conditions in the countries where STADA has Group companies
• Forward projection of current regulatory conditions in markets relevant for STADA
1) See the Company’s ad hoc release of July 11, 2016.2) See the Company’s ad hoc release of March 17, 2017.

62 Group Management Report of the Executive Board
OPPORTUNITIES AND RISK REPORT
As an internationally active pharmaceutical company, STADA is part of a global business community and as a result is exposed
to a variety of risks in a dynamic market environment. These are mandatory consequences of business activity, as one can only
take advantage of opportunities if one is prepared to take risks.
As a supplier of pharmaceutical products, STADA is less affected by economic cycles. STADA’s international orientation and the
diversification of the Branded Products and Generics segments also reduce the dependence on individual negative developments
or events. In addition, long-term experience in the pharmaceutical market provides a solid basis for being able to realistically
assess risks and take a targeted approach to growth opportunities.
Opportunities management
STADA sees opportunities management as an ongoing entrepreneurial task. As part of its opportunities management, STADA
improves the existing situation and creates new possibilities. STADA management intensively monitors the markets and
competitors at all levels and can use this information to identify and analyze trends, requirements and opportunities in the
often-fragmented markets, and plan its actions accordingly. Furthermore, the individual corporate areas hold a targeted
exchange of knowledge in order to identify and use additional opportunities and synergies. The opportunities can be found in
the Group Management Report of this Annual Report in the chapter “Report on Expected Developments”.
Risk management
STADA also defines the management of risks as an ongoing task of entrepreneurial activities. The risk strategy is applied in all
business segments of the STADA Group and is closely linked with STADA’s corporate strategy, forming the basis of the Executive
Board’s continuous risk management system. This system is then integrated into the value-based management and existing
organizational structure of the Group. STADA’s risk management system is based on the international risk management system
COSO II Enterprise Risk Management – Integrated Framework (2004).
The objective of STADA’s risk management system is to ensure across the Group that both business benefits for decision making
processes are achieved and that relevant legislation is fully complied with. At the same time, the risk management system is
intended to guarantee sufficient security to ensure that STADA’s objectives, particularly financial, operational and strategic
objectives, can be reached according to plan. The company-wide standard and integrated approach to the management of risks
is intended to ensure the efficiency of Group-wide risk management and make it possible to aggregate risks and provide trans-
parent reporting.
STADA’s risk strategy is substantiated by risk policy principles. This is to ensure that all risks are fully identified, presented
transparently and comparably and are assessed. It obligates those responsible for risks to proactively manage and monitor the
risks. The risk policy principles are defined in the risk management guide. The guide also sets out binding methodical and
organizational standards for the approach to risks.

63Group Management Report of the Executive Board | Opportunities and Risk Report
The fundamental components of the Group-wide risk management system are:
1. the Risk Management department, which is vertically and horizontally integrated in the Company, is responsible for
the planning and further development of the risk management system (including the Group-wide establishment of the risk
management software “R2C – Risk to Chance”), as well as the methods and procedures used to identify and assess risks
and support the local risk confidants;
2. the local risk confidants who identify and assess risks (including measures) and document and update them in the risk
management system and who are integrated in all corporate units and subsidiaries throughout the Group.
3. regular queries sent to the responsible risk confidants by the Risk Management department on current topics and the risk
situation in the individual areas of the Group.
4. the company-specific risk management guide in which risk management terms, risk policy and the risk management
system including the risk management process and responsibilities are defined;
5. Risk reporting at Group and individual-company level.
STADA’s Group-wide risk management covers STADA Arzneimittel AG and its Group companies as well as companies in which
STADA holds a stake of at least 50%, even if they are not consolidated. Insofar as risks to the Group arise at subsidiaries in which
STADA holds a stake of less than 50%, these risks are also recorded in the Group’s risk management system.
Only risks are recorded in the risk management system. Opportunities are not recorded in the risk management system along
the lines of risks. The identification and evaluation of opportunities takes place in the respective business environments. An
overarching, systematic classification regarding the probability and effects of the opportunities is not performed.
At STADA, the risk management process comprises the phases of risk identification, risk measurement, risk control, risk
monitoring, risk aggregation and risk reporting.
Phase 1 Phase 2 Phase 3 Phase 4 Phase 5 Phase 6
Risk identification
Risk measurement
Risk control
Risk monitoring
Risk aggregation
Risk reporting
The closed, ongoing and IT-supported risk management process begins with risk identification (phase 1), in which all individual
risks that could have significant negative impacts on STADA’s business model are systematically recorded. These individual risks
are identified, on the one hand, via self-assessment of the risk confidants and, on the other hand, via inquiries of the Risk
Management department.
Risk measurement (phase 2) is carried out following risk identification. The evaluation of individual risks is based on probability
and potential impact; the evaluation should consider potential direct damage as well as indirect results caused by individual
risks if they arise.
As part of risk management (phase 3), possible measures for risk avoidance, reduction, transferring and/or compensation are
identified. The measures identified can relate to the cause (preventative) as well as to the effect (reactive).
In phases 1 to 3, the Risk Management department ensures the uniform definition of individual risks through plausibility tests
and guarantees continuous risk management throughout all departments and countries.

64 Group Management Report of the Executive Board
The risk monitoring (phase 4) ensures that the development of risks as well as the implementation and effectiveness of the
identified measures are continuously monitored by the risk confidants, who are supported by the Risk Management department
when necessary.
Before a risk report is created, the Risk Management department aggregates individual risks with identical or similar causes to
increase transparency, following an analysis of the risk causes (phase 5).
In the risk report (phase 6), the Risk Management department creates recipient-oriented risk reports on the identified indi vidual
risks for the management and Supervisory Board. Significant individual risks and risk aggregates indicated are jointly discussed
by the Executive Board and the Supervisory Board and, if required, further measures to counter risks are addressed. In the case
of new significant individual risks or risk aggregates, the Executive Board and the Supervisory Board are also immediately
informed through ad-hoc reporting, including outside of the quarterly risk reporting.
Internal Auditing is responsible for the regular monitoring of the risk management system established by the Executive Board.
As part of the monitoring of the Executive Board, the Supervisory Board also looks at the efficiency of the risk management
system. In the scope of auditing the annual financial statements, STADA’s auditor also reviews and evaluates whether the early
risk detection system, which is integrated in the risk management system, is generally suitable to recognize risks that may
jeopardize the continued existence of the Group at an early stage.
The relevant period for internal risk reporting is principally 24 months. The assessment of the risks in the Group Management
Report principally refers to one year, in line with the forward-looking period. The assessment of the individual risks relates to
December 31, 2016. There were no relevant changes after the reporting date that would have required a change in the presen-
tation of STADA’s risk situation. However, there is no absolute certainty that risks can be fully identified and managed.
Internal control and risk management system for the Group accounting process (report in accordance with Sections 289 (5), 315 (2) No. 5 HGB)
The Group-wide internal control and risk management system with regard to the financial reporting process (ICRMS) is
a component of STADA’s Group-wide risk management system and aims to ensure the accuracy and effectiveness of the account-
ing and financial reporting. STADA ensures the reliability of the accounting processes and the correctness of the financial
reporting with a variety of different measures and internal controls. This includes the preparation of separate and consolidated
financial statements and management reports that comply with regulations. The ICRMS is constantly developed and is an integral
component of the accounting and financial reporting processes in all relevant legal units and central functions. The system
contains principles, processes and preventative and disclosing controls.
It includes:
• Uniform accounting, measurement and account assignment specifications for the entire Group that are continuously
examined, updated and regularly communicated,
• Supplementary processes instructions, Group-internal reporting formats as well as IT-based coordination processes for
Group-internal balances,
• Processes ensuring the completeness of financial reporting,
• Processes for functional separation, the dual-control principle within the context of the preparation of financial state-
ments and for authorization and access regulations for relevant IT accounting systems,
• External experts, who are consulted when necessary, for example for purchase price allocation in accordance with
IFRS 3.
65Group Management Report of the Executive Board | Opportunities and Risk Report
The primary control functions for the most important accounting processes are carried out by the respective plausibility tests
integrated in the programs. Outside the software-supported systems, manual plausibility tests and verification of the complete-
ness and accuracy of data and calculations are carried out at all Group levels. The vast majority of the separate financial
statements of Group companies (included in STADA’s Consolidated Financial Statements) are generally subject to review by the
auditor once a year. In addition, the auditor also carries out a review of the half-year reports of the significant consolidated Group
companies.
Responsibility for the introduction as well as the functionality of the ICRMS rests with the Executive Board of STADA Arznei-
mittel AG, who assess its appropriateness and effectiveness at least once every financial year. Its appropriateness and
effectiveness are also regularly examined across the Group by Internal Auditing.
Furthermore, the Audit Committee of the STADA Supervisory Board regularly monitors the accounting process and the
effectiveness of the control system, the risk management system and the internal auditing system as well as the audit on the
basis of Section 107 (3) AktG. The ICRMS for the accounting process cannot, however, offer any absolute security that false
statements are not made in accounting.
Business-related risks
Risks that could have a significant influence on the net assets, financial position and results of operations of the STADA Group
are described below. Risks are reported in the form of net risks, i.e. risks including the measures taken to manage the risk, and
by the individual segments. If no segment is explicitly referenced, the described risks affect both the Branded Products and
Generics segments. As yet unknown risks and those that have been assessed as insignificant could also influence net assets,
financial position and results of operations.
Industry risks, regulatory and economic risks
a) Industry risks
STADA is subject to the constantly changing market conditions in the individual national markets. In terms of competition, the
risks exist on the basis of strong competition in particular in terms of pricing, range of products and services as well as supply
and discount conditions of existing and new competitors. In terms of demand, there is also the risk of a potential increase in
purchasing power of individual customer groups such as doctors, pharmacists, patients, health insurance organizations, buying
groups, pharmacy chains, wholesalers or mail-order companies. Such developments could weaken STADA’s competitive position,
for example through the (partial) loss of newly planned tenders or through a (partial) loss of previously won tenders, and
consequently result in a loss in sales or earnings. However, STADA principally takes advantage of opportunities arising in
individual markets or individual products or product groups and is also willing to accept, if necessary, temporary losses, for
example, in national markets with major potential for growth or to maintain or expand its market position. Overall, STADA tries
to counteract industry risks through a diversification of brands and products.

66 Group Management Report of the Executive Board
b) Regulatory risks
The national markets in which STADA is active are characterized by a large number of regulations. The changing, lifting or
passing of new regulations could have significant economic and strategic impacts on STADA and the economic success of
individual products or investments. Regulations at a national or supranational level are highly significant if, for example, they
affect the market structure, pricing, reimbursement or approvals of pharmaceutical products. This can mean that as a result of
national regulations, the prices of pharmaceutical products are regulated directly (for example through statutory price reduc-
tions) or indirectly (for example through reference prices, mandatory discounts, terms concerning discounts, reduction or
exclusion of cost reimbursement). Furthermore, direct costs for the fulfillment of requirements (e.g. during approval) or increased
indirect costs (e.g. through evasive action by competitors or consumers) can be incurred. This can reduce the profitability of
individual products in the affected countries and prevent the market launch of a product in individual cases. STADA assumes
that the extent of price regulation and pricing pressure will remain, primarily in the Generics segment. STADA counters these
risks, among other things, through a targeted expansion of the product portfolio in less regulated areas.
Exact predictions concerning potential changes in national or supranational regulations as well as their effects on STADA’s
business activities are not possible since the introduction and scope of such regulations depend on the political process of the
country in question or on court decisions. The consequences are influenced to a large degree by the reactions of the market
participants affected. Changes in the regulatory environment in STADA’s main markets by sales volume are continuously
analyzed. Depending on the extent of state regulation, it could become necessary to adjust the business model.
c) Economic risks
STADA’s business success is, among other things, dependent on economic influences, as an economic downturn often results
in a reduction in purchasing power in the affected market. A reduction in purchasing power can particularly cause a reluctance
to buy in the area of Branded Products - primarily a self-pay market. Furthermore, an economic downturn can increase the
already prevalent cost pressure in the individual national health care systems. It could subsequently potentially significantly
increase the speed and extent of regional regulatory measures to contain costs. As a result, adverse characteristics for STADA
such as state-required price reductions, particularly for prescription drugs, cannot be ruled out. In general, STADA is con-
tinuously working to counteract potential risks through performance increases or cost reductions.
Since the beginning of the conflict between Russia and Ukraine in 2014, the development of STADA in the Russian market and
the former CIS markets has been burdened by this conflict. In financial year 2016, this had a negative impact on STADA due to
a reluctance to buy among Russian consumers and wholesalers. In the MENA region, the continued unrest had a negative impact
on export business. It is currently unclear how long the political upheaval will last. If these crises continue, this could have
further negative impacts on the results of operations and financial position of the STADA Group.
Furthermore, in the referendum of June 23, 2016, voters in the United Kingdom voted in favor of the United Kingdom leaving
the European Union (“Brexit”). The negotiations on the conditions of the exit have not yet begun. The economy of the United
Kingdom is currently very robust. There is the risk that an economic downturn will occur during the course of or following
negotiations, potentially increasing cost pressure in the health care system and, for example, result in price reduction measures.
Furthermore, an economic downturn could result in a reluctance to buy among consumers in the self-pay market.

67Group Management Report of the Executive Board | Opportunities and Risk Report
Product portfolio risks
The continuous expansion of the product portfolio plays an essential role for the competitive position and business success at
STADA. Associated with this is the risk that products to be added to the product portfolio either cannot be launched on the
market, are launched belatedly or only launched at higher development and production costs than originally assumed due to
unexpected events or faulty implementation. Reasons for this can include additional requirements of approval authorities,
direct government price controls or additional approvals for reimbursement via the relevant national health system. The risks
of development and approval processes for new products are continuously identified and evaluated.
Furthermore, in the Generics segment in particular, a significant factor in the development and approval of each product is the
meticulous observance of relevant legislation such as commercial property rights. This involves the risk that an individual
regulation is violated despite careful investigation of the legal situation and the introduction of a new product is delayed or even
hindered. This also applies retrospectively for products already introduced to the market. There is also the risk that, despite
intensive investigation, potential side effects or quality defects in products are not uncovered until after approval or that new
scientific findings and evaluations lead to a market recall and corresponding legal proceedings.
Legal risks
STADA’s business activities are subject to risks resulting from existing or potential future legal disputes. Risks that occur in
relation to legal disputes are identified, evaluated and communicated on a continuous basis.
In the Generics core segment in particular, STADA’s business activities are associated with an increased risk of legal disputes
regarding commercial property rights (particularly patents and supplementary protection certificates), product liability,
warranty obligations, breaches of duty of care as well as the allegations of violations of company or trade confidentiality. In
order to protect trade and business secrets deemed as confidential, STADA makes use of confidentiality agreements with
employees, external cooperation partners, service providers or other contractual partners. As a consequence of these legal
disputes, in particular in the cases of such processes in the USA, damage claims, legal fees, a complete or temporary ban on the
marketing of products or costs for recalls may be incurred, irrespective of whether a damage claim ultimately exists.
Furthermore, it may be difficult for STADA to enforce its own claims under the law of a country where STADA undertakes business
at affordable costs and without any materially adverse effects on business in this country. If, contrary to expectations, it turns
out that this is not a case in a country, this can have significant negative impacts on the Group as a whole.
Moreover, STADA’s business activity in the individual national markets is subject to the applicable national or supranational
legal tax regulations. Changes to the tax laws and their jurisdiction as well as different interpretations as part of external audit
can result in risks with impacts on tax expenses, tax revenues, tax receivables and tax liabilities. The Group tax department
identifies, evaluates and monitors tax risks as early as possible and systematically and initiates measures to reduce risk, where
appropriate.
If there is a serious risk of future damage claims, STADA creates case-specific provisions for potential damage claims. However,
STADA currently does not expect any negative effects on the net assets, financial position and results of operations from
pending processes.

68 Group Management Report of the Executive Board
Operational risks
a) Corporate strategy risks
STADA’s corporate strategy is mainly focused on growth and internationalization in the pharmaceutical market in the Generics
and Branded Products segments. STADA’s growth strategy is associated with the risk that companies, products or other assets
acquired in the past or in the future may only be able to be integrated with high integration costs or that intended synergy effects
cannot be achieved at the desired level. Furthermore, acquired companies or products may not achieve the expected results
on the market, as markets or market segments focused on by STADA may develop differently than expected. Although
STADA undertakes every effort to minimize these risks through careful analyses, any of the above circumstances can result in
necessities for impairments to intangible assets.
b) Performance-related risks
The Group’s own production facilities (including product development and logistics) are subject to the risk of defective or in-
efficient planning and production processes as well as to production faults or breakdowns as a result of this or external influence.
As hazardous substances are regularly used within this process, such faults can also damage employees’ and third parties’
health or result in environmental damage. This could have a materially adverse effect on costs, competitiveness, supply
availability and the associated expectations regarding units sold, sales and earnings as well as the image with clients.
STADA’s supply availability can also be negatively influenced through the supply unavailability or insolvency of a supplier (see
also default risk), as the change in a supplier is generally associated with delays. STADA restricts this risk by partially using more
than one resource supply (dual sourcing).
In the Generics segment, individual national markets are increasingly characterized by very large volume fluctuations that
regularly arise in the context of tenders by governmental institutions or public health insurance organizations. Although
STADA undertakes every effort to avoid delivery bottlenecks or an unintentional increase in inventories, this cannot be ruled
out in consideration of the comprehensive portfolio.
STADA is also dependent on global developments with respect to purchase prices for active ingredients or auxiliary materials
required as well as on the prices negotiated with contract manufacturers in the case of products produced by these companies;
these prices may fluctuate significantly, also depending on the product. To limit the risk of market-related margin losses due to
falling selling prices, STADA partly makes use of instruments with suppliers that involve them in the market price risk such as
price escalation clauses linking procurement prices to current selling prices, retroactive negotiations or the agreement of
special procurement prices for special sales volumes, in the context of tenders, for example. However, it cannot be ruled out
that procurement cost increases and/or supply shortages in the case of individual products will have materially adverse effects
on the Group’s sales and/or profit margins.
c) Human resources risks
STADA depends to a large extent on the commitment, motivation and abilities of its employees. The loss of specialists and
managers as well as an ongoing search for re-appointments in key positions could have significant adverse effects on the
development of the Group. STADA’s continued success also depends on its ability, in competition with other companies, to attract
and retain qualified employees in the future for the long term regardless of demographic challenges. Country, industry and
business-specific fluctuation risks must be proactively identified and addressed specifically to maintain and achieve success

69Group Management Report of the Executive Board | Opportunities and Risk Report
and critical skills and competencies within the company. STADA counters these risks through global staff development and
succession processes through which the potential of employees is systematically identified and promoted. These processes
support both young professionals and experienced highly qualified employees in their professional development and to help
STADA to develop, promote and retain performance-critical skills in the company.
d) Compliance risks
It is STADA’s expressed objective that all business activities are carried out exclusively within the framework of the respective
laws and internal guidelines. STADA has therefore implemented a Group-wide compliance system, in which all employees are
regularly informed about existing compliance guidelines at STADA, adapted to their individual area of responsibility. STADA
believes that the compliance system is sufficient provision for the compliance with, and observance of, national and international
regulations. Training courses and compliance guidelines cannot, however, fully guarantee that employees do not accidentally,
negligently or deliberately breach laws or internal guidelines. Such breaches can disturb internal business processes and
negatively influence the financial position.
e) Risks in relation to information technology
STADA’s strategic goals can only be achieved through optimal alignment and appropriate support using a variety of IT systems
and processes. Therefore, the Group has to make continuous investments to appropriately adapt these complex and high-
performing systems to changing business processes.
Global IT applications consequently form the basis for the delivery of products to the global customers of the STADA Group as
agreed upon. Inefficiencies in the IT processes in the Group, the failure of business-critical IT applications as well as the failure
of a data center could have a direct impact on STADA’s supply availability.
In addition, all IT systems used in the STADA Group could principally be affected by misuse of digital technologies as a means to
perpetrate new types of crime, so-called cybercrime (e-crime), that alongside the manipulation or failure of the affected IT
systems could also result in the transfer of confidential information to third parties or a revocation of pharmaceutical approval
due to the deficient validation of relevant IT systems.
To reduce the risk of failure and to protect against cybercrime, STADA operates a quality management system for IT and
re dundantly designed data centers.
Financial risks
To the extent that it is possible, STADA counters financial risks with finance policy methods and specific risk management. The
basic principles of financial policy and of financial risk management are determined or confirmed at least once annually by the
Executive Board in the context of the budget process. Furthermore, all transactions above a certain limit determined to be
relevant by the Executive Board must first be approved by the Executive Board. The Executive Board is also regularly informed
of the nature, scope and amount of current risks.
a) Liquidity risks
Liquidity risks may result, for example, from the loss of existing cash items, lack of availability of credit, reduced access to
financing markets or fluctuation in the operational course of business. The objective of the liquidity management is to ensure
solvency and financial flexibility of the STADA Group at all times by way of maintaining a sufficient supply of liquidity reserves
and having free credit lines. STADA finances itself with short-term and long-term borrowings from banks, promissory note loans,
bonds and factoring. Furthermore, STADA has solid operating cash flow and further bilateral credit contracts with various banks
(credit lines) that can be utilized as needed.

70 Group Management Report of the Executive Board
b) Currency risks
Due to the international alignment of business activities, STADA is subject to risks arising from exchange rate fluctuations. These
particularly result from fluctuations of the US dollar, Russian ruble, British pound sterling and the Serbian dinar in relation to
the euro. A currency risk consists of potential changes in value, especially of receivables and liabilities in a currency other than
the respective functional currency or as a result of exchange rate fluctuation (transaction risk). However, STADA is only subject
to this risk to a limited extent, as the company counters risks from currency related fluctuations, alongside natural hedges,
through the use of derivative financial instruments. These are used to hedge currency risks from operating activities, financial
transactions and investments. In the reporting year, STADA made use of foreign-exchange futures contracts and interest /
currency swaps. The maturity dates of futures contracts are thereby selected to match the Company’s anticipated cash flows.
The remaining term of the contracts is currently up to one year.
Furthermore, currency risks also exist in relation to the conversion of the balance sheet items as well as the conversion of
earnings and expenses of international Group companies outside of the euro zone (translation risk). In this connection, the
current political conflict between Ukraine and the Russian Federation, as well as negotiations between the United Kingdom
and the EU over “Brexit”, could indirectly continue to have a negative influence on the earnings situation and exchange rates.
A currency sensitivity analysis on the basis of the outstanding foreign currency items as of December 31, 2016 showed that in
financial year 2016, an appreciation or devaluation of the functional currency compared with the ruble by 10% with otherwise
unchanged conditions changed the EBITDA by approx. € 1.8 million (previous year: € 1.3 million) (translation risk). At the same
time, an appreciation or devaluation of the functional currency in relation to the British pound sterling of 10% with otherwise
unchanged conditions would lead to a change in EBITDA of approx. € 0.6 million (previous year: € 1.0 million) (translation risk).
c) Interest rate risks
STADA is subject to interest rate risks from financial assets and financial debts, primarily in the euro zone and Russia. STADA
calculates existing interest rate risks with sensitivity analyses that show the effects of changes in market interest rates on
interest payments, interest income and expenses as well as on equity. Should the sensitivity analysis show that interest rate
fluctuations could lead to significant impacts, STADA could use derivative hedging instruments to avoid the risk.
A sensitivity analysis has shown that an increase in market interest rates of 100 basis points in financial year 2016 would have
led to a burden on earnings in the amount of € 1.4 million (previous year: € 0.7 million) and a decrease in market interest rates
of 100 basis points would have led to a relief on earnings in the amount of € 0.6 million (previous year: € 0.7 million).
d) Default risks
STADA is exposed to a default risk in its operating business or as a result of financing activities if contracting parties fail to meet
their obligations. To avoid default risks in financing activities, appropriate credit management processes are in place and such
transactions are generally only concluded with counterparties of impeccable financial standing.
Risks of default also exist as a result of the supply of goods and services. STADA therefore strives to maintain business relations
only with partners of impeccable financial standing. In addition, STADA partly uses suitable measures such as guarantees, loan
insurances or the transfer of assets to safeguard itself against default risk. Past due receivables in the operating area are con-
tinuously monitored and potential default risks are anticipated through value adjustments. In addition, there is the risk that in
a difficult economic and financial environment, national health care systems delay or fail to make payments to STADA or business
partners of STADA and that, as a result, directly or indirectly increased default risks arise.

71Group Management Report of the Executive Board | Opportunities and Risk Report
e) Transfer price risks
STADA takes advantage of an international network and carries out strategic Group functions centrally through STADA Arznei-
mittel AG. As a result, an overarching tax transfer-pricing model for the billing of the corresponding Group-internal services is
of increasing importance. Potential risks of non-recognition of these transfer prices for tax purposes, for example from retro-
active tax claims of the local tax authorities against a subsidiary of the STADA Group, are limited by way of the introduction of
corresponding agreement procedures and a comprehensive definition of transfer prices in the form of a Group guideline. How-
ever, non-recognition of transfer prices cannot be completely ruled out.
f) Impairment risks
The valuation rates of the assets included in the consolidated balance sheet are subject to changes in market and business
relationships and thereby to changes in fair value. As part of an annual or case-related impairment test, significant non-cash
burdens on earnings and impacts on balance sheet ratios may result. This particularly applies to goodwill primarily resulting
from purchase price allocations linked to previous acquisitions, and for other intangible assets. All relevant risks are considered
in the context of the preparation of the consolidated financial.
Other risks
STADA as a Group and the STADA subsidiaries in the markets, like any company, are subject to additional general business risks
such as unexpected disruptions in infrastructure, strikes, accidents, natural disasters, sabotage, criminal activities, terrorism,
war and other unforeseeable materially adverse influences. STADA protects itself against such risks to the extent possible and
financially reasonable through appropriate insurance policies. However, it cannot be ruled out that these insurances are
insufficient.
Should STADA no longer meet the necessary criteria according to IFRS 10 (“Consolidated Financial Statements”) for control, and
consequently for consolidation, of subsidiaries due to particular capital constraints or other measures – such as may come as a
result of political or military conflict – STADA would have to deconsolidate these companies. The resulting effects depend on
the significance of the affected companies for STADA and could result in materially adverse effects for the Group.
Evaluation of risk categories
Significant risks that could result in deviations from the planned corporate development within the one-year forward-looking
period are shown below:
Pro
bab
ilit
y
high
moderate
• Suppliers• Regulatory
environment• IT
low
• Currencies• Legal disputes• Warehousing and
logistics
• R&D projects• Approvals and licenses
• Taxes• Market and
competition
low moderate high
Impact

72 Group Management Report of the Executive Board
The scales for the classification of the potential impact and probability are presented in the charts below:
Probability Classification
Low > 0% to ≤ 25%
Moderate > 25% to ≤ 50%
High > 50% to < 100%
Potential impact Description of the impact1)
Low Negligible negative impacton the 1-year outlook (0% to 5%)
Moderate Moderate negative impacton the 1-year outlook (5% to 10%)
High Significant negative impacton the 1-year outlook (> 10%)
Summary evaluation of risks
The assessment of the overall risk situation is the result of the consolidated consideration of all significant individual risks on
the basis of the applied risk management. As a result of the continued tense geopolitical situation in the CIS region, the risk
environment of STADA in this region is unchanged. The risk environment of STADA has also become slightly more negative through
the upcoming negotiations regarding “Brexit”. In the event that one or more of the above-mentioned risks should materialize
or newly occur in the development of business, this could respectively have materially adverse effects on the Group’s business
activities. In particular, respectively material adverse effects on STADA’s business, financial and earnings situation could be
associated with this. From today’s perspective, however, no risks are discernible which, individually or as a whole, could
jeopardize the continued existence of the Group. In terms of organization, STADA has created the necessary prerequisites to be
informed of possible risk situations early and to be able to take appropriate measures.
1) Deviation in terms of the Guidance on adjusted EBITDA.
73Group Management Report of the Executive Board | Opportunities and Risk Report | Takeover-relevant Disclosures
TAKEOVER-RELATED DISCLOSURES
In accordance with Section 315 (4) HGB, STADA is obligated to disclose the following information in the Annual Report:
Composition of share capital, rights and obligations/restrictions associated with shares affecting the transfer of shares
The share capital amounted to € 162,090,344.00 as of December 31, 2016, divided into 62,342,440 registered shares with an
arithmetical share in share capital of € 2.60 per share.
Until December 9, 2016, the shares of the company were registered shares with restricted transferability that, in accordance
with the Articles of Incorporation, could only be transferred and entered into the share register with the consent of the Executive
Board. On August 26, 2016, the STADA Annual General Meeting resolved to eliminate limitations on transferability. Since the
entry of this resolution in the commercial register on December 9, 2016, there are now exclusively registered shares that, in
accordance with the Articles of Incorporation, grant one vote at the Annual General Meeting. Shareholders are only those who
are registered as such in the share registry and only such persons are authorized to participate in the Annual General Meeting
and to exercise voting rights. No shareholder and no shareholder group shall have any special rights.
Shares acquired by employees within the scope of the employee stock option program are subjected to a three-year lockup
period.
Appointment and dismissal of Executive Board members/Amendments to the Articles of Incorporation
The Executive Board is appointed and dismissed exclusively in accordance with legal regulations (Sections 84, 85 AktG).
The Articles of Incorporation do not provide special provisions on the appointment or dismissal of individual and all members
of the Executive Board. Only the Supervisory Board is responsible for the appointment and dismissal. It appoints members of
the Executive Board for a maximum of five years. A repeated appointment or extension of the term is allowed, for a maximum
of five years each, in accordance with the legal regulations. In accordance with Section 9 of the Articles of Incorporation, the
Executive Board consists of two or more persons. In addition, the Supervisory Board determines the number of Executive Board
Members and may appoint deputy Executive Board Members.
The Articles of Incorporation may generally be amended through a resolution of the Annual General Meeting.
The amendment takes effect with the entry of the amendment to the Articles of Incorporation into the commercial register.
Amendments to Articles of Incorporation require, according to Section 179 (1) of the German Stock Corporation Act (AktG), a
resolution of the Annual General Meeting, provided no other majority is foreseen, a majority of three-fourths of the share
capital represented in the vote pursuant to Section 179 (2) AktG. Insofar as a change to the purpose of the company is affected,
the Articles of Incorporation may call for a large majority. The Articles of Incorporation exercises in Section 23 (1) AktG the
possibility of a deviation pursuant to Section 179 (2) AktG shall be passed by a simple majority of the votes cast and, insofar as
a majority of the share capital is represented at the time the resolution is passed, with a simple majority of the capital present
insofar as this is legally permissible. In case of a tie, a motion shall be deemed denied.
Furthermore, the Supervisory Board is authorized in accordance with Section 32 of the Articles of Incorporation to resolve on
amendments and additions to the Articles of Incorporation which relate only to their wording.
Authorizations of the Executive Board to issue or buy back shares
On June 5, 2013 in accordance with Section 6 (1) of the Articles of Incorporation, the Annual General Meeting authorized the
Executive Board, with the approval of the Supervisory Board, to increase the share capital of the Company on one or more
occasions by June 4, 2018, by up to € 77,134,304.00 through the issue of up to 29,667,040 registered shares1) with restricted
transfer ability against contributions in cash and/or in kind (authorized capital). Shareholders have statutory subscription rights.
The Executive Board is nevertheless authorized, with the approval of the Supervisory Board, to exclude the statutory rights of
the shareholders in the cases described in the authorization. The Executive Board is authorized, with the approval of the
Supervisory Board, to determine the content of the share rights, the individual details of the capital increase as well as the
conditions of the share issue, in particular the issue price. The Executive Board has not made use of this authorization to date.
1) On August 26, 2016, the STADA Annual General Meeting resolved to eliminate restrictions on the transferability of registered shares by means of a change to the Articles of Incorpo- ration. The change to the Articles of Incorporation was registered in the commercial register
and became effective on December 9, 2016. The authorization of the approved capital in accordance with Section 6 (1) of the Articles of Incorporation therefore no longer refers to registered shares with restricted transferability.
74 Group Management Report of the Executive Board
1) As part of the change to the Articles of Incorporation agreed by the STADA Annual General Meeting on August 26, 2016 for the elimination of restrictions on the transferability of registered shares, a corresponding amendment to the authorization of the Executive Board of June 5, 2013, on the issuing of options and/or convertible bonds, participation rights and/or participating bonds was made, so that the affected options or convertible bonds refer to registered shares (rather than registered shares with restricted transferability), effective with entry in the Articles of Incorporation. The associated conditional capital 2013 in accor-
dance with Section 6 (2) was adapted effective from the entry of the change to the Articles of Incorporation in the commercial register, so that it regulates the conditional issue of registered shares rather than the conditional issue of registered shares with restricted transferability. The change to the Articles of Incorporation was registered in the commercial register and thereby became effective on December 9, 2016.
On June 5, 2013, furthermore, the Annual General Meeting authorized the Executive Board, on one or more occasions until
June 4, 2018, to issue bearer and/or registered bonds with warrants and/or convertible bonds, participation rights and/or
participating bonds (or a combination of these instruments) (collectively “bonds”) in an aggregate nominal amount of up to
€ 1,000,000,000.00 with or without limiting the term, and to grant the holders or creditors of the bonds with warrants and/or
convertible bonds a proportionate amount of the share capital of up to € 69,188,340.00 for a total of up to 26,610,900 of the
Company’s registered shares1) in accordance with the more detailed provisions of the terms of the bonds. For the purposes of
servicing these bonds, the Annual General Meeting on June 5, 2013 conditionally increased the share capital by up to
€ 69,188,340.00 in accordance with Section 6 (2) of the Articles of Incorporation by issuing up to 26,610,900 registered shares
and carrying a dividend right as of the beginning of the financial year in which they are issued. The Executive Board, with
approval of the Supervisory Board, is authorized to determine the further details of implementation of the conditional capital
increase (Conditional Capital 2013). The Executive Board has not made use of this authorization to date.
Following the resolution adopted at the Annual General Meeting on June 5, 2013, in accordance with Section 71 (1) No. 8 AktG,
the Company was authorized from June 6, 2013 until June 5, 2018 to acquire own shares of up to 10% of the share capital. The
Executive Board has not made use of this authorization to date.
Significant agreements on condition of a change of control
In case of a change of control resulting from a takeover offer to the company, there are, in accordance with common business
practice, possibilities of termination for certain credit contracts, the lenders of several credit contracts, the issued corporate
bonds and the issued promissory note loans (see “Report on Economic Position – Course of Business and Net Assets, Financial
Position and Results of Operations – Financial Position”).
For the agreement of the company with members of the Executive Board in the case of a change of control, please refer to the
Remuneration Report in this Annual Report.
75Group Management Report of the Executive Board | Takeover-relevant Disclosures | Remuneration Report
REMUNERATION REPORT
This remuneration report outlines the principles of the remuneration system for members of the Executive Board and Super-
visory Board as well as the amount of individual remuneration. It also presents the remuneration of the Advisory Board members
of STADA Arzneimittel AG. The report meets the requirements of the German Commercial Code (HGB) and German Accounting
Standard No. 17 (DRS 17), the recommendations of the German Corporate Governance Code (GCGC).
Remuneration of the Executive Board
Objective
The full Supervisory Board determines the Executive Board remuneration system and the remuneration of individual Executive
Board members upon the proposal of the Human Resources Committee and reviews these regularly. The objective of this
Executive Board remuneration system relevant in the financial year is to allow members of the Executive Board to participate
appropriately in the increase in enterprise value in accordance with their personal tasks and performance, the overall per-
formance of the Executive Board as well as success-oriented company management under consideration of the competitive
environment. Overall, remuneration of the Executive Board in the framework of this remuneration system is performance-
oriented and assessed in a way that is competitive both nationally and internationally and therefore presents an attractive
basis for committed and successful performance in a dynamic environment. Through the application of appropriate caps,
however, the remuneration system avoids excessively strong incentives towards risk-oriented behavior.
The core elements of the system include non-performance related remuneration that takes the tasks and performance of
members of the Executive Board into consideration along with a component that depends on the achievement of annual per-
formance goals (“Short Term Incentive”, STI). In addition to the annual performance-related remuneration, members of the
Executive Board also receive a remuneration component geared toward the long term (“Long Term Incentive”, LTI), which is
measured to a significant extent on the increase in value of the STADA share and therefore sets an incentive for the members of
the Executive Board toward a sustainable increase in enterprise value. The objective of the long-term variable remuneration is
also to consider the interests of shareholders in the incentive structure of the remuneration in an overall sustainable manner.
There are no stock option plans.
The individual performance-related components are limited to a maximum amount.
The amount and structure of the Executive Board remuneration is reviewed regularly by the Supervisory Board and adjusted
whenever necessary. The most recent review took place in December 2016 and included the participation of an independent
remuneration consultant.
Structure of the Executive Board remuneration system in financial year 2016
The Executive Board remuneration system relevant in the reporting year took effect from January 1, 2016 with uniform appli-
cation for all members of the Executive Board.

76 Group Management Report of the Executive Board
The following is an overview of the remuneration system relevant in the reporting year for Executive Board members:
Non-performance related component
Annual basic remuneration
The non-performance related remuneration consists of an agreed basic salary paid out in twelve equal monthly installments.
This fixed annual salary is determined in accordance with the requirements of stock company law under consideration of usual
market remuneration as well as the position and responsibility of the member of the Executive Board.
Fringe benefits
The members of the Executive Board receive other remuneration in the form of fringe benefits, which consist for the most part
only of the private use of a company car, contributions to health and nursing care insurance and other insurance services
(accident insurance, among other things). The remuneration does not include any company-organized pension plans.
Performance-related component
The performance-related component is structured in the same way for all members of the Executive Board and includes a
one-year part (“annual bonus” as an STI component) and a multi-year, long-term incentive-oriented part (“LTIP deferrals”).
With full target achievement of the performance parameters, the total performance-related remuneration (STI + LTI) amounts
to the fixed remuneration of the member of the Executive Board, i.e. the non-performance related remuneration (“personal
target amount”).
The determination of the amount of the performance-related remuneration as well as the payment dates are discussed below.
Performance parameters for the determination of the mathematical starting amount of the performance-related remuneration awarded for a financial year (STI and LTI)
Both the annual bonus (STI) and the LTIP deferrals are dependent on the target of the Supervisory Board for the company
performance as well as the individual Executive Board performance for the financial year. Depending on the degree of target
attainment of these criteria, a starting amount for variable remuneration is calculated (“mathematical starting amount”).
50% of this amount is paid as an annual bonus. The remaining half is made up of the starting amount for the determination of
the LTIP deferrals, which are also dependent on the performance of the STADA share in relation to the MDAX® over a period of
several years (share-dependent multi-year components).
Non-perfor-mance related
componentBasic salary
Performance-re-lated compo-
nent
“Annual bonus” as an STI component
— One-year part (immediate payment)
— Long-term multi-year part (deferred remuneration dependent on additional prerequisites)
LTIP deferrals

77Group Management Report of the Executive Board | Remuneration Report
Company performance
Before the beginning of each financial year, the Supervisory Board sets the targets for company performance for the
full Executive Board in the upcoming financial year (“performance period”) for the variable remuneration. The assessment
basis for this is the adjusted net income, which is determined through the operative planning of the Executive Board for net
income for this performance period, and is adjusted for extraordinary expenses and income.
At the end of each financial year, the degree of target achievement of company performance is determined for this performance
period. If the target is fully reached, the mathematical starting amount for the variable remuneration of this financial year
(STI + LTI) is the personal target amount (i.e. the fixed remuneration of the Executive Board member). If the target was missed
by 25 percentage points or more, there is no performance-related remuneration for this financial year (i.e. both the annual
bonus and the LTIP deferrals). If the target is exceeded by 20 or more percentage points, the mathematical starting amount of
the performance-related remuneration amounts to a maximum of 180% of the personal target amount (i.e. the respective fixed
remuneration). Interim values are determined on a linear basis.
The target set for financial year 2016 and the degree of target achievement are presented together the explanation of remuner-
ation 2016.
Personal performance of an Executive Board member
Under consideration of the personal performance of an Executive Board member, the Supervisory Board has the possibility of
increasing or decreasing the mathematical starting amount for the variable remuneration for this financial year (STI and LTI) by
up to 20% in accordance with contractual criteria. Uniform qualitative parameters are determined for all Executive Board
members for the measurement of exceptional or below average personal performance (e.g. employee satisfaction, exceptional
workload, contributions towards the further development of the company).1) In the case of a significant deviation from the
expectations in connection with the personal performance of a member of the Executive Board, the Supervisory Board may
exercise its right to make adjustments, whereby this cannot result in the mathematical starting amount exceeds 180% of the
personal target amount (i.e. individual fixed remuneration).
The factors determined for the measurement of personal performance in financial year 2016 are presented together with the
explanation of remuneration in 2016.
The following overview illustrates how this works:
Personal target amount
for variable remuneration
(represents fixed salary)
x x
Qualitative assessment
by the Supervisory
Board
(Adjustment of up to ±20%,
cap at 180% of the target amount)
=
Performance-related remuneration
“Annual bonus”
as an STI compo-
nent (50%)
3 LTIP- Deferrals
(50%)
16
.7%
16
.7%
16
.7%
Company performance
180%
100%
0% 75% 100% 120%
Amount of the variable remuneration as % of the personal target amount
Target achievement
1) In the course of calendar year 2016, the Supervisory Board decided on a specification of the qualitative parameters for assessment of the individual Executive Board performance retroactively to January 1, 2016 in the course of changes to the Executive Board employment contracts.

78 Group Management Report of the Executive Board
1) Payment is due at the end of the calendar month following the approval of the consolidated financial statements of the respective financial year by the Supervisory Board.2) Payment is at the end of the calendar month following the approval of the consolidated financial statements of the previous financial year by the Supervisory Board.3) The Supervisory Board decided on the extension of the basis of measurement for the LTIP deferrals by one year each in the course of the 2016 calendar year retroactively to January 1, 2016. Payment of deferral 1 was previously scheduled to take place already after two years. The extension of the time of payment by one year was implemented by means of the supple- ment to the Executive Board contracts of Dr. Wiedenfels and Mr. Kraft; for Mr. Retzlaff, who at that point had already left the Executive Board, no such contract adjustment was made.
4) The stock yield also considers distributed dividends in the LTIP deferral period, in addition to price changes. It is calculated as follows:
Stock yield =Closing price + Dividend
Opening price
Determination and payment of the one-year performance-related remuneration (annual bonus, STI)
Of the mathematical starting amount, as described above, 50% is paid in the following year as an annual bonus (STI) for the
respective financial year.1) The STI component of the variable remuneration is thus generally dependent on the performance of
the company and – due to the adjustment authority of the Supervisory Board – on the individual Executive Board performance.
Due to the cap of the mathematical starting amount at 180% of the personal target amount (i.e. the fixed remuneration), the
annual bonus (STI) of an Executive Board member may reach a maximum of 90% of their fixed remuneration (the upper limit
for the one-year performance-related remuneration, STI).
Determination and payment of the multi-year, long-term incentive-oriented performance-related remuneration (LTIP deferrals) depending on share performance
The other half of the mathematical starting amount calculated on the basis of the criteria presented is divided up into three
equal values (“LTIP deferral 1”, “LTIP deferral 2” and “LTIP deferral 3”). Payment of the deferrals is carried out over a
period of three to five years. Payments also depend in terms of their amount on the share performance of the STADA share in
comparison with the MDAX® over a period of several years (multi-year, long-term incentive-oriented performance-related
remuneration).
Whether an LTIP deferral is paid and the amount of this payment are determined by the share performance of the STADA share
compared with the MDAX® during the so-called deferral periods. The deferral period for the first deferral is one or two financial
years following the performance period, for the second deferral the period of two or three financial years following the perfor-
mance period and for the third deferral the period of three or four financial years following the performance period. Payment
is based on the lower value of the two relevant deferral periods.
The payment is made in the financial year following each deferral period.2) The LTIP deferral 1 is thus paid out after a period of
three years, the LTIP deferral 2 after four years and the LTIP deferral 3 after five years. For example, for the performance period
2016 the deferral 1 payment will be made in 2019, the deferral 2 payment will be made in 2020 and the deferral 3 payment in
2021.3)
To determine the payment amount of an LTIP deferral, the stock yield of the STADA share4) during the deferral period in relation
to the performance of the MDAX® is set as a constant, neutrally determined performance index for medium-sized publicly
listed companies such as STADA Arzneimittel AG. Particularly in the case that the company is no longer part of the MDAX®, the
Supervisory Board may select another more suitable stock index as a basis.
The payment amount for an LTIP deferral corresponds to the initial value, if the yield of the STADA share has developed in line
with the MDAX® in the underlying deferral period. If the development of the STADA share yield is 70% or less of the MDAX®
development, the LTIP deferral is dropped as part of a malus regulation and there is no payment made for this LTIP deferral. If
the ratio is at least 130%, the payment amount of a deferral is 130% of the initial value as part of a bonus regulation. Interim
values are determined on a linear basis. If the maximum amount of 130% per deferral is reached for all three of the LTIP deferrals,
a maximum of 117% of the personal target amount (i.e. the fixed remuneration) can result for the multi-year performance
related remuneration of a financial year (upper limit of the multi-year performance-dependent remuneration, LTIP).
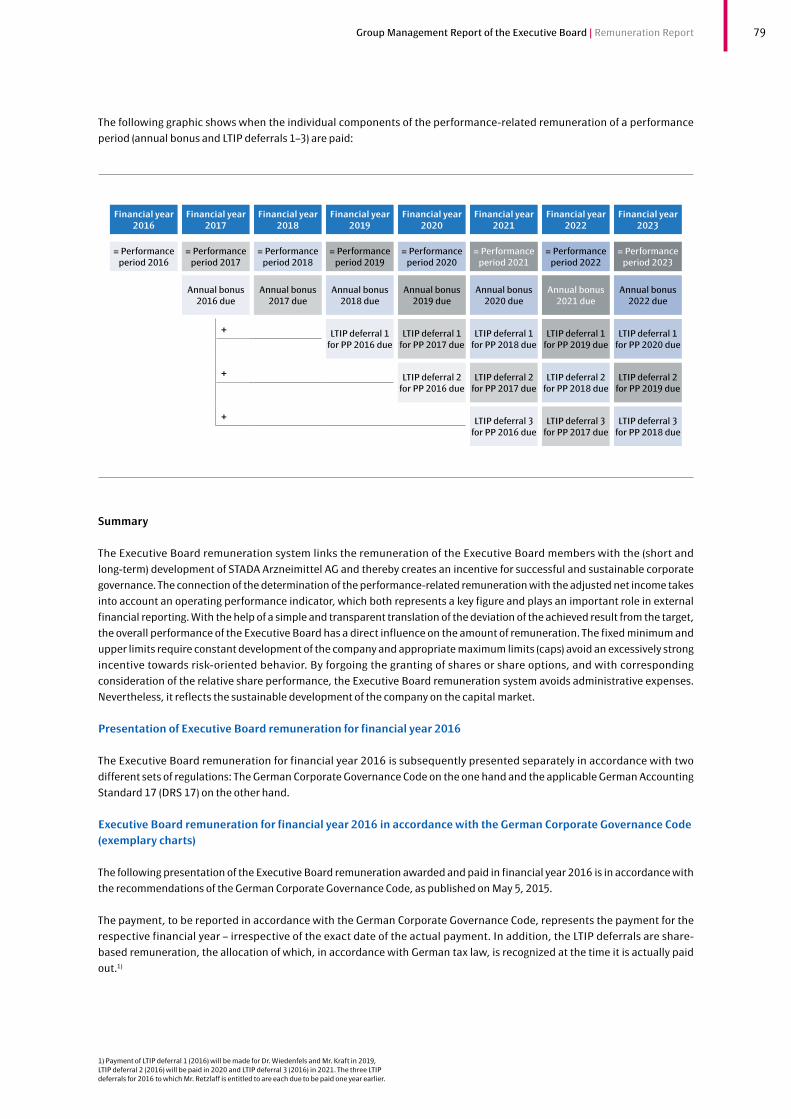
79Group Management Report of the Executive Board | Remuneration Report
The following graphic shows when the individual components of the performance-related remuneration of a performance
period (annual bonus and LTIP deferrals 1–3) are paid:
Summary
The Executive Board remuneration system links the remuneration of the Executive Board members with the (short and
long-term) development of STADA Arzneimittel AG and thereby creates an incentive for successful and sustainable corporate
governance. The connection of the determination of the performance-related remuneration with the adjusted net income takes
into account an operating performance indicator, which both represents a key figure and plays an important role in external
financial reporting. With the help of a simple and transparent translation of the deviation of the achieved result from the target,
the overall performance of the Executive Board has a direct influence on the amount of remuneration. The fixed minimum and
upper limits require constant development of the company and appropriate maximum limits (caps) avoid an excessively strong
incentive towards risk-oriented behavior. By forgoing the granting of shares or share options, and with corresponding
consideration of the relative share performance, the Executive Board remuneration system avoids administrative expenses.
Nevertheless, it reflects the sustainable development of the company on the capital market.
Presentation of Executive Board remuneration for financial year 2016
The Executive Board remuneration for financial year 2016 is subsequently presented separately in accordance with two
different sets of regulations: The German Corporate Governance Code on the one hand and the applicable German Accounting
Standard 17 (DRS 17) on the other hand.
Executive Board remuneration for financial year 2016 in accordance with the German Corporate Governance Code (exemplary charts)
The following presentation of the Executive Board remuneration awarded and paid in financial year 2016 is in accordance with
the recommendations of the German Corporate Governance Code, as published on May 5, 2015.
The payment, to be reported in accordance with the German Corporate Governance Code, represents the payment for the
respective financial year – irrespective of the exact date of the actual payment. In addition, the LTIP deferrals are share-
based remuneration, the allocation of which, in accordance with German tax law, is recognized at the time it is actually paid
out.1)
Financial year 2016
Financial year 2017
Financial year 2018
Financial year 2019
Financial year 2020
Financial year 2021
Financial year 2022
Financial year 2023
= Performance period 2016
= Performance period 2017
= Performance period 2018
= Performance period 2019
= Performance period 2020
= Performance period 2021
= Performance period 2022
= Performance period 2023
Annual bonus 2016 due
Annual bonus 2017 due
Annual bonus 2018 due
Annual bonus 2019 due
Annual bonus 2020 due
Annual bonus 2021 due
Annual bonus 2022 due
+ LTIP deferral 1 for PP 2016 due
LTIP deferral 1 for PP 2017 due
LTIP deferral 1 for PP 2018 due
LTIP deferral 1 for PP 2019 due
LTIP deferral 1 for PP 2020 due
+ LTIP deferral 2 for PP 2016 due
LTIP deferral 2 for PP 2017 due
LTIP deferral 2 for PP 2018 due
LTIP deferral 2 for PP 2019 due
+ LTIP deferral 3 for PP 2016 due
LTIP deferral 3 for PP 2017 due
LTIP deferral 3 for PP 2018 due
1) Payment of LTIP deferral 1 (2016) will be made for Dr. Wiedenfels and Mr. Kraft in 2019, LTIP deferral 2 (2016) will be paid in 2020 and LTIP deferral 3 (2016) in 2021. The three LTIP deferrals for 2016 to which Mr. Retzlaff is entitled to are each due to be paid one year earlier.

80 Group Management Report of the Executive Board
1) Payment of the residual amount of the multi-year variable remuneration component “long-term targets 2016” granted in accordance with the former Executive Board employ- ment contract for the period from May 3, 2013 to December 31, 2015 is carried out on the basis of the final calculation of the long-term targets 2016 and therefore reported as inflow in the remuneration table for the reporting year.
2) The residual amount of € 1,445,000 of the provisional benefit from the long-term special remuneration 2016 based on 44 months reported in financial year 2015 was based on the then outlook for target achievement, which was slightly below the actual target achievement.
Prior to the beginning of financial year 2016, the Supervisory Board determined an adjusted net income in the amount of
€ 170.1 million and the adjustment items to be considered as a target for the performance-dependent remuneration 2016 for
the full Executive Board with regard to the company performance. There was a target achievement of 100.5% for financial year
2016. In order to take into account the personal performance of Dr. Wiedenfels and Mr. Kraft in financial year 2016, the Super-
visory Board applied a factor of 0.9 for the individual assessment. For Mr. Retzlaff, a factor of 1.0 was applied in the severance
agreement.
The remuneration of the individual members of the Executive Board who were active for the Company in financial year 2016,
in accordance with the German Corporate Governance Code, is as follows:
Dr. Matthias Wiedenfels, Chairman of the Executive Board since June 5, 2016 (on the Executive Board since May 2013)
Benefits granted Allocation
in € 000s 2016 2015 2016 (min) 2016 (max) 2016 2015
Fixed remuneration 1,136 750 1,136 1,136 1,136 750
Fringe benefits 36 33 36 36 36 33
Total 1,172 783 1,172 1,172 1,172 783
One-year variable remuneration 390 350 0 765 390 350
Multi-year variable remuneration
• Long-term targets 2016 – 394 – – 7611) 0
• LTIP deferral 1 (2016) 58 – 0 332 0 –
• LTIP deferral 2 (2016) 53 – 0 332 0 –
• LTIP deferral 3 (2016) 49 – 0 332 0 –
Other – – – – – –
Total 550 744 0 1,761 1,151 350
Service cost – – – – – –
Total remuneration 1,722 1,527 1,172 2,933 2,323 1,133
Explanations:
In the reporting year, Dr. Wiedenfels received a fixed salary of € 850,000 plus fringe benefits and, after assuming the office of
the Chairman of the Executive Board for the period from June 5, 2016, an additional fixed remuneration of € 286,000.
Benefits granted from variable remuneration for financial year 2016 are reported in accordance with the Executive Board
employment contract applicable in the reporting year as one-year variable remuneration of the annual bonus 2016 and as
multi-year variable remuneration in the form of the fair values of the three LTIP deferrals 2016. The values are determined using
the presented degree of target attainment for the company performance of 100.5% and a factor of 0.9 for personal perfor-
mance. Based on the personal target value of € 850,000 (which corresponds to the fixed salary of Dr. Wiedenfels), applying the
linear calculation formula results in a starting amount for variable remuneration of € 781,000, of which half (€ 390,000) is
granted as an annual bonus for 2016. The remaining half represents the starting amount for benefits presented as LTIP deferrals
1–3 (2016), which are measured using a recognized statistical measurement model (Monte Carlo Model) as of December 31,
2016.
From the previous Executive Board employment contract with Dr. Wiedenfels of May 3, 2013 (“old contract”), which was replaced
with the new employment contract effective from January 1, 2016, Dr. Wiedenfels is entitled to a residual amount of € 761,000
for the period of actual implementation of the old contract up to December 31, 2015 from the final calculation of the multi-year
variable long-term special remuneration “long-term goals 2016” (based on adjusted EBITDA 2016). As agreed, at the end
of financial year 2016 as the target year of the “long-term goals 2016”, the total amount for the original contract period of
May 3, 2013 to December 31, 2016 was to be calculated on the basis of actual target achievement (€ 1,459,0002) based on the

81Group Management Report of the Executive Board | Remuneration Report
original 44 months), which as a result of the change in contract is only partially granted for the period of actual contract
im plementation from May 3, 2013 to December 31, 2015, i.e. in the amount of 32/44 (i.e. € 1,061,000). Subtracting the progress
payments already made in 2013 and 2014 of a total of € 300,000, a residual amount of € 761,000 results, which is reported as
an inflow for the current financial year.
Helmut Kraft, Chief Financial, Marketing & Sales Officer (on the Executive Board since January 2010)
Benefits granted Allocation
in € 000s 2016 2015 2016 (min) 2016 (max) 2016 2015
Fixed remuneration 1,097 800 1,097 1,097 1,097 800
Fringe benefits 34 30 34 34 34 30
Total 1,131 830 1,131 1,131 1,131 830
One-year variable remuneration 425 350 0 833 425 350
Multi-year variable remuneration
• Long-term targets 2018 – 303 – – 01) 01)
• LTIP deferral 1 (2016) 63 – 0 361 0 –
• LTIP deferral 2 (2016) 57 – 0 361 0 –
• LTIP deferral 3 (2016) 53 – 0 361 0 –
Other – – – – – –
Total 598 653 0 1,916 425 350
Service cost – – – – – –
Total remuneration 1,729 1,483 1,131 3,047 1,556 1,180
Explanations:
In the reporting year, Mr. Kraft received a fixed salary of € 925,000 plus fringe benefits and, after partially assuming the
tasks for the former Chairman of the Executive Board Hartmut Retzlaff for the period from June 5, 2016, an additional fixed
remuneration of € 172,000.
Benefits granted from variable remuneration for financial year 2016 are reported in accordance with the Executive Board
employment contract applicable in the reporting year as one-year variable remuneration of the annual bonus 2016 and as
multi-year variable remuneration in the form of the fair values of the three LTIP deferrals 2016. The values are determined using
the presented degree of target attainment for the company performance of 100.5% and a factor of 0.9 for personal perfor-
mance. Based on the personal target value of € 925,000 (which corresponds to the fixed salary of Mr. Kraft), applying the linear
calculation formula results in a starting amount for variable remuneration of € 850,000, of which half (€ 425,000) is granted as
an annual bonus for 2016. The remaining half represents the starting amount for benefits presented as LTIP deferrals 1–3 (2016),
which are measured using a recognized statistical measurement model (Monte Carlo Model) as of December 31, 2016.
From the previous Executive Board employment contract, applicable from January 1, 2015 (“old contract”), which was replaced
with the new employment contract effective from January 1, 2016, for the period of actual implementation of the old contract
from January 1, 2015 to December 31, 2015, Mr. Kraft has partial entitlement from the final calculation of the multi-year variable
long-term special remuneration “long-term goals 2018”, which will be calculated on the basis of actual target achievement
at the end of financial year 2018 as the target year of the “long-term goals 2018”, as agreed.
1) Any amount paid out following the final statement of the long-term targets for 2018 will be disclosed in the 2018 Annual Report.

82 Group Management Report of the Executive Board
1) The benefit for 2015 reported for the multi-year variable remuneration component “long-term goals 2016” was based on the outlook for target achievement of the time, which was slightly below the actual target achievement.2) Payment of the residual amount of the multi-year variable remuneration component “long-term targets 2016” granted in accordance with the former Executive Board employ- ment contract for the period from January 1, 2015 to December 31, 2015 is carried out on the basis of the final calculation of the long-term targets 2016 and therefore reported as inflow in the remuneration table for the reporting year.
3) The residual amount of € 1,618,000 of the provisional benefit from the long-term special remuneration 2016 based on 20 months reported in financial year 2015 was based on the then outlook for target achievement, which was slightly below the actual target achieve- ment. The amount of € 971,000 reported as a benefit for 2015 in the last Annual Report corresponds to the expected value of the time based on 12 months.
Hartmut Retzlaff (Member of the Executive Board until August 15, 2016)
Benefits granted Allocation
in € 000s 2016 2015 2016 (min) 2016 (max) 2016 2015
Fixed remuneration 1,247 2,000 1,247 1,247 1,247 2,000
Fringe benefits 23 35 23 23 23 35
Total 1,270 2,035 1,270 1,270 1,270 2,035
One-year variable remuneration 503 589 0 918 503 589
Multi-year variable remuneration
• Long-term targets 2016 – 9711) – – 9912) 0
• LTIP deferral 1 (2016) 154 – 0 398 133 –
• LTIP deferral 2 (2016) 153 – 0 398 133 –
• LTIP deferral 3 (2016) 151 – 0 398 133 –
Other – – – – – –
Total 961 1,560 0 2,112 1,893 589
Service cost – – – – – –
Total remuneration 2,231 3,595 1,270 3,382 3,163 2,624
Explanations:
Under consideration of the time of departure from the Executive Board of Mr. Retzlaff, in terms of the presentation of all grants
and disclosures within the code table, a pro rata figure is derived for the time until the end of his Executive Board mandate on
August 15, 2016.
In the reporting year, for the period until the end of his Executive Board mandate on August 15, 2016, Mr. Retzlaff received a
fixed salary in the amount of € 1,247,000 (pro rata amount on the basis of an annual fixed salary of € 2,000,000) plus fringe
benefits.
The chart also shows the benefits granted and inflows from the variable remuneration, pro rata for the period until August 15,
2016, for the past financial year 2016 (pro rata annual bonus 2016 as well as pro rata LTIP deferrals 2016).
In the termination agreement signed with Mr. Retzlaff on August 15, 2016, a lump sum fixed amount for the one-year variable
remuneration as well as the LTIP deferrals of € 800,000 was defined for the first half of 2016 and has, in this connection, already
been paid out. In the benefits and inflows for 2016 presented above, a total amount is allocated to the period until June 30,
2016 of € 400,000 to the one-year variable remuneration and € 133,000 each to the multi-year variable remuneration in the
form of three LTIP deferrals 2016. For the second half of 2016 (i.e. from July 1, 2016), the termination agreement includes the
calculation of the partial variable remuneration 2016, applying the actual degree of target achievement for the company
performance (i.e. 100.5%) and fixed personal target achievement measured with a factor of 1.0. For the period from July 1, 2016
to August 15, 2016, this represents a partial annual bonus for 2016 of € 103,000 (total reported partial annual bonus 2016 for
the period January 1, 2016 to August 15, 2016 therefore € 503,000). Benefits reported until the LTIP deferrals 1–3 (2016) are
measured using a recognized statistical measurement model (Monte Carlo Model) at the current time, broken down into the
period July 1, 2016 to August 15, 2016 and supplemented with the fixed payment as part of the termination agreement (each
€ 133,000, see above).
From the earlier Executive Board employment contract with Mr. Retzlaff until December 31, 2015, the final calculation of
the multi-year variable long-term special remuneration “long-term goals 2016” on the basis of adjusted EBITDA 2016, a
residual amount of € 991,000 results. As agreed, at the end of financial year 2016 as the target year of the “long-term goals
2016”, the total amount for the original period on which the long-term goals 2016 were based, of January 1, 2015 to August 31,
2016 was to be calculated on the basis of actual target achievement (€ 1,651,0003) based on the original 20 months), which as
a result of the change in contract is only partially granted for the period of actual contract implementation from January 1, 2015
to December 31, 2015, i.e. in the amount of 12/20 (i.e. € 991,000).

83Group Management Report of the Executive Board | Remuneration Report
In connection with the termination of his employment on August 15, 2016, in accordance with employment contract provisions
(termination of contract as of December 31, 2016), as part of his termination contract, Mr. Retzlaff also continued to receive
salary in the total amount of € 1,253,000 (thereof € 762,000 non-performance related including € 9,000 in fringe benefits as
well as € 491,000 performance-related1)) as well as a severance payment in the amount of € 5,885,000 (thereof € 3,285,000
fixed and € 2,600,000 variable components in arithmetical terms).
Executive Board remuneration for financial year 2016 in accordance with DRS 17
The following details on the remuneration granted to Executive Board members in financial year 2016 are provided in accordance
with the requirements of DRS 17. In contrast with the presented regulations of the German Corporate Governance Code, the
disclosure of the payments for multi-year variable remuneration components, which are not granted as share-based payment
(LTIP deferrals), in accordance with DRS 17 is made in full in the year the final target is reached, rather than on a pro rata basis.
If a payment is made in the year before the final targets are achieved (e.g. as a progress payment), then the amount is to be
recorded as an advance in the year of payment.
The remuneration of the individual members of the Executive Board who were active for the Company in financial year 2016,
in accordance with DRS 17, is as follows:
Dr. Matthias Wiedenfels, Chairman of the Executive Board
since June 5, 2016 (on the Executive Board since
May 2013)
Benefits granted
in € 000s 2016 2015
Fixed remuneration 1,136 750
Fringe benefits 36 33
Total 1,172 783
One-year variable remuneration 390 350
Multi-year variable remuneration
• Long-term targets 2016 1,061 –
• LTIP deferral 1 (2016) 58 –
• LTIP deferral 2 (2016) 53 –
• LTIP deferral 3 (2016) 49 –
Other – –
Total 1,611 350
Service cost – –
Total remuneration 2,783 1,133
Because financial year 2016 corresponded to the defined target year in the context of long-term targets 2016, payments made
to Dr. Wiedenfels as part of long-term special remuneration in 2016 were fully disclosed in financial year 2016. Accordingly, this
also included the contractually agreed progress payments for the long-term special remuneration in the total amount of € 300,000
upon achievement of the interim goals in the previous years.
1) Derived from the actual target achievement or the adjusted net profit 2016 as well as the evaluation of the deferrals carried out as of December 31, 2016 for the period from 2018 – 2020.

84 Group Management Report of the Executive Board
1) Contractually agreed performance-related progress payments of the long-term special remuneration upon achieving the respective interim goals.
Helmut Kraft, Chief Financial, Marketing & Sales
Officer (on the Executive Board since January 2010)
Benefits granted
in € 000s 2016 2015
Fixed remuneration 1,097 800
Fringe benefits 34 30
Total 1,131 830
One-year variable remuneration 425 350
Multi-year variable remuneration
• Long-term targets 2018 – –
• LTIP deferral 1 (2016) 63 –
• LTIP deferral 2 (2016) 57 –
• LTIP deferral 3 (2016) 53 –
Other – –
Total 598 350
Service cost – –
Total remuneration 1,729 1,180
The defined target year for the multi-year variable remuneration “long-term targets 2018” is financial year 2018, as a result of
which benefits for these remuneration components are to be fully disclosed in the corresponding financial year in accordance
with DRS 17.
Hartmut Retzlaff (Member of the Executive Board
until August 15, 2016
Benefits granted
in € 000s 2016 2015
Fixed remuneration 1,247 2,000
Fringe benefits 23 35
Total 1,270 2,035
One-year variable remuneration 503 589
Multi-year variable remuneration
• Long-term targets 2016 991 –
• LTIP deferral 1 (2016) 154 –
• LTIP deferral 2 (2016) 153 –
• LTIP deferral 3 (2016) 151 –
Other – –
Total 1,952 589
Service cost – –
Total remuneration 3,222 2,624
Because financial year 2016 corresponded to the defined target year in the context of long-term targets 2016, payments made
to Mr. Retzlaff as part of long-term special remuneration in 2016 were fully disclosed in financial year 2016.
Members of the Executive Board received no performance-based advances in financial year 2016 on top of the remuneration
above. In the previous year, there were performance-related advances1) totaling € 200,000 attributable entirely to Dr. Matthias
Wiedenfels.

85Group Management Report of the Executive Board | Remuneration Report
The percentage ratio between non-performance related and performance-related remuneration of members of the Executive
Board ranges in the area of approx. 39% to approx. 65% non-performance related and approx. 35% to approx. 61% perfor-
mance-related remuneration.
Commitments to members of the Executive Board
Commitments to members of the Executive Board in case of premature or regular termination of their activity and any corresponding benefits
The Executive Board contracts as of the reporting date also contain a severance payment regulation for a more closely-defined
change of control, which, in accordance with the German Corporate Governance Code, is not higher than the value of the
remaining term of the Executive Board contract, and is limited in amount to a maximum of three years’ remuneration.
Should an Executive Board contract be terminated early, no commitment is made to a severance payment. However, a severance
payment can result from a termination agreement, which is made in individual cases. For the Executive Board contracts in the
reporting year, it was agreed that any payments to Executive Board members with early termination of contract including
fringe benefits may not exceed two years’ remuneration (severance cap) and may not be compensated with more than
the remuneration for the remaining period of the contract in accordance with the specifications of the German Corporate
Governance Code.
Other commitments
The Executive Board contracts include the provision that, in the case of invalidity due to illness or accident, the Company will
continue to pay the salary, for the duration of the invalidity, up to a maximum of three years, whereby the amount of the
continued payment in the first year after the occurrence of invalidity corresponds to the fixed annual salary and the variable
remuneration and, in the second and third year of invalidity, to the fixed annual salary. Payment continues until the end of the
Executive Board contract at the latest.
The Company has concluded an accident insurance for each of the members of the Executive Board.
In the context of a group insurance for all of the Executive Board members, a so-called D&O insurance exists with a deductible
for the Executive Board members within the legal framework.
Benefits from third parties outside the Group, which were promised or granted to members of the Executive Board in the reporting year with regard to their position in the Executive Board
Third parties outside the Group have neither promised nor granted benefits to Executive Board members with regard to their
position in the Executive Board in financial year 2016.

86 Group Management Report of the Executive Board
Supervisory Board remuneration
Remuneration system for the Supervisory Board according to the Articles of Incorporation
The remuneration system of the Supervisory Board is governed by Section 18 of STADA Arzneimittel AG’s Articles of Incorpo-
ration. In accordance with this, the members of the Supervisory Board receive the following remuneration, in addition to the
reimbursement of their expenses in the previous financial year:
• an annual fixed sum of € 48,000.00 and
• a remuneration based on the long-term success of the Company (long-term variable remuneration) in the amount of 0.02%
of the average Group earnings before taxes as reported in the consolidated financial statements of the past three financial
years. The annual cap for long-term variable remunerations is € 48,000.00.
The Chairman of the Supervisory Board receives triple this amount and his deputy twice the amount.
In addition, Supervisory Board members receive an annual fixed remuneration of € 15,000.00 for their committee activities for
the past financial year. The Chairman of a committee receives twice this amount in remuneration. Members of the nomination
committee do not receive any special remuneration.
In addition, sales tax is payable on all Supervisory Board remuneration.
Remuneration of the Supervisory Board in financial year 2016
The remuneration of the individual members of the Supervisory Board who were active for the Company in financial year 2016
is as follows:
Current members of the Supervisory Board
• Carl Ferdinand Oetker € 210,976.49 (thereof € 146,762.30 non-performance related and € 64,214.19 performance-related)
(previous year: € 188,906.26 thereof € 126,000.00 non-performance related and € 62,906.26 performance-related)
• Jens Steegers € 116,672.71 (thereof € 79,786.89 non-performance related and € 36,885.82 performance-related)
(previous year: € 79,453.13 thereof € 48,000.00 non-performance related and € 31,453.13 performance-related)
• Dr. Eric Cornut € 34,295.17 (thereof € 24,737.70 non-performance related and € 9,557.47 performance-related)
(Member of the Supervisory Board since the end of the Annual General Meeting, August 26, 2016)
• Halil Duru € 90,328.37 (thereof € 63,000.00 non-performance related and € 27,328.37 performance-related)
(previous year: € 79,453.13, thereof € 48,000.00 non-performance related and € 31,453.13 performance-related)
• Rolf Hoffmann € 34,295.17 (thereof € 24,737.70 non-performance related and € 9,557.47 performance-related)
(Member of the Supervisory Board since the end of the Annual General Meeting, August 26, 2016)
• Dr. Birgit Kudlek € 34,295.17 (thereof € 24,737.70 non-performance related and € 9,557.47 performance-related)
(Member of the Supervisory Board since the end of the Annual General Meeting, August 26, 2016)
• Tina Müller € 34,295.17 (thereof € 24,737.70 non-performance related and € 9,557.47 performance-related)
(Member of the Supervisory Board since the end of the Annual General Meeting, August 26, 2016)
• Dr. Ute Pantke € 79,303.78 (thereof € 51,975.41 non-performance related and € 27,328.37 performance-related)
(previous year: € 79,453.13, thereof € 48,000.00 non-performance related and € 31,453.13 performance-related)
• Dr. Gunnar Riemann € 34,295.17 (thereof € 24,737.70 non-performance related and € 9,557.47 performance-related)
(Member of the Supervisory Board since the end of the Annual General Meeting, August 26, 2016)

87Group Management Report of the Executive Board | Remuneration Report
Members of the Supervisory Board who left the Board in financial year 2016
• Dr. Martin Abend € 176,954.75 (thereof € 123,418.03 non-performance related and € 53,536.72 performance-related)
(previous year: € 283,359.38 thereof € 189,000.00 non-performance related and € 94,359.38 performance-related)
(Member of the Supervisory Board until the end of the Annual General Meeting, August 26, 2016)
• Dr. Eckhard Brüggemann € 49,189.83 (thereof € 31,344.26 non-performance related and € 17,845.57 performance-related)
(previous year: € 79,453.13 thereof € 48,000.00 non-performance related and € 31,453.13 performance-related)
(Member of the Supervisory Board until the end of the Annual General Meeting, August 26, 2016)
• Dr. K.F. Arnold Hertzsch € 58,984.92 (thereof € 41,139.34 non-performance related and € 17,845.58 performance-related)
(previous year: € 94,453.13 thereof € 63,000.00 non-performance related and € 31,453.13 performance-related)
(Member of the Supervisory Board until the end of the Annual General Meeting, August 26, 2016)
• Dieter Koch € 58,984.92 (thereof € 41,139.34 non-performance related and € 17,845.58 performance-related)
(previous year: € 94,453.13 thereof € 63,000.00 non-performance related and € 31,453.13 performance-related)
(Member of the Supervisory Board until the end of the Annual General Meeting, August 26, 2016)
• Constantin Meyer € 58,984.92 (thereof € 41,139.34 non-performance related and € 17,845.58 performance-related)
(previous year: € 94,453.13 thereof € 63,000.00 non-performance related and € 31,453.13 performance-related)
(Member of the Supervisory Board until the end of the Annual General Meeting, August 26, 2016)
Beyond this remuneration no additional monies or benefits have been granted to members of the Supervisory Board for
personally rendered services in the context of their activities as Supervisory Board members; however, in the context of a group
insurance, a so-called D&O insurance exists for all members of the Supervisory Board, with a deductible for the Supervisory
Board members, which reflects the legal framework of the deduction of the Executive Board members.
Remuneration of the Advisory Board
In accordance with Section 9 of the bylaws of the Advisory Board of STADA Arzneimittel AG, members of the Advisory Board
receive a flat fee of € 1,000 per meeting of the Advisory Board and for participation in the Annual General Meeting, plus sales
tax and reimbursement of their expenses. Time for travel to and from meetings is not considered part of the meeting. The Chair-
man of the Advisory Board also receives a flat rate annual compensation for allowances in the amount of € 3,000 plus sales tax
and his deputy receives € 2,500 plus sales tax.

88 Group Management Report of the Executive Board
CORPORATE GOVERNANCE REPORT INCLUDING THE CORPORATE GOVERNANCE DECLARATION FOR STADA ARZNEIMITTEL AG AND THE GROUP
The Corporate Governance Report pursuant to Section 3.10 of the German Corporate Governance Code (GCGC) and the
Corporate Governance Declaration for STADA Arzneimittel AG and the Group pursuant to Section 315 (5) in conjunction
with Section 289a of the German Commercial Code (HGB) are available on the STADA website at www.stada.de/cg and
www.stada.com/cg.
Corporate Governance Declaration for STADA Arzneimittel AG and the Group
The corporate governance declaration for STADA Arzneimittel AG and the Group in accordance with Section 315 (5) in
conjunction with Section 289a of the German Commercial Code (HGB) includes the explanation of the German Corporate
Governance Code in accordance with Section 161 of the German Stock Corporation Act (AktG), the relevant information on
corporate management practices, a description of the working practices of the Executive Board and Supervisory Board as well
as the composition and working practices of the Supervisory Board committees, the specifications pursuant to Section 76 (4)
and Section 111 (5) of the German Stock Corporation Act as well as the information whether the specified targets were met
during the reference period or not and, if not, details on the reasons.
1. Declaration of Compliance
The Executive Board and Supervisory Board agreed a new Declaration of Compliance in accordance with the German Corporate
Governance Code on March 2, 2017. Both the current Declaration of Compliance and the Declaration of Compliance issued in
the reporting year on July 14, 2016 are included below:
Declaration of Compliance March 2017
Joint Declaration of the Executive Board and the Supervisory Board of STADA Arzneimittel AG concerning the German Corporate Governance Code pursuant to Section 161 of the German Stock Corporation Act (AktG)
STADA Arzneimittel AG (“STADA”) had complied with the recommendations of the German Corporate Governance Code in the
version of May 5, 2015 (published on June 12, 2015 in the Federal Gazette) since the last Declaration of Compliance on July 14,
2016, with the exception of the deviations as mentioned there, and STADA will comply with the recommendations of the German
Corporate Governance Code in this version in future with the following deviations:
In the last Declaration of Compliance dated July 14, 2016, the STADA Executive Board and Supervisory Board, as a matter of
mere precaution, disclosed a deviation from the recommendations pursuant to Section 4.2.3 Para. 2 Sentence 4, Section 4.2.3
Para. 2 Sentence 6 and Section 4.2.3 Para. 2 Sentence 8 GCGC based on the system for remuneration of Executive Board
members current at this point of time. Even on the basis of the system for remuneration of Executive Board members current at
this point of time such disclosure would not have been necessary from a strictly legal point of view. Nevertheless, the Executive
Board and the Supervisory Board of STADA had decided to include the information in the Declaration of Compliance 2016 in
accordance with the results of a previously completed extensive Corporate Governance audit of STADA and to increase
transparency for investors and the capital market. In December 2016, the Supervisory Board of STADA again reviewed the
system for remuneration of Executive Board members and proposed a new remuneration system that does not give any grounds
to disclose, even as a matter of mere precaution, a deviation at least from the recommendations pursuant to Section 4.2.3 Para. 2
Sentence 4 and Section 4.2.3 Para. 2 Sentence 8 GCGC. The Executive Board members of STADA are to be remunerated in line
with this new remuneration system in future. The service contract concluded with Dr. Barthold Piening as a future Executive
Board member has also already been based on the new remuneration system. The service contracts of the Executive Board
members currently in office are still based on the remuneration system that was current at the time the Declaration of
Compliance 2016 was issued. In view of the aforesaid, the Executive Board and Supervisory Board therefore disclose the
following deviations, again as a matter of mere precaution:
89Group Management Report of the Executive Board | Corporate Governance Report incl. Corporate Governance Declaration
Section 4.2.3 Para. 2 Sentence 4: Positive and negative development
If the target is fallen short of by 25 percentage points or more, the variable remuneration of the members of the Executive Board
is reduced to 0%. If the target is exceeded by more than 20 percentage points, the variable remuneration amounts to 180%. If
more than 75% but a maximum of 120% of the target is achieved, the variable remuneration is calculated applying a formula.
In addition, no parameters have been agreed through which any positive or negative development is reported, as the members
of the Executive Board already participate in any positive or negative development with the regulation mentioned above.
Section 4.2.3 Para. 2 Sentence 6: Caps
The variable remuneration components which the company grants to the Executive Board members in addition to a fixed
annual salary are limited in terms of amount by way of specified, clear mathematical formulae. In addition, customary fringe
benefits are granted to each member of the Executive Board. These include in particular a company car the private use of which
is also permitted, as well as insurances which STADA makes financial contributions to and/or bears the costs of. As regards the
amounts of such fringe benefits, no caps have been determined since such costs vary and are not precisely foreseeable, and
such determination would appear to be dispensable in line with the intent and purpose of the GCGC recommendation.
Section 4.2.3 Para. 2 Sentence 8: No repricing
The contracts of the members of the Executive Board do not exclude subsequent changes to the performance targets or
comparative parameters. The Executive Board contracts stipulate, among other things, that the Supervisory Board may choose
a suitable share index other than the MDAX when calculating the deferral payment amount of the long-term variable remuner-
ation, e.g. in the case that STADA is not an MDAX-listed company anymore. The regulations stipulated in the contracts of the
members of the Executive Board which allow such changes enable the Supervisory Board to avoid any positive or negative
disincentives that could result from any unpredicted development.
Bad Vilbel, March 2, 2017
signed signed
Carl Ferdinand Oetker Dr. Matthias Wiedenfels
Chairman of the Supervisory Board Chairman of the Executive Board
Declaration of Compliance 2016
Joint Declaration of the Executive Board and the Supervisory Board of STADA Arzneimittel AG concerning the German Corporate Governance Code pursuant to Section 161 of the German Stock Corporation Act (AktG)
STADA Arzneimittel AG (“STADA”) had complied with the recommendations of the German Corporate Governance Code in
the version of May 5, 2015 (published on June 12, 2015 in the Federal Gazette) since the last Declaration of Compliance on
October 8, 2015, with the exception of the deviations as mentioned there, and STADA will comply with the recommendations
of the German Corporate Governance Code in this version in future with the following deviations.
The STADA Executive Board and Supervisory Board are of the opinion that the following disclosures made on Section 4.2.3 Para. 2
Sentence 4, Section 4.2.3 Para. 2 Sentence 6 and Section 4.2.3 Para. 2 Sentence 8 would not be necessary from a strictly legal
point of view. However, the Executive Board and the Supervisory Board of STADA have decided to include the information in the
Declaration of Compliance 2016 in accordance with the results of the extensive Corporate Governance audit of STADA and to
increase transparency for investors and the capital market.

90 Group Management Report of the Executive Board
Section 4.2.3 Para. 2 Sentence 4: Positive and negative development
If the target is fallen short of by 25 percentage points or more, the variable remuneration of the members of the Executive Board
is reduced to 0%. If the target is exceeded by more than 20 percentage points, the variable remuneration amounts to 180%.
If more than 75% but a maximum of 120% of the target is achieved, the variable remuneration is calculated applying a
formula. In addition, no parameters have been agreed through which any positive or negative development is reported, as the
members of the Executive Board already participate in any positive or negative development with the regulation mentioned
above.
Section 4.2.3 Para. 2 Sentence 6: Caps
The company grants fringe benefits to each member of the Executive Board, in particular a company car. Private use of the
car is also permitted. Any costs incurred for the maintenance and use of the vehicle are covered by STADA. Moreover, STADA
grants the members of the Executive Board financial contributions to and/or pays for insurances. As regards the amounts of
such fringe benefits, there are no caps as such costs vary and are not precisely foreseeable. Since no caps with regard to the
amounts have been determined, there are also no caps for the amount of the remuneration in general. There are, however, caps
for variable remuneration. These do not indicate amounts but are to be calculated applying mathematical formulae. Since the
mathematical formulae are very comprehensible, this presentation serves to improve readability of the Executive Board
contracts.
Section 4.2.3 Para. 2 Sentence 8: No repricing
The contracts of the members of the Executive Board do not exclude subsequent changes to the performance targets or
comparative parameters. The Executive Board contracts stipulate, among other things, that the Supervisory Board may choose
a suitable share index other than the MDAX when calculating the deferral payment amount of the long-term variable remuner-
ation, e.g. in the case that STADA is not an MDAX-listed company anymore. The regulations stipulated in the contracts of the
members of the Executive Board which allow such changes enable the Supervisory Board to avoid any positive or negative
disincentives that could result from any unpredicted development.
Section 5.4.1 Para. 2 Sentence 1: Age limit and regular length of membership for the members of the Supervisory Board
The objectives specified by the Supervisory Board regarding its composition do not contain an age limit or a regular limit of
length of membership of the Supervisory Board. To date, the Supervisory Board has been of the opinion that age is not a suitable
criterion for choosing qualified candidates. However, it has been considered to comply with the recommendation in
Section 5.4.1, Para. 2, Sentence 1, which suggests an age limit, in the future. This is to be decided shortly. Furthermore, in the
view of the Supervisory Board, the expertise of long-standing and experienced Supervisory Board members shall in principle
also be made available to the company. A limit of maximum length of membership defined in advance is not considered
appropriate by the Supervisory Board.
Bad Vilbel, July 14, 2016
signed signed
Dr. Martin Abend Dr. Matthias Wiedenfels
Chairman of the Supervisory Board Chairman of the Executive Board

91Group Management Report of the Executive Board | Corporate Governance Report incl. Corporate Governance Declaration
2. Relevant information on Company practices
Corporate governance
STADA Arzneimittel AG is a joint stock corporation under German law and has a dual management and monitoring structure
consisting of the Executive Board and the Supervisory Board. The third body of the Company is the Annual General Meeting.
Furthermore, there is an Advisory Board according to the Articles of Incorporation.
In the Executive Board and Supervisory Board’s view, good corporate governance is an important basis for the Company’s
success. The Executive Board and the Supervisory Board of STADA view corporate governance as a comprehensive concept of
responsible, transparent and value-based corporate management. The Executive Board, Supervisory Board and management
staff ensure that corporate governance is actively approached and continuously developed in all areas at STADA. In addition to
legal and regulatory requirements as well as the German Corporate Governance Code, corporate governance at STADA also
comprises the standards of the internal control system and compliance, the regulations on organizational and supervisory
duties in the Company, as well as STADA’s internal business guidelines and shared principles and values.
Risk Management and Internal Auditing
The responsible handling of risks is an element of good corporate governance. STADA has systematic risk management and a
control system that puts the Executive Board in the position to recognize risks and market trends at an early stage and to
immediately react to relevant changes in the risk profile. STADA’s risk management and control system thus contributes to the
success of the Company. Risk management is part, in regular intervals, of the annual audit of financial statements as well as
Internal Auditing. Details hereof can be found in the Group Management Report of this Annual Report in the “Opportunities
and Risk Report” chapter.
Furthermore, Internal Auditing supports the Executive Board as an independent department outside of the daily operational
business. The department evaluates internal procedures and processes from an objective perspective and with the necessary
distance. The objective is to achieve optimized business processes, reduced costs, increased efficiency, and to reach internally
determined goals, by way of improved internal controls.
Strong compliance culture
Compliance comprises all actions taken by a company in line with legal requirements as well as the drafting and monitoring of
internal regulations which a company places on itself. The goal of all compliance efforts is to avoid possible damage to the
company and to prevent wrong-doing. At STADA, compliance is embedded in the mission statement of a responsible company
leadership and corporate governance. The Compliance Office is responsible for the constant development of a Compliance
Management System within STADA. The Compliance Office is an independent consultant and advisor for all departments and
all employees of STADA.
STADA’s Code of Conduct establishes binding Group-wide behavioral guidelines for the entire management and staff of the
STADA Group. The aim of the Code of Conduct is to support all employees in legal and ethical challenges in their daily work and
to provide them with orientation for correct behavior. Furthermore, internal guidelines, the so-called Corporate Policies, make
these behavioral guidelines clearer for specific topics.
With the aid of various measures such as e-learning measures, traditional training, regular newsletters and leaflets with
compliance-relevant content, STADA employees are informed and trained on an ongoing basis of relevant legal requirements
and internal guidelines.
The Chief Compliance Officer, who is responsible for the Compliance Management System, reports to the Chairman of the
Executive Board and Supervisory Board as well as the Audit Committee. The Chief Compliance Officer coordinates the entire
system and receives complaints and information – anonymously if necessary – and follows up on suspected compliance
breaches. Any suspicious cases reported are assessed and evaluated. If necessary, appropriate measures are introduced and
processes are adapted. Disciplinary measures are also taken. These can range from a simple warning to the dismissal of the
employee. The officer is supported in Germany and internationally by Compliance Managers, and by an external Ombudsman

92 Group Management Report of the Executive Board
in Germany. In reporting year 2016 the compliance organization was further strengthened and the international exchange of
compliance officers was intensified. In order to guarantee the adherence to legal regulations and internal company policies of
compliance in an effective manner, STADA regularly controls and further develops the Compliance Management System based
on risk.
The Code of Conduct, the contact information of the Ombudsman along with further information regarding compliance, can be
found on the company website at www.stada.de or www.stada.com in the Sustainability section of “Corporate Management”.
Quality and safety, sustainability and environment, and the STADA mission statement
Details on the topics of “quality”, “safety”, “sustainability” and “environment” and the mission statement of STADA can be found
in the Group Management Report of this Annual Report in the chapters “Procurement, Production and Quality Management”
and “Responsibility and Sustainability”.
More detailed information on the discussed corporate governance practices at STADA as well as further information can also
be found on the company website at www.stada.de or www.stada.com in the Sustainability section.
3. Description of the working practices of the Executive Board and the Supervisory Board as well as the composition and working practices of their committees
The Executive Board and the Supervisory Board of STADA work in close cooperation for the good of the Company and, after
extensive consultation, make fundamental strategic decisions in the context of their legal responsibilities. The Executive Board
briefs the Supervisory Board – in the context of its legal obligation to make reports – regularly, promptly and comprehensively
regarding all Company-relevant questions of strategy, planning, business development, the risk situation, risk management
and compliance. It confirms the strategic orientation of the Company with the Supervisory Board and, in the course of the
implementation of the strategy, discusses the respective status at regular intervals. Furthermore, the Chairman of the Super-
visory Board maintains regular contact with the Executive Board, particularly with the Chairman of the Executive Board, and
discusses with them the strategy, planning, business development, the risk situation, risk management and the compliance of
STADA Arzneimittel AG and the Group. The Executive Board and the Supervisory Board adhere to the rules of proper corporate
management and have each established their own rules of procedure.
a) Executive Board
The Executive Board is appointed and dismissed in accordance with legal regulations. The Articles of Incorporation do not
provide special provisions on the appointment or dismissal of individual and all members of the Executive Board. Only the
Supervisory Board is responsible for the appointment and dismissal. It appoints Executive Board members for a maximum
period of five years. A repeated appointment or extension of the term is permitted, for a maximum of five years each.
Tasks and responsibilities
The Executive Board manages the Company with the objective of sustainable added value in its own responsibility in consider-
ation of the concerns of the shareholders, its employees and other groups connected to the Company. The members of the
Executive Board are jointly responsible for corporate governance. The Executive Board runs the businesses in accordance with
the legal requirements, the Articles of Incorporation, the rules of procedure and the schedule of responsibilities.
STADA’s Executive Board comprises at least two people in accordance with the Articles of Incorporation.
The following changes occurred at Executive Board level in financial year 2016: On August 15, 2016, the long-standing Chairman
of the Executive Board Hartmut Retzlaff resigned from his office as member of the Executive Board with immediate effect. The
employment relationship between him and STADA Arzneimittel AG was ended with effect from December 31, 2016 by mutual
agreement due to personal circumstances.1) The STADA Supervisory Board had already decided on a change at the company’s
helm at an extraordinary meeting held on June 5, 2016, due to the serious and likely long-term illness of Mr. Retzlaff.2) The two
remaining Executive Board members initially assumed his tasks on a temporary basis.
1) See the Company’s ad hoc release of August 15, 2016.2) See the Company’s ad hoc release of June 5, 2016.
93Group Management Report of the Executive Board | Corporate Governance Report incl. Corporate Governance Declaration
1) See the Company’s investor news of January 23, 2017.
As of the reporting date, the Executive Board consisted of two members responsible for the following areas:
• Dr. Matthias Wiedenfels, Chairman of the Executive Board (under contract until December 31, 2020) is the member
of the STADA Executive Board responsible for Strategy, Business Development, Corporate Communications, Corporate
Governance, Human Resources, Legal, IP/Patents, Corporate Compliance and Export Control, Quality Assurance and
Quality Control, Research and Development as well as Production.
• Helmut Kraft, Chief Financial, Marketing & Sales Officer (under contract until December 31, 2019), is responsible for,
in addition to the area of finance (Corporate Accounting and Controlling, Corporate Treasury and Taxes) Marketing and
Sales, Investor Relations, Internal Revision, Corporate IT, Business Excellence and Business Transformation, Purchasing
and Supply Chain, Portfolio Management, Biotechnology, Market Research and Risk Management.
On January 23, 2017, the Supervisory Board announced that it had appointed Dr. Barthold Piening as a full Member of the
Executive Board.1) Dr. Piening will take up his position on April 1, 2017 and will assume responsibility for Production, Research
and Development, Biotechnology and Quality Assurance and Control.
Working practices of the Executive Board
Despite the overall responsibility of the Executive Board, each member of the Executive Board is responsible for managing his
area of the business. The distribution of the business areas to individual members of the Executive Board results from a
schedule of responsibilities that is a component of the rules of procedure for the Executive Board. The Executive Board as a
whole decides upon all matters of fundamental and/or strategic significance or of particular importance for the Company. All
members of the Executive Board inform themselves of the significant proceedings within the business areas. Regarding
proceedings that also impact the business area of another member of the Executive Board, a member of the Executive Board
confers with other affected members of the Executive Board before coming to a decision.
According to the rules of procedure for the Executive Board, the Chairman of the Executive Board is responsible for the
coordination of the Executive Board as a whole. The Chairman of the Executive Board represents the Executive Board and the
Company in public matters, in particular concerning authorities, associations, economic organizations and publication outlets.
He can delegate this task to another member of the Executive Board for particular areas or in individual cases.
The Executive Board regularly holds Executive Board meetings that are convened by the Chairman of the Executive Board. Upon
request of a member of the Executive Board, the Chairman must convene an Executive Board meeting. The Executive Board can
make resolutions when all members have been invited and at least half of the members take part in the resolution. The
Executive Board passes resolutions with a simple majority of votes cast. Absent members of the Executive Board can cast their
votes in written form, via text or telephone. The use of a representative is not permitted. Resolution by circulation procedure is
also possible provided no member of the Executive Board objects. In case of a tie, the Chairman of the Executive Board shall
have the deciding vote. If the Chairman of the Executive Board is absent or delayed, the proposed resolution is rejected in the
case of a tie.
For certain business defined in the Executive Board’s rules of procedure, the Executive Board must first obtain the approval of
the Supervisory Board.
The STADA Executive Board has not established any Executive Board committees.
Conflicts of interest
According to the rules of procedure of the Executive Board, every member of the Executive Board is required to disclose conflicts
of interest without delay to the Supervisory Board and to inform the other members of the Executive Board of this (Section 4.3.3
of the German Corporate Governance Code, GCGC). Carrying out ancillary activities, particularly taking on Group-external
Supervisory Board positions, requires the prior approval of the Supervisory Board.
Remuneration report
The Remuneration Report, which can be found in the Group Management Report of the Executive Board, presents the principles
of the remuneration system of the Executive Board of STADA as well as individual details of the remuneration of individual
members of the Executive Board. It is also published on the Company’s website at www.stada.de or www.stada.com in the
Corporate Governance section.

94 Group Management Report of the Executive Board
b) Supervisory Board
In accordance with the provisions of the German One-Third Participation Act, the STADA Supervisory Board is comprised of nine
members, of which six are representatives of the shareholders and three represent employees. The Annual General Meeting
elects the shareholder representatives in accordance with the German Stock Corporation Act and employees elect employee
representatives in accordance with the German One-Third Participation Act.
The Supervisory Board included the following members on the reporting date:
• Carl Ferdinand Oetker, Managing Partner of FO Holding GmbH, Bielefeld (Chairman)
• Jens Steegers, Chairman of the Worker’s Council released from duty, Frankfurt am Main (Deputy Chairman;
Employee representative)
• Dr. Eric Cornut, Independent Consultant, Binningen, Switzerland
• Halil Duru, Deputy Chairman of the Worker’s Council released from duty, Frankfurt am Main (Employee Representative)
• Rolf Hoffmann, Adjunct Professor at University of North Carolina Kenan-Flagler Business School (Chapel Hill, USA),
Weggis, Switzerland
• Dr. Birgit Kudlek, Manager in the Pharma Industry, Bad Soden
• Tina Müller, Chief Marketing Officer/Member of the Managing Directors Board Opel Group GmbH,
Vice President, General Motors, Frankfurt am Main
• Dr. Ute Pantke, Director Special Brand Projects, Wettenberg (Employee Representative)
• Dr. Gunnar Riemann, Independent Business Consultant in the Life Science Industry, Berlin
The term in office of the shareholder representatives Carl Ferdinand Oetker and Dr. Eric Cornut will end with the completion of
the Annual General Meeting 2018. The remaining shareholder representatives in the Supervisory Board were elected by the
Annual General Meeting on August 26, 2016 until completion of the Annual General Meeting 2021. The employee representa-
tives have been appointed until completion of the Annual General Meeting 2019.
Tasks and responsibilities
The Supervisory Board appoints the members of the Executive Board. Furthermore, the Supervisory Board monitors and
advises the Executive Board in the running of its business operations. Through a regular dialog with the Executive Board, the
Supervisory Board is informed of the business development, strategy, corporate planning, the risk situation, risk management
and compliance. It agrees the company planning and approves the annual financial statements of STADA Arzneimittel AG and
the consolidated financial statements of the STADA Group.
Working practices of the Supervisory Board
The Chairman of the Supervisory Board is responsible for the coordination of work, chairing Supervisory Board meetings and
handling the external matters of the Supervisory Board.
The Chairman of the Supervisory Board convenes the Supervisory Board in writing at least 14 days, which may be reduced in
exceptional cases, prior to a meeting according to need. Meetings of the Supervisory Board should convene at least once per
quarter and must convene twice within a half year (see also Section 16 (5) of the Articles of Incorporation). The meetings of the
Supervisory Board and its committees shall as a rule be by personal attendance. In exceptional cases with good reason, the
Chairman of the Supervisory Board can elect to hold the meetings of the Supervisory Board and its committees in the form of a
telephone or video conference, or permit individual members of the Supervisory Board to participate via telephone or video
connection.
The Supervisory Board generally passes resolutions in meetings. Outside of meetings, resolutions made via telephone or in
written form (via telefax or with the aid of other common means of communication such as e-mail) are permitted. The Super-
visory Board shall constitute a quorum if at least two thirds of its members, including the Chairman of the Supervisory Board or
the deputy, are present, or absent members have had another member of the Supervisory Board submit their written vote.
Supervisory Board resolutions are passed with a simple majority of votes cast. In case of a tie, the chairman of the meeting shall
have the casting vote.
95Group Management Report of the Executive Board | Corporate Governance Report incl. Corporate Governance Declaration
Composition and working practices of the Supervisory Board committees
The Supervisory Board had four Supervisory Board committees in the reporting year: an Audit Committee, a Human Resources
Committee, a Strategy Committee and a Nomination Committee.
• Audit Committee
The Audit Committee deals in particular with monitoring the accounting process, the effectiveness of the internal control
system and that of the internal auditing system, the risk management system and compliance. Furthermore, the Audit
Committee deals with the financial statement audits, in particular the required independence of the auditor, the additional
tasks rendered by the auditor, the award of the audit contract to the auditor, the determination of the main areas for the
audit and the fees agreement with the auditor. In addition, it discusses the annual and interim reports with the Executive
Board prior to their publication.
The chairman of the Audit Committee shall have specialist knowledge and experience in the application of accounting
principles and internal control processes. Furthermore, the Chairman of the Audit Committee shall be independent and
neither the Chairman of the Supervisory Board, nor a former member of the Executive Board whose position ended less than
two years ago.
As of the reporting date, the Audit Committee consisted of the Supervisory Board members Dr. Gunnar Riemann (Chairman),
Dr. Birgit Kudlek, Carl Ferdinand Oetker and Jens Steegers. As Chairman of the Audit Committee, Dr. Gunnar Riemann fulfills
the above requirements of a so-called independent financial expert.
• Human Resources Committee
The Chairman of the Supervisory Board is the Chairman of the Human Resources Committee. The Human Resources
Committee prepares the personnel decisions of the Supervisory Board related to Executive Board appointments. The com-
mittee discusses, in particular, the conditions of the employment contracts for the members of the Executive Board and
prepares the resolutions of the Supervisory Board regarding the remuneration system of the Executive Board in that it
recommends to the Supervisory Board the structure of the remuneration system and the ranges of the fixed and variable
components of the remuneration of the Executive Board. In addition, it ensures together with the Executive Board that long-
term succession planning takes place.
Moreover, the Human Resources Committee consults with the Executive Board regarding the strategic personnel development
of STADA Arzneimittel AG and prepares the decisions of the Supervisory Board in this area.
The members of the Human Resources Committee on the reorting date were the Supervisory Board members Carl Ferdinand
Oetker (Chairman), Halil Duru, Rolf Hoffmann and Tina Müller.
• Strategy Committee
The Supervisory Board established a Strategy Committee on September 26, 2016. In cooperation with the Executive Board,
the Strategy Committee advises on strategic perspectives, positioning and further development of the company and prepares
fundamental decisions of the entire Supervisory Board. It deals with fundamental questions of Group strategy including the
operating policy and business orientation of the Group. It monitors the competitive situation of the company and advises on
possible strategy changes together with the Executive Board in this context. It supervises strategic processes and strategy
implementation.
As of the reporting date, the Strategy Committee consisted of Supervisory Board members Dr. Eric Cornut (Chairman), Rolf
Hoffmann, Dr. Birgit Kudlek, Tina Müller and Dr. Ute Pantke.

96 Group Management Report of the Executive Board
• Nomination Committee
In accordance with the German Corporate Governance Code, the Supervisory Board established a Nomination Committee
on May 22, 2016. Its task is to make recommend suitable candidates for the election of shareholder representatives to
Supervisory Board through the Annual General Meeting to the Supervisory Board and to manage the objectives for the
composition of the Supervisory Board. The Nomination Committee deals exclusively with shareholder representatives. It
meets when required. Its members do not receive any special committee remuneration.
As of the reorting date, the Nomination Committee consisted of the shareholder representatives Carl Ferdinand Oetker
(Chairman), Rolf Hoffmann and Tina Müller.
Prior to May 22, 2016, a Nomination Committee, consisting of the Chairman of the Human Resources Committee and the Audit
Committee existed, with the task of developing objectives and a profile for the composition of the Supervisory Board.
The Supervisory Board Report contains more detailed information on its meetings and the focus of the Supervisory Board’s
activities and its committees.
Individualized disclosure of meeting participation
The Supervisory Board considers the individualized disclosure of participation in meetings of the Supervisory Board Plenum
and the Supervisory Board committees as part of good corporate governance.
Meeting participation
Attendance in %
Supervisory Board Plenum
Dr. Martin Abend1) 9/9 100
Dr. Eckhard Brüggemann1) 8/9 88.88
Dr. Eric Cornut2) 7/7 100
Halil Duru 15/16 93.75
Dr. Arnold Hertzsch1) 9/9 100
Rolf Hoffmann2) 7/7 100
Dieter Koch1) 8/9 88.88
Dr. Birgit Kudlek2) 7/7 100
Constantin Meyer1) 9/9 100
Tina Müller2) 6/7 85.71
Carl Ferdinand Oetker 15/16 93.75
Dr. Ute Pantke 15/16 93.75
Dr. Gunnar Riemann2) 7/7 100
Jens Steegers 15/16 93.75
1) Member of the Supervisory Board until the end of the Annual General Meeting, August 26, 2016.2) Member of the Supervisory Board since the end of the Annual General Meeting, August 26, 2016.

97Group Management Report of the Executive Board | Corporate Governance Report incl. Corporate Governance Declaration
1) Member of the Supervisory Board until the end of the Annual General Meeting, August 26, 2016.2) Member of the Supervisory Board since the end of the Annual General Meeting, August 26, 2016.3) Member of the Human Resources Committee since September 26, 2016.
Meeting participation
Attendance in %
Audit Committee
Dr. Martin Abend1) 5/5 100
Dr. Arnold Hertzsch1) 5/5 100
Dr. Birgit Kudlek2) 3/3 100
Carl Ferdinand Oetker 8/8 100
Dr. Gunnar Riemann2) 3/3 100
Jens Steegers 7/8 87.5
Meeting participation
Attendance in %
Human Resources Committee
Dr. Martin Abend1) 3/3 100
Halil Duru 8/8 100
Rolf Hoffmann2) 5/5 100
Dieter Koch1) 3/3 100
Constantin Meyer1) 2/3 66.6
Tina Müller2) 5/5 100
Carl Ferdinand Oetker3) 5/5 100
Meeting participation
Attendance in %
Strategy Committee (since September 26, 2016)
Dr. Eric Cornut2) 1/1 100
Rolf Hoffmann2) 1/1 100
Dr. Birgit Kudlek2) 1/1 100
Tina Müller2) 1/1 100
Dr. Ute Pantke 1/1 100
Meeting participation
Attendance in %
Nomination Committee (since May 22, 2016)
Dr. Martin Abend1) 4/4 100
Rolf Hoffmann2) 0/0 –
Dieter Koch1) 3/4 75
Tina Müller2) 0/0 –
Carl Ferdinand Oetker 4/4 100
98 Group Management Report of the Executive Board
Objectives for the composition of the Supervisory Board
The Supervisory Board is to be composed in a manner that its members as a whole have the required knowledge, abilities and
specialist experience in order to appropriately assume the tasks. Prior to the elections at the Annual General Meeting in 2013,
the Supervisory Board established objectives for its composition and punctually updated these objectives in 2015.1) In terms of
its composition and as part of the early new election of some of the shareholder representatives in financial year 2016, the
Supervisory Board established the following requirements for the shareholder representatives:
1. General objectives, which apply to all Supervisory Board members
The members of the Supervisory Board are to fulfill the following general criteria:
• Fulfillment of the requirements of the German Stock Corporation Act and German Corporate Governance Code
• Professional excellence
• Independence in terms of STADA Arzneimittel AG and its major stakeholders
• Sufficient availability and commitment
• Very good knowledge of German and English
• Integrative communication, persuasiveness, common creative drive
• Modern understanding of business ethics and overall responsibility
2. Professional requirements that at least one Supervisory Board member must fulfill
The following professional criteria are each to be fulfilled by at least one Supervisory Board member:
• Pharmaceutical perspective, ideally trained as a pharmacist, pharmacologist or pharmaceutical-related
natural scientist or a medical doctor
• Leadership experience in the European pharma industry
• Understanding of eastern European markets with a focus on CIS
• Expertise in the market for generics and biosimilar
• Leadership experience with various distribution channels, in particular in the non-food/fast-moving consumer
goods sector
• Experience with trademarks/branding issues
• Strong finance background (e.g. experience in accounting, auditing financial statements, financing and
capital market issues)
• Knowledge of relevant corporate law questions and important regulatory issues.
3. Balance criteria that the Supervisory Board (shareholder representatives) must fulfill overall as a Board
The following criteria must be fulfilled by the Supervisory Board (shareholder representatives) overall as Board:
• Age: Majority of the shareholder representatives born in 1956 or later, if possible no member born before 1951
• Board experience: Two to four of the shareholder representatives to be or have been on the Supervisory Board of a listed
company
• Knowledge transfer and stability: At least two of the shareholder representatives to have been on the Supervisory Board
of STADA Arzneimittel AG for several years
• Gender: At least two shareholder representatives are to be male/female.
The Supervisory Board continually monitors the currentness and implementation of the objectives for its composition.
With the current composition following the election of five new shareholder representatives by the Annual General Meeting of
August 26, 2016, the Supervisory Board believes that the stated objectives in terms of the share holder representatives are
fulfilled.
1) See the 2015 Annual Report, page 41 ff.

99Group Management Report of the Executive Board | Corporate Governance Report incl. Corporate Governance Declaration
1) = fully applies. = partially applies.
As regards the number of independent members in accordance with Section 5.4.2 GCGC, the Supervisory Board continues to
believe that all shareholder representatives in the Supervisory Board of STADA Arzneimittel AG should be independent. In the
view of the Supervisory Board, this applies to all shareholder representatives with the exception Dr. Eric Cornut, who was
elected to the Supervisory Board on the recommendation of shareholder Active Ownership Fund SICAV-FIS SCS.
At the beginning of financial year 2017, the newly composed Supervisory Board agreed the following general age limits and
limits for the duration of membership of the Supervisory Board: “Supervisory Board members shall generally not hold their
position for longer than the Annual General Meeting in the year after they turn 75 (general age limit). Election recommendations
are to take into account the duration of membership of the Supervisory Board of three full terms (generally 15 years).” This
stipulation is met in the current composition of the Supervisory Board.
The newly composed Supervisory Board decided in December 2016 as a Board to carry out, and detailed the decision in January
2017, a comprehensive effectiveness and efficiency audit in financial year 2017 that goes beyond the usual methods (see below),
and plans to incorporate the findings in the designation process when the specific goals for its composition are updated. In
connection with this, work on the competencies profile shall be extended to the Board as a whole. Competencies are dis tributed
among the shareholders as follows:
Carl Ferdinand
Oetker (Chair)
Dr. Eric Cornut
Rolf Hoffmann
Dr. Birgit Kudlek
Tina Müller
Dr. Gunnar Riemann
Professional criteria1)
Pharmaceutical perspective (pharmacist/pharmacologist)
Leadership experience in the European pharma industry
Understanding of Eastern European markets/CIS
International corporate background
Expertise in the market in Generics and Biosimilars
Leadership experience with various distribution channels, in particular non food/fast-moving consumer goods
Marketing/Branding know how
Financial expertise
Experience on public company Supervisory Boards
Experience with M&A
Regulatory Experience (focus: pharma)
Corporate Governance, Corporate Law & Compliance
Conflicts of interest
According to the rules of procedure of the Supervisory Board, members of the Supervisory Board shall not be a member of any
board at, or provide consulting services to, significant competitors of the Company. Furthermore, the Supervisory Board
members are required to disclose conflicts of interest to the Supervisory Board, particularly those which may arise as a result
of consultation or board membership with customers, suppliers, banks or other third parties. Significant and not only temporary
conflicts of interest for an individual in the Supervisory Board shall result in termination of the position. In its report, the Super-
visory Board informs the Annual General Meeting whether conflicts of interest were recognized and how they were handled.
100 Group Management Report of the Executive Board
Efficiency review
The Supervisory Board regularly reviews the efficiency of its activities in accordance with Section 5.6 of the German Corporate
Governance Code GCGC. Due to the major changes in its composition in financial year 2016, the Supervisory Board agreed in its
December meeting to carry out a comprehensive effectiveness and efficiency audit in financial year 2017 that goes beyond the
usual method of questionnaires, and to also enlist the services of an independent, external auditor (among other things to
carry out structured one-on-one interviews, analyses and have discussions with the Board). The efficiency audit serves to
evaluate the effectiveness and efficiency of the Supervisory Board. The objective is to critically evaluate the working practices
and composition of the Board as well as to derive possible suggestions for improvement, including, in terms of optimizing work
processes, the organization of the reporting system, as well as the improvement of the performance of the Supervisory Board
as a monitoring body and the lawfulness of the Board’s work.
Remuneration report
The principles of the remuneration system of the STADA Supervisory Board as well as individual details of the remuneration of
individual members of the Supervisory Board are discussed in the Group Management Report of this Annual Report in the
“Remuneration Report” chapter.
c) Advisory Board
The Chairman of the Supervisory Board convenes the members of the Advisory Board of STADA Arzneimittel AG upon re-
commendation of the Executive and Supervisory Boards. According to the Company’s Articles of Incorporation, the duty of the
Advisory Board is to support and advise the Executive and Supervisory Boards. Furthermore, members of the Advisory Board
are available to act as proxy for shareholders who do not wish to exercise their voting rights in person at the Annual General
Meeting. The Advisory Board had 11 members on the reporting date. The currently elected eleven members of the Advisory
Board are appointed until the end of financial year 2018. The principles of the remuneration system of the STADA Advisory Board
are discussed in the Group Management Report of this Annual Report in the “Remuneration Report” chapter.
4. Specifications of Section 76 (4) and Section 111 (5) AktG as well as information regarding whether the set targets were reached during the reference period and justification if not reached
In accordance with Section 76 (4) AktG and Section 111 (5) AktG, the Executive Board and the Supervisory Board have agreed
the following targets for the proportion of women in the Supervisory Board, the Executive Board and the subsequent two
management levels. The initial deadline for implementation is June 30, 2017.
a) Specifications by the Executive Board in accordance with Section 76 (4) AktG
In financial year 2015, the Executive Board agreed unanimously on the following targets for the proportion of women in the two
management levels below the Executive Board of STADA Arzneimittel AG, in accordance with Section 76 (4) AktG:
The existing proportion of women in the first management level at 23.5% and at 25% in the second management level should
at least be maintained for the period up to June 30, 2017. The first management level includes employees of STADA Arznei-
mittel AG who have personnel responsibility and a direct reporting line to the Executive Board, the second management level
includes employees of STADA Arzneimittel AG with personnel responsibility and a direct reporting line to the first management
level. As before, the Executive Board will continue to ensure an appropriate promotion of women to continually increase the
proportion of women in management positions. The proportion of women of over 50% across the entire workforce of the STADA
Group forms the basis for this. However, management positions are awarded primarily based on the professional and personal
qualifications of the candidate, rather than based on gender.

101Group Management Report of the Executive Board | Corporate Governance Report incl. Corporate Governance Declaration
b) Specifications by the Supervisory Board in accordance with Section 111 (5) AktG
In financial year 2015, in accordance with Section 111 (5) AktG as regards the setting of targets for the proportion of women in
the Executive Board, the Supervisory Board agreed to initially maintain the status quo of 0% until June 30, 2017. Positions on
the Executive Board are awarded primarily based on the professional and personal qualifications of the candidate, rather than
based on gender. In awarding future Executive Board positions the Supervisory Board will consider an appropriate proportion
of women.
As regards the setting of targets for the proportion of women on the Supervisory Board, in financial year 2015 the Supervisory
Board agreed to at least maintain the status quo of the time until June 30, 2017 and set a target of at least 11.11% for the
proportion of women in the Supervisory Board. The Supervisory Board also agreed to continue to promote the proportion of
women on its board, however the professional and personal qualifications of the candidate rather than the gender are con-
sidered most important. As part of the elections to the Supervisory Board, which were partially completed ahead of schedule
in financial year 2016, at the recommendation of the Supervisory Board, Dr. Birgit Kudlek and Tina Müller were appointed to
the Supervisory Board as female shareholder representatives by the Annual General Meeting of August 26, 2016, as a result
of which the actual proportion of women is currently 33.33%, including Dr. Ute Pantke.
c) Report on the achievement of goals
The Annual Report 2017, after the deadline of June 30, 2017, will report on the achievement of the objectives.

102 Group Management Report of the Executive Board
Shareholders and the Annual General Meeting
The shareholders1) assume their rights in the Annual General Meeting and exercise their voting rights. Each STADA share2) grants
entitlement to one vote. Shareholders have the option to exercise their voting right themselves in the Annual General Meeting
or to have their voting right exercised by an authorized representative of their choice or by way of a voting representative from
the Company, who is bound by instructions. Every shareholder is entitled to participate in the Annual General Meeting, to speak
on individual agenda items there and to request information about Company issues, if this is required for the appropriate
assessment of an item on the agenda.
The Annual General Meeting takes place annually in the first eight months of the financial year and passes resolutions, among
other things, on the allocation of profits, the approval of the Executive Board and Supervisory Board, the selection of the
auditor as well as on any changes to the Articles of Incorporation and capital-changing measures.
Securities Transactions Subject to Reporting and Shares Held by the Executive Board and Supervisory Board
As of the reporting date, the total number of shares of STADA Arzneimittel AG held by Executive Board and Supervisory Board
members amounted to less than 1% of the shares issued by the company. Members of the Executive Board held a total of 3,000
shares; this corresponds to 0.005% of the share capital of STADA Arzneimittel AG; members of the Supervisory Board held a
total of 3,260 shares; this corresponds to 0.005% of the share capital of STADA Arzneimittel AG. This translates into the follow-
ing individual breakdown of shares held as of December 31, 2016: Mr. Kraft: 3,000 shares, Mr. Oetker: 2,000 shares,
Mr. Steegers: 25 shares, Dr. Kudlek: 935 shares, Dr. Pantke: 300 shares.
In accordance with Article 19 of the EU Directive No. 596/2014 of the European Parliament and Council of April 16, 2014 on
market abuse (Market Abuse Directive), Members of the Executive Board and Supervisory Board as well as closely related
persons are obligated to disclose share transactions or debt and equity securities of STADA Arzneimittel AG or related financial
instruments if the value of the transactions reaches or exceeds € 5,000 within one calendar year. The transactions reported in
the past financial year were published on the company’s website at www.stada.de/investor-relations/aktie/directors-dealings.
Transparent Corporate Governance
In order to ensure transparent corporate governance, STADA informs shareholders, financial analysts, other capital market
participants, the media and the interested public regularly and promptly about the situation of the Company and about any
significant business changes.
In order to ensure the equal treatment of all users and to provide market participants the same information in terms of content
and in due time, STADA provides all the important documentation on the company’s website at www.stada.de and
www.stada.com. There, all interested individuals are provided access, in particular, to all compulsory information such as
financial reports (annual and interim reports) and ad hoc releases, voting rights notices, reports in accordance with Article 19
of the Market Abuse Directive (Director’s Dealings), information on the Annual General Meeting, as well as other comprehensive
Company and share information such as investor news, press releases, Company profile, financial calendar, presentations and
current share price information on STADA (including peer group comparisons). The Company generally publishes up-to-date
presentations on its website for the capital markets.
The reporting about the situation and results of STADA Arzneimittel AG and the STADA Group is delivered by the Annual Report,
the interim reports and at press and analysts’ conferences, which can generally be followed live and can be viewed for some
time as a recording on the STADA website at www.stada.de and www.stada.com.
1) For capital and shareholder structure see “The STADA Share”.
2) In accordance with the Articles of Incorporation, registered STADA shares grant one vote at the Annual General Meeting. Shareholders are only those who are registered as such in the share registry and only such persons are authorized to participate in the Annual General Meeting and to exercise voting rights. No shareholder and no shareholder group shall have any special rights.

103Group Management Report of the Executive Board | Corporate Governance Report incl. Corporate Governance Declaration
Financial Reporting and Financial Statement Audit
STADA prepares the consolidated financial statements and the consolidated interim financial statements in accordance with
the relevant international financial reporting standards and the Annual Financial Statements of STADA Arzneimittel AG in
accordance with the rules and regulations of the German Commercial Code.
The auditor and Supervisory Board audit the Consolidated Financial Statements and the Consolidated Interim Financial State-
ments for the first half of the year provided by the Executive Board. The Audit Committee discusses the interim financial reports
with the Executive Board prior to their publishing.
STADA publishes the Annual Financial Statements of STADA Arzneimittel AG (including the Management Report) and the
Consolidated Financial Statements of the STADA Group (including the Group Management Report) within 90 days of the end of
the respective financial year and, in addition, informs shareholders and third parties during the year via interim financial reports
within 45 days of the end of the reporting period. The Consolidated Interim Financial Report for the first half of the year is vol-
untarily audited by the auditor elected by the Annual General Meeting for this purpose.
The Annual Financial Statements of STADA Arzneimittel AG and the Consolidated Financial Statements as of December 31, 2016
as well as the Management Report and the Group Management Report for financial year 2016 were audited by PKF Deutschland
GmbH, Wirtschaftsprüfungsgesellschaft, Hamburg. Annika Fröde was appointed as the responsible auditor for the audit of the
Annual and Consolidated Financial Statements 2016 for the first time (previously auditor Santosh Varughese).
The Company does not have a stock option plan.
The significant investments of the Company as well as the related parties are presented in the Notes to the Consolidated
Financial Statements.
Prior to submitting the nomination, the Audit Committee receives a declaration from the selected auditor of whether and to
what extent commercial, financial, personal or other relationships exist between the auditor, its board members and head
auditors on one side, and STADA and its members of governing bodies on the other side, which could represent any doubts
regarding the independence of the auditor. The declaration also covers to what extent in the past financial year other services
were provided – or have been contractually agreed upon for the following year – to the Company, in particular in the area of
consultancy.
The Supervisory Board agreed with the auditor that the Chairman of the Supervisory Board or Audit Committee shall be informed
without delay of any possible grounds for exclusion or bias arising during the audit insofar as these are not remedied
immediately.
Furthermore, the Supervisory Board agreed with the auditor that the auditor shall report without delay on all facts and events
of importance for the tasks of the Supervisory Board which arise during the performance of the audit, as well as that the auditor
shall disclose and/or note in the Auditor’s Report if, during the performance of the audit, the auditor comes across facts which
show a misstatement by the Executive Board and Supervisory Board in the declaration on the German Corporate Governance
Code.
The auditor participates in the meetings of the Supervisory Board regarding the semi-annual, annual and consolidated financial
statements and reports the significant results of the audit.

PassioBalance® – Finding the right balance.Hoggar® Night – Sleep well.

STADA CONSOLIDATED FINANCIAL STATEMENTS 2016
105STADA Consolidated Financial Statements | Table of Contents
CONSOLIDATED INCOME STATEMENT 106
CONSOLIDATED STATEMENT OF COMPREHENSIVE INCOME 107
CONSOLIDATED BALANCE SHEET 108
CONSOLIDATED CASH FLOW STATEMENT 109
CONSOLIDATED STATEMENT OF CHANGES IN EQUITY 110
NOTES TO THE CONSOLIDATED FINANCIAL STATEMENTS 112
General Information 112
Notes to the Consolidated Income Statement 138
Notes to the Consolidated Balance Sheet 147
Other Disclosures 174

106 STADA Consolidated Financial Statements
CONSOLIDATED INCOME STATEMENT
Consolidated Income Statement for the period from Jan. 1 to Dec. 31 in € 000s
2016
Previous year
Note
Sales 2,139,220 2,115,129 11.
Cost of sales 1,105,313 1,101,709 12.
Gross profit 1,033,907 1,013,420
Selling expenses 488,323 482,643 13.
General and administrative expenses 182,696 178,364 14.
Research and development expenses 65,111 64,993 15.
Other income 19,279 20,032 16.
Other expenses 138,933 83,709 17.
Operating profit 178,123 223,743
Result from investments measured at equity 703 1,419
Investment income 24 138
Financial income 2,716 1,170
Financial expenses 54,137 68,667
Financial result -50,694 -65,940 18.
Earnings before taxes 127,429 157,803
Income taxes 31,938 40,638 19.
Earnings after taxes 95,491 117,165
thereof
• distributable to shareholders of STADA Arzneimittel AG (net income) 85,904 110,404
• distributable to non-controlling shareholders 9,587 6,761 20.
Earnings per share in € (basic) 1.38 1.79 21.
Earnings per share in € (diluted)1) – 1.79
1) Earnings per share will not be diluted in financial year 2016, because the share options from the STADA warrants in connection with the Conditional Capital Increase 2004/I expired on June 26, 2015.

107STADA Consolidated Financial Statements | Consolidated Income Statement | Consolidated Statement of Comprehensive Income
CONSOLIDATED STATEMENT OF COMPREHENSIVE INCOME
Consolidated Statement of Comprehensive Income in € 000s
2016
Previous year
Note
Earnings after taxes 95,491 117,165
Items to be recycled to the income statement in future:
Currency translation gains and losses -13,914 8,928 34.
thereof
• income taxes -1,493 352 19.
Gains and losses on available-for-sale financial assets – -22 45.
thereof
• income taxes – 5 19.
Gains and losses on hedging instruments (cash flow hedges) 913 1,054 45.
thereof
• income taxes -360 -338 19.
Items not to be recycled to the income statement in future:
Revaluation of net debt from defined benefit plans -4,980 2,822 35.
thereof
• income taxes 1,226 -23 19.
Other comprehensive income -17,981 12,782
Consolidated comprehensive income 77,510 129,947
thereof
• distributable to shareholders of STADA Arzneimittel AG 66,520 120,584
• distributable to non-controlling shareholders 10,990 9,363

108 STADA Consolidated Financial Statements
CONSOLIDATED BALANCE SHEET
Consolidated Balance Sheet as of Dec. 31 in € 000s Assets
Dec. 31, 2016
Dec. 31, 2015
Note
Non-current assets 1,949,543 2,032,309
Intangible assets 1,582,361 1,649,020 24.
Property, plant and equipment 322,715 321,617 25.
Financial assets 2,236 1,339 26.
Investments measured at equity 13,872 13,168 27.
Other financial assets 4,450 8,718 29.
Other assets 3,095 4,374 30.
Deferred tax assets 20,814 34,073 19.
Current assets 1,490,901 1,255,106
Inventories 484,904 501,520 31.
Trade accounts receivable 489,071 485,901 28.
Income tax receivables 12,816 21,182 19.
Other financial assets 39,880 74,279 29.
Other assets 28,690 29,046 30.
Cash and cash equivalents 352,580 143,178 32.
Non-current assets and disposal groups held for sale 82,960 – 33.
Total assets 3,440,444 3,287,415
Equity and liabilities Dec. 31, 2016 Dec. 31, 2015
Equity 1,047,105 1,018,530 34.
Share capital 162,090 162,090
Capital reserve 514,189 514,171
Retained earnings including net income 673,253 635,344
Other provisions -379,074 -364,105
Treasury shares -1,418 -1,458
Equity attributable to shareholders of the parent 969,040 946,042
Shares relating to non-controlling shareholders 78,065 72,488
Non-current borrowed capital 1,493,712 1,282,577
Other non-current provisions 35,997 28,869 35.
Financial liabilities 1,336,414 1,084,213 36.
Other financial liabilities 3,916 7,201 38.
Other liabilities 969 2,053 39.
Deferred tax liabilities 116,416 160,241 19.
Current borrowed capital 899,627 986,308
Other provisions 20,273 22,532 40.
Financial liabilities 134,343 274,672 36.
Trade accounts payable 336,844 328,487 37.
Income tax liabilities 60,625 39,444 19.
Other financial liabilities 214,031 218,792 38.
Other liabilities 118,933 102,381 39.
Non-current liabilities and associated liabilities of disposal groups held for sale and disposal groups
14,578
–
33.
Total assets 3,440,444 3,287,415

109STADA Consolidated Financial Statements | Consolidated Balance Sheet | Consolidated Cash Flow Statement
CONSOLIDATED CASH FLOW STATEMENT
Consolidated Cash Flow Statement in € 000s Dec. 31, 2016 Dec. 31, 2015 Note
Net income 95,491 117,165
Depreciation and amortization net of write-ups of non-current assets 182,657 151,848 23.
Income taxes 31,938 40,638 19.
Income tax paid -18,580 -29,940
Interest income and expenses 50,175 64,434 18.
Interest and dividends received 4,161 4,674
Interest paid -50,548 -69,886
Result from investments measured at equity -703 -1,419 18.
Result from the disposals of non-current assets 1,438 -2,317 16./17.
Additions to / reversals of other non-current provisions 3,127 6,125 35.
Currency translation income and expenses 9,379 19,549 16./17.
Other non-cash expenses and gains1) 211,976 229,469
Gross cash flow 520,511 530,340
Changes in inventories -18,012 -52,918 31.
Changes in trade accounts receivable 1,248 -12,889 28.
Changes in trade accounts payable 5,038 -25,765 37.
Changes in other net assets, unless attributable to investing or financing activities1)
-175,263
-127,020
Cash flow from operating activities 333,522 311,748 41.
Payments for investments in
• intangible assets -76,127 -81,410 24.
• property, plant and equipment -49,765 -51,230 25.
• financial assets -4,869 -615 26.
• business combinations according to IFRS 3 -52,901 -56,778 8.
Proceeds from the disposal of
• intangible assets 4,000 4,689 24.
• property, plant and equipment 6,142 832 25.
• financial assets – 498 26.
• shares in consolidated companies 854 5,797
Cash flow from investing activities -172,666 -178,217 41.
Borrowing of funds 494,145 677,316 36.
Settlement of financial liabilities -389,973 -816,727 36.
Dividend distribution -50,616 -47,873 34.
Capital increase from share options – 28,224 34.
Changes in non-controlling interests 1,623 3,918 34.
Changes in treasury shares 58 53 34.
Cash flow from financing activities 55,237 -155,089 41.
Changes in cash and cash equivalents 216,093 -21,558 41.
Changes in cash and cash equivalents due to the scope of consolidation in accordance with IFRS 5
-3,431
228
Changes in cash and cash equivalents due to exchange rates -3,260 299
Net change in cash and cash equivalents 209,402 -21,031 32.
Balance at beginning of the period 143,178 164,209
Balance at end of the period 352,580 143,178
1) Non-cash additions to accruals for discounts to health insurance organizations in 2016 in the amount of € 163.2 million (previous year: € 166.3 million) are recognized in gross cash flow and are therefore not included in changes in other net assets.

110 STADA Consolidated Financial Statements
CONSOLIDATED STATEMENT OF CHANGES IN SHAREHOLDERS’ EQUITY
Consolidated Statement of Changes in Shareholders’ Equity in € 000s 2016
Number of shares
Share capital
Capital reserve
Retained earnings
including net income
Provisions for currency
translation
Provisions available
for sale
Provisions for cash flow
hedges
Treasury shares
Equity
attributable to shareholders of the parent
Shares
relating to non-controlling
shareholders
Group equity
Balance as of Dec. 31, 2016 62,342,440 162,090 514,189 673,253 -379,074 – – -1,418 969,040 78,065 1,047,105
Dividend distribution -43,580 -43,580 -7,036 -50,616
Capital increase from share options – –
Changes in treasury shares 18 40 58 58
Changes in retained earnings – –
Changes in non-controlling interests – 1,623 1,623
Changes in the scope of consolidation – –
Other income -4,415 -15,882 913 -19,384 1,403 -17,981
Net income 85,904 85,904 9,587 95,491
Balance as of Jan. 1, 2016 62,342,440 162,090 514,171 635,344 -363,192 – -913 -1,458 946,042 72,488 1,018,530
Previous year
Balance as of Dec. 31, 2015 62,342,440 162,090 514,171 635,344 -363,192 – -913 -1,458 946,042 72,488 1,018,530
Dividend distribution -39,955 -39,955 -7,919 -47,874
Capital increase from share options 1,715,740 4,461 23,763 28,224 28,224
Changes in treasury shares 7 46 53 53
Adjustments previous year on current account 1,177 1,177 1,177
Changes in retained earnings – –
Changes in non-controlling interests – 3,756 3,756
Changes in the scope of consolidation -92 -92 -92
Other income 2,434 6,714 -22 1,054 10,180 2,602 12,782
Net income 110,404 110,404 6,761 117,165
Balance as of Jan. 1, 2015 60,626,700 157,629 490,401 561,376 -369,906 22 -1,967 -1,504 836,051 67,288 903,339

111STADA Consolidated Financial Statements | Consolidated Statement of Changes in Shareholders’ Equity
CONSOLIDATED STATEMENT OF CHANGES IN SHAREHOLDERS’ EQUITY
Consolidated Statement of Changes in Shareholders’ Equity in € 000s 2016
Number of shares
Share capital
Capital reserve
Retained earnings
including net income
Provisions for currency
translation
Provisions available
for sale
Provisions for cash flow
hedges
Treasury shares
Equity
attributable to shareholders of the parent
Shares
relating to non-controlling
shareholders
Group equity
Balance as of Dec. 31, 2016 62,342,440 162,090 514,189 673,253 -379,074 – – -1,418 969,040 78,065 1,047,105
Dividend distribution -43,580 -43,580 -7,036 -50,616
Capital increase from share options – –
Changes in treasury shares 18 40 58 58
Changes in retained earnings – –
Changes in non-controlling interests – 1,623 1,623
Changes in the scope of consolidation – –
Other income -4,415 -15,882 913 -19,384 1,403 -17,981
Net income 85,904 85,904 9,587 95,491
Balance as of Jan. 1, 2016 62,342,440 162,090 514,171 635,344 -363,192 – -913 -1,458 946,042 72,488 1,018,530
Previous year
Balance as of Dec. 31, 2015 62,342,440 162,090 514,171 635,344 -363,192 – -913 -1,458 946,042 72,488 1,018,530
Dividend distribution -39,955 -39,955 -7,919 -47,874
Capital increase from share options 1,715,740 4,461 23,763 28,224 28,224
Changes in treasury shares 7 46 53 53
Adjustments previous year on current account 1,177 1,177 1,177
Changes in retained earnings – –
Changes in non-controlling interests – 3,756 3,756
Changes in the scope of consolidation -92 -92 -92
Other income 2,434 6,714 -22 1,054 10,180 2,602 12,782
Net income 110,404 110,404 6,761 117,165
Balance as of Jan. 1, 2015 60,626,700 157,629 490,401 561,376 -369,906 22 -1,967 -1,504 836,051 67,288 903,339

112 STADA Consolidated Financial Statements
NOTES TO THE CONSOLIDATED FINANCIAL STATEMENTSGeneral Information
1. Corporate information
STADA Arzneimittel Aktiengesellschaft (STADA Arzneimittel AG) as the parent company of the STADA Group (hereafter referred
to as “STADA”), based at Stadastrasse 2 – 18, 61118 Bad Vilbel, is an internationally-oriented company based in Germany and
active throughout the world in the health care and pharmaceuticals markets, especially in the Generics and Branded Products
segments.
The consolidated financial statements of STADA Arzneimittel AG for financial year 2016 were approved for publication by the
Executive Board on March 27, 2017.
2. Basis of preparation of the financial statements
The consolidated financial statements prepared for STADA Arzneimittel AG as parent company as of December 31, 2016, were
prepared in accordance with the International Financial Reporting Standards (IFRS) and interpretations published by the
International Accounting Standards Board (IASB) and the International Financial Reporting Standards Committee (IFRIC), as
applicable in the European Union (EU), as well as in accordance with the supplementary provisions pursuant to Section 315a (1)
of the German Commercial Code (HGB).
The financial year corresponds to the calendar year. The separate financial statements of the companies included in the scope
of consolidation are prepared as of the same reporting date as the consolidated financial statements.
The structure of the consolidated income statement follows the cost-of-sales method, according to which expenses incurred in
generating sales are divided into functional areas. In the statement of comprehensive income, use was made of the option to
present this separately from the consolidated income statement. The balance sheet classification distinguishes between
non-current and current assets and liabilities, some of which are presented in detail in the notes according to their maturities.
The consolidated financial statements are prepared in euro. Unless otherwise indicated, figures in the notes are shown in euro
thousands (€ 000s). Rounding is necessary, although this of course is not significant in its nature.
3. Consequences of new or amended standards and interpretations
In financial year 2016, STADA observed and, if relevant, applied the pronouncements and amendments to pronouncements
published by the IASB and endorsed by the EU which were first applicable as of January 1, 2016. The changes had no or no
significant effect on the presentation of STADA’s net assets, financial position and results of operations.
The following IFRS standards, which are not yet applicable, have been published by the IASB. Adoption into European
law in accordance with IFRS 16 is still pending:
In July 2014, IASB published the standard IFRS 9 “Financial Instruments”. IFRS 9 replaces IAS 39 and includes guidelines for the
classification, recognition and valuation of financial instruments. Furthermore, IFRS 9 also includes guidelines on the account-
ing of hedging transactions. IFRS 9 is to be applied for financial years beginning on or after January 1, 2018. Earlier application
is permitted. An examination of the impact of the application of IFRS 9 on the consolidated financial statements has not yet
been completed. As a result of the new guidelines for the impairment of financial instruments, in some cases expected future
losses may lead to earlier recognition of expenses.

113STADA Consolidated Financial Statements | Notes to the Consolidated Financial Statements
In May 2014, the IASB published the new standard IFRS 15 “Revenue from Contracts with Customers”. IFRS 15 governs revenue
recognition for contracts with customers in a 5-step model and in particular replaces the existing standards IAS 11 “Construc-
tion Contracts” and IAS 18 “Revenue”. IFRS 15 is to be applied for financial years beginning on or after January 1, 2018. Earlier
application is permitted. An examination of the impact of the application of IFRS 15 on the consolidated financial statements
has not yet been completed. However, the new standard on the realization of sales will have little impact on sales accounting,
as sales are largely realized in the consolidated financial statements as a result of routine transactions. There are no agreements
in the Group which regulate multiple services within one contract or within several contracts (multi-element arrangements).
Changes may occur exclusively in the accounting of licensing agreements, which amounted to less than 2% of the total sales
revenue in financial year 2016. However, this only affects license agreements which are not bound by the sales achieved by the
licensee and which grant the licensee the right to use the license, without further actions by STADA being required. For such
license agreements, as a result of the new IFRS 15 standard, in future sales will be realized in the amount of the entire license
fee with the granting of a license and therefore not, as they are presently, divided over the term of the license.
In January 2016, the IASB published the new IFRS 16 “Leases” standard, which determines the recognition of contractual rights
(assets) and obligations (financial liabilities) associated with leases in the balance sheet for lessees. Lessees are no longer
required to classify leases as finance leases or operating leases. IFRS 16 is to be applied for financial years beginning on or
after January 1, 2019. Earlier application is permitted. An examination of the impact of the application of IFRS 16 on the
consolidated financial statements has not yet been completed. As a result of the accounting of assets and liabilities in the
lessee’s balance sheet, as required by IFRS 16, an increase of the balance sheet total is expected at the point of initial application.
Instead of leasing expenses, as a result of the changes from IFRS 16, future depreciation and amortization and interest
expenses will be recorded in the income statement – with a corresponding positive impact on EBITDA.
From today’s perspective, no or no significant effects on the consolidated financial statements are expected from the future
application of the further standards and interpretations not yet applied.
4. Changes in accounting policies
With the exception of the changed accounting policies listed in Note 3., there were no changes to accounting policies with
significant consequences for the presentation of STADA’s net assets, financial position and results of operations or cash flow in
financial year 2016.
5. Scope of consolidation
All significant subsidiaries, joint ventures and associates are included in the consolidated financial statements. Subsidiaries are
companies that are directly or indirectly controlled by STADA and are therefore fully consolidated. Control exists if STADA
Arzneimittel AG or its subsidiaries are in control of an investee, are exposed to variable backflows and, due to control over
existing rights, are able to substantially influence the investee’s variable backflows. Control is usually substantiated by a share
of voting rights of more than 50%.
Joint arrangements are characterized by joint control by two or more parties and should be classified as either joint operations
or as joint ventures. In joint operations, the parties that exercise joint control possess the rights to assets and liabilities in-
cluded in the agreement. In joint ventures, however, the parties involved possess rights to the company’s net assets. Joint
ventures are to be included in the consolidated financial statements using the equity method.
Associates are companies over which STADA is able to exercise significant influence and which are not subsidiaries or joint
ventures. They are included in the consolidated financial statements using the equity method.

114 STADA Consolidated Financial Statements
Subsidiaries, joint ventures and associates whose influence, both individually and as a whole, on the net assets, financial position
and results of operations situation of the STADA Group is immaterial, are not consolidated or accounted for using the equity
method. Investments in these companies are accounted for either at fair value or at amortized cost under financial assets.
Accumulated, the sales and balance sheet total of these companies make up about 1% of total Group sales and/or the balance
sheet total.
Changes in the scope of consolidation resulted regarding the number of subsidiaries, joint ventures and associates included in
financial year 2016 and are as follows:
Number of companies in the scope of consolidation
Germany
Outside Germany
Total
January 1, 2016 12 75 87
Acquisitions – 3 3
Disposals – 2 2
December 31, 2016 12 76 88
The acquisition of the Argentinian company Laboratorio Vannier S.A. was completed in accordance with corporate law in the
first quarter of 2016. The initial consolidation of the company as a subsidiary occurred on January 1, 2016. In addition, the
acquisition of the British company BSMW Limited was completed in accordance with corporate law and was consolidated as a
subsidiary for the first time as of February 1, 2016.
Furthermore, the Finnish company Oy STADA Pharma Ab was deconsolidated in the second quarter of 2016 as a result of the
completed liquidation.
In addition, the Egyptian company STADA Egypt Ltd. was deconsolidated due to liquidation initiated in the third quarter of 2016.
Furthermore, the British company Natures Aid was included in the scope of consolidation as a result of the acquisition in
accordance with corporate law. The initial consolidation was on November 21, 2016.
In the consolidated financial statements of the STADA Group, 84 companies were consolidated as subsidiaries and four
companies as associates as of the reporting date on December 31, 2016.
As in the previous year, the aforementioned chart includes BIOCEUTICALS Arzneimittel AG, which is included in the consolidated
financial statements as an associate according to the equity method. STADA holds 15.86% of the shares in this company. The
significant influence is therefore not directly due to the amount of shares held, but instead is a result of STADA’s representation
in the supervisory body of BIOCEUTICALS as well as distribution rights granted for Epo-zeta in Germany through cell pharm
Gesellschaft für pharmazeutische Präparate mbH and the associated significant business transactions.
As in the previous year, the aforementioned chart also includes both French companies Pharm Ortho Pedic SAS and AELIA SAS,
pursuant to shareholdings of 25.0% and 20.0% acquired by STADA, which are included in the consolidated financial statements
as an associate in accordance with the equity method. The initial inclusion of the Russian Dialogfarma LLC as an associate took
place as of August 1, 2015. The following condensed financial information is given for these four associates:
in € million 2016 2015
Share of result from continuing operations 0.7 1.4
Share of result from discontinued operations – –
Share of other comprehensive income – –
Share of comprehensive income 0.7 1.4
Aggregate carrying amount 13.9 13.2

115STADA Consolidated Financial Statements | Notes to the Consolidated Financial Statements
There are significant non-controlling interests in the Vietnamese subsidiaries Pymepharco Joint Stock Company and STADA
Vietnam J.V. Co. of the STADA Group.
In the following, the influence of other shareholders in these subsidiaries as of December 31, 2016 is presented:
Name of subsidiary
Headquarters/ place of founding
Share in
voting rights of non-controlling
interests
Result of
non-controlling interests in 2016
in € 000s
Accumulated non-controlling
shares as of Dec. 31, 2016
in € 000s
Pymepharco Vietnam 41% 3,459 32,114
STADA Vietnam Vietnam 50% 4,935 32,266
The disclosures for the previous year are as follows:
Name of subsidiary
Headquarters/ place of founding
Share in
voting rights of non-controlling
interests
Result of
non-controlling interests in 2015
in € 000s
Accumulated non-controlling
shares as of Dec. 31, 2015
in € 000s
Pymepharco Vietnam 41% 2,185 27,983
STADA Vietnam Vietnam 50% 3,633 31,137
In the following, the financial information of both subsidiaries as of December 31, 2016 and for financial year 2016 is
summarized:
Assets as of Dec. 31, 2016 Liabilities as of Dec. 31, 2016
in € 000s current non-current current non-current
Pymepharco 54,332 52,465 7,652 9,887
STADA Vietnam 44,111 39,482 6,087 7,715
Earnings after taxes in 2016
in € 000s
Sales
distributable to STADA
distributable
to non- controlling
interests
Total earnings in 2016
Dividends to non-con-
trolling interests in
2016
Pymepharco 60,576 4,978 3,459 10,370 1,623
STADA Vietnam 41,856 4,935 4,935 11,515 4,561

116 STADA Consolidated Financial Statements
For the previous year, the following disclosures are made regarding the summarized financial information:
Assets as of Dec. 31, 2015 Liabilities as of Dec. 31, 2015
in € 000s current non-current current non-current
Pymepharco 57,079 40,712 8,743 10,159
STADA Vietnam 45,771 36,466 6,281 8,558
Earnings after taxes in 2015
in T €
Sales
distributable to STADA
distributable
to non- controlling
interests
Total earnings in
2015
Dividends to non-
controlling interests in
2015
Pymepharco 53,849 3,033 2,185 8,192 2,249
STADA Vietnam 55,827 3,594 3,633 9,982 4,863

117STADA Consolidated Financial Statements | Notes to the Consolidated Financial Statements
1) Currently in the process of liquidation.2) Currently in the process of liquidation. Deconsolidation as of September 30, 2016.
Subsidiaries, joint ventures and associates as well as all non-consolidated and other investments are included in the con-
solidated financial statements as investments and listed below.
Direct investments of STADA Arzneimittel AG:
Name of the company, registered office Share in capital Form of consolidation
AO Nizhpharm, Nizhny Novgorod, Russia 100% subsidiary
BEPHA Beteiligungsgesellschaft für Pharmawerte mbH, Bad Vilbel, Germany 100% subsidiary
BIOCEUTICALS Arzneimittel AG, Bad Vilbel, Germany 15.86% associate
Ciclum Farma, Unipessoal, LDA, Paco de Arcos, Portugal 100% subsidiary
Crinos S.p.A., Milan, Italy 96.77% subsidiary
EG Labo - Laboratoires Eurogenerics SAS, Boulogne-Billancourt, France 100% subsidiary
EG S.p.A., Milan, Italy 98.87% subsidiary
Grunenthal Ukraine LLC, Kiev, Ukraine1) 100% not included
Laboratorio STADA, S.L., Barcelona, Spain 100% subsidiary
Laboratorio Vannier S.A., Buenos Aires, Argentina 85% subsidiary
Mobilat Produktions GmbH, Pfaffenhofen, Germany 100% subsidiary
OOO Hemofarm, Obninsk, Russia 10% subsidiary
OOO STADA Marketing, Nizhny Novgorod, Russia 10% subsidiary
SCIOTEC Diagnostics Technologies GmbH, Tulln, Austria 100% subsidiary
STADA Aesthetics Belgique (BVBA), Zaventem, Belgium 100% not included
STADA Aesthetics Deutschland GmbH, Bad Homburg, Germany 100% not included
STADA Arzneimittel Gesellschaft m.b.H., Vienna, Austria 100% subsidiary
STADA d.o.o., Ljubljana, Slovenia 100% subsidiary
STADA d.o.o., Zagreb, Croatia 100% subsidiary
STADA Egypt Ltd., Cairo, Egypt2) 83.33% not included
STADA (Shanghai) Company Management Consulting Co. Ltd., Shanghai, China 100% not included
STADA GmbH, Bad Vilbel, Germany 100% subsidiary
STADA LUX S.à R.L., Luxembourg, Luxembourg 100% not included
STADA PHARMA Bulgaria EOOD, Sofia, Bulgaria 100% subsidiary
STADA PHARMA CZ s.r.o., Prague, Czech Republic 100% subsidiary
STADA Pharma International GmbH, Bad Vilbel, Germany 100% subsidiary
STADA Pharma Services India Private Ltd., Mumbai, India 85% not included
STADA PHARMA Slovakia s.r.o., Bratislava, Slovakia 100% subsidiary
STADA Pharmaceuticals (Asia) Ltd., Hong Kong, China 100% subsidiary
STADA Pharmaceuticals Australia Pty. Ltd., Sydney, Australia 100% not included
STADA Poland Sp. z o.o., Piaseczno, Poland 100% subsidiary
STADA Service Holding B.V., Etten-Leur, Netherlands 100% subsidiary
STADApharm GmbH, Bad Vilbel, Germany 100% subsidiary
STADA UK Holdings Ltd., Reading, United Kingdom 100% subsidiary

118 STADA Consolidated Financial Statements
Indirect investments of STADA Arzneimittel AG through EG Labo - Laboratoires Eurogenerics SAS:
Name of the company, registered office Share in capital Form of consolidation
AELIA SAS, Saint Brieuc, France 20% associate
Pharm Ortho Pedic SAS, Trélazé, France 25% associate
Indirect investments of STADA Arzneimittel AG through STADA UK Holdings Ltd.:
Name of the company, registered office Share in capital Form of consolidation
BSMW Ltd., Huddersfield, United Kingdom 100% subsidiary
Clonmel Healthcare Ltd., Clonmel, Ireland 100% subsidiary
Fresh Vape Electronic Cigarettes Ltd., Huddersfield, United Kingdom 100% subsidiary
Internis Pharmaceuticals Ltd., Huddersfield, United Kingdom 100% subsidiary
Lowry Solutions Ltd., Huddersfield, United Kingdom 100% subsidiary
Natures Aid Ltd., Huddersfield, United Kingdom 100% subsidiary
Pegach AG, Egerkingen, Switzerland 100% subsidiary
Slam Trading Ltd., Huddersfield, United Kingdom 100% subsidiary
Socialites E-Commerce Ltd., Huddersfield, United Kingdom 100% subsidiary
Socialites Retail Ltd., Huddersfield, United Kingdom 100% subsidiary
Sundrops Ltd., Huddersfield, United Kingdom 100% subsidiary
Thornton & Ross Ltd., Huddersfield, United Kingdom 100% subsidiary
Indirect investments of STADA Arzneimittel AG through STADA UK Holdings Ltd. and Thornton & Ross Ltd.:
Name of the company, registered office Share in capital Form of consolidation
LCM Ltd., Huddersfield, United Kingdom 100% subsidiary
Thornton & Ross Ireland Ltd., Clonmel, Ireland 100% subsidiary
Zeroderma Ltd., Huddersfield, United Kingdom 100% subsidiary
Indirect investments of STADA Arzneimittel AG through STADA UK Holdings Ltd. and through Slam Trading Ltd.:
Name of the company, registered office Share in capital Form of consolidation
LAS Trading Ltd., Huddersfield, United Kingdom 100% subsidiary
Socialites Nederlands B.V., Beuningen, Netherlands 100% subsidiary

119STADA Consolidated Financial Statements | Notes to the Consolidated Financial Statements
1) Currently in the process of liquidation. Deconsolidation as of September 30, 2016.
Indirect investments of STADA Arzneimittel AG through BEPHA Beteiligungsgesellschaft für Pharmawerte mbH:
Name of the company, registered office Share in capital Form of consolidation
ALIUD PHARMA GmbH, Laichingen, Germany 100% subsidiary
Blitz F15-487 GmbH, Bad Vilbel, Germany 100% not included
cell pharm Gesellschaft für pharmazeutische und diagnostische Präparate mbH, Bad Vilbel, Germany
100%
subsidiary
Crinos S.p.A., Milan, Italy 3.23% subsidiary
Croma Medic, Inc., Manila, Philippines 100% subsidiary
EG S.p.A., Milan, Italy 1.13% subsidiary
Grippostad GmbH, Bad Vilbel, Germany 100% not included
Laboratorio Vannier S.A., Buenos Aires, Argentina 15% subsidiary
Nizhpharm-Ukraine DO, Kiev, Ukraine 100% subsidiary
STADA Aesthetics AG, Bottighofen, Switzerland 100% not included
PharmaSwyzz Deutschland GmbH, Bad Homburg, Germany 100% not included
STADA CEE GmbH, Bad Vilbel, Germany 100% subsidiary
STADA Egypt Ltd., Cairo, Egypt1) 16.67% not included
STADA Nordic ApS, Herlev, Denmark 100% subsidiary
STADA Pharma Services India Private Ltd., Mumbai, India 15% not included
STAdata LLC, Kiev, Ukraine 100% not included
STADA (Thailand) Company, Ltd., Bangkok, Thailand 60% subsidiary
STADAvita GmbH, Bad Homburg, Germany 100% subsidiary
Indirect investments of STADA Arzneimittel AG through BEPHA Beteiligungsgesellschaft für Pharmawerte mbH and through
STADA Aesthetics AG:
Name of the company, registered office Share in capital Form of consolidation
STADA Aesthetics Italia S.R.L., Verona, Italy 100% not included
STADA Aesthetics UK Limited, West Wickham, United Kingdom 100% not included
Indirect investments of STADA Arzneimittel AG through STADA GmbH:
Name of the company, registered office Share in capital Form of consolidation
STADA Medical GmbH, Bad Vilbel, Germany 100% subsidiary
Indirect investments of STADA Arzneimittel AG through STADA Service Holding B.V.:
Name of the company, registered office Share in capital Form of consolidation
Centrafarm Nederland B.V., Etten-Leur, Netherlands 100% subsidiary
Hemofarm A.D., Vrsac, Serbia 100% subsidiary
Pymepharco Joint Stock Company, Tuy Hoa, Vietnam 49% subsidiary
S.A. Eurogenerics N.V., Brussels, Belgium 90% subsidiary
STADA MENA DWC-LLC, Dubai, United Arab Emirates 100% subsidiary

120 STADA Consolidated Financial Statements
Indirect investments of STADA Arzneimittel AG through STADA Service Holding B.V. and through Centrafarm Nederland B.V.:
Name of the company, registered office Share in capital Form of consolidation
Centrafarm Services B.V., Etten-Leur, Netherlands 100% subsidiary
Healthypharm B.V., Etten-Leur, Netherlands 100% subsidiary
HTP Huisapotheek B.V., Etten-Leur, Netherlands 100% subsidiary
Quatropharma Holding B.V., Etten-Leur, Netherlands 100% subsidiary
S.A. Eurogenerics N.V., Brussels, Belgium 10% subsidiary
Indirect investments of STADA Arzneimittel AG through STADA Service Holding B.V., through Centrafarm Nederland B.V. and
through Quatropharma Holding B.V.:
Name of the company, registered office Share in capital Form of consolidation
Centrafarm B.V., Etten-Leur, Netherlands 100% subsidiary
Indirect investments of STADA Arzneimittel AG through STADA Pharmaceuticals (Asia) Ltd.:
Name of the company, registered office Share in capital Form of consolidation
STADA Import/Export International Ltd., Hong Kong, China 51% subsidiary
STADA Pharmaceuticals (Beijing) Ltd., Beijing, China 83.35% subsidiary
STADA Vietnam J.V. Co., Ltd., Ho Chi Minh City, Vietnam 50% subsidiary
Well Light Investment Services JSC, Ho Chi Minh City, Vietnam 49% subsidiary
Indirect investments of STADA Arzneimittel AG through STADA Pharmaceuticals (Asia) Ltd. and through
Well Light Investment Services JSC:
Name of the company, registered office Share in capital Form of consolidation
Pymepharco Joint Stock Company, Tuy Hoa, Vietnam 10% subsidiary
Indirect investments of STADA Arzneimittel AG through STADA Service Holding B.V. and through Pymepharco JSC and/or indirect
investments of STADA Arzneimittel AG through STADA Pharmaceuticals (Asia) Ltd., through Well Light Investment Services JSC
and through Pymepharco JSC:
Name of the company, registered office Share in capital Form of consolidation
Dak Nong Pharmaceutical JSC, Dak Nong, Vietnam 43% not included
Phu Yen Export Import Pharmaceutical JSC, Phu Yen, Vietnam 20% not included
Quang Tri Pharmaceutical JSC, Quang Tri, Vietnam 37.44% not included

121STADA Consolidated Financial Statements | Notes to the Consolidated Financial Statements
Indirect investments of STADA Arzneimittel AG through STADA UK Holdings Ltd. and through Clonmel Healthcare Ltd.:
Name of the company, registered office Share in capital Form of consolidation
CNRD 2009 Ireland Ltd., Dublin, Ireland 50% not included
Crosspharma Ltd., Belfast, United Kingdom 100% subsidiary
Genus Pharmaceuticals Holdings Ltd., Huddersfield, United Kingdom 100% subsidiary
STADA Financial Investments Ltd., Clonmel, Ireland 100% subsidiary
Indirect investments of STADA Arzneimittel AG through STADA UK Holdings Ltd., through Clonmel Healthcare Ltd. and through
Genus Pharmaceuticals Holdings Ltd.:
Name of the company, registered office Share in capital Form of consolidation
Britannia Pharmaceuticals Ltd., Reading, United Kingdom 100% subsidiary
Genus Pharmaceuticals Ltd., Huddersfield, United Kingdom 100% subsidiary
Indirect investments of STADA Arzneimittel AG through STADA UK Holdings Ltd., through Clonmel Healthcare Ltd., through
Genus Pharmaceuticals Holdings Ltd. and through Britannia Pharmaceuticals Ltd.:
Name of the company, registered office Share in capital Form of consolidation
Brituswip Ltd., Reading, United Kingdom 50% not included
Indirect investments of STADA Arzneimittel AG through AO Nizhpharm:
Name of the company, registered office Share in capital Form of consolidation
000 Dialogfarma, Moscow, Russia
50%
associate
Nizhpharm-Kazakhstan TOO DO, Almaty, Kazakhstan 100% subsidiary
OOO Aqualor, Moscow, Russia 100% subsidiary
OOO Hemofarm, Obninsk, Russia 90% subsidiary
OOO STADA CIS, Nizhny Novgorod, Russia 100% subsidiary
OOO STADA Marketing, Nizhny Novgorod, Russia 90% subsidiary
OOO STADA PharmDevelopment, Nizhny Novgorod, Russia 100% subsidiary
STADA M&D S.r.L., Bucharest, Romania 100% subsidiary
UAB STADA-Nizhpharm-Baltija, Vilnius, Lithuania 100% subsidiary
ZAO Makiz-Pharma, Moscow, Russia 100% subsidiary
ZAO Skopinpharm, Ryazanskaya obl., Russia 100% subsidiary
Indirect investments of STADA Arzneimittel AG through Ciclum Farma, Unipessoal, LDA:
Name of the company, registered office Share in capital Form of consolidation
STADA, LDA, Paco de Arcos, Portugal 98% not included

122 STADA Consolidated Financial Statements
Indirect investments of STADA Arzneimittel AG through Laboratorio STADA, S.L.:
Name of the company, registered office Share in capital Form of consolidation
STADA Genericos, S.L., Barcelona, Spain 100% not included
STADA, LDA, Paco de Arcos, Portugal 2% not included
Indirect investments of STADA Arzneimittel AG through STADA Service Holding B.V. and through Hemofarm A.D.:
Name of the company, registered office Share in capital Form of consolidation
Hemofarm Banja Luka d.o.o., Banja Luka, Bosnia-Herzegovina 91.50% subsidiary
Hemofarm Komerc d.o.o., Skopje, Macedonia1) 99.18% not included
Hemofarm S.à.R.L., Constantine, Algeria 40% not included
Hemomont d.o.o., Podgorica, Montenegro 71.02% subsidiary
Hemopharm GmbH Pharmazeutisches Unternehmen, Bad Homburg, Germany 100% subsidiary
Jinan Pharmaceuticals Co., Jinan, China 35.50% not included
STADA HEMOFARM S.R.L., Temeswar, Romania 100% subsidiary
STADA IT Solutions d.o.o., Belgrade, Serbia 100% subsidiary
Velefarm A.D., Belgrade, Serbia 19.65% not included
Vetfarm A.D., Belgrade, Serbia 15% not included
Indirect investments of STADA Arzneimittel AG through STADA UK Holdings Ltd. and through Pegach AG:
Name of the company, registered office Share in capital Form of consolidation
Spirig HealthCare AG, Egerkingen, Switzerland 100% subsidiary
The exemption rule stated in Section 264 (3) HGB was applied to ALIUD PHARMA GmbH, BEPHA Beteiligungsgesellschaft für
Pharmawerte mbH, cell pharm Gesellschaft für pharmazeutische und diagnostische Präparate mbH, STADA GmbH,
STADA Medical GmbH, STADA CEE GmbH, STADApharm GmbH, STADAvita GmbH, STADA Pharma International GmbH and
Mobilat Produktions GmbH.
6. Principles for the consolidation of subsidiaries, joint ventures and associates
According to IFRS, business combinations are to be accounted for using the acquisition method. Assets, liabilities and contingent
liabilities from business combinations are generally recognized in full – irrespective of the amount of the shareholding – as of
the acquisition date at their fair values. If the historical costs of the subsidiary acquired exceed the proportionate newly measured
net assets of the acquiree, STADA recognizes the positive difference as goodwill. After critical examination of the premises
underlying the purchase price allocation, a negative difference is recognized through profit or loss in the period of the ac-
quisition. In a business combination achieved in stages, it is necessary to carry out a revaluation through profit or loss of the
shares previously held at the date control was achieved. The shares of non-controlling interests are reported in the amount of
their share in net assets of the subsidiary.
The acquisition of additional shares from an existing controlling position in a subsidiary is recognized through other
com prehensive income in accordance with IFRS 10, as it is a transaction between the equity investors.
1) Currently in the process of liquidation.

123STADA Consolidated Financial Statements | Notes to the Consolidated Financial Statements
Subsidiaries are generally included in the consolidated financial statements from the acquisition date to the end of control by
the parent company. Receivables and financial liabilities, expenses and income, as well as earnings between the companies
included in the consolidated financial statements are eliminated, intragroup value allowances and provisions are released. If
these consolidation measures result in deviations between the IFRS carrying amounts and the tax base of assets and liabilities,
deferred tax liabilities are recognized.
Shares in associates are recognized according to the equity method at historical cost on the date when joint control is established
(joint ventures) or when significant influence was established (associate) and carried forward from this date in the amount of
the proportionate share of earnings in the financial year. A positive difference determined during the purchase price allocation
is recognized as goodwill in the carrying amount of the investment in the associate. A negative difference is recognized in income
in the period of the acquisition in the results from associates. Profit and loss from transactions with associates is recognized in
the consolidated financial statements only according to the share of minority interests.
If indications arise from the application of IAS 39 that the carrying amount determined using the equity method might be
impaired, an impairment test is carried out and, if applicable, an impairment loss in the amount of the difference between the
carrying amount and the recoverable amount is recognized. The recoverable amount is the higher of the fair value less cost to
sell and the value in use of the shares in an associate.
7. Currency translation
The functional currency of STADA Arzneimittel AG is the euro and represents the reporting currency of the Group.
In the separate financial statements of companies included in the consolidated financial statements, foreign currency trans-
actions are translated into the functional currency at the exchange rate applicable at the time of the transactions. On every
reporting date, monetary items are translated using the closing rate and non-monetary items are translated using the trans-
action rate. Resulting currency translation differences are recognized in income as exchange gains or losses.
The translation of the companies included in the consolidated financial statements with a functional currency other than the
euro into the Group functional currency is carried out using the closing rate method. Assets and liabilities are generally trans-
lated using the closing rate, while individual components of equity are translated using the historical rates at their respective
dates of inflow from the Group’s perspective. The income and expenses of the income statements are translated – and also the
resulting translation of the annual results to be entered in equity – using the average exchange rate of the period.
Currency translation differences arising from the use of different foreign exchange rates are recognized through other
com prehensive income in the equity in the “reserves for currency translation”. These reserves are released and recognized in
income if Group companies leave the scope of consolidation.
The exchange rate development of currencies important to STADA to the euro can be seen in the following chart:
Significant currency relations in local currency to € 1
Closing rate on Dec. 31 in local currency
Average rate for the reporting period
2016 2015 ± % 2016 2015 ± %
Pound sterling 0.85620 0.73390 +17% 0.81886 0.72604 +13%
Swiss franc 1.07390 1.08350 -1% 1.09018 1.06764 +2%
Russian ruble 64.30000 80.67360 -20% 74,22592 68.01339 +9%
Serbian dinar 123.47230 121.62610 +2% 123,10467 120.75718 +2%
Ukrainian hryvnia 28.42260 26.05560 +9% 28.28164 24.22888 +17%
US dollar 1.05410 1.08870 -3% 1.10660 1.10970 0%

124 STADA Consolidated Financial Statements
8. Business combinations
In financial year 2016, the following significant business combinations in accordance with IFRS 3 occurred for which the
preliminary purchase price allocation is described in more detail below.
In the first quarter of 2016, the purchase price allocation for the British Socialites group based in Chesterfield and acquired in
the fourth quarter of 2015 was finalized. STADA achieved control upon conclusion of the contract on December 4, 2015. The
purchase price for the acquisition amounted to GBP 21.0 million and was paid in cash or cash equivalents.
In the context of the final purchase price allocation, goodwill in the amount of € 16.6 million resulted from this business
combination and was broken down as follows:
in € million
Purchase price for 100% of the shares of the company approx. 29.5
Proportionate fair values of the assets and liabilities acquired approx. 12.9
Goodwill 16.6
Goodwill primarily resulted from an expansion of company presence and sales activities in the British market in the Branded
Products segment.
For the assets acquired and liabilities assumed in the context of the business combination, the following fair values were
recognized at the acquisition date:
Fair values in € million
Intangible assets 13.9
Other non-current assets 0.4
Inventories 2.8
Other current assets 1.5
Assets 18.6
Deferred tax liabilities 2.8
Other non-current liabilities 0.0
Trade payables 2.1
Other current financial liabilities 0.8
Liabilities 5.7
Fair values were determined on the basis of observable market prices. To the extent that market prices could not be determined,
income or cost-oriented procedures were used for the evaluation of acquired assets and liabilities assumed.
Sales generated in the Branded Products segment with the Socialites group amounted to around € 10.1 million in financial year
2016. The operating profit of this business combination adjusted for the effects of the purchase price allocation (around
€ 1.9 million) amounted to around € 0.8 million in the reporting year.
In order to strengthen the Generics segment, STADA and the STADA subsidiary BEPHA Beteiligungsgesellschaft für Pharmawerte
mbH signed a contract for the purchase of the Argentinian generics producer Laboratorio Vannier in the fourth quarter of 2015.
The purchase price amounted to USD 13.0 million (according to the foreign exchange rate at the date of acquisition approx.
€ 11.9 million) and was or will be paid in cash or cash equivalents. This includes certain conditional purchase price components,
which are to be paid upon reaching a fixed earnings figure. This is guaranteed to reach a minimum of USD 1 million, with a
maximum of USD 1.5 million. The seller was a private individual. The purchase was completed in the first quarter of 2016. STADA
achieved control on January 4, 2016.

125STADA Consolidated Financial Statements | Notes to the Consolidated Financial Statements
In the context of the purchase price allocation completed in the third quarter of 2016, goodwill in the amount of € 5.9 million
resulted from this business combination and was broken down as follows:
in € million
Purchase price for 100% of the shares of the company approx. 11.9
Proportionate fair values of the assets and liabilities acquired approx. 6.0
Goodwill 5.9
Goodwill primarily resulted from the expansion of the international sales network in a country in which the STADA Group had
not yet been represented with its own sales company in the Generics segment.
For the assets acquired and liabilities assumed in the context of the business combination, the following fair values were
recognized at the acquisition date:
Fair values in € million
Intangible assets 5.6
Other non-current assets 0.2
Inventories and other current assets 2.5
Cash and cash equivalents 1.2
Assets 9.5
Deferred tax liabilities 1.9
Other non-current liabilities 0.2
Other current financial liabilities 1.4
Liabilities 3.5
Fair values were determined on the basis of observable market prices. To the extent that market prices could not be determined,
income or cost-oriented procedures were used for the evaluation of acquired assets and liabilities assumed.
Sales generated in the Generics segment with Laboratorio Vannier amounted to around € 7.8 million in financial year 2016. The
operating profit of this business combination, adjusted for the effects of the purchase price allocation (around € 0.2 million),
amounted to around € 0.9 million in the reporting year.
In the first quarter of 2016, STADA acquired the British BSMW, based in Stockport. STADA achieved control upon conclusion of
the contract on February 5, 2016. The purchase price for the acquisition amounted to GBP 3.4 million and was completely paid
in cash or cash equivalents.
In the context of the final purchase price allocation in the first quarter of 2016, goodwill in the amount of € 3.5 million resulted
from this business combination and was broken down as follows:
in € million
Purchase price for 100% of the shares of the company approx. 4.4
Proportionate fair values of the assets and liabilities acquired approx. 0.9
Goodwill 3.5

126 STADA Consolidated Financial Statements
Goodwill primarily resulted from an expansion of presence and sales activities in the British market in the Branded Products
segment.
For the assets acquired and liabilities assumed in the context of the business combination, the following fair values were
recognized at the acquisition date:
Fair values in € million
Property, plant and equipment 0.1
Inventories 0.3
Other current assets 0.2
Cash and cash equivalents 0.6
Assets 1.2
Deferred tax liabilities 0.0
Other current financial liabilities 0.3
Liabilities 0.3
Fair values were determined on the basis of observable market prices. To the extent that market prices could not be determined,
income or cost-oriented procedures were used for the evaluation of acquired assets and liabilities assumed.
Sales generated in the Branded Products segment with BSMW amounted to around € 3.9 million in the eleven months since the
initial consolidation. The operating profit of this business combination adjusted for the effects of the purchase price allocation
(around € 0.2 million) amounted to around € 2.1 million in the reporting year. If STADA had acquired BSMW on January 1, 2016,
sales of around € 4.2 million and operating profit, adjusted for effects from the purchase price allocation (around € 0.2 million),
of around € 2.3 million would have been achieved on a straight-line basis in 2016.
In the third quarter of 2016, the Serbian subsidiary of STADA Arzneimittel AG, Hemofarm A.D., acquired a local product port folio
that primarily includes drugs for treating inflammations of the gastrointestinal tract, including the related processes.
The purchase price for the acquisition of the product portfolio including the associated sales structure amounted to a total of
€ 21.6 million and will be or has already been completely paid in cash or cash equivalents. The acquisition includes a portfolio
of 50 product presentations for the sales in Serbia, Bosnia-Herzegovina, Macedonia and Montenegro, the corresponding
IP rights and license agreements and a local production and packaging facilities. In addition, Hemofarm will take over
104 employees. STADA achieved control upon conclusion of the contract on August 1, 2016, as a result of which the acquired
business has been consolidated within the STADA Group since August 1, 2016.
In the context of the final purchase price allocation, goodwill in the amount of € 0.4 million resulted from this business
combination and was broken down as follows:
in € million
Purchase price for 100% of the shares of the company approx. 21.6
Proportionate fair values of the assets and liabilities acquired approx. 21.2
Goodwill 0.4
Goodwill resulted primarily from the expansion of STADA’s presence and sales activities in the Branded Products segment,
particularly in the Serbian market.

127STADA Consolidated Financial Statements | Notes to the Consolidated Financial Statements
For the assets acquired and liabilities assumed in the context of the business combination, the following fair values were
recognized at the acquisition date:
Fair values in € million
Intangible assets 18.4
Property, plant and equipment 2.7
Deferred tax assets 0.1
Assets 21.2
Liabilities 0.0
Fair values were determined on the basis of observable market prices. To the extent that market prices could not be determined,
income or cost-oriented procedures were used for the evaluation of acquired assets and liabilities assumed.
The acquired sales amounted to approx. € 3.5 million in the five months after initial consolidation. The operating profit of this
business combination adjusted for the effects of the purchase price allocation (around € 0.7 million) amounted to around
€ 1.5 million in the reporting year. If STADA had acquired the Serbian product portfolio on January 1, 2016, sales of around
€ 8.4 million and operating profit, adjusted for effects from the purchase price allocation (around € 1.7 million), of around
€ 3.6 million would have been achieved on a straight-line basis in 2016.
During the negotiations with the seller of the rights for the product portfolio, Hemofarm A.D. acquired inventories for a purchase
price of € 1.9 million in May 2016. This will be settled entirely in cash. The corresponding obligation was recognized as trade
payables. Since the acquisition date, the acquired inventories have been billed to third-party customers.
In the fourth quarter of 2016, STADA acquired the British Natures Aid, based in Preston. STADA achieved control upon con clusion
of the contract on November 21, 2016. The purchase price for the acquisition amounted to GBP 16.8 million and was complete-
ly paid in cash or cash equivalents.
In the context of the final purchase price allocation, goodwill in the amount of € 4.7 million resulted from this business combi-
nation and was broken down as follows:
in € million
Purchase price for 100% of the shares of the company approx. 19.4
Proportionate fair values of the assets and liabilities acquired approx. 14.7
Goodwill 4.7
Goodwill primarily resulted from an expansion of the presence and sales activities in the Branded products segment, particu-
larly within the nutritional supplements area.
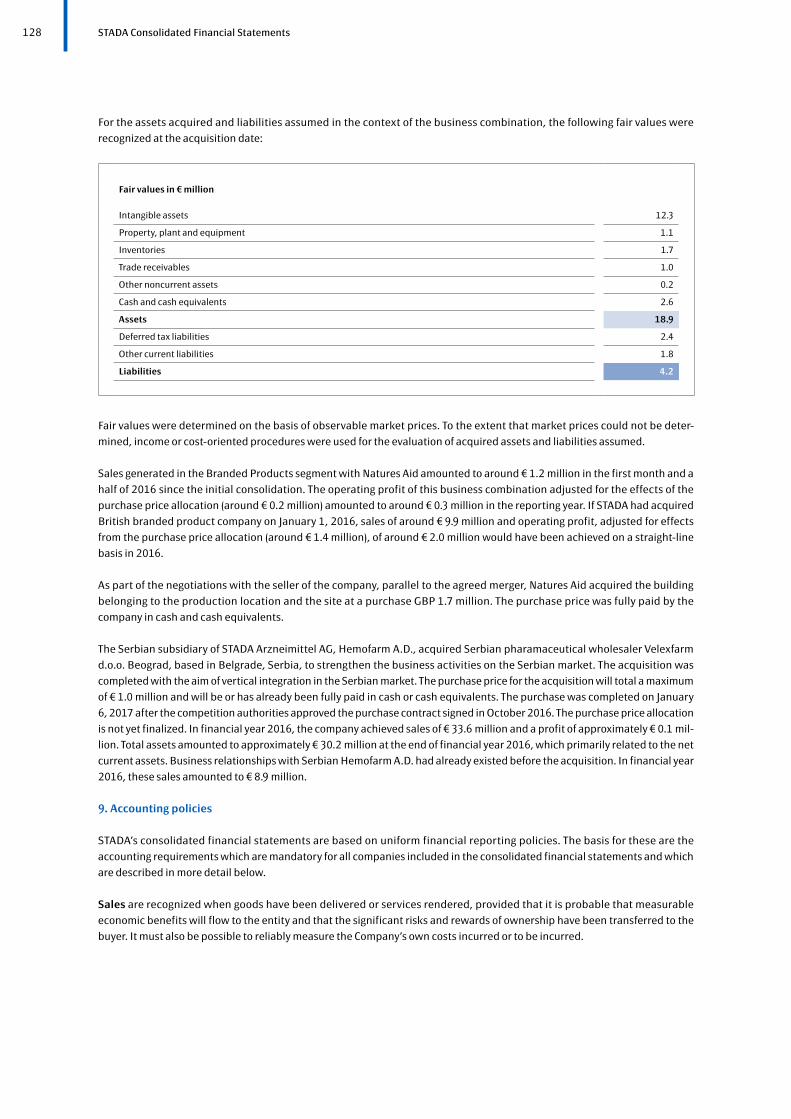
128 STADA Consolidated Financial Statements
For the assets acquired and liabilities assumed in the context of the business combination, the following fair values were
recognized at the acquisition date:
Fair values in € million
Intangible assets 12.3
Property, plant and equipment 1.1
Inventories 1.7
Trade receivables 1.0
Other noncurrent assets 0.2
Cash and cash equivalents 2.6
Assets 18.9
Deferred tax liabilities 2.4
Other current liabilities 1.8
Liabilities 4.2
Fair values were determined on the basis of observable market prices. To the extent that market prices could not be deter-
mined, income or cost-oriented procedures were used for the evaluation of acquired assets and liabilities assumed.
Sales generated in the Branded Products segment with Natures Aid amounted to around € 1.2 million in the first month and a
half of 2016 since the initial consolidation. The operating profit of this business combination adjusted for the effects of the
purchase price allo cation (around € 0.2 million) amounted to around € 0.3 million in the reporting year. If STADA had acquired
British branded product company on January 1, 2016, sales of around € 9.9 million and operating profit, adjusted for effects
from the purchase price allocation (around € 1.4 million), of around € 2.0 million would have been achieved on a straight-line
basis in 2016.
As part of the negotiations with the seller of the company, parallel to the agreed merger, Natures Aid acquired the building
belonging to the production location and the site at a purchase GBP 1.7 million. The purchase price was fully paid by the
company in cash and cash equivalents.
The Serbian subsidiary of STADA Arzneimittel AG, Hemofarm A.D., acquired Serbian pharamaceutical wholesaler Velexfarm
d.o.o. Beograd, based in Belgrade, Serbia, to strengthen the business activities on the Serbian market. The acquisition was
completed with the aim of vertical integration in the Serbian market. The purchase price for the acquisition will total a maximum
of € 1.0 million and will be or has already been fully paid in cash or cash equivalents. The purchase was completed on January
6, 2017 after the competition authorities approved the purchase contract signed in October 2016. The purchase price allocation
is not yet finalized. In financial year 2016, the company achieved sales of € 33.6 million and a profit of approximately € 0.1 mil-
lion. Total assets amounted to approximately € 30.2 million at the end of financial year 2016, which primarily related to the net
current assets. Business relationships with Serbian Hemofarm A.D. had already existed before the acquisition. In financial year
2016, these sales amounted to € 8.9 million.
9. Accounting policies
STADA’s consolidated financial statements are based on uniform financial reporting policies. The basis for these are the
accounting requirements which are mandatory for all companies included in the consolidated financial statements and which
are described in more detail below.
Sales are recognized when goods have been delivered or services rendered, provided that it is probable that measurable
economic benefits will flow to the entity and that the significant risks and rewards of ownership have been transferred to the
buyer. It must also be possible to reliably measure the Company’s own costs incurred or to be incurred.

129STADA Consolidated Financial Statements | Notes to the Consolidated Financial Statements
Sales are recognized before taxes and after deduction of revenue reductions (rebates or discounts) at fair value of the
con sideration received or receivable. Expenses from the creation of provisions for warranties are deducted from sales on the
basis of estimated amounts. The estimates are based on experience regarding amounts used in the past. The estimated expense
from the creation of provisions is determined as a percentage of sales. Discounts to health insurance organizations are also
recognized with a reduction on sales based on the respective contract in force.
Income and expenses from the same transactions are generally accounted in the same period. Expenses related to accruals for
future revenue reductions are thus recorded in the period in which the sales are realized.
Cost of sales includes the costs of conversion of the products sold and the purchase price of commercial goods sold or given
free of charge. The expense is recognized in the period in which the associated income is realized. In addition, cost of sales also
includes costs directly attributable to commercial goods (e.g. cost of materials and personnel expenses), overheads (e.g. depre-
ciation of production equipment and regulatory drug approvals and licenses) as well as valuation allowances of excess or
obsolete inventories.
Research expenses are costs that are incurred in relation to the research activity of a company that aims to provide new
scientific or technical findings. The product portfolio of the STADA Group continues to focus on products that do not require the
Group to conduct its own research. As in previous years, no research expenses were incurred in financial year 2016.
Development costs consist of expenses involved initially in the technical implementation of theoretical discoveries in
production and production processes and ultimately their commercial implementation.
As a rule, the objective of a development process at STADA is to obtain national or multinational regulatory drug approval.
Development costs relative to approvals for new drugs obtained by STADA result in capitalization as intangible assets if all the
following preconditions are met:
• It is technically possible to complete the asset (generally, achieve regulatory drug approval), enabling it to become
available for use or sale.
• The intention and ability, as well as the necessary resources, exist to complete the asset and to use or sell it in the future.
• The intangible asset provides the Group with a future economic benefit.
• It must be possible to reliably determine the development costs of the intangible asset.
STADA immediately recognizes development costs not eligible for capitalization as expense in the periods in which they are
incurred. These include expenses for technical and regulatory maintenance of products marketed.
Interest income is reported in the income statement as a component of financial income. In this regard, both interest income
and interest expenses for all financial instruments measured at amortized cost as well as interest-bearing financial assets
classified as available for sale are recognized on the basis of the effective interest rate.
Dividends received from companies not included in the consolidated financial statements are disclosed within the investment
income. This shall be recognized when the shareholder’s right to receive payment is established.
Income taxes include actual taxes on income as well as deferred tax liabilities. The tax receivables and liabilities recognized in
the balance sheet include demands or liabilities for income taxes in Germany and outside Germany from financial year 2016 as
well as from previous years, if applicable. The tax receivables and liabilities are calculated on the basis of tax rates effective as
of the reporting date or known and already concluded for the future in the countries in which the taxable profit is generated.
Deferred tax liabilities are created for temporary differences between the tax base of the assets or liabilities and their valuation
rate in the IFRS financial statements as well as for tax loss carryforwards. Deferred tax assets are recognized to the extent that
it is probable that a taxable profit will result against which the temporary difference can be utilized. Deferred tax liabilities are

130 STADA Consolidated Financial Statements
recognized for temporary differences taxable in the future. STADA determines deferred taxes on the basis of tax rates applicable
at the reporting date or those that have already been resolved and communicated for the future. Deferred tax receivables and
liabilities are offset if these relate to the same taxation authority.
The tax expense in the period is recognized in the income statement, provided the changes in value that are recognized
directly in equity are not affected. To the extent that there are changes in the tax rate with an effect on deferred taxes, the
resulting effects are recognized in the period in which they arise.
Goodwill is not amortized over the period of useful life. Instead, an impairment test is performed at least once per year
(impairment-only approach). For this purpose, goodwill is allocated to cash-generating units aggregated into operating
segments, where a cash-generating unit corresponds to one of the two operating segments of the STADA Group for the purpose
of an impairment test of goodwill.
STADA carries out impairment tests for capitalized goodwill at least once a year. Additional reviews also take place if indications
of impairment become apparent. During the impairment test, the carrying amount of each cash-generating unit is compared
with its recoverable amount. The carrying amount of a cash-generating unit comprises the carrying amounts of all assets and
liabilities attributable to the valuation unit including the carrying amount of goodwill to be tested. If the recoverable amount of
a cash-generating unit is lower than the carrying amount, an impairment loss results. The recoverable amount is generally
defined as the higher of the fair value less costs to sell, if measurable, and the value in use of the cash-generating unit. The dis-
counted cash flow method is used to determine the value in use, applying an individual interest rate for each cash-generating
unit and a detailed planning period of three years. For the period after this three-year detailed planning horizon, a specific
estimated growth rate in the amount of the expected long-term inflation rate is assumed. Significant assumptions made in
order to determine the value in use include assumptions regarding sales development, regulatory conditions, investments, the
discount rate, currency relations as well as the growth rate. These assumptions are made individually according to the individ-
ual situations for every cash-generating unit and are partly based on internally determined assumptions that both reflect past
experience and include external market data.
Other intangible assets with determinable useful lives are recognized at cost and amortized on a straight-line basis over the
period of their useful life. Amortization shall begin when the asset is available for use, i.e. when it is in the condition necessary
for it to be capable of operating in the intended manner. The useful life of regulatory drug approvals, trademarks, licenses,
dossiers with data for drug approvals or in preparation of drug approvals, software, concessions, property rights and similar
rights is between three and 30 years. If on the reporting date, there are indications that these assets are impaired, the recover-
able amount of the asset is re-evaluated and impairment losses are recognized according to the difference to the carrying
amount. If the reasons for recognizing an impairment loss cease to exist, corresponding write-ups are carried out up to a
maximum of the amortized cost.
Intangible assets with indeterminable useful lives are not amortized. In the context of annual impairment tests and addition-
ally in all cases where there are indications of impairment, the recoverable amounts of these assets are compared with their
carrying amounts and if necessary, an impairment loss is recognized. For this purpose, the fair value of the asset less costs to
sell was determined using the relief from royalty method. At STADA, this affects the umbrella brand Hemofarm capitalized in
the context of the acquisition of the Hemofarm group, the umbrella brand Pymepharco capitalized in the context of achieving
control over Pymepharco, and the umbrella brand Vannier capitlalized in the context of the acquisition of Laboratorio Vannier.
Intangible assets that are not yet available for use are also generally put through annual impairment tests. Furthermore, in each
reporting period, an audit is carried out to check whether the reasons for recognizing an indefinite useful life continue to exist.
Internal development costs are capitalized according the criteria of IAS 38. Capitalized development costs consist mainly of
costs that can be allocated to the projects, such as the costs of individuals working in development, material costs, external
services and directly allocable overheads. Internally created intangible assets are amortized on a straight-line basis over their
useful life, generally 20 years.

131STADA Consolidated Financial Statements | Notes to the Consolidated Financial Statements
Property, plant and equipment is reported at cost less depreciation and any impairment losses plus write-ups. Depreciation
shall begin when the asset is available for use and is accordingly in the condition necessary for it to be capable of operating.
Subsequent acquisition costs are capitalized. Capitalization requires that a future economic benefit will flow to the company
and that the cost of the asset can be reliably measured. Expenses for repairs and maintenance that do not represent significant
replacement investments are recognized as expenses in the financial year in which they are incurred.
Items of property, plant and equipment are depreciated according to their useful life using the straight-line method. The
depreciation period may be up to 50 years in the case of buildings, eight to 20 years in the case of technical facilities and three
to 14 years for other plant and office furniture and equipment. The component approach, according to which every significant
component of property, plant and equipment with different useful lives must be depreciated separately, is not applied at STADA
due to a lack of relevance. To the extent necessary, impairment losses are recognized pursuant to IAS 36; these are reversed if
the reasons for the original recognition of an impairment loss no longer exist.
Borrowing costs that are directly attributable to the acquisition or production of a qualifying asset are capitalized as part of the
cost of the intangible asset and property, plant and equipment. Other borrowing costs are not capitalized. Where acquisitions
are made in a currency other than the respective functional currency, subsequent changes in exchange rates have no impact
on the recording of original historical costs.
Impairments on other intangible assets and property, plant and equipment exist when the recoverable amount of an asset
is lower that its carrying amount. At each reporting date, STADA assesses whether indications for impairment are apparent. If
this is the case, e.g. if certain defined critical values are exceeded, the asset’s recoverable amount is determined. The recoverable
amount is the higher of the asset’s fair value less costs to sell and its value in use, where the value in use is calculated with a
discounted cash flow method. Under this procedure, future cash flows of intangible assets are discounted at the weighted
average cost of capital, which is determined individually for two operating segments with specific parameters. Expenses arising
from impairments are reported under “Other expenses”.
For the purpose of impairment tests of other intangible assets and property, plant and equipment, cash-generating units
within the STADA Group are defined at the level of individual assets within the reportable segments of Branded Products and
Generics.
If the reasons for an impairment no longer exist, the corresponding write-ups are carried out up to a maximum of the carrying
amounts determined at amortized cost. Income from write-ups is reported under the item “Other income”.
Leases are classified either as operating leases or as finance leases, depending on whether the significant risks and rewards of
ownership remain with the lessor or with the lessee. The lease is not recognized in the lessee’s balance sheet in case of
operating leases. STADA records the lease payments for these leases through profit or loss over the lease term. Assets from
finance leases are, on initial recognition, recognized at the lower of the fair value of the lease and the present value of minimum
lease payments, and are depreciated according to their estimated useful lives or shorter contractual period. An amount is
reported as lease liability, when, on initial recognition, it corresponds to the lease’s carrying amount and is extinguished and
carried forward in subsequent periods with a constant effective interest rate. The interest that is part of the lease installment
is recognized as an expense.
In addition, in case of sale and leaseback transactions that represent a finance lease, any surplus of sales proceeds over the
carrying amount is deferred and recognized in the income statement over the lease term.
The total value of capitalized leases is not of material significance for STADA when compared with the total volume of
fixed assets.

132 STADA Consolidated Financial Statements
Under financial assets, STADA recognizes shares in non-consolidated, affiliated companies and other investments. Shares in
associated companies and other investments are classified as available-for-sale financial assets and are generally reported at
fair value with no effect on income. If no quoted market prices in an active market are available to measure these shares and
their fair value therefore cannot be determined reliably, they are measured at amortized cost. If any objective indications of
impairment are determined, these are quantified by means of an impairment test and recognized in income in accordance with
IAS 39.
Inventories include such assets that are held for sale in the ordinary course of business (finished goods) that are in the process
of production for such sale (work in progress), and that are consumed in the production process or in the rendering of services
(materials and supplies). Inventories are measured at the lower of historical costs or costs of sales and net realizable value.
Historical costs or costs of sales are determined based on weighted average costs. Costs of sales include both costs that
are directly incurred in production and overheads that can be allocated to the production process, including reasonable
depreciation on production facilities. Financing costs are not included, but are instead recognized as an expense in the period
in which they occur. Net realizable value is the estimated selling price in the ordinary course of business less the estimated costs
of completion and the estimated costs necessary to make the sale.
Financial assets can be broken down into the following categories in accordance with IAS 39: Loans and receivables, financial
assets at fair value through profit or loss, available-for-sale financial assets and held-to-maturity investments. Financial assets
are accounted for and measured pursuant to IAS 39. Accordingly, financial assets are, as a rule, initially recognized at fair value.
In addition, for financial assets that are subsequently measured at amortized cost, transaction costs directly attributable to the
acquisition are to be taken into account. Different measurement policies apply for subsequent measurement in accordance
with the applicable categories for financial assets pursuant to IAS 39.
Loans and receivables are non-derivative financial assets with fixed or determinable payments that are not quoted in an active
market. They are allocated to current assets to the extent that they are due for settlement within twelve months after the reporting
date. STADA reports loans and receivables under “Trade accounts receivable”, “Other financial assets” and “Cash and cash
equivalents”. They are measured at amortized cost using the effective interest method.
STADA reports receivables from derivatives which, if applicable, may also be part of hedge accounting, as financial assets at
fair value through profit or loss. Assets in this category are reported under the “Other financial assets” item. They are measured
at fair value. If these assets do not have a quoted market price in an active market, fair value is determined with appropriate
measurement models. This includes the application of discounted cash flow methods. These are largely based on input
parameters observable in the market. Changes in the fair values are recognized in income at the time of the increase or impair-
ment in value.
Held-to-maturity financial investments include non-derivative assets with fixed or determinable payments and a fixed
term that STADA intends to hold to maturity. They are measured at amortized cost using the effective interest method. STADA
reports these assets in financial assets under the item “Other financial assets”.
Available-for-sale financial assets are non-derivative assets that are not allocated to any of the above categories. In particular,
they comprise, in addition to shares in affiliated companies and other investments included in financial assets, equity securities
and are recognized under “Other financial assets”. They are measured at fair value, with changes reported under “Provisions
available for sale” directly in equity with no effect on profit or loss. These measurement results are reclassified through profit
and loss upon sale or valuation allowance of these assets. There must be objective evidence that there is a significant or
continuing decrease in fair value below historical cost. Published market price quotations usually can be used for determining
fair value.

133STADA Consolidated Financial Statements | Notes to the Consolidated Financial Statements
Trade accounts receivable are measured at amortized cost less impairments using the effective interest rate method. Impair-
ments are made in the form of individual impairments and general individual impairments for specific defaults and expected
default risks resulting from the insolvency of customers. To quantify the expected default risk, STADA determines the expected
future cash flows from receivables grouped by debtor. To this end, the maturity structures of net receivables and experience
relating to derecognition of receivables in the past, the creditworthiness of the customers as well as changes in payment
conditions are taken into account. In addition, a trade credit insurance that covers part of the loss in case of default is to be
taken into consideration for various Group companies. The required impairment determined reduces the assets’ carrying
amounts through recognition of an impairment account.
The loss is recognized in profit and loss under “Other expenses”. Bad debts are derecognized against the impairment account.
Subsequent cash receipts for receivables already derecognized are presented net of expenses.
Non-current assets and disposal groups held for sale are classified as held for sale, if the related carrying amount will be
recovered principally through a sale transaction rather than through continuing use, and if the sale is regarded as highly
probable. Measurement of these assets is based on the lower of carrying amount and fair value less costs to sell. In addition to
assets held of sale, associated liabilities are also reported separately in the balance sheet.
Cash and cash equivalents include cash and call deposits as well as current and highly liquid financial investments with a
maximum term of 90 days from the purchase date. These can be converted to cash immediately and are subject only to minor
price fluctuation risks. They are measured at amortized cost. Cash and cash equivalents are reported in accordance with their
definition as financial resources in IAS 7.
Other assets, which are not based on any contractual rights involving the direct or indirect exchange of cash, are reported under
the item Other assets.
STADA maintains defined benefit plans in various countries, according to which the amount of pension benefits depends on the
employees’ pensionable remuneration and the length of their service or which contain guarantees not permitting recognition
as defined contribution plan. Pension obligations are measured in accordance with actuarial principles using the projected
unit credit method. The pension provisions recognized in the balance sheet correspond to the present value of the defined
benefit obligation on the balance sheet date less the fair value of plan assets adjusted for the effect resulting from any effect of
limiting the benefit asset. In addition to earned pensions and entitlements, the calculation also includes future salary and
pension increases. For German Group companies, pension obligations are calculated based on the biometric accounting
principles of the Heubeck 2005G mortality tables. Outside Germany, country-specific mortality tables are used. Future pension
benefits are subject to individual pension agreements. The discount rate shall be based on long-term rates of return on high
quality corporate bonds with fixed interest rates at the reporting date. In countries where there is no liquid market in such
corporate bonds, the discount rate is determined on the basis of market yields on government bonds.
The standard IAS 19 only permits actuarial gains and losses to be recognized with no effect on income. It differentiates between
gains and losses due to changes in demographic assumptions, due to changes in financial assumptions as well as due to
experience-based amendments. They are recognized directly in equity with no effect on income in the period in which they
occur (“other comprehensive income, OCI”). The relevant amounts are reported separately in the consolidated statement of
comprehensive income. For the calculation of the portion of the interest income on plan assets recognized through profit or
loss, the standard IAS 19 requires the application of the discount rate underlying the obligation. The remainder of the actual
income from plan assets is to be recognized directly in other comprehensive income with no effect on profit or loss. The current
service cost is recognized in staff costs of the individual functional areas. All past service cost that arises in the financial year
shall be recognized immediately through profit or loss.

134 STADA Consolidated Financial Statements
Various Group companies additionally grant their employees defined contribution plans. Here, Group companies pay defined
contributions to independent institutions due to legal or contractual requirements or on a voluntary basis; liabilities beyond
this do not exist. Contributions to be paid for the respective plans are recognized as expense in the respective period in the
relevant functional areas.
The other non-current provisions contain anniversary provisions as other long-term employee benefits. Commitments to
anniversary payments are accounted in accordance with the guidelines in IAS 19 as other long-term employee benefits. In
contrast to pension provisions, actuarial gains and losses are not recognized without an effect on the income statement. Such
potential gains and losses are immediately reported as income or expenditure in the relevant functional area. Furthermore,
there is a working time accounts plan that is accounted for in the same way as commitments to anniversary payments.
Other provisions are made by STADA if there are current legal or constructive obligations to third parties arising from past
events that will probably lead to an outflow of resources embodying economic benefits that can be reliably determined. An
outflow of assets embodying economic benefits is considered as probable if it is more likely than not. Other provisions are
recognized in an amount that, taking into account all recognizable risks, offers the best possible estimate of expenditures
necessary to fulfill the obligations. Any existing reimbursement claims by third parties are not netted with other provisions.
Expenses from the creation of provisions are allocated to functional costs according to where they arise. If changes in estimates
result in a reduction of the obligation, the other provisions are reversed on a pro rata basis and recognized through profit and
loss under the item where the original expense was recognized.
STADA reports all other provisions as current financial liabilities because a settlement date within twelve months of the report-
ing date is expected. The amounts recognized are not discounted. Liabilities incurred due to outstanding accounts or obligations
to personnel and taxation authorities, as well as other liabilities are not reported as provisions, but under “Trade payable” or
“Other liabilities”.
Differentiated from provisions, there are contingent liabilities for possible obligations based on past events but which will not
become manifest until the occurrence of one or more uncertain future events not under STADA’s control. In addition, there are
also contingent liabilities for current obligations, for which however the associated outflow of resources is not con sidered
probable or the amount of the obligation cannot be adequately estimated. In accordance with IAS 37, such contingent liabilities
are not recognized.
Financial liabilities are measured on initial recognition at fair value plus transaction costs directly attributable to the acquisi-
tion. For financial liabilities that subsequently continue to be measured at fair value, any transaction costs are recognized as an
expense in the period in which they occur. This relates to the accounting of derivative financial instruments with negative
market values that are not part of an effective hedging relationship and allocated to the category “at fair value through profit or
loss” in accordance with IAS 39. STADA reports these financial liabilities in the “Other financial liabilities” item. Here, those
derivative financial instruments are also included which serve to hedge interest rate and currency risks resulting from operating
activities, financial transactions and investments, and which are also measured at fair value in accordance with the regulations
of IAS 39 on hedge accounting. Unless market prices are available, fair value is determined with measurement models based
on discounted cash flow models.
Derivative financial instruments exist at STADA in the context of derivatives measured at fair value through profit or loss as
well as in the context of derivative hedging instruments. In each case, depending on whether the market value of the derivatives
is positive or negative, they are recognized under the item “Other financial assets” or “Other financial liabilities” (see financial
reporting policies for financial assets and financial liabilities). Cash flow hedges, fair value hedges and hedges of net investments
in a foreign operation can generally be recognized as derivative hedging instruments in the context of hedge accounting in
accordance with IAS 39.

135STADA Consolidated Financial Statements | Notes to the Consolidated Financial Statements
At STADA, cash flow hedges are used to hedge against fluctuations of cash flows associated with an accounted asset or an
accounted financial liability or a highly probable planned transaction. Changes in the fair value of these hedging instruments
are recognized with no effect on income in the amount of the effective part of the hedging relationship directly in equity under
“Provisions for cash flow hedges”. A transfer to the income statement takes place in the period when the underlying hedged
item becomes effective. The ineffective part of the changes in value is, however, recognized directly in the income statement.
In the context of fair value hedges, the risk of a change in fair value of accounted assets or accounted liabilities or fixed off balance
liabilities is hedged. Changes in the fair value of these hedging transactions are recorded in profit and loss like changes in the
fair value of the underlying hedged items. If the requirements for hedge accounting are no longer met, the carrying amounts of
the previously hedged items are adjusted on the basis of their remaining terms. Hedges of net investments in a foreign operation
are treated according to the same accounting policies as cash flow hedges.
STADA regularly reviews the effectiveness of the hedging relationships as a prerequisite for hedge accounting pursuant to
IAS 39. A hedging relationship is in general considered to be effective, if changes in fair value of the hedging transaction are both
prospectively and retrospectively within a range of 80% to 125% of the offsetting changes in fair value of the hedged item.
STADA measures all other financial liabilities, in particular trade payable as well as financial liabilities, at amortized cost using
the effective interest method.
STADA has so far not made use of the option to designate financial liabilities on initial recognition as financial liabilities to be
recognized at fair value through profit or loss.
Other financial liabilities, which are not based on any contractual rights involving the direct or indirect exchange of cash, are
reported under the item “Other liabilities”.
At STADA, share-based payments are used as long-term oriented remuneration components in the context of performance-
related remuneration of Executive Board members and are paid in cash. These payments are recognized at the fair value of
the liability in accordance with IFRS 2. Until the liability is settled, the fair value of the liability is to be reclassified on each
reporting date and on the settlement date, and all changes in the fair value are to be recognized through profit and loss.
STADA uses the Monte Carlo model to determine the fair value of share-based payments. The fair value of share-based payments
to the Executive Board from deferrals are recognized under the item “Other liabilities”.
10. Estimates, assumptions and discretion in the application of accounting principles
The presentation of the net assets, financial position and results of operations in the consolidated Group financial statement is
determined by recognition and valuation methods. To a certain extent, STADA makes estimates and assumptions relating to the
future that are based on past experience as well as other factors that are considered to be appropriate in the particular circum-
stances. Although the estimates and assumptions are constantly re-evaluated, estimates derived in this way may differ from
actual circumstances. The significant estimates, accounting judgments and related assumptions for the accounting issues
concerned are detailed below.
As part of purchase price allocations in business combinations, goodwill is the difference between the acquired net assets
evaluated according to IFRS 3 and the consideration transferred plus the fair value of the previously held shares and the amount
recognized of non-controlling shareholders. Various valuation methods are used for this that are primarily based on estimates
and assumptions.
STADA carries out an impairment test for capitalized goodwill at least once a year. The discounted future cash flows of the
cash-generating units, aggregated into operating segments, which are based on certain assumptions, are to be determined for
this purpose. The discounted cash flow method is used to determine the value in use, applying an individual interest rate for
each cash-generating unit and a detailed planning period of three years based on approved budgets. For the period after this
three-year detailed planning horizon, a specific estimated growth rate in the amount of the expected long-term inflation rate

136 STADA Consolidated Financial Statements
is assumed. The budget values for future financial years, which are subject to some uncertainty due to unforeseeable future
legal developments and developments in the health care market, as well as the parameters determined in the context of current
market information but also as a best possible estimate mean that the assessment of impairment may differ from actual circum-
stances, and despite good forecasts in the reporting year an impairment requirement may be necessary in subsequent years.
For items of property plant and equipment and intangible assets, the expected useful lives and associated amortization or
depreciation expenses are determined on the basis of the expectations and assessments of management. If the actual useful
life is less than the expected useful life, the amount of depreciation or amortization is adjusted accordingly. As part of the
determination of impairment losses on fixed assets, estimates relating to the cause, timing and amount of the impairments
are also made. Particularly in the context of impairment tests for yet unused approvals, which are reported as advance payments,
the growth rates applied for the present value test as well as the long-term price and cost development of active pharmaceutical
ingredients are based on best possible estimates. This also applies to the impairment tests of other intangible assets with
indefinite useful lives.
Development costs are capitalized based on the assessment of whether the capitalization requirements of IAS 38 are met.
Planning calculations are necessary to determine the future economic benefit, which are by their nature subject to estimates
and may therefore deviate from actual circumstances in the future.
STADA makes valuation allowances on receivables in order to anticipate losses expected in relation to insolvency of customers.
The maturity structure of the net receivables and past experience in relation to bad debts as well as the customers’ credit-
worthiness are used as the criteria for evaluating the appropriateness of the valuation allowances. This does not, however,
exclude the possibility that the actual derecognitions will exceed the expected valuation allowances due to a significant
worsening in the financial position of the customer. Accounting judgments and estimates regarding the assessment of the value
of receivables relate particularly to impaired receivables from debtors in CEE countries.
STADA operates in various countries and is obliged to pay respective income taxes in each tax jurisdiction. In order to calculate
the income tax provisions and the deferred tax liabilities in the Group, the expected income tax as well as the temporary differ-
ences resulting from the different treatment of certain balance sheet item according to IFRS and their accounting in accordance
with tax law are each to be determined on the basis of assumptions. If the final taxation imposed deviates from the assumed
values, this has a corresponding effect on current and deferred taxes and thus on the net assets, financial position and results
of operations of the Group in the respective period. Furthermore, increasing importance within the STADA Group is being
allotted to a comprehensive tax transfer-pricing model for the renumeration of intragroup services. Possible risks of non-
recognition of these transfer prices for tax purposes are limited by the introduction of appropriate communication methods
and an overarching definition of transfer pricing in the form of a Group guideline.
When determining the fair values of derivatives and other financial instruments, for which no market price in an active market
is available, valuation models based on input parameters observable in the market are applied. The cash flows, which are already
fixed or calculated by means of the current yield curve using so-called “forward rates”, are discounted to the measurement date
with the discount factors determined by means of the yield curve valid on the reporting date.
The amount of pension obligations from defined benefit plans is calculated using actuarial methods. This procedure is based
upon assumptions, among other things, regarding the discount rate, life expectancy and future salary and pension increases.
Changes to these assumptions can significantly influence the amount of future pension costs.
137STADA Consolidated Financial Statements | Notes to the Consolidated Financial Statements
The creation of other provisions is based on the assessment of management regarding the probability and amount of an outflow
of resources. STADA creates provisions if there is a present external obligation and a probable outflow of resources, i.e. if it is
more likely to occur than not. Provisions in relation to pending legal disputes are created based on how STADA estimates the
prospects of success of these methods. The determination of provisions for damages is also associated with substantial estimates
and can change due to new information. The same applies for the recognition of the amount of contingent liabilities.
Expenses from the creation of provisions for warranties are considered in sales and charged against income. Estimated values
based on past experience are used for this purpose. This means that the actual expenses for warranties may differ from the
estimate and sales would accordingly turn out to be higher or lower. The same applies for the consideration of discounts (e.g.
discounts to health insurance organizations) prescribed by law and due to other regulatory requirements. These are recognized
with a reduction on sales based on the respective underlying contract with an estimated amount in expectation of probable
sales.

138 STADA Consolidated Financial Statements
Notes to the Consolidated Income Statement
11. Sales
Sales at STADA primarily resulted from the supply of products and, to a much lesser extent, from license revenues. For informa-
tion on the reporting of sales, please refer to details included in Financial Reporting Policies.
In 2016, the increase in sales compared to 2015 was primarily based on strong sales development in the markets Germany,
Italy and Vietnam. This development was primarily attributable to the strong growth in the German Branded Products
segment as well as the sales increase in the two core segments in the Italian and Vietnamese markets. Exchange rate effects
and portfolio changes had a total influence of € 28.0 million on sales in the reporting year. For information on how sales are
broken down according to segments, please refer to the “Segment reporting” in Note 42.
12. Cost of sales
Cost of sales is divided into the following items:
in € 000s 2016 2015
Material expenses 883,480 874,066
Impairment, depreciation and amortization 100,976 101,497
Expenses from inventory write-downs 28,207 36,545
Remaining cost of sales 92,650 89,601
Total 1,105,313 1,101,709
Impairment, depreciation and amortization in the amount of € 101.0 million (previous year: € 101.5 million) mainly includes
amortization on intangible assets, the ownership of which represents a necessary condition for the marketing of the products
manufactured – in particular drug approvals.
Expenses from inventory write-downs included inventories written down to net realizable value offset with reversals. The
reversals amounted to € 7.7 million in financial year 2016 (previous year: € 7.2 million).
13. Selling expenses
In addition to the costs for sales departments and sales force, selling expenses also comprise the costs for advertising and
marketing activities including samples for doctors. They also include all costs for logistics that occur for completed final products.
Discounts in the form of free retail packages, so-called discounts in kind, – if possible under the legal regulations in a national
market – are not included. The resulting expenses are reported as a part of cost of sales.
In the reporting year, marketing expenses in the amount of € 210.4 million (previous year: € 210.0 million) corresponded to a
share of 43% in selling expenses (previous year: 44%). In addition, selling expenses included depreciation in the amount of
€ 6.9 million (previous year: € 7.1 million).
14. General and administrative expenses
Personnel and material costs of service and administrative units are reported under general and administrative expenses,
unless they have been charged to other functional areas as internal services.
In 2016, the general and administrative expenses included depreciation in the amount of € 7.0 million (previous year: € 7.9 mil-
lion).

139STADA Consolidated Financial Statements | Notes to the Consolidated Financial Statements
General and administrative expenses increased in the reporting year by a total of € 4.3 million. The increase primarily resulted
from the subsidiaries consolidated for the first time in the reporting year or at the end of the previous year.
15. Research and development costs
For information on the composition of research and development costs, please refer to the details included in Financial
Reporting Policies.
In financial year 2016, research and development costs increased by € 0.1 million compared to the previous year.
The research and development costs include depreciation in the amount of € 2.3 million (previous year: € 2.1 million). Devel-
opment costs for new products in the amount of € 28.4 million (previous year: € 26.1 million) were capitalized in financial
year 2016 (see the note on the item “Intangible assets”).
16. Other income
Other income is divided into the following items:
in € 000s 2016 2015
Income from write-ups 3 –
Income from disposals – 2,317
Remaining other income 19,276 17,715
Total 19,279 20,032
The remaining other income includes a milestone payment received in the Branded Products segment in the United Kingdom,
income from insurance compensation, income from damage claims payments as well as other other income not directly
associated with functional costs that comprise many immaterial individual items in the Group companies.
Furthermore, the income from disposals mainly resulted from the deconsolidation of the French subsidiary Laboratoires d’études
et de recherches en oligo éléments thérapie SA in the previous year.
17. Other expenses
Other expenses are broken down as follows:
in € 000s 2016 2015
Expenses from valuation allowances on accounts receivable 5,972 9,367
Currency translation expenses 9,379 19,549
Impairment losses on non-current assets excluding goodwill 65,480 32,790
Impairment losses on goodwill – 410
Remaining other expenses 58,102 21,593
Total 138,933 83,709
Expenses for valuation allowances on accounts receivable were reported offset with the corresponding income from their
reversal.

140 STADA Consolidated Financial Statements
Other expenses include impairment losses in the amount of € 65.5 million (previous year: € 32.8 million) that exclusively relate
to impairment losses on non-current assets excluding goodwill in the reporting year. In the previous year, impairments to
goodwill resulted from an impairment for the Asia/Pacific & MENA region. The increase in comparison with the previous year
was primarily due to reorganization decisions in connection with the adapted corporate strategy. These impairment losses were
considered by STADA as a special item of financial year 2016.
The item also included net currency translation expenses in the amount of € 9.4 million in the reporting year (previous year:
€ 19.5 million). This development was particularly attributable to the strong devaluation of the major currencies in the CIS region
and the resulting currency translation expenses, reported as special items.
Within remaining other expenses, personnel expenses are recognized in the amount of € 24.8 million (previous year: € 4.4 mil-
lion). The increase in comparison with the same period of the previous year was particularly due to a severance payment for the
former Chairman of the Executive Board as well as further personnel expenses in connection with the merging of the German
sales companies. Furthermore, remaining other expenses also increased due to the termination of a distribution agreement
with the Belgian sales partner OMEGA and the associated damage claim payment.
The item other expenses includes expenses in the amount of € 21.6 million in connection with the termination of substantial
parts of the aesthetics business. These expenses particularly resulted from impairments to intangible assets, impairments to
financial assets, a payment for the termination of the distribution agreement, the reduction in inventories, outstanding rental
payments and severance payments.
18. Financial result
The result from investments measured at equity in financial year 2016 relates to the companies BIOCEUTICALS Arznei-
mittel AG, Pharm Ortho Pedic SAS and AELIA SAS as well as Dialogfarma LLC since last year, and are accounted for using the
equity method.
Investment income primarily relates to profit distributions from companies not included in the consolidated financial
statements.
Financial income and financial expenses are composed of the interest result and other financial income and other financial
expenses.
The interest result developed as follows:
in € 000s 2016 2015
Interest income 2,716 1,142
Interest expense 52,891 65,576
Interest result 50,175 64,434
thereof: from financial instruments of the valuation categories in accordance with IAS 39:
• Loans and receivables 2,716 1,142
• Financial assets and liabilities at fair value through profit and loss -12,711 -18,213
• Held-to-maturity investments – –
• “Available-for-sale” financial assets – –
• Financial liabilities measured at amortized costs -39,120 -46,349
In addition, the interest result in financial year 2016 includes an interest expense from other non-current provisions, which
comprises interest income on plan assets as well as interest expenses from pension obligations and other non-current provisions,
in the amount of € 1.1 million (previous year: € 1.0 million).

141STADA Consolidated Financial Statements | Notes to the Consolidated Financial Statements
In financial year 2016, the Group refinanced itself at interest rates of between 0.7% p.a. and 26.0% p.a. (previous year: between
0.7% p.a. and 16.6% p.a.). On the reporting date of December 31, 2016, the weighted average interest rate for non-current
financial liabilities was approx. 1.66% p.a. (previous year: approx. 2.0% p.a.) and for current financial liabilities approx.
3.12% p.a. (previous year: approx. 5.1% p.a.). For all of the Group’s financial liabilities the weighted average interest amounted
to approx. 1.78% p.a. (previous year: approx. 2.6% p.a.).
Interest payments partially resulting from interest rate swaps designated by STADA as hedging instruments in cash flow
hedges are not netted for each swap contract and are recognized as interest income or interest expense in the valuation
category of the associated underlying hedged item. For the reporting year, this exclusively concerns financial liabilities which
were valued at amortized costs.
Borrowing costs capitalized as part of the cost of qualifying assets amounted to € 1.4 million in financial year 2016 (previous
year: € 1.0 million). A capitalization rate of 2.0% for intangible assets (previous year: 2.3%) was taken as a basis.
Other financial income and other financial expenses consist of the following:
in € 000s 2016 2015
Other financial income – 28
thereof
• from the measurement of financial instruments – –
• from the disposal of financial instruments – 28
Other financial expenses 1,246 3,091
thereof
• from the measurement of financial instruments 518 3,087
• from the disposal of financial instruments 728 4
The result from the measurement of financial instruments in the reporting year resulted from interest rate swaps and interest
rate/currency swaps measured at fair value through profit or loss. There was a net burden on earnings in the amount of € 0.5 mil-
lion before or € 0.4 million after taxes. In the previous year, there was a net burden on earnings from the measurement of
derivative financial instruments in the amount of € 3.1 million before and € 3.1 million after taxes. The measurement of interest
rate hedge transactions depends on the development of the money market interest rate.
The result from the disposal of financial instruments was due to the early utilization of interest rate swaps in financial year 2016.
19. Income taxes
The item income taxes includes taxes on income and earnings paid or owed in the individual countries as well as deferred tax
liabilities. Other taxes that cannot be meaningfully attributed to the sales, administration or research and development functions
are included in other expenses.

142 STADA Consolidated Financial Statements
Actual income taxes can be divided according to timing as follows:
in € 000s 2016 2015
Actual income taxes 54,212 43,591
Tax expense in the current period 50,288 48,569
Tax expense from previous periods 4,619 546
Tax income from previous periods 695 5,524
The deferred taxes are as follows:
in € 000s 2016 2015
Deferred taxes -22,274 -2,953
• from temporary differences -30,073 -2,808
• from loss/interest carryforwards 7,799 -145
• from tax credits – –
• from others – –
The effective income tax rate amounted to 25.1% for financial year 2016. The effective income tax rate in the previous year was
25.8%. The nominal income tax rate amounted to 28.3% in financial year 2016 for STADA Arzneimittel AG in Germany, this
includes corporation tax with a tax rate of 15.0% and the solidarity surcharge in the amount of 5.5% as well as trade income
tax with an assessment rate of 357%. In the previous year, the nominal income tax rate of STADA Arzneimittel AG amounted
to 27.4%. The difference resulted from the increase in the assessment rate for corporation tax of 27 percentage points in
Bad Vilbel.
The following overview explains how the effective income tax expense reported in the income statement was derived from the
expected income tax expense. The expected income tax expense is calculated by applying the nominal tax rate of a corporation
headquartered in Bad Vilbel to earnings before taxes. The tax effects of the respective tax rates to be applied locally depending
on their applicable national and legal forms are reported in a separate reconciliation.
in € 000s 2016 2015
Earnings before taxes 127,429 157,803
Nominal income tax rate of STADA Arzneimittel AG (in %) 28.3% 27.4%
Expected income tax expense 36,088 43,207
Deviation in local tax rate -8,701 -4,779
Tax effects from non-deductible impairment on investments and goodwill – 28
Tax effects from loss carryforwards -6,067 -6,582
Tax effects from previous years -3,676 -4,910
Effects from tax rate changes -4,157 -7,495
Tax effects from non-deductible expenses and tax-free earnings 19,436 21,376
Other tax effects -985 -207
Income tax expense shown on the income statement 31,938 40,638
Effective income tax rate (in %) 25.1% 25.8%

143STADA Consolidated Financial Statements | Notes to the Consolidated Financial Statements
Deviations in the local tax rate primarily resulted from lower nominal tax rates in the United Kingdom.
Tax effects from loss carryforwards primarily resulted from the utilization of tax loss carryforwards for which no deferred tax
assets have been reccognized so far.
The effects from tax rate changes in the previous year primarily resulted from a decrease in the tax rate in the United Kingdom
and the associated remeasurement of deferred taxes.
The actual income taxes and deferred taxes recognized in the balance sheet were as follows:
in € 000s Dec. 31, 2016 Dec. 31, 2015
Income tax receivables 12,816 21,182
Income tax liabilities 60,625 39,444
in € 000s 2016 2015
Deferred tax assets 20,814 34,073
Deferred tax liabilities 116,416 160,241
Deferred taxes as of December 31 -95,602 -126,168
Difference compared to previous year 30,566 -8,878
thereof
• Recognized in income 22,274 2,953
• Recognized through other comprehensive income -627 -4
• Acquisitions/disposals/changes in the scope of consolidation -3,276 -6,648
• Reclassifications in accordance with IFRS 5 5,490 –
• Currency translation differences 6,705 -5,179
Deferred taxes result from the following balance sheet items and loss carryforwards:
in € 000s
Dec. 31, 2016Deferred
tax assets
Dec. 31, 2015Deferred
tax assets
Dec. 31, 2016Deferred
tax liabilities
Dec. 31, 2015Deferred
tax liabilities
Intangible assets 2,684 2,244 123,318 153,077
Property, plant and equipment 1,816 1,423 6,187 6,009
Financial assets 830 981 652 617
Inventories 10,824 10,948 909 1,317
Receivables 8,896 5,144 3,919 4,325
Other assets 2,180 3,006 28 5
Other non-current provisions 5,079 3,631 464 58
Other provisions 1,966 1,555 6,715 8,102
Liabilities 4,713 3,541 367 974
Loss carryforwards 7,969 15,843 – –
Total 46,957 48,316 142,559 174,484
Offsetting -26,143 -14,243 -26,143 -14,243
Deferred taxes as per balance sheet 20,814 34,073 116,416 160,241

144 STADA Consolidated Financial Statements
Deferred tax liabilities reported by STADA resulted, among other things, from deferred taxes in the context of purchase price
allocations carried out under IFRS 3. The reduction in deferred tax liabilities compared with the previous year was primarily a
result of scheduled amortization on intangible assets with purchase price allocations measured in accordance with IFRS 3, as
well as a decrease in the tax rate in the United Kingdom and the associated remeasurement of deferred taxes.
Tax advantages that are highly probable and expected from the future utilization of tax loss carryforwards are reported under
“Tax loss carryforwards”.
Tax loss carryforwards are only capitalized if their future utilization is highly probable. Tax loss carryforwards capitalized as of
the December 31, 2016 reporting date amounted to € 30.9 million in financial year 2016 (previous year: € 73.2 million).
Income taxes decreased by a total of € 6.1 million (previous year: Increase of income tax expense by € 6.6 million) through
the utilization of previously unrecognized tax loss carryforwards from previous years for which no deferred taxes have been
recognized so far and through tax loss carryforwards from the current financial year for which no deferred taxes have been
recognized.
The future usable tax loss carryforwards and similar items are listed in the following chart according to their expiry date:
in € 000s Dec. 31, 2016 Dec. 31, 2015
Loss carryforward expiry date within
• 1 year – 707
• 2 years 799 –
• 3 years – 799
• 4 years – –
• 5 years 707 141
• more than 5 years 416 5,966
• unlimited carryforward 28,936 65,594
No deferred taxes were recognized for the following tax loss carryforwards and similar items as it is not probable that they will
be realized in the foreseeable future:
in € 000s Dec. 31, 2016 Dec. 31, 2015
Loss carryforward expiry date within
• 1 year – 182
• 2 years – –
• 3 years – –
• 4 years – –
• 5 years – –
• more than 5 years 19,470 24,420
• unlimited carryforward 84,055 98,650
Temporary differences -426 1,379

145STADA Consolidated Financial Statements | Notes to the Consolidated Financial Statements
1) On August 26, 2016, the STADA Annual General Meeting resolved to eliminate restrictions on the transferability of registered shares by means of a change to the Articles of Incorpora- tion. The change to the Articles Incorporation was entered in the commericial register on December 9, 2016 and took effect on this date. The authorization of the approved capital in accordance with Section 6 (1) of the Articles of Incorporate therefore no longer refers to registered shares with restricted transferability.
20. Income distributable to non-controlling interests
in € 000s Dec. 31, 2016 Dec. 31, 2015
Earnings after taxes 95,491 117,165
• thereof distributable to shareholders of STADA Arzneimittel AG (net income) 85,904 110,404
• thereof distributable to non-controlling interests 9,587 6,761
Net income related to non-controlling interests pertains to the subsidiaries STADA Thailand, STADA Import/Export International,
STADA Vietnam J.V., Pymepharco, STADA Pharmaceuticals (Beijing), Hemomont and Hemofarm Banja Luka.
21. Earnings per share
The basic earnings per share are as follows:
Basic earnings per share 2016 2015
Net income (in € 000s) 85,904 110,404
Adjustment – –
Adjusted net income (basic) (in € 000s) 85,904 110,404
Average number of registered shares1) issued (in unit shares) 62,342,440 61,725,885
Average number of treasury shares (in unit shares) 85,908 88,264
Adjusted average number of shares (basic) (in unit shares) 62,256,532 61,637,621
Basic earnings per share (in €) 1.38 1.79
Basic earnings per share are calculated by dividing the adjusted net income distributable to the shareholders of STADA
Arznei mittel AG by the time-weighted average number of registered shares1) outstanding.
22. Number of employees and personnel expenses
The average number of employees at STADA by functional area and functional sub-area is as follows:
2016 2015
Marketing/Sales 3,089 3,012
Logistics 360 299
Finance/IT 707 684
Production/Quality Assurance 4,809 4,644
Procurement/Supply Chain 340 333
Product Development 623 594
Administration 911 875
Entire Group 10,839 10,441
Personnel expenses (in € million) 365.7 342.7

146 STADA Consolidated Financial Statements
The average number of employees in the reporting year was above the level of the previous year at 10,839 (previous year: 10,441).
The most substantial reasons for the increase in the number of employees in financial year 2016 include the consolidation of
the Argentinian Laboratorio Vannier S.A. the acquisition of the British company BMSW Limited and Natures Aid Limited, as
well as the acquisition of a local product portfolio, the Serbian IVANCIC I SINOVI I DOO with a total of 218 employees. On the
reporting date, the STADA Group’s number of employees in 2016 totaled 10,923 (previous year: 10,532).
Personnel expenses, which are included in expenses of the individual functional areas according to their functional relevance,
increased in financial year 2016 to € 365.7 million (previous year: € 342.7 million). The increase was primarily attributable to
expenses from reorganization decisions and structural measures resulting from a changed coporate structure.
23. Depreciation, amortization and impairment losses
Depreciation, amortization and impairment losses are included in expenses of the individual functional areas according to their
functional relevance and can be attributed to intangible assets, property, plant and equipment as follows:
in € 000s 2016 2015
Depreciation /amortization 117,180 118,648
Intangible assets 83,506 84,429
Property, plant and equipment 33,674 34,219
Impairment losses 65,480 33,200
Intangible assets 61,807 32,948
thereof
• goodwill – 410
Property, plant and equipment 223 161
thereof
• land and buildings 36 –
• plant and machinery 97 118
• other fixtures and fittings, tools and equipment 90 43
Financial assets 3,450 91
thereof
• Investments 3,450 91
The impairment of intangible assets concerns various drug approvals and trademarks.
Impairments of financial assets recorded in the financial year particularly resulted from the termination of further parts of the
aesthetics business. The impairments in the previous year primarily related to the carrying amounts of Hetmak FZCO in Dubai.
Depreciation and amortization decreased by 1.2% as compared to the previous year. More information on amortization,
depreciation and impairment losses is included in the Notes on non-current assets.

147STADA Consolidated Financial Statements | Notes to the Consolidated Financial Statements
Notes to the Consolidated Balance Sheet
24. Intangible assets
Intangible assets developed as follows in financial year 2016:
2016 in € 000s
Regulatory drug approvals,
trademarks, customer
relationships, software,
licenses and similar rights
Goodwill
Advance payments made and
capitalized development
costs for current
projects
Total
Cost as of Jan. 1, 2016 1,854,400 465,034 201,653 2,521,087
Currency translation -12,653 2,137 -102 -10,618
Changes in the scope of consolidation -51 -927 – -978
Additions 484 – 81,037 81,521
Additions from business combinations according to IFRS 3
30,585
18,367
–
48,952
Disposals 3,085 – 375 3,460
Transfers noncurrent assets and disposal groups held for sale
30,387
5,785
–
36,172
Transfers 67,980 – -67,687 293
Cost as of Dec. 31, 2016 1,907,273 478,826 214,526 2,600,625
Accumulated depreciation as of Jan. 1, 2016 739,059 73,422 59,586 872,067
Currency translation 8,855 1,510 987 11,352
Changes in the scope of consolidation -51 – – -51
Depreciation/amortization 83,506 – – 83,506
Impairment losses 54,677 – 7,130 61,807
Disposals 2,241 – 359 2,600
Write-ups – – 3 3
Reclassifications to noncurrent assets and disposal groups held for sale
7,169
690
–
7,859
Transfers 488 – -443 45
Accumulated amortization as of Dec. 31, 2016 877,124 74,242 66,898 1,018,264
Residual carrying amounts as of Dec. 31, 2016 1,030,149 404,584 147,628 1,582,361
Residual carrying amounts as of Dec. 31, 2015 1,115,341 391,612 142,067 1,649,020
Additions from business combinations according to IFRS 3, which are based on fair values determined as part of the purchase
price allocation, primarily relate to € 18.8 million from the acquisition of a Serbian product portfolio to strengthen the position
in the consumer healthcare area, € 11.5 million from the purchase of the Argentinian Laboratorio Vannier S.A. and € 3.5 million
and € 17.4 million from the acquisitions of the British BSMW Limited and Natures Aid Limited.
In the reporting year, reclassifications of non-current assets and disposal groups held for sale relate to two subsidiaries in Asia.

148 STADA Consolidated Financial Statements
The umbrella brand Hemofarm capitalized in 2006 in the context of the acquisition of the Hemofarm group is included in
recognized trademarks as an intangible asset with an indefinite useful life, as STADA intends to make continuing use of it.
As at December 31, 2016, this umbrella brand has a carrying amount of € 37.4 million (previous year: € 45.4 million). In the
context of the impairment test of December 31, 2016, a royalty rate of 2% and a discount rate of 13.2% were used. There was
a necessity for impairment for the reporting year in the amount of € 7.4 million. In addition, the change compared to the pre-
vious year figure of € 0.6 million is a result of different foreign exchange rates.
Furthermore, in the context of the control achieved over Pymepharco in 2013, the umbrella brand Pymepharco was capitalized
as an intangible asset with an indefinite useful life as a trademark, as STADA intends to continue to use the trademark. As of
December 31, 2016, it has a carrying amount of € 9.7 million (previous year: € 9.5 million). The change is a result of different
foreign exchange rates. In the context of the impairment test of December 31, 2016, a royalty rate of 2% and a discount rate of
13.8% were used. There was no necessity for impairment for the reporting year.
As part of the acquisition of Laboratorio Vannier in the reporting year, the umbrella brand Vannier was capitalized as an in-
tangible asset with a carrying amount of € 0.3 million and an indefinite useful life as a trademark as STADA inteds to continue
to use the trademark. As at December 31, 2016, it has a carrying amount of € 0.3 million. In the context of the impairment test
of December 31, 2016, a royalty rate of 2% and a discount rate of 21.9% were used. There was no necessity for impairment for
the reporting year.
Borrowing costs capitalized in 2016 for intangible assets and directly attributable to the acquisition or the production of a
qualifying asset amounted to € 1.4 million (previous year: € 1.0 million). In financial year 2016, the capitalization rate taken as
a basis for determining borrowing costs eligible for capitalization was 2.0% (previous year: 2.3%).
Development costs of € 31.0 million were capitalized in the reporting year (previous year: € 27.5 million). Capitalized development
costs consist mainly of costs that can be allocated to the projects, such as the costs of individuals working in development,
material costs and external services, together with directly allocable overhead costs. Internally created intangible assets are
amortized on a straight-line basis over their useful life, generally 20 years. STADA immediately recognizes development costs
that do not qualify for capitalization as expense in the period in which they are incurred (see Note 15.). In financial year 2016,
these development costs amounted to € 65.1 million (previous year: € 65.0 million).
Amortization on intangible assets mainly relates to regulatory drug approvals as well as trademarks and is recognized in the
income statement primarily under cost of sales. In the reporting year, this related to an amount of € 83.5 million (previous year:
€ 84.4 million).
In financial year 2016, impairments on intangible assets were recognized in the total amount of € 61.8 million (previous year:
€ 32.9 million). No valuation allowances on goodwill were recorded in the reporting year. In the previous year, this related to
valuation allowances on goodwill for market region Asia/Pacific & MENA in the amount of € 0.4 million.
Details on changes in the scope of consolidation can be found in the Note on the scope of consolidation (see Note 5.).

149STADA Consolidated Financial Statements | Notes to the Consolidated Financial Statements
Intangible assets developed as follows in the previous year:
2015 in € 000s
Regulatory drug approvals,
trademarks, customer
relationships, software,
licenses and similar rights
Goodwill
Advance payments made and
capitalized development
costs for current
projects
Total
Cost as of Jan. 1, 2015 1,744,755 445,874 207,121 2,397,750
Currency translation 7,752 2,172 2,534 12,458
Changes in the scope of consolidation 37 1,087 – 1,124
Additions 14,889 – 56,912 71,801
Additions from business combinations according to IFRS 3
33,316
17,728
70
51,114
Disposals 10,748 1,827 585 13,160
Transfers 64,399 – -64,399 0
Cost as of Dec. 31, 2015 1,854,400 465,034 201,653 2,521,087
Accumulated amortization as of Jan. 1, 2015 635,523 73,571 57,140 766,234
Currency translation -3,267 -559 -434 -4,620
Changes in the scope of consolidation – – – –
Depreciation/amortization 84,429 – – 84,429
Impairment losses 28,736 410 3,802 32,948
Disposals 6,361 – 563 6,924
Write-ups – – – –
Transfers 359 – -359 0
Accumulated amortization as of Dec. 31, 2015 739,059 73,422 59,586 872,067
Residual carrying amounts as of Dec. 31, 2015 1,115,341 391,612 142,067 1,649,020
Residual carrying amounts as of Dec. 31, 2014 1,109,232 372,303 149,981 1,631,516
The following amortization expense is expected for the intangible assets in the next five years:
in € 000s
Expected amortization
2017 83,245
2018 83,785
2019 84,944
2020 84,802
2021 85,598

150 STADA Consolidated Financial Statements
1) It should be noted here that as a result of the redefinition of the cash-generating units in financial year 2016, the results of the impairment test in financial year 2015 are not comparable with those of financial year 2016.
The following table shows which cash-generating units the capitalized goodwill can be attributed to:
Residual carrying amount as of Dec. 31, 2016 in € million
Generics 188.7
Branded Products 215.9
Total 404.6
In accordance with the fundamental change to reporting structures in the third quarter of 2016 agreed by the Executive Board,
the STADA Group no longer reports by segments and market regions, but by operating segments, i.e. the two segments Generics
and Branded Products. This measure is in line with the growth strategy, including central management of the segements, an
increasing internationalization of the product portfolio as well as a stricter cost control and is first applied in the reporting
and planning process as part of these Consolidated Financial Statements. In the course of the change, the non-core activity
Commercial Business was integrated into the Generics segment.
In the course of converting the internal reporting and the associated aggregation of cash-generating units, an impairment test
was carried out on June 30, 2016 based on the cash-generating units from the previous year due to an indication of a possible
impairment. No necessity for impairment was identified.
In the previous year, the capitalized goodwill for cash-generating units was as follows:
Residual carrying amount as of Dec. 31, 2015 in € million
Generics 187.8
Branded Products 203.8
Total 391.6
In comparison with the previous year1), there were the following significant changes in the carrying amounts of goodwill:
• The increase in goodwill in the cash-generating unit Branded Products was primarily attributable to the finalizing of the
purchase price allocation for the acquisition of the British company Natures Aid
In the context of the regular impairment tests for capitalized goodwill of September 30, 2016, the discounted cash flow method
is used to determine anticipated cash inflows, applying the following parameters defined for the individual cash-generating
units according to segment:
According to segment, defined as cash-generating unit
Growth rates of the
forward-projectphase 2016
in %
WACCs 2016 in %
Generics 2.4% 10.3%
Branded Products 2.7% 10.0%
151STADA Consolidated Financial Statements | Notes to the Consolidated Financial Statements
The discounted cash flow method is used to determine the value in use of the cash-generating units, applying an individual
interest rate for each cash-generating unit and a detailed planning period of three years. This detailed planning period reflects
the assumptions for short and medium-term market developments. For the period after this three-year detailed planning
horizon, a specific estimated growth rate in the amount of the expected long-term inflation rate is assumed. The detailed
planning period for the determination of the value in use is based on assumptions in light of past experience, supplemented by
current internal developments and verified through external market data and analyses. The most important assumptions include
the development of future selling prices, amounts and costs, the influence of the regulatory market environment, investments,
market shares, exchange rates and growth rates. Significant changes to the above-described assumptions would influence the
determination of the value in use of the cash-generating units. The discount rates applied are determined on the basis of
external factors derived from the market and adjusted for the respective predominant risks of the cash-generating
units.
Changes in the calculation parameters used for the impairment tests may influence the fair values of cash-generating units.
A sensitivity analysis was therefore carried out for the different cash-generating units with a 1.0 percentage points higher
discount rate, a decrease in the growth rate of 0.5 percentage points and a decrease in EBIT of 10.0 percentage points. Using
these assumptions, there was also no necessity for an impairment to any cash-generating unit.

152 STADA Consolidated Financial Statements
25. Property, plant and equipment
Property, plant and equipment developed as follows in financial year 2016:
2016 in € 000s
Land, leasehold rights and buildings including
buildings on third-party
land
Plant and tools and
machinery equipment
Other plants and
business equipment
Advance payment and construction
in progress
Total
Cost as of Jan. 1, 2016 263,806 225,444 102,389 27,780 619,419
Currency translation 1,193 3,555 2,235 -11 6,972
Changes in the scope of consolidation – – -122 – -122
Additions 2,242 7,956 8,035 31,894 50,127
Additions from business combinations according to IFRS 3
1,519
2,047
628
–
4,194
Disposals 18,061 16,733 7,796 148 42,738
Reclassification to non-current assets and disposal groups held for sale
11,693
9,915
1,026
49
22,683
Transfers 11,042 10,521 4,383 -26,239 -293
Cost as of Dec. 31, 2016 250,048 222,875 108,726 33,227 614,876
Accumulated depreciation as of Jan. 1, 2016 95,410 132,349 70,043 – 297,802
Currency translation 806 3,274 669 – 4,749
Changes in the scope of consolidation – – -119 – -119
Depreciation/amortization 6,796 16,574 10,304 – 33,674
Impairment losses 36 97 90 – 223
Disposals 14,335 15,911 6,925 – 37,171
Write-ups – – – – –
Reclassification to non-current assets and disposal groups held for sale
1,527
4,858
567
–
6,952
Transfers -1 -1 -43 – -45
Accumulated amortization as of Dec. 31, 2016 87,185 131,524 73,452 – 292,161
Residual carrying amounts as of Dec. 31, 2016 162,863 91,351 35,274 33,227 322,715
Residual carrying amounts as of Dec. 31, 2015 168,396 93,095 32,346 27,780 321,617
Property, plant and equipment included assets from finance leases, primarily relating to cars and vehicles, in the amount of
€ 4.4 million (previous year: € 2.8 million), which, in accordance with IAS 17, were recognized at the present value of minimum
lease payments and have since been subjected to depreciation.
In the reporting year, reclassifications of non-current assets and disposal groups held for sale relate to two subsidiaries in Asia.
As in the previous year, no borrowing costs were capitalized for property, plant and equipment in financial year 2016.

153STADA Consolidated Financial Statements | Notes to the Consolidated Financial Statements
Property, plant and equipment developed as follows in the previous year:
2015 in € 000s
Land, leasehold rights and buildings including
buildings on third-party
land
Plant and tools and
machinery equipment
Other plants and
business equipment
Advance payment and construction
in progress
Total
Cost as of Jan. 1, 2015 255,066 202,977 99,965 21,270 579,278
Currency translation -828 -1,923 -1,398 -961 -5,110
Changes in the scope of consolidation 47 1 82 – 130
Additions 2,698 10,110 5,542 34,521 52,871
Additions from business combinations according to IFRS 3
36
523
87
–
646
Disposals 801 1,748 5,962 367 8,878
Reclassification from non-current assets and disposal groups held for sale
482
–
–
–
482
Transfers 7,106 15,504 4,073 -26,683 0
Cost as of Dec. 31, 2015 263,806 225,444 102,389 27,780 619,419
Accumulated amortization as of Jan. 1, 2015 88,738 119,149 65,961 – 273,848
Currency translation -763 -2,035 -654 – -3,452
Changes in the scope of consolidation – – – – –
Depreciation/amortization 7,461 16,685 10,073 – 34,219
Impairment losses – 118 43 – 161
Disposals 189 1,638 5,302 – 7,129
Write-ups – – – – –
Reclassification from non-current assets and disposal groups held for sale
155
–
–
–
155
Transfers 8 70 -78 – 0
Accumulated amortization as of Dec. 31, 2015 95,410 132,349 70,043 – 297,802
Residual carrying amounts as of Dec. 31, 2015 168,396 93,095 32,346 27,780 321,617
Residual carrying amounts as of Dec. 31, 2014 166,328 83,828 34,004 21,270 305,430
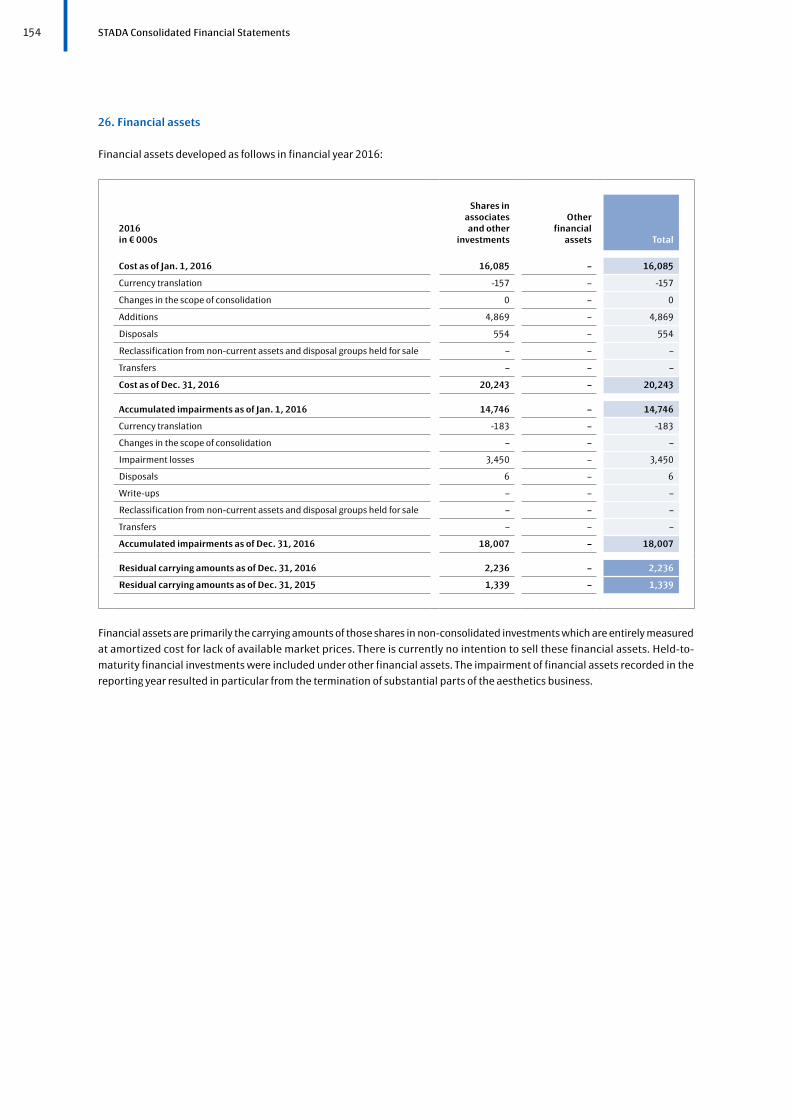
154 STADA Consolidated Financial Statements
26. Financial assets
Financial assets developed as follows in financial year 2016:
2016 in € 000s
Shares in associates and other
investments
Other
financial assets
Total
Cost as of Jan. 1, 2016 16,085 – 16,085
Currency translation -157 – -157
Changes in the scope of consolidation 0 – 0
Additions 4,869 – 4,869
Disposals 554 – 554
Reclassification from non-current assets and disposal groups held for sale – – –
Transfers – – –
Cost as of Dec. 31, 2016 20,243 – 20,243
Accumulated impairments as of Jan. 1, 2016 14,746 – 14,746
Currency translation -183 – -183
Changes in the scope of consolidation – – –
Impairment losses 3,450 – 3,450
Disposals 6 – 6
Write-ups – – –
Reclassification from non-current assets and disposal groups held for sale – – –
Transfers – – –
Accumulated impairments as of Dec. 31, 2016 18,007 – 18,007
Residual carrying amounts as of Dec. 31, 2016 2,236 – 2,236
Residual carrying amounts as of Dec. 31, 2015 1,339 – 1,339
Financial assets are primarily the carrying amounts of those shares in non-consolidated investments which are entirely measured
at amortized cost for lack of available market prices. There is currently no intention to sell these financial assets. Held-to-
maturity financial investments were included under other financial assets. The impairment of financial assets recorded in the
reporting year resulted in particular from the termination of substantial parts of the aesthetics business.

155STADA Consolidated Financial Statements | Notes to the Consolidated Financial Statements
Financial assets developed as follows in the previous year:
2015 in € 000s
Shares in associates and other
investments
Other
financial assets
Total
Cost as of Jan. 1, 2015 18,859 – 18,859
Currency translation -58 – -58
Changes in the scope of consolidation -1,092 – -1,092
Additions 615 – 615
Disposals 2,235 – 2,235
Reclassification from non-current assets and disposal groups held for sale – – –
Transfers -4 – -4
Cost as of Dec. 31, 2015 16,085 – 16,085
Accumulated impairments as of Jan. 1, 2015 16,823 – 16,823
Currency translation -3 – -3
Changes in the scope of consolidation – – –
Impairment losses 91 – 91
Disposals 2,165 – 2,165
Write-ups – – –
Reclassification from non-current assets and disposal groups held for sale – – –
Transfers – – –
Accumulated impairments as of Dec. 31, 2015 14,746 – 14,746
Residual carrying amounts as of Dec. 31, 2015 1,339 – 1,339
Residual carrying amounts as of Dec. 31, 2014 2,036 – 2,036
27. Investments measured at equity
The disclosure relates to the accounting of shares in the associates BIOCEUTICALS Arzneimittel AG, as well as Pharm Ortho
Pedic SAS, AELIA SAS and Dialogfarma LLC using the equity method. Investments measured at equity developed as follows in
financial year 2016 compared with the previous year:
in € 000s 2016 2015
As of Jan. 1 13,168 10,569
Increase in investment share – 3
Result from associates 704 1,419
Previous year adjustment – 1,177
Elimination of dividend income – –
Currency translation differences – –
As of Dec. 31 13,872 13,168
In financial year 2016, the increase of the investment share in associates was due to the result of associates. The invest-
ment share in associates had increased in the previous year due to an adjustment of financial year 2014 recognized directly
in equity on current account of the previous year in the amount of € 1.2 million.

156 STADA Consolidated Financial Statements
28. Trade accounts receivable
Trade accounts receivable are composed as follows:
in € 000s Dec. 31, 2016 Dec. 31, 2015
Trade accounts receivable from third parties 589,952 589,664
Trade accounts receivable from non-consolidated companies 6,923 1,298
Valuation allowances vis-à-vis third parties -107,804 -105,061
Total 489,071 485,901
As of December 31, 2016, there are trade accounts receivable due after one year in the amount of € 3.3 million (December 31,
2015: € 1.1 million).
Collateral exists for a portion of trade accounts receivable whose value was not impaired in the form of bank or corporate
guarantees as well as pledged inventories. Furthermore, there is commercial credit insurance for certain markets and cus tomers.
The following non-impaired trade accounts receivable were past due at the reporting date:
in € 000s
Carrying amount
thereof:neither
impaired nor past due as at the reporting
date
thereof: not impaired as at the reporting date and past due in the following
time band
up to
30 days
between 31 and 90
days
between 91 and 180
days
more than
180 days
Dec. 31, 2016 489,071 415,318 17,453 32,191 18,058 6,051
Dec. 31, 2015 485,901 443,106 20,081 14,286 7,717 711
There were no recognizable indications as of the reporting date that the debtors would not meet their payment obligations.
Therefore, the trade accounts receivable that are not impaired and not past due are considered to be unconditionally
recoverable. There are also no indications of impairment for the overdue receivables that have not been impaired.
Overall, valuation allowances on trade accounts receivable developed as follows:
in € 000s 2016 2015
As of Jan. 1 105,061 117,430
Added 8,564 2,818
Utilized 3,248 12,866
Reversed 2,304 1,047
Changes in the scope of consolidation and reclassifications in accordance with IFRS 5 -33 -19
Currency translation differences -236 -1,255
As of Dec. 31 107,804 105,061

157STADA Consolidated Financial Statements | Notes to the Consolidated Financial Statements
29. Other financial assets
Other financial assets are composed as follows:
Dec. 31, 2016 Dec. 31, 2015
in € 000s
Total
thereof: current
Total
thereof: current
Loan receivables 234 – 6 6
Outstanding purchase price receivables 1,070 765 4,024 3,559
Derivative financial assets 9,914 9,914 27,461 26,702
Other financial assets 33,112 29,201 51,506 44,012
Total 44,330 39,880 82,997 74,279
The outstanding purchase price receivables in financial year 2016 and also primarily in the previous year relate to the still-
outstanding installments from the sale of a product portfolio in Italy.
The derivative financial assets include the positive market values of cross-currency swaps as well as of currency forwards
(see Note 45.1.).
The remaining financial assets include accruals for price compensations in connection with tender contracts in the amount
of € 14.1 million, receivables from the German factoring business in the amount of € 6.4 million and also comprise many
immaterial individual items in the Group companies.
As of December 31, 2016, other financial assets included impairments in the amount of € 8.1 million (previous year: € 6.6 million).
There are no outstanding amounts for non-impaired other financial assets.
30. Other assets
Other assets are composed as follows:
Dec. 31, 2016 Dec. 31, 2015
in € 000s
Total
thereof: current
Total
thereof: current
Other receivables due from the tax authorities 12,495 12,253 13,085 12,842
Prepaid expenses/deferred charges 11,982 10,780 14,342 11,039
Assets from overfunded pension plans 18 – 63 –
Other assets 7,290 5,657 5,930 5,165
Total 31,785 28,690 33,420 29,046
Remaining assets comprise many immaterial individual items in the Group companies.
Remaining assets are impaired in the amount of € 3.2 million (previous year: € 5.5 million).

158 STADA Consolidated Financial Statements
31. Inventories
Inventories can be subdivided as follows:
in € 000s Dec. 31, 2016 Dec. 31, 2015
Materials and supplies 93,156 97,992
Work in progress 20,686 25,522
Finished goods and merchandise 364,483 372,778
Advance payments 6,579 5,228
Total 484,904 501,520
In financial year 2016, impairments offset with reversals were made on the net realizable value of inventories in the amount of
€ 28.2 million (previous year: € 36.5 million), which were already deducted from the amounts shown above through profit and
loss. In financial year 2016, reversals here amounted to € 7.7 million (previous year: € 7.2 million).
32. Cash and cash equivalents
Cash and cash equivalents include cash on hand and call deposits as well as current and highly liquid financial investments with
a maximum term of 90 days from the purchase date. In certain countries, specific transactions are subjected to special
monitoring in the context of the requirements of the respective national bank or foreign exchange acts in force. Restrictions on
disposal for cash and cash equivalents amount to € 2.3 million (previous year: € 2.3 million) and, as in the previous year, ex clusively
relate to cash and cash equivalents in China.
The increase in cash and cash equivalents from € 143.2 million as of December 31, 2015 to € 352.6 million as of December 31,
2016 is primarily due to reporting date effects. Further details on the development of cash and cash equivalents can be found
in the con solidated cash flow statement.
33. Non-current assets and disposal groups held for sale as well as associated debts
As of December 31, 2016, assets in the amount of € 83.0 million and liabilities in the amount of € 14.6 million held for sale in the
context of a disposal group were reported in a separate line item in the balance sheet. The disposal group relates to two
sub sidiaries STADA Vietnam J.V. Co. Ltd., Ho-Chi-Minh City, Vietnam, and STADA Import/Export International Ltd., Hongkong,
China, which are expected to be sold in financial year 2017.
The assets and liabilities held for sale are divided between the following main groups:
Assets held for sale as of Dec. 31, 2016in € 000s
Dec. 31, 2016
Dec. 31, 2015
Intangible assets 28,314 –
Property, plant and equipment 15,731 –
Other non-current assets 88 –
Inventories 24,451 –
Trade receivables 9,743 –
Cash 3,223 –
Other current assets 1,410 –
Assets held for sale 82,960 –

159STADA Consolidated Financial Statements | Notes to the Consolidated Financial Statements
Liabilities held for sale as of Dec. 31, 2016in € 000s
Dec. 31, 2016
Dec. 31, 2015
Deferred taxes 5,574 –
Other non-current liabilities 528 –
Trade payables 5,588 –
Other current liabilities 2,888 –
Liabilities associated with assets held for sale 14,578 –
As the carrying amount of the disposal group was below fair value less disposal costs as of December 31, 2016, no impairment
expense was recorded.
34. Equity
Group equity amounted to € 1,047.1 million as of the reporting date (previous year: € 1,018.5 million). This corresponds to an
equity-to-assets ratio of 30.4% (previous year: 31.0%).
34.1. Share Capital
As of December 31, 2016, share capital amounted to € 162,090,344.00 (December 31, 2015: € 162,090,344.00) and was
divided into 62,342,440 registered shares (December 31, 2015: 62,342,440), each with an arithmetical share of share capital
of € 2.60 per share, and is fully paid. Each share grants one vote in the Annual General Meeting.
As of December 31, 2016, authorized share capital and conditional capital were comprised as follows:
Amount in € Shares Purpose
Authorized capital 77,134,304.00 29,667,040 Increase of share capital (until June 4, 2018)
Conditional Capital 2013
69,188,340.00
26,610,900
Settlement of options and/or conversion rights (until June 4, 2018) in connection with issued bonds with
warrants and/or convertible bonds, participation rights and/or participating bonds in the total nominal amount of up to € 1.0 billion, or in the scope of a guarantee assumed
for bonds with warrants and/or convertible bonds, participation rights and/or participating bonds issued by
subordinate Group companies
34.2. Capital reserve
Changes in the capital reserve of the Group are shown in the consolidated statement of changes in equity and particularly include
the capital reserve of STADA Arzneimittel AG. Differences from the capital reserve determined according to the provisions of
German commercial law primarily result from the recognition at their market value of the shares of STADA Arzneimittel AG
newly issued in 2003 as well as the associated treatment of issuing costs, which were deducted from the capital reserve.
Changes in the capital reserve were solely the result of the change in treasury shares in fiancial year 2016. In the previous year
the increase of capital reserve in particular resulted from STADA warrants 2000/2015 in the context of the exercise of options,
which expired at the end of June 26, 2015.

160 STADA Consolidated Financial Statements
34.3. Retained earnings including net income
Retained earnings including net income comprise net income for the financial year as well as earnings generated in previous
periods, provided these were not distributed, including amounts transferred to retained earnings. In addition, revaluations of
net debt from defined benefit plans that were recognized through other comprehensive income are reported under this item,
taking deferred taxes into account.
In the context of measuring the defined benefit obligations as of December 31, 2016, net income in the amount of € 4.8 million
after deferred taxes – not considering amounts attributable to non-controlling interests – resulted from the remeasurement.
It is mainly based on the reduction of discount rate on which the remeasurement is based for various defined benefit plans in
the STADA Group underlying the measurement of December 31, 2016 in comparison with December 31, 2015.
34.4. Other reserves
Other reserves include results recognized directly in equity. This relates, among other things, to foreign exchange gains and
losses resulting from the currency translation with no effect on income of financial statements of companies included in the
Group, which are reported in the statement of changes in equity under the currency translation reserve. The reserve “available
for sale” and the reserve for cash flow hedges include the results from the measurement at fair value of financial instruments
categorized as available for sale, and the measurement results from cash flow hedges from the effective portion of the hedge,
allowing for respective deferred taxes.
The reduction of other reserves compared with the previous year is primarily composed of the following opposing effects:
On the one hand, the devaluation of the British pound sterling since December 31, 2015 led to expenses recognized directly
in equity from the currency translation of financial statements of companies reporting in British pound sterling. On the other
hand, the appreciation of the Russian ruble since December 31, 2015 has resulted in income recognized in equity from
the currency translations of financial statements of companies reporting in the respective currency, which only partially com-
pensated for the previously described expenses.
34.5. Treasury shares
As of the reporting date, the Company held 85,043 treasury shares (previous year: 87,259), each with an arithmetical par
value of € 2.60 per share, which is equivalent to 0.14% (previous year: 0.14%) of the share capital. In financial year 2016,
2,216 treasury shares were sold at an average price of € 36.31 per share within the scope of an employee share ownership plan.
34.6. Shares relating to non-controlling shareholders
Shares of non-controlling shareholders relate to minority interests of other shareholders in the subsidiaries STADA Thailand,
STADA Import/Export International, STADA Vietnam, Pymepharco, STADA Pharmaceuticals (Beijing), Well Light Investment
Services, Hemomont and Hemofarm Banja Luka.
35. Other non-current provisions
Other non-current provisions made by STADA as of the reporting date in Germany and outside Germany include pension
pro visions and other non-current provisions in the form of anniversary provisions and provisions for working time accounts
as follows:
in € 000s Dec. 31, 2016 Dec. 31, 2015
Germany 13,157 11,464
Outside Germany 22,840 17,405
Total 35,997 28,869

161STADA Consolidated Financial Statements | Notes to the Consolidated Financial Statements
In Germany, STADA has plan assets in the form of reinsurance policies, which are used to serve the pension entitlements of a
small number of former employees. In addition, there are plan assets for a pension obligation which was outsourced to a pension
fund. All further pension entitlements are financed internally in the scope of pension provisions. In addition, there are plan
assets in a few foreign subsidiaries in the form of, among others, insurances, government bonds and securities funds.
In financial year 2016, the plan assets of one international subsidiary exceeded their pension obligations, with the result that
these assets in excess were reported under other assets as assets from overfunded pension plans in the amount of € 0.02 mil-
lion (previous year: € 0.1 million including Germany).
Plan assets were divided according to investment type as follows:
Share of plan assets in € 000s 2016 2015
Cash and cash equivalents 1,245 682
Equity securities 6,045 5,279
Debt securities 18,983 13,811
Real estate 1,813 1,359
Derivatives – –
Shares in investment funds 13,075 18,475
Insurance policies 77,009 64,990
Other 459 363
Total 118,629 104,959
The plan assets, which have a quoted market price, consist of the following:
Share of plan assets (quoted market price) in € 000s 2016 2015
Cash and cash equivalents 1,245 682
Equity securities 6,045 5,279
Debt securities 18,983 13,811
Real estate 1,813 1,359
Derivatives – –
Shares in investment funds 13,075 16,235
Insurance policies – –
Other 459 363
Total 41,620 37,729
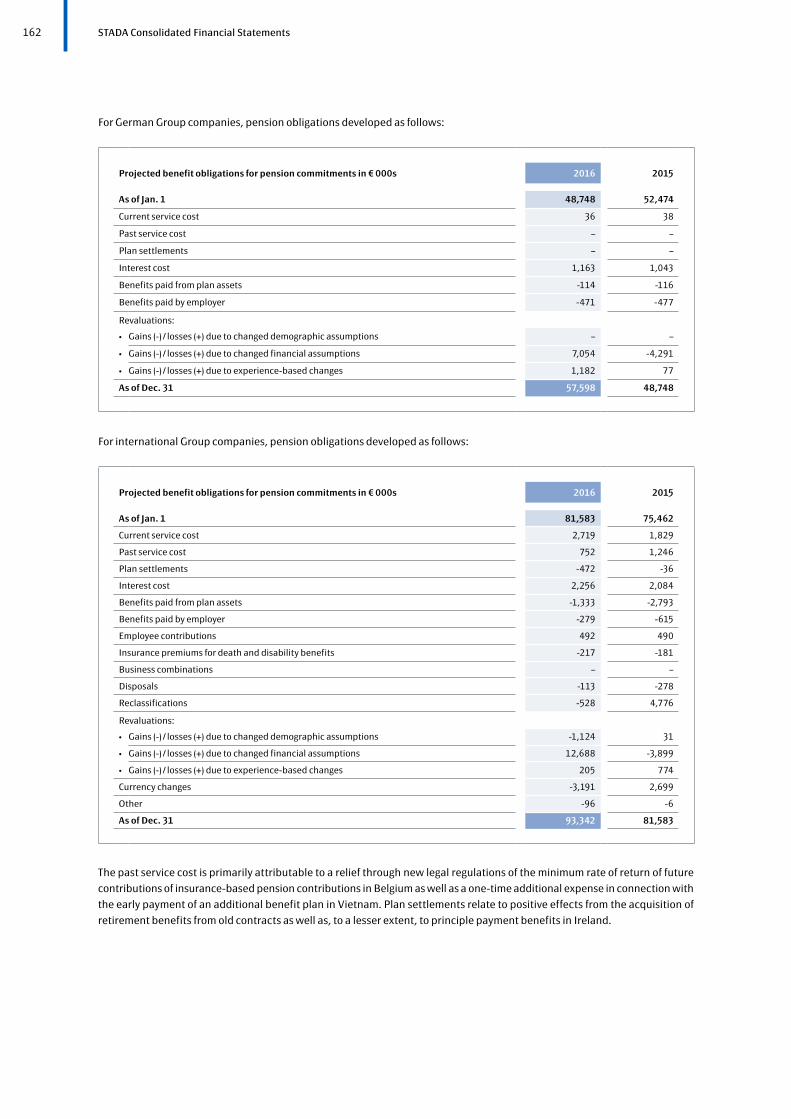
162 STADA Consolidated Financial Statements
For German Group companies, pension obligations developed as follows:
Projected benefit obligations for pension commitments in € 000s 2016 2015
As of Jan. 1 48,748 52,474
Current service cost 36 38
Past service cost – –
Plan settlements – –
Interest cost 1,163 1,043
Benefits paid from plan assets -114 -116
Benefits paid by employer -471 -477
Revaluations:
• Gains (-) / losses (+) due to changed demographic assumptions – –
• Gains (-) / losses (+) due to changed financial assumptions 7,054 -4,291
• Gains (-) / losses (+) due to experience-based changes 1,182 77
As of Dec. 31 57,598 48,748
For international Group companies, pension obligations developed as follows:
Projected benefit obligations for pension commitments in € 000s 2016 2015
As of Jan. 1 81,583 75,462
Current service cost 2,719 1,829
Past service cost 752 1,246
Plan settlements -472 -36
Interest cost 2,256 2,084
Benefits paid from plan assets -1,333 -2,793
Benefits paid by employer -279 -615
Employee contributions 492 490
Insurance premiums for death and disability benefits -217 -181
Business combinations – –
Disposals -113 -278
Reclassifications -528 4,776
Revaluations:
• Gains (-) / losses (+) due to changed demographic assumptions -1,124 31
• Gains (-) / losses (+) due to changed financial assumptions 12,688 -3,899
• Gains (-) / losses (+) due to experience-based changes 205 774
Currency changes -3,191 2,699
Other -96 -6
As of Dec. 31 93,342 81,583
The past service cost is primarily attributable to a relief through new legal regulations of the minimum rate of return of future
contributions of insurance-based pension contributions in Belgium as well as a one-time additional expense in connection with
the early payment of an additional benefit plan in Vietnam. Plan settlements relate to positive effects from the acquisition of
retirement benefits from old contracts as well as, to a lesser extent, to principle payment benefits in Ireland.

163STADA Consolidated Financial Statements | Notes to the Consolidated Financial Statements
Reclassifications carried out in the reporting year in the amount of € 0.5 million relate to two Asian subsidiaries, the pension
obligations for which were reclassified as liabilities associated with current assets and disposal groups held for sale in accordance
with IFRS 5. Furthermore, one plan was removed from the scope of consolidation due to the deconsolidation of the company
STADA Egypt and reported under the corresponding disposals.
The fair value of plan assets underlying the pension obligations developed as follows for German group companies:
Fair value of plan assets in € 000s 2016 2015
As of Jan. 1 37,314 39,319
Interest income 766 660
Employer contributions -29 338
Employee contributions – –
Pension payments -114 -116
Actuarial gains (+) / losses (-) on plan assets (not included in interest result) 6,504 -2,887
Other – –
As of Dec. 31 44,441 37,314
The fair value of plan assets underlying the pension obligations developed as follows for international Group companies:
Fair value of plan assets in € 000s 2016 2015
As of Jan. 1 67,645 62,029
Interest income 1,816 1,667
Employer contributions 2,195 1,422
Employee contributions 492 490
Pension payments -1,333 -2,793
Insurance premiums for death and disability benefits -217 -181
Business combinations – –
Disposals – –
Reclassifications – 4,454
Actuarial gains (+) / losses (-) on plan assets (not included in interest result) 7,228 -1,722
Currency changes -3,456 2,453
Other -182 -174
As of Dec. 31 74,188 67,645

164 STADA Consolidated Financial Statements
The amount of the pension provisions recognized as of the reporting date for companies with plan assets is therefore as follows:
in € 000s 2016 2015
Projected benefit obligations for pension commitments 137,452 118,991
Fair value of plan assets 118,629 104,959
Net obligation 18,823 14,032
Effect from the limit on a defined benefit asset according to IFRIC 14 – –
Net liability recognized in balance sheet 18,823 14,032
The amount of the pension provisions recognized as of the reporting date for companies without plan assets is therefore as
follows:
in € 000s 2016 2015
Projected benefit obligations for pension commitments 13,488 11,340
Net liability recognized in balance sheet 13,488 11,340
Expenses for defined benefit plans amounted to net expenses in the total amount of € 4.0 million in financial year 2016 (pre-
vious year: € 4.0 million) and consisted of the following components:
in € 000s 2016 2015
Current service cost 2,755 1,867
Past service cost 752 1,246
Plan settlements -472 -36
Net interest expense:
• Interest expense (DBO) 3,419 3,127
• Interest income (plan assets) -2,582 -2,327
• Interest income from reimbursement – –
• Interest expense (+) / interest income (-) from the limit on an asset – 7
Administration costs 153 131
Other – 0
Total 4,025 4,015
The income from plan assets amounted to € 7.3 million in financial year 2016 (previous year: expense of € 2.2 million) for
German group companies and € 9.0 million for international group companies (previous year: expense of € 0.1 million). The
increase in plan assets for German Group companies is mainly due to an increase of the plan assets of an approval to the level
of the gross obligation as a result of existing reinsurance; this is a consequence of a decreased measurement rate in financial
year 2016. The increase in the plan assets abroad particularly results from an increase in the plan assets in the United Kingdom
and the Netherlands.

165STADA Consolidated Financial Statements | Notes to the Consolidated Financial Statements
The following actuarial parameters were used as a basis for measuring the German pension obligations and pension costs:
Parameters for pension obligations for German Group companies (weighted) Dec. 31, 2016 Dec. 31, 2015
Discount rate 1.7% 2.4%
Salary trend 3.0% 1.9%
Benefits trend 1.4% 1.4%
Inflation 1.8% 1.8%
The increase in the salary trend is due to the fact that the last active plan participant in a pension plan will receive a pension
from 2017 and this pension plan will no longer have a negative influence on the average salary trend.
The following actuarial parameters were used as a basis for measuring the international pension obligations and pension costs:
Parameters for pension obligations for international Group companies (weighted) Dec. 31, 2016 Dec. 31, 2015
Discount rate 2.1% 3.0%
Salary trend 2.7% 2.6%
Benefits trend 0.9% 0.9%
Inflation 2.0% 1.9%
A sensitivity analysis was carried out in which only one assumption was changed in each case and all other assumptions were
not changed. In the following, the change in the defined benefit obligation of the pension obligations (DBO) for German Group
companies is presented according to a change in the discount rate, salary trends and pension trends.
Change in the defined benefit obligation for pension obligations (DBO) as of December 31, 2016 (€ 57,598,000) according to changed assumption in € 000s
Dec. 31, 2016
Dec. 31, 2015
Discount rate +0.5% -5,376 -4,691
Discount rate -0.5% 6,019 5,448
Salary trend +0.5% 16 4,051
Salary trend -0.5% -11 -3,480
Pension trend +0.5% 6,111 5,236
Pension trend -0.5% -5,284 -4,556
The salary trend is largely insignificant after the last active plan participant in a pension plan receives a pension from 2017.

166 STADA Consolidated Financial Statements
In the following, the change in the defined benefit obligation of the pension obligations (DBO) for international Group companies
is presented according to a change in the discount rate, salary trends and pension trends.
Change in the defined benefit obligation for pension obligations (DBO) as of December 31, 2016 (€ 93,342,000) according to changed assumption in € 000s
Dec. 31, 2016
Dec. 31, 2015
Discount rate +0.5% -7,618 -6,599
Discount rate -0.5% 8,575 7,532
Salary trend +0.5% 867 793
Salary trend -0.5% -814 -767
Pension trend +0.5% 4,850 4,033
Pension trend -0.5% -1,256 -1,132
As of December 31, 2016, the weighted duration of the pension obligations amounts to 20 years (previous year: 21 years) for
German Group companies and 17 years (previous year: 17 years) for international Group companies.
In the coming financial years, the following payments from the Company and from plan assets overall are expected for defined
benefit plans:
Expected pension payments according to maturity dates in € 000s
Germany
Outside Germany
Less than 1 year 1,673 3,627
Between 1 and 2 years 1,726 3,947
Between 2 and 3 years 1,987 3,148
Between 3 and 4 years 1,982 2,875
Between 4 and 5 years 1,992 2,995
Between 5 and 10 years 9,957 17,949
For the coming financial year, employer contributions, consisting of direct pension payments and contributions to the plan, are
expected in the amount of € 0.7 million for German Group companies and € 3.6 million for international Group companies.
The regulations of IAS 19 require a presentation of the benefit plans that generate obligations for the company. For the STADA
Group, retirement benefit plans in Germany, the Netherlands, the United Kingdom and Switzerland account for the largest share
of total obligations with 83%. Accordingly, the following details focus more on these countries.
In Germany, the legal framework for company pension plans is provided by the Company Pensions Act (Betriebsrentengesetz
– BetrAVG), in which the minimum legal requirements for company pension plans are embedded. Regulation and legal
pre cedents within labor law must also be followed. The retirement benefit plans are predominantly based upon the final
salary and are concluded with newly hired employees. Plan participants are primarily beneficiaries. Benefits are paid out in the
form of a pension.
In Germany, STADA has plan assets in the form of reinsurance policies and in the form of assets in a pension fund. As of Decem-
ber 31, 2016, plan assets amounted to € 44.4 million and were composed of three different plans. There are no plan assets for
two additional plans.
In the context of risk assessment, the life expectancy of plan participants plays a smaller role in Germany, as the material
obligation regarding its amount and including associated risks was outsourced externally. Furthermore, there is also the common
risk of the interest rate development and the risk that the real future salary development exceeds the salary development derived
from assumptions taken in the evaluation.

167STADA Consolidated Financial Statements | Notes to the Consolidated Financial Statements
The pension commitment for the former Chairman of the Executive Board was transferred to a pension fund in full in financial
year 2014. Despite the transfer, the necessity remains, due to the secondary liability of STADA, to treat the benefit plan as defined
benefit plan in accordance with IAS 19 and measure and recognize it accordingly in the balance sheet. The existing plan assets
lead to a provision of zero due to offsetting that must be carried out at the time of the plan amendment for this benefit plan.
Because the pension commitment is fully funded, no further provisions are expected in the future.
Pension legislation in the Netherlands requires pension plans to be backed by assets to such an extent that the vested benefits
are completely covered. The underlying average career pension plan in the Netherlands is, in part, financed via insurance
contributions that are designed to fulfill the aforementioned requirement. The plan is open for new employees and contains
benefits that fall due in case of retirement or early death.
In the Netherlands, the pension plan is partially financed via contributions to an insurance company. Assets received by the
insurance company cannot be allocated to specific participating companies. The assets cannot be determined by a quoted
active market price, instead they are determined according to the amount of vested benefit obligations. As of December 31,
2016, plan assets amounted to € 26.9 million.
The Dutch company pays annual pension contributions. In the process, life expectancy risk and interest rate risk are transferred
to the insurance company. The insurance company also assumes the risk of investing the proceeds. These risks are assumed by
the insurance company for the entire term of the contract. If, for example, the discount rate used by the insurance company in
its calculations should change, a new contract could be concluded that applies the new discount rate to underlie only future
proceeds received.
Not all risks have been transferred to the insurance company. Dutch law for example specifies that former employees have the
right to transfer their pension entitlements to the pension plan of a new employer. If the evaluation assumptions applied in the
transfer differ from the originally applied assumptions of the insurance, the company could be required to pay an additional
contribution payment.
In the United Kingdom, STADA provides its employees with defined benefit plans that are concluded for new hires. The em ployees
can also no longer earn an additional increase in their entitlements. The pension plans are subject to the UK Trust Law and the
UK Pension Regulator and are monitored by trustees who determine the investment strategy. The trustees are also responsible
for fulfilling the legally required pension plan funding and ensuring sufficient assets to cover the technical provision of the plan.
The pension plan is subject to risks relating to the discount rate and participant life expectancy as well as inflation risk, if these
values develop contrary to expectations. If the discount rate is low, the level of funding decreases, which may require the pay-
ment of additional contributions. There is a financing risk in plan assets in that plan assets could develop contrary to expectations
and plan assets could therefore only compensate in part for changes in the obligations.
In the long-term, 40% of the plan assets in the United Kingdom should be invested in so-called matching assets, which
guarantee the fulfillment of future pension obligations under changing market conditions. In accordance with target allocation,
the remaining 60% should be invested in so-called growth assets, for which an above-average rate of return is expected in
comparison with the obligation development. As of December 31, 2016, plan assets amounted to € 23.3 million. All assets have
quoted market prices on an active market.

168 STADA Consolidated Financial Statements
In Switzerland, all employers must offer their employees a pension plan according to federal pension law (Bundesgesetz über
die berufliche Alters-, Hinterlassenen- und Invalidenvorsorge – BVG). Employees whose salary exceeds the entry limit are obliged
to be insured – this is re-determined periodically. The BVG requires a minimum plan (the “BVG minimum”) that must always be
covered. STADA’s Swiss benefit plan includes benefits in case of death, disability, departure and upon reaching retirement age.
The annual pension is calculated based on a savings account and conversion rate determined according to the age of retirement.
Plan participants can opt for a capital option.
The contributions for defined contribution plans, which are reported as expense in the respective period in the relevant
functional areas, amounted to € 23.2 million in financial year 2016 (previous year: € 22.4 million).
The other non-current provisions developed as follows:
Other non-current provisions in € 000s 2016 2015
As of Jan. 1 3,434 3,243
Current service cost 295 282
Past service cost -203 1
Plan settlements – –
Interest cost 223 207
Benefits paid -330 -443
Business combinations – –
Revaluations
• Gains (-) / losses (+) due to changed demographic assumptions 22 19
• Gains (-) / losses (+) due to changed financial assumptions 472 -1
• Gains (-) / losses (+) due to experience-based changes -230 132
Currency changes -15 -6
Reclassifications – –
As of Dec. 31 3,668 3,434
The following actuarial parameters were used as a basis for measuring the other long-term provisions:
Parameters for other long-term provisions for international Group companies (weighted)
Dec. 31, 2016
Dec. 31, 2015
Discount rate 5.0% 6.7%
Salary trend 4.0% 4.0%
Inflation 3.3% 3.3%

169STADA Consolidated Financial Statements | Notes to the Consolidated Financial Statements
36. Financial liabilities
Financial liabilities are comprised as follows in accordance with their remaining terms as of the balance sheet date:
in € 000s
Liabilities promissory note loans
Amounts due to banks
Liabilities from bonds
Total
Dec. 31, 2016
Dec. 31, 2015
Dec. 31, 2016
Dec. 31, 2015
Dec. 31, 2016
Dec. 31, 2015
Dec. 31, 2016
Dec. 31, 2015
Remaining terms up to 1 year
43,993
187,734
90,351
86,938
–
–
134,343
274,672
Remaining terms over 1 year up to 3 years
294,487
43,935
25,575
80,353
348,912
348,149
668,974
472,437
Remaining terms over 3 years up to 5 years
307,665
314,252
542
–
–
–
308,207
314,252
Remaining terms over 5 years
61,314
–
–
–
297,918
297,524
359,232
297,524
Financial liabilities
707,459
545,921
116,468
167,291
646,830
645,673
1,470,757
1,358,885
The increase in financial liabilities was attributable to the securing of additional promissory note loans in the total amount of
€ 350.0 million, which will be used for the financing of the promissory note loans, which expired in financial year 2016 in the
total amount of € 188.0 million.
The contractually agreed undiscounted cash flows, as of the reporting date December 31, 2016, from interest payments and
repayment of financial liabilities for the coming years can be seen in the following table:
2017 2018 > 2019
in € 000s
Interest rate
fixed
Interest rate
variable
Repay-
ment
Interest rate
fixed
Interest rate
variable
Repay-
ment
Interest rate
fixed
Interest rate
variable
Repay-
ment
Cash flows from financial liabilities
22,471
2,396
125,066
20,347
2,322
383,350
35,734
2,508
966,789
The following projection of cash flows from financial liabilities was generated in the previous year:
2016 2017 > 2017
in € 000s
Interest rate
fixed
Interest rate
variable
Repay-
ment
Interest rate
fixed
Interest rate
variable
Repay-
ment
Interest rate
fixed
Interest rate
variable
Repay-
ment
Cash flows from financial liabilities
30,295
3,856
248,978
19,167
2,188
94,352
42,164
2,377
990,142

170 STADA Consolidated Financial Statements
For the financial liabilities existing as of the reporting date, a repayment in accordance with the maturity disclosed in the balance
sheet was generally assumed. For current liabilities due to banks, an extension of existing credit lines was partly assumed. The
variable interest payments from the promissory note loans were determined based on the interest rate last fixed before Decem-
ber 31, 2016.
Internal measures to ensure the necessary liquidity for repayment of financial liabilities are detailed in the Notes on the capital
management of liquidity risk (see Note 46.5.).
37. Trade payables
Trade payables are composed as follows:
in € 000s Dec. 31, 2016 Dec. 31, 2015
Trade payables to third parties 244,138 252,278
Trade payables to non-consolidated Group companies 3,784 115
Advances received on orders from third parties 634 1,618
Liabilities from outstanding accounts 88,288 74,476
Total 336,844 328,487
Of the total amount of trade payables, € 0.0 million (previous year: € 0.0 million) are due after one year.
The change in trade payables primarily resulted from effects related to the reporting date, especially relating to deferrals for
outstanding invoices. Furthermore, financial year 2016 saw an increase in comparison to the previous year resulting from
business combinations reported in accordance with IFRS 3.
38. Other financial liabilities
Other financial liabilities are broken down as follows:
Dec. 31, 2016 Dec. 31, 2015
in € 000s
Total
thereof: current
Total
thereof: current
Outstanding purchase price liabilities 5,609 3,616 3,972 1,545
Finance lease liabilities 3,316 1,489 2,211 1,010
Liabilities from derivative financial instruments 11,869 11,869 4,611 4,283
Other financial liabilities 197,153 197,057 215,199 215,199
Total 217,947 214,031 225,993 222,037
As of December 31, 2016, the outstanding purchase price liabilities were primarily attributable to outstanding contingent
consideration for the acquisition of Argentinean company Laboratorio Vannier and product acquisitions in Italy and the United
Kingdom.
As of December 31, 2015 the outstanding purchase price liabilities had mainly comprised amounts from the acquisition of the
British Socialites group and various products in the United Kingdom, which were not yet due.

171STADA Consolidated Financial Statements | Notes to the Consolidated Financial Statements
Finance lease liabilities, such as for vehicles and passenger vehicles, amount to € 3.3 million (previous year: € 2.2 million).
Considering interest in the amount of € 0.6 million (previous year: € 0.3 million), lease installments payable in subsequent years
total € 3.9 million (previous year: € 2.5 million). The lease liabilities are due as follows:
Lease installments
Interest
Finance lease liabilities
in € 000sDec. 31,
2016Dec. 31,
2015Dec. 31,
2016Dec. 31,
2015Dec. 31,
2016Dec. 31,
2015
Remaining terms up to 1 year 1,807 1,214 318 204 1,489 1,010
Remaining terms over 1 year up to 3 years
1,679
1,294
271
113
1,408
1,181
Remaining terms over 3 years up to 5 years
402
22
17
2
385
20
Remaining terms over 5 years 34 – – – 34 –
Total 3,922 2,530 606 319 3,316 2,211
In addition, the negative market values of derivatives measured at fair value through profit or loss were reported in liabilities
from derivative financial instruments. In financial year 2016, this related to cross-currency swaps and currency forwards (see
Note 45.1.). Within the scope of the maturity date analysis, the following contractually agreed remaining terms result for these
derivative financial liabilities:
Derivative financial liabilities
in € 000s Dec. 31, 2016 Dec. 31, 2015
Remaining terms up to 1 year 11,869 1,238
Remaining terms over 1 year up to 3 years – 3,328
Remaining terms over 3 years up to 5 years – –
Remaining terms over 5 years – –
Total 11,869 4,611
Remaining financial liabilities include liabilities from discount agreements of German STADA companies in the amount of
€ 166.3 million (previous year: € 178.3 million) and furthermore comprise many insignificant individual items in the Group
companies. The remaining financial liabilities fall due in the amount of € 197.2 million (previous year: € 215.2 million) within one
year, in the amount of € 0.1 million after one year and up to five years.
The contractually agreed undiscounted cash flows, as of the reporting date December 31, 2016, from interest payments and
repayment of finance lease liabilities and for the liabilities from derivative financial instruments for the coming years can be
seen in the following table:
2017 2018 2019 – 2021
in € 000s
Interest rate
fixed
Interest rate
variable
Repay-
ment
Interest rate
fixed
Interest rate
variable
Repay-
ment
Interest rate
fixed
Interest rate
variable
Repay-
ment
Cash flows from finance lease liabilities
318
–
1,489
179
–
862
109
–
931
Cash flows from derivatives
156
–
–
–
–
–
–
–
–

172 STADA Consolidated Financial Statements
The following projection of cash flows from finance lease liabilities as well as derivatives was generated in the previous year:
2016 2017 2018 – 2020
in € 000s
Interest rate
fixed
Interest rate
variable
Repay-
ment
Interest rate
fixed
Interest rate
variable
Repay-
ment
Interest rate
fixed
Interest rate
variable
Repay-
ment
Cash flows from finance lease liabilities
204
–
1,010
96
–
883
19
–
218
Cash flows from derivatives
1,465
–
–
107
–
–
–
–
–
Included were all financial instruments used by STADA which existed as of December 31, 2016 and for which payments had
already been contractually agreed.
Further details on liabilities from derivative financial instruments can be found in the Notes on financial instruments Note 45.
and Note 46.7.
39. Other financial liabilities
Other liabilities were comprised as follows:
Dec. 31, 2016 Dec. 31, 2015
in € 000s
Total
thereof: current
Total
thereof: current
Tax liabilities 8,170 8,121 12,499 12,499
Personnel related liabilities 64,308 64,308 47,387 47,254
Other liabilities 47,424 46,504 44,548 42,628
Total 119,902 118,933 104,434 102,381
Among other things, other liabilities include the share-based Executive Board remuneration from deferrals, which is calculated
at fair value. Until the liability is settled, the fair value is to be calculated at each financial statement reporting date and at the
date of settlement, and the changes in current fair values are to be recognized in the income statement through profit or loss.
In addition, personnel-related liabilities increased primarily due to reorganizational decisions and structural measures resulting
from a changed corporate structure.
Remaining liabilities comprise many insignificant individual items in the Group companies.

173STADA Consolidated Financial Statements | Notes to the Consolidated Financial Statements
40. Other provisions
Other provisions are composed as follows:
in € 000s Dec. 31, 2016 Dec. 31, 2015
Provisions set aside for damages 1,425 1,082
Warranties 18,848 21,450
Total 20,273 22,532
Provisions set aside for damages include possible utilization from pending legal disputes including the associated legal costs
and developed as follows:
in € 000s Dec. 31, 2016 Dec. 31, 2015
As of Jan. 1 1,082 343
Added 857 739
Utilized 200 –
Reversed 306 –
Currency translation differences -8 –
As of Dec. 31 1,425 1,082
Utilization is expected within the next twelve months.
Provisions for warranties developed as follows:
in € 000s Dec. 31, 2016 Dec. 31, 2015
As of Jan. 1 21,450 17,099
Added 12,964 13,046
Utilized 12,426 8,632
Reversed 3,140 63
Changes in the scope of consolidation 0 –
As of Dec. 31 18,848 21,450

174 STADA Consolidated Financial Statements
Other Disclosures
41. Notes to the cash flow statement
Cash flow from operating activities consists of changes in items not covered by investments, financing, exchange differences
on the conversion of foreign financial statements or transactions in foreign currencies or through changes in the scope of
consolidation and measurement. Cash flow from operating activities improved to € 333.5 million in the reporting year (previous
year: € 311.7 million). The increase in cash flow from operating activities of € 21.8 million compared to the previous year is
primarily due to a comparatively significantly lower cash-effective increase of inventories and a cash-effective increase in trade
accounts payable, although in the previous year a significant cash-effective decrease was recorded here. This positive effect on
cash flow from operating activities was partly compensated by cash flows from other net assets that were significantly higher
than the previous year.
Cash flow from investing activities reflects the cash outflows for investments reduced by the inflows from disposals. It amounted
to € -172.7 million in the reporting year (previous year: € -178.2 million).
In financial year 2016, payments for investments in intangible assets in the amount of € 76.1 million (previous year: € 81.4 mil-
lion) were made, of which € 33.4 million (previous year: € 32.3 million) related to significant investments in intangible assets
for the short-term expansion of the product portfolio. Acquisition-related sales growth was generally associated with these
investments in the reporting year. Proceeds from the disposal of non-current assets amounted to € 11.0 million (previous
year: € 11.8 million) in the financial year.
The cash flow from investing activities was particularly influenced by payments for investments in intangible assets in the
financial year 2016, primarily relating to advance payments made for the development of approvals, trademarks and licence
acquisitions in Germany and the United Kingdom. Furthermore, payments were also made for business con tributions, in
particular from the purchase of a product portfolio in Serbia, as well as the purchase of the British Natures Aid and the Argen-
tinean Laboratorio Vannier.
Cash flow from financing activities amounts to € 55.2 million in financial year 2016 (previous year: € -155.1 million) and
encompasses payments from changes in financial liabilities, dividend distribution payments and payments for treasury shares
as well as additions to shareholders’ equity. This development was primarily attributable to the securing of additional pro-
missory note loans in the total amount of € 350.0 million, which will be used for the refinancing of the promissory note
loans expiring in financial year 2016 in the total amount of € 188.0 million. In addition, significantly fewer financial liabilities
were repaid in the reporting year than in the previous year.
Dividend distribution payments of € 43.6 million primarily related to the dividend paid to the shareholders of STADA Arznei-
mittel AG for financial year 2015.
Free cash flow as the sum of cash flow from operating activities and cash flow from investing activities amounted to € 160.9 mil-
lion in financial year 2016 (previous year: € 133.5 million) and is therefore still significantly characterized by a high volume of
acquisitions.
Free cash flow, adjusted for effects from payments for significant investments and acquisitions and effects of proceeds from
significant disposals is calculated as follows:

175STADA Consolidated Financial Statements | Notes to the Consolidated Financial Statements
in € 000s 2016 2015
Cash flow from operating activities 333,522 311,748
Cash flow from investing activities -172,666 -178,217
+ Payments for investments in business combinations according to IFRS 3 52,901 56,778
+ Payments for significant investments in intangible assets for the short-term expansion of the product portfolio
33,420
32,256
- Proceeds from disposals in significant disinvestments 4,169 10,207
Adjusted free cash flow 243,008 212,358
42. Segment Reporting
The measurement approaches for segment reporting are in accordance with the financial reporting methods used in the IFRS
consolidated financial statements. Services between the segments are charged based on market prices.
Segmentation within the STADA Group is based on sales differentiation. Thus, the allocation to the individual segments is
determined to a large extent by the sales positioning. If this positioning changes for parts of the product portfolio, associated
sales are reclassified.
In the previous year, STADA aggregated business segments into the reportable segments of Generics and Branded Products,
because the type of products, the sales methods and the regulatory framework conditions are largely comparable. According
to the new reporting structure, which was introduced in the third quarter, the Group is now only managed by operating
segment, i.e. according to the two segments Generics and Branded Products. This measure is primarily designed to take account
of the growth strategy including central management of the segments, increasing internationalization of the Branded product
portfolio as well as stricter cost control. As part of the changes to the reporting structures over the course of the current
financial year, the non-core Commercial Business segment was integrated into the Generics segment. Therefore, the figures
reported for the Generics segment for financial year 2016 as well as those for the previous year include the non-core activity
Commercial Business, which was previously disclosed separately.
Generics are products for the health care market – usually with a drug character – which contain one or several active ingredients
whose commercial property rights have expired and whose sales positioning complies with one of the two following criteria:
• The product is offered by emphasizing its low price, usually in contrast to the product of another supplier which contains
the identical active pharmaceutical ingredient,
or
• the product is an integral part of a marketing concept targeting more than one product and indication for primarily
prescription products with active ingredients whose commercial property rights have expired,
or
• the product is sold under its international non-proprietary name (INN).
Branded Products are products for the health care market which contain one or several active ingredients whose commercial
property rights have expired and whose sales positioning complies with one of the two following criteria:
• The product is sold under a product-specific brand name and with emphasis on specific product characteristics which
aim at a unique position of the product in contrast to competitive products and other Group products,
or
• the product is part of a marketing concept for primarily non-prescription products which are mainly sold under a
product-specific brand name and with emphasis on different specific product characteristics which aim at a unique
position of the product in contrast to competitive products and other Group products.

176 STADA Consolidated Financial Statements
All other income, expenses and assets, which cannot be directly allocated to the segments, as well as the elimination of sales
between segments are recognized under the reconciliation Group holdings/other and consolidation.
Disclosures on significant non-cash items include impairments on inventories and receivables; they do not, however, include
depreciation and amortization as well as the offsetting of impairments and write-ups. In addition, further non-cash items,
particularly non-cash effects from accruals for health insurance organization billings are included here. Reporting of the segment
liabilities and non-current segment assets is waived, as this is without relevance for Group monitoring and for Group reporting.
42.1 Information by operating segment
in € 000s 2016 2015
Generics External sales 1,280,757 1,261,444
Sales with other segments 3,431 398
Total sales 1,284,188 1,261,842
Operating profit 195,188 177,668
Depreciation/amortization 50,535 49,770
Impairment losses 9,858 5,480
Reversals 3 –
Other significant non-cash items within operating result -186,136 -192,359
Branded Products External sales 858,462 853,598
Sales with other segments 40 –
Total sales 858,502 853,598
Operating profit 81,361 130,043
Depreciation/amortization 62,140 60,704
Impairment losses 42,706 20,970
Reversals – –
Other significant non-cash items within operating result -29,358 -32,466
Reconciliation Group holdings/other and consolidation
External sales
1
87
Sales with other segments -3,471 -398
Total sales -3,470 -311
Operating profit -98,426 -83,968
Depreciation/amortization 4,506 8,175
Impairment losses 12,916 6,750
Reversals – –
Other significant non-cash items within operating result -3,426 -1,404
Group External sales 2,139,220 2,115,129
Sales with other segments – –
Total sales 2,139,220 2,115,129
Operating profit 178,123 223,743
Depreciation/amortization 117,180 118,648
Impairment losses 65,480 33,200
Reversals 3 –
Other significant non-cash items within operating result -218,920 -226,229

177STADA Consolidated Financial Statements | Notes to the Consolidated Financial Statements
42.2. Reconciliation of segment results to net profit
in € 000s 2016 2015
Operating segment profit 276,549 307,711
Reconciliation Group holdings/other and consolidation -98,426 -83,968
Result from investments measured at equity 703 1,419
Investment income 24 138
Financial income 2,716 1,170
Financial expenses 54,137 68,667
Earnings before taxes, Group 127,429 157,803
42.3. Reconciliation of segment assets to Group assets
in € 000s Dec. 31, 2016 Dec. 31, 2015
Segment assets 1,837,984 1,868,754
Reconciliation Group holdings/other and consolidation 69,327 103,223
Other non-current assets 42,231 60,332
Current assets 1,490,902 1,255,106
Total assets, Group 3,440,444 3,287,415
42.4. Information by country
Sales developments by the business premises
Non-current assets
in € 000s 2016 2015 Dec. 31, 2016 Dec. 31, 2015
Germany 532,138 482,838 551,812 577,247
Russian Federation 265,459 315,755 234,046 192,230
United Kingdom 259,369 252,383 470,204 525,101
Italy 201,389 189,183 35,809 38,414
Spain 117,084 117,190 61,312 61,687
Other regions 763,781 757,780 551,893 575,958
Total, Group 2,139,220 2,115,129 1,905,076 1,970,637
In the presentation of sales by the company’s business premises, sales to third parties are shown according to the invoicing
company’s registered office of the countries listed.
Disclosures on assets by country relate to parts of the non-current assets (intangible assets, property, plant and equipment).

178 STADA Consolidated Financial Statements
42.5. Information about major customers
In accordance with IFRS 8.34, a company must provide notification when sales revenues from business activities from a single
external customer amount to at least 10% of the company’s total sales revenues. As in the previous year, this related to no
customer in the reporting year.
43. Contingent liabilities
Contingent liabilities describe possible obligations with respect to third parties which result from past events and which may
lead to a future outflow of resources depending on specific events. As of the balance sheet date, these contingent liabilities were
considered improbable and are therefore not accounted.
STADA has contingent liabilities, among other things, in connection with patent risks for certain active pharmaceutical
ingredients and associated pending or impending proceedings. The resulting possible obligations amounted to approx. € 12.9 mil-
lion (previous year: € 12.4 million). The development compared with the previous year was primarily attributable to the
elimination of possible liabilities in the amount of € 5.1 million, but also possible liabilities in the amount of € 4.5 million being
recognized. Furthermore, a changed estimation relating to the high imminent outflow of resources for patent risks, which ex-
isted in the previous year, led to a further increase of contingent liabilities in the amount of € 1.1 million.
Provisions were not created for contingent liabilities as the probability of an outflow of assets is under 50%. Outflows poten-
tially resulting from these risks would generally be short-term.
44. Other financial obligations
In addition to the contingent liabilities, there were other future financial obligations, which can be broken down as follows:
in € 000s Dec. 31, 2016 Dec. 31, 2015
Operating lease liabilities 69,111 81,288
Other financial obligations 42,460 33,634
Total 111,571 114,922
Liabilities from operating leases relate particularly to IT equipment and vehicles. In addition, there are liabilities from long-term
rental agreements for office buildings with an average contract term of four years.
The total of future minimum lease payments under operating leases amounted to € 69.1 million as of the end of the financial
year (previous year: € 81.3 million) and can be broken down according to remaining term as follows:
Operating leases
in € 000s Dec. 31, 2016 Dec. 31, 2015
Remaining terms up to 1 year 28,673 32,151
Remaining terms over 1 year to 5 years 37,860 39,473
Remaining terms over 5 years 2,578 9,664
Total 69,111 81,288
Lease payments in the amount of € 32.4 million (previous year: € 30.5 million) were recognized as an expense in financial year
2016.

179STADA Consolidated Financial Statements | Notes to the Consolidated Financial Statements
There is still a guarantee amounting to € 25.0 million towards Hospira Inc., Lake Forest, Illinois, USA, in connection with a
supply agreement between Hospira and the shares in the associate BIOCEUTICALS Arzneimittel AG which are recognized under
the equity method.
STADA, as guarantor, has continued to recognize this guarantee as a financial guarantee in accordance with IAS 39 with a fair
value in the amount of € 0.3 million in the reporting year (previous year: € 0.3 million). Utilization of this guarantee granted is
currently not expected.
Furthermore, additional guarantees assumed by the STADA Group are included in other financial liabilities, among other things.

180 STADA Consolidated Financial Statements
45. Disclosures about financial instruments
45.1. Carrying amounts, valuation rates and fair values according to valuation categories
The following disclosures are made on carrying amounts, valuation rates and fair values by valuation category, whereby
the following abbreviations are used for the valuation categories pursuant to IAS 39: LaR (loans and receivables), HtM (held-
to-maturity investments), AfS (available-for-sale financial assets), FAHfT (financial assets held for trading), FLHfT (financial
liabilities held for trading) and FLAC (financial liabilities measured at amortized cost).
Valuation rate balance sheet in accordance with IAS 39
Valuation rate balance sheet in accordance with IAS 39
in € 000s
Carrying amount Dec. 31,
2016
Valuation
category pursuant to
IAS 39
Amortized cost
Fair value not
included in the income statement
Fair value
included in the income statement
Valuation
rate in accordance with IAS 17
Fair Value Dec. 31,
2016
Carrying amount
previous year
Amortized cost
Fair value not
included in the income statement
Fair value
included in the income statement
Valuation
rate in accordance with IAS 17
Fair Value Dec. 31,
2015
Assets
Cash and cash equivalents 352,580 LaR 352,580 – – – 352,580 143,178 143,178 – – – 143,178
Trade accounts receivable 489,071 LaR 489,071 – – – 489,071 485,901 485,901 – – – 485,901
Available-for-sale financial assets 2,236 AfS 2,236 – – – 2,236 1,339 1,339 – – – 1,339
Derivative financial assets without hedging relationship
9,914
FAHfT
–
–
9,914
–
9,914
27,461
–
–
27,461
–
27,461
Other financial assets 34,416 LaR 34,416 – – – 34,416 55,536 55,536 – – – 55,536
Equity and liabilities
Trade accounts payable 336,844 FLAC 336,844 – – – 336,844 326,869 326,869 – – – 326,869
Amounts due to banks 116,468 FLAC 116,468 – – – 117,531 167,290 167,290 – – – 165,045
Promissory note loans 707,459 FLAC 707,459 – – – 746,076 545,921 545,921 – – – 577,812
Bonds 646,830 FLAC 646,830 – – – 665,138 645,673 645,673 – – – 659,125
Liabilities financial leasing 3,316 n/a – – – 3,316 3,316 2,211 – – – 2,211 2,211
Derivative financial liabilities with hedging relationship
–
n/a
–
–
–
–
–
1,273
–
1,273
–
–
1,273
Derivative financial liabilities without hedging relationship
11,869
FLHfT
–
–
11,869
–
11,869
3,338
–
–
3,338
–
3,338
Other financial liabilities 202,763 FLAC 202,763 – – – 202,763 219,172 219,172 – – – 219,172
Thereof aggregated according to valuation categories in accordance with IAS 39
Loans and receivables 876,067 LaR 876,067 – – – 876,067 684,615 684,615 – – – 684,615
Available-for-sale financial assets 2,236 AfS 2,236 – – – 2,236 1,339 1,339 – – – 1,339
Financial assets held for trading 9,914 FAHfT – – 9,914 – 9,914 27,461 – – 27,461 – 27,461
Financial liabilities measured at amortized cost 2,010,364 FLAC 2,010,364 – – – 2,068,352 1,904,924 1,904,924 – – – 1,948,022
Financial liabilities held for trading 11,869 FLHfT – – 11,869 – 11,869 3,338 – – 3,338 – 3,338
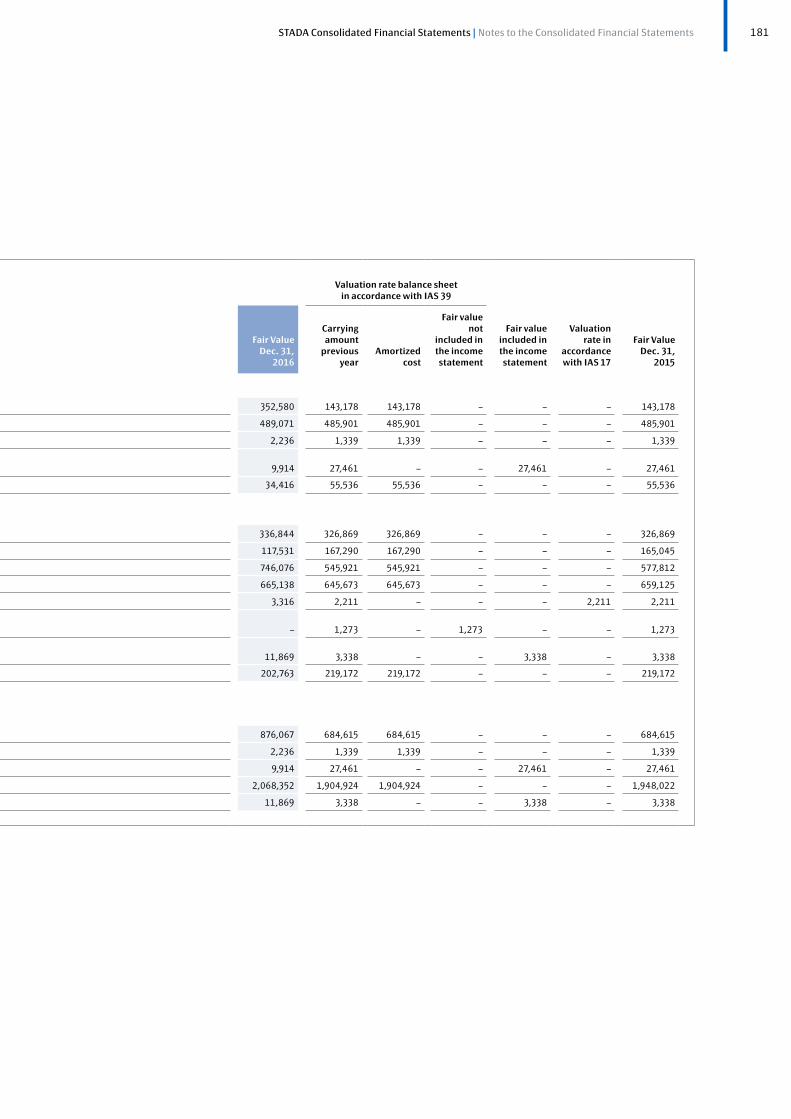
181STADA Consolidated Financial Statements | Notes to the Consolidated Financial Statements
45. Disclosures about financial instruments
45.1. Carrying amounts, valuation rates and fair values according to valuation categories
The following disclosures are made on carrying amounts, valuation rates and fair values by valuation category, whereby
the following abbreviations are used for the valuation categories pursuant to IAS 39: LaR (loans and receivables), HtM (held-
to-maturity investments), AfS (available-for-sale financial assets), FAHfT (financial assets held for trading), FLHfT (financial
liabilities held for trading) and FLAC (financial liabilities measured at amortized cost).
Valuation rate balance sheet in accordance with IAS 39
Valuation rate balance sheet in accordance with IAS 39
in € 000s
Carrying amount Dec. 31,
2016
Valuation
category pursuant to
IAS 39
Amortized cost
Fair value not
included in the income statement
Fair value
included in the income statement
Valuation
rate in accordance with IAS 17
Fair Value Dec. 31,
2016
Carrying amount
previous year
Amortized cost
Fair value not
included in the income statement
Fair value
included in the income statement
Valuation
rate in accordance with IAS 17
Fair Value Dec. 31,
2015
Assets
Cash and cash equivalents 352,580 LaR 352,580 – – – 352,580 143,178 143,178 – – – 143,178
Trade accounts receivable 489,071 LaR 489,071 – – – 489,071 485,901 485,901 – – – 485,901
Available-for-sale financial assets 2,236 AfS 2,236 – – – 2,236 1,339 1,339 – – – 1,339
Derivative financial assets without hedging relationship
9,914
FAHfT
–
–
9,914
–
9,914
27,461
–
–
27,461
–
27,461
Other financial assets 34,416 LaR 34,416 – – – 34,416 55,536 55,536 – – – 55,536
Equity and liabilities
Trade accounts payable 336,844 FLAC 336,844 – – – 336,844 326,869 326,869 – – – 326,869
Amounts due to banks 116,468 FLAC 116,468 – – – 117,531 167,290 167,290 – – – 165,045
Promissory note loans 707,459 FLAC 707,459 – – – 746,076 545,921 545,921 – – – 577,812
Bonds 646,830 FLAC 646,830 – – – 665,138 645,673 645,673 – – – 659,125
Liabilities financial leasing 3,316 n/a – – – 3,316 3,316 2,211 – – – 2,211 2,211
Derivative financial liabilities with hedging relationship
–
n/a
–
–
–
–
–
1,273
–
1,273
–
–
1,273
Derivative financial liabilities without hedging relationship
11,869
FLHfT
–
–
11,869
–
11,869
3,338
–
–
3,338
–
3,338
Other financial liabilities 202,763 FLAC 202,763 – – – 202,763 219,172 219,172 – – – 219,172
Thereof aggregated according to valuation categories in accordance with IAS 39
Loans and receivables 876,067 LaR 876,067 – – – 876,067 684,615 684,615 – – – 684,615
Available-for-sale financial assets 2,236 AfS 2,236 – – – 2,236 1,339 1,339 – – – 1,339
Financial assets held for trading 9,914 FAHfT – – 9,914 – 9,914 27,461 – – 27,461 – 27,461
Financial liabilities measured at amortized cost 2,010,364 FLAC 2,010,364 – – – 2,068,352 1,904,924 1,904,924 – – – 1,948,022
Financial liabilities held for trading 11,869 FLHfT – – 11,869 – 11,869 3,338 – – 3,338 – 3,338

182 STADA Consolidated Financial Statements
Since cash and cash equivalents as well as trade receivables mainly have short remaining terms, their carrying amounts as of
the closing date correspond approximately to the fair value.
Deviations of the fair values from the carrying amounts occur as shown in the chart above in the case of promissory note loans,
bonds, as well as liabilities to banks. The cash flows calculated by means of the current yield curve were discounted to the
measurement date to determine the fair values.
Available-for-sale financial assets are primarily the carrying amounts of those shares in non-consolidated investments which
are entirely measured at amortized cost for lack of available market prices.
The fair values of remaining financial receivables as well as of held-to-maturity financial investments with remaining terms of
more than a year correspond to the present values of the payments connected with the assets taking into consideration the
respective current interest parameters that reflect market and partner-related changes in the conditions and expectations.
Trade payables as well as remaining financial liabilities also regularly have short remaining terms so that the recognized values
approximate the fair values.
For the disclosures according to class of financial instrument necessary in accordance with IFRS 7, STADA defines each valuation
category as a class.
The table below shows how the valuation rates of financial instruments measured at fair value were determined for the
respective classes of financial instruments:
Fair values by levels of hierarchy in € 000s on a recurring basis
Level 1
Quoted prices in active markets
Level 2Valuation methods
with input parameters observable
in the market
Level 3Valuation methods
with input parameters not observable
in the market
Dec. 31, 2016
Dec. 31, 2015
Dec. 31, 2016
Dec. 31, 2015
Dec. 31, 2016
Dec. 31, 2015
Financial assets held for trading (FAHfT)
• Currency forwards – – 4 – – 3,118
• Interest rate/currency swaps – – – – 9,910 24,343
Financial liabilities held for trading (FLHfT)
• Currency forwards – – 8,507 – – 9
• Interest rate/currency swaps – – – – 3,362 3,329
Derivative financial liabilities with hedging relationship
• Cash flow hedges – – – – – 1,273
In the context of the preparation of the financial statements, STADA reviews the allocation to the respective hierarchy levels
according to information available on the determination of the fair values. If the need for reclassification is determined, the
reclassification is carried out as of the beginning of the reporting period. In the financial year, there were no reclassifications
among the respective hierarchy levels.
The fair values are analyzed in the context of the preparation of the financial statements. For this purpose, market comparisons
and change analyses are carried out.
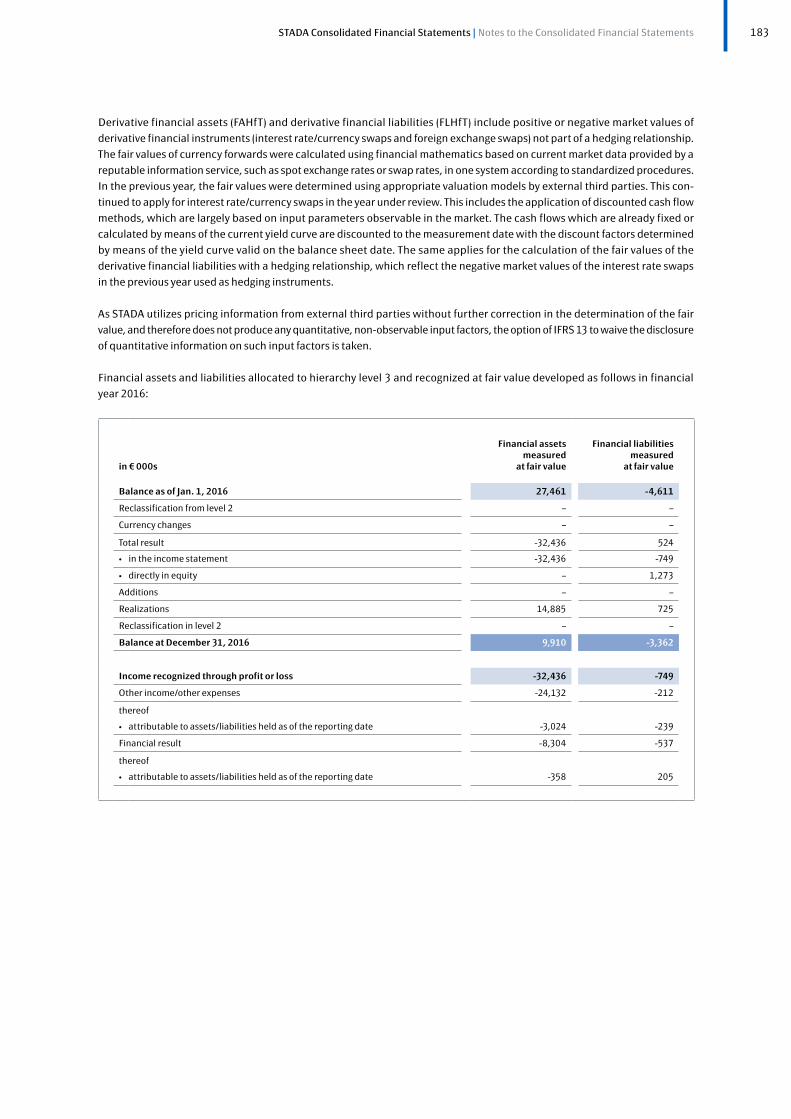
183STADA Consolidated Financial Statements | Notes to the Consolidated Financial Statements
Derivative financial assets (FAHfT) and derivative financial liabilities (FLHfT) include positive or negative market values of
derivative financial instruments (interest rate/currency swaps and foreign exchange swaps) not part of a hedging relationship.
The fair values of currency forwards were calculated using financial mathematics based on current market data provided by a
reputable information service, such as spot exchange rates or swap rates, in one system according to standardized procedures.
In the previous year, the fair values were determined using appropriate valuation models by external third parties. This con-
tinued to apply for interest rate/currency swaps in the year under review. This includes the application of discounted cash flow
methods, which are largely based on input parameters observable in the market. The cash flows which are already fixed or
calculated by means of the current yield curve are discounted to the measurement date with the discount factors determined
by means of the yield curve valid on the balance sheet date. The same applies for the calculation of the fair values of the
derivative financial liabilities with a hedging relationship, which reflect the negative market values of the interest rate swaps
in the previous year used as hedging instruments.
As STADA utilizes pricing information from external third parties without further correction in the determination of the fair
value, and therefore does not produce any quantitative, non-observable input factors, the option of IFRS 13 to waive the disclosure
of quantitative information on such input factors is taken.
Financial assets and liabilities allocated to hierarchy level 3 and recognized at fair value developed as follows in financial
year 2016:
in € 000s
Financial assets measured
at fair value
Financial liabilities measured
at fair value
Balance as of Jan. 1, 2016 27,461 -4,611
Reclassification from level 2 – –
Currency changes – –
Total result -32,436 524
• in the income statement -32,436 -749
• directly in equity – 1,273
Additions – –
Realizations 14,885 725
Reclassification in level 2 – –
Balance at December 31, 2016 9,910 -3,362
Income recognized through profit or loss -32,436 -749
Other income/other expenses -24,132 -212
thereof
• attributable to assets/liabilities held as of the reporting date -3,024 -239
Financial result -8,304 -537
thereof
• attributable to assets/liabilities held as of the reporting date -358 205

184 STADA Consolidated Financial Statements
Financial assets and liabilities allocated to hierarchy level 3 and measured at equity developed as follows as compared to the
previous year:
in € 000s
Financial assets measured
at fair value
Financial liabilities measured
at fair value
Balance as of Jan. 1, 2015 33,250 -3,124
Reclassification from level 2 – –
Currency changes – –
Total result -782 -1,728
• in the income statement -782 -3,120
• directly in equity – 1,392
Additions – –
Realizations -5,007 241
Reclassification in level 2 – –
Balance at December 31, 2015 27,461 -4,611
Income recognized through profit or loss -12,804 -3,120
Other income/other expenses 6,826 -2,890
thereof
• attributable to assets/liabilities held as of the reporting date 8,302 -2,653
Financial result -7,609 -230
thereof
• attributable to assets/liabilities held as of the reporting date -7,332 -231
45.2. Net earnings from financial instruments by valuation category
Net earnings recognized through profit or loss from financial assets and liabilities can be broken down as follows:
From subsequent measurement Net earnings
Net earnings by valuation category in € 000s
From interest and
dividends
at
fair value
Currency
translation
Value
adjustmentfrom
disposals
Dec. 31,
2016
Dec. 31,
2015
Loans and receivables (LaR) 2,716 – 32,236 -5,972 – 28,980 -46,085
Available-for-sale financial assets (AfS)
24
–
–
-3,450
–
-3,426
3
Financial assets held for trading (FAHfT)
-1,055
2,296
–
–
-36,307
-35,066
-5,789
Financial liabilities measured at amortized cost
-39,120
–
8,595
–
–
-30,525
-54,414
Financial liabilities held for trading (FLHfT)
-686
-8,542
–
–
-19,873
-29,101
-15,617
Total -38,121 -6,246 40,831 -9,422 -56,180 -69,138 -97,453

185STADA Consolidated Financial Statements | Notes to the Consolidated Financial Statements
The disclosure of interest from financial instruments is made in financial income and financial expenses in the interest result.
Dividends received are disclosed in investment income. With the exception of the valuation results from interest rate/currency
swaps and/or currency swaps recognized at fair value through profit or loss, which are reported under financial income or
financial expenses and partially also in the currency translation result, disclosure of the remaining components of net earnings
is made in other income or other expenses. Earnings from the disposal of financial instruments relate to currency swaps expired
in financial year 2016 and the partial fulfillment of cross-currency swaps.
Valuation results from financial assets held for sale and cash flow hedges, which are reported under other comprehensive income
in equity, are not included in this presentation as they had no effect on income.
46. Risk management, derivative financial instruments and disclosures on capital management
46.1. Principles of risk management
The basic principles of financial policy and of financial risk management are determined or confirmed at least once annually by
the Executive Board in the context of the budget process. Furthermore, all transactions above a certain limit determined to be
relevant by the Executive Board must first be approved by the Executive Board. The Executive Board is also regularly informed
of the nature, scope and amount of current risks.
46.2. Currency risks
STADA’s Group and balance sheet currency is euro. Due to the international alignment of business activities, STADA is subject
to risks arising from exchange rate fluctuations.
On the one hand, these risks consist of potential changes in value, especially of receivables and liabilities in a currency other
than the respective functional currency as a result of exchange rate fluctuation (transaction risk).
However, STADA is only subject to this risk to a limited extent, as the company counters risks from currency-related fluctuations,
alongside natural hedges, through the use of derivative financial instruments, which are used to hedge currency risks from
operating activities, financial transactions and investments. In the reporting year, STADA made use of foreign-exchange futures
contracts and interest / currency swaps. The maturity dates of futures contracts are thereby selected to match the Company’s
anticipated cash flows. The remaining term of the contracts is currently up to one year.
In the context of consolidated financial statements, on the other hand, exchange rate fluctuations lead to an accounting effect
as a result of the conversion of the balance sheet items as well as the conversion of earnings and expenses of international Group
companies with a different functional currency than euro (translation risk). The appreciation of the euro as compared to the
other currencies is generally negative and devaluation is generally positive.

186 STADA Consolidated Financial Statements
STADA determines quantitative disclosures on risks in connection with currency changes by means of aggregating all of the
Group companies’ foreign currency items that are not denominated in the respective Group company’s functional currency. In
case of hedging transactions they are compared with the positive or negative balances from the aggregation. This results in
the subsequent material outstanding foreign currency items as of the respective reporting dates, which in case of a change to
the foreign currency item due to a 10% appreciation or a 10% depreciation of the euro in comparison respective functional
currency are as follows:
Dec. 31, 2016 Dec. 31, 2015
in € 000s
Kazakhstani tenge
US dollarUkrainian
hryvniaKazakhstani
tengeRussian
rubleUkrainian
hryvnia
Outstanding foreign currency item
+1,003
-27,799
+5,651
-16,944
+45,441
-17,117
Income (+) / expense (-) from an appreciation of the euro in comparison to the respective functional currency by 10%
-2,126
+2,780
-3,089
-1,694
+1,341
-3,721
Income (+) / expense (-) from a depreciation of the euro in comparison to the respective functional currency by 10%
+2,126
-2,780
+3,089
+1,694
-1,341
+3,721
Equity increase (+) / equity reduction (-) from an appreciation of the euro in comparison to the respective functional currency by 10%
-2,552
+2,796
-2,669
-2,053
-2,054
-3,740
Equity increase (+) / equity reduction (-) from a devaluation of the euro in comparison to the respective functional currency by 10%
+2,552
-2,796
+2,669
+2,053
+2,054
+3,740
Here, any currency risk is isolated, i.e. it is taken into account without mutual dependencies.
The outstanding foreign currency items in Kazakhstani tenge, US dollar and Ukrainian hryvnia relate to a balance from inter-
national Group companies in euro and outstanding foreign currency reserves in Kazakhstani tenge, US dollar and Ukrainian
hryvnia. The risk in connection with the outstanding foreign currency reserves in euro, from the Group’s perspective, results
from the functional currency of the respective international Group company. Overall, based on outstanding foreign currency
items as of the reporting date, an appreciation or a devaluation of the respective functional currency by 10% compared to
the currencies of relevance for the Group would have led to an effect on earnings in the amount of an expense of € 2.6 million
(previous year: € 6.8 million) or in the amount of earnings of € 2.6 million (previous year: € 6.8 million).
46.3. Interest rate risks
STADA is subject to interest risks from financial assets as well as financial debts, primarily in the Euro zone and Russia.
In order to minimize the effects of significant interest rate fluctuations, STADA manages the interest rate risk for the financial
liabilities denominated in euro with hedging transactions. In financial year 2016, to hedge the interest rate risk, there were cash
flow hedges in the form of interest rate swaps in the first six months. Taking into account these hedging transactions, an average
of 85% (previous year: 85%) of financial liabilities denominated in euro and 100% (previous year: 100%) of those denominated
in ruble had fixed interest rates in 2016.

187STADA Consolidated Financial Statements | Notes to the Consolidated Financial Statements
STADA calculates existing interest rate risks using sensitivity analyses, which show the effects of changes in market interest
rates on interest payments, interest income and expenses as well as equity. The following factors – if relevant – are generally
included in the calculation:
• changes in the market interest rate of interest rate derivatives designated as hedging instruments in the context of cash
flow hedges,
• changes in the market interest rate of original financial liabilities with variable interest rates that are not hedged against
interest rate risks, and
• changes in the market interest rate of interest rate derivatives not part of a hedging relationship.
in € million Dec. 31, 2016 Dec. 31, 2015
Income (+) / expense (-) from an increase in the market interest rate level of 100 basis points -1.4 -0.7
Income (+) / expense (-) from a decrease in the market interest rate level of 100 basis points +0.6 -0.7
Equity increase (+) / equity reduction (-) from an increase in the market interest rate level of 100 basis points
–
+0.3
Equity increase (+) / equity reduction (-) from a decrease in the market interest rate level of 100 basis points
–
-0.3
46.4. Default risks
STADA is exposed to a default risk in its operating business or as a result of financing activities if contracting parties fail to meet
their obligations. Alongside the implementation of appropriate credit management processes, such transactions are generally
only concluded with counterparties of impeccable financial standing to avoid default risks in financing activities.
Default risks also exist as a result of the supply of goods and services. STADA therefore strives to maintain business relations
only with partners of impeccable financial standing. In addition, STADA partly uses suitable measures such as guarantees, loan
insurances or the transfer of assets to safeguard itself against default risk. Overdue receivables in the operating area are
continuously monitored and potential default risks are anticipated through the creation of valuation adjustments. In addition,
there is the risk that in a difficult economic and financial environment, national health care systems delay or fail to make
payments to STADA or business partners of STADA and that, as a result, directly or indirectly increased default risks arise.
STADA’s maximum credit default risk is calculated from the carrying amounts of the financial assets accounted. In addition,
STADA granted guarantees, which amounted to a total nominal volume of € 25.3 million (previous year: € 25.3 million) as of the
reporting date (see Note 44.). STADA has various forms of collateral for credit securities such as mortgages, bank or corporate
guarantees, assignments of receivables and pledged inventories. Furthermore, there is commercial credit insurance for certain
markets and customers.
46.5. Liquidity risks
Liquidity risks may result, for example, from the loss of existing cash items, lack of availability of credit, reduced access to
financing markets or fluctuation in the operational development of business. The goal of the liquidity management is to ensure
solvency and financial flexibility of the STADA Group at all times by way of maintaining a sufficient supply of liquidity reserves
and having free credit lines. STADA finances itself with short-term and long-term borrowings from banks, promissory note loans,
bonds and factoring. Furthermore, STADA has solid operating cash flow and further bilateral credit contracts with various banks
(credit lines), which can be utilized as needed.

188 STADA Consolidated Financial Statements
46.6. Derivative financial instruments and hedging instruments
STADA counters risks from fluctuations in cash flow with derivative financial instruments, which are exclusively used to hedge
interest and currency risks resulting from operating activities, financial transactions and investments. Derivative financial
instruments are neither held nor issued for speculation purposes.
In financial year 2016, there are cash flow hedges exclusively in the form of payer interest rate swaps in the first six months.
Here, variable interest payments were transformed into fixed interest payments and the cash flow risk of variable interest
liabilities is thus hedged. In the context of these hedging relationships, interest rate related cash flow changes of the hedged
items are netted with cash flow changes of interest rate swaps.
In financial year 2016, no new payer interest-rate swaps were designated as cash flow hedges in order to secure interest
payments from promissory note loans. The payer interest rate swap, accounted in the previous year, has expired in the current
reporting year.
The total volume of currency and interest rate related derivatives is comprised as follows:
Dec. 31, 2016 Dec. 31, 2015
in € 000s Nominal value Fair Value Nominal value Fair Value
Derivatives without hedging relationship
Interest rate/currency swaps 48,621 6,548 69,337 21,015
Currency swaps 188,634 -8,503 151,540 3,109
Derivatives with hedging relationship
Interest rate swaps – – 66,500 -1,273
thereof
• fixed rate payer – – 66,500 -1,273
• fixed rate recipient – – – –
Total 237,255 -1,955 287,377 22,851
All of the above hedging relationships presented above were effective until expiration. All changes in the fair value of the
derivative hedging instruments were therefore recognized directly in equity under “Provisions for cash flow hedges” with no
effect on profit or loss. In financial year 2016, the resulting earnings amounted to € 0.9 million after consideration of deferred
taxes (previous year: € 1.1 million).
46.7. Disclosures on capital management
The objectives of the STADA capital management are the safeguarding of the business operation, the creation of a solid equity
base for financing profitable growth as well as guaranteeing attractive dividend payments and the capital service. The STADA
capital management consistently aims for the Group companies to have an equity basis that corresponds to the local require-
ments. When implementing and checking the Group’s capital and liquidity the legal requirements are taken into account.
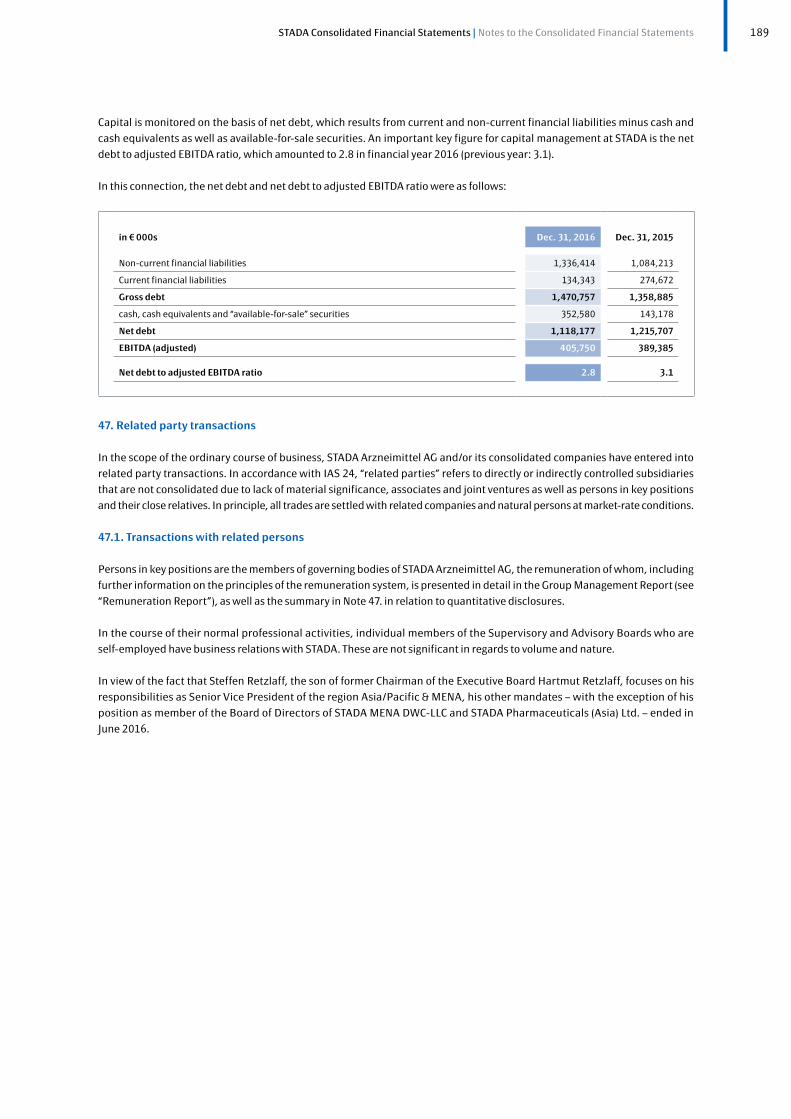
189STADA Consolidated Financial Statements | Notes to the Consolidated Financial Statements
Capital is monitored on the basis of net debt, which results from current and non-current financial liabilities minus cash and
cash equivalents as well as available-for-sale securities. An important key figure for capital management at STADA is the net
debt to adjusted EBITDA ratio, which amounted to 2.8 in financial year 2016 (previous year: 3.1).
In this connection, the net debt and net debt to adjusted EBITDA ratio were as follows:
in € 000s Dec. 31, 2016 Dec. 31, 2015
Non-current financial liabilities 1,336,414 1,084,213
Current financial liabilities 134,343 274,672
Gross debt 1,470,757 1,358,885
cash, cash equivalents and “available-for-sale” securities 352,580 143,178
Net debt 1,118,177 1,215,707
EBITDA (adjusted) 405,750 389,385
Net debt to adjusted EBITDA ratio 2.8 3.1
47. Related party transactions
In the scope of the ordinary course of business, STADA Arzneimittel AG and/or its consolidated companies have entered into
related party transactions. In accordance with IAS 24, “related parties” refers to directly or indirectly controlled subsidiaries
that are not consolidated due to lack of material significance, associates and joint ventures as well as persons in key positions
and their close relatives. In principle, all trades are settled with related companies and natural persons at market-rate conditions.
47.1. Transactions with related persons
Persons in key positions are the members of governing bodies of STADA Arzneimittel AG, the remuneration of whom, including
further information on the principles of the remuneration system, is presented in detail in the Group Management Report (see
“Remuneration Report”), as well as the summary in Note 47. in relation to quantitative disclosures.
In the course of their normal professional activities, individual members of the Supervisory and Advisory Boards who are
self-employed have business relations with STADA. These are not significant in regards to volume and nature.
In view of the fact that Steffen Retzlaff, the son of former Chairman of the Executive Board Hartmut Retzlaff, focuses on his
responsibilities as Senior Vice President of the region Asia/Pacific & MENA, his other mandates – with the exception of his
position as member of the Board of Directors of STADA MENA DWC-LLC and STADA Pharmaceuticals (Asia) Ltd. – ended in
June 2016.

190 STADA Consolidated Financial Statements
47.2. Transactions with related companies
in € 000s Dec. 31, 2016 Dec. 31, 2015
Trade accounts receivable
Non-consolidated subsidiaries / joint ventures 6,297 372
Associates – 202
Joint ventures – –
Other investors 626 745
Trade payables
Non-consolidated subsidiaries / joint ventures 3,753 113
Associates 17 1
Joint ventures – –
Other investors 14 –
Expenses and income essentially related to related party transactions as follows:
in € 000s 2016 2015
Sales
Non-consolidated subsidiaries/joint ventures 6,585 –
Associates – 62
Joint ventures – –
Other investors 1,521 1,575
Interest income
Non-consolidated subsidiaries/joint ventures 281 3
Associates – 8
Joint ventures – –
Other investors – –
Interest expense
Non-consolidated subsidiaries/joint ventures – –
Associates 3 1
Joint ventures – –
Other investors – –
In addition, the following disclosures on related party transactions are made:
STADA continues to provide the associate BIOCEUTICALS Arzneimittel AG with a credit line facility with an interest rate that is
partly usual for risk capital and which was not utilized as of December 31, 2016, as in the previous year.

191STADA Consolidated Financial Statements | Notes to the Consolidated Financial Statements
1) This includes the final calculation of the multi-year variable long-term special remunera- tion “long-term targets 2016” (year of target achievement), however only for the period of the actual implementation of the contracts, on which the remuneration is based, up to December 31, 2015 in the total amount of € 2,052,000.2) No progress payments on the variable long-term special remuneration were made for financial year 2015.
3) € 1,253,000 thereof is attributable to the continued salary payment and € 5,885,000 to a severance payment in connection with the end of the Executive Board appointment of Mr. Retzlaff as of August 15, 2016.
There is a service contract with BIOCEUTICALS Arzneimittel AG, as well as distribution rights for Epo-zeta in Germany granted
by BIOCEUTICALS Arzneimittel AG to, among others, cell pharm Gesellschaft für pharmazeutische und diagnostische Präparate
mbH. In some other European countries (such as Serbia or Russia, for example), a local STADA-owned subsidiary can also receive
or has already received a local sales license at the same time.
Furthermore, STADA also has business relations with its fellow partner of the Chinese subsidiary STADA Import/Export Inter-
national Ltd. As of the reporting date, outstanding loan liabilities in the amount of € 0.6 million resulted from this business
relationship.
48. Remuneration of the Executive Board and the Supervisory Board
The aggregate remuneration of the Executive Board and the Supervisory Board including further information on the principles
of the remuneration system are presented in detail in the Group Management Report (see “Remuneration Report”).
In summary, the following disclosures regarding the remuneration of the Executive Board and Supervisory Board at STADA
Arzneimittel AG are made according to IAS 24 in consideration of the disclosure requirements of Section 314 (1) no. 6a sentence
1–4 of the German Commercial Code:
Fixed and variable
current remuneration
Termination benefits
Expenses for pension commitments earned
in the current year
Total remuneration
in accordance with IFRS
in € 000s 2016 2015 2016 2015 2016 2015 2016 2015
Members of the Executive Board
7,7341)
4,9372)
7,1383)
–
–
–
14,872
4,937
Members of the Supervisory Board
1,072
1,073
–
–
–
–
1,072
1,073
The variable current remuneration of Executive Board members, reported within other liabilities, includes a share-based pay-
ment as a long-term oriented remuneration component, which is paid in cash. The fair value of the share-based payment was
calculated using the Monte Carlo model. As of December 31, 2016, the expense for the share-based payment amounted to
€ 1.0 million (previous year: € 0).
Remuneration to former members of the Executive Board amounted to a total of € 297,000 in financial year 2016. The present
values of pension commitments for former Executive Board members amounted to € 52,113,000 as of December 31, 2016.
There were no loans granted to members of the Executive Board and Supervisory Board at STADA Arzneimittel AG as of the
reporting date. Nor has STADA taken on any contingent liabilities for the benefit of the members of governing bodies of
STADA Arzneimittel AG.

192 STADA Consolidated Financial Statements
49. Fees for the auditor
In financial year 2016, the following professional fees were recognized as expenses for services rendered by the auditor of the
consolidated financial statements, PKF Deutschland GmbH:
in € 000s 2016 2015
Fees for the auditor 617 506
• thereof for audits 370 348
• thereof for other confirmation services 100 142
• thereof for other services 147 16
• thereof for tax consultancy services – –
The fees for audits relate to payment for the audit of the consolidated financial statements as well as the statements of STADA
Arzneimittel AG and its German subsidiaries at the end of the financial year.
Other confirmation services include the review of the interim consolidated financial statements of June 30 of the corresponding
financial year.
Other services include diverse consulting services.
50. Corporate governance
The declaration on the German Corporate Governance Code prescribed by Article 161 of the German Stock Corporation Act
(AktG) was last issued by the Executive Board and Supervisory Board on March 2, 2017. The declaration is publicly available via
the Company’s website (www.stada.de in German or www.stada.com in English) and is also presented in the Annual Report.
51. Events after the reporting date
Events after the reporting date with a significant or possibly significant impact on the net assets, financial position and results
of operations of the STADA Group:
• On January 23, 2017, the Supervisory Board announced the appointment of Dr. Barthold Piening as a full Member of
the STADA Executive Board with effect from April 1, 2017. He will assume Executive Board responsibility for Production,
Research and Development, Biotechnology as well as Quality Assurance and Control.

193STADA Consolidated Financial Statements | Notes to the Consolidated Financial Statements
52. Dividend
According to the German Stock Corporation Act, the distributable dividend is determined according to the distributable profit
reported by STADA Arzneimittel AG in its annual financial statements prepared in accordance with the rules and regulations of
the German Commercial Code. This amounted to € 67,032,635.51 as of December 31, 2016. The Executive Board of STADA
Arzneimittel AG proposes that a dividend of € 0.72 per STADA share be appropriated from this distributable profit for financial
year 2016. In financial year 2016, a dividend in the amount of € 0.70 per STADA share was distributed to shareholders from the
distributable profit of financial year 2015.
Bad Vilbel, March 27, 2017
Dr. M. Wiedenfels H. Kraft
Chairman Chief Financial,
of the Executive Board Marketing & Sales Officer

Locastad® – Fast relief for sore throats. Grippostad® C – Strong against colds and flu.

FURTHER INFORMATION 2016
195Further Information | Table of Contents
RESPONSIBILITY STATEMENT 196
AUDITOR’S REPORT 197
REPORT OF THE SUPERVISORY BOARD 198
BOARDS OF THE COMPANY 206
THE STADA SUPERVISORY BOARD 206
THE STADA EXECUTIVE BOARD 207
THE STADA ADVISORY BOARD 208
GLOSSARY A–Z 209
FINANCIAL CALENDAR 211
PUBLISHING INFORMATION 212
OVERVIEW OF SALES 214
FIVE-YEAR CONSOLIDATED SUMMARY 215

196 Responsibility Statement
RESPONSIBILITY STATEMENT
To the best of our knowledge and in accordance with the applicable reporting principles for consolidated financial statements
reporting, the Consolidated Financial Statements give a true and fair view of the net assets, financial position and results of
operations of the Group, and the Group Management Report includes a fair review of the course of business and business
performance and the net assets, financial position and results of operations of the Group, together with a description of the
principal opportunities and risks associated with the Group’s expected development.
Bad Vilbel, March 27, 2017
Dr. M. Wiedenfels H. Kraft
Chairman of the Executive Board Chief Financial, Marketing & Sales Officer

197Auditor’s Report
AUDITOR’S REPORT
We have audited the consolidated financial statements prepared by STADA Arzneimittel Aktiengesellschaft, Bad Vilbel,
comprising the balance sheet, the income statement, statement of comprehensive income, statement of changes in equity, the
cash flow statement and the notes to the consolidated financial statements, together with the group management report for
the business year from January 1 to December 31, 2016. The preparation of the consolidated financial statements and the
group management report in accordance with IFRSs, as adopted by the EU, and the additional requirements of German
commercial law pursuant to § 315a Abs. (paragraph) 1 HGB (“Handelsgesetzbuch”: German Commercial Code) are the respon-
sibility of the legal representatives of the company. Our responsibility is to express an opinion on these consolidated financial
statements and on the group management report based on our audit.
We conducted our audit of the consolidated financial statements in accordance with § 317 HGB and German generally
accepted standards for the audit of financial statements promulgated by the Institut der Wirtschaftsprüfer (Institute of Public
Auditors in Germany) (IDW). Those standards require that we plan and perform the audit such that misstatements materially
affecting the presentation of net assets, financial position and results of operations in the consolidated financial statements in
accordance with the applicable financial reporting framework and in the group management report are detected with reasonable
assurance. Knowledge of the business activities and the economic and legal environment of the Group and expectations as to
possible misstatements are taken into account in the determination of audit procedures. The effectiveness of the accounting
related internal control system and the evidence supporting the disclosures in the consolidated financial statements and the
group management report are examined primarily on a test basis within the framework of the audit.
The audit includes assessing the annual financial statements of those entities included in consolidation, the determination
of the entities to be included in consolidation, the accounting and consolidation principles used and significant estimates
made by management, as well as evaluating the overall presentation of the consolidated financial statements and the group
management report.
We believe that our audit provides a reasonable basis for our opinion.
Our audit has not led to any reservations.
In our opinion based on the findings of our audit the consolidated financial statements comply with the IFRSs as adopted by the
EU, the additional requirements of German commercial law pursuant to § 315a Abs. 1 HGB and give a true and fair view of the
net assets, financial position and results of operations of the Group in accordance with these requirements. The group
management report is consistent with the consolidated financial statements, complies with the legal requirements and as a
whole provides a suitable view of the Group’s position and suitably presents the opportunities and risks of future development.
Frankfurt, March 27, 2017
PKF Deutschland GmbH
Wirtschaftsprüfungsgesellschaft
Arno Kramer Annika Fröde
German Public Accountant German Public Accountant

198 Report of the Supervisory Board
REPORT OF THE SUPERVISORY BOARD
Dear Shareholders,
The Supervisory Board looks back on an unusual, eventful financial year 2016. A year that brought far-reaching changes to
the Board itself and to the entire company, particularly in the second half.
The starting point for the changes was a process by one individual investor, which in May of last year accelerated the already
ongoing discussions about a personnel restructuring of the Supervisory Board through an application to dismiss all Super-
visory Board members at the Annual General Meeting, originally planned for June. On the basis of intensive discussions with
further investors, the Supervisory Board agreed to accept the request and bring forward the reappointment of the Board by
the Annual General Meeting in a structured and transparent process. In order to allow sufficient time for this process, the
Executive Board decided to postpone the Annual General Meeting until August 26, 2016. The Supervisory Board welcomed
this decision.
Four Supervisory Board members resigned from their positions at the end of the Annual General Meeting, paving the way for a
personnel realignment of the Board. The Annual General Meeting elected Mr. Rolf Hoffmann, Dr. Birgit Kudlek, Ms. Tina Müller
and Dr. Gunnar Riemann to the Supervisory Board. The Annual General Meeting also received a request to dismiss the former
Chairman of the Supervisory Board, Dr. Martin Abend, and elected Dr. Eric Cornut as a new member of the Board. The Super-
visory Board would like to take this opportunity to thank Dr. Martin Abend, Dr. Eckhard Brüggemann, Dr. K. F. Arnold Hertzsch,
Dieter Koch and Constantin Meyer for their many years of successful work.
Following the Annual General Meeting, the newly appointed Supervisory Board elected Mr. Carl Ferdinand Oetker as its
Chairman and Mr. Jens Steegers as its Deputy Chairman. The new Board began work immediately and, in addition to the
integration of the new Supervisory Board members, set new focuses. The Supervisory Board is consistently pursuing an
open and dialog-oriented communication with investors about the strategy that was introduced in summer 2016. The Board
also restructured its cooperation with the Executive Board. The Supervisory Board supports the Executive Board in an
ad visory capacity with its extensive professional and operating expertise, but also takes its supervisory duties very seriously
with a clear understanding of corporate governance. This partnership approach was expressed, among other things, by
the founding of the Strategy Committee, which supports and monitors the Executive Board in the development of the corpo-
rate strategy. The competencies of the Supervisory Board members were optimally applied in the appointment of the other
committees.
In June 2016, the long-standing Chairman of the Executive Board of STADA Arzneimittel AG, Hartmut Retzlaff, stepped
down from his position for health reasons and in August he agreed with the Supervisory Board that he would leave the
company at the end of the year. The Supervisory Board reacted quickly and consistently to this situation and initially
appointed Dr. Matthias Wiedenfels as the new Chairman of the Executive Board. The Supervisory Board also immediately
began the process of searching for a replacement Executive Board member for marketing and sales (Chief Sales & Marketing
Officer, CSMO) as well as an Executive Board member for production and technology (Chief Technology Officer, CTO). As part
of this process, the Supervisory Board placed great importance on creating the best team and a personal fit with the existing
Executive Board team that enhances its competencies. Highly renowned specialist Dr. Barthold Piening was appointed to
the position of CTO – he will start his work at STADA on April 1, 2017. The search for a CSMO is continuing.

199Report of the Supervisory Board
A further important task of the new Supervisory Board was the revision of the remuneration system for the Executive Board,
which was rejected by the Annual General Meeting in August. The Human Resources Committee has dealt intensively with
this issue under the leadership of Supervisory Board member Mr. Hoffmann. In addition to the focus on market standards
and competitiveness, in future an increased orientation towards the capital market will be ensured through the use of
specific key figures (including return on capital employed, ROCE) as well as the expansion of the peer group comparison
through the addition of diverse companies from the pharmaceutical industry. In order to increase its performance-depend-
ent nature, the remuneration structure has been changed to include greater variable portions with a focus on longer-term
components (LTI). The clauses on the withholding or recovery of variable remuneration components (so-called “hold back”/
“claw back”) have also been developed. The new remuneration system is to be presented to the Annual General Meeting for
approval and will be described in more detail at that time.
The Supervisory Board of STADA Arzneimittel AG carefully executed the duties imposed on it in accordance with the law and
the Articles of Incorporation. The Supervisory Board continuously monitored the management of the Company and regularly
advised the Executive Board, particularly on the course of business and business policy, corporate planning including
financial, investment and personnel planning, accounting, and the position and strategy of the Company and the Group. In
all decisions of fundamental importance for the Company, the Executive Board involved the Supervisory Board in accord-
ance with the requirements of the German Stock Corporation Act. The Executive Board briefed the Supervisory Board – also
between the regular meetings – regarding all questions related to strategy, planning, business development, the risk
situation, risk management, the internal control system and compliance.
The Supervisory Board dealt with the issues submitted to it and reviewed these procedures in detail and discussed
them with the Executive Board, whereby the focus was regularly placed on the benefits, risks and effects of the respective
procedure.
Meetings of the Supervisory Board and focus of activities
In financial year 2016, the Supervisory Board convened for a total of sixteen meetings. All members of the Supervisory
Board attended at least half of the meetings of the Board and of the committees to which they belong. The average partici-
pation rate for meetings of the Supervisory Board and its committees was approximately 96% in financial year 2016. Indi-
vidual attendance is detailed in the corporate governance report under “individualized disclosure of meeting participation”
in this Annual Report. With the exception of specific Supervisory Board issues, the members of the Executive Board regularly
participated in the meetings of the Supervisory Board.
In the past financial year, the Supervisory Board dealt with the following topics in particular:
In an intensive exchange with the Executive Board, it examined the business development of the Company and the Group,
the fundamental corporate strategy, particularly in terms of the positioning of the two core segments Generics and Branded
Products, corporate planning of the Company and the Group as well as the position of the Group, especially the net assets
and financial position. The Supervisory Board talked regularly to the Executive Board about the Group’s financial and liquid-
ity situation, considering especially the investment plans in the Group, the financing structures and refinancing strategies as
well as the development of the debt-to-equity ratio. A common subject of meetings in the past financial year also included
the economic and political developments in the region CIS/Eastern Europe, particularly considering the CIS crisis as a result
of the devaluation of the Russian ruble, the Ukrainian hryvnia and the Kazakhstani tenge. The referendum in the United
Kingdom on leaving the European Union and the resulting new opportunities and risks were also discussed in detail.

200 Report of the Supervisory Board
The Supervisory Board had the Executive Board report to it regularly on the market structures, development of demand, the
competitive situation and the price, conditions and discount development, in particular the development of the Group’s
market share and that of its relevant competitors. An important role in this regard was played by the effects of regulatory
state interventions on the Group and/or on the individual subsidiaries and the necessary reactions to these, especially in the
German home market with regard to discount agreements with health insurance organizations. In addition, the Supervisory
Board regularly gained an overview of the product development and product portfolio of the Group. It discussed with the
Executive Board the possibilities related to cost, tax and process optimization.
The Supervisory Board also dealt intensively with risk and opportunities management in the Group, the internal control and
auditing system, the compliance management system, considered, planned and executed acquisitions, disposals and
co operations of the Group as well as with the integration of acquired companies and products into the Group.
The Annual General Meeting 2016 was the subject of intensive discussion of the Supervisory Board and Executive Board in
the past financial year. Prior to the Annual General Meeting 2016, the former Chairman of the Supervisory Board, Dr. Martin
Abend, had held discussions on significant Supervisory Board issues with investors as part of a governance roadshow (in-
cluding the early realignment of the Supervisory Board, Executive Board remuneration and the auditor). The presentation
used for these discussions was published on the Company’s website prior to the Annual General Meeting. The new Chairman
of the Supervisory Board, Carl Ferdinand Oetker, also continued the dialog with investors about Supervisory Board issues.
In the reporting year, the Supervisory Board also dealt with the completion of the legal process for the appointment of a
special auditor. Following the Annual General Meeting 2015, Professor Strenger, together with other shareholders, request-
ed that as part of a special audit the Frankfurt am Main district court examine the benefits granted to the former Chairman
of the Executive Board Hartmut Retzlaff by the Supervisory Board for financial year 2014 as well as the transfer of his pen-
sion entitlements to an external pension fund. The process, which had been inactive, was completed and declared resolved
as a result of a mutually agreed settlement submitted to the court on January 31, 2017.1) The mutual agreement was based on
an examination at the end of December 2016 by Professor Dr. Hans-Joachim Böcking (Professor of Business Administration,
with a focus on auditing and corporate governance, at the Goethe-Universität Frankfurt am Main), appointed by the appli-
cants, as well as a document- based legal discussion with representatives of STADA in the presence of Professor Strenger and
Professor Dr. Böcking. On the basis of the documents and information provided, Professor Dr. Böcking reached the con-
clusion that there was no evidence that the Supervisory Board had not fulfilled its duty of diligence as regards the issue in
question, although the remuneration received by the former Chairman of the Executive Board Hartmut Retzlaff in 2014 was
above the average for the MDAX®. Professor Dr. Böcking believed that the transfer of pension obligations to an external
pension fund and the associated significant reduction in pension obligations in 2014 was an appropriate compromise for
both sides. The fringe benefits received by Hartmut Retzlaff in 2014 were also the subject of investigation. In the 2014 Annual
Report, of a reported figure of € 142,000, around € 106,000 was attributable to consulting services on the personal tax con-
sequences of the pension change, which were reimbursed to Hartmut Retzlaff as part of the transfer of pension obligations.
Professor Dr. Böcking considered this to be standard practice. The investigation also included the mutual termination of
position and termination of contract of Hartmut Retzlaff in August 2016, which had been excluded from the original special
auditing mandate. As part of this investigation, Professor Dr. Böcking also did not find any indication that the Supervisory
Board had not met its duty of diligence. The Supervisory Board was always informed of the status of the discussions held and
welcomed the settlement that was reached.
1) See notification of the conclusion of proceedings in the Federal Gazette of February 3, 2017.

201Report of the Supervisory Board
At its financial statements review meeting on March 22, 2016, the Supervisory Board dealt especially intensively with the
business situation and earnings development in the previous financial year 2015 as well as with the Annual and Consolidated
Financial Statements as of December 31, 2015. Following a detailed review of the documentation for the financial state-
ments and after discussions with the auditor, the Supervisory Board, based on the recommendation of the Audit Committee,
adopted the Consolidated and Annual Financial Statements for financial year 2015. The auditor participated in the con-
sultations and reported prior to the resolution on the significant results of the audit. The Supervisory Board discussed and
approved the agenda for the Annual General Meeting 2016, originally planned for June 9, 2016, and adopted the Report of
the Supervisory Board to the Annual General Meeting for financial year 2015.
In its meeting of May 10, 2016, the Supervisory Board discussed, among other things, the current status of the process
for the request for special audit at the Frankfurt am Main district court as well as requests received from shareholders for
additions to the agenda for the Annual General Meeting 2016 in accordance with Article 122 (2) AktG.
At its meeting on May 18, 2016, the Supervisory Board, based on reporting from the Audit Committee as well as from the
Executive Board, dealt with the results from the first quarter of financial year 2016 and with the current business develop-
ment. In addition to the Executive Board report on current developments in the individual areas of responsibility of the
Executive Board, the Supervisory Board also discussed selected business areas of STADA Arzneimittel AG.
In its extraordinary meeting on May 22, 2016, the Supervisory Board agreed to bring forward the structured process to
significantly renew the Supervisory Board and to establish a Nomination Committee (on the basis of the current Nomination
Panel). The Executive Board declared its intention to postpone the Annual General Meeting originally scheduled for June 9,
2016 to August 26, 2016 in order to ensure an orderly and transparent process for the selection of candidates and for the
preparation of the election of the new Supervisory Board members. The Supervisory Board acknowledged and approved
this approach.
In its extraordinary meeting of June 5, 2016, the Supervisory Board agreed a change at the Company’s helm due to the
serious and likely long-term illness of Chairman of the Executive Board Hartmut Retzlaff.
In its meeting of July 14, 2016, the Supervisory Board dealt with the strategy and performance update as well as the
medium-term growth targets for 2019, which had previously been agreed and presented by the Executive Board. It also
discussed preparations for the Annual General Meeting on August 26, 2016 as well as the report of the Human Resources
Committee, among other things. Finally, the Supervisory Board also discussed the submission of the declarations of compli-
ance pursuant to the German Corporate Governance Code.
At its meeting on August 2, 2016, the Supervisory Board, based on reports from the Audit Committee as well as from the
Executive Board, dealt with the results from the first half of financial year 2016 and with the current business development.
The Supervisory Board also acknowledged the changed reporting structure to the core segments Branded Products and
Generics in place of the previous division by market regions, as presented by the Executive Board. The Supervisory Board
once again discussed Executive Board personnel issues without the presence of the Executive Board.
In its meeting of August 15, 2016, the Supervisory Board particularly dealt with the termination of the employment of the
former Chairman of the Executive Board Hartmut Retzlaff including the severance agreement.
On the day prior to the Annual General Meeting, on August 25, 2016, members of the Supervisory Board convened for a
meeting to discuss issues related to the upcoming Annual General Meeting 2016.
In the meeting immediately following the Annual General Meeting 2016 on August 26, 2016, the Supervisory Board elected
Carl Ferdinand Oetker as its new Supervisory Board chairman and Jens Steegers as the new deputy chairman.

202 Report of the Supervisory Board
1) See the Company’s ad hoc release of August 15, 2016.2) See the Company’s ad hoc release of June 5, 2016.
In its meeting of September 26, 2016, the newly appointed Supervisory Board discussed general topics related to Super-
visory Board work and organization as well as its rights and obligations. During this meeting, the Supervisory Board also
agreed the establishment of a Strategy Committee and the appointment of all four Supervisory Board committees.
On October 6, 2016 and October 7, 2016, the newly appointed Supervisory Board met with the Executive Board and ex-
tended management level for an intensive and detailed discussion as part of an in-depth onboarding process. These dis-
cussions particularly included the presentation and introduction of the operating business, key financial figures and the
Group strategy of the Generics and Branded Products segments by the members of the Executive Board as well as the
presentation of the risk management, internal auditing, corporate compliance, business excellence and transformation
corporate departments by the heads of department.
In its meeting of November 2, 2016, the Supervisory Board dealt in detail with the financial results for the first nine months
of financial year 2016, as presented by the Executive Board, the APAC and MENA and Russia/CIS regions as well as the
Generics business in Germany. The Executive Board also informed the Supervisory Board of current M&A projects.
On November 30, 2016, the Supervisory Board received a detailed report on national and international compliance devel-
opments, measurements and benchmarks as well as the cultural change from the Executive Board.
At its last meeting of the reporting year on December 13, 2016, in addition to topics related to individual business areas and
current M&A projects, the Supervisory Board particularly discussed the Group budget for financial year 2017, as presented
by the Executive Board.
Composition of the Executive Board and the Supervisory Board
The following changes occurred at Executive Board level in financial year 2016: On August 15, 2016, the long-standing
Chairman of the Executive Board Hartmut Retzlaff stepped down from his office as member of the Executive Board with
immediate effect. The employment relationship between him and STADA Arzneimittel AG was ended with effect from
December 31, 2016 by mutual agreement due to personal circumstances.1) The Supervisory Board had already decided on a
change at the company’s helm at an extraordinary meeting held on June 5, 2016, due to the serious and likely long-term
illness of Hartmut Retzlaff.2)
As of the reporting date, the Executive Board comprised Dr. Matthias Wiedenfels as Chairman and Helmut Kraft as Chief
Financial, Marketing & Sales Officer. The Supervisory Board also appointed Dr. Barthold Piening as a full member of the
Executive Board, effective from April 1, 2017.
The following changes occurred in the Supervisory Board in financial year 2016: Effective from the end of the Annual General
Meeting on August 26, 2016, the long-standing Supervisory Board members Dr. Eckhard Brüggemann, Dr. K. F. Arnold
Hertzsch, Dieter Koch and Constantin Meyer stepped down from their positions as shareholder representatives. At the
recommendation of the Supervisory Board, the Annual General Meeting 2016 elected Rolf Hoffmann, Dr. Birgit Kudlek,
Tina Müller and Dr. Gunnar Riemann to the Supervisory Board. At the request of the shareholders, the Annual General Meet-
ing also agreed to dismiss the former Chairman of the Supervisory Board, Dr. Martin Abend, as well as the election of
Dr. Eric Cornut. The Supervisory Board elected Carl Ferdinand Oetker as its new Chairman and Jens Steegers as the new
Vice-Chairman.

203Report of the Supervisory Board
Work of the committees
The consultative committees established by the Supervisory Board, the Audit Committee, Human Resources Committee,
Strategy Committee and Nomination Committee supported the Supervisory Board in its duties.
The Audit Committee convened for eight meetings in financial year 2016 (on March 18, May 18, June 23, July 14, August 1,
November 2, November 11 and December 12), in which all members of the Executive Board generally participated. The
auditor took part in the financial statements review meeting on March 22, 2016 as well as in the meetings on August 1,
2016 and November 11, 2016. It was agreed that in future the auditor is generally to participate in all meetings of the Audit
Committee. The Chairman of the Audit Committee and the Chairman of the Supervisory Board also maintained an exchange
with the auditor between the meetings. Both Dr. Gunnar Riemann (Chairman of the Audit Committee) and Audit Committee
member Carl Ferdinand Oetker have the necessary expertise in accounting and auditing as required by the German Stock
Corporation Act.
The focus of the committee’s work was, in particular, the review of the Annual and Consolidated Financial Statements from
financial year 2015 together with the Management Report and the Group Management Report, the proposal for the appro-
priation of profits and the report of the auditor as well as the preparation of the Supervisory Board resolutions on these
items. In addition, the condensed Interim Consolidated Financial Statements and Group Interim Management Report as of
June 30, 2016 under consideration of the report of the auditor on the review of the financial statements were discussed in
detail. The interim reports on the first quarter of 2016 and the first nine months of 2016 were also subjects that were dealt
with by the committee. In addition, the Audit Committee dealt primarily with the operating results, key figures, accounting,
Group financing principles, internal risk management, internal audit as well as compliance in the Group. The Audit
Committee received detailed reports from both the Executive Board and the Chief Compliance Officer on devel opments and
optimizations of the compliance managements system on the basis of external benchmarks (including the analysis and
recommendations of an external auditor).
In the reporting year, the Audit Committee agreed to implement the process for the selection of the auditor as part of the
changed EU auditing regulation and to publicly tender the audit of the Annual and Consolidated Financial Statements for
STADA for financial year 2017 in a diligent and transparent selection process in accordance with Article 16 of the EU regula-
tion. The Audit Committee was always involved as the responsible Board in all significant process and decision stages of the
tender process. On the basis of its preferred election recommendation, the Supervisory Board will make the Annual General
Meeting 2017 a recommendation for financial year 2017.
The Human Resources Committee convened for eight meetings in financial year 2016 (on February 19, June 14, June 21,
October 10, November 1, November 2, November 15 and December 16). Alongside numerous discussions outside of
meetings, these meetings also dealt with questions of Executive Board remuneration and Executive Board employment
contracts, general Executive Board issues and strategic personnel issues as well as consultation on the termination of the
employment of the former Chairman of the Executive Board Hartmut Retzlaff including questions concerning his replace-
ment in the Executive Board. Finally, the Human Resources Committee prepared the appointment of Dr. Barthold Piening as
Member of the Executive Board.
The Strategy Committee held one meeting in financial year 2016 on December 14, 2016, in which all five committee mem-
bers took part. At this meeting, the Strategy Committee discussed the Branded Products core segment, portfolio manage-
ment and the inter nationalization strategy. After an in-depth introduction from the Executive Board, the entire Supervisory
Board in its new composition also dealt with the corporate strategy.

204 Report of the Supervisory Board
The Nomination Committee convened at four meetings in financial year 2016 (on May 25, May 26, May 30 and June 2,
2016) and held discussions outside of the meetings in order to manage the early process for the renewal of the Super visor
Board, advise on suitable election recommendations for the Annual General Meeting 2016 in accordance with the selection
criteria developed by the Supervisory Board and to prepare proposed resolutions of the Supervisory Board to the Annual
General Meeting.
The Chairmen of the committees informed the Supervisory Board Plenum at its ordinary meetings regularly and thoroughly
on their work.
Corporate governance
In financial year 2016, the Supervisory Board and Executive Board also dealt in detail with the further development of
corporate governance in the Company while taking the current version of the German Corporate Governance Code into
account. The joint Declaration of Compliance 2016 issued on the basis of the German Corporate Governance Code of May 5,
2015 by the Executive Board and the Supervisory Board on July 14, 2016 in accordance with Article 161 of the German Stock
Corporation Act as well as the new Declaration of Compliance of March 2017 issued on March 2, 2017 in accordance with
Article 161 of the German Stock Corporation Act is included in this Annual Report in the “Corporate Governance Report
including Declaration of Compliance for STADA Arzneimittel AG and the Group” chapter and is publicly available on the
Company’s website in the Investor Relations/Corporate Governance section at www.stada.de and www.stada.com together
with past Declarations of Compliance.
No conflicts of interest arose in the reporting year which had to be disclosed to the Supervisory Board and about which the
Annual General Meeting must be informed.
Annual and Consolidated Financial Statements, audit
The Annual Financial Statements of STADA Arzneimittel AG and the Consolidated Financial Statements as of December 31,
2016 as well as the Company’s Management Report for financial year 2016 were audited by PKF Deutschland GmbH,
Wirtschaftsprüfungsgesellschaft, Hamburg, and issued with an unqualified audit opinion. The legal requirements and
rotation obligations from Sections 319 and 319a of the German Commercial Code (Handelsgesetzbuch – HGB) are complied
with. In addition to these legal requirements, the responsible auditor should in future not be active for a period longer than
five years. Annika Fröde was appointed as the responsible auditor for the audit of the Annual and Consolidated Financial
Statements 2016 for the first time (previous auditor Santosh Varughese).
The Supervisory Board had no doubts with regard to the independence of the auditor. The auditor submitted the Statement
of Independence as required by the German Corporate Governance Code. The main areas of the audit were established by
the Supervisory Board within the scope of the commissioning of the auditor. The Audit Committee reviewed the Financial
Statements and Consolidated Financial Statements as well as the Management Report and the Group Management Report
as well as the proposal for the appropriation of profits and also included the reports of the auditor on the audit of the
Financial Statements in its review. The auditor reported on significant results of the audit in a meeting of the Audit Commit-
tee and was available for questions to the members of the Committee. The members of the Audit Committee dealt extensively
with the submissions from the Executive Board and the audit reports and discussed these with the auditor. The Audit
Committee raised no objections and recommended to the Supervisory Board to approve the Financial Statements and the
Management Report as well as the Group Management Report and assent to the Executive Board’s proposal for the appro-
priation of profits.
On the basis of the preparation by the Audit Committee, the Supervisory Board examined the Financial Statements and the
Consolidated Financial Statements prepared by the Executive Board, the Management Report and the Group Management
Report of the Executive Board on the financial year 2016 as well as the Executive Board’s proposal for the appropriation of
profits. The Chairman of the Audit Committee reported to the Supervisory Board on the work and the audit results of the
Audit Committee. The auditor reported to the Supervisory Board on significant results of the audit and was available for
questions from members of the Supervisory Board. The Supervisory Board discussed the submissions mentioned above and

205Report of the Supervisory Board
the conclusions of the auditor in detail with the auditor and the Executive Board. Also following the final results of the
Supervisory Board’s own examination, the Supervisory Board had no objections to the Annual Financial Statements, the
Management Report, the Consolidated Financial Statements and the Group Management Report on the financial year 2016
and concurred with the outcome of the audit. The auditor also determined that the Executive Board had implemented an
appropriate information and monitoring system which, in its concept and use, is suitable for the early recognition of any
developments that could threaten the continuation of the Company.
The Supervisory Board approved the Annual Financial Statements and the Consolidated Financial Statements prepared
by the Executive Board. The Annual Financial Statements are thus adopted. The Supervisory Board concurred with the
individual assessments of the business situation and the outlook as given in the Management Report of the Executive Board
and with the proposal of the Executive Board for the appropriation of profits that provides for a dividend of € 0.72 per STADA
share.
Conclusion
Although the Supervisory Board was newly appointed at the end of August 2016, we can draw an extremely positive con-
clusion for the past financial year. The Supervisory Board has largely achieved its targets for 2016: the pre-selection and
integration of the new members following their election by the Annual General Meeting, the reorganization of the Board
and intensive integration, the appointment of a new Chief Technology Officer, the intensive dialog with shareholders, the
tendering of the audit of the Consolidated Financial Statements and finally a new, modern remuneration system for the
Executive Board. The Supervisory Board has also supported all corporate governance issues, which affect it as a Board
(introduction of a general age limit and limit for membership of the Board; introduction of a structured and comprehensive
efficiency review with external support). There is of course still a lot to do, the completion of the Executive Board with a
Chief Sales & Marketing Officer is just one example. The Supervisory Board is aware of its responsibility and will continue to
carry out its work with determination, a professional approach and a high level of personal commitment.
We look forward to future cooperation with all employees of the Group, the Executive Board and management and thank
you all for your tremendous commitment in financial year 2016.
Bad Vilbel, March 27, 2017
Carl Ferdinand Oetker
Chairman of the Supervisory Board

206 Boards of the Company
BOARDS OF THE COMPANY
THE STADA SUPERVISORY BOARD (as of March 1, 2017)
Carl Ferdinand Oetker, Düsseldorf, Germany (Chairman)
Jens Steegers1), Bad Vilbel, Germany (Deputy Chairman)
Dr. Eric Cornut, Binningen, Switzerland
Halil Duru1), Frankfurt am Main, Germany
Rolf Hoffmann, Weggis, Switzerland
Dr. Birgit Kudlek, Bad Soden, Germany
Tina Müller, Frankfurt am Main, Germany
Dr. Ute Pantke1), Wettenberg, Germany
Dr. Gunnar Riemann, Berlin, Germany
The Supervisory Board members can be contacted via STADA Arzneimittel AG’s business address.
1) Employee representative.

207Boards of the Company | The STADA Supervisory Board | The STADA Executive Board
THE STADA EXECUTIVE BOARD (as of March 1, 2017)
Dr. Matthias Wiedenfels
Chairman of the Executive Board
Executive Board member since 2013
Contract until December 31, 2020
Helmut Kraft
Chief Financial, Marketing & Sales Officer
Executive Board member since 2010
Contract until December 31, 2019
The Executive Board members can be contacted via STADA Arzneimittel AG’s business address.
208 Boards of the Company
THE STADA ADVISORY BOARD (as of March 1, 2017)
Members of the STADA Advisory Board are appointed by the Chairman of the Supervisory Board on the recommendation of the
Executive Board and the Supervisory Board. According to the Company’s Articles of Incorporation, the duty of the Advisory Board
is to support and advise the Executive and Supervisory Boards. Furthermore, members of the Advisory Board are available
to act as proxy for shareholders who do not wish to exercise their voting rights in person at the Annual General Meeting. The
Advisory Board, appointed for five years from 2014 through 2018, currently includes the following members:
Dr. Thomas Meyer, Seelze, Germany (Chairman)
Dr. Frank-R. Leu, Gießen, Germany (Deputy Chairman)
Rika Aschenbrenner, Mainburg, Germany
Wolfgang Berger, Giessen, Germany
Gerd Berlin, Hassloch, Germany
Alfred Böhm, Munich, Germany
Jürgen Böhm, Kirchhain, Germany
Axel Boos, Darmstadt, Germany
Reimar Michael von Kolczynski, Stuttgart, Germany
Dr. Wolfgang Schlags, Mayen, Germany
Jürgen Schneider, Offenbach, Germany
The Advisory Board members can be contacted via STADA Arzneimittel AG’s business address.

209Glossary A – Z
GLOSSARY A–Z
Active pharmaceutical ingredient: In the pharmaceutical market: the pharmaceutically effective component of a drug
(also API).
Adalimumab: Adalimumab is the first entirely human monoclonal antibody (against the tumor necrosis factor , TNF ).
Adalimumab is used for the treatment of rheumatoid arthritis, psoriatic arthritis, ankylosing spondylitis and Crohn’s disease.
Approval: Permission under drug laws to market a drug in a national market.
Audit: In the pharmaceutical market: control of equipment and documentation of manufacturers or their suppliers.
Bevacizumab: Bevacizumab is a monoclonal antibody, which is used to treat various forms of cancer, such as metastasized
colon or rectal cancer and metastasized breast cancer.
Biosimilar: A biosimilar is a drug with an active pharmaceutical ingredient produced in a biotechnological process that has
been developed in comparison with an original product already on the market. It is so similar to the original product that it has
proven therapeutic equivalence and is comparable in terms of safety and quality. Therefore, a biosimilar is an equivalent
successor product of an off-patent biopharmaceutical product.
Commercial Business: Purchase and subsequent sale of third-party products; in the pharmaceutical market this frequently
refers to wholesale business or parallel imports.
Commercial property rights: Provide inventors or companies with protection against competition for an invention for a
limited time period. The best-known commercial property right is the patent.
Dossier: Includes all scientific and technical documentation required for an application for drug approval that describes the
quality, safety, and efficacy of that drug.
Epoetin or Erythropoietin: Epoetin or erythropoietin is a biopharmaceutical active ingredient in protein form that is produced
by living cell lines. The erythropoietin biosimilar developed by BIOCEUTICALS is epoetin zeta. Erythropoietin is used, among
other things, in nephrology for dialysis patients to stimulate hematopoieses as well as in cancer therapy.
Filgrastim: Filgrastim is the form of the human granulocytes colony-stimulating factor (G-CSF) produced by using bio-
technology. Filgrastim is, among others, used for the treatment of neutropenia, a low count of a special type of white blood cells.
Neutropenia can arise e.g. after a cytotoxic chemotherapy or a bone marrow transplantation.
GMP: Good Manufacturing Practice – international production standard in the pharmaceutical industry.
Indication: Diseases for which a certain drug is used.
Monoclonal antibodies: Monoclonal antibodies are immunologically active proteins that are used against an individual epitope
(surface structure) of an antigen (infectious substances or certain molecules) and specifically bind to that substance. Mono-
clonal antibodies are generated with molecular biological methods and produced biotechnologically through genetically
engineered cell lines.
Patent: In the pharmaceutical market: commercial property right granting active pharmaceutical ingredients market
exclusivity for a limited period (in the EU 20 years, for example).
Pegfilgrastim: Pegfilgrastim is a biopharmaceutical active ingredient in the form of a protein that is produced from esche richia
coli and subsequent conjugation with polyethylene glycol (PEG). Pegfilgrastim is used to shorten the duration of neutropenia
and to avoid frequent neutropenic fever in adult patients who are being treated for a malignant disease with cytotoxic chemo-
therapy.

210 Glossary A – Z
Prescription obligation: The legal requirement specifying that, depending on the potential risk involved, drugs may be dispensed
to patients on prescription only.
Rituximab: Rituximab is a monoclonal antibody used in the treatment of various forms of cancer, such as non-Hodgkin
lymphomas, as well as various auto-immune diseases, such as rheumatoid arthritis.
Teriparatide: Teriparatide is a biotechnologically-produced fragment of the human parathormone for hypodermic injection.
Teriparatide is used for the treatment of post-menopausal women with manifest osteoporosis and a high fracture risk, of men
with osteoporosis and a high fracture risk, as well as for glucocorticoid-induced osteoporosis of adults with an elevated fracture
risk.

211Financial Calendar
FINANCIAL CALENDAR
2017 March 29, 2017 Publication of 2016 results with analysts’ and press conference
May 11, 2017 Publication of the results of the first three months of 2017
June 8, 2017 Annual General Meeting 2017
August 3, 2017 Publication of the results of the first six months of 2017
November 9, 2017 Publication of the results of the first nine months of 2017
2018 March 8, 2018 Publication of the 2017 results
May 3, 2018 Publication of results of the first three months of 2018
June 6, 2018 Annual General Meeting 2018
August 9, 2018 Publication of the results of the first six months of 2018
October 31, 2018 Publication of the results of the first nine months of 2018
Status at time of going to print; STADA reserves the right to change these dates. The current financial calendar can be found on
the Internet at: www.stada.de and www.stada.com.
The Annual Report and the interim reports will be published on the dates listed above on the Company website (www.stada.de
and www.stada.com), usually before trading begins on the Frankfurt Stock Exchange. Shareholders may receive printed copies
of the reports on request.

212 Publishing Information
PUBLISHING INFORMATION
Publisher STADA Arzneimittel AG
Stadastrasse 2–18
61118 Bad Vilbel, Germany
Phone: +49 (0) 61 01/6 03-0
Fax: +49 (0) 61 01/6 03-2 59
E-mail: [email protected]
Website: www.stada.de and www.stada.com
Contact STADA Arzneimittel AG
Investor Relations
Phone: +49 (0) 61 01/6 03-1 13
Fax: +49 (0) 61 01/6 03-2 15
E-mail: [email protected]
Text STADA Arzneimittel AG, Bad Vilbel, Germany
This Annual Report is published in German (original version) and English (non-binding translation)
and is subject to German law.
Publication The complete annual report as well as current Information on the STADA Group can be found
on the Internet at www.stada.de and www.stada.com.
Design and wagneralliance Kommunikation GmbH,
Realization Offenbach am Main, Germany
Translation MBETraining & Translations, Wiesbaden, Germany
Photography Michael Dannenmann, Korschenbroich, Germany
Fotolia, Amsterdam, Netherlands
STADA Group
Printing gds Steiner GmbH, Alzenau, Germany

213Publishing Information
Forward-looking statements
This STADA Arzneimittel AG (hereinafter “STADA”) annual report contains certain statements regarding future events that are
based on the current expectations, estimates and forecasts on the part of the company management of STADA as well as other
currently available information. They imply various known and unknown risks and uncertainties, which may result in actual
earnings, the net assets, financial position and results of operations, growth or performance being materially different from the
estimates expressed or implied in the forward-looking statements. Statements with respect to the future are characterized by
the use of words such as “expect”, “intend”, “plan”, “anticipate”, “believe”, “estimate” and similar terms. STADA may, where
appropriate, also make forward-looking statements in other reports, in presentations, in material delivered to shareholders,
in investor news and in press releases. Furthermore, our representatives may from time to time make forward-looking statements
verbally. STADA is of the opinion that the expectations reflected in forward-looking statements are appropriate; however, it
cannot guarantee that these expectations will actually materialize. Risk factors include in particular: The influence of regulation
of the pharmaceutical industry; the difficulty in making predictions concerning approvals by the regulatory authorities and
other supervisory agencies; the regulatory environment and changes in the health-care policy and in the health care system of
various countries; acceptance of and demand for new drugs and new therapies; the results of clinical studies; the influence of
competitive products and prices; the availability and costs of the active ingredients used in the production of pharmaceutical
products; uncertainty concerning market acceptance when innovative products are introduced, presently being sold or under
development; the effect of changes in the customer structure; dependence on strategic alliances; exchange rate and interest
rate fluctuations, operating results, as well as other factors detailed in the annual reports and in other Company statements.
STADA does not assume any obligation to update these forward-looking statements.
Rounding
In the general portion of this Annual Report, STADA key figures are, as a rule, rounded to millions of euro, while the Notes
present these figures, as a rule, with greater accuracy in thousands of euro. Due to rounding of these figures, differences may
arise in individual figures between the general portion and the Notes, as well as from figures actually achieved in euro; these
differences cannot be considered material.

214 Overview of Sales
OVERVIEW OF SALES
Group sales in € million 2016 2015
Total Group sales 2,139.2 2,115.1
• Generics 1,280.7 1,261.4
• Branded Products 858.5 853.6
Sales Generics in € 000s 2016 2015
Top 8 markets
• Germany 308.0 308.3
• Italy 157.7 149.0
• Spain 105.4 107.0
• Russia 92.5 83.6
• Belgium 90.7 95.0
• France 81.9 80.1
• Vietnam 69.1 63.2
• Serbia 55.8 73.7
Other 319.6 301.5
Total Generics 1,280.7 1,261.4
Sales Branded Products in € 000s 2016 2015
Top 5 markets
• Germany 177.4 128.3
• United Kingdom 175.4 168.0
• Russia 150.1 212.2
• Italy 43.9 40.4
• Vietnam 36.7 30.8
Other 275.0 273.9
Total Branded Products 858.5 853.6

215Five-year Consolidated Financial Summary
FIVE-YEAR CONSOLIDATED FINANCIAL SUMMARY
Financial key figures in € million 2016 2015 2014 2013 2012
Total Group sales 2,139.2 2,115.1 2,062.2 2,003.9 1,837.5
• Generics1) 1,280.7 1,261.4 1,261.7 1,268.9 1,231.3
• Branded Products 858.5 853.6 800.5 704.4 596.2
Operating profit 178.1 223.7 188.5 248.3 202.1
EBITDA 361.5 377.1 418.8 382.6 323.7
Adjusted EBITDA 398.0 389.4 431.9 414.3 367.4
EBIT 178.9 225.3 190.3 252.4 205.9
Earnings before taxes (EBT) 127.4 157.8 124.7 189.3 135.6
Net income 85.9 110.4 64.6 121.4 86.5
Adjusted net income 177.3 165.8 186.2 160.6 147.9
Cash flow from operating activities 333.5 311.7 223.8 203.7 212.7
Asset /capital structure in € million 2016 2015 2014 2013 2012
Balance sheet total 3,440.4 3,287.4 3,335.5 3,413.2 2,982.8
Non-current assets 1,949.5 2,032.3 2,013.8 2,060.0 1,802.2
Current assets 1,490.9 1,255.1 1,321.7 1,353.2 1,180.6
Equity 1,047.1 1,018.5 903.4 1,010.1 910.3
Equity-to-assets ratio in percent 30.4% 31.0% 27.1% 29.6% 30.5%
Non-current liabilities 1,493.7 1,282.6 1,246.7 1,358.4 1,102.9
Current liabilities 899.6 986.3 1,185.4 1,044.7 969.6
Net debt 1,118.2 1,215.7 1,327.5 1,306.8 1,177.3
Capital expenditure/depreciation and amortization in € million
2016
2015
2014
2013
2012
Total capital expenditure 189.7 177.0 279.0 365.0 401.0
• on intangible assets 130.5 122.9 241.0 285.4 367.1
• on property, plant and equipment 54.3 53.5 37.9 78.7 30.3
• on financial assets/associates 4.9 0.6 0.1 0.9 3.6
Total depreciation and amortization 182.7 151.9 228.5 130.7 123.3
• on intangible assets 145.3 117.4 192.5 100.7 88.8
• on property, plant and equipment 33.9 34.4 33.4 29.1 33.3
• on financial assets 3.5 0.1 2.6 0.9 1.2
Employees 2016 2015 2014 20132) 20122)
Average number per year 10,839 10,441 10,209 8,841 7,814
Number as of the balance sheet date 10,923 10,532 10,363 9,825 7,761
Key figures per STADA share 2016 2015 2014 2013 2012
Market capitalization (year-end) in € million 3,066.3 2,327.9 1,530.8 2,171.7 1,448.3
Year-end closing price in € 49.19 37.34 25.25 35.93 24.41
Average number of shares (without treasury shares) 62,256,532 61,637,621 60,408,501 59,571,959 59,059,393
Basic earnings per share in €3) 1.38 1.79 1.07 2.04 1.46
Adjusted earnings per share in € 2.85 2.69 3.08 2.70 2.50
Diluted earnings per share in €4) – 1.79 1.05 2.00 1.44
Adjusted diluted earnings per share in € – 2.69 3.04 2.65 2.47
Dividend per share in € 0.725) 0.70 0.66 0.66 0.50
Total dividend payments in € million 44.85) 43.6 40.0 39.8 29.6
Distribution ratio in percent 52%5) 39% 62% 33% 34%
1) The figures in the reporting year and in the previous year include the non-core activity Commercial Business, which was previously reported separately.2) Employees of companies consolidated at only 50% have been included in accordance with their respective consolidation rate.
3) In accordance with IAS 33.10.4) In accordance with IAS 33.31.5) Proposed.

www.stada.dewww.stada.com