Embed Size (px)
Citation preview
EIF ANN
UAL REPORT 2016
SUPPORTING SMART, SUSTAINABLE AND INCLUSIVE GROWTH FOR SMEs
2016ANNUAL REPORT

EIF ANNUAL REPORT 2016

3
FOREWORD CHAIRMAN OF THE BOARD OF DIRECTORS 4
FOREWORD CHIEF EXECUTIVE 5
CHAPTER 1 THE EUROPEAN MARKET ENVIRONMENT IN 2016 7
CHAPTER 2 THE INVESTMENT PLAN FOR EUROPE 9
CHAPTER 3 INSTITUTIONAL MANDATES 15
CHAPTER 4 BUSINESS YEAR 2016 21
4.1. EQUITY ACTIVITY 21 4.2. GUARANTEES AND SECURITISATION ACTIVITY 33 4.3. INCLUSIVE FINANCE ACTIVITY 46
CHAPTER 5 NATIONAL AND REGIONAL MANDATES 52
CHAPTER 6 LATEST DEVELOPMENT AND PLANS 62
CHAPTER 7 EX-POST IMPACT ASSESSMENT RESEARCH STUDIES 64
CHAPTER 8 NEW OPERATIONS IN 2016 67
CHAPTER 9 GOVERNANCE 74
9.1. CAPITAL AND SHAREHOLDERS 74 9.2. BOARD OF DIRECTORS 76 9.3. AUDIT BOARD 77 9.4. PICTURE BOARD OF DIRECTORS 78
PICTURE MANAGEMENT 79 9.5. AUDIT AND CONTROLS 80 9.6. RISK MANAGEMENT 82 9.7. LEGAL SERVICE 83
TABLE OF CONTENTS
4
EIF ANNUAL REPORT 2016
FOREWORD CHAIRMAN OF THE BOARD OF DIRECTORS
EIF's strong performance in 2016 fully reflects the unwavering commitment and determination which fuel EIF's successful support to European small and medium-sized enterprises (SMEs), underpinned by the backing of shareholders and stakeholders.
In the context of a fragile economic recovery in Europe, coupled with the impact of political uncertainties coming from within and from outside the European Union, EIF achieved extremely good operational results across its activities, promoting access to finance for SMEs and microenterprises within its sectoral and geographic scope and as the EIB Group's specialist provider of risk finance.
EIF's implementation of the Investment Plan for Europe's EFSI SME Window – which is at the heart of EIF's co-operation with the European Commission (EC) across key mandates and financial instruments – reached a significant milestone in 2016, when coverage under the programme was completed in all 28 EU Member States. The implementation of EFSI remains one of EIF's primary objectives and next steps will entail a broadening of EFSI's impact through the funding of additional products.
Regulatory change and political and policy developments have always been key factors in EIF's operational environment, as illustrated by EIF's involvement in EU discussions on changes to the regulatory framework of the European SME securitisation market. In 2016, EIF persisted in its efforts to give a new impetus to this underdeveloped market, where regulatory change could allow EIF to further expand its important role.
The Board of Directors managed high volumes of operational, strategic and policy documents throughout 2016, benefit ting, at the Annual General Meeting in April, from both the re-appointments of already experienced members, together with the appointment of new members designated by the EIB and the financial
institution shareholders. Thanks and recognition are due with respect to the expertise and dedication of all those having served on the Board in 2016.
EIF was pleased to welcome two additional financial institutional shareholders, firstly in January, when the new French shareholder BPCE joined, followed in April by the Technology Development Foundation of Turkey (Türkiye Teknoloji Geliştirme Vakfı – TTGV). With a shareholder base including 30 financial institutions, alongside the EIB and the European Union represented by the European Commission, EIF enjoys – and presents its shareholders with – an extensive network of like-minded and valuable counterparts.
At the same time, this combination of public and private shareholding continued to give us a dual focus: to support EU policy objectives, while acting as a market-oriented institution that provides appropriate return on capital. We delivered strongly on both objectives in the past year.
As illustrated in this report, the solid and valued support of EIF's shareholders, mandators and other stakeholders allows EIF to intervene in ways which bring very tangible results and make a real difference to SMEs and micro-entrepreneurs in Europe. Thanks to EIF's management and staff having delivered outstanding results in 2016, EIF is well positioned to continue in its mission to develop a stronger, more competitive, entrepreneurial, innovative and inclusive Europe.
DARIO SCANNAPIECO
5
FOREWORD
FOREWORD CHIEF EXECUTIVE
EIF's work in 2016 remained anchored in our overarching goal of serving the European economy, through a commitment to fostering invigorated and inclusive economic development by breaking down investment barriers for SMEs and thus allowing them to innovate, grow and create jobs.
Whilst challenging at times, it was altogether a very successful year in terms of EIF's achievements. Our results show that we have been able to make a sizeable positive impact in facilitating access to affordable finance for European enterprises, not least in the context of the Investment Plan for Europe's EFSI SME Window.
Driven by the persistently strong market demand, a reallocation of resources allowed us to maintain the implementation pace of our core EFSI-backed guarantee instruments in favour of innovation and competitiveness, as well as the equity pillar of the EFSI SME Window. By the end of 2016, approved transactions under EFSI are expected to benefit some 385 000 micro-borrowers, SMEs and small mid-caps across all EU Member States.
In this context, EIF's co-operation with National Promotional Institutions (NPIs) reached a new level with the launch of the NPI Equity Platform. Strongly catalytic and novel initiatives – such as the first Thematic Investment Platform for SMEs in Italy – proved EIF's capacity to innovate and adapt and, together with our counterparts, to devise meaningful instruments that help the achievement of the Investment Plan for Europe's key policy objectives at national level. We look forward to capitalising on this experience to pioneer further instruments with NPIs.
EIF's delivery beyond its ambitious targets led to a significant increase of more than 35 percent in signatures compared to 2015. This translates into EUR 9.45bn of total commitments across a new record volume of 362 transactions. EIF also signed 22 new mandates, the majority of which were entrusted to us by national and regional counterparts.
Equity signatures in 2016 reached close to EUR 3.2bn across 117 transactions and demonstrated EIF's ability to capitalise on a range of investment resources and to forge a strong portfolio of catalytic funding instruments for growth and innovation in the European SMEs sector.
Guarantee and microfinance signatures exceeded EUR 6.2bn, through a record number of 245 transactions. Delivering beyond expectations under EFSI was the main driver of EIF's exceptional performance in this field. Moreover, our efforts in reviving the European securitisation market have started to produce tangible results.
The assessment of the impact of EIF's extensive operations is an area in which we continue to develop our analysis, in order to measure and demonstrate the added value of EIF’s activity in the market and, in particular, at the level of final beneficiaries, the SMEs.
Alongside increased volumes, the Investment Plan for Europe has also enabled us to expand the reach of our financing toolbox to include equity and guarantee inst ruments dedicated to social enterpr ises and organisations with a clearly defined social mission. Empowering entrepreneurs from every walk of life to achieve financial inclusion, and making economic growth sustainable has been – and will remain – a key priority of our agenda.
The progress we made in 2016 would not have been possible without the expertise, dynamism and flexibility demonstrated by EIF staff. Following years of growth, including as an organisation, a period of consolidation will grant us stability to reflect on and further develop EIF's strategic choices for the years to come.
PIER LUIGI GILIBERT
EIF ANNUAL REPORT 2016
6
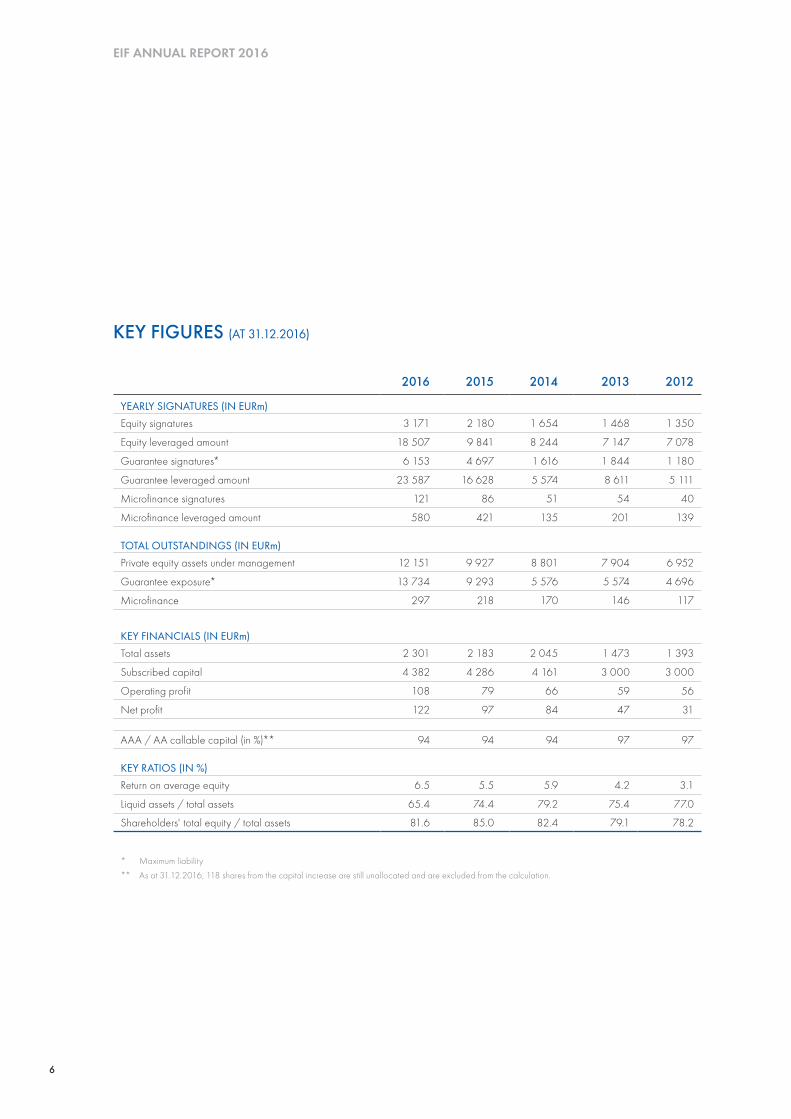
2016 2015 2014 2013 2012
YEARLY SIGNATURES (IN EURm)Equity signatures 3 171 2 180 1 654 1 468 1 350
Equity leveraged amount 18 507 9 841 8 244 7 147 7 078
Guarantee signatures* 6 153 4 697 1 616 1 844 1 180
Guarantee leveraged amount 23 587 16 628 5 574 8 611 5 111
Microfinance signatures 121 86 51 54 40
Microfinance leveraged amount 580 421 135 201 139
TOTAL OUTSTANDINGS (IN EURm)Private equity assets under management 12 151 9 927 8 801 7 904 6 952
Guarantee exposure* 13 734 9 293 5 576 5 574 4 696
Microfinance 297 218 170 146 117
KEY FINANCIALS (IN EURm)Total assets 2 301 2 183 2 045 1 473 1 393
Subscribed capital 4 382 4 286 4 161 3 000 3 000
Operating profit 108 79 66 59 56
Net profit 122 97 84 47 31
AAA / AA callable capital (in %)** 94 94 94 97 97
KEY RATIOS (IN %)Return on average equity 6.5 5.5 5.9 4.2 3.1
Liquid assets / total assets 65.4 74.4 79.2 75.4 77.0
Shareholders' total equity / total assets 81.6 85.0 82.4 79.1 78.2
* Maximum liability
** As at 31.12.2016, 118 shares from the capital increase are still unallocated and are excluded from the calculation.
KEY FIGURES (AT 31.12.2016)
7
CHAPTER 1 THE EUROPEAN MARKET ENVIRONMENT IN 2016
2016 was the first year when tangible signs of a somewhat improved financial environment for SMEs started to show. This, in conjunction with a moderate recovery of the European economy, led to an overall posi t ive development of the SME business climate. However, investment growth expectations in this sector remained subdued and the recovery is still fragile.
MACROECONOMIC AND STRUCTURAL SETTING
Small and medium-sized enterprises (SMEs) underpin the EU economy and contribute to job creation and economic growth. According to the latest European Commission (EC) Annual Report on SMEs1, 23m SMEs in the EU accounted for 99.8 percent of all non-financial enterprises and employed 91m people, accounting for two thirds of total employment.
Access to finance and the cost of finance are key concerns for SMEs, reflecting general market failures that have been amplified by the economic crisis. Moreover, SMEs are confronted with a deteriorated lending and risk-taking capacity of banks, their main source of external finance, notably due to tighter regulatory requirements and the banks’ accumulation of non-performing loans.
However, according to the latest EC/European Central Bank (ECB) Survey on the Access to Finance of Enterprises (published in November 20162), access to finance as an impediment to the business activity of SMEs has become less important than other factors (such as finding customers and the availability of skilled staff), potentially facilitated by successful public
1 Annual Report on European SMEs 2015/2016 - http://ec.europa.eu/DocsRoom/documents/21251/attachments/1/translations/en/renditions/native
2 EC DG Growth – http://ec.europa.eu/growth/access-to-finance/data-surveys_en
support. Nevertheless, considerable national disparities persist among EU Member States. Moreover, the analysis found that from the perspective of SMEs, a lack of access to publicly-supported financing instruments and the generally difficult economic outlook have negatively impacted the availability of external financing for SMEs.
Borrowing costs have remained low in Europe, mainly due to the expansionary monetary policy stance. However, the dif ference between interest rates of small loans (typically demanded by SMEs) and large loans remained significant and even increased in some countries. This can be explained by the same market imperfections in the financing of smaller companies as mentioned above.
Access to finance for SMEs can be improved through instruments that either enhance the lending capacity of banks or provide complementary sources of financing, such as credit guarantees, securitisation, microfinance and private equity /venture capital and other non-bank intermediated finance. A brief overview of the relevant market segments is given below. Further details on EIF’s activities, aiming to improve access to finance in these areas, are provided in the following sections of this report.
PRIVATE EQUITY
Following the severe downturn of the European private equity market in 2008/2009, the activity has continued along its recovery path and total private equity fundraising further increased in 2016. However, the venture capital segment, which is of particular importance for the financing of young innovative companies, has lagged behind, and activity levels were still far below their pre-crisis highs.
CHAPTER 1THE EUROPEAN MARKET ENVIRONMENT IN 2016
EIF ANNUAL REPORT 2016
8
Some of the remaining gaps were filled by business angels, not least due to their proximity to the market. Government agencies have also continued to support the markets in order to incentivise additional deal flow and attract further private investment.
SME GUARANTEES/SECURITISATION
Credit guarantees have been widely used to alleviate market failures in the area of SME financing. Despite improvements in the economic environment and an increase in new guarantee issuance, fiscal constraints were still limiting the ability of governments to provide public support for credit guarantees in several EU Member States. Therefore, financial and regulatory support at the European level can help improve the availability of guarantees even further.
SME securitisation has also been identified as an important source of funding or regulatory capital relief, thus enhancing the ability of banks to lend to SMEs. The importance of securitisation, as a tool to enhance access to finance for SMEs, has been confirmed in the context of the EU’s plan to create a fully functioning Capital Markets Union (CMU). Although the European securitisation market is still well below its pre-crisis levels with the total volume of new issuances remaining weak in 2016, the market performed relatively well and the SME segment exhibited low default rates.
Various initiatives aim to remove current hurdles and to help the revival of high-quality SME securitisation.
EIF’S IMPACT ASSESSMENT STUDIESIn 2016, EIF boosted its research and analysis activity focusing on the economic impact of its main financial instruments. For more details see Chapter 7. – EIF’s ex-post impact assessment research studies.
EIF WORKING PAPER SERIESAn in-depth analysis of European SME finance and its market segments is provided by EIF semi -annually in its Working Paper series “European Small Business Finance Outlook”. EIF Working Papers are designed to make selected topics and research studies relating to EIF́ s activity available to a wider audience at: www.eif.org/news_centre/research/index.htm
These include regulatory proposals to introduce simple, transparent and standardised (STS) securitisation which should receive preferential regulatory treatment.
MICROFINANCE
Microfinance continued to be generally associated with social and economic objectives and has remained an important financing source for job creation. The majority of European microfinance institutions (MFIs) targeted the achievement of social impact, sustainable employment, as well as social and financial inclusion. However, the European microfinance market is still young and heterogeneous, especially with regard to the diversity of lending approaches.
Difficulties in access to finance have been particularly acute for micro-enterprises and other microfinance target groups. According to the above-mentioned EC/ECB Survey, micro-enterprises cited access to finance as their most pressing concern more frequently than their larger peers.
Microfinance can fill this financing gap, thereby serving both economic and social objectives and benefiting a wide range of target groups. European microfinance has shown remarkable growth over the past years, which could, however, be undermined by reduced public support due to budget restrictions. This underlines the need for further support in the field of microfinance and social finance at European level.

9
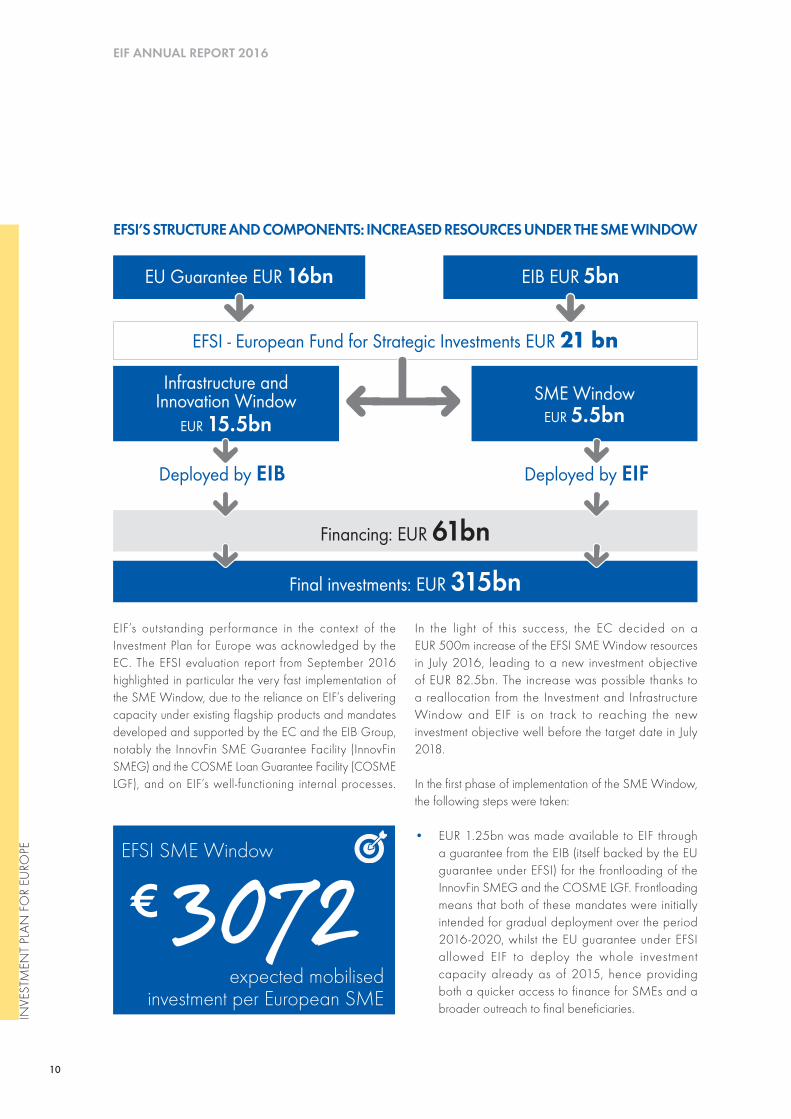
capital contribution (initially EUR 5bn). The deployment of the initial EUR 21bn of EFSI funds aims to generate a total of EUR 315bn of investments, as a result of the EIB Group’s efforts to crowd-in additional public and private resources.
EFSI has two components to support projects with wide sector eligibility: the Infrastructure and Innovation Window managed by the EIB and the SME Window implemented by EIF. The financial instruments used for the purposes of the EFSI SME Window are mainly guarantees and equity investments.
The initial investment volume expected to be triggered under the EFSI SME Window by mid -2018 was EUR 75bn. However, EIF has effectively responded to the acute market demand for EFSI-backed financial instruments that support innovation and competitiveness, and already within the first year of EFSI’s deployment, the agreements signed are expected to mobilise more than two-thirds of the initially foreseen EUR 75bn target.
This entails an estimated fifteen-fold leverage, meaning that every EUR 1 guaranteed by EIF generates EUR 15 of investment for the benefit of SMEs and mid-caps. Year-end 2016 results confirmed that EIF had not only achieved, but exceeded this initial estimate.
CHAPTER 2 INVESTMENT PLAN FOR EUROPE
CHAPTER 2INVESTMENT PLAN FOR EUROPE
IMPACT AND ACHIEVEMENTS*INVESTMENT PLAN FOR EUROPEDelivering beyond expectations to foster an innovative, competitive and inclusive economic growth for SMEs
Leveraging on EFSI
8.2 BILLION
EIF FINANCING
Expected to mobilise
69.5BILLION
INVESTMENTS
Estimated to benefit
385 000ENTERPRISES
IN THE SME SECTOR
* Ba
sed
on re
sults
in 2
016
Full geographic coverage ofALL EU-28MEMBER STATESACHIEVED
The first full year of implementing the Investment Plan for Europe’s
ambitious agenda required EIF to stay dynamic and fully engaged. Under the EFSI SME Window, EIF contributed to fighting suboptimal investment situations in key areas, aiming to relaunch investments in innovation, restore competitiveness, boost economic growth and sustain jobs in Europe in line with the EU's policy objectives. EIF helped fill persistent market gaps so that affordable financing reaches SMEs at a faster rate.
EFSI was launched in July 2015 and is a joint initiative of the European Commission (EC) and the European Investment Bank (EIB) Group – of which EIF is part – to overcome investment barriers across the EU Member States by mobilising financing in strategically important economic areas and sectors. EFSI is the financial pillar of the Investment Plan for Europe. Alongside fostering regulatory and structural reforms, it seeks to achieve an investment-friendly environment in Europe.
EFSI takes the form of a contractual arrangement between the EC and the EIB Group, translating into an EU guarantee to the EIB (initially EUR 16bn) and an EIB
INVESTM
ENT PLAN
FOR EU
ROPE
EIF ANNUAL REPORT 2016
10
EFSI’S STRUCTURE AND COMPONENTS: INCREASED RESOURCES UNDER THE SME WINDOW
Final investments: EUR 315bn
Financing: EUR 61bn
EU Guarantee EUR 16bn EIB EUR 5bn
Infrastructure and Innovation Window
EUR 15.5bnSME Window
EUR 5.5bn
EFSI - European Fund for Strategic Investments EUR 21 bn
Deployed by EIB Deployed by EIF
EIF’s outstanding performance in the context of the Investment Plan for Europe was acknowledged by the EC. The EFSI evaluation report from September 2016 highlighted in particular the very fast implementation of the SME Window, due to the reliance on EIF’s delivering capacity under existing flagship products and mandates developed and supported by the EC and the EIB Group, notably the InnovFin SME Guarantee Facility (InnovFin SMEG) and the COSME Loan Guarantee Facility (COSME LGF), and on EIF’s well-functioning internal processes.
In the light of this success, the EC decided on a EUR 500m increase of the EFSI SME Window resources in July 2016, leading to a new investment objective of EUR 82.5bn. The increase was possible thanks to a reallocation from the Investment and Infrastructure Window and EIF is on track to reaching the new investment objective well before the target date in July 2018.
In the first phase of implementation of the SME Window, the following steps were taken:
• EUR 1.25bn was made available to EIF through a guarantee from the EIB (itself backed by the EU guarantee under EFSI) for the frontloading of the InnovFin SMEG and the COSME LGF. Frontloading means that both of these mandates were initially intended for gradual deployment over the period 2016-2020, whilst the EU guarantee under EFSI allowed EIF to deploy the whole investment capacity already as of 2015, hence providing both a quicker access to finance for SMEs and a broader outreach to final beneficiaries.
3072€EFSI SME Window
expected mobilisedinvestment per European SME
INVE
STM
ENT
PLAN
FO
R EU
ROPE
11
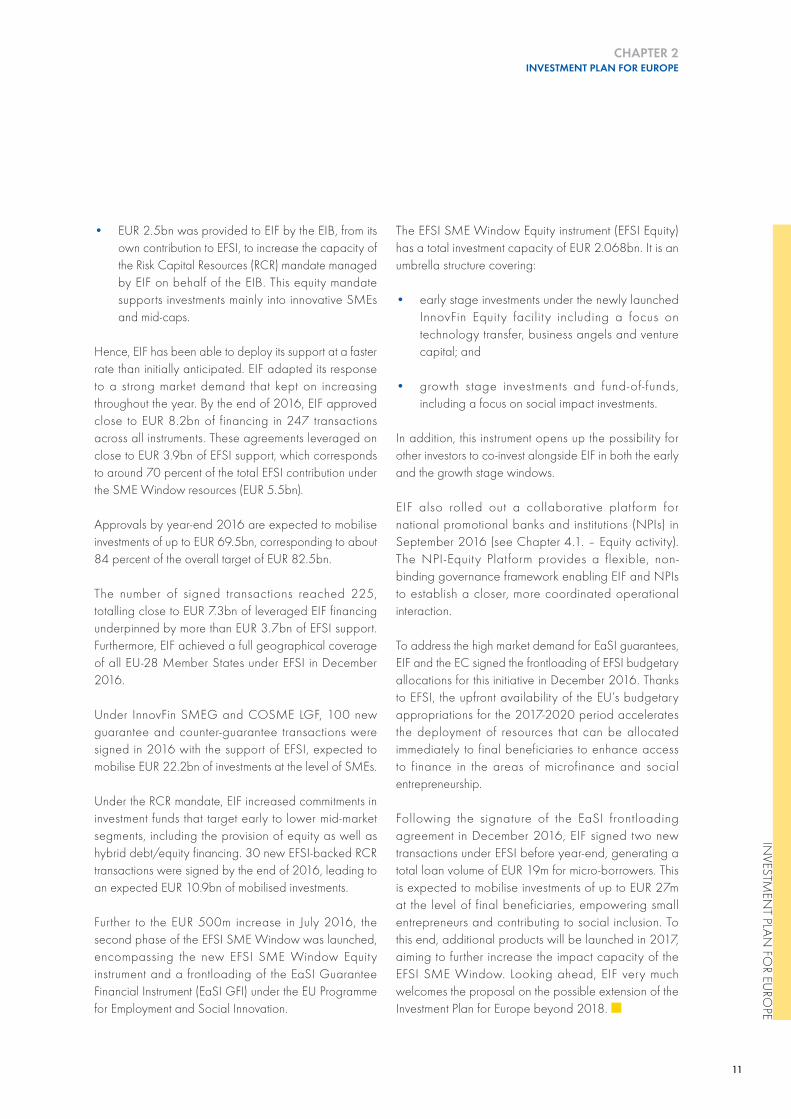
• EUR 2.5bn was provided to EIF by the EIB, from its own contribution to EFSI, to increase the capacity of the Risk Capital Resources (RCR) mandate managed by EIF on behalf of the EIB. This equity mandate supports investments mainly into innovative SMEs and mid-caps.
Hence, EIF has been able to deploy its support at a faster rate than initially anticipated. EIF adapted its response to a strong market demand that kept on increasing throughout the year. By the end of 2016, EIF approved close to EUR 8.2bn of financing in 247 transactions across all instruments. These agreements leveraged on close to EUR 3.9bn of EFSI support, which corresponds to around 70 percent of the total EFSI contribution under the SME Window resources (EUR 5.5bn).
Approvals by year-end 2016 are expected to mobilise investments of up to EUR 69.5bn, corresponding to about 84 percent of the overall target of EUR 82.5bn.
The number of signed transactions reached 225, totalling close to EUR 7.3bn of leveraged EIF financing underpinned by more than EUR 3.7bn of EFSI support. Furthermore, EIF achieved a full geographical coverage of all EU-28 Member States under EFSI in December 2016.
Under InnovFin SMEG and COSME LGF, 100 new guarantee and counter-guarantee transactions were signed in 2016 with the support of EFSI, expected to mobilise EUR 22.2bn of investments at the level of SMEs.
Under the RCR mandate, EIF increased commitments in investment funds that target early to lower mid-market segments, including the provision of equity as well as hybrid debt/equity financing. 30 new EFSI-backed RCR transactions were signed by the end of 2016, leading to an expected EUR 10.9bn of mobilised investments.
Further to the EUR 500m increase in July 2016, the second phase of the EFSI SME Window was launched, encompassing the new EFSI SME Window Equity instrument and a frontloading of the EaSI Guarantee Financial Instrument (EaSI GFI) under the EU Programme for Employment and Social Innovation.
The EFSI SME Window Equity instrument (EFSI Equity) has a total investment capacity of EUR 2.068bn. It is an umbrella structure covering:
• early stage investments under the newly launched InnovFin Equity facility including a focus on technology transfer, business angels and venture capital; and
• growth stage investments and fund-of- funds, including a focus on social impact investments.
In addition, this instrument opens up the possibility for other investors to co-invest alongside EIF in both the early and the growth stage windows.
EIF also rolled out a collaborative plat form for national promotional banks and institutions (NPIs) in September 2016 (see Chapter 4.1. – Equity activity). The NPI -Equity Platform provides a flexible, non-binding governance framework enabling EIF and NPIs to establish a closer, more coordinated operational interaction.
To address the high market demand for EaSI guarantees, EIF and the EC signed the frontloading of EFSI budgetary allocations for this initiative in December 2016. Thanks to EFSI, the upfront availability of the EU’s budgetary appropriations for the 2017-2020 period accelerates the deployment of resources that can be allocated immediately to final beneficiaries to enhance access to finance in the areas of microfinance and social entrepreneurship.
Following the signature of the EaSI frontloading agreement in December 2016, EIF signed two new transactions under EFSI before year-end, generating a total loan volume of EUR 19m for micro-borrowers. This is expected to mobilise investments of up to EUR 27m at the level of final beneficiaries, empowering small entrepreneurs and contributing to social inclusion. To this end, additional products will be launched in 2017, aiming to further increase the impact capacity of the EFSI SME Window. Looking ahead, EIF very much welcomes the proposal on the possible extension of the Investment Plan for Europe beyond 2018. ■
INVESTM
ENT PLAN
FOR EU
ROPE
CHAPTER 2INVESTMENT PLAN FOR EUROPE
12
EIF ANNUAL REPORT 2016
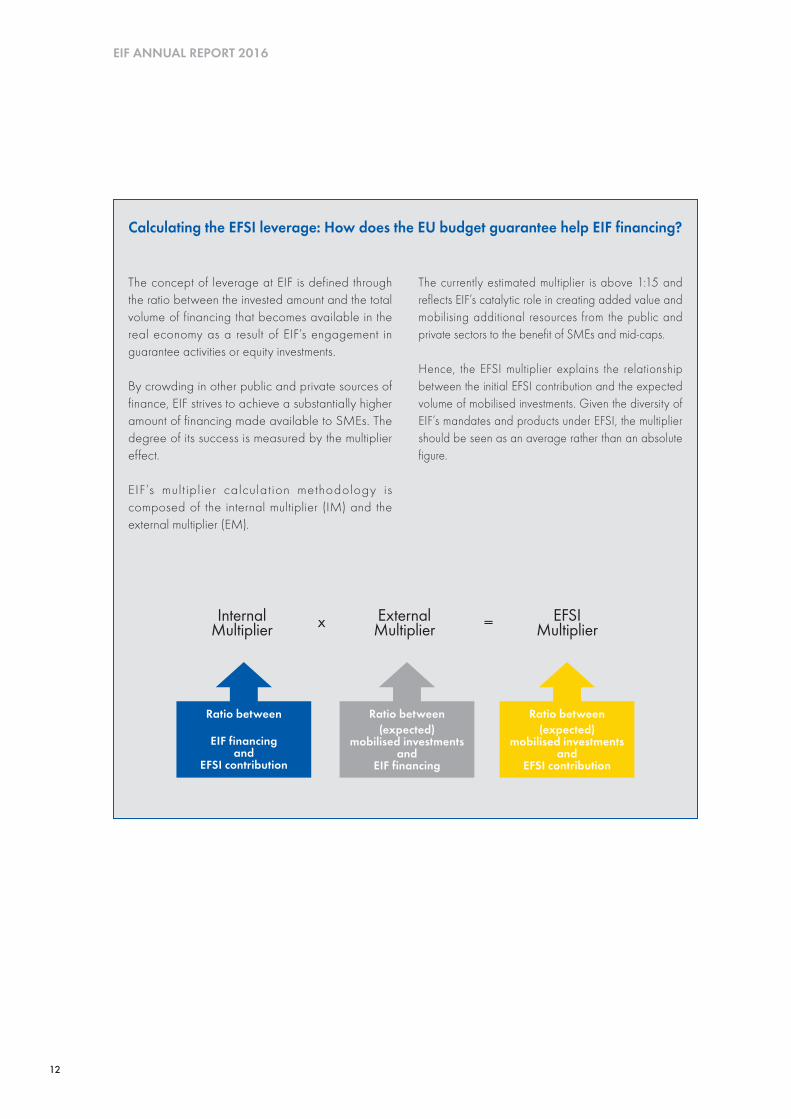
Calculating the EFSI leverage: How does the EU budget guarantee help EIF financing?
The concept of leverage at EIF is defined through the ratio between the invested amount and the total volume of financing that becomes available in the real economy as a result of EIF’s engagement in guarantee activities or equity investments.
By crowding in other public and private sources of finance, EIF strives to achieve a substantially higher amount of financing made available to SMEs. The degree of its success is measured by the multiplier effect.
EIF’s mult ipl ier calculat ion methodology is composed of the internal multiplier (IM) and the external multiplier (EM).
The currently estimated multiplier is above 1:15 and reflects EIF’s catalytic role in creating added value and mobilising additional resources from the public and private sectors to the benefit of SMEs and mid-caps.
Hence, the EFSI multiplier explains the relationship between the initial EFSI contribution and the expected volume of mobilised investments. Given the diversity of EIF’s mandates and products under EFSI, the multiplier should be seen as an average rather than an absolute figure.
Ratio between
EIF financingand
EFSI contribution
Ratio between(expected)
mobilised investmentsand
EIF financing
Ratio between(expected)
mobilised investmentsand
EFSI contribution
Internal Multiplier
External Multiplier
EFSI Multiplierx =

13
CHAPTER 2INVESTMENT PLAN FOR EUROPE
CASE STUDY
CompanyExovite (Spain)
Type of businessMedical technology, rehabilitation
EU-supported guaranteeInnovFin SMEG, EFSI
Exovite
.exovite.com
Bringing technological innovation to medical treatment
The Exovite system is already in use in seven hospitals across Spain and the company is looking to expand to other European countries and beyond, for example Israel and the United States.
“We plan to install new technology 3D printers in clinics that will produce the splints in five minutes instead of the current seven hours”, explains Luis Monzon, Chief Operating Officer.
To support this growth, Exovite received an EU-guaranteed loan under InnovFin SMEG and supported by the Investment Plan for Europe’s EFSI SME Window. In this framework, EIF provided a counter-guarantee to CERSA that in turn, was able to support the creation of loan portfolios benefitting Spanish SMEs. ■
Traditional splints were mostly inflexible and rather uncomfortable to wear. Rehabilitation
was lengthy until the muscle mass beneath could fully recover. Exovite’s state of the art medical technology represents a welcome change in this regard.
From its headquarters in Zaragoza, Exovite has developed a comprehensive system using 3D-scanners and 3D-printers to produce light, durable, ergonomic splints for the affected limb.
Through an electro-stimulator attached to the splint and dedicated software installed on the patient’s smartphone, doctors are able to initiate rehabilitation exercises and monitor progress remotely, without the need for frequent visits to the clinic. In this way, treatments can start earlier, with the limb still immobilised, thus preventing loss of muscle-mass. The average recovery time for broken bones is generally reduced from ten to seven weeks.
Exovite’s success is largely due to considerable initial investments in research and development. A recipient of no fewer than 12 international awards, the company has expanded rapidly over the past year, almost tripling its staff base. Growth prospects remain strong also for the upcoming period.
INVESTM
ENT PLAN
FOR EU
ROPE
14
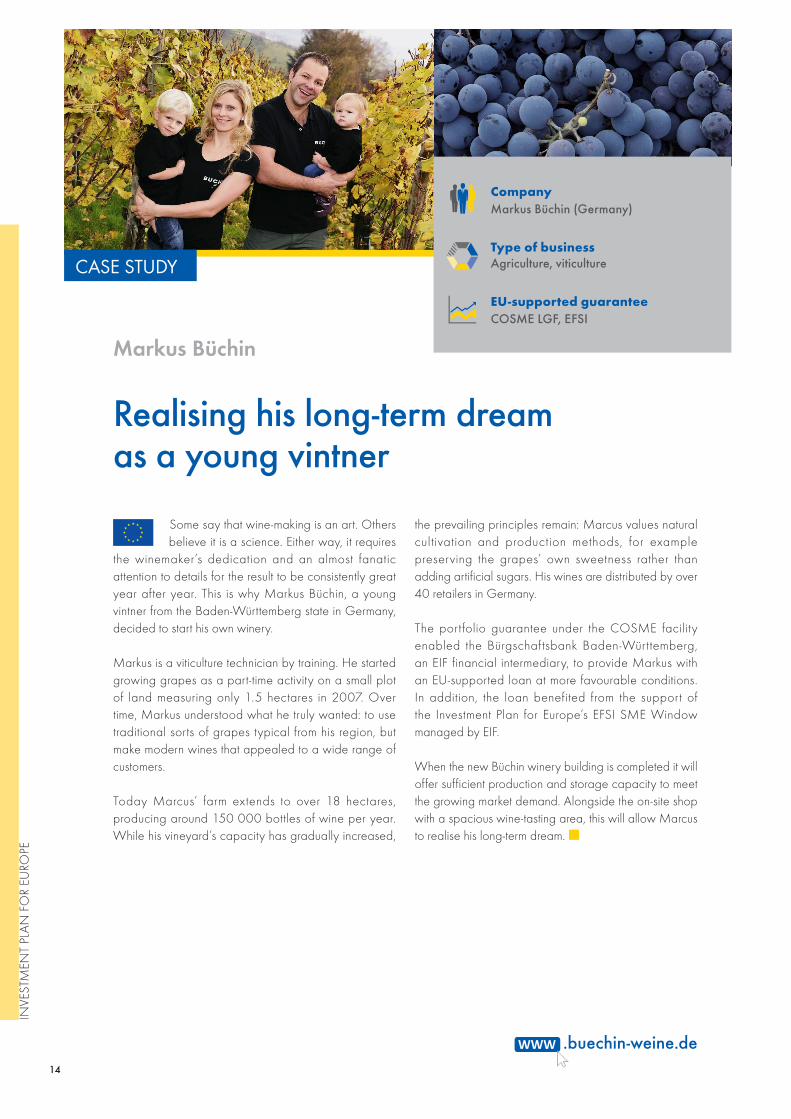
Markus Büchin
.buechin-weine.de
Realising his long-term dream as a young vintner
CASE STUDY
the prevailing principles remain: Marcus values natural cultivation and production methods, for example preserving the grapes’ own sweetness rather than adding artificial sugars. His wines are distributed by over 40 retailers in Germany.
The portfolio guarantee under the COSME facility enabled the Bürgschaftsbank Baden-Württemberg, an EIF financial intermediary, to provide Markus with an EU-supported loan at more favourable conditions. In addition, the loan benefited from the support of the Investment Plan for Europe’s EFSI SME Window managed by EIF.
When the new Büchin winery building is completed it will offer sufficient production and storage capacity to meet the growing market demand. Alongside the on-site shop with a spacious wine-tasting area, this will allow Marcus to realise his long-term dream. ■
Some say that wine-making is an art. Others believe it is a science. Either way, it requires
the winemaker’s dedication and an almost fanatic attention to details for the result to be consistently great year after year. This is why Markus Büchin, a young vintner from the Baden-Württemberg state in Germany, decided to start his own winery.
Markus is a viticulture technician by training. He started growing grapes as a part-time activity on a small plot of land measuring only 1.5 hectares in 2007. Over time, Markus understood what he truly wanted: to use traditional sorts of grapes typical from his region, but make modern wines that appealed to a wide range of customers.
Today Marcus’ farm extends to over 18 hectares, producing around 150 000 bottles of wine per year. While his vineyard’s capacity has gradually increased,
CompanyMarkus Büchin (Germany)
Type of businessAgriculture, viticulture
EU-supported guaranteeCOSME LGF, EFSI
INVE
STM
ENT
PLAN
FO
R EU
ROPE
15
Institutional mandates are resources managed by EIF on behalf of its larger shareholders, the European Investment Bank (EIB) and the European Commission (EC). Thanks to these mandates, EIF fostered invigorated and inclusive economic development by breaking down investment barriers for European enterprises. At the end of 2016, EIF managed 40 institutional mandates, including five new guarantee and equity initiatives launched during the year.
EIB MANDATES
EIF invests EIB resources under two major mandates: the Risk Capital Resources (RCR) instrument for equity investments and the EIB Group Risk Enhancement Mandate (EREM) for debt and hybrid financing. These mandates reinforce the cooperation between EIF and the EIB, and their combined resources serve to maximise the funding impact for the benefit of SMEs and mid-caps.
RCR – ADDRESSING FUNDRAISING SHORTFALLS
The EIB Risk Capital Resources (RCR) mandate is the core pillar of EIF’s equity activity and a critical resource that has enabled EIF to pursue its equity strategy under the Investment Plan for Europe’s EFSI SME Window. The RCR mandate relies on a general requirement for EIF to co-invest its own resources alongside mandate resources.
Early stage (venture capital and technology transfer) investments under the RCR mandate support innovation in sectors that are prompting the emergence of start-ups, with a view to contributing to Europe’s rapid economic recovery. Such sectors include for example information and communications technologies and life sciences. Growth and lower-mid-market activities have a more general focus and traditionally cover a wide range of economic activities.
As at September 2016, using RCR resources, funds in EIF’s portfolio have invested in total EUR 43.7bn in
more than 7 000 investee companies since inception. The amount of mobilised investments supported by these portfolio funds has been estimated at EUR 108bn.
Against this background of strong market demand, EIF has played an instrumental role in attracting participation from private sector players and institutional investors in particular for first time fund managers. Capitalising on its catalytic role and best practices, EIF aims to direct funding to enterprises which can generate significant added value in the European economy, but which would otherwise remain insufficiently financed by commercial banks alone.
Within the RCR mandate, the EUR 100m hybrid debt/equity Mezzanine Co-Investment Facility (MCIF) has contributed to addressing fundraising shortfalls in the SME sector through co-investments alongside mezzanine funds. In 2016, commitments under MCIF reached EUR 24.7m.
EREM – ADDRESSING DIVERSE MARKET NEEDS
The EIB Group Risk Enhancement Mandate (EREM) underpins a substantial array of the financial instruments deployed by EIF. The different windows of EREM comprise the ABS Credit Enhancement initiative, with a primary focus on providing increased cover for mezzanine tranches of SME securitisation transactions, the Social Impact Finance programme, including the Social Impact Accelerator initiative, the Loan Funds instrument launched in 2015 and the Cooperative Banks and Smaller Institutions (CBSI) window that was rolled out in late 2016.
The EREM mandate also contributes to the financing of the SME Initiative that is currently deployed in six EU Member States including Bulgaria, Finland, Italy, Malta, Romania and Spain (see Chapter 4.2. – Guarantees and securitisation activity and Chapter 5 - National and regional mandates).
While the individual focus of the different EREM products varies, they all seek to respond to emerging market needs by offering alternative sources of financing and
CHAPTER 3INSTITUTIONAL MANDATES
CHAPTER 3INSTITUTIONAL MANDATES
16
EIF ANNUAL REPORT 2016
effectively broadening the long-term financing spectrum available to SMEs.
The EREM product windows are to be deployed over a seven-year timeframe in the 2014-2020 period. The results of EREM’s first implementation phase that ended in 2016 are detailed below.
The EUR 1.015bn EREM ABS Credit Enhancement instrument equipped EIF with additional capacity to support mezzanine tranches of SME/small mid-caps-based securitisation transactions, including both synthetic and true sale transactions. This supported EIF in its efforts to stimulate the development of the SME securitisation market in Europe. By year-end 2016, commitments under the ABS Credit Enhancement window amounted to EUR 916m.
The initial tranche of EUR 189m under the Social Impact Finance window increased the investment capacity of EIF’s Social Impact Accelerator (SIA) instrument, hence consolidating a viable funding infrastructure for social enterprises through established social venture funds. During EREM’s first period, EIF concluded SIA transactions with an aggregate commitment of EUR 105m.
The EREM Loan Funds instrument earmarked an initial EUR 175m in April 2015, which was increased to EUR 725m as of January 2016 due to the strong pipeline built up in the rollout phase. Its objective is to widen the availability of loan financing for SMEs and small mid-caps beyond traditional bank channels.
EIF’s commitments concerned both diversified loan funds, applying an investment approach close to bank lending, and selective loan funds managed like private equity. EIF committed a total of EUR 630m in the 2014-2016 period with additional EUR 80m already approved and to be committed in the first few months of 2017.
The Cooperative Banks and Smaller Institutions (CBSI) initiative was signed between the EIB and EIF in October 2016 with a view to widening the availability of small bank and non-bank financing for SMEs and small mid-caps by EIF granting senior loans to eligible cooperative banks and financial institutions. CBSI’s initial size was agreed at EUR 125m, of which EUR 76.5m was
committed by the end of the year. The remaining budget is expected to be fully committed in early 2017.
EC MANDATES
EIF’s cooperat ion with the European Commission (EC) has been continuously
ensuring that the EC’s financial instruments and mandates contribute to a rapid achievement of strategic EU policy objectives. In addition to developing or extending existing programmes, the EC entrusted EIF in 2016 with an additional EUR 1.27bn of equity mandate capacity to be deployed under the EFSI Equity instrument forming part of the Investment Plan for Europe’s EFSI SME Window.
The EFSI SME Window enabled EIF to become more efficient in tackling investment shortcomings and in fostering innovation, jobs and growth. Furthermore, it has widened the opportunities for finance in priority sectors across all EU-28 Member States.
Following the launch of the new EFSI Equity instrument, the Single EU Equity Financial Instrument – a parallel equity initiative mandated by the EC in 2015 – has remained available for financial intermediaries that do not meet the EFSI eligibility requirements, for example when an intermediary is located outside the EU-28 Member States but otherwise is eligible for support under the COSME or Horizon 2020 frameworks.
COSME – INVESTING IN COMPETITIVENESS AND GROWTH
The Compet i t iveness of Enterpr ises and SMEs (COSME) programme was set up in 2014 by the EC (Directorate-General for Enterprise and Industry, now Internal Market, Industry, Entrepreneurship and SMEs, or DG GROW) to promote competit iveness and entrepreneurship in Europe, improve access to finance for European businesses and provide higher-risk SME loans and finance leases.
The COSME programme is deployed through two f inancial instruments managed by EIF: the Loan IN
VEST
MEN
T PL
AN F
OR
EURO
PE
17
Guarantee Facility (LGF) and the Equity Facility for Growth (EFG). These financial instruments are foreseen to run in the 2014-2020 period with an indicative aggregate budget of EUR 1.4bn.
COSME LGF allows EIF to provide guarantees and counter-guarantees to selected f inancial intermediaries, supporting them in their endeavours to grant loans and leases or issue guarantees to SMEs which they could not otherwise provide due to the high risks involved. Under the COSME programme, EIF provides free-of-charge capped guarantees to allow financial institutions to increase the range and volume of SME financing, especially in riskier segments. COSME also supports the provision of guarantees underpinning the securitisation of SME debt finance portfolios, which enables financial intermediaries to generate new SME debt finance portfolios.
In addit ion to the EU -28, the EU enlargement candidate countries Albania, FYROM, Montenegro, Serbia and Turkey, as well as Iceland are eligible for COSME. Additional countries may join at a later stage.
By the end of 2016, 41 LGF agreements were signed – of these, 39 EFSI -backed signatures, one transaction in Serbia and another in Turkey – representing a guarantee commitment of EUR 337m, which is expected to leverage EUR 7.5bn of financing.
COSME EFG forms part of the Single EU Equity Instrument, alongside InnovFin Equity, supporting investments in funds that provide equity and mezzanine finance to expansion and growth stage SMEs.Since inception, EIF has invested through COSME EFG in 9 funds, including multi-stage investments together with InnovFin Equity, committing EUR 101.4m of COSME resources.
Investments in portfolio companies cover a wide range of sectors. In line with EFG’s policy objectives, investee funds are pursuing a multi-country investment strategy or strongly support the internationalisation of their investees. To date, six countries have benefitted from COSME EFG investments.
INNOVFIN – DRIVING INNOVATION AND JOB CREATION
InnovFin – EU Finance for Innovators (InnovFin) is a joint EIB Group and EC (Directorate-General for Research and Innovation) initiative under Horizon 2020, the EU research programme for 2014-2020. InnovFin consists of a range of tailored products – from guarantees to financial intermediaries and direct loans to enterprises, to equity and advisory services – to support research and development projects in the EU-28 Member States and beyond.
The range of Horizon 2020 associated countries eligible to benefit from the InnovFin programme currently includes Albania, Armenia, Bosnia and Herzegovina, Faroe Islands, FYROM, Georgia, Iceland, Israel, Moldova, Montenegro, Norway, Serbia, Switzerland, Tunisia, Turkey and Ukraine.
Within the EU, InnovFin Equity is deployed as part of the EFSI Equity instrument. Beyond the EU borders, InnovFin Equity can be deployed also in countries covered by the Horizon 2020 programme through the Single EU Equity Instrument.
InnovFin Equity comprises four different products, ranging from technology transfer to investments in fund-of-funds as further elaborated below.
InnovFin Technology Transfer (InnovFin TT) targets investments in technology transfer funds focusing on the areas of key enabling technologies and other Horizon 2020 objectives. InnovFin TT mainly supports investments in funds operating in the pre-seed (including proof of concept) and seed stages.
InnovFin Business Angels (InnovFin BA) supports investments in funds managed by business angels or co-investment funds, which invest in early-stage enterprises at regional, national or cross-border level.
InnovFin Venture Capital (InnovFin VC) promotes investments into venture capital funds that provide funding to enterprises in their early stage operating in innovative sectors, especially information and
CHAPTER 3INSTITUTIONAL MANDATES
INVESTM
ENT PLAN
FOR EU
ROPE
18
EIF ANNUAL REPORT 2016
communicat ions technologies ( ICT), medical technologies, biotechnologies, green technologies and nanotechnologies.
InnovFin Fund-of-Funds (InnovFin FoF) enables investments in fund-of-funds structures that hold or intend to build a portfolio of underlying investee funds with significant early stage focus.
By the end of 2016, EIF invested in 10 funds, committing EUR 164.5m of InnovFin Equity financing blended with EFSI and EIF resources. The majority of these investee funds pursue multi-country strategies focusing primarily on early stage companies active in life sciences and ICT sectors.
In addition, EIF has been implementing the InnovFin SME Guarantee (SMEG) financial product since the programme’s launch in June 2014. The InnovFin SMEG is a 50 percent uncapped guarantee or counter-guarantee that EIF provides to financial intermediaries (and for which a standard guarantee fee is charged), allowing them to provide debt financing on favourable terms to innovative SMEs and small mid-caps in EU Member States and associated countries.
With the support of the EUR 1bn EC budget, EIF is expected to enter into guarantee agreements with financial intermediaries for a total amount of around EUR 5bn, which should result in approximately EUR 10bn of debt finance for innovative companies. This is expected to catalyse around EUR 14bn in investments.
EIF concluded a record amount of 78 new signatures under InnovFin SMEG in 2016 – of which 62 transactions leveraging on the EFSI guarantee – reaching an aggregate signature amount of more than EUR 2.3bn, which is expected to leverage EUR 5bn of financing.
EaSI – ENHANCING EMPLOYMENT AND SOCIAL INNOVATION
The financial instruments under the European Union Programme for Employment and Social Innovation (EaSI) are being set up by the European Commission Directorate-General for Employment, Social Affairs
and Inclusion (DG EMPL) in co-operation with EIF with the aim of achieving sustainable employment, guaranteeing adequate social protection and promoting the achievement of social goals in line with the Europe 2020 strategy.
The EU has indicatively allocated EUR 193m to the EaSI financial instrument for the 2014-2020 programming period. EIF has been entrusted so far with the implementation of two financial instruments: the EaSI Guarantee and the EaSI Capacity Building Investments Window, launched respectively in June 2015 and December 2016, for a total indicative amount of EUR 112m.
The deployment of these financial instruments aims to increase the availability of financial resources for disadvantaged groups of entrepreneurs as well as social enterprises, and especially for the benefit of those who are typically excluded from the commercial credit markets. In addition to the EU-28 Member States, the EaSI instruments are also available in Albania, FYROM, Iceland, Montenegro, Serbia and Turkey. Other countries may join the programme at a later stage.
The EaSI Guarantee provides capped guarantees or counter-guarantees to portfolios of loans not exceeding EUR 25 000 in the field of microfinance, and up to EUR 500 000 for social enterprises, the latter being enterprises whose primary objective is the achievement of measurable, positive social impact rather than having a pure profit-making purpose.
Beneficiaries may include underprivileged groups such as the young, the unemployed or migrants who wish to set up their own businesses. A very high market uptake of the EaSI financial instrument led to a frontloading under EFSI in July 2016 (see Chapter 4.3 – Inclusive finance activity).
In 2016, EIF signed 29 EaSI guarantee transactions – of which 23 microfinance and six social entrepreneurship agreements – totalling EUR 32.2m, leveraging close to EUR 409m of financing in co-operation with financial intermediaries in Albania, Austria, Belgium, the Czech Republic, Greece, Estonia, Montenegro, Poland, Portugal, Romania, Serbia, Slovakia and Spain. ■IN
VEST
MEN
T PL
AN F
OR
EURO
PE
19
For the new EaSI Capacity Building Investments Window, DG EMPL and EIF signed the relevant agreements and launched the calls for expression of interest in December 2016. This new facility aims to build up the institutional capacity of microcredit and social finance providers primarily through equity investments in selected intermediaries. Portfolios of loans or investments into micro-enterprises and social enterprises are not financed under this window.
ERASMUS+ – ENSURING INTERNATIONAL MOBILITY FOR STUDENTS
The Erasmus+ Master Student Loan Guarantee Facility was launched in spring 2015 and offers credit risk protection in the form of capped guarantees or counter-guarantees to financial intermediaries that grant new loans to internationally mobile masters students.
The instrument represents a major step towards the achievement of the 20 percent target for higher education student mobility in Europe in accordance with the Bologna Process agreement3.
This loan guarantee scheme consists of a free-of-charge capped portfolio guarantee, covering student loans of up to EUR 12 000 (for a 1-year degree) and EUR 18 000 (for master’s studies of more than one year).
Four new ERASMUS+ guarantee agreements for EUR 16.2m were concluded in 2016 with counterparts in France, Ireland, Luxembourg and Turkey, supporting the disbursement of a total of EUR 100m in student loans.
CCS – SUPPORTING THE CULTURAL AND CREATIVE SECTORS
The Cultural and Creative Sectors (CCS) Guarantee Facility was launched in June 2016 in the context of the EU’s Creative Europe programme for the budgetary period 2014-2020. The objective of Creative Europe is to promote cultural diversity and Europe’s cultural heritage, and to strengthen the competitiveness of the cultural and creative sectors.
This new mandate aims to suppor t SMEs and organisations in the cultural and creative sectors such as audio-visual, music, fashion, architecture, libraries, theatres and museums. These sectors of ten face difficulties in accessing loans due to the intangible nature of their assets and a general lack of financial intermediary expertise in addressing the specificities of this sector.
At the same time, the European cultural and creative sector accounts for more than 7 million jobs in the EU and 4.2% of the EU's GDP, hence this new financial instrument is expected to help bridge a substantial market gap. The CCS mandate has an overall envelope of EUR 121m and is expected to support more than EUR 600m in loans and other financial products.
The CCS mandate is made up of two pillars. On the one hand, it offers free-of-charge, capped first- loss portfolio guarantees and counter-guarantees to enable selected financial intermediaries to provide loans and leases to relevant entrepreneurs. On the other hand, it offers an optional capacity-building programme, also free of charge, to help financial intermediaries improve their understanding of the specificities of the cultural and creative sectors.
The new programme has been very well received by the market and EIF already signed three CCS transactions, committing EUR 12.7m in France, Romania and Spain. These agreements are expected to generate EUR 86.6m of leveraged financing.
DCFTA – IMPROVING BUSINESS CONDITIONS IN THE EASTERN NEIGHBOURHOOD
The Deep and Comprehensive Free Trade Area Initiative East, including its Guarantee Facility pillar (DCFTA GF), was signed in December 2016 between EC and the EIB Group.
The DCFTA mandate aims to strengthen the economic development in EU associated countries (Georgia, Moldova and Ukraine) by providing targeted financial and technical support to SMEs so that they can align to EU standards.
3 EC Education and Training - http://ec.europa.eu/education/policy/higher-education/bologna-process_en
CHAPTER 3INSTITUTIONAL MANDATES
20
EIF ANNUAL REPORT 2016
DCFTA GF wil l suppor t economic growth and employment-generating activities and enhance access to finance for SMEs by allowing first loss portfolio guarantees to be provided to financial intermediaries, enabling local intermediary banks to take on more risk and reach out to underserved segments of the economy.
A total loan volume of more than EUR 300m is expected to be generated for the benefit of SMEs in these countries. The EU funding for this guarantee facility has been provided by the Neighbouring Investment Facility (NIF) and the programme of EU Support to Ukraine to Re-launch the Economy (EU SURE).
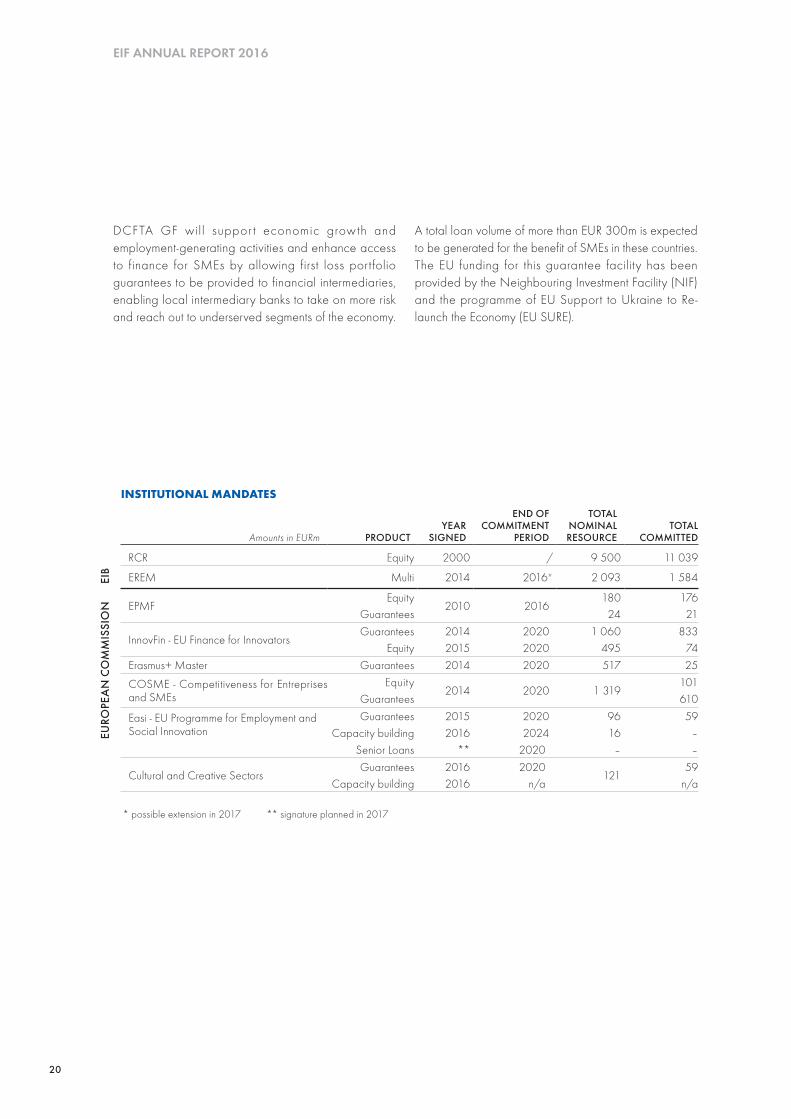
INSTITUTIONAL MANDATES
Amounts in EURm PRODUCTYEAR
SIGNED
END OF COMMITMENT
PERIOD
TOTAL NOMINAL RESOURCE
TOTAL COMMITTED
RCR Equity 2000 / 9 500 11 039
EREM Multi 2014 2016* 2 093 1 584
EPMFEquity
2010 2016180 176
Guarantees 24 21
InnovFin - EU Finance for Innovators Guarantees 2014 2020 1 060 833
Equity 2015 2020 495 74Erasmus+ Master Guarantees 2014 2020 517 25
COSME - Competitiveness for Entreprises and SMEs
Equity2014 2020 1 319
101Guarantees 610
Easi - EU Programme for Employment and Social Innovation
Guarantees 2015 2020 96 59Capacity building 2016 2024 16 –
Senior Loans ** 2020 – –
Cultural and Creative SectorsGuarantees 2016 2020
12159
Capacity building 2016 n/a n/a
* possible extension in 2017 ** signature planned in 2017
EIB
EURO
PEA
N C
OM
MIS
SIO
N
21
CHAPTER 4 BUSINESS YEAR 2016
CHAPTER 4BUSINESS YEAR 2016
4.1. EQUITY ACTIVITY
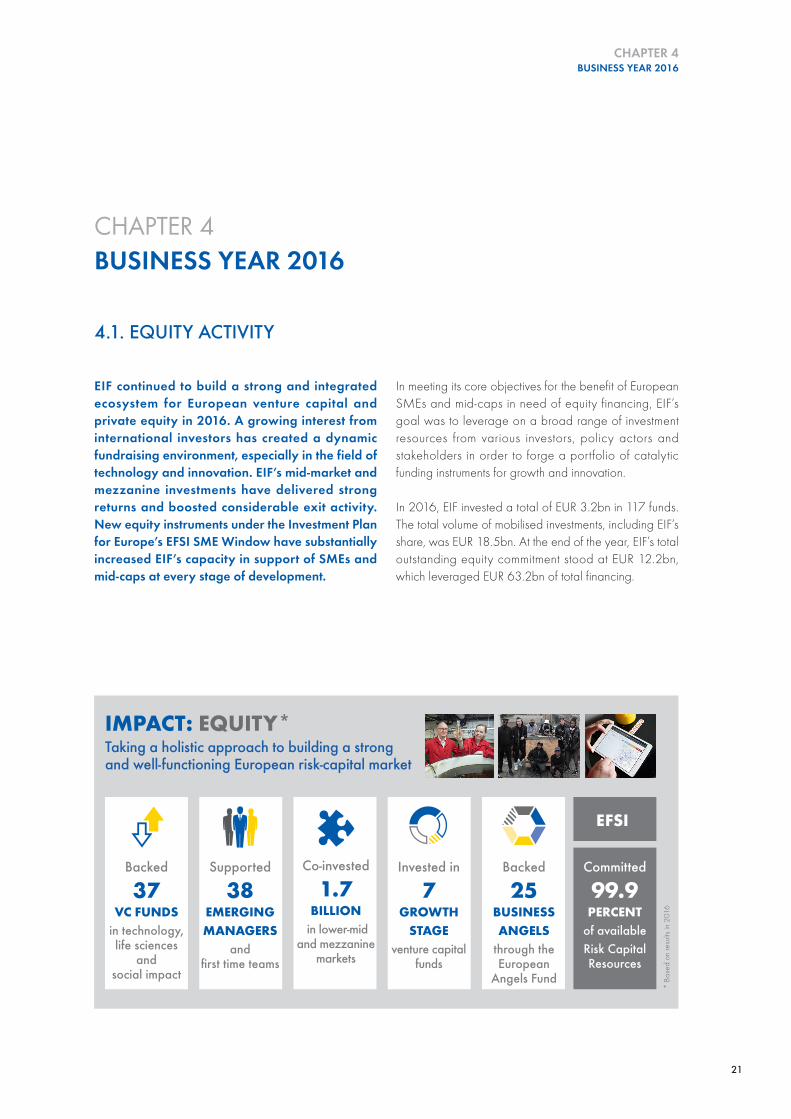
EIF continued to build a strong and integrated ecosystem for European venture capital and private equity in 2016. A growing interest from international investors has created a dynamic fundraising environment, especially in the field of technology and innovation. EIF’s mid-market and mezzanine investments have delivered strong returns and boosted considerable exit activity. New equity instruments under the Investment Plan for Europe’s EFSI SME Window have substantially increased EIF’s capacity in support of SMEs and mid-caps at every stage of development.
In meeting its core objectives for the benefit of European SMEs and mid-caps in need of equity financing, EIF’s goal was to leverage on a broad range of investment resources from various investors, policy actors and stakeholders in order to forge a portfolio of catalytic funding instruments for growth and innovation.
In 2016, EIF invested a total of EUR 3.2bn in 117 funds. The total volume of mobilised investments, including EIF’s share, was EUR 18.5bn. At the end of the year, EIF’s total outstanding equity commitment stood at EUR 12.2bn, which leveraged EUR 63.2bn of total financing.
IMPACT: EQUITY*Taking a holistic approach to building a strong and well-functioning European risk-capital market
Backed
37VC FUNDS
in technology, life sciences
and social impact
Backed
25BUSINESSANGELS
through the European
Angels Fund
Supported
38EMERGINGMANAGERS
and first time teams
Committed
99.9PERCENT
of available Risk Capital Resources
Co-invested
1.7BILLION
in lower-mid and mezzanine
markets
Invested in
7GROWTH
STAGEventure capital
funds
EFSI
* Ba
sed
on re
sults
in 2
016
22
EIF ANNUAL REPORT 2016
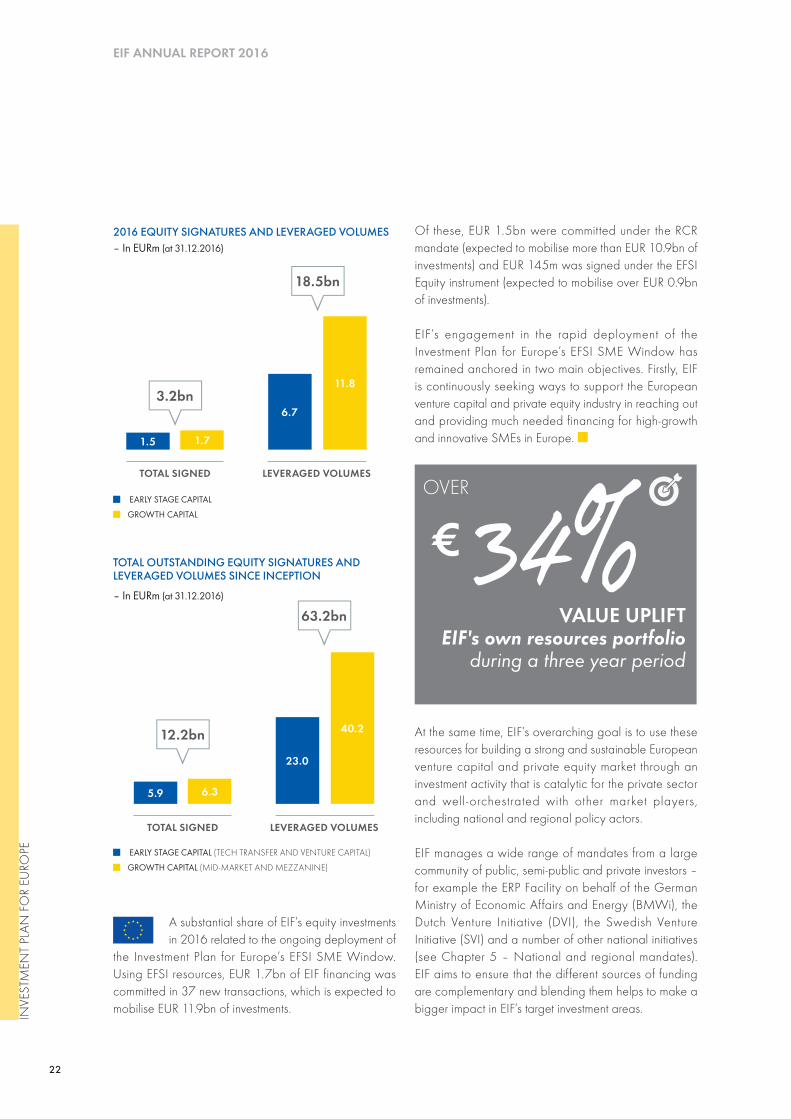
Of these, EUR 1.5bn were committed under the RCR mandate (expected to mobilise more than EUR 10.9bn of investments) and EUR 145m was signed under the EFSI Equity instrument (expected to mobilise over EUR 0.9bn of investments).
EIF’s engagement in the rapid deployment of the Investment Plan for Europe’s EFSI SME Window has remained anchored in two main objectives. Firstly, EIF is continuously seeking ways to support the European venture capital and private equity industry in reaching out and providing much needed financing for high-growth and innovative SMEs in Europe. ■
34%€OVER
VALUE UPLIFT EIF's own resources portfolio
during a three year period
At the same time, EIF’s overarching goal is to use these resources for building a strong and sustainable European venture capital and private equity market through an investment activity that is catalytic for the private sector and well -orchestrated with other market players, including national and regional policy actors.
EIF manages a wide range of mandates from a large community of public, semi-public and private investors – for example the ERP Facility on behalf of the German Ministry of Economic Affairs and Energy (BMWi), the Dutch Venture Initiative (DVI), the Swedish Venture Initiative (SVI) and a number of other national initiatives (see Chapter 5 – National and regional mandates). EIF aims to ensure that the different sources of funding are complementary and blending them helps to make a bigger impact in EIF’s target investment areas.
EARLY STAGE CAPITAL
GROWTH CAPITAL
2016 EQUITY SIGNATURES AND LEVERAGED VOLUMES – In EURm (at 31.12.2016)
18.5bn
3.2bn
TOTAL SIGNED LEVERAGED VOLUMES
1.5 1.7
6.7
11.8
EARLY STAGE CAPITAL (TECH TRANSFER AND VENTURE CAPITAL)
GROWTH CAPITAL (MID-MARKET AND MEZZANINE)
TOTAL SIGNED LEVERAGED VOLUMES
TOTAL OUTSTANDING EQUITY SIGNATURES AND LEVERAGED VOLUMES SINCE INCEPTION
– In EURm (at 31.12.2016)
12.2bn
63.2bn
5.9 6.3
23.0
40.2
A substantial share of EIF’s equity investments in 2016 related to the ongoing deployment of
the Investment Plan for Europe’s EFSI SME Window. Using EFSI resources, EUR 1.7bn of EIF financing was committed in 37 new transactions, which is expected to mobilise EUR 11.9bn of investments. INVE
STM
ENT
PLAN
FO
R EU
ROPE
23
Fur thermore, EIF has s tepped up i ts cooperation with national promotional
institutions (NPIs) in the framework of the Investment Plan for Europe (with a scope and horizon that reaches also beyond EFSI), by creating a platform for the development and rollout of joint products at national level, which will have cross-border relevance and serve to strengthen the European venture capital and private equity markets.
The NPI-Equity Platform was launched in September 2016. It aims at knowledge-sharing and exchange of best practices and builds on the shared objective of EIF and NPIs to support a well-functioning European venture capital and private equity market.
Since the Platform’s inauguration, EIF has been able to discuss with NPIs on the effective allocation of joint investments, particularly where such combined capacity would bring added value at the European level, including through EFSI-related activities.
The first tailored investment programme enabled by the NPI-Equity Platform was set up with Cassa Depositi e Prestiti (CDP) in Italy in December 2016. The ITAtech equity investment platform targets a significant market gap in Italy and will provide EUR 200m of equity support to funds investing in technology transfer and the commercialisation of intellectual property. Most importantly, it represents one of the main forms of cooperation concepts that have been envisaged in the framework of the Platform’s activities.
Moreover, EIF has been developing and market testing a suite of additional innovative investment solutions that will be implemented through standardised mandate frameworks with NPIs. The first mandate of this kind, a co-investment programme in partnership with the Netherlands Investment Agency (NIA) was approved in October 2016. Seven more agreements of this kind are currently under development with NPIs. ■
BUILDING A SUSTAINABLE ECOSYSTEM FOR INNOVATION AND GROWTH
For a number of years now, EIF has taken a holistic approach to building a well - functioning risk-capital
market in Europe: rather than looking at individual market segments in isolation, EIF has focused on promoting funding tools that serve the full value creation chain of an enterprise’s development, from pre-seed and early stages to achieving a global market presence.
Therefore, EIF’s investment approach has been following a commercial return logic in market segments that are crucial to Europe’s competitiveness and social cohesion, seeking to mobilise private sector capital in target investment areas.
This catalytic effect relies to a large extent on EIF’s high quality standards and market expertise, which have allowed EIF to retain its reputation as a reference investor. Similarly to previous years, in 2016, EIF was able to reinforce this role across all its equity business lines as further described below.
963m€
MORE THAN
REFLOWSof all equity resources
managed by EIF in 2016
BUSINESS ANGELS
The European Angels Fund (EAF) initiative provides equity to business angels and other non-institutional investors with a view to financing innovative companies through co-investments.
EAF’s current volume is around EUR 290m, of which approximately EUR 130m have been committed to around 50 business angels for investments over a period
CHAPTER 4 BUSINESS YEAR 2016
INVESTM
ENT PLAN
FOR EU
ROPE
24
EIF ANNUAL REPORT 2016
TECHNOLOGY TRANSFER
Technology transfer continues to be a strategic piece in the jigsaw of the European venture capital ecosystem due to its important role in driving innovation and entrepreneurship. Thus, EIF has taken a long-term interest in promoting investments in this field as technology transfer investments are a vital ingredient to ensuring a strong and continuous deal flow in a well-functioning venture capital market. By the end of 2016, EIF committed close to EUR 163m in eight technology transfer funds and accelerators.
In the field of technology transfer and the commercialisation of research results, EIF has undertaken a particular market development effort also in geographies with an emerging venture capital ecosystem. The ITAtech investment scheme for technology transfer in Italy in cooperation with CDP represents the first “tailored NPI mandate” devised in connection with the NPI-Equity Platform.
VENTURE CAPITAL
Growth stage venture capital was at the forefront of EIF’s investment strategy in 2016, building a new venture capital market segment targeted at technology companies that need an extra injection of capital on their path leading to internationalisation and global industry leadership.
EIF provided tailored support to the development of Europe based growth stage venture capital funds that are able to lead large financing rounds and compete even at global level in terms of their value added to investees.
As a cornerstone investor with a strong signalling effect to the market, EIF helped funds to attract additional funding and reach their target sizes in order to credibly execute their investment strategy. In this way, EIF enabled Europe-based fund managers to lead international and global funding rounds, opening a new chapter in the development of the entire European growth stage venture capital market.
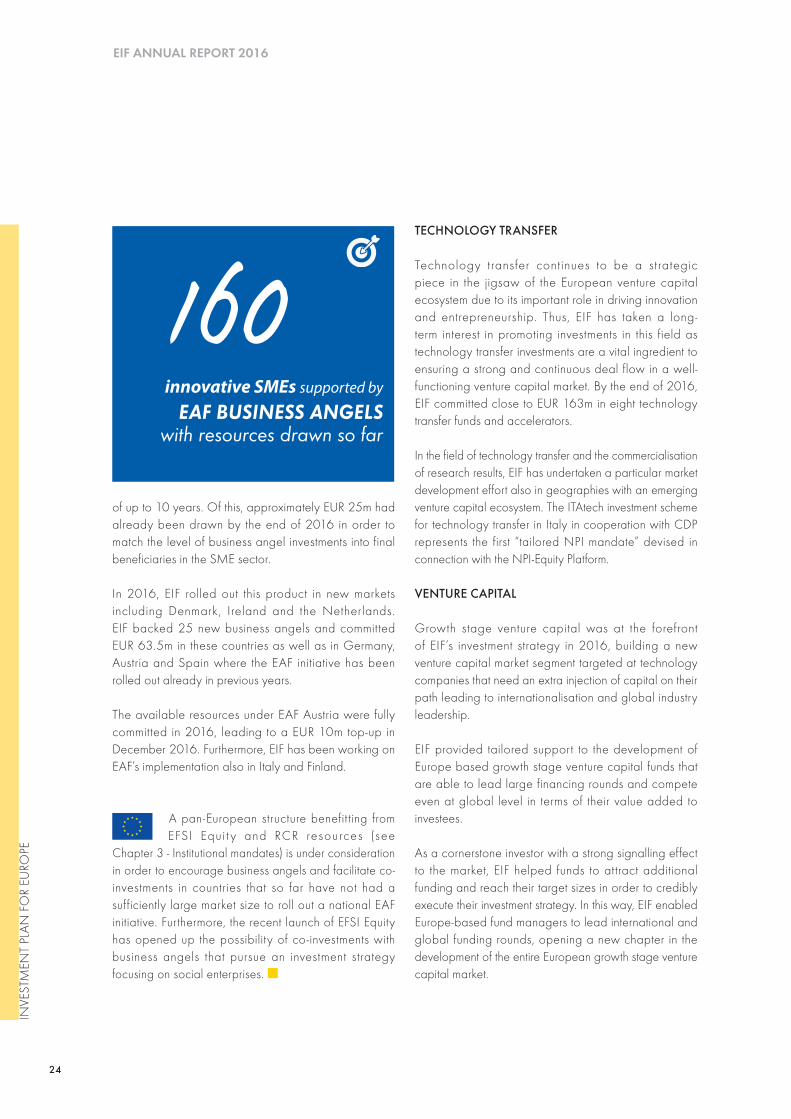
160innovative SMEs supported by
EAF BUSINESS ANGELSwith resources drawn so far
of up to 10 years. Of this, approximately EUR 25m had already been drawn by the end of 2016 in order to match the level of business angel investments into final beneficiaries in the SME sector.
In 2016, EIF rolled out this product in new markets including Denmark, Ireland and the Netherlands. EIF backed 25 new business angels and committed EUR 63.5m in these countries as well as in Germany, Austria and Spain where the EAF initiative has been rolled out already in previous years.
The available resources under EAF Austria were fully committed in 2016, leading to a EUR 10m top-up in December 2016. Furthermore, EIF has been working on EAF’s implementation also in Italy and Finland.
A pan-European structure benefit ting from EFSI Equi t y and RCR resources (see
Chapter 3 - Institutional mandates) is under consideration in order to encourage business angels and facilitate co-investments in countries that so far have not had a sufficiently large market size to roll out a national EAF initiative. Furthermore, the recent launch of EFSI Equity has opened up the possibility of co-investments with business angels that pursue an investment strategy focusing on social enterprises. ■
INVE
STM
ENT
PLAN
FO
R EU
ROPE
25
CHAPTER 4 BUSINESS YEAR 2016
EIF together with its longstanding partners, the German Ministry of Economic Affairs and Energy (BMWi), the LfA Förderbank Bayern and the NRW.BANK signed the second mandate under the Mezzanine Dachfonds für Deutschland (MDD) initiative in November 2016 (see Chapter 5 – National and regional mandates).
For the second consecutive year, EIF deployed the EIB EREM Loan Funds Instrument, investing in selective debt funds and demonstrating the market fit of this new asset class through its role as a pioneering limited partner.
EIF has also ramped up its co- investment activity alongside mezzanine funds under the EREM Mezzanine Co-Investment Facility (MCIF), further supporting the most promising managers through eight co-investment structures for a total of EUR 89m.
SOCIAL IMPACT FUNDS
EIF has continued providing strong support to the emerging class of fund managers focusing their investment activities on social enterprises. This new community of entrepreneurs seeks to address mounting challenges to Europe’s social cohesion through business models that generate tangible and measurable societal benefits coupled with sound economics.
In this context, EIF’s Social Impact Accelerator (SIA) was launched in 2013 with an initial size of EUR 53m under the EREM Social Impact Finance Instruments (see Chapter 3 – Institutional mandates) and reached an investment capacity of EUR 243m in 2015, attracting four other institutional investors.
45%€CLOSE TO
SIA commitments in start-ups & early-stage SMEs
EIF’s commitments into flagship European venture capital funds with global ambitions as well as a proven capability of scaling companies successfully – such as Highland Capital Partners, Holtzbrinck Ventures, Lakestar, EQT Ventures, Atomico and Partech – is expected to have a long-term catalytic affect.
Further to this, EIF launched a EUR 500m co-investment growth facility for venture capital funds under the European Recovery Programme (ERP) mandate in Germany in March 2016 (see Chapter 5 – National and regional mandates). This co-investment product allows funds with highflyers in their port folios to maintain the lead in late stage funding rounds, thus maximising value creation even if their portfolio’s funding requirements exceed the initial investment capacity.
The ERP Co-Investment Growth Facility was rolled out as a pilot project and it is planned to be extended to other European countries in the framework of the NPI-Equity Platform in 2017.
PRIVATE EQUITY AND PRIVATE DEBT FUNDS
In 2016, EIF’s mid-market and mezzanine funds became increasingly attractive for investors looking for alternatives to fixed interest products. Continuing the upward trend observed in 2015, this segment of the private equity industry showed strong returns through sustained value creation and renewed exit activity. This substantial boost resulted in more fundraising, which in its turn, has been beneficial for European SMEs and mid-caps.
Positive market conditions were also reflected in EIF’s rich deal flow throughout the year. A total of close to EUR 1.7bn were committed to 50 lower mid-market private equity and private debt funds which exceeded the previous year’s record volume of signatures by more than 40 percent.
In addition to a growing investment activity in lower mid-market funds, EIF has continued to develop its hybrid debt equity/mezzanine investments, providing continued support to more mature companies seeking organic and international growth or needing restructuring.
26
EIF ANNUAL REPORT 2016
Two new SIA transactions were signed in 2016. In July, EIF signed an investment of up to EUR 15m in Coöperative Social Impact Venture NL Fund I U.A., a new Dutch fund providing early growth and expansion stage capital to innovative SMEs in the social sector.
In November, EIF committed EUR 10m in the French fund Impact Création. The fund’s novel strategy, managed by one of the first social impact fund managers in Europe, aims to stimulate economic activity in the most deprived areas in France, by investing into franchise businesses expanding into these regions.
At the end of the past year, EIF’s SIA portfolio comprised ten social impact funds focused on building successful social enterprises in France, Germany, Italy, the Netherlands and the United Kingdom.
In order to also offer equity investments to social enterprises in the pre-seed and seed
stages as well as to other social sector organisations, three new products were launched under EFSI Equity in support of social entrepreneurship and social finance in October 2016. Firstly, the successful business angels co-
investment instrument was extended to the segment of social impact investments so that business angels across Europe will now be able to benefit from this funding tool to scale up their support to social enterprises.
Secondly, the EFSI Equity instrument expands the equity product offer to investments in or alongside financial intermediaries linked to incubators, accelerators and intermediaries that provide incubation services. This new instrument is dedicated to structures operating in the very early stage of social entrepreneurship.
Thirdly, EIF introduced a new product line in the form of a payment-by-result instrument, for example through social impact bonds, enabling intermediaries to draw on co-investment resources for the funding of social intervention projects, which are typically commissioned by national or local governments. This instrument should prove particularly impactful in supporting the activities of social sector organisations in response to the migration crisis in Europe.
The first transactions under the three new products are currently in EIF’s investment pipeline. ■
Strengthening the social dimension of EFSI: Payment-by-result transactions
Payment-by-results transactions are a form of outcome-based commissioning. By focusing on the positive outcomes, an alignment of interests among all relevant stakeholders is created. This enables improved focus and efficiency in spending on social sector interventions, encouraging the development of the most cost-effective solutions, which is therefore expected to increase the value for money in social service delivery. Social impact bonds are a good example of this kind of transactions.
Thanks to EFSI, EIF and the EC have been able to launch a pilot based on this new, innovative financial mechanism with the aim to test the use of the payment-by-result model for funding social enterprises and social sector organisations.
Investments into payment-by-result transactions will typically be made via a special purpose vehicle that provides social sector organisations with upfront funding of their activities, enabling them to effectively deliver on their social mission.
INVE
STM
ENT
PLAN
FO
R EU
ROPE
27
MAKING EUROPEAN VENTURE GLOBALLY COMPETITIVE
25 European tech and life sciences
UNICORNSfinanced by EIF-backed funds
since 2003
EIF has sought to stay abreast of and consciously contribute to a market development process that can serve the global competitiveness of European venture capital and private equity as an attractive asset class. The impact of EIF’s investment activities therefore stretches far beyond the short term recording of investment volumes and returns.
Overall, venture capital and private equity plays a substantial role in the development of high-growth and innovative companies. In this context, EIF has fuelled the growth of a dynamic ecosystem where the continuous emergence of new-age entrepreneurs creates more and more innovation.
There is also tangible evidence for the return potential of such investments to investors. As an example, in November 2016, one of EIF’s portfolio funds, Scottish Equity Partners, exited its investment in Skyscanner through a trade sale at a valuation multiple of close to 50.
At the time of the initial investment in 2007, Skyscanner employed fewer than 30 people and focused primarily on budget airlines in Europe. Today, the company has over 800 employees and is one of the top online travel brands in the world.
The buoyant market environment, especially for digital economy businesses, has not only materialised in a lively exit market for European technology companies, but it
has also considerably improved the interest of institutional investors.
Thanks to these developments, EIF was able to scale back its usual share of commitments to levels comparable to the investment size of other participants. EIF has been particularly attentive to this market development in order to ensure complementarity and to act as a catalyst for private sector capital.
8 300CLOSE TO
ENTERPRISESsupported through EIF equity
since inception
Many of the first time investment teams backed by EIF in the past have matured to established market players with access to a diversified investor base. In light of this success, EIF continued its support to emerging managers and first time teams in 2016 in order to seed the next generation of successful European fund managers.
In 2016, EIF backed 38 emerging managers and first time teams, of which 15 in venture capital and impact investing and 23 in the lower mid-market / mezzanine segment.
The rather receptive market environment for venture capital and private equity has also created an opportunity for EIF to pioneer new market segments that require particular support, including a more specific focus on the growth stage venture capital market segment, and targeted market development efforts in underdeveloped venture capital markets such as Italy and Central and Eastern European countries including Bulgaria and Romania. The first successful exit from a Bulgarian equity fund in April 2016 delivered early tangible proof of the untapped market potential represented by these geographies.
CHAPTER 4 BUSINESS YEAR 2016
28
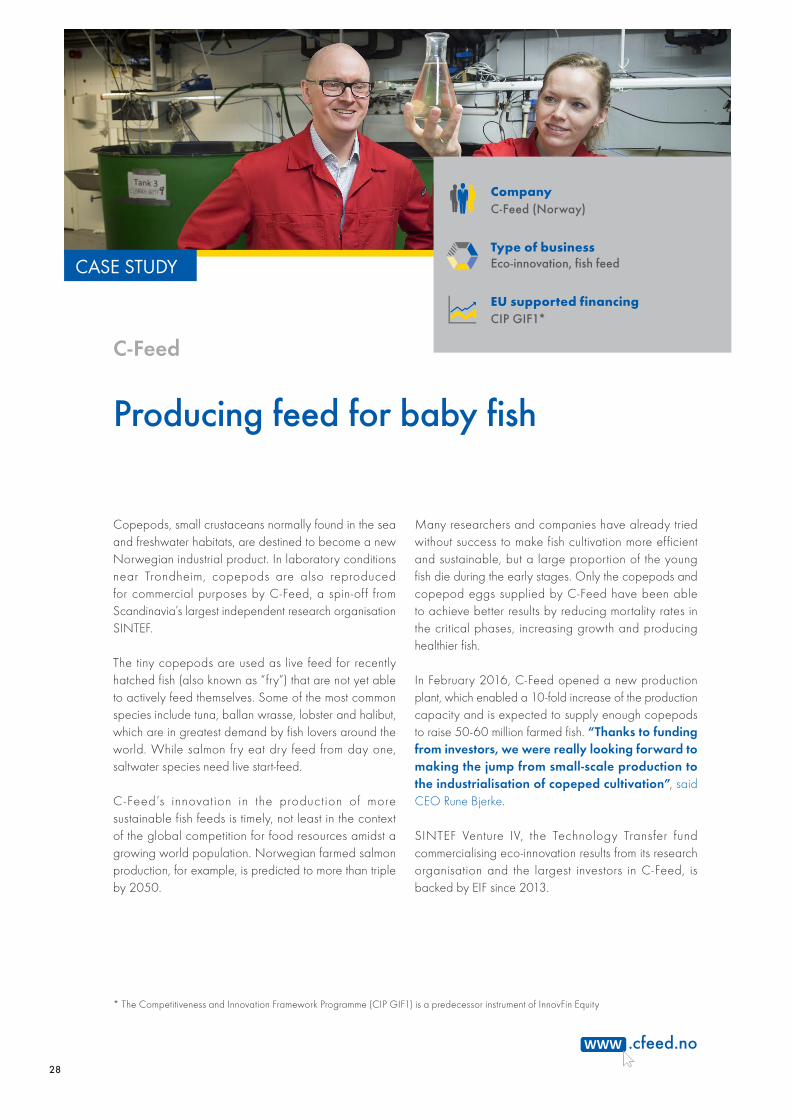
C-Feed
.cfeed.no
Producing feed for baby fish
CASE STUDY
Many researchers and companies have already tried without success to make fish cultivation more efficient and sustainable, but a large proportion of the young fish die during the early stages. Only the copepods and copepod eggs supplied by C-Feed have been able to achieve better results by reducing mortality rates in the critical phases, increasing growth and producing healthier fish.
In February 2016, C-Feed opened a new production plant, which enabled a 10-fold increase of the production capacity and is expected to supply enough copepods to raise 50-60 million farmed fish. “Thanks to funding from investors, we were really looking forward to making the jump from small-scale production to the industrialisation of copeped cultivation”, said CEO Rune Bjerke.
SINTEF Venture IV, the Technology Transfer fund commercialising eco-innovation results from its research organisation and the largest investors in C-Feed, is backed by EIF since 2013.
Copepods, small crustaceans normally found in the sea and freshwater habitats, are destined to become a new Norwegian industrial product. In laboratory conditions near Trondheim, copepods are also reproduced for commercial purposes by C-Feed, a spin-off from Scandinavia’s largest independent research organisation SINTEF.
The tiny copepods are used as live feed for recently hatched fish (also known as “fry”) that are not yet able to actively feed themselves. Some of the most common species include tuna, ballan wrasse, lobster and halibut, which are in greatest demand by fish lovers around the world. While salmon fry eat dry feed from day one, saltwater species need live start-feed.
C-Feed’s innovation in the production of more sustainable fish feeds is timely, not least in the context of the global competition for food resources amidst a growing world population. Norwegian farmed salmon production, for example, is predicted to more than triple by 2050.
CompanyC-Feed (Norway)
Type of businessEco-innovation, fish feed
EU supported financingCIP GIF1*
* The Competitiveness and Innovation Framework Programme (CIP GIF1) is a predecessor instrument of InnovFin Equity
29
CASE STUDY
CompanyMovidius (Ireland)
Type of businessHardware development (machine vision processing)
EIF financingRCR mandate and own resources
Movidius
.movidius.com
Giving sight to machines
In addition, Movidius’ machine vision processors are used in technologies powering augmented reality and virtual reality applications, which aim to convincingly blend the real world with the digital, e.g. through eye-tracking, gesture and object recognition, and emotion analytics. Movidius also collaborated in the past with Google on a 3D mapping project.
Capital-E, an early stage venture fund backed by EIF, supported Movidius’ development and growth from the beginnings with an initial investment already in 2008. Later on, other investors joined, notably Draper Fisher Jurvetson (DFJ), Draper Esprit and Atlantic Bridge, the latter having a particularly significant role in transforming Movidius into the industry leader it is today.
Movidius has grown enormously over the past years, opening offices in Dublin, Hong Kong and a substantial software development centre in Romania. Driven by the recognition that vision processing and machine intelligence are of critical importance in the wake of robotisation and automatisation, Intel acquired Movidius in September 2016.
Drones can see almost like humans, capturing and analysing visual information from different sources. They can avoid obstacles in real time, navigate a map and hover over a fixed position without the need for a GPS signal.
In today’s world of fast paced technology developments, we rarely take the time to reflect on how such innovations actually work. What makes drones so intelligent? It's the unique vision processing chips and machine intelligence algorithms developed by the Irish hardware firm Movidius. Its high performance, ultra-low power and programmable chips represent a disruptive innovation amidst the growing relevance of these technologies for image and object recognition.
Similar image recognition systems had already been available on the market, but they were very power hungry and impractical for mass adoption. Movidius’ breakthrough came after several years of product development to substantially reduce the chip’s power consumption and size, making it suitable for mobile devices, wearables, and small robots such as drones.
30
EIF ANNUAL REPORT 2016
Latimer Group
.latimergroup.org
Empowering audiences
CASE STUDY
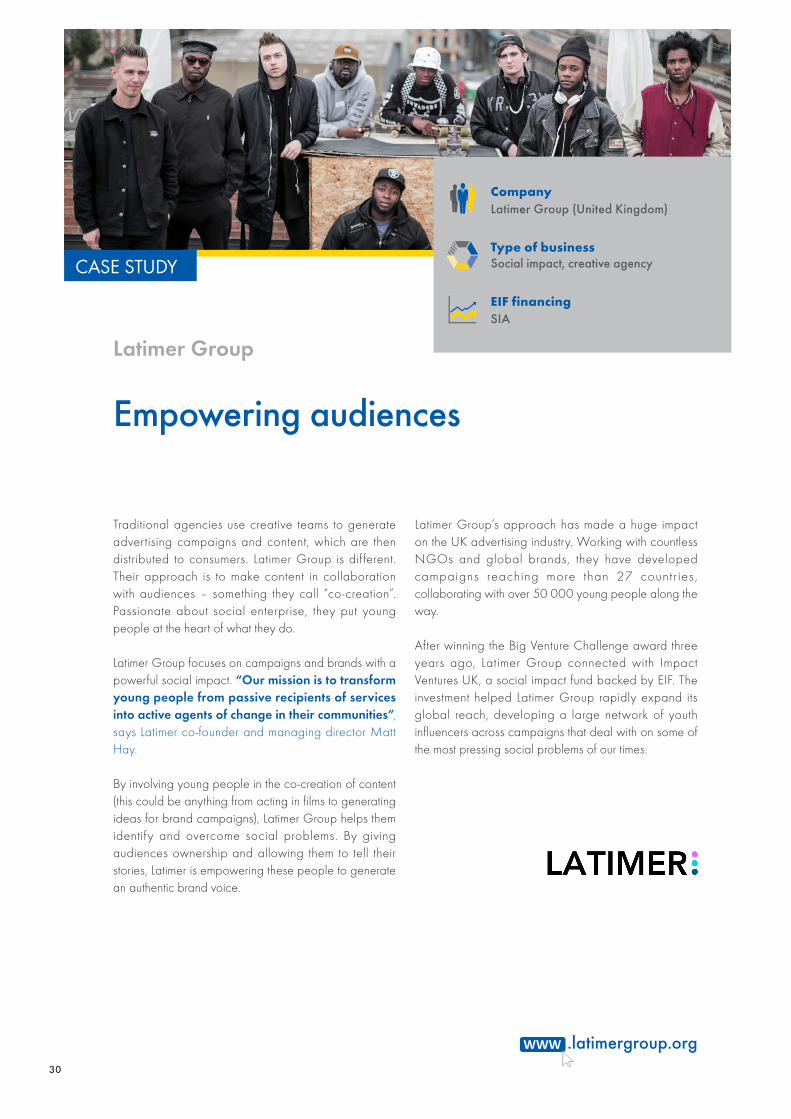
Latimer Group’s approach has made a huge impact on the UK advertising industry. Working with countless NGOs and global brands, they have developed campaigns reaching more than 27 count r ies , collaborating with over 50 000 young people along the way.
After winning the Big Venture Challenge award three years ago, Latimer Group connected with Impact Ventures UK, a social impact fund backed by EIF. The investment helped Latimer Group rapidly expand its global reach, developing a large network of youth influencers across campaigns that deal with on some of the most pressing social problems of our times.
Traditional agencies use creative teams to generate advertising campaigns and content, which are then distributed to consumers. Latimer Group is different. Their approach is to make content in collaboration with audiences – something they call “co-creation”. Passionate about social enterprise, they put young people at the heart of what they do.
Latimer Group focuses on campaigns and brands with a powerful social impact. “Our mission is to transform young people from passive recipients of services into active agents of change in their communities”, says Latimer co-founder and managing director Matt Hay.
By involving young people in the co-creation of content (this could be anything from acting in films to generating ideas for brand campaigns), Latimer Group helps them identify and overcome social problems. By giving audiences ownership and allowing them to tell their stories, Latimer is empowering these people to generate an authentic brand voice.
CompanyLatimer Group (United Kingdom)
Type of businessSocial impact, creative agency
EIF financingSIA
31
CASE STUDY
CompanyUtimaco (Germany)
Type of businessHardware development (cyber security)
EU-supported financingCIP GIF2*
Utimaco
.utimaco.com
Providing security that builds trust
Backed by EIF, PINOVA Capital, a Munich-based private equity firm focusing on innovative high-growth SMEs, supported Utimaco’s continued development. Alongside one additional equity co-investor and NRW.BANK as a mezzanine provider, PINOVA Capital acquired the company in 2013 jointly with members of the management team.
PINOVA Capital helped the existing management team to spin-out from the former parent company and transform Utimaco’s two main business lines into independent legal entities.
Utimaco’s international expansion reached a milestone with the opening of a subsidiary office in Silicon Valley in 2014. During the holding period of PINOVA Capital, Utimaco experienced a strong growth with the number of employees increasing from 87 to 128 over the past three years.
At the time of investment, PINOVA Capital was a first time fund. EIF’s commitment made a significant contribution to the fundraising efforts of the team. EIF invested in May 2016 in the successor fund, PINOVA Fund 2, using RCR resources.
Cyber security has dramatically gained in importance in recent years across all industries. In an increasingly digitised world, Utimaco has become a leading provider of professional cyber security and compliance solutions, protecting people around the world from terrorism and organised crime, and securing private or sensitive data against theft or abuse.
Headquartered in Aachen (Germany), Utimaco stands for recognised product quality, user-friendly software, excellent support and trusted high security, made in Germany. The company develops lawful interception management systems and data retention solutions that fulfil the legal regulatory requirements applicable to telecommunications companies (mobile and fixed networks) and Internet service providers.
Utimaco is also a technology leader in the field of hardware-based, high-security appliances that ensure the safekeeping of digital assets, such as cryptographic key materials and high value data. Today, Utimaco’s hardware security modules are deployed in over 1 000 installations across more than 80 countries and demand is expected to grow at double digits in the coming years.
* The Competitiveness and Innovation Framework Programme (CIP GIF2) is a predecessor instrument of COSME Equity
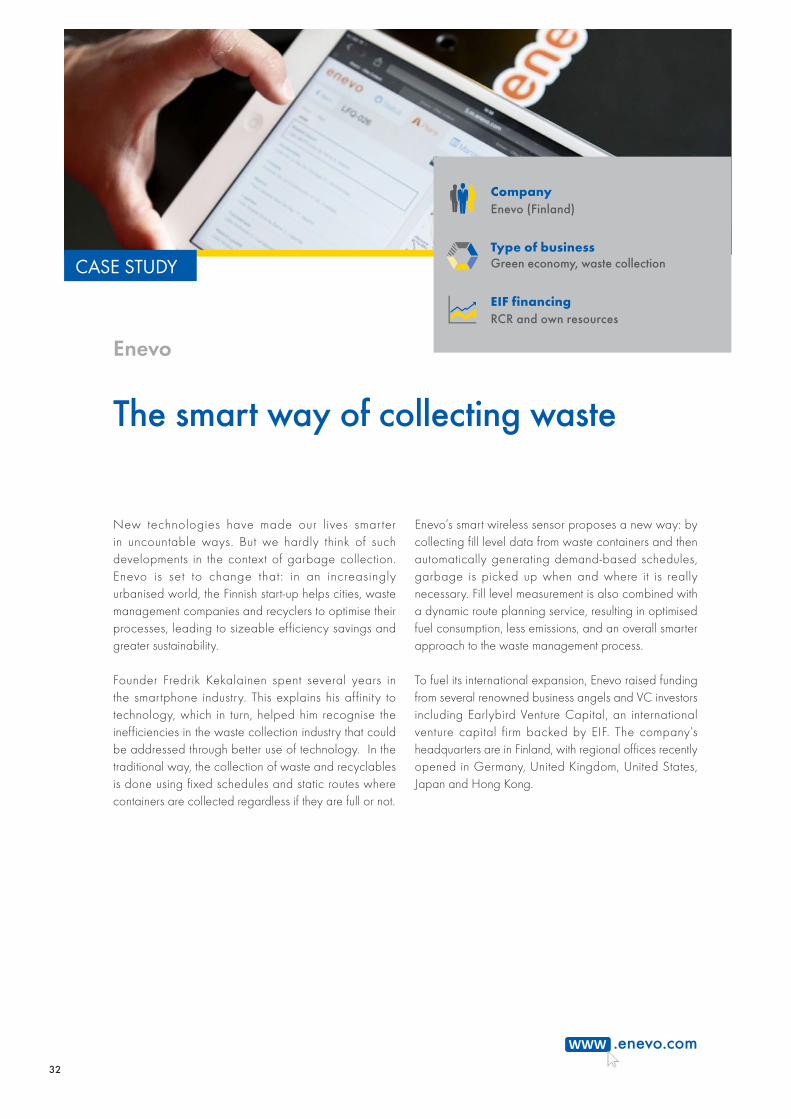
32
Enevo
.enevo.com
The smart way of collecting waste
CASE STUDY
Enevo’s smart wireless sensor proposes a new way: by collecting fill level data from waste containers and then automatically generating demand-based schedules, garbage is picked up when and where it is really necessary. Fill level measurement is also combined with a dynamic route planning service, resulting in optimised fuel consumption, less emissions, and an overall smarter approach to the waste management process.
To fuel its international expansion, Enevo raised funding from several renowned business angels and VC investors including Earlybird Venture Capital, an international venture capital firm backed by EIF. The company’s headquarters are in Finland, with regional offices recently opened in Germany, United Kingdom, United States, Japan and Hong Kong.
New technologies have made our lives smarter in uncountable ways. But we hardly think of such developments in the context of garbage collection. Enevo is set to change that: in an increasingly urbanised world, the Finnish start-up helps cities, waste management companies and recyclers to optimise their processes, leading to sizeable efficiency savings and greater sustainability.
Founder Fredrik Kekalainen spent several years in the smartphone industry. This explains his affinity to technology, which in turn, helped him recognise the inefficiencies in the waste collection industry that could be addressed through better use of technology. In the traditional way, the collection of waste and recyclables is done using fixed schedules and static routes where containers are collected regardless if they are full or not.
CompanyEnevo (Finland)
Type of businessGreen economy, waste collection
EIF financingRCR and own resources
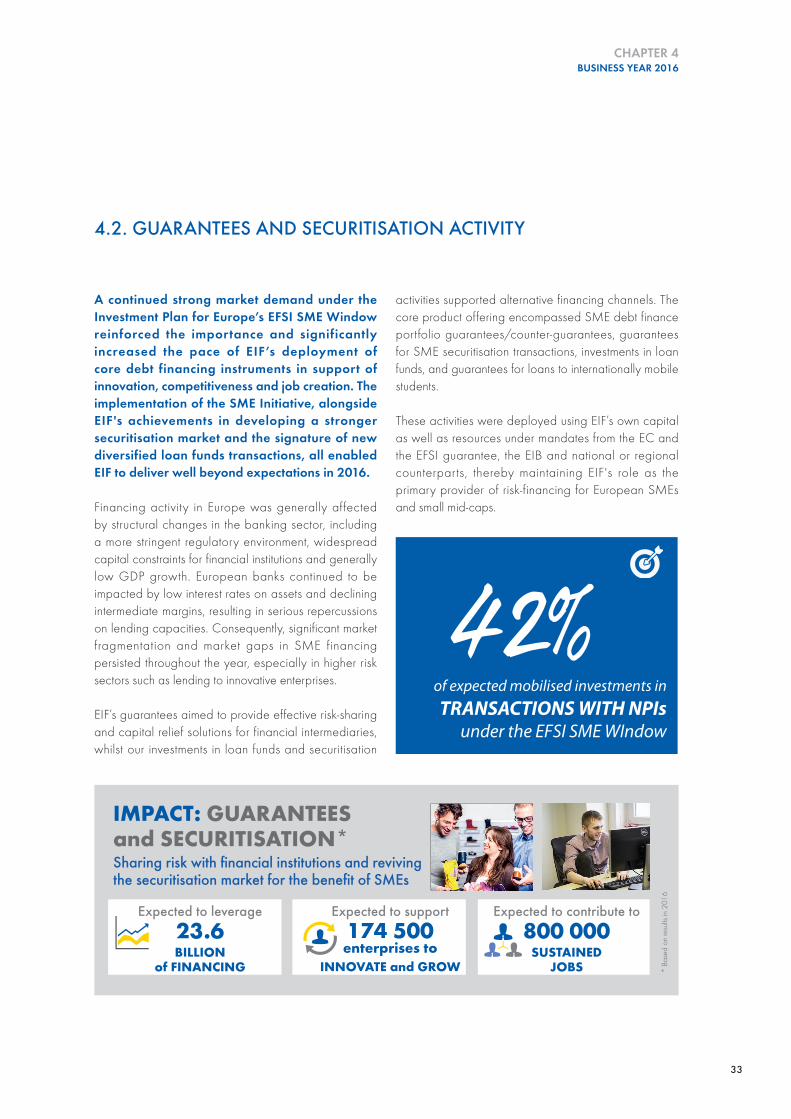
33
4.2. GUARANTEES AND SECURITISATION ACTIVITY
A continued strong market demand under the Investment Plan for Europe’s EFSI SME Window reinforced the importance and significantly increased the pace of EIF’s deployment of core debt financing instruments in support of innovation, competitiveness and job creation. The implementation of the SME Initiative, alongside EIF's achievements in developing a stronger securitisation market and the signature of new diversified loan funds transactions, all enabled EIF to deliver well beyond expectations in 2016.
Financing activity in Europe was generally affected by structural changes in the banking sector, including a more stringent regulatory environment, widespread capital constraints for financial institutions and generally low GDP growth. European banks continued to be impacted by low interest rates on assets and declining intermediate margins, resulting in serious repercussions on lending capacities. Consequently, significant market fragmentation and market gaps in SME financing persisted throughout the year, especially in higher risk sectors such as lending to innovative enterprises.
EIF’s guarantees aimed to provide effective risk-sharing and capital relief solutions for financial intermediaries, whilst our investments in loan funds and securitisation
activities supported alternative financing channels. The core product offering encompassed SME debt finance portfolio guarantees/counter-guarantees, guarantees for SME securitisation transactions, investments in loan funds, and guarantees for loans to internationally mobile students.
These activities were deployed using EIF’s own capital as well as resources under mandates from the EC and the EFSI guarantee, the EIB and national or regional counterparts, thereby maintaining EIF's role as the primary provider of risk-financing for European SMEs and small mid-caps.
42%of expected mobilised investments in
TRANSACTIONS WITH NPIsunder the EFSI SME WIndow
IMPACT: GUARANTEES and SECURITISATION*Sharing risk with financial institutions and reviving the securitisation market for the benefit of SMEs
* Ba
sed
on re
sults
in 2
016
Expected to leverage23.6BILLION
of FINANCING
Expected to support174 500
enterprises toINNOVATE and GROW
Expected to contribute to800 000
SUSTAINED JOBS
CHAPTER 4 BUSINESS YEAR 2016
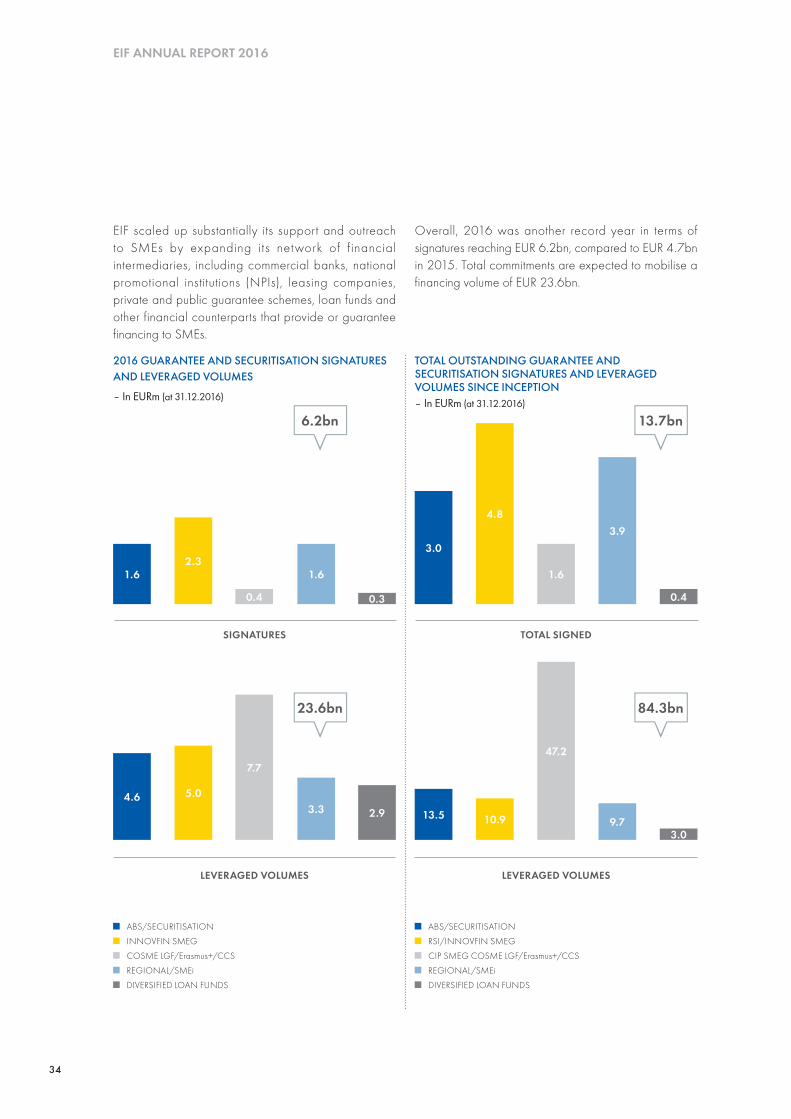
34
EIF ANNUAL REPORT 2016
EIF scaled up substantially its support and outreach to SMEs by expanding its network of f inancial intermediaries, including commercial banks, national promotional institutions (NPIs), leasing companies, private and public guarantee schemes, loan funds and other financial counterparts that provide or guarantee financing to SMEs.
Overall, 2016 was another record year in terms of signatures reaching EUR 6.2bn, compared to EUR 4.7bn in 2015. Total commitments are expected to mobilise a financing volume of EUR 23.6bn.
2016 GUARANTEE AND SECURITISATION SIGNATURES AND LEVERAGED VOLUMES
– In EURm (at 31.12.2016)
TOTAL OUTSTANDING GUARANTEE AND SECURITISATION SIGNATURES AND LEVERAGED VOLUMES SINCE INCEPTION – In EURm (at 31.12.2016)
13.7bn6.2bn
84.3bn23.6bn
ABS/SECURITISATION
INNOVFIN SMEG
COSME LGF/Erasmus+/CCS
REGIONAL/SMEi
DIVERSIFIED LOAN FUNDS
ABS/SECURITISATION
RSI/INNOVFIN SMEG
CIP SMEG COSME LGF/Erasmus+/CCS
REGIONAL/SMEi
DIVERSIFIED LOAN FUNDS
SIGNATURES
1.62.3
1.6
0.4 0.3
4.6 5.03.3
7.7
2.9
LEVERAGED VOLUMES
TOTAL SIGNED
1.6
4.8
0.4
3.93.0
47.2
10.93.0
9.713.5
LEVERAGED VOLUMES
35
CHAPTER 4 BUSINESS YEAR 2016
STIMULATING GROWTH, COMPETITIVENESS, INNOVATION AND JOBS
The year 2016 was marked by a particularly strong deployment of debt financing solutions
under the Investment Plan for Europe’s EFSI SME Window with an all-time-high number of signatures under the EU Finance for Innovators (InnovFin) and Competitiveness for Enterprises and SMEs (COSME) programmes (see Chapter 3 – Institutional mandates), enabling EIF to make a sizeable contribution to a more rapid achievement of key EU policy objectives.
While it is still premature to fully assess the impact of EIF’s engagement, an initial analysis shows a significant increase in annual turnover and total number of employees for SMEs supported, both under InnovFin and under COSME. ■
InnovFin remained the programme of choice for numerous financial intermediaries due to the inherent uncapped nature of the guarantee that provides capital relief and loss sharing on a pari passu basis, thus enabling counterparts to provide financing for SMEs at more favourable conditions.
36% of expected mobilised
INVESTMENTS in RDI under the EFSI SME Window
Against this background, EIF nearly tripled the number of InnovFin guarantee signatures compared to the previous year, concluding a total of 78 new InnovFin agreements, amounting to EUR 2.3bn and representing an expected total leveraged financing of EUR 5bn for innovative
enterprises. Of these, 62 new transactions were backed by the EFSI guarantee.
Since the InnovFin guarantee is also available to beneficiaries in associated or partner countries under the Horizon 2020 programme, EIF was able to maximise the programme’s outreach and absorption. In co-operation with larger banking groups – including the ProCredit Group, the UniCredit Group and seven regional German NPIs under the leadership of NRW.BANK – EIF developed flexible umbrella structures with a multi -country or multi - region focus, reaching out to beneficiaries and bridging market gaps both in EU Member States and beyond.
The ProCredit Group agreement, for example, with a portfolio volume of EUR 270m, covered not only three EU Member States (Bulgaria, Greece and Romania) but also five Horizon 2020 associated countries: Albania, Bosnia and Herzegovina, FYROM, the Republic of Moldova and Serbia.
Novel types of guarantee transactions with debt funds enabled EIF to diversify its risk-financing toolkit and further scale up its impact in the financing of innovative SMEs. The EUR 25m InnovFin signature with Entrepreneur Venture in April 2016 was a reference agreement in this regard. Entrepreneur Ventures is a French fund manager company that channels financing to technology and research-driven SMEs and small mid-caps mainly in the form of equity, through buying convertible bonds issued by those enterprises.
20 700COSME GUARANTEE
JOBS SUPPORTEDEACH MONTH at the current
pace of deployment
INVESTM
ENT PLAN
FOR EU
ROPE
36
EIF ANNUAL REPORT 2016
Under the InnovFin agreement, EIF shares the risk with Entrepreneur Venture on each bond, thus lowering the interest rate and making the financing more favourable for the final beneficiaries. In addition, the guarantee helps Entrepreneur Venture increase the size of investments.
Similarly, by sharing credit risk under the COSME guarantee, EIF allowed financial intermediaries to support riskier SMEs.
The capped guarantee product has been particularly attractive for guarantee schemes and promotional institutions as it helps to increase guarantee volumes and finance SMEs with insufficient collateral.
In 2016, EIF signed 41 new COSME LGF agreements for a total guarantee amount of
EUR 337m, supporting EUR 7.5bn of financing in 16 countries. Of these, 39 transactions were backed by EFSI.
The creation of a dedicated EFSI Thematic Investment Platform for Italian SMEs in cooperation with Cassa Depositi e Prestiti (CDP) was a milestone event in December 2016. It is the first platform promoted by an NPI and EIF, encompassing a risk-sharing arrangement between CDP, EIF and Italy’s Ministry of Economy and Finance (MEF) to provide guarantees and counter-guarantees to financial institutions on new SME debt financing under the EFSI SME Window.
The platform is expected to generate at least 25 percent higher leverage than stand-alone guarantee transactions under EFSI and the first transaction was immediately concluded, representing a guarantee agreement of EUR 112.5m under COSME LGF. The operation is estimated to support a portfolio of up to some EUR 6bn of investments to the benefit of more than 67 000 Italian SMEs, representing the largest COSME transaction under EFSI since the launch of the Investment Plan for Europe.
The launch of the thematic investment platform in Italy underlined EIF’s repeated ability to create added value on the market by blending different sources of funding and ensuring that public resources can be maximised through well-tested financial instruments.
1 in 3 supported SMEs
owned by a
FEMALE ENTREPRENEUR
Another EFSI signature of similarly novel nature was concluded in December 2016 with the Strategic Banking Corporation of Ireland (SBCI), an Irish NPI established in 2014. This COSME guarantee agreement, covering a loan portfolio of EUR 100m, allows the institution to roll out its first risk-sharing programme, alongside its usual SME on-lending product offer.
SBCI is expected to launch a number of risk-sharing products targeting perceived market failures in Ireland. The first one is being developed in co-operation with the country’s Department of Agriculture Food and the Marine (DAFM), entailing a loan scheme allowing to alleviate cash-flow/liquidity constraints and to provide access to working capital to 2 000 SMEs in the Irish farming sector.
In total, around 280 000 SMEs are expected to benefit from guarantee transactions approved so far with the support of the EFSI-backed COSME guarantee. Close to 80 percent of the COSME supported loans were granted to companies with fewer than 10 employees, suggesting that EIF’s impact in sustaining competitiveness is particularly tangible for smaller enterprises that usually struggle the most to access finance. ■
INVESTING IN EDUCATION AND CULTURE
In 2016, EIF signed four new agreements for a total amount of EUR 16.2m under the Erasmus+ Master
INVE
STM
ENT
PLAN
FO
R EU
ROPE

37
CHAPTER 4 BUSINESS YEAR 2016
Student Loan Guarantee. These agreements will enable financial intermediaries in France, Ireland, Luxembourg and Turkey to disburse EUR 100m to internationally mobile students, facilitating easier access to quality education programmes in Europe.
Furthermore, EIF has been working with the EC to enhance the facility’s design. In this regard, EIF’s recent partnership with the University of Luxembourg allowed a wider assessment of the financing needs of this sector. As a pilot, the agreement will allow internationally mobile students to defer tuit ion fees and student accommodation rent payments of up to EUR 18 000 for six years or more.
The new Creative and Cultural Sectors programme (CCS, see Chapter 3 – Institutional mandates) was equally well received by the market. EIF signed three CCS transactions within six months after the programme's launch for an amount of EUR 12.7m. Financial intermediaries in France, Romania and Spain will support SMEs in these sectors through a total financing volume of EUR 86.6m. The pipeline of CCS signatures is expected to remain strong in 2017.
BOOSTING SME LENDING THROUGH REGIONAL ACTIVITIES
Building on the success of the JEREMIE mandate, EIF launched two new initiatives in the French region of Languedoc-Roussillon in the second half of 2016 (see Chapter 5 – National and regional mandates). Under each mandate, one transaction has already been concluded, guaranteeing a total loan amount of EUR 223.7m.
The Western Balkans Enterprise Development and Innovation Facility WB EDIF experienced very strong demand for its SME loan guarantees and the facility was increased by EUR 16.1m. As a result, five new agreements were signed with members of the ProCredit Bank Group in Serbia, Kosovo and FYROM, as well as with CKB in Montenegro and the Raiffeisen Bank in Albania, making EUR 107m available for disbursement to SMEs in these countries.
The Cyprus Entrepreneurship Fund (CYPEF) also showed good performance. After the successful deployment of the initial EUR 30m resources, a EUR 30m increase was agreed with the Bank of Cyprus, creating a total loan volume of EUR 120m for beneficiaries in the Cypriot SMEs sector.
Under the Greater Anatolia Guarantee Facility (GAGF), the last reallocations were made in order to maximise the utilisation of the remaining resources.
EXPANDING THE SME INITIATIVE
Portfolio guarantees under the SME Initiative (see Chapter 5 – National and regional mandates) were initially launched in Spain and in Malta, and the implementation continued successfully in Bulgaria, Finland, Italy and Romania in the course of 2016.
Since inception, the SME Initiative in Spain has enabled loans amounting to EUR 5.6bn for Spanish SMEs in cooperation with nine financial intermediaries, of which three new par tners in 2016 including one umbrella agreement covering 19 subsidiaries throughout Spain.
Within one year from the signature of the first guarantee agreements, close to 30 000 SMEs have already benefitted from close to EUR 2.6bn under this facility.
In Malta, two guarantee agreements were signed, which led to a full allocation of the available funds, creating a loan volume of more than EUR 60m for new SME financing.
The SME Initiative in Bulgaria was also marked by a quick uptake through ten financial intermediaries, enabling more than EUR 600m of new loans and leases to Bulgarian SMEs.
Finland launched the SME Initiative in September 2016 and a full allocation of the facility is expected in the first quarter of 2017, with the aggregate amount of SME loans expected to reach EUR 400m.
38
EIF ANNUAL REPORT 2016
Romania was the latest country to join the SME initiative. Following the publication of the call for expression of interest in October 2016, the selection of financial intermediaries is ongoing and the signatures are foreseen in the first quarter of 2017.
The SME Initiative in Italy pioneered the adoption of the securitisation instrument that represents the second pillar of the facility’s framework. The instrument can be implemented through unfunded and cash (true sale) securitisation in the form of either embedded or bilateral EIF guarantees. In turn, financial intermediaries will provide new financing to SMEs located in Southern Italy at reduced pricing. After the launch of the call for expression of interest in October 2016, the mandate is expected to be fully implemented in 2017, generating a total securitised loan volume of EUR 2bn.
PAVING THE WAY FOR MORE CAPITAL MARKET FINANCE TO EUROPEAN SMES
EREM diversified loan funds (DLF, see Chapter 3 – Institutional mandates) enabled the EIB Group to establish itself as a key contributor to the development of a financing channel that links savings with growth, which is a key objective of the Capital Markets Union.
By the end of the year, six EREM loan fund commitments were signed for a total amount of EUR 301.3m, confirming a robust implementation pace. These funds usually have a pan-European focus, aiming to create almost EUR 3bn of total financing for SMEs and small mid-caps in Belgium, France, Italy, the Netherlands, Spain and the United Kingdom.
As an example, EIF was a cornerstone investor in the BNP Paribas European SME Debt Fund using EREM resources in 2016. The fund reached EUR 500m of total commitments from private institutional investors and it is the first SME-focused fund being awarded the European Long Term Investment Fund (ELTIF) label in France, due to its focus on supporting unlisted companies and SMEs.
BUILDING UP NEW SECURITISATION PORTFOLIOS
Despite the ongoing decline of volumes in the European SME securitisation market, EIF closed a record year in issuing guarantees and mobilising resources with broad geographical coverage.
Five guarantee agreements covering mezzanine tranches of SME securitisations under EREM amounted to a total commitment amount of EUR 558.8m. Thanks to EREM, the EIB Group’s role was pivotal in a number of transactions in dif ferent countr ies including Austr ia, France, Germany, Italy, Poland and the United Kingdom. One agreement was concluded with a multi-country focus. EIF participated in transactions for funding purposes as well as synthetic SME securitisation transactions.
In light of the difficult market environment, EIF’s regular participation in the securitisation market was instrumental in supporting the ABS transactions in the European SME sector. Our involvement was particularly beneficial in less developed markets (e.g. Greece, Poland, Portugal), as well as in supporting niche players such as leasing companies and fintechs (financial services based on technology, particularly marketplace lending platforms).
In addition, the provision of guarantees for mezzanine tranches in synthetic securitisations for SME portfolios allowed banks to release regulatory capital that can then be deployed for new SME lending.
The creation of a uniform regulatory regime that would replace sectoral legislations related to due diligence, risk retention and disclosure/transparency and would apply equally to all institutional investors, was among the most important priorities of the Capital Markets Union discussions in 2016.
The proposed new regulat ion aims to repeal securitisation provisions appearing in other EU legislative measures (CRR, Solvency II, UCITS/AIFMR) and replace them with a set of common provisions. The aim would be to define a category of securitisation transactions which will be simple, transparent and standardised (STS transactions) and attract more favourable treatment.
39
CHAPTER 4 BUSINESS YEAR 2016
The EIB Group, leveraging on EIF’s structured finance capabilities, participated strongly in several consultations related to a number of amendments in the securitisation regulation, especially those concerning SME portfolios. In conclusion, the proposed new regulatory environment for securitisation transactions foresees higher capital charges for future transactions under the new regime; particularly in light of the fact that even the capital charges for STS transactions are envisaged to be higher than under the current regime.
EIF would welcome further changes, especially with respect to synthetic transactions and the reliance on rating agencies. EIF believes that in order for the synthetic securitisation market to be fully revived, the eligible range of investors that can participate in such deals has to be expanded. This view has also been shared by the European Banking Authority (EBA) in their report on synthetic securitisation published in December 2015.
Meanwhi le, EIF’s involvement in warehousing transactions continued in 2016. The UK asset finance market continued to be dominated by a few, large and typically bank-owned leasing providers, but a number of smaller, independent asset finance providers were also active in the field. The latter have traditionally relied on funding provided by large banks. Since the onset of the financial crisis and largely due to the deleveraging process, large banks have limited their overall exposure to such mid-sized and small asset finance providers.
In this context, EIF carried out f ive warehousing transactions over the past two years, providing funding to non-bank lessors to allow them to grow their own portfolio of SME leases. Three of those transactions were deployed in partnership with the British Business Bank under the ENABLE programme, a scheme designed to specifically support selected asset finance providers through funding generated by means of securitisation.
EIF also participated in two breakthrough transactions: firstly, EIF guaranteed GBP 44m of the senior tranche of the securitisation originated by the largest UK SME P2P lender, Funding Circle; and secondly, EIF invested in the senior tranche of the first public SME securitisation in Greece following the financial crisis.
Overall, EIF experienced an increasing interest from financial institutions across Europe to capitalise on securitisation for achieving regulatory capital relief and despite the ongoing regulatory framework uncertainties, EIF believes in the continuation of this trend during 2017.
STEPPING UP CO-OPERATION WITH NPIS IN SECURITISATION
In July 2016, EIF and seven NPIs launched the EIF-NPIs Securitisation Initiative (ENSI) to stimulate SME lending via capital markets. The initiative’s principal objective is to use securitisation techniques to enable financial intermediaries to provide more financing to SMEs. This is mainly achieved through increased funding to financial intermediaries; however, ENSI could also help to lower the capital requirements of originators, reduce portfolio concentrations and potentially deconsolidate portfolios of SME exposures. This goes hand-in-hand with a commitment by financial intermediaries to lend the freed-up capital to SMEs.
In light of the ENSI’s success, EIF launched a multi-country Investment Platform for SMEs through securitisation in December 2016, which is expected to make further use of EFSI resources and crowd in additional funding from NPIs and EU Member States. The proposed platform is expected to be finalised in the first quarter of 2017, allowing its members and EIF to cooperate under a new securitisation instrument backed by EFSI.
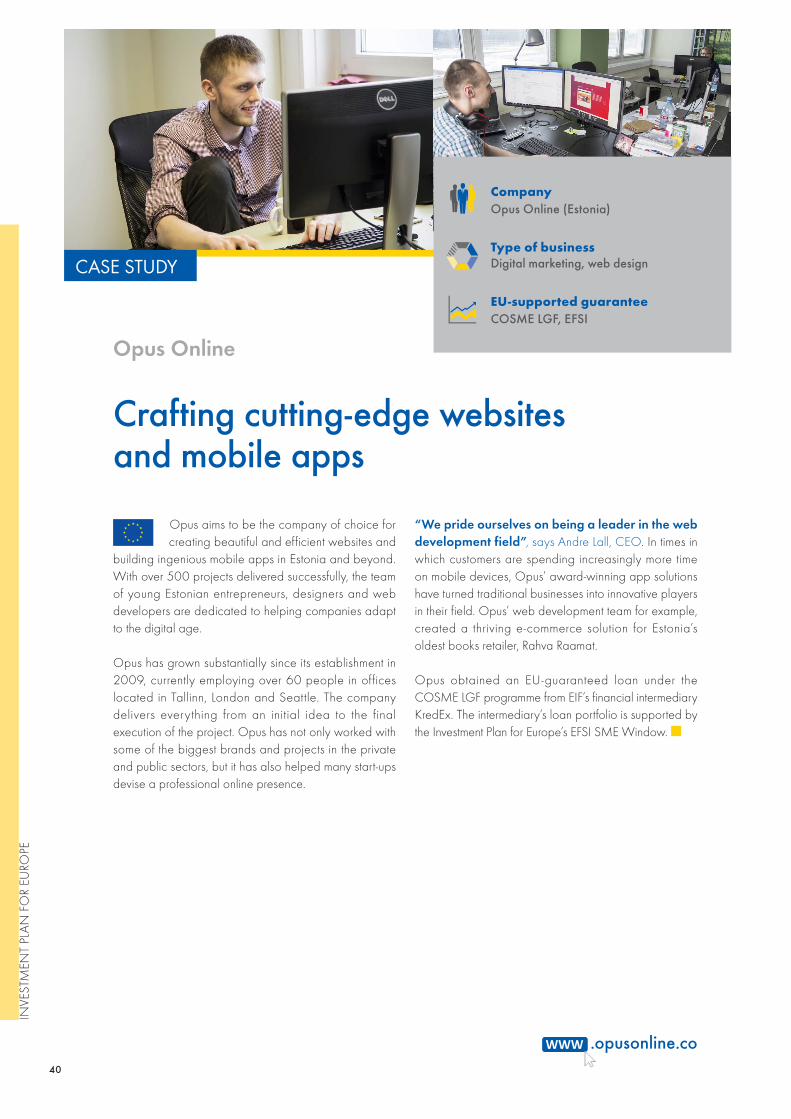
40
Opus Online
.opusonline.co
Crafting cutting-edge websites and mobile apps
CASE STUDY
“We pride ourselves on being a leader in the web development field”, says Andre Lall, CEO. In times in which customers are spending increasingly more time on mobile devices, Opus’ award-winning app solutions have turned traditional businesses into innovative players in their field. Opus’ web development team for example, created a thriving e-commerce solution for Estonia’s oldest books retailer, Rahva Raamat.
Opus obtained an EU-guaranteed loan under the COSME LGF programme from EIF’s financial intermediary KredEx. The intermediary’s loan portfolio is supported by the Investment Plan for Europe’s EFSI SME Window. ■
Opus aims to be the company of choice for creating beautiful and efficient websites and
building ingenious mobile apps in Estonia and beyond. With over 500 projects delivered successfully, the team of young Estonian entrepreneurs, designers and web developers are dedicated to helping companies adapt to the digital age.
Opus has grown substantially since its establishment in 2009, currently employing over 60 people in offices located in Tallinn, London and Seattle. The company delivers everything from an initial idea to the final execution of the project. Opus has not only worked with some of the biggest brands and projects in the private and public sectors, but it has also helped many start-ups devise a professional online presence.
CompanyOpus Online (Estonia)
Type of businessDigital marketing, web design
EU-supported guaranteeCOSME LGF, EFSI
INVE
STM
ENT
PLAN
FO
R EU
ROPE
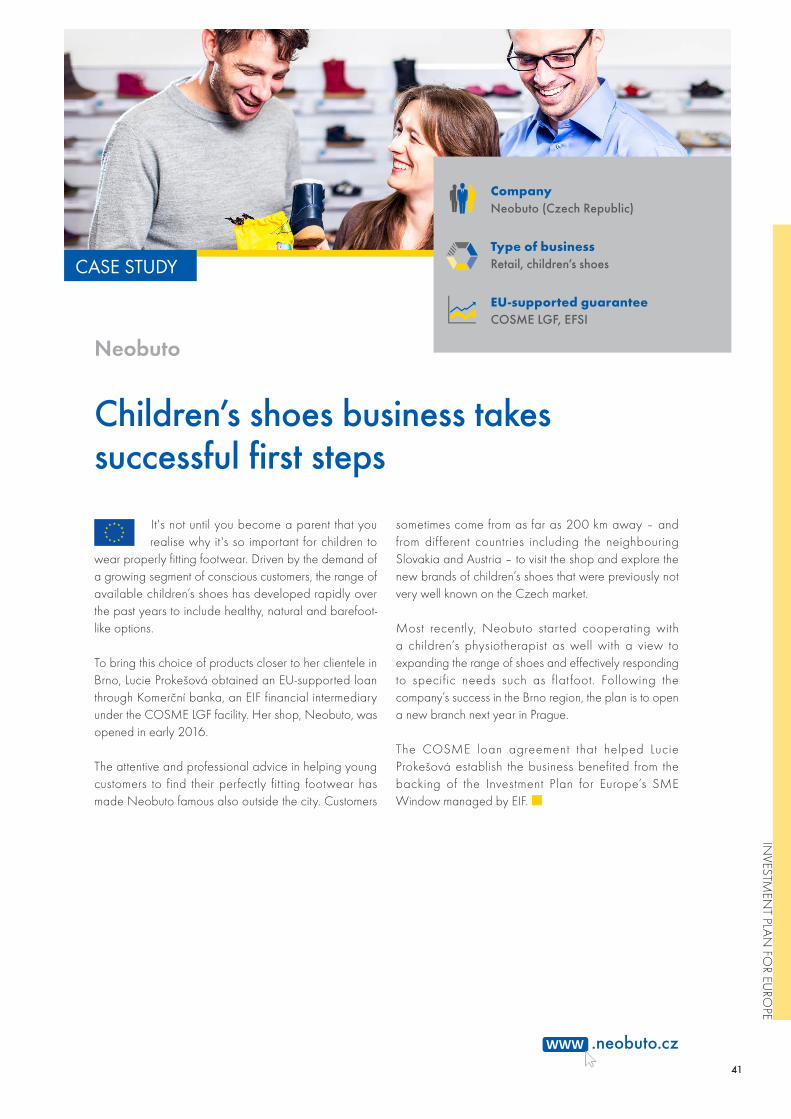
41
CASE STUDY
CompanyNeobuto (Czech Republic)
Type of businessRetail, children’s shoes
EU-supported guaranteeCOSME LGF, EFSI
Neobuto
.neobuto.cz
Children’s shoes business takes successful first steps
sometimes come from as far as 200 km away – and from dif ferent countries including the neighbouring Slovakia and Austria – to visit the shop and explore the new brands of children’s shoes that were previously not very well known on the Czech market.
Most recently, Neobuto started cooperating with a children’s physiotherapist as well with a view to expanding the range of shoes and effectively responding to specific needs such as flat foot. Following the company’s success in the Brno region, the plan is to open a new branch next year in Prague.
The COSME loan agreement that helped Lucie Prokešová establish the business benefited from the backing of the Investment Plan for Europe’s SME Window managed by EIF. ■
It's not until you become a parent that you realise why it's so important for children to
wear properly fitting footwear. Driven by the demand of a growing segment of conscious customers, the range of available children’s shoes has developed rapidly over the past years to include healthy, natural and barefoot-like options.
To bring this choice of products closer to her clientele in Brno, Lucie Prokešová obtained an EU-supported loan through Komerční banka, an EIF financial intermediary under the COSME LGF facility. Her shop, Neobuto, was opened in early 2016.
The attentive and professional advice in helping young customers to find their perfectly fitting footwear has made Neobuto famous also outside the city. Customers
INVESTM
ENT PLAN
FOR EU
ROPE
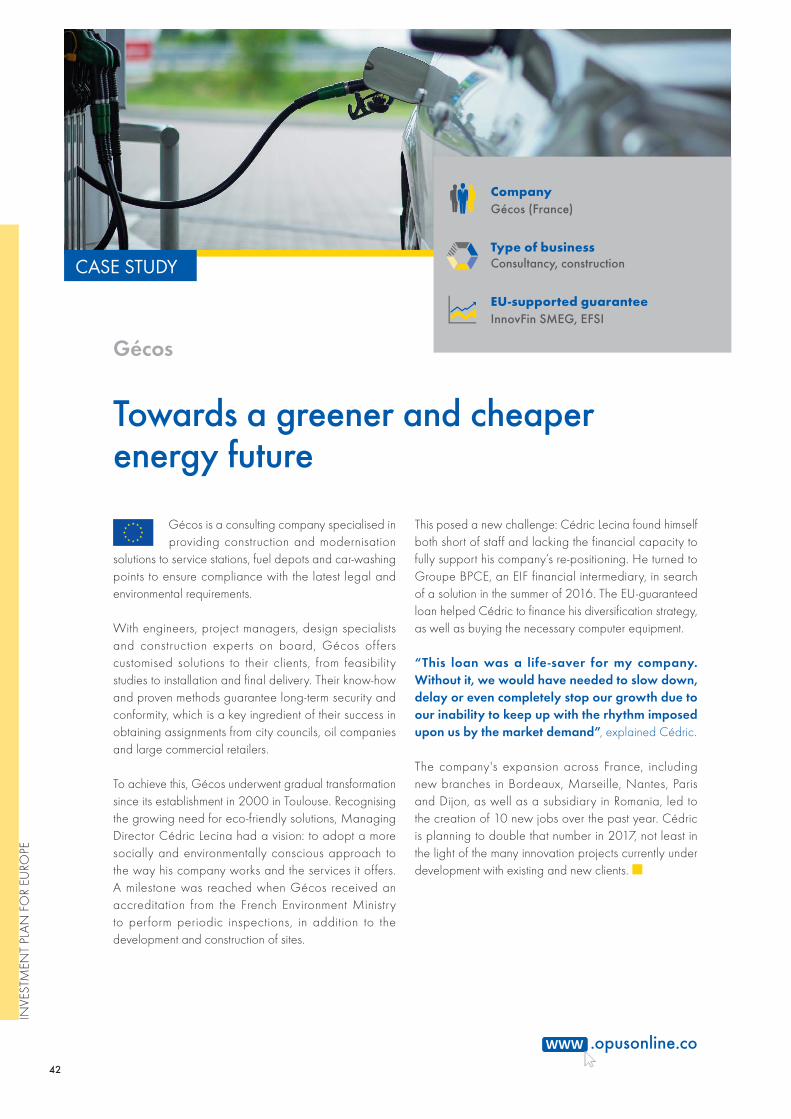
42
Gécos
.opusonline.co
Towards a greener and cheaper energy future
CASE STUDY
This posed a new challenge: Cédric Lecina found himself both short of staff and lacking the financial capacity to fully support his company’s re-positioning. He turned to Groupe BPCE, an EIF financial intermediary, in search of a solution in the summer of 2016. The EU-guaranteed loan helped Cédric to finance his diversification strategy, as well as buying the necessary computer equipment.
“This loan was a life-saver for my company. Without it, we would have needed to slow down, delay or even completely stop our growth due to our inability to keep up with the rhythm imposed upon us by the market demand”, explained Cédric.
The company's expansion across France, including new branches in Bordeaux, Marseille, Nantes, Paris and Dijon, as well as a subsidiary in Romania, led to the creation of 10 new jobs over the past year. Cédric is planning to double that number in 2017, not least in the light of the many innovation projects currently under development with existing and new clients. ■
Gécos is a consulting company specialised in providing construction and modernisation
solutions to service stations, fuel depots and car-washing points to ensure compliance with the latest legal and environmental requirements.
With engineers, project managers, design specialists and construction experts on board, Gécos of fers customised solutions to their clients, from feasibility studies to installation and final delivery. Their know-how and proven methods guarantee long-term security and conformity, which is a key ingredient of their success in obtaining assignments from city councils, oil companies and large commercial retailers.
To achieve this, Gécos underwent gradual transformation since its establishment in 2000 in Toulouse. Recognising the growing need for eco-friendly solutions, Managing Director Cédric Lecina had a vision: to adopt a more socially and environmentally conscious approach to the way his company works and the services it offers. A milestone was reached when Gécos received an accreditation from the French Environment Ministry to perform periodic inspections, in addition to the development and construction of sites.
CompanyGécos (France)
Type of businessConsultancy, construction
EU-supported guaranteeInnovFin SMEG, EFSI
INVE
STM
ENT
PLAN
FO
R EU
ROPE

43
CASE STUDY
CompanyInnovAid (Denmark)
Type of businessInteractive rehabilitation assistance
EU-supported guaranteeInnovFin SMEG
Interactive rehabilitation
.iaid.dk
Better quality of life for disabled people
Following the success of his first product, Martin designed other training systems for rehabilitation including TREAX, the multi-coloured pads that help persons recover in a more playful way, for example after suffering a stroke.
InnovAid has been selling its products primarily in Denmark and Norway while interest has also been growing from abroad. However, funds were not easy to raise for international expansion given the lack of sufficient collateral.
Turning toward Vaekstfonden, an EIF financial intermediary, Martin obtained an EU-supported loan under the InnovFin programme that provides access to finance at more favourable conditions for innovative SMEs.
“The InnovFin loan enabled me to increase the production capacity and hire more staff. I am confident that the international expansion of my business will result in a doubling of sales over the next two years”, says Martin Hjort.
More than one billion people in the world today suffer from a disability. Luckily, fast paced technology innovations – such as those of Martin Hjort, Danish engineer and owner of InnovAid – are rapidly improving the array of rehabilitation methods and helping people with disabilities to become more independent.
Martin has a son with cerebral palsy, a form of brain injury that may result in muscle tone, coordination or speech impairments. He accompanied his son to physical therapy and started to become interested in developing a more efficient workout to improve his son's quality of life.
Martin developed an innovative system, the Happy Rehab, combining specially designed interactive computer games with a dynamic standing frame. The cognitive and motoric exercises activate certain parts of the brain that lead to increased balance and mobility over time.
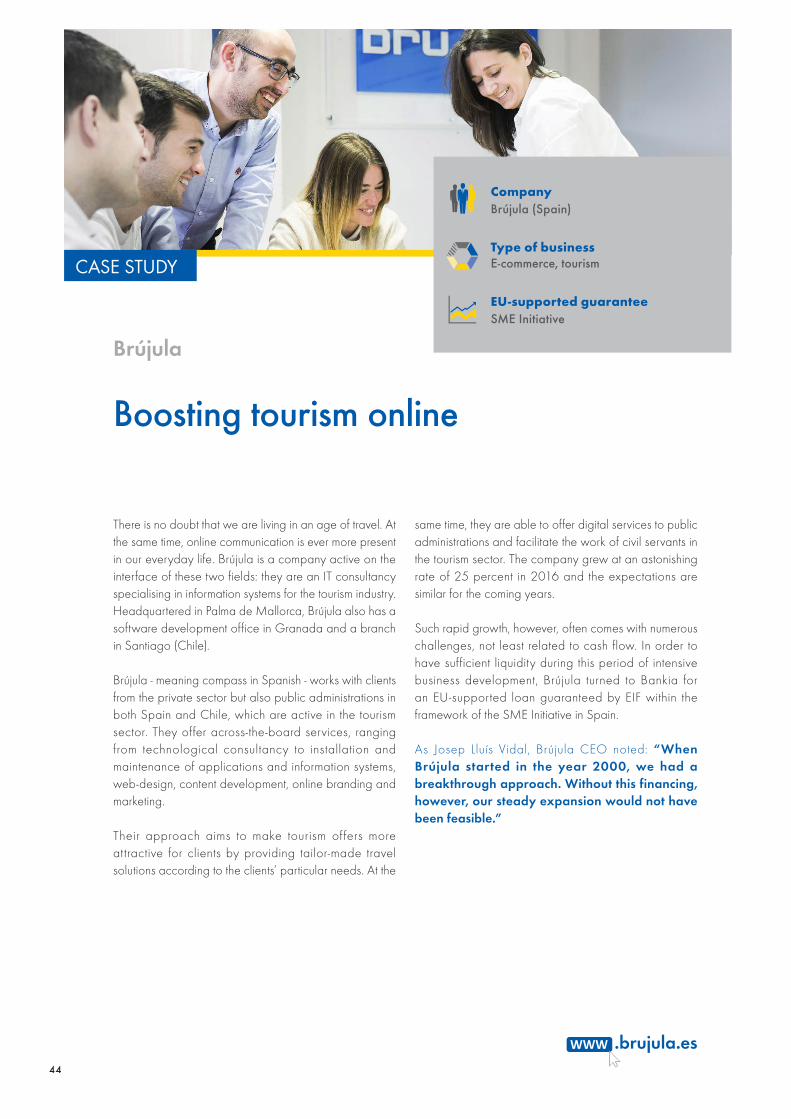
44
Brújula
.brujula.es
Boosting tourism online
CASE STUDY
same time, they are able to offer digital services to public administrations and facilitate the work of civil servants in the tourism sector. The company grew at an astonishing rate of 25 percent in 2016 and the expectations are similar for the coming years.
Such rapid growth, however, often comes with numerous challenges, not least related to cash flow. In order to have sufficient liquidity during this period of intensive business development, Brújula turned to Bankia for an EU-supported loan guaranteed by EIF within the framework of the SME Initiative in Spain.
As Josep Lluís Vidal, Brújula CEO noted: “When Brújula started in the year 2000, we had a breakthrough approach. Without this financing, however, our steady expansion would not have been feasible.”
There is no doubt that we are living in an age of travel. At the same time, online communication is ever more present in our everyday life. Brújula is a company active on the interface of these two fields: they are an IT consultancy specialising in information systems for the tourism industry. Headquartered in Palma de Mallorca, Brújula also has a software development office in Granada and a branch in Santiago (Chile).
Brújula - meaning compass in Spanish - works with clients from the private sector but also public administrations in both Spain and Chile, which are active in the tourism sector. They offer across-the-board services, ranging from technological consultancy to installation and maintenance of applications and information systems, web-design, content development, online branding and marketing.
Their approach aims to make tourism offers more attractive for clients by providing tailor-made travel solutions according to the clients’ particular needs. At the
CompanyBrújula (Spain)
Type of businessE-commerce, tourism
EU-supported guaranteeSME Initiative

45
CASE STUDY
CompanyTeasdale Motorcycles (United Kingdom)
Type of businessRetails, motorcycles and accessories
EIF financingOwn resources (securitisation)
Teasdale Motorcycles
.teasdale-motorcycles.co.uk
The first choice for motorcycle enthusiasts
terms. Hence, their significant growth would have been virtually impossible without the loans obtained from Funding Circle, a peer-to-peer lending platform backed by EIF as part of its growing securitisation activity.
The funding helped Teasdale Motorcycles acquire an online e-commerce website, which enabled the business to expand into bigger freehold premises, acquire a broader product range, increase head count and boost revenues through impressive sales growth. Up to 10 jobs have been created since Teasdale Motorcycles first borrowed through Funding Circle.
Teasdale Motorcycles is still growing. Once they have built their second floor showroom, they will be able to bring in more motorcycles and drive sales even further with the addition of at least one more sales representative. Ultimately, their goal is to become the largest motorcycle dealership in the North of England.
In 2002, Andy Walker decided to turn his love for motorcycles into a career. Since then, Teasdale Motorcycles has flourished and they currently hold the franchise for Aprilia, Moto Guzzi, Norton and KTM Street Motorcycles.
Teasdale Motorcycles are currently midway through a total redevelopment of their showroom, located in North Yorkshire, upsizing by two-thirds of its original size. They have a huge variety of new and used motorcycles, clothing and accessories, whilst also operating full onsite repair facilities. They are now working through the process of introducing a second floor showroom area to expand their bike range and move the clothing department upstairs.
Banks had been unwilling to finance businesses in the aftermath of the credit crunch and Teasdale Motorcycles struggled initially, being offered very difficult lending
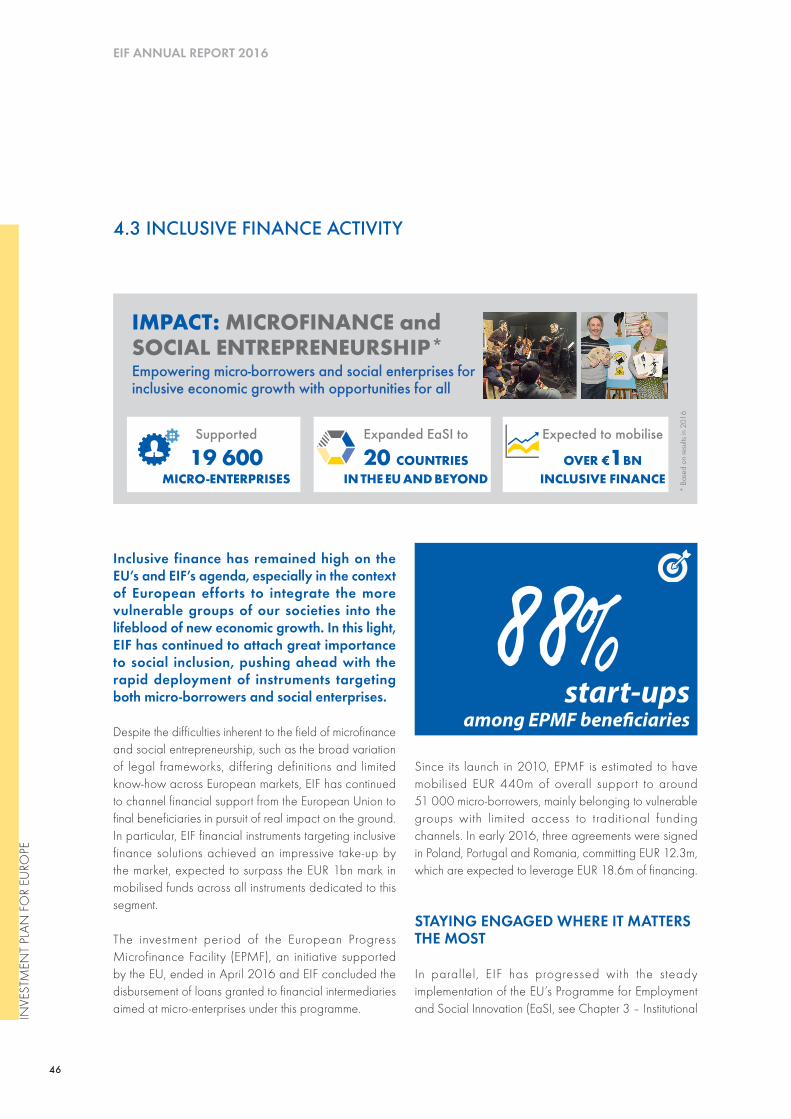
46
EIF ANNUAL REPORT 2016
Inclusive finance has remained high on the EU’s and EIF’s agenda, especially in the context of European efforts to integrate the more vulnerable groups of our societies into the lifeblood of new economic growth. In this light, EIF has continued to attach great importance to social inclusion, pushing ahead with the rapid deployment of instruments targeting both micro-borrowers and social enterprises.
Despite the difficulties inherent to the field of microfinance and social entrepreneurship, such as the broad variation of legal frameworks, differing definitions and limited know-how across European markets, EIF has continued to channel financial support from the European Union to final beneficiaries in pursuit of real impact on the ground. In particular, EIF financial instruments targeting inclusive finance solutions achieved an impressive take-up by the market, expected to surpass the EUR 1bn mark in mobilised funds across all instruments dedicated to this segment.
The investment period of the European Progress Microfinance Facility (EPMF), an initiative supported by the EU, ended in April 2016 and EIF concluded the disbursement of loans granted to financial intermediaries aimed at micro-enterprises under this programme.
88% start-ups
among EPMF beneficiaries
Since its launch in 2010, EPMF is estimated to have mobilised EUR 440m of overall support to around 51 000 micro-borrowers, mainly belonging to vulnerable groups with limited access to traditional funding channels. In early 2016, three agreements were signed in Poland, Portugal and Romania, committing EUR 12.3m, which are expected to leverage EUR 18.6m of financing.
STAYING ENGAGED WHERE IT MATTERS THE MOST
In parallel, EIF has progressed with the steady implementation of the EU’s Programme for Employment and Social Innovation (EaSI, see Chapter 3 – Institutional
4.3 INCLUSIVE FINANCE ACTIVITY
IMPACT: MICROFINANCE andSOCIAL ENTREPRENEURSHIP*Empowering micro-borrowers and social enterprises for inclusive economic growth with opportunities for all
* Ba
sed
on re
sults
in 2
016
Supported
19 600MICRO-ENTERPRISES
Expected to mobilise
OVER €1BN INCLUSIVE FINANCE
Expanded EaSI to
20 COUNTRIESIN THE EU AND BEYOND
INVE
STM
ENT
PLAN
FO
R EU
ROPE
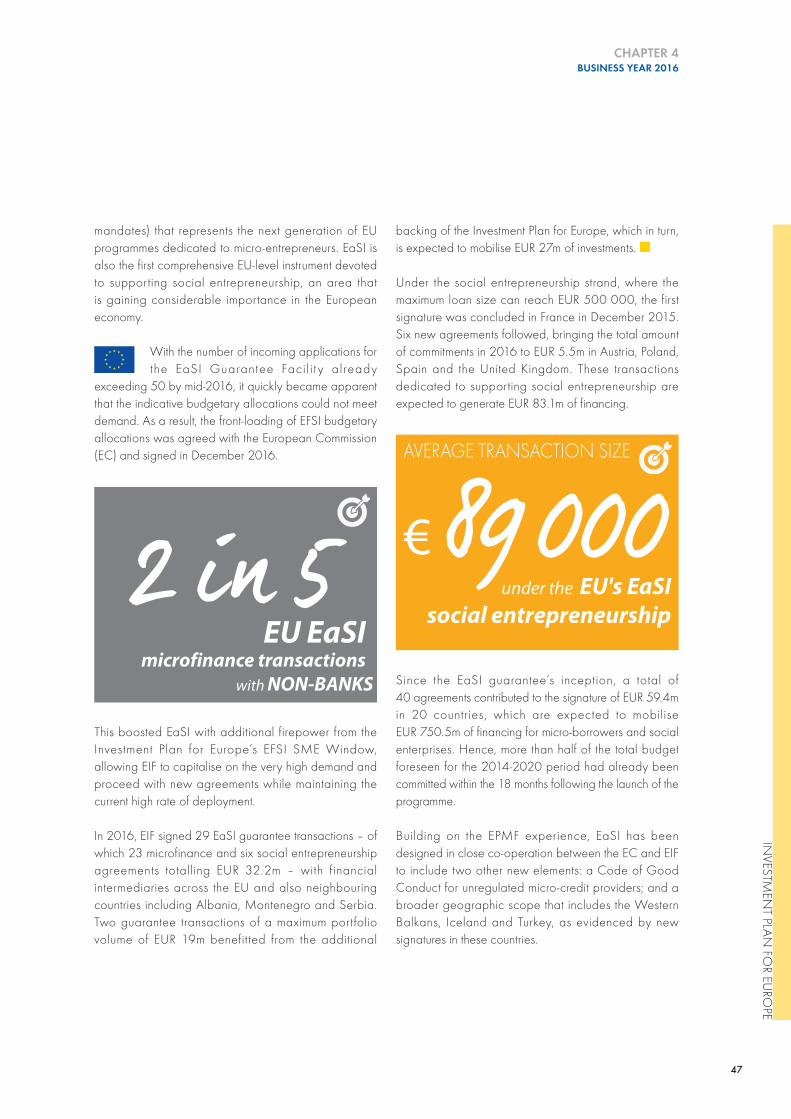
47
CHAPTER 4 BUSINESS YEAR 2016
mandates) that represents the next generation of EU programmes dedicated to micro-entrepreneurs. EaSI is also the first comprehensive EU-level instrument devoted to supporting social entrepreneurship, an area that is gaining considerable importance in the European economy.
With the number of incoming applications for the EaSI Guarantee Faci l i t y already
exceeding 50 by mid-2016, it quickly became apparent that the indicative budgetary allocations could not meet demand. As a result, the front-loading of EFSI budgetary allocations was agreed with the European Commission (EC) and signed in December 2016.
2 in 5EU EaSI
microfinance transactions with NON-BANKS
This boosted EaSI with additional firepower from the Investment Plan for Europe’s EFSI SME Window, allowing EIF to capitalise on the very high demand and proceed with new agreements while maintaining the current high rate of deployment.
In 2016, EIF signed 29 EaSI guarantee transactions – of which 23 microfinance and six social entrepreneurship agreements totalling EUR 32.2m – with financial intermediaries across the EU and also neighbouring countries including Albania, Montenegro and Serbia. Two guarantee transactions of a maximum portfolio volume of EUR 19m benefit ted from the additional
backing of the Investment Plan for Europe, which in turn, is expected to mobilise EUR 27m of investments. ■
Under the social entrepreneurship strand, where the maximum loan size can reach EUR 500 000, the first signature was concluded in France in December 2015. Six new agreements followed, bringing the total amount of commitments in 2016 to EUR 5.5m in Austria, Poland, Spain and the United Kingdom. These transactions dedicated to supporting social entrepreneurship are expected to generate EUR 83.1m of financing.
€ 89000AVERAGE TRANSACTION SIZE
under the EU's EaSI social entrepreneurship
Since the EaSI guarantee’s inception, a total of 40 agreements contributed to the signature of EUR 59.4m in 20 countries, which are expected to mobilise EUR 750.5m of financing for micro-borrowers and social enterprises. Hence, more than half of the total budget foreseen for the 2014-2020 period had already been committed within the 18 months following the launch of the programme.
Building on the EPMF experience, EaSI has been designed in close co-operation between the EC and EIF to include two other new elements: a Code of Good Conduct for unregulated micro-credit providers; and a broader geographic scope that includes the Western Balkans, Iceland and Turkey, as evidenced by new signatures in these countries.
INVESTM
ENT PLAN
FOR EU
ROPE
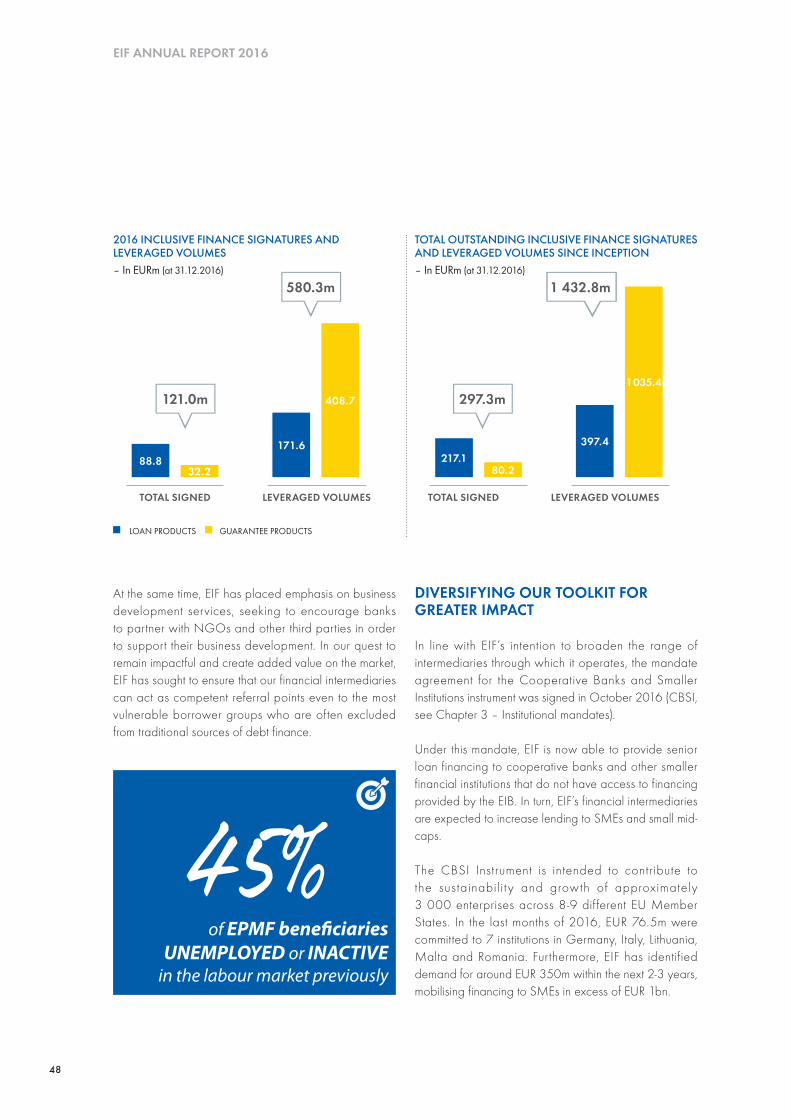
48
EIF ANNUAL REPORT 2016
At the same time, EIF has placed emphasis on business development services, seeking to encourage banks to partner with NGOs and other third parties in order to support their business development. In our quest to remain impactful and create added value on the market, EIF has sought to ensure that our financial intermediaries can act as competent referral points even to the most vulnerable borrower groups who are often excluded from traditional sources of debt finance.
45% of EPMF beneficiaries
UNEMPLOYED or INACTIVE in the labour market previously
DIVERSIFYING OUR TOOLKIT FOR GREATER IMPACT
In line with EIF’s intention to broaden the range of intermediaries through which it operates, the mandate agreement for the Cooperative Banks and Smaller Institutions instrument was signed in October 2016 (CBSI, see Chapter 3 – Institutional mandates).
Under this mandate, EIF is now able to provide senior loan financing to cooperative banks and other smaller financial institutions that do not have access to financing provided by the EIB. In turn, EIF’s financial intermediaries are expected to increase lending to SMEs and small mid-caps.
The CBSI Instrument is intended to contribute to the sustainabili t y and growth of approximately 3 000 enterprises across 8-9 different EU Member States. In the last months of 2016, EUR 76.5m were committed to 7 institutions in Germany, Italy, Lithuania, Malta and Romania. Furthermore, EIF has identified demand for around EUR 350m within the next 2-3 years, mobilising financing to SMEs in excess of EUR 1bn.
121.0m 297.3m
580.3m 1 432.8m
LOAN PRODUCTS GUARANTEE PRODUCTS
2016 INCLUSIVE FINANCE SIGNATURES AND LEVERAGED VOLUMES – In EURm (at 31.12.2016)
TOTAL SIGNED TOTAL SIGNEDLEVERAGED VOLUMES LEVERAGED VOLUMES
TOTAL OUTSTANDING INCLUSIVE FINANCE SIGNATURES AND LEVERAGED VOLUMES SINCE INCEPTION – In EURm (at 31.12.2016)
88.8 217.1171.6 397.4
32.2 80.2
408.71 035.4
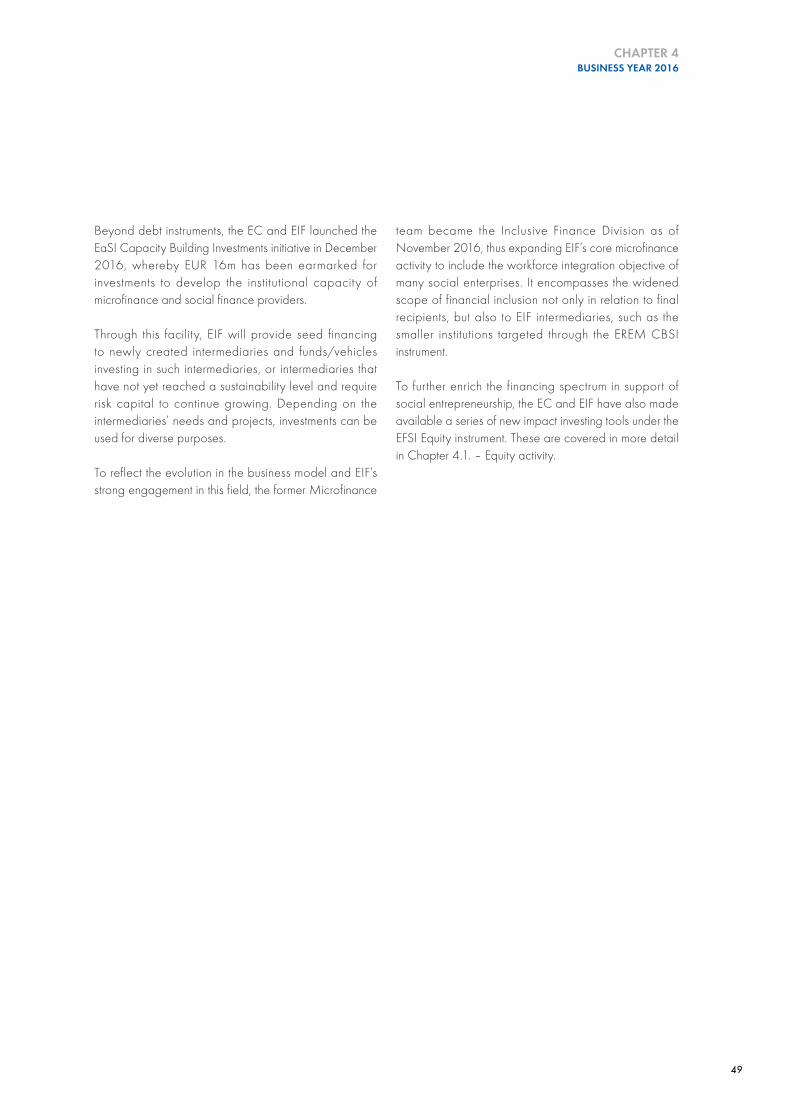
49
CHAPTER 4 BUSINESS YEAR 2016
Beyond debt instruments, the EC and EIF launched the EaSI Capacity Building Investments initiative in December 2016, whereby EUR 16m has been earmarked for investments to develop the institutional capacity of microfinance and social finance providers.
Through this facility, EIF will provide seed financing to newly created intermediaries and funds/vehicles investing in such intermediaries, or intermediaries that have not yet reached a sustainability level and require risk capital to continue growing. Depending on the intermediaries’ needs and projects, investments can be used for diverse purposes.
To reflect the evolution in the business model and EIF’s strong engagement in this field, the former Microfinance
team became the Inclusive Finance Division as of November 2016, thus expanding EIF’s core microfinance activity to include the workforce integration objective of many social enterprises. It encompasses the widened scope of financial inclusion not only in relation to final recipients, but also to EIF intermediaries, such as the smaller institutions targeted through the EREM CBSI instrument.
To further enrich the financing spectrum in support of social entrepreneurship, the EC and EIF have also made available a series of new impact investing tools under the EFSI Equity instrument. These are covered in more detail in Chapter 4.1. – Equity activity.
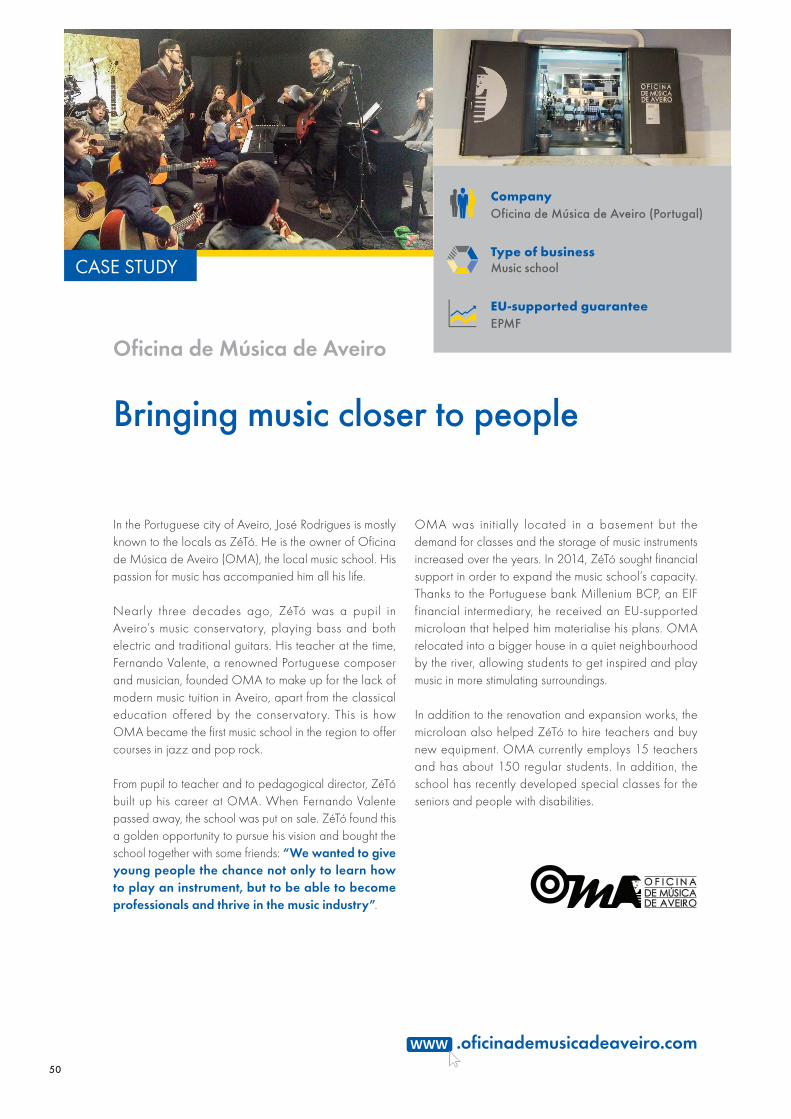
50
Oficina de Música de Aveiro
.oficinademusicadeaveiro.com
Bringing music closer to people
CASE STUDY
OMA was initially located in a basement but the demand for classes and the storage of music instruments increased over the years. In 2014, ZéTó sought financial support in order to expand the music school’s capacity. Thanks to the Portuguese bank Millenium BCP, an EIF financial intermediary, he received an EU-supported microloan that helped him materialise his plans. OMA relocated into a bigger house in a quiet neighbourhood by the river, allowing students to get inspired and play music in more stimulating surroundings.
In addition to the renovation and expansion works, the microloan also helped ZéTó to hire teachers and buy new equipment. OMA currently employs 15 teachers and has about 150 regular students. In addition, the school has recently developed special classes for the seniors and people with disabilities.
In the Portuguese city of Aveiro, José Rodrigues is mostly known to the locals as ZéTó. He is the owner of Oficina de Música de Aveiro (OMA), the local music school. His passion for music has accompanied him all his life.
Nearly three decades ago, ZéTó was a pupil in Aveiro’s music conservatory, playing bass and both electric and traditional guitars. His teacher at the time, Fernando Valente, a renowned Portuguese composer and musician, founded OMA to make up for the lack of modern music tuition in Aveiro, apart from the classical education offered by the conservatory. This is how OMA became the first music school in the region to offer courses in jazz and pop rock.
From pupil to teacher and to pedagogical director, ZéTó built up his career at OMA. When Fernando Valente passed away, the school was put on sale. ZéTó found this a golden opportunity to pursue his vision and bought the school together with some friends: “We wanted to give young people the chance not only to learn how to play an instrument, but to be able to become professionals and thrive in the music industry”.
CompanyOficina de Música de Aveiro (Portugal)
Type of businessMusic school
EU-supported guaranteeEPMF
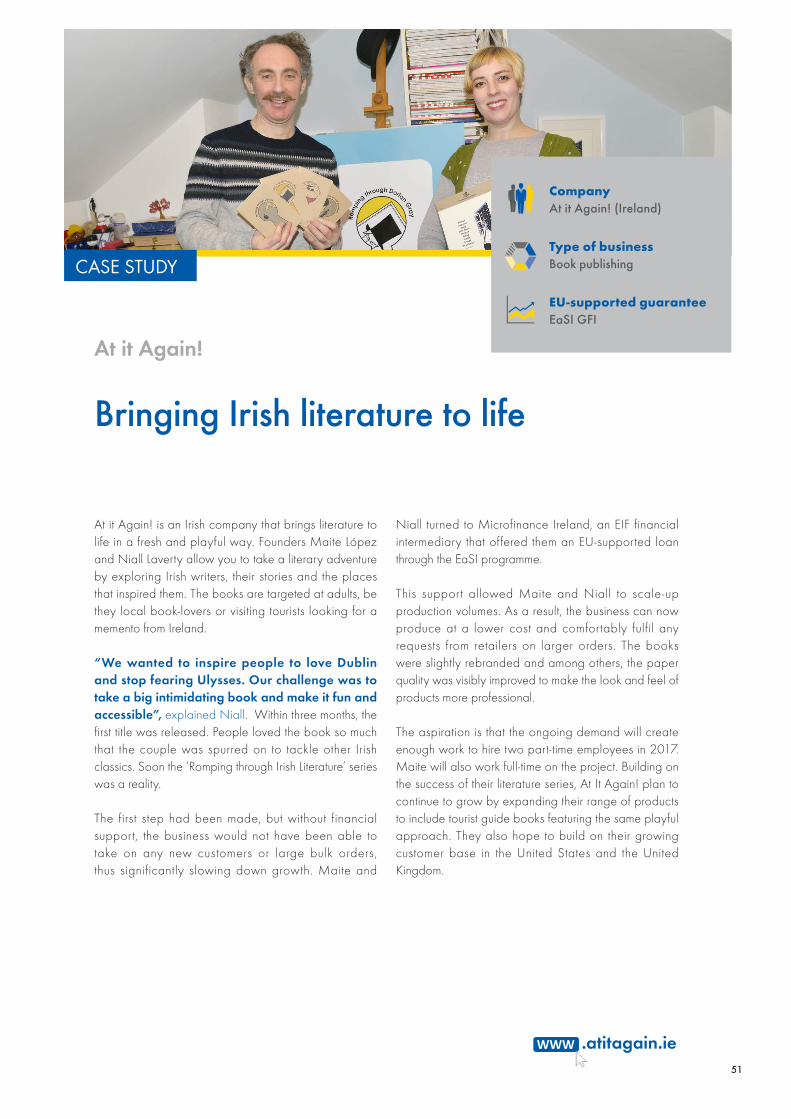
51
CASE STUDY
CompanyAt it Again! (Ireland)
Type of businessBook publishing
EU-supported guaranteeEaSI GFI
At it Again!
.atitagain.ie
Bringing Irish literature to life
Niall turned to Microfinance Ireland, an EIF financial intermediary that offered them an EU-supported loan through the EaSI programme.
This support allowed Maite and Niall to scale-up production volumes. As a result, the business can now produce at a lower cost and comfortably fulfil any requests from retailers on larger orders. The books were slightly rebranded and among others, the paper quality was visibly improved to make the look and feel of products more professional.
The aspiration is that the ongoing demand will create enough work to hire two part-time employees in 2017. Maite will also work full-time on the project. Building on the success of their literature series, At It Again! plan to continue to grow by expanding their range of products to include tourist guide books featuring the same playful approach. They also hope to build on their growing customer base in the United States and the United Kingdom.
At it Again! is an Irish company that brings literature to life in a fresh and playful way. Founders Maite López and Niall Laverty allow you to take a literary adventure by exploring Irish writers, their stories and the places that inspired them. The books are targeted at adults, be they local book-lovers or visiting tourists looking for a memento from Ireland.
“We wanted to inspire people to love Dublin and stop fearing Ulysses. Our challenge was to take a big intimidating book and make it fun and accessible”, explained Niall. Within three months, the first title was released. People loved the book so much that the couple was spurred on to tackle other Irish classics. Soon the ‘Romping through Irish Literature’ series was a reality.
The first step had been made, but without financial support, the business would not have been able to take on any new customers or large bulk orders, thus significantly slowing down growth. Maite and
52
EIF ANNUAL REPORT 2016
CHAPTER 5 NATIONAL AND REGIONAL MANDATES
EIF’s co-operation with national and regional mandators represents an important part of our overall activities as we jointly seek to achieve key policy objectives and tackle strategic investment gaps. In 2016, EIF pioneered the use of ESIF funds as a major source of finance in newly launched initiatives. Combined with EFSI, these resources increased the impact for SMEs and enabled EIF to pilot new initiatives, including in agriculture.
The resources under the Joint European Resources for Micro to Medium Enterprises (JEREMIE) instrument have been fully absorbed while new business opportunities have emerged, offering complementarity between European Structural and Investment Funds (ESIF) and EFSI, and allowing EIF to bring added value to mandators and final beneficiaries through a more effective and efficient use of both sources of funding.
€ 7.7 bn
MORE THAN
TOTAL ASSETSmanaged by EIF under national and
regional mandates over the past decade
As further developed in Chapter 4.1.-Equity activity, EIF’s national and regional activities also included the steady expansion of the European Angels Fund (EAF) initiative that supports business angels and other non-institutional investors.
DEPLOYING STRUCTURAL FUNDS TO THEIR FULLEST POTENTIAL
BLENDING DIFFERENT RESOURCES12 new mandates2 follow-on mandates
signed by EIF in 2016
+
The SME Initiative is a joint EIB Group/European Commission (EC) financial instrument, which was launched to address the financial constraints faced by European SMEs as national economies slowly recover from the recent economic turmoil.
The programme combines different resources, including ESIF, the EU centralised budget under Horizon 2020 and/or COSME as well as the EIB Group’s own funds. EIF manages and implements the SME Initiative within the EIB Group.
Two dif ferent instruments define the operational framework of the SME Initiative: an uncapped portfolio guarantee facility, by which financial intermediaries are covered against the credit risk of newly originated SME loans, leases and guarantees (Option I); and a securitisation instrument (Option II).
The first mandates under the SME Initiative were signed in Spain (October 2014) and in Malta (July 2015). During
53
CHAPTER 5NATIONAL AND REGIONAL MANDATES
2016, EIF received four new SME Initiative mandates with activities being extended to Bulgaria, Finland and Romania under the uncapped guarantee pillar; and to Italy under the securitisation component, entrusting in total close to EUR 1.25bn of Member States contributions – European Regional Development Fund (ERDF) resources and, if any, national co-financing – to EIF.
In Bulgaria, the SME Initiative was signed in March 2016 with a target fund size of EUR 102m that is expected to generate an overall portfolio of EUR 608m, to benefit around 3 000 local enterprises in the next two years. It follows the successful implementation of the JEREMIE initiative, which ensured access to finance in the form of debt and equity instruments to over 8 000 SMEs.
In Finland, the funding agreement between the EIB Group and the Government of Finland was concluded in September 2016, entailing a contribution of EUR 40m of combined ESIF and national resources, foreseen to mobilise EUR 400m of new financing to around 2 000 SMEs in the country.
In Romania, the agreement launching the SME Initiative was signed in October 2016 with a contribution of EUR 100m from the country’s ESIF and additional EIB Group resources, which are expected to create around EUR 540m of new financing for more than 2 500 Romanian SMEs. Similarly to Bulgaria, the launch of the SME Initiative builds on the experiences of deploying the JEREMIE mandate that supported 6 000 enterprises through debt financing and equity products.
In October 2016, Italy was the first country to adopt the SME Initiative’s securitisation component and effectively blend different sources of financing provided by the Italian Government – including EUR 100m from ERDF and EUR 102.5m of own resources.
The SME Initiative in Italy leverages on additional funds from the COSME programme whilst the mandates in Bulgaria, Finland, Malta, Romania and Spain make use of Horizon 2020 resources. For further details on the implementation and signatures in the respective countries, see Chapter 4.2. – Guarantees and securitisation.
BOOSTING INVESTMENTS IN AGRICULTURE
Based on the positive experiences of implementing joint financial initiatives, the French region of Languedoc Roussillon decided to entrust part of its European Agricultural Fund for Rural Development (EAFRD), as well as additional own budget, to EIF with a view to developing financial instruments with a high added-value in the agriculture sector.
A first mandate in this regard, branded as FOSTER TPE-PME, is under implementation in Languedoc Roussillon, funded by the region’s own resources and EAFRD. At the end of 2016, an operational agreement between EIF and Banque Populaire du Sud was signed to build up a portfolio of EUR 67.5m at better terms for final recipients active in the agriculture sector. In addition, EIF is in advanced negotiations with the French region of Midi-Pyrénées, and in Italy, with a number of regions that will each contribute to a joint multi-regional financial instrument.
EIF is working with the EC to develop a joint financial instrument benefit ting from EFSI
funding and EAFRD to increase the market impact of the support to the agriculture sector. The initiative, which was launched in co-operation with the EC Directorate-General for Agriculture and Rural Development (DG AGRI) and the EIB in November 2016 will start with pilot projects in several EU Member States. Building on EIF standard products, EIF expects to encourage a higher number of national and regional Managing Authorities to engage in the process of implementing financial instruments by dedicating an allocation of their EAFRD funds to a possible financial instrument with additional EFSI financing.
54 000 SMEs in agriculture supported by EIF under
different mandates since 2000
INVESTM
ENT PLAN
FOR EU
ROPE
54
EIF ANNUAL REPORT 2016
By including EFSI financing within the product design, EIF will be able to deliver more impactful products to the agricultural sector, where EIF has already acquired considerable experience and built up a relevant portfolio through other mandates including COSME guarantees and EREM microfinance agreements. ■
REGIONAL OUTREACH THROUGH FUND-OF-FUNDS
EIF has continued to forge, maintain and continuously expand all iances with key counterpar ts across EU Member States. New agreements have been established in Estonia, France, Greece, Poland, Romania and Sweden, and a strong delivery has been maintained under EIF’s existing mandates in Germany, Luxembourg, the Netherlands and Turkey, as well as under multi -country mandates in the Baltics and the Western Balkans.
54IN TOTAL
national and regionalmandates managed by EIF
at the end of 2016
EIF IN THE BALTICS
The Baltic Innovation Fund (BIF) was established in 2012 in partnership with three national development finance agencies in Estonia, Latvia and Lithuania. The EUR 100m fund targets the expansion of the Baltic venture capital and private equity market. EIF invested in five funds and mobilised around twice the amount of its own commitment by attracting additional resources from private investors.
A strong market response triggered a EUR 30m increase and extension of the BIF investment period until end-2017, enabling EIF to diversify its investments into additional funds of different size and vintage.
EIF’s Annual Achievement Award for Private Equity and Venture Capital in the Baltics was awarded in 2016 to the Latvian, Lithuanian and Estonian Venture Capital & Private Equity Associations for their decision to join forces in establishing the Baltic Private Equity and Venture Capital Association, seeking to foster successful cross-border cooperation and develop an attractive and viable regional ecosystem for fund managers and investors.
EIF IN ESTONIA
EstFund is a new EUR 60m fund-of-funds initiative launched by EIF in close co-operation
with KredEx and the Estonian Ministry of Economic Affairs and Communications in March 2016 to stimulate equity investments into innovative and high growth-focussed enterprises in Estonia. With EstFund, EIF has pioneered the combination of ESIF and EFSI resources.
By supporting smaller risk capital funds and targeting early stage investments, EstFund will be complementary to the already existing and successful Baltic Innovation Fund that focuses on investments into later stage companies in the Baltic region. EstFund is expected to make around EUR 100m of equity financing available for Estonian enterprises over the coming years. Following a call for expression of interest, 17 applications were received by the closing date in August 2016. ■
EIF IN GERMANY
EIF manages the European Recovery Programme (ERP) facility, which was mandated by the German Federal Ministry for Economic Affairs and Energy (BMWi) in 2004. Following several increases over time, we are currently managing EUR 3.2bn of total assets under this initiative.
These resources are dedicated to funding either German-based technology-focused SMEs in their early and expansion stages or international venture capital IN
VEST
MEN
T PL
AN F
OR
EURO
PE
55
firms that are strongly focused on the German market. The co-investment growth pocket complements the range of other mandates – including a venture capital fund-of-funds and the EAF Germany instrument – under the umbrella of the joint ERP-EIF initiative.
This mandate was expanded in March 2016 to include the ERP-EIF Growth Co-Investment instrument focusing specifically on growth-stage technology companies. The new facility enables EIF to enlarge its range of products and to address an important market gap by providing additional resources for venture capital funds to finance the best performers in their portfolios. The ERP Growth Co-investment Facility has been rolled out as a pilot project and it is planned to be extended to other European countries in the framework of the NPI Equity Platform.
In early 2016, the EUR 150m LfA-EIF Facility offered carried interest thanks to positive developments in some of the 17 underlying funds and a number of successful exits. Investing in all technology areas (ICT, life sciences, energy, emerging and conversing technologies), the facility has pursued co-investments in promising business angels from Bavaria within the scope of the EAF Germany pilot programme.
In the framework of the ERP-EIF initiative, EIF committed EUR 477.6m in 8 venture capital funds and 10 business angels/non - inst i tut ional investors in 2016. One agreement was signed by combining EUR 36m of resources under the ERP Growth Co-investment Facility with EUR 5m from the LfA-EIF Facility.
Furthermore, EIF signed the extension of the Mezzanine Dachfonds für Deutschland mandate (MDD2) in November 2016 with a fund size of EUR 400m targeting hybrid debt/equity investments in Germany. A first investment was executed in 2016.
EIF IN GREECE
EquiFund, the f irst mandate using ESIF resources for an equity fund-of- funds in
Greece was signed in December 2016. Blending structural funds with EFSI, the ESIF fund-of-funds initiative was launched with an initial size of EUR 260m that aims
to boost entrepreneurship across three different windows: an innovation window (including technology transfer and accelerators), an early stage window and a growth window.
The initiative is drawing on ESIF resources from the country’s Operational Programme for Competitiveness, Entrepreneurship and Innovation 2014-2020 and benefits in addition from EFSI. By attracting additional funding from institutional investors, EquiFund is expected to unlock substantial volumes of new equity financing for Greek SMEs at every stage of development.
EquiFund is among the largest and most ambitious ESIF fund-of-funds initiatives implemented by EIF, seeking to have a transformational and catalytic effect on the Greek venture capital market. ■
EIF IN THE NETHERLANDS
The Dutch Venture Initiative 2 (DVI-2) is a EUR 200m fund-of- funds launched in April 2016 by EIF and supported by the Dutch Ministry of Economic Affairs through the agency Participatiemaatschappij Oost Nederland. Drawing on the strategy of the successful predecessor fund DVI -1, this follow-on fund targets investments in ICT, clean-tech, med-tech, renewable energy and life sciences, through primary investments in Dutch-oriented venture capital funds.
In 2016, DVI-1 committed EUR 21.5m into two venture capital and growth capital investment funds. Under DVI -2, new signatures with two additional funds amounted to EUR 25.5m.
EIF IN POLAND
The agreement establishing a new ESIF fund-of-funds (FoF) initiative for a total amount of up to EUR 178m in Poland was signed between the EIB Group and the representatives of the region of Silesia in November 2016.
The Silesia FoF is the first joint EIF-EIB mandate blending ESIF resources, which was established under a common funding agreement, with each institution being responsible for implementing financial instruments under
CHAPTER 5NATIONAL AND REGIONAL MANDATES
INVESTM
ENT PLAN
FOR EU
ROPE
56
EIF ANNUAL REPORT 2016
the different sub-windows comprised in the FoF’s overall activity. In line with its expertise, EIF will implement the FoF’s SME window for an amount of up to EUR 91m that will be disbursed to SMEs in the Silesia region through a risk-sharing facility and portfolio guarantees to financial intermediaries. The EIB will implement a parallel activity focused on urban regeneration, energy efficiency and social economy.
EIF IN ROMANIA
In addition to the rollout of the SME Initiative, the Competitiveness Fund-of-Funds for SMEs in Romania was also launched in September 2016, in close co-operation with the Romanian Ministry of European Funds. This mandate of EUR 59.3m with resources from the Competitiveness Operational Programme 2014-2020 is co-financed through funding from the country’s European Regional Development Fund (ERDF).
Of the total available resources, EUR 40m are earmarked to support innovative enterprises through equity provided to accelerators and seed funds, and the remaining contribution is dedicated to a risk sharing instrument for loan portfolios. The calls for expression of interest were published in December 2016.
EIF IN SWEDEN
The Swedish Venture Init iative (SVI), a SEK 582m (approximately EUR 65m) fund-of-
funds, was launched by EIF and the Swedish Agency for Economic and Regional Growth in April 2016 to support access to equity capital for Swedish early-stage high-growth enterprises.
Similarly to EstFund, the Swedish initiative is among the first fund-of-funds to combine ESIF resources with EFSI in order to effectively support first time or emerging venture capital funds focused on early stage investments. This is expected to generate SEK 1bn of equity financing for Swedish enterprises in the coming years. ■
EIF IN TURKEY
Following its launch in late 2015, the Turkish Growth and Innovation Fund (TGIF) reached its first closing at a size of EUR 200m in May 2016. Three investors – EIF, the SMEs Development Organisation of Turkey (KOSGEB) and the Turkish Treasury – each contributed EUR 60m alongside an investment of EUR 20m by the Development Bank of Turkey (TSKB).
In the first three months of operations, TGIF committed one-third of the available resources into three funds, including a regional fund of an established global fund manager; a fund managed by a former first-time team under the TGIF’s predecessor initiative, the Istanbul Venture Initiative (iVCi); and a fund managed by a first-time team. The diversity of these investee funds reflects the conscious market development effort underlying EIF’s engagement in the Turkish venture capital market.
At the same time, the iVCi’s underlying portfolio has continued to grow, currently comprising 62 companies that were supported through equity investments since inception. Based on iVCi’s strong performance, the initiative has been able to create financial returns for its investors.
The Technology Transfer Accelerator Fund (TTA Turkey) was launched in 2014 and is co-financed by the EU and Turkey’s Ministry of Science, Industry and Technology (MoSIT) under the regional development component of the country’s Instrument for Pre-Accession Assistance (IPA) funds. Diffusion Capital and ACT Venture Partners, the first two funds supported under TTA Turkey, invested altogether in 27 proof-of-concept projects, start-ups and early-stage enterprises.
The Greater Anatolia Guarantee Facility (GAGF) has been supporting SMEs in Turkey’s emerging regions since late 2010. By the end of 2016, GAGF generated EUR 800m of new financing for more than 13 000 micro-enterprises and SMEs in some of the country’s less developed regions.
INVE
STM
ENT
PLAN
FO
R EU
ROPE
57
EIF IN THE WESTERN BALKANS
The Western Balkans Enterprise Development and Innovation Facility (WB EDIF) is an EU-funded initiative which promotes the emergence and growth of innovative and high-potential companies, as well as the creation of a sustainable venture capital market in the region. It consists of four pillars: the Guarantee Facility (GF), the Enterprise Innovation Fund (ENIF), the Enterprise Expansion Fund (ENEF) and the Technical Assistance Facility. EIF manages the Guarantee Facility as well as invests into ENIF and ENEF (both with its own funding and on behalf of the EC).
At the end of 2016, EIF was nearing total absorption under the initial allocation of EUR 20m EU funding to six banks, and had finalised the additional five agreements with banks under a subsequent replenishment of the instrument. With these combined sets of EU funding, the GF instrument shall mobilise over EUR 200m of SME lending in the region.
2016 has also seen some important investments both under the ENIF and ENEF in support of seed and early stage enterprises (with a focus on ICT) and expansion stage enterprises respectively.
WB EDIF is an outstanding example of the fruit ful cooperation between EIF, the EIB and the EC Directorate-General for Neighbourhood and Enlargement Negotiations (DG NEAR), also involving other important players in the Western Balkans region such as the European Bank for Reconstruction and Development (EBRD) and the KfW Bankengruppe in Germany, the World Bank, OECD, the Government of Italy, the Development Bank of Austria (OeEB) and others.
OTHER GLOBAL INITIATIVES
The Global Energy Efficiency and Renewable Energy Fund (GEEREF) is an innovative fund-of-funds which catalyses private sector capital into renewable energy and energy efficiency projects in Africa, Asia and Latin America. GEEREF was launched in 2006 by the EC and is advised by EIF.
EIF’s expertise in the field of equity fund-of-funds and the EIB’s knowledge of the region made them the ideal leaders of this initiative. GEEREF anchors private equity funds that invest in private sector projects which potentially accelerate the transfer, development, use and enforcement of environmentally sound technologies.
By the end of 2016, GEEREF committed EUR 178m in 13 funds in Africa, Eastern Europe (countries outside the EU), Central Asia, Latin America and the Caribbean, East and South Asia as well as the Pacific.
Through its involvement in GEEREF, EIF not only contributes to the global efforts for combating climate change but also ensures the dissemination of equity-related best practices in developing countries.
CHAPTER 5NATIONAL AND REGIONAL MANDATES
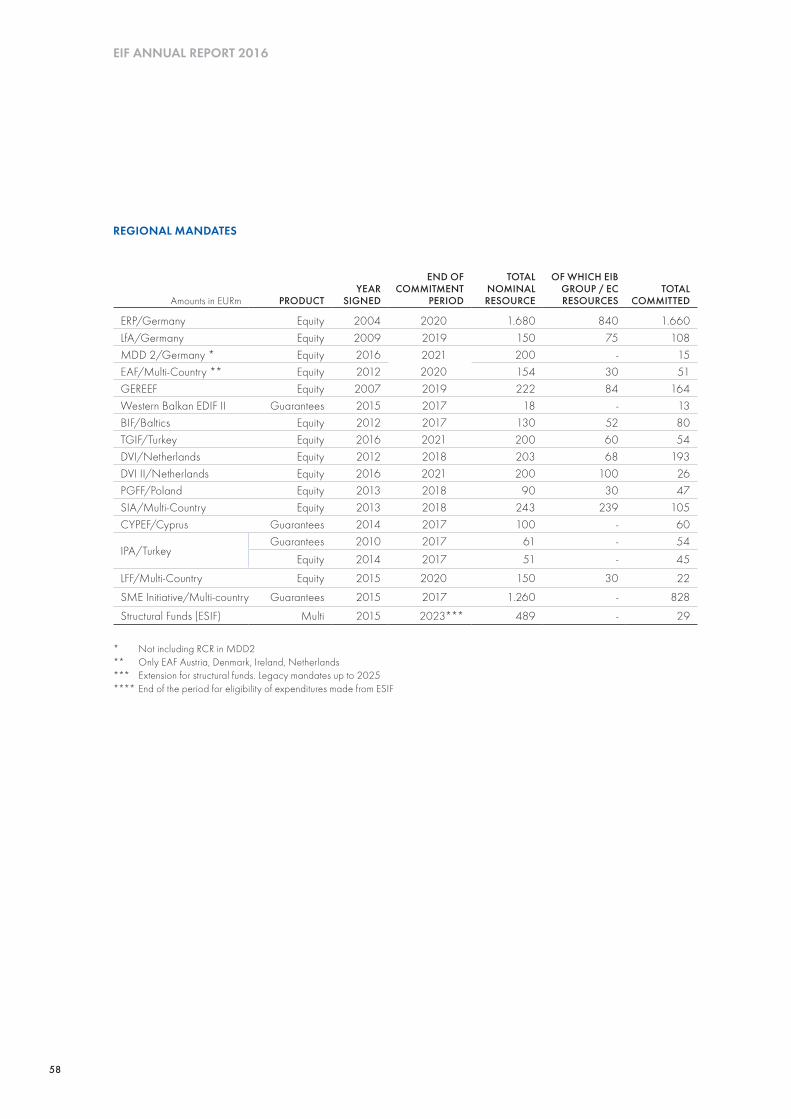
58
EIF ANNUAL REPORT 2016
* Not including RCR in MDD2** Only EAF Austria, Denmark, Ireland, Netherlands*** Extension for structural funds. Legacy mandates up to 2025**** End of the period for eligibility of expenditures made from ESIF
REGIONAL MANDATES
Amounts in EURm PRODUCTYEAR
SIGNED
END OF COMMITMENT
PERIOD
TOTAL NOMINAL RESOURCE
OF WHICH EIB GROUP / EC RESOURCES
TOTAL COMMITTED
ERP/Germany Equity 2004 2020 1.680 840 1.660LfA/Germany Equity 2009 2019 150 75 108MDD 2/Germany * Equity 2016 2021 200 - 15EAF/Multi-Country ** Equity 2012 2020 154 30 51GEREEF Equity 2007 2019 222 84 164Western Balkan EDIF II Guarantees 2015 2017 18 - 13BIF/Baltics Equity 2012 2017 130 52 80TGIF/Turkey Equity 2016 2021 200 60 54DVI/Netherlands Equity 2012 2018 203 68 193DVI II/Netherlands Equity 2016 2021 200 100 26PGFF/Poland Equity 2013 2018 90 30 47SIA/Multi-Country Equity 2013 2018 243 239 105CYPEF/Cyprus Guarantees 2014 2017 100 - 60
IPA/TurkeyGuarantees 2010 2017 61 - 54
Equity 2014 2017 51 - 45
LFF/Multi-Country Equity 2015 2020 150 30 22
SME Initiative/Multi-country Guarantees 2015 2017 1.260 - 828
Structural Funds (ESIF) Multi 2015 2023*** 489 - 29

59
CHAPTER 5NATIONAL AND REGIONAL MANDATES
STRUCTURAL FUNDS - ESIF
STRUCTURAL FUNDS - SME INITIATIVE
Amounts in EURm PRODUCTYEAR
SIGNED
END OF COMMITMENT
PERIOD*
TOTAL NOMINAL RESOURCE
TOTAL COMMITTED
Estonia Equity 2016 2023 48 - Greece Equity 2016 2023 200 - Languedoc-R. EAFRD (F) Guarantees 2015 2023 15 14Languedoc-R. ERDF (F) Multi 2015 2023 37 15Romania Multi 2016 2023 59 - Silesia (PL) Guarantees 2016 2023 89 - Sweden Equity 2016 2023 41 -
489 29
Amounts in EURmYEAR
SIGNED
END OF COMMITMENT
PERIOD*
TOTAL NOMINAL RESOURCE
TOTAL COMMITTED
Bulgaria 2016 2017 102 95Finland 2016 2017 40 - Italy 2016 2017 203 - Malta 2015 2016 15 15Romania 2016 2017 100 - Spain 2015 2016 800 718
1.260 828
* End of the period for eligibility of expenditures made from ESIF
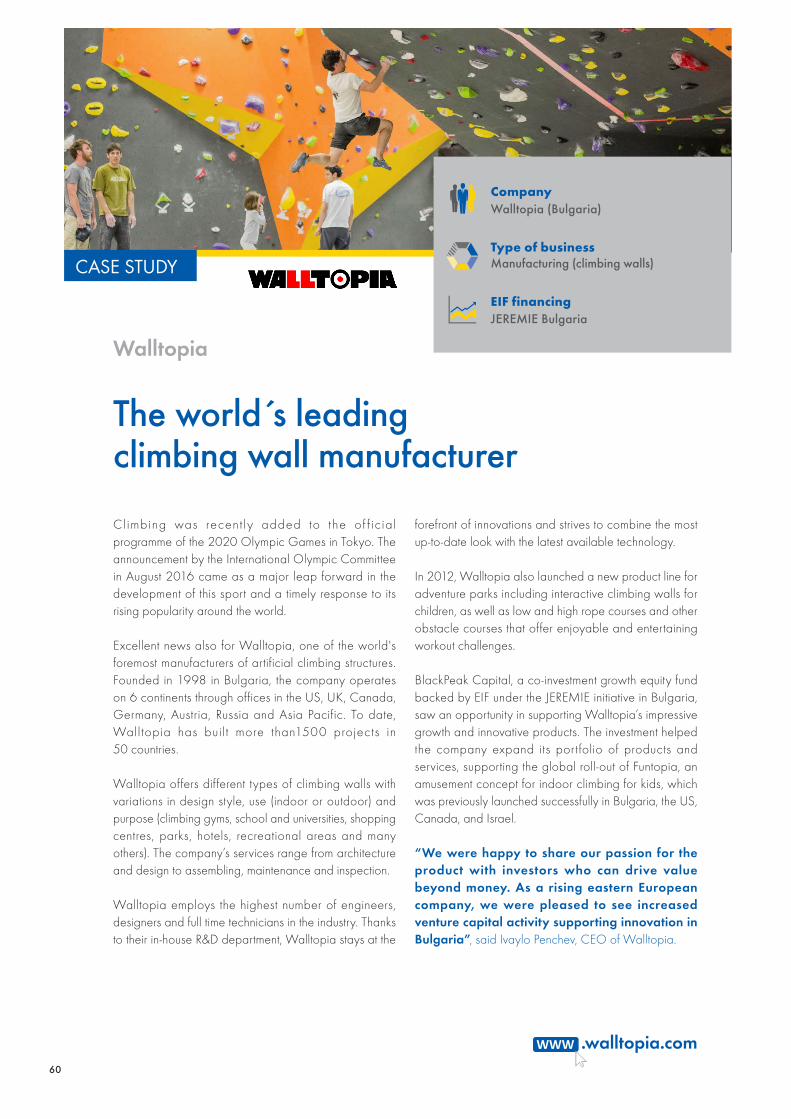
60
Walltopia
.walltopia.com
The world́ s leading climbing wall manufacturer
CASE STUDY
forefront of innovations and strives to combine the most up-to-date look with the latest available technology.
In 2012, Walltopia also launched a new product line for adventure parks including interactive climbing walls for children, as well as low and high rope courses and other obstacle courses that offer enjoyable and entertaining workout challenges.
BlackPeak Capital, a co-investment growth equity fund backed by EIF under the JEREMIE initiative in Bulgaria, saw an opportunity in supporting Walltopia’s impressive growth and innovative products. The investment helped the company expand its portfolio of products and services, supporting the global roll-out of Funtopia, an amusement concept for indoor climbing for kids, which was previously launched successfully in Bulgaria, the US, Canada, and Israel.
“We were happy to share our passion for the product with investors who can drive value beyond money. As a rising eastern European company, we were pleased to see increased venture capital activity supporting innovation in Bulgaria”, said Ivaylo Penchev, CEO of Walltopia.
Cl imbing was recent ly added to the of f ic ial programme of the 2020 Olympic Games in Tokyo. The announcement by the International Olympic Committee in August 2016 came as a major leap forward in the development of this sport and a timely response to its rising popularity around the world.
Excellent news also for Walltopia, one of the world's foremost manufacturers of artificial climbing structures. Founded in 1998 in Bulgaria, the company operates on 6 continents through offices in the US, UK, Canada, Germany, Austria, Russia and Asia Pacific. To date, Walltopia has buil t more than1500 projects in 50 countries.
Walltopia offers different types of climbing walls with variations in design style, use (indoor or outdoor) and purpose (climbing gyms, school and universities, shopping centres, parks, hotels, recreational areas and many others). The company’s services range from architecture and design to assembling, maintenance and inspection.
Walltopia employs the highest number of engineers, designers and full time technicians in the industry. Thanks to their in-house R&D department, Walltopia stays at the
CompanyWalltopia (Bulgaria)
Type of businessManufacturing (climbing walls)
EIF financingJEREMIE Bulgaria

61
CASE STUDY
CompanyAgrivi (Croatia)
Type of businessICT in agriculture
EIF financingWB ENIF and own resources
Agrivi
.agrivi.com
The most powerful farm management software
comprehensive, knowledge-based management tool that allows farmers to plan, monitor and analyse all activities.
Tillage, planting, crop protection, fertilisation, irrigation, harvesting and all other activities are managed with a few clicks, which ultimately leads to improved productivity and allows for sharing information, including best practices and experiences with other farmers. The regular monitoring and data analyses functionalities also help to recognise and protect crops and yields from diseases in a timely manner, achieving a more sustainable and profitable agricultural production.
Agrivi was awarded the title of World's Best Startup in 2014. Southern Central Ventures, a fund supported by EIF, recognised the significant impact of Agrivi’s visionary software development work and invested in the company from the early stages. The financing allowed Agrivi to accelerate its growth, both in terms of market outreach and by nearly doubling the staff base. Today, the company has more than 30 000 clients in 150 countries worldwide.
Hunger, food security and unsustainable agriculture represent some of the biggest global challenges. Driven by the recognition that the global food and agriculture system needs to change at its core, Matija Zulj decided to leave the corporate ICT world and focus on developing powerful farm management software that would revolutionise agricultural production.
First, Matija decided to become a farmer to understand what exactly it means to grow food. He started his own blueberry farm. Very soon he faced the same challenges as other farmers around the world: best practices in farming were difficult to access and there was no simple, yet affordable software on the market that could help him in making data-driven decisions.
His company, Agrivi was founded in 2013, when he decided to develop such software solutions himself, relying on a team of experienced agricultural experts and software engineers. By combining their agricultural knowledge and technology savviness, Agrivi built a
62
EIF ANNUAL REPORT 2016
To maximise the impact and outreach of its existing mandates, EIF's relationships with NPIs remain high on the agenda, further leveraging on the two recently launched platforms for private equity and securitisation activities and a greater cooperation in the field of loan funds and risk sharing guarantee products.
EIF will focus on the absorption of existing national and regional mandates and the launch of novel initiatives that capitalise on structural funds, combining them, where possible, with EFSI and/or EIB resources and thus ensuring complementarity among different sources of finance. ■
At the policy level, EIF's collaboration with the EC on key EU initiatives, including the Capital Markets Union and the Anti Tax Avoidance Directive, is of real importance. Moreover, and in co-operation with the EIB, EIF will assess the possibility of extending its activities to new sectors (for example agriculture, skills and energy) and of increasing its engagement in promoting social inclusion.
EIF will also seek new opportunities to source additional resources, in particular from the private sector and possibly sovereign wealth funds, in order to crowd-in further funds to support its mission. A clear focus will remain on developing the depth and breadth of impact assessment research studies, allowing the added value of EIF’s activities in the market to be measured and demonstrated.
EQUITY
The core contributors to EIF’s equity activity are expected to remain the RCR mandate,
with a planned total increase of EUR 2.5 to 3bn, and the new EUR 2.068bn EFSI Equity instrument, targeting early
CHAPTER 6 LATEST DEVELOPMENTS AND PLANS
Following years of growth, EIF’s overall transaction volumes are expected to stabilise in 2017. EIF will remain firmly focused on the delivery of policy objectives, especially in the context of the Investment Plan for Europe. A continued strong deployment of EFSI through different equity, guarantee and securitisation instruments will involve an extended cooperation with NPIs. The planned increases of EIF’s core guarantee mandates will enable us to secure real and sustainable impact for SMEs.
The current EUR 5.5bn resources under the EFSI SME Window are foreseen to be fully
allocated by early 2017. Going forward, focus will be placed on the increases of existing mandates including COSME LGF, InnovFin SMEG and the EaSI Guarantee, as well as the EUR 2bn equity window targeting early and later stage companies through a variety of products.
The planned EFSI 2 SME Window is anticipated to have an additional budget of EUR 5bn where the EIB is expected to cover EUR 1.5bn through an RCR increase and the EC to provide EUR 3.5bn of new risk capacity for the ongoing development and implementation of equity and guarantee instruments by EIF.
This is expected to trigger a revised mobilised investment target of EUR 157.5bn to be achieved under the SME Window by 2020. EIF will therefore be in a position to deploy new instruments, one of which could be a sizeable new facility for securitisation and to further promote the use of f inancial instruments in new sectors (for example skills, energy and agriculture). Complementarity with European Structural Investment Funds (ESIF) will remain a priority for national and regional mandates.
INVE
STM
ENT
PLAN
FO
R EU
ROPE
63
and later stage companies through tech transfer, business angels and social impact as well as the pan-European FoF. The majority of eligible COSME EFG transactions will be originated through the EFSI equity window (see Chapter 3 – Institutional mandates). ■
The successful fund-of-fund model for national and cross-regional equity activities will be pursued with existing and new counterparts. After the first two transactions using ESIF (Estonia and Sweden), EIF will launch more ESIF partnerships with national and regional agencies.
GUARANTEES AND SECURITISATION
The first phase of EREM, which concluded at the end of 2016, was successfully implemented. A strong emphasis will be placed on EREM’s continuation and, following on from the initially implemented windows, such as ABS, the newly created products for loan funds and smaller banks are facing strong demand.
The ENSI securitisation platform is expected to benefit from EFSI resources in order to
support lower-rated tranches. The first EFSI -backed securitisation instrument under the SME Window is planned to be launched in 2017 and, in addition,
activities will continue to centre on the deployment of the EREM ABS mandate and own resource transactions.
COSME LGF and InnovFin SMEG resources are likely to be almost doubled in the light of the persistently high market demand. Furthermore, the amendment of the InnovFin eligibility criteria will allow EIF to extend coverage to subordinated loans to SMEs. The resources under the EaSI programme will be increased by EUR 100m. ■
SME Initiative resources in the six countries where this financial instrument is currently implemented are foreseen to reach full allocation by the end of 2017. Discussions are underway with the EC on the implementation of a second phase of the SME Initiative.
INCLUSIVE FINANCE
In the second half of 2017, the EaSI product offering will benefit from at least one new pillar: a funded product succeeding the EPMF funded instrument and including potential contribution from EREM and EIF to provide senior and subordinated loans to financial intermediaries. The initial EUR 125m resources under the CBSI instrument are foreseen to be increased by EUR 350m in the course of 2017.
CHAPTER 6LATEST DEVELOPMENTS AND PLANS
INVESTM
ENT PLAN
FOR EU
ROPE

64
EIF ANNUAL REPORT 2016
EIF places a particular focus on the real effects of its support to the European SME sector. Against this background, EIF’s Research and Market Analysis team started an impact assessment work stream, delivering so far four working papers and covering a significant share of EIF’s policy toolbox (guarantees, microfinance and venture capital). Significant further work and output is in preparation.
THE ECONOMIC IMPACT OF EU GUARANTEES ON CREDIT TO SMES. EVIDENCE FROM CESEE COUNTRIES
Despite their policy relevance, credit guarantee schemes have seldom been subject to rigorous academic research. Using state-of-the art statistical techniques, the paper - as joint EC and EIF working study - analysed the possibilities of estimating the economic additionality of credit guarantee schemes.
The main results are summarised below:
■ The beneficiaries of the Multi-Annual Programme for Enterprise and Entrepreneurship for Small and Medium-sized Enterprises (MAP) programme in Central Eastern and Southeastern European (CESEE) countries have experienced, on average a significant increase in employment in the order of 14-18 percent, compared to their counterfactuals.
■ A similar result, albeit slightly less significant is related to a rise in turnover up to 19 percent within the first five years after signature date.
■ MAP beneficiaries also face a temporary setback in productivity. Such gap was, however, partially absorbed over the medium run.
■ The MAP effect on employment program is most noticeable for micro and small enterprises, and for young firms.
■ The MAP has contributed the most where it was expected to: help small businesses with low credit score to access bank financing.
■ There are differences across countries: some gain significantly, some not. However, none of the countries experiences significant negative results.
EVALUATING THE IMPACT OF EUROPEAN MICROFINANCE. THE FOUNDATIONS
As a detailed literature review and discussion of the various methodologies, this paper sets the framework for an approach for impact assessment in the field of microfinance. Even in developing countries where impact evaluation studies have been carried out for many years, there are still fierce debates on the efficiency and viability of microfinance.
This review identifies several reasons for this situation and advocates for the implementation of evaluation methods which manage to strike the right balance between meeting the stakeholders’ needs, providing comparable results, being cost effective, taking into consideration various microfinance’s settings and being able to adapt to microfinance sector’s changes.
THE EUROPEAN VENTURE CAPITAL LANDSCAPE: AN EIF PERSPECTIVE
The current strand of work is focused on venture capital. It features a series of publications currently in the making, all based on EIF proprietary data. The first
CHAPTER 7 EX-POST IMPACT ASSESSMENT RESEARCH STUDIES

65
issue of the series – entitled “The impact of EIF on the Venture Capital ecosystem” - seeks to respond to the question whether EIF activity has effectively crowded-in VC financing, contributing to a sustainable European VC ecosystem.
Moreover, it offers an introductory perspective on 20 years of EIF VC activity, focusing on the geographic features of the EIF VC portfolio.
The main findings are as follows:
■ In the 2007-2014 period, about 1 in every 18 euros invested in European start-ups was provided by EIF, reaching 1 in every 10 start-ups based in Europe.
■ Such counter-cyclical investment policy produced a significant involvement of EIF in the broader VC ecosystem. A role that gives EIF an important position but - due to the catalysing effect - without being monopolistic.
■ By looking at the geographic concentration of EIF-backed companies, the analysis notices that key VC hubs originated 83 percent of all invested amounts. Of these, 63 percent is invested within national borders, while 37 percent is cross-border.
■ While VC hubs constitute the backbone of the European VC activity, the study also notices that the range of EIF-backed investments has broadened over time, expanding more and more towards more peripheral areas.
■ Teaming up with Invest Europe, VC investment levels across European regions (NUTS2) were compared in the 2007-2014 period. The results show that EIF had a positive significant crowding-in impact on European VC in the aftermath of the recent economic crisis: more capital flew into the market as a result of EIF activity.
■ Specifically, it is estimated that a 1 percent increase in EIF activities caused a 1.41 percent increase in investment volumes of other market players the year thereafter.
■ The crowding-in effect of EIF is stronger in areas with less developed VC markets, as signalled by the regional rate of tertiary educational attainment.
The second issue entitled “Growth patterns of EIF-backed startups” (December 2016) analyses the performance trends of investees after receiving EIF support, and identifies four main profiles of growth:
■ Under-performers, representing almost 13 percent of the portfolio; moderate performers, constituting 55 percent of all investees; sale-based growers; and patent-based growers, representing respectively 12 percent and 20 percent of the portfolio.
■ Sale-based growers achieve an explosive five-year growth driven by sales, while their investment valuation and patenting growth rates have lower levels. Patent -based growers show the highest patenting growth rates, as well as the highest valuation growth rate.
■ Growth profiles tend to be persistent over time: in most cases, it is more likely that start-ups hold on to their profile than transition to another. If convergence
CHAPTER 7EX-POST IMPACT ASSESSMENT RESEARCH STUDIES
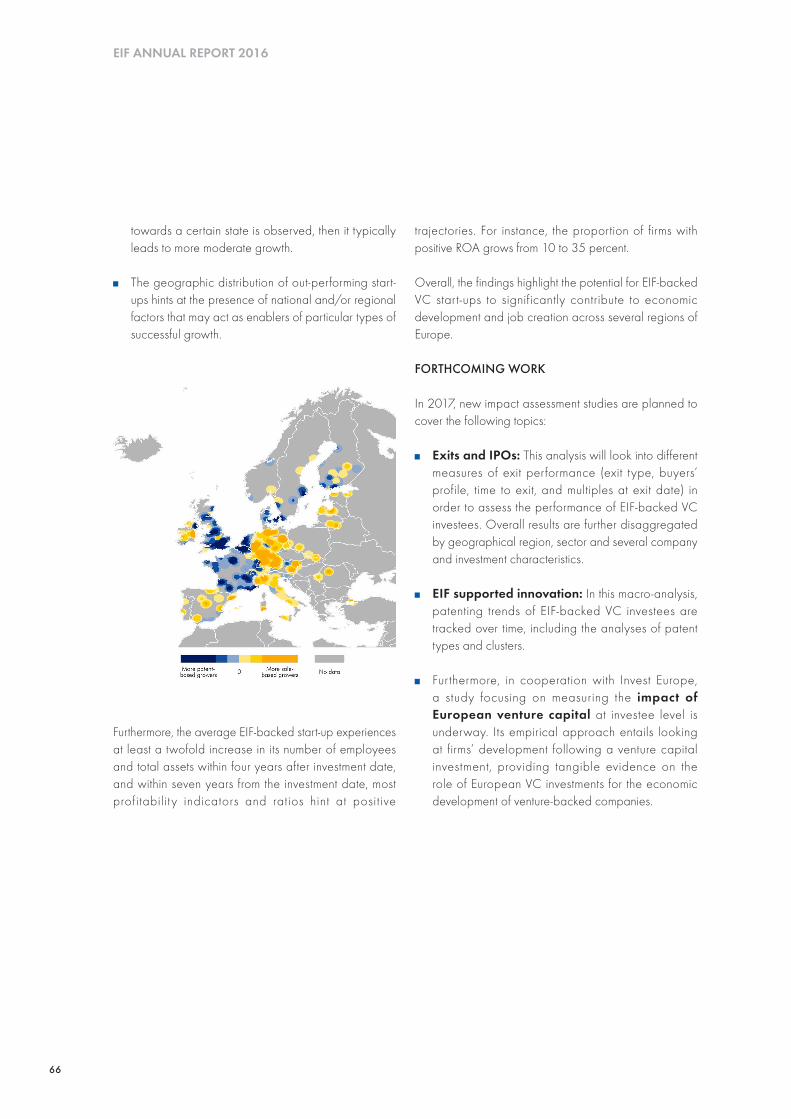
66
EIF ANNUAL REPORT 2016
towards a certain state is observed, then it typically leads to more moderate growth.
■ The geographic distribution of out-performing start-ups hints at the presence of national and/or regional factors that may act as enablers of particular types of successful growth.
Furthermore, the average EIF-backed start-up experiences at least a twofold increase in its number of employees and total assets within four years after investment date, and within seven years from the investment date, most profitabilit y indicators and ratios hint at posit ive
trajectories. For instance, the proportion of firms with positive ROA grows from 10 to 35 percent.
Overall, the findings highlight the potential for EIF-backed VC start-ups to significantly contribute to economic development and job creation across several regions of Europe.
FORTHCOMING WORK
In 2017, new impact assessment studies are planned to cover the following topics:
■ Exits and IPOs: This analysis will look into different measures of exit performance (exit type, buyers’ profile, time to exit, and multiples at exit date) in order to assess the performance of EIF-backed VC investees. Overall results are further disaggregated by geographical region, sector and several company and investment characteristics.
■ EIF supported innovation: In this macro-analysis, patenting trends of EIF-backed VC investees are tracked over time, including the analyses of patent types and clusters.
■ Furthermore, in cooperation with Invest Europe, a study focusing on measuring the impact of European venture capital at investee level is underway. Its empirical approach entails looking at firms’ development following a venture capital investment, providing tangible evidence on the role of European VC investments for the economic development of venture-backed companies.
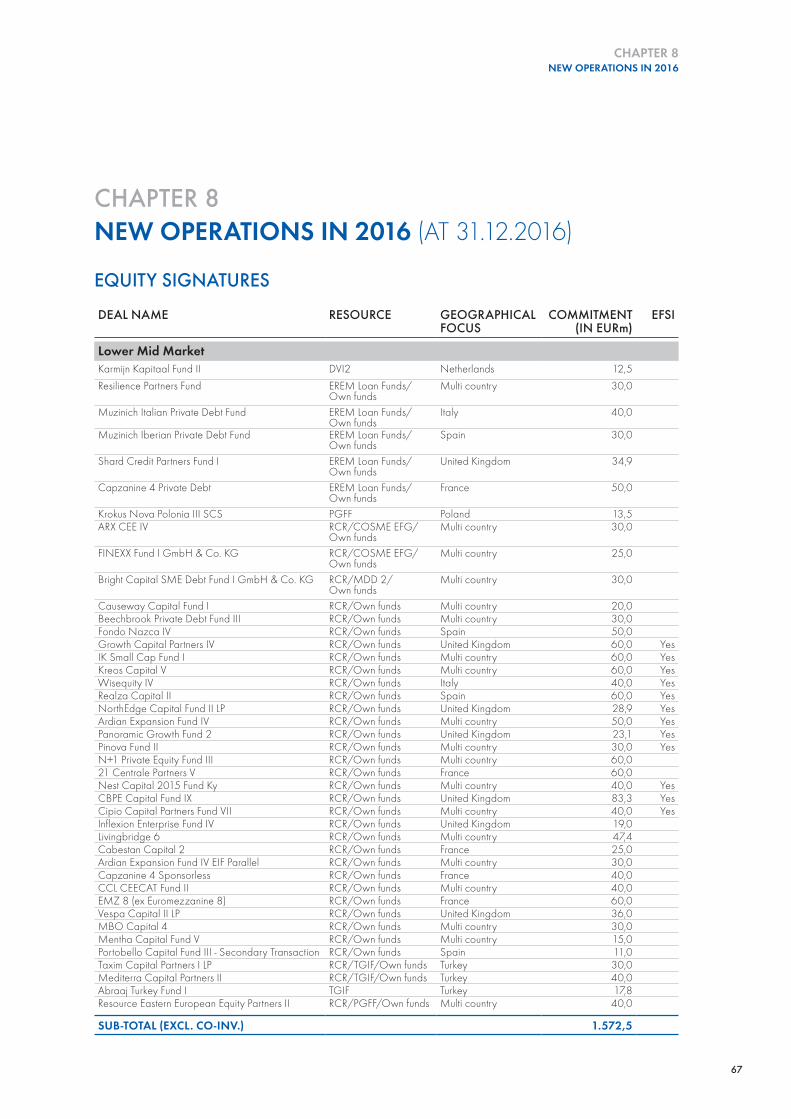
67
CHAPTER 8 NEW OPERATIONS IN 2016 (AT 31.12.2016)
CHAPTER 8NEW OPERATIONS IN 2016
EQUITY SIGNATURESDEAL NAME RESOURCE GEOGRAPHICAL
FOCUSCOMMITMENT
(IN EURm)EFSI
Lower Mid MarketKarmijn Kapitaal Fund II DVI2 Netherlands 12,5 Resilience Partners Fund EREM Loan Funds/
Own fundsMulti country 30,0
Muzinich Italian Private Debt Fund EREM Loan Funds/Own funds
Italy 40,0
Muzinich Iberian Private Debt Fund EREM Loan Funds/Own funds
Spain 30,0
Shard Credit Partners Fund I EREM Loan Funds/Own funds
United Kingdom 34,9
Capzanine 4 Private Debt EREM Loan Funds/Own funds
France 50,0
Krokus Nova Polonia III SCS PGFF Poland 13,5 ARX CEE IV RCR/COSME EFG/
Own fundsMulti country 30,0
FINEXX Fund I GmbH & Co. KG RCR/COSME EFG/Own funds
Multi country 25,0
Bright Capital SME Debt Fund I GmbH & Co. KG RCR/MDD 2/ Own funds
Multi country 30,0
Causeway Capital Fund I RCR/Own funds Multi country 20,0 Beechbrook Private Debt Fund III RCR/Own funds Multi country 30,0 Fondo Nazca IV RCR/Own funds Spain 50,0 Growth Capital Partners IV RCR/Own funds United Kingdom 60,0 YesIK Small Cap Fund I RCR/Own funds Multi country 60,0 YesKreos Capital V RCR/Own funds Multi country 60,0 YesWisequity IV RCR/Own funds Italy 40,0 YesRealza Capital II RCR/Own funds Spain 60,0 YesNorthEdge Capital Fund II LP RCR/Own funds United Kingdom 28,9 YesArdian Expansion Fund IV RCR/Own funds Multi country 50,0 YesPanoramic Growth Fund 2 RCR/Own funds United Kingdom 23,1 YesPinova Fund II RCR/Own funds Multi country 30,0 YesN+1 Private Equity Fund III RCR/Own funds Multi country 60,0 21 Centrale Partners V RCR/Own funds France 60,0 Nest Capital 2015 Fund Ky RCR/Own funds Multi country 40,0 YesCBPE Capital Fund IX RCR/Own funds United Kingdom 83,3 YesCipio Capital Partners Fund VII RCR/Own funds Multi country 40,0 YesInflexion Enterprise Fund IV RCR/Own funds United Kingdom 19,0 Livingbridge 6 RCR/Own funds Multi country 47,4 Cabestan Capital 2 RCR/Own funds France 25,0 Ardian Expansion Fund IV EIF Parallel RCR/Own funds Multi country 30,0 Capzanine 4 Sponsorless RCR/Own funds France 40,0 CCL CEECAT Fund II RCR/Own funds Multi country 40,0 EMZ 8 (ex Euromezzanine 8) RCR/Own funds France 60,0 Vespa Capital II LP RCR/Own funds United Kingdom 36,0 MBO Capital 4 RCR/Own funds Multi country 30,0 Mentha Capital Fund V RCR/Own funds Multi country 15,0 Portobello Capital Fund III - Secondary Transaction RCR/Own funds Spain 11,0 Taxim Capital Partners I LP RCR/TGIF/Own funds Turkey 30,0 Mediterra Capital Partners II RCR/TGIF/Own funds Turkey 40,0 Abraaj Turkey Fund I TGIF Turkey 17,8 Resource Eastern European Equity Partners II RCR/PGFF/Own funds Multi country 40,0
SUB-TOTAL (EXCL. CO-INV.) 1.572,5
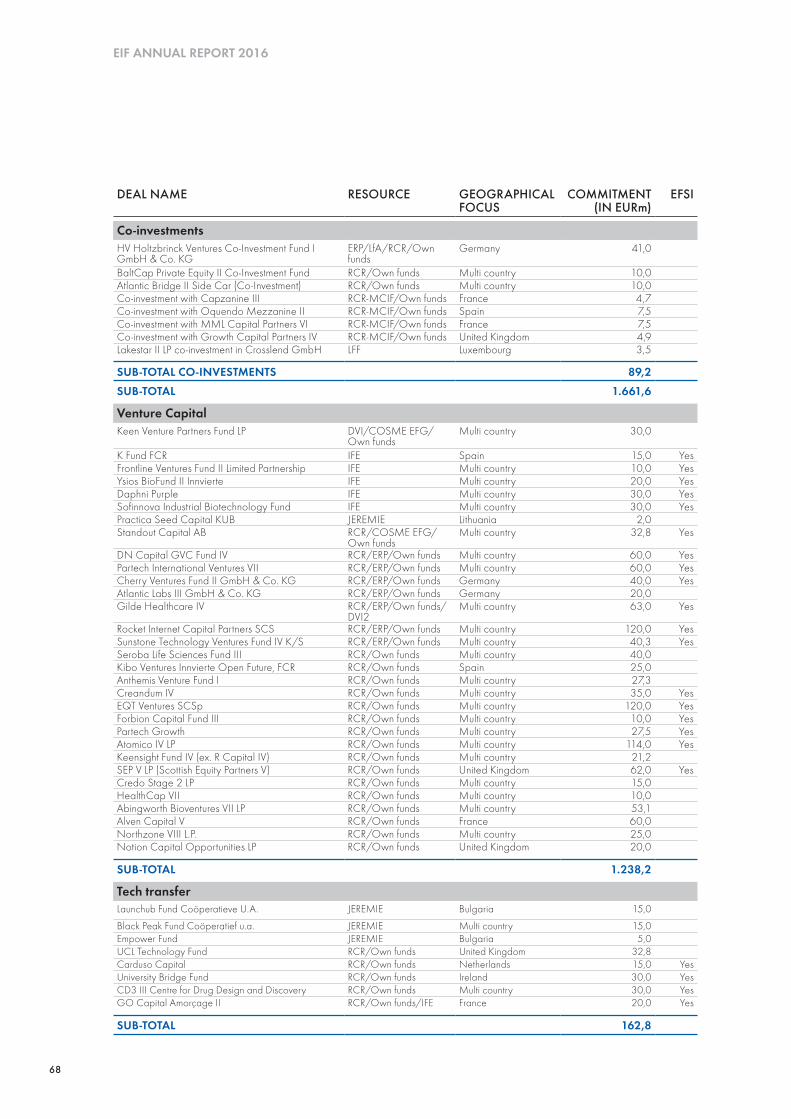
68
EIF ANNUAL REPORT 2016
DEAL NAME RESOURCE GEOGRAPHICAL FOCUS
COMMITMENT (IN EURm)
EFSI
Co-investmentsHV Holtzbrinck Ventures Co-Investment Fund I GmbH & Co. KG
ERP/LfA/RCR/Own funds
Germany 41,0
BaltCap Private Equity II Co-Investment Fund RCR/Own funds Multi country 10,0 Atlantic Bridge II Side Car (Co-Investment) RCR/Own funds Multi country 10,0 Co-investment with Capzanine III RCR-MCIF/Own funds France 4,7 Co-investment with Oquendo Mezzanine II RCR-MCIF/Own funds Spain 7,5 Co-investment with MML Capital Partners VI RCR-MCIF/Own funds France 7,5 Co-investment with Growth Capital Partners IV RCR-MCIF/Own funds United Kingdom 4,9 Lakestar II LP co-investment in Crosslend GmbH LFF Luxembourg 3,5
SUB-TOTAL CO-INVESTMENTS 89,2 SUB-TOTAL 1.661,6
Venture CapitalKeen Venture Partners Fund LP DVI/COSME EFG/
Own fundsMulti country 30,0
K Fund FCR IFE Spain 15,0 YesFrontline Ventures Fund II Limited Partnership IFE Multi country 10,0 YesYsios BioFund II Innvierte IFE Multi country 20,0 YesDaphni Purple IFE Multi country 30,0 YesSofinnova Industrial Biotechnology Fund IFE Multi country 30,0 YesPractica Seed Capital KUB JEREMIE Lithuania 2,0 Standout Capital AB RCR/COSME EFG/
Own fundsMulti country 32,8 Yes
DN Capital GVC Fund IV RCR/ERP/Own funds Multi country 60,0 YesPartech International Ventures VII RCR/ERP/Own funds Multi country 60,0 YesCherry Ventures Fund II GmbH & Co. KG RCR/ERP/Own funds Germany 40,0 YesAtlantic Labs III GmbH & Co. KG RCR/ERP/Own funds Germany 20,0 Gilde Healthcare IV RCR/ERP/Own funds/
DVI2Multi country 63,0 Yes
Rocket Internet Capital Partners SCS RCR/ERP/Own funds Multi country 120,0 YesSunstone Technology Ventures Fund IV K/S RCR/ERP/Own funds Multi country 40,3 YesSeroba Life Sciences Fund III RCR/Own funds Multi country 40,0 Kibo Ventures Innvierte Open Future, FCR RCR/Own funds Spain 25,0 Anthemis Venture Fund I RCR/Own funds Multi country 27,3 Creandum IV RCR/Own funds Multi country 35,0 YesEQT Ventures SCSp RCR/Own funds Multi country 120,0 YesForbion Capital Fund III RCR/Own funds Multi country 10,0 YesPartech Growth RCR/Own funds Multi country 27,5 YesAtomico IV LP RCR/Own funds Multi country 114,0 YesKeensight Fund IV (ex. R Capital IV) RCR/Own funds Multi country 21,2 SEP V LP (Scottish Equity Partners V) RCR/Own funds United Kingdom 62,0 YesCredo Stage 2 LP RCR/Own funds Multi country 15,0 HealthCap VII RCR/Own funds Multi country 10,0 Abingworth Bioventures VII LP RCR/Own funds Multi country 53,1 Alven Capital V RCR/Own funds France 60,0 Northzone VIII L.P. RCR/Own funds Multi country 25,0 Notion Capital Opportunities LP RCR/Own funds United Kingdom 20,0
SUB-TOTAL 1.238,2
Tech transferLaunchub Fund Coöperatieve U.A. JEREMIE Bulgaria 15,0
Black Peak Fund Coöperatief u.a. JEREMIE Multi country 15,0 Empower Fund JEREMIE Bulgaria 5,0 UCL Technology Fund RCR/Own funds United Kingdom 32,8 Carduso Capital RCR/Own funds Netherlands 15,0 YesUniversity Bridge Fund RCR/Own funds Ireland 30,0 YesCD3 III Centre for Drug Design and Discovery RCR/Own funds Multi country 30,0 YesGO Capital Amorçage II RCR/Own funds/IFE France 20,0 Yes
SUB-TOTAL 162,8
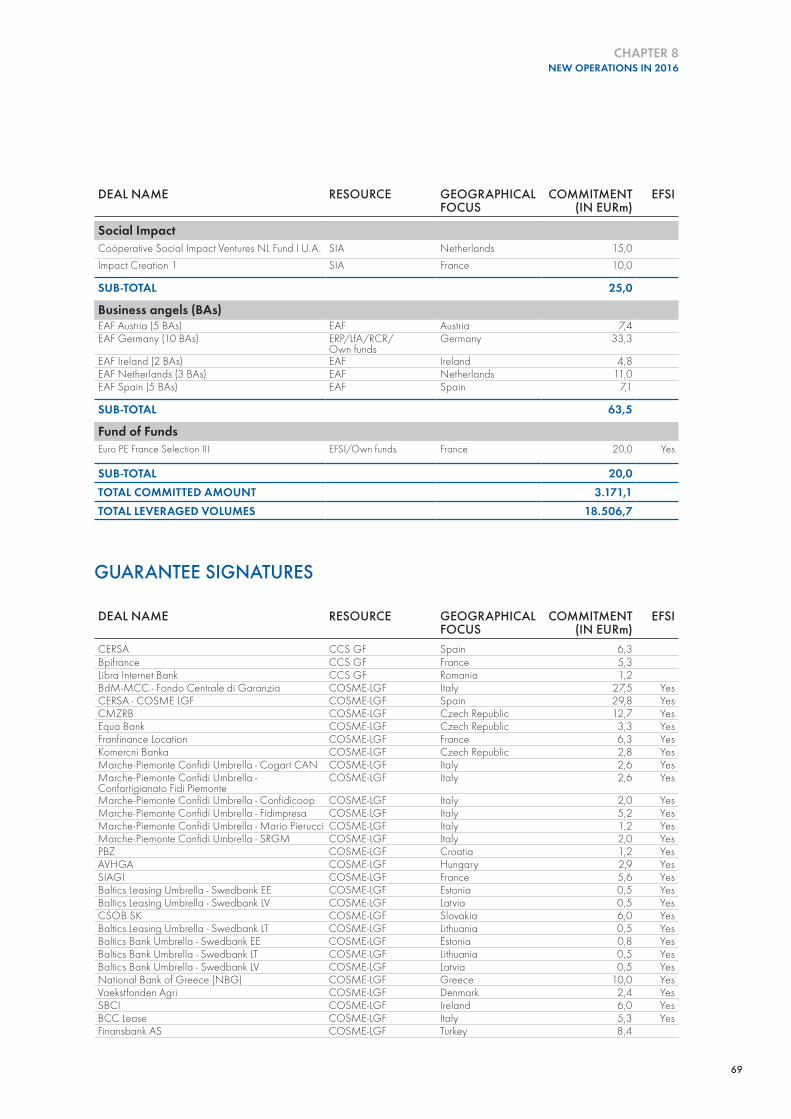
69
CHAPTER 8NEW OPERATIONS IN 2016
DEAL NAME RESOURCE GEOGRAPHICAL FOCUS
COMMITMENT (IN EURm)
EFSI
Social ImpactCoöperative Social Impact Ventures NL Fund I U.A. SIA Netherlands 15,0 Impact Creation 1 SIA France 10,0
SUB-TOTAL 25,0
Business angels (BAs)EAF Austria (5 BAs) EAF Austria 7,4 EAF Germany (10 BAs) ERP/LfA/RCR/
Own fundsGermany 33,3
EAF Ireland (2 BAs) EAF Ireland 4,8 EAF Netherlands (3 BAs) EAF Netherlands 11,0 EAF Spain (5 BAs) EAF Spain 7,1
SUB-TOTAL 63,5
Fund of FundsEuro PE France Selection III EFSI/Own funds France 20,0 Yes
SUB-TOTAL 20,0 TOTAL COMMITTED AMOUNT 3.171,1 TOTAL LEVERAGED VOLUMES 18.506,7
GUARANTEE SIGNATURES
DEAL NAME RESOURCE GEOGRAPHICAL FOCUS
COMMITMENT (IN EURm)
EFSI
CERSA CCS GF Spain 6,3Bpifrance CCS GF France 5,3Libra Internet Bank CCS GF Romania 1,2BdM-MCC - Fondo Centrale di Garanzia COSME-LGF Italy 27,5 YesCERSA - COSME LGF COSME-LGF Spain 29,8 YesCMZRB COSME-LGF Czech Republic 12,7 YesEqua Bank COSME-LGF Czech Republic 3,3 YesFranfinance Location COSME-LGF France 6,3 YesKomercni Banka COSME-LGF Czech Republic 2,8 YesMarche-Piemonte Confidi Umbrella - Cogart CAN COSME-LGF Italy 2,6 YesMarche-Piemonte Confidi Umbrella - Confartigianato Fidi Piemonte
COSME-LGF Italy 2,6 Yes
Marche-Piemonte Confidi Umbrella - Confidicoop COSME-LGF Italy 2,0 YesMarche-Piemonte Confidi Umbrella - Fidimpresa COSME-LGF Italy 5,2 YesMarche-Piemonte Confidi Umbrella - Mario Pierucci COSME-LGF Italy 1,2 YesMarche-Piemonte Confidi Umbrella - SRGM COSME-LGF Italy 2,0 YesPBZ COSME-LGF Croatia 1,2 YesAVHGA COSME-LGF Hungary 2,9 YesSIAGI COSME-LGF France 5,6 YesBaltics Leasing Umbrella - Swedbank EE COSME-LGF Estonia 0,5 YesBaltics Leasing Umbrella - Swedbank LV COSME-LGF Latvia 0,5 YesCSOB SK COSME-LGF Slovakia 6,0 YesBaltics Leasing Umbrella - Swedbank LT COSME-LGF Lithuania 0,5 YesBaltics Bank Umbrella - Swedbank EE COSME-LGF Estonia 0,8 YesBaltics Bank Umbrella - Swedbank LT COSME-LGF Lithuania 0,5 YesBaltics Bank Umbrella - Swedbank LV COSME-LGF Latvia 0,5 YesNational Bank of Greece (NBG) COSME-LGF Greece 10,0 YesVaekstfonden Agri COSME-LGF Denmark 2,4 YesSBCI COSME-LGF Ireland 6,0 YesBCC Lease COSME-LGF Italy 5,3 YesFinansbank AS COSME-LGF Turkey 8,4

70
EIF ANNUAL REPORT 2016
Nord e Centro Italia Confidi Umbrella - FidiToscana COSME-LGF Italy 1,0 YesNord e Centro Italia Confidi Umbrella - Cooperfidi Italia
COSME-LGF Italy 1,5 Yes
Nord e Centro Italia Confidi Umbrella - Neafidi COSME-LGF Italy 1,5 YesNord e Centro Italia Confidi Umbrella - Artigiancredito Toscano
COSME-LGF Italy 5,0 Yes
Eurobank COSME-LGF Greece 13,0 YesNord e Centro Italia Confidi Umbrella - Artigianfidi Vicenza
COSME-LGF Italy 5,0 Yes
BDB COSME-LGF Bulgaria 1,2 YesNord e Centro Italia Confidi Umbrella - Italia Comfidi
COSME-LGF Italy 4,0 Yes
Banca Intesa ad Beograd COSME-LGF Serbia 1,8Raiffeisen Bank Bulgaria COSME-LGF Bulgaria 4,0 YesRaiffeisen Leasing Bulgaria COSME-LGF Bulgaria 1,3 YesCDP EFSI Investment Platform COSME-LGF Italy 112,5 YesSOCAMA 2 COSME-LGF France 35,0 YesBDB NGF COSME-LGF Bulgaria 1,2 YesBank of Cyprus CYPEF Cyprus 30,0BPCE – Caisses d’Épargne ERASMUS - GF France 4,9Finansbank A.S. ERASMUS - GF Turkey 4,9Future Finance ERASMUS - GF Ireland 5,6University Luxembourg ERASMUS - GF Luxembourg 0,8Germany Synthetic 1 EREM-ABS Germany 125,4German Synthetic 2 EREM-ABS Germany 89,8 YesRBS Health Care EREM-ABS United Kingdom 43,8Austrian Synthetic EREM-ABS/Own funds Multi country 59,8SIENA PMI 2015 EREM-ABS/Own funds Italy 240,0ACOFI PREDIREC Innovation 2020 EREM Loan Funds/
Own fundsFrance 30,0
BNPP-AM SME and Mid-Cap Debt Fund EREM Loan Funds/Own funds
Multi country 60,0
Robeco Bedrijfsleningen Fonds (BLF) [ex NLOF] EREM Loan Funds/Own funds
Netherlands 30,0
Hermes Direct Lending Fund I EREM Loan Funds/Own funds
United Kingdom 71,3
HI CrescItalia PMI Fund (Italy) EREM Loan Funds/Own funds
Italy 40,0
Idinvest Lease Fund I EREM Loan Funds/Own funds
Multi country 70,0
Banque Populaire du Sud ESIF-Languedoc Roussillon ERDF
France 15,0
Banque Populaire du Sud ESIF-Languedoc Roussillon EAFRD
France 13,5
Banca CRS InnovFin SMEG Italy 15,0 YesBANCO POPOLARE InnovFin SMEG Italy 150,0 YesBank Leumi InnovFin SMEG Israël 45,8BCC Cambiano - Umbrella - Cambiano InnovFin SMEG Italy 15,0 YesBCC Cambiano - Umbrella - Castagneto InnovFin SMEG Italy 12,5 YesBCC Cambiano - Umbrella - Fornacette InnovFin SMEG Italy 12,5 YesBCC Cambiano - Umbrella - Viterbo InnovFin SMEG Italy 5,0 YesBP Bari InnovFin SMEG Italy 50,0BPCE-BP InnovFin SMEG France 150,0 YesCERSA InnovFin SMEG Spain 60,0 YesCommerzbank InnovFin SMEG Germany 100,0 YesCREVAL InnovFin SMEG Italy 75,0 YesDE-NPB-Umbrella_IB.SH InnovFin SMEG Germany 3,5 YesDE-NPB-Umbrella_IBB InnovFin SMEG Germany 3,5 YesDE-NPB-Umbrella_IFB.HH InnovFin SMEG Germany 3,5 YesDE-NPB-Umbrella_ILB InnovFin SMEG Germany 3,5 YesDE-NPB-Umbrella_ISB.RP InnovFin SMEG Germany 3,5 YesDE-NPB-Umbrella_NRW.BANK InnovFin SMEG Germany 10,5 YesDE-NPB-Umbrella_WIBank InnovFin SMEG Germany 10,5 YesKfW InnovFin SMEG Germany 125,0 Yes
DEAL NAME RESOURCE GEOGRAPHICAL FOCUS
COMMITMENT (IN EURm)
EFSI
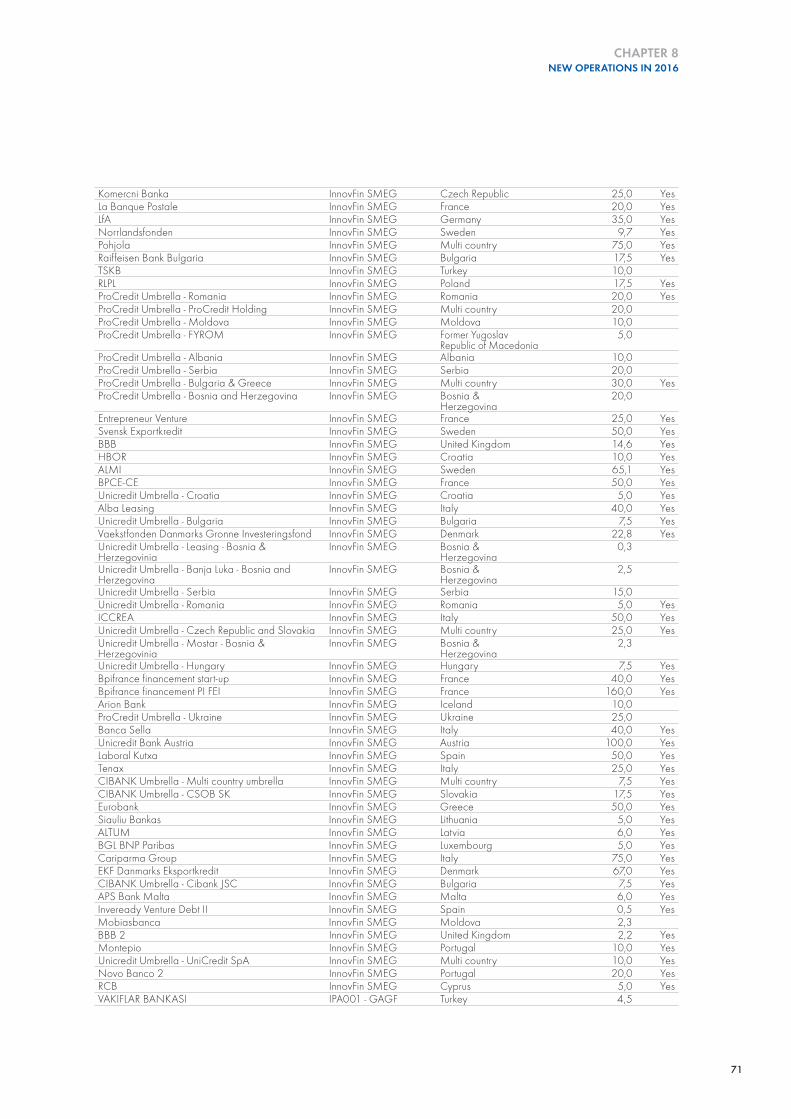
71
CHAPTER 8NEW OPERATIONS IN 2016
Komercni Banka InnovFin SMEG Czech Republic 25,0 YesLa Banque Postale InnovFin SMEG France 20,0 YesLfA InnovFin SMEG Germany 35,0 YesNorrlandsfonden InnovFin SMEG Sweden 9,7 YesPohjola InnovFin SMEG Multi country 75,0 YesRaiffeisen Bank Bulgaria InnovFin SMEG Bulgaria 17,5 YesTSKB InnovFin SMEG Turkey 10,0RLPL InnovFin SMEG Poland 17,5 YesProCredit Umbrella - Romania InnovFin SMEG Romania 20,0 YesProCredit Umbrella - ProCredit Holding InnovFin SMEG Multi country 20,0ProCredit Umbrella - Moldova InnovFin SMEG Moldova 10,0ProCredit Umbrella - FYROM InnovFin SMEG Former Yugoslav
Republic of Macedonia5,0
ProCredit Umbrella - Albania InnovFin SMEG Albania 10,0ProCredit Umbrella - Serbia InnovFin SMEG Serbia 20,0ProCredit Umbrella - Bulgaria & Greece InnovFin SMEG Multi country 30,0 YesProCredit Umbrella - Bosnia and Herzegovina InnovFin SMEG Bosnia &
Herzegovina20,0
Entrepreneur Venture InnovFin SMEG France 25,0 YesSvensk Exportkredit InnovFin SMEG Sweden 50,0 YesBBB InnovFin SMEG United Kingdom 14,6 YesHBOR InnovFin SMEG Croatia 10,0 YesALMI InnovFin SMEG Sweden 65,1 YesBPCE-CE InnovFin SMEG France 50,0 YesUnicredit Umbrella - Croatia InnovFin SMEG Croatia 5,0 YesAlba Leasing InnovFin SMEG Italy 40,0 YesUnicredit Umbrella - Bulgaria InnovFin SMEG Bulgaria 7,5 YesVaekstfonden Danmarks Gronne Investeringsfond InnovFin SMEG Denmark 22,8 YesUnicredit Umbrella - Leasing - Bosnia & Herzegovinia
InnovFin SMEG Bosnia & Herzegovina
0,3
Unicredit Umbrella - Banja Luka - Bosnia and Herzegovina
InnovFin SMEG Bosnia & Herzegovina
2,5
Unicredit Umbrella - Serbia InnovFin SMEG Serbia 15,0Unicredit Umbrella - Romania InnovFin SMEG Romania 5,0 YesICCREA InnovFin SMEG Italy 50,0 YesUnicredit Umbrella - Czech Republic and Slovakia InnovFin SMEG Multi country 25,0 YesUnicredit Umbrella - Mostar - Bosnia & Herzegovinia
InnovFin SMEG Bosnia & Herzegovina
2,3
Unicredit Umbrella - Hungary InnovFin SMEG Hungary 7,5 YesBpifrance financement start-up InnovFin SMEG France 40,0 YesBpifrance financement PI FEI InnovFin SMEG France 160,0 YesArion Bank InnovFin SMEG Iceland 10,0ProCredit Umbrella - Ukraine InnovFin SMEG Ukraine 25,0Banca Sella InnovFin SMEG Italy 40,0 YesUnicredit Bank Austria InnovFin SMEG Austria 100,0 YesLaboral Kutxa InnovFin SMEG Spain 50,0 YesTenax InnovFin SMEG Italy 25,0 YesCIBANK Umbrella - Multi country umbrella InnovFin SMEG Multi country 7,5 YesCIBANK Umbrella - CSOB SK InnovFin SMEG Slovakia 17,5 YesEurobank InnovFin SMEG Greece 50,0 YesSiauliu Bankas InnovFin SMEG Lithuania 5,0 YesALTUM InnovFin SMEG Latvia 6,0 YesBGL BNP Paribas InnovFin SMEG Luxembourg 5,0 YesCariparma Group InnovFin SMEG Italy 75,0 YesEKF Danmarks Eksportkredit InnovFin SMEG Denmark 67,0 YesCIBANK Umbrella - Cibank JSC InnovFin SMEG Bulgaria 7,5 YesAPS Bank Malta InnovFin SMEG Malta 6,0 YesInveready Venture Debt II InnovFin SMEG Spain 0,5 YesMobiasbanca InnovFin SMEG Moldova 2,3BBB 2 InnovFin SMEG United Kingdom 2,2 YesMontepio InnovFin SMEG Portugal 10,0 YesUnicredit Umbrella - UniCredit SpA InnovFin SMEG Multi country 10,0 YesNovo Banco 2 InnovFin SMEG Portugal 20,0 YesRCB InnovFin SMEG Cyprus 5,0 YesVAKIFLAR BANKASI IPA001 - GAGF Turkey 4,5

72
EIF ANNUAL REPORT 2016
Procredit Romania JER-002 ROMANIA Romania 2,5RAIFFEISEN ROMANIA JER-002 ROMANIA Romania 7,5Tatra Bank JER-005 SLOVAKIA Slovakia 14,0Sberbank Slovensko JER-005 SLOVAKIA Slovakia 6,0Allianz Bank Bulgaria JER-009 BULGARIA Bulgaria 0,7ProCredit JER-009 BULGARIA Bulgaria 2,0LDF (British Business Bank) Own funds United Kingdom 33,0HHF (British Business Bank) Own funds United Kingdom 33,4Turkish DPR Own funds Turkey 73,9SBOLT Own funds United Kingdom 55,7Alba 8 Own funds Italy 127,0ROOF Leasing Austria Own funds Austria 250,0Asset Advantage Warehouse Facility Own funds United Kingdom 49,3abc SME Lease Germany Own funds Germany 48,7ICCREA SME CART 2016 Own funds Italy 65,0NBG Sinepia DAC Own funds Greece 35,0Lusitano SME NO. 3 Own funds Portugal 260,0Bank of Valletta SME Initiative - Malta Malta 45,8Banif Malta SME Initiative - Malta Malta 4,6Banco Popular SME Initiative - Spain Spain 50,0Bankia 2 SME Initiative - Spain Spain 150,0Bankia SME Initiative - Spain Spain 16,0Bankinter SME Initiative - Spain Spain 100,0La Caixa SME Initiative - Spain Spain 40,0Sabadell SME Initiative - Spain Spain 31,3Santander SME Initiative - Spain Spain 50,0Liberbank SME Initiative - Spain Spain 150,5BCE - Caja Rural de Benicarlo - Umbrella SME Initiative - Spain Spain 0,5BCE - Caixa de Credit del Enginyers - Umbrella SME Initiative - Spain Spain 5,0BCE - Caja Rural de Burgos - Umbrella SME Initiative - Spain Spain 4,9BCE - Caja Siete - Umbrella SME Initiative - Spain Spain 7,5BCE - Caja Rural de Extremadura - Umbrella SME Initiative - Spain Spain 6,0BCE - Caja Rural Central - Umbrella SME Initiative - Spain Spain 5,0BCE - Caja Rural Nuestra Senora de la Esperanza de Onda - Umbrella
SME Initiative - Spain Spain 0,3
BCE - Caja Rural de Zamora - Umbrella SME Initiative - Spain Spain 2,2BCE - Caja Rural de Teruel - Umbrella SME Initiative - Spain Spain 5,0BCE - Caja Rural de Jaén - Umbrella SME Initiative - Spain Spain 7,5BCE - Caixa Rural Galega - Umbrella SME Initiative - Spain Spain 3,0BCE - Caja Rural de Aragón - Umbrella SME Initiative - Spain Spain 12,0BCE - Caja Rural de Albacete - Umbrella SME Initiative - Spain Spain 4,5BCE - Caja Rural de Granada - Umbrella SME Initiative - Spain Spain 5,0BCE - Caja Rural de Navarra - Umbrella SME Initiative - Spain Spain 2,5BCE - Ruralnostra - Umbrella SME Initiative - Spain Spain 2,0BCE - Caixa Popular-Caixa Rural - Umbrella SME Initiative - Spain Spain 6,0BCE - Caja Rural de Soria - Umbrella SME Initiative - Spain Spain 10,0BCE - Banco Cooperativo Espanol - Umbrella SME Initiative - Spain Spain 9,5Sabadell 2 SME Initiative - Spain Spain 110,0Santander 2 SME Initiative - Spain Spain 145,0Ibercaja SME Initiative - Spain Spain 84,9Raiffeisen Bank SME Initiative - Bulgaria Bulgaria 42,0UBB SME Initiative - Bulgaria Bulgaria 39,0CIBANK SME Initiative - Bulgaria Bulgaria 30,0ProCredit Bulgaria SME Initiative - Bulgaria Bulgaria 84,8Unicredit Bulbank SME Initiative - Bulgaria Bulgaria 60,0DSK SME Initiative - Bulgaria Bulgaria 24,0Eurobank Bulgaria AD SME Initiative - Bulgaria Bulgaria 42,0Deutsche Leasing Bulgaria EAD SME Initiative - Bulgaria Bulgaria 3,0Societe Generale Expressbank SME Initiative - Bulgaria Bulgaria 10,0Piraeus Bank Bulgaria AD SME Initiative - Bulgaria Bulgaria 30,0CKB Montenegro WB EDIF GF II Montenegro 3,5ProCredit Bank Serbia WB EDIF GF II Serbia 3,5
DEAL NAME RESOURCE GEOGRAPHICAL FOCUS
COMMITMENT (IN EURm)
EFSI
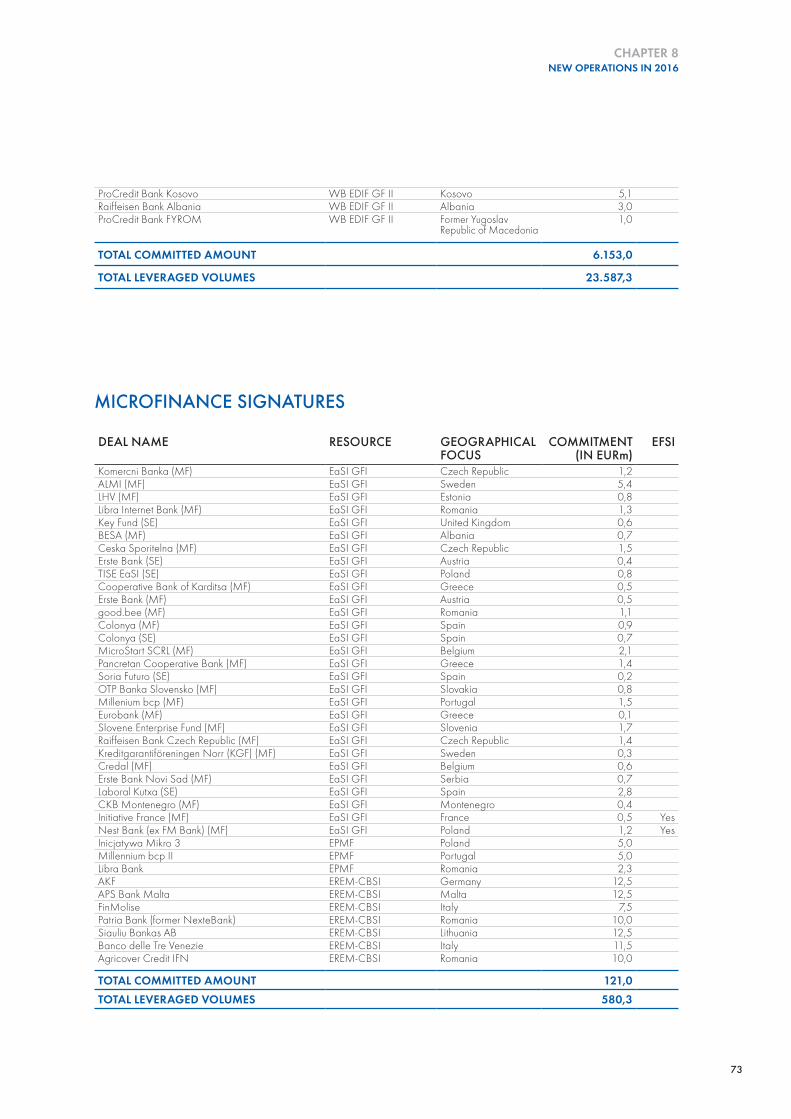
73
CHAPTER 8NEW OPERATIONS IN 2016
Komercni Banka (MF) EaSI GFI Czech Republic 1,2ALMI (MF) EaSI GFI Sweden 5,4LHV (MF) EaSI GFI Estonia 0,8Libra Internet Bank (MF) EaSI GFI Romania 1,3Key Fund (SE) EaSI GFI United Kingdom 0,6BESA (MF) EaSI GFI Albania 0,7Ceska Sporitelna (MF) EaSI GFI Czech Republic 1,5Erste Bank (SE) EaSI GFI Austria 0,4TISE EaSI (SE) EaSI GFI Poland 0,8Cooperative Bank of Karditsa (MF) EaSI GFI Greece 0,5Erste Bank (MF) EaSI GFI Austria 0,5good.bee (MF) EaSI GFI Romania 1,1Colonya (MF) EaSI GFI Spain 0,9Colonya (SE) EaSI GFI Spain 0,7MicroStart SCRL (MF) EaSI GFI Belgium 2,1Pancretan Cooperative Bank (MF) EaSI GFI Greece 1,4Soria Futuro (SE) EaSI GFI Spain 0,2OTP Banka Slovensko (MF) EaSI GFI Slovakia 0,8Millenium bcp (MF) EaSI GFI Portugal 1,5Eurobank (MF) EaSI GFI Greece 0,1Slovene Enterprise Fund (MF) EaSI GFI Slovenia 1,7Raiffeisen Bank Czech Republic (MF) EaSI GFI Czech Republic 1,4Kreditgarantiföreningen Norr (KGF) (MF) EaSI GFI Sweden 0,3Credal (MF) EaSI GFI Belgium 0,6Erste Bank Novi Sad (MF) EaSI GFI Serbia 0,7Laboral Kutxa (SE) EaSI GFI Spain 2,8CKB Montenegro (MF) EaSI GFI Montenegro 0,4Initiative France (MF) EaSI GFI France 0,5 Yes Nest Bank (ex FM Bank) (MF) EaSI GFI Poland 1,2 Yes Inicjatywa Mikro 3 EPMF Poland 5,0Millennium bcp II EPMF Portugal 5,0Libra Bank EPMF Romania 2,3AKF EREM-CBSI Germany 12,5APS Bank Malta EREM-CBSI Malta 12,5FinMolise EREM-CBSI Italy 7,5Patria Bank (former NexteBank) EREM-CBSI Romania 10,0Siauliu Bankas AB EREM-CBSI Lithuania 12,5Banco delle Tre Venezie EREM-CBSI Italy 11,5Agricover Credit IFN EREM-CBSI Romania 10,0
TOTAL COMMITTED AMOUNT 121,0TOTAL LEVERAGED VOLUMES 580,3
DEAL NAME RESOURCE GEOGRAPHICAL FOCUS
COMMITMENT (IN EURm)
EFSI
ProCredit Bank Kosovo WB EDIF GF II Kosovo 5,1Raiffeisen Bank Albania WB EDIF GF II Albania 3,0ProCredit Bank FYROM WB EDIF GF II Former Yugoslav
Republic of Macedonia1,0
TOTAL COMMITTED AMOUNT 6.153,0
TOTAL LEVERAGED VOLUMES 23.587,3
MICROFINANCE SIGNATURES
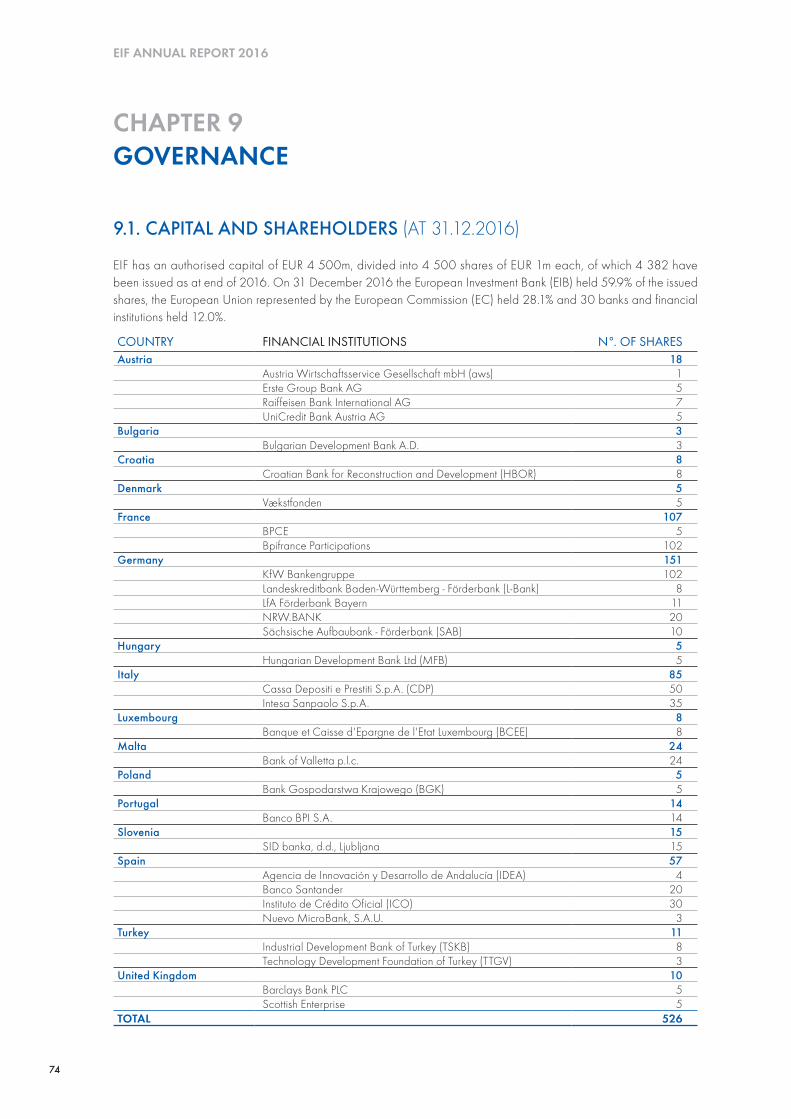
74
EIF ANNUAL REPORT 2016
COUNTRY FINANCIAL INSTITUTIONS N°. OF SHARESAustria 18
Austria Wirtschaftsservice Gesellschaft mbH (aws) 1Erste Group Bank AG 5Raiffeisen Bank International AG 7UniCredit Bank Austria AG 5
Bulgaria 3Bulgarian Development Bank A.D. 3
Croatia 8Croatian Bank for Reconstruction and Development (HBOR) 8
Denmark 5Vækstfonden 5
France 107BPCE 5Bpifrance Participations 102
Germany 151KfW Bankengruppe 102Landeskreditbank Baden-Württemberg - Förderbank (L-Bank) 8LfA Förderbank Bayern 11NRW.BANK 20Sächsische Aufbaubank - Förderbank (SAB) 10
Hungary 5Hungarian Development Bank Ltd (MFB) 5
Italy 85Cassa Depositi e Prestiti S.p.A. (CDP) 50Intesa Sanpaolo S.p.A. 35
Luxembourg 8Banque et Caisse d'Epargne de l'Etat Luxembourg (BCEE) 8
Malta 24Bank of Valletta p.l.c. 24
Poland 5Bank Gospodarstwa Krajowego (BGK) 5
Portugal 14Banco BPI S.A. 14
Slovenia 15 SID banka, d.d., Ljubljana 15
Spain 57Agencia de Innovación y Desarrollo de Andalucía (IDEA) 4Banco Santander 20Instituto de Crédito Oficial (ICO) 30Nuevo MicroBank, S.A.U. 3
Turkey 11Industrial Development Bank of Turkey (TSKB) 8Technology Development Foundation of Turkey (TTGV) 3
United Kingdom 10Barclays Bank PLC 5Scottish Enterprise 5
TOTAL 526
9.1. CAPITAL AND SHAREHOLDERS (AT 31.12.2016)
EIF has an authorised capital of EUR 4 500m, divided into 4 500 shares of EUR 1m each, of which 4 382 have been issued as at end of 2016. On 31 December 2016 the European Investment Bank (EIB) held 59.9% of the issued shares, the European Union represented by the European Commission (EC) held 28.1% and 30 banks and financial institutions held 12.0%.
CHAPTER 9GOVERNANCE
75
CHAPTER 9GOVERNANCE
EIF was pleased to welcome two new financial institutions as members:
– BPCE of France acquired five shares, ef fective 26 January 2016.
– Technology Development Foundation of Turkey (Türkiye Teknoloji Geliştirme Vakfı – TTGV) purchased three shares, effective 15 April 2016.
In addition to its already existing subscription of 1136 shares, and in the context of the third annual subscription period of the capital increase, the EC acquired 96 additional shares, effective 15 July 2016.
THE GOVERNANCE OF THE EUROPEAN INVESTMENT FUND
EIF’s institutional organisation and strong corporate governance are central to the successful delivery of its objectives. Its tripartite shareholding structure positions EIF uniquely among other EU and international financial institutions.
The brochure entitled “The Governance of the European Investment Fund” provides an overview of EIF’s governing bodies as well as the decision-making processes regarding its activities.
www.eif.org/news_centre/publications/governance.htm?lang=-en
76
EIF ANNUAL REPORT 2016
9.2. BOARD OF DIRECTORS (AT 31.12.2016)
CHAIRMAN
Dario SCANNAPIECO Vice-President, European Investment Bank
MEMBERS
Benjamin ANGEL Director, Treasury and Financial Operations, Directorate-General for Economic and Financial Affairs, European Commission
Pierre DELSAUX Deputy Director-General, Directorate-General for Internal Market, Industry, Entrepreneurship and SMEs, European Commission
Marc DESCHEEMAECKER Chairman of the boards of Brussels Airport Company and of De Lijn, Belgium
Ambroise FAYOLLE Vice-President, European Investment Bank
Emmanuel MASSÉ1 Assistant Secretary, Macroeconomic and European Affairs Department, Directorate-General of the Treasury, Ministry of Economy and Finance, France
Harriet WIRTH Senior Vice President, Head of Product Management Mittelstandsbank, KfW Group, Germany
ALTERNATES2
Filipe CARTAXO Managing Director, Banco BPI, Portugal
Martin HEIPERTZ Head of Division European Policy, Federal Ministry of Finance, Germany
Jean-Christophe LALOUX Director General, Head of Operations, European Investment Bank
Nicholas MARTYN Deputy Director-General for Policy, Performance and Compliance, Directorate-General for Regional and Urban Policy, European Commission
Marjut SANTONI Deputy Secretary General, European Investment Bank
Robert-Jan SMITS Director-General, Directorate-General for Research and Innovation, European Commission
1 Following his nomination by the European Investment Bank, Emmanuel MASSÉ was appointed by the General Meeting on 15 November 2016 to complete the remaining term of office of Karina KARAIVANOVA, who resigned on 15 September 2016, in connection with her resignation from the EIB's Board of Directors.
2 Following the resignation of Carla DÍAZ ÁLVAREZ DE TOLEDO, former Head of EU Economic and Financial Affairs, Ministry for Economy and Competitiveness, Spain, on 21 September 2016, the nomination of an alternate member by the European Investment Bank is pending.
77
9.3. AUDIT BOARD
CHAIRMAN
Jacek DOMINIK3 General Counselor, Ministry of Finance, Poland
MEMBERS
Rudi DRIES4 Deputy Head of Unit IAS.C.3, Directorate-General Internal Audit Service, European Commission, Belgium
Paolo Enrico PERNICE5 Chief Financial Officer Intesa Sanpaolo Bank Luxembourg
ALTERNATE MEMBER
Gerard SMYTH Former Secretary and Director of Audit, Office of the Comptroller and Auditor General, Ireland
3 Following his nomination by the European Investment Bank, Jacek DOMINIK was appointed by the General Meeting on 26 October 2015 to complete the remaining term of office of Bettina JAKOBSEN, following her resignation in May 2015, in connection with her appointment as Member of the European Court of Auditors (ECA).
4 Rudi DRIES was reappointed by the General Meeting on 20 April 2015 as a member of the Audit Board for a three-year term of office expiring on the day of the 2018 Annual General Meeting.
5 Following the nomination by the financial institutions, Paolo Enrico PERNICE was appointed by the General Meeting on 11 April 2016, to replace Charles BORG, whose term of office as Audit Board member came to an end on the same day.
CHAPTER 9GOVERNANCE
78
EIF ANNUAL REPORT 2016
9.4. BOARD OF DIRECTORS
Pierre Delsaux ӏ Benjamin Angel ӏ Marc Descheemaecker ӏ Marjut Santoni ӏ Dario Scannapieco
Harriet Wirth ӏ Ambroise Fayolle ӏ Filipe Cartaxo ӏ Jean-Christophe Laloux ӏ Emmanuel Massé
79
MANAGEMENT
Hubert Cottogni ӏ Martine Lepert ӏ José Grincho ӏ Maria Leander ӏ Roger Havenith
Pier Luigi Gilibert ӏ Frédérique Schepens ӏ John Holloway ӏ Jobst Neuss ӏ Alessandro Tappi
CHAPTER 9GOVERNANCE
80
EIF ANNUAL REPORT 2016
EIF is characterised by a mult i - layered control environment embedded in the EU institutional framework and aligned with the financial sector’s principles and best practices.
EIF’s first layer of control is exercised through internal processes and procedures developed and implemented by the Executive Management by means of financial and operational controls designed to enable effective and efficient day-to-day operations, ensure reliable financial reporting and compliance with regulations and achieve EIF’s objectives.
In this context, EIF’s organisational chart sets out the competences, authorities and reporting lines within EIF, with a view to ensuring segregation of duties both on a horizontal level, through the interaction between front office and back office services, and on a vertical level through central control by the Board of Directors of the decision-making process in relation to all business activities.
The second layer of control consists of independent risk and compliance functions whose opinion is requested for each transaction proposed to the Board of Directors, as part of an integrated ex ante risk assessment and ex post risk monitoring under the responsibility of the Executive Management (see sections on Risk Management and Legal Service).
EIF regularly produces an Internal Control Framework (ICF) report, which in particular includes a risk control matrix outlining the main residual operational risks to which EIF is exposed. Through the ICF, the Executive Management is in a position to obtain the necessary comfort that the key risks related to EIF’s business activities are properly identified, that control objectives are defined, that significant risks are mitigated and that the controls designed to achieve these objectives are in place and operating efficiently. The ICF forms the basis for the confirmation by the Chief Executive to the Audit Board that the main risks have been identified and mitigated.
The description of risks, control objectives and agreed improvements as described in the ICF is reviewed by Internal Audit, which, on the basis of the audits performed and the follow-up on agreed action plans, expresses an opinion on the effectiveness of EIF’s internal control system, risk management and internal administration.
The third layer includes both internal and external audit, activities which are coordinated by the Audit Board. The Audit Board, as an oversight body, conducts its activity in accordance with the standards of the audit profession and relies on both internal and external audit assurances in order to confirm annually that, to the best of its knowledge and judgement, the operations of EIF have been carried out in compliance with the Statutes and
9.5. AUDIT AND CONTROLS
81
CHAPTER 9GOVERNANCE
the Rules of Procedure, and that the financial statements give a true and fair view of the financial position of EIF as regards its assets and liabilities, and of the results of its operations for the financial year under review. This information is included in the annual report submitted by the Board of Directors to EIF’s Annual General Meeting.
In order to discharge its duty in relation to the financial statements, the Audit Board may have recourse to external auditors. The audit of the financial statements of the Fund for the year ending 31 December 2016 was carried out by the external auditor, KPMG. While performing the audit of the annual accounts, KPMG undertakes to maintain its independence in accordance with the Code of Professional Ethics adopted in Luxembourg by the Commission de Surveillance du Secteur Financier (CSSF). KPMG performs its audits in accordance with the International Standards on Auditing (ISA) and is committed to inform EIF of any material weaknesses in the design or implementation of internal control over financial information that come to its attention during the audit of financial statements.
Internal Audit (which is outsourced to EIB Internal Audit) examines and evaluates the relevance, design and effectiveness of the internal control systems and procedures within EIF. To that end, a rolling three-year audit plan covering all key operational activities of EIF is implemented, on the basis of a risk-assessment methodology, in alignment with the ICF. The plan is
discussed with the Executive Management and external auditor prior to submission for approval to the Audit Board. Internal Audit examines all EIF’s activities in order to provide reasonable assurance to the Executive Management that EIF is operating properly and efficiently and reports on its findings by means of agreed action plans or recommendations to improve control and working procedures.
The Head of Internal Audit reports annually on the execution of the internal audit programme to the Executive Management, the Audit Board and the Chairman of the Board of Directors. Internal Audit adheres to the professional and ethical guidance issued by the Institute of Internal Auditors and the Information Systems Audit and Control Association, and is subject to a quality assurance and improvement programme that covers all aspects of the internal audit activity. Moreover, internal auditors shall comply with the internal policy statements governing their actions.
In addition to the maintenance of an internal control environment in line with the highest standards of the financial and banking sector, EIF is subject to periodical and sector-specific reviews by independent control bodies such as the European Court of Auditors (ECA), the Internal Audit Service of the European Commission and national or regional authorities entrusted with the task of monitoring the correct utilisation of funds under the relevant rules and within their respective remits.
82
EIF ANNUAL REPORT 2016
EIF’s mission is supported through a robust and coherent approach to risk management which seeks to ensure the highest quality standards for its operations and the best corporate rating from the major rating agencies.
Risk management is embedded in EIF’s corporate culture and is based on the so-called “three-lines-of-defence” model, which permeates all areas of EIF’s business functions and processes. These are: first line – front office; second line – independent risk management and compliance; and third line – internal and external audit.
Accordingly, in 2016 EIF continued to strengthen its Risk Management department in the three core areas of its activity, including operations risk, corporate risk and compliance.
This enhanced structure aims to address the rapid developments in the field of EIF’s operations and at considering its specific business focus as well as its position as international financial institution, multilateral development bank and risk finance provider to European SMEs.
More specifically, it allows for a comprehensive view on risk management through a thorough assessment of financial and non-financial risks in a business environment where non-financial, in particular reputational, risk has gained significant importance and become more inter- linked with the risks related to the financial positions of the organisation.
COMPLIANCE
EIF’s compliance risk assessment strives to protect the institution against risks which could have an adverse effect on its reputation. Under the terms of its Compliance Charter, the compliance team assesses - in line with best market practices and in line with the EIB Group’s policy framework – the (i) institutional, (ii) transactional and (iii) conduct aspects of EIF’s compliance risk.
Ensuring the independence of the compliance risk assessment, as a matter of best practice, is a key requirement for any financial institution. In EIF, the principle of independence is included in the EIF Compliance Charter and it materialises through the unrestricted direct access of the Head of Compliance to the Chief Executive, the Deputy Chief Executive, the Board of Directors and the Audit Board.
With the adoption of the OECD Action Plan on Base Erosion and Profit Shifting (BEPS) by the G20 in October 2015, and of various policy initiatives and actions launched at EU level, the fight against tax evasion and tax avoidance has become a prominent goal. EIF is committed to contribute to the efforts of the International Community in this regard and hence its compliance risk assessment of counterparty structures was enhanced. EIF reinforced its compliance risk control framework through additional controls focusing on the structure of the proposed operations.
CORPORATE AND OPERATIONS RISK MANAGEMENT
The Corporate Risk Management division dedicates its attention to overall corporate risks, including, in particular, operational risk, mandate risk management and treasury risk. It also takes care of EIF’s obligations within the EIB Group’s risk reporting and risks related to the principles of Corporate Social Responsibility (CSR).
The Operations Risk Management division assesses and monitors the financial risks related to all EIF operations. In this context, for each operation an independent risk opinion is issued, which evaluates and rates the financial risk of such operation and identifies risk mitigating factors. Financial and non-financial risks in EIF operations are subject to a risk surveillance process.
9.6. RISK MANAGEMENT
83
CHAPTER 9GOVERNANCE
EIF is supported by a strong in-house legal team whose remit, within its area of responsibility, is to pursue the strategic goals and protect and preserve the legal integrity of the Fund. This is achieved through the provision of legal advice based on the expertise and specialist knowledge of the team throughout the lifecycle of all EIF’s transactional activities and in connection with institutional, strategic and policy-related matters, a dual objective which is reflected in the legal team’s internal structure.
With regard to transactions, in order to address increasing business volumes and the strategic goal of achieving performance gains through specialisation, the transactions team is split into two divisions, one focused on debt transactions and the other on equity transactions.
The legal service's transaction teams work on all stages of transaction implementation, including (i) structuring and product development, (ii) review of proposals to the Investment and Risk Committee and EIF’s Board of Directors, (iii) contractual negotiations and (iv) active portfolio management, in each case in close collaboration with other EIF services.
The legal service's proactive approach to identifying and preventing legal risk is a key element in the development and structuring of transactions of varying complexity, as well as in the conception of new products and mandates. Following the conclusion of contracts, Legal provides support in the post-signature management
of the existing EIF portfolio. It is also active in maintaining an up-to-date view of the EU legislation that is relevant across the scope of EIF’s activities.
In terms of institutional and corporate matters, the legal service supports the implementation of good corporate governance, coordinates and advises on contractual arrangements at institutional level. The legal service aims to ensure that EIF conducts its activities in accordance with its Statutes, mission and values, applicable law and relevant contractual obligations. It further aims to ensure a smooth functioning of EIF’s corporate bodies, under the coordination of the EIF’s Secretary General. As a European Union body, a member of the EIB Group and a financial institution, institutional matters concerning EIF include a wide range of areas and at times necessitate cooperation with EIF’s shareholders as well as specific and proactive attention to the development of EU policy, and legislative and governance frameworks.
In addition, the legal service is called upon to advise on numerous structuring, corporate, governance and regulatory matters relating to third party mandates, including external structures (funds-of-funds), for which EIF acts as manager and/or adviser. In order to create the necessary interface between EIF’s institutional role, its mandate management activity and transaction delivery, the activities of the transactions and the corporate and institutional teams are closely coordinated with the aim of providing seamless advice and expertise across EIF’s business.
9.7. LEGAL SERVICE
84
EIF ANNUAL REPORT 2016
European Investment Fund37B, avenue J. F. KennedyL - 2968 Luxembourg
3 +352 2485-15 +352 2485-81200U [email protected] www.eif.org
EIF also has offices in Athens, Bratislava, Bucharest, Istanbul, Madrid, Rome, Sofia and Vilnius
Europe Direct is a service to help you find answers to your questions about the European UnionFreephone: 00 800 67 89 10 11
Additional information is also available on the internet: http://europa.eu
Management team picture by: Blitz agency s.à r.l., Luxembourg
Case study images were mostly provided by the supported companies unless otherwise stated. Copyrights belong to the respective companies or the authors listed below: Enevo - ©Eeva Anundi; Brújula - ©Kamal Fotografia; Gécos - ©istockphoto.com; ©Walltopia - ©Joe Segreti Photography.
ISBN 978-92-861-3157-8ISSN 1725-5392DOI 10.2868/796844
CONTACTS AND REFERENCES
Disclaimer: Numbers in the EIF Annual Report 2016 are correct as at 31 December 2016 and any references to figures throughout the text apply to the same period unless otherwise stated.
EIF's 2016 figures related to SME outreach and employment including the estimated numbers on sustained jobs and employment are indicative only and are based on reports received from financial intermediaries between 30 September 2015 and 30 September 2016. EIF assumes no liability for the accuracy thereof.
Copyright European Investment Fund, 2017Reproduction is authorised provided the source is acknowledged
Printed by Imprimerie Centrale on Condat Silk paper using vegetable oil-based inks. Certified in accordance with Forest Stewardship Council (FSC) rules, the paper consists of 100% virgin fibre (of which at least 50% from well-managed forests).

© EIB 03/2017 print: QY-AA-17-001-EN-C ISBN 978-92-861-3157-8 ISSN 1725-5392 doi:10.2868/796844 © EIB GraphicTeamdigital: QY-AA-17-001-EN-N ISBN 978-92-861-3158-5 ISSN 2363-4103 doi:10.2868/88192
European Investment Fund37B, avenue J. F. KennedyL - 2968 Luxembourg3 +352 2485-15 +352 2485-81200U www.eif.org – [email protected]
EIF ANN
UAL REPORT 2016
EIF FINAN
CIAL STATEM
ENTS 2016
2016FINANCIAL STATEMENTS
SUPPORTING SMART, SUSTAINABLE AND INCLUSIVE GROWTH FOR SMEs

Disclaimer: EIF’s Financial Statements 2016 form an integral part of EIF’s Annual Report 2016.
EIF FINANCIAL STATEMENTS 2016

2
3
INDEPENDENT AUDITOR’S REPORT 4
STATEMENT BY THE AUDIT BOARD 5
STATEMENT OF FINANCIAL POSITION 6
STATEMENT OF COMPREHENSIVE INCOME 7
STATEMENT OF CHANGES IN EQUITY 8
CASH FLOW STATEMENT 9
NOTES TO THE FINANCIAL STATEMENTS 10
TABLE OF CONTENTS
4
EIF ANNUAL REPORT 2016
To the Audit Board of the European Investment Fund37B, avenue J.F. Kennedy L-2968 Luxembourg
REPORT OF THE REVISEUR D’ENTREPRISES AGREE
Following our appointment by the Audit Board, we have audited the accompanying financial statements of the European Investment Fund (hereafter “the Fund”), which comprise the statement of financial position as at 31 December 2016 and the statement of comprehensive income, statement of changes in equity and cash flow statement for the year then ended, and a summary of significant accounting policies and other explanatory information as set out on pages 6 to 59.
MANAGEMENT RESPONSIBILITY FOR THE FINANCIAL STATEMENTSThe Management is responsible for the preparation and fair presentation of these financial statements in accordance with International Financial Reporting Standards as adopted by the European Union and for such internal control as the Management determines is necessary to enable the preparation of financial statements that are free from material misstatement, whether due to fraud or error.
RESPONSIBILITY OF THE RÉVISEUR D’ENTREPRISES AGRÉÉOur responsibility is to express an opinion on these financial statements based on our audit. We conducted our audit in accordance with International Standards on Auditing as adopted for Luxembourg by the Commission de Surveillance du Secteur Financier. Those standards require that we comply with ethical requirements and plan and perform the audit to obtain reasonable assurance about whether the financial statements are free from material misstatement.
An audit involves performing procedures to obtain audit evidence about the amounts and disclosures in the financial statements. The procedures selected depend on the judgement of the Réviseur d’Entreprises agréé, including the assessment of the risks of material misstatement of the financial statements, whether due to fraud or error. In making those risk assessments, the Réviseur d’Entreprises agréé considers internal control
relevant to the entity’s preparation and fair presentation of the financial statements in order to design audit procedures that are appropriate in the circumstances, but not for the purpose of expressing an opinion on the effectiveness of the entity’s internal control. An audit also includes evaluating the appropriateness of accounting policies used and the reasonableness of accounting estimates made by the Management, as well as evaluating the overall presentation of the financial statements.
We believe that the audit evidence we have obtained is sufficient and appropriate to provide a basis for our audit opinion.
OPINIONIn our opinion, the financial statements give a true and fair view of the financial position of the European Investment Fund as of 31 December 2016, and of its financial performance and its cash flows for the year then ended in accordance with International Financial Reporting Standards as adopted by the European Union.
OTHER INFORMATIONThe Management is responsible for the other information. The other information comprises the information included in the annual report and the statement by the Audit Board but does not include the financial statements and our report of Réviseur d’Entreprises agréé thereon.Our opinion on the financial statements does not cover the other information and we do not express any form of assurance conclusion thereon.
In connection with our audit of the financial statements, our responsibility is to read the other information and, in doing so, consider whether the other information is materially inconsistent with the financial statements or our knowledge obtained in the audit or otherwise appears to be materially misstated. If, based on the work we have performed, we conclude that there is a material misstatement of this other information, we are required to report this fact. We have nothing to report in this regard.
Luxembourg, 8 March 2017KPMG Luxembourg
Société CoopérativeCabinet de révision agréé
M. Tabart
INDEPENDENT AUDITOR’S REPORT
5
FINANCIAL STATEMENTS
Luxembourg, 8 March 2017
THE AUDIT BOARD
Paolo Enrico Pernice Jacek Dominik Rudi Dries
The Audit Board, set up pursuant to article 22 of the Statutes of the European Investment Fund (“ElF” or the “Fund”),
■ acting in accordance with the customary standards of the audit profession,
■ having designated KPMG Luxembourg, Société coopérative cabinet de révision agréé as external auditor of the ElF pursuant to Art. 19 of the Rules of Procedure,
■ having studied the f inancial statements, which comprise the statement of f inancial position as at 31 December 2016 and the s tatement of comprehensive income, statement of changes in equity and cash flow statement for the year then ended, and a summary of significant accounting policies and other explanatory information as set out on pages 6 to 59 (“the Financial Statements”) and such documents which it deemed necessary to examine in the discharge of its duties,
■ having examined and discussed the report dated 8 March 2017 drawn up by KPMG Luxembourg, Société coopérative cabinet de révision agréé,
■ noting that this report gives an unqualified opinion on the Financial Statements of ElF for the financial year ending 31 December 2016,
■ having examined and discussed reports and opinions issued by EIF’s Internal Audit, Risk Management and Compliance and Operational Risk functions,
■ having received assurance from the Chief Executive in particular concerning the effectiveness of the internal control systems, risk management and internal administration,
considering Articles 17, 18 and 19 of the Rules of Procedure,
hereby confirms that to the best of its knowledge and judgement,
■ the operations of the Fund have been carried out in compliance with the formalities and procedures laid down in the Statutes and the Rules of Procedure;
■ the Financial Statements give a true and fair view of the financial position of the Fund as regards its assets and liabilities, and of the results of its operations for the financial year under review.
STATEMENT BY THE AUDIT BOARD
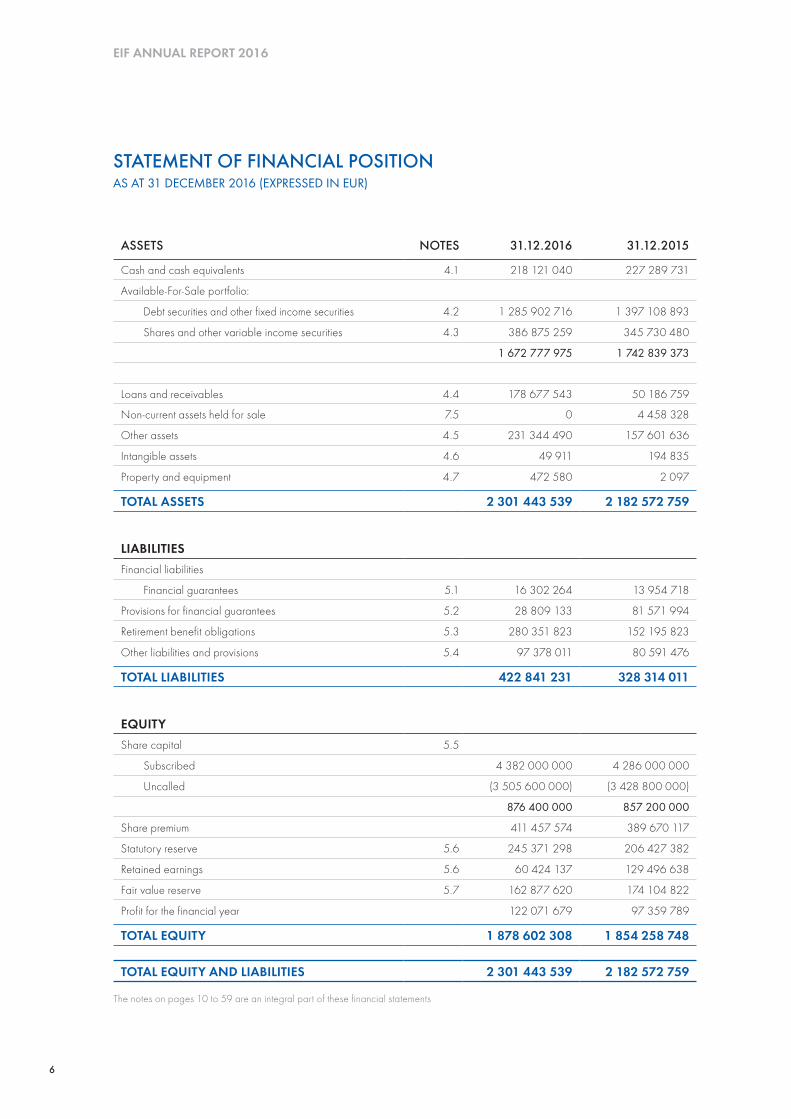
6
EIF ANNUAL REPORT 2016
ASSETS NOTES 31.12.2016 31.12.2015
Cash and cash equivalents 4.1 218 121 040 227 289 731
Available-For-Sale portfolio:
Debt securities and other fixed income securities 4.2 1 285 902 716 1 397 108 893
Shares and other variable income securities 4.3 386 875 259 345 730 480
1 672 777 975 1 742 839 373
Loans and receivables 4.4 178 677 543 50 186 759
Non-current assets held for sale 7.5 0 4 458 328
Other assets 4.5 231 344 490 157 601 636
Intangible assets 4.6 49 911 194 835
Property and equipment 4.7 472 580 2 097
TOTAL ASSETS 2 301 443 539 2 182 572 759
LIABILITIESFinancial liabilities
Financial guarantees 5.1 16 302 264 13 954 718
Provisions for financial guarantees 5.2 28 809 133 81 571 994
Retirement benefit obligations 5.3 280 351 823 152 195 823
Other liabilities and provisions 5.4 97 378 011 80 591 476
TOTAL LIABILITIES 422 841 231 328 314 011
EQUITYShare capital 5.5
Subscribed 4 382 000 000 4 286 000 000
Uncalled (3 505 600 000) (3 428 800 000)
876 400 000 857 200 000
Share premium 411 457 574 389 670 117
Statutory reserve 5.6 245 371 298 206 427 382
Retained earnings 5.6 60 424 137 129 496 638
Fair value reserve 5.7 162 877 620 174 104 822
Profit for the financial year 122 071 679 97 359 789
TOTAL EQUITY 1 878 602 308 1 854 258 748
TOTAL EQUITY AND LIABILITIES 2 301 443 539 2 182 572 759
The notes on pages 10 to 59 are an integral part of these financial statements
STATEMENT OF FINANCIAL POSITIONAS AT 31 DECEMBER 2016 (EXPRESSED IN EUR)

7
FINANCIAL STATEMENTS
NOTES 31.12.2016 31.12.2015
Interest and similar income 7.1 25 612 606 25 648 769
Income from investments in shares and other variable income securities 23 248 430 13 164 054
Net gain from financial guarantee operations 7.2 46 694 622 49 560 750
Commission income 7.3 138 901 512 103 136 454
Net gain/(loss) on financial operations 7.4 1 841 171 9 474 214
Net result from financial instruments at fair value through profit or loss 4.3 116 123 2 743 378
Other operating income 7.5 3 254 832 437 378
General administrative expenses 7.6
Staff costs:
- wages and salaries (47 012 680) (38 269 174)
- social security and contribution costs (34 235 959) (29 828 904)
(81 248 639) (68 098 078)
Other administrative expenses (31 070 022) (25 321 728)
(112 318 661) (93 419 806)
Depreciation and amortisation 4.6, 4.7 (205 093) (546 678)
Impairment losses on available-for-sale investments 4.3 (5 073 863) (2 788 608)
Impairment losses on loans and receivables 4.4 0 (10 050 116)
PROFIT FOR THE FINANCIAL YEAR 122 071 679 97 359 789
Other comprehensive income
- Net change in fair value of available-for-sale financial assets (12 037 459) 25 909 772
- Net change in fair value of available-for-sale financial assets
transferred to profit/(loss) 810 257 (11 488 726)
- Re-measurement of defined benefit obligation not
reclassified subsequently to profit/(loss) (103 148 832) 28 938 000
(114 376 034) 43 359 046
TOTAL COMPREHENSIVE INCOME FOR THE FINANCIAL YEAR 7 695 645 140 718 835
The notes on pages 10 to 59 are an integral part of these financial statements
STATEMENT OF COMPREHENSIVE INCOMEFOR THE YEAR ENDED 31 DECEMBER 2016 (EXPRESSED IN EUR)
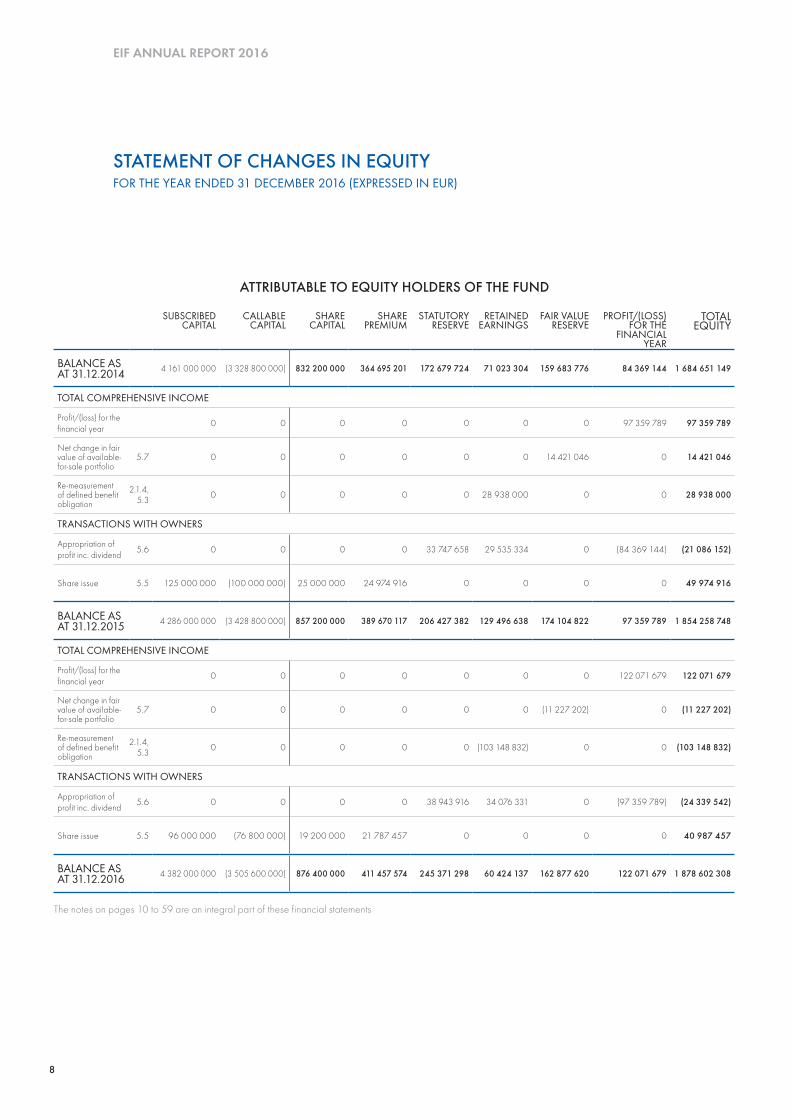
8
EIF ANNUAL REPORT 2016
SUBSCRIBED CAPITAL
CALLABLECAPITAL
SHARECAPITAL
SHARE PREMIUM
STATUTORYRESERVE
RETAINEDEARNINGS
FAIR VALUERESERVE
PROFIT/(LOSS) FOR THE
FINANCIAL YEAR
TOTAL EQUITY
BALANCE AS AT 31.12.2014 4 161 000 000 (3 328 800 000) 832 200 000 364 695 201 172 679 724 71 023 304 159 683 776 84 369 144 1 684 651 149
TOTAL COMPREHENSIVE INCOME
Profit/(loss) for the financial year 0 0 0 0 0 0 0 97 359 789 97 359 789
Net change in fair value of available-for-sale portfolio
5.7 0 0 0 0 0 0 14 421 046 0 14 421 046
Re-measurement of defined benefit obligation
2.1.4, 5.3 0 0 0 0 0 28 938 000 0 0 28 938 000
TRANSACTIONS WITH OWNERS
Appropriation of profit inc. dividend 5.6 0 0 0 0 33 747 658 29 535 334 0 (84 369 144) (21 086 152)
Share issue 5.5 125 000 000 (100 000 000) 25 000 000 24 974 916 0 0 0 0 49 974 916
BALANCE AS AT 31.12.2015 4 286 000 000 (3 428 800 000) 857 200 000 389 670 117 206 427 382 129 496 638 174 104 822 97 359 789 1 854 258 748
TOTAL COMPREHENSIVE INCOME
Profit/(loss) for the financial year 0 0 0 0 0 0 0 122 071 679 122 071 679
Net change in fair value of available-for-sale portfolio
5.7 0 0 0 0 0 0 (11 227 202) 0 (11 227 202)
Re-measurement of defined benefit obligation
2.1.4, 5.3 0 0 0 0 0 (103 148 832) 0 0 (103 148 832)
TRANSACTIONS WITH OWNERS
Appropriation of profit inc. dividend 5.6 0 0 0 0 38 943 916 34 076 331 0 (97 359 789) (24 339 542)
Share issue 5.5 96 000 000 (76 800 000) 19 200 000 21 787 457 0 0 0 0 40 987 457
BALANCE AS AT 31.12.2016 4 382 000 000 (3 505 600 000) 876 400 000 411 457 574 245 371 298 60 424 137 162 877 620 122 071 679 1 878 602 308
The notes on pages 10 to 59 are an integral part of these financial statements
ATTRIBUTABLE TO EQUITY HOLDERS OF THE FUND
STATEMENT OF CHANGES IN EQUITYFOR THE YEAR ENDED 31 DECEMBER 2016 (EXPRESSED IN EUR)
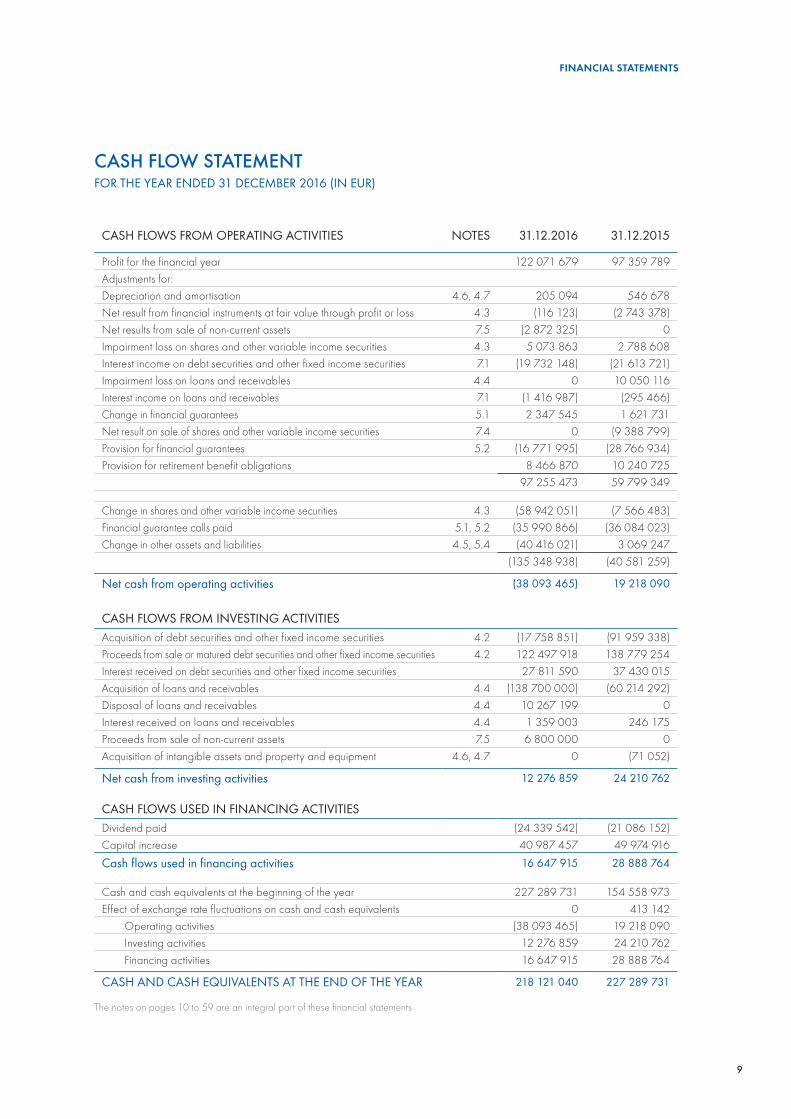
9
FINANCIAL STATEMENTS
CASH FLOWS FROM OPERATING ACTIVITIES NOTES 31.12.2016 31.12.2015
Profit for the financial year 122 071 679 97 359 789Adjustments for: Depreciation and amortisation 4.6, 4.7 205 094 546 678Net result from financial instruments at fair value through profit or loss 4.3 (116 123) (2 743 378)Net results from sale of non-current assets 7.5 (2 872 325) 0Impairment loss on shares and other variable income securities 4.3 5 073 863 2 788 608Interest income on debt securities and other fixed income securities 7.1 (19 732 148) (21 613 721)Impairment loss on loans and receivables 4.4 0 10 050 116Interest income on loans and receivables 7.1 (1 416 987) (295 466)Change in financial guarantees 5.1 2 347 545 1 621 731Net result on sale of shares and other variable income securities 7.4 0 (9 388 799)Provision for financial guarantees 5.2 (16 771 995) (28 766 934)Provision for retirement benefit obligations 8 466 870 10 240 725
97 255 473 59 799 349
Change in shares and other variable income securities 4.3 (58 942 051) (7 566 483)Financial guarantee calls paid 5.1, 5.2 (35 990 866) (36 084 023)Change in other assets and liabilities 4.5, 5.4 (40 416 021) 3 069 247
(135 348 938) (40 581 259)
Net cash from operating activities (38 093 465) 19 218 090
CASH FLOWS FROM INVESTING ACTIVITIESAcquisition of debt securities and other fixed income securities 4.2 (17 758 851) (91 959 338)Proceeds from sale or matured debt securities and other fixed income securities 4.2 122 497 918 138 779 254Interest received on debt securities and other fixed income securities 27 811 590 37 430 015Acquisition of loans and receivables 4.4 (138 700 000) (60 214 292)Disposal of loans and receivables 4.4 10 267 199 0Interest received on loans and receivables 4.4 1 359 003 246 175Proceeds from sale of non-current assets 7.5 6 800 000 0Acquisition of intangible assets and property and equipment 4.6, 4.7 0 (71 052)
Net cash from investing activities 12 276 859 24 210 762
CASH FLOWS USED IN FINANCING ACTIVITIESDividend paid (24 339 542) (21 086 152)Capital increase 40 987 457 49 974 916
Cash flows used in financing activities 16 647 915 28 888 764
Cash and cash equivalents at the beginning of the year 227 289 731 154 558 973Effect of exchange rate fluctuations on cash and cash equivalents 0 413 142
Operating activities (38 093 465) 19 218 090Investing activities 12 276 859 24 210 762Financing activities 16 647 915 28 888 764
CASH AND CASH EQUIVALENTS AT THE END OF THE YEAR 218 121 040 227 289 731
The notes on pages 10 to 59 are an integral part of these financial statements
CASH FLOW STATEMENTFOR THE YEAR ENDED 31 DECEMBER 2016 (IN EUR)
10
EIF ANNUAL REPORT 2016
1. GENERAL
The EUROPEAN INVESTMENT FUND (hereafter the “Fund” or “EIF”) was incorporated on 14 June 1994, in Luxembourg, as an international financial institution. The address of its registered office is 37B, avenue J.F. Kennedy, L-2968 Luxembourg.
The task of the Fund shall be to contribute to the pursuit of the objectives of the European Union. The Fund shall pursue this task through activities consisting of:
■ The provision of guarantees as well as of other comparable instruments for loans and other financial obligations in whatever form is legally permissible,
■ The acquisition, holding, managing and disposal of participations in any enterprise subject to the conditions laid down in paragraph 2 (i) of Article 12 of EIF’s Statutes (“the Statutes”).
In addit ion, the Fund may engage in other activit ies connected with or resulting from these tasks as set out in Article 2 of the Statutes. The activities of the Fund may include borrowing operations.
The activities of the Fund shall be based on sound banking principles or other sound commercial principles and practices as applicable. Without prejudice to the provisions of Article 28, the said activities shall be pursued in close co-operation between the Fund and its founder members or between the Fund and its actual members at the relevant time, as the case may be.
The Fund operates as a partnership whose members are the European Investment Bank (hereafter the “EIB”), the European Union, represented by the European Commission (the “Commission”), and a group of financial institutions of Member States of the European Union and of a candidate country. The members of the Fund shall be liable for the obligations of the Fund only up to the amount of their share of the capital subscribed and not paid in.
The financial year of the Fund runs from 1 January to 31 December each year.
The EIB has a majorit y shareholding in the Fund. Consequently the Fund is included in the consolidated financial statements of the EIB Group. The consolidated financial statements are available at the registered office of the EIB at 98-100, boulevard Konrad Adenauer, L-2950 Luxembourg.
2. SIGNIFICANT ACCOUNTING POLICIES AND BASIS OF PREPARATION
2.1 Basis of preparation
2.1.1 Statement of compliance
The Fund’s financial statements have been prepared in accordance with International Financial Reporting Standards (IFRS), as issued by the International Accounting Standards Board (IASB), as endorsed by the European Union.
The Fund’s financial statements have been authorised for issue by the Board of Directors on 8 March 2017.
2.1.2 Basis of measurement
The financial statements have been prepared on an historical cost basis except for the following material items in the statement of financial position:
■ available-for-sale financial assets which are measured at fair value
■ financial instruments held at fair value through profit or loss
■ the defined benefit liability is recognised as the present value of expected future payments.
■ Financial guarantees are measured at the higher of the amount initially recognised i.e. Net present value (“NPV”) less, where appropriate cumulative amortisation and the provision amount in accordance with IAS 37.
NOTES TO THE FINANCIAL STATEMENTSFOR THE YEAR ENDED 31 DECEMBER 2016
11
FINANCIAL STATEMENTS
2.1.3 Use of estimates and judgments
The preparation of financial statements in accordance with IFRS requires the use of certain critical accounting estimates. It also requires management to exercise its judgment when applying the Fund’s policies. Use of available information and application of judgment are inherent in the formation of estimates. Actual results in the future could differ from such estimates and the differences may be material to the financial statements.
Estimates and underlying assumptions are reviewed on an ongoing basis. Revisions to accounting estimates are recognised in the period in which the estimates are revised and in any future periods affected.
Information about significant areas of estimation uncertainty and critical judgments in applying accounting policies that have the most significant effect on the amounts recognised in the financial statements are described in notes 2.3, 2.8 and 3.
Judgments and estimates are principally made in the following areas:■ Determination of fair value of equity investments as
disclosed in note 2.3.2;■ Impairment of available- for-sale equity and debt
investments, as disclosed in notes 2.3.1 and 2.3.2;■ Impairment of loans and receivables, as disclosed in
note 2.4;■ Determination of provisions and liabilities for financial
guarantees;■ Actuaries’ assumptions related to the measurement
of pension liabilities and post-retirement benefits as described in note 5.3;
■ Determination of control over investees as described in note 2.3.4;
■ Determination and disclosures of unconsolidated structured entities and investment entities in which the Fund has an interest as described in note 6.
In respect of unconsolidated structured entities and investment entities in which the Fund has an interest, further disclosures are described in note 6.
Regarding EIF’s exposure to the United Kingdom, EIF is monitoring the developments of the political situation in the United Kingdom, specifically as regards the consequences
of the referendum on the UK’s continued EU membership held on 23 June 2016 and the approval by the UK House of Commons of a bill authorising the notification of the UK’s decision to withdraw from the EU on 8 February 2017. In this context, it has been assessed that these events have not materially affected the financial position and performance of the Fund as at 31 December 2016. The Fund will continue to monitor the evolution of the situation and the possible impact on its financial statements as necessary.
2.1.4 Changes in accounting policies and presentation
The accounting policies adopted have been applied consistently with those used in the previous year.
2.1.5 Foreign currency translation
The Euro (EUR) is the functional and presentation currency. Depending on the classification of a non-monetary f inancial asset, exchange dif ferences are ei ther recognised in the profit or loss or within equity.
Non-monetary items are reported using the exchange rate at the date of the transaction (historical cost). Exchange differences on non-monetary financial assets are a component of the change in their fair value. Non-monetary items measured at fair value in a foreign currency are translated using the exchange rates at the date when the fair value is determined.
Monetary items, which include all other assets and liabilities expressed in a currency other than EUR are reported using the closing exchange rate prevailing at the reporting date of the financial statements, as issued by the European Central Bank. Exchange differences are recognised in the profit or loss in the year in which they arise.
Income and charges in foreign currencies are translated into EUR at the exchange rate prevailing at the date of the transaction.
2.2 Cash and cash equivalents
Cash and cash equivalents comprise short term, highly liquid securities and interest-earnings deposits with short maturities of three months or less.
12
EIF ANNUAL REPORT 2016
2.3 Available-For-Sale portfolio
2.3.1 Classification and Measurement
ClassificationExcept for investment in joint ventures (see note 2.3.4), the Fund classifies its investments in the Available-For-Sale category (hereafter “AFS”). The classification of the investments is determined at initial recognition.
Initial recognition and derecognitionPurchases and sales are initially recognised on trade date at fair value plus transaction costs. Fair value consideration is explained in the section below.
Financial assets are derecognised when the right to receive cash flows from the financial assets has expired or when EIF has substantially transferred all risks and rewards of ownership.
Subsequent measurementThe financial assets are subsequently measured at fair value, and any changes in fair value are directly recognised in other comprehensive income, until the financial asset is derecognised or impaired. At this time, the cumulative gain or loss previously recognised in equity is recognised in the profit or loss.
Impairment of financial assetsEIF assesses at each statement of financial position date whether there is objective evidence that a financial asset or a group of financial assets is impaired. If any such evidence exists, the cumulative loss – measured as the difference between the acquisition cost and the current fair value, less any impairment loss on that financial asset previously recognised in the profit or loss – is removed from equity and recognised in the profit or loss. For equity securities, a significant and/or prolonged decline in the fair value of the security below its cost is considered in determining whether the securities are impaired.
Impairment losses on equity instruments previously recognised in the profit or loss are not reversed through the profit or loss. In contrast, if in a subsequent year, the fair value of a debt instrument classified as AFS increases and the increase can be objectively related to an event occurring after the impairment loss was recognised, the impairment loss is reversed through the profit or loss.
2.3.2 Shares and other variable income securities
2.3.2.1 Investments in private equity funds
Investments in private equity funds are included in “Shares and other variable income securities”. They are acquired for a long term in the normal course of the Fund’s activities.
a) Fair value measurement:Private equity (PE) investments are classified as “Available-for-Sale” and measured at fair value through equity and disclosed in accordance with the fair value hierarchy required by IFRS 13 as described in note 3.6. Given the nature of PE, market prices are often not readily available and in the absence of these, valuation techniques (level 3 according to the fair value hierarchy) are applied. For the valuation of PE the Fund further breaks down these valuation techniques into three categories as follows:■ Category A - funds that have adopted the fair value
requirements of IAS 39 or International Private Equity and Venture Capital guidelines (IPEVC). The fair value is calculated by applying the aggregated Net Asset Value (NAV) method. This valuation method implicitly assumes that if the NAVs of underlying funds can be considered as equivalent to the fair value as determined under IAS 39, then the aggregation of the NAVs of all funds will itself be equivalent to the fair value as determined under IAS 39.
■ Category B - funds that have adopted other valuation guidelines (such as the former 2001 European Venture Capital Association (EVCA) guidelines) or standards that can be considered as in line with IAS 39 from which an equivalent NAV can be calculated.
■ Category C – funds that have not adopted the fair value requirements of IAS 39 or any other valuation guidelines complying with IAS 39. These investments are valued at cost less impairment.
Although it is assumed for category A and B that the NAV is a reliable estimation of the fair value and a specific review is performed, it must be stated that underlying investments have been estimated in the absence of readily ascertainable market values. Because of the inherent uncertainty of valuation and current market conditions, actual results in the future could differ from the fund manager’s estimate of values and the difference may be material to the financial statements.
13
FINANCIAL STATEMENTS
The fair value is determined by applying either the Fund’s percentage ownership in the underlying vehicle to the net asset value reflected in the most recent report adjusted for cash flows or, where available, the precise share value at the same date, submitted by the respective fund manager. In order to bridge the interval between the last available NAV and the year-end reporting, a subsequent event review procedure is performed and if necessary the reported NAV is adjusted.
b) Impairment considerations:Shares and other variable income securities are assessed for objective evidence of impairment. Impairment losses are only recognised if there is objective evidence of impairment as a result of one or more events that have occurred. On each official reporting date, EIF analyses unrealised losses so as to determine whether they should be recognised as impairment losses in the profit or loss or as changes in the fair value reserve.
In addition, EIF defines quantitative thresholds for assessing what is significant and what is prolonged which allows the classification of the funds as follows:■ funds with no indication of impairment;■ funds with an indication of potential impairment which
are reviewed for impairment by the Investment and Risk Committee;
■ funds showing objective evidence of impairment
For impaired investments in category C the amount of impairment is calculated based on a matrix of fixed impairment percentages in tranches of 25% depending on the operational and performance grading of the respective funds.
2.3.2.2 Investments other than in private equity funds
Investments other than in private equity funds classified in “Shares and other variable income securities” are composed of EIF’s senior tranche exposure into the European Fund for Strategic Investments through the sub-window 2 of the equity platform.
a) Fair value measurementInvestments other than in private equity funds are classified as “Available-for-Sale” and measured at fair value through equity and disclosed in accordance with the fair value hierarchy required by IFRS 13 as described in note 3.6. Given the nature of EIF’s senior tranche exposure,
valuation technique (level 3) according to the fair value hierarchy” are applied. The fair value is composed of the net paid in representing the drawdonws paid net of any repayment and of the 2.5% of internal rate return expected on the underlying port folio calculated in arear. At each reporting date, the internal rate return is reviewed and adjusted according to the performance of the underlying investments.
b) Impairment considerationsThe sub window 2 of the equity plat form shall be considered as securitisation transaction into which there is a junior risk taker and two senior risk takers. As such, impairment losses are only recognised if there is objective evidence of impairment as a result of one or more events that have occurred and if the junior tranche is fully impaired. On each official reporting date and considering the junior tranche, EIF analyses first unrealised losses at the level of the underlying investments with the approach of compensating such unrealised losses with unrealised gains so as to determine whether they should be recognised as impairment losses in the profit or loss.
2.3.3 Debt securities and other fixed income securities
Securities held by the Fund are mainly quoted on an active market. Consequently, the fair value of financial instruments is based on bid prices at the statement of financial position date.
Premiums paid over the maturity value and discounts received in comparison to the maturity value of securities are recognised in profit or loss over the expected life of the instrument through the use of the effective interest rate method.
2.3.4 Interests in joint ventures and associates
EIF complies with the conditions necessary to use the venture capital organisations and similar entities measurement exemption included in IFRS 11 and IAS 28 (11) and consequently decides not to use equity accounting in respect of any investments in joint ventures or associates: upon initial recognition, holdings in the joint ventures or associates are designated as at fair value through the profit or loss, and measured subsequently at fair value in accordance with IAS 39, with changes in fair value recognised in the profit or loss during the year of the change.
14
EIF ANNUAL REPORT 2016
Joint ventures are contractual agreements whereby EIF and other parties undertake an economic activity that is subject to joint control. Joint control is the contractually agreed sharing of control over an economic activity, and exists only when the strategic, financial and operating decisions relating to the activity require the unanimous consent of the parties sharing the control (the venturers).The shares acquired by EIF for its own account or on behalf of its mandate providers typically represent investments in private equity or venture capital funds. According to industry practice, such investments are generally investments subscribed to by a number of investors, none of whom is in a position to individually influence the daily operations and the investment activity of such funds. As a consequence, any membership by an investor in a governing body of such a fund does not, in principle, entitle said investor to influence the day-to-day operations of the fund. In addition, individual investors in a private equity or a venture capital fund do not determine policies of a fund such as distribution policies on capital repayments or other distributions. Such decisions are typically taken by the management of a fund on the basis of the shareholders’ agreement governing the rights and obligations of the management and all shareholders of the fund. The shareholders’ agreement also generally prevents individual investors from bilaterally executing material transactions with the fund, interchanging managerial personnel or obtaining privileged access to essential technical information.
EIF’s investments, made for its own account or on behalf of its mandate providers, are executed in line with the aforementioned industry practice. In addition, the Fund is exposed to variability of returns from these investments. Therefore, in considering whether it has control, the Fund considers whether it manages key decisions that most significantly affect these investments’ returns. As a result and according to IFRS 10, the Fund has concluded that it does not control those vehicles.
2.4 Loans and receivables
ClassificationThese investments consist of Asset-backed Securities with SME loans in the underlying portfolios which take the form of notes issued by Special Purpose Vehicles (SPV) or financial institutions. They are classified in the “Loans and
receivables” category (hereafter “L&R”). The classification is determined at initial recognition.
Initial recognition and derecognitionPurchases and sales are initially recognised on trade date at fair value plus transaction costs. Fair value corresponds to the consideration paid.
Financial assets are derecognised when the right to receive cash flows from the financial assets has expired or when EIF has substantially transferred all risks and rewards of ownership.
Subsequent measurementThe investments are subsequently measured at amortised cost, using the effective interest rate method. The effective interest rate is the rate that exactly discounts estimated future cash payments or receipts through the expected life of the financial instrument to the net carrying amount of the financial asset.
ImpairmentEIF assesses at each statement of financial position date whether there is any objective evidence of impairment. Impairment losses are recognised only if there is objective evidence as a result of one or more events that occurred after the initial recognition of the asset. The amount of the loss is measured as the difference between the asset’s carrying amount and the present value of estimated cash flows discounted at the financial asset’s original effective interest rate.
If, in a subsequent period, the amount of the impairment loss decreases due to an event occurring after the impairment was originally recognised, the previously recognised impairment loss is reversed through the profit or loss.
2.5 Financial guarantee operations
Financial guarantee contracts are contracts that require EIF to make specified payments to reimburse the holder for a loss it incurs because a specified debtor fails to make payments when due in accordance with the terms of a debt instrument.
Financial guarantees are initially recognised at fair value plus transaction costs that are directly attributable to the

15
FINANCIAL STATEMENTS
issuance of the financial guarantees. At initial recognition the obligation to pay corresponds to the Net Present Value (NPV) of expected premium inflows. EIF has developed a model to estimate the NPV. This calculation is performed at the starting date of each transaction
Subsequent to initial recognition, financial guarantees are measured at the higher of:
■ the amount determined in accordance with IAS 37 Provisions, Contingent Liabilities and Contingent Assets;or
■ the amount initially recognised i.e. NPV less, where appropriate, cumulative amortisation recognised in accordance with IAS 18 Revenue. EIF’s amortisation of the amount initially recognised is in line with the risk profile of the transactions, namely a linear amortisation over the first two-thirds of the Weighted Average Life (WAL) of the transaction, followed by a linear amortisation down to a minimum floor calculated as a one-year expected loss. The transaction is totally amortised following full repayment of a securitisation tranche.
The best est imate of expenditure is determined in accordance with IAS 37. Financial guarantee provisions correspond to the cost of settling the obligation, which is the expected loss, estimated on the basis of all relevant factors and information existing at the statement of financial position date.
Any increase or decrease in the liability relating to financial guarantees other than the payment of guarantee calls is recognised in the profit or loss under “Net result from financial guarantee operations”.
2.6 Other assets
Other assets include mainly the funds designated to cover the pension liability, accrued commission income and debtors and are accounted for at amortised cost.
2.7 Intangible assets, property and equipment
2.7.1 Intangible assets
Intangible assets are composed of internally generated software and purchased software, and are accounted for at cost net of accumulated amortisation and impairment losses.
Direct costs associated with the development of software are capitalised provided that these costs are separately identifiable, the software provides a future benefit to the Fund and the cost can be reliably measured. Maintenance costs are recognised as expenses during the year in which they occur. However costs to develop additional functionalities are recognised as separate intangible assets. Intangible assets are reviewed for indicators of impairment at the date of the statement of financial position. Intangible assets are amortised using the straight-line method over the following estimated useful lives:
Internally generated software: 3 years
Purchased software: 2 to 5 years
2.7.2 Property and equipment
Equipment is stated at cost less accumulated depreciation and impairment losses. Equipment is reviewed for indica-tions of impairment at the date of the statement of financial position.
Depreciation is calculated on a straight-line basis over the following estimated useful lives:
Fixtures and Fittings: 3 to 10 years
Office Equipment: 3 to 5 years
Computer Equipment and Vehicles: 3 years
Buildings: 30 years
2.7.3 Non-current assets held for sale
Non-current assets classified as held for sale include assets reclassified from investment property for which the sale is highly probable and the asset is available for immediate sale in its current condition. They are classified as held for sale as their carrying amount will be recovered through a sale transaction rather than through continuing use and are measured at the lower of carrying amount and fair value less costs to sell.
2.7.4 Impairment of non-financial assets
EIF assesses at each reporting date the carrying amounts of the non-financial assets to determine whether there is any indication of impairment. If any such indication exists, then the asset’s recoverable amount is estimated. If the carrying amount exceeds the estimated recoverable amount, impairment losses are recognised in the profit or loss.
16
EIF ANNUAL REPORT 2016
2.8 Employee benefits
2.8.1 Post-employment benefits
Pension fundEIF operates an unfunded pension plan of the defined benefit type, providing retirement benefits based on final salary. The cost of providing this benefit is calculated by the actuary using the projected unit credit cost method. The defined benefit liability is recognised as the present value of expected future payments.
Actuarial valuations involve making assumptions about discount rates, expected rates of return of assets, future salary increases, mortality rates and future pension increases. All assumptions are reviewed at each reporting date. Due to the long-term nature of this pension scheme, such estimates are subject to significant uncertainty.
Actuarial gains and losses arising from experience adjustments and changes in actuarial assumptions are debited or credited to equity in other comprehensive income in the period in which they arise.
The Fund’s defined benefit scheme was initiated in March 2003 to replace the previous defined contribution scheme. The scheme is financed by contributions from staff and the Fund. These amounts are transferred to the EIB for management with the EIB’s own assets and appear on the Fund’s statement of financial position as an asset under the heading “Other assets”.
The charge for the year, actuarial gains and losses, and the total defined benefit obligation are calculated annually by qualified external actuaries.
Optional supplementary provident schemeThe optional supplementary provident scheme is a defined contribution pension scheme, funded by voluntary staf f contributions and employer contributions. It is accounted for on the basis of the contributions from staff and employer and the corresponding liability is recorded in “Other liabilities”.
Health insurance schemeThe Fund has subscribed to a health insurance scheme with an insurance company for the benefit of staff at retirement age, financed by contributions from the
Fund and its employees. The entitlement is of a defined benefit type and is based on the employee remaining in service up to retirement age and on the completion of a minimum service period. The expected costs of this benefit are accrued over the period of employment, using a methodology similar to that for defined benefit pension plans. Health insurance liabilities are determined based on actuarial calculations, performed annually by qualified external actuaries.
2.8.2 Short-term employee benefits
Employee entitlements to short-term benefits are recognised when they accrue to employees. A provision is made for the estimated liability for any outstanding short-term benefit entitlement as a result of services rendered by employees up to the date of the statement of financial position.
2.8.3 Other long-term employee benefits
An accrual for other long-term employee benefit costs relating to the year is included in the profit or loss under the heading “Staff costs”, resulting in a provision for the estimated liability at the date of the statement of financial position.
2.9 Other liabilities and provisions
Other liabilities are classified according to the substance of the contractual arrangements entered into. Trade payables are non-interest bearing liabilities and are stated at amortised cost.
Provisions are recognised when the Fund has a present obligation, legal or constructive, as a result of a past event, and it is probable that the Fund will be required to settle that obligation.
2.10 Interest and similar income
Interest income and similar income is recognised in the profit or loss for all interest-bearing instruments on an accrual basis using the effective interest method based on the purchase price including direct transaction costs. This is a method of calculating the amortised cost of a financial asset and allocating the interest income over the relevant period. The effective interest rate is the rate that
17
FINANCIAL STATEMENTS
exactly discounts estimated future cash receipts through the expected life of the financial instrument to the net carrying amount of the financial asset.
2.11 Income from investment in shares and other variable income securities
Income from investment in shares and other variable income securit ies includes capital dividends and repayments which are recognised when EIF’s investment cost is fully reimbursed.
2.12 Net result from financial guarantee operations
Net result from financial guarantee operations includes:■ Guarantee premiums received; ■ Interest income on the discounting of the expected
premium inflows and any amortisation of the financial guarantees;
■ Valuation changes triggered by ratings downgrades / upgrades;
■ Changes in estimates of provisions for financial guarantees accounted for under IAS 37.
2.13 Commission income
This heading includes fees and commissions on mandates and advisory activities and excludes guarantee premiums.
Fees and commissions are recognised on an accrual basis when the service foreseen under an agreement has been provided. Portfolio and management advisory and service fees are recognised based on the applicable service contracts, usually on a pro-rata basis. Asset management fees related to investment funds are recognised over the period in which the service is provided.
2.14 Leases
The leases entered into by EIF as a lessee or a lessor, are operating leases under which all the risks and benefits of ownership are effectively retained by the lessor. Payments or receipts made under operating leases are recognised in the profit or loss in other administrative expenses or other operating income on a straight-line basis over the period of the lease.
When an operating lease is terminated before the lease period has expired, any payment required to be made to the lessor by way of penalty is recognised as an expense in the period in which termination takes place.
2.15 New standards and interpretations not yet adopted
The following IFRS and IFRIC interpretations applicable to EIF were issued but are not yet effective. The Fund has chosen not to early adopt these standards and interpretations. The Fund plans to adopt them at the date of endorsement by the European Union.
■ IFRS 9 – Financial instruments: This standard is the first step in a three-part project
by the IASB to replace IAS 39 financial instruments. This first part, dealing with the classification and measurement of f inancial assets, simplif ies the recognition of financial assets by requiring such assets to be measured at either amortised cost or fair value, depending on certain criteria. The standard is effective for annual reporting periods beginning on or after 1 January 2018, with early adoption permitted. The date of the adoption of this standard by the Fund will also be dependent on the timing of the EU endorsement process.
The Fund is in the process of analysing the impact of this standard on its operations.
■ IFRS 15 – Revenue from contracts with customers: IFRS 15 establishes a comprehensive framework for
determining whether, how much and when revenue is recognised. This standard will replace existing revenue recognition guidance including IAS 18 Revenue, IAS 11 Construction Contracts and IFRIC 13 Customer Loyalty Programmes. IFRS 15 will be effective for annual reporting periods beginning on or after 1 January 2018, with early adoption permitted. The date of the adoption of this standard by the Fund will also be dependent on the timing of the EU endorsement process.
The Fund is in the process of analysing the impact of this standard on its operations.
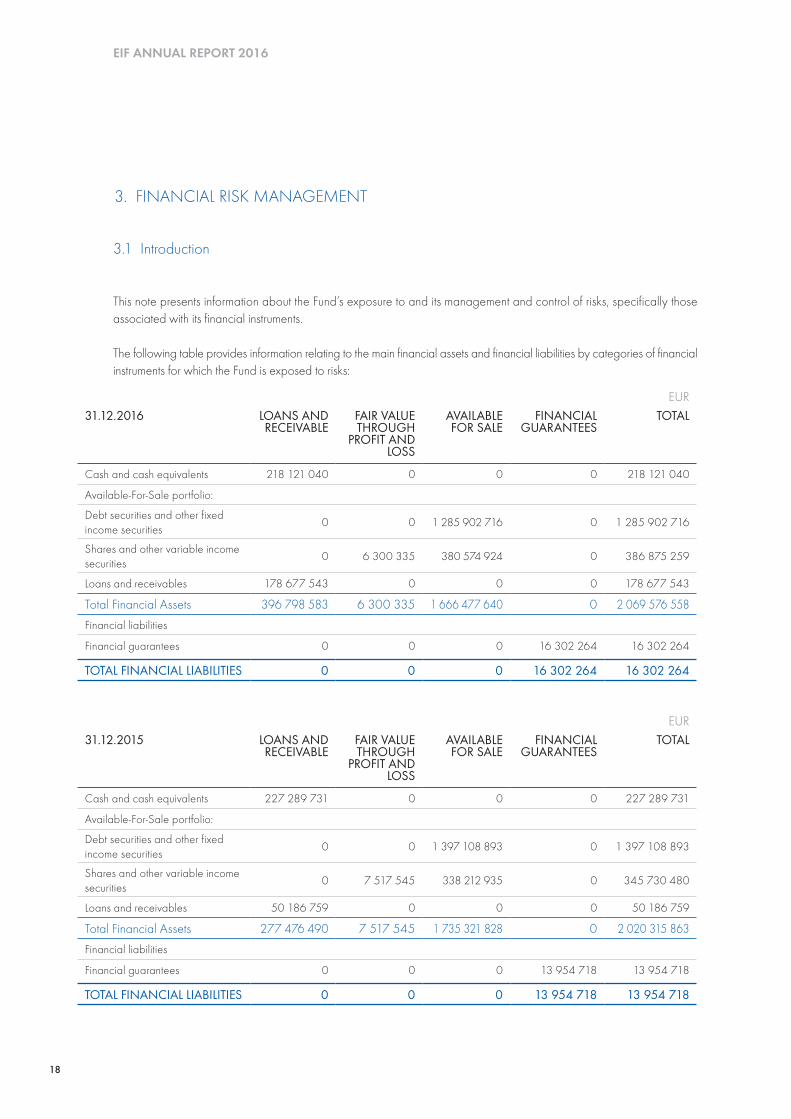
18
EIF ANNUAL REPORT 2016
3.1 Introduction
EUR31.12.2016 LOANS AND
RECEIVABLEFAIR VALUE THROUGH
PROFIT AND LOSS
AVAILABLE FOR SALE
FINANCIAL GUARANTEES
TOTAL
Cash and cash equivalents 218 121 040 0 0 0 218 121 040
Available-For-Sale portfolio:
Debt securities and other fixed income securities 0 0 1 285 902 716 0 1 285 902 716
Shares and other variable income securities 0 6 300 335 380 574 924 0 386 875 259
Loans and receivables 178 677 543 0 0 0 178 677 543
Total Financial Assets 396 798 583 6 300 335 1 666 477 640 0 2 069 576 558Financial liabilities
Financial guarantees 0 0 0 16 302 264 16 302 264
TOTAL FINANCIAL LIABILITIES 0 0 0 16 302 264 16 302 264
EUR31.12.2015 LOANS AND
RECEIVABLEFAIR VALUE THROUGH
PROFIT AND LOSS
AVAILABLE FOR SALE
FINANCIAL GUARANTEES
TOTAL
Cash and cash equivalents 227 289 731 0 0 0 227 289 731
Available-For-Sale portfolio:
Debt securities and other fixed income securities 0 0 1 397 108 893 0 1 397 108 893
Shares and other variable income securities 0 7 517 545 338 212 935 0 345 730 480
Loans and receivables 50 186 759 0 0 0 50 186 759
Total Financial Assets 277 476 490 7 517 545 1 735 321 828 0 2 020 315 863Financial liabilities
Financial guarantees 0 0 0 13 954 718 13 954 718
TOTAL FINANCIAL LIABILITIES 0 0 0 13 954 718 13 954 718
This note presents information about the Fund’s exposure to and its management and control of risks, specifically those associated with its financial instruments.
The following table provides information relating to the main financial assets and financial liabilities by categories of financial instruments for which the Fund is exposed to risks:
3. FINANCIAL RISK MANAGEMENT
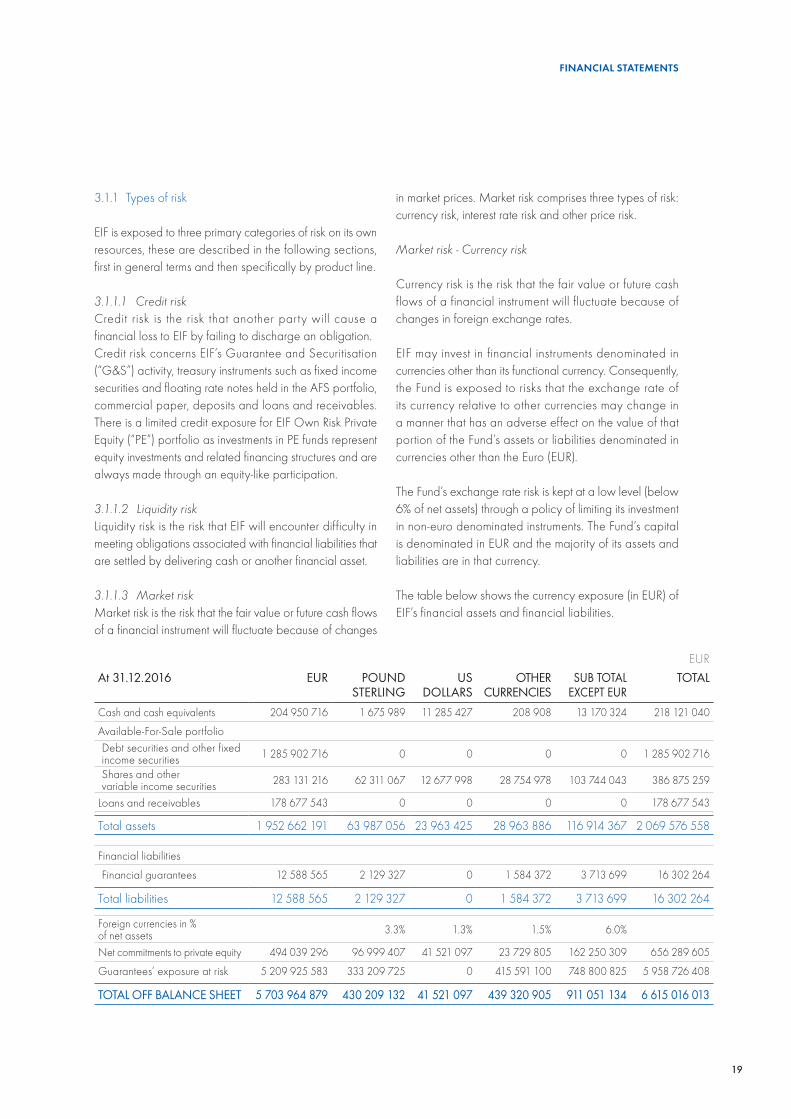
19
FINANCIAL STATEMENTS
3.1.1 Types of risk
EIF is exposed to three primary categories of risk on its own resources, these are described in the following sections, first in general terms and then specifically by product line.
3.1.1.1 Credit riskCredit risk is the risk that another party will cause a financial loss to EIF by failing to discharge an obligation.Credit risk concerns EIF’s Guarantee and Securitisation (“G&S”) activity, treasury instruments such as fixed income securities and floating rate notes held in the AFS portfolio, commercial paper, deposits and loans and receivables. There is a limited credit exposure for EIF Own Risk Private Equity (“PE”) portfolio as investments in PE funds represent equity investments and related financing structures and are always made through an equity-like participation.
3.1.1.2 Liquidity riskLiquidity risk is the risk that EIF will encounter difficulty in meeting obligations associated with financial liabilities that are settled by delivering cash or another financial asset.
3.1.1.3 Market riskMarket risk is the risk that the fair value or future cash flows of a financial instrument will fluctuate because of changes
in market prices. Market risk comprises three types of risk: currency risk, interest rate risk and other price risk.
Market risk - Currency risk
Currency risk is the risk that the fair value or future cash flows of a financial instrument will fluctuate because of changes in foreign exchange rates.
EIF may invest in financial instruments denominated in currencies other than its functional currency. Consequently, the Fund is exposed to risks that the exchange rate of its currency relative to other currencies may change in a manner that has an adverse effect on the value of that portion of the Fund’s assets or liabilities denominated in currencies other than the Euro (EUR).
The Fund’s exchange rate risk is kept at a low level (below 6% of net assets) through a policy of limiting its investment in non-euro denominated instruments. The Fund’s capital is denominated in EUR and the majority of its assets and liabilities are in that currency.
The table below shows the currency exposure (in EUR) of EIF’s financial assets and financial liabilities.
EURAt 31.12.2016 EUR POUND
STERLINGUS
DOLLARSOTHER
CURRENCIESSUB TOTAL
EXCEPT EURTOTAL
Cash and cash equivalents 204 950 716 1 675 989 11 285 427 208 908 13 170 324 218 121 040
Available-For-Sale portfolio Debt securities and other fixed income securities 1 285 902 716 0 0 0 0 1 285 902 716
Shares and other variable income securities 283 131 216 62 311 067 12 677 998 28 754 978 103 744 043 386 875 259
Loans and receivables 178 677 543 0 0 0 0 178 677 543
Total assets 1 952 662 191 63 987 056 23 963 425 28 963 886 116 914 367 2 069 576 558
Financial liabilities
Financial guarantees 12 588 565 2 129 327 0 1 584 372 3 713 699 16 302 264
Total liabilities 12 588 565 2 129 327 0 1 584 372 3 713 699 16 302 264
Foreign currencies in % of net assets 3.3% 1.3% 1.5% 6.0%
Net commitments to private equity 494 039 296 96 999 407 41 521 097 23 729 805 162 250 309 656 289 605
Guarantees’ exposure at risk 5 209 925 583 333 209 725 0 415 591 100 748 800 825 5 958 726 408
TOTAL OFF BALANCE SHEET 5 703 964 879 430 209 132 41 521 097 439 320 905 911 051 134 6 615 016 013
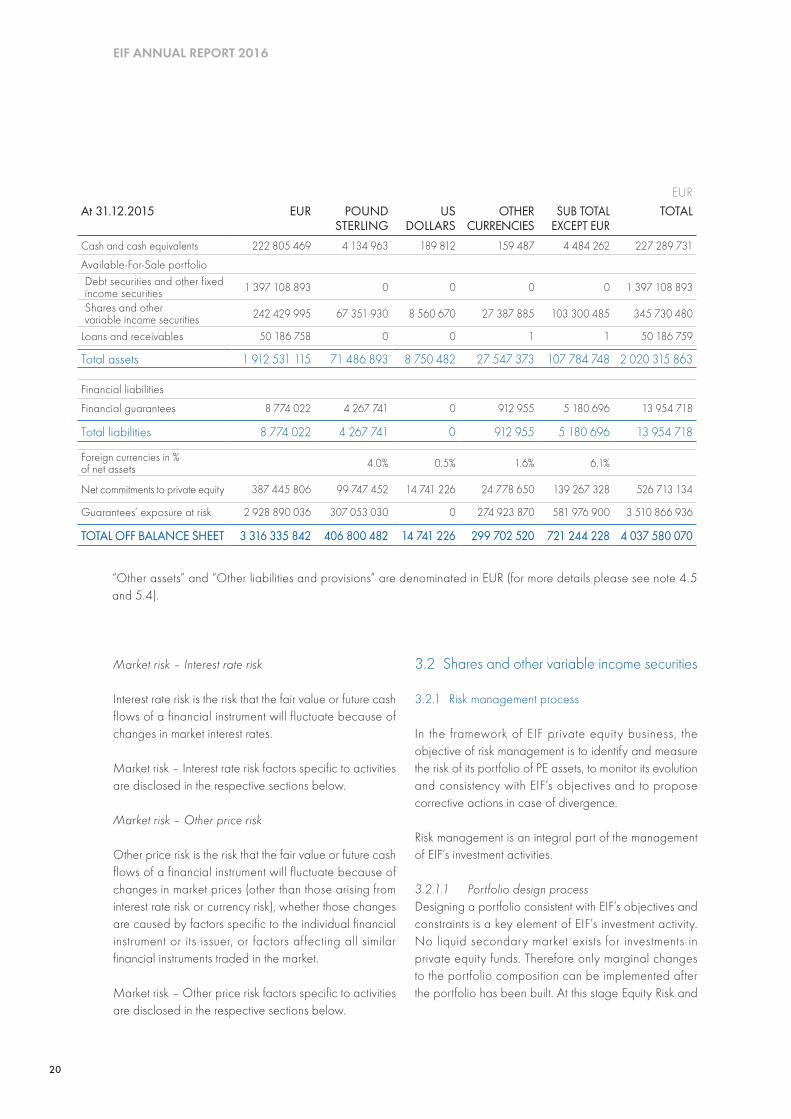
20
EIF ANNUAL REPORT 2016
Market risk – Interest rate risk
Interest rate risk is the risk that the fair value or future cash flows of a financial instrument will fluctuate because of changes in market interest rates.
Market risk – Interest rate risk factors specific to activities are disclosed in the respective sections below.
Market risk – Other price risk
Other price risk is the risk that the fair value or future cash flows of a financial instrument will fluctuate because of changes in market prices (other than those arising from interest rate risk or currency risk), whether those changes are caused by factors specific to the individual financial instrument or its issuer, or factors affecting all similar financial instruments traded in the market.
Market risk – Other price risk factors specific to activities are disclosed in the respective sections below.
3.2 Shares and other variable income securities
3.2.1 Risk management process
In the framework of EIF private equity business, the objective of risk management is to identify and measure the risk of its portfolio of PE assets, to monitor its evolution and consistency with EIF’s objectives and to propose corrective actions in case of divergence.
Risk management is an integral part of the management of EIF’s investment activities.
3.2.1.1 Portfolio design processDesigning a portfolio consistent with EIF’s objectives and constraints is a key element of EIF’s investment activity. No liquid secondary market exists for investments in private equity funds. Therefore only marginal changes to the portfolio composition can be implemented after the portfolio has been built. At this stage Equity Risk and
EURAt 31.12.2015 EUR POUND
STERLINGUS
DOLLARSOTHER
CURRENCIESSUB TOTAL
EXCEPT EURTOTAL
Cash and cash equivalents 222 805 469 4 134 963 189 812 159 487 4 484 262 227 289 731
Available-For-Sale portfolio Debt securities and other fixed income securities 1 397 108 893 0 0 0 0 1 397 108 893
Shares and other variable income securities 242 429 995 67 351 930 8 560 670 27 387 885 103 300 485 345 730 480
Loans and receivables 50 186 758 0 0 1 1 50 186 759
Total assets 1 912 531 115 71 486 893 8 750 482 27 547 373 107 784 748 2 020 315 863
Financial liabilities
Financial guarantees 8 774 022 4 267 741 0 912 955 5 180 696 13 954 718
Total liabilities 8 774 022 4 267 741 0 912 955 5 180 696 13 954 718
Foreign currencies in % of net assets 4.0% 0.5% 1.6% 6.1%
Net commitments to private equity 387 445 806 99 747 452 14 741 226 24 778 650 139 267 328 526 713 134
Guarantees’ exposure at risk 2 928 890 036 307 053 030 0 274 923 870 581 976 900 3 510 866 936
TOTAL OFF BALANCE SHEET 3 316 335 842 406 800 482 14 741 226 299 702 520 721 244 228 4 037 580 070
“Other assets” and “Other liabilities and provisions” are denominated in EUR (for more details please see note 4.5 and 5.4).
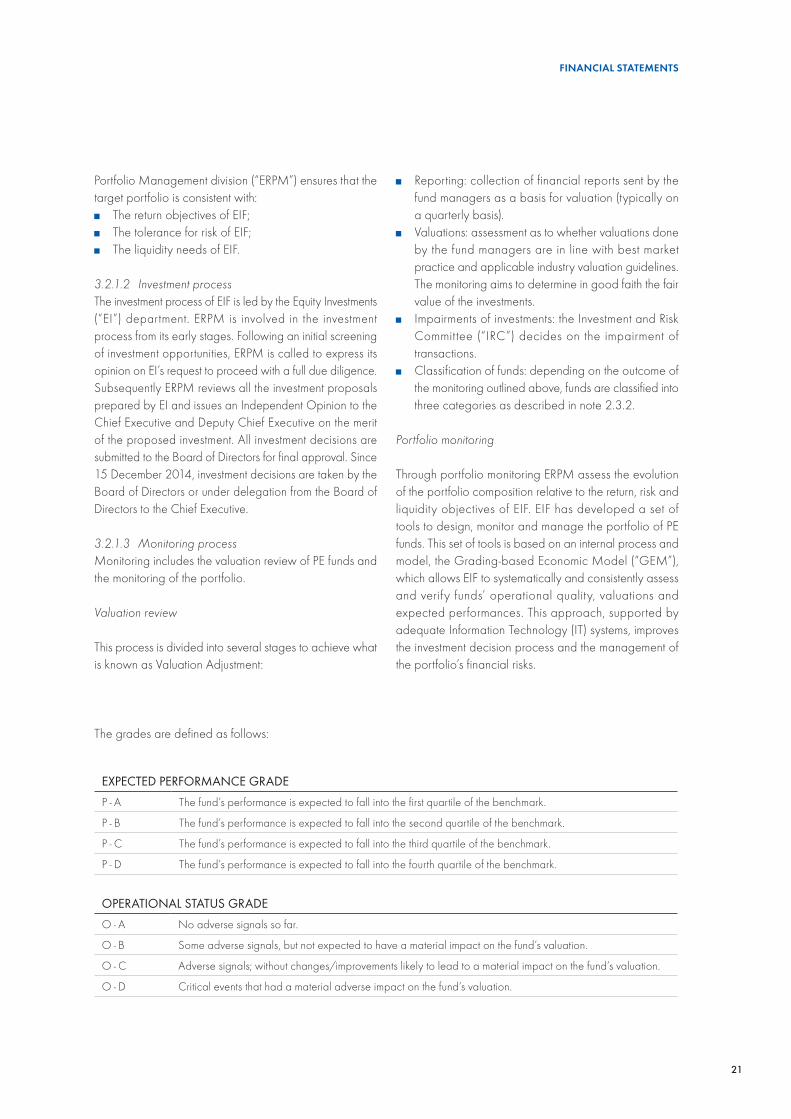
21
FINANCIAL STATEMENTS
EXPECTED PERFORMANCE GRADEP - A The fund’s performance is expected to fall into the first quartile of the benchmark.
P - B The fund’s performance is expected to fall into the second quartile of the benchmark.
P - C The fund’s performance is expected to fall into the third quartile of the benchmark.
P - D The fund’s performance is expected to fall into the fourth quartile of the benchmark.
OPERATIONAL STATUS GRADEO - A No adverse signals so far.
O - B Some adverse signals, but not expected to have a material impact on the fund’s valuation.
O - C Adverse signals; without changes/improvements likely to lead to a material impact on the fund’s valuation.
O - D Critical events that had a material adverse impact on the fund’s valuation.
Portfolio Management division (“ERPM”) ensures that the target portfolio is consistent with: ■ The return objectives of EIF;■ The tolerance for risk of EIF;■ The liquidity needs of EIF.
3.2.1.2 Investment processThe investment process of EIF is led by the Equity Investments (“EI”) department. ERPM is involved in the investment process from its early stages. Following an initial screening of investment opportunities, ERPM is called to express its opinion on EI’s request to proceed with a full due diligence. Subsequently ERPM reviews all the investment proposals prepared by EI and issues an Independent Opinion to the Chief Executive and Deputy Chief Executive on the merit of the proposed investment. All investment decisions are submitted to the Board of Directors for final approval. Since 15 December 2014, investment decisions are taken by the Board of Directors or under delegation from the Board of Directors to the Chief Executive.
3.2.1.3 Monitoring processMonitoring includes the valuation review of PE funds and the monitoring of the portfolio.
Valuation review
This process is divided into several stages to achieve what is known as Valuation Adjustment:
■ Reporting: collection of financial reports sent by the fund managers as a basis for valuation (typically on a quarterly basis).
■ Valuations: assessment as to whether valuations done by the fund managers are in line with best market practice and applicable industry valuation guidelines. The monitoring aims to determine in good faith the fair value of the investments.
■ Impairments of investments: the Investment and Risk Committee (“IRC”) decides on the impairment of transactions.
■ Classification of funds: depending on the outcome of the monitoring outlined above, funds are classified into three categories as described in note 2.3.2.
Portfolio monitoring
Through portfolio monitoring ERPM assess the evolution of the portfolio composition relative to the return, risk and liquidity objectives of EIF. EIF has developed a set of tools to design, monitor and manage the portfolio of PE funds. This set of tools is based on an internal process and model, the Grading-based Economic Model (“GEM”), which allows EIF to systematically and consistently assess and verify funds’ operational quality, valuations and expected performances. This approach, supported by adequate Information Technology (IT) systems, improves the investment decision process and the management of the portfolio’s financial risks.
The grades are defined as follows:
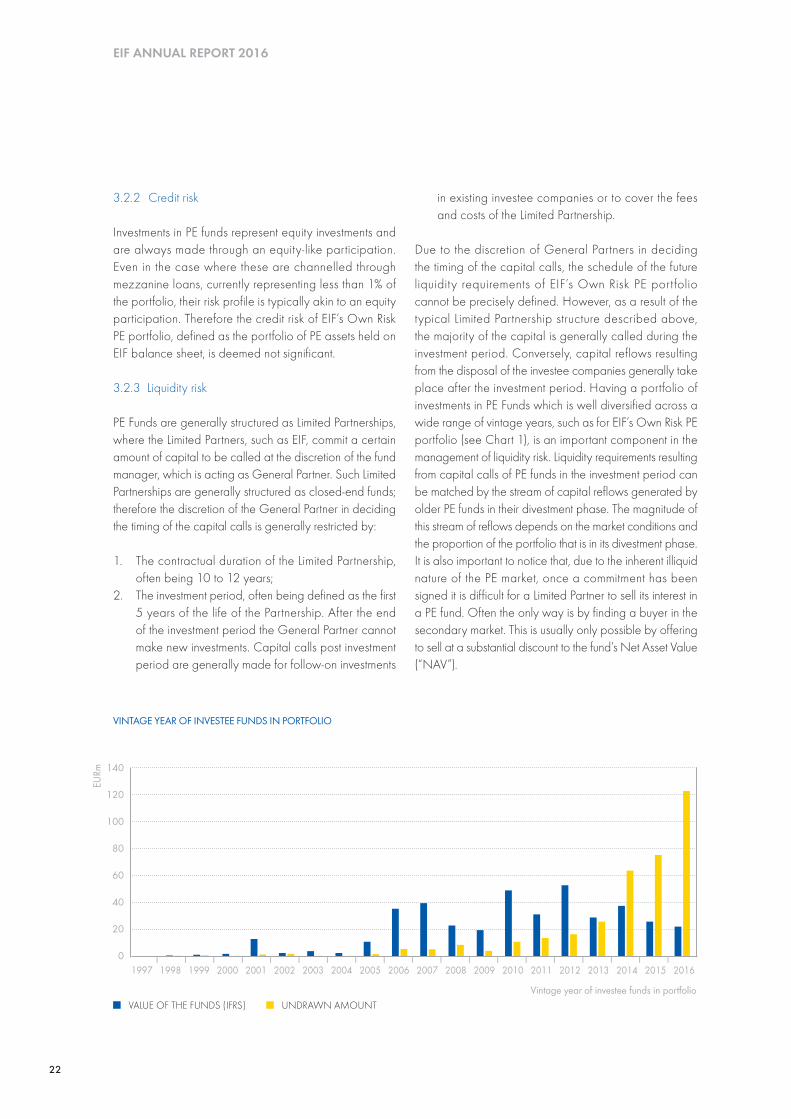
22
EIF ANNUAL REPORT 2016
3.2.2 Credit risk
Investments in PE funds represent equity investments and are always made through an equity-like participation. Even in the case where these are channelled through mezzanine loans, currently representing less than 1% of the portfolio, their risk profile is typically akin to an equity participation. Therefore the credit risk of EIF’s Own Risk PE portfolio, defined as the portfolio of PE assets held on EIF balance sheet, is deemed not significant.
3.2.3 Liquidity risk
PE Funds are generally structured as Limited Partnerships, where the Limited Partners, such as EIF, commit a certain amount of capital to be called at the discretion of the fund manager, which is acting as General Partner. Such Limited Partnerships are generally structured as closed-end funds; therefore the discretion of the General Partner in deciding the timing of the capital calls is generally restricted by:
1. The contractual duration of the Limited Partnership, often being 10 to 12 years;
2. The investment period, often being defined as the first 5 years of the life of the Partnership. After the end of the investment period the General Partner cannot make new investments. Capital calls post investment period are generally made for follow-on investments
in existing investee companies or to cover the fees and costs of the Limited Partnership.
Due to the discretion of General Partners in deciding the timing of the capital calls, the schedule of the future liquidity requirements of EIF’s Own Risk PE portfolio cannot be precisely defined. However, as a result of the typical Limited Partnership structure described above, the majority of the capital is generally called during the investment period. Conversely, capital reflows resulting from the disposal of the investee companies generally take place after the investment period. Having a portfolio of investments in PE Funds which is well diversified across a wide range of vintage years, such as for EIF’s Own Risk PE portfolio (see Chart 1), is an important component in the management of liquidity risk. Liquidity requirements resulting from capital calls of PE funds in the investment period can be matched by the stream of capital reflows generated by older PE funds in their divestment phase. The magnitude of this stream of reflows depends on the market conditions and the proportion of the portfolio that is in its divestment phase. It is also important to notice that, due to the inherent illiquid nature of the PE market, once a commitment has been signed it is difficult for a Limited Partner to sell its interest in a PE fund. Often the only way is by finding a buyer in the secondary market. This is usually only possible by offering to sell at a substantial discount to the fund’s Net Asset Value (“NAV”).
140
120
100
80
60
40
20
0
EURm
Vintage year of investee funds in portfolio VALUE OF THE FUNDS (IFRS) UNDRAWN AMOUNT
VINTAGE YEAR OF INVESTEE FUNDS IN PORTFOLIO
I I I I I I I I I I I I I I I I I I I 1997 1998 1999 2000 2001 2002 2003 2004 2005 2006 2007 2008 2009 2010 2011 2012 2013 2014 2015 2016
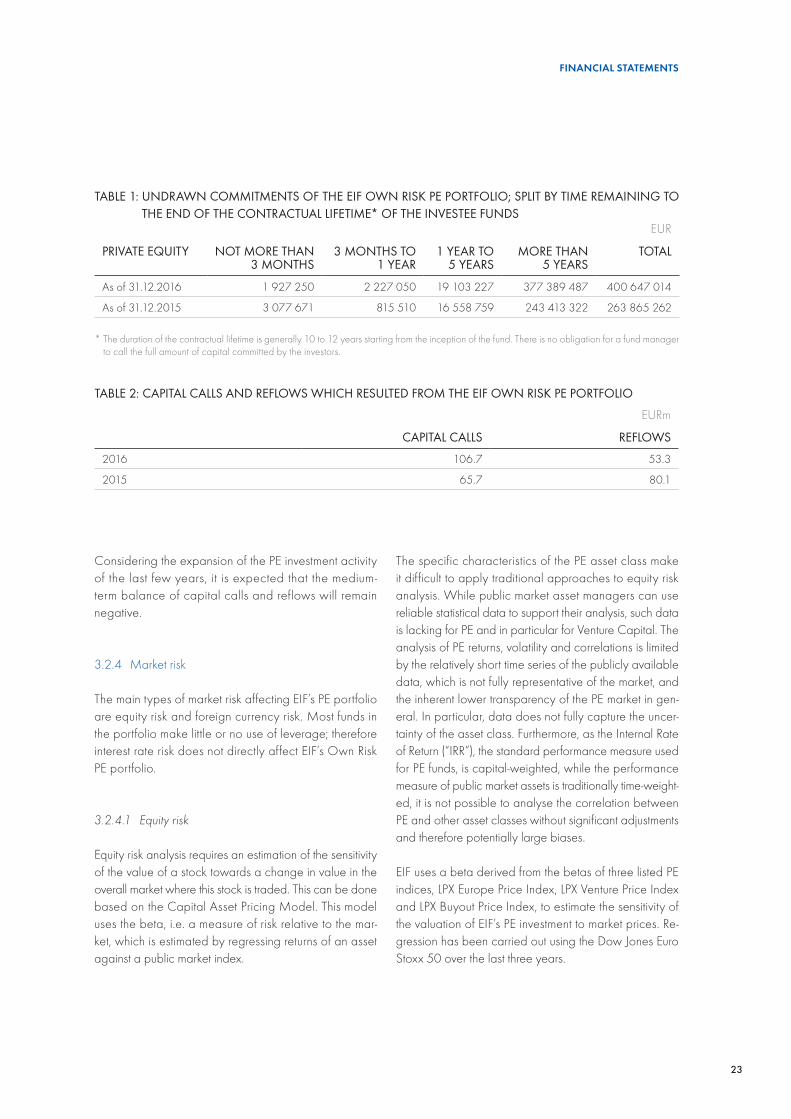
23
FINANCIAL STATEMENTS
TABLE 1: UNDRAWN COMMITMENTS OF THE EIF OWN RISK PE PORTFOLIO; SPLIT BY TIME REMAINING TO THE END OF THE CONTRACTUAL LIFETIME* OF THE INVESTEE FUNDS
EUR
PRIVATE EQUITY NOT MORE THAN 3 MONTHS
3 MONTHS TO 1 YEAR
1 YEAR TO 5 YEARS
MORE THAN 5 YEARS
TOTAL
As of 31.12.2016 1 927 250 2 227 050 19 103 227 377 389 487 400 647 014
As of 31.12.2015 3 077 671 815 510 16 558 759 243 413 322 263 865 262
* The duration of the contractual lifetime is generally 10 to 12 years starting from the inception of the fund. There is no obligation for a fund manager to call the full amount of capital committed by the investors.
TABLE 2: CAPITAL CALLS AND REFLOWS WHICH RESULTED FROM THE EIF OWN RISK PE PORTFOLIO
EURm
CAPITAL CALLS REFLOWS
2016 106.7 53.3
2015 65.7 80.1
Considering the expansion of the PE investment activity of the last few years, it is expected that the medium-term balance of capital calls and reflows will remain negative.
3.2.4 Market risk
The main types of market risk affecting EIF’s PE portfolio are equity risk and foreign currency risk. Most funds in the portfolio make little or no use of leverage; therefore interest rate risk does not directly affect EIF’s Own Risk PE portfolio.
3.2.4.1 Equity risk
Equity risk analysis requires an estimation of the sensitivity of the value of a stock towards a change in value in the overall market where this stock is traded. This can be done based on the Capital Asset Pricing Model. This model uses the beta, i.e. a measure of risk relative to the mar-ket, which is estimated by regressing returns of an asset against a public market index.
The specific characteristics of the PE asset class make it difficult to apply traditional approaches to equity risk analysis. While public market asset managers can use reliable statistical data to support their analysis, such data is lacking for PE and in particular for Venture Capital. The analysis of PE returns, volatility and correlations is limited by the relatively short time series of the publicly available data, which is not fully representative of the market, and the inherent lower transparency of the PE market in gen-eral. In particular, data does not fully capture the uncer-tainty of the asset class. Furthermore, as the Internal Rate of Return (“IRR”), the standard performance measure used for PE funds, is capital-weighted, while the performance measure of public market assets is traditionally time-weight-ed, it is not possible to analyse the correlation between PE and other asset classes without significant adjustments and therefore potentially large biases.
EIF uses a beta derived from the betas of three listed PE indices, LPX Europe Price Index, LPX Venture Price Index and LPX Buyout Price Index, to estimate the sensitivity of the valuation of EIF’s PE investment to market prices. Re-gression has been carried out using the Dow Jones Euro Stoxx 50 over the last three years.
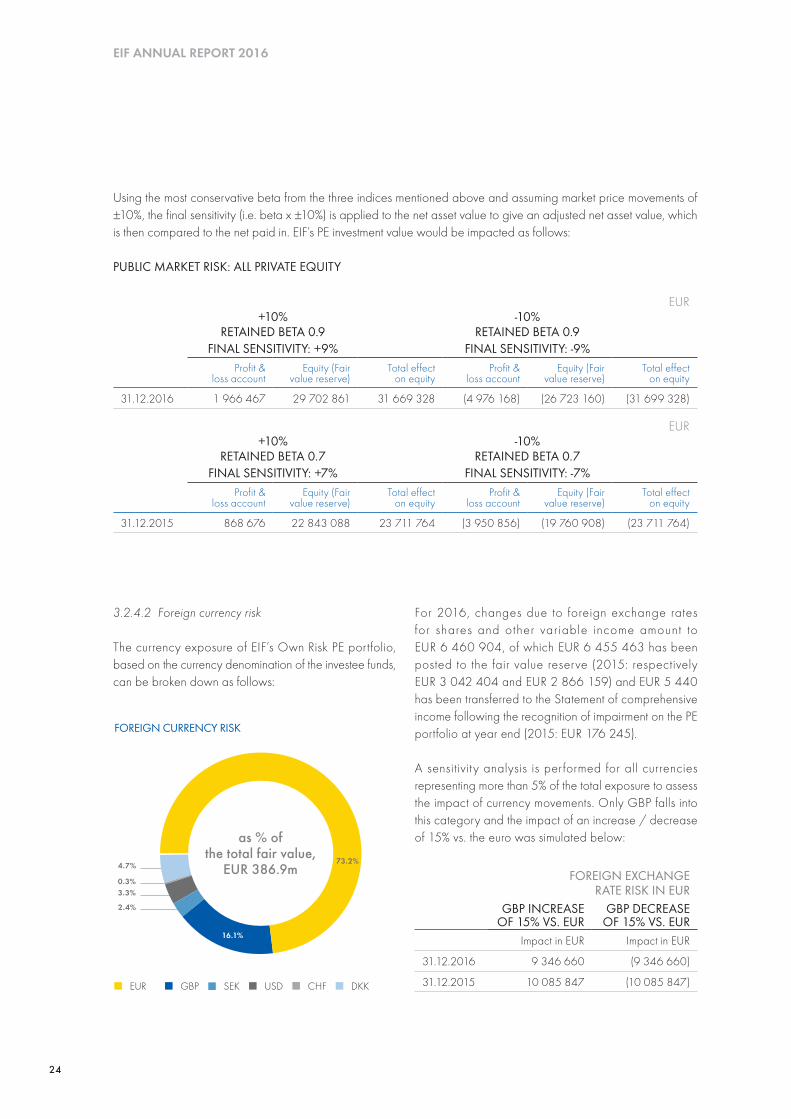
24
EIF ANNUAL REPORT 2016
Using the most conservative beta from the three indices mentioned above and assuming market price movements of ±10%, the final sensitivity (i.e. beta x ±10%) is applied to the net asset value to give an adjusted net asset value, which is then compared to the net paid in. EIF’s PE investment value would be impacted as follows:
PUBLIC MARKET RISK: ALL PRIVATE EQUITY
EUR+10% -10%
RETAINED BETA 0.9 RETAINED BETA 0.9FINAL SENSITIVITY: +9% FINAL SENSITIVITY: -9%
Profit & loss account
Equity (Fair value reserve)
Total effect on equity
Profit & loss account
Equity (Fair value reserve)
Total effect on equity
31.12.2016 1 966 467 29 702 861 31 669 328 (4 976 168) (26 723 160) (31 699 328)
EUR+10% -10%
RETAINED BETA 0.7 RETAINED BETA 0.7FINAL SENSITIVITY: +7% FINAL SENSITIVITY: -7%
Profit & loss account
Equity (Fair value reserve)
Total effect on equity
Profit & loss account
Equity (Fair value reserve)
Total effect on equity
31.12.2015 868 676 22 843 088 23 711 764 (3 950 856) (19 760 908) (23 711 764)
3.2.4.2 Foreign currency risk
The currency exposure of EIF’s Own Risk PE portfolio, based on the currency denomination of the investee funds, can be broken down as follows:
For 2016, changes due to foreign exchange rates for shares and other var iable income amount to EUR 6 460 904, of which EUR 6 455 463 has been posted to the fair value reserve (2015: respectively EUR 3 042 404 and EUR 2 866 159) and EUR 5 440 has been transferred to the Statement of comprehensive income following the recognition of impairment on the PE portfolio at year end (2015: EUR 176 245).
A sensitivity analysis is performed for all currencies representing more than 5% of the total exposure to assess the impact of currency movements. Only GBP falls into this category and the impact of an increase / decrease of 15% vs. the euro was simulated below:
FOREIGN EXCHANGE RATE RISK IN EUR
GBP INCREASE OF 15% VS. EUR
GBP DECREASE OF 15% VS. EUR
Impact in EUR Impact in EUR
31.12.2016 9 346 660 (9 346 660)
31.12.2015 10 085 847 (10 085 847) EUR GBP SEK USD CHF DKK
4.7%
0.3%3.3%
2.4%
73.2%
16.1%
as % of the total fair value,
EUR 386.9m
FOREIGN CURRENCY RISK
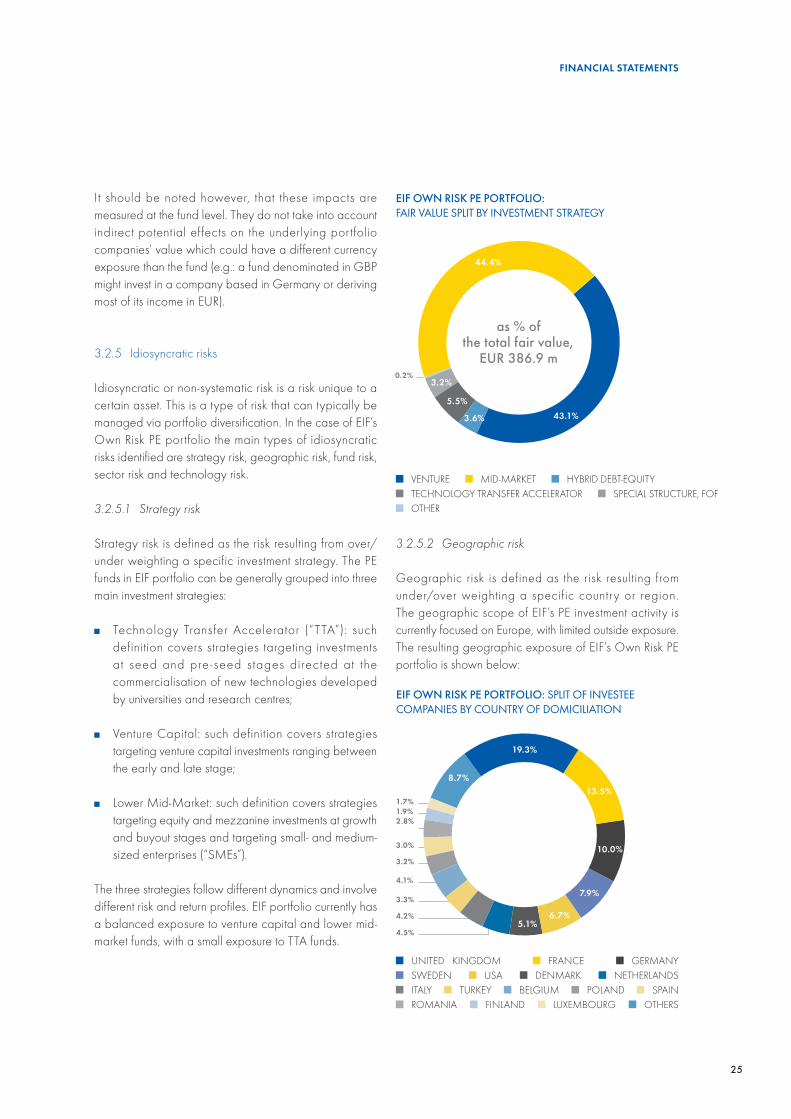
25
FINANCIAL STATEMENTS
It should be noted however, that these impacts are measured at the fund level. They do not take into account indirect potential effects on the underlying portfolio companies’ value which could have a different currency exposure than the fund (e.g.: a fund denominated in GBP might invest in a company based in Germany or deriving most of its income in EUR).
3.2.5 Idiosyncratic risks
Idiosyncratic or non-systematic risk is a risk unique to a certain asset. This is a type of risk that can typically be managed via portfolio diversification. In the case of EIF’s Own Risk PE portfolio the main types of idiosyncratic risks identified are strategy risk, geographic risk, fund risk, sector risk and technology risk.
3.2.5.1 Strategy risk
Strategy risk is defined as the risk resulting from over/under weighting a specific investment strategy. The PE funds in EIF portfolio can be generally grouped into three main investment strategies:
■ Technology Transfer Accelerator (“TTA”): such definition covers strategies targeting investments at seed and pre - seed stages directed at the commercialisation of new technologies developed by universities and research centres;
■ Venture Capital: such definition covers strategies targeting venture capital investments ranging between the early and late stage;
■ Lower Mid-Market: such definition covers strategies targeting equity and mezzanine investments at growth and buyout stages and targeting small- and medium-sized enterprises (“SMEs”).
The three strategies follow different dynamics and involve different risk and return profiles. EIF portfolio currently has a balanced exposure to venture capital and lower mid-market funds, with a small exposure to TTA funds.
3.2.5.2 Geographic risk
Geographic risk is defined as the risk resulting from under/over weighting a specific country or region. The geographic scope of EIF’s PE investment activity is currently focused on Europe, with limited outside exposure. The resulting geographic exposure of EIF’s Own Risk PE portfolio is shown below:
43.1%
44.4%
5.5%
as % of the total fair value,
EUR 386.9 m
EIF OWN RISK PE PORTFOLIO: FAIR VALUE SPLIT BY INVESTMENT STRATEGY
VENTURE MID-MARKET HYBRID DEBT-EQUITY TECHNOLOGY TRANSFER ACCELERATOR SPECIAL STRUCTURE, FOF
OTHER
EIF OWN RISK PE PORTFOLIO: SPLIT OF INVESTEE COMPANIES BY COUNTRY OF DOMICILIATION
1.7%1.9%2.8%
3.0%
3.2%
4.1%
3.3%
4.2%
4.5%
19.3%
13.5%
10.0%
7.9%
6.7%5.1%
8.7%
UNITED KINGDOM FRANCE GERMANY
SWEDEN USA DENMARK NETHERLANDS ITALY TURKEY BELGIUM POLAND SPAIN ROMANIA FINLAND LUXEMBOURG OTHERS
3.6%
3.2%0.2%
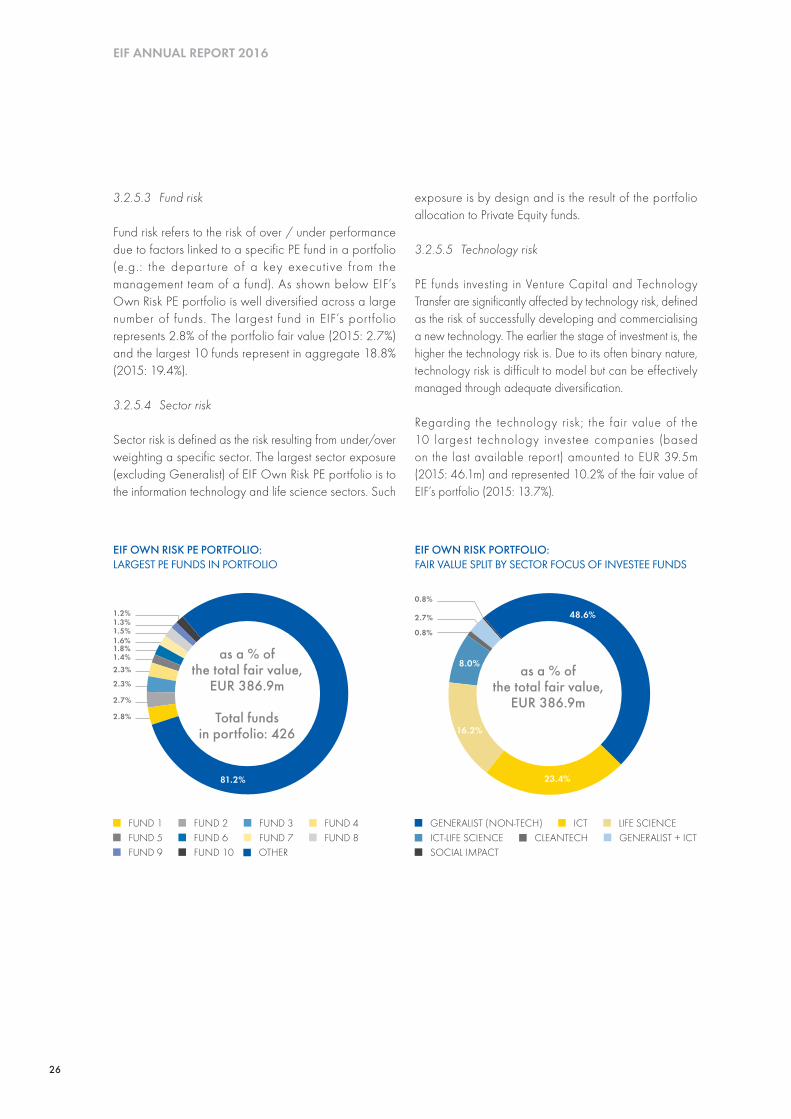
26
EIF ANNUAL REPORT 2016
exposure is by design and is the result of the portfolio allocation to Private Equity funds.
3.2.5.5 Technology risk
PE funds investing in Venture Capital and Technology Transfer are significantly affected by technology risk, defined as the risk of successfully developing and commercialising a new technology. The earlier the stage of investment is, the higher the technology risk is. Due to its often binary nature, technology risk is difficult to model but can be effectively managed through adequate diversification.
Regarding the technology risk; the fair value of the 10 largest technology investee companies (based on the last available report) amounted to EUR 39.5m (2015: 46.1m) and represented 10.2% of the fair value of EIF’s portfolio (2015: 13.7%).
3.2.5.3 Fund risk
Fund risk refers to the risk of over / under performance due to factors linked to a specific PE fund in a portfolio (e.g.: the depar ture of a key execut ive f rom the management team of a fund). As shown below EIF’s Own Risk PE portfolio is well diversified across a large number of funds. The largest fund in EIF’s port folio represents 2.8% of the portfolio fair value (2015: 2.7%) and the largest 10 funds represent in aggregate 18.8% (2015: 19.4%).
3.2.5.4 Sector risk
Sector risk is defined as the risk resulting from under/over weighting a specific sector. The largest sector exposure (excluding Generalist) of EIF Own Risk PE portfolio is to the information technology and life science sectors. Such
2.8%
2.7%
2.3%
2.3%1.4%1.8%1.6%1.5%1.3%1.2%
81.2%
as a % of the total fair value,
EUR 386.9m
Total funds in portfolio: 426
EIF OWN RISK PE PORTFOLIO: LARGEST PE FUNDS IN PORTFOLIO
FUND 1 FUND 2 FUND 3 FUND 4
FUND 5 FUND 6 FUND 7 FUND 8
FUND 9 FUND 10 OTHER
2.7%
0.8%
0.8%
16.2%
8.0%
48.6%
23.4%
EIF OWN RISK PORTFOLIO: FAIR VALUE SPLIT BY SECTOR FOCUS OF INVESTEE FUNDS
GENERALIST (NON-TECH) ICT LIFE SCIENCE
ICT-LIFE SCIENCE CLEANTECH GENERALIST + ICT
SOCIAL IMPACT
as a % of the total fair value,
EUR 386.9m
27
FINANCIAL STATEMENTS
rating approach defining how the rating to calculate the value of the financial guarantee is selected amongst any available external rating(s) and the assigned EIF’s internal rating. To allocate capital for an own risk guarantee tranche, EIF computes the economic capital allocation rates based on its internal guidelines, which follow a conservative approach that define a minimum level of capital that needs to be allocated to EIF investments and operations to ensure a 1-year 99.99% level of confidence that investment/operational losses can be absorbed. The rating used to calculate the economic capital allocation is EIF’s internal rating. Valuation and capital charge are functions of the expected loss, i.e. they are risk-adjusted and consequently vary according to the assigned rating.
3.3.1.2 On-going risk monitoring
The performance of a transaction is reviewed regularly – at least on a quarterly basis – and assessed based on EIF’s surveillance triggers which take into account ele-ments such as the level of cumulative defaults, the credit enhancement, the provisioning amount and any rating ac-tions by external rating agencies, if applicable.
In case of breach of such triggers and depending on the magnitude and expected consequence(s) of such a breach, a transaction can either change its status (e.g. Under review, Positive or Negative outlook) or a model re-run is initiated to reassess EIF’s internal rating. Dedicated professionals within ORM submit proposals to the relevant Investment Risk Com-mittee (“IRC”) to flag transactions as Under review, Positive or Negative outlook and/or to initiate an EIF’s model re-run. Permission to carry out EIF’s rating model re-run may also be re-quested from the IRC before an EIF’s trigger is breached (upon request by GSM or ORM-CRM) when other circumstances suggest that EIF’s internal rating may already be affected.
EIF systematically puts “Under review” any transaction with an internal rating below iBa2 level. Transactions flagged Under review, Negative outlook or Positive out-look are closely scrutinised for a possible breach of EIF’s surveillance trigger as they have the potential to trigger a model re-run and an internal rating action proposal, which in turn could impact the expected loss. EIF’s guarantees with the status “Defaulted” are fully provisioned as a loss of 100% is expected or the underlying portfolio is only composed of defaulted and restructured assets and the loss is hence primarily driven by uncertain recoveries.
3.3 Portfolio Guarantees and Securitisation (“G&S”)
3.3.1 Introduction
EIF has developed a set of tools for its G&S business to analyse and monitor portfolio guarantees and structured finance transactions in line with common market practices. The risk management activity can be split into two parts: an initial risk assessment and ongoing risk monitoring.
3.3.1.1 Initial risk assessment
In the context of the independent opinion process, the Operations Risk Management division (“ORM”) reviews the investment proposal provided by the Guarantees, Securitisations and Microfinance (“GS&M”) department in accordance with EIF’s internal rules and procedures. This review includes a detailed analysis of the risks related to the new G&S transaction, the methodologies applied and EIF’s internal rating initially proposed by GS&M. A transaction is only eligible if, at the time EIF enters into the transaction, the assigned internal rating is in the range of iAaa-iB2 (iAaa and iB2 are mapped to Moody’s Aaa and B2, respectively).
EIF assigns an internal rating to each new transaction to estimate the credit quality based on an expected loss concept. EIF’s internal rating is based on quantitative parameters and qualitative aspects. The following quantitative factors are examples of variables having an impact on the determination of EIF’s internal rating: weighted average rating of the underlying portfolio and volatility of the default rates distribution, weighted average life of transaction, possible loan port folio performance triggers, available credit enhancement, timing of defaults, expected recovery rates and its volatility, and level of diversification in the underlying pool of assets. The credit risk estimation also takes into account various qualitative factors, such as: reliability and completeness of the available data, size, quality and time horizon of the statistical samples, discontinuity in the origination criteria and servicing procedures, macro-economic effects.
The majority of EIF’s financial guarantees are typically rated by at least one external rating agency. In case there are differences in the rating levels among external rating agencies and EIF’s internal rating, EIF applies a retained
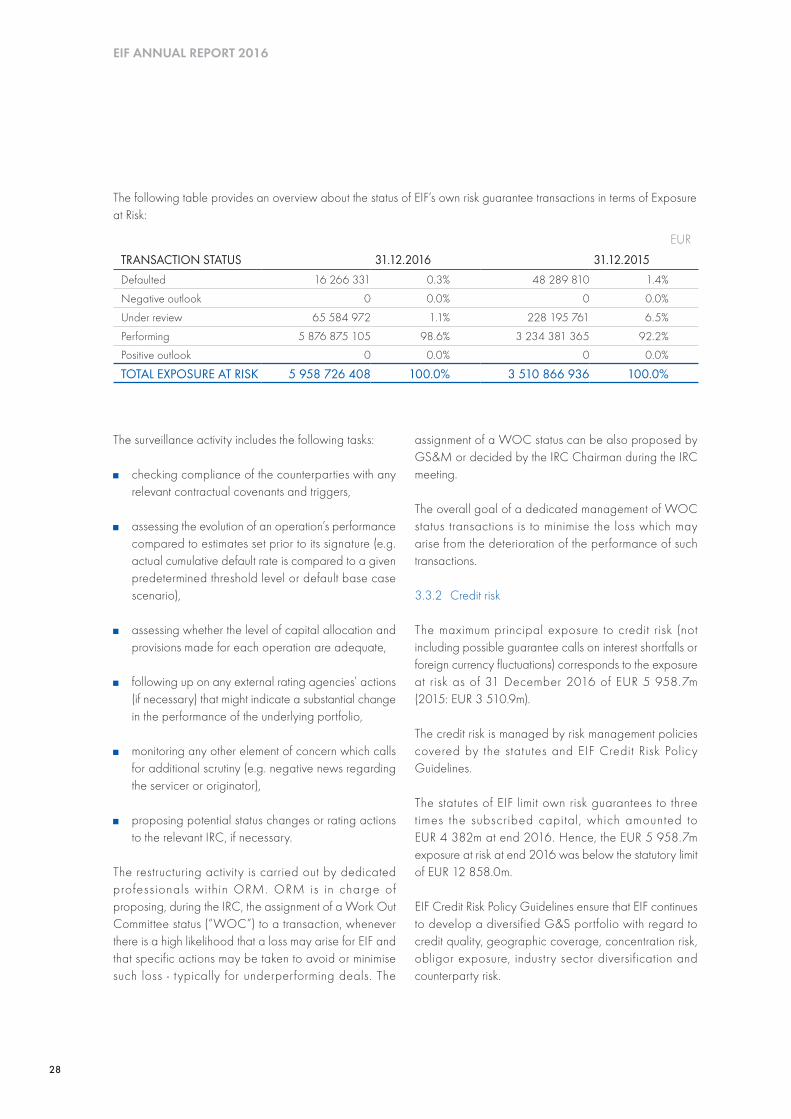
28
EIF ANNUAL REPORT 2016
The surveillance activity includes the following tasks:
■ checking compliance of the counterparties with any relevant contractual covenants and triggers,
■ assessing the evolution of an operation’s performance compared to estimates set prior to its signature (e.g. actual cumulative default rate is compared to a given predetermined threshold level or default base case scenario),
■ assessing whether the level of capital allocation and provisions made for each operation are adequate,
■ following up on any external rating agencies’ actions (if necessary) that might indicate a substantial change in the performance of the underlying portfolio,
■ monitoring any other element of concern which calls for additional scrutiny (e.g. negative news regarding the servicer or originator),
■ proposing potential status changes or rating actions to the relevant IRC, if necessary.
The restructuring activity is carried out by dedicated professionals within ORM. ORM is in charge of proposing, during the IRC, the assignment of a Work Out Committee status (“WOC”) to a transaction, whenever there is a high likelihood that a loss may arise for EIF and that specific actions may be taken to avoid or minimise such loss - typically for underperforming deals. The
EUR
TRANSACTION STATUS 31.12.2016 31.12.2015Defaulted 16 266 331 0.3% 48 289 810 1.4%
Negative outlook 0 0.0% 0 0.0%
Under review 65 584 972 1.1% 228 195 761 6.5%
Performing 5 876 875 105 98.6% 3 234 381 365 92.2%
Positive outlook 0 0.0% 0 0.0%
TOTAL EXPOSURE AT RISK 5 958 726 408 100.0% 3 510 866 936 100.0%
assignment of a WOC status can be also proposed by GS&M or decided by the IRC Chairman during the IRC meeting.
The overall goal of a dedicated management of WOC status transactions is to minimise the loss which may arise from the deterioration of the performance of such transactions.
3.3.2 Credit risk
The maximum principal exposure to credit risk (not including possible guarantee calls on interest shortfalls or foreign currency fluctuations) corresponds to the exposure at risk as of 31 December 2016 of EUR 5 958.7m (2015: EUR 3 510.9m).
The credit risk is managed by risk management policies covered by the statutes and EIF Credit Risk Policy Guidelines.
The statutes of EIF limit own risk guarantees to three t imes the subscribed capital, which amounted to EUR 4 382m at end 2016. Hence, the EUR 5 958.7m exposure at risk at end 2016 was below the statutory limit of EUR 12 858.0m.
EIF Credit Risk Policy Guidelines ensure that EIF continues to develop a diversified G&S portfolio with regard to credit quality, geographic coverage, concentration risk, obligor exposure, industry sector diversification and counterparty risk.
The following table provides an overview about the status of EIF’s own risk guarantee transactions in terms of Exposure at Risk:
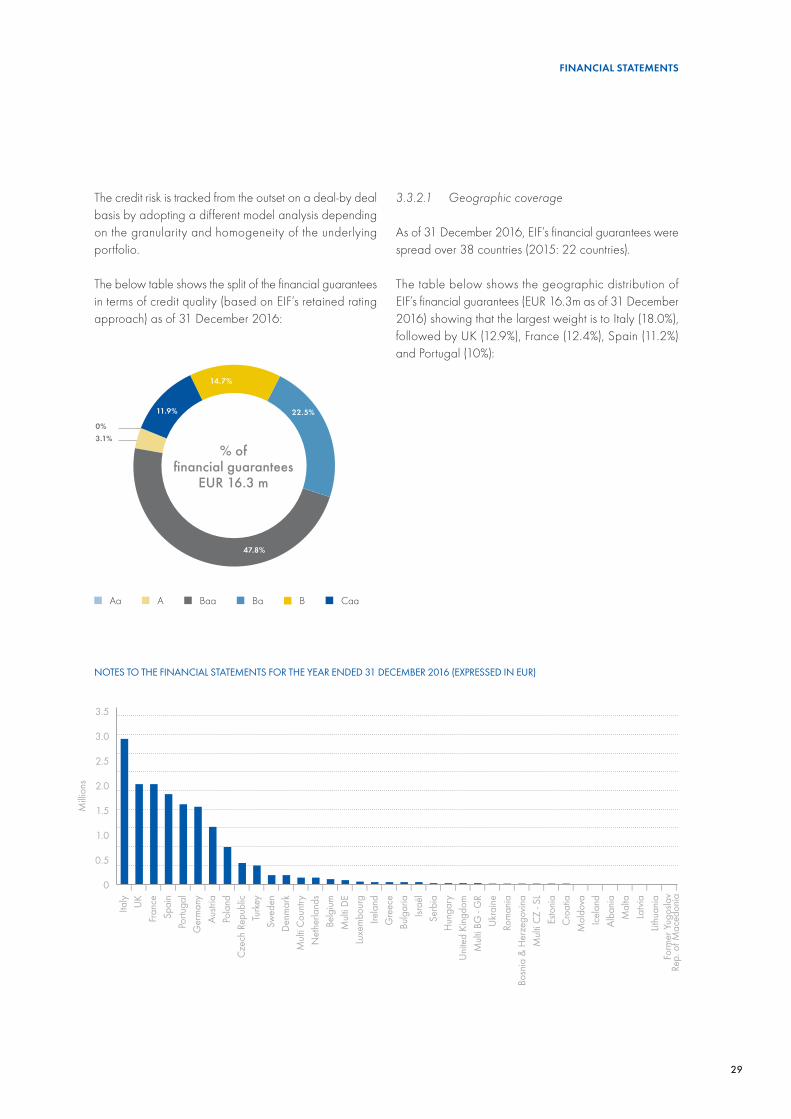
29
FINANCIAL STATEMENTS
The credit risk is tracked from the outset on a deal-by deal basis by adopting a different model analysis depending on the granularity and homogeneity of the underlying portfolio.
The below table shows the split of the financial guarantees in terms of credit quality (based on EIF’s retained rating approach) as of 31 December 2016:
3.1%0%
11.9% 22.5%
14.7%
47.8%
% of financial guarantees
EUR 16.3 m
Aa A Baa Ba B Caa
3.3.2.1 Geographic coverage
As of 31 December 2016, EIF’s financial guarantees were spread over 38 countries (2015: 22 countries).
The table below shows the geographic distribution of EIF’s financial guarantees (EUR 16.3m as of 31 December 2016) showing that the largest weight is to Italy (18.0%), followed by UK (12.9%), France (12.4%), Spain (11.2%) and Portugal (10%):
I I I I I I I I I I I I I I I I I I I I I I I I I I I I I I I I I I I I I I
3.5
3.0
2.5
2.0
1.5
1.0
0.5
0
Milli
ons
Italy UK
Fran
ceSp
ain
Portu
gal
Ger
man
yAu
stria
Pola
ndCz
ech
Repu
blic
Turk
eySw
eden
Denm
ark
Mul
ti Co
untry
Net
herla
nds
Belg
ium
Mul
ti DE
Luxe
mbo
urg
Irela
ndG
reec
eBu
lgar
iaIsr
aël
Serb
iaH
unga
ryUn
ited
King
dom
Mul
ti BG
- G
RUk
rain
eRo
man
iaBo
snia
& H
erze
govin
aM
ulti
CZ -
SLEs
toni
aCr
oatia
Mol
dova
Icel
and
Alba
nia
Mal
taLa
tvia
Lithu
ania
NOTES TO THE FINANCIAL STATEMENTS FOR THE YEAR ENDED 31 DECEMBER 2016 (EXPRESSED IN EUR)Fo
rmer
Yug
osla
v Re
p. o
f Mac
edon
ia
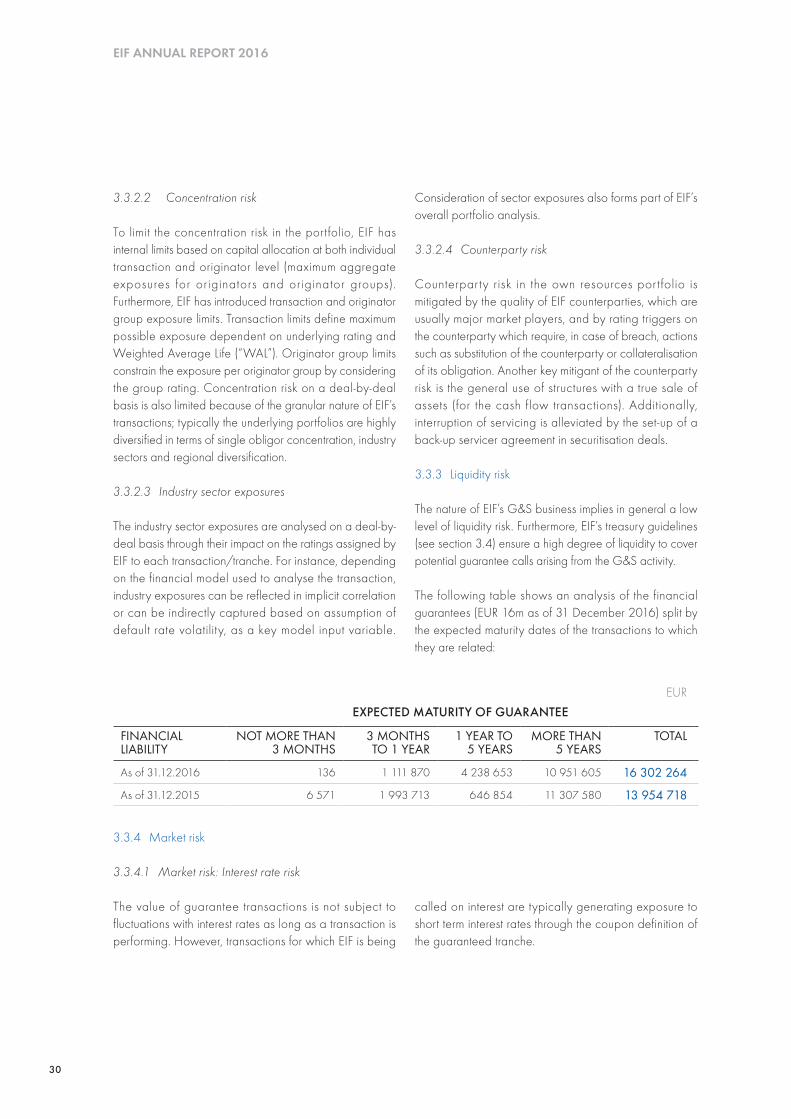
30
EIF ANNUAL REPORT 2016
3.3.2.2 Concentration risk
To limit the concentration risk in the portfolio, EIF has internal limits based on capital allocation at both individual transaction and originator level (maximum aggregate exposures for originators and originator groups). Furthermore, EIF has introduced transaction and originator group exposure limits. Transaction limits define maximum possible exposure dependent on underlying rating and Weighted Average Life (“WAL”). Originator group limits constrain the exposure per originator group by considering the group rating. Concentration risk on a deal-by-deal basis is also limited because of the granular nature of EIF’s transactions; typically the underlying portfolios are highly diversified in terms of single obligor concentration, industry sectors and regional diversification.
3.3.2.3 Industry sector exposures
The industry sector exposures are analysed on a deal-by-deal basis through their impact on the ratings assigned by EIF to each transaction/tranche. For instance, depending on the financial model used to analyse the transaction, industry exposures can be reflected in implicit correlation or can be indirectly captured based on assumption of default rate volatility, as a key model input variable.
Consideration of sector exposures also forms part of EIF’s overall portfolio analysis.
3.3.2.4 Counterparty risk
Counterparty risk in the own resources port folio is mitigated by the quality of EIF counterparties, which are usually major market players, and by rating triggers on the counterparty which require, in case of breach, actions such as substitution of the counterparty or collateralisation of its obligation. Another key mitigant of the counterparty risk is the general use of structures with a true sale of assets (for the cash flow transactions). Additionally, interruption of servicing is alleviated by the set-up of a back-up servicer agreement in securitisation deals.
3.3.3 Liquidity risk
The nature of EIF’s G&S business implies in general a low level of liquidity risk. Furthermore, EIF’s treasury guidelines (see section 3.4) ensure a high degree of liquidity to cover potential guarantee calls arising from the G&S activity.
The following table shows an analysis of the financial guarantees (EUR 16m as of 31 December 2016) split by the expected maturity dates of the transactions to which they are related:
EUREXPECTED MATURITY OF GUARANTEE
FINANCIAL LIABILITY
NOT MORE THAN 3 MONTHS
3 MONTHS TO 1 YEAR
1 YEAR TO 5 YEARS
MORE THAN 5 YEARS
TOTAL
As of 31.12.2016 136 1 111 870 4 238 653 10 951 605 16 302 264
As of 31.12.2015 6 571 1 993 713 646 854 11 307 580 13 954 718
3.3.4 Market risk
3.3.4.1 Market risk: Interest rate risk
The value of guarantee transactions is not subject to fluctuations with interest rates as long as a transaction is performing. However, transactions for which EIF is being
called on interest are typically generating exposure to short term interest rates through the coupon definition of the guaranteed tranche.
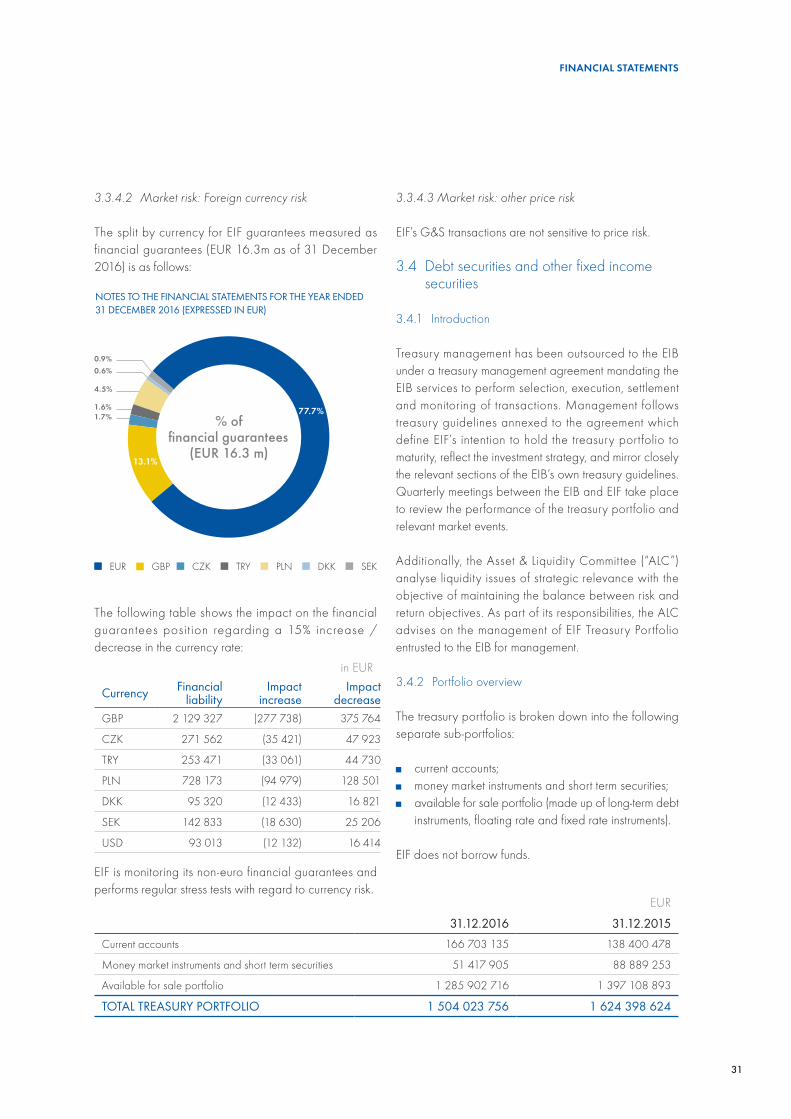
31
FINANCIAL STATEMENTS
3.3.4.2 Market risk: Foreign currency risk
The split by currency for EIF guarantees measured as financial guarantees (EUR 16.3m as of 31 December 2016) is as follows:
EUR
31.12.2016 31.12.2015Current accounts 166 703 135 138 400 478
Money market instruments and short term securities 51 417 905 88 889 253
Available for sale portfolio 1 285 902 716 1 397 108 893
TOTAL TREASURY PORTFOLIO 1 504 023 756 1 624 398 624
The following table shows the impact on the financial guarantees posit ion regarding a 15% increase / decrease in the currency rate:
in EUR
Currency Financial liability
Impact increase
Impact decrease
GBP 2 129 327 (277 738) 375 764
CZK 271 562 (35 421) 47 923
TRY 253 471 (33 061) 44 730
PLN 728 173 (94 979) 128 501
DKK 95 320 (12 433) 16 821
SEK 142 833 (18 630) 25 206
USD 93 013 (12 132) 16 414
EIF is monitoring its non-euro financial guarantees and performs regular stress tests with regard to currency risk.
3.3.4.3 Market risk: other price risk
EIF’s G&S transactions are not sensitive to price risk.
3.4 Debt securities and other fixed income securities
3.4.1 Introduction
Treasury management has been outsourced to the EIB under a treasury management agreement mandating the EIB services to perform selection, execution, settlement and monitoring of transactions. Management follows treasury guidelines annexed to the agreement which define EIF’s intention to hold the treasury portfolio to maturity, reflect the investment strategy, and mirror closely the relevant sections of the EIB’s own treasury guidelines. Quarterly meetings between the EIB and EIF take place to review the performance of the treasury portfolio and relevant market events.
Additionally, the Asset & Liquidity Committee (“ALC”) analyse liquidity issues of strategic relevance with the objective of maintaining the balance between risk and return objectives. As part of its responsibilities, the ALC advises on the management of EIF Treasury Portfolio entrusted to the EIB for management.
3.4.2 Portfolio overview
The treasury portfolio is broken down into the following separate sub-portfolios:
■ current accounts;■ money market instruments and short term securities;■ available for sale portfolio (made up of long-term debt
instruments, floating rate and fixed rate instruments).
EIF does not borrow funds.
NOTES TO THE FINANCIAL STATEMENTS FOR THE YEAR ENDED 31 DECEMBER 2016 (EXPRESSED IN EUR)
1.7%1.6%
4.5%
0.6%0.9%
77.7%
13.1%
% of financial guarantees
(EUR 16.3 m)
EUR GBP CZK TRY PLN DKK SEK

32
EIF ANNUAL REPORT 2016
3.4.3 Credit risk
The Fund is exposed to credit risk relating to its assets held in the treasury portfolio. However, EIF adheres to conservative credit investment guidelines and internal limits. For each port folio, the eligibility criteria for counterparties are fixed according to their nature, to their credit quality (as measured by their external credit ratings) and to their own funds.
EUR
MAXIMUM EXPOSURE 2016 MAXIMUM EXPOSURE 2015Cash and cash equivalents 218 121 040 227 289 731
Debt securities and other fixed income securities 1 285 902 716 1 397 108 893
TOTAL CREDIT RISK EXPOSURE 1 504 023 756 1 624 398 624
As at 31 December 2016 and 2015, all investments in the available for sale portfolio are made in EUR.The following table shows the maximum exposure to credit risk for treasury:
The following table outlines the credit quality of the Fund’s debt securities and other fixed income securities as of 31 December 2016 and 2015, based on external ratings.
AFS - DEBT SECURITIES AND OTHER FIXED INCOME SECURITIES
31.12.2016 31.12.2015
MINIMUM ISSUE RATING FAIR VALUEIN EUR
% FAIR VALUEIN EUR
%
Aaa 304 513 914 23.68% 316 626 728 22.65%
Aa1 96 699 310 7.52% 97 229 482 6.96%
Aa2 156 845 109 12.20% 184 243 919 13.19%
Aa3 120 521 257 9.37% 113 751 054 8.14%
A1 166 301 973 12.93% 189 256 752 13.55%
A2 168 650 797 13.12% 186 768 524 13.37%
A3 76 341 666 5.94% 66 217 946 4.74%
Baa1 52 881 254 4.11% 74 567 449 5.34%
Baa2 102 097 854 7.94% 126 967 527 9.09%
Baa3 0 0.00% 0 0.00%
Ba1 21 313 592 1.66% 22 106 481 1.58%
Ba3 0 0.00% 0 0.00%
Unrated 19 735 990 1.53% 19 373 031 1.39%
TOTAL 1 285 902 716 100.00% 1 397 108 893 100.00%
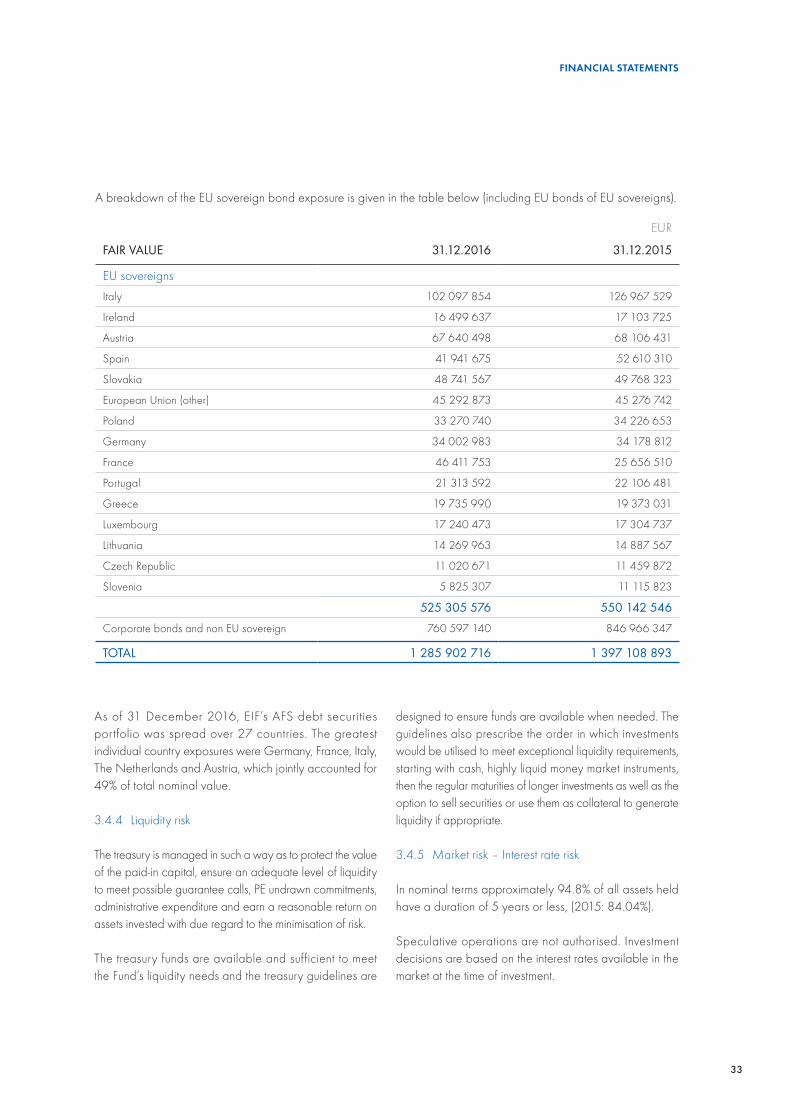
33
FINANCIAL STATEMENTS
EUR
FAIR VALUE 31.12.2016 31.12.2015
EU sovereignsItaly 102 097 854 126 967 529
Ireland 16 499 637 17 103 725
Austria 67 640 498 68 106 431
Spain 41 941 675 52 610 310
Slovakia 48 741 567 49 768 323
European Union (other) 45 292 873 45 276 742
Poland 33 270 740 34 226 653
Germany 34 002 983 34 178 812
France 46 411 753 25 656 510
Portugal 21 313 592 22 106 481
Greece 19 735 990 19 373 031
Luxembourg 17 240 473 17 304 737
Lithuania 14 269 963 14 887 567
Czech Republic 11 020 671 11 459 872
Slovenia 5 825 307 11 115 823
525 305 576 550 142 546Corporate bonds and non EU sovereign 760 597 140 846 966 347
TOTAL 1 285 902 716 1 397 108 893
A breakdown of the EU sovereign bond exposure is given in the table below (including EU bonds of EU sovereigns).
As of 31 December 2016, EIF’s AFS debt securities portfolio was spread over 27 countries. The greatest individual country exposures were Germany, France, Italy, The Netherlands and Austria, which jointly accounted for 49% of total nominal value.
3.4.4 Liquidity risk
The treasury is managed in such a way as to protect the value of the paid-in capital, ensure an adequate level of liquidity to meet possible guarantee calls, PE undrawn commitments, administrative expenditure and earn a reasonable return on assets invested with due regard to the minimisation of risk.
The treasury funds are available and sufficient to meet the Fund’s liquidity needs and the treasury guidelines are
designed to ensure funds are available when needed. The guidelines also prescribe the order in which investments would be utilised to meet exceptional liquidity requirements, starting with cash, highly liquid money market instruments, then the regular maturities of longer investments as well as the option to sell securities or use them as collateral to generate liquidity if appropriate.
3.4.5 Market risk – Interest rate risk
In nominal terms approximately 94.8% of all assets held have a duration of 5 years or less, (2015: 84.04%).
Speculative operations are not authorised. Investment decisions are based on the interest rates available in the market at the time of investment.
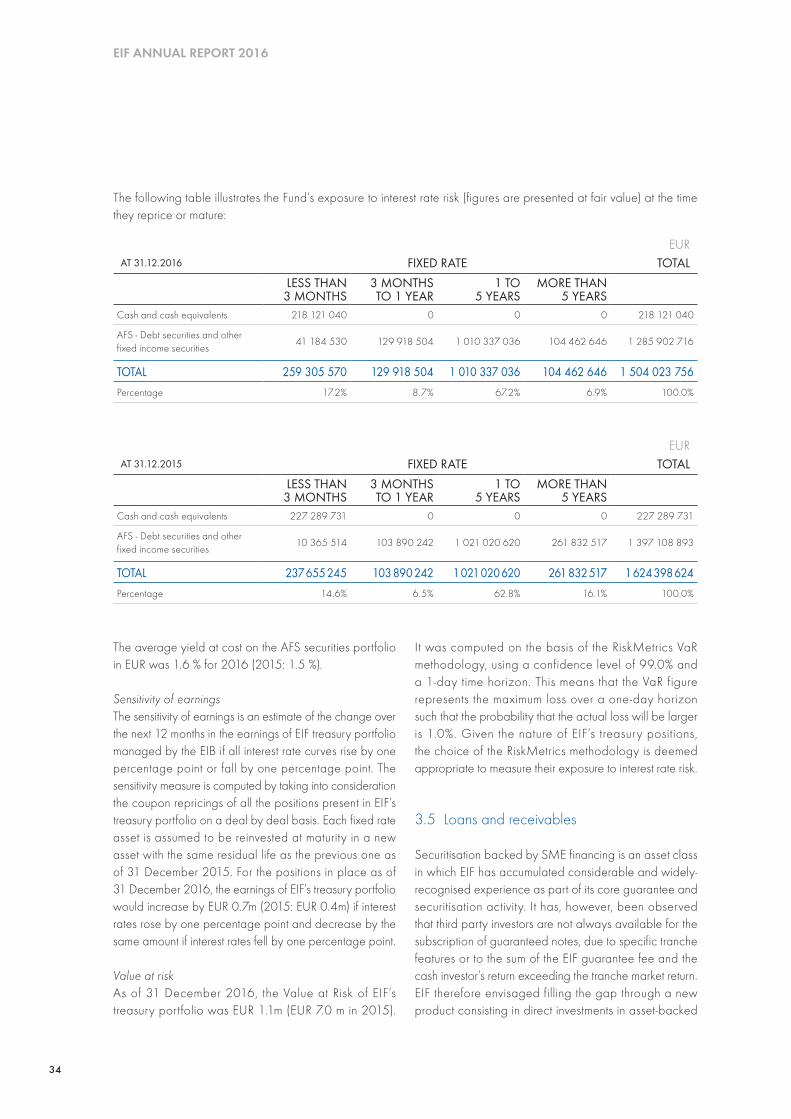
34
EIF ANNUAL REPORT 2016
The following table illustrates the Fund’s exposure to interest rate risk (figures are presented at fair value) at the time they reprice or mature:
EURAT 31.12.2016 FIXED RATE TOTAL
LESS THAN 3 MONTHS
3 MONTHS TO 1 YEAR
1 TO 5 YEARS
MORE THAN 5 YEARS
Cash and cash equivalents 218 121 040 0 0 0 218 121 040
AFS - Debt securities and other fixed income securities
41 184 530 129 918 504 1 010 337 036 104 462 646 1 285 902 716
TOTAL 259 305 570 129 918 504 1 010 337 036 104 462 646 1 504 023 756Percentage 17.2% 8.7% 67.2% 6.9% 100.0%
EURAT 31.12.2015 FIXED RATE TOTAL
LESS THAN 3 MONTHS
3 MONTHS TO 1 YEAR
1 TO 5 YEARS
MORE THAN 5 YEARS
Cash and cash equivalents 227 289 731 0 0 0 227 289 731
AFS - Debt securities and other fixed income securities
10 365 514 103 890 242 1 021 020 620 261 832 517 1 397 108 893
TOTAL 237 655 245 103 890 242 1 021 020 620 261 832 517 1 624 398 624Percentage 14.6% 6.5% 62.8% 16.1% 100.0%
The average yield at cost on the AFS securities portfolio in EUR was 1.6 % for 2016 (2015: 1.5 %).
Sensitivity of earningsThe sensitivity of earnings is an estimate of the change over the next 12 months in the earnings of EIF treasury portfolio managed by the EIB if all interest rate curves rise by one percentage point or fall by one percentage point. The sensitivity measure is computed by taking into consideration the coupon repricings of all the positions present in EIF’s treasury portfolio on a deal by deal basis. Each fixed rate asset is assumed to be reinvested at maturity in a new asset with the same residual life as the previous one as of 31 December 2015. For the positions in place as of 31 December 2016, the earnings of EIF’s treasury portfolio would increase by EUR 0.7m (2015: EUR 0.4m) if interest rates rose by one percentage point and decrease by the same amount if interest rates fell by one percentage point.
Value at riskAs of 31 December 2016, the Value at Risk of EIF’s treasury portfolio was EUR 1.1m (EUR 7.0 m in 2015).
It was computed on the basis of the RiskMetrics VaR methodology, using a confidence level of 99.0% and a 1-day time horizon. This means that the VaR figure represents the maximum loss over a one-day horizon such that the probability that the actual loss will be larger is 1.0%. Given the nature of EIF’s treasury positions, the choice of the RiskMetrics methodology is deemed appropriate to measure their exposure to interest rate risk.
3.5 Loans and receivables
Securitisation backed by SME financing is an asset class in which EIF has accumulated considerable and widely-recognised experience as part of its core guarantee and securitisation activity. It has, however, been observed that third party investors are not always available for the subscription of guaranteed notes, due to specific tranche features or to the sum of the EIF guarantee fee and the cash investor’s return exceeding the tranche market return. EIF therefore envisaged filling the gap through a new product consisting in direct investments in asset-backed
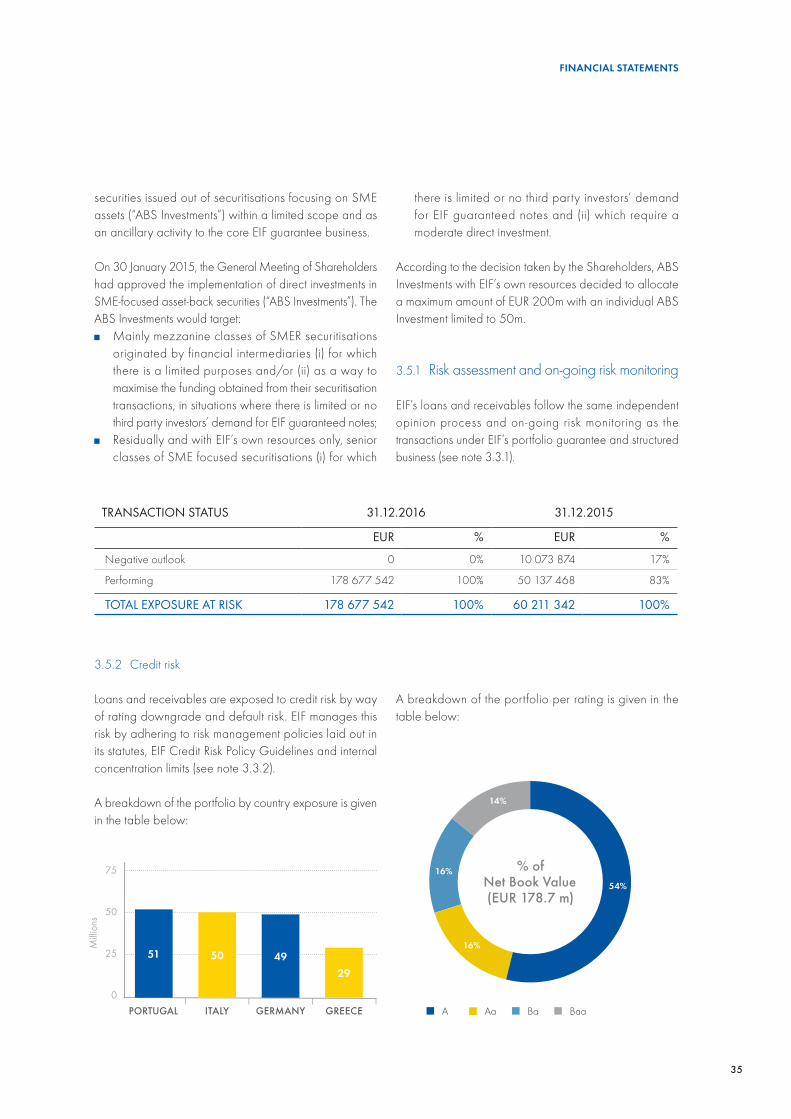
35
FINANCIAL STATEMENTS
securities issued out of securitisations focusing on SME assets (“ABS Investments”) within a limited scope and as an ancillary activity to the core EIF guarantee business.
On 30 January 2015, the General Meeting of Shareholders had approved the implementation of direct investments in SME-focused asset-back securities (“ABS Investments”). The ABS Investments would target:■ Mainly mezzanine classes of SMER securitisations
originated by financial intermediaries (i) for which there is a limited purposes and/or (ii) as a way to maximise the funding obtained from their securitisation transactions, in situations where there is limited or no third party investors’ demand for EIF guaranteed notes;
■ Residually and with EIF’s own resources only, senior classes of SME focused securitisations (i) for which
there is limited or no third party investors’ demand for EIF guaranteed notes and (ii) which require a moderate direct investment.
According to the decision taken by the Shareholders, ABS Investments with EIF’s own resources decided to allocate a maximum amount of EUR 200m with an individual ABS Investment limited to 50m.
3.5.1 Risk assessment and on-going risk monitoring
EIF’s loans and receivables follow the same independent opinion process and on-going risk monitoring as the transactions under EIF’s portfolio guarantee and structured business (see note 3.3.1).
TRANSACTION STATUS 31.12.2016 31.12.2015
EUR % EUR %
Negative outlook 0 0% 10 073 874 17%
Performing 178 677 542 100% 50 137 468 83%
TOTAL EXPOSURE AT RISK 178 677 542 100% 60 211 342 100%
3.5.2 Credit risk
Loans and receivables are exposed to credit risk by way of rating downgrade and default risk. EIF manages this risk by adhering to risk management policies laid out in its statutes, EIF Credit Risk Policy Guidelines and internal concentration limits (see note 3.3.2).
A breakdown of the portfolio by country exposure is given in the table below:
54%
16%
16%
14%
% of Net Book Value(EUR 178.7 m)
A Aa Ba BaaPORTUGAL GERMANYITALY GREECE I I I I
75
50
25
0
Milli
ons
51 495029
A breakdown of the portfolio per rating is given in the table below:
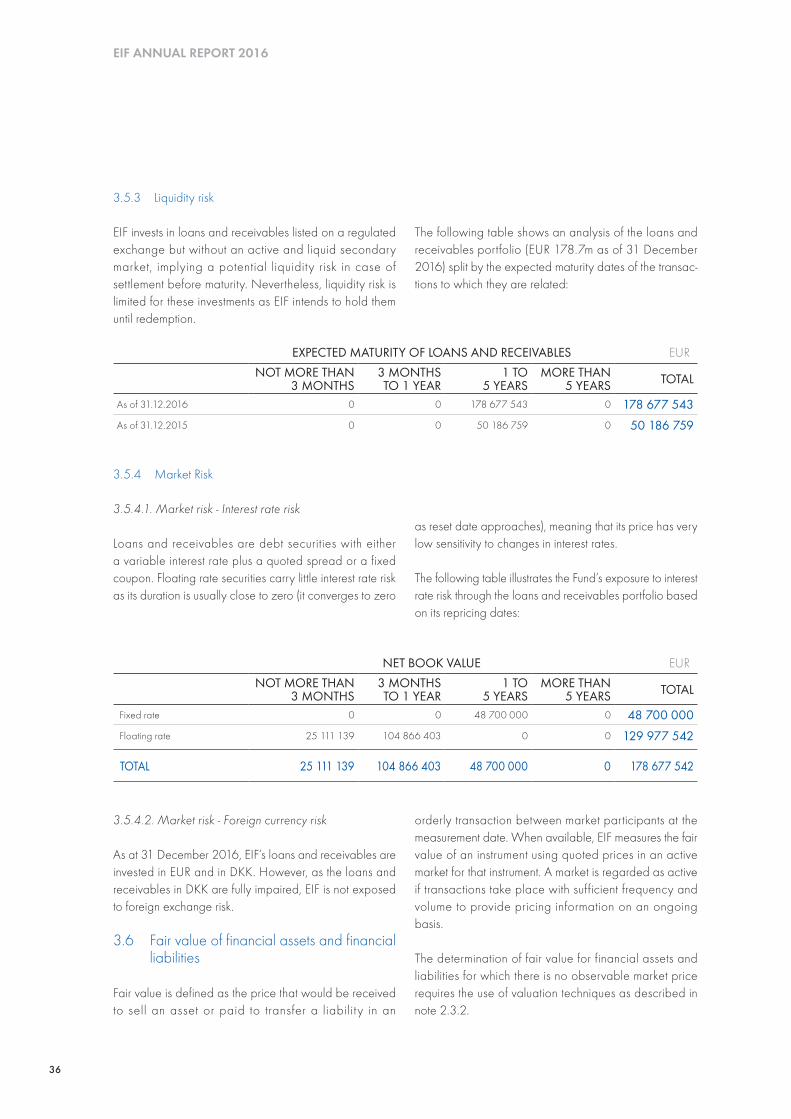
36
EIF ANNUAL REPORT 2016
3.5.3 Liquidity risk
EIF invests in loans and receivables listed on a regulated exchange but without an active and liquid secondary market, implying a potential liquidity risk in case of settlement before maturity. Nevertheless, liquidity risk is limited for these investments as EIF intends to hold them until redemption.
The following table shows an analysis of the loans and receivables portfolio (EUR 178.7m as of 31 December 2016) split by the expected maturity dates of the transac-tions to which they are related:
3.5.4 Market Risk
3.5.4.1. Market risk - Interest rate risk
Loans and receivables are debt securities with either a variable interest rate plus a quoted spread or a fixed coupon. Floating rate securities carry little interest rate risk as its duration is usually close to zero (it converges to zero
as reset date approaches), meaning that its price has very low sensitivity to changes in interest rates.
The following table illustrates the Fund’s exposure to interest rate risk through the loans and receivables portfolio based on its repricing dates:
EXPECTED MATURITY OF LOANS AND RECEIVABLES EURNOT MORE THAN
3 MONTHS3 MONTHS TO 1 YEAR
1 TO 5 YEARS
MORE THAN 5 YEARS TOTAL
As of 31.12.2016 0 0 178 677 543 0 178 677 543As of 31.12.2015 0 0 50 186 759 0 50 186 759
NET BOOK VALUE EURNOT MORE THAN
3 MONTHS3 MONTHS TO 1 YEAR
1 TO 5 YEARS
MORE THAN 5 YEARS TOTAL
Fixed rate 0 0 48 700 000 0 48 700 000 Floating rate 25 111 139 104 866 403 0 0 129 977 542
TOTAL 25 111 139 104 866 403 48 700 000 0 178 677 542
3.5.4.2. Market risk - Foreign currency risk
As at 31 December 2016, EIF‘s loans and receivables are invested in EUR and in DKK. However, as the loans and receivables in DKK are fully impaired, EIF is not exposed to foreign exchange risk.
3.6 Fair value of financial assets and financial liabilities
Fair value is defined as the price that would be received to sell an asset or paid to transfer a liability in an
orderly transaction between market participants at the measurement date. When available, EIF measures the fair value of an instrument using quoted prices in an active market for that instrument. A market is regarded as active if transactions take place with sufficient frequency and volume to provide pricing information on an ongoing basis.
The determination of fair value for financial assets and liabilities for which there is no observable market price requires the use of valuation techniques as described in note 2.3.2.
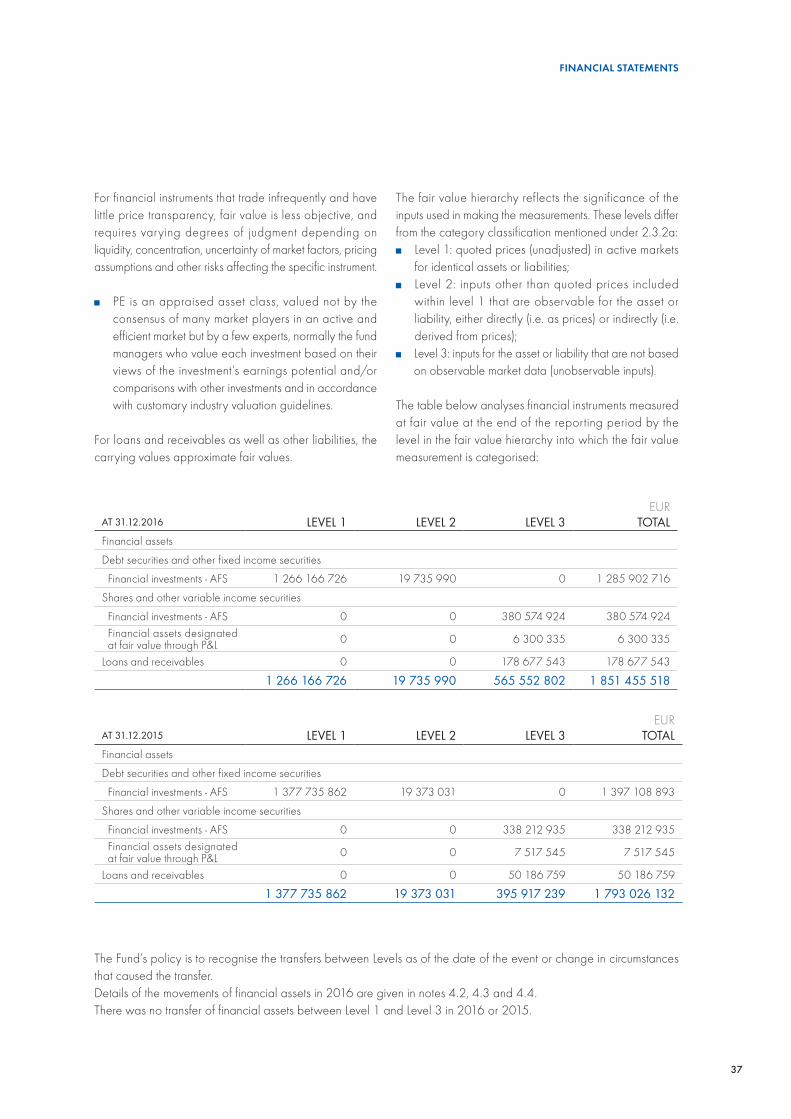
37
FINANCIAL STATEMENTS
EURAT 31.12.2016 LEVEL 1 LEVEL 2 LEVEL 3 TOTALFinancial assets
Debt securities and other fixed income securities
Financial investments - AFS 1 266 166 726 19 735 990 0 1 285 902 716
Shares and other variable income securities
Financial investments - AFS 0 0 380 574 924 380 574 924 Financial assets designated at fair value through P&L 0 0 6 300 335 6 300 335
Loans and receivables 0 0 178 677 543 178 677 543
1 266 166 726 19 735 990 565 552 802 1 851 455 518
EURAT 31.12.2015 LEVEL 1 LEVEL 2 LEVEL 3 TOTALFinancial assets
Debt securities and other fixed income securities
Financial investments - AFS 1 377 735 862 19 373 031 0 1 397 108 893
Shares and other variable income securities
Financial investments - AFS 0 0 338 212 935 338 212 935 Financial assets designated at fair value through P&L 0 0 7 517 545 7 517 545
Loans and receivables 0 0 50 186 759 50 186 759
1 377 735 862 19 373 031 395 917 239 1 793 026 132
For financial instruments that trade infrequently and have little price transparency, fair value is less objective, and requires varying degrees of judgment depending on liquidity, concentration, uncertainty of market factors, pricing assumptions and other risks affecting the specific instrument.
■ PE is an appraised asset class, valued not by the consensus of many market players in an active and efficient market but by a few experts, normally the fund managers who value each investment based on their views of the investment’s earnings potential and/or comparisons with other investments and in accordance with customary industry valuation guidelines.
For loans and receivables as well as other liabilities, the carrying values approximate fair values.
The Fund’s policy is to recognise the transfers between Levels as of the date of the event or change in circumstances that caused the transfer.Details of the movements of financial assets in 2016 are given in notes 4.2, 4.3 and 4.4. There was no transfer of financial assets between Level 1 and Level 3 in 2016 or 2015.
The fair value hierarchy reflects the significance of the inputs used in making the measurements. These levels differ from the category classification mentioned under 2.3.2a: ■ Level 1: quoted prices (unadjusted) in active markets
for identical assets or liabilities;■ Level 2: inputs other than quoted prices included
within level 1 that are observable for the asset or liability, either directly (i.e. as prices) or indirectly (i.e. derived from prices);
■ Level 3: inputs for the asset or liability that are not based on observable market data (unobservable inputs).
The table below analyses financial instruments measured at fair value at the end of the reporting period by the level in the fair value hierarchy into which the fair value measurement is categorised:
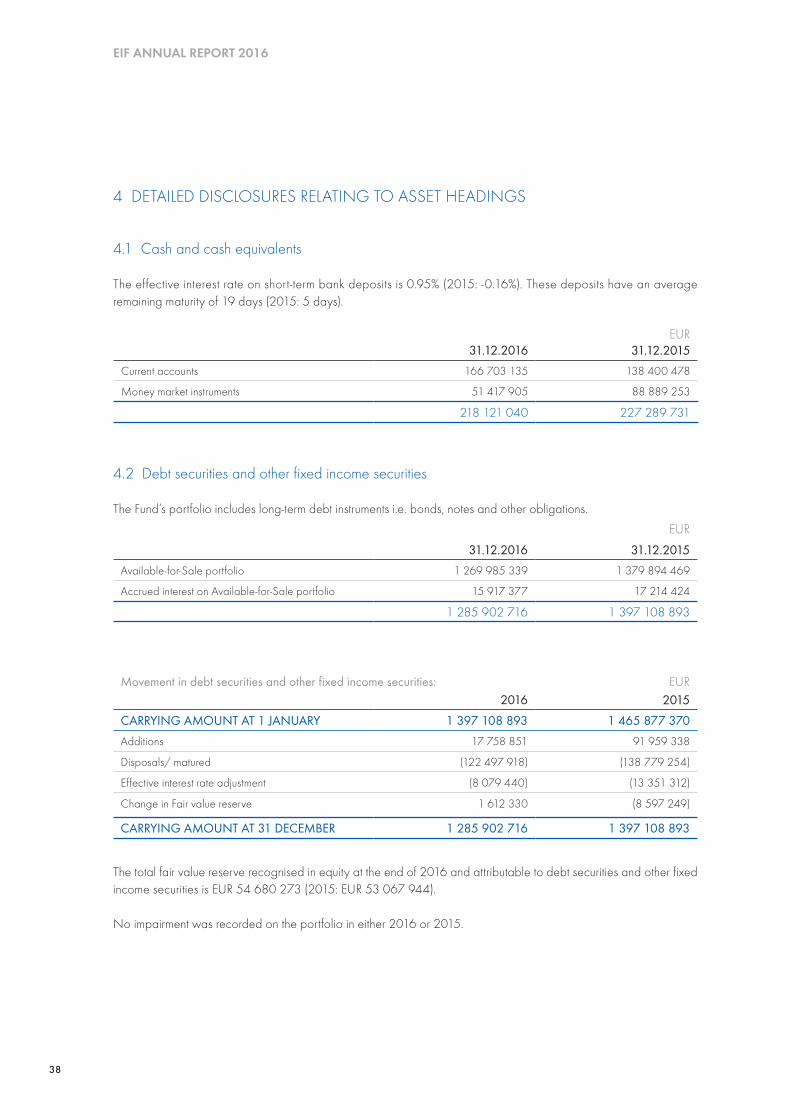
38
EIF ANNUAL REPORT 2016
4 DETAILED DISCLOSURES RELATING TO ASSET HEADINGS
4.1 Cash and cash equivalents
The effective interest rate on short-term bank deposits is 0.95% (2015: -0.16%). These deposits have an average remaining maturity of 19 days (2015: 5 days).
EUR31.12.2016 31.12.2015
Current accounts 166 703 135 138 400 478
Money market instruments 51 417 905 88 889 253
218 121 040 227 289 731
4.2 Debt securities and other fixed income securities
The Fund’s portfolio includes long-term debt instruments i.e. bonds, notes and other obligations.EUR
31.12.2016 31.12.2015Available-for-Sale portfolio 1 269 985 339 1 379 894 469
Accrued interest on Available-for-Sale portfolio 15 917 377 17 214 424
1 285 902 716 1 397 108 893
Movement in debt securities and other fixed income securities: EUR2016 2015
CARRYING AMOUNT AT 1 JANUARY 1 397 108 893 1 465 877 370Additions 17 758 851 91 959 338
Disposals/ matured (122 497 918) (138 779 254)
Effective interest rate adjustment (8 079 440) (13 351 312)
Change in Fair value reserve 1 612 330 (8 597 249)
CARRYING AMOUNT AT 31 DECEMBER 1 285 902 716 1 397 108 893
The total fair value reserve recognised in equity at the end of 2016 and attributable to debt securities and other fixed income securities is EUR 54 680 273 (2015: EUR 53 067 944).
No impairment was recorded on the portfolio in either 2016 or 2015.

39
FINANCIAL STATEMENTS
4.3 Shares and other variable income securities
Shares and other variable income securities are analysed as follows:EUR
2016 2016 OF WHICH LEVEL 3
Investment at cost at 1 January 263 213 768 263 213 768
Disbursements 101 388 039 101 388 039
Net disbursements in relation to EFSI EP - SW2 5 334 804 5 334 804
Capital repayments (48 270 416) (48 270 416)
Terminated deals (3 784 536) (3 784 536)
Transferred to other assets due to earn out transactions (1 275 927) (1 275 927)
Transferred to other assets due to secondary sale transactions
INVESTMENT AT COST AT 31 DECEMBER 316 605 732 316 605 732
Fair value adjustment and foreign exchange adjustment at 1 January 82 516 712 82 516 712
Adjustments to fair value reserve during the financial year:
- Decrease in fair value for non impaired funds (11 734 379) (11 734 379)
- Decrease in fair value for funds previously impaired (1 924 596) (1 924 596)
- Transfer of fair value reserve due to 2016 events
- for funds newly impaired 1 343 080 1 343 080
- for funds terminated (518 205) (518 205)
- for funds earned out (14 618) (14 618)
Increase in fair value in relation to EFSI EP SW2 9 186 9 186
(12 839 532) (12 839 532)Terminated transactions - cumulated impairment losses until derecognition 4 288 777 4 288 777
Earn out transactions - cumulated impairment losses 1 261 310 1 261 310
Impairment losses (5 073 863) (5 073 863)
Changes in fair value through profit or loss 116 123 116 123
VALUE ADJUSTMENT AND FOREIGN EXCHANGE ADJUSTMENT AT 31 DECEMBER 70 269 527 70 269 527
CARRYING AMOUNT AT 31 DECEMBER 386 875 259 386 875 259
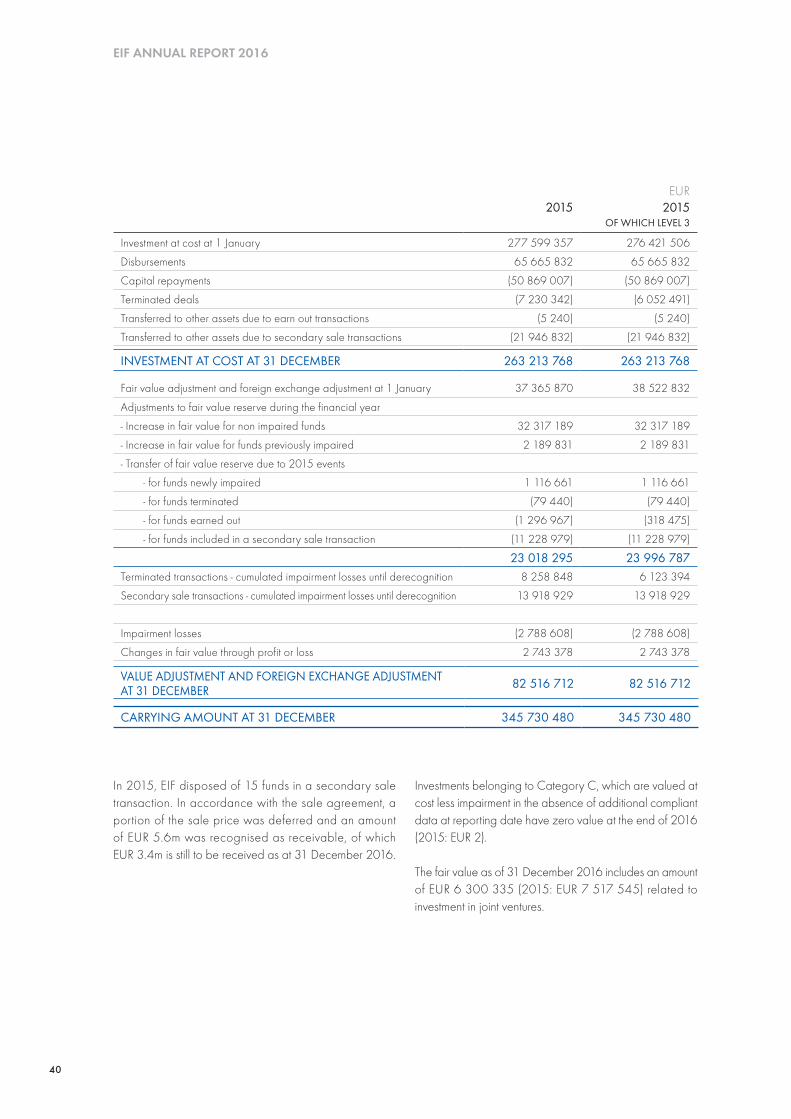
40
EIF ANNUAL REPORT 2016
In 2015, EIF disposed of 15 funds in a secondary sale transaction. In accordance with the sale agreement, a portion of the sale price was deferred and an amount of EUR 5.6m was recognised as receivable, of which EUR 3.4m is still to be received as at 31 December 2016.
Investments belonging to Category C, which are valued at cost less impairment in the absence of additional compliant data at reporting date have zero value at the end of 2016 (2015: EUR 2).
The fair value as of 31 December 2016 includes an amount of EUR 6 300 335 (2015: EUR 7 517 545) related to investment in joint ventures.
EUR2015 2015
OF WHICH LEVEL 3
Investment at cost at 1 January 277 599 357 276 421 506
Disbursements 65 665 832 65 665 832
Capital repayments (50 869 007) (50 869 007)
Terminated deals (7 230 342) (6 052 491)
Transferred to other assets due to earn out transactions (5 240) (5 240)
Transferred to other assets due to secondary sale transactions (21 946 832) (21 946 832)
INVESTMENT AT COST AT 31 DECEMBER 263 213 768 263 213 768
Fair value adjustment and foreign exchange adjustment at 1 January 37 365 870 38 522 832
Adjustments to fair value reserve during the financial year
- Increase in fair value for non impaired funds 32 317 189 32 317 189
- Increase in fair value for funds previously impaired 2 189 831 2 189 831
- Transfer of fair value reserve due to 2015 events
- for funds newly impaired 1 116 661 1 116 661
- for funds terminated (79 440) (79 440)
- for funds earned out (1 296 967) (318 475)
- for funds included in a secondary sale transaction (11 228 979) (11 228 979)
23 018 295 23 996 787Terminated transactions - cumulated impairment losses until derecognition 8 258 848 6 123 394
Secondary sale transactions - cumulated impairment losses until derecognition 13 918 929 13 918 929
Impairment losses (2 788 608) (2 788 608)
Changes in fair value through profit or loss 2 743 378 2 743 378
VALUE ADJUSTMENT AND FOREIGN EXCHANGE ADJUSTMENT AT 31 DECEMBER 82 516 712 82 516 712
CARRYING AMOUNT AT 31 DECEMBER 345 730 480 345 730 480
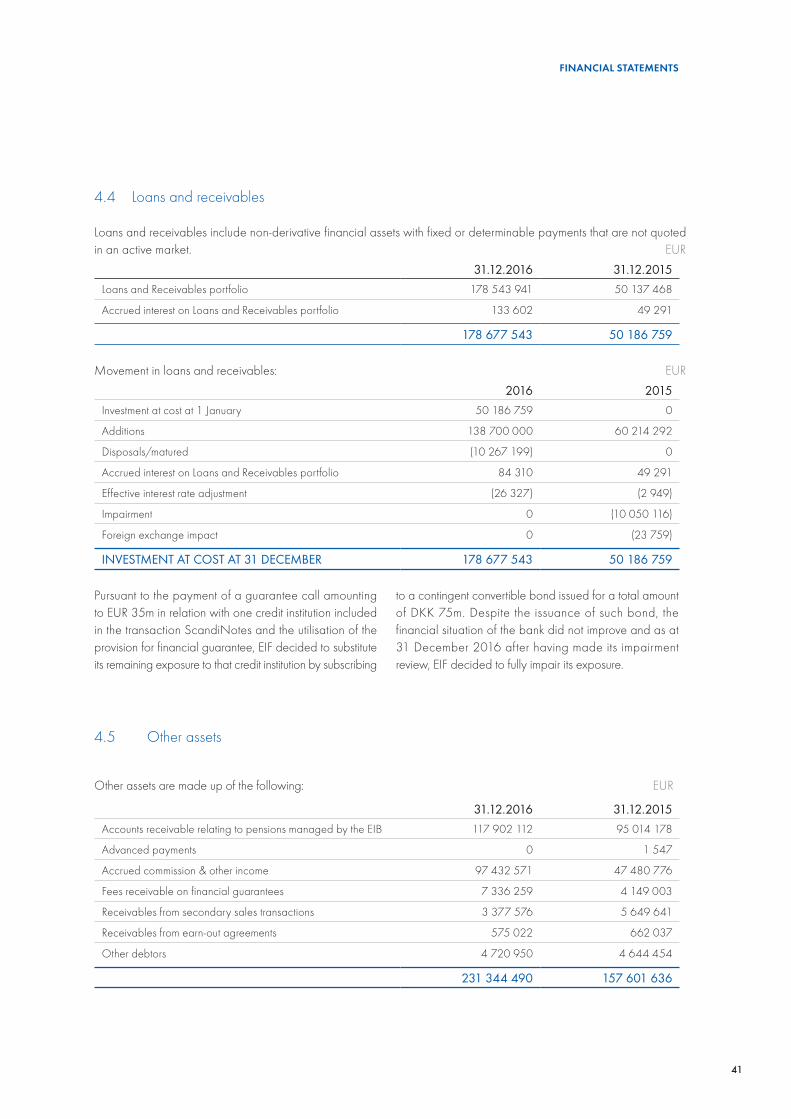
41
FINANCIAL STATEMENTS
Pursuant to the payment of a guarantee call amounting to EUR 35m in relation with one credit institution included in the transaction ScandiNotes and the utilisation of the provision for financial guarantee, EIF decided to substitute its remaining exposure to that credit institution by subscribing
to a contingent convertible bond issued for a total amount of DKK 75m. Despite the issuance of such bond, the financial situation of the bank did not improve and as at 31 December 2016 after having made its impairment review, EIF decided to fully impair its exposure.
4.5 Other assets
Other assets are made up of the following: EUR
31.12.2016 31.12.2015Accounts receivable relating to pensions managed by the EIB 117 902 112 95 014 178
Advanced payments 0 1 547
Accrued commission & other income 97 432 571 47 480 776
Fees receivable on financial guarantees 7 336 259 4 149 003
Receivables from secondary sales transactions 3 377 576 5 649 641
Receivables from earn-out agreements 575 022 662 037
Other debtors 4 720 950 4 644 454
231 344 490 157 601 636
4.4 Loans and receivables
Loans and receivables include non-derivative financial assets with fixed or determinable payments that are not quoted in an active market. EUR
31.12.2016 31.12.2015Loans and Receivables portfolio 178 543 941 50 137 468
Accrued interest on Loans and Receivables portfolio 133 602 49 291
178 677 543 50 186 759
Movement in loans and receivables: EUR2016 2015
Investment at cost at 1 January 50 186 759 0
Additions 138 700 000 60 214 292
Disposals/matured (10 267 199) 0
Accrued interest on Loans and Receivables portfolio 84 310 49 291
Effective interest rate adjustment (26 327) (2 949)
Impairment 0 (10 050 116)
Foreign exchange impact 0 (23 759)
INVESTMENT AT COST AT 31 DECEMBER 178 677 543 50 186 759
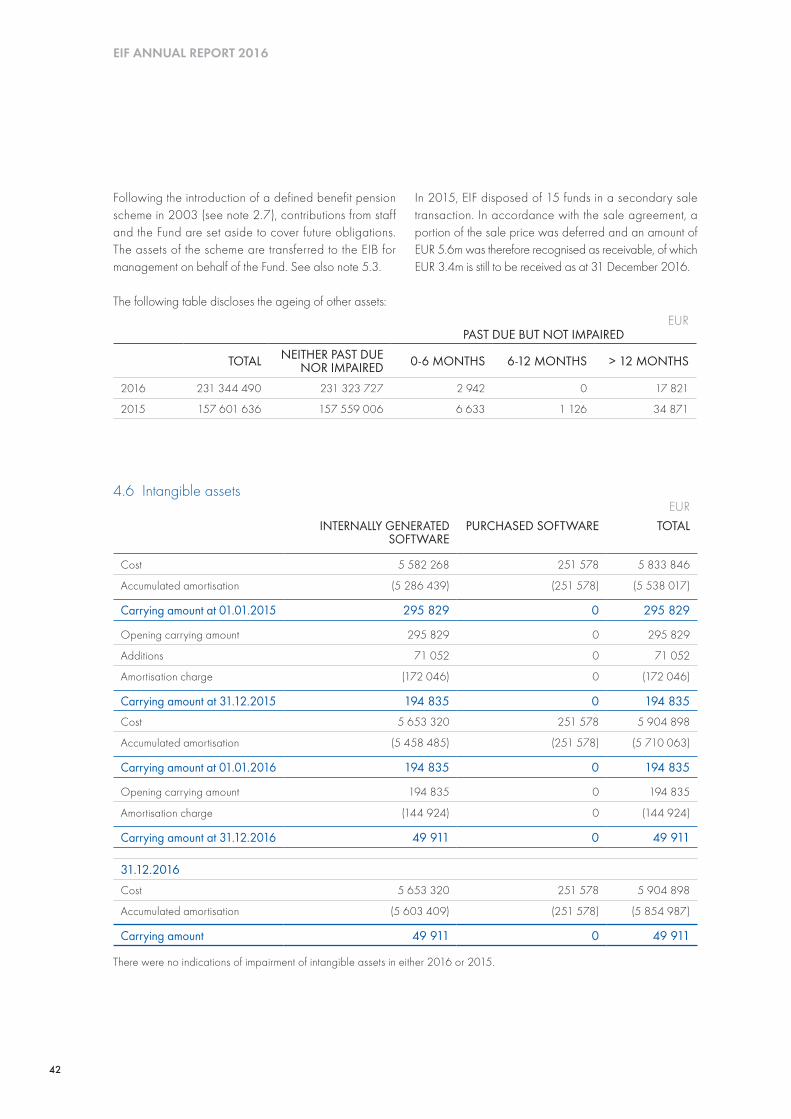
42
EIF ANNUAL REPORT 2016
Following the introduction of a defined benefit pension scheme in 2003 (see note 2.7), contributions from staff and the Fund are set aside to cover future obligations. The assets of the scheme are transferred to the EIB for management on behalf of the Fund. See also note 5.3.
In 2015, EIF disposed of 15 funds in a secondary sale transaction. In accordance with the sale agreement, a portion of the sale price was deferred and an amount of EUR 5.6m was therefore recognised as receivable, of which EUR 3.4m is still to be received as at 31 December 2016.
The following table discloses the ageing of other assets: +10% -10% EUR
PAST DUE BUT NOT IMPAIRED
TOTAL NEITHER PAST DUE NOR IMPAIRED 0-6 MONTHS 6-12 MONTHS > 12 MONTHS
2016 231 344 490 231 323 727 2 942 0 17 821
2015 157 601 636 157 559 006 6 633 1 126 34 871
4.6 Intangible assetsEUR
INTERNALLY GENERATED SOFTWARE
PURCHASED SOFTWARE TOTAL
Cost 5 582 268 251 578 5 833 846
Accumulated amortisation (5 286 439) (251 578) (5 538 017)
Carrying amount at 01.01.2015 295 829 0 295 829
Opening carrying amount 295 829 0 295 829
Additions 71 052 0 71 052
Amortisation charge (172 046) 0 (172 046)
Carrying amount at 31.12.2015 194 835 0 194 835Cost 5 653 320 251 578 5 904 898
Accumulated amortisation (5 458 485) (251 578) (5 710 063)
Carrying amount at 01.01.2016 194 835 0 194 835
Opening carrying amount 194 835 0 194 835
Amortisation charge (144 924) 0 (144 924)
Carrying amount at 31.12.2016 49 911 0 49 911
31.12.2016Cost 5 653 320 251 578 5 904 898
Accumulated amortisation (5 603 409) (251 578) (5 854 987)
Carrying amount 49 911 0 49 911
There were no indications of impairment of intangible assets in either 2016 or 2015.
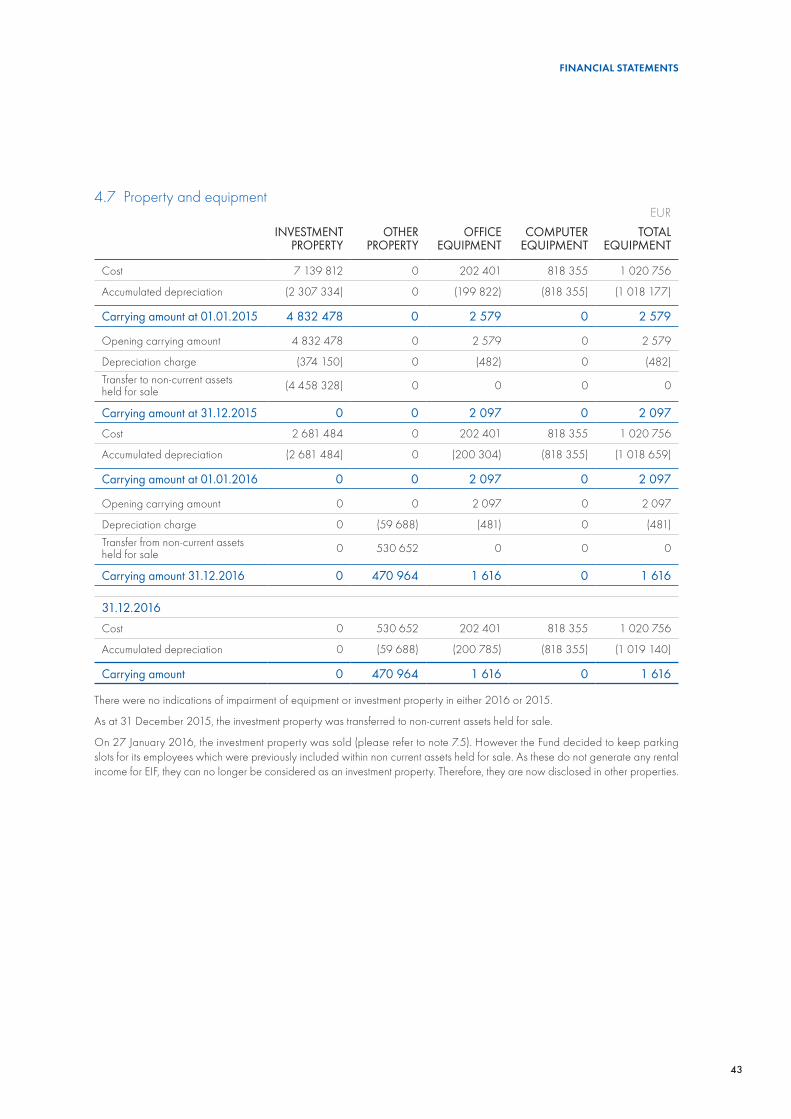
43
FINANCIAL STATEMENTS
4.7 Property and equipmentEUR
INVESTMENT PROPERTY
OTHER PROPERTY
OFFICE EQUIPMENT
COMPUTER EQUIPMENT
TOTAL EQUIPMENT
Cost 7 139 812 0 202 401 818 355 1 020 756
Accumulated depreciation (2 307 334) 0 (199 822) (818 355) (1 018 177)
Carrying amount at 01.01.2015 4 832 478 0 2 579 0 2 579
Opening carrying amount 4 832 478 0 2 579 0 2 579
Depreciation charge (374 150) 0 (482) 0 (482)Transfer to non-current assets held for sale (4 458 328) 0 0 0 0
Carrying amount at 31.12.2015 0 0 2 097 0 2 097Cost 2 681 484 0 202 401 818 355 1 020 756
Accumulated depreciation (2 681 484) 0 (200 304) (818 355) (1 018 659)
Carrying amount at 01.01.2016 0 0 2 097 0 2 097
Opening carrying amount 0 0 2 097 0 2 097
Depreciation charge 0 (59 688) (481) 0 (481)Transfer from non-current assets held for sale 0 530 652 0 0 0
Carrying amount 31.12.2016 0 470 964 1 616 0 1 616
31.12.2016Cost 0 530 652 202 401 818 355 1 020 756
Accumulated depreciation 0 (59 688) (200 785) (818 355) (1 019 140)
Carrying amount 0 470 964 1 616 0 1 616
There were no indications of impairment of equipment or investment property in either 2016 or 2015.
As at 31 December 2015, the investment property was transferred to non-current assets held for sale.
On 27 January 2016, the investment property was sold (please refer to note 7.5). However the Fund decided to keep parking slots for its employees which were previously included within non current assets held for sale. As these do not generate any rental income for EIF, they can no longer be considered as an investment property. Therefore, they are now disclosed in other properties.
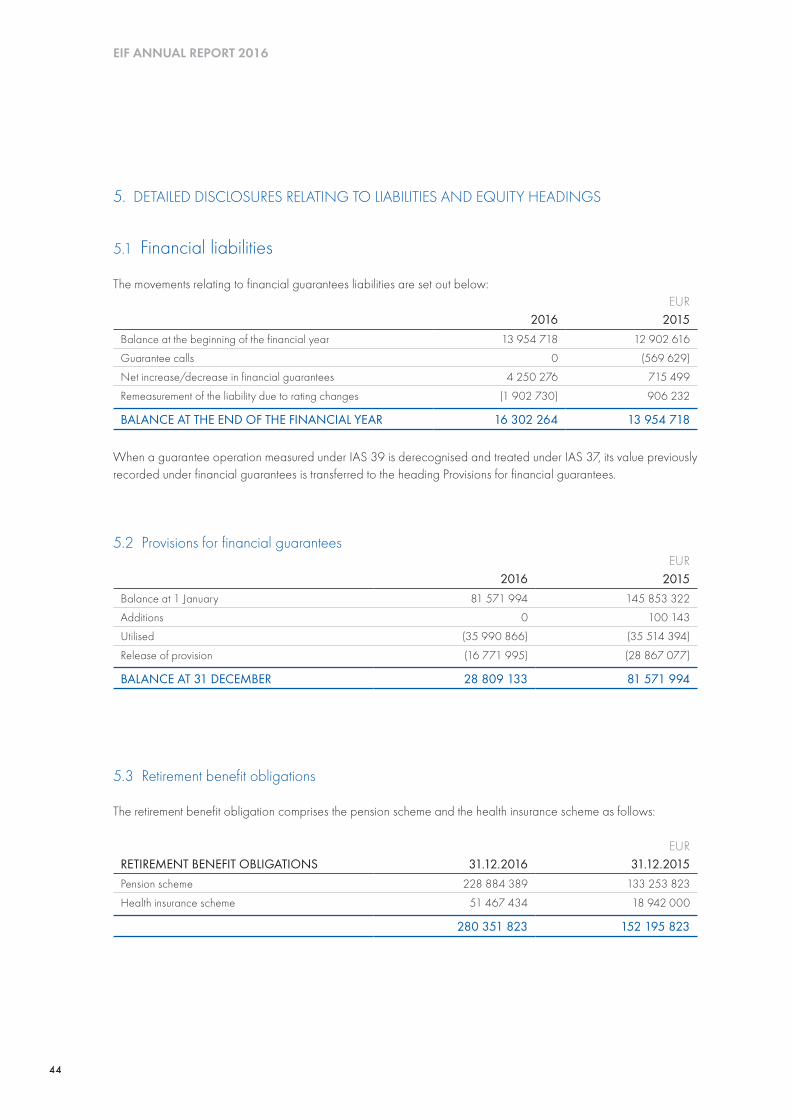
44
EIF ANNUAL REPORT 2016
5.3 Retirement benefit obligations
The retirement benefit obligation comprises the pension scheme and the health insurance scheme as follows:
EURRETIREMENT BENEFIT OBLIGATIONS 31.12.2016 31.12.2015Pension scheme 228 884 389 133 253 823
Health insurance scheme 51 467 434 18 942 000
280 351 823 152 195 823
5. DETAILED DISCLOSURES RELATING TO LIABILITIES AND EQUITY HEADINGS
5.1 Financial liabilities
The movements relating to financial guarantees liabilities are set out below:EUR
2016 2015Balance at the beginning of the financial year 13 954 718 12 902 616
Guarantee calls 0 (569 629)
Net increase/decrease in financial guarantees 4 250 276 715 499
Remeasurement of the liability due to rating changes (1 902 730) 906 232
BALANCE AT THE END OF THE FINANCIAL YEAR 16 302 264 13 954 718
When a guarantee operation measured under IAS 39 is derecognised and treated under IAS 37, its value previously recorded under financial guarantees is transferred to the heading Provisions for financial guarantees.
5.2 Provisions for financial guaranteesEUR
2016 2015 Balance at 1 January 81 571 994 145 853 322
Additions 0 100 143
Utilised (35 990 866) (35 514 394)
Release of provision (16 771 995) (28 867 077)
BALANCE AT 31 DECEMBER 28 809 133 81 571 994
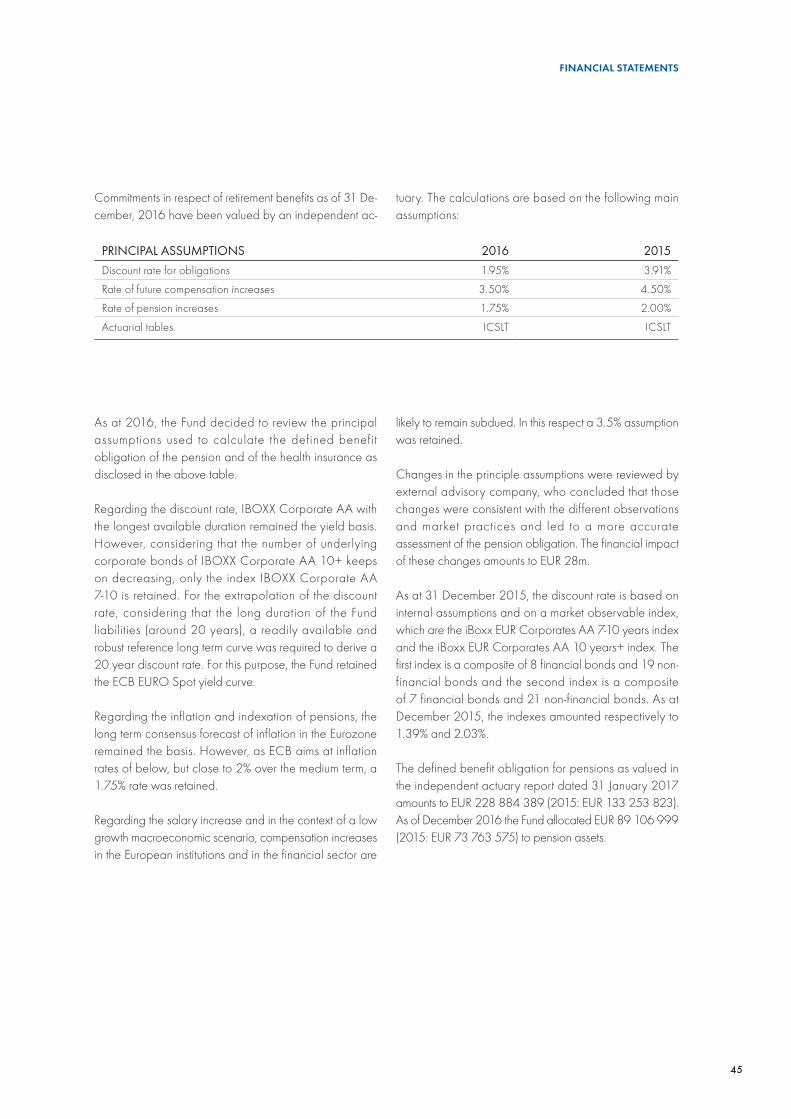
45
FINANCIAL STATEMENTS
As at 2016, the Fund decided to review the principal assumptions used to calculate the defined benefit obligation of the pension and of the health insurance as disclosed in the above table.
Regarding the discount rate, IBOXX Corporate AA with the longest available duration remained the yield basis. However, considering that the number of underlying corporate bonds of IBOXX Corporate AA 10+ keeps on decreasing, only the index IBOXX Corporate AA 7-10 is retained. For the extrapolation of the discount rate, considering that the long duration of the Fund liabilities (around 20 years), a readily available and robust reference long term curve was required to derive a 20 year discount rate. For this purpose, the Fund retained the ECB EURO Spot yield curve.
Regarding the inflation and indexation of pensions, the long term consensus forecast of inflation in the Eurozone remained the basis. However, as ECB aims at inflation rates of below, but close to 2% over the medium term, a 1.75% rate was retained.
Regarding the salary increase and in the context of a low growth macroeconomic scenario, compensation increases in the European institutions and in the financial sector are
Commitments in respect of retirement benefits as of 31 De-cember, 2016 have been valued by an independent ac-
PRINCIPAL ASSUMPTIONS 2016 2015Discount rate for obligations 1.95% 3.91%
Rate of future compensation increases 3.50% 4.50%
Rate of pension increases 1.75% 2.00%
Actuarial tables ICSLT ICSLT
tuary. The calculations are based on the following main assumptions:
likely to remain subdued. In this respect a 3.5% assumption was retained.
Changes in the principle assumptions were reviewed by external advisory company, who concluded that those changes were consistent with the different observations and market practices and led to a more accurate assessment of the pension obligation. The financial impact of these changes amounts to EUR 28m.
As at 31 December 2015, the discount rate is based on internal assumptions and on a market observable index, which are the iBoxx EUR Corporates AA 7-10 years index and the iBoxx EUR Corporates AA 10 years+ index. The first index is a composite of 8 financial bonds and 19 non-financial bonds and the second index is a composite of 7 financial bonds and 21 non-financial bonds. As at December 2015, the indexes amounted respectively to 1.39% and 2.03%.
The defined benefit obligation for pensions as valued in the independent actuary report dated 31 January 2017 amounts to EUR 228 884 389 (2015: EUR 133 253 823). As of December 2016 the Fund allocated EUR 89 106 999 (2015: EUR 73 763 575) to pension assets.
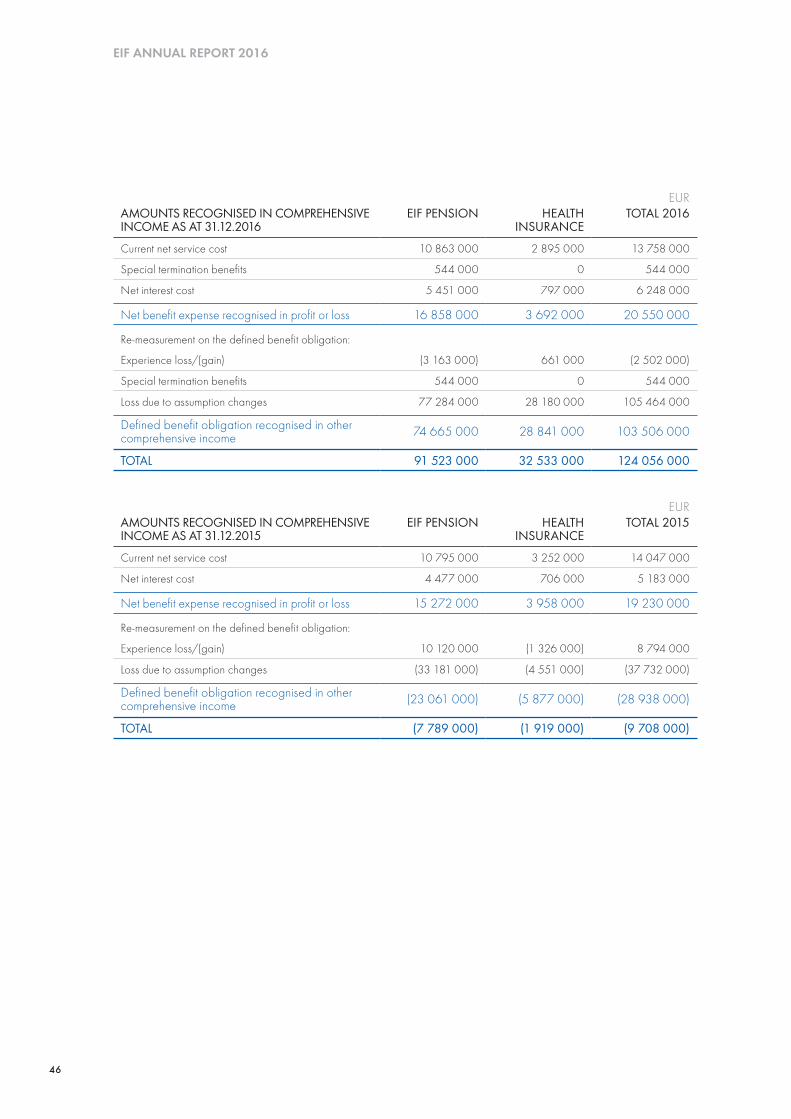
46
EIF ANNUAL REPORT 2016
EURAMOUNTS RECOGNISED IN COMPREHENSIVE INCOME AS AT 31.12.2016
EIF PENSION HEALTHINSURANCE
TOTAL 2016
Current net service cost 10 863 000 2 895 000 13 758 000
Special termination benefits 544 000 0 544 000
Net interest cost 5 451 000 797 000 6 248 000
Net benefit expense recognised in profit or loss 16 858 000 3 692 000 20 550 000
Re-measurement on the defined benefit obligation:
Experience loss/(gain) (3 163 000) 661 000 (2 502 000)
Special termination benefits 544 000 0 544 000
Loss due to assumption changes 77 284 000 28 180 000 105 464 000
Defined benefit obligation recognised in other comprehensive income 74 665 000 28 841 000 103 506 000
TOTAL 91 523 000 32 533 000 124 056 000
EURAMOUNTS RECOGNISED IN COMPREHENSIVE INCOME AS AT 31.12.2015
EIF PENSION HEALTHINSURANCE
TOTAL 2015
Current net service cost 10 795 000 3 252 000 14 047 000
Net interest cost 4 477 000 706 000 5 183 000
Net benefit expense recognised in profit or loss 15 272 000 3 958 000 19 230 000
Re-measurement on the defined benefit obligation:
Experience loss/(gain) 10 120 000 (1 326 000) 8 794 000
Loss due to assumption changes (33 181 000) (4 551 000) (37 732 000)
Defined benefit obligation recognised in other comprehensive income (23 061 000) (5 877 000) (28 938 000)
TOTAL (7 789 000) (1 919 000) (9 708 000)

47
FINANCIAL STATEMENTS
EURCHANGES IN DEFINED BENEFIT OBLIGATION AS AT 31.12.2016
EIF PENSION HEALTHINSURANCE
TOTAL 2016
Defined benefit obligation, Beginning of year 133 253 823 18 942 000 152 195 823
Net service cost 10 863 000 2 895 000 13 758 000
Net interest cost 5 451 000 797 000 6 248 000
Employee contributions 3 238 000 7 000 3 245 000
Benefits Paid 1 436 000 (37 000) 1 399 000
Special termination benefits 544 000 0 544 000
Experience Loss/ (gain) (3 163 000) 661 000 (2 502 000)
Loss due to assumption changes 77 284 000 28 180 000 105 464 000
DEFINED BENEFIT OBLIGATION, END OF YEAR 228 906 823 51 445 000 280 351 823
EURCHANGES IN DEFINED BENEFIT OBLIGATION AS AT 31.12.2015
EIF PENSION HEALTHINSURANCE
TOTAL 2015
Defined benefit obligation, Beginning of year 135 971 823 20 884 000 156 855 823
Net service cost 10 795 000 3 252 000 14 047 000
Net interest cost 4 477 000 706 000 5 183 000
Employee contributions 2 630 000 0 2 630 000
Benefits Paid 2 441 000 (23 000) 2 418 000
Experience Loss/ (gain) 10 120 000 (1 326 000) 8 794 000
Loss due to assumption changes (33 181 000) (4 551 000) (37 732 000)
DEFINED BENEFIT OBLIGATION, END OF YEAR 133 253 823 18 942 000 152 195 823
The sensitivity of the DBO to possible changes at the reporting date to key actuarial assumptions, holding other assumptions constant, is shown below:
31 DECEMBER 2016 EFFECT ON THE DEFINED BENEFIT OBLIGATION
EIF PENSION HEALTH INSURANCEDiscount rate 1% increase -26% -30%
Discount rate 1% decrease 38% 45%
Life expectancy 1 year increase 4% 6%
Life expectancy 1 year decrease -4% -6%
Inflation 1% increase 21%
Inflation 1% decrease -16%
Salary rate 1% increase 14%
Salary rate 1% decrease -11%
Medical cost 1% increase 43%
Medical cost 1% decrease -29%
The movements in the “Retirement benefit obligations” rounded to the nearest EUR 1 000 are as follows:

48
EIF ANNUAL REPORT 2016
Assumptions regarding future mortality have been based on published statistics and mortality tables. The current longevities underlying the values of the DBO at the reporting date were as follows:
31 DECEMBER 2016 EIF PENSION HEALTH INSURANCE
YEARS YEARSDuration of active members 31.1 36.6Duration of deferred members* 33.1 0
Duration of retired members 15.4 22.7
31 DECEMBER 2015 EIF PENSION HEALTH INSURANCE
YEARS YEARSDuration of active members 29.4 33.9
Duration of deferred members* 31.9 0
Duration of retired members 14.2 21.4
Life expectancy at age 60 for a male using ICSLT (year 2016) mortality tables: 25 yearsLife expectancy at age 60 for a female using ICSLT (year 2016) mortality tables: 26.7 years
* Staff members who have left the Fund before retirement age and have a right to a deferred pension.
Life expectancy at age 60 for a male using ICSLT (year 2015) mortality tables: 24.9 yearsLife expectancy at age 60 for a female using ICSLT (year 2015) mortality tables: 26.6 years
* Staff members who have left the Fund before retirement age and have a right to a deferred pension.
31 DECEMBER 2015 EFFECT ON THE DEFINED BENEFIT OBLIGATION
EIF PENSION HEALTH INSURANCEDiscount rate 1% increase -24% -27%
Discount rate 1% decrease 34% 40%
Life expectancy 1 year increase 3% 4%
Life expectancy 1 year decrease -3% -5%
Inflation 1% increase 19%
Inflation 1% decrease -15%
Salary rate 1% increase 14%
Salary rate 1% decrease -12%
Medical cost 1% increase 40%
Medical cost 1% decrease -28%
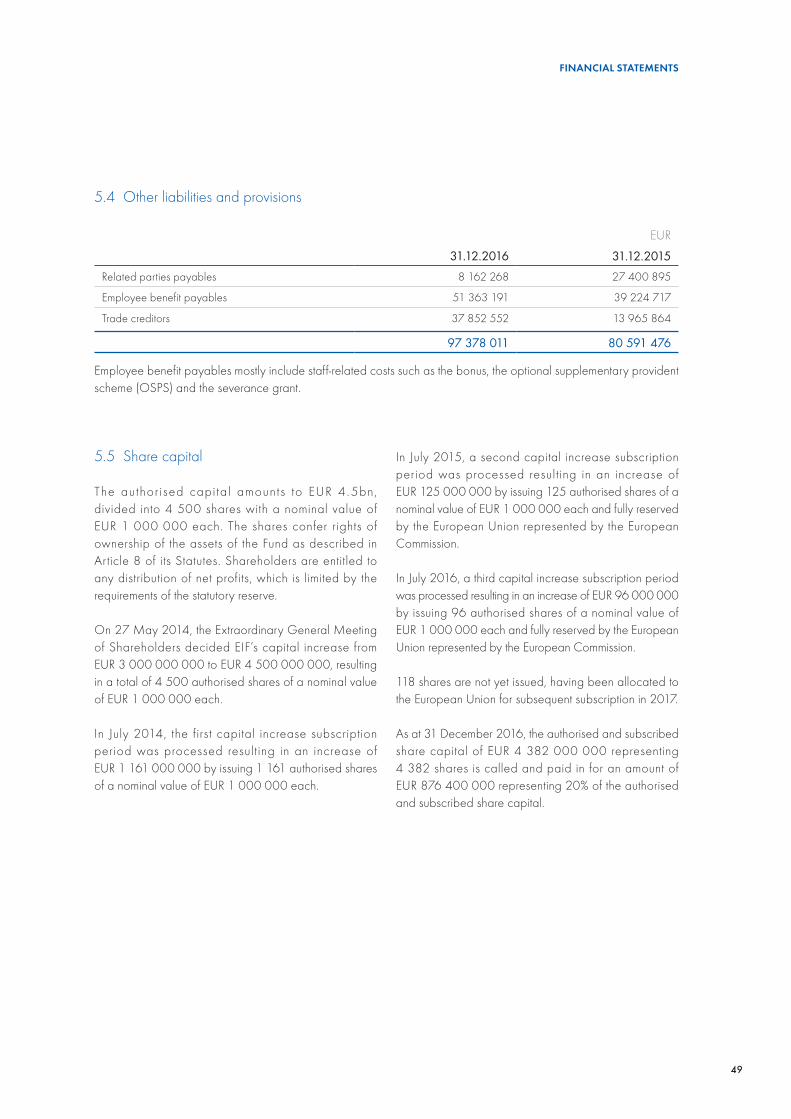
49
FINANCIAL STATEMENTS
5.4 Other liabilities and provisions
EUR
31.12.2016 31.12.2015Related parties payables 8 162 268 27 400 895
Employee benefit payables 51 363 191 39 224 717
Trade creditors 37 852 552 13 965 864
97 378 011 80 591 476
Employee benefit payables mostly include staff-related costs such as the bonus, the optional supplementary provident scheme (OSPS) and the severance grant.
5.5 Share capital
The author ised capi ta l amounts to EUR 4 .5bn, divided into 4 500 shares with a nominal value of EUR 1 000 000 each. The shares confer rights of ownership of the assets of the Fund as described in Article 8 of its Statutes. Shareholders are entitled to any distribution of net profits, which is limited by the requirements of the statutory reserve.
On 27 May 2014, the Extraordinary General Meeting of Shareholders decided EIF’s capital increase from EUR 3 000 000 000 to EUR 4 500 000 000, resulting in a total of 4 500 authorised shares of a nominal value of EUR 1 000 000 each.
In July 2014, the first capital increase subscription period was processed result ing in an increase of EUR 1 161 000 000 by issuing 1 161 authorised shares of a nominal value of EUR 1 000 000 each.
In July 2015, a second capital increase subscription period was processed result ing in an increase of EUR 125 000 000 by issuing 125 authorised shares of a nominal value of EUR 1 000 000 each and fully reserved by the European Union represented by the European Commission.
In July 2016, a third capital increase subscription period was processed resulting in an increase of EUR 96 000 000 by issuing 96 authorised shares of a nominal value of EUR 1 000 000 each and fully reserved by the European Union represented by the European Commission.
118 shares are not yet issued, having been allocated to the European Union for subsequent subscription in 2017.
As at 31 December 2016, the authorised and subscribed share capital of EUR 4 382 000 000 representing 4 382 shares is called and paid in for an amount of EUR 876 400 000 representing 20% of the authorised and subscribed share capital.
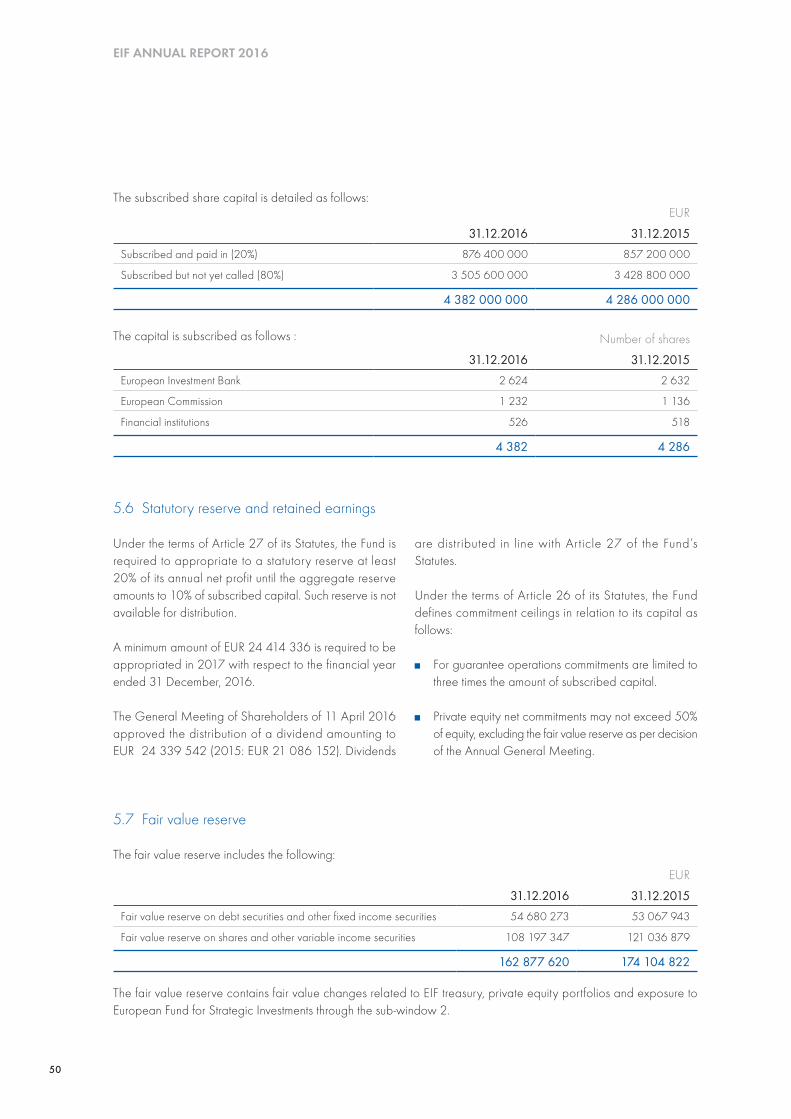
50
EIF ANNUAL REPORT 2016
5.7 Fair value reserve
The fair value reserve includes the following:EUR
31.12.2016 31.12.2015Fair value reserve on debt securities and other fixed income securities 54 680 273 53 067 943
Fair value reserve on shares and other variable income securities 108 197 347 121 036 879
162 877 620 174 104 822
The fair value reserve contains fair value changes related to EIF treasury, private equity portfolios and exposure to European Fund for Strategic Investments through the sub-window 2.
Under the terms of Article 27 of its Statutes, the Fund is required to appropriate to a statutory reserve at least 20% of its annual net profit until the aggregate reserve amounts to 10% of subscribed capital. Such reserve is not available for distribution.
A minimum amount of EUR 24 414 336 is required to be appropriated in 2017 with respect to the financial year ended 31 December, 2016.
The General Meeting of Shareholders of 11 April 2016 approved the distribution of a dividend amounting to EUR 24 339 542 (2015: EUR 21 086 152). Dividends
are distributed in line with Article 27 of the Fund’s Statutes.
Under the terms of Article 26 of its Statutes, the Fund defines commitment ceilings in relation to its capital as follows:
■ For guarantee operations commitments are limited to three times the amount of subscribed capital.
■ Private equity net commitments may not exceed 50% of equity, excluding the fair value reserve as per decision of the Annual General Meeting.
5.6 Statutory reserve and retained earnings
The subscribed share capital is detailed as follows:EUR
31.12.2016 31.12.2015Subscribed and paid in (20%) 876 400 000 857 200 000
Subscribed but not yet called (80%) 3 505 600 000 3 428 800 000
4 382 000 000 4 286 000 000
The capital is subscribed as follows : Number of shares
31.12.2016 31.12.2015European Investment Bank 2 624 2 632
European Commission 1 232 1 136
Financial institutions 526 518
4 382 4 286
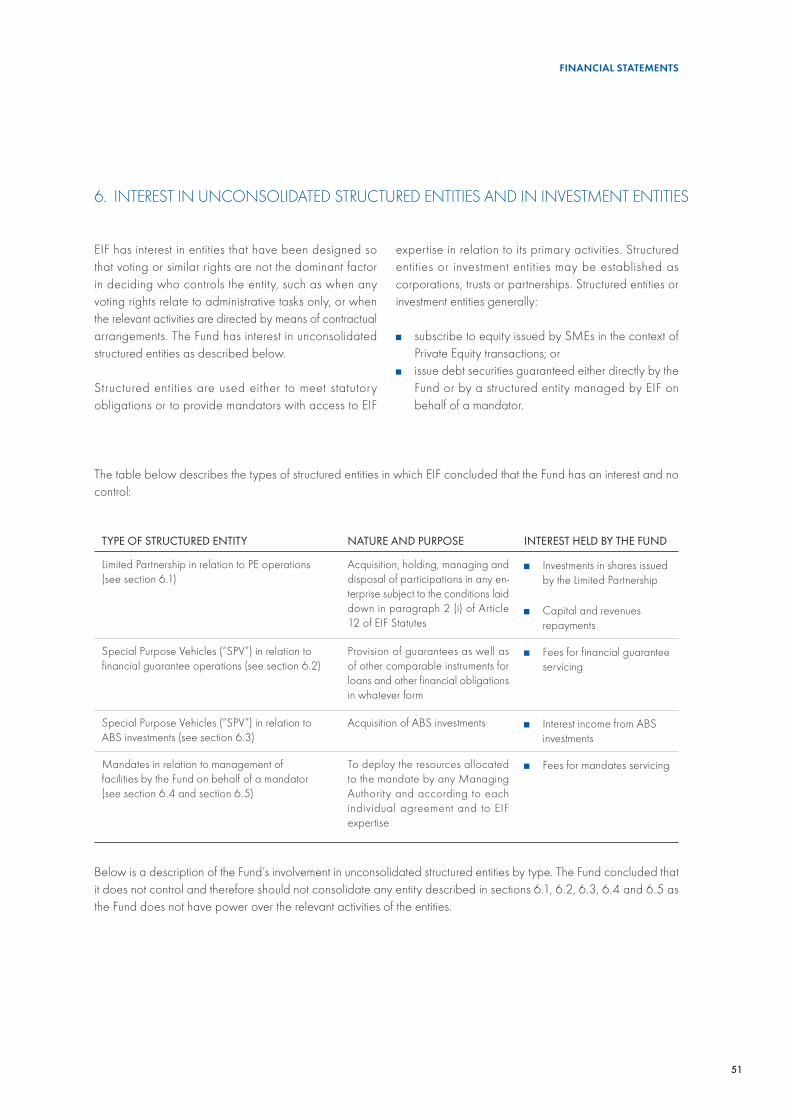
51
FINANCIAL STATEMENTS
EIF has interest in entities that have been designed so that voting or similar rights are not the dominant factor in deciding who controls the entity, such as when any voting rights relate to administrative tasks only, or when the relevant activities are directed by means of contractual arrangements. The Fund has interest in unconsolidated structured entities as described below.
Structured entities are used either to meet statutory obligations or to provide mandators with access to EIF
expertise in relation to its primary activities. Structured entities or investment entities may be established as corporations, trusts or partnerships. Structured entities or investment entities generally:
■ subscribe to equity issued by SMEs in the context of Private Equity transactions; or
■ issue debt securities guaranteed either directly by the Fund or by a structured entity managed by EIF on behalf of a mandator.
6. INTEREST IN UNCONSOLIDATED STRUCTURED ENTITIES AND IN INVESTMENT ENTITIES
The table below describes the types of structured entities in which EIF concluded that the Fund has an interest and no control:
TYPE OF STRUCTURED ENTITY NATURE AND PURPOSE INTEREST HELD BY THE FUND
Limited Partnership in relation to PE operations (see section 6.1)
Acquisition, holding, managing and disposal of participations in any en-terprise subject to the conditions laid down in paragraph 2 (i) of Article 12 of EIF Statutes
■ Investments in shares issued by the Limited Partnership
■ Capital and revenues repayments
Special Purpose Vehicles (“SPV”) in relation to financial guarantee operations (see section 6.2)
Provision of guarantees as well as of other comparable instruments for loans and other financial obligations in whatever form
■ Fees for financial guarantee servicing
Special Purpose Vehicles (“SPV”) in relation to ABS investments (see section 6.3)
Acquisition of ABS investments ■ Interest income from ABS investments
Mandates in relation to management of facilities by the Fund on behalf of a mandator (see section 6.4 and section 6.5)
To deploy the resources allocated to the mandate by any Managing Authority and according to each individual agreement and to EIF expertise
■ Fees for mandates servicing
Below is a description of the Fund’s involvement in unconsolidated structured entities by type. The Fund concluded that it does not control and therefore should not consolidate any entity described in sections 6.1, 6.2, 6.3, 6.4 and 6.5 as the Fund does not have power over the relevant activities of the entities.
52
EIF ANNUAL REPORT 2016
6.1 Interest in structured entities in relation to Private Equity operations
Operations are typically structured as follows:
■ An investment fund is setup with a General Partner (hereaf ter “GP”) and with a number of Limited Partners (hereafter “LPs”), who form together the Limited Partnership. In addition, the Limited Partnership Agreement discloses the investment strategy foreseen within the entity and agreed between the GP and the LPs;
■ When financing is brought by the LPs, full authority and power is given to the GP, which could delegate the investment part to an investment manager;
■ The use of voting rights by the LPs is often foreseen to revocate the GP either with a cause or without cause. Even if an investment board within the entity is setup, it should be noted that such an investment board has a consultative role only and is not therefore one of the decision-making bodies of the Limited Partnership.
The Fund is an LP, it does not act as a GP and is from time to time a member of the consultative investment board. As at 31 December 2016, the Fund’s interest ranged from 0.1% to 50%.
Maximum loss exposure from PE structured entities is limited to the amount of committed investment as disclosed in note 3.2.
For more quantitative details on PE operations, please refer to note 3.2.
6.2 Interest in structured entities in relation to financial guarantee operations
When the Fund enters into a securitisation transaction in the context of its activity of financial guarantee provided to the European financial institutions, the Fund could be exposed to a special purpose vehicle (hereafter “SPV”) as follows:
■ In the context of a bilateral guarantee
Under this type of financial guarantee, even if the Fund provides a bilateral guarantee for the benefit of the holder of the mezzanine/senior notes, the Fund is not a direct party to the securitisation transactions agreement to benefit from the operation. The Fund enters into a financial guarantee agreement directly with the beneficiary, which is typically the beneficiary of the securitisation transaction agreement. Through the financial guarantee agreement, the Fund has no negotiating power and no voting rights within the structure and the role of the Fund is to guarantee one of the tranches of a more global transaction.
In the context of such transactions, an SPV could be established to initially purchase a pool of receivables from the originator and to issue consequently several classes of notes, which will be guaranteed. On the other hand, if no SPV is established, the originator will issue the notes and will retain the pool of receivables.
■ In the context of an embedded guarantee
Under this type of operation and contrary to a bilateral guarantee, an SPV shall be established to issue the notes and to be the owner of the pool of receivables. In such operations, the Fund, as guarantor, will be part of the structure of the transaction and will be part of the agreement without having any control over the SPV.
Maximum loss exposure from guarantee operations structured entities is limited to the total exposure at risk as disclosed in note 3.3.
As at 31 December 2016, the Fund is exposed to 63 bilateral guarantees (2015: 55 transactions) and to 6 embedded guarantees (2015: 9 transactions), which represent respectively EUR 5 861m and EUR 98m of EIF’s guarantees in terms of exposure at risk (2015: respectively EUR 3 321m and EUR 189m).
In addition, 1 bilateral guarantee and 4 embedded guarantees were classified into the caption “Provisions for financial guarantee” (2015: respectively 9 and 4)
53
FINANCIAL STATEMENTS
and represent respectively EUR 1m and EUR 28m of the total amount of provisions for EIF’s guarantees (2015: respectively EUR 41m and EUR 40m).
For more quantitative details on the guarantee portfolio, please refer to note 3.3.
6.3 Interest in structured entities in relation to ABS investments
When the Fund enters into a securitisation backed by SME financing, the Fund could be exposed to an SPV, which may be established to issue the ABS investment. In such operations, the Fund will make a direct investment in the ABS issued out by the SPV.
As at 31 December 2016, the Fund invested in 7 ABS investments issued by SPVs (2015: 2) for a total amount of EUR 178.7m, which are classified into the caption “Loans and receivables” (2015: 50.2m).
For more quantitative details on ABS investments, please refer to note 3.5.
6.4 Interest in structured entities in relation to management of facilities by the Fund on behalf of a mandator
The Fund acts as an integrated operational platform for SME finance, deploying resources mandated for management by its related parties (EIB and EC see note 8.1 and 8.2, respectively) and other third parties (public and private entities) depending on the nature of the investment but also in relation to the Fund’s expertise and in compliance with its Statutes. When the Fund manages a facility on behalf of a mandator, the management will be performed by the Fund either through a trusteeship or partnership depending on the requirements of the mandatory, which have been classified as follows:
■ The EIB, which means EIB resources is managed by the Fund according to a defined scope;
■ The European Commission, which means European Commission contributions managed by the Fund according to the financial regulation and to dedicated agreements;
■ Other third parties: the Fund has sought to further enhance its market impact by establishing joint investment facilities with public and private entities through trust accounts and country, multi-country or sector-specific funds-of-funds.
EIF is entrusted with the management of the funds, operating under clear rules defined in an agreement, investing in entities whose maximum risk is defined in the agreement and performing the treasury asset management under guidelines defined in the agreement. The Fund is remunerated for i ts services through management fees (or on a cost recovery basis for some mandates) which are defined upfront in the agreement. In that context, the Fund classifies the mandates as follows and according to the nature of financial instruments foreseen under each individual agreement:
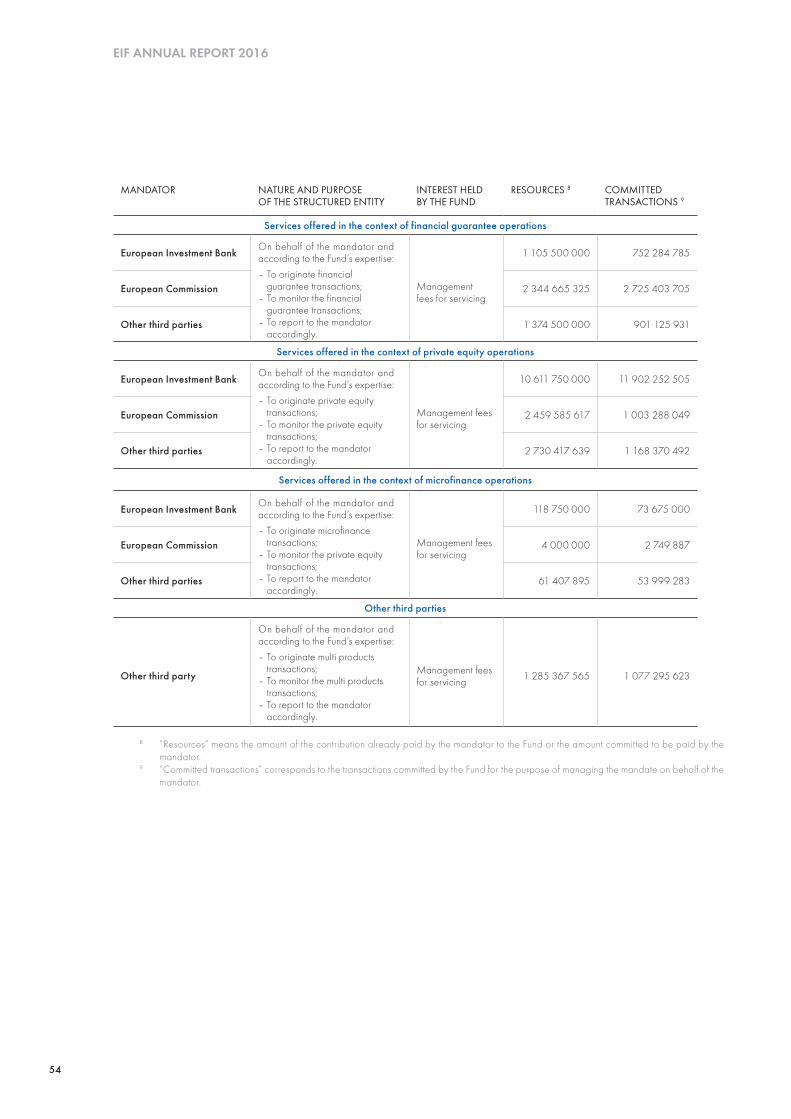
54
EIF ANNUAL REPORT 2016
MANDATOR NATURE AND PURPOSE OF THE STRUCTURED ENTITY
INTEREST HELD BY THE FUND
RESOURCES 8 COMMITTED TRANSACTIONS 9
Services offered in the context of financial guarantee operations
European Investment Bank On behalf of the mandator and according to the Fund’s expertise:– To originate financial
guarantee transactions; – To monitor the financial
guarantee transactions;– To report to the mandator
accordingly.
Management fees for servicing
1 105 500 000 752 284 785
European Commission 2 344 665 325 2 725 403 705
Other third parties 1 374 500 000 901 125 931
Services offered in the context of private equity operations
European Investment Bank On behalf of the mandator and according to the Fund’s expertise:– To originate private equity
transactions;– To monitor the private equity
transactions;– To report to the mandator
accordingly.
Management fees for servicing
10 611 750 000 11 902 252 505
European Commission 2 459 585 617 1 003 288 049
Other third parties 2 730 417 639 1 168 370 492
Services offered in the context of microfinance operations
European Investment Bank On behalf of the mandator and according to the Fund’s expertise:– To originate microfinance
transactions;– To monitor the private equity
transactions;– To report to the mandator
accordingly.
Management fees for servicing
118 750 000 73 675 000
European Commission 4 000 000 2 749 887
Other third parties 61 407 895 53 999 283
Other third parties
Other third party
On behalf of the mandator and according to the Fund’s expertise:– To originate multi products
transactions;– To monitor the multi products
transactions;– To report to the mandator
accordingly.
Management fees for servicing 1 285 367 565 1 077 295 623
8 “Resources” means the amount of the contribution already paid by the mandator to the Fund or the amount committed to be paid by the mandator.
9 “Committed transactions” corresponds to the transactions committed by the Fund for the purpose of managing the mandate on behalf of the mandator.

55
FINANCIAL STATEMENTS
MANDATOR COUNTRY NATURE AND PURPOSE OF THE STRUCTURED ENTITY
INTEREST HELD BY THE FUND
RESOURCES 10 COMMITTED TRANSACTIONS 11
European Investment Bank and European Commission
Multicountry with a focus on European Microfinance
On behalf of the mandator and according to the Fund’s expertise:
- To act as investment adviser and to propose private equity transaction for the approval of governing bodies of the fund of funds;
- To originate private equity transactions;
- To monitor the private equity transactions;
- To report to the mandator accordingly.
Management fees for servicing
180 000 000 176 221 571
European Commission
Multicountry with a focus on Global Energy Efficiency and Renewable Energy Fund
222 024 863 164 245 602
Other third parties
Turkey 360 000 000 220 772 636
Portugal 111 330 000 102 055 215
Spain 183 000 000 174 288 389
The United Kingdom 233 595 736 241 212 540
The Netherlands 402 500 000 218 500 000
Multi country with a focus on European Angels
304 401 970 73 773 531
10 Resources” means the amount of contribution already paid by the mandator to the Fund or the amount committed to be paid by the mandator.11 “Committed transactions” corresponds to the transactions committed by the Fund for the purpose of managing the mandate on behalf of the
mandator.
6.5 Interest in investment entities in relation to management of facilities by the Fund on behalf of a mandator
Under certain circumstances and depending on the requirements of a mandatory, EIF could establish a legal entity from which EIF will act as an integrated operational platform for SME finance, deploying resources mandated for management by its related parties and other third parties.
EIF is entrusted with the management of the funds, operating under clear rules defined in an agreement, investing in entities whose maximum risk is defined in the agreement and performing the treasury asset management under guidelines defined in the agreement. The Fund is remunerated for its services through management fees (or on a cost recovery basis for some mandates) which are defined upfront in the agreement. In that context, the Fund classifies the mandates as follows and according to the nature of financial instruments foreseen under each individual agreement:
As at 31 December 2016, total assets under management defined as the initial resources and contributions allocated to each mandate amounts to EUR 22.09bn (2015: EUR 18.26bn).
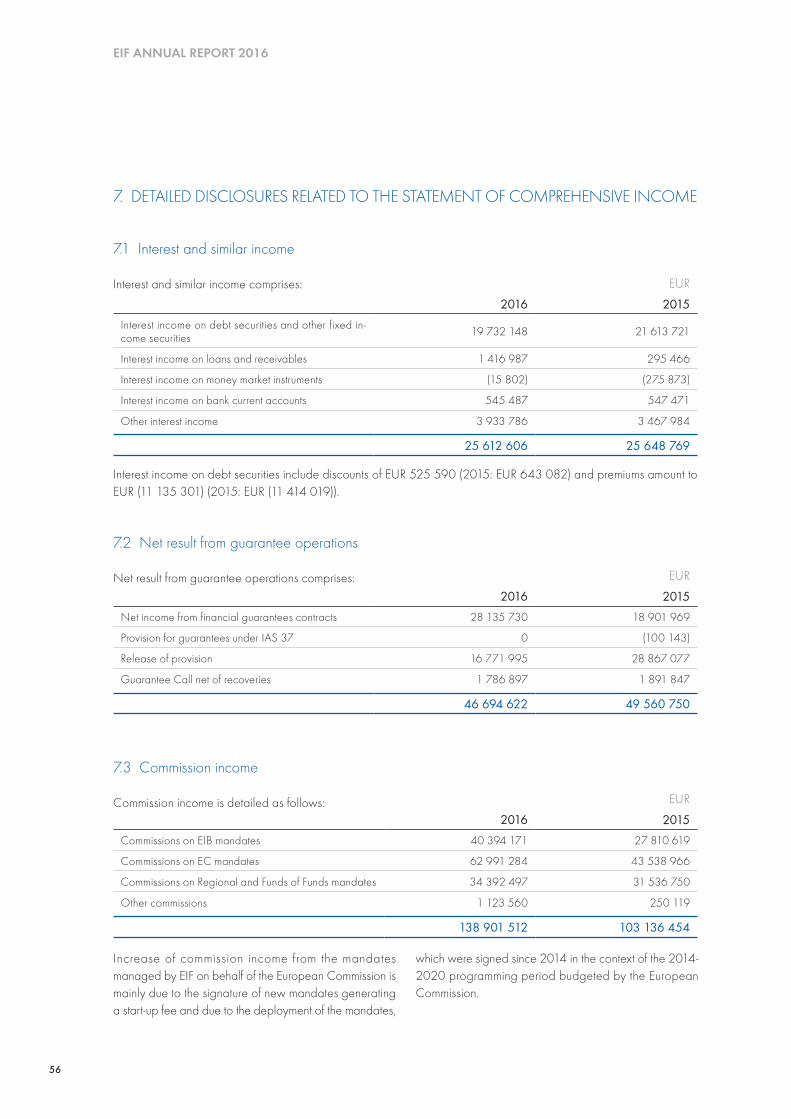
56
EIF ANNUAL REPORT 2016
7. DETAILED DISCLOSURES RELATED TO THE STATEMENT OF COMPREHENSIVE INCOME
7.1 Interest and similar income
Interest and similar income comprises:
Interest income on debt securities include discounts of EUR 525 590 (2015: EUR 643 082) and premiums amount to EUR (11 135 301) (2015: EUR (11 414 019)).
7.2 Net result from guarantee operations
Net result from guarantee operations comprises:
7.3 Commission income
Commission income is detailed as follows:
EUR
2016 2015Interest income on debt securities and other fixed in-come securities 19 732 148 21 613 721
Interest income on loans and receivables 1 416 987 295 466
Interest income on money market instruments (15 802) (275 873)
Interest income on bank current accounts 545 487 547 471
Other interest income 3 933 786 3 467 984
25 612 606 25 648 769
EUR
2016 2015Commissions on EIB mandates 40 394 171 27 810 619
Commissions on EC mandates 62 991 284 43 538 966
Commissions on Regional and Funds of Funds mandates 34 392 497 31 536 750
Other commissions 1 123 560 250 119
138 901 512 103 136 454
EUR
2016 2015Net income from financial guarantees contracts 28 135 730 18 901 969
Provision for guarantees under IAS 37 0 (100 143)
Release of provision 16 771 995 28 867 077
Guarantee Call net of recoveries 1 786 897 1 891 847
46 694 622 49 560 750
Increase of commission income from the mandates managed by EIF on behalf of the European Commission is mainly due to the signature of new mandates generating a start-up fee and due to the deployment of the mandates,
which were signed since 2014 in the context of the 2014-2020 programming period budgeted by the European Commission.
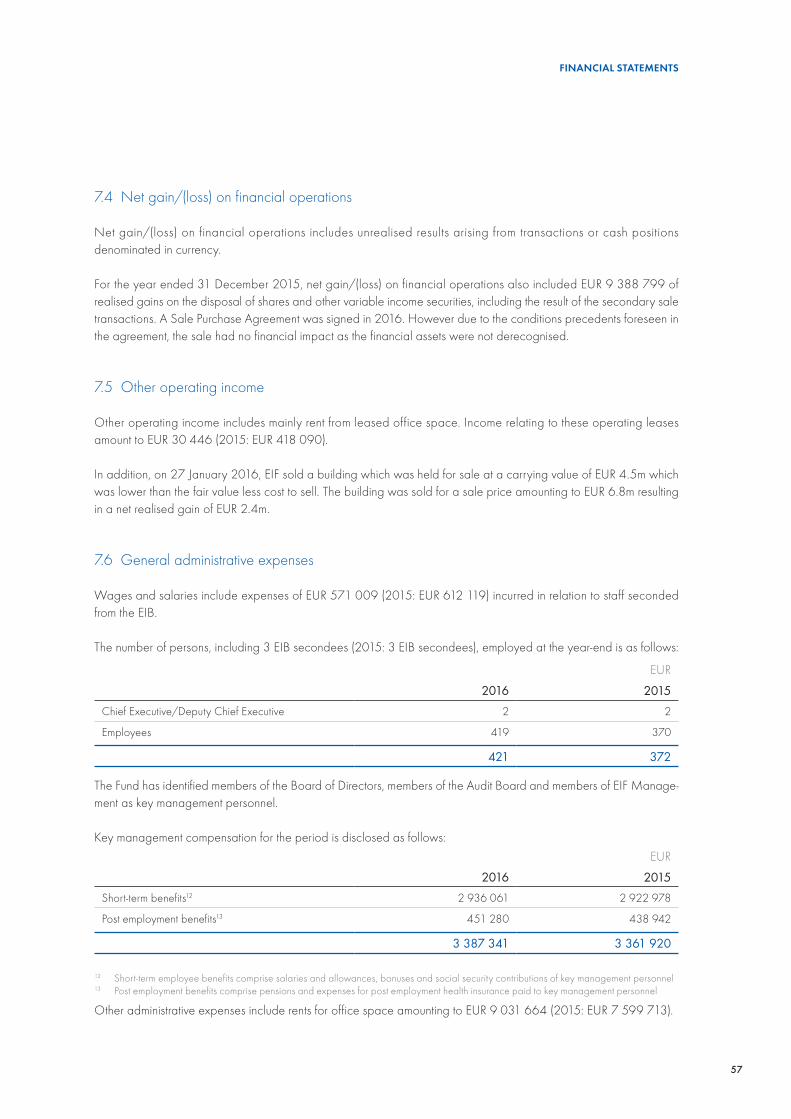
57
FINANCIAL STATEMENTS
7.4 Net gain/(loss) on financial operations
Net gain/(loss) on financial operations includes unrealised results arising from transactions or cash positions denominated in currency.
For the year ended 31 December 2015, net gain/(loss) on financial operations also included EUR 9 388 799 of realised gains on the disposal of shares and other variable income securities, including the result of the secondary sale transactions. A Sale Purchase Agreement was signed in 2016. However due to the conditions precedents foreseen in the agreement, the sale had no financial impact as the financial assets were not derecognised.
7.5 Other operating income
Other operating income includes mainly rent from leased office space. Income relating to these operating leases amount to EUR 30 446 (2015: EUR 418 090).
In addition, on 27 January 2016, EIF sold a building which was held for sale at a carrying value of EUR 4.5m which was lower than the fair value less cost to sell. The building was sold for a sale price amounting to EUR 6.8m resulting in a net realised gain of EUR 2.4m.
7.6 General administrative expenses
Wages and salaries include expenses of EUR 571 009 (2015: EUR 612 119) incurred in relation to staff seconded from the EIB.
The number of persons, including 3 EIB secondees (2015: 3 EIB secondees), employed at the year-end is as follows:
EUR
2016 2015Chief Executive/Deputy Chief Executive 2 2
Employees 419 370
421 372
The Fund has identified members of the Board of Directors, members of the Audit Board and members of EIF Manage-ment as key management personnel.
Key management compensation for the period is disclosed as follows:EUR
2016 2015Short-term benefits12 2 936 061 2 922 978
Post employment benefits13 451 280 438 942
3 387 341 3 361 920
12 Short-term employee benefits comprise salaries and allowances, bonuses and social security contributions of key management personnel13 Post employment benefits comprise pensions and expenses for post employment health insurance paid to key management personnel
Other administrative expenses include rents for office space amounting to EUR 9 031 664 (2015: EUR 7 599 713).
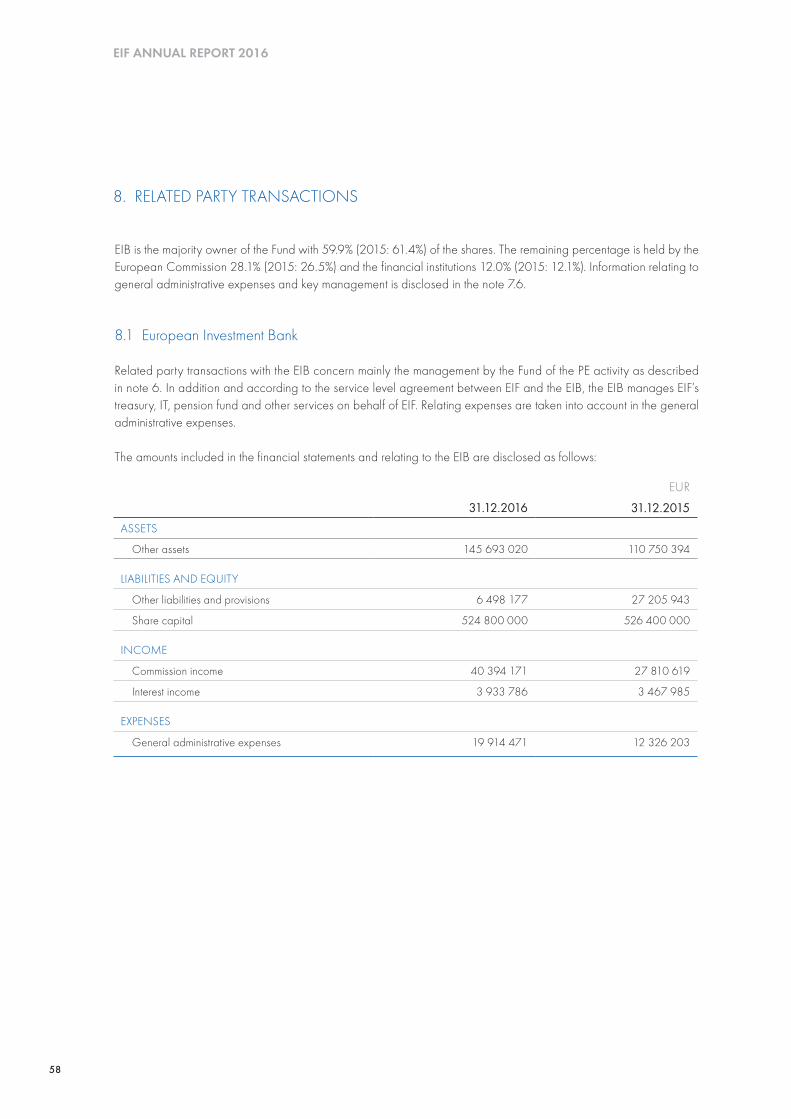
58
EIF ANNUAL REPORT 2016
EIB is the majority owner of the Fund with 59.9% (2015: 61.4%) of the shares. The remaining percentage is held by the European Commission 28.1% (2015: 26.5%) and the financial institutions 12.0% (2015: 12.1%). Information relating to general administrative expenses and key management is disclosed in the note 7.6.
8.1 European Investment Bank
Related party transactions with the EIB concern mainly the management by the Fund of the PE activity as described in note 6. In addition and according to the service level agreement between EIF and the EIB, the EIB manages EIF’s treasury, IT, pension fund and other services on behalf of EIF. Relating expenses are taken into account in the general administrative expenses.
The amounts included in the financial statements and relating to the EIB are disclosed as follows:
8. RELATED PARTY TRANSACTIONS
EUR
31.12.2016 31.12.2015ASSETS
Other assets 145 693 020 110 750 394
LIABILITIES AND EQUITY
Other liabilities and provisions 6 498 177 27 205 943
Share capital 524 800 000 526 400 000
INCOME
Commission income 40 394 171 27 810 619
Interest income 3 933 786 3 467 985
EXPENSES
General administrative expenses 19 914 471 12 326 203
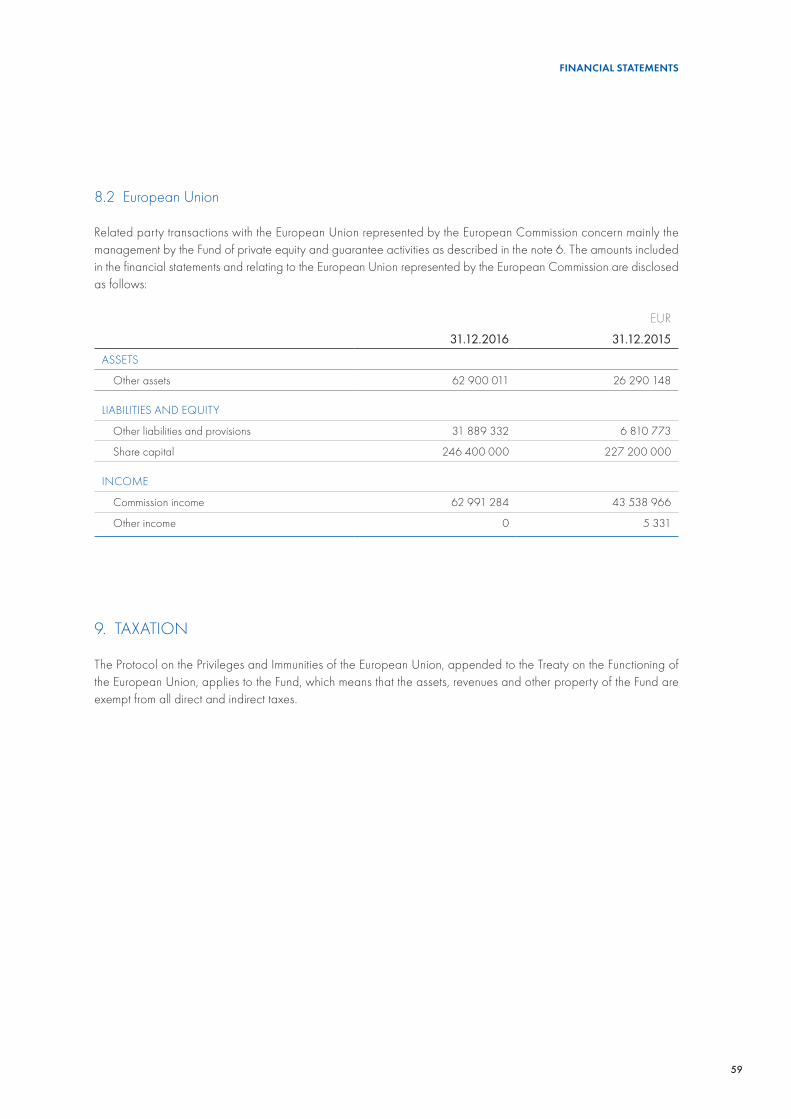
59
FINANCIAL STATEMENTS
8.2 European Union
Related party transactions with the European Union represented by the European Commission concern mainly the management by the Fund of private equity and guarantee activities as described in the note 6. The amounts included in the financial statements and relating to the European Union represented by the European Commission are disclosed as follows:
9. TAXATION
The Protocol on the Privileges and Immunities of the European Union, appended to the Treaty on the Functioning of the European Union, applies to the Fund, which means that the assets, revenues and other property of the Fund are exempt from all direct and indirect taxes.
EUR
31.12.2016 31.12.2015ASSETS
Other assets 62 900 011 26 290 148
LIABILITIES AND EQUITY
Other liabilities and provisions 31 889 332 6 810 773
Share capital 246 400 000 227 200 000
INCOME
Commission income 62 991 284 43 538 966
Other income 0 5 331
60
EIF ANNUAL REPORT 2016
European Investment Fund37B, avenue J. F. KennedyL - 2968 Luxembourg
3 +352 2485-15 +352 2485-81200U [email protected] www.eif.org
EIF also has offices in Athens, Bratislava, Bucharest, Istanbul, Madrid, Rome, Sofia and Vilnius.
Europe Direct is a service to help you find answers to your questions about the European UnionFreephone: 00 800 67 89 10 11Additional information is also available on the internet: http://europa.eu
Management team picture by: Blitz agency s.à r.l., Luxembourg
ISBN 978-92-861-3229-2ISSN 2529-4393DOI 10.2868/271684
CONTACTS AND REFERENCES
Disclaimer: Numbers in the EIF Annual Report 2016 are correct as at 31 December 2016 and any references to figures throughout the text apply to the same period unless otherwise stated.
EIF's 2016 figures related to SME outreach and employ-ment including the estimated numbers on sustained jobs and employment are indicative only and are based on reports received from financial intermediaries between 30 September 2015 and 30 September 2016. EIF as-sumes no liability for the accuracy thereof.
Copyright European Investment Fund, 2017Reproduction is authorised provided the source is acknowledged
Printed by Imprimerie Centrale on Condat Silk paper using vegetable oil-based inks. Certified in accordance with Forest Stewardship Council (FSC) rules, the paper consists of 100% virgin fibre (of which at least 50% from well-managed forests).

© EIB 03/2017 print: QY-AB-17-001-EN-C ISBN 978-92-861-3229-2 ISSN 2529-4393 doi:10.2868/271684 © EIB GraphicTeamdigital: QY-AB-17-001-EN-N ISBN 978-92-861-3230-8 ISSN 2529-4407 doi:10.2868/881142
European Investment Fund37B, avenue J. F. KennedyL - 2968 Luxembourg3 +352 2485-15 +352 2485-81200U www.eif.org – [email protected]
EIF FINAN
CIAL STATEM
ENTS 2016