Embed Size (px)
Citation preview
Annual Report 2016
This annual report features images taken from our new website www.fpn.ch.
In case of doubt or differences of interpretation, the French version shall prevail over the English and the German text.
ContactFonds de Pensions Nestlé P. O. Box 353 Avenue Nestlé 55 1800 Vevey (Switzerland) Telephone : +41 21 924 64 00 E-mail : [email protected] www.fpn.ch
Impressum© May 2017 / Fonds de Pensions Nestlé Designed by : Fonds de Pensions Nestlé, Vevey, Switzerland & Neidhart + Schön AG, Zurich, Switzerland Printed by : Neidhart + Schön AG, Zurich, Switzerland
1
Contents
Organisation of the Fonds de Pensions Nestlé 2
Key points of the year 2016 4
Balance sheet 6
Income statement 7
Focus 8
Investments 12
Funding ratio and actuarial situation 16
Membership statistics : Active members and pensioners 18
2
www.fpn.ch Simulation
Organisation
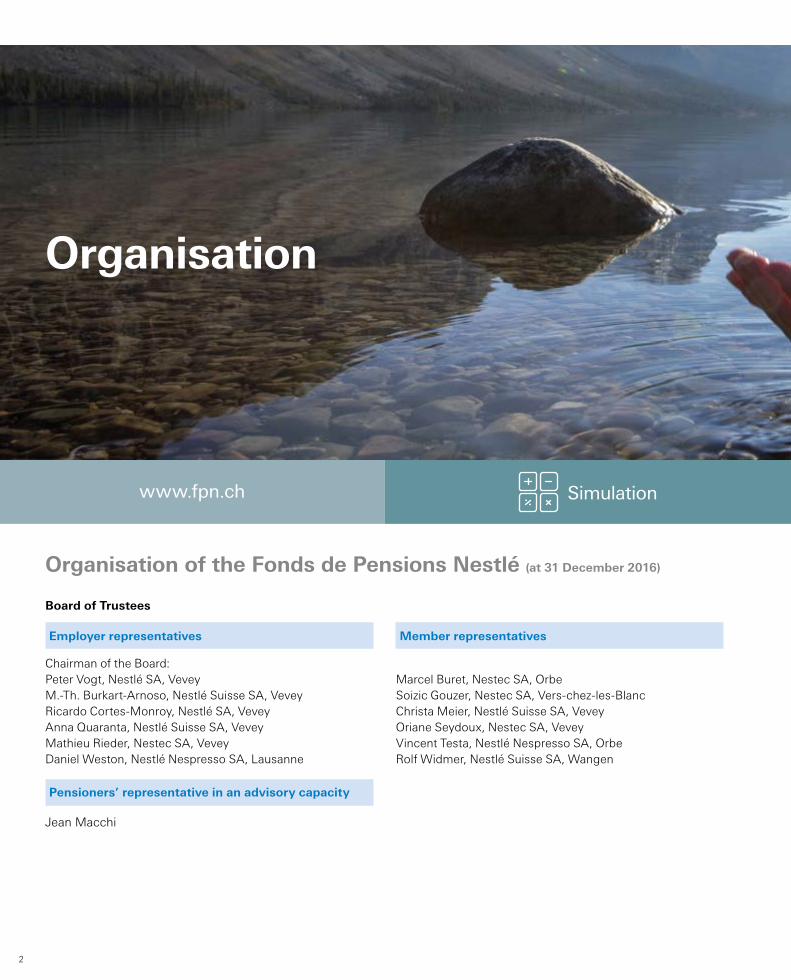
Organisation of the Fonds de Pensions Nestlé (at 31 December 2016)
Board of Trustees
Employer representatives
Chairman of the Board: Peter Vogt, Nestlé SA, VeveyM.-Th. Burkart-Arnoso, Nestlé Suisse SA, VeveyRicardo Cortes-Monroy, Nestlé SA, VeveyAnna Quaranta, Nestlé Suisse SA, VeveyMathieu Rieder, Nestec SA, VeveyDaniel Weston, Nestlé Nespresso SA, Lausanne
Pensioners’ representative in an advisory capacity
Jean Macchi
Member representatives
Marcel Buret, Nestec SA, OrbeSoizic Gouzer, Nestec SA, Vers-chez-les-BlancChrista Meier, Nestlé Suisse SA, VeveyOriane Seydoux, Nestec SA, VeveyVincent Testa, Nestlé Nespresso SA, OrbeRolf Widmer, Nestlé Suisse SA, Wangen
3
Simulation Documents Contact
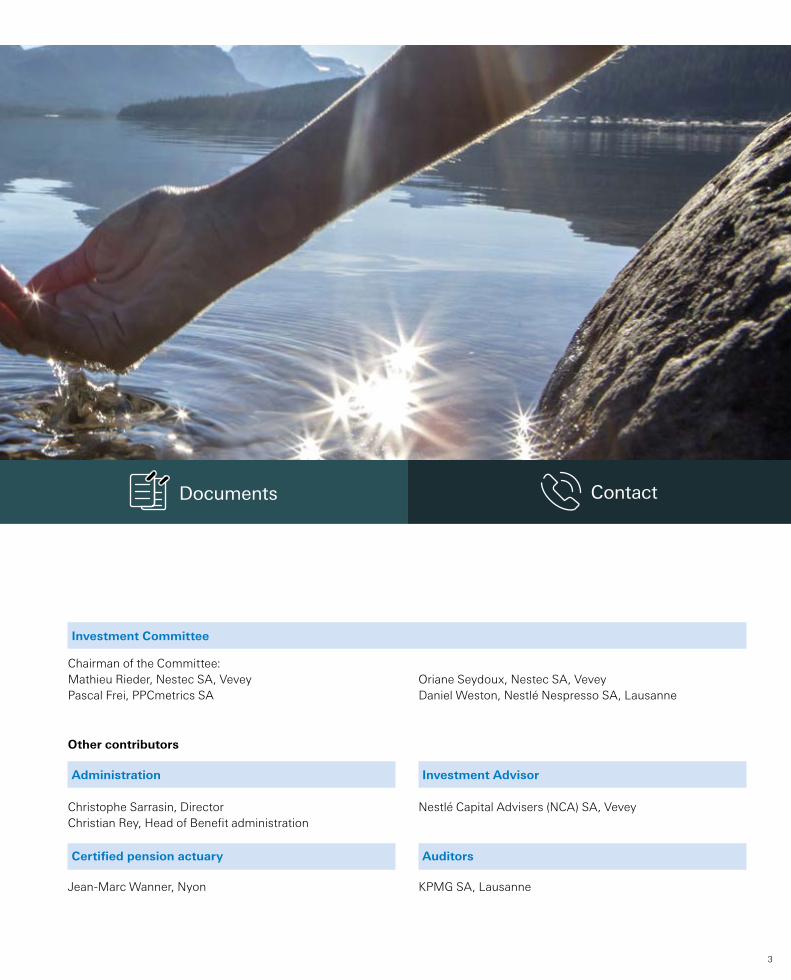
Investment Committee
Chairman of the Committee: Mathieu Rieder, Nestec SA, VeveyPascal Frei, PPCmetrics SA
Other contributors
Administration
Christophe Sarrasin, DirectorChristian Rey, Head of Benefit administration
Certified pension actuary
Jean-Marc Wanner, Nyon
Oriane Seydoux, Nestec SA, VeveyDaniel Weston, Nestlé Nespresso SA, Lausanne
Investment Advisor
Nestlé Capital Advisers (NCA) SA, Vevey
Auditors
KPMG SA, Lausanne
4
www.fpn.ch Simulation
Year 2016
Positive performance in 2016: 5.9%
Funding ratio: 106.9%
Key points of the year 2016
Financial situation of the Fund The Fonds de Pensions Nestlé (the Fund) posted a very good performance of 5.9% in 2016 thanks to a better than expected financial year. This encouraging result is higher than the average performance of around 3.9% achieved by Swiss pension funds.
The Fund’s funding ratio as at 31 December 2016 was 106.9 %, compared with 105.2% as at 31 December 2015. The funding ratio is one of the most commonly used statistical measures for evaluating the financial health of a pension fund, since it reflects the ratio of its assets to its obligations.
It should be noted that this funding ratio of 106.9% takes account of an amount of CHF 170.2 million, which corre-sponds to the value of a provision for a future reduction in the technical interest rate recognised on the liabilities side of the Fund’s balance sheet.
This provision was created in 2015 and funded over the last two years with a view to anticipating the consequences of a reduction in the technical interest rate as mentioned on page 8 of this annual report.
Board of Trustees decisionsIn 2016, the Board decided to: – modify its strategic asset allocation, see page 8 ; – keep the technical interest rate at 3% for the actuarial
assessment as at 31 December 2016, taking into account the additional contribution of CHF 86.5 million to the provision for a future reduction in the technical interest rate on the same date ;
– pay 1.25% on the retirement savings capital of active members in 2016 and not to grant any additional interest as at 31 December 2016 ;
– fix the rate of interest on the retirement savings capital of active members at 1% for 2017, in line with the decision of the Swiss Federal Council regarding the LOB minimum interest rate (LOB stands for the Federal Law on Occupa-tional Benefit Plan) ;
5
Simulation Documents Contact
– not to grant any pension increase as at 1 January 2017 in light of the Fund’s financial situation and the absence of inflation in 2016.
The Board also acknowledged the appointment of Yves Sudan by Nestlé Switzerland as deputy to Anna Quaranta.
The Board approved the transfer of Froneri employees belonging to the savings plan (new plan) to an external collective insurance foundation. However, it accepted the proposal to keep Froneri employees covered by the objective pension plan (old plan) in the Fund. In this regard, the Board noted that the conditions for partial liquidation were fulfilled and the certified pension actuary will prepare a report on this during 2017.
Finally, the Board modified the content of articles 2, 15, 18, 19 and 20 of the Fund regulations (savings plan, version dated 1 July 2013) by way of an amendment to the regula-tions. The two changes are as follows :
Payment of vested benefits for employees working abroad for another company within the Nestlé GroupTo date, the retirement savings capital of employees who left Switzerland to work for another Nestlé Group company without having expatriate status has remained in the Fund. From now onwards, this retirement savings capital may no longer be kept in the Fund and will be subject to the same conditions as vested benefits.
Implementation of new rules on sharing occupational pension benefitsNew rules on pension sharing in the event of divorce entered into force on 1 January 2017. The change relates principally to the sharing of retirement savings capital, even if an insured event (disability or retirement) has already occurred for one of the spouses.
These amendments entered into force on 1 January 2017.
6
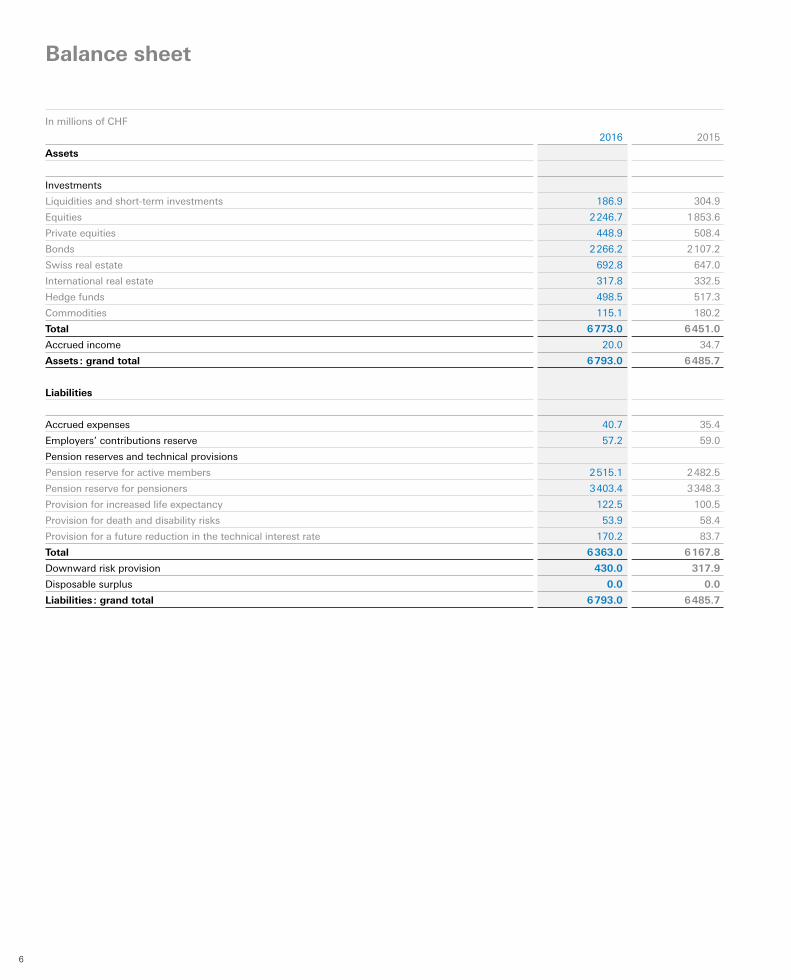
In millions of CHF
2016 2015
Assets
Investments
Liquidities and short-term investments 186.9 304.9
Equities 2 246.7 1 853.6
Private equities 448.9 508.4
Bonds 2 266.2 2 107.2
Swiss real estate 692.8 647.0
International real estate 317.8 332.5
Hedge funds 498.5 517.3
Commodities 115.1 180.2
Total 6 773.0 6 451.0
Accrued income 20.0 34.7
Assets : grand total 6 793.0 6 485.7
Liabilities
Accrued expenses 40.7 35.4
Employers’ contributions reserve 57.2 59.0
Pension reserves and technical provisions
Pension reserve for active members 2 515.1 2 482.5
Pension reserve for pensioners 3 403.4 3 348.3
Provision for increased life expectancy 122.5 100.5
Provision for death and disability risks 53.9 58.4
Provision for a future reduction in the technical interest rate 170.2 83.7
Total 6 363.0 6 167.8
Downward risk provision 430.0 317.9
Disposable surplus 0.0 0.0
Liabilities : grand total 6 793.0 6 485.7
Balance sheet
7
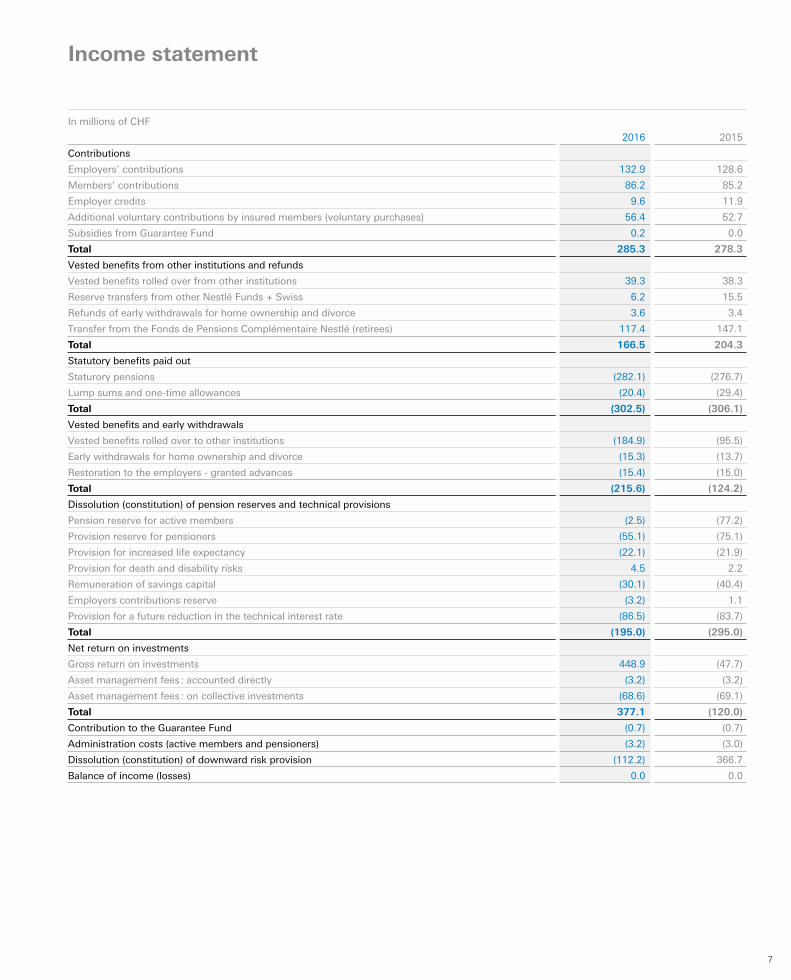
In millions of CHF
2016 2015
Contributions
Employers’ contributions 132.9 128.6
Members’ contributions 86.2 85.2
Employer credits 9.6 11.9
Additional voluntary contributions by insured members (voluntary purchases) 56.4 52.7
Subsidies from Guarantee Fund 0.2 0.0
Total 285.3 278.3
Vested benefits from other institutions and refunds
Vested benefits rolled over from other institutions 39.3 38.3
Reserve transfers from other Nestlé Funds + Swiss 6.2 15.5
Refunds of early withdrawals for home ownership and divorce 3.6 3.4
Transfer from the Fonds de Pensions Complémentaire Nestlé (retirees) 117.4 147.1
Total 166.5 204.3
Statutory benefits paid out
Staturory pensions (282.1) (276.7)
Lump sums and one-time allowances (20.4) (29.4)
Total (302.5) (306.1)
Vested benefits and early withdrawals
Vested benefits rolled over to other institutions (184.9) (95.5)
Early withdrawals for home ownership and divorce (15.3) (13.7)
Restoration to the employers - granted advances (15.4) (15.0)
Total (215.6) (124.2)
Dissolution (constitution) of pension reserves and technical provisions
Pension reserve for active members (2.5) (77.2)
Provision reserve for pensioners (55.1) (75.1)
Provision for increased life expectancy (22.1) (21.9)
Provision for death and disability risks 4.5 2.2
Remuneration of savings capital (30.1) (40.4)
Employers contributions reserve (3.2) 1.1
Provision for a future reduction in the technical interest rate (86.5) (83.7)
Total (195.0) (295.0)
Net return on investments
Gross return on investments 448.9 (47.7)
Asset management fees : accounted directly (3.2) (3.2)
Asset management fees : on collective investments (68.6) (69.1)
Total 377.1 (120.0)
Contribution to the Guarantee Fund (0.7) (0.7)
Administration costs (active members and pensioners) (3.2) (3.0)
Dissolution (constitution) of downward risk provision (112.2) 366.7
Balance of income (losses) 0.0 0.0
Income statement
8
www.fpn.ch Simulation
Focus
Change in strategic asset allocation in 2017
Focus
Change of strategic asset allocationAt its meeting in November 2016, the Fund’s Board of Trustees followed the recommendation of its Investment Committee to significantly modify and simplify the strategic asset allocation of its investments. The transition will take place in stages and is due to be completed by the end of 2017.
There are three main reasons behind this change of direc-tion :
Paradigm shift on the financial marketsAs we have stated in the past, we are facing a macro- economic and financial environment that is as uncertain as it is unique, characterised in particular by extremely low or even negative interest rates. Return expectations across all asset classes have therefore had to be revised significantly downwards. In addition, some investments, notably alterna-tive investments in hedge funds, are no longer deemed
relevant in the new asset allocation. It has therefore become necessary to adapt our strategic asset allocation.
The downward revision of the expected returns on the Fund’s asset classes thus has a negative impact on the expected overall performance of the Fund over the next ten years, irrespective of the changes made. Whereas the Fund was only recently able to look forward to returns of around 3.5% over the next decade, it will now have to settle for a more modest level of just over 2%. It is therefore imperative that we conduct an in-depth analysis of our tech-nical interest rate of 3%, and this study is currently under-way.
We must remember that the technical interest rate is used not only to calculate the Fund’s obligations to its pensioners but also to determine the capital conversion rates for active insured members at retirement age.

9
Simulation Documents Contact
Willingness to simplify and improve the efficiency of our investment philosophyTo date, the Fund’s policy as regards to its investment philoso-phy has been geared largely towards “active” investment strategies rather than those commonly referred to as “pas-sive”. The former aim to outperform the basket of securities they use as their investment benchmark (and to generate excess returns). Passive investment strategies, meanwhile, allow you to practically guarantee the return on the basket in question. The latter are thus certainly less ambitious, but easier to implement and above all much less expensive. In future, we will be favouring these passive strategies in sectors where we believe this makes sense. This will enable us to focus our resources and attention more strongly on a reduced number of active strategies remaining in our global portfolio.
In the same vein, the decision has been taken to dispose of all of our investments in hedge funds and commodities, which account for 10% of our total allocation. The reasoning behind this major decision is as follows :
– While results have been relatively satisfactory from a historical perspective, it should be borne in mind that these types of investment are very costly, particularly in an environment characterised by very low interest rates and expected returns ;
– The potential risk and therefore cost of choosing a wrong underlying asset manager is very high, much higher than for more traditional investment strategies ;
– Asset manager monitoring is much more intense and costly ;
– There is also a higher level of reputational risk at stake ; – Finally, we have been able to propose less costly invest-
ment alternatives that do no significantly change the Fund’s risk/return profile and do not affect the protection of its funding ratio.
10
www.fpn.ch Simulation
Management and control of our asset management feesAs indicated above, one consequence of the investment policy pursued up until 2016 was higher asset management fees (total expense ratio or TER) for the Fund. Our fees were significantly higher than those of our peers in Switzerland. It is difficult to justify this in an environment such as the one we are currently facing, with low interest rates and poor expected returns. These fixed operating costs are simply too high in the face of the poor returns expected for the Fund over the next few years.
As a result, the Fund’s new strategic asset allocation, which will be finalised in late 2017/early 2018, will be as follows :
Allocation in %
end 2016 2017–2018
Liquidities and short-term investments 3% 3%
Equities 31% 33%
Private equities 7% 7%
Bonds 34% 35%
Swiss real estate 9% 15%
International real estate 6% 7%
Hedge funds 7% 0%
Commodities 3% 0%
Total 100% 100%
Complete exit from investments in hedge funds and commodities primarily in favour of investments in Swiss real estate. There will also be a marginal increase in the allocations in both listed equities and bonds.
11
Simulation Documents Contact
www.fpn.ch
Come and visit your website !
Finally and as already mentioned, this new strategic asset allocation will have no detrimental impact, relative to the 2016 allocation, on either the Fund’s expected risk-adjusted return over the next few years or the protection of its funding ratio.
www.fpn.ch New website now live !A website has been created to improve communication from our Fund. You can visit it as of now at www.fpn.ch.
There are various tabs to grab your attention. You will find useful information for active insured members, those approaching retirement and pension beneficiaries. The topic of investments is also addressed in more detail. You will find our key figures and the history of the Fund. Another page is dedicated to administration contacts and the members of the Board of Trustees and Investment Committee.
The website enables insured members to access documents online, in particular their pension certificate.
There is also a fully secure simulation module for active insured members, enabling them to carry out various calculations on the basis of their personal details.
Members can determine the impact of changing their savings plan (Basic, Standard and Top), calculate their maximum voluntary purchase amount, simulate early withdrawal according to their needs and discover their projected retirement pension at their desired retirement age.
The website also allows you to download all the documents you may need to consult, and to contact us directly via the contact form.
We should also make it clear that the site will continue to evolve, principally in response to your feedback and comments, for which we thank you in advance.
12
Investments
2016 in reviewWe should remember that 2016 did not get off to a very good start, with the financial markets shrouded in uncer-tainty due in particular to the UK’s potential exit from the European Union (Brexit) and the US presidential elections. The results of these two major political events came as a surprise. Coupled with a slowdown in economic activity at the start of the year, we could have been expecting the worst during the year under review.
2016 ultimately displayed two very distinct sides, with a relatively disappointing first phase followed by something of a recovery in the second part of the year.
The start of the year saw the fears referred to in the introduc-tion borne out, since it coincided with a drop in global economic growth. The following two examples illustrate this trend : – US economic activity hit by a lagging industrial sector
following the delayed effect of the appreciation of the US dollar ;
– The fall in commodity prices continued, confirming the deflationary fears and the negative impact on emerging markets.
Following this very subdued first period, the second part of the year was fortunately much better due to an upturn in economic growth. For 2016 at least, the unexpected out-comes of the votes on Brexit and the US presidency had only a limited negative impact on the financial markets.
This phase of improvement was influenced in particular by strong domestic demand in the US and the healthy labour market, which stimulated available income and consump-tion. The rise in commodity prices subsequently provided the expected positive effect on emerging countries and deflation risks.
Finally, and in line with this two-sided macroeconomic context, Switzerland behaved in a similar fashion. The end of the year nevertheless enabled it to close 2016 with GDP growth of 1.5%.
Performance of the Pension FundIn 2016, the Fund thus posted a positive performance (net of costs) of 5.9%. The performance in the year under review is attributable to the following factors : All asset classes made a positive contribution to the performance of the Fund, in particular listed equities which contributed 3.6%. Bonds contributed 1.8%, private equities 0.7% and real estate 0.8%. Finally, currency effects detracted 1.2% from the overall performance. For the main asset classes, the Fund posted the following performance (expressed in Swiss francs) in 2016 :
Performance in %
2016 2015
3 years
average 1)
Equities 11.4 (4.5) 6.7
Private equities 8.9 6.7 11.9
Bonds 6.5 (0.6) 6.4
Swiss real estate 6.8 7.3 7.5
International real estate 2.3 0.3 5.2
Hedge funds 2.3 (0.1) 5.5
Commodities 9.2 (22.4) (8.4)
1) annualised
Comparison of the Fund’s performance against its objectivesThe objective of the Fund over the long term, in terms of performance, is measured by means of its strategic asset allocation. Its performance is computed based on indices which compose it and which exclude any fees whether management or transaction-related. On the other hand, the Fund’s performance, i.e. 5.9% , does take account of management and transactions fees.
The performance of the Fund was slightly lower than that of its strategic asset allocation (6.2%) in 2016, i.e. an under-performance of 0.3%. This underperformance is attributable to the following factors : – Private equities, measured against listed equities,
detracted 0.6% ; – International real estate and commodities also made
negative contributions of -0.1% and -0.2% respectively ; – Listed equities made a positive contribution of 0.6%.
Over five years, the Fund’s performance is below that of its strategic asset allocation.
13
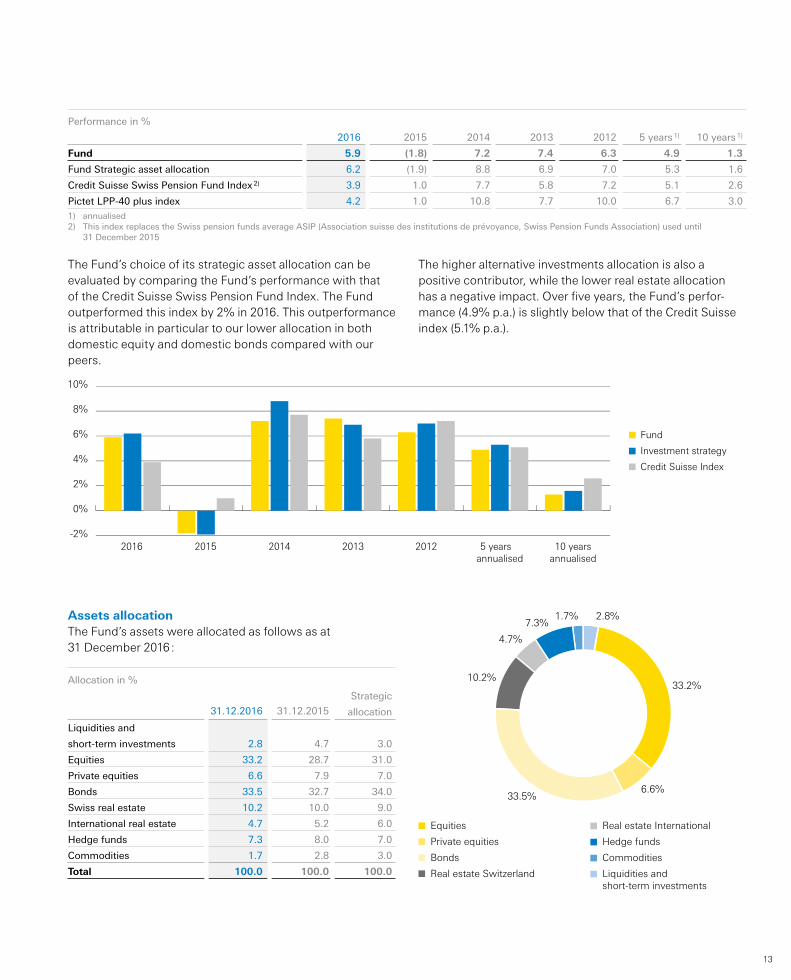
Performance in %
2016 2015 2014 2013 2012 5 years 1) 10 years 1)
Fund 5.9 (1.8) 7.2 7.4 6.3 4.9 1.3
Fund Strategic asset allocation 6.2 (1.9) 8.8 6.9 7.0 5.3 1.6
Credit Suisse Swiss Pension Fund Index 2) 3.9 1.0 7.7 5.8 7.2 5.1 2.6
Pictet LPP-40 plus index 4.2 1.0 10.8 7.7 10.0 6.7 3.01) annualised2) This index replaces the Swiss pension funds average ASIP (Association suisse des institutions de prévoyance, Swiss Pension Funds Association) used until 31 December 2015
The Fund’s choice of its strategic asset allocation can be evaluated by comparing the Fund’s performance with that of the Credit Suisse Swiss Pension Fund Index. The Fund outperformed this index by 2% in 2016. This outperformance is attributable in particular to our lower allocation in both domestic equity and domestic bonds compared with our peers.
2.8%
Equities
Private equities
Bonds
Real estate Switzerland
33.2%
6.6%33.5%
10.2%
4.7%
7.3%1.7%
Real estate International
Hedge funds
Commodities
Liquidities and short-term investments
The higher alternative investments allocation is also a positive contributor, while the lower real estate allocation has a negative impact. Over five years, the Fund’s perfor-mance (4.9% p.a.) is slightly below that of the Credit Suisse index (5.1% p.a.).
Fund
Investment strategy
Credit Suisse Index
-8%
-6%
-4%
-2%
0%
2%
4%
6%
8%
10%
2016 2015 2014 2013 2012 5 years 10 years annualised annualised
Assets allocationThe Fund’s assets were allocated as follows as at 31 December 2016 :
Allocation in %
31.12.2016 31.12.2015
Strategic
allocation
Liquidities and
short-term investments 2.8 4.7 3.0
Equities 33.2 28.7 31.0
Private equities 6.6 7.9 7.0
Bonds 33.5 32.7 34.0
Swiss real estate 10.2 10.0 9.0
International real estate 4.7 5.2 6.0
Hedge funds 7.3 8.0 7.0
Commodities 1.7 2.8 3.0
Total 100.0 100.0 100.0
14
www.fpn.ch Simulation
Investment Committee activitiesThe Investment Committee’s main activities in the year under review was to continue and above all step up its discussions, launched in 2015, regarding the relevance of the Fund’s strategic asset allocation.
As already outlined above in the “Focus” section on page 8 of this annual report, in 2016 the Investment Committee focused primarily on addressing the adequacy of the Fund’s investment structure given the new conditions and require-ments encountered on the financial markets. The result of this work led to a new strategic asset allocation, which was presented to the Fund’s Board of Trustees in November 2016 and is set out on page 10.
The optimisation exercise was also implemented with a view to gaining strict control of the Fund’s asset management fees (TER) and simplifying its investment philosophy.
In this context, the Investment Committee took the following key decisions :
– To propose to the Board of Trustees meeting in November 2016 that the Fund dispose of all its investments in hedge funds and commodities, primarily in favour of investments in Swiss real estate. This recommendation was based on the fact that the committee was able to identify invest-ment alternatives that are every bit as attractive, offering similar risk/return and portfolio diversification profiles but at a much lower cost ;
– To take no preventative action regarding the Fund’s asset allocation in the wake of last June’s Brexit vote. The committee took the view that the Fund would not be significantly affected by the UK’s exit from the European Union, as its asset allocation was already sufficiently balanced and diversified ;
15
Simulation Documents Contact
Our challenges : longer life expectancy and lower expected returns on the financial markets
– To approve the appointment of the manager HarbourVest in place of the current manager SCM/Mercer to manage the Fund’s investments in private equities. Factors such as HarbourVest’s depth of resources and network, the discipline and coherence of its investment approach and its historical performance achieved over a very long period played a decisive role in this choice ;
– To acknowledge the appointment of the bond manager BlackRock to replace Nestlé Capital Management in the multimanager collective investment fund Robusta Global Credit Bond Fund.
Conclusion 2016 can be summarised for the Fund in two points : a very good performance of 5.9% and major changes.
Although predicted to be a difficult year, 2016 actually turned out much better than anticipated in terms of the financial performance of the Fund’s investments.
Over the next few years the Fund will face major challenges such as the ongoing increase in life expectancy and even lower expected returns on the financial markets across all asset classes.
The Fund has already implemented a number of measures to tackle these challenges. For example, it has created provisions on the liabilities side of its balance sheet (namely the provision for a future reduction in the technical interest rate and the provision for increased life expectancy) and adapted its strategic asset allocation. Other measures are still necessary, however, such as the review of the technical interest rate that is currently taking place.
All these initiatives have a single objective: to ensure the long-term financial sustainability of your Fund. This is our mission, one we intend to carry out with success.
16
Funding ratio and actuarial situation
Actuarial situation
In millions of CHF
31.12.2016 31.12.2015
Available assets 6 695.1 6 391.2
Liabilities
Pension reserve for active members 2 515.1 2 482.5
Pension reserve for pensioners 3 403.4 3 348.3
Provision for increased life expectancy 122.5 100.4
Provision for death and disability risks 53.9 58.4
Provision for a future reduction in the
technical interest rate 170.2 83.7
Total 6 265.1 6 073.3
Technical surplus
Downward risk provision 430.0 317.9
Disposable surplus 0.0 0.0
Total 430.0 317.9
Funding ratio (assets / liabilities) 106.9 % 105.2 %
Available assetsThe available assets are determined by subtracting short-term debt, transitional liabilities and ordinary contributions reserves from total balance sheet assets (page 6).
LiabilitiesThe Fund’s liabilities consist of : – The pension reserve for active members, which
corresponds to the total of the accrued retirement savings capitals of those members ;
– The pension reserve for pensioners, which is the total amount necessary to ensure payment of current pen-sions. These reserves are often defined as mathematical reserves and are calculated from 31 December 2011 using 2010 actuarial tariffs and take into account a technical discount rate or internal rate of return of 3% ;
– The provision for increased life expectancy, which has been set up to cover the future costs which the Fund expects to incur due to this trend. This provision is funded by an annual allocation calculated on the basis of the pen-sion reserve for pensioners. This provision stood at 3.6% or CHF 122.5 million as at 31 December 2016 ;
– The provision for death and disability risks, which aims to cover the inevitable fluctuations between the effective costs per benefit claim and its average costs. This provision stood at CHF 53.9 million as at 31 Decem-ber 2016 ;
– The provision for a future reduction in the technical interest rate, which will cover any subsequent increase in liability relating to a potential decrease in the technical interest rate for pensioners. As agreed with the certified pension actuary, a provision was created at the end of 2015. It was funded by a further CHF 86.5 million in 2016 and stood at CHF 170.2 million as at 31 December 2016.
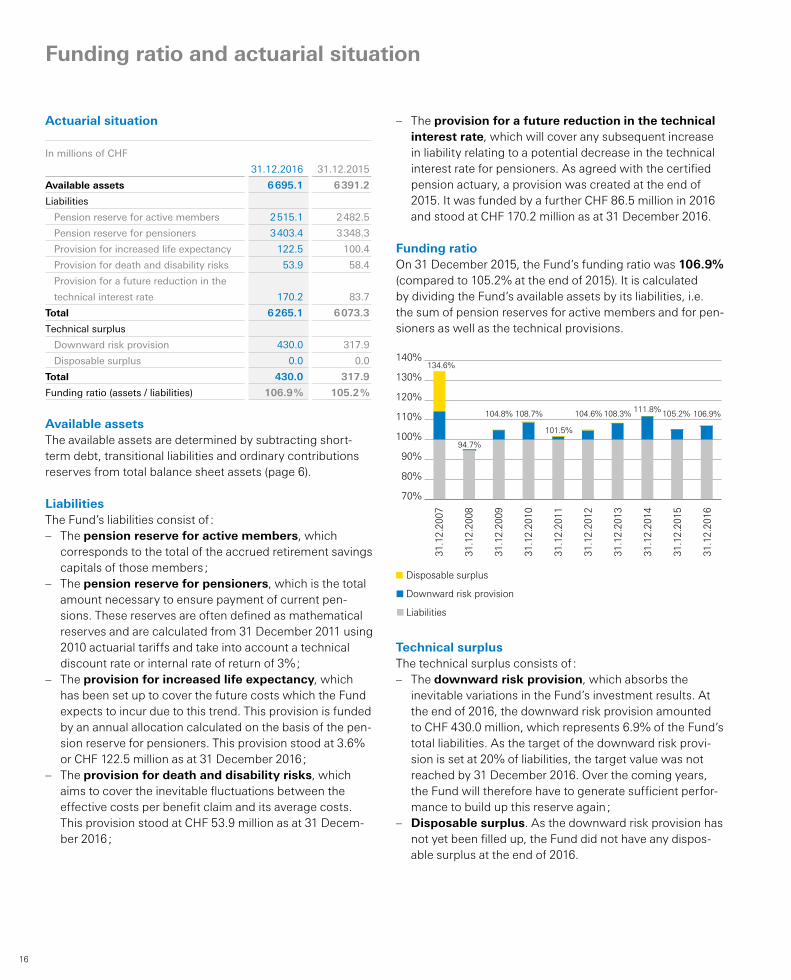
Funding ratioOn 31 December 2015, the Fund’s funding ratio was 106.9% (compared to 105.2% at the end of 2015). It is calculated by dividing the Fund’s available assets by its liabilities, i.e. the sum of pension reserves for active members and for pen-sioners as well as the technical provisions.
31.1
2.20
07
31.1
2.20
08
31.1
2.20
09
31.1
2.20
10
31.1
2.20
11
31.1
2.20
12
31.1
2.20
13
31.1
2.20
14
31.1
2.20
15
31.1
2.20
16
Disposable surplus
Downward risk provision
Liabilities
70%
80%
90%
100%
110%
120%
130%
140%134.6%
104.8% 108.7% 108.3%
101.5%
104.6%
94.7%
111.8% 105.2% 106.9%
Technical surplusThe technical surplus consists of : – The downward risk provision, which absorbs the
inevitable variations in the Fund’s investment results. At the end of 2016, the downward risk provision amounted to CHF 430.0 million, which represents 6.9% of the Fund’s total liabilities. As the target of the downward risk provi-sion is set at 20% of liabilities, the target value was not reached by 31 December 2016. Over the coming years, the Fund will therefore have to generate sufficient perfor-mance to build up this reserve again ;
– Disposable surplus. As the downward risk provision has not yet been filled up, the Fund did not have any dispos-able surplus at the end of 2016.
17
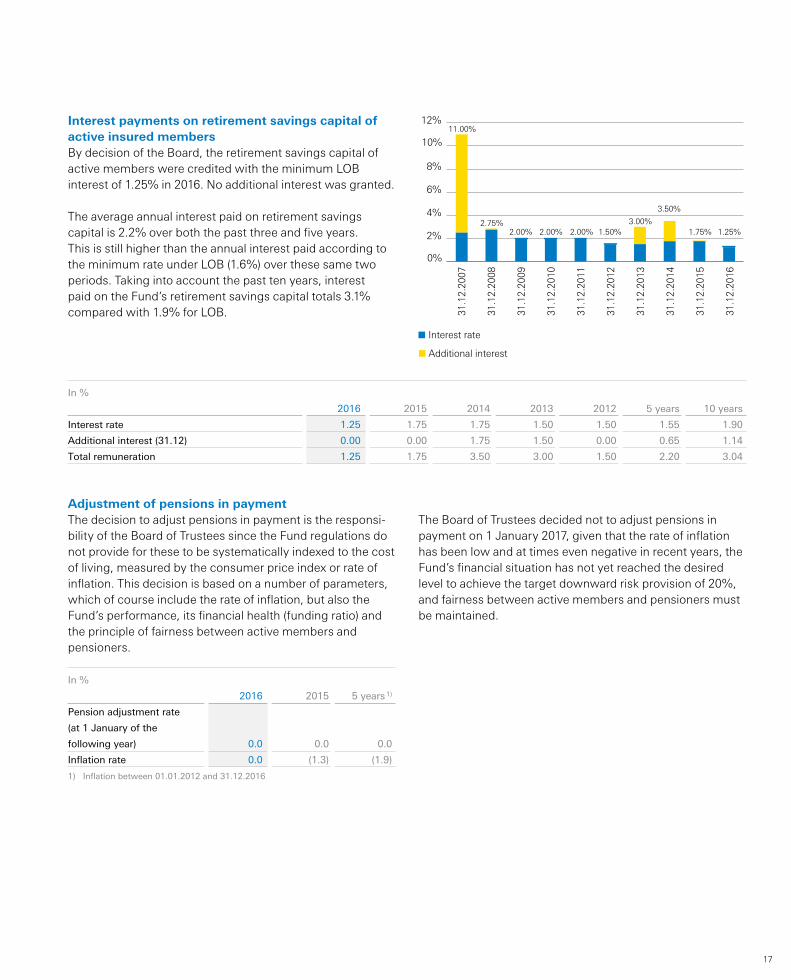
Interest payments on retirement savings capital of active insured membersBy decision of the Board, the retirement savings capital of active members were credited with the minimum LOB interest of 1.25% in 2016. No additional interest was granted.
The average annual interest paid on retirement savings capital is 2.2% over both the past three and five years. This is still higher than the annual interest paid according to the minimum rate under LOB (1.6%) over these same two periods. Taking into account the past ten years, interest paid on the Fund’s retirement savings capital totals 3.1% compared with 1.9% for LOB.
The Board of Trustees decided not to adjust pensions in payment on 1 January 2017, given that the rate of inflation has been low and at times even negative in recent years, the Fund’s financial situation has not yet reached the desired level to achieve the target downward risk provision of 20%, and fairness between active members and pensioners must be maintained.
Interest rate
Additional interest
0%
2%
4%
6%
8%
10%
12%11.00%
2.00% 2.00% 2.00%3.00%
1.50%2.75%
3.50%
1.75% 1.25%
31.1
2.20
07
31.1
2.20
08
31.1
2.20
09
31.1
2.20
10
31.1
2.20
11
31.1
2.20
12
31.1
2.20
13
31.1
2.20
14
31.1
2.20
15
31.1
2.20
16
In %
2016 2015 2014 2013 2012 5 years 10 years
Interest rate 1.25 1.75 1.75 1.50 1.50 1.55 1.90
Additional interest (31.12) 0.00 0.00 1.75 1.50 0.00 0.65 1.14
Total remuneration 1.25 1.75 3.50 3.00 1.50 2.20 3.04
Adjustment of pensions in paymentThe decision to adjust pensions in payment is the responsi-bility of the Board of Trustees since the Fund regulations do not provide for these to be systematically indexed to the cost of living, measured by the consumer price index or rate of inflation. This decision is based on a number of parameters, which of course include the rate of inflation, but also the Fund’s performance, its financial health (funding ratio) and the principle of fairness between active members and pensioners.
In %
2016 2015 5 years 1)
Pension adjustment rate
(at 1 January of the
following year) 0.0 0.0 0.0
Inflation rate 0.0 (1.3) (1.9)
1) Inflation between 01.01.2012 and 31.12.2016
18
www.fpn.ch Simulation
Active members
Membership statistics : Active members and pensioners
Active members
Men Women Total
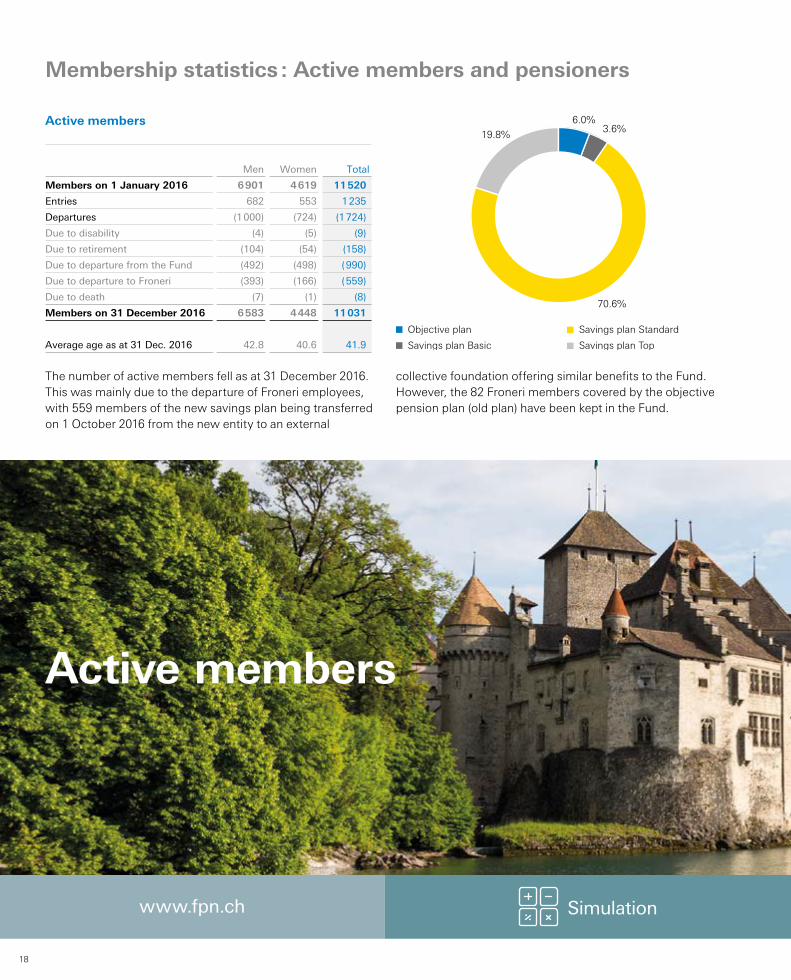
Members on 1 January 2016 6 901 4 619 11 520
Entries 682 553 1 235
Departures (1 000) (724) (1 724)
Due to disability (4) (5) (9)
Due to retirement (104) (54) (158)
Due to departure from the Fund (492) (498) ( 990)
Due to departure to Froneri (393) (166) ( 559)
Due to death (7) (1) (8)
Members on 31 December 2016 6 583 4 448 11 031
Average age as at 31 Dec. 2016 42.8 40.6 41.9
The number of active members fell as at 31 December 2016. This was mainly due to the departure of Froneri employees, with 559 members of the new savings plan being transferred on 1 October 2016 from the new entity to an external
collective foundation offering similar benefits to the Fund. However, the 82 Froneri members covered by the objective pension plan (old plan) have been kept in the Fund.
3.6%
Objective plan
Savings plan Basic
70.6%
19.8%
6.0%
Savings plan Standard
Savings plan Top
19
Simulation Documents Contact
The number of active members fell in 2016, mainly due to the transfer of Froneri employees
The number of active members of the objective plan (old plan) is falling constantly, as the change of savings plan implemented on 1 July 2013 only affected members born in 1959 and after. On this basis, the objective plan is projected to no longer exist from December 2023 onwards.
Breakdown of active members by savings plan 2016 2015
Objective plan (old plan) 659 6.0% 819 7.1%
Savings plan (new plan) 10 372 94.0% 10 701 92.9%
Basic 399 3.6% 439 3.8%
Standard 7 788 70.6% 8 075 70.1%
Top 2 185 19.8% 2 187 19.0%
Other information
Payments in connection with divorce 39 30
Cash withdrawals for home ownership 136 117
The savings plan allows members to choose annually from three contribution levels. The breakdown remains relatively stable, with members continuing to favour the Standard plan.
Early withdrawals following divorce and to encourage home ownership increased in 2016.
20
www.fpn.ch Simulation
Pensioners
Pensioners
Retirement Disability Surviving spouse Children Total
Pensioners on 1 January 2016 3 798 219 1 256 259 5 532
New pensions 177 14 73 52 316
Pensions terminations (6) (19) - (43) (68)
Deaths (127) (3) (76) - (206)
Pensioners on 31 December 2016 3 842 211 1 253 268 5 574
Average age as at 31 December 2016 74.5 54.2 78.5 16.2 71.9
Evolution of total headcount
2016 2015 2014 2013 2012
Active members 11 031 11 520 11 601 10 976 10 633
Pensioners 5 574 5 532 5 484 5 385 5 326
Total as at 31 December 16 605 17 052 17 085 16 361 15 959
Ratio active members / pensioners 1.98 2.08 2.12 2.04 2.00
Ratio pension reserve for pensioners 59.0 % 58.2 % 58.0 % 59.7 % 64.8 %
21
Simulation Documents Contact
The Jomini Social Grant can help pensioners with an unforeseen expense
The number of pension beneficiaries continues to grow at the same rate as in previous years.
Despite the decrease in the number of active members, however, the share of pensioners’ pension reserves added to the provisions dedicated to them (59%) remains stable relative to that of active members.
The incidence of disability remains stable thanks to the efforts of human resources and their proactive intervention strategy.
Jomini Social GrantOn her death in 2000, Mrs Marie-Madeleine Jomini, the widow of Mr Marcel Jomini, founder of the Louis Dapples Foundation, left CHF 2.2 million with no conditions regarding how the money was to be used.
In 2001, the Board of Trustees decided to set up the Jomini Social Grant (Fonds de Secours Jomini) with the aim of providing unique financial support to beneficiaries of a Fund
pension and to pensioners’ spouses. Those seeking assistance must have a modest income and be domiciled in Switzerland.
An unforeseen expense such as high dental fees or a hearing aid may qualify for a payment from the Jomini Social Grant.
A written request together with supporting documentation must be submitted to the administration of the Fonds de Pensions Nestlé, Avenue Nestlé 55, 1800 Vevey.
Grant decisions are made by a committee made up of HR representatives from the Centre and Nestlé Switzerland, as well as from the Fund.
Fon
ds d
e Pensio
ns N
estlé, A
venu
e Nestlé 5
5, 1
80
0 V
evey (Sw
itzerland
)