Embed Size (px)
Citation preview
ANNUAL REPORT 2016

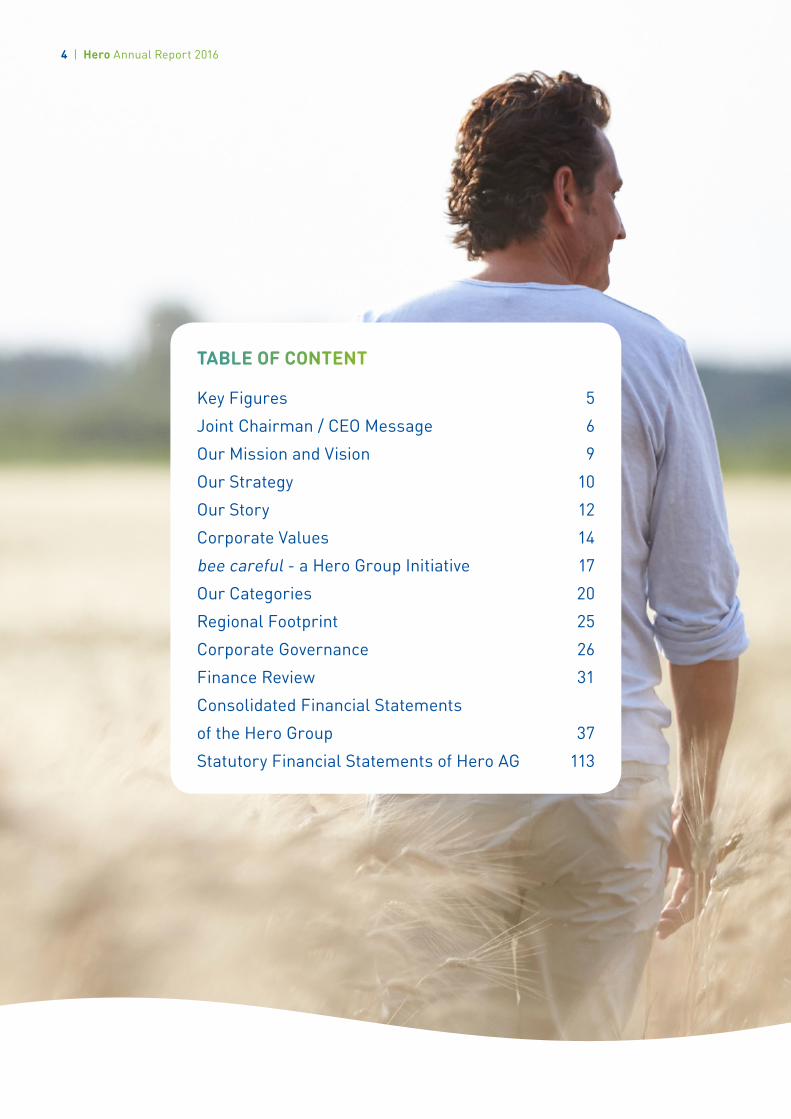
TABLE OF CONTENT
Key Figures 5
Joint Chairman / CEO Message 6
Our Mission and Vision 9
Our Strategy 10
Our Story 12
Corporate Values 14
bee careful - a Hero Group Initiative 17
Our Categories 20
Regional Footprint 25
Corporate Governance 26
Finance Review 31
Consolidated Financial Statements
of the Hero Group 37
Statutory Financial Statements of Hero AG 113
4 | Hero Annual Report 2016
in CHF million 2016 2015 2014
Net sales 1 269.2 1 260.6 1 343.4Organic growth in % 0.1 1.7 (1.0)
Operating Profit (EBIT) 113.8 108.2 65.0in % of net sales 9.0 8.6 4.8
Income for the year 73.4 71.8 112.9in % of net sales 5.8 5.7 8.4
Cash flow from operating activities 118.3 118.8 104.9in % of net sales 9.3 9.4 7.8
Total Equity 682.6 839.2 911.3Equity ratio in % 44.9 53.2 54.4
EBITDA 153.7 145.9 152.2
Net Debt 329.0 166.2 125.5
Net debt / EBITDA 2.1 1.1 0.8
Headcount 3 900 3 747 3 685
KEY FIGURES
North America
23%
Emerging Markets
13%
Europe 64%
Share of total net sales
by Region
Jam 20%
Healthy Snacks 8%
Baby & Toddler Food 30%
Baby & Toddler Milk
10%
Specialties 32%
Share of net sales by
Category
Hero Annual Report 2016 | 5Hero Annual Report 2016 | 5
JOINT CHAIRMAN / CEO MESSAGEIn the past year, the company made further progress in the exe-
cution of its mission, vison and strategy to drive profitable growth.
In 2016, Hero managed to increase both absolute and relative
profitability with EBIT now reaching 9.0% of net sales.
Top line growth of our branded sales in our core categories of
Baby & Toddler Food, Jams and Healthy Snacks accelerated to a
satisfying level of 3.8%. These positive developments were coun-
tered by a decrease in sales of our Baby & Toddler Milks caused
by changes in the regulatory environment in China as well as
adverse developments in our specialties and non-branded
businesses, leading to an overall stable development of our total
sales versus prior year.
Outlook 2017We are proud to have a mission forged in the furnaces of tradition
and built around the goodness of nature. We believe in its power
and will continue to make steps in aligning the company to our
mission statement in 2017. We plan to grow top and bottom line in
our core categories, fueled by new product initiatives and our
focus on commercial execution. Market conditions will however
remain challenging in 2017. We expect continuous volatility in
emerging markets, as well as a potential decrease in consumer
confidence in both the USA and Europe in line with political
developments.
A more detailed analysis of our performance and outlook can be
found in our financial review.
Dr Hasso Kaempfe, Chairman (left)
and Rob Versloot, CEO
6 | Hero Annual Report 2016

Board of Directors / Executive BoardIn 2016, we welcomed Leopold Oetker to the Hero Group Board of
Directors. The Oetker family are the shareholders of the Hero
Group, and Leopold Oetker follows in the steps of his father,
Dr Arend Oetker, who sat on the board until January 2013 when
he took on the role as Honorary Chairman.
The Hero Group saw the appointment of Karsten Boyens to the
Executive Board as CFO. Long-standing member of the Executive
Board René Bänziger retired from the company and was
succeeded by Witte van Cappellen as CMO.
Our local heroesWe would like to take the opportunity to express our appreciation
to all our employees for their passion and commitment to our
business in the past year. At Hero, we are proud of our people and
culture and consider them key assets of our company. Together
with our colleagues in the Board of Directors and Executive Board
we will continue to focus on long-term value creation for our
shareholders, whom we would like to herewith thank for their
valuable support.
Sincerely,
Dr Hasso Kaempfe
Chairman Board of Directors
Rob Versloot
Chief Executive Officer
Hero Annual Report 2016 | 7
DELIGHT CONSUMERS BY CONSERVING THE GOODNESS OF NATURE
OUR MISSION AND VISION
The world today is different from the one that
existed 10 years ago, and nothing like what it
was in 1886 when Hero came into existence.
Since the first day, our company has however been
on a journey, and while the wording may have
changed, the mission has always been to delight
consumers by conserving the goodness of nature.
It’s what we do and what we are good at.
Bringing nature into people’s homes in convenient
jars, pouches, tins and other containers is our
core business. We want to ensure that the food
we offer is the best in terms of quality, using
the best natural ingredients whilst minimizing
processing. We continuously ask ourselves the
question: how can we delight consumers and
create preference for our products and brands?
We believe in the following principles:
• Having superior natural products that
communicate goodness, nature and homemade
• Using sustainable and responsible sourcing
• Minimizing the use of artificial additives
• Building consumer and shopper understanding
• Innovation in our processes, products and
packaging
Our United Local Heroes vision reflects that our group of companies is more than the sum of its parts.
UNITED because we all work together towards
a common goal. We work collaboratively to pre-
serve the consistency of and leverage synergies
from our multi-country brands to drive success;
it is LOCAL because the people who know our
customers and shoppers best are the ones in the
field/working most closely to them, and they are
better placed to focus on building our brands and
superior local execution; finally, it’s also HEROES
as we aspire to go that extra mile to make sure
our customers in our markets are happy and
deliver on our profitable growth ambitions.
Hero Annual Report 2016 | 9Hero Annual Report 2016 | 9

Focus on core categoriesAt Hero, we aim to drive organic growth of our
core categories, namely Baby & Toddler Food,
Jams, and Healthy Snacks, supported by our
business in Baby & Toddler Milk, and Specialties.
We do so by increasingly aligning the portfolios
of our core categories to our mission ‘to delight
consumers by conserving the goodness of
nature’ and by focusing our central and country
organizations on these businesses. Next to this,
our business development agenda is targeted
at increasing the weight of our core categories
in our total Group sales.
Profitable growthOur Hero profitable growth model guides
the implementation of our strategy. We aim to
increase the profitability of our Group by
increasingly unlocking synergies between our
operating companies.
OUR STRATEGY
profitable growth model
GrossMargin
Improvement
Organic Growth
Investment& Profit
IncreaseScale
10 | Hero Annual Report 2016
Operating modelOur goal as an organization is to achieve profita-
ble growth: a virtuous cycle where performance
improvement creates financial returns that can
be invested in brand building and innovation,
driving economies of scale / scope that lead to
ever improving performance and accelerated
growth.
We strive to find the advantages of being part of
a Group – scale, synergies and specialist skills
– while retaining the advantages of being highly
local, quick on the ground, and close to the
consumer / shopper.
To make this type of organization work, one
where we are neither fully centralized nor fully
decentralized, we rely on leadership at all levels
and a strong link to our Hero values to underpin
our way of working.
The theme is clear: the center provides unified
overarching direction and added value to coun-
tries. Countries drive focused execution and
deliver results, given that they are the ones
who ultimately bring growth and profit. They
also implement central initiatives as a means
to help drive growth and margin improvement
for the whole company.
Hero Annual Report 2016 | 11
Our beliefs echo those of archeologists and restorers: what is
of value deserves to be conserved, defended, protected and
nurtured for everyone to enjoy. This is why we at Hero have made
it our mission to conserve the works of the greatest artist of all
times – Mother Nature.
Our work starts at the source itself: farmers, growers and planters
all over the world. From Francisco Javier, a farmer in Jumilla,
Spain, who grows peaches for our baby food, to Dirk, a strawberry
farmer in Schmilau, Germany, and Hans, who grows potatoes for
our Swiss Rösti in Endingen. In Egypt, Khalil and Mahmoud work
the fields to provide us with fresh produce, while Sören in Köping,
Sweden, provides hundreds of tons of oats for our infant cereals.
These are real people who we know personally and trust.
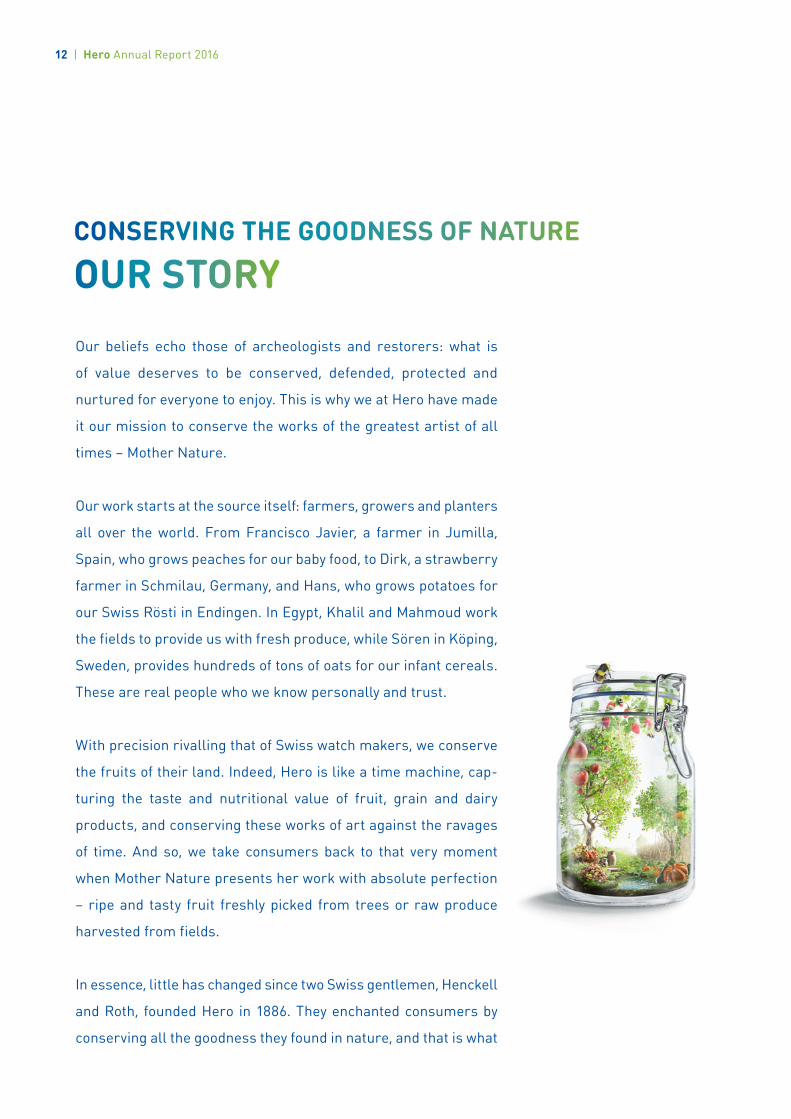
With precision rivalling that of Swiss watch makers, we conserve
the fruits of their land. Indeed, Hero is like a time machine, cap-
turing the taste and nutritional value of fruit, grain and dairy
products, and conserving these works of art against the ravages
of time. And so, we take consumers back to that very moment
when Mother Nature presents her work with absolute perfection
– ripe and tasty fruit freshly picked from trees or raw produce
harvested from fields.
In essence, little has changed since two Swiss gentlemen, Henckell
and Roth, founded Hero in 1886. They enchanted consumers by
conserving all the goodness they found in nature, and that is what
CONSERVING THE GOODNESS OF NATURE
OUR STORY
12 | Hero Annual Report 2016
we still do today. In the 130 years between then and now, Hero has
acquired a considerable global reputation. Using both timeless care
and state-of-the-art technology, we distribute nature’s goodness
to hundreds of millions of consumers in scores of countries,
spread over five continents.
Our customers may be 82 years old, or 82 months, or 82 days.
In each case, our food provides the nutrients needed for them to
lead a healthy life, all conveniently packaged and conserved.
Our family-owned company includes dozens of brands. We repre-
sent a significant force in jams, healthy snacks, and baby/infant
foods. With brands synonymous with quality, such as Hero, Hero
Baby, Organix, Beech-Nut, Semper, Vitrac, Corny, and Schwartau,
we are accustomed to prominent market positions in many local
markets. They are our local heroes.
Some call us a food manufacturer – we disagree. For us, it is
Mother Nature who makes food – all we do is conserve the
goodness, for you. We are her treasurer and are in her debt.
This is why we are striving to help nature through our bee careful
initiative, which seeks to protect bee populations that are vital
to fruit diversity.
Ever since 1886, we have been nature lovers with one aspiration;
to delight consumers by conserving the goodness of nature.
Some call us a food manufacturer –
we disagree. For us, it is Mother
Nature who makes food – all we do
is conserve the goodness, for you.

Change
Juliana Fantini Marketing Coordinator Queensberry (Brazil)
“Having Change as one of the
Group values is important as it
is one in which I strongly believe.
In my opinion, being willing to
change is synonymous with
courage and intelligence. We
are willing to promote change
to keep growing and spreading
the goodness of nature around
the world. Our Employee Advo-
cacy Project is all about change
as well, since Hero is willing to
include a new culture in order
to reach more consumers and
further improve the reputation
of the company and its products.”
Empowerment
Ceyda HafizogluProject Manager I&Q Hero Group (Turkey)
“I really enjoy being a member
of this multinational family
because Hero believes in
Empowerment. This holds true
in our projects and work, and it
really boosts my creativity and
motivation. The end result is
that the work I do is done from
my heart.”
Veronika KangerNPD Manager Hero Russia
“Hero promotes and supports
employees’ professional devel-
opment by providing challenges
and giving opportunities to show
our worth in our work. This gives
us the Empowerment we need
to give our all for the benefit
of all parties. It’s a win-win
situation.”
CHANGE EMPOWERMENT
CORPORATE VALUES
14 | Hero Annual Report 2016

Speed
Ricardo EijbertsGroup Account Manager Hero Benelux (The Netherlands)
“Speed is one of the values why
I really appreciate working for
Hero. It’s a privilege to work in
a multinational company with
such short, transparent (hier-
archical) line in which everyone
is personally accessible. This
means that everyone knows
and appreciates the urgency of
taking decisions at the right
time, with the required thought
and taking all elements into con-
sideration. I’m really convinced
that speed is a true character-
istic of the Hero Group.”
Entrepreneurship
Stine HasseløProduct Manager Infant Semper Norway
“The entrepreneurial spirit at
Hero inspires me every day. The
freedom and trust shown in
taking (calculated) risks, the
passion shared for finding solu-
tions that work in each market,
the openness for discussions,
and the freedom given to crea-
tivity that ultimately may lead
to innovation or new business
solutions are all crucial factors
in driving the business forward.
I believe that Hero embraces
and supports Entrepreneurship,
and this is why I really enjoy
working for the company.”
Family
Chris BraitchCustomer Marketing Controller Organix (UK)
“I enjoy working for Hero be-
cause I’ve had an amazing op-
portunity to enjoy our Family
value within the Summit of
United Local Heroes project.
Working in an international
cross-functional team for the
first time in my career has re-
ally opened my eyes to the di-
versity of talent and experience
that can be tapped into, and
because of the family spirit,
I’ve made some good friends
through it. Hero people have a
great sense of humor and an
entrepreneurial spirit, so chal-
lenges are quickly overcome.”
ENTREPENEURSHIP FAMILYSPEED
Hero Annual Report 2016 | 15

AN INITIATIVE TO PROTECT BEE HEALTH AND FRUIT DIVERSITY
The world of bees is as fascinating as it is threatened. Every year,
higher than average losses in bee colonies are being reported
around the world.
The Hero Group launched the bee careful® initiative in an effort to
better understand and address the bee colony collapse disorder
problem. Bees pollinate about 80 % of the world’s plants – fruit in
particular. Without bees not only would orchard yields and fruit
quality be considerably lower, some fruit species would practically
disappear. Bees are essential for us all, and in particular for
the Hero Group as a major fruit user. The main aims behind bee
careful are:
• To assist in targeted research
• The dissemination of knowledge in schools and other institutions
• To provide support to beekeepers and prospective beekeepers
“This is not just another sustainability program, but rather a small
step we are taking to contribute to the survival of the bee, which
works tirelessly to carry out the important task assigned to it.
In recognition of its work, we should do our utmost to ensure
its survival, and by doing so, ensure our own survival,” said Rob
Versloot, CEO Hero Group.
Our efforts are backed by renowned bee expert Professor Jürgen
Tautz from the University of Würzburg and his Honey Bee Online
Studies (HOBOS) research and teaching platform.
BEE CAREFULA HERO GROUPINITIATIVE
Hero Annual Report 2016 | 17Hero Annual Report 2016 | 17
Country initiativesThe Group has pledged a substantial budget for local bee careful
initiatives. These include:
• Creating bee-friendly communities
• Research projects aimed at saving the Egyptian bee
Apis lamarckii
• Assessing the impact of pollination by bees on yield
and nutritional value of peach and apple trees
• Establishment and maintenance of HOBOS stations
• Promotions for people to build bee homes
• Promoting bee keeping among students
• Launching of on pack consumer campaigns
• Education for and support to bee keepers
• Promoting bee-friendly agricultural projects
• Creation of country websites aimed at promoting
the initiative and, therefore, the health of bees.
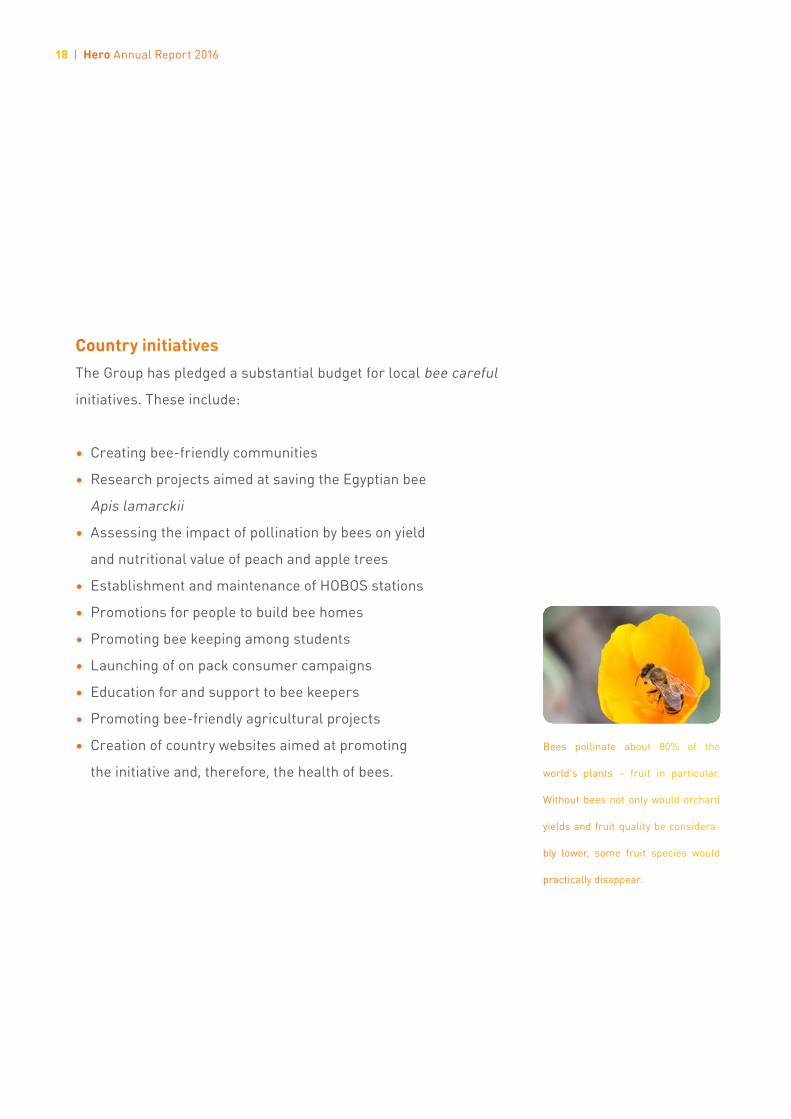
Bees pollinate about 80% of the
world’s plants – fruit in particular.
Without bees not only would orchard
yields and fruit quality be considera-
bly lower, some fruit species would
practically disappear.
18 | Hero Annual Report 2016

JamsAt Hero, it’s all about goodness of nature, and we are experts in
conserving the best of what nature provides with our jams. Trans-
forming fresh fruits in the gentlest of ways for our jams to keep
their authentic fruit taste is part of our daily striving to improve
quality. In our plants, we produce millions of jam jars every year.
We work closely with the local farmers whom we have known for
a long time, benefiting from their expertise in growing the best
quality fruit for our jams.
Today, millions of consumers all over the world start their day
with our products. Hero jams are available in over 120 countries
worldwide, and our brands hold leading market positions in
Europe, MEA and South America.
The Jams category, a mainstay of the Hero Group, made up 20.4% of
the total sales.
Healthy SnacksThe Healthy Snacks category has experienced phenomenal growth
in the last years. In 2016 alone, the category grew by 15.2%
compared to the previous year. It made up 8.1% of the total Hero
Group sales. Our wide range of cereal products – including cereal
bars, nut bars, fruit bars, sandwich bars with creamy fillings and
pouches – provide consumers with great flavors and energy
throughout the day. The first Hero cereal bar was produced in 1984.
Since then we have become one of the market leaders in Europe.
OUR CATEGORIES
20 | Hero Annual Report 201620 | Hero Annual Report 2016

We are constantly looking for ways to improve our bars, develop
new ranges and offer our consumers innovative and delicious
products. Last year saw the launch of a number of innovations,
including a protein sports bar and an oat power bar, fruit bars,
soft oat bars and fruit & oat smoothies in pouches.
Global brand equity building via consumer communication and
shopper activation, portfolio structure optimization, innovation
power and market entries in new emerging markets will be the
strategic success factors for accelerating the profitable growth
for the Healthy Snacks category.
Baby & Toddler Food (BTF)We are on a mission to delight babies and toddlers with the best
nutrition possible. They are our inspiration. Having a baby is chal-
lenging enough without having to worry about balanced nutrition.
The Hero BTF category provides great tasting, nutritionally-
balanced food for babies and toddlers from four months and up.
Our portfolio covers cereals, jars, pouches, biscuits, and juices
served as in-betweens and snacks. As well as regular BTF, we
have a strong competence in Organic BTF.
We manufacture and sell our food under various brands across
North America, Europe and MEA (Middle East & Africa). Investments
in packaging, technology and ingredients ensure we maintain out
leading position in key markets. Of the four main Group categories,
BTF is the largest with 29.5% of our total net sales.
Baby & Toddler Milk (BTM)‘Delighting moms (and dads) & babies by conserving the goodness
of nature’ is at the core of Hero BTM mission and inspiration. We
believe breast milk is the best to ensure our babies have the best
start in life. For those times when breastfeeding is not possible,
Hero has developed a range of infant milk formulas.
Hero is present in numerous European countries, the MEA region
and China with different brands, including Hero Baby, Semper
and Sunar. We are especially proud of our new infant formula with
Lipilact containing unique blend of milk fat & MFGM that mimics
mothers’ breast milk. Since 2014, Lipilact has been launched in
different markets. The BTM category made up 10.1% of the Hero
Group’s total for 2016.
SpecialtiesThe Hero Group includes a fifth category of specialized products
for niche markets. One of the most important in this sector is our
gluten free range which is particularly strong in the Nordics
with Semper and the UK with Juvela. These products offer
gluten-intolerant and gluten-sensitive consumers and others
diagnosed with coeliac disease a tasty alternative.
Other products are sold seasonally and include products created
around festivities or themes, such as Easter and Halloween, plus
a cake decoration business. This Specialties category makes up
31.9% of the Group total.
Hero Annual Report 2016 | 23Hero Annual Report 2016 | 23
Europe remains the largest sales area for the
Hero Group, accounting for two-thirds of the total
for 2016. At 64.3%, sales in Europe increased by
1.0% when compared to the previous year. North
America, at 23.0%, is the second largest sales
area. This region registered a marginal drop of
0.6% in the year in review. Emerging Markets,
which include Egypt, China, Turkey, Russia and
Brazil, made up the remainder of sales, coming
in at 12.7% of the total.
In terms of production, the Hero Group has
its own facilities in Egypt (Cairo), Germany
(Bad Schwartau), Spain (Alcantarilla), Sweden
(Gotene and Korsnăs), Switzerland (Lenzburg),
Turkey (Ankara), and the USA (Amsterdam, NY,
and Ocala, Florida). Furthermore, the Group
relies on external production and co-packers
to produce its products. These include facilities
in Belgium, Denmark, France, the Netherlands,
Spain, Switzerland, the UK and the US.
REGIONAL FOOTPRINT
Hero Annual Report 2016 | 25

Board of directors(from left to right)
Dr Hasso Kaempfe, Chairman
Leopold Oetker
Michael Pieper
Dr Hagen Duenbostel
Herbert J. Scheidt, Vice-chairman
Honorary ChairmanDr Arend Oetker
Executive Board(from left to right)
Rob Versloot, CEO
Markus Lenke, COO
Witte van Cappellen, CMO
Dr Karsten Boyens, CFO
CORPORATE GOVERNANCE
26 | Hero Annual Report 2016

IntroductionHero is committed to modern corporate govern-
ance principles. Professional processes and re-
sponsible management are upheld and followed
by the Group’s management teams.
Hero’s corporate regulations are oriented towards
the guidelines outlined in the Swiss Code of Best
Practices in addition to the provisions set out by
the Swiss law. The Hero Group Board of Directors
and Executive Board are separate decision-
making bodies with distinct functions and respon-
sibilities. No official on the Board of Directors is
a member of the management team.
Board of DirectorsThe Hero Board of Directors consists of five
members who are elected by the Annual General
Meeting for a period of two years.
The current Board of Directors consist of Dr
Hasso Kaempfe (Chairman), Herbert J. Scheidt,
Dr Hagen Duenbostel, Michael Pieper, and
Leopold Oetker. Dr Arend Oetker holds the post
of Honorary Chairman.
The Board of Directors convenes its own meet-
ings at least four times a year. At least one board
meeting is held in a country / office outside
Switzerland. The Board of Directors has dele-
gated individual tasks to two sub-committees,
which analyze specific issues in more depth on
behalf of the board.
Finance & Audit Committee
Herbert J. Scheidt (Chairman)
Dr Hagen Duenbostel
Dr Hasso Kaempfe
Human Resources Committee
Dr Hasso Kaempfe (Chairman)
Herbert J. Scheidt
Dr Hagen Duenbostel
The Board of Directors elects the members of
these two sub-committees from the directors
sitting on the board. At each Board of Directors
meeting, the chairmen of the sub-committees
inform the members about the issues dealt with
by the sub-committees and any corresponding
board resolutions. The Board of Directors has
Hero Annual Report 2016 | 27
delegated all operative management functions
to the Executive Board with the exception of those
tasks assigned to other bodies as prescribed
by law, the articles of incorporation, or other
corporate regulations.
Executive BoardThe Executive Board is ultimately responsible
for the operational management of the business.
The Executive Board’s responsibilities encompass
the execution and achievement of the Group’s
strategies, the direction of Group companies, as
well as extracting maximum synergies from the
Group’s structures.
The leaders of the business divisions and the
heads of the subsidiary companies are respon-
sible for the development and achievement of
their commercial and financial targets, and for
the leadership of their areas. The Executive
Board answers to the Board of Directors for the
results of the Group.
Board and management compensationAnnually, the Board of Directors determines the
principles of the remuneration system and annual
compensation for the Board of Directors and
Executive Board at the recommendation of the
Human Resources Committee. The Human Re-
sources Committee deliberates and reviews the
annual compensation in light of market practices
of companies of similar size and industry.
The remuneration paid to the Board of Directors
comprises a fixed salary paid in cash which is
not related to performance. Remuneration of
the members of the Executive Board comprises
a fixed and a variable component. The variable
component consists of a short-term incentive
plan paid in cash.
For 2016 related compensation, this performance-
based incentive relates to achievements in the
2016 financial year. Performance criteria were
Group EBIT and individual targets. The non-
achievement of targets may lead to this remuner-
ation being significantly reduced. In case of over-
achievement of targets, the payout can increase
to a maximum of 150% of the target amount.
28 | Hero Annual Report 2016
From January 1, 2017 a change has been made
to the variable component of the Executive
Board’s remuneration. The incentive is now
based on achievement of a three-year average
of Net Income plus individual performance tar-
gets. This change was made to align the long-
term interests of the shareholders with those of
the Executive Board.
After a two-year waiting period, Executive Board
members may participate in a long-term incen-
tive plan where they are offered to invest up to
50% of their short-term incentive plan payment
in shares. Refer to the note ‘5. Accounting poli-
cies’ of the consolidated financial statements for
an explanation of the provisions of the long term
incentive plan.
AuditorsIn general, the auditors participate in four Finance
& Audit Committee Meetings per year to report,
both verbally and in writing, on audit planning,
execution, and recommendations. The auditors
for the Hero Group Annual Report 2016 are:
Ernst & Young Ltd., Zürich
Hero Annual Report 2016 | 29


SUMMARYIn 2016, Hero continued on its profitable growth
path driven by a strong performance in European
core markets and branded business in our lead
categories. With these positive developments,
Hero compensated for challenges related to
regulatory changes in the Baby & Toddler Milk
(BTM) business in China as well as in certain
business segments in North America.
Net sales reached CHF 1,269.2 million, an in-
crease of 0.7% over 2015. Organic growth ad-
justed for currency and acquisition effects is up
by 0.1% compared to prior year. The underlying
branded business in our lead categories Baby &
Toddler Food (BTF), Jams and Healthy Snacks
achieved continued strong development with
organic net sales growth of 3.8% (2015: 3.3%).
Operating profit increased to CHF 113.8 million
(2015: CHF 108.2 million). This represents a further
improvement of the operating profit margin from
8.6% in 2015 to 9.0% in the year under review. The
Cash Flow from operating activities was stable at
CHF 118.3 million (2015: CHF 118.8 million).
The Hero Group successfully completed the re-
financing of the hybrid bond that reached the first
call date on October 28, 2016. With the issuance
of a CHF 200 million hybrid bond with a coupon
of 2.125% and a CHF 135 million 10-year 1.0%
straight bond, Hero was able to ensure a sound
financial ground to support future profitable
growth as well as to substantially lower the cost
of capital for the Group.
Net Sales – RegionsEurope remains Hero’s most important sales
area with a share of 64.3 % (2015: 64.0 %) of total
net sales in 2016. Organic growth reached 0.4%
in 2016. Similar to last year, the European sales
development was negatively impacted by a de-
crease in non-strategic, non-branded business.
Adjusted for that effect, organic growth in
Europe was up by 1.9% in 2016. Certain European
core businesses such as Germany, the Nordics,
the UK and the Czech Republic contributed
over-proportionately to this growth.
Hero’s business in North America represented
23.0% (2015: 23.5%) of total net sales in 2016.
The business in the USA declined by 2.9% or-
ganically. The main causes for this development
were lower sales in the non-core specialties and
in the co-packing business.
FINANCE REVIEW
Hero Annual Report 2016 | 31
Our main Emerging Markets are Egypt, China,
Turkey, Russia, and Brazil. In 2016, Hero reached a
positive organic net sales growth of 4.0% in these
markets. Overall, this growth is a solid performance
in light of the volatile economic circumstances in
many regions as well as regulatory uncertainties
regarding BTM in China. The new entity in Brazil,
of which Hero acquired 50% plus one share in
December 2015, contributed positively to the
development of Hero’s Emerging Markets.
in CHF million Net sales 2016
Net sales 2015
2016 vs 2015 in %
Acquisition effect
Currency effect
Organic Growth
Europe 815.3 807.1 1.0% - 0.6% 0.4%
North America 292.3 294.2 -0.6% - 2.3% -2.9%
Emerging Markets 161.6 159.3 1.4% 7.9% -10.5% 4.0%
HERO GROUP 1 269.2 1 260.6 0.7% 1.0% -0.4% 0.1%
Net Sales – CategoriesThe Jams category represented 20.4% of sales
(2015: 19.7%) in 2016. The increase in share
is mainly driven by our acquisition in Brazil.
While we face saturated jam markets in many
European countries, Hero achieved a positive
organic net sales growth of 0.2% in 2016 after a
decline of 1.4% in 2015.
Healthy Snacks is Hero’s fastest growing cate-
gory with an organic net sales growth of 15.2% in
2016 (2015: 9.0%). The growth was carried by a
strong performance of our Corny brand in Ger-
many, which is our biggest healthy snacks market.
However, many other markets such as Russia,
Spain and the Netherlands also show very posi-
tive developments. In 2016, Healthy Snacks con-
tributed 8.1% to Hero’s net sales (2015: 7.2%).
Baby & Toddler Food (BTF) represented 29.5%
of Hero Group’s sales in 2016 (2015: 29.8%). Net
sales grew slightly by 0.2% organically (2015:
-1.3%). As in prior year, net sales development in
BTF were negatively impacted by a reduction in
non-branded business. The branded-business
in BTF showed a healthy organic growth of 3.5%
(2015: 3.3%) driven by a dynamic growth of Hero’s
product range in pouches.
Net sales in the Baby & Toddler Milk (BTM) cat-
egory declined 6.7% organically in 2016 after the
considerable growth of 16.2% the year before.
While Hero achieved growth in regions and coun-
tries such as Scandinavia, the Czech Republic,
32 | Hero Annual Report 2016
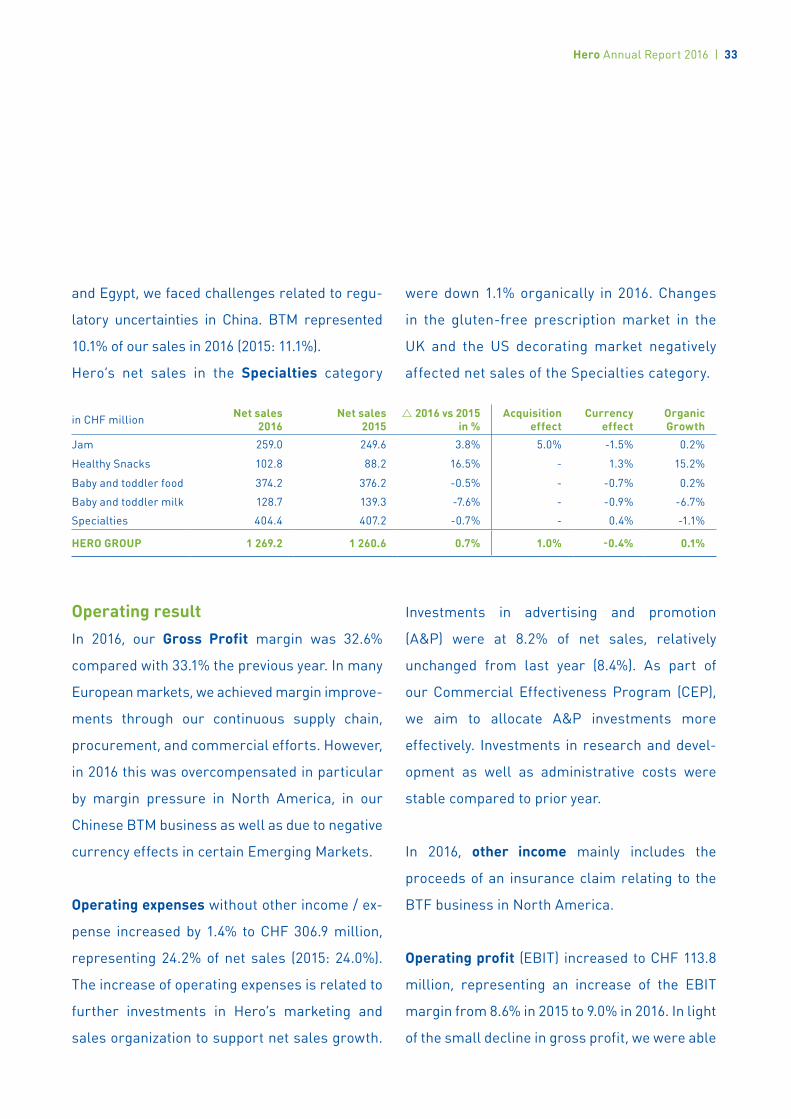
and Egypt, we faced challenges related to regu-
latory uncertainties in China. BTM represented
10.1% of our sales in 2016 (2015: 11.1%).
Hero’s net sales in the Specialties category
were down 1.1% organically in 2016. Changes
in the gluten-free prescription market in the
UK and the US decorating market negatively
affected net sales of the Specialties category.
in CHF million Net sales 2016
Net sales 2015
2016 vs 2015 in %
Acquisition effect
Currency effect
Organic Growth
Jam 259.0 249.6 3.8% 5.0% -1.5% 0.2%
Healthy Snacks 102.8 88.2 16.5% - 1.3% 15.2%
Baby and toddler food 374.2 376.2 -0.5% - -0.7% 0.2%
Baby and toddler milk 128.7 139.3 -7.6% - -0.9% -6.7%
Specialties 404.4 407.2 -0.7% - 0.4% -1.1%
HERO GROUP 1 269.2 1 260.6 0.7% 1.0% -0.4% 0.1%
Operating resultIn 2016, our Gross Profit margin was 32.6%
compared with 33.1% the previous year. In many
European markets, we achieved margin improve-
ments through our continuous supply chain,
procurement, and commercial efforts. However,
in 2016 this was overcompensated in particular
by margin pressure in North America, in our
Chinese BTM business as well as due to negative
currency effects in certain Emerging Markets.
Operating expenses without other income / ex-
pense increased by 1.4% to CHF 306.9 million,
representing 24.2% of net sales (2015: 24.0%).
The increase of operating expenses is related to
further investments in Hero’s marketing and
sales organization to support net sales growth.
Investments in advertising and promotion
(A&P) were at 8.2% of net sales, relatively
unchanged from last year (8.4%). As part of
our Commercial Effectiveness Program (CEP),
we aim to allocate A&P investments more
effectively. Investments in research and devel-
opment as well as administrative costs were
stable compared to prior year.
In 2016, other income mainly includes the
proceeds of an insurance claim relating to the
BTF business in North America.
Operating profit (EBIT) increased to CHF 113.8
million, representing an increase of the EBIT
margin from 8.6% in 2015 to 9.0% in 2016. In light
of the small decline in gross profit, we were able
Hero Annual Report 2016 | 33
to achieve this result with strict cost manage-
ment and the increase in other income.
Financial result and taxesThe net finance expense increased from CHF
13.6 million in 2015 to CHF 21.4 million in the
year under review. The net interest expense of
CHF 4.3 million (2015: CHF 4.6 million) benefited
from the low interest environment. The net
foreign exchange expense including fair value
results amounted to CHF 13.4 million, an in-
crease of CHF 6.9 million compared to 2015.
This increase is mainly due to the devaluation of
the Egyptian Pound and higher hedging costs
related to Group internal financing.
In 2016, income tax expense decreased by CHF
3.8 million. In 2015, the higher tax expense relat-
ed mainly to the reassessment of the valuation
of tax loss carry forwards in North America.
Income for the yearIncome for the year amounted to CHF 73.4
million. This represents an increase of CHF 1.6
million, or 2.2%, over 2015. As a result, the
income margin increased slightly from 5.7%
in 2015 to 5.8% in 2016.
Cash flowCash flow from operating activities before
changes in net working capital further improved
from CHF 143.4 million in 2015 to CHF 149.7 mil-
lion in 2016. Despite the fact that net working
capital increased slightly by CHF 6.8 million to
CHF 111.3 million, it remains at a good level
(8.8% of net sales). Cash flow from operating
activities in 2016 was CHF 118.3 million, on a
similar level as the prior year (CHF 118.8 mil-
lion). Investing activities in 2016 concentrated
mainly on production capacity improvements
(CHF 41 million) and included capacity expan-
sions for the production of cold extraction BTF,
pouches and Healthy Snacks. In Egypt, Hero
completed the building of a new jam factory.
Equity and net debtThe Hero Group decided to call the hybrid bond
of 2009 at its first call date on October 28, 2016,
in order to take the opportunity to refinance at
lower cost. A new CHF 200 million hybrid bond
and a CHF 135 million 10-year straight bond
were issued end of October 2016. In light of the
significantly lower coupons (2.125% and 1.0%
respectively) the Hero Group was able to reduce
annual coupon payments by over CHF 16 million.
This refinancing had an impact on Hero’s equity
and debt ratios. As CHF 135 million of the hybrid
34 | Hero Annual Report 2016
bond has been refinanced by a straight bond,
Hero sees a shift of that amount from equity to
debt. This is the main reason for the increase of
net debt from CHF 166.2 million to CHF 329.0
million. Hero’s equity ratio of 44.9% (2015:
53.2%) and the net debt / EBITDA ratio of 2.1
(2015: 1.1) are on very solid foundations, allow-
ing the current financing structure to serve as a
good basis to support the Group’s long-term
strategy.
RisksHero follows an Enterprise Risk Management
approach in which the Group systematically
captures strategic, operational, financial and
compliance risks from all entities.
In Emerging Markets, currency fluctuations and
economic instability are major risks. The Hero
Group was confronted with significant devalua-
tions of the Egyptian Pound and Turkish Lira in
the last months of 2016 and does not expect sta-
bilization short-term. Regulatory changes could
constitute a risk, for example in the BTM busi-
ness in China or the gluten-free prescription
business in the UK. Hero’s US business faces
commercial risks in light of a challenging
market and competitive environment. The main
risks for the Group also include product safety,
supply chain, and the development of raw mate-
rial prices.
The results of the risk assessment are reported
to the Board of Directors and appropriate meas-
ures are taken to mitigate or transfer these
risks. Further, Hero’s external auditors regular-
ly report their findings to the Finance and Audit
committee.
OutlookThe overall global economic outlook for the
markets in which Hero operates remains some-
what bleak. The European economies have been
stable in the last year, but this could be fragile
in light of Brexit, the UK’s departure from the
European Union, and upcoming elections. The
outlook for Emerging Markets is still rather weak
and we expect a continued volatile economic
development in this region. For 2017, Hero is
cautiously optimistic that it will continue its path
of profitable growth. In line with our strategy,
we expect to be able to deliver continued positive
organic growth in our core categories.
Hero Annual Report 2016 | 35

CONTINUED PROFITABLE GROWTH PATH
CONSOLIDATED FINANCIAL STATEMENTS OF THE HERO GROUP
Content
38 Consolidated Income Statement
39 Consolidated Statement of Comprehensive Income
40 Consolidated Balance Sheet
42 Changes in Equity
43 Consolidated Cash Flow Statement
45 Notes to the Consolidated Financial Statements
108 Statutory Auditor’s Report on the Audit of the Consolidated Financial Statements
Hero Annual Report 2016 | 37
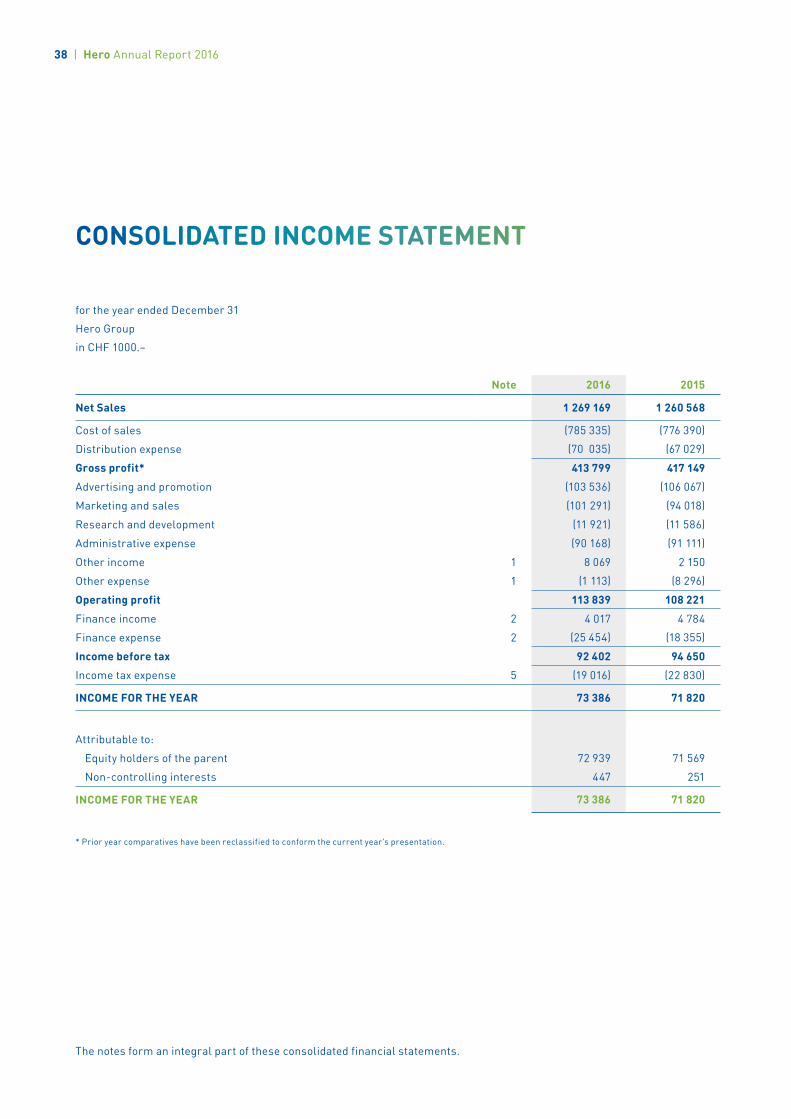
CONSOLIDATED INCOME STATEMENT
for the year ended December 31
Hero Group
in CHF 1000.–
Note 2016 2015
Net Sales 1 269 169 1 260 568
Cost of sales (785 335) (776 390)
Distribution expense (70 035) (67 029)
Gross profit* 413 799 417 149
Advertising and promotion (103 536) (106 067)
Marketing and sales (101 291) (94 018)
Research and development (11 921) (11 586)
Administrative expense (90 168) (91 111)
Other income 1 8 069 2 150
Other expense 1 (1 113) (8 296)
Operating profit 113 839 108 221
Finance income 2 4 017 4 784
Finance expense 2 (25 454) (18 355)
Income before tax 92 402 94 650
Income tax expense 5 (19 016) (22 830)
INCOME FOR THE YEAR 73 386 71 820
Attributable to:
Equity holders of the parent 72 939 71 569
Non-controlling interests 447 251
INCOME FOR THE YEAR 73 386 71 820
* Prior year comparatives have been reclassified to conform the current year’s presentation.
The notes form an integral part of these consolidated financial statements.
38 | Hero Annual Report 2016
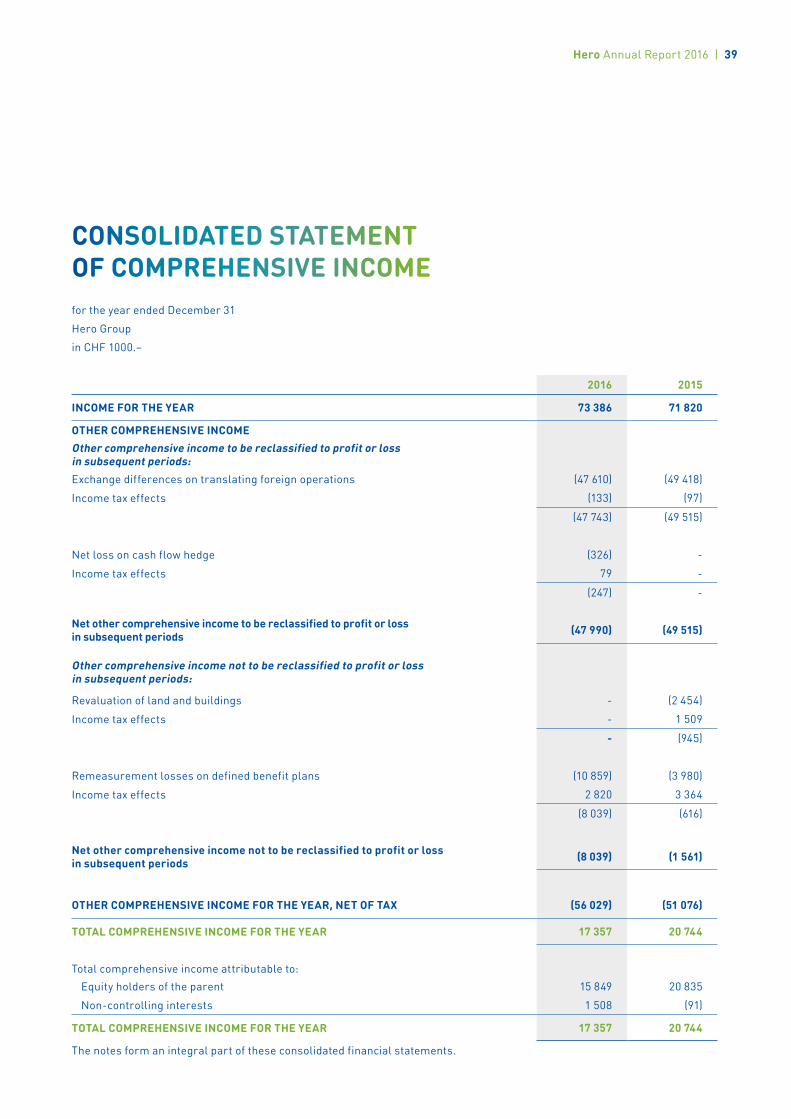
CONSOLIDATED STATEMENT OF COMPREHENSIVE INCOMEfor the year ended December 31
Hero Group
in CHF 1000.–
2016 2015
INCOME FOR THE YEAR 73 386 71 820
OTHER COMPREHENSIVE INCOMEOther comprehensive income to be reclassified to profit or loss in subsequent periods:Exchange differences on translating foreign operations (47 610) (49 418)
Income tax effects (133) (97)
(47 743) (49 515)
Net loss on cash flow hedge (326) -
Income tax effects 79 -
(247) -
Net other comprehensive income to be reclassified to profit or lossin subsequent periods (47 990) (49 515)
Other comprehensive income not to be reclassified to profit or loss in subsequent periods:
Revaluation of land and buildings - (2 454)
Income tax effects - 1 509
- (945)
Remeasurement losses on defined benefit plans (10 859) (3 980)
Income tax effects 2 820 3 364
(8 039) (616)
Net other comprehensive income not to be reclassified to profit or loss in subsequent periods (8 039) (1 561)
OTHER COMPREHENSIVE INCOME FOR THE YEAR, NET OF TAX (56 029) (51 076)
TOTAL COMPREHENSIVE INCOME FOR THE YEAR 17 357 20 744
Total comprehensive income attributable to: Equity holders of the parent 15 849 20 835
Non-controlling interests 1 508 (91)
TOTAL COMPREHENSIVE INCOME FOR THE YEAR 17 357 20 744
The notes form an integral part of these consolidated financial statements.
Hero Annual Report 2016 | 39
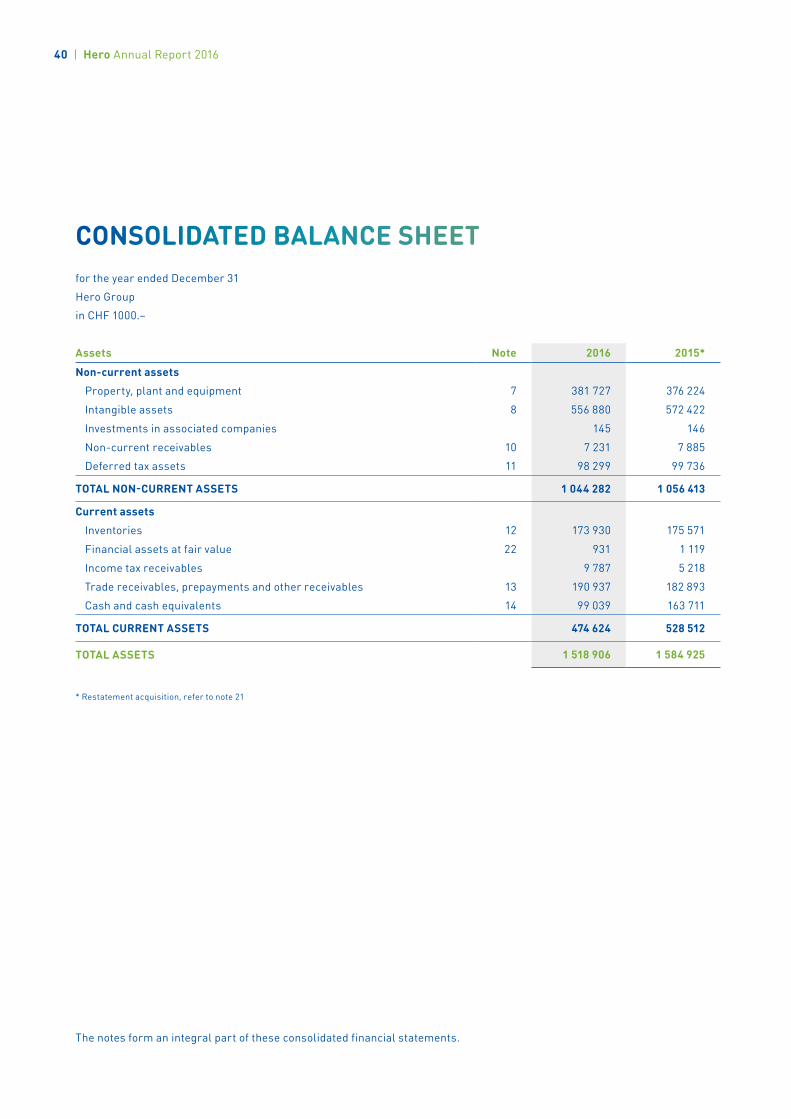
CONSOLIDATED BALANCE SHEETfor the year ended December 31
Hero Group
in CHF 1000.–
Assets Note 2016 2015*
Non-current assets
Property, plant and equipment 7 381 727 376 224
Intangible assets 8 556 880 572 422
Investments in associated companies 145 146
Non-current receivables 10 7 231 7 885
Deferred tax assets 11 98 299 99 736
TOTAL NON-CURRENT ASSETS 1 044 282 1 056 413
Current assets
Inventories 12 173 930 175 571
Financial assets at fair value 22 931 1 119
Income tax receivables 9 787 5 218
Trade receivables, prepayments and other receivables 13 190 937 182 893
Cash and cash equivalents 14 99 039 163 711
TOTAL CURRENT ASSETS 474 624 528 512
TOTAL ASSETS 1 518 906 1 584 925
* Restatement acquisition, refer to note 21
The notes form an integral part of these consolidated financial statements.
40 | Hero Annual Report 2016
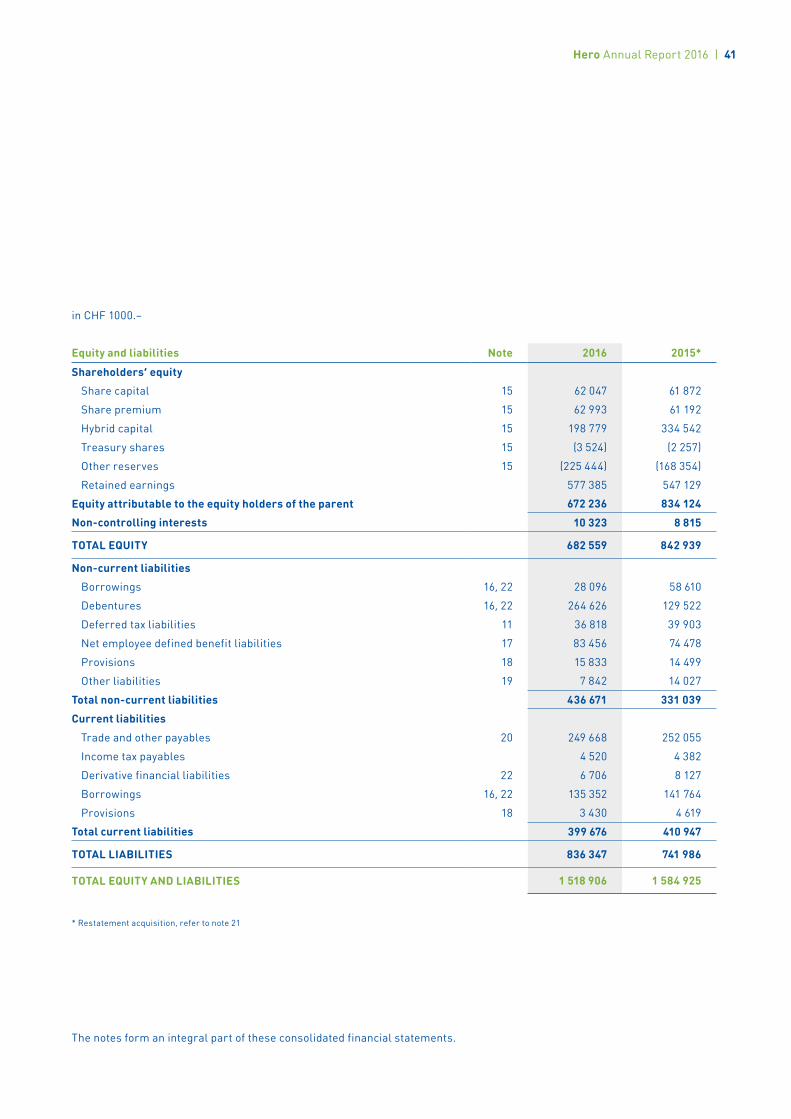
in CHF 1000.–
Equity and liabilities Note 2016 2015*
Shareholders’ equity
Share capital 15 62 047 61 872
Share premium 15 62 993 61 192
Hybrid capital 15 198 779 334 542
Treasury shares 15 (3 524) (2 257)
Other reserves 15 (225 444) (168 354)
Retained earnings 577 385 547 129
Equity attributable to the equity holders of the parent 672 236 834 124
Non-controlling interests 10 323 8 815
TOTAL EQUITY 682 559 842 939
Non-current liabilities
Borrowings 16, 22 28 096 58 610
Debentures 16, 22 264 626 129 522
Deferred tax liabilities 11 36 818 39 903
Net employee defined benefit liabilities 17 83 456 74 478
Provisions 18 15 833 14 499
Other liabilities 19 7 842 14 027
Total non-current liabilities 436 671 331 039
Current liabilities
Trade and other payables 20 249 668 252 055
Income tax payables 4 520 4 382
Derivative financial liabilities 22 6 706 8 127
Borrowings 16, 22 135 352 141 764
Provisions 18 3 430 4 619
Total current liabilities 399 676 410 947
TOTAL LIABILITIES 836 347 741 986
TOTAL EQUITY AND LIABILITIES 1 518 906 1 584 925
* Restatement acquisition, refer to note 21
The notes form an integral part of these consolidated financial statements.
Hero Annual Report 2016 | 41
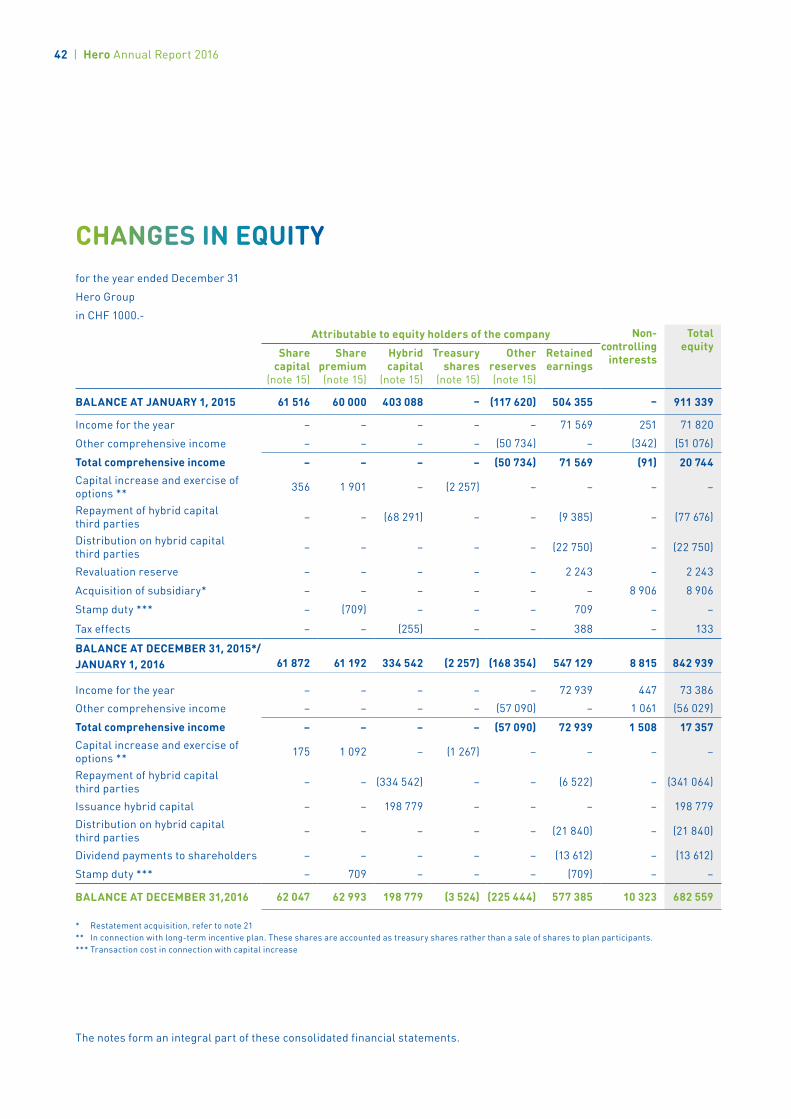
CHANGES IN EQUITYfor the year ended December 31
Hero Group
in CHF 1000.-
Attributable to equity holders of the company Non-controlling
interests
Total equityShare
capital (note 15)
Share premium (note 15)
Hybrid capital
(note 15)
Treasury shares
(note 15)
Other reserves (note 15)
Retained earnings
BALANCE AT JANUARY 1, 2015 61 516 60 000 403 088 – (117 620) 504 355 – 911 339
Income for the year – – – – – 71 569 251 71 820
Other comprehensive income – – – – (50 734) – (342) (51 076)
Total comprehensive income – – – – (50 734) 71 569 (91) 20 744Capital increase and exercise of options ** 356 1 901 – (2 257) – – – –
Repayment of hybrid capital third parties – – (68 291) – – (9 385) – (77 676)
Distribution on hybrid capital third parties – – – – – (22 750) – (22 750)
Revaluation reserve – – – – – 2 243 – 2 243
Acquisition of subsidiary* – – – – – – 8 906 8 906
Stamp duty *** – (709) – – – 709 – –
Tax effects – – (255) – – 388 – 133
BALANCE AT DECEMBER 31, 2015*/ JANUARY 1, 2016 61 872 61 192 334 542 (2 257) (168 354) 547 129 8 815 842 939
Income for the year – – – – – 72 939 447 73 386
Other comprehensive income – – – – (57 090) – 1 061 (56 029)
Total comprehensive income – – – – (57 090) 72 939 1 508 17 357Capital increase and exercise of options ** 175 1 092 – (1 267) – – – –
Repayment of hybrid capital third parties – – (334 542) – – (6 522) – (341 064)
Issuance hybrid capital – – 198 779 – – – – 198 779
Distribution on hybrid capital third parties – – – – – (21 840) – (21 840)
Dividend payments to shareholders – – – – – (13 612) – (13 612)
Stamp duty *** – 709 – – – (709) – –
BALANCE AT DECEMBER 31,2016 62 047 62 993 198 779 (3 524) (225 444) 577 385 10 323 682 559
* Restatement acquisition, refer to note 21 ** In connection with long-term incentive plan. These shares are accounted as treasury shares rather than a sale of shares to plan participants.*** Transaction cost in connection with capital increase
The notes form an integral part of these consolidated financial statements.
42 | Hero Annual Report 2016
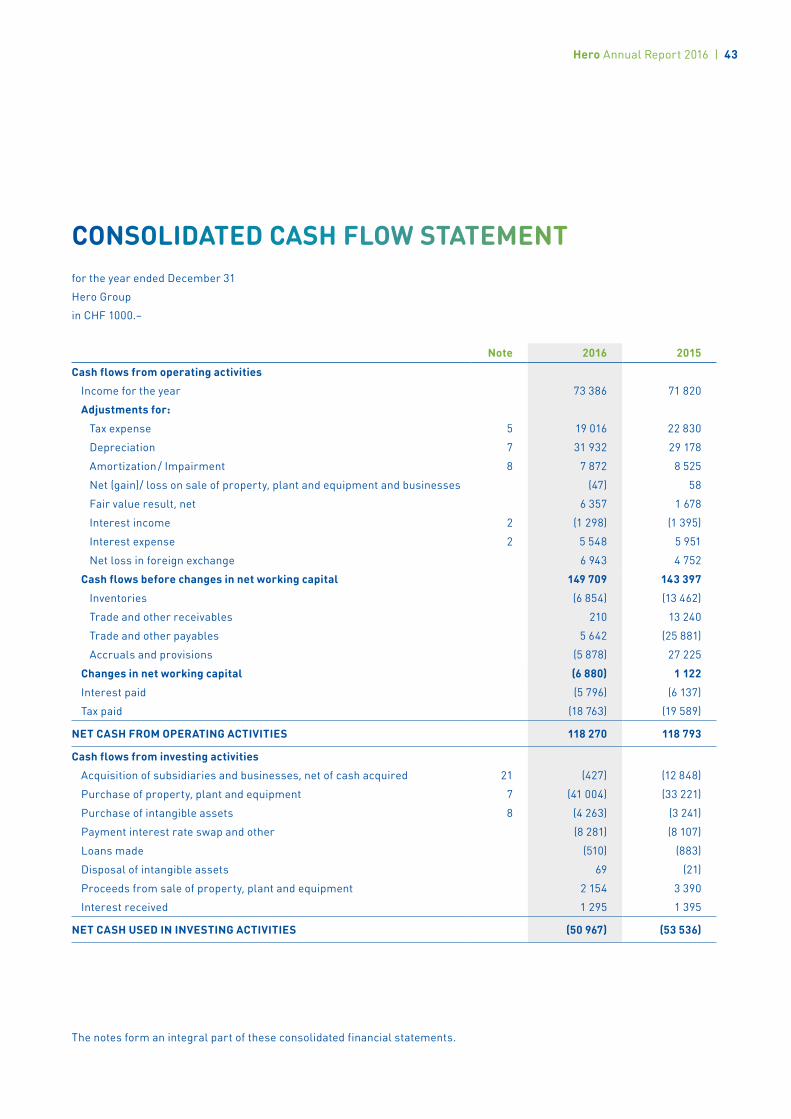
CONSOLIDATED CASH FLOW STATEMENTfor the year ended December 31
Hero Group
in CHF 1000.–
Note 2016 2015
Cash flows from operating activities
Income for the year 73 386 71 820
Adjustments for:
Tax expense 5 19 016 22 830
Depreciation 7 31 932 29 178
Amortization / Impairment 8 7 872 8 525
Net (gain)/ loss on sale of property, plant and equipment and businesses (47) 58
Fair value result, net 6 357 1 678
Interest income 2 (1 298) (1 395)
Interest expense 2 5 548 5 951
Net loss in foreign exchange 6 943 4 752
Cash flows before changes in net working capital 149 709 143 397
Inventories (6 854) (13 462)
Trade and other receivables 210 13 240
Trade and other payables 5 642 (25 881)
Accruals and provisions (5 878) 27 225
Changes in net working capital (6 880) 1 122
Interest paid (5 796) (6 137)
Tax paid (18 763) (19 589)
NET CASH FROM OPERATING ACTIVITIES 118 270 118 793
Cash flows from investing activities
Acquisition of subsidiaries and businesses, net of cash acquired 21 (427) (12 848)
Purchase of property, plant and equipment 7 (41 004) (33 221)
Purchase of intangible assets 8 (4 263) (3 241)
Payment interest rate swap and other (8 281) (8 107)
Loans made (510) (883)
Disposal of intangible assets 69 (21)
Proceeds from sale of property, plant and equipment 2 154 3 390
Interest received 1 295 1 395
NET CASH USED IN INVESTING ACTIVITIES (50 967) (53 536)
The notes form an integral part of these consolidated financial statements.
Hero Annual Report 2016 | 43
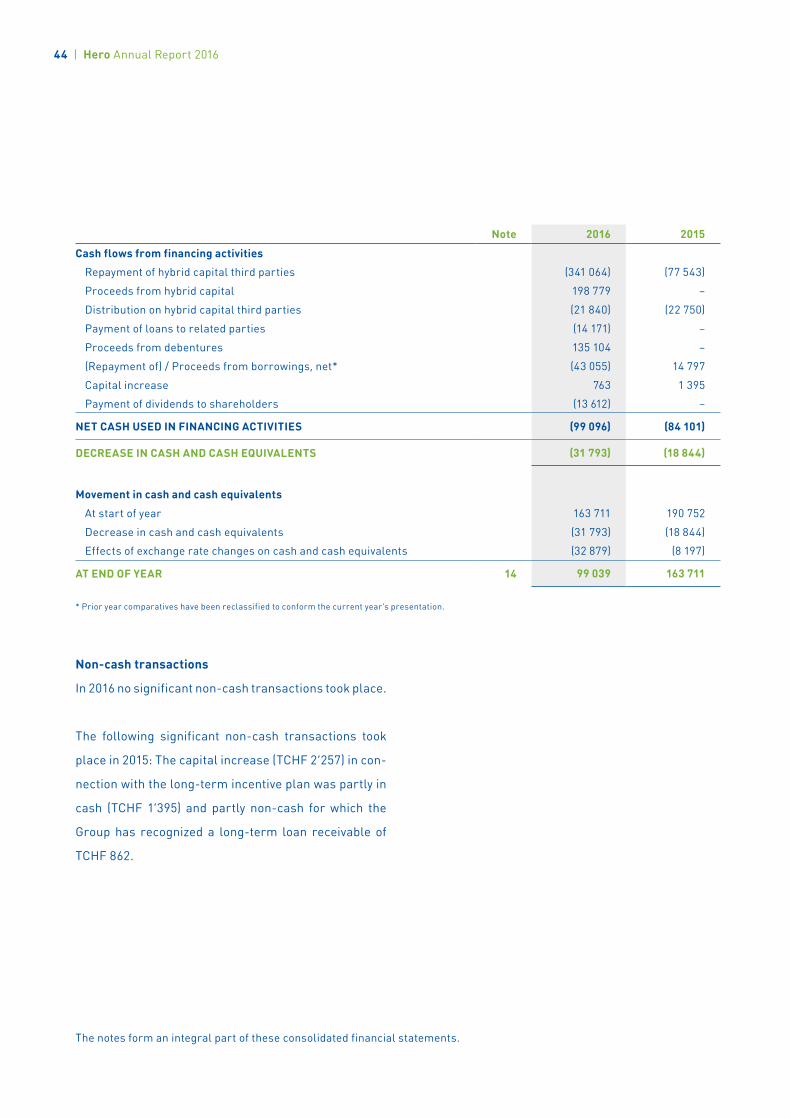
Note 2016 2015
Cash flows from financing activities
Repayment of hybrid capital third parties (341 064) (77 543)
Proceeds from hybrid capital 198 779 –
Distribution on hybrid capital third parties (21 840) (22 750)
Payment of loans to related parties (14 171) –
Proceeds from debentures 135 104 –
(Repayment of) / Proceeds from borrowings, net* (43 055) 14 797
Capital increase 763 1 395
Payment of dividends to shareholders (13 612) –
NET CASH USED IN FINANCING ACTIVITIES (99 096) (84 101)
DECREASE IN CASH AND CASH EQUIVALENTS (31 793) (18 844)
Movement in cash and cash equivalents
At start of year 163 711 190 752
Decrease in cash and cash equivalents (31 793) (18 844)
Effects of exchange rate changes on cash and cash equivalents (32 879) (8 197)
AT END OF YEAR 14 99 039 163 711
* Prior year comparatives have been reclassified to conform the current year’s presentation.
The notes form an integral part of these consolidated financial statements.
Non-cash transactions
In 2016 no significant non-cash transactions took place.
The following significant non-cash transactions took
place in 2015: The capital increase (TCHF 2’257) in con-
nection with the long-term incentive plan was partly in
cash (TCHF 1’395) and partly non-cash for which the
Group has recognized a long-term loan receivable of
TCHF 862.
44 | Hero Annual Report 2016

NOTES TO THE CONSOLIDATED FINANCIAL STATEMENTS
1. GeneralHero AG (Hero) is a limited liability company head-
quart ered in Lenzburg, Switzerland. Schwartau Inter-
national GmbH, Bad Schwartau, Germany, a subsidiary
of AOH Nahrungs mittel GmbH & Co. KG, Germany,
holds 99.1% of the share capital of Hero and 0.9% are
held by executive board members in relation with the
long term incentive plan. The Group’s primary activities
are the production and selling of consumer food prod-
ucts in the pro duct areas of jams, healthy snacks, baby
and toddler food, baby and toddler milk and specialities
which are sold in Europe, North America and Emerging
Markets. At the end of 2016 the Group had 3’900
employees (2015: 3’747). All figures in the financial
statements are presented in thousands of Swiss francs
(TCHF) except where otherwise indicated.
These financial statements were approved by the
Board of Directors on March 15, 2017, and are subject
to approval by the annual general meeting of share-
holders to be held on March 29, 2017.
2. Basis for PreparationThe principal accounting policies applied in the prepa-
ration of these consolidated financial statements are
set out below. These principles have been consistently
applied to all the years presented, unless otherwise
stated. The consolidated financial statements for the
year ending December 31, 2016, have been prepared
in accordance with International Financial Reporting
Standards (IFRS) as issued by the International
Accounting Standards Board (IASB). The consolidated
financial statements have been prepared under the
historic cost convention, unless otherwise stated
(i.e. revaluation of land, financial assets and liabilities
held-for-trading). The pre paration of financial state-
ments in conformity with IFRS requires the use of
certain critical account ing estimates. It also requires
management to exercise its judgement in the process
of applying the Group’s Account ing Principles. The areas
involving a higher degree of judgement or complexity, or
areas where as sump tions and estimates are significant
to the con soli dated financial statements, are disclosed
in Accounting Principles no. 8 Critical Accounting Esti-
mates, Assumptions and Judgements.
Hero Annual Report 2016 | 45
Changes in accounting policies and disclosures
The Group started to apply hedge accounting in 2016
and disclosures to the new transactions and the Group’s
policies can be found in note 22.
Status of adoption of significant new or amended IFRS
standards or interpretations
The following new IFRS standards will, based on a Hero
analysis, be of relevance to the Group. There are no
plans to adopt any standard or amendment prior to the
mandatory effective date.
— IFRS 9 Financial Instruments (effective January 1,
2018) will substantially change the classification and
measurement of financial instruments; will require
impairments to be based on a forward-looking model;
will change the approach to hedging financial exposures
and related documentation and also the recognition of
certain fair value changes. However, the Group does
not expect IFRS 9 to have a significant impact on its
consolidated financial statements.
— IFRS 15 Revenue from contracts with customers (ef-
fective January 1, 2018) amends revenue recognition
requirements and establishes principles for reporting
information about the nature, amount, timing and
uncertainty of revenue and cash flows arising from
contracts with customers. The standard replaces IAS 18
Revenue and IAS 11 Construction contracts and related
interpretations. However, the Group does not expect
IFRS 15 to have a significant impact on its consolidated
financial statements.
— IFRS 16 Leases (effective January 1, 2019) substan-
tially changes the financial statements as the majority
of leases will become on-balance sheet liabilities with
corresponding right of use assets on the balance sheet.
The standard replaces IAS 17 Leases. The current
operating lease commitments of CHF 12.8 million as of
December 31, 2016 and disclosed in note 25 provide,
subject to the provision of the standard, an indicator of
the impact of the implementation of IFRS 16 on the
Group’s consolidated balance sheet.
There are no other IFRS standards or interpretations
which are not yet effective which would be expected to
have a material impact on the Group.
46 | Hero Annual Report 2016
3. ConsolidationConsolidation Method
The consolidated financial statements include Hero AG,
Switzerland and those companies over which Hero AG
has control, which is generally the case with a share-
holding of more than one half of the voting rights.
Companies controlled by the Group are fully conso-
lidated from the date on which control is transferred
to the Group. They are de-consolidated from the date
that control ceases.
Business Combinations
Business combinations are accounted for using the
acquisition method. The cost of an acquisition is meas-
ured as the aggregate of the consideration transferred,
measured at acquisition date fair value and the amount
of any non-controlling interest in the acquiree. For
each business combination, the Group measures the
non-controlling interest in the acquiree either at fair
value or at the proportionate share of the acquiree’s
identifiable net assets. Acquisition costs incurred are
expensed and included in administrative expenses.
When the Group acquires a business, it assesses the
assets and liabilities assumed for appropriate classi-
fication and designation in accordance with the con-
tractual terms, economic circumstances and pertinent
conditions as at the acquisition date.
If the business combination is achieved in stages, the
acquirer’s previously held equity interest in the
acquiree is remeasured to fair value at the acquisition
date through profit or loss.
Any contingent consideration to be transferred by the
acquirer will be recognized at fair value at the acquisi-
tion date. Subsequent changes to the fair value of the
contingent consideration which is deemed to be an
asset or liability, will be recognized in profit or loss.
If the contingent consideration is classified as equity,
it is not subsequently remeasured.
Goodwill is initially measured at cost being the excess
of the aggregate of the consideration transferred and
the amount recognized for non-controlling interest
over the net identifiable assets acquired and liabilities
assumed. If this consideration is lower than the fair
value of the net assets of the subsidiary acquired, the
difference is recognized in profit or loss.
After initial recognition, goodwill is measured at cost
less any accumulated impairment losses. For the
purpose of impairment testing, goodwill acquired in
a business combination is, from the acquisition date,
allocated to each of the Group’s cash-generating units
that are expected to benefit from the combination,
irrespective of whether other assets or liabilities of the
acquiree are assigned to those units.
Where goodwill forms part of a cash-generating unit
and part of the operation within that unit is disposed of,
the goodwill associated with the operation disposed of
is included in the carrying amount of the operation
when determining the gain or loss on disposal of the
operation. Goodwill disposed of in this circumstance is
measured based on the relative values of the operation
disposed of and the portion of the cash-generating unit
retained.
Hero Annual Report 2016 | 47

Acquisitions of non-controlling interests are accounted
for as transactions with owners in their capacity as
owners and therefore no goodwill is recognized as a
result of such transactions. The adjustments to
non-controlling interests are based on a proportionate
amount of the net assets of the subsidiary.
Investments, where Hero has significant influence
(generally accompanying a shareholding of between
20% and 50% of the voting rights) but neither control
nor joint control, are accounted for using the equity
method and are initially recognized at cost. The Group’s
investment in associates includes goodwill (net of any
accumulated impairment loss) identified on acquisition.
The Group’s share of its associates’ post-acquisition
profits or losses is recognized in the income statement,
and its share of post-acquisition movements in re-
serves is recognized in reserves. The cumulative
post-acquisition movements are adjusted against the
carrying amount of the investment. When the Group’s
share of losses in an associate equals or exceeds its
interest in the associate, including any other unsecured
receivables, the Group does not recognize further
losses, unless it incurred obligations or made pay-
ments on behalf of the associate. Unrealized gains on
transactions between the Group and its as sociates
are eliminated to the extent of the Group’s interest in
the associates. Unrealized losses are also eliminated
unless the transaction provides evidence of an impair-
ment of the asset transferred.
Investments meeting none of these criteria are treated
as financial instruments (refer to section “Financial
Instru ments” for further details).
A list of investments, the investment percentage and
the applicable consolidation method can be found in
note 27.
Eliminations in the Course of Consolidation
All intra-group balances / transactions / unrealized
gains / losses and dividends are eliminated in full.
Accounting policies of subsidiaries have been changed
where necessary to ensure consistency with the prin-
ciples adopted by the Group.
Related Parties
Include AOH Nahrungsmittel Group companies (Ger-
many), members of the Board of Directors and Execu-
tive Board and non-controlling interests shareholders.
Changes in the Scope of Consolidation
The scope of consolidation has not changed in the re-
porting period.
Effective December 1, 2015, Hero acquired 50% plus
one share of Kiviks Marknad Industrias Alimenticias
S.A., Brasil. Hero has control over the company and it is
fully consolidated with a non-controlling interest of
50%. The purchase accounting was finalized in 2016.
Details can be found in note 21.
48 | Hero Annual Report 2016
4. Foreign Currency TranslationThe presentation currency for the Group is the Swiss
Franc, which is also the functional currency of Hero AG,
Switzer land. Financial statements denominated in
foreign currencies have been translated into Swiss
Francs as follows:
• Assets and liabilities, including goodwill, are translat-
ed at the closing rate at the date of the balance sheet
• Revenues and costs are translated using average
exchange rates for the accounting period
• Exchange differences out of the translation of assets
and liabilities and the related income statements are
booked in other comprehensive income
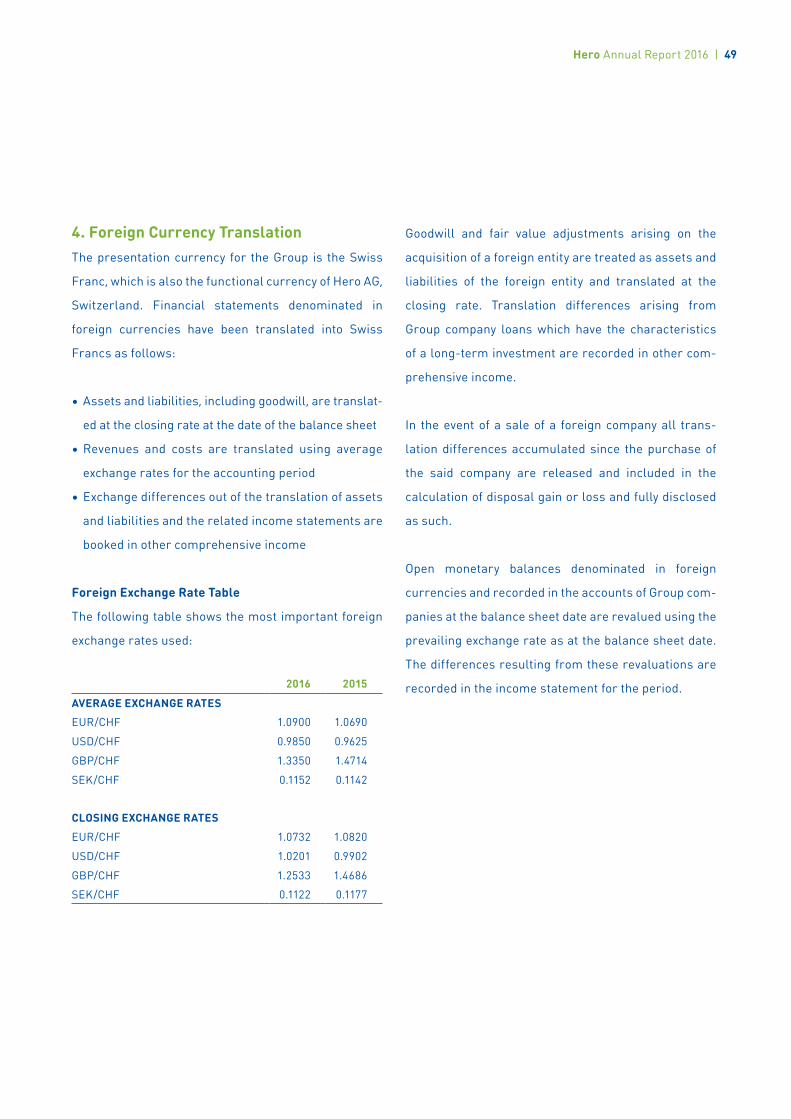
Foreign Exchange Rate Table
The following table shows the most important foreign
exchange rates used:
2016 2015
AVERAGE EXCHANGE RATES
EUR/CHF 1.0900 1.0690
USD/CHF 0.9850 0.9625
GBP/CHF 1.3350 1.4714
SEK/CHF 0.1152 0.1142
CLOSING EXCHANGE RATES
EUR/CHF 1.0732 1.0820
USD/CHF 1.0201 0.9902
GBP/CHF 1.2533 1.4686
SEK/CHF 0.1122 0.1177
Goodwill and fair value adjustments arising on the
acqui sition of a foreign entity are treated as assets and
liabilities of the foreign entity and translated at the
closing rate. Translation differences arising from
Group company loans which have the characteristics
of a long-term investment are recorded in other com-
prehensive income.
In the event of a sale of a foreign company all trans-
lation differences accumulated since the purchase of
the said company are released and included in the
calculation of disposal gain or loss and fully disclosed
as such.
Open monetary balances denominated in foreign
currencies and recorded in the accounts of Group com-
panies at the balance sheet date are revalued using the
prevailing exchange rate as at the balance sheet date.
The differences resulting from these revaluations are
recorded in the income statement for the period.
Hero Annual Report 2016 | 49
5. Accounting PoliciesRevenue Recognition
Net sales to third parties are recorded net of trade
discounts and sales-related taxes, and represent the
fair value of consideration received or receivable from
the sale of products and provision of services in the
ordinary course of the Group’s activities.
Revenue is recognized as follows:
Sales of goods
Sales of goods are recognized when significant risks
and rewards of ownership of the goods are transferred
to the buyer (i.e. a Group entity has delivered products
to the customer, the customer has accepted the prod-
ucts and col lectability of the related receivables is
reasonably assured).
Interest income
Interest income is recognized on a pro rata temporis
basis using the effective interest method.
Royalty income
Royalty income is recognized on an accrual basis
in ac cord ance with the substance of the relevant
agreements.
Dividend income
Dividend income is recognized when the right to receive
payment is established.
Segment Reporting
Operating segments are reported in a manner consist-
ent with the internal reporting provided to the chief
operating decision-maker. The chief operating deci-
sion-maker, who is responsible for making strategic
decisions, allocating resources and assessing perfor-
mance of the operating segments, has been identified
as the Group Executive Board.
Research and Development Costs
Research costs are recorded in the income statement
in the period in which they are incurred. Development
costs are recognized as intangible assets to the extent
that they meet the recognition criteria of IAS 38. Fol-
lowing initial recognition of development expen diture
as an asset, the asset is carried at cost less accumulat-
ed amortization and accumulated impairment losses.
Development costs are amortized on a straight-line-
basis over the period of their expected benefit or tested
for impairment annually. Other development costs are
recorded in the income statement in the period in which
they are incurred.
Deferred Taxes
Deferred income tax is calculated using the balance
sheet liability method. Where the tax base of an asset
or liab ility differs from its carrying amount, deferred
tax liabi lities or assets are recorded. Most of these
temporary differences arise from differences in Group
and local tax depreciation methods.
Unused tax credits and unused tax losses which may be
carried forward to future accounting periods are capi-
talized as deferred tax assets in so far as it is probable
that future taxable income will be generated in the
same tax entity and same taxation authority and the
said losses may be applied against such profits.
50 | Hero Annual Report 2016

The carrying amount of deferred income taxes is
reviewed at each balance sheet date and reduced to
the extent that it is no longer probable that sufficient
taxable profit will be available to allow all or part of the
deferred income tax asset to be utilized.
Unrecognized deferred tax assets are reassessed at
each reporting date and are recognized to the extent
that it has become probable that future taxable profits
will allow the deferred tax assets to be recovered.
Locally enacted or substantively enacted tax rates are
used in order to value the tax effect of temporary differ-
ences. When these tax rates change, deferred taxes are
adjusted accordingly. Adjustments to deferred income
taxes are directly booked to the income statement as
part of the tax expense.
Deferred income tax is provided on temporary differ-
ences arising on investments in subsidiaries and asso-
ciates, except where the timing of the reversal of the
temporary difference is controlled by the Group and
it is probable that the temporary difference will not
reverse in the foreseeable future.
Deferred income tax relating to items recognized
directly in equity is recognized in equity and not in the
income statement. Deferred income tax relating to
items recognized in other comprehensive income is
recognized in other comprehensive income.
Deferred tax assets and deferred tax liabilities are
offset, if a legally enforceable right exists to set off
current tax assets against current income tax liab ilities
and the de ferred taxes relate to the same taxable entity
and the same taxation authority.
Current Income Tax
Current income tax assets and liabilities for the current
and prior periods are measured at the amount expected
to be recovered from or paid to the taxation authorities.
The tax rates and tax laws used to compute the amount
are those that are enacted or substantively enacted by
the balance sheet date.
Current income tax relating to items recognized directly
in equity is recognized in equity and not in the income
statement. Current income tax relating to items recog-
nized in other comprehensive income is recognized in
other comprehensive income.
Government Grants and Other Subsidies
Government grants are recognized only when the Group
complies with the applicable conditions and if there is
reasonable assurance that the grants will be received.
Government grants are deferred and recognized in the
income statement over the period necessary to match
them with the related costs which they are intended
to compensate on a systematic basis, or the carrying
amount of the asset to which the grant relates is
reduced by the grant. The grant is then recognized as
income over the useful life of the depreciable asset
by way of a reduced depreciation charge.
Inventories
Inventories are recorded at the lower of acquisition or
production cost and net realizable value. Net realizable
value is the estimated selling price in the ordinary
Hero Annual Report 2016 | 51
course of business, less estimated cost of completion and
the necessary cost to make the sale. Production costs
include direct and indirect material and production
costs. Inventory is valued using the weighted average
method. A valuation allowance is recognized for any
damaged or slow-moving goods.
Property, Plant and Equipment
Tangible fixed assets, other than land, are recorded at
historical acquisition cost less accumulated deprecia-
tion, and / or accumulated impairment losses. Historical
cost includes expenditure that is directly attributable to
the acquisition of the items. Sub sequent costs are in-
cluded in the asset’s carrying amount or recognized as
a separate asset, as appropriate, only when it is probable
that future economic benefits will flow to the Group and
the cost of the item can be measured reliably. All other
repair and maintenance expense is charged to the in-
come statement during the financial period in which
they are incurred. Depreciation is recorded on a straight-
line basis over the course of the useful economic life of
the asset. Land is not depreciated. The general useful
economic lives for various asset categories can be
sum marized as follows:
• Buildings (25 to 50 years),
• Fixtures and fittings (20 years),
• Plant and machinery (8 to 15 years),
• Motor vehicles (4 to 10 years),
• Furniture (5 to 10 years),
• Information technology hardware (3 to 5 years).
Gains or losses arising from the disposal of property,
plant and equipment assets are recorded in the income
statement as part of operating profit.
Land is shown at fair value, based on periodic
valuations by external independent valuers. Increases
in the carrying amount arising on revaluation of land
are credited to other comprehensive income in the
revaluation reserve in share hold ers’equity. Decreases
that offset previous increases of the same asset are
charged against other comprehensive income in other
reserves; all other decreases are charged to the in-
come statement.
The assets’ residual values and useful lives are
reviewed, and adjusted if appropriate, at each balance
sheet date. An asset’s carrying amount is written down
immediately to its recoverable amount if the asset’s
carrying amount is greater than its estimated recover-
able amount.
Gains and losses on disposals are determined by
comparing proceeds with the carrying amount. These
are included in the income statement. When revalued
assets are sold, the amounts included in the revalua-
tion reserve are transferred to retained earnings.
52 | Hero Annual Report 2016

Leases
Leases where the Group has substantially retained all
the risks and rewards of ownership are classified as
finance leases.
Leases in which a significant portion of the risks and
rewards of ownership are retained by the lessor are
classified as operating leases. Liabilities arising from
operating leases (e.g. rental contracts) include costs for
offices, motor vehicles, photocopiers. Payments made
under operating leases (net of any incentives received
from the lessor) are charged to the income statement
on a straight-line basis over the period of the lease.
Intangible Assets
Goodwill is tested annually for impairment and carried
at cost less accumulated impairment losses. Gains and
losses on the disposal of a subsidiary include the carry-
ing amount of goodwill relating to the subsidiary sold.
Goodwill is allocated to cash-generating units for the
purpose of impairment testing.
Brands with an indefinite useful life are carried at
historical cost (generally fair value in a business
combination) less accumulated impairment losses and
are tested an nually for impairment using a value in use
calculation. Brands are classified as indefinite useful
life brands if the brand has sufficient history and the
Group has no intention of re-branding.
Brands and other intangible assets with a definite use-
ful life are carried at historical cost less accumulated
amortization. Amortization is calculated using the
straight-line method to allocate the costs over their
estimated useful lives:
• Brands (up to 20 years),
• Software (1 to 3 years),
• Customer relationships (up to 10 years),
• Distribution Network (up to 5 years),
• Other intangibles (3 to 5 years).
Impairment of Non-Financial Assets
Assets that have an indefinite useful life are not subject
to amortization and are tested for impairment annually
or when there is an indication of impairment. Assets
that are subject to amortization are reviewed for
impairment whenever events or changes in circum-
stances indicate that the carrying amount may not be
recoverable. An im pairment loss is recognized for the
amount by which the asset’s carry ing amount exceeds
its recoverable amount. The recoverable amount is the
higher of an asset’s fair value less costs of disposal and
value in use. For the pur poses of assessing impair-
ment, assets are grouped at the lowest levels for which
there are separately identifiable cash inflows (cash
generating units). Non-financial assets other than
goodwill that were impaired are reviewed for possible
reversal of the impairment at each reporting date.
Provisions
Provisions arise from restructuring programs, legal
claims, and potential liabilities from normal opera-
tions. A provision is recognized in cases where the
Group has a present legal or constructive obligation as
a result of past events, it is probable that an outflow of
resour ces will be required to settle the obligation and
Hero Annual Report 2016 | 53
the amount can be reliably estimated. Severance and
redundancy payments relating to restructuring are
provided for when the Group has committed itself to
such restructuring program s, when the location,
function and num ber of employees to be laid off or
re-deployed is known and when the affected employees
have been informed. Provisions are not recognized for
future operating losses. In case the effect of time value
is material, provisions are measured at the present
value of the expenditures expected to be required to
settle the obligation using a pretax rate that reflects
current market assessments of the time value of
money and the risks specific to the obligation. The
increase in the provision due to the passage of time is
recognized as interest expense.
Pension Obligations
The Group operates various post-employment schemes,
including both defined benefit and defined contribution
pension plans.
The pension plans in Switzerland have been set up ac-
cording to the Swiss method of defined contributions
but do not fulfil all the criteria of a defined contribution
pension plan according to IAS 19. For this reason, the
Swiss pension plans are treated as defined benefit plans
in the consolidated financial statements.
A defined contribution plan is a pension plan under
which the Group pays fixed contributions into a sepa-
rate entity. The Group has no legal obligations to pay
further contributions if the fund does not hold suffi-
cient assets to pay all employees the benefits relating
to em ployee service in the current and prior periods.
A defined benefit plan is a pension plan that is not a
defined con tribution plan.
Typically defined benefit plans define an amount of
pension benefit that an employee will receive on retire-
ment, usually dependent on one or more factors such
as age, years of service and compensation.
The liability recognized in the balance sheet in respect
of defined benefit pension plans is the present value of
the defined benefit obligation at the end of the report-
ing period less the fair value of plan assets. The defined
benefit obligation is calculated annually by independ-
ent actuaries using the projected unit credit method.
The present value of the defined benefit obligation is
determined by discounting the estimated future cash
outflows using interest rates of high-quality corporate
bonds that are denominated in the currency in which
the benefits will be paid, and that have terms to matu-
rity approximating to the terms of the related pension
obligation. In countries where there is no deep market
in such bonds, the market rates on government bonds
are used.
Actuarial gains and losses arising from experience
adjust ments and changes in actuarial assumptions as
well as changes in the effect of the asset ceiling are
charged or credited to other comprehensive income in
the period in which they arise.
Past-service costs are recognized immediately in
income.
54 | Hero Annual Report 2016


For defined contribution plans, the group pays contri-
butions to publicly or privately administered pension
insurance plans on a mandatory, contractual or volun-
tary basis. The group has no further payment obliga-
tions once the contributions have been paid. The con-
tributions are recognized as employee benefit expense
when they are due. Prepaid contributions are recog-
nized as an asset to the extent that a cash refund or a
reduction in the future payments is available.
Long Term Incentive Plan
Effective January 1, 2014, the Group issued a long term
incentive plan for the executive board members.
There is a two years waiting period for newly appointed
executive board members before they may participate
in the plan. Under the plan, the participants may be
offered the opportunity to invest up to 50% of their
bonus payment in shares. After a restriction period of
three years, participants may sell the shares back to
Hero at a price based on a formula defined in the plan.
In conjunction with the plan, participants may be
granted loans to fund the share issue. As the shares
are restricted and will ultimately revert to the company
and the share price does not reflect the fair value of the
Hero shares, the Group has accounted for the plan
under an IAS 19 long-term benefits model. Under the
IAS 19 model, management has estimated the future
payment at the end of the restriction period and the
expense is recognized over a 4-year vesting period in
the income statement. At each reporting date the
amount is re-assessed and the impact is recognized
prospectively.
Contingent Liabilities
A contingent liability is a possible obligation that arises
from past events and whose existence will be confirmed
only by the occurrence or non-occurrence of one or
more uncertain future events not wholly within the
control of the entity; or present obligation that arises
from past events but is not recognized because: it is not
probable that an outflow of resources embodying eco-
nomic benefits will be required to settle the obligation;
or the amount of the obligation cannot be measured with
sufficient reliability. Contingent liabilities are disclosed
in the notes to the financial statements.
Dividends
Dividend distribution to the Group’s shareholders is
recognized as a liability in the Group’s financial state-
ments in the period in which the dividends are approved
by the Group’s shareholders.
Share Capital
Ordinary shares are classified as equity. Incremental
costs directly attributable to the issue of new shares or
options are shown in equity as a deduction, net of tax,
from the proceeds. Where such shares are subse-
quently sold or reissued, any consideration received,
net of any directly attributable incremental transaction
costs and the related income tax effects, is included in
equity at tributable to the company’s equity holders.
Where any group company purchases the company’s
equity share capital (treasury shares), the considera-
tion paid, including any directly attributable incremen-
tal costs (net of income taxes), is deducted from equity
attributable to the com pany’s equity holders until the
shares are cancelled, reissued or disposed of. Where
56 | Hero Annual Report 2016
such shares are subsequently sold or reissued, any
consideration received, net of any directly attributable
incremental transaction costs and the related income
tax effects, is included in equity attributable to the
company’s equity holders.
Hybrid Capital
Hybrid capital comprises listed bonds issued to third
parties. The listed bonds are undated securities in
respect of which there is no maturity date and where
there is no obligation on the part of Hero either to
redeem at any future date the underlying nominal
amounts or to pay any annual coupon insofar as no
compulsory payment event occurs in any given
accounting period. The key compulsory payment events
listed in the terms and conditions of the bonds include
the payment to Hero’s shareholders of either a dividend
or an amount in connection with a capital re-purchase.
The bonds are subordinated obligations and are
subordinate to all of Hero’s present and future unsub-
ordinated indebtedness. Coupon payments are record-
ed directly in equity.
6. Financial InstrumentsGeneral
The Group classifies financial assets in the following
categories: financial assets at fair value through profit
or loss, loans and receivables, and available-for-sale
financial assets. The classification depends on the
purpose for which the financial assets were acquired.
Management determines the classification of financial
assets at initial recognition and re-evaluates this
designation at every reporting date.
Financial instruments are classified as current if they
are expected to be realized within 12 months of the
balance sheet date.
Financial assets at fair value through profit or loss
This category has two sub-categories: financial assets
held-for-trading, and those designated at fair value
through profit or loss at inception. A financial asset is
classified in this category if acquired principally for the
purpose of selling in the short term or if so designated
by management.
Loans and receivables
Loans and receivables are non-derivative financial
assets with fixed or determinable payments that are
not quoted in an active market. They arise when the
Group provides money, goods or services directly to a
debtor with no intention of trading the associated
receivable. Loans and receivables comprise cash and
cash equivalents, trade receivables and certain other
receivables.
Hero Annual Report 2016 | 57
Borrowings
Borrowings are recognized initially at fair value,
net of transaction costs incurred. Borrowings are
subsequently stated at amortized cost; any difference
between the proceeds (net of transaction costs) and
the redemption value is recognized in the income state-
ment over the period of the borrowings using the
effective interest method.
Borrowings are classified as current liabilities unless
the Group has an unconditional right to defer settle-
ment of the liability for at least 12 months after the
balance sheet date.
Derivative Financial Instruments and Hedge
Accounting
The Group uses derivative financial instruments, such
as forward currency contracts and interest rate swaps,
to hedge its foreign currency risks and interest rate
risks, respectively. Such derivative financial instru-
ments are initially recognised at fair value on the date
on which a derivative contract is entered into and are
subsequently remeasured at fair value. Derivatives are
carried as financial assets when the fair value is posi-
tive and as financial liabilities when the fair value is
negative.
Any gains or losses arising from changes in the fair
value of derivatives are taken directly to profit or loss,
except for the effective portion of cash flow hedges,
which is recognised in OCI and later reclassified to profit
or loss when the hedge item affects profit or loss.
For the purpose of hedge accounting, hedges are clas-
sified as cash flow hedges when hedging the exposure to
variability in cash flows that is attributable to a highly
probable forecast transaction.
At the inception of a hedge relationship, the Group
formally designates and documents the hedge relation-
ship to which it wishes to apply hedge accounting and
the risk management objective and strategy for under-
taking the hedge. The documentation includes identifi-
cation of the hedging instrument, the hedged item or
transaction, the nature of the risk being hedged and
how the entity will assess the effectiveness of changes
in the hedging instrument’s fair value in offsetting the
exposure to changes in the hedged item’s fair value or
cash flows attributable to the hedged risk. Such hedges
are expected to be highly effective in achieving offset-
ting changes in fair value or cash flows and are as-
sessed on an ongoing basis to determine that they ac-
tually have been highly effective throughout the financial
reporting periods for which they were designated.
Cash flow hedges that meet the strict criteria for hedge
accounting are accounted for, as described below:
The effective portion of the gain or loss on the hedging
instrument is recognised in OCI in the cash flow hedge
reserve, while any ineffective portion is recognised
immediately in the statement of profit or loss.
The Group uses forward currency contracts as hedges
of its exposure to foreign currency risk in forecast
transactions. The ineffective portion relating to foreign
currency contracts is recognised in profit or loss.
58 | Hero Annual Report 2016
Amounts recognised as OCI are transferred to profit or
loss when the hedged transaction affects profit or loss,
such as when a forecast sale occurs.
Fair Value Estimation
The fair value of publicly traded derivatives and trading
and available-for-sale securities is based on quoted
market prices at the balance sheet date. The fair value
of interest rate swaps is calculated as the present
value of the estimated future cash flows. The fair value
of forward foreign exchange contracts is determined
using forward exchange market rates at the balance
sheet date.
In assessing the fair value of non-traded derivatives and
other financial instruments, the Group uses a variety of
methods and makes assumptions that are based on
market conditions existing at each balance sheet date.
Quoted market prices or dealer quotes for similar
instruments are used for long-term debt. Other tech-
niques, such as option pricing models and estimated
discounted value of future cash flows, are used to deter-
mine fair value for the remaining financial instruments.
The face values less any estimated credit adjustments
for financial assets and liabilities with a maturity of
less than one year are assumed to approximate to their
fair values. The fair value of financial liabilities for
disclosure purposes is estimated by discounting the
future contractual cash flows at the current market
interest rate available to the Group for similar financial
instruments.
7. Financial Risk ManagementFinancial Risk Factors
The Group’s activities expose it to a variety of financial
risks, including the effects of: changes in debt, foreign
currency exchange rates and interest rates. The
Group’s overall risk management program focuses on
the unpredictability of financial markets and usually
seeks to minimize potential adverse effects on the
financial performance of the Group. The Group uses
deri vative financial instruments such as foreign ex-
change contracts and interest rate swaps to hedge
certain exposures. In selected cases the Group takes
open positions in derivative or other financial instru-
ments which are driven by other considerations than
overall risk reduction.
Risk management is carried out by a central treasury
department (Group Treasury) under policies approved
by the Board of Directors. Group Treasury identifies,
evaluates and hedges financial risks in close co-opera-
tion with the operating units. The Board provides poli-
cies covering spe cific areas, such as foreign exchange
risk, interest rate risk, credit risk, use of derivative
financial instruments and liquidity management.
Foreign Exchange Risk
The Group uses foreign currency-denominated cash
and cash equivalents, borrowings and foreign exchange
forward contracts to manage some of its transaction
exposures. The foreign exchange forward contracts
are designated as cash flow hedges and are entered
into for periods consistent with foreign currency expo-
sure of the underlying transactions, generally from one
to 18 months.
Hero Annual Report 2016 | 59

Foreign exchange forward contracts are designated as
hedging instruments in cash flow hedges of forecast
sales mainly in SEK, EUR and GBP and forecast pur-
chases mainly in EUR, GBP, USD. These forecast trans-
actions are highly probable, and they comprise about
50-75% of the Group’s total expected export sales and
of its total expected purchases in foreign currencies.
While the Group also enters into other foreign exchange
forward contracts with the intention of reducing the
foreign exchange risk of financing transactions, these
are not designated in hedge relationships and are
measured at fair value through profit or loss.
The terms of the foreign currency forward contracts
match the terms of the expected highly probable fore-
cast transactions. As a result, there is no hedge inef-
fectiveness to be recognised in the statement of profit
or loss. Notional amounts are as provided in Note 22.
The Group has a number of investments in foreign sub-
sidiaries, whose net assets are exposed to currency
translation risk. The Group tries to reduce the currency
exposure through borrowings in the corresponding
currencies where possible and economically prudent.
The Group uses a risk computation similar to Value-at-
Risk (VAR). It includes financial instruments (mainly cur-
rency forwards) as well as balance sheet positions and
future operating cash flows (non-discounted) in foreign
currency. The estimates are made assuming normal
market con ditions, using a 97.7% confidence interval.
The correlations between currency pairs and the volatil-
ities are observed over a 360 day period. The estimated
potential intra-day loss in the VAR model amounts to
TCHF 617 as per December 31, 2016 (2015: TCHF 798).
Foreign Currency Risk Table
The following table demonstrates the sensitivity to a
reasonably possible change in the USD, GBP, SEK and
EUR exchange rate, with all other variables held con-
stant, of the Group’s profit before tax (due to changes
in the fair value of forward foreign exchange contracts).
In 2015 there was no effect on the Group’s equity as the
Group did not apply hedge accounting.
increase/ (decrease) in
USD/EUR/GBP/SEK rate
Effect on profit
before tax in CHF 1000.–
Effect on equity in
in CHF 1000.–
2016 5% 2 918 429
(5%) (2 918) (429)
2015 5% 3 277 –
(5%) (3 277) –
Interest Rate Risk
As the Group has no significant interest-bearing assets,
the Group’s income and operating cash flows are substan-
tially independent of changes in market interest rates.
The Group’s long-term borrowings are with fixed maturity
and interest rates. The Group is only exposed to interest
risk in case of re-financing of matured borrowings.
Credit Risk
The Group has policies in place to ensure that sales of
products are made to customers with an appropriate
credit history. Derivative counterparts and cash trans-
actions are limited to highly creditworthy financial
institutions. Other credit risk exposures are minimized
60 | Hero Annual Report 2016
by dealing only with a limited range of counterparties.
The Group also makes loans to related parties. Where
material the Group seeks adequate pledges or guaran-
tees. The maximum credit risk represents net carrying
value of the loans and receivables included.
Liquidity Risk
Prudent liquidity risk management implies maintaining
sufficient cash and marketable securities, the availabil-
ity of funding through an adequate amount of committed
credit facilities and the ability to close out market
positions. Due to the dynamic nature of the underlying
businesses, Group Treasury aims to maintain flexibility
in funding by keeping committed credit lines available.
Management monitors rolling forecasts of the Group’s
liquidity reserve (comprising undrawn borrowing
facilities and cash and cash equivalents [note 14]) on the
basis of expected cash flows.
Hero Annual Report 2016 | 61
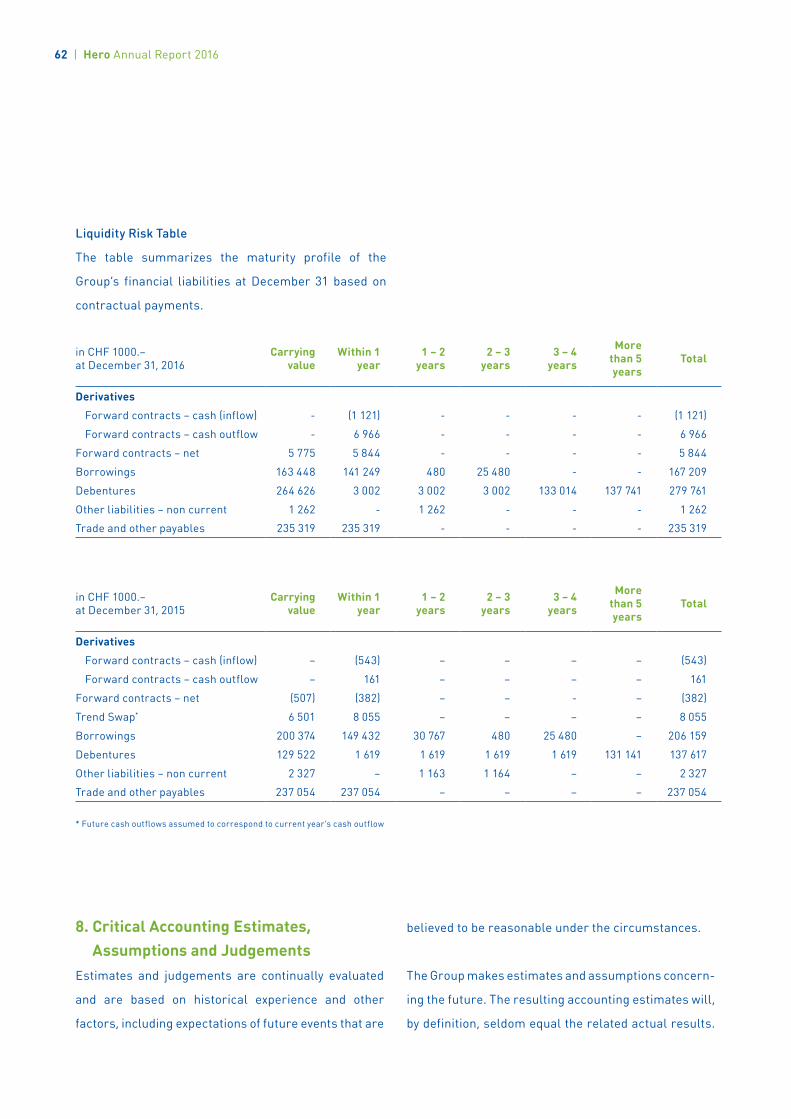
Liquidity Risk Table
The table summarizes the maturity profile of the
Group’s financial liabilities at December 31 based on
contractual payments.
8. Critical Accounting Estimates, Assumptions and Judgements
Estimates and judgements are continually evaluated
and are based on historical experience and other
factors, including expectations of future events that are
believed to be reasonable under the circumstances.
The Group makes estimates and assumptions concern-
ing the future. The resulting accounting estimates will,
by definition, seldom equal the related actual results.
in CHF 1000.–at December 31, 2016
Carryingvalue
Within 1 year
1 – 2 years
2 – 3 years
3 – 4 years
More than 5 years
Total
Derivatives
Forward contracts – cash (inflow) - (1 121) - - - - (1 121)
Forward contracts – cash outflow - 6 966 - - - - 6 966
Forward contracts – net 5 775 5 844 - - - - 5 844
Borrowings 163 448 141 249 480 25 480 - - 167 209
Debentures 264 626 3 002 3 002 3 002 133 014 137 741 279 761
Other liabilities – non current 1 262 - 1 262 - - - 1 262
Trade and other payables 235 319 235 319 - - - - 235 319
in CHF 1000.–at December 31, 2015
Carryingvalue
Within 1 year
1 – 2 years
2 – 3 years
3 – 4 years
More than 5 years
Total
Derivatives
Forward contracts – cash (inflow) – (543) – – – – (543)
Forward contracts – cash outflow – 161 – – – – 161
Forward contracts – net (507) (382) – – - – (382)
Trend Swap* 6 501 8 055 – – – – 8 055
Borrowings 200 374 149 432 30 767 480 25 480 – 206 159
Debentures 129 522 1 619 1 619 1 619 1 619 131 141 137 617
Other liabilities – non current 2 327 – 1 163 1 164 – – 2 327
Trade and other payables 237 054 237 054 – – – – 237 054
* Future cash outflows assumed to correspond to current year’s cash outflow
62 | Hero Annual Report 2016
The estimates and assumptions that have a significant
risk of causing a material adjustment to the carrying
amounts of assets and liabilities within the next finan-
cial year are discussed below:
Goodwill
The Group tests annually in December whether good-
will has suffered any impairment, in accordance with
the valuation prin ciples stated in Accounting Principle
No. 5, Intangible Assets. The recoverable amounts of
cash- generating units have been determined based on
value-in-use calculations. These calculations require
the use of estimates.
These calculations use cash flow projections based on
financial budgets approved by management and fore-
casts covering a five-year period. Cash flows beyond
the five-year period are projected using the estimated
growth rates stated below. The growth rates generally
correspond to the inflation rates plus general real gross
domestic product (GDP) growth of the corresponding
country. They are individ ually assessed and in case where
management expects a significant deviation from general
economic conditions they might be adjusted. Manage-
ment determined budgeted growth rates based on past
performance and its expectations for the market develop-
ment. Where general industry forecasts do not reflect
the growth expecations of management for specific
businesses, the growth rates used depart from forecasts
included in such industry reports in order to better reflect
the specific growth potentials expected by management.
These assumptions have been used for the analysis
of each CGU.
The discount rates used are pre-tax and reflect specific
risks relating to the relevant country.
The growth rate used to extrapolate cash flows beyond
the budget and the pre-tax discount rate have a signi-
ficant impact on the sensitivity of the impairment test.
For all CGU’s no reasonable possible change in any key
assumptions would lead to an impairment.
In 2016, no goodwill was impaired.
Brands with indefinite life
The Group tests annually whether brands with indefi-
nite life are impaired. These calculations require the
use of estimates.
The discount rates used are pre-tax and reflect specific
risks relating to the relevant country. The growth rates
used to extrapolate cash flows beyond the budget and
the pre-tax discount rate have a significant impact on
the sensitivity of the impairment test.
In 2016, no impairment was identified.
Hero Annual Report 2016 | 63
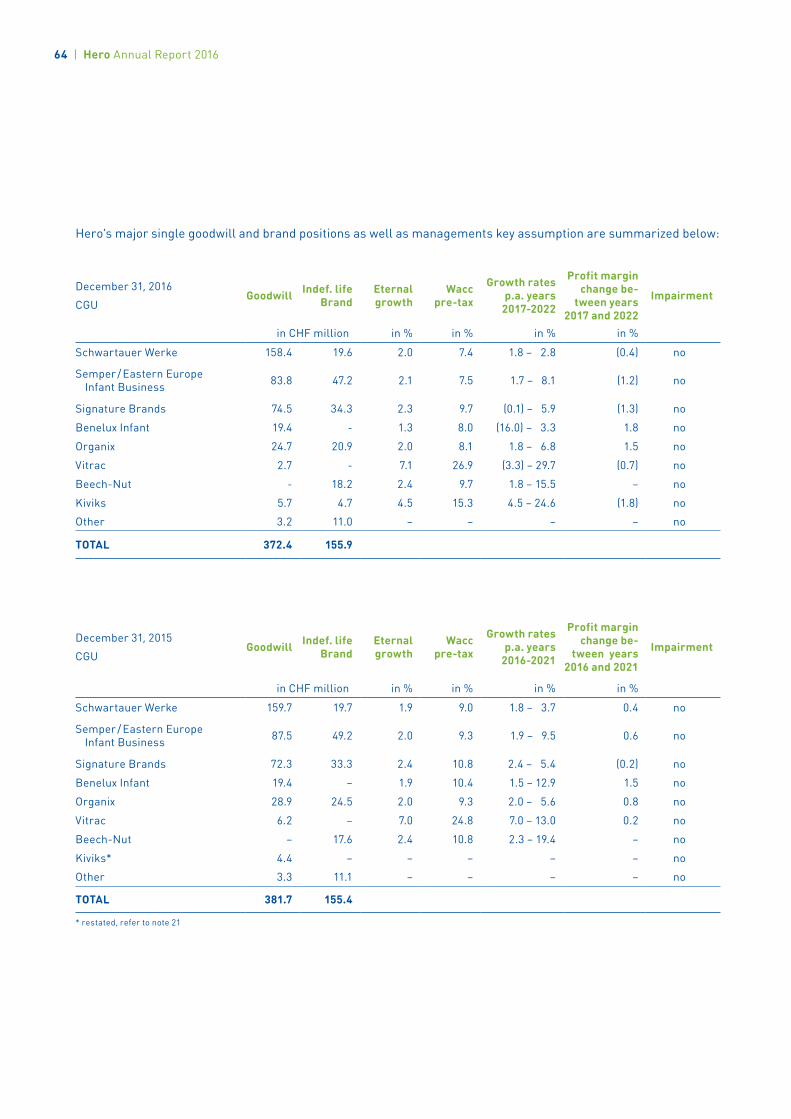
Hero’s major single goodwill and brand positions as well as managements key assumption are summarized below:
December 31, 2016
CGUGoodwill Indef. life
BrandEternal growth
Wacc pre-tax
Growth rates p.a. years
2017-2022
Profit margin change be-
tween years 2017 and 2022
Impair ment
in CHF million in % in % in % in %
Schwartauer Werke 158.4 19.6 2.0 7.4 1.8 – 2.8 (0.4) no
Semper / Eastern Europe Infant Business 83.8 47.2 2.1 7.5 1.7 – 8.1 (1.2) no
Signature Brands 74.5 34.3 2.3 9.7 (0.1) – 5.9 (1.3) no
Benelux Infant 19.4 - 1.3 8.0 (16.0) – 3.3 1.8 no
Organix 24.7 20.9 2.0 8.1 1.8 – 6.8 1.5 no
Vitrac 2.7 - 7.1 26.9 (3.3) – 29.7 (0.7) no
Beech-Nut - 18.2 2.4 9.7 1.8 – 15.5 – no
Kiviks 5.7 4.7 4.5 15.3 4.5 – 24.6 (1.8) no
Other 3.2 11.0 – – – – no
TOTAL 372.4 155.9
December 31, 2015
CGUGoodwill Indef. life
BrandEternal growth
Wacc pre-tax
Growth rates p.a. years
2016-2021
Profit margin change be-
tween years 2016 and 2021
Impair ment
in CHF million in % in % in % in %
Schwartauer Werke 159.7 19.7 1.9 9.0 1.8 – 3.7 0.4 no
Semper / Eastern Europe Infant Business 87.5 49.2 2.0 9.3 1.9 – 9.5 0.6 no
Signature Brands 72.3 33.3 2.4 10.8 2.4 – 5.4 (0.2) no
Benelux Infant 19.4 – 1.9 10.4 1.5 – 12.9 1.5 no
Organix 28.9 24.5 2.0 9.3 2.0 – 5.6 0.8 no
Vitrac 6.2 – 7.0 24.8 7.0 – 13.0 0.2 no
Beech-Nut – 17.6 2.4 10.8 2.3 – 19.4 – no
Kiviks* 4.4 – – – – – no
Other 3.3 11.1 – – – – no
TOTAL 381.7 155.4
* restated, refer to note 21
64 | Hero Annual Report 2016
Income taxes
As described in note 5, the Group is subject to income
taxes in numerous jurisdictions. Significant judgement
is re quired in determining the worldwide provision
for income taxes. There are many transactions and
calculations for which the ultimate tax determination
is uncertain during the ordinary course of business.
The Group recognizes liabilities for anticipated tax audit
issues based on estimates of whether additional taxes
will be due. Where the final tax outcome of these
matters is different from the amounts that were initial-
ly recorded, such differences will impact the income
tax and deferred tax provisions in the period in which
such determination is made.
Recognized tax loss carryforwards
The Group has recognized deferred tax assets in
relation to the recoverability of tax loss carryforwards
(note 11). The recoverability of such assets is based on
the ability of the entity to which the losses relate to
generate future taxable profits. These calculations
require the use of estimates. Management re-evalu-
ates the recoverability at each balance sheet date.
Valuation of financial instruments
As described in note 22, the Group uses valuation
techniques that include inputs that are not based on
observable market data to estimate the fair value of
certain types of financial instruments. Note 22
provides information about the key assumptions used
in the determination of the fair value of financial instru-
ments. Management believes that the chosen valuation
techniques and assumptions used are appropriate in
determining the fair value of financial instruments and
are constantly applied.
Provisions
The Group has provisions for various cases based on
estimates (note 18). Such estimates are based on the
Group’s experience, taking also into account economic
conditions. Manage ment believes that the total provi-
sions for these items is adequate, based upon currently
available information. As these provisions are based on
management estimates, they may be subject to change
as better information becomes available. Such changes
that arise could impact the pro visions recognized in the
balance sheet in future periods and consequently the
expenses recognized in the income statement in future
periods.
Pension benefits
The cost of the defined benefit pension plan and the
present value of the pension obligation are determined
using actuarial valuations (note 17). An actuarial valua-
tion involves making various assumptions that may
differ from actual developments in the future. These
include the determination of the discount rate, future
salary increases, mortality rates and future pension
increases. Due to the complexity of the valuation and its
long-term nature, a defined benefit obligation is highly
sensitive to changes in these assumptions. All assump-
tionsare reviewed at each reporting date.
Hero Annual Report 2016 | 65
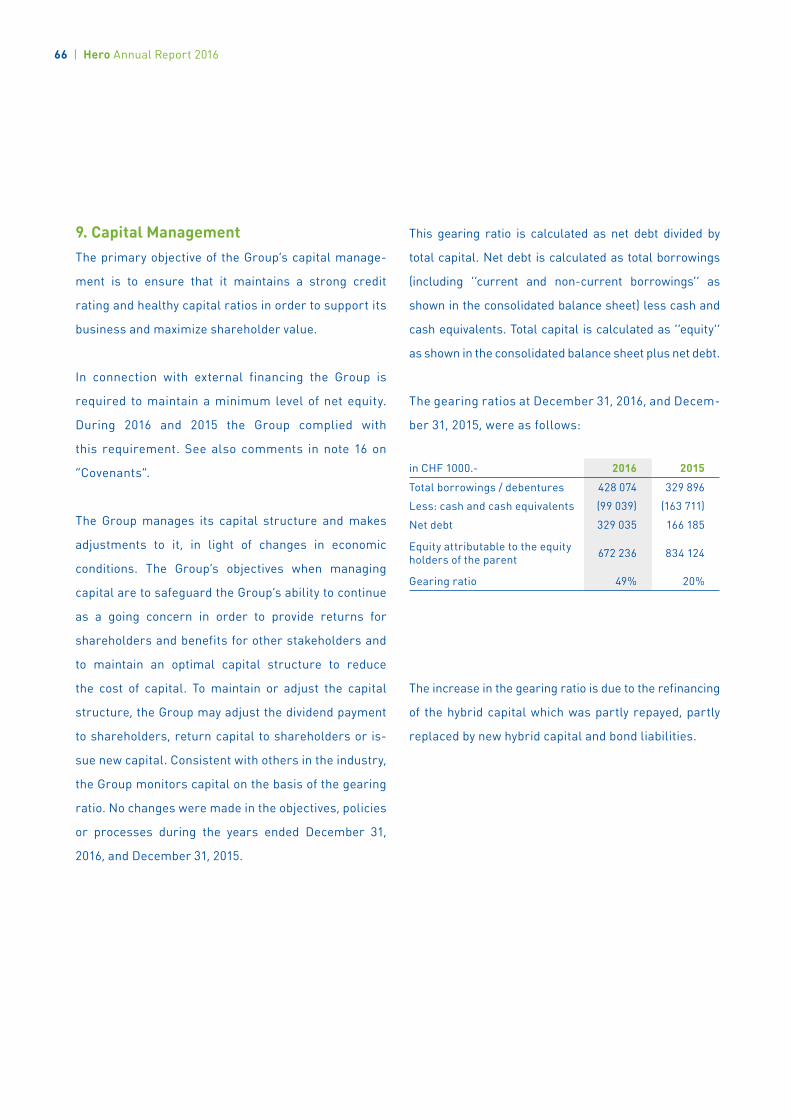
9. Capital ManagementThe primary objective of the Group’s capital manage-
ment is to ensure that it maintains a strong credit
rating and healthy capital ratios in order to support its
business and maximize shareholder value.
In connection with external financing the Group is
required to maintain a minimum level of net equity.
During 2016 and 2015 the Group complied with
this requirement. See also comments in note 16 on
“Covenants”.
The Group manages its capital structure and makes
adjustments to it, in light of changes in economic
conditions. The Group’s objectives when managing
capital are to safeguard the Group’s ability to continue
as a going concern in order to provide returns for
shareholders and benefits for other stakeholders and
to maintain an optimal capital structure to reduce
the cost of capital. To maintain or adjust the capital
structure, the Group may adjust the dividend payment
to shareholders, return capital to shareholders or is-
sue new capital. Consistent with others in the industry,
the Group monitors capital on the basis of the gearing
ratio. No changes were made in the objectives, policies
or processes during the years ended December 31,
2016, and December 31, 2015.
This gearing ratio is calculated as net debt divided by
total capital. Net debt is calculated as total borrowings
(including ‘‘current and non-current borrowings’’ as
shown in the consolidated balance sheet) less cash and
cash equivalents. Total capital is calculated as ‘‘equity’’
as shown in the consolidated balance sheet plus net debt.
The gearing ratios at December 31, 2016, and Decem-
ber 31, 2015, were as follows:
in CHF 1000.- 2016 2015
Total borrowings / debentures 428 074 329 896
Less: cash and cash equivalents (99 039) (163 711)
Net debt 329 035 166 185
Equity attributable to the equity holders of the parent 672 236 834 124
Gearing ratio 49% 20%
The increase in the gearing ratio is due to the refinancing
of the hybrid capital which was partly repayed, partly
replaced by new hybrid capital and bond liabilities.
66 | Hero Annual Report 2016
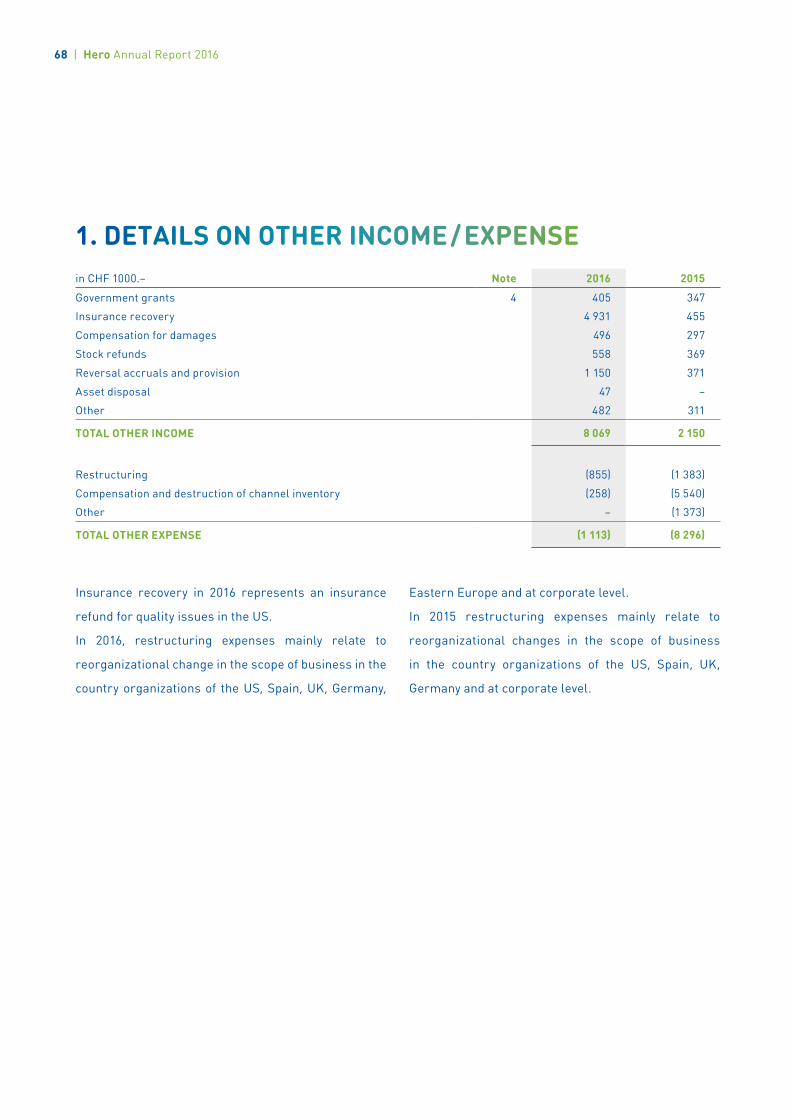
1. DETAILS ON OTHER INCOME/EXPENSEin CHF 1000.– Note 2016 2015
Government grants 4 405 347
Insurance recovery 4 931 455
Compensation for damages 496 297
Stock refunds 558 369
Reversal accruals and provision 1 150 371
Asset disposal 47 –
Other 482 311
TOTAL OTHER INCOME 8 069 2 150
Restructuring (855) (1 383)
Compensation and destruction of channel inventory (258) (5 540)
Other – (1 373)
TOTAL OTHER EXPENSE (1 113) (8 296)
Insurance recovery in 2016 represents an insurance
refund for quality issues in the US.
In 2016, restructuring expenses mainly relate to
reorganiz ational change in the scope of business in the
country organizations of the US, Spain, UK, Germany,
Eastern Europe and at corporate level.
In 2015 restructuring expenses mainly relate to
reor ganizational changes in the scope of business
in the country organizations of the US, Spain, UK,
Germany and at corporate level.
68 | Hero Annual Report 2016
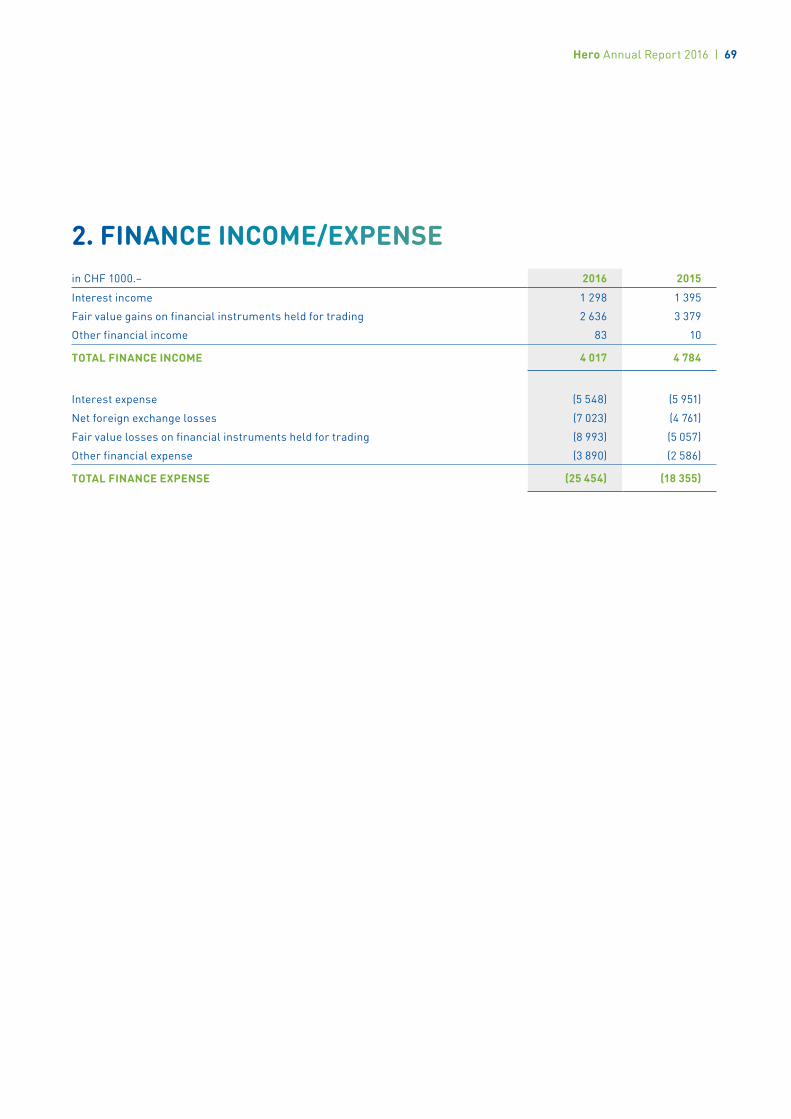
2. FINANCE INCOME/EXPENSEin CHF 1000.– 2016 2015
Interest income 1 298 1 395
Fair value gains on financial instruments held for trading 2 636 3 379
Other financial income 83 10
TOTAL FINANCE INCOME 4 017 4 784
Interest expense (5 548) (5 951)
Net foreign exchange losses (7 023) (4 761)
Fair value losses on financial instruments held for trading (8 993) (5 057)
Other financial expense (3 890) (2 586)
TOTAL FINANCE EXPENSE (25 454) (18 355)
Hero Annual Report 2016 | 69

3. ADDITIONAL INFORMATION ON THE NATURE OF EXPENSE
in CHF 1000.– Note 2016 2015
Wages and salaries (183 441) (174 191)
Social security costs (40 090) (36 929)
Pension costs – defined contribution plans (3 651) (4 019)
Pension costs – defined benefit plans 17 (3 842) (3 111)
TOTAL PERSONNEL EXPENSE (231 024) (218 250)
Year ended December 31, 2016 Property, plant and equipment Intangible assets
Note Depreciation Amortization Impairment
Cost of sales (26 983) (216) -
Distribution expense (931) - -
Advertising and promotion (20) - -
Marketing and sales (217) (2 287) -
Research and development (765) (794) -
Administrative expense (3 016) (4 575) -
TOTAL 7, 8 (31 932) (7 872) -
Year ended December 31, 2015Property, plant and
equipment Intangible assets
Note Depreciation Amortization Impairment
Cost of sales (24 355) (193) -
Distribution expense (767) (2) -
Marketing and sales (198) (3 173) -
Research and development (809) (945) (146)
Administrative expense (3 049) (4 066) -
TOTAL 7, 8 (29 178) (8 379) (146)
The Group employed 3’900 employees in 2016 (2015: 3’747).
Depreciation, amortization and impairments are included in the consolidated statement of income as follows:
70 | Hero Annual Report 2016
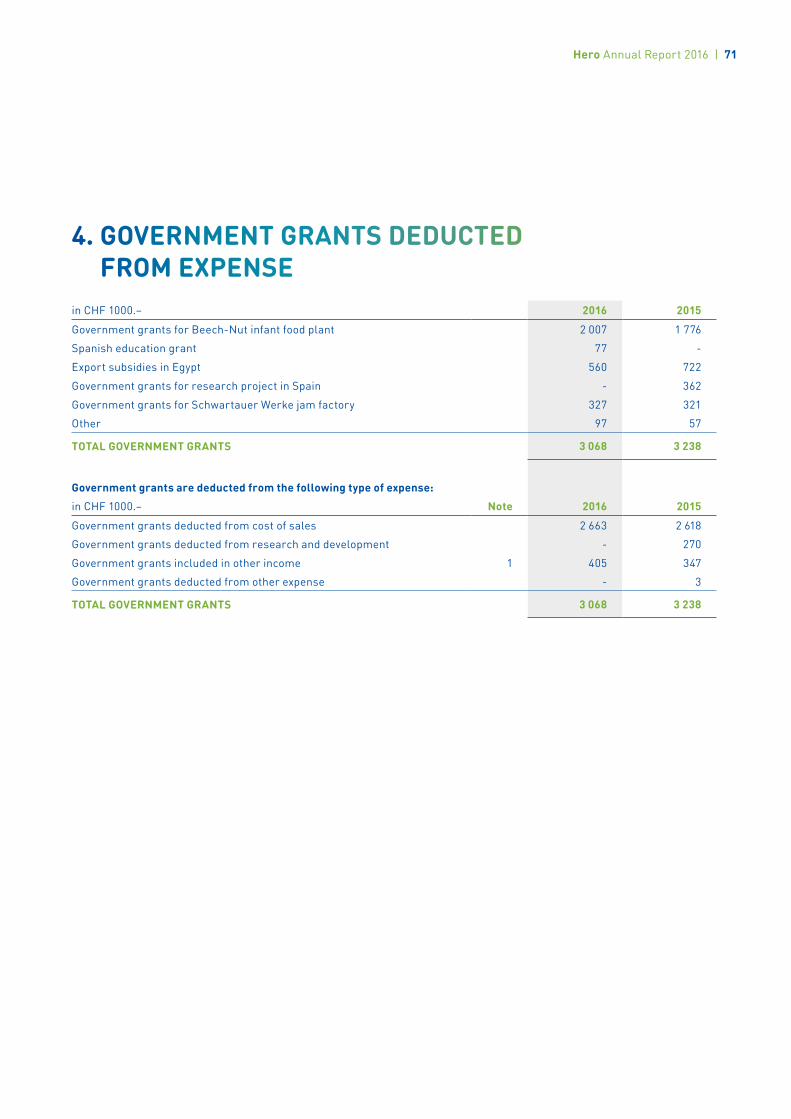
4. GOVERNMENT GRANTS DEDUCTED FROM EXPENSE
in CHF 1000.– 2016 2015
Government grants for Beech-Nut infant food plant 2 007 1 776
Spanish education grant 77 -
Export subsidies in Egypt 560 722
Government grants for research project in Spain - 362
Government grants for Schwartauer Werke jam factory 327 321
Other 97 57
TOTAL GOVERNMENT GRANTS 3 068 3 238
Government grants are deducted from the following type of expense:
in CHF 1000.– Note 2016 2015
Government grants deducted from cost of sales 2 663 2 618
Government grants deducted from research and development - 270
Government grants included in other income 1 405 347
Government grants deducted from other expense - 3
TOTAL GOVERNMENT GRANTS 3 068 3 238
Hero Annual Report 2016 | 71
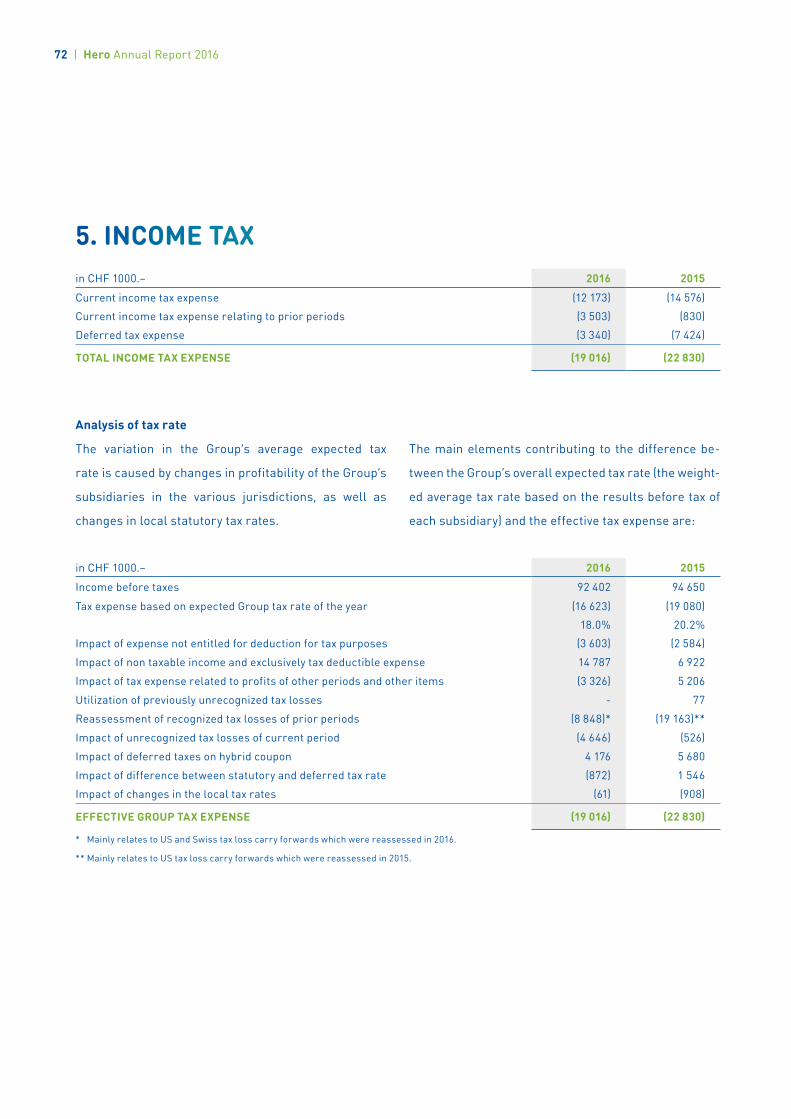
in CHF 1000.– 2016 2015
Income before taxes 92 402 94 650
Tax expense based on expected Group tax rate of the year (16 623)
18.0%
(19 080)
20.2%
Impact of expense not entitled for deduction for tax purposes (3 603) (2 584)
Impact of non taxable income and exclusively tax deductible expense 14 787 6 922
Impact of tax expense related to profits of other periods and other items (3 326) 5 206
Utilization of previously unrecognized tax losses - 77
Reassessment of recognized tax losses of prior periods (8 848)* (19 163)**
Impact of unrecognized tax losses of current period (4 646) (526)
Impact of deferred taxes on hybrid coupon 4 176 5 680
Impact of difference between statutory and deferred tax rate (872) 1 546
Impact of changes in the local tax rates (61) (908)
EFFECTIVE GROUP TAX EXPENSE (19 016) (22 830)
* Mainly relates to US and Swiss tax loss carry forwards which were reassessed in 2016.
** Mainly relates to US tax loss carry forwards which were reassessed in 2015.
5. INCOME TAXin CHF 1000.– 2016 2015
Current income tax expense (12 173) (14 576)
Current income tax expense relating to prior periods (3 503) (830)
Deferred tax expense (3 340) (7 424)
TOTAL INCOME TAX EXPENSE (19 016) (22 830)
Analysis of tax rate
The variation in the Group’s average expected tax
rate is caused by changes in profitability of the Group’s
subsidiaries in the various juris dictions, as well as
changes in local statutory tax rates.
The main elements contributing to the difference be-
tween the Group’s overall expected tax rate (the weight-
ed average tax rate based on the results before tax of
each subsidiary) and the effective tax expense are:
72 | Hero Annual Report 2016
6. DIVIDENDAt the Annual General Meeting in 2017 a dividend in re-
spect of 2016 of CHF 5.75 per share amounting to a total
dividend of CHF 35.7 million is to be proposed (2016:
CHF 13.6 million). These financial statements do not
reflect this dividend payable, which will be accounted
for in shareholders’ equity as an appropriation of re-
tained earnings in the year ending December 31, 2017.
Hero Annual Report 2016 | 73

7. PROPERTY, PLANT AND EQUIPMENT
in CHF 1000.– Note Land Buildings Plant and machinery
Other equipment Total
Cost or valuation
BALANCE AT JANUARY 1, 2015 35 606 271 129 372 705 33 341 712 781
Additions – 3 166 22 948 7 107 33 221
Acquisition of subsidiary* 21 2 840 8 155 1 891 417 13 303
Decrease/disposals of assets (2 682) (12 129) (17 785) (985) (33 581)
Revaluations 62 – – – 62
Foreign exchange differences (3 232) (11 117) (24 096) (2 431) (40 876)BALANCE AT DECEMBER 31, 2015*/ JANUARY 1, 2016 32 594 259 204 355 663 37 449 684 910 Additions - 2 116 35 665 3 223 41 004
Decrease/disposals of assets (30) (1 033) (3 251) (1 818) (6 132)
Reclassifications - 741 54 (1 202) (407)
Foreign exchange differences (317) 58 (6 764) (3 507) (10 530)
BALANCE AT DECEMBER 31, 2016 32 247 261 086 381 367 34 145 708 845
Accumulated depreciation
BALANCE AT JANUARY 1, 2015 5 68 806 241 774 22 621 333 206
Additions 1 7 618 18 540 3 019 29 178
Decrease/disposals of assets – (11 523) (17 653) (915) (30 091)
Foreign exchange differences – (4 801) (17 151) (1 655) (23 607)BALANCE AT DECEMBER 31, 2015/ JANUARY 1, 2016 6 60 100 225 510 23 070 308 686 Additions 1 7 967 20 779 3 185 31 932
Decrease/disposals of assets - (20) (2 685) (1 518) (4 223)
Reclassifications - (5) (125) (29) (159)
Foreign exchange differences - (1 016) (6 021) (2 081) (9 118)
BALANCE AT DECEMBER 31, 2016 7 67 026 237 458 22 627 327 118
Carrying amount
At January 1, 2016 32 588 199 104 130 153 14 379 376 224
At December 31, 2016 32 240 194 060 143 909 11 518 381 727
* restated, refer to note 21
74 | Hero Annual Report 2016
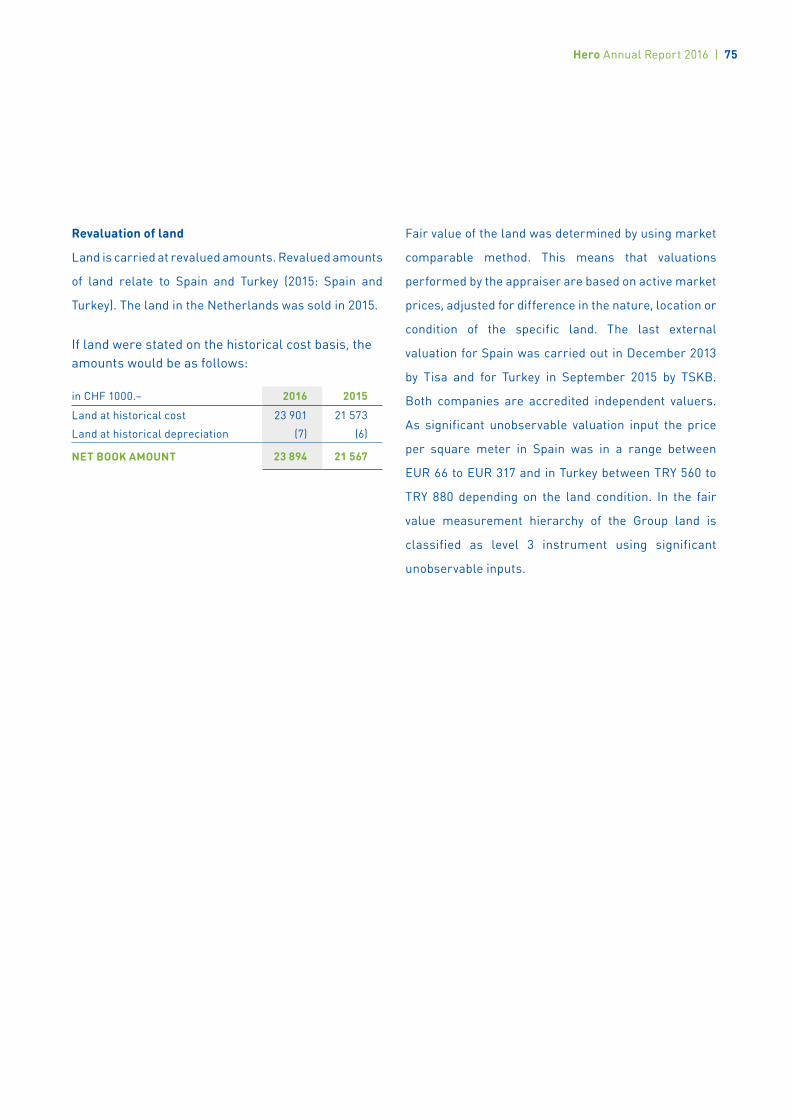
Revaluation of land
Land is carried at revalued amounts. Revalued amounts
of land relate to Spain and Turkey (2015: Spain and
Turkey). The land in the Netherlands was sold in 2015.
If land were stated on the historical cost basis, the amounts would be as follows:
in CHF 1000.– 2016 2015
Land at historical cost 23 901 21 573
Land at historical depreciation (7) (6)
NET BOOK AMOUNT 23 894 21 567
Fair value of the land was determined by using market
comparable method. This means that valuations
performed by the appraiser are based on active market
prices, adjusted for difference in the nature, location or
condition of the specific land. The last external
valuation for Spain was carried out in December 2013
by Tisa and for Turkey in September 2015 by TSKB.
Both companies are accredited independent valuers.
As significant unobservable valuation input the price
per square meter in Spain was in a range between
EUR 66 to EUR 317 and in Turkey between TRY 560 to
TRY 880 depending on the land condition. In the fair
value measurement hierarchy of the Group land is
classified as level 3 instrument using significant
unobservable inputs.
Hero Annual Report 2016 | 75
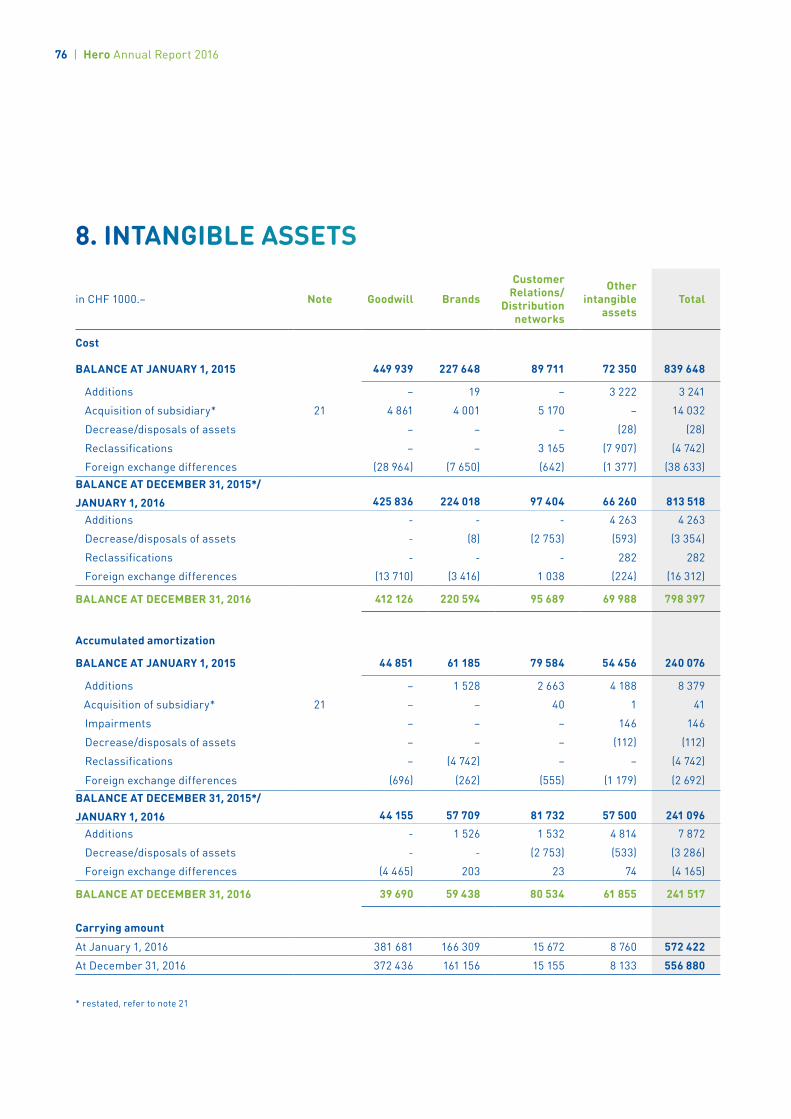
8. INTANGIBLE ASSETS
in CHF 1000.– Note Goodwill Brands
Customer Relations/
Distribution networks
Other intangible
assetsTotal
Cost
BALANCE AT JANUARY 1, 2015 449 939 227 648 89 711 72 350 839 648
Additions – 19 – 3 222 3 241
Acquisition of subsidiary* 21 4 861 4 001 5 170 – 14 032
Decrease/disposals of assets – – – (28) (28)
Reclassifications – – 3 165 (7 907) (4 742)
Foreign exchange differences (28 964) (7 650) (642) (1 377) (38 633)BALANCE AT DECEMBER 31, 2015*/ JANUARY 1, 2016 425 836 224 018 97 404 66 260 813 518 Additions - - - 4 263 4 263
Decrease/disposals of assets - (8) (2 753) (593) (3 354)
Reclassifications - - - 282 282
Foreign exchange differences (13 710) (3 416) 1 038 (224) (16 312)
BALANCE AT DECEMBER 31, 2016 412 126 220 594 95 689 69 988 798 397
Accumulated amortization
BALANCE AT JANUARY 1, 2015 44 851 61 185 79 584 54 456 240 076
Additions – 1 528 2 663 4 188 8 379
Acquisition of subsidiary* 21 – – 40 1 41
Impairments – – – 146 146
Decrease/disposals of assets – – – (112) (112)
Reclassifications – (4 742) – – (4 742)
Foreign exchange differences (696) (262) (555) (1 179) (2 692)
BALANCE AT DECEMBER 31, 2015*/ JANUARY 1, 2016 44 155 57 709 81 732 57 500 241 096 Additions - 1 526 1 532 4 814 7 872
Decrease/disposals of assets - - (2 753) (533) (3 286)
Foreign exchange differences (4 465) 203 23 74 (4 165)
BALANCE AT DECEMBER 31, 2016 39 690 59 438 80 534 61 855 241 517
Carrying amount
At January 1, 2016 381 681 166 309 15 672 8 760 572 422
At December 31, 2016 372 436 161 156 15 155 8 133 556 880
* restated, refer to note 21
76 | Hero Annual Report 2016
Other intangibles
Other intangibles mainly include licenses, software,
patents and recipes.
Recognised development costs
In 2016, development costs in the amount of TCHF 500
were capitalized (2015: TCHF 490).
Impairment tests for goodwill
Goodwill and intangible assets with indefinite useful
lives are allocated to the respective cash-generating
units (CGUs), which for Goodwill primarily represents
the legal entity. The recoverable amount of a CGU is
determined based on value-in-use calculations. Refer
to accounting policies no. 8 for information about
impairment testing and corresponding estimates.
Impairment of Goodwill and Brands
In 2016 as well as in 2015, the recoverable amounts
exceeded the carrying amounts for all CGU’s.
Hero Annual Report 2016 | 77
9. SEGMENT REPORTINGFor management purposes, the Group is organized
based on geographical areas and has three reportable
operating segments: Europe, North America and
Emerging Markets.
The segment Europe produces and sells mainly con-
sumer food products such as jams, healthy snacks, baby
and toddler food, baby and toddler milk and specialities.
The segment North America produces and sells mainly
consumer food products such as baby and toddler food
and specialities.
The segment Emerging Markets mainly includes
Turkey, Egypt, Russia, China and Brazil and produces
and sells mainly consumer food products such as jams,
healthy snacks, baby and toddler food and baby and
toddler milk.
The accounting policies of the operating segments
are the same as those described in the summary of
significant accounting policies.
Trading operating profit excludes amortization and
impairment as well as exceptional charges.
Net working capital external is composed of income tax
receivables, trade and other receivables, prepayments
and inventories less trade and other payables, short-
term income tax payables and short-term provisions.
Non-current assets comprise property, plant and
equipment and intangible assets excluding goodwill.
78 | Hero Annual Report 2016
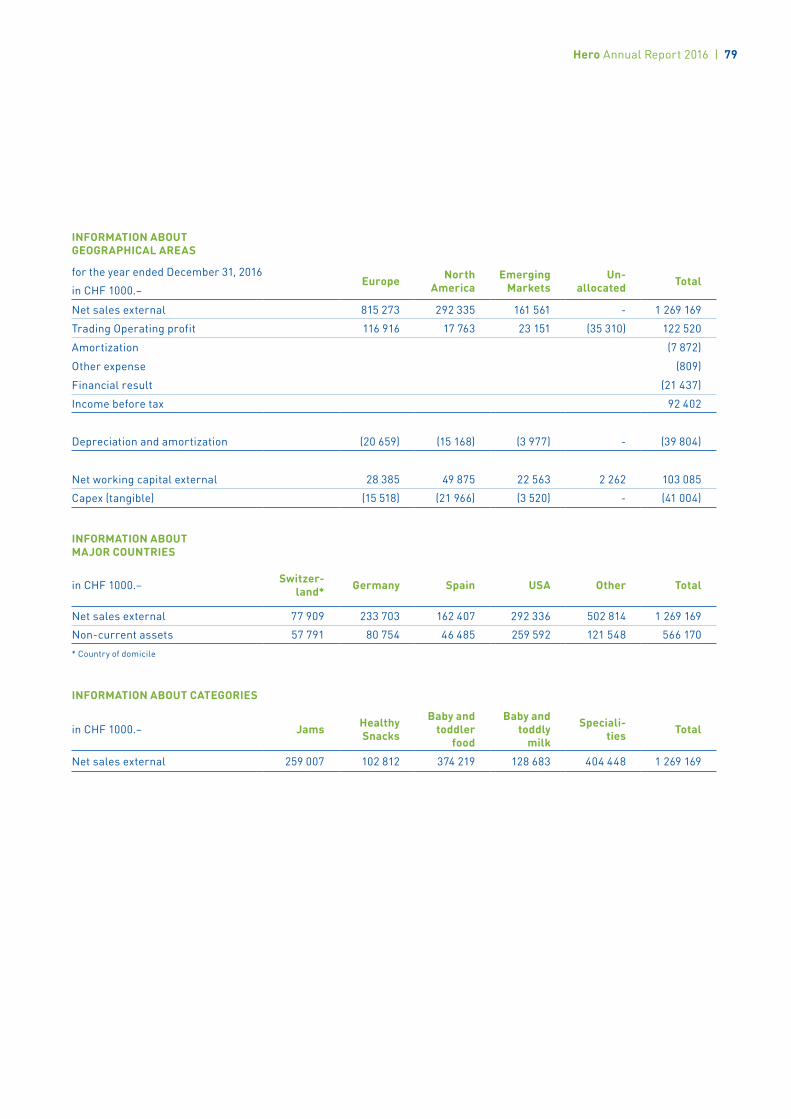
INFORMATION ABOUT GEOGRAPHICAL AREAS
for the year ended December 31, 2016
in CHF 1000.–Europe North
AmericaEmerging
MarketsUn-
allocated Total
Net sales external 815 273 292 335 161 561 - 1 269 169
Trading Operating profit 116 916 17 763 23 151 (35 310) 122 520
Amortization (7 872)
Other expense (809)
Financial result (21 437)
Income before tax 92 402
Depreciation and amortization (20 659) (15 168) (3 977) - (39 804)
Net working capital external 28 385 49 875 22 563 2 262 103 085
Capex (tangible) (15 518) (21 966) (3 520) - (41 004)
INFORMATION ABOUT MAJOR COUNTRIES
in CHF 1000.– Switzer-land* Germany Spain USA Other Total
Net sales external 77 909 233 703 162 407 292 336 502 814 1 269 169
Non-current assets 57 791 80 754 46 485 259 592 121 548 566 170
* Country of domicile
INFORMATION ABOUT CATEGORIES
in CHF 1000.– Jams Healthy Snacks
Baby and toddler
food
Baby and toddly
milk
Speciali-ties Total
Net sales external 259 007 102 812 374 219 128 683 404 448 1 269 169
Hero Annual Report 2016 | 79
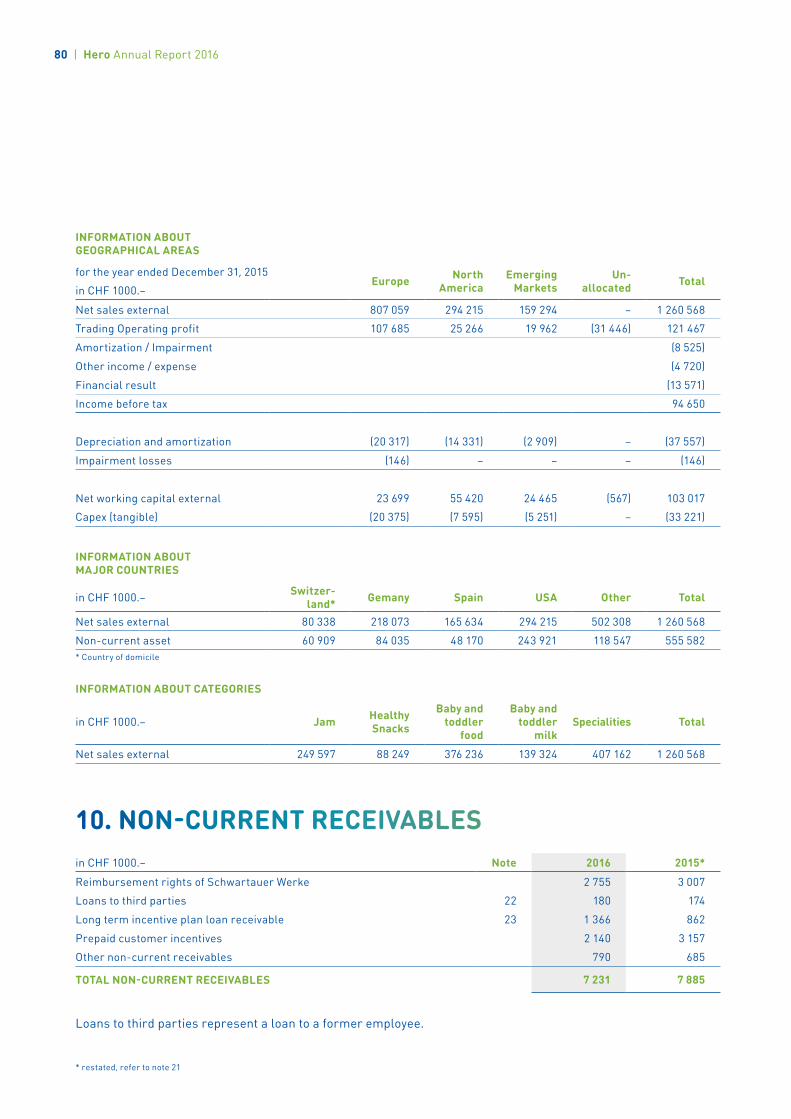
INFORMATION ABOUT GEOGRAPHICAL AREAS
for the year ended December 31, 2015
in CHF 1000.–Europe North
AmericaEmerging
MarketsUn-
allocated Total
Net sales external 807 059 294 215 159 294 – 1 260 568
Trading Operating profit 107 685 25 266 19 962 (31 446) 121 467
Amortization / Impairment (8 525)
Other income / expense (4 720)
Financial result (13 571)
Income before tax 94 650
Depreciation and amortization (20 317) (14 331) (2 909) – (37 557)
Impairment losses (146) – – – (146)
Net working capital external 23 699 55 420 24 465 (567) 103 017
Capex (tangible) (20 375) (7 595) (5 251) – (33 221)
INFORMATION ABOUT MAJOR COUNTRIES
in CHF 1000.– Switzer-land* Gemany Spain USA Other Total
Net sales external 80 338 218 073 165 634 294 215 502 308 1 260 568
Non-current asset 60 909 84 035 48 170 243 921 118 547 555 582* Country of domicile
INFORMATION ABOUT CATEGORIES
in CHF 1000.– Jam Healthy Snacks
Baby and toddler
food
Baby and toddler
milkSpecialities Total
Net sales external 249 597 88 249 376 236 139 324 407 162 1 260 568
10. NON-CURRENT RECEIVABLESin CHF 1000.– Note 2016 2015*
Reimbursement rights of Schwartauer Werke 2 755 3 007
Loans to third parties 22 180 174
Long term incentive plan loan receivable 23 1 366 862
Prepaid customer incentives 2 140 3 157
Other non-current receivables 790 685
TOTAL NON-CURRENT RECEIVABLES 7 231 7 885
Loans to third parties represent a loan to a former employee.
* restated, refer to note 21
80 | Hero Annual Report 2016
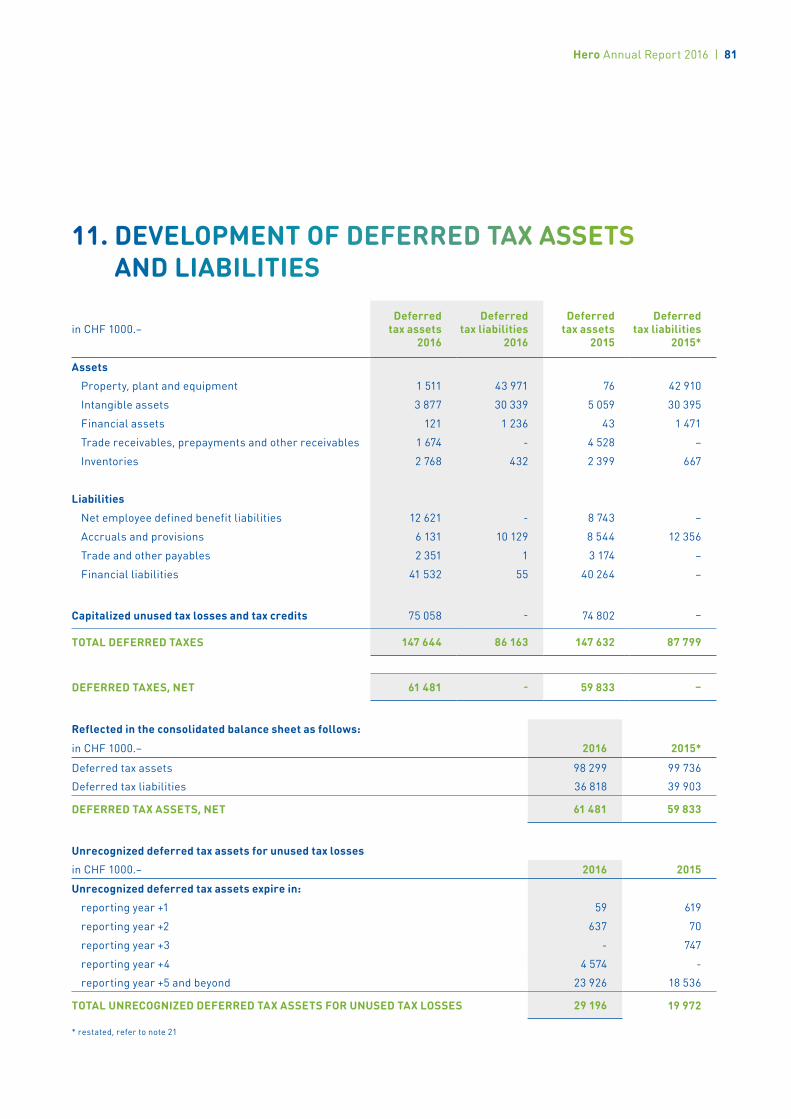
11. DEVELOPMENT OF DEFERRED TAX ASSETS AND LIABILITIES
in CHF 1000.–Deferred
tax assets 2016
Deferred tax liabilities
2016
Deferred tax assets
2015
Deferred tax liabilities
2015*
Assets
Property, plant and equipment 1 511 43 971 76 42 910
Intangible assets 3 877 30 339 5 059 30 395
Financial assets 121 1 236 43 1 471
Trade receivables, prepayments and other receivables 1 674 - 4 528 –
Inventories 2 768 432 2 399 667
Liabilities
Net employee defined benefit liabilities 12 621 - 8 743 –
Accruals and provisions 6 131 10 129 8 544 12 356
Trade and other payables 2 351 1 3 174 –
Financial liabilities 41 532 55 40 264 –
Capitalized unused tax losses and tax credits 75 058 - 74 802 –
TOTAL DEFERRED TAXES 147 644 86 163 147 632 87 799
DEFERRED TAXES, NET 61 481 - 59 833 –
Reflected in the consolidated balance sheet as follows:
in CHF 1000.– 2016 2015*
Deferred tax assets 98 299 99 736
Deferred tax liabilities 36 818 39 903
DEFERRED TAX ASSETS, NET 61 481 59 833
Unrecognized deferred tax assets for unused tax losses
in CHF 1000.– 2016 2015
Unrecognized deferred tax assets expire in:
reporting year +1 59 619
reporting year +2 637 70
reporting year +3 - 747
reporting year +4 4 574 -
reporting year +5 and beyond 23 926 18 536
TOTAL UNRECOGNIZED DEFERRED TAX ASSETS FOR UNUSED TAX LOSSES 29 196 19 972
* restated, refer to note 21
Hero Annual Report 2016 | 81
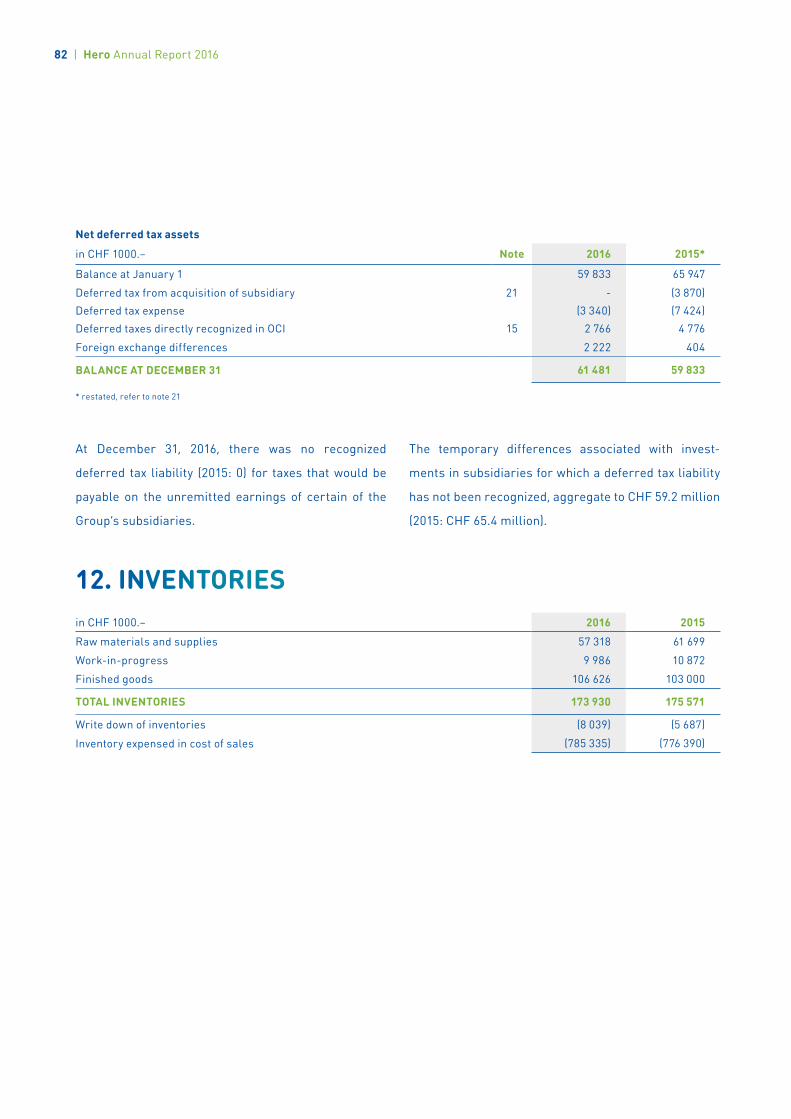
Net deferred tax assets
in CHF 1000.– Note 2016 2015*
Balance at January 1 59 833 65 947
Deferred tax from acquisition of subsidiary 21 - (3 870)
Deferred tax expense (3 340) (7 424)
Deferred taxes directly recognized in OCI 15 2 766 4 776
Foreign exchange differences 2 222 404
BALANCE AT DECEMBER 31 61 481 59 833
* restated, refer to note 21
At December 31, 2016, there was no recognized
deferred tax liability (2015: 0) for taxes that would be
payable on the unremitted earnings of certain of the
Group’s subsi diaries.
The temporary differences associated with invest-
ments in subsidiaries for which a deferred tax liability
has not been recognized, aggregate to CHF 59.2 million
(2015: CHF 65.4 million).
12. INVENTORIESin CHF 1000.– 2016 2015
Raw materials and supplies 57 318 61 699
Work-in-progress 9 986 10 872
Finished goods 106 626 103 000
TOTAL INVENTORIES 173 930 175 571
Write down of inventories (8 039) (5 687)
Inventory expensed in cost of sales (785 335) (776 390)
82 | Hero Annual Report 2016
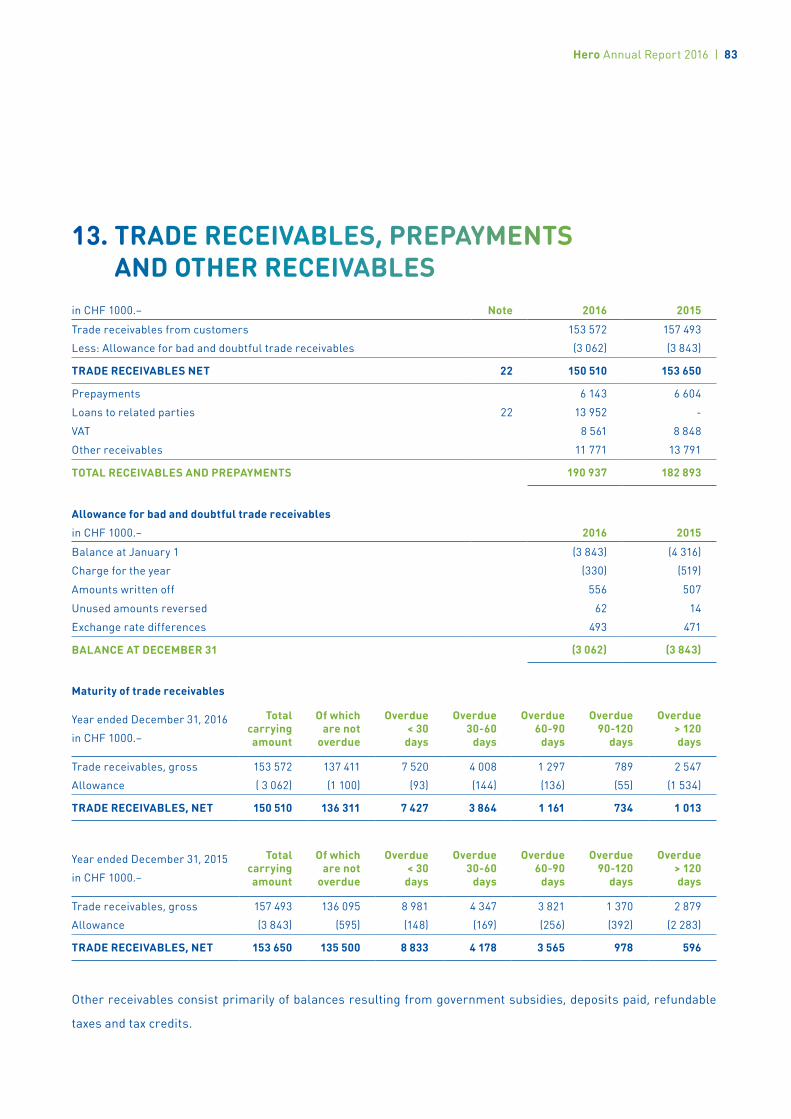
13. TRADE RECEIVABLES, PREPAYMENTS AND OTHER RECEIVABLES
in CHF 1000.– Note 2016 2015
Trade receivables from customers 153 572 157 493
Less: Allowance for bad and doubtful trade receivables (3 062) (3 843)
TRADE RECEIVABLES NET 22 150 510 153 650
Prepayments 6 143 6 604
Loans to related parties 22 13 952 -
VAT 8 561 8 848
Other receivables 11 771 13 791
TOTAL RECEIVABLES AND PREPAYMENTS 190 937 182 893
Allowance for bad and doubtful trade receivables
in CHF 1000.– 2016 2015
Balance at January 1 (3 843) (4 316)
Charge for the year (330) (519)
Amounts written off 556 507
Unused amounts reversed 62 14
Exchange rate differences 493 471
BALANCE AT DECEMBER 31 (3 062) (3 843)
Maturity of trade receivables
Year ended December 31, 2016
in CHF 1000.–
Total carrying amount
Of which are not
overdue
Overdue < 30 days
Overdue 30-60
days
Overdue 60-90
days
Overdue 90-120
days
Overdue > 120 days
Trade receivables, gross 153 572 137 411 7 520 4 008 1 297 789 2 547
Allowance ( 3 062) (1 100) (93) (144) (136) (55) (1 534)
TRADE RECEIVABLES, NET 150 510 136 311 7 427 3 864 1 161 734 1 013
Year ended December 31, 2015
in CHF 1000.–
Total carrying amount
Of which are not
overdue
Overdue < 30 days
Overdue 30-60
days
Overdue 60-90
days
Overdue 90-120
days
Overdue > 120 days
Trade receivables, gross 157 493 136 095 8 981 4 347 3 821 1 370 2 879
Allowance (3 843) (595) (148) (169) (256) (392) (2 283)
TRADE RECEIVABLES, NET 153 650 135 500 8 833 4 178 3 565 978 596
Other receivables consist primarily of balances resulting from government subsidies, deposits paid, refundable
taxes and tax credits.
Hero Annual Report 2016 | 83
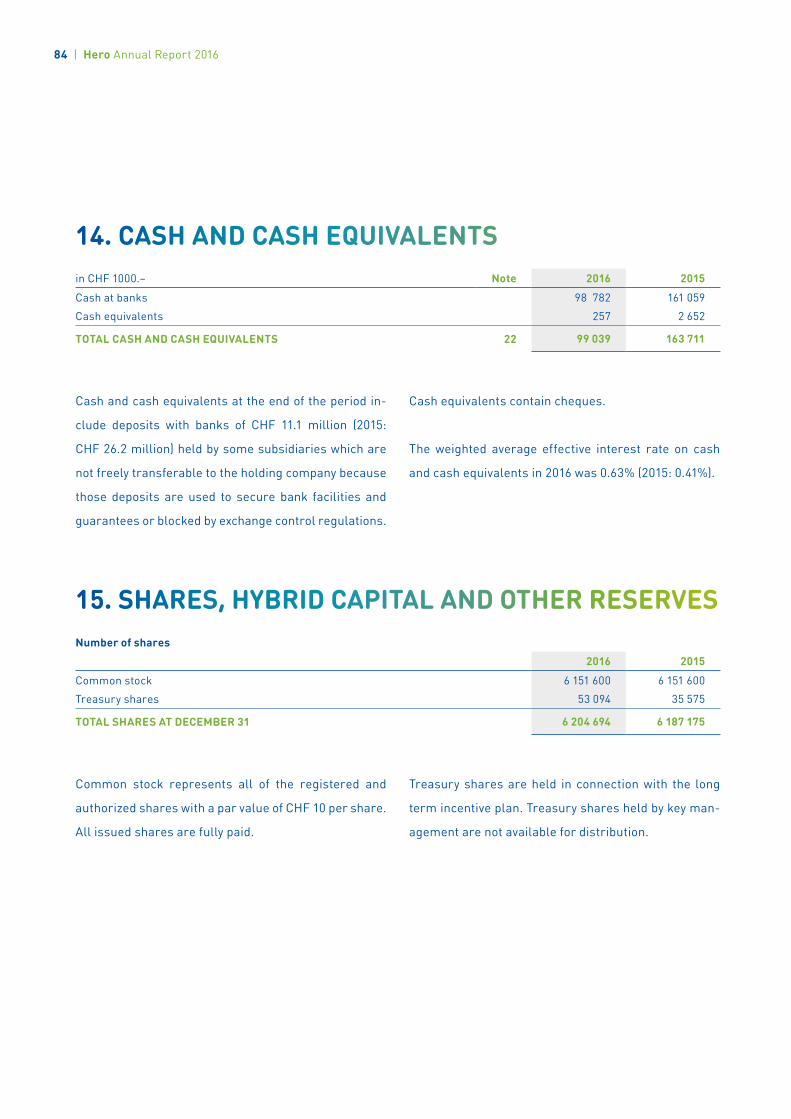
14. CASH AND CASH EQUIVALENTSin CHF 1000.– Note 2016 2015
Cash at banks 98 782 161 059
Cash equivalents 257 2 652
TOTAL CASH AND CASH EQUIVALENTS 22 99 039 163 711
15. SHARES, HYBRID CAPITAL AND OTHER RESERVESNumber of shares
2016 2015
Common stock 6 151 600 6 151 600
Treasury shares 53 094 35 575
TOTAL SHARES AT DECEMBER 31 6 204 694 6 187 175
Cash and cash equivalents at the end of the period in-
clude deposits with banks of CHF 11.1 million (2015:
CHF 26.2 million) held by some subsidiaries which are
not freely transferable to the holding company because
those deposits are used to secure bank facilities and
guarantees or blocked by exchange control regulations.
Cash equivalents contain cheques.
The weighted average effective interest rate on cash
and cash equivalents in 2016 was 0.63% (2015: 0.41%).
Common stock represents all of the registered and
authorized shares with a par value of CHF 10 per share.
All issued shares are fully paid.
Treasury shares are held in connection with the long
term incentive plan. Treasury shares held by key man-
agement are not available for distribution.
84 | Hero Annual Report 2016
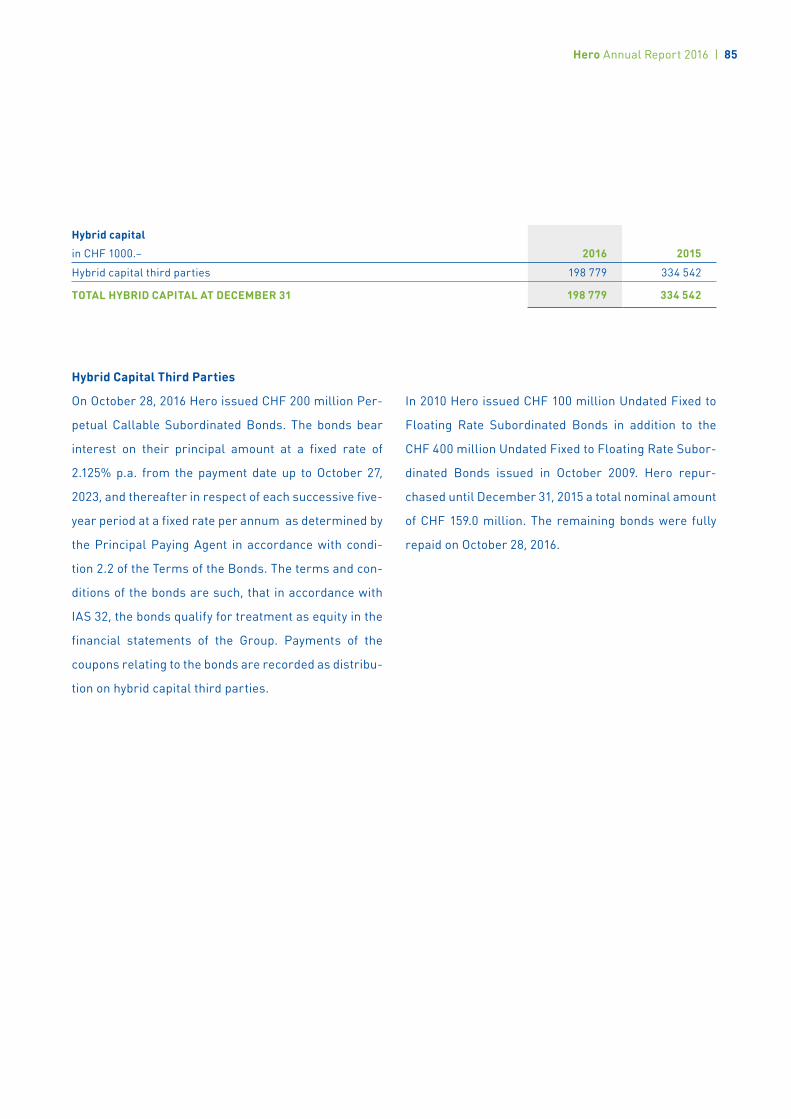
Hybrid capital
in CHF 1000.– 2016 2015
Hybrid capital third parties 198 779 334 542
TOTAL HYBRID CAPITAL AT DECEMBER 31 198 779 334 542
Hybrid Capital Third Parties
On October 28, 2016 Hero issued CHF 200 million Per-
petual Callable Subordinated Bonds. The bonds bear
interest on their principal amount at a fixed rate of
2.125% p.a. from the payment date up to October 27,
2023, and thereafter in respect of each successive five-
year period at a fixed rate per annum as determined by
the Principal Paying Agent in accordance with condi-
tion 2.2 of the Terms of the Bonds. The terms and con-
ditions of the bonds are such, that in accordance with
IAS 32, the bonds qualify for treatment as equity in the
financial statements of the Group. Payments of the
coupons relating to the bonds are recorded as distribu-
tion on hybrid capital third parties.
In 2010 Hero issued CHF 100 million Undated Fixed to
Floating Rate Subordinated Bonds in addition to the
CHF 400 million Undated Fixed to Floating Rate Subor-
dinated Bonds issued in October 2009. Hero repur-
chased until December 31, 2015 a total nominal amount
of CHF 159.0 million. The remaining bonds were fully
repaid on October 28, 2016.
Hero Annual Report 2016 | 85
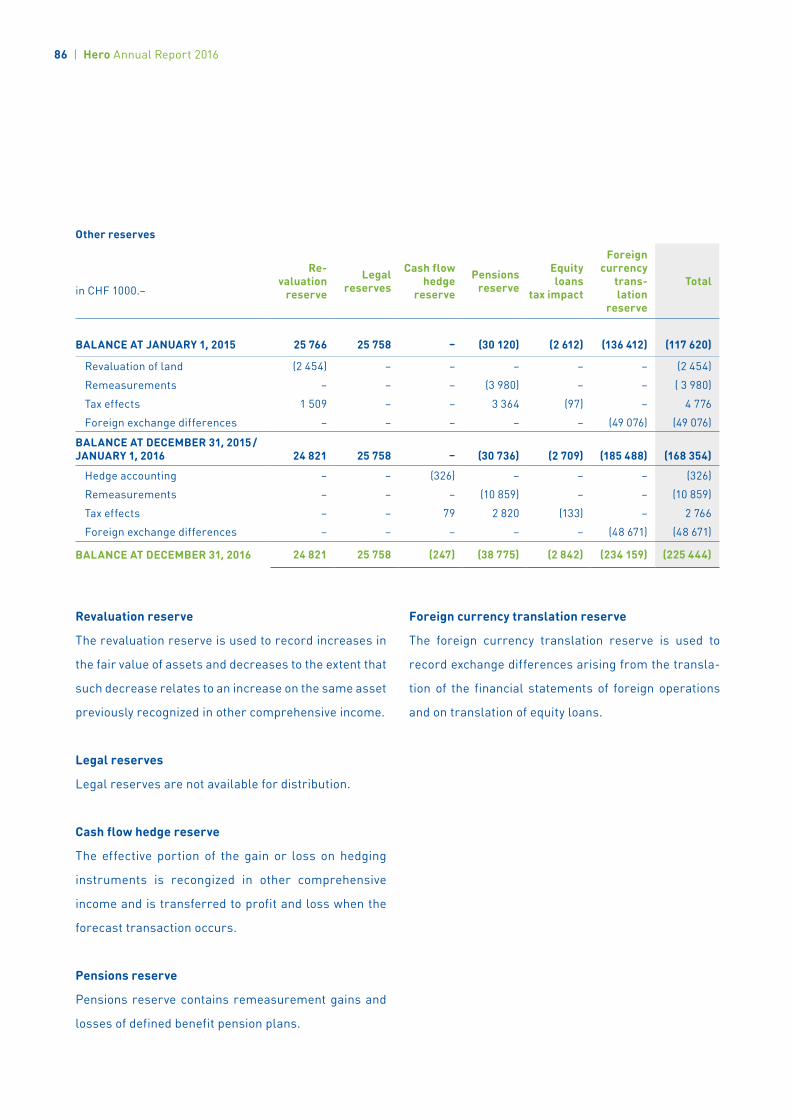
Other reserves
in CHF 1000.–
Re-valuation
reserve
Legal reserves
Cash flow hedge
reserve
Pensions reserve
Equity loans
tax impact
Foreign currency
trans-lation
reserve
Total
BALANCE AT JANUARY 1, 2015 25 766 25 758 – (30 120) (2 612) (136 412) (117 620)
Revaluation of land (2 454) – – – – – (2 454)
Remeasurements – – – (3 980) – – ( 3 980)
Tax effects 1 509 – – 3 364 (97) – 4 776
Foreign exchange differences – – – – – (49 076) (49 076)
BALANCE AT DECEMBER 31, 2015 / JANUARY 1, 2016 24 821 25 758 – (30 736) (2 709) (185 488) (168 354)
Hedge accounting – – (326) – – – (326)
Remeasurements – – – (10 859) – – (10 859)
Tax effects – – 79 2 820 (133) – 2 766
Foreign exchange differences – – – – – (48 671) (48 671)
BALANCE AT DECEMBER 31, 2016 24 821 25 758 (247) (38 775) (2 842) (234 159) (225 444)
Revaluation reserve
The revaluation reserve is used to record increases in
the fair value of assets and decreases to the extent that
such decrease relates to an increase on the same asset
previously recognized in other comprehensive income.
Legal reserves
Legal reserves are not available for distribution.
Cash flow hedge reserve
The effective portion of the gain or loss on hedging
instruments is recongized in other comprehensive
income and is transferred to profit and loss when the
forecast transaction occurs.
Pensions reserve
Pensions reserve contains remeasurement gains and
losses of defined benefit pension plans.
Foreign currency translation reserve
The foreign currency translation reserve is used to
record exchange differences arising from the transla-
tion of the financial statements of foreign operations
and on translation of equity loans.
86 | Hero Annual Report 2016
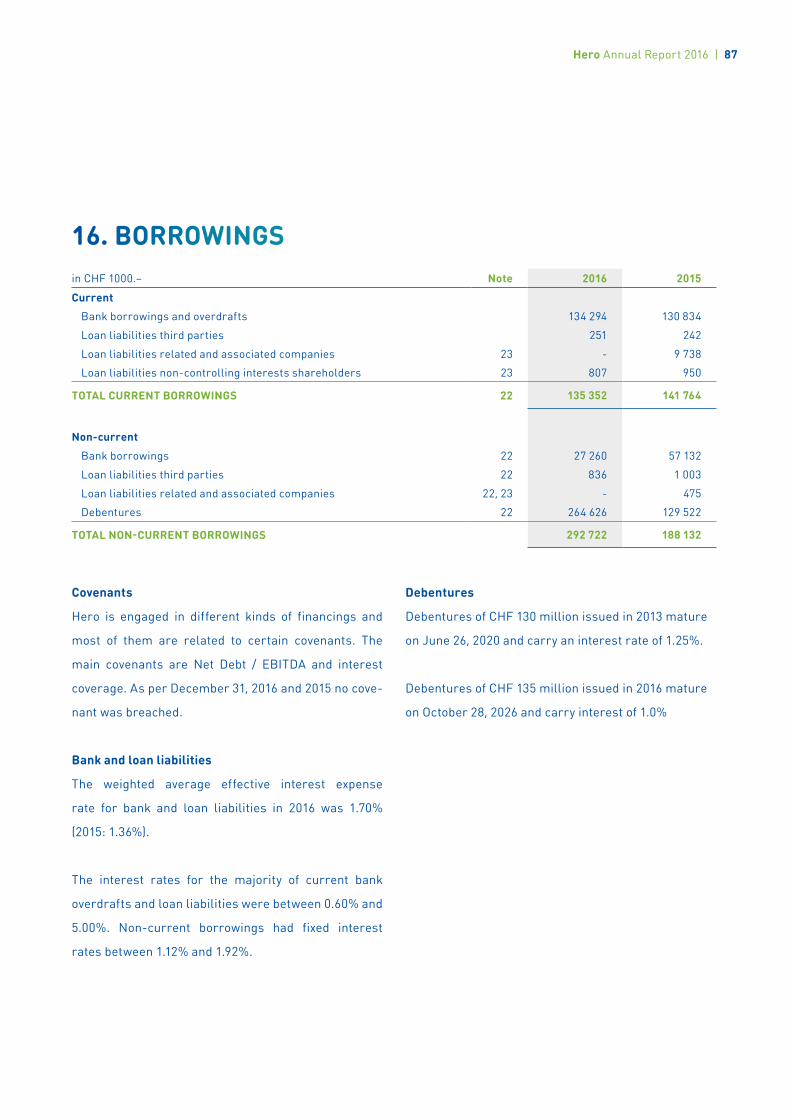
Covenants
Hero is engaged in different kinds of financings and
most of them are related to certain covenants. The
main covenants are Net Debt / EBITDA and interest
coverage. As per December 31, 2016 and 2015 no cove-
nant was breached.
Bank and loan liabilities
The weighted average effective interest expense
rate for bank and loan liabilities in 2016 was 1.70%
(2015: 1.36%).
The interest rates for the majority of current bank
overdrafts and loan liabilities were between 0.60% and
5.00%. Non-current borrowings had fixed interest
rates between 1.12% and 1.92%.
Debentures
Debentures of CHF 130 million issued in 2013 mature
on June 26, 2020 and carry an interest rate of 1.25%.
Debentures of CHF 135 million issued in 2016 mature
on October 28, 2026 and carry interest of 1.0%
16. BORROWINGSin CHF 1000.– Note 2016 2015
Current
Bank borrowings and overdrafts 134 294 130 834
Loan liabilities third parties 251 242
Loan liabilities related and associated companies 23 - 9 738
Loan liabilities non-controlling interests shareholders 23 807 950
TOTAL CURRENT BORROWINGS 22 135 352 141 764
Non-current
Bank borrowings 22 27 260 57 132
Loan liabilities third parties 22 836 1 003
Loan liabilities related and associated companies 22, 23 - 475
Debentures 22 264 626 129 522
TOTAL NON-CURRENT BORROWINGS 292 722 188 132
Hero Annual Report 2016 | 87
17. DEFINED BENEFIT OBLIGATIONSDepending on the legal, economic and fiscal circum-
stances in each country, different retirement benefit
systems are provided for the employees of the Group.
As a rule, these systems are based on length of service
and salary of the employees. Pension obligations in the
Group relate to both defined benefit and defined contri-
bution plans. Defined benefit plans are funded and un-
funded. Most Group companies sponsor defined benefit
pension schemes which are funded by payments to
separate trustee-administered funds. The obligations of
German companies are unfunded. The latest actuarial
valuations under IAS 19 were carried out as at December
31, 2016, for all significant pension plans.
The Group’s largest pension plans are in Switzerland
and Germany (Schwartauer Werke). They account for
85% (2015: 85%) of the Group’s defined benefit obliga-
tions and 87% (2015: 87%) of the Group’s plan assets.
Pension plans in Switzerland
Pension plans are governed by the Swiss Federal Law
on Occupational Retirement, Survivors’ and Disability
Pension Plans (BVG), which stipulates that pension
plans are to be managed by independent, legally
autonomous units. Pen sion plans are overseen by
a regulator as well as by a state supervisory body.
A pension plan’s most senior governing body (Board
of Trustees) must be composed of equal numbers of
employee and employer representatives.
Plan participants are insured against the financial con-
sequences of old age, disability and death. The various
insurance benefits are governed in regulations, with
the BVG specifying the minimum benefits that are to be
provided. The employer and employees pay contribu-
tions to the pension plan. In case of an underfunding,
various measures can be taken such as the adjustment
of the pension commitment by altering the conversion
rates or increasing current contributions. The employer
can also make additional restructuring contributions.
The BVG prescribes how employees and employer have
to jointly fund potential restructurings.
The Swiss pension plan “Hero Pensionskasse” has the
legal structure of a foundation. All actuarial risks are
borne by the foundation. These risks consist of demo-
graphic risks (primarily life expectancy) and financial
risks (primarily the discount rate, future increases in
salaries/wages, and the return on plan assets) and are
regularly assessed by the Board of Trustees. In addition,
an annual actuarial report is drawn up in accordance
with the requirements of the BVG. The report is not
produced using the projected unit credit method, as
required by IFRS. The definitive funded status according
to the BVG is determined in the first quarter of the
following year. According to estimates, the funded status
at December 31, 2016, is 106% (2015: 105%, final). In
addition, a report is prepared annually in accordance
with IFRS requirements.
The Board of Trustees is responsible for the investment
of the assets. It defines the investment strategy when-
ever necessary – especially in the case of significant
market developments or changes to the structure of
88 | Hero Annual Report 2016
the plan participants. When defining the investment
strategy, it takes account of the foundation’s objectives,
benefit obligations and risk capacity. The investment
strategy is defined in the form of a long-term target
asset structure (investment policy). The Board of Trus-
tees delegates the implementation of the investment
policy – in accordance with the investment strategy as
well as various principles and objectives – to an exter-
nal Investment Trust. The funded plans also include
“Pensionskasse der Direktionsmitglieder der Hero
Schweiz AG” (an extra-mandatory, semi-autonomous
management pension plan). The purpose of this pen-
sion plan for employees in management functions is to
extend the insurance cover provided by the existing
pension plan.
The Swiss pension plans are treated as defined benefit
plans under IAS 19 because both the actuarial risks
and the investment risks are borne not only by the
insured but also by the company.
Pension plan Schwartauer Werke, Germany
Schwartauer Werke grants pension benefits to its
em ployees in addition to the state plan. The plan is an
unfunded plan and the risks associated to the plan are
covered by pension liabilities of Schwartauer Werke,
and reimbursement rights under an insurance policy.
The rights to reimbursement are under an insurance
policy that exactly matches the amount and timing of
some of the benefits payable under the pension
scheme. They are disclosed as an asset (see note 10).
The book value of the reimbursement rights in 2016 is
TCHF 2’755 (2015: TCHF 3’007).
Employee benefits are mainly based on three compo-
nents: 1) direct obligation with no contributions of
employees; 2) indirect obligations with no contributions
of employees; 3) direct obligation with contributions of
employees.
All employees under regular and permanent employ-
ment are entitled to participate in the plan. Employees
need to have a minimum age of 30 years and a
minimum time of service of three years. Employees are
entitled to retirement capital, early retirement capital,
old-age pension, invalidity pension and survivor bene-
fits depending on the employees reinsurance value.
Multi-employer plans
The Group has multi-employer defined benefit plans in
the US, The Netherlands and Sweden. For these plans
there is no consistent and reliable basis for allocating
the obligation, plan assets and cost of the plans to the
individual entities parti cipating in the plan. Therefore,
defined benefit accounting cannot be used and these
plans are treated as a defined contribution plans in
accordance with IAS 19. Expected contributions for
2017 are TCHF 1’737.
The most significant multi-employer plan is Beech-Nut
Bakery and Confectio nery Union and Industry Interna-
tional Health Benefits and Pension Fund. It is funded by
employer contributions made pursuant to collective
bargaining agreements between employers and the
Bakery, Confectionary, Tobacco Workers and Grain
Millers International Union. The plan is funded on an
hours worked basis. The rate is set based on the pen-
sion rules. The plan rates are set by the Pension Board
Hero Annual Report 2016 | 89
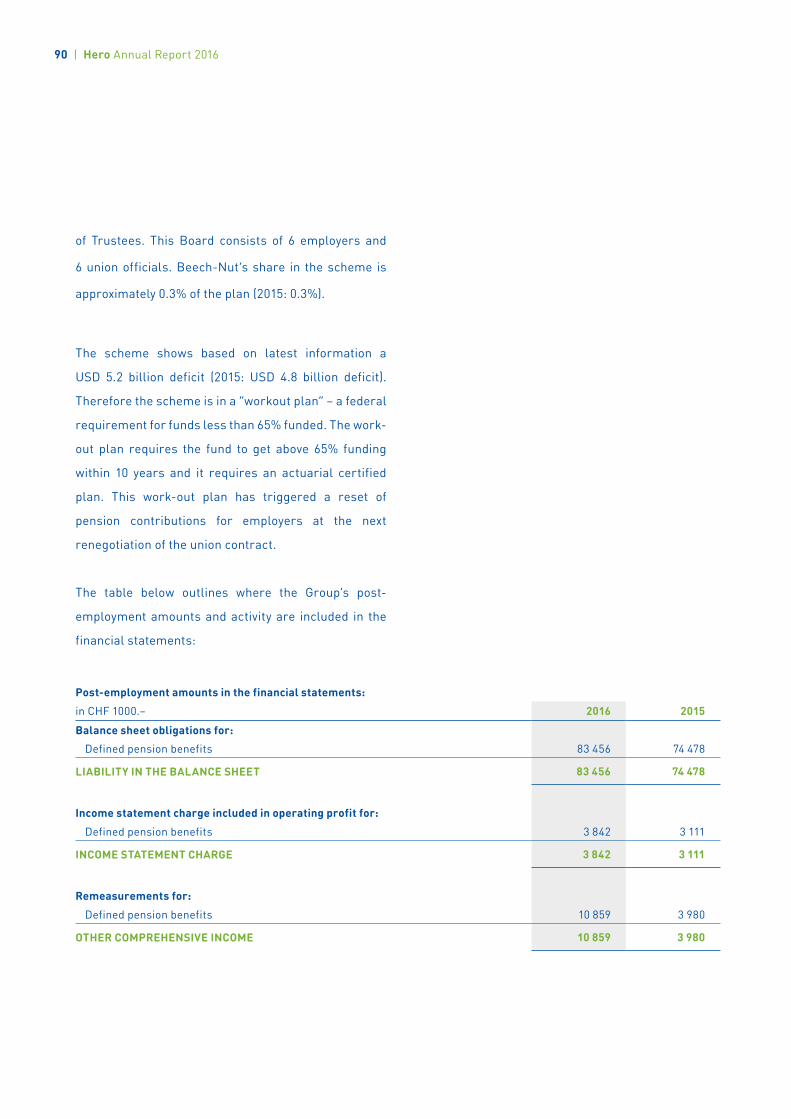
The scheme shows based on latest information a
USD 5.2 billion deficit (2015: USD 4.8 billion deficit).
Therefore the scheme is in a “workout plan” – a federal
requirement for funds less than 65% funded. The work-
out plan requires the fund to get above 65% funding
within 10 years and it requires an actuarial certified
plan. This work-out plan has triggered a reset of
pension contributions for employers at the next
renegotiation of the union contract.
The table below outlines where the Group’s post-
employment amounts and activity are included in the
financial statements:
Post-employment amounts in the financial statements:
in CHF 1000.– 2016 2015
Balance sheet obligations for: Defined pension benefits 83 456 74 478
LIABILITY IN THE BALANCE SHEET 83 456 74 478
Income statement charge included in operating profit for:
Defined pension benefits 3 842 3 111
INCOME STATEMENT CHARGE 3 842 3 111
Remeasurements for:
Defined pension benefits 10 859 3 980
OTHER COMPREHENSIVE INCOME 10 859 3 980
of Trustees. This Board consists of 6 employers and
6 union officials. Beech-Nut’s share in the scheme is
approximately 0.3% of the plan (2015: 0.3%).
90 | Hero Annual Report 2016

Amounts recognized in the balance sheet:
in CHF 1000.– 2016 2015
Switzerland
Present value of funded obligations 103 795 107 339
(Fair value of plan assets) (87 527) (91 620)
Deficit of funded obligations 16 268 15 719
Impact of asset ceiling 2 362 1 723
LIABILITY IN THE BALANCE SHEET 18 630 17 442
Germany
Present value of unfunded obligations 49 627 43 051
LIABILITY IN THE BALANCE SHEET 49 627 43 051
Other
Present value of funded obligations 16 312 15 887
(Fair value of plan assets) (13 259) (13 433)
Deficit of funded obligations 3 053 2 454
Present value of unfunded obligations 10 980 9 941
Total deficit of defined benefit pension plans 14 033 12 395
Impact of asset ceiling 1 166 1 590
LIABILITY IN THE BALANCE SHEET 15 199 13 985
Total
Present value of funded obligations 120 107 123 226
(Fair value of plan assets) (100 786) (105 053)
Deficit of funded obligations 19 321 18 173
Present value of unfunded obligations 60 607 52 992
Total deficit of defined benefit pension plans 79 928 71 165
Impact of asset ceiling 3 528 3 313
LIABILITY IN THE BALANCE SHEET 83 456 74 478
Hero Annual Report 2016 | 91
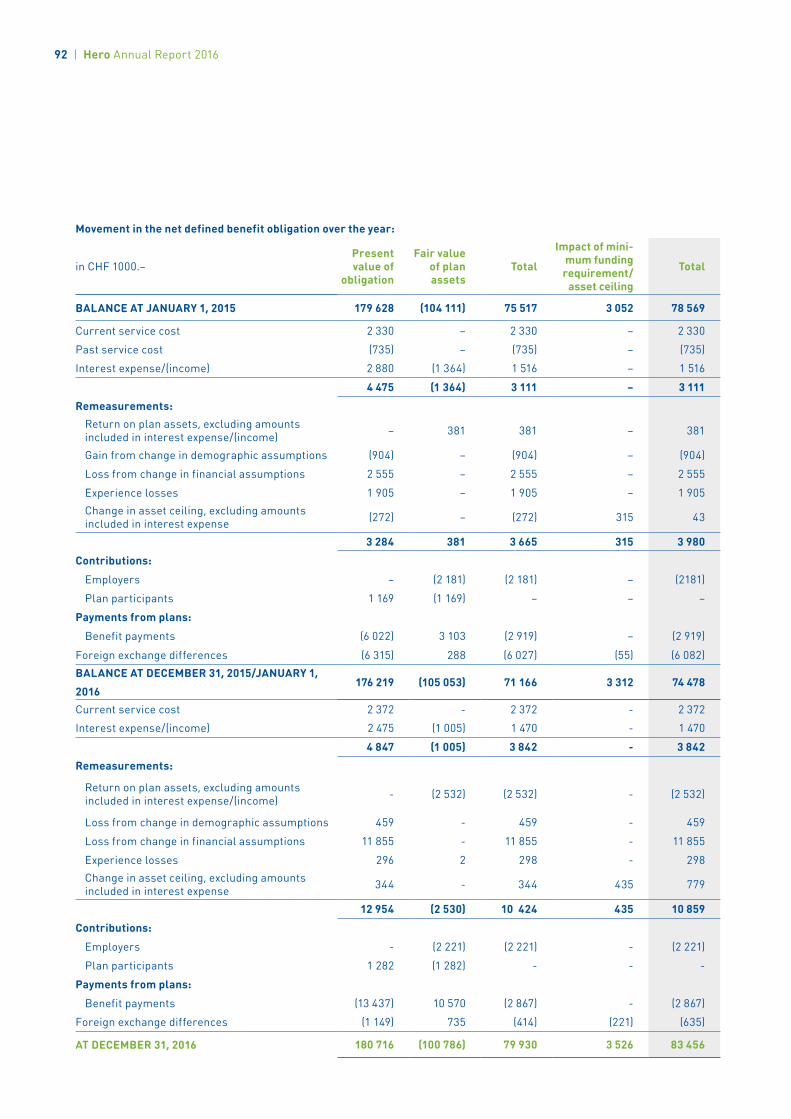
Movement in the net defined benefit obligation over the year:
in CHF 1000.–Present value of
obligation
Fair value of plan assets
Total
Impact of mini-mum funding requirement/
asset ceiling
Total
BALANCE AT JANUARY 1, 2015 179 628 (104 111) 75 517 3 052 78 569
Current service cost 2 330 – 2 330 – 2 330
Past service cost (735) – (735) – (735)
Interest expense/(income) 2 880 (1 364) 1 516 – 1 516
4 475 (1 364) 3 111 – 3 111
Remeasurements: Return on plan assets, excluding amounts
included in interest expense/(income) – 381 381 – 381
Gain from change in demographic assumptions (904) – (904) – (904)
Loss from change in financial assumptions 2 555 – 2 555 – 2 555
Experience losses 1 905 – 1 905 – 1 905 Change in asset ceiling, excluding amounts
included in interest expense (272) – (272) 315 43
3 284 381 3 665 315 3 980
Contributions:
Employers – (2 181) (2 181) – (2181)
Plan participants 1 169 (1 169) – – –
Payments from plans:
Benefit payments (6 022) 3 103 (2 919) – (2 919)
Foreign exchange differences (6 315) 288 (6 027) (55) (6 082)
BALANCE AT DECEMBER 31, 2015/JANUARY 1, 2016
176 219 (105 053) 71 166 3 312 74 478
Current service cost 2 372 - 2 372 - 2 372
Interest expense/(income) 2 475 (1 005) 1 470 - 1 470
4 847 (1 005) 3 842 - 3 842
Remeasurements:
Return on plan assets, excluding amounts included in interest expense/(income) - (2 532) (2 532) - (2 532)
Loss from change in demographic assumptions 459 - 459 - 459
Loss from change in financial assumptions 11 855 - 11 855 - 11 855
Experience losses 296 2 298 - 298 Change in asset ceiling, excluding amounts
included in interest expense 344 - 344 435 779
12 954 (2 530) 10 424 435 10 859
Contributions:
Employers - (2 221) (2 221) - (2 221)
Plan participants 1 282 (1 282) - - -
Payments from plans:
Benefit payments (13 437) 10 570 (2 867) - (2 867)
Foreign exchange differences (1 149) 735 (414) (221) (635)
AT DECEMBER 31, 2016 180 716 (100 786) 79 930 3 526 83 456
92 | Hero Annual Report 2016
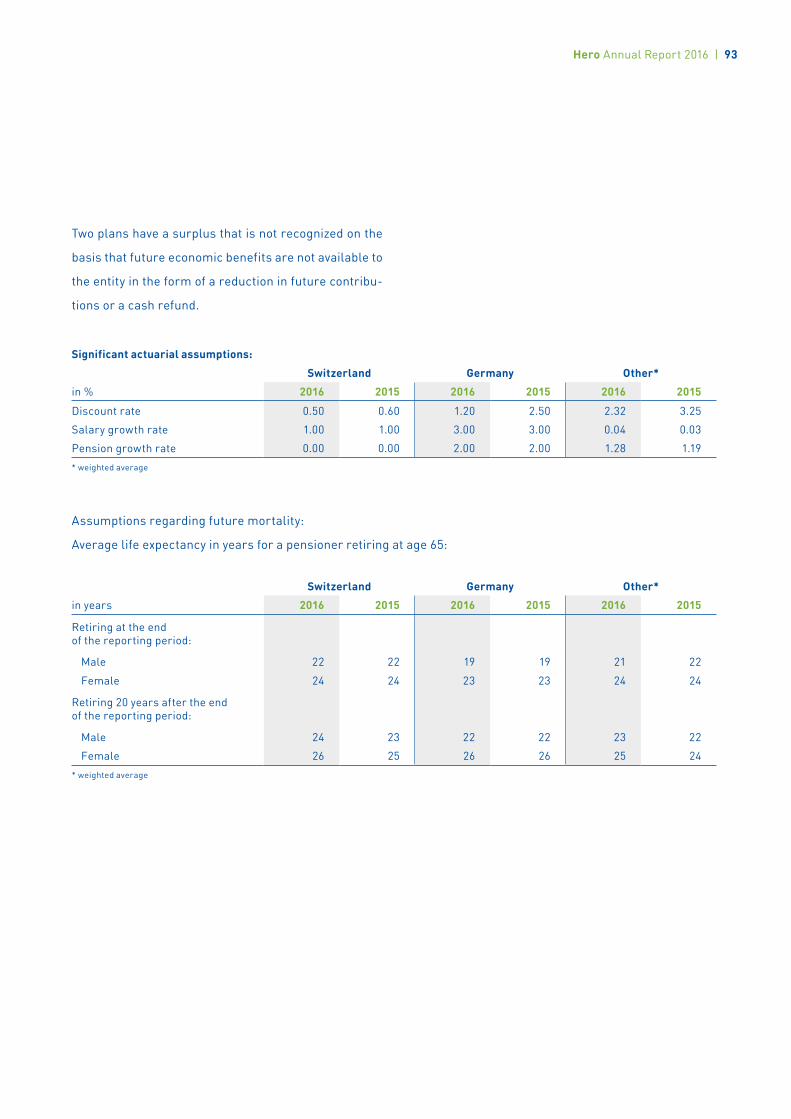
Two plans have a surplus that is not recognized on the
basis that future economic benefits are not available to
the entity in the form of a reduction in future contribu-
tions or a cash refund.
Assumptions regarding future mortality:
Average life expectancy in years for a pensioner retiring at age 65:
Significant actuarial assumptions:
Switzerland Germany Other*
in % 2016 2015 2016 2015 2016 2015
Discount rate 0.50 0.60 1.20 2.50 2.32 3.25
Salary growth rate 1.00 1.00 3.00 3.00 0.04 0.03
Pension growth rate 0.00 0.00 2.00 2.00 1.28 1.19
* weighted average
Switzerland Germany Other*
in years 2016 2015 2016 2015 2016 2015
Retiring at the end of the reporting period:
Male 22 22 19 19 21 22
Female 24 24 23 23 24 24
Retiring 20 years after the end of the reporting period:
Male 24 23 22 22 23 22
Female 26 25 26 26 25 24
* weighted average
Hero Annual Report 2016 | 93
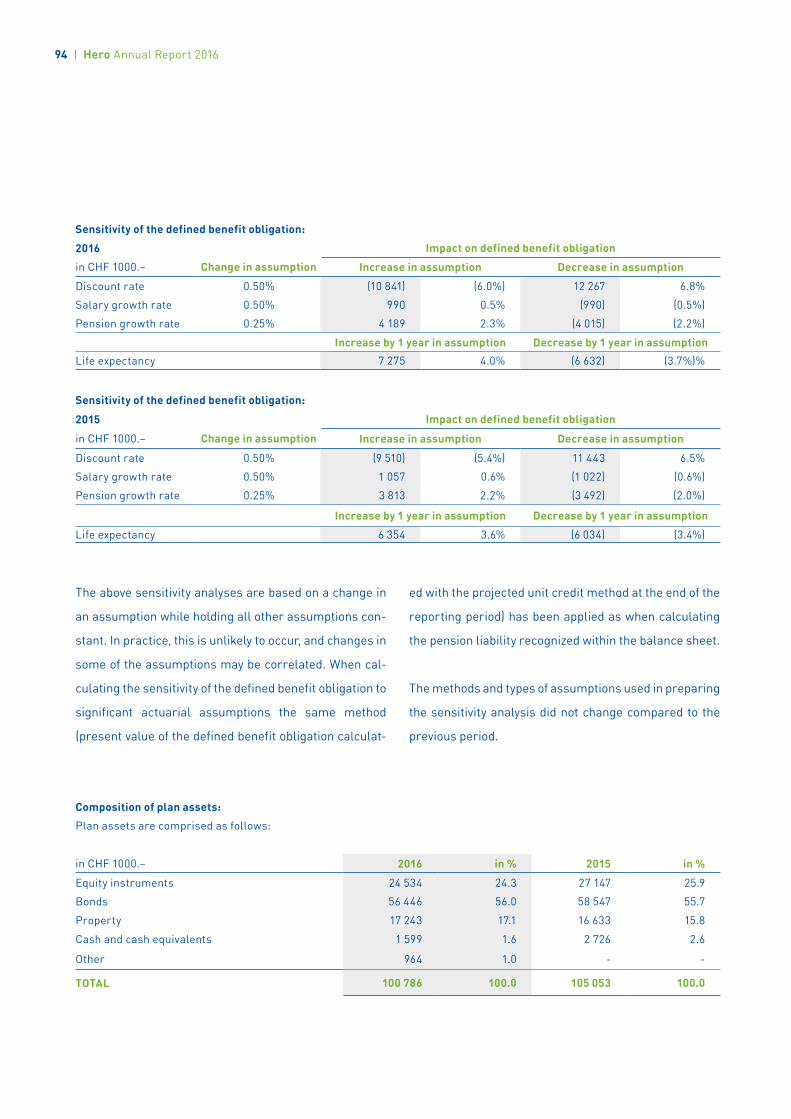
Sensitivity of the defined benefit obligation:
2016 Impact on defined benefit obligation
in CHF 1000.– Change in assumption Increase in assumption Decrease in assumption
Discount rate 0.50% (10 841) (6.0%) 12 267 6.8%
Salary growth rate 0.50% 990 0.5% (990) (0.5%)
Pension growth rate 0.25% 4 189 2.3% (4 015) (2.2%)
Increase by 1 year in assumption Decrease by 1 year in assumptionLife expectancy 7 275 4.0% (6 632) (3.7%)%
Sensitivity of the defined benefit obligation:
2015 Impact on defined benefit obligation
in CHF 1000.– Change in assumption Increase in assumption Decrease in assumption
Discount rate 0.50% (9 510) (5.4%) 11 443 6.5%
Salary growth rate 0.50% 1 057 0.6% (1 022) (0.6%)
Pension growth rate 0.25% 3 813 2.2% (3 492) (2.0%)
Increase by 1 year in assumption Decrease by 1 year in assumption
Life expectancy 6 354 3.6% (6 034) (3.4%)
The above sensitivity analyses are based on a change in
an assumption while holding all other assumptions con-
stant. In practice, this is unlikely to occur, and changes in
some of the assumptions may be correlated. When cal-
culating the sensitivity of the defined benefit obligation to
significant actuarial assumptions the same method
(present value of the defined benefit obligation calculat-
ed with the projected unit credit method at the end of the
reporting period) has been applied as when calculating
the pension liability recognized within the balance sheet.
The methods and types of assumptions used in preparing
the sensitivity analysis did not change compared to the
previous period.
Composition of plan assets:Plan assets are comprised as follows:
in CHF 1000.– 2016 in % 2015 in %
Equity instruments 24 534 24.3 27 147 25.9
Bonds 56 446 56.0 58 547 55.7
Property 17 243 17.1 16 633 15.8
Cash and cash equivalents 1 599 1.6 2 726 2.6
Other 964 1.0 - -
TOTAL 100 786 100.0 105 053 100.0
94 | Hero Annual Report 2016
The assets of the Swiss pension funds which represent
87% (2015: 87%) of the Group’s plan assets are com-
prised of:
• 23% (2015: 23%) Equity instruments with quoted pric-
es in an active market (level 1 fair value classification).
• 56% (2015: 57%) Bonds with quoted prices in an
active market (level 1 fair value classification).
• 20% (2015: 18%) Property with quoted prices in
active markets for similar assets or liabilities or
other valuation techniques for which all significant
inputs are based on observable market data (level 2
fair value classification).
• 1% (2015: 3%) Cash and cash equivalents with
quoted prices in an active market (level 1 fair value
classification).
Through its defined benefit pension plans, the Group is
exposed to a number of risks, the most significant of
which are detailed below:
Asset volatility
The plan liabilities are calculated using a discount rate
set with reference to corporate bond yields; if plan
assets underperform this yield, this will create a deficit.
Changes in bond yields
A decrease in corporate bond yields will increase plan
liabilities, although this will be partially offset by an
increase in the value of the plans’ bond holdings.
Inflation risk
The majority of the plans’ benefit obligations are linked
to inflation, and higher inflation will lead to higher
liabilities (although, in most cases, caps on the level of
inflationary increases are in place to protect the plan
against extreme inflation). The majority of the plan’s
assets are either un affected by (fixed interest bonds) or
loosely correlated with (equities) inflation, meaning that
an increase in inflation will also increase the deficit.
Life expectancy
The majority of the plans’ obligations are to provide
benefits for the life of the member, so increases in
life expectancy will result in an increase in the plans’
liabilities. In case of the funded plans, the group ensures
that the investment positions are managed within an
asset-liability matching (ALM) framework that has been
developed to achieve long-term investments that are in
line with the obligations under the pension schemes.
Within this framework, the Group’s ALM objective is to
match assets to the pension obligations by investing in
long-term fixed interest securities with maturities that
match the benefit payments as they fall due and in the
appropriate cur rency. The company actively monitors
how the duration and the expected yield of the invest-
ments are matching the expected cash outflows arising
from the pension obligations. The Group has not changed
the processes used to manage its risks from previous
periods. The Group does not use derivatives to manage
its pension scheme risk. Investments are well diversi-
fied, such that the failure of any single investment would
not have a material impact on the overall level of assets.
The largest proportion of assets is invested in bonds,
although the Group also invests in property, equity, cash
and alternative investments.
Hero Annual Report 2016 | 95
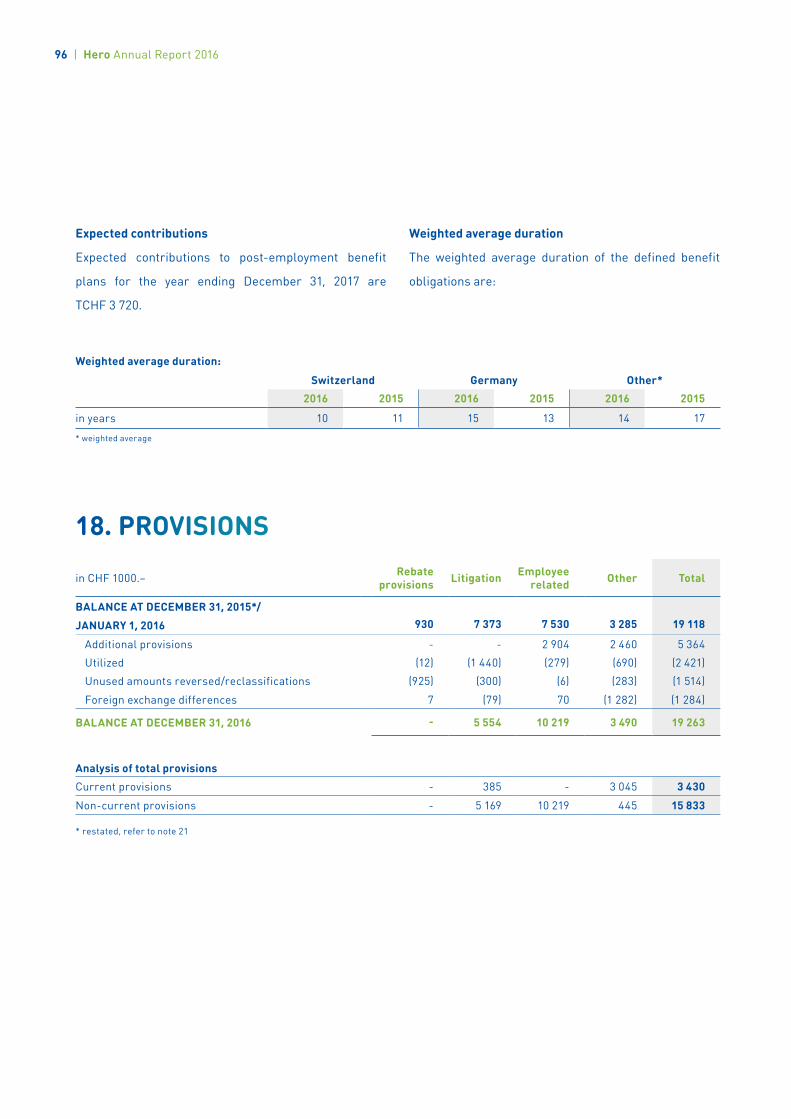
Expected contributions
Expected contributions to post-employment benefit
plans for the year ending December 31, 2017 are
TCHF 3 720.
Weighted average duration
The weighted average duration of the defined benefit
obligations are:
Weighted average duration:
Switzerland Germany Other*2016 2015 2016 2015 2016 2015
in years 10 11 15 13 14 17
* weighted average
18. PROVISIONS
in CHF 1000.– Rebate provisions Litigation Employee
related Other Total
BALANCE AT DECEMBER 31, 2015*/ JANUARY 1, 2016 930 7 373 7 530 3 285 19 118
Additional provisions - - 2 904 2 460 5 364
Utilized (12) (1 440) (279) (690) (2 421)
Unused amounts reversed/reclassifications (925) (300) (6) (283) (1 514)
Foreign exchange differences 7 (79) 70 (1 282) (1 284)
BALANCE AT DECEMBER 31, 2016 - 5 554 10 219 3 490 19 263
Analysis of total provisionsCurrent provisions - 385 - 3 045 3 430
Non-current provisions - 5 169 10 219 445 15 833
* restated, refer to note 21
96 | Hero Annual Report 2016
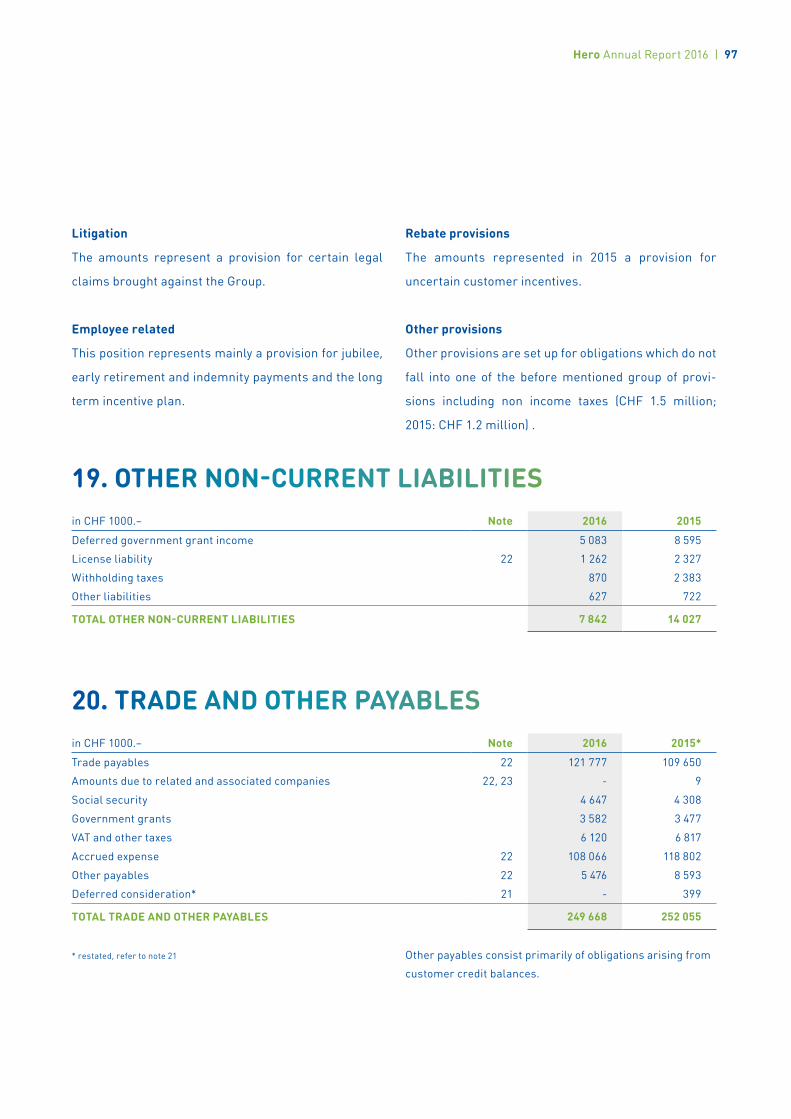
Litigation
The amounts represent a provision for certain legal
claims brought against the Group.
Employee related
This position represents mainly a provision for jubilee,
early retirement and indemnity payments and the long
term incentive plan.
Rebate provisions
The amounts represented in 2015 a provision for
uncertain customer incentives.
Other provisions
Other provisions are set up for obligations which do not
fall into one of the before mentioned group of provi-
sions including non income taxes (CHF 1.5 million;
2015: CHF 1.2 million) .
* restated, refer to note 21 Other payables consist primarily of obligations arising from
customer credit balances.
19. OTHER NON-CURRENT LIABILITIESin CHF 1000.– Note 2016 2015
Deferred government grant income 5 083 8 595
License liability 22 1 262 2 327
Withholding taxes 870 2 383
Other liabilities 627 722
TOTAL OTHER NON-CURRENT LIABILITIES 7 842 14 027
20. TRADE AND OTHER PAYABLESin CHF 1000.– Note 2016 2015*
Trade payables 22 121 777 109 650
Amounts due to related and associated companies 22, 23 - 9
Social security 4 647 4 308
Government grants 3 582 3 477
VAT and other taxes 6 120 6 817
Accrued expense 22 108 066 118 802
Other payables 22 5 476 8 593
Deferred consideration* 21 - 399
TOTAL TRADE AND OTHER PAYABLES 249 668 252 055
Hero Annual Report 2016 | 97
21. BUSINESS COMBINATIONS, ACQUISITION OF NON-CONTROLLING INTERESTS AND DISPOSALS
Effective December 1, 2015, the Group acquired 50%
plus one share in the share capital of the Brazilian jam
manufacturer and distributor Kiviks Marknad Indus-
trias Alimenticias S.A. and obtained control of the
company. The products are sold under the brand name
“Queensberry”. The Group acquired Kiviks Marknad
Industrias Alimenticias S.A. to establish a market
presence in the South American continent. The Group
has elected to measure the non-controlling interests in
the acquiree at the proportionate share of its interest
in the acquiree’s identifiable net assets.
The Group incurred acquisition-related costs of CHF 0.6
million mainly on legal fees and due diligence costs. These
costs have been included in ‘administrative expense’.
The goodwill on the acquisition is attributable to the
profitability of the acquired business and its leverage on
the existing business. None of the goodwill recognized
is expected to be deductible for income tax purposes.
The acquisition values of Kiviks Marknad Industrias
Alimenticias S.A. which have been provisionally
determined in 2015 have been finally assessed in 2016.
The acquisition values are shown on the next page.
The comparative amounts disclosed in these financial
statements have been retrospectively adjusted.
98 | Hero Annual Report 2016
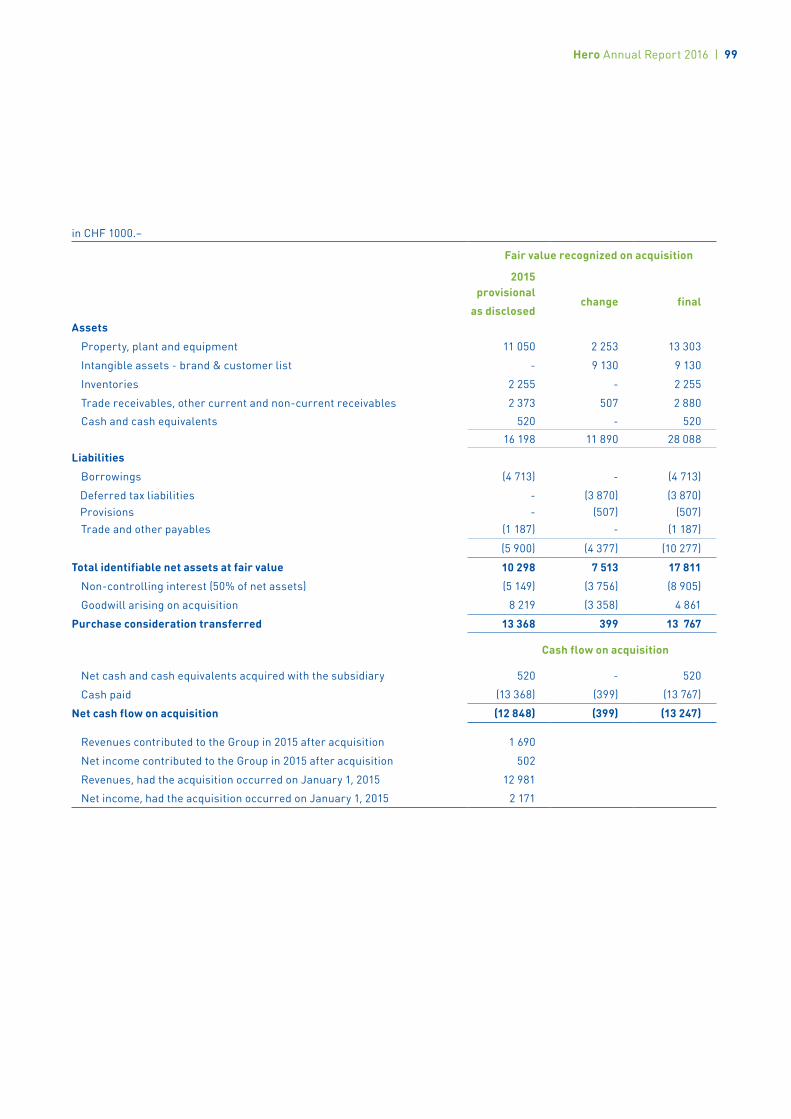
in CHF 1000.–
Fair value recognized on acquisition
2015provisional
as disclosedchange final
Assets
Property, plant and equipment 11 050 2 253 13 303
Intangible assets - brand & customer list - 9 130 9 130
Inventories 2 255 - 2 255
Trade receivables, other current and non-current receivables 2 373 507 2 880
Cash and cash equivalents 520 - 520
16 198 11 890 28 088
Liabilities
Borrowings (4 713) - (4 713)
Deferred tax liabilities - (3 870) (3 870) Provisions - (507) (507) Trade and other payables (1 187) - (1 187)
(5 900) (4 377) (10 277)
Total identifiable net assets at fair value 10 298 7 513 17 811
Non-controlling interest (50% of net assets) (5 149) (3 756) (8 905)
Goodwill arising on acquisition 8 219 (3 358) 4 861
Purchase consideration transferred 13 368 399 13 767
Cash flow on acquisition
Net cash and cash equivalents acquired with the subsidiary 520 - 520
Cash paid (13 368) (399) (13 767)
Net cash flow on acquisition (12 848) (399) (13 247)
Revenues contributed to the Group in 2015 after acquisition 1 690
Net income contributed to the Group in 2015 after acquisition 502
Revenues, had the acquisition occurred on January 1, 2015 12 981
Net income, had the acquisition occurred on January 1, 2015 2 171
Hero Annual Report 2016 | 99
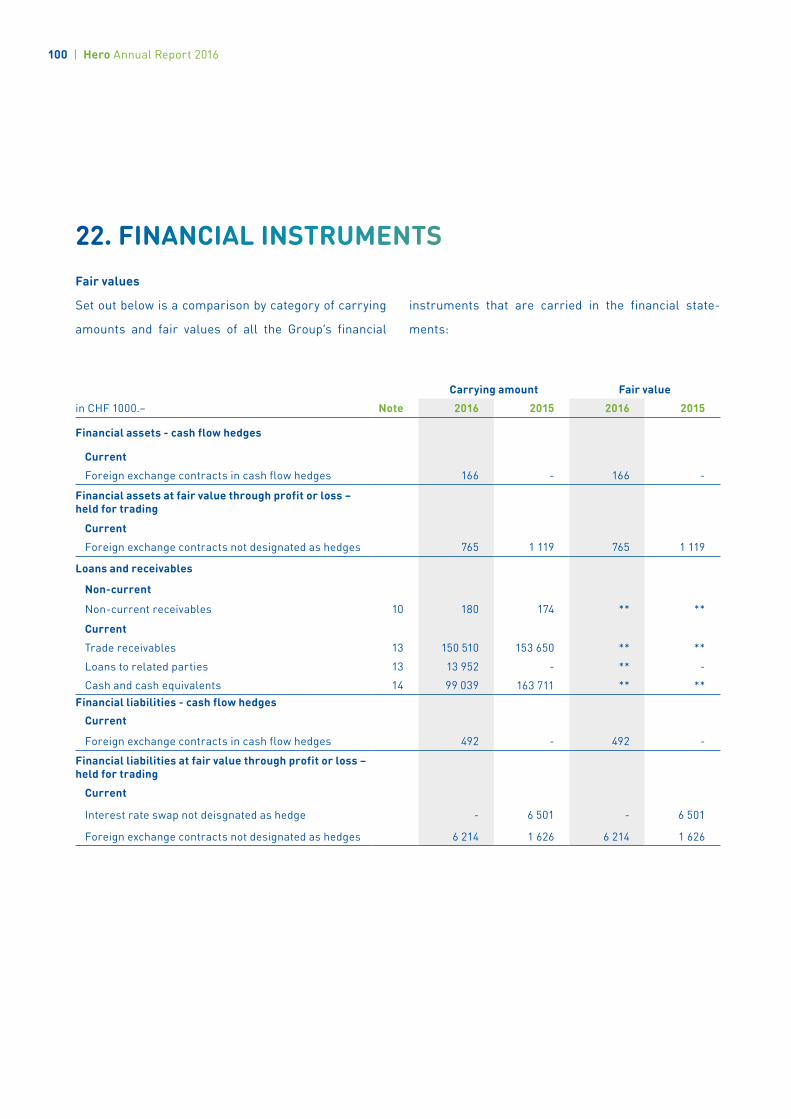
22. FINANCIAL INSTRUMENTSFair values
Set out below is a comparison by category of carrying
amounts and fair values of all the Group’s financial
instruments that are carried in the financial state-
ments:
Carrying amount Fair value
in CHF 1000.– Note 2016 2015 2016 2015
Financial assets - cash flow hedges
Current
Foreign exchange contracts in cash flow hedges 166 - 166 -
Financial assets at fair value through profit or loss – held for trading
Current
Foreign exchange contracts not designated as hedges 765 1 119 765 1 119
Loans and receivables
Non-current
Non-current receivables 10 180 174 ** **
Current
Trade receivables 13 150 510 153 650 ** **
Loans to related parties 13 13 952 - ** -
Cash and cash equivalents 14 99 039 163 711 ** **Financial liabilities - cash flow hedges Current
Foreign exchange contracts in cash flow hedges 492 - 492 -
Financial liabilities at fair value through profit or loss – held for trading
Current
Interest rate swap not deisgnated as hedge - 6 501 - 6 501
Foreign exchange contracts not designated as hedges 6 214 1 626 6 214 1 626
100 | Hero Annual Report 2016
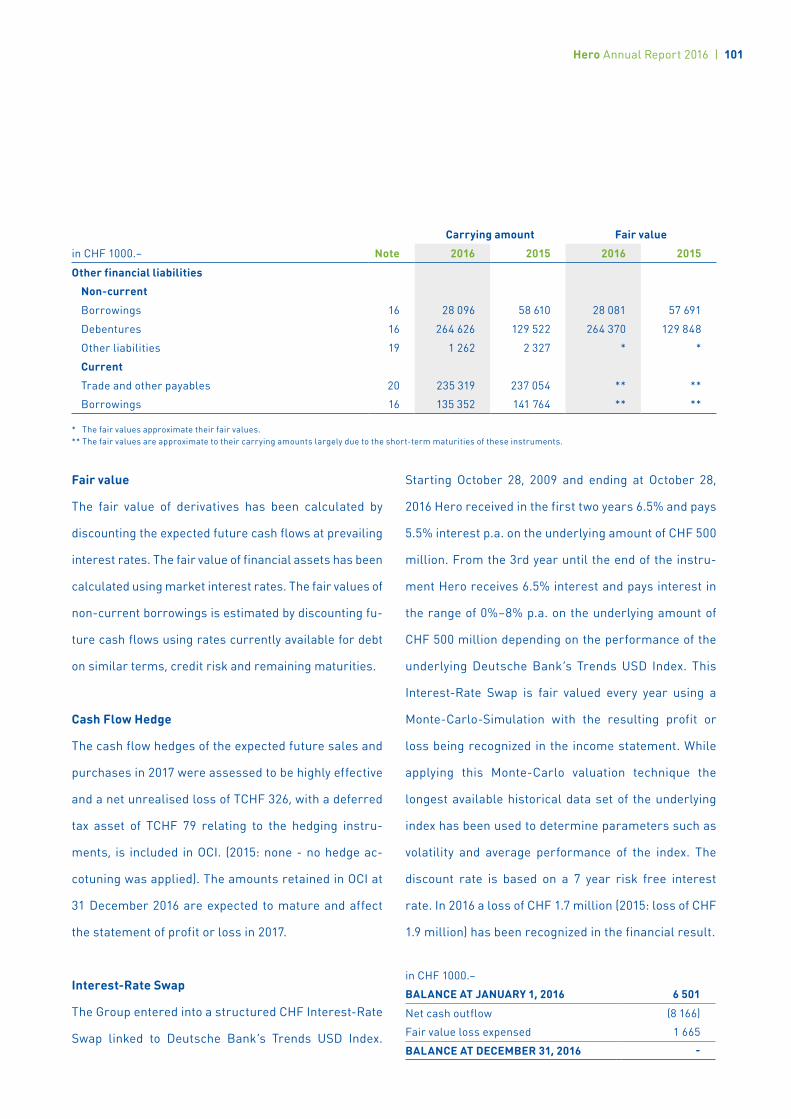
Carrying amount Fair value
in CHF 1000.– Note 2016 2015 2016 2015
Other financial liabilities
Non-current
Borrowings 16 28 096 58 610 28 081 57 691
Debentures 16 264 626 129 522 264 370 129 848
Other liabilities 19 1 262 2 327 * *
Current
Trade and other payables 20 235 319 237 054 ** **
Borrowings 16 135 352 141 764 ** **
* The fair values approximate their fair values.** The fair values are approximate to their carrying amounts largely due to the short-term maturities of these instruments.
Fair value
The fair value of derivatives has been calculated by
discounting the expected future cash flows at prevailing
interest rates. The fair value of financial assets has been
calculated using market interest rates. The fair values of
non-current borrowings is estimated by discounting fu-
ture cash flows using rates currently available for debt
on similar terms, credit risk and remaining maturities.
Cash Flow Hedge
The cash flow hedges of the expected future sales and
purchases in 2017 were assessed to be highly effective
and a net unrealised loss of TCHF 326, with a deferred
tax asset of TCHF 79 relating to the hedging instru-
ments, is included in OCI. (2015: none - no hedge ac-
cotuning was applied). The amounts retained in OCI at
31 December 2016 are expected to mature and affect
the statement of profit or loss in 2017.
Interest-Rate Swap
The Group entered into a structured CHF Interest-Rate
Swap linked to Deutsche Bank’s Trends USD Index.
Starting October 28, 2009 and ending at October 28,
2016 Hero received in the first two years 6.5% and pays
5.5% interest p.a. on the underlying amount of CHF 500
million. From the 3rd year until the end of the instru-
ment Hero receives 6.5% interest and pays interest in
the range of 0%–8% p.a. on the underlying amount of
CHF 500 million depending on the performance of the
underlying Deutsche Bank’s Trends USD Index. This
Interest-Rate Swap is fair valued every year using a
Monte-Carlo-Simulation with the resulting profit or
loss being recognized in the income statement. While
applying this Monte-Carlo valuation technique the
longest available historical data set of the underlying
index has been used to determine parameters such as
volatility and average performance of the index. The
discount rate is based on a 7 year risk free interest
rate. In 2016 a loss of CHF 1.7 million (2015: loss of CHF
1.9 million) has been recognized in the financial result.
in CHF 1000.–
BALANCE AT JANUARY 1, 2016 6 501
Net cash outflow (8 166)
Fair value loss expensed 1 665
BALANCE AT DECEMBER 31, 2016 -
Hero Annual Report 2016 | 101
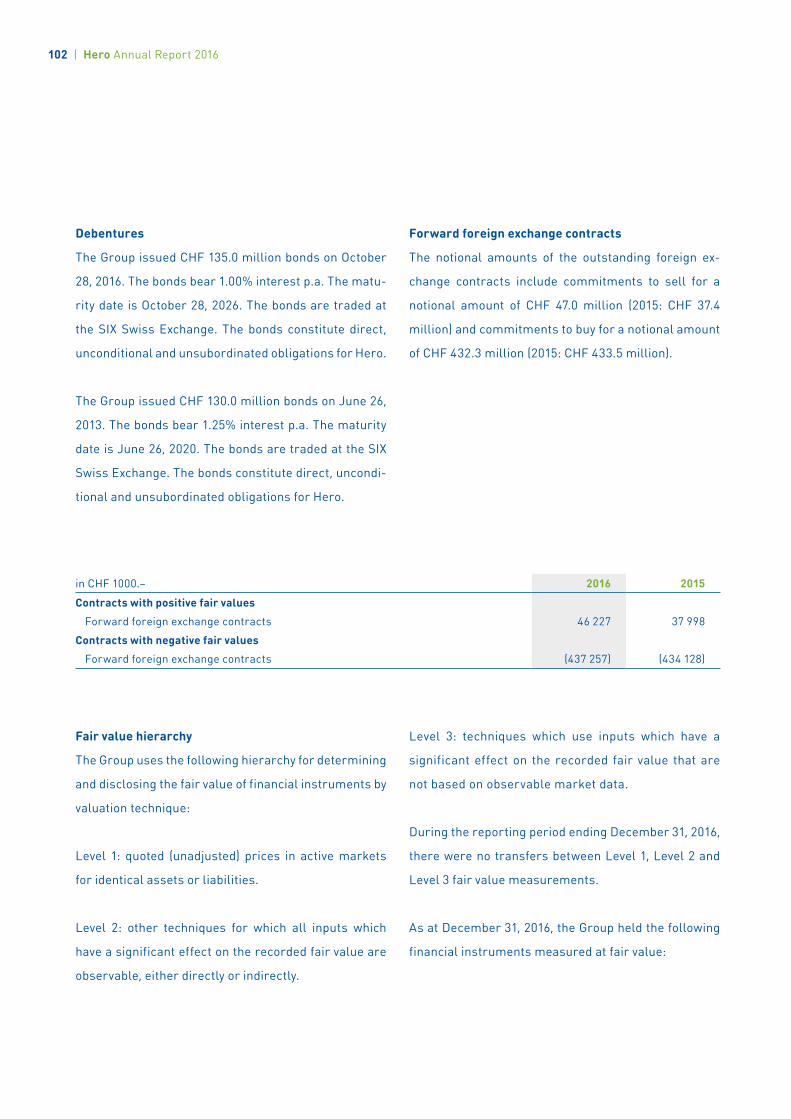
Debentures
The Group issued CHF 135.0 million bonds on October
28, 2016. The bonds bear 1.00% interest p.a. The matu-
rity date is October 28, 2026. The bonds are traded at
the SIX Swiss Exchange. The bonds constitute direct,
unconditional and unsubordinated obligations for Hero.
The Group issued CHF 130.0 million bonds on June 26,
2013. The bonds bear 1.25% interest p.a. The maturity
date is June 26, 2020. The bonds are traded at the SIX
Swiss Exchange. The bonds constitute direct, uncondi-
tional and unsubordinated obligations for Hero.
Forward foreign exchange contracts
The notional amounts of the outstanding foreign ex-
change contracts include commitments to sell for a
notional amount of CHF 47.0 million (2015: CHF 37.4
million) and commitments to buy for a notional amount
of CHF 432.3 million (2015: CHF 433.5 million).
Fair value hierarchy
The Group uses the following hierarchy for determining
and disclosing the fair value of financial instruments by
valuation technique:
Level 1: quoted (unadjusted) prices in active markets
for identical assets or liabilities.
Level 2: other techniques for which all inputs which
have a significant effect on the recorded fair value are
observable, either directly or indirectly.
Level 3: techniques which use inputs which have a
significant effect on the recorded fair value that are
not based on observable market data.
During the reporting period ending December 31, 2016,
there were no transfers between Level 1, Level 2 and
Level 3 fair value measurements.
As at December 31, 2016, the Group held the following
financial instruments measured at fair value:
in CHF 1000.– 2016 2015
Contracts with positive fair values
Forward foreign exchange contracts 46 227 37 998
Contracts with negative fair values
Forward foreign exchange contracts (437 257) (434 128)
102 | Hero Annual Report 2016
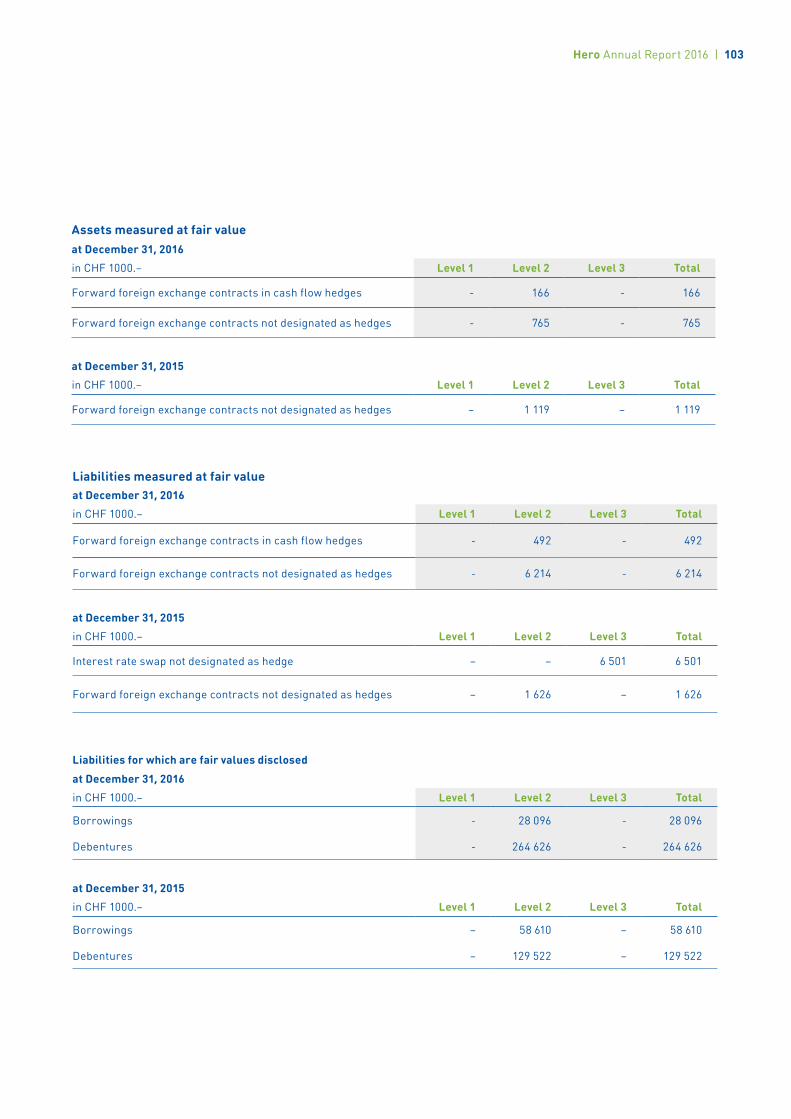
Assets measured at fair valueat December 31, 2016
in CHF 1000.– Level 1 Level 2 Level 3 Total
Forward foreign exchange contracts in cash flow hedges - 166 - 166
Forward foreign exchange contracts not designated as hedges - 765 - 765
at December 31, 2015
in CHF 1000.– Level 1 Level 2 Level 3 Total
Forward foreign exchange contracts not designated as hedges – 1 119 – 1 119
Liabilities measured at fair valueat December 31, 2016
in CHF 1000.– Level 1 Level 2 Level 3 Total
Forward foreign exchange contracts in cash flow hedges - 492 - 492
Forward foreign exchange contracts not designated as hedges - 6 214 - 6 214
at December 31, 2015
in CHF 1000.– Level 1 Level 2 Level 3 Total
Interest rate swap not designated as hedge – – 6 501 6 501
Forward foreign exchange contracts not designated as hedges – 1 626 – 1 626
Liabilities for which are fair values disclosed
at December 31, 2016
in CHF 1000.– Level 1 Level 2 Level 3 Total
Borrowings - 28 096 - 28 096
Debentures - 264 626 - 264 626
at December 31, 2015
in CHF 1000.– Level 1 Level 2 Level 3 Total
Borrowings – 58 610 – 58 610
Debentures – 129 522 – 129 522
Hero Annual Report 2016 | 103
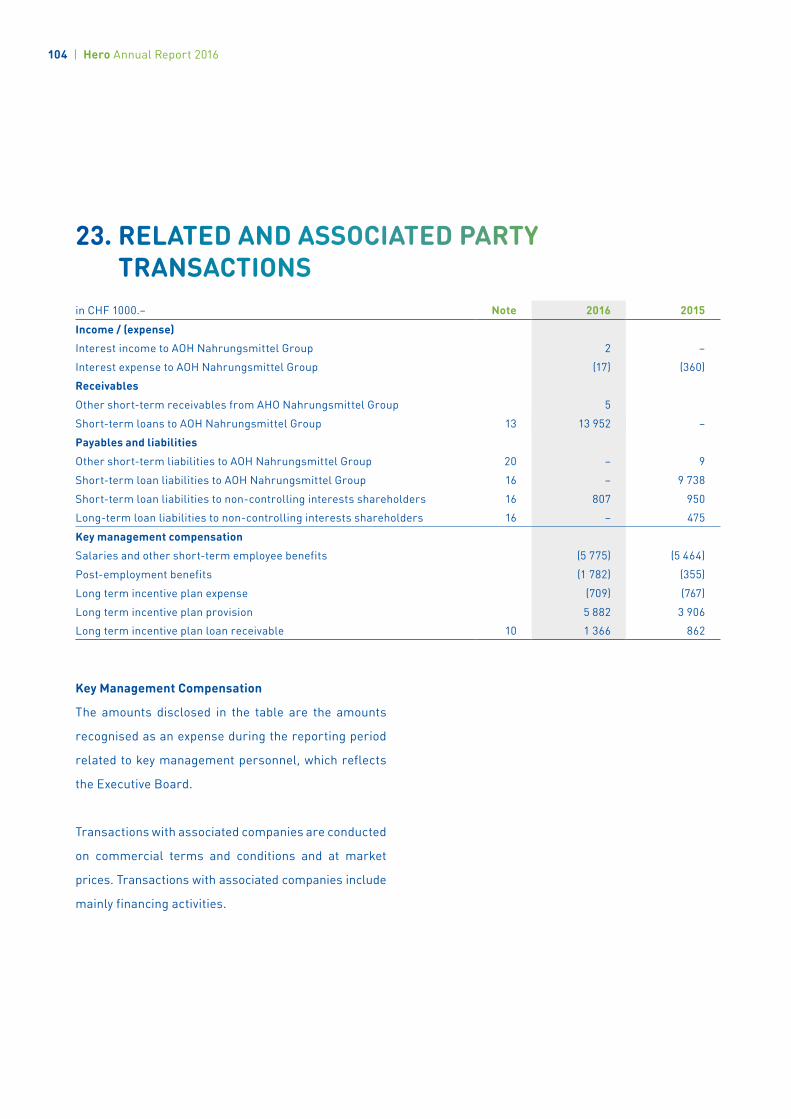
23. RELATED AND ASSOCIATED PARTY TRANSACTIONS
in CHF 1000.– Note 2016 2015
Income / (expense)
Interest income to AOH Nahrungsmittel Group 2 –
Interest expense to AOH Nahrungsmittel Group (17) (360)
Receivables
Other short-term receivables from AHO Nahrungsmittel Group 5
Short-term loans to AOH Nahrungsmittel Group 13 13 952 –
Payables and liabilities
Other short-term liabilities to AOH Nahrungsmittel Group 20 – 9
Short-term loan liabilities to AOH Nahrungsmittel Group 16 – 9 738
Short-term loan liabilities to non-controlling interests shareholders 16 807 950
Long-term loan liabilities to non-controlling interests shareholders 16 – 475
Key management compensation
Salaries and other short-term employee benefits (5 775) (5 464)
Post-employment benefits (1 782) (355)
Long term incentive plan expense (709) (767)
Long term incentive plan provision 5 882 3 906
Long term incentive plan loan receivable 10 1 366 862
Key Management Compensation
The amounts disclosed in the table are the amounts
recognised as an expense during the reporting period
related to key management personnel, which reflects
the Executive Board.
Transactions with associated companies are con ducted
on commercial terms and conditions and at market
prices. Transactions with associated companies include
mainly financing activities.
104 | Hero Annual Report 2016
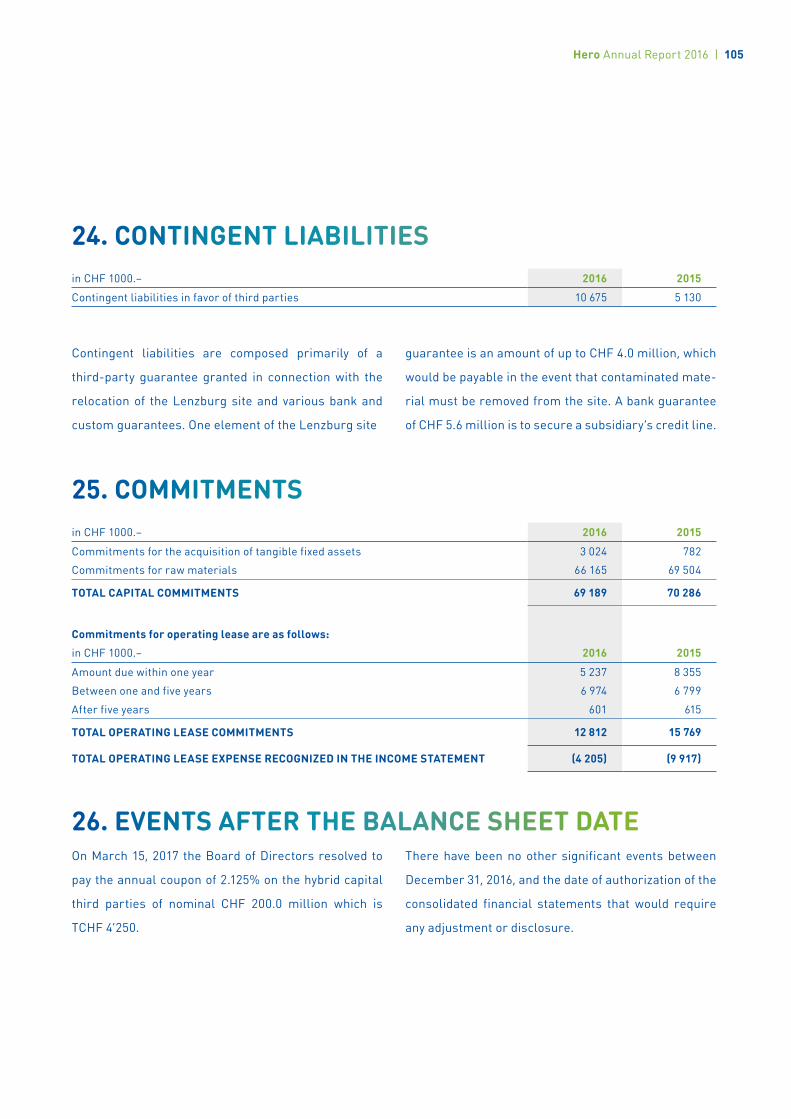
24. CONTINGENT LIABILITIESin CHF 1000.– 2016 2015
Contingent liabilities in favor of third parties 10 675 5 130
25. COMMITMENTSin CHF 1000.– 2016 2015
Commitments for the acquisition of tangible fixed assets 3 024 782
Commitments for raw materials 66 165 69 504
TOTAL CAPITAL COMMITMENTS 69 189 70 286
Commitments for operating lease are as follows:
in CHF 1000.– 2016 2015
Amount due within one year 5 237 8 355
Between one and five years 6 974 6 799
After five years 601 615
TOTAL OPERATING LEASE COMMITMENTS 12 812 15 769
TOTAL OPERATING LEASE EXPENSE RECOGNIZED IN THE INCOME STATEMENT (4 205) (9 917)
Contingent liabilities are composed primarily of a
third-party guarantee granted in connection with the
relocation of the Lenzburg site and various bank and
custom guarantees. One element of the Lenzburg site
guarantee is an amount of up to CHF 4.0 million, which
would be payable in the event that contaminated mate-
rial must be removed from the site. A bank guarantee
of CHF 5.6 million is to secure a subsidiary’s credit line.
26. EVENTS AFTER THE BALANCE SHEET DATEOn March 15, 2017 the Board of Directors resolved to
pay the annual coupon of 2.125% on the hybrid capital
third parties of nominal CHF 200.0 million which is
TCHF 4’250.
There have been no other significant events between
December 31, 2016, and the date of authorization of the
consolidated financial statements that would require
any adjustment or disclosure.
Hero Annual Report 2016 | 105
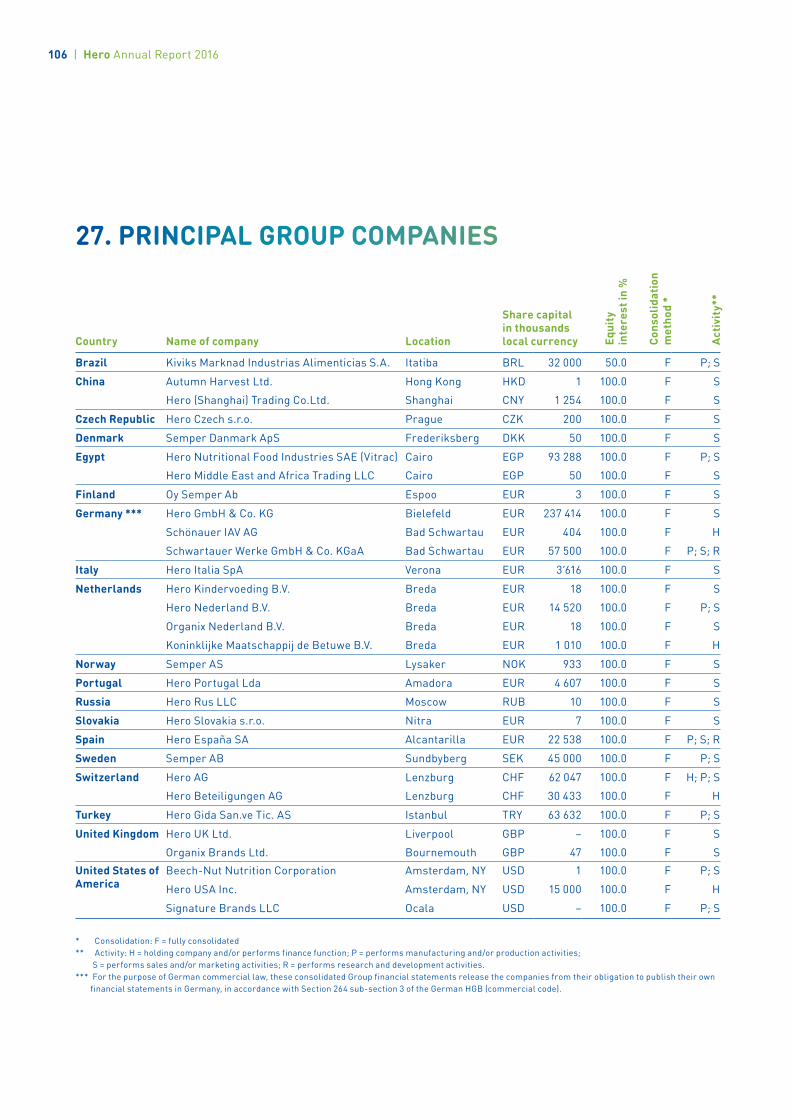
27. PRINCIPAL GROUP COMPANIES
Country Name of company Location
Share capital in thousands local currency Eq
uity
in
tere
st in
%
Cons
olid
atio
n
met
hod
*
Acti
vity
**
Brazil Kiviks Marknad Industrias Alimenticias S.A. Itatiba BRL 32 000 50.0 F P; S
China Autumn Harvest Ltd. Hong Kong HKD 1 100.0 F S
Hero (Shanghai) Trading Co.Ltd. Shanghai CNY 1 254 100.0 F S
Czech Republic Hero Czech s.r.o. Prague CZK 200 100.0 F S
Denmark Semper Danmark ApS Frederiksberg DKK 50 100.0 F S
Egypt Hero Nutritional Food Industries SAE (Vitrac) Cairo EGP 93 288 100.0 F P; S
Hero Middle East and Africa Trading LLC Cairo EGP 50 100.0 F S
Finland Oy Semper Ab Espoo EUR 3 100.0 F S
Germany *** Hero GmbH & Co. KG Bielefeld EUR 237 414 100.0 F S
Schönauer IAV AG Bad Schwartau EUR 404 100.0 F H
Schwartauer Werke GmbH & Co. KGaA Bad Schwartau EUR 57 500 100.0 F P; S; R
Italy Hero Italia SpA Verona EUR 3‘616 100.0 F S
Netherlands Hero Kindervoeding B.V. Breda EUR 18 100.0 F S
Hero Nederland B.V. Breda EUR 14 520 100.0 F P; S
Organix Nederland B.V. Breda EUR 18 100.0 F S
Koninklijke Maatschappij de Betuwe B.V. Breda EUR 1 010 100.0 F H
Norway Semper AS Lysaker NOK 933 100.0 F S
Portugal Hero Portugal Lda Amadora EUR 4 607 100.0 F S
Russia Hero Rus LLC Moscow RUB 10 100.0 F S
Slovakia Hero Slovakia s.r.o. Nitra EUR 7 100.0 F S
Spain Hero España SA Alcantarilla EUR 22 538 100.0 F P; S; R
Sweden Semper AB Sundbyberg SEK 45 000 100.0 F P; S
Switzerland Hero AG Lenzburg CHF 62 047 100.0 F H; P; S
Hero Beteiligungen AG Lenzburg CHF 30 433 100.0 F H
Turkey Hero Gida San.ve Tic. AS Istanbul TRY 63 632 100.0 F P; S
United Kingdom Hero UK Ltd. Liverpool GBP – 100.0 F S
Organix Brands Ltd. Bournemouth GBP 47 100.0 F S
United States of America
Beech-Nut Nutrition Corporation Amsterdam, NY USD 1 100.0 F P; S
Hero USA Inc. Amsterdam, NY USD 15 000 100.0 F H
Signature Brands LLC Ocala USD – 100.0 F P; S
* Consolidation: F = fully consolidated** Activity: H = holding company and/or performs finance function; P = performs manufacturing and/or production activities; S = performs sales and/or marketing activities; R = performs research and development activities.*** For the purpose of German commercial law, these consolidated Group financial statements release the companies from their obligation to publish their own
financial statements in Germany, in accordance with Section 264 sub-section 3 of the German HGB (commercial code).
106 | Hero Annual Report 2016

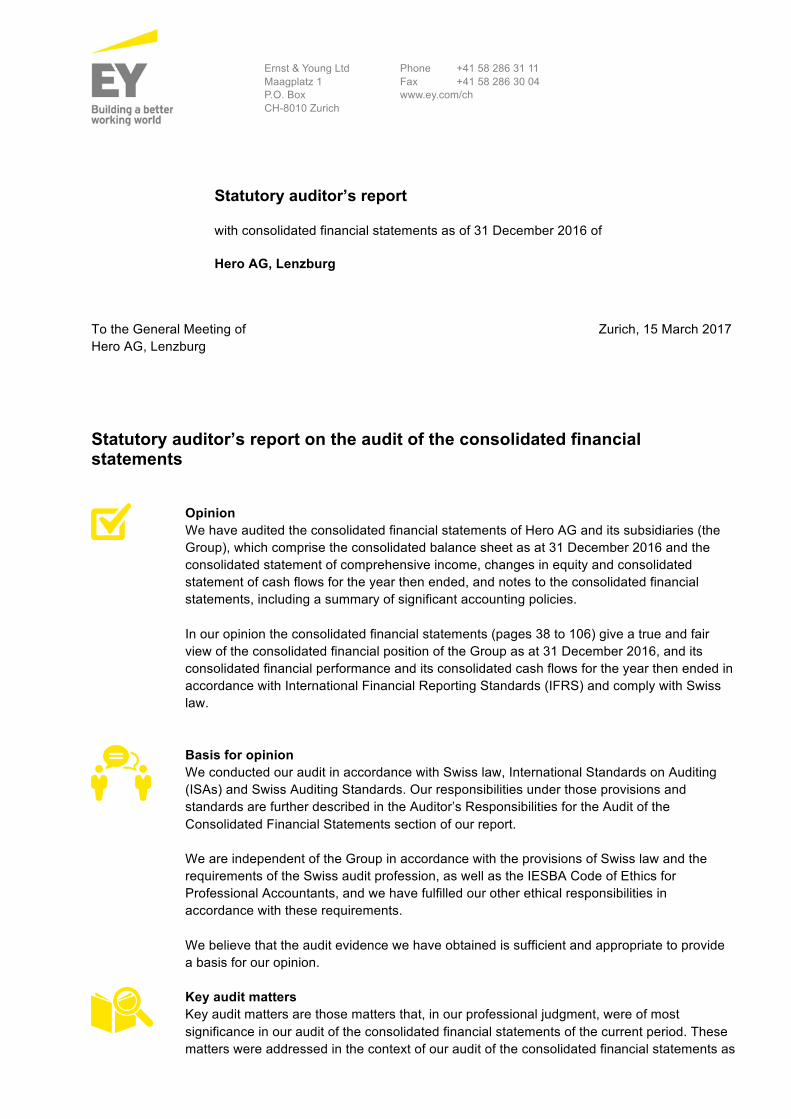
Ernst & Young Ltd Maagplatz 1 P.O. Box CH-8010 Zurich
Phone +41 58 286 31 11 Fax +41 58 286 30 04 www.ey.com/ch
To the General Meeting of Hero AG, Lenzburg
Zurich, 15 March 2017
Statutory auditor’s report on the audit of the consolidated financial statements
Opinion We have audited the consolidated financial statements of Hero AG and its subsidiaries (the Group), which comprise the consolidated balance sheet as at 31 December 2016 and the consolidated statement of comprehensive income, changes in equity and consolidated statement of cash flows for the year then ended, and notes to the consolidated financial statements, including a summary of significant accounting policies. In our opinion the consolidated financial statements (pages 38 to 106) give a true and fair view of the consolidated financial position of the Group as at 31 December 2016, and its consolidated financial performance and its consolidated cash flows for the year then ended in accordance with International Financial Reporting Standards (IFRS) and comply with Swiss law.
Basis for opinion We conducted our audit in accordance with Swiss law, International Standards on Auditing (ISAs) and Swiss Auditing Standards. Our responsibilities under those provisions and standards are further described in the Auditor’s Responsibilities for the Audit of the Consolidated Financial Statements section of our report. We are independent of the Group in accordance with the provisions of Swiss law and the requirements of the Swiss audit profession, as well as the IESBA Code of Ethics for Professional Accountants, and we have fulfilled our other ethical responsibilities in accordance with these requirements. We believe that the audit evidence we have obtained is sufficient and appropriate to provide a basis for our opinion.
Key audit matters Key audit matters are those matters that, in our professional judgment, were of most significance in our audit of the consolidated financial statements of the current period. These matters were addressed in the context of our audit of the consolidated financial statements as
Statutory auditor’s report
with consolidated financial statements as of 31 December 2016 of
Hero AG, Lenzburg

a whole, and in forming our opinion thereon, and we do not provide a separate opinion on these matters. For each matter below, our description of how our audit addressed the matter is provided in that context. We have fulfilled the responsibilities described in the Auditor’s responsibilities for the audit of the consolidated financial statements section of our report, including in relation to these matters. Accordingly, our audit included the performance of procedures designed to respond to our assessment of the risks of material misstatement of the consolidated financial statements. The results of our audit procedures, including the procedures performed to address the matters below, provide the basis for our audit opinion on the consolidated financial statements.
Deferred tax balances and current income tax positions
Area of focus Significant judgment is involved in determining deferred tax balances and current income tax positions. The assessment is complex, since the Company engages in many intercompany transactions and arrangements concerning multiple tax jurisdictions. The amounts involved are material. Due to the significance of the deferred tax balances and current income tax positions and the judgment involved in determining these, in particular as it relates to the United States, this matter was considered significant to our audit. Refer to notes 5 and 11 of the consolidated financial statements for the Company’s disclosures on current and deferred taxes.
Our audit response
We assessed the Company’s internal controls over its tax processes and key assumptions applied. We considered the Company’s transfer pricing concept, changes thereto and the corresponding documentation. We assessed the Company’s correspondence with tax authorities and inquired regarding ongoing tax audits and potential disputes. We considered developments in tax legislation and whether these were reflected in the Company’s assumptions. We evaluated whether the key assumptions applied in the Company’s assessment of recoverability of deferred tax assets is consistent with management’s budgets and forecasts. We involved tax specialist to assist in examining the Company’s tax methodologies and analyzing the underlying key assumptions.
Goodwill and indefinite-lived intangible assets
Area of focus Goodwill and indefinite-lived intangible assets represent 35% of the Group’s total assets and 79% of the Group’s total shareholders’ equity as at December 2016. As stated in the accounting principles included in the notes to the consolidated financial statements, the carrying value of goodwill and indefinite-lived intangible assets is tested annually for impairment. The Company performed its annual impairment test of goodwill and indefinite-lived intangible assets in the fourth quarter of 2016 and determined that there was no impairment. Key assumptions

concerning the impairment test are disclosed in the consolidated financial statements (refer to notes: 8. critical accounting estimates, assumptions and judgments). In determining the recoverable amount of cash-generating units, the Company must apply judgment in estimating – amongst other factors – future revenues and margins, long-term growth and discount rates. Due to the significance of the carrying values for goodwill and indefinite-lived intangible assets and the judgment involved in performing the impairment test, this matter was considered significant to our audit.
Our audit response
We assessed the Company’s internal controls over its annual impairment test and key assumptions applied as well as the authorization of the impairment test by the Board of Directors. We evaluated management’s interpretation of cash-generating units. We involved valuation specialists to assist in examining the Company’s valuation model and analyzing the underlying key assumptions, including future revenues and margins, long-term growth and discount rates. We assessed the historical accuracy of the Company’s estimates and considered its ability to produce accurate long-term forecasts. We evaluated the sensitivity in the valuation resulting from changes to the key assumptions applied and compared these assumptions to corroborating information, including industry reports and data from competitors.
Other information in the annual report The Board of Directors is responsible for the other information in the annual report. The other information comprises all information included in the annual report, but does not include the consolidated financial statements, the stand-alone financial statements and our auditor’s reports thereon. Our opinion on the consolidated financial statements does not cover the other information in the annual report and we do not express any form of assurance conclusion thereon. In connection with our audit of the consolidated financial statements, our responsibility is to read the other information in the annual report and, in doing so, consider whether the other information is materially inconsistent with the consolidated financial statements or our knowledge obtained in the audit, or otherwise appears to be materially misstated. If, based on the work we have performed, we conclude that there is a material misstatement of this other information, we are required to report that fact. We have nothing to report in this regard.
Responsibility of the Board of Directors for the consolidated financial statements The Board of Directors is responsible for the preparation of the consolidated financial statements that give a true and fair view in accordance with IFRS and the provisions of Swiss law, and for such internal control as the Board of Directors determines is necessary to enable the preparation of consolidated financial statements that are free from material misstatement, whether due to fraud or error. In preparing the consolidated financial statements, the Board of Directors is responsible for assessing the Group’s ability to continue as a going concern, disclosing, as applicable, matters related to going concern and using the going concern basis of accounting unless the

Board of Directors either intends to liquidate the Group or to cease operations, or has no realistic alternative but to do so.
Auditor’s responsibilities for the audit of the consolidated financial statements Our objectives are to obtain reasonable assurance about whether the consolidated financial statements as a whole are free from material misstatement, whether due to fraud or error, and to issue an auditor’s report that includes our opinion. Reasonable assurance is a high level of assurance, but is not a guarantee that an audit conducted in accordance with Swiss law, ISAs and Swiss Auditing Standards will always detect a material misstatement when it exists. Misstatements can arise from fraud or error and are considered material if, individually or in the aggregate, they could reasonably be expected to influence the economic decisions of users taken on the basis of these consolidated financial statements. A further description of our responsibilities for the audit of the consolidated financial statements is located at the website of EXPERTsuisse: http://www.expertsuisse.ch/en/audit-report-for-public-companies. This description forms part of our auditor’s report.
Report on other legal and regulatory requirements In accordance with article 728a para. 1 item 3 CO and the Swiss Auditing Standard 890, we confirm that an internal control system exists, which has been designed for the preparation of consolidated financial statements according to the instructions of the Board of Directors. We recommend that the consolidated financial statements submitted to you be approved.
Ernst & Young Ltd
André Schaub Philipp Baumann Licensed audit expert Licensed audit expert (Auditor in charge)
CONTINUED PROFITABLE GROWTH PATH
STATUTORY FINANCIAL STATEMENTS OF HERO AG, LENZBURG
Content
114 Income Statement
115 Balance Sheet
116 Notes to the Statutory Financial Statements
124 Proposal of the Board on the Appropriation
of Retained Earnings
126 Report of the Statutory Auditor on the Financial Statements
Hero Annual Report 2016 | 113
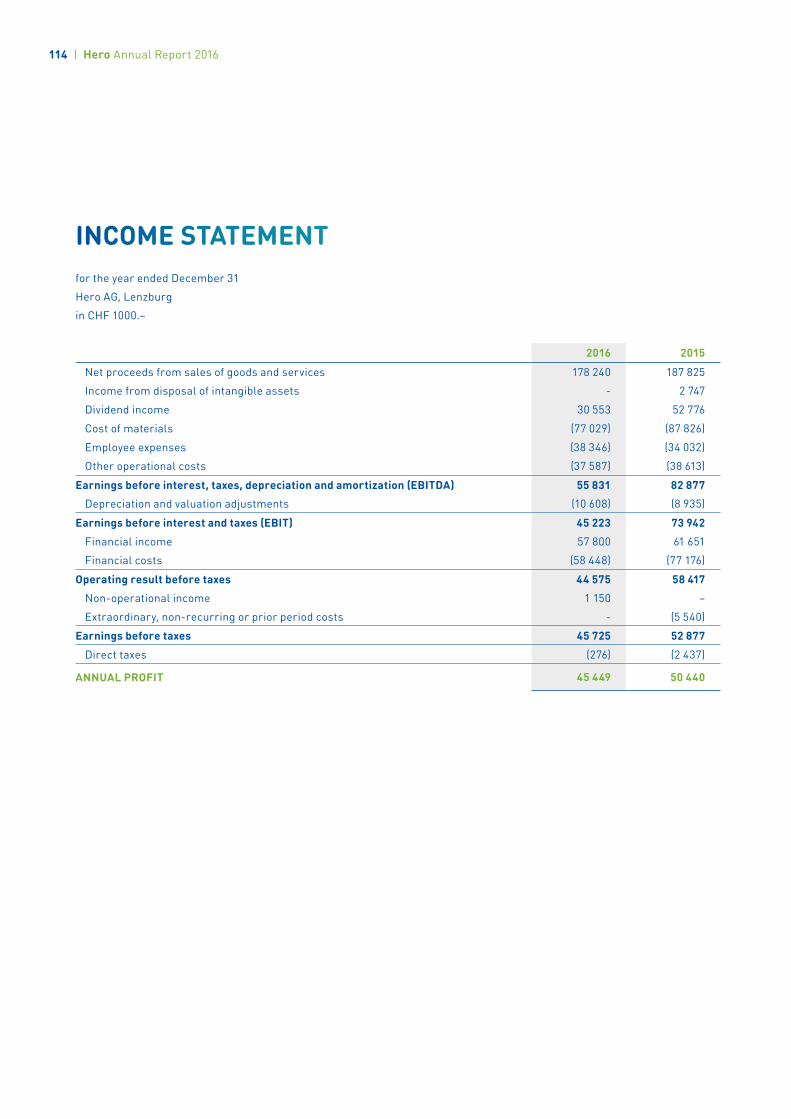
INCOME STATEMENTfor the year ended December 31
Hero AG, Lenzburg
in CHF 1000.–
2016 2015
Net proceeds from sales of goods and services 178 240 187 825
Income from disposal of intangible assets - 2 747
Dividend income 30 553 52 776
Cost of materials (77 029) (87 826)
Employee expenses (38 346) (34 032)
Other operational costs (37 587) (38 613)
Earnings before interest, taxes, depreciation and amortization (EBITDA) 55 831 82 877 Depreciation and valuation adjustments (10 608) (8 935)
Earnings before interest and taxes (EBIT) 45 223 73 942
Financial income 57 800 61 651
Financial costs (58 448) (77 176)
Operating result before taxes 44 575 58 417
Non-operational income 1 150 –
Extraordinary, non-recurring or prior period costs - (5 540)
Earnings before taxes 45 725 52 877
Direct taxes (276) (2 437)
ANNUAL PROFIT 45 449 50 440
114 | Hero Annual Report 2016

BALANCE SHEETas at December 31, before appropriation of profit
Hero AG, Lenzburg
in CHF 1000.–
Assets Note 2016 2015
Cash and cash equivalents 1 27 737 76 996
Trade receivables 3 20 516 23 214
Other current receivables 3 179 477 128 383
Inventories 1 9 498 10 044
Current assets 237 228 238 637
Financial assets 3 347 010 512 149
Investments 2 422 410 445 776
Tangible fixed assets 1 36 610 38 064
Intangible assets 54 324 60 933
Non-current assets 860 354 1 056 922
TOTAL ASSETS 1 097 582 1 295 559
Liabilities Note 2016 2015
Trade payables 3 12 261 13 867
Current interest-bearing liabilities 3 233 159 420 543
Other current liabilities 3 10 615 6 386
Deferred income and accrued expenses 1 20 461 27 418
Current provisions 1 7 095 10 245
Current liabilities 283 591 478 459
Non-current interest-bearing liabilities 1, 3 489 626 525 397
Non-current provisions 1 7 868 8 310
Non-current liabilities 497 494 533 707
TOTAL LIABILITIES 781 085 1 012 166
Share capital 62 047 61 872
Capital contribution reserve 62 993 61 192
Legal reserve 25 758 25 758
Profit carry forward 120 250 84 131
Net income for the year 45 449 50 440
Voluntary retained earnings 165 699 134 571
TOTAL EQUITY 316 497 283 393
TOTAL LIABILITIES 1 097 582 1 295 559
Hero Annual Report 2016 | 115
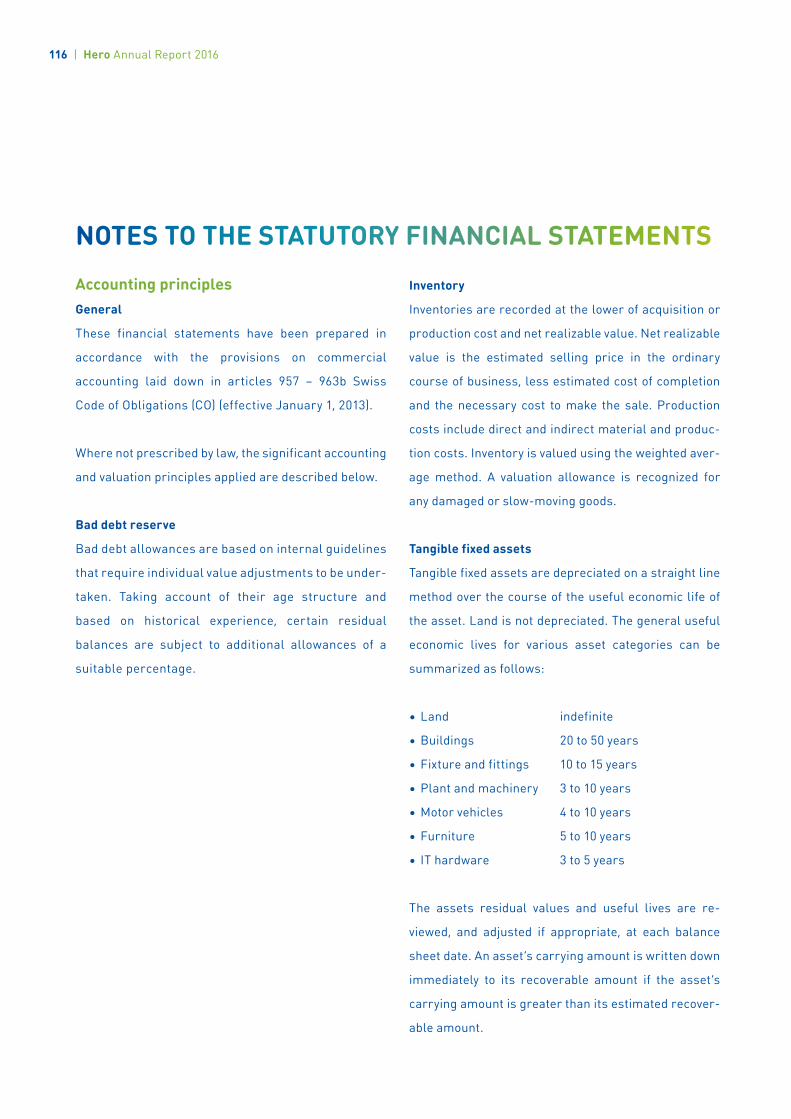
NOTES TO THE STATUTORY FINANCIAL STATEMENTS
Accounting principlesGeneral
These financial statements have been prepared in
accordance with the provisions on commercial
accounting laid down in articles 957 – 963b Swiss
Code of Obligations (CO) (effective January 1, 2013).
Where not prescribed by law, the significant accounting
and valuation principles applied are described below.
Bad debt reserve
Bad debt allowances are based on internal guidelines
that require individual value adjustments to be under-
taken. Taking account of their age structure and
based on historical experience, certain residual
balances are subject to additional allowances of a
suitable percentage.
Inventory
Inventories are recorded at the lower of acquisition or
production cost and net realizable value. Net realizable
value is the estimated selling price in the ordinary
course of business, less estimated cost of completion
and the necessary cost to make the sale. Production
costs include direct and indirect material and produc-
tion costs. Inventory is valued using the weighted aver-
age method. A valuation allowance is recognized for
any damaged or slow-moving goods.
Tangible fixed assets
Tangible fixed assets are depreciated on a straight line
method over the course of the useful economic life of
the asset. Land is not depreciated. The general useful
economic lives for various asset categories can be
summarized as follows:
• Land indefinite
• Buildings 20 to 50 years
• Fixture and fittings 10 to 15 years
• Plant and machinery 3 to 10 years
• Motor vehicles 4 to 10 years
• Furniture 5 to 10 years
• IT hardware 3 to 5 years
The assets residual values and useful lives are re-
viewed, and adjusted if appropriate, at each balance
sheet date. An asset’s carrying amount is written down
immediately to its recoverable amount if the asset’s
carrying amount is greater than its estimated recover-
able amount.
116 | Hero Annual Report 2016
Intangible assets
Software:
Software is amortized on a reducing-balance method
over the course of the useful economic life of the asset.
Brands:
Brands and other intangible assets with a definite use-
ful life are carried at historical cost less accumulated
amortization. Amortization is calculated using the
following method to allocate the costs over their esti-
mated useful lives:
• Brands up to 25 years
straight-line method
• Software 1 to 5 years
reducing-balance method
• Other intangible assets 5 to 25 years
straight-line method
Investments
The carrying value of investments comprises costs
less accumulated write-downs and are tested annually
for impairment.
Long term incentive plan
Effective January 1, 2014, the Group issued a long term
incentive plan for the executive board members. There
is a two years waiting period for newly appointed exec-
utive board members before they may participate in the
plan. Under the plan, the participants may be offered
the opportunity to invest up to 50% of their bonus
payment in shares. After a restriction period of three
years, participants may sell the shares back to Hero AG
at a price based on a formula defined in the plan. In
conjunction with the plan, participants may be granted
loans to fund the share issue. As the shares are re-
stricted, it will ultimately revert to the company and the
share price does not reflect the fair value of the Hero
AG shares, the Group has accounted for.
The shares which allow the executive board members
to participate in the plan are revalued yearly by using a
predefined enterprise valuation model.
Non-current interest-bearing liabilities
Interest-bearing liabilities are recognized in the
balance sheet at nominal value. Discounts and issue
costs for bonds are recognized as prepaid expenses
and amortized on a straight-line basis over the bond’s
maturity period. Premiums are recognized as accrued
expenses and amortized on a straight-line basis over
the loan’s matur ity period.
Hero Annual Report 2016 | 117
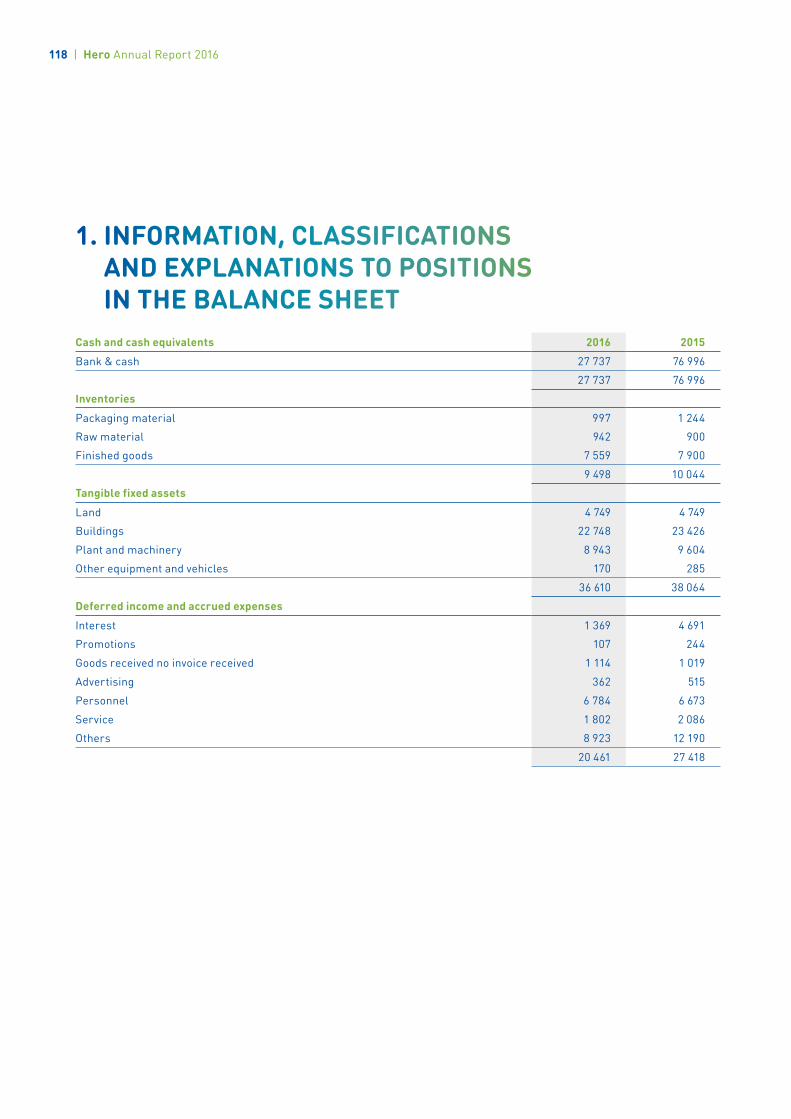
1. INFORMATION, CLASSIFICATIONS AND EXPLANATIONS TO POSITIONS IN THE BALANCE SHEET
Cash and cash equivalents 2016 2015
Bank & cash 27 737 76 996
27 737 76 996
Inventories
Packaging material 997 1 244
Raw material 942 900
Finished goods 7 559 7 900
9 498 10 044
Tangible fixed assets
Land 4 749 4 749
Buildings 22 748 23 426
Plant and machinery 8 943 9 604
Other equipment and vehicles 170 285
36 610 38 064
Deferred income and accrued expenses
Interest 1 369 4 691
Promotions 107 244
Goods received no invoice received 1 114 1 019
Advertising 362 515
Personnel 6 784 6 673
Service 1 802 2 086
Others 8 923 12 190
20 461 27 418
118 | Hero Annual Report 2016
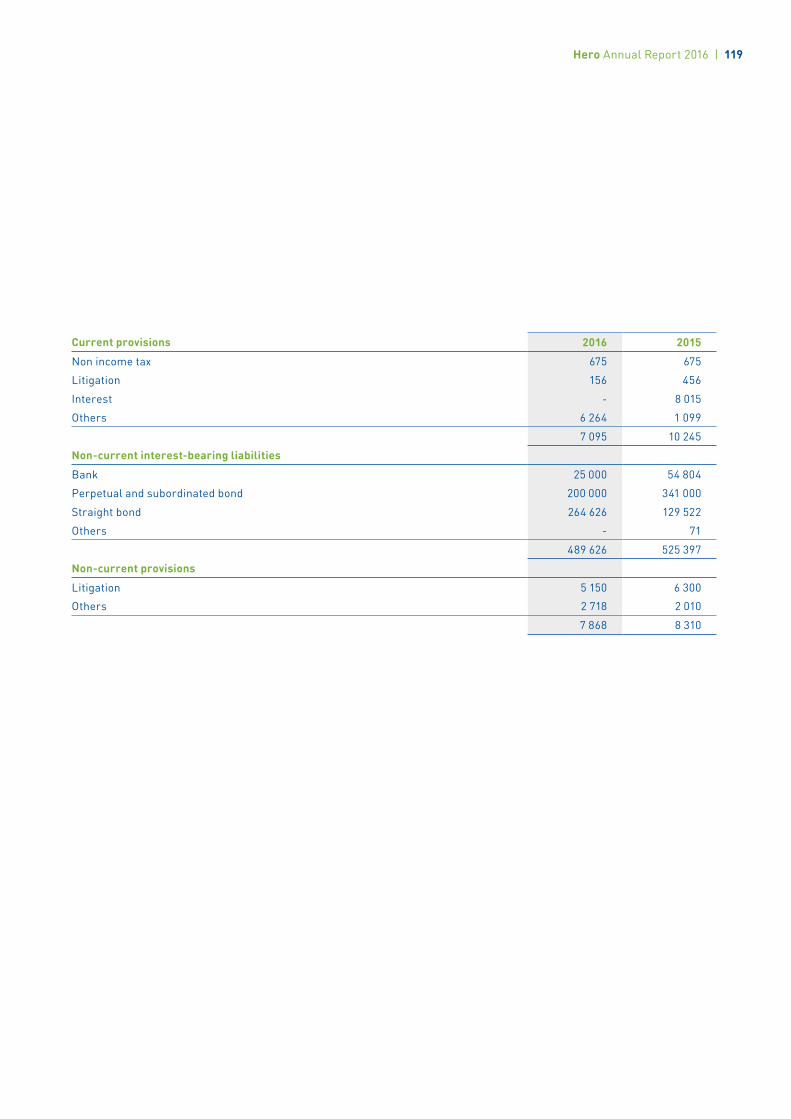
Current provisions 2016 2015
Non income tax 675 675
Litigation 156 456
Interest - 8 015
Others 6 264 1 099
7 095 10 245
Non-current interest-bearing liabilities
Bank 25 000 54 804
Perpetual and subordinated bond 200 000 341 000
Straight bond 264 626 129 522
Others - 71
489 626 525 397
Non-current provisions
Litigation 5 150 6 300
Others 2 718 2 010
7 868 8 310
Hero Annual Report 2016 | 119
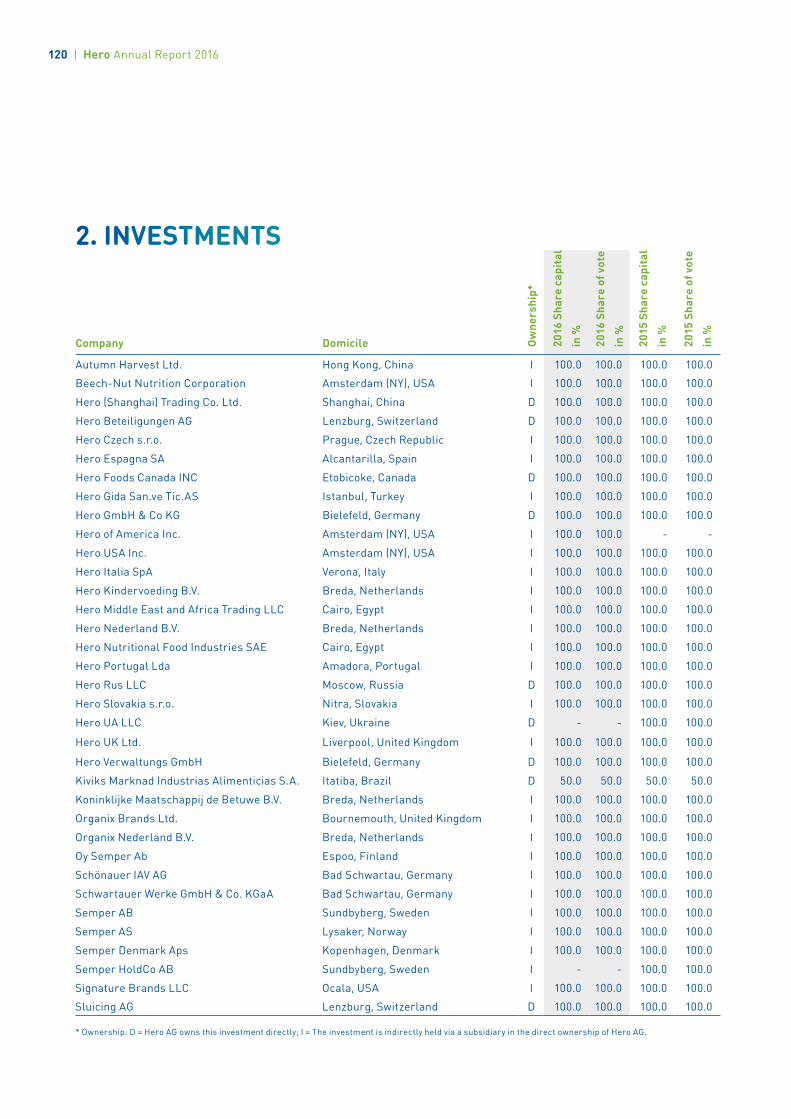
2. INVESTMENTS
Company Domicile Ow
ners
hip*
2016
Sha
re c
apit
al
in %
2016
Sha
re o
f vot
e in
%
2015
Sha
re c
apit
al
in %
2015
Sha
re o
f vot
e in
%
Autumn Harvest Ltd. Hong Kong, China I 100.0 100.0 100.0 100.0
Beech-Nut Nutrition Corporation Amsterdam (NY), USA I 100.0 100.0 100.0 100.0
Hero (Shanghai) Trading Co. Ltd. Shanghai, China D 100.0 100.0 100.0 100.0
Hero Beteiligungen AG Lenzburg, Switzerland D 100.0 100.0 100.0 100.0
Hero Czech s.r.o. Prague, Czech Republic I 100.0 100.0 100.0 100.0
Hero Espagna SA Alcantarilla, Spain I 100.0 100.0 100.0 100.0
Hero Foods Canada INC Etobicoke, Canada D 100.0 100.0 100.0 100.0
Hero Gida San.ve Tic.AS Istanbul, Turkey I 100.0 100.0 100.0 100.0
Hero GmbH & Co KG Bielefeld, Germany D 100.0 100.0 100.0 100.0
Hero of America Inc. Amsterdam (NY), USA I 100.0 100.0 - -
Hero USA Inc. Amsterdam (NY), USA I 100.0 100.0 100.0 100.0
Hero Italia SpA Verona, Italy I 100.0 100.0 100.0 100.0
Hero Kindervoeding B.V. Breda, Netherlands I 100.0 100.0 100.0 100.0
Hero Middle East and Africa Trading LLC Cairo, Egypt I 100.0 100.0 100.0 100.0
Hero Nederland B.V. Breda, Netherlands I 100.0 100.0 100.0 100.0
Hero Nutritional Food Industries SAE Cairo, Egypt I 100.0 100.0 100.0 100.0
Hero Portugal Lda Amadora, Portugal I 100.0 100.0 100.0 100.0
Hero Rus LLC Moscow, Russia D 100.0 100.0 100.0 100.0
Hero Slovakia s.r.o. Nitra, Slovakia I 100.0 100.0 100.0 100.0
Hero UA LLC Kiev, Ukraine D - - 100.0 100.0
Hero UK Ltd. Liverpool, United Kingdom I 100.0 100.0 100.0 100.0
Hero Verwaltungs GmbH Bielefeld, Germany D 100.0 100.0 100.0 100.0
Kiviks Marknad Industrias Alimenticias S.A. Itatiba, Brazil D 50.0 50.0 50.0 50.0
Koninklijke Maatschappij de Betuwe B.V. Breda, Netherlands I 100.0 100.0 100.0 100.0
Organix Brands Ltd. Bournemouth, United Kingdom I 100.0 100.0 100.0 100.0
Organix Nederland B.V. Breda, Netherlands I 100.0 100.0 100.0 100.0
Oy Semper Ab Espoo, Finland I 100.0 100.0 100.0 100.0
Schönauer IAV AG Bad Schwartau, Germany I 100.0 100.0 100.0 100.0
Schwartauer Werke GmbH & Co. KGaA Bad Schwartau, Germany I 100.0 100.0 100.0 100.0
Semper AB Sundbyberg, Sweden I 100.0 100.0 100.0 100.0
Semper AS Lysaker, Norway I 100.0 100.0 100.0 100.0
Semper Denmark Aps Kopenhagen, Denmark I 100.0 100.0 100.0 100.0
Semper HoldCo AB Sundbyberg, Sweden I - - 100.0 100.0
Signature Brands LLC Ocala, USA I 100.0 100.0 100.0 100.0
Sluicing AG Lenzburg, Switzerland D 100.0 100.0 100.0 100.0
* Ownership: D = Hero AG owns this investment directly; I = The investment is indirectly held via a subsidiary in the direct ownership of Hero AG.
120 | Hero Annual Report 2016
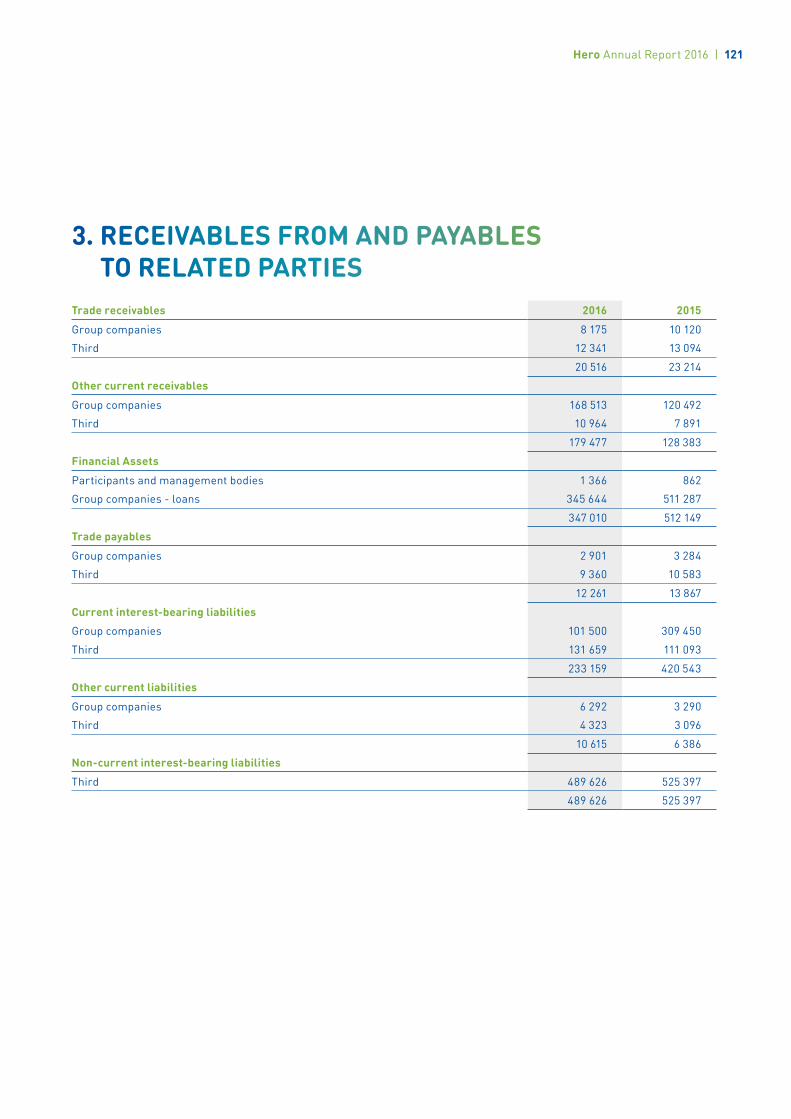
3. RECEIVABLES FROM AND PAYABLES TO RELATED PARTIES
Trade receivables 2016 2015
Group companies 8 175 10 120
Third 12 341 13 094
20 516 23 214
Other current receivables
Group companies 168 513 120 492
Third 10 964 7 891
179 477 128 383
Financial Assets
Participants and management bodies 1 366 862
Group companies - loans 345 644 511 287
347 010 512 149
Trade payables
Group companies 2 901 3 284
Third 9 360 10 583
12 261 13 867
Current interest-bearing liabilities
Group companies 101 500 309 450
Third 131 659 111 093
233 159 420 543
Other current liabilities
Group companies 6 292 3 290
Third 4 323 3 096
10 615 6 386
Non-current interest-bearing liabilities
Third 489 626 525 397
489 626 525 397
Hero Annual Report 2016 | 121

4. EXCESS RESERVES2016 2015
Release of excess reserves (build up [+] / release [–]) (294) 436
5. PARTICIPATION RIGHTS AND OPTIONS IN THE OWNERSHIP OF MANAGEMENT BODIES AND EMPLOYEES
number2016
Total value in TCHF
number2015
Total value in TCHF
Participation rights in the ownership of
Management bodies 53 094 3 524 35 575 2 257
Option rights in the ownership of*
Management bodies 8 301 700 22 832 1 498
* Provisionally determined
6. OTHER INFORMATION2016 2015
Lease obligations not recorded in the balance sheet 440 193
Guarantees in the name of Hero AG in the favour of third parties 5 598 –
Contingent liabilities 4 300 4 300
7. NUMBER OF EMPLOYEES2016 2015
The average number of full time employees was between 50 to 249 between 50 to 249
122 | Hero Annual Report 2016

8. EXCEPTIONAL, NON-RECURRING INCOME STATEMENT ITEMS OR ITEMS RELATING TO OTHER PERIODS
In 2015 Hero AG has repurchased obsolete stock from a distribution partner in the amount of TCHF 5’540.
9. SIGNIFICANT EVENTS AFTER THE BALANCE SHEET DATE
There have been no significant events between December 31, 2016, and the date of authorization of the financial
statements that would require any adjustment or disclosure.
10. BONDSType of bond Subordinated bond
Nominal value issued CHF 200 million
Valor number 34172587/ISIN CH0341725874
Interest rate 2.125%
Maturity period No fixed maturity
Maturity date No fixed maturity
Type of bond Senior bond
Nominal value CHF 130 million
Valor number 21488315/ISIN CH0214883156
Interest rate 1.25 %
Maturity period June 26, 2013 to June 26, 2020
Maturity date June 26, 2020
Type of bond Senior bond
Type of bond CHF 135 million
Valor number 34172588/ISIN CH0341725882
Interest rate 1.00%
Maturity period October 28, 2016 to October 28, 2026
Maturity date October 28, 2026
Hero Annual Report 2016 | 123
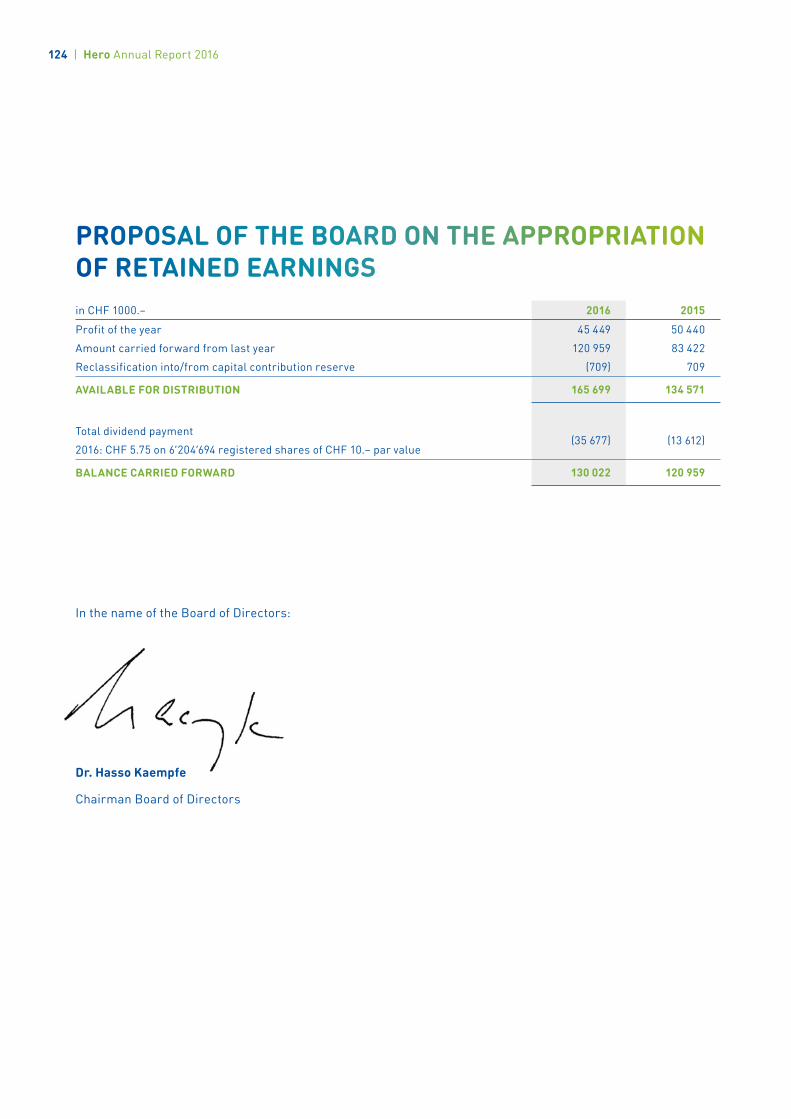
PROPOSAL OF THE BOARD ON THE APPROPRIATION OF RETAINED EARNINGSin CHF 1000.– 2016 2015
Profit of the year 45 449 50 440
Amount carried forward from last year 120 959 83 422
Reclassification into/from capital contribution reserve (709) 709
AVAILABLE FOR DISTRIBUTION 165 699 134 571
Total dividend payment
2016: CHF 5.75 on 6‘204’694 registered shares of CHF 10.– par value(35 677) (13 612)
BALANCE CARRIED FORWARD 130 022 120 959
In the name of the Board of Directors:
Dr. Hasso Kaempfe
Chairman Board of Directors
124 | Hero Annual Report 2016

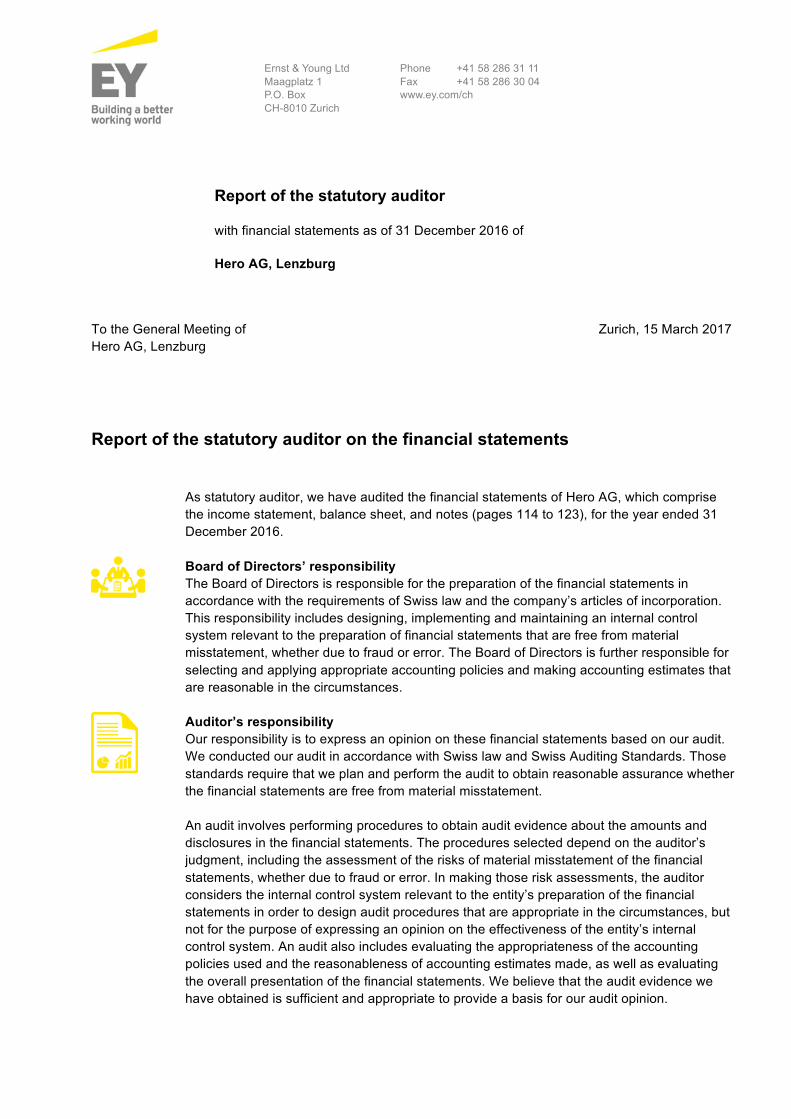
Ernst & Young Ltd Maagplatz 1 P.O. Box CH-8010 Zurich
Phone +41 58 286 31 11 Fax +41 58 286 30 04 www.ey.com/ch
To the General Meeting of Hero AG, Lenzburg
Zurich, 15 March 2017
Report of the statutory auditor on the financial statements As statutory auditor, we have audited the financial statements of Hero AG, which comprise
the income statement, balance sheet, and notes (pages 114 to 123), for the year ended 31 December 2016.
Board of Directors’ responsibility The Board of Directors is responsible for the preparation of the financial statements in accordance with the requirements of Swiss law and the company’s articles of incorporation. This responsibility includes designing, implementing and maintaining an internal control system relevant to the preparation of financial statements that are free from material misstatement, whether due to fraud or error. The Board of Directors is further responsible for selecting and applying appropriate accounting policies and making accounting estimates that are reasonable in the circumstances.
Auditor’s responsibility Our responsibility is to express an opinion on these financial statements based on our audit. We conducted our audit in accordance with Swiss law and Swiss Auditing Standards. Those standards require that we plan and perform the audit to obtain reasonable assurance whether the financial statements are free from material misstatement. An audit involves performing procedures to obtain audit evidence about the amounts and disclosures in the financial statements. The procedures selected depend on the auditor’s judgment, including the assessment of the risks of material misstatement of the financial statements, whether due to fraud or error. In making those risk assessments, the auditor considers the internal control system relevant to the entity’s preparation of the financial statements in order to design audit procedures that are appropriate in the circumstances, but not for the purpose of expressing an opinion on the effectiveness of the entity’s internal control system. An audit also includes evaluating the appropriateness of the accounting policies used and the reasonableness of accounting estimates made, as well as evaluating the overall presentation of the financial statements. We believe that the audit evidence we have obtained is sufficient and appropriate to provide a basis for our audit opinion.
Report of the statutory auditor
with financial statements as of 31 December 2016 of
Hero AG, Lenzburg
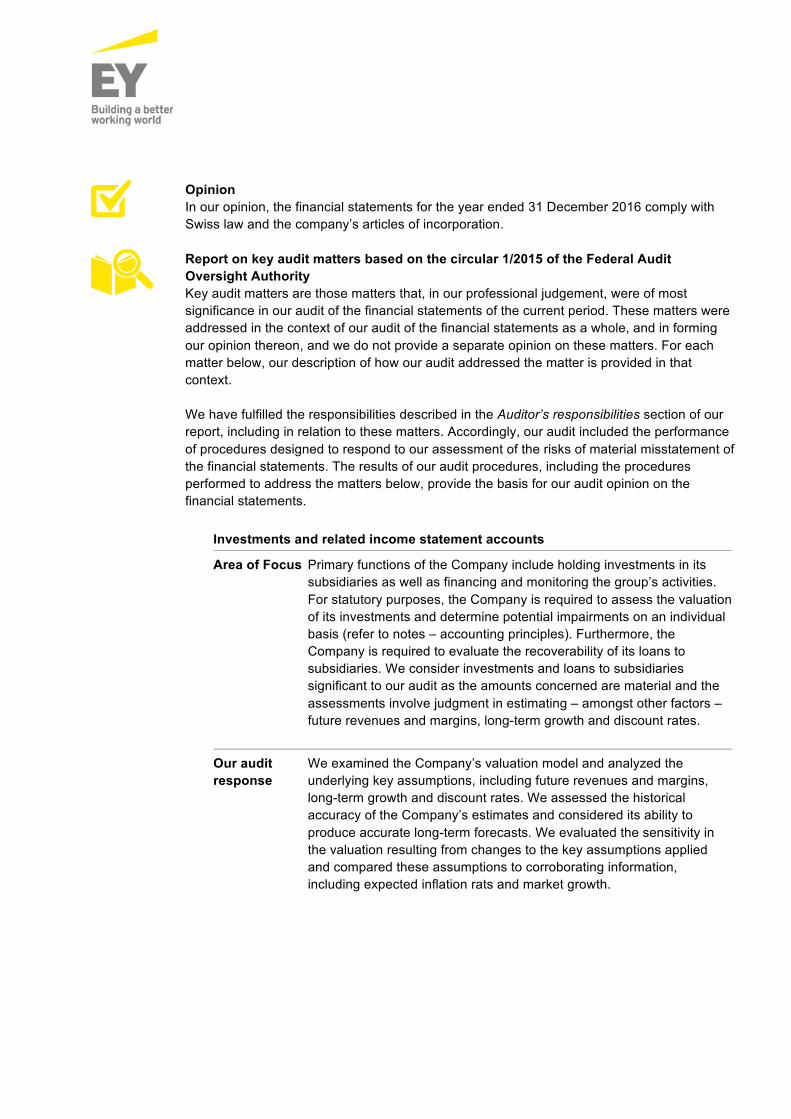
Opinion In our opinion, the financial statements for the year ended 31 December 2016 comply with Swiss law and the company’s articles of incorporation.
Report on key audit matters based on the circular 1/2015 of the Federal Audit Oversight Authority Key audit matters are those matters that, in our professional judgement, were of most significance in our audit of the financial statements of the current period. These matters were addressed in the context of our audit of the financial statements as a whole, and in forming our opinion thereon, and we do not provide a separate opinion on these matters. For each matter below, our description of how our audit addressed the matter is provided in that context. We have fulfilled the responsibilities described in the Auditor’s responsibilities section of our report, including in relation to these matters. Accordingly, our audit included the performance of procedures designed to respond to our assessment of the risks of material misstatement of the financial statements. The results of our audit procedures, including the procedures performed to address the matters below, provide the basis for our audit opinion on the financial statements.
Investments and related income statement accounts
Area of Focus Primary functions of the Company include holding investments in its subsidiaries as well as financing and monitoring the group’s activities. For statutory purposes, the Company is required to assess the valuation of its investments and determine potential impairments on an individual basis (refer to notes – accounting principles). Furthermore, the Company is required to evaluate the recoverability of its loans to subsidiaries. We consider investments and loans to subsidiaries significant to our audit as the amounts concerned are material and the assessments involve judgment in estimating – amongst other factors – future revenues and margins, long-term growth and discount rates.
Our audit response
We examined the Company’s valuation model and analyzed the underlying key assumptions, including future revenues and margins, long-term growth and discount rates. We assessed the historical accuracy of the Company’s estimates and considered its ability to produce accurate long-term forecasts. We evaluated the sensitivity in the valuation resulting from changes to the key assumptions applied and compared these assumptions to corroborating information, including expected inflation rats and market growth.
Report on other legal requirements We confirm that we meet the legal requirements on licensing according to the Auditor Oversight Act (AOA) and independence (article 728 CO and article 11 AOA) and that there are no circumstances incompatible with our independence. In accordance with article 728a para. 1 item 3 CO and Swiss Auditing Standard 890, we confirm that an internal control system exists, which has been designed for the preparation of financial statements according to the instructions of the Board of Directors. We further confirm that the proposed appropriation of available earnings complies with Swiss law and the company’s articles of incorporation. We recommend that the financial statements submitted to you be approved.
Ernst & Young Ltd
André Schaub Philipp Baumann Licensed audit expert Licensed audit expert (Auditor in charge)
Delight consumers
by conserving
the goodness of nature
HERO AG
Karl Roth-Strasse 8
CH-5600 Lenzburg
Phone: +41 (0)62 885 51 11
Fax: +41 (0)62 885 54 30
www.hero-group.ch
CONTACT


![Ravi Hero Report[1]](https://img.pdfslide.net/doc/110x75/577d29e51a28ab4e1ea82f6a/ravi-hero-report1.jpg)