Embed Size (px)
Citation preview
1CORBION ANNUAL REPORT 2016
Keep creating
ANNUAL REPORT
2016
Keep creating
2 CORBION ANNUAL REPORT 2016
ContactIf you have any questions or remarks regarding this report, we kindly invite you to contact us.
Postal addressCorbion nvP.O. Box 3491000 AH Amsterdam The Netherlands
Tel. +31 20 590 69 11E-mail [email protected] www.corbion.com
Registered office: AmsterdamRegistered Amsterdam no. 33006580
3CORBION ANNUAL REPORT 2016 CONTENTs
Corbion at a glance 4
Message from the CEO 6
Company highlights 8
Report of the Board of Management 9
Our strategy 10Execution of our strategic direction 2015-2018 . . . 10How Corbion creates value for people, planet and profit . . . . . . . . . . . . . . . . . . . . . . 15sustainability framework . . . . . . . . . . . . . . . . . 16
Our performance 20Financial performance . . . . . . . . . . . . . . . . . . . 20sustainability performance . . . . . . . . . . . . . . . . 30
Our governance 36Corporate governance . . . . . . . . . . . . . . . . . . . 36Risk management . . . . . . . . . . . . . . . . . . . . . 38
Report of the Supervisory Board 49Remuneration policy and report . . . . . . . . . . . . . 51
Sustainability statements 58Materiality and stakeholder engagement . . . . . . . 58GRI Index . . . . . . . . . . . . . . . . . . . . . . . . . . . 67UN Global Compact . . . . . . . . . . . . . . . . . . . . 70
Financial statements 71
Other information 129statutory arrangement of appropriation of profit . 129Independent auditor’s report . . . . . . . . . . . . . . 130Brief resumés of the members of the supervisory Board . . . . . . . . . . . . . . . . . . . . 136Brief resumés of the members of the Board of Management . . . . . . . . . . . . . . . . . . 137Group structure . . . . . . . . . . . . . . . . . . . . . . 138Five years in figures . . . . . . . . . . . . . . . . . . . 140Information on the Corbion share . . . . . . . . . . . 141
CONTENTS
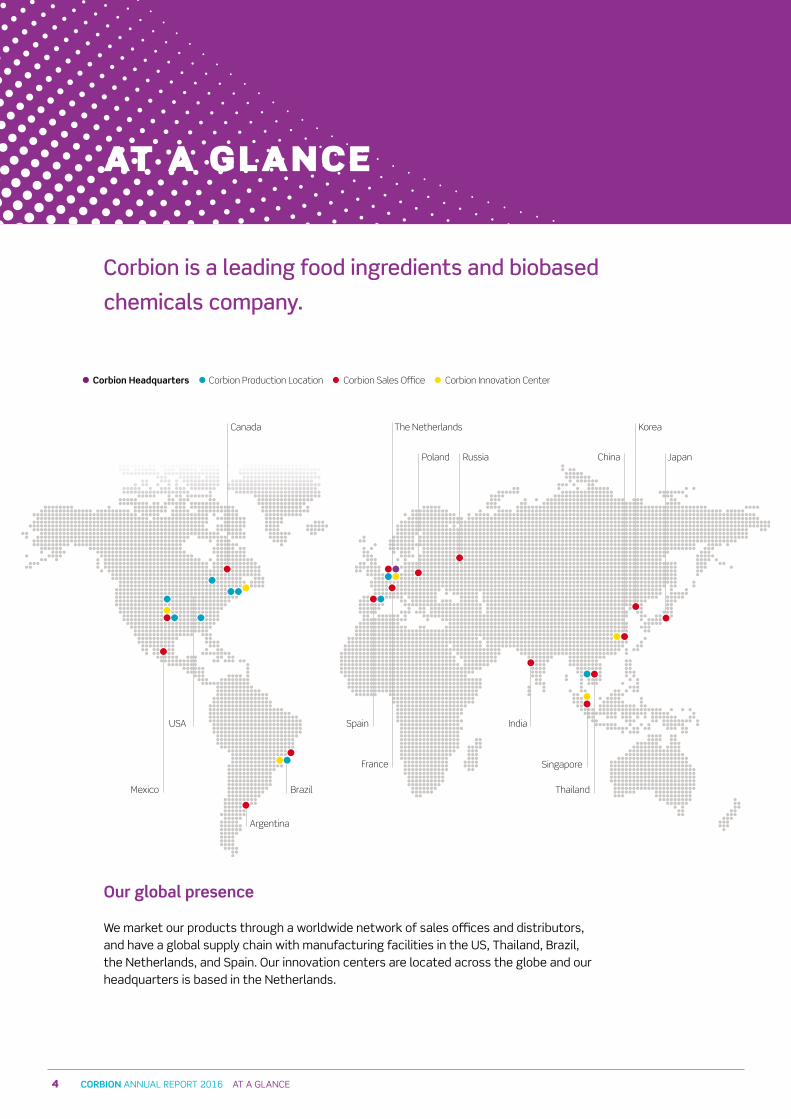
4 CORBION ANNUAL REPORT 2016 AT A GLANCE
Corbion Headquarters Corbion Production Location Corbion Sales O�ce Corbion Innovation Center
Canada The Netherlands
Poland Russia China Japan
USA Spain India
Singapore
ThailandBrazilMexico
Argentina
France
Korea
Corbion is a leading food ingredients and biobased
chemicals company
Our global presence
We market our products through a worldwide network of sales offices and distributors, and have a global supply chain with manufacturing facilities in the Us, Thailand, Brazil, the Netherlands, and spain. Our innovation centers are located across the globe and our headquarters is based in the Netherlands.
AT A GLANCE
5CORBION ANNUAL REPORT 2016 AT A GLANCE
Corbion has an established biobased technology platform based on over 80 years of fermentation experience. We lead the way in lactic acid as well as in cutting-edge emulsification technology and functional blending capability. At Corbion, we live our brand promise “Keep creating”, through our science, clear understanding of the markets we serve, and of course through our creative people. Drawing on the deep rooted application and market knowledge that has been built up over decades, we work hand in hand with our customers to make our technology work for them.
Corbion’s strategy and every aspect of our operations are built around advancing sustainability underpinned by high ethical standards, whether this relates to the management of our global supply chain, responsible procurement of our raw materials, or the safety and wellbeing of our people.
In 2016, Corbion generated annual sales of € 911.3 million and had a workforce of 1,684. Corbion is listed on Euronext Amsterdam.
Two lines of business
At Corbion we distinguish between two lines of business, each with a different set of characteristics: Biobased Ingredients and Biobased Innovations. These business units are supported companywide by globally managed R&D, operations, and business support functions.
Biobased IngredientsThe Biobased Ingredients business unit focuses on our core business: ingredients for Food and Biochemicals.
Food We are a global food ingredient supplier for leading food manufacturers. We strive to be the leader in keeping food tasty, consistent, and fully safe from date of production to day of consumption. With our proven food solutions based on conscious choices, we work side by side to empower our customers to grow and to create affordable food, in the markets of meat, beverage, bakery, confectionery, and dairy, that people love and can safely enjoy with their friends and family, just as we enjoy with ours.
BiochemicalsOur biobased chemicals offer improved functional performance, production efficiency, and safety for our customers. Manufactured from renewable resources, and using the most advanced and resource-efficient fermentation processes, our products provide a sustainable alternative to fossil-based chemicals for customers operating across a wide spectrum of industries, including medical biomaterials, plastics, pharma, electronics, home and personal care, agriculture, coatings, adhesives, solvents, and animal health. We are constantly exploring opportunities to bring the benefits of our products and solutions to our customer’s applications.
Biobased InnovationsOur Biobased Innovations business unit creates new biotechnology business platforms. By using our own core technologies, stand-alone or combined with our partners’ technologies, we drive growth via a disciplined stage-gate investment approach. Our 50/50 joint venture with Total for the production and marketing of polylactic acid bioplastic (PLA) will be part of this business unit. Our high performance PLA resin can be used to make a bioplastic for a wide range of applications, ranging from (degradable) food packaging to touchscreen computers and durable automotive components.Biobased Innovations also comprises the succinic acid joint venture with BAsF (succinity), as well as our longer-term development projects such as FDCA, a potential replacement for purified terephthalic acid (PTA), our gypsum-free lactic acid process and the use of alternative feedstocks (lignocellulosic biomass, agricultural residues, or waste) to make lactic acid.
6 CORBION ANNUAL REPORT 2016 MEssAGE FROM THE CEO
For our Food customers we offer market-leading products such as preservatives, lactates, blends, and emulsifiers that deliver proven functional benefits. However, the value we deliver to customers goes far beyond the ingredients we sell. In the global food industry, manufacturers get the greatest value from suppliers who help them excite consumers with food products that are delicious, easy to prepare, safe, nutritious, and sustainable. Corbion is very well positioned to meet all of these needs in the Food industry. The same can be said of our Biochemicals segment. Whether the value delivered by our Biochemicals team is safety, performance, sustainability, or cost-effectiveness, what counts is understanding the true needs of our customers and staying focused on where we add most value. Which is why in 2016 we worked hard on a new market-oriented approach. With the customer perspective as our starting point, we work backwards and “translate” the qualities that they want into the Corbion solution that meets their need.
With the closure of our Kansas Avenue plant in June 2016, we completed the savings initiative of program “streamline,” and achieved the targeted savings. I would like to express my gratitude to all involved in making these changes possible and especially the men and women who have worked in our Kansas facility all these years. The continued delivery of safe and high-quality products until the last day before closure has been an exceptional team performance.
In Biobased Innovations, we reached many milestones. Not only did we start the construction of the PLA plant in Thailand we also joined forces with Total to develop bioplastics by creating a 50/50 joint venture for the production and marketing of PLA polymers. Combining Total’s technical and marketing knowledge and leading position in polymers with Corbion’s expertise in lactic acid and biopolymers, will enable us to supply innovative products and will accelerate market acceptance.
Megatrends such as climate change and resource scarcity are reshaping the world we live in. To create a future with sufficient resources for a growing population, the world needs to adopt circular systems, where material flows are recovered and re-used. This so-called circular economy has become the basis of our sustainability approach. Corbion’s biobased products are inherently circular and a critical enabler of the circular economy, as they replenish those resources that cannot be re-circulated sustainably. This creates a tremendous opportunity for innovation and future growth. To capture this opportunity, we need to make sure we have our house in order. A sustainable bioeconomy can only be realized if we consider the full value chain, from raw material sourcing to manufacturing, use, and end of life. We need to responsibly source our renewable resources, taking into account social and ecological impacts, including responsible land use. We also have to ensure that we use our renewable resources efficiently. In 2016, we have formulated
Over the past two years we have worked very hard on getting
the core of our company right We had to make some tough
decisions, but we are now about to reap the benefits I am very
proud of what we have accomplished so far I am confident
that we are on the right track in successfully executing our
“Disciplined Value Creation” strategy
MESSAGE FROM THE CEO
7CORBION ANNUAL REPORT 2016 MEssAGE FROM THE CEO
clear guidance on sustainably growing renewable raw materials, as defined in Corbion’s cane sugar code. We also have kicked off a zero waste program, involving employees across Corbion manufacturing sites and sales offices to create a zero waste Corbion.
In 2016 our profitability increased substantially, driven by a combination of business mix improvements, cost savings, and lower input costs. However, our top-line growth was clearly below our ambition level. Growth was negatively affected by our process of improving the portfolio profitability and the adverse effects of customer consolidation. We anticipate these effects to be of a temporary nature, and remain confident that we will achieve our multi-year guidance. Our “Disciplined Value Creation” strategy will continue guiding us in achieving our ambition to become a leading biotechnology company while at the same time generating good growth and strong profitability in our existing ingredients businesses.
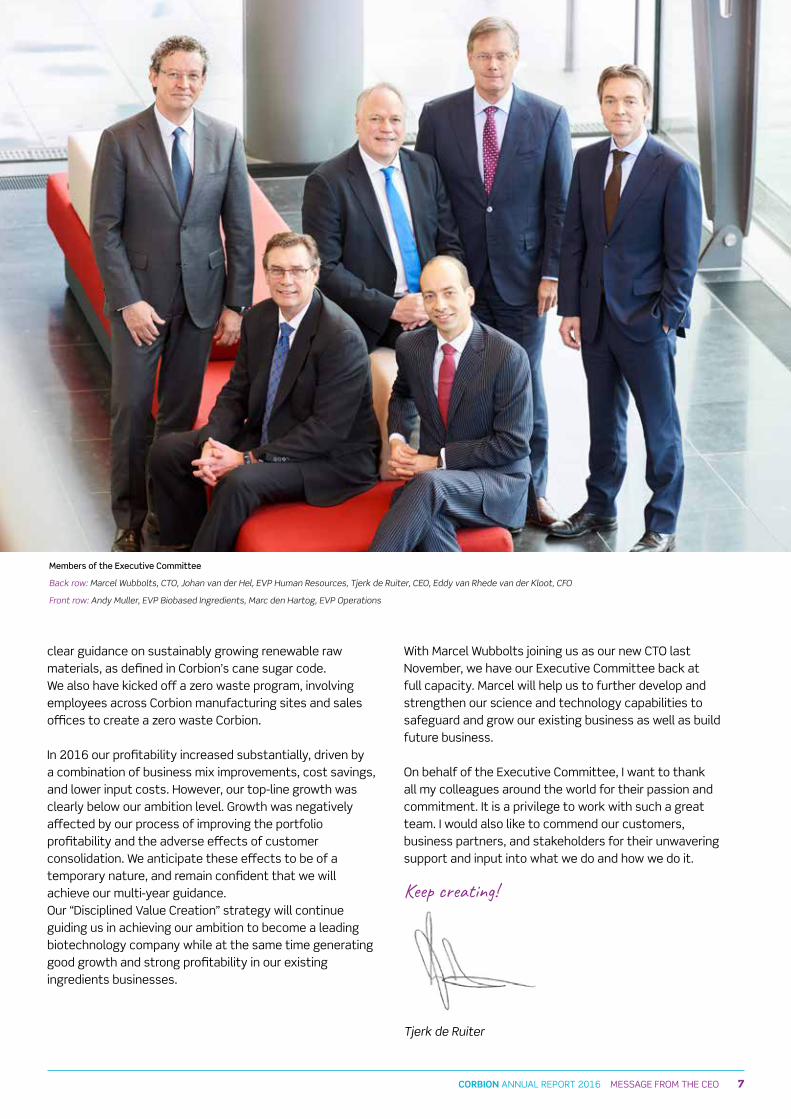
With Marcel Wubbolts joining us as our new CTO last November, we have our Executive Committee back at full capacity. Marcel will help us to further develop and strengthen our science and technology capabilities to safeguard and grow our existing business as well as build future business.
On behalf of the Executive Committee, I want to thank all my colleagues around the world for their passion and commitment. It is a privilege to work with such a great team. I would also like to commend our customers, business partners, and stakeholders for their unwavering support and input into what we do and how we do it.
Keep creating!
Tjerk de Ruiter
Over the past two years we have worked very hard on getting
the core of our company right We had to make some tough
decisions, but we are now about to reap the benefits I am very
proud of what we have accomplished so far I am confident
that we are on the right track in successfully executing our
“Disciplined Value Creation” strategy
Members of the Executive Committee
Back row: Marcel Wubbolts, CTO, Johan van der Hel, EVP Human Resources, Tjerk de Ruiter, CEO, Eddy van Rhede van der Kloot, CFO
Front row: Andy Muller, EVP Biobased Ingredients, Marc den Hartog, EVP Operations
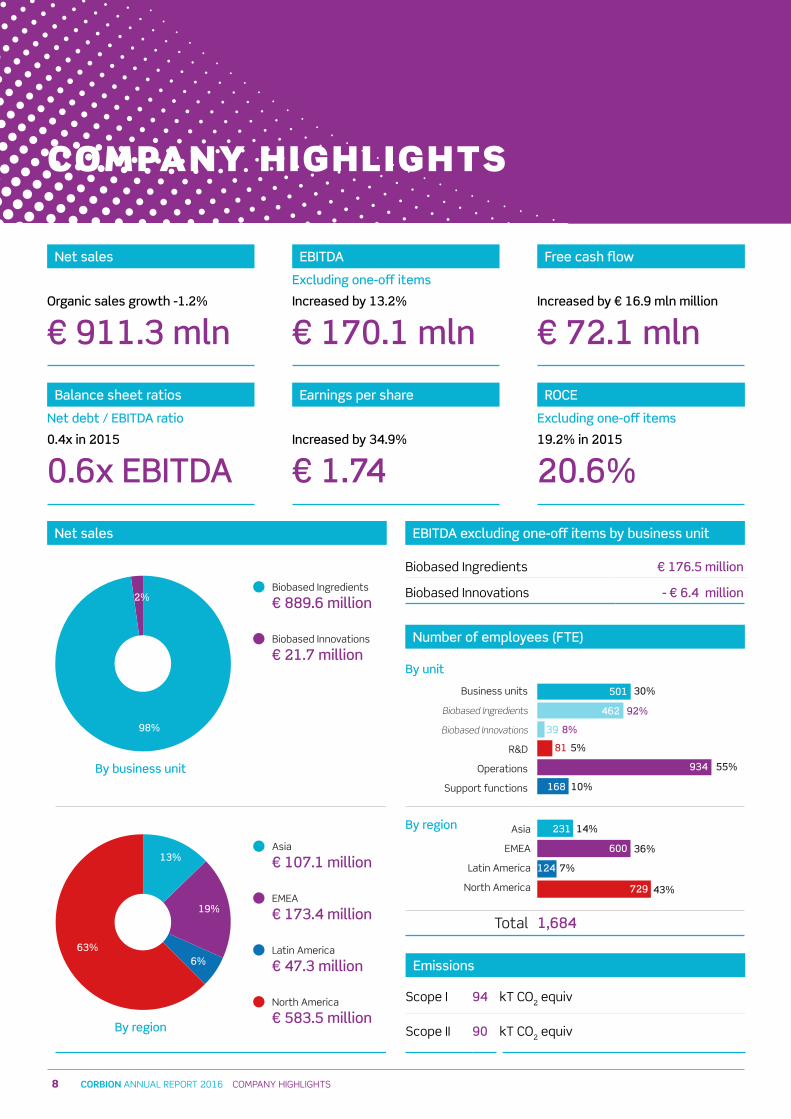
Net sales
Organic sales growth -1 2%
€ 911 3 mln
EBITDA
Excluding one-off items
Increased by 13 2%
€ 170 1 mln
Free cash flow
Increased by € 16 9 mln million
€ 72 1 mln
ROCE
Excluding one-off items
19 2% in 2015
20 6%
By business unit
By region
Biobased Ingredients
€ 889.6 million
Biobased Innovations
€ 21.7 million
Asia
€ 107.1 million
EMEA
€ 173.4 million
Latin America
€ 47.3 million
North America
€ 583.5 million
19%
98%
2%
13%
63%6%
By region
By unit
Business units
Biobased Ingredients
Biobased Innovations
R&D
Operations
Support functions
30%
5%
55%
10%
14%231
501
462
934
168
81
39
600
124
729
7%
36%
43%
92%
8%
Asia
EMEA
Latin America
North America
1,684Total
Balance sheet ratios
Net debt / EBITDA ratio
0 4x in 2015
0 6x EBITDA
Earnings per share
Increased by 34 9%
€ 1 74
EBITDA excluding one-off items by business unit
Biobased Ingredients € 176 5 million
Biobased Innovations - € 6 4 million
Net sales
Number of employees (FTE)
Emissions
scope I 94 kT CO2 equiv
scope II 90 kT CO2 equiv
CORBION ANNUAL REPORT 2016 COMPANy HIGHLIGHTs 8
COMPANY HIGHLIGHTS
REPORT OF THE BOARD OF MANAGEMENT
Keep creating
10 CORBION ANNUAL REPORT 2016 OUR sTRATEGy
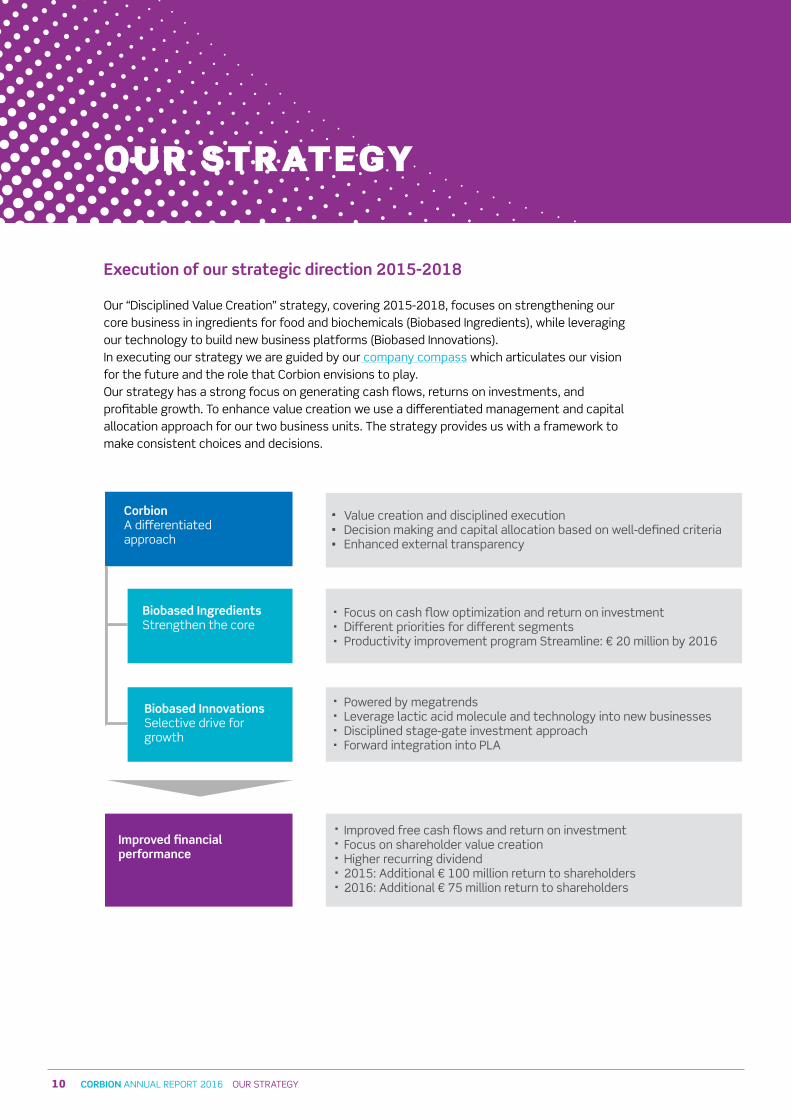
Execution of our strategic direction 2015-2018
Our “Disciplined Value Creation” strategy, covering 2015-2018, focuses on strengthening our core business in ingredients for food and biochemicals (Biobased Ingredients), while leveraging our technology to build new business platforms (Biobased Innovations). In executing our strategy we are guided by our company compass which articulates our vision for the future and the role that Corbion envisions to play. Our strategy has a strong focus on generating cash flows, returns on investments, and profitable growth. To enhance value creation we use a differentiated management and capital allocation approach for our two business units. The strategy provides us with a framework to make consistent choices and decisions.
CorbionA di�erentiated approach
Biobased IngredientsStrengthen the core
Biobased InnovationsSelective drive for growth
Improved financial performance
Value creation and disciplined executionDecision making and capital allocation based on well-defined criteriaEnhanced external transparency
Focus on cash flow optimization and return on investmentDi�erent priorities for di�erent segmentsProductivity improvement program Streamline: € 20 million by 2016
Powered by megatrendsLeverage lactic acid molecule and technology into new businessesDisciplined stage-gate investment approachForward integration into PLA
Improved free cash flows and return on investmentFocus on shareholder value creationHigher recurring dividend 2015: Additional € 100 million return to shareholders2016: Additional € 75 million return to shareholders
OUR STRATEGY
11CORBION ANNUAL REPORT 2016 OUR sTRATEGy
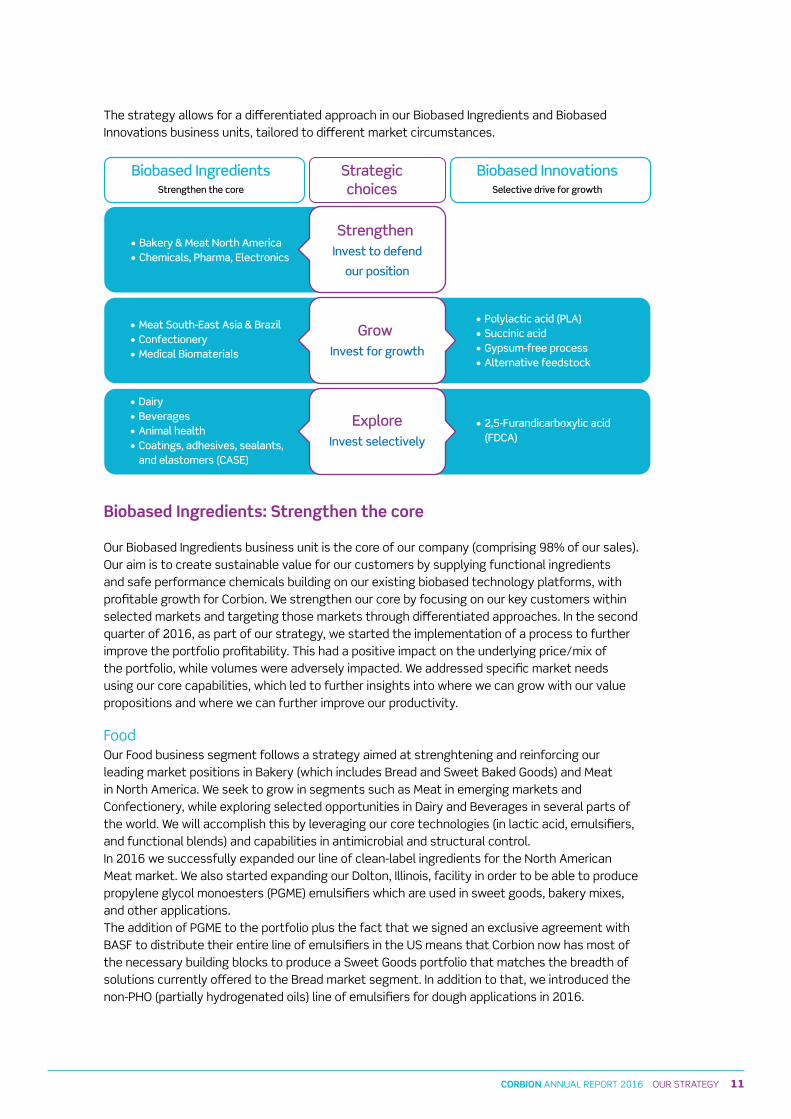
The strategy allows for a differentiated approach in our Biobased Ingredients and Biobased Innovations business units, tailored to different market circumstances.
Strategicchoices
Biobased IngredientsStrengthen the core
Biobased InnovationsSelective drive for growth
• Bakery & Meat North America• Chemicals, Pharma, Electronics
• Meat South-East Asia & Brazil• Confectionery• Medical Biomaterials
• Polylactic acid (PLA)• Succinic acid• Gypsum-free process• Alternative feedstock
• 2,5-Furandicarboxylic acid (FDCA)
• Dairy• Beverages • Animal health• Coatings, adhesives, sealants, and elastomers (CASE)
Strengthen Invest to defend
our position
Grow Invest for growth
ExploreInvest selectively
Biobased Ingredients: Strengthen the core
Our Biobased Ingredients business unit is the core of our company (comprising 98% of our sales). Our aim is to create sustainable value for our customers by supplying functional ingredients and safe performance chemicals building on our existing biobased technology platforms, with profitable growth for Corbion. We strengthen our core by focusing on our key customers within selected markets and targeting those markets through differentiated approaches. In the second quarter of 2016, as part of our strategy, we started the implementation of a process to further improve the portfolio profitability. This had a positive impact on the underlying price/mix of the portfolio, while volumes were adversely impacted. We addressed specific market needs using our core capabilities, which led to further insights into where we can grow with our value propositions and where we can further improve our productivity.
Food Our Food business segment follows a strategy aimed at strenghtening and reinforcing our leading market positions in Bakery (which includes Bread and sweet Baked Goods) and Meat in North America. We seek to grow in segments such as Meat in emerging markets and Confectionery, while exploring selected opportunities in Dairy and Beverages in several parts of the world. We will accomplish this by leveraging our core technologies (in lactic acid, emulsifiers, and functional blends) and capabilities in antimicrobial and structural control. In 2016 we successfully expanded our line of clean-label ingredients for the North American Meat market. We also started expanding our Dolton, Illinois, facility in order to be able to produce propylene glycol monoesters (PGME) emulsifiers which are used in sweet goods, bakery mixes, and other applications. The addition of PGME to the portfolio plus the fact that we signed an exclusive agreement with BAsF to distribute their entire line of emulsifiers in the Us means that Corbion now has most of the necessary building blocks to produce a sweet Goods portfolio that matches the breadth of solutions currently offered to the Bread market segment. In addition to that, we introduced the non-PHO (partially hydrogenated oils) line of emulsifiers for dough applications in 2016.
12 CORBION ANNUAL REPORT 2016 OUR sTRATEGy
As the industry leader, Corbion succeeded in eliminating all PHO products in its portfolio by the end of 2016, long before the June 2018 deadline mandated by the Us Food and Drug Administration (FDA). We successfully introduced our coated acid portfolio (PPMA) for Confectionery where it provides stability and delivers an instant but long-lasting sour taste.The European patent we received for our unique vinegar powder used as a preservative in Meat and other foods and in Beverage applications, strengthens our position as an industry expert in preservation and clean-label meat solutions.
BiochemicalsOur Biochemicals business aims to deliver sustainable value to manufacturers around the world. For our customers value is defined as the quality of a product’s functional performance balanced out against its cost-effectiveness. Our value propositions deliver proven performance with safety and sustainability uniquely ingrained in our technologies. We do this across several key areas: antimicrobials, PH-control, solvency, and polymers. By continuing to put customer needs at the center of everything we do, we will achieve strong growth in Biochemicals. In 2016 we have seen further formulations containing our (EPA registered) natural antimicrobial sANILAC in Home Care, an increased number of agrochemical formulations based on our PURAsOLV solvents, and we are scaling up adhesive polymers prototypes for the market as well as proceeding with customer-led investments in our Fiberlive production capabilities for orthopedics in our Medical Biomaterials market.
Productivity improvement program “streamline”In order to deliver structural productivity improvements in all our processes, we launched the “streamline” program to align the organization with the portfolio choices, simplify our business processes, optimize our manufacturing footprint, and drive competence development in commerce (enhanced customer loyalty), operations (world-class operations), innovation (accelerated innovation), and people (leadership and engagement). In all of these areas we have conducted projects in 2016, including commercial excellence training and portfolio management, the optimization of our sales and operations planning, the alignment of our innovation programs with customer opportunities, and the implementation of a leadership development program.
The targeted € 20 million in cumulative annual savings from our productivity improvement program have been fully achieved in 2016, and the consolidation of our two Us powder plants (integration of Kansas Avenue into Totowa) has been completed by June 2016, closing out our savings initiative of program “streamline”.
Biobased Innovations: Selective drive for growth
Our Biobased Innovations business unit builds new biotechnology business platforms, using our capabilities in fermentation and downstream processing. We have a portfolio of high-growth opportunities which require potentially high investments, the exact timing of which is difficult to predict. In this business unit we will drive growth via a disciplined capital investment approach, governed by a strict stage-gate process, while mitigating risks via upfront commercial commitments, market development, and/or partnering.
As part of our strategy we are making the next step in the bioplastics value chain by becoming a PLA producer. In November 2016 we announced the intention to join forces with Total by creating a 50/50 joint venture to produce and market polylactic acid (PLA) polymers. Together with Total we are building a world-class PLA polymerization plant with a capacity of 75,000 tons per year at Corbion’s site in Thailand (next to our existing lactic acid plant).
13CORBION ANNUAL REPORT 2016 OUR sTRATEGy
Following the successful launch in the European and Asia-Pacific markets, we launched our PLA portfolio of neat bioplastic resins for the North American market in 2016. Making these pre-marketing resins available in the Us is expected to accelerate market acceptance of PLA and allows Corbion to gain a deeper insight into the various product-market combinations.
Building further on our gypsum-free lactic acid technology we successfully incorporated process design improvements aimed at reducing both the operating cost of the process and the capital expenditure required for an industrial-scale production facility.In september 2016 we organized a workshop to establish a consortium for the acceleration of alternative feedstock development for PLA. Alternative or second-generation feedstocks are lignocellulosic biomass or woody crops, agricultural residues, or waste such as bagasse, corn stover, and wheat straw. Corbion is the first company in the world to have made PLA from alternative feedstocks, optimizing the lactic acid fermentation process to fit the special characteristics of the biomass. In the future, these alternative feedstocks can have a major impact on the biochemical and bioplastics industries and, combined with our gypsum-free technology bring us a step closer to producing biobased acids with superior resource and land-use efficiency.
We have developed a proprietary process to produce 2,5-Furandicarboxylic acid (FDCA) from renewable resources. In 2015 we demonstrated our capability to produce the polymer PEF, based on FDCA – proving the excellent barrier properties, and better mechanical/thermal properties of FDCA, when compared to PET. In 2016 we scaled up the FDCA process to pilot level as next step in our development process. This has put us in a position to supply FDCA and PEF material to partners for the purpose of researching and testing a variety of applications.
Together with BAsF, Corbion operates the joint venture succinity for the production and sale of biobased succinic acid. The production technology has been further optimized and sufficient succinic acid volumes have been produced to support market development. The main focus in the coming period will be the further development of the technology and ensuring the availability of cost-competitive biobased succinic acid in line with market growth.
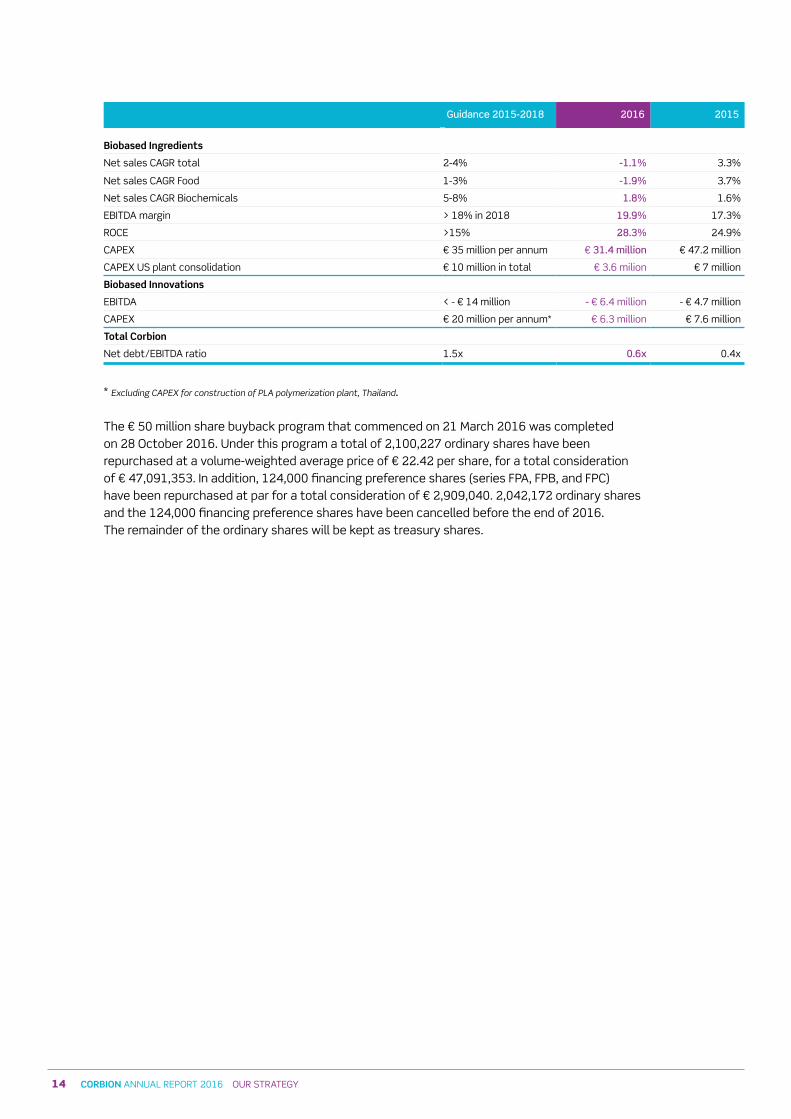
Improved financial performance
In 2016 we continued to make good progress in executing our strategy and we are well on track to deliver on our 2015-2018 targets. In the past year we have made strategic choices involving our customer and product portfolios. These choices resulted in a significant margin improvement, but at the same time had an adverse, albeit temporary, impact on our top-line growth in the year. As a result our business unit Biobased Ingredients showed full-year sales growth below the guidance range of 2-4%. For 2017, we are confident top-line growth will return to our guidance range. In Biobased Innovations the EBITDA loss of € 6.4 million for the year was higher than 2015, because of lower heat-stable PLA sales and higher PLA-related expenses. We announced in November 2016 the intention to form a 50/50 joint venture with Total, which commenced 2 March 2017. The new PLA plant is estimated to be operational in the second half of 2018.In 2016 our net debt/EBITDA ratio was 0.6x. Our net debt/EBITDA ratio is expected to remain well below our covenants limit of 3.5x in 2017. Corbion continues to target a net debt/EBITDA ratio of 1.5x over the investment cycle.
14 CORBION ANNUAL REPORT 2016 OUR sTRATEGy
Guidance 2015-2018 2016 2015
Biobased Ingredients
Net sales CAGR total 2-4% -1 1% 3.3%
Net sales CAGR Food 1-3% -1 9% 3.7%
Net sales CAGR Biochemicals 5-8% 1 8% 1.6%
EBITDA margin > 18% in 2018 19 9% 17.3%
ROCE >15% 28 3% 24.9%
CAPEX € 35 million per annum € 31 4 million € 47.2 million
CAPEX Us plant consolidation € 10 million in total € 3.6 milion € 7 million
Biobased Innovations
EBITDA < - € 14 million - € 6.4 million - € 4.7 million
CAPEX € 20 million per annum* € 6.3 million € 7.6 million
Total Corbion
Net debt/EBITDA ratio 1.5x 0 6x 0.4x
* Excluding CAPEX for construction of PLA polymerization plant, Thailand.
The € 50 million share buyback program that commenced on 21 March 2016 was completed on 28 October 2016. Under this program a total of 2,100,227 ordinary shares have been repurchased at a volume-weighted average price of € 22.42 per share, for a total consideration of € 47,091,353. In addition, 124,000 financing preference shares (series FPA, FPB, and FPC) have been repurchased at par for a total consideration of € 2,909,040. 2,042,172 ordinary shares and the 124,000 financing preference shares have been cancelled before the end of 2016. The remainder of the ordinary shares will be kept as treasury shares.
15CORBION ANNUAL REPORT 2016 OUR sTRATEGy
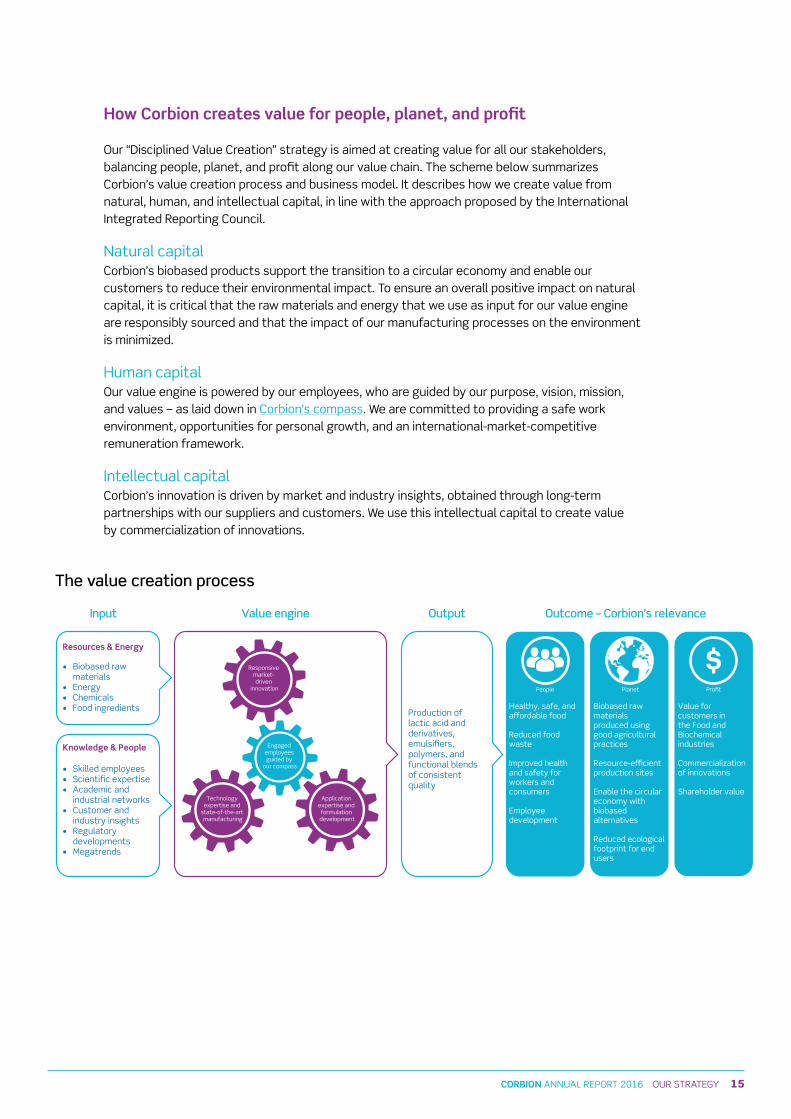
How Corbion creates value for people, planet, and profit
Our “Disciplined Value Creation” strategy is aimed at creating value for all our stakeholders, balancing people, planet, and profit along our value chain. The scheme below summarizes Corbion’s value creation process and business model. It describes how we create value from natural, human, and intellectual capital, in line with the approach proposed by the International Integrated Reporting Council.
Natural capitalCorbion’s biobased products support the transition to a circular economy and enable our customers to reduce their environmental impact. To ensure an overall positive impact on natural capital, it is critical that the raw materials and energy that we use as input for our value engine are responsibly sourced and that the impact of our manufacturing processes on the environment is minimized.
Human capitalOur value engine is powered by our employees, who are guided by our purpose, vision, mission, and values – as laid down in Corbion’s compass. We are committed to providing a safe work environment, opportunities for personal growth, and an international-market-competitive remuneration framework.
Intellectual capitalCorbion’s innovation is driven by market and industry insights, obtained through long-term partnerships with our suppliers and customers. We use this intellectual capital to create value by commercialization of innovations.
Input Value engine Output Outcome – Corbion’s relevance
• Biobased raw materials • Energy• Chemicals• Food ingredients
• Skilled employees• Scientific expertise• Academic and industrial networks• Customer and industry insights• Regulatory developments • Megatrends
Knowledge & People
Resources & Energy
Production of lactic acid and derivatives, emulsifiers, polymers, and functional blends of consistent quality
Engaged employees guided by
our compass
Application expertise and formulation
development
Responsive market- driven
innovation
Technology expertise and
state-of-the-art manufacturing
Healthy, safe, and a�ordable food
Reduced food waste
Improved health and safety for workers and consumers
Employee development
Biobased raw materials produced using good agricultural practices
Resource-e�cient production sites
Enable the circular economy with biobased alternatives
Reduced ecological footprint for end users
Value for customers in the Food and Biochemical industries
Commercialization of innovations
Shareholder value
People Planet Profit
The value creation process
16 CORBION ANNUAL REPORT 2016 OUR sTRATEGy
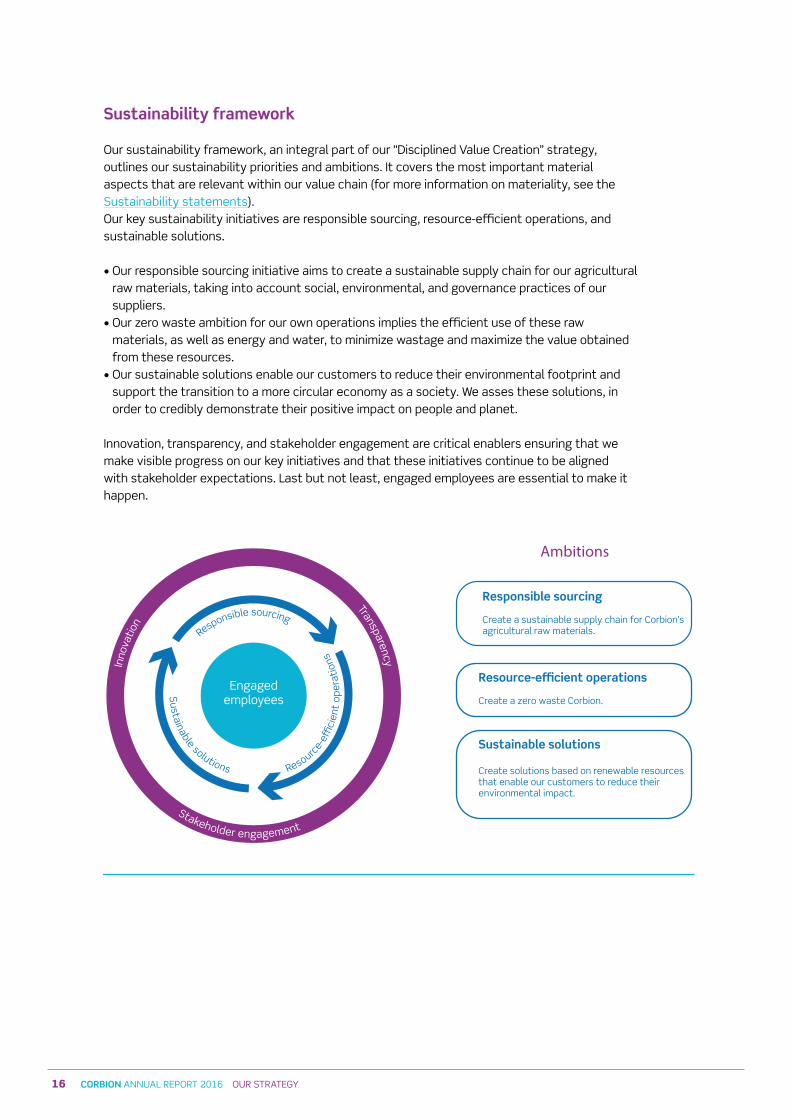
Sustainability framework
Our sustainability framework, an integral part of our “Disciplined Value Creation” strategy, outlines our sustainability priorities and ambitions. It covers the most important material aspects that are relevant within our value chain (for more information on materiality, see the sustainability statements). Our key sustainability initiatives are responsible sourcing, resource-efficient operations, and sustainable solutions.
• Our responsible sourcing initiative aims to create a sustainable supply chain for our agricultural raw materials, taking into account social, environmental, and governance practices of our suppliers.
• Our zero waste ambition for our own operations implies the efficient use of these raw materials, as well as energy and water, to minimize wastage and maximize the value obtained from these resources.
• Our sustainable solutions enable our customers to reduce their environmental footprint and support the transition to a more circular economy as a society. We asses these solutions, in order to credibly demonstrate their positive impact on people and planet.
Innovation, transparency, and stakeholder engagement are critical enablers ensuring that we make visible progress on our key initiatives and that these initiatives continue to be aligned with stakeholder expectations. Last but not least, engaged employees are essential to make it happen.
Responsible sourcing
Resource-e
�ci
ent
oper
atio
ns
Sustainable solutions
Transparency
Responsible sourcing
Create a sustainable supply chain for Corbion’s agricultural raw materials.
Resource-e�cient operations
Create a zero waste Corbion.
Sustainable solutions
Create solutions based on renewable resourcesthat enable our customers to reduce theirenvironmental impact.
Inno
vatio
n
Engagedemployees
Ambitions
Stakeholder engagement
17CORBION ANNUAL REPORT 2016 OUR sTRATEGy
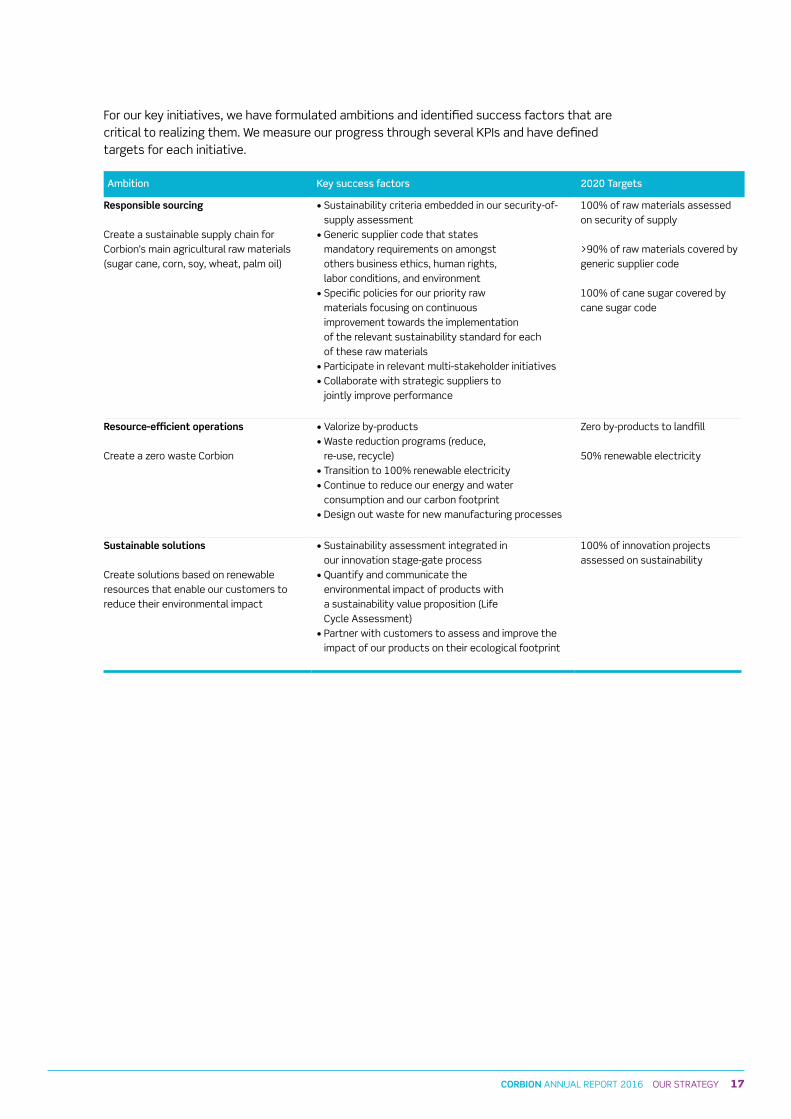
For our key initiatives, we have formulated ambitions and identified success factors that are critical to realizing them. We measure our progress through several KPIs and have defined targets for each initiative.
Ambition Key success factors 2020 Targets
Responsible sourcing
Create a sustainable supply chain for Corbion’s main agricultural raw materials (sugar cane, corn, soy, wheat, palm oil)
• sustainability criteria embedded in our security-of-supply assessment
• Generic supplier code that states mandatory requirements on amongst others business ethics, human rights, labor conditions, and environment
• specific policies for our priority raw materials focusing on continuous improvement towards the implementation of the relevant sustainability standard for each of these raw materials
• Participate in relevant multi-stakeholder initiatives• Collaborate with strategic suppliers to
jointly improve performance
100% of raw materials assessed on security of supply
>90% of raw materials covered by generic supplier code
100% of cane sugar covered by cane sugar code
Resource-efficient operations
Create a zero waste Corbion
• Valorize by-products• Waste reduction programs (reduce,
re-use, recycle)• Transition to 100% renewable electricity• Continue to reduce our energy and water
consumption and our carbon footprint• Design out waste for new manufacturing processes
Zero by-products to landfill
50% renewable electricity
Sustainable solutions
Create solutions based on renewable resources that enable our customers to reduce their environmental impact
• sustainability assessment integrated in our innovation stage-gate process
• Quantify and communicate the environmental impact of products with a sustainability value proposition (Life Cycle Assessment)
• Partner with customers to assess and improve the impact of our products on their ecological footprint
100% of innovation projects assessed on sustainability

18 CORBION ANNUAL REPORT 2016 OUR sTRATEGy
I create smooth running machinery.
Marçal Gotanegra FontMaintenance ManagerCorbion Spain
At Corbion we’re creating a better future together
Keep creating
19CORBION ANNUAL REPORT 2016 OUR sTRATEGy
Marçal Gotanegra Font
How did I get here?
I studied electronic engineering and first came to Corbion in 1993 when I was 20 years old as
a student, for work experience. It was my father who suggested I come: he worked for Corbion
(then Purac) for 38 years – although he worked in the Finance department. For me, finance
was never my passion. I’ve always enjoyed scientific things and the challenge of solving
practical problems. Which is why now, as the Maintenance Manager for Corbion in Montmeló, I
am in the ideal job.
What do I do?
Quite simply, my role is to maintain all the equipment and machinery at our manufacturing
facility, ensuring maximum availability at the lowest possible cost. I have a team of around 30
people and in the factory alone we are responsible for 9,000 different pieces of equipment.
Our mantra is that prediction is better than prevention. The better we are able to predict and
repair – the smoother the operation. We use various technology and instruments to monitor
the health of our equipment. And we also conduct planned maintenance where, for example,
we will visually inspect oil levels. If levels are too low in a piece of equipment it could start
failing and affect production. Bottom line: it’s easier and cheaper to inspect the oil level than
to repair a failure due to lack of lubrication!
Going the extra mile
Here in Spain we are part of the global maintenance platform. What exactly is the platform?
It’s a place where we can learn from each other, share experiences and adopt new ways of
improving our maintenance – in a standardized and consistent way. Corbion seems to be doing
a good job: in recent years we have advised the Catalan government on energy efficiency
and savings based on advanced maintenance; we were invited to coach a multinational
agribusiness and food company in how to improve their maintenance; and we shape the
syllabus of the Maintenance Post-Degree from our local university.
The future
We are not there yet, and there is still room for improvement. When I began in this role in 2009
I was not an expert. I relied on my colleagues, especially in Gorinchem, to mentor me. Now
we are adopting this attitude across Corbion with our maintenance platform. I spent time
with global colleagues learning about new reliability methodologies that help us make better
decisions on maintenance strategy that affect the day-to-day running of the factory. My
ambition is very simple: to improve every day!
Prediction is better than prevention
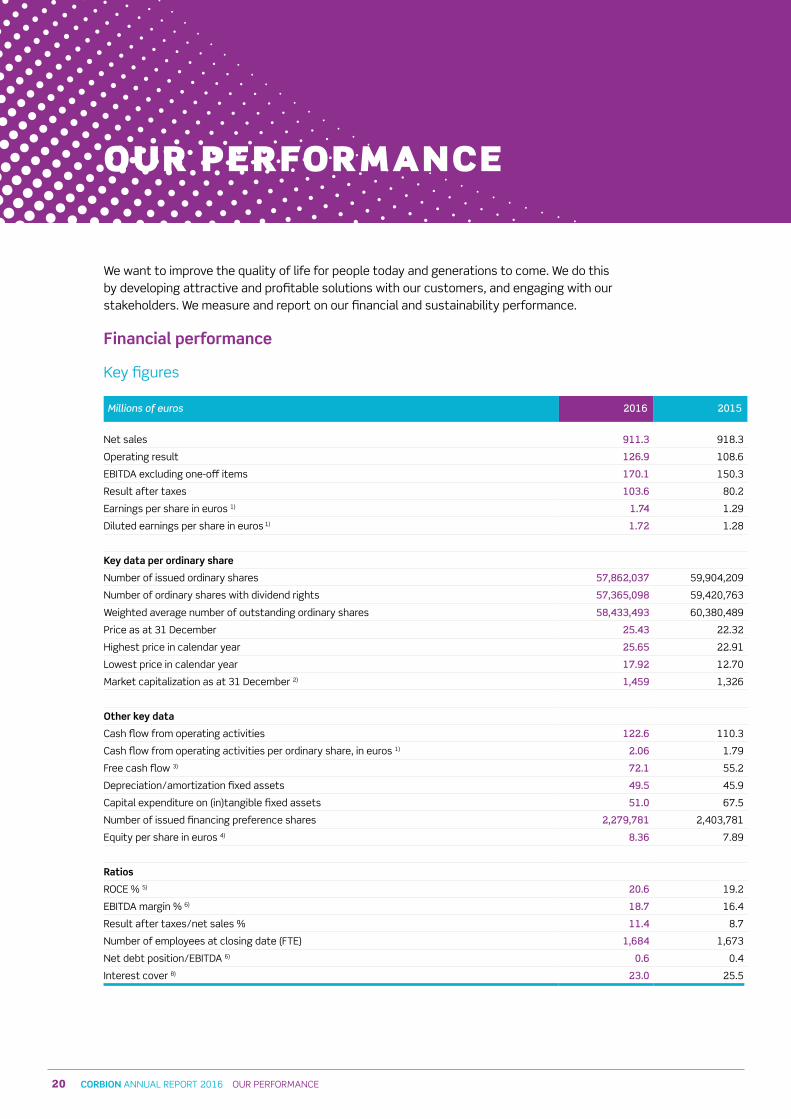
20 CORBION ANNUAL REPORT 2016 OUR PERFORMANCE
We want to improve the quality of life for people today and generations to come. We do this by developing attractive and profitable solutions with our customers, and engaging with our stakeholders. We measure and report on our financial and sustainability performance.
Financial performance Key figures
Millions of euros 2016 2015
Net sales 911 3 918.3
Operating result 126 9 108.6
EBITDA excluding one-off items 170 1 150.3
Result after taxes 103 6 80.2
Earnings per share in euros 1) 1 74 1.29
Diluted earnings per share in euros 1) 1 72 1.28
Key data per ordinary share
Number of issued ordinary shares 57,862,037 59,904,209
Number of ordinary shares with dividend rights 57,365,098 59,420,763
Weighted average number of outstanding ordinary shares 58,433,493 60,380,489
Price as at 31 December 25 43 22.32
Highest price in calendar year 25 65 22.91
Lowest price in calendar year 17 92 12.70
Market capitalization as at 31 December 2) 1,459 1,326
Other key data
Cash flow from operating activities 122 6 110.3
Cash flow from operating activities per ordinary share, in euros 1) 2 06 1.79
Free cash flow 3) 72 1 55.2
Depreciation/amortization fixed assets 49 5 45.9
Capital expenditure on (in)tangible fixed assets 51 0 67.5
Number of issued financing preference shares 2,279,781 2,403,781
Equity per share in euros 4) 8 36 7.89
Ratios
ROCE % 5) 20 6 19.2
EBITDA margin % 6) 18 7 16.4
Result after taxes/net sales % 11 4 8.7
Number of employees at closing date (FTE) 1,684 1,673
Net debt position/EBITDA 6) 0 6 0.4
Interest cover 8) 23 0 25.5
OUR PERFORMANCE
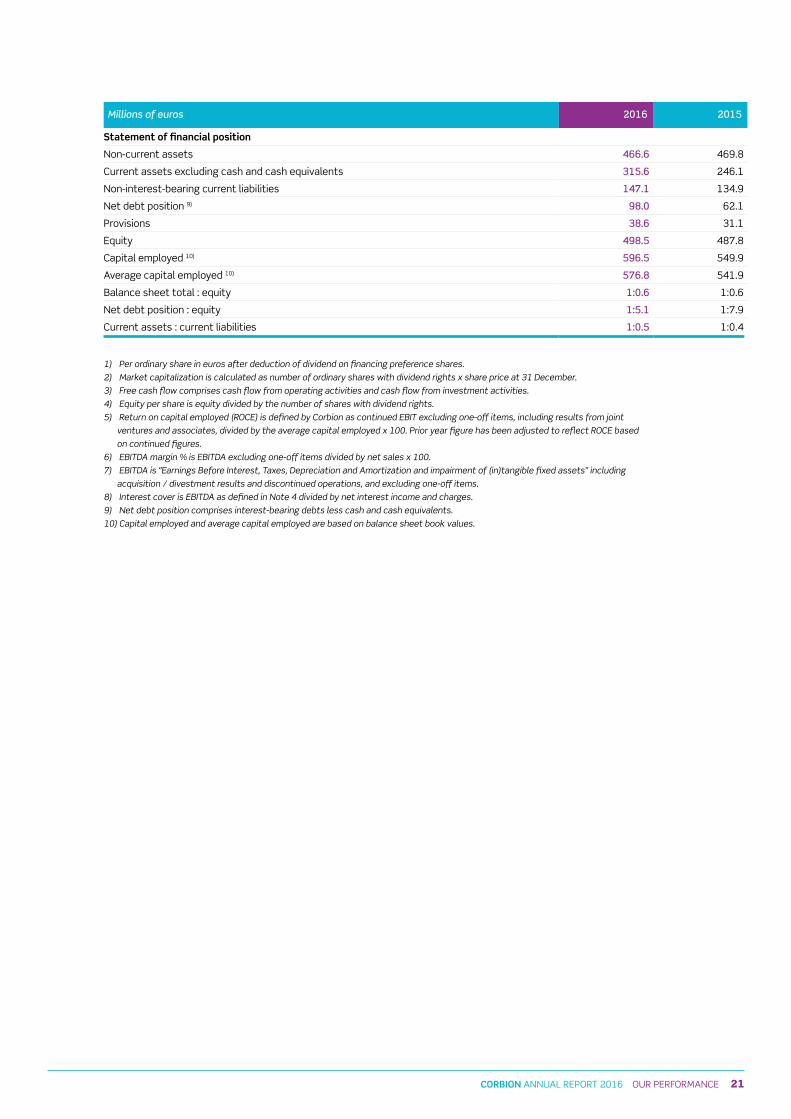
21CORBION ANNUAL REPORT 2016 OUR PERFORMANCE
Millions of euros 2016 2015
Statement of financial position
Non-current assets 466 6 469.8
Current assets excluding cash and cash equivalents 315 6 246.1
Non-interest-bearing current liabilities 147 1 134.9
Net debt position 9) 98 0 62.1
Provisions 38 6 31.1
Equity 498 5 487.8
Capital employed 10) 596 5 549.9
Average capital employed 10) 576 8 541.9
Balance sheet total : equity 1:0 6 1:0.6
Net debt position : equity 1:5 1 1:7.9
Current assets : current liabilities 1:0 5 1:0.4
1) Per ordinary share in euros after deduction of dividend on financing preference shares.
2) Market capitalization is calculated as number of ordinary shares with dividend rights x share price at 31 December.
3) Free cash flow comprises cash flow from operating activities and cash flow from investment activities.
4) Equity per share is equity divided by the number of shares with dividend rights.
5) Return on capital employed (ROCE) is defined by Corbion as continued EBIT excluding one-off items, including results from joint
ventures and associates, divided by the average capital employed x 100. Prior year figure has been adjusted to reflect ROCE based
on continued figures.
6) EBITDA margin % is EBITDA excluding one-off items divided by net sales x 100.
7) EBITDA is ‘’Earnings Before Interest, Taxes, Depreciation and Amortization and impairment of (in)tangible fixed assets’’ including
acquisition / divestment results and discontinued operations, and excluding one-off items.
8) Interest cover is EBITDA as defined in Note 4 divided by net interest income and charges.
9) Net debt position comprises interest-bearing debts less cash and cash equivalents.
10) Capital employed and average capital employed are based on balance sheet book values.
22 CORBION ANNUAL REPORT 2016 OUR PERFORMANCE
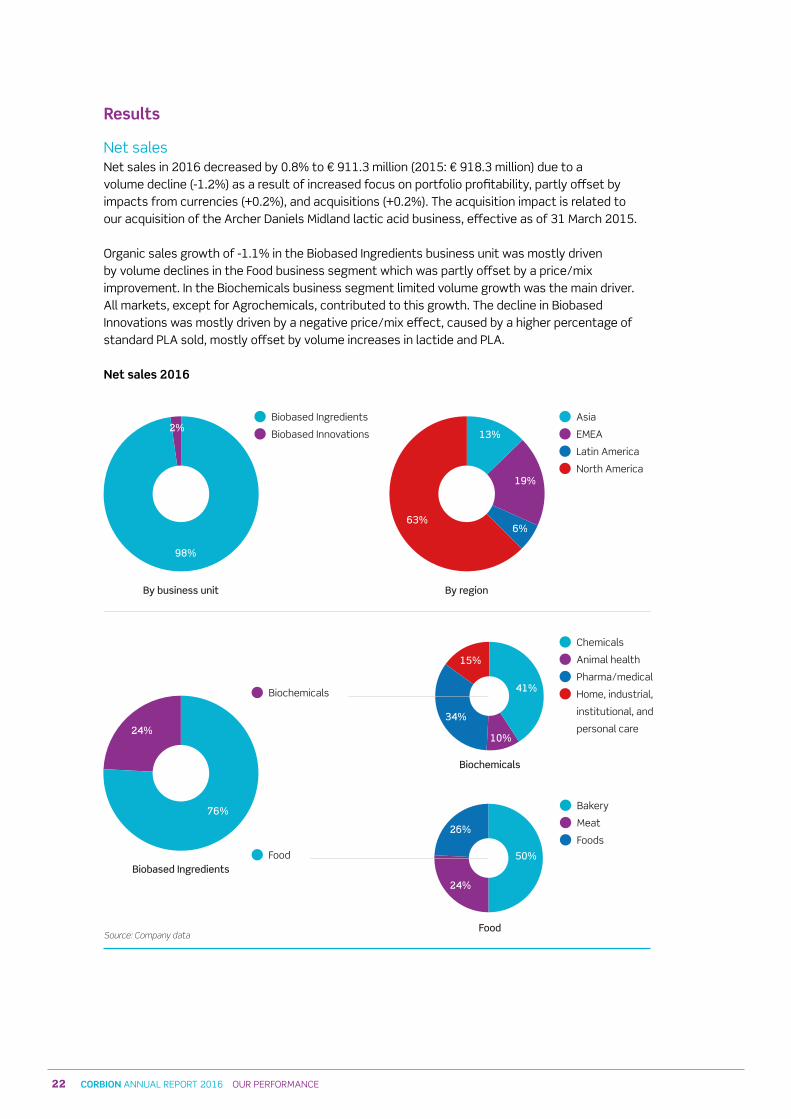
Results
Net salesNet sales in 2016 decreased by 0.8% to € 911.3 million (2015: € 918.3 million) due to a volume decline (-1.2%) as a result of increased focus on portfolio profitability, partly offset by impacts from currencies (+0.2%), and acquisitions (+0.2%). The acquisition impact is related to our acquisition of the Archer Daniels Midland lactic acid business, effective as of 31 March 2015.
Organic sales growth of -1.1% in the Biobased Ingredients business unit was mostly driven by volume declines in the Food business segment which was partly offset by a price/mix improvement. In the Biochemicals business segment limited volume growth was the main driver. All markets, except for Agrochemicals, contributed to this growth. The decline in Biobased Innovations was mostly driven by a negative price/mix effect, caused by a higher percentage of standard PLA sold, mostly offset by volume increases in lactide and PLA.
Net sales 2016
Biochemicals
Chemicals
Animal health
Pharma/medical
Home, industrial,
institutional, and
personal care
41%
15%
10%
34%
Biobased Ingredients
Source: Company data
Biochemicals
Biobased Ingredients
Biobased Innovations
76%
24%
By business unit
98%
2%Asia
EMEA
Latin America
North America
By region
19%
6%
13%
63%
Food
Bakery
Meat
Foods
50%
26%
24%
Food
Net sales 2016
23CORBION ANNUAL REPORT 2016 OUR PERFORMANCE
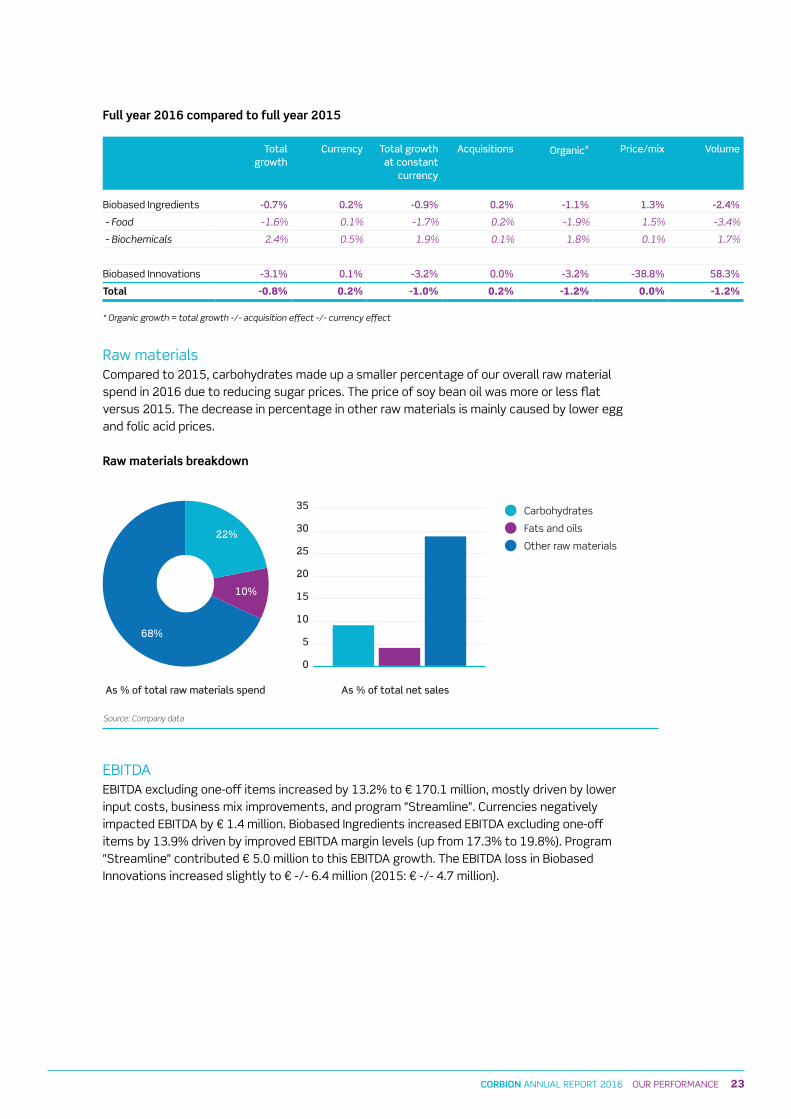
Full year 2016 compared to full year 2015
Total growth
Currency Total growth at constant
currency
Acquisitions Organic* Price/mix Volume
Biobased Ingredients -0 7% 0 2% -0 9% 0 2% -1 1% 1 3% -2 4%
- Food -1.6% 0.1% -1.7% 0.2% -1.9% 1.5% -3.4%
- Biochemicals 2.4% 0.5% 1.9% 0.1% 1.8% 0.1% 1.7%
Biobased Innovations -3 1% 0 1% -3 2% 0 0% -3 2% -38 8% 58 3%
Total -0.8% 0.2% -1.0% 0.2% -1.2% 0.0% -1.2%
* Organic growth = total growth -/- acquisition effect -/- currency effect
Raw materialsCompared to 2015, carbohydrates made up a smaller percentage of our overall raw material spend in 2016 due to reducing sugar prices. The price of soy bean oil was more or less flat versus 2015. The decrease in percentage in other raw materials is mainly caused by lower egg and folic acid prices.
Raw materials breakdown
As % of total raw materials spend As % of total net sales
Carbohydrates
Fats and oils
Other raw materials22%
68%
10%
35
30
25
20
15
10
5
0
Raw materials breakdown
Source: Company data
EBITDAEBITDA excluding one-off items increased by 13.2% to € 170.1 million, mostly driven by lower input costs, business mix improvements, and program "streamline". Currencies negatively impacted EBITDA by € 1.4 million. Biobased Ingredients increased EBITDA excluding one-off items by 13.9% driven by improved EBITDA margin levels (up from 17.3% to 19.8%). Program "streamline" contributed € 5.0 million to this EBITDA growth. The EBITDA loss in Biobased Innovations increased slightly to € -/- 6.4 million (2015: € -/- 4.7 million).
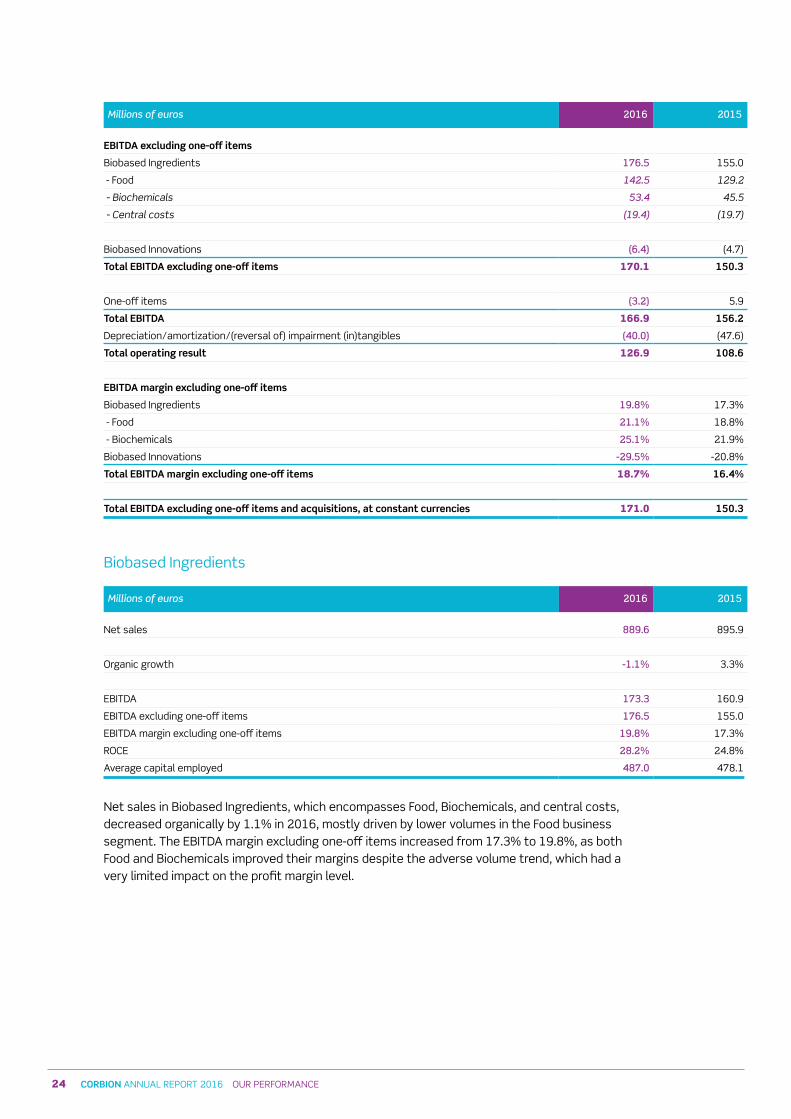
24 CORBION ANNUAL REPORT 2016 OUR PERFORMANCE
Millions of euros 2016 2015
EBITDA excluding one-off items
Biobased Ingredients 176 5 155.0
- Food 142.5 129.2
- Biochemicals 53.4 45.5
- Central costs (19.4) (19.7)
Biobased Innovations (6 4) (4.7)
Total EBITDA excluding one-off items 170.1 150.3
One-off items (3 2) 5.9
Total EBITDA 166.9 156.2
Depreciation/amortization/(reversal of) impairment (in)tangibles (40 0) (47.6)
Total operating result 126.9 108.6
EBITDA margin excluding one-off items
Biobased Ingredients 19 8% 17.3%
- Food 21 1% 18.8%
- Biochemicals 25 1% 21.9%
Biobased Innovations -29 5% -20.8%
Total EBITDA margin excluding one-off items 18.7% 16.4%
Total EBITDA excluding one-off items and acquisitions, at constant currencies 171.0 150.3
Biobased Ingredients
Millions of euros 2016 2015
Net sales 889 6 895.9
Organic growth -1 1% 3.3%
EBITDA 173 3 160.9
EBITDA excluding one-off items 176 5 155.0
EBITDA margin excluding one-off items 19 8% 17.3%
ROCE 28 2% 24.8%
Average capital employed 487 0 478.1
Net sales in Biobased Ingredients, which encompasses Food, Biochemicals, and central costs, decreased organically by 1.1% in 2016, mostly driven by lower volumes in the Food business segment. The EBITDA margin excluding one-off items increased from 17.3% to 19.8%, as both Food and Biochemicals improved their margins despite the adverse volume trend, which had a very limited impact on the profit margin level.
25CORBION ANNUAL REPORT 2016 OUR PERFORMANCE
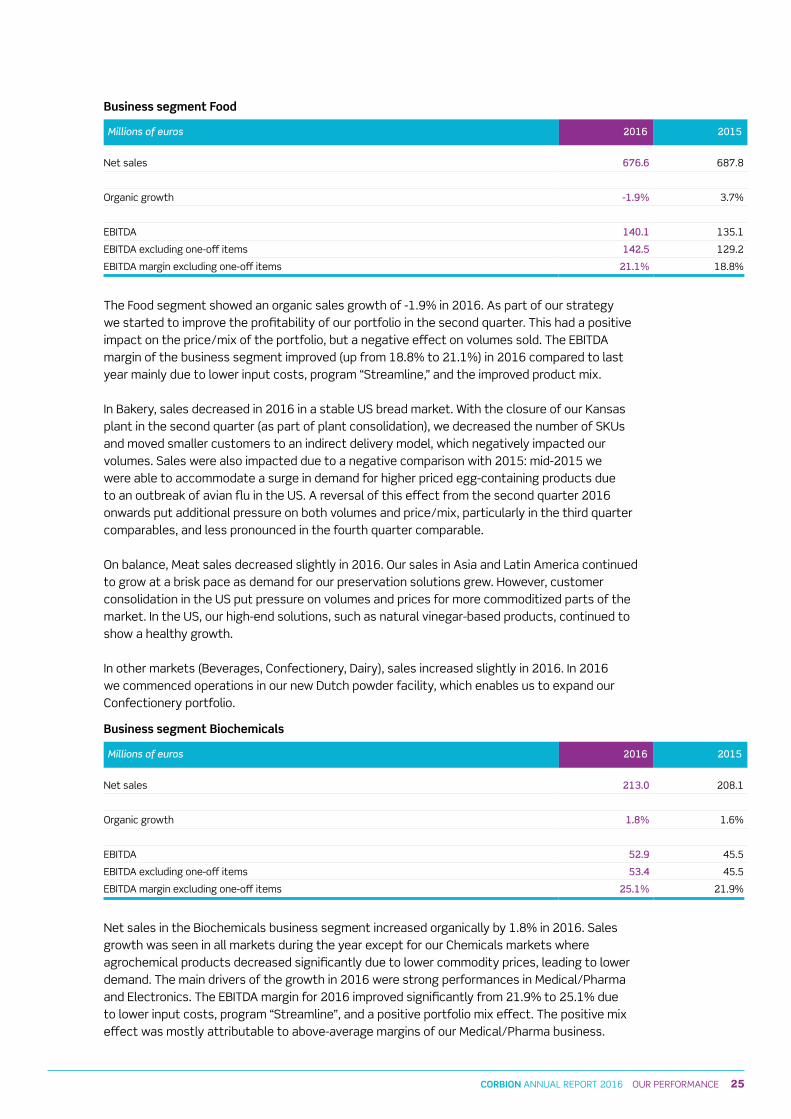
Business segment Food
Millions of euros 2016 2015
Net sales 676 6 687.8
Organic growth -1 9% 3.7%
EBITDA 140 1 135.1
EBITDA excluding one-off items 142 5 129.2
EBITDA margin excluding one-off items 21 1% 18.8%
The Food segment showed an organic sales growth of -1.9% in 2016. As part of our strategy we started to improve the profitability of our portfolio in the second quarter. This had a positive impact on the price/mix of the portfolio, but a negative effect on volumes sold. The EBITDA margin of the business segment improved (up from 18.8% to 21.1%) in 2016 compared to last year mainly due to lower input costs, program “streamline,” and the improved product mix.
In Bakery, sales decreased in 2016 in a stable Us bread market. With the closure of our Kansas plant in the second quarter (as part of plant consolidation), we decreased the number of sKUs and moved smaller customers to an indirect delivery model, which negatively impacted our volumes. sales were also impacted due to a negative comparison with 2015: mid-2015 we were able to accommodate a surge in demand for higher priced egg-containing products due to an outbreak of avian flu in the Us. A reversal of this effect from the second quarter 2016 onwards put additional pressure on both volumes and price/mix, particularly in the third quarter comparables, and less pronounced in the fourth quarter comparable.
On balance, Meat sales decreased slightly in 2016. Our sales in Asia and Latin America continued to grow at a brisk pace as demand for our preservation solutions grew. However, customer consolidation in the Us put pressure on volumes and prices for more commoditized parts of the market. In the Us, our high-end solutions, such as natural vinegar-based products, continued to show a healthy growth.
In other markets (Beverages, Confectionery, Dairy), sales increased slightly in 2016. In 2016 we commenced operations in our new Dutch powder facility, which enables us to expand our Confectionery portfolio.
Business segment Biochemicals
Millions of euros 2016 2015
Net sales 213 0 208.1
Organic growth 1 8% 1.6%
EBITDA 52 9 45.5
EBITDA excluding one-off items 53 4 45.5
EBITDA margin excluding one-off items 25 1% 21.9%
Net sales in the Biochemicals business segment increased organically by 1.8% in 2016. sales growth was seen in all markets during the year except for our Chemicals markets where agrochemical products decreased significantly due to lower commodity prices, leading to lower demand. The main drivers of the growth in 2016 were strong performances in Medical/Pharma and Electronics. The EBITDA margin for 2016 improved significantly from 21.9% to 25.1% due to lower input costs, program “streamline”, and a positive portfolio mix effect. The positive mix effect was mostly attributable to above-average margins of our Medical/Pharma business.
26 CORBION ANNUAL REPORT 2016 OUR PERFORMANCE
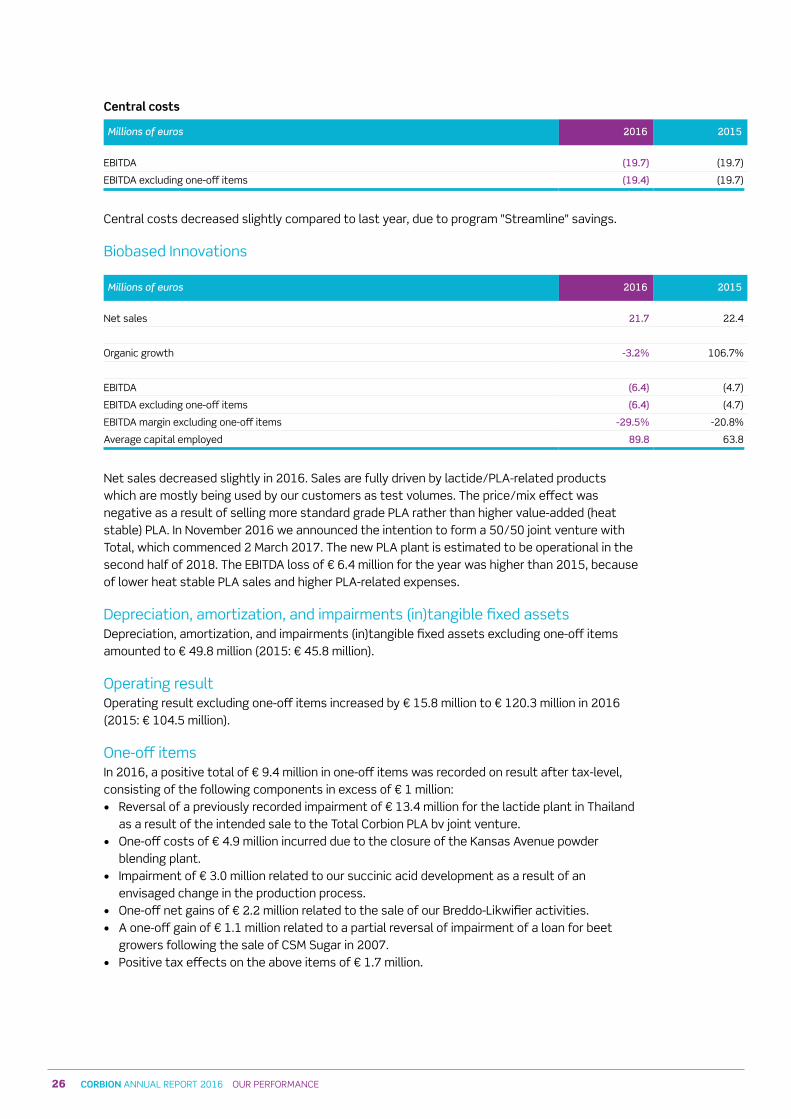
Central costs
Millions of euros 2016 2015
EBITDA (19 7) (19.7)
EBITDA excluding one-off items (19 4) (19.7)
Central costs decreased slightly compared to last year, due to program "streamline" savings.
Biobased Innovations
Millions of euros 2016 2015
Net sales 21 7 22.4
Organic growth -3 2% 106.7%
EBITDA (6 4) (4.7)
EBITDA excluding one-off items (6 4) (4.7)
EBITDA margin excluding one-off items -29 5% -20.8%
Average capital employed 89 8 63.8
Net sales decreased slightly in 2016. sales are fully driven by lactide/PLA-related products which are mostly being used by our customers as test volumes. The price/mix effect was negative as a result of selling more standard grade PLA rather than higher value-added (heat stable) PLA. In November 2016 we announced the intention to form a 50/50 joint venture with Total, which commenced 2 March 2017. The new PLA plant is estimated to be operational in the second half of 2018. The EBITDA loss of € 6.4 million for the year was higher than 2015, because of lower heat stable PLA sales and higher PLA-related expenses.
Depreciation, amortization, and impairments (in)tangible fixed assetsDepreciation, amortization, and impairments (in)tangible fixed assets excluding one-off items amounted to € 49.8 million (2015: € 45.8 million).
Operating resultOperating result excluding one-off items increased by € 15.8 million to € 120.3 million in 2016 (2015: € 104.5 million).
One-off itemsIn 2016, a positive total of € 9.4 million in one-off items was recorded on result after tax-level, consisting of the following components in excess of € 1 million:• Reversal of a previously recorded impairment of € 13.4 million for the lactide plant in Thailand
as a result of the intended sale to the Total Corbion PLA bv joint venture.• One-off costs of € 4.9 million incurred due to the closure of the Kansas Avenue powder
blending plant.• Impairment of € 3.0 million related to our succinic acid development as a result of an
envisaged change in the production process.• One-off net gains of € 2.2 million related to the sale of our Breddo-Likwifier activities.• A one-off gain of € 1.1 million related to a partial reversal of impairment of a loan for beet
growers following the sale of CsM sugar in 2007.• Positive tax effects on the above items of € 1.7 million.
27CORBION ANNUAL REPORT 2016 OUR PERFORMANCE
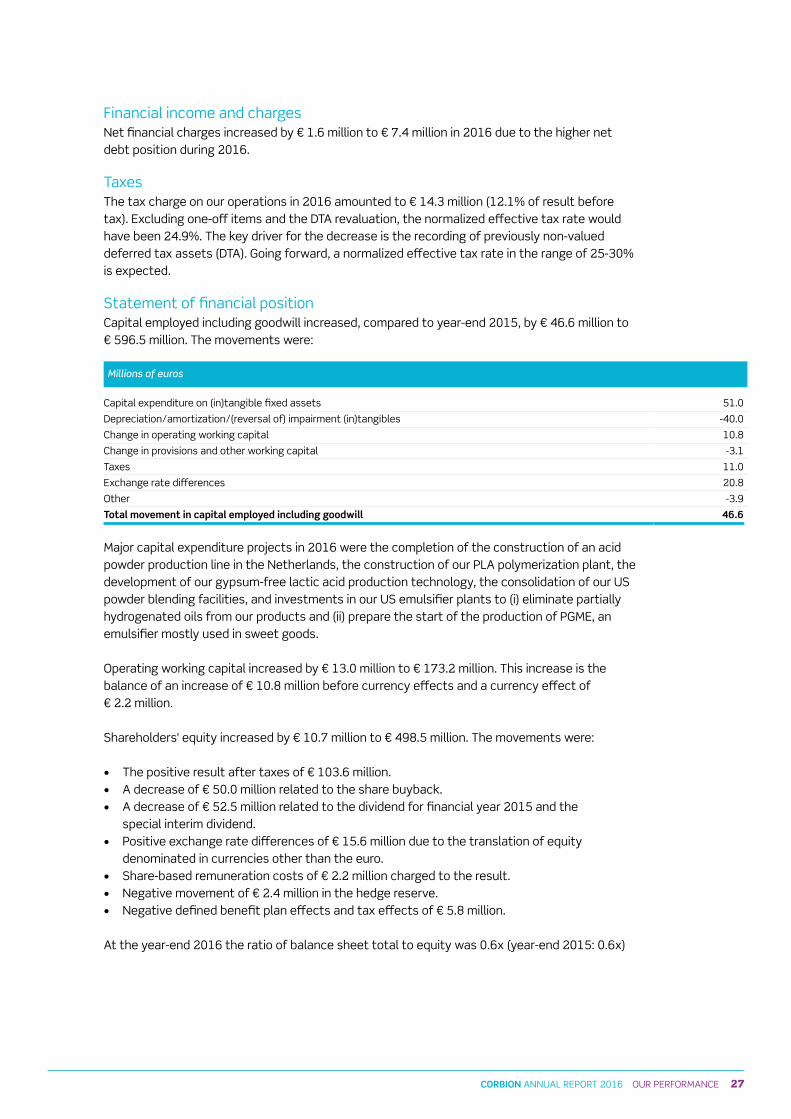
Financial income and charges Net financial charges increased by € 1.6 million to € 7.4 million in 2016 due to the higher net debt position during 2016.
Taxes The tax charge on our operations in 2016 amounted to € 14.3 million (12.1% of result before tax). Excluding one-off items and the DTA revaluation, the normalized effective tax rate would have been 24.9%. The key driver for the decrease is the recording of previously non-valued deferred tax assets (DTA). Going forward, a normalized effective tax rate in the range of 25-30% is expected.
statement of financial positionCapital employed including goodwill increased, compared to year-end 2015, by € 46.6 million to € 596.5 million. The movements were:
Millions of euros
Capital expenditure on (in)tangible fixed assets 51.0
Depreciation/amortization/(reversal of) impairment (in)tangibles -40.0
Change in operating working capital 10.8
Change in provisions and other working capital -3.1
Taxes 11.0
Exchange rate differences 20.8
Other -3.9
Total movement in capital employed including goodwill 46.6
Major capital expenditure projects in 2016 were the completion of the construction of an acid powder production line in the Netherlands, the construction of our PLA polymerization plant, the development of our gypsum-free lactic acid production technology, the consolidation of our Us powder blending facilities, and investments in our Us emulsifier plants to (i) eliminate partially hydrogenated oils from our products and (ii) prepare the start of the production of PGME, an emulsifier mostly used in sweet goods.
Operating working capital increased by € 13.0 million to € 173.2 million. This increase is the balance of an increase of € 10.8 million before currency effects and a currency effect of € 2.2 million.
shareholders' equity increased by € 10.7 million to € 498.5 million. The movements were:
• The positive result after taxes of € 103.6 million.• A decrease of € 50.0 million related to the share buyback.• A decrease of € 52.5 million related to the dividend for financial year 2015 and the
special interim dividend.• Positive exchange rate differences of € 15.6 million due to the translation of equity
denominated in currencies other than the euro.• share-based remuneration costs of € 2.2 million charged to the result.• Negative movement of € 2.4 million in the hedge reserve.• Negative defined benefit plan effects and tax effects of € 5.8 million.
At the year-end 2016 the ratio of balance sheet total to equity was 0.6x (year-end 2015: 0.6x)
28 CORBION ANNUAL REPORT 2016 OUR PERFORMANCE
Cash flow/financingCash flow from operating activities increased compared to 2015 by € 12.3 million to € 122.6 million. This is the balance of the higher operational cash flow before movements in working capital and provisions of € 10.8 million, a positive impact of the movement in working capital and provisions of € 2.7 million, lower taxes of € 0.3 million, and higher interest paid of € 1.5 million.
The cash flow required for investment activities decreased compared to 2015 by € 4.6 million to € 50.5 million. Capital expenditures accounted for most of this cash outflow, partly offset by a cash inflow from the divestment of our Us-based Breddo-Likwifier activities in December 2016.
The net debt position at the end of 2016 was € 98.0 million, an increase of € 35.9 million compared to year-end 2015, mainly due to capital expenditures, the regular dividend, the special interim dividend payment, and the share buyback, partly compensated by the positive cash flow from operating activities.
At the year-end 2016 the ratio of net debt to EBITDA was 0.6x (year-end 2015: 0.4x). The interest cover for 2016 was 23.0x (year-end 2015: 25.5x). We continue to stay well within the limits of our financing covenants.
Reservation and dividend policyCorbion’s reservation policy is aimed at creating and retaining sufficient financial capacity and flexibility to realize our strategic objectives while maintaining healthy balance sheet ratios. Corbion intends to add the profit (or charge the loss) to the company reserves after payment of the statutory dividend on financing preference shares and after deduction of the proposed dividend on ordinary shares. Events potentially impacting our financing requirements such as acquisitions, divestments, reorganizations, or other strategic considerations can lead to adjustments in the reservation amount and the reservation policy.
As regards Corbion’s dividend policy, the amount and structure of dividend on ordinary shares that the company will pay to its shareholders depend on the financial results of the company, the market environment, the outlook, and other relevant factors. The current dividend policy is to pay out 35-45% of net profit adjusted for one-off items. Periodically Corbion will review its net debt position in relation to the investment plans, and decide upon potential additional distributions.
Dividend and share buyback proposal Upon adoption of the financial statements, holders of financing preference shares will receive the statutory dividend. A proposal to distribute a regular dividend in cash of € 0.56 per ordinary share will be submitted for approval to the General shareholders' Meeting to be held on 15 May 2017. This represents 35% of our net profit excluding one-off items. The dividend will be charged to the Corbion reserves.
In addition to the regular dividend on ordinary shares, € 25 million is proposed to be distributed as an additional cash dividend of € 0.44 per ordinary share, payable at the same time as the regular dividend. The proposed additional cash dividend on ordinary shares will also be submitted for approval to the General shareholders' Meeting.
Corbion also intends to distribute € 25 million to shareholders in 2017 through a new share buyback program to be commenced in April 2017 and to be completed before the end of 2017.
29CORBION ANNUAL REPORT 2016 OUR PERFORMANCE
Outlook 2017Our expectations for 2017 are based on moderate global economic growth. We are confident in the execution of our "Disciplined Value Creation" strategy. In the Food business segment we anticipate a better sales growth performance in 2017 as the temporary adverse sales growth effects of the portfolio optimization are expected to fade out in the first half of 2017. The Biochemicals business segment is also expected to show an improved sales growth performance in 2017 compared to 2016. As a consequence, for Biobased Ingredients, we expect full-year growth to be within the multi-year average guidance range of 2-4%.
We expect the portfolio changes initiated over 2016 to have a continued positive effect on our EBITDA margin in Biobased Ingredients. However, as the price of sugar cane, one of our main raw materials, increased over the course of 2016, we anticipate an adverse effect on our EBITDA margin in 2017. On balance we expect some EBITDA margin pressure and our EBITDA excluding one-off items for 2017 to be slightly below that of 2016. The EBITDA margin in Biobased Ingredients is expected to remain firmly above the 18% target level.Volatility in the EBITDA of Biobased Innovations will remain high due to irregular product and sales order patterns and spend phasing of our major innovation initiatives.
Overall capital expenditure in 2017 is expected to be between € 60-70 million (including 50% share of PLA joint venture capital expenditure) .
We will hold a Capital Markets Day in the fourth quarter of 2017 to provide an update on our strategy progress, targets, and plans for the future.
30 CORBION ANNUAL REPORT 2016 OUR PERFORMANCE
Sustainability performance
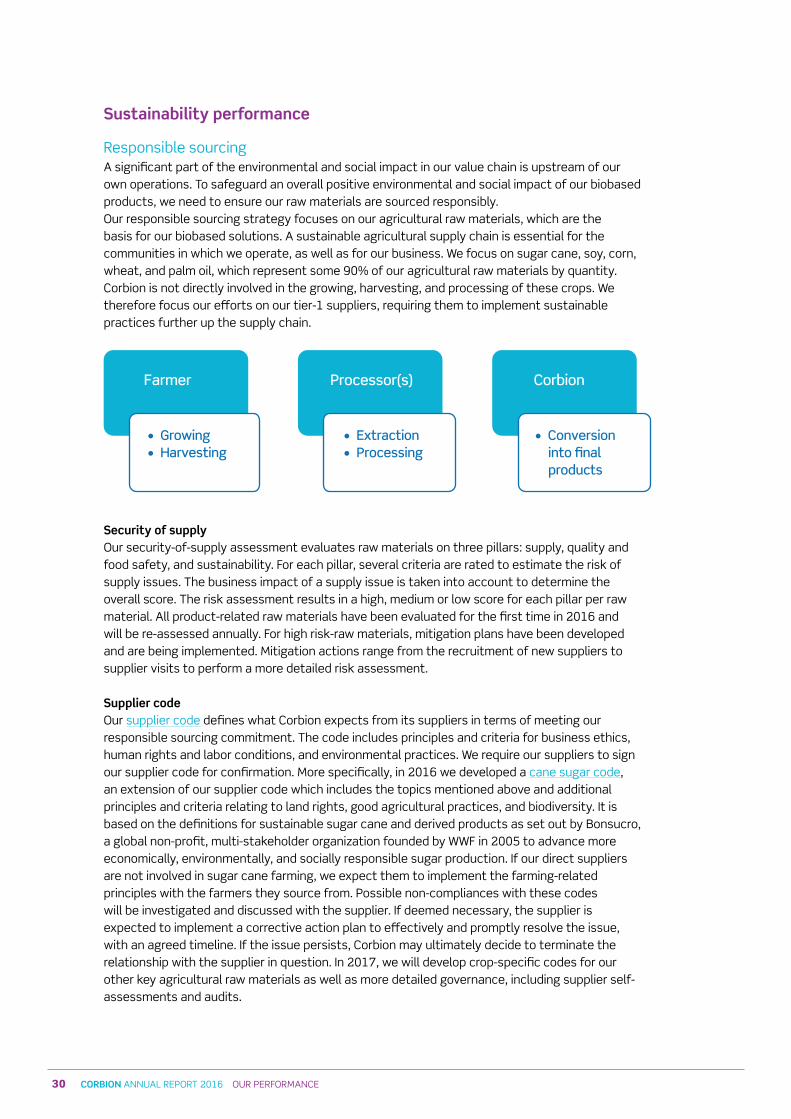
Responsible sourcingA significant part of the environmental and social impact in our value chain is upstream of our own operations. To safeguard an overall positive environmental and social impact of our biobased products, we need to ensure our raw materials are sourced responsibly. Our responsible sourcing strategy focuses on our agricultural raw materials, which are the basis for our biobased solutions. A sustainable agricultural supply chain is essential for the communities in which we operate, as well as for our business. We focus on sugar cane, soy, corn, wheat, and palm oil, which represent some 90% of our agricultural raw materials by quantity. Corbion is not directly involved in the growing, harvesting, and processing of these crops. We therefore focus our efforts on our tier-1 suppliers, requiring them to implement sustainable practices further up the supply chain.
Farmer Processor(s) Corbion
• Growing• Harvesting
• Extraction• Processing
• Conversion into final products
Security of supplyOur security-of-supply assessment evaluates raw materials on three pillars: supply, quality and food safety, and sustainability. For each pillar, several criteria are rated to estimate the risk of supply issues. The business impact of a supply issue is taken into account to determine the overall score. The risk assessment results in a high, medium or low score for each pillar per raw material. All product-related raw materials have been evaluated for the first time in 2016 and will be re-assessed annually. For high risk-raw materials, mitigation plans have been developed and are being implemented. Mitigation actions range from the recruitment of new suppliers to supplier visits to perform a more detailed risk assessment.
Supplier codeOur supplier code defines what Corbion expects from its suppliers in terms of meeting our responsible sourcing commitment. The code includes principles and criteria for business ethics, human rights and labor conditions, and environmental practices. We require our suppliers to sign our supplier code for confirmation. More specifically, in 2016 we developed a cane sugar code, an extension of our supplier code which includes the topics mentioned above and additional principles and criteria relating to land rights, good agricultural practices, and biodiversity. It is based on the definitions for sustainable sugar cane and derived products as set out by Bonsucro, a global non-profit, multi-stakeholder organization founded by WWF in 2005 to advance more economically, environmentally, and socially responsible sugar production. If our direct suppliers are not involved in sugar cane farming, we expect them to implement the farming-related principles with the farmers they source from. Possible non-compliances with these codes will be investigated and discussed with the supplier. If deemed necessary, the supplier is expected to implement a corrective action plan to effectively and promptly resolve the issue, with an agreed timeline. If the issue persists, Corbion may ultimately decide to terminate the relationship with the supplier in question. In 2017, we will develop crop-specific codes for our other key agricultural raw materials as well as more detailed governance, including supplier self-assessments and audits.
31CORBION ANNUAL REPORT 2016 OUR PERFORMANCE
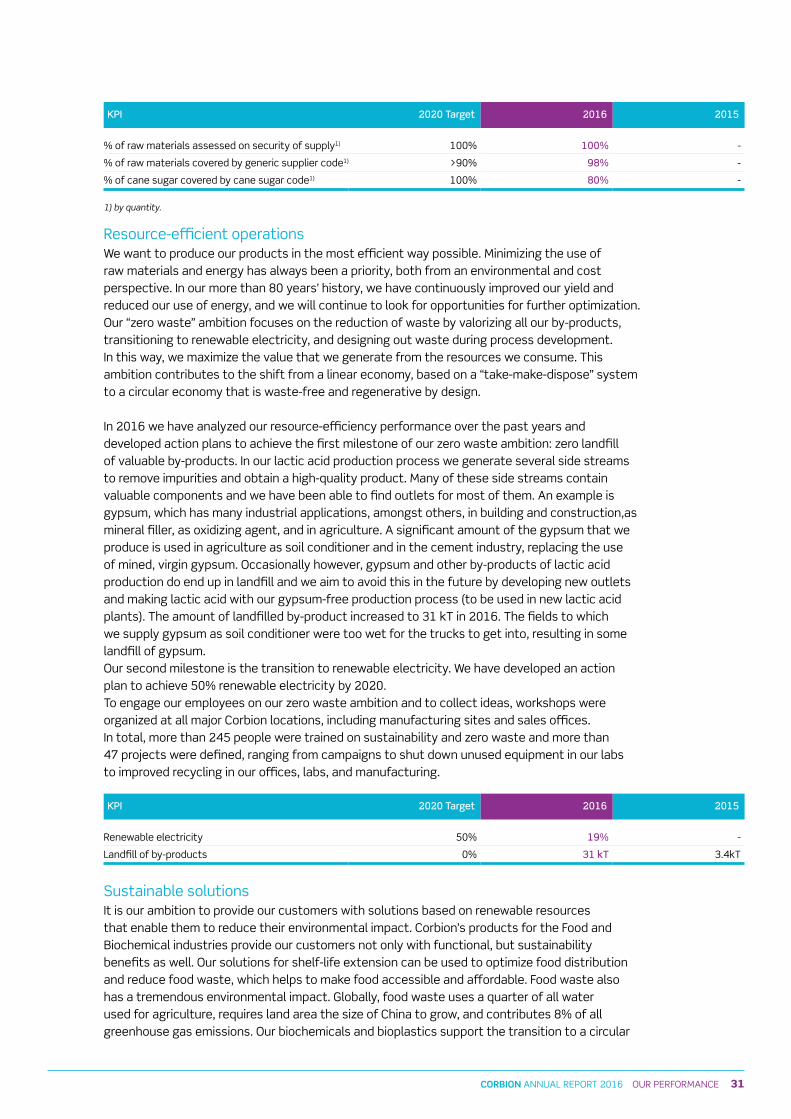
KPI 2020 Target 2016 2015
% of raw materials assessed on security of supply1) 100% 100% -
% of raw materials covered by generic supplier code1) >90% 98% -
% of cane sugar covered by cane sugar code1) 100% 80% -
1) by quantity.
Resource-efficient operationsWe want to produce our products in the most efficient way possible. Minimizing the use of raw materials and energy has always been a priority, both from an environmental and cost perspective. In our more than 80 years’ history, we have continuously improved our yield and reduced our use of energy, and we will continue to look for opportunities for further optimization. Our “zero waste” ambition focuses on the reduction of waste by valorizing all our by-products, transitioning to renewable electricity, and designing out waste during process development. In this way, we maximize the value that we generate from the resources we consume. This ambition contributes to the shift from a linear economy, based on a “take-make-dispose” system to a circular economy that is waste-free and regenerative by design.
In 2016 we have analyzed our resource-efficiency performance over the past years and developed action plans to achieve the first milestone of our zero waste ambition: zero landfill of valuable by-products. In our lactic acid production process we generate several side streams to remove impurities and obtain a high-quality product. Many of these side streams contain valuable components and we have been able to find outlets for most of them. An example is gypsum, which has many industrial applications, amongst others, in building and construction,as mineral filler, as oxidizing agent, and in agriculture. A significant amount of the gypsum that we produce is used in agriculture as soil conditioner and in the cement industry, replacing the use of mined, virgin gypsum. Occasionally however, gypsum and other by-products of lactic acid production do end up in landfill and we aim to avoid this in the future by developing new outlets and making lactic acid with our gypsum-free production process (to be used in new lactic acid plants). The amount of landfilled by-product increased to 31 kT in 2016. The fields to which we supply gypsum as soil conditioner were too wet for the trucks to get into, resulting in some landfill of gypsum. Our second milestone is the transition to renewable electricity. We have developed an action plan to achieve 50% renewable electricity by 2020.To engage our employees on our zero waste ambition and to collect ideas, workshops were organized at all major Corbion locations, including manufacturing sites and sales offices. In total, more than 245 people were trained on sustainability and zero waste and more than 47 projects were defined, ranging from campaigns to shut down unused equipment in our labs to improved recycling in our offices, labs, and manufacturing.
KPI 2020 Target 2016 2015
Renewable electricity 50% 19% -
Landfill of by-products 0% 31 kT 3.4kT
sustainable solutionsIt is our ambition to provide our customers with solutions based on renewable resources that enable them to reduce their environmental impact. Corbion’s products for the Food and Biochemical industries provide our customers not only with functional, but sustainability benefits as well. Our solutions for shelf-life extension can be used to optimize food distribution and reduce food waste, which helps to make food accessible and affordable. Food waste also has a tremendous environmental impact. Globally, food waste uses a quarter of all water used for agriculture, requires land area the size of China to grow, and contributes 8% of all greenhouse gas emissions. Our biochemicals and bioplastics support the transition to a circular
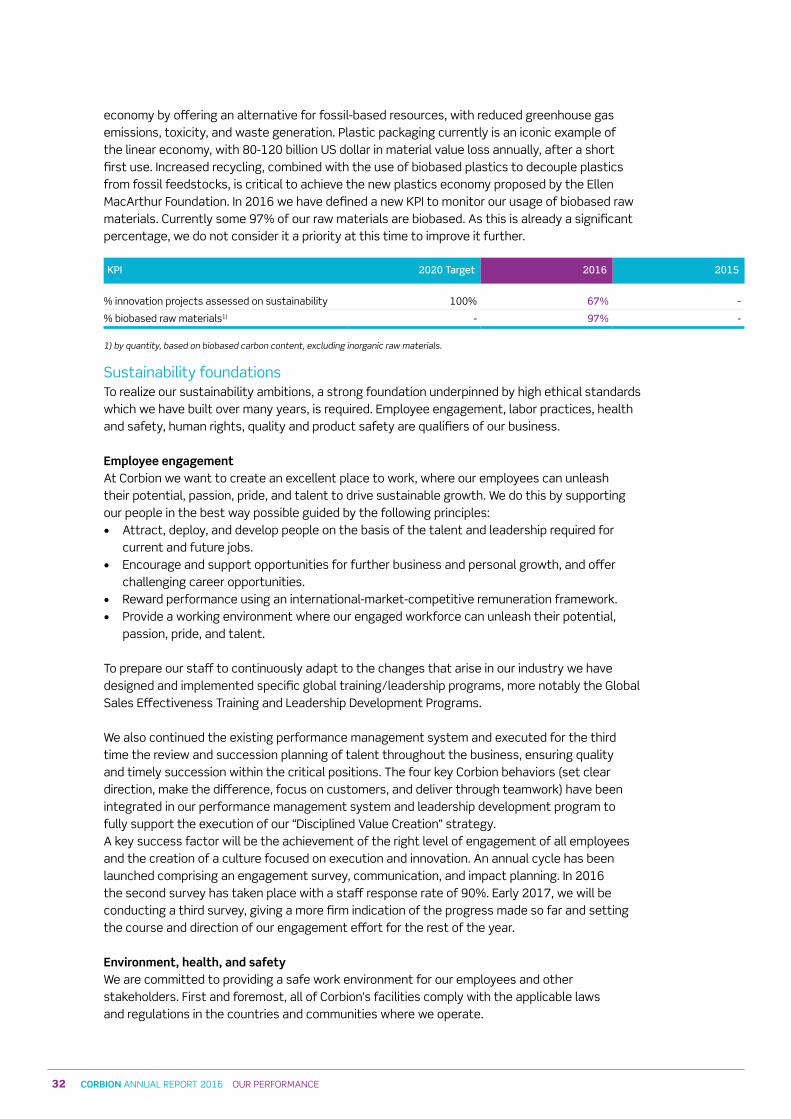
32 CORBION ANNUAL REPORT 2016 OUR PERFORMANCE
economy by offering an alternative for fossil-based resources, with reduced greenhouse gas emissions, toxicity, and waste generation. Plastic packaging currently is an iconic example of the linear economy, with 80-120 billion Us dollar in material value loss annually, after a short first use. Increased recycling, combined with the use of biobased plastics to decouple plastics from fossil feedstocks, is critical to achieve the new plastics economy proposed by the Ellen MacArthur Foundation. In 2016 we have defined a new KPI to monitor our usage of biobased raw materials. Currently some 97% of our raw materials are biobased. As this is already a significant percentage, we do not consider it a priority at this time to improve it further.
KPI 2020 Target 2016 2015
% innovation projects assessed on sustainability 100% 67% -
% biobased raw materials1) - 97% -
1) by quantity, based on biobased carbon content, excluding inorganic raw materials.
sustainability foundationsTo realize our sustainability ambitions, a strong foundation underpinned by high ethical standards which we have built over many years, is required. Employee engagement, labor practices, health and safety, human rights, quality and product safety are qualifiers of our business.
Employee engagementAt Corbion we want to create an excellent place to work, where our employees can unleash their potential, passion, pride, and talent to drive sustainable growth. We do this by supporting our people in the best way possible guided by the following principles:• Attract, deploy, and develop people on the basis of the talent and leadership required for
current and future jobs.• Encourage and support opportunities for further business and personal growth, and offer
challenging career opportunities.• Reward performance using an international-market-competitive remuneration framework.• Provide a working environment where our engaged workforce can unleash their potential,
passion, pride, and talent.
To prepare our staff to continuously adapt to the changes that arise in our industry we have designed and implemented specific global training/leadership programs, more notably the Global sales Effectiveness Training and Leadership Development Programs.
We also continued the existing performance management system and executed for the third time the review and succession planning of talent throughout the business, ensuring quality and timely succession within the critical positions. The four key Corbion behaviors (set clear direction, make the difference, focus on customers, and deliver through teamwork) have been integrated in our performance management system and leadership development program to fully support the execution of our “Disciplined Value Creation” strategy. A key success factor will be the achievement of the right level of engagement of all employees and the creation of a culture focused on execution and innovation. An annual cycle has been launched comprising an engagement survey, communication, and impact planning. In 2016 the second survey has taken place with a staff response rate of 90%. Early 2017, we will be conducting a third survey, giving a more firm indication of the progress made so far and setting the course and direction of our engagement effort for the rest of the year.
Environment, health, and safetyWe are committed to providing a safe work environment for our employees and other stakeholders. First and foremost, all of Corbion’s facilities comply with the applicable laws and regulations in the countries and communities where we operate.
33CORBION ANNUAL REPORT 2016 OUR PERFORMANCE
Corbion aims to create a safe and healthy workspace with the goal of having zero incidents because we believe no job is so important that it cannot be done safely and without adverse environmental impact. We therefore operate with the greatest care for safety, health and the environment for our employees and the communities we engage with. Our activities are supported by a management system that includes policies, procedures, training, and feedback, which ascertain that we comply with laws and regulations applicable to our operations and in accordance with our own corporate standards and codes.
In 2016 we have implemented a global Environment, Health, and safety policy to harmonize best practices at our facilities.
Corbion leadership and employees are committed to achieving a “zero incident culture.” Corbion fosters an open and transparent culture by encouraging all employees to report, amongst others, all near misses and events in order to continuously improve our safety and environmental performance. Our LTIR (Lost Time Injury Rate per 200,000 hours worked) was 1.2 for the full year of 2016 (2015: 1.9). The LDR or Lost Day Rate decreased from 56.8 to 33.3. Our employee absentee rate was 2.0% overall compared to 1.8% in 2015. We record and investigate all incidents, including those with contractors, by determining the root cause and implementing corrective and preventive measures.
We deploy Environmental, Health, and safety (EHs) management systems, such as IsO 14001 and OHsAs 18001.
Human rightsWe support the United Nations Universal Declaration of Human Rights, the key conventions of the International Labor Organization, the OECD guidelines, and we are a signatory of the United Nations Global Compact. We integrate these principles into our business activities. Our Code of Business Conduct covers amongst others child and forced labor, discrimination, and freedom of association. All of our sites are assessed through sedex and regularly audited (4-Pillar sedex Members Ethical Trade Audit). Through our supplier code and our cane sugar code, we expect our suppliers to respect human rights in their operations.
QualityWe are committed to delivering high-quality solutions that safely meet our customer expectations and fulfilling our customer promise through quality and manufacturing systems and processes.
On a local level we operate in compliance with local regulations and legislation, while ensuring certifications are in place to meet customer and industry-adopted standards and requirements, such as IsO 9001, GFsI (BRC, FsCC22000), GMP+, GMP Pharma, FDA Pharma, Halal, Kosher, non GMO, Organic, and most recently FsMA. In addition we host customer audits predominantly from our international pharmaceutical customers and large food clients. These, and our self-assessment audits performed by our global Quality platform, ensure that we continue to improve our operational standards for quality and food safety.
In 2016, the main area of quality incidents was again related to transportation (documentation), distribution, and packaging. To address this a company-wide effort has been started to work with our third-party logistics providers and transportation companies to improve performance. At the same time broader training efforts have been made for proper root cause analysis to improve effectiveness of our corrective and preventive actions (CAPA). An enterprise quality management system (EQMs) has been implemented to create a global system for case registration, investigation and CAPA records, which will also act as a repository of critical Management of Change notifications.

34 CORBION ANNUAL REPORT 2016 OUR PERFORMANCE
I create a sensory experience
Margaret WalshSenior ScientistCorbion North America
At Corbion we’re creating a better future together
Keep creating
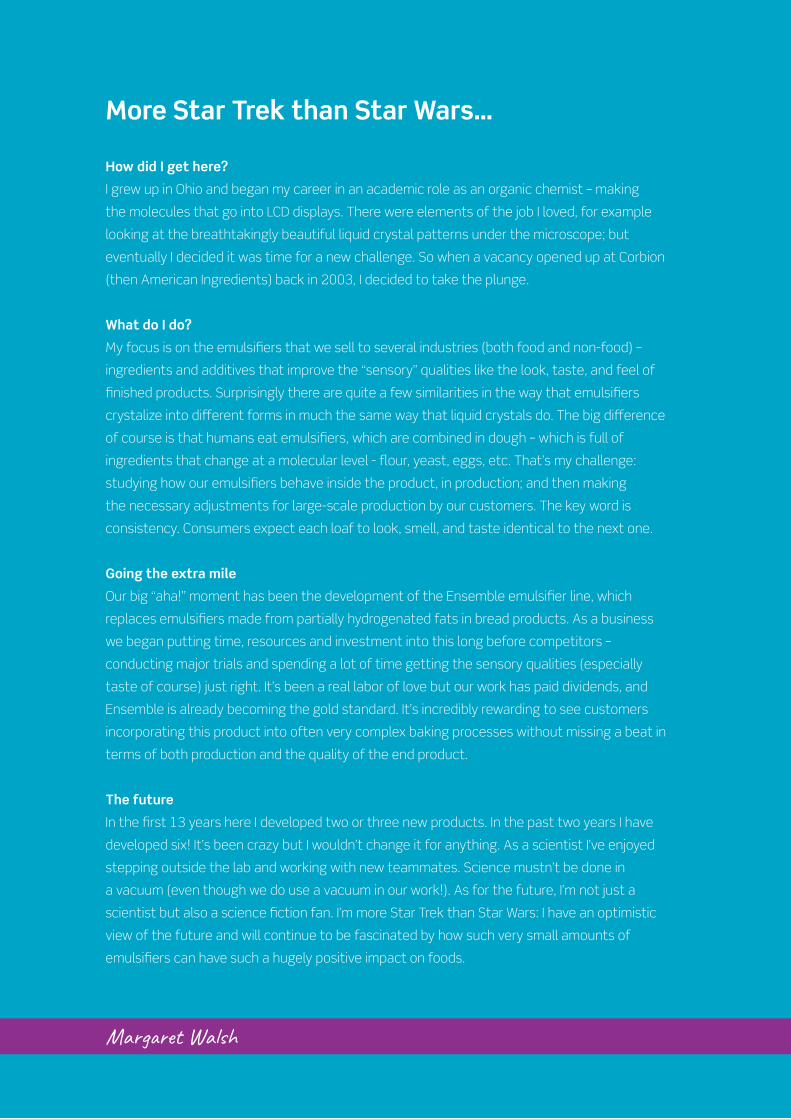
35CORBION ANNUAL REPORT 2016 OUR PERFORMANCE
Margaret Walsh
How did I get here?
I grew up in Ohio and began my career in an academic role as an organic chemist – making
the molecules that go into LCD displays. There were elements of the job I loved, for example
looking at the breathtakingly beautiful liquid crystal patterns under the microscope; but
eventually I decided it was time for a new challenge. So when a vacancy opened up at Corbion
(then American Ingredients) back in 2003, I decided to take the plunge.
What do I do?
My focus is on the emulsifiers that we sell to several industries (both food and non-food) –
ingredients and additives that improve the “sensory” qualities like the look, taste, and feel of
finished products. Surprisingly there are quite a few similarities in the way that emulsifiers
crystalize into different forms in much the same way that liquid crystals do. The big difference
of course is that humans eat emulsifiers, which are combined in dough – which is full of
ingredients that change at a molecular level - flour, yeast, eggs, etc. That’s my challenge:
studying how our emulsifiers behave inside the product, in production; and then making
the necessary adjustments for large-scale production by our customers. The key word is
consistency. Consumers expect each loaf to look, smell, and taste identical to the next one.
Going the extra mile
Our big “aha!” moment has been the development of the Ensemble emulsifier line, which
replaces emulsifiers made from partially hydrogenated fats in bread products. As a business
we began putting time, resources and investment into this long before competitors –
conducting major trials and spending a lot of time getting the sensory qualities (especially
taste of course) just right. It’s been a real labor of love but our work has paid dividends, and
Ensemble is already becoming the gold standard. It’s incredibly rewarding to see customers
incorporating this product into often very complex baking processes without missing a beat in
terms of both production and the quality of the end product.
The future
In the first 13 years here I developed two or three new products. In the past two years I have
developed six! It’s been crazy but I wouldn’t change it for anything. As a scientist I’ve enjoyed
stepping outside the lab and working with new teammates. Science mustn’t be done in
a vacuum (even though we do use a vacuum in our work!). As for the future, I’m not just a
scientist but also a science fiction fan. I’m more Star Trek than Star Wars: I have an optimistic
view of the future and will continue to be fascinated by how such very small amounts of
emulsifiers can have such a hugely positive impact on foods.
More Star Trek than Star Wars…
36 CORBION ANNUAL REPORT 2016 OUR GOVERNANCE
Corporate governance
Corbion recognizes the importance of good corporate governance and the principles contained within the Dutch corporate governance code 2008 (the “Code”), namely, that a company is a long-term partnership between various parties related to the company. Our management bears overall responsibility for balancing the interests of these parties, mostly with the aim of ensuring continuity of the company. At the same time, Corbion aims to create long-term value for its shareholders. Corbion is committed to embedding the Code principles within the company, thereby abiding by the core concepts of good business practices, integrity, openness, and transparent and well-supervised management. The full text of the Code can be viewed at: www.commissiecorporategovernance.nl.
Compliance with the CodeWith the exception of the deviations outlined in the paragraphs below, Corbion endorses and adheres to the principles and best practices of the Code.Important changes in the corporate governance structure are presented to the General shareholders’ Meeting for discussion. Our corporate governance policy, including the relevant regulations and reports, can be consulted on the Corbion website.
Deviations from the CodeWith respect to best practice provision II.2.5 of the Code, Corbion applies share ownership requirements instead of holding restrictions. The supervisory Board believes that a mandatory share ownership leads to a more sustainable build-up and alignment of the interests of the Board members and the shareholders. As long as a member of the Board of Management does not comply with the share ownership requirements, vested shares received under share plans will be kept in a restricted account and cannot be traded.
Corbion departs from the provisions of the Code with regard to the possible financing of income tax on vested shares under the share plan by selling part of the vested shares.
Regarding its composition, the supervisory Board always tries to strike the right balance between (international) expertise and experience. Diversity in – a certain degree of – nationality, age and gender variation may be instrumental in achieving the desired balance in the composition of the Board. In this respect, the profile of Corbion's supervisory Board deviates from best practice provision III.3.1 of the Code. The required expertise and experience, as well as the availability of the right candidates, are decisive when proposing candidates for (re)appointment.Corbion continues to pay close attention to diversity including gender diversity in the profiles of new Board of Management and supervisory Board members in accordance with section 2:166 subsection 2 of the Dutch Civil Code, although it currently does not strictly follow the recommendation for an explicit target on gender diversity yet and has not formulated concrete targets in this respect. A diversity policy including possible target (setting) ambitions will be further prepared in 2017.
OUR GOVERNANCE
37CORBION ANNUAL REPORT 2016 OUR GOVERNANCE
There are two other aspects in which Corbion departs from the Code. The members of the supervisory Board and the Board of Management are appointed by the General shareholders’ Meeting on the basis of nominations by the supervisory Board. The Corbion Articles of Association state that the General shareholders’ Meeting can overrule any such nomination by an absolute majority of the votes cast, provided the said majority represents at least one third of the issued capital. In contrast with the Code, no second meeting will be convened if there is no quorum, as a second meeting is not required by law.
The General shareholders’ Meeting may decide to suspend or dismiss a member of the Board of Management or the supervisory Board by an absolute majority of the votes cast, provided the said majority represents at least one third of the issued capital. This quorum requirement does not apply if the proposal for suspension or dismissal is submitted by the supervisory Board. In contrast with the Code, no second meeting will be convened if there is no quorum, as a second meeting is not required by law.
Corporate governance statementThe information and statement pursuant to the Decree to determine additional regulations regarding the content of the Report of the Board of Management (Vaststellingsbesluit nadere voorschriften inhoud bestuursverslag), have been published on Corbion’s website, www.corbion.com (Investor Relations, Corporate Governance).
structureCorbion nv is an international holding company as described by section 153, subsection 3 under b, of Book 2 of the Dutch Civil Code. The “large company” regime therefore does not apply to Corbion nv. Corporate governance relates to the management and supervision of the company, accountability, and the influence of stakeholders on decision-making.
The Board of Management (Chief Executive Officer and Chief Financial Officer) is entrusted with the management of the company. As per 1 January 2015, certain key officers have been appointed to manage the company together with the Board of Management. The members of the Board of Management and these key officers together constitute the Executive Committee. Under the chairmanship of the Chief Executive Officer, the members of the Executive Committee share responsibility for developing objectives and the strategy, determining the risk profile, and implementing strategic and operational policies. The Board of Management has ultimate responsibility for the company’s management and the external reporting and is answerable to shareholders of the company at the annual General shareholders’ Meeting. The independent supervisory Board oversees and advises the Board of Management. From among its members, the supervisory Board has appointed an Audit Committee, a Nomination Committee, a Remuneration Committee, and a science and Technology Committee.
The Board of Management fulfills its duties by promoting the interests of Corbion and its businesses. These interests are understood as the interests of all stakeholders, including customers, shareholders, employees, suppliers, and business and financial partners. Corbion is aware of its corporate and social responsibilities and is deeply committed to protecting the interests of the community. Corbion works on the principle that corporate management should consistently develop and implement corporate policies taking into account the long-term and continuity perspective. Corbion endorses the importance of clear accountability for its policies and the results thereof.
Ordinary shares in Corbion are listed on the Euronext in Amsterdam. The financing preference shares are not listed. No restrictions apply to the transfer of shares. If a shareholder or group of shareholders acquires 30% or more of the share capital, the said shareholder or group of shareholders is required by law to make an offer for the entire outstanding capital.
38 CORBION ANNUAL REPORT 2016 OUR GOVERNANCE
shareholders have voting rights in proportion to the number of shares held.The annual General shareholders’ Meeting will be held within six months of the close of the financial year. At this meeting, the Report of the Board of Management and Financial statements drawn up by the Board of Management will be presented for adoption, amongst other things. If requests are received from shareholders who individually or collectively represent at least 1% of the issued capital to place items on the General shareholders’ Meeting agenda, these will be honored provided they are submitted to Corbion at least 45 days prior to the date of the meeting.
Extraordinary General shareholders’ Meetings will be held as often as the Board of Management and supervisory Board deem necessary. An Extraordinary General shareholders’ Meeting will also be held if one or more shareholders who collectively represent at least 10% of the issued capital submit a written request to this effect to the Board of Management or the supervisory Board enclosing a detailed list of agenda items. If neither the Board of Management nor the supervisory Board – which have equal powers in this matter – respond in such a way that this Extraordinary General shareholders’ Meeting can be convened within six weeks of the request, the applicants are at liberty to convene the meeting themselves and appoint a Chairman.
With the exception of cases in which a larger majority is required by law or the Articles of Association, decisions at the General shareholders’ Meeting will be taken by an absolute majority of the votes cast. Decisions to amend the Articles of Association and/or dissolve the company may only be taken at a General shareholders’ Meeting in which at least two-thirds of the issued capital is represented and by a majority of at least three-quarters of the votes cast, unless the proposal has been submitted by all incumbent members of the Board of Management with the collective approval of all incumbent members of the supervisory Board, in which case the decision may be taken by an absolute majority of votes, regardless of the represented capital.
Risk management
Risk management and internal controlWith worldwide operations in various markets and jurisdictions, Corbion needs to ensure timely identification and effective management of all significant risks inherent to the execution of its strategy and realization of its objectives. Corbion has an enterprise-wide risk management (ERM) in place to preserve its reputation, assets, competitive edge, and profits. ERM is the process of systematically identifying, analyzing, evaluating, and addressing risks that may impact the achievement of corporate objectives. The Board of Management is responsible for the design, implementation, and operation of Corbion’s risk management and internal control system. Corbion has defined a governance model that identifies clear reporting and accountability structures in line with the Dutch corporate governance code 2008.
Risk appetiteOur risk appetite is the amount of risk we are willing to accept to achieve our strategic goals. This requires adequate understanding and awareness of potential risks and their magnitude within the company. The level of risk appetite is set by the Executive Committee, but for areas that are close to or exceeding our risk appetite, involvement of both senior Management and Executive Committee will be required. Our risk appetite can be summarized as follows.
Risk category Risk appetite
strategic/market risk Moderate to high: balancing risks and rewards to achieve our growth, innovation and sustainability objectives
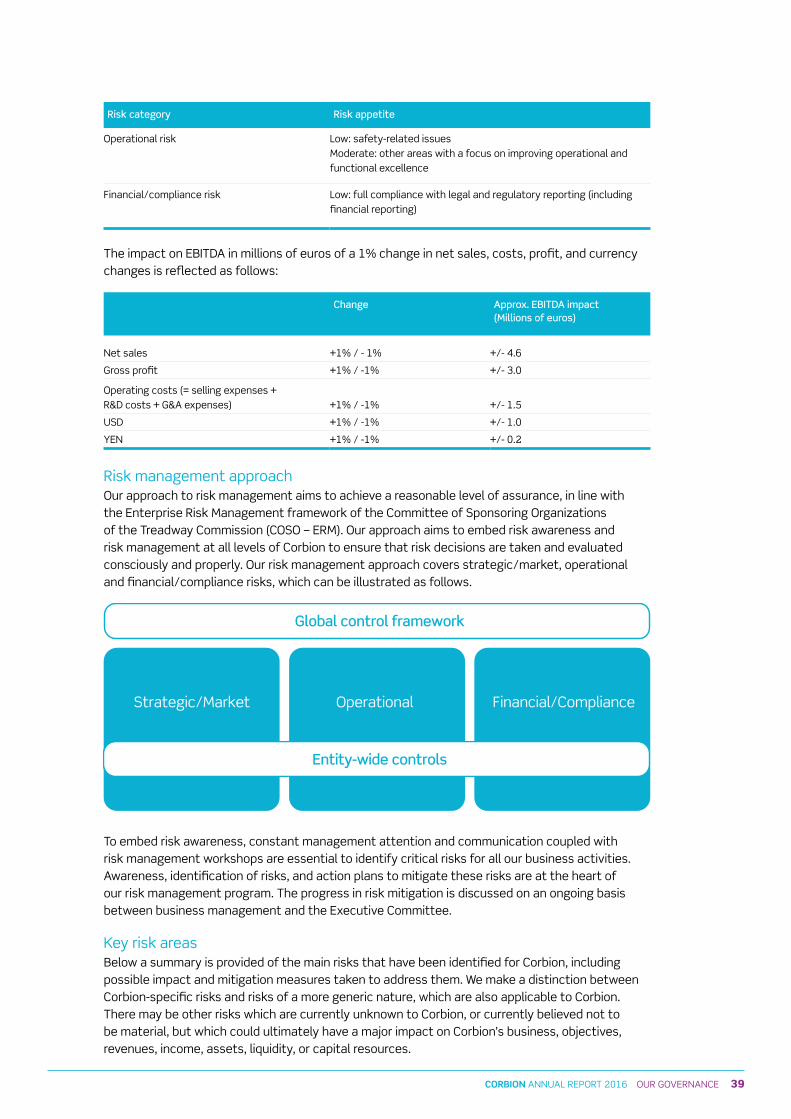
39CORBION ANNUAL REPORT 2016 OUR GOVERNANCE
Risk category Risk appetite
Operational risk Low: safety-related issuesModerate: other areas with a focus on improving operational and functional excellence
Financial/compliance risk Low: full compliance with legal and regulatory reporting (including financial reporting)
The impact on EBITDA in millions of euros of a 1% change in net sales, costs, profit, and currency changes is reflected as follows:
Change Approx EBITDA impact (Millions of euros)
Net sales +1% / - 1% +/- 4.6
Gross profit +1% / -1% +/- 3.0
Operating costs (= selling expenses +R&D costs + G&A expenses) +1% / -1% +/- 1.5
UsD +1% / -1% +/- 1.0
yEN +1% / -1% +/- 0.2
Risk management approachOur approach to risk management aims to achieve a reasonable level of assurance, in line with the Enterprise Risk Management framework of the Committee of sponsoring Organizations of the Treadway Commission (COsO – ERM). Our approach aims to embed risk awareness and risk management at all levels of Corbion to ensure that risk decisions are taken and evaluated consciously and properly. Our risk management approach covers strategic/market, operational and financial/compliance risks, which can be illustrated as follows.
Global control framework
Strategic/Market
Operational Financial/Compliance
Entity-wide controls
To embed risk awareness, constant management attention and communication coupled with risk management workshops are essential to identify critical risks for all our business activities. Awareness, identification of risks, and action plans to mitigate these risks are at the heart of our risk management program. The progress in risk mitigation is discussed on an ongoing basis between business management and the Executive Committee.
Key risk areasBelow a summary is provided of the main risks that have been identified for Corbion, including possible impact and mitigation measures taken to address them. We make a distinction between Corbion-specific risks and risks of a more generic nature, which are also applicable to Corbion. There may be other risks which are currently unknown to Corbion, or currently believed not to be material, but which could ultimately have a major impact on Corbion’s business, objectives, revenues, income, assets, liquidity, or capital resources.
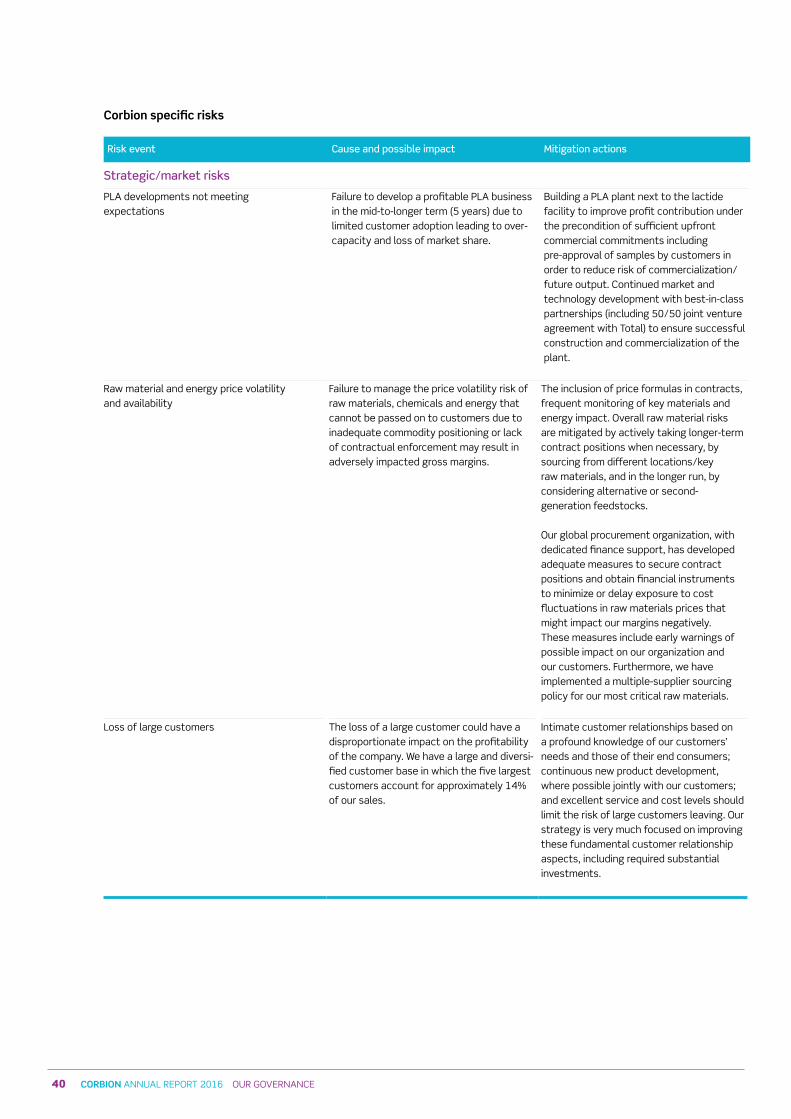
40 CORBION ANNUAL REPORT 2016 OUR GOVERNANCE
Corbion specific risks
Risk event Cause and possible impact Mitigation actions
Strategic/market risks
PLA developments not meeting expectations
Failure to develop a profitable PLA business in the mid-to-longer term (5 years) due to limited customer adoption leading to over-capacity and loss of market share.
Building a PLA plant next to the lactide facility to improve profit contribution under the precondition of sufficient upfront commercial commitments including pre-approval of samples by customers in order to reduce risk of commercialization/future output. Continued market and technology development with best-in-class partnerships (including 50/50 joint venture agreement with Total) to ensure successful construction and commercialization of the plant.
Raw material and energy price volatility and availability
Failure to manage the price volatility risk of raw materials, chemicals and energy that cannot be passed on to customers due to inadequate commodity positioning or lack of contractual enforcement may result in adversely impacted gross margins.
The inclusion of price formulas in contracts, frequent monitoring of key materials and energy impact. Overall raw material risks are mitigated by actively taking longer-term contract positions when necessary, by sourcing from different locations/key raw materials, and in the longer run, by considering alternative or second- generation feedstocks.
Our global procurement organization, with dedicated finance support, has developed adequate measures to secure contract positions and obtain financial instruments to minimize or delay exposure to cost fluctuations in raw materials prices that might impact our margins negatively. These measures include early warnings of possible impact on our organization and our customers. Furthermore, we have implemented a multiple-supplier sourcing policy for our most critical raw materials.
Loss of large customers The loss of a large customer could have a disproportionate impact on the profitability of the company. We have a large and diversi-fied customer base in which the five largest customers account for approximately 14% of our sales.
Intimate customer relationships based on a profound knowledge of our customers’ needs and those of their end consumers; continuous new product development, where possible jointly with our customers; and excellent service and cost levels should limit the risk of large customers leaving. Our strategy is very much focused on improving these fundamental customer relationship aspects, including required substantial investments.
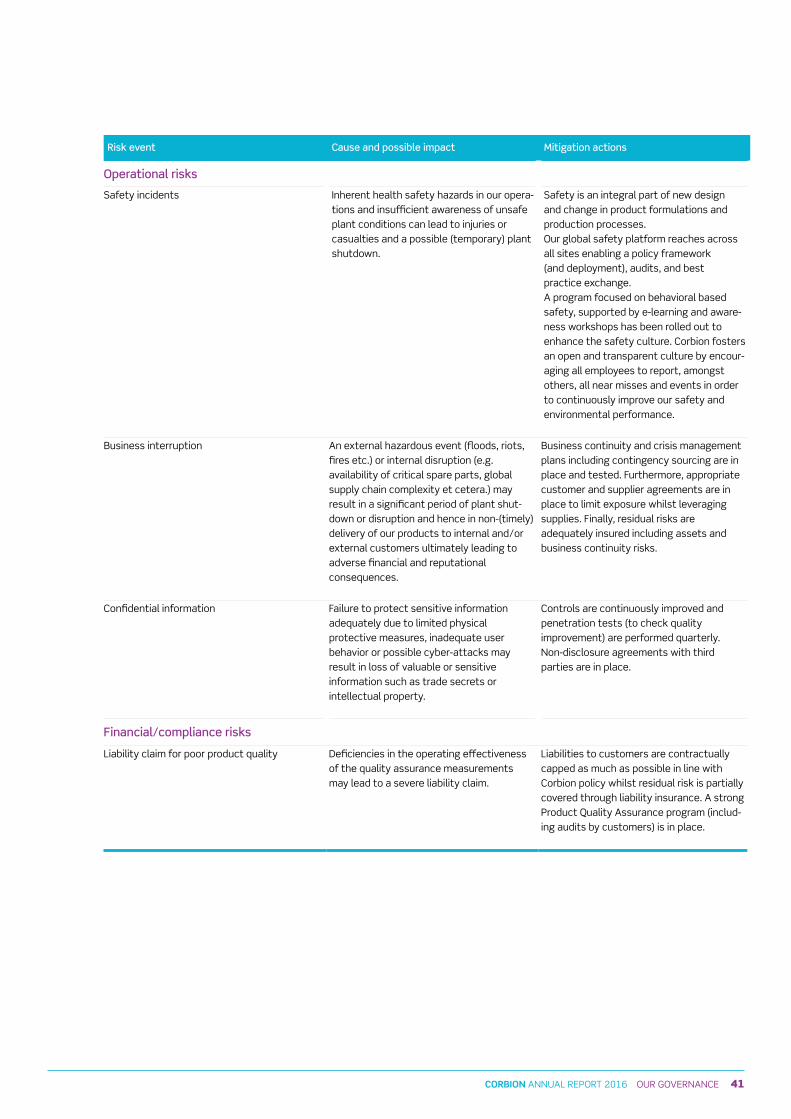
41CORBION ANNUAL REPORT 2016 OUR GOVERNANCE
Risk event Cause and possible impact Mitigation actions
Operational risks
safety incidents Inherent health safety hazards in our opera-tions and insufficient awareness of unsafe plant conditions can lead to injuries or casualties and a possible (temporary) plant shutdown.
safety is an integral part of new design and change in product formulations and production processes.Our global safety platform reaches across all sites enabling a policy framework (and deployment), audits, and best practice exchange.A program focused on behavioral based safety, supported by e-learning and aware-ness workshops has been rolled out to enhance the safety culture. Corbion fosters an open and transparent culture by encour-aging all employees to report, amongst others, all near misses and events in order to continuously improve our safety and environmental performance.
Business interruption An external hazardous event (floods, riots, fires etc.) or internal disruption (e.g. availability of critical spare parts, global supply chain complexity et cetera.) may result in a significant period of plant shut-down or disruption and hence in non-(timely) delivery of our products to internal and/or external customers ultimately leading to adverse financial and reputational consequences.
Business continuity and crisis management plans including contingency sourcing are in place and tested. Furthermore, appropriate customer and supplier agreements are in place to limit exposure whilst leveraging supplies. Finally, residual risks are adequately insured including assets and business continuity risks.
Confidential information Failure to protect sensitive information adequately due to limited physical protective measures, inadequate user behavior or possible cyber-attacks may result in loss of valuable or sensitive information such as trade secrets or intellectual property.
Controls are continuously improved and penetration tests (to check quality improvement) are performed quarterly.Non-disclosure agreements with third parties are in place.
Financial/compliance risks
Liability claim for poor product quality Deficiencies in the operating effectiveness of the quality assurance measurements may lead to a severe liability claim.
Liabilities to customers are contractually capped as much as possible in line with Corbion policy whilst residual risk is partially covered through liability insurance. A strong Product Quality Assurance program (includ-ing audits by customers) is in place.
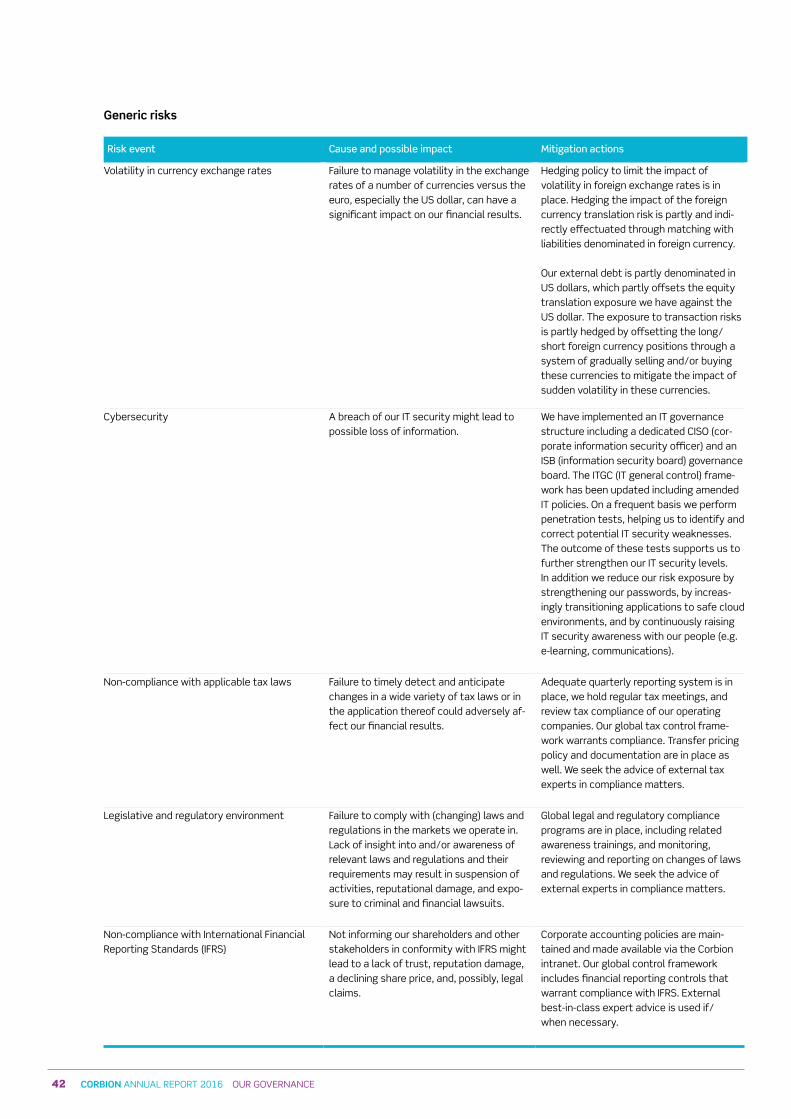
42 CORBION ANNUAL REPORT 2016 OUR GOVERNANCE
Generic risks
Risk event Cause and possible impact Mitigation actions
Volatility in currency exchange rates Failure to manage volatility in the exchange rates of a number of currencies versus the euro, especially the Us dollar, can have a significant impact on our financial results.
Hedging policy to limit the impact of volatility in foreign exchange rates is in place. Hedging the impact of the foreign currency translation risk is partly and indi-rectly effectuated through matching with liabilities denominated in foreign currency.
Our external debt is partly denominated in Us dollars, which partly offsets the equity translation exposure we have against the Us dollar. The exposure to transaction risks is partly hedged by offsetting the long/short foreign currency positions through a system of gradually selling and/or buying these currencies to mitigate the impact of sudden volatility in these currencies.
Cybersecurity A breach of our IT security might lead to possible loss of information.
We have implemented an IT governance structure including a dedicated CIsO (cor-porate information security officer) and an IsB (information security board) governance board. The ITGC (IT general control) frame-work has been updated including amended IT policies. On a frequent basis we perform penetration tests, helping us to identify and correct potential IT security weaknesses. The outcome of these tests supports us to further strengthen our IT security levels. In addition we reduce our risk exposure by strengthening our passwords, by increas-ingly transitioning applications to safe cloud environments, and by continuously raising IT security awareness with our people (e.g. e-learning, communications).
Non-compliance with applicable tax laws Failure to timely detect and anticipate changes in a wide variety of tax laws or in the application thereof could adversely af-fect our financial results.
Adequate quarterly reporting system is in place, we hold regular tax meetings, and review tax compliance of our operating companies. Our global tax control frame-work warrants compliance. Transfer pricing policy and documentation are in place as well. We seek the advice of external tax experts in compliance matters.
Legislative and regulatory environment Failure to comply with (changing) laws and regulations in the markets we operate in. Lack of insight into and/or awareness of relevant laws and regulations and their requirements may result in suspension of activities, reputational damage, and expo-sure to criminal and financial lawsuits.
Global legal and regulatory compliance programs are in place, including related awareness trainings, and monitoring, reviewing and reporting on changes of laws and regulations. We seek the advice of external experts in compliance matters.
Non-compliance with International Financial Reporting standards (IFRs)
Not informing our shareholders and other stakeholders in conformity with IFRs might lead to a lack of trust, reputation damage, a declining share price, and, possibly, legal claims.
Corporate accounting policies are main-tained and made available via the Corbion intranet. Our global control framework includes financial reporting controls that warrant compliance with IFRs. External best-in-class expert advice is used if/ when necessary.
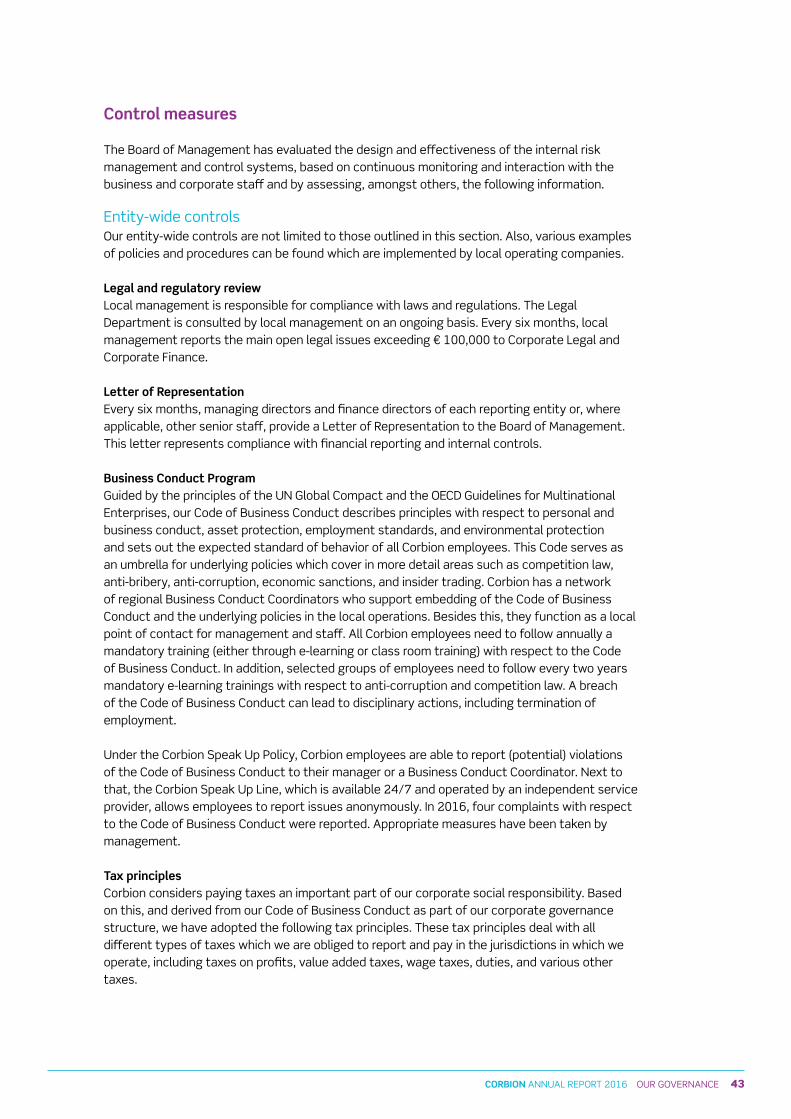
43CORBION ANNUAL REPORT 2016 OUR GOVERNANCE
Control measures
The Board of Management has evaluated the design and effectiveness of the internal risk management and control systems, based on continuous monitoring and interaction with the business and corporate staff and by assessing, amongst others, the following information.
Entity-wide controlsOur entity-wide controls are not limited to those outlined in this section. Also, various examples of policies and procedures can be found which are implemented by local operating companies.
Legal and regulatory reviewLocal management is responsible for compliance with laws and regulations. The Legal Department is consulted by local management on an ongoing basis. Every six months, local management reports the main open legal issues exceeding € 100,000 to Corporate Legal and Corporate Finance.
Letter of RepresentationEvery six months, managing directors and finance directors of each reporting entity or, where applicable, other senior staff, provide a Letter of Representation to the Board of Management. This letter represents compliance with financial reporting and internal controls.
Business Conduct ProgramGuided by the principles of the UN Global Compact and the OECD Guidelines for Multinational Enterprises, our Code of Business Conduct describes principles with respect to personal and business conduct, asset protection, employment standards, and environmental protection and sets out the expected standard of behavior of all Corbion employees. This Code serves as an umbrella for underlying policies which cover in more detail areas such as competition law, anti-bribery, anti-corruption, economic sanctions, and insider trading. Corbion has a network of regional Business Conduct Coordinators who support embedding of the Code of Business Conduct and the underlying policies in the local operations. Besides this, they function as a local point of contact for management and staff. All Corbion employees need to follow annually a mandatory training (either through e-learning or class room training) with respect to the Code of Business Conduct. In addition, selected groups of employees need to follow every two years mandatory e-learning trainings with respect to anti-corruption and competition law. A breach of the Code of Business Conduct can lead to disciplinary actions, including termination of employment.
Under the Corbion speak Up Policy, Corbion employees are able to report (potential) violations of the Code of Business Conduct to their manager or a Business Conduct Coordinator. Next to that, the Corbion speak Up Line, which is available 24/7 and operated by an independent service provider, allows employees to report issues anonymously. In 2016, four complaints with respect to the Code of Business Conduct were reported. Appropriate measures have been taken by management.
Tax principlesCorbion considers paying taxes an important part of our corporate social responsibility. Based on this, and derived from our Code of Business Conduct as part of our corporate governance structure, we have adopted the following tax principles. These tax principles deal with all different types of taxes which we are obliged to report and pay in the jurisdictions in which we operate, including taxes on profits, value added taxes, wage taxes, duties, and various other taxes.
44 CORBION ANNUAL REPORT 2016 OUR GOVERNANCE
Business rationale/transfer pricingCorbion’s tax strategy follows from and is aligned with the business strategy and objectives. Consequently, we aim to pay the appropriate amount of tax depending on where value is created in each of the jurisdictions we operate in, following the normal course of commercial activity, and in accordance with domestic and international rules and standards. All our intercompany transfer pricing and policies are based on the “arm’s length principle.”
ComplianceWe act at all times in accordance with all applicable laws in which we are guided by the relevant local and international standards. Compliance is monitored within a global tax control framework. Corbion complies with its statutory obligations and aims to file all required tax-relevant information with the appropriate tax authorities in a timely, transparent, and complete manner. Tax-related disclosures are made in accordance with the relevant domestic regulations, as well as applicable reporting requirements under IFRs.
Relationship with tax authoritiesWe seek to develop mutually respectful relationships with the various national tax authorities based on trust and transparency. To accomplish this we aim for an open and constructive dialog with the various tax authorities on the basis of disclosure of all relevant facts and circumstances. In the Netherlands we concluded a so-called tax covenant (“horizontal monitoring”) with the Dutch tax authorities. such covenant entails that the tax authorities can rely on Corbion to provide upfront disclosure of all relevant information, while it allows Corbion to get upfront confirmation of applicable tax treatment.
Tax governanceWithin the governance framework, the conduct of the group’s tax affairs and the management of tax risks are delegated to the group’s tax department with support and assistance from the group and local finance departments. The Audit Committee supervises the activities of the Board of Management with respect to the tax governance framework.
Global control frameworkBusiness planning, budgeting, and management reviewBased on Corbion’s strategy and plans, targets are set for the annual budget. After determining these budgets, the targets are rolled out to the responsibility areas (business units, operations, etc.) within Corbion. Quarterly updated estimates are made based on a forecast until the end of the year. Forecasts are specifically discussed between responsibility area leaders and the Board of Management. The Board of Management monitors business performance on a monthly and quarterly basis using a defined set of key performance indicators and reviews of actual results versus budgets, quarterly estimates, and the previous year. Local entities are visited frequently. Operational management meets at least once a month to discuss the strategy and related risks, the actual performance versus budget, and other significant matters in their respective areas.
Financial control frameworkAs Corbion operates worldwide, it is committed to maintaining high-quality, reliable financial reporting, and a good control environment. All reporting entities assess operational effectiveness of their financial closing and reporting processes, at mid-year and end-of-year, confirming compliance with the relevant guidelines and IFRs. Together with the Letters of Representation, this ensures the integrity of our financial reporting.
During 2016 our main legal entities performed quarterly assessments of the effectiveness of their key financial process controls. The assessments have been included in internal audits and used as a starting point by external auditors. Improvement recommendations based on audit findings are followed up by local management, the status of which is being monitored regularly by the Board of Management.
45CORBION ANNUAL REPORT 2016 OUR GOVERNANCE
InsuranceInsurance is an integral part of our risk management approach as it is an instrument to manage the financial consequences of risks. The choice to obtain external insurance cover depends on the cost efficiency of the instrument. The coverage of insurances is monitored and benchmarked regularly.
Internal audit Internal audit supports the organization in accomplishing its objectives by providing a systematic, disciplined approach for the evaluation and improvement of the effectiveness of our internal control and governance processes. The Internal Audit Charter is approved by the Board of Management and the Audit Committee annually. The objective of internal audit is to provide a broad range of audit services designed to assist the Board of Management in controlling the business operations. It provides independent, risk-based objective assurance and consulting services designed to add value to the organization. Internal audit evaluates risks and ensures that the controls in place are adequate to mitigate the risks identified by management, identifying best practices, and recommending improvement opportunities to management. Internal audit at Corbion is based on a guest auditor and co-sourcing model where internal / external professionals provide the Internal Audit Director with specialized knowledge and capacity flexibility. Audit results are reported to the Board of Management and the Audit Committee.
External auditOur external financial audit engagement ensures that all main entities are audited by the external auditor either for statutory and/or group purposes. The focus of the external auditor’s work is the financial reporting with the objective of providing a reasonable basis for the audit opinion on the fairness of the presentation of the financial position of our company.
In control statement
Corbion’s risk management and internal control systems are designed to identify in a timely manner the risks inherent to our strategic, operational, and financial reporting and compliance objectives and to determine appropriate risk responses as described above. Risk management and actions taken in the year under review were reported to and discussed by the supervisory Board and Audit Committee. Internal representations received from management, regular management reviews, evaluations of the design and implementation of our risk management and internal control systems, and business and Audit Committee reviews are an integral part of the company’s risk management approach.
It should be noted that the above does not imply that these systems and procedures provide certainty as to the realization of strategic, operational, and financial business objectives, nor that they can prevent all misstatements, inaccuracies, errors, fraud, and non-compliance with laws and regulations.
On the basis thereof, the Board of Management believes to the best of its knowledge that the internal risk management and control systems with respect to the financial reporting have adequately performed in 2016 and that these systems provide a reasonable level of assurance against inaccuracies of material importance in the financial reporting. There are no indications that the systems would not be adequate in 2017.
All in all, the Board of Management is of the opinion that it has fulfilled the best practice provision II.1.4 of the Dutch corporate governance code 2008 with due observance of the recommendations of the Corporate Governance Code Monitoring Commission.
46 CORBION ANNUAL REPORT 2016 OUR GOVERNANCE
Responsibility statement
To the best of our knowledge the Financial statements give a true and fair view of the assets, liabilities, financial position, and earnings of Corbion and its consolidated companies. Further, to the best of our knowledge the Annual Report gives a true and fair view of the position of Corbion as at the balance sheet date, and of the development during the financial year of Corbion and its group companies included in the Financial statements, together with a description of principal risks Corbion faces. The members of the Board of Management have signed the Financial statements pursuant to their statutory obligations under section 101 subsection 2 of Book 2 of the Dutch Civil Code and section 25c subsection 2 sub c of Chapter 5 of the Financial Markets supervision Act (“Wet op het financieel toezicht”).
Amsterdam, the Netherlands, 3 March 2017
Board of Management Corbion nv
Tjerk de Ruiter, CEOEddy van Rhede van der Kloot, CFO

47CORBION ANNUAL REPORT 2016 OUR GOVERNANCE
I create a happy customer.
Rezlyn ChuaCRM AnalystCorbion Asia
At Corbion we’re creating a better future together
Keep creating
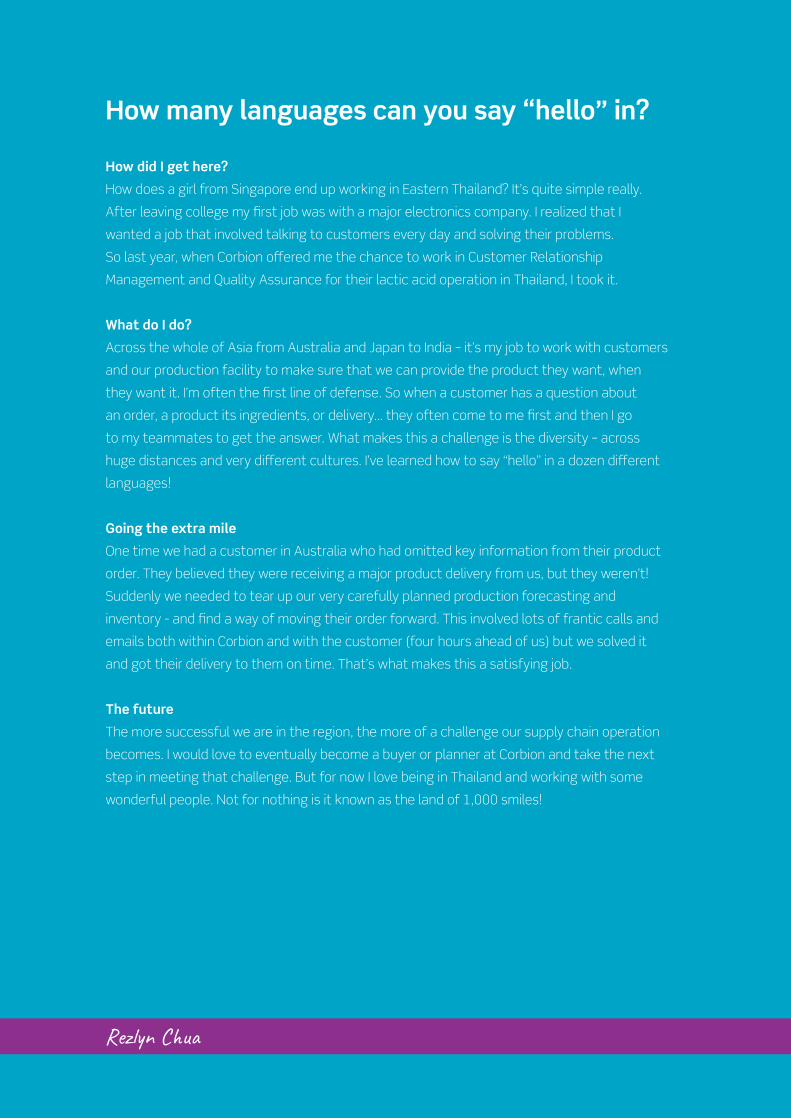
48 CORBION ANNUAL REPORT 2016 OUR GOVERNANCE
Rezlyn Chua
How did I get here?
How does a girl from Singapore end up working in Eastern Thailand? It’s quite simple really.
After leaving college my first job was with a major electronics company. I realized that I
wanted a job that involved talking to customers every day and solving their problems.
So last year, when Corbion offered me the chance to work in Customer Relationship
Management and Quality Assurance for their lactic acid operation in Thailand, I took it.
What do I do?
Across the whole of Asia from Australia and Japan to India – it’s my job to work with customers
and our production facility to make sure that we can provide the product they want, when
they want it. I’m often the first line of defense. So when a customer has a question about
an order, a product its ingredients, or delivery… they often come to me first and then I go
to my teammates to get the answer. What makes this a challenge is the diversity – across
huge distances and very different cultures. I’ve learned how to say “hello” in a dozen different
languages!
Going the extra mile
One time we had a customer in Australia who had omitted key information from their product
order. They believed they were receiving a major product delivery from us, but they weren’t!
Suddenly we needed to tear up our very carefully planned production forecasting and
inventory - and find a way of moving their order forward. This involved lots of frantic calls and
emails both within Corbion and with the customer (four hours ahead of us) but we solved it
and got their delivery to them on time. That’s what makes this a satisfying job.
The future
The more successful we are in the region, the more of a challenge our supply chain operation
becomes. I would love to eventually become a buyer or planner at Corbion and take the next
step in meeting that challenge. But for now I love being in Thailand and working with some
wonderful people. Not for nothing is it known as the land of 1,000 smiles!
How many languages can you say “hello” in?
49CORBION ANNUAL REPORT 2016 REPORT OF THE sUPERVIsORy BOARD
Overview 2016
In 2016, Corbion continued to execute its strategy “Disciplined Value Creation,” leading amongst others to the announcement that Total and Corbion will create a 50/50 joint venture to produce and market polylactic acid (PLA) polymers. The joint venture will combine Total’s technical and marketing knowledge and leading position in polymers with Corbion’s expertise in lactic acid and biopolymers, and is expected to accelerate market adoption of the innovative products it will supply. The supervisory Board is pleased that Marcel Wubbolts joined Corbion as Chief Technology Officer as per 1 November 2016. In this capacity, Mr. Wubbolts is a member of Corbion’s Executive Committee and responsible for Corbion’s global R&D organization. He will be driving the innovation and technology agenda enabling business development opportunities to support the company’s growth journey.
From a financial perspective, 2016 was a good year, with strong improvements in EBITDA,EBITDA margins, ROCE, and EPs. On 28 October 2016 Corbion successfully completed its € 50 million share buyback program that commenced on 21 March 2016. The share buyback program was part of Corbion’s commitment to return € 75 million to its shareholders in 2016 through a € 25 million additional cash dividend and a € 50 million share buyback program.
The supervisory Board would like to thank the Executive Committee and all Corbion employees around the world for their dedication, loyalty, and hard work in 2016.
Meetings of the Supervisory Board
During the reporting year the supervisory Board held six regular meetings with the Board of Management and four conference-call meetings. The discussions at these meetings covered frequently recurring topics, such as the strategy execution, the Corbion portfolio, developments in financial results, business developments in the business units and operating companies, trends in the markets where Corbion operates, key investments, group risks, internal risk management and control systems, the outcome of the evaluation by the Board of Management of the set-up and operation of these control systems, corporate governance, corporate social responsibility, organizational and people readiness, succession planning, the organizational top structure, acquisitions and divestments, the Financial statements, the Annual report, and the succession of the CTO. In addition, the supervisory Board discussed in great detail the joint venture with Total.
Prior to its regular meetings with the Board of Management the supervisory Board also met in the absence of the Board of Management to discuss, amongst others, developments in the financial results, and the profile, composition, and performance of the Board of Management.
The supervisory Board conducted a self-evaluation of the performance of the supervisory Board, its committees and that of its members, supported by an independent external specialist. The review was based on the feedback provided in the previous year and a number of business
REPORT OF THE SUPERVISORY BOARD
50 CORBION ANNUAL REPORT 2016 REPORT OF THE sUPERVIsORy BOARD
challenges in the year under review. All findings were formally reported and discussed in the full supervisory Board. The review showed that the feedback in the previous year (on succession planning, permanent education, and informal interaction) was addressed properly. The business challenges (addressing strategy, succession planning, and composition of the supervisory Board) indicated that the supervisory Board received timely and adequate information, enabling it to cooperate professionally and constructively when needed. Focus points for 2017 relate to the continued monitoring of strategy execution and leadership, with a special focus on diversity.
Attendance at the in-person meetings held in 2016 was 100%. Attendance at the conference-call meetings was almost 100%; in one instance one member was not able to attend and he provided input in advance and designated another supervisory Board member to proxy for him. The Chairman and Vice-Chairman of the supervisory Board regularly met with the CEO, either in person or by phone. Also in this very intensive and important year for Corbion, all supervisory Board members were able to make themselves sufficiently available to give adequate attention to the needs of Corbion.
Members of the supervisory Board regularly met with the members of the Executive Committee, business leaders, and members of corporate staff.
Composition of the Supervisory Board
The supervisory Board consists of:M.F.J.P. Vrijsen, ChairmanR.H.P. Markham, Vice-ChairmanM.E. Doherty J.P. de Kreij s. Riisgaard
Mr. R. Pieterse stepped down at the annual General shareholders’ Meeting of 12 May 2016, after twelve years of distinguished service to the company, in various supervisory Board membership roles. The supervisory Board has benefited immensely from his extensive management and financial experience and would like to thank him for his contribution.
Regarding its composition the supervisory Board always tries to strike the right balance between (international) expertise and experience. A certain degree of nationality, age and gender variation may be instrumental in achieving the desired balance in the composition of the Board. Required expertise and experience as well as the availability and diversity of the right candidates will be decisive when proposing candidates for (re)appointment.
In the judgment of the supervisory Board all its members are independent as required by the Dutch corporate governance code 2008.
Committees of the Supervisory Board
Audit CommitteeThe members of the Audit Committee are Mr. J.P de Kreij (Chairman), Mrs. M.E. Doherty, and Mr. R. Pieterse (until 12 May 2016). In 2016 the Audit Committee met six times in the presence of the CFO, the external auditor, the VP Group Finance, and the senior Director Internal Audit. The agenda at these meetings covered, amongst others, the annual and half-year figures, the interim management statements, accounting issues, the operation of the internal risk management and control systems, tax matters, the financing plan, treasury, status of legal
51CORBION ANNUAL REPORT 2016 REPORT OF THE sUPERVIsORy BOARD
challenges in the year under review. All findings were formally reported and discussed in the full supervisory Board. The review showed that the feedback in the previous year (on succession planning, permanent education, and informal interaction) was addressed properly. The business challenges (addressing strategy, succession planning, and composition of the supervisory Board) indicated that the supervisory Board received timely and adequate information, enabling it to cooperate professionally and constructively when needed. Focus points for 2017 relate to the continued monitoring of strategy execution and leadership, with a special focus on diversity.
Attendance at the in-person meetings held in 2016 was 100%. Attendance at the conference-call meetings was almost 100%; in one instance one member was not able to attend and he provided input in advance and designated another supervisory Board member to proxy for him. The Chairman and Vice-Chairman of the supervisory Board regularly met with the CEO, either in person or by phone. Also in this very intensive and important year for Corbion, all supervisory Board members were able to make themselves sufficiently available to give adequate attention to the needs of Corbion.
Members of the supervisory Board regularly met with the members of the Executive Committee, business leaders, and members of corporate staff.
Composition of the Supervisory Board
The supervisory Board consists of:M.F.J.P. Vrijsen, ChairmanR.H.P. Markham, Vice-ChairmanM.E. Doherty J.P. de Kreij s. Riisgaard
Mr. R. Pieterse stepped down at the annual General shareholders’ Meeting of 12 May 2016, after twelve years of distinguished service to the company, in various supervisory Board membership roles. The supervisory Board has benefited immensely from his extensive management and financial experience and would like to thank him for his contribution.
Regarding its composition the supervisory Board always tries to strike the right balance between (international) expertise and experience. A certain degree of nationality, age and gender variation may be instrumental in achieving the desired balance in the composition of the Board. Required expertise and experience as well as the availability and diversity of the right candidates will be decisive when proposing candidates for (re)appointment.
In the judgment of the supervisory Board all its members are independent as required by the Dutch corporate governance code 2008.
Committees of the Supervisory Board
Audit CommitteeThe members of the Audit Committee are Mr. J.P de Kreij (Chairman), Mrs. M.E. Doherty, and Mr. R. Pieterse (until 12 May 2016). In 2016 the Audit Committee met six times in the presence of the CFO, the external auditor, the VP Group Finance, and the senior Director Internal Audit. The agenda at these meetings covered, amongst others, the annual and half-year figures, the interim management statements, accounting issues, the operation of the internal risk management and control systems, tax matters, the financing plan, treasury, status of legal
claims and litigations, status of the business conduct program, information technology developments and organization, and the reports of the internal and external auditors.
The Audit Committee closely monitors the independence of the external auditor. It evaluates the performance of the external auditor on a yearly basis and where appropriate recommends the replacement of the external auditor. Furthermore, approval of the Audit Committee is required with respect to the fees for all audit services to be performed by the external auditor as requested by the Board of Management. The Audit Committee acts as the principal contact for the external auditor in case of irregularities in the content of financial reports.
Nomination CommitteeThe Nomination Committee consists of Messrs. M.F.J.P. Vrijsen (Chairman), R.H.P. Markham, and s. Riisgaard. The Nomination Committee met five times in 2016 in the presence of the EVP Human Resources. It discussed amongst other subjects the succession planning and composition of, and changes in the supervisory Board, the performance of the Board of Management and its members, talent management, succession planning, the people strategy, and the succession of the CTO.
Remuneration CommitteeThe Remuneration Committee consists of Messrs. R.H.P. Markham (Chairman), M.F.J.P. Vrijsen, and s. Riisgaard. The Remuneration Committee met five times in 2016 in the presence of the EVP Human Resources, and discussed amongst other subjects the remuneration of the Board of Management, the level of achievement of the 2015 short-Term Incentive Plan (sTIP) targets for the members of the Board of Management, the progress of the sTIP 2016 targets and the targets of the running Long-Term Incentive Plan programs, and the target setting for sTIP 2017 and for the LTIP 2016-2019.
science and Technology CommitteeThe science and Technology Committee consists of Messrs. s. Riisgaard (Chairman) and M.F.J.P. Vrijsen. The science and Technology Committee met four times in 2016 in the presence of the CTO (or his replacement) and members of the R&D leadership team. The agenda at these meetings covered, amongst other subjects, new technologies, PLA production and application, Food applications, Biochemicals and Medical Biomaterials, and external technology trends.
Financial Statements, 1 January 2016 - 31 December 2016
The Financial statements prepared by the Board of Management for the financial year 2016 have been audited and certified by KPMG Accountants N.V. The auditor’s findings on the Financial statements have been discussed with the supervisory Board. The supervisory Board has accepted the Financial statements and recommends that they be adopted by the General shareholders’ Meeting. The members of the supervisory Board have signed the Financial statements pursuant to their statutory obligation under section 101 subsection 2 of Book 2 of the Dutch Civil Code.
Remuneration policy and report
Remuneration policy and its implementation in 2016To ensure Corbion’s development as a successful biobased ingredients and biotechnology company, the objective of the remuneration policy for the Board of Management is to create competitive remuneration packages and employment conditions, which align the interests of the Board of Management with the strategic direction and horizon of the company, with a strong
52 CORBION ANNUAL REPORT 2016 REPORT OF THE sUPERVIsORy BOARD
emphasis on performance-related pay. The policy is in place since 2015 and was approved by the annual General shareholders’ Meeting (AGM) in that same year. As we have described the full policy on our website www.corbion.com, this section only describes the highlights as applied in 2016.
Remuneration reference levels The total compensation levels (base salary, short-term incentive, long-term incentive, and pay mix) are based on a combined reference group of European biotechnology companies and Dutch general industry companies (AMX and smaller AEX). Every two years a reference check will be performed to align the total compensation levels with market levels, for the first time in 2017.
Base salaryMembers of the Board of Management are entitled to a base salary. Based on median market data the base salary for the CEO will be set between € 500,000 and € 600,000. For the CFO base pay is set between € 300,000 and € 400,000. The individual pay of the Board members will be determined by the supervisory Board within the boundaries of the aforementioned ranges (from time to time). There are no automatic annual increases in the base salary levels.
Per 1 April 2016, the annual base salary for Mr. De Ruiter (CEO) is € 550,000 and for Mr. Van Rhede van der Kloot (CFO) € 350,000.
short-Term Incentive Plan (sTIP)Members of the Board of Management are entitled to a short-term incentive. The sTIP rewards operational execution and is aimed at strengthening and growing the Corbion business. It is determined by two financial targets: EBITDA and earnings per share (EPs) (both as defined in the policy). EBITDA will account for 70% of the total sTIP; the remaining 30% will be determined by EPs. A range of 30% around each performance target (or such lower percentage as determined by the supervisory Board) is set annually to determine the actual payout. The sTIP payout at target level is set at 50% of base salary for the CEO, and 40% for the CFO. For 2016, the supervisory Board applied the range of 30% for actual payout as follows: the threshold level was set at 85% and the maximum level at 115% for each target.
An actual payout level of 114.5% has been achieved for the EBITDA target and a maximum payout level for EPs in the reporting year. This has led to a total payout of 125.2% of the at-target sTIP for both Mr. De Ruiter and Mr. Van Rhede van der Kloot
Long-Term Incentive Plan (LTIP)The long-term incentive for the Board of Management is aimed at longer-term value creation in line with shareholders’ interests, measured over a performance period of three calendar years. To ensure that short-term performance also leads to sustainable long-term value creation, the LTIP measurement is fully aligned with the sTIP: EBITDA and EPs account for 60% respectively 20% of the LTIP. In addition, 20% of the LTIP is determined by relative Total shareholder Return (TsR) as compared to a specific TsR peer group.
The CEO is entitled to a conditional share grant value of 100% of base salary. The CFO is entitled to a conditional share grant value of 80% of base salary. Meeting the performance target(s) will result in an LTIP payout at target level. A range of 50% around the performance target(s) (or such lower percentage as determined by the supervisory Board) is set for the EBITDA and EPs performance to determine the actual payout. For TsR performance, threshold payout is set at meeting the eighth position in the peer group. Based on independent analysis by a leading bank in the Netherlands the TsR performance of Corbion versus the TsR peer group will be assessed after the three-year performance period. The number of performance shares conditionally granted to Mr. De Ruiter in 2016 (possible
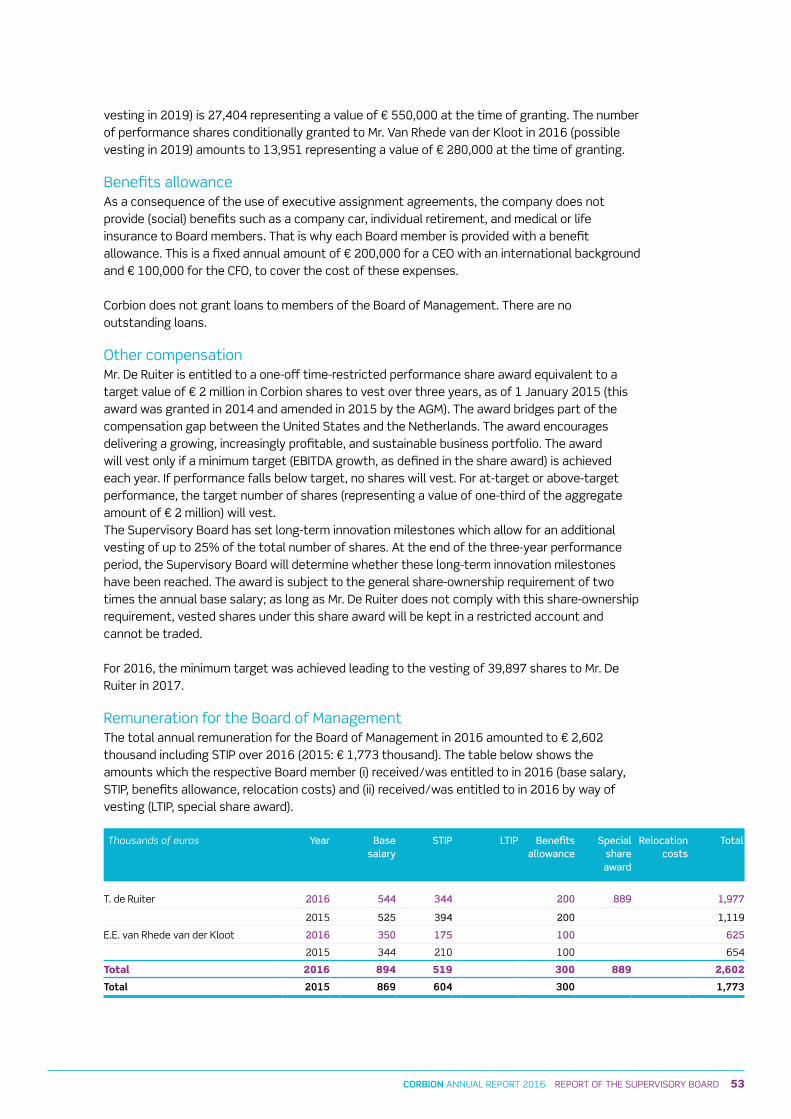
53CORBION ANNUAL REPORT 2016 REPORT OF THE sUPERVIsORy BOARD
emphasis on performance-related pay. The policy is in place since 2015 and was approved by the annual General shareholders’ Meeting (AGM) in that same year. As we have described the full policy on our website www.corbion.com, this section only describes the highlights as applied in 2016.
Remuneration reference levels The total compensation levels (base salary, short-term incentive, long-term incentive, and pay mix) are based on a combined reference group of European biotechnology companies and Dutch general industry companies (AMX and smaller AEX). Every two years a reference check will be performed to align the total compensation levels with market levels, for the first time in 2017.
Base salaryMembers of the Board of Management are entitled to a base salary. Based on median market data the base salary for the CEO will be set between € 500,000 and € 600,000. For the CFO base pay is set between € 300,000 and € 400,000. The individual pay of the Board members will be determined by the supervisory Board within the boundaries of the aforementioned ranges (from time to time). There are no automatic annual increases in the base salary levels.
Per 1 April 2016, the annual base salary for Mr. De Ruiter (CEO) is € 550,000 and for Mr. Van Rhede van der Kloot (CFO) € 350,000.
short-Term Incentive Plan (sTIP)Members of the Board of Management are entitled to a short-term incentive. The sTIP rewards operational execution and is aimed at strengthening and growing the Corbion business. It is determined by two financial targets: EBITDA and earnings per share (EPs) (both as defined in the policy). EBITDA will account for 70% of the total sTIP; the remaining 30% will be determined by EPs. A range of 30% around each performance target (or such lower percentage as determined by the supervisory Board) is set annually to determine the actual payout. The sTIP payout at target level is set at 50% of base salary for the CEO, and 40% for the CFO. For 2016, the supervisory Board applied the range of 30% for actual payout as follows: the threshold level was set at 85% and the maximum level at 115% for each target.
An actual payout level of 114.5% has been achieved for the EBITDA target and a maximum payout level for EPs in the reporting year. This has led to a total payout of 125.2% of the at-target sTIP for both Mr. De Ruiter and Mr. Van Rhede van der Kloot
Long-Term Incentive Plan (LTIP)The long-term incentive for the Board of Management is aimed at longer-term value creation in line with shareholders’ interests, measured over a performance period of three calendar years. To ensure that short-term performance also leads to sustainable long-term value creation, the LTIP measurement is fully aligned with the sTIP: EBITDA and EPs account for 60% respectively 20% of the LTIP. In addition, 20% of the LTIP is determined by relative Total shareholder Return (TsR) as compared to a specific TsR peer group.
The CEO is entitled to a conditional share grant value of 100% of base salary. The CFO is entitled to a conditional share grant value of 80% of base salary. Meeting the performance target(s) will result in an LTIP payout at target level. A range of 50% around the performance target(s) (or such lower percentage as determined by the supervisory Board) is set for the EBITDA and EPs performance to determine the actual payout. For TsR performance, threshold payout is set at meeting the eighth position in the peer group. Based on independent analysis by a leading bank in the Netherlands the TsR performance of Corbion versus the TsR peer group will be assessed after the three-year performance period. The number of performance shares conditionally granted to Mr. De Ruiter in 2016 (possible
vesting in 2019) is 27,404 representing a value of € 550,000 at the time of granting. The number of performance shares conditionally granted to Mr. Van Rhede van der Kloot in 2016 (possible vesting in 2019) amounts to 13,951 representing a value of € 280,000 at the time of granting.
Benefits allowanceAs a consequence of the use of executive assignment agreements, the company does not provide (social) benefits such as a company car, individual retirement, and medical or life insurance to Board members. That is why each Board member is provided with a benefit allowance. This is a fixed annual amount of € 200,000 for a CEO with an international background and € 100,000 for the CFO, to cover the cost of these expenses.
Corbion does not grant loans to members of the Board of Management. There are no outstanding loans.
Other compensationMr. De Ruiter is entitled to a one-off time-restricted performance share award equivalent to a target value of € 2 million in Corbion shares to vest over three years, as of 1 January 2015 (this award was granted in 2014 and amended in 2015 by the AGM). The award bridges part of the compensation gap between the United states and the Netherlands. The award encourages delivering a growing, increasingly profitable, and sustainable business portfolio. The award will vest only if a minimum target (EBITDA growth, as defined in the share award) is achieved each year. If performance falls below target, no shares will vest. For at-target or above-target performance, the target number of shares (representing a value of one-third of the aggregate amount of € 2 million) will vest. The supervisory Board has set long-term innovation milestones which allow for an additional vesting of up to 25% of the total number of shares. At the end of the three-year performance period, the supervisory Board will determine whether these long-term innovation milestones have been reached. The award is subject to the general share-ownership requirement of two times the annual base salary; as long as Mr. De Ruiter does not comply with this share-ownership requirement, vested shares under this share award will be kept in a restricted account and cannot be traded.
For 2016, the minimum target was achieved leading to the vesting of 39,897 shares to Mr. De Ruiter in 2017.
Remuneration for the Board of Management The total annual remuneration for the Board of Management in 2016 amounted to € 2,602 thousand including sTIP over 2016 (2015: € 1,773 thousand). The table below shows the amounts which the respective Board member (i) received/was entitled to in 2016 (base salary, sTIP, benefits allowance, relocation costs) and (ii) received/was entitled to in 2016 by way of vesting (LTIP, special share award).
Thousands of euros Year Base salary
STIP LTIP Benefits allowance
Special share award
Relocation costs
Total
T. de Ruiter 2016 544 344 200 889 1,977
2015 525 394 200 1,119
E.E. van Rhede van der Kloot 2016 350 175 100 625
2015 344 210 100 654
Total 2016 894 519 300 889 2,602
Total 2015 869 604 300 1,773
54 CORBION ANNUAL REPORT 2016 REPORT OF THE sUPERVIsORy BOARD
Remuneration for the supervisory Board Total remuneration for members of the supervisory Board in 2016 amounted to € 0.3 million (2015: € 0.4 million).
Every supervisory Board member receives an annual base fee of € 45,000; the Vice-Chairman receives € 50,000 and the Chairman € 60,000.
For membership of the Audit Committee an additional fee of € 10,000 applies, and for the Chairman € 15,000. Members of the Nomination Committee, Remuneration Committee, or science and Technology Committee receive an additional € 5,000 in fee; the fee for the Chairman of these committees amounts to € 7,500. In addition, members received reimbursement of expenses.
Breakdown remuneration Supervisory Board
Thousands of euros Year Base fee Committee fee
Total
M.F.J.P Vrijsen, Chairman, Vice-Chairman till May 2015 (Chairman Nomination Committee, member until May 2015 / member Remuneration Committee, Chairman until May 2015/member science & Technology Committee) 2016 60 18 78
2015 56 17 73
R.H.P. Markham, Vice-Chairman, Chairman until May 2015, (Chairman Remuneration Committee, member until May 2015 / member Nomination Committee, Chairman until May 2015) 2016 50 13 63
2015 54 13 67
M.E. Doherty (member Audit Committee), appointed per May 2015 2016 45 10 55
2015 27 6 33
J.P. de Kreij (Chairman Audit Committee, member until May 2016) 2016 45 15 60
2015 45 10 55
R. Pieterse (Chairman Audit Committee), resigned per May 2016 2016 17 4 21
2015 45 15 60
s. Riisgaard (Chairman science and Technology Committee, member Remuneration Committee / Nomination Committee 2016 45 18 63
2015 45 17 62
W. spinner (member Audit Committee), resigned per May 2015 2016
2015 18 4 22
Total 2016* 262 78 340
Total 2015* 290 82 372
*) Excluding expenses
No loans or advance payments or any guarantees to that effect have been granted to the members of the supervisory Board. None of the members of the supervisory Board has shares in the company or any option rights relating thereto (as at 3 March 2017).
Remuneration for former members of the Board of ManagementMr. Thormählen (CTO) stepped down as a member of the Board of Management as per 22 september 2015 and his contractual notice period of six months commenced on 1 October 2015. During the period of inactive duty in 2016, Mr. Thormählen received his regular base salary and benefits allowance as contractually agreed. Mr. Thormählen received in 2016 the contractually agreed severance payment of € 450,000.
55CORBION ANNUAL REPORT 2016 REPORT OF THE sUPERVIsORy BOARD
Remuneration for the supervisory Board Total remuneration for members of the supervisory Board in 2016 amounted to € 0.3 million (2015: € 0.4 million).
Every supervisory Board member receives an annual base fee of € 45,000; the Vice-Chairman receives € 50,000 and the Chairman € 60,000.
For membership of the Audit Committee an additional fee of € 10,000 applies, and for the Chairman € 15,000. Members of the Nomination Committee, Remuneration Committee, or science and Technology Committee receive an additional € 5,000 in fee; the fee for the Chairman of these committees amounts to € 7,500. In addition, members received reimbursement of expenses.
Breakdown remuneration Supervisory Board
Thousands of euros Year Base fee Committee fee
Total
M.F.J.P Vrijsen, Chairman, Vice-Chairman till May 2015 (Chairman Nomination Committee, member until May 2015 / member Remuneration Committee, Chairman until May 2015/member science & Technology Committee) 2016 60 18 78
2015 56 17 73
R.H.P. Markham, Vice-Chairman, Chairman until May 2015, (Chairman Remuneration Committee, member until May 2015 / member Nomination Committee, Chairman until May 2015) 2016 50 13 63
2015 54 13 67
M.E. Doherty (member Audit Committee), appointed per May 2015 2016 45 10 55
2015 27 6 33
J.P. de Kreij (Chairman Audit Committee, member until May 2016) 2016 45 15 60
2015 45 10 55
R. Pieterse (Chairman Audit Committee), resigned per May 2016 2016 17 4 21
2015 45 15 60
s. Riisgaard (Chairman science and Technology Committee, member Remuneration Committee / Nomination Committee 2016 45 18 63
2015 45 17 62
W. spinner (member Audit Committee), resigned per May 2015 2016
2015 18 4 22
Total 2016* 262 78 340
Total 2015* 290 82 372
*) Excluding expenses
No loans or advance payments or any guarantees to that effect have been granted to the members of the supervisory Board. None of the members of the supervisory Board has shares in the company or any option rights relating thereto (as at 3 March 2017).
Remuneration for former members of the Board of ManagementMr. Thormählen (CTO) stepped down as a member of the Board of Management as per 22 september 2015 and his contractual notice period of six months commenced on 1 October 2015. During the period of inactive duty in 2016, Mr. Thormählen received his regular base salary and benefits allowance as contractually agreed. Mr. Thormählen received in 2016 the contractually agreed severance payment of € 450,000.
Messrs. Hoetmer (CEO) and Kramer (CFO) stepped down as members of the Board of Management on 12 May 2014. The LTIP shares conditionally granted in 2013 to Messrs. Hoetmer and Kramer have not vested in 2016, as Corbion ranked 7th in the peer group. The TsR performance for the 2013 LTIP series was based on the previous peer group.
Breakdown remuneration former members of the Board of ManagementThe table below shows the amounts which the respective former Board member (i) received/was entitled to over 2016 (base salary, sTIP, pension benefits, relocation costs, notice period) and (ii) received/was entitled to in 2016 by way of vesting (LTIP, commitment award) or received in 2016 by way of contractual severance (other termination benefits).
Thousands of euros
Year Base salary
STIP LTIP Benefits allow-
ance
Pension benefits
Reloca-tion
costs
Notice period
Other termi-nation
benefits
Other 4) Total
G.H. Hoetmer 2016
2015 77 1) 1,798 (223) 1,652
N.J.M. Kramer 2016
2015 194 (127) 67
s. Thormählen 2016 113 2) 450 563
2015 263 75 112 3) 450
Total 2016 113 450 563
Total 2015 263 75 189 1,992 (350) 2,169
1) This includes base salary, pension benefit, and the pension-related compensation for salaries above € 100,000.
2) This includes base salary and benefit allowance until 1 April 2016.
3) This includes base salary and benefit allowance as of 1 October 2015.
4) This relates to the repayment by Messrs. Hoetmer and Kramer of in total € 350,000 pursuant to the settlement agreement with
respect to the share award granted in 2013 to Messrs. Hoetmer and Kramer in recognition of the successful completion of the
divestment of the Bakery Supplies businesses in 2013.
Amsterdam, the Netherlands, 3 March 2017
On behalf of the supervisory BoardM.F.J.P. Vrijsen
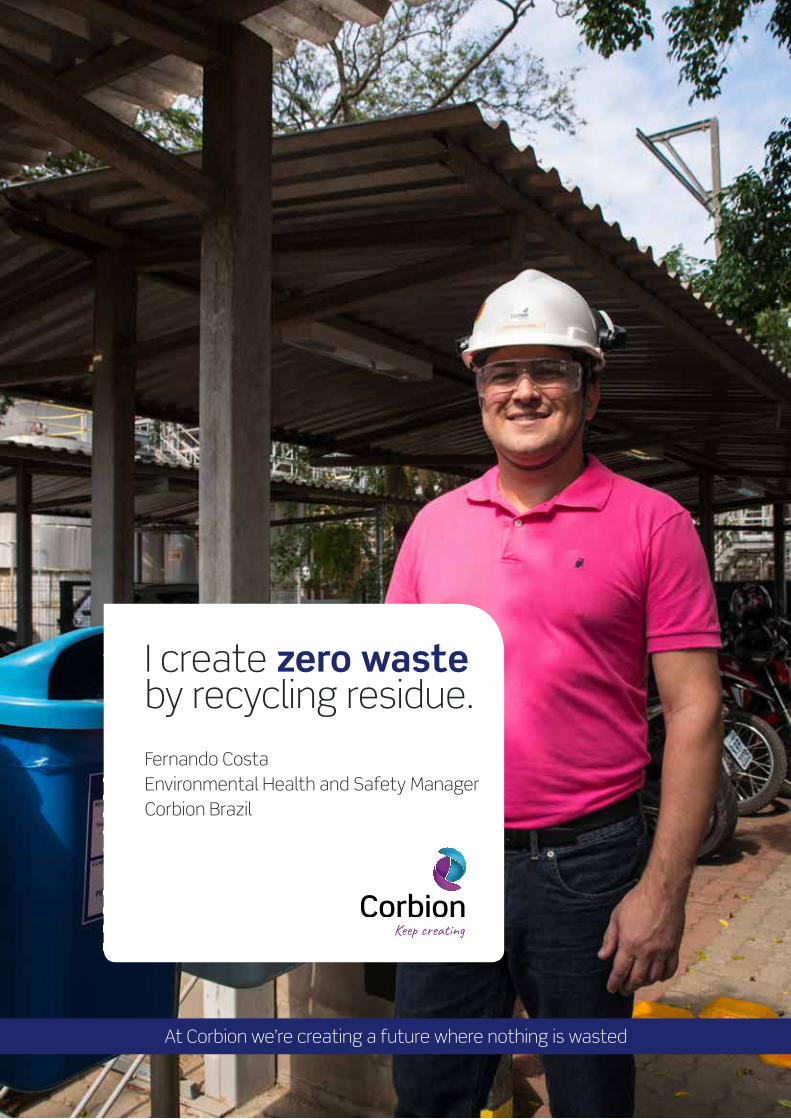
56 CORBION ANNUAL REPORT 2016 REPORT OF THE sUPERVIsORy BOARD
I create zero waste by recycling residue.
Fernando CostaEnvironmental Health and Safety ManagerCorbion Brazil
At Corbion we’re creating a future where nothing is wasted
Keep creating
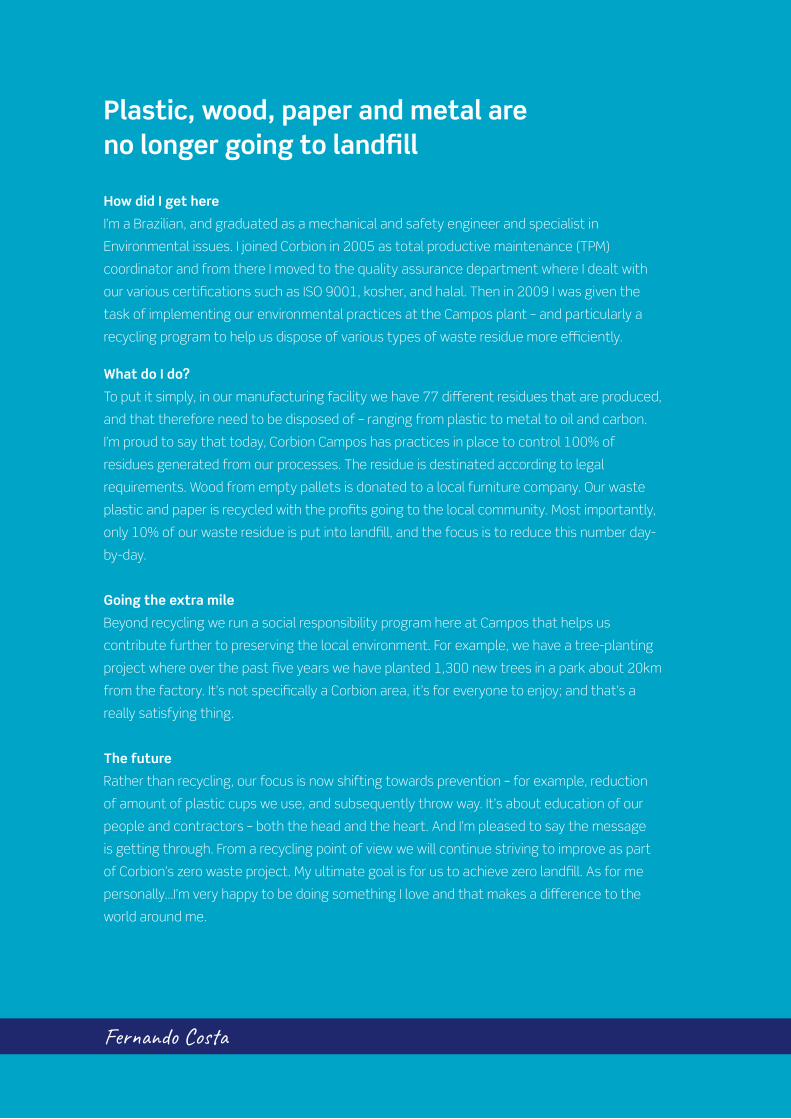
57CORBION ANNUAL REPORT 2016 REPORT OF THE sUPERVIsORy BOARD
Fernando Costa
How did I get here
I’m a Brazilian, and graduated as a mechanical and safety engineer and specialist in
Environmental issues. I joined Corbion in 2005 as total productive maintenance (TPM)
coordinator and from there I moved to the quality assurance department where I dealt with
our various certifications such as ISO 9001, kosher, and halal. Then in 2009 I was given the
task of implementing our environmental practices at the Campos plant – and particularly a
recycling program to help us dispose of various types of waste residue more efficiently.
What do I do?
To put it simply, in our manufacturing facility we have 77 different residues that are produced,
and that therefore need to be disposed of – ranging from plastic to metal to oil and carbon.
I’m proud to say that today, Corbion Campos has practices in place to control 100% of
residues generated from our processes. The residue is destinated according to legal
requirements. Wood from empty pallets is donated to a local furniture company. Our waste
plastic and paper is recycled with the profits going to the local community. Most importantly,
only 10% of our waste residue is put into landfill, and the focus is to reduce this number day-
by-day.
Going the extra mile
Beyond recycling we run a social responsibility program here at Campos that helps us
contribute further to preserving the local environment. For example, we have a tree-planting
project where over the past five years we have planted 1,300 new trees in a park about 20km
from the factory. It’s not specifically a Corbion area, it’s for everyone to enjoy; and that’s a
really satisfying thing.
The future
Rather than recycling, our focus is now shifting towards prevention – for example, reduction
of amount of plastic cups we use, and subsequently throw way. It’s about education of our
people and contractors – both the head and the heart. And I’m pleased to say the message
is getting through. From a recycling point of view we will continue striving to improve as part
of Corbion’s zero waste project. My ultimate goal is for us to achieve zero landfill. As for me
personally…I’m very happy to be doing something I love and that makes a difference to the
world around me.
Plastic, wood, paper and metal are no longer going to landfill
58 CORBION ANNUAL REPORT 2016 sUsTAINABILITy sTATEMENTs
Materiality and stakeholder engagementThe foundation of our updated sustainability strategy is the materiality matrix, which we use to set priorities and ensures that we take a focused approach. A materiality analysis is about the identification of key issues that are important to our stakeholders and our strategy. The materiality matrix visualizes the results of this analysis, by plotting the relevant social, environmental, governance and economic issues as a function of their importance to stakeholders (vertical axis) and Corbion’s strategy (horizontal axis).
In 2015 we updated our materiality matrix using an in-depth methodology (see Figure 1). We increased the number of issues in the evaluation to get a more detailed picture of their relative importance. To determine the relevance of these issues to our stakeholders, we conducted interviews with representatives of each stakeholder group (see Figure 2) to understand their expectations. Generally, our stakeholders really appreciated this opportunity to share their views and recommendations. We will continue this dialog to keep our assessment up to date and to signal emerging issues in time.
Combined with our internal assessment of the importance of the issues to our strategy, this resulted in the identification of six material themes, which are the six themes in the upper right quadrant of the matrix. These six themes have a high impact on our strategy and are considered important by the majority of our stakeholders.
Figure 3 provides an overview of the priority themes per stakeholder group, for the stakeholders that have a high impact on Corbion and vice versa. Each of the material themes is considered a priority for 3 to 4 high impact stakeholders. Each stakeholder also indicated some specific topics that are relevant to them, but not considered material overall.
In 2017 we will update the materiality matrix, as input for our next strategy update.
SUSTAINABILITY STATEMENTS
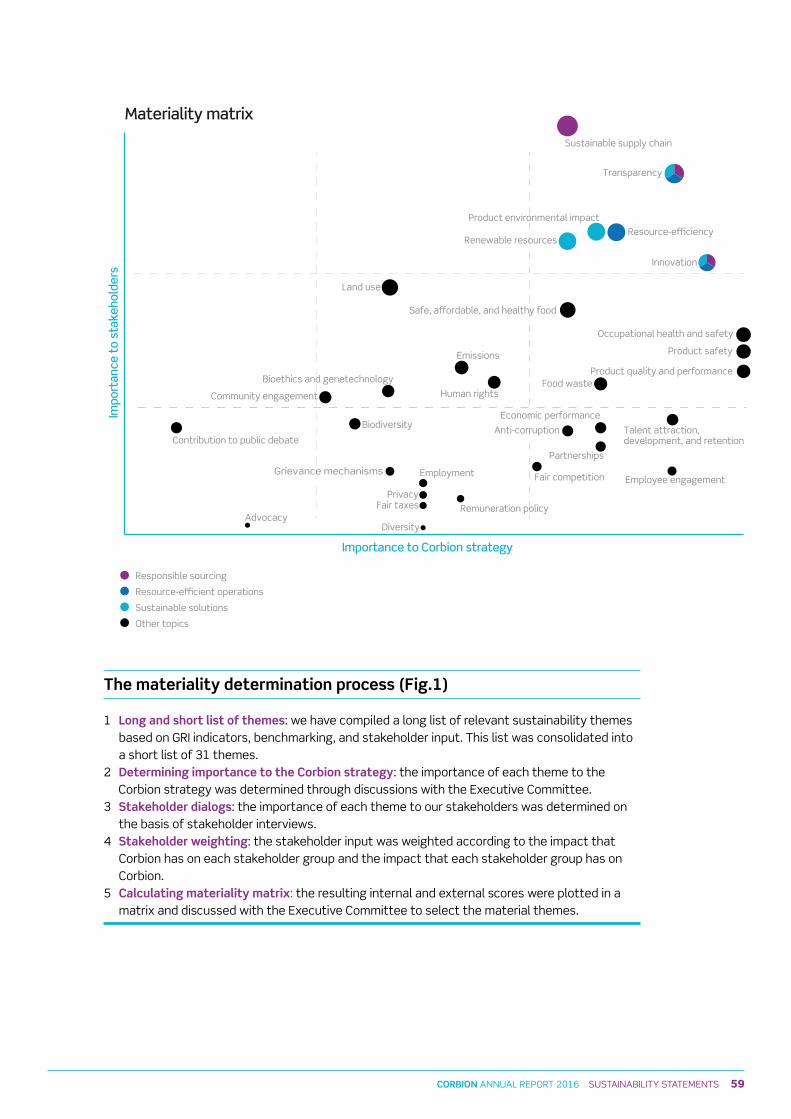
59CORBION ANNUAL REPORT 2016 sUsTAINABILITy sTATEMENTs
Responsible sourcing
Resource-e�cient operations
Sustainable solutions
Other topics
Materiality matrix
Importance to Corbion strategy
Impo
rtan
ce t
o st
akeh
olde
rs
Product quality and performance
Occupational health and safety
Product safety
Innovation
Transparency
Employee engagement
Talent attraction, development, and retention
Partnerships
Economic performance
Resource-e�ciencyProduct environmental impact
Food waste
Sustainable supply chain
Anti-corruption
Renewable resources
Safe, a�ordable, and healthy food
Fair competition
Human rights
Emissions
Remuneration policy
Employment
Privacy
Diversity
Land use
Grievance mechanisms
Bioethics and genetechnology
Biodiversity
Fair taxes
Community engagement
Advocacy
Contribution to public debate
The materiality determination process (Fig.1)
1 Long and short list of themes: we have compiled a long list of relevant sustainability themes based on GRI indicators, benchmarking, and stakeholder input. This list was consolidated into a short list of 31 themes.
2 Determining importance to the Corbion strategy: the importance of each theme to the Corbion strategy was determined through discussions with the Executive Committee. 3 Stakeholder dialogs: the importance of each theme to our stakeholders was determined on
the basis of stakeholder interviews.4 Stakeholder weighting: the stakeholder input was weighted according to the impact that
Corbion has on each stakeholder group and the impact that each stakeholder group has on Corbion.
5 Calculating materiality matrix: the resulting internal and external scores were plotted in a matrix and discussed with the Executive Committee to select the material themes.
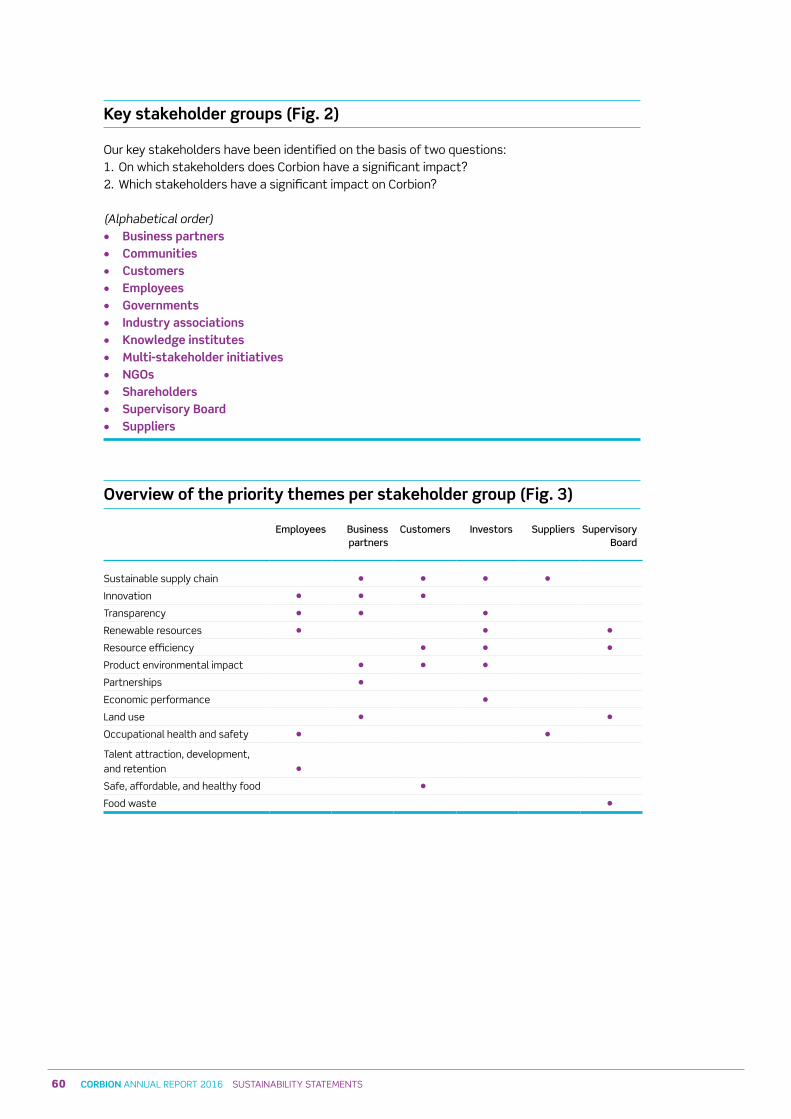
60 CORBION ANNUAL REPORT 2016 sUsTAINABILITy sTATEMENTs
Key stakeholder groups (Fig. 2)
Our key stakeholders have been identified on the basis of two questions: 1. On which stakeholders does Corbion have a significant impact? 2. Which stakeholders have a significant impact on Corbion?
(Alphabetical order) • Business partners• Communities• Customers• Employees• Governments• Industry associations• Knowledge institutes• Multi-stakeholder initiatives• NGOs• Shareholders• Supervisory Board• Suppliers
Overview of the priority themes per stakeholder group (Fig. 3)
Employees Businesspartners
Customers Investors Suppliers SupervisoryBoard
sustainable supply chain • • • •Innovation • • •Transparency • • •Renewable resources • • •Resource efficiency • • •Product environmental impact • • •Partnerships •Economic performance •Land use • •Occupational health and safety • •
Talent attraction, development,and retention •safe, affordable, and healthy food •Food waste •
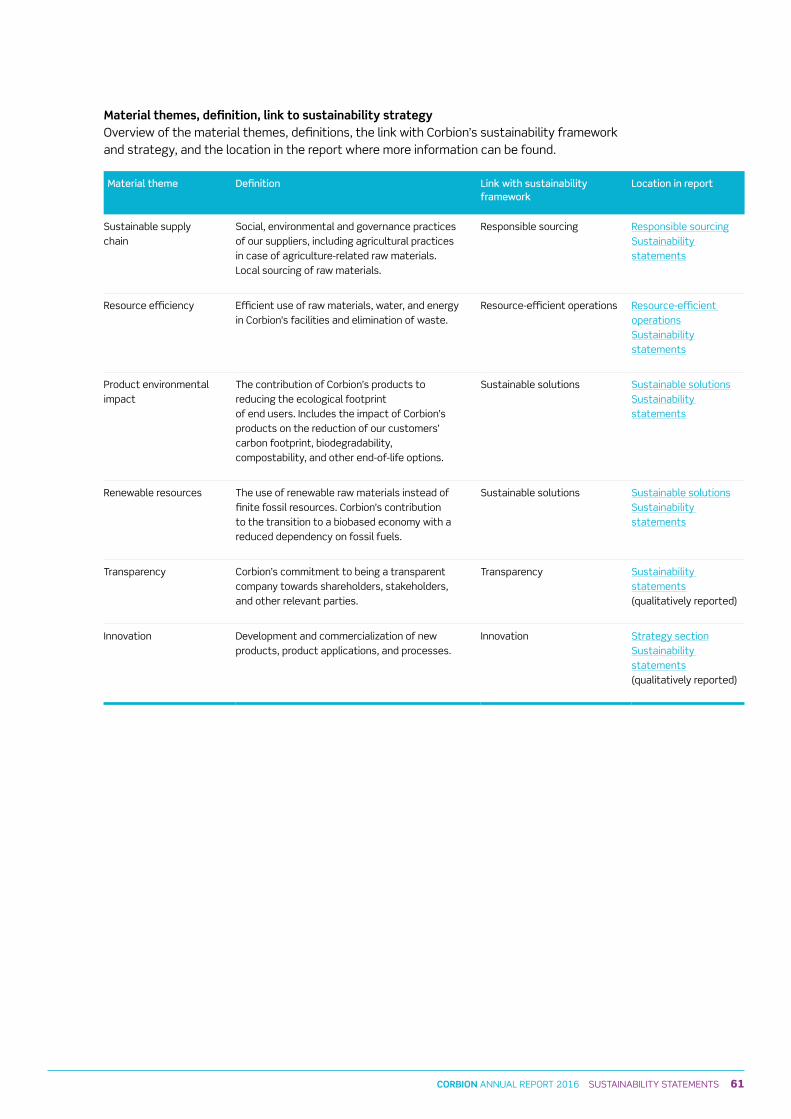
61CORBION ANNUAL REPORT 2016 sUsTAINABILITy sTATEMENTs
Material themes, definition, link to sustainability strategyOverview of the material themes, definitions, the link with Corbion’s sustainability framework and strategy, and the location in the report where more information can be found.
Material theme Definition Link with sustainability framework
Location in report
sustainable supply chain
social, environmental and governance practices of our suppliers, including agricultural practices in case of agriculture-related raw materials. Local sourcing of raw materials.
Responsible sourcing Responsible sourcingsustainability statements
Resource efficiency Efficient use of raw materials, water, and energy in Corbion's facilities and elimination of waste.
Resource-efficient operations Resource-efficient operationssustainabilitystatements
Product environmental impact
The contribution of Corbion’s products to reducing the ecological footprint of end users. Includes the impact of Corbion’s products on the reduction of our customers’ carbon footprint, biodegradability, compostability, and other end-of-life options.
sustainable solutions sustainable solutionssustainability statements
Renewable resources The use of renewable raw materials instead of finite fossil resources. Corbion’s contribution to the transition to a biobased economy with a reduced dependency on fossil fuels.
sustainable solutions sustainable solutionssustainability statements
Transparency Corbion’s commitment to being a transparent company towards shareholders, stakeholders, and other relevant parties.
Transparency sustainability statements(qualitatively reported)
Innovation Development and commercialization of new products, product applications, and processes.
Innovation strategy sectionsustainability statements(qualitatively reported)
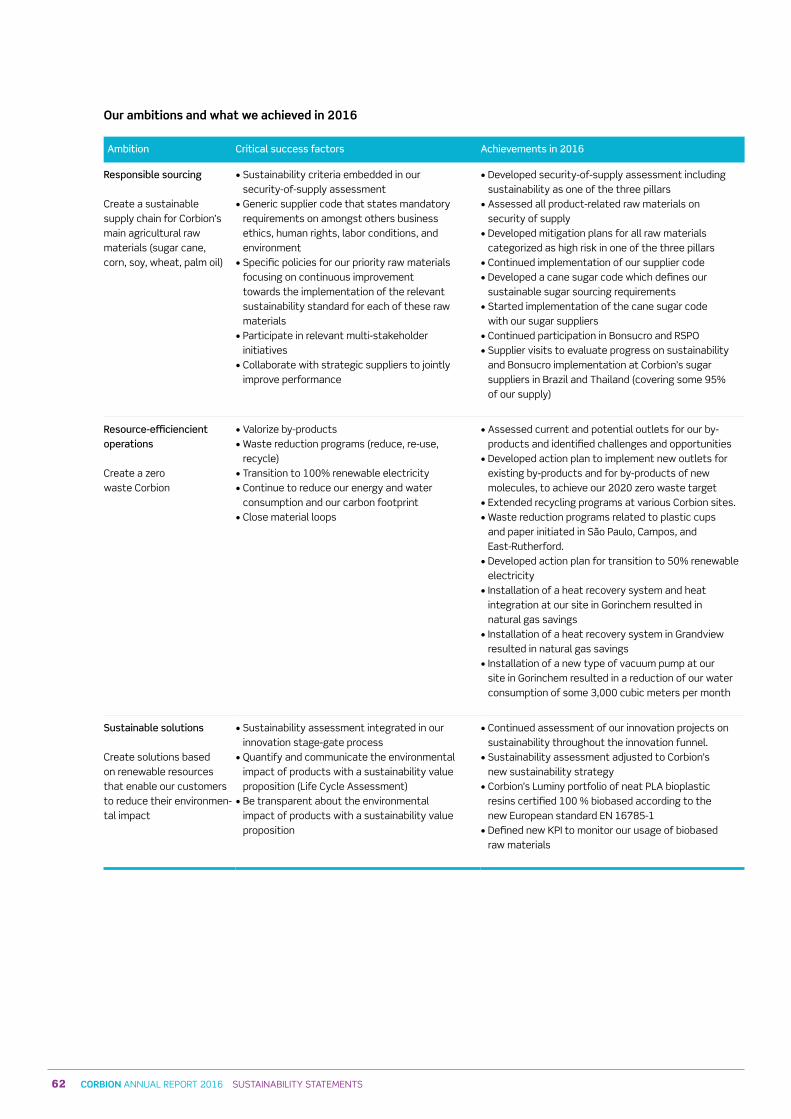
62 CORBION ANNUAL REPORT 2016 sUsTAINABILITy sTATEMENTs
Our ambitions and what we achieved in 2016
Ambition Critical success factors Achievements in 2016
Responsible sourcing
Create a sustainable supply chain for Corbion’s main agricultural raw materials (sugar cane, corn, soy, wheat, palm oil)
• sustainability criteria embedded in our security-of-supply assessment
• Generic supplier code that states mandatory requirements on amongst others business ethics, human rights, labor conditions, and environment
• specific policies for our priority raw materials focusing on continuous improvement towards the implementation of the relevant sustainability standard for each of these raw materials
• Participate in relevant multi-stakeholder initiatives
• Collaborate with strategic suppliers to jointly improve performance
• Developed security-of-supply assessment including sustainability as one of the three pillars
• Assessed all product-related raw materials on security of supply
• Developed mitigation plans for all raw materials categorized as high risk in one of the three pillars
• Continued implementation of our supplier code• Developed a cane sugar code which defines our
sustainable sugar sourcing requirements• started implementation of the cane sugar code
with our sugar suppliers• Continued participation in Bonsucro and RsPO• supplier visits to evaluate progress on sustainability
and Bonsucro implementation at Corbion’s sugar suppliers in Brazil and Thailand (covering some 95% of our supply)
Resource-efficiencient operations
Create a zero waste Corbion
• Valorize by-products• Waste reduction programs (reduce, re-use,
recycle)• Transition to 100% renewable electricity• Continue to reduce our energy and water
consumption and our carbon footprint• Close material loops
• Assessed current and potential outlets for our by-products and identified challenges and opportunities
• Developed action plan to implement new outlets for existing by-products and for by-products of new molecules, to achieve our 2020 zero waste target
• Extended recycling programs at various Corbion sites.• Waste reduction programs related to plastic cups
and paper initiated in são Paulo, Campos, and East-Rutherford.
• Developed action plan for transition to 50% renewable electricity
• Installation of a heat recovery system and heat integration at our site in Gorinchem resulted in natural gas savings
• Installation of a heat recovery system in Grandview resulted in natural gas savings
• Installation of a new type of vacuum pump at our site in Gorinchem resulted in a reduction of our water consumption of some 3,000 cubic meters per month
Sustainable solutions
Create solutions based on renewable resources that enable our customers to reduce their environmen-tal impact
• sustainability assessment integrated in our innovation stage-gate process
• Quantify and communicate the environmental impact of products with a sustainability value proposition (Life Cycle Assessment)
• Be transparent about the environmental impact of products with a sustainability value proposition
• Continued assessment of our innovation projects on sustainability throughout the innovation funnel.
• sustainability assessment adjusted to Corbion’s new sustainability strategy
• Corbion’s Luminy portfolio of neat PLA bioplastic resins certified 100 % biobased according to the new European standard EN 16785-1
• Defined new KPI to monitor our usage of biobased raw materials
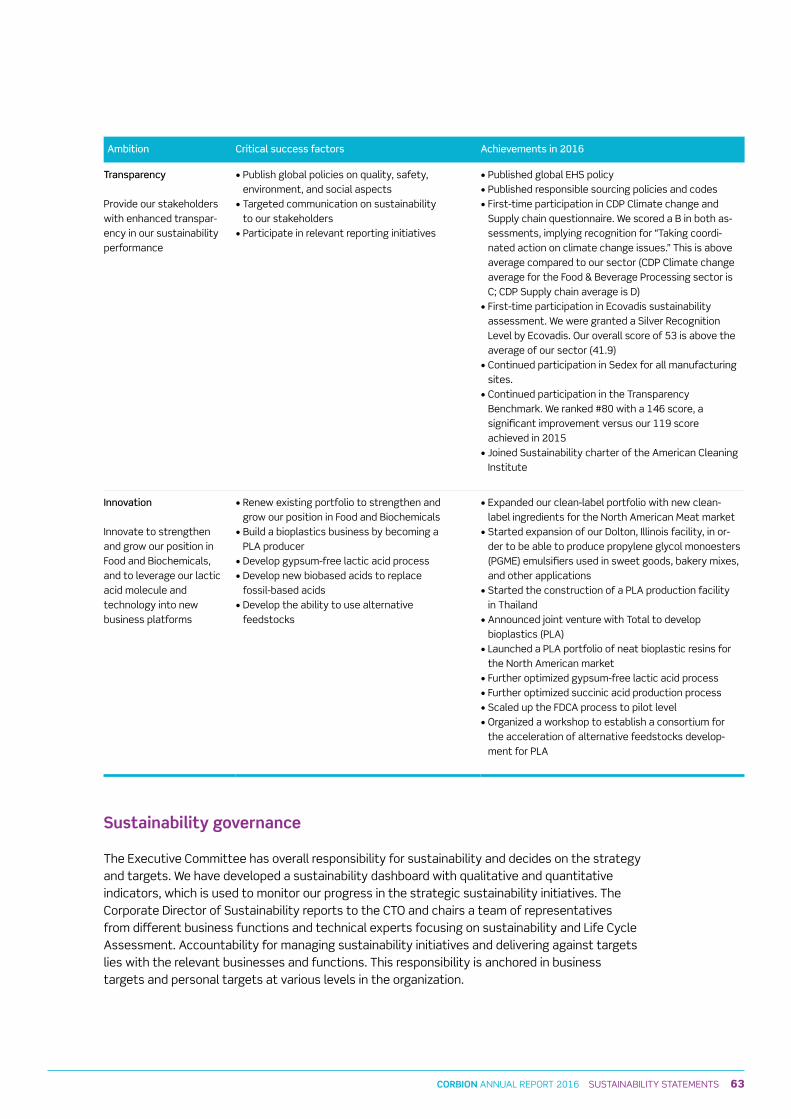
63CORBION ANNUAL REPORT 2016 sUsTAINABILITy sTATEMENTs
Ambition Critical success factors Achievements in 2016
Transparency
Provide our stakeholders with enhanced transpar-ency in our sustainability performance
• Publish global policies on quality, safety, environment, and social aspects
• Targeted communication on sustainability to our stakeholders
• Participate in relevant reporting initiatives
• Published global EHs policy• Published responsible sourcing policies and codes• First-time participation in CDP Climate change and
supply chain questionnaire. We scored a B in both as-sessments, implying recognition for “Taking coordi-nated action on climate change issues.” This is above average compared to our sector (CDP Climate change average for the Food & Beverage Processing sector is C; CDP supply chain average is D)
• First-time participation in Ecovadis sustainability assessment. We were granted a silver Recognition Level by Ecovadis. Our overall score of 53 is above the average of our sector (41.9)
• Continued participation in sedex for all manufacturing sites.
• Continued participation in the Transparency Benchmark. We ranked #80 with a 146 score, a significant improvement versus our 119 score achieved in 2015
• Joined sustainability charter of the American Cleaning Institute
Innovation
Innovate to strengthen and grow our position in Food and Biochemicals, and to leverage our lactic acid molecule and technology into new business platforms
• Renew existing portfolio to strengthen and grow our position in Food and Biochemicals
• Build a bioplastics business by becoming a PLA producer
• Develop gypsum-free lactic acid process• Develop new biobased acids to replace
fossil-based acids • Develop the ability to use alternative
feedstocks
• Expanded our clean-label portfolio with new clean-label ingredients for the North American Meat market
• started expansion of our Dolton, Illinois facility, in or-der to be able to produce propylene glycol monoesters (PGME) emulsifiers used in sweet goods, bakery mixes, and other applications
• started the construction of a PLA production facility in Thailand
• Announced joint venture with Total to develop bioplastics (PLA)
• Launched a PLA portfolio of neat bioplastic resins for the North American market
• Further optimized gypsum-free lactic acid process• Further optimized succinic acid production process• scaled up the FDCA process to pilot level• Organized a workshop to establish a consortium for
the acceleration of alternative feedstocks develop-ment for PLA
Sustainability governance
The Executive Committee has overall responsibility for sustainability and decides on the strategy and targets. We have developed a sustainability dashboard with qualitative and quantitative indicators, which is used to monitor our progress in the strategic sustainability initiatives. The Corporate Director of sustainability reports to the CTO and chairs a team of representatives from different business functions and technical experts focusing on sustainability and Life Cycle Assessment. Accountability for managing sustainability initiatives and delivering against targets lies with the relevant businesses and functions. This responsibility is anchored in business targets and personal targets at various levels in the organization.
64 CORBION ANNUAL REPORT 2016 sUsTAINABILITy sTATEMENTs
Reporting policy
Our sustainability reporting is based on the guidelines of the Global Reporting Initiative (GRI). For this report, the core option of the GRI G4 guidelines has been used. As required by the GRI G4 guidelines, the selection of topics is based on a materiality assessment (see Materiality). Additionally, we report on a number of themes such as occupational health and safety, quality, and product safety, which we consider qualifiers of our business. The environmental and social results for both the material topics and additional themes in this report include all entities that belong to the scope of the consolidated financial statements. The scope of the environmental data includes Corbion’s manufacturing sites. Offices and R&D laboratories are not included, except for our R&D laboratories and offices located at our Gorinchem and Totowa manufacturing sites. Please refer for our reporting approach on acquisitions and disinvestments to Note 2 of our consolidated financial statements. The sustainability results follow the same principles as our financial results.Data is collected from various reporting systems. For each KPI, data reporters, data reviewers, and data owners are defined, either at site level or at corporate level. The data reporter is responsible for the annual reporting of the data via the central reporting systems and for document retention and record-keeping related to this data. The data reviewer (from Finance) is responsible for the validation of the reported data. The data owner reviews and signs off. site-specific data is consolidated and reviewed at corporate level by Finance and the sustainability team. The review includes a comparison to data from previous years and a review of changes that could have impacted the results, such as improvement projects. In case of uncertainties, data estimation may be required, which is validated during review. We strive to continuously improve the data collection process and the reliability of the data. significant changes that impact comparability including changes in measurement methods are explained in footnotes. There were no major changes in our sustainability policy in 2016.The sustainability sections of this report have not been reviewed by external auditors. This year we put effort into improving the quality of our reporting processes and next year we aim for assurance on the KPIs related to responsible sourcing, resource-efficient operations, and sustainable solutions.
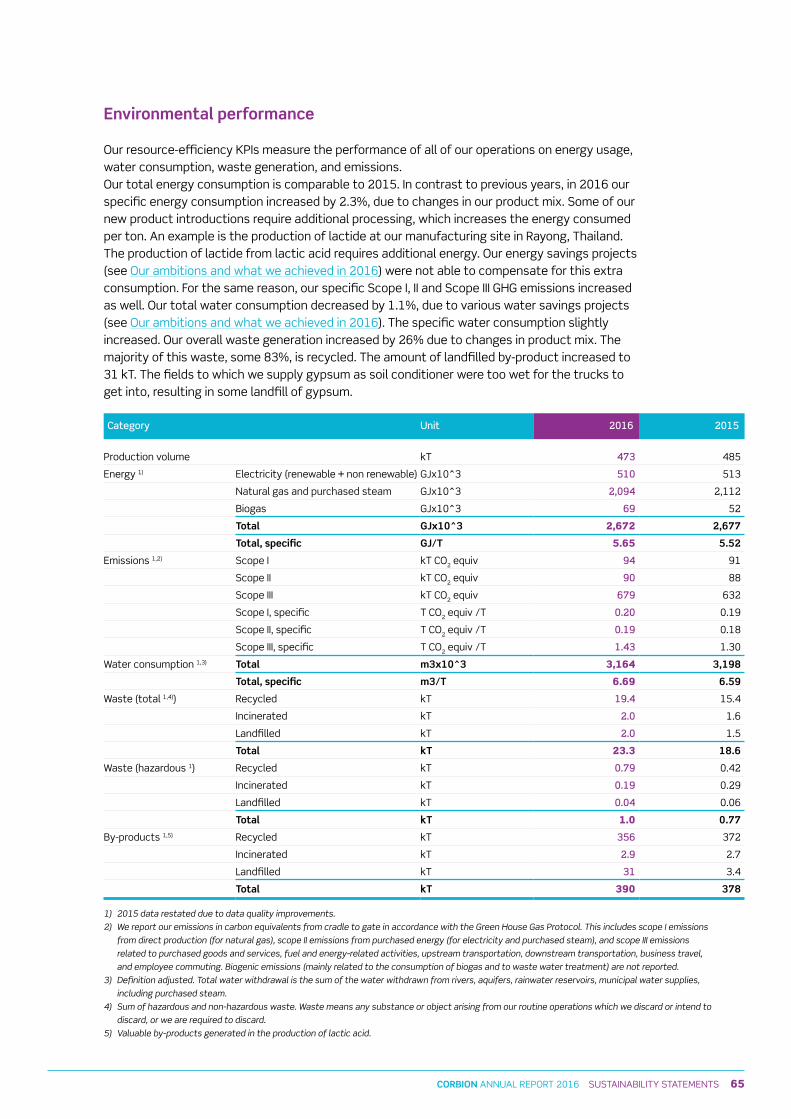
65CORBION ANNUAL REPORT 2016 sUsTAINABILITy sTATEMENTs
Environmental performance
Our resource-efficiency KPIs measure the performance of all of our operations on energy usage, water consumption, waste generation, and emissions. Our total energy consumption is comparable to 2015. In contrast to previous years, in 2016 our specific energy consumption increased by 2.3%, due to changes in our product mix. some of our new product introductions require additional processing, which increases the energy consumed per ton. An example is the production of lactide at our manufacturing site in Rayong, Thailand. The production of lactide from lactic acid requires additional energy. Our energy savings projects (see Our ambitions and what we achieved in 2016) were not able to compensate for this extra consumption. For the same reason, our specific scope I, II and scope III GHG emissions increased as well. Our total water consumption decreased by 1.1%, due to various water savings projects (see Our ambitions and what we achieved in 2016). The specific water consumption slightly increased. Our overall waste generation increased by 26% due to changes in product mix. The majority of this waste, some 83%, is recycled. The amount of landfilled by-product increased to 31 kT. The fields to which we supply gypsum as soil conditioner were too wet for the trucks to get into, resulting in some landfill of gypsum.
Category Unit 2016 2015
Production volume kT 473 485
Energy 1) Electricity (renewable + non renewable) GJx10^3 510 513
Natural gas and purchased steam GJx10^3 2,094 2,112
Biogas GJx10^3 69 52
Total GJx10^3 2,672 2,677
Total, specific GJ/T 5.65 5.52
Emissions 1,2) scope I kT CO2 equiv 94 91
scope II kT CO2 equiv 90 88
scope III kT CO2 equiv 679 632
scope I, specific T CO2 equiv /T 0 20 0.19
scope II, specific T CO2 equiv /T 0 19 0.18
scope III, specific T CO2 equiv /T 1 43 1.30
Water consumption 1,3) Total m3x10^3 3,164 3,198
Total, specific m3/T 6.69 6.59
Waste (total 1,4)) Recycled kT 19 4 15.4
Incinerated kT 2 0 1.6
Landfilled kT 2 0 1.5
Total kT 23.3 18.6
Waste (hazardous 1) Recycled kT 0 79 0.42
Incinerated kT 0 19 0.29
Landfilled kT 0 04 0.06
Total kT 1.0 0.77
By-products 1,5) Recycled kT 356 372
Incinerated kT 2 9 2.7
Landfilled kT 31 3.4
Total kT 390 378
1) 2015 data restated due to data quality improvements.
2) We report our emissions in carbon equivalents from cradle to gate in accordance with the Green House Gas Protocol. This includes scope I emissions
from direct production (for natural gas), scope II emissions from purchased energy (for electricity and purchased steam), and scope III emissions
related to purchased goods and services, fuel and energy-related activities, upstream transportation, downstream transportation, business travel,
and employee commuting. Biogenic emissions (mainly related to the consumption of biogas and to waste water treatment) are not reported.
3) Definition adjusted. Total water withdrawal is the sum of the water withdrawn from rivers, aquifers, rainwater reservoirs, municipal water supplies,
including purchased steam.
4) Sum of hazardous and non-hazardous waste. Waste means any substance or object arising from our routine operations which we discard or intend to
discard, or we are required to discard.
5) Valuable by-products generated in the production of lactic acid.
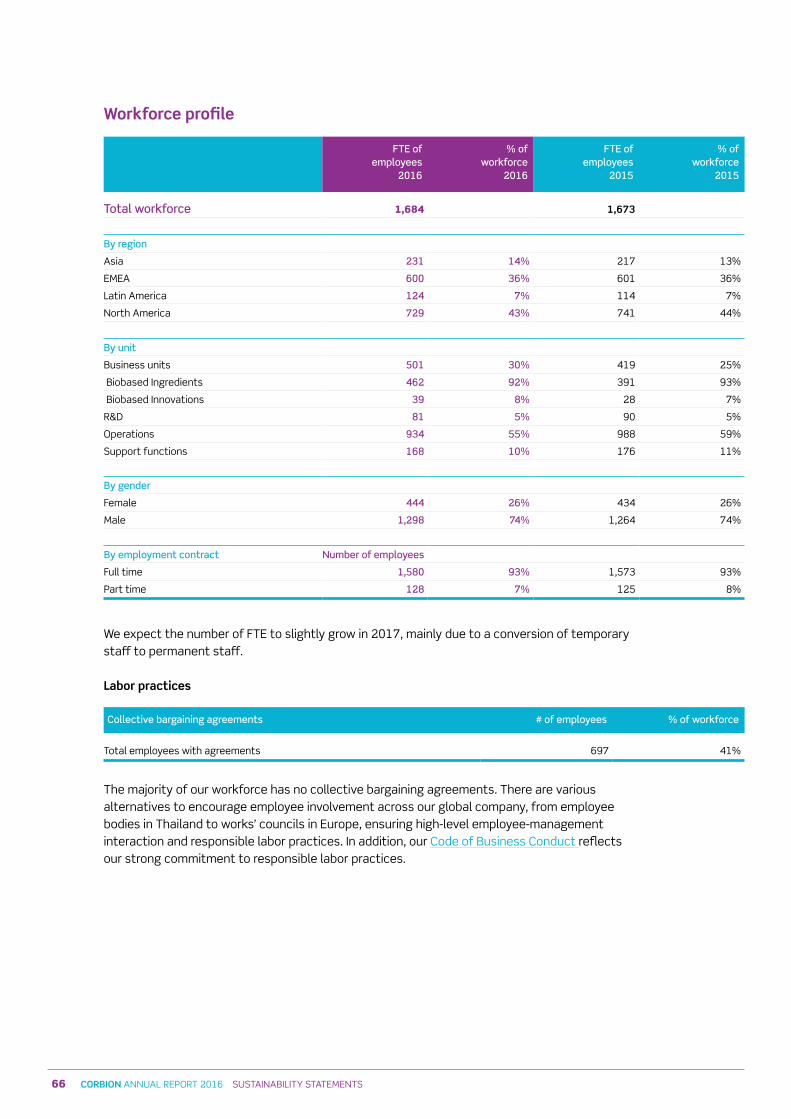
66 CORBION ANNUAL REPORT 2016 sUsTAINABILITy sTATEMENTs
Workforce profile
FTE of employees
2016
% of workforce
2016
FTE of employees
2015
% of workforce
2015
Total workforce 1,684 1,673
By region
Asia 231 14% 217 13%
EMEA 600 36% 601 36%
Latin America 124 7% 114 7%
North America 729 43% 741 44%
By unit
Business units 501 30% 419 25%
Biobased Ingredients 462 92% 391 93%
Biobased Innovations 39 8% 28 7%
R&D 81 5% 90 5%
Operations 934 55% 988 59%
support functions 168 10% 176 11%
By gender
Female 444 26% 434 26%
Male 1,298 74% 1,264 74%
By employment contract Number of employees
Full time 1,580 93% 1,573 93%
Part time 128 7% 125 8%
We expect the number of FTE to slightly grow in 2017, mainly due to a conversion of temporary staff to permanent staff.
Labor practices
Collective bargaining agreements # of employees % of workforce
Total employees with agreements 697 41%
The majority of our workforce has no collective bargaining agreements. There are various alternatives to encourage employee involvement across our global company, from employee bodies in Thailand to works’ councils in Europe, ensuring high-level employee-management interaction and responsible labor practices. In addition, our Code of Business Conduct reflects our strong commitment to responsible labor practices.
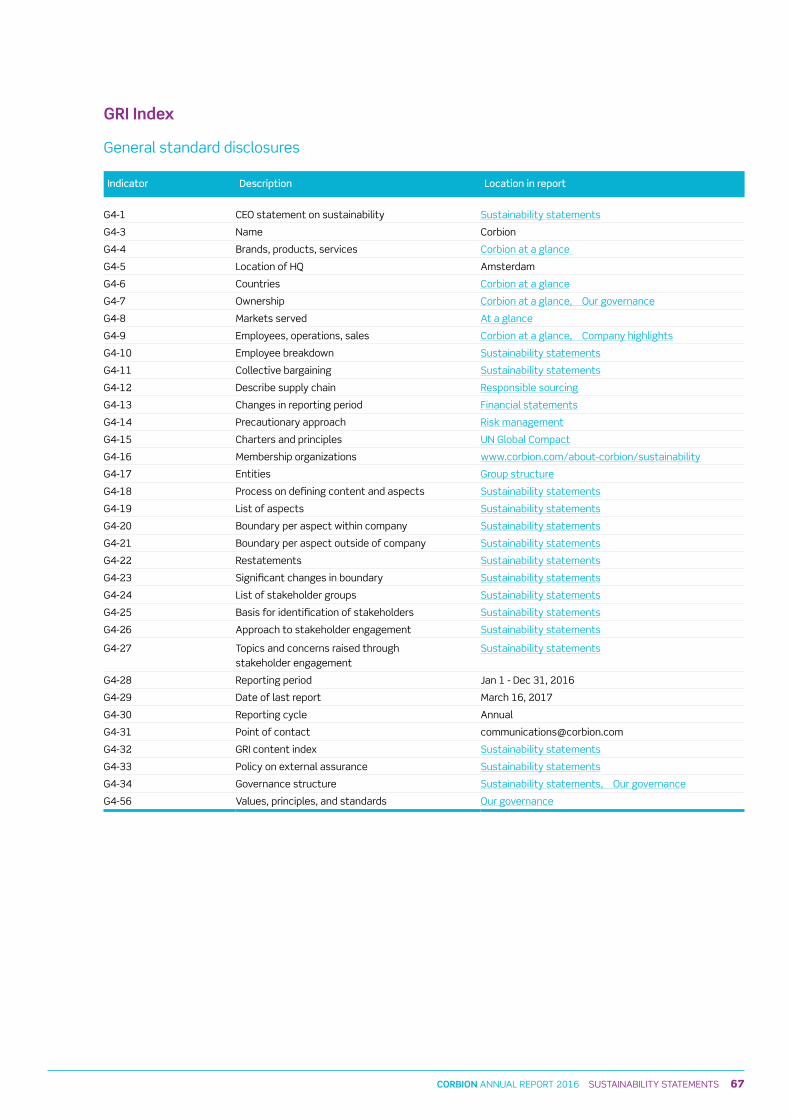
67CORBION ANNUAL REPORT 2016 sUsTAINABILITy sTATEMENTs
GRI Index
General standard disclosures
Indicator Description Location in report
G4-1 CEO statement on sustainability sustainability statements
G4-3 Name Corbion
G4-4 Brands, products, services Corbion at a glance
G4-5 Location of HQ Amsterdam
G4-6 Countries Corbion at a glance
G4-7 Ownership Corbion at a glance, Our governance
G4-8 Markets served At a glance
G4-9 Employees, operations, sales Corbion at a glance, Company highlights
G4-10 Employee breakdown sustainability statements
G4-11 Collective bargaining sustainability statements
G4-12 Describe supply chain Responsible sourcing
G4-13 Changes in reporting period Financial statements
G4-14 Precautionary approach Risk management
G4-15 Charters and principles UN Global Compact
G4-16 Membership organizations www.corbion.com/about-corbion/sustainability
G4-17 Entities Group structure
G4-18 Process on defining content and aspects sustainability statements
G4-19 List of aspects sustainability statements
G4-20 Boundary per aspect within company sustainability statements
G4-21 Boundary per aspect outside of company sustainability statements
G4-22 Restatements sustainability statements
G4-23 significant changes in boundary sustainability statements
G4-24 List of stakeholder groups sustainability statements
G4-25 Basis for identification of stakeholders sustainability statements
G4-26 Approach to stakeholder engagement sustainability statements
G4-27 Topics and concerns raised through stakeholder engagement
sustainability statements
G4-28 Reporting period Jan 1 - Dec 31, 2016
G4-29 Date of last report March 16, 2017
G4-30 Reporting cycle Annual
G4-31 Point of contact [email protected]
G4-32 GRI content index sustainability statements
G4-33 Policy on external assurance sustainability statements
G4-34 Governance structure sustainability statements, Our governance
G4-56 Values, principles, and standards Our governance
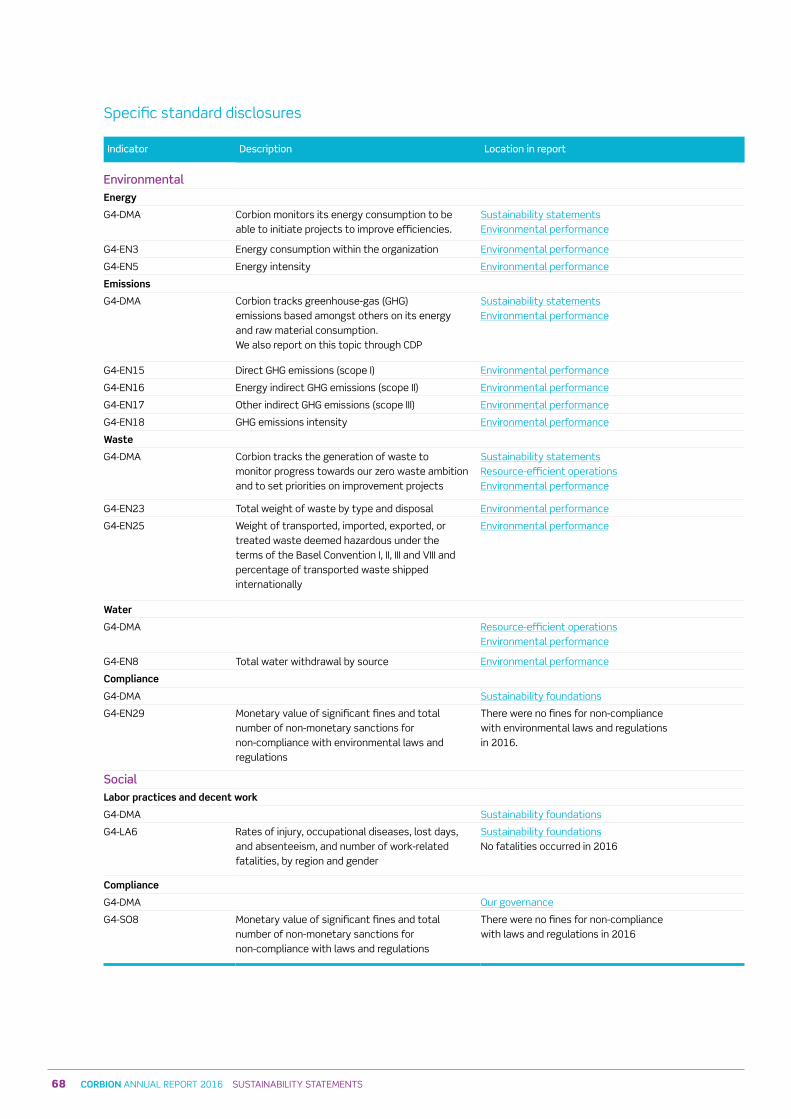
68 CORBION ANNUAL REPORT 2016 sUsTAINABILITy sTATEMENTs
specific standard disclosures
Indicator Description Location in report
EnvironmentalEnergy
G4-DMA Corbion monitors its energy consumption to be able to initiate projects to improve efficiencies.
sustainability statementsEnvironmental performance
G4-EN3 Energy consumption within the organization Environmental performance
G4-EN5 Energy intensity Environmental performance
Emissions
G4-DMA Corbion tracks greenhouse-gas (GHG)emissions based amongst others on its energy and raw material consumption. We also report on this topic through CDP
sustainability statementsEnvironmental performance
G4-EN15 Direct GHG emissions (scope I) Environmental performance
G4-EN16 Energy indirect GHG emissions (scope II) Environmental performance
G4-EN17 Other indirect GHG emissions (scope III) Environmental performance
G4-EN18 GHG emissions intensity Environmental performance
Waste
G4-DMA Corbion tracks the generation of waste to monitor progress towards our zero waste ambition and to set priorities on improvement projects
sustainability statementsResource-efficient operationsEnvironmental performance
G4-EN23 Total weight of waste by type and disposal Environmental performance
G4-EN25 Weight of transported, imported, exported, or treated waste deemed hazardous under the terms of the Basel Convention I, II, III and VIII and percentage of transported waste shipped internationally
Environmental performance
Water
G4-DMA Resource-efficient operationsEnvironmental performance
G4-EN8 Total water withdrawal by source Environmental performance
Compliance
G4-DMA sustainability foundations
G4-EN29 Monetary value of significant fines and total number of non-monetary sanctions for non-compliance with environmental laws and regulations
There were no fines for non-compliance with environmental laws and regulations in 2016.
SocialLabor practices and decent work
G4-DMA sustainability foundations
G4-LA6 Rates of injury, occupational diseases, lost days, and absenteeism, and number of work-related fatalities, by region and gender
sustainability foundationsNo fatalities occurred in 2016
Compliance
G4-DMA Our governance
G4-sO8 Monetary value of significant fines and total number of non-monetary sanctions for non-compliance with laws and regulations
There were no fines for non-compliance with laws and regulations in 2016
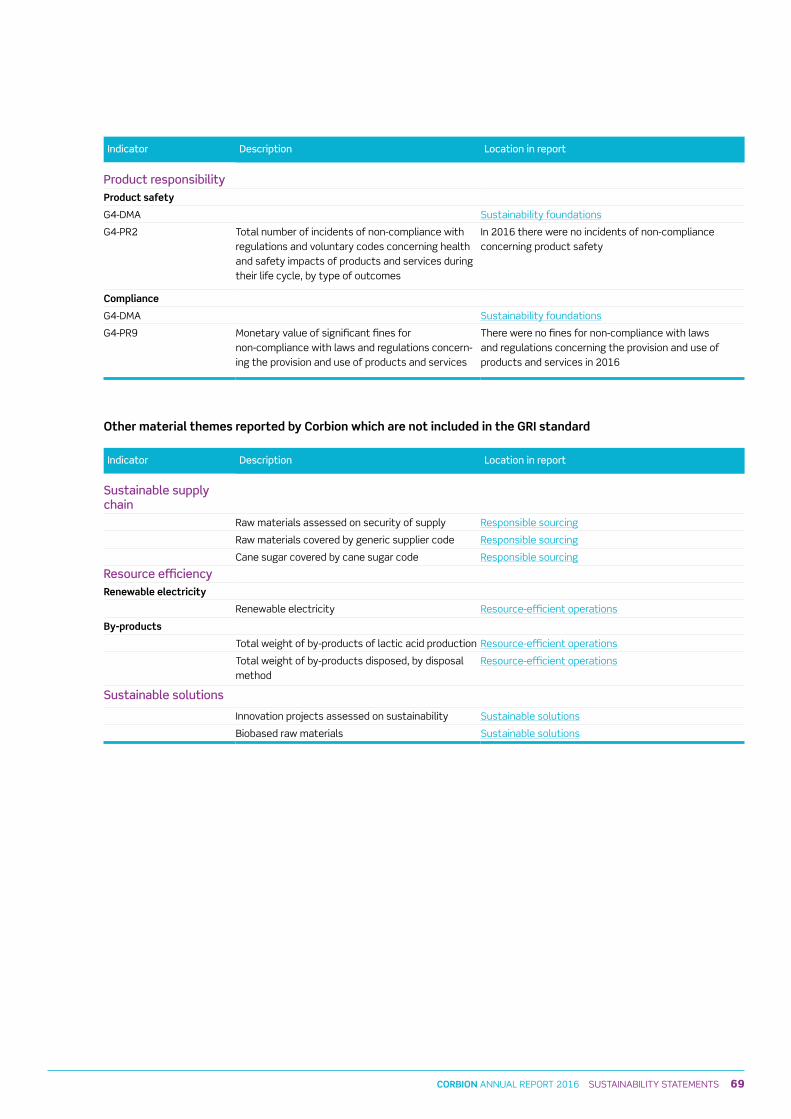
69CORBION ANNUAL REPORT 2016 sUsTAINABILITy sTATEMENTs
specific standard disclosures
Indicator Description Location in report
EnvironmentalEnergy
G4-DMA Corbion monitors its energy consumption to be able to initiate projects to improve efficiencies.
sustainability statementsEnvironmental performance
G4-EN3 Energy consumption within the organization Environmental performance
G4-EN5 Energy intensity Environmental performance
Emissions
G4-DMA Corbion tracks greenhouse-gas (GHG)emissions based amongst others on its energy and raw material consumption. We also report on this topic through CDP
sustainability statementsEnvironmental performance
G4-EN15 Direct GHG emissions (scope I) Environmental performance
G4-EN16 Energy indirect GHG emissions (scope II) Environmental performance
G4-EN17 Other indirect GHG emissions (scope III) Environmental performance
G4-EN18 GHG emissions intensity Environmental performance
Waste
G4-DMA Corbion tracks the generation of waste to monitor progress towards our zero waste ambition and to set priorities on improvement projects
sustainability statementsResource-efficient operationsEnvironmental performance
G4-EN23 Total weight of waste by type and disposal Environmental performance
G4-EN25 Weight of transported, imported, exported, or treated waste deemed hazardous under the terms of the Basel Convention I, II, III and VIII and percentage of transported waste shipped internationally
Environmental performance
Water
G4-DMA Resource-efficient operationsEnvironmental performance
G4-EN8 Total water withdrawal by source Environmental performance
Compliance
G4-DMA sustainability foundations
G4-EN29 Monetary value of significant fines and total number of non-monetary sanctions for non-compliance with environmental laws and regulations
There were no fines for non-compliance with environmental laws and regulations in 2016.
SocialLabor practices and decent work
G4-DMA sustainability foundations
G4-LA6 Rates of injury, occupational diseases, lost days, and absenteeism, and number of work-related fatalities, by region and gender
sustainability foundationsNo fatalities occurred in 2016
Compliance
G4-DMA Our governance
G4-sO8 Monetary value of significant fines and total number of non-monetary sanctions for non-compliance with laws and regulations
There were no fines for non-compliance with laws and regulations in 2016
Indicator Description Location in report
Product responsibilityProduct safety
G4-DMA sustainability foundations
G4-PR2 Total number of incidents of non-compliance with regulations and voluntary codes concerning health and safety impacts of products and services during their life cycle, by type of outcomes
In 2016 there were no incidents of non-compliance concerning product safety
Compliance
G4-DMA sustainability foundations
G4-PR9 Monetary value of significant fines for non-compliance with laws and regulations concern-ing the provision and use of products and services
There were no fines for non-compliance with laws and regulations concerning the provision and use of products and services in 2016
Other material themes reported by Corbion which are not included in the GRI standard
Indicator Description Location in report
Sustainable supplychain
Raw materials assessed on security of supply Responsible sourcing
Raw materials covered by generic supplier code Responsible sourcing
Cane sugar covered by cane sugar code Responsible sourcing
Resource efficiencyRenewable electricity
Renewable electricity Resource-efficient operations
By-products
Total weight of by-products of lactic acid production Resource-efficient operations
Total weight of by-products disposed, by disposal method
Resource-efficient operations
Sustainable solutions
Innovation projects assessed on sustainability sustainable solutions
Biobased raw materials sustainable solutions
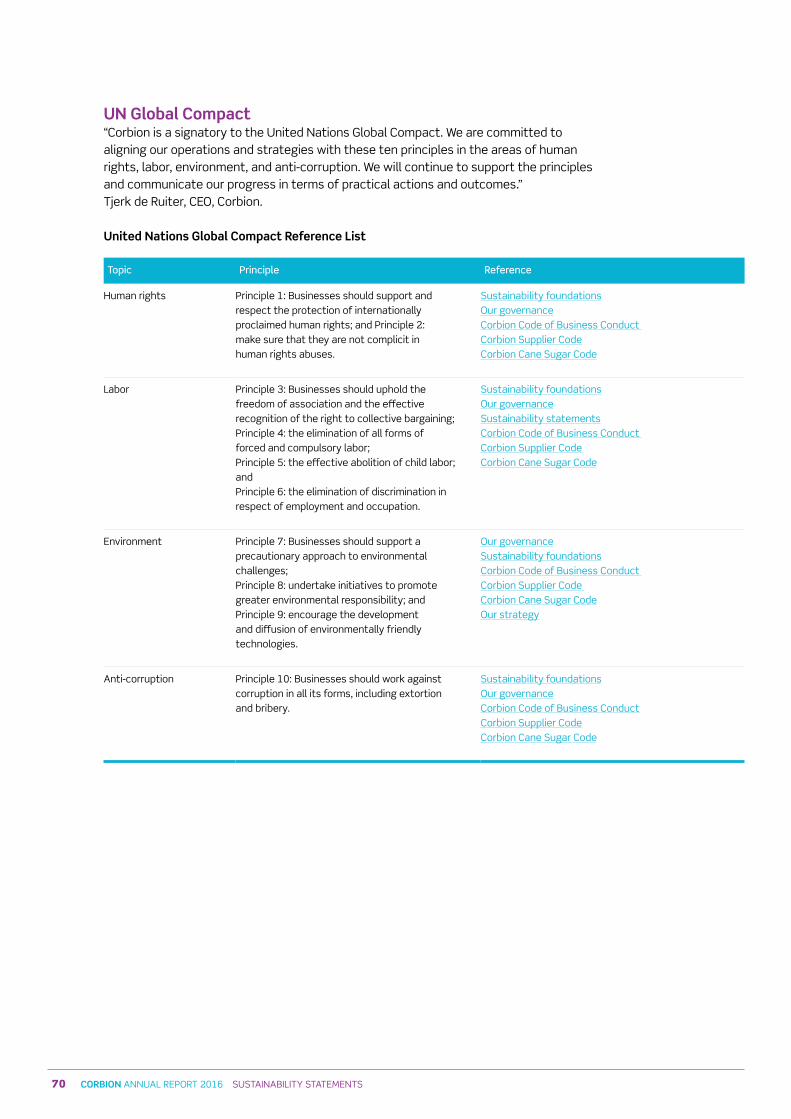
70 CORBION ANNUAL REPORT 2016 sUsTAINABILITy sTATEMENTs
UN Global Compact“Corbion is a signatory to the United Nations Global Compact. We are committed to aligning our operations and strategies with these ten principles in the areas of human rights, labor, environment, and anti-corruption. We will continue to support the principles and communicate our progress in terms of practical actions and outcomes.” Tjerk de Ruiter, CEO, Corbion.
United Nations Global Compact Reference List
Topic Principle Reference
Human rights Principle 1: Businesses should support and respect the protection of internationally proclaimed human rights; and Principle 2: make sure that they are not complicit in human rights abuses.
sustainability foundations Our governanceCorbion Code of Business Conduct Corbion supplier Code Corbion Cane sugar Code
Labor Principle 3: Businesses should uphold the freedom of association and the effective recognition of the right to collective bargaining;Principle 4: the elimination of all forms of forced and compulsory labor;Principle 5: the effective abolition of child labor; andPrinciple 6: the elimination of discrimination in respect of employment and occupation.
sustainability foundations Our governance sustainability statementsCorbion Code of Business Conduct Corbion supplier Code Corbion Cane sugar Code
Environment Principle 7: Businesses should support a precautionary approach to environmental challenges;Principle 8: undertake initiatives to promote greater environmental responsibility; andPrinciple 9: encourage the development and diffusion of environmentally friendly technologies.
Our governance sustainability foundationsCorbion Code of Business Conduct Corbion supplier Code Corbion Cane sugar Code Our strategy
Anti-corruption Principle 10: Businesses should work against corruption in all its forms, including extortion and bribery.
sustainability foundationsOur governanceCorbion Code of Business Conduct Corbion supplier CodeCorbion Cane sugar Code

71CORBION ANNUAL REPORT 2016 sUsTAINABILITy sTATEMENTs
FINANCIAL STATEMENTS
Keep creating
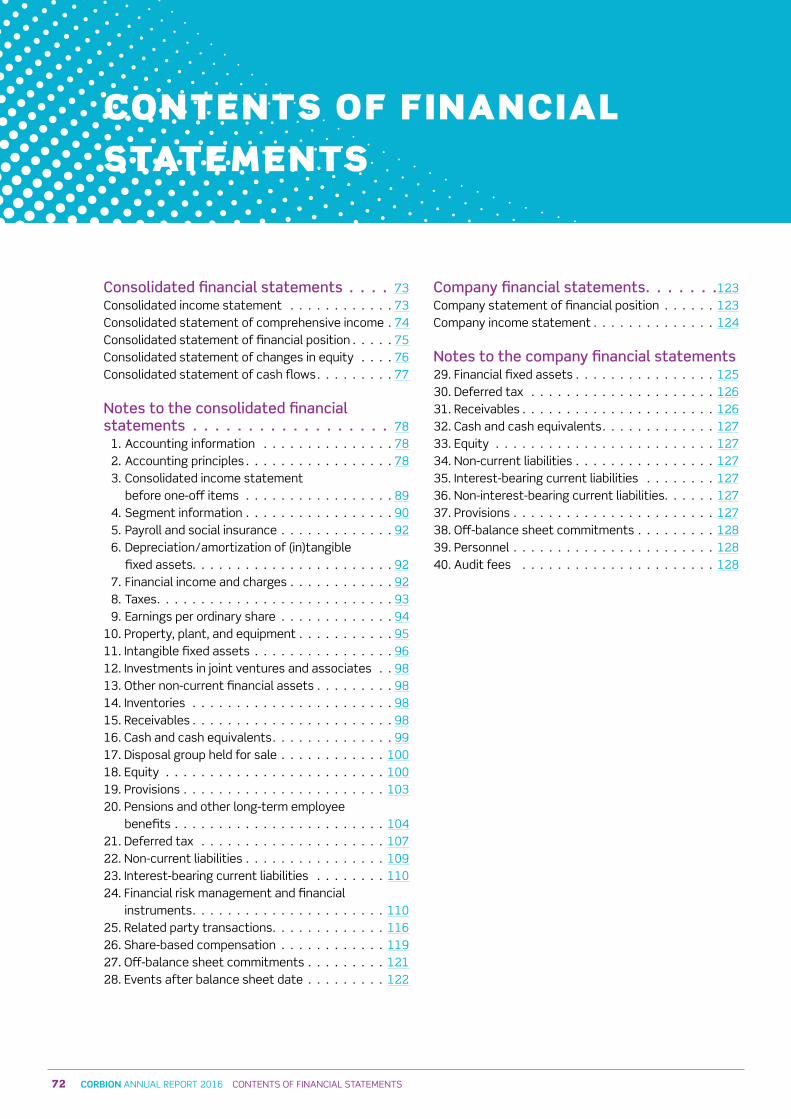
72 CORBION ANNUAL REPORT 2016 CONTENTs OF FINANCIAL sTATEMENTs
Consolidated financial statements 73Consolidated income statement . . . . . . . . . . . . 73Consolidated statement of comprehensive income . 74Consolidated statement of financial position . . . . . 75Consolidated statement of changes in equity . . . . 76Consolidated statement of cash flows . . . . . . . . . 77
Notes to the consolidated financial statements 78 11. Accounting information . . . . . . . . . . . . . . . 7812. Accounting principles . . . . . . . . . . . . . . . . . 7813. Consolidated income statement
before one-off items . . . . . . . . . . . . . . . . . 8914. segment information . . . . . . . . . . . . . . . . . 9015. Payroll and social insurance . . . . . . . . . . . . . 9216. Depreciation/amortization of (in)tangible
fixed assets. . . . . . . . . . . . . . . . . . . . . . . 9217. Financial income and charges . . . . . . . . . . . . 9218. Taxes . . . . . . . . . . . . . . . . . . . . . . . . . . . 9319. Earnings per ordinary share . . . . . . . . . . . . . 9410. Property, plant, and equipment . . . . . . . . . . . 9511. Intangible fixed assets . . . . . . . . . . . . . . . . 9612. Investments in joint ventures and associates . . 9813. Other non-current financial assets . . . . . . . . . 9814. Inventories . . . . . . . . . . . . . . . . . . . . . . . 9815. Receivables . . . . . . . . . . . . . . . . . . . . . . . 9816. Cash and cash equivalents . . . . . . . . . . . . . . 9917. Disposal group held for sale . . . . . . . . . . . . 10018. Equity . . . . . . . . . . . . . . . . . . . . . . . . . 10019. Provisions . . . . . . . . . . . . . . . . . . . . . . . 10320. Pensions and other long-term employee benefits . . . . . . . . . . . . . . . . . . . . . . . . 10421. Deferred tax . . . . . . . . . . . . . . . . . . . . . 10722. Non-current liabilities . . . . . . . . . . . . . . . . 10923. Interest-bearing current liabilities . . . . . . . . 11024. Financial risk management and financial instruments . . . . . . . . . . . . . . . . . . . . . . 11025. Related party transactions . . . . . . . . . . . . . 11626. share-based compensation . . . . . . . . . . . . 11927. Off-balance sheet commitments . . . . . . . . . 12128. Events after balance sheet date . . . . . . . . . 122
Company financial statements 123 Company statement of financial position . . . . . . 123Company income statement . . . . . . . . . . . . . . 124
Notes to the company financial statements 29. Financial fixed assets . . . . . . . . . . . . . . . . 12530. Deferred tax . . . . . . . . . . . . . . . . . . . . . 12631. Receivables . . . . . . . . . . . . . . . . . . . . . . 12632. Cash and cash equivalents . . . . . . . . . . . . . 12733. Equity . . . . . . . . . . . . . . . . . . . . . . . . . 12734. Non-current liabilities . . . . . . . . . . . . . . . . 12735. Interest-bearing current liabilities . . . . . . . . 12736. Non-interest-bearing current liabilities . . . . . . 12737. Provisions . . . . . . . . . . . . . . . . . . . . . . . 12738. Off-balance sheet commitments . . . . . . . . . 12839. Personnel . . . . . . . . . . . . . . . . . . . . . . . 12840. Audit fees . . . . . . . . . . . . . . . . . . . . . . 128
CONTENTS OF FINANCIAL STATEMENTS
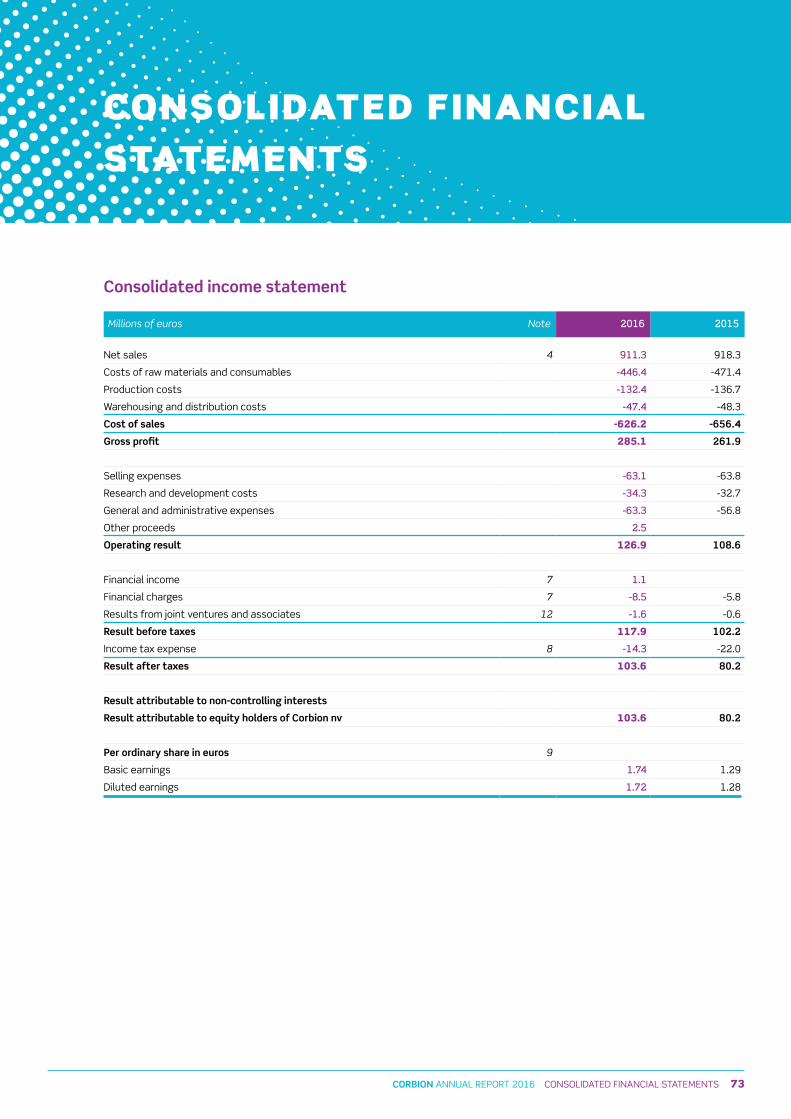
73CORBION ANNUAL REPORT 2016 CONsOLIDATED FINANCIAL sTATEMENTs
Consolidated income statement
Millions of euros Note 2016 2015
Net sales 4 911 3 918.3
Costs of raw materials and consumables -446 4 -471.4
Production costs -132 4 -136.7
Warehousing and distribution costs -47 4 -48.3
Cost of sales -626.2 -656.4
Gross profit 285.1 261.9
selling expenses -63 1 -63.8
Research and development costs -34 3 -32.7
General and administrative expenses -63 3 -56.8
Other proceeds 2 5
Operating result 126.9 108.6
Financial income 7 1 1
Financial charges 7 -8 5 -5.8
Results from joint ventures and associates 12 -1 6 -0.6
Result before taxes 117.9 102.2
Income tax expense 8 -14 3 -22.0
Result after taxes 103.6 80.2
Result attributable to non-controlling interests
Result attributable to equity holders of Corbion nv 103.6 80.2
Per ordinary share in euros 9
Basic earnings 1 74 1.29
Diluted earnings 1 72 1.28
CONSOLIDATED FINANCIAL STATEMENTS
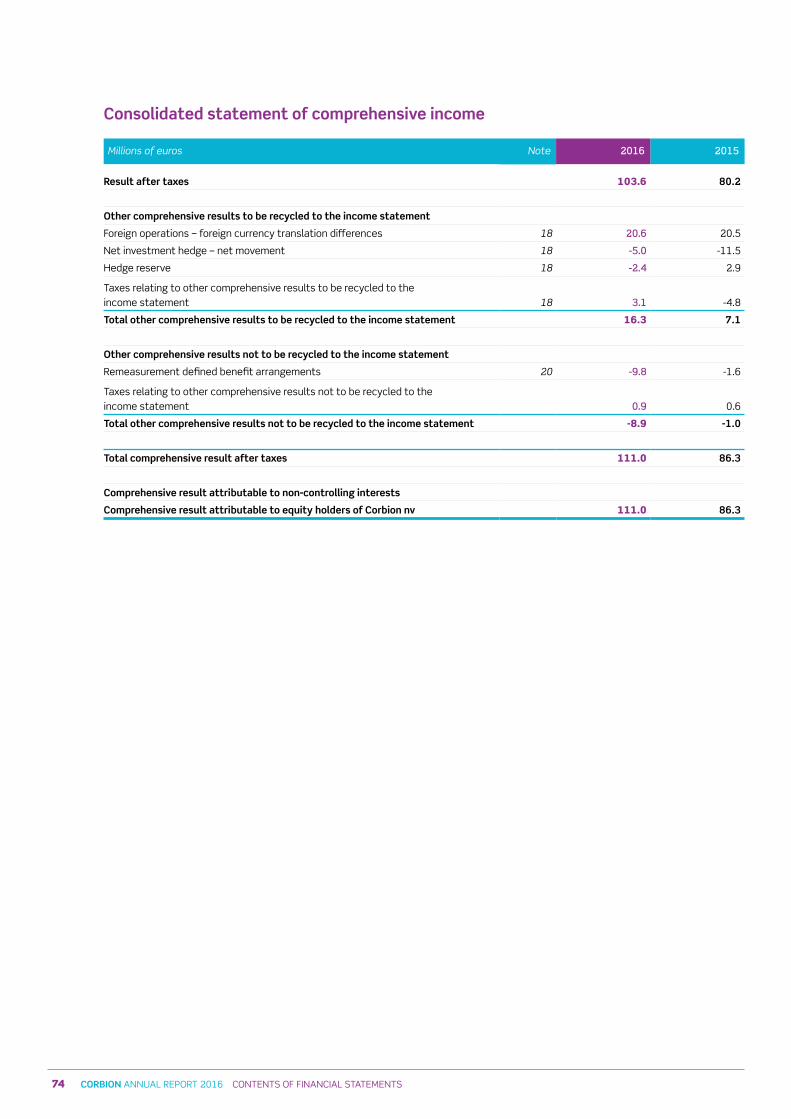
74 CORBION ANNUAL REPORT 2016 CONTENTs OF FINANCIAL sTATEMENTs
Consolidated statement of comprehensive income
Millions of euros Note 2016 2015
Result after taxes 103.6 80.2
Other comprehensive results to be recycled to the income statement
Foreign operations – foreign currency translation differences 18 20 6 20.5
Net investment hedge – net movement 18 -5 0 -11.5
Hedge reserve 18 -2 4 2.9
Taxes relating to other comprehensive results to be recycled to the income statement 18 3 1 -4.8
Total other comprehensive results to be recycled to the income statement 16.3 7.1
Other comprehensive results not to be recycled to the income statement
Remeasurement defined benefit arrangements 20 -9 8 -1.6
Taxes relating to other comprehensive results not to be recycled to the income statement 0 9 0.6
Total other comprehensive results not to be recycled to the income statement -8.9 -1.0
Total comprehensive result after taxes 111.0 86.3
Comprehensive result attributable to non-controlling interests
Comprehensive result attributable to equity holders of Corbion nv 111.0 86.3
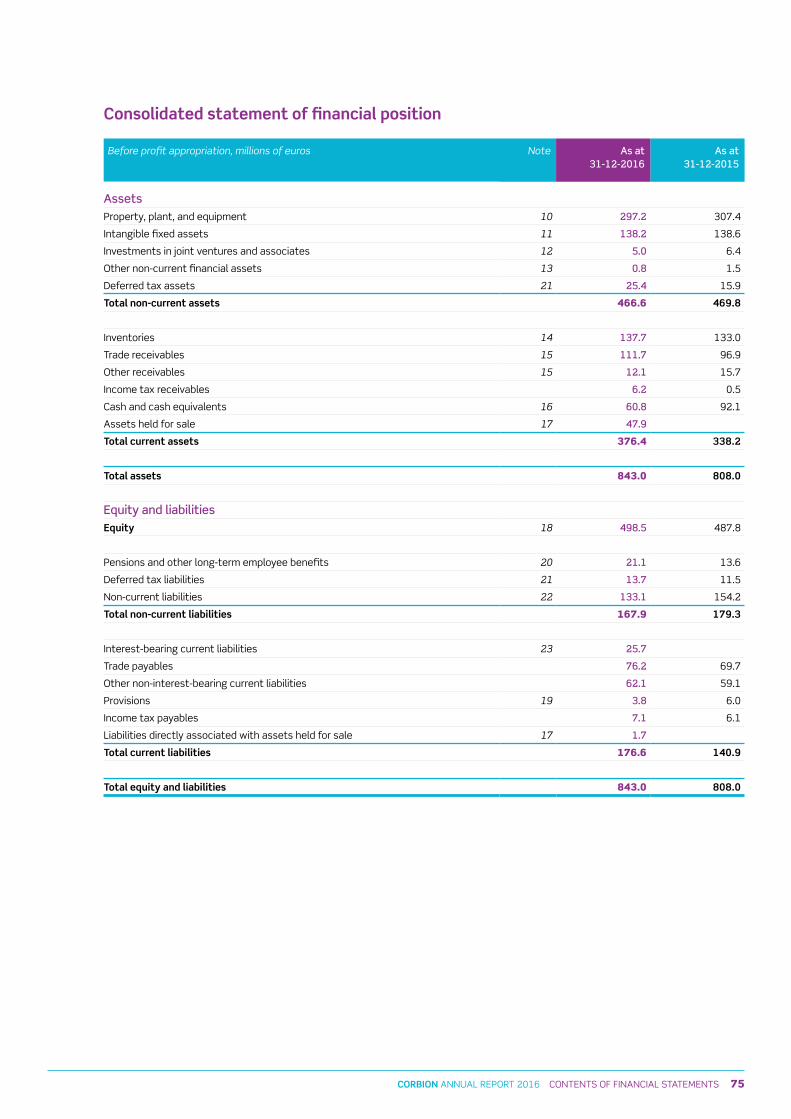
75CORBION ANNUAL REPORT 2016 CONTENTs OF FINANCIAL sTATEMENTs
Consolidated statement of comprehensive income
Millions of euros Note 2016 2015
Result after taxes 103.6 80.2
Other comprehensive results to be recycled to the income statement
Foreign operations – foreign currency translation differences 18 20 6 20.5
Net investment hedge – net movement 18 -5 0 -11.5
Hedge reserve 18 -2 4 2.9
Taxes relating to other comprehensive results to be recycled to the income statement 18 3 1 -4.8
Total other comprehensive results to be recycled to the income statement 16.3 7.1
Other comprehensive results not to be recycled to the income statement
Remeasurement defined benefit arrangements 20 -9 8 -1.6
Taxes relating to other comprehensive results not to be recycled to the income statement 0 9 0.6
Total other comprehensive results not to be recycled to the income statement -8.9 -1.0
Total comprehensive result after taxes 111.0 86.3
Comprehensive result attributable to non-controlling interests
Comprehensive result attributable to equity holders of Corbion nv 111.0 86.3
Consolidated statement of financial position
Before profit appropriation, millions of euros Note As at 31-12-2016
As at31-12-2015
AssetsProperty, plant, and equipment 10 297 2 307.4
Intangible fixed assets 11 138 2 138.6
Investments in joint ventures and associates 12 5 0 6.4
Other non-current financial assets 13 0 8 1.5
Deferred tax assets 21 25 4 15.9
Total non-current assets 466.6 469.8
Inventories 14 137 7 133.0
Trade receivables 15 111 7 96.9
Other receivables 15 12 1 15.7
Income tax receivables 6 2 0.5
Cash and cash equivalents 16 60 8 92.1
Assets held for sale 17 47 9
Total current assets 376.4 338.2
Total assets 843.0 808.0
Equity and liabilitiesEquity 18 498 5 487.8
Pensions and other long-term employee benefits 20 21 1 13.6
Deferred tax liabilities 21 13 7 11.5
Non-current liabilities 22 133 1 154.2
Total non-current liabilities 167.9 179.3
Interest-bearing current liabilities 23 25 7
Trade payables 76 2 69.7
Other non-interest-bearing current liabilities 62 1 59.1
Provisions 19 3 8 6.0
Income tax payables 7 1 6.1
Liabilities directly associated with assets held for sale 17 1 7
Total current liabilities 176.6 140.9
Total equity and liabilities 843.0 808.0
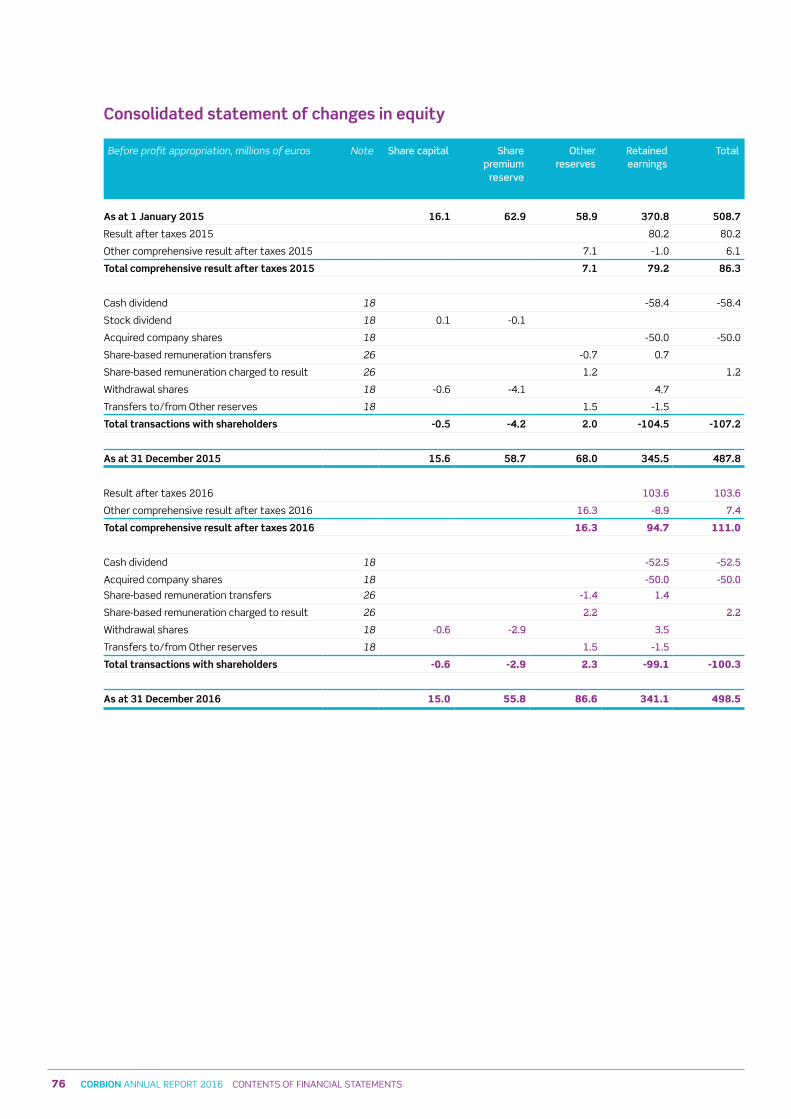
76 CORBION ANNUAL REPORT 2016 CONTENTs OF FINANCIAL sTATEMENTs
Consolidated statement of changes in equity
Before profit appropriation, millions of euros Note Share capital Share premium
reserve
Other reserves
Retained earnings
Total
As at 1 January 2015 16.1 62.9 58.9 370.8 508.7
Result after taxes 2015 80.2 80.2
Other comprehensive result after taxes 2015 7.1 -1.0 6.1
Total comprehensive result after taxes 2015 7.1 79.2 86.3
Cash dividend 18 -58.4 -58.4
stock dividend 18 0.1 -0.1
Acquired company shares 18 -50.0 -50.0
share-based remuneration transfers 26 -0.7 0.7
share-based remuneration charged to result 26 1.2 1.2
Withdrawal shares 18 -0.6 -4.1 4.7
Transfers to/from Other reserves 18 1.5 -1.5
Total transactions with shareholders -0.5 -4.2 2.0 -104.5 -107.2
As at 31 December 2015 15.6 58.7 68.0 345.5 487.8
Result after taxes 2016 103 6 103 6
Other comprehensive result after taxes 2016 16 3 -8 9 7 4
Total comprehensive result after taxes 2016 16.3 94.7 111.0
Cash dividend 18 -52 5 -52 5
Acquired company shares 18 -50 0 -50 0
share-based remuneration transfers 26 -1 4 1 4
share-based remuneration charged to result 26 2 2 2 2
Withdrawal shares 18 -0 6 -2 9 3 5
Transfers to/from Other reserves 18 1 5 -1 5
Total transactions with shareholders -0.6 -2.9 2.3 -99.1 -100.3
As at 31 December 2016 15.0 55.8 86.6 341.1 498.5
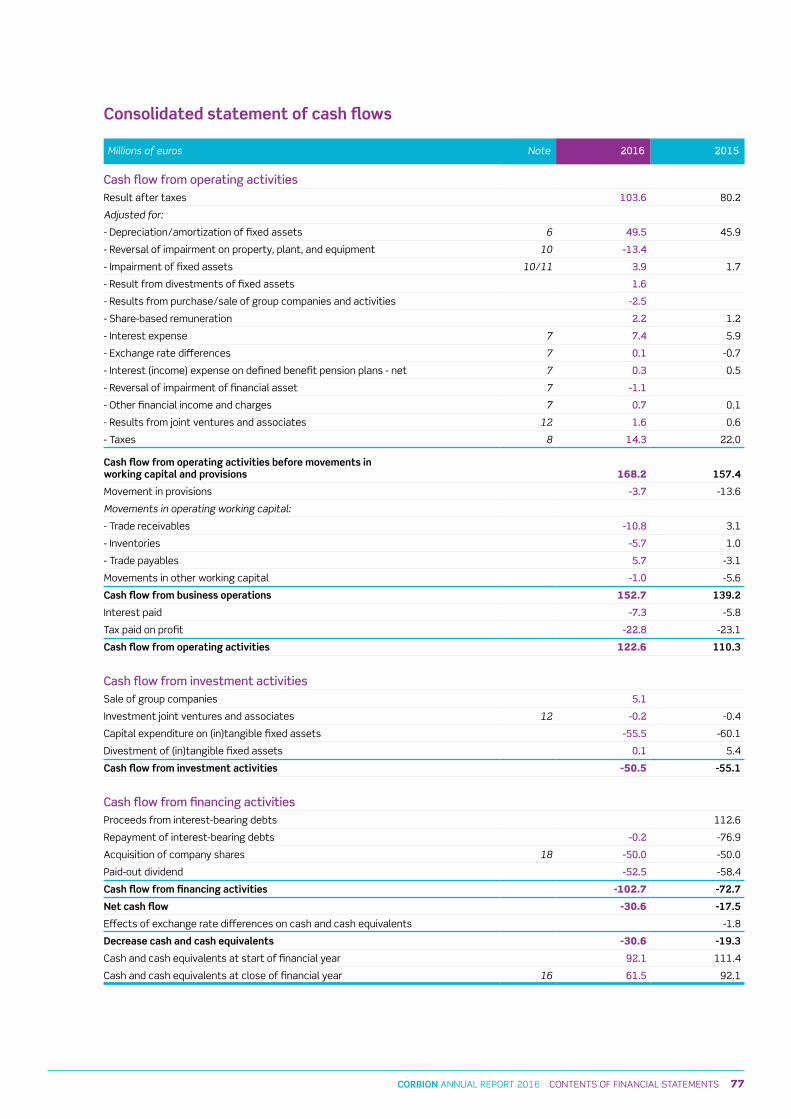
77CORBION ANNUAL REPORT 2016 CONTENTs OF FINANCIAL sTATEMENTs
Consolidated statement of cash flows
Millions of euros Note 2016 2015
Cash flow from operating activitiesResult after taxes 103 6 80.2
Adjusted for:
- Depreciation/amortization of fixed assets 6 49 5 45.9
- Reversal of impairment on property, plant, and equipment 10 -13 4
- Impairment of fixed assets 10/11 3 9 1.7
- Result from divestments of fixed assets 1 6
- Results from purchase/sale of group companies and activities -2 5
- share-based remuneration 2 2 1.2
- Interest expense 7 7 4 5.9
- Exchange rate differences 7 0 1 -0.7
- Interest (income) expense on defined benefit pension plans - net 7 0 3 0.5
- Reversal of impairment of financial asset 7 -1 1
- Other financial income and charges 7 0 7 0.1
- Results from joint ventures and associates 12 1 6 0.6
- Taxes 8 14 3 22.0
Cash flow from operating activities before movements in working capital and provisions 168.2 157.4
Movement in provisions -3 7 -13.6
Movements in operating working capital:
- Trade receivables -10 8 3.1
- Inventories -5 7 1.0
- Trade payables 5 7 -3.1
Movements in other working capital -1 0 -5.6
Cash flow from business operations 152.7 139.2
Interest paid -7 3 -5.8
Tax paid on profit -22 8 -23.1
Cash flow from operating activities 122.6 110.3
Cash flow from investment activitiessale of group companies 5 1
Investment joint ventures and associates 12 -0 2 -0.4
Capital expenditure on (in)tangible fixed assets -55 5 -60.1
Divestment of (in)tangible fixed assets 0 1 5.4
Cash flow from investment activities -50.5 -55.1
Cash flow from financing activitiesProceeds from interest-bearing debts 112.6
Repayment of interest-bearing debts -0 2 -76.9
Acquisition of company shares 18 -50 0 -50.0
Paid-out dividend -52 5 -58.4
Cash flow from financing activities -102.7 -72.7
Net cash flow -30.6 -17.5
Effects of exchange rate differences on cash and cash equivalents -1.8
Decrease cash and cash equivalents -30.6 -19.3
Cash and cash equivalents at start of financial year 92 1 111.4
Cash and cash equivalents at close of financial year 16 61 5 92.1
78 CORBION ANNUAL REPORT 2016 NOTEs TO THE CONsOLIDATED FINANCIAL sTATEMENTs
1. Accounting information
GeneralCorbion is the global market leader in lactic acid, lactic acid derivatives, and lactides, and a leading company in emulsifiers, functional enzyme blends, minerals, and vitamins. The company delivers high-performance biobased products made from renewable resources and applied in global markets such as bakery, meat, pharmaceuticals and medical devices, home and personal care, packaging, automotive, coatings, and adhesives. Its products have a differentiating functionality in all kinds of consumer products worldwide.
Corbion is based in Amsterdam, the Netherlands and listed on Euronext Amsterdam.
The consolidated financial statements drawn up by the Board of Management have been approved by the supervisory Board on 3 March 2017. They will be presented to the General shareholders’ Meeting for adoption on 15 May 2017. The supervisory Board will give a preliminary recommendation regarding the consolidated financial statements to the General shareholders’ Meeting.
Reported amountsUnless stated otherwise all amounts in the financial statements are reported in millions of euros.
Exchange rates of main currencies in euros
Average exchange rate 2016
Average exchange rate 2015
Exchange rate 31-12-2016
Exchange rate 31-12-2015
Us dollar 1 11 1.11 1 05 1.09
Japanese yen 120 18 134.31 123 40 131.07
Brazilian real 3 86 3.69 3 43 4.31
Thai baht 39 04 38.01 37 73 39.25
2. Accounting principles
Basis of preparationThe consolidated financial statements of Corbion nv have been prepared in accordance with the International Financial Reporting standards (IFRs) adopted by the European Union.
New and amended standards adopted by the groupIn 2016, Corbion applied all the new and amended standards and interpretations published by the International Accounting standards Board (IAsB) and the International Financial Reporting Interpretations Committee (IFRIC), if and insofar as these applied to Corbion and were effective as at 1 January 2016.
NOTES TO THE CONSOLIDATED FINANCIAL STATEMENTS
79CORBION ANNUAL REPORT 2016 NOTEs TO THE CONsOLIDATED FINANCIAL sTATEMENTs
1. Accounting information
GeneralCorbion is the global market leader in lactic acid, lactic acid derivatives, and lactides, and a leading company in emulsifiers, functional enzyme blends, minerals, and vitamins. The company delivers high-performance biobased products made from renewable resources and applied in global markets such as bakery, meat, pharmaceuticals and medical devices, home and personal care, packaging, automotive, coatings, and adhesives. Its products have a differentiating functionality in all kinds of consumer products worldwide.
Corbion is based in Amsterdam, the Netherlands and listed on Euronext Amsterdam.
The consolidated financial statements drawn up by the Board of Management have been approved by the supervisory Board on 3 March 2017. They will be presented to the General shareholders’ Meeting for adoption on 15 May 2017. The supervisory Board will give a preliminary recommendation regarding the consolidated financial statements to the General shareholders’ Meeting.
Reported amountsUnless stated otherwise all amounts in the financial statements are reported in millions of euros.
Exchange rates of main currencies in euros
Average exchange rate 2016
Average exchange rate 2015
Exchange rate 31-12-2016
Exchange rate 31-12-2015
Us dollar 1 11 1.11 1 05 1.09
Japanese yen 120 18 134.31 123 40 131.07
Brazilian real 3 86 3.69 3 43 4.31
Thai baht 39 04 38.01 37 73 39.25
2. Accounting principles
Basis of preparationThe consolidated financial statements of Corbion nv have been prepared in accordance with the International Financial Reporting standards (IFRs) adopted by the European Union.
New and amended standards adopted by the groupIn 2016, Corbion applied all the new and amended standards and interpretations published by the International Accounting standards Board (IAsB) and the International Financial Reporting Interpretations Committee (IFRIC), if and insofar as these applied to Corbion and were effective as at 1 January 2016.
The main effective changes applied by Corbion at 1 January 2016 are:
- Annual improvements to IFRSs 2012-2014 CycleCorbion applied the amendments to IFRss included in the Annual improvements to IFRss 2012-2014 Cycle for the first time in the reporting year. The application of the amendments had no impact on the disclosures or amounts recognized in the consolidated financial statements.
Accounting standards and interpretations not yet adoptedNone of the new and amended IFRs and IFRIC interpretations not yet effective, have been applied by Corbion.
The main effective changes after 1 January 2017 are:
- IFRS 9 Financial instrumentsIFRs 9, issued in July 2015, replaces most of the guidance in IAs 39. IFRs 9 will be effective for annual reporting periods beginning on or after 1 January 2018, subject to endorsement in certain territories. Corbion does not expect any significant impact on its consolidated financial statements resulting from this standard.
- IFRS 15 Revenue from contracts with customersIFRs 15 establishes a comprehensive framework for determining whether, how much, and when revenue is recognized. It replaces existing revenue recognition guidance, including IAs 18 Revenue, IAs 11 Construction Contracts, and IFRIC 13 Customer Loyalty Programmes. IFRs 15 is effective for annual reporting periods beginning on or after 1 January 2018, with early adoption permitted. Corbion is assessing the potential impact on its consolidated financial statements resulting from this standard. so far, Corbion does not expect any significant impact.
- IFRS 16 Leases IFRs 16, published in January 2016, establishes a revised framework for determining whether a lease is recognized on the (consolidated) statement of financial position. It replaces existing guidance on leases, including IAs 17. IFRs 16 is effective on or after 1 January 2019, with early adoption permitted. Corbion is assessing the impact on its consolidated financial statements resulting from the application of IFRs 16.
Corbion anticipates that the application of all other new and amended IFRs and IFRIC interpretations currently known for future periods will have no significant impact on its financial statements.
ConsolidationThe consolidation includes the financial data of Corbion nv and its group companies (together “Corbion”). All inter-company receivables, debts, and transactions have been eliminated. Group companies are companies in which Corbion nv exercises control. The results of acquisitions and divestments are recognized from the moment that control is obtained or transferred.
Control is achieved when Corbion:• has power over the investee; • is exposed, or has rights, to variable returns from its involvement with the investee; and• has the ability to use its power to affect its returns. Corbion reassesses whether or not it controls an investee if facts and circumstances indicate that there are changes to one or more of the three elements of control listed above.When Corbion loses control over a group company, it derecognises the assets and liabilities of the group company, and any related non-controlling interests and other components of equity.
80 CORBION ANNUAL REPORT 2016 NOTEs TO THE CONsOLIDATED FINANCIAL sTATEMENTs
Any resulting gain or loss is recognised in profit or loss. Any interest retained in the former group company is measured at fair value when control is lost.
Foreign currencyThe consolidated financial statements are in euros. The euro is Corbion nv’s functional and presentation currency. The functional currency is the currency of the primary environment where the group company operates and may therefore differ from one company to another. Transactions in other than the functional currency are translated at the exchange rates that apply on the transaction date. Any monetary assets and liabilities resulting from such transactions are translated at the exchange rates on the balance sheet date. Any exchange rate differences are recognized in the income statement, except when deferred in other comprehensive income as qualifying cash flow hedges and net investment hedges. The assets and liabilities of consolidated foreign group companies and the long-term foreign-currency loans, which have been taken out to finance these subsidiaries, are converted into euros on the balance sheet date, taking taxes into account. The subsequent currency translation differences are incorporated in the translation reserve in equity. The results of the foreign group companies are translated into euros on the basis of average exchange rates. The difference between net profit on the basis of average exchange rates and net profit on the basis of the exchange rates as at the balance sheet date is incorporated in the translation reserve in equity. The same applies to exchange rate differences arising from borrowings and other financial instruments if they hedge the currency risk related to net investments. If a foreign operation is divested or scaled down the associated cumulative currency translation differences are recognized as result in the income statement.
Property, plant, and equipmentLand, buildings, machinery and equipment, and other operating assets are valued at the acquisition price or the cost of production, subject to straight-line depreciation calculated over the estimated economic life and the estimated residual value. The cost of production includes the cost of materials and direct labor and an attributable part of the indirect costs. Land is not depreciated. Grants are deducted from the acquisition price or the production costs of the assets to which the grant relates. subsequent expenditure is capitalised only if it is probable that the future economic benefits associated with the expenditure will flow to Corbion. Depreciation methods, useful lives, and residual values are reviewed at each reporting date and adjusted if appropriate.
Intangible fixed assetsGoodwillGoodwill is measured as the excess of the sum of the consideration transferred, the amount of any non-controlling interests in the acquiree, and the fair value of the acquirer’s previously held equity interest in the acquiree (if any) over the net of the acquisition date amounts of the identifiable assets acquired and liabilities assumed.
Goodwill is valued at cost less impairment. Goodwill is tested for impairment annually – or more often if there are indications for impairment. Impairment is the amount by which the book value of the goodwill of a cash-generating unit exceeds the recoverable amount, being the higher of (a) value in use and (b) fair value less cost to sell. The value in use is the present value of the cash flows which the unit is expected to generate. If the recoverable amount of the cash-generating unit is less than its carrying amount, the impairment loss is allocated first to reduce the carrying amount of any goodwill allocated to the unit and then to the other assets of the unit pro-rata based on the carrying amount of each asset in the unit. If impairment is incurred, the impairment is charged to the income statement. An impairment loss recognized for goodwill is not reversed in subsequent periods.
81CORBION ANNUAL REPORT 2016 NOTEs TO THE CONsOLIDATED FINANCIAL sTATEMENTs
Any resulting gain or loss is recognised in profit or loss. Any interest retained in the former group company is measured at fair value when control is lost.
Foreign currencyThe consolidated financial statements are in euros. The euro is Corbion nv’s functional and presentation currency. The functional currency is the currency of the primary environment where the group company operates and may therefore differ from one company to another. Transactions in other than the functional currency are translated at the exchange rates that apply on the transaction date. Any monetary assets and liabilities resulting from such transactions are translated at the exchange rates on the balance sheet date. Any exchange rate differences are recognized in the income statement, except when deferred in other comprehensive income as qualifying cash flow hedges and net investment hedges. The assets and liabilities of consolidated foreign group companies and the long-term foreign-currency loans, which have been taken out to finance these subsidiaries, are converted into euros on the balance sheet date, taking taxes into account. The subsequent currency translation differences are incorporated in the translation reserve in equity. The results of the foreign group companies are translated into euros on the basis of average exchange rates. The difference between net profit on the basis of average exchange rates and net profit on the basis of the exchange rates as at the balance sheet date is incorporated in the translation reserve in equity. The same applies to exchange rate differences arising from borrowings and other financial instruments if they hedge the currency risk related to net investments. If a foreign operation is divested or scaled down the associated cumulative currency translation differences are recognized as result in the income statement.
Property, plant, and equipmentLand, buildings, machinery and equipment, and other operating assets are valued at the acquisition price or the cost of production, subject to straight-line depreciation calculated over the estimated economic life and the estimated residual value. The cost of production includes the cost of materials and direct labor and an attributable part of the indirect costs. Land is not depreciated. Grants are deducted from the acquisition price or the production costs of the assets to which the grant relates. subsequent expenditure is capitalised only if it is probable that the future economic benefits associated with the expenditure will flow to Corbion. Depreciation methods, useful lives, and residual values are reviewed at each reporting date and adjusted if appropriate.
Intangible fixed assetsGoodwillGoodwill is measured as the excess of the sum of the consideration transferred, the amount of any non-controlling interests in the acquiree, and the fair value of the acquirer’s previously held equity interest in the acquiree (if any) over the net of the acquisition date amounts of the identifiable assets acquired and liabilities assumed.
Goodwill is valued at cost less impairment. Goodwill is tested for impairment annually – or more often if there are indications for impairment. Impairment is the amount by which the book value of the goodwill of a cash-generating unit exceeds the recoverable amount, being the higher of (a) value in use and (b) fair value less cost to sell. The value in use is the present value of the cash flows which the unit is expected to generate. If the recoverable amount of the cash-generating unit is less than its carrying amount, the impairment loss is allocated first to reduce the carrying amount of any goodwill allocated to the unit and then to the other assets of the unit pro-rata based on the carrying amount of each asset in the unit. If impairment is incurred, the impairment is charged to the income statement. An impairment loss recognized for goodwill is not reversed in subsequent periods.
When an entity or activity is sold or closed down the goodwill allocated to the entity or activity is included in the calculations for the result of the sale.
Customer baseThe customer base comprises the part of the paid acquisition sum which, upon acquisition, is allocated to the value of the acquired customer base. It is valued at fair value as at the acquisition date and amortized using a straight-line method over the estimated economic life. Amortization charges arising from the customer base are recognized in selling expenses.
Brands and licensesBrands and licenses comprise the part of the paid acquisition sum which is allocated to the value of the acquired trademarks and product licenses. Brands and licenses are valued at fair value as at the acquisition date and are subject to straight-line amortization calculated over the estimated economic life. Amortization charges arising from brands and licenses are recognized in selling expenses.
Research and development costsResearch and development costs comprise the part of the paid acquisition sum which is allocated to the value of the acquired research and development costs. These costs are valued at fair value as at the acquisition date. Own research costs are not capitalized, but charged to the income statement. Own development costs are capitalized if the appropriate criteria are met. Research and development costs are valued at cost and amortized using a straight-line method over the estimated economic life. Amortization charges arising from research and development costs are recognized in research and development costs.
Other intangible fixed assets Other intangible fixed assets consist primarily of capitalized or acquired third-party software and licenses. Other intangible fixed assets are valued at historical cost if capitalized or at fair value if acquired and amortized on a straight-line basis over the estimated economic life. software and licenses amortization charges are recognized in general and administrative expenses. Emission rights are not recognized in the statement of financial position as cost is zero.
Impairment of non-current assets other than goodwill At each reporting date an assessment is made whether there is any indication that non-current assets may be impaired. If indicators of impairment exist, the recoverable amount of the asset is estimated. If it is not possible to estimate the recoverable amount of an individual asset, the recoverable amount of the cash-generating unit to which it belongs is estimated.
The recoverable amount is the higher of an asset’s fair value less cost to sell and the asset’s value in use. In assessing value in use, the estimated future cash flows are discounted to their present value using a pre-tax discount rate that reflects current market assessments of the time value of money and the risks specific to the asset. An impairment loss is recognized in the income statement to the amount by which the asset’s carrying amount exceeds its recoverable amount.
82 CORBION ANNUAL REPORT 2016 NOTEs TO THE CONsOLIDATED FINANCIAL sTATEMENTs
In subsequent years, an assessment is made whether indications exist that impairment losses previously recognized for non-current assets other than goodwill may no longer exist or may have decreased. If any such indication exists, the recoverable amount of that asset is recalculated and, if required, its carrying amount is increased to the revised recoverable amount. The increase is recognized in operating income as an impairment reversal. An impairment reversal is recognized only if it arises from a change in the assumptions that were used to calculate the recoverable amount. The increase in an asset’s carrying amount due to an impairment reversal is limited to the depreciated amount that would have been recognized had the original impairment not occurred.
Investments in joint arrangements and associatesInvestments in joint arrangements are classified as either joint operations or joint ventures depending on the contractual rights and obligations each investor has rather than the legal structure of the joint arrangement. Joint operations arise where Corbion has rights to the assets and obligations relating to the arrangement and therefore accounts for its share of assets, liabilities, revenue, and expenses. Joint ventures arise where Corbion has rights to the net assets of the arrangement and therefore equity accounts for its interest. Associates are entities over which Corbion has significant influence but not control, generally involving a shareholding of between 20% and 50% of the voting rights. significant influence is the power to participate in the financial and operating policy decisions of the entity but is not control or joint control over those policies. Associates are accounted for using the equity method.
Under the equity method, investments in joint ventures and associates are measured initially at cost and subsequently adjusted for post-acquisition changes in Corbion’s share of the net assets of the investment (net of any accumulated impairment in the value of individual investments). Where necessary, adjustments are made to the financial figures of joint ventures and associates to ensure consistency with the accounting policies of Corbion. Unrealized gains on transactions between Corbion and its joint ventures and associates are eliminated to the extent of Corbion’s stake in these investments. Unrealized losses are also eliminated unless the transaction provides evidence of an impairment of the assets transferred.
Deferred taxesDeferred taxes concern tax loss carry forward and liabilities and assets arising from temporary differences between the tax bases and their carrying amounts in the consolidated financial statements of (in-)tangible fixed assets, inventories, and provisions. Deferred taxes are determined using tax rates that have been enacted at the balance sheet date and are expected to apply when the related deferred income tax is realized or the deferred tax liability is settled. Deferred tax assets are recognized if and insofar that is probable that future taxable profit will be available against which the temporary difference and tax loss carry forward can be utilized. Tax assets and liabilities are netted when there is a legal right and the intention to offset. Deferred tax assets and liabilities with the same term and relating to the same fiscal unities are offset against each other.
InventoriesInventories of raw materials, consumables, technical materials, and packaging are stated at the lower of cost (first in, first out) and net realizable value. Inventories of work in progress and finished products are stated at the lower of production cost and net realizable value. Total cost of production includes payroll costs and materials and an attributable part of the indirect production costs.
83CORBION ANNUAL REPORT 2016 NOTEs TO THE CONsOLIDATED FINANCIAL sTATEMENTs
In subsequent years, an assessment is made whether indications exist that impairment losses previously recognized for non-current assets other than goodwill may no longer exist or may have decreased. If any such indication exists, the recoverable amount of that asset is recalculated and, if required, its carrying amount is increased to the revised recoverable amount. The increase is recognized in operating income as an impairment reversal. An impairment reversal is recognized only if it arises from a change in the assumptions that were used to calculate the recoverable amount. The increase in an asset’s carrying amount due to an impairment reversal is limited to the depreciated amount that would have been recognized had the original impairment not occurred.
Investments in joint arrangements and associatesInvestments in joint arrangements are classified as either joint operations or joint ventures depending on the contractual rights and obligations each investor has rather than the legal structure of the joint arrangement. Joint operations arise where Corbion has rights to the assets and obligations relating to the arrangement and therefore accounts for its share of assets, liabilities, revenue, and expenses. Joint ventures arise where Corbion has rights to the net assets of the arrangement and therefore equity accounts for its interest. Associates are entities over which Corbion has significant influence but not control, generally involving a shareholding of between 20% and 50% of the voting rights. significant influence is the power to participate in the financial and operating policy decisions of the entity but is not control or joint control over those policies. Associates are accounted for using the equity method.
Under the equity method, investments in joint ventures and associates are measured initially at cost and subsequently adjusted for post-acquisition changes in Corbion’s share of the net assets of the investment (net of any accumulated impairment in the value of individual investments). Where necessary, adjustments are made to the financial figures of joint ventures and associates to ensure consistency with the accounting policies of Corbion. Unrealized gains on transactions between Corbion and its joint ventures and associates are eliminated to the extent of Corbion’s stake in these investments. Unrealized losses are also eliminated unless the transaction provides evidence of an impairment of the assets transferred.
Deferred taxesDeferred taxes concern tax loss carry forward and liabilities and assets arising from temporary differences between the tax bases and their carrying amounts in the consolidated financial statements of (in-)tangible fixed assets, inventories, and provisions. Deferred taxes are determined using tax rates that have been enacted at the balance sheet date and are expected to apply when the related deferred income tax is realized or the deferred tax liability is settled. Deferred tax assets are recognized if and insofar that is probable that future taxable profit will be available against which the temporary difference and tax loss carry forward can be utilized. Tax assets and liabilities are netted when there is a legal right and the intention to offset. Deferred tax assets and liabilities with the same term and relating to the same fiscal unities are offset against each other.
InventoriesInventories of raw materials, consumables, technical materials, and packaging are stated at the lower of cost (first in, first out) and net realizable value. Inventories of work in progress and finished products are stated at the lower of production cost and net realizable value. Total cost of production includes payroll costs and materials and an attributable part of the indirect production costs.
Financial instrumentsFinancial assets and liabilitiesFinancial assets and liabilities are recognized when Corbion becomes a party to the contractual provisions of a financial instrument. Financial assets are derecognized when the rights to receive cash flows from the financial assets expire, or if the company transfers the financial asset to another party and does not retain control of substantially all risks and rewards of the asset. Financial liabilities are derecognized when Corbion’s obligations specified in the contract expire or are discharged or canceled.
At initial recognition, management classifies the company’s financial assets as either (i) at fair value through profit or loss, (ii) loans and receivables, (iii) held to maturity, or (iv) available for sale, depending on the underlying purpose of the acquired financial assets. Financial assets are initially recognized at fair value. For instruments not classified as at fair value through profit or loss, any directly attributable transaction costs are initially recognized as part of the asset value. Directly attributable transaction costs related to financial assets at fair value through profit or loss are expensed when incurred. The fair value of quoted investments is based on current bid prices. If the market for a financial asset is not active, or if the financial asset represents an unlisted security, Corbion establishes fair value using valuation techniques. These include the use of recent arm’s-length transactions, reference to other instruments that are substantially the same, and discounted cash flow analysis, making maximum use of market inputs. subsequent to initial recognition, financial assets are measured as described below. At each balance sheet date, Corbion assesses whether there is objective evidence that a financial asset or a group of financial assets is impaired.
Investments at fair value through profit or lossInvestments at fair value through profit or loss are investments held for trading or designated as such by Corbion. A financial asset is classified as held for trading if it is acquired principally for the purpose of selling it in the short term. Derivatives are classified as held for trading unless they are designated as hedges. Financial instruments held for trading are measured at fair value and changes therein are recognized in the income statement.
Loans and receivablesLoans and receivables are non-derivative financial assets with fixed or determinable payments that are not quoted in an active market. They are carried at amortized cost using the effective interest method, less any impairment losses. They are included in current assets, except for loans and receivables with maturities greater than 12 months after the balance sheet date. Held-to-maturity financial assetsHeld-to-maturity financial assets are non-derivative financial assets with fixed or determinable payments and a fixed maturity that the company intends to hold to maturity. They are carried at amortized cost using the effective interest method, less any impairment losses. They are included in current assets, except for held-to-maturity financial assets with maturities greater than 12 months after the balance sheet date.
Available-for-sale financial assetsAvailable-for-sale financial assets are non-derivative financial assets that are either designated in this category of financial assets or not classified in any of the other categories. They are measured at fair value based on quoted market prices with changes therein recognized directly in equity until the investment is derecognized or determined to be impaired, at which time the cumulative gain or loss previously recorded in equity is transferred to the income statement. Investments in equity instruments that do not have a quoted market price and whose fair value cannot be reliably measured are carried at cost. Available-for-sale financial assets are included in non-current assets unless management intends to dispose of the investment within 12 months after the balance sheet date.
84 CORBION ANNUAL REPORT 2016 NOTEs TO THE CONsOLIDATED FINANCIAL sTATEMENTs
Derivative financial instruments and hedge activitiesDerivative financial instruments are used to manage exposure to foreign exchange risk, interest rate risk, and commodity price risk. Derivative financial instruments are recognized at fair value. The gain or loss on the remeasurement to fair value is immediately recognized in the income statement. However where derivative financial instruments qualify for hedge accounting, recognition depends on the nature of the item being hedged.
Fair value hedgeFair value hedges hedge the exposure to changes in the fair value of a recognized asset or liability or an unrecognized firm commitment. Changes in the fair value of a hedging derivative are recognized in the income statement. Changes in the fair value of the hedged item attributable to the risk hedged are recorded as part of the carrying value of the hedged item and are also recognized in the income statement.
Cash flow hedge Cash flow hedges hedge possible fluctuations in cash flows which can be attributed to a certain currency, interest rate, or commodity price risk associated with a recognized asset or liability, or a highly probable expected future transaction. The effective part of changes in the fair value of derivative financial instruments which are designated and classified as cash flow hedges is recognized in equity. Gains or losses from the non-effective part are directly recognized in the income statement. If a hedging instrument expires, is sold, or if the instrument can no longer be qualified as a hedging instrument, the cumulative gains and losses remain in equity until the expected future transaction is recognized in the income statement. If the expected future transaction is no longer probable the cumulative result is transferred immediately from equity to the income statement. Net investment hedgeHedges for net investments in foreign operations are handled in a similar way as cash flow hedges. Gains or losses from the hedging instrument which can be attributed to the effective part of the hedge are recognized in equity; any gains or losses which cannot be attributed to the effective part are directly recognized as financial income and charges in the income statement.
Cumulative gains and losses in equity are recognized in the income statement as soon as the foreign operation is partly divested or sold. Upon entering into a transaction the relationship between the hedging instrument and the hedged position, the risk management aims and the starting points for entering into various hedging transactions are documented. Corbion also documents its estimate as to whether the derivative financial instrument offsets the movements in the fair values or cash flows of the hedged positions effectively. The documentation process starts at the time of entering into such a contract and is updated continuously.
ReceivablesReceivables are valued on the basis of the amortized cost using the effective interest rate method less provisions deemed necessary for non-collectability.
Cash and cash equivalentsCash and cash equivalents comprise cash in bank, cash in hand, current deposits, money market funds, and highly liquid treasury bonds with original maturities of no more than three months. Bank overdrafts are presented as current interest-bearing liabilities.
85CORBION ANNUAL REPORT 2016 NOTEs TO THE CONsOLIDATED FINANCIAL sTATEMENTs
Derivative financial instruments and hedge activitiesDerivative financial instruments are used to manage exposure to foreign exchange risk, interest rate risk, and commodity price risk. Derivative financial instruments are recognized at fair value. The gain or loss on the remeasurement to fair value is immediately recognized in the income statement. However where derivative financial instruments qualify for hedge accounting, recognition depends on the nature of the item being hedged.
Fair value hedgeFair value hedges hedge the exposure to changes in the fair value of a recognized asset or liability or an unrecognized firm commitment. Changes in the fair value of a hedging derivative are recognized in the income statement. Changes in the fair value of the hedged item attributable to the risk hedged are recorded as part of the carrying value of the hedged item and are also recognized in the income statement.
Cash flow hedge Cash flow hedges hedge possible fluctuations in cash flows which can be attributed to a certain currency, interest rate, or commodity price risk associated with a recognized asset or liability, or a highly probable expected future transaction. The effective part of changes in the fair value of derivative financial instruments which are designated and classified as cash flow hedges is recognized in equity. Gains or losses from the non-effective part are directly recognized in the income statement. If a hedging instrument expires, is sold, or if the instrument can no longer be qualified as a hedging instrument, the cumulative gains and losses remain in equity until the expected future transaction is recognized in the income statement. If the expected future transaction is no longer probable the cumulative result is transferred immediately from equity to the income statement. Net investment hedgeHedges for net investments in foreign operations are handled in a similar way as cash flow hedges. Gains or losses from the hedging instrument which can be attributed to the effective part of the hedge are recognized in equity; any gains or losses which cannot be attributed to the effective part are directly recognized as financial income and charges in the income statement.
Cumulative gains and losses in equity are recognized in the income statement as soon as the foreign operation is partly divested or sold. Upon entering into a transaction the relationship between the hedging instrument and the hedged position, the risk management aims and the starting points for entering into various hedging transactions are documented. Corbion also documents its estimate as to whether the derivative financial instrument offsets the movements in the fair values or cash flows of the hedged positions effectively. The documentation process starts at the time of entering into such a contract and is updated continuously.
ReceivablesReceivables are valued on the basis of the amortized cost using the effective interest rate method less provisions deemed necessary for non-collectability.
Cash and cash equivalentsCash and cash equivalents comprise cash in bank, cash in hand, current deposits, money market funds, and highly liquid treasury bonds with original maturities of no more than three months. Bank overdrafts are presented as current interest-bearing liabilities.
EquityOrdinary shares and financing preference shares are classified as equity. Financing preference shares are classified as equity since distributions to holders are at the discretion of Corbion. Incremental costs directly attributable to the issue of ordinary shares and share options are recognized as an equity deduction, net of tax. The price paid for repurchased shares (treasury shares) is deducted from equity until the shares are cancelled or reissued. Dividend to be distributed to the holders of ordinary shares is recognized as a liability upon approval of the profit appropriation by the Annual General shareholders’ Meeting.
Corbion runs a share plan for the Board of Management and senior Management and a share-based plan for senior Management. The fair value of the right to shares on the date of allocation is recognized in the income statement as payroll costs over the vesting period of the awards with a corresponding increase in equity.
Pension and other post-employment benefitsPension and early-retirement schemes A defined contribution plan is a post-employment benefit plan under which an entity pays fixed contributions into a separate pension plan or insurance company and will have no legal or constructive obligation to pay further amounts. Payments to defined contribution retirement benefit plans are recognized as an expense when employees have rendered service entitling them to the contributions. For defined benefit retirement benefit plans the cost of providing benefits is determined using the projected unit credit method, with actuarial valuations being carried out at the end of each annual reporting period. Remeasurements, comprising actuarial gains and losses, the effect of changes to the asset ceiling (if applicable), and the return on plan assets (excluding interest), are reflected immediately in the statement of financial position with a charge or credit recognized in other comprehensive income in the period in which they occur. Remeasurement recognized in other comprehensive income is reflected immediately in retained earnings and will not be reclassified to profit or loss. Past service costs are recognized in profit or loss in the period of a plan amendment. Net interest is calculated by applying the discount rate at the beginning of the period to the net defined benefit liability or asset. Defined benefit costs are categorized as follows:- service cost (including current service cost, past-service cost, as well as gains and losses on
curtailments and settlements)- Net interest expense or income- RemeasurementsThe first two components of defined benefit costs are presented in profit or loss. Curtailment gains and losses are accounted for as past-service costs.
The retirement benefit obligation in the consolidated statement of financial position represents the actual deficit or surplus in the defined benefit plans. Any surplus resulting from this calculation is limited to the present value of any economic benefits available in the form of refunds from the plans or reductions in future contributions to the plans. A liability for a termination benefit is recognized at the earlier of when the entity can no longer withdraw the offer of the termination benefit and when the entity recognizes any related restructuring costs.
Other long-term employee benefit commitmentsThe other long-term employee commitments relate mainly to anniversary commitments, past-service commitments, conditional incentive plans, and health insurance. These provisions are recognized on the basis of estimates that are consistent with the estimates used for the defined benefit obligations. However, all actuarial gains and losses are recognized in the income statement immediately.
86 CORBION ANNUAL REPORT 2016 NOTEs TO THE CONsOLIDATED FINANCIAL sTATEMENTs
ProvisionsProvisions relate to a legal or constructive obligation as a result of a past event, the amount of which is uncertain but can be estimated reliably and of which it is more likely than not that an outflow of resources is required to settle the obligation. If the effect is material, provisions are determined by discounting the expected future cash flow at a pre-tax rate that reflects the current market assessments of time value of money and the risks specific to the liability. A provision for reorganization is recognized after Corbion has approved a detailed and formal restructuring plan and the restructuring has either commenced or been announced publicly. A provision for a legal claim is recognized if a reliable estimate can be made of the expected outcome of the claim, measuring the claim as a weighting of all possible outcomes against their probabilities. A provision for an onerous contract is recognized when the expected benefits to be derived from the contract are lower than the unavoidable costs of fulfilling its terms and conditions.
LiabilitiesInterest-bearing liabilities are recognized initially at fair value and subsequently at amortized cost using the effective interest method. Upon sale or settlement of interest-bearing liabilities any profits or losses are directly recognized in the income statement.
Leases Lease agreements in which the lessor transfers substantially all the risks and rewards of the ownership of an asset to the lessee are classified as financial leases. All assets and liabilities of a financial lease are capitalized at the lower of the fair value of the leased asset and the present value of the minimum lease payments. Lease agreements that do not qualify as a financial lease are classified as operational leases. Payments made are charged to income on a straight-line basis over the period of the lease.
segment reportingAn operating segment is a component that engages in business activities from which it earns revenues and incurs expenses. All operating segments are reviewed regularly by the Board of Management to make decisions about resources to be allocated to the segments and assess its performance for which discrete financial information is available.
Net salesNet sales comprises the proceeds of goods delivered to third parties less discounts and value-added tax. Net sale of goods is recognized when Corbion has transferred the actual risks and rewards of ownership of the goods to the buyer, when the amount of the proceeds can be reliably measured, and when it is probable that the economic benefits of the sale will flow to Corbion.
Costs of raw materials and consumables Costs of raw materials and consumables relate to the cost of consumption of raw materials, consumables, and packaging materials. Costs of raw materials and consumables are recognized in the income statement when the risks and rewards of ownership of the goods sold have been transferred to a party outside the group. These costs include the purchase price of all raw material and all directly attributable costs.
Production costsProduction costs are the costs relating to production operations.
Warehousing and distribution costsWarehousing and distribution costs relate to the costs of warehousing and transport, including transport insurance.
87CORBION ANNUAL REPORT 2016 NOTEs TO THE CONsOLIDATED FINANCIAL sTATEMENTs
ProvisionsProvisions relate to a legal or constructive obligation as a result of a past event, the amount of which is uncertain but can be estimated reliably and of which it is more likely than not that an outflow of resources is required to settle the obligation. If the effect is material, provisions are determined by discounting the expected future cash flow at a pre-tax rate that reflects the current market assessments of time value of money and the risks specific to the liability. A provision for reorganization is recognized after Corbion has approved a detailed and formal restructuring plan and the restructuring has either commenced or been announced publicly. A provision for a legal claim is recognized if a reliable estimate can be made of the expected outcome of the claim, measuring the claim as a weighting of all possible outcomes against their probabilities. A provision for an onerous contract is recognized when the expected benefits to be derived from the contract are lower than the unavoidable costs of fulfilling its terms and conditions.
LiabilitiesInterest-bearing liabilities are recognized initially at fair value and subsequently at amortized cost using the effective interest method. Upon sale or settlement of interest-bearing liabilities any profits or losses are directly recognized in the income statement.
Leases Lease agreements in which the lessor transfers substantially all the risks and rewards of the ownership of an asset to the lessee are classified as financial leases. All assets and liabilities of a financial lease are capitalized at the lower of the fair value of the leased asset and the present value of the minimum lease payments. Lease agreements that do not qualify as a financial lease are classified as operational leases. Payments made are charged to income on a straight-line basis over the period of the lease.
segment reportingAn operating segment is a component that engages in business activities from which it earns revenues and incurs expenses. All operating segments are reviewed regularly by the Board of Management to make decisions about resources to be allocated to the segments and assess its performance for which discrete financial information is available.
Net salesNet sales comprises the proceeds of goods delivered to third parties less discounts and value-added tax. Net sale of goods is recognized when Corbion has transferred the actual risks and rewards of ownership of the goods to the buyer, when the amount of the proceeds can be reliably measured, and when it is probable that the economic benefits of the sale will flow to Corbion.
Costs of raw materials and consumables Costs of raw materials and consumables relate to the cost of consumption of raw materials, consumables, and packaging materials. Costs of raw materials and consumables are recognized in the income statement when the risks and rewards of ownership of the goods sold have been transferred to a party outside the group. These costs include the purchase price of all raw material and all directly attributable costs.
Production costsProduction costs are the costs relating to production operations.
Warehousing and distribution costsWarehousing and distribution costs relate to the costs of warehousing and transport, including transport insurance.
selling expensesselling expenses relate to the costs of marketing and sales.
General and administrative expensesGeneral and administrative expenses relate to the costs of administration, management, and IT.
Financial income and chargesFinancial income comprises interest income on cash and cash equivalents and interest income on loans to other parties. Interest income is recognized in the period to which it relates, using the effective interest method.Financial charges comprise interest expenses and exchange differences on borrowings, finance lease expenses, impairments of available-for-sale assets, and other financial expenses. All borrowing costs are recognized in the income statement using the effective interest method.
TaxesTax on the result is calculated on the basis of the result before taxes, taking account of untaxed profit elements, non- and part-deductible costs, and fiscal facilities. The prevailing nominal tax rates are applied. Non-recoverable withholding taxes on foreign dividends are taken into account.Taxes in the income statement for the year comprise current and deferred taxes. Taxes are recognized in the income statement unless they relate to items directly recognized in equity. Current tax is the expected tax rate payable on the taxable income for the year, using statutory tax rates at the balance sheet date, and any adjustment to tax payable in respect of previous years.
Discontinued operations and non-current assets held for saleNon-current assets and disposal groups are classified as held for sale if their carrying amount will be recovered through a sale transaction rather than through continuing use. For this to be the case, the asset (or disposal group) must be available for immediate sale in its present condition and the sale must be highly probable. A discontinued operation is a component that either has been disposed of, or that is classified as held for sale, and: (i) represents a separate major line of business or geographical area of operations, or (ii) is part of a single coordinated plan to dispose of a separate major line of business or geographical area of operations. Discontinued operations are stated on the basis of the lower of carrying amount and fair value less cost to sell. Discontinued operations are presented separately in the income statement and cash flow statement. Fixed assets related to discontinued operations will no longer be depreciated and amortized after the classification as held for sale.
Cash flow statement The consolidated cash flow statement is drawn up using the indirect method. The items in the consolidated income statement and consolidated statement of the financial position have been adjusted for changes that do not impact cash inflow and outflow in the reporting year. Cash flows in foreign currencies are translated to the functional currency at the average foreign exchange rates unless this average is not a reasonable approximation of the cumulative effect of the rates prevailing on the transaction dates, in which case cash flows are translated at the rate on the dates of the transactions. Working capital consists of inventories and receivables minus non-interest-bearing current liabilities, excluding payable dividend, interest, and income tax. The interest-bearing debts consist of non-current and current liabilities.
88 CORBION ANNUAL REPORT 2016 NOTEs TO THE CONsOLIDATED FINANCIAL sTATEMENTs
Critical accounting estimates and judgmentsCorbion makes use of accounting estimates and judgments. Described below are the estimates and judgments as at the balance sheet date that carry a substantial risk of a material adjustment to the book value of assets and liabilities in the next financial year.
AcquisitionsCorbion has a process in place to identify all assets and liabilities acquired, including intangible fixed assets. The judgments made in identifying all acquired assets, determining the estimated fair value assigned to each class of assets acquired and liabilities assumed, as well as asset lives, can materially impact the results of operations. Estimated fair values are based on information available around the acquisition date and on expectations and assumptions of anticipated discounted cash flows that have been assessed as reasonable by Corbion.
Goodwill impairmentEvery year, Corbion tests the goodwill based on the higher of fair value less costs to sell and the value-in-use method. The value-in-use is calculated on the basis of estimates and judgments of the expected cash flows which are discounted on a WACC basis. For a description of the main estimates, valuation assumptions, and a sensitivity analysis of the applied assumptions see Note 11.
Valuation and impairment testing (in)tangible fixed assets(In)tangible fixed assets are tested for sustained impairment if there is an indication of possible impairment. A key factor is the recoverable amount which is calculated on the basis of estimates and assumptions of anticipated discounted cash flows, on the one hand, and an estimate of the fair value less cost to sell, on the other.
Pension and early-retirement schemesActuarial calculations are used to determine provisions for group personnel arrangements and net receivables or obligations from group pension plans. These calculations use assumptions in respect of future developments in salary, mortality, staff turnover, return on investments et cetera. Changes to these estimates and assumptions can lead to actuarial gains and losses which are recognized in the consolidated statement of comprehensive income. For more information on the applied assumptions see Note 20.
TaxesCorbion is subject to various tax systems across the world. Estimates and judgments are used to determine the tax items in the financial statements. Interpretation differences in tax liabilities are also taken into account. For more information on taxes see Note 21.
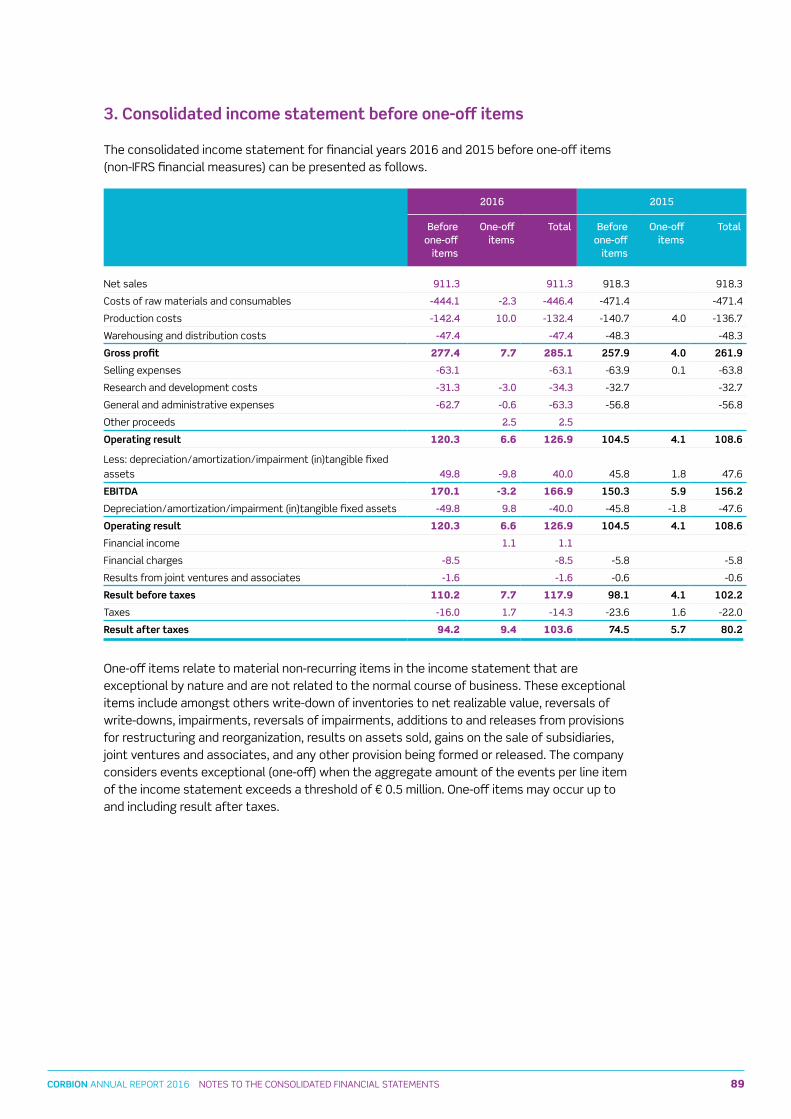
89CORBION ANNUAL REPORT 2016 NOTEs TO THE CONsOLIDATED FINANCIAL sTATEMENTs
Critical accounting estimates and judgmentsCorbion makes use of accounting estimates and judgments. Described below are the estimates and judgments as at the balance sheet date that carry a substantial risk of a material adjustment to the book value of assets and liabilities in the next financial year.
AcquisitionsCorbion has a process in place to identify all assets and liabilities acquired, including intangible fixed assets. The judgments made in identifying all acquired assets, determining the estimated fair value assigned to each class of assets acquired and liabilities assumed, as well as asset lives, can materially impact the results of operations. Estimated fair values are based on information available around the acquisition date and on expectations and assumptions of anticipated discounted cash flows that have been assessed as reasonable by Corbion.
Goodwill impairmentEvery year, Corbion tests the goodwill based on the higher of fair value less costs to sell and the value-in-use method. The value-in-use is calculated on the basis of estimates and judgments of the expected cash flows which are discounted on a WACC basis. For a description of the main estimates, valuation assumptions, and a sensitivity analysis of the applied assumptions see Note 11.
Valuation and impairment testing (in)tangible fixed assets(In)tangible fixed assets are tested for sustained impairment if there is an indication of possible impairment. A key factor is the recoverable amount which is calculated on the basis of estimates and assumptions of anticipated discounted cash flows, on the one hand, and an estimate of the fair value less cost to sell, on the other.
Pension and early-retirement schemesActuarial calculations are used to determine provisions for group personnel arrangements and net receivables or obligations from group pension plans. These calculations use assumptions in respect of future developments in salary, mortality, staff turnover, return on investments et cetera. Changes to these estimates and assumptions can lead to actuarial gains and losses which are recognized in the consolidated statement of comprehensive income. For more information on the applied assumptions see Note 20.
TaxesCorbion is subject to various tax systems across the world. Estimates and judgments are used to determine the tax items in the financial statements. Interpretation differences in tax liabilities are also taken into account. For more information on taxes see Note 21.
3. Consolidated income statement before one-off items
The consolidated income statement for financial years 2016 and 2015 before one-off items (non-IFRs financial measures) can be presented as follows.
2016 2015
Before one-off
items
One-off items
Total Before one-off
items
One-off items
Total
Net sales 911 3 911 3 918.3 918.3
Costs of raw materials and consumables -444 1 -2 3 -446 4 -471.4 -471.4
Production costs -142 4 10 0 -132 4 -140.7 4.0 -136.7
Warehousing and distribution costs -47 4 -47 4 -48.3 -48.3
Gross profit 277.4 7.7 285.1 257.9 4.0 261.9
selling expenses -63 1 -63 1 -63.9 0.1 -63.8
Research and development costs -31 3 -3 0 -34 3 -32.7 -32.7
General and administrative expenses -62 7 -0 6 -63 3 -56.8 -56.8
Other proceeds 2 5 2 5
Operating result 120.3 6.6 126.9 104.5 4.1 108.6
Less: depreciation/amortization/impairment (in)tangible fixed assets 49 8 -9 8 40 0 45.8 1.8 47.6
EBITDA 170.1 -3.2 166.9 150.3 5.9 156.2
Depreciation/amortization/impairment (in)tangible fixed assets -49 8 9 8 -40 0 -45.8 -1.8 -47.6
Operating result 120.3 6.6 126.9 104.5 4.1 108.6
Financial income 1 1 1 1
Financial charges -8 5 -8 5 -5.8 -5.8
Results from joint ventures and associates -1 6 -1 6 -0.6 -0.6
Result before taxes 110.2 7.7 117.9 98.1 4.1 102.2
Taxes -16 0 1 7 -14 3 -23.6 1.6 -22.0
Result after taxes 94.2 9.4 103.6 74.5 5.7 80.2
One-off items relate to material non-recurring items in the income statement that are exceptional by nature and are not related to the normal course of business. These exceptional items include amongst others write-down of inventories to net realizable value, reversals of write-downs, impairments, reversals of impairments, additions to and releases from provisions for restructuring and reorganization, results on assets sold, gains on the sale of subsidiaries, joint ventures and associates, and any other provision being formed or released. The company considers events exceptional (one-off) when the aggregate amount of the events per line item of the income statement exceeds a threshold of € 0.5 million. One-off items may occur up to and including result after taxes.
90 CORBION ANNUAL REPORT 2016 NOTEs TO THE CONsOLIDATED FINANCIAL sTATEMENTs
In 2015, a total of € 5.7 million in one-off items was recorded:1. One-off insurance gains of € 10.4 million related to the Grandview incident in March 2015.2. Cost incurred of € 5.4 million related to the explosion at the Grandview manufacturing
facility, including an impairment of tangible fixed assets of € 1.1 million.3. A one-off gain of € 0.7 million following the release of the reorganization provision related
to “streamline”.4. One-off costs of € 0.8 million incurred related to the closure of the Kansas Avenue powder
blending plant.5. An impairment was recognized of € 0.8 million due to an obsolete production
line in the Netherlands. 6. Tax effects on the above items of € 1.7 million.7. Net positive tax effects of € 3.3 million related to the divestment of the Bakery supplies
businesses in 2013.
In 2016, a total of € 9.4 million in one-off items was recorded:1. Reversal of a previously recorded impairment of € 13.4 million for the lactide plant in Thailand
as a result of the intended sale to the joint venture Total Corbion PLA bv.2. One-off costs of € 4.9 million incurred related to the closure of the Kansas Avenue powder
blending plant.3. An impairment of € 3.0 million related to our succinic acid development as a result of an
envisaged change in the production process.4. One-off net gains of € 2.2 million related to the sale of our Breddo-Likwifier business.5. One-off costs of € 0.6 million incurred related to a restructuring at our spanish plant.6. An impairment of € 0.6 million related to basic engineering for the lactide plant in Thailand.7. Net one-off costs of € 0.4 million related to an increase of the excessive levy provision for
a former board member.8 One-off insurance gains of € 0.5 million related to the Grandview incident in March 2015.9. A one-off gain of € 1.1 million related to a partial reversal of impairment of a loan for beet
growers following the sale of CsM sugar in 2007.10. Positive tax effects on the above items of € 1.7 million.
4. Segment information
For its strategic decision-making process Corbion distinguishes between Biobased Ingredients and Biobased Innovations. For IFRs segmentation purposes Biobased Ingredients has been segmented into two further businesses, Food and Biochemicals. The unallocated part of total operations mainly comprises central activities. In the Food segment, our food ingredients portfolio keeps food safe and fresh, from creation to consumption, and as such, reduces food waste. It ranges from preservation ingredients to microbial spoilage prevention and ingredients that keep food fresh and tasty throughout shelf life. The combined use of industry knowledge and scientific creativity enables us to offer industry-leading biobased technology and sustainability gains. Our future-focused thinking impacts every industry ranging from baking, meat, and dairy to confectionery and beverage. In the Biochemicals segment, our biobased chemicals derived from renewable resources such as sugar or starch, are a sustainable alternative to fossil-based chemicals in various applications, including cleaning detergents, hand soap, coatings, and animal feed. Offering improved performance and multiple benefits, our biobased solutions are versatile and, at the same time, provide lower cost in use with enhanced environmental credentials.
91CORBION ANNUAL REPORT 2016 NOTEs TO THE CONsOLIDATED FINANCIAL sTATEMENTs
In 2015, a total of € 5.7 million in one-off items was recorded:1. One-off insurance gains of € 10.4 million related to the Grandview incident in March 2015.2. Cost incurred of € 5.4 million related to the explosion at the Grandview manufacturing
facility, including an impairment of tangible fixed assets of € 1.1 million.3. A one-off gain of € 0.7 million following the release of the reorganization provision related
to “streamline”.4. One-off costs of € 0.8 million incurred related to the closure of the Kansas Avenue powder
blending plant.5. An impairment was recognized of € 0.8 million due to an obsolete production
line in the Netherlands. 6. Tax effects on the above items of € 1.7 million.7. Net positive tax effects of € 3.3 million related to the divestment of the Bakery supplies
businesses in 2013.
In 2016, a total of € 9.4 million in one-off items was recorded:1. Reversal of a previously recorded impairment of € 13.4 million for the lactide plant in Thailand
as a result of the intended sale to the joint venture Total Corbion PLA bv.2. One-off costs of € 4.9 million incurred related to the closure of the Kansas Avenue powder
blending plant.3. An impairment of € 3.0 million related to our succinic acid development as a result of an
envisaged change in the production process.4. One-off net gains of € 2.2 million related to the sale of our Breddo-Likwifier business.5. One-off costs of € 0.6 million incurred related to a restructuring at our spanish plant.6. An impairment of € 0.6 million related to basic engineering for the lactide plant in Thailand.7. Net one-off costs of € 0.4 million related to an increase of the excessive levy provision for
a former board member.8 One-off insurance gains of € 0.5 million related to the Grandview incident in March 2015.9. A one-off gain of € 1.1 million related to a partial reversal of impairment of a loan for beet
growers following the sale of CsM sugar in 2007.10. Positive tax effects on the above items of € 1.7 million.
4. Segment information
For its strategic decision-making process Corbion distinguishes between Biobased Ingredients and Biobased Innovations. For IFRs segmentation purposes Biobased Ingredients has been segmented into two further businesses, Food and Biochemicals. The unallocated part of total operations mainly comprises central activities. In the Food segment, our food ingredients portfolio keeps food safe and fresh, from creation to consumption, and as such, reduces food waste. It ranges from preservation ingredients to microbial spoilage prevention and ingredients that keep food fresh and tasty throughout shelf life. The combined use of industry knowledge and scientific creativity enables us to offer industry-leading biobased technology and sustainability gains. Our future-focused thinking impacts every industry ranging from baking, meat, and dairy to confectionery and beverage. In the Biochemicals segment, our biobased chemicals derived from renewable resources such as sugar or starch, are a sustainable alternative to fossil-based chemicals in various applications, including cleaning detergents, hand soap, coatings, and animal feed. Offering improved performance and multiple benefits, our biobased solutions are versatile and, at the same time, provide lower cost in use with enhanced environmental credentials.
Our Biobased Innovations business unit creates new biotechnology business platforms. Our drive for growth is supported by a disciplined stage-gate investment approach using our own core technology platforms, acquired or licensed technologies, and partnerships to increase the odds of success.Our 50/50 joint venture with Total for the production and marketing of polylactic acid bioplastic (PLA) will be part of this business unit. Our high-performance PLA resin can be used to make a bioplastic for a wide range of applications, ranging from (degradable) food packaging to touchscreen computers and durable automotive components.Biobased Innovations also comprises the succinic acid joint venture with BAsF (succinity), as well as our longer-term development projects such as FDCA, a potential replacement for purified terephthalic acid (PTA), our gypsum-free lactic acid process, and the developments regarding the use of alternative feedstocks (lignocellulosic biomass, agricultural residues, or waste). Transfer prices between operating segments are on an arm’s length basis in a manner similar to transactions with third parties.
segment information by business area
Food Biochemicals BiobasedInnovations
Unallocated(central activities)
Corbiontotal
operations
2016 2015 2016 2015 2016 2015 2016 2015 2016 2015
Income statement information
Net sales 676 6 687.8 213 0 208.1 21 7 22.4 911 3 918.3
Operating result 114 9 109.9 40 1 34.0 -7 4 -14.9 -20 7 -20.4 126 9 108.6
One-off items included in operating result 2 4 -4.4 0 5 0.3 -9 8 0 3 -6 6 -4.1
Operating result excluding one-off items 117 3 105.5 40 6 34.3 -17 2 -14.9 -20 4 -20.4 120 3 104.5
Alternative non-IFRS performance measures
EBITDA 140 1 135.1 52 9 45.5 -6 4 -4.7 -19 7 -19.7 166 9 156.2
One-off items included in EBITDA 2 4 -5.9 0 5 0 3 3 2 -5.9
EBITDA excluding one-off items 142 5 129.2 53 4 45.5 -6 4 -4.7 -19 4 -19.7 170 1 150.3
Ratios alternative non-IFRS performance measures
EBITDA margin % 20 7 19.6 24 8 21.9 -29 5 -20.8 18 3 17.0
EBITDA margin % excluding one-off items 21 1 18.8 25 1 21.9 -29 5 -20.8 18 7 16.4
Corbion generates almost all of its revenues from the sale of goods.
Information on the use of alternative non-IFRs performance measuresIn the above table and elsewhere in the financial statements a number of non-IFRs performance measures are presented. Management is of the opinion that these so-called alternative performance measures might be useful for the readers of these financial statements. Corbion management uses these performance measures to make financial, operational, and strategic decisions and evaluate performance of the segments. The alternative performance measures can be calculated as follows:• EBITDA is the operating result before depreciation, amortization, and impairment of
(in)tangible fixed assets.• EBITDA margin is EBITDA divided by net sales x 100.
92 CORBION ANNUAL REPORT 2016 NOTEs TO THE CONsOLIDATED FINANCIAL sTATEMENTs
segment information by geographical region
Net sales Non-current assets
2016 2015 2016 2015
The Netherlands 102 4 108.1 147 1 148.3
Rest of Europe 65 8 66.7 26 1 33.0
North America 576 4 591.3 197 9 185.4
Other countries 166 7 152.2 70 1 87.2
Corbion total operations 911.3 918.3 441.2 453.9
The above information is based on the geographical location of the assets. Non-current assets exclude those relating to deferred tax assets.
5. Payroll and social insurance
2016 2015(restated)
Payroll 118 4 123.1
Pension expenses – defined benefit pension plans 0 4 0.1
Pension expenses – defined contribution pension plans 9 1 8.6
Other social insurance 12 2 13.1
share-based remuneration 2 2 1.2
Total 142.3 146.1
6. Depreciation/amortization of (in)tangible fixed assets
2016 2015
Depreciation of property, plant, and equipment 42 4 39.0
Amortization of intangible fixed assets 7 1 6.9
Total 49.5 45.9
7. Financial income and charges
2016 2015
Interest charge 7 4 5.9
Exchange rate differences 0 1 -0.7
Interest expense on defined benefit pension plans - net 0 3 0.5
Reversal of impairment of financial asset -1 1
Other 0 7 0.1
Total 7.4 5.8
93CORBION ANNUAL REPORT 2016 NOTEs TO THE CONsOLIDATED FINANCIAL sTATEMENTs
segment information by geographical region
Net sales Non-current assets
2016 2015 2016 2015
The Netherlands 102 4 108.1 147 1 148.3
Rest of Europe 65 8 66.7 26 1 33.0
North America 576 4 591.3 197 9 185.4
Other countries 166 7 152.2 70 1 87.2
Corbion total operations 911.3 918.3 441.2 453.9
The above information is based on the geographical location of the assets. Non-current assets exclude those relating to deferred tax assets.
5. Payroll and social insurance
2016 2015(restated)
Payroll 118 4 123.1
Pension expenses – defined benefit pension plans 0 4 0.1
Pension expenses – defined contribution pension plans 9 1 8.6
Other social insurance 12 2 13.1
share-based remuneration 2 2 1.2
Total 142.3 146.1
6. Depreciation/amortization of (in)tangible fixed assets
2016 2015
Depreciation of property, plant, and equipment 42 4 39.0
Amortization of intangible fixed assets 7 1 6.9
Total 49.5 45.9
7. Financial income and charges
2016 2015
Interest charge 7 4 5.9
Exchange rate differences 0 1 -0.7
Interest expense on defined benefit pension plans - net 0 3 0.5
Reversal of impairment of financial asset -1 1
Other 0 7 0.1
Total 7.4 5.8
8. Taxes
2016 2015
Current tax 20 7 29.0
Current tax (previous year adjustments) -2 7 -0.4
Deferred tax -3 7 -6.6
Tax charge (income) 14.3 22.0
Reconciliation of result before taxes and tax charge
2016 2015
Result before taxes 117.9 102.2
Applicable tax charge at average statutory tax rate 35 8 33.9
Income not subject to tax -11 3 -9.5
Expenses not deductible for tax purposes 1 8 1.6
Effect of the reversal of tax assets -8 0 -2.3
Additions/releases of tax provision -0 8 0.8
Prior years effects -3 2 -2.5
Tax charge (income) 14.3 22.0
Average tax rate on operations 12.1% 21.5%
The average statutory tax rate is the average of the statutory tax rates in the countries where Corbion operates, weighted on the basis of the result before taxes in each of these countries. The realization of deferred tax assets depends on the expected future profitability. Based on management’s expectations the valuation allowance has been reduced. The adjustment in respect of prior years reflects the effects of changes to relevant regulations, facts, or other factors compared to those used in establishing the current tax position or deferred tax balance in previous years.
Breakdown of the tax charge recognized in equity
2016 2015
Tax liability due to loan-related exchange rate differences -2 5 4.1
Tax liability due to hedge results of financial instruments -0 6 0.7
Tax charge due to remeasurement of defined benefit obligation -0 9 -0.6
Tax charge (income) recognized in equity -4.0 4.2
94 CORBION ANNUAL REPORT 2016 NOTEs TO THE CONsOLIDATED FINANCIAL sTATEMENTs
9. Earnings per ordinary share
Earnings per ordinary share are calculated by dividing the profit available for holders of ordinary shares by the weighted average number of outstanding ordinary shares in Corbion nv. Diluted earnings per ordinary share are calculated by dividing the profit available for holders of ordinary shares by the weighted average number of outstanding ordinary shares in Corbion nv adjusted for the effects of potential exercise of share rights by the Board of Management and senior Management.
2016 2015
Result after taxes 103.6 80.2
Minus: dividend financing preference shares 2 1 2.2
Profit available for holders of ordinary shares (A) 101.5 78.0
Weighted average number of outstanding ordinary shares (B) 58 4 60.4
Plus: ordinary shares related to share rights 0 6 0.4
Weighted average number of outstanding ordinary shares after dilution (C) 59.0 60.8
Per ordinary share in euros
Basic earnings (A/B) 1 74 1.29
Diluted earnings (A/C) 1 72 1.28
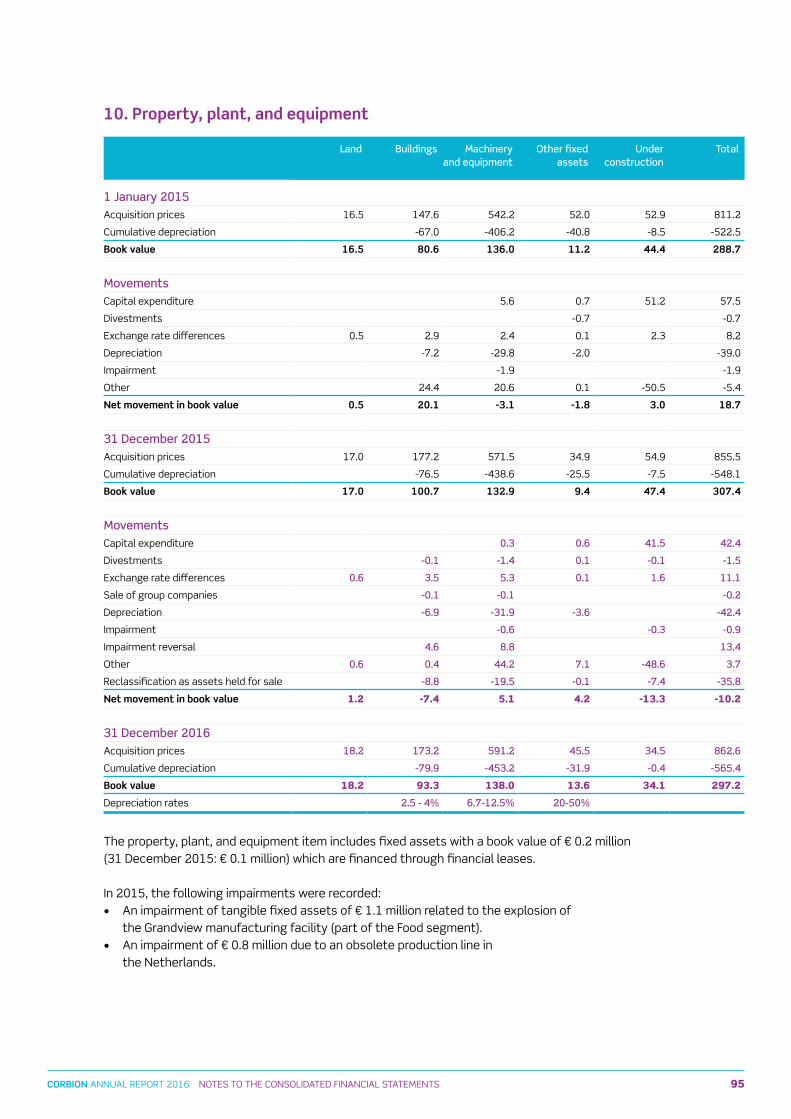
95CORBION ANNUAL REPORT 2016 NOTEs TO THE CONsOLIDATED FINANCIAL sTATEMENTs
9. Earnings per ordinary share
Earnings per ordinary share are calculated by dividing the profit available for holders of ordinary shares by the weighted average number of outstanding ordinary shares in Corbion nv. Diluted earnings per ordinary share are calculated by dividing the profit available for holders of ordinary shares by the weighted average number of outstanding ordinary shares in Corbion nv adjusted for the effects of potential exercise of share rights by the Board of Management and senior Management.
2016 2015
Result after taxes 103.6 80.2
Minus: dividend financing preference shares 2 1 2.2
Profit available for holders of ordinary shares (A) 101.5 78.0
Weighted average number of outstanding ordinary shares (B) 58 4 60.4
Plus: ordinary shares related to share rights 0 6 0.4
Weighted average number of outstanding ordinary shares after dilution (C) 59.0 60.8
Per ordinary share in euros
Basic earnings (A/B) 1 74 1.29
Diluted earnings (A/C) 1 72 1.28
10. Property, plant, and equipment
Land Buildings Machinery and equipment
Other fixed assets
Under construction
Total
1 January 2015Acquisition prices 16.5 147.6 542.2 52.0 52.9 811.2
Cumulative depreciation -67.0 -406.2 -40.8 -8.5 -522.5
Book value 16.5 80.6 136.0 11.2 44.4 288.7
MovementsCapital expenditure 5.6 0.7 51.2 57.5
Divestments -0.7 -0.7
Exchange rate differences 0.5 2.9 2.4 0.1 2.3 8.2
Depreciation -7.2 -29.8 -2.0 -39.0
Impairment -1.9 -1.9
Other 24.4 20.6 0.1 -50.5 -5.4
Net movement in book value 0.5 20.1 -3.1 -1.8 3.0 18.7
31 December 2015Acquisition prices 17.0 177.2 571.5 34.9 54.9 855.5
Cumulative depreciation -76.5 -438.6 -25.5 -7.5 -548.1
Book value 17.0 100.7 132.9 9.4 47.4 307.4
MovementsCapital expenditure 0 3 0 6 41 5 42 4
Divestments -0 1 -1 4 0 1 -0 1 -1 5
Exchange rate differences 0 6 3 5 5 3 0 1 1 6 11 1
sale of group companies -0 1 -0 1 -0 2
Depreciation -6 9 -31 9 -3 6 -42 4
Impairment -0 6 -0 3 -0 9
Impairment reversal 4 6 8 8 13 4
Other 0 6 0 4 44 2 7 1 -48 6 3 7
Reclassification as assets held for sale -8 8 -19 5 -0 1 -7 4 -35 8
Net movement in book value 1.2 -7.4 5.1 4.2 -13.3 -10.2
31 December 2016Acquisition prices 18 2 173 2 591 2 45 5 34 5 862 6
Cumulative depreciation -79 9 -453 2 -31 9 -0 4 -565 4
Book value 18.2 93.3 138.0 13.6 34.1 297.2
Depreciation rates 2 5 - 4% 6 7-12 5% 20-50%
The property, plant, and equipment item includes fixed assets with a book value of € 0.2 million (31 December 2015: € 0.1 million) which are financed through financial leases. In 2015, the following impairments were recorded: • An impairment of tangible fixed assets of € 1.1 million related to the explosion of
the Grandview manufacturing facility (part of the Food segment).• An impairment of € 0.8 million due to an obsolete production line in
the Netherlands.
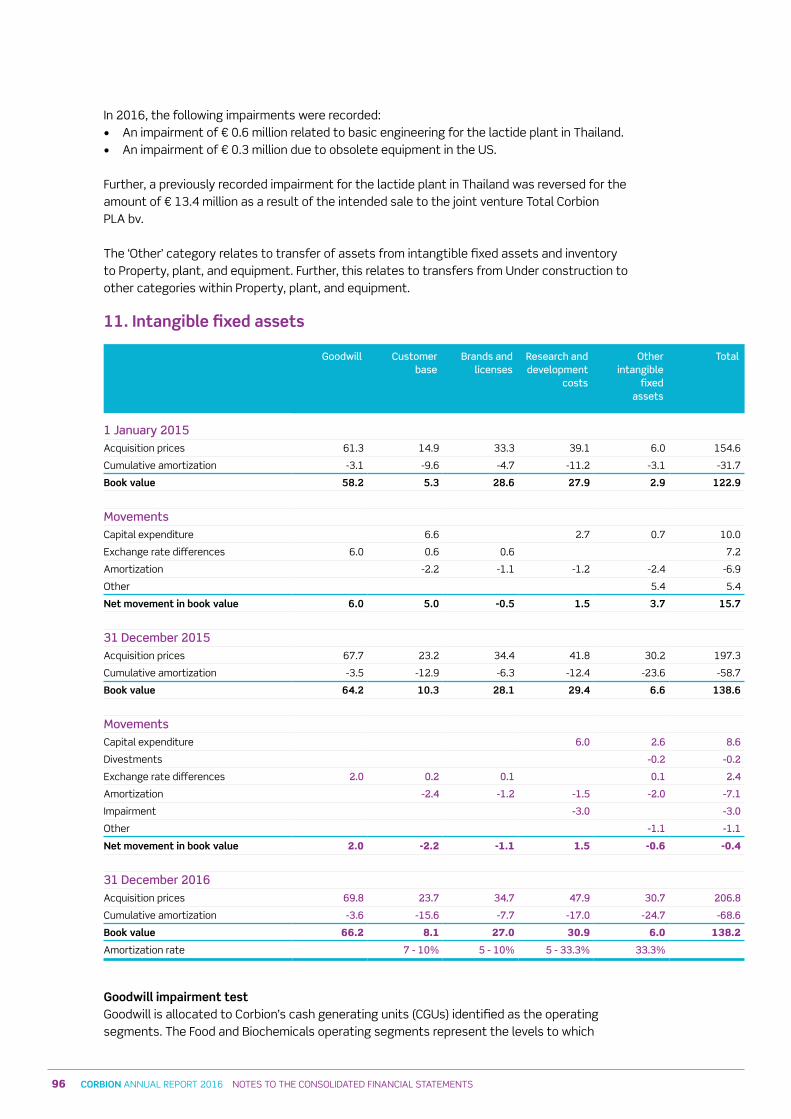
96 CORBION ANNUAL REPORT 2016 NOTEs TO THE CONsOLIDATED FINANCIAL sTATEMENTs
In 2016, the following impairments were recorded: • An impairment of € 0.6 million related to basic engineering for the lactide plant in Thailand.• An impairment of € 0.3 million due to obsolete equipment in the Us.
Further, a previously recorded impairment for the lactide plant in Thailand was reversed for the amount of € 13.4 million as a result of the intended sale to the joint venture Total Corbion PLA bv.
The ‘Other’ category relates to transfer of assets from intangtible fixed assets and inventory to Property, plant, and equipment. Further, this relates to transfers from Under construction to other categories within Property, plant, and equipment.
11. Intangible fixed assets
Goodwill Customer base
Brands and licenses
Research and development
costs
Otherintangible
fixed assets
Total
1 January 2015Acquisition prices 61.3 14.9 33.3 39.1 6.0 154.6
Cumulative amortization -3.1 -9.6 -4.7 -11.2 -3.1 -31.7
Book value 58.2 5.3 28.6 27.9 2.9 122.9
MovementsCapital expenditure 6.6 2.7 0.7 10.0
Exchange rate differences 6.0 0.6 0.6 7.2
Amortization -2.2 -1.1 -1.2 -2.4 -6.9
Other 5.4 5.4
Net movement in book value 6.0 5.0 -0.5 1.5 3.7 15.7
31 December 2015Acquisition prices 67.7 23.2 34.4 41.8 30.2 197.3
Cumulative amortization -3.5 -12.9 -6.3 -12.4 -23.6 -58.7
Book value 64.2 10.3 28.1 29.4 6.6 138.6
MovementsCapital expenditure 6 0 2 6 8 6
Divestments -0 2 -0 2
Exchange rate differences 2 0 0 2 0 1 0 1 2 4
Amortization -2 4 -1 2 -1 5 -2 0 -7 1
Impairment -3 0 -3 0
Other -1 1 -1 1
Net movement in book value 2.0 -2.2 -1.1 1.5 -0.6 -0.4
31 December 2016Acquisition prices 69 8 23 7 34 7 47 9 30 7 206 8
Cumulative amortization -3 6 -15 6 -7 7 -17 0 -24 7 -68 6
Book value 66.2 8.1 27.0 30.9 6.0 138.2
Amortization rate 7 - 10% 5 - 10% 5 - 33 3% 33 3%
Goodwill impairment testGoodwill is allocated to Corbion’s cash generating units (CGUs) identified as the operating segments. The Food and Biochemicals operating segments represent the levels to which
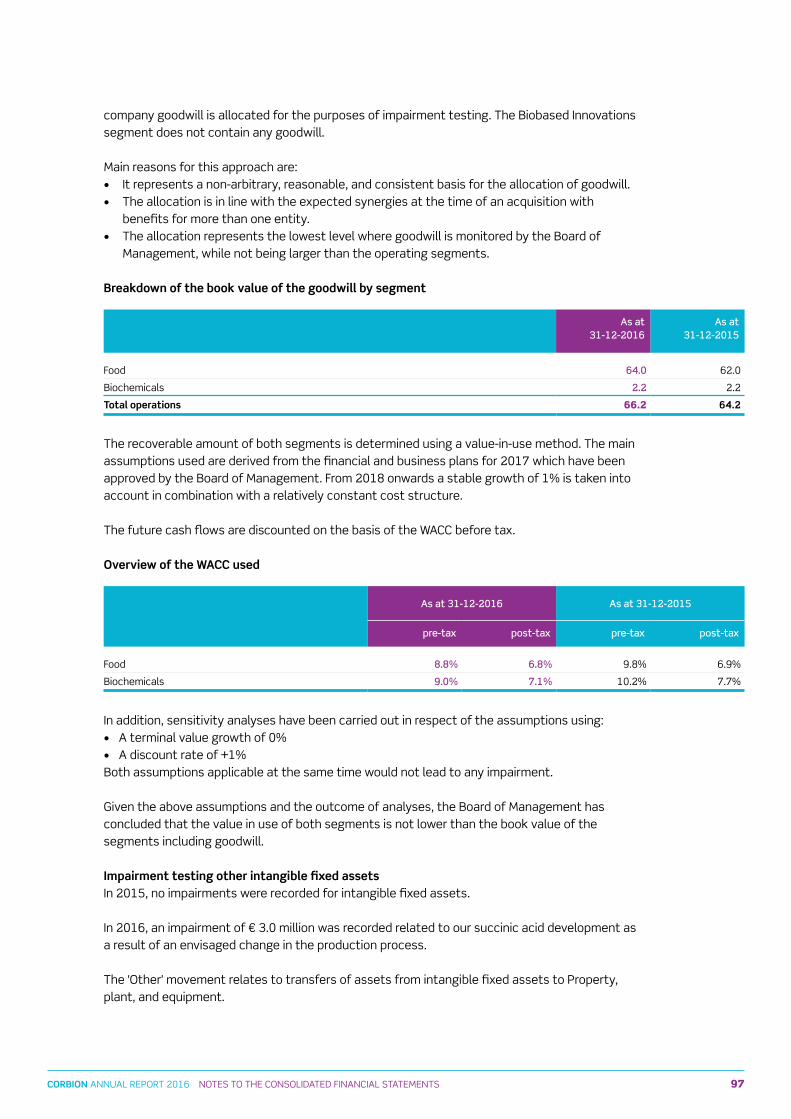
97CORBION ANNUAL REPORT 2016 NOTEs TO THE CONsOLIDATED FINANCIAL sTATEMENTs
In 2016, the following impairments were recorded: • An impairment of € 0.6 million related to basic engineering for the lactide plant in Thailand.• An impairment of € 0.3 million due to obsolete equipment in the Us.
Further, a previously recorded impairment for the lactide plant in Thailand was reversed for the amount of € 13.4 million as a result of the intended sale to the joint venture Total Corbion PLA bv.
The ‘Other’ category relates to transfer of assets from intangtible fixed assets and inventory to Property, plant, and equipment. Further, this relates to transfers from Under construction to other categories within Property, plant, and equipment.
11. Intangible fixed assets
Goodwill Customer base
Brands and licenses
Research and development
costs
Otherintangible
fixed assets
Total
1 January 2015Acquisition prices 61.3 14.9 33.3 39.1 6.0 154.6
Cumulative amortization -3.1 -9.6 -4.7 -11.2 -3.1 -31.7
Book value 58.2 5.3 28.6 27.9 2.9 122.9
MovementsCapital expenditure 6.6 2.7 0.7 10.0
Exchange rate differences 6.0 0.6 0.6 7.2
Amortization -2.2 -1.1 -1.2 -2.4 -6.9
Other 5.4 5.4
Net movement in book value 6.0 5.0 -0.5 1.5 3.7 15.7
31 December 2015Acquisition prices 67.7 23.2 34.4 41.8 30.2 197.3
Cumulative amortization -3.5 -12.9 -6.3 -12.4 -23.6 -58.7
Book value 64.2 10.3 28.1 29.4 6.6 138.6
MovementsCapital expenditure 6 0 2 6 8 6
Divestments -0 2 -0 2
Exchange rate differences 2 0 0 2 0 1 0 1 2 4
Amortization -2 4 -1 2 -1 5 -2 0 -7 1
Impairment -3 0 -3 0
Other -1 1 -1 1
Net movement in book value 2.0 -2.2 -1.1 1.5 -0.6 -0.4
31 December 2016Acquisition prices 69 8 23 7 34 7 47 9 30 7 206 8
Cumulative amortization -3 6 -15 6 -7 7 -17 0 -24 7 -68 6
Book value 66.2 8.1 27.0 30.9 6.0 138.2
Amortization rate 7 - 10% 5 - 10% 5 - 33 3% 33 3%
Goodwill impairment testGoodwill is allocated to Corbion’s cash generating units (CGUs) identified as the operating segments. The Food and Biochemicals operating segments represent the levels to which
company goodwill is allocated for the purposes of impairment testing. The Biobased Innovations segment does not contain any goodwill.
Main reasons for this approach are:• It represents a non-arbitrary, reasonable, and consistent basis for the allocation of goodwill. • The allocation is in line with the expected synergies at the time of an acquisition with
benefits for more than one entity.• The allocation represents the lowest level where goodwill is monitored by the Board of
Management, while not being larger than the operating segments.
Breakdown of the book value of the goodwill by segment
As at 31-12-2016
As at 31-12-2015
Food 64 0 62.0
Biochemicals 2 2 2.2
Total operations 66.2 64.2
The recoverable amount of both segments is determined using a value-in-use method. The main assumptions used are derived from the financial and business plans for 2017 which have been approved by the Board of Management. From 2018 onwards a stable growth of 1% is taken into account in combination with a relatively constant cost structure.
The future cash flows are discounted on the basis of the WACC before tax.
Overview of the WACC used
As at 31-12-2016 As at 31-12-2015
pre-tax post-tax pre-tax post-tax
Food 8 8% 6 8% 9.8% 6.9%
Biochemicals 9 0% 7 1% 10.2% 7.7%
In addition, sensitivity analyses have been carried out in respect of the assumptions using:• A terminal value growth of 0%• A discount rate of +1%Both assumptions applicable at the same time would not lead to any impairment.
Given the above assumptions and the outcome of analyses, the Board of Management has concluded that the value in use of both segments is not lower than the book value of the segments including goodwill.
Impairment testing other intangible fixed assetsIn 2015, no impairments were recorded for intangible fixed assets. In 2016, an impairment of € 3.0 million was recorded related to our succinic acid development as a result of an envisaged change in the production process.
The 'Other' movement relates to transfers of assets from intangible fixed assets to Property, plant, and equipment.
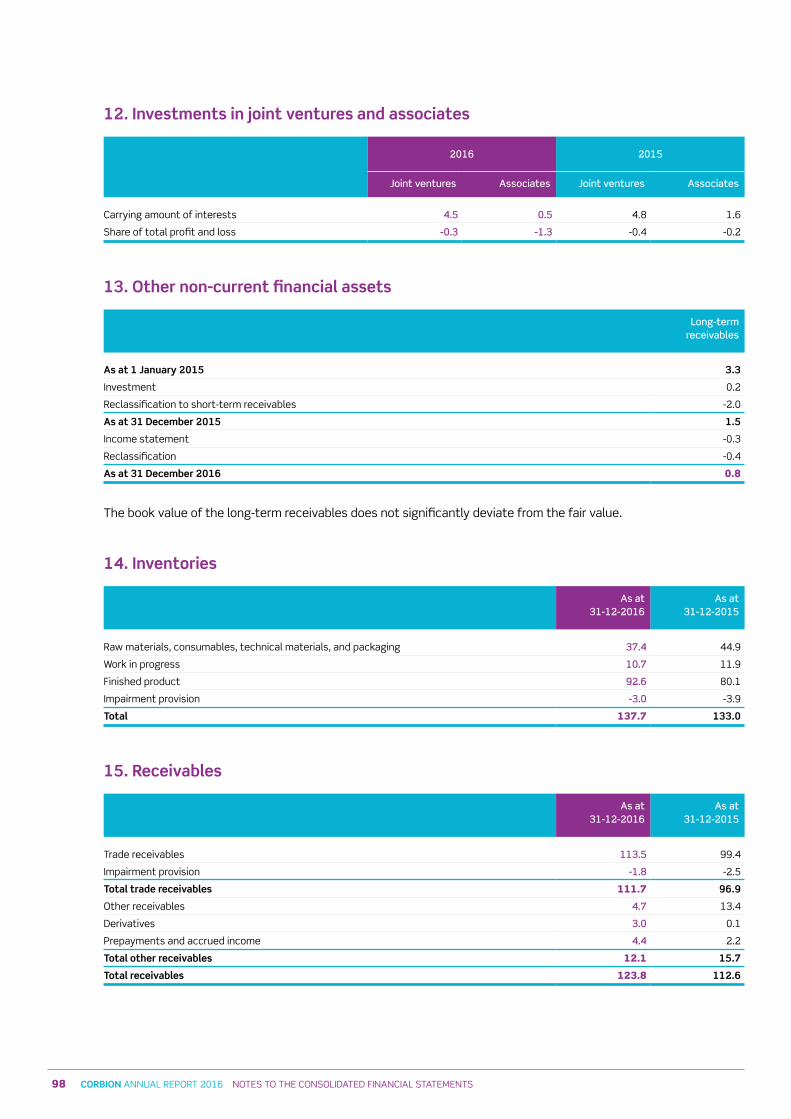
98 CORBION ANNUAL REPORT 2016 NOTEs TO THE CONsOLIDATED FINANCIAL sTATEMENTs
12. Investments in joint ventures and associates
2016 2015
Joint ventures Associates Joint ventures Associates
Carrying amount of interests 4 5 0 5 4.8 1.6
share of total profit and loss -0 3 -1 3 -0.4 -0.2
13. Other non-current financial assets
Long-term receivables
As at 1 January 2015 3.3
Investment 0.2
Reclassification to short-term receivables -2.0
As at 31 December 2015 1.5
Income statement -0.3
Reclassification -0.4
As at 31 December 2016 0.8
The book value of the long-term receivables does not significantly deviate from the fair value.
14. Inventories
As at 31-12-2016
As at 31-12-2015
Raw materials, consumables, technical materials, and packaging 37 4 44.9
Work in progress 10 7 11.9
Finished product 92 6 80.1
Impairment provision -3 0 -3.9
Total 137.7 133.0
15. Receivables
As at 31-12-2016
As at 31-12-2015
Trade receivables 113 5 99.4
Impairment provision -1 8 -2.5
Total trade receivables 111.7 96.9
Other receivables 4 7 13.4
Derivatives 3 0 0.1
Prepayments and accrued income 4 4 2.2
Total other receivables 12.1 15.7
Total receivables 123.8 112.6
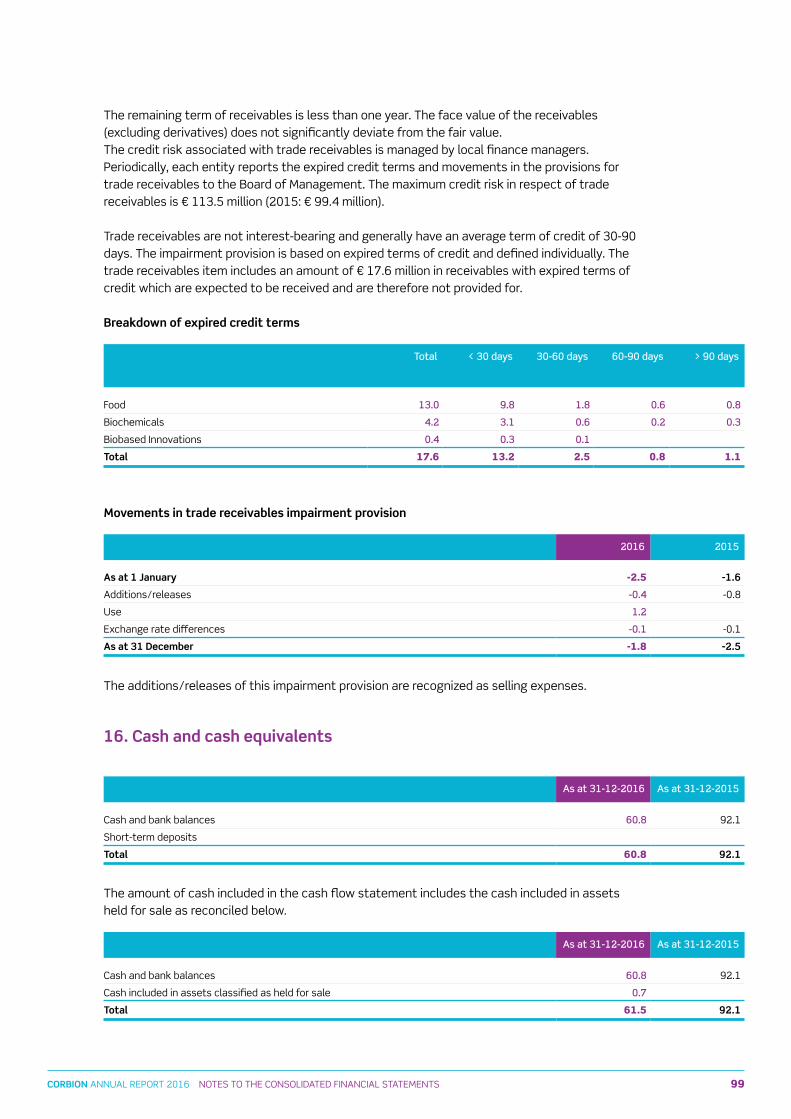
99CORBION ANNUAL REPORT 2016 NOTEs TO THE CONsOLIDATED FINANCIAL sTATEMENTs
12. Investments in joint ventures and associates
2016 2015
Joint ventures Associates Joint ventures Associates
Carrying amount of interests 4 5 0 5 4.8 1.6
share of total profit and loss -0 3 -1 3 -0.4 -0.2
13. Other non-current financial assets
Long-term receivables
As at 1 January 2015 3.3
Investment 0.2
Reclassification to short-term receivables -2.0
As at 31 December 2015 1.5
Income statement -0.3
Reclassification -0.4
As at 31 December 2016 0.8
The book value of the long-term receivables does not significantly deviate from the fair value.
14. Inventories
As at 31-12-2016
As at 31-12-2015
Raw materials, consumables, technical materials, and packaging 37 4 44.9
Work in progress 10 7 11.9
Finished product 92 6 80.1
Impairment provision -3 0 -3.9
Total 137.7 133.0
15. Receivables
As at 31-12-2016
As at 31-12-2015
Trade receivables 113 5 99.4
Impairment provision -1 8 -2.5
Total trade receivables 111.7 96.9
Other receivables 4 7 13.4
Derivatives 3 0 0.1
Prepayments and accrued income 4 4 2.2
Total other receivables 12.1 15.7
Total receivables 123.8 112.6
The remaining term of receivables is less than one year. The face value of the receivables (excluding derivatives) does not significantly deviate from the fair value.The credit risk associated with trade receivables is managed by local finance managers. Periodically, each entity reports the expired credit terms and movements in the provisions for trade receivables to the Board of Management. The maximum credit risk in respect of trade receivables is € 113.5 million (2015: € 99.4 million).
Trade receivables are not interest-bearing and generally have an average term of credit of 30-90 days. The impairment provision is based on expired terms of credit and defined individually. The trade receivables item includes an amount of € 17.6 million in receivables with expired terms of credit which are expected to be received and are therefore not provided for.
Breakdown of expired credit terms
Total < 30 days 30-60 days 60-90 days > 90 days
Food 13 0 9 8 1 8 0 6 0 8
Biochemicals 4 2 3 1 0 6 0 2 0 3
Biobased Innovations 0 4 0 3 0 1
Total 17.6 13.2 2.5 0.8 1.1
Movements in trade receivables impairment provision
2016 2015
As at 1 January -2.5 -1.6
Additions/releases -0 4 -0.8
Use 1 2
Exchange rate differences -0 1 -0.1
As at 31 December -1.8 -2.5
The additions/releases of this impairment provision are recognized as selling expenses.
16. Cash and cash equivalents
As at 31-12-2016 As at 31-12-2015
Cash and bank balances 60 8 92.1
short-term deposits
Total 60.8 92.1
The amount of cash included in the cash flow statement includes the cash included in assets held for sale as reconciled below.
As at 31-12-2016 As at 31-12-2015
Cash and bank balances 60 8 92.1
Cash included in assets classified as held for sale 0 7
Total 61.5 92.1
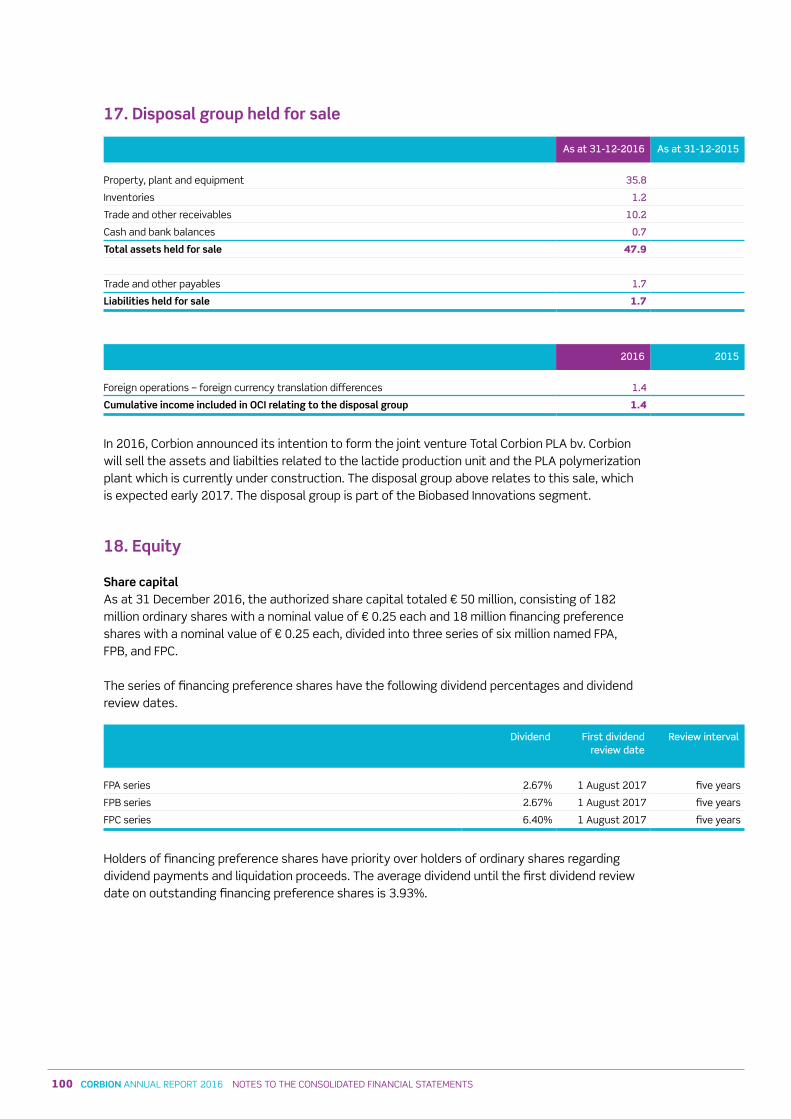
100 CORBION ANNUAL REPORT 2016 NOTEs TO THE CONsOLIDATED FINANCIAL sTATEMENTs
17. Disposal group held for sale
As at 31-12-2016 As at 31-12-2015
Property, plant and equipment 35 8
Inventories 1 2
Trade and other receivables 10 2
Cash and bank balances 0 7
Total assets held for sale 47.9
Trade and other payables 1 7
Liabilities held for sale 1.7
2016 2015
Foreign operations – foreign currency translation differences 1 4
Cumulative income included in OCI relating to the disposal group 1.4
In 2016, Corbion announced its intention to form the joint venture Total Corbion PLA bv. Corbion will sell the assets and liabilties related to the lactide production unit and the PLA polymerization plant which is currently under construction. The disposal group above relates to this sale, which is expected early 2017. The disposal group is part of the Biobased Innovations segment.
18. Equity
Share capitalAs at 31 December 2016, the authorized share capital totaled € 50 million, consisting of 182 million ordinary shares with a nominal value of € 0.25 each and 18 million financing preference shares with a nominal value of € 0.25 each, divided into three series of six million named FPA, FPB, and FPC. The series of financing preference shares have the following dividend percentages and dividend review dates.
Dividend First dividend review date
Review interval
FPA series 2.67% 1 August 2017 five years
FPB series 2.67% 1 August 2017 five years
FPC series 6.40% 1 August 2017 five years
Holders of financing preference shares have priority over holders of ordinary shares regarding dividend payments and liquidation proceeds. The average dividend until the first dividend review date on outstanding financing preference shares is 3.93%.
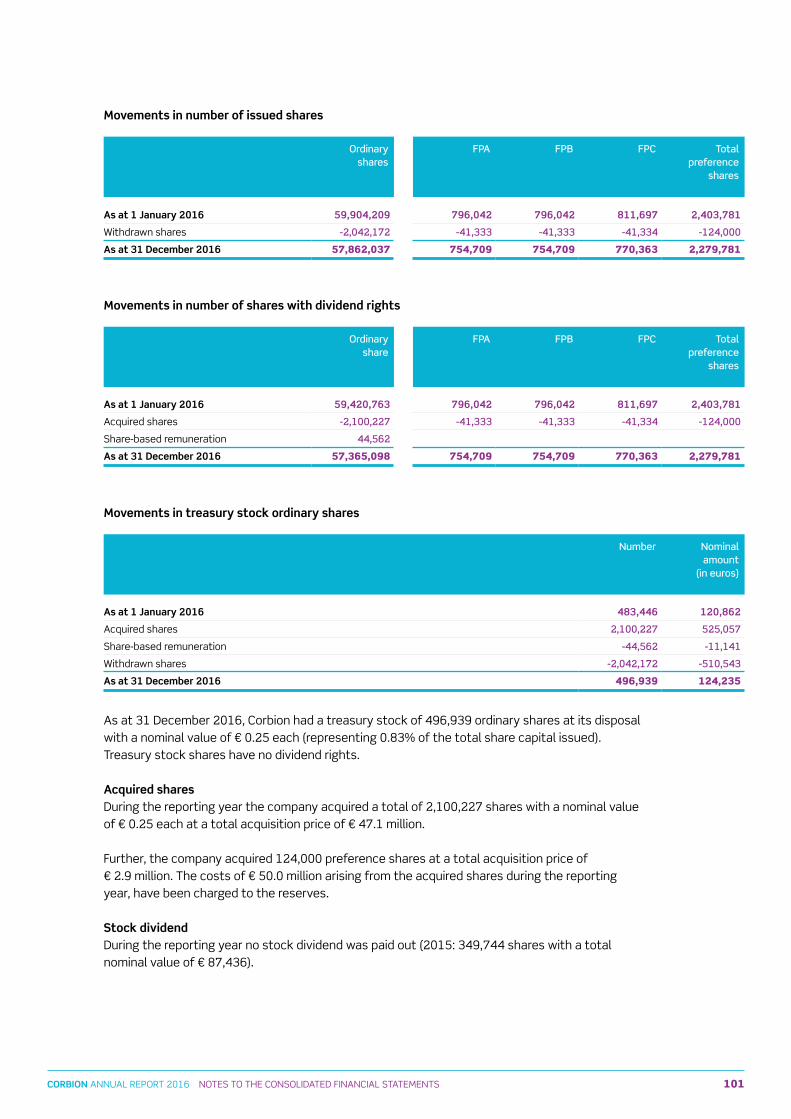
101CORBION ANNUAL REPORT 2016 NOTEs TO THE CONsOLIDATED FINANCIAL sTATEMENTs
17. Disposal group held for sale
As at 31-12-2016 As at 31-12-2015
Property, plant and equipment 35 8
Inventories 1 2
Trade and other receivables 10 2
Cash and bank balances 0 7
Total assets held for sale 47.9
Trade and other payables 1 7
Liabilities held for sale 1.7
2016 2015
Foreign operations – foreign currency translation differences 1 4
Cumulative income included in OCI relating to the disposal group 1.4
In 2016, Corbion announced its intention to form the joint venture Total Corbion PLA bv. Corbion will sell the assets and liabilties related to the lactide production unit and the PLA polymerization plant which is currently under construction. The disposal group above relates to this sale, which is expected early 2017. The disposal group is part of the Biobased Innovations segment.
18. Equity
Share capitalAs at 31 December 2016, the authorized share capital totaled € 50 million, consisting of 182 million ordinary shares with a nominal value of € 0.25 each and 18 million financing preference shares with a nominal value of € 0.25 each, divided into three series of six million named FPA, FPB, and FPC. The series of financing preference shares have the following dividend percentages and dividend review dates.
Dividend First dividend review date
Review interval
FPA series 2.67% 1 August 2017 five years
FPB series 2.67% 1 August 2017 five years
FPC series 6.40% 1 August 2017 five years
Holders of financing preference shares have priority over holders of ordinary shares regarding dividend payments and liquidation proceeds. The average dividend until the first dividend review date on outstanding financing preference shares is 3.93%.
Movements in number of issued shares
Ordinaryshares
FPA FPB FPC Total preference
shares
As at 1 January 2016 59,904,209 796,042 796,042 811,697 2,403,781
Withdrawn shares -2,042,172 -41,333 -41,333 -41,334 -124,000
As at 31 December 2016 57,862,037 754,709 754,709 770,363 2,279,781
Movements in number of shares with dividend rights
Ordinaryshare
FPA FPB FPC Total preference
shares
As at 1 January 2016 59,420,763 796,042 796,042 811,697 2,403,781
Acquired shares -2,100,227 -41,333 -41,333 -41,334 -124,000
share-based remuneration 44,562
As at 31 December 2016 57,365,098 754,709 754,709 770,363 2,279,781
Movements in treasury stock ordinary shares
Number Nominal amount
(in euros)
As at 1 January 2016 483,446 120,862
Acquired shares 2,100,227 525,057
share-based remuneration -44,562 -11,141
Withdrawn shares -2,042,172 -510,543
As at 31 December 2016 496,939 124,235
As at 31 December 2016, Corbion had a treasury stock of 496,939 ordinary shares at its disposal with a nominal value of € 0.25 each (representing 0.83% of the total share capital issued). Treasury stock shares have no dividend rights.
Acquired sharesDuring the reporting year the company acquired a total of 2,100,227 shares with a nominal value of € 0.25 each at a total acquisition price of € 47.1 million.
Further, the company acquired 124,000 preference shares at a total acquisition price of € 2.9 million. The costs of € 50.0 million arising from the acquired shares during the reporting year, have been charged to the reserves.
Stock dividendDuring the reporting year no stock dividend was paid out (2015: 349,744 shares with a total nominal value of € 87,436).
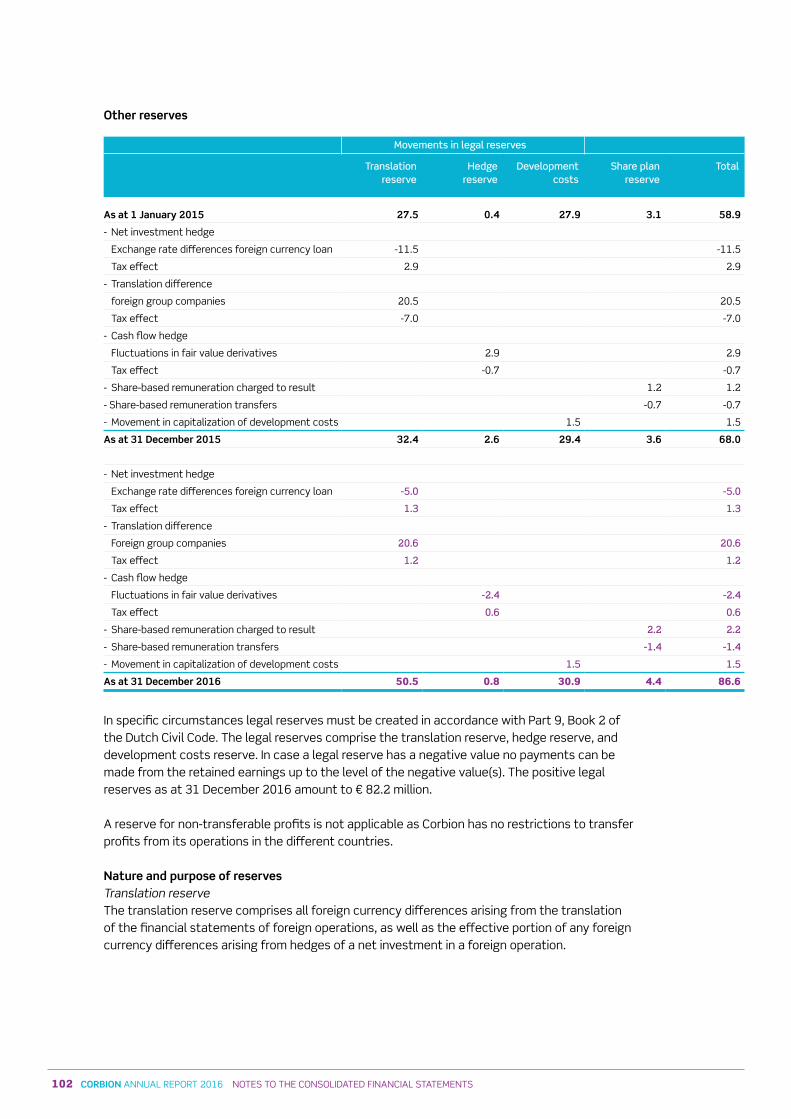
102 CORBION ANNUAL REPORT 2016 NOTEs TO THE CONsOLIDATED FINANCIAL sTATEMENTs
Other reserves
Movements in legal reserves
Translation reserve
Hedge reserve
Development costs
Share plan reserve
Total
As at 1 January 2015 27.5 0.4 27.9 3.1 58.9
- Net investment hedge
Exchange rate differences foreign currency loan -11.5 -11.5
Tax effect 2.9 2.9
- Translation difference
foreign group companies 20.5 20.5
Tax effect -7.0 -7.0
- Cash flow hedge
Fluctuations in fair value derivatives 2.9 2.9
Tax effect -0.7 -0.7
- share-based remuneration charged to result 1.2 1.2
- share-based remuneration transfers -0.7 -0.7
- Movement in capitalization of development costs 1.5 1.5
As at 31 December 2015 32.4 2.6 29.4 3.6 68.0
- Net investment hedge
Exchange rate differences foreign currency loan -5 0 -5 0
Tax effect 1 3 1 3
- Translation difference
Foreign group companies 20 6 20 6
Tax effect 1 2 1 2
- Cash flow hedge
Fluctuations in fair value derivatives -2 4 -2 4
Tax effect 0 6 0 6
- share-based remuneration charged to result 2 2 2 2
- share-based remuneration transfers -1 4 -1 4
- Movement in capitalization of development costs 1 5 1 5
As at 31 December 2016 50.5 0.8 30.9 4.4 86.6
In specific circumstances legal reserves must be created in accordance with Part 9, Book 2 of the Dutch Civil Code. The legal reserves comprise the translation reserve, hedge reserve, and development costs reserve. In case a legal reserve has a negative value no payments can be made from the retained earnings up to the level of the negative value(s). The positive legal reserves as at 31 December 2016 amount to € 82.2 million.
A reserve for non-transferable profits is not applicable as Corbion has no restrictions to transfer profits from its operations in the different countries.
Nature and purpose of reserves Translation reserve The translation reserve comprises all foreign currency differences arising from the translation of the financial statements of foreign operations, as well as the effective portion of any foreign currency differences arising from hedges of a net investment in a foreign operation.
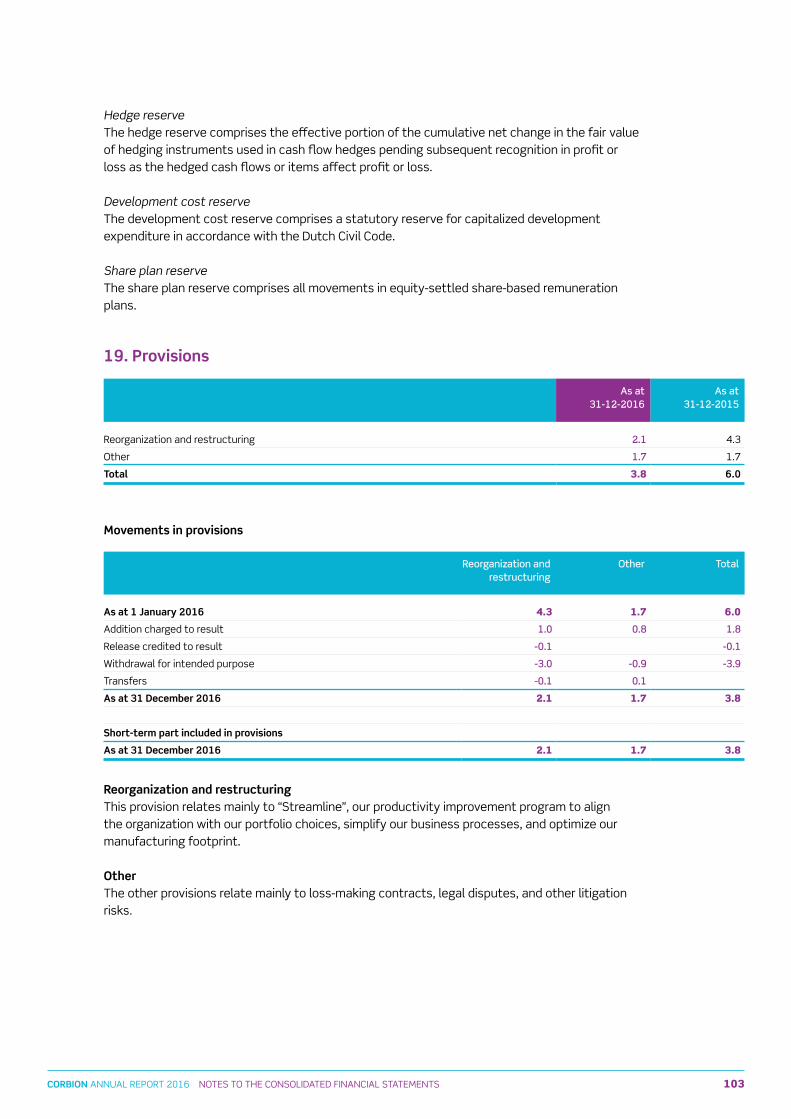
103CORBION ANNUAL REPORT 2016 NOTEs TO THE CONsOLIDATED FINANCIAL sTATEMENTs
Other reserves
Movements in legal reserves
Translation reserve
Hedge reserve
Development costs
Share plan reserve
Total
As at 1 January 2015 27.5 0.4 27.9 3.1 58.9
- Net investment hedge
Exchange rate differences foreign currency loan -11.5 -11.5
Tax effect 2.9 2.9
- Translation difference
foreign group companies 20.5 20.5
Tax effect -7.0 -7.0
- Cash flow hedge
Fluctuations in fair value derivatives 2.9 2.9
Tax effect -0.7 -0.7
- share-based remuneration charged to result 1.2 1.2
- share-based remuneration transfers -0.7 -0.7
- Movement in capitalization of development costs 1.5 1.5
As at 31 December 2015 32.4 2.6 29.4 3.6 68.0
- Net investment hedge
Exchange rate differences foreign currency loan -5 0 -5 0
Tax effect 1 3 1 3
- Translation difference
Foreign group companies 20 6 20 6
Tax effect 1 2 1 2
- Cash flow hedge
Fluctuations in fair value derivatives -2 4 -2 4
Tax effect 0 6 0 6
- share-based remuneration charged to result 2 2 2 2
- share-based remuneration transfers -1 4 -1 4
- Movement in capitalization of development costs 1 5 1 5
As at 31 December 2016 50.5 0.8 30.9 4.4 86.6
In specific circumstances legal reserves must be created in accordance with Part 9, Book 2 of the Dutch Civil Code. The legal reserves comprise the translation reserve, hedge reserve, and development costs reserve. In case a legal reserve has a negative value no payments can be made from the retained earnings up to the level of the negative value(s). The positive legal reserves as at 31 December 2016 amount to € 82.2 million.
A reserve for non-transferable profits is not applicable as Corbion has no restrictions to transfer profits from its operations in the different countries.
Nature and purpose of reserves Translation reserve The translation reserve comprises all foreign currency differences arising from the translation of the financial statements of foreign operations, as well as the effective portion of any foreign currency differences arising from hedges of a net investment in a foreign operation.
Hedge reserve The hedge reserve comprises the effective portion of the cumulative net change in the fair value of hedging instruments used in cash flow hedges pending subsequent recognition in profit or loss as the hedged cash flows or items affect profit or loss.
Development cost reserve The development cost reserve comprises a statutory reserve for capitalized development expenditure in accordance with the Dutch Civil Code.
Share plan reserveThe share plan reserve comprises all movements in equity-settled share-based remuneration plans.
19. Provisions
As at 31-12-2016
As at 31-12-2015
Reorganization and restructuring 2 1 4.3
Other 1 7 1.7
Total 3.8 6.0
Movements in provisions
Reorganization and restructuring
Other Total
As at 1 January 2016 4.3 1.7 6.0
Addition charged to result 1 0 0 8 1 8
Release credited to result -0 1 -0 1
Withdrawal for intended purpose -3 0 -0 9 -3 9
Transfers -0 1 0 1
As at 31 December 2016 2.1 1.7 3.8
Short-term part included in provisions
As at 31 December 2016 2.1 1.7 3.8
Reorganization and restructuringThis provision relates mainly to “streamline”, our productivity improvement program to align the organization with our portfolio choices, simplify our business processes, and optimize our manufacturing footprint.
Other The other provisions relate mainly to loss-making contracts, legal disputes, and other litigation risks.
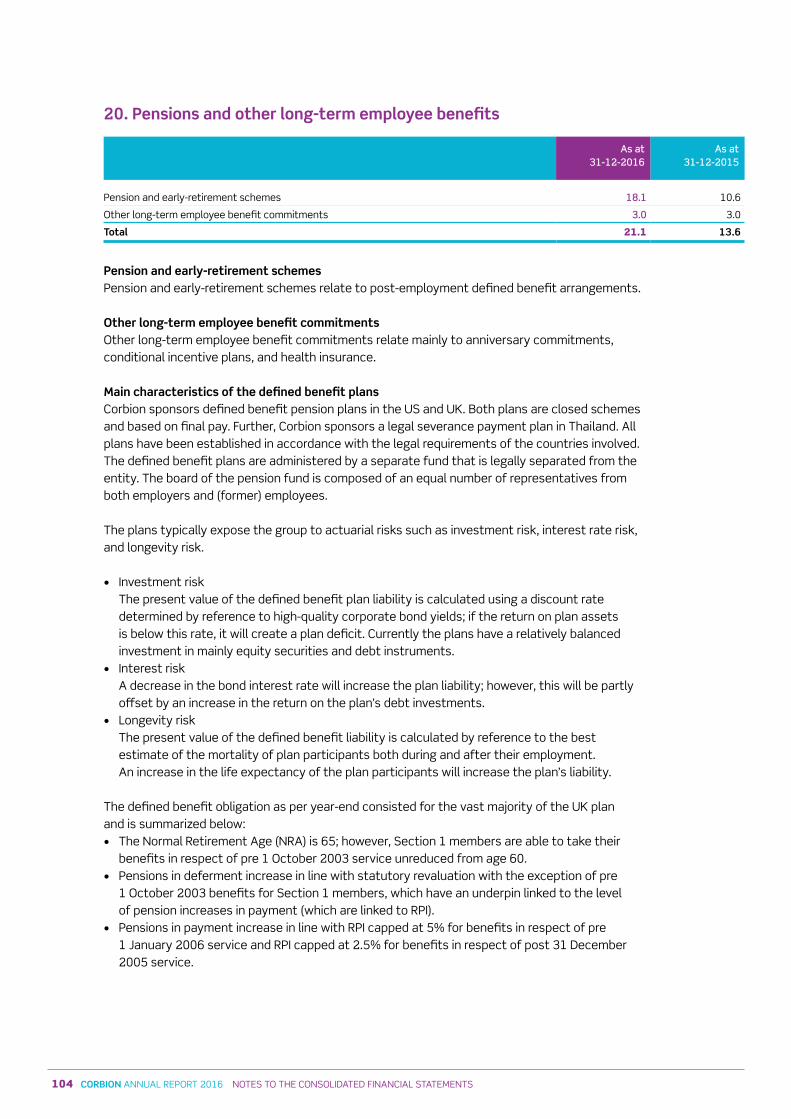
104 CORBION ANNUAL REPORT 2016 NOTEs TO THE CONsOLIDATED FINANCIAL sTATEMENTs
20. Pensions and other long-term employee benefits
As at 31-12-2016
As at 31-12-2015
Pension and early-retirement schemes 18 1 10.6
Other long-term employee benefit commitments 3 0 3.0
Total 21.1 13.6
Pension and early-retirement schemes Pension and early-retirement schemes relate to post-employment defined benefit arrangements.
Other long-term employee benefit commitmentsOther long-term employee benefit commitments relate mainly to anniversary commitments, conditional incentive plans, and health insurance.
Main characteristics of the defined benefit plansCorbion sponsors defined benefit pension plans in the Us and UK. Both plans are closed schemes and based on final pay. Further, Corbion sponsors a legal severance payment plan in Thailand. All plans have been established in accordance with the legal requirements of the countries involved. The defined benefit plans are administered by a separate fund that is legally separated from the entity. The board of the pension fund is composed of an equal number of representatives from both employers and (former) employees.
The plans typically expose the group to actuarial risks such as investment risk, interest rate risk, and longevity risk.
• Investment risk The present value of the defined benefit plan liability is calculated using a discount rate determined by reference to high-quality corporate bond yields; if the return on plan assets is below this rate, it will create a plan deficit. Currently the plans have a relatively balanced investment in mainly equity securities and debt instruments.
• Interest risk A decrease in the bond interest rate will increase the plan liability; however, this will be partly offset by an increase in the return on the plan’s debt investments.
• Longevity risk The present value of the defined benefit liability is calculated by reference to the best estimate of the mortality of plan participants both during and after their employment. An increase in the life expectancy of the plan participants will increase the plan’s liability.
The defined benefit obligation as per year-end consisted for the vast majority of the UK plan and is summarized below:• The Normal Retirement Age (NRA) is 65; however, section 1 members are able to take their
benefits in respect of pre 1 October 2003 service unreduced from age 60.• Pensions in deferment increase in line with statutory revaluation with the exception of pre
1 October 2003 benefits for section 1 members, which have an underpin linked to the level of pension increases in payment (which are linked to RPI).
• Pensions in payment increase in line with RPI capped at 5% for benefits in respect of pre 1 January 2006 service and RPI capped at 2.5% for benefits in respect of post 31 December 2005 service.
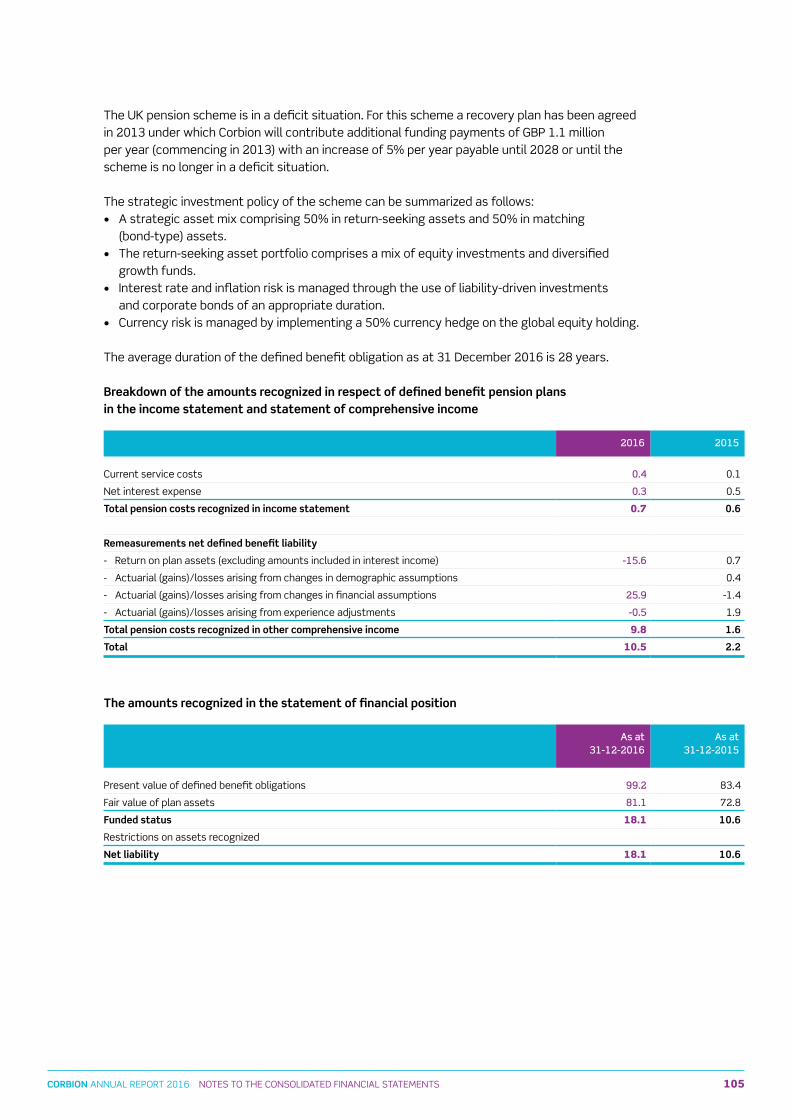
105CORBION ANNUAL REPORT 2016 NOTEs TO THE CONsOLIDATED FINANCIAL sTATEMENTs
20. Pensions and other long-term employee benefits
As at 31-12-2016
As at 31-12-2015
Pension and early-retirement schemes 18 1 10.6
Other long-term employee benefit commitments 3 0 3.0
Total 21.1 13.6
Pension and early-retirement schemes Pension and early-retirement schemes relate to post-employment defined benefit arrangements.
Other long-term employee benefit commitmentsOther long-term employee benefit commitments relate mainly to anniversary commitments, conditional incentive plans, and health insurance.
Main characteristics of the defined benefit plansCorbion sponsors defined benefit pension plans in the Us and UK. Both plans are closed schemes and based on final pay. Further, Corbion sponsors a legal severance payment plan in Thailand. All plans have been established in accordance with the legal requirements of the countries involved. The defined benefit plans are administered by a separate fund that is legally separated from the entity. The board of the pension fund is composed of an equal number of representatives from both employers and (former) employees.
The plans typically expose the group to actuarial risks such as investment risk, interest rate risk, and longevity risk.
• Investment risk The present value of the defined benefit plan liability is calculated using a discount rate determined by reference to high-quality corporate bond yields; if the return on plan assets is below this rate, it will create a plan deficit. Currently the plans have a relatively balanced investment in mainly equity securities and debt instruments.
• Interest risk A decrease in the bond interest rate will increase the plan liability; however, this will be partly offset by an increase in the return on the plan’s debt investments.
• Longevity risk The present value of the defined benefit liability is calculated by reference to the best estimate of the mortality of plan participants both during and after their employment. An increase in the life expectancy of the plan participants will increase the plan’s liability.
The defined benefit obligation as per year-end consisted for the vast majority of the UK plan and is summarized below:• The Normal Retirement Age (NRA) is 65; however, section 1 members are able to take their
benefits in respect of pre 1 October 2003 service unreduced from age 60.• Pensions in deferment increase in line with statutory revaluation with the exception of pre
1 October 2003 benefits for section 1 members, which have an underpin linked to the level of pension increases in payment (which are linked to RPI).
• Pensions in payment increase in line with RPI capped at 5% for benefits in respect of pre 1 January 2006 service and RPI capped at 2.5% for benefits in respect of post 31 December 2005 service.
The UK pension scheme is in a deficit situation. For this scheme a recovery plan has been agreed in 2013 under which Corbion will contribute additional funding payments of GBP 1.1 million per year (commencing in 2013) with an increase of 5% per year payable until 2028 or until the scheme is no longer in a deficit situation. The strategic investment policy of the scheme can be summarized as follows: • A strategic asset mix comprising 50% in return-seeking assets and 50% in matching
(bond-type) assets. • The return-seeking asset portfolio comprises a mix of equity investments and diversified
growth funds. • Interest rate and inflation risk is managed through the use of liability-driven investments
and corporate bonds of an appropriate duration. • Currency risk is managed by implementing a 50% currency hedge on the global equity holding.
The average duration of the defined benefit obligation as at 31 December 2016 is 28 years.
Breakdown of the amounts recognized in respect of defined benefit pension plans in the income statement and statement of comprehensive income
2016 2015
Current service costs 0 4 0.1
Net interest expense 0 3 0.5
Total pension costs recognized in income statement 0.7 0.6
Remeasurements net defined benefit liability
- Return on plan assets (excluding amounts included in interest income) -15 6 0.7
- Actuarial (gains)/losses arising from changes in demographic assumptions 0.4
- Actuarial (gains)/losses arising from changes in financial assumptions 25 9 -1.4
- Actuarial (gains)/losses arising from experience adjustments -0 5 1.9
Total pension costs recognized in other comprehensive income 9.8 1.6
Total 10.5 2.2
The amounts recognized in the statement of financial position
As at31-12-2016
As at 31-12-2015
Present value of defined benefit obligations 99 2 83.4
Fair value of plan assets 81 1 72.8
Funded status 18.1 10.6
Restrictions on assets recognized
Net liability 18.1 10.6
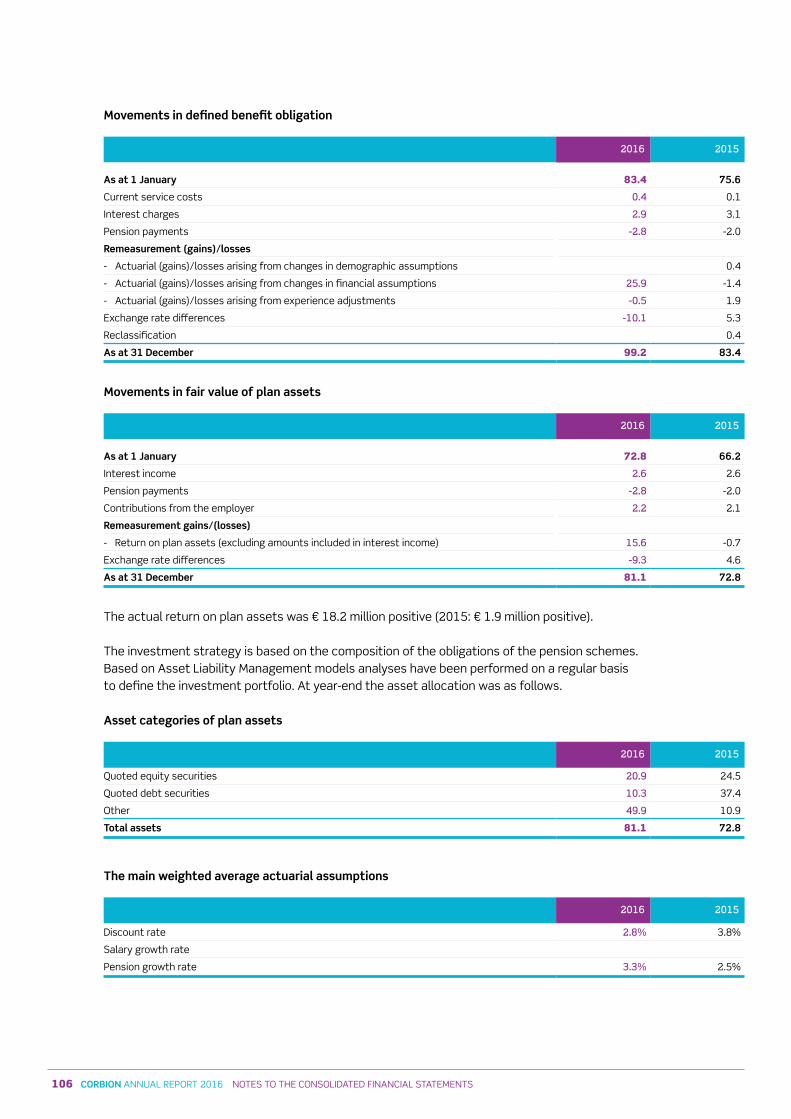
106 CORBION ANNUAL REPORT 2016 NOTEs TO THE CONsOLIDATED FINANCIAL sTATEMENTs
Movements in defined benefit obligation
2016 2015
As at 1 January 83.4 75.6
Current service costs 0 4 0.1
Interest charges 2 9 3.1
Pension payments -2 8 -2.0
Remeasurement (gains)/losses
- Actuarial (gains)/losses arising from changes in demographic assumptions 0.4
- Actuarial (gains)/losses arising from changes in financial assumptions 25 9 -1.4
- Actuarial (gains)/losses arising from experience adjustments -0 5 1.9
Exchange rate differences -10 1 5.3
Reclassification 0.4
As at 31 December 99.2 83.4
Movements in fair value of plan assets
2016 2015
As at 1 January 72.8 66.2
Interest income 2 6 2.6
Pension payments -2 8 -2.0
Contributions from the employer 2 2 2.1
Remeasurement gains/(losses)
- Return on plan assets (excluding amounts included in interest income) 15 6 -0.7
Exchange rate differences -9 3 4.6
As at 31 December 81.1 72.8
The actual return on plan assets was € 18.2 million positive (2015: € 1.9 million positive).
The investment strategy is based on the composition of the obligations of the pension schemes. Based on Asset Liability Management models analyses have been performed on a regular basis to define the investment portfolio. At year-end the asset allocation was as follows.
Asset categories of plan assets
2016 2015
Quoted equity securities 20 9 24.5
Quoted debt securities 10 3 37.4
Other 49 9 10.9
Total assets 81.1 72.8
The main weighted average actuarial assumptions
2016 2015
Discount rate 2 8% 3.8%
salary growth rate
Pension growth rate 3 3% 2.5%
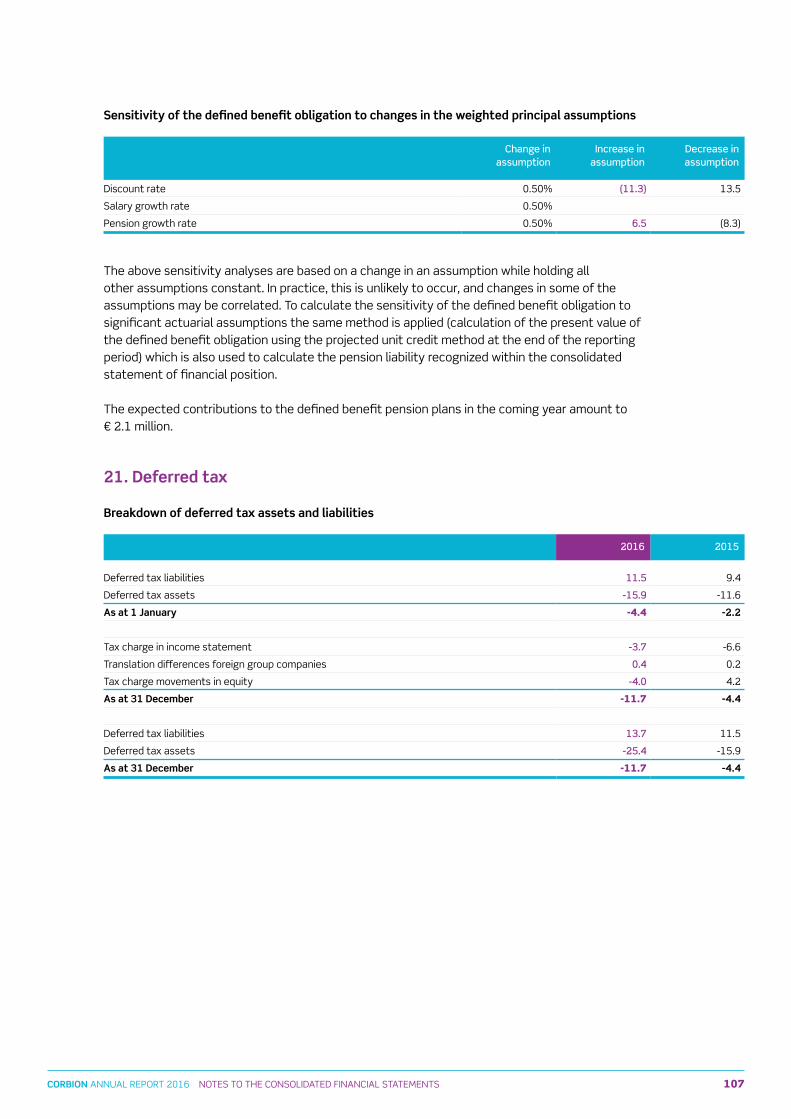
107CORBION ANNUAL REPORT 2016 NOTEs TO THE CONsOLIDATED FINANCIAL sTATEMENTs
Movements in defined benefit obligation
2016 2015
As at 1 January 83.4 75.6
Current service costs 0 4 0.1
Interest charges 2 9 3.1
Pension payments -2 8 -2.0
Remeasurement (gains)/losses
- Actuarial (gains)/losses arising from changes in demographic assumptions 0.4
- Actuarial (gains)/losses arising from changes in financial assumptions 25 9 -1.4
- Actuarial (gains)/losses arising from experience adjustments -0 5 1.9
Exchange rate differences -10 1 5.3
Reclassification 0.4
As at 31 December 99.2 83.4
Movements in fair value of plan assets
2016 2015
As at 1 January 72.8 66.2
Interest income 2 6 2.6
Pension payments -2 8 -2.0
Contributions from the employer 2 2 2.1
Remeasurement gains/(losses)
- Return on plan assets (excluding amounts included in interest income) 15 6 -0.7
Exchange rate differences -9 3 4.6
As at 31 December 81.1 72.8
The actual return on plan assets was € 18.2 million positive (2015: € 1.9 million positive).
The investment strategy is based on the composition of the obligations of the pension schemes. Based on Asset Liability Management models analyses have been performed on a regular basis to define the investment portfolio. At year-end the asset allocation was as follows.
Asset categories of plan assets
2016 2015
Quoted equity securities 20 9 24.5
Quoted debt securities 10 3 37.4
Other 49 9 10.9
Total assets 81.1 72.8
The main weighted average actuarial assumptions
2016 2015
Discount rate 2 8% 3.8%
salary growth rate
Pension growth rate 3 3% 2.5%
Sensitivity of the defined benefit obligation to changes in the weighted principal assumptions
Change inassumption
Increase in assumption
Decrease in assumption
Discount rate 0.50% (11 3) 13.5
salary growth rate 0.50%
Pension growth rate 0.50% 6 5 (8.3)
The above sensitivity analyses are based on a change in an assumption while holding all other assumptions constant. In practice, this is unlikely to occur, and changes in some of the assumptions may be correlated. To calculate the sensitivity of the defined benefit obligation to significant actuarial assumptions the same method is applied (calculation of the present value of the defined benefit obligation using the projected unit credit method at the end of the reporting period) which is also used to calculate the pension liability recognized within the consolidated statement of financial position.
The expected contributions to the defined benefit pension plans in the coming year amount to € 2.1 million.
21. Deferred tax
Breakdown of deferred tax assets and liabilities
2016 2015
Deferred tax liabilities 11 5 9.4
Deferred tax assets -15 9 -11.6
As at 1 January -4.4 -2.2
Tax charge in income statement -3 7 -6.6
Translation differences foreign group companies 0 4 0.2
Tax charge movements in equity -4 0 4.2
As at 31 December -11.7 -4.4
Deferred tax liabilities 13 7 11.5
Deferred tax assets -25 4 -15.9
As at 31 December -11.7 -4.4
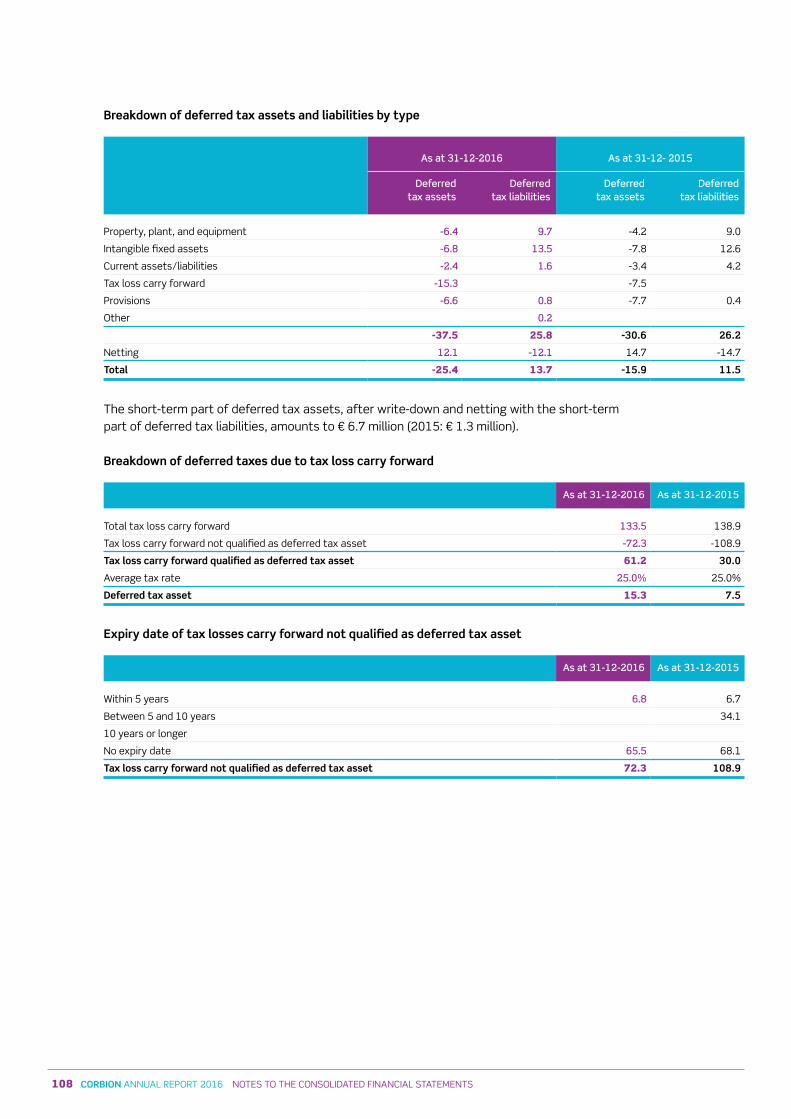
108 CORBION ANNUAL REPORT 2016 NOTEs TO THE CONsOLIDATED FINANCIAL sTATEMENTs
Breakdown of deferred tax assets and liabilities by type
As at 31-12-2016 As at 31-12- 2015
Deferred tax assets
Deferred tax liabilities
Deferred tax assets
Deferred tax liabilities
Property, plant, and equipment -6 4 9 7 -4.2 9.0
Intangible fixed assets -6 8 13 5 -7.8 12.6
Current assets/liabilities -2 4 1 6 -3.4 4.2
Tax loss carry forward -15 3 -7.5
Provisions -6 6 0 8 -7.7 0.4
Other 0 2
-37.5 25.8 -30.6 26.2
Netting 12 1 -12 1 14.7 -14.7
Total -25.4 13.7 -15.9 11.5
The short-term part of deferred tax assets, after write-down and netting with the short-term part of deferred tax liabilities, amounts to € 6.7 million (2015: € 1.3 million). Breakdown of deferred taxes due to tax loss carry forward
As at 31-12-2016 As at 31-12-2015
Total tax loss carry forward 133 5 138.9
Tax loss carry forward not qualified as deferred tax asset -72 3 -108.9
Tax loss carry forward qualified as deferred tax asset 61.2 30.0
Average tax rate 25 0% 25.0%
Deferred tax asset 15.3 7.5
Expiry date of tax losses carry forward not qualified as deferred tax asset
As at 31-12-2016 As at 31-12-2015
Within 5 years 6 8 6.7
Between 5 and 10 years 34.1
10 years or longer
No expiry date 65 5 68.1
Tax loss carry forward not qualified as deferred tax asset 72.3 108.9
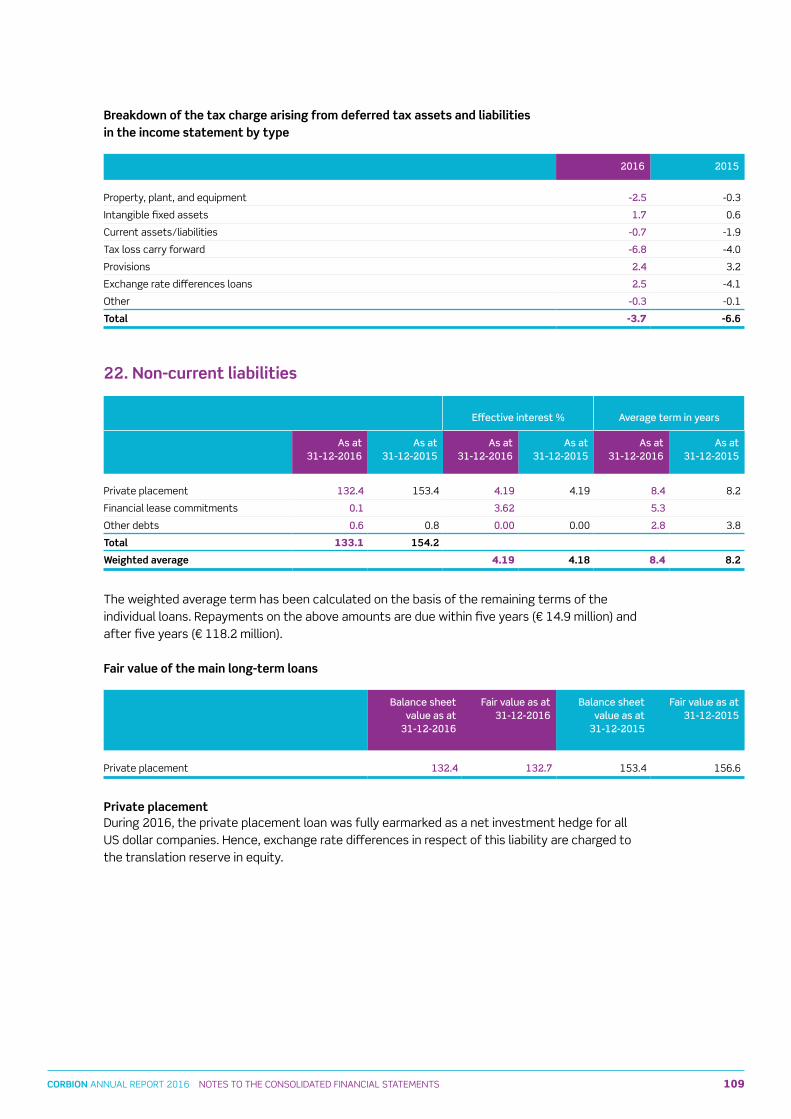
109CORBION ANNUAL REPORT 2016 NOTEs TO THE CONsOLIDATED FINANCIAL sTATEMENTs
Breakdown of deferred tax assets and liabilities by type
As at 31-12-2016 As at 31-12- 2015
Deferred tax assets
Deferred tax liabilities
Deferred tax assets
Deferred tax liabilities
Property, plant, and equipment -6 4 9 7 -4.2 9.0
Intangible fixed assets -6 8 13 5 -7.8 12.6
Current assets/liabilities -2 4 1 6 -3.4 4.2
Tax loss carry forward -15 3 -7.5
Provisions -6 6 0 8 -7.7 0.4
Other 0 2
-37.5 25.8 -30.6 26.2
Netting 12 1 -12 1 14.7 -14.7
Total -25.4 13.7 -15.9 11.5
The short-term part of deferred tax assets, after write-down and netting with the short-term part of deferred tax liabilities, amounts to € 6.7 million (2015: € 1.3 million). Breakdown of deferred taxes due to tax loss carry forward
As at 31-12-2016 As at 31-12-2015
Total tax loss carry forward 133 5 138.9
Tax loss carry forward not qualified as deferred tax asset -72 3 -108.9
Tax loss carry forward qualified as deferred tax asset 61.2 30.0
Average tax rate 25 0% 25.0%
Deferred tax asset 15.3 7.5
Expiry date of tax losses carry forward not qualified as deferred tax asset
As at 31-12-2016 As at 31-12-2015
Within 5 years 6 8 6.7
Between 5 and 10 years 34.1
10 years or longer
No expiry date 65 5 68.1
Tax loss carry forward not qualified as deferred tax asset 72.3 108.9
Breakdown of the tax charge arising from deferred tax assets and liabilitiesin the income statement by type
2016 2015
Property, plant, and equipment -2 5 -0.3
Intangible fixed assets 1 7 0.6
Current assets/liabilities -0 7 -1.9
Tax loss carry forward -6 8 -4.0
Provisions 2 4 3.2
Exchange rate differences loans 2 5 -4.1
Other -0 3 -0.1
Total -3.7 -6.6
22. Non-current liabilities
Effective interest % Average term in years
As at31-12-2016
As at31-12-2015
As at31-12-2016
As at31-12-2015
As at31-12-2016
As at31-12-2015
Private placement 132 4 153.4 4 19 4.19 8 4 8.2
Financial lease commitments 0 1 3 62 5 3
Other debts 0 6 0.8 0 00 0.00 2 8 3.8
Total 133.1 154.2
Weighted average 4.19 4.18 8.4 8.2
The weighted average term has been calculated on the basis of the remaining terms of the individual loans. Repayments on the above amounts are due within five years (€ 14.9 million) and after five years (€ 118.2 million).
Fair value of the main long-term loans
Balance sheet value as at
31-12-2016
Fair value as at 31-12-2016
Balance sheet value as at
31-12-2015
Fair value as at 31-12-2015
Private placement 132 4 132 7 153.4 156.6
Private placementDuring 2016, the private placement loan was fully earmarked as a net investment hedge for all Us dollar companies. Hence, exchange rate differences in respect of this liability are charged to the translation reserve in equity.
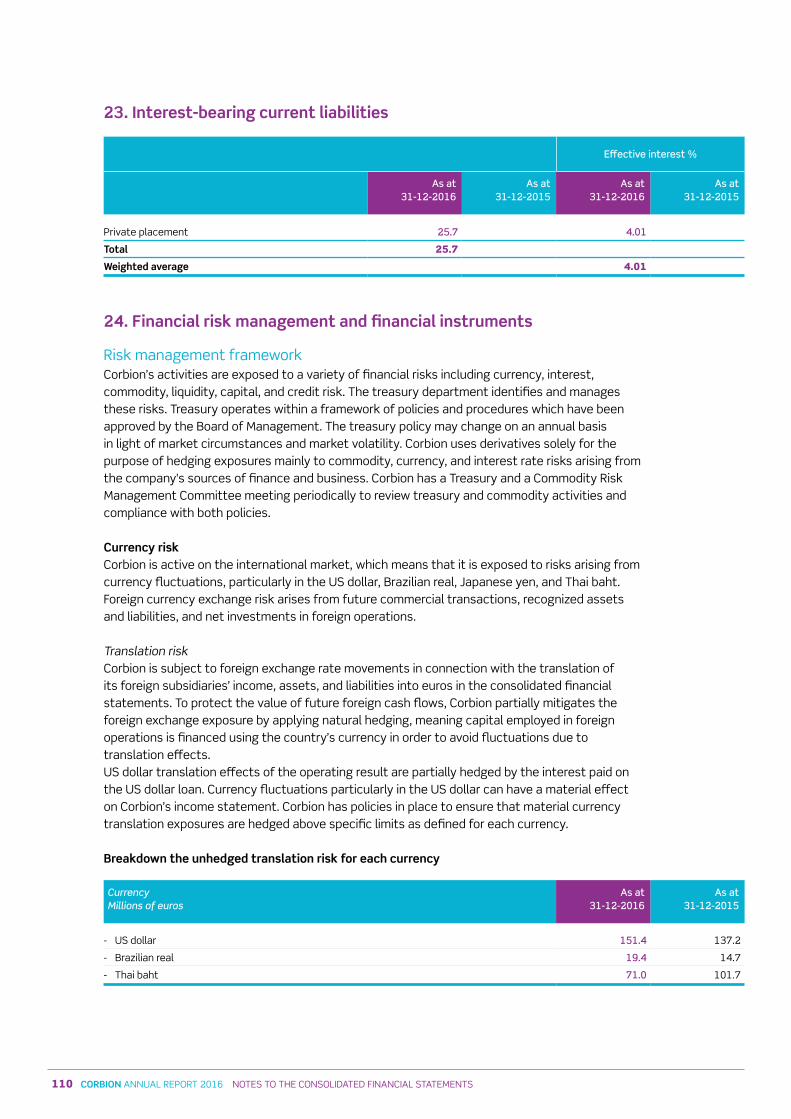
110 CORBION ANNUAL REPORT 2016 NOTEs TO THE CONsOLIDATED FINANCIAL sTATEMENTs
23. Interest-bearing current liabilities
Effective interest %
As at 31-12-2016
As at 31-12-2015
As at 31-12-2016
As at 31-12-2015
Private placement 25 7 4 01
Total 25.7
Weighted average 4.01
24. Financial risk management and financial instruments
Risk management frameworkCorbion’s activities are exposed to a variety of financial risks including currency, interest, commodity, liquidity, capital, and credit risk. The treasury department identifies and manages these risks. Treasury operates within a framework of policies and procedures which have been approved by the Board of Management. The treasury policy may change on an annual basis in light of market circumstances and market volatility. Corbion uses derivatives solely for the purpose of hedging exposures mainly to commodity, currency, and interest rate risks arising from the company's sources of finance and business. Corbion has a Treasury and a Commodity Risk Management Committee meeting periodically to review treasury and commodity activities and compliance with both policies.
Currency riskCorbion is active on the international market, which means that it is exposed to risks arising from currency fluctuations, particularly in the Us dollar, Brazilian real, Japanese yen, and Thai baht. Foreign currency exchange risk arises from future commercial transactions, recognized assets and liabilities, and net investments in foreign operations.
Translation riskCorbion is subject to foreign exchange rate movements in connection with the translation of its foreign subsidiaries’ income, assets, and liabilities into euros in the consolidated financial statements. To protect the value of future foreign cash flows, Corbion partially mitigates the foreign exchange exposure by applying natural hedging, meaning capital employed in foreign operations is financed using the country’s currency in order to avoid fluctuations due to translation effects.Us dollar translation effects of the operating result are partially hedged by the interest paid on the Us dollar loan. Currency fluctuations particularly in the Us dollar can have a material effect on Corbion’s income statement. Corbion has policies in place to ensure that material currency translation exposures are hedged above specific limits as defined for each currency.
Breakdown the unhedged translation risk for each currency
CurrencyMillions of euros
As at31-12-2016
As at31-12-2015
- Us dollar 151 4 137.2
- Brazilian real 19 4 14.7
- Thai baht 71 0 101.7
111CORBION ANNUAL REPORT 2016 NOTEs TO THE CONsOLIDATED FINANCIAL sTATEMENTs
23. Interest-bearing current liabilities
Effective interest %
As at 31-12-2016
As at 31-12-2015
As at 31-12-2016
As at 31-12-2015
Private placement 25 7 4 01
Total 25.7
Weighted average 4.01
24. Financial risk management and financial instruments
Risk management frameworkCorbion’s activities are exposed to a variety of financial risks including currency, interest, commodity, liquidity, capital, and credit risk. The treasury department identifies and manages these risks. Treasury operates within a framework of policies and procedures which have been approved by the Board of Management. The treasury policy may change on an annual basis in light of market circumstances and market volatility. Corbion uses derivatives solely for the purpose of hedging exposures mainly to commodity, currency, and interest rate risks arising from the company's sources of finance and business. Corbion has a Treasury and a Commodity Risk Management Committee meeting periodically to review treasury and commodity activities and compliance with both policies.
Currency riskCorbion is active on the international market, which means that it is exposed to risks arising from currency fluctuations, particularly in the Us dollar, Brazilian real, Japanese yen, and Thai baht. Foreign currency exchange risk arises from future commercial transactions, recognized assets and liabilities, and net investments in foreign operations.
Translation riskCorbion is subject to foreign exchange rate movements in connection with the translation of its foreign subsidiaries’ income, assets, and liabilities into euros in the consolidated financial statements. To protect the value of future foreign cash flows, Corbion partially mitigates the foreign exchange exposure by applying natural hedging, meaning capital employed in foreign operations is financed using the country’s currency in order to avoid fluctuations due to translation effects.Us dollar translation effects of the operating result are partially hedged by the interest paid on the Us dollar loan. Currency fluctuations particularly in the Us dollar can have a material effect on Corbion’s income statement. Corbion has policies in place to ensure that material currency translation exposures are hedged above specific limits as defined for each currency.
Breakdown the unhedged translation risk for each currency
CurrencyMillions of euros
As at31-12-2016
As at31-12-2015
- Us dollar 151 4 137.2
- Brazilian real 19 4 14.7
- Thai baht 71 0 101.7
Transaction risk The currency transaction risk arises in the course of ordinary business activities. Corbion’s exposure to exchange rate movements in commercial operations is mainly related to EUR/UsD, THB/yEN, and EUR/yEN. Corbion uses forward currency contracts and currency swaps in order to hedge risks arising from purchase and sales deals and/or commitments from current purchase and sales contracts. Transactions that are highly probable are hedged and included in cash flow hedge accounting. Other reasonably probable transactions are partially hedged. For practical reasons a specific limit is defined for each currency.Hedge accounting is being applied to these contracts, so any unrealized fluctuations in the fair value are deferred in the hedge reserve of equity until the underlying hedged transaction is recognized in the result. All forward currency contracts expire within a year.
Sensitivity analysis of financial instruments to exchange rate changesA 10% weakening of the euro against the Japanese yen would decrease equity by € 1.2 million, while the net result would not be significantly impacted.
Interest rate riskCorbion's interest rate risk arises primarily from its debt. Corbion has an interest rate policy aimed at reducing volatility in its interest expense and maintaining a target percentage of its debt in fixed rate instruments. Currently, Corbion's interest rate exposure has been fully fixed (4.19% on average) for all of Corbion's long-term debt (€ 133.1 million) for a period of on average 8.4 years.
Sensitivity analysis to changes in market interest rateAssuming the same mix of variable and fixed interest rate instruments, an interest rate increase by 50 basis points versus the rates on 31 December 2016 with all other variables held constant, would result in an increase of € 0 in the net result and of € 0 in equity.
Commodity risk Corbion uses commodity derivative contracts to reduce the risk of price fluctuations in the main commodities used, being wheat, oils, gas, corn, and sugar.
Corbion entered into commodity derivative contracts to hedge the variable price risk of the main commodities used. The fair value of these contracts was an asset of € 2.2 million as at 31 December 2016 (31 December 2015: asset of € 0.1 million). Hedge accounting is applied for the major part of these commodity derivative contracts. Further analysis can be found in the section on hedge transactions. All commodity derivative contracts expire within a year.
Sensitivity analysisIf the purchase price of the involved commodities would increase by 10%, net result would be impacted by € 0.1 million.
Liquidity riskLiquidity risk is the risk of Corbion not being able to obtain sufficient financial means to meet its obligations in time. The company actively manages liquidity risk by maintaining sufficient cash and cash equivalents and the availability to committed borrowing capacity. Corbion manages cash flow based on cash flow analysis for the next 12 months.
The committed credit facilities at Corbion’s long-term disposal amounted to € 300 million as at 31 December 2016. Corbion also has a private placement of $ 167 million with American institutional investors.
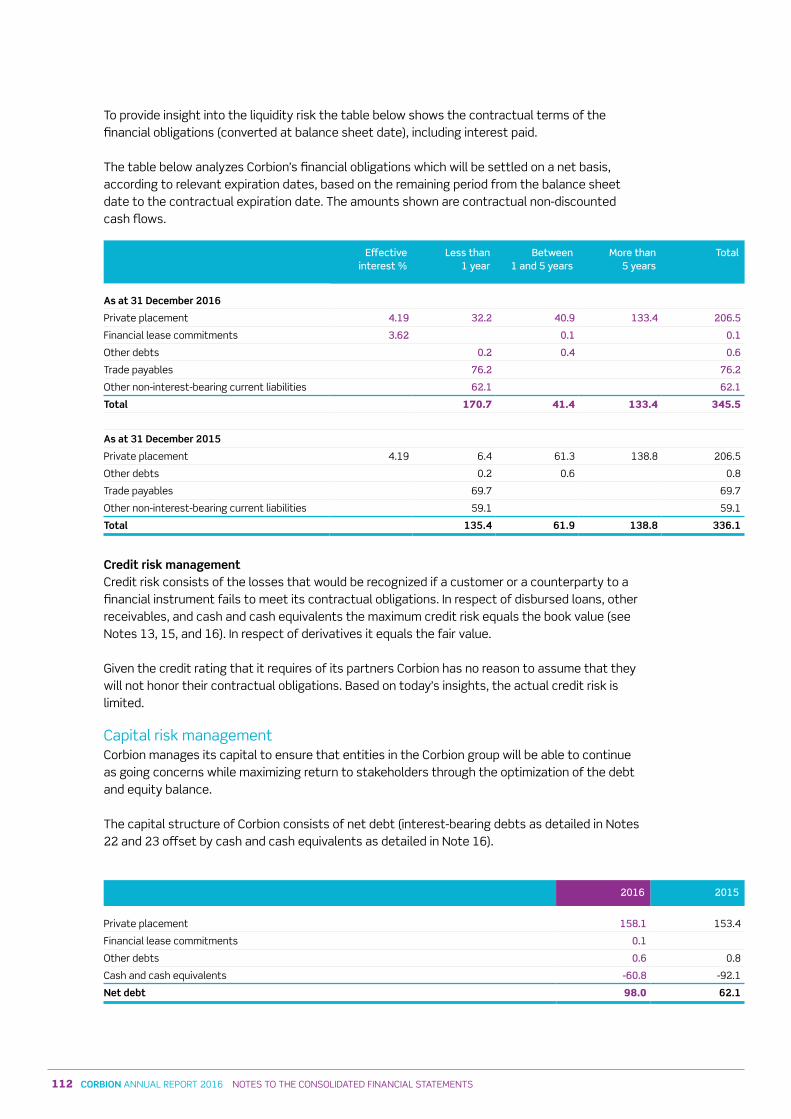
112 CORBION ANNUAL REPORT 2016 NOTEs TO THE CONsOLIDATED FINANCIAL sTATEMENTs
To provide insight into the liquidity risk the table below shows the contractual terms of the financial obligations (converted at balance sheet date), including interest paid.
The table below analyzes Corbion’s financial obligations which will be settled on a net basis, according to relevant expiration dates, based on the remaining period from the balance sheet date to the contractual expiration date. The amounts shown are contractual non-discounted cash flows.
Effective interest %
Less than 1 year
Between 1 and 5 years
More than 5 years
Total
As at 31 December 2016
Private placement 4 19 32 2 40 9 133 4 206 5
Financial lease commitments 3 62 0 1 0 1
Other debts 0 2 0 4 0 6
Trade payables 76 2 76 2
Other non-interest-bearing current liabilities 62 1 62 1
Total 170.7 41.4 133.4 345.5
As at 31 December 2015
Private placement 4.19 6.4 61.3 138.8 206.5
Other debts 0.2 0.6 0.8
Trade payables 69.7 69.7
Other non-interest-bearing current liabilities 59.1 59.1
Total 135.4 61.9 138.8 336.1
Credit risk managementCredit risk consists of the losses that would be recognized if a customer or a counterparty to a financial instrument fails to meet its contractual obligations. In respect of disbursed loans, other receivables, and cash and cash equivalents the maximum credit risk equals the book value (see Notes 13, 15, and 16). In respect of derivatives it equals the fair value.
Given the credit rating that it requires of its partners Corbion has no reason to assume that they will not honor their contractual obligations. Based on today’s insights, the actual credit risk is limited.
Capital risk managementCorbion manages its capital to ensure that entities in the Corbion group will be able to continue as going concerns while maximizing return to stakeholders through the optimization of the debt and equity balance.
The capital structure of Corbion consists of net debt (interest-bearing debts as detailed in Notes 22 and 23 offset by cash and cash equivalents as detailed in Note 16).
2016 2015
Private placement 158 1 153.4
Financial lease commitments 0 1
Other debts 0 6 0.8
Cash and cash equivalents -60 8 -92.1
Net debt 98.0 62.1
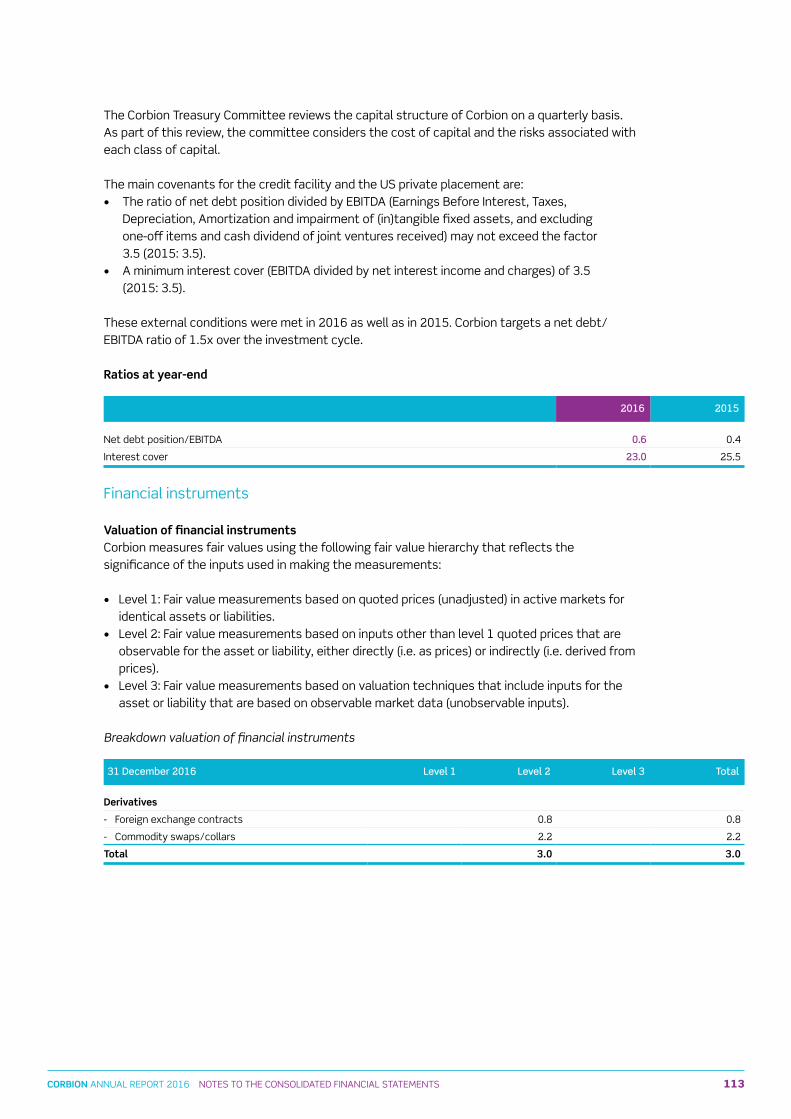
113CORBION ANNUAL REPORT 2016 NOTEs TO THE CONsOLIDATED FINANCIAL sTATEMENTs
To provide insight into the liquidity risk the table below shows the contractual terms of the financial obligations (converted at balance sheet date), including interest paid.
The table below analyzes Corbion’s financial obligations which will be settled on a net basis, according to relevant expiration dates, based on the remaining period from the balance sheet date to the contractual expiration date. The amounts shown are contractual non-discounted cash flows.
Effective interest %
Less than 1 year
Between 1 and 5 years
More than 5 years
Total
As at 31 December 2016
Private placement 4 19 32 2 40 9 133 4 206 5
Financial lease commitments 3 62 0 1 0 1
Other debts 0 2 0 4 0 6
Trade payables 76 2 76 2
Other non-interest-bearing current liabilities 62 1 62 1
Total 170.7 41.4 133.4 345.5
As at 31 December 2015
Private placement 4.19 6.4 61.3 138.8 206.5
Other debts 0.2 0.6 0.8
Trade payables 69.7 69.7
Other non-interest-bearing current liabilities 59.1 59.1
Total 135.4 61.9 138.8 336.1
Credit risk managementCredit risk consists of the losses that would be recognized if a customer or a counterparty to a financial instrument fails to meet its contractual obligations. In respect of disbursed loans, other receivables, and cash and cash equivalents the maximum credit risk equals the book value (see Notes 13, 15, and 16). In respect of derivatives it equals the fair value.
Given the credit rating that it requires of its partners Corbion has no reason to assume that they will not honor their contractual obligations. Based on today’s insights, the actual credit risk is limited.
Capital risk managementCorbion manages its capital to ensure that entities in the Corbion group will be able to continue as going concerns while maximizing return to stakeholders through the optimization of the debt and equity balance.
The capital structure of Corbion consists of net debt (interest-bearing debts as detailed in Notes 22 and 23 offset by cash and cash equivalents as detailed in Note 16).
2016 2015
Private placement 158 1 153.4
Financial lease commitments 0 1
Other debts 0 6 0.8
Cash and cash equivalents -60 8 -92.1
Net debt 98.0 62.1
The Corbion Treasury Committee reviews the capital structure of Corbion on a quarterly basis. As part of this review, the committee considers the cost of capital and the risks associated with each class of capital.
The main covenants for the credit facility and the Us private placement are:• The ratio of net debt position divided by EBITDA (Earnings Before Interest, Taxes,
Depreciation, Amortization and impairment of (in)tangible fixed assets, and excluding one-off items and cash dividend of joint ventures received) may not exceed the factor 3.5 (2015: 3.5).
• A minimum interest cover (EBITDA divided by net interest income and charges) of 3.5 (2015: 3.5).
These external conditions were met in 2016 as well as in 2015. Corbion targets a net debt/EBITDA ratio of 1.5x over the investment cycle.
Ratios at year-end
2016 2015
Net debt position/EBITDA 0 6 0.4
Interest cover 23 0 25.5
Financial instruments
Valuation of financial instrumentsCorbion measures fair values using the following fair value hierarchy that reflects the significance of the inputs used in making the measurements:
• Level 1: Fair value measurements based on quoted prices (unadjusted) in active markets for identical assets or liabilities.
• Level 2: Fair value measurements based on inputs other than level 1 quoted prices that are observable for the asset or liability, either directly (i.e. as prices) or indirectly (i.e. derived from prices).
• Level 3: Fair value measurements based on valuation techniques that include inputs for the asset or liability that are based on observable market data (unobservable inputs).
Breakdown valuation of financial instruments
31 December 2016 Level 1 Level 2 Level 3 Total
Derivatives
- Foreign exchange contracts 0.8 0.8
- Commodity swaps/collars 2.2 2.2
Total 3.0 3.0
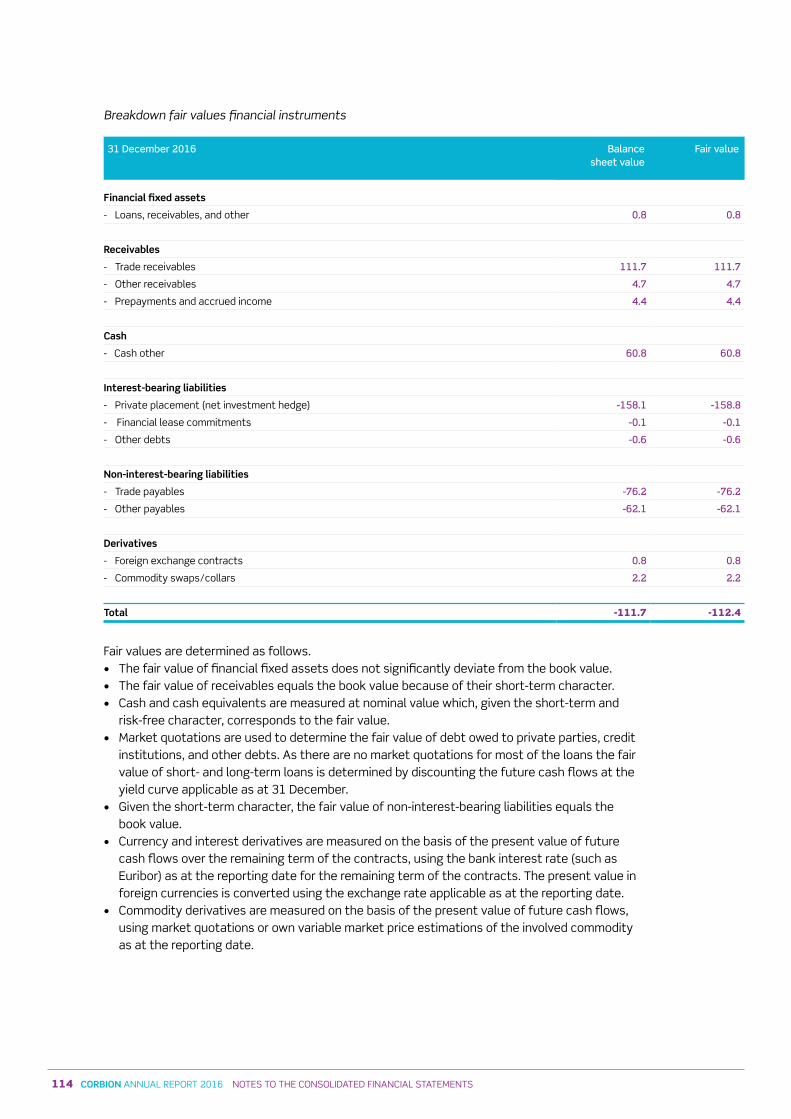
114 CORBION ANNUAL REPORT 2016 NOTEs TO THE CONsOLIDATED FINANCIAL sTATEMENTs
Breakdown fair values financial instruments
31 December 2016 Balance sheet value
Fair value
Financial fixed assets
- Loans, receivables, and other 0 8 0 8
Receivables
- Trade receivables 111 7 111 7
- Other receivables 4 7 4 7
- Prepayments and accrued income 4 4 4 4
Cash
- Cash other 60 8 60 8
Interest-bearing liabilities
- Private placement (net investment hedge) -158 1 -158 8
- Financial lease commitments -0 1 -0 1
- Other debts -0 6 -0 6
Non-interest-bearing liabilities
- Trade payables -76 2 -76 2
- Other payables -62 1 -62 1
Derivatives
- Foreign exchange contracts 0 8 0 8
- Commodity swaps/collars 2 2 2 2
Total -111.7 -112.4
Fair values are determined as follows.• The fair value of financial fixed assets does not significantly deviate from the book value.• The fair value of receivables equals the book value because of their short-term character.• Cash and cash equivalents are measured at nominal value which, given the short-term and
risk-free character, corresponds to the fair value.• Market quotations are used to determine the fair value of debt owed to private parties, credit
institutions, and other debts. As there are no market quotations for most of the loans the fair value of short- and long-term loans is determined by discounting the future cash flows at the yield curve applicable as at 31 December.
• Given the short-term character, the fair value of non-interest-bearing liabilities equals the book value.
• Currency and interest derivatives are measured on the basis of the present value of future cash flows over the remaining term of the contracts, using the bank interest rate (such as Euribor) as at the reporting date for the remaining term of the contracts. The present value in foreign currencies is converted using the exchange rate applicable as at the reporting date.
• Commodity derivatives are measured on the basis of the present value of future cash flows, using market quotations or own variable market price estimations of the involved commodity as at the reporting date.
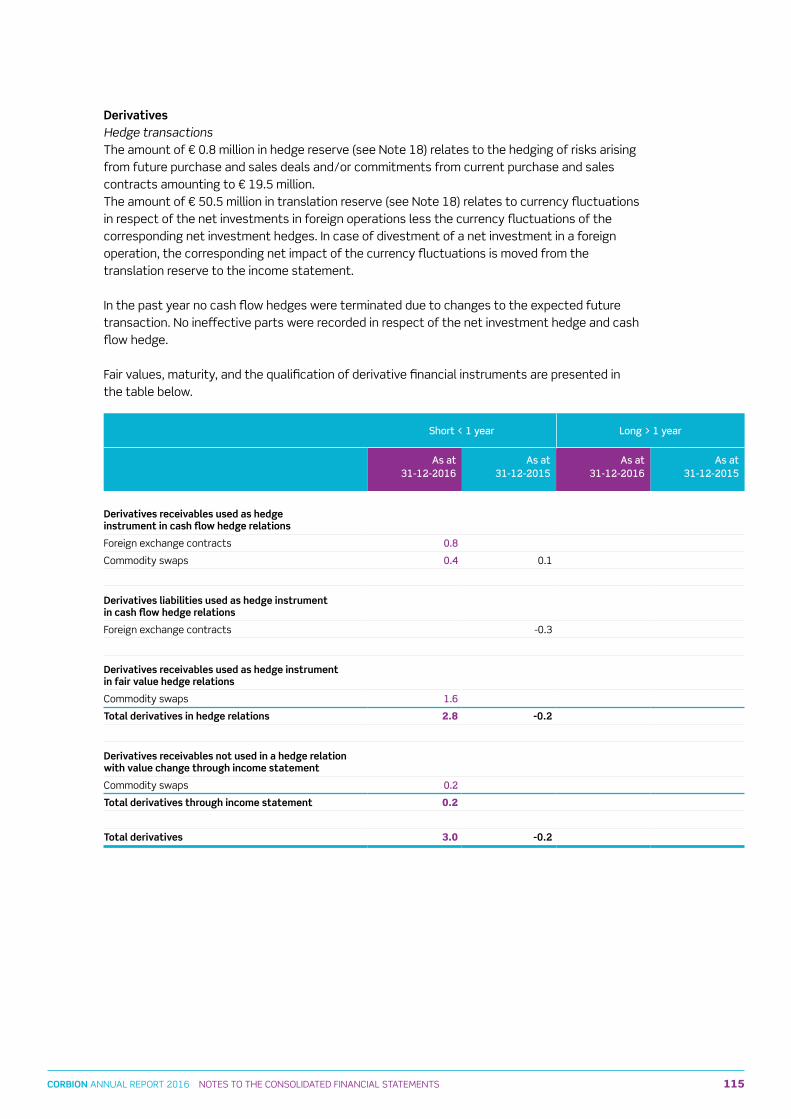
115CORBION ANNUAL REPORT 2016 NOTEs TO THE CONsOLIDATED FINANCIAL sTATEMENTs
Breakdown fair values financial instruments
31 December 2016 Balance sheet value
Fair value
Financial fixed assets
- Loans, receivables, and other 0 8 0 8
Receivables
- Trade receivables 111 7 111 7
- Other receivables 4 7 4 7
- Prepayments and accrued income 4 4 4 4
Cash
- Cash other 60 8 60 8
Interest-bearing liabilities
- Private placement (net investment hedge) -158 1 -158 8
- Financial lease commitments -0 1 -0 1
- Other debts -0 6 -0 6
Non-interest-bearing liabilities
- Trade payables -76 2 -76 2
- Other payables -62 1 -62 1
Derivatives
- Foreign exchange contracts 0 8 0 8
- Commodity swaps/collars 2 2 2 2
Total -111.7 -112.4
Fair values are determined as follows.• The fair value of financial fixed assets does not significantly deviate from the book value.• The fair value of receivables equals the book value because of their short-term character.• Cash and cash equivalents are measured at nominal value which, given the short-term and
risk-free character, corresponds to the fair value.• Market quotations are used to determine the fair value of debt owed to private parties, credit
institutions, and other debts. As there are no market quotations for most of the loans the fair value of short- and long-term loans is determined by discounting the future cash flows at the yield curve applicable as at 31 December.
• Given the short-term character, the fair value of non-interest-bearing liabilities equals the book value.
• Currency and interest derivatives are measured on the basis of the present value of future cash flows over the remaining term of the contracts, using the bank interest rate (such as Euribor) as at the reporting date for the remaining term of the contracts. The present value in foreign currencies is converted using the exchange rate applicable as at the reporting date.
• Commodity derivatives are measured on the basis of the present value of future cash flows, using market quotations or own variable market price estimations of the involved commodity as at the reporting date.
DerivativesHedge transactionsThe amount of € 0.8 million in hedge reserve (see Note 18) relates to the hedging of risks arising from future purchase and sales deals and/or commitments from current purchase and sales contracts amounting to € 19.5 million.The amount of € 50.5 million in translation reserve (see Note 18) relates to currency fluctuations in respect of the net investments in foreign operations less the currency fluctuations of the corresponding net investment hedges. In case of divestment of a net investment in a foreign operation, the corresponding net impact of the currency fluctuations is moved from the translation reserve to the income statement.
In the past year no cash flow hedges were terminated due to changes to the expected future transaction. No ineffective parts were recorded in respect of the net investment hedge and cash flow hedge.
Fair values, maturity, and the qualification of derivative financial instruments are presented in the table below.
Short < 1 year Long > 1 year
As at31-12-2016
As at31-12-2015
As at31-12-2016
As at31-12-2015
Derivatives receivables used as hedge instrument in cash flow hedge relations
Foreign exchange contracts 0 8
Commodity swaps 0 4 0.1
Derivatives liabilities used as hedge instrument in cash flow hedge relations
Foreign exchange contracts -0.3
Derivatives receivables used as hedge instrument in fair value hedge relations
Commodity swaps 1 6
Total derivatives in hedge relations 2.8 -0.2
Derivatives receivables not used in a hedge relation with value change through income statement
Commodity swaps 0 2
Total derivatives through income statement 0.2
Total derivatives 3.0 -0.2
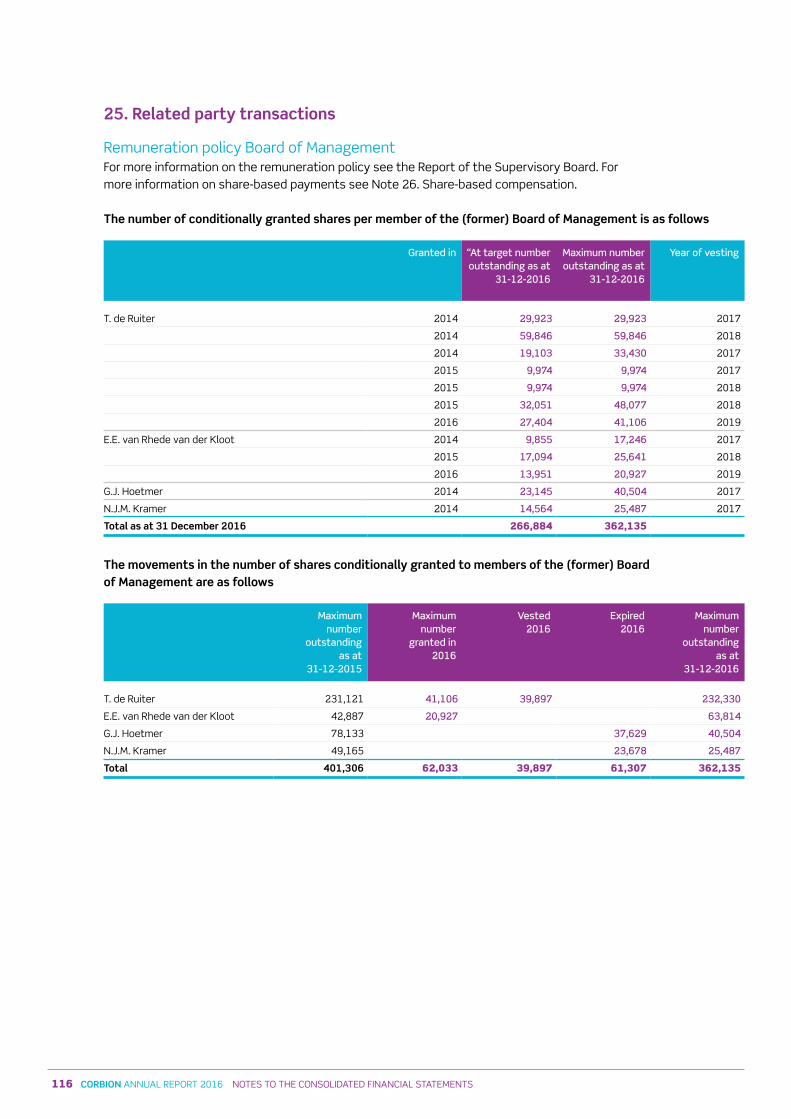
116 CORBION ANNUAL REPORT 2016 NOTEs TO THE CONsOLIDATED FINANCIAL sTATEMENTs
25. Related party transactions
Remuneration policy Board of ManagementFor more information on the remuneration policy see the Report of the supervisory Board. For more information on share-based payments see Note 26. share-based compensation.
The number of conditionally granted shares per member of the (former) Board of Management is as follows
Granted in “At target number outstanding as at
31-12-2016
Maximum number outstanding as at
31-12-2016
Year of vesting
T. de Ruiter 2014 29,923 29,923 2017
2014 59,846 59,846 2018
2014 19,103 33,430 2017
2015 9,974 9,974 2017
2015 9,974 9,974 2018
2015 32,051 48,077 2018
2016 27,404 41,106 2019
E.E. van Rhede van der Kloot 2014 9,855 17,246 2017
2015 17,094 25,641 2018
2016 13,951 20,927 2019
G.J. Hoetmer 2014 23,145 40,504 2017
N.J.M. Kramer 2014 14,564 25,487 2017
Total as at 31 December 2016 266,884 362,135
The movements in the number of shares conditionally granted to members of the (former) Board of Management are as follows
Maximum number
outstanding as at
31-12-2015
Maximum number
granted in 2016
Vested2016
Expired2016
Maximumnumber
outstanding as at
31-12-2016
T. de Ruiter 231,121 41,106 39,897 232,330
E.E. van Rhede van der Kloot 42,887 20,927 63,814
G.J. Hoetmer 78,133 37,629 40,504
N.J.M. Kramer 49,165 23,678 25,487
Total 401,306 62,033 39,897 61,307 362,135
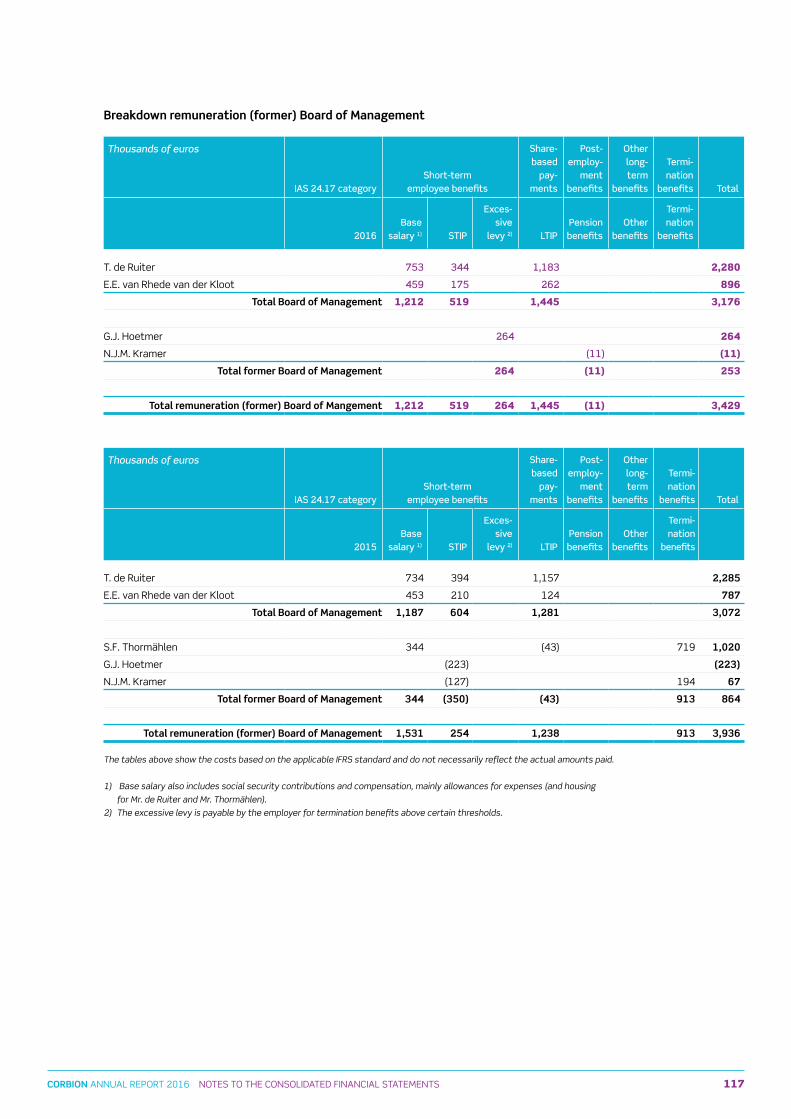
117CORBION ANNUAL REPORT 2016 NOTEs TO THE CONsOLIDATED FINANCIAL sTATEMENTs
25. Related party transactions
Remuneration policy Board of ManagementFor more information on the remuneration policy see the Report of the supervisory Board. For more information on share-based payments see Note 26. share-based compensation.
The number of conditionally granted shares per member of the (former) Board of Management is as follows
Granted in “At target number outstanding as at
31-12-2016
Maximum number outstanding as at
31-12-2016
Year of vesting
T. de Ruiter 2014 29,923 29,923 2017
2014 59,846 59,846 2018
2014 19,103 33,430 2017
2015 9,974 9,974 2017
2015 9,974 9,974 2018
2015 32,051 48,077 2018
2016 27,404 41,106 2019
E.E. van Rhede van der Kloot 2014 9,855 17,246 2017
2015 17,094 25,641 2018
2016 13,951 20,927 2019
G.J. Hoetmer 2014 23,145 40,504 2017
N.J.M. Kramer 2014 14,564 25,487 2017
Total as at 31 December 2016 266,884 362,135
The movements in the number of shares conditionally granted to members of the (former) Board of Management are as follows
Maximum number
outstanding as at
31-12-2015
Maximum number
granted in 2016
Vested2016
Expired2016
Maximumnumber
outstanding as at
31-12-2016
T. de Ruiter 231,121 41,106 39,897 232,330
E.E. van Rhede van der Kloot 42,887 20,927 63,814
G.J. Hoetmer 78,133 37,629 40,504
N.J.M. Kramer 49,165 23,678 25,487
Total 401,306 62,033 39,897 61,307 362,135
Breakdown remuneration (former) Board of Management
Thousands of euros
IAS 24 17 categoryShort-term
employee benefits
Share-based
pay-ments
Post-employ-
ment benefits
Other long-term
benefits
Termi-nation
benefits Total
2016Base
salary 1) STIP
Exces-sive
levy 2) LTIPPension benefits
Other benefits
Termi-nation
benefits
T. de Ruiter 753 344 1,183 2,280
E.E. van Rhede van der Kloot 459 175 262 896
Total Board of Management 1,212 519 1,445 3,176
G.J. Hoetmer 264 264
N.J.M. Kramer (11) (11)
Total former Board of Management 264 (11) 253
Total remuneration (former) Board of Mangement 1,212 519 264 1,445 (11) 3,429
Thousands of euros
IAS 24 17 categoryShort-term
employee benefits
Share-based
pay-ments
Post-employ-
ment benefits
Other long-term
benefits
Termi-nation
benefits Total
2015Base
salary 1) STIP
Exces-sive
levy 2) LTIPPension benefits
Other benefits
Termi-nation
benefits
T. de Ruiter 734 394 1,157 2,285
E.E. van Rhede van der Kloot 453 210 124 787
Total Board of Management 1,187 604 1,281 3,072
s.F. Thormählen 344 (43) 719 1,020
G.J. Hoetmer (223) (223)
N.J.M. Kramer (127) 194 67
Total former Board of Management 344 (350) (43) 913 864
Total remuneration (former) Board of Management 1,531 254 1,238 913 3,936
The tables above show the costs based on the applicable IFRS standard and do not necessarily reflect the actual amounts paid.
1) Base salary also includes social security contributions and compensation, mainly allowances for expenses (and housing
for Mr. de Ruiter and Mr. Thormählen).
2) The excessive levy is payable by the employer for termination benefits above certain thresholds.

118 CORBION ANNUAL REPORT 2016 NOTEs TO THE CONsOLIDATED FINANCIAL sTATEMENTs
Compensation of key management personnelThe table below specifies the remuneration of the Executive Committee (ExCo), comprising the Board of Management members as listed above and the additional ExCo members who are not part of the Board of Management.
Thousands of euros 2016 2015
short-term employee benefits 3,269 3,694
share-based payments 1,977 1,422
Post-employment benefits 37 23
Other long-term benefits
Termination benefits 719
Breakdown remuneration Supervisory Board
Thousands of euros IAS 24 7 category
Short-term
employee benefits 1)
Share-based
payments
Post-em-ployment
benefits
Other long-term
benefits
Termi-nation
benefits Total
Year
Base fee
Committee fee LTIP
Pension benefits
Other benefits
Severancepayments
M.F.J.P. Vrijsen, Chairman; Vice-Chairman until May 2015 (Chairman Nomination Committee, member until May 2015 / member Remuneration Committee, Chairman until May 2015 / member science & Technology Committee)
2016 60 18 78
2015 56 17 73
R.H.P. Markham, Vice-Chairman; Chairman until May 2015, (Chairman Remuneration Committee, member until May 2015 / member Nomination Committee, Chairman until May 2015)
2016 50 13 63
2015 54 13 67
M.E. Doherty (member Audit Committee), appointed per May 2015
2016 45 10 55
2015 27 6 33
J.P. de Kreij (Chairman Audit Committee), member until May 2016
2016 45 15 60
2015 45 10 55
R. Pieterse (Chairman Audit Committee, resigned per May 2016)
2016 17 4 21
2015 45 15 60
s. Riisgaard (Chairman science and Technology Committee, member Remuneration Committee/Nomination Committee)
2016 45 18 63
2015 45 17 62
W. spinner (member Audit Committee), resigned per May 2015
2016
2015 18 4 22
Total 2016 262 78 340
Total 2015 290 82 372
1) Excluding expenses
No loans, advance payments, or any guarantees to that effect have been made or issued to the members of the supervisory Board. None of the members of the supervisory Board has shares in the company or any option rights relating thereto.
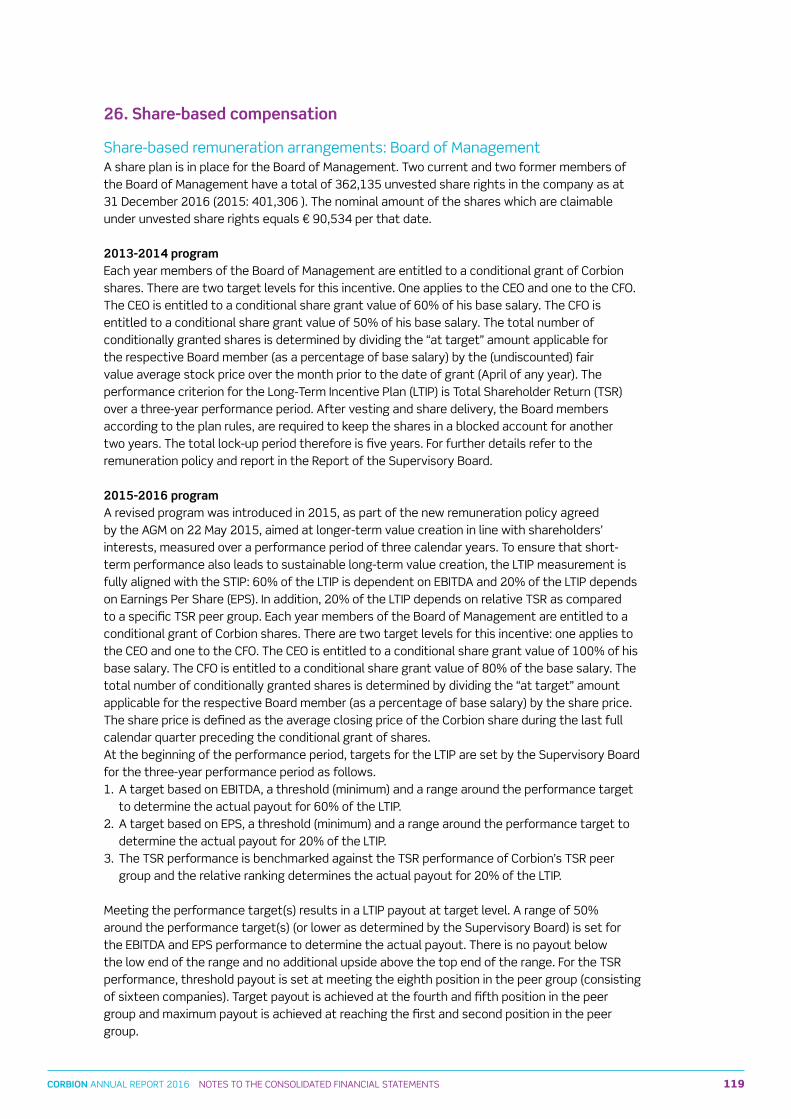
119CORBION ANNUAL REPORT 2016 NOTEs TO THE CONsOLIDATED FINANCIAL sTATEMENTs
Compensation of key management personnelThe table below specifies the remuneration of the Executive Committee (ExCo), comprising the Board of Management members as listed above and the additional ExCo members who are not part of the Board of Management.
Thousands of euros 2016 2015
short-term employee benefits 3,269 3,694
share-based payments 1,977 1,422
Post-employment benefits 37 23
Other long-term benefits
Termination benefits 719
Breakdown remuneration Supervisory Board
Thousands of euros IAS 24 7 category
Short-term
employee benefits 1)
Share-based
payments
Post-em-ployment
benefits
Other long-term
benefits
Termi-nation
benefits Total
Year
Base fee
Committee fee LTIP
Pension benefits
Other benefits
Severancepayments
M.F.J.P. Vrijsen, Chairman; Vice-Chairman until May 2015 (Chairman Nomination Committee, member until May 2015 / member Remuneration Committee, Chairman until May 2015 / member science & Technology Committee)
2016 60 18 78
2015 56 17 73
R.H.P. Markham, Vice-Chairman; Chairman until May 2015, (Chairman Remuneration Committee, member until May 2015 / member Nomination Committee, Chairman until May 2015)
2016 50 13 63
2015 54 13 67
M.E. Doherty (member Audit Committee), appointed per May 2015
2016 45 10 55
2015 27 6 33
J.P. de Kreij (Chairman Audit Committee), member until May 2016
2016 45 15 60
2015 45 10 55
R. Pieterse (Chairman Audit Committee, resigned per May 2016)
2016 17 4 21
2015 45 15 60
s. Riisgaard (Chairman science and Technology Committee, member Remuneration Committee/Nomination Committee)
2016 45 18 63
2015 45 17 62
W. spinner (member Audit Committee), resigned per May 2015
2016
2015 18 4 22
Total 2016 262 78 340
Total 2015 290 82 372
1) Excluding expenses
No loans, advance payments, or any guarantees to that effect have been made or issued to the members of the supervisory Board. None of the members of the supervisory Board has shares in the company or any option rights relating thereto.
26. Share-based compensation
share-based remuneration arrangements: Board of ManagementA share plan is in place for the Board of Management. Two current and two former members of the Board of Management have a total of 362,135 unvested share rights in the company as at 31 December 2016 (2015: 401,306 ). The nominal amount of the shares which are claimable under unvested share rights equals € 90,534 per that date.
2013-2014 programEach year members of the Board of Management are entitled to a conditional grant of Corbion shares. There are two target levels for this incentive. One applies to the CEO and one to the CFO. The CEO is entitled to a conditional share grant value of 60% of his base salary. The CFO is entitled to a conditional share grant value of 50% of his base salary. The total number of conditionally granted shares is determined by dividing the “at target” amount applicable for the respective Board member (as a percentage of base salary) by the (undiscounted) fair value average stock price over the month prior to the date of grant (April of any year). The performance criterion for the Long-Term Incentive Plan (LTIP) is Total shareholder Return (TsR) over a three-year performance period. After vesting and share delivery, the Board members according to the plan rules, are required to keep the shares in a blocked account for another two years. The total lock-up period therefore is five years. For further details refer to the remuneration policy and report in the Report of the supervisory Board.
2015-2016 programA revised program was introduced in 2015, as part of the new remuneration policy agreed by the AGM on 22 May 2015, aimed at longer-term value creation in line with shareholders’ interests, measured over a performance period of three calendar years. To ensure that short-term performance also leads to sustainable long-term value creation, the LTIP measurement is fully aligned with the sTIP: 60% of the LTIP is dependent on EBITDA and 20% of the LTIP depends on Earnings Per share (EPs). In addition, 20% of the LTIP depends on relative TsR as compared to a specific TsR peer group. Each year members of the Board of Management are entitled to a conditional grant of Corbion shares. There are two target levels for this incentive: one applies to the CEO and one to the CFO. The CEO is entitled to a conditional share grant value of 100% of his base salary. The CFO is entitled to a conditional share grant value of 80% of the base salary. The total number of conditionally granted shares is determined by dividing the “at target” amount applicable for the respective Board member (as a percentage of base salary) by the share price. The share price is defined as the average closing price of the Corbion share during the last full calendar quarter preceding the conditional grant of shares.At the beginning of the performance period, targets for the LTIP are set by the supervisory Board for the three-year performance period as follows.1. A target based on EBITDA, a threshold (minimum) and a range around the performance target
to determine the actual payout for 60% of the LTIP.2. A target based on EPs, a threshold (minimum) and a range around the performance target to
determine the actual payout for 20% of the LTIP. 3. The TsR performance is benchmarked against the TsR performance of Corbion’s TsR peer
group and the relative ranking determines the actual payout for 20% of the LTIP.
Meeting the performance target(s) results in a LTIP payout at target level. A range of 50% around the performance target(s) (or lower as determined by the supervisory Board) is set for the EBITDA and EPs performance to determine the actual payout. There is no payout below the low end of the range and no additional upside above the top end of the range. For the TsR performance, threshold payout is set at meeting the eighth position in the peer group (consisting of sixteen companies). Target payout is achieved at the fourth and fifth position in the peer group and maximum payout is achieved at reaching the first and second position in the peer group.
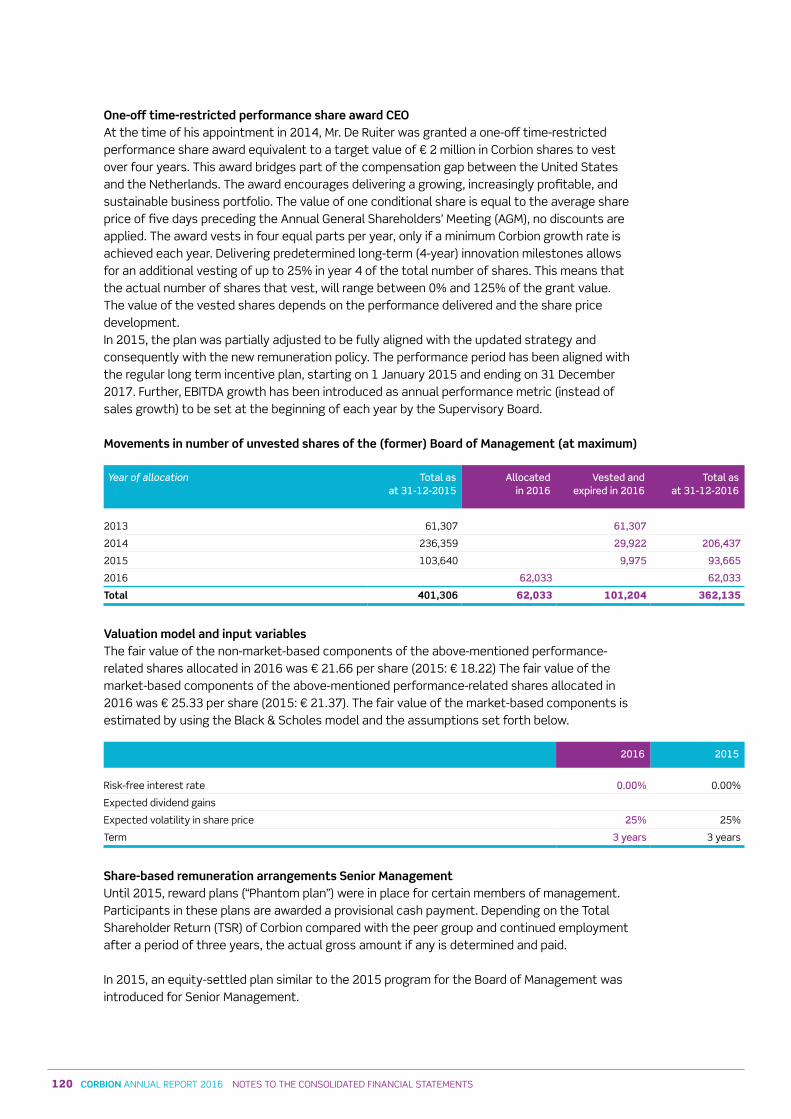
120 CORBION ANNUAL REPORT 2016 NOTEs TO THE CONsOLIDATED FINANCIAL sTATEMENTs
One-off time-restricted performance share award CEOAt the time of his appointment in 2014, Mr. De Ruiter was granted a one-off time-restricted performance share award equivalent to a target value of € 2 million in Corbion shares to vest over four years. This award bridges part of the compensation gap between the United states and the Netherlands. The award encourages delivering a growing, increasingly profitable, and sustainable business portfolio. The value of one conditional share is equal to the average share price of five days preceding the Annual General shareholders’ Meeting (AGM), no discounts are applied. The award vests in four equal parts per year, only if a minimum Corbion growth rate is achieved each year. Delivering predetermined long-term (4-year) innovation milestones allows for an additional vesting of up to 25% in year 4 of the total number of shares. This means that the actual number of shares that vest, will range between 0% and 125% of the grant value. The value of the vested shares depends on the performance delivered and the share price development. In 2015, the plan was partially adjusted to be fully aligned with the updated strategy and consequently with the new remuneration policy. The performance period has been aligned with the regular long term incentive plan, starting on 1 January 2015 and ending on 31 December 2017. Further, EBITDA growth has been introduced as annual performance metric (instead of sales growth) to be set at the beginning of each year by the supervisory Board.
Movements in number of unvested shares of the (former) Board of Management (at maximum)
Year of allocation Total as at 31-12-2015
Allocated in 2016
Vested and expired in 2016
Total as at 31-12-2016
2013 61,307 61,307
2014 236,359 29,922 206,437
2015 103,640 9,975 93,665
2016 62,033 62,033
Total 401,306 62,033 101,204 362,135
Valuation model and input variables The fair value of the non-market-based components of the above-mentioned performance-related shares allocated in 2016 was € 21.66 per share (2015: € 18.22) The fair value of the market-based components of the above-mentioned performance-related shares allocated in 2016 was € 25.33 per share (2015: € 21.37). The fair value of the market-based components is estimated by using the Black & scholes model and the assumptions set forth below.
2016 2015
Risk-free interest rate 0 00% 0.00%
Expected dividend gains
Expected volatility in share price 25% 25%
Term 3 years 3 years
Share-based remuneration arrangements Senior ManagementUntil 2015, reward plans (“Phantom plan”) were in place for certain members of management. Participants in these plans are awarded a provisional cash payment. Depending on the Total shareholder Return (TsR) of Corbion compared with the peer group and continued employment after a period of three years, the actual gross amount if any is determined and paid. In 2015, an equity-settled plan similar to the 2015 program for the Board of Management was introduced for senior Management.
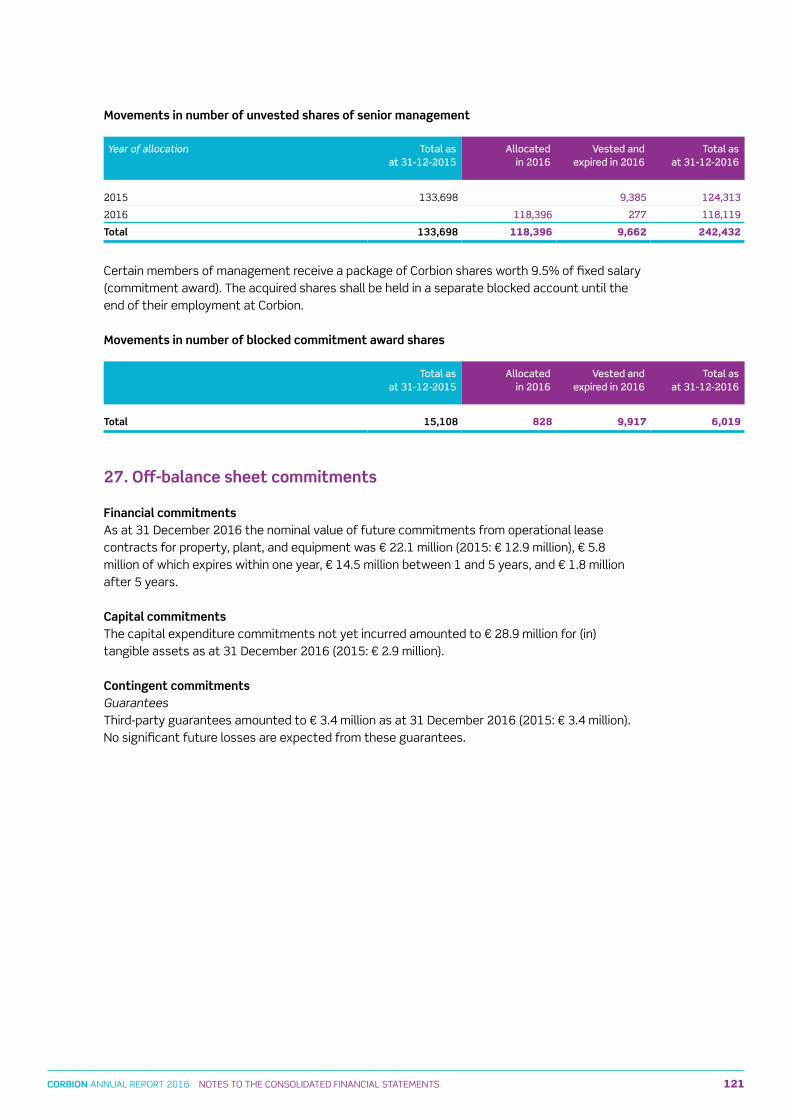
121CORBION ANNUAL REPORT 2016 NOTEs TO THE CONsOLIDATED FINANCIAL sTATEMENTs
One-off time-restricted performance share award CEOAt the time of his appointment in 2014, Mr. De Ruiter was granted a one-off time-restricted performance share award equivalent to a target value of € 2 million in Corbion shares to vest over four years. This award bridges part of the compensation gap between the United states and the Netherlands. The award encourages delivering a growing, increasingly profitable, and sustainable business portfolio. The value of one conditional share is equal to the average share price of five days preceding the Annual General shareholders’ Meeting (AGM), no discounts are applied. The award vests in four equal parts per year, only if a minimum Corbion growth rate is achieved each year. Delivering predetermined long-term (4-year) innovation milestones allows for an additional vesting of up to 25% in year 4 of the total number of shares. This means that the actual number of shares that vest, will range between 0% and 125% of the grant value. The value of the vested shares depends on the performance delivered and the share price development. In 2015, the plan was partially adjusted to be fully aligned with the updated strategy and consequently with the new remuneration policy. The performance period has been aligned with the regular long term incentive plan, starting on 1 January 2015 and ending on 31 December 2017. Further, EBITDA growth has been introduced as annual performance metric (instead of sales growth) to be set at the beginning of each year by the supervisory Board.
Movements in number of unvested shares of the (former) Board of Management (at maximum)
Year of allocation Total as at 31-12-2015
Allocated in 2016
Vested and expired in 2016
Total as at 31-12-2016
2013 61,307 61,307
2014 236,359 29,922 206,437
2015 103,640 9,975 93,665
2016 62,033 62,033
Total 401,306 62,033 101,204 362,135
Valuation model and input variables The fair value of the non-market-based components of the above-mentioned performance-related shares allocated in 2016 was € 21.66 per share (2015: € 18.22) The fair value of the market-based components of the above-mentioned performance-related shares allocated in 2016 was € 25.33 per share (2015: € 21.37). The fair value of the market-based components is estimated by using the Black & scholes model and the assumptions set forth below.
2016 2015
Risk-free interest rate 0 00% 0.00%
Expected dividend gains
Expected volatility in share price 25% 25%
Term 3 years 3 years
Share-based remuneration arrangements Senior ManagementUntil 2015, reward plans (“Phantom plan”) were in place for certain members of management. Participants in these plans are awarded a provisional cash payment. Depending on the Total shareholder Return (TsR) of Corbion compared with the peer group and continued employment after a period of three years, the actual gross amount if any is determined and paid. In 2015, an equity-settled plan similar to the 2015 program for the Board of Management was introduced for senior Management.
Movements in number of unvested shares of senior management
Year of allocation Total as at 31-12-2015
Allocated in 2016
Vested and expired in 2016
Total as at 31-12-2016
2015 133,698 9,385 124,313
2016 118,396 277 118,119
Total 133,698 118,396 9,662 242,432
Certain members of management receive a package of Corbion shares worth 9.5% of fixed salary (commitment award). The acquired shares shall be held in a separate blocked account until the end of their employment at Corbion.
Movements in number of blocked commitment award shares
Total as at 31-12-2015
Allocated in 2016
Vested and expired in 2016
Total as at 31-12-2016
Total 15,108 828 9,917 6,019
27. Off-balance sheet commitments
Financial commitmentsAs at 31 December 2016 the nominal value of future commitments from operational lease contracts for property, plant, and equipment was € 22.1 million (2015: € 12.9 million), € 5.8 million of which expires within one year, € 14.5 million between 1 and 5 years, and € 1.8 million after 5 years.
Capital commitmentsThe capital expenditure commitments not yet incurred amounted to € 28.9 million for (in)tangible assets as at 31 December 2016 (2015: € 2.9 million).
Contingent commitmentsGuaranteesThird-party guarantees amounted to € 3.4 million as at 31 December 2016 (2015: € 3.4 million). No significant future losses are expected from these guarantees.
122 CORBION ANNUAL REPORT 2016 NOTEs TO THE CONsOLIDATED FINANCIAL sTATEMENTs
28. Events after balance sheet date
On 16 November 2016, Corbion and Total announced they are joining forces to develop bioplastics by creating a joint venture to produce and market polylactic acid (PLA) polymers. This joint venture legal entity, named ‘Total Corbion PLA bv’ has been established beginning of 2017. On 2 March 2017, Corbion has sold its subsidiary ‘Total Corbion PLA (Thailand) Limited’ (formerly known as ‘Expalkan (Thailand) Limited’) to the joint venture Total Corbion PLA bv.
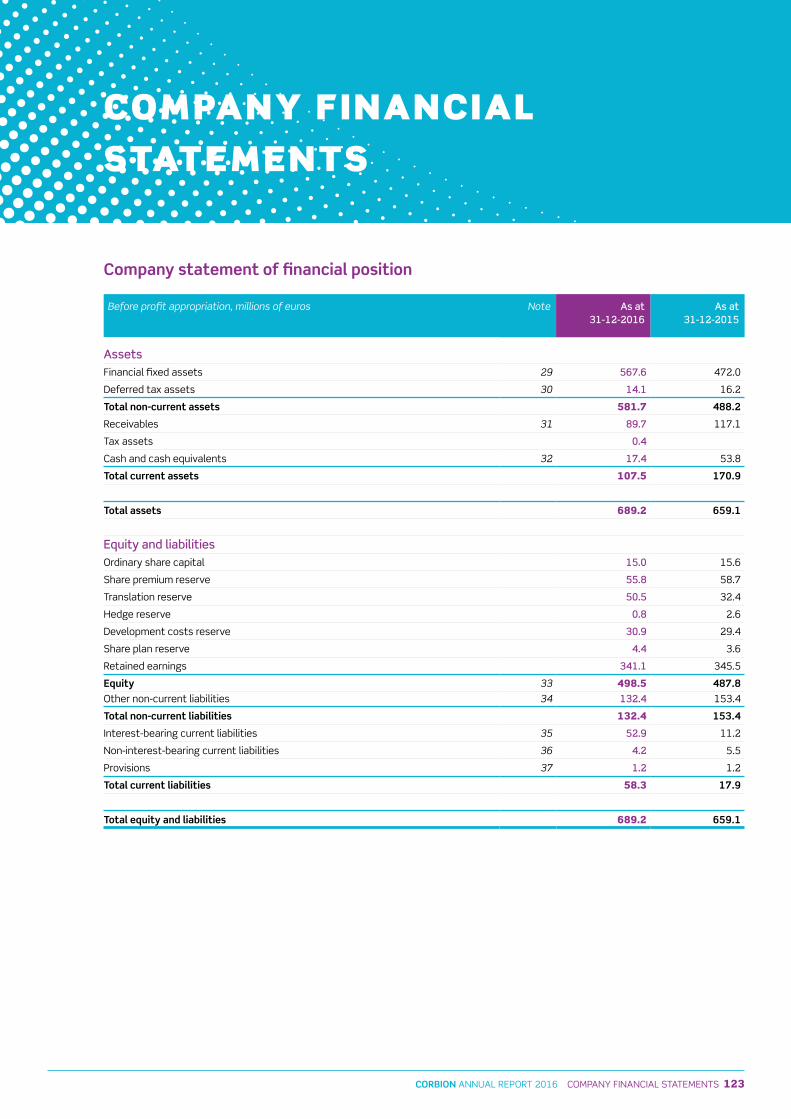
123CORBION ANNUAL REPORT 2016 COMPANy FINANCIAL sTATEMENTs
28. Events after balance sheet date
On 16 November 2016, Corbion and Total announced they are joining forces to develop bioplastics by creating a joint venture to produce and market polylactic acid (PLA) polymers. This joint venture legal entity, named ‘Total Corbion PLA bv’ has been established beginning of 2017. On 2 March 2017, Corbion has sold its subsidiary ‘Total Corbion PLA (Thailand) Limited’ (formerly known as ‘Expalkan (Thailand) Limited’) to the joint venture Total Corbion PLA bv.
Company statement of financial position
Before profit appropriation, millions of euros Note As at 31-12-2016
As at31-12-2015
AssetsFinancial fixed assets 29 567 6 472.0
Deferred tax assets 30 14 1 16.2
Total non-current assets 581.7 488.2
Receivables 31 89 7 117.1
Tax assets 0 4
Cash and cash equivalents 32 17 4 53.8
Total current assets 107.5 170.9
Total assets 689.2 659.1
Equity and liabilitiesOrdinary share capital 15 0 15.6
share premium reserve 55 8 58.7
Translation reserve 50 5 32.4
Hedge reserve 0 8 2.6
Development costs reserve 30 9 29.4
share plan reserve 4 4 3.6
Retained earnings 341 1 345.5
Equity 33 498.5 487.8
Other non-current liabilities 34 132 4 153.4
Total non-current liabilities 132.4 153.4
Interest-bearing current liabilities 35 52 9 11.2
Non-interest-bearing current liabilities 36 4 2 5.5
Provisions 37 1 2 1.2
Total current liabilities 58.3 17.9
Total equity and liabilities 689.2 659.1
COMPANY FINANCIAL STATEMENTS
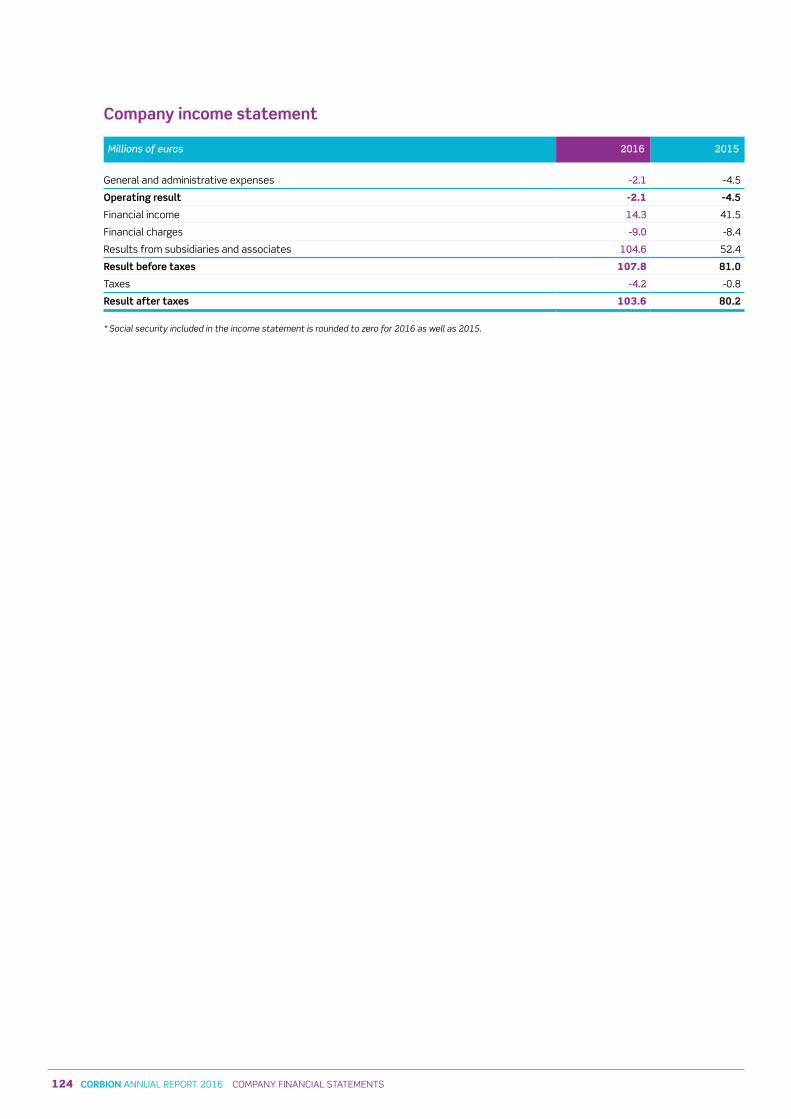
124 CORBION ANNUAL REPORT 2016 COMPANy FINANCIAL sTATEMENTs
Company income statement
Millions of euros 2016 2015
General and administrative expenses -2 1 -4.5
Operating result -2.1 -4.5
Financial income 14 3 41.5
Financial charges -9 0 -8.4
Results from subsidiaries and associates 104 6 52.4
Result before taxes 107.8 81.0
Taxes -4 2 -0.8
Result after taxes 103.6 80.2
* Social security included in the income statement is rounded to zero for 2016 as well as 2015.
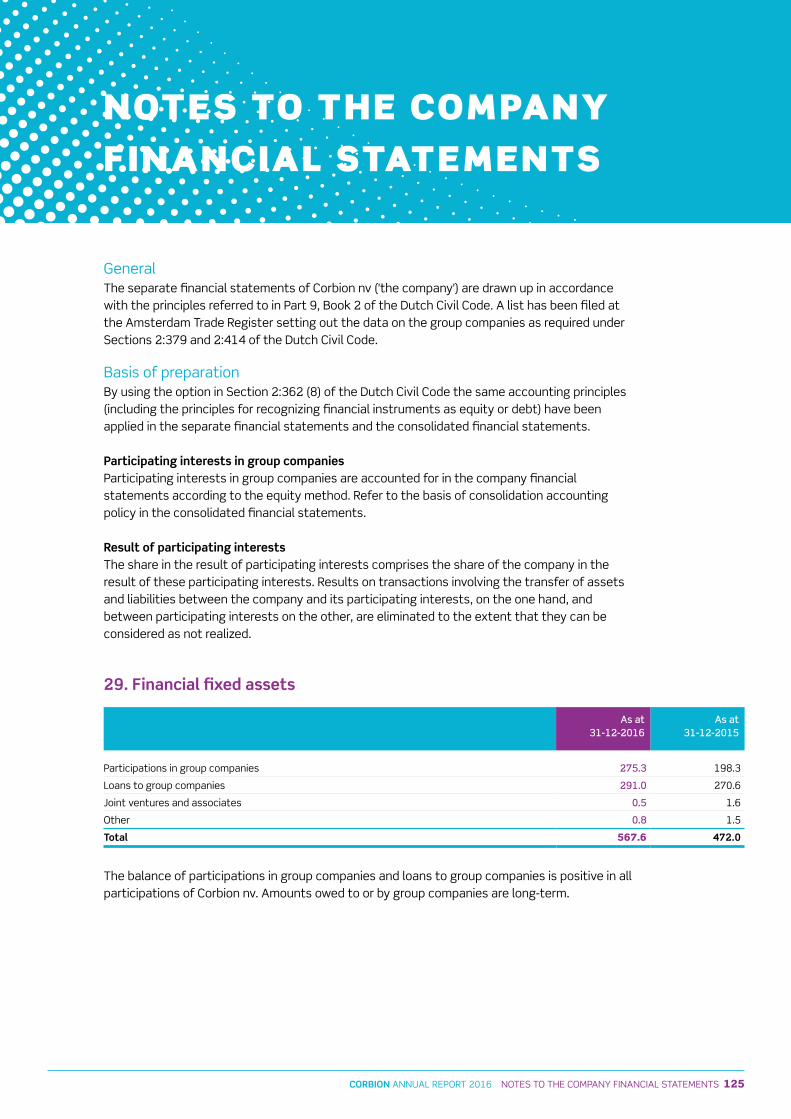
125CORBION ANNUAL REPORT 2016 NOTEs TO THE COMPANy FINANCIAL sTATEMENTs
Company income statement
Millions of euros 2016 2015
General and administrative expenses -2 1 -4.5
Operating result -2.1 -4.5
Financial income 14 3 41.5
Financial charges -9 0 -8.4
Results from subsidiaries and associates 104 6 52.4
Result before taxes 107.8 81.0
Taxes -4 2 -0.8
Result after taxes 103.6 80.2
* Social security included in the income statement is rounded to zero for 2016 as well as 2015.
GeneralThe separate financial statements of Corbion nv ('the company') are drawn up in accordance with the principles referred to in Part 9, Book 2 of the Dutch Civil Code. A list has been filed at the Amsterdam Trade Register setting out the data on the group companies as required under sections 2:379 and 2:414 of the Dutch Civil Code.
Basis of preparation By using the option in section 2:362 (8) of the Dutch Civil Code the same accounting principles (including the principles for recognizing financial instruments as equity or debt) have been applied in the separate financial statements and the consolidated financial statements. Participating interests in group companiesParticipating interests in group companies are accounted for in the company financial statements according to the equity method. Refer to the basis of consolidation accounting policy in the consolidated financial statements.
Result of participating interests The share in the result of participating interests comprises the share of the company in the result of these participating interests. Results on transactions involving the transfer of assets and liabilities between the company and its participating interests, on the one hand, and between participating interests on the other, are eliminated to the extent that they can be considered as not realized.
29. Financial fixed assets
As at 31-12-2016
As at 31-12-2015
Participations in group companies 275 3 198.3
Loans to group companies 291 0 270.6
Joint ventures and associates 0 5 1.6
Other 0 8 1.5
Total 567.6 472.0
The balance of participations in group companies and loans to group companies is positive in all participations of Corbion nv. Amounts owed to or by group companies are long-term.
NOTES TO THE COMPANY FINANCIAL STATEMENTS
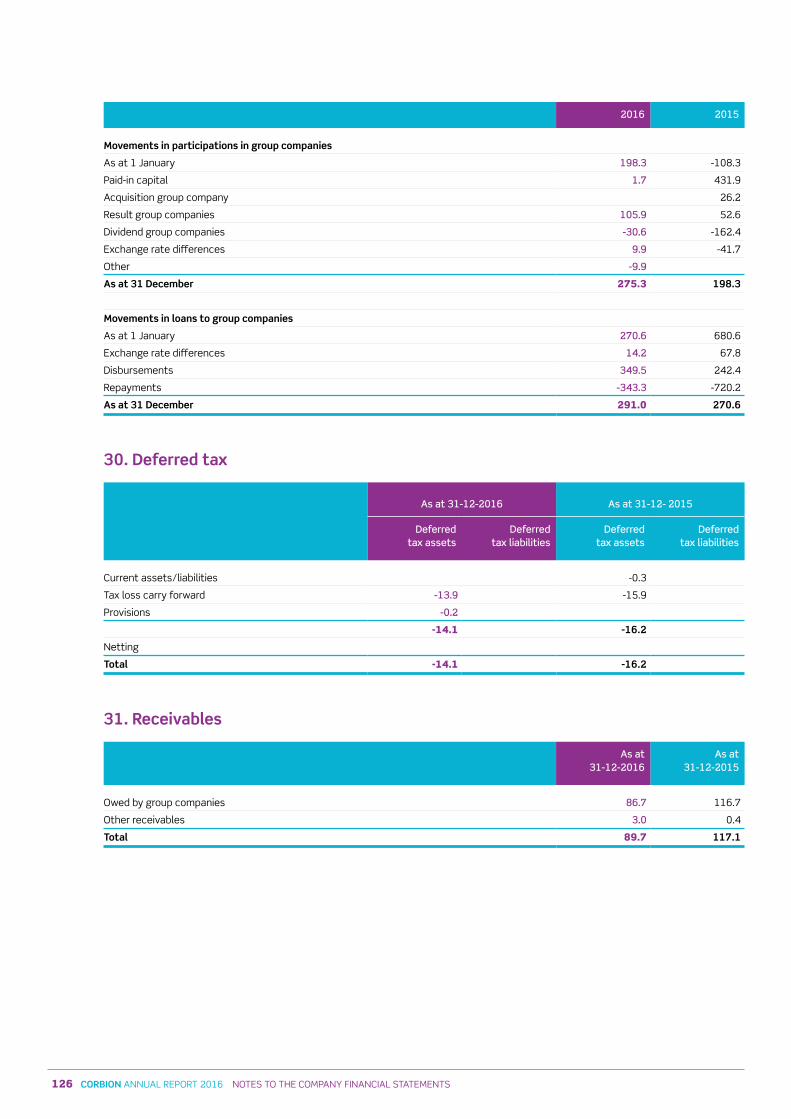
126 CORBION ANNUAL REPORT 2016 NOTEs TO THE COMPANy FINANCIAL sTATEMENTs
2016 2015
Movements in participations in group companies
As at 1 January 198 3 -108.3
Paid-in capital 1 7 431.9
Acquisition group company 26.2
Result group companies 105 9 52.6
Dividend group companies -30 6 -162.4
Exchange rate differences 9 9 -41.7
Other -9 9
As at 31 December 275.3 198.3
Movements in loans to group companies
As at 1 January 270 6 680.6
Exchange rate differences 14 2 67.8
Disbursements 349 5 242.4
Repayments -343 3 -720.2
As at 31 December 291.0 270.6
30. Deferred tax
As at 31-12-2016 As at 31-12- 2015
Deferred tax assets
Deferred tax liabilities
Deferred tax assets
Deferred tax liabilities
Current assets/liabilities -0.3
Tax loss carry forward -13 9 -15.9
Provisions -0 2
-14.1 -16.2
Netting
Total -14.1 -16.2
31. Receivables
As at 31-12-2016
As at 31-12-2015
Owed by group companies 86 7 116.7
Other receivables 3 0 0.4
Total 89.7 117.1
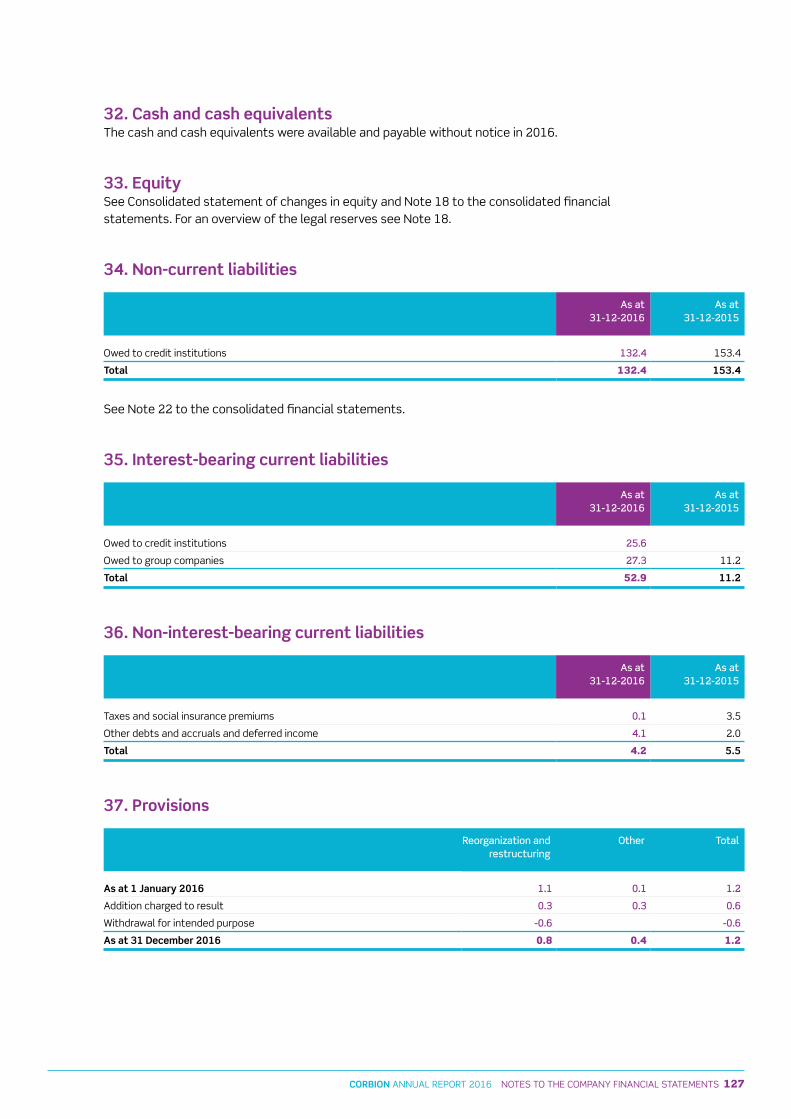
127CORBION ANNUAL REPORT 2016 NOTEs TO THE COMPANy FINANCIAL sTATEMENTs
2016 2015
Movements in participations in group companies
As at 1 January 198 3 -108.3
Paid-in capital 1 7 431.9
Acquisition group company 26.2
Result group companies 105 9 52.6
Dividend group companies -30 6 -162.4
Exchange rate differences 9 9 -41.7
Other -9 9
As at 31 December 275.3 198.3
Movements in loans to group companies
As at 1 January 270 6 680.6
Exchange rate differences 14 2 67.8
Disbursements 349 5 242.4
Repayments -343 3 -720.2
As at 31 December 291.0 270.6
30. Deferred tax
As at 31-12-2016 As at 31-12- 2015
Deferred tax assets
Deferred tax liabilities
Deferred tax assets
Deferred tax liabilities
Current assets/liabilities -0.3
Tax loss carry forward -13 9 -15.9
Provisions -0 2
-14.1 -16.2
Netting
Total -14.1 -16.2
31. Receivables
As at 31-12-2016
As at 31-12-2015
Owed by group companies 86 7 116.7
Other receivables 3 0 0.4
Total 89.7 117.1
32. Cash and cash equivalentsThe cash and cash equivalents were available and payable without notice in 2016.
33. Equitysee Consolidated statement of changes in equity and Note 18 to the consolidated financial statements. For an overview of the legal reserves see Note 18.
34. Non-current liabilities
As at 31-12-2016
As at 31-12-2015
Owed to credit institutions 132 4 153.4
Total 132.4 153.4
see Note 22 to the consolidated financial statements.
35. Interest-bearing current liabilities
As at 31-12-2016
As at 31-12-2015
Owed to credit institutions 25 6
Owed to group companies 27 3 11.2
Total 52.9 11.2
36. Non-interest-bearing current liabilities
As at 31-12-2016
As at 31-12-2015
Taxes and social insurance premiums 0 1 3.5
Other debts and accruals and deferred income 4 1 2.0
Total 4.2 5.5
37. Provisions
Reorganization and restructuring
Other Total
As at 1 January 2016 1 1 0 1 1 2
Addition charged to result 0 3 0 3 0 6
Withdrawal for intended purpose -0 6 -0 6
As at 31 December 2016 0.8 0.4 1.2
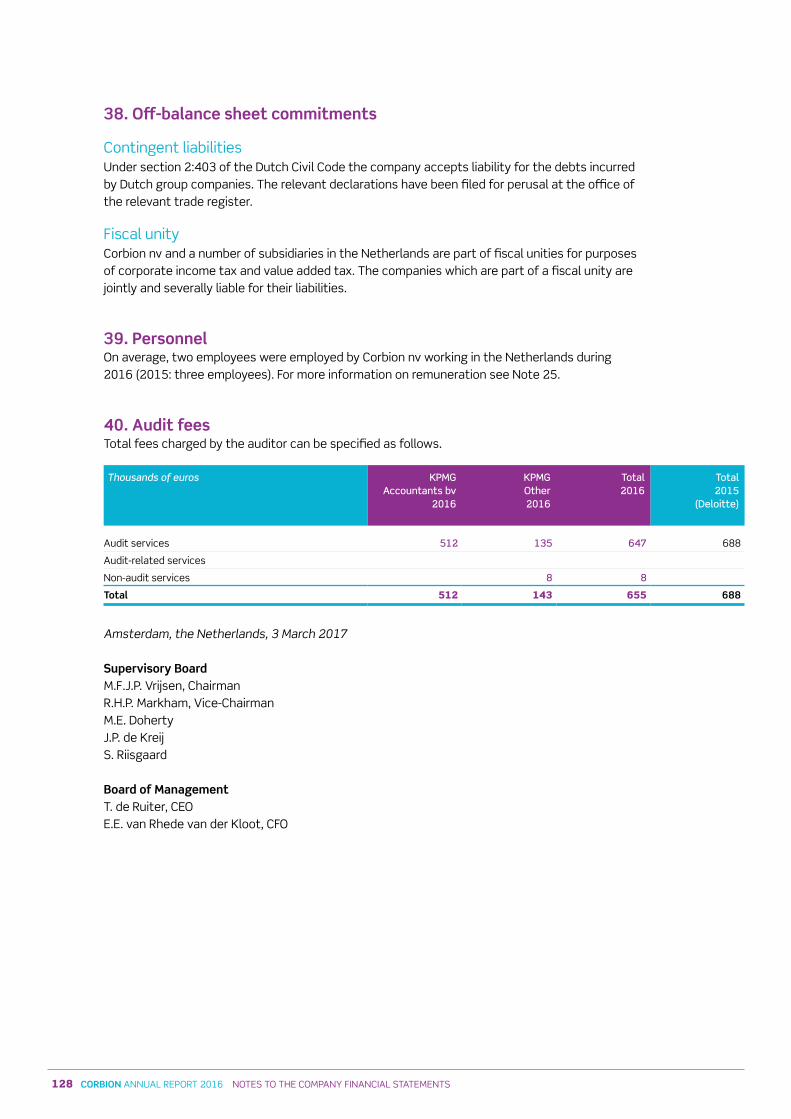
128 CORBION ANNUAL REPORT 2016 NOTEs TO THE COMPANy FINANCIAL sTATEMENTs
38. Off-balance sheet commitments
Contingent liabilitiesUnder section 2:403 of the Dutch Civil Code the company accepts liability for the debts incurred by Dutch group companies. The relevant declarations have been filed for perusal at the office of the relevant trade register.
Fiscal unityCorbion nv and a number of subsidiaries in the Netherlands are part of fiscal unities for purposes of corporate income tax and value added tax. The companies which are part of a fiscal unity are jointly and severally liable for their liabilities.
39. PersonnelOn average, two employees were employed by Corbion nv working in the Netherlands during 2016 (2015: three employees). For more information on remuneration see Note 25.
40. Audit fees Total fees charged by the auditor can be specified as follows.
Thousands of euros KPMGAccountants bv
2016
KPMGOther2016
Total2016
Total2015
(Deloitte)
Audit services 512 135 647 688
Audit-related services
Non-audit services 8 8
Total 512 143 655 688
Amsterdam, the Netherlands, 3 March 2017
Supervisory BoardM.F.J.P. Vrijsen, Chairman R.H.P. Markham, Vice-ChairmanM.E. Doherty J.P. de Kreijs. Riisgaard
Board of ManagementT. de Ruiter, CEOE.E. van Rhede van der Kloot, CFO
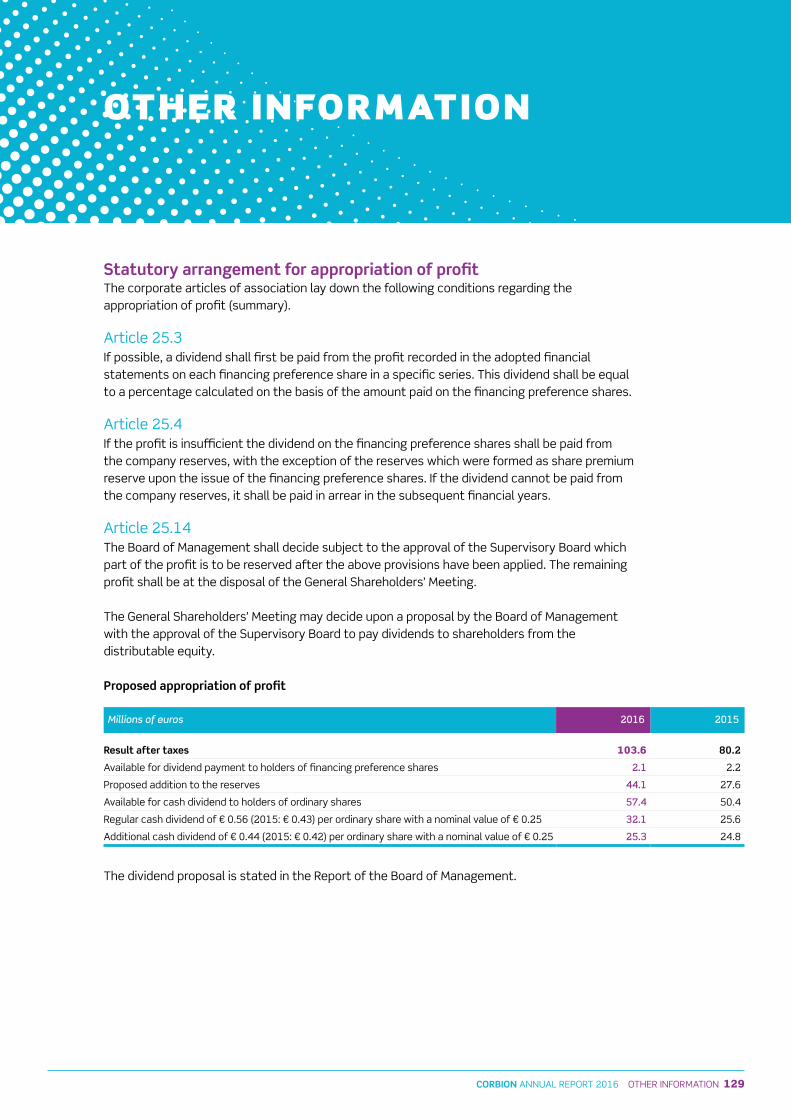
129CORBION ANNUAL REPORT 2016 OTHER INFORMATION
38. Off-balance sheet commitments
Contingent liabilitiesUnder section 2:403 of the Dutch Civil Code the company accepts liability for the debts incurred by Dutch group companies. The relevant declarations have been filed for perusal at the office of the relevant trade register.
Fiscal unityCorbion nv and a number of subsidiaries in the Netherlands are part of fiscal unities for purposes of corporate income tax and value added tax. The companies which are part of a fiscal unity are jointly and severally liable for their liabilities.
39. PersonnelOn average, two employees were employed by Corbion nv working in the Netherlands during 2016 (2015: three employees). For more information on remuneration see Note 25.
40. Audit fees Total fees charged by the auditor can be specified as follows.
Thousands of euros KPMGAccountants bv
2016
KPMGOther2016
Total2016
Total2015
(Deloitte)
Audit services 512 135 647 688
Audit-related services
Non-audit services 8 8
Total 512 143 655 688
Amsterdam, the Netherlands, 3 March 2017
Supervisory BoardM.F.J.P. Vrijsen, Chairman R.H.P. Markham, Vice-ChairmanM.E. Doherty J.P. de Kreijs. Riisgaard
Board of ManagementT. de Ruiter, CEOE.E. van Rhede van der Kloot, CFO
Statutory arrangement for appropriation of profitThe corporate articles of association lay down the following conditions regarding the appropriation of profit (summary).
Article 25.3If possible, a dividend shall first be paid from the profit recorded in the adopted financial statements on each financing preference share in a specific series. This dividend shall be equal to a percentage calculated on the basis of the amount paid on the financing preference shares.
Article 25.4If the profit is insufficient the dividend on the financing preference shares shall be paid from the company reserves, with the exception of the reserves which were formed as share premium reserve upon the issue of the financing preference shares. If the dividend cannot be paid from the company reserves, it shall be paid in arrear in the subsequent financial years.
Article 25.14 The Board of Management shall decide subject to the approval of the supervisory Board which part of the profit is to be reserved after the above provisions have been applied. The remaining profit shall be at the disposal of the General shareholders’ Meeting.
The General shareholders’ Meeting may decide upon a proposal by the Board of Management with the approval of the supervisory Board to pay dividends to shareholders from the distributable equity.
Proposed appropriation of profit
Millions of euros 2016 2015
Result after taxes 103.6 80.2
Available for dividend payment to holders of financing preference shares 2 1 2.2
Proposed addition to the reserves 44 1 27.6
Available for cash dividend to holders of ordinary shares 57 4 50.4
Regular cash dividend of € 0.56 (2015: € 0.43) per ordinary share with a nominal value of € 0.25 32 1 25.6
Additional cash dividend of € 0.44 (2015: € 0.42) per ordinary share with a nominal value of € 0.25 25 3 24.8
The dividend proposal is stated in the Report of the Board of Management.
OTHER INFORMATION
130 CORBION ANNUAL REPORT 2016 OTHER INFORMATION
KPMG Accountants N.V., registered with the trade register in the Netherlands under number 33263683, is a member firm of the KPMG network of independent member firms affiliated with KPMG International Cooperative (‘KPMG International’), a Swiss entity.
Independent auditor’s report To: the General Shareholders Meeting and the Supervisory Board of Corbion N.V.
Report on the accompanying financial statements 2016
Our opinion
In our opinion:
• the accompanying consolidated financial statements give a true and fair view of the financial position of Corbion N.V. as at 31 December 2016, and of its result and its cash flows for 2016 in accordance with International Financial Reporting Standards as adopted by the European Union (EU-IFRS) and with Part 9 of Book 2 of the Netherlands Civil Code;
• the accompanying company financial statements give a true and fair view of the financial position of Corbion N.V. as at 31 December 2016, and of its result for 2016 in accordance with Part 9 of Book 2 of the Netherlands Civil Code.
What we have audited
We have audited the financial statements 2016 of Corbion N.V., based in Amsterdam. The financial statements include the consolidated financial statements and the company financial statements.
The consolidated financial statements comprise:
1 the consolidated statement of financial position as at 31 December 2016; 2 the following consolidated statements for 2016: the income statement, the statement of
comprehensive income, changes in equity and cash flows; and 3 the notes comprising a summary of the significant accounting policies and other explanatory
information.
The company financial statements comprise:
1 the company statement of financial position as at 31 December 2016; 2 the company statement of income for 2016; and 3 the notes comprising a summary of the accounting policies and other explanatory information.
Basis for our opinion
We conducted our audit in accordance with Dutch law, including the Dutch Standards on Auditing. Our responsibilities under those standards are further described in the ‘Our responsibilities for the audit of the financial statements’ section of our report.
We are independent of Corbion N.V. in accordance with the Verordening inzake de onafhankelijkheid van accountants bij assurance-opdrachten (ViO, Code of Ethics for Professional Accountants, a regulation with respect to independence) and other relevant independence regulations in the Netherlands. Furthermore, we have complied with the Verordening gedrags- en beroepsregels accountants (VGBA, Dutch Code of Ethics).
We believe that the audit evidence we have obtained is sufficient and appropriate to provide a basis for our opinion.
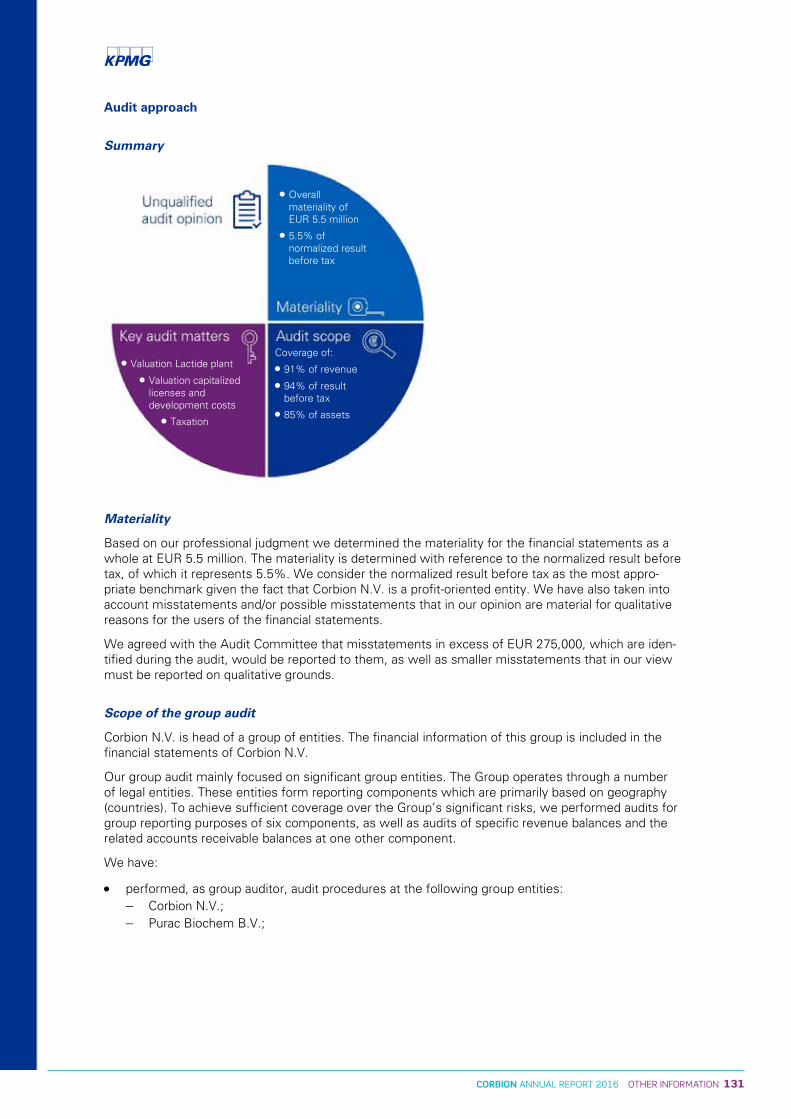
131CORBION ANNUAL REPORT 2016 OTHER INFORMATION
Audit approach
Summary
Materiality
Based on our professional judgment we determined the materiality for the financial statements as a whole at EUR 5.5 million. The materiality is determined with reference to the normalized result before tax, of which it represents 5.5%. We consider the normalized result before tax as the most appro-priate benchmark given the fact that Corbion N.V. is a profit-oriented entity. We have also taken into account misstatements and/or possible misstatements that in our opinion are material for qualitative reasons for the users of the financial statements.
We agreed with the Audit Committee that misstatements in excess of EUR 275,000, which are iden-tified during the audit, would be reported to them, as well as smaller misstatements that in our view must be reported on qualitative grounds.
Scope of the group audit
Corbion N.V. is head of a group of entities. The financial information of this group is included in the financial statements of Corbion N.V.
Our group audit mainly focused on significant group entities. The Group operates through a number of legal entities. These entities form reporting components which are primarily based on geography (countries). To achieve sufficient coverage over the Group’s significant risks, we performed audits for group reporting purposes of six components, as well as audits of specific revenue balances and the related accounts receivable balances at one other component.
We have:
• performed, as group auditor, audit procedures at the following group entities: − Corbion N.V.; − Purac Biochem B.V.;
• Overall materiality of EUR 5.5 million
• 5.5% of normalized result before tax
• Valuation Lactide plant
• Valuation capitalized licenses and development costs
• Taxation
Coverage of:
• 91% of revenue
• 94% of result before tax
• 85% of assets
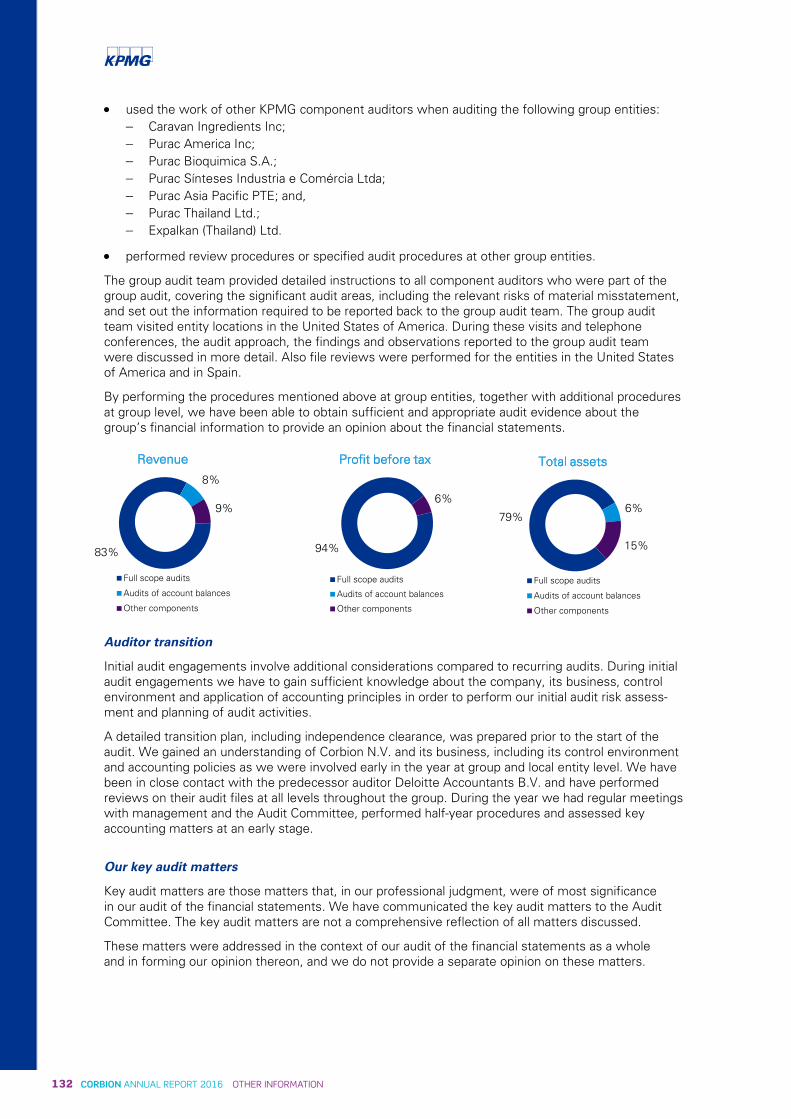
132 CORBION ANNUAL REPORT 2016 OTHER INFORMATION
• used the work of other KPMG component auditors when auditing the following group entities: − Caravan Ingredients Inc; − Purac America Inc; − Purac Bioquimica S.A.; − Purac Sínteses Industria e Comércia Ltda; − Purac Asia Pacific PTE; and, − Purac Thailand Ltd.; − Expalkan (Thailand) Ltd.
• performed review procedures or specified audit procedures at other group entities.
The group audit team provided detailed instructions to all component auditors who were part of the group audit, covering the significant audit areas, including the relevant risks of material misstatement, and set out the information required to be reported back to the group audit team. The group audit team visited entity locations in the United States of America. During these visits and telephone conferences, the audit approach, the findings and observations reported to the group audit team were discussed in more detail. Also file reviews were performed for the entities in the United States of America and in Spain.
By performing the procedures mentioned above at group entities, together with additional procedures at group level, we have been able to obtain sufficient and appropriate audit evidence about the group’s financial information to provide an opinion about the financial statements.
Auditor transition
Initial audit engagements involve additional considerations compared to recurring audits. During initial audit engagements we have to gain sufficient knowledge about the company, its business, control environment and application of accounting principles in order to perform our initial audit risk assess-ment and planning of audit activities.
A detailed transition plan, including independence clearance, was prepared prior to the start of the audit. We gained an understanding of Corbion N.V. and its business, including its control environment and accounting policies as we were involved early in the year at group and local entity level. We have been in close contact with the predecessor auditor Deloitte Accountants B.V. and have performed reviews on their audit files at all levels throughout the group. During the year we had regular meetings with management and the Audit Committee, performed half-year procedures and assessed key accounting matters at an early stage.
Our key audit matters
Key audit matters are those matters that, in our professional judgment, were of most significance in our audit of the financial statements. We have communicated the key audit matters to the Audit Committee. The key audit matters are not a comprehensive reflection of all matters discussed.
These matters were addressed in the context of our audit of the financial statements as a whole and in forming our opinion thereon, and we do not provide a separate opinion on these matters.
94%
6%
Profit before tax
Full scope audits
Audits of account balances
Other components
83%
8%
9%
Revenue
Full scope audits
Audits of account balances
Other components
79%6%
15%
Total assets
Full scope audits
Audits of account balances
Other components
133CORBION ANNUAL REPORT 2016 OTHER INFORMATION
Valuation lactide plant
Description
The valuation of the Lactide plant in Thailand is significant to our audit due to its invested amount and expected judgement involved in the assessment of the recoverability of this asset.
In 2016, Corbion announced it entered into an agreement with Total to set up a 50/50 joint venture in 2017 and to sell its lactide production unit and the PLA polymerization plant in Thailand to the joint venture. The book value of the Lactide plant is significantly lower than the lower range of the market valuation of the Lactide plant as agreed in the joint venture agreement, which resulted in the reversal of the impairment taken in previous years under IAS 36 having a significant impact on the 2016 finan-cial statements. As a result of the joint venture agreement, the Lactide plant is included in the Assets Held for Sale.
We refer to note 10 Property, plant and equipment in the consolidated financial statements.
Our response
Audit procedures included, among others, inspection of the signed agreements with the joint venture partner. We compared the book value of the lactide plant with the calculation of the recoverable amount based on agreed selling price.
Our observation
Overall we found that the assessment made by management resulted in an acceptable valuation of the Lactide plant in Thailand.
Valuation capitalized licenses and development costs
Description
The valuation of the capitalized intangible fixed assets, related to licenses and develop-ment cost, are significant to our audit due to their size and judgement involved in the assessment of the recoverability of those items.
We refer to note 11 Intangible fixed assets in the consolidated financial statements.
Our response
Our audit procedures included, among others, an evaluation of the company’s policies and procedures for evaluating the presence of potential impairments, challenging manage-ment’s main assumptions and the robustness of forecasts. We evaluated key assumptions amongst others through discussions with management and market developments, historical analysis and cooperation agreements with third parties. We, amongst others, critically assessed and tested methodologies, the weighted average cost of capital and other data used, such as market expec-tations and projected cash flows. Further, as part of our audit procedures, we included valuation experts in our team to analyse and evaluate the discount rates used by the company to determine the recoverable value and have assessed the results of their work as part our audit. We have evaluated whether adequate disclosure of impairments were made in accordance with IAS 36.
Our observation
Based on our procedures performed we considered management’s key assumptions to be within a reasonable range and that disclosure in the financial statements of the capitalized licenses and development cost meets the requirements of IAS 36.
134 CORBION ANNUAL REPORT 2016 OTHER INFORMATION
Taxation
Description
Corbion operates in various tax jurisdictions. During 2016, Corbion utilized EUR 3 million of previously unrecognized deferred tax assets and recognized EUR 10 million of additional deferred tax assets mainly related to the Netherlands and Spain. Both the evaluation of tax risks and valuation of deferred tax assets in respect of taxable losses, were significant to our audit because the assessment requires specialised tax knowledge, significant judgment and is based on assumptions that are affected by uncertain future events such as profitability of operations.
We refer to note 8 Taxes and note 21 Deferred tax in the consolidated financial statements.
Our response
Our audit procedures included, among others, evaluating management’s assessment of tax risks and using our own tax specialists to assist us in assessing identified tax risks. We further inspected the appropriateness of the level of deferred tax asset balance recognized in the balance sheet. We mainly focused on the long-term forecasts and critically assessed the assump-tions and judgments included in these forecasts by considering the historical accuracy of forecasts and the sensitivities of the profit forecasts.
We have evaluated whether adequate disclosure of the tax position and tax loss carry forwards were made in accordance with IAS 12.
Our observation
Overall we assessed that the assumptions used by management resulted in a balanced valuation of the deferred tax assets and that disclosure in the financial statements of Corbion’s tax position meets the requirements of IAS12.
Report on the other information included in the annual report
In addition to the financial statements and our auditor’s report thereon, the annual report contains other information that consists of:
• Corbion at a glance; • Message of the CEO; • Company Highlights; • Report of the Board of Management; • Report of the Supervisory Board; • Sustainability statements; • Other information, as included on page 129 until 141.
Based on the below procedures performed, we conclude that the other information:
• is consistent with the financial statements and does not contain material misstatements; • contains the information as required by Part 9 of Book 2 of the Netherlands Civil Code.
We have read the other information. Based on our knowledge and understanding obtained through our audit of the financial statements or otherwise, we have considered whether the other information contains material misstatements.
By performing these procedures, we comply with the requirements of Part 9 of Book 2 of the Nether-lands Civil Code and the Dutch Standard 720. The scope of the procedures performed is substantially less than the scope of those performed in our audit of the financial statements.
Management is responsible for the preparation of other information, including the Management Board’s Report in accordance with Part 9 of Book 2 of the Netherlands Civil Code and the other Information pursuant to Part 9 of Book 2 of the Netherlands Civil Code.
135CORBION ANNUAL REPORT 2016 OTHER INFORMATION
Report on other legal and regulatory requirements
Engagement
We were engaged by the General Shareholders Meeting as auditor of Corbion N.V. on 22 May 2015. The audit of the 2016 financial statements was our first year’s audit.
Description of the responsibilities for the financial statements
Responsibilities of the Board of Management and the Supervisory Board for the financial statements
The Board of Management is responsible for the preparation and fair presentation of the financial statements in accordance with EU-IFRS and with Part 9 of Book 2 of the Netherlands Civil Code. Furthermore, the Board of Management is responsible for such internal control as the Board of Management determines is necessary to enable the preparation of the financial statements that are free from material misstatement, whether due to errors or fraud.
As part of the preparation of the financial statements, the Board of Management is responsible for assessing the company’s ability to continue as a going concern. Based on the financial reporting framework mentioned, the Board of Management should prepare the financial statements using the going concern basis of accounting unless the Board of Management either intends to liquidate the company or to cease operations, or has no realistic alternative but to do so. The Board of Manage-ment should disclose events and circumstances that may cast significant doubt on the company’s ability to continue as a going concern in the financial statements.
The Supervisory Board is responsible for overseeing the company’s financial reporting process.
Our responsibilities for the audit of financial statements
Our objective is to plan and perform the audit to obtain sufficient and appropriate audit evidence for our opinion. Our audit has been performed with a high, but not absolute, level of assurance, which means we may not have detected all material errors and fraud during the audit.
Misstatements can arise from fraud or error and are considered material if, individually or in aggre-gate, they could reasonably be expected to influence the economic decisions of users taken on the basis of these financial statements. The materiality affects the nature, timing and extent of our audit procedures and the evaluation of the effect of identified misstatements on our opinion.
For a further description of our responsibilities in respect of an audit of financial statements we refer to the website of the professional body for accountants in the Netherlands (NBA) https://www.nba.nl/Documents/Tools%20Vaktechniek/Standaardpassages/Standaardpassage_nieuwe_controletekst_oob_variant_%20Engels.docx.
Utrecht, 3 March 2017
KPMG Accountants N.V.
J.G.R. Wilmink RA
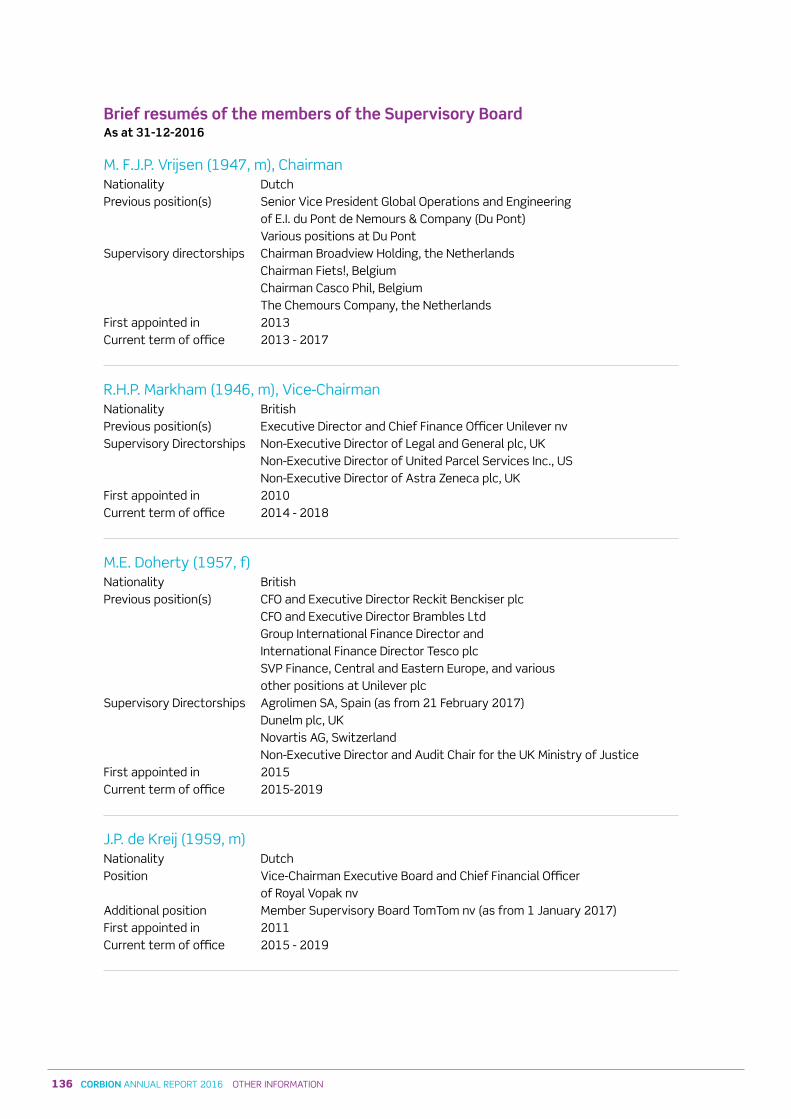
136 CORBION ANNUAL REPORT 2016 OTHER INFORMATION
Brief resumés of the members of the Supervisory BoardAs at 31-12-2016
M. F.J.P. Vrijsen (1947, m), ChairmanNationality DutchPrevious position(s) senior Vice President Global Operations and Engineering of E.I. du Pont de Nemours & Company (Du Pont) Various positions at Du Pont supervisory directorships Chairman Broadview Holding, the Netherlands Chairman Fiets!, Belgium Chairman Casco Phil, Belgium The Chemours Company, the NetherlandsFirst appointed in 2013Current term of office 2013 - 2017
R.H.P. Markham (1946, m), Vice-ChairmanNationality BritishPrevious position(s) Executive Director and Chief Finance Officer Unilever nvsupervisory Directorships Non-Executive Director of Legal and General plc, UK Non-Executive Director of United Parcel services Inc., Us Non-Executive Director of Astra Zeneca plc, UKFirst appointed in 2010Current term of office 2014 - 2018
M.E. Doherty (1957, f)Nationality BritishPrevious position(s) CFO and Executive Director Reckit Benckiser plc CFO and Executive Director Brambles Ltd Group International Finance Director and International Finance Director Tesco plc sVP Finance, Central and Eastern Europe, and various other positions at Unilever plcsupervisory Directorships Agrolimen sA, spain (as from 21 February 2017) Dunelm plc, UK Novartis AG, switzerland Non-Executive Director and Audit Chair for the UK Ministry of JusticeFirst appointed in 2015Current term of office 2015-2019
J.P. de Kreij (1959, m)Nationality DutchPosition Vice-Chairman Executive Board and Chief Financial Officer of Royal Vopak nvAdditional position Member supervisory Board TomTom nv (as from 1 January 2017)First appointed in 2011Current term of office 2015 - 2019
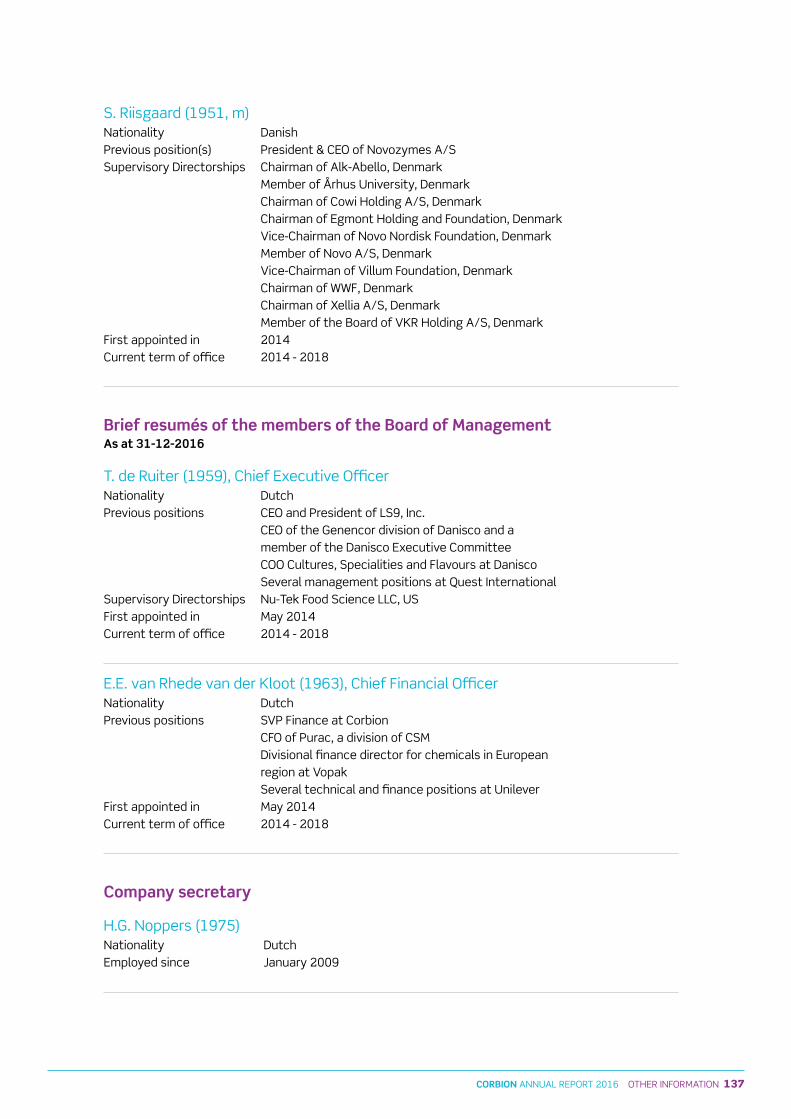
137CORBION ANNUAL REPORT 2016 OTHER INFORMATION
Brief resumés of the members of the Supervisory BoardAs at 31-12-2016
M. F.J.P. Vrijsen (1947, m), ChairmanNationality DutchPrevious position(s) senior Vice President Global Operations and Engineering of E.I. du Pont de Nemours & Company (Du Pont) Various positions at Du Pont supervisory directorships Chairman Broadview Holding, the Netherlands Chairman Fiets!, Belgium Chairman Casco Phil, Belgium The Chemours Company, the NetherlandsFirst appointed in 2013Current term of office 2013 - 2017
R.H.P. Markham (1946, m), Vice-ChairmanNationality BritishPrevious position(s) Executive Director and Chief Finance Officer Unilever nvsupervisory Directorships Non-Executive Director of Legal and General plc, UK Non-Executive Director of United Parcel services Inc., Us Non-Executive Director of Astra Zeneca plc, UKFirst appointed in 2010Current term of office 2014 - 2018
M.E. Doherty (1957, f)Nationality BritishPrevious position(s) CFO and Executive Director Reckit Benckiser plc CFO and Executive Director Brambles Ltd Group International Finance Director and International Finance Director Tesco plc sVP Finance, Central and Eastern Europe, and various other positions at Unilever plcsupervisory Directorships Agrolimen sA, spain (as from 21 February 2017) Dunelm plc, UK Novartis AG, switzerland Non-Executive Director and Audit Chair for the UK Ministry of JusticeFirst appointed in 2015Current term of office 2015-2019
J.P. de Kreij (1959, m)Nationality DutchPosition Vice-Chairman Executive Board and Chief Financial Officer of Royal Vopak nvAdditional position Member supervisory Board TomTom nv (as from 1 January 2017)First appointed in 2011Current term of office 2015 - 2019
s. Riisgaard (1951, m)Nationality DanishPrevious position(s) President & CEO of Novozymes A/ssupervisory Directorships Chairman of Alk-Abello, Denmark Member of Århus University, Denmark Chairman of Cowi Holding A/s, Denmark Chairman of Egmont Holding and Foundation, Denmark Vice-Chairman of Novo Nordisk Foundation, Denmark Member of Novo A/s, Denmark Vice-Chairman of Villum Foundation, Denmark Chairman of WWF, Denmark Chairman of Xellia A/s, Denmark Member of the Board of VKR Holding A/s, DenmarkFirst appointed in 2014Current term of office 2014 - 2018
Brief resumés of the members of the Board of ManagementAs at 31-12-2016
T. de Ruiter (1959), Chief Executive OfficerNationality DutchPrevious positions CEO and President of Ls9, Inc. CEO of the Genencor division of Danisco and a member of the Danisco Executive Committee COO Cultures, specialities and Flavours at Danisco several management positions at Quest International supervisory Directorships Nu-Tek Food science LLC, UsFirst appointed in May 2014Current term of office 2014 - 2018
E.E. van Rhede van der Kloot (1963), Chief Financial OfficerNationality DutchPrevious positions sVP Finance at Corbion CFO of Purac, a division of CsM Divisional finance director for chemicals in European region at Vopak several technical and finance positions at UnileverFirst appointed in May 2014Current term of office 2014 - 2018
Company secretary
H.G. Noppers (1975) Nationality DutchEmployed since January 2009
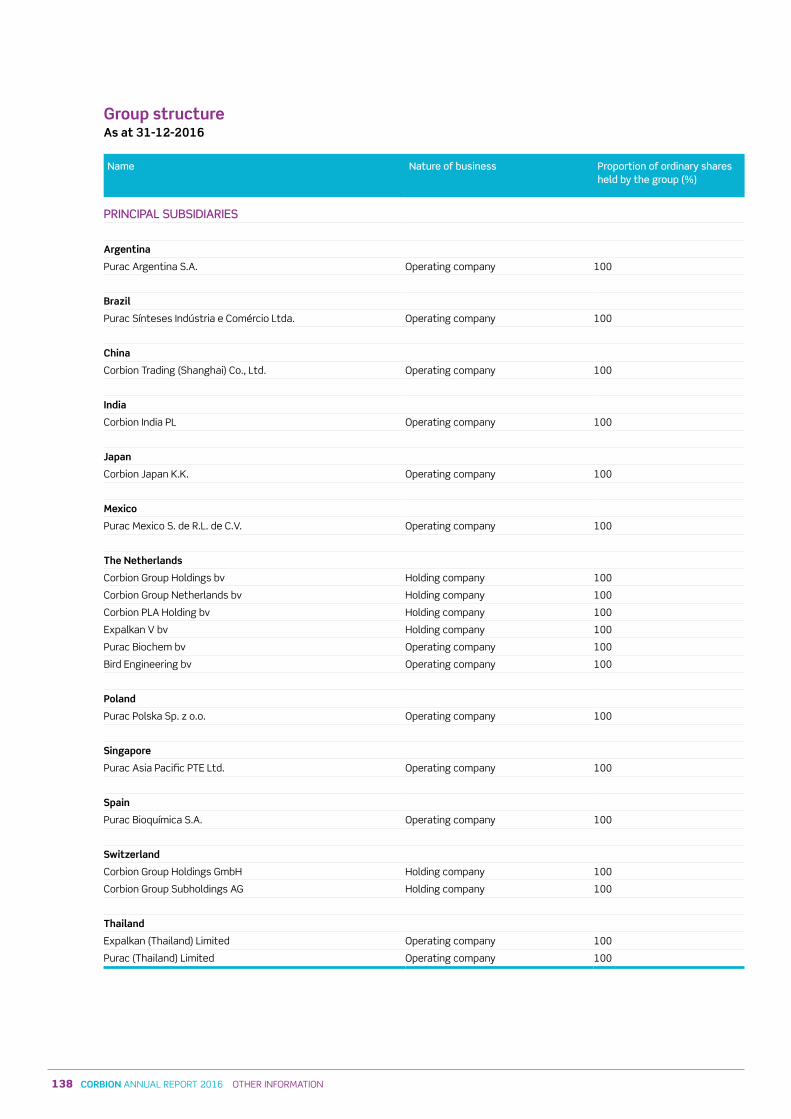
138 CORBION ANNUAL REPORT 2016 OTHER INFORMATION
Group structureAs at 31-12-2016
Name Nature of business Proportion of ordinary shares held by the group (%)
PRINCIPAL SUBSIDIARIES
Argentina
Purac Argentina s.A. Operating company 100
Brazil
Purac sínteses Indústria e Comércio Ltda. Operating company 100
China
Corbion Trading (shanghai) Co., Ltd. Operating company 100
India
Corbion India PL Operating company 100
Japan
Corbion Japan K.K. Operating company 100
Mexico
Purac Mexico s. de R.L. de C.V. Operating company 100
The Netherlands
Corbion Group Holdings bv Holding company 100
Corbion Group Netherlands bv Holding company 100
Corbion PLA Holding bv Holding company 100
Expalkan V bv Holding company 100
Purac Biochem bv Operating company 100
Bird Engineering bv Operating company 100
Poland
Purac Polska sp. z o.o. Operating company 100
Singapore
Purac Asia Pacific PTE Ltd. Operating company 100
Spain
Purac Bioquímica s.A. Operating company 100
Switzerland
Corbion Group Holdings GmbH Holding company 100
Corbion Group subholdings AG Holding company 100
Thailand
Expalkan (Thailand) Limited Operating company 100
Purac (Thailand) Limited Operating company 100
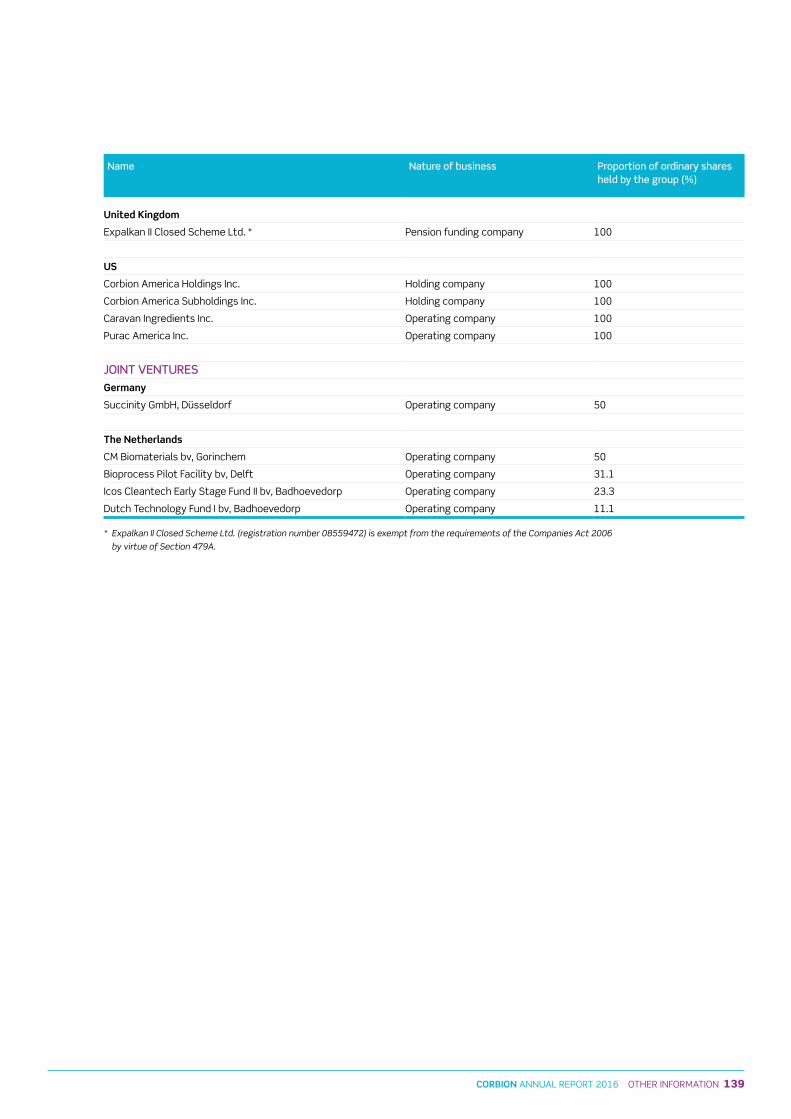
139CORBION ANNUAL REPORT 2016 OTHER INFORMATION
Group structureAs at 31-12-2016
Name Nature of business Proportion of ordinary shares held by the group (%)
PRINCIPAL SUBSIDIARIES
Argentina
Purac Argentina s.A. Operating company 100
Brazil
Purac sínteses Indústria e Comércio Ltda. Operating company 100
China
Corbion Trading (shanghai) Co., Ltd. Operating company 100
India
Corbion India PL Operating company 100
Japan
Corbion Japan K.K. Operating company 100
Mexico
Purac Mexico s. de R.L. de C.V. Operating company 100
The Netherlands
Corbion Group Holdings bv Holding company 100
Corbion Group Netherlands bv Holding company 100
Corbion PLA Holding bv Holding company 100
Expalkan V bv Holding company 100
Purac Biochem bv Operating company 100
Bird Engineering bv Operating company 100
Poland
Purac Polska sp. z o.o. Operating company 100
Singapore
Purac Asia Pacific PTE Ltd. Operating company 100
Spain
Purac Bioquímica s.A. Operating company 100
Switzerland
Corbion Group Holdings GmbH Holding company 100
Corbion Group subholdings AG Holding company 100
Thailand
Expalkan (Thailand) Limited Operating company 100
Purac (Thailand) Limited Operating company 100
Name Nature of business Proportion of ordinary shares held by the group (%)
United Kingdom
Expalkan II Closed scheme Ltd. * Pension funding company 100
US
Corbion America Holdings Inc. Holding company 100
Corbion America subholdings Inc. Holding company 100
Caravan Ingredients Inc. Operating company 100
Purac America Inc. Operating company 100
JOINT VENTURESGermany
succinity GmbH, Düsseldorf Operating company 50
The Netherlands
CM Biomaterials bv, Gorinchem Operating company 50
Bioprocess Pilot Facility bv, Delft Operating company 31.1
Icos Cleantech Early stage Fund II bv, Badhoevedorp Operating company 23.3
Dutch Technology Fund I bv, Badhoevedorp Operating company 11.1
* Expalkan II Closed Scheme Ltd. (registration number 08559472) is exempt from the requirements of the Companies Act 2006
by virtue of Section 479A.
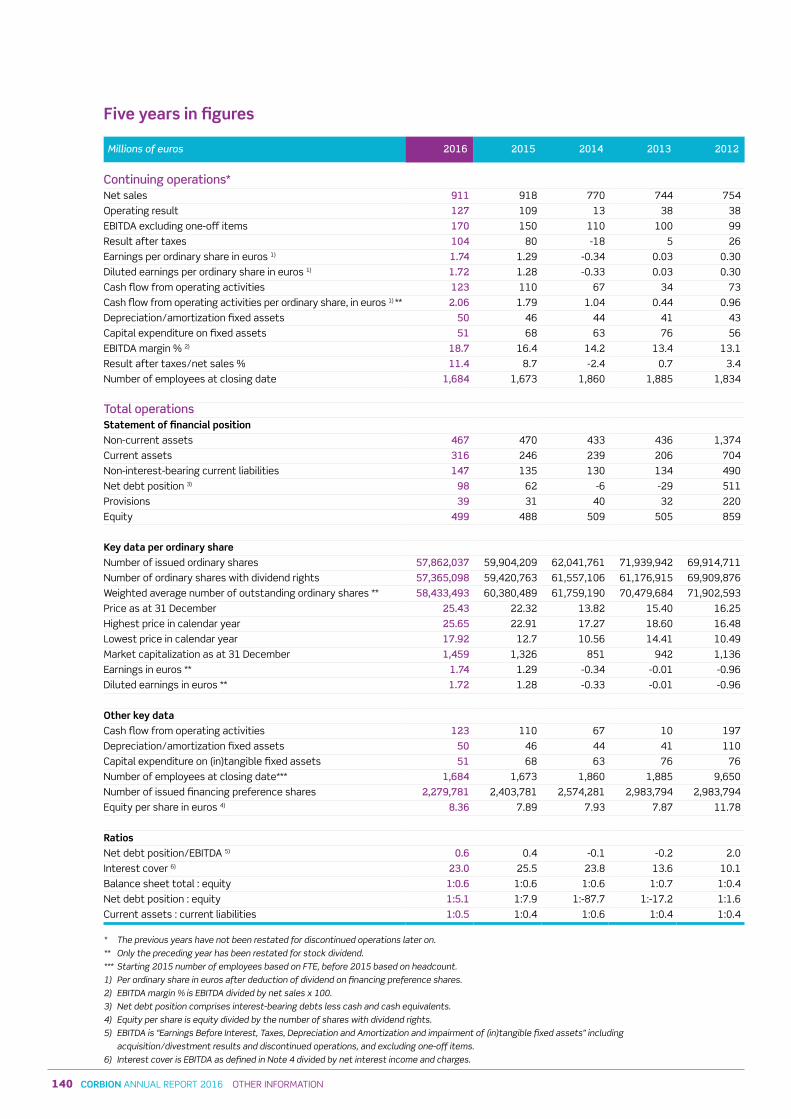
140 CORBION ANNUAL REPORT 2016 OTHER INFORMATION
Five years in figures
Millions of euros 2016 2015 2014 2013 2012
Continuing operations*Net sales 911 918 770 744 754Operating result 127 109 13 38 38EBITDA excluding one-off items 170 150 110 100 99Result after taxes 104 80 -18 5 26Earnings per ordinary share in euros 1) 1 74 1.29 -0.34 0.03 0.30Diluted earnings per ordinary share in euros 1) 1 72 1.28 -0.33 0.03 0.30Cash flow from operating activities 123 110 67 34 73Cash flow from operating activities per ordinary share, in euros 1) ** 2 06 1.79 1.04 0.44 0.96Depreciation/amortization fixed assets 50 46 44 41 43Capital expenditure on fixed assets 51 68 63 76 56EBITDA margin % 2) 18 7 16.4 14.2 13.4 13.1Result after taxes/net sales % 11 4 8.7 -2.4 0.7 3.4Number of employees at closing date 1,684 1,673 1,860 1,885 1,834
Total operationsStatement of financial position
Non-current assets 467 470 433 436 1,374Current assets 316 246 239 206 704Non-interest-bearing current liabilities 147 135 130 134 490Net debt position 3) 98 62 -6 -29 511Provisions 39 31 40 32 220Equity 499 488 509 505 859
Key data per ordinary share
Number of issued ordinary shares 57,862,037 59,904,209 62,041,761 71,939,942 69,914,711Number of ordinary shares with dividend rights 57,365,098 59,420,763 61,557,106 61,176,915 69,909,876Weighted average number of outstanding ordinary shares ** 58,433,493 60,380,489 61,759,190 70,479,684 71,902,593Price as at 31 December 25 43 22.32 13.82 15.40 16.25Highest price in calendar year 25 65 22.91 17.27 18.60 16.48Lowest price in calendar year 17 92 12.7 10.56 14.41 10.49Market capitalization as at 31 December 1,459 1,326 851 942 1,136Earnings in euros ** 1 74 1.29 -0.34 -0.01 -0.96Diluted earnings in euros ** 1 72 1.28 -0.33 -0.01 -0.96
Other key data
Cash flow from operating activities 123 110 67 10 197Depreciation/amortization fixed assets 50 46 44 41 110Capital expenditure on (in)tangible fixed assets 51 68 63 76 76Number of employees at closing date*** 1,684 1,673 1,860 1,885 9,650Number of issued financing preference shares 2,279,781 2,403,781 2,574,281 2,983,794 2,983,794Equity per share in euros 4) 8 36 7.89 7.93 7.87 11.78
Ratios
Net debt position/EBITDA 5) 0 6 0.4 -0.1 -0.2 2.0Interest cover 6) 23 0 25.5 23.8 13.6 10.1Balance sheet total : equity 1:0 6 1:0.6 1:0.6 1:0.7 1:0.4Net debt position : equity 1:5 1 1:7.9 1:-87.7 1:-17.2 1:1.6Current assets : current liabilities 1:0 5 1:0.4 1:0.6 1:0.4 1:0.4
* The previous years have not been restated for discontinued operations later on.
** Only the preceding year has been restated for stock dividend.
*** Starting 2015 number of employees based on FTE, before 2015 based on headcount.
1) Per ordinary share in euros after deduction of dividend on financing preference shares.
2) EBITDA margin % is EBITDA divided by net sales x 100.
3) Net debt position comprises interest-bearing debts less cash and cash equivalents.
4) Equity per share is equity divided by the number of shares with dividend rights.
5) EBITDA is “Earnings Before Interest, Taxes, Depreciation and Amortization and impairment of (in)tangible fixed assets” including
acquisition/divestment results and discontinued operations, and excluding one-off items.
6) Interest cover is EBITDA as defined in Note 4 divided by net interest income and charges.
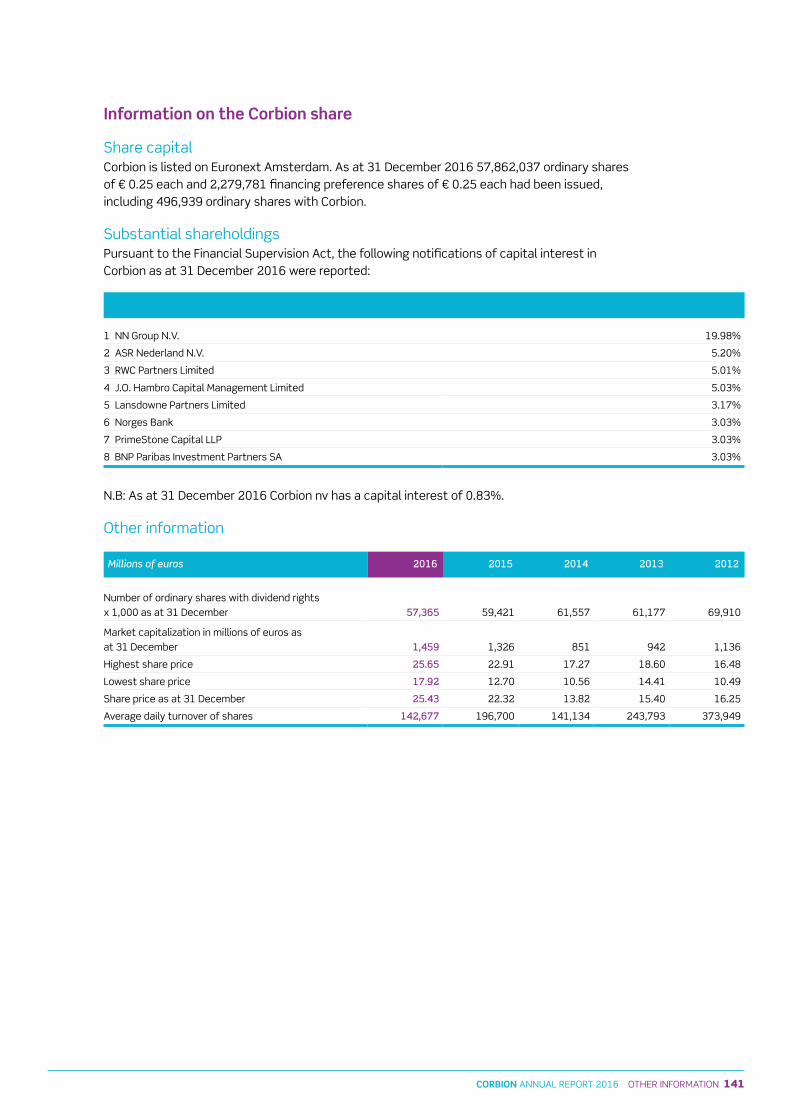
141CORBION ANNUAL REPORT 2016 OTHER INFORMATION
Five years in figures
Millions of euros 2016 2015 2014 2013 2012
Continuing operations*Net sales 911 918 770 744 754Operating result 127 109 13 38 38EBITDA excluding one-off items 170 150 110 100 99Result after taxes 104 80 -18 5 26Earnings per ordinary share in euros 1) 1 74 1.29 -0.34 0.03 0.30Diluted earnings per ordinary share in euros 1) 1 72 1.28 -0.33 0.03 0.30Cash flow from operating activities 123 110 67 34 73Cash flow from operating activities per ordinary share, in euros 1) ** 2 06 1.79 1.04 0.44 0.96Depreciation/amortization fixed assets 50 46 44 41 43Capital expenditure on fixed assets 51 68 63 76 56EBITDA margin % 2) 18 7 16.4 14.2 13.4 13.1Result after taxes/net sales % 11 4 8.7 -2.4 0.7 3.4Number of employees at closing date 1,684 1,673 1,860 1,885 1,834
Total operationsStatement of financial position
Non-current assets 467 470 433 436 1,374Current assets 316 246 239 206 704Non-interest-bearing current liabilities 147 135 130 134 490Net debt position 3) 98 62 -6 -29 511Provisions 39 31 40 32 220Equity 499 488 509 505 859
Key data per ordinary share
Number of issued ordinary shares 57,862,037 59,904,209 62,041,761 71,939,942 69,914,711Number of ordinary shares with dividend rights 57,365,098 59,420,763 61,557,106 61,176,915 69,909,876Weighted average number of outstanding ordinary shares ** 58,433,493 60,380,489 61,759,190 70,479,684 71,902,593Price as at 31 December 25 43 22.32 13.82 15.40 16.25Highest price in calendar year 25 65 22.91 17.27 18.60 16.48Lowest price in calendar year 17 92 12.7 10.56 14.41 10.49Market capitalization as at 31 December 1,459 1,326 851 942 1,136Earnings in euros ** 1 74 1.29 -0.34 -0.01 -0.96Diluted earnings in euros ** 1 72 1.28 -0.33 -0.01 -0.96
Other key data
Cash flow from operating activities 123 110 67 10 197Depreciation/amortization fixed assets 50 46 44 41 110Capital expenditure on (in)tangible fixed assets 51 68 63 76 76Number of employees at closing date*** 1,684 1,673 1,860 1,885 9,650Number of issued financing preference shares 2,279,781 2,403,781 2,574,281 2,983,794 2,983,794Equity per share in euros 4) 8 36 7.89 7.93 7.87 11.78
Ratios
Net debt position/EBITDA 5) 0 6 0.4 -0.1 -0.2 2.0Interest cover 6) 23 0 25.5 23.8 13.6 10.1Balance sheet total : equity 1:0 6 1:0.6 1:0.6 1:0.7 1:0.4Net debt position : equity 1:5 1 1:7.9 1:-87.7 1:-17.2 1:1.6Current assets : current liabilities 1:0 5 1:0.4 1:0.6 1:0.4 1:0.4
* The previous years have not been restated for discontinued operations later on.
** Only the preceding year has been restated for stock dividend.
*** Starting 2015 number of employees based on FTE, before 2015 based on headcount.
1) Per ordinary share in euros after deduction of dividend on financing preference shares.
2) EBITDA margin % is EBITDA divided by net sales x 100.
3) Net debt position comprises interest-bearing debts less cash and cash equivalents.
4) Equity per share is equity divided by the number of shares with dividend rights.
5) EBITDA is “Earnings Before Interest, Taxes, Depreciation and Amortization and impairment of (in)tangible fixed assets” including
acquisition/divestment results and discontinued operations, and excluding one-off items.
6) Interest cover is EBITDA as defined in Note 4 divided by net interest income and charges.
Information on the Corbion share
share capitalCorbion is listed on Euronext Amsterdam. As at 31 December 2016 57,862,037 ordinary shares of € 0.25 each and 2,279,781 financing preference shares of € 0.25 each had been issued, including 496,939 ordinary shares with Corbion.
substantial shareholdingsPursuant to the Financial supervision Act, the following notifications of capital interest in Corbion as at 31 December 2016 were reported:
1 NN Group N.V. 19.98%
2 AsR Nederland N.V. 5.20%
3 RWC Partners Limited 5.01%
4 J.O. Hambro Capital Management Limited 5.03%
5 Lansdowne Partners Limited 3.17%
6 Norges Bank 3.03%
7 Primestone Capital LLP 3.03%
8 BNP Paribas Investment Partners sA 3.03%
N.B: As at 31 December 2016 Corbion nv has a capital interest of 0.83%.
Other information
Millions of euros 2016 2015 2014 2013 2012
Number of ordinary shares with dividend rights x 1,000 as at 31 December 57,365 59,421 61,557 61,177 69,910
Market capitalization in millions of euros as at 31 December 1,459 1,326 851 942 1,136
Highest share price 25 65 22.91 17.27 18.60 16.48
Lowest share price 17 92 12.70 10.56 14.41 10.49
share price as at 31 December 25 43 22.32 13.82 15.40 16.25
Average daily turnover of shares 142,677 196,700 141,134 243,793 373,949
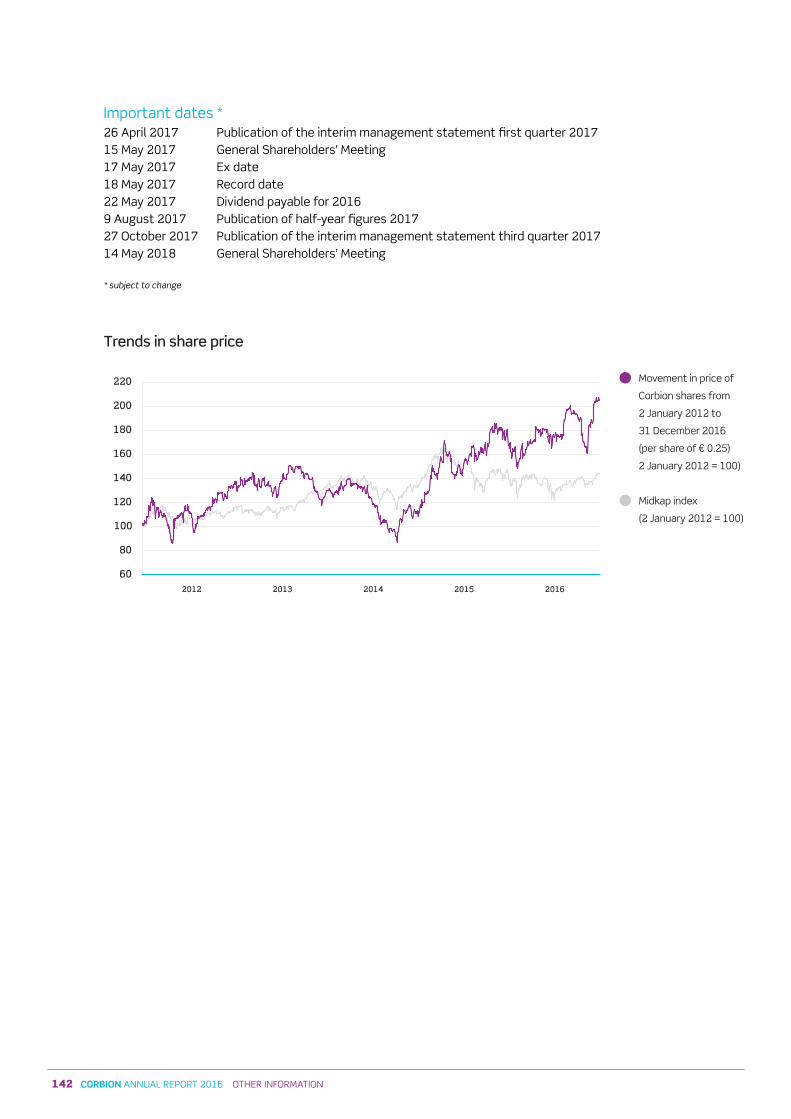
Important dates *26 April 2017 Publication of the interim management statement first quarter 201715 May 2017 General shareholders’ Meeting17 May 2017 Ex date18 May 2017 Record date22 May 2017 Dividend payable for 20169 August 2017 Publication of half-year figures 201727 October 2017 Publication of the interim management statement third quarter 201714 May 2018 General shareholders’ Meeting
* subject to change
Movement in price of
Corbion shares from
2 January 2012 to
31 December 2016
(per share of € 0.25)
2 January 2012 = 100)
Midkap index
(2 January 2012 = 100)
2012 2013 2014 2015 2016
Trends in share price
60
80
120
100
160
140
200
180
220
142 CORBION ANNUAL REPORT 2016 OTHER INFORMATION

Concept and designCascade - visuele communicatie Publication dateMarch 2017
Important dates *26 April 2017 Publication of the interim management statement first quarter 201715 May 2017 General shareholders’ Meeting17 May 2017 Ex date18 May 2017 Record date22 May 2017 Dividend payable for 20169 August 2017 Publication of half-year figures 201727 October 2017 Publication of the interim management statement third quarter 201714 May 2018 General shareholders’ Meeting
* subject to change
Movement in price of
Corbion shares from
2 January 2012 to
31 December 2016
(per share of € 0.25)
2 January 2012 = 100)
Midkap index
(2 January 2012 = 100)
2012 2013 2014 2015 2016
Trends in share price
60
80
120
100
160
140
200
180
220