Embed Size (px)
Citation preview
Annual Report 2016
SOS International A/S Nitivej 6, 2000 Frederiksberg, Denmark CVR No. 17 01 37 18

SOS INTERNATIONAL ANNUAL REPORT 2016
Contents
1
Preface ...................................................................................... 2
Focus ........................................................................................ 3
Assistance at a crossroads ....................................................................................... 3
Connected 2020........................................................................................................ 4
Anchor Point in a Changing World ............................................................................ 5
Regulation and demands .......................................................................................... 7
Reduced medical claims costs .................................................................................. 8
Management’s Review .............................................................. 10
Consolidated key figures and financial ratios ............................................................ 10
Financial review ........................................................................................................ 11
Expectations for 2017 ............................................................................................... 13
Special risks .............................................................................................................. 14
Corporate Social Responsibility ................................................................................ 16
Company information ................................................................................................ 17
Group overview ......................................................................................................... 18
Reviews .................................................................................... 19
Management’s statement .......................................................................................... 19
Independent auditor’s report ..................................................................................... 20
Consolidated and Annual Financial Statements 2016 ............... 22
Accounting policies ................................................................................................... 22
Statement of income ................................................................................................. 29
Statement of financial position .................................................................................. 30
Statement of changes in equity ................................................................................. 32
Statement of cash flow .............................................................................................. 33
Notes ........................................................................................................................ 34

SOS INTERNATIONAL ANNUAL REPORT 2016
PREFACE
Annual Report 2016
2
2016 was a dynamic year. Nordic travellers both by plane
and car have, as always, been in need of assistance on
many journeys the past year.
Despite the sale of Trygghetssentralen as of January 1st
2016 SOS International experienced a growth of 3% in net
revenue, which both expresses a high level of activity and a
high retention rate of costumers.
The financial result of 2016 reflects high competitiveness
and SOS International have managed to close 2016 with a
satisfactory result of DKK 39.4 million before tax, which is
DKK 13.3 million better than 2015.
High customer satisfaction and cost-consciousness are the
cornerstones of our assistance services, and we are proud
to report that in 2016, SOS International increased customer
and end-users satisfaction. New services, operational
improvements, organisational adjustments and a constant
focus on costumers’ demands have been the means to stay
competitive and retain our customers.
We can look back on several strategic achievements in
2016. But we can also observe that the demands and
expectations of our customers and end-users are
continuously changing and increasing. This calls for action.
The past year’s focus on establishing a solid operational
platform has, however, given SOS International a good
foundation and starting point.
To meet the increasing demands in 2017, we have
revitalised our existing strategy called “Next Generation” to
an updated and very ambitious new strategy, which we have
named “Connected 2020”.
We expect 2017 to be yet another year in which we will
improve our ability to create value. We will do this by
connecting even more to end-users, customers, partners
and employees and leave our mark on a number of new
agendas.
I hope you enjoy the report.
Best regards,
Niels Krag Printz

SOS INTERNATIONAL ANNUAL REPORT 2016
FOCUS
Assistance at a crossroads
3
2016 has been an exciting year from the perspective of
an assistance company. New trends have started to
impact the assistance market. However, 2016 also
indicated that old habits die hard, and assistance
companies may face years of simultaneously doing
assistance in a new and old way.
Digital transformation. The rise of smartphones as the
preferred personal platform. Internet of things. Sharing
economy. Peer-to-peer communication. These are among
the megatrends that have begun to impact the assistance
business at different paces. The trends all call for change.
Some directly, such as expected deliverables from
customers and new generations of end-users, who expect
individualisation, availability through social media and apps.
Some indirectly, through disruptive changes in closely
related industries such as insurance and the automobile
industry.
CHANGES UNDERWAY
Both the insurance business and the automobile industry, which
accounts for the majority of SOS International’s customers, are
facing changes which are impacting the operational set-up as
well as business models. As an assistance company, SOS
International must be ready to meet changes with new products
and services and adapted setups in order to continuously be a
trusted partner to our customers. At the same time, it is vital to
understand the needs and expectations of the end-user in terms
of communication channels enabling us to deliver the optimal
end-user experience.
CONVENTIONAL ASSISTANCE
Other indicators from 2016 suggest, that the existing business
models of assistance will maintain momentum in the coming
years. For instance, the sale of conventional cars is rising. That
does not only prolong the market transition towards connected
cars, it also shows that even though sharing economy is one of
the hottest buzzwords right now, it has not yet made a dent in
the Nordic car market.
Looking at travel, low-fare airlines on long distance routes has
resulted in a rise in shorter trips to distant destinations. Older
age groups travel farther as well. The rise in airline travel affects
SOS International positively.
A MARKET SPLIT
These opposite trends point towards an assistance market that
will split in two. One part of the market will call for conventional
services supported by business models as we know them
today. The other part will be the beginning of a new paradigm
driven by the emerging, indicative trends, which call for a more
connected approach to assistance.
The shift between the old and the new assistance is difficult to
extrapolate and the transition could be prolonged with
conventional and connected business models coexisting for a
long time.
Indications of a changing assistance business in 2016
Communication with end-users through apps, social media
and self-service portals
Full digital integration of the business value chain
Globalisation of competition
Remote tracking and monitoring, including connected cars
and healthcare devices and wearable’s
Business intelligence reporting and analysis to improve
performance and develop new services
Transparency in prices and cost structures
Changing travel patterns, e.g. short holidays at distant
destinations via online self-booking of low-fare airline
tickets, hotels or Airbnb.

SOS INTERNATIONAL ANNUAL REPORT 2016
FOCUS
Connected 2020
4
As a consequence of a very fast changing assistance
market, SOS International has defined a new strategy going
towards 2020 named “Connected 2020”.
The strategy is reflecting the split of the market within
assistance, where SOS International needs to continue
improving existing conventional assistance, while at the same
time implementing new and more “connected services”.
AMBITIONS FOR 2020
In 2020 we are a solid company connected to our customers,
end-users, partners and employees providing dedicated advice
and help as the preferred Nordic partner.
The success criteria of the strategy is to continuously stay
relevant to all our stakeholders, reflected in high satisfaction,
quality and efficiency as well as launching new value creating
services. This is creating the basis for the future growth with
focus on the Nordic market and on being a strong white label
partner within assistance services. To achieve this, SOS
International regards the following six points as key elements:
Strong market position through growth in core markets and
proactive customer advisor role
Optimised value chain and strong global network balancing
superior end-users experience and total cost optimisation
New revenue streams through strong product development
and new digital services and channels for customers and
end-users
Be the leading medical competence centre in the Nordic
providing modular healthcare services through a preferred
provider network powered by digital solutions
Digitalised and automated processes based on a strong
shared IT platform optimally operated
Cost efficiency and performance oriented culture supported
by competence development.
As a highly reliable trusted assistance provider, SOS
International will continuously update the existing high standard
of governance including quality, information security and
environment and high ethics standards based on transparency.
This needs to go hand in hand with increased speed of
innovation and increasing exchange of data with all
stakeholders through digital integration, new digital services and
communication channels. That requires special attention and
focus from SOS International en route towards 2020.
SOS International’s strategy, “Connected 2020”, includes the
ambition to successfully transfer SOS International gradually
into the new more connected assistance business, but at the
same time continue improving competencies and service
deliveries that the traditional assistance business is based on.

SOS INTERNATIONAL ANNUAL REPORT 2016
FOCUS
Anchor Point in a Changing World
5
In the past year, SOS International has been an anchor
point in a world of changes as cunning terror, random
violence and the power of Mother Nature have closed in on
preferred travel destinations for Nordic travellers.
Across media, countries and politics, terror has been on the
agenda. Bombings and violent acts have hit European
metropolises as well as popular tourist destinations several
times the past year.
Geographically, the threats are coming closer and Nordic
travellers need to adjust to the fact that terror at well-known
western destinations is becoming part of travelling as well as of
daily life in a globalised world.
ANCHOR IN THE STORM
Also natural forces have tormented travellers during the past
year. Florida and Thailand are characterised as tropic and
sunny, but becomes less enjoyable when flight cancellations
and delays follow heavy weather, floods or hurricanes. Also in
our own Nordic neighbourhood massive rain and heavy snow
underline the need for acute roadside assistance.
SOS International is the anchor point when terror moves into
our backyard and the elements rage on the dream holiday.
With unique competencies, targeted and relevant
communication and a strong global network, SOS International
has provided fast, dedicated and professional assistance
through tragic terror attacks as well as storms.
CRISIS PREPAREDNESS
A proactive and watchful effort characterises SOS
International’s role in crisis situations. SOS International
monitors, evaluates and adjusts the dedicated 24/7 alarm
centre consisting of nurses, doctors, assistance coordinators,
counsellors and psychologists in order to meet any situation.
The alert crisis staff and close cooperation with local authorities
as well as our global network ensure that we are able to help.
And in crisis situations SOS International is constantly
connected to customers, end-users and network through
devices, platforms and personal contact providing the best
guidance for all to be and feel safe.
In some situations we are physically present on site, for
example during The Olympic Games in Rio or after the attacks
in Nice and Brussels.
Crisis preparedness setup has always been an integrated part
of SOS International’s 24/7 services.
In 2016 it became evident, that travel assistance at SOS
International embraces all medical and security aspects as we
strive to not only assist, but also create a sense of safety and
security in a tough situation.

On July 14 at 10.30 PM a terror attack hits central
Nice. 84 people die.
By midnight SOS International delivers the first psychological crisis
counselling over the phone.
Major incidents in 2016
During the following days, three crisis psychologists deliver counselling from the crisis centre
to Nordic travellers.
In all, SOS International received more than 120
cases from Nordic travellers.
After a few hours, the crisis staff arrives at the alarm centre to
secure preparedness and plan the crisis team’s departure for Nice.
Due to criticality of the attack and massive need for help,
SOS International decides to prolong the crisis centre in
Nice to a total of three days.
Within an hour the alarm centre in Copenhagen receives the first calls.
On July 15 at 11 AM SOS International opens a crisis centre at the SAS Radisson
in central Nice.
SOS International delivers indi-vidual and group counselling, on the phone, face-to-face and on
site where the attack hit.
EXAMPLES OF SOS INTERNATIONAL’S TRAVEL CRISIS PREPAREDNESS
January– Snow storm in USA – Terror in Hurghada
February– Terror in Ankara
March– Bombs in Brussels
April– Earthquake in Japan
May– Terror and plane crash EgyptAir
June– SAS pilot strike – Shootings in Atatürk Airport, Istanbul
July
– Terror in Nice
– Military coup in Turkey – Shootings in Munich
August– Bombs in Hua Hin– Olympic Games in Rio de Janeiro– Shootings in JFK airport
September– Bombings in the Philipines
October– Hurricane Matthew in USA– Earthquake in Italy
November– Lufthansa strike– Earth footprints quake and tsunami in Japan
December– Floods in Southern Thailand– Terror in Berlin

SOS INTERNATIONAL ANNUAL REPORT 2016
FOCUS
Regulation and demands
7
Many of SOS International’s customers are insurance
companies and as such they are subject to a heavy
regulation. An example of the regulation imposed on the
industry is the Solvency II directive and the resulting
national legislation, which came into force January 1st
2016.
The directive is setting high standards for the insurance
companies in terms of capital requirements, internal
procedures, processes, operations and reporting as well as
requirement for outsourcing partners need to fulfil. Since SOS
International is acting as outsourcing partner for the insurance
industry, the regulation also affects SOS International.
SOLVENCY II
SOS International works continuously, proactively and in a
structured way to ensure the company meets the Solvency II
requirements as well as all other national and international
legislation. As a Trusted Partner, SOS International is taking the
customers’ businesses and interests into account in the daily
operation and strategic decisions.
Doing business according to business ethics and meeting
requirements from customers and legislation is, among other
things, ensured through a number of initiatives:
Company Code of Conduct and Supplier Code of Conduct
ensuring compliance, observance of national standards and
legal and contractual requirements are implemented and
made available
Compliance Board established to prepare for and ensure
fulfilment of existing and new regulation
Total Quality Management system (TQM) minimising and
managing risks
Reporting and regular audits ensuring continued high
quality of all services
Customer contracts adjusted to Solvency II requirements
Contract management ensuring SOS International commits
and lives up to the regulatory requirements
Accreditations and certifications such as ISO 9001 (quality
management), ISO 27001 (information security) and ISO
14001 (environment management in the Technical Division)
ensuring proactive and continuous work with quality,
environment and information security.
DATA PROTECTION
In May 2018, the new EU data protection regulation comes into
effect. In a number of areas, the new regulation will increase the
existing requirements regarding the protection of personal data.
SOS International has initiated a project dedicated to make sure
SOS International is meeting the new requirements by May
2018. The project includes assessments of a number of areas
for example processes and routines, as the new regulation sets
increased demands in relation to:
IT design and IT systems
Contracts
Consent
IT security
A number of other demands.
The project ensures SOS International will meet the increased
demands when they come into force.

SOS INTERNATIONAL ANNUAL REPORT 2016
FOCUS
Reduced medical claims costs
8
Being the Nordic insurance companies’ trusted partner
calls for long term strategic steps and vigilance in the daily
work in order to provide the best end-user experience and
at the same time continuously try to reduce costs for our
customers.
The competition in the business of assistance has increased
dramatically over the recent years. To meet the demands of the
market and to ensure SOS International’s position as the
leading assistance organisation in the Nordic countries, we
continuously focus on initiatives that assure reduction of costs
year by year.
PATTERNS AND DEMANDS
SOS International’s assistance is dynamic and adjusted
according to the change in the Nordic end-users travel patterns.
To ensure an efficient, adaptive and successful business, SOS
International has appointed a number of focus points across the
Medical and Technical business areas over the past years, for
example:
Preventive and proactive communication
Digital initiatives to end-users and customers
Flexible operational setup
Taking advantage of large scale network
Continuous quality and cost control.
COST AND QUALITY BALANCE
Costs for hospitals and repatriations are some of the most
expensive when handling travel assistance.
Even though SOS International is constantly working to bring
down claims costs, a decrease in costs cannot compromise on
end-user experience or the quality of the case handling. Giving
the patient the right treatment is essential to SOS International
– no more, no less.
INITIATIVES IN MEDICAL IN 2016
All in all, SOS International’s on-going focus on the core
business has resulted in satisfied end-users and in a reduction
of costs for the Medical area of 10-12% in the period 2013-
2016. Some of the initiatives that have led to this are:
Optimisation of the Global Network
Continuing use of new technology and digitalisation
Proactive case handling and fewer “hands” on each case
Experienced nurses handling an increased amount of alarm
centre cases
An improved screening of new and existing cases
Increased use of local escorts where it benefits our end-
users
Less complex repatriations are more often handled directly
at the alarm centre.

EXAMPLES OF DIGITAL AND INNOVATIVE FOOTPRINTS OF 2016
It has been a year of several digital initiatives from SOS International’s hand and new communication platforms, systems integrations and
other innovative solutions across the Medical and Technical area have led to enhanced customer experience.
Total concept of psycholog-ical counselling (Medical Com-
petence Center) and video psychological counselling
Deployment of digital universe targeted expats
Self-service universe and launch of new responsive
platforms www.sos.eu and www.dah.dk
Attention on the demands for the future insurance and
assistance market “InsurTech report - Future trends and
influences on the insurance and assistance business”
New crisis setup secures proactive and integrated
communication to customers and end-users
Implementation of new telephone system
New responsive www.sosveihjelp.no
ISO14001 on environmental management in the Technical
Division is not a digital foot-print, but a certification that indeed ensures the environ-
mental footprint
Launch of SOS Live app, which offers video consulta-
tion face-to-face with Scandi-navian personnel
Rødt Kort app re-launched and focus on optimisation of
the customer journey
New claims online form eases end-users’ access to SOS
International after their travel
Crisis, Risk & Security launched as a flexible concept
providing optimal customer journeys through multiple
channels
Quick form implemented at alarm centre for faster and
better case handling
Updated Travel app
System integration between SOS International and custo-
mers leads to reductions of costs for the customer and
better end-user experiences
SOS INTERNATIONAL ANNUAL REPORT 2016
MANAGEMENT'S REVIEW
Consolidated key figures and financial ratios
10
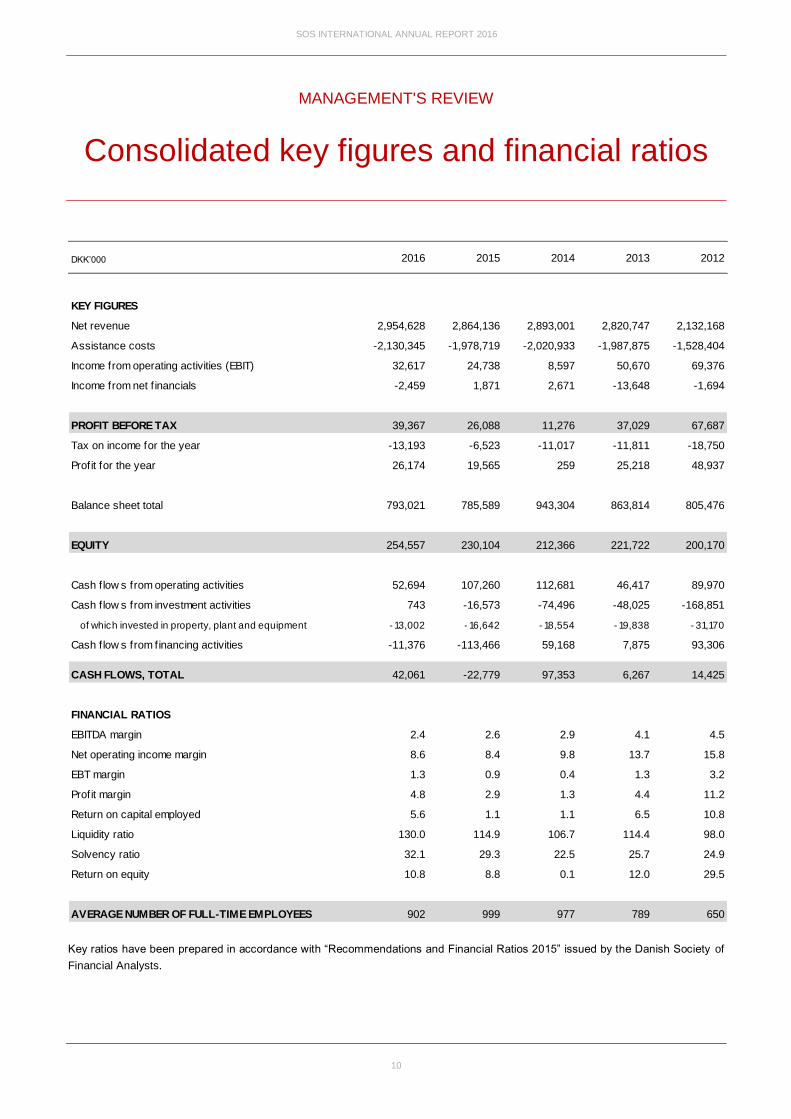
DKK’000 2016 2015 2014 2013 2012
KEY FIGURES
Net revenue 2,954,628 2,864,136 2,893,001 2,820,747 2,132,168
Assistance costs -2,130,345 -1,978,719 -2,020,933 -1,987,875 -1,528,404
Income from operating activities (EBIT) 32,617 24,738 8,597 50,670 69,376
Income from net f inancials -2,459 1,871 2,671 -13,648 -1,694
PROFIT BEFORE TAX 39,367 26,088 11,276 37,029 67,687
Tax on income for the year -13,193 -6,523 -11,017 -11,811 -18,750
Profit for the year 26,174 19,565 259 25,218 48,937
Balance sheet total 793,021 785,589 943,304 863,814 805,476
EQUITY 254,557 230,104 212,366 221,722 200,170
Cash flow s from operating activities 52,694 107,260 112,681 46,417 89,970
Cash flow s from investment activities 743 -16,573 -74,496 -48,025 -168,851
of which invested in property, plant and equipment - 13,002 - 16,642 - 18,554 - 19,838 - 31,170
Cash flow s from financing activities -11,376 -113,466 59,168 7,875 93,306
CASH FLOWS, TOTAL 42,061 -22,779 97,353 6,267 14,425
FINANCIAL RATIOS
EBITDA margin 2.4 2.6 2.9 4.1 4.5
Net operating income margin 8.6 8.4 9.8 13.7 15.8
EBT margin 1.3 0.9 0.4 1.3 3.2
Profit margin 4.8 2.9 1.3 4.4 11.2
Return on capital employed 5.6 1.1 1.1 6.5 10.8
Liquidity ratio 130.0 114.9 106.7 114.4 98.0
Solvency ratio 32.1 29.3 22.5 25.7 24.9
Return on equity 10.8 8.8 0.1 12.0 29.5
AVERAGE NUMBER OF FULL-TIME EMPLOYEES 902 999 977 789 650
Key ratios have been prepared in accordance with “Recommendations and Financial Ratios 2015” issued by the Danish Society of
Financial Analysts.
SOS INTERNATIONAL ANNUAL REPORT 2016
MANAGEMENT’S REVIEW
Financial review
11
MAIN ACTIVITIES
SOS International is the leading assistance organisation in the
Nordic region. From alarm centres in Denmark, Sweden,
Norway and Finland, SOS International provides acute
assistance all over the world, night and day, all year round.
SOS International offers a wide range of solutions in the form of
worldwide medical, travel and roadside assistance as well as
healthcare solutions. SOS International secures the value chain
on behalf of the customers as a trusted partner and aims to
provide the optimal end-user experience while taking the total
cost for the customers into account. As a trusted partner quality
and compliance are also key parameters.
The worldwide travel, health and medical assistance is
conducted in close cooperation with SOS International’s global
network of clinics, hospitals and assistance companies as well
as more than 20 SOS International partner offices. The network
also includes exclusive service offices in high volume areas
such as Spain, Thailand and Greece. In the Nordic region SOS
International provides a range of health related services in
cooperation with local networks.
Roadside assistance covers all kinds of assistance related to
car breakdown in the Nordic region and in the rest of Europe. In
the Nordics roadside assistance is carried out locally by SOS
International’s subsidiaries in Denmark, Finland, Norway and
Sweden.
SOS International was founded in 1957 and is now owned by
15 of the largest insurance companies in the Nordic. SOS
International has a case volume that places the company as
one of the largest assistance organisations in the Nordic region.
INCOME STATEMENT
The total profit before tax for the group amounted to DKK 39.4
million for 2016 as opposed to DKK 26.1 million in 2015. The
profit is higher than anticipated in the Annual Report for 2015,
where SOS International anticipated the profit to be at the level
of DKK 20 million in 2016.
The higher profit in the Annual Report for 2016 is partly due to
the sale of Trygghetssentralen since the price achieved was
higher than book value at the end of 2015 and partly due to
both a higher activity level and lower costs than expected.
NET REVENUE
The group's net turnover constituted DKK 2,955 million in 2016
as opposed to DKK 2,864 million in 2015, corresponding to
increase of DKK 91 million or 3%.
The increase is due to a higher activity in the Technical Division
compared to 2015. On the other hand the sale of Trygghets-
sentralen and a general alignment of the activities in Norway
has had a negative impact.
ASSISTANCE COSTS
Assistance costs are on a higher level than in 2015. Assistance
costs amounted to DKK 2,130 million in 2016 as opposed to
DKK 1,979 million in 2015. This reflects the higher activity level
in 2016.
CONTRIBUTION MARGIN
The contribution margin is lower than in 2015, but this is offset
by lower costs which secures an EBT in 2016 which is higher
than in 2015.
OTHER OPERATING INCOME
Other operating income is on a lower level and amounted to
DKK 4 million in 2016 as opposed to DKK 18 million in 2015.
EXTERNAL COSTS
The external expenses amounted to DKK 180 million in 2016 as
opposed to DKK 203 million in 2015.The main reason for the
lower external costs is a very high focus on cost awareness.
STAFF COSTS
The total employee expenses amounted to DKK 578 million in
2016 as opposed to DKK 627 million in 2015, just as the
average number of employees decreased from 999 to 902.
The decrease is partly due to a reduction in the number of
employees in November 2015 and the sale of Trygghets–
sentralen.
DEPRECIATION AND AMORTISATION
The total depreciation and amortisation for the year amounted
to DKK 38 million in 2016 as opposed to DKK 50 million in
2015.
Total depreciation and amortisation decrease due to a decrease
in intangible assets and the sale of Trygghetssentralen.
SOS INTERNATIONAL ANNUAL REPORT 2016
MANAGEMENT’S REVIEW
Financial review
12
On the immaterial fixed assets the total amortisation amounted
to DKK 26 million in 2016. For material fixed assets the total
depreciation amounted to DKK 14 million in 2016. Additionally
there has been a gain on sale of material fixed assets of DKK 2
million in 2016.
FINANCIAL INCOME AND EXPENSES
The total financial income and expenses constituted a net cost
of DKK 2 million in 2016 against a net income of DKK 2 million
in 2015.
Exchange rate fluctuations are within the natural risk in
connection with the business lines.
TAX ON INCOME FOR THE YEAR
The tax calculated for the group amounted to DKK 13 million for
2016 as opposed to DKK 7 million in 2015.
BALANCE SHEET
INTANGIBLE ASSETS
The carrying amount of intangible fixed assets constituted DKK
196 million at the end of 2016 as opposed to DKK 226 million at
the end of 2015. The change can primarily be attributed to
depreciation and amortisation of DKK 26 million, while
disposals, exchange rate regulation and the sales of
Trygghetssentralen represents the remaining part.
PROPERTY, PLANT AND EQUIPMENT
The total carrying amount of tangible fixed assets constituted
DKK 25 million at the end of 2016 as opposed to DKK 28 million
at the end of 2015.
RECEIVABLES
The carrying amount of receivables constituted DKK 394 million
at the end of 2016 as opposed to DKK 395 million at the end of
2015 as part of the ordinary business activity.
EQUITY
Equity amounted to DKK 255 million at the end of 2016
compared with DKK 230 million at the end of 2015. The annual
profit after tax amounted to DKK 26 million in 2016, while
exchange rate adjustment of subsidiaries contributed negatively
with DKK 2 million.
LIABILITIES
The total carrying amount of liabilities is reduced by DKK 12
million from the end of 2015 to the end of 2016. The change
can primarily be attributed to a decrease in the debt to trade
creditors and other short-term liabilities.
LONG-TERM LIABILITIES
The carrying amount of long-term debt commitments constituted
DKK 69 million at the end of 2016 as opposed to DKK 58 million
at the end of 2015.
The long-term customer deposit has increased by DKK 9 million
in 2016.
SHORT-TERM LIABILITIES
The carrying amount of short-term debt commitments
constituted DKK 439 million at the end of 2016 as opposed to
DKK 462 million at the end of 2015. The change can primarily
be attributed to prepayments from customers, which has
increased by DKK 38 million in 2016 and a decrease in other
short-term liabilities by DKK 19 million.
DIVIDEND
The Board of Directors’ recommendation to the company’s
general meeting is to transfer the year’s profit to equity.
CASH FLOW STATEMENT
Cash flows from operating activities amounted to DKK 51
million, which is a decrease compared to 2015 where cash flow
from operating activities amounted to DKK 107 million.
Cash flows from investment activities was positive in 2016 and
amounted to DKK 2 million as opposed to minus DKK 17 million
in 2015. In 2016, the cash flow is positively affected by the sale
of Trygghetssentralen.
The cash flow from financing activities amounted to DKK 11
million in 2016 as opposed to a drawn of DKK 113 million in
2015.
At the end of 2016, the group's liquidity preparedness
amounted to DKK 176 million, which is an increase compared to
the end of 2015, where the liquidity amounted to DKK 134
million.

SOS INTERNATIONAL ANNUAL REPORT 2016
MANAGEMENT’S REVIEW
Expectations for 2017
13
In 2017, SOS International will continue its significant
investments and implementation of the new strategy
“Connected 2020” to further strengthen the competitiveness
and digitalisation of the company. The continual price
pressure and the expected high level of investment in
digitalisation and product development etc. is forecasted to
affect profit before tax negatively compared to 2016. The
profit before tax is therefore expected to be positive, but at a
lower level than in 2016.
To this date, no event has occurred in 2017 that will change
this view.

SOS INTERNATIONAL ANNUAL REPORT 2016
MANAGEMENT’S REVIEW
Special risks
14
RISK MANAGEMENT
SOS International continually works with risk management.
The Group Compliance Board is responsible for monitoring
all types of risks including risks caused by legal and
contractual requirements, IT security and cyber-crime risks.
In addition, the Compliance Board sets and oversees the
company’s personal data protection, controlling procedures
and governance structure. The Compliance Board reports to
Group Management and the Board’s Audit Committee. Risks
are presented to Group Management on a regular basis and
twice a year to the Audit Committee as well as the Board of
Directors. Any security incidents are reported and escalated
through a structured and written process.
As a trusted partner, SOS International is mindful of the
Solvency II regime when managing risk since our customers
are subject to these requirements. Risk management is
performed in SOS International’s total quality management
system in which risks are identified, addressed and mitigated
when appropriate. SOS International has achieved the ISO
9001, ISO 14001 and the ISO 27001 certifications regarding
quality management, environment and information security
in which risk assessment pose an integral part.
FINANCIAL RISKS
SOS International is exposed to financial risks which can be
divided into the following three main groups: Currency, credit
and liquidity risks.
CURRENCY RISK
Currency risk is the risk of suffering a loss caused by change
in exchange rates of foreign currencies against the functional
currency. SOS International has adopted a finance policy
which lays down the framework for identifying, hedging and
reporting this risk. The policy contains the basic principle that
SOS International does not wish to speculate in foreign
currencies. The policy is approved by Group Management
and the Board of Directors annually. A significant part of the
paid assistance costs are in foreign currencies whereas the
re-invoicing in most cases is done in Danish Kroner (DKK).
SOS International is primarily exposed to foreign exchange
risks from EUR, NOK, SEK and USD. Currency risks are
typically managed by matching the timing of the income and
costs in each foreign currency.
CREDIT RISK
Credit risk is the risk of incurring a loss in case SOS
International’s customers or other collaboration partners
cannot meet their obligations. The credit risk in SOS
International is evaluated to be low since some of the major
debtors and major customers make prepayments and since
most costumers have a very high credit rating. Accordingly,
credit risks are significantly mitigated.
LIQUIDITY RISK
Liquidity risk is the risk of not being able to meet present or
future financial obligations on time. To ensure the financial
resources necessary to perform its tasks, the finance policy
establishes continuous monitoring of the cash flow in the
organisation and a minimum disposable liquidity is
determined.
OPERATIONAL RISKS
Operational risks typically stem from inadequate or failed
internal processes, from personnel or systems or from
external events. SOS International is always on 365 days a
year and this requires focus on the operational aspects of
the company. Operational risks include non-conformances
with procedures and IT disruption. By continually
documenting, reviewing and improving corporate policies,
processes and instructions, operational risks relating to
procedures are mitigated. Business continuity plans for
telephone and IT systems limit the operational risk by
ensuring responsiveness and quality in case of business
disruption. Findings from quality management are
documented and communicated to raise awareness about
operational risks and ensure on-going learning across the
organisation.
COMPLIANCE
Compliance with legal and contractual requirements as well
as national standards and conventions is embedded in the
business model of SOS International. SOS International is
very attentive to the rules concerning the protection of
personal data and protection of confidential information.
SOS International has issued numerous corporate policies
on the matter including the Company Code of Conduct, the
Information Security Code of Conduct and the Personal Data
Policy to mitigate the risk of non-compliance
.

SOS INTERNATIONAL ANNUAL REPORT 2016
MANAGEMENT’S REVIEW
Special risks
15
OTHER RISKS
Other risks include geographical and technological
development risks. Within recent years, SOS International
has increased the business areas especially within Roadside
assistance thus mitigating the geographical risk. The
technological development within communications, medical
and healthcare solutions and roadside assistance requires
SOS International to be able to advance still more rapidly.
The quality management system enables SOS International
to swiftly identify, commence and implement changes
caused by such development.

SOS INTERNATIONAL ANNUAL REPORT 2016
MANAGEMENT’S REVIEW
Corporate Social Responsibility
16
SOS International actively works with Corporate Social
Responsibility (CSR) which creates a positive effect for our
customers, employees and other stakeholders. We strive to
achieve good results within our main CSR focus areas –
environment, human rights and anticorruption.
Read more about our CSR initiatives including equal gender
representation at management level and the results for 2016
on our webpage cf. §99a and §99b of the Danish Financial
Statements Act
https://www.sos.eu/en/who-we-are/compliance/

SOS INTERNATIONAL ANNUAL REPORT 2016
MANAGEMENT’S REVIEW
Company information
17
SOS International A/S — Nitivej 6 — DK2000 Frederiksberg
Telephone:
Telefax:
Website:
E-mail:
CVR No.
Founded:
Municipality of domicile:
Financial year:
+45 70 10 50 55
+45 70 10 50 56
www.sos.eu
17 01 37 18
03 May 1961
Frederiksberg
1 January 31 December
THE BOARD OF DIRECTORS
Amund Skarholt (Chairman)
Jesper Mørch Sørensen (Vice Chairman)
Sigurd Ivar Austin
Ann Sommer
Dag Rehme
Annkristine Vuopio Mogestedt
Timo Olavi Ahvonen
Camilla Amstrup
Rikard Livman (Employee representative)
Rune Sixtus Glæser (Employee representative)
Alexander Barren (Employee representative)
Markku Reinikainen (Employee representative)
THE EXECUTIVE BOARD
Niels Krag Printz
AUDIT
Ernst & Young
Godkendt Revisionspartnerselskab
Osvald Helmuths Vej 4
P.O. Box 250
DK2000 Frederiksberg
SOS INTERNATIONAL ANNUAL REPORT 2016
MANAGEMENT’S REVIEW
Group overview
18
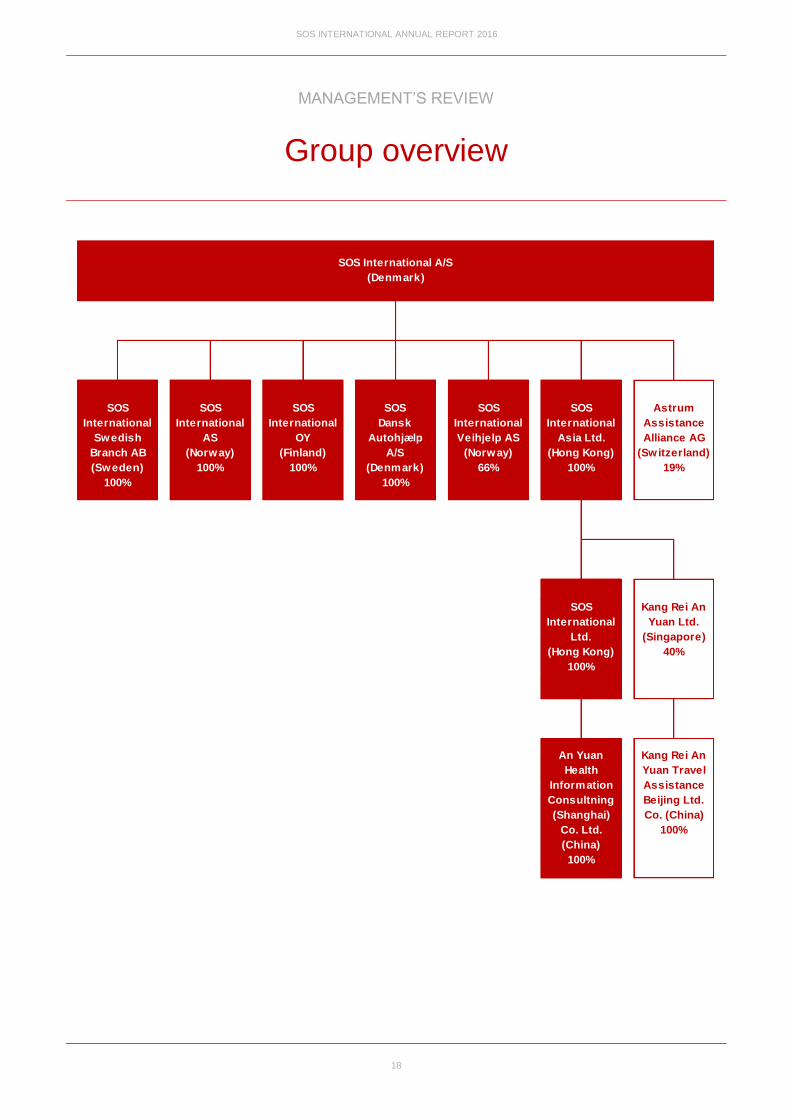
SOS International A/S
(Denmark)
SOS
International
AS
(Norway)
100%
Kang Rei An
Yuan Ltd.
(Singapore)
40%
SOS
International
Ltd.
(Hong Kong)
100%
An Yuan
Health
Information
Consultning
(Shanghai)
Co. Ltd.
(China)
100%
Kang Rei An
Yuan Travel
Assistance
Beijing Ltd.
Co. (China)
100%
SOS
International
Swedish
Branch AB
(Sweden)
100%
Astrum
Assistance
Alliance AG
(Switzerland)
19%
SOS
International
Asia Ltd.
(Hong Kong)
100%
SOS
International
Veihjelp AS
(Norway)
66%
SOS
Dansk
Autohjælp
A/S
(Denmark)
100%
SOS
International
OY
(Finland)
100%

SOS INTERNATIONAL ANNUAL REPORT 2016
REVIEWS
Management’s statement
19
The Board of Directors and the Executive Board have today
discussed and approved the Annual Report of SOS International
A/S for the financial year 1 January - 31 December 2016.
The Annual Report has been prepared in accordance with the
Danish Financial Statements Act.
In our opinion, the consolidated financial statements and the
parent company financial statements give a true and fair view of
the Group's and the parent company's financial position at 31
December 2016 and of the results of the Group's and the parent
company's operations and consolidated cash flows for the
financial year 1 January – 31 December 2016.
Further, in our opinion, the Management's review gives a fair
review of the development in the Group's and the parent
company's operations and financial matters and the results of
the Group's and the parent company's operations and financial
position.
The Annual Report will be submitted for approval at the annual
general meeting.
Copenhagen, 23 March 2017
Niels Krag Printz
CEO
Ole Joachim Jensen
CFO
THE BOARD OF DIRECTORS
Amund Skarholt Jesper Mørch Sørensen Sigurd Ivar Austin
Chairman Vice Chairman
Ann Sommer Dag Rehme Annkristine Vuopio Mogestedt
Timo Olavi Ahvonen Camilla Amstrup Rikard Livman
Rune Sixtus Glæser Alexander Barren Markku Reinikainen

SOS INTERNATIONAL ANNUAL REPORT 2016
REVIEWS
Independent auditor’s report
20
TO THE SHAREHOLDERS OF
SOS INTERNATIONAL A/S
OPINION
We have audited the consolidated financial statements and the
parent company financial statements of SOS International A/S
for the financial year 1 January – 31 December 2016, which
comprise income statement, balance sheet, statement of
changes in equity and notes, including a summary of significant
accounting policies, for both the group and the parent company,
as well as consolidated statement of cash flows. The
consolidated financial statements and the parent company
financial statements are prepared under the Danish Financial
Statements Act.
In our opinion, the consolidated financial statements and the
parent company financial statements give a true and fair view of
the financial position of the Group and the parent company at
31 December 2016, and of the results of the Group and parent
company operations as well as the consolidated cash flows for
the financial year 1 January – 31 December 2016 in accordance
with the Danish Financial Statements Act.
BASIS FOR OPINION
We conducted our audit in accordance with International
Standards on Auditing (ISAs) and the additional requirements
applicable in Denmark. Our responsibilities under those
standards and requirements are further described in the
"Auditor's responsibilities for the audit of the consolidated
financial statements and the parent company financial
statements" section of our report. We are independent of the
Group in accordance with the International Ethics Standards
Board for Accountants' Code of Ethics for Professional
Accountants (IESBA Code) and the additional requirements
applicable in Denmark, and we have fulfilled our other ethical
responsibilities in accordance with these rules and
requirements. We believe that the audit evidence we have
obtained is sufficient and appropriate to provide a basis for our
opinion.
MANAGEMENT'S RESPONSIBILITIES FOR THE
CONSOLIDATED FINANCIAL STATEMENTS AND THE
PARENT COMPANY FINANCIAL STATEMENTS
Management is responsible for the preparation of consolidated
financial statements and parent company financial statements
that give a true and fair view in accordance with the Danish
Financial Statements Act, and for such internal control as
Management determines is necessary to enable the preparation
of consolidated financial statements and parent company
financial statements that are free from material misstatement,
whether due to fraud or error.
In preparing the consolidated financial statements and the
parent company financial statements, Management is
responsible for assessing the Group's and the parent
company's ability to continue as a going concern, disclosing, as
applicable, matters related to going concern and using the
going concern basis of accounting in preparing the consolidated
financial statements and the parent company financial
statements unless Management either intends to liquidate the
Group or the company or to cease operations, or has no
realistic alternative but to do so.
AUDITOR'S RESPONSIBILITIES FOR THE AUDIT OF THE
CONSOLIDATED FINANCIAL STATEMENTS AND THE
PARENT COMPANY FINANCIAL STATEMENTS
Our objectives are to obtain reasonable assurance about
whether the consolidated financial statements and the parent
company financial statements as a whole are free from material
misstatement, whether due to fraud or error, and to issue an
auditor's report that includes our opinion. Reasonable
assurance is a high level of assurance, but is not a guarantee
that an audit conducted in accordance with ISAs and the
additional requirements applicable in Denmark will always
detect a material misstatement when it exists. Misstatements
can arise from fraud or error and are considered material if,
individually or in the aggregate, they could reasonably be
expected to influence the economic decisions of users taken on
the basis of these consolidated financial statements and parent
company financial statements.
As part of an audit conducted in accordance with ISAs and the
additional requirements applicable in Denmark, we exercise
professional judgment and maintain professional skepticism
throughout the audit. We also:
Identify and assess the risks of material misstatement of the
consolidated financial statements and the parent company
financial statements, whether due to fraud or error, design
and perform audit procedures responsive to those risks, and
obtain audit evidence that is sufficient and appropriate to
provide a basis for our opinion. The risk of not detecting a
material misstatement resulting from fraud is higher than for
one resulting from error as fraud may involve collusion,
forgery, intentional omissions, misrepresentations, or the
override of internal control.

SOS INTERNATIONAL ANNUAL REPORT 2016
REVIEWS
Independent auditor’s report
21
Obtain an understanding of internal control relevant to the
audit in order to design audit procedures that are
appropriate in the circumstances, but not for the purpose of
expressing an opinion on the effectiveness of the Group's
and the parent company's internal control.
Evaluate the appropriateness of accounting policies used
and the reasonableness of accounting estimates and
related disclosures made by Management.
Conclude on the appropriateness of Management's use of
the going concern basis of accounting in preparing the
consolidated financial statements and the parent company
financial statements and, based on the audit evidence
obtained, whether a material uncertainty exists related to
events or conditions that may cast significant doubt on the
Group's and the parent company's ability to continue as a
going concern. If we conclude that a material uncertainty
exists, we are required to draw attention in our auditor's
report to the related disclosures in the consolidated financial
statements and the parent company financial statements or,
if such disclosures are in-adequate, to modify our opinion.
Our conclusion is based on the audit evidence obtained up
to the date of our auditor's report. However, future events or
conditions may cause the Group and the company to cease
to continue as a going concern.
Evaluate the overall presentation, structure and contents of
the consolidated financial statements and the parent
company financial statements, including the disclosures,
and whether the consolidated financial statements and the
parent company financial statements represent the
underlying transactions and events in a manner that gives a
true and fair view.
Obtain sufficient appropriate audit evidence regarding the
financial information of the entities or business activities
within the Group to express an opinion on the consolidated
financial statements. We are responsible for the direction,
supervision and performance of the group audit. We remain
solely responsible for our audit opinion.
We communicate with those charged with governance
regarding, among other matters, the planned scope and timing
of the audit and significant audit findings, including any
significant deficiencies in internal control that we identify during
our audit.
STATEMENT ON MANAGEMENT'S REVIEW
Management is responsible for Management's review.
Our opinion on the consolidated financial statements and the
parent company financial statements does not cover
Management's review, and we do not express any form of
assurance conclusion thereon.
In connection with our audit of the consolidated financial
statements and the parent company financial statements, our
responsibility is to read Management's review and, in doing so,
consider whether Management's review is materially
inconsistent with the consolidated financial statements or the
parent company financial statements or our knowledge obtained
during the audit, or otherwise appears to be materially
misstated.
Moreover, it is our responsibility to consider whether
Management's review provides the information required under
the Danish Financial Statements Act.
Based on the work we have performed, we conclude that
Management's review is in accordance with the consolidated
financial statements and the parent company financial
statements and has been prepared in accordance with the
requirements of the Danish Financial Statement Act. We did not
identify any material misstatement of Management's review.
Copenhagen, 23 March 2017
Ernst & Young
Godkendt Revisionspartnerselskab
CVR No. 30 70 02 28
Jesper Jørn Pedersen
State Authorised Public Accountant
Allan Lunde Pedersen
State Authorised Public Accountant

SOS INTERNATIONAL ANNUAL REPORT 2016
CONSOLIDATED AND ANNUAL FINANCIAL STATEMENTS 2016
Accounting policies
22
The 2016 Annual Report of SOS International has been
prepared in accordance with the provisions applying to
reporting class C large enterprises under the Danish
Financial Statements Act.
Effective 1 January 2016 SOS International has adopted Act
no. 738 of 1. June 2015. This leads to the following changes
in the recognition and measurement:
Yearly reassessment of residual values of property, plant
and equipment
Method applied to intra-group company mergers
Restructuring in connection with company mergers
Amortisation period, intangible assets
Reserve for development costs
None of the above mentioned changes have an impact on
the financial statement or the balance sheet for 2016 or for
the comparative figures.
Except the changes above, the accounting policies used in
the preparation of the income statement are consistent with
those of last year.
RECOGNITION AND MEASUREMENT
The financial statements are prepared in accordance with the
historical cost convention.
Revenue is recognised in the income statement as it is earned.
Value adjustments of financial assets and liabilities are
measured at fair value or amortised cost. The same applies to
all expenses incurred to achieve earnings, including
depreciations, impairment losses/gains, accruals and reversals
due to changes in accounting estimates of amounts previously
recognised in the income statement.
Assets are recognised in the balance sheet when it is probable
that future economic benefits will flow to the company, and the
value of the asset can be reliably measured.
Liabilities are recognised in the balance sheet when it is
probable that future economic benefits will flow out of the
company and the value of the liability can be reliably measured.
On initial recognition, assets and liabilities are measured at
cost. Subsequently, assets and liabilities are measured as
described for each individual item below:
Certain financial assets and liabilities are measured at
amortised cost to achieve a constant effective interest rate over
the life of the asset or liability. Amortised cost is stated as the
original cost less any repayments plus or minus the cumulative
amortisation of any difference between cost and nominal
amount. In this way, capital losses and gains are amortised over
the life of the asset or liability.
Recognition and measurement take into consideration
anticipated losses and risks that arise before the time of
presentation of the annual report and which confirm or invalidate
affairs and conditions existing at the balance sheet date.
The parent company uses Danish Kroner (DKK) as its
functional currency. All other currencies are considered as
foreign currency.
CONSOLIDATED FINANCIAL STATEMENTS
The consolidated financial statements include the parent
company SOS International A/S, as well as the subsidiaries of
which SOS International A/S directly or indirectly holds more
than 50 % of the voting rights or have a deciding influence in
another way. Companies of which the Group holds between 20
% and 50 % of the voting rights and in addition to considerable
but not deciding influence, are considered as associated
companies, see the Group overview.
For the consolidated companies, elimination is carried out of
intra-group income and expenses, shareholdings, internal debts
and dividends as well as realised and unrealised profits and
losses for transactions between the consolidated companies.
Investments in subsidiaries are offset with the proportionate
share of the subsidiaries' fair value of net assets and liabilities
on the acquisition date.
COMPANY MERGERS
Newly acquired or newly established companies are recognised
in the consolidated financial statements from the acquisition
date. Sold or discontinued companies are recognised in the
consolidated income statement up to the divestment date.
Comparative figures are not adjusted for newly acquired or
discontinued companies.
Profit or loss in the event of divestment of subsidiaries and
associated companies is calculated as the difference between
the divestment sum and the carrying amount of net assets on

SOS INTERNATIONAL ANNUAL REPORT 2016
CONSOLIDATED AND ANNUAL FINANCIAL STATEMENTS 2016
Accounting policies
23
the date of sale including goodwill that is not depreciated and
the expected costs for the sale or discontinuation.
For the acquisition of new companies, the acquisition method is
used after which the newly acquired companies' identified
assets and liabilities are measured at fair value on the date of
acquisition. Accruals to cover the costs of decided and
published restructuring in the acquired company are recognised
in connection with the acquisition. Consideration is taken of the
tax effect of the conducted revaluations.
Positive differential amounts (goodwill) between cost price and
fair value of the identified assets and liabilities taken over,
including accruals for restructuring, are recognised under
intangible fixed assets and are amortised systematically over
the income statement after an individual evaluation of the
financial service life, however, maximum 15 years.
Goodwill from acquired companies can be adjusted until 12
month after an acquisition.
INTRA-GROUP COMPANY MERGERS
The book value method is used for company consolidations
such as the purchase and sale of investments, mergers, de-
mergers, injection of assets and exchange of shares, etc. in the
event of participation by companies under the parent company's
control. The differences between the agreed payment and the
acquired company's carrying amount are recognised in the
equity. Furthermore, adjustment of the comparative figures for
earlier financial years is carried out.
TRANSLATION OF FOREIGN CURRENCY
Transactions in foreign currency are translated on the first
recognition at the rate on the date of transaction. Foreign
currency differences that arise between the rate on the date of
transaction and the rate on the date of payment are recognised
in the income statement as a financial item.
Receivables, debt and other monetary items in foreign currency
are translated at the exchange rate on the balance sheet date.
The difference between the rate on the balance sheet date and
the rate on the date of the occurrence of the receivable or debt
are recognised in the income statement under financial income
and expenses.
Foreign subsidiaries are considered as being independent units.
The income statements are translated to an average exchange
rate for the month and the balance sheet items are translated to
the exchange rates on the balance sheet date. Exchange rate
differences that have arisen with the translation of the foreign
subsidiaries' equity at the beginning of the year, at the
exchange rates on the balance sheet date, as well as with
translation of the income statements from average exchange
rates, at the exchange rates on the balance sheet date, are
recognised directly in equity.
Exchange rate adjustments of debts with independent foreign
subsidiaries that are considered as part of the total investment in
the subsidiary are recognised directly in equity. Similarly,
exchange rate gains and losses on loans to foreign subsidiaries
are recognised in equity.
INCOME STATEMENT
NET REVENUE
The net revenue for the sale of services is recognised in the
income statement if delivery and risk transfer to the buyer has
taken place before the end of the year. The net revenue is
recognised excluding VAT and tax charges on behalf of a third
party, as well as with the deduction of discounts in connection
with the sale.
Net revenue is recognised in line with the processing of the
projects by which the net revenue corresponds to the sale value
of the year's performed work. Net revenue is recognised when
the total revenue, costs of the contract and degree of
completion on the balance sheet date can be reliably
calculated, and it is probable that the economic benefits,
including payments, will be received by the company.
ASSISTANCE COSTS
Assistance costs regard disbursements on projects that are re-
invoiced to SOS International's customers.
OTHER OPERATING INCOME
Other operating income contains accounting items of secondary
character in relation to the companies' activities.
EXTERNAL COSTS
External costs include costs for distribution, sale,
advertising, administration, facilities, loss on debtors,
operational leases, etc.

SOS INTERNATIONAL ANNUAL REPORT 2016
CONSOLIDATED AND ANNUAL FINANCIAL STATEMENTS 2016
Accounting policies
24
STAFF COSTS
Staff costs include payrolls, pensions, other costs for social
security as well as other employee costs.
Staff costs furthermore include payments of medical
consultants.
RESULTS OF INVESTMENTS IN SUBSIDIARIES AND
ASSOCIATED COMPANIES
The proportionate share of the individual subsidiaries' results
after tax, after full elimination of internal profits/loss, is
recognised in the parent company's income statement.
The proportionate share of the associated companies' results
after tax, after elimination of proportionate share of internal
profits/loss, is recognised in the income statements of both the
Group and parent company.
FINANCIAL INCOME AND EXPENSES
Financial income and expenses contain interest, exchange
gains and losses related to debt and transactions in foreign
currencies, as well as supplements and allowances under the
tax pre-payment scheme, etc.
TAX ON INCOME FOR THE YEAR
The parent company is covered by the Danish rules on
compulsory joint taxation of SOS International A/S Group’s
Danish subsidiaries. Subsidiaries are covered by joint taxation
as of the date they are included in the consolidation in the
Consolidated Financial Statement, prior to this they are not part
of consolidation.
The parent company is the administrative company for the joint
taxation and, as a result of this, settles all payments of
corporate taxes with the Danish tax authorities.
The applicable Danish corporate tax is allocated by settling joint
taxation contributions among the jointly taxed companies, in
relation to their taxable incomes. In this connection, companies
with tax losses, receive joint taxation contributions from
companies that have been able to apply this loss to reduce their
own tax profit.
Tax for the year, consisting of the year’s current corporate tax,
the year’s joint taxation contribution and changes in deferred
tax rates, is recognised in the statement of income, with the
portion that can be attributed to the income for the year, and
directly to equity, with the portion that can be directly attributed
to equity.
BALANCE SHEET
INTANGIBLE ASSETS
GOODWILL
Acquired goodwill is measured at cost price with deductions of
accumulated depreciation. Goodwill is amortised over its
estimated economic life, which is determined based on
management’s experience within the individual business areas.
Goodwill is amortised on a straight-line basis over the
amortisation period which is between 5-15 years and will be
longest for strategically acquired companies with strong market
positions and long-term earnings profiles.
SOFTWARE
Software is measured at cost less accumulated amortisation
and impairments. Amortisation is performed on a straight line
basis over the estimated service life. The amortisation period is
usually 3-5 years.
The cost price includes the purchase price as well as costs
directly associated to the purchase, until the time where the
asset is ready to be used.
CUSTOMER-RELATED ASSETS AND TRADEMARKS
Acquired customer related assets and trademarks are
measured at cost price with deductions of accumulated
depreciation. Customer-related assets and trademarks are
amortised over their estimated economic life, which is
determined based on management’s experience within the
individual business areas. Customer-related assets and
trademarks are depreciated or amortised on a straight-line basis
over the depreciation or amortisation period between 5-15
years.
PROPERTY, PLANT AND EQUIPMENT
Leasehold improvements as well as fixtures and fittings, tools
and equipment are measured at cost less accumulated
depreciation and impairment losses.
The cost includes the purchase price as well as costs directly
associated to the purchase until the time where the asset is
ready to be used.
SOS INTERNATIONAL ANNUAL REPORT 2016
CONSOLIDATED AND ANNUAL FINANCIAL STATEMENTS 2016
Accounting policies
25
Depreciation is performed on a straight-line basis over the
estimated service life, based on the following assessment of the
remaining service life of the assets:
Leasehold improvements 5 years
Other fixtures and fittings, tools and equipment 3-5 years
The basis of depreciation is based on the residual value of the
asset at the end of its useful life and is reduced by impairment
losses, if any. The depreciation period and the residual value
are determined at the time of acquisition and are reassessed
every year. Where the residual value exceeds the carrying
amount of the asset, no further depreciation charges are
recognised.
In case of changes in the depreciation period or the residual
value, the effect on the amortisation charges is recognised
prospectively as a change in accounting estimates.
Gains or losses on the divestment of property, plant and
equipment are recognised as the difference between the sales
price, less sales costs, and the carrying amount at the time of
sale. Gains or losses are recognised in the income statement
under depreciation.
FINANCIAL ASSETS
INVESTMENTS IN SUBSIDIARIES AND ASSOCIATES
Investments in subsidiaries and associates are measured
according to the equity method.
Investments in subsidiaries and associates are measured at the
proportional share of the companies’ equity value measured
according to the Group’s accounting policies minus or plus
unrealised intra-group profits and losses and plus or minus the
residual value of positive or negative goodwill measured
according to the acquisition method.
Investments in subsidiaries and associates with a negative net
asset value are measured at DKK 0 and any receivables from
these companies will be impaired to the extent the receivable is
deemed non-collectable. To the extent the parent company has a
legal or actual obligation to cover a negative balance that
exceeds the receivable; the balance will be recognised under
accruals. If SOS International has a legal or actual obligation to
the company's deficit, an allocated commitment will be included
to this.
Net revaluation of investments in subsidiaries and associates
are shown as a reserve for net revaluation according to the
equity method in equity to the extent the carrying amount
exceeds the cost price. Dividends from subsidiaries expected to
be approved before the approval of the annual report for SOS
International A/S are not bound on the revaluation reserve. For
company acquisitions, the acquisition method is used; cf.
description above under the Consolidated Financial Statement.
For company acquisitions, the acquisition method is used; cf.
description above under the Consolidated Financial Statement.
IMPAIRMENT TEST OF ASSETS
The carrying amount of intangible assets and property, plant
and equipment are measured annually for indications of value
impairments other than the decrease in value reflected by
amortisation or depreciation.
If there are indications of value impairment, impairment is
performed on each individual asset, respectively, group of
assets. Write-down is made to the asset’s recoverable amount,
if this is lower than the carrying amount.
The recoverable amount that is used will be the highest value of
the net selling price and intrinsic value. The intrinsic value is
measured as the current value of the estimated net income from
the use of the asset or asset group.
RECEIVABLES
Receivables are measured at amortised cost.
Impairments for potential losses are made where it is estimated
that there is objective indication that a receivable or a portfolio of
receivables are impaired. If there is objective indication that an
individual receivable is impaired, impairment is made at
individual level.
Receivables for which there is no objective indication of
impairment at individual level, objective indication for impairment
is assessed at portfolio level.
The portfolios are primarily based on the domicile of the debtors
and a credit assessment in accordance with the Company’s and
the Group's credit risk management policy. The objective
indicators used for portfolios are established based on historical
records of losses.
SOS INTERNATIONAL ANNUAL REPORT 2016
CONSOLIDATED AND ANNUAL FINANCIAL STATEMENTS 2016
Accounting policies
26
Impairments are calculated as the difference between the
carrying amount of receivables and the present value of
anticipated cash flows, including the realisable value of any
accepted collaterals. The effective interest rate is used as the
discount rate for the individual receivable or portfolio.
WORK IN PROGRESS
Work in progress consists of incurred costs for projects
measured at the market value. The market value is measured
based on the rate of completion at the reporting date and the
total anticipated income from work in progress.
PREPAYMENTS
Prepayments recognised under current assets cover costs
incurred relating to the following financial year.
SECURITIES
Listed securities recognised under current assets are measured
at the fair value at the balance sheet date.
EQUITY
RESERVE FOR NET REVALUATION ACCORDING TO THE
EQUITY METHOD
Reserve for net revaluation applying the equity method covers
net revaluations of equity investments in subsidiaries in relation
to cost.
The reserve can be eliminated in case of losses, if investments
are realised or changes are made to accounting estimates.
The reserve may not be recognised at a negative amount.
RESERVE FOR DEVELOPMENT COSTS
The reserve for development costs comprises recognised
development costs. The reserve cannot be used to distribute
dividend or cover losses. The reserve will be reduced or
dissolved if the recognised development costs are no longer
part of the Company's operations by a transfer directly to the
distributable reserves under equity.
If the recognised development costs are written down, part of
the reserve for development costs must be reversed. The
reversed portion corresponds to the write-down of the
development costs. If a write-down of the development costs is
subsequently reversed, the reserve for development costs must
be re-established. The reserve for development costs is also
reduced by amortisation charges. In doing so, the equity
reserve will not exceed the amount recognised in the balance
sheet as development costs.
DIVIDEND
Proposed dividends are recognised as a liability at the time of
adoption by the Annual General Meeting (the time of
declaration). Dividends expected to be declared for the year are
shown as a separate item under equity.
CORPORATE TAX AND DEFERRED TAX
As the administrative company, SOS International A/S assumes
liability for the subsidiaries’ corporate taxes to the Danish tax
authorities concurrently with the subsidiaries’ payment of joint-
taxation contributions.
Current tax payable and receivable is recognised in the balance
sheet as calculated tax on the taxable income for the year,
adjusted for previous years’ taxable income and taxes paid on
account. Payable or receivable joint taxation contributions are
recognised in the balance sheet as “Payable corporate tax” or
“Corporate tax.”
Deferred tax is measured according to the balance sheet
liability method on all temporary differences between
accounting and tax values of assets and liabilities. However,
deferred tax on temporary differences related to taxable non-
deductible goodwill, as well as other items where temporary
differences – except for acquisitions of companies – have
arisen at the time of acquisition without having an effect on the
income or taxable income, is not recognised. In cases where the
determination of the tax value can be performed under various
taxation rules, deferred tax is measured based on
management's planned use of the asset, respectively,
settlement of the liability.
Deferred tax assets, including the tax base of tax loss carry-for-
wards, are recognised at the value at which they are expected
to be used, either by elimination in the tax of future earnings, or
by offsets in deferred tax payables in companies within the
same legal tax entity or jurisdiction.
Adjustment of deferred tax is made concerning performed
elimination of unrealized payable intra-group profits and losses.
Deferred tax is measured on the basis of the tax rules and tax
rates in the respective countries that will be effective under the
legislation, at the reporting date, when the deferred tax is
expected to be crystalized as current tax.
SOS INTERNATIONAL ANNUAL REPORT 2016
CONSOLIDATED AND ANNUAL FINANCIAL STATEMENTS 2016
Accounting policies
27
PROVISIONS
Provisions comprise anticipated costs related to warranties,
losses on work in progress, restructurings, etc. Provisions are
recognised when, as a result of past events, the Group has a
legal or a constructive obligation and it is probable that there
may be an outflow of resources embodying economic benefits
to settle the obligation. Provisions are measured at net
realisable value or fair value. If the obligation is expected to be
settled far into the future, the obligation is measured at fair
value.
If it is likely that total costs will exceed total income from a
construction contract, a provision is made for the total loss
anticipated on the contract. The provision is recognised in
assistance costs.
LIABILITIES
Financial liabilities are recognised upon raising the loan at the
proceeds received, less incurred transaction costs. For
subsequent periods, financial liabilities are measured at amortised
cost.
PREPAYMENTS
Prepayments recognised under liabilities include received
payments regarding revenue in the following financial year.
CASH FLOW STATEMENT
The cash flow statement shows consolidated cash flow
distributed on operating, investing and financing activities for
the year, changes in cash and cash equivalents for the year, as
well as cash and cash equivalents at the beginning and end of
the year.
The effect on cash flow from the acquisition of companies is
shown separately under cash flow from investment activities.
Cash flow from acquired companies from the date of the
acquisition is recognised in the cash flow statement.
CASH FLOW FROM OPERATING ACTIVITIES
Cash flow from operating activities is measured as income for
the year adjusted for non-cash operating items, changes in
working capital and corporation tax paid.
CASH FLOW FROM INVESTMENT ACTIVITIES
Cash flow from investing activities cover payments made
related to the purchase and divestment of companies and
activities, and the purchase and divestment of property, plant
and equipment, intangible assets and other financial assets.
CASH FLOW FROM FINANCING ACTIVITIES
Cash flow from financing activities comprise changes in the size
or structure of the company’s share capital and incidental costs,
as well as loans, repayments of principals of interest-bearing
debt and payment of dividends to shareholders.
CASH AND CASH EQUIVALENTS
Cash and cash equivalents comprise holdings of short-term
securities that can readily be converted to cash or cash
equivalents and for which there is only insignificant risk of
changes in value.
SEGMENT INFORMATION
Disclosures include information related to business segments
and geographic markets. The segment information follows the
Group's accounting policies and internal financial management.

SOS INTERNATIONAL ANNUAL REPORT 2016
CONSOLIDATED AND ANNUAL FINANCIAL STATEMENTS 2016
Accounting policies
28
KEY FIGURES
The ratios and key figures shown in the statement of financial
highlights and key figures are calculated as follows:
EBITDA margin:
Profit before interest, taxes, depreciation and amortisation (EBITDA) x 100
Net revenue
Net operating income margin:
Profit before interest, taxes, depreciation and amortisation (EBITDA) x 100
Contribution margin
EBT Margin:
Profit before tax x 100
Net revenue
Profit margin:
Profit before tax x 100
Contribution margin
Return on capital employed:
Profit from ordinary operating activities (EBIT) x 100
Average operating assets
Operating assets:
Operating assets are total assets less cash and cash equivalents, other
interest-bearing assets (incl. shares) as well as investments in associated
companies.
Liquidity ratio:
Current assets x 100
Current liabilities
Solvency ratio:
Equity, end of year x 100
Liabilities, total, end of year
Return on equity:
Profit for the year x 100
Average equity

SOS INTERNATIONAL ANNUAL REPORT 2016
CONSOLIDATED AND ANNUAL FINANCIAL STATEMENTS 2016
Statement of income
29
DKK’000 NOTE 2016 2015 2016 2015
NET REVENUE 1 2,954,628 2,864,136 2,018,169 2,027,068
Assistance costs -2,130,345 -1,978,719 -1,494,376 -1,480,398
CONTRIBUTION MARGIN 824,283 885,417 523,793 546,670
Other operating income 4,053 18,096 3,942 2,405
External costs 2 -179,862 -202,735 -133,714 -107,589
GROSS PROFIT 648,474 700,778 394,021 441,486
Staff costs 3 -577,566 -626,519 -365,320 -417,933
Depreciation and amortisation
on tangible and intangible assets 4 -38,291 -49,521 -10,234 -14,729
INCOME FROM OPERATING ACTIVITIES 32,617 24,738 18,467 8,824
Income from subsidiaries after tax 5 9,184 0 12,258 10,640
Income from associates after tax 25 -521 25 0
Financial income 6 13,897 39,727 14,007 37,311
Financial expenses 7 -16,356 -37,856 -14,700 -34,602
PROFIT BEFORE TAX 39,367 26,088 30,057 22,173
Tax on income for the year 8 -13,193 -6,523 -3,883 -2,608
PROFIT FOR THE YEAR 26,174 19,565 26,174 19,565
PROPOSED PROFIT APPROPRIATION
DKK’000 2016 2015
Retained income 26,174 19,565
Proposed dividends 0 0
26,174 19,565
GROUP PARENT COMPANY

SOS INTERNATIONAL ANNUAL REPORT 2016
CONSOLIDATED AND ANNUAL FINANCIAL STATEMENTS 2016
Statement of financial position
30
DKK’000 NOTE 2016 2015 2016 2015
ASSETS
INTANGIBLE ASSETS 9
Goodw ill 116,799 136,828 0 0
Softw are 2,550 2,530 787 236
Customer-related assets 57,957 66,337 0 0
Trademarks 18,321 20,039 0 0
195,627 225,734 787 236
PROPERTY, PLANT AND EQUIPMENT 10
Leasehold improvements 585 1,532 46 157
Fixtures and f ittings, tools and equipment 24,409 25,853 13,295 13,604
Property, plant and equipment under construction 0 551 0 551
24,994 27,936 13,341 14,312
FINANCIAL ASSETS
Investments in group enterprises 11 0 0 262,714 282,682
Investments in associates 12 1,870 1,494 202 222
1,870 1,494 262,916 282,904
NON-CURRENT ASSETS, TOTAL 222,491 255,164 277,044 297,452
INVENTORIES
Manufactured goods and goods for resale 583 2,056 0 0
583 2,056 0 0
RECEIVABLES
Trade debtors 189,288 170,440 63,644 69,479
Work in progress 156,006 159,610 144,747 150,009
Prepayments to business partners 25,145 34,189 25,145 34,189
Receivables from group enterprises 0 0 22,013 24,000
Deferred tax assets 16 3,088 6,522 0 0
Corporate tax receivables 13 3,762 1,829 2,595 0
Other receivables 4,351 16,220 49 12,424
Prepayments 14 12,422 5,733 6,900 2,621
394,062 394,543 265,093 292,722
SECURITIES 74 76 18 18
CASH AND CASH EQUIVALENTS 175,811 133,750 157,513 128,428
CURRENT ASSETS, TOTAL 570,530 530,425 422,624 421,168
ASSETS, TOTAL 793,021 785,589 699,668 718,620
GROUP PARENT COMPANY

SOS INTERNATIONAL ANNUAL REPORT 2016
CONSOLIDATED AND ANNUAL FINANCIAL STATEMENTS 2016
Statement of financial position
31
DKK’000 NOTE 2016 2015 2016 2015
EQUITY AND LIABILITIES
EQUITY
Share capital 15 21,388 21,388 21,388 21,388
Retained income 233,169 208,716 233,169 208,716
Proposed dividends 0 0 0 0
EQUITY, TOTAL 254,557 230,104 254,557 230,104
PROVISIONS
Deferred tax 16 23,331 25,768 2,938 3,756
Other provisions 7,325 9,870 7,085 8,600
PROVISIONS, TOTAL 30,656 35,638 10,023 12,356
LIABILITIES OTHER THAN PROVISIONS
LONG-TERM LIABILITIES 17
Customer deposits 42,630 33,719 42,503 33,594
Other long-term liabilities 26,239 24,595 26,085 24,141
68,869 58,314 68,588 57,735
SHORT-TERM LIABILITIES
Credit institutions 35,507 46,883 35,507 46,883
Trade payables 61,212 86,503 23,794 49,048
Amounts ow ed to group enterprises 0 0 67,676 91,323
Prepayments from customers 234,506 196,010 178,828 152,874
Corporation tax 13 0 5,336 0 3,276
Other short-term liabilities 107,714 126,801 60,695 75,021
438,939 461,533 366,500 418,425
LIABILITIES OTHER THAN PROVISIONS, TOTAL 507,808 519,847 435,088 476,160
EQUITY AND LIABILITIES, TOTAL 793,021 785,589 699,668 718,620
CONTINGENT LIABILITIES 18
DISPOSAL OF SUBSIDIARIES AND ACTIVITIES 21
RELATED PARTIES 22
GROUP PARENT COMPANY

SOS INTERNATIONAL ANNUAL REPORT 2016
CONSOLIDATED AND ANNUAL FINANCIAL STATEMENTS 2016
Statement of changes in equity
32
DKK’000 Share capital Retained income Proposed dividends Total
Equity at 1 Jan 2015 21,388 190,978 0 212,366
Dividends distributed 0 0 0 0
Transferred via distribution of income 0 19,565 0 19,565
Exchange rate adjustment, group enterprises 0 -1,827 0 -1,827
Equity at 31 Dec 2015 21,388 208,716 0 230,104
Equity at 1 Jan 2016 21,388 208,716 0 230,104
Dividends distributed 0 0 0 0
Transferred via distribution of income 0 26,174 0 26,174
Exchange rate adjustment, group enterprises 0 -1,721 0 -1,721
Equity at 31 Dec 2016 21,388 233,169 0 254,557
GROUP AND PARENT COMPANY

SOS INTERNATIONAL ANNUAL REPORT 2016
CONSOLIDATED AND ANNUAL FINANCIAL STATEMENTS 2016
Statement of cash flow
33
DKK’000 NOTE 2016 2015
Operating cash flow s before changes in w orking capital 19 72,333 74,595
Change in w orking capital 20 890 45,172
Operating cash flow s 73,223 119,767
Interest income, paid 13,897 39,727
Interest costs, paid -16,356 -37,856
Cash flow s from ordinary activities 70,764 121,638
Corporation tax, paid -19,495 -14,378
Cash flows from operating activities 51,269 107,260
Disposal of subsidiaries and activities 16,447 0
Acquisition of intangible f ixed assets -2,541 0
Acquisition of property, plant and equipment -13,002 -16,642
Disposal of property, plant and equipment 1,264 69
Cash flows from investment activities 2,168 -16,573
Change in debt to credit institutions -11,376 -113,466
Cash flows from financing activities -11,376 -113,466
Cash flow s, 1 Jan – 31 dec 42,061 -22,779
Cash and cash equivalents, 1 Jan 133,750 156,529
Cash and cash equivalents, 31 Dec 175,811 133,750
The Statement of Cash Flow s cannot be derived directly
from the other components of the Consolidated and Parent
Company Financial Statement.
GROUP

SOS INTERNATIONAL ANNUAL REPORT 2016
CONSOLIDATED AND ANNUAL FINANCIAL STATEMENTS 2016
Notes
34
DKK’000 2016 2015 2016 2015
NOTE 1 NET REVENUE
Segment information by activity
Travel 1,911,901 1,917,107 1,907,581 1,914,641
Roadside 999,742 860,138 103,265 102,295
Health 42,985 86,891 7,323 10,132
2,954,628 2,864,136 2,018,169 2,027,068
Segment information by geography
Denmark 840,630 811,641 504,975 486,270
Sw eden 921,673 847,320 677,248 692,543
Norw ay 649,071 741,157 465,335 523,146
Finland 295,810 258,485 218,437 207,961
Other countries 247,444 205,533 152,174 117,148
2,954,628 2,864,136 2,018,169 2,027,068
NOTE 2 OTHER EXTERNAL COSTS
Rent, etc. 28,752 33,260 15,093 14,457
Consultant fee, etc. 64,488 55,797 45,842 38,191
IT service, softw are licenses, etc. 31,245 32,001 20,305 20,926
Other external costs 55,377 81,677 52,474 34,015
179,862 202,735 133,714 107,589
Fees for auditor elected by the
annual general meeting
Statutory audit 1,349 1,331 550 550
Other assurance services w ith security 21 21 5 5
Tax and VAT advisory services 806 805 609 609
Other services 347 29 130 0
2,523 2,186 1,294 1,164
NOTE 3 STAFF COSTS
Wages and salaries 476,463 522,285 307,359 359,249
Pensions 51,437 53,385 38,678 39,437
Other social security costs 34,752 36,566 11,549 10,898
Other staff costs 14,914 14,283 7,734 8,349
577,566 626,519 365,320 417,933
Average number of full-time employees 902 999 460 474
GROUP PARENT COMPANY

SOS INTERNATIONAL ANNUAL REPORT 2016
CONSOLIDATED AND ANNUAL FINANCIAL STATEMENTS 2016
Notes
35
DKK’000 2016 2015 2016 2015
GROUP PARENT COMPANY
NOTE 3 STAFF COSTS
Staff costs include w ages and salaries accrued by
Executive Management and the Supervisory Board in the
amount DKK’000 4,164 (2015: DKK’000 4,159).
NOTE 4 DEPRECIATION AND AMORTISATION
Depreciation Leasehold improvements 592 1,079 111 511
Depreciation Fixtures and f ittings, tools and equipment 13,516 19,857 9,540 13,656
Amortisation Intangible assets 25,608 28,921 583 848
Losses/gains from the sale of f ixed assets -1,425 -336 0 -286
38,291 49,521 10,234 14,729
NOTE 5 INCOME FROM SUBSIDIARIES AFTER TAX
Profit/loss in subsidiaries after tax 0 0 19,000 26,236
Goodw ill amortisation 0 0 -15,926 -15,596
Profit from sale of subsidiaries 9,184 0 9,184 0
9,184 0 12,258 10,640
NOTE 6 FINANCIAL INCOME
Interest income from subsidiaries 0 0 508 584
Currency gains 13,674 39,429 13,428 36,636
Other f inancial income 223 298 71 91
13,897 39,727 14,007 37,311
NOTE 7 FINANCIAL EXPENSES
Interest expenses to subsidiaries 0 0 1 122
Exchange losses 12,440 33,371 11,828 31,015
Bank fees 3,014 2,564 2,093 1,777
Interest expenses 902 1,921 778 1,688
16,356 37,856 14,700 34,602
NOTE 8 TAX OF INCOME FOR THE YEAR
Current tax 12,095 18,541 4,639 7,476
Adjustment of tax from previous years 63 -290 62 -290
Adjustment of deferred tax for the year 1,035 -11,728 -818 -4,578
13,193 6,523 3,883 2,608

SOS INTERNATIONAL ANNUAL REPORT 2016
CONSOLIDATED AND ANNUAL FINANCIAL STATEMENTS 2016
Notes
36
NOTE 9 INTANGIBLE ASSETS
Customer- Intangible
DKK’000 Goodw ill Softw are related Trademarks assets under Total
assets construction
Cost price, 1 Jan 2016 186,278 37,075 93,116 25,765 0 342,234
Exchange rate adjustments 2,031 66 1,019 0 0 3,116
Disposals relating to sale of subsidiaries -27,305 -4,693 0 0 0 -31,998
Additions 0 2,541 0 0 0 2,541
Disposals 0 -2,567 0 0 0 -2,567
Cost price, 31 Dec 2016 161,004 32,422 94,135 25,765 0 313,326
Amortisation, 1 Jan 2016 -49,450 -34,545 -26,779 -5,726 0 -116,500
Exchange rate adjustments -351 -65 -176 0 0 -592
Disposals relating to sale of subsidiaries 18,108 4,328 0 0 0 22,436
Disposals 0 2,565 0 0 0 2,565
Amortisation -12,512 -2,155 -9,223 -1,718 0 -25,608
Amortisation, 31 Dec 2016 -44,205 -29,872 -36,178 -7,444 0 -117,699
CARRYING AMOUNT, 31 DEC 2016 116,799 2,550 57,957 18,321 0 195,627
GROUP
NOTE 9 INTANGIBLE ASSETS
Intagible
DKK’000 Softw are assets under Total
construction
Cost price, 1 Jan 2016 8,692 0 8,692
Additions 1,134 0 1,134
Cost price, 31 Dec 2016 9,826 0 9,826
Amortisation, 1 Jan 2016 -8,456 0 -8,456
Amortisation -583 0 -583
Amortisation, 31 Dec 2016 -9,039 0 -9,039
CARRYING AMOUNT, 31 DEC 2016 787 0 787
PARENT COMPANY

SOS INTERNATIONAL ANNUAL REPORT 2016
CONSOLIDATED AND ANNUAL FINANCIAL STATEMENTS 2016
Notes
37
NOTE 10 PROPERTY, PLANT AND EQUIPMENT
Leasehold Fixtures and Property, plant &
DKK’000 improvements fittings, tools and equipment under Total
equipment construction
Cost price, 1 Jan 2016 13,191 120,468 551 134,210
Exchange rate adjustments -67 619 0 552
Disposal relating to sale of subsidiaries -1,618 -27,731 0 -29,349
Additions 39 13,869 0 13,908
Disposals -906 -14,890 0 -15,796
Transfers 0 551 -551 0
Cost price, 31 Dec 2016 10,639 92,886 0 103,525
Amortisation, 1 Jan 2016 -11,659 -94,615 0 -106,274
Exchange rate adjustments 37 -634 0 -597
Disposal relating to sale of subsidiaries 1,093 26,304 0 27,397
Disposals 906 14,145 0 15,051
Depreciation -431 -13,677 0 -14,108
Amortisation, 31 Dec 2016 -10,054 -68,477 0 -78,531
CARRYING AMOUNT, 31 DEC 2016 585 24,409 0 24,994
NOTE 10 PROPERTY, PLANT AND EQUIPMENT
Leasehold Fixtures and Property, plant &
DKK’000 improvementsfittings, tools and equipment under Total
equipment construction
Cost price, 1 Jan 2016 9,960 53,222 551 63,733
Additions 0 9,231 0 9,231
Disposals -906 -4,710 0 -5,616
Transfers 0 551 -551 0
Cost price, 31 Dec 2016 9,054 58,294 0 67,348
Amortisation, 1 Jan 2016 -9,803 -39,618 0 -49,421
Disposals 906 4,159 0 5,065
Depreciation -111 -9,540 0 -9,651
Amortisation, 31 Dec 2016 -9,008 -44,999 0 -54,007
CARRYING AMOUNT, 31 DEC 2016 46 13,295 0 13,341
PARENT COMPANY
GROUP
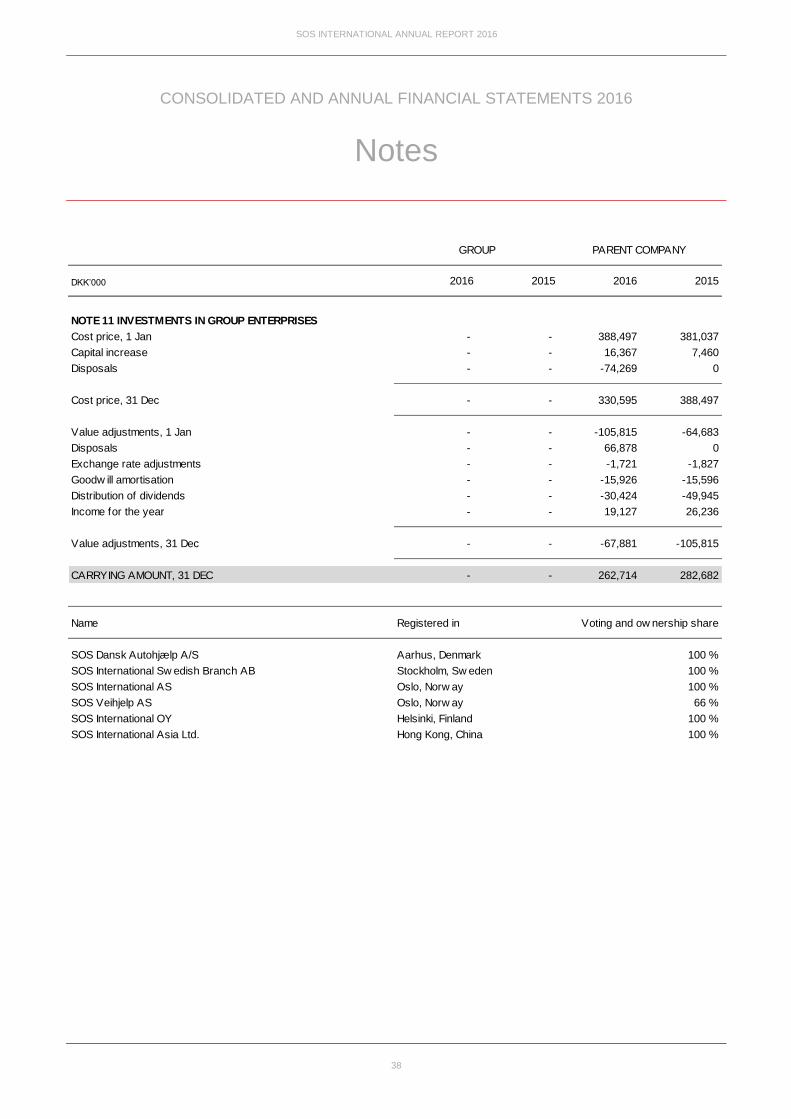
SOS INTERNATIONAL ANNUAL REPORT 2016
CONSOLIDATED AND ANNUAL FINANCIAL STATEMENTS 2016
Notes
38
DKK’000 2016 2015 2016 2015
NOTE 11 INVESTMENTS IN GROUP ENTERPRISES
Cost price, 1 Jan - - 388,497 381,037
Capital increase - - 16,367 7,460
Disposals - - -74,269 0
Cost price, 31 Dec - - 330,595 388,497
Value adjustments, 1 Jan - - -105,815 -64,683
Disposals - - 66,878 0
Exchange rate adjustments - - -1,721 -1,827
Goodw ill amortisation - - -15,926 -15,596
Distribution of dividends - - -30,424 -49,945
Income for the year - - 19,127 26,236
Value adjustments, 31 Dec - - -67,881 -105,815
CARRYING AMOUNT, 31 DEC - - 262,714 282,682
Name Registered in Voting and ow nership share
SOS Dansk Autohjælp A/S Aarhus, Denmark 100 %
SOS International Sw edish Branch AB Stockholm, Sw eden 100 %
SOS International AS Oslo, Norw ay 100 %
SOS Veihjelp AS Oslo, Norw ay 66 %
SOS International OY Helsinki, Finland 100 %
SOS International Asia Ltd. Hong Kong, China 100 %
GROUP PARENT COMPANY

SOS INTERNATIONAL ANNUAL REPORT 2016
CONSOLIDATED AND ANNUAL FINANCIAL STATEMENTS 2016
Notes
39
DKK’000 2016 2015 2016 2015
GROUP PARENT COMPANY
NOTE 12 INVESTMENTS IN ASSOCIATES
Cost price, 1 Jan 1,911 153 121 153
Additions 397 1,790 0 0
Disposals -29 -32 -29 -32
Cost price, 31 Dec 2,279 1,911 92 121
Value adjustments, 1 Jan -417 113 102 113
Exchange rate adjustments 32 -9 32 -12
Income for the year 16 -521 16 0
Disposals -40 0 -40 1
Value adjustments, 31 Dec -409 -417 110 102
CARRYING AMOUNT, 31 DEC 1,870 1,494 202 223
Name Registered in Voting and ow nership share
Astrum Assistance Alliance AG Sw itzerland 19 %
Kang Rei An Yuan Ltd. Singapore 50 % / 40 %
DKK’000 2016 2015 2016 2015
GROUP PARENT COMPANY
NOTE 13 CORPORATION TAX
Corporation tax payable, 1 Jan -3,507 357 -3,276 787
Exchange rate adjustment -64 8 0 0
Adjustments for previous years -67 291 -62 292
Current tax for the year -12,095 -18,541 -4,639 -7,476
Corporation tax for the year, paid 19,495 14,378 10,572 3,121
CARRYING AMOUNT, 31 DEC 3,762 -3,507 2,595 -3,276
Recognised in the Statement of Financial Position as:
Corporate tax receivables 3,762 1,829 2,595 0
Corporation tax 0 -5,336 0 -3,276
CARRYING AMOUNT, 31 DEC 3,762 -3,507 2,595 -3,276

SOS INTERNATIONAL ANNUAL REPORT 2016
CONSOLIDATED AND ANNUAL FINANCIAL STATEMENTS 2016
Notes
40
DKK’000 2016 2015 2016 2015
GROUP PARENT COMPANY
NOTE 14 PREPAYMENTS
Prepaid expenses 12,422 5,733 6,900 2,621
CARRYING AMOUNT, 31 DEC 12,422 5,733 6,900 2,621
NOTE 15 SHARE CAPITAL
Unlisted share capital:
Nominal value at 1 January 2009 20,960 20,960 20,960 20,960
Capital increase August 2012 428 428 428 428
NOMINAL VALUE, YEAR-END 21,388 21,388 21,388 21,388
The share capital consists of 2,138,766 shares of DKK 10 nominal
value and is paid up in full. No shares have special rights.
NOTE 16 DEFFERRED TAX
Deferred tax, 1 Jan 19,246 30,553 3,756 8,334
Exchange rate adjustment 422 421 0 0
Adjustments for previous years -460 0 0 0
Adjustment of deferred tax for the year 1,035 -11,728 -818 -4,578
CARRYING AMOUNT, 31 DEC 20,243 19,246 2,938 3,756
Recognised in the Statement of Financial Position as:
Deferred tax assets -3,088 -6,522 0 0
Provision for deferred tax 23,331 25,768 2,938 3,756
CARRYING AMOUNT, 31 DEC 20,243 19,246 2,938 3,756
NOTE 17 LONG-TERM LIABILITIES
Long-term liabilities are due w ithin f ive years
from the closing of the f inancial year.

SOS INTERNATIONAL ANNUAL REPORT 2016
CONSOLIDATED AND ANNUAL FINANCIAL STATEMENTS 2016
Notes
41
DKK’000 2016 2015 2016 2015
GROUP PARENT COMPANY
NOTE 18 CONTINGENT LIABILITIES
SOS International is a party to individual ongoing legal disputes. It is
the opinion of the management that the outcome of these legal
disputes w ill not affect the f inancial situation beyond the
receivables and liabilities that have been factored in the balance
as of 31 December 2016.
The parent company participates in joint taxation w ith its Danish
subsidiary. The companies bear unlimited joint and several liability
for Danish corporation tax and tax at source on dividends, interest
and royalties w ithin the joint taxation scheme. Any subsequent
adjustment of the income subject to joint taxation or tax at source
on dividend etc. could result in an increase of the companies’
liability. The group as a w hole is not liable for others.
Operating lease commitments due w ithin f ive years 5,882 7,465 1,128 2,576
Rent commitments due w ithin f ive years 23,880 29,093 7,457 7,457
NOTE 19 OPERATING CASH FLOWS BEFORE
CHANGES IN WORKING CAPITAL
Operating income 32,617 24,738
Adjustments for non-cash operating items, etc.
Depreciations 38,291 49,521
Losses/gains from the sale of f ixed assets 1,425 336
72,333 74,595
NOTE 20 CHANGE IN WORKING CAPITAL
Changes in inventories 1,473 282
Changes in trade receivables -18,848 18,062
Changes in w ork in progress 3,604 41,469
Changes in other receivables, including prepayments, etc. 14,224 40,947
Changes in trade payables -25,291 3,172
Changes in customer prepayments 47,407 -9,332
Changes in other debts -21,679 -49,428
890 45,172

SOS INTERNATIONAL ANNUAL REPORT 2016
CONSOLIDATED AND ANNUAL FINANCIAL STATEMENTS 2016
Notes
42
DKK’000 2016 2015 2016 2015
GROUP PARENT COMPANY
NOTE 21 DISPOSAL OF SUBSIDIARIES AND ACTIVITIES
In 2016 Trygghetssentralen in Norw ay has been sold. Trygghets-
sentralen w as a part of SOS International AS in Norw ay.
Adjusted sales price for Trygghetssentralen 16,447 0 16,447 0
Investments in Trygghetssentralen -10,135 0 -10,135 0
Exchange rate adjustments 2,872 0 2,872 0
Profit from sale of subsidiaries 9,184 0 9,184 0
NOTE 22 RELATED PARTIES
SOS International A/S has no related parties w ith controlling
influence. According to section 98(3) of the Danish Financial
Statements Act, transactions w ith w holly-ow ned subsidiaries
are not disclosed. Wages and salaries accrued by Executive
Management and the Supervisory Board is disclosed in note 3.

www.sos.eu