Embed Size (px)
Citation preview

ACN 139 308 973 ANNUAL REPORT 2017
For
per
sona
l use
onl
y
CORPORATE DIRECTORY/CONTENTS PAGE
St George Mining Limited – Annual Report 2017 P 2
CORPORATE DIRECTORY Board of Directors John Prineas ‐ Executive Chairman Tim Hronsky ‐ Executive Director Sarah Shipway ‐ Non‐Executive Director Company Secretary Sarah Shipway Registered and Principal Office Level 1, 115 Cambridge Street WEST LEEDERVILLE WA 6007 Tel: + 61 8 9322 6600 Fax: + 61 8 9322 6610 Website: www.stgeorgemining.com.au Email: [email protected] Australian Business Number ABN 21 139 308 973 Share Register Computershare Investor Services Pty Ltd Level 11 172 St Georges Terrace PERTH WA 6000 Tel: 1300 850 505 Int: +61 8 9323 2000 Fax: + 61 8 9323 2033 Stock Exchange Code SGQ – Ordinary Shares Auditors Stantons International Bankers Commonwealth Bank
CONTENTS PAGE
Chairman’s Letter 3
Review of Operations 4
Directors’ Report 13
Consolidated Statement of Profit or Loss and Other Comprehensive Income
22
Consolidated Statement of Financial Position
23
Consolidated Statement of Changes in Equity
24
Consolidated Statement of Cash Flows
25
Notes to the Financial Statements 26
Directors’ Declaration 46
Auditor’s Independence Declaration 47
Independent Auditor’s Report 48
Shareholder Information 52
Schedule of Tenements 54
For
per
sona
l use
onl
y
CHAIRMAN’S LETTER
St George Mining Limited – Annual Report 2017 P 3
Dear Fellow Shareholders On behalf of the Board of Directors, I am pleased to present the Annual Report of St George Mining Limited for the financial year ended 30 June 2017 – a year where the hard work of our team continued to deliver excellent results for the Company. Further drilling success at our Mt Alexander Project confirmed its status as one of the most exciting exploration projects in Western Australia. Drill programmes in the past financial year have achieved the best high grade intersections to date with multiple discoveries of additional nickel‐copper‐cobalt‐PGE mineralisation within a 3.5km strike length of the Cathedrals Belt. Initial metallurgical testing has delivered outstanding results with greater than 99% recoveries of nickel and copper to concentrates. The nickel concentrate graded 18%Ni with 0.55%Co and 13.5g/t PGEs. The copper concentrate graded 32%Cu. The high grades and excellent recoveries, together with favourable operational features like shallow depth to mineralisation and proximity to existing processing facilities, suggest attractive economics for a potential mining operation. The Company is well positioned for a significant re‐rating as we establish and grow our resource inventory while the nickel price is recovering from multi‐year lows. At our East Laverton Project, exploration is focused on systematically testing a portfolio of nickel sulphide and gold targets. Early results in this highly prospective yet underexplored area are encouraging and exploration is being escalated in a prudent and technically rigorous manner. Our commitment to create enduring value for shareholders is unwavering. I look forward to sharing further success with you in the coming year.
John Prineas Executive Chairman
For
per
sona
l use
onl
y
REVIEW OF OPERATIONS
St George Mining Limited – Annual Report 2017 P 4
MT ALEXANDER PROJECT Best Drill Intersections To Date: Drilling success continued at the Mt Alexander Project during the year with multiple, thick intersections of high grade nickel‐copper‐cobalt‐PGE mineralisation along a 3.5km section of the Cathedrals Belt including:
MAD56 (Cathedrals Prospect): 7.5m @ 3.90%Ni, 1.74%Cu, 0.12%Co and 3.32g/t total PGEs from 57.8m
including 3.15m @ 6.36%Ni, 2.92%Cu, 0.20%Co and 5.03g/t total PGEs from 61.81m MAD55 (Cathedrals Prospect): 4.28m @ 2.75%Ni, 1.21%Cu, 0.09%Co and 2.59g/t total PGEs from 60.67m
including 1.05m @ 5.91%Ni, 2.63%Cu, 0.21%Co and 2.57g/t total PGEs from 63.9m MAD60 (Investigators Prospect): 5.3m @ 4.95%Ni, 2.75%Cu, 0.16%Co and 4.55g/t total PGEs from 157.9m
including 3m @ 6.40%Ni, 3.55%Cu, 0.21%Co and 5.25g/t total PGEs from 159.38m
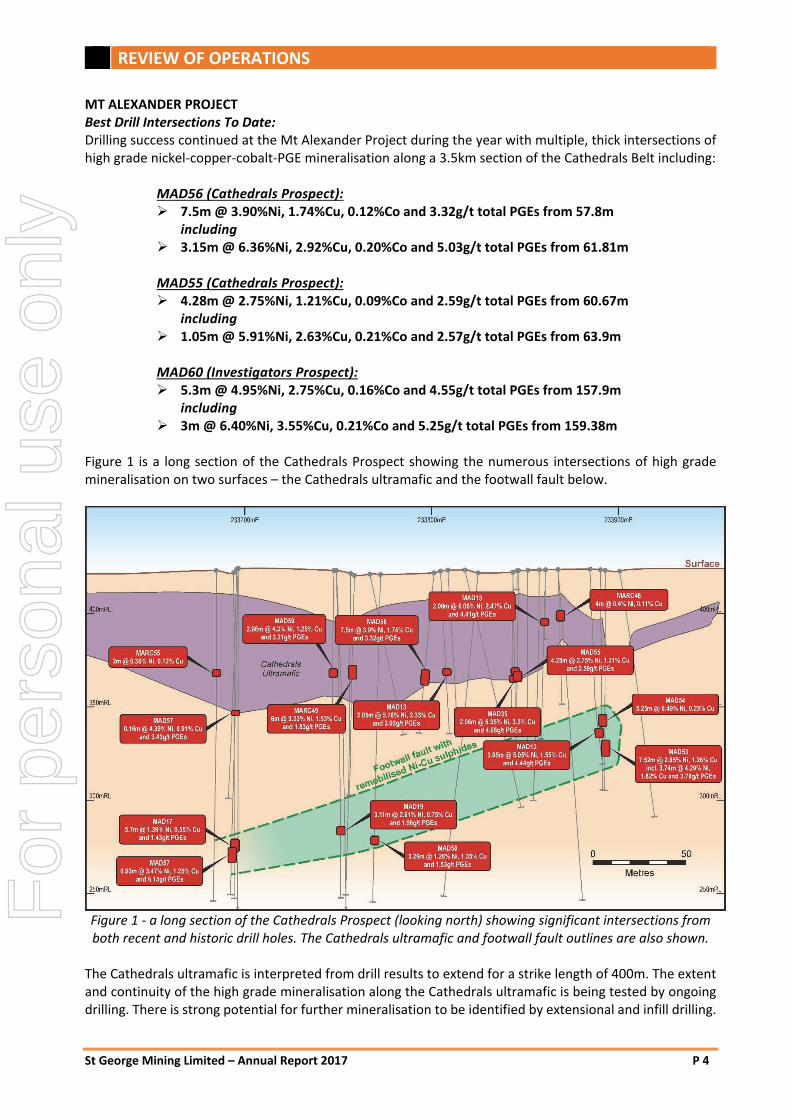
Figure 1 is a long section of the Cathedrals Prospect showing the numerous intersections of high grade mineralisation on two surfaces – the Cathedrals ultramafic and the footwall fault below.
Figure 1 ‐ a long section of the Cathedrals Prospect (looking north) showing significant intersections from both recent and historic drill holes. The Cathedrals ultramafic and footwall fault outlines are also shown.
The Cathedrals ultramafic is interpreted from drill results to extend for a strike length of 400m. The extent and continuity of the high grade mineralisation along the Cathedrals ultramafic is being tested by ongoing drilling. There is strong potential for further mineralisation to be identified by extensional and infill drilling.
For
per
sona
l use
onl
y
REVIEW OF OPERATIONS
St George Mining Limited – Annual Report 2017 P 5
Multiple drill holes at Cathedrals have intersected remobilised massive sulphides in the footwall fault. These sulphides may have been remobilised from the Cathedrals ultramafic above. Further drilling of the footwall fault is planned to test for additional mineralisation.
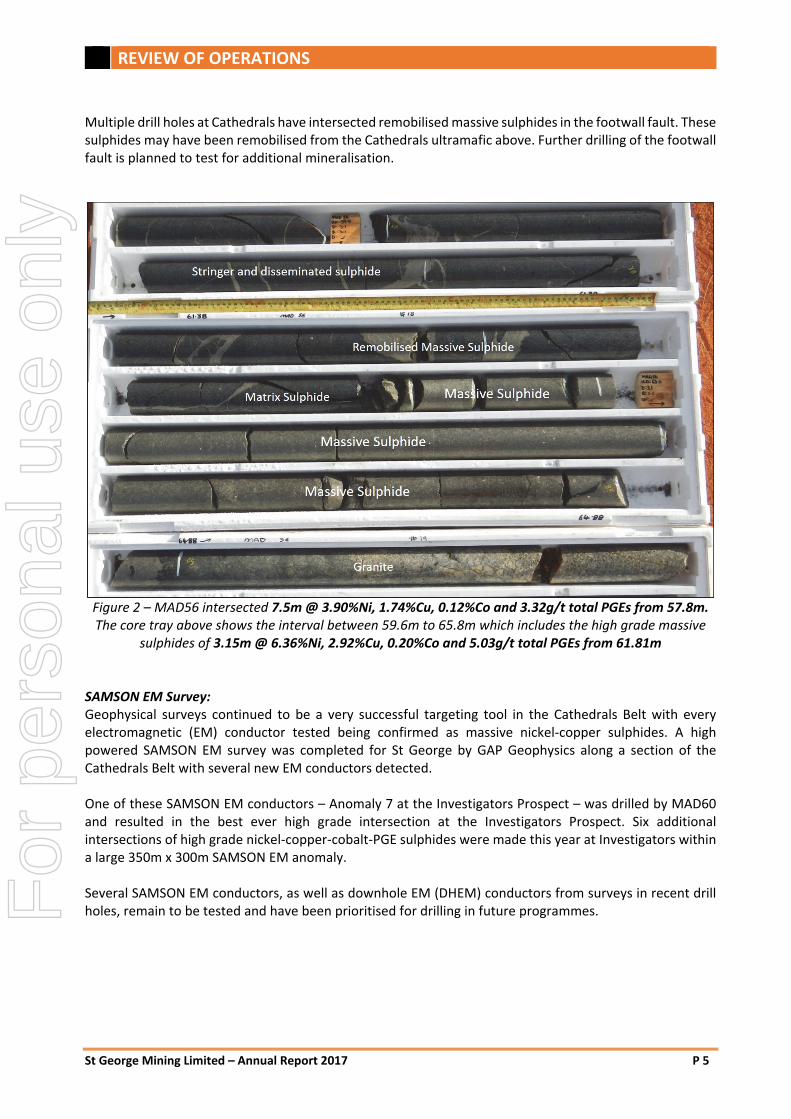
Figure 2 – MAD56 intersected 7.5m @ 3.90%Ni, 1.74%Cu, 0.12%Co and 3.32g/t total PGEs from 57.8m. The core tray above shows the interval between 59.6m to 65.8m which includes the high grade massive
sulphides of 3.15m @ 6.36%Ni, 2.92%Cu, 0.20%Co and 5.03g/t total PGEs from 61.81m
SAMSON EM Survey: Geophysical surveys continued to be a very successful targeting tool in the Cathedrals Belt with every electromagnetic (EM) conductor tested being confirmed as massive nickel‐copper sulphides. A high powered SAMSON EM survey was completed for St George by GAP Geophysics along a section of the Cathedrals Belt with several new EM conductors detected. One of these SAMSON EM conductors – Anomaly 7 at the Investigators Prospect – was drilled by MAD60 and resulted in the best ever high grade intersection at the Investigators Prospect. Six additional intersections of high grade nickel‐copper‐cobalt‐PGE sulphides were made this year at Investigators within a large 350m x 300m SAMSON EM anomaly. Several SAMSON EM conductors, as well as downhole EM (DHEM) conductors from surveys in recent drill holes, remain to be tested and have been prioritised for drilling in future programmes. F
or p
erso
nal u
se o
nly
REVIEW OF OPERATIONS
St George Mining Limited – Annual Report 2017 P 6
Regional Exploration Supports Exploration Upside: The Company also initiated some key regional exploration initiatives during the year to investigate the broader potential at the Project tenements. A moving loop EM (MLEM) survey was completed along the east‐northeast structural corridor that lies 1km south of the Cathedrals Belt. A prominent EM conductor was identified – Anomaly 11 (see Figure 4) – which has been prioritised for drilling. An airborne magnetic survey was completed by St George in October 2016 over all four granted tenements within the Project area. A total of 4,472 line kilometres were flown in the survey, which was completed on a 50m line spacing with a sensor height around 40m. A number of new structures were identified from the high resolution magnetic data generated by the survey. These structures, in particular the east‐northeast structures, have potential to host mineralised ultramafics similar to the Cathedrals Belt. Exploration of these new target areas is ongoing. One area selected for priority exploration is the western extension of the Cathedrals Belt where a new SAMSON EM survey will be completed (see Figure 4). This area includes the intersection of the Cathedrals Belt and the Ida Fault which may be an important regional geological control on the mineralised ultramafics within the Project tenements. Multiple untested magnetic anomalies have been identified in the SAMSON survey area. Similar magnetic anomalies along strike in the Belt have been confirmed by drilling to represent mineralised ultramafics hosting high grade nickel‐copper‐cobalt‐PGE massive sulphides.
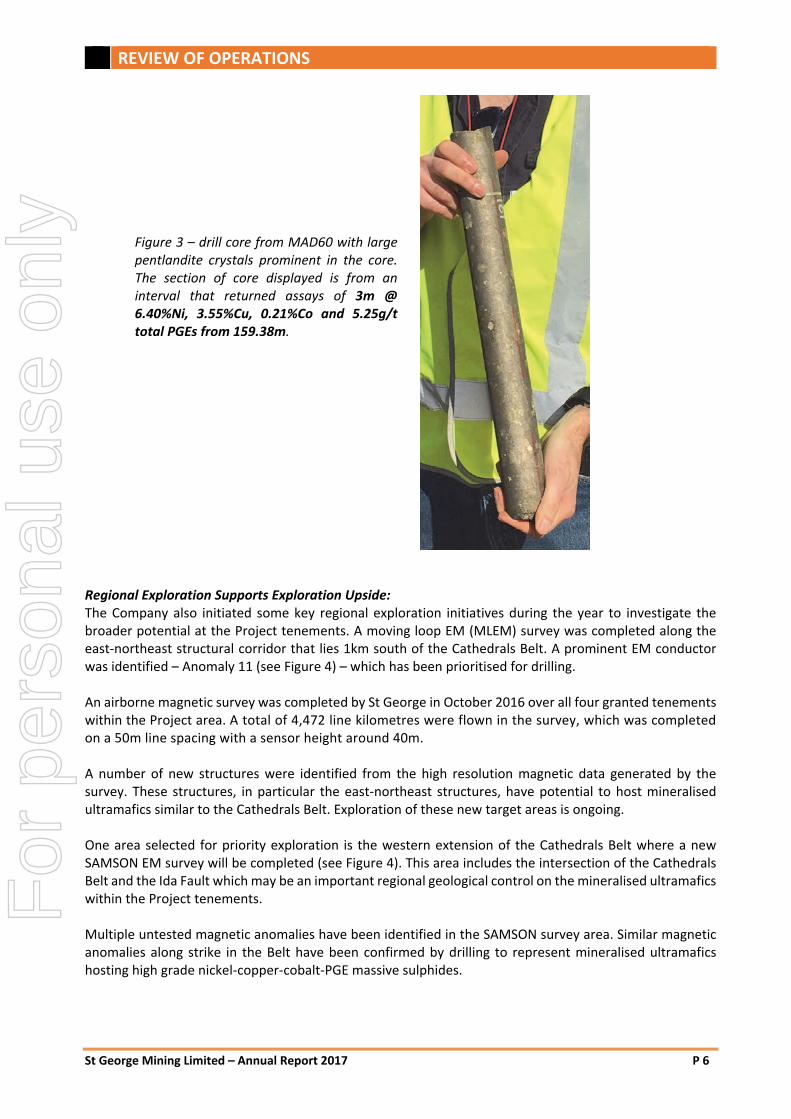
Figure 3 – drill core from MAD60 with large pentlandite crystals prominent in the core. The section of core displayed is from an interval that returned assays of 3m @ 6.40%Ni, 3.55%Cu, 0.21%Co and 5.25g/t total PGEs from 159.38m.
For
per
sona
l use
onl
y
REVIEW OF OPERATIONS
St George Mining Limited – Annual Report 2017 P 7
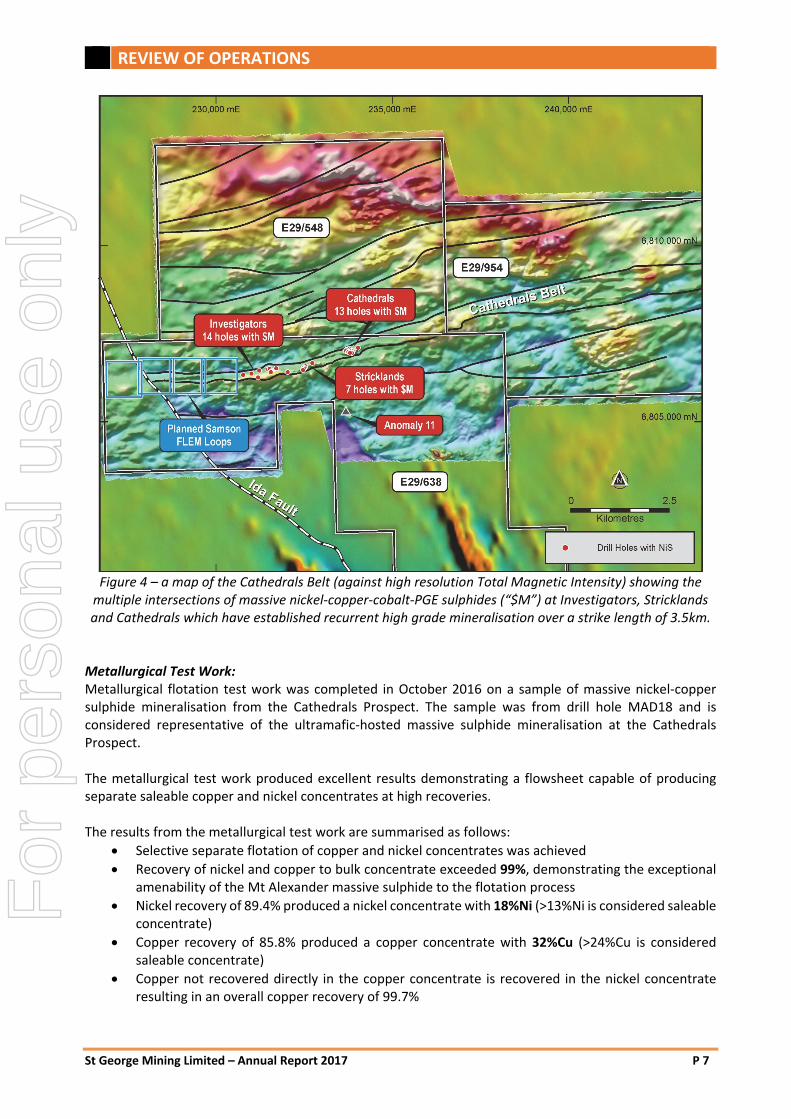
Figure 4 – a map of the Cathedrals Belt (against high resolution Total Magnetic Intensity) showing the multiple intersections of massive nickel‐copper‐cobalt‐PGE sulphides (“$M”) at Investigators, Stricklands and Cathedrals which have established recurrent high grade mineralisation over a strike length of 3.5km. Metallurgical Test Work: Metallurgical flotation test work was completed in October 2016 on a sample of massive nickel‐copper sulphide mineralisation from the Cathedrals Prospect. The sample was from drill hole MAD18 and is considered representative of the ultramafic‐hosted massive sulphide mineralisation at the Cathedrals Prospect. The metallurgical test work produced excellent results demonstrating a flowsheet capable of producing separate saleable copper and nickel concentrates at high recoveries. The results from the metallurgical test work are summarised as follows:
Selective separate flotation of copper and nickel concentrates was achieved
Recovery of nickel and copper to bulk concentrate exceeded 99%, demonstrating the exceptional amenability of the Mt Alexander massive sulphide to the flotation process
Nickel recovery of 89.4% produced a nickel concentrate with 18%Ni (>13%Ni is considered saleable concentrate)
Copper recovery of 85.8% produced a copper concentrate with 32%Cu (>24%Cu is considered saleable concentrate)
Copper not recovered directly in the copper concentrate is recovered in the nickel concentrate resulting in an overall copper recovery of 99.7%
For
per
sona
l use
onl
y
REVIEW OF OPERATIONS
St George Mining Limited – Annual Report 2017 P 8
Cobalt is recovered in the nickel concentrate with a grade of 0.55%Co which would attract smelter credits
Excellent recoveries of Platinum Group Elements (PGEs), with 3.2g/t PGEs + Au in the copper concentrate and 13.5g/t PGEs + Au in the nickel concentrate. The PGEs in the nickel concentrate would likely attract significant smelter credits
The levels of deleterious smelter elements in both concentrates are very low
The test work was completed by Strategic Metallurgy Pty Ltd, recognised as leading consultants in nickel sulphide metallurgy.
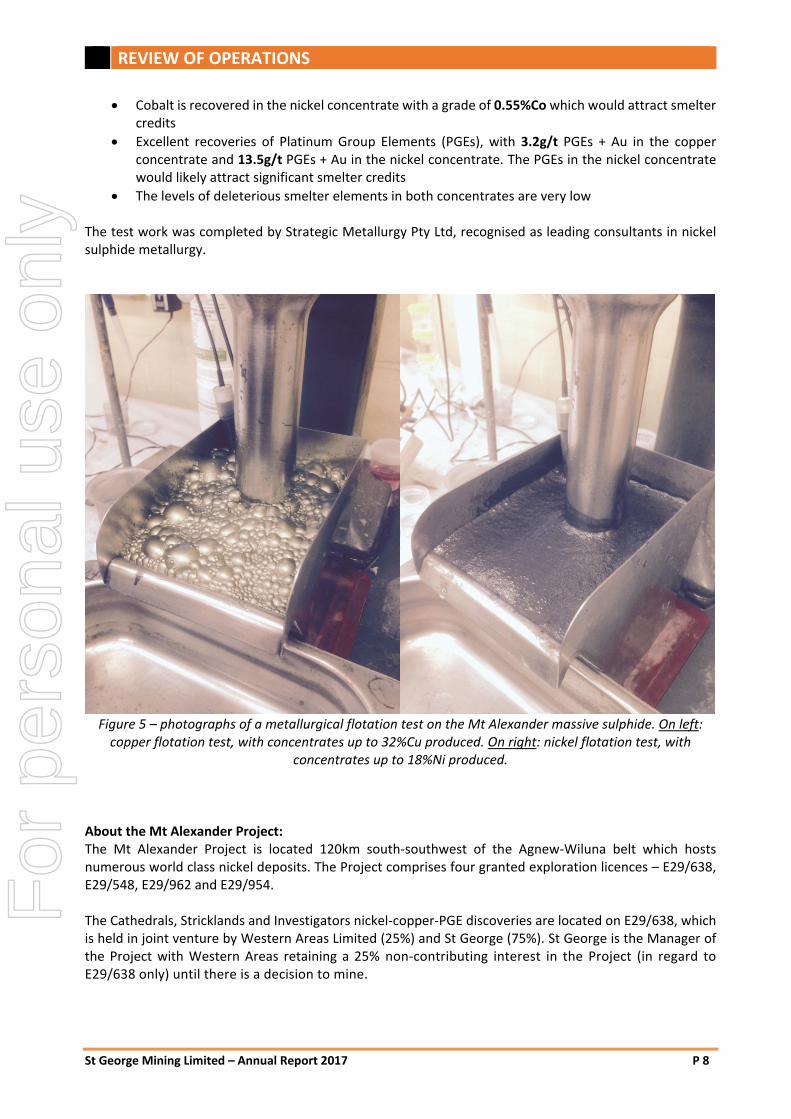
Figure 5 – photographs of a metallurgical flotation test on the Mt Alexander massive sulphide. On left: copper flotation test, with concentrates up to 32%Cu produced. On right: nickel flotation test, with
concentrates up to 18%Ni produced. About the Mt Alexander Project: The Mt Alexander Project is located 120km south‐southwest of the Agnew‐Wiluna belt which hosts numerous world class nickel deposits. The Project comprises four granted exploration licences – E29/638, E29/548, E29/962 and E29/954. The Cathedrals, Stricklands and Investigators nickel‐copper‐PGE discoveries are located on E29/638, which is held in joint venture by Western Areas Limited (25%) and St George (75%). St George is the Manager of the Project with Western Areas retaining a 25% non‐contributing interest in the Project (in regard to E29/638 only) until there is a decision to mine.
For
per
sona
l use
onl
y
REVIEW OF OPERATIONS
St George Mining Limited – Annual Report 2017 P 9
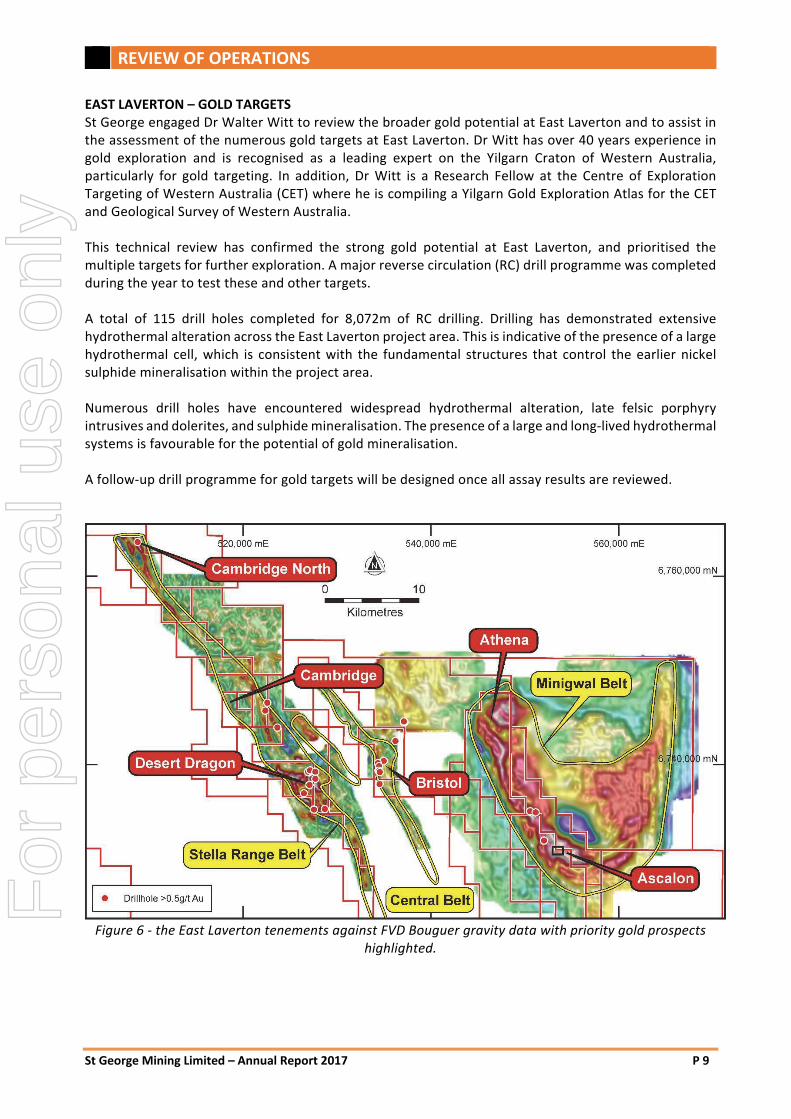
EAST LAVERTON – GOLD TARGETS St George engaged Dr Walter Witt to review the broader gold potential at East Laverton and to assist in the assessment of the numerous gold targets at East Laverton. Dr Witt has over 40 years experience in gold exploration and is recognised as a leading expert on the Yilgarn Craton of Western Australia, particularly for gold targeting. In addition, Dr Witt is a Research Fellow at the Centre of Exploration Targeting of Western Australia (CET) where he is compiling a Yilgarn Gold Exploration Atlas for the CET and Geological Survey of Western Australia. This technical review has confirmed the strong gold potential at East Laverton, and prioritised the multiple targets for further exploration. A major reverse circulation (RC) drill programme was completed during the year to test these and other targets. A total of 115 drill holes completed for 8,072m of RC drilling. Drilling has demonstrated extensive hydrothermal alteration across the East Laverton project area. This is indicative of the presence of a large hydrothermal cell, which is consistent with the fundamental structures that control the earlier nickel sulphide mineralisation within the project area. Numerous drill holes have encountered widespread hydrothermal alteration, late felsic porphyry intrusives and dolerites, and sulphide mineralisation. The presence of a large and long‐lived hydrothermal systems is favourable for the potential of gold mineralisation. A follow‐up drill programme for gold targets will be designed once all assay results are reviewed.
Figure 6 ‐ the East Laverton tenements against FVD Bouguer gravity data with priority gold prospects
highlighted.
For
per
sona
l use
onl
y
REVIEW OF OPERATIONS
St George Mining Limited – Annual Report 2017 P 10
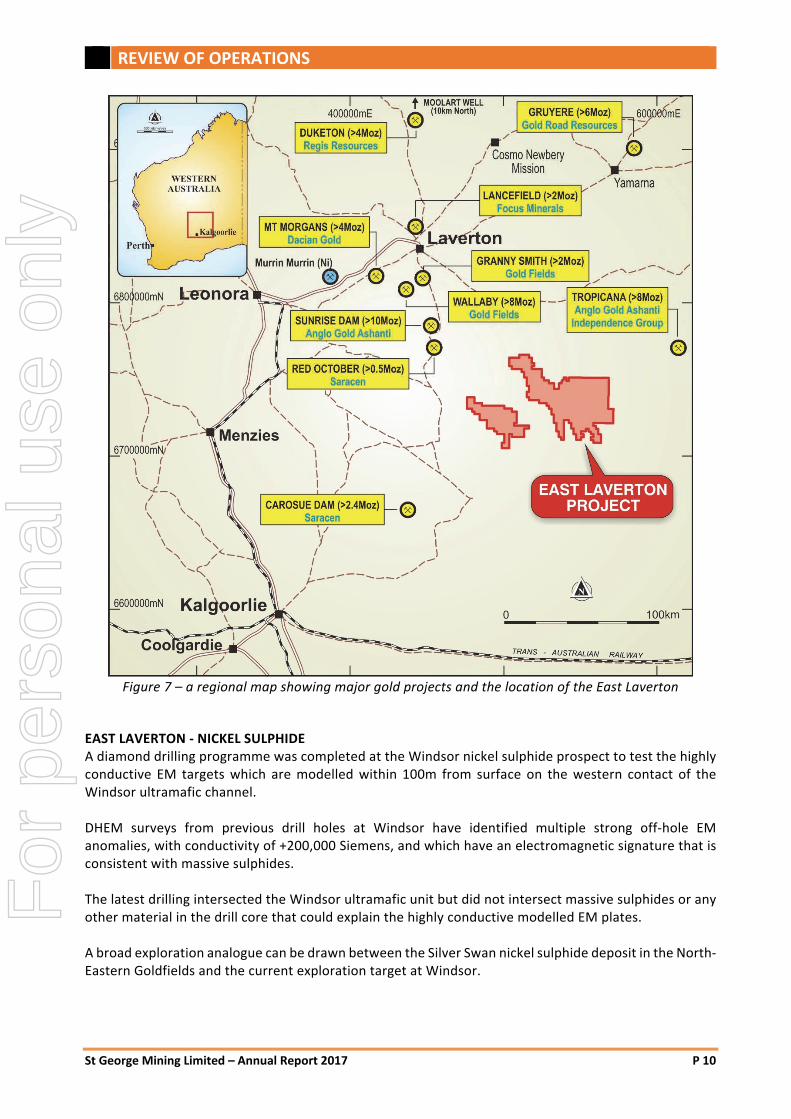
Figure 7 – a regional map showing major gold projects and the location of the East Laverton
EAST LAVERTON ‐ NICKEL SULPHIDE A diamond drilling programme was completed at the Windsor nickel sulphide prospect to test the highly conductive EM targets which are modelled within 100m from surface on the western contact of the Windsor ultramafic channel. DHEM surveys from previous drill holes at Windsor have identified multiple strong off‐hole EM anomalies, with conductivity of +200,000 Siemens, and which have an electromagnetic signature that is consistent with massive sulphides. The latest drilling intersected the Windsor ultramafic unit but did not intersect massive sulphides or any other material in the drill core that could explain the highly conductive modelled EM plates. A broad exploration analogue can be drawn between the Silver Swan nickel sulphide deposit in the North‐Eastern Goldfields and the current exploration target at Windsor.
For
per
sona
l use
onl
y
REVIEW OF OPERATIONS
St George Mining Limited – Annual Report 2017 P 11
The high grade Silver Swan deposit presented as a narrow segmented, steeply dipping, highly conductive massive nickel sulphide shoot extending from 190m below the surface. Newexco, St George’s geophysical consultants, were also advisers in the discovery and exploration at Silver Swan and Silver Swan Deeps. To further explore the prospective Windsor channel for nickel sulphides, a SAMSON EM survey has been designed for this area. SAMSON uses a high powered transmitter and sensitive receiver that has the capability to deliver greater EM depth penetration than that achieved by conventional EM systems. The SAMSON EM survey will search for deep conductors at the basal contact of the Windsor channel and will also provide further EM data to corroborate modelling of the shallow EM targets at Windsor that have already been recognised by DHEM surveys. COMPETENT PERSON STATEMENT: The information in this report that relates to Exploration Targets, Exploration Results, Mineral Resources or Ore Reserves regarding the East Laverton Project is based on information compiled by Mr Tim Hronsky, a Competent Person who is a Member of The Australasian Institute of Mining and Metallurgy. Mr Tim Hronsky is employed by Essential Risk Solutions Ltd which has been retained by St George Mining Limited to provide technical advice on mineral projects. The information in this report that related to Exploration Targets, Exploration Results, Minerals Resources or Ore Reserves regarding the Mt Alexander Project is based on information complied by Mr Matthew McCarthy, a Competent Person who is a Member of The Australian Institute of Geoscientists. Mr McCarthy is employed by St George Mining Limited. This ASX announcement contains information extracted from the following reports which are available on the Company’s website at www.stgm.com.au:
20 October 2016 Strong Results Continue at Mt Alexander
22 November 2016 Compelling Survey Results at Mt Alexander
8 February 2017 SAMSON Survey Lights Up New Targets at Mt Alexander
15 February 2017 Massive Nickel Sulphide Targets at Stricklands
22 February 2017 Priority Targets for Cathedrals Prospect
28 February 2017 EM Survey over New Target Areas at Mt Alexander
14 March 2017 St George Commences Drilling at Mt Alexander
6 April 2017 Drilling Success Continues at Mt Alexander
2 June 2017 Drilling at Nickel Sulphide Target
5 July 2017 High Grade Nickel‐Copper‐Cobalt‐PGEs at Investigators
6 July 2017 Nickel Sulphide Exploration at Windsor is Escalated
19 July 2017 High Grade Nickel‐Copper‐Cobalt‐PGEs at Investigators
27 July 2017 Gold Drilling at East Laverton The Company confirms that it is not aware of any new information or data that materially affects the exploration results included in any original market announcements referred to in this report and that no material change in the results has occurred. The Company confirms that the form and context in which the Competent Person’s findings are presented have not been materially modified from the original market announcements.
For
per
sona
l use
onl
y
REVIEW OF OPERATIONS
St George Mining Limited – Annual Report 2017 P 12
CORPORATE UPDATE Heavily Oversubscribed Capital Raising St George completed a private placement of ordinary shares in August 2016 that raised $6.47 million. The Company allotted 43,165,470 fully paid ordinary shares at $0.15 per share with one (1) free attaching option exercisable at $0.20 on or before 30 June 2017 for every five (5) shares applied for. The options were part of the option series that traded under ASX code SGQOA. The shares issued under the private placement were issued pursuant to the Company’s 15% placement capacity under ASX Listing Rule 7.1 and the Company’s additional 10% placement capacity under ASX Listing Rule 7.1A. A General Meeting of the Company was held on 30 September 2016 at which the capital raising was approved and ratified by shareholders. R&D Cash Rebate In October 2016, St George received a cash payment of $2,336,000 pursuant to the Federal Government’s R&D Tax Incentive Scheme.
The Company’s 2015/2016 financial year tax return was assessed to include research and development expenditure eligible for the cash rebate under the Scheme, which is administered jointly by AusIndustry and the Australian Taxation Office.
Exploration Development Incentive (EDI) Tax Credits The Company announced on 4 May 2017 that shareholders were to receive an EDI tax credit through a Federal Government initiative. The initiative allows Australian resident shareholders to obtain a refundable tax offset for greenfields exploration undertaken by Australian junior exploration companies that do not derive any taxable income. St George participated in the EDI for the 2016/2017 tax year with $768,164 of tax credits approved by the Federal Government. The credits were distributed to eligible shareholders of St George who held ordinary fully paid shares in the Company on 31 May 2017.
For
per
sona
l use
onl
y
DIRECTORS’ REPORT
St George Mining Limited – Annual Report 2017 P 13
The Directors of St George Mining Limited submit the annual financial report of St George Mining Limited from 1 July 2016 to 30 June 2017. In compliance with the provisions of the Corporations Act 2001, the Directors report as follows: DIRECTORS The names and particulars of the directors of the Company as at 30 June 2017, and at the date of this report, are as follows. Directors were in office for the entire period unless otherwise stated. JOHN PRINEAS B.EC LL.B F FIN Executive Chairman Appointed 19 October 2009 John is a founding shareholder and director of St George Mining Limited. His involvement in the mining sector spans over 25 years with experience in commercial, legal and finance roles. Prior to establishing St George Mining, John was Chief Operating Officer and Country Head of Dresdner Bank in Sydney with a focus on project and acquisition finance for resources and infrastructure projects. John has Economics and Law degrees from the University of Sydney and commenced his career as a lawyer in Sydney with Allen, Allen & Hemsley. During the past 3 years he has held no other listed company directorships. TIM HRONSKY B.ENG (Geology) MAUSIMM, MSEG Executive Director Appointed 25 November 2009 Tim is a geologist with over 26 years international experience in the mineral exploration and mining industry, including 15 years with Placer Dome Inc. After graduating from the West Australian School of Mines, Tim began his career in a number of operational roles before being appointed as the Exploration Manager (Asia) for Placer Dome. Tim also undertook a number of corporate roles at Placer Dome related to business improvement, risk management and assurance. Prior to joining St George Mining, Tim provided consulting services to a range of clients in the global exploration and mining industry. During the past 3 years he has held no other listed company directorships. SARAH SHIPWAY CA, B.Com Non‐Executive Director Appointed 11 June 2015 Sarah Shipway was appointed Non‐Executive Director on 11 June 2015 and was appointed Company Secretary of St George Mining on 22 March 2012. Ms Shipway has a Bachelor of Commerce from the Murdoch University and is a member of the Institute of Chartered Accountants. During the past 3 years she has also served as a director of the following listed companies:
Company Date of Appointment Date of Resignation
Beacon Minerals Limited 11 June 2015 Not applicable Argent Minerals Limited 11 June 2015 17 September 2015
For
per
sona
l use
onl
y
DIRECTORS’ REPORT
St George Mining Limited – Annual Report 2017 P 14
COMPANY SECRETARY Sarah Shipway was appointed Company Secretary on 22 March 2012. For details relating to Sarah Shipway, please refer to the details on directors above. DIRECTORS’ INTERESTS At the date of this report the Directors held the following interests in St George Mining.
Name Ordinary Shares
Class E Unlisted Options
Class A Performance
Shares
Class B Performance
Shares
John Prineas 10,214,221 ‐ 20 20 Tim Hronsky 1,062,500 300,000 15 15 Sarah Shipway ‐ ‐ 5 5
John Prineas and Sarah Shipway have no interest, whether directly or indirectly, in a contract or proposed contract with St George Mining Limited during the financial year end. Tim Hronsky through Essential Risk Solutions Ltd (“ERS”), of which Tim Hronsky is a Director, provides technical consulting services to the Company. PRINCIPAL ACTIVITIES The principal activity of the Group is mineral exploration in Australia. RESULTS AND REVIEW OF OPERATIONS The results of the consolidated entity for the financial year from 1 July 2016 to 30 June 2017 after income tax was a loss of $4,289,216 (2016: $6,142,617). A review of operations of the consolidated entity during the year ended 30 June 2017 is provided in the “Review of the Operations” immediately preceding this Directors’ Report. LIKELY DEVELOPMENTS The Group will continue its exploration activities over the next financial year with a focus on its key projects at the East Laverton Project and Mt Alexander Project. Further commentary on planned activities over the forthcoming year is provided in the “Review of Operations”. The Board will continue to focus on creating value from the Group’s existing resource assets, as well as considering new opportunities in the resources sector to complement the Group’s current projects. SIGNIFICANT CHANGES IN STATE OF AFFAIRS There has not been any significant change in the state of affairs of the Group during the financial year, other than as noted in this financial report. ENVIRONMENTAL ISSUES The Group is aware of its environmental obligations with regards to its exploration activities and ensures that it complies with all applicable regulations when carrying out exploration work.
For
per
sona
l use
onl
y

DIRECTORS’ REPORT
St George Mining Limited – Annual Report 2017 P 15
DIVIDENDS PAID OR RECOMMENDED The directors do not recommend the payment of a dividend and no amount has been paid or declared by way of a dividend to the date of this report. DIRECTORS’ MEETINGS The following table sets out the number of meetings held during the year ended 30 June 2017 and the number of meetings attended by each director.
Name Eligible to attend Attended
J Prineas 13 13 T Hronsky 13 13 S Shipway 13 13
REMUNERATION REPORT – AUDITED Remuneration policy The remuneration policy of St George Mining Limited has been designed to align directors’ objectives with shareholder and business objectives by providing a fixed remuneration component, which is assessed on an annual basis in line with market rates. The Board of St George Mining Limited believes the remuneration policy to be appropriate and effective in its ability to attract and retain the best directors to run and manage the Company. The Board’s policy for determining the nature and amount of remuneration for Board members is as follows:
The remuneration policy and setting the terms and conditions for the Executive directors and other senior staff members is developed and approved by the Board based on local and international trends among comparative companies and industry generally. It examines terms and conditions for employee incentive schemes, benefit plans and share plans. Independent advice is obtained when considered necessary to confirm that executive remuneration is in line with market practice and is reasonable within Australian executive reward practices.
All executives receive a base salary (which is based on factors such as length of service and experience) and superannuation.
The Group is an exploration entity, and therefore speculative in terms of performance. Consistent with attracting and retaining talented executives, directors and senior executives are paid market rates associated with individuals in similar positions within the same industry. Options and performance incentives may be issued particularly as the entity moves from an exploration to a producing entity and key performance indicators such as profit and production and reserves growth can be used as measurements for assessing executive performance.
The Board policy is to remunerate non‐executive directors at market rates for comparable companies for time, commitment and responsibilities. The Executive Directors, in consultation with independent advisors, determine payments to the non‐executives and review their remuneration annually, based on market practice, duties and accountability. The maximum aggregate amount of fees that can be paid to non‐executive directors is subject to approval by shareholders at the Annual General Meeting and is currently $150,000 per annum. Fees for independent non‐executive directors are not linked to the performance of the Group. To align Directors’ interests with shareholder interests, the directors are encouraged to hold shares in the Company.
For
per
sona
l use
onl
y
DIRECTORS’ REPORT
St George Mining Limited – Annual Report 2017 P 16
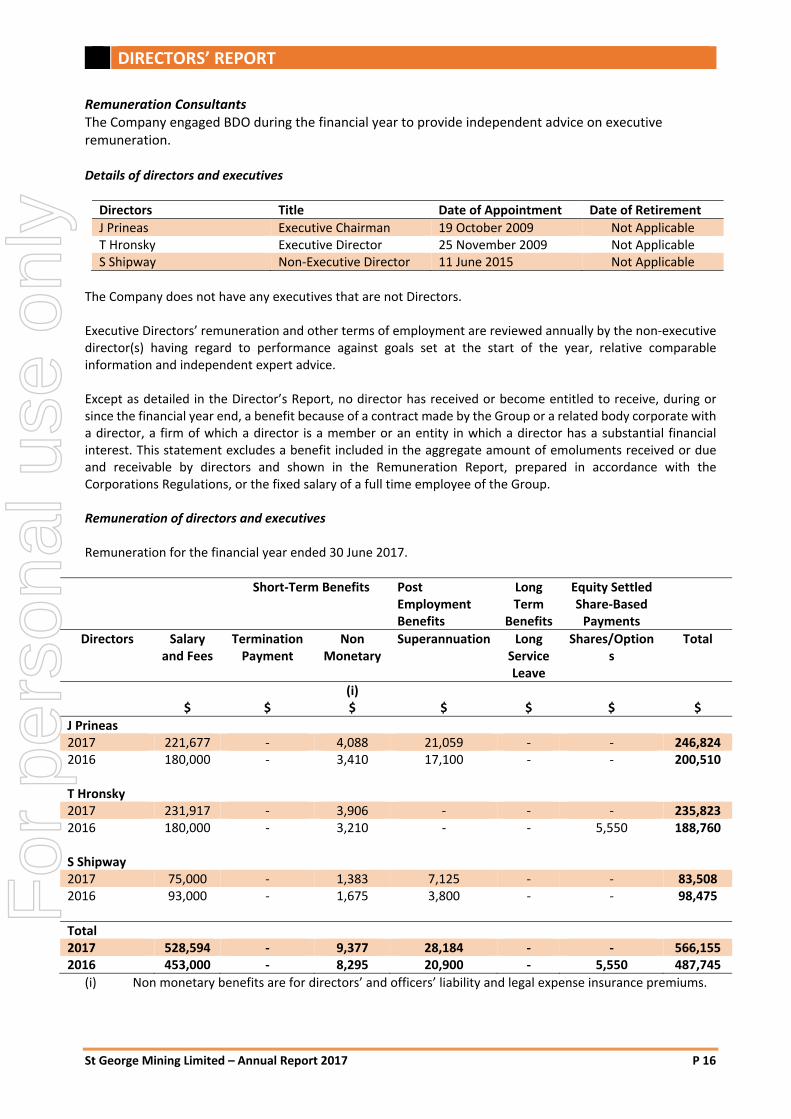
Remuneration Consultants The Company engaged BDO during the financial year to provide independent advice on executive remuneration. Details of directors and executives
Directors Title Date of Appointment Date of Retirement
J Prineas Executive Chairman 19 October 2009 Not Applicable T Hronsky Executive Director 25 November 2009 Not Applicable S Shipway Non‐Executive Director 11 June 2015 Not Applicable
The Company does not have any executives that are not Directors. Executive Directors’ remuneration and other terms of employment are reviewed annually by the non‐executive director(s) having regard to performance against goals set at the start of the year, relative comparable information and independent expert advice. Except as detailed in the Director’s Report, no director has received or become entitled to receive, during or since the financial year end, a benefit because of a contract made by the Group or a related body corporate with a director, a firm of which a director is a member or an entity in which a director has a substantial financial interest. This statement excludes a benefit included in the aggregate amount of emoluments received or due and receivable by directors and shown in the Remuneration Report, prepared in accordance with the Corporations Regulations, or the fixed salary of a full time employee of the Group. Remuneration of directors and executives Remuneration for the financial year ended 30 June 2017.
Short‐Term Benefits Post Employment Benefits
Long Term
Benefits
Equity Settled Share‐Based Payments
Directors Salary and Fees
Termination Payment
Non Monetary
Superannuation Long Service Leave
Shares/Options
Total
(i) $ $ $ $ $ $ $
J Prineas 2017 221,677 ‐ 4,088 21,059 ‐ ‐ 246,824 2016 180,000 ‐ 3,410 17,100 ‐ ‐ 200,510 T Hronsky 2017 231,917 ‐ 3,906 ‐ ‐ ‐ 235,823 2016 180,000 ‐ 3,210 ‐ ‐ 5,550 188,760 S Shipway 2017 75,000 ‐ 1,383 7,125 ‐ ‐ 83,508 2016 93,000 ‐ 1,675 3,800 ‐ ‐ 98,475
Total 2017 528,594 ‐ 9,377 28,184 ‐ ‐ 566,155 2016 453,000 ‐ 8,295 20,900 ‐ 5,550 487,745
(i) Non monetary benefits are for directors’ and officers’ liability and legal expense insurance premiums.
For
per
sona
l use
onl
y
DIRECTORS’ REPORT
St George Mining Limited – Annual Report 2017 P 17
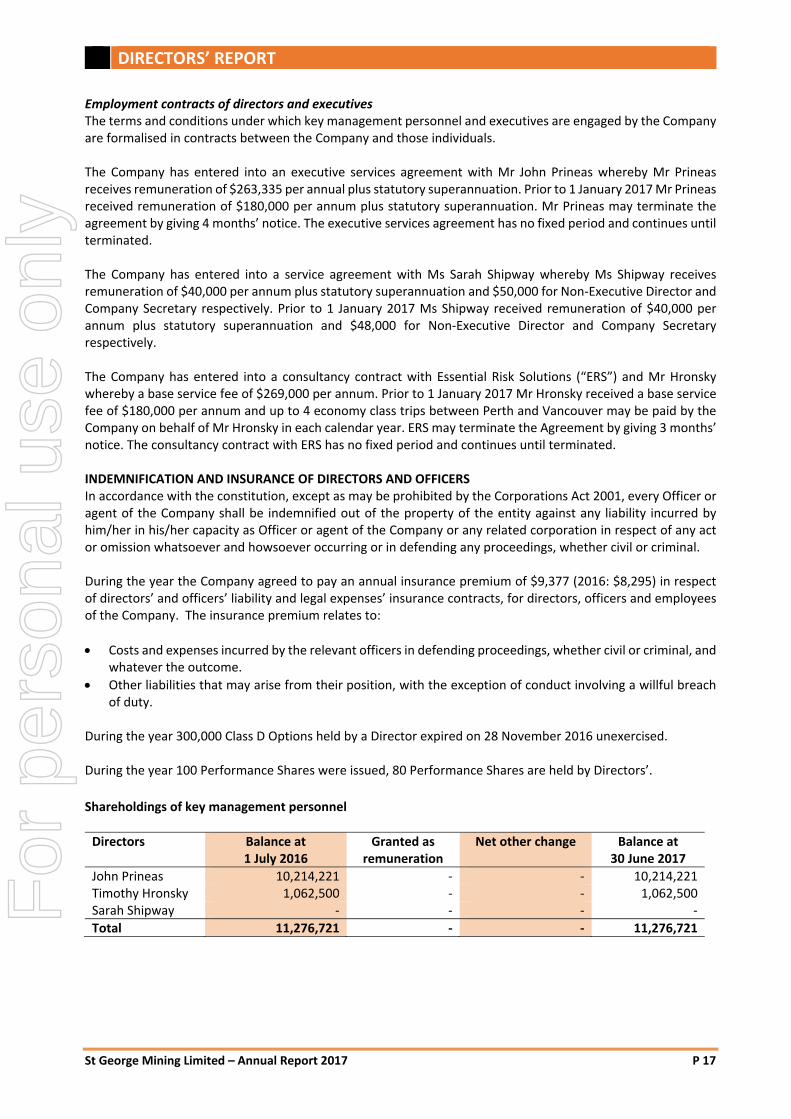
Employment contracts of directors and executives The terms and conditions under which key management personnel and executives are engaged by the Company are formalised in contracts between the Company and those individuals. The Company has entered into an executive services agreement with Mr John Prineas whereby Mr Prineas receives remuneration of $263,335 per annual plus statutory superannuation. Prior to 1 January 2017 Mr Prineas received remuneration of $180,000 per annum plus statutory superannuation. Mr Prineas may terminate the agreement by giving 4 months’ notice. The executive services agreement has no fixed period and continues until terminated. The Company has entered into a service agreement with Ms Sarah Shipway whereby Ms Shipway receives remuneration of $40,000 per annum plus statutory superannuation and $50,000 for Non‐Executive Director and Company Secretary respectively. Prior to 1 January 2017 Ms Shipway received remuneration of $40,000 per annum plus statutory superannuation and $48,000 for Non‐Executive Director and Company Secretary respectively. The Company has entered into a consultancy contract with Essential Risk Solutions (“ERS”) and Mr Hronsky whereby a base service fee of $269,000 per annum. Prior to 1 January 2017 Mr Hronsky received a base service fee of $180,000 per annum and up to 4 economy class trips between Perth and Vancouver may be paid by the Company on behalf of Mr Hronsky in each calendar year. ERS may terminate the Agreement by giving 3 months’ notice. The consultancy contract with ERS has no fixed period and continues until terminated. INDEMNIFICATION AND INSURANCE OF DIRECTORS AND OFFICERS In accordance with the constitution, except as may be prohibited by the Corporations Act 2001, every Officer or agent of the Company shall be indemnified out of the property of the entity against any liability incurred by him/her in his/her capacity as Officer or agent of the Company or any related corporation in respect of any act or omission whatsoever and howsoever occurring or in defending any proceedings, whether civil or criminal. During the year the Company agreed to pay an annual insurance premium of $9,377 (2016: $8,295) in respect of directors’ and officers’ liability and legal expenses’ insurance contracts, for directors, officers and employees of the Company. The insurance premium relates to:
Costs and expenses incurred by the relevant officers in defending proceedings, whether civil or criminal, and whatever the outcome.
Other liabilities that may arise from their position, with the exception of conduct involving a willful breach of duty.
During the year 300,000 Class D Options held by a Director expired on 28 November 2016 unexercised. During the year 100 Performance Shares were issued, 80 Performance Shares are held by Directors’.
Shareholdings of key management personnel
Directors
Balance at 1 July 2016
Granted as remuneration
Net other change
Balance at 30 June 2017
John Prineas 10,214,221 ‐ ‐ 10,214,221 Timothy Hronsky 1,062,500 ‐ ‐ 1,062,500 Sarah Shipway ‐ ‐ ‐ ‐
Total 11,276,721 ‐ ‐ 11,276,721
For
per
sona
l use
onl
y
DIRECTORS’ REPORT
St George Mining Limited – Annual Report 2017 P 18
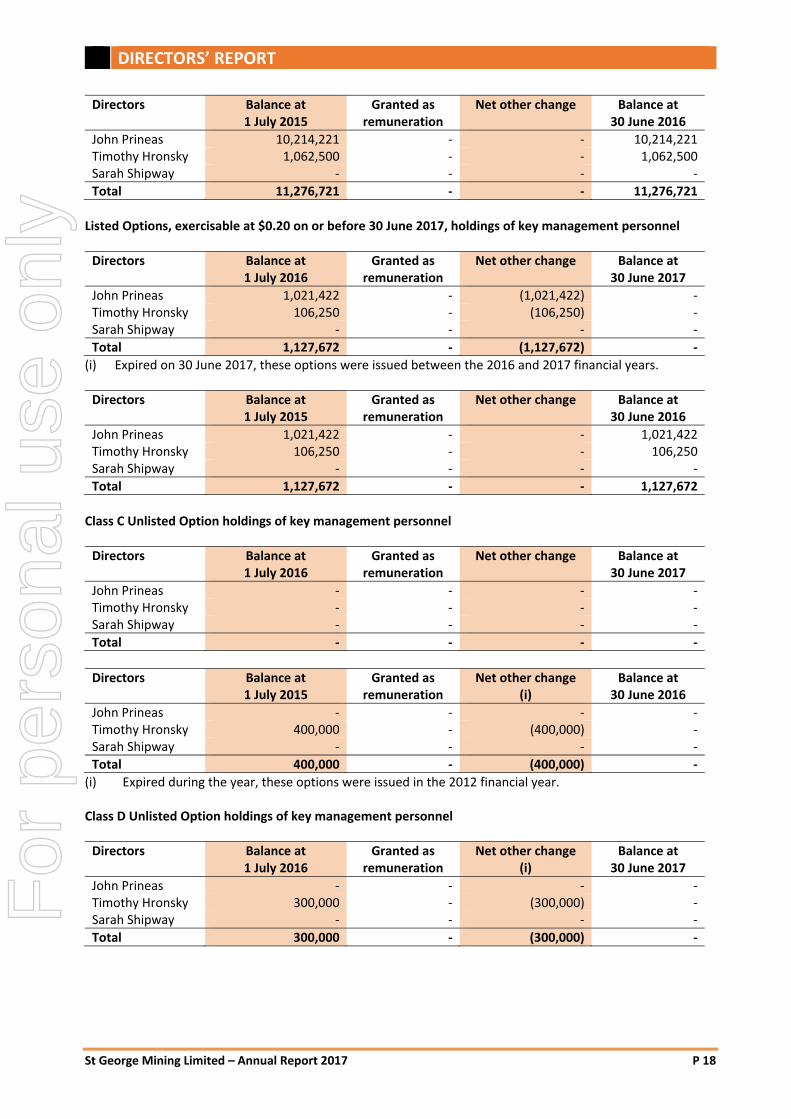
Directors
Balance at 1 July 2015
Granted as remuneration
Net other change
Balance at 30 June 2016
John Prineas 10,214,221 ‐ ‐ 10,214,221 Timothy Hronsky 1,062,500 ‐ ‐ 1,062,500 Sarah Shipway ‐ ‐ ‐ ‐
Total 11,276,721 ‐ ‐ 11,276,721
Listed Options, exercisable at $0.20 on or before 30 June 2017, holdings of key management personnel
Directors
Balance at 1 July 2016
Granted as remuneration
Net other change
Balance at 30 June 2017
John Prineas 1,021,422 ‐ (1,021,422) ‐ Timothy Hronsky 106,250 ‐ (106,250) ‐ Sarah Shipway ‐ ‐ ‐ ‐
Total 1,127,672 ‐ (1,127,672) ‐
(i) Expired on 30 June 2017, these options were issued between the 2016 and 2017 financial years.
Directors
Balance at 1 July 2015
Granted as remuneration
Net other change
Balance at 30 June 2016
John Prineas 1,021,422 ‐ ‐ 1,021,422 Timothy Hronsky 106,250 ‐ ‐ 106,250 Sarah Shipway ‐ ‐ ‐ ‐
Total 1,127,672 ‐ ‐ 1,127,672
Class C Unlisted Option holdings of key management personnel
Directors
Balance at 1 July 2016
Granted as remuneration
Net other change Balance at 30 June 2017
John Prineas ‐ ‐ ‐ ‐ Timothy Hronsky ‐ ‐ ‐ ‐ Sarah Shipway ‐ ‐ ‐ ‐
Total ‐ ‐ ‐ ‐
Directors
Balance at 1 July 2015
Granted as remuneration
Net other change (i)
Balance at 30 June 2016
John Prineas ‐ ‐ ‐ ‐ Timothy Hronsky 400,000 ‐ (400,000) ‐ Sarah Shipway ‐ ‐ ‐ ‐
Total 400,000 ‐ (400,000) ‐
(i) Expired during the year, these options were issued in the 2012 financial year. Class D Unlisted Option holdings of key management personnel
Directors
Balance at 1 July 2016
Granted as remuneration
Net other change (i)
Balance at 30 June 2017
John Prineas ‐ ‐ ‐ ‐ Timothy Hronsky 300,000 ‐ (300,000) ‐ Sarah Shipway ‐ ‐ ‐ ‐
Total 300,000 ‐ (300,000) ‐
For
per
sona
l use
onl
y
DIRECTORS’ REPORT
St George Mining Limited – Annual Report 2017 P 19
Directors
Balance at 1 July 2015
Granted as remuneration
(ii)
Net other change
Balance at 30 June 2016
John Prineas ‐ ‐ ‐ ‐ Timothy Hronsky ‐ 300,000 ‐ 300,000 Sarah Shipway ‐ ‐ ‐ ‐
Total ‐ 300,000 ‐ 300,000
(i) Expired during the year (ii) The Class D Unlisted Options were granted on 27 November 2015 and will vest 12 months from the date
of issue. (iii) The value of the Class D Unlisted Options granted to a Director was $3,840. The full amount was expensed
in the year ended 30 June 2016.
Class E Unlisted Option holdings of key management personnel
Directors
Balance at 1 July 2016
Granted as remuneration
Net other change
Balance at 30 June 2017
John Prineas ‐ ‐ ‐ ‐ Timothy Hronsky 300,000 ‐ ‐ 300,000 Sarah Shipway ‐ ‐ ‐ ‐
Total 300,000 ‐ ‐ 300,000
Directors
Balance at 1 July 2015
Granted as remuneration
(i)
Net other change
Balance at 30 June 2016
John Prineas ‐ ‐ ‐ ‐ Timothy Hronsky ‐ 300,000 ‐ 300,000 Sarah Shipway ‐ ‐ ‐ ‐
Total ‐ 300,000 ‐ 300,000
(i) The Class E Unlisted options were granted on 27 November 2015 and will vest 12 months from the date of issue.
(ii) The value of the Class E Unlisted Options granted to a Director was $7,260. The full amount was expensed in the year ended 30 June 2016.
Performance Shareholdings of key management personnel
Directors
Balance at 1 July 2016
Granted as remuneration
(i)
Net other change
Balance at 30 June 2017
John Prineas ‐ 40 ‐ 40 Timothy Hronsky ‐ 30 ‐ 30 Sarah Shipway ‐ 10 ‐ 10
Total ‐ 80 ‐ 80
(i) On satisfaction of certain milestone events, each Performance Share converts into 50,000 ordinary shares in which case John Prineas would become entitled to a further 2,000,000 ordinary shares, Timothy Hronsky a further 1,500,000 ordinary shares and Sarah Shipway a further 500,000 ordinary shares.
END OF REMUNERATION REPORT
For
per
sona
l use
onl
y
DIRECTORS’ REPORT
St George Mining Limited – Annual Report 2017 P 20
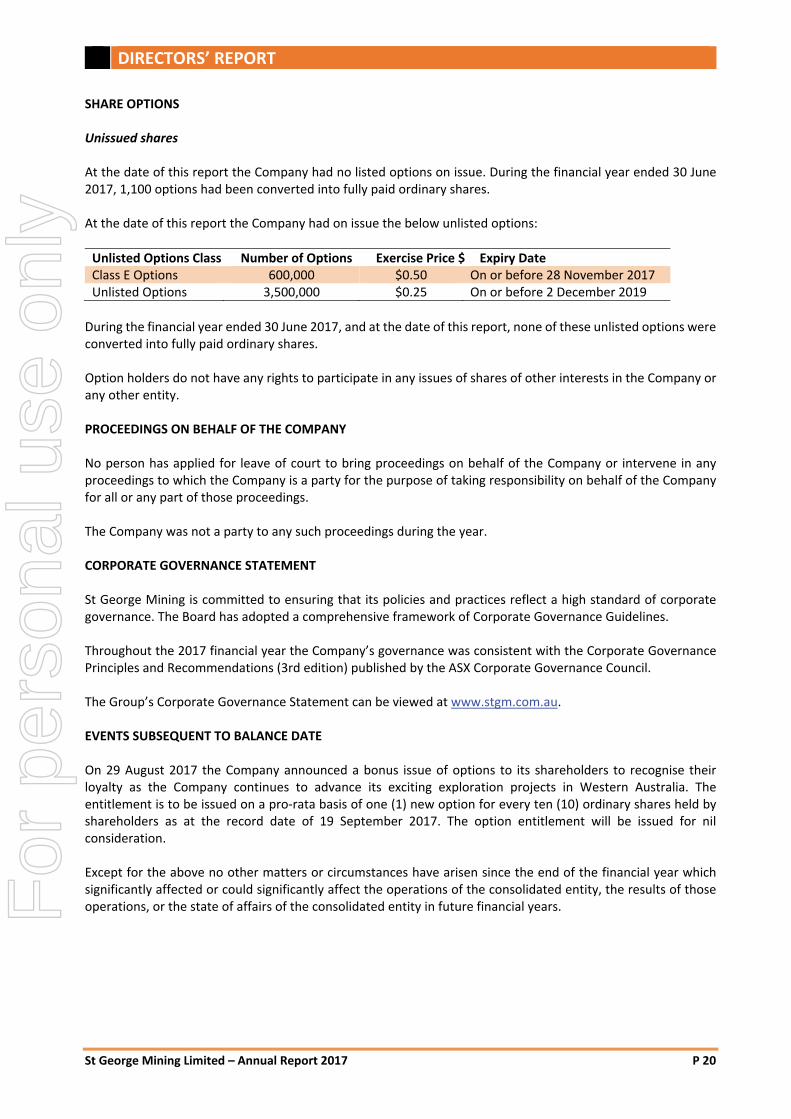
SHARE OPTIONS Unissued shares At the date of this report the Company had no listed options on issue. During the financial year ended 30 June 2017, 1,100 options had been converted into fully paid ordinary shares. At the date of this report the Company had on issue the below unlisted options:
Unlisted Options Class Number of Options Exercise Price $ Expiry Date Class E Options 600,000 $0.50 On or before 28 November 2017 Unlisted Options 3,500,000 $0.25 On or before 2 December 2019
During the financial year ended 30 June 2017, and at the date of this report, none of these unlisted options were converted into fully paid ordinary shares. Option holders do not have any rights to participate in any issues of shares of other interests in the Company or any other entity. PROCEEDINGS ON BEHALF OF THE COMPANY No person has applied for leave of court to bring proceedings on behalf of the Company or intervene in any proceedings to which the Company is a party for the purpose of taking responsibility on behalf of the Company for all or any part of those proceedings. The Company was not a party to any such proceedings during the year. CORPORATE GOVERNANCE STATEMENT St George Mining is committed to ensuring that its policies and practices reflect a high standard of corporate governance. The Board has adopted a comprehensive framework of Corporate Governance Guidelines. Throughout the 2017 financial year the Company’s governance was consistent with the Corporate Governance Principles and Recommendations (3rd edition) published by the ASX Corporate Governance Council. The Group’s Corporate Governance Statement can be viewed at www.stgm.com.au. EVENTS SUBSEQUENT TO BALANCE DATE On 29 August 2017 the Company announced a bonus issue of options to its shareholders to recognise their loyalty as the Company continues to advance its exciting exploration projects in Western Australia. The entitlement is to be issued on a pro‐rata basis of one (1) new option for every ten (10) ordinary shares held by shareholders as at the record date of 19 September 2017. The option entitlement will be issued for nil consideration. Except for the above no other matters or circumstances have arisen since the end of the financial year which significantly affected or could significantly affect the operations of the consolidated entity, the results of those operations, or the state of affairs of the consolidated entity in future financial years.
For
per
sona
l use
onl
y
DIRECTORS’ REPORT
St George Mining Limited – Annual Report 2017 P 21
AUDITOR’S INDEPENDENCE DECLARATION The auditor’s independence declaration for the year ended 30 June 2017 has been received and can be found on page 47 of the financial report.
Non Audit Services The Company’s auditor, Stantons International, did not provide any non‐audit services to the Company during the financial year ended 30 June 2017. Signed in accordance with a resolution of the directors made pursuant to s 298(2) of the Corporations Act 2001. On behalf of the directors
JOHN PRINEAS Executive Chairman St George Mining Limited Dated 20 September 2017
For
per
sona
l use
onl
y
FINANCIAL REPORT FOR THE YEAR ENDED 30 JUNE 2017
St George Mining Limited – Annual Report 2017 P 22
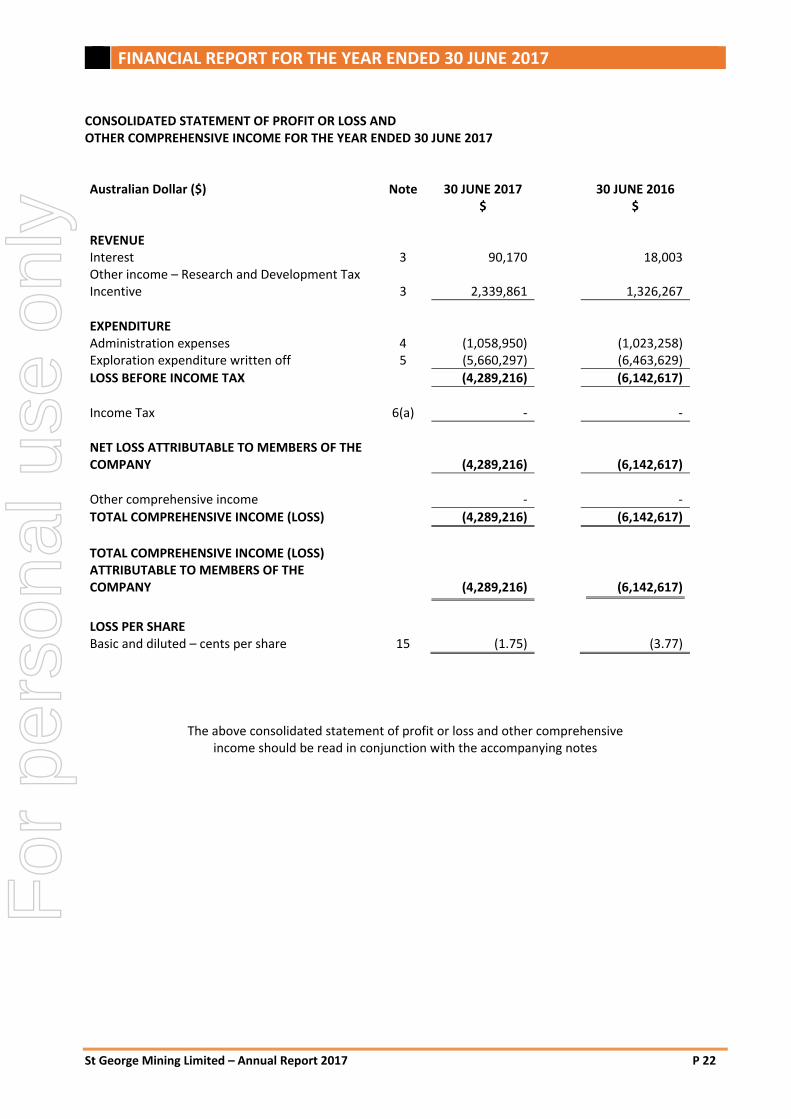
CONSOLIDATED STATEMENT OF PROFIT OR LOSS AND OTHER COMPREHENSIVE INCOME FOR THE YEAR ENDED 30 JUNE 2017 Australian Dollar ($) Note 30 JUNE 2017
$ 30 JUNE 2016
$
REVENUE Interest 3 90,170 18,003 Other income – Research and Development Tax Incentive
3
2,339,861
1,326,267
EXPENDITURE Administration expenses 4 (1,058,950) (1,023,258) Exploration expenditure written off 5 (5,660,297) (6,463,629)
LOSS BEFORE INCOME TAX (4,289,216) (6,142,617)
Income Tax 6(a) ‐ ‐
NET LOSS ATTRIBUTABLE TO MEMBERS OF THE COMPANY
(4,289,216)
(6,142,617)
Other comprehensive income ‐ ‐
TOTAL COMPREHENSIVE INCOME (LOSS) (4,289,216) (6,142,617)
TOTAL COMPREHENSIVE INCOME (LOSS) ATTRIBUTABLE TO MEMBERS OF THE COMPANY
(4,289,216)
(6,142,617)
LOSS PER SHARE Basic and diluted – cents per share 15 (1.75) (3.77)
The above consolidated statement of profit or loss and other comprehensive income should be read in conjunction with the accompanying notes
For
per
sona
l use
onl
y
FINANCIAL REPORT FOR THE YEAR ENDED 30 JUNE 2017
St George Mining Limited – Annual Report 2017 P 23
CONSOLIDATED STATEMENT OF FINANCIAL POSITION AS AT 30 JUNE 2017 Australian Dollar ($) Note 30 JUNE 2017
$ 30 JUNE 2016
$ CURRENT ASSETS Cash and cash equivalents 16(a) 4,773,546 1,437,025 Trade and other receivables 9(a) 85,543 66,786 Other assets 9(b) 169,425 52,174
TOTAL CURRENT ASSETS 5,028,514 1,555,985
NON CURRENT ASSETS Security bond 1,000 1,000 Plant and equipment 10 24,685 34,431 Exploration and evaluation expenditure 11 ‐ 482,581
TOTAL NON CURRENT ASSETS 25,685 518,012
TOTAL ASSETS 5,054,199 2,073,997
CURRENT LIABILITIES Trade and other payables 12 2,225,921 1,106,980 Provisions 26,089 10,577
TOTAL CURRENT LIABILITIES 2,252,010 1,117,557
TOTAL LIABILITIES 2,252,010 1,117,557
NET ASSETS 2,802,189 956,440
EQUITY Issued capital 13(a) 24,142,945 18,277,130 Reserves 13(b) 430,876 352,841 Accumulated losses 14 (21,771,632) (17,673,531)
TOTAL EQUITY 2,802,189 956,440
The above consolidated statement of financial position should be read in conjunction with the accompanying notes
For
per
sona
l use
onl
y
FINANCIAL REPORT FOR THE YEAR ENDED 30 JUNE 2017
St George Mining Limited – Annual Report 2017 P 24
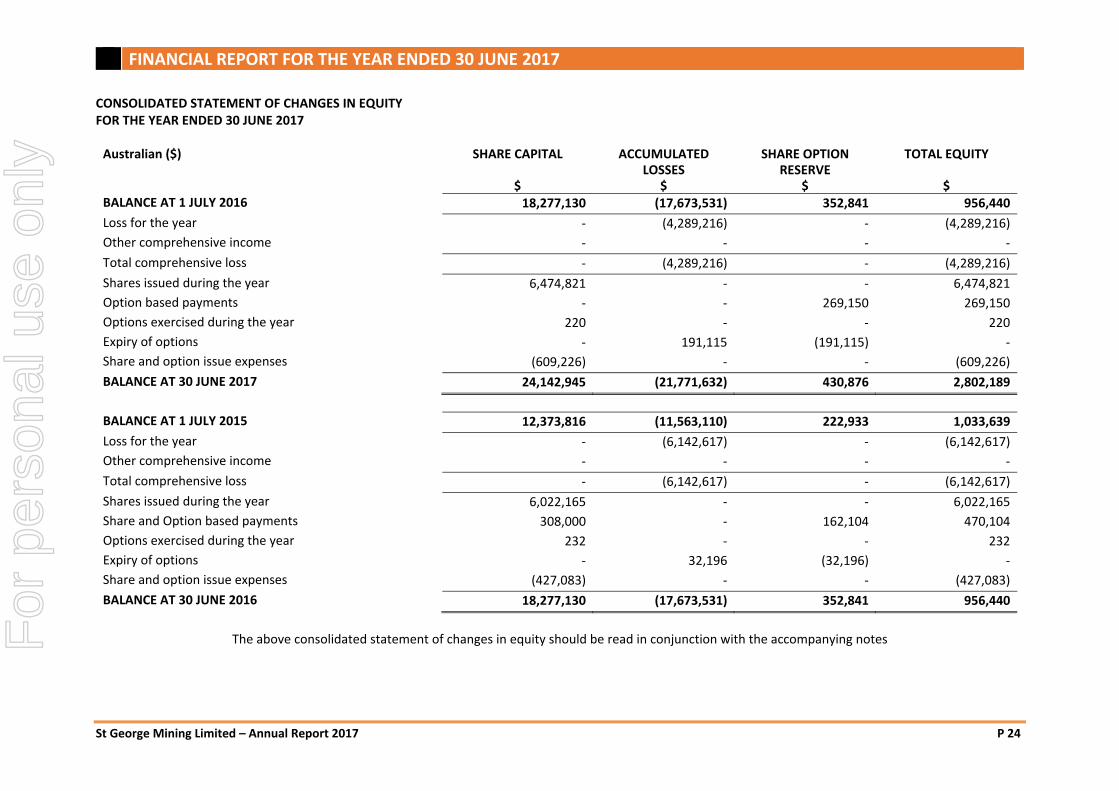
CONSOLIDATED STATEMENT OF CHANGES IN EQUITY FOR THE YEAR ENDED 30 JUNE 2017 Australian ($) SHARE CAPITAL
$
ACCUMULATED LOSSES
$
SHARE OPTION RESERVE
$
TOTAL EQUITY $
BALANCE AT 1 JULY 2016 18,277,130 (17,673,531) 352,841 956,440
Loss for the year ‐ (4,289,216) ‐ (4,289,216)
Other comprehensive income ‐ ‐ ‐ ‐
Total comprehensive loss ‐ (4,289,216) ‐ (4,289,216)
Shares issued during the year 6,474,821 ‐ ‐ 6,474,821
Option based payments ‐ ‐ 269,150 269,150
Options exercised during the year 220 ‐ ‐ 220
Expiry of options ‐ 191,115 (191,115) ‐
Share and option issue expenses (609,226) ‐ ‐ (609,226)
BALANCE AT 30 JUNE 2017 24,142,945 (21,771,632) 430,876 2,802,189
BALANCE AT 1 JULY 2015 12,373,816 (11,563,110) 222,933 1,033,639
Loss for the year ‐ (6,142,617) ‐ (6,142,617)
Other comprehensive income ‐ ‐ ‐ ‐
Total comprehensive loss ‐ (6,142,617) ‐ (6,142,617)
Shares issued during the year 6,022,165 ‐ ‐ 6,022,165
Share and Option based payments 308,000 ‐ 162,104 470,104
Options exercised during the year 232 ‐ ‐ 232
Expiry of options ‐ 32,196 (32,196) ‐
Share and option issue expenses (427,083) ‐ ‐ (427,083)
BALANCE AT 30 JUNE 2016 18,277,130 (17,673,531) 352,841 956,440
The above consolidated statement of changes in equity should be read in conjunction with the accompanying notesF
or p
erso
nal u
se o
nly
FINANCIAL REPORT FOR THE YEAR ENDED 30 JUNE 2017
St George Mining Limited – Annual Report 2017 P 25
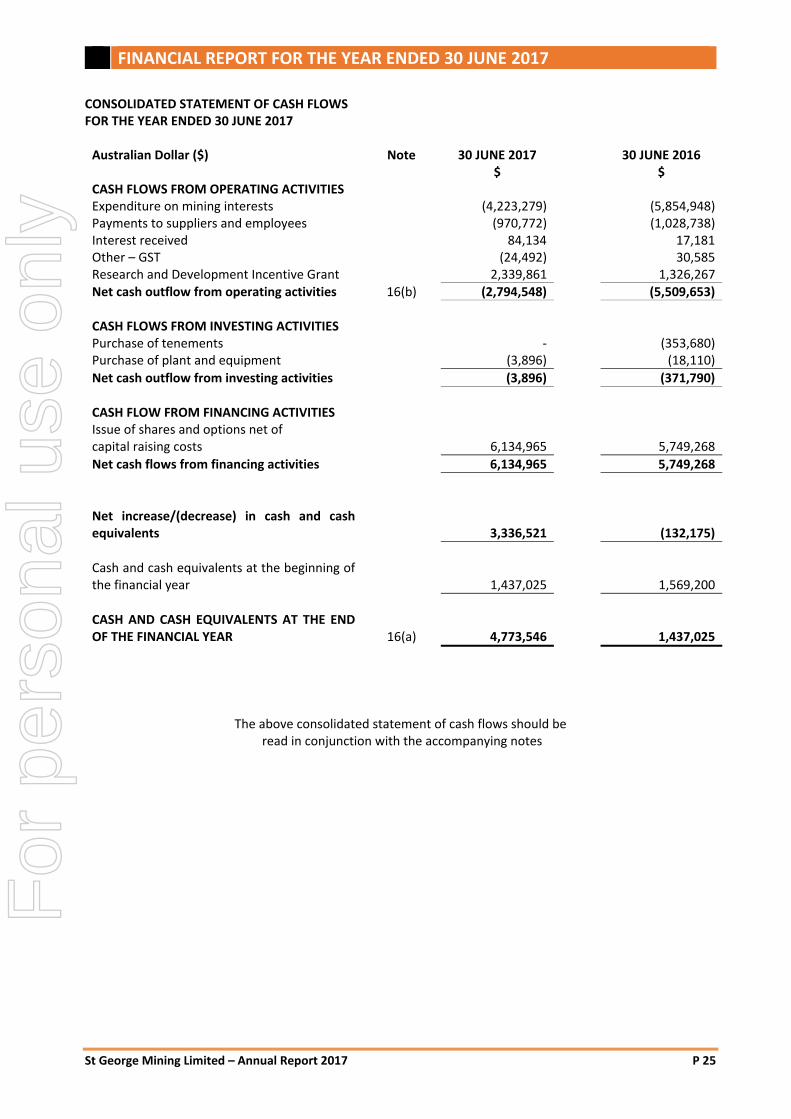
CONSOLIDATED STATEMENT OF CASH FLOWS FOR THE YEAR ENDED 30 JUNE 2017 Australian Dollar ($) Note 30 JUNE 2017 30 JUNE 2016 $ $ CASH FLOWS FROM OPERATING ACTIVITIES Expenditure on mining interests (4,223,279) (5,854,948) Payments to suppliers and employees (970,772) (1,028,738) Interest received 84,134 17,181 Other – GST (24,492) 30,585 Research and Development Incentive Grant 2,339,861 1,326,267 Net cash outflow from operating activities 16(b) (2,794,548) (5,509,653) CASH FLOWS FROM INVESTING ACTIVITIES Purchase of tenements ‐ (353,680) Purchase of plant and equipment (3,896) (18,110)
Net cash outflow from investing activities (3,896) (371,790) CASH FLOW FROM FINANCING ACTIVITIES Issue of shares and options net of capital raising costs
6,134,965
5,749,268
Net cash flows from financing activities 6,134,965 5,749,268
Net increase/(decrease) in cash and cash equivalents
3,336,521
(132,175)
Cash and cash equivalents at the beginning of the financial year
1,437,025
1,569,200
CASH AND CASH EQUIVALENTS AT THE END OF THE FINANCIAL YEAR
16(a)
4,773,546
1,437,025
The above consolidated statement of cash flows should be read in conjunction with the accompanying notes
F
or p
erso
nal u
se o
nly
NOTES TO THE FINANCIAL REPORT FOR THE YEAR ENDED 30 JUNE 2017
St George Mining Limited – Annual Report 2017 P 26
1 CORPORATE INFORMATION The financial report of St George Mining Limited (”St George Mining” or “the Company”) for the year ended 30 June 2017 was authorised for issue in accordance with a resolution of the directors on 20 September 2017. St George Mining Limited is a company limited by shares, incorporated in Australia on 19 October 2009. The consolidated financial statements of the Company for year ended 30 June 2017 comprise of the Company and its subsidiaries together referred to as the Group or consolidated entity. The nature of the operations and principal activity of the Group is mineral exploration. 2 SUMMARY OF SIGNIFICANT ACCOUNTING POLICIES (a) Statement of compliance The financial report complies with Australian Accounting Standards, which include Australian equivalents to International Financial Reporting Standards (“AIFRS”). Compliance with AIFRS ensures that the financial report, comprising the financial statements and notes thereto, complies with International Financial Reporting Standards (“IFRS”). (b) Basis of Preparation of the Financial Report The financial report is a general purpose financial report, which has been prepared in accordance with the requirements of the Corporations Act 2001, Accounting Standards and Interpretations and complies with other requirements of the law. The financial report also complies with the International Financial Reporting Standards. The financial report has also been prepared on a historical cost basis. The financial report is presented in Australian dollars. The following accounting policies have been approved by the consolidated entity, except as noted below. Going Concern
The directors have prepared the financial statements on a going concern basis, which contemplates continuity of normal business activities and the realisation of assets and extinguishment of liabilities in the ordinary course of business. The Consolidated Entity has recorded a net accounting loss of $4,289,216 and net operating cash outflows of $2,794,548 for the year ended 30 June 2017. The Board is confident that the Group will have sufficient funds to finance its operations in the 2017/2018 Financial Year. (c) Principles of Consolidation The consolidated financial statements incorporate all of the assets, liabilities and results of the parent St George Mining Limited and all of the subsidiaries (including any structured entities). Subsidiaries are entities the parent controls. The parent controls an entity when it is exposed to, or has rights to, variable returns from its involvement with the entity and has the ability to affect those returns through its power over the entity. A list of the subsidiaries is provided in Note 21. The assets, liabilities and results of all subsidiaries are fully consolidated into the financial statements of the Group from the date on which control is obtained by the Group. The consolidation of a subsidiary is discontinued from the date that control ceases. Intercompany transactions, balances and unrealised gains or losses on transactions between Group entities are fully eliminated on consolidation. Accounting policies of subsidiaries have been
For
per
sona
l use
onl
y
NOTES TO THE FINANCIAL REPORT FOR THE YEAR ENDED 30 JUNE 2017
St George Mining Limited – Annual Report 2017 P 27
changed and adjustments made where necessary to ensure uniformity of the accounting policies adopted by the Group. Equity interests in a subsidiary not attributable, directly or indirectly, to the Group are presented as “non controlling interests". The Group initially recognises non‐controlling interests that are present ownership interests in subsidiaries and are entitled to a proportionate share of the subsidiary's net assets on liquidation at either fair value or at the non‐controlling interests' proportionate share of the subsidiary's net assets. Subsequent to initial recognition, non‐controlling interests are attributed their share of profit or loss and each component of other comprehensive income. Non‐controlling interests are shown separately within the equity section of the statement of financial position and statement of comprehensive income. (d) Significant accounting estimates and judgements The carrying amount of certain assets and liabilities are often determined based on estimates and assumptions of future events. The key estimates and assumptions that have a significant risk of causing a material adjustment to the carrying amounts of certain assets and liabilities within the next annual reporting period are: Deferred taxation The potential deferred tax asset arising from the tax losses and temporary differences have not been recognised as an asset because recovery of the tax losses is not yet considered probable (refer note 6). Capitalised exploration costs The application of the Group’s accounting policy for exploration and evaluation expenditure requires judgement in determining whether it is likely that future economic benefits are likely, either from future exploration or sale, or where activities have not reached a stage which permits reasonable assessment. Subsidiary Loans Provision has been made for all unsecured loans with subsidiaries as it is uncertain if and when the loans will be recovered. All inter‐company loans have been eliminated on consolidation. (e) Revenue Revenue is recognised to the extent that it is probable that the economic benefits will flow to the Group and the revenue can be reliably measured. The following specific recognition criteria must also be met before revenue is recognised: Interest Interest revenue is recognised using the effective interest method. (f) Employee benefits Provision is made for the Group’s liability for employee benefits arising from services rendered by employees to balance date. Employee benefits expected to be settled within one year together with entitlements arising from wages and salaries and annual leave which will be settled after one year, have been measured at the amounts expected to be paid when the liability is settled, plus related on‐costs. Other employee benefits payable later than one year have been measured at the present value of the estimated cash outflows to be made to those benefits. Contributions are made by the Group to employee superannuation funds and are charged as expenses when incurred.
For
per
sona
l use
onl
y
NOTES TO THE FINANCIAL REPORT FOR THE YEAR ENDED 30 JUNE 2017
St George Mining Limited – Annual Report 2017 P 28
(g) Research & Development Tax Incentives Refundable tax incentives are accounted for as a government grant under AASB 120 Accounting for Government Grants and Disclosure of Government Assistance. (h) Exploration and evaluation expenditure Exploration and evaluation expenditure on areas of interest are expensed as incurred. Costs of acquisition will normally be expensed but will be assessed on a case by case basis and may be capitalised to areas of interest and carried forward where right of tenure of the area of interest is current and they are expected to be recouped through sale or successful development and exploitation of the area of interest or, where exploration and evaluation activities in the area of interest have not yet reached a stage that permits reasonable assessment of the existence of economically recoverable reserves. When an area of interest is abandoned or the directors decide that it is not commercial, any accumulated acquisition costs in respect of that area are written off in the financial period the decision is made. Each area of interest is also reviewed at the end of each accounting period and accumulated costs written off to the extent that they will not be recoverable in the future. Where projects have advanced to the stage that directors have made a decision to mine, they are classified as development properties. When further development expenditure is incurred in respect of a development property, such expenditure is carried forward as part of the cost of that development property only when substantial future economic benefits are established. Otherwise such expenditure is classified as part of the cost of production or written off where production has not commenced. (i) Income Tax Current income tax refunded/(expensed) charged to profit or loss is tax refundable/(payable). Those amounts recognised are expected to be recovered from/(paid to) the relevant taxation authority. Deferred income tax is provided on all temporary differences at the balance sheet date between the tax bases of assets and liabilities and their carrying amounts for financial reporting purposes. Deferred income tax liabilities are recognised for all taxable temporary differences:
except where the deferred income tax liability arises from the initial recognition of an asset or liability in a transaction that is not a business combination and, at the time of the transaction, affects neither that accounting profit nor taxable profit or loss; and,
in respect of taxable temporary differences associated with investments in subsidiaries, associates and interests in joint ventures, except where the timing of the reversal of the temporary differences will not reverse in the foreseeable future.
Deferred income tax assets are recognised for all the deductible temporary differences, carry‐forward of unused tax assets and unused tax losses, to the extent that it is probable that taxable profit will be available against which the deductible temporary differences, and the carry‐forward of unused tax assets and unused tax losses can be utilised:
except where the deferred income tax asset relating to the deductible temporary difference arises from the initial recognition of an asset or liability in a transaction that is not a business combination and, at the time of the transaction, affects neither the accounting profit nor taxable profit or loss; and,
in respect of deductible temporary differences with investments in subsidiaries, associates and interest in joint ventures, deferred tax assets in the foreseeable future and taxable profit will be available against which the temporary differences can be utilised.
For
per
sona
l use
onl
y
NOTES TO THE FINANCIAL REPORT FOR THE YEAR ENDED 30 JUNE 2017
St George Mining Limited – Annual Report 2017 P 29
The carrying amount of deferred income tax is reviewed at each balance sheet date and reduced to the extent that is no longer probable that sufficient taxable profit will be available to allow all or part of the deferred income tax asset to be utilised. Deferred income tax assets and liabilities are measured at the tax rates that are expected to apply to the year when the asset is realised or the liability is settled, based on tax rates (and tax laws) that have been enacted or substantively enacted at the balance sheet date. Income taxes relating to items recognised directly in equity are not in the income statement. (j) Goods and services tax (GST) Revenues, expenses and assets are recognised net of the amount of GST, except where the amount of GST incurred is not recoverable from the Australian Taxation Office (“ATO”). In these circumstances the GST is recognised as part of the cost of acquisition of the asset or as part of an item of the expense. Receivables and payables in the consolidated Statement of Financial Position are shown inclusive of GST. The net amount of GST recoverable from, or payable to, the ATO is included as a current asset or liability in the Consolidated Statement of Financial Position. Cash Flows are included in the Consolidated Statement of Cash Flows net of GST. The GST components of cash flows arising from investing and financial activities which are recoverable from, or payable to, the ATO are classified as operating cash flows. (k) Plant and equipment
Plant and equipment is stated at cost less accumulated depreciation and any accumulated impairment losses. Depreciation is calculated on a diminishing value basis over the estimated useful life of the assets as follows:
Class of Fixed Asset Depreciation Rate Plant and Equipment ‐ Year 1 18.75% ‐ Subsequent Years 37.50% The assets' residual values and useful lives are reviewed, and adjusted if appropriate, at each financial year end. (l) Earnings per share Basic earnings per share is calculated as net loss attributable to members of the Company, adjusted to exclude any costs of servicing equity (other than dividends) and preference share dividends, divided by the weighted average number of ordinary shares, adjusted for any bonus element. (m) Cash and cash equivalents Cash and short‐term deposits in the consolidated Statement of Financial Position comprise cash at bank and in hand and short‐term deposits with an original maturity of three months or less. For the purposes of the consolidated Statement of Cash Flows, cash and cash equivalents consist of cash and cash equivalents as defined above, net of outstanding bank overdrafts.
For
per
sona
l use
onl
y
NOTES TO THE FINANCIAL REPORT FOR THE YEAR ENDED 30 JUNE 2017
St George Mining Limited – Annual Report 2017 P 30
(n) Impairment of assets The Group assesses at each reporting date whether there is an indication that an asset may be impaired. If any such indication exists, or when annual impairment testing for an asset is required, the Group makes an estimate of the asset’s recoverable amount. An asset’s recoverable amount is the higher of its fair value; less costs to sell and its value in use and is determined for an individual asset, unless the asset does not generate cash inflows that are largely independent of those from other assets or groups of assets and the asset’s value in use cannot be estimated to be close to its fair value. In such cases the asset is tested for impairment as part of the cash‐generating unit to which it belongs. When the carrying amount of an asset or cash‐generating unit exceeds its recoverable amount, the asset or cash‐generating unit is considered impaired and it is written down to its recoverable amount. In assessing the value in use, the estimated future cash flows are discounted to their present value using a pre‐tax discount rate that reflects current market assessments of the time value of money and the risks specific to the asset. Impairment losses relating to continuing operations are recognised in those expense categories consistent with the function of the impaired asset unless the asset is carried at revalued amount (in which case the impairment loss is treated as a revaluation decrease). An assessment is also made at each reporting date as to whether there is any indication that previously recognised impairment losses may no longer exist or may have decreased. If such indication exists, the recoverable amount is estimated. A previously recognised impairment loss is reversed only if there has been a change in the estimates used to determine the asset’s recoverable amount since the last impairment loss was recognised. If that is the case the carrying amount of the asset is increased to its recoverable amount. That increased amount cannot exceed the carrying amount that would have been determined, net of depreciation, had no impairment loss been recognised for the asset in prior years. Such reversal is recognised in profit or loss unless the asset is carried at revalued amount, in which case the reversal is treated as a revaluation increase. After such a reversal the depreciation charge is adjusted in future periods to allocate the asset’s revised carrying amount, less any residual value, on a systemic basis over its remaining useful life. (o) Contributed equity Ordinary shares and options are classified as contributed equity. Incremental costs directly attributable to the issue of new shares or options are shown in equity as a deduction, net of GST, from the proceeds. (p) Investments All investments are initially recognised at cost, being the fair value of the consideration given and including acquisition charges associated with the investment. After initial recognition, investments, which are classified as held for trading and available‐for‐sale, are measured at fair value. Gains or losses on investments held for trading are recognised in the consolidated profit or loss. Gains or losses on available‐for‐sale investments are recognised as a separate component of equity until the investment is sold, collected or otherwise disposed of, or until the investment is determined to be impaired, at which time the cumulative gain or loss previously reported in equity is included in the profit or loss. (q) Financial assets Financial assets and financial liabilities are recognised in the Consolidated Statement of Financial Position when the Group becomes party to the contractual provisions of the financial instrument. A financial asset is derecognised when the contractual rights to the Consolidated Statement of Cash Flows from the financial assets expire or are transferred and no longer controlled by the entity. A financial liability is removed from the Consolidated Statement of Financial Position when the obligation specified in the contract is discharged or cancelled or expires.
For
per
sona
l use
onl
y
NOTES TO THE FINANCIAL REPORT FOR THE YEAR ENDED 30 JUNE 2017
St George Mining Limited – Annual Report 2017 P 31
Financial assets and financial liabilities classified as held for trading are measured at fair value through the profit or loss. Upon initial recognition a financial asset or financial liability is designated as at fair value through the profit or loss when: (a) an entire contract containing one or more embedded derivatives is designated as a financial asset or
financial liability at fair value through the profit or loss; (b) doing so results in more relevant information, because either:
(i) it eliminates or significantly reduces a measurement or recognition inconsistency that would otherwise arise from measuring assets or liabilities or recognizing gains or losses on them on different bases; or
(ii) a group of financial assets, financial liabilities or both is managed and its performance is evaluated on a fair value basis, in accordance with a documented risk management or investment strategy, and information about the group is provided internally on that basis to key management personnel.
Investments in equity instruments that do not have a quoted market price in an active market, and whose fair value cannot be reliably measured are not designated as at fair value through the profit or loss. A gain or loss arising from a change in the fair value of a financial asset or financial liability classified as at fair value through the profit or loss is recognised in the profit or loss. Financial assets not measured at fair value comprise: a) loans and receivables being non‐derivative financial assets with fixed or determinable payments that are
not quoted in an active market. These are measured at amortised cost using the effective interest rate method;
(b) held‐to‐maturity investments being non‐derivative financial assets with fixed or determinable payments and fixed maturity that will be held to maturity. These are measured at amortised cost using the effective interest method; and
(c) investments in equity instruments that do not have a quoted market price in an active market and the fair value of which cannot be reliably measured. These are measured at cost together with derivatives that are linked to and must be settled by the delivery of such investments.
Available‐for‐sale financial assets are non‐derivative financial assets, which are designated as available‐for‐sale or that are not classified as loans and receivables, held‐to‐maturity investments or financial assets as at fair value through the profit and loss. A gain or loss arising from a change in the fair value of an available‐for‐sale financial asset is recognised directly in equity, through the Consolidated Statement of Changes in Equity (except for impairment losses and foreign exchange gains or losses) until the financial asset is derecognised at which time the cumulative gain or loss previously recognised in equity is recognised in the profit or loss.
Regular way purchases of financial assets are accounted for as follows:
financial assets held for trading – at trade date
held‐to‐maturity investments – at trade date
loans and receivables – at trade date
available‐for‐sale financial assets – at trade date Except for the following all financial liabilities are measured at amortised cost using the effective interest rate method:
For
per
sona
l use
onl
y
NOTES TO THE FINANCIAL REPORT FOR THE YEAR ENDED 30 JUNE 2017
St George Mining Limited – Annual Report 2017 P 32
(a) financial liabilities at fair value through the profit and loss and derivatives that are liabilities measured at
fair value; (b) financial liabilities that arise when a transfer of financial asset does not qualify for de‐recognition or are
accounted for using the continuing involvement approach. The amortised cost of a financial asset or a financial liability is the amount initially recognised minus principal repayments, plus or minus cumulative amortisation of any difference between the initial amount and maturity amount and minus any write‐down for impairment or un‐collectability. (r) Business combinations Business combinations occur where an acquirer obtains control over one or more businesses and results in the consolidation of its assets and liabilities. A business combination is accounted for by applying the acquisition method, unless it is a combination involving entities or businesses under common control. The acquisition method requires that for each business combination one of the combining entities must be identified as the acquirer (i.e. parent entity). The business combination will be accounted for as at the acquisition date, which is the date that control over the acquiree is obtained by the parent entity. At this date, the parent shall recognise, in the consolidated accounts, and subject to certain limited exceptions, the fair value of the identifiable assets acquired and liabilities assumed. In addition, contingent liabilities of the acquiree will be recognised where a present obligation has been incurred and its fair value can be reliably measured. The acquisition may result in the recognition of goodwill or a gain from a bargain purchase. The method adopted for the measurement of goodwill will impact on the measurement of any non‐controlling interest to be recognised in the acquiree where less than 100% ownership interest is held in the acquiree. The acquisition date fair value of the consideration transferred for a business combination plus the acquisition date fair value of any previously held equity interest shall form the cost of the investment in the separate financial statements. Consideration may comprise the sum of the assets transferred by the acquirer, liabilities incurred by the acquirer to the former owners of the acquiree and the equity interests issued by the acquirer. Fair value uplifts in the value of pre‐existing holdings are taken to the statement of comprehensive income. Where changes in the value of such equity holdings had previously been recognised in other comprehensive income, such amounts are recycled to profit or loss. Included in the measurement of consideration transferred is any asset or liability resulting from a contingent consideration arrangement. Any obligation incurred relating to contingent consideration is classified as either a financial liability or equity instrument, depending upon the nature of the arrangement. Rights to refunds of consideration previously paid are recognised as a receivable. Subsequent to initial recognition, contingent consideration classified as equity is not remeasured and its subsequent settlement is accounted for within equity. Contingent consideration classified as an asset or a liability is remeasured each reporting period to fair value through the statement of comprehensive income unless the change in value can be identified as existing at acquisition date. All transaction costs incurred in relation to the business combination are expensed to the statement of comprehensive income. (s) Adoption of new and revised standards The Group has consistently applied the following accounting policies to all periods presented in the financial statements. The Group has considered the implications of new and amended Accounting Standards applicable for
For
per
sona
l use
onl
y
NOTES TO THE FINANCIAL REPORT FOR THE YEAR ENDED 30 JUNE 2017
St George Mining Limited – Annual Report 2017 P 33
annual reporting periods beginning after 1 January 2016 but determined that their application to the financial statements is either not relevant or not material. (t) Comparative information Comparative information is amended where appropriate to ensure consistency in presentation with the current year. 3 REVENUE CONSOLIDATED
30 JUNE 2017 CONSOLIDATED
30 JUNE 2016 $ $ Interest income 90,170 18,003 Research and Development Tax Incentive (i) 2,339,861 1,326,267
(i) The Research and Development rebate $2,339,861 is in relation to the year ended 30 June 2016 (2016:
$1,326,267 in relation to the year ended 30 June 2015). 4 EXPENSES Administration expenses include the following expenses: CONSOLIDATED
30 JUNE 2017 CONSOLIDATED
30 JUNE 2016 $ $ Employee benefit expense Wages and salaries 316,678 352,500 Accrued annual leave 15,512 10,577 Employee share based payments ‐ 11,100 Defined contribution superannuation expense 30,084 33,488
362,274 407,665
Other administration costs Accounting fees 29,655 25,064 Research and Development consulting fees 27,110 10,100 Administrative fees 34,613 48,776 Legal fees 40,498 18,187 Publications and subscriptions 48,604 140,862 Presentations and seminars 69,653 71,156 Share registry costs 51,131 44,076 Travel expenses 129,278 108,326
430,542 466,547
For
per
sona
l use
onl
y
NOTES TO THE FINANCIAL REPORT FOR THE YEAR ENDED 30 JUNE 2017
St George Mining Limited – Annual Report 2017 P 34
5 EXPLORATION EXPENDITURE WRITTEN OFF CONSOLIDATED
30 JUNE 2017 CONSOLIDATED
30 JUNE 2016 $ $ Exploration expenditure written off 5,177,716 5,801,949 Tenement acquisition costs 482,581 661,680
5,660,297 6,463,629
6 INCOME TAX (a) Prima facie income tax benefit at 27.5% (2016: 28.5%) on loss from ordinary activities is reconciled to
the income tax provided in the financial statements RESTATED CONSOLIDATED
30 JUNE 2017 CONSOLIDATED
30 JUNE 2016 $ $ Loss before income tax (4,289,216) (6,142,617)
Income tax calculated at 27.5% (2016: 28.5%) (i) (1,179,534) (1,750,645) Tax effect of;‐ Sundry – temporary differences (19,371) 4,687 Section 40‐880 deduction (96,189) (71,413) Future income tax benefit not brought to account 1,295,094 1,817,371
Income tax benefit ‐ ‐
(i) The income tax reconciliation for 2016 has been restated to reflect the reduced tax rates for small business
entities from 30% to 28.5% in the 2016 financial year. (b) Deferred tax assets The potential deferred tax asset arising from the tax losses and temporary differences have not been recognised as an asset because recovery of tax losses is not yet probable. CONSOLIDATED CONSOLIDATED 30 JUNE 2017
$ 30 JUNE 2016
$
Australian accumulated tax losses (i) 3,538,257 2,325,077 Provisions ‐ net of prepayments (12,652) (4,021) Exploration and evaluation expenditure ‐ (137,536) Section 40‐880 deduction 260,823 196,365
Unrecognised deferred tax assets relating to the above temporary differences
3,786,428
2,379,885
(i) The Australian accumulated tax losses opening balance at 30 June 2016 has been restated due to the 30
June 2016 Research and Development rebate $2,339,861 being received during the 2016/2017 financial year.
F
or p
erso
nal u
se o
nly
NOTES TO THE FINANCIAL REPORT FOR THE YEAR ENDED 30 JUNE 2017
St George Mining Limited – Annual Report 2017 P 35
The benefits will only be obtained if: (i) The Group derives future assessable income of a nature and of an amount sufficient to enable the benefit
from the deduction for the losses to be realised; (ii) The Group continues to comply with the conditions in deductibility imposed by the Law; and (iii) No change in tax legislation adversely affect the Group in realising the benefits from the deductions or
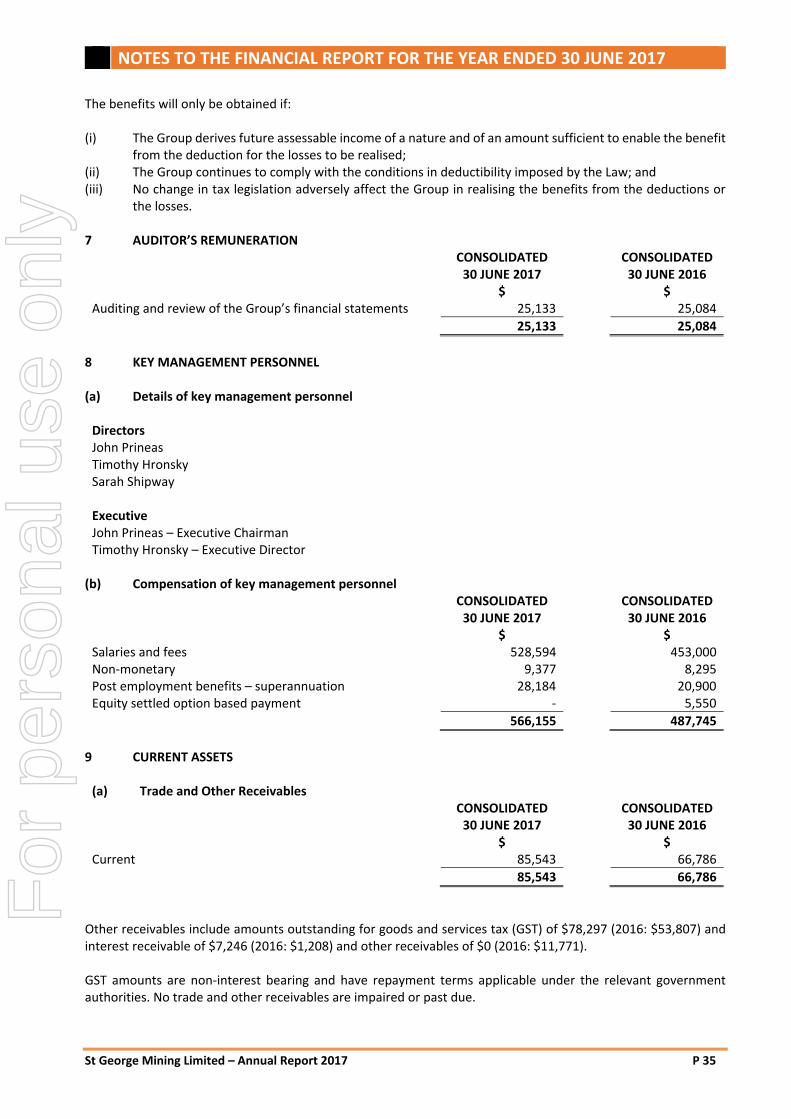
the losses. 7 AUDITOR’S REMUNERATION CONSOLIDATED
30 JUNE 2017 CONSOLIDATED
30 JUNE 2016 $ $ Auditing and review of the Group’s financial statements 25,133 25,084
25,133 25,084
8 KEY MANAGEMENT PERSONNEL (a) Details of key management personnel
Directors John Prineas Timothy Hronsky
Sarah Shipway Executive John Prineas – Executive Chairman Timothy Hronsky – Executive Director
(b) Compensation of key management personnel CONSOLIDATED
30 JUNE 2017 CONSOLIDATED
30 JUNE 2016 $ $ Salaries and fees 528,594 453,000 Non‐monetary 9,377 8,295 Post employment benefits – superannuation 28,184 20,900 Equity settled option based payment ‐ 5,550
566,155 487,745
9 CURRENT ASSETS (a) Trade and Other Receivables CONSOLIDATED
30 JUNE 2017 CONSOLIDATED
30 JUNE 2016 $ $ Current 85,543 66,786
85,543 66,786
Other receivables include amounts outstanding for goods and services tax (GST) of $78,297 (2016: $53,807) and interest receivable of $7,246 (2016: $1,208) and other receivables of $0 (2016: $11,771). GST amounts are non‐interest bearing and have repayment terms applicable under the relevant government authorities. No trade and other receivables are impaired or past due.
For
per
sona
l use
onl
y
NOTES TO THE FINANCIAL REPORT FOR THE YEAR ENDED 30 JUNE 2017
St George Mining Limited – Annual Report 2017 P 36
(b) Other Assets CONSOLIDATED
30 JUNE 2017 CONSOLIDATED
30 JUNE 2016 $ $ Prepayments 149,425 32,174 Deposit 20,000 20,000
169,425 52,174
10 PLANT AND EQUIPMENT
CONSOLIDATED 30 JUNE 2017
CONSOLIDATED 30 JUNE 2016
$ $ Plant and Equipment At Cost 82,518 78,622 Accumulated depreciation (57,833) (44,191)
Total plant and equipment 24,685 34,431
Plant and Equipment Carrying amount at the beginning of the year 34,431 37,577 Additions 3,896 16,255 Disposals ‐ (2,262) Depreciation expense (13,642) (17,139)
Total carrying amount at end of year 24,685 34,431
11 EXPLORATION, EVALUATION AND ACQUISITION EXPENDITURE The Group has capitalised acquisition expenditure on the basis that either the expenditure is expected to be recouped through future successful development (or alternatively sale) of the areas of interest concerned or on the basis that it is not yet possible to assess whether it will be recouped.
CONSOLIDATED 30 JUNE 2017
CONSOLIDATED 30 JUNE 2016
$ $ Balance at the beginning of the year 482,581 482,581 Additions/(write‐off) (482,581) ‐
Balance at the end of the year ‐ 482,581
12 CURRENT LIABILITIES CONSOLIDATED
30 JUNE 2017 CONSOLIDATED
30 JUNE 2016 $ $ Trade and other payables 2,225,921 1,106,980
2,225,921 1,106,980
Trade payables are non‐interest bearing and are settled on normal commercial trade terms. F
or p
erso
nal u
se o
nly
NOTES TO THE FINANCIAL REPORT FOR THE YEAR ENDED 30 JUNE 2017
St George Mining Limited – Annual Report 2017 P 37
13 ISSUED CAPITAL Australian Dollar $ CONSOLIDATED
30 JUNE 2017 CONSOLIDATED
30 JUNE 2016 $ $ (a) Issued and paid up capital At the beginning of the reporting period 18,277,130 12,373,816 August 2016: 43,165,470 shares issued at $0.15 per share 6,474,821 ‐ June 2017: 1,100 shares issued at $0.20 per share 220 ‐ July 2015: 5,555,556 shares issued at $0.09 per share ‐ 500,000 November 2015: 22,630,631 shares issued at $0.08 per share ‐ 1,810,450 January 2016: 3,500,000 shares issued at $0.088 per share ‐ 308,000 March 2016: 27,169,591 shares issued at $0.085 per share ‐ 2,309,415 April 2016: 16,497,647 shares issued at $0.085 per share ‐ 1,402,300 May 2016: 1,160 shares issued at $0.20 per share ‐ 232 Transactions costs arising from issue of shares (609,226) (427,083)
At reporting date 250,360,825 (30 June 2016: 207,194,255) fully paid ordinary shares
24,142,945
18,277,130
Movements in Ordinary Shares Number Number At the beginning of the reporting period 207,194,255 131,839,670 Shares issued during the year 43,165,470 75,353,425 Options exercised during the year 1,100 1,160
At reporting date 250,360,825 207,194,255
Movements in Performance Shares Number Number At the beginning of the reporting period ‐ 100 Changes to performance shares issued during the year (i) ‐ (100) Issued during the year (ii) 100 ‐
At reporting date 100 ‐
(i) 100 Performance shares expired on 28 November 2015. (ii) 100 Performance shares issued on 2 December 2016. (b) Option Reserve
Movements in options reserve CONSOLIDATED
30 JUNE 2017 CONSOLIDATED
30 JUNE 2016 $ $ At the beginning of the year 352,841 222,933 Options expensed over the vesting period ‐ 11,100 Listed options ‐ 151,004 Expiry of options transferred to accumulated losses (i) (191,115) (32,196) Option based payments (ii) 269,150 ‐ Options issue expense ‐ ‐
At reporting date 430,876 352,841
(i) The Company had on issue 600,000 Class D Options under the Company’s Employee Incentive Option Plan. On 28 November 2016 600,000 Class D Options expired, unexercised.
(ii) The Company issued 3,500,000 Unlisted Options as consideration for advisory services. Using the Black & Scholes option mode and based on the assumptions below, the Unlisted Options were ascribed the following value. The fair value of these options has been charged to capital raising costs.
For
per
sona
l use
onl
y
NOTES TO THE FINANCIAL REPORT FOR THE YEAR ENDED 30 JUNE 2017
St George Mining Limited – Annual Report 2017 P 38
Class of Option Number of
Options
Valuation Date
Market Price of
Shares
Exercise Price
Expiry Date
Risk Free
Interest Rate
Volatility (discount)
Indicative Value per Option
Unlisted Options 3,500,000 02.12.2016 $0.14 $0.25 02.12.2019 1.98% 107% $0.077
A summary of the outstanding options at 30 June 2017 in the Company is listed below:
Class Number of Options Exercise Price Expiry Date
Class E Unlisted Options 600,000 $0.50 28 November 2017 Unlisted Options 3,500,000 $0.25 2 December 2019
14 ACCUMULATED LOSSES CONSOLIDATED
30 JUNE 2017 CONSOLIDATED
30 JUNE 2016 $ $ Accumulated losses at the beginning of the year (17,673,531) (11,563,110) Loss for the year (4,289,215) (6,142,617) Expiry of options 191,115 32,196
Accumulated losses at the end of the year (21,771,631) (17,673,531)
15 LOSS PER SHARE CONSOLIDATED CONSOLIDATED 30 JUNE 2017
$ 30 JUNE 2016
$
Basic loss per share after income tax attributable to members of the Company (cents per share)
(1.75)
(3.77)
Diluted loss per share (cents per share) (1.75) (3.77)
2017 Number
2016 Number
Weighted average number of shares on issue during the financial year used in the calculation of basic earnings per share
244,564,911
163,005,341
Weighted average number of ordinary shares for diluted earnings per share
244,564,911
163,005,341
16 NOTES TO THE CONSOLIDATED STATEMENT OF CASH FLOWS (a) Reconciliation of cash and cash equivalents For the purposes of the consolidated statement of cash flows, cash and cash equivalents consist of cash at bank and in hand and short‐term deposits with an original maturity of three months or less, net of outstanding bank overdrafts. CONSOLIDATED
30 JUNE 2017 CONSOLIDATED
30 JUNE 2016 $ $ Current – cash at bank 4,773,546 1,437,025
4,773,546 1,437,025
For
per
sona
l use
onl
y
NOTES TO THE FINANCIAL REPORT FOR THE YEAR ENDED 30 JUNE 2017
St George Mining Limited – Annual Report 2017 P 39
(b) Reconciliation of loss after tax to net cash flows from operations
CONSOLIDATED 30 JUNE 2017
CONSOLIDATED 30 JUNE 2016
$ $ Loss after income tax (4,289,216) (6,142,617)
Share based payments ‐ 319,100 Depreciation expense 13,642 17,139 Tenement acquisition expense ‐ 357,797 (Increase)/decrease in assets Trade and other receivables (22,490) 29,763 Other assets 369,063 (21,622) Increase/(decrease) in liabilities Trade and other payables 1,118,941 (79,789) Provisions 15,512 10,576
(2,794,548) (5,509,653)
(c) Non cash financing and investing activities (i) On 2 December 2016 the Company issued 3,500,000 Unlisted Options exercisable at $0.25 on or before 2
December 2019 as consideration for advisory services.
17 SHARE BASED PAYMENTS
(i) On 2 December 2016 the Company issued 3,500,000 Unlisted Options as consideration for advisory services. Using the Black & Scholes option mode and based on the assumptions below, the Unlisted Options were ascribed the following value:
Class of Option Number of
Options
Valuation Date
Market Price of
Shares
Exercise Price
Expiry Date
Risk Free
Interest Rate
Volatility (discount)
Indicative Value per Option
Unlisted Options 3,500,000 02.12.2016 $0.14 $0.25 02.12.2019 1.98% 107% $0.077
(ii) The Company agreed and Shareholders approved at the Company’s Annual General Meeting held on 27
November 2015 to allot and issue a total 600,000 Class E Options to Mr Timothy Hronsky and Mr Matthew McCarthy. The terms and conditions of the options are detailed in the Notice of Annual General Meeting dated 27 October 2015. Using the Black & Scholes option model and based on the assumption below, the Class E Options were ascribed the following value:
Class of Options
Number Options
Valuation Date
Market Price of Shares
Exercise Price
Expiry Date Risk Free Interest Rate
Volatility (discount)
Indicative Value per Option
Class E Options
600,000 27.11.2015 $0.07 $0.50 28.11.2017 2.09% 110% $0.01210
Of the above options granted, the following were issued to Mr Timothy Hronsky (key management personnel):
For
per
sona
l use
onl
y
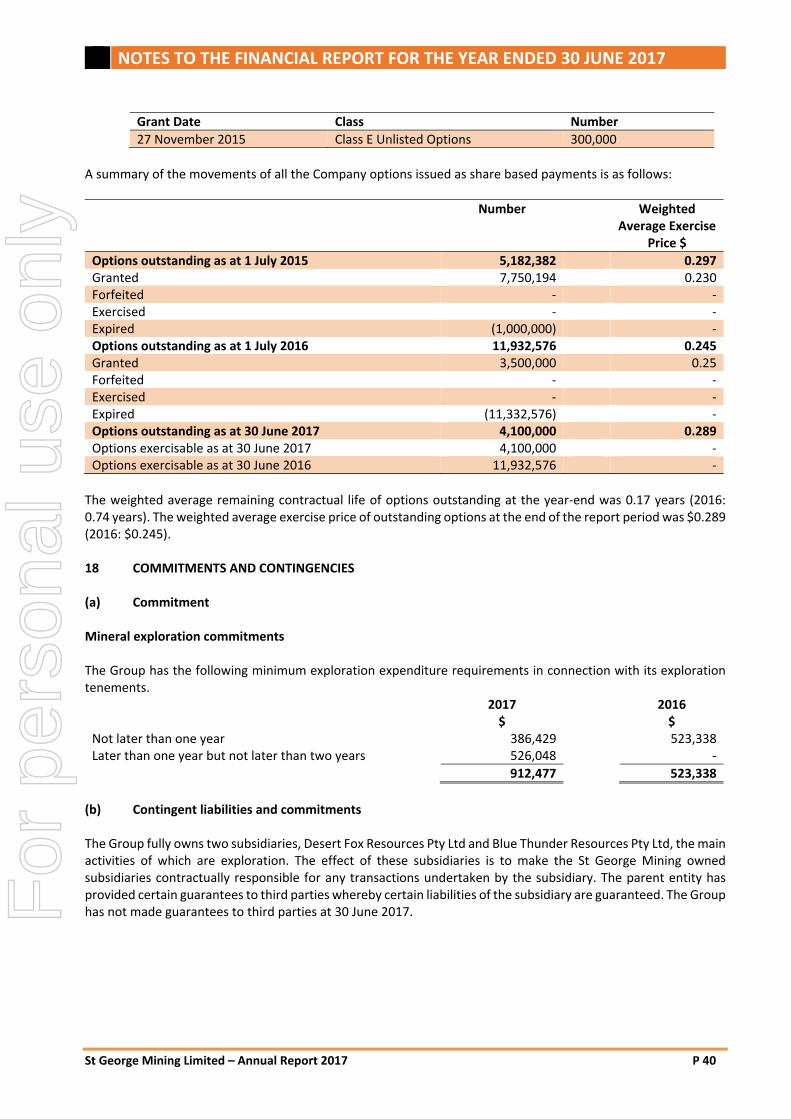
NOTES TO THE FINANCIAL REPORT FOR THE YEAR ENDED 30 JUNE 2017
St George Mining Limited – Annual Report 2017 P 40
Grant Date Class Number
27 November 2015 Class E Unlisted Options 300,000
A summary of the movements of all the Company options issued as share based payments is as follows:
Number Weighted Average Exercise
Price $
Options outstanding as at 1 July 2015 5,182,382 0.297 Granted 7,750,194 0.230 Forfeited ‐ ‐ Exercised ‐ ‐ Expired (1,000,000) ‐ Options outstanding as at 1 July 2016 11,932,576 0.245 Granted 3,500,000 0.25 Forfeited ‐ ‐ Exercised ‐ ‐ Expired (11,332,576) ‐ Options outstanding as at 30 June 2017 4,100,000 0.289 Options exercisable as at 30 June 2017 4,100,000 ‐ Options exercisable as at 30 June 2016 11,932,576 ‐
The weighted average remaining contractual life of options outstanding at the year‐end was 0.17 years (2016: 0.74 years). The weighted average exercise price of outstanding options at the end of the report period was $0.289 (2016: $0.245). 18 COMMITMENTS AND CONTINGENCIES (a) Commitment Mineral exploration commitments The Group has the following minimum exploration expenditure requirements in connection with its exploration tenements. 2017
$ 2016
$
Not later than one year 386,429 523,338 Later than one year but not later than two years 526,048 ‐
912,477 523,338
(b) Contingent liabilities and commitments The Group fully owns two subsidiaries, Desert Fox Resources Pty Ltd and Blue Thunder Resources Pty Ltd, the main activities of which are exploration. The effect of these subsidiaries is to make the St George Mining owned subsidiaries contractually responsible for any transactions undertaken by the subsidiary. The parent entity has provided certain guarantees to third parties whereby certain liabilities of the subsidiary are guaranteed. The Group has not made guarantees to third parties at 30 June 2017.
For
per
sona
l use
onl
y
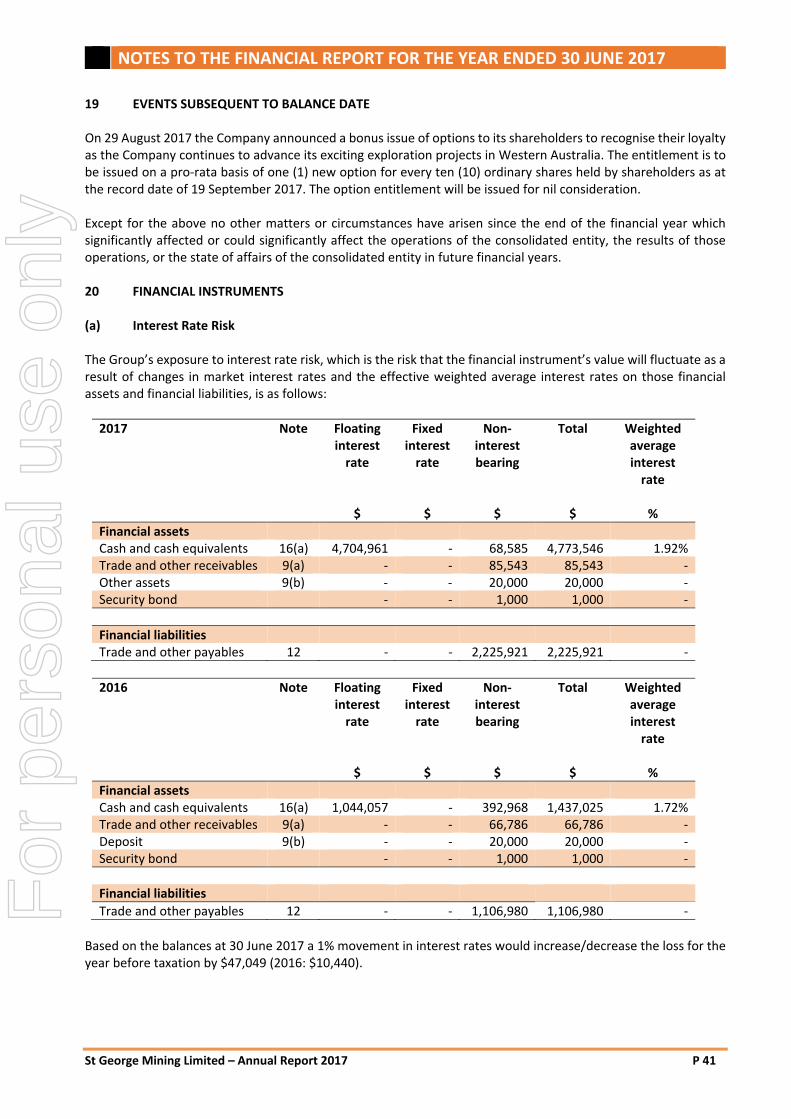
NOTES TO THE FINANCIAL REPORT FOR THE YEAR ENDED 30 JUNE 2017
St George Mining Limited – Annual Report 2017 P 41
19 EVENTS SUBSEQUENT TO BALANCE DATE On 29 August 2017 the Company announced a bonus issue of options to its shareholders to recognise their loyalty as the Company continues to advance its exciting exploration projects in Western Australia. The entitlement is to be issued on a pro‐rata basis of one (1) new option for every ten (10) ordinary shares held by shareholders as at the record date of 19 September 2017. The option entitlement will be issued for nil consideration. Except for the above no other matters or circumstances have arisen since the end of the financial year which significantly affected or could significantly affect the operations of the consolidated entity, the results of those operations, or the state of affairs of the consolidated entity in future financial years. 20 FINANCIAL INSTRUMENTS (a) Interest Rate Risk The Group’s exposure to interest rate risk, which is the risk that the financial instrument’s value will fluctuate as a result of changes in market interest rates and the effective weighted average interest rates on those financial assets and financial liabilities, is as follows:
2017
Note Floating interest rate
Fixed interest rate
Non‐interest bearing
Total Weighted average interest rate
$ $ $ $ %
Financial assets Cash and cash equivalents 16(a) 4,704,961 ‐ 68,585 4,773,546 1.92% Trade and other receivables 9(a) ‐ ‐ 85,543 85,543 ‐ Other assets 9(b) ‐ ‐ 20,000 20,000 ‐ Security bond ‐ ‐ 1,000 1,000 ‐
Financial liabilities Trade and other payables 12 ‐ ‐ 2,225,921 2,225,921 ‐
2016
Note Floating interest rate
Fixed interest rate
Non‐interest bearing
Total Weighted average interest rate
$ $ $ $ %
Financial assets Cash and cash equivalents 16(a) 1,044,057 ‐ 392,968 1,437,025 1.72% Trade and other receivables 9(a) ‐ ‐ 66,786 66,786 ‐ Deposit 9(b) ‐ ‐ 20,000 20,000 ‐ Security bond ‐ ‐ 1,000 1,000 ‐
Financial liabilities
Trade and other payables 12 ‐ ‐ 1,106,980 1,106,980 ‐
Based on the balances at 30 June 2017 a 1% movement in interest rates would increase/decrease the loss for the year before taxation by $47,049 (2016: $10,440).
For
per
sona
l use
onl
y
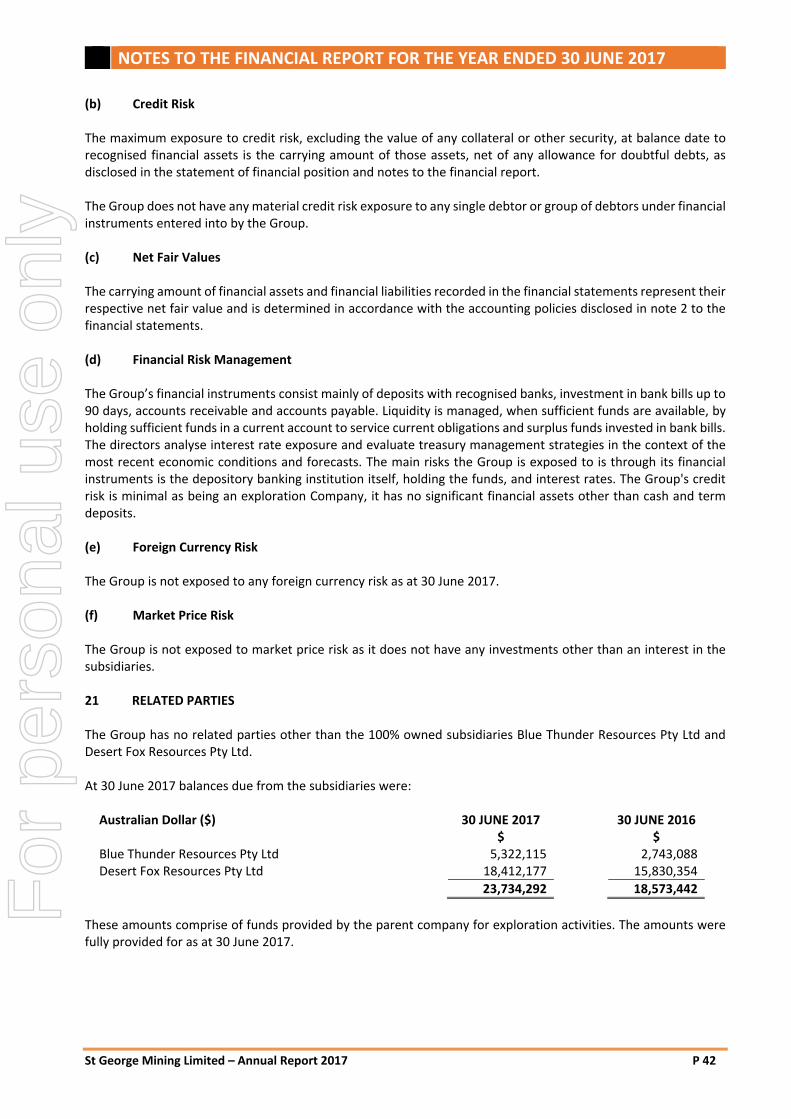
NOTES TO THE FINANCIAL REPORT FOR THE YEAR ENDED 30 JUNE 2017
St George Mining Limited – Annual Report 2017 P 42
(b) Credit Risk The maximum exposure to credit risk, excluding the value of any collateral or other security, at balance date to recognised financial assets is the carrying amount of those assets, net of any allowance for doubtful debts, as disclosed in the statement of financial position and notes to the financial report. The Group does not have any material credit risk exposure to any single debtor or group of debtors under financial instruments entered into by the Group. (c) Net Fair Values The carrying amount of financial assets and financial liabilities recorded in the financial statements represent their respective net fair value and is determined in accordance with the accounting policies disclosed in note 2 to the financial statements. (d) Financial Risk Management The Group’s financial instruments consist mainly of deposits with recognised banks, investment in bank bills up to 90 days, accounts receivable and accounts payable. Liquidity is managed, when sufficient funds are available, by holding sufficient funds in a current account to service current obligations and surplus funds invested in bank bills. The directors analyse interest rate exposure and evaluate treasury management strategies in the context of the most recent economic conditions and forecasts. The main risks the Group is exposed to is through its financial instruments is the depository banking institution itself, holding the funds, and interest rates. The Group's credit risk is minimal as being an exploration Company, it has no significant financial assets other than cash and term deposits. (e) Foreign Currency Risk The Group is not exposed to any foreign currency risk as at 30 June 2017. (f) Market Price Risk The Group is not exposed to market price risk as it does not have any investments other than an interest in the subsidiaries. 21 RELATED PARTIES The Group has no related parties other than the 100% owned subsidiaries Blue Thunder Resources Pty Ltd and Desert Fox Resources Pty Ltd. At 30 June 2017 balances due from the subsidiaries were:
Australian Dollar ($) 30 JUNE 2017 30 JUNE 2016 $ $ Blue Thunder Resources Pty Ltd 5,322,115 2,743,088 Desert Fox Resources Pty Ltd 18,412,177 15,830,354
23,734,292 18,573,442
These amounts comprise of funds provided by the parent company for exploration activities. The amounts were fully provided for as at 30 June 2017.
For
per
sona
l use
onl
y
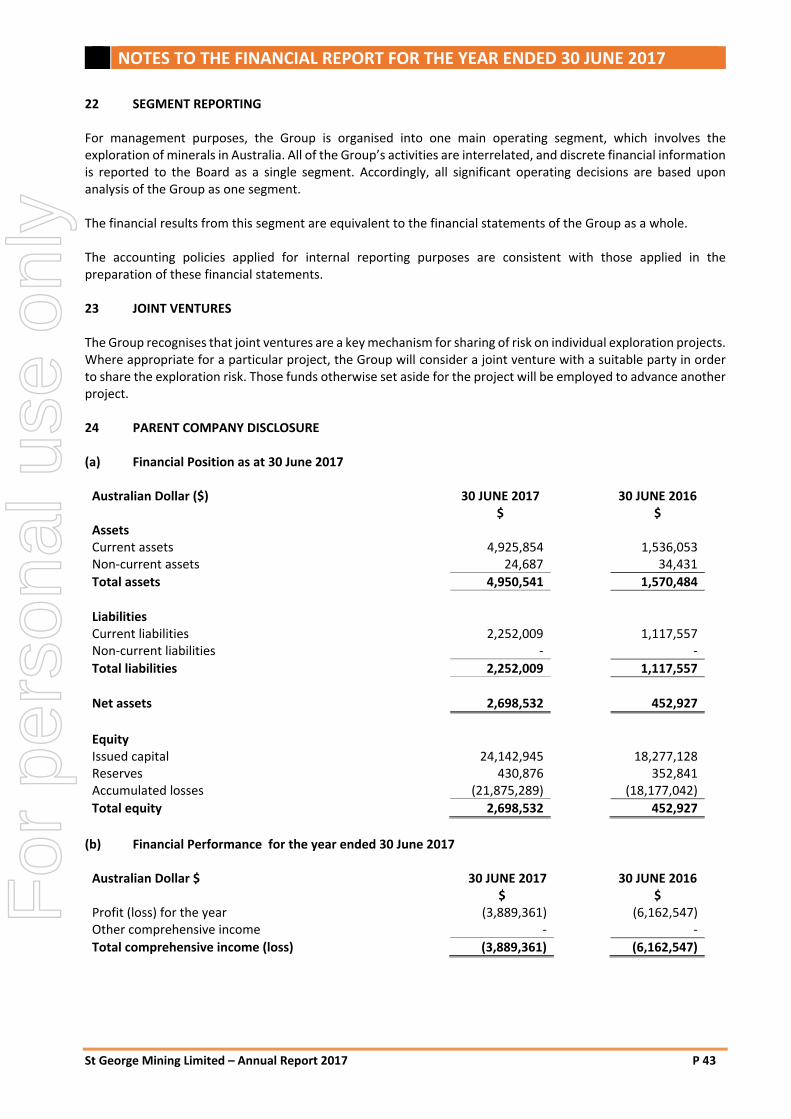
NOTES TO THE FINANCIAL REPORT FOR THE YEAR ENDED 30 JUNE 2017
St George Mining Limited – Annual Report 2017 P 43
22 SEGMENT REPORTING For management purposes, the Group is organised into one main operating segment, which involves the exploration of minerals in Australia. All of the Group’s activities are interrelated, and discrete financial information is reported to the Board as a single segment. Accordingly, all significant operating decisions are based upon analysis of the Group as one segment. The financial results from this segment are equivalent to the financial statements of the Group as a whole. The accounting policies applied for internal reporting purposes are consistent with those applied in the preparation of these financial statements. 23 JOINT VENTURES The Group recognises that joint ventures are a key mechanism for sharing of risk on individual exploration projects. Where appropriate for a particular project, the Group will consider a joint venture with a suitable party in order to share the exploration risk. Those funds otherwise set aside for the project will be employed to advance another project. 24 PARENT COMPANY DISCLOSURE (a) Financial Position as at 30 June 2017
Australian Dollar ($) 30 JUNE 2017
$ 30 JUNE 2016
$
Assets Current assets 4,925,854 1,536,053 Non‐current assets 24,687 34,431
Total assets 4,950,541 1,570,484
Liabilities Current liabilities 2,252,009 1,117,557 Non‐current liabilities ‐ ‐
Total liabilities 2,252,009 1,117,557
Net assets 2,698,532 452,927
Equity Issued capital 24,142,945 18,277,128 Reserves 430,876 352,841 Accumulated losses (21,875,289) (18,177,042)
Total equity 2,698,532 452,927
(b) Financial Performance for the year ended 30 June 2017 Australian Dollar $ 30 JUNE 2017 30 JUNE 2016 $ $ Profit (loss) for the year (3,889,361) (6,162,547) Other comprehensive income ‐ ‐
Total comprehensive income (loss) (3,889,361) (6,162,547)
For
per
sona
l use
onl
y
NOTES TO THE FINANCIAL REPORT FOR THE YEAR ENDED 30 JUNE 2017
St George Mining Limited – Annual Report 2017 P 44
(c) Guarantees entered into by the Parent Entity The parent entity has not provided guarantees to third parties as at 30 June 2017. 25 NEW ACCOUNTING STANDARDS FOR APPLICATION IN FUTURE PERIODS Accounting Standards issued by the AASB that are not yet mandatorily applicable to the Group, together with an assessment of the potential impact of such pronouncements on the Group when adopted in future periods, are discussed below:
AASB 9: Financial Instruments and associated Amending Standards (applicable for annual reporting period commencing 1 January 2018)
The Standard will be applicable retrospectively (subject to the provisions on hedge accounting outlined below) and includes revised requirements for the classification and measurement of financial instruments, revised recognition and derecognition requirements for financial instruments and simplified requirements for hedge accounting.
The key changes that may affect the Group on initial application include certain simplifications to the classification of financial assets, simplifications to the accounting of embedded derivatives, upfront accounting for expected credit loss, and the irrevocable election to recognise gains and losses on investments in equity instruments that are not held for trading in other comprehensive income. AASB 9 also introduces a new model for hedge accounting that will allow greater flexibility in the ability to hedge risk, particularly with respect to hedges of non‐financial items. Should the entity elect to change its hedge policies in line with the new hedge accounting requirements of the Standard, the application of such accounting would be largely prospective.
Although the directors anticipate that the adoption of AASB 9 may have an impact on the Group’s financial instruments it is impractical at this stage to provide a reasonable estimate of such impact.
AASB 15: Revenue from Contracts with Customers (applicable to annual reporting periods commencing on or after 1 January 2018).
When effective, this Standard will replace the current accounting requirements applicable to revenue with a single, principles‐based model. Apart from a limited number of exceptions, including leases, the new revenue model in AASB 15 will apply to all contracts with customers as well as non‐monetary exchanges between entities in the same line of business to facilitate sales to customers and potential customers.
The core principle of the Standard is that an entity will recognise revenue to depict the transfer of promised goods or services to customers in an amount that reflects the consideration to which the entity expects to be entitled in exchange for the goods or services. To achieve this objective, AASB 15 provides the following five‐step process:
‐ identify the contract(s) with a customer; ‐ identify the performance obligations in the contract(s); ‐ determine the transaction price; ‐ allocate the transaction price to the performance obligations in the contract(s); and ‐ recognise revenue when (or as) the performance obligations are satisfied.
This Standard will require retrospective restatement, as well as enhanced disclosures regarding revenue.
Although the directors anticipate that the adoption of AASB 15 may have an impact on the Group's financial statements, it is impracticable at this stage to provide a reasonable estimate of such impact.
For
per
sona
l use
onl
y
NOTES TO THE FINANCIAL REPORT FOR THE YEAR ENDED 30 JUNE 2017
St George Mining Limited – Annual Report 2017 P 45
AASB 16: Leases (applicable to annual reporting periods commencing on or after 1 January 2019).
When effective, this Standard will replace the current accounting requirements applicable to leases in AASB117: Leases and related interpretations. AASB 16 introduces a single lessee accounting model thateliminates the requirement for leases to be classified as either operating leases or finance leases. Lessoraccounting remains similar to current practice.
The main changes introduced by the new Standard are as follows:
‐ recognition of the right‐to‐use asset and liability for all leases (excluding short term leases with less than 12 months of tenure and leases relating to low value assets);
‐ depreciating the right‐to‐use assets in line with AASB 116: Property, Plant and Equipment in profit or loss and unwinding of the liability in principal and interest components;
‐ inclusion of variable lease payments that depend on an index or a rate in the initial measurement of the lease liability using the index or rate at the commencement date;
‐ application of a practical expedient to permit a lessee to elect not to separate non‐lease components and instead account for all components as a lease; and
‐ additional disclosure requirements.
The transitional provisions of AASB 16 allow a lease to either retrospectively apply the Standard to comparatives in line with AASB 108 or recognise the cumulative effect of retrospective application as an adjustment to opening equity at the date of initial application.
Although the directors anticipate that the adoption of AASB 16 may have an impact on the Group's financial statements, it is impracticable at this stage to provide a reasonable estimate of such impact.
AASB 2014‐10: Amendments to Australian Accounting Standards – Sale or Contribution of Assets betweenan Investor and its Associate or Joint Venture (applicable to annual reporting periods commencing on orafter 1 January 2018).
This Standard amends AASB 10: Consolidated Financial Statements with regards to a parent losing controlover a subsidiary that is not a “business” as defined in AASB 3: Business Combinations to an associate orjoint venture and requires that:
‐ a gain or loss (including any amounts in other comprehensive income (OCI)) be recognised only to theextent of the unrelated investor’s interest in that associate or joint venture;
‐ the remaining gain or loss be eliminated against the carrying amount of the investment in that associate or joint venture; and
‐ any gain or loss from remeasuring the remaining investment in the former subsidiary at fair value also be recognised only to the extent of the unrelated investor’s interest in the associate or joint venture. The remaining gain or loss should be eliminated against the carrying amount of the remaining investment.
Although the directors anticipate that the adoption of AASB 2014‐10 may have an impact on the Group's financial statements, it is impracticable at this stage to provide a reasonable estimate of such impact.
For
per
sona
l use
onl
y
DIRECTOR’S DECLARATION
St George Mining Limited – Annual Report 2017 P 46
In the opinion of the Directors of St George Mining Limited (“the Company”)
(a) The financial statements and the notes and the additional disclosures included in the directors’ reportdesignated as audited of the Group are in accordance with the Corporations Act 2001, including:
(i) Giving a true and fair view of the Group’s financial position as at 30 June 2017 and of itsperformance for the year ended that date; and
(ii) Complying with Accounting Standards and Corporations Regulations 2001, and:
(b) There are reasonable grounds to believe that the Company will be able to pay its debts as and whenthey become due and payable.
(c) The financial statements and notes comply with International Financial Reporting Standards as disclosedin note 2.
This declaration has been made after receiving the declarations required to be made to the directors in accordance with section 295A of the Corporations Act 2001 for the financial year ended 30 June 2017.
Signed in accordance with a resolution of the Directors made pursuant to section 295(5) of the Corporations Act 2001.
On behalf of the Board
John Prineas Executive Chairman
Dated: 20 September 2017 Perth, Western Australia
For
per
sona
l use
onl
y
P 47
For
per
sona
l use
onl
y
P 48
For
per
sona
l use
onl
y
P 49
For
per
sona
l use
onl
y
P 50
For
per
sona
l use
onl
y
P 51
For
per
sona
l use
onl
y
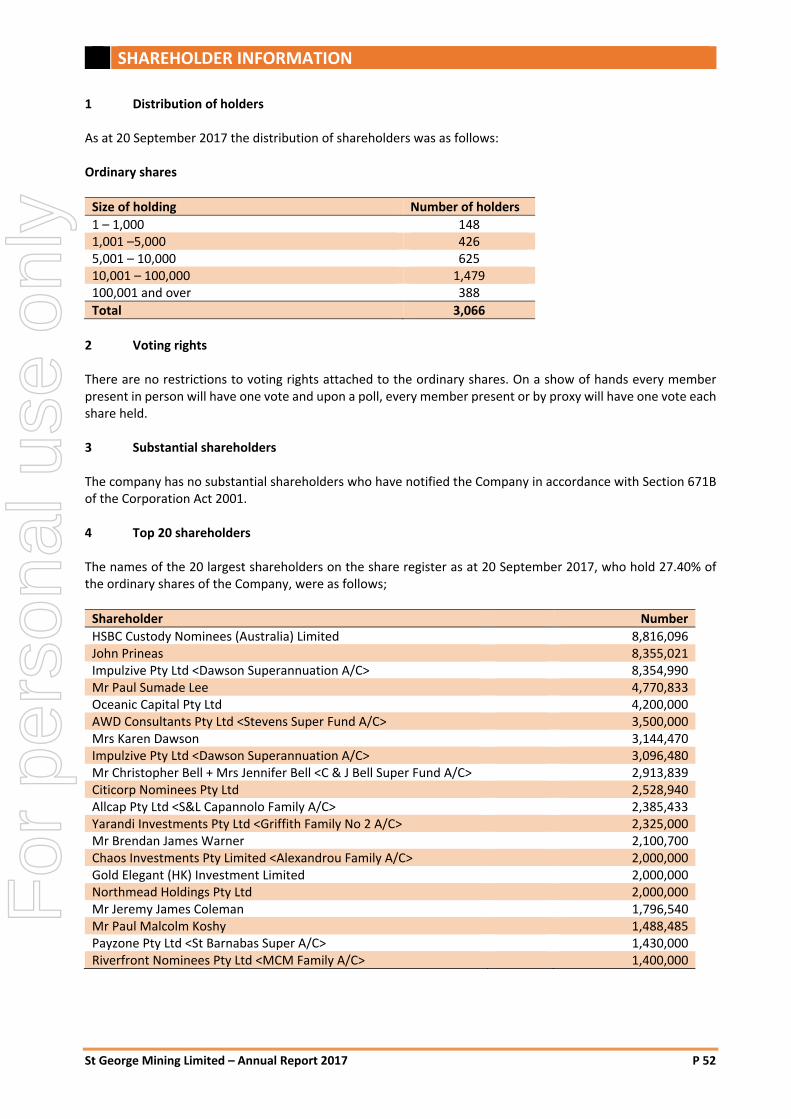
SHAREHOLDER INFORMATION
St George Mining Limited – Annual Report 2017 P 52
1 Distribution of holders
As at 20 September 2017 the distribution of shareholders was as follows:
Ordinary shares
Size of holding Number of holders
1 – 1,000 148 1,001 –5,000 426 5,001 – 10,000 625 10,001 – 100,000 1,479 100,001 and over 388
Total 3,066
2 Voting rights
There are no restrictions to voting rights attached to the ordinary shares. On a show of hands every member present in person will have one vote and upon a poll, every member present or by proxy will have one vote each share held.
3 Substantial shareholders
The company has no substantial shareholders who have notified the Company in accordance with Section 671B of the Corporation Act 2001.
4 Top 20 shareholders
The names of the 20 largest shareholders on the share register as at 20 September 2017, who hold 27.40% of the ordinary shares of the Company, were as follows;
Shareholder Number
HSBC Custody Nominees (Australia) Limited 8,816,096 John Prineas 8,355,021 Impulzive Pty Ltd <Dawson Superannuation A/C> 8,354,990 Mr Paul Sumade Lee 4,770,833 Oceanic Capital Pty Ltd 4,200,000 AWD Consultants Pty Ltd <Stevens Super Fund A/C> 3,500,000 Mrs Karen Dawson 3,144,470 Impulzive Pty Ltd <Dawson Superannuation A/C> 3,096,480 Mr Christopher Bell + Mrs Jennifer Bell <C & J Bell Super Fund A/C> 2,913,839 Citicorp Nominees Pty Ltd 2,528,940 Allcap Pty Ltd <S&L Capannolo Family A/C> 2,385,433 Yarandi Investments Pty Ltd <Griffith Family No 2 A/C> 2,325,000 Mr Brendan James Warner 2,100,700 Chaos Investments Pty Limited <Alexandrou Family A/C> 2,000,000 Gold Elegant (HK) Investment Limited 2,000,000 Northmead Holdings Pty Ltd 2,000,000 Mr Jeremy James Coleman 1,796,540 Mr Paul Malcolm Koshy 1,488,485 Payzone Pty Ltd <St Barnabas Super A/C> 1,430,000 Riverfront Nominees Pty Ltd <MCM Family A/C> 1,400,000
For
per
sona
l use
onl
y

SHAREHOLDER INFORMATION
St George Mining Limited – Annual Report 2017 P 53
5 Consistency with business objectives The Company has used its cash and assets in a form readily convertible to cash that it had at the time of listing in a way the consistent with its stated objectives.
For
per
sona
l use
onl
y
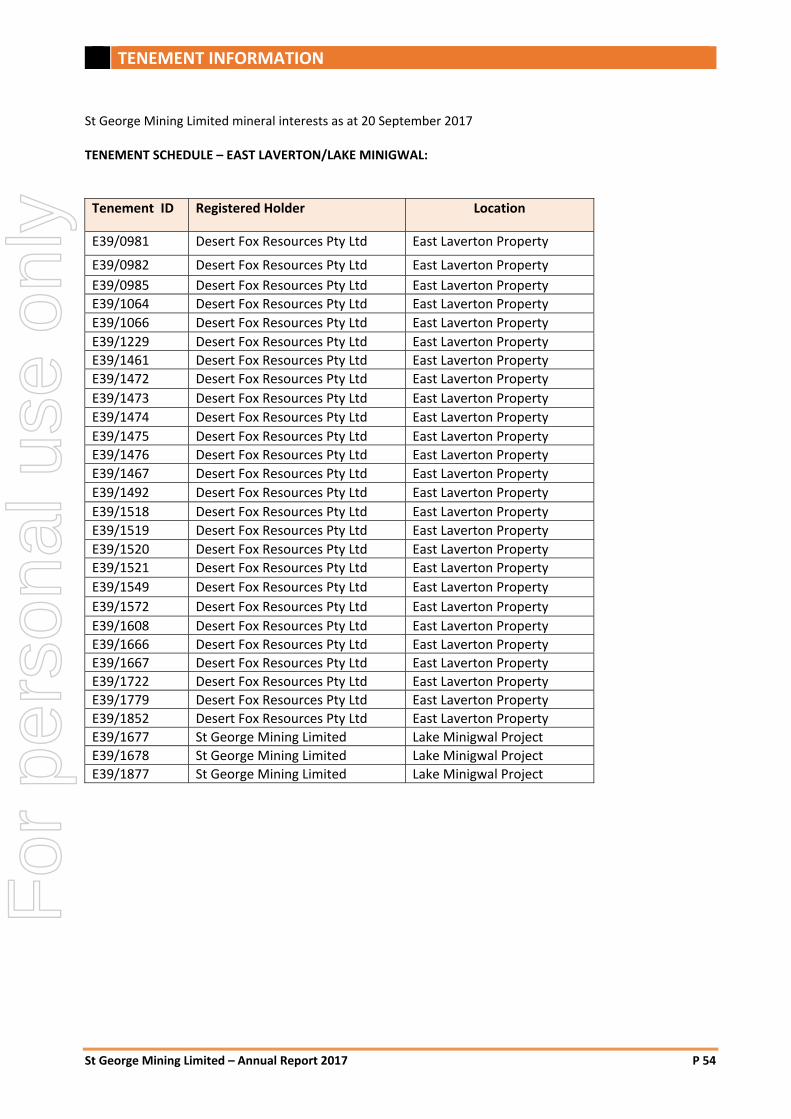
TENEMENT INFORMATION
St George Mining Limited – Annual Report 2017 P 54
St George Mining Limited mineral interests as at 20 September 2017
TENEMENT SCHEDULE – EAST LAVERTON/LAKE MINIGWAL:
Tenement ID Registered Holder Location
E39/0981 Desert Fox Resources Pty Ltd East Laverton Property
E39/0982 Desert Fox Resources Pty Ltd East Laverton Property
E39/0985 Desert Fox Resources Pty Ltd East Laverton Property
E39/1064 Desert Fox Resources Pty Ltd East Laverton Property
E39/1066 Desert Fox Resources Pty Ltd East Laverton Property
E39/1229 Desert Fox Resources Pty Ltd East Laverton Property
E39/1461 Desert Fox Resources Pty Ltd East Laverton Property
E39/1472 Desert Fox Resources Pty Ltd East Laverton Property
E39/1473 Desert Fox Resources Pty Ltd East Laverton Property
E39/1474 Desert Fox Resources Pty Ltd East Laverton Property
E39/1475 Desert Fox Resources Pty Ltd East Laverton Property
E39/1476 Desert Fox Resources Pty Ltd East Laverton Property
E39/1467 Desert Fox Resources Pty Ltd East Laverton Property
E39/1492 Desert Fox Resources Pty Ltd East Laverton Property
E39/1518 Desert Fox Resources Pty Ltd East Laverton Property
E39/1519 Desert Fox Resources Pty Ltd East Laverton Property
E39/1520 Desert Fox Resources Pty Ltd East Laverton Property
E39/1521 Desert Fox Resources Pty Ltd East Laverton Property
E39/1549 Desert Fox Resources Pty Ltd East Laverton Property
E39/1572 Desert Fox Resources Pty Ltd East Laverton Property
E39/1608 Desert Fox Resources Pty Ltd East Laverton Property
E39/1666 Desert Fox Resources Pty Ltd East Laverton Property
E39/1667 Desert Fox Resources Pty Ltd East Laverton Property
E39/1722 Desert Fox Resources Pty Ltd East Laverton Property
E39/1779 Desert Fox Resources Pty Ltd East Laverton Property
E39/1852 Desert Fox Resources Pty Ltd East Laverton Property
E39/1677 St George Mining Limited Lake Minigwal Project
E39/1678 St George Mining Limited Lake Minigwal Project
E39/1877 St George Mining Limited Lake Minigwal Project
For
per
sona
l use
onl
y
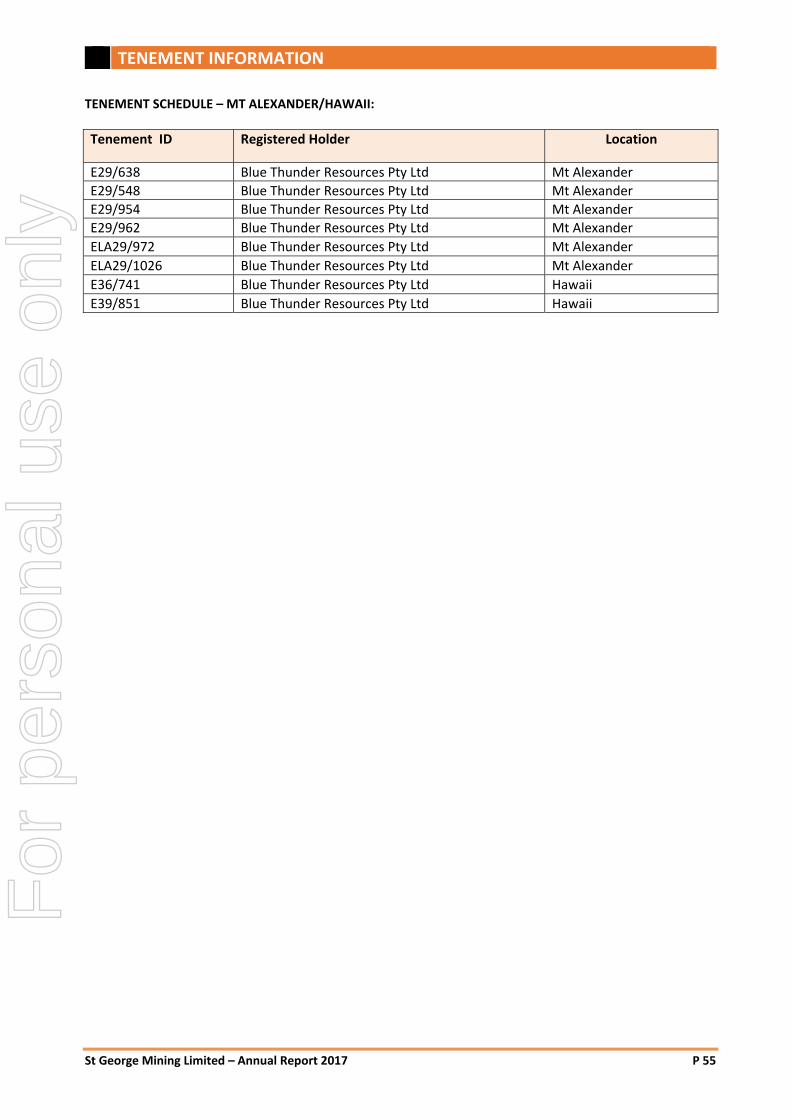
TENEMENT INFORMATION
St George Mining Limited – Annual Report 2017 P 55
TENEMENT SCHEDULE – MT ALEXANDER/HAWAII:
Tenement ID Registered Holder Location
E29/638 Blue Thunder Resources Pty Ltd Mt Alexander
E29/548 Blue Thunder Resources Pty Ltd Mt Alexander E29/954 Blue Thunder Resources Pty Ltd Mt Alexander E29/962 Blue Thunder Resources Pty Ltd Mt Alexander ELA29/972 Blue Thunder Resources Pty Ltd Mt Alexander
ELA29/1026 Blue Thunder Resources Pty Ltd Mt Alexander
E36/741 Blue Thunder Resources Pty Ltd Hawaii E39/851 Blue Thunder Resources Pty Ltd Hawaii
For
per
sona
l use
onl
y

St George Mining Limited ACN 139 308 973 Level 1, 115 Cambridge Street, PO Box 1305, West Leederville WA 6007 www.stgeorgemining.com.au P 08 9322 6600 F 08 9322 6610
ATE DIRECTORY/CONTENTS PAGE
For
per
sona
l use
onl
y