Embed Size (px)
Citation preview
AN
NU
AL R
EPORT 2017
Arcus ASA
Destilleriveien 11Postbox 64
NO-1483 Hagan
Tel. (+47) 67 06 50 [email protected]
www.arcus.no
Facebook:ArcusGruppen

2 ANNUAL REPORT 2017 Arcus ASAContents In brief Group CEO The Company Corporate Social Responsibility Directors’ Report Financial Statements and Notes Contact 2/123Corporate Governance

3 ANNUAL REPORT 2017 Arcus ASAIN BRIEF | Business Structure
IN BRIEF Business Structure 3A Leading Nordic Brand Company 4Key Figures 2017 5Strategy and Key Information 6Group CEO 8
THE COMPANYThe Company in Brief 9Spirits 11 Wine 16Group Supply Chain 21 Distribution 22Organisation 24Group Management 27
CORPORATE SOCIAL RESPONSIBILITY 28
CORPORATE GOVERNANCE 38
DIRECTORS’ REPORT 42
FINANCIAL STATEMENTS & NOTESContents 48 Consolidated Financial Statements with Notes 49 Parent Company Financial Statements with Notes 111 Auditor's Report 121
CONTENTSBUSINESS STRUCTURE
IR and Media Contact Group Director Communications and IR Per Bjørkum [email protected] Tel. (+47) 922 55 777
Concept, design and production: oktanoslo.no
Arcus ASA
Arcus-Gruppen AS
Finance, IT, HR, Communication
Business AreaWine
Sweden:Vingruppen i Norden AB
Norway:Vingruppen AS
Finland:Vingruppen Finland Oy
Business AreaSpirits
Subsidiaries:NO, SWE, FI, DK, DE
Third-party distribution:DE, US and others
Tiffon (Cognac):34.75% owner share
Group Supply Chain
Norway:Gjelleråsen
Business AreaDistribution
Norway:Vectura AS
IN BRIEF
Business Structure
A Leading Nordic Brand Company
Key Figures 2017
Strategy and Key Information
Group CEO
Contents In brief Group CEO The Company Corporate Social Responsibility Directors’ Report Financial Statements and Notes Contact 3/123Corporate Governance

4 ANNUAL REPORT 2017 Arcus ASAIN BRIEF | A Leading Nordic Brand Company
A LEADING NORDIC BRAND COMPANY SALES REVENUE BY BUSINESS AREA IN 2017
SOLID POSITIONS IN THE NORDIC REGION AND GERMANY
SALES REVENUE BY COUNTRY IN 2017
THE BEST OF NORDIC SPIRITS TO THE WORLD AND THE WORLD’S BEST WINES TO THE NORDICS
#8 Spirits
#3 Wine
#1 Wine
#1 Spirits
#2 Spirits
#4 Spirits
#2 Wine
#1 Aquavit
10 %
30 %
60 %
■ Wine
■ Spirits
■ Distribution (Vectura)
4 %2 %
6 %
9 %
40 %
39 %
■ Norway
■ Sweden
■ Finland
■ Denmark
■ Germany
■ Tax-free
■ Other countries
IN BRIEF
Business Structure
A Leading Nordic Brand Company
Key Figures 2017
Strategy and Key Information
Group CEO
Contents In brief Group CEO The Company Corporate Social Responsibility Directors’ Report Financial Statements and Notes Contact 4/123Corporate Governance

5 ANNUAL REPORT 2017 Arcus ASAIN BRIEF | Key Figures 2017
KEY FIGURES 2017
GROWTH 2006–2017
2,575OPERATING REVENUES
NOK million
361EBITDA adjusted for non-
recurring items NOK million
426NUMBER OFEMPLOYEES
Arcus ASA Group 2017 2016 2015 2014 2013Operating revenues NOK million 2,575.1 2,582.5 2,470.9 2,332.4 2,268.2 Of which operating revenues outside Norway NOK million 1,554.4 1,567.7 1,479.5 1,288.5 1,255.9 EBITDA NOK million 347.6 290.5 257.8 272.1 259.0 EBITDA adjusted for non-recurring items NOK million 360.7 335.3 274.4 266.3 268.0 EBITDA margin adjusted for non-recurring items (%) 14.0 % 13.0 % 11.1 % 11.4 % 11.8 %Number of FTEs, 31.12 Persons 426 409 422 448 441
■ EBITDA adjusted for non-recurring items ■ Operating revenues
0
50
100
150
200
250
300
350
400
2017201620152014201320122011201020092008200720060
500
1000
1500
2000
2500
3000
MNOK MNOK
68
109121 128
170198 210
268 266 274
335
965
1,220 1,309
1,5051,632
1,7891,957
2,268 2,332 2,4712,583
361
2,575
IN BRIEF
Business Structure
A Leading Nordic Brand Company
Key Figures 2017
Strategy and Key Information
Group CEO
Contents In brief Group CEO The Company Corporate Social Responsibility Directors’ Report Financial Statements and Notes Contact 5/123Corporate Governance
6 ANNUAL REPORT 2017 Arcus ASAIN BRIEF | Strategy and Key Information
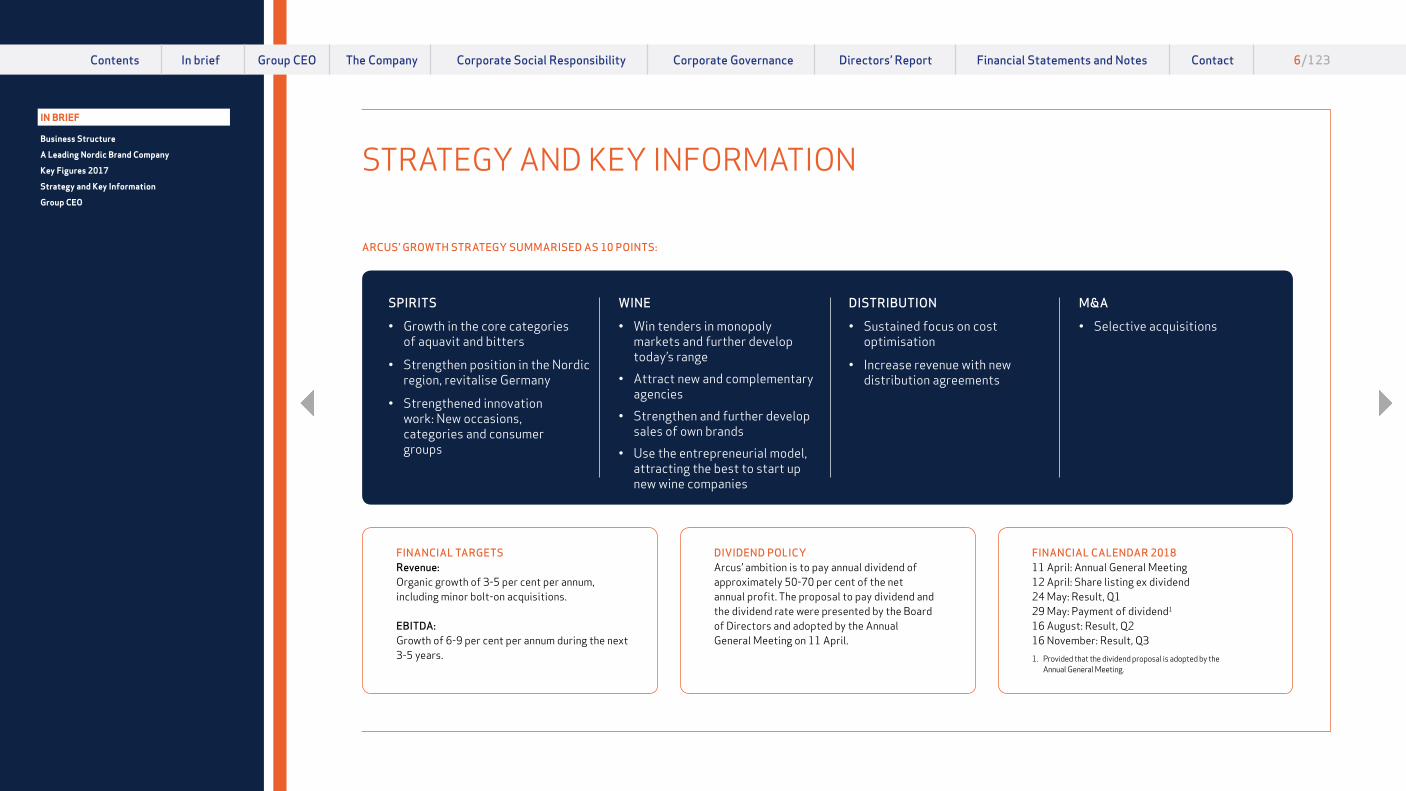
DIVIDEND POLICYArcus’ ambition is to pay annual dividend of approximately 50-70 per cent of the net annual profit. The proposal to pay dividend and the dividend rate were presented by the Board of Directors and adopted by the Annual General Meeting on 11 April.
FINANCIAL TARGETSRevenue: Organic growth of 3-5 per cent per annum, including minor bolt-on acquisitions.
EBITDA: Growth of 6-9 per cent per annum during the next 3-5 years.
FINANCIAL CALENDAR 201811 April: Annual General Meeting12 April: Share listing ex dividend 24 May: Result, Q129 May: Payment of dividend1
16 August: Result, Q216 November: Result, Q3
1. Provided that the dividend proposal is adopted by the Annual General Meeting.
SPIRITS
• Growth in the core categories of aquavit and bitters
• Strengthen position in the Nordic region, revitalise Germany
• Strengthened innovation work: New occasions, categories and consumer groups
WINE
• Win tenders in monopoly markets and further develop today’s range
• Attract new and complementary agencies
• Strengthen and further develop sales of own brands
• Use the entrepreneurial model, attracting the best to start up new wine companies
DISTRIBUTION
• Sustained focus on cost optimisation
• Increase revenue with new distribution agreements
M&A
• Selective acquisitions
STRATEGY AND KEY INFORMATION
ARCUS’ GROWTH STRATEGY SUMMARISED AS 10 POINTS:
IN BRIEF
Business Structure
A Leading Nordic Brand Company
Key Figures 2017
Strategy and Key Information
Group CEO
Contents In brief Group CEO The Company Corporate Social Responsibility Directors’ Report Financial Statements and Notes Contact 6/123Corporate Governance

7 ANNUAL REPORT 2017 Arcus ASAIN BRIEF | Strategy and Key Information
LIST OF SHAREHOLDERS AS OF 31 DECEMBER 2017Arcus ASA has issued 68,023,255 shares, distributed to 2,622 shareholders.
Shareholder Number of shares
Ownership interest
1 Canica AS 22,670,000 33.3%2 Geveran Trading Co Ltd 6,750,000 9.9%3 Verdipapirfondet DNB Norge (IV) 3,577,915 5.3%4 Hoff SA 3,297,000 4.8 %5 Sundt AS 3,234,957 4.8 %6 Folketrygdfondet 1,800,000 2.6 %7 Danske Invest Norske Instit. (II) 1,725,100 2.5 %8 KLP Aksjenorge 1,266,494 1.9 %9 Verdipapirfondet DNB Norden (III) 1,222,178 1.8 %
10 Centra Invest AS 1,169,846 1.7 %11 Ilmarinen Mutual Pens Ins Comp 1,000,000 1.5 %12 Holta Invest AS 1,000,000 1.5 %13 Verdipapirfondet DNB Norge Selektiv 936,616 1.4 %14 Goldman Sachs International 900,000 1.3 %15 Skandinaviska Enskilda Banken AB 862,000 1.3 %16 Danske Invest Norske Aksjer Inst 855,400 1.3 %17 Landkreditt Utbytte 850,000 1.2 %18 Kommunal Landspensjonskasse 809,707 1.2 %19 Skandinaviska Enskilda Banken AB 795,113 1.2 %20 Citibank Europe Plc 794,127 1.2 %
YIELD INCLUDING DIVIDEND FROM ARCUS’ STOCK-EXCHANGE LISTING ON 1 DEC. 2016
ArcusOslo Stock Exchange
Consumer IndexOslo Stock Exchange
Main Index01.12.2016–29.12.2017 11.6% 6.1% 22.9%
Source: Oslo Stock Exchange
2016 DIVIDEND PAID 2017NOK 1.47 per share.
GEOGRAPHICAL DISTRIBUTION OF SHAREHOLDERS AS OF 31 DECEMBER 2017
3.7 %
2.9 %
2.9 %2.1 %
1.1 %1.0 %
1.2 %
9.9 %
75.1 %
■ Norway
■ Cyprus
■ Luxembourg
■ Sweden
■ Great Britain
■ Finland
■ Denmark
■ Other countries
NEWS AND STOCK-EXCHANGE ANNOUNCEMENTSYou can subscribe for stock-exchange announcements and quarterly reports from Arcus via this link: https://www.arcus.no/en/subscribe Remember to click on “Information type” on the right-hand side.
IN BRIEF
Business Structure
A Leading Nordic Brand Company
Key Figures 2017
Strategy and Key Information
Group CEO
Contents In brief Group CEO The Company Corporate Social Responsibility Directors’ Report Financial Statements and Notes Contact 7/123Corporate Governance
8 ANNUAL REPORT 2017 Arcus ASAIN BRIEF | Group CEO
KENNETH HAMNES Group CEO
MY RECOMMENDATIONSOPLAND EDEL MADEIRAThe world's best aquavit naturally comes from Arcus. It's called Opland Edel Madeira. Perfect for every thing, all year! Now with new design and new attractive bottles.
NERVI GATTINARAIt’s nearly impossible to pick a favourite wine, as we have so many fantastic products. But I have a weakness for Nervi's lovely wines, and it’s interesting that the successful vineyard in Piemonte is owned by Norwegians.
LA PARRAMy seafood favourite is our own La Parra, which can be enjoyed from a bottle or bag- in-box. It’s fresh and balanced, at a very good price. Lots of good taste for your money!
Kenneth HamnesGroup CEO
2017:RECORD RESULT
FOR ARCUSArcus achieved its best result ever in 2017. Operating profit
(adjusted EBITDA) was NOK 361 million, an increase of 8 per cent from 2016. Revenue was NOK 2,575 million, compared to
NOK 2,582 million last year.
The growth plans for 2018 are in place. Activities in countries without monopolies will be strengthened. Early in the year, Gammel Opland, Norway’s most popular aquavit, will be relaunched with a new bottle and design, aimed to strengthen sales in Norway and abroad. Our wine portfolio is continuously being renewed, to meet current and future trends.
The basis for this development is continuous improvement. Nonetheless, revenue is under pressure from increasing foreign travel and strong growth in border trade. Negative exchange rate development has also proved to be challenging, but overall the result is very satisfactory.
Based on the Group’s financial results, Arcus’ Board of Directors recommends a dividend of NOK 1.66 per share, an increase of 13 per cent from the previous year. The dividend rate will be approved by the annual general meeting on 11 April 2018.
High innovation rate and continued good operations contributed to the good result. In addition, Vectura, the logistics and distribution company, is now profitable and has won market shares.
IN BRIEF
Business Structure
A Leading Nordic Brand Company
Key Figures 2017
Strategy and Key Information
Group CEO
Contents In brief Group CEO The Company Corporate Social Responsibility Directors’ Report Financial Statements and Notes Contact 8/123Corporate Governance

9 ANNUAL REPORT 2017 Arcus ASATHE COMPANY | The Company in Brief
handles all distribution operations in Norway. In other countries, this function is handled by external partners.
Vectura offers logistics services for produ-cers, agents and importers of wine, spirits, beer and other beverages, delivering their goods to Vinmonopolet’s shops, as well as to hotels, restaurants and cafés throughout Norway. AGENCIES, PRODUCTION AND BRANDSArcus is the world’s largest producer of aquavit
Arcus ASA owns the brand company Arcus-Gruppen AS and the distribution company Vectura AS. The Group’s operational activities are run via the Spirits, Wine and Distribution business segments. Group Supply Chain (GSC) is reported as part of the Spirits business segments.
The Spirits and Wine business areas handle product development, imports, sales and marketing within their respective product categories. GSC is responsible for purchasing, production, storage and bottling. Vectura
and one of the major players for production and sale of spirits in the Nordic region. The company has an extensive brand portfolio and a modern, efficient production facility at Gjelleråsen outside Oslo. The well-known Norwegian aquavit brands are produced here, and also the traditional Danish spirits, such as Aalborg Akvavit and Gammel Dansk. Considerable volumes of vodka are also bottled, including Vikingfjord and the popular Dworek vodka, which Arcus took over in 2016. As from 2018, the vodka shot Hot n’Sweet is also bottled here, after the acquisition on 31 December 2017. Arcus owns 34.75 per cent of the French cognac house, Tiffon, the producer of Braastad Cognac. Arcus has the sole rights to sell Braastad in the Nordic region. In addition, Arcus has significant sales of its own brands, blended and bottled according to local consumer preferences.
Arcus is the largest importer of wine in Norway, the second largest in Sweden and the third largest in Finland. The Group’s wine-related operations cover a wide range of agencies, representing all categories in all the important wine producing countries. In addition, Arcus has significant sales of its own brands, produced according to tailor-made specifications for each market. These products are imported in bulk and bottled at Gjelleråsen.
HISTORYArcus, including Vectura, was established as a state-owned enterprise on 1 January 1996. As part of Norway’s adaptation to the EEA rules, the operations of Vinmonopolet AS were split. Sales to Norwegian consumers remained the responsibility of the state monopoly, while the
Arcus is one of the Nordic region's largest brand companies within wine and spirits. Sweden, Denmark, Norway, Finland and Germany constitute
the home market. Vectura is Norway's leading logistics business for alcoholic beverages.
The Company in Brief
THE COMPANY
The Company in Brief
Spirits
Wine
Group Supply Chain
Distribution
Organisation
Group Management
Contents In brief Group CEO The Company Corporate Social Responsibility Directors’ Report Financial Statements and Notes Contact 9/123Corporate Governance

10 ANNUAL REPORT 2017 Arcus ASA
newly established commercial enterprise took over the activities related to imports, production, distribution and exports. The traditional distilleries and recipes, and the rights to the extensive brand portfolio with an emphasis on aquavit, were also included in the commercial enterprise. The company was partly privatised in 2001 and fully privatised in 2003. As from 2005, the investment company Ratos was the largest owner, with an interest of 83.4 per cent, and Hoff was the next largest owner with an interest of 9.9 per cent. On 1 December 2016, Arcus ASA was listed on the Oslo Stock Exchange, and by year-end had 2,622 shareholders.
THE NORDIC ALCOHOL MARKETThe Nordic alcohol market is complex, with significant variations in each market. The structure, regulatory regimes, advertising opportunities and pricing mechanisms differ greatly from country to country. Vinmonopolet in Norway, Systembolaget in Sweden and Alko in Finland all have a monopoly on consumer sales. The monopolies are the consequence of health policy considerations designed to regulate and restrict access to alcohol by means of availability, pricing and responsible trading practices. Apart from the monopoly outlets, importers and producers can sell directly to hotels, restaurants and cafés, usually referred to as the HORECA market, as well as to tax-free outlets. Around 90 per cent of the respective domestic volume is sold via mono-polies in countries with a monopoly structure.
The remaining approximately 10 per cent is sales to hotels, cafés and restaurants.
SALES THROUGH MONOPOLIESArcus' companies in Norway, Sweden and Finland each have years of experience from interacting with the retail monopolies in their respective countries, and are highly knowledgeable about how the monopolies
work. This creates an important competitive advantage.
Sales to the monopolies consist of popular, listed products. In many cases, the monopolies add new products by obtaining bids from several suppliers, where they specify the price level and characteristics in detail. Finally, blind taste tests are run by the monopoly to deter-mine which bids to accept.
Based on their own assessments of market potential, wine and spirits companies may also introduce products through the catalogues of the monopolies. The sales figures then deter-mine whether a product may be added to the inventory of the monopolies’ stores, and in how many stores, dependent on each individual store’s size and customer base. The wine and spirits companies indirectly set the price to the consumers.
The suppliers’ wine and spirits knowledge, as well as their insight into the taste preferences of the target customers, are crucial, both in relation to invitations to tender and self-initiated product launches. Arcus' size, its longstanding experience and the systematically accumulated knowledge, have proved highly valuable.
CROSS-BORDER SHOPPING AND TAX-FREEThe cross-border retail trade is a factor influencing all the Nordic markets, particularly Norway, Sweden and Finland, where taxation policies lead to significantly higher prices than in their respective neighbouring countries such as Sweden, Germany/Denmark and Estonia.
The volume of tax-free sales is also substantial in the Nordic countries. The tax-free retailers primarily purchase their goods directly from the producer. They are therefore an important customer group for the Spirits business area, while the wine companies have limited sales to this customer segment.
THE COMPANY | The Company in Brief
Rosé wine in a pouch, in 1.5-litre packaging, soon became a success in the spring and summer of 2017. Easy to take with you, in eco-friendly packaging – and a great taste!
THE COMPANY
The Company in Brief
Spirits
Wine
Group Supply Chain
Distribution
Organisation
Group Management
Contents In brief Group CEO The Company Corporate Social Responsibility Directors’ Report Financial Statements and Notes Contact 10/123Corporate Governance

11 ANNUAL REPORT 2017 Arcus ASATHE COMPANY | Spirits
Business Segment
SPIRITS
permitted. Spirits advertising is not permitted in Sweden and Finland, although some advertising of alcohol with a lower alcohol content is permitted.
Arcus has an important competitive advan-tage over its international competitors, due to the distinctive market situation in the countries with state-run alcohol monopolies. Arcus has local sales companies that have many years’ experience from selling to the retail monopolies in their respective countries, and detailed knowledge of how these monopolies work.
GERMANYIn Germany, which together with the Nordic countries constitutes Arcus' domestic market, there are no restrictions on the sale of spirits. For Arcus, aquavit is the largest export category, and both German, Norwegian and Danish brands are well-represented. Malteser Aquavit is a German aquavit from Berlin with a long
The primary focus of the Spirits business segment is to develop and market spirits brands, primarily Nordic spirits. The business segment has its own brands within all important spirits categories, as well as extensive agency operations for foreign products.
The operations of the Spirits business segment include product development, marketing and sales.
THE NORDIC MARKETSNorway, Sweden and Finland are characterised by the three major state-owned retail monopolies, Vinmonopolet, Systembolaget and Alko, respectively.
In Denmark, spirits sales are unrestricted and spirits are primarily sold to consumers via supermarket chains. Sales are subject to highly competitive pricing, and participation in cam-paigns run by the chains is essential to promote sales. In Denmark, all alcohol advertising is
Arcus is the world’s largest producer of aquavit and a leading player in the Nordic spirits market. Aquavit is the largest category, but we also
sell a lot of proprietary vodka and bitters, and other spirits.
Arcus’ expertise from working with the alcohol monopolies is an important competi-tive advantage.
THE COMPANY
The Company in Brief
Spirits
Wine
Group Supply Chain
Distribution
Organisation
Group Management
Contents In brief Group CEO The Company Corporate Social Responsibility Directors’ Report Financial Statements and Notes Contact 11/123Corporate Governance

12 ANNUAL REPORT 2017 Arcus ASATHE COMPANY | Spirits
tradition in the German market. LINIE Aquavit and Aalborg Jubilæum are also popular. Sales and marketing in Germany take place via a local importer, supported by Arcus’ own staff.
TAX-FREETax-free retailers mainly purchase their goods directly from the producer. Due to its significant portfolio of own products and popular brands, the Spirits business segment is a significant supplier in the Nordic region. The most important catego-ries are Norwegian and Danish aquavit, although cognac and vodka also hold a strong position.
BRANDS AND AGENCY BRANDSThe largest proportion of brands produced in-house are Norwegian, Danish and German aquavits, although considerable volumes of such categories as vodka, bitters and gin are also produced. In addition, Arcus offers its own brands of whisky and grape spirits, based on imported spirits, bottled at the Gjelleråsen facility. The company owns a 34.75 per cent stake in the French cognac house, Tiffon SA, the producer of Braastad Cognac. Arcus has the sole rights to sell Braastad Cognac in the Nordic region.
Arcus manages agencies for producers in several countries, the largest of which are the USA, the UK and France. When competing for the most attractive agencies, the Spirits business segment's expertise, consumer insight and close cooperation with the Swedish, Norwegian and Finnish alcohol monopolies are important competitive advantages.
Another advantage is the fact that Arcus is one of only a few players in the industry who are able to operate through-
BUSINESS AREA SPIRITS 2017 2016 2015 2014 2013
Total operating revenue (NOK million) 913.3 904.0 855.0 903.2 887.5
EBITDA (NOK million) 175.6 158.7 112.2 154.3 163.8
EBITDA adjusted for non-recurring items (NOK million) 182.8 162.6 113.0 142.0 166.3
EBITDA margin adjusted for non-recurring items 20.0 % 18.0 % 13.2 % 15.7 % 18.7 %
External sales revenue by country
External sales revenue by category
■ Aquavit
■ Bitter
■ Other
49 %
10 %
41 %
NOK million767.6
■ Norway
■ Sweden
■ Finland
■ Denmark
■ Germany
■ Tax-free
■ Other countries
40 %
16 %4 %
19 %
8 %
12 %1 %
NOK million767.6
THE COMPANY
The Company in Brief
Spirits
Wine
Group Supply Chain
Distribution
Organisation
Group Management
Contents In brief Group CEO The Company Corporate Social Responsibility Directors’ Report Financial Statements and Notes Contact 12/123Corporate Governance
13 ANNUAL REPORT 2017 Arcus ASATHE COMPANY | Spirits
out the Nordic region. Even though the Nordic countries individually represent small markets for major international suppliers, the Nordic region in total generates a large customer base.
ACQUISTIONSArcus shall grow through organic growth, as well as small bolt-on acquisitions. Three acquisitions took place in 2017.
In January 2017, Arcus acquired the remaining 50 per cent of the Danish sales company, Det Danske Spiritus Kompagni. This ensures that Arcus can use this important sales organisation in full, and in accordance with its own business plan.
In August 2017, Arcus took over the Norwegian company, Bevco, a niche producer best known for its Dooley’s Toffee Liqueur.
In the autumn of 2017, Arcus acquired the Hot n’Sweet brand, a very popular vodka shot. Hot n’Sweet has been sold in Denmark since 1992. There is potential for additional sales of this popular product, not only in Denmark, but
also in Norway and Sweden. Production of Hot n’Sweet has been transferred to Arcus’ facility.
In the autumn of 2017, Arcus also took over the Swedish low-price brands Vanlig Vodka and Vanlig Gin. This gives Arcus a stronger footing in the important Swedish market, and the market share is increasing. Production of both vodka and gin have been moved to Arcus’ production facility.
PREFERENCES AND TRENDSFor several years now, there has been an inter-national trend for growth in the premium segment for the most important spirits categories, with increasing interest in specialised whiskey and exclusive aquavits, for example. In parallel, a growth in the low price segment indicates a degree of polarisation in the market.
Vodka is the best-selling category in the western world, and the Nordic region is no exception. There is a key trend for whisky to gain market shares over time, while cognac and grape spirits are losing ground, despite fluctua-tions from year to year and between markets. The bitters category is relatively stable. The aquavit category grew particularly in Norway. Low alcohol products are also gaining ground.
Small niche manufacturers of spirits are found in all the Nordic countries, producing primarily gin, aquavit and whisky. The number of micro distilleries is increasing, showing how the local production of spirits is following the same trend as microbreweries and a growing interest for local food traditions. Arcus is capitalising on this trend through its broad selection of regional aquavits and other locally-distilled spirits. With the small-scale craft beer operations at Atlungstad Brenneri in Stange, Norway, and the Snälleröds brewery in Ljungbyhed in Skåne, Sweden, Arcus has created excellent conditions for enhancing its position in the craft spirits market.
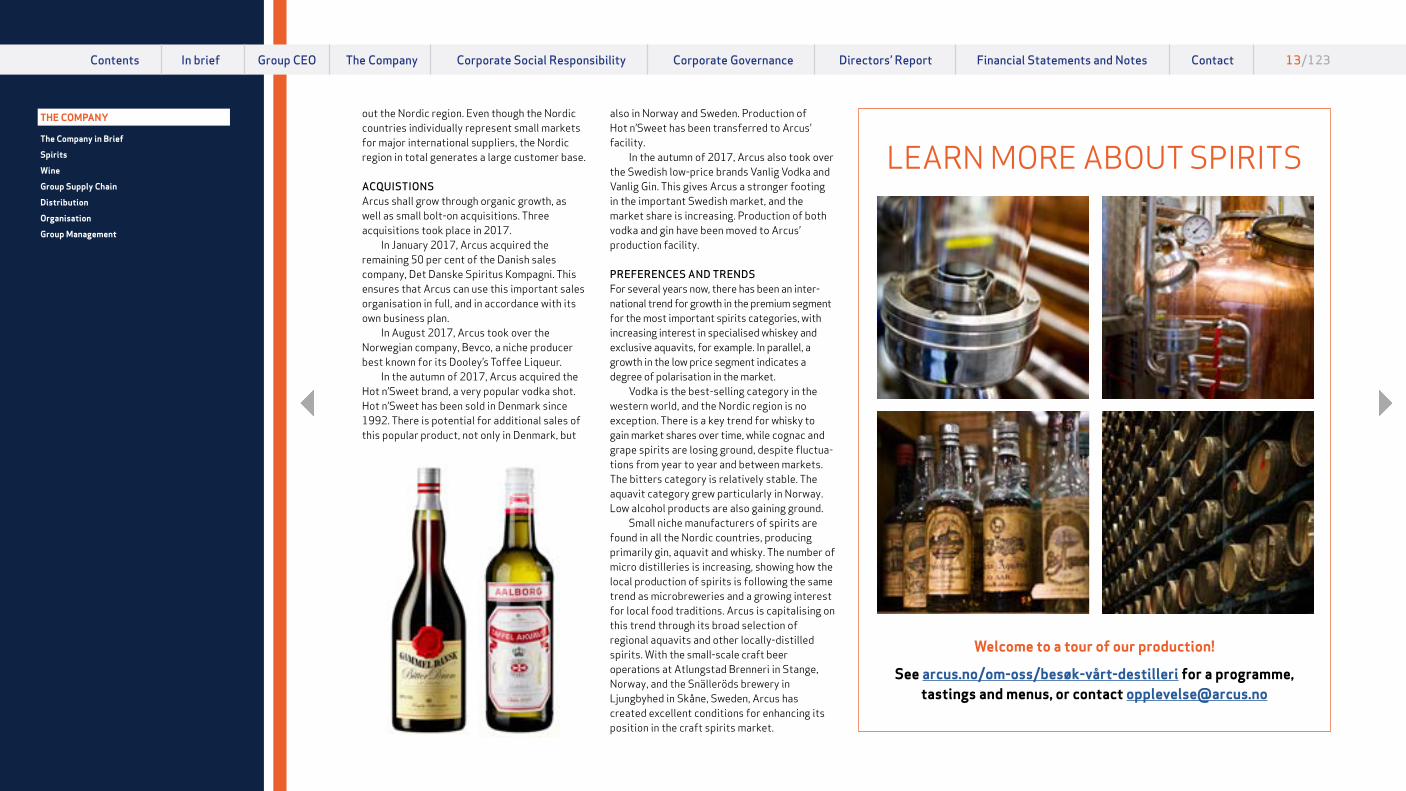
See arcus.no/om-oss/besøk-vårt-destilleri for a programme, tastings and menus, or contact [email protected]
Welcome to a tour of our production!
LEARN MORE ABOUT SPIRITSTHE COMPANY
The Company in Brief
Spirits
Wine
Group Supply Chain
Distribution
Organisation
Group Management
Contents In brief Group CEO The Company Corporate Social Responsibility Directors’ Report Financial Statements and Notes Contact 13/123Corporate Governance
14 ANNUAL REPORT 2017 Arcus ASATHE COMPANY | Spirits
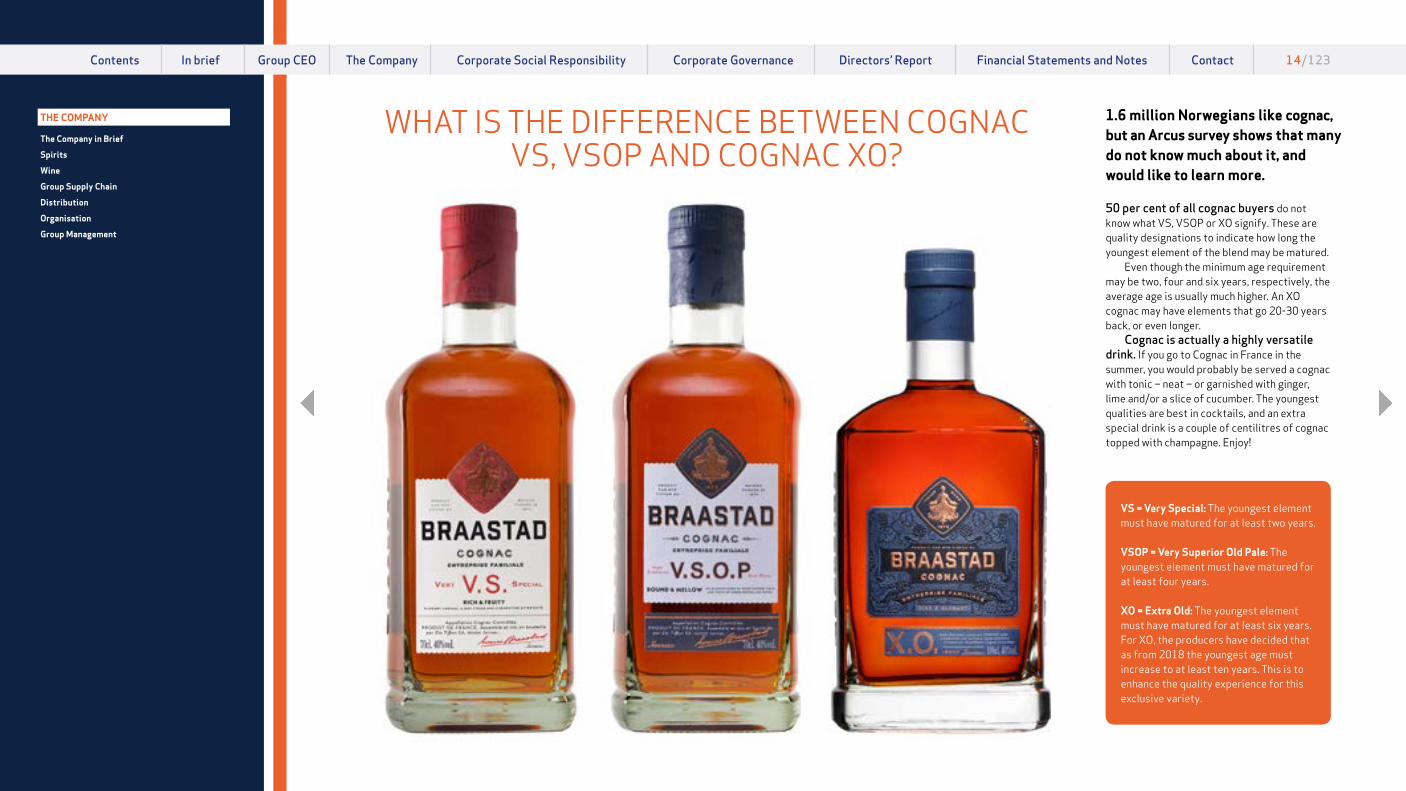
WHAT IS THE DIFFERENCE BETWEEN COGNAC VS, VSOP AND COGNAC XO?
50 per cent of all cognac buyers do not know what VS, VSOP or XO signify. These are quality designations to indicate how long the youngest element of the blend may be matured.
Even though the minimum age requirement may be two, four and six years, respectively, the average age is usually much higher. An XO cognac may have elements that go 20-30 years back, or even longer.
Cognac is actually a highly versatile drink. If you go to Cognac in France in the summer, you would probably be served a cognac with tonic – neat – or garnished with ginger, lime and/or a slice of cucumber. The youngest qualities are best in cocktails, and an extra special drink is a couple of centilitres of cognac topped with champagne. Enjoy!
1.6 million Norwegians like cognac, but an Arcus survey shows that many do not know much about it, and would like to learn more.
VS = Very Special: The youngest element must have matured for at least two years.
VSOP = Very Superior Old Pale: The youngest element must have matured for at least four years.
XO = Extra Old: The youngest element must have matured for at least six years. For XO, the producers have decided that as from 2018 the youngest age must increase to at least ten years. This is to enhance the quality experience for this exclusive variety.
THE COMPANY
The Company in Brief
Spirits
Wine
Group Supply Chain
Distribution
Organisation
Group Management
Contents In brief Group CEO The Company Corporate Social Responsibility Directors’ Report Financial Statements and Notes Contact 14/123Corporate Governance
15 ANNUAL REPORT 2017 Arcus ASATHE COMPANY | Spirits
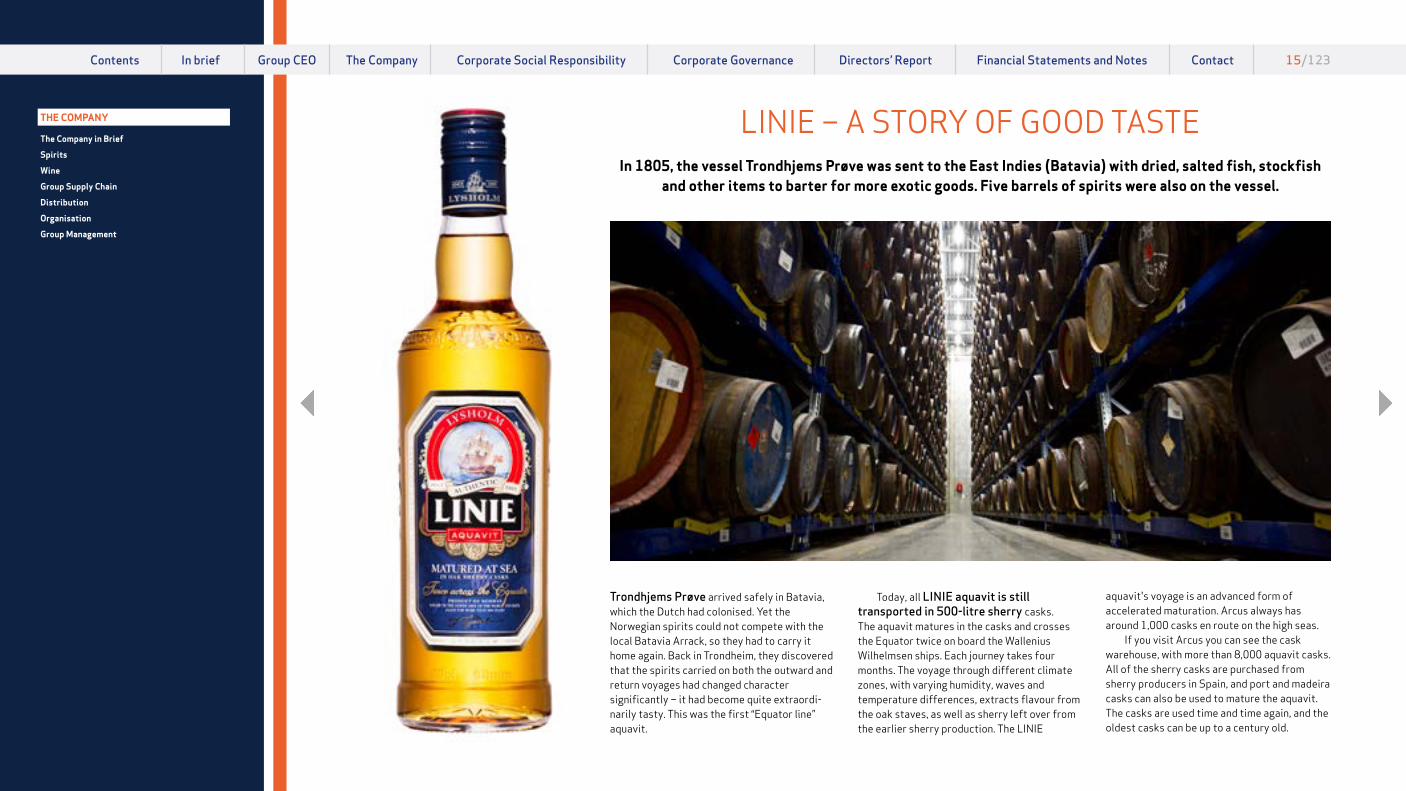
Trondhjems Prøve arrived safely in Batavia, which the Dutch had colonised. Yet the Norwegian spirits could not compete with the local Batavia Arrack, so they had to carry it home again. Back in Trondheim, they discovered that the spirits carried on both the outward and return voyages had changed character significantly – it had become quite extraordi-narily tasty. This was the first “Equator line” aquavit.
Today, all LINIE aquavit is still transported in 500-litre sherry casks. The aquavit matures in the casks and crosses the Equator twice on board the Wallenius Wilhelmsen ships. Each journey takes four months. The voyage through different climate zones, with varying humidity, waves and temperature differences, extracts flavour from the oak staves, as well as sherry left over from the earlier sherry production. The LINIE
aquavit's voyage is an advanced form of accelerated maturation. Arcus always has around 1,000 casks en route on the high seas.
If you visit Arcus you can see the cask warehouse, with more than 8,000 aquavit casks. All of the sherry casks are purchased from sherry producers in Spain, and port and madeira casks can also be used to mature the aquavit. The casks are used time and time again, and the oldest casks can be up to a century old.
In 1805, the vessel Trondhjems Prøve was sent to the East Indies (Batavia) with dried, salted fish, stockfish and other items to barter for more exotic goods. Five barrels of spirits were also on the vessel.
LINIE – A STORY OF GOOD TASTETHE COMPANY
The Company in Brief
Spirits
Wine
Group Supply Chain
Distribution
Organisation
Group Management
Contents In brief Group CEO The Company Corporate Social Responsibility Directors’ Report Financial Statements and Notes Contact 15/123Corporate Governance

16 ANNUAL REPORT 2017 Arcus ASATHE COMPANY | Wine
mass-market advertising is not permitted, while it is possible to advertise wine in both Sweden and Finland.
TAX-FREETax-free players make the bulk of their wine purchases directly from the producers, and therefore their contribution to Arcus' wine revenue growth is minimal. In the autumn of 2016, Heinemann at Gardermoen Airport began to sell Ruby Zin red wine in bag-in-box, and in 2017, Color Line to sell the popular Falling Feather red wine.
AGENCIES AND BRANDSMost of Arcus' wine sales in Sweden, Norway and Finland take place through national import companies in each country. These companies manage agencies for overseas producers’ established brands.
Arcus will strengthen sales by maintaining and developing the agencies. This requires a strong network of contacts, in addition to professional wine expertise. The industry is
The Wine business area covers imports, marketing and sales of wine in Sweden, Norway and Finland. Operations are mainly based on agencies, which are managed by Arcus’ own wine import companies in each country, but also include in-house brands, produced according to specifications from the wine companies, and bottled in Arcus' facilities at Gjelleråsen.
THE NORDIC MARKETSIn Sweden, Norway and Finland, all wine sales to consumers are channelled through state retail monopolies.
The situation in Denmark is different, where consumers are free to buy wine in grocery stores and supermarkets.
The Danish market is subject to fiercely competitive pricing and competition from the stores' own brands, and profit margins are low. So far, Arcus has chosen to concentrate its Danish operations on spirits.
Marketing and advertising opportunities also vary between the countries. In Norway,
Arcus is the largest player in the Norwegian wine market and the second largest in Sweden. In Finland, Arcus has grown to be the third largest. In 2017, wines sales accounted for 60 per cent of Arcus’ total sales.
Business Area
WINE
Arcus’ wine companies have substantial consumer insights in the Nordic wine market.Masi Agricola was named as “Winery of the year”
in the Three-Glass Italian Wines Guide 2018.After just two months, Camillac was
Vinmonopolet’s 5th most sold Bordeaux wine.
THE COMPANY
The Company in Brief
Spirits
Wine
Group Supply Chain
Distribution
Organisation
Group Management
Contents In brief Group CEO The Company Corporate Social Responsibility Directors’ Report Financial Statements and Notes Contact 16/123Corporate Governance

17 ANNUAL REPORT 2017 Arcus ASATHE COMPANY | Wine
characterised by personal relationships between producers and agents. That is why Arcus' import operations are organised into a number of smaller companies, several of which are owned by founders or key people with strong relationships to attractive suppli ers. This model also encourages the continuation of an entrepreneurial approach and the continued development of the business.
There is a clear trend towards closer cooperation between producers and importers to develop products adapted to local preferences. Wines blended and bottled on special order from Arcus is one manifes-tation of this trend. Arcus holds a leading position in this segment.
BAG-IN-BOXBoth Norwegians and Swedes are major consumers of wine as bag-in-box. In both countries, bag-in-box red wine accounts for 58 per cent of all consumption, while for white wine the figure is 54 per cent. Arcus’ fully-owned company, Arcus Wine Brands, imports wine which is filled as bag-in-box in Arcus’ facility at Gjelleråsen. Both productdevelopment and branding are undertaken by Arcus Wine Brands, which gives the company a lot of flexibility and the ability to quickly adjust to market demand. At year-end 2017/18, 17 of the company's wines were listed permanently at Vinmonopolet (Norway), four at Systembolaget (Sweden) and one at Alko (Finland) – where sale had just commenced.
PREFERENCES AND TRENDSThere are differences in the taste preferences of consumers in Sweden, Norway and Finland, and with Arcus’ expertise, this gives opportunities. The differences apply to grape varieties and
country of origin, as well as brands. In both Sweden and Norway, Italian, French and Spanish wine is most popular, but in Sweden new wine countries such as South Africa, Chile and Australia are relatively strong. Chile, Spain, France and Italy are the most popular wine producing countries in the Finnish market.
The wine market is focused on new products and all three countries experience high product turnover. Brand loyalty is low and wine brands have shorter life cycles than spirits brands. Consumer insight and the ability to innovate, in combination with market knowledge, are therefore crucial for maintaining a product portfolio that can be quickly adapted to meet new customer preferences.
BUSINESS AREA WINE 2017 2016 2015 2014 2013
Total operating revenue (NOK million) 1,540.9 1,552.4 1,466.6 1,281.3 1,177.1
EBITDA (NOK million) 186.5 194.2 197.1 180.3 192.8
EBITDA adjusted for non-recurring items (NOK million) 191.7 194.2 197.5 179.4 195.6
EBITDA margin adjusted for non-recurring items 12.4 % 12.5 % 13.5 % 14.0 % 16.6 %
External sales revenue by brands
External sales revenue by country
■ Arcus brands
■ Agency brands
90 %
10 %
NOK million1,521.5
■ Norway
■ Sweden
■ Finland
30 %
58 %
12 %
NOK million1,521.5
THE COMPANY
The Company in Brief
Spirits
Wine
Group Supply Chain
Distribution
Organisation
Group Management
Contents In brief Group CEO The Company Corporate Social Responsibility Directors’ Report Financial Statements and Notes Contact 17/123Corporate Governance

18 ANNUAL REPORT 2017 Arcus ASATHE COMPANY | Wine
Bag-in-box is popular in both Sweden and Norway, and in both countries it accounts for 58 per cent of red wine sales. Portuguese Periquita has become very popular in Sweden. Norwegians still love Italian wine, and Miopasso is one of Arcus’ successes in this segment.
THE COMPANY
The Company in Brief
Spirits
Wine
Group Supply Chain
Distribution
Organisation
Group Management
Contents In brief Group CEO The Company Corporate Social Responsibility Directors’ Report Financial Statements and Notes Contact 18/123Corporate Governance

19 ANNUAL REPORT 2017 Arcus ASATHE COMPANY | Wine
CALORIES IN ALCOHOL ARE NOT JUST ABOUT
SUGAR Many of us our count calories, and in alcoholic
beverages sugar is not the only source of calories. Most red and white wines have far more calories from
alcohol than from sugar.
Both the amount we drink and the alcohol content are important. For example, a glass of beer has around 40 per cent more calories than a glass of wine.
As a rule, sugar gives fewer calories than alcohol: in a medium-sweet white wine with 10 per cent alcohol and 28 grammes of sugar per litre, sugar accounts for only around 16 per cent of the calorie content, while alcohol accounts for around 84 per cent.
CALORIES IN ALCOHOLSource: spiritsEUROPE
68 kcal
A GLASS OF AQUAVIT30 ml,
40% alcohol
A GLASS OF WINE100 ml,
12% alcohol
74 kcal
A GLASS OF BEER250 ml,
5% alcohol
106 kcal
Doppio Passo is on of Arcus’ most popular wines , and the amount of sugar has been reduced. Now there is only 9 grammes of sugar per 100 ml.
THE COMPANY
The Company in Brief
Spirits
Wine
Group Supply Chain
Distribution
Organisation
Group Management
Contents In brief Group CEO The Company Corporate Social Responsibility Directors’ Report Financial Statements and Notes Contact 19/123Corporate Governance
20 ANNUAL REPORT 2017 Arcus ASATHE COMPANY | Wine
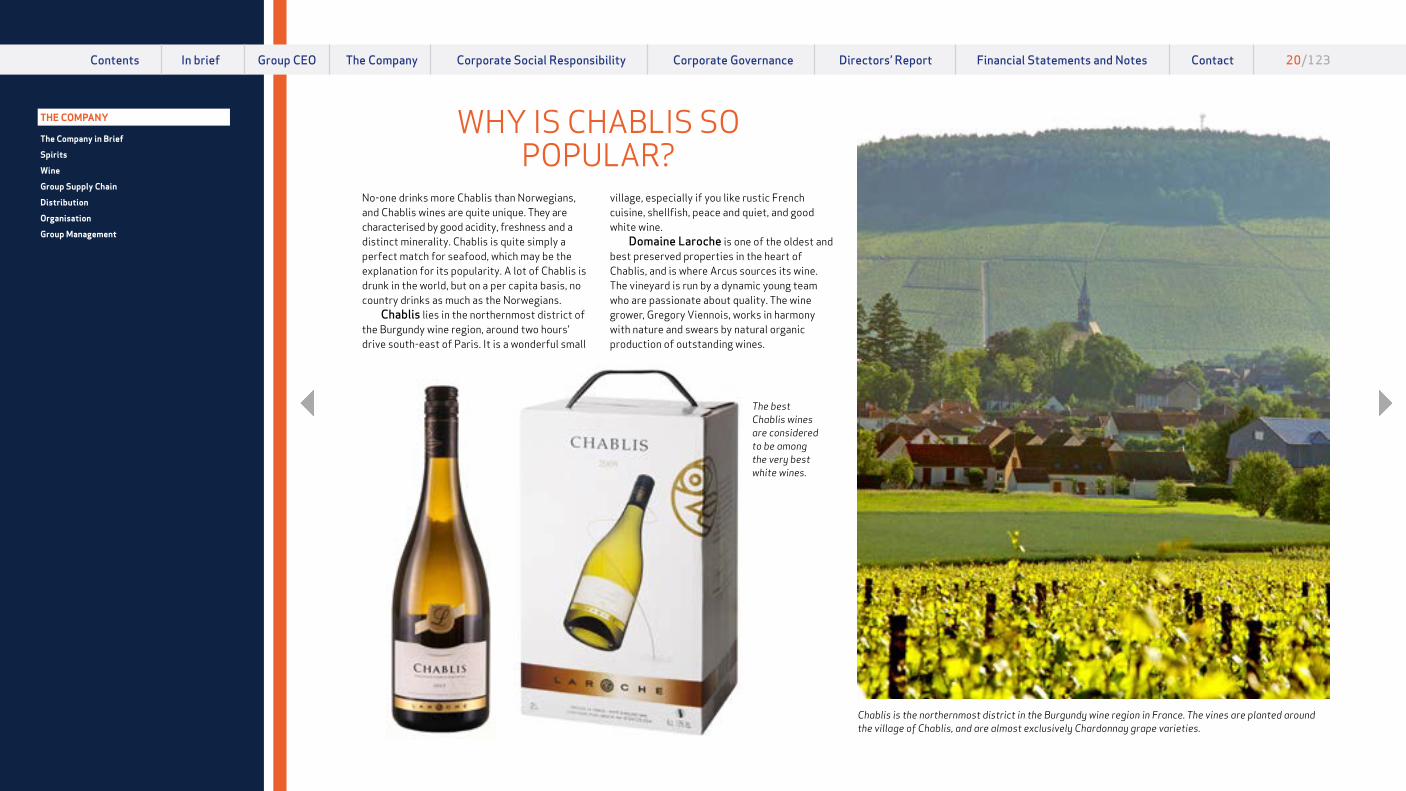
No-one drinks more Chablis than Norwegians, and Chablis wines are quite unique. They are characterised by good acidity, freshness and a distinct minerality. Chablis is quite simply a perfect match for seafood, which may be the explanation for its popularity. A lot of Chablis is drunk in the world, but on a per capita basis, no country drinks as much as the Norwegians.
Chablis lies in the northernmost district of the Burgundy wine region, around two hours’ drive south-east of Paris. It is a wonderful small
village, especially if you like rustic French cuisine, shellfish, peace and quiet, and good white wine.
Domaine Laroche is one of the oldest and best preserved properties in the heart of Chablis, and is where Arcus sources its wine. The vineyard is run by a dynamic young team who are passionate about quality. The wine grower, Gregory Viennois, works in harmony with nature and swears by natural organic production of outstanding wines.
WHY IS CHABLIS SO POPULAR?
Chablis is the northernmost district in the Burgundy wine region in France. The vines are planted around the village of Chablis, and are almost exclusively Chardonnay grape varieties.
The best Chablis wines are considered to be among the very best white wines.
THE COMPANY
The Company in Brief
Spirits
Wine
Group Supply Chain
Distribution
Organisation
Group Management
Contents In brief Group CEO The Company Corporate Social Responsibility Directors’ Report Financial Statements and Notes Contact 20/123Corporate Governance

21 ANNUAL REPORT 2017 Arcus ASATHE COMPANY | Group Supply Chain
spirits production facility, and the spirits and wine bottling facility.
The facilities at Gjelleråsen are one of Europe’s newest and most advanced, and one of very few with their own accredited laboratory for quality assurance and monitoring. The laboratory carries out chemical, microbiological and sensory tests. All products to be bottled at the facilities in Gjelleråsen are checked and approved by the laboratory prior to bottling. The laboratory also sells its services externally.
The facilities offer extensive capacity and one of GSC's strategic goals is to achieve the highest possible degree of utilisation.
RESTRUCTURING AND INNOVATIONWith modern facilities GSC now performs large bottling assignments for external companies.
Finished goods warehousing and distribution are part of GSC's responsibility. In Norway, these functions are outsourced to Vectura, who distribute directly to Vinmonopolet and hotels and restaurants. In other countries, distribution takes place via partners and wholesalers under agreements with GSC.
Group Supply Chain (GSC) is responsible for purchasing, production, storage, bottling, distribution, logistics and warehousing across the business areas. GSC's financial figures are reported together with the accounts of the Spirits business area.
Based on their own sales forecasts and other underlying material, the Wine and Spirits business areas place orders with GSC, which then plans the purchasing, production and stock levels. The purchase of finished goods, as part of the agency operations, is handled by the Wine and Spirits business areas themselves.
PRODUCTION FACILITIESAt Gjelleråsen outside Oslo, GSC is responsible for operating the process, the raw materials warehouse and the cask warehouse, the latter consisting of more than 8,000 casks for the maturing of aquavit and other spirits. At all times there are always around 1,000 casks of aquavit on board the Wallenius Wilhelmsen ships, a four-month voyage during which the Equator is crossed twice. GSC is also responsible for the operation and maintenance of the
Group Supply Chain ensures the efficient flow of goods across business areas and national borders. At its advanced production
facilities at Gjelleråsen, outside Oslo, Arcus' Norwegian and Danish aquavit brands are produced, besides a lot of vodka, and large
volumes of wine are bottled.
GROUP SUPPLY CHAIN
The facility at Gjelleråsen near Oslo is one of Europe's newest and most advanced.
THE COMPANY
The Company in Brief
Spirits
Wine
Group Supply Chain
Distribution
Organisation
Group Management
Contents In brief Group CEO The Company Corporate Social Responsibility Directors’ Report Financial Statements and Notes Contact 21/123Corporate Governance

22 ANNUAL REPORT 2017 Arcus ASATHE COMPANY | Distribution
high stability and a high degree of predictability. Vectura also offers purchasing forecasts, extensive advisory services and various key performance reports that measure delivery services, circulation and forecasting accuracy. The portfolios of all importers with logistics agreements with Vectura are automatically available to all customers in the hotel and restaurant segment (HORECA customers).
SALES FORCEThe Vectura sales force is the company's point of contact with customers in the HORECA segment, in the purchasing chains and Vinmonopolet. The primary task of the sales force is to meet the customer’s wishes and needs, in line with the Vectura business model. The customers are also free to make their purchases through Vectura's online store.
SHIPPING AND CUSTOMSThrough its network, Vectura offers shipments to Norway from more than 800 suppliers. The size of its network makes it possible to be competitive, both with fully loaded cargoes and singular transports. Vectura has its own customs service for all goods imported via the company's warehouse.
Vectura delivers a full range of inbound logistics services, storage and product distribution. Vinmonopolet, the hotel and restaurant industry and wholesalers are the main customers. Its partners include well over a hundred producers/importers of alcoholic beverages, covering the entire range from the largest industry players to small crafts producers. The products handled originate from more than 40 countries.
Vectura AS was established in 1996 and is owned by Arcus ASA. The company is located at Gjelleråsen, outside Oslo, in the same facilities as Arcus, and is closely integrated with this operation. Vectura has state-of-the-art logistics facilities, and handles approximately 10,000 different products.
Vectura has 160 employees in total and turnover of NOK 284 million in 2017.
PURCHASING AND WHOLESALE SERVICESVectura's purchasing department is made up of experienced buyers. Proactive advisory services to importers, as well as digital collaboration, help these importers to ensure deliveries of the right quantities at the right time and cost. This provides excellent, consistent results for purchasing portfolios managed by Vectura: increased delivery precision, reduced stocks, low costs,
Vectura AS delivers alcoholic drinks from the entire world to the whole of Norway. The company has a market share of 47 per cent for
deliveries to Vinmonopolet. 2/3 of revenue concerns other customers besides Arcus. Vectura has a modern logistics
facility at Gjelleråsen, outside Oslo.
Business Area
DISTRIBUTION
Vectura has one of the most modern logistics facilities in the industry.
THE COMPANY
The Company in Brief
Spirits
Wine
Group Supply Chain
Distribution
Organisation
Group Management
Contents In brief Group CEO The Company Corporate Social Responsibility Directors’ Report Financial Statements and Notes Contact 22/123Corporate Governance

23 ANNUAL REPORT 2017 Arcus ASATHE COMPANY | Distribution
WAREHOUSING SERVICESVectura's modern warehousing facilities at Gjelleråsen can hold a total of 36,000 pallets. The facilities are temperature-controlled and fully automated. A monorail transport system is used for goods restocking from the raised storage platforms to the picking stations. There is also an automated weight control station for pallets with picked goods. This will detect potential errors in the shipment before the goods are transported to the customer.
DISTRIBUTIONVectura has country-wide distribution to both the HORECA market and all of Vinmonopolet’s stores. In the regions close to Oslo (Østlandet), this service is provided via an in-house fleet of trucks. For the rest of the country, distribution is handled via a partnership agreement with postal services, Bring.
ENVIRONMENTArcus must be an active contributor to a better environment. One of the goals is to reduce carbon dioxide emissions. Vectura uses lorries to transport goods, and it has been decided to reduce carbon dioxide emissions by 30 per cent from 2017 to 2020. This will be achieved with new and more environmentally-friendly engines in new vehicles, and by ensuring that important subsuppliers such as Bring also reduce their emissions on at least the same scale.
Vectura sorts its waste at source, ensuring that bottles, plastic, paper and aluminium are sorted. The remaining waste fractions that are not sorted at source must be reduced by 30 per cent during 2017-2020.
BUSINESS AREA DISTRIBUTION 2017 2016 2015 2014 2013
Volume (millions of litres) 44.9 43.5 40.6 45.0 48.0
Total operating revenue (NOK million) 284.4 262.9 250.1 272.0 286.7
EBITDA (NOK million) 13.5 2.2 -19.2 -37.2 -68.9
EBITDA adjusted for non-recurring items (NOK million) 14.1 2.6 -15.7 -34.6 -63.1
EBITDA margin adjusted for non-recurring items 5.0 % 1.0 % -6.3 % -12.7 % -22.0 %
THE COMPANY
The Company in Brief
Spirits
Wine
Group Supply Chain
Distribution
Organisation
Group Management
Contents In brief Group CEO The Company Corporate Social Responsibility Directors’ Report Financial Statements and Notes Contact 23/123Corporate Governance
24 ANNUAL REPORT 2017 Arcus ASATHE COMPANY | Organisation
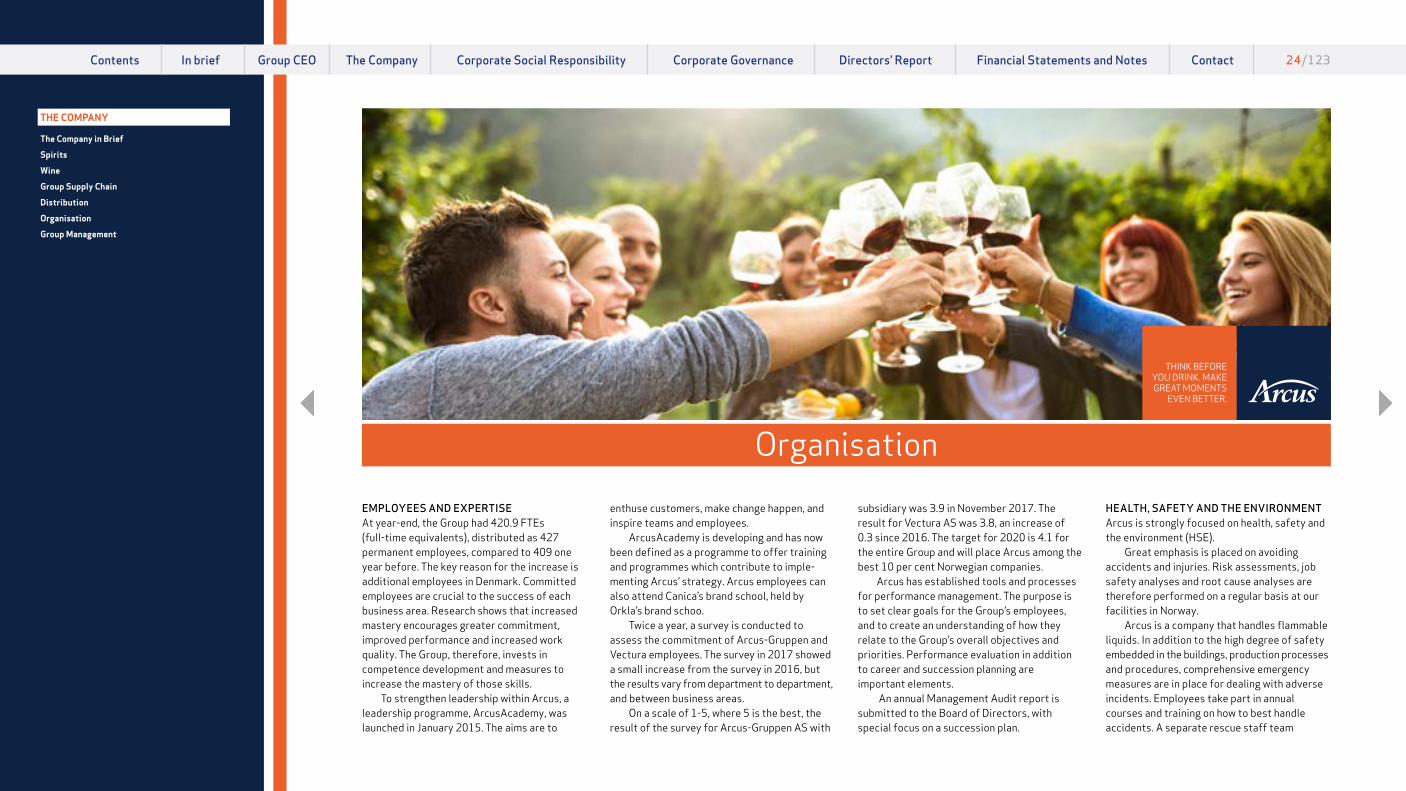
enthuse customers, make change happen, and inspire teams and employees.
ArcusAcademy is developing and has now been defined as a programme to offer training and programmes which contribute to imple-menting Arcus’ strategy. Arcus employees can also attend Canica’s brand school, held by Orkla’s brand schoo.
Twice a year, a survey is conducted to assess the commitment of Arcus-Gruppen and Vectura employees. The survey in 2017 showed a small increase from the survey in 2016, but the results vary from department to department, and between business areas.
On a scale of 1-5, where 5 is the best, the result of the survey for Arcus-Gruppen AS with
EMPLOYEES AND EXPERTISEAt year-end, the Group had 420.9 FTEs (full-time equivalents), distributed as 427 permanent employees, compared to 409 one year before. The key reason for the increase is additional employees in Denmark. Committed employees are crucial to the success of each business area. Research shows that increased mastery encourages greater commitment, improved performance and increased work quality. The Group, therefore, invests in competence development and measures to increase the mastery of those skills.
To strengthen leadership within Arcus, a leadership programme, ArcusAcademy, was launched in January 2015. The aims are to
subsidiary was 3.9 in November 2017. The result for Vectura AS was 3.8, an increase of 0.3 since 2016. The target for 2020 is 4.1 for the entire Group and will place Arcus among the best 10 per cent Norwegian companies.
Arcus has established tools and processes for performance management. The purpose is to set clear goals for the Group’s employees, and to create an understanding of how they relate to the Group’s overall objectives and priorities. Performance evaluation in addition to career and succession planning are important elements.
An annual Management Audit report is submitted to the Board of Directors, with special focus on a succession plan.
HEALTH, SAFETY AND THE ENVIRONMENTArcus is strongly focused on health, safety and the environment (HSE).
Great emphasis is placed on avoiding accidents and injuries. Risk assessments, job safety analyses and root cause analyses are therefore performed on a regular basis at our facilities in Norway.
Arcus is a company that handles flammable liquids. In addition to the high degree of safety embedded in the buildings, production processes and procedures, comprehensive emergency measures are in place for dealing with adverse incidents. Employees take part in annual courses and training on how to best handle accidents. A separate rescue staff team
Organisation
THE COMPANY
The Company in Brief
Spirits
Wine
Group Supply Chain
Distribution
Organisation
Group Management
Contents In brief Group CEO The Company Corporate Social Responsibility Directors’ Report Financial Statements and Notes Contact 24/123Corporate Governance

25 ANNUAL REPORT 2017 Arcus ASATHE COMPANY | Organisation
undergoes annual training in a hypothetical, but comprehensive emergency situation. This training is conducted with police, fire brigade and ambulance personnel present.
Arcus ASA is an IA (inclusive working life) company in Norway, and works closely with occupational health services and NAV
(Norwegian Labour and Welfare Administration) to reduce sick leave. Individual follow-up and facilitation are important tools in this work. For Arcus-Gruppen with subsidiaries in Norway, sick leave amounted to 4.5 per cent in 2017, and the target for 2018 is sick leave no higher than 4.2 per cent. In Vectura AS, sick leave was
8.9 per cent in 2017, and the target for 2018 is sick leave no higher than 7.5 per cent. Sick leave varies between departments and business areas. For the Arcus ASA Group in Norway, total sick leave amounted to 6.6 per cent in 2017, which is an improvement of 0.1 percentage point from 2016. For comparison,
NHO’s sick leave statistics for beverage production in 2017 show total sick leave of 6.7 per cent.
Sick leave statistics and HSE incidents are presented each month at departmental meetings and on bulletin boards.
THE COMPANY
The Company in Brief
Spirits
Wine
Group Supply Chain
Distribution
Organisation
Group Management
Contents In brief Group CEO The Company Corporate Social Responsibility Directors’ Report Financial Statements and Notes Contact 25/123Corporate Governance

26 ANNUAL REPORT 2017 Arcus ASATHE COMPANY | Organisation
Arcus’ production facility outside Oslo, inaugurated in 2012, is as large as six soccer pitches.
Distribution and logistics
Coopers
Bottling Cask warehouseWarehouse
Production
Sales and administration
THE COMPANY
The Company in Brief
Spirits
Wine
Group Supply Chain
Distribution
Organisation
Group Management
Contents In brief Group CEO The Company Corporate Social Responsibility Directors’ Report Financial Statements and Notes Contact 26/123Corporate Governance

27 ANNUAL REPORT 2017 Arcus ASATHE COMPANY | Group Management
Kenneth HamnesGroup CEO of Arcus ASAMaster of Business AdministrationGroup CEO since August 2015.CEO Maarud 2009-15, Sales Director at Orkla-owned Stabburet 2006-09 and Bakers 2004-06. Consultant/Project Manager, Boston Consulting Group, 2000-04 and Brand Manager/Key Account Manager, Lilleborg (Orkla), 1997-2000.
Erlend StefanssonGroup Director SpiritsMaster of Business AdministrationMember of the Group Management since 2012. Sales Director, Ringnes, 2008-12, CEO Spits ASA, 2006-08, CEO Virtual Garden/Staal, 2003-06, between 1993 and 2003 various roles within sales, marketing and consulting (including McKinsey 1993-1996).
Thomas Patay Group Director Wine NorwayBachelor of Arts, Major in MarketingMember of the Group Management since 2008. Managing Director of Bibendum, 2003-08. Previously held management positions within sales and marketing of FMCG in Norway and internationally, including as Marketing Director of Steen & Strøm ASA.
Erik BernGroup Director, Group Supply Chain, Purchasing and Property ManagementMaster in EngineeringMember of the Group Management since 2012. Project Director, Arcus-Gruppen, 2008-13, Managing Director, Vectura AS, 2012-13, Factory Manager, 2000-03, Technical Director, Ringnes, 1999-08, and Sales Manager, project/process design Landteknikk 1986-99.
GROUP MANAGEMENT
Per Bjørkum Group Director IR and CommunicationsBachelor of Commerce, Master of Business AdministrationMember of the Group Management since January 2013. Partner in First House, 2009-12, Director of Trolltind Kommu-nikasjon, 2003-09, GCI Monsen, 2000-03, VP Communications NetCom, 1996-00, journalist and editor, Reuters Norge, 1992-96.
Bjørn DelbækGroup Director HRMilitary Academy and Master's Programme in HR & Change ManagementMember of the Group Management since June 2015. HR Director Vectura and Director Change programme in Arcus, Program Director NHO, Partner and Advisor, HR Director/Vice President Ringnes/Carlsberg 1995-2008. Head of Negotiation YS 82-94, and army officer 1971-80.
Svante SellingCEO Vingruppen i Norden AB(Wine Sweden and Finland)SommelierMember of the Group Management since February 2018. Nordic Sales Director, Arcus Brennevin, 2016-17, Country Manager, Arcus Norge (Brennevin), 2015, Country Manager Arcus Sweden, 2008-15, Key Account Manager for Systembolaget, at Pernod Ricard 2005-08.
Christian GranlundCEO Vectura ASMaster of Business AdministrationVP Sales, Uteliv Ringnes 2015-2017. Logistics Director, Ringnes 2012-2015.Factory Director, Farris/Imsdal 2010-2012.Planning Director, Ringnes 2008-2010. Prognosis & Planning, TINE 2003-2008.
Sigmund Toth CFO, Group Director FinanceITMaster, Business Administration (Diplôme ESSEC), ESSEC, FranceMember of the Group Management since 2016. Head of Business Controlling & Treasury, Arcus-Gruppen, 2015-16, Associate and Engagement Manager, McKinsey, 2012-15, Head of Sales Controlling, Procter & Gamble (P&G), 2010-11, Head of Corporate Finance, P&G, 2008-09, Business Controller, P&G, 2002-08.
THE COMPANY
The Company in Brief
Spirits
Wine
Group Supply Chain
Distribution
Organisation
Group Management
Contents In brief Group CEO The Company Corporate Social Responsibility Directors’ Report Financial Statements and Notes Contact 27/123Corporate Governance

28 ANNUAL REPORT 2017 Arcus ASACORPORATE SOCIAL RESPONSIBILITY | Goals and obligations
RESPONSIBLE ALCOHOL CONSUMPTIONAs a major spirits producer and wine importer, Arcus has a special responsibility for contributing to responsible alcohol consumption. Arcus has assumed the active role of promoting responsible alcohol consumption. Every year, since its launch in 2015, the “Think before you drink” campaign has increased in scope. Responsible alcohol consump-tion and “Think before you drink” are an important part of the 11 new goals set for 2017-2020.
ENTIRE VALUE CHAINThe Group will continue recent years’ successful efforts to reduce its environmental impact and create a sustainable society. The new aspect from 2017 is that the goals are no longer selective, but cover the entire value chain. Arcus’ four goals for 2012-2016 have been replaced by 11 new goals. They apply to the 2017-2020 period. The goals concern all three business areas, and thereby the entire Group.
Arcus has two overall obligations in its CSR work: to continue to work to reduce the environmental impact of the entire value chain, and to work continuously to ensure responsible alcohol consumption. In 2017, Arcus set concrete and ambitious goals
for how the Group will continue the good work of contributing to a better society.
Corporate Social Responsibility
ARCUS’ ENVIRONMENTAL GOALS AND RESULTS, 2012-2016
Goal ResultUse more renewable energy for heating Increased to 100 per centReduce our energy consumption in production Reduced by 13 per centReduce our water consumption in production Reduced by 8 per centReduce waste of wine in production Reduced by 40 per cent
CORPORATE SOCIAL RESPONSIBILITY
Goals and obligations
Guidelines
Priorities for sustainable development
Responsible alcohol consumption
Good energy economy
Bag-in-Box is environmentally smart
Contents In brief Group CEO The Company Corporate Social Responsibility Directors’ Report Financial Statements and Notes Contact 28/123Corporate Governance

29 ANNUAL REPORT 2017 Arcus ASACORPORATE SOCIAL RESPONSIBILITY | Guidelines
harassment and corruption. All employees are required to sign a declaration stating that they are familiar with the CSR policy and the company’s ethical guidelines, and that they understand what it means to comply with these. All managers with staff responsibility are required to discuss the ethical guidelines with their employees on an annual basis. This will strengthen compliance with the guidelines.
As part of the ethical guidelines, provision is also made for the notification of any mis conduct within the Group. Whistle-blowers can use a designated phone number, established for this purpose. All employees have been made aware of this, and the fact that their anonymity is guaranteed. There were no reported cases of whistle-blowing in 2017.
DRUGS AND ALCOHOL POLICY Arcus has its own drugs and alcohol policy, aiming to combat alcohol abuse among its own employees. All employees are expected to comply with the Group's drugs and alcohol policy. The Group has its own committee (AKAN) to prevent gaming and/or substance abuse, and to help those who already have an addiction to quit.
CODE OF CONDUCTArcus supports and participates actively in the Nordic alcohol monopolies' (NAM) CSR initiative and complies with all requirements of the NAM Code of Conduct. The Group expects the same from all our suppliers and partners. This work is monitored through established follow-up systems. Arcus’ Code of Conduct must be part of all purchasing contracts and agreements entered into by Arcus.
UN GLOBAL COMPACT Arcus supports the UN Global Compact initiative for social responsibility work. The Group adheres to the ten principles laid down in the Global Compact for the environment, human rights, standards for working life and anti- corruption. Arcus' annual Global Compact reports are available at www.unglobalcompact.org
ETHICAL GUIDELINES The Group’s ethical guidelines define, clarify and ensure a common business ethics framework to outline the expectations for the ethical and appropriate behaviour of all employees.
The Group’s ethical guidelines stipulate that Arcus has zero tolerance for discrimination,
To preserve competitiveness and realise its ambitions, Arcus must have a relationship of trust with its most important stakeholders: employees, customers,
suppliers, owners, politicians and government authorities. This involves integrating a responsible approach to alcohol consumption, workers’ rights,
social issues, the environment and anti-corruption in the day-to-day operations of the company. An annual assessment of the corporate social responsibility
report, prepared by management, is evaluated by the Board of Directors.
GUIDELINES FOR ARCUS’ CORPORATE SOCIAL RESPONSIBILITY
CORPORATE SOCIAL RESPONSIBILITY
Goals and obligations
Guidelines
Priorities for sustainable development
Responsible alcohol consumption
Good energy economy
Bag-in-Box is environmentally smart
Contents In brief Group CEO The Company Corporate Social Responsibility Directors’ Report Financial Statements and Notes Contact 29/123Corporate Governance

30 ANNUAL REPORT 2017 Arcus ASACORPORATE SOCIAL RESPONSIBILITY | Priorities for sustainable development
2017-2020: PRIORITIES FOR
SUSTAINABLE DEVELOPMENT
Reduce Arcus’ environmental impact �1
Increase the number of environmentally-friendly products �2
Promote responsible alcohol consumption �3
Achieve a high level of safety in the workplace �4
Read more about the Group's priorities and 11 new goals �
CORPORATE SOCIAL RESPONSIBILITY
Goals and obligations
Guidelines
Priorities for sustainable development
Responsible alcohol consumption
Good energy economy
Bag-in-Box is environmentally smart
Contents In brief Group CEO The Company Corporate Social Responsibility Directors’ Report Financial Statements and Notes Contact 30/123Corporate Governance

31 ANNUAL REPORT 2017 Arcus ASACORPORATE SOCIAL RESPONSIBILITY | Priorities for sustainable development
2017-2020:PRIORITIES FOR SUSTAINABLE DEVELOPMENT
EXPECTATIONS OF ARCUS ARCUS’ GOALS 2017-2020
OUR MISSIONWe must continue the work to reduce our environmental impact.
GOOD RESULTSIn 2012-2016 Arcus achieved important and permanent environmental adjustments:
• Our water consumption in production has been reduced by 8 per cent.
• Waste of wine in production of wine has been reduced by 40 per cent.
• Use of renewable energy for heating has increased to 100 per cent.
1. EMISSIONSIn 2020, Vectura’s CO2 emissions must be reduced by 30 per cent from the 2017 level.
2. RECIRCULATIONIn 2020, the volume of waste that cannot be recirculated must be reduced by 30 per cent from 2017.
3. ENERGYIn 2020, energy consumption in the production process must be reduced by 20 per cent from 2017.
Reduce Arcus’ environmental impact1
�
CORPORATE SOCIAL RESPONSIBILITY
Goals and obligations
Guidelines
Priorities for sustainable development
Responsible alcohol consumption
Good energy economy
Bag-in-Box is environmentally smart
Contents In brief Group CEO The Company Corporate Social Responsibility Directors’ Report Financial Statements and Notes Contact 31/123Corporate Governance

32 ANNUAL REPORT 2017 Arcus ASACORPORATE SOCIAL RESPONSIBILITY | Priorities for sustainable development
2017-2020:PRIORITIES FOR SUSTAINABLE DEVELOPMENT
EXPECTATIONS OF ARCUS ARCUS’ GOALS 2017–2020
OUR MISSIONAs a major producer, we are aware of our environmental impact. The packaging we use is one of the most important factors, so that we must continue our systematic efforts to use more environ mentally-friendly packaging.
Arcus will also work to increase its ecologically and organically developed products, thereby contributing to environmentally- friendly production.
1. PACKAGINGIn 2020, 35 per cent of our own bottling will be in recirculated plastic bottles.
2. PRODUCTSIn 2020, 15 per cent of all items sold must be produced on an environmentally-friendly basis.
Increase the number of environmentally-friendly products2
�
CORPORATE SOCIAL RESPONSIBILITY
Goals and obligations
Guidelines
Priorities for sustainable development
Responsible alcohol consumption
Good energy economy
Bag-in-Box is environmentally smart
Contents In brief Group CEO The Company Corporate Social Responsibility Directors’ Report Financial Statements and Notes Contact 32/123Corporate Governance
33 ANNUAL REPORT 2017 Arcus ASACORPORATE SOCIAL RESPONSIBILITY | Priorities for sustainable development
2017-2020:PRIORITIES FOR SUSTAINABLE DEVELOPMENT
EXPECTATIONS OF ARCUS ARCUS’ GOALS 2017-2020
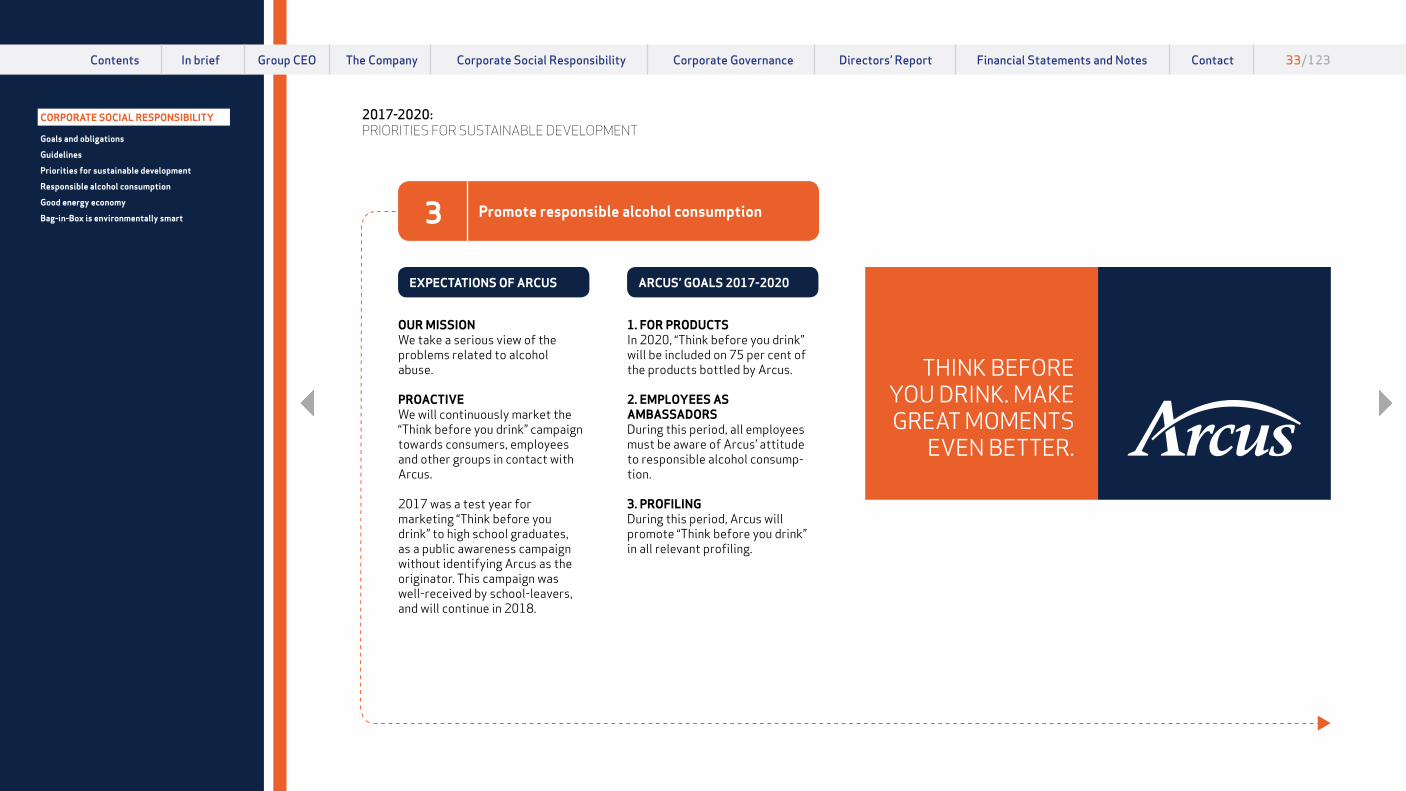
OUR MISSIONWe take a serious view of the problems related to alcohol abuse.
PROACTIVEWe will continuously market the “Think before you drink” campaign towards consumers, employees and other groups in contact with Arcus.
2017 was a test year for marketing “Think before you drink” to high school graduates, as a public awareness campaign without identifying Arcus as the originator. This campaign was well-received by school-leavers, and will continue in 2018.
1. FOR PRODUCTSIn 2020, “Think before you drink” will be included on 75 per cent of the products bottled by Arcus.
2. EMPLOYEES AS AMBASSADORSDuring this period, all employees must be aware of Arcus’ attitude to responsible alcohol consump-tion.
3. PROFILINGDuring this period, Arcus will promote “Think before you drink” in all relevant profiling.
Promote responsible alcohol consumption3
�
CORPORATE SOCIAL RESPONSIBILITY
Goals and obligations
Guidelines
Priorities for sustainable development
Responsible alcohol consumption
Good energy economy
Bag-in-Box is environmentally smart
Contents In brief Group CEO The Company Corporate Social Responsibility Directors’ Report Financial Statements and Notes Contact 33/123Corporate Governance
34 ANNUAL REPORT 2017 Arcus ASACORPORATE SOCIAL RESPONSIBILITY | Priorities for sustainable development
2017-2020:PRIORITIES FOR SUSTAINABLE DEVELOPMENT
EXPECTATIONS OF ARCUS ARCUS’ GOALS 2017–2020
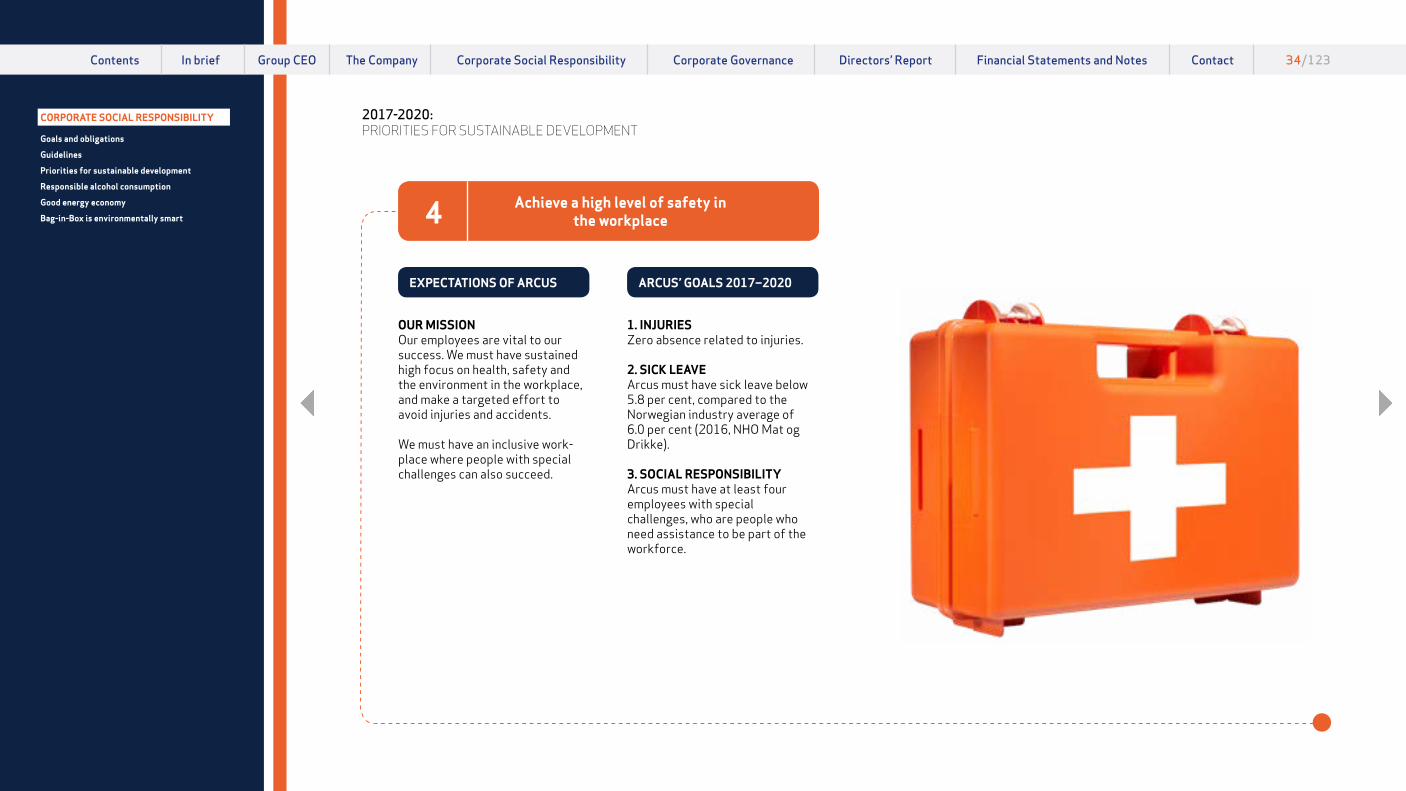
OUR MISSIONOur employees are vital to our success. We must have sustained high focus on health, safety and the environment in the workplace, and make a targeted effort to avoid injuries and accidents.
We must have an inclusive work-place where people with special challenges can also succeed.
1. INJURIESZero absence related to injuries.
2. SICK LEAVEArcus must have sick leave below 5.8 per cent, compared to the Norwegian industry average of 6.0 per cent (2016, NHO Mat og Drikke).
3. SOCIAL RESPONSIBILITYArcus must have at least four employees with special challenges, who are people who need assistance to be part of the workforce.
Achieve a high level of safety in the workplace4
∑
CORPORATE SOCIAL RESPONSIBILITY
Goals and obligations
Guidelines
Priorities for sustainable development
Responsible alcohol consumption
Good energy economy
Bag-in-Box is environmentally smart
Contents In brief Group CEO The Company Corporate Social Responsibility Directors’ Report Financial Statements and Notes Contact 34/123Corporate Governance

35 ANNUAL REPORT 2017 Arcus ASACORPORATE SOCIAL RESPONSIBILITY | Responsible alcohol consumption
ARCUS DONATED 6,000 BOTTLES OF WATER TO HIGH SCHOOL GRADUATES
Tryvann, Oslo May 2017: Busy queues all night to fill empty water bottles.
Text messages are sent to school-leavers on the evening that the celebrations begin.
High school graduates celebrations are a time when many young people consume a lot of alcohol. Many of them have little experience with drinking alcohol, and are often under a lot of pressure to drink. School-leavers also have a big influence on other young people and many look up to them. This is the background to Arcus’ “Think before you drink” campaign targeted at high school graduates in the spring of 2017. The campaign is repeated in 2018.
ACTIVITIES FOR THE 2017 SCHOOL-LEAVING CAMPAIGN• “Think before you drink” on the school-
leavers’ popular ID wristband, together with Amnesty’s “No is no. Rape = Sex without consent”.
• The “Think before you drink” message on school-leavers’ social media.
• Evening before the celebrations: Text message with the “Think before you drink” message to around half of Norway's 45,000 school-leavers.
• No promotion of Arcus. The sender of the message was “Think before you drink”.
CAMPAIGN AT THE TRYVANN FESTIVAL• Distribution of 6,000 filled water
bottles: easy to attach to your school-leaver outfit.
• Water stations for easy filling of empty bottles.
• Free water reduced alcohol sales, especially during the last two hours.
• Very good feedback from the police, medical teams, Oslo municipality, parents and, not least, school-leavers themselves.
CORPORATE SOCIAL RESPONSIBILITY
Goals and obligations
Guidelines
Priorities for sustainable development
Responsible alcohol consumption
Good energy economy
Bag-in-Box is environmentally smart
Contents In brief Group CEO The Company Corporate Social Responsibility Directors’ Report Financial Statements and Notes Contact 35/123Corporate Governance

36 ANNUAL REPORT 2017 Arcus ASACORPORATE SOCIAL RESPONSIBILITY | Good energy economy
Arcus’ head office and production facilities cover an area equivalent to six soccer pitches. This entire area is heated with ground heating, or geothermal heating. This geothermal heating is surplus heat from the ground. This is clean, non-polluting, energy that keeps heating costs down.
COLD OUTDOORS, GROUND HEATING INDOORS
CORPORATE SOCIAL RESPONSIBILITY
Goals and obligations
Guidelines
Priorities for sustainable development
Responsible alcohol consumption
Good energy economy
Bag-in-Box is environmentally smart
Contents In brief Group CEO The Company Corporate Social Responsibility Directors’ Report Financial Statements and Notes Contact 36/123Corporate Governance
37 ANNUAL REPORT 2017 Arcus ASACORPORATE SOCIAL RESPONSIBILITY | Bag-in-Box is environmentally smart
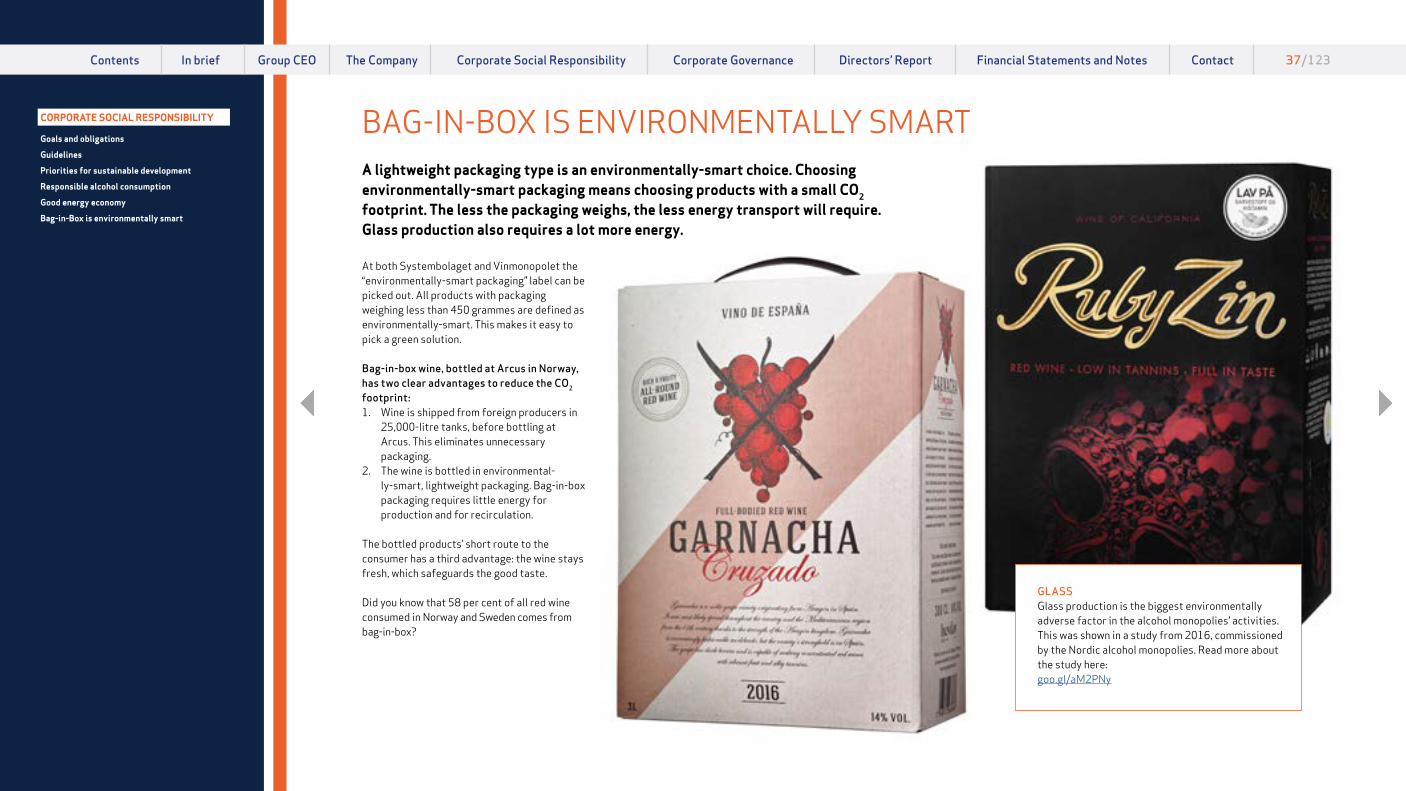
At both Systembolaget and Vinmonopolet the “environmentally-smart packaging” label can be picked out. All products with packaging weighing less than 450 grammes are defined as environmentally-smart. This makes it easy to pick a green solution.
Bag-in-box wine, bottled at Arcus in Norway, has two clear advantages to reduce the CO2 footprint:1. Wine is shipped from foreign producers in
25,000-litre tanks, before bottling at Arcus. This eliminates unnecessary packaging.
2. The wine is bottled in environmental-ly-smart, lightweight packaging. Bag-in-box packaging requires little energy for production and for recirculation.
The bottled products’ short route to the consumer has a third advantage: the wine stays fresh, which safeguards the good taste.
Did you know that 58 per cent of all red wine consumed in Norway and Sweden comes from bag-in-box?
BAG-IN-BOX IS ENVIRONMENTALLY SMARTA lightweight packaging type is an environmentally-smart choice. Choosing environmentally- smart packaging means choosing products with a small CO2 footprint. The less the packaging weighs, the less energy transport will require. Glass production also requires a lot more energy.
GLASSGlass production is the biggest environmentally adverse factor in the alcohol monopolies’ activities. This was shown in a study from 2016, commissioned by the Nordic alcohol monopolies. Read more about the study here:goo.gl/aM2PNy
CORPORATE SOCIAL RESPONSIBILITY
Goals and obligations
Guidelines
Priorities for sustainable development
Responsible alcohol consumption
Good energy economy
Bag-in-Box is environmentally smart
Contents In brief Group CEO The Company Corporate Social Responsibility Directors’ Report Financial Statements and Notes Contact 37/123Corporate Governance
38 ANNUAL REPORT 2017 Arcus ASACORPORATE GOVERNANCE
respects based on the Code, to which the board has resolved that the company shall adhere. The Board will ensure that the Company at all times has sound corporate governance.
Arcus works continuously to develop attitudes and monitoring systems which live up to the expectations set for a significant Nordic player in the wine and spirits. The Group defines its social responsibility through its corporate social responsibility policy which is available at www.arcus.no/investor. The company also sets clear standards for itself and its employees through its ethical standards, environmental policy, workplace regulations and other internal guidelines. Arcus’ values are Market Focused, Determined and Collective.
Deviations from the Code: None
2. BUSINESSArcus is involved in the production, bottling, import, marketing, sale and distribution of wine and spirits. The Group is represented in all Nordic countries, with subsidiary companies in Norway, Sweden, Denmark and Finland, as well as in Germany. The Group has further exports of spirits to markets outside the Nordic region and Germany, most importantly to the United States.
Arcus’ business is defined in the Company’s articles of association as follows:
The company's business shall entail the import, export, production, storage and distribution of alcoholic beverages and other goods, and other activities related to this business, as well as the ownership of participations in other companies that conduct such business.
Arcus ASA (“Arcus” or the “Company”) considers good corporate governance to be a prerequisite for value creation and trustworthiness and for access to capital. In order to secure strong and sustainable corporate governance, it is important that the Company ensures good and healthy business practices, reliable financial reporting and an environment of compliance with legislation and regulations. Arcus’ Board of Directors (the “Board”) actively adheres to good corporate governance standards and will at all times ensure that Arcus complies with “The Norwegian Code of Practice for Corporate Governance” most recently revised on 30 October 2014 (the “Code”) as issued by the Norwegian Corporate Governance Policy Board, or explain possible deviations from the Code. The Code can be found at www.nues.no. Arcus has governance documents setting out principles for how business should be conducted, and these also apply to Arcus’ subsidiaries (together with Arcus, the “Group”). The Code covers 15 topics, and this statement covers each of these topics. Information concerning corporate governance pursuant to section 3-3 b of the Norwegian Accounting Standard Act is included in the section below.
Arcus holds the view that its current policies for corporate governance are in line with the latest version of the Code. The following section explain how Arcus has addressed the various issues covered by the Code.
1. IMPLEMENTATION AND REPORTING ON CORPORATE GOVERNANCEA corporate governance policy was adopted by the Board on 10 October 2016 for and on behalf of the Company and is, in all material
The articles of association are available on the Company’s website: www.arcus.no/investor. To achieve the objective set forth in the articles of association, the Company has established a strategy for profitable growth, primarily in the Group’s home markets, the Nordic countries and Germany, based on its own brands and agency brands within wine and spirits, as well as logistics and distribution in the Nordic region.
Deviations from the Code: None
3. EQUITY AND DIVIDENDSThe shareholder’s equity as of 31 December 2017was NOK 1,669,415, which represents 37 per cent of the Company’s total assets. In the opinion of the Board, Arcus’ equity capital is appropriate for its objectives, strategy and risk profile.
The Board has resolved to target a dividend pay-out ratio of 50-70 per cent of the Company’s net profit for each year going forward.
The Board may obtain authorisation from the general meeting of shareholders to buy back Arcus shares in the market. In such cases, the Board will normally request that the shares be acquired in the open market, and that the authority lasts no longer than until the next general meeting. At the extraordinary general meeting on 3 May 2017, the Board was given an authorization to acquire own shares in the Company on behalf of the Company with an aggregate nominal value of up to NOK 136,000. The authorisation expires at the annual general meeting in 2018.
When the general meeting of shareholders considers whether or not to authorise the Board to carry out share capital increases for multiple purposes, each purpose must be considered separately by the meeting. Such authorisation will be limited in time, and will last no longer than until the date of the next general meeting. Authorisation granted to the board of directors is restricted to specific purposes.
At the extraordinary general meeting on 3 May 2017, the Board was given an authorisation to increase the share capital of the Company by up to NOK 136,000. The authorisation may only be used to finance further growth and to issues shares as consideration on the acquisition of other companies/activities/assets, or to finance such acquisitions. The authorisation expires at the annual general meeting in 2018.
Deviations from the Code: None
4. EQUAL TREATMENT OF SHAREHOLDERS AND TRANSACTIONS WITH CLOSE ASSOCIATESArcus has only one class of shares. Each share in the Company carries one vote, and all shares carry equal rights, including the right to participate at general meetings of the Company. The nominal value of each share is NOK 0.02.
If the board resolves to propose to the general meeting a share issue without pre- emption rights for existing shareholders, the justification shall be publicly disclosed in the notice to the relevant general meeting.
In the event that the Board decides to use its current authorisation to re-purchase its own shares, the transactions will be carried out through the stock exchange or at prevailing stock exchange prices if carried out in any other way.
The Board is currently authorised to set aside the pre-emption rights of existing shareholders in capital increases if it exercises its authority to issue new shares. This is to simplify the procedure in connection with capital increases with the intention to finance further growth and/or the offering of shares as consideration in acquisitions where this is deemed a favourable term of settlement. If the Board resolves to carry out a share issue without pre-emption rights for existing share-holders based on its authorisation, then the justification shall be publicly disclosed in a
CORPORATE GOVERNANCECORPORATE GOVERNANCE
Contents In brief Group CEO The Company Corporate Social Responsibility Directors’ Report Financial Statements and Notes Contact 38/123Corporate Governance

39 ANNUAL REPORT 2017 Arcus ASACORPORATE GOVERNANCE
The notice contains detailed information on the resolutions proposed and matters to be considered at the general meeting. It includes the deadline for shareholders to register their intention to attend the general meeting, as well as instructions on how they can cast their votes by proxy. The deadline for registration is set as close to the date of the general meeting as possible. The notice shall also include informa-tion regarding the right of shareholders to propose resolutions for consideration by the general meeting.
The general meeting votes for each candidate nominated for election to the company’s corporate bodies. To the extent possible, the form of proxy will facilitate separate voting instructions for each matter to be considered by the meeting and for each of the candidates nominated for election. It is possible to vote in advance.
When documents concerning matters that are to be dealt with at a general meeting have been made accessible to the shareholders on the Company’s website, the Board may decide that the documents shall not be sent to share-holders by ordinary mail. This also applies to documents which, according to law, shall be included in or enclosed with the notice of a general meeting. A shareholder can, however, demand that documents concerning matters that are to be dealt with at a general meeting be sent to him or her by ordinary mail.
The notice of a general meeting contains a reference to the Company’s website, where shareholders can access relevant documents and, if appropriate, any other information that shareholders may need to gain access to such documents.
The annual general meeting elects a chair to preside over the meeting and one person to sign the minutes of the meeting together with the elected chair. The minutes are published on the Company’s website.
stock exchange announcement issued in connection with the share issue.
The Board will arrange for a valuation to be obtained from an independent third party, in the event of a not immaterial transaction between the company and its shareholders, a sharehold-er’s parent company, members of the board, executive management or closely-related parties of any such parties.
Members of the Board and executive management are obliged to notify the Board if they have a significant, direct or indirect, interest in any transaction carried out by the Company other than by virtue of their position within the Company. The Board will report in the annual report any transactions with related parties.
The Company has implemented rules of procedure which state that the members of the Board and the Company’s chief executive officer may not participate in discussions or decision of issues of significant importance to the relevant person or anyone affiliated with him/her.
Deviations from the Code: None
5. FREELY NEGOTIABLE SHARESAll shares are freely negotiable with no form of restriction on negotiability.
Deviations from the Code: None
6. GENERAL MEETINGThe interests of the Company’s shareholders are primarily exercised at the Company’s general meetings. It is the Company’s goal that as many shareholders as possible are given the opportunity to participate in its general meetings and that the general meetings are organized so as to ensure that they represent an effective forum for the Company’s shareholders to express their views.
Notices of general meetings are made available on the Company’s website, www.arcus.no/investor, and through a separate notice to the Oslo Stock Exchange at least 21 days in advance of the general meeting.
The annual general meeting approves the annual accounts and annual report, and any proposed dividend. The annual general meeting also approves the remuneration to be paid to the members of the Board, the nomination committee (as defined below) and the external auditor.
All shares carry an equal right to vote at general meetings. Resolutions at the annual general meeting are normally passed by simple majority unless otherwise required by Norwegian law.
The chairperson of the board of directors, the nomination committee representative and the auditor attend the general meeting.
Deviations from the Code: None
7. NOMINATION COMMITTEEIn accordance with Arcus’ articles of association, the Company shall have a nomination committee consisting of three members. The current members of the nomination committee are Sverre R. Kjær (head of the nomination committee), Karin Bing Orgland and Nils Selte. Kjær and Orgland were elected at the extraordinary general meeting on 2 March 2017, while Selte was elected as a new member of the nomination committee at the general meeting on 3 May 2017.
The members of the nomination committee shall be shareholders or representatives of shareholders. The members of the nomination committee, including its chairman, are elected by the general meeting. The members of the nomination committee’s period of service shall be two years unless the general meeting decides otherwise. The members of the nomination committee’s fees shall be determined by the general meeting.
The majority of the nomination committee will be independent of the Board and the Company’s executive management.
The nomination committee will submit its recommendations to the annual general meeting regarding the election of members to the Board
and the nomination committee and their respec-tive remuneration. The nomination committee should have contact with shareholders, the board of directors and the company’s executive person-nel as part of its work on proposing candidates for election to the board. The nomination committee shall justify its recommendations.
On 21 October 2016, the general meeting approved a set of instructions defining the responsibilities of the nomination committee. All shareholders are invited to propose candidates to the Board and the nomination committee through the Company’s website.
Deviations from the Code: None
8. CORPORATE ASSEMBLY AND BOARD OF DIRECTORS: COMPOSITION AND INDEPENDENCE The Company does not have a corporate assembly.
According to the Company’s articles of association, the Company shall have a Board consisting of a minimum of three and a maximum of eight shareholder-elected board members. The chairman of the Board is elected by the general meeting based on a proposal from the nomination committee, as are the other members representing the shareholders. In addition, board members are elected by and among the employees in accordance with applicable company legislation.
Board members are elected for a period of two years at a time.
The Board consists of ten members, of whom seven are elected by the general meeting and three are representatives of the employees. The Group leases buildings and the property at Gjelleråsen from Gjelleråsen Eiendom AS, a company owned by Canica AS, which is controlled by Stein Erik Hagen and his related parties. HOFF SA is the sole provider of Norwegian potato spirit to the Group, and Eilif Due is Chairman of the Board of Directors. With the exception of these two members of the Board of Directors, all
CORPORATE GOVERNANCE
Contents In brief Group CEO The Company Corporate Social Responsibility Directors’ Report Financial Statements and Notes Contact 39/123Corporate Governance
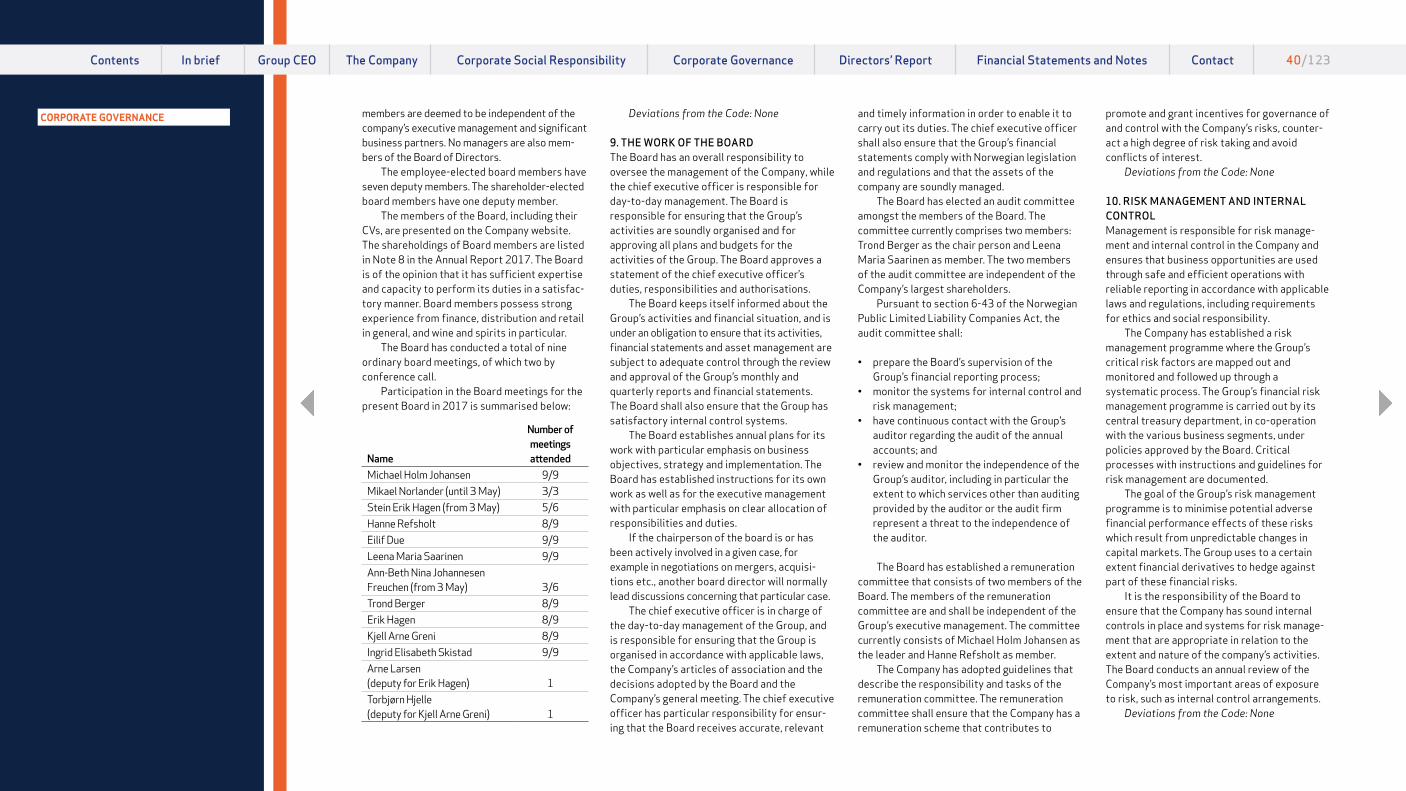
40 ANNUAL REPORT 2017 Arcus ASACORPORATE GOVERNANCE
Deviations from the Code: None
9. THE WORK OF THE BOARD The Board has an overall responsibility to oversee the management of the Company, while the chief executive officer is responsible for day-to-day management. The Board is responsible for ensuring that the Group’s activities are soundly organised and for approving all plans and budgets for the activities of the Group. The Board approves a statement of the chief executive officer’s duties, responsibilities and authorisations.
The Board keeps itself informed about the Group’s activities and financial situation, and is under an obligation to ensure that its activities, financial statements and asset management are subject to adequate control through the review and approval of the Group’s monthly and quarterly reports and financial statements. The Board shall also ensure that the Group has satisfactory internal control systems.
The Board establishes annual plans for its work with particular emphasis on business objectives, strategy and implementation. The Board has established instructions for its own work as well as for the executive management with particular emphasis on clear allocation of responsibilities and duties.
If the chairperson of the board is or has been actively involved in a given case, for example in negotiations on mergers, acquisi-tions etc., another board director will normally lead discussions concerning that particular case.
The chief executive officer is in charge of the day-to-day management of the Group, and is responsible for ensuring that the Group is organised in accordance with applicable laws, the Company’s articles of association and the decisions adopted by the Board and the Company’s general meeting. The chief executive officer has particular responsibility for ensur-ing that the Board receives accurate, relevant
members are deemed to be independent of the company’s executive management and significant business partners. No managers are also mem-bers of the Board of Directors.
The employee-elected board members have seven deputy members. The shareholder-elected board members have one deputy member.
The members of the Board, including their CVs, are presented on the Company website. The shareholdings of Board members are listed in Note 8 in the Annual Report 2017. The Board is of the opinion that it has sufficient expertise and capacity to perform its duties in a satisfac-tory manner. Board members possess strong experience from finance, distribution and retail in general, and wine and spirits in particular.
The Board has conducted a total of nine ordinary board meetings, of which two by conference call.
Participation in the Board meetings for the present Board in 2017 is summarised below:
Name
Number of meetings attended
Michael Holm Johansen 9/9Mikael Norlander (until 3 May) 3/3Stein Erik Hagen (from 3 May) 5/6Hanne Refsholt 8/9Eilif Due 9/9Leena Maria Saarinen 9/9Ann-Beth Nina Johannesen Freuchen (from 3 May) 3/6Trond Berger 8/9Erik Hagen 8/9Kjell Arne Greni 8/9Ingrid Elisabeth Skistad 9/9Arne Larsen (deputy for Erik Hagen) 1Torbjørn Hjelle (deputy for Kjell Arne Greni) 1
and timely information in order to enable it to carry out its duties. The chief executive officer shall also ensure that the Group’s financial statements comply with Norwegian legislation and regulations and that the assets of the company are soundly managed.
The Board has elected an audit committee amongst the members of the Board. The committee currently comprises two members: Trond Berger as the chair person and Leena Maria Saarinen as member. The two members of the audit committee are independent of the Company’s largest shareholders.
Pursuant to section 6-43 of the Norwegian Public Limited Liability Companies Act, the audit committee shall:
• prepare the Board’s supervision of the Group’s financial reporting process;
• monitor the systems for internal control and risk management;
• have continuous contact with the Group’s auditor regarding the audit of the annual accounts; and
• review and monitor the independence of the Group’s auditor, including in particular the extent to which services other than auditing provided by the auditor or the audit firm represent a threat to the independence of the auditor.
The Board has established a remuneration committee that consists of two members of the Board. The members of the remuneration committee are and shall be independent of the Group’s executive management. The committee currently consists of Michael Holm Johansen as the leader and Hanne Refsholt as member.
The Company has adopted guidelines that describe the responsibility and tasks of the remuneration committee. The remuneration committee shall ensure that the Company has a remuneration scheme that contributes to
promote and grant incentives for governance of and control with the Company’s risks, counter-act a high degree of risk taking and avoid conflicts of interest.
Deviations from the Code: None
10. RISK MANAGEMENT AND INTERNAL CONTROLManagement is responsible for risk manage-ment and internal control in the Company and ensures that business opportunities are used through safe and efficient operations with reliable reporting in accordance with applicable laws and regulations, including requirements for ethics and social responsibility.
The Company has established a risk management programme where the Group’s critical risk factors are mapped out and monitored and followed up through a systematic process. The Group’s financial risk management programme is carried out by its central treasury department, in co-operation with the various business segments, under policies approved by the Board. Critical processes with instructions and guidelines for risk management are documented.
The goal of the Group’s risk management programme is to minimise potential adverse financial performance effects of these risks which result from unpredictable changes in capital markets. The Group uses to a certain extent financial derivatives to hedge against part of these financial risks.
It is the responsibility of the Board to ensure that the Company has sound internal controls in place and systems for risk manage-ment that are appropriate in relation to the extent and nature of the company’s activities. The Board conducts an annual review of the Company’s most important areas of exposure to risk, such as internal control arrangements.
Deviations from the Code: None
CORPORATE GOVERNANCE
Contents In brief Group CEO The Company Corporate Social Responsibility Directors’ Report Financial Statements and Notes Contact 40/123Corporate Governance
41 ANNUAL REPORT 2017 Arcus ASACORPORATE GOVERNANCE
Group’s policy regarding salaries and other remuneration to executive personnel, see Note 8 to the Group’s consolidated financial accounts for 2017.
Deviations from the Code: None
13. INFORMATION AND COMMUNICATIONSThe Board has established guidelines for investor communication. The Company’s objective is to ensure that the financial market and the shareholders have sufficient information about the Company to be certain that pricing reflects underlying values. Care will be taken by the Company to ensure an impartial distribution of information when dealing with shareholders and analysts.
Arcus will publish its financial calendar every year, identifying the dates on which it will present its quarterly reports, when the annual general meeting will be held and other key events.
All information considered to be relevant and significant for valuing the company’s shares will be distributed and published in English via disclosure system of the Oslo Stock Exchange, www.newsweb.no, and via the Company’s website: www.arcus.no. All financial reports and other information are prepared and disclosed in such a way as to ensure that shareholders, investors and others receive correct, clear, relevant and up-to-date information equally and in a timely manner. The Company holds public presentations of its results quarterly. The presentation material is made available via the Oslo Stock Exchange's news site, www.newsweb.no, and www.arcus.no.
The Company will publish an annual, electronic finance calendar with an overview of the dates for important events, such as the annual general meetings and publishing of interim reports. Any communication with shareholders outside the Company’s general meeting will take place in accordance with
11. REMUNERATION OF THE BOARD The remuneration of the Board is proposed by the nomination committee and decided by the shareholders at the annual general meeting of the company. The level of remuneration of the Board reflects the responsibility of the board, its expertise and the level of activity in both the Board and any Board committees. The remuneration of the Board is not linked to the Company’s performance. All members of the Board, with the exception of the chairman of the Board, receive the same remuneration. The members of the audit committee and remuneration committee receive separate, additional remuneration. The remuneration paid to members of the Board is disclosed in Note 8 to the Arcus financial statements.
Deviations from the Code: None
12. REMUNERATION OF EXECUTIVE PERSONNELThe Board has established guidelines for the remuneration of the executive personnel. These guidelines are communicated to the annual general meeting and included in the Company’s annual report.
The Board is directly responsible for determining the chief executive officer’s salary and other benefits. The chief executive officer is, in consultation with the chairman of the Board, responsible for determining the salary and other benefits for the Group’s other senior executives.
The purpose of Arcus' terms and conditions policy is to attract personnel with the competence that the Group requires, to further develop and retain employees with key expertise, and to promote a long-term perspective and continuous improvement with a view to achieving Arcus' business goals. In general, Arcus’ policy shall be competitive but not market-leading in terms of the total compensation package. For further detail of the
applicable equal treatment requirements and applicable legislation regarding inside information.
Deviations from the Code: None
14. COMPANY TAKE-OVERSThe Board has established guiding principles for how it will act in the event of a take-over offer.
In the event of a take-over bid being made for the Company, the Board will follow the overriding principle of equal treatment for all shareholders, and will seek to ensure that the Company’s business activities are not disrupted unnecessarily. The Board will strive to ensure that shareholders are given sufficient informa-tion and time to form a view of the offer.
The Board will not seek to prevent any take-over bid unless it believes that the interests of the Company and the shareholders justify such actions. The Board will not exercise mandates or pass any resolutions with the intention of obstructing any take-over bid unless this is approved by the general meeting following the announcement of the bid. There are no defence mechanisms against take-over bids in Arcus’ articles of association or in any underlying steering document. Neither has the Company implemented any measures to limit the opportunity to acquire shares in the Company.
If a take-over bid is made, the Board will issue a statement in accordance with statutory requirements and the recommendations in the Code.
In the event of a take-over bid, the Board will obtain a valuation from an independent expert.
Any transaction that is in effect a disposal of the Company’s activities will be submitted to the general meeting for its approval.
Deviations from the Code: None
15. AUDITORThe Company’s elected external auditor is EY. The auditor is independent of Arcus and is appointed by the general meeting. The auditor’s fee is approved by the general meeting.
The auditor presents a plan to the audit committee for the audit, and is present at Board meetings dealing with the preparation of the annual accounts, where the audited financial statements are reviewed and approved. The auditor is also present at all meetings with the audit committee. The auditor also participates in meetings of the Board that deal with the annual financial statements and, at least once a year, carries out a review of the company’s procedures for internal control in collaboration with the audit committee. In addition, the external auditor meets with the Board, without management being present, at least once per year.
The Board reports annually to the annual general meeting on the auditor’s overall fees, broken down between audit work and other services.
Deviations from the Code: None
CORPORATE GOVERNANCE
Contents In brief Group CEO The Company Corporate Social Responsibility Directors’ Report Financial Statements and Notes Contact 41/123Corporate Governance

42 ANNUAL REPORT 2017 Arcus ASADIRECTORS' REPORT
Group’s ambition is to pay annual dividend of around 50-70 per cent of the year’s net profit.
The consolidated financial statements of Arcus ASA are presented in accordance with IFRS (International Financial Reporting Standards).
FINANCIAL DEVELOPMENTStatement of incomeIn 2017, the Group’s total operating revenue was NOK 2,575 million (NOK 2,582 million in 2016). New customers for Vectura, as well as acquisitions, contributed positively to revenue, while sales of wine and spirits were more subdued compared to the previous year, as a consequence of low market growth and somewhat lower market shares in a few markets.
Consolidated operating costs totalled NOK 2,292 million (NOK 2,305 million). The cost decrease is mainly related to a lower cost of sales.
In 2017, the Group’s operating profit before depreciation (EBITDA) was NOK 348 million, compared with NOK 290 million in 2016. Operating EBITDA (adjusted for non-recurring
STRATEGYWithin spirits, Arcus’ key objective is to achieve growth in the core categories of aquavit and bitters. Sales in the Nordic region must be further developed, while the German market must be revitalised. Innovation is key, in terms of categories, consumer groups and occasions.
For wine, there is strong focus on winning tenders and attracting complementing agencies. Further development of own brands, primarily through Arcus Wine Brands, is also important. The opportunity for minority ownership interests must be used actively to attract skilled individuals for starting up wine companies.
Concerning distribution, there is sustained focus on cost optimisation and on increasing revenue primarily by attracting new customers.
The Group’s financial objectives, adopted in conjunction with the Group’s IPO on 1 December 2016, are firm. This requires organic growth of 3-5 per cent per annum (including minor bolt-on acquisitions) and EBITDA growth of 6-9 per cent per annum during the next three to five years. The
items) was NOK 361 million, compared with NOK 335 million in 2016. Reported operating profit of NOK 273 million includes impairment of goodwill in Excellars, acquired in 2011, at NOK 22.7 million.
The Group’s net financial items amounted to NOK -15 million (NOK -237 million). The reduction in net financial items is primarily related to the lapse of the previous year’s IPO costs and the buy-out of previous and current employees’ synthetic shares and options. In addition, the company’s interest costs were significantly lower, due to a lower debt ratio after the IPO.
The Group’s pre-tax profit was NOK 259 million (NOK 2 million).
The Group’s profit for the year after tax was NOK 188 million (NOK -24 million).
The parent company has no operating revenues. The pre-tax profit of the parent company, Arcus ASA, was NOK 48 million, compared with NOK -233 million for the previous year. The increase is mainly related to how 2016 was burdened with high costs for the IPO which
do not affect 2017, while for 2017 a Group contribution from the subsidiary Arcus-Gruppen AS of NOK 65 million was recognised, compared to 0 in 2016.
Financial position, investments and liquidityAt the end of the year, the Group had brands and goodwill of NOK 1,862 million (NOK 1,679 million). The increase is mainly related to the acquisition of the Hot n’Sweet and Vanlig brands, as well as currency adjustments concerning brands and goodwill in foreign currency.
At the close of the year, the Group had investments in fixed assets and software for NOK 359 million (NOK 381 million). In 2017, the Group invested NOK 22 million in fixed assets and software, while depreciation of NOK 44 million resulted in a lower book value at the end of 2017 compared to the end of 2016. No significant investments are expected in the coming years.
At the end of 2017, financial assets totalled NOK 60 million (NOK 58 million).
Total current assets were NOK 2,114 million, compared with NOK 2,004 million at the same time last year. Of this amount, receivables at year-end totalled NOK 1,519 million (NOK 1,426 million).
At the end of 2017, cash and bank deposits were NOK 184 million (NOK 199 million).
Group equity was NOK 1,669 million as at 31 December (NOK 1,503 million). Changes in equity are affected positively by the profit for the year, but reduced by the divided paid to minority shareholders in the Group and share-holders in the parent company. At year-end, the equity ratio was 37 per cent, compared with 35 per cent at the end of 2016.
The Group is financed through a non-current loan of NOK 749 million. In addition, the Group has debt of NOK 183 million related to financial leasing, of which NOK 17 million falls due during 2018. At year-end, the Group had drawn NOK 73 million on the facility under the Group cash
Arcus ASA is a holding company whose purpose is the import, export, production, storage and distribution of alcoholic beverages and other goods, as well as other activities related to this
business, and the ownership of interests in other companies that conduct such business. With its head office at Gjelleråsen in Nittedal Municipality, the Group is a leading wine and spirits
company in the Nordic region. The Group is a global market leader in the aquavit category, a market leader in spirits in Norway and number two in Denmark. The Group is also the market leader for
wine in Norway, number two in Sweden, and number three in Finland.
Directors’ Report
ARCUS ASADIRECTORS' REPORT
Strategy
Financial development
Statement of income
Financial position, investments and liquidity
Financial risk and risk management
Credit risk
Interest rate risk
Liquidity risk
Currency risk
About the company
Employees, working environment and sick leave
Equal opportunities
Data protection
Environment
Alcohol
Ownership
Continued operations
Events after the close of the financial year
Appropriation of profits
Future prospects
Declaration
Board of Directors
Contents In brief Group CEO The Company Corporate Social Responsibility Directors’ Report Financial Statements and Notes Contact 42/123Corporate Governance

43 ANNUAL REPORT 2017 Arcus ASADIRECTORS' REPORT
pool system. As of 31 December 2017, the Group’s total liabilities amounted to NOK 2,863 million (NOK 2,792 million), of which the interest-bearing debt amounted to 35 per cent.
Consolidated net cash flow from operating activities was NOK 200 million (NOK -2 million). The increase is affected significantly by the termination of the factoring agreement with SEB in 2016 (NOK -225 million effect on the previous year’s cash flow).
Net cash flow from investment activities was NOK -144 million (NOK -47 million). Net cash flow from investment activities is affected by the acquisition of the Vanlig and Hot n’Sweet brands.
Net cash flow from financing activities was NOK -164 million (NOK 75 million). Net cash flow from financing activities is affected by dividend payment, as well as increased ownership interests in subsidiaries with non-controlling interests.
Holdings of cash and cash equivalents were NOK 112 million (NOK 199 million). Deviations between the company’s operating profit and operating cash flow are the Group’s financial expenses, changes in working capital and tax paid during the period.
Financial risk and risk managementThe Board has adopted a financial policy, defining the framework and guidelines for financial risk management within the Group.
Arcus’ principal source of income is the core business. The main risk management strategy for the Group is to limit the financial risk created by the core business.
The most important financial risks to which the Group is exposed are associated with credit risk, interest rate risk, liquidity risk and foreign currency risk.
To a small extent, Arcus uses financial instruments to hedge interest rate and currency risks. The Group does not meet the accounting requirements for hedge accounting, and such
instruments are therefore, on initial recognition, accounted for as financial instruments at fair value, while changes in value are recognised through profit or loss.
Credit riskThe finance policy stipulates that credit risk must be assessed before establishing credit purchase agreements with new customers. The
assessment includes a review of accounting information, as well as other relevant and accessible data, to determine the credit limit and credit terms. Once a relationship has been established with a customer, credit risk and credit limits are continuously assessed in relation to the client’s financial performance and payment history. Receivables outstanding are continuously monitored by the finance
department in cooperation with the marketing departments of the individual businesses.A large proportion of the Group’s accounts receivable arise from the sale of wines and spirits to the state-owned monopoly outlets in the Nordic region. Credit risk associated with these custom-ers is considered to be non-existent. The Group’s credit risk is otherwise spread over a large number of small customers within the hotel, restaurant
DIRECTORS' REPORT
Strategy
Financial development
Statement of income
Financial position, investments and liquidity
Financial risk and risk management
Credit risk
Interest rate risk
Liquidity risk
Currency risk
About the company
Employees, working environment and sick leave
Equal opportunities
Data protection
Environment
Alcohol
Ownership
Continued operations
Events after the close of the financial year
Appropriation of profits
Future prospects
Declaration
Board of Directors
Contents In brief Group CEO The Company Corporate Social Responsibility Directors’ Report Financial Statements and Notes Contact 43/123Corporate Governance

44 ANNUAL REPORT 2017 Arcus ASADIRECTORS' REPORT
and café market, as well as a small number of distributors outside the Nordic region.
Interest rate riskThe Group is exposed to interest rate risk via financing activities (debt financing and financial leasing liabilities) and investments (bank deposits). At the end of 2017, the Group’s non-current liabilities consisted of credit facilities at SEB and financial leasing at Nordea Finans. The interest rate hedging policy entails that up to 50 per cent of the base rate on non-current loans can be hedged. At the end of 2017, none of the Group’s interest-bearing debt was hedged. The interest rate margin on credit facilities at SEB is related to the size of the Group’s net interest-bearing debt relative to EBITDA, while the agreement with Nordea Finans involves a fixed interest rate margin.
Liquidity riskLiquidity risk is the risk that the Group will not
be in a position to service its financial liabilities as they fall due. Arcus must at all times have sufficient liquidity to meet its obligations. At the same time, the aim is to minimise the Group’s surplus liquidity. The Group will work continuously to develop its financial independence, through close monitoring of income development and capital binding, and through continuous assessment of alternative sources of finance.
Arcus aims for the highest possible degree of flexibility in terms of utilising liquid assets as effectively as possible in day-to-day operations. This is achieved through a Group cash pool system with a drawing facility managed by Arcus AS.
When funds are needed for investment purposes, the Group relies on its own liquidity as far as possible. However, for larger invest-ments external debt financing from a financial institution is also used. During 2017, the Arcus Group acquired the remaining 50 per cent of the shares in the DDSK A/S Group, 100 per cent of the shares in BevCo AS, the Vanlig brand and
the Hot n’Sweet brand, and also acquired further non-controlling interests in existing subsidiaries for NOK 13 million. All of these acquisitions were financed with own liquidity and existing drawing facilities.
The Group did not raise new non-current loans in 2017, but renewed the existing financial leasing with Nordea.
Currency riskThe Group is exposed to currency risk as it operates in several countries and makes significant purchases in foreign currencies. The most significant currencies are euro, Danish krone, Swedish krona and US dollar.
The Group’s currency exposure can mainly be divided into two groups: cash flow risk and translation risk. The principal objective is to limit the effect of exchange rate fluctuations on the Group’s cash flow in Norwegian kroner. Changes in purchase costs from suppliers in functional currency, due to exchange rate fluctuations, are continuously sought to be offset by changes in customer prices and through renegotiation of purchase prices from suppliers.
The risk horizon, i.e. the time it takes to compensate for negative currency movements, is generally controlled by the price-adjustment opportunities in relation to the Nordic state monopolies. In Norway, this takes place every fourth month and in Sweden, every sixth month. As a general rule, currency is purchased in the spot market, but also to some extent in the forward market, in order to continuously offset net cash positions.
Some of the Group’s non-current borrowing is undertaken in Swedish kronor, as a natural hedging of cash flows in the form of dividends in Swedish kronor.
For reporting purposes, receivables and debt, as well as monetary items in foreign currency, are translated at the closing rates in the companies’ functional currencies. The Group’s presentation
currency is Norwegian kroner. The Group is therefore further exposed to currency risk on translating foreign subsidiaries from their functional currency to the Group’s presentation currency. This translation risk is not hedged.
ABOUT THE COMPANYArcus ASA owns all of the shares in Arcus- Gruppen AS and Vectura AS. The purpose of the company is to manage shares and other company holdings and the Group operates in the business areas of spirits, wine and distribution.
The Spirits business area imports, produces, bottles, markets and sells wine and spirits primarily in the Nordic region and Germany, but also in other selected export markets. The company also provides bottling services for associated companies.
The Wine business area imports, bottles, markets and sells wine in Norway, Sweden and Finland.
The Distribution business area distributes alcoholic beverages in the Norwegian market.
The company’s registered office is in Nittedal Municipality, Norway.
Employees, working environment and sick leaveAt year-end, the Group had 420.9 FTEs (Full Time Equivalents) distributed as 427 permanent employees, of whom 339 are employed in Norway. The parent company Arcus ASA has two employees
The Board considers the working environment and cooperation with employee representatives to be good and constructive. The co-involvement of employees is ensured at several levels of the Group. Permanent cooperation committees, consisting of employee representatives and representatives from management, have been set up in the operating companies in Norway. At these meetings, the management provides information, and engages in discussions when needed. A corporate
Norway Sweden Denmark Finland Germany TotalWomen 96 28 4 11 1 140 Men 243 26 11 7 287 Total 339 54 15 18 1 427
NUMBER OF EMPLOYEES IN THE ARCUS GROUP AS OF 31.12.2017 DISTRIBUTED BY COUNTRY
NUMBER OF EMPLOYEES IN THE ARCUS GROUP AS OF 31.12.2017 DISTRIBUTED BY BUSINESS AREA
Men Women Total Spirits 97 50 147 Wine 32 49 81 Arcus-Gruppen AS 23 14 37 Vectura AS 133 27 160 Arcus ASA 2 - 2 Total 287 140 427
DIRECTORS' REPORT
Strategy
Financial development
Statement of income
Financial position, investments and liquidity
Financial risk and risk management
Credit risk
Interest rate risk
Liquidity risk
Currency risk
About the company
Employees, working environment and sick leave
Equal opportunities
Data protection
Environment
Alcohol
Ownership
Continued operations
Events after the close of the financial year
Appropriation of profits
Future prospects
Declaration
Board of Directors
Contents In brief Group CEO The Company Corporate Social Responsibility Directors’ Report Financial Statements and Notes Contact 44/123Corporate Governance

45 ANNUAL REPORT 2017 Arcus ASADIRECTORS' REPORT
committee has also been established where the employees’ Board members and key representatives meet before each Board meeting to discuss relevant, Group-wide issues.
The Group’s operating companies work systematically with health, safety and the environment. Individual action plans are estab-lished and followed up centrally, in the business areas and in the working environment committees.
The Norwegian companies in Arcus ASA are IA (inclusive working life) companies in Norway, and work closely with the occupational health service and NAV (the Norwegian Labour and Welfare Administration) to reduce sick leave. Individual follow-up and facilitation are important tools in this work. In 2017, sick leave for Arcus-Gruppen AS with subsidiary in Norway was 4.2 per cent. The objective for 2018 is for sick leave not to exceed 4.2 per cent. In 2017, sick leave amounted to 8.9 per cent in Vectura AS. The objective for 2018 is for sick leave not to exceed 7.5 per cent. Sick leave varies between departments and business areas.
Sick leave statistics and HSE incidents are presented each month at departmental meetings and on bulletin boards, and are considered by the working environment committees.
To avoid serious injuries and incidents, it is important to have an organisation and culture that identifies hazardous conditions, registers adverse incidents and introduces corrective measures on an ongoing basis. In this respect, the operating companies in the Group have been successful Adverse incidents are reported regularly. These incidents are reported on a monthly basis to management, employees, working environment committees and safety representatives.
All injuries are investigated to discover the underlying cause, and measures are then implemented to avoid similar incidents.
In 2017, there were seven injuries resulting in absence due to illness (five in Vectura AS and
two in Arcus Norway AS). The injuries were not serious and the persons returned to work after brief periods of absence. The Group’s goal for 2018 is zero absence due to injuries.
Equal opportunitiesOf the Group’s 427 employees at year-end, 32.4 per cent were women and 67.6 per cent were men, compared with 30.0 per cent women and 70.0 per cent men in the previous year. The management groups of the operating companies all have female members. The Group Management of Arcus ASA consists of nine men.
At the end of 2017, the Board of Directors of the holding company (Arcus ASA) comprised ten Board members, of whom four were women. Three members of the Board of Directors are elected by the employees, and one of these members is a woman. The proportion of female members of the Board of Directors thereby fulfils the statutory requirements concerning female representatives on an ASA’s board of directors.
In connection with the local salary settlement in 2017 in Norway, the parties reviewed the situation concerning equal opportunities and equal pay. The parties agreed
that satisfactory consideration is made of equal pay and equal opportunities.
The Group’s goal for the operating companies is for them to be workplaces with no discrimination or harassment in any form. Both the working regulations and the ethical rules have guidelines in this respect. In addition, good reporting routines have been established.
At the end of 2017, the employees represented around 35 different languages. The Group has a stated policy, included through ethical rules, not to discriminate on the basis of gender, disability, ethnicity, religion, etc. The Board of Directors and the management groups
DIRECTORS' REPORT
Strategy
Financial development
Statement of income
Financial position, investments and liquidity
Financial risk and risk management
Credit risk
Interest rate risk
Liquidity risk
Currency risk
About the company
Employees, working environment and sick leave
Equal opportunities
Data protection
Environment
Alcohol
Ownership
Continued operations
Events after the close of the financial year
Appropriation of profits
Future prospects
Declaration
Board of Directors
Contents In brief Group CEO The Company Corporate Social Responsibility Directors’ Report Financial Statements and Notes Contact 45/123Corporate Governance

46 ANNUAL REPORT 2017 Arcus ASADIRECTORS' REPORT
of the operating companies’ consider this in relation to recruitment, appointments, salaries and working conditions, as well as through awareness-raising activities.
Data protectionOn 25 May 2018, the new EU General Data Protection Regulation (GDPR) will enter into force. The key aspects of the existing legislation are continued, with additions comprising extensive new requirements of companies which process personal data. For Arcus this entails extensive investigation and documentation work.
In 2017, Arcus commenced the work of mapping current personal data, as well as procedures, systems and documentation related to the processing of all personal data, and gap analyses, production and documentation, as well as implementation and operation. In early 2018, procedures for compliance, control and auditing will also be reviewed, so that Arcus will handle personal data protection in accordance with the new Regulation when it enters into force.
EnvironmentConsideration for the external environment is an important part of corporate social responsi-bility at Arcus. The Group’s operations affect the external environment via the production and distribution of its products. Arcus supports a precautionary approach to environmental challenges, and works systematically to reduce the impact of its activities on the external environment. As an element of Arcus’ CSR work, concrete KPIs have been set for carbon dioxide reduction and increased recirculation of waste.
AlcoholArcus takes a clear stance on responsible alcohol consumption. Our aim is to raise awareness and understanding among all of the target groups which are relevant for Arcus
about our corporate approach to alcohol and responsible consumption. This is the back-ground to the important “Think before you drink” campaign, which has been further developed since it was first launched in 2015. “Think before you drink” is both an internal and external awareness campaign, reaching all employees and all stakeholders in contact with Arcus. In 2017, Arcus ran a campaign which targeted high school graduates. The “Think before you drink” message was shared on the high school graduates’ own digital channels. At the four big parties at Tryvann in Oslo, 6,000 bottles of water were distributed to high school graduates, and it was easy for the young people to refill the bottles with water. Arcus was not identified as the originator of the initiative.
AKAN (organisation to prevent alcohol abuse at work) committees and AKAN contacts have also been established in the operating companies. This is an integrated element of the Annual Report.
The Annual Report includes a separate report on Arcus’ corporate social responsibility and organisation.
OwnershipOn 1 December 2016, Arcus ASA was listed on the Oslo Stock Exchange, and at year-end 2017/18 had 2,622 shareholders. At the close of the year, three shareholders each held more than 5 per cent of the company’s shares: Canica AS (33.3 per cent), Geveran Trading Co Ltd (9.9 per cent) and Verdipapirfondet DNB Norge (IV) (5.3 per cent). Each quarterly result has been presented to investors in Oslo and London. In addition, the result for Q1 was presented to investors in Helsinki, and the result for Q2 in Stockholm.
The Annual Report includes a separate report on Arcus’ corporate governance compliance. This is an integrated element of the Annual Report.
Continued operationsIn accordance with Section 3-3a of the Norwegian Accounting Act, it is confirmed that the company is a going concern. The basis for this lies in the long-term plans and strategic choices that have been made.
EVENTS AFTER THE CLOSE OF THE FINANCIAL YEARNo significant events have occurred after the close of the financial year, between the date of the statement of financial position and the Board of Directors’ consideration of the financial statements for 2017.
APPROPRIATION OF PROFITSThe parent company Arcus ASA reported a result for the year of NOK 31.0 million in 2017, compared with NOK -199.7 million in 2016. The Board proposes the allocation of dividend of NOK 1.66 per share, in total NOK 112.9 million, and that the profit of NOK 31.0 million be trans-ferred to other equity.
FUTURE PROSPECTSIn conjunction with the IPO, the company published its long-term growth targets, including organic revenue growth of 3-5 per cent including minor bolt-on acquisitions, and EBITDA growth of 6-9 per cent in the next three to five years. The Board continues to set these targets as the basis for the Group’s continued development.
DECLARATIONThe Board of Directors and the General Manager confirm that, to the best of their knowledge, the annual financial statements have been prepared in accordance with current accounting standards and that the information presented in the financial statements provides a true and fair view of the assets, debt, financial position and overall results of the Group. The Board of Directors and the General Manager also confirm that, to the best of their knowledge, the annual financial statements present a true and fair view of the development, results and position of the company and the Group, and a good description of the most central risk and uncertainty factors faced by the company.
Gjelleråsen 15 March 2018
Michael Holm JohansenChairman of the Board
Stein Erik Hagen Hanne Refsholt Eilif Due
Trond Berger Leena Saarinen Erik Hagen Kjell Arne Greni
Ingrid E. Skistad Ann-Beth Freuchen Kenneth HamnesGroup CEO
DIRECTORS' REPORT
Strategy
Financial development
Statement of income
Financial position, investments and liquidity
Financial risk and risk management
Credit risk
Interest rate risk
Liquidity risk
Currency risk
About the company
Employees, working environment and sick leave
Equal opportunities
Data protection
Environment
Alcohol
Ownership
Continued operations
Events after the close of the financial year
Appropriation of profits
Future prospects
Declaration
Board of Directors
Contents In brief Group CEO The Company Corporate Social Responsibility Directors’ Report Financial Statements and Notes Contact 46/123Corporate Governance

47 ANNUAL REPORT 2017 Arcus ASADIRECTORS' REPORT
BOARD OF DIRECTORS
Erik HagenBoard member
Kjell Arne GreniBoard member
Ingrid E. SkistadBoard member
Leena SaarinenBoard member
Michael Holm JohansenChairman of the Board
Eilif DueBoard member
Trond BergerBoard member
Stein Erik HagenBoard member
Hanne RefsholtBoard member
Ann-Beth FreuchenBoard member
DIRECTORS' REPORT
Strategy
Financial development
Statement of income
Financial position, investments and liquidity
Financial risk and risk management
Credit risk
Interest rate risk
Liquidity risk
Currency risk
About the company
Employees, working environment and sick leave
Equal opportunities
Data protection
Environment
Alcohol
Ownership
Continued operations
Events after the close of the financial year
Appropriation of profits
Future prospects
Declaration
Board of Directors
Contents In brief Group CEO The Company Corporate Social Responsibility Directors’ Report Financial Statements and Notes Contact 47/123Corporate Governance

48 ANNUAL REPORT 2017 Arcus ASAFINANCIAL STATEMENTS AND NOTES | Contents
Financial Statements and NotesPARENT COMPANY ACCOUNTSStatement of income 01.01.-31.12. 111Statement of financial position as at 31 December 112Statement of cash flows 01.01.-31.12. 113Accounting policies 114Notes
Note 1: Payroll costs 115Note 2: Tax 116Note 3: Subsidiaries 116Note 4: Share capital and shareholder information 117Note 5: Equity 117Note 6: Pension obligations and costs 117Note 7: Provisions for liabilities 118Note 8: Loans, pledges and guarantees, etc. 119Note 9: Intragroup receivables and liabilities 119Note 10: Cash and cash equivalents 119Note 11: Financial market risk 120Note 12: Events after the close of the financial year 120
AUDITOR'S REPORT 121
CONSOLIDATED FINANCIAL STATEMENTSStatement of income 01.01.-31.12. 49Statement of other comprehensive income 01.01.-31.12. 50Statement of financial position as at 31 December 51Statement of cash flows 01.01.-31.12. 53Statement of changes in equity 54Brief history of the Group 55Accounting policies 56Notes
Note 1: Companies in the Group 62Note 2: Management of financial risk 66Note 3: Information on cash flows 73
Note 4: Revenues 75Note 5: Segment information 77Note 6: Transactions with related parties 79Note 7: Other operating expenses 80Note 8: Salaries and other personnel costs 81Note 9: Share-based payment 84Note 10: Pension costs, assets and obligations 87Note 11: Financial income and costs 89Note 12: Tax 90Note 13: Investments in associated companies and jointly controlled entities 92Note 14: Tangible fixed assets 93Note 15: Intangible assets 94Note 16: Leasing agreements 97Note 17: Other receivables 97Note 18: Inventories 98Note 19: Cash and cash equivalents 98Note 20: Share capital and shareholder information 99Note 21: Debt to financial institutions 101Note 22: Liabilities at fair value through profit or loss 103Note 23: Other provisions for liabilities 104Note 24: Current liabilities 104Note 25: Pledges and guarantees 105Note 26 Business mergers 105Note 27 Events after the close of the financial year 106
Alternative performance measurements 107
FINANCIAL STATEMENTS & NOTES
Consolidated financial statements with notes
Statement of income 01.01.-31.12.
Statement of other comprehensive income 01.01.-31.12.
Statement of financial position as at 31 December
Statement of cash flows 01.01.-31.12.
Statement of changes in equity
Brief history of the Group
Accounting policies
Notes
Alternative performance measurements
Parent Company accounts with notes
Statement of income 01.01.-31.12.
Statement of financial position as at 31 December
Statement of cash flows 01.01.-31.12.
Accounting policies
Notes
Auditor's report
Contents In brief Group CEO The Company Corporate Social Responsibility Directors’ Report Financial Statements and Notes Contact 48/123Corporate Governance

49 ANNUAL REPORT 2017 Arcus ASAFINANCIAL STATEMENTS AND NOTES | Arcus ASA Group
Statement of income 01.01.-31.12.
CONSOLIDATED FINANCIAL STATEMENTS
Figures in NOK 1,000 Note 2017 2016
OPERATING REVENUE AND EXPENSESSales revenues 4,5 2,530,126 2,521,826Other operating revenues 4,5 44,934 60,571Total operating revenues 4,5 2,575,060 2,582,397
Net gain on sale of fixed assets 3,14,15 30 144Cost of sales 6,18 -1,408,524 -1,467,920Salaries and other personnel costs 8,9,10 -417,412 -392,545Depreciation and amortisation 14,15 -51,581 -51,625Write-downs 14,15 -22,700 0Other operating expenses 6,7,16 -391,699 -392,516Share of profit from associated companies and jointly controlled entities 13 3,286 5,789Operating profit before other income and expenses 286,460 283,724
Other income and expenses 7, APM -13,167 -44,874Operating profit 273,293 238,850
Figures in NOK 1,000 Note 2017 2016
FINANCIAL INCOME AND EXPENSESInterest income 11 6,654 7,944Other financial income 11,22 19,243 10,419Interest costs 11 -31,475 -70,414Other financial costs 11,22 -8,965 -184,677Net financial profit/loss -14,543 -236,728
PRE-TAX PROFIT 258,750 2,122
Tax 12 -70,528 -26,211
Profit for the year 188,222 -24,089The profit for the year is allocated toNon-controlling interests 1 6,944 10,480Parent company shareholders 181,278 -34,569
188,222 -24,089
Earnings per share (NOK)Earnings per share 20 2.66 -0.67Diluted earnings per share 20 2.62 -0.67
CONSOLIDATED FINANCIAL STATEMENTS WITH NOTES
Statement of income 01.01.-31.12.
Statement of other comprehensive income 01.01.-31.12.
Statement of financial position as at 31 December
Statement of cash flows 01.01.-31.12.
Statement of changes in equity
Brief history of the Group
Accounting policies
Notes
Note 1: Companies in the Group
Note 2: Management of financial risk
Note 3: Information on cash flows
Note 4: Revenues
Note 5: Segment information
Note 6: Transactions with related parties
Note 7: Other operating expenses
Note 8: Salaries and other personnel costs
Note 9: Share-based payment
Note 10: Pension costs, assets and obligations
Note 11: Financial income and costs
Note 12: Tax
Note 13: Investments in associated companies and jointly controlled entities
Note 14: Tangible fixed assets
Note 15: Intangible assets
Note 16: Leasing agreements
Note 17: Other receivables
Note 18: Inventories
Note 19: Cash and cash equivalents
Note 20: Share capital and shareholder information
Note 21: Debt to financial institutions
Note 22: Liabilities at fair value through profit or loss
Note 23: Other provisions for liabilities
Note 24: Current liabilities
Note 25: Pledges and guarantees
Note 26 Business mergers
Note 27 Events after the close of the financial year
Alternative performance measurements
Auditor's report
Contents In brief Group CEO The Company Corporate Social Responsibility Directors’ Report Financial Statements and Notes Contact 49/123Corporate Governance

50 ANNUAL REPORT 2017 Arcus ASAFINANCIAL STATEMENTS AND NOTES | Arcus ASA Group
Statement of other comprehensive income 01.01.-31.12.Figures in NOK 1,000 Note 2017 2016
Profit for the year 188,222 -24,089
Items that will not be reclassified against the statement of income:Estimate deviations, pensions 10 4,439 -1,278Total items that will not be reclassified against the statement of income, before tax 4,439 -1,278
Tax on items that will not be reclassified against the statement of income 12 -1,065 320Total items that will not be reclassified against the statement of income, after tax 3,374 -959
Items that may be reclassified against the statement of income:Translation differences on translation of foreign subsidiaries 73,207 -39,242Total items that may be reclassified against the statement of income, before tax 73,207 -39,242
Tax on items that may be reclassified against the statement of income 0 0Total items that may be reclassified against the statement of income, after tax 73,207 -39,242
TOTAL OTHER COMPREHENSIVE INCOME 76,581 -40,201
TOTAL COMPREHENSIVE INCOME FOR THE YEAR 264,803 -64,290
The total comprehensive income for the year is allocated as followNon-controlling interests 8,127 7,703Parent company shareholders 256,676 -71,993TOTAL COMPREHENSIVE INCOME FOR THE YEAR 264,803 -64,290
Total comprehensive income per share (NOK)Earnings per share 20 3.77 -1.40Diluted earnings per share 20 3.70 -1.40
CONSOLIDATED FINANCIAL STATEMENTS WITH NOTES
Statement of income 01.01.-31.12.
Statement of other comprehensive income 01.01.-31.12.
Statement of financial position as at 31 December
Statement of cash flows 01.01.-31.12.
Statement of changes in equity
Brief history of the Group
Accounting policies
Notes
Note 1: Companies in the Group
Note 2: Management of financial risk
Note 3: Information on cash flows
Note 4: Revenues
Note 5: Segment information
Note 6: Transactions with related parties
Note 7: Other operating expenses
Note 8: Salaries and other personnel costs
Note 9: Share-based payment
Note 10: Pension costs, assets and obligations
Note 11: Financial income and costs
Note 12: Tax
Note 13: Investments in associated companies and jointly controlled entities
Note 14: Tangible fixed assets
Note 15: Intangible assets
Note 16: Leasing agreements
Note 17: Other receivables
Note 18: Inventories
Note 19: Cash and cash equivalents
Note 20: Share capital and shareholder information
Note 21: Debt to financial institutions
Note 22: Liabilities at fair value through profit or loss
Note 23: Other provisions for liabilities
Note 24: Current liabilities
Note 25: Pledges and guarantees
Note 26 Business mergers
Note 27 Events after the close of the financial year
Alternative performance measurements
Auditor's report
Contents In brief Group CEO The Company Corporate Social Responsibility Directors’ Report Financial Statements and Notes Contact 50/123Corporate Governance

51 ANNUAL REPORT 2017 Arcus ASAFINANCIAL STATEMENTS AND NOTES | Arcus ASA Group
Statement of financial position as at 31 DecemberFigures in NOK 1,000 Note 2017 2016
ASSETSFixed assetsIntangible assetsGoodwill 15 1,042,596 1,010,176Brands 15 819,702 669,237Software 15 29,151 30,651Total intangible assets 1,891,449 1,710,064
Tangible assetsMachinery and equipment 14 304,534 326,049Fixtures and fittings, tools, office equipment etc. 14 19,614 21,454Assets under construction 14 5,678 2,732Total tangible assets 329,826 350,235
Deferred tax assets 12 136,786 172,120
Financial assetsInvestments in associated companies and jointly controlled entities
13 58,670 56,811
Other investments in shares 200 200Other non-current receivables 17 1,205 1,235Total financial assets 60,075 58,246
Total fixed assets 2,418,136 2,290,665
Figures in NOK 1,000 Note 2017 2016
Current assetsInventories 18 410,759 378,777
ReceivablesTrade receivables 2 1,432,164 1,344,067Prepayments to suppliers 17 64,570 62,810Other receivables 12,17 22,325 19,112Total receivables 1,519,059 1,425,989
Bank deposits 2,19 184,415 199,385Cash and cash equivalents 184,415 199,385 Total current assets 2,114,233 2,004,151
TOTAL ASSETS 4,532,369 4,294,816
CONSOLIDATED FINANCIAL STATEMENTS WITH NOTES
Statement of income 01.01.-31.12.
Statement of other comprehensive income 01.01.-31.12.
Statement of financial position as at 31 December
Statement of cash flows 01.01.-31.12.
Statement of changes in equity
Brief history of the Group
Accounting policies
Notes
Note 1: Companies in the Group
Note 2: Management of financial risk
Note 3: Information on cash flows
Note 4: Revenues
Note 5: Segment information
Note 6: Transactions with related parties
Note 7: Other operating expenses
Note 8: Salaries and other personnel costs
Note 9: Share-based payment
Note 10: Pension costs, assets and obligations
Note 11: Financial income and costs
Note 12: Tax
Note 13: Investments in associated companies and jointly controlled entities
Note 14: Tangible fixed assets
Note 15: Intangible assets
Note 16: Leasing agreements
Note 17: Other receivables
Note 18: Inventories
Note 19: Cash and cash equivalents
Note 20: Share capital and shareholder information
Note 21: Debt to financial institutions
Note 22: Liabilities at fair value through profit or loss
Note 23: Other provisions for liabilities
Note 24: Current liabilities
Note 25: Pledges and guarantees
Note 26 Business mergers
Note 27 Events after the close of the financial year
Alternative performance measurements
Auditor's report
Contents In brief Group CEO The Company Corporate Social Responsibility Directors’ Report Financial Statements and Notes Contact 51/123Corporate Governance
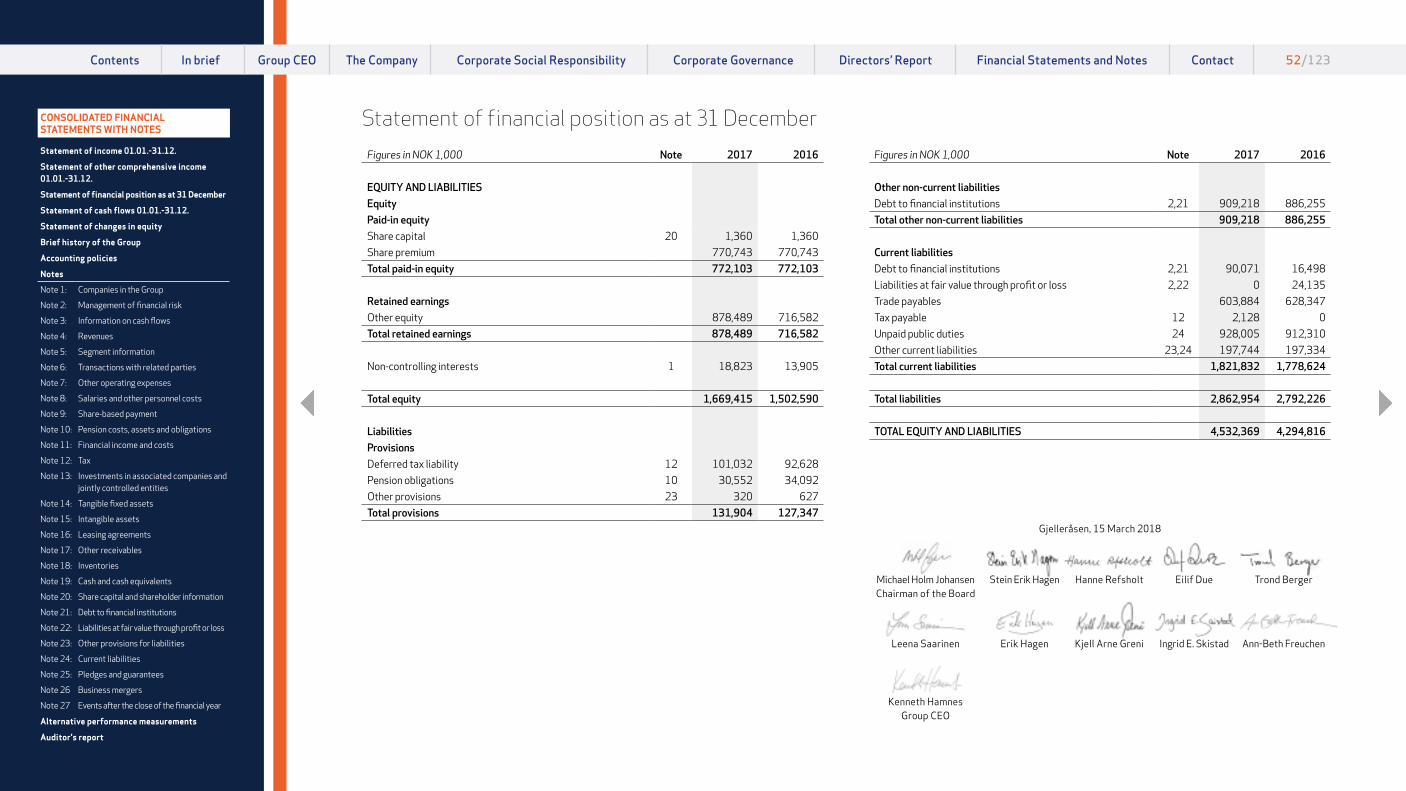
52 ANNUAL REPORT 2017 Arcus ASAFINANCIAL STATEMENTS AND NOTES | Arcus ASA Group
Gjelleråsen, 15 March 2018
Michael Holm JohansenChairman of the Board
Stein Erik Hagen Hanne Refsholt Eilif Due Trond Berger
Leena Saarinen Erik Hagen Kjell Arne Greni Ingrid E. Skistad Ann-Beth Freuchen
Kenneth HamnesGroup CEO
Statement of financial position as at 31 DecemberFigures in NOK 1,000 Note 2017 2016
EQUITY AND LIABILITIESEquityPaid-in equityShare capital 20 1,360 1,360Share premium 770,743 770,743Total paid-in equity 772,103 772,103
Retained earningsOther equity 878,489 716,582Total retained earnings 878,489 716,582
Non-controlling interests 1 18,823 13,905
Total equity 1,669,415 1,502,590
LiabilitiesProvisionsDeferred tax liability 12 101,032 92,628Pension obligations 10 30,552 34,092Other provisions 23 320 627Total provisions 131,904 127,347
Figures in NOK 1,000 Note 2017 2016
Other non-current liabilitiesDebt to financial institutions 2,21 909,218 886,255Total other non-current liabilities 909,218 886,255
Current liabilitiesDebt to financial institutions 2,21 90,071 16,498Liabilities at fair value through profit or loss 2,22 0 24,135Trade payables 603,884 628,347Tax payable 12 2,128 0Unpaid public duties 24 928,005 912,310Other current liabilities 23,24 197,744 197,334Total current liabilities 1,821,832 1,778,624
Total liabilities 2,862,954 2,792,226
TOTAL EQUITY AND LIABILITIES 4,532,369 4,294,816
CONSOLIDATED FINANCIAL STATEMENTS WITH NOTES
Statement of income 01.01.-31.12.
Statement of other comprehensive income 01.01.-31.12.
Statement of financial position as at 31 December
Statement of cash flows 01.01.-31.12.
Statement of changes in equity
Brief history of the Group
Accounting policies
Notes
Note 1: Companies in the Group
Note 2: Management of financial risk
Note 3: Information on cash flows
Note 4: Revenues
Note 5: Segment information
Note 6: Transactions with related parties
Note 7: Other operating expenses
Note 8: Salaries and other personnel costs
Note 9: Share-based payment
Note 10: Pension costs, assets and obligations
Note 11: Financial income and costs
Note 12: Tax
Note 13: Investments in associated companies and jointly controlled entities
Note 14: Tangible fixed assets
Note 15: Intangible assets
Note 16: Leasing agreements
Note 17: Other receivables
Note 18: Inventories
Note 19: Cash and cash equivalents
Note 20: Share capital and shareholder information
Note 21: Debt to financial institutions
Note 22: Liabilities at fair value through profit or loss
Note 23: Other provisions for liabilities
Note 24: Current liabilities
Note 25: Pledges and guarantees
Note 26 Business mergers
Note 27 Events after the close of the financial year
Alternative performance measurements
Auditor's report
Contents In brief Group CEO The Company Corporate Social Responsibility Directors’ Report Financial Statements and Notes Contact 52/123Corporate Governance

53 ANNUAL REPORT 2017 Arcus ASAFINANCIAL STATEMENTS AND NOTES | Arcus ASA Group
Statement of cash flows 01.01. -31.12.Figures in NOK 1,000 Note 2017 2016
CASH FLOWS FROM OPERATIONSPre-tax profit 258,750 2,122Depreciation and amortisation 14,15 74,281 51,625Share of profit from associated companies and jointly controlled entities 13 -3,286 -5,789Dividends received from associated companies and jointly controlled entities 13 0 2,947Taxes paid 12 -33,221 -46,711Interest costs during the period 31,475 70,414Pension costs and other provisions without cash effect 3 591 -3,601Value changes and other costs without cash effect 3 -4,444 164,974Profit/loss on sale of fixed assets and intangible fixed assets 3 -30 -1,051Unrealised agio 3 19,195 -15,964Change in inventories 3,18 -31,781 9,440Change in trade receivables 3 -43,939 -340,739Change in trade payables 3 -45,437 76,890Change in other current assets and other liabilities 3 -22,256 33,491Net cash flows from operational activities 199,898 -1,952
CASH FLOWS FROM INVESTMENT ACTIVITIESPayments on acquisition of intangible fixed assets 15 -124,820 -36,429Payments on purchase of tangible fixed assets 14 -15,894 -11,379Proceeds from sale of tangible fixed assets 3,14 30 1,060Payments on acquisition of business 26 -2,752 0Payment of loans to minority interests 0 -810Payments on acquisition of other financial investments 3 -454 0Net cash flow from investment activities -143,890 -47,558
Figures in NOK 1,000 Note 2017 2016
CASH FLOWS FROM FINANCING ACTIVITIESProceeds - incentive programme 22 0 1,000Payments - incentive programme 22 0 -158,316Capital increase 0 768,883Proceeds from non-current interest-bearing debt to financial institutions 2,21 0 802,632Repayment of non-current interest-bearing debt to financial institutions 2,21 -15,719 -1,081,048Change in other non-current loans 0 -246Change in overdraft facility 72,700 0Interest cost paid during the period 3 -31,454 -83,031Payments for acquisition of non-controlling interests -12,913 -146,325Payments of dividends/Group contributions 1,3 -103,515 -28,260Net cash flow from financing activities -90,901 75,289
Effect of exchange rate fluctuations on cash and cash equivalents 19,923 -16,813Effect of exchange rate fluctuations on cash and cash equivalents 19,923 -16,813
Net change in cash and cash equivalents -14,970 8,966Holdings of cash and cash equivalents as at 01.01 199,385 190,419Holdings of cash and cash equivalents as at 31.12. 19 184,415 199,385
CONSOLIDATED FINANCIAL STATEMENTS WITH NOTES
Statement of income 01.01.-31.12.
Statement of other comprehensive income 01.01.-31.12.
Statement of financial position as at 31 December
Statement of cash flows 01.01.-31.12.
Statement of changes in equity
Brief history of the Group
Accounting policies
Notes
Note 1: Companies in the Group
Note 2: Management of financial risk
Note 3: Information on cash flows
Note 4: Revenues
Note 5: Segment information
Note 6: Transactions with related parties
Note 7: Other operating expenses
Note 8: Salaries and other personnel costs
Note 9: Share-based payment
Note 10: Pension costs, assets and obligations
Note 11: Financial income and costs
Note 12: Tax
Note 13: Investments in associated companies and jointly controlled entities
Note 14: Tangible fixed assets
Note 15: Intangible assets
Note 16: Leasing agreements
Note 17: Other receivables
Note 18: Inventories
Note 19: Cash and cash equivalents
Note 20: Share capital and shareholder information
Note 21: Debt to financial institutions
Note 22: Liabilities at fair value through profit or loss
Note 23: Other provisions for liabilities
Note 24: Current liabilities
Note 25: Pledges and guarantees
Note 26 Business mergers
Note 27 Events after the close of the financial year
Alternative performance measurements
Auditor's report
Contents In brief Group CEO The Company Corporate Social Responsibility Directors’ Report Financial Statements and Notes Contact 53/123Corporate Governance
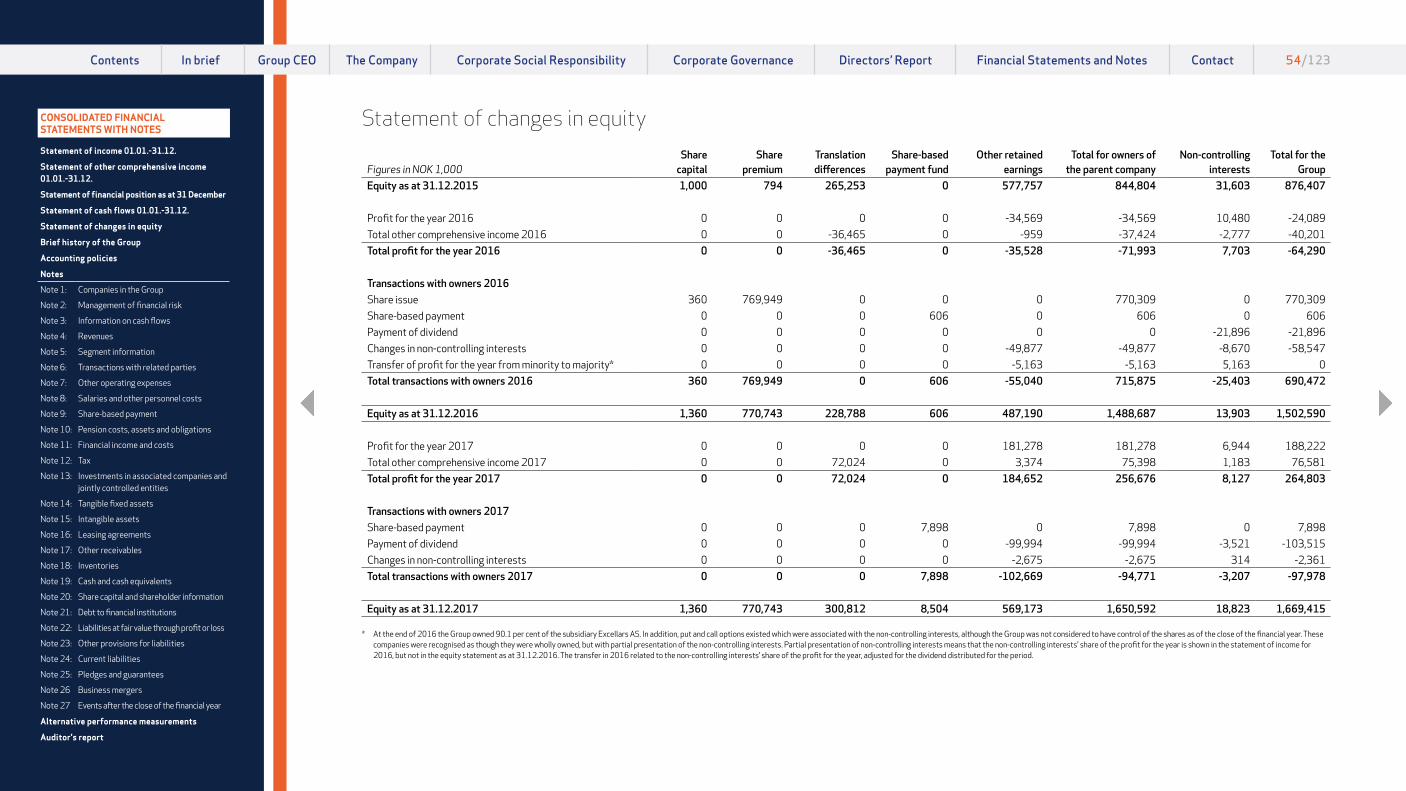
54 ANNUAL REPORT 2017 Arcus ASAFINANCIAL STATEMENTS AND NOTES | Arcus ASA Group
Statement of changes in equity
Figures in NOK 1,000Share
capitalShare
premium Translationdifferences
Share-based payment fund
Other retained earnings
Total for owners of the parent company
Non-controlling interests
Total for the Group
Equity as at 31.12.2015 1,000 794 265,253 0 577,757 844,804 31,603 876,407
Profit for the year 2016 0 0 0 0 -34,569 -34,569 10,480 -24,089Total other comprehensive income 2016 0 0 -36,465 0 -959 -37,424 -2,777 -40,201Total profit for the year 2016 0 0 -36,465 0 -35,528 -71,993 7,703 -64,290
Transactions with owners 2016Share issue 360 769,949 0 0 0 770,309 0 770,309Share-based payment 0 0 0 606 0 606 0 606Payment of dividend 0 0 0 0 0 0 -21,896 -21,896Changes in non-controlling interests 0 0 0 0 -49,877 -49,877 -8,670 -58,547Transfer of profit for the year from minority to majority* 0 0 0 0 -5,163 -5,163 5,163 0Total transactions with owners 2016 360 769,949 0 606 -55,040 715,875 -25,403 690,472
Equity as at 31.12.2016 1,360 770,743 228,788 606 487,190 1,488,687 13,903 1,502,590
Profit for the year 2017 0 0 0 0 181,278 181,278 6,944 188,222Total other comprehensive income 2017 0 0 72,024 0 3,374 75,398 1,183 76,581Total profit for the year 2017 0 0 72,024 0 184,652 256,676 8,127 264,803
Transactions with owners 2017Share-based payment 0 0 0 7,898 0 7,898 0 7,898Payment of dividend 0 0 0 0 -99,994 -99,994 -3,521 -103,515Changes in non-controlling interests 0 0 0 0 -2,675 -2,675 314 -2,361Total transactions with owners 2017 0 0 0 7,898 -102,669 -94,771 -3,207 -97,978
Equity as at 31.12.2017 1,360 770,743 300,812 8,504 569,173 1,650,592 18,823 1,669,415
* At the end of 2016 the Group owned 90.1 per cent of the subsidiary Excellars AS. In addition, put and call options existed which were associated with the non-controlling interests, although the Group was not considered to have control of the shares as of the close of the financial year. These companies were recognised as though they were wholly owned, but with partial presentation of the non-controlling interests. Partial presentation of non-controlling interests means that the non-controlling interests' share of the profit for the year is shown in the statement of income for 2016, but not in the equity statement as at 31.12.2016. The transfer in 2016 related to the non-controlling interests’ share of the profit for the year, adjusted for the dividend distributed for the period.
CONSOLIDATED FINANCIAL STATEMENTS WITH NOTES
Statement of income 01.01.-31.12.
Statement of other comprehensive income 01.01.-31.12.
Statement of financial position as at 31 December
Statement of cash flows 01.01.-31.12.
Statement of changes in equity
Brief history of the Group
Accounting policies
Notes
Note 1: Companies in the Group
Note 2: Management of financial risk
Note 3: Information on cash flows
Note 4: Revenues
Note 5: Segment information
Note 6: Transactions with related parties
Note 7: Other operating expenses
Note 8: Salaries and other personnel costs
Note 9: Share-based payment
Note 10: Pension costs, assets and obligations
Note 11: Financial income and costs
Note 12: Tax
Note 13: Investments in associated companies and jointly controlled entities
Note 14: Tangible fixed assets
Note 15: Intangible assets
Note 16: Leasing agreements
Note 17: Other receivables
Note 18: Inventories
Note 19: Cash and cash equivalents
Note 20: Share capital and shareholder information
Note 21: Debt to financial institutions
Note 22: Liabilities at fair value through profit or loss
Note 23: Other provisions for liabilities
Note 24: Current liabilities
Note 25: Pledges and guarantees
Note 26 Business mergers
Note 27 Events after the close of the financial year
Alternative performance measurements
Auditor's report
Contents In brief Group CEO The Company Corporate Social Responsibility Directors’ Report Financial Statements and Notes Contact 54/123Corporate Governance

55 ANNUAL REPORT 2017 Arcus ASAFINANCIAL STATEMENTS AND NOTES | Arcus ASA Group
Brief history of the GroupArcus ASA is registered and domiciled in Norway, and located at Destilleriveien 11 in Gjelleråsen in Nittedal Municipality, just north of Oslo. The consolidated financial statements include the parent company and subsidiaries (together referred to as "Arcus" or the "Group", and individually as a "Group company"), as well as the Group’s holdings in associated companies. The Group’s principal activity is the import, production, marketing, sale and distribution of wine and spirits.
Historical developmentThe Group has carried out the following important transactions in recent years: 2017• In January, the Group acquired the remaining 50 per cent interest in Det Danske Spiritus Kompagni A/S.
Det Danske Spiritus Kompagni A/S thereby became a wholly-owned subsidiary in the Group's spirits activities.
• In January, the Group established Vingruppen Finland Oy, as a wholly-owned subsidiary of Vingruppen i Norden AB.
• In February, the Group acquired the remaining 9.9 per cent interest in Excellars AS. Excellars AS thereby became a wholly-owned subsidiary in the Group's wine activities.
• In June, the Group increased its ownership of Valid Wines Sweden AB from 97.0 per cent to 100.0 per cent by the subsidiary Vingruppen i Norden AB's acquisition of additional minority shares. At the same time, the Group sold 16.9 per cent of the shares to the company's general manager, so that after the transaction the Group has an ownership interest of 83.1 per cent in Valid Wines Sweden AB.
• In September, the Group acquired 100 per cent of the shares in the Norwegian company BevCo AS, which as from the same date is part of the Group's spirits activities. Among other things, the company has the distribution rights for Dooley’s Toffee in Norway.
• In October, the Group acquired the Vanlig brand, which comprises a vodka and a gin product. The Group took over sales of this product as from the same date, while production was taken over during Q1 2018.
• In December, the Group acquired the Hot n’Sweet brand, which is a vodka shot. The Group took over sales of this product as from 1 January 2018, while production was taken over during Q1 2018.
2016• In February, the Group increased its ownership of Excellars AS from 51.0 per cent to 90.1 per cent by
the subsidiary Vingruppen AS' acquisition of minority shares.• In February, the Group increased its ownership of Wineagency Sweden AB from 80.0 per cent to 90.0
per cent by the subsidiary Vingruppen i Norden AB's acquisition of additional minority shares.• In July, the Group increased its ownership of Wineworld Sweden AB from 80.0 per cent to 90.0 per
cent by the subsidiary Vingruppen i Norden AB's acquisition of additional minority shares.• In August, the Group acquired the Dworek vodka brand.• In December, the Group increased its ownership of Vingruppen i Norden AB from 99.37 per cent to 100.0
per cent by the subsidiary VinGruppen Sweden Holding AB's acquisition of the remaining minority shares.• Arcus-Gruppen Holding AS was restructured as a public limited liability company and changed its name
to Arcus ASA, before the company's listing on the Oslo Stock Exchange on 1 December.
2015• In February, acquired the aquavit brand Snälleröds in Sweden.• In April, acquired the wine activity from Fondberg in Finland. Changed the name of the company to
Social Wines Oy.• In September, acquired 70 per cent of the shares in a recently-founded Norwegian wine company,
Heyday Wines AS.• In Q4, reorganised the ownership of Vingruppen i Norden AB, by selling the shares to a newly-
established wholly-owned holding company in Sweden called VinGruppen Sweden Holding AB.• Discontinued production in Aalborg and moved the production and bottling of the Danish brands
(Aalborg Aquavit, Malteserkreutz and Gammel Dansk) to customised facilities at Gjelleråsen.
2014• Established Vingruppen AS as the new holding structure for the wine business in Norway.
2013• In January, acquired all the shares in Arcus Denmark A/S from Pernod Ricard, which included the
Aalborg Aquavit and Gammel Dansk brands, and all the shares in Arcus Deutschland GmbH, which owns the Malteserkreutz brand.
2012• Completed the new production and distribution facility and head office at Gjelleråsen, and moved the
business there.
2011• Acquired 28.2 per cent of the shares in Vingruppen i Norden AB, increasing the holding from 62.5 per
cent to 90.7 per cent. At the same time, entered into an option agreement for the remaining 9.3 per cent. • Acquired 51 per cent of the shares in Excellars AS, with an option for the remaining 49 per cent. • Swapped 34 per cent of the shares in SAS de L’île Madame for 32.6 per cent of the shares in Tiffon SA.
Acquired a further 106 shares and increased the holding in Tiffon SA to 34 per cent.
2010• Implemented an agreement on sale of Gjelleråsen Prosjekt 1 AS.• Started construction of a new production and distribution facility and head office at Gjelleråsen.
2009• Acquired the brands Star Gin, Red Port and Dry Anise from Pernod Ricard. • Acquired 80 per cent of the company Symposium Wines AS.
2008• Acquired Gjelleråsen Prosjekt 1 AS, which included the site of the new operating location at Gjelleråsen in
Nittedal Municipality north of Oslo.
CONSOLIDATED FINANCIAL STATEMENTS WITH NOTES
Statement of income 01.01.-31.12.
Statement of other comprehensive income 01.01.-31.12.
Statement of financial position as at 31 December
Statement of cash flows 01.01.-31.12.
Statement of changes in equity
Brief history of the Group
Accounting policies
Notes
Note 1: Companies in the Group
Note 2: Management of financial risk
Note 3: Information on cash flows
Note 4: Revenues
Note 5: Segment information
Note 6: Transactions with related parties
Note 7: Other operating expenses
Note 8: Salaries and other personnel costs
Note 9: Share-based payment
Note 10: Pension costs, assets and obligations
Note 11: Financial income and costs
Note 12: Tax
Note 13: Investments in associated companies and jointly controlled entities
Note 14: Tangible fixed assets
Note 15: Intangible assets
Note 16: Leasing agreements
Note 17: Other receivables
Note 18: Inventories
Note 19: Cash and cash equivalents
Note 20: Share capital and shareholder information
Note 21: Debt to financial institutions
Note 22: Liabilities at fair value through profit or loss
Note 23: Other provisions for liabilities
Note 24: Current liabilities
Note 25: Pledges and guarantees
Note 26 Business mergers
Note 27 Events after the close of the financial year
Alternative performance measurements
Auditor's report
Contents In brief Group CEO The Company Corporate Social Responsibility Directors’ Report Financial Statements and Notes Contact 55/123Corporate Governance

56 ANNUAL REPORT 2017 Arcus ASAFINANCIAL STATEMENTS AND NOTES | Arcus ASA Group
Accounting policiesThe consolidated financial statements for 2017, including comparative information, have been prepared in accordance with IFRS applicable as at 31 December 2017, and as described in the note on the accounting policies. Applicable IFRS have been applied retrospectively.
The annual financial statements were adopted by the Board of Directors on 15 March 2018. The Group’s head office is located at Gjelleråsen in Nittedal Municipality and the core activities are the production, sale and distribution of alcoholic beverages. The Group’s domestic market is the Nordic region, but the Group also has sales to other countries, mainly Germany and the USA.
Arcus ASA is listed on the Oslo Stock Exchange. The price on 31.12.2017 was NOK 46.50 per share, compared to NOK 44.50 per share at the end of 2016.
NEW ACCOUNTING STANDARDSNo changes which have significantly affected the Group’s financial statements have been made to the framework conditions from IFRS in the current year. The most important changes to the accounting standards that will affect the Group in the future are presented below.
Adopted IFRS and IFRIC with future effective dates:The standards and interpretations adopted up to the date of presentation of the consolidated financial statements, but where the effective date is in the future, are shown below. The Group’s intention is to implement the relevant changes on the effective date, on the assumption that the EU approves the changes before the presentation of the consolidated financial statements.
CHANGES RELEVANT TO THE ARCUS GROUP:IFRS 9 Financial instruments In July 2014, the IASB published the final subproject of IFRS 9 and the standard has now been finalised. IFRS 9 includes changes related to classification and measurement, hedge accounting and impairment IFRS 9 will replace IAS 39 Financial Instruments – Recognition and Measurement. The parts of IAS 39 that were not changed as part of this project were transferred and included in IFRS 9.
The standard will be implemented retrospectively, with the exception of hedge accounting, although the preparation of comparative figures is not a requirement. The rules for hedge accounting will mainly be implemented prospectively, with a few exceptions. The Group has no plans for the early implementation of the standard. The new standard will apply with effect from reporting years beginning on 1 January 2018 or later.
The new standard is not expected to have any material impact on the Group’s financial reporting, but may affect the Group’s classification and measurement of financial assets and liabilities.
IFRS 15 Revenue recognition IASB has released a new standard for revenue recognition, IFRS 15 Revenue from Contracts with Customers. The standard replaces all existing standards and interpretations for revenue recognition. The core principle of IFRS 15 is that revenue is recognised in order to reflect the transfer of agreed goods or services to customers, and at an amount that reflects the consideration the company expects to be entitled to in exchange for these goods or services
The standard applies, with a few exceptions, to all revenue-generating contracts with customers and
includes a model for recognition and measurement of the sale of individual non-financial assets. IFRS 15 will be implemented using either a fully retro-spective or a modified method. The new standard will apply with effect from reporting years beginning on 1 January 2018 or later.
In 2017, the Group undertook an analysis of its income recognition principles and assessed the changes that are necessary due to the implementation of IFRS 15 as from 1 January 2018. The key aspects of these assessments were the time of revenue recognition of our products, classification of dis-counts, annual bonuses, market support and outbound shipping, and an agent/principal assessment concerning net or gross recognition of revenue.
The analysis did not reveal significant changes from existing principles, apart from the book entry of outbound shipping. Up to and including 2017, the Group has booked outbound shipping as a reduction of revenue. Based on an assessment of the agent/principal principle, the Group assesses that as from 1 January 2018, the costs of outbound shipping must be presented on a gross basis, as a cost under other indirect costs. The Group plans to include all effects of the new standard at the time of its first application in 2018, and this will entail changes to the statement of income, and to some extent also to the Revenue note and Segment note. This will increase the Group’s reported revenue by an amount of around NOK 30-50 million. The chan-ge will not affect the Group’s reported EBITDA.
IFRS 16 LeasesIFRS 16 Leases replaces the existing IFRS standard for leases, IAS 17 Leases. IFRS 16 sets out principles for recognition, measurement, presentation and disclosure of leasing agreements for both parties to a leasing agreement, i.e., the customer (lessee)
and provider (lessor). The new standard requires the lessee to recognise the assets and liabilities of most leasing agreements, which is a significant change from current principles. The standard comes into force on 1 January 2019, but has not yet been approved by the EU. The new standard will apply with effect from reporting years beginning on 1 January 2019 or later.
New IFRS 16 concerning leases will entail a significant change to the accounting policy related to leasing costs. As from financial years commencing in 2019, all significant leasing agreements must be capitalised. This will give an intangible right on the asset side and an equivalent liability on the debt side.
On the implementation of IFRS 16, the Group has two options: the full retrospective method or the modified retrospective method. The difference between the two methods is that the full retro-spective method calculates the effects of the new standard related to the share of the lease contracts which has already accrued as of the date of imple-mentation. This means that if the lease contract was signed on 1.1.2016 and the standard was implemented on 1.1.2019, the effects from the first three years must be booked to equity as from 1 January in the comparison year. If the Group chooses the modified retrospective method, the effects are only calculated as from the implemen-tation date, and there is no adjustment in relation to equity. The full retrospective method has a lower effect on the statement of financial position and equivalently lower future depreciation than the modified retrospective method, but has a negative equity effect as of the implementation date.
At the end of 2017, the Group made a calculation based on the Group’s existing leasing agreements. The estimate shows that if IFRS 16 had been implemented as of 31.12.2017, the Group would
CONSOLIDATED FINANCIAL STATEMENTS WITH NOTES
Statement of income 01.01.-31.12.
Statement of other comprehensive income 01.01.-31.12.
Statement of financial position as at 31 December
Statement of cash flows 01.01.-31.12.
Statement of changes in equity
Brief history of the Group
Accounting policies
Notes
Note 1: Companies in the Group
Note 2: Management of financial risk
Note 3: Information on cash flows
Note 4: Revenues
Note 5: Segment information
Note 6: Transactions with related parties
Note 7: Other operating expenses
Note 8: Salaries and other personnel costs
Note 9: Share-based payment
Note 10: Pension costs, assets and obligations
Note 11: Financial income and costs
Note 12: Tax
Note 13: Investments in associated companies and jointly controlled entities
Note 14: Tangible fixed assets
Note 15: Intangible assets
Note 16: Leasing agreements
Note 17: Other receivables
Note 18: Inventories
Note 19: Cash and cash equivalents
Note 20: Share capital and shareholder information
Note 21: Debt to financial institutions
Note 22: Liabilities at fair value through profit or loss
Note 23: Other provisions for liabilities
Note 24: Current liabilities
Note 25: Pledges and guarantees
Note 26 Business mergers
Note 27 Events after the close of the financial year
Alternative performance measurements
Auditor's report
Contents In brief Group CEO The Company Corporate Social Responsibility Directors’ Report Financial Statements and Notes Contact 56/123Corporate Governance

57 ANNUAL REPORT 2017 Arcus ASAFINANCIAL STATEMENTS AND NOTES | Arcus ASA Group
have had an effect on the statement of financial position of between NOK 1,050 and 1,150 million, depending on the method chosen. The negative equity effect on choosing the full retrospective method would have been NOK 108 million. Based on the estimate, the future effect on the result would have shown lower operating costs of NOK 91 million, which would give equivalently higher EBITDA. Depreciation and amortisation would have been NOK 58-65 million higher, which would have given net EBIT that was NOK 25-32 million higher in the first financial year after implementation than without IFRS 16 implementation. Calculated interest costs of NOK 44 million would have led to a pre-tax profit NOK 12-19 million lower than without IFRS 16 implementation, in the first year after implementation.
On the introduction of IFRS 16 Leases as from 2019, the Group’s reported net interest-bearing debt and adjusted EBITDA will change significantly. The loan agreement with SEB specifies that the loan terms must be calculated according to today’s model, independently of the introduction of IFRS 16, so that the Group’s ability to fulfil the loan terms will not be affected by the introduction of IFRS 16.
Other changesOther changes resulting from new standards that have yet to come into effect will not influence or have any significant effect on the consolidated financial statements.
ACCOUNTING POLICIESConsolidation principlesThe consolidated financial statements comprise Arcus ASA and subsidiaries in which Arcus ASA has control, and present the overall financial results, the overall financial position, and the overall cash flows, as one financial entity. Control takes place when the Group is entitled to variable returns from an investment object, and can also influence relevant activities which affect the returns on the investment
object. Normally this will be the company in which Arcus ASA, either directly, or indirectly via subsidiaries, owns more than 50 per cent of the shares with voting rights. In the consolidated financial statements, this Group is referred to as Arcus or the Arcus Group.
See Note 1 for an overview of all the companies included in the consolidation.
In the consolidated financial statements all intra- Group receivables and internal transactions between companies within the Group have been eliminated. The cost price of shares in subsidiaries is eliminated against equity at the time of acquisition. Accounting values including goodwill and excess values associ-ated with foreign subsidiaries are translated from the functional currency to NOK according to the exchange rate at the close of the financial year.
Goodwill is included in the consolidated financial statements as an intangible asset.
Any changes in the Group’s ownership of a subsidiary, without any loss of control, is recognised as an equity transaction. If the Group loses control of a subsidiary, underlying assets (including goodwill), debt, minority interests and other equity
components are deducted, while gains and losses are recognised in the income statement. Any remaining investment is recognised at fair value.
Non-controlling interestsNon-controlling interests’ share of profit after tax is shown on a separate line after the Group’s profit for the year. Non-controlling interests’ share of equity is shown on a separate line as part of the Group’s equity.
In instances where there are put and/or call options associated with the non-controlling interests, and where the Group has determined that it does not have an existing interest in the shares to which the options apply, the subsidiary is presented as if it were wholly owned, but with partial presentation of non-controlling interests. Partial presentation of non-controlling interests means that for each reporting period the non-controlling interests will receive their part of the profit for the year, which is shown under the profit allocation in the consolidated statement of income and in the statement of changes in equity. At the end of each period, the non-controlling minority interests’ share of profit, adjusted for the distribution of dividend for the period to the non-controlling interests, will be transferred as an equity transaction from the non-controlling interests’ share of equity to the
majority’s equity. The option liabilities will be recognised at the present value of the redemption amount and presented in the statement of financial position as an obligation at fair value via profit or loss.
CurrencyAll transactions in foreign currency are translated to functional currency as of the date of the transaction. Monetary items in foreign currency are translated as of the close of the financial year to functional currency using the exchange rate as of the close of the financial year.
The Group’s presentation currency is NOK, which is also the parent company’s functional currency.
The functional currency of subsidiaries is the currency in which the subsidiary reports its financial statements. On consolidation of subsidiaries that have a functional currency other than NOK, items of income and expenses are converted to the Group’s presentation currency in accordance with average conversion rates. This means that at the end of each period, items of income and expenses are translated at the average exchange rate to date in the year. For the statement of financial position, including excess value and goodwill, the closing exchange rate as of the close of the financial year is
As of 31.12.2017, the following exchange rates have been used when translating income and financial position figures from subsidiaries with functional currencies other than NOK:
Exchange rates 2017 2016EUR average rate Income statement items 9.3326 9.2980EUR closing rate Financial position items 9.8510 9.0865SEK average rate Income statement items 0.9684 0.9830SEK closing rate Financial position items 0.9992 0.9484DKK average rate Income statement items 1.2546 1.2488DKK closing rate Financial position items 1.3231 1.2223
CONSOLIDATED FINANCIAL STATEMENTS WITH NOTES
Statement of income 01.01.-31.12.
Statement of other comprehensive income 01.01.-31.12.
Statement of financial position as at 31 December
Statement of cash flows 01.01.-31.12.
Statement of changes in equity
Brief history of the Group
Accounting policies
Notes
Note 1: Companies in the Group
Note 2: Management of financial risk
Note 3: Information on cash flows
Note 4: Revenues
Note 5: Segment information
Note 6: Transactions with related parties
Note 7: Other operating expenses
Note 8: Salaries and other personnel costs
Note 9: Share-based payment
Note 10: Pension costs, assets and obligations
Note 11: Financial income and costs
Note 12: Tax
Note 13: Investments in associated companies and jointly controlled entities
Note 14: Tangible fixed assets
Note 15: Intangible assets
Note 16: Leasing agreements
Note 17: Other receivables
Note 18: Inventories
Note 19: Cash and cash equivalents
Note 20: Share capital and shareholder information
Note 21: Debt to financial institutions
Note 22: Liabilities at fair value through profit or loss
Note 23: Other provisions for liabilities
Note 24: Current liabilities
Note 25: Pledges and guarantees
Note 26 Business mergers
Note 27 Events after the close of the financial year
Alternative performance measurements
Auditor's report
Contents In brief Group CEO The Company Corporate Social Responsibility Directors’ Report Financial Statements and Notes Contact 57/123Corporate Governance
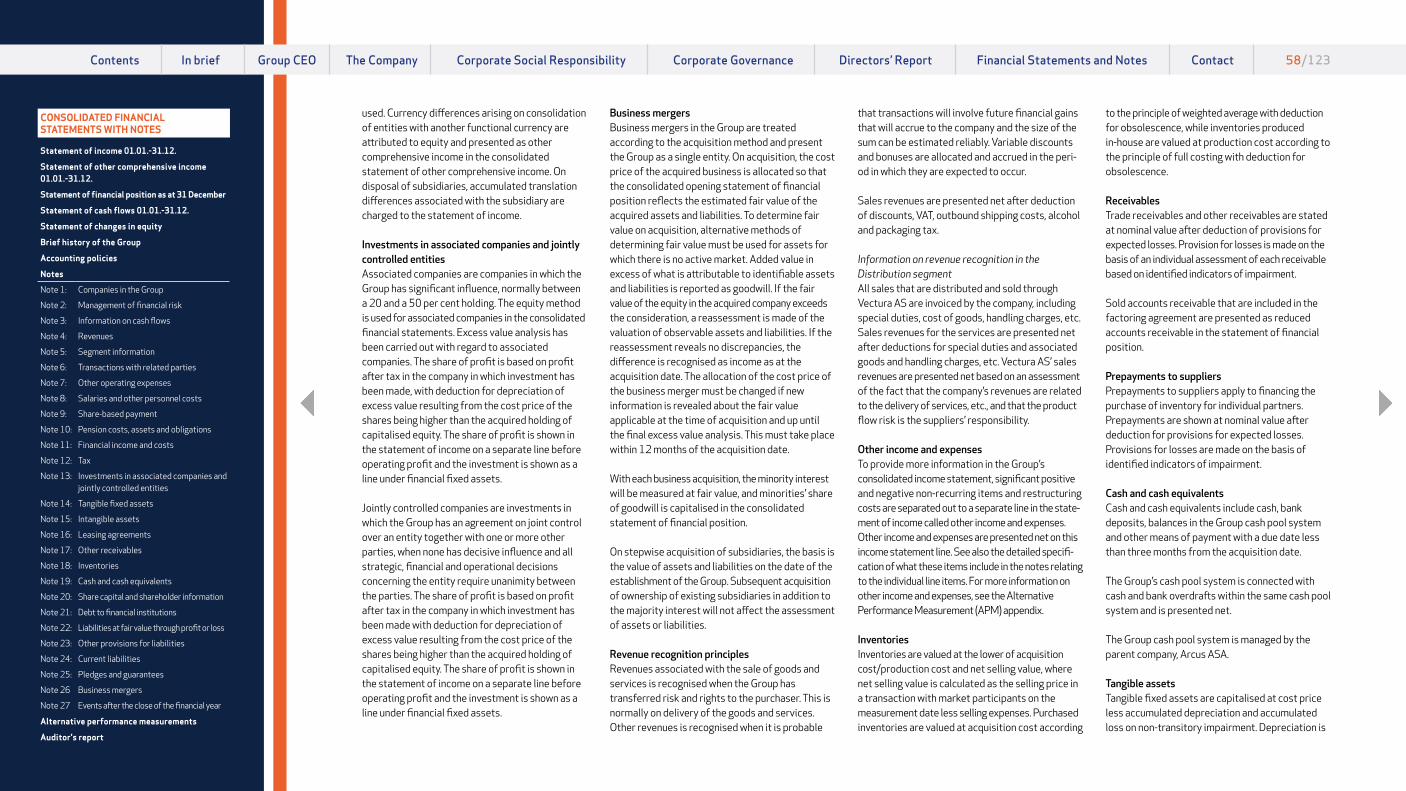
58 ANNUAL REPORT 2017 Arcus ASAFINANCIAL STATEMENTS AND NOTES | Arcus ASA Group
Business mergersBusiness mergers in the Group are treated according to the acquisition method and present the Group as a single entity. On acquisition, the cost price of the acquired business is allocated so that the consolidated opening statement of financial position reflects the estimated fair value of the acquired assets and liabilities. To determine fair value on acquisition, alternative methods of determining fair value must be used for assets for which there is no active market. Added value in excess of what is attributable to identifiable assets and liabilities is reported as goodwill. If the fair value of the equity in the acquired company exceeds the consideration, a reassessment is made of the valuation of observable assets and liabilities. If the reassessment reveals no discrepancies, the difference is recognised as income as at the acquisition date. The allocation of the cost price of the business merger must be changed if new information is revealed about the fair value applicable at the time of acquisition and up until the final excess value analysis. This must take place within 12 months of the acquisition date.
With each business acquisition, the minority interest will be measured at fair value, and minorities’ share of goodwill is capitalised in the consolidated statement of financial position.
On stepwise acquisition of subsidiaries, the basis is the value of assets and liabilities on the date of the establishment of the Group. Subsequent acquisition of ownership of existing subsidiaries in addition to the majority interest will not affect the assessment of assets or liabilities.
Revenue recognition principlesRevenues associated with the sale of goods and services is recognised when the Group has transferred risk and rights to the purchaser. This is normally on delivery of the goods and services. Other revenues is recognised when it is probable
that transactions will involve future financial gains that will accrue to the company and the size of the sum can be estimated reliably. Variable discounts and bonuses are allocated and accrued in the peri-od in which they are expected to occur.
Sales revenues are presented net after deduction of discounts, VAT, outbound shipping costs, alcohol and packaging tax.
Information on revenue recognition in the Distribution segmentAll sales that are distributed and sold through Vectura AS are invoiced by the company, including special duties, cost of goods, handling charges, etc. Sales revenues for the services are presented net after deductions for special duties and associated goods and handling charges, etc. Vectura AS’ sales revenues are presented net based on an assessment of the fact that the company’s revenues are related to the delivery of services, etc., and that the product flow risk is the suppliers’ responsibility.
Other income and expensesTo provide more information in the Group’s consolidated income statement, significant positive and negative non-recurring items and restructuring costs are separated out to a separate line in the state-ment of income called other income and expenses. Other income and expenses are presented net on this income statement line. See also the detailed specifi-cation of what these items include in the notes relating to the individual line items. For more information on other income and expenses, see the Alternative Performance Measurement (APM) appendix.
InventoriesInventories are valued at the lower of acquisition cost/production cost and net selling value, where net selling value is calculated as the selling price in a transaction with market participants on the measurement date less selling expenses. Purchased inventories are valued at acquisition cost according
to the principle of weighted average with deduction for obsolescence, while inventories produced in-house are valued at production cost according to the principle of full costing with deduction for obsolescence.
ReceivablesTrade receivables and other receivables are stated at nominal value after deduction of provisions for expected losses. Provision for losses is made on the basis of an individual assessment of each receivable based on identified indicators of impairment.
Sold accounts receivable that are included in the factoring agreement are presented as reduced accounts receivable in the statement of financial position.
Prepayments to suppliersPrepayments to suppliers apply to financing the purchase of inventory for individual partners. Prepayments are shown at nominal value after deduction for provisions for expected losses. Provisions for losses are made on the basis of identified indicators of impairment.
Cash and cash equivalentsCash and cash equivalents include cash, bank deposits, balances in the Group cash pool system and other means of payment with a due date less than three months from the acquisition date.
The Group’s cash pool system is connected with cash and bank overdrafts within the same cash pool system and is presented net.
The Group cash pool system is managed by the parent company, Arcus ASA.
Tangible assetsTangible fixed assets are capitalised at cost price less accumulated depreciation and accumulated loss on non-transitory impairment. Depreciation is
used. Currency differences arising on consolidation of entities with another functional currency are attributed to equity and presented as other comprehensive income in the consolidated statement of other comprehensive income. On disposal of subsidiaries, accumulated translation differences associated with the subsidiary are charged to the statement of income.
Investments in associated companies and jointly controlled entitiesAssociated companies are companies in which the Group has significant influence, normally between a 20 and a 50 per cent holding. The equity method is used for associated companies in the consolidated financial statements. Excess value analysis has been carried out with regard to associated companies. The share of profit is based on profit after tax in the company in which investment has been made, with deduction for depreciation of excess value resulting from the cost price of the shares being higher than the acquired holding of capitalised equity. The share of profit is shown in the statement of income on a separate line before operating profit and the investment is shown as a line under financial fixed assets.
Jointly controlled companies are investments in which the Group has an agreement on joint control over an entity together with one or more other parties, when none has decisive influence and all strategic, financial and operational decisions concerning the entity require unanimity between the parties. The share of profit is based on profit after tax in the company in which investment has been made with deduction for depreciation of excess value resulting from the cost price of the shares being higher than the acquired holding of capitalised equity. The share of profit is shown in the statement of income on a separate line before operating profit and the investment is shown as a line under financial fixed assets.
CONSOLIDATED FINANCIAL STATEMENTS WITH NOTES
Statement of income 01.01.-31.12.
Statement of other comprehensive income 01.01.-31.12.
Statement of financial position as at 31 December
Statement of cash flows 01.01.-31.12.
Statement of changes in equity
Brief history of the Group
Accounting policies
Notes
Note 1: Companies in the Group
Note 2: Management of financial risk
Note 3: Information on cash flows
Note 4: Revenues
Note 5: Segment information
Note 6: Transactions with related parties
Note 7: Other operating expenses
Note 8: Salaries and other personnel costs
Note 9: Share-based payment
Note 10: Pension costs, assets and obligations
Note 11: Financial income and costs
Note 12: Tax
Note 13: Investments in associated companies and jointly controlled entities
Note 14: Tangible fixed assets
Note 15: Intangible assets
Note 16: Leasing agreements
Note 17: Other receivables
Note 18: Inventories
Note 19: Cash and cash equivalents
Note 20: Share capital and shareholder information
Note 21: Debt to financial institutions
Note 22: Liabilities at fair value through profit or loss
Note 23: Other provisions for liabilities
Note 24: Current liabilities
Note 25: Pledges and guarantees
Note 26 Business mergers
Note 27 Events after the close of the financial year
Alternative performance measurements
Auditor's report
Contents In brief Group CEO The Company Corporate Social Responsibility Directors’ Report Financial Statements and Notes Contact 58/123Corporate Governance

59 ANNUAL REPORT 2017 Arcus ASAFINANCIAL STATEMENTS AND NOTES | Arcus ASA Group
calculated and taken to expenses from the date the fixed asset is taken into use, and is calculated on the basis of expected useful life, taking account of estimated residual value.
Different rates of depreciation are used for a fixed asset’s components if these have different economic lives. Assets under construction are not depreciated. Depreciation is taken to expenses only when the asset is ready for use. Profit and loss on sales of fixed assets are set as the difference between the selling price and the book value at the time of sale. Profits on sales of fixed assets are recognised as operating income and losses as operating expenses. If there are indications of impairment, the amount recoverable is estimated in order to assess any loss through the impairment. If the book value exceeds the amount recoverable, the asset is written down to recoverable value, while the remaining depreciation period is maintained (breakpoint solution). Depreciation methods, residual values and estimated life are continuously assessed.
Intangible assetsIntangible assets comprise brands, software and goodwill. Intangible assets are capitalised at cost price with deduction for accumulated depreciation and accumulated write-downs in the event of non-transitory impairment.
Intangible assets with limited useful lives are depreciated by the straight-line method over the expected useful life.
The capitalised value of goodwill, brands and other intangible assets with indeterminate lifetime is tested for impairment at least once a year, or more often if there are indications that the value of the asset has decreased. This requires estimates of the amount recoverable by cash-generating units to which goodwill and other intangible assets are attributed
To determine the recoverable amount, the Group estimates expected future pre-tax cash flows from the cash-generating unit and applies suitable discount rates in order to calculate the present value of future cash flows. Cash flows for brands are calculated based on a market-based ”relief from royalty” method before tax. See Note 15 for a more detailed description of this model.
Expectations regarding future cash flows will vary over time. Changes in the market conditions and expected cash flows may cause losses in the event of impairment in the future. The most important assumptions with significance for the present value of the cash flows associated with the investments are future profits and growth, as well as the discount rate used.
PensionsNet pension costs for defined benefit plans comprise the period’s service cost, including future growth in salaries and interest rates on the estimated obligation, less expected returns on the pension assets. Prepaid pension is shown as a non-current asset in the statement of financial position where it is probable that the over- financing can be used or repaid. Correspondingly, a non-current liability is shown in the accounts when the pension obligation is greater than the pension assets. Net pension costs are classified as payroll costs in the statement of income. Changes in the liability resulting from changes in pension plans are taken to profit or loss immediately. Changes in the pension liability and the pension assets resulting from changes in, and deviations from, the estimate assumptions (estimate deviations), are recognised against equity and are presented in the statement of other comprehensive income.
The Group also has defined contribution pension plans,which are schemes whereby the company pays contributions on an ongoing basis to the employees’ individual pension plans. Ongoing
premium invoices of this kind are expensed as salaries and other personnel costs.
RestructuringProvisions for restructuring are recognised as expenses when the programme has been adopted and announced and the costs are identifiable and quantifiable. Provisions linked to restructuring are included as other provisions for liabilities calculated at present value. Agreements securing future work input are recognised as expenses over the period in which the work input is delivered.
TaxesThe tax expense comprises both tax payable and the change in deferred tax. Tax payable is based on taxable income for the year. Taxable income is different from the pre-tax profit as presented in the statement of income because of income and expenditure items that are not taxable/deductible (permanent differences) and the change in differences in taxable and accounting accruals (temporary differences). Tax payable is calculated based on tax rates that are adopted at the end of the period.
Deferred tax is capitalised on the basis of the temporary differences and any deficit to be carried forward existing at the end of the financial year and that involves increased or reduced future tax payable, when these differences are reversed in future periods. Temporary differences are differences between accounting and taxable results arising during a period and are reversed during a later period. Deferred tax is calculated on the basis of nominal tax rates (rates adopted as of the close of the financial year in the individual country) multiplied by temporary differences and the deficit to be carried forward. Deferred tax assets are capitalised when the probability exists that future taxable income will enable utilisation of the asset.
Share-based paymentThe Group has two share-based incentive schemes for senior executives, and a general share savings programme for all employees.
The costs related to the two share-based incentive schemes for senior executives are accrued during the vesting period, which is the period between the allocation date and the date of receipt. The costs which are accrued are the calculated value of the matching shares or options as of the allocation date, and this value is not adjusted during the vesting period. These costs are booked as personnel costs, set off to Group equity.
The related employer tax is in principle accrued during the same period. The costs of the employer tax in each period are calculated on the basis of the fair value of the matching shares or options. The costs for the period comprise the change in provisions, and are booked as personnel costs, set off as debt in the statement of financial position.
The costs related to this programme are recognised in accordance with IFRS 2.
The general share savings programme for all employees is based on the Group selling shares to the employees below market value. The costs related to this programme are recognised by booking the difference between the market value of the shares and the purchase price for the employees as personnel costs.
Classification principlesOther assets included in the operating cycle or falling due within 12 months are classified as current assets. Remaining assets are classified as fixed assets.
Liabilities included in the operating cycle or falling due within 12 months, where there is no unconditional right to defer settlement, are
CONSOLIDATED FINANCIAL STATEMENTS WITH NOTES
Statement of income 01.01.-31.12.
Statement of other comprehensive income 01.01.-31.12.
Statement of financial position as at 31 December
Statement of cash flows 01.01.-31.12.
Statement of changes in equity
Brief history of the Group
Accounting policies
Notes
Note 1: Companies in the Group
Note 2: Management of financial risk
Note 3: Information on cash flows
Note 4: Revenues
Note 5: Segment information
Note 6: Transactions with related parties
Note 7: Other operating expenses
Note 8: Salaries and other personnel costs
Note 9: Share-based payment
Note 10: Pension costs, assets and obligations
Note 11: Financial income and costs
Note 12: Tax
Note 13: Investments in associated companies and jointly controlled entities
Note 14: Tangible fixed assets
Note 15: Intangible assets
Note 16: Leasing agreements
Note 17: Other receivables
Note 18: Inventories
Note 19: Cash and cash equivalents
Note 20: Share capital and shareholder information
Note 21: Debt to financial institutions
Note 22: Liabilities at fair value through profit or loss
Note 23: Other provisions for liabilities
Note 24: Current liabilities
Note 25: Pledges and guarantees
Note 26 Business mergers
Note 27 Events after the close of the financial year
Alternative performance measurements
Auditor's report
Contents In brief Group CEO The Company Corporate Social Responsibility Directors’ Report Financial Statements and Notes Contact 59/123Corporate Governance

60 ANNUAL REPORT 2017 Arcus ASAFINANCIAL STATEMENTS AND NOTES | Arcus ASA Group
classified as current liabilities. Remaining liabilities are classified as non-current.
Proposed dividend/Group contributions are capitalised in the statement of financial position as a liability when the Group has an irrevocable obligation to make dividend payments/Group contributions, normally after adoption by the Annual General Meeting.
Measurement and classification of financial instrumentsThe Group classifies financial instruments in the following categories: financial instruments at fair value through profit or loss, loans and receivables, financial assets available for sale and financial liabilities. The classification depends on the purpose of the asset or liability. Management classifies financial assets and liabilities on acquisition.
Financial instruments at fair value through profit or lossFinancial instruments are recognised in the statement of financial position when the Group has become party to the instrument’s contractual provisions, and deducted when the contractual rights or obligations are fulfilled or cancelled, or have expired or been transferred. Financial instruments are classified as current assets if the expected settlement date is within 12 months of the close of the financial year, and as fixed assets if the settlement date is later than 12 months after the close of the financial year
Financial instruments at fair value through profit or loss are either financial instruments held for trading purposes or financial instruments earmarked at fair value. A financial instrument is classified in the category ”held for trading” if it is primarily acquired with a view to producing profit from short-term price fluctuations. Derivatives are classified as held for trading unless they form part of a hedge. Assets and liabilities in this category are classified
as current assets or current debt if it is expected that they will be settled within 12 months; otherwise they are classified as financial assets or non-current debt.
Loans and receivablesLoans and receivables are financial assets that are not derivatives, that have fixed or determinable payments and that are not traded in an active market. They are classified as current assets unless they fall due more than 12 months after the close of the financial year. Loans and receivables comprise accounts receivable and other receivables, as well as cash and cash equivalents in the statement of financial position.
Loans and receivables are measured at amortised cost, and value changes resulting from interest rate changes are not recognised.
Financial assets available for saleFinancial assets available for sale are financial assets that are not derivatives and that have been placed in this category, or that do not belong to any other category. They are classified as fixed assets provided that the investment does not fall due or the management does not intend to sell the investment within 12 months from the close of the financial year.
Other financial liabilitiesFinancial liabilities not falling into the category of ”financial instruments at fair value through profit or loss” are classified as other financial liabilities. For measurement of financial liabilities at fair value, see measurement of financial instruments in Note 2.
Financial liabilities through borrowing are recognised at the amount received net of transaction costs. Financial liabilities are recognised at amortised cost based on an effective interest rate method. Transaction costs (arrangement charges) are capitalised in the statement of financial position as part of the book value of the loan, and depreciated over the period of the loan (amortised cost).
Borrowing in currencies other than the functional currency is translated at the exchange rate at the close of the financial year.
Categorisation of financial assets and debtThe Group’s measurement of financial assets, debt and other financial instruments at fair value can be divided into three categories:Level 1: Listed (unadjusted) prices in active markets.Level 2: Direct or indirect inputs other than listed prices included in Level 1, that are observable for the asset or the liability.Level 3: Techniques for calculation of fair value based on other than observable market data.
LeasesLeases where a significant part of the risk and return associated with ownership continues to lie with the lessor are classified as operational leases. Lease payments from operational leases (with deduction for any financial incentives from the lessor) are charged as expenses using the straight-line method over the period of the lease.
Leases with regard to property, plant and equipment in which the Group principally holds all risks and rewards are classified as financial leasing. Financial leasing is capitalised at the start of the lease period at the lower of fair value of the leased fixed assets and the present value of the total minimum lease amount. Each lease payment is allocated between a repayment element and an interest element. The lease cost is charged to profit or loss as financial expenses. The lease liability, less the cost of interest, is classified as other current lia-bilities and other non-current liabilities. Property, plant and equipment acquired through a financial lease agreement is depreciated over the expected life or the period of the lease if this is shorter.
Statement of cash flowsThe indirect method is used in the preparation of
the statement of cash flows. Cash and cash equivalents in the statement of financial position are defined as holdings of cash and cash equivalents in the statement of cash flows.
Segment informationOperating segments are reported in the same way as for internal reporting to Group management. The Group’s business areas comprise Spirits, Wine and Distribution and decisions within each busi-ness area are taken by the Group CEO.
The Group’s activities consist of sales and marketing of Spirits, sales and marketing of Wine, and distribution of spirits and wine.
The Spirits business area comprises the following companies: Arcus Norway AS with subsidiaries, Det Danske Spiritus Kompagni A/S, Arcus Denmark A/S, Arcus Sweden AB, Arcus Finland Oy and Arcus Deutschland GmbH. Supply Chain is also included as a production facility in the Spirits business area.
The Wine business area comprises the following companies: Vingruppen Sweden Holding AB and subsidiaries, and Vingruppen AS and subsidiaries.
The Distribution business area comprises the Vectura AS company.
In addition, there are the remaining Group income and expenses, as well as financing costs, that comprise Arcus-Gruppen AS and Arcus ASA.
The Group presents no segment assets or liabilities, as this is not done in the Group’s internal reporting
For further information about the Group’s operating segments, see Note 5.
Related partiesThe Group’s related parties, in addition to subsidiaries, associated companies and jointly
CONSOLIDATED FINANCIAL STATEMENTS WITH NOTES
Statement of income 01.01.-31.12.
Statement of other comprehensive income 01.01.-31.12.
Statement of financial position as at 31 December
Statement of cash flows 01.01.-31.12.
Statement of changes in equity
Brief history of the Group
Accounting policies
Notes
Note 1: Companies in the Group
Note 2: Management of financial risk
Note 3: Information on cash flows
Note 4: Revenues
Note 5: Segment information
Note 6: Transactions with related parties
Note 7: Other operating expenses
Note 8: Salaries and other personnel costs
Note 9: Share-based payment
Note 10: Pension costs, assets and obligations
Note 11: Financial income and costs
Note 12: Tax
Note 13: Investments in associated companies and jointly controlled entities
Note 14: Tangible fixed assets
Note 15: Intangible assets
Note 16: Leasing agreements
Note 17: Other receivables
Note 18: Inventories
Note 19: Cash and cash equivalents
Note 20: Share capital and shareholder information
Note 21: Debt to financial institutions
Note 22: Liabilities at fair value through profit or loss
Note 23: Other provisions for liabilities
Note 24: Current liabilities
Note 25: Pledges and guarantees
Note 26 Business mergers
Note 27 Events after the close of the financial year
Alternative performance measurements
Auditor's report
Contents In brief Group CEO The Company Corporate Social Responsibility Directors’ Report Financial Statements and Notes Contact 60/123Corporate Governance

61 ANNUAL REPORT 2017 Arcus ASAFINANCIAL STATEMENTS AND NOTES | Arcus ASA Group
controlled companies, are defined as the owners, all members of the Board of Directors and Group Management, and companies in which any of these parties either have controlling interests, Board appointments, or are senior employees.
All transactions between Group companies and related parties are made on market terms.
Important accounting estimates and discretionary assessmentsPreparation of the annual financial statements requires management to make estimates and assumptions that affect the value of assets, liabilities and conditional liabilities in the statement of financial position, and income and expenses for the financial year.
Future events and changes in the regulatory framework may mean that estimates and assumptions must be changed, while new opinions and interpretations of standards may mean that the choice of principles and presentation will be
Areas in which estimates have major significance will be:Figures in NOK 1,000
Accounting item Note AssumptionsBook value
2017Book value
2016Goodwill 15 Present value of future cash flows 1,042,596 1,010,176 Brands 15 Present value of future cash flows 819,702 669,237 Other intangible assets 15 Recoverable amounts and correct useful life 29,151 30,651 Tangible assets 14 Recoverable amounts and correct useful life 329,826 350,235Deferred tax assets 12 Assessment of the ability to exploit tax assets in the future 136,790 172,120Pension obligations 10 Economic and demographic assumptions 30,552 34,092Liabilities at fair value through profit or loss 22 Present value of future cash flows 0 24,135 Provisions 23 Correct basis for estimate calculations 12,478 12,903
changed. Estimates and underlying assumptions are examined and evaluated continuously, and changes in accounting estimates are recognised in the period in which the estimates are changed.
Present value estimates of future cash flows are affected by correct assumptions and estimates of future cash flows and estimates of return requirements. Return requirements are determi-ned using the capital asset pricing model (CAPM) and assumptions in using the CAPM are: risk-free interest; market risk premium; and beta.
The areas with greatest risk of substantial changes are capitalised goodwill, brands, tax assets and liabilities at fair value through profit/loss, on the basis that the capitalised sums are substantial, and that there may be considerable discretion. The estimates are based on assumptions concerning future cash flows that are discounted at a selected discount rate.
Estimates and assumptions are described in the various notes.
CONSOLIDATED FINANCIAL STATEMENTS WITH NOTES
Statement of income 01.01.-31.12.
Statement of other comprehensive income 01.01.-31.12.
Statement of financial position as at 31 December
Statement of cash flows 01.01.-31.12.
Statement of changes in equity
Brief history of the Group
Accounting policies
Notes
Note 1: Companies in the Group
Note 2: Management of financial risk
Note 3: Information on cash flows
Note 4: Revenues
Note 5: Segment information
Note 6: Transactions with related parties
Note 7: Other operating expenses
Note 8: Salaries and other personnel costs
Note 9: Share-based payment
Note 10: Pension costs, assets and obligations
Note 11: Financial income and costs
Note 12: Tax
Note 13: Investments in associated companies and jointly controlled entities
Note 14: Tangible fixed assets
Note 15: Intangible assets
Note 16: Leasing agreements
Note 17: Other receivables
Note 18: Inventories
Note 19: Cash and cash equivalents
Note 20: Share capital and shareholder information
Note 21: Debt to financial institutions
Note 22: Liabilities at fair value through profit or loss
Note 23: Other provisions for liabilities
Note 24: Current liabilities
Note 25: Pledges and guarantees
Note 26 Business mergers
Note 27 Events after the close of the financial year
Alternative performance measurements
Auditor's report
Contents In brief Group CEO The Company Corporate Social Responsibility Directors’ Report Financial Statements and Notes Contact 61/123Corporate Governance

62 ANNUAL REPORT 2017 Arcus ASAFINANCIAL STATEMENTS AND NOTES | Arcus ASA Group
NOTE 1 COMPANIES IN THE GROUP
The consolidated financial statements for 2017 cover the following subsidiaries and associated companies:
Figures in 1,000 (local currency)Registered office Currency
Nominal share capital
Group holding and voting share
Company nameArcus ASA (parent company) Nittedal NOK 1,360
Subsidiaries Arcus-Gruppen AS Nittedal NOK 276,552 100%Vectura AS Nittedal NOK 14,014 100%
Shares owned by Arcus-Gruppen ASArcus Norway AS Nittedal NOK 62,100 100%Arcus Denmark AS Copenhagen DKK 10,324 100%Det Danske Spiritus Kompagni A/S* Copenhagen DKK 6,500 100%Vingruppen AS Nittedal NOK 60 100%VinGruppen Sweden Holding AB Stockholm SEK 50 100%Arcus Deutschland GmbH** Bremen EUR 500 100%
Shares owned by Arcus Norway ASArcus Sweden AB Stockholm SEK 100 100%Arcus Finland OY Helsinki EUR 311 100%BevCo AS Nittedal NOK 600 100%De Lysholmske Brenneri- og Destillasjonsfabrikker ANS Nittedal NOK 0 100%Siemers & Cos Destillasjon ANS Nittedal NOK 0 100%Løiten Brænderis Destillation ANS Nittedal NOK 0 100%Oplandske Spritfabrik ANS Nittedal NOK 0 100%
Shares owned by VinGruppen Sweden Holding ABVingruppen i Norden AB Stockholm SEK 4,192 100%
Figures in 1,000 (local currency)Registered office Currency
Nominal share capital
Group holding and voting share
Shares owned by Vingruppen ASArcus Wine Brands AS Nittedal NOK 100 100%Vinordia AS Nittedal NOK 968 100%Symposium Wines AS Nittedal NOK 500 80%Vinuniq AS Nittedal NOK 100 100%Excellars AS Nittedal NOK 181 100%Heyday Wines AS Nittedal NOK 100 70%
Shares owned by Symposium Wines ASHedoni Wines AS Nittedal NOK 30 80%
Shares owned by Vingruppen i Norden ABVinunic AB Stockholm SEK 145 100%Wineworld Sweden AB Stockholm SEK 500 90%The WineAgency Sweden AB Stockholm SEK 100 90%Valid Wines Sweden AB Stockholm SEK 1,100 83%Social Wines OY Helsinki EUR 8 94%Vinum Import Oy Åbo EUR 3 88%Vingruppen Oy Helsinki EUR 3 100%
Shares owned by Wineworld Sweden ABWineworld Finland Oy Helsinki EUR 220 76%Quaffable Wines Sweden AB Stockholm SEK 100 72%
Shares owned by Vinunic ABVingaraget AB Stockholm SEK 50 100%
Shares owned by The WineAgency Sweden AB and WineWorld Sweden ABYour Wineclub Sweden AB Stockholm SEK 50 90%
Shares owned by Social Wines OYVinunic Oy Helsinki EUR 3 94%
* Det Danske Spiritus Kompagni A/S was booked as a jointly-controlled company up to 1.1.2017, and consolidated as a wholly-owned subsidiary as from the same date.
** Arcus Deutschland GmbH has had a financial year from 1 July to 30 June. As from 1.1.2018, the company's financial year follows the calendar year. Impacts on earnings from the company in the consolidated financial statements are based on an estimated annual result for the calendar year, which is the Group’s financial year.
NotesCONSOLIDATED FINANCIAL STATEMENTS WITH NOTES
Statement of income 01.01.-31.12.
Statement of other comprehensive income 01.01.-31.12.
Statement of financial position as at 31 December
Statement of cash flows 01.01.-31.12.
Statement of changes in equity
Brief history of the Group
Accounting policies
Notes
Note 1: Companies in the Group
Note 2: Management of financial risk
Note 3: Information on cash flows
Note 4: Revenues
Note 5: Segment information
Note 6: Transactions with related parties
Note 7: Other operating expenses
Note 8: Salaries and other personnel costs
Note 9: Share-based payment
Note 10: Pension costs, assets and obligations
Note 11: Financial income and costs
Note 12: Tax
Note 13: Investments in associated companies and jointly controlled entities
Note 14: Tangible fixed assets
Note 15: Intangible assets
Note 16: Leasing agreements
Note 17: Other receivables
Note 18: Inventories
Note 19: Cash and cash equivalents
Note 20: Share capital and shareholder information
Note 21: Debt to financial institutions
Note 22: Liabilities at fair value through profit or loss
Note 23: Other provisions for liabilities
Note 24: Current liabilities
Note 25: Pledges and guarantees
Note 26 Business mergers
Note 27 Events after the close of the financial year
Alternative performance measurements
Auditor's report
Contents In brief Group CEO The Company Corporate Social Responsibility Directors’ Report Financial Statements and Notes Contact 62/123Corporate Governance

63 ANNUAL REPORT 2017 Arcus ASAFINANCIAL STATEMENTS AND NOTES | Arcus ASA Group
Figures in 1,000 (local currency)Registered office Currency
Nominal share capital
Group holding and voting share
Associated company Tiffon SA Jarnac EUR 1,131 34.75%
Profit, dividends and equity attributable to non-controlling interests
Figures in NOK 1,000
Profits attribut-able to non-
controlling interests in 2017
Accumulated non-controlling
interests 31.12.2017*
Dividend distri-buted to non-
controlling interests in 2017
Symposium Wines AS 1,089 2,290 -1,337Heyday Wines AS 213 459 0Wineworld Sweden AB 3,161 7,583 -693The WineAgency Sweden AB 1,454 4,777 -1,098Social Wines OY 150 1,357 0Vinum Import Oy 501 1,280 -335Other companies with minority interests 376 1,077 -58Total 6,944 18,823 -3,521
Figures in NOK 1,000
Profits attribut-able to non-
controllingInterests in 2016
Accumulated non-controlling
interests 31.12.2016*
Dividend distri-buted to non-
controllinginterests in 2016
Symposium Wines AS 1,382 1,975 -1,560 Excellars AS* 772 0 -4,900 Vingruppen i Norden AB 0 0 -375 Wineworld Sweden AB 6,148 4,766 -12,919 The WineAgency Sweden AB 1,342 4,169 -1,607 Social Wines OY 140 1,111 0 Vinum Import Oy 396 933 -359 Other companies with minority interests 300 951 -176 Total 10,480 13,905 -21,896
* At the end of 2016 the Group owned 90.1 per cent of the subsidiary Excellars AS. In addition, put and call options existed which were associated with the non-controlling interests, although the Group was not considered to have control of the shares as of the date of the statement of financial position. These companies were booked as though they were wholly owned, but with partial presentation of the non-controlling interests. Partial presentation of non-controlling interests means that the non-controlling interests’ share of the profit for 2016 is shown in the statement of income, but not in the equity statement.
CONSOLIDATED FINANCIAL STATEMENTS WITH NOTES
Statement of income 01.01.-31.12.
Statement of other comprehensive income 01.01.-31.12.
Statement of financial position as at 31 December
Statement of cash flows 01.01.-31.12.
Statement of changes in equity
Brief history of the Group
Accounting policies
Notes
Note 1: Companies in the Group
Note 2: Management of financial risk
Note 3: Information on cash flows
Note 4: Revenues
Note 5: Segment information
Note 6: Transactions with related parties
Note 7: Other operating expenses
Note 8: Salaries and other personnel costs
Note 9: Share-based payment
Note 10: Pension costs, assets and obligations
Note 11: Financial income and costs
Note 12: Tax
Note 13: Investments in associated companies and jointly controlled entities
Note 14: Tangible fixed assets
Note 15: Intangible assets
Note 16: Leasing agreements
Note 17: Other receivables
Note 18: Inventories
Note 19: Cash and cash equivalents
Note 20: Share capital and shareholder information
Note 21: Debt to financial institutions
Note 22: Liabilities at fair value through profit or loss
Note 23: Other provisions for liabilities
Note 24: Current liabilities
Note 25: Pledges and guarantees
Note 26 Business mergers
Note 27 Events after the close of the financial year
Alternative performance measurements
Auditor's report
Contents In brief Group CEO The Company Corporate Social Responsibility Directors’ Report Financial Statements and Notes Contact 63/123Corporate Governance
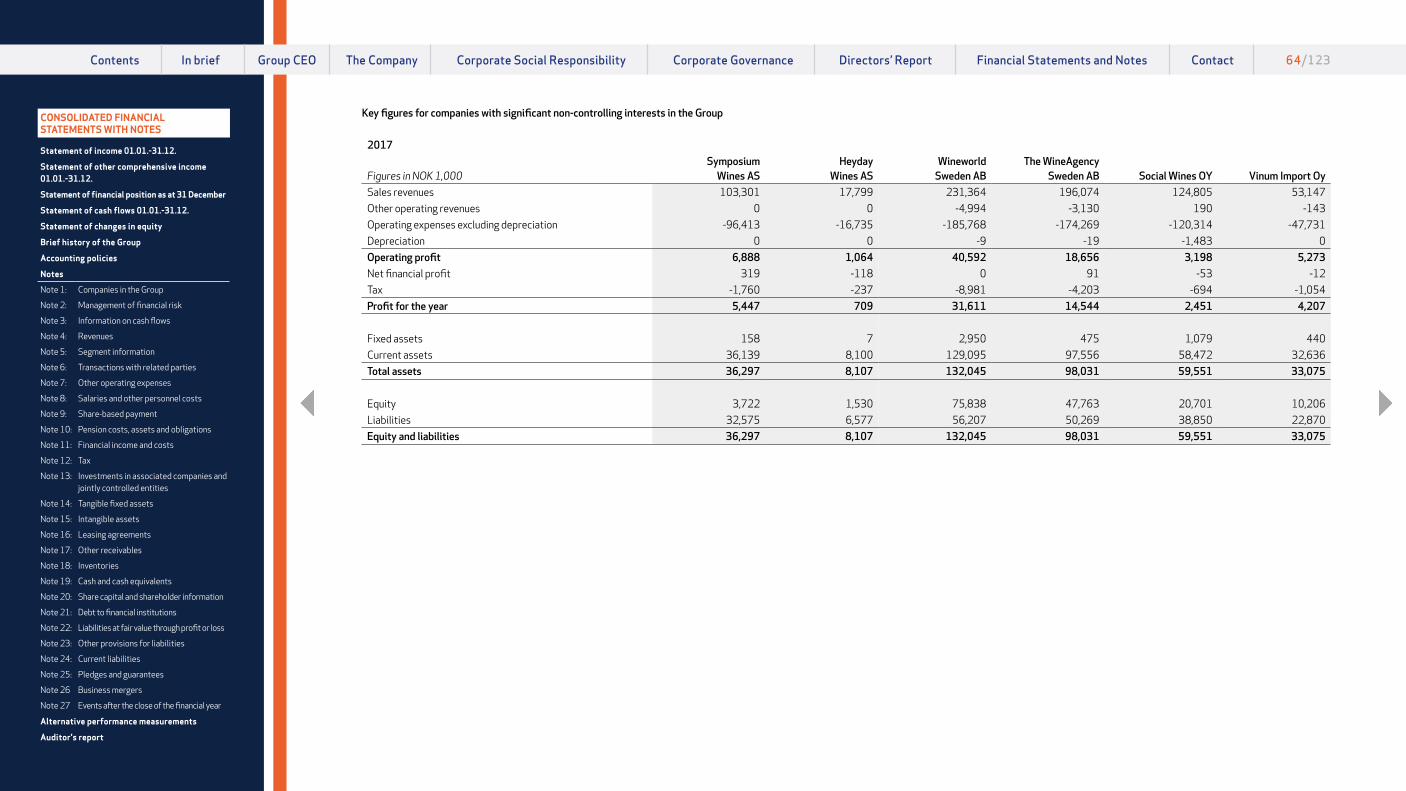
64 ANNUAL REPORT 2017 Arcus ASAFINANCIAL STATEMENTS AND NOTES | Arcus ASA Group
Key figures for companies with significant non-controlling interests in the Group
2017
Figures in NOK 1,000Symposium
Wines ASHeyday
Wines ASWineworld
Sweden AB The WineAgency
Sweden AB Social Wines OY
Vinum Import Oy Sales revenues 103,301 17,799 231,364 196,074 124,805 53,147Other operating revenues 0 0 -4,994 -3,130 190 -143Operating expenses excluding depreciation -96,413 -16,735 -185,768 -174,269 -120,314 -47,731Depreciation 0 0 -9 -19 -1,483 0Operating profit 6,888 1,064 40,592 18,656 3,198 5,273Net financial profit 319 -118 0 91 -53 -12Tax -1,760 -237 -8,981 -4,203 -694 -1,054Profit for the year 5,447 709 31,611 14,544 2,451 4,207
Fixed assets 158 7 2,950 475 1,079 440Current assets 36,139 8,100 129,095 97,556 58,472 32,636Total assets 36,297 8,107 132,045 98,031 59,551 33,075
Equity 3,722 1,530 75,838 47,763 20,701 10,206Liabilities 32,575 6,577 56,207 50,269 38,850 22,870Equity and liabilities 36,297 8,107 132,045 98,031 59,551 33,075
CONSOLIDATED FINANCIAL STATEMENTS WITH NOTES
Statement of income 01.01.-31.12.
Statement of other comprehensive income 01.01.-31.12.
Statement of financial position as at 31 December
Statement of cash flows 01.01.-31.12.
Statement of changes in equity
Brief history of the Group
Accounting policies
Notes
Note 1: Companies in the Group
Note 2: Management of financial risk
Note 3: Information on cash flows
Note 4: Revenues
Note 5: Segment information
Note 6: Transactions with related parties
Note 7: Other operating expenses
Note 8: Salaries and other personnel costs
Note 9: Share-based payment
Note 10: Pension costs, assets and obligations
Note 11: Financial income and costs
Note 12: Tax
Note 13: Investments in associated companies and jointly controlled entities
Note 14: Tangible fixed assets
Note 15: Intangible assets
Note 16: Leasing agreements
Note 17: Other receivables
Note 18: Inventories
Note 19: Cash and cash equivalents
Note 20: Share capital and shareholder information
Note 21: Debt to financial institutions
Note 22: Liabilities at fair value through profit or loss
Note 23: Other provisions for liabilities
Note 24: Current liabilities
Note 25: Pledges and guarantees
Note 26 Business mergers
Note 27 Events after the close of the financial year
Alternative performance measurements
Auditor's report
Contents In brief Group CEO The Company Corporate Social Responsibility Directors’ Report Financial Statements and Notes Contact 64/123Corporate Governance

65 ANNUAL REPORT 2017 Arcus ASAFINANCIAL STATEMENTS AND NOTES | Arcus ASA Group
2016
Figures in NOK 1,000Symposium
Wines AS Excellars ASWineworld
Sweden AB The WineAgency
Sweden AB Social Wines OY
Vinum Import Oy Sales revenues 95,568 87,612 277,856 191,997 129,352 46,075Other operating revenues 0 0 2,901 4,582 6,298 1,054Operating expenses excluding depreciation -86,981 -77,028 -230,422 -179,430 -130,932 -42,974Depreciation 0 -440 -29 -13 -1,497 0Operating profit 8,587 10,144 50,306 17,136 3,221 4,155Net financial profit -266 332 -6 157 -73 -1Tax -2,120 -2,679 -11,743 -3,870 -818 -828Profit for the year 6,201 7,797 38,557 13,424 2,330 3,326
Fixed assets 107 2,973 2,905 386 2,628 418Current assets 35,608 45,098 122,956 84,281 65,546 26,933Total assets 35,715 48,071 125,861 84,667 68,174 27,351
Equity 2,863 3,614 50,256 41,522 17,792 7,834Liabilities 32,852 44,457 75,605 43,145 50,382 19,517Equity and liabilities 35,715 48,071 125,861 84,667 68,174 27,351
CONSOLIDATED FINANCIAL STATEMENTS WITH NOTES
Statement of income 01.01.-31.12.
Statement of other comprehensive income 01.01.-31.12.
Statement of financial position as at 31 December
Statement of cash flows 01.01.-31.12.
Statement of changes in equity
Brief history of the Group
Accounting policies
Notes
Note 1: Companies in the Group
Note 2: Management of financial risk
Note 3: Information on cash flows
Note 4: Revenues
Note 5: Segment information
Note 6: Transactions with related parties
Note 7: Other operating expenses
Note 8: Salaries and other personnel costs
Note 9: Share-based payment
Note 10: Pension costs, assets and obligations
Note 11: Financial income and costs
Note 12: Tax
Note 13: Investments in associated companies and jointly controlled entities
Note 14: Tangible fixed assets
Note 15: Intangible assets
Note 16: Leasing agreements
Note 17: Other receivables
Note 18: Inventories
Note 19: Cash and cash equivalents
Note 20: Share capital and shareholder information
Note 21: Debt to financial institutions
Note 22: Liabilities at fair value through profit or loss
Note 23: Other provisions for liabilities
Note 24: Current liabilities
Note 25: Pledges and guarantees
Note 26 Business mergers
Note 27 Events after the close of the financial year
Alternative performance measurements
Auditor's report
Contents In brief Group CEO The Company Corporate Social Responsibility Directors’ Report Financial Statements and Notes Contact 65/123Corporate Governance

66 ANNUAL REPORT 2017 Arcus ASAFINANCIAL STATEMENTS AND NOTES | Arcus ASA Group
NOTE 2 MANAGEMENT OF FINANCIAL RISK
Financial riskThe Group has a Board-adopted financial policy in which strategy and guidelines for financial risk management are defined. Responsibility for the execution of the adopted financial policy lies with Arcus ASA, but it is implemented in cooperation with the individual business areas. The Arcus Group’s principal source of income is the core business, and the Group’s main strategy with regard to risk is not to speculate, but to limit the financial risk that the core business creates. The most important financial risks to which the Group is exposed are associated with credit risk, interest rate risk, liquidity risk and foreign currency risk.
For hedging purposes associated with interest rate and currency risk, the Group to a certain degree uses financial derivatives. The Group does not fulfil the accounting requirements for hedge accounting and therefore does not treat these as hedging for accounting purposes. The accounting treatment of financial derivatives is described under Accounting Policies.
Credit riskCredit risk must be assessed before establishing a customer relationship by examining financial statements and other relevant and available information. Credit periods and credit limits must then be determined. Once a customer relationship is established, credit risk and credit limits are continuously assessed in relation to the client’s financial performance and payment history.
Outstanding amounts are continuously monitored in cooperation between the finance department and the marketing departments of the individual businesses.
A significant share of the Group’s revenues is associated with the state monopolies in the Nordic region, where there is not considered to be any credit risk. The Group’s credit risk is otherwise spread over a large number of small customers within the HORECA market, as well as a small number of distributors outside the home markets.
At the end of 2017 the Group had no significant factoring agreements.
The Group’s maximum credit risk is equivalent to the book value of financial assets. See also the table to this Note which categorises financial assets.
Overview of bad debts and age analysis of accounts receivable
Figures in NOK 1,000 31.12.17 31.12.16Nominal accounts receivable 1,432,873 1,345,198
The provision for bad debt on accounts receivable as at 31.12.2017 was TNOK 709 (2016: 1,131). Losses on accounts receivable are classified as other operating expenses in the statement of income.
The change in provision for losses is as follows:
Figures in NOK 1,000 2017 2016Opening Balance -1,131 -1,672Provision for losses for the year -212 -334Confirmed losses for the year 424 181Received on previously written-off receivables during the period
0 -13
Reversal of previous provisions 238 677Translation differences -28 30Closing Balance -709 -1,131
As at 31 December, the Group had the following accounts receivable fallen due but not paid
Figures in NOK 1,000 Total Not dueDue 0-60
daysDue 61-365
daysDue date after
more than 1 year31.12.20171 1,432,873 1,274,624 158,242 7 031.12.20161 1,345,198 1,245,438 99,760 0 0
1. As at 31.12.2017, the Group had significant accounts receivable that had fallen due. Of this amount, NOK 127 million is related to accounts receivable from Vinmonopolet related to receivables which fell due during the Christmas period on 30 and 31 December 2017, and these were paid on the first banking day in 2018, i.e. 2 January 2018. In the same way, NOK 76 million was items receivable from Vinmonopolet at the end of 2016.
Interest rate riskThe Group is exposed to interest rate risk via financing activities (debt financing and financial leasing liabilities) and investments (bank deposits). At the end of 2017, the Group’s non-current liabilities were associated with credit facilities at SEB and financial leasing at Nordea Finans. Group policy is to hedge up to 50 per cent of the base interest rate on non-current loans. The Group assesses the policy on an ongoing basis, and as at 31.12.2017 all interest rates were variable. The margin on credit facilities at SEB is related to the ratio of net interest-bearing debt in relation to EBITDA, while the margin at Nordea Finance is fixed.
Figures in NOK 1,000Curr-ency
Interest- rate profile
Due date 2017 2016
Current interest-bearing debtDrawing on the Group's overdraft facility NOK Variable 2018 72,700 0Liabilities related to financial leasing NOK Variable 2018 17,371 16,498
Non-current interest-bearing debtMortgage loans to financial institutions SEK Variable 2021 749,400 711,300Liabilities related to financial leasing NOK Variable 2018 166,395 182,987
CONSOLIDATED FINANCIAL STATEMENTS WITH NOTES
Statement of income 01.01.-31.12.
Statement of other comprehensive income 01.01.-31.12.
Statement of financial position as at 31 December
Statement of cash flows 01.01.-31.12.
Statement of changes in equity
Brief history of the Group
Accounting policies
Notes
Note 1: Companies in the Group
Note 2: Management of financial risk
Note 3: Information on cash flows
Note 4: Revenues
Note 5: Segment information
Note 6: Transactions with related parties
Note 7: Other operating expenses
Note 8: Salaries and other personnel costs
Note 9: Share-based payment
Note 10: Pension costs, assets and obligations
Note 11: Financial income and costs
Note 12: Tax
Note 13: Investments in associated companies and jointly controlled entities
Note 14: Tangible fixed assets
Note 15: Intangible assets
Note 16: Leasing agreements
Note 17: Other receivables
Note 18: Inventories
Note 19: Cash and cash equivalents
Note 20: Share capital and shareholder information
Note 21: Debt to financial institutions
Note 22: Liabilities at fair value through profit or loss
Note 23: Other provisions for liabilities
Note 24: Current liabilities
Note 25: Pledges and guarantees
Note 26 Business mergers
Note 27 Events after the close of the financial year
Alternative performance measurements
Auditor's report
Contents In brief Group CEO The Company Corporate Social Responsibility Directors’ Report Financial Statements and Notes Contact 66/123Corporate Governance

67 ANNUAL REPORT 2017 Arcus ASAFINANCIAL STATEMENTS AND NOTES | Arcus ASA Group
Sensitivity analysis, interest 2017
Figures in NOK 1,000Increase/reduction
in basis pointsEffect on
pre-tax profitLoans in NOK 50 -4,666Loans in NOK -50 4,666
Liquidity riskLiquidity risk is the risk that the Group will not be in a position to service its financial liabilities as they fall due. The Arcus Group’s capital management is described in a separate section of this note.
The Group’s activities are subject to seasonal fluctuations, and alcohol sales normally increase in periods with national celebrations and public holidays, especially at Easter and Christmas. The fourth quarter is normally the best quarter for the Group, which is also reflected in cash flows.
Cash flows from operations, which are, for example, affected by changes in working capital, are managed operationally by the business areas. Via reporting, the finance department monitors liquidity flows in the short and long term. Interest-bearing debt is followed up and managed together with interest-bearing receivables at Group level.
The following table presents an overview of the maturity structure for the Group’s financial liabilities, based on non-discounted contractual payments. In instances where the counterparty can demand earlier redemption, the sum is recorded in the earliest period in which the payment can be demanded by the counterparty.
2017 Remaining period
0-1 year 1-5 yearsMore than
5 yearsDebt to financial institutions – mortgage loans 0 749,400 0Debt to financial institutions – leasing* 17,371 166,395 0Other provisions 0 320 0Trade payables 603,884 0 0Current liabilities** 1,125,747 0 0Interest related to mortgage loans 11,241 33,723 0Interest related to financial leasing debt 4,316 6,809 0Total 1,762,559 956,647 0
2016 Remaining period
0-1 year 1-5 yearsMore than
5 yearsDebt to financial institutions – mortgage loans 0 711,300 0Debt to financial institutions – leasing* 16,498 182,987 0Liabilities at fair value 24,135 0 0Other provisions 0 627 0Trade payables 628,347 0 0Current liabilities** 1,109,643 0 0Interest related to mortgage loans 12,803 51,214 0Interest related to financial leasing debt 5,713 2,528 0Total 1,797,139 948,656 0
* Read more about the maturity profile of financial leases in Note 16 concerning Leasing agreements.** Current liabilities include collected alcohol taxes.
Currency riskThe Group is exposed to currency risk as it has operations in several different countries. The Group’s currency exposure can mainly be divided into two areas: cash flow risk and translation risk. The principal objective is to limit the effect of exchange rate fluctuations on the Group’s cash flow in NOK. Changes in costs from suppliers in functional currency due to currency changes are continuously offset by changes in sales prices to customers and through renegotiation of purchase prices from suppliers. The most significant currencies are EUR, USD, SEK and DKK. The risk horizon, i.e., the time it takes to compensate for negative exchange rate fluctuations, is to a great extent controlled by price-adjustment opportunities in the state monopolies in the Nordic region. In Norway this takes place every four months and in Sweden every six months. As a general rule, currency is purchased in the spot market, but also to some extent in the forward market, in order to continuously offset net cash positions.
All of the Group’s non-current borrowing is undertaken in SEK, as a natural hedging of cash flow in the form of dividends in SEK.
For reporting purposes, receivables and debt, as well as monetary items in foreign currency, are translated at the closing rate in the companies’ functional currencies.
The Group’s presentation currency is NOK. The Group is therefore further exposed to currency risk when translating foreign subsidiaries from their functional currency to the Group’s presentation currency. This translation risk is not hedged. As at 31.12.2017, the net translation difference associated with the majority’s equity was positive at NOK 300.8 million, corresponding to a positive change in 2017 of NOK 72.0 million (positive by NOK 228.8 million at the end of 2016).
CONSOLIDATED FINANCIAL STATEMENTS WITH NOTES
Statement of income 01.01.-31.12.
Statement of other comprehensive income 01.01.-31.12.
Statement of financial position as at 31 December
Statement of cash flows 01.01.-31.12.
Statement of changes in equity
Brief history of the Group
Accounting policies
Notes
Note 1: Companies in the Group
Note 2: Management of financial risk
Note 3: Information on cash flows
Note 4: Revenues
Note 5: Segment information
Note 6: Transactions with related parties
Note 7: Other operating expenses
Note 8: Salaries and other personnel costs
Note 9: Share-based payment
Note 10: Pension costs, assets and obligations
Note 11: Financial income and costs
Note 12: Tax
Note 13: Investments in associated companies and jointly controlled entities
Note 14: Tangible fixed assets
Note 15: Intangible assets
Note 16: Leasing agreements
Note 17: Other receivables
Note 18: Inventories
Note 19: Cash and cash equivalents
Note 20: Share capital and shareholder information
Note 21: Debt to financial institutions
Note 22: Liabilities at fair value through profit or loss
Note 23: Other provisions for liabilities
Note 24: Current liabilities
Note 25: Pledges and guarantees
Note 26 Business mergers
Note 27 Events after the close of the financial year
Alternative performance measurements
Auditor's report
Contents In brief Group CEO The Company Corporate Social Responsibility Directors’ Report Financial Statements and Notes Contact 67/123Corporate Governance

68 ANNUAL REPORT 2017 Arcus ASAFINANCIAL STATEMENTS AND NOTES | Arcus ASA Group
The table below shows the Group’s purchase of non-functional foreign exchange during 2017.
Purchase of currency 2017Figures in 1,000 (in the currency concerned) Spot Forward Total
Proportion hedged via forward contracts
EUR 85,554 15,885 101,439 15.7%USD 10,092 390 10,482 3.7%AUD 1,048 230 1,278 18.0%GBP 2,215 80 2,295 3.5%DKK 70,000 0 70,000 0.0%SEK 40 0 40 0.0%
Purchase of currency 2016Figures in 1,000 (in the currency concerned) Spot Forward Total
Proportion hedged via forward contracts
EUR 89,114 23,450 112,564 20.8%USD 9,116 780 9,896 7.9%AUD 1,043 0 1,043 0.0%GBP 830 195 1,025 19.0%SEK 70 0 70 0.0%
At the end of the year, the Group had the following forward contracts related to the distribution activities, which were booked at fair value with value changes through the profit or loss. The represents financial hedging and the Group does not use hedge accounting.
31.12.17
Forward contracts
Figures in NOK 1,000 CurrencyCurrency
amount
Value in NOK - at end of
period
Forward value
in NOKFair value
in NOKDue
datePurchase contracts EUR 2,000 19,702 18,783 919 2018Purchase contracts USD 110 907 856 51 2018Purchase contracts AUD 60 385 373 12 2018Purchase contracts GBP 20 222 211 11 2018Total 993
31.12.16
Forward contracts
Figures in NOK 1,000 CurrencyCurrency
amount
Value in NOK - at end of
period
Forward value in
NOKFair value
in NOKDue
datePurchase contracts EUR 3,600 32,711 33,579 -868 2017Purchase contracts GBP 25 265 270 -5 2017Purchase contracts USD 80 692 664 28 2017Total -844
All forward contracts are recognised at fair value as of the close of the financial year.
Sensitivity to exchange rate fluctuation:The following table shows the Group’s sensitivity to changes in the most important exchange rates, if all other variables remain constant.
The effect on the Group’s profit before tax is calculated as changes in the fair value of monetary assets and liabilities as at 31.12.2017 in foreign currency (non-functional currency). This includes hedging derivatives recognised at fair value with value changes via profit or loss.
The effect on other comprehensive income (OCI) is calculated as the effect of the translation differences associated with subsidiaries in foreign currency as at 31.12.2017.
Figures in NOK 1,000Change in
exchange rateEffect on
pre-tax profitTotal effect on OCI before tax
EUR 5% 1,416 1,461EUR -5% -1,416 -1,461SEK 5% -2,187 -168SEK -5% 2,187 168DKK 5% 4,378 41,317DKK -5% -4,378 -41,317
The Group’s exposure to other currencies is insignificant as at 31.12.2017.
CONSOLIDATED FINANCIAL STATEMENTS WITH NOTES
Statement of income 01.01.-31.12.
Statement of other comprehensive income 01.01.-31.12.
Statement of financial position as at 31 December
Statement of cash flows 01.01.-31.12.
Statement of changes in equity
Brief history of the Group
Accounting policies
Notes
Note 1: Companies in the Group
Note 2: Management of financial risk
Note 3: Information on cash flows
Note 4: Revenues
Note 5: Segment information
Note 6: Transactions with related parties
Note 7: Other operating expenses
Note 8: Salaries and other personnel costs
Note 9: Share-based payment
Note 10: Pension costs, assets and obligations
Note 11: Financial income and costs
Note 12: Tax
Note 13: Investments in associated companies and jointly controlled entities
Note 14: Tangible fixed assets
Note 15: Intangible assets
Note 16: Leasing agreements
Note 17: Other receivables
Note 18: Inventories
Note 19: Cash and cash equivalents
Note 20: Share capital and shareholder information
Note 21: Debt to financial institutions
Note 22: Liabilities at fair value through profit or loss
Note 23: Other provisions for liabilities
Note 24: Current liabilities
Note 25: Pledges and guarantees
Note 26 Business mergers
Note 27 Events after the close of the financial year
Alternative performance measurements
Auditor's report
Contents In brief Group CEO The Company Corporate Social Responsibility Directors’ Report Financial Statements and Notes Contact 68/123Corporate Governance
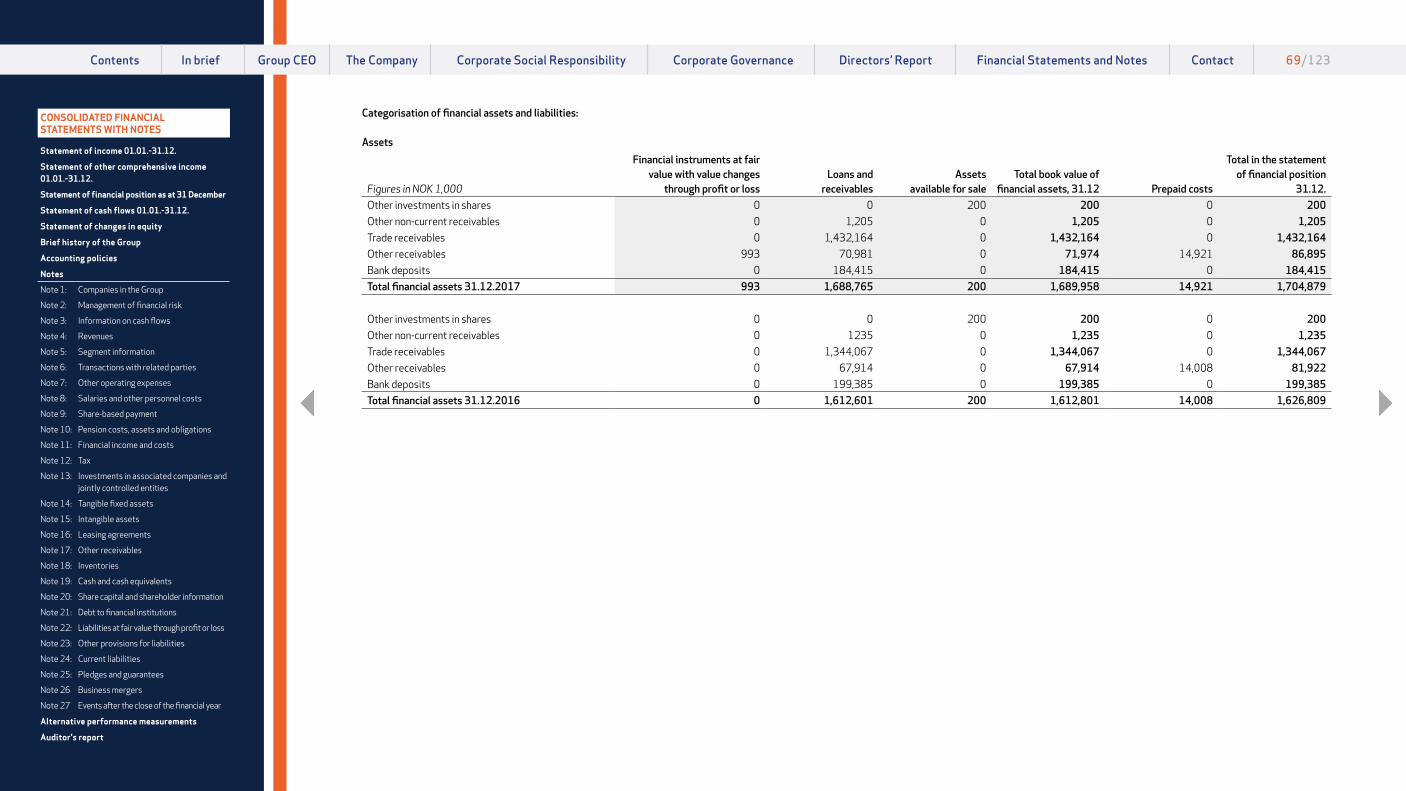
69 ANNUAL REPORT 2017 Arcus ASAFINANCIAL STATEMENTS AND NOTES | Arcus ASA Group
Categorisation of financial assets and liabilities:
Assets
Figures in NOK 1,000
Financial instruments at fair value with value changes
through profit or lossLoans and
receivablesAssets
available for saleTotal book value of
financial assets, 31.12 Prepaid costs
Total in the statement of financial position
31.12.Other investments in shares 0 0 200 200 0 200Other non-current receivables 0 1,205 0 1,205 0 1,205Trade receivables 0 1,432,164 0 1,432,164 0 1,432,164Other receivables 993 70,981 0 71,974 14,921 86,895Bank deposits 0 184,415 0 184,415 0 184,415Total financial assets 31.12.2017 993 1,688,765 200 1,689,958 14,921 1,704,879
Other investments in shares 0 0 200 200 0 200Other non-current receivables 0 1235 0 1,235 0 1,235Trade receivables 0 1,344,067 0 1,344,067 0 1,344,067Other receivables 0 67,914 0 67,914 14,008 81,922Bank deposits 0 199,385 0 199,385 0 199,385Total financial assets 31.12.2016 0 1,612,601 200 1,612,801 14,008 1,626,809
CONSOLIDATED FINANCIAL STATEMENTS WITH NOTES
Statement of income 01.01.-31.12.
Statement of other comprehensive income 01.01.-31.12.
Statement of financial position as at 31 December
Statement of cash flows 01.01.-31.12.
Statement of changes in equity
Brief history of the Group
Accounting policies
Notes
Note 1: Companies in the Group
Note 2: Management of financial risk
Note 3: Information on cash flows
Note 4: Revenues
Note 5: Segment information
Note 6: Transactions with related parties
Note 7: Other operating expenses
Note 8: Salaries and other personnel costs
Note 9: Share-based payment
Note 10: Pension costs, assets and obligations
Note 11: Financial income and costs
Note 12: Tax
Note 13: Investments in associated companies and jointly controlled entities
Note 14: Tangible fixed assets
Note 15: Intangible assets
Note 16: Leasing agreements
Note 17: Other receivables
Note 18: Inventories
Note 19: Cash and cash equivalents
Note 20: Share capital and shareholder information
Note 21: Debt to financial institutions
Note 22: Liabilities at fair value through profit or loss
Note 23: Other provisions for liabilities
Note 24: Current liabilities
Note 25: Pledges and guarantees
Note 26 Business mergers
Note 27 Events after the close of the financial year
Alternative performance measurements
Auditor's report
Contents In brief Group CEO The Company Corporate Social Responsibility Directors’ Report Financial Statements and Notes Contact 69/123Corporate Governance

70 ANNUAL REPORT 2017 Arcus ASAFINANCIAL STATEMENTS AND NOTES | Arcus ASA Group
Liabilities
Figures in NOK 1,000
Financial instruments at fair value with value changes
through profit or loss Financial liability
Total book value of financial
liabilities 31.12.
Provision for accrued expenses and
statutory liabilities
Total in the statement of financial position
31.12.Debt to financial institutions 0 999,289 999,289 0 999,289Liabilities at fair value 0 0 0 0 0Other non-current liabilities 0 0 0 0 0Trade payables 0 603,884 603,884 0 603,884Other current liabilities 0 14,916 14,916 182,826 197,742Total financial liabilities 31.12.2017 0 1,618,089 1,618,089 182,826 1,800,915
Debt to financial institutions 0 902,753 902,753 0 902,753Liabilities at fair value 24,135 0 24,135 0 24,135Other non-current liabilities 0 0 0 0 0Trade payables 0 628,347 628,347 0 628,347Other current liabilities 844 7,793 8,637 188,697 197,334Total financial liabilities 31.12.2016 24,979 1,538,893 1,563,872 188,697 1,752,569
CONSOLIDATED FINANCIAL STATEMENTS WITH NOTES
Statement of income 01.01.-31.12.
Statement of other comprehensive income 01.01.-31.12.
Statement of financial position as at 31 December
Statement of cash flows 01.01.-31.12.
Statement of changes in equity
Brief history of the Group
Accounting policies
Notes
Note 1: Companies in the Group
Note 2: Management of financial risk
Note 3: Information on cash flows
Note 4: Revenues
Note 5: Segment information
Note 6: Transactions with related parties
Note 7: Other operating expenses
Note 8: Salaries and other personnel costs
Note 9: Share-based payment
Note 10: Pension costs, assets and obligations
Note 11: Financial income and costs
Note 12: Tax
Note 13: Investments in associated companies and jointly controlled entities
Note 14: Tangible fixed assets
Note 15: Intangible assets
Note 16: Leasing agreements
Note 17: Other receivables
Note 18: Inventories
Note 19: Cash and cash equivalents
Note 20: Share capital and shareholder information
Note 21: Debt to financial institutions
Note 22: Liabilities at fair value through profit or loss
Note 23: Other provisions for liabilities
Note 24: Current liabilities
Note 25: Pledges and guarantees
Note 26 Business mergers
Note 27 Events after the close of the financial year
Alternative performance measurements
Auditor's report
Contents In brief Group CEO The Company Corporate Social Responsibility Directors’ Report Financial Statements and Notes Contact 70/123Corporate Governance

71 ANNUAL REPORT 2017 Arcus ASAFINANCIAL STATEMENTS AND NOTES | Arcus ASA Group
Fair value hierarchy The Group uses the following hierarchy to determine and report the fair value of financial instruments: Level 1: Listed (unadjusted) prices in active markets Level 2: Direct or indirect inputs other than listed prices included in Level 1, that are observable for the asset or the liability. Level 3: Techniques for calculation of fair value based on other than observable market data. As at 31 December 2017, the Arcus Group had the following financial liabilities at fair value in the statement of financial position:
31.12.17 Level 1 Level 2 Level 3
Book value as at 31.12.
Currency derivatives 0 993 0 993Total assets 0 993 0 993
Level 1 Level 2 Level 3Book value as
at 31.12.Liabilities at fair value 0 0 0 0Currency derivatives 0 0 0 0Total liabilities 0 0 0 0
31.12.16Level 1 Level 2 Level 3
Book value as at 31.12.
Currency derivatives 0 0 0 0Total assets 0 0 0 0
Level 1 Level 2 Level 3Book value as
at 31.12.Liabilities at fair value 0 0 24,135 24,135Currency derivatives 0 844 0 844Total liabilities 0 844 24,135 24,979
There have been no reclassifications between Level 1 and Level 2 during the period. Nor have there been any transfers out of Level 3 during the period.
Reconciliation of liabilities (Level 3):Commitments classified at Level 3 are historically related to options for the purchase of non-controlling interests and a previous co-investment programme for senior executives. Further information on these commitments is presented in Note 22.
Book value 31.12.2016
Used/exercised
2017
Provision made/issued
2017
Valuechanges
2017
Recognised interest
2017Book value
31.12.2017Liabilities at fair value 24,135 -10,483 0 -13,673 21 0Total 24,135 -10,483 0 -13,673 21 0
Book value 31.12.2015
Used/exercised
2016
Provision made/issued
2016
Valuechanges
2016
Recognised interest
2016Book value
31.12.2016Liabilities at fair value 118,999 -244,275 1,000 148,155 256 24,135Total 118,999 -244,275 1,000 148,155 256 24,135
CONSOLIDATED FINANCIAL STATEMENTS WITH NOTES
Statement of income 01.01.-31.12.
Statement of other comprehensive income 01.01.-31.12.
Statement of financial position as at 31 December
Statement of cash flows 01.01.-31.12.
Statement of changes in equity
Brief history of the Group
Accounting policies
Notes
Note 1: Companies in the Group
Note 2: Management of financial risk
Note 3: Information on cash flows
Note 4: Revenues
Note 5: Segment information
Note 6: Transactions with related parties
Note 7: Other operating expenses
Note 8: Salaries and other personnel costs
Note 9: Share-based payment
Note 10: Pension costs, assets and obligations
Note 11: Financial income and costs
Note 12: Tax
Note 13: Investments in associated companies and jointly controlled entities
Note 14: Tangible fixed assets
Note 15: Intangible assets
Note 16: Leasing agreements
Note 17: Other receivables
Note 18: Inventories
Note 19: Cash and cash equivalents
Note 20: Share capital and shareholder information
Note 21: Debt to financial institutions
Note 22: Liabilities at fair value through profit or loss
Note 23: Other provisions for liabilities
Note 24: Current liabilities
Note 25: Pledges and guarantees
Note 26 Business mergers
Note 27 Events after the close of the financial year
Alternative performance measurements
Auditor's report
Contents In brief Group CEO The Company Corporate Social Responsibility Directors’ Report Financial Statements and Notes Contact 71/123Corporate Governance

72 ANNUAL REPORT 2017 Arcus ASAFINANCIAL STATEMENTS AND NOTES | Arcus ASA Group
Capital managementThe Group’s overall objective is that the Group at all times has sufficient liquidity to fulfil its obligations in both the short and long term. At the same time, the aim is to minimise the Group’s surplus liquidity. The Group will work continuously to develop its financial independence, through close monitoring of income development and capital binding, and through continuous assessment of alternative sources of finance. Unutilised credit opportunities are described in Note 19.
As far as possible, the Group wishes to have flexibility for its liquid assets in relation to day-to-day operations. The Group achieves this through a Group cash pool system with a drawing facility that as of 31.12.2017 is managed by Arcus ASA.
When funds are needed for investment purposes, the Group relies on its own liquidity as far as possible. However, for larger investments external debt financing from a financial institution is also used. The Group works according to the objective that the net interest-bearing debt may not exceed 2.5 times EBITDA.
There were no changes in the Group’s non-current debt financing during 2017. At the end of 2017, the agreement on a mortgage loan facility contains a loan term (covenant) concerning net interest-bearing debt as a ratio of adjusted EBITDA. The Group continuously monitors this clause and reports to the bank on a quarterly basis. As at 31.12.2017 the Group was well within the required ratio.
On the introduction of IFRS 16 Leases as from 2019, the Group’s reported net interest-bearing debt and adjusted EBITDA will change significantly. The loan agreement with SEB specifies that the loan terms must be calculated according to today’s model, independently of the introduction of IFRS 16, so that the Group’s ability to fulfil the loan terms will not be affected by the introduction of IFRS 16.
The Group also has financial leasing agreements for major investments in production equipment.
NOK million 2017 2016Net interest-bearing debtNon-current interest-bearing debt to credit institutions 909,218 886,255Current interest-bearing debt to credit institutions 90,071 16,498Capitalised front-end fees 6,577 8,032Bank deposits and other cash and cash equivalents -184,415 -199,385Net interest-bearing debt 821,451 711,400
CONSOLIDATED FINANCIAL STATEMENTS WITH NOTES
Statement of income 01.01.-31.12.
Statement of other comprehensive income 01.01.-31.12.
Statement of financial position as at 31 December
Statement of cash flows 01.01.-31.12.
Statement of changes in equity
Brief history of the Group
Accounting policies
Notes
Note 1: Companies in the Group
Note 2: Management of financial risk
Note 3: Information on cash flows
Note 4: Revenues
Note 5: Segment information
Note 6: Transactions with related parties
Note 7: Other operating expenses
Note 8: Salaries and other personnel costs
Note 9: Share-based payment
Note 10: Pension costs, assets and obligations
Note 11: Financial income and costs
Note 12: Tax
Note 13: Investments in associated companies and jointly controlled entities
Note 14: Tangible fixed assets
Note 15: Intangible assets
Note 16: Leasing agreements
Note 17: Other receivables
Note 18: Inventories
Note 19: Cash and cash equivalents
Note 20: Share capital and shareholder information
Note 21: Debt to financial institutions
Note 22: Liabilities at fair value through profit or loss
Note 23: Other provisions for liabilities
Note 24: Current liabilities
Note 25: Pledges and guarantees
Note 26 Business mergers
Note 27 Events after the close of the financial year
Alternative performance measurements
Auditor's report
Contents In brief Group CEO The Company Corporate Social Responsibility Directors’ Report Financial Statements and Notes Contact 72/123Corporate Governance

73 ANNUAL REPORT 2017 Arcus ASAFINANCIAL STATEMENTS AND NOTES | Arcus ASA Group
NOTE 3 INFORMATION ON CASH FLOWS
The Group prepares the statement of cash flows according to an indirect method. Below is a specification of cash flow effects which are not presented elsewhere in the Notes.
EFFECTS OF CASH FLOWS FROM OPERATIONS:
Pension costs and other provisions without cash effectPension costs without cash effect are the change in pension obligations in the statement of financial position adjusted for obligations from acquisition or sale, and the effects of booked estimate deviations booked to the total comprehensive income (OCI).
Figures in NOK 1000 Note 2017 2016Book pension obligations at the beginning of the year 10 -34,092 -35,902Estimate deviations booked to the total comprehensive income 10 4,438 -1,278Book pension obligations at the end of the year 10 30,552 34,092Pension costs without cash effect 898 -3,088
Book other provisions for obligations at the beginning of the year 23 -627 -1,140Book other provisions for obligations at the end of the year 23 320 627Costs from other provisions without cash effect -307 -513Total pension costs and other provisions without cash effect 591 -3,601
Value changes without cash effectBelow is a specification of value changes included in the statement of income, but without cash effect.
Figures in NOK 1000 Note 2017 2016Value change in options for the purchase of non-controlling interests 11,22 147 28,180Value change in previous co-investment programme for senior executives 11,22 -13,821 119,979Costs related to share-based remuneration without cash effect 9 9,415 731Amortisation of front-end fees for interest-bearing debt 21 1,652 20,636Value change, interest rate swaps 11 0 -4,552Value change, forward exchange contracts 11 -1,837 0Total value changes without cash effect -4,444 164,974
Loss on sale of fixed assets and intangible fixed assetsThe accounting loss or profit on the sale of fixed assets and intangible fixed assets has no cash flow effect, which is thereby reversed from the operational activities in the indirect method. The sales proceeds related to these divestments is the Group’s cash flow effect under investment activities.
Figures in NOK 1000 Note 2017 2016Book value of sold fixed assets and intangible fixed assets 14,15 0 9Sales proceeds from sold fixed assets and intangible fixed assets 30 1,060Profit (-) / loss (+) on sale of fixed assets and intangible fixed assets -30 -1,051
Unrealised agioUrealised agio is related to translation differences for working capital items in foreign subsidiaries with a functional currency in other than the functional currency, and statement of income items linked to the currency translation of loans booked in other currencies than the functional currency.
Figures in NOK 1000 Note 2017 2016Translation differences for working capital items 19,195 -13,454The effects on the result of the translation of loans booked in another currency than the functional currency 0 -2,510Total unrealised agio 19,195 -15,964
Changes in working capitalChanges in working capital are the change in working capital items in the statement of financial position, adjusted for working capital items from the acquisition or sale of companies during the period.
Figures in NOK 1000 Note 2017 2016Book value of inventories at the beginning of the year 378,777 388,217Addition of inventories on acquisition of companies during the year 201 0Book value of inventories at the end of the year -410,759 -378,777Change in inventories -31,781 9,440
CONSOLIDATED FINANCIAL STATEMENTS WITH NOTES
Statement of income 01.01.-31.12.
Statement of other comprehensive income 01.01.-31.12.
Statement of financial position as at 31 December
Statement of cash flows 01.01.-31.12.
Statement of changes in equity
Brief history of the Group
Accounting policies
Notes
Note 1: Companies in the Group
Note 2: Management of financial risk
Note 3: Information on cash flows
Note 4: Revenues
Note 5: Segment information
Note 6: Transactions with related parties
Note 7: Other operating expenses
Note 8: Salaries and other personnel costs
Note 9: Share-based payment
Note 10: Pension costs, assets and obligations
Note 11: Financial income and costs
Note 12: Tax
Note 13: Investments in associated companies and jointly controlled entities
Note 14: Tangible fixed assets
Note 15: Intangible assets
Note 16: Leasing agreements
Note 17: Other receivables
Note 18: Inventories
Note 19: Cash and cash equivalents
Note 20: Share capital and shareholder information
Note 21: Debt to financial institutions
Note 22: Liabilities at fair value through profit or loss
Note 23: Other provisions for liabilities
Note 24: Current liabilities
Note 25: Pledges and guarantees
Note 26 Business mergers
Note 27 Events after the close of the financial year
Alternative performance measurements
Auditor's report
Contents In brief Group CEO The Company Corporate Social Responsibility Directors’ Report Financial Statements and Notes Contact 73/123Corporate Governance

74 ANNUAL REPORT 2017 Arcus ASAFINANCIAL STATEMENTS AND NOTES | Arcus ASA Group
Figures in NOK 1000 Note 2017 2016Book value of trade receivables at the beginning of the year 1,344,067 1,003,328Addition of trade receivables on acquisition of companies during the year 44,158 0Book value of trade receivables at the end of the year -1,432,164 -1,344,067Change in trade receivables -43,939 -340,739
Figures in NOK 1000 Note 2017 2016Book value of trade payables at the beginning of the year -628,347 -551,457Addition of trade payables on acquisition of companies during the year -20,974 0Book value of trade payables at the end of the year 603,884 628,347Change in trade payables -45,437 76,890
Figures in NOK 1000 Note 2017 2016Book value of other current receivables at the beginning of the year 17 78,996 90,520Addition of other current receivables on acquisition of companies during the year 26 845 0Book value of other current receivables at the end of the year 17 -85,902 -78,966Change in other current receivables -6,061 11,554
Book value of other current liabilities at the beginning of the year 24 -1,108,674 -1,086,737Addition of other current liabilities on acquisition of companies during the year
26 -31,626 0
Book value of other current liabilities at the end of the year 24 1,124,105 1,108,674Change in other current liabilities -16,195 21,937Change in other current assets and other liabilities -22,256 33,491
EFFECTS OF CASH FLOWS FROM INVESTMENT ACTIVITIESPayments on acquisition of other financial investmentsIn 2017 the entire amount concerns a payment related to an increased ownership interest in an associated company. The Group had no equivalent payments in 2016.
Figures in NOK 1000 Note 2017 2016Increased ownership interest in an associated company (Tiffon SA) 13 -454 0Payments on acquisition of other financial investments -454 0
EFFECTS IN CASH FLOWS FROM FINANCING ACTIVITIESInterest cost paid during the periodThe Group has quarterly interest payment dates, so that the Group’s recognised interest payable coincides with the interest paid during the year. The difference between recognised interest payable and interest paid is related to calculated interest costs relating to liabilities at fair value through profit and loss. In 2016 this also concerns the settlement of an interest rate swap, which entailed a difference in relation to recognised interest costs.
Figures in NOK 1000 Note 2017 2016Interest paid to credit institutions 11 -31,454 -70,158Paid on settlement of interest rate swap 0 -12,873Interest cost paid during the period -31,454 -83,031
Payment of dividendThe difference in divided paid in 2016 and divided carried to equity in 2016 is related to how dividend to a minority for 2015 was not paid before January 2016.
CONSOLIDATED FINANCIAL STATEMENTS WITH NOTES
Statement of income 01.01.-31.12.
Statement of other comprehensive income 01.01.-31.12.
Statement of financial position as at 31 December
Statement of cash flows 01.01.-31.12.
Statement of changes in equity
Brief history of the Group
Accounting policies
Notes
Note 1: Companies in the Group
Note 2: Management of financial risk
Note 3: Information on cash flows
Note 4: Revenues
Note 5: Segment information
Note 6: Transactions with related parties
Note 7: Other operating expenses
Note 8: Salaries and other personnel costs
Note 9: Share-based payment
Note 10: Pension costs, assets and obligations
Note 11: Financial income and costs
Note 12: Tax
Note 13: Investments in associated companies and jointly controlled entities
Note 14: Tangible fixed assets
Note 15: Intangible assets
Note 16: Leasing agreements
Note 17: Other receivables
Note 18: Inventories
Note 19: Cash and cash equivalents
Note 20: Share capital and shareholder information
Note 21: Debt to financial institutions
Note 22: Liabilities at fair value through profit or loss
Note 23: Other provisions for liabilities
Note 24: Current liabilities
Note 25: Pledges and guarantees
Note 26 Business mergers
Note 27 Events after the close of the financial year
Alternative performance measurements
Auditor's report
Contents In brief Group CEO The Company Corporate Social Responsibility Directors’ Report Financial Statements and Notes Contact 74/123Corporate Governance
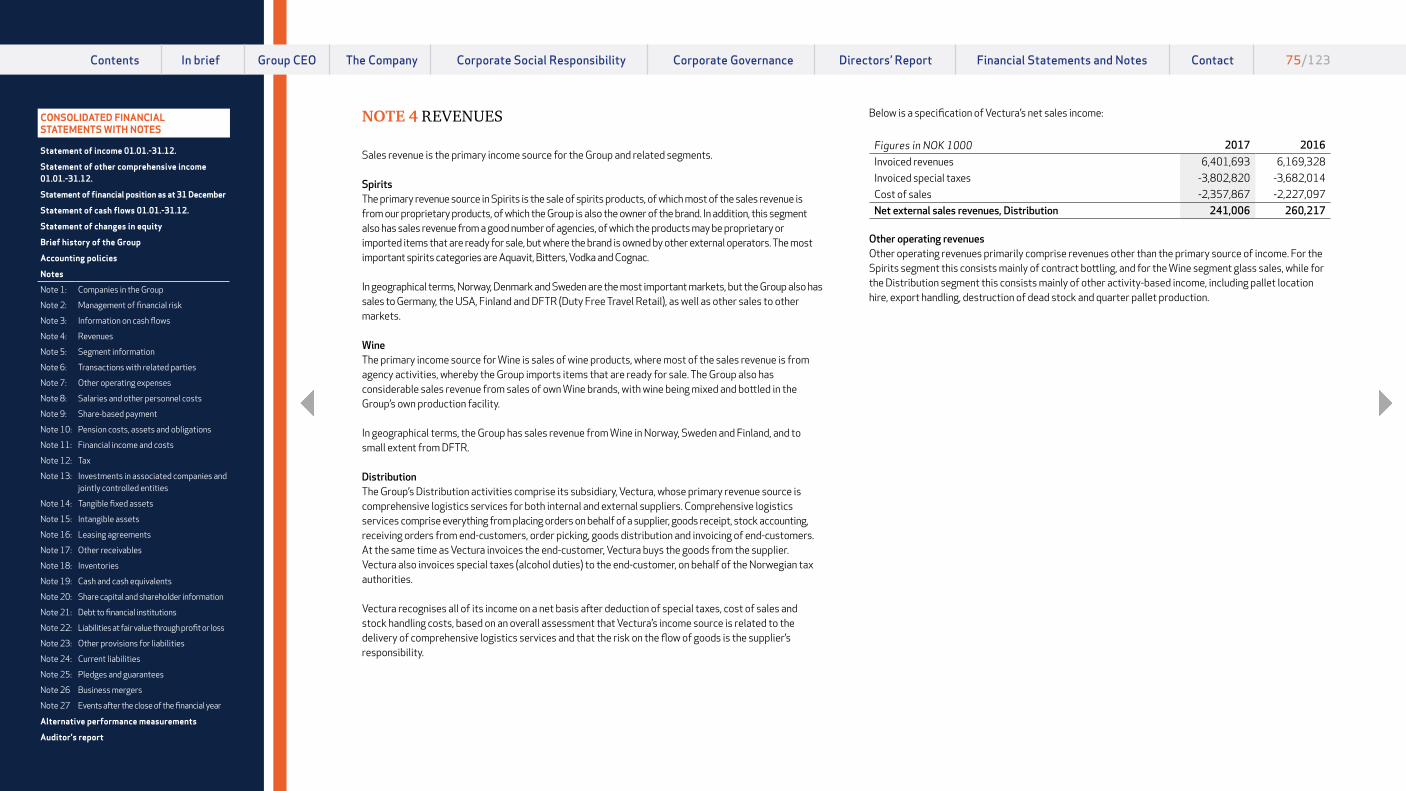
75 ANNUAL REPORT 2017 Arcus ASAFINANCIAL STATEMENTS AND NOTES | Arcus ASA Group
NOTE 4 REVENUES
Sales revenue is the primary income source for the Group and related segments.
SpiritsThe primary revenue source in Spirits is the sale of spirits products, of which most of the sales revenue is from our proprietary products, of which the Group is also the owner of the brand. In addition, this segment also has sales revenue from a good number of agencies, of which the products may be proprietary or imported items that are ready for sale, but where the brand is owned by other external operators. The most important spirits categories are Aquavit, Bitters, Vodka and Cognac.
In geographical terms, Norway, Denmark and Sweden are the most important markets, but the Group also has sales to Germany, the USA, Finland and DFTR (Duty Free Travel Retail), as well as other sales to other markets.
WineThe primary income source for Wine is sales of wine products, where most of the sales revenue is from agency activities, whereby the Group imports items that are ready for sale. The Group also has considerable sales revenue from sales of own Wine brands, with wine being mixed and bottled in the Group’s own production facility.
In geographical terms, the Group has sales revenue from Wine in Norway, Sweden and Finland, and to small extent from DFTR.
DistributionThe Group’s Distribution activities comprise its subsidiary, Vectura, whose primary revenue source is comprehensive logistics services for both internal and external suppliers. Comprehensive logistics services comprise everything from placing orders on behalf of a supplier, goods receipt, stock accounting, receiving orders from end-customers, order picking, goods distribution and invoicing of end-customers. At the same time as Vectura invoices the end-customer, Vectura buys the goods from the supplier. Vectura also invoices special taxes (alcohol duties) to the end-customer, on behalf of the Norwegian tax authorities.
Vectura recognises all of its income on a net basis after deduction of special taxes, cost of sales and stock handling costs, based on an overall assessment that Vectura’s income source is related to the delivery of comprehensive logistics services and that the risk on the flow of goods is the supplier’s responsibility.
Below is a specification of Vectura’s net sales income:
Figures in NOK 1000 2017 2016Invoiced revenues 6,401,693 6,169,328Invoiced special taxes -3,802,820 -3,682,014Cost of sales -2,357,867 -2,227,097Net external sales revenues, Distribution 241,006 260,217
Other operating revenuesOther operating revenues primarily comprise revenues other than the primary source of income. For the Spirits segment this consists mainly of contract bottling, and for the Wine segment glass sales, while for the Distribution segment this consists mainly of other activity-based income, including pallet location hire, export handling, destruction of dead stock and quarter pallet production.
CONSOLIDATED FINANCIAL STATEMENTS WITH NOTES
Statement of income 01.01.-31.12.
Statement of other comprehensive income 01.01.-31.12.
Statement of financial position as at 31 December
Statement of cash flows 01.01.-31.12.
Statement of changes in equity
Brief history of the Group
Accounting policies
Notes
Note 1: Companies in the Group
Note 2: Management of financial risk
Note 3: Information on cash flows
Note 4: Revenues
Note 5: Segment information
Note 6: Transactions with related parties
Note 7: Other operating expenses
Note 8: Salaries and other personnel costs
Note 9: Share-based payment
Note 10: Pension costs, assets and obligations
Note 11: Financial income and costs
Note 12: Tax
Note 13: Investments in associated companies and jointly controlled entities
Note 14: Tangible fixed assets
Note 15: Intangible assets
Note 16: Leasing agreements
Note 17: Other receivables
Note 18: Inventories
Note 19: Cash and cash equivalents
Note 20: Share capital and shareholder information
Note 21: Debt to financial institutions
Note 22: Liabilities at fair value through profit or loss
Note 23: Other provisions for liabilities
Note 24: Current liabilities
Note 25: Pledges and guarantees
Note 26 Business mergers
Note 27 Events after the close of the financial year
Alternative performance measurements
Auditor's report
Contents In brief Group CEO The Company Corporate Social Responsibility Directors’ Report Financial Statements and Notes Contact 75/123Corporate Governance

76 ANNUAL REPORT 2017 Arcus ASAFINANCIAL STATEMENTS AND NOTES | Arcus ASA Group
The following tables present the Group’s total external revenues:
2017 2016Sales revenue by market - Group: Sales revenue Other operating revenues Total Sales revenue Other operating revenues TotalNorway 996,050 24,568 1,020,618 993,760 20,990 1,014,750Sweden 1,006,576 12,944 1,019,520 1,028,103 11,682 1,039,785Finland 221,385 4,610 225,995 207,728 0 207,728Denmark 146,109 0 146,109 133,108 0 133,108Germany 59,940 1,504 61,444 58,940 0 58,940USA 3,238 580 3,818 5,727 0 5,727DFTR 94,870 0 95,537 92,954 0 92,954Other international 1,958 728 2,019 1,506 27,899 29,405Total operating revenues 2,530,126 44,934 2,575,060 2,521,826 60,571 2,582,397
The following tables present the segments’ total external and internal revenues:
2017 2016Revenue by market - Spirits: Sales revenues Other operating revenues Total Sales revenue Other operating revenues TotalNorway 301,579 141,306 442,885 308,463 122,955 431,418Sweden 126,469 5,455 131,924 116,543 1,942 118,485Finland 32,711 289 33,000 35,267 0 35,267Denmark 146,109 0 146,109 133,108 0 133,108Germany 59,940 1,504 61,444 58,940 0 58,940USA 3,238 580 3,818 5,727 0 5,727DFTR 91,417 0 92,084 91,554 0 91,554Other international 1,958 728 2,019 1,505 27,879 29,384Total operating revenues 763,421 149,862 913,283 751,107 152,776 903,883
2017 2016Revenue by market - Wine: Sales revenue Other operating revenues Total Sales revenue Other operating revenues TotalNorway 448,477 360 448,837 453,255 0 453,255Sweden 882,085 13,509 895,594 911,560 13,697 925,257Finland 188,674 4,321 192,995 172,461 0 172,461DFTR 3,453 0 3,453 1,400 0 1,400Total operating revenues 1,522,689 18,190 1,540,879 1,538,676 13,697 1,552,373
2017 2016Revenue by market - Distribution: Sales revenue Other operating revenues Total Sales revenue Other operating revenues TotalNorway 251,332 33,071 284,403 232,043 30,881 262,924Total operating revenues 251,332 33,071 284,403 232,043 30,881 262,924
CONSOLIDATED FINANCIAL STATEMENTS WITH NOTES
Statement of income 01.01.-31.12.
Statement of other comprehensive income 01.01.-31.12.
Statement of financial position as at 31 December
Statement of cash flows 01.01.-31.12.
Statement of changes in equity
Brief history of the Group
Accounting policies
Notes
Note 1: Companies in the Group
Note 2: Management of financial risk
Note 3: Information on cash flows
Note 4: Revenues
Note 5: Segment information
Note 6: Transactions with related parties
Note 7: Other operating expenses
Note 8: Salaries and other personnel costs
Note 9: Share-based payment
Note 10: Pension costs, assets and obligations
Note 11: Financial income and costs
Note 12: Tax
Note 13: Investments in associated companies and jointly controlled entities
Note 14: Tangible fixed assets
Note 15: Intangible assets
Note 16: Leasing agreements
Note 17: Other receivables
Note 18: Inventories
Note 19: Cash and cash equivalents
Note 20: Share capital and shareholder information
Note 21: Debt to financial institutions
Note 22: Liabilities at fair value through profit or loss
Note 23: Other provisions for liabilities
Note 24: Current liabilities
Note 25: Pledges and guarantees
Note 26 Business mergers
Note 27 Events after the close of the financial year
Alternative performance measurements
Auditor's report
Contents In brief Group CEO The Company Corporate Social Responsibility Directors’ Report Financial Statements and Notes Contact 76/123Corporate Governance
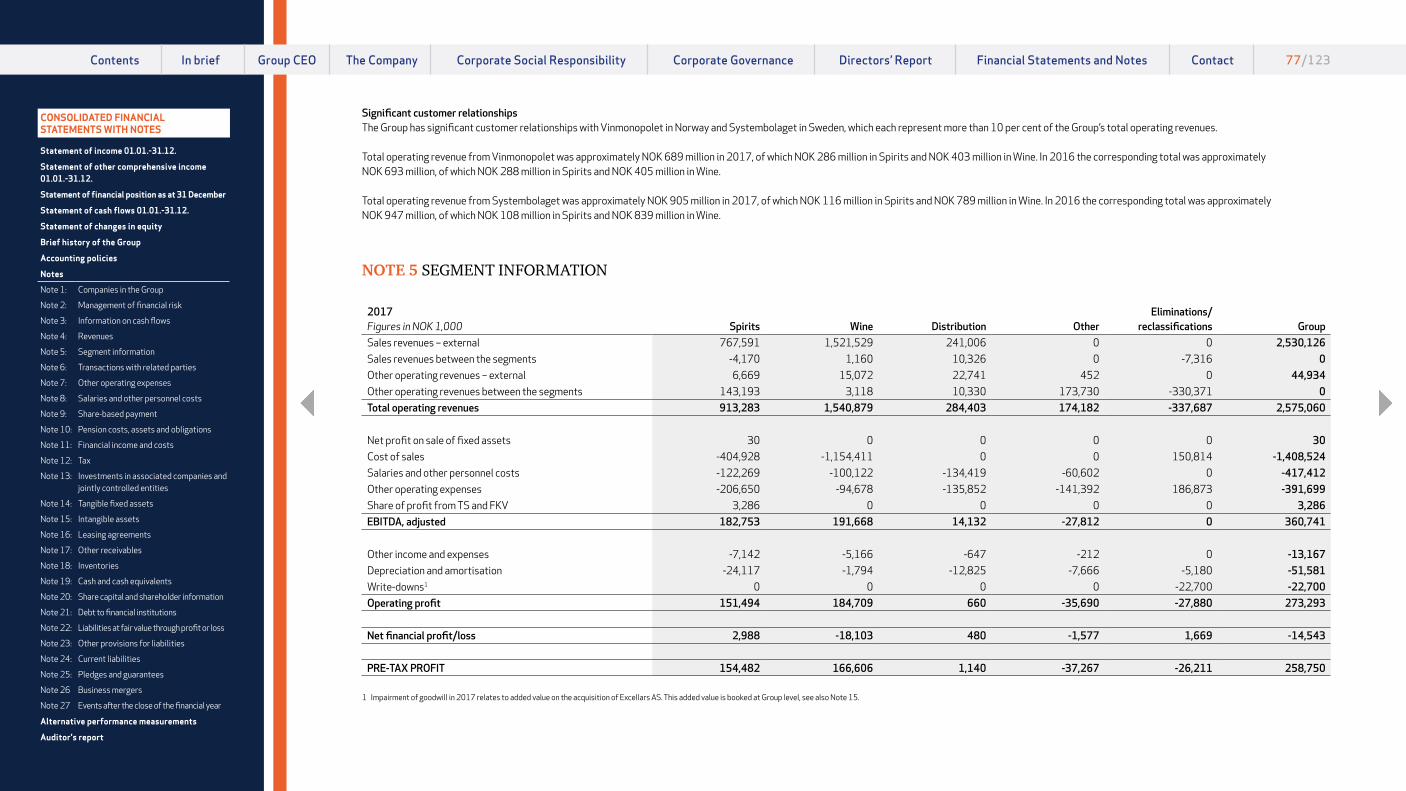
77 ANNUAL REPORT 2017 Arcus ASAFINANCIAL STATEMENTS AND NOTES | Arcus ASA Group
Significant customer relationshipsThe Group has significant customer relationships with Vinmonopolet in Norway and Systembolaget in Sweden, which each represent more than 10 per cent of the Group’s total operating revenues.
Total operating revenue from Vinmonopolet was approximately NOK 689 million in 2017, of which NOK 286 million in Spirits and NOK 403 million in Wine. In 2016 the corresponding total was approximately NOK 693 million, of which NOK 288 million in Spirits and NOK 405 million in Wine.
Total operating revenue from Systembolaget was approximately NOK 905 million in 2017, of which NOK 116 million in Spirits and NOK 789 million in Wine. In 2016 the corresponding total was approximately NOK 947 million, of which NOK 108 million in Spirits and NOK 839 million in Wine.
NOTE 5 SEGMENT INFORMATION
2017Figures in NOK 1,000 Spirits Wine Distribution Other
Eliminations/ reclassifications Group
Sales revenues – external 767,591 1,521,529 241,006 0 0 2,530,126Sales revenues between the segments -4,170 1,160 10,326 0 -7,316 0Other operating revenues – external 6,669 15,072 22,741 452 0 44,934Other operating revenues between the segments 143,193 3,118 10,330 173,730 -330,371 0Total operating revenues 913,283 1,540,879 284,403 174,182 -337,687 2,575,060
Net profit on sale of fixed assets 30 0 0 0 0 30Cost of sales -404,928 -1,154,411 0 0 150,814 -1,408,524Salaries and other personnel costs -122,269 -100,122 -134,419 -60,602 0 -417,412Other operating expenses -206,650 -94,678 -135,852 -141,392 186,873 -391,699Share of profit from TS and FKV 3,286 0 0 0 0 3,286EBITDA, adjusted 182,753 191,668 14,132 -27,812 0 360,741
Other income and expenses -7,142 -5,166 -647 -212 0 -13,167Depreciation and amortisation -24,117 -1,794 -12,825 -7,666 -5,180 -51,581Write-downs1 0 0 0 0 -22,700 -22,700Operating profit 151,494 184,709 660 -35,690 -27,880 273,293
Net financial profit/loss 2,988 -18,103 480 -1,577 1,669 -14,543
PRE-TAX PROFIT 154,482 166,606 1,140 -37,267 -26,211 258,750
1 Impairment of goodwill in 2017 relates to added value on the acquisition of Excellars AS. This added value is booked at Group level, see also Note 15.
CONSOLIDATED FINANCIAL STATEMENTS WITH NOTES
Statement of income 01.01.-31.12.
Statement of other comprehensive income 01.01.-31.12.
Statement of financial position as at 31 December
Statement of cash flows 01.01.-31.12.
Statement of changes in equity
Brief history of the Group
Accounting policies
Notes
Note 1: Companies in the Group
Note 2: Management of financial risk
Note 3: Information on cash flows
Note 4: Revenues
Note 5: Segment information
Note 6: Transactions with related parties
Note 7: Other operating expenses
Note 8: Salaries and other personnel costs
Note 9: Share-based payment
Note 10: Pension costs, assets and obligations
Note 11: Financial income and costs
Note 12: Tax
Note 13: Investments in associated companies and jointly controlled entities
Note 14: Tangible fixed assets
Note 15: Intangible assets
Note 16: Leasing agreements
Note 17: Other receivables
Note 18: Inventories
Note 19: Cash and cash equivalents
Note 20: Share capital and shareholder information
Note 21: Debt to financial institutions
Note 22: Liabilities at fair value through profit or loss
Note 23: Other provisions for liabilities
Note 24: Current liabilities
Note 25: Pledges and guarantees
Note 26 Business mergers
Note 27 Events after the close of the financial year
Alternative performance measurements
Auditor's report
Contents In brief Group CEO The Company Corporate Social Responsibility Directors’ Report Financial Statements and Notes Contact 77/123Corporate Governance

78 ANNUAL REPORT 2017 Arcus ASAFINANCIAL STATEMENTS AND NOTES | Arcus ASA Group
2016Figures in NOK 1,000 Spirits Wine Distribution Other
Eliminations/ reclassification Group
Sales revenues – external 746,230 1,515,379 260,217 0 0 2,521,826Sales revenues between the segments 4,877 23,297 -28,174 0 0 0Other operating revenues – external 28,045 11,478 20,646 403 0 60,571Other operating revenues between the segments 124,731 2,220 10,235 173,011 -310,196 0Total operating revenues 903,883 1,552,373 262,924 173,414 -310,196 2,582,397
Net profit on sale of fixed assets 144 0 0 0 0 144Cost of sales -427,031 -1,165,620 0 0 124,731 -1,467,920Salaries and other personnel costs -117,244 -93,289 -124,008 -58,004 0 -392,545Other operating expenses -202,954 -99,302 -136,320 -139,405 185,465 -392,516Share of profit from TS and FKV 5,789 0 0 0 0 5,789EBITDA, adjusted 162,587 194,162 2,596 -23,995 0 335,349
Other income and expenses -3,916 0 -399 -40,559 0 -44,874Depreciation and amortisation -23,906 -1,014 -13,632 -8,363 -4,710 -51,625Write-downs 0 0 0 0 0 0Operating profit 134,765 193,148 -11,435 -72,917 -4,711 238,850
Net financial profit/loss -9,086 -17,576 404 -183,385 -27,085 -236,728
PRE-TAX PROFIT 125,679 175,572 -11,031 -256,302 -31,796 2,122
The Group does not present the segments’ assets or liabilities as this is not part of the Group’s internal reporting either.
For information regarding pricing associated with sales between the segments, see Note 6.
CONSOLIDATED FINANCIAL STATEMENTS WITH NOTES
Statement of income 01.01.-31.12.
Statement of other comprehensive income 01.01.-31.12.
Statement of financial position as at 31 December
Statement of cash flows 01.01.-31.12.
Statement of changes in equity
Brief history of the Group
Accounting policies
Notes
Note 1: Companies in the Group
Note 2: Management of financial risk
Note 3: Information on cash flows
Note 4: Revenues
Note 5: Segment information
Note 6: Transactions with related parties
Note 7: Other operating expenses
Note 8: Salaries and other personnel costs
Note 9: Share-based payment
Note 10: Pension costs, assets and obligations
Note 11: Financial income and costs
Note 12: Tax
Note 13: Investments in associated companies and jointly controlled entities
Note 14: Tangible fixed assets
Note 15: Intangible assets
Note 16: Leasing agreements
Note 17: Other receivables
Note 18: Inventories
Note 19: Cash and cash equivalents
Note 20: Share capital and shareholder information
Note 21: Debt to financial institutions
Note 22: Liabilities at fair value through profit or loss
Note 23: Other provisions for liabilities
Note 24: Current liabilities
Note 25: Pledges and guarantees
Note 26 Business mergers
Note 27 Events after the close of the financial year
Alternative performance measurements
Auditor's report
Contents In brief Group CEO The Company Corporate Social Responsibility Directors’ Report Financial Statements and Notes Contact 78/123Corporate Governance

79 ANNUAL REPORT 2017 Arcus ASAFINANCIAL STATEMENTS AND NOTES | Arcus ASA Group
NOTE 6 TRANSACTIONS WITH RELATED PARTIES
In addition to subsidiaries and associated companies, the Group’s related parties are defined as the owners, all members of the Board of Directors and Group executive management, as well as companies in which any of these parties have either controlling interests, Board appointments or managerial positions.
The Group’s transactions with related parties: Purchase of goods and services:
Figures in NOK 1,000 Relationship Delivery 2017 2016Hoff SA Shareholder Raw materials 22,386 22,469Tiffon SA Associated company (34.75%) Raw materials and consumables 52,746 56,051Det Danske Spiritus Kompagni A/S1 Jointly controlled entity (50%) Leased offices, licences 0 3,314Gjelleråsen Eiendom AS Owned by shareholder (Canica AS) Rent 79,150 77,605Thomas Patay General manager of Vingruppen AS Minority shareholder in Vinordia AS, Symposium Wines AS and Vinuniq AS 2,741 0Total purchase of goods and services 157,023 159,439
Sales of goods and services:
Figures in NOK 1,000 Relationship Delivery 2017 2016Tiffon SA Associated company (34.75%) Market support 3,714 3,393Det Danske Spiritus Kompagni A/S1 Jointly controlled entity (50%) Sales of finished goods 0 132,184Total sales of goods and services 3,714 135,577
Receivables from related parties as at 31.12.:
Figures in NOK 1,000 Relationship Nature of receivable 2017 2016Tiffon SA Associated company (34.75%) Current receivables 170 0Det Danske Spiritus Kompagni A/S1 Jointly controlled entity (50%) Current receivables 0 21,061Total receivables from related parties as at 31.12.: 170 21,061
Liabilities to related parties as at 31.12.:
Figures in NOK 1,000 Relationship Nature of liability 2017 2016Hoff SA Shareholder Current liabilities 1,147 549Tiffon SA Associated company (34.75%) Current liabilities 10,821 11,082Det Danske Spiritus Kompagni A/S1 Jointly controlled entity (50%) Current liabilities 0 113Total liabilities to related parties as at 31.12.: 11,968 11,744
All transactions with related parties are on market terms.
1 Det Danske Spiritus Kompagni A/S was a jointly-controlled company up to January 2017, when the Group acquired the remaining 50 per cent ownership interest. For further information, see Note 26.
CONSOLIDATED FINANCIAL STATEMENTS WITH NOTES
Statement of income 01.01.-31.12.
Statement of other comprehensive income 01.01.-31.12.
Statement of financial position as at 31 December
Statement of cash flows 01.01.-31.12.
Statement of changes in equity
Brief history of the Group
Accounting policies
Notes
Note 1: Companies in the Group
Note 2: Management of financial risk
Note 3: Information on cash flows
Note 4: Revenues
Note 5: Segment information
Note 6: Transactions with related parties
Note 7: Other operating expenses
Note 8: Salaries and other personnel costs
Note 9: Share-based payment
Note 10: Pension costs, assets and obligations
Note 11: Financial income and costs
Note 12: Tax
Note 13: Investments in associated companies and jointly controlled entities
Note 14: Tangible fixed assets
Note 15: Intangible assets
Note 16: Leasing agreements
Note 17: Other receivables
Note 18: Inventories
Note 19: Cash and cash equivalents
Note 20: Share capital and shareholder information
Note 21: Debt to financial institutions
Note 22: Liabilities at fair value through profit or loss
Note 23: Other provisions for liabilities
Note 24: Current liabilities
Note 25: Pledges and guarantees
Note 26 Business mergers
Note 27 Events after the close of the financial year
Alternative performance measurements
Auditor's report
Contents In brief Group CEO The Company Corporate Social Responsibility Directors’ Report Financial Statements and Notes Contact 79/123Corporate Governance
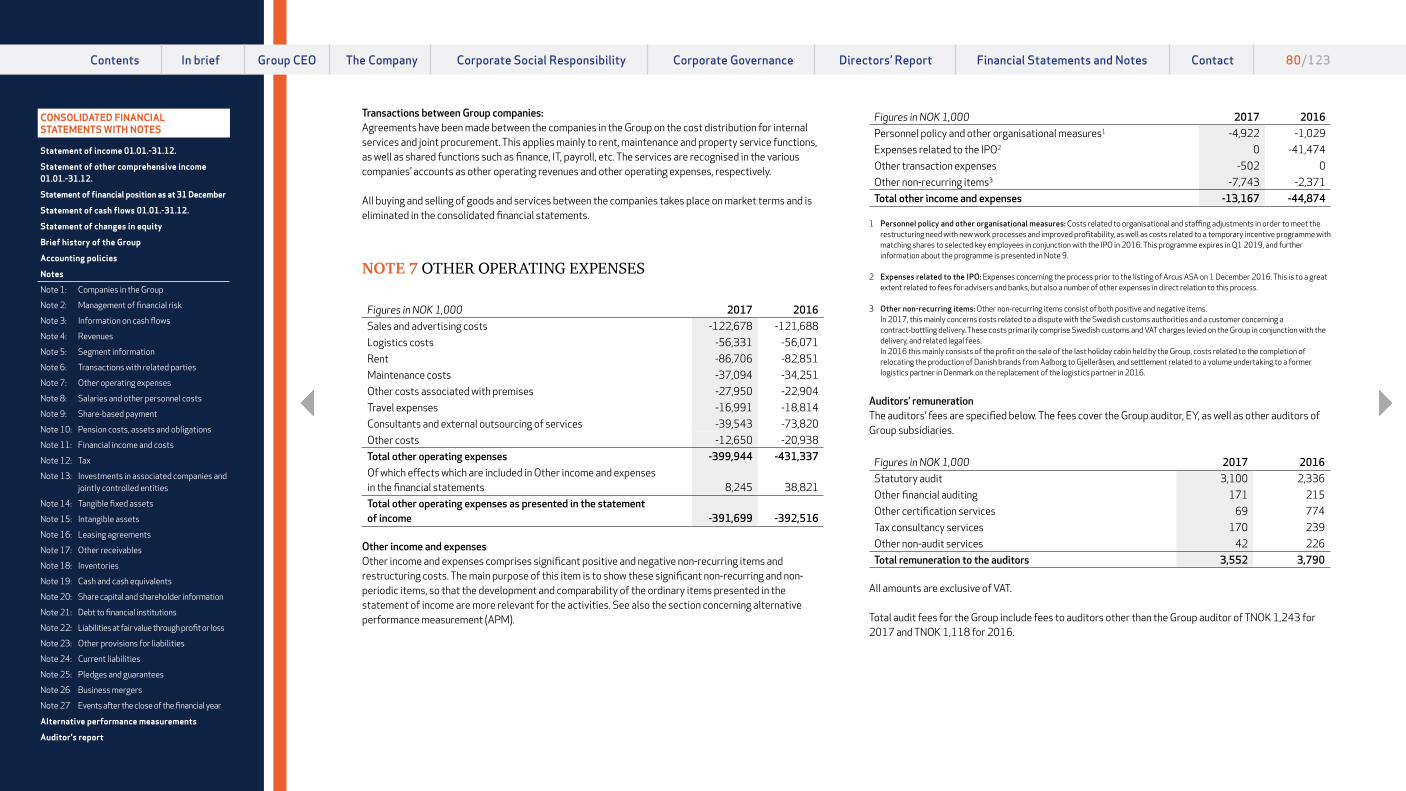
80 ANNUAL REPORT 2017 Arcus ASAFINANCIAL STATEMENTS AND NOTES | Arcus ASA Group
Transactions between Group companies:Agreements have been made between the companies in the Group on the cost distribution for internal services and joint procurement. This applies mainly to rent, maintenance and property service functions, as well as shared functions such as finance, IT, payroll, etc. The services are recognised in the various companies’ accounts as other operating revenues and other operating expenses, respectively.
All buying and selling of goods and services between the companies takes place on market terms and is eliminated in the consolidated financial statements.
NOTE 7 OTHER OPERATING EXPENSES
Figures in NOK 1,000 2017 2016Sales and advertising costs -122,678 -121,688Logistics costs -56,331 -56,071Rent -86,706 -82,851Maintenance costs -37,094 -34,251Other costs associated with premises -27,950 -22,904Travel expenses -16,991 -18,814Consultants and external outsourcing of services -39,543 -73,820Other costs -12,650 -20,938Total other operating expenses -399,944 -431,337Of which effects which are included in Other income and expenses in the financial statements 8,245 38,821Total other operating expenses as presented in the statement of income -391,699 -392,516
Other income and expensesOther income and expenses comprises significant positive and negative non-recurring items and restructuring costs. The main purpose of this item is to show these significant non-recurring and non- periodic items, so that the development and comparability of the ordinary items presented in the statement of income are more relevant for the activities. See also the section concerning alternative performance measurement (APM).
Figures in NOK 1,000 2017 2016Personnel policy and other organisational measures1 -4,922 -1,029Expenses related to the IPO2 0 -41,474Other transaction expenses -502 0Other non-recurring items3 -7,743 -2,371Total other income and expenses -13,167 -44,874
1 Personnel policy and other organisational measures: Costs related to organisational and staffing adjustments in order to meet the restructuring need with new work processes and improved profitability, as well as costs related to a temporary incentive programme with matching shares to selected key employees in conjunction with the IPO in 2016. This programme expires in Q1 2019, and further information about the programme is presented in Note 9.
2 Expenses related to the IPO: Expenses concerning the process prior to the listing of Arcus ASA on 1 December 2016. This is to a great extent related to fees for advisers and banks, but also a number of other expenses in direct relation to this process.
3 Other non-recurring items: Other non-recurring items consist of both positive and negative items. In 2017, this mainly concerns costs related to a dispute with the Swedish customs authorities and a customer concerning a
contract-bottling delivery. These costs primarily comprise Swedish customs and VAT charges levied on the Group in conjunction with the delivery, and related legal fees.
In 2016 this mainly consists of the profit on the sale of the last holiday cabin held by the Group, costs related to the completion of relocating the production of Danish brands from Aalborg to Gjelleråsen, and settlement related to a volume undertaking to a former logistics partner in Denmark on the replacement of the logistics partner in 2016.
Auditors’ remunerationThe auditors’ fees are specified below. The fees cover the Group auditor, EY, as well as other auditors of Group subsidiaries.
Figures in NOK 1,000 2017 2016Statutory audit 3,100 2,336Other financial auditing 171 215Other certification services 69 774Tax consultancy services 170 239Other non-audit services 42 226Total remuneration to the auditors 3,552 3,790
All amounts are exclusive of VAT. Total audit fees for the Group include fees to auditors other than the Group auditor of TNOK 1,243 for 2017 and TNOK 1,118 for 2016.
CONSOLIDATED FINANCIAL STATEMENTS WITH NOTES
Statement of income 01.01.-31.12.
Statement of other comprehensive income 01.01.-31.12.
Statement of financial position as at 31 December
Statement of cash flows 01.01.-31.12.
Statement of changes in equity
Brief history of the Group
Accounting policies
Notes
Note 1: Companies in the Group
Note 2: Management of financial risk
Note 3: Information on cash flows
Note 4: Revenues
Note 5: Segment information
Note 6: Transactions with related parties
Note 7: Other operating expenses
Note 8: Salaries and other personnel costs
Note 9: Share-based payment
Note 10: Pension costs, assets and obligations
Note 11: Financial income and costs
Note 12: Tax
Note 13: Investments in associated companies and jointly controlled entities
Note 14: Tangible fixed assets
Note 15: Intangible assets
Note 16: Leasing agreements
Note 17: Other receivables
Note 18: Inventories
Note 19: Cash and cash equivalents
Note 20: Share capital and shareholder information
Note 21: Debt to financial institutions
Note 22: Liabilities at fair value through profit or loss
Note 23: Other provisions for liabilities
Note 24: Current liabilities
Note 25: Pledges and guarantees
Note 26 Business mergers
Note 27 Events after the close of the financial year
Alternative performance measurements
Auditor's report
Contents In brief Group CEO The Company Corporate Social Responsibility Directors’ Report Financial Statements and Notes Contact 80/123Corporate Governance

81 ANNUAL REPORT 2017 Arcus ASAFINANCIAL STATEMENTS AND NOTES | Arcus ASA Group
NOTE 8 SALARIES AND OTHER PERSONNEL COSTS
Figures in NOK 1,000 2017 2016Salaries including holiday pay -280,838 -266,685Social security costs -58,434 -63,732Pension costs including social security costs -32,406 -28,397Other personnel costs -50,656 -40,691Total salaries and other personnel costs -422,334 -399,505Of which non-recurring items and restructuring costs, which are included under Other income and expenses in the statement of income (see Note 7) 4,922 6,960Total other operating costs, as presented in the statement of income line under salary costs -417,412 -392,545
Average number of FTEs employed during the year 420 411
Remuneration to senior executivesThe terms and conditions for the Group CEO are set by the Board of Directors, which also makes decisions in principle concerning the Group’s terms and conditions policy and compensation schemes for other employees. The Board has a remuneration committee which prepares remuneration proposals for decision by the Board. The committee comprises two members of the Board elected by the shareholders. The administration handles cases for the remuneration committee and the Board.
In 2017, the Group Management was covered by the Group’s annual bonus system, a temporary share programme (matching shares) that was established in conjunction with the IPO in 2016, as well as a newly-established option programme adopted at the Annual General Meeting in May 2017. The Group CEO has an ordinary bonus agreement which, under certain conditions, will release payment of up to five months’ salary, while other members of the Group Management can receive up to four months’ salary.
The Group CEO and other members of the Norwegian Group Management have an ordinary occupational pension with Storebrand, which entails 5 per cent pension contributions for salaries of 0 to 7.1G and 11 per cent for salaries from 7.1 to 12G. The Swedish member of the Group Management has a defined contribution pension scheme for which the contribution rates vary with the salary by up to 34 per cent. The Group CEO also has a supplementary pension agreement that gives pension earnings of 15 per cent of salaries above 12G. This pension entitlement is capitalised annually in the consolidated statement of financial position and the return is based on the return from the Storebrand Balansert pension fund.
Salaries and other remuneration to the Group Management in 2017:
Figures in 1000 Local currency
Currency Salary
Bonus earned in 2017
Benefitsin kind
Pension costs
Kenneth Hamnes NOK 3,031 286 227 386Sigmund Toth NOK 1,728 147 146 84Erlend Stefansson NOK 2,033 139 179 84Erik Bern NOK 1,780 132 190 84Bjørn Delbæk NOK 1,572 103 191 84Per Bjørkum NOK 1,523 107 137 84Thomas Patay NOK 2,288 144 195 84Lorna Stangeland1 NOK 900 0 50 21Christian Granlund2 NOK 870 290 90 45Claes Lindquist3 SEK 2,193 1,031 102 862
1. Lorna Stangeland resigned on 31 March 2017 and the benefits stated represent three months’ employment. Lorna joined the Board of Directors of Vectura AS after her resignation.
2. Christian Granlund was appointed on 12 June 2017 and the benefits stated represent 6.5 months’ employment. 3. Claes Lindquist is reducing his activities and will leave his position on 31.03.2018. Claes will join the Board of Directors of the subsidiary
Vingruppen I Norden AB after his resignation.
Salaries and other remuneration to the Group Management in 2016:
Figures in 1000 Local currency
Currency
Salary
Bonus earned in 2016
Benefitsin kind
Pension costs
Kenneth Hamnes NOK 2,444 1,100 220 308Rune Midtgaard1 NOK 1,820 446 150 69Sigmund Toth2 NOK 550 614 2 28Erlend Stefansson NOK 1,981 669 147 83Erik Bern NOK 1,743 585 217 83Bjørn Delbæk3 NOK 249 511 25 14Per Bjørkum NOK 1,437 485 135 83Thomas Patay4 NOK 2,264 455 192 83Lorna Stangeland NOK 1,700 617 194 83Claes Lindquist SEK 2,141 956 69 983
1. Rune Midtgaard was CFO up to 1 September 2016, but was a member of the Group Management until he resigned on 31.10.2016. Benefits paid equivalent to ten months’ employment.
2. Sigmund Toth took over as CFO as from 1 September 2016. The benefits paid represent the four months in which he was a member of the Group Management.
3. Bjørn Delbæk was employed on a permanent basis as from 1.11.2016, and the benefits paid represent two months’ employment. During the period from 1.1.2016 to 31.10.2016, Bjørn was a contractor and invoiced his services from his own company.
4. TNOK 151 of the salary paid is related to payment of services earned in previous years.
CONSOLIDATED FINANCIAL STATEMENTS WITH NOTES
Statement of income 01.01.-31.12.
Statement of other comprehensive income 01.01.-31.12.
Statement of financial position as at 31 December
Statement of cash flows 01.01.-31.12.
Statement of changes in equity
Brief history of the Group
Accounting policies
Notes
Note 1: Companies in the Group
Note 2: Management of financial risk
Note 3: Information on cash flows
Note 4: Revenues
Note 5: Segment information
Note 6: Transactions with related parties
Note 7: Other operating expenses
Note 8: Salaries and other personnel costs
Note 9: Share-based payment
Note 10: Pension costs, assets and obligations
Note 11: Financial income and costs
Note 12: Tax
Note 13: Investments in associated companies and jointly controlled entities
Note 14: Tangible fixed assets
Note 15: Intangible assets
Note 16: Leasing agreements
Note 17: Other receivables
Note 18: Inventories
Note 19: Cash and cash equivalents
Note 20: Share capital and shareholder information
Note 21: Debt to financial institutions
Note 22: Liabilities at fair value through profit or loss
Note 23: Other provisions for liabilities
Note 24: Current liabilities
Note 25: Pledges and guarantees
Note 26 Business mergers
Note 27 Events after the close of the financial year
Alternative performance measurements
Auditor's report
Contents In brief Group CEO The Company Corporate Social Responsibility Directors’ Report Financial Statements and Notes Contact 81/123Corporate Governance

82 ANNUAL REPORT 2017 Arcus ASAFINANCIAL STATEMENTS AND NOTES | Arcus ASA Group
If the CEO gives notice of termination, he is subject to six months’ notice of termination. If notice of termination is given by the Group, the Group CEO will be entitled to 12 months’ severance pay, and during this period will not be able to take employment in competing companies.
Concerning the other Group Management members, Sigmund Toth, Erlend Stefansson, Erik Bern, Thomas Patay and Christian Granlund are subject to six months’ notice of termination, while Per Bjørkum and Bjørn Delbæk are subject to three months’ notice of termination. Claes Lindquist had nine months’ notice of termination on his own resignation, and will work until the end of Q1 2018.
Concerning the other Group Management members, Erik Bern, Thomas Patay and Claes Lindquist are subject to a 12-month non-competition clause, while Sigmund Toth, Bjørn Delbæk, Per Bjørkum and Erlend Stefansson are subject to a six-month non-competition clause. They all have an agreement concerning severance pay during the period to which the non-competition clause applies.
No loans or surety are provided for the Group CEO, other Group Management or members of the Board of Directors.
The Group Management’s holdings of ordinary shares in Arcus ASA are stated in Note 20.
Concerning the declaration of the Board of Directors regarding the fixing of salaries and other remuneration to executive personnel.Pursuant to Section 6-16a of the Norwegian Public Limited Liability Companies Act, the Board of Directors will prepare a separate declaration on the fixing of salaries and other remuneration to executive personnel.
Furthermore, under section 5-6 (3) of the Norwegian Public Limited Liability Companies Act, an advisory vote must be held at the general meeting on the Board of Directors’ guidelines for fixing remuneration to executive personnel for the coming financial year (see (ii) below). In so far as the guidelines concern share-based incentive arrangements, these shall also be approved by the general meeting (see (iii)).
(i) Salaries and other remuneration to executive personnelSalaries and other remuneration to executive personnel for the preceding financial year are presented in Notes 8, 9 and 10 of the annual financial statements for Arcus ASA.
(ii) Guidelines for the fixing of salaries and other remuneration to executive personnelWith regard to guidelines for fixing salaries and other remuneration to executive personnel in the coming financial year, the Board of Directors will present the following guidelines to the General Meeting in 2018 for an advisory vote:
The purpose of Arcus’ terms and conditions policy is to attract personnel with the competence that the Group requires, to further develop and retain employees with key expertise, and to promote a long-term perspective and continuous improvement with a view to achieving Arcus’ business goals. As an overall principle, Arcus’ policy must be competitive but not market-leading in terms of the total compensation package. The total compensation may consist of the following elements:
(a) Fixed elements – Basic salary, pension, etc.Arcus uses internationally recognised job assessment systems to find the ”right” level for the job and the fixed salary. Jobs are assessed in relation to their local market (country) and a pay range in relation to the median. The employee’s area of responsibility, results and performance determine where he or she is placed on the salary scale.
Arcus has a defined-contribution occupational pension plan in Norway. The contribution rate is 5 per cent for salaries up to 7.1G and 11 per cent for salaries between 7.1G and 12G (as from 1.5.2017 1G is NOK 93,634). The CEO is the only employee who currently has an occupational pension for salaries above 12G and the contribution rate is 15 per cent. There are no arrangements or agreements regarding early retirement age for Group Management other than the AFP arrangement and the national insurance scheme, which allow all employ-ees a flexible retirement age starting at the age of 62. All employees in Norway are subject to a statutory age limit of 72, but the age limit in the Group is contractually set at 70, which also applies to the Group Management.
The CEO of Vectura AS has the same pension scheme as the Group Management. The CEO of Vingruppen i Norden AB adheres to the Swedish regulations. The pension scheme in Sweden has different rules and higher contribution rates than in Norway.
In addition to the above, the Group provides benefits such as a company car and company telephone and other limited benefits in kind.
(b) Variable elements – annual bonusArcus has an annual bonus system. The bonus system for the Group Management has consisted of a financial component (70 per cent) tied to a performance-related target for the Group, and an individual component (30 per cent) tied to concrete and defined KPIs for the individual. For all other executive positions, the financial element is 50 per cent related to the target for the Group or company, and the individual element is 50 per cent.
All bonuses are self-financed. The maximum possible bonus for Group Management members is 30 per cent of their annual salary (four monthly salaries), although the CEO may receive a maximum annual bonus of five monthly salaries. In addition to the Group Management, approximately 70 managers and key staff participate in a bonus programme, but the criteria vary. These staff members may receive a bonus of between one and three monthly salaries.
The bonus programme for 2018 will consist of the same components, and its primary target will be the Group’s and/or the company’s earnings (financial element of 70 per cent). Individual bonuses (personal targets) with a maximum percentage of 30 per cent for Group Management are also a key element of the programme.
Executives of Vectura AS adhere to the same guidelines as the Group Management, but based on the company’s EBIT.
Executives of Vingruppen i Norden AB currently adhere to a staggered bonus model, based on the company’s EBIT, with maximum five monthly salaries.
CONSOLIDATED FINANCIAL STATEMENTS WITH NOTES
Statement of income 01.01.-31.12.
Statement of other comprehensive income 01.01.-31.12.
Statement of financial position as at 31 December
Statement of cash flows 01.01.-31.12.
Statement of changes in equity
Brief history of the Group
Accounting policies
Notes
Note 1: Companies in the Group
Note 2: Management of financial risk
Note 3: Information on cash flows
Note 4: Revenues
Note 5: Segment information
Note 6: Transactions with related parties
Note 7: Other operating expenses
Note 8: Salaries and other personnel costs
Note 9: Share-based payment
Note 10: Pension costs, assets and obligations
Note 11: Financial income and costs
Note 12: Tax
Note 13: Investments in associated companies and jointly controlled entities
Note 14: Tangible fixed assets
Note 15: Intangible assets
Note 16: Leasing agreements
Note 17: Other receivables
Note 18: Inventories
Note 19: Cash and cash equivalents
Note 20: Share capital and shareholder information
Note 21: Debt to financial institutions
Note 22: Liabilities at fair value through profit or loss
Note 23: Other provisions for liabilities
Note 24: Current liabilities
Note 25: Pledges and guarantees
Note 26 Business mergers
Note 27 Events after the close of the financial year
Alternative performance measurements
Auditor's report
Contents In brief Group CEO The Company Corporate Social Responsibility Directors’ Report Financial Statements and Notes Contact 82/123Corporate Governance

83 ANNUAL REPORT 2017 Arcus ASAFINANCIAL STATEMENTS AND NOTES | Arcus ASA Group
(iii) Share-based incentive programmesIn conjunction with the IPO in 2016, the Group Management and an additional 33 managers/key staff were offered investment in shares in exchange for ”matching shares” on conditions specified in the prospectus. In total, 29 people in addition to the Group Management subscribed to the offer. The matching programme will be concluded after the presentation of the result for Q4/2018 in 2019.
The Annual General Meeting in 2017 approved an option-based long-term incentive scheme for the Group Management, as well as the CEO of Vectura and the CEO of Vingruppen i Norden, and for additional managers and key persons. The primary objective of the programme is to provide executive personnel with incentives to generate long-term and continuous success and value creation for shareholders. Reference is made to the report described in Annex 4 to the notice convening the Annual General Meeting.
Arcus ASA has key persons in several wine companies in which it has invested as a minority owner, and this mainly concerns the general manager. This model has been a success for Group and created profitable new business, with well-motivated managers. It is appropriate to continue to allow the general manager of a wine company, based on an individual assessment, to be a minority owner, with an ownership interest limited to 9.9 per cent.
Such a model is intended to encourage an entrepreneurship culture, sound business acumen and internal competition between companies which, in turn, can increase the profitability of the company and of the employee. Financing must primarily take place as the employee’s contribution of equity.
On starting up a new company, greater flexibility (up to 30 per cent ownership interest) must be accepted in terms of how much the employee should/may invest, based on an individual and commercial assessment.
(iv) Executive salary policy in previous financial yearsThe guidelines for salaries and other remuneration to executive personnel described in item (ii) also served as guidelines for fixing executive salaries and other remuneration in 2017. Full individual bonus was paid for 2016, while for 2017, 26 per cent of the maximum bonus will be paid.
(v) Changes in contractual agreementsManaging Director of Vectura AS Lorna Stangeland stepped down on 30 March 2017 and was replaced by Christian Granlund, who took over on 12 June 2017. Lorna Stangeland became an external member of the Board of Directors of Vectura AS as from 1 April 2017.
CEO Claes Lindquist of Vingruppen i Norden AB resigned with effect from 1 April 2018 in order to retire, and was replaced by Svante Selling, who took up the position on 1 February 2018. Claes Lindquist continues as an external member of the Board of Directors of Vingruppen i Norden AB as from 1 April 2018, and after his resignation as of 31 March 2018 will work on a consultant basis, so far for the rest of the year.
The remuneration of the Board of Directors is as follows, as from 3.5.2017
Chairman of the Board of Directors NOK 500,000 p.a.Board members elected by the shareholders NOK 225,000 p.a.Board members elected by the employees NOK 150,000 p.a.Deputy member elected by the employees NOK 7,500 per meeting
Audit CommitteeChair of the committee NOK 85,000 p.a.Member NOK 40,000 p.a.
Remuneration CommitteeChair of the committee NOK 40,000 p.a.Member NOK 25,000 p.a.
Remuneration to the members of the Board of Directors in 2017:
Figures in NOK 1000 Board fees including
committee work
Number of shares
31.12.2017Board members elected by the shareholdersMichael Holm Johansen Chairman of the Board 480 150,000Mikael Norlander Resigning Board member in 2017 177 0Hanne Refsholt 222 0Leena Maria Saarinen 227 1,860Trond Berger 301 17,441Eilif Due1 275 3,299,325Isabelle Ducellier Resigning Board member in 2017 0 0Stein Erik Hagen2 Newly-elected Board member in 2017 150 22,670,000Ann-Beth Freuchen Newly-elected Board member in 2017 150 0
Board members elected by the employeesErik Hagen See the Table below 566Ingrid E. Skistad3 See the Table below 1,368Kjell Arne Greni See the Table below 0
1. Eilif Due owns 2,325 shares on a personal basis. Other declared shareholdings relate to the shareholder Hoff SA, of which he is Chairman of the Board.
2. Stein Erik Hagen does not own shares on a personal basis. Declared shareholdings relate to the shareholder Canica AS, which is controlled by Stein Erik Hagen and his associate, and of which he is a member of the Board.
3. Ingrid E. Skistad owns 322 shares personally. Other shareholding is owned through Ibrygging Invest AS, where she is Chairman of the Board.
CONSOLIDATED FINANCIAL STATEMENTS WITH NOTES
Statement of income 01.01.-31.12.
Statement of other comprehensive income 01.01.-31.12.
Statement of financial position as at 31 December
Statement of cash flows 01.01.-31.12.
Statement of changes in equity
Brief history of the Group
Accounting policies
Notes
Note 1: Companies in the Group
Note 2: Management of financial risk
Note 3: Information on cash flows
Note 4: Revenues
Note 5: Segment information
Note 6: Transactions with related parties
Note 7: Other operating expenses
Note 8: Salaries and other personnel costs
Note 9: Share-based payment
Note 10: Pension costs, assets and obligations
Note 11: Financial income and costs
Note 12: Tax
Note 13: Investments in associated companies and jointly controlled entities
Note 14: Tangible fixed assets
Note 15: Intangible assets
Note 16: Leasing agreements
Note 17: Other receivables
Note 18: Inventories
Note 19: Cash and cash equivalents
Note 20: Share capital and shareholder information
Note 21: Debt to financial institutions
Note 22: Liabilities at fair value through profit or loss
Note 23: Other provisions for liabilities
Note 24: Current liabilities
Note 25: Pledges and guarantees
Note 26 Business mergers
Note 27 Events after the close of the financial year
Alternative performance measurements
Auditor's report
Contents In brief Group CEO The Company Corporate Social Responsibility Directors’ Report Financial Statements and Notes Contact 83/123Corporate Governance

84 ANNUAL REPORT 2017 Arcus ASAFINANCIAL STATEMENTS AND NOTES | Arcus ASA Group
Figures in NOK 1000 Fixed salary
Board fees including committee work
Benefits in kind
Pensioncosts
Board members elected by the employeesErik Hagen 495 157 6 25Ingrid E. Skistad 617 150 4 31Kjell Arne Greni1 185 155 6 9
1. Kjell Arne Greni has a 40 per cent position
Remuneration to the members of the Board of Directors in 2016:
Figures in NOK 1000
Board fees including
committee work
Number of shares,
31.12.2016Board members elected by the shareholdersMichael Holm Johansen Newly-elected Board member in 2016 637 146,512Mikael Norlander1 0 16,077,244Hanne Refsholt Newly-elected Board member in 2016 218 0Leena Maria Saarinen Newly-elected Board member in 2016 187 1,860Trond Berger Newly-elected Board member in 2016 34 17,441Eilif Due2 140 3,299,325Isabelle Ducellier Newly-elected Board member in 2016 100 1,860Leif Johansson Resigning Board member in 2016 0 0Daniel Repfennig Resigning Board member in 2016 0 0Marius Juul Møller Resigning Board member in 2016 0 0
Board members elected by the employeesErik Hagen See the Table below 244Ingrid E. Skistad3 Newly-elected Board member in 2016 See the Table below 1,046Kjell Arne Greni See the Table below 0
1. Mikael Norlander represented the main shareholder, Ratos AB. The declared number of shares related to him also includes Ratos AB’s shareholding.
2. Eilif Due owns 2,325 shares on a personal basis. Other declared shareholdings related to the shareholder Hoff SA, of which he is Chairman of the Board.
3. Shareholding is owned through Ibrygging Invest AS, where Ingrid E. Skistad is Chariman of the Board.
Figures in NOK 1000 Fixed salary
Board fees including committee work
Benefits in kind
Pensioncosts
Board members elected by the employeesErik Hagen 484 103 6 24 Ingrid E. Skistad1 97 25 0 5 Kjell Arne Greni2 174 83 7 9
1. Ingrid Skistad was elected to the Board as from 1.11.2016. The amounts paid represent two months as from her election to the Board.2. Kjell Arne Greni has a 40 per cent position
NOTE 9 SHARE-BASED REMUNERATION
Share-based incentive schemesThe Group has two share-based incentive schemes for senior executives, which are related to the value growth of the Group. The Group also has a share savings programme in which all employees can participate.
Matching shares for senior executives and other key persons.Before the Board of Directors in 2017 adopted a new long-term incentive scheme for senior executives, in conjunction with the IPO in 2016 a temporary two-year incentive scheme (interim retention plan) was adopted, in which 37 employees, including the Group Management, were awarded matching shares. These matching shares are granted to recipients in 2019 after the publication of the quarterly report for Q4 2018, if the person in question is still employed at this time.
For the Group Management, matching shares were granted whereby for each share they acquired in addition to their reinvestment obligations related to the settlement of the completed programme with synthetic shares and options, they also received one matching share. The members of the Group Management, who did not already hold synthetic shares or options were entitled to receive either one matching share for each share they purchased in total, or one matching share for every two shares they purchased in total.
Other key persons were invited to purchase shares for up to a given amount, with the right to receive one matching share for every two shares they purchased. Of the 33 key persons who received this offer, 29 made use of it. In 2017, two persons who were covered by this programme resigned, so at the end of 2017 there were 27 key persons in this programme.
If the listed share price on the redemption date exceeds two times the listed price on the allocation date, the number of matching shares will be reduced, so that the total value of the matching shares allocated does not exceed two times the value on the allocation date.
CONSOLIDATED FINANCIAL STATEMENTS WITH NOTES
Statement of income 01.01.-31.12.
Statement of other comprehensive income 01.01.-31.12.
Statement of financial position as at 31 December
Statement of cash flows 01.01.-31.12.
Statement of changes in equity
Brief history of the Group
Accounting policies
Notes
Note 1: Companies in the Group
Note 2: Management of financial risk
Note 3: Information on cash flows
Note 4: Revenues
Note 5: Segment information
Note 6: Transactions with related parties
Note 7: Other operating expenses
Note 8: Salaries and other personnel costs
Note 9: Share-based payment
Note 10: Pension costs, assets and obligations
Note 11: Financial income and costs
Note 12: Tax
Note 13: Investments in associated companies and jointly controlled entities
Note 14: Tangible fixed assets
Note 15: Intangible assets
Note 16: Leasing agreements
Note 17: Other receivables
Note 18: Inventories
Note 19: Cash and cash equivalents
Note 20: Share capital and shareholder information
Note 21: Debt to financial institutions
Note 22: Liabilities at fair value through profit or loss
Note 23: Other provisions for liabilities
Note 24: Current liabilities
Note 25: Pledges and guarantees
Note 26 Business mergers
Note 27 Events after the close of the financial year
Alternative performance measurements
Auditor's report
Contents In brief Group CEO The Company Corporate Social Responsibility Directors’ Report Financial Statements and Notes Contact 84/123Corporate Governance
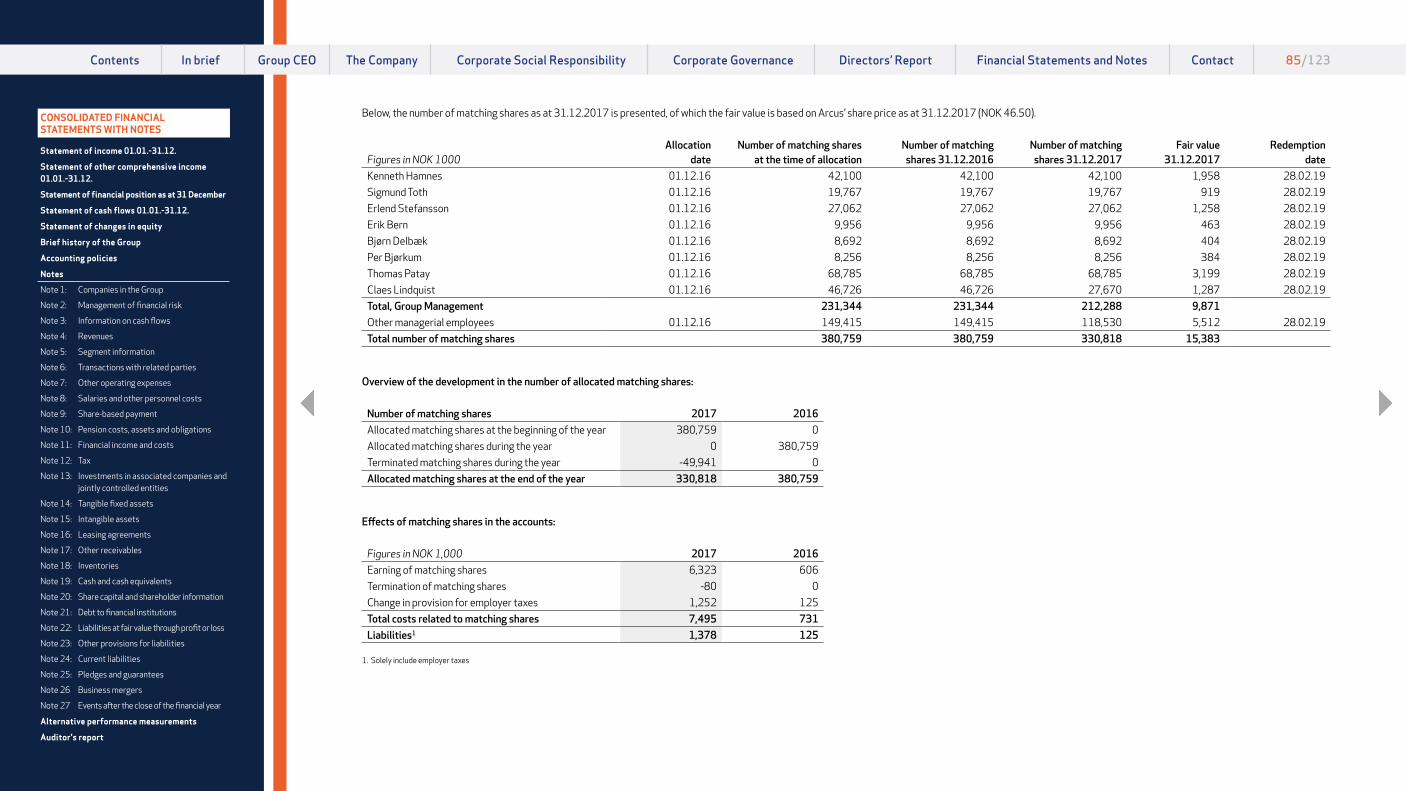
85 ANNUAL REPORT 2017 Arcus ASAFINANCIAL STATEMENTS AND NOTES | Arcus ASA Group
Below, the number of matching shares as at 31.12.2017 is presented, of which the fair value is based on Arcus’ share price as at 31.12.2017 (NOK 46.50).
Figures in NOK 1000Allocation
dateNumber of matching shares
at the time of allocationNumber of matching shares 31.12.2016
Number of matching shares 31.12.2017
Fair value 31.12.2017
Redemptiondate
Kenneth Hamnes 01.12.16 42,100 42,100 42,100 1,958 28.02.19Sigmund Toth 01.12.16 19,767 19,767 19,767 919 28.02.19Erlend Stefansson 01.12.16 27,062 27,062 27,062 1,258 28.02.19Erik Bern 01.12.16 9,956 9,956 9,956 463 28.02.19Bjørn Delbæk 01.12.16 8,692 8,692 8,692 404 28.02.19Per Bjørkum 01.12.16 8,256 8,256 8,256 384 28.02.19Thomas Patay 01.12.16 68,785 68,785 68,785 3,199 28.02.19Claes Lindquist 01.12.16 46,726 46,726 27,670 1,287 28.02.19Total, Group Management 231,344 231,344 212,288 9,871Other managerial employees 01.12.16 149,415 149,415 118,530 5,512 28.02.19Total number of matching shares 380,759 380,759 330,818 15,383
Overview of the development in the number of allocated matching shares:
Number of matching shares 2017 2016Allocated matching shares at the beginning of the year 380,759 0Allocated matching shares during the year 0 380,759Terminated matching shares during the year -49,941 0Allocated matching shares at the end of the year 330,818 380,759
Effects of matching shares in the accounts:
Figures in NOK 1,000 2017 2016Earning of matching shares 6,323 606Termination of matching shares -80 0Change in provision for employer taxes 1,252 125Total costs related to matching shares 7,495 731Liabilities1 1,378 125
1. Solely include employer taxes
CONSOLIDATED FINANCIAL STATEMENTS WITH NOTES
Statement of income 01.01.-31.12.
Statement of other comprehensive income 01.01.-31.12.
Statement of financial position as at 31 December
Statement of cash flows 01.01.-31.12.
Statement of changes in equity
Brief history of the Group
Accounting policies
Notes
Note 1: Companies in the Group
Note 2: Management of financial risk
Note 3: Information on cash flows
Note 4: Revenues
Note 5: Segment information
Note 6: Transactions with related parties
Note 7: Other operating expenses
Note 8: Salaries and other personnel costs
Note 9: Share-based payment
Note 10: Pension costs, assets and obligations
Note 11: Financial income and costs
Note 12: Tax
Note 13: Investments in associated companies and jointly controlled entities
Note 14: Tangible fixed assets
Note 15: Intangible assets
Note 16: Leasing agreements
Note 17: Other receivables
Note 18: Inventories
Note 19: Cash and cash equivalents
Note 20: Share capital and shareholder information
Note 21: Debt to financial institutions
Note 22: Liabilities at fair value through profit or loss
Note 23: Other provisions for liabilities
Note 24: Current liabilities
Note 25: Pledges and guarantees
Note 26 Business mergers
Note 27 Events after the close of the financial year
Alternative performance measurements
Auditor's report
Contents In brief Group CEO The Company Corporate Social Responsibility Directors’ Report Financial Statements and Notes Contact 85/123Corporate Governance

86 ANNUAL REPORT 2017 Arcus ASAFINANCIAL STATEMENTS AND NOTES | Arcus ASA Group
Option programme for senior executivesAt the Annual General Meeting in May 2017, a new option programme for senior executives in the Group was adopted, with annual allocation of new options.
The options’ vesting period will be three years from the allocation date, where the participants have two years to redeem the options after the vesting period. A condition for redemption of an option is that the executive is still employed after the vesting period, and that the Group’s KPI objectives, as determined by the Board of Directors, have been achieved in the same period.
The number of options allocated annually will vary, and will correspond to the individual executive’s po-tential maximum bonus that can be achieved in relation to the listed price on the allocation date. The options’ strike price is calculated as the volume-adjusted listed price for the last ten days prior to the allocation date, with the addition of 10 per cent.
The options are valued using the Black-Scholes model, for which the most important assumptions on the valuation date will be the spot rate on the valuation date, the estimated time during the redemption period in which the Group assumes that the holders will redeem the option, the dividend in the period, and the share’s assumed volatility. The option’s maximum redemption price is limited to three times the spot rate at the time of allocation.
There are no dividend rights related to the options during the period prior to redemption.
Below the Group Management’s options holdings are listed.
Allocation date 2017Vesting period 04.05.2017 - 04.05.2020Redemption period 04.05.2020 - 04.05.2022Strike price NOK 51.53
Number of options 2017 2016Kenneth Hamnes 199,426 0Sigmund Toth 90,773 0Erlend Stefansson 110,628 0Erik Bern 96,546 0Bjørn Delbæk 84,508 0Per Bjørkum 82,524 0Thomas Patay 115,034 0Christian Granlund 95,724 0Claes Lindquist 40,584 0Total, Group Management 915,747 0Other managerial employees 313,557 0Total number of options 1,229,304 0
Option calculation assumptions: 2017 2016Share price on the allocation date NOK 47.90 0Share price on the balance sheet date NOK 46.50 0Redemption price – minimum NOK 51.53 0Redemption price – maximum NOK 143.70 0Risk-free interest % % 1.1% 0.0%Volatility* % % 25.0% 0.0%Expected dividend % % 3.1% 0.0%
* As the company has no historical volatility figures that can be applied, the company has calculated average volatility for comparable companies on European stock exchanges within the same sector for the last five years.
Overview of development in the number of allocated options
Number of options 2017 2016Allocated options during the year 1,407,369 0Terminated options during the year -178,065 0Outstanding options at the end of the year 1,229,304 0
Effects of options in the accounts:
Figures in NOK 1,000 2017 2016Earning of options 1,655 0Change in provision for employer taxes 265 0Total option costs 1,920 0Liabilities1 265 0
1 Solely includes employer taxes
Share savings programme for all employeesIn 2017, the Board of Directors adopted a general share savings scheme for all employees, under which all employees will annually have the opportunity to buy a limited number of shares in Arcus ASA, with a discount of 20 per cent. Sale of shares to employees below market value is recognised as a personnel cost comprising the difference between the market value of the shares and the purchase price.
This was first performed in November 2017, when 100 employees in total subscribed for a total of 31,234 shares. These shares were purchased at an average price of 46.56 and sold to the employees at a discount of 20 per cent, whereby each employee could purchase either 322 or 161 shares. For this, costs of TNOK 290 were charged to the consolidated accounts in 2017.
CONSOLIDATED FINANCIAL STATEMENTS WITH NOTES
Statement of income 01.01.-31.12.
Statement of other comprehensive income 01.01.-31.12.
Statement of financial position as at 31 December
Statement of cash flows 01.01.-31.12.
Statement of changes in equity
Brief history of the Group
Accounting policies
Notes
Note 1: Companies in the Group
Note 2: Management of financial risk
Note 3: Information on cash flows
Note 4: Revenues
Note 5: Segment information
Note 6: Transactions with related parties
Note 7: Other operating expenses
Note 8: Salaries and other personnel costs
Note 9: Share-based payment
Note 10: Pension costs, assets and obligations
Note 11: Financial income and costs
Note 12: Tax
Note 13: Investments in associated companies and jointly controlled entities
Note 14: Tangible fixed assets
Note 15: Intangible assets
Note 16: Leasing agreements
Note 17: Other receivables
Note 18: Inventories
Note 19: Cash and cash equivalents
Note 20: Share capital and shareholder information
Note 21: Debt to financial institutions
Note 22: Liabilities at fair value through profit or loss
Note 23: Other provisions for liabilities
Note 24: Current liabilities
Note 25: Pledges and guarantees
Note 26 Business mergers
Note 27 Events after the close of the financial year
Alternative performance measurements
Auditor's report
Contents In brief Group CEO The Company Corporate Social Responsibility Directors’ Report Financial Statements and Notes Contact 86/123Corporate Governance

87 ANNUAL REPORT 2017 Arcus ASAFINANCIAL STATEMENTS AND NOTES | Arcus ASA Group
NOTE 10 PENSION COSTS, ASSETS AND OBLIGATIONS
Defined benefit pension planUp until 31 December 2008, Arcus ASA and its subsidiaries had a group defined benefit plan for their employees in Statens Pensjonskasse (the Norwegian Public Service Pension Fund – SPK) and Storebrand. The SPK pension plan also included a contractual early retirement plan (AFP) with financing from the commencement of employment. From 31 December 2008, the Board of Directors terminated the SPK group pension plan for the entire Group in order to switch to defined contribution plans.
With the transition to the new pension plan, all those who were ill or disabled remained in the respective defined benefit plans. Statens Pensjonskasse has confirmed that Arcus no longer has any legal obligations associated with the remaining pension recipients who are linked to the SPK defined benefit plan, but is only obliged to pay annual premium contributions specified by SPK, according to the same principle as for defined contribution plans. The Group therefore takes the current invoices from SPK to expenses in the same way as for the defined contribution plan. Within the pension obligation as at 31.12.2017, a provision of NOK 4.1 million is linked to five individuals in the Storebrand defined benefit plan. This is the only pension obligation secured with assets.
In addition, two individuals, who are no longer employed by the company, have a defined benefit plan for salaries above 12G (National Insurance base amount). This plan has been recognised with obligations totalling NOK 4.2 million at the end of 2017.
Gift pension and unfunded pension arrangementOn the transition to the defined contribution plan in 2009, there were individual employees who had previously been with SPK who would be disadvantaged in the event of early retirement at 65-67 years of age. To compensate for this, it was agreed that a gift pension would be paid to all employees who were with SPK before the transition. As at 31.12.2017, this gift pension is linked to 136 employees in the Norwegian operations, while the total obligation has been recognised at NOK 13.1 million.
The Group CEO has an unfunded pension arrangement in which the pension entitlement earned is 15 per cent of the salary above 12G. At the end of 2017, this obligation was recognised at NOK 0.7 million.
Contractual early retirement plan pension (AFP)On 1 January 2011, a new contractual early retirement plan (AFP) pension scheme was introduced in Norway Unlike the old scheme, the new AFP plan is not an early retirement plan, but a scheme that provides a lifelong supplement to the ordinary pension. Employees can choose to take out the new AFP pension as from the age of 62, also while continuing to work, and add additional earnings by working up to the age of 67. This new AFP plan is a defined benefit multi-enterprise pension scheme, and is financed through premiums that are set as a percentage of salary. So far no reliable measurement and allocation of obligations and assets is available for the plan. In accounting terms, the plan is treated as a defined-contribution pension plan in which premium payments are charged as current costs and no provisions are made in the financial statements. In 2016 and 2017, the current premium payments were set at 2.50 per cent of total salary payments between 1 G and 7.1 G to the company’s employees. It has been decided not to change the premium payments for 2018. There is no accumulation of funds in the plan and it is expected that the premium level will increase over the coming years.
There are some seniority requirements associated with the new AFP plan with regard to accumulated length of employment in the scheme. This means that on reaching the age of 62, the individual employee must have been employed for seven of the previous nine years in order to meet the seniority requirements to be able to draw an AFP pension under the new scheme. For the Arcus Group there were 17 individuals who did not fulfil this seniority requirement on the introduction of the new AFP plan. In 2011, Arcus applied for these individuals to have their accumulated period of employment in the old AFP plan in SPK included before transition to the LO/NHO (Norwegian Confederation of Trade Unions/ Confederation of Norwegian Enterprise) plan from 1 January 2009. Fellesordningen (Joint Pension Plan) gave its consent to this in return for Arcus paying the entire excess above and beyond the state supplement of 1/3 of the AFP pension. As at 31.12.2017, this relates to a residual obligation for seven people and the obligation is recognised at NOK 5.2 million.
Defined contribution pensionThe Arcus Group’s general pension scheme for all other employees concerns defined-contribution pension schemes which are adapted to the regulations in the individual countries in which the Group has employees.
NorwayThe general defined-contribution pension scheme has contribution rates of 5 per cent of salary in the bracket from 0 to 7.1 times the National Insurance basic amount (G); and 11 per cent of salary in the bracket from 7.1 to 12 times the National Insurance basic amount (G). In addition, there is a private disability plan with a 66 per cent benefit level, without free policy accumulation. The child and dependent supplement to Arcus’ group life plan is a replacement for the previous spouse and child pension.
The costs associated with the defined contribution pension are related to the current premium invoices from the insurance company with which Arcus has signed a defined contribution pension agreement. The current defined contribution pensions and disability pensions for employees in the defined contribution plan are adjusted annually on the basis of the pension fund’s surplus.
Employees in the defined contribution plan who have become disabled are entitled to have their disability obligations regulated by the same adjustment as the basic amount (G) each year and the capitalised obligation related to this was NOK 3.2 million at the end of 2017.
SwedenIn Sweden, the contributions are, to a great extent, individually agreed contribution rates based on individual salaries, and these can vary considerably. In 2017, the contribution rates vary between 9 per cent and 34 per cent of the individual’s salary. The contribution rates apply as from the first krone earned.
DenmarkThe general defined-contribution pension scheme in Denmark has contribution rates varying from 8 to 10 per cent. The contribution rates apply as from the first krone earned.
FinlandThe general defined-contribution pension scheme in Finland has contribution rates of 18.95 per cent for employees aged below 53, and 17.45 per cent for employees aged over 53.
GermanyThe contribution rate in Germany is 9.35 per cent of the employee’s salary, up to the maximum calculation basis of EUR 76,200.
CONSOLIDATED FINANCIAL STATEMENTS WITH NOTES
Statement of income 01.01.-31.12.
Statement of other comprehensive income 01.01.-31.12.
Statement of financial position as at 31 December
Statement of cash flows 01.01.-31.12.
Statement of changes in equity
Brief history of the Group
Accounting policies
Notes
Note 1: Companies in the Group
Note 2: Management of financial risk
Note 3: Information on cash flows
Note 4: Revenues
Note 5: Segment information
Note 6: Transactions with related parties
Note 7: Other operating expenses
Note 8: Salaries and other personnel costs
Note 9: Share-based payment
Note 10: Pension costs, assets and obligations
Note 11: Financial income and costs
Note 12: Tax
Note 13: Investments in associated companies and jointly controlled entities
Note 14: Tangible fixed assets
Note 15: Intangible assets
Note 16: Leasing agreements
Note 17: Other receivables
Note 18: Inventories
Note 19: Cash and cash equivalents
Note 20: Share capital and shareholder information
Note 21: Debt to financial institutions
Note 22: Liabilities at fair value through profit or loss
Note 23: Other provisions for liabilities
Note 24: Current liabilities
Note 25: Pledges and guarantees
Note 26 Business mergers
Note 27 Events after the close of the financial year
Alternative performance measurements
Auditor's report
Contents In brief Group CEO The Company Corporate Social Responsibility Directors’ Report Financial Statements and Notes Contact 87/123Corporate Governance

88 ANNUAL REPORT 2017 Arcus ASAFINANCIAL STATEMENTS AND NOTES | Arcus ASA Group
Other mattersThe Group applies a discount rate equivalent to the covered bond interest rate to its pension commitments. The pension assumptions made by the Group are consistent with the recommendations of the Accounting Standards Board from September 2017. Due to the lack of significance, the assumptions were not updated as of 31.12.2017.
The table below shows both defined benefit and other pension obligations based on actuarial assumptions.
Figures in NOK 1,000Pension costs 2017 2016Present value of pension earnings for the year 778 1,053Interest cost of pension obligations 890 953Return on pension assets -215 -252Administration costs 174 173Recognised estimation loss/(profit) 0 -736Accrued social security contributions 218 262Net pension costs after social security contributions 1,845 1,453
Defined contribution pension plan Recognised contributions excluding social security contributions 30,561 26,944
Net pension obligations Estimated accrued obligations, funded pension plans 14,436 13,707 Estimated value of pension assets -10,328 -9,741 Net estimated pension obligations (-)/assets (+), funded pension plans 4,108 3,966 Estimated accrued obligations, non-funded pension plans 26,444 30,126 Net pension assets/(obligations) recognised in the statement of financial position 30,552 34,092
Changes in obligationsNet pension obligations 01.01 34,092 35,902Pension costs, continued operations 1,845 1,453Paid out through operations -743 -4,071Premium payments including SSC -204 -471Estimate deviations recognised directly in equity (IAS19R) -4,438 1,279Net pension obligations 31.12. 30,552 34,092
Summary of pension assets: Shares and other equity instruments 10,328 9,741Total pension assets 31.12. 10,328 9,741
Figures in NOK 1,000Financial assumptions 2017 2016Discount rate 2.30% 2.10%Expected salary adjustment 2.50% 2.25%Expected pension increase 1.50% 1.25%Expected adjustment of the National Insurance basic amount (G) 2.25% 2.00%Expected return on pension assets 2.30% 2.10%
Actuarial and demographic assumptions Withdrawal rate at 62 years 50% 50%Withdrawal rate at 67 years 50% 50%Mortality K2013 K2013Disability K1963 K1963Voluntary retirement (under 50 years) 5% 5%Voluntary retirement (over 50 years) 0% 0%
The actuarial assumptions are based on commonly used assumptions within the insurance industry with regard to demographic factors.
The Group’s pension plans satisfy the statutory requirements concerning mandatory occupational pension schemes.
CONSOLIDATED FINANCIAL STATEMENTS WITH NOTES
Statement of income 01.01.-31.12.
Statement of other comprehensive income 01.01.-31.12.
Statement of financial position as at 31 December
Statement of cash flows 01.01.-31.12.
Statement of changes in equity
Brief history of the Group
Accounting policies
Notes
Note 1: Companies in the Group
Note 2: Management of financial risk
Note 3: Information on cash flows
Note 4: Revenues
Note 5: Segment information
Note 6: Transactions with related parties
Note 7: Other operating expenses
Note 8: Salaries and other personnel costs
Note 9: Share-based payment
Note 10: Pension costs, assets and obligations
Note 11: Financial income and costs
Note 12: Tax
Note 13: Investments in associated companies and jointly controlled entities
Note 14: Tangible fixed assets
Note 15: Intangible assets
Note 16: Leasing agreements
Note 17: Other receivables
Note 18: Inventories
Note 19: Cash and cash equivalents
Note 20: Share capital and shareholder information
Note 21: Debt to financial institutions
Note 22: Liabilities at fair value through profit or loss
Note 23: Other provisions for liabilities
Note 24: Current liabilities
Note 25: Pledges and guarantees
Note 26 Business mergers
Note 27 Events after the close of the financial year
Alternative performance measurements
Auditor's report
Contents In brief Group CEO The Company Corporate Social Responsibility Directors’ Report Financial Statements and Notes Contact 88/123Corporate Governance

89 ANNUAL REPORT 2017 Arcus ASAFINANCIAL STATEMENTS AND NOTES | Arcus ASA Group
Sensitivity analysis of net pension obligations:The table below shows the effects of changes in pension obligations, deferred tax assets and equity in the event of a change in the most important economic assumptions by one percentage point up or down. The calculations are otherwise carried out in the same way as the actuarial calculations and are based on all other economic and demographic assumptions remaining unchanged.
Sensitivity 2017 Discount rate Salary growthAdjustment of NI basic amount (G)
Change in percentage points 1% -1% 1% -1% 1% -1%Change in pension obligations -3,116 3,697 6,019 -4,980 -2,566 2,597 Change in deferred tax assets 717 -850 -1,384 1,145 590 -597 Change in equity 2,400 -2,847 -4,634 3,835 1,976 -2,000 Percentage change in obligations -10.2% 12.1% 19.7% -16.3% -8.4% 8.5%
Sensitivity 2016 Discount rate Salary growthAdjustment of NI basic amount (G)
Change in percentage points 1% -1% 1% -1% 1% -1%Change in pension obligations -3,477 4,125 6,716 -5,557 -2,864 2,898 Change in deferred tax assets 835 -990 -1,612 1,334 687 -695 Change in equity 2,643 -3,135 -5,104 4,223 2,176 -2,202 Percentage change in obligations -10.2% 12.1% 19.7% -16.3% -8.4% 8.5%
Summary of cash flows related to pension plans
Figures in NOK 1,000 2017 2016Premium payments, Storebrand defined benefit plan recognised in the statement of financial position 204 425Payments from operations, gift pension at 65-67 years of age 743 566Payments under unfunded pension to former CEO recognised in the statement of financial position 0 3,316Premium payments, AFP plan not recognised in the statement of financial position 4,069 4,165Premium payments, remaining in SPK 72 66Premium payments, defined contribution pension 29,240 25,404Total 34,328 33,942
All figures include social security costs
Premium payments associated with ordinary defined-contribution pension schemes are the largest dis-bursement items associated with pensions. The basis for the premium payments to the defined contribution plan is calculated according to the actual salaries and will reflect the salary development within the company.
Premium payments to the new AFP plan are also calculated on the basis of actual salaries, in addition to how the premium rate is expected to increase in the years ahead. The premium rate was 2.50 per cent in 2016 and 2017 and this will remain unchanged in 2018.
NOTE 11 FINANCIAL INCOME AND COSTS
Figures in NOK 1,000 2017 2016Financial incomeExternal interest income 6,654 7,944Total interest income 6,654 7,944
Value adjustment of interest rate swap agreements at fair value 0 4,552Value adjustment of foreign exchange forward contracts at fair value 1,837 0Value adjustment of co-investment programme (synthetic shares and options)
13,821 0
Net agio gains 2,854 5,848Other financial income 731 19Total other financial income 19,243 10,419Total financial income 25,897 18,363
Financial costsInterest costs to financial institutions -31,454 -70,158Interest costs on liabilities at fair value -21 -256Total interest costs -31,475 -70,414
Value adjustment of minority options at fair value -147 -28,180Value adjustment of foreign exchange forward contracts at fair value 0 -2,021Value adjustment of co-investment programme (synthetic shares and options)
0 -119,979
Amortisation of front-end fee related to credit facilities at SEB -1,652 -20,636Other financial costs -7,166 -13,861Total other financial costs -8,965 -184,677Total financial costs -40,440 -255,091
Net financial profit/loss -14,543 -236,728
CONSOLIDATED FINANCIAL STATEMENTS WITH NOTES
Statement of income 01.01.-31.12.
Statement of other comprehensive income 01.01.-31.12.
Statement of financial position as at 31 December
Statement of cash flows 01.01.-31.12.
Statement of changes in equity
Brief history of the Group
Accounting policies
Notes
Note 1: Companies in the Group
Note 2: Management of financial risk
Note 3: Information on cash flows
Note 4: Revenues
Note 5: Segment information
Note 6: Transactions with related parties
Note 7: Other operating expenses
Note 8: Salaries and other personnel costs
Note 9: Share-based payment
Note 10: Pension costs, assets and obligations
Note 11: Financial income and costs
Note 12: Tax
Note 13: Investments in associated companies and jointly controlled entities
Note 14: Tangible fixed assets
Note 15: Intangible assets
Note 16: Leasing agreements
Note 17: Other receivables
Note 18: Inventories
Note 19: Cash and cash equivalents
Note 20: Share capital and shareholder information
Note 21: Debt to financial institutions
Note 22: Liabilities at fair value through profit or loss
Note 23: Other provisions for liabilities
Note 24: Current liabilities
Note 25: Pledges and guarantees
Note 26 Business mergers
Note 27 Events after the close of the financial year
Alternative performance measurements
Auditor's report
Contents In brief Group CEO The Company Corporate Social Responsibility Directors’ Report Financial Statements and Notes Contact 89/123Corporate Governance
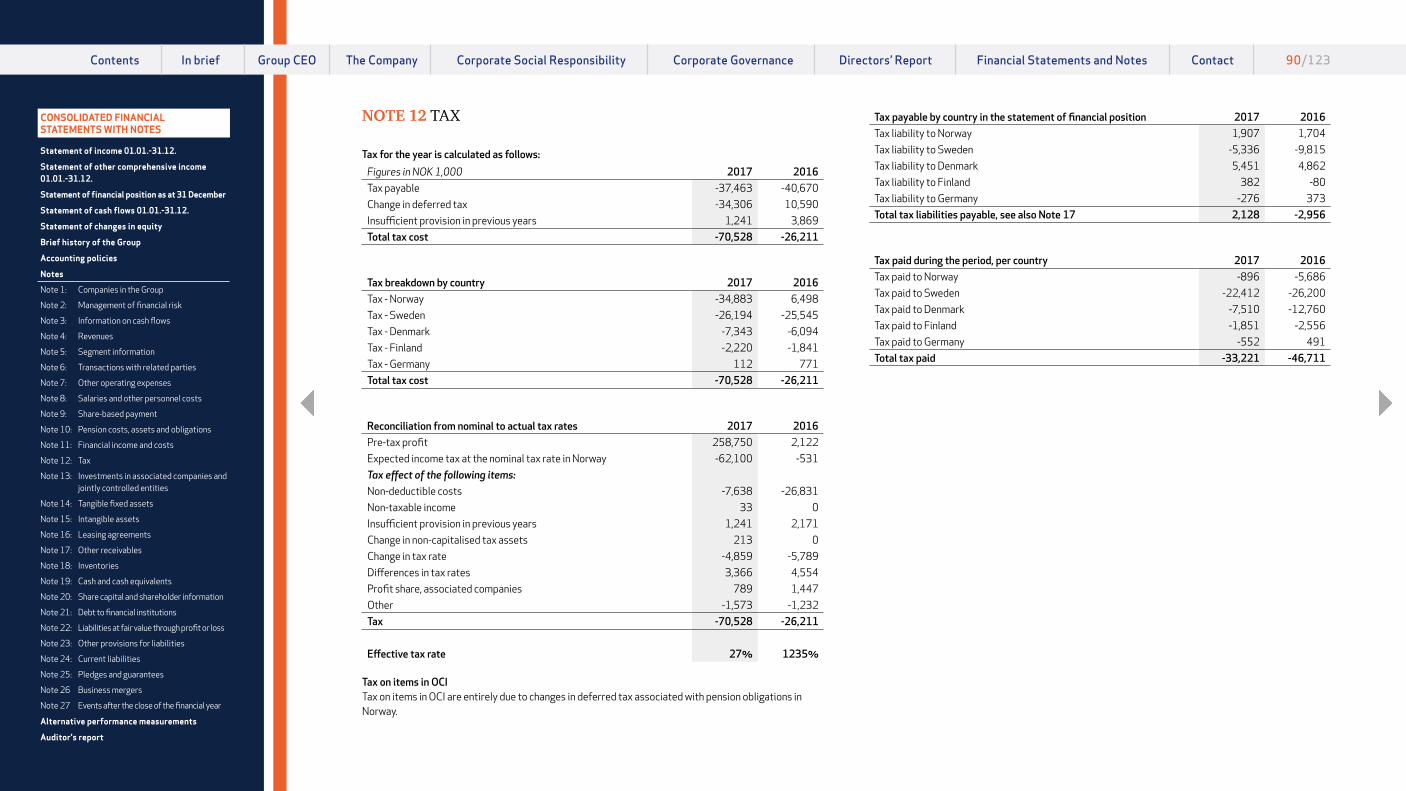
90 ANNUAL REPORT 2017 Arcus ASAFINANCIAL STATEMENTS AND NOTES | Arcus ASA Group
NOTE 12 TAX
Tax for the year is calculated as follows:
Figures in NOK 1,000 2017 2016Tax payable -37,463 -40,670Change in deferred tax -34,306 10,590Insufficient provision in previous years 1,241 3,869Total tax cost -70,528 -26,211
Tax breakdown by country 2017 2016Tax - Norway -34,883 6,498Tax - Sweden -26,194 -25,545Tax - Denmark -7,343 -6,094Tax - Finland -2,220 -1,841Tax - Germany 112 771Total tax cost -70,528 -26,211
Reconciliation from nominal to actual tax rates 2017 2016Pre-tax profit 258,750 2,122Expected income tax at the nominal tax rate in Norway -62,100 -531Tax effect of the following items:Non-deductible costs -7,638 -26,831Non-taxable income 33 0Insufficient provision in previous years 1,241 2,171Change in non-capitalised tax assets 213 0Change in tax rate -4,859 -5,789Differences in tax rates 3,366 4,554Profit share, associated companies 789 1,447Other -1,573 -1,232Tax -70,528 -26,211
Effective tax rate 27% 1235%
Tax on items in OCITax on items in OCI are entirely due to changes in deferred tax associated with pension obligations in Norway.
Tax payable by country in the statement of financial position 2017 2016Tax liability to Norway 1,907 1,704Tax liability to Sweden -5,336 -9,815Tax liability to Denmark 5,451 4,862Tax liability to Finland 382 -80Tax liability to Germany -276 373Total tax liabilities payable, see also Note 17 2,128 -2,956
Tax paid during the period, per country 2017 2016Tax paid to Norway -896 -5,686Tax paid to Sweden -22,412 -26,200Tax paid to Denmark -7,510 -12,760Tax paid to Finland -1,851 -2,556Tax paid to Germany -552 491Total tax paid -33,221 -46,711
CONSOLIDATED FINANCIAL STATEMENTS WITH NOTES
Statement of income 01.01.-31.12.
Statement of other comprehensive income 01.01.-31.12.
Statement of financial position as at 31 December
Statement of cash flows 01.01.-31.12.
Statement of changes in equity
Brief history of the Group
Accounting policies
Notes
Note 1: Companies in the Group
Note 2: Management of financial risk
Note 3: Information on cash flows
Note 4: Revenues
Note 5: Segment information
Note 6: Transactions with related parties
Note 7: Other operating expenses
Note 8: Salaries and other personnel costs
Note 9: Share-based payment
Note 10: Pension costs, assets and obligations
Note 11: Financial income and costs
Note 12: Tax
Note 13: Investments in associated companies and jointly controlled entities
Note 14: Tangible fixed assets
Note 15: Intangible assets
Note 16: Leasing agreements
Note 17: Other receivables
Note 18: Inventories
Note 19: Cash and cash equivalents
Note 20: Share capital and shareholder information
Note 21: Debt to financial institutions
Note 22: Liabilities at fair value through profit or loss
Note 23: Other provisions for liabilities
Note 24: Current liabilities
Note 25: Pledges and guarantees
Note 26 Business mergers
Note 27 Events after the close of the financial year
Alternative performance measurements
Auditor's report
Contents In brief Group CEO The Company Corporate Social Responsibility Directors’ Report Financial Statements and Notes Contact 90/123Corporate Governance

91 ANNUAL REPORT 2017 Arcus ASAFINANCIAL STATEMENTS AND NOTES | Arcus ASA Group
Specification of tax effect of temporary differences and deficit carried forward:
2017 2016Asset Liability Asset Liability
Tangible assets -3,093 532 37 667Intangible fixed assets -45,585 -101,588 -47,905 -93,848Financial assets -931 0 -717 0Inventories -10,271 0 -8,536 338Trade receivables 1,545 0 1,539 215Pension obligations 6,604 0 7,833 0Provisions 5,781 0 10,437 0Gain/loss tax fund from sale of fixed assets -864 24 -1,127 0Deficit carried forward 183,600 0 210,559 0Total deferred tax, gross 136,786 -101,032 172,120 -92,628Unrecognised deferred tax assets 0 0 0 0Net deferred tax in the statement of financial position 136,786 -101,032 172,120 -92,628
At the end of the year, the Group had NOK 183.6 million in capitalised deferred tax assets associated with the deficit carried forward. Based on an assessment and analysis of the Group’s earnings in Norway historically, and the future prognosis, it is assessed that the deficit carried forward can be utilised in full, and the related deferred tax asset has therefore been entered.
Deferred tax positions are calculated on the basis of local tax rates in the respective countries on the reporting date. At the end of 2017, the rates were 23 per cent in Norway, 22 per cent in Sweden, 22 per cent in Denmark and 20 per cent in Finland.
At the end of 2017, deferred tax assets were associated with net negative temporary differences for the tax regimes in Norway and Sweden, while deferred tax liabilities were linked to net positive temporary differences for the tax regime in Denmark. At the end of 2016, deferred tax assets were associated with net negative temporary differences for the tax regime in Norway, while deferred tax liabilities were linked to net positive temporary differences for the tax regimes in Denmark and Sweden.
CONSOLIDATED FINANCIAL STATEMENTS WITH NOTES
Statement of income 01.01.-31.12.
Statement of other comprehensive income 01.01.-31.12.
Statement of financial position as at 31 December
Statement of cash flows 01.01.-31.12.
Statement of changes in equity
Brief history of the Group
Accounting policies
Notes
Note 1: Companies in the Group
Note 2: Management of financial risk
Note 3: Information on cash flows
Note 4: Revenues
Note 5: Segment information
Note 6: Transactions with related parties
Note 7: Other operating expenses
Note 8: Salaries and other personnel costs
Note 9: Share-based payment
Note 10: Pension costs, assets and obligations
Note 11: Financial income and costs
Note 12: Tax
Note 13: Investments in associated companies and jointly controlled entities
Note 14: Tangible fixed assets
Note 15: Intangible assets
Note 16: Leasing agreements
Note 17: Other receivables
Note 18: Inventories
Note 19: Cash and cash equivalents
Note 20: Share capital and shareholder information
Note 21: Debt to financial institutions
Note 22: Liabilities at fair value through profit or loss
Note 23: Other provisions for liabilities
Note 24: Current liabilities
Note 25: Pledges and guarantees
Note 26 Business mergers
Note 27 Events after the close of the financial year
Alternative performance measurements
Auditor's report
Contents In brief Group CEO The Company Corporate Social Responsibility Directors’ Report Financial Statements and Notes Contact 91/123Corporate Governance

92 ANNUAL REPORT 2017 Arcus ASAFINANCIAL STATEMENTS AND NOTES | Arcus ASA Group
NOTE 13 INVESTMENTS IN ASSOCIATED COMPANIES AND JOINTLY CONTROLLED ENTITIES
2017
Figures in NOK 1,000Companytype
Ownership interest
Book value 01.01.2017
Buy/sell/issue
Share of profit for the year Dividend
Translation differences
Book value 31.12.2017
Tiffon SA * TS 34.8% 48,029 454 3,286 0 6,901 58,670 Det Danske Spiritus Kompagni A/S ** FKV 8,782 -8,782 0 0 0 0Total investments in associated companies and jointly controlled entities 56,811 -8,328 3,286 0 6,901 58,670
2016
Figures in NOK 1,000Company type
Ownership interest
Book value 1.1.2016
Buy/sell/issue
Share of profit for the year Dividend
Translation differences
Book value 31.12.2016
Tiffon SA * TS 34.0% 46,280 0 1,749 0 0 48,029 Det Danske Spiritus Kompagni A/S ** FKV 50.0% 8,439 0 4,040 -2,946 -751 8,782Total investments in associated companies and jointly controlled entities 54,719 0 5,789 -2,946 -751 56,811
* The Group buys Cognac from Tiffon SA, see detailed information on these transactions with associates in Note 6. In September 2017, Arcus acquired a further 0.75 per cent ownership interest in the company, and at the end of the year has an ownership interest of 34.75 per cent. Tiffon SA has a financial year from 1 July to 30 June. The share of profit from Tiffon is based on an estimated annual profit for the calendar year that is equivalent to the Group’s financial year.
** Det Danske Spiritus Kompagni A/S was established in 2013 to handle sales of Arcus products in Denmark, and was owned jointly with Flemming Karberg Familieholding ApS. In January 2017, the Arcus Group acquired the rest of the shares in the company, and as from this date the company is recognised as a wholly-owned subsidiary, and consolidated in the consolidated accounts. Prior to the acquisition, both ownership and voting shares, as well as Board composition, were divided 50/50 between Arcus and Flemming Karberg Familieholding ApS. See detailed information on transactions with related parties in Note 6.
None of the associated companies or jointly controlled entities has listed share prices. The Group’s share of profit from associated companies, after tax, is presented on a separate line before Group operating profit.
Summarised financial information regarding associated companies and jointly controlled entities, based on 100 per cent:
2017
Figures in NOK 1,000Total current assets
31.12.2017Total fixed assets
31.12.2017Total current liabilities
31.12.2017Total non-current
liabilities 31.12.2017Total equity
31.12.2017Operating
revenues 2017Operating
expenses 2017Profit for the
year 2017 Tiffon SA 329,085 16,933 33,193 144,009 168,815 101,248 82,784 9,457
2016
Figures in NOK 1,000Total current assets
31.12.2016Total fixed assets
31.12.2016Total current liabilities
31.12.2016Total non-current
liabilities 31.12.2016Total equity
31.12.2016Operating
revenues 2016Operating
expenses 2016Profit for the
year 2016 Tiffon SA 301,695 16,390 35,031 136,547 146,507 107,964 96,067 5,145 Det Danske Spiritus Kompagni A/S* 68,815 21 52,950 0 15,886 161,188 150,827 8,081
* As a consequence of both ownership and voting rights being divided 50/50 between the owners, the Group was not deemed to have control of DDSK A/S at the end of 2016. DDSK A/S was therefore not consolidated in the Group’s accounts before the acquisition of the remaining 50 per cent in 2017.
CONSOLIDATED FINANCIAL STATEMENTS WITH NOTES
Statement of income 01.01.-31.12.
Statement of other comprehensive income 01.01.-31.12.
Statement of financial position as at 31 December
Statement of cash flows 01.01.-31.12.
Statement of changes in equity
Brief history of the Group
Accounting policies
Notes
Note 1: Companies in the Group
Note 2: Management of financial risk
Note 3: Information on cash flows
Note 4: Revenues
Note 5: Segment information
Note 6: Transactions with related parties
Note 7: Other operating expenses
Note 8: Salaries and other personnel costs
Note 9: Share-based payment
Note 10: Pension costs, assets and obligations
Note 11: Financial income and costs
Note 12: Tax
Note 13: Investments in associated companies and jointly controlled entities
Note 14: Tangible fixed assets
Note 15: Intangible assets
Note 16: Leasing agreements
Note 17: Other receivables
Note 18: Inventories
Note 19: Cash and cash equivalents
Note 20: Share capital and shareholder information
Note 21: Debt to financial institutions
Note 22: Liabilities at fair value through profit or loss
Note 23: Other provisions for liabilities
Note 24: Current liabilities
Note 25: Pledges and guarantees
Note 26 Business mergers
Note 27 Events after the close of the financial year
Alternative performance measurements
Auditor's report
Contents In brief Group CEO The Company Corporate Social Responsibility Directors’ Report Financial Statements and Notes Contact 92/123Corporate Governance

93 ANNUAL REPORT 2017 Arcus ASAFINANCIAL STATEMENTS AND NOTES | Arcus ASA Group
NOTE 14 TANGIBLE FIXED ASSETS
Figures in NOK 1,000Land, buildings and
other real estate Machinery and
equipment Fixtures and fittings, tools,
office equipment etc. Assets under
construction Total tangible
assets Acquisition cost as at 01.01.2016 0 500,992 86,364 67,417 654,773Addition of tangible fixed assets 0 7,992 1,445 1,945 11,382Transferred from facilities under construction 0 62,645 0 -66,630 -3,985Reclassifications 0 0 -1,297 0 -1,297Translation differences 0 -309 -809 0 -1,118Acquisition cost as at 01.01.2017 0 571,320 85,703 2,732 659,755Addition of tangible fixed assets 0 5,320 2,857 7,717 15,894Transferred from facilities under construction 0 2,693 290 -4,771 -1,788Disposal at cost (sale of tangible fixed assets) 0 -30,643 -358 0 -31,001Translation differences 0 185 524 0 709Acquisition cost 01.01.2017 0 548,875 89,016 5,678 643,569
Accumulated depreciation 01.01.2016 0 -216,117 -60,764 0 -276,881Ordinary depreciation 0 -29,355 -5,529 0 -34,884Reclassifications 0 0 1,297 0 1,297Translation differences 0 201 747 0 948Accumulated depreciation 01.01.2017 0 -245,271 -64,249 0 -309,520Ordinary depreciation 0 -29,567 -5,009 0 -34,576Disposal, accumulated depreciation (sale of tangible fixed assets) 0 30,643 358 0 31,001Translation differences 0 -146 -502 0 -648Accumulated depreciation 31.12.2017 0 -244,341 -69,402 0 -313,743
Book value as at 31.12.17 0 304,534 19,614 5,678 329,826
Of which book value of capitalised leases 0 176,697 0 0 176,697Ordinary depreciation for the year – capitalised leases 0 -16,385 0 0 -16,385Book value of capitalised interest costs 0 3,291 0 0 3,291
Annual leasing fee for non-capitalised tangible fixed assets 83,928 2,309 463 0 93,739
CONSOLIDATED FINANCIAL STATEMENTS WITH NOTES
Statement of income 01.01.-31.12.
Statement of other comprehensive income 01.01.-31.12.
Statement of financial position as at 31 December
Statement of cash flows 01.01.-31.12.
Statement of changes in equity
Brief history of the Group
Accounting policies
Notes
Note 1: Companies in the Group
Note 2: Management of financial risk
Note 3: Information on cash flows
Note 4: Revenues
Note 5: Segment information
Note 6: Transactions with related parties
Note 7: Other operating expenses
Note 8: Salaries and other personnel costs
Note 9: Share-based payment
Note 10: Pension costs, assets and obligations
Note 11: Financial income and costs
Note 12: Tax
Note 13: Investments in associated companies and jointly controlled entities
Note 14: Tangible fixed assets
Note 15: Intangible assets
Note 16: Leasing agreements
Note 17: Other receivables
Note 18: Inventories
Note 19: Cash and cash equivalents
Note 20: Share capital and shareholder information
Note 21: Debt to financial institutions
Note 22: Liabilities at fair value through profit or loss
Note 23: Other provisions for liabilities
Note 24: Current liabilities
Note 25: Pledges and guarantees
Note 26 Business mergers
Note 27 Events after the close of the financial year
Alternative performance measurements
Auditor's report
Contents In brief Group CEO The Company Corporate Social Responsibility Directors’ Report Financial Statements and Notes Contact 93/123Corporate Governance

94 ANNUAL REPORT 2017 Arcus ASAFINANCIAL STATEMENTS AND NOTES | Arcus ASA Group
Both the parent company and the Group use straight-line depreciation for all tangible fixed assets. The economic life of tangible fixed assets is estimated as follows:
* Machines, vehicles and plant 3-15 years* Office machinery and inventory 4-10 years* Land, buildings and other real estate 0 years
No indications of impairment or a need to adjust the useful lives of assets were identified during the period.
NOTE 15 INTANGIBLE ASSETS
Figures in NOK 1,000 Goodwill Brands Software Total Acquisition cost 01.01.2016 1,042,182 706,257 111,969 1,860,408Addition of intangible assets 0 32,647 3,782 36,429Transferred from facilities under construction 0 0 3,985 3,985Translation differences -32,006 -23,572 0 -55,578Acquisition cost 01.01.2017 1,010,176 715,332 119,736 1,845,244Addition of intangible assets 0 118,611 6,209 124,820Transferred from facilities under construction 0 0 1,788 1,788Acquisition of business 16,583 3,900 0 20,483Translation differences 38,537 35,403 136 74,076Acquisition cost 31.12.2017 1,065,296 873,246 127,869 2,066,411
Accumulated depreciation 01.01.2016 0 -40,568 -77,927 -118,495Ordinary depreciation 0 0 -11,158 -11,158Amortisation 0 -5,583 0 -5,583Translation differences 0 56 0 56Accumulated depreciation 01.01.2017 0 -46,095 -89,085 -135,180Ordinary depreciation 0 0 -9,621 -9,621Amortisation 0 -7,396 0 -7,396Write-downs -22,700 0 0 -22,700Translation differences 0 -53 -12 -65Accumulated depreciation 31.12.2017 -22,700 -53,544 -98,718 -174,962
Book value 31.12.2017 1,042,596 819,702 29,151 1,891,449Of which capitalised value of assets with indefinite useful lives 1,042,596 780,288 0 1,822,884
Economic life of intangible assets with identifiable useful lives 10-19 years 3-10 yearsDepreciation plan Straight line Straight line
CONSOLIDATED FINANCIAL STATEMENTS WITH NOTES
Statement of income 01.01.-31.12.
Statement of other comprehensive income 01.01.-31.12.
Statement of financial position as at 31 December
Statement of cash flows 01.01.-31.12.
Statement of changes in equity
Brief history of the Group
Accounting policies
Notes
Note 1: Companies in the Group
Note 2: Management of financial risk
Note 3: Information on cash flows
Note 4: Revenues
Note 5: Segment information
Note 6: Transactions with related parties
Note 7: Other operating expenses
Note 8: Salaries and other personnel costs
Note 9: Share-based payment
Note 10: Pension costs, assets and obligations
Note 11: Financial income and costs
Note 12: Tax
Note 13: Investments in associated companies and jointly controlled entities
Note 14: Tangible fixed assets
Note 15: Intangible assets
Note 16: Leasing agreements
Note 17: Other receivables
Note 18: Inventories
Note 19: Cash and cash equivalents
Note 20: Share capital and shareholder information
Note 21: Debt to financial institutions
Note 22: Liabilities at fair value through profit or loss
Note 23: Other provisions for liabilities
Note 24: Current liabilities
Note 25: Pledges and guarantees
Note 26 Business mergers
Note 27 Events after the close of the financial year
Alternative performance measurements
Auditor's report
Contents In brief Group CEO The Company Corporate Social Responsibility Directors’ Report Financial Statements and Notes Contact 94/123Corporate Governance

95 ANNUAL REPORT 2017 Arcus ASAFINANCIAL STATEMENTS AND NOTES | Arcus ASA Group
Addition of brandsVanligIn October 2017, the Group acquired the Vanlig brand, which includes a vodka and a gin product, from Svensk Vodka Export AB in Sweden. The Group took over sales of these products as from 1 October 2017, while production will be taken over during Q2 2018.
Hot n’SweetAt the end of December 2017, the Group acquired the Hot n’Sweet brand from Strandgaarden Wine & Spirits A/S in Denmark. Hot n’Sweet is a liqueur with a flavour characterised by Turkish pepper candy. The Group took over sales of this product as from 1 January 2018, while production will be taken over during Q1 2018.
Impairment testingGoodwill is allocated to the Group’s cash-generating units and is tested for impairment annually, or more often if there are indicators that the values may have been subject to impairment. Testing for impairment involves determining the recoverable amount for the cash-generating unit. The recoverable amount is determined by discounting expected cash flows, based on the cash-generating entity’s Board-approved business plans. The cash-generating entity is the lowest level at which it is possible to follow up operations comprising the relevant goodwill. At the end of 2017, cash-generating units relating to impairment testing of goodwill are defined both at the company and business area levels. The same is carried out for brands with indefinite useful lives. The cash-generating unit for impairment testing of brands is the brand itself.
The discount rate used for both brands and goodwill is 9.0 per cent before tax, and reflects estimated risk and capital costs for the Group, based on a capital structure considered representative for the activities in which the Arcus Group is engaged.
Recoverable amount in an impairment test of goodwillThe recoverable amount for the cash-generating units is calculated on the basis of the present value estimate of the expected cash flows before tax. The cash flows used as the basis for the impairment test are based on assumptions about future sales volume, sales prices, purchase prices for input factors, salary development and other direct costs set out in Board-approved budgets and long-term plans. The terminal value is based on the cash flow in the last forecast year (2020). The growth assumption in the terminal value is set to inflation only (no real growth) and level of reinvestments are expected to be the same as depreciation of the entities’ fixed assets.
CGU related to goodwill from the acquisition of the production activity in Denmark is assessed to be the entire Spirits segment since, as from 2015, the business in Denmark was integrated with other spirits operations in the Group.
In 2017 the Group wrote down goodwill related to the acquisition of Excellars AS in 2011. The recoverable amount on impairment testing of goodwill in Excellars is based on the 2018 budget, with growth of 2 per cent (inflation) up to 2021 in both revenue and EBITDA, which gives somewhat higher growth in the EBITDA margin during the period. This growth is also applied to the terminal value. On the basis of the impairment tests performed, the Group has recognised impairment of goodwill amounting to TNOK 22,700. This impairment is a consequence of weaker development in the company’s results. To some extent, the company’s earnings have been dependent on revenue from wines with a high sugar content. This is a wine segment that has enjoyed longstanding popularity in Norway, but for which demand has declined significantly, especially during the past year. Any negative change in the assumptions applied to the calculation of the recoverable amount may lead to further impairment. The management is working on new strategy plans to achieve a turnaround for the company, so that the Group avoids further impairment.
Concerning other goodwill in the Group, the impairment tests have not entailed impairment, and down-ward adjustment of the estimated cash flows by 20 per cent, or an increase in the discount rate by 2 per cent, would not have entailed impairment of other goodwill either.
CONSOLIDATED FINANCIAL STATEMENTS WITH NOTES
Statement of income 01.01.-31.12.
Statement of other comprehensive income 01.01.-31.12.
Statement of financial position as at 31 December
Statement of cash flows 01.01.-31.12.
Statement of changes in equity
Brief history of the Group
Accounting policies
Notes
Note 1: Companies in the Group
Note 2: Management of financial risk
Note 3: Information on cash flows
Note 4: Revenues
Note 5: Segment information
Note 6: Transactions with related parties
Note 7: Other operating expenses
Note 8: Salaries and other personnel costs
Note 9: Share-based payment
Note 10: Pension costs, assets and obligations
Note 11: Financial income and costs
Note 12: Tax
Note 13: Investments in associated companies and jointly controlled entities
Note 14: Tangible fixed assets
Note 15: Intangible assets
Note 16: Leasing agreements
Note 17: Other receivables
Note 18: Inventories
Note 19: Cash and cash equivalents
Note 20: Share capital and shareholder information
Note 21: Debt to financial institutions
Note 22: Liabilities at fair value through profit or loss
Note 23: Other provisions for liabilities
Note 24: Current liabilities
Note 25: Pledges and guarantees
Note 26 Business mergers
Note 27 Events after the close of the financial year
Alternative performance measurements
Auditor's report
Contents In brief Group CEO The Company Corporate Social Responsibility Directors’ Report Financial Statements and Notes Contact 95/123Corporate Governance

96 ANNUAL REPORT 2017 Arcus ASAFINANCIAL STATEMENTS AND NOTES | Arcus ASA Group
Recoverable amount in an impairment test of brandsThe recoverable amount for the brands is calculated on the basis of a ”relief from royalty” method before taxes, where the brand’s annual royalty is estimated as future revenues of the brand multiplied by a long-term expected profit level for the relevant brands. Cash flow estimates used are discounted using a discount rate.
Downward adjustment of the estimated cash flows by 20 per cent, or an increase in the discount rate by 2 per cent, would not have entailed impairment for any of the brands.
The table below shows the Group’s intangible assets with indefinite useful lives (goodwill and brands) by cash-generating unit. The most important brands are presented individually, while less important brands are presented under other brands.
Figures in NOK 1,000 Category Currency Segment Goodwill Brands Total Cash-generating unitNorwegian aquavits Aquavit DKK Spirits 0 119,846 119,846Danish aquavits Aquavit NOK Spirits 0 291,082 291,082Other aquavits Aquavit NOK, DKK, SEK Spirits 0 165,729 165,729Danish bitters Bitter dram NOK Spirits 0 9,262 9,262Norwegian cognac Cognac NOK Spirits 0 17,585 17,585Norwegian vodka Vodka NOK Spirits 0 35,104 35,104International vodka Vodka NOK Spirits 0 68,200 68,200Agency wine Agency wine NOK Wine 0 5,024 5,024Other brands Other NOK, DKK Spirits 0 107,870 107,870Spirits segment DKK Spirits 424,186 0 424,186Spirits segment NOK Spirits 381,346 0 381,346Vingruppen i Norden AB (sub-Group) SEK Wine 95,852 0 95,852Social Wines OY EUR Wine 25,994 0 25,994Excellars AS NOK Wine 115,218 0 115,218Total 1,042,596 819,702 1,862,298
The various cash-generating entities listed below include the following known brands:
Cash-generating unit BrandsNorwegian aquavits Lysholm Linie, Løiten Linie, Gammel Opland and Gilde, and other Norwegian aquavitsDanish aquavits AalborgOther aquavits Malteserkreutz and SnällerödsDanish bitters Gammel DanskNorwegian cognac Braastad cognacNorwegian vodka Vikingfjord, Amundsen and Brennevin SekstiInternational vodka Vanlig, Dworek, Hammer, Kalinka and DobraAgency wine Doppio Passo and Pietro de CampoOther brands Hot n’Sweet, Dooley’s, Eau de Vie, Golden Cock, St. Hallvard, Upper Ten, Dry Anis and Star Gin
CONSOLIDATED FINANCIAL STATEMENTS WITH NOTES
Statement of income 01.01.-31.12.
Statement of other comprehensive income 01.01.-31.12.
Statement of financial position as at 31 December
Statement of cash flows 01.01.-31.12.
Statement of changes in equity
Brief history of the Group
Accounting policies
Notes
Note 1: Companies in the Group
Note 2: Management of financial risk
Note 3: Information on cash flows
Note 4: Revenues
Note 5: Segment information
Note 6: Transactions with related parties
Note 7: Other operating expenses
Note 8: Salaries and other personnel costs
Note 9: Share-based payment
Note 10: Pension costs, assets and obligations
Note 11: Financial income and costs
Note 12: Tax
Note 13: Investments in associated companies and jointly controlled entities
Note 14: Tangible fixed assets
Note 15: Intangible assets
Note 16: Leasing agreements
Note 17: Other receivables
Note 18: Inventories
Note 19: Cash and cash equivalents
Note 20: Share capital and shareholder information
Note 21: Debt to financial institutions
Note 22: Liabilities at fair value through profit or loss
Note 23: Other provisions for liabilities
Note 24: Current liabilities
Note 25: Pledges and guarantees
Note 26 Business mergers
Note 27 Events after the close of the financial year
Alternative performance measurements
Auditor's report
Contents In brief Group CEO The Company Corporate Social Responsibility Directors’ Report Financial Statements and Notes Contact 96/123Corporate Governance

97 ANNUAL REPORT 2017 Arcus ASAFINANCIAL STATEMENTS AND NOTES | Arcus ASA Group
NOTE 16 LEASING AGREEMENTS
Operational leasing As at 31 December 2017, the Group had the following leasing agreements which are defined and recognised as operational leasing agreements. There were no significant terms and conditions concerning sub-letting, purchase, escalation or restrictions to the operational leasing agreements as at 31 December 2017.
Figures in nominal NOK 1,000
Annual leasing
cost
Due date within 1 year
Due date 2-5 years
Due date after more than
5 years TotalLeased premises 83,928 83,659 331,851 1,216,118 1,636,628Vehicles 2,309 2,265 2,497 0 4,762Machines and office equipment 463 463 471 0 934Total 86,700 86,387 334,819 1,216,118 1,642,324
This overview includes the agreement concluded with Gjelleråsen Eiendom AS on the lease of production, distribution and administration buildings at Gjelleråsen for a term of 25 years starting on 1 January 2012. The annual rent under this agreement is TNOK 80,132 as from 2018.
Financial leasingAs at 31 December 2017, the Group had four contracts to lease equipment used at Gjelleråsen. All of the above agreements took effect on 1 June 2012 and have a duration of 15 years. This equipment was recognised in the Arcus Group’s statement of financial position as at 31.12.2017.
Figures in nominal NOK 1,000
Annually Lease
amount
Due date within 1 year
Due date 2-5 years
Due date after more than
5 years TotalMachinery and equipment 21,687 21,687 173,203 0 194,890Total 21,687 21,687 173,203 0 194,890
The contract partner for the financial leasing agreements is Nordea, and the agreements are subject to variable interest rates.
Even though, in principle, the leasing agreements have been entered into with a 15-year repayment and interest profile (annuity), the terms of the agreements are for a shorter period of time. Remaining capitalised lease liabilities will fall due in the course of the last 12 months of the agreement period. The Group and Nordea are in continuous dialogue concerning an extension of the agreements to a total maturity profile of 15 years. All changes to the agreements must be formally handled by the landlord.
The present value of future lease payments is NOK 180,3 million as at 31.12.2017, based on a discount rate equivalent to the effective interest rate on the financing in 2017.
Arcus-Gruppen AS has pledged a 100 per cent surety guarantee for all liabilities that the subsidiaries have undertaken or may undertake in connection with the signed leasing agreements. All fixed assets are included in the pledged assets as security for the Arcus Group’s non-current bank financing; see Note 25.
NOTE 17 OTHER RECEIVABLES
Figures in NOK 1,000 Note 2017 2016Non-current receivablesOther non-current receivables 1,205 1,235Total other non-current receivables 1,205 1,235
The Group has no receivables with a term of more than five years.
Figures in NOK 1,000 Note 2017 2016Current receivablesPrepaid costs* 14,920 11,052Prepaid tax 11 0 2,956Fair value of forward contracts 993 0Other current receivables* 6,412 5,104Total other current receivables 22,325 19,112
Figures in NOK 1,000 2017 2016
Prepayments to suppliersNominal prepayments to suppliers 70,755 68,480Provisions -6,185 -5,670Total prepayments to suppliers* 64,570 62,810
Through its distribution business, Vectura purchases goods on behalf of agents and importers. Depending on the type of agreement entered into by the agent or importer, there will be instances where Vectura buys in goods on behalf of the agent or importer and where the agent or importer bears most of the risk associated with this inventory. This type of financing of inventory for individual partners is stated at nominal value less provision for expected losses, and is presented as prepayments to suppliers.
* Items included in changes in working capital in Note 3.
CONSOLIDATED FINANCIAL STATEMENTS WITH NOTES
Statement of income 01.01.-31.12.
Statement of other comprehensive income 01.01.-31.12.
Statement of financial position as at 31 December
Statement of cash flows 01.01.-31.12.
Statement of changes in equity
Brief history of the Group
Accounting policies
Notes
Note 1: Companies in the Group
Note 2: Management of financial risk
Note 3: Information on cash flows
Note 4: Revenues
Note 5: Segment information
Note 6: Transactions with related parties
Note 7: Other operating expenses
Note 8: Salaries and other personnel costs
Note 9: Share-based payment
Note 10: Pension costs, assets and obligations
Note 11: Financial income and costs
Note 12: Tax
Note 13: Investments in associated companies and jointly controlled entities
Note 14: Tangible fixed assets
Note 15: Intangible assets
Note 16: Leasing agreements
Note 17: Other receivables
Note 18: Inventories
Note 19: Cash and cash equivalents
Note 20: Share capital and shareholder information
Note 21: Debt to financial institutions
Note 22: Liabilities at fair value through profit or loss
Note 23: Other provisions for liabilities
Note 24: Current liabilities
Note 25: Pledges and guarantees
Note 26 Business mergers
Note 27 Events after the close of the financial year
Alternative performance measurements
Auditor's report
Contents In brief Group CEO The Company Corporate Social Responsibility Directors’ Report Financial Statements and Notes Contact 97/123Corporate Governance

98 ANNUAL REPORT 2017 Arcus ASAFINANCIAL STATEMENTS AND NOTES | Arcus ASA Group
NOTE 18 INVENTORIES
Figures in NOK 1,000 2017 2016Raw materials 22,709 22,891 Goods in progress 99,629 101,797 Finished goods/goods for resale 310,111 273,719 Obsolescence provision (21,690) (19,630)Total inventories 410,759 378,777
Cost of inventories in the statement of income comprises input costs for finished goods/goods for resale and production value at cost price for goods produced in-house. The total cost of inventories was NOK 1,409 million in 2017 (2016: NOK 1,467 million).
See also Note 25 for details of pledges and guarantees.
NOTE 19 CASH AND CASH EQUIVALENTS
Figures in NOK 1,000 2017 2016Cash and cash equivalents in the Group's cash pool system 0 100,731Other bank deposits 184,402 98,654Cash holdings 13 0Total cash and cash equivalents 184,415 199,385
Available drawing rights 604,982 601,897Utilised drawing rights -72,700 0Available liquidity 716,697 801,282
Figures in NOK 1,000 2017 2016Restricted bank depositsRestricted bank deposits 531 0Total restricted bank deposits 531 0
The Group has a Group cash pool system at Skandinaviska Enskilda Banken (SEB), which includes all subsidiaries, with the exception of the companies included in the wine activities in Sweden and Finland, and Det Danske Spiritus Kompagni A/S. At the end of 2017, this Group cash pool system was managed by the parent company, Arcus ASA.
The joint overdraft limit in the Group cash pool system is TNOK 600,000. The total drawing on the Group cash pool system as at 31 December 2017 amounts to TNOK 72,700, while at the end of 2016 the Group had deposit of TNOK 100,731. The parent company, Arcus ASA, has pledged surety on behalf of all of its subsidiaries, linked at all times to outstanding drawings on this scheme.
In addition, the subsidiary group Vingruppen i Norden AB has a separate overdraft arrangement in Sweden, with a maximum credit facility of TSEK 4,000 (TNOK 3,997); and in Finland with a maximum credit facility of TEUR 100 (TNOK 985) at the end of 2017. There was no drawing on these entitlements at the end of 2017.
The Group’s exposure to interest rate risk is stated in Note 2.
Summary of bank guarantees as at 31 December:
Figures in NOK 1,000 2017 2016Bank guarantees for tax deduction funds 30,549 37,732Bank guarantees for customs and duty credit facilities 22,246 13,899Other bank guarantees 369 0Total bank guarantees 53,164 51,631
CONSOLIDATED FINANCIAL STATEMENTS WITH NOTES
Statement of income 01.01.-31.12.
Statement of other comprehensive income 01.01.-31.12.
Statement of financial position as at 31 December
Statement of cash flows 01.01.-31.12.
Statement of changes in equity
Brief history of the Group
Accounting policies
Notes
Note 1: Companies in the Group
Note 2: Management of financial risk
Note 3: Information on cash flows
Note 4: Revenues
Note 5: Segment information
Note 6: Transactions with related parties
Note 7: Other operating expenses
Note 8: Salaries and other personnel costs
Note 9: Share-based payment
Note 10: Pension costs, assets and obligations
Note 11: Financial income and costs
Note 12: Tax
Note 13: Investments in associated companies and jointly controlled entities
Note 14: Tangible fixed assets
Note 15: Intangible assets
Note 16: Leasing agreements
Note 17: Other receivables
Note 18: Inventories
Note 19: Cash and cash equivalents
Note 20: Share capital and shareholder information
Note 21: Debt to financial institutions
Note 22: Liabilities at fair value through profit or loss
Note 23: Other provisions for liabilities
Note 24: Current liabilities
Note 25: Pledges and guarantees
Note 26 Business mergers
Note 27 Events after the close of the financial year
Alternative performance measurements
Auditor's report
Contents In brief Group CEO The Company Corporate Social Responsibility Directors’ Report Financial Statements and Notes Contact 98/123Corporate Governance

99 ANNUAL REPORT 2017 Arcus ASAFINANCIAL STATEMENTS AND NOTES | Arcus ASA Group
NOTE 20 SHARE CAPITAL AND SHAREHOLDER INFORMATION
The share capital comprises:
Date ChangeTotal number
of sharesNominal
valueBook value
(NOK 1,000)31.12.15 1,000,000 1.00 1,000 20.10.16 Split 1:50 50,000,000 0.02 1,000 01.12.16 Share issue 68,023,255 0.02 1,360 31.12.17 68,023,255 0.02 1,360
20 largest shareholders as at 31.12.2017:
Number of shares
Ownership and voting rights
Canica AS 22,670,000 33.3%Geveran Trading Co Ltd 6,750,000 9.9%Verdipapirfondet DNB Norge (IV) 3,577,915 5.3%Hoff SA 3,297,000 4.8%Sundt AS 3,234,957 4.8%Folketrygdfondet 1,800,000 2.6%Danske Invest Norske Instit. II. 1,725,100 2.5%KLP Aksjenorge 1,266,494 1.9%Verdipapirfondet DNB Norden (III) 1,222,178 1.8%Centra Invest AS 1,169,846 1.7%Holta Invest AS 1,000,000 1.5%Ilmarinen Mutual Pens Ins Comp 1,000,000 1.5%Verdipapirfondet DNB Norge Selektiv 936,616 1.4%Goldman Sachs International NOM 900,000 1.3%Skandinaviska Enskilda Banken AB (A/C SEB AIF - Swedish Residents)
NOM 862,000 1.3%
Danske Invest Norske Aksjer Inst 855,400 1.3%Landkreditt dividend 850,000 1.2%Kommunal Landspensjonskasse 809,707 1.2%Skandinaviska Enskilda Banken AB (A/C clients account) NOM 795,113 1.2%Citibank Europe Plc NOM 794,127 1.2%Other shareholders 12,506,802 18.4%Total 68,023,255 100.0%
Shareholdings of the Group Management as at 31.12.2017: Number of
sharesOwnership and
voting rightsKenneth Hamnes1 126,499 0.2%Sigmund Toth 19,767 0.0%Erik Bern 20,233 0.0%Bjørn Delbæk2 22,705 0.0%Per Bjørkum 16,511 0.0%Erlend Stefansson 54,124 0.1%Thomas Patay 110,156 0.2%Christian Granlund 2,822 0.0%Claes Lindquist 46,726 0.1%Total shareholdings of the Group Management 419,543 0.6%
1. The shareholding is held via Ekelyveien AS 2. Of the holdings, 5,000 shares are held via Oso Consulting AS
Dividend and Group contributions The Board of Directors proposes dividend distribution of NOK 1.66 per share for 2017 (2016 NOK 1.47 per share ).
CONSOLIDATED FINANCIAL STATEMENTS WITH NOTES
Statement of income 01.01.-31.12.
Statement of other comprehensive income 01.01.-31.12.
Statement of financial position as at 31 December
Statement of cash flows 01.01.-31.12.
Statement of changes in equity
Brief history of the Group
Accounting policies
Notes
Note 1: Companies in the Group
Note 2: Management of financial risk
Note 3: Information on cash flows
Note 4: Revenues
Note 5: Segment information
Note 6: Transactions with related parties
Note 7: Other operating expenses
Note 8: Salaries and other personnel costs
Note 9: Share-based payment
Note 10: Pension costs, assets and obligations
Note 11: Financial income and costs
Note 12: Tax
Note 13: Investments in associated companies and jointly controlled entities
Note 14: Tangible fixed assets
Note 15: Intangible assets
Note 16: Leasing agreements
Note 17: Other receivables
Note 18: Inventories
Note 19: Cash and cash equivalents
Note 20: Share capital and shareholder information
Note 21: Debt to financial institutions
Note 22: Liabilities at fair value through profit or loss
Note 23: Other provisions for liabilities
Note 24: Current liabilities
Note 25: Pledges and guarantees
Note 26 Business mergers
Note 27 Events after the close of the financial year
Alternative performance measurements
Auditor's report
Contents In brief Group CEO The Company Corporate Social Responsibility Directors’ Report Financial Statements and Notes Contact 99/123Corporate Governance

100 ANNUAL REPORT 2017 Arcus ASAFINANCIAL STATEMENTS AND NOTES | Arcus ASA Group
Earnings per shareEarnings per share is calculated on the basis of the profit for the year attributable to the shareholders in the parent company divided by a weighted average of the number of outstanding ordinary shares for the year, reduced for ordinary shares bought by the company and held as own shares.
The Arcus Group has an sharebased incentive schemes for senior executives under which externally owned shares can be diluted by issuing matching shares. To take account of this future increase in the number of shares, diluted earnings per share are also calculated, which takes account of a weighted average for the year of the estimated number of matching shares and options.
Earnings per share: 2017 2016Profit for the year 188,227 -24,089Profit for the year attributable to non-controlling interests 6,944 10,480Profit for the year to the owners of the parent company 181,283 -34,569
Comprehensive income 264,803 -64,290Comprehensive income attributable to non-controlling interests 8,127 7,703Comprehensive income to the owners of the parent company 256,681 -71,993
Weighted average of the number of outstanding shares 68,023,255 51,501,938Dilution effect from option scheme 893,730 0Dilution effects from matching shares 368,274 31,730Weighted average of the number of outstanding shares – diluted 69,285,259 51,533,668
Earnings per share in NOK 2.66 -0.67Diluted earnings per share in NOK 2.62 -0.67Comprehensive income per share in NOK 3.77 -1.40Diluted comprehensive income per share in NOK 3.70 -1.40
CONSOLIDATED FINANCIAL STATEMENTS WITH NOTES
Statement of income 01.01.-31.12.
Statement of other comprehensive income 01.01.-31.12.
Statement of financial position as at 31 December
Statement of cash flows 01.01.-31.12.
Statement of changes in equity
Brief history of the Group
Accounting policies
Notes
Note 1: Companies in the Group
Note 2: Management of financial risk
Note 3: Information on cash flows
Note 4: Revenues
Note 5: Segment information
Note 6: Transactions with related parties
Note 7: Other operating expenses
Note 8: Salaries and other personnel costs
Note 9: Share-based payment
Note 10: Pension costs, assets and obligations
Note 11: Financial income and costs
Note 12: Tax
Note 13: Investments in associated companies and jointly controlled entities
Note 14: Tangible fixed assets
Note 15: Intangible assets
Note 16: Leasing agreements
Note 17: Other receivables
Note 18: Inventories
Note 19: Cash and cash equivalents
Note 20: Share capital and shareholder information
Note 21: Debt to financial institutions
Note 22: Liabilities at fair value through profit or loss
Note 23: Other provisions for liabilities
Note 24: Current liabilities
Note 25: Pledges and guarantees
Note 26 Business mergers
Note 27 Events after the close of the financial year
Alternative performance measurements
Auditor's report
Contents In brief Group CEO The Company Corporate Social Responsibility Directors’ Report Financial Statements and Notes Contact 100/123Corporate Governance

101 ANNUAL REPORT 2017 Arcus ASAFINANCIAL STATEMENTS AND NOTES | Arcus ASA Group
NOTE 21 DEBT TO FINANCIAL INSTITUTIONS
Figures in NOK 1,000Type of financing Currency Interest rate profile
Loan amount in foreign currency
31.12.2016Loan amount in NOK
31.12.2017Loan amount in NOK
31.12.2016SEB Mortgage loan SEK Variable 750,000 749,400 711,300SEB Overdraft facility NOK Variable 72,700 72,700 0Nordea Financial leasing NOK Variable 183,766 183,766 199,485Total debt to financial institutions 1,005,866 910,785Capitalised front-end fees -6,577 -8,032Book value of debt to financial institutions 999,289 902,753
Term structure Type of financing Currency Maturity 2018 Maturity 2019 Maturity 2020Maturity 2021
or later TotalSEB Mortgage loan SEK 0 0 0 749,400 749,400SEB Overdraft facility NOK 72,700 0 0 0 72,700Nordea ** Financial leasing NOK 17,371 17,804 101,796 46,795 183,766Total debt to financial institutions* 90,071 17,804 101,796 796,195 1,005,866
Reconciliation of interest-bearing debt on 31.12.2017
Figures in NOK 1,000Book value
31.12.2016
Cash flow 2017 Without cash flow 2017Book value
31.12.2017Raised RepaymentAmortisation front-end fee Reclassification
Acquisition/sale of companies
Translationdifferences
Non-current debtMortgage loan 703,268 0 0 1,652 0 0 37,903 742,823Financial leasing 182,987 0 0 0 -16,592 0 0 166,395Total non-current interest-bearing debt 886,255 0 0 1,652 -16,592 0 37,903 909,218
Current debtMortgage loan 0 0 0 0 0 0 0 0Financial leasing 16,498 0 -15,719 0 16,592 0 0 17,371Overdraft facility 0 72,700 0 0 0 0 0 72,700Total current interest-bearing debt 16,498 72,700 -15,719 0 16,592 0 0 90,071Total interest-bearing debt 902,753 72,700 -15,719 1,652 0 0 37,903 999,289
CONSOLIDATED FINANCIAL STATEMENTS WITH NOTES
Statement of income 01.01.-31.12.
Statement of other comprehensive income 01.01.-31.12.
Statement of financial position as at 31 December
Statement of cash flows 01.01.-31.12.
Statement of changes in equity
Brief history of the Group
Accounting policies
Notes
Note 1: Companies in the Group
Note 2: Management of financial risk
Note 3: Information on cash flows
Note 4: Revenues
Note 5: Segment information
Note 6: Transactions with related parties
Note 7: Other operating expenses
Note 8: Salaries and other personnel costs
Note 9: Share-based payment
Note 10: Pension costs, assets and obligations
Note 11: Financial income and costs
Note 12: Tax
Note 13: Investments in associated companies and jointly controlled entities
Note 14: Tangible fixed assets
Note 15: Intangible assets
Note 16: Leasing agreements
Note 17: Other receivables
Note 18: Inventories
Note 19: Cash and cash equivalents
Note 20: Share capital and shareholder information
Note 21: Debt to financial institutions
Note 22: Liabilities at fair value through profit or loss
Note 23: Other provisions for liabilities
Note 24: Current liabilities
Note 25: Pledges and guarantees
Note 26 Business mergers
Note 27 Events after the close of the financial year
Alternative performance measurements
Auditor's report
Contents In brief Group CEO The Company Corporate Social Responsibility Directors’ Report Financial Statements and Notes Contact 101/123Corporate Governance

102 ANNUAL REPORT 2017 Arcus ASAFINANCIAL STATEMENTS AND NOTES | Arcus ASA Group
Reconciliation of interest-bearing debt, 31.12.2016
Figures in NOK 1,000Book value
31.12.2015
Cash flow 2016 Without cash flow 2016Book value
31.12.2016Raised RepaymentAmortisation of
front-end fee ReclassificationAcquisition/sale
of companiesTranslationdifferences
Non-current debtMortgage loan 833,305 802,632 -908,130 20,636 0 0 -45,175 703,268Financial leasing 200,181 0 0 0 -17,194 0 0 182,987Total non-current interest-bearing debt 1,033,486 802,632 -908,130 20,636 -17,194 0 -45,175 886,255
Current debtMortgage loan 156,849 0 -156,849 0 0 0 0 0Financial leasing 15,373 0 -16,069 0 17,194 0 0 16,498Overdraft facility 0 0 0 0 0 0 0 0Total current interest-bearing debt 172,222 0 -172,918 0 17,194 0 0 16,498Total interest-bearing debt 1,205,708 802,632 -1,081,048 20,636 0 0 -45,175 902,753
In connection with the IPO in 2016, the Group refinanced its non-current loans in SEB. In this connection the entire original mortgage loan, denominated in NOK and SEK, was redeemed, while the entire new loan was denominated in SEK.
The non-current mortgage loan is legally placed in the subsidiary VinGruppen Sweden Holding AB in Stockholm, and falls due in its entirety at the end of 2021.
After the refinancing in 2016, the Group has not hedged interest rates. The previous interest hedging agreement entailed a positive value change of TNOK 4,552 in 2016, but led to a non-recurring payment of TNOK -12,873 on settlement in December 2016.
On the establishment of the new loan, a front-end fee was paid, which is capitalised in the statement of financial position and written off over the duration of the loan. The remaining book value of the front-end fee related to the previous mortgage loan was written down in 2016, and this is classified under other financial costs.
* Maturity in 2018 is presented as current liabilities in the statement of financial position.**See Note 16 concerning leasing agreements for information on the term structure of annual leasing amounts.
The agreement on a mortgage loan facility contains a loan clause (covenant) concerning net interest-bearing debt as a ratio of adjusted EBITDA. The Group continuously monitors this clause and reports to the bank on a quarterly basis. As at 31.12.2017 the Group was well within the required ratio.
CONSOLIDATED FINANCIAL STATEMENTS WITH NOTES
Statement of income 01.01.-31.12.
Statement of other comprehensive income 01.01.-31.12.
Statement of financial position as at 31 December
Statement of cash flows 01.01.-31.12.
Statement of changes in equity
Brief history of the Group
Accounting policies
Notes
Note 1: Companies in the Group
Note 2: Management of financial risk
Note 3: Information on cash flows
Note 4: Revenues
Note 5: Segment information
Note 6: Transactions with related parties
Note 7: Other operating expenses
Note 8: Salaries and other personnel costs
Note 9: Share-based payment
Note 10: Pension costs, assets and obligations
Note 11: Financial income and costs
Note 12: Tax
Note 13: Investments in associated companies and jointly controlled entities
Note 14: Tangible fixed assets
Note 15: Intangible assets
Note 16: Leasing agreements
Note 17: Other receivables
Note 18: Inventories
Note 19: Cash and cash equivalents
Note 20: Share capital and shareholder information
Note 21: Debt to financial institutions
Note 22: Liabilities at fair value through profit or loss
Note 23: Other provisions for liabilities
Note 24: Current liabilities
Note 25: Pledges and guarantees
Note 26 Business mergers
Note 27 Events after the close of the financial year
Alternative performance measurements
Auditor's report
Contents In brief Group CEO The Company Corporate Social Responsibility Directors’ Report Financial Statements and Notes Contact 102/123Corporate Governance
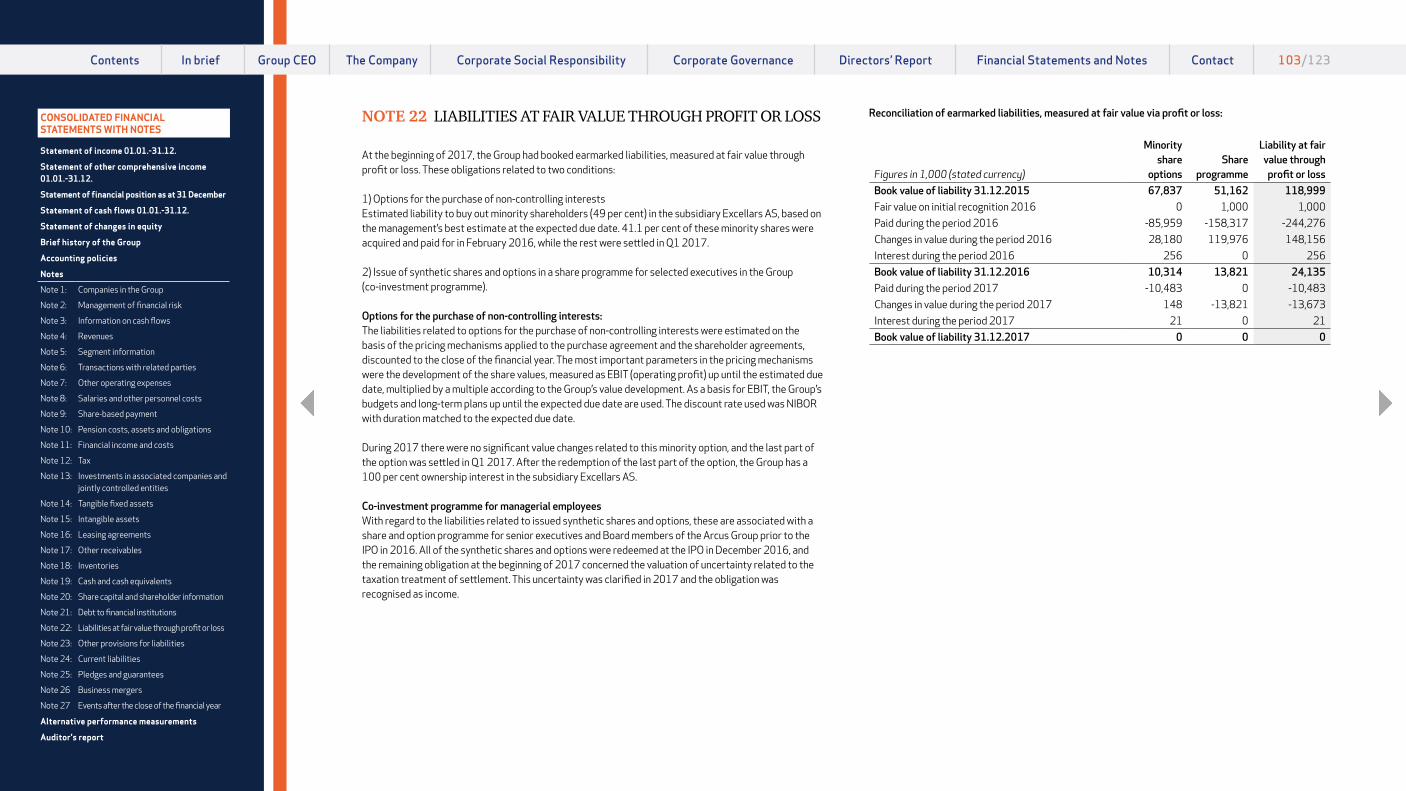
103 ANNUAL REPORT 2017 Arcus ASAFINANCIAL STATEMENTS AND NOTES | Arcus ASA Group
NOTE 22 LIABILITIES AT FAIR VALUE THROUGH PROFIT OR LOSS
At the beginning of 2017, the Group had booked earmarked liabilities, measured at fair value through profit or loss. These obligations related to two conditions:
1) Options for the purchase of non-controlling interests Estimated liability to buy out minority shareholders (49 per cent) in the subsidiary Excellars AS, based on the management’s best estimate at the expected due date. 41.1 per cent of these minority shares were acquired and paid for in February 2016, while the rest were settled in Q1 2017.
2) Issue of synthetic shares and options in a share programme for selected executives in the Group (co-investment programme).
Options for the purchase of non-controlling interests:The liabilities related to options for the purchase of non-controlling interests were estimated on the basis of the pricing mechanisms applied to the purchase agreement and the shareholder agreements, discounted to the close of the financial year. The most important parameters in the pricing mechanisms were the development of the share values, measured as EBIT (operating profit) up until the estimated due date, multiplied by a multiple according to the Group’s value development. As a basis for EBIT, the Group’s budgets and long-term plans up until the expected due date are used. The discount rate used was NIBOR with duration matched to the expected due date.
During 2017 there were no significant value changes related to this minority option, and the last part of the option was settled in Q1 2017. After the redemption of the last part of the option, the Group has a 100 per cent ownership interest in the subsidiary Excellars AS.
Co-investment programme for managerial employeesWith regard to the liabilities related to issued synthetic shares and options, these are associated with a share and option programme for senior executives and Board members of the Arcus Group prior to the IPO in 2016. All of the synthetic shares and options were redeemed at the IPO in December 2016, and the remaining obligation at the beginning of 2017 concerned the valuation of uncertainty related to the taxation treatment of settlement. This uncertainty was clarified in 2017 and the obligation was recognised as income.
Reconciliation of earmarked liabilities, measured at fair value via profit or loss:
Figures in 1,000 (stated currency)
Minority share
optionsShare
programme
Liability at fair value through profit or loss
Book value of liability 31.12.2015 67,837 51,162 118,999Fair value on initial recognition 2016 0 1,000 1,000Paid during the period 2016 -85,959 -158,317 -244,276Changes in value during the period 2016 28,180 119,976 148,156Interest during the period 2016 256 0 256Book value of liability 31.12.2016 10,314 13,821 24,135Paid during the period 2017 -10,483 0 -10,483Changes in value during the period 2017 148 -13,821 -13,673Interest during the period 2017 21 0 21Book value of liability 31.12.2017 0 0 0
CONSOLIDATED FINANCIAL STATEMENTS WITH NOTES
Statement of income 01.01.-31.12.
Statement of other comprehensive income 01.01.-31.12.
Statement of financial position as at 31 December
Statement of cash flows 01.01.-31.12.
Statement of changes in equity
Brief history of the Group
Accounting policies
Notes
Note 1: Companies in the Group
Note 2: Management of financial risk
Note 3: Information on cash flows
Note 4: Revenues
Note 5: Segment information
Note 6: Transactions with related parties
Note 7: Other operating expenses
Note 8: Salaries and other personnel costs
Note 9: Share-based payment
Note 10: Pension costs, assets and obligations
Note 11: Financial income and costs
Note 12: Tax
Note 13: Investments in associated companies and jointly controlled entities
Note 14: Tangible fixed assets
Note 15: Intangible assets
Note 16: Leasing agreements
Note 17: Other receivables
Note 18: Inventories
Note 19: Cash and cash equivalents
Note 20: Share capital and shareholder information
Note 21: Debt to financial institutions
Note 22: Liabilities at fair value through profit or loss
Note 23: Other provisions for liabilities
Note 24: Current liabilities
Note 25: Pledges and guarantees
Note 26 Business mergers
Note 27 Events after the close of the financial year
Alternative performance measurements
Auditor's report
Contents In brief Group CEO The Company Corporate Social Responsibility Directors’ Report Financial Statements and Notes Contact 103/123Corporate Governance

104 ANNUAL REPORT 2017 Arcus ASAFINANCIAL STATEMENTS AND NOTES | Arcus ASA Group
NOTE 23 OTHER PROVISIONS FOR LIABILITIES
Severance pay (long-term)Provisions for liabilities are associated with severance pay on termination of employment. The plan covered initially 70 employees of the Group who have received severance packages in connection with the restructuring of the companies. The obligations are paid monthly up to 2019 and are presented under other non-current provisions for liabilities. The provision is calculated by discounting future payments including social security contributions at a discount rate which depends on the length of the obligation. As at 31.12.2017, the provision was associated with four remaining individuals.
Severance pay (short-term)It has been necessary for the Group to make organisational and staffing adjustments in order to meet new requirements, including new work processes and improved profitability. During this change process, the Group offered a range of personnel policy initiatives to its employees, in order to fulfil the new framework conditions without compulsory downsizing. As at 31.12.2017, the liability associated with this was recognised at NOK 2.2 million.
All of the current liabilities are recognised in the statement of financial position under other current liabilities.
Non-current liabilities
2017
Figures in NOK 1000
Bookvalue as at
31.12.2016
Reversed provision
2017
Recognised provision
2017
Translation difference
2017
Bookvalue as at
31.12.2017Severance pay 627 -307 0 0 320Non-current provisions 627 -307 0 0 320
2016
Figures in NOK 1000
Bookvalue as at
31.12.2015
Reversed provision
2016
Recognised provision
2016
Translation difference
2016
Bookvalue as at
31.12.2016Severance pay 1,140 -513 0 0 627Non-current provisions 1,140 -513 0 0 627
Current liabilities
2017
Figures in NOK 1000
Bookvalue as at
31.12.2016
Reversed provision
2017
Recognised provision
2017
TranslationDifference
2017
Bookvalue as at
31.12.2017Severance pay 2,276 -1,900 1,762 20 2,158Other provisions 10,000 0 0 0 10,000Other current liabilities 12,276 -1,900 1,762 20 12,158
2016
Figures in NOK 1000
Bookvalue as at
31.12.2015
Reversed provision
2016
Recognised provision
2016
TranslationDifference
2016
Bookvalue as at
31.12.2016Severance pay 7,080 -5,434 630 0 2,276Other provisions 10,000 0 0 0 10,000Other current liabilities 17,080 -5,434 630 0 12,276
NOTE 24 CURRENT LIABILITIES
Figures in NOK 1000 2017 2016Unpaid public dutiesSpecial duties, alcohol 569,034 549,231Value added tax 339,151 304,407Other public duties 19,820 58,672Total unpaid public duties* 928,005 912,310
Figures in NOK 1000 2017 2016Other current liabilitiesCurrent non-interest-bearing debt* 25,329 19,088Fair value, foreign exchange forward contracts 0 844Provision for social security costs related to share-based remuneration 1,642 125Provision for liabilities*, see Note 23 12,158 12,276Other accrued costs* 158,615 165,001Total other current liabilities 197,744 197,334
All current liabilities fall due within 12 months.
* Items included in changes in working capital in Note 3.
CONSOLIDATED FINANCIAL STATEMENTS WITH NOTES
Statement of income 01.01.-31.12.
Statement of other comprehensive income 01.01.-31.12.
Statement of financial position as at 31 December
Statement of cash flows 01.01.-31.12.
Statement of changes in equity
Brief history of the Group
Accounting policies
Notes
Note 1: Companies in the Group
Note 2: Management of financial risk
Note 3: Information on cash flows
Note 4: Revenues
Note 5: Segment information
Note 6: Transactions with related parties
Note 7: Other operating expenses
Note 8: Salaries and other personnel costs
Note 9: Share-based payment
Note 10: Pension costs, assets and obligations
Note 11: Financial income and costs
Note 12: Tax
Note 13: Investments in associated companies and jointly controlled entities
Note 14: Tangible fixed assets
Note 15: Intangible assets
Note 16: Leasing agreements
Note 17: Other receivables
Note 18: Inventories
Note 19: Cash and cash equivalents
Note 20: Share capital and shareholder information
Note 21: Debt to financial institutions
Note 22: Liabilities at fair value through profit or loss
Note 23: Other provisions for liabilities
Note 24: Current liabilities
Note 25: Pledges and guarantees
Note 26 Business mergers
Note 27 Events after the close of the financial year
Alternative performance measurements
Auditor's report
Contents In brief Group CEO The Company Corporate Social Responsibility Directors’ Report Financial Statements and Notes Contact 104/123Corporate Governance

105 ANNUAL REPORT 2017 Arcus ASAFINANCIAL STATEMENTS AND NOTES | Arcus ASA Group
NOTE 25 PLEDGES AND GUARANTEES
Non-current credit financing in SEBThe Group has a Group cash pool system at Skandinaviska Enskilda Banken (SEB), which includes the subsidiaries with the exception of the companies in the wine business in Sweden and Finland, and Det Danske Spiritus Kompagni A/S in Denmark. At the end of 2017, this Group cash pool system was managed by the parent company, Arcus ASA. The parent company has pledged surety on behalf of all of its subsidiaries, which is linked to the outstanding drawing on this scheme at any time.
No collateral is pledged for the Group’s non-current credit financing in SEB. For further information about the non-current credit financing, see Note 21.
Surety guarantee related to financial leasingOne of the Group’s subsidiaries, Arcus-Gruppen AS, has pledged a surety guarantee for leased assets (financial leasing) with Nordea Finans. At the end of 2017, the surety guarantee amounted to TNOK 194,890 for the Group’s own leased operating equipment. See also Note 16 concerning leasing agreements.
NOTE 26 BUSINESS MERGERS
Acquisition of the remaining 50 per cent of Det Danske Spiritus Kompagni A/SIn January 2017, the Arcus Group reached agreement with Flemming Karberg Familieholding ApS on the acquisition of the remaining 50 per cent ownership interest in Det Danske Spiritus Kompagni A/S (DDSK). Up to and including 31.12.2016, DDSK was owned on a 50/50 basis by the Arcus Group and Flemming Karberg Familieholding ApS, and was treated as a Joint Venture in the Arcus Group, see also Note 13. This is a strategic acquisition to gain control of the entire value chain related to the company’s activities in Denmark. The acquisition was implemented as from 1.1.2017 and means that in accounting terms, DDSK will be fully consolidated in the Group as from the same date.
A final acquisition analysis is presented below, based on the company’s statement of financial position as of the acquisition date.
Figures in NOK 1,000
Recognised value of acquired
businessObservable
excess values
Fair value of acquired business
Tangible assets 21 0 21Receivables 44,883 0 44,883Bank deposits 23,933 0 23,933Unpaid public duties -12,318 0 -12,318Other current liabilities -39,915 0 -39,915Tax payable -715 0 -715Fair value, observable net assets 15,887Acquisition value 31,535Goodwill 15,647
The acquisition of the remaining shares in DDSK was mainly based on the same share price as for the existing shares, so that the acquisition did not entail any revaluation gains. The company is not assessed to have any excess value other than goodwill. On acquisition, goodwill is the part of the net excess value that is not identifiable. Estimated goodwill is capitalised in the consolidated statement of financial position based on the expectation that synergies with the Group’s existing operations will provide opportunities for increased earnings in the future. The acquisition analysis is final.
Net cash outflow related to the acquisition:
Figures in NOK 1000 2017- Cash payment on acquisition -22,753+ Cash and cash equivalents in the acquired business 23,933Net cash outflow on acquisition 1,180
CONSOLIDATED FINANCIAL STATEMENTS WITH NOTES
Statement of income 01.01.-31.12.
Statement of other comprehensive income 01.01.-31.12.
Statement of financial position as at 31 December
Statement of cash flows 01.01.-31.12.
Statement of changes in equity
Brief history of the Group
Accounting policies
Notes
Note 1: Companies in the Group
Note 2: Management of financial risk
Note 3: Information on cash flows
Note 4: Revenues
Note 5: Segment information
Note 6: Transactions with related parties
Note 7: Other operating expenses
Note 8: Salaries and other personnel costs
Note 9: Share-based payment
Note 10: Pension costs, assets and obligations
Note 11: Financial income and costs
Note 12: Tax
Note 13: Investments in associated companies and jointly controlled entities
Note 14: Tangible fixed assets
Note 15: Intangible assets
Note 16: Leasing agreements
Note 17: Other receivables
Note 18: Inventories
Note 19: Cash and cash equivalents
Note 20: Share capital and shareholder information
Note 21: Debt to financial institutions
Note 22: Liabilities at fair value through profit or loss
Note 23: Other provisions for liabilities
Note 24: Current liabilities
Note 25: Pledges and guarantees
Note 26 Business mergers
Note 27 Events after the close of the financial year
Alternative performance measurements
Auditor's report
Contents In brief Group CEO The Company Corporate Social Responsibility Directors’ Report Financial Statements and Notes Contact 105/123Corporate Governance

106 ANNUAL REPORT 2017 Arcus ASAFINANCIAL STATEMENTS AND NOTES | Arcus ASA Group
The effect of acquired activities on the profit for the year:
Figures in NOK 1,000 2017Sales revenue 147,418Total operating revenues 147,418
Cost of sales -119,853Payroll costs -9,810Share of operating expenses -10,063Total operating expenses -139,726
Operating profit 7,692
Acquisition of BevCo ASIn September 2017, the Group acquired all of the shares in BevCo AS. Among other things, the company holds the distribution rights for Dooley’s Toffee in Norway, and the acquisition was thus part of the Group’s strategy to make small and selective acquisitions in order to strengthen its position in the Nordic region. The acquisition was implemented as from 1.9.2017 and the company has been fully consolidated in the Group as from the same date.
A final acquisition analysis is presented below, based on the company’s statement of financial position as of the acquisition date.
Figures in NOK 1,000
Recognised value of acquired
businessObservable
excess values
Fair value of acquired business
Brands 0 3,900 3,900Inventories 201 0 201Receivables 120 0 120Bank deposits 1,008 0 1,008Unpaid public duties -93 0 -93Other current liabilities -274 0 -274Deferred tax liability 0 -858 -858Fair value, observable net assets 4,004Acquisition value 4,940Goodwill 936
Net cash outflow related to the acquisition:
Figures in NOK 1000 2017- Cash payment on acquisition -4,940+ Cash and cash equivalents in the acquired business 1,008Net cash outflow on acquisition -3,932
NOTE 27 EVENTS AFTER THE CLOSE OF THE FINANCIAL YEAR
Other No significant events occurred between the close of the financial year and the date on which Arcus ’s consolidated financial statements and parent company financial statements were approved for publication. This applies to events that would have provided knowledge of factors present at the close of the financial year, or events concerning matters that have arisen since the close of the financial year. The consolidated financial statements were approved for publication by resolution of the Board of Directors on 15 March 2018.
CONSOLIDATED FINANCIAL STATEMENTS WITH NOTES
Statement of income 01.01.-31.12.
Statement of other comprehensive income 01.01.-31.12.
Statement of financial position as at 31 December
Statement of cash flows 01.01.-31.12.
Statement of changes in equity
Brief history of the Group
Accounting policies
Notes
Note 1: Companies in the Group
Note 2: Management of financial risk
Note 3: Information on cash flows
Note 4: Revenues
Note 5: Segment information
Note 6: Transactions with related parties
Note 7: Other operating expenses
Note 8: Salaries and other personnel costs
Note 9: Share-based payment
Note 10: Pension costs, assets and obligations
Note 11: Financial income and costs
Note 12: Tax
Note 13: Investments in associated companies and jointly controlled entities
Note 14: Tangible fixed assets
Note 15: Intangible assets
Note 16: Leasing agreements
Note 17: Other receivables
Note 18: Inventories
Note 19: Cash and cash equivalents
Note 20: Share capital and shareholder information
Note 21: Debt to financial institutions
Note 22: Liabilities at fair value through profit or loss
Note 23: Other provisions for liabilities
Note 24: Current liabilities
Note 25: Pledges and guarantees
Note 26 Business mergers
Note 27 Events after the close of the financial year
Alternative performance measurements
Auditor's report
Contents In brief Group CEO The Company Corporate Social Responsibility Directors’ Report Financial Statements and Notes Contact 106/123Corporate Governance

107 ANNUAL REPORT 2017 Arcus ASAFINANCIAL STATEMENTS AND NOTES | Arcus ASA Group
Alternative performance measurementsIn the discussion of the reported operational results, statement of financial position and cash flows, the Group refers to a number of parameters for Alternative performance measurements. These are not defined in the general accounting policies, as for IFRS.
The Group Management of the Arcus Group frequently uses these parameters for Alternative performance measurements and believes that, in combination with comparable parameters defined in ordinary accounting policies, these are of great benefit to investors wishing to understand the Group’s business, ability to fulfil its commitments, and ability to monitor the development of new business opportunities. These alternative measurements of results should not be seen in isolation, but, as the name indicates, are an alternative to more well-known result measurement parameters as defined in international accounting standards.
Below, the Group’s parameters for Alternative performance measurements are defined.
Gross profitThe Arcus Group defines gross profit as total operating revenue less cost of sales.
Figures in NOK 1000 2017 2016GroupSales revenues 2,530,126 2,521,826Other operating revenues 44,934 60,571Total operating revenue 2,575,060 2,582,397Cost of sales -1,408,524 -1,467,920Gross profit 1,166,536 1,114,477
Figures in NOK 1000 2017 2016SpiritsSales revenues 763,421 751,107Other operating revenues 149,862 152,776Total operating revenue 913,283 903,883Cost of sales -404,928 -427,031Gross profit 508,355 476,851
Figures in NOK 1000 2017 2016WineSales revenues 1,522,689 1,538,676Other operating revenues 18,190 13,697Total operating revenue 1,540,879 1,552,373Cost of sales -1,154,411 -1,165,620Gross profit 386,469 386,753
Figures in NOK 1000 2017 2016DistributionSales revenues 251,332 232,043Other operating revenues 33,071 30,881Total operating revenue 284,403 262,924Cost of sales 0 0Gross profit 284,403 262,924
CONSOLIDATED FINANCIAL STATEMENTS WITH NOTES
Statement of income 01.01.-31.12.
Statement of other comprehensive income 01.01.-31.12.
Statement of financial position as at 31 December
Statement of cash flows 01.01.-31.12.
Statement of changes in equity
Brief history of the Group
Accounting policies
Notes
Note 1: Companies in the Group
Note 2: Management of financial risk
Note 3: Information on cash flows
Note 4: Revenues
Note 5: Segment information
Note 6: Transactions with related parties
Note 7: Other operating expenses
Note 8: Salaries and other personnel costs
Note 9: Share-based payment
Note 10: Pension costs, assets and obligations
Note 11: Financial income and costs
Note 12: Tax
Note 13: Investments in associated companies and jointly controlled entities
Note 14: Tangible fixed assets
Note 15: Intangible assets
Note 16: Leasing agreements
Note 17: Other receivables
Note 18: Inventories
Note 19: Cash and cash equivalents
Note 20: Share capital and shareholder information
Note 21: Debt to financial institutions
Note 22: Liabilities at fair value through profit or loss
Note 23: Other provisions for liabilities
Note 24: Current liabilities
Note 25: Pledges and guarantees
Note 26 Business mergers
Note 27 Events after the close of the financial year
Alternative performance measurements
Auditor's report
Contents In brief Group CEO The Company Corporate Social Responsibility Directors’ Report Financial Statements and Notes Contact 107/123Corporate Governance

108 ANNUAL REPORT 2017 Arcus ASAFINANCIAL STATEMENTS AND NOTES | Arcus ASA Group
Other income and expensesTo improve the information value of the Group’s consolidated income statement, significant positive and negative non-recurring items and restructuring costs are separated out to a separate line in the statement of income called other income and expenses. Other income and expenses are presented net on this income statement line. Other income and expenses are presented in Note 7.
Below, the income statement is presented up to and including EBIT, with and without adjustment for other income and expenses:
2017 2016 Figures in NOK 1000
AdjustedNon-
adjusted Adjusted Non-
adjustedSales revenues 2,530,126 2,530,126 2,521,826 2,521,826Other operating revenues 44,934 44,934 60,571 60,571Total operating revenues 2,575,060 2,575,060 2,582,397 2,582,397
Net profit on sale of fixed assets 30 30 144 1,051Cost of sales -1,408,524 -1,408,524 -1,467,920 -1,467,920Salaries and other personnel costs -417,412 -422,334 -392,545 -399,505Other operating expenses -391,699 -399,944 -392,516 -431,337Share of profit from associated companies and jointly controlled entities 3,286 3,286 5,789 5,789EBITDA 360,741 347,574 335,349 290,475
Depreciation and amortisation -51,581 -51,581 -51,625 -51,625Write-downs 0 -22,700 0 0Operating profit (EBIT) 309,160 273,293 283,724 238,850
Other income and expenses -13,167 0 -44,874 0Write-downs -22,700 0 0 0Reported operating profit 273,293 273,293 238,850 238,850
EBITDA and adjusted EBITDAEBITDA is defined as operating profit before depreciation, write-downs and amortisation. Adjusted EBITDA is defined as operating profit before depreciation, write-downs, amortisation and other income and expenses. EBITDA margin = EBITDA/Total operating revenueAdjusted EBITDA margin = adjusted EBITDA/Total operating revenue
Below is a reconciliation of operating profit to adjusted EBITDA:
Figures in NOK 1000 2017 2016GroupOperating profit 273,293 238,850Depreciation, write-downs and amortisation 74,281 51,625EBITDA 347,574 290,475Other income and expenses 13,167 44,874Adjusted EBITDA 360,741 335,349
Figures in NOK 1000 2017 2016SpiritsOperating profit 151,494 134,765Depreciation, write-downs and amortisation 24,117 23,906EBITDA 175,611 158,671Other income and expenses 7,142 3,916Adjusted EBITDA 182,753 162,587
Figures in NOK 1000 2017 2016WineOperating profit 184,709 193,148Depreciation, write-downs and amortisation 1,794 1,014EBITDA 186,502 194,162Other income and expenses 5,166 0Adjusted EBITDA 191,668 194,162
CONSOLIDATED FINANCIAL STATEMENTS WITH NOTES
Statement of income 01.01.-31.12.
Statement of other comprehensive income 01.01.-31.12.
Statement of financial position as at 31 December
Statement of cash flows 01.01.-31.12.
Statement of changes in equity
Brief history of the Group
Accounting policies
Notes
Note 1: Companies in the Group
Note 2: Management of financial risk
Note 3: Information on cash flows
Note 4: Revenues
Note 5: Segment information
Note 6: Transactions with related parties
Note 7: Other operating expenses
Note 8: Salaries and other personnel costs
Note 9: Share-based payment
Note 10: Pension costs, assets and obligations
Note 11: Financial income and costs
Note 12: Tax
Note 13: Investments in associated companies and jointly controlled entities
Note 14: Tangible fixed assets
Note 15: Intangible assets
Note 16: Leasing agreements
Note 17: Other receivables
Note 18: Inventories
Note 19: Cash and cash equivalents
Note 20: Share capital and shareholder information
Note 21: Debt to financial institutions
Note 22: Liabilities at fair value through profit or loss
Note 23: Other provisions for liabilities
Note 24: Current liabilities
Note 25: Pledges and guarantees
Note 26 Business mergers
Note 27 Events after the close of the financial year
Alternative performance measurements
Auditor's report
Contents In brief Group CEO The Company Corporate Social Responsibility Directors’ Report Financial Statements and Notes Contact 108/123Corporate Governance

109 ANNUAL REPORT 2017 Arcus ASAFINANCIAL STATEMENTS AND NOTES | Arcus ASA Group
Figures in NOK 1000 2017 2016DistributionOperating profit 660 -11,435Depreciation, write-downs and amortisation 12,825 13,632EBITDA 13,485 2,197Other income and expenses 647 399Adjusted EBITDA 14,132 2,596
Figures in NOK 1000 2017 2016OtherOperating profit -35,690 -72,917Depreciation, write-downs and amortisation 7,666 8,363EBITDA -28,024 -64,554Other income and expenses 212 40,559Adjusted EBITDA -27,812 -23,995
OTHER DEFINITIONS OF ALTERNATIVE PERFORMANCE MEASUREMENTS, SHOWN IN KEY FIGURESEquity ratioEquity ratio = equity/total equity and debt
Net interest-bearing debtNet interest-bearing debt = Debt to financial institutions + book value of capitalised front-end fee + fair value, interest rate swap - bank deposits and other cash and cash equivalents.
Figures in NOK 1000 2017 2016Net interest-bearing debtNon-current interest-bearing debt to credit institutions 909,218 886,255Short-term interest-bearing debt to credit institutions 90,071 16,498Book value of capitalised front-end fee 6,577 8,032Bank deposits and other cash and cash equivalents -184,415 -199,385Net interest-bearing debt 821,451 711,400
Organic growthOrganic growth in income is the Group or segment’s total operating revenue, adjusted for translation effects and structural changes.
Figures in NOK 1000 2017 2016GroupSales revenues 2,530,126 2,521,826Other operating revenues 44,934 60,571Total operating revenue 2,575,060 2,582,397Currency effects1 0 -13,682Structural changes2 -46,060 -6,940Calculation basis, organic growth 2,529,000 2,561,775
1 Currency effects are calculated by translation of income in 2016 in other currencies than NOK at the same average rate as for translation of income in 2017.2 The structural changes in 2017 primarily comprise adjustment for revenue from the acquisition of the Dworek and Vanlig brands, and the acquisition of the DDSK and BevCo activities. The adjustment in 2016 is related to the effect on income of the discontinuation of the deposit scheme in Denmark.
Figures in NOK 1000 2017 2016SpiritsSales revenues 763,421 751,107Other operating revenues 149,862 152,776
Total operating revenue 913,283 903,883Currency effects1 0 -485Structural changes2 -46,060 -6,940Calculation basis, organic growth 867,223 896,458
1 Currency effects are calculated by translation of income in 2016 in other currencies than NOK at the same average rate as for translation of income in 2017.2 The structural changes in 2017 primarily comprise adjustment for revenue from the acquisition of the Dworek and Vanlig brands, and the acquisition of the DDSK and BevCo business. The adjustment in 2016 is related to the effect on revenue from the discontinuation of the deposit scheme for re-used bottles in Denmark.
Figures in NOK 1000 2017 2016WineSales revenues 1,522,689 1,538,676Other operating revenues 18,190 13,697Total operating revenue 1,540,879 1,552,373Currency effects1 0 -12,988Structural changes 0 0Calculation basis, organic growth 1,540,879 1,539,385
1 Currency effects are calculated by translation of income in 2016 in other currencies than NOK at the same average rate as for translation of income in 2017.
CONSOLIDATED FINANCIAL STATEMENTS WITH NOTES
Statement of income 01.01.-31.12.
Statement of other comprehensive income 01.01.-31.12.
Statement of financial position as at 31 December
Statement of cash flows 01.01.-31.12.
Statement of changes in equity
Brief history of the Group
Accounting policies
Notes
Note 1: Companies in the Group
Note 2: Management of financial risk
Note 3: Information on cash flows
Note 4: Revenues
Note 5: Segment information
Note 6: Transactions with related parties
Note 7: Other operating expenses
Note 8: Salaries and other personnel costs
Note 9: Share-based payment
Note 10: Pension costs, assets and obligations
Note 11: Financial income and costs
Note 12: Tax
Note 13: Investments in associated companies and jointly controlled entities
Note 14: Tangible fixed assets
Note 15: Intangible assets
Note 16: Leasing agreements
Note 17: Other receivables
Note 18: Inventories
Note 19: Cash and cash equivalents
Note 20: Share capital and shareholder information
Note 21: Debt to financial institutions
Note 22: Liabilities at fair value through profit or loss
Note 23: Other provisions for liabilities
Note 24: Current liabilities
Note 25: Pledges and guarantees
Note 26 Business mergers
Note 27 Events after the close of the financial year
Alternative performance measurements
Auditor's report
Contents In brief Group CEO The Company Corporate Social Responsibility Directors’ Report Financial Statements and Notes Contact 109/123Corporate Governance

110 ANNUAL REPORT 2017 Arcus ASAFINANCIAL STATEMENTS AND NOTES | Arcus ASA Group
Figures in NOK 1000 2017 2016DistributionSales revenues 251,332 232,043Other operating revenues 33,071 30,881Total operating revenue 284,403 262,924Currency effects 0 0Structural changes 0 0Calculation basis, organic growth 284,403 262,924
CONSOLIDATED FINANCIAL STATEMENTS WITH NOTES
Statement of income 01.01.-31.12.
Statement of other comprehensive income 01.01.-31.12.
Statement of financial position as at 31 December
Statement of cash flows 01.01.-31.12.
Statement of changes in equity
Brief history of the Group
Accounting policies
Notes
Note 1: Companies in the Group
Note 2: Management of financial risk
Note 3: Information on cash flows
Note 4: Revenues
Note 5: Segment information
Note 6: Transactions with related parties
Note 7: Other operating expenses
Note 8: Salaries and other personnel costs
Note 9: Share-based payment
Note 10: Pension costs, assets and obligations
Note 11: Financial income and costs
Note 12: Tax
Note 13: Investments in associated companies and jointly controlled entities
Note 14: Tangible fixed assets
Note 15: Intangible assets
Note 16: Leasing agreements
Note 17: Other receivables
Note 18: Inventories
Note 19: Cash and cash equivalents
Note 20: Share capital and shareholder information
Note 21: Debt to financial institutions
Note 22: Liabilities at fair value through profit or loss
Note 23: Other provisions for liabilities
Note 24: Current liabilities
Note 25: Pledges and guarantees
Note 26 Business mergers
Note 27 Events after the close of the financial year
Alternative performance measurements
Auditor's report
Contents In brief Group CEO The Company Corporate Social Responsibility Directors’ Report Financial Statements and Notes Contact 110/123Corporate Governance
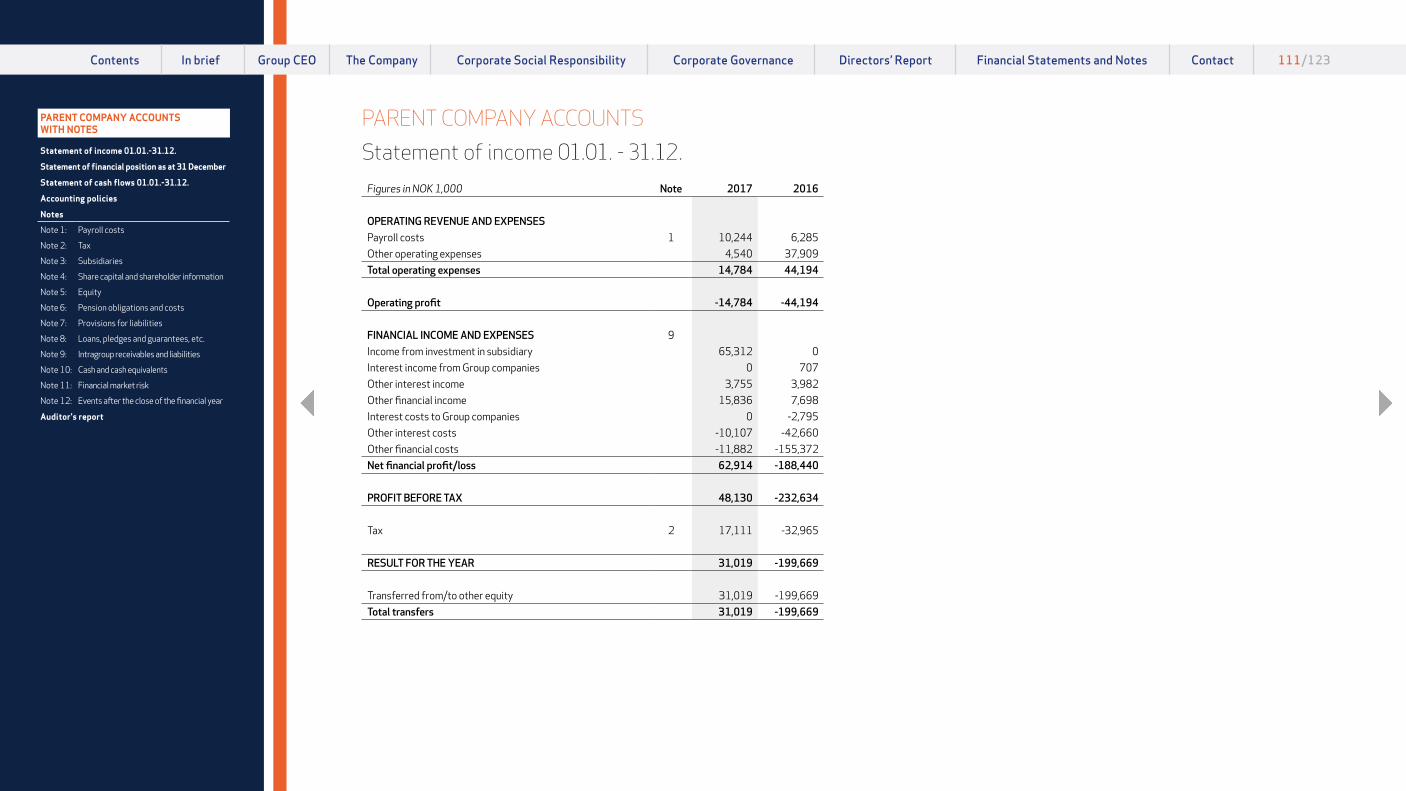
111 ANNUAL REPORT 2017 Arcus ASAFINANCIAL STATEMENTS AND NOTES | Arcus ASA
Figures in NOK 1,000 Note 2017 2016
OPERATING REVENUE AND EXPENSESPayroll costs 1 10,244 6,285Other operating expenses 4,540 37,909Total operating expenses 14,784 44,194
Operating profit -14,784 -44,194
FINANCIAL INCOME AND EXPENSES 9Income from investment in subsidiary 65,312 0Interest income from Group companies 0 707Other interest income 3,755 3,982Other financial income 15,836 7,698Interest costs to Group companies 0 -2,795Other interest costs -10,107 -42,660Other financial costs -11,882 -155,372Net financial profit/loss 62,914 -188,440
PROFIT BEFORE TAX 48,130 -232,634
Tax 2 17,111 -32,965
RESULT FOR THE YEAR 31,019 -199,669
Transferred from/to other equity 31,019 -199,669Total transfers 31,019 -199,669
Statement of income 01.01. - 31.12.
PARENT COMPANY ACCOUNTSPARENT COMPANY ACCOUNTS WITH NOTES
Statement of income 01.01.-31.12.
Statement of financial position as at 31 December
Statement of cash flows 01.01.-31.12.
Accounting policies
Notes
Note 1: Payroll costs
Note 2: Tax
Note 3: Subsidiaries
Note 4: Share capital and shareholder information
Note 5: Equity
Note 6: Pension obligations and costs
Note 7: Provisions for liabilities
Note 8: Loans, pledges and guarantees, etc.
Note 9: Intragroup receivables and liabilities
Note 10: Cash and cash equivalents
Note 11: Financial market risk
Note 12: Events after the close of the financial year
Auditor's report
Contents In brief Group CEO The Company Corporate Social Responsibility Directors’ Report Financial Statements and Notes Contact 111/123Corporate Governance

112 ANNUAL REPORT 2017 Arcus ASAFINANCIAL STATEMENTS AND NOTES | Arcus ASA
Statement of financial position as at 31 DecemberFigures in NOK 1,000 Note 2017 2016
EQUITY AND LIABILITIESEquityPaid-in equityShare capital 4,5 1,360 1,360Share premium 5 719,280 770,744Total paid-in equity 720,640 772,104
Retained earningsOther equity 5 0 22,664Total retained earnings 0 22,664
Total equity 720,640 794,768
LiabilitiesProvisionsPension obligations 6 757 0Other provisions 7 0 13,821Total provisions 757 13,821
Other non-current liabilitiesDebt to financial institutions 8 -3,055 -3,835Total other non-current liabilities -3,055 -3,835
Current liabilitiesDebt to financial institutions 8 72,700 0Trade payables 106 19,498Trade payables to Group companies 9 3 19,559Other current liabilities 6,423 46,571Other current liabilities payable to Group companies 9 0 1,350Allocated dividend 5 112,920 99,994Intragroup balance in Group cash pool system 9,10 725,894 689,015Total current liabilities 918,046 875,987
Total liabilities 915,748 885,973
TOTAL EQUITY AND LIABILITIES 1,636,388 1,680,741
Figures in NOK 1,000 Note 2017 2016
ASSETSFixed assetsIntangible assetsDeferred tax assets 2 124,137 141,248Total intangible assets 124,137 141,248
Financial assetsInvestment in subsidiary 3 1,438,317 1,438,317Total financial assets 1,438,317 1,438,317
Total fixed assets 1,562,454 1,579,565
Current assetsReceivablesTrade receivables from Group companies 9 22 0Group contributions from Group companies 9 65,312 0Current receivables from Group companies 9 8,326 0Other receivables 274 445Total receivables 73,934 445
Cash and cash equivalents 10 0 100,731
Total current assets 73,934 101,176
TOTAL ASSETS 1,636,388 1,680,741
Gjelleråsen, 15 March 2018
Michael Holm JohansenChairman of the Board
Stein Erik Hagen Hanne Refsholt Eilif Due Trond Berger
Leena Saarinen Erik Hagen Kjell Arne Greni Ingrid E. Skistad Ann-Beth Freuchen
Kenneth HamnesGroup CEO
PARENT COMPANY ACCOUNTS WITH NOTES
Statement of income 01.01.-31.12.
Statement of financial position as at 31 December
Statement of cash flows 01.01.-31.12.
Accounting policies
Notes
Note 1: Payroll costs
Note 2: Tax
Note 3: Subsidiaries
Note 4: Share capital and shareholder information
Note 5: Equity
Note 6: Pension obligations and costs
Note 7: Provisions for liabilities
Note 8: Loans, pledges and guarantees, etc.
Note 9: Intragroup receivables and liabilities
Note 10: Cash and cash equivalents
Note 11: Financial market risk
Note 12: Events after the close of the financial year
Auditor's report
Contents In brief Group CEO The Company Corporate Social Responsibility Directors’ Report Financial Statements and Notes Contact 112/123Corporate Governance
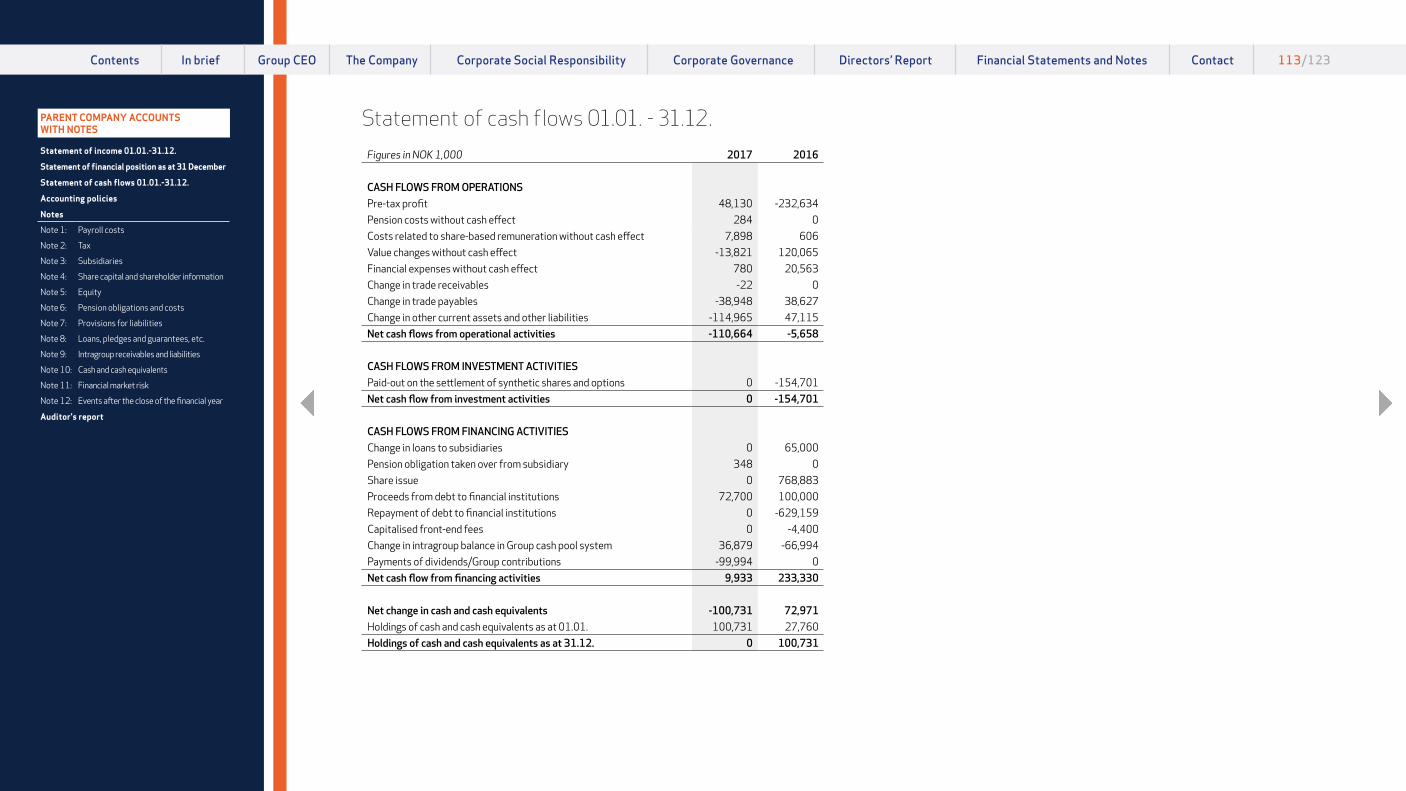
113 ANNUAL REPORT 2017 Arcus ASAFINANCIAL STATEMENTS AND NOTES | Arcus ASA
Statement of cash flows 01.01. - 31.12.Figures in NOK 1,000 2017 2016
CASH FLOWS FROM OPERATIONSPre-tax profit 48,130 -232,634Pension costs without cash effect 284 0Costs related to share-based remuneration without cash effect 7,898 606Value changes without cash effect -13,821 120,065Financial expenses without cash effect 780 20,563Change in trade receivables -22 0Change in trade payables -38,948 38,627Change in other current assets and other liabilities -114,965 47,115Net cash flows from operational activities -110,664 -5,658
CASH FLOWS FROM INVESTMENT ACTIVITIESPaid-out on the settlement of synthetic shares and options 0 -154,701Net cash flow from investment activities 0 -154,701
CASH FLOWS FROM FINANCING ACTIVITIESChange in loans to subsidiaries 0 65,000Pension obligation taken over from subsidiary 348 0Share issue 0 768,883Proceeds from debt to financial institutions 72,700 100,000Repayment of debt to financial institutions 0 -629,159Capitalised front-end fees 0 -4,400Change in intragroup balance in Group cash pool system 36,879 -66,994Payments of dividends/Group contributions -99,994 0Net cash flow from financing activities 9,933 233,330
Net change in cash and cash equivalents -100,731 72,971Holdings of cash and cash equivalents as at 01.01. 100,731 27,760Holdings of cash and cash equivalents as at 31.12. 0 100,731
PARENT COMPANY ACCOUNTS WITH NOTES
Statement of income 01.01.-31.12.
Statement of financial position as at 31 December
Statement of cash flows 01.01.-31.12.
Accounting policies
Notes
Note 1: Payroll costs
Note 2: Tax
Note 3: Subsidiaries
Note 4: Share capital and shareholder information
Note 5: Equity
Note 6: Pension obligations and costs
Note 7: Provisions for liabilities
Note 8: Loans, pledges and guarantees, etc.
Note 9: Intragroup receivables and liabilities
Note 10: Cash and cash equivalents
Note 11: Financial market risk
Note 12: Events after the close of the financial year
Auditor's report
Contents In brief Group CEO The Company Corporate Social Responsibility Directors’ Report Financial Statements and Notes Contact 113/123Corporate Governance

114 ANNUAL REPORT 2017 Arcus ASAFINANCIAL STATEMENTS AND NOTES | Arcus ASA
Accounting policiesThe annual accounts have been prepared in accordance with the Norwegian Accounting Act of 1998 and generally accepted accounting policies.
The company was founded on 5 November 2004, and listed on the Oslo Stock Exchange on 1 December 2016.
The purpose of the company is to operate the import, export, production, storage and distribution of alcoholic beverages and other goods, and other activities related to this business, as well as the ownership of participations in other companies that conduct such business.
CONSOLIDATED FINANCIAL STATEMENTSArcus ASA owns 100 per cent of the shares in Arcus-Gruppen AS and Vectura AS.
GENERAL RULE FOR VALUATION AND CLASSIFICATION OF ASSETS AND LIABILITIESAssets intended for continuing ownership or use are classified as fixed assets. Other assets are classified as current assets. Receivables due for payment within one year are classified as current assets. The classification of current and non- current liabilities is based on similar criteria.
Fixed assets are valued at acquisition cost, but written down to fair value if the impairment is not expected to be temporary. Fixed assets with a limited economic life are depreciated according to a reasonable depreciation plan.
Current assets are valued at the lower of cost or fair value. Current and non-current liabilities are capitalised at the nominal amounts received at the time of establishment. Borrowing costs are capitalised together with the loan and amortised
over the term of the loan. The first year’s instalment is reclassified as a current liability.
Certain items are valued according to different principles, as explained below. SHARES IN SUBSIDIARIESShares in subsidiaries are valued using the cost method. The transaction costs are added to the purchase price of shares in subsidiaries. Shares are written down to fair value if this is lower than the recognised value.
Group contributions are recognised in the statement of income in the same year as they are allocated in the subsidiary. If dividends/other distributions exceed the share of retained profit after the acquisition, the surplus represents repayment of invested capital and the distributions are deducted from the value of the investment in the statement of financial position.
RECEIVABLESTrade receivables and other receivables are stated at nominal value after deduction of provisions for expected losses. Provisions for losses are made on the basis of an individual assessment of each receivable.
CASH AND CASH EQUIVALENTSCash and cash equivalents include cash, bank deposits and other means of payment with a due date less than three months from the acquisition date. BORROWINGFinancial liabilities through borrowing are recognised at the amount received net of transacti-on costs. Transaction costs (front-end fees) are
capitalised in the statement of financial position and depreciated over the term of the loan.
Borrowing in currencies other than the functional currency is translated at the exchange rate at the close of the financial year.
PENSIONSPension costs comprise the change in pension obligations based on actuarial assumptions and costs related to defined-contribution pension schemes. For pension obligations based on actuarial assumptions the costs concern the pension earned during the period, based on assumptions concerning future wage growth and interest costs on the calculated obligation. Net pension costs are classified as payroll costs in the statement of income. Changes in the liability resulting from changes in pension plans are taken to profit or loss immediately. Changes in the pension liability and the pension assets resulting from changes in, and deviations from, the estimate assumptions (estimate deviations), are recognised against equity.
TAXESTax expenses are matched with profit/loss before tax. Tax costs comprise tax payable (tax on the year’s directly taxable income) and changes in net deferred tax. Tax costs are allocated to ordinary profit/loss and profit/loss from extraordinary items in accordance with the taxation basis. Deferred tax and deferred tax assets are presented net in the statement of financial position.
Tax assets are only capitalised if it can be shown to be probable that they can be utilised via future taxable income.
STATEMENT OF CASH FLOWS The indirect method is used in the preparation of the statement of cash flows. Cash and cash equivalents in the statement of financial position are defined as holdings of cash and cash equivalents in the statement of cash flows.
All figures in the financial statements are presented in NOK 1,000 unless otherwise indicated.
PARENT COMPANY ACCOUNTS WITH NOTES
Statement of income 01.01.-31.12.
Statement of financial position as at 31 December
Statement of cash flows 01.01.-31.12.
Accounting policies
Notes
Note 1: Payroll costs
Note 2: Tax
Note 3: Subsidiaries
Note 4: Share capital and shareholder information
Note 5: Equity
Note 6: Pension obligations and costs
Note 7: Provisions for liabilities
Note 8: Loans, pledges and guarantees, etc.
Note 9: Intragroup receivables and liabilities
Note 10: Cash and cash equivalents
Note 11: Financial market risk
Note 12: Events after the close of the financial year
Auditor's report
Contents In brief Group CEO The Company Corporate Social Responsibility Directors’ Report Financial Statements and Notes Contact 114/123Corporate Governance
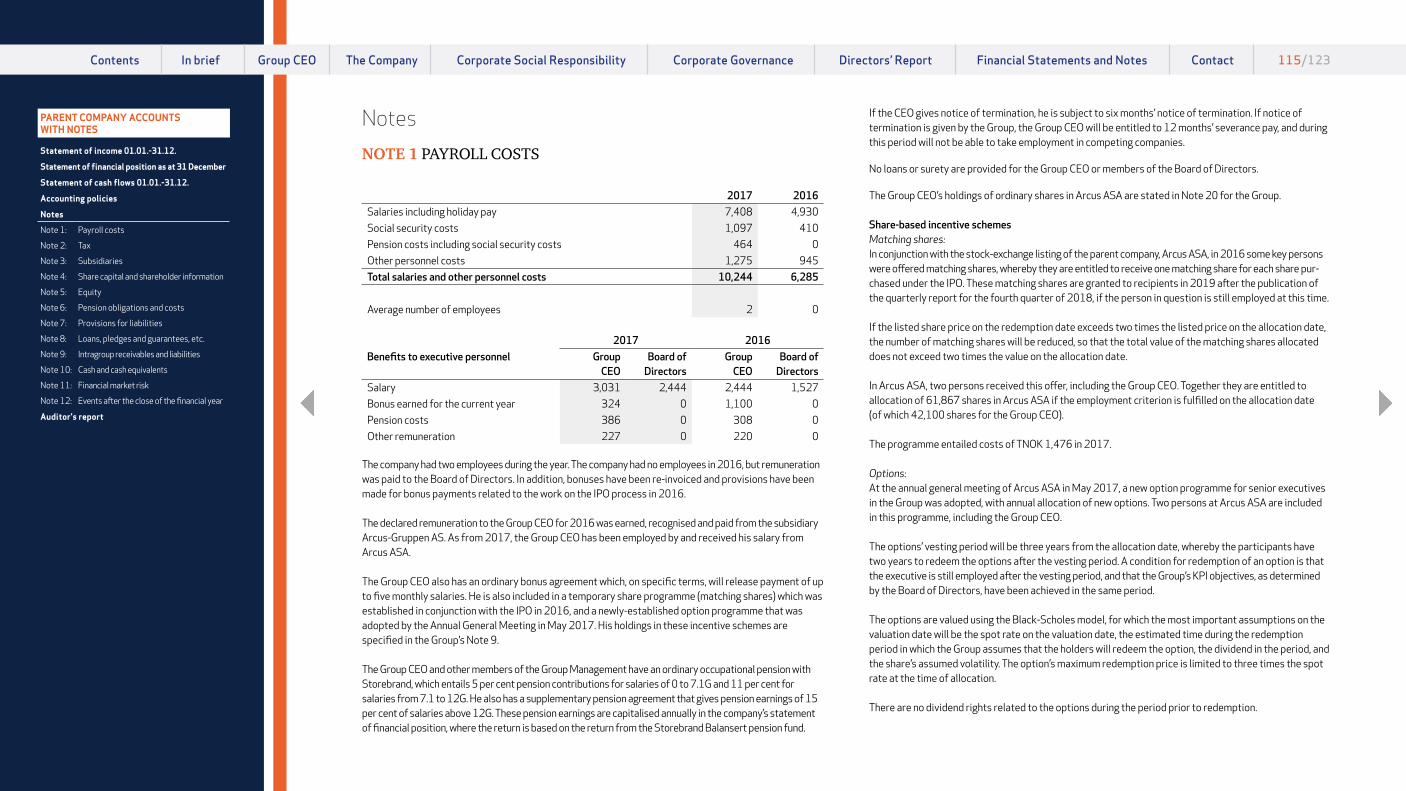
115 ANNUAL REPORT 2017 Arcus ASAFINANCIAL STATEMENTS AND NOTES | Arcus ASA
NotesNOTE 1 PAYROLL COSTS
2017 2016Salaries including holiday pay 7,408 4,930Social security costs 1,097 410Pension costs including social security costs 464 0Other personnel costs 1,275 945Total salaries and other personnel costs 10,244 6,285
Average number of employees 2 0
2017 2016Benefits to executive personnel Group
CEOBoard of
DirectorsGroup
CEOBoard of
DirectorsSalary 3,031 2,444 2,444 1,527Bonus earned for the current year 324 0 1,100 0Pension costs 386 0 308 0Other remuneration 227 0 220 0
The company had two employees during the year. The company had no employees in 2016, but remuneration was paid to the Board of Directors. In addition, bonuses have been re-invoiced and provisions have been made for bonus payments related to the work on the IPO process in 2016.
The declared remuneration to the Group CEO for 2016 was earned, recognised and paid from the subsidiary Arcus-Gruppen AS. As from 2017, the Group CEO has been employed by and received his salary from Arcus ASA.
The Group CEO also has an ordinary bonus agreement which, on specific terms, will release payment of up to five monthly salaries. He is also included in a temporary share programme (matching shares) which was established in conjunction with the IPO in 2016, and a newly-established option programme that was adopted by the Annual General Meeting in May 2017. His holdings in these incentive schemes are specified in the Group’s Note 9.
The Group CEO and other members of the Group Management have an ordinary occupational pension with Storebrand, which entails 5 per cent pension contributions for salaries of 0 to 7.1G and 11 per cent for salaries from 7.1 to 12G. He also has a supplementary pension agreement that gives pension earnings of 15 per cent of salaries above 12G. These pension earnings are capitalised annually in the company’s statement of financial position, where the return is based on the return from the Storebrand Balansert pension fund.
If the CEO gives notice of termination, he is subject to six months’ notice of termination. If notice of termination is given by the Group, the Group CEO will be entitled to 12 months’ severance pay, and during this period will not be able to take employment in competing companies.
No loans or surety are provided for the Group CEO or members of the Board of Directors.
The Group CEO’s holdings of ordinary shares in Arcus ASA are stated in Note 20 for the Group.
Share-based incentive schemes Matching shares: In conjunction with the stock-exchange listing of the parent company, Arcus ASA, in 2016 some key persons were offered matching shares, whereby they are entitled to receive one matching share for each share pur-chased under the IPO. These matching shares are granted to recipients in 2019 after the publication of the quarterly report for the fourth quarter of 2018, if the person in question is still employed at this time.
If the listed share price on the redemption date exceeds two times the listed price on the allocation date, the number of matching shares will be reduced, so that the total value of the matching shares allocated does not exceed two times the value on the allocation date.
In Arcus ASA, two persons received this offer, including the Group CEO. Together they are entitled to allocation of 61,867 shares in Arcus ASA if the employment criterion is fulfilled on the allocation date (of which 42,100 shares for the Group CEO).
The programme entailed costs of TNOK 1,476 in 2017.
Options: At the annual general meeting of Arcus ASA in May 2017, a new option programme for senior executives in the Group was adopted, with annual allocation of new options. Two persons at Arcus ASA are included in this programme, including the Group CEO.
The options’ vesting period will be three years from the allocation date, whereby the participants have two years to redeem the options after the vesting period. A condition for redemption of an option is that the executive is still employed after the vesting period, and that the Group’s KPI objectives, as determined by the Board of Directors, have been achieved in the same period.
The options are valued using the Black-Scholes model, for which the most important assumptions on the valuation date will be the spot rate on the valuation date, the estimated time during the redemption period in which the Group assumes that the holders will redeem the option, the dividend in the period, and the share’s assumed volatility. The option’s maximum redemption price is limited to three times the spot rate at the time of allocation.
There are no dividend rights related to the options during the period prior to redemption.
PARENT COMPANY ACCOUNTS WITH NOTES
Statement of income 01.01.-31.12.
Statement of financial position as at 31 December
Statement of cash flows 01.01.-31.12.
Accounting policies
Notes
Note 1: Payroll costs
Note 2: Tax
Note 3: Subsidiaries
Note 4: Share capital and shareholder information
Note 5: Equity
Note 6: Pension obligations and costs
Note 7: Provisions for liabilities
Note 8: Loans, pledges and guarantees, etc.
Note 9: Intragroup receivables and liabilities
Note 10: Cash and cash equivalents
Note 11: Financial market risk
Note 12: Events after the close of the financial year
Auditor's report
Contents In brief Group CEO The Company Corporate Social Responsibility Directors’ Report Financial Statements and Notes Contact 115/123Corporate Governance

116 ANNUAL REPORT 2017 Arcus ASAFINANCIAL STATEMENTS AND NOTES | Arcus ASA
The programme entailed costs of TNOK 441 in 2017. Below is a specification of outstanding options at the end of the year:
Number of options 2017 2016 Outstanding options at the beginning of the year 0 0Allocated options during the year 290,199 0Outstanding options at the end of the year* 290,199 0
* Of which 199,426 outstanding options to the Group CEO.
Auditors' fees 2017 2016Statutory audit 328 326 Other financial auditing 88 0 Other certification services 0 707 Total auditors' fees 416 1,033
The amounts are stated in TNOK and exclude VAT.
Other services than auditing in 2016 are solely related to fees in conjunction with the IPO process.
NOTE 2 TAX
Tax for the year is calculated as follows: 2017 2016Change in deferred tax 17,111 -34,392Tax effect of costs related to the IPO, carried to equity 0 1,427Tax 17,111 -32,965
Reconciliation from nominal to actual tax rates:Profit before tax 48,130 -232,634Expected income tax at a nominal tax rate of 24 per cent (25 per cent in 2016)
11,551 -58,159
Tax effect of the following items:Non-deductible costs 276 17,882Change due to a change in tax rate 5,397 5,885Tax on costs booked directly to equity -113 1,427Tax 17,111 -32,965
Effective tax rate 35.6% 14.2%
Specification of temporary differences and deficit carried forward:
2017 2016Asset Liability Asset Liability
Non-current debt 0 3,055 0 3,835Pension obligations 757 0 0 0Other liabilities 1,271 0 16,312 0Deficit carried forward 540,754 0 576,057 0Total 542,782 3,055 592,369 3,835
Basis for deferred tax asset/liability 539,727 588,534Net deferred tax asset in the statement of financial position*
124,137 141,248
At the end of the year, the company had NOK 124.4 million in capitalised deferred tax assets associated with the deficit to be carried forward. Based on the Group’s strategic plans and current long-term plans for companies in the tax group, the Board of Directors and executive management expect that the deferred tax assets can be utilised.
At the end of 2017, deferred tax was calculated at 23 per cent as a result of government tax changes as from 2018. At the end of 2016, deferred tax was calculated at 24 per cent.
NOTE 3 SUBSIDIARIES
Subsidiaries of Arcus ASA
CompanyDate of
acquisitionBusiness
officeVoting and ownership Currency
Nominal share capital
Arcus-Gruppen AS 10.10.05 Nittedal 100% NOK 276,000Vectura AS 30.09.13 Nittedal 100% NOK 14,000
Company Cost price
(NOK)Book value
as at 31.12
Equity according to last annual
financial state-ments (NOK)
Profit for the year
2017 (NOK) Arcus-Gruppen AS 1,886,607 1,362,217 1,958,409 114,747 Vectura AS 76,100 76,100 21,708 -2,433 Total subsidiaries 1,962,707 1,438,317 1,980,117 112,314
PARENT COMPANY ACCOUNTS WITH NOTES
Statement of income 01.01.-31.12.
Statement of financial position as at 31 December
Statement of cash flows 01.01.-31.12.
Accounting policies
Notes
Note 1: Payroll costs
Note 2: Tax
Note 3: Subsidiaries
Note 4: Share capital and shareholder information
Note 5: Equity
Note 6: Pension obligations and costs
Note 7: Provisions for liabilities
Note 8: Loans, pledges and guarantees, etc.
Note 9: Intragroup receivables and liabilities
Note 10: Cash and cash equivalents
Note 11: Financial market risk
Note 12: Events after the close of the financial year
Auditor's report
Contents In brief Group CEO The Company Corporate Social Responsibility Directors’ Report Financial Statements and Notes Contact 116/123Corporate Governance

117 ANNUAL REPORT 2017 Arcus ASAFINANCIAL STATEMENTS AND NOTES | Arcus ASA
NOTE 4 SHARE CAPITAL AND SHAREHOLDER INFORMATION
The share capital comprises:
Date ChangeTotal number
of sharesNominal
valueBook value
(NOK 1,000)31.12.2015 1,000,000 1.00 1,000 20.10.16 Split 1:50 50,000,000 0.02 1,000 01.12.2016 Share issue 68,023,255 0.02 1,360 31.12.17 68,023,255 0.02 1,360
20 largest shareholders as at 31.12.2017:Number of
sharesOwnership and
voting rightsCanica AS 22,670,000 33.3%Geveran Trading Co Ltd 6,750,000 9.9%Verdipapirfondet DNB Norge (IV) 3,577,915 5.3%Hoff SA 3,297,000 4.8%Sundt AS 3,234,957 4.8%Folketrygdfondet 1,800,000 2.6%Danske Invest Norske Instit. II. 1,725,100 2.5%KLP Aksjenorge 1,266,494 1.9%Verdipapirfondet DNB Norden (III) 1,222,178 1.8%Centra Invest AS 1,169,846 1.7%Holta Invest AS 1,000,000 1.5%Ilmarinen Mutual Pens Ins Comp 1,000,000 1.5%Verdipapirfondet DNB Norge Selektiv 936,616 1.4%Goldman Sachs International NOM 900,000 1.3%Skandinaviska Enskilda Banken AB (A/C SEB AIF - Swedish Residents) NOM 862,000 1.3%Danske Invest Norske Aksjer Inst 855,400 1.3%Landkreditt dividend 850,000 1.2%Kommunal Landspensjonskasse 809,707 1.2%Skandinavniska Enskilda Banken AB (A/C clients account) NOM 795,113 1.2%Citibank Europe Plc NOM 794,127 1.2%Other shareholders 12,506,802 18.4%Total 68,023,255 100.0%
Dividend The Board of Directors proposes dividend distribution of NOK 1.66 per share for 2017 (2016 NOK 1.47 per share ).
NOTE 5 EQUITY
Share capital Share premium Other equity Total Equity as at 01.01 1,360 770,744 22,664 794,768Profit for the year 0 0 31,019 31,019Share-based payment 0 0 7,898 7,898Estimate deviations, pensions 0 0 -125 -125Allocated dividend 0 -51,464 -61,456 -112,920Equity as at 31.12 1,360 719,280 0 720,640
NOTE 6 PENSION OBLIGATIONS AND COSTS
The company is obliged to have an occupational pension scheme under the Norwegian Mandatory Oc-cupational Pensions Act, and has a pension scheme which fulfils the requirements of the Act.
Defined-contribution pension The Arcus Group’s ordinary pension plan for all other employees is a defined-contribution pension plan with Storebrand. The contribution rate is 5 per cent of salary in the bracket from 0 to 7.1 times the National Insurance basic amount (G), and 11 per cent of salary in the bracket from 7.1 to 12 times the National Insurance basic amount (G). In addition, there is a private disability plan with a 66 per cent benefit level, without free policy accumulation. The child and dependent supplement to Arcus’ group life plan is a replacement for the previous spouse and child pension.
The costs associated with the defined-contribution pension plan are related to the current premium invoices from the insurance company with which the Arcus Group has signed a defined-contribution pension agreement. The current defined-contribution pensions and disability pensions for employees in the defined-contribution plan are adjusted annually on the basis of the pension fund’s surplus.
Employees in the defined-contribution plan who have become disabled are entitled to have their disability obligations regulated by the same adjustment as the basic amount (G) each year and the capitalised obligation related to this was NOK 0.1 million at the end of 2017.
Unfunded pension arrangementThe Group CEO also has an unfunded pension arrangEment in which the pension entitlement earned is 15 per cent of the salary above 12G. Ongoing provision is made for this obligation in the company’s balance sheet, with annual interest at the same rate as achieved in Storebrand Balansert Pensjon. At the end of 2017, this obligation was recognised at NOK 0.7 million.
General assumptions The company applies a discount rate equivalent to the covered bond interest rate to its pension commit-ments. This is in line with the recommendations of the Norwegian Accounting Standards Board (NASB). The pension assumptions made by the company are consistent with the recommendations of the Accounting Standards Board from September 2017.
PARENT COMPANY ACCOUNTS WITH NOTES
Statement of income 01.01.-31.12.
Statement of financial position as at 31 December
Statement of cash flows 01.01.-31.12.
Accounting policies
Notes
Note 1: Payroll costs
Note 2: Tax
Note 3: Subsidiaries
Note 4: Share capital and shareholder information
Note 5: Equity
Note 6: Pension obligations and costs
Note 7: Provisions for liabilities
Note 8: Loans, pledges and guarantees, etc.
Note 9: Intragroup receivables and liabilities
Note 10: Cash and cash equivalents
Note 11: Financial market risk
Note 12: Events after the close of the financial year
Auditor's report
Contents In brief Group CEO The Company Corporate Social Responsibility Directors’ Report Financial Statements and Notes Contact 117/123Corporate Governance

118 ANNUAL REPORT 2017 Arcus ASAFINANCIAL STATEMENTS AND NOTES | Arcus ASA
Figures in NOK 1,000Pension costs 2017 2016Current value of pension earnings for the year 213 0Interest cost of pension obligations 36 0Accrued social security contributions 35 0Net pension costs after social security contributions 284 0
Defined-contribution pension plan: Recognised contributions excluding social security contributions 180 0
Net pension obligations: Estimated accrued obligations, non-funded pension plans 757 0Net pension assets/obligations recognised in the statement of financial position 757 0
Changes in obligations: Net pension obligations 01.01 0 0Pension costs, continued operations 284 0Paid in via operations after taking over an obligation from a subsidiary 348 0Estimated deviations recognised directly in equity (IAS19R) 125 0Net pension obligations 31.12. 757 0
Economic assumptions: Discount rate 2.30% 2.10%Expected salary adjustment 2.50% 2.25%Expected pension increase 1.50% 1.25%Expected adjustment of the National Insurance basic amount (G) 2.25% 2.00%Expected return on pension assets 2.30% 2.10%
Actuarial and demographic assumptions: Withdrawal rate at 62 years 50% 50%Withdrawal rate at 67 years 50% 50%Mortality K2013 K2013Disability K1963 K1963Voluntary retirement (under 50 years) 5% 5%Voluntary retirement (over 50 years) 0% 0%
The actuarial assumptions are based on commonly used assumptions within the insurance industry with regard to demographic factors.
The Group’s pension plans satisfy the statutory requirements concerning mandatory occupational pension schemes.
NOTE 7 PROVISIONS FOR LIABILITIES
At the beginning of the year, 23,971 synthetic shares and 102,270 synthetic options associated with the parent company, Arcus ASA, had been issued. All of these were derecognised in conjunction with the parent company’s IPO in December 2016. At the end of 2016, there were no longer any agreements in this co-investment programme in Arcus ASA. The Group CEO had 5,970 synthetic options in this programme.
The synthetic shares and options were issued at the estimated fair value on the issue date. The valuation on the issue date was calculated on the basis of external valuations, according to a cash flow model in which cash flows were discounted to fair value using a discount rate corresponding to the Group’s weighted average cost of capital (WACC), adjusted for a liquidity premium, but where the final value was also assessed against the pricing of comparable companies. The development in value in reporting periods between issue and settlement was calculated according to the same principles.
On settlement, the synthetic shares resulted in a payment equivalent to the fair value of the actual shares in the parent company, multiplied by the number of synthetic shares. The fair value of the shares was set as the parent company’s opening price on the Oslo Stock Exchange. On settlement, the synthetic options resulted in a payment equivalent to the value per share beyond the exercise price, multiplied by the number of synthetic options.
Value changes related to this incentive programme are presented under financial items.
At the beginning of 2017 there was a remaining liability of NOK 13.8 million, which is mainly related to the remaining provision for uncertainty concerning a previous co-investment programme for executive personnel, with synthetic shares and options. This uncertainty was assessed to be insignificant in 2017, and the provision has been reversed. The changes in 2017 are presented in the table below. Reference is also made to Note 22 in the consolidated financial statements.
Figures in NOK 1,000Synthetic
optionsTotal provisions for
liabilitiesRecognised value of liability, 1.1. 13,821 13,821Changes in value during the period -13,821 -13,821Payments during the period 0 0Book value of liability, 31.12 0 0
PARENT COMPANY ACCOUNTS WITH NOTES
Statement of income 01.01.-31.12.
Statement of financial position as at 31 December
Statement of cash flows 01.01.-31.12.
Accounting policies
Notes
Note 1: Payroll costs
Note 2: Tax
Note 3: Subsidiaries
Note 4: Share capital and shareholder information
Note 5: Equity
Note 6: Pension obligations and costs
Note 7: Provisions for liabilities
Note 8: Loans, pledges and guarantees, etc.
Note 9: Intragroup receivables and liabilities
Note 10: Cash and cash equivalents
Note 11: Financial market risk
Note 12: Events after the close of the financial year
Auditor's report
Contents In brief Group CEO The Company Corporate Social Responsibility Directors’ Report Financial Statements and Notes Contact 118/123Corporate Governance

119 ANNUAL REPORT 2017 Arcus ASAFINANCIAL STATEMENTS AND NOTES | Arcus ASA
NOTE 8 LOANS, PLEDGES AND GUARANTEES ETC.
Debt to financial institutions 2017 2016
Figures in NOK 1,000 CurrencyInterest
rate profileLoan amount
in currencyLoan amount
in NOKLoan amount
in NOKOverdraft facility, SEB NOK Floating 72,700 72,700 0Total debt to financial institutions 72,700 0Capitalised front-end fees -3,055 -3,835Book value as at 31.12 69,645 -3,835
Term structureMaturity
2018Due date
2019-2021Due date
after 2021 TotalSEB 72,700 0 0 72,700Total debt to financial institutions 72,700 0 0 72,700
The Group has a Group cash pool system at Skandinaviska Enskilda Banken (SEB), which includes the subsidiaries with the exception of the companies in the wine business in Sweden and Finland. At the end of 2017, this Group cash pool system was managed by Arcus ASA. Arcus ASA, has pledged surety on behalf of all of its subsidiaries, linked at all times to outstanding drawings on this scheme.
The capitalised front-end fee with a book value of TNOK 3,055 relates to the front-end fee for the cash pool scheme. The outstanding value is here amortised over the duration of the loan, until the end of 2021.
The Group has a long-term financing agreement with SEB, whereby the loan is formally for TSEK 750 and is booked in one of the subsidiaries in Sweden, VinGruppen Sweden Holding AB. The financing agreement does not include a pledger of security.
The company has no non-current debt with terms exceeding five years.
The agreement on a mortgage loan facility contains a loan term (covenant) concerning net interest- bearing debt as a ratio of adjusted EBITDA. The Group continuously monitors this clause and reports to the bank on a quarterly basis. As at 31.12.2017 the Group was well within the required ratio.
NOTE 9 INTRAGROUP RECEIVABLES AND LIABILITIES
Receivables 2017 2016Claims on Group contributions from Arcus-Gruppen AS 65,312 0Trade receivables from Group companies 22 0Other current receivables from Group companies 8,326 0Total 73,660 0
Liabilities 2017 2016Trade payables to Group companies 3 19,559Other current liabilities payable to Group companies 0 1,350Intragroup balance in Group cash pool system 725,894 689,015Total 725,897 709,924
The company has no consolidated assets or liabilities that will fall due more than five years after the close of the financial year.
NOTE 10 CASH AND CASH EQUIVALENTS
The company has no restricted bank deposits, but has a bank guarantee for a tax payment of TNOK 2,500.
The company administrates the Group cash pool scheme for the Group and the scheme includes most of the Group’s subsidiaries. The Swedish and Finnish wine activities, and the new subsidiary, Det Danske Spiritus Kompagni A/S, are not included in the scheme.
Net deposits or drawings by the subsidiaries are presented as intragroup balances with Arcus ASA. The joint overdraft limit in the Group cash pool system is TNOK 600,000.
At year-end, the Group had total drawings of TNOK 72,700 from the scheme, which are presented as an overdraft for Arcus ASA, compared with a deposit of TNOK 100,731 at the end of 2016.
As at 31.12.2017, Arcus ASA has drawings of TNOK 725,894 in the Group cash pool system, compared with drawings of TNOK 689,015 at the end of 2016.
PARENT COMPANY ACCOUNTS WITH NOTES
Statement of income 01.01.-31.12.
Statement of financial position as at 31 December
Statement of cash flows 01.01.-31.12.
Accounting policies
Notes
Note 1: Payroll costs
Note 2: Tax
Note 3: Subsidiaries
Note 4: Share capital and shareholder information
Note 5: Equity
Note 6: Pension obligations and costs
Note 7: Provisions for liabilities
Note 8: Loans, pledges and guarantees, etc.
Note 9: Intragroup receivables and liabilities
Note 10: Cash and cash equivalents
Note 11: Financial market risk
Note 12: Events after the close of the financial year
Auditor's report
Contents In brief Group CEO The Company Corporate Social Responsibility Directors’ Report Financial Statements and Notes Contact 119/123Corporate Governance

120 ANNUAL REPORT 2017 Arcus ASAFINANCIAL STATEMENTS AND NOTES | Arcus ASA
NOTE 11 FINANCIAL MARKET RISK
Financial risk The company has individual financial derivatives for hedging purposes. The company does not fulfil the accounting requirements for hedge accounting and therefore does not treat these as hedging for accounting purposes.
The risk management procedures are adopted by the Board of Directors and are undertaken by administration in collaboration with the individual business areas. The most important financial risks to which the company is exposed are associated with interest rate risk, liquidity risk and foreign currency risk. The company’s management continuously assesses how these are to be handled.
Interest rate riskThe company is exposed to interest rate risk on the investment of liquid assets and drawing on the Group cash pool system. At 31.12.2017 all of the company’s interest-bearing deposits and liabilities were subject to variable interest rates.
Liquidity risk Liquidity risk is the risk that the Company will not be in a position to service its financial liabilities as they fall due. The company must at all times have sufficient liquidity to meet its obligations. It is also the goal to minimise the company’s excess liquidity. The company will work continuously to develop its financial independence, through close monitoring of income development and capital binding, and through continuous assessment of alternative sources of finance.
As far as possible, the company wishes to have flexibility for its liquid assets in relation to day-to-day operations. The Group achieves this through a Group cash pool system with a drawing facility that as of 31.12.2017 is managed by Arcus ASA.
When funds are needed for investment purposes, the company relies on its own liquidity as far as possible. However, for larger investments external debt financing from a financial institution is also used.
Foreign currency risk In view of the company’s international activities, there is some exposure to foreign currency risk. As a general rule, currency is purchased in the spot market, but also to some extent in the forward market, in order to continuously offset net cash positions. The accounting treatment of financial derivatives is described under “Accounting policies”.
The company makes some purchases in foreign currency (mainly EUR), while the functional currency is NOK.
Receivables and debt, as well as monetary items in foreign currency, are translated at the closing rate on the balance sheet date. Foreign currency exposure is mainly hedged used forward contracts.
During the year, purchase and sale of goods in foreign currency are hedged to a certain degree, and the forward rate achieved in the market is used as the transaction rate. As a general rule, the foreign currency exposure is hedged three times a year, at four-month intervals.
At 31.12.2017 the company did not have any forward contracts (hedging) to hedge balance sheet items and orders received.
NOTE 12 EVENTS AFTER THE CLOSE OF THE FINANCIAL YEAR
No significant events occurred between the close of the financial year and the date on which Arcus ASA’s consolidated financial statements and parent company financial statements were approved for publication. This applies to events that would have provided knowledge of factors present at the close of the financial year, or events concerning matters that have arisen since the close of the financial year. The consolidated financial statements were approved for publication by resolution of the Board of Directors on 15 March 2018.
PARENT COMPANY ACCOUNTS WITH NOTES
Statement of income 01.01.-31.12.
Statement of financial position as at 31 December
Statement of cash flows 01.01.-31.12.
Accounting policies
Notes
Note 1: Payroll costs
Note 2: Tax
Note 3: Subsidiaries
Note 4: Share capital and shareholder information
Note 5: Equity
Note 6: Pension obligations and costs
Note 7: Provisions for liabilities
Note 8: Loans, pledges and guarantees, etc.
Note 9: Intragroup receivables and liabilities
Note 10: Cash and cash equivalents
Note 11: Financial market risk
Note 12: Events after the close of the financial year
Auditor's report
Contents In brief Group CEO The Company Corporate Social Responsibility Directors’ Report Financial Statements and Notes Contact 120/123Corporate Governance
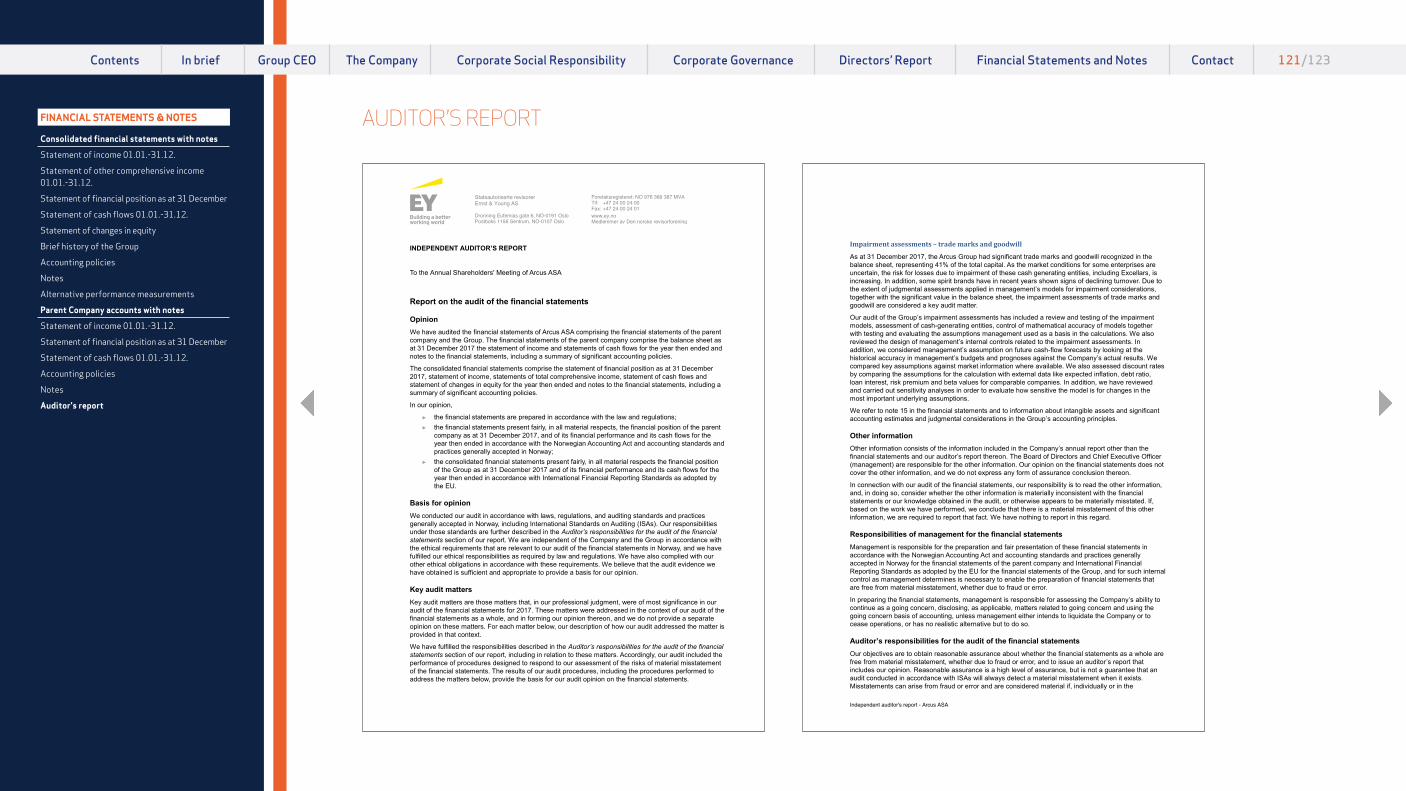
121 ANNUAL REPORT 2017 Arcus ASAFINANCIAL STATEMENTS AND NOTES | Auditor's report
AUDITOR’S REPORT
Statsautoriserte revisorer Ernst & Young AS Dronning Eufemias gate 6, NO-0191 Oslo Postboks 1156 Sentrum, NO-0107 Oslo
Foretaksregisteret: NO 976 389 387 MVA Tlf: +47 24 00 24 00 Fax: +47 24 00 24 01 www.ey.no Medlemmer av Den norske revisorforening
INDEPENDENT AUDITOR’S REPORT
To the Annual Shareholders' Meeting of Arcus ASA
Report on the audit of the financial statements
Opinion We have audited the financial statements of Arcus ASA comprising the financial statements of the parent company and the Group. The financial statements of the parent company comprise the balance sheet as at 31 December 2017 the statement of income and statements of cash flows for the year then ended and notes to the financial statements, including a summary of significant accounting policies.
The consolidated financial statements comprise the statement of financial position as at 31 December 2017, statement of income, statements of total comprehensive income, statement of cash flows and statement of changes in equity for the year then ended and notes to the financial statements, including a summary of significant accounting policies.
In our opinion,
► the financial statements are prepared in accordance with the law and regulations; ► the financial statements present fairly, in all material respects, the financial position of the parent
company as at 31 December 2017, and of its financial performance and its cash flows for the year then ended in accordance with the Norwegian Accounting Act and accounting standards and practices generally accepted in Norway;
► the consolidated financial statements present fairly, in all material respects the financial position of the Group as at 31 December 2017 and of its financial performance and its cash flows for the year then ended in accordance with International Financial Reporting Standards as adopted by the EU.
Basis for opinion We conducted our audit in accordance with laws, regulations, and auditing standards and practices generally accepted in Norway, including International Standards on Auditing (ISAs). Our responsibilities under those standards are further described in the Auditor’s responsibilities for the audit of the financial statements section of our report. We are independent of the Company and the Group in accordance with the ethical requirements that are relevant to our audit of the financial statements in Norway, and we have fulfilled our ethical responsibilities as required by law and regulations. We have also complied with our other ethical obligations in accordance with these requirements. We believe that the audit evidence we have obtained is sufficient and appropriate to provide a basis for our opinion.
Key audit matters Key audit matters are those matters that, in our professional judgment, were of most significance in our audit of the financial statements for 2017. These matters were addressed in the context of our audit of the financial statements as a whole, and in forming our opinion thereon, and we do not provide a separate opinion on these matters. For each matter below, our description of how our audit addressed the matter is provided in that context.
We have fulfilled the responsibilities described in the Auditor’s responsibilities for the audit of the financial statements section of our report, including in relation to these matters. Accordingly, our audit included the performance of procedures designed to respond to our assessment of the risks of material misstatement of the financial statements. The results of our audit procedures, including the procedures performed to address the matters below, provide the basis for our audit opinion on the financial statements.
Independent auditor's report - Arcus ASA
Impairment assessments – trade marks and goodwill
As at 31 December 2017, the Arcus Group had significant trade marks and goodwill recognized in the balance sheet, representing 41% of the total capital. As the market conditions for some enterprises are uncertain, the risk for losses due to impairment of these cash generating entities, including Excellars, is increasing. In addition, some spirit brands have in recent years shown signs of declining turnover. Due to the extent of judgmental assessments applied in management’s models for impairment considerations, together with the significant value in the balance sheet, the impairment assessments of trade marks and goodwill are considered a key audit matter.
Our audit of the Group’s impairment assessments has included a review and testing of the impairment models, assessment of cash-generating entities, control of mathematical accuracy of models together with testing and evaluating the assumptions management used as a basis in the calculations. We also reviewed the design of management’s internal controls related to the impairment assessments. In addition, we considered management’s assumption on future cash-flow forecasts by looking at the historical accuracy in management’s budgets and prognoses against the Company’s actual results. We compared key assumptions against market information where available. We also assessed discount rates by comparing the assumptions for the calculation with external data like expected inflation, debt ratio, loan interest, risk premium and beta values for comparable companies. In addition, we have reviewed and carried out sensitivity analyses in order to evaluate how sensitive the model is for changes in the most important underlying assumptions.
We refer to note 15 in the financial statements and to information about intangible assets and significant accounting estimates and judgmental considerations in the Group’s accounting principles.
Other information Other information consists of the information included in the Company’s annual report other than the financial statements and our auditor’s report thereon. The Board of Directors and Chief Executive Officer (management) are responsible for the other information. Our opinion on the financial statements does not cover the other information, and we do not express any form of assurance conclusion thereon.
In connection with our audit of the financial statements, our responsibility is to read the other information, and, in doing so, consider whether the other information is materially inconsistent with the financial statements or our knowledge obtained in the audit, or otherwise appears to be materially misstated. If, based on the work we have performed, we conclude that there is a material misstatement of this other information, we are required to report that fact. We have nothing to report in this regard.
Responsibilities of management for the financial statements Management is responsible for the preparation and fair presentation of these financial statements in accordance with the Norwegian Accounting Act and accounting standards and practices generally accepted in Norway for the financial statements of the parent company and International Financial Reporting Standards as adopted by the EU for the financial statements of the Group, and for such internal control as management determines is necessary to enable the preparation of financial statements that are free from material misstatement, whether due to fraud or error.
In preparing the financial statements, management is responsible for assessing the Company’s ability to continue as a going concern, disclosing, as applicable, matters related to going concern and using the going concern basis of accounting, unless management either intends to liquidate the Company or to cease operations, or has no realistic alternative but to do so.
Auditor’s responsibilities for the audit of the financial statements Our objectives are to obtain reasonable assurance about whether the financial statements as a whole are free from material misstatement, whether due to fraud or error, and to issue an auditor’s report that includes our opinion. Reasonable assurance is a high level of assurance, but is not a guarantee that an audit conducted in accordance with ISAs will always detect a material misstatement when it exists. Misstatements can arise from fraud or error and are considered material if, individually or in the
FINANCIAL STATEMENTS & NOTES
Consolidated financial statements with notes
Statement of income 01.01.-31.12.
Statement of other comprehensive income 01.01.-31.12.
Statement of financial position as at 31 December
Statement of cash flows 01.01.-31.12.
Statement of changes in equity
Brief history of the Group
Accounting policies
Notes
Alternative performance measurements
Parent Company accounts with notes
Statement of income 01.01.-31.12.
Statement of financial position as at 31 December
Statement of cash flows 01.01.-31.12.
Accounting policies
Notes
Auditor's report
Contents In brief Group CEO The Company Corporate Social Responsibility Directors’ Report Financial Statements and Notes Contact 121/123Corporate Governance

122 ANNUAL REPORT 2017 Arcus ASAFINANCIAL STATEMENTS AND NOTES | Auditor's report
Independent auditor's report - Arcus ASA
aggregate, they could reasonably be expected to influence the economic decisions of users taken on the basis of these financial statements.
As part of an audit in accordance with law, regulations and generally accepted auditing principles in Norway, including ISAs, we exercise professional judgment and maintain professional scepticism throughout the audit. We also: ► identify and assess the risks of material misstatement of the financial statements, whether due to fraud or error,
design and perform audit procedures responsive to those risks, and obtain audit evidence that is sufficient and appropriate to provide a basis for our opinion. The risk of not detecting a material misstatement resulting from fraud is higher than for one resulting from error, as fraud may involve collusion, forgery, intentional omissions, misrepresentations, or the override of internal control.
► obtain an understanding of internal control relevant to the audit in order to design audit procedures that are appropriate in the circumstances, but not for the purpose of expressing an opinion on the effectiveness of the Company’s internal control
► evaluate the appropriateness of accounting policies used and the reasonableness of accounting estimates and related disclosures made by management.
► conclude on the appropriateness of management’s use of the going concern basis of accounting and, based on the audit evidence obtained, whether a material uncertainty exists related to events or conditions that may cast significant doubt on the Company’s ability to continue as a going concern. If we conclude that a material uncertainty exists, we are required to draw attention in our auditor’s report to the related disclosures in the financial statements or, if such disclosures are inadequate, to modify our opinion. Our conclusions are based on the audit evidence obtained up to the date of our auditor’s report. However, future events or conditions may cause the Company to cease to continue as a going concern.
► evaluate the overall presentation, structure and content of the financial statements, including the disclosures, and whether the financial statements represent the underlying transactions and events in a manner that achieves fair presentation.
► obtain sufficient appropriate audit evidence regarding the financial information of the entities or business activities within the Group to express an opinion on the consolidated financial statements. We are responsible for the direction, supervision and performance of the group audit. We remain solely responsible for our audit opinion.
We communicate with those charged with governance regarding, among other matters, the planned scope and timing of the audit and significant audit findings, including any significant deficiencies in internal control that we identify during our audit.
We also provide those charged with governance with a statement that we have complied with relevant ethical requirements regarding independence, and communicate with them all relationships and other matters that may reasonably be thought to bear on our independence, and where applicable, related safeguards.
From the matters communicated with those charged with governance, we determine those matters that were of most significance in the audit of the financial statements of the current period and are therefore the key audit matters. We describe these matters in our auditor’s report unless law or regulation precludes public disclosure about the matter or when, in extremely rare circumstances, we determine that a matter should not be communicated in our report because the adverse consequences of doing so would reasonably be expected to outweigh the public interest benefits of such communication.
Report on other legal and regulatory requirements
Opinion on the Board of Directors’ report and on the statements on corporate governance and corporate social responsibility Based on our audit of the financial statements as described above, it is our opinion that the information presented in the Board of Directors’ report and in the statements on corporate governance and corporate social responsibility concerning the financial statements, the going concern assumption, and proposal for the allocation of the result is consistent with the financial statements and complies with the law and regulations.
Independent auditor's report - Arcus ASA
Opinion on registration and documentation Based on our audit of the financial statements as described above, and control procedures we have considered necessary in accordance with the International Standard on Assurance Engagements (ISAE) 3000, «Assurance Engagements Other than Audits or Reviews of Historical Financial Information», it is our opinion that management has fulfilled its duty to ensure that the Company's accounting information is properly recorded and documented as required by law and bookkeeping standards and practices accepted in Norway.
Oslo, 16 March 2018 ERNST & YOUNG AS
Kjetil Rimstad State Authorised Public Accountant (Norway)
(This translation from Norwegian has been made for information purposes only.)
FINANCIAL STATEMENTS & NOTES
Consolidated financial statements with notes
Statement of income 01.01.-31.12.
Statement of other comprehensive income 01.01.-31.12.
Statement of financial position as at 31 December
Statement of cash flows 01.01.-31.12.
Statement of changes in equity
Brief history of the Group
Accounting policies
Notes
Alternative performance measurements
Parent Company accounts with notes
Statement of income 01.01.-31.12.
Statement of financial position as at 31 December
Statement of cash flows 01.01.-31.12.
Accounting policies
Notes
Auditor's report
Contents In brief Group CEO The Company Corporate Social Responsibility Directors’ Report Financial Statements and Notes Contact 122/123Corporate Governance

Arcus ASA
Destilleriveien 11Postbox 64NO-1483 Hagan
Tel. (+47) 67 06 50 [email protected]
www.arcusgruppen.no
Contents In brief Group CEO The Company Corporate Social Responsibility Directors’ Report Financial Statements and Notes Contact 123/123Corporate Governance