Embed Size (px)
Citation preview

Kennedy Wilson Annual Report 2017 1
Annual Report 2017

Kennedy Wilson Annual Report 2017 3
ONE Santa Monica, California offi ce in 1988 has grown into a leading
global real estate investment company with a focus on multi family
and offi ce properti es located across the Western U.S., the U.K. and
Ireland. Since going public in 2009, we have completed approximately
$30 billion in real estate investment transacti ons. Currently, our real
estate portf olio generates $439 million of esti mated annual NOI, with
82% coming from assets wholly owned by Kennedy Wilson. Every day,
we work to drive NOI growth, enhance our existi ng portf olio and
grow our investment management fee stream, delivering value to our
shareholders and the communiti es where we invest. The acquisiti on of
KWE in 2017 has increased our scale, improved our balance sheet and
our fl exibility to deploy capital more effi ciently across geographies.
It has strengthened our entrepreneurial spirit and ensures we can
selecti vely act on att racti ve real estate opportuniti es that deliver
the best risk-adjusted returns. Our success is driven by our talented
team of real estate veterans with deep industry relationships
and decades of market experti se, all working together as ONE.
T H E P O W E R O F O N E
CONTENTS
2017 By The Numbers 2
Our Year in Review 4
A Historic Transacti on – Q&A 10
U.S. Portf olio 12
European Portf olio 14
Pipeline of Growth 16
Corporate Social Responsibility 18
The Evoluti on of Kennedy Wilson 20
Financial Report 25
We are a leading global real estate investment company.
We own, operate and invest in real estate, both on our own
and through our investment management platform. We focus
on multifamily and offi ce properties located in the Western
U.S., the U.K. and Ireland. Headquartered in Beverly Hills, CA,
Kennedy Wilson has 25 offi ces located across the globe
On the Cover: A rendering of Kennedy Wilson’s State Street offi ce building adjacent to its Capital Dock development. Spanning nearly fi ve acres of prime waterfront space, the development is a one-of-a-kind city campus under construction by Kennedy Wilson and partners in the heart of Dublin, Ireland.
See page 35 for defi niti ons and reconciliati ons of non-GAAP measures to the most directly comparable GAAP measures

2 Kennedy Wilson Annual Report 2017
Portf olio Overview
Diversi�cation by Geography
Geography by product
Diversi�cation by Geography
Geography by product
1 See page 35 for certain defi niti ons and reconciliati ons of non-GAAP measures to the most directly comparable GAAP measures. Informati on shown as of December 31, 2017, except where indicated.2 Based on 1-2018 uarterly Dividend and the closing price of NYSE:KW on April 23, 2018.
2017 BY THE NUMBERS 1
$2.6BMARKET CAP
$811MRE V ENUE
4.1%DI V IDEND Y IELD 2
$456MADJUSTED EBITDA
$8BENTERPRISE V ALUE
$16BAUM
Sectors• Multi family 39%
• Offi ce 33%
• Retail 19%
• Hotels and Industrial 9%
Geography• Western U.S. 47%
• U.K. 29%
• Ireland 18%
• Italy and Spain 6%
72%Multi family and Offi ce
$439MEsti mated Annual NOI
$439MEsti mated Annual NOI
47%Portf olio located in the Western U.S.
Kennedy Wilson Annual Report 2017 3
Annual Dividend per Share
2012
$0.20
2012
$40M
2013
$0.28
2013
$61M
2014
$0.36
2014
$134M
2015
$0.48
2015
$208M
2017
$0.70
2017
$243M
$0.56
2016
$191M
2016
Adjusted Net Income 514%Cumulati ve Growth
$0.76Annual DPS
Investment Transactions: Capital Return
Capital Return: $104MDividends: $74MShare repurchases $30M
$74MDividends
$30MShare Repurchases
CAPITAL RETURN
$104M
Investment Transactions: Capital Return
Capital Return: $104MDividends: $74MShare repurchases $30M
$1.3BAcquisiti ons
$1.9BDispositi ons
IN V ESTMENT TRANSACTIONS
$3.2B
2018
$0.76
44%CAGR
25%CAGR

The $4 billion acquisition of Kennedy Wilson Europe Real Estate Plc ( KWE”) in the fourth quarter created a leading real estate investment and asset management platform that paves the way for continued long-term growth. As one global team, we closed out 2017 looking forward to the significant near-term opportunities that lie ahead for Kennedy Wilson.
A Year of MilestonesThe accomplishments of the past year are a testament to the people of Kennedy Wilson who worked tirelessly to produce our impressive results, including significant NOI growth and double-digit returns on our existing portfolio. In addition to the acquisition of KWE on October 20, 2017, our team delivered record net income (after $148 million in depreciation) of $101 million, record Adjusted EBITDA of $456 million, and record Adjusted Net Income of $243 million in 2017.
Since 2016, we have repurchased and retired 4.6 million shares for approximately $90 million as part of the buyback program authorized that year while also paying $167 million in common dividends. In March 2018, we announced a larger buyback program of $250 million to be funded primarily by the sale of non-core and non-income producing assets. This program is expected to bring the total cash return to shareholders in the form of buybacks to $340 million.
2017 was another active year on both the acquisition and disposition front, as we and our partners completed $3.2 billion in investment transactions, including $1.3 billion of acquisitions and $1.9 billion of dispositions. Since going public in 2009, we have acquired approximately $20 billion in real estate investments at cost, of which 75% were off-market transactions.
Recurring Income Fuels Corporate GrowthGrowing our recurring NOI remains a top priority. We are focused on reducing non-income producing and smaller assets on our balance sheet while improving property-level operating fundamentals to further fuel NOI growth. Our current portfolio generates $439 million of estimated annual NOI to Kennedy Wilson, of which $362 million, or 82%, comes from wholly-owned assets.
4 Kennedy Wilson Annual Report 2017
T O O U R F E L L O W S H A R E H O L D E R S ,
2017 was an exceptional year for Kennedy Wilson! Our talented team of professionals executed on our core strategy to generate sustainable returns with record financial and operating results while simultaneously completing the most transformative and complex transaction in the company’s 30-year history.
OUR YEAR IN REVIEW
William J. McMorrowChairman and Chief Executive Officer
0.1
0.2
0.3
0.4
0.5
0.6
0.7
0.8
0.10.20.30.40.50.60.70.8
2012 2013 2014 2015 2016 2017 2018
For more detail on the KWE transaction, see page 10 for a Q&A with Bill McMorrow and Kennedy Wilson Europe President and CEO, Mary Ricks.
Kennedy Wilson Annual Report 2017 5
Lake Club, The Ritz-Carlton,
Lake TahoeLaunched in 2017, Lake Club provides
access to Lake Tahoe and new amenities
for the resort.
8 Kennedy Wilson Annual Report 2017 Kennedy Wilson Annual Report 2017 9
The acquisition of KWE added an estimated $100 million of annual recurring cash flow back to Kennedy Wilson and improved our balance sheet, which now includes over $2 billion of unencumbered assets. As a result, Standard and Poor’s increased our corporate credit rating by two notches to BB+ this past year.
We also have a strong track record in growing our dividend per share, which has increased 375% since we started paying a dividend in 2011.
Across our portfolio, we are improving the value of our assets through redevelopment, refurbishment and new development that we currently expect will add an additional $35 million of estimated annual NOI by the end of 2019.
Two of our largest development projects are in Dublin, Ireland. Capital Dock is the largest single-phase development in Ireland totaling 690,000 square feet and is on track to be completed by the end of 2018. Clancy Quay includes the development of an additional 422 high-quality multifamily units across nine historic army barracks and will be the largest multifamily community in Ireland with 845 units when complete.
Based upon anticipated moderate rent growth and assuming the continuation of our capital recycling plan focused on selling non-income producing assets, we are targeting over $500 million of in-place annual property NOI by the end of 2019, roughly twice the level we ended with in 2016.
Our PerformanceWe primarily invest in multifamily and office properties in key growth markets throughout the Western U.S., the U.K. and Ireland. At year end, these two sectors comprised 72% of estimated annual NOI to Kennedy Wilson.
Multifamily portfolio firing on all cylindersWe continue to see significant growth opportunities in the multifamily segment, particularly in the Western U.S., the U.K. and Ireland. We focus on securing high-quality properties that fulfill significant housing needs in these dynamic markets and are positioned near local transportation, employers, retailers and restaurants.
In 2017, rents grew in the markets where we have already established a strong foothold, including Portland, Seattle, and Dublin, Ireland. Driven by the severe shortage of housing and the growing millennial segment with its high propensity to rent, Kennedy Wilson’s multifamily group has improved same-property performance across its portfolio, with four consecutive years of greater than 6% year-over-year same-property revenue growth, and NOI growth of almost 9% in 2017 compared to the prior year.
Our strong operational performance is a result of the relative affordability of our portfolio and the opportunities to implement our value-add initiatives. Our Western U.S. multifamily portfolio offers fully amenitized communities at 40% to 50% discounts compared to central business district communities, with our average rents of $1,508 at the end of 2017. Our multifamily portfolio is heavily weighted in the state of Washington, which has led our markets with stellar same-property NOI growth of 9% in 2017 compared to the prior year, and may further benefit from the recent federal elimination of the state and local tax deduction passed in 2017. Seattle remains one of the most affordable large U.S. cities on a rent-to-income basis within a state with no income tax.
Our affordable housing joint venture, Vintage Housing Holdings, is 95% occupied with same-property rents up 4% and same-property NOI up 6% during the year. The demand for affordable housing from seniors and families in our target markets continues to greatly outpace supply. We look to continue expanding this portfolio with another 2,150 units currently under development or undergoing entitlements. When complete, this will bring our total affordable portfolio to almost 8,000 units by 2020.
In Europe, our ambition is to double our multifamily portfolio to 5,000 units over the next three years. This will include “build-to-rent” units under development at Capital Dock and Clancy Quay and a future pipeline at Leisureplex, near our Stillorgan Shopping Centre in Dublin. At the end of the year,
The KWE transaction added an estimated $100 million of annual recurring cash flow back to Kennedy Wilson.
Dividend growth since 2011 u
Global Portfolio
24,446MULTIFAMILY UNITS
18.2MSQUARE FEET OF COMMERCIAL SPACE
5 HOTELS
470 RESIDENTIAL UNITS/LOTS
Kennedy Wilson’s multifamily group continued to improve same-property performance across its portfolio, with four consecutive years of greater than 6% year-over-year same-property revenue growth.
OUR YEAR IN REVIEW
0.1
0.2
0.3
0.4
0.5
0.6
0.7
0.8
0.10.20.30.40.50.60.70.8
2012 2013 2014 2015 2016 2017 2018
0.1
0.2
0.3
0.4
0.5
0.6
0.7
0.8
0.10.20.30.40.50.60.70.8
2012 2013 2014 2015 2016 2017 2018
Global Pipeline of Growth
+3,300MULTIFAMILY UNITS
+1.7MSQUARE FEET OF COMMERCIAL SPACE
+150 HOTEL ROOMS
375%TO $0.76 ANNUALLY
+30%Increase from 2016
+27%Increase from 2016
we acquired 124 units at Northbank for €45 million, which is near our Liffey Trust multifamily property located in Dublin’s North Docks, and in April 2018 we acquired 206 units at The Elysian in Cork, Ireland for €87.5 million.
A commercial portfolio with strong growth potentialOur global office portfolio comprised one-third of our total estimated annual NOI at year end, with 65% of our NOI generated in the U.K. and Ireland. Favorable long-term lease structures in both the U.K. and Ireland, coupled with particularly strong office fundamentals in the Dublin market, provide an attractive investment landscape with the ability to produce stable, durable cash flows. We ended the year with a weighted-average unexpired lease term of 6.8 years (to first break) for our U.K. and Irish office portfolio, where 95% of the leases were fully repairing and insuring or triple-net equivalent.
In the U.S., our team pursued stable, high-quality properties with credit tenants and large operating cash flows to add to our growing portfolio. In July, we acquired 90 East, a 573,000 square foot, wholly-owned office building fully leased to Microsoft and Costco for $153 million at an 8.5% cap rate.
Adjusted EBITDA
$350MIN 2016
$456MIN 2017
Adjusted Net Income
$191MIN 2016
$243MIN 2017
10 Kennedy Wilson Annual Report 2017 Kennedy Wilson Annual Report 2017 1110 Kennedy Wilson Annual Report 2017
Our asset management teams are focused on unlocking value in all our acti ve markets. At 90 East in Washington, we executed a seven-year lease extension with Costco to conti nue occupying their space unti l 2027, just four months aft er acquisiti on. And, in March 2018, we leased the enti re offi ce tower at 430 California Street in San Francisco to WeWork nearly two years ahead of our initi al business plan. At Capital Dock, we completed a 20-year lease with Indeed, which will fully occupy the 216,000 square-foot offi ce component of this best-in-class mixed-use campus development when it is complete later this year. We also closed the forward sale of 200 Capital Dock, a 130,000 square-foot offi ce building, to J.P. Morgan. Finally, we leased the remaining 52,900 square feet of vacant space to a global blue-chip tenant at The Chase in Dublin, Ireland, bringing the building to full occupancy. These leasing accomplishments would not be possible without the extraordinary eff orts and local market experti se of our asset management teams.
Leveraging our Competi ti ve StrengthsOur biggest competi ti ve strength is the talented group of professionals working together at Kennedy Wilson within an entrepreneurial culture. Our 25 offi ces across the Western U.S. and Europe and regional experti se give Kennedy Wilson a competi ti ve edge. The unrivaled long-term relati onships we have forged with major insti tuti ons creates a unique global network that supports deal fl ow and leads to favorable fi nancing across Kennedy Wilson’s portf olio.
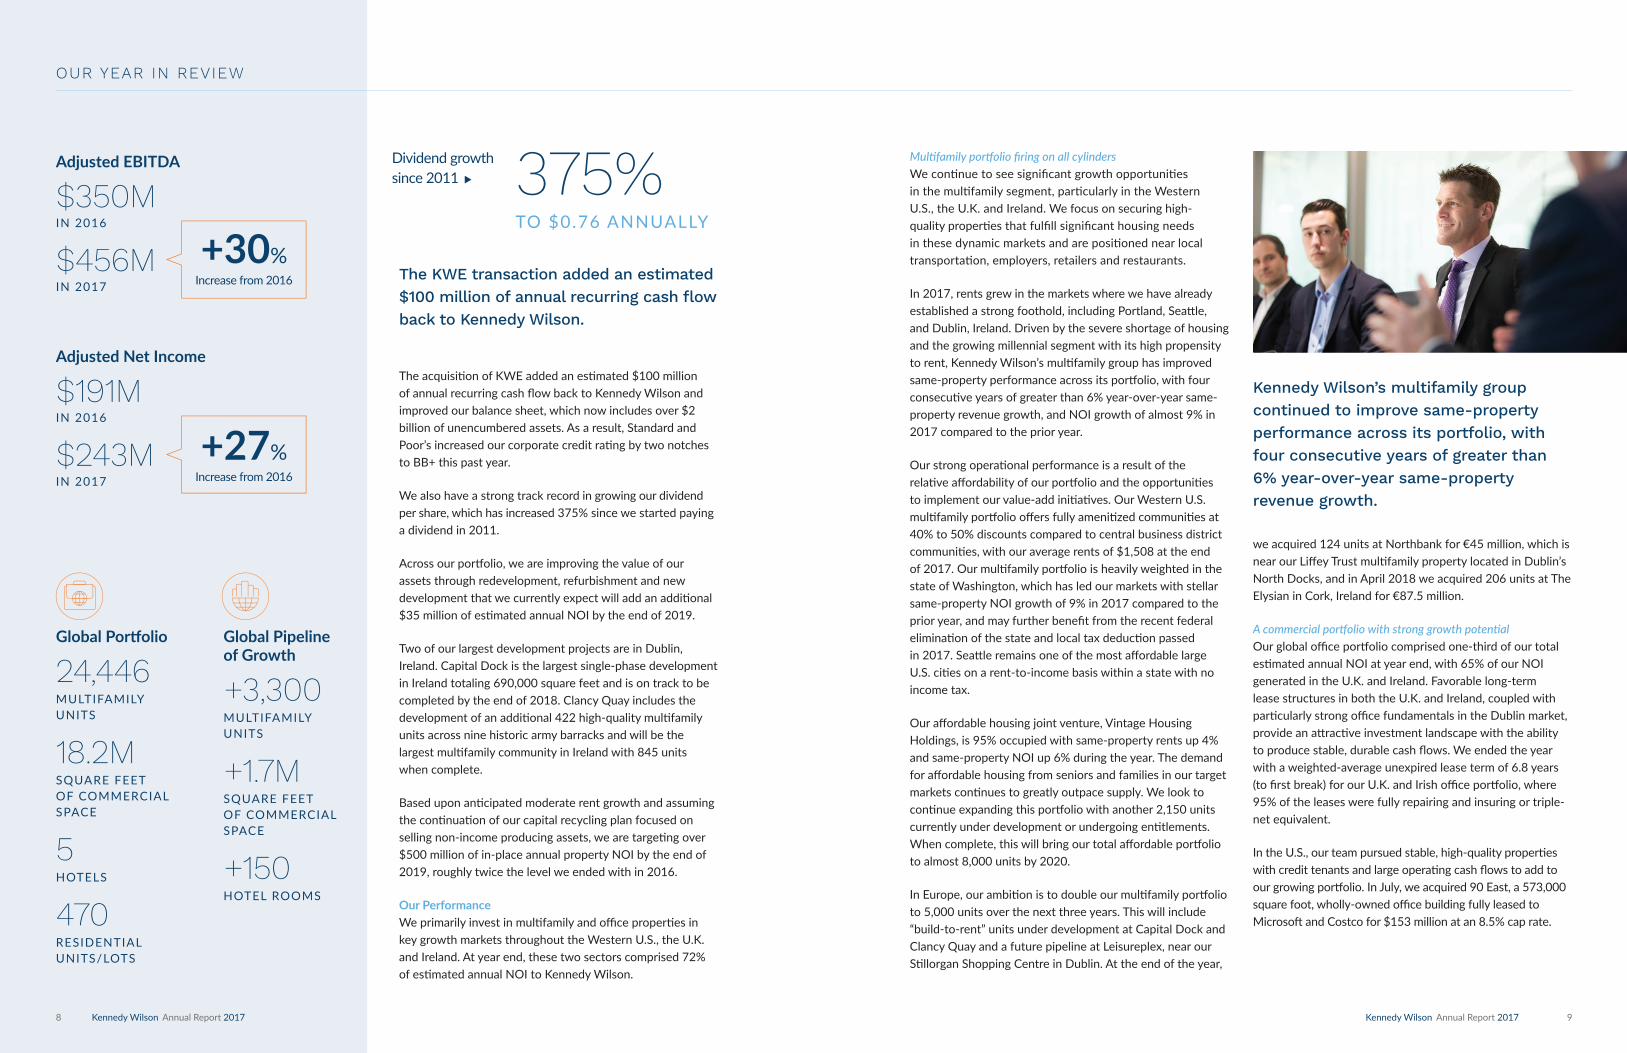
Importantly, our senior management team, which is collecti vely the largest shareholder of Kennedy Wilson, has decades of experience working closely together executi ng our business plan. The conti nuity of our team is essenti al for us to come together to execute one global vision and grow both our investment portf olio and our investment management business over the long term.
Looking AheadAs we look ahead, our focus remains on thoughtf ully allocati ng capital in high-growth markets and taking a highly selecti ve approach to our deal strategy. We strive to think creati vely about our value-enhancing initi ati ves to grow our business and conti nue our track record of providing healthy returns to our shareholders and investors.
Our Western U.S. multi family business is one of the biggest drivers of revenue to Kennedy Wilson, accounti ng for 39% of total esti mated annual NOI, and we sti ll see signifi cant growth opportuniti es in this sector. Globally, our multi family portf olio includes more than 24,000 units, and we are looking to grow our holdings to 40,000 units in the next fi ve years.
We will build on our strong history of fundraising – we have raised $12 billion of public and private equity since 2009 to fund approximately $20 billion of real estate acquisiti ons. We are focused on growing our U.S. fund management business
as well as our multi family/PRS and investment management platf orms in Europe by leveraging our history of generati ng excepti onal risk-adjusted returns for our partners.
In the coming year, we plan to invest $225 million of capital into existi ng assets and high-quality development opportuniti es currently underway. Additi onally, a porti on of our capital will be used to execute the announced $250 million stock buyback program as well as to fund our co-investment into our U.S. and European fund platf orms.
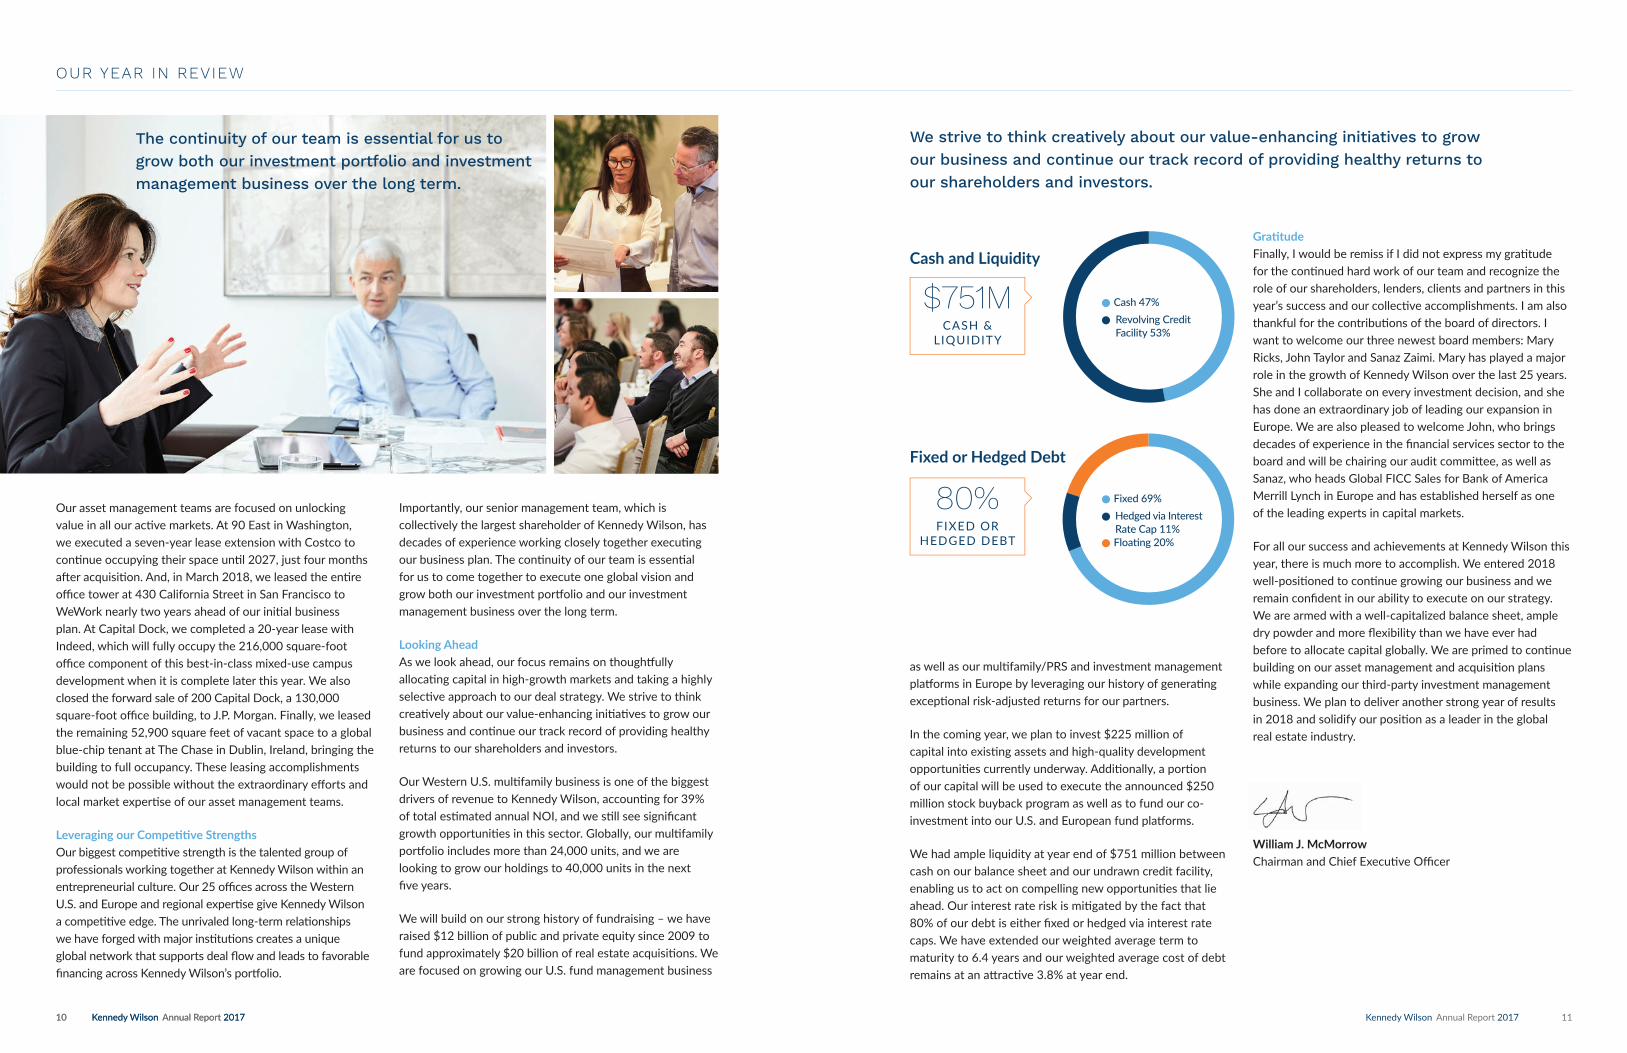
We had ample liquidity at year end of $751 million between cash on our balance sheet and our undrawn credit facility, enabling us to act on compelling new opportuniti es that lie ahead. Our interest rate risk is miti gated by the fact that 80% of our debt is either fi xed or hedged via interest rate caps. We have extended our weighted average term to maturity to 6.4 years and our weighted average cost of debt remains at an att racti ve 3.8% at year end.
We strive to think creatively about our value-enhancing initiatives to grow our business and continue our track record of providing healthy returns to our shareholders and investors.
OUR YEAR IN REVIEW
$751MCASH &
LIQUIDITY
80%FIXED OR
HEDGED DEBT
Cash and Liquidity
Fixed or Hedged Debt
Ample Liquidity
Fixed/Hedged Debt
Ample Liquidity
Fixed/Hedged Debt
• Cash 47%
• Revolving Credit Facility 53%
• Fixed 69%
• Hedged via Interest Rate Cap 11%
• Floati ng 20%
Grati tudeFinally, I would be remiss if I did not express my grati tude for the conti nued hard work of our team and recognize the role of our shareholders, lenders, clients and partners in this year’s success and our collecti ve accomplishments. I am also thankful for the contributi ons of the board of directors. I want to welcome our three newest board members: Mary Ricks, John Taylor and Sanaz Zaimi. Mary has played a major role in the growth of Kennedy Wilson over the last 25 years. She and I collaborate on every investment decision, and she has done an extraordinary job of leading our expansion in Europe. We are also pleased to welcome John, who brings decades of experience in the fi nancial services sector to the board and will be chairing our audit committ ee, as well as Sanaz, who heads Global FICC Sales for Bank of America Merrill Lynch in Europe and has established herself as one of the leading experts in capital markets.
For all our success and achievements at Kennedy Wilson this year, there is much more to accomplish. We entered 2018 well-positi oned to conti nue growing our business and we remain confi dent in our ability to execute on our strategy. We are armed with a well-capitalized balance sheet, ample dry powder and more fl exibility than we have ever had before to allocate capital globally. We are primed to conti nue building on our asset management and acquisiti on plans while expanding our third-party investment management business. We plan to deliver another strong year of results in 2018 and solidify our positi on as a leader in the global real estate industry.
William J. McMorrowChairman and Chief Executi ve Offi cer
The continuity of our team is essential for us to grow both our investment portfolio and investment management business over the long term.

12 Kennedy Wilson Annual Report 2017 Kennedy Wilson Annual Report 2017 13
An Interview with Bill McMorrow and Mary Ricks
A HISTORIC TRANSACTION – Q&A
Introduction
Kennedy Wilson’s story in Europe began eight years ago, when Chairman and CEO Bill McMorrow made his first trip to Dublin, Ireland. Soon thereafter, he led the team in acquiring Bank of Ireland Real Estate Investment Management in December 2010 to establish a strong local presence in the country. Kennedy Wilson made its first European acquisition in 2011, and Mary Ricks has quickly grown Kennedy Wilson’s team from 14 professionals to 100 while expanding the company’s real estate holdings across its target markets.
Kennedy Wilson’s success in Europe continued with the London Stock Exchange listing of Kennedy Wilson Europe Real Estate Plc (“KWE”) in February 2014 that initially raised £1 billion of equity in the second-largest real estate IPO in the 200-year history of the London Stock Exchange, as well as a secondary offering of £350 million in October 2014. Kennedy Wilson served as investment manager of KWE and was its largest shareholder with an initial 12% stake at IPO, rising to 24% over time. On October 20, 2017, Kennedy Wilson completed a transformational $4 billion acquisition of KWE. Bill McMorrow, Chairman and CEO of Kennedy Wilson, and Mary Ricks, President and CEO of Kennedy Wilson Europe, share their thoughts on this pivotal transaction.
Why was 2017 the right time to acquire the remaining 76% interest in KWE that Kennedy Wilson did not already own?
Bill McMorrow: In 2017, we saw a unique opportunity emerge as the effects of Brexit took hold of the capital markets. Shares of major European property companies, including KWE, began trading significantly below their net asset value, and Sterling and the Euro both weakened against the dollar. The public markets were largely disconnected from what we saw at the property level across KWE’s portfolio. Despite the uncertainty related to Brexit, 2017 saw a surge in U.K. investment transaction volumes, supported by strong demand for real estate by foreign investors. As value investors, the time was right to capitalize on the disconnect between the public and private real estate markets. The acquisition of KWE enabled us to combine the strengths of both companies to improve our scale and liquidity while providing added flexibility to efficiently allocate capital across a single global platform.
Since closing, the acquisition has already exceeded our expectations. We are finding substantial operational and financial efficiencies as one global company, with the added benefit of the Euro and Sterling recovering from depressed levels.
Mary Ricks: The underlying fundamentals of our target markets remain strong. We are excited by the opportunities to grow our NOI, with the completion of our development pipeline as a material contributor. Ireland is on course to be the fastest growing economy in the eurozone through 2024 with extremely attractive long-term fundamentals, especially in Dublin, where we are witnessing favorable dynamics across both office and multifamily. Madrid and Milan are firmly in recovery mode and our U.K. portfolio’s diversity is proving resilient to the effects of Brexit. Our leasing volumes remain strong and we continue to see active demand for the non-core assets we are selling. These positive fundamentals alongside an improved balance sheet and ability to allocate capital quickly as one consolidated company put us in a strong position to capitalize on future growth.
What benefits do you foresee from the transaction?
Mary: The transaction has created a unique global real estate investment and asset management platform that combines the strengths of our talented U.S. and European teams. The Kennedy Wilson team now has greater flexibility than we’ve ever had to allocate capital across multiple geographies and ample liquidity to move quickly on attractive opportunities that meet our risk-adjusted return requirements.
Bill: There are also significant benefits from a corporate structure standpoint. Since Kennedy Wilson was already managing the KWE portfolio, we are seeing most of the additional KWE cash flow going straight to the bottom line. As a result of the transaction, 82% of our estimated annual NOI now comes from wholly-owned assets. Looking ahead, you’ll see expense levels plateauing as we continue to push for high margin growth including raising additional fee-bearing capital and also growing our NOI through having a larger ownership in our European portfolio. We’ve also improved our overall balance sheet while increasing recurring annual cash flow to Kennedy Wilson by approximately $100 million from our European assets. Finally, and possibly most importantly, we maintain continuity among our leadership team with a strong track record of working together for decades and building value for our shareholders.
How does the transaction position Kennedy Wilson for success moving forward?
Mary: The transaction enables us to build on the impressive platform we’ve created in the U.K., Ireland and Spain. Over the last seven years investing in Europe, we’ve developed a high-quality portfolio of assets with long leases and a well-diversified tenant base. Looking ahead, we are continuing to grow our NOI and anticipate additional upside from our
value-enhancing asset management initiatives including the completion of our major development projects and our non-core capital recycling program.
We are excited about growing our multifamily portfolio in Europe, primarily through build-to-rent (BTR). We are acquiring well-located properties with significant asset management angles, including Northbank in December 2017, which doubled our exposure to the North Docks in Dublin, Ireland. We are delivering strong leasing performance across our European portfolio, with 208 lease transactions completed across 2.2 million square feet at rents 11.7% ahead of previous passing, and we are seeing that strong momentum continue in 2018. We are pruning the portfolio where we have completed our asset management plans. In 2017, we completed 31 dispositions, achieving a return on cost of 35%. The profit we crystallize from sales, both in the U.S. and Europe, is selectively allocated to our growth targets: completing existing developments, expanding our multifamily portfolio and investment management platform in the U.S. and Europe, and our share repurchase program.
Bill: Following the acquisition of KWE, our business plan is simple: we will focus on using the balance sheet to hold properties with strong recurring cash flows for the long term, and take advantage of shorter-term opportunities via our fund platforms and partnerships with third-party investors. We look to continue to optimize our balance sheet portfolio through selling non-income producing and low-yielding assets and recycle the proceeds into high quality properties with strong cash flow and upside potential. Our global teams will work hard to achieve our goal of generating attractive risk-adjusted returns and deliver value for our shareholders and execute on our one global vision for Kennedy Wilson.
The acquisition of KWE combined the strengths of our U.S. and European teams to improve our scale and liquidity while providing added flexibility to efficiently allocate capital across a single global platform.
William McMorrow, Chairman and CEO, Kennedy Wilson
Mary Ricks, President and CEO, Kennedy Wilson Europe

14 Kennedy Wilson Annual Report 2017 Kennedy Wilson Annual Report 2017 15
9350 Civic Center Beverly Hills, CA
45,000 Square Feet Key Tenants: Live Nation and Gibson Guitar
Acquired in 2015, this 45,000 square-foot creative office building is located in the Golden Triangle in Beverly Hills, CA.
Multifamily Commercial
U.S. PORTFOLIO
Over the past 30 years, Kennedy Wilson has established a strong track record of investing in real estate across various regions and sectors. Our investment philosophy starts with identifying attractive markets that we believe are capable of fundamental growth in jobs and population. We then leverage our local relationships and knowledge to find unique investment opportunities that are typically off-market deals and/or sourced directly from financial institutions. Our diversified U.S. portfolio is focused on four key markets that are well positioned for continued long-term growth.
Pacific Northwest
11,454 Multifamily Units
1.6M Commercial Square Feet
Southern California
2,968 Multifamily Units
1.2M Commercial Square Feet
217 Residential Units/Lots
Northern California
3,669 Multifamily Units
0.2M Commercial Square Feet
4 Residential Units/Lots
Mountain States
4,426 Multifamily Units
2.2M Commercial Square Feet
4 Key Markets
MT
UTCA
HI
N V
ID
OR
WASeattle
Portland
Boise
Salt Lake CityReno
Los Angeles
San Francisco
Radius Seattle, WA
282 Units
Located in the South Lake Union submarket of Seattle, Radius was constructed in 2015 and offers a modern, amenity-rich lifestyle for residents.
22,517MULTIFAMILY UNITS
5.2MCOMMERCIAL SQUARE FEET
90 East Issaquah, WA
573,000 Square Feet Key Tenants: Costco and Microsoft
This office campus includes three Class-A office buildings in greater Bellevue, Washington.
Mission Hills Apartment Homes Camarillo, CA
386 Units
Recently rebranded, this community has undergone a multi-million dollar renovation, including the creation of a new clubhouse.

16 Kennedy Wilson Annual Report 2017 Kennedy Wilson Annual Report 2017 17
Leavesden Park Watford
Area: 210,196 Square FeetKey Tenant: Asos
1,881MULTIFAMILY
UNITS
12.9MCOMMERCIAL SQUARE FEET
Ireland
1,587 Multifamily Units
1.4M Commercial Square Feet
Spain
0.8M Commercial Square Feet
United Kingdom
294 Multifamily Units
9.6M Commercial Square Feet
Italy
1.1M Commercial Square Feet
SPAINITALY
UNITED KINGDOM
4 Key Markets
IRELAND
EUROPEAN PORTFOLIO
Dublin
London
Madrid
The Chase Dublin
Area: 173,400 Square FeetKey Tenants: Google, Dun & Bradstreet, Mars
Vantage Dublin
442 Units
111 Buckingham Palace Road London
Area: 223,410 Square Feet Key Tenants: Telegraph Media Group, Shop Direct, iRobot

18 Kennedy Wilson Annual Report 2017 Kennedy Wilson Annual Report 2017 19
400/430 California, San Francisco, CaliforniaIn December 2016, Kennedy Wilson joint-ventured with the Takenaka Corporati on to acquire 400/430 California Street for $135 million. Located in the heart of San Francisco’s Central Business District, the property includes an offi ce tower and a historic bank branch that were previously owned by Union Bank. Kennedy Wilson launched a full-scale repositi oning of the two buildings to coincide with Union Bank vacati ng the property, and in March 2018, announced that coworking enterprise WeWork signed an 18-year lease to occupy all 20 fl oors of the 430 California Street tower. The lease has stabilized the property nearly two years ahead of Kennedy Wilson’s initi al business plan.
PIPELINE OF GROWTH
Vintage at Mill Creek, Mill Creek, WashingtonVintage Housing Holdings, a joint-venture partner of Kennedy Wilson, has 2,150 units under constructi on or in the design review process across the Western U.S. Mill Creek, acquired in August 2016 with Vintage Housing, is a 216-unit aff ordable reti rement housing project under constructi on on four acres in Mill Creek, Washington in the Seatt le metro area. When complete, the homes will be available for income-qualifi ed, acti ve seniors with a broad array of ameniti es and on-site services. Constructi on of the multi family units is expected to be complete in Q2 2018.
Pioneer Point in Ilford, LondonSet in the heart of Ilford, London, Pioneer Point is a landmark development of 294 rental apartments across two towers of 31 and 23 stories. Kennedy Wilson secured the property through acquiring a non-performing loan for £68.5m in May 2015, and immediately launched a wide-ranging asset management plan to complete and lease up the formerly vacant South Tower and to stabilize the property. The team rebranded and relaunched both towers with new amenity spaces including resident lounges, meeti ng spaces and work pods as well as entertainment areas throughout.
+$35MOF NOI THROUGH DEV ELOPMENT AND STABILIZATION EXPECTED BY YEAR-END 2019
Clancy Quay in Dublin, IrelandClancy Quay is set to become a wide-ranging multi family development that includes the conservati on and refurbishment of nine historic army barracks and the constructi on of four new blocks. Since purchasing Clancy Quay for €82.5 million in 2013 with its partner, Kennedy Wilson has completed the development of Phase 2, adding 163 multi family units to the property’s existi ng 423 units. Constructi on has just begun on Phase 3. When complete, the total 845 units will represent the largest multi family project in Dublin.
Capital Dock in Dublin, Ireland Capital Dock is a visionary mixed-use urban development owned by Kennedy Wilson in a joint venture with Fairfax Financial Holdings Limited and the Nati onal Asset Management Agency. The project extends over 4.8 acres and will deliver 370,000 square feet of commercial space and 190 high-quality multi family units across six buildings, one of which is a 23-story tower marking the gateway to the city. In May 2017, Kennedy Wilson sold the 130,000 square-foot 200 Capital Dock building to J.P. Morgan on a forward-funding sale agreement. In December 2017, Kennedy Wilson signed a 20-year lease with Indeed to fully occupy buildings 100 and 300 Capital Dock. This lease represented the largest Dublin offi ce lease this cycle and enabled Kennedy Wilson to fully lease the offi ce component of Capital Dock more than a year prior to constructi on completi on.
+3,300MULTIFAMILY UNITS
+1.7MCOMMERCIAL SQUARE FEET

20 Kennedy Wilson Annual Report 2017
CORPORATE SOCIAL RESPONSIBILITY
As we drive growth across our global platform to deliver value to our shareholders, we also endeavor to maximize value delivered to the communities where we invest.
Vintage HousingKennedy Wilson’s affordable housing joint venture, Vintage Housing, is an industry leader in developing income and age-restricted properties across the Western United States. Their experience extends beyond development through the delivery of enriching programs and resident services that benefit low-income families and seniors while providing services for those with special needs. Programs include social support groups, after-school programs, transportation assistance, computer training, and health and wellness classes.
6,000*
AFFORDABLE AND SENIORS HOUSING HOMES PROVIDED THROUGH VINTAGE HOUSING
Approximate figuresAmenities at Vintage Housing’s Urban Center apartments in Lynnwood, Washington
Whether it’s committing to environmentally sustainable initiatives in our buildings, providing new affordable housing to underserved regions or creating new local construction jobs, each investment decision is made with an eye towards being responsible, corporate citizens and creating a strong, sustainable future that enables communities to thrive.
We also give back through our charitable platform, supporting causes and organizations that produce measurable results and create positive lasting impacts. Our employees often drive our annual grant program, as we focus on the non-profit organizations that our employees have demonstrated a commitment and passion to supporting through their own financial resources and time.
Kennedy Wilson Annual Report 2017 21
The Navy SEAL FoundationKennedy Wilson is proud to be aligned with the Navy SEAL Foundation, which provides immediate and ongoing support and assistance to the U.S. Navy SEALs and their families. Beyond a presence on the Board of Directors, we are actively placing SEALs in jobs once they return from active duty, fund raising and providing grants for foundations created by SEALs for their community. We are inspired by this elite group of individuals and endeavor to support these men and their families.
The Shelbourne HotelWe understand the responsibility and opportunity that comes with working on heritage buildings in our key locations. For example, in Dublin, Ireland, we look to contribute by regenerating older historic assets. To date, Kennedy Wilson has invested over €45 million in redeveloping or refurbishing heritage buildings in Europe, including The Shelbourne Hotel, a timeless landmark in the heart of Dublin. Originally constructed in 1824, the building has played a significant role in the literary, social, political, culinary and artistic traditions of Irish society for nearly two centuries. Following our acquisition of the hotel in 2014, we implemented a long-term value-add asset management program with the aim of refurbishing the entire hotel while maintaining and protecting the building’s original Georgian features. In 2016, we began carrying out significant refurbishments to the exterior facade as well as renovating all the suites, adjoining corridors and the lobbies. Our second phase involved extensively renovating the main hotel staircase, a traditional Georgian feature that is central to the building. In 2017, we were awarded the Irish Georgian Society Conservation Award in recognition of our work to preserve and protect one of Dublin’s most valued heritage buildings.
PhilanthropyWe give back through our charitable platform, supporting causes and organizations that produce measurable results and create positive lasting impacts. We are particularly focused on improving lives of children through educational opportunities and quality health care, and supporting our U.S. Armed Forces. Our employees also help steer our annual giving, as Kennedy Wilson often provides additional funding for the non-profit organizations they are passionate about and dedicate their time and resources to support.
Christine Deschaine, Senior Vice President in Kennedy Wilson’s brokerage group, volunteers her time creating new opportunities for children in Uganda.
Bill McMorrow addresses the crowd at a Navy SEAL Foundation event in Beverly Hills, CA.
The iconic Shelbourne Hotel in Dublin, Ireland

22 Kennedy Wilson Annual Report 2017
1
1999
2000
2002
2009
2011
2012
2014
2016
2017
U.S. fund management business launched
Company launches multifamily investment platform
IPO of Kennedy Wilson Japan completed. Lists on Tokyo Stock Exchange.
Kennedy-Wilson Holdings, Inc. (NYSE:KW) goes public. Market cap is $400 million.
Kennedy Wilson Europe established when company acquires Bank of Ireland Real Estate Investment Management
Company sources and participates in the $1.5 billion recapitalization of Bank of Ireland. Company completes purchase of $1.8 billion UK loan portfolio, its first acquisition in Europe.
Company purchases the Alliance multifamily building its first real estate purchase in Ireland
Kennedy Wilson launches Zonda, a mobile app created by wholly owned subsidiary Meyers Research LLC
Kennedy Wilson launches the £1 billion ($1.7 billion) IPO of Kennedy Wilson Europe Real Estate Plc (LSE:KWE)
The second largest real estate IPO in the history of the London Stock Exchange
Company has over $1.7 billion in capital development projects, including Capital Dock in Dublin, Ireland
Since going public, Kennedy Wilson and its partners complete over $18 billion in acquisitions. Company’s global multifamily portfolio surpasses 26,000 units.
Kennedy Wilson completes merger with Kennedy Wilson Europe Real Estate Plc (LSE:KWE)
The merger creates a leading global real estate investment company with an enterprise value of $8 billion.
GL
OB
AL
TE
AM
1977
1
1988
1993
1995
1998
-9
9Kennedy Wilson founded as a real estate auction company
Kennedy Wilson purchased by William McMorrow & Partners
The company has 11 employees in one office. Auction marketing evolves into global business with high end property sales.
First commercial investment
520 Broadway in Santa Monica, CA acquired
Commercial brokerage business launches with a focus on high value properties
Kennedy Wilson acquires Heitman Properties, LTD. and six other real estate service companies to provide property management, leasing and construction management
Company also launches acquisition platform in Japan by acquiring Kawasaki Tech Center
OF
FIC
E

One cohesive team. Drive growth. Deliver
value. Flexible. Invest in communities. Adaptable.
Industry veterans. Strong.Global reach. Record results.
Deep industry relationships. 498 employees. 25 offices in seven different countries. Redevelopment. Refurbishment. New development. $7.0 billion carrying value of real estate. 30-year track record as a global real estate investor. Global business positioned to grow. $439 million in estimated annual NOI – 72% of portfolio multifamily and office.
Entrepreneurial spirit. Regional expertise. Record GAAP net income of $101 million. First mover advantage. Long-term growth. Record Adjusted Net I ncome of $243 m i l l i on . Completed approximately $30 billion in real estate investment transactions since going public in 2009. Unrivaled long-term re lat ionsh ips wi th major institutions. Unlocking value through asset management and leasing. Record Adjusted EBITDA of $456 mill ion. Focus on securing high-quality assets. Global vision. Think creatively. Leveraging our competitive strengths. Global multifamily portfolio of approximately 24,000 units. Sourcing off-market deals. Simplified corporate structure. High margin growth. Well-diversified tenant base. Identifying undervalued markets. Providing new affordable housing to underserved regions. Generating attractive risk-adjusted returns for our shareholders.

Kennedy Wilson Annual Report 2017 27
Financial Report 2017

Kennedy Wilson Annual Report 2017 2726 Kennedy Wilson Annual Report 2017
Company OverviewKennedy Wilson is a global real estate investment company. We own, operate, and invest in real estate both on our own and through our investment management platform. We focus primarily on multifamily and office properties located in the Western U.S., UK, and Ireland. To complement our investment business, the Company also provides real estate services primarily to financial services clients.
Our value is primarily derived from our ownership in income producing real estate assets. We have an ownership interest in approximately 53.1 million square feet of property globally, including 27,161 multifamily rental units and 18.8 million square feet of commercial property. In addition to our core income producing real estate, we engage in development, redevelopment and value add initiatives through which we enhance cash flows or reposition asset to increase sale value. Additionally, our investment management and property services business (“IMRES”) manages approximately $16 billion of IMRES AUM, the majority of which we have an ownership interest in and the balance we manage for third parties.
We have 498 employees in 25 offices throughout the United States, the United Kingdom, Ireland, Jersey, Spain and Japan.
The following is our business model:
• Identify countries and markets with an attractive investment landscape
• Establish operating platforms in our target markets
• Develop local intelligence and create long-lasting relationships, primarily with financial institutions
• Leverage relationships and local knowledge to drive proprietary investment opportunities with a focus on off-market transactions that we expect will result in above average cash flows and returns over the long term
• Acquire high quality assets, either on our own or with strategic partners, utilizing cash from our balance sheet (funded by cash flows from operations, refinancing of current investments, investments sales or the sale of equity or debt securities) and typically financing them on a long-term basis
• Reposition assets to enhance cash flows post-acquisition
• Explore development opportunities on underutilized portions of assets, primarily excess land with little or no basis that is adjacent to income producing properties
• Continuously evaluate and selectively harvest asset and entity value through strategic realizations utilizing both the public and private markets
• Utilize our services businesses to meet client needs, strengthen relationships with financial institutions, and position us as a valuable resource and partner to these institutions for any future real estate opportunities
Business
27 Business
37 Selected Financial Data
39 Management’s Discussion and Analysis of Financial Condition and Results of Operations
72 Report of Independent Registered Public Accounting Firm
74 Consolidated Balance Sheets
75 Consolidated Statements of Operations
76 Consolidated Statements of Comprehensive Income
77 Consolidated Statements of Equity
79 Consolidated Statements of Cash Flows
8 1 Notes to Consolidated Financial Statements
124 Performance Graph
125 Market for Registrant’s Common Equity, Related Stockholder Matters and Issuer Purchases of Equity Securities
126 Forward-Looking Statements
127 Reconciliation of Non-GAAP Measures
Financial ReportTable of Contents

28 Kennedy Wilson Annual Report 2017 Kennedy Wilson Annual Report 2017 29
The table below highlights some of the Company’s performance metrics over the past five years:
Year Ended December 31,
(In millions, except per share amounts) 2017 2016 2015 2014 2013Statements of operations data and dividends:Revenue $ 810.6 $ 703.4 $ 603.7 $ 398.6 $ 123.1Net income (loss) to Kennedy-Wilson Holdings Inc. common shareholders(1) 100.5 2.8 71.1 13.8 (14.5)Basic income (loss) per share 0.83 0.01 0.66 0.14 (0.21)Dividends declared per share of common stock 0.70 0.56 0.48 0.36 0.28Adjusted EBITDA(2) 455.7 349.9 371.2 317.8 159.1Adjusted EBITDA annual increase (decrease) 30% (6)% 17% 100%Adjusted Net Income(2) 242.5 191.3 208.2 133.7 61.1
Adjusted Net Income annual increase (decrease) 27% (8)% 56% 119%Adjusted Fees(2) 86.6 108.9 158.2 121.0 72.4Adjusted Fees annual (decrease) increase (20)% (31)% 31% 67%
As of December 31,
2017 2016 2015 2014 2013Balance sheet data:Cash and cash equivalents $ 351.3 $ 885.7 $ 731.6 $ 937.7 $ 178.2Total assets 7,724.8 7,656.6 7,595.6 6,297.6 1,786.8Mortgage debt 3,156.6 2,770.4 2,772.5 2,175.7 400.2KW unsecured debt 1,179.4 934.1 688.8 813.1 438.6KWE unsecured bonds 1,325.9 1,185.7 855.0 — —Kennedy Wilson equity 1,365.6 1,048.0 1,133.8 901.1 768.3Noncontrolling interests 211.9 1,295.1 1,731.3 2,142.8 50.6Total equity 1,577.5 2,343.1 2,865.1 3,043.9 818.9Common shares outstanding 151.6 115.7 114.5 96.1 82.6( 1) GAAP Net Income to Common Shareholders for the year ended December 31, 2017, includes a one-time tax benefit of $44.8 million that was recorded in the quarter
ended December 31, 2017, or $0.38 per share.( 2) See Non-GAAP Measures and Certain Definitions and “Management’s Discussion and Analysis of Financial Condition and Results of Operations-Non-GAAP measures”
for a description of Adjusted EBITDA and adjusted fees and a reconciliation of these metrics to net income as reported under GAAP.
Our segments have a symbiotic relationship and work closely together. IMRES plays a critical role in supporting our investment strategy by providing local market intelligence and real-time data for evaluating investments, generating proprietary transaction flow and creating value through efficient implementation of asset management or repositioning strategies. KW Investments provides clients the ability to utilize the capabilities of IMRES.
KW InvestmentsWe invest our capital in real estate assets and loans secured by real estate either on our own or through our investment management platform. When we have partners, we are typically the general partner in the arrangement with a promoted interest in the profits of our investments beyond our ownership percentage. The Company has an average ownership interest across all investments of approximately 62% as of December 31, 2017. Our equity partners include, financial institutions, foundations, endowments, high net worth individuals and other institutional investors. We typically act as asset managers on our investments and generally will outsource the day to day property management to third parties.
During the year ended December 31, 2017, together with our equity partners, we acquired $1.3 billion of real estate at purchase price. These acquisitions were comprised of the following: 61% multifamily, 31% office, 4% retail and 4% residential and other.
The following are product types we invest in through the KW Investments segment:
Multifamily—We pursue multifamily acquisition opportunities where we believe we can unlock value through a myriad of strategies, including institutional management, asset rehabilitation, repositioning and creative recapitalization. We focus primarily on apartments in supply-constrained, infill markets. Additionally, through our Vintage Housing Holdings (“VHH”) partnership, we also utilize low-income housing tax credit (“LIHTC”) structures for income and age restricted properties.
As of December 31, 2017, we hold investments in 27,161 multifamily apartment units across 102 properties primarily located in the Western United States, Ireland and United Kingdom. Within our Western United States portfolio 54% is located in the Pacific Northwest primarily in suburbs of Seattle and Portland. The rest of the Western Unites States portfolio is in Northern and Southern California and the Mountain States region of Utah and Idaho.
Commercial—As of December 31, 2017, we hold investments in 227 commercial properties, totaling over 18.8 million square feet, predominately in the United Kingdom and Ireland with additional investments in Italy, the Pacific Northwest and Southern California.
We acquire office buildings that typically have value-add opportunities that can benefit from our asset management expertise. After acquisition, the properties are generally repositioned to enhance market value. Assets are either sold as part of property-specific investment strategies designed to deliver above-market returns to our clients and shareholders or held if producing above average cash flows.
Our retail portfolio has different characteristics based on the geographic markets the properties are located in. In Europe we have a mixture of high street retail, suburban shopping centers and leisure assets which are mainly located in the United Kingdom as well as Dublin and Madrid. In our Western United States retail portfolio we invest in shopping centers that are generally grocery anchored.
Our industrial portfolio is mainly distribution centers located in the United Kingdom.
Hotel—We acquire hotels in certain opportunistic situations in which we are able to purchase at a discount to replacement cost or can implement our value-add investment approach. As of December 31, 2017, we own 6 hotels with 1,124 hotel rooms located in Ireland, the United Kingdom, Northern California, and the Mountain States.
Residential, Loan and Other—In certain cases, we may pursue for sale housing acquisition opportunities, including land for entitlements, finished lots, urban infill housing sites and partially finished and finished housing projects. On certain income-producing acquisitions, there are adjacent land parcels to which we assign little or no basis and for which we may pursue entitlement activities or, in some cases, development or re-development opportunities.
We acquire and/or originate loans secured by real estate. Our acquisitions and originations include individual notes on all real estate property types as well as portfolios of loans purchased from financial institutions, corporations and government agencies. We deliver value through loan resolutions, discounted payoffs, and sales. We also convert certain loans into a direct ownership in the underlying real estate collateral.
Our loan investment portfolio is principally related to loans acquired at a discount from their contractual balance due as a result of deteriorated credit quality of the
KWE TransactionOn October 20, 2017, the Company purchased the remaining 76% of KWE shares it did not previously own for $1.4 billion, which represented a discount of approximately $260 million to the original value of the shares when issued. As part of the acquisition consideration, the Company issued 37.2 million shares of common stock valued at $722.2 million. Due to KWE’s previous consolidation by the Company, the carrying value of the remaining 76% non-controlling interest in KWE was $1.1 billion, which included the cumulative effects of depreciation and foreign currency losses. As a result of paying a premium above carrying value, Kennedy-Wilson Holdings, Inc. shareholders’ equity only increased by $322.4 million. Prior to the acquisition, Kennedy Wilson owned 24% of the share capital of KWE and all results presented below are based on this ownership amount up through the closing of the transaction.
Business SegmentsOur operations are defined by two core business units: KW Investments and KW Investment Management and Real Estate Services (IMRES).
• KW Investments invests our capital in real estate-related assets.
• IMRES encompasses our fee-generating businesses and includes both our investment management platform as well as our third-party services business. These businesses offer a comprehensive line of real estate services for the full lifecycle of real estate ownership to clients that include financial institutions, institutional investors, insurance companies, developers, builders and government agencies and included shareholders of KWE prior to the closing of the KWE Transaction. IMRES has five main lines of business: investment management, property services, research, brokerage, and auction and conventional sales.
Business (continued)

30 Kennedy Wilson Annual Report 2017 Kennedy Wilson Annual Report 2017 31
borrower. Such loans are underwritten by us based on the value of the underlying real estate collateral. Due to the discounted purchase price, we seek and are generally able to accomplish near term realization of the loan in a cash settlement or by obtaining title to the property. Accordingly, the credit quality of the borrower is not of substantial importance to our evaluation of the risk of recovery from the investment.
This group also includes our investment in liquid non-real estate investments which include marketable securities, investment funds that hold marketable securities and private equity investments.
As of December 31, 2017, we hold 25 investments which is comprised of 470 residential units/lots, 4,005 acres, and 13 unresolved loans with a gross asset value of $290.1 million.
KW Investment Management and Real Estate Services (IMRES)IMRES includes both our investment management platform as well as our third-party services business and offers a comprehensive line of real estate services for the full lifecycle of real estate ownership to clients that include financial institutions, institutional investors, insurance companies, developers, builders and government agencies and included shareholders of KWE prior to the KWE Transaction. IMRES has five main lines of business: investment management, property services, research, brokerage, and auction and conventional sales. These five business lines generate revenue for us through fees and commissions.
We manage approximately 53.1 million square feet of properties for the Company and its investment partners in the United States, Europe, and Asia, which includes assets we have ownership interests in and third party owned assets. With 25 offices throughout the United States, the United Kingdom, Ireland, Jersey, Spain and Japan, we have the capabilities and resources to provide property services to real estate owners as well as the experience, as a real estate investor, to understand client concerns. The managers of IMRES have an extensive track record in their respective lines of business and in the real estate community as a whole. Their knowledge and relationships are an excellent driver of business through the services business as well as on the investment front.
Additionally, IMRES plays a critical role in supporting our investment strategy by providing local market intelligence and real-time data for evaluating investments, generating
proprietary transaction flow and creating value through efficient implementation of asset management or repositioning strategies.
Investment Management—Our investment management platform utilizes a number of different investment vehicles for which we provide acquisition, asset management and financing, and other investment-related services, and typically includes a co-investment from us. We usually provide investment management services on our consolidated investment portfolio as well as investments with strategic partners many of whom have separate account agreements with us. Through our fund management business we have three closed end funds for which we seek to generate attractive, risk adjusted returns.
Commingled funds—We have three closed end funds that we manage and receive investment management fees. Most recently, we completed fund-raising for our fifth value-add fund, Kennedy Wilson Fund V (“Fund V”), a $500 million private fund targeting the Western U.S. We are the largest investor in the fund with a 12% interest. As of December 31, 2017 Fund V had a portfolio of 18 investments with an aggregate purchase price of $1.0 billion. While we have historically focused on sourcing investors and investments in the U.S. with respect to our commingled funds, we are exploring the possibilities of expanding the business to Europe.
Separate accounts—We have a few strategic equity partners that have separate account agreements with us. As part of the agreement we act as the general partner and receive investment management fees including potential performance fees.
KWE—Prior to the KWE Transaction that was completed in the fourth quarter of 2017, we externally managed KWE through one of our wholly-owned subsidiaries, whom we refer to as KWE Manager, pursuant to an investment management agreement whereby we were entitled to receive certain management and performance fees.
Property Services—This division manages or advises on office, retail and residential real estate for third-party clients, fund investors, and investments held by Kennedy Wilson. In addition to earning property management fees, consulting fees, lease commissions, construction management fees, disposition fees, and accounting fees, the Property Services group gives us insight into local markets and potential acquisitions. This group previously included our Spanish loan servicing platform which managed an
IMRES AUM of $1.6 billion. This platform was sold in October 2017.
Research—Meyers Research LLC (“Meyers”), a Kennedy Wilson company, is a premier real estate consulting practice and provider of data and analytics for the residential real estate development and new home construction industry. Meyers’ offers a national perspective as well as local expertise to homebuilders, multifamily developers, lenders and financial institutions. These relationships have led to investment opportunities with homebuilders in the Western U.S. region. We believe that Zonda™, a Meyers innovation, is the housing industry’s most comprehensive solution for smart business analysis, real-time market data reporting and economic and housing data in one place and on-the-go. The Company has hired an adviser and is currently exploring strategic options for this business.
Brokerage—Our brokerage division represents tenants and landlords on every aspect of site selection, negotiation and occupancy. The division also specializes in innovative marketing programs tailored to client objectives for all types of investment grade and income producing real estate. The division’s property marketing programs combine proven techniques with its detailed market knowledge to create optimum results.
Auction and Conventional Sales—Kennedy Wilson was founded in 1977 as a real estate auction business and has since grown into a vertically integrated international real estate firm. The auction and conventional sales division provides innovative marketing and sales strategies for all types of commercial and residential real estate, including single family homes, mixed-use developments, estate homes, multifamily dwellings, new home projects, and conversions. Generally, the division’s auction sales business is countercyclical to the traditional sales real estate market and has been a bellwether for us in forecasting market conditions.
Kennedy Wilson Europe Real Estate Plc (LSE: KWE)Prior to the KWE Transaction that was completed during the fourth quarter of 2017, KWE was externally managed by one of our wholly-owned subsidiaries, KWE Manager pursuant to an investment management agreement whereby we were entitled to receive certain management and performance fees. KWE Manager was entitled to an annual management fee (payable quarterly in arrears) equal to 1% of KWE’s adjusted net asset value and certain performance fees. The management fee payable to KWE Manager was paid half in cash and half in shares of KWE. The management fee for the second quarter of 2017 was paid fully in cash from KWE.
During year ended December 31, 2017, KWH earned $16.0 million in management fees from KWE.
Due to the terms of the investment management agreement and Kennedy Wilson’s equity ownership interest in KWE, pursuant to the guidance set forth in FASB Accounting Standards Codification Subtopic 810 - Consolidation (“Subtopic 810”), the results and financial position of KWE are consolidated in our financial statements. As such, fees earned by KWE Manager were eliminated in the attached consolidated financial statements. Compensation and certain general and administrative expenses relating to KWE were borne by Kennedy Wilson as employees of the Company worked on behalf of KWE Manager.
Value CreationKennedy Wilson’s differentiated and unique approach to investing is the cornerstone of how we create value for our shareholders. Our investment philosophy is based on three core fundamentals:
• Leverage our global footprint and complementary investments and services businesses to identify attractive investment markets across the world.
• Selectively invest in opportunities across many real estate product types with a goal of maximizing cash flow and return on capital.
• Actively manage assets and finance them conservatively in a manner designed to generate stable, predictable and growing cash flows for shareholders and clients.
Kennedy Wilson is able to create value for its shareholders in the following ways:
• We are able to identify and acquire attractive real estate assets across many markets, in part due to the significant proprietary deal flow driven from an established global network of industry relationships, particularly with financial institutions. This can create value by allowing us to maintain and develop a large pipeline of attractive opportunities.
• Our operating expertise allows us to focus on opportunistic investments where we believe we can increase the value of assets and cash flows, such as distressed real estate owners or lenders seeking liquidity, under-managed or under-leased assets, and repositioning opportunities.
• Many times, these investments are acquired at a discount to replacement cost or recent comparative
Business (continued)

32 Kennedy Wilson Annual Report 2017 Kennedy Wilson Annual Report 2017 33
sales, thereby offering opportunities to achieve above average total returns. In many cases, this may lead to significant additional returns, such as a promoted interest, based on the performance of the assets.
• In many instances, our long-lasting and deep relationships with financial institutions allow us to refinance loans to reduce interest rates and/or increase borrowings due to property appreciation and thereby obtain cash flow to use for new investments. We generally implement this strategy after our value add initiatives have been executed, thus allowing us to maintain moderate levels of leverage.
• KW Investment Management and Real Estate Services (IMRES) plays a critical role in supporting our investment strategy by providing local market intelligence and real-time data for evaluating investments, generating proprietary transaction flow and creating value through efficient implementation of asset management or repositioning strategies.
• We understand that real estate is cyclical. Our management team employs a multi-cyclical approach that has resulted in our IMRES AUM being globally diversified across many sectors of real estate while maintaining a healthy liquidity position and adequate access to capital.
Competitive StrengthsWe have a unique platform from which to execute our investment and services strategy. The combination of an investment platform and a service business provides several competitive strengths when compared to other real estate buyers operating stand-alone or investment-focused firms and may allow us to generate superior risk-adjusted returns. Our investment strategy focuses on investments that offer significant appreciation potential through intensive property management, leasing, repositioning, redevelopment and the opportunistic use of capital. We differentiate ourselves from other firms in the industry with our full service, investment oriented structure. Whereas most other firms use an investment platform to obtain additional service business revenue, we use our service platform to enhance the investment process and ensure the alignment of interests with our investors.
Our competitive strengths include:
• Transaction experience: Our Executive Committee has more than 125 years of combined real estate experience and has been working and investing together on average for over 15 years. Members of the Executive Committee
have collectively acquired, developed and managed in excess of $20 billion of real estate investments in the United States, the United Kingdom, Ireland, Spain, Italy and Japan throughout various economic cycles, both at our Company and throughout their careers.
• Extensive relationship and sourcing network: We leverage our services business in order to source off-market deals. In addition, the Executive Committee and our acquisition team have transacted deals in nearly every major metropolitan market on the West Coast of the United States, as well as in the United Kingdom, Ireland, Spain, Italy and Japan. Their local presence and reputation in these markets have enabled them to cultivate key relationships with major holders of property inventory, in particularly financial institutions, throughout the real estate community.
• Structuring expertise and speed of execution: Prior acquisitions completed by us have taken a variety of forms, including direct property investments, joint ventures, exchanges involving stock or operating partnership units, participating loans and investments in performing and non-performing mortgages at various capital stock positions with the objective of long-term ownership. We believe we have developed a reputation of being able to quickly execute, as well as originate and creatively structure acquisitions, dispositions and financing transactions.
• Vertically integrated platform for operational enhancement: We have over 498 employees in both KW Investments and IMRES, with 25 offices throughout the United States, the United Kingdom, Ireland, Spain, Jersey and Japan. We have a hands-on approach to real estate investing and possess the local expertise in property management, leasing, construction management, development and investment sales, which we believe enable us to invest successfully in selected submarkets.
• Risk protection and investment discipline: We underwrite our investments based upon a thorough examination of property economics and a critical understanding of market dynamics and risk management strategies. We conduct an in-depth sensitivity analysis on each of our acquisitions. This analysis applies various economic scenarios that include changes to rental rates, absorption periods, operating expenses, interest rates, exit values and holding periods. We use this analysis to develop our disciplined acquisition strategies.
• Management’s alignment with shareholders: As of December 31, 2017 our directors and executive officers
and their respective affiliates owned an aggregate of approximately 13% of the outstanding shares of our common stock. Due to management team’s ownership interest in the Company its interests are in alignment with common shareholders of the Company.
The real estate business is cyclical. Real estate cycles are generally impacted by many factors, including availability of equity and debt capital, borrowing cost, rent levels, and asset values. Our strategy has resulted in a strong track record of creating both asset and entity value for the benefit of our shareholders and partners over these various real estate cycles.
Industry Overview
Key Investment Markets
Western United StatesThe U.S. real estate market continued to improve in 2017. Real estate prices were supported by a strong U.S. job market, rise in household wealth, and historically low interest rates. The global pursuit of yield coupled with a strong U.S. economy resulted in the continued investment by foreign investors into U.S. income-producing real estate.
The outlook for 2018 sustains positive momentum with some uncertainty around rising interest rates. The tax reform measures passed at the end of 2017 could stimulate occupier demand through lower corporate taxes. Housing shortages remain in the more desirable markets. Interest rates began to rise near the end of 2017, with the 10-year bond yield surpassing 2.75% for the first time since 2014. The future direction of interest rates will play a large role in how real estate ultimately performs in 2018. However, we believe the long-term fundamentals of the U.S. real estate market are still positive, although our outlook has moderated slightly from a year ago. As usual, we remain selective on new acquisitions, focusing on key high growth markets while continuing to take advantage of the current strong demand for real estate.
United KingdomDespite the uncertain political outlook following the United Kingdom general election and the ongoing Brexit negotiations, the United Kingdom investment market has seen a rebound in transaction volumes as the market remains attractive to a wide range of investors, both domestic and overseas. Investment activity in 2017 was strong and demand for office properties in Central London is expected to remain high. Beyond Central London, office investment activity in the south east was also robust in 2017, with transactions levels during the year are expected to surpass
2016’s total. Overall, United Kingdom investment demand remains strong for prime core office assets and long-dated leases, which we have seen across our own portfolio.
The industrial sector continues to be a star performer, underpinned by strong demand coupled with supply constraints, as it benefits from ongoing structural shifts to online retail. Industrial property remains the strongest performing sector across the United Kingdom as a whole, with rental value growth of 5.1% over 2017. Industrial’s outperformance of the wider market is forecast to continue as it offers the most stable returns.
Strong high street investment demand has resulted in 2017 being the strongest year since 2010, with £2.1 billion transacted outside of Central London. Strong private investor demand was a large contributor and we continue to see this in our own high street portfolio and this is expected to continue in 2018 with demand outstripping supply. While consumer confidence has been hit, a relatively weaker pound will continue to draw overseas tourists and many United Kingdom residents will opt to spend their holidays in the United Kingdom and spend more locally.
IrelandDublin office take-up reached a peak 3.6 million square feet in 2017 as occupational demand primarily came from expansion and relocation from existing occupiers and Brexit adding an additional layer of demand. With 237 letting deals completed in 2017, year-on-year leasing activity volume from United Kingdom occupiers more than doubled. Dublin suburbs claimed 29% of total take-up, or 1.1 million square feet and where we expected to benefit from our own South Dublin exposure at The Chase and Blackrock Business Park. At The Chase, this was delivered in the first quarter of 2018 where we leased-up the remaining vacant space.
The Dublin multifamily market remains a strong performer. The Dublin residential sector saw year-on-year rental growth of 8.1% to Q3-17 to average monthly rent of €1,416, according to the Residential Tenancy Board.
Prime retail rents, driven by Grafton Street Zone A rents, of €585 per square foot are flat year-on-year. With strong Irish economic indicators coupled with solid consumer sentiment, that has now firmly taken hold, the retail sales index continues its upward trajectory, up 7.2% year-on-year, according to the Central Statistics Office of Ireland (“CSO”). Dublin is on the radar for international retailers looking to grow their European portfolios with strong demand for prime high street and retail schemes.
Business (continued)

34 Kennedy Wilson Annual Report 2017 Kennedy Wilson Annual Report 2017 35
Ireland’s buoyant tourism reached more than 10.6 million visitors last year, a figure expected to increase going forward when direct flights to several new destinations in the United States and China commence. The CSO reports that Dublin Airport passenger arrivals continue to hit new peaks of 1.24 million A decline in the sterling has resulted in reduced United Kingdom visitors but this was more than offset by a double-digit increase in United States visitors in 2017.
Other Smaller Investment Markets
Spain and ItalyRetail investment volumes reached €3.5 billion in 2017 in Spain, with prime retail yields remaining at historic lows owing to strong levels of institutional demand. Positive consumer confidence is providing momentum to stronger retail sales and footfall improvements. This is partly underpinned by a strong pickup in tourism of 9% year-on-year, making Spain the second most visited in the world. This strong retail activity continues to fuel our retail portfolio, where we are seeing positive signs across high street retail occupational and investment markets in central Madrid. Against this backdrop, current rents continue to sit significantly below prior cycles, with prime Madrid high street retail rental growth of 5.1% year-on-year and we expect a healthy level of rental increases across the retail sector as a whole in the near- to medium-term.
Political uncertainty remains fluid in Italy with its election in March, the expectation is for a hung parliament and/or grand-coalition type government. The Italian commercial real estate market continues to witness robust levels of investment activity. Total 2017 transaction volumes reached €10 billion, driven by high investor appetite for core assets, which have driven yields lower. Supply remains constrained, with limited development but an increased focus on refurbishments in key locations. Milan office take-up was almost 4 million square feet over 2017, in line with the record result of 2015. Increasing occupier demand in the CBD has driven prime rents to €51 per square foot, an increase of 10% year-on-year and a level not seen since 2009.
CompetitionWe compete with a range of global, national and local real estate firms, individual investors and other corporations, both private and public. Because of our unique mix of investments and services businesses, we compete with companies that invest in real estate and loans secured by real estate along with brokerage and property management
companies. Our investment business competes with real estate investment partnerships, real estate investments trusts, private equity firms and other investment companies and regional investors and developers. We believe that our relationships with the sellers and our ability to close an investment transaction in a short time period at competitive pricing provide us a competitive advantage. The real estate services business is both highly fragmented and competitive. We compete with real estate brokerage and auction companies on the basis of our relationship with property owners, quality of service, and commissions charged. We compete with property management and leasing firms also on the basis of our relationship with clients, the range and quality of services provided, and fees and commissions charged.
Foreign CurrencyApproximately 49% of our investment account is invested through our foreign platforms in their local currencies. Investment level debt is generally incurred in local currencies and we consider our equity investment as the appropriate exposure to evaluate for hedging purposes. Fluctuations in foreign exchanges rates may have a significant impact on the results of our operations. In order to manage the effect of these fluctuations, we generally hedge our book equity exposure to foreign currencies through currency forward contracts and options. Please refer to Item 7. Management’s Discussion and Analysis of Financial Condition and Results of Operation for a discussion regarding foreign currency and currency derivative instruments.
Transaction-based ResultsA significant portion of our cash flow is tied to transaction activity which can affect an investor’s ability to compare our financial condition and results of operations on a quarter-by-quarter basis or to easily evaluate the breadth of our operation. Historically, this variability has caused our revenue, operating income, net income and cash flows to be tied to transaction activity, which is not necessarily concentrated in any one quarter.
EmployeesAs of December 31, 2017, we have over 498 employees in 25 offices throughout the United States, the United Kingdom, Ireland, Spain, Jersey and Japan. We believe that we have been able to attract and maintain high quality employees. There are no employees subject to collective bargaining agreements. In addition, we believe we have a good relationship with our employees.
Available InformationInformation about us is available on our website (http://www.kennedywilson.com) (this website address is not intended to function as a hyperlink, and the information contained in, or accessible from, our website is not intended to be a part of this filing). We make available on our website, free of charge, copies of our Annual Report on Form 10-K, Quarterly Reports on Form 10-Q, Current Reports on Form 8-K, Proxy Statements on Schedule 14A and amendments to those reports and other statements filed or furnished pursuant to Section 13(a), 14 or 15(d) of the Securities Exchange Act of 1934, as amended, as soon as reasonably practicable after filing or submitting such material electronically or otherwise furnishing it to the SEC. In addition, we have previously filed registration statements and other documents with the SEC. Any document we file may be inspected, without charge, at the SEC’s public reference room at 100 F Street NE, Washington, D.C. 20549 or at the SEC’s internet address at http://www.sec.gov (this website address is not intended to function as a hyperlink, and the information contained in, or accessible from, the SEC’s website is not intended to be a part of this filing). Information related to the operation of the SEC’s public reference room may be obtained by calling the SEC at 1-800-SEC-0330.
Non-GAAP Measures and Certain Definitions “KWH,” “KW,” “Kennedy Wilson,” the “Company,” “we,” “our,” or “us” refers to Kennedy-Wilson Holdings, Inc. and its wholly-owned subsidiaries. The consolidated financial statements of the Company include the results of the Company’s consolidated subsidiaries.
“KWE” refers to Kennedy Wilson Europe Real Estate plc, which was a London Stock Exchange-listed company that we externally managed through a wholly-owned subsidiary. On October 20, 2017 we acquired KWE, which is now a wholly-owned subsidiary. Prior to the acquisition, we owned approximately 24% and in accordance with U.S. GAAP, the results of KWE were consolidated in our financial statements due to our role as asset manager.
“Acquisition-related gains” consist of non-cash gains recognized by the Company or its consolidated subsidiaries upon a GAAP -required fair value measurement due to a business combination. These gains are typically recognized when a loan is converted into consolidated real estate owned and the fair value of the underlying real estate at the time of conversion exceeds the basis in the previously held loan. These gains also arise when there is a change of control of an investment. The gain amount is based upon the fair value of the Company’s or its consolidated subsidiaries’
equity in the investment in excess of the carrying amount of the equity immediately preceding the change of control.
“Adjusted EBITDA” represents net income before interest expense, our share of interest expense included in income from investments in unconsolidated investments, depreciation and amortization, our share of depreciation and amortization included in income from unconsolidated investments, early extinguishment of corporate debt, provision for (benefit from) income taxes, share-based compensation expense for the Company and EBITDA attributable to noncontrolling interests. Please also see “Management’s Discussion and Analysis of Financial Condition and Results of Operations - Non-GAAP measures” for a reconciliation of Adjusted EBITDA to net income as reported under GAAP. Our management uses Adjusted EBITDA to analyze our business because it adjusts net income for items we believe do not accurately reflect the nature of our business going forward or that relate to non-cash compensation expense or noncontrolling interests. Such items may vary for different companies for reasons unrelated to overall operating performance. Additionally, we believe Adjusted EBITDA is useful to investors to assist them in getting a more accurate picture of our results from operations. However, Adjusted EBITDA is not a recognized measurement under GAAP and when analyzing our operating performance, readers should use Adjusted EBITDA in addition to, and not as an alternative for, net income as determined in accordance with GAAP. Because not all companies use identical calculations, our presentation of Adjusted EBITDA may not be comparable to similarly titled measures of other companies. Furthermore, Adjusted EBITDA is not intended to be a measure of free cash flow for our management’s discretionary use, as it does not remove all non-cash items (such as acquisition-related gains) or consider certain cash requirements such as tax and debt service payments. The amount shown for Adjusted EBITDA also differs from the amount calculated under similarly titled definitions in our debt instruments, which are further adjusted to reflect certain other cash and non-cash charges and are used to determine compliance with financial covenants and our ability to engage in certain activities, such as incurring additional debt and making certain restricted payments.
“Adjusted fees’’ refers to Kennedy Wilson’s gross investment management, property services and research fees adjusted to include fees eliminated in consolidation and Kennedy Wilson’s share of fees in unconsolidated service businesses. Our management uses Adjusted fees to analyze our investment management and real estate services business because the measure removes required eliminations under GAAP for properties in which the Company provides services but also
Business (continued)

36 Kennedy Wilson Annual Report 2017 Kennedy Wilson Annual Report 2017 37
has an ownership interest. These eliminations understate the economic value of the investment management, property services and research fees and makes the Company comparable to other real estate companies that provide investment management and real estate services but do not have an ownership interest in the properties they manage. Our management believes that adjusting GAAP fees to reflect these amounts eliminated in consolidation presents a more holistic measure of the scope of our investment management and real estate services business. Please also see “Management’s Discussion and Analysis of Financial Condition and Results of Operations - Non-GAAP measures” for a reconciliation of Adjusted Fees to its closest comparable GAAP measure.
“Adjusted Net Income” represents net income before depreciation and amortization, our share of depreciation and amortization included in income from unconsolidated investments, share-based compensation, the tax impact of the recently enacted tax reform and net income attributable to noncontrolling interests, before depreciation and amortization. Please also see “Management’s Discussion and Analysis of Financial Condition and Results of Operations - Non-GAAP measures” for a reconciliation of Adjusted Income to net income as reported under GAAP.
“Consolidated investment account” refers to the sum of Kennedy Wilson’s equity in: cash held by consolidated investments, consolidated real estate and acquired in-place leases gross of accumulated depreciation and amortization, net hedge asset or liability, unconsolidated investments, consolidated loans, and net other assets.
“Equity partners” refers to non-wholly-owned subsidiaries that we consolidate in our financial statements under U.S. GAAP and third party equity providers.
“Gross Asset Value” refers to the gross carrying value of assets, before debt, depreciation and amortization, and net of noncontrolling interests.
“Investment account” refers to the consolidated investment account presented after noncontrolling interest on invested assets gross of accumulated depreciation and amortization.
“Investment Management and Real Estate Services Assets under Management” (“IMRES AUM”) generally refers to
Selected Financial Data
The following tables summarize our selected historical consolidated financial information. This information was derived from our audited financial statements for each of the years ended December 31, 2017, 2016, 2015, 2014 and 2013. This information is only a summary. You should read this information together in conjunction with “Management’s Discussion and Analysis of Financial Condition and Results of Operations” and the financial statements and related notes included elsewhere in this document.
Year Ended December 31,
(In millions, except per share amounts) 2017 2016 2015 2014 2013Statements of operations data and dividends:Revenue $ 810.6 $ 703.4 $ 603.7 $ 398.6 $ 123.1Net income (loss) to Kennedy-Wilson Holdings Inc. common shareholders(1) 100.5 2.8 71.1 13.8 (14.5)
Basic income (loss) per share 0.83 0.01 0.66 0.14 (0.21)
Dividends declared per share of common stock 0.70 0.56 0.48 0.36 0.28
Adjusted EBITDA(2) 455.7 349.9 371.2 317.8 159.1
Adjusted EBITDA annual increase (decrease) 30% (6)% 17% 100%
Adjusted Net Income(2) 242.5 191.3 208.2 133.7 61.1
Adjusted Net Income annual increase (decrease) 26.8% (8.1)% 55.7% 118.8%
Adjusted Fees(2) 86.6 108.9 158.2 121.0 72.4
Adjusted Fees annual (decrease) increase (20)% (31)% 31% 67%
As of December 31,
2017 2016 2015 2014 2013Balance sheet data:
Cash and cash equivalents $ 351.3 $ 885.7 $ 731.6 $ 937.7 $ 178.2
Total assets 7,724.8 7,656.6 7,595.6 6,297.6 1,786.8
Mortgage debt 3,156.6 2,770.4 2,772.5 2,175.7 400.2
KW unsecured debt 1,179.4 934.1 688.8 813.1 438.6
KWE unsecured bonds 1,325.9 1,185.7 855.0 — —
Kennedy Wilson equity 1,365.6 1,048.0 1,133.8 901.1 768.3
Noncontrolling interests 211.9 1,295.1 1,731.3 2,142.8 50.6
Total equity 1,577.5 2,343.1 2,865.1 3,043.9 818.9
Common shares outstanding 151.6 115.7 114.5 96.1 82.6
( 1) GAAP Net Income to Common Shareholders for the year ended December 31, 2017, includes a one-time tax benefit of $44.8 million that was recorded in the quarter ended December 31, 2017, or $0.38 per share.
( 2) See Non-GAAP Measures and Certain Definitions and “Management’s Discussion and Analysis of Financial Condition and Results of Operations-Non-GAAP measures” for a description of Adjusted EBITDA, Adjusted Net Income and Adjusted fees and a reconciliation of these metrics to net income as reported under GAAP.
Due to our significant acquisition activity, the periods presented above may not be comparable. See Note 4 in our Notes to the Consolidated Financial Statements for discussion of the business combinations that occurred during the years ended December 31, 2017 and 2016.
Business (continued)
the properties and other assets with respect to which we provide (or participate in) oversight, investment management services and other advice, and which generally consist of real estate properties or loans, and investments in joint ventures. Our IMRES AUM is principally intended to reflect the extent of our presence in the real estate market, not the basis for determining our management fees. Our IMRES AUM consists of the total estimated fair value of the real estate properties and other real estate related assets either owned by third parties, wholly owned by us or held by joint ventures and other entities in which our sponsored funds or investment vehicles and client accounts have invested. Committed (but unfunded) capital from investors in our sponsored funds is not included in our IMRES AUM. The estimated value of development properties is included at estimated completion cost.
“Net operating income” or “NOI” is a non-GAAP measure representing the income produced by a property calculated by deducting operating expenses from operating revenues. Our management uses net operating income to assess and compare the performance of our properties and to estimate their fair value. Net operating income does not include the effects of depreciation or amortization or gains or losses from the sale of properties because the effects of those items do not necessarily represent the actual change in the value of our properties resulting from our value-add initiatives or changing market conditions. Our management believes that net operating income reflects the core revenues and costs of operating our properties and is better suited to evaluate trends in occupancy and lease rates.
“Noncontrolling interests” represents the portion of equity ownership in a consolidated subsidiary not attributable to Kennedy Wilson.
“Same property” refers to properties in which Kennedy Wilson has an ownership interest during the entire span of both periods being compared. The same property information presented throughout this report is shown on a cash basis and excludes non-recurring expenses. This analysis excludes properties that are either under development or undergoing lease up as part of our asset management strategy.

38 Kennedy Wilson Annual Report 2017 Kennedy Wilson Annual Report 2017 39
Investment Management and Real Estate Services Assets under Management IMRES AUMIMRES AUM generally refers to the properties and other assets with respect to which we provide (or participate in) oversight, investment management services and other advice, and which generally consist of real estate properties or loans and investments in joint ventures. Our IMRES AUM is principally intended to reflect the extent of our presence in the real estate market, not the basis for determining our management fees. Our IMRES AUM consists of the total estimated fair value of the real estate properties and other real estate related assets either owned by third parties, wholly owned by us or held by joint ventures and other entities in which our sponsored funds or investment vehicles and client accounts have invested. Committed (but unfunded) capital from investors in our sponsored funds is not included in our IMRES AUM. The estimated value of development properties is included at estimated completion cost.
The table below details the changes in the Company’s IMRES AUM for the twelve months ended December 31, 2017:
(In millions) December 31, 2016 Increases Decreases December 31, 2017IMRES AUM $ 17,171.3 $ 2,380.7 $ (3,822.6) $ 15,729.4
IMRES AUM was approximately $16 billion as of December 31, 2017 as compared to approximately $17 billion at December 31, 2016. The increases are primarily due to new acquisitions and appreciation in the value of investments we own. The decreases are primarily due to sale of a loan servicing platform in Spain, the sale of property management office in the Western United States and fewer assets under management in the property services group.
Foreign currency and currency derivative instrumentsPlease refer to Item 7. Management’s Discussion and Analysis of Financial Condition and Results of Operation for a discussion regarding foreign currency and currency derivative instruments.
Management’s Discussion and Analysis of Financial Condition and Results of Operations
Selected Financial Data (continued)
The following discussion and analysis should be read in conjunction with the financial statements and related notes and the other financial information appearing elsewhere in this report. This discussion and analysis contains forward-looking statements that involve risks, uncertainties and assumptions. See the section title “Forward-Looking Statements” for more information. Actual results could differ materially from those anticipated in the forward-looking statements as a result of many factors, including those discussed in “Risk Factors” and elsewhere in this report.
Unless specifically noted otherwise, as used throughout this Management’s Discussion and Analysis section, “we,” “our,” “us,” “the Company” or “Kennedy Wilson” refers to Kennedy-Wilson Holdings, Inc. and its wholly-owned subsidiaries. “KWE” refers to Kennedy Wilson Europe Real Estate plc, a London Stock Exchange listed company that we previously externally managed through a wholly-owned subsidiary prior to the KWE Acquisition. “Equity partners” refers to the subsidiaries that we consolidate in our financial statements under U.S. GAAP (other than wholly-owned subsidiaries) and third-party equity providers. Please refer to “Non-GAAP Measures and Certain Definitions” for definitions of certain terms used throughout this report.
OverviewKennedy Wilson is a global real estate investment company. We own, operate, and invest in real estate both on our own and through our investment management platform. We focus primarily on multifamily and office properties located in the Western U.S., UK, and Ireland. To complement our investment business, the Company also provides real estate services primarily to financial services clients.
Our value is primarily derived from our ownership in income producing real estate assets. We have an ownership stake in approximately 53.1 million square feet of property globally, including 27,161 multifamily rental units. In addition to our core income producing real estate, we engage in redevelopment and value add initiatives through which we enhance cashflows or reposition asset to increase disposal value. Additionally, our investment management and property services business manages approximately $16 billion of IMRES AUM the majority of which we have an ownership stake in and the balance we manage for third parties.
We have 498 employees in 25 offices throughout the United States, the United Kingdom, Ireland, Jersey, Spain, and Japan.
Our operations are defined by two core business segments, KW Investments and KW Investment Management and
Real Estate Services (IMRES), which work closely together to identify attractive investment markets and opportunities around the world.
Financial Measures and DescriptionsOur key financial measures and indicators are discussed below. Please refer to the critical accounting policies in the Notes to the Consolidated Financial Statements for additional detail regarding the GAAP recognition policies associated with the captions described below.
RevenuesRental income—rental income is comprised of rental revenue earned by our consolidated real estate investments.
Hotel income—hotel income is comprised of hotel revenue earned by our consolidated hotels.
Sale of real estate—sales of real estate consists of gross sales proceeds received on the sale of consolidated real estate that is not defined as a business by U.S. GAAP. This includes the development project at Capital Dock, the sale of condominium units and undeveloped land.
Investment Management, Property Services and Research Fees—Investment management, property services, and research fees are primarily comprised of base asset management fees, performance based fees, and acquisition fees generated by our investment management division, property management fees generated by our property services division, leasing fees and sales commissions generated by our brokerage and auction divisions, and consulting fees generated by Meyers Research LLC and Zonda™, a Meyers innovation. Fees earned from consolidated investments, for example KWE prior to the KWE Transaction, are eliminated in consolidation with the amount relating to our equity partners being recognized through income attributable to noncontrolling interests.
Loans and other income—Loans and other income is primarily composed of interest income earned on the Company’s loan originations and investments in discounted loan purchases.
ExpensesRental operating expenses—rental operating expenses consists of the operating expenses of our consolidated real estate investments, including items such as property taxes, insurance, maintenance and repairs, utilities, supplies, salaries and management fees.
Hotel operating expenses—hotel operating expenses consists of operating expenses of our consolidated hotel investments,

40 Kennedy Wilson Annual Report 2017 Kennedy Wilson Annual Report 2017 41
including items such as property taxes, insurance, maintenance and repairs, utilities, supplies, salaries and management fees.
Commission and marketing expenses—commission and marketing expenses includes fees paid to third party sales and leasing agents as well as business development costs necessary to generate revenues.
Compensation and related expenses—compensation and related expenses include: (a) employee compensation, comprising of salary, bonus, employer payroll taxes and benefits paid on behalf of employees and (b) share-based compensation associated with the grants of share-based awards.
General and administrative—general and administrative expenses represent administrative costs necessary to run Kennedy Wilson’s businesses and include things such as occupancy and equipment expenses, professional fees, public company costs, travel and related expenses, and communications and information services.
Depreciation and amortization—depreciation and amortization is comprised of depreciation expense which is recognized ratably over the useful life of an asset and amortization expense which primarily consist of the amortization of assets allocated to the value of in-place leases upon acquisition of a consolidated real estate asset.
Non-Operating Income (Expense)Income from unconsolidated investments—Income from unconsolidated investments consists of (a) the Company’s share of income or loss earned on investments in which the Company can exercise significant influence but does not have control, and (b) interest income from unconsolidated loan pool participations.
Acquisition-related gains—Acquisition-related gains consist of non-cash gains recognized by the Company upon a GAAP required fair value remeasurement due to a business combination. These gains are typically recognized with the change of control of an existing investment. The gain amount is based upon the fair value of the Company’s equity in the investment in excess of the carrying amount of the equity directly preceding the change of control or the separately determined fair value of an investment being an excess of cash paid. These gains also arise when Kennedy Wilson converts a loan into consolidated real estate owned and the fair value of the underlying real estate exceeds the basis in the previously held loan.
Acquisition-related expenses—Acquisition-related expenses consists of the costs incurred to acquire assets. Generally, the majority of these expenses relate to stamp duty taxes on foreign transactions. Acquisition-related expenses may also include any professional fees associated with closing the transactions and the write off of any costs associated with acquisitions which did not materialize.
Gain on sale of real estate—Gain on sale of real estate relates to the amount received over the carrying value of assets sold that met the definition of a business under US GAAP.
Interest expense—Interest expense represents interest costs associated with our senior notes payable, revolving credit facility, mortgages on our consolidated real estate, and unsecured debt held by KWE. The corporate debt is unsecured and we typically use the funds generated from corporate borrowings to fund new investments. The mortgages are typically secured by the underlying real estate collateral.
Other Income—Other income includes the realized foreign currency exchange income or loss relating to the settlement of foreign transactions during the year which arise due to changes in currency exchange rates, realized gains or losses related to the settlement of derivative instruments, the gain or loss on the sale of marketable securities, and other non-operating interest income.
Income taxes—The Company’s services business operates globally as corporate entities subject to federal, state, and local income taxes and the investment business operates through various partnership structures to participate in multifamily, office and residential property acquisitions as well as originate loans and purchases loan pools. The Company’s distributive share of income from its partnership investments will be subject to federal, state, and local taxes at the entity level and the related tax provision attributable to the Company’s share of the income tax is reflected in the consolidated financial statements.
Noncontrolling Interests— Noncontrolling interests represents income or loss attributable to equity partners for their ownership in investments which the Company controls. Income or loss is attributed to noncontrolling interest partners based on their respective ownership interest in an investment.
Accumulated other comprehensive income—Accumulated other comprehensive income represents the Company’s share of foreign currency movement on translating Kennedy
Management’s Discussion and Analysis of Financial Condition and Results of Operations (continued)
Wilson’s foreign subsidiaries from their functional currency into the Company’s reporting currency. These amounts are offset by Kennedy Wilson’s effective portion of currency related hedge instruments. Unrealized changes in fair value on the Company’s investment in marketable securities are also included in this account.
Foreign CurrencyAs of December 31, 2017, approximately 49% of our investment account is invested through our foreign platforms in their local currencies. Investment level debt is generally incurred in local currencies and therefore we consider the carrying value of our equity investment as the appropriate exposure to evaluate for hedging purposes. Fluctuations in foreign exchanges rates may have a significant impact on the results of our operations. In order to manage the effect of these fluctuations, we generally hedge our book equity exposure to foreign currencies through currency forward contracts and options. Please see Qualitative and Quantitative Disclosures About Market Risk - Currency Risk - Foreign Currencies for a detailed discussion with respect to foreign currency.
Kennedy Wilson Europe Real Estate Plc (LSE: KWE) and the KWE TransactionOn October 20, 2017, the Company purchased the remaining 76% of KWE shares it did not previously own for $1.4 billion, which represented a discount of approximately $260 million to the original value of the shares when issued. As part of the acquisition consideration, the Company issued 37.2 million shares of common stock valued at $722.2 million. Due to KWE’s previous consolidation by the Company, the carrying value of the remaining 76% non-controlling interest in KWE was $1.1 billion, which included the cumulative effects
of depreciation and foreign currency losses. As a result of paying a premium above carrying value, Kennedy-Wilson Holdings, Inc. shareholders’ equity only increased by $322.4 million. Prior to the acquisition, Kennedy Wilson owned 23.8% of the share capital of KWE and all results presented below are based on this ownership amount up through the closing of the transaction.
Prior to the KWE Transaction that was completed during the fourth quarter of 2017, KWE was externally managed by one of our wholly-owned subsidiaries, KWE Manager pursuant to an investment management agreement whereby we were entitled to receive certain management and performance fees. KWE Manager was entitled to an annual management fee (payable quarterly in arrears) equal to 1% of KWE’s adjusted net asset value and certain performance fees. The management fee payable to KWE Manager was paid half in cash and half in shares of KWE. The management fee for the second quarter of 2017 was paid fully in cash from KWE. During year ended December 31, 2017, KWH earned $16.0 million in management fees from KWE.
Due to the terms of the investment management agreement and Kennedy Wilson’s equity ownership interest in KWE, pursuant to the guidance set forth in FASB Accounting Standards Codification Subtopic 810 - Consolidation (“Subtopic 810”), the results and financial position of KWE are consolidated in our financial statements. As such, fees earned by KWE Manager were eliminated in the attached consolidated financial statements. Compensation and certain general and administrative expenses relating to KWE were borne by Kennedy Wilson as employees of the Company worked on behalf of KWE Manager.

42 Kennedy Wilson Annual Report 2017 Kennedy Wilson Annual Report 2017 43
Year Ended December 31, 2016
(Dollars in millions) Investments IMRES Corporate Total
Rental $ 485.9 $ — $ — $ 485.9
Hotel 116.2 — — 116.2
Sale of real estate 29.3 — — 29.3
Investment management, property services and research fees — 59.4 — 59.4
Loan purchases, loan originations, and other 12.6 — — 12.6
Revenue 644.0 59.4 — 703.4
Operating expenses (345.2) (54.9) (93.6) (493.7)
Depreciation and amortization (197.4) (0.8) — (198.2)
Income from unconsolidated investments, net of depreciation and amortization 122.8 3.8 — 126.6
Operating income loss 224.2 7.5 (93.6) 138.1
Non-operating income (expense):
Gain on sale of real estate 130.7 — — 130.7
Acquisition - related gains 16.2 — — 16.2
Acquisition - related expenses (9.5) — — (9.5)
Interest expense (137.4) — (54.2) (191.6)
Other non-operating expenses (1.2) — 7.8 6.6
Provision for income taxes 5.0 — (19.0) (14.0)
Total non-operating income (loss) 3.8 — (65.4) (61.6)
Net income loss 228.0 7.5 (159.0) 76.5
Add back (less):
Interest expense 137.4 — 54.2 191.6
Kennedy Wilson’s share of interest expense included in unconsolidated investments 22.1 0.9 — 23.0
Depreciation and amortization 198.2 — — 198.2Kennedy Wilson’s share of depreciation and amortization included in unconsolidated investments 17.2 3.6 — 20.8
Provision for income taxes (5.0) — 19.0 14.0
Fees eliminated in consolidation (36.9) 36.9 — —
Share-based compensation — — 65.1 65.1
EBITDA attributable to noncontrolling interests(2) (239.3) — — (239.3)
Adjusted EBITDA 1 $ 321.7 $ 48 .9 20.7 $ 349.9
( 1) See “Non-GAAP Measures and Certain Definitions” for definitions and discussion of Adjusted EBITDA.( 2) $169.3 million of depreciation, amortization, taxes and interest for the year ended December 31, 2016.
Management’s Discussion and Analysis of Financial Condition and Results of Operations (continued)
Year Ended December 31, 2017
(Dollars in millions) Investments IMRES Corporate TotalRental $ 504.7 $ — $ — $ 504.7
Hotel 127.5 — — 127.5
Sale of real estate 111.5 — — 111.5
Investment management, property services and research fees — 51.7 — 51.7
Loan purchases, loan originations, and other 15.2 — — 15.2
Revenue 758.9 51.7 — 810.6
Operating expenses (433.8) (54.3) (70.2) (558.3)
Depreciation and amortization (212.2) (0.3) — (212.5)
Income from unconsolidated investments, net of depreciation and amortization 66.4 2.6 — 69.0
Operating income expense 179.3 (0.3) (70.2) 108.8
Non-operating income (expense):
Gain on sale of real estate 226.7 — — 226.7
Acquisition - related expenses (4.4) — — (4.4)
Interest expense (145.6) — (72.1) (217.7)
Other non-operating (expenses) income (5.1) — 13.4 8.3
(Provision for) benefit from income taxes (4.8) — 21.1 16.3
Total non-operating income (loss) 66.8 — (37.6) 29.2
Net income loss 246.1 (0.3) (107.8) 138.0
Add back (less):
Interest expense 145.6 — 72.1 217.7
Kennedy Wilson’s share of interest expense included in unconsolidated investments 22.5 0.5 — 23.0
Depreciation and amortization 212.2 0.3 — 212.5Kennedy Wilson’s share of depreciation and amortization included in unconsolidated investments 13.5 2.7 — 16.2
(Provision for) benefit from income taxes 4.8 — (21.1) (16.3)
Fees eliminated in consolidation (26.9) 26.9 — —
Share-based compensation — — 38.4 38.4
EBITDA attributable to noncontrolling interests(2) (173.8) — — (173.8)
Adjusted EBITDA 1 444.0 30.1 1 .4 $ 455.7( 1) See “Non-GAAP Measures and Certain Definitions” for definitions and discussion of Adjusted EBITDA.( 2) $136.3 million of depreciation, amortization, interest and taxes for the year ended December 31, 2017. This includes allocation to noncontrolling interest holders of KWE up through the acquisition date of October 20, 2017.
Results of OperationsThe following tables summarize the Company’s revenue, operating expenses, non-operating expenses, operating income (loss) and net income (loss) and calculate EBITDA and Adjusted EBITDA by segment for the years ended December 31, 2017, 2016 and 2015 and is intended to be helpful in understanding the year over year explanations following the tables:
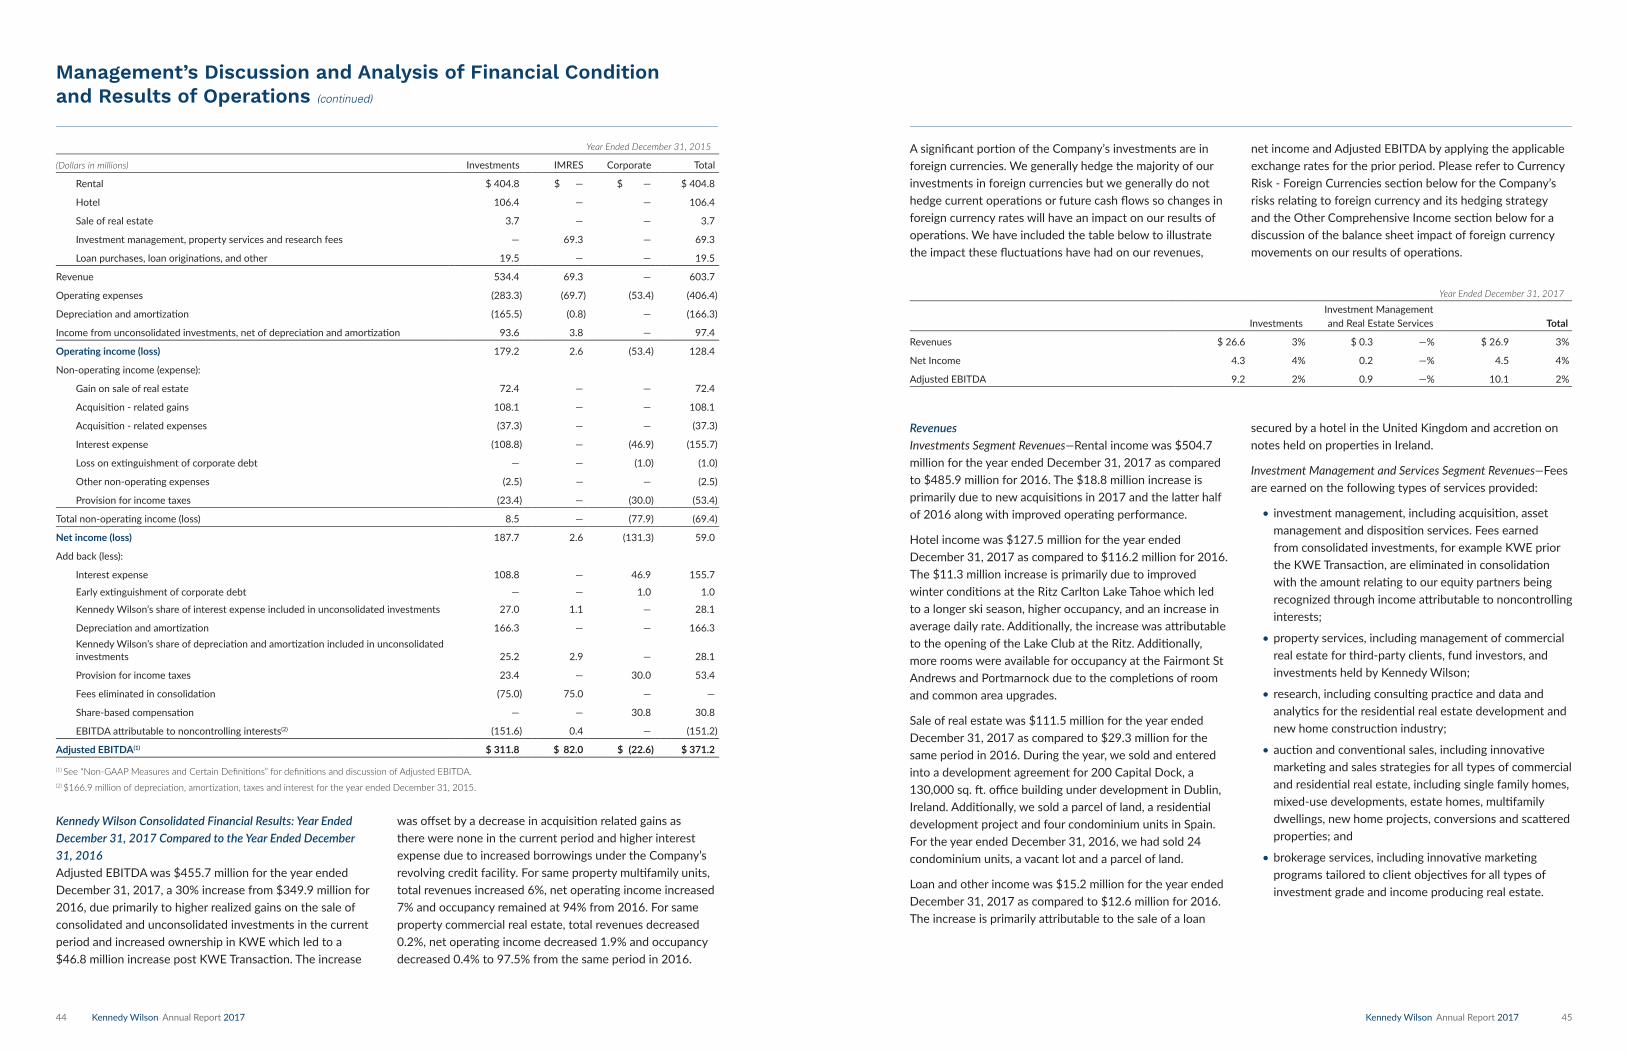
44 Kennedy Wilson Annual Report 2017 Kennedy Wilson Annual Report 2017 45
Management’s Discussion and Analysis of Financial Condition and Results of Operations (continued)
Year Ended December 31, 2015
(Dollars in millions) Investments IMRES Corporate Total
Rental $ 404.8 $ — $ — $ 404.8
Hotel 106.4 — — 106.4
Sale of real estate 3.7 — — 3.7
Investment management, property services and research fees — 69.3 — 69.3
Loan purchases, loan originations, and other 19.5 — — 19.5
Revenue 534.4 69.3 — 603.7
Operating expenses (283.3) (69.7) (53.4) (406.4)
Depreciation and amortization (165.5) (0.8) — (166.3)
Income from unconsolidated investments, net of depreciation and amortization 93.6 3.8 — 97.4
Operating income loss 179.2 2.6 (53.4) 128.4
Non-operating income (expense):
Gain on sale of real estate 72.4 — — 72.4
Acquisition - related gains 108.1 — — 108.1
Acquisition - related expenses (37.3) — — (37.3)
Interest expense (108.8) — (46.9) (155.7)
Loss on extinguishment of corporate debt — — (1.0) (1.0)
Other non-operating expenses (2.5) — — (2.5)
Provision for income taxes (23.4) — (30.0) (53.4)
Total non-operating income (loss) 8.5 — (77.9) (69.4)
Net income loss 187.7 2.6 (131.3) 59.0
Add back (less):
Interest expense 108.8 — 46.9 155.7
Early extinguishment of corporate debt — — 1.0 1.0
Kennedy Wilson’s share of interest expense included in unconsolidated investments 27.0 1.1 — 28.1
Depreciation and amortization 166.3 — — 166.3Kennedy Wilson’s share of depreciation and amortization included in unconsolidated investments 25.2 2.9 — 28.1
Provision for income taxes 23.4 — 30.0 53.4
Fees eliminated in consolidation (75.0) 75.0 — —
Share-based compensation — — 30.8 30.8
EBITDA attributable to noncontrolling interests(2) (151.6) 0.4 — (151.2)
Adjusted EBITDA 1 $ 311.8 2.0 22.6 $ 371.2
( 1) See “Non-GAAP Measures and Certain Definitions” for definitions and discussion of Adjusted EBITDA.( 2) $166.9 million of depreciation, amortization, taxes and interest for the year ended December 31, 2015.
Kennedy Wilson Consolidated Financial Results: Year Ended December 31, 2017 Compared to the Year Ended December 31, 2016 Adjusted EBITDA was $455.7 million for the year ended December 31, 2017, a 30% increase from $349.9 million for 2016, due primarily to higher realized gains on the sale of consolidated and unconsolidated investments in the current period and increased ownership in KWE which led to a $46.8 million increase post KWE Transaction. The increase
was offset by a decrease in acquisition related gains as there were none in the current period and higher interest expense due to increased borrowings under the Company’s revolving credit facility. For same property multifamily units, total revenues increased 6%, net operating income increased 7% and occupancy remained at 94% from 2016. For same property commercial real estate, total revenues decreased 0.2%, net operating income decreased 1.9% and occupancy decreased 0.4% to 97.5% from the same period in 2016.
A significant portion of the Company’s investments are in foreign currencies. We generally hedge the majority of our investments in foreign currencies but we generally do not hedge current operations or future cash flows so changes in foreign currency rates will have an impact on our results of operations. We have included the table below to illustrate the impact these fluctuations have had on our revenues,
net income and Adjusted EBITDA by applying the applicable exchange rates for the prior period. Please refer to Currency Risk - Foreign Currencies section below for the Company’s risks relating to foreign currency and its hedging strategy and the Other Comprehensive Income section below for a discussion of the balance sheet impact of foreign currency movements on our results of operations.
Year Ended December 31, 2017
InvestmentsInvestment Management and Real Estate Services T o t a l
Revenues $ 26.6 3% $ 0.3 —% $ 26.9 3%
Net Income 4.3 4% 0.2 —% 4.5 4%
Adjusted EBITDA 9.2 2% 0.9 —% 10.1 2%
RevenuesInvestments Segment Revenues—Rental income was $504.7 million for the year ended December 31, 2017 as compared to $485.9 million for 2016. The $18.8 million increase is primarily due to new acquisitions in 2017 and the latter half of 2016 along with improved operating performance.
Hotel income was $127.5 million for the year ended December 31, 2017 as compared to $116.2 million for 2016. The $11.3 million increase is primarily due to improved winter conditions at the Ritz Carlton Lake Tahoe which led to a longer ski season, higher occupancy, and an increase in average daily rate. Additionally, the increase was attributable to the opening of the Lake Club at the Ritz. Additionally, more rooms were available for occupancy at the Fairmont St Andrews and Portmarnock due to the completions of room and common area upgrades.
Sale of real estate was $111.5 million for the year ended December 31, 2017 as compared to $29.3 million for the same period in 2016. During the year, we sold and entered into a development agreement for 200 Capital Dock, a 130,000 sq. ft. office building under development in Dublin, Ireland. Additionally, we sold a parcel of land, a residential development project and four condominium units in Spain. For the year ended December 31, 2016, we had sold 24 condominium units, a vacant lot and a parcel of land.
Loan and other income was $15.2 million for the year ended December 31, 2017 as compared to $12.6 million for 2016. The increase is primarily attributable to the sale of a loan
secured by a hotel in the United Kingdom and accretion on notes held on properties in Ireland.
Investment Management and Services Segment Revenues—Fees are earned on the following types of services provided:
• investment management, including acquisition, asset management and disposition services. Fees earned from consolidated investments, for example KWE prior the KWE Transaction, are eliminated in consolidation with the amount relating to our equity partners being recognized through income attributable to noncontrolling interests;
• property services, including management of commercial real estate for third-party clients, fund investors, and investments held by Kennedy Wilson;
• research, including consulting practice and data and analytics for the residential real estate development and new home construction industry;
• auction and conventional sales, including innovative marketing and sales strategies for all types of commercial and residential real estate, including single family homes, mixed-use developments, estate homes, multifamily dwellings, new home projects, conversions and scattered properties; and
• brokerage services, including innovative marketing programs tailored to client objectives for all types of investment grade and income producing real estate.

46 Kennedy Wilson Annual Report 2017 Kennedy Wilson Annual Report 2017 47
The following table shows Adjusted Fees for the years ended December 31, 2017 and 2016:
Year Ended December 31,
(Dollars in millions) 2017 2016
Investment management, property services and research fees $ 51.7 $ 59.4
Non-GAAP adjustments:
Add back:
Fees eliminated in consolidation(1) 26.3 36.9
Kennedy Wilson’s share of fees in unconsolidated service businesses 8.6 12.6
Adjusted Fees 2 $ 8 6.6 10 .( 1) The years ended December 31, 2017 and 2016 include $17.3 million and $23.1 million, respectively, of fees recognized in net (income) loss attributable to
noncontrolling interests relating to portion of fees paid by noncontrolling interest holders in KWE and equity partner investments. ( 2) See “Non-GAAP Measures and Certain Definitions” for a definition and discussion of Adjusted Fees.
property management fees due to having fewer assets under management during the period.
Research—Research fees from the Meyers group increased to $12.4 million during the year ended December 31, 2017 as compared to $11.4 million due to increased revenue from its advisory practice of $0.5 million and increased subscriptions to Zonda which led to an additional $0.5 million increase.
Operating ExpensesInvestments Segment Operating Expenses—Operating expenses for the year ended December 31, 2017 increased to $433.8 million compared to $345.2 million for 2016. The increase is primarily attributable to the following:
During the year ended December 31, 2017, we sold and entered into a development agreement for 200 Capital Dock, a 130,000 sq. ft. office building under development in Dublin, Ireland. Additionally, we sold a parcel of land, a residential development project and four condominium units in Spain, which resulted in $80.2 million of sale-related costs. For the year ended December 31, 2016, we had sold 24 condominium units, a vacant lot and a parcel of land, which resulted in $22.1 million of sale-related costs.
Rental operating expenses increased by $15.8 million, hotel operating expenses increased by $4.0 million and depreciation and amortization increased by $14.3 million due to increased acquisitions for rental properties and increased occupancy at hotels.
Compensation and related expenses increased by $12.2 million due to an increase in discretionary compensation.
Investment Management and Services Segment Operating Expenses—Operating expenses for the year ended December 31, 2017 remained constant at $54.3 million as compared to 2016.
Corporate Operating Expenses—Operating expenses for the year ended December 31, 2017 were approximately $70.2 million as compared to $93.6 million for 2016. Compensation and related expenses decreased by $22.6 million primarily due to higher stock compensation during 2016. The higher stock compensation in 2016 is mainly due to $26.5 million or 60% cliff vesting of restricted stock that was granted in 2012 under our Amended and Restated 2009 Equity Participation Plan.
Income from Unconsolidated InvestmentsInvestments Segment Income from Unconsolidated Investments—During the year ended December 31, 2017,
income from unconsolidated investments was $66.4 million as compared to $122.8 million for 2016.
The following table presents income from unconsolidated investments recognized by Kennedy Wilson during the years ended December 31, 2017 and 2016:
Year Ended December 31,
(Dollars in millions) 2017 2016
Operating performance $ 13.8 $ 7.7
Realized gains 14.0 59.0
Equity in joint venture income - fair value 38.6 56.6
Interest (loss) income recognized(1) — (0.5)
$ 66.4 $ 122.8
( 1) Related to loan pools, all of which were fully resolved as of December 31, 2017.
The Company recognized fair value gains during the year related to acquisitions and dilution from resyndications in VHH, sales in a condo project, and improved property performance by FV Option investments and investments held within our Funds totaling $38.6 million. In addition to the above, the Company recognized realized gains on sales of joint venture investments mainly on multifamily and office properties located in the Western United States during the year. The Company sold 51 multifamily properties (49 of which were in the 5% interest we hold in a Japanese portfolio), two office properties, a residential development project, four lots, and a residential home during 2017, resulting in a gain of $14.0 million. The remaining $13.8 million in equity in joint venture income is related to operating performance.
In 2016, five multifamily properties were sold in the Western U.S. for a gain of $59.0 million (excluding $2.4 million of promoted interest recognized in investment management fees). In addition to the sales discussed above the Company recognized $24.3 million of fair value gains on its VHH portfolio due to dilution from resyndications and development fees. It also recognized $6.1 million from operating distributions made by VHH during the year. The Company sold equity ownership interests in the Kona Village Resort (“Kona Village”) in Kona, Hawaii to a third party that resulted in the loss of control and deconsolidation of the development. The sales price to the third party indicated that the value of the Company’s continuing interest was greater than its carrying value, resulting in the recording of a $19.5 million gain. The Company has elected the fair value option to record this equity investment and the $19.5 million dilution-related gain above is not related to any subsequent change in value.
Management’s Discussion and Analysis of Financial Condition and Results of Operations (continued)
Investment management and real estate services fees were $51.7 million during the year ended December 31, 2017 as compared to $59.4 million for 2016 mainly due to lower performance fees earned during 2017.
Fees earned from investments that were eliminated in consolidation totaled $26.3 million compared to $36.9 million for 2016. The decrease is primarily attributable to prior period performance fees earned on the sale of an Irish office building.
Additionally, we recognized $16.0 million and $22.2 million of adjusted fees related to our management of KWE during the year ended December 31, 2017 and 2016, respectively. Subsequent to the closing of the KWE Transaction on October 20, 2017, we no longer earned such fees. In accordance with U.S. GAAP, the fees we historically received from KWE were eliminated in consolidation and excluded from total fees of $51.7 million and $59.4 million, respectively.
The table below breaks down Adjusted Fees from investment management and real estate related services for the year ended December 31, 2017 and 2016:
(Dollars in millions) Year Ended December 31,
Fee Description 2017 2016
Property Services $ 28 .9 $ 36.3
Research 12.4 11.4
Investment Management - Base 35.7 41.1
Investment Management - Performance 8.7 19.8
Investment Management - Acquisition / Disposition 0.9 0.3
Investment Management - Total 45.3 61.2
Total Adjusted Fees 1 $ 8 6.6 10 .( 1) See “Non-GAAP Measures and Certain Definitions” for definitions and discussion of Adjusted Fees.
Investment management—Investment management generated adjusted fees of $45.3 million during the year ended December 31, 2017 as compared to $61.2 million for 2016. The decrease is primarily attributable to the recognition of unrealized performance fees related to the management of the funds in 2016. Each period, the Company calculates the performance fee (related to its management of the funds) that would be due to the Company if the funds and their underlying investments were realized at their estimated fair values. In the current period, the Company recognized less unrealized performance fees as the fair values of the underlying properties did not increase above the funds’
preferred return thresholds at an equivalent amount over the same period in 2016. Base management fees decreased during the year due to the KWE Transaction, which eliminated the fees the Company received from the management of KWE.
Property Services—Real estate related services fees decreased to $28.9 million during the year ended December 31, 2017 as compared to $36.3 million for 2016 primarily due to the sale of our servicing platform in Spain which accounted for $8.6 million and $12.6 million of fees during the year ended December 31, 2017 and 2016, respectively. Additionally, there was a decrease in brokerage fees and

48 Kennedy Wilson Annual Report 2017 Kennedy Wilson Annual Report 2017 49
Services Segment Income from Unconsolidated Investments— During the year ended December 31, 2017, income from unconsolidated investments was $2.6 million compared to $3.8 million in 2016. Services segment income from unconsolidated investments related to the Company’s approximate 5% interest in a loan servicing platform in Spain that had approximately €23.0 billion of assets under management. This entity was sold during the fourth quarter 2017 and decreased our IMRES AUM by $1.6 billion. Over the life of the investment we put $23.8 million in and received $42.2 million for a cash gain of $18.4 million (based on December 31, 2017 rates).
Non-operating ItemsGains on sale of real estate were $226.7 million for the year ended December 31, 2017 compared to $130.7 million in the prior period. The gain recognized during the year ended December 31, 2017 relates primarily to the sale of Summerhouse, a 615-unit wholly-owned multifamily community in Alameda, CA, the sale of Rock Creek Landing, a 576-unit wholly-owned multifamily community in Kent, Washington, the sale of the multifamily component of The Rock, a 233-unit apartment complex in Manchester, England, and sales by KWE of non-core assets out of its United Kingdom commercial property portfolio. During the prior period, we sold a commercial property in the United Kingdom, a commercial property in Ireland, an office building in North Hollywood, CA, equity interests in Kona Village and sales by KWE of non-core assets out of its United Kingdom commercial properties and an office building in central district Dublin. These gains are presented net as a component of non-operating income (expense) as the properties were treated as businesses at acquisition.
There were no acquisition related gains for the year ended December 31, 2017 as compared to $16.2 million for 2016. The acquisition-related gains during the year ended December 31, 2016 were due to the Company acquiring additional equity interest in a retail center in the Western United States that was previously accounted for as an unconsolidated investment. The Company acquired additional equity interests and took control of Kona Village that was previously accounted for as an unconsolidated investment. Subsequently after taking control, the Company sold a 50% interest to a strategic partner and accounted for Kona Village as an unconsolidated investment at the year ended December 31, 2017.
Acquisition-related expenses were $4.4 million for the year ended December 31, 2017 compared to $9.5 million during 2016. The acquisition related expenses during the
year ended December 31, 2017 primarily relate to three multifamily properties, an office property, and a retail property in the Western United States and a wholly-owned multifamily property acquired in Ireland. The acquisition-related expenses for the year ended December 31, 2016 relate primarily to professional fees and the payment of stamp duty taxes in the United Kingdom and Ireland.
Interest expense was $217.7 million for the year ended December 31, 2017 as compared to $191.6 million for 2016. During the third quarter of 2016, Kennedy Wilson issued an additional $250.0 million of 5.875% senior unsecured notes due 2024 which resulted in the higher interest expense. In addition, the greater amount outstanding on our line of credit during the year ended December 31, 2017 led to increased interest expense as compared to the prior period. We had an average outstanding debt balance of $5,416.9 million and $4,684.7 million for the years ended December 31, 2017 and 2016, respectively.
Other income was $8.3 million for the year ended December 31, 2017 as compared to $6.6 million for 2016. In the current period, the Company paid out approximately £290.5 million of cash relating to the KWE Transaction which was held in an escrow cash account for approximately 5 months. Since this was held in a currency different than the Company’s functional currency, changes in foreign currency rates were recorded to other income. In order to mitigate these fluctuations the Company entered into foreign currency hedge contracts. During the year ended December 31, 2017, the Company recognized a gain of $24.2 million due to changes in foreign currency rates on the escrow cash which was offset by a loss of $10.8 million from the associated hedges. During the year ended December 31, 2016, the Company recognized a loss of $2.5 million on transactional foreign exchange losses which was offset by a gain of $7.8 million on undesignated hedges.
Income tax benefit was $16.3 million in 2017 as compared to a provision for income taxes of $14.0 million in 2016. The decrease in income tax expense is primarily due to a $44.8 million tax benefit realized as a result of a decrease in our U.S. net deferred tax liability resulting from the reduction in the U.S. corporate tax rate from 35% to 21% pursuant to the Tax Cuts and Jobs Act. In addition, as a result of the adoption of ASU 2016-09 on January 1, 2017, the Company recorded an adjustment to opening retained earnings of $9.3 million for excess tax benefits from share awards which had not been recognized under the prior accounting standard. The Company also recorded a tax benefit of $3.7 million through December 31, 2017 related to excess tax benefits realized
from the vesting of restricted stock awards and dividend equivalents on restricted stock.
The SEC issued Staff Accounting Bulletin (“SAB 118”) on December 22, 2017, which provided guidance on how to account for the effects of the Tax Reform. Pursuant to SAB 118, adjustments for the effects of the new legislation should be recorded to the extent a reasonable estimate for all or a portion of the effects of the law can be made. If a company cannot determine a reasonable estimate, it should not record a provisional amount and should continue to apply ASC 740 based on the tax law in effect before the enactment. While we were able to make a reasonable, provisional estimates of the impact of the reduction in the corporate rate and other provisions that may have a significant impact to the Company, the final impact of the Tax Reform may differ from our estimates due to additional guidance that might be issued by the IRS, Treasury Regulations or state taxing authorities and changes in our assumptions and interpretations. We are continuing to assess changes from and gather information related to Tax Reform in order to finalize our provisional estimates and to assess the impact of Tax Reform in the future periods.
We had net income of $37.5 million attributable to noncontrolling interests during the year ended December 31, 2017 compared to net income of $70.9 million attributable to noncontrolling interests during 2016. The decrease during the year is primarily attributable our increased ownership in KWE subsequent to the KWE Acquisition and to greater sales in the prior period that had noncontrolling interests associated with them.
The Company’s Series B shares were retired in the year ended December 31, 2016. Accordingly, there were no preferred dividends or accretion of preferred stock issue costs during 2017, as compared to $2.8 million during 2016.
Other Comprehensive IncomeThe two major components that drive the change in other comprehensive loss are the change in foreign currency rates and the gains or loss of any associated foreign currency hedges. Please refer to the Currency Risk - Foreign Currencies section below for the Company’s risks relating to foreign currency and its hedging strategy.
Management’s Discussion and Analysis of Financial Condition and Results of Operations (continued)
Year Ended December 31,
(Dollars in millions) 2017 2016
Unrealized foreign currency translation gain (loss), net of noncontrolling interests and tax $ 48.9 $ (32.5)
Amounts reclassified out of accumulated other comprehensive income during the period 2.0 3.4
Unrealized foreign currency derivative contract (losses) gains, net of noncontrolling interests and tax (48.6) 5.5
Unrealized gains on marketable securities, net of noncontrolling interests and tax 0.2 0.1
Other comprehensive loss 2.5 (23.5)
Realized foreign currency exchange gain - consolidated statements of operations 24.2 (2.5)
Realized foreign currency derivative contract (loss) gain - consolidated statements of operations (10.8) 7.8
Comprehensive loss - foreign exchange $ 15.9 $ (18.2)
The main currencies that the Company has exposure to are the euro and pound sterling. The table below represents the change in rates over the year ended December 31, 2017 and 2016 as compared to the U.S. Dollar:
Year Ended December 31,
2017 2016
Euro 15.0% (3.0)%
GBP 10.0% (16.0)%
Other compressive loss, net of taxes and noncontrolling interests, for the year ended December 31, 2017 and 2016 was $2.5 million and $23.5 million, respectively.
The unrealized foreign currency translation, net of taxes and non-controlling interests, was a gain of $48.9 million and
loss of $32.5 million for the year ended December 31, 2017 and 2016, respectively. The gain in the current period is due the strengthening of the GBP and Euro during the year. The losses relating to unrealized foreign currency translation during the prior period related to the pound sterling and the Euro, primarily as a result of the Brexit vote.
The unrealized foreign currency derivative contract (loss) gain, net of taxes and non-controlling interests, was a loss of $48.6 million and gain of $5.5 million for the year ended December 31, 2017 and 2016, respectively. The Company typically hedges its net investments in certain non-U.S. operations through use of currency derivative contracts, such as foreign currency forward contracts and options. The loss in the current year primarily relates to the strengthening of the GBP during the year which lead to hedge losses that the

50 Kennedy Wilson Annual Report 2017 Kennedy Wilson Annual Report 2017 51
Company held against the currency. The gain in the prior year primarily relates to the strengthening of the dollar against the GBP related the Company’s stock investment in KWE which was offset by our share of the decreased value of derivative contracts at KWE (due to the strengthening of the euro against the British pound sterling) from hedges on its Euro denominated assets.
Amounts reclassified out of accumulated other comprehensive income are for amounts that are moved out of other comprehensive income and recognized on the statement of operations. Although there is activity for the prior period the amounts reclassified are inception-to-date, and, accordingly, they are not indicative of current period movements. During the current period the amounts reclassified related to the sale of the Company’s investment in a loan servicing platform in Spain. The reclassification for the prior period relates to the resolution of European loan pools and the sale of office properties in Ireland and Japan during the year.
Kennedy Wilson Consolidated Financial Results: Year Ended December 31, 2016 Compared to the Year Ended December 31, 2015 Adjusted EBITDA was $349.9 million, a 6% decrease from $371.2 million for 2015, due to lower non-cash acquisition-related gains in the current period as the Company took control
Investment Management and Services Segment Revenues—Fees are earned on the following types of services provided:
• investment management, including acquisition, asset management and disposition services;
• property services, including management of commercial real estate for third-party clients, fund investors, and investments held by KW;
• research, including consulting practice and data and analytics for the residential real estate development and new home construction industry;
• auction and conventional sales, including innovative marketing and sales strategies for all types of commercial and residential real estate, including single family homes, mixed-use developments, estate homes, multifamily dwellings, new home projects, conversions and scattered properties; and
• brokerage services, including innovative marketing programs tailored to client objectives for all types of investment grade and income producing real estate.
Management’s Discussion and Analysis of Financial Condition and Results of Operations (continued)
of fewer properties as compared to the prior period as well as no performance fee being earned on KWE in the current period. This decrease was offset by higher realized gains on the sale of consolidated and unconsolidated investments in the current period. For same property multifamily units, total revenues increased 10%, net operating income increased 12% and occupancy remained at 94% from 2015. For same property commercial real estate, total revenues increased 5%, net operating income increased 6% and occupancy increased 2% to 96% from the same period in 2015.
A significant portion of the Company’s investments are in foreign currencies. We generally hedge the majority of our investments in foreign currencies but we generally do not hedge future operations or cash flows so changes in foreign currency rates will have an impact on our results of operations. We have included the table below to illustrate the impact these fluctuations have had on our revenues, net income and Adjusted EBITDA by applying the applicable exchange rates for the prior period. Please refer to Currency Risk - Foreign Currencies section below for the Company’s risks relating to foreign currency and its hedging strategy and the Other Comprehensive Income section below for a discussion of the balance sheet impact of foreign currency movements on our results of operations.
Year Ended December 31, 2016
InvestmentsInvestment Management and Real Estate Services Total
Revenues $ (28.8) (4)% $ — —% $ (28.8) (4)%
Net Income (2.1) (75)% (1.5) (53)% (3.6) (128)%
Adjusted EBITDA (5.3) (2)% (1.4) —% (6.7) (2)%
RevenuesInvestments Segment Revenues—Rental income was $485.9 million for the year ended December 31, 2016 as compared to $404.8 million for 2015. The $81.1 million increase is primarily due to new acquisitions in 2016 and the latter half of 2015.
Hotel income was $116.2 million for the year ended December 31, 2016 as compared to $106.4 million for 2015. The $9.8 million increase is primarily due to a $8.1 million (25%) increase at Ritz Carlton, Lake Tahoe due to improved winter conditions in the first and fourth quarters of 2016, mainly through increases in average daily rates and occupancy as compared to the prior period and a $4.7 million (12%) increase at the Shelbourne due to higher average daily rates. These have been offset by Fairmont St Andrews
and Portmarnock, which are held by KWE, that have been undergoing renovation programs in 2016 and have had fewer rooms available than the prior period.
During the year ended December 31, 2016, we sold 24 condominium units, a vacant lot and a parcel of land generating $29.3 million of proceeds as compared to one condominium unit sold in 2015 for proceeds of $3.7 million.
Loan and other income was $12.6 million for the year ended December 31, 2016 as compared to $19.5 million for 2015. The decrease in income was mainly due to loans that were resolved or sold on notes held by KWE in the latter half of the prior period and during the beginning 2016. As there was a lower note receivable balance over the current period KW received less in interest income.
The following table shows Adjusted Fees for the year December 31, 2016 and 2015:
Year Ended December 31,
2016 2015
Investment management, property services and research fees $ 59.4 $ 69.3
Non-GAAP adjustments:
Add back:
Fees eliminated in consolidation(1) 36.9 75.0
Kennedy Wilson’s share of fees in unconsolidated service businesses 12.6 13.9
Adjusted Fees(2) 10 . $ 158 .2
( 1) The year ended December 31, 2016 and 2015 includes $23.1 million and $57.7 million of fees recognized in net (income) loss attributable to noncontrolling interests relating to portion of fees paid by noncontrolling interest holders in KWE and equity partner investments.
( 2) See Non-GAAP Measures and Certain Definitions for a definition and discussion of Adjusted Fees.
Investment management and real estate services fees were $59.4 million during the year ended December 31, 2016 as compared to $69.3 million for 2015. The decrease is mainly due to lower performance fees earning during 2016.
Fees earned from investments that were eliminated in consolidation totaled $36.9 million compared to $75.0 million for 2015. The decrease is primarily due to fees earned with respect to performance fees on Kennedy Wilson’s external management of KWE in 2016 compared
to $43.7 million ($36.1 million of which was allocated to noncontrolling interest holders) of such fees being earned in 2015. In accordance with U.S. GAAP, these fees were eliminated in consolidation and excluded from total fees of $59.4 million and $69.3 million, respectively.
The table below shows Adjusted Fees from investment management and real estate related services for the year ended December 31, 2016 and 2015:
Year Ended December 31,
Fee Description 2016 2015
Property Services $ 36.3 $ 39.3
Research 11.4 9.2
Investment Management - Base 41.1 44.0
Investment Management - Performance 19.8 62.5
Investment Management - Acquisition / Disposition 0.3 3.2
Investment Management - Total 61.2 10 .7
Total Adjusted Fees(1) 10 . $ 158 .2
( 1) See “Non-GAAP Measures and Certain Definitions” for definitions and discussion of Adjusted Fees.

52 Kennedy Wilson Annual Report 2017 Kennedy Wilson Annual Report 2017 53
Investment management—Investment management generated adjusted fees of $61.2 million during the year ended December 31, 2016 as compared to $109.7 million for 2015. The decrease is primarily attributable to $43.7 million of accrued performance fee related to our management of KWE in 2015. No such accrual was made through December 31, 2016. 2015 also had disposition fees associated with the sale of our Japanese multifamily portfolio with no comparable activity in 2016. Base management fees decreased in the period ended December 31, 2016 due to the Company recognizing fees associated with a loan pool in the prior period that was fully resolved at December 31, 2015. However, this was partially offset during the year ended December 31, 2016 by performance fees earned on the sale of an Irish office building and a multifamily property in the Western U.S. and accrued performance fees relating to KW Fund V.
Property Services—Property Services decreased to $36.3 million during the year ended December 31, 2016 as compared to $39.3 million for 2015. The decrease is primarily due to lower fees earned on our loan servicing platform in Spain.
Research—Research increased to $11.4 million during the year ended December 31, 2016 as compared to $9.2 million for 2015. The increase is due to higher fees in Meyer’s advisory business and more subscription sales associated with Zonda which led to increased fees of $0.6 million and $1.6 million, respectively.
Operating ExpensesInvestments Segment Operating Expenses—Operating expenses for the year ended December 31, 2016 increased to $345.2 million compared to $283.3 million for 2015. The increase is primarily attributable to the following:
Rental operating expenses increased by $27.4 million, hotel operating expenses increased by $6.4 million and depreciation and amortization increased by $31.9 million due to increased acquisitions.
Compensation and related expenses increased by $5.2 million due to higher headcount.
During the year ended December 31, 2016 we sold 1 condominium unit which resulted in $2.6 million of sale-related costs. During the year ended December 31, 2015, we sold 10 condominium units which resulted in $20.7 million of sale-related costs.
Services Segment Operating Expenses—Operating expenses for the year ended December 31, 2016 were approximately
$54.9 million as compared to $69.7 million for 2015. The decrease is primarily attributable to lower adjusted fees and lower discretionary compensation driven by the lack of a performance fee earned on KWE in 2016.
Corporate Operating Expenses—Operating expenses for the year ended December 31, 2016 were approximately $93.6 million as compared to $53.4 million for 2015. Compensation and related expenses increased by $39.8 million primarily due higher stock compensation and an increase in discretionary compensation. The increase in stock compensation in 2016 is mainly due to $26.5 million or 60% of the expense of the restricted stock that was granted in 2012 under our Amended and Restated 2009 Equity Participation Plan being incurred during April 2016 to March 2017 due to the cliff vesting that is scheduled to occur in 2017. A portion of the increase was also attributed to the restricted stock that was granted during the fourth quarter of 2015 and during 2016.
Income from Unconsolidated InvestmentsInvestments Segment Income from Unconsolidated Investments—During the year ended December 31, 2016, income from unconsolidated investments was $122.8 million as compared to $93.6 million for 2015.
The following table presents income from unconsolidated investments recognized by Kennedy Wilson during the years ended December 31, 2016 and 2015:
Year Ended December 31,
(Dollars in millions) 2016 2015
Operating performance $ 7.7 $ 7.8
Realized gains 59.0 46.6
Equity in joint venture income - fair value 56.6 34.9
Interest (loss) income recognized(1) (0.5) 4.3
$ 122.8 $ 93.6
( 1) Related to loan pools, all of which were fully resolved as of December 31, 2016.
Five multifamily properties were sold in the Western U.S. which attributed to the increase in income as compared to 2015. Upon sale, the Company recognized gains of $59.0 million (excluding $2.4 million of promoted interest recognized in investment management fees). In addition to sales discussed above the Company recognized $24.3 million of fair value gains on its VHH portfolio due to dilution from resyndications and development fees. It also recognized $6.1 million from operating distributions made by VHH during 2016. The Company sold equity ownership interests the iconic Kona Village in Kona, Hawaii to a third party that resulted in the loss of control and deconsolidation of the
Management’s Discussion and Analysis of Financial Condition and Results of Operations (continued)
development. The sales price to the third party indicated that the value of the Company’s continuing interest was greater than its carrying value, resulting in the recording of a $19.5 million gain. The Company has elected the fair value option to record this equity investment and the $19.5 million dilution-related gain above is not related to any subsequent change in value.
In 2015 the Company recognized $34.9 million of fair value gains during the year relating to improved market conditions and dilution gains from resyndications in VHH, entitlements achieved on development projects, commencing sales process on a condo project as well as improved property performance in investments held within fund investments carried at fair value. In addition to fair value gains, the Company has recognized $7.3 million in equity income related to operating distributions from VHH during the year. The prior period income primarily related to the recognition of $46.6 million in gains on the sale of four multifamily properties and an office building all in the Western United States.
Services Segment Income from Unconsolidated Investments—Services segment income from unconsolidated investments relates to the Company’s acquired interest in a loan servicing platform in Spain with approximately €23.0 billion of assets under management. During the year ended December 31, 2016, income from unconsolidated investments was $3.8 million compared to $3.8 million in 2015.
Non-operating ItemsGains on sale of real estate were $130.7 million for the year ended December 31, 2016 compared to $72.4 million in the prior period. The gain recognized during the year ended December 31, 2016 relates primarily to the sale of a commercial property in the United Kingdom, a commercial property in Ireland, an office building in North Hollywood, CA, the sale of an equity interest in Kona Village and sales by KWE of non-core assets out of its United Kingdom commercial properties and an office building in central district Dublin. During 2015, KW sold the majority of its investment in its Japanese multifamily portfolio, which resulted in a gain of $33.5 million before noncontrolling interest and KWE sold non-core assets out of its United Kingdom commercial properties during the year, which resulted in a gain of $38.9 million before noncontrolling interest. These gains are presented net as a component of non-operating income (expense) as the properties were treated as businesses at acquisition.
Acquisition-related gains were $16.2 million for the year ended December 31, 2016 as compared to $108.1 million for 2015.
The acquisition-related gains during the year ended December 31, 2016 were due to the Company acquiring additional equity interest in a retail center in the Western United States that was previously accounted for as an unconsolidated investment. The Company acquired additional equity interests and took control of Kona Village that was previously accounted for as an unconsolidated investment. Subsequently after taking control the Company sold a 50% interest to a strategic partner and accounted for Kona Village as an unconsolidated investment at year end December 31, 2017.
In 2015, the Company acquired additional equity interests in multifamily and commercial properties located in Western United States that were previously accounted for as unconsolidated investments. KW also converted two notes secured by three commercial buildings located in Dublin, Ireland and a note secured by a multifamily property in London into a direct 100% ownership interest in the property. As a result of acquiring control of the properties, the assets and liabilities were consolidated in Kennedy Wilson’s financial statements at fair value which resulted in an acquisition-related gains primarily by the remeasurement of the previously owned interest to current market values.
Acquisition-related expenses were $9.5 million for the year ended December 31, 2016 compared to $37.3 million during 2015. The acquisition related expenses primarily relate to professional fees and the payment of stamp duty taxes in the United Kingdom and Ireland. The decrease year over year is due to lower acquisition activity at KWE.
Interest expense associated with corporate debt was $54.2 million for the year ended December 31, 2016 as compared to $46.9 million for 2015. During the third quarter of 2016, KW issued an additional $250.0 million of 5.875% senior unsecured notes due 2024 which resulted in the higher interest expense. In addition, our line of credit was utilized for a longer period as compared to 2015 which led to increased interest expense.
Interest expense associated with investment debt was $137.4 million for the year ended December 31, 2015 as compared to $108.8 million for 2015. The increase is due to the acquisitions and consolidations that occurred in the second half of 2015 and refinancings were the Company was able to increase its leverage on properties.
Other income was $6.6 million for the year ended December 31, 2016 as compared to a loss of $2.5 million for 2015. The increase is due to higher realized gains on foreign currency

54 Kennedy Wilson Annual Report 2017 Kennedy Wilson Annual Report 2017 55
derivative investments that were not designated as net investment hedges.
Provision for income taxes was $14.0 million in 2016 as compared to a provision for income taxes of $53.4 million in 2015. The decrease is primarily due to lower U.S. pre-tax book income which is taxed at a higher statutory rate. We also released a valuation allowance as new evidence indicated that it is now more likely than not that certain net operating losses in the United Kingdom will be realized. During 2015, a significant tax expense was recorded due to taxable gain on the disposition of our Japanese multifamily portfolio The Company had $109.4 million and $108.4 million of federal and state net operating losses as of December 31, 2016, respectively.
We had net income of $70.9 million attributable to noncontrolling interests during the year ended December 31, 2016 compared to net loss of $15.7 million
attributable to noncontrolling interests during 2015. The increase during the current period is due to gains on sales of properties, lower acquisition related expenses and the lack of performance fee earned by Kennedy Wilson and paid by KWE on the Company’s investment in KWE. Fees on KWE are eliminated in revenues and operating expenses but the Company recognizes the amount of the fee that is allocated to noncontrolling interest holders through net income/loss attributable to noncontrolling interests.
Preferred dividends and accretion of preferred stock issue costs were $2.8 million for the year ended December 31, 2016 as compared to $3.6 million for 2015. The decrease in the current period is due to Series A shares being outstanding for one quarter last period. The Series B shares converted at the end of the current period, and as of December 31, 2016 the Company has no preferred stock outstanding.
investment in KWE which was offset by our share of the decreased value of derivative contracts at KWE (due to the strengthening of the euro against the British pound sterling) from hedges on its Euro denominated assets. The prior period gains relate to the strengthening of the U.S. Dollar in relation to all the foreign currencies the Company invests in.
Amounts reclassified out of accumulated other comprehensive income are for amounts that are moved out of other comprehensive income and recognized on the statement of operations. Although there is activity for the period the amounts reclassified are inception-to-date, and, accordingly, they are not indicative of current period movements. The reclassification for the current period relates to the resolution of European loan pools and the sale of office properties in Ireland and Japan during the year. The prior period included amounts relating to the sale of the Company’s Japanese multifamily portfolio.
Liquidity and Capital ResourcesOur liquidity and capital resources requirements include acquisitions of real estate and real estate related assets, capital expenditures for consolidated real estate and unconsolidated investments and working capital needs. We finance these activities with internally generated funds, borrowings under our revolving lines of credit, sales of equity and debt securities and cash out refinancings to the extent they are available and fit within our overall portfolio leverage strategy. Our investments in real estate are typically financed with equity from our balance sheet, third party equity and mortgage loans secured primarily by that real estate. These mortgage loans are generally nonrecourse in that, in the event of default, recourse will be limited to the mortgaged property serving as collateral, subject to limited customary exceptions. In some cases, we guarantee a portion of the loan related to a consolidated property or an unconsolidated investment, usually until some condition, such as completion of construction or leasing or certain net operating income criteria, has been met. We do not expect these guarantees to materially affect liquidity or capital resources. Please refer to the “Off Balance Sheet Arrangements” section for further information. Historically,
we have not required significant capital resources to support our IMRES business.
Our short-term liquidity requirements primarily consist of operating expenses and other expenditures associated with our properties, dividend payments to our shareholders, capital expenditures and, potentially, acquisitions. We expect to meet our short-term liquidity requirements through our existing cash and cash equivalents plus capital generated from our IMRES business, sales of real estate, collections from loans, as well as availability on our current revolving lines of credit (which had $400.0 million available to draw as of December 31, 2017). As of December 31, 2017, we and our consolidated subsidiaries had approximately $751.3 million of potential liquidity, which includes $400.0 million of availability under lines of credit and $351.3 million of cash.
Our need to raise funds from time to time to meet our capital requirements will depend on many factors, including the success and pace of the implementation of our strategy for strategic and accretive growth where appropriate. Additionally, we may opportunistically seek to raise capital (equity or debt) when we believe market conditions are favorable and when consistent with our growth strategy. In addition, we may seek third party financing to the extent that we engage in additional strategic investments, including capital necessary to execute potential development or redevelopment strategies or acquisition of real estate, note portfolios, or other real estate related companies or real estate related securities. Similarly, we may from time to time seek to refinance our existing indebtedness opportunistically in order to reduce our overall cost of debt capital or optimize the maturity schedule of our outstanding indebtedness, or for other strategic reasons.
Development and redevelopment—This section includes the developments or redevelopment projects that the Company is undergoing or considering, and excludes residential investments. The scope of these projects may change. There is no certainty that the Company will develop or redevelop any or all of these potential projects. All dollar amounts are Kennedy Wilson’s share.
Management’s Discussion and Analysis of Financial Condition and Results of Operations (continued)
Other Comprehensive Income(Dollars in millions) Year Ended December 31,
2016 201
Unrealized foreign currency translation loss, net of noncontrolling interests and tax $ (32.5) $ (46.3)
Amounts reclassified out of accumulated other comprehensive income during the period 3.4 9.7
Unrealized foreign currency derivative contract gains, net of noncontrolling interests and tax 5.5 17.0
Unrealized losses on marketable securities, net of noncontrolling interests tax 0.1 0.1
Other comprehensive loss (23.5) (19.5)
Realized foreign currency exchange loss - consolidated statements of operations (2.5) (0.5)
Realized foreign currency derivative contract gain - consolidated statements of operations 7.8 2.9
Comprehensive loss - foreign exchange $ 1 .2 $ 17.1
The main currencies that the Company has exposure to are the euro and pound sterling. The table below represents the change in rates over the year ended December 31, 2016 and 2015 as compared to the U.S. Dollar:
Year Ended December 31,
2016 201
Euro (3.0)% (10.0)%
GBP (16.0)% (5.0)%
Other compressive loss, net of taxes and noncontrolling interests, for the year ended December 31, 2016 and 2015 was $23.5 million and $19.5 million, respectively.
The unrealized foreign currency translation loss, net of taxes and non-controlling interests, was $32.5 million and
$46.3 million for the year ended December 31, 2016 and 2015, respectively. The losses relating to unrealized foreign currency translation decreased during the current period as we incurred losses on the pound sterling and the Euro, primarily as a result of the Brexit vote.
The unrealized foreign currency derivative contract gain, net of taxes and non-controlling interests, was a gain of $5.5 million and $17.0 million for the year ended December 31, 2016 and 2015, respectively. he Company typically hedges 50%-100% of its net investments in certain non-U.S. operations through use of currency derivative contracts, such as foreign currency forward contracts and options. The gain in the current year primarily relates to the strengthening of the dollar against the GBP related the Company’s stock

56 Kennedy Wilson Annual Report 2017 Kennedy Wilson Annual Report 2017 57
If Completed
Location Type Investment Status
Est. Completion
DateCommercial
Sq. Ft.
MF Units /
Hotel Rooms
KW Share Total
Capitalization
KW Est. Costs to
Complete
KW Est. Cash to
CompleteIreland Mixed-Use Capital Dock Under
Construction2018 240,000 190 $ 129.1 $ 49.7 $ 18.1
WA and NV Multifamily - Affordable
Vintage Housing Holdings 3 Under Construction
2018-2019 — 711 70.9 32.8 —
Spain Retail Puerta del Sol In Planning 2019 37,000 — 68.9 4.8 4.8
Nor Cal Multifamily Santa Rosa In Design 2019 — 120 24.8 23.6 9.6
WA and NV Multifamily - Affordable
Vintage Housing Holdings 5 In Design 2019-2020 — 1,435 157.6 142.2 —
Ireland Multifamily Clancy Quay - Phase 3 In Planning 2020 6,000 259 52.7 45.3 22.6
Ireland Office Hanover Quay In Planning 2020 61,000 — 35.4 28.9 14.5
Ireland Office Kildare In Design 2020 65,000 — 56.1 45.9 23.0
Nor Cal Office 400 California Under Construction
2020 247,000 — TBD TBD TBD
Hawaii Hotel Kona Village Resort In Design 2021 — 150 TBD TBD TBD
T o ta l 6 6,000 2, 8 65 $ 595.5 $ 373.2 $ 92.6
partners, undrawn proceeds from the construction loan and cash received from the sale of 200 Capital Dock. We expect to be finished by the end of 2018. This is a budgeted figure, however, and is subject to change (increase or decrease) due to a number of factors, including, that this project is being developed under a construction management contract with the general contractor and therefore could be called upon to contribute additional capital in the event that actual costs exceed budgeted costs (currently approximately 98% of the budgeted costs have been fixed under price-capped agreements between the general contractor and various subcontractors). We may decide to sell all or part of the remaining Capital Dock development before the development is complete. In addition to Capital Dock, we are concurrently building approximately 259 multifamily units in Dublin, Ireland.
Recent Developments—Subsequent to December 31, 2017, we and our equity partners acquired $264.8 million of real estate-related investments, including two multifamily properties (580 units) and a 689k square feet retail center in Salt Lake City, UT and a hotel in Honolulu, HI. Our total equity investment in these transactions was approximately $39.5 million (including closing costs). In addition, we and our equity partners disposed of $93.8 million of real estate-related investments, including non-core commercial assets in the United Kingdom and received $46.3 million in cash proceeds.
In addition, as of February 21, 2018, we and our equity partners are under separate contracts to purchase a multifamily property in Salt Lake City, UT and a multifamily development project in Santa Rosa, CA for a total of $63.9 million. We anticipate financing these acquisitions with a combination of debt financing, balance sheet cash and partner equity. With respect to such assets under contract, we have non-refundable deposits of approximately $1.8 million held in escrow. The amount of our equity investment in these acquisitions has not yet been determined, but we currently expect our aggregate equity investment in these acquisitions to be between $20 million to $30 million. There can be no assurance that we will complete the potential acquisitions under contract. Also as of February 21, 2018, we and our equity partners are under separate contracts to dispose of an office building in northern California and two retail buildings in the United Kingdom at an aggregate sales price of approximately $27.6 million. We currently expect to receive a total of approximately $4.7 million in proceeds from these transactions. There can be no assurance that we will complete the potential dispositions under contract.
Consolidated and unconsolidated investment portfolio—In addition to our development and redevelopment initiatives we regularly implement a value-add approach to our consolidated and unconsolidated investments which includes rehabbing properties and adding or updating property amenities. The capital required to implement these value-add initiatives is typically funded with capital calls, refinancing or supplemental financings at the property level. We are not required to make these investments but they are a key driver in our ability to increase net operating income at our properties post acquisition. We typically invest $30 million to $50 million a year to fund capital expenditures for our consolidated and unconsolidated investment portfolio.
Under our current joint venture strategy, we generally contribute property expertise and a fully funded initial cash contribution, with commitments to provide additional funding. Accordingly, we generally do not have significant capital commitments with unconsolidated entities. As of December 31, 2017, we have unfulfilled capital commitments totaling $63.6 million to our unconsolidated investments.
Cash FlowsThe following table summarizes the cash provided by or used in our operating, investing and financing activities for the years ended December 31, 2017, 2016 and 2015:
Year ended December 31,
(Dollars in millions) 2017 2016 2015
Net cash provided by operating activities $ 73.0 $ 102.9 $ 178.2
Net cash used in investing activities (70.2) (286.7) (1,483.6)Net cash (used in) provided by financing activities (565.3) 419.8 1,118.8
Operating—Our cash flows from operating activities are primarily dependent upon operations from consolidated properties, the operating distributions from our unconsolidated investments, revenues from our IMRES business net of operating expenses and other general and administrative costs. Substantially all of the cash flows from operations of $73.0 million, $102.9 million and $178.2 million for the year ended December 31, 2017, 2016 and 2015 respectively, were generated from net rental income received from our rental properties, operating distributions from our unconsolidated investments and fees earned on our service business.
Cash provided from operating activities decreased during 2017 as compared to 2016 due to higher interest payments mainly from the revolving credit facility having a larger balance outstanding and for a longer period than the prior
Management’s Discussion and Analysis of Financial Condition and Results of Operations (continued)
Kennedy Wilson has a number of development, redevelopment and entitlement projects that are underway or in the planning stages. These initiatives may ultimately result in 2,865 multifamily units and 656,000 commercial rentable square feet, along with substantial upgrades to certain multifamily and commercial properties and hotels. If these projects were brought to completion the estimated share of the Company’s total capital would be approximately $595.5 million which we expect would be funded through our existing equity, third party equity, project sales and secured debt financing. This represents total capital over the life of the projects and is not a representation of peak equity and does not take into account any distributions over the course of the investment. As of December 31, 2017, we expect to invest $373.2 million which would be comprised of $92.6 million of cash from us to develop to completion or complete the entitlement process on these projects. These figures are budgeted costs and are subject to change. We and our equity partners are under no obligation to complete these projects and may dispose of any such assets after adding value through the entitlement process.
We, along with our equity partners (the “Capital Dock JV”), are currently developing “Capital Dock,” a prime waterfront property located in Dublin, Ireland, consisting of 370,000 square feet of commercial space across three buildings and 190 multifamily units across an additional three buildings. On May 12, 2017, the Capital Dock JV sold “200 Capital Dock,” one of the three commercial buildings of the greater Capital Dock development consisting of 130,000 sq. ft. of
office space. Concurrent with the transaction, the Capital Dock JV entered into a development agreement with the buyer to complete the construction of 200 Capital Dock on behalf of the buyer. With respect to 200 Capital Dock, the development agreement provides that upon certain events (including the insolvency of the Capital Dock JV and certain delivery deadlines not being met), the buyer may exercise a right to take over the construction of the project. In the event that the buyer exercises such right, the Capital Dock JV will receive a reduced amount of proceeds from the sales transaction. In December 2017, Indeed, one of the world’s largest talent recruiting companies, signed the largest Dublin lease of this cycle to fully occupy the office space at Capital Dock.
The Capital Dock development is currently being funded with proceeds from the sale of 200 Capital Dock, equity from us and our equity partners as well as a construction loan that we have in place. We hold 42.5% ownership interest in the development and as of December 31, 2017 we have invested $43.8 million of equity in the project. During the year ended December 31, 2017, we contributed a total of $19.5 million to the project. Additionally, we received a $22.7 million distribution relating to the $142.8 million construction loan that we entered into during the second quarter of 2017 ($88.6 million drawn down as of December 31, 2017).
We currently expect the estimated remaining cost to complete the development to be approximately $129.1 million with additional equity from us of approximately $18.1 million. The remaining equity will be funded from our

58 Kennedy Wilson Annual Report 2017 Kennedy Wilson Annual Report 2017 59
period and an increase in discretionary bonuses and the timing of when they were paid. Bonuses for the previous calendar year have typically been paid out in the first quarter of the year. A portion of the 2017 bonus was paid during December 2017.
When comparing 2016 versus 2015, while recurring revenues from our rental business continue to increase, these increases were offset in 2016 by the timing of the payments of accrued expenses and liabilities, including a tax payment in 2016 related to the 2015 sale of our Japanese multifamily portfolio, additional interest expense related to our corporate bonds, value added tax (“VAT”) payments in Europe, and payment of accounts payable.
Investing—Our cash flows used in investing activities are generally comprised of cash used to fund consolidated property acquisitions, investments in unconsolidated investments, capital expenditures and purchases of loans secured by real estate. These items are offset from cash provided from investing activities for property sales on our consolidated and unconsolidated investments and distributions received from refinancings on our unconsolidated investments.
Net cash used in investing activities totaled $70.2 million for the year ended December 31, 2017. During the current period Kennedy Wilson had $814.3 million of purchases and additions to real estate and $79.9 million contributions to new and existing unconsolidated investments. The cash used in the aforementioned investing activities was offset by receipt of $659.1 million, mainly from sales of multifamily properties in the Western United States which were than tax deferred exchanged into higher quality multifamily properties in the Western United States and non-core commercial properties in the United Kingdom and Ireland. Additionally, we received $133.4 million of investing distributions from unconsolidated investments due to the sales of multifamily properties in the Western United States and Japan, commercial properties in the Western United States, a servicing platform in Spain, and homes in residential development projects in the Western United States, and the refinancing of property level debt.
Net cash used in investing activities totaled $286.7 million for the year ended December 31, 2016. During the year ended December 31, 2016, KW had $949.6 million of purchases and additions to real estate and $124.9 million contributions to new and existing unconsolidated investments. The cash used in the aforementioned investing
activities was offset by receipt of $540.1 million, mainly from commercial property sales in Europe. KW also collected $146.9 million on loans primarily from the sale of a portfolio of loans in Europe during the first quarter.
Net cash used in investing activities totaled $1.5 billion for the year ended December 31, 2015. Kennedy Wilson spent $1.9 billion of purchases and additions to real estate. In addition, Kennedy Wilson invested $235.8 million to fund our equity in loans secured by real estate. The investment in the loans were mainly for the acquisition of a loan portfolio secured by eight hotels across the United Kingdom and a loan secured by a residential property also in the United Kingdom. The cash used in the aforementioned investing activities was offset by receipt of $622.6 million, mainly from the sale of our Japanese multifamily portfolio and other asset sales.
Financing—Our net cash related to financing activities is generally impacted by capital-raising activities net of dividends and distributions paid to common and preferred shareholders and noncontrolling interests as well as financing activities for consolidated real estate investments. Net cash used in financing activities totaled $565.3 million for the year ended December 31, 2017. As part of the KWE Transaction $719.8 million was paid to noncontrolling interest holders of KWE and $55.8 million in transaction costs relating to professional and banking fees to close the KWE Transaction. Kennedy Wilson received proceeds $848.3 million from mortgage loans to finance and refinance consolidated property acquisitions, which were offset by repayment of $684.7 million of investment debt. During the year ended December 31, 2017, we borrowed $800.0 million on our revolving line of credit and repaid $500.0 million. We also paid $55.0 million to pay off in full at par the 2042 Senior Notes. Distributions of $106.0 million were paid to noncontrolling interest holders primarily as a result of asset sales and cash received from financings.
Net cash provided by financing activities totaled $419.8 million for the year ended December 31, 2016. Kennedy Wilson received proceeds of $250.0 million from the issuance of senior notes and $1.2 billion from mortgage loans to finance and refinance consolidated property acquisitions, these were offset by repayment of $608.1 million of investment debt. In addition, KWE and the Company spent $196.9 million for KWE’s share repurchase program and the Company’s open market purchases of KWE shares. Distributions of $116.6 million to noncontrolling interest holders due mainly to asset sales
also offset cash from financing. The Company also drew and repaid $125 million on its line of credit during the current year.
Net cash provided by financing activities totaled $1.1 billion for the year ended December 31, 2015. This was primarily due to net proceeds of $215.0 million received from the issuance of 8.6 million shares of common stock. In addition, Kennedy Wilson received proceeds of $2.1 billion from mortgage loans to finance and refinance consolidated property acquisitions which included $888.3 million generated by two investment grade senior unsecured bond offerings. These were offset by repayment of $681.1 million of investment debt and distributions of $239.2 million to noncontrolling interest holders mainly due to the sale of our Japanese multifamily portfolio.
Contractual Obligations and Commercial CommitmentsAt December 31, 2017, Kennedy Wilson’s contractual cash obligations, including debt, lines of credit, and operating leases included the following:
Payments due by period
(Dollars in millions) TotalLess than
1 year1 - 3
years4 - 5
yearsAfter 5
years
Contractual obligations
Borrowings:(1)(4)
Mortgage debt(2)(4) $ 3,178.1 $ 67.7 $ 680.2 $ 886.9 $ 1,543.3
Senior notes(3)(4) 900.0 — — — 900.0
Credit Facility(4) 300.0 — 300.0 — — KWE unsecured bonds(4)(5) 1,335.6 — — 675.8 659.8
Total borrowings 5,713.7 67.7 980.2 1,562.7 3,103.1
Operating leases 9.7 2.8 5.3 1.6 —T o t a l c o n t r a c t u a l c a s h
obligations $ 5, 723.4 70. $ 98 5.5 $ 1, 564.3 $ 3,103.1( 1) See Notes 8-11 of our Notes to Consolidated Financial Statements. Figures do
not include scheduled interest payments. Assuming each debt obligation is held until maturity, we estimate that we will make the following interest payments: Less than 1 year-$196.6 million; 1-3 years-$548.2 million; 4-5 years-$291.5 million; After 5 years: $164.6 million. The interest payments on variable rate debt have been calculated at the interest rate in effect as of December 31, 2017.
( 2) Excludes $2.4 million net unamortized debt premium on mortgage debt.( 3) Excludes $1.9 million unamortized debt discount on senior notes.(4) Excludes $48.0 million unamortized loan fees.(5) Excludes $4.3 million net unamortized discount on KWE unsecured bonds.
At December 31, 2017, Kennedy Wilson’s share of contractual cash obligations (excluding amounts that are attributable to noncontrolling interests), including debt, lines of credit, and operating leases included the following:
Payments due by period
(Dollars in millions) TotalLess than
1 year1 - 3
years4 - 5
yearsAfter 5
years
Contractual obligations
Borrowings:(1)
Mortgage debt $ 2,896.2 $ 62.7 $ 601.1 $ 876.8 $ 1,355.6
Senior notes(2) 900.0 — — — 900.0
Credit Facility 300.0 — 300.0 — — KWE unsecured bonds(3) 1,335.6 — — 675.8 659.8
Total borrowings 5,431.8 62.7 901.1 1,552.6 2,915.4
Operating leases 9.7 2.8 5.3 1.6 —T o t a l c o n t r a c t u a l c a s h obligations $ 5, 441.5 $ 65.5 $ 06.4 $ 1, 554.2 $ 2, 915.4( 1) See Notes 8-11 of our Notes to Consolidated Financial Statements. Figures do
not include scheduled interest payments.( 2) Excludes $1.9 million net unamortized debt discount on senior notes.( 3) Excludes $4.3 million net unamortized discount on KWE unsecured bonds.
Indebtedness and Related CovenantsThe following describes our corporate indebtedness and related covenants.
Senior Notes PayableIn March 2014, Kennedy-Wilson, Inc., completed a public offering of $300.0 million aggregate principal amount of 5.875% Senior Notes due 2024 (the “2024 Notes”), for approximately $290.7 million, net of discount and estimated offering expenses. The 2024 Notes were issued pursuant to an indenture dated as of March 25, 2014, by and among Kennedy-Wilson, Inc., as issuer, and Wilmington Trust National Association, as trustee, as supplemented by a supplemental indenture, dated as of March 25, 2014, by and between Kennedy-Wilson, Inc. as issuer, Kennedy-Wilson Holdings, Inc., as parent guarantor, certain subsidiaries of the issuer, as subsidiary guarantors, and Wilmington Trust National Association, as trustee (the indenture, as so supplemented, the “2024 Indenture”). The issuer’s obligations under the 2024 Notes are fully and unconditionally guaranteed by Kennedy-Wilson Holdings, Inc. and the subsidiary guarantors. At any time prior to April 1, 2019, the issuer may redeem the 2024 Notes, in whole or in part, at a redemption price equal to 100% of their principal amount, plus an applicable “make-whole” premium and accrued and unpaid interest, if any, to the redemption date. At any time and from time to time on or after April 1, 2019, the issuer may redeem the 2024 Notes, in whole or in part, at the redemption price specified in the 2024 Indenture, plus accrued and unpaid interest, if any, to the redemption date. Prior to April 1, 2017, the issuer may also redeem up to 35% of the 2024 Notes
Management’s Discussion and Analysis of Financial Condition and Results of Operations (continued)

60 Kennedy Wilson Annual Report 2017 Kennedy Wilson Annual Report 2017 61
from the proceeds of certain equity offerings. Interest on the 2024 Notes accrues at a rate of 5.875% per annum and is payable semi-annually in arrears on April 1 and October 1 of each year, commencing on October 1, 2014. The 2024 Notes will mature on April 1, 2024. In November 2014 and August 2016, we completed two additional public offerings of $350 million and $250 million, respectively, aggregate principal amounts of 5.875% Senior Notes, due 2024 (the “Additional Notes”). The Additional Notes have substantially identical terms as the 2024 Notes described above, and are treated as a single series with the 2024 Notes under such 2024 Indenture. The Additional Notes were issued and sold at a public offering prices of 100.0% of their principal amount, plus accrued interest. The amount of the 2024 Notes included in the accompanying consolidated balance sheets was $898.1 million at December 31, 2017.
In November and December 2012, Kennedy-Wilson, Inc. completed a public offering of $55.0 million aggregate principal amount of 7.750% Senior Notes due 2042 (the “2042 Notes”). On December 1, 2017 the 2042 Notes were redeemed in full at a redemption price equal to 100% of the principal amount.
KWE Senior Notes PayableIn June 2015, KWE completed its inaugural bond offering (“KWE Bonds”) of approximately $405.3 million (based on December 31, 2017 rates) (£300 million) in 3.95% fixed-rate senior unsecured bonds due 2022. In September 2016, KWE completed an additional bond offering of approximately $270.3 million (based on December 31, 2017 rates) (£200 million) under the same indenture as the KWE Bonds mentioned above. The KWE Bonds have a carrying value of $675.6 million as of December 31, 2017. KWE effectively reduced the interest rate to 3.35% as a result of it entering into swap arrangements to convert 50% of the proceeds into Euros.
In addition, during the fourth quarter of 2015, KWE established a £2.0 billion (approximately $2.7 billion based on December 31, 2017 rates) Euro Medium Term Note Programme (“EMTN”). Under the EMTN Programme, KWE may issue, from time to time, up to £2.0 billion of various types of debt securities in certain markets and currencies. During the fourth quarter of 2015 and second quarter of 2016, KWE drew down under its EMTN Programme, with issuances of senior unsecured notes for an aggregate principal amount of approximately $660.3 million (based on December 31, 2017 rates) (€550 million) (the “KWE Notes”). The KWE Notes were issued at a discount and have
a carrying value of $655.7 million, have an annual fixed coupon of 3.25%, and mature in 2025. The KWE Notes rank pari passu with the KWE Bonds, and are subject to the same restrictive covenants.
The KWE Bonds and KWE Notes require KWE to maintain (i) consolidated net indebtedness (as defined in the trust deed for the notes) of no more than 60% of the total asset value; (ii) consolidated secured indebtedness (less cash and cash equivalents) of no more than 50% of total asset value; (iii) an interest coverage ratio of at least 1.50 to 1.00, and (iv) unencumbered assets of no less than 125% of the unsecured indebtedness (less cash & cash equivalents). The covenants associated with KWE Bonds and KWE Notes are not an obligation of KWH and these amounts are presented as a component of our investment debt as it is an unsecured obligation relating to an underlying investment of ours.
Borrowings Under Line of CreditOn October 3, 2017, Kennedy-Wilson, Inc. (the “Borrower”), a wholly-owned subsidiary of Kennedy-Wilson Holdings, Inc. (the “Company”), KWH and certain subsidiaries of the Company (the “Subsidiary Guarantors”) entered into an Escrow Agreement with a syndicate of lenders (the “Lenders”), Bank of America, N.A. (“BofA”), as administrative agent and Merrill Lynch, Pierce, Fenner & Smith Incorporated (“Merrill”), JPMorgan Chase Bank, N.A. (“JPM”) and U.S. Bank National Association, as joint lead arrangers and joint bookrunners, pursuant to which the parties delivered executed signature pages to a $700 million unsecured revolving credit and term loan facility (the “A&R Facility”), which amended and restated the Borrower’s existing revolving credit facility. The A&R Facility is comprised of a $500 million revolving line of credit and a $200 million term loan facility. Loans under the revolving line of credit bear interest at a rate equal to LIBOR plus between 1.75% and 2.75%, depending on the consolidated leverage ratio as of the applicable measurement date. Loans under the term loan facility bear interest at a rate equal to LIBOR plus between 1.65% and 2.65%, depending on the consolidated leverage ratio as of the applicable measurement date. The A&R Facility has a maturity date of March 31, 2021. Subject to certain conditions precedent and at the Borrower’s option, the maturity date of the A&R Facility may be extended by one year. At closing, the Company drew the full term loan amount of $200.0 million, borrowed $200.0 million under the A&R Facility’s revolving line, and repaid the $350.0 million outstanding on the existing revolving credit facility. As of December 31, 2017, the Company had an outstanding
balance of $300.0 million on the A&R Facility with $400.0 million available to be drawn under the revolving credit facility.
On December 10, 2015, the Borrower entered into a $475 million unsecured revolving credit facility (the “KW Revolving Facility”) with a syndicate of lenders including JPMorgan Chase Bank, N.A., Deutsche Bank AG New York Branch, U.S. Bank N.A., East West Bank, Fifth Third Bank, The Governor and Company of the Bank of Ireland, Compass Bank, City National Bank, and Bank of America, N.A., as administrative agent and letter of credit issuer. Loans under the KW Revolving Facility bear interest at a rate equal to LIBOR plus 2.50% or 3.00%, depending on the consolidated leverage ratio as of the applicable measurement date, and have a maturity date of December 10, 2018. In October 2017, the KW Revolving Facility was amended and restated, which resulted in the A&R Facility.
KWE Facility—KWE had an unsecured floating rate revolving debt facility (“KWE Facility”) with Bank of America Merrill Lynch, Deutsche Bank, and J.P. Morgan Chase of approximately $304.0 million (based on December 31, 2017 rates) (£225 million). On October 20, 2017, the KWE Facility was terminated in conjunction with the Transaction.
Debt CovenantsThe A&R Facility and the indentures governing the 2024 Notes contain numerous restrictive covenants that, among other things, limit Kennedy Wilson’s and certain of its subsidiaries’ ability to incur additional indebtedness, pay dividends or make distributions to stockholders, repurchase capital stock or debt, make investments, sell assets or subsidiary stock, create or permit liens on assets, engage in transactions with affiliates, enter into sale/leaseback transactions, issue subsidiary equity and enter into consolidations or mergers. The A&R Revolving Facility requires Kennedy Wilson to maintain a minimum tangible net worth and a specified amount of cash and cash equivalents.
The A&R Facility has certain covenants as defined within its Amended and Restated Credit Agreement, Dated as of October 20, 2017 (the “Credit Agreement”) that, among other things, limit the Company and certain of its subsidiaries’ ability to incur additional indebtedness, repurchase capital stock or debt, sell assets or subsidiary stock, create or permit liens on assets, engage in transactions with affiliates, enter into sale/leaseback transactions, issue subsidiary equity and enter into consolidations or mergers. The Credit Agreement requires the Company to maintain (i) a maximum consolidated
leverage ratio (as defined in the Credit Agreement) of not greater than 65%, measured as of the last day of each fiscal quarter, (ii) a minimum fixed charge coverage ratio (as defined in the Credit Agreement) of not less than 1.70 to 1.00, measured as of the last day of each fiscal quarter for the period of four full fiscal quarters then ended, (iii) a minimum consolidated tangible net worth equal to or greater than the sum of $1,066,775,300 plus an amount equal to fifty percent (50%) of net equity proceeds received by the Company after the date of the most recent financial statements that are available as of the Closing Date, measured as of the last day of each fiscal quarter, (iv) a maximum recourse leverage ratio (as defined in the Credit Agreement) of not greater than an amount equal to consolidated tangible net worth as of the measurement date multiplied by 1.5, measured as of the last day of each fiscal quarter, (v) a maximum secured recourse leverage ratio (as defined in the Credit Agreement) of not greater than an amount equal to 3.5% of consolidated total asset value (as defined in the Credit Agreement) and $300,351,000, (vi) a maximum adjusted secured leverage ratio (as defined in the Credit Agreement) of not greater than 55%, measured as of the last day of each fiscal quarter, and (vii) liquidity (as defined in the Credit Agreement) of at least $75.0 million.
As of December 31, 2017, the Company’s consolidated leverage ratio was 63.1%, its fixed charge coverage ratio was 3.1 to 1.00, its consolidated tangible net worth was $1,954.5 million, its adjusted secured leverage ratio was 37.9%, its secured recourse leverage ratio was 0.8%, its recourse leverage ratio was 0.65, and liquidity was $358.8 million. The obligations of the Borrower pursuant to the Credit Agreement are guaranteed by the Company and certain wholly-owned subsidiaries of the Company.
The indentures governing the 2024 Notes limit the ability of Kennedy Wilson and its restricted subsidiaries to incur additional indebtedness if, on the date of such incurrence and after giving effect to the new indebtedness, the maximum balance sheet leverage ratio (as defined in the indenture) is greater than 1.50 to 1.00. This ratio is measured at the time of incurrence of additional indebtedness. As of December 31, 2017, the maximum balance sheet leverage ratio was 0.94 to 1.00.
O -Balance Sheet ArrangementsGuarantees—We have provided guarantees associated with loans secured by consolidated assets. At December 31, 2017, the maximum potential amount of future payments (undiscounted) we could be required to make under the
Management’s Discussion and Analysis of Financial Condition and Results of Operations (continued)

62 Kennedy Wilson Annual Report 2017 Kennedy Wilson Annual Report 2017 63
guarantees was approximately $69.4 million at December 31, 2017. The guarantees expire through 2027 and our performance under the guarantees would be required to the extent there is a shortfall in liquidation between the principal amount of the loan and the net sale proceeds of the applicable properties. If we were to become obligated to perform on these guarantees, it could have an adverse effect on our financial condition.
As of December 31, 2017, we have unfulfilled capital commitments totaling $63.6 million to our unconsolidated investments. As we identify investment opportunities in the future, we may be called upon to contribute additional capital to unconsolidated investments in satisfaction of our capital commitment obligations.
Non-Recourse Carve Out Guarantees—Most of our real estate properties within our equity partnerships are encumbered by traditional non-recourse debt obligations. In connection with most of these loans, however, we entered into certain “non-recourse carve out” guarantees, which provide for the loans to become partially or fully recourse against us if certain triggering events occur. Although these events are different for each guarantee, some of the common events include:
• the special purpose property-owning subsidiary’s filing a voluntary petition for bankruptcy;
• the special purpose property-owning subsidiary’s failure to maintain its status as a special purpose entity; and
• subject to certain conditions, the special purpose property-owning subsidiary’s failure to obtain lender’s written consent prior to any subordinate financing or other voluntary lien encumbering the associated property.
In the event that any of these triggering events occur and the loans become partially or fully recourse against us, our business, financial condition, results of operations and common stock price could be materially adversely affected.
In addition, other items that are customarily recourse to a non-recourse carve out guarantor include, but are not limited to, the payment of real property taxes, liens which are senior to the mortgage loan and outstanding security deposits.
Impact of In ation and Changing PricesInflation has not had a significant impact on the results of operations of our company in recent years.
Our exposure to market risk from changing prices consists primarily of fluctuations in rental rates of commercial and residential properties, market interest rates on residential mortgages and debt obligations and real estate property
values. Rental rate increases are dependent upon market conditions and the competitive environments in the respective locations of the properties. The revenues associated with the real estate services businesses are impacted by fluctuations in interest rates, lease rates, real property values and the availability of space and competition in the market place. Real estate service revenues are derived from a broad range of real estate services that are primarily transaction driven and are therefore volatile in nature and highly competitive. The revenues of the investment management operations with respect to rental properties are highly dependent upon the aggregate rents of the properties managed, which are affected by rental rates and building occupancy rates. Employee compensation is the principal cost element of investment management. To the extent that we engage in development activities, we may have exposure to changing prices in materials or cost of labor.
Qualitative and Quantitative Disclosures about Market RiskOur primary market risk exposure relates to changes in interest rates in connection with our short-term borrowings, some of which bear interest at variable rates based on the lender’s base rate, prime rate, EURIBOR, GBP LIBOR, or LIBOR plus an applicable borrowing margin. These borrowings do not give rise to a significant interest rate risk because they have short maturities. However, the amount of income or loss we recognize for unconsolidated joint ventures or consolidated interest expense from property level debt may be impacted by changes in interest rates. Historically, the impact from the changes in rates has not been significant. Our exposure to market risk also consists of foreign currency exchange rate fluctuations related to our international operations.
Interest Rate RiskWe have established an interest rate management policy, which attempts to minimize our overall cost of debt while taking into consideration the earnings implications associated with the volatility of short-term interest rates. As part of this policy, we have elected to maintain a combination of variable and fixed rate debt. As of December 31, 2017, 69% of our consolidated debt is fixed rate, 9% is floating rate with interest caps and 22% is floating rate without interest caps.
We hold variable rate debt on some of our consolidated properties that are subject to interest rate fluctuations. In order to mitigate some of the risk associated with increasing interest rates we have purchased interest rate caps that limit the amount that interest expense can increase with rate increases. However, some of our debt is uncapped and
the mortgages that do have interest caps are subject to increased interest expense until rates hit the level of caps that have been purchased. If there was a 100 basis point increase or decrease, we would have a $8.8 million increase in interest expense or $4.6 million in interest expense savings during 2018 of our current consolidated mortgages. The weighted average strike price on caps and maturity of Kennedy Wilson’s variable rate mortgages is 3.32% and approximately 4 years, respectively, as of December 31, 2017.
Management’s Discussion and Analysis of Financial Condition and Results of Operations (continued)
The table below represents contractual balances of our financial instruments at the expected maturity dates as well as the fair value as of December 31, 2017. The weighted average interest rate for the various assets and liabilities presented are actual as of December 31, 2017. We closely monitor the fluctuation in interest rates, and if rates were to increase significantly, we believe that we would be able to either hedge the change in the interest rate or refinance the loans with fixed interest rate debt. All instruments included in this analysis are non-trading.
Principal Maturing in: Fair Value
2018 2019 2020 2021 2022 Thereafter TotalDecember 31,
2017
(Dollars in millions)
Interest rate sensitive assets
Cash equivalents $ 351.3 $ — $ — $ — $ — $ — $ 351.3 $ 351.3Average interest rate 0.02% —% —% —% —% —% 0.02% —Fixed rate receivables 68.9 4.5 — — — — 73.4 73.4Average interest rate (1) 6.00% 5.00% —% —% —% —% 5.22% —Variable rate receivables 11.3 — — — — — 11.3 11.3Average interest rate 3.53% —% —% —% —% —% 3.53% —
Total $ 431.5 $ 4.5 $ — $ — $ — $ — $ 436.0 $ 436.0Weighted average interest rate(1) 0.15% 5.00% —% —% —% —% 0.22%Interest rate sensitive liabilities
Variable rate borrowings $ 35.9 $260.4 $ 37.4 $401.1 $ 384.1 $ 371.0 $ 1,489.9 $ 1,508.3Average interest rate 2.68% 2.66% 2.95% 3.59% 1.98% 2.15% 2.61% —Fixed rate borrowings 53.9 53.3 114.3 46.3 688.7 3,267.3 4,223.8 4,285.7Average interest rate 4.14% 4.23% 3.14% 4.85% 3.96% 4.05% 4.02% —
Total $ 89.8 $313.7 $151.7 $447.4 $ 1,072.8 $ 3,638.3 $ 5,713.7 $ 5,794.0Weighted average interest rate 3.55% 2.92% 3.09% 3.72% 3.25% 3.86% 3.66%
( 1) Interest rate sensitive assets’ weighted average interest rates are exclusive of non-performing receivables.
Currency Risk - Foreign CurrenciesThe financial statements of Kennedy Wilson’s subsidiaries located outside the United States are measured using the local currency as this is their functional currency. The assets and liabilities of these subsidiaries are translated at the rates of exchange at the balance sheet date, and income and expenses are translated at the average monthly rate. The foreign currencies primarily include the euro and the British pound sterling. Cumulative translation adjustments, to the extent not included in cumulative net income, are included in the consolidated statement of equity as a component of accumulated other comprehensive income. Currency translation gains and losses and currency derivative gains and losses will remain in other comprehensive income unless and until the Company substantially liquidates underlying investments.
As our business in Europe continues to grow, fluctuations in the Euro and GBP foreign exchange rates will have a greater impact on our business. Investment level debt is generally incurred in local currencies and therefore we consider our equity investment as the appropriate exposure to evaluate for hedging purposes. In order to manage the potential exposure from adverse changes in foreign exchange rates arising from our net investments in foreign operations, we may enter into currency derivative contracts such as foreign currency forward contracts and options to hedge all or portions of the net investments in our non-U.S. dollar denominated foreign operations. With the closing of KWE Transaction we will have a higher exposure to Euro and GBP investments and greater foreign exchange impact on our financial statements. We are currently looking into different strategies on how to handle this increased exposure going

64 Kennedy Wilson Annual Report 2017 Kennedy Wilson Annual Report 2017 65
forward and may enter into different types of derivative contracts in order to mitigate our increased foreign currency exposure.
Our service businesses typically do not require much capital so foreign currency translation and derivative activity primarily relates to the investments segment as that has greater balance sheet exposure to foreign currency fluctuations.
We typically have not hedged the impact foreign currency fluctuations may have on our future operations or cash flows. The costs to operate these businesses, such as compensation, overhead and interest expense are incurred in local currencies. As we are not currently hedging our current operations there will be foreign currency impact on our results of operations for both the investment and services segments.
Years Ended December 31,
(Dollars in millions) 2017 2016 2015 2014 2013
Investment management, property services and research fees(1) $ 51.7 $ 59.4 $ 69.3 $ 82.6 $ 68.1
Non-GAAP adjustments:
Add back:
Fees eliminated in consolidation 26.3 36.9 75.0 21.6 4.3
Kennedy Wilson’s share of fees in unconsolidated service businesses 8.6 12.6 13.9 16.8 —
Adjusted Fees $ 8 6.6 $ 10 . $ 158 .2 $ 121.0 $ 72.4
( 1) Amounts previously presented as Management and leasing fees and commissions on prior period statement of operations. Amounts above represent total of fees and commissions from prior periods.
Management’s Discussion and Analysis of Financial Condition and Results of Operations (continued)
If there was a 5% increase or decrease in foreign exchange rates on the currencies we invest to the U.S. Dollar our net asset value would increase by $31.6 million or decrease by $34.4 million. If rates moved 10% we would have an increase of $60.1 million and a decrease of $67.7 million.
Non-GAAP MeasuresWe use certain non-GAAP measures to analyze our business, including Adjusted EBITDA, Adjusted Net Income and Adjusted Fees. We use these metrics for evaluating the success of our company and believe that they enhance the understanding of our operating results. A reconciliation of net income to Adjusted EBITDA, Adjusted Net Income and Adjusted Fees is presented below:
Years Ended December 31,
(Dollars in millions) 2017 2016 2015 2014 2013
Net income $ 138.0 $ 76.5 $ 59.0 $ 90.1 $ 13.9
Non-GAAP adjustments:
Add back:
Interest expense 217.7 191.6 155.7 103.4 51.7
Early extinguishment of corporate debt — — 1.0 27.3 —Kennedy Wilson’s share of interest expense included in investment
in unconsolidated investments 23.0 23.0 28.1 35.5 45.0
Depreciation and amortization 212.5 198.2 166.3 104.5 17.4Kennedy Wilson’s share of depreciation and amortization included
in unconsolidated investments 16.2 20.8 28.1 47.1 46.7
Provision for (benefit from) income taxes (16.3) 14.0 53.4 32.4 2.9
Share-based compensation 38.4 65.1 30.8 15.8 7.5
EBITDA attributable to noncontrolling interests(1) (173.8) (239.3) (151.2) (138.3) (26.0)
Adjusted EBITDA 2 $ 455.7 $ 349.9 $ 371.2 $ 317.8 $ 159.1
( 1) ( 2) See “Non-GAAP Measures and Certain Definitions” for definitions and discussion of Adjusted EBITDA.
Years Ended December 31,
(Dollars in millions) 2017 2016 2015 2014 2013
Net income $ 138.0 $ 76.5 $ 59.0 $ 90.1 $ 13.9
Non-GAAP adjustments:
Add back:
Depreciation and amortization 212.5 198.2 166.3 104.5 17.4
Kennedy Wilson’s share of depreciation and amortization included in unconsolidated investments 16.2 20.8 28.1 47.1 46.7
Share-based compensation 38.4 65.1 30.8 15.8 7.5
Net income attributable to the noncontrolling interests, before depreciation and amortization(1) (117.8) (169.3) (76.0) (123.8) (24.4)
One-time tax remeasurement (44.8) — — — —
Adjusted Net Income 2 $ 242.5 $ 191.3 $ 20 .2 $ 133.7 $ 61.1
( 1) ( 2) See “Non-GAAP Measures and Certain Definitions” for definitions and discussion of Adjusted Net Income.
Same property analysisThe same property analysis reflects, and is weighted by, Kennedy Wilson’s ownership in each underlying property. Previously, the Company had presented this analysis without adjusting for Kennedy Wilson’s ownership interest.
The table below is a reconciliation of Non-GAAP measures included within the Company’s same property analysis, to their most comparable GAAP measures.
Year Ended December 31, 2017 Year Ended December 31, 2016
Same Property Same Property
(Dollars in millions) Revenue NOI Revenue NOI
Operating Income 10 . 10 . $ 138 .1 $ 138 .1
Less: Sale of real estate (111.5) (111.5) (29.3) (29.3)
Less: Investment management, property services and research fees (51.7) (51.7) (59.4) (59.4)
Less: Loans and other income (15.2) (15.2) (12.6) (12.6)
Add: Rental operating 151.2 — 135.4 —
Add: Hotel operating 100.3 — 96.3 —
Add: Cost of real estate sold 80.2 80.2 22.1 22.1
Add: Commission and marketing 7.2 7.2 8.0 8.0
Add: Compensation and related 177.2 177.2 186.5 186.5
Add: General and administrative 42.2 42.2 45.4 45.4
Add: Depreciation and amortization 212.5 212.5 198.2 198.2
Less: Income from unconsolidated investments (69.0) (69.0) (126.6) (126.6)
Property-Level Consolidated $ 632.2 3 0.7 602.1 370.4
Less: NCI adjustments (1) (50.2) (18.3) (47.7) (18.6)
Add: Unconsolidated investment adjustments (2) 58.5 39.3 55.8 37.0
Add: Straight-line and above/below market rents (10.2) (10.2) (7.1) (7.1)
Less: Reimbursement of recoverable operating expenses (27.6) — (27.9) —
Less: Properties bought and sold (3) (93.2) (64.7) (78.5) (58.1)
Less: Other properties excluded (4) (36.8) (16.3) (41.2) (25.1)
Other Reconciling Items (5) 1.6 4.9 0.3 7.5
Same Property $ 474.3 $ 315.4 $ 455.8 306.0

66 Kennedy Wilson Annual Report 2017 Kennedy Wilson Annual Report 2017 67
Year Ended December 31, 2017 Year Ended December 31, 2016
Same Property Same Property
Same Property Reported Revenue NOI Revenue NOI
Commercial - Same Property $ 186.9 $ 169.5 $ 187.4 $ 172.7
Multifamily Market Rate Portfolio - Same Property 151.8 102.3 143.3 95.8
Multifamily Affordable Portfolio - Same Property 27.3 18.2 26.1 17.2
Hotel - Same Property 108.3 25.4 99.0 20.3
Same Property $ 474.3 $ 315.4 $ 455.8 306.0
( 1) Represents rental revenue and operating expenses and hotel revenue and operating expenses attributable to non-controlling interests.( 2) Represents the Company’s share of unconsolidated investment rental revenues and net operating income, as applicable, which are within the applicable same property
population.( 3) Represents properties excluded from the same property population that were purchased or sold during the applicable period.(4) Represents properties excluded from the same property population that were not during the applicable period.(5) Represents other properties excluded from the same property population that were not classified as either a commercial or multifamily property within the Company’s
portfolio. Also includes immaterial adjustments for foreign exchange rates, changes in ownership percentages, and certain non-recurring income and expenses.
of Kennedy Wilson’s real estate funds and loan pool participations based on the cumulative performance of the fund and loan pools and are subject to preferred return thresholds of the limited partners and participants. At the end of each reporting period, Kennedy Wilson calculates the performance fee that would be due as if the fair value of the underlying investments were realized as of such date, irrespective of whether such amounts have been realized. As the fair value of underlying investments varies between reporting periods, it is necessary to make adjustments to amounts recorded as performance fees to reflect either (a) positive performance resulting in an increase in the performance fee allocated to the general partner or asset manager or (b) negative performance that would cause the amount due to Kennedy Wilson to be less than the amount previously recognized as revenue, resulting in a negative adjustment to performance fees allocated to the general partner or asset manager. Substantially all of the performance fees are recognized in investment management fees in our consolidated statements of operations. Total performances fees recognized to date through December 31, 2017 that may be reversed in future periods if there is negative fund performance totaled $32.9 million. Performance fees recognized during the years ended December 31, 2017, 2016, and 2015 were $5.6 million, $13.0 million and $18.0 million and the amounts that have not been received are included in other assets in the accompanying consolidated balance sheet.
KWE was externally managed by one of the Company’s wholly-owned subsidiaries (“KWE Manager”) pursuant to an investment management agreement in which capacity Kennedy Wilson was entitled to receive certain management and performance fees. KWE Manager was paid an annual management fee (payable quarterly in arrears) equal to 1% of KWE’s adjusted net asset value (EPRA NAV). The management fee payable to KWE Manager was paid half in cash and half in shares of KWE. KW Manager earned $16.0 million in management fees for the year ended December 31, 2017 which is eliminated in consolidation due to the Company’s consolidation of KWE.
Commissions primarily consist of acquisition fees, auction and real estate sales commissions, leasing commissions, and consulting fees. Acquisition fees are earned for identifying and closing investments on behalf of investors and are based on a fixed percentage of the acquisition price. Acquisition fees are recognized upon the successful completion of an acquisition after all required services have been performed. In the case of auction and real estate sales commissions,
the revenue is generally recognized when escrow closes. In accordance with the guidelines established for Reporting Revenue Gross as a Principal versus Net as an Agent in the ASC Subtopic 605-45, Kennedy Wilson records commission revenues and expenses on a gross basis. Of the criteria listed in the Subtopic 605-45, Kennedy Wilson is the primary obligor in the transaction, does not have inventory risk, performs all or part of the service, has credit risk, and has wide latitude in establishing the price of services rendered and discretion in selection of agents and determination of service specifications. Leasing fees that are payable upon tenant occupancy, payment of rent or other events beyond Kennedy Wilson’s control are recognized upon the occurrence of such events.
Rental income from operating leases is generally recognized on a straight-line basis over the terms of the leases. Hotel income is earned when rooms are occupied or goods and services have been delivered or rendered.
Sales of real estate are recognized when title to the real property passes to the buyer and there is no continuing involvement in the real property. Kennedy Wilson follows the requirements for profit recognition as set forth by the Sale of Real Estate ASC Subtopic 360-20.
Interest income from investments in loans acquired at a discount are recognized using the effective interest method. Interest income from investments in loans which Kennedy Wilson originates are recognized at the stated interest rate. When a loan or loans are acquired with deteriorated credit quality primarily for the rewards of collateral ownership, such loans are accounted for as loans until Kennedy Wilson is in possession of the collateral. However, accrual of income is not recorded during the conversion period under ASC Subtopic 310-30-25. Income is recognized to the extent that cash is received from the loan.
REAL ESTATE ACQUISITIONS — The purchase price of acquired properties is recorded to land, buildings and building improvements and intangible lease value (value of above-market and below-market leases, acquired in-place lease values, and tenant relationships, if any) based on their respective estimated fair values in accordance with Business Combinations ASC Subtopics 805-10. Acquisition-related costs are expensed as incurred.
The valuations of real estate are based on management estimates of the real estate assets using income and market approaches. The indebtedness securing the real estate are valued, in part, based on third party valuations and management estimates also using an income approach.
Management’s Discussion and Analysis of Financial Condition and Results of Operations (continued)
Critical Accounting PoliciesBASIS OF PRESENTATION — The consolidated financial statements include the accounts of Kennedy Wilson and voting interest entities which it controls. All significant intercompany balances and transactions have been eliminated in consolidation. In addition, Kennedy Wilson evaluates its relationships with other entities to identify whether they are variable interest entities (“VIE”) as defined by Financial Accounting Standards Board (“FASB”) Accounting Standards Codification (“ASC”) Subtopic 810 – Consolidation and to assess whether it is the primary beneficiary of such entities. In determining whether Kennedy Wilson is the primary beneficiary of a VIE, qualitative and quantitative factors are considered, including, but not limited to: the amount and characteristics of Kennedy Wilson’s investment; the obligation or likelihood for Kennedy Wilson to provide financial support; Kennedy Wilson’s ability to control or significantly influence key decisions for the VIE; and the similarity with and significance to the business activities of Kennedy Wilson. Significant judgments related to these determinations include estimates about the future fair values and performance of real estate held by these VIEs and general market conditions.
USE OF ESTIMATES — The preparation of the accompanying consolidated financial statements in conformity with U.S. generally accepted accounting principles (“GAAP”) requires management to make estimates and assumptions about future events. These estimates and the underlying assumptions affect the amounts of assets and liabilities reported, disclosure about contingent assets and liabilities, and reported amounts of revenues and expenses. Management evaluates its estimates and assumptions on an ongoing basis using historical experience and other
factors, including the current economic environment, which management believes to be reasonable under the circumstances. Management adjusts such estimates and assumptions when facts and circumstances dictate. As future events and their effects cannot be determined with precision, actual results could differ significantly from these estimates. Changes in those estimates will be reflected in the financial statements in future periods.
REVENUE RECOGNITION — Revenue consists of management and leasing fees (including performance fees), commissions, rental and hotel income, sales of real estate and loan income.
Management fees are primarily comprised of investment management, property services, and research fees. Investment management fees are earned from limited partners of funds, co-investments, or separate accounts and are generally based on a fixed percentage of committed capital or net asset value. Property services fees are earned for managing the operations of real estate assets and are generally based on a fixed percentage of the revenues generated from the respective real estate assets. Research fees are earned from consulting arrangements. These fees are recognized as revenue ratably over the period that the respective services are performed. The Company provides investment management and property services on investments it also has an ownership interest in. Fees earned on consolidated properties are eliminated in consolidation and fees on unconsolidated investments are eliminated for the portion that relate to the Company’s ownership interest. During the year ended December 31, 2017, $26.3 million were eliminated in consolidation.
Performance fees or carried interest are allocated to the general partner, special limited partner or asset manager
68 Kennedy Wilson Annual Report 2017 Kennedy Wilson Annual Report 2017 69
NONCONTROLLING INTERESTS — Noncontrolling interests are reported within equity as a separate component of Kennedy Wilson’s equity in accordance with Noncontrolling Interests in Consolidated Financial Statements ASC Subtopic 810-10. Revenues, expenses, gains, losses, net income or loss, and other comprehensive income are reported in the consolidated statements of operations at the consolidated amounts and net income and comprehensive income attributable to noncontrolling interests are separately stated. Prior to the KWE Transaction, management fees earned by KWE Manager for managing KWE were eliminated in consolidation however the amount attributable to the noncontrolling interest holders of KWE were recognized through net income (loss) attributable to noncontrolling interest holders.
FOREIGN CURRENCIES — The financial statements of subsidiaries located outside the United States are measured using the local currency as the functional currency. The assets and liabilities of these subsidiaries are translated at the rates of exchange at the balance sheet date, and income and expenses are translated at the average monthly rate. The foreign currencies include the Euro and the British pound sterling. Cumulative translation adjustments, to the extent not included in cumulative net income, are included in the consolidated statements of equity and comprehensive income as a component of accumulated other comprehensive income. The Company hedges its investments in foreign subsidiaries with forward and option contracts as discussed below.
At December 31, 2017, approximately 49% of our investment account is invested through our foreign platforms in their local currencies. Investment level debt and operational costs of our platforms are generally incurred in local currencies. Fluctuations in foreign exchanges rates may have a significant impact on the results of our operations. In order to manage the effect of these fluctuations, we generally hedge our book equity exposure to foreign currencies through currency forward contracts and options. We typically hedge 50%-100% of the book equity exposure to these foreign currencies.
DERIVATIVE INSTRUMENTS AND HEDGING ACTIVITIES — Kennedy Wilson has derivatives to reduce its exposure to foreign currencies. All derivative instruments are recognized as either assets or liabilities in the balance sheet at their respective fair values. For derivatives designated in hedging relationships, changes in fair value of cash flow hedges or net investment hedges are recognized in accumulated other comprehensive income, to the extent the derivative is
effective at offsetting the changes in the item being hedged until the hedged item affects earnings.
UNCONSOLIDATED INVESTMENTS — Kennedy Wilson has a number of joint venture interests that were formed to acquire, manage, and/or sell real estate and invest in loan pools and discounted loan portfolios. Investments in unconsolidated investments are accounted for under the equity method of accounting as Kennedy Wilson can exercise significant influence, but does not have the ability to control the unconsolidated investment. An investment in an unconsolidated investment is recorded at its initial investment and is increased or decreased by Kennedy Wilson’s share of income or loss, plus additional contributions and less distributions. A decline in the value of an unconsolidated investment that is other than temporary is recognized when evidence indicates that such a decline has occurred in accordance with Equity Method Investments ASC Subtopic 323-10.
Profits on the sale of real estate held by unconsolidated investments in which Kennedy Wilson has continuing involvement are deferred until such time that the continuing involvement has been concluded and all the risks and rewards of ownership have passed to the buyer. Profit on sales to unconsolidated investments in which Kennedy Wilson retains an equity ownership interest results in partial sales treatment in accordance with Sale of Real Estate ASC Subtopic 360-20, thus deferring a portion of the gain as a result of Kennedy Wilson’s continuing ownership percentage in the unconsolidated investment.
Kennedy Wilson records its investments in certain commingled funds it manages and sponsors (“the Funds”) that are investment companies under the Investment Companies ASC Subtopic 946-10, based upon the net assets that would be allocated to its interests in the Funds assuming the Funds were to liquidate their investments at fair value as of the reporting date. Thus, the Funds reflect their investments at fair value, with unrealized gains and losses resulting from changes in fair value reflected in their earnings. Kennedy Wilson has retained the specialized accounting for the Funds pursuant to Retention of Specialized Accounting for Investments in Consolidation ASC Subtopic 323-10 in recording its equity in joint venture income from the Funds.
Additionally, Kennedy Wilson elected the fair value option for seventeen investments in unconsolidated investment entities. Due to the nature of these investments, Kennedy Wilson elected to record these investments at fair value in
order to report the value in the underlying investments in the results of our current operations.
FAIR VALUE MEASUREMENTS — Kennedy Wilson accounts for fair value measurements of financial assets and financial liabilities and for fair value measurements of non-financial items that are recognized or disclosed at fair value in the financial statements on a recurring basis under the provisions of Fair Value Measurements ASC Subtopic 820-10. Subtopic 820-10 defines fair value as the price that would be received to sell an asset or paid to transfer a liability in an orderly transaction between market participants at the measurement date. When estimating fair value in the absence of an orderly transaction between market participants, valuations of real estate are based on management estimates of the real estate assets using income and market approaches. The indebtedness securing the real estate and the investments in debt securities are valued, in part, based on third party valuations and management estimates also using an income approach.
FAIR VALUE OF FINANCIAL INSTRUMENTS — The estimated fair value of financial instruments is determined using available market information and appropriate valuation methodologies. Considerable judgment, however, is necessary to interpret market data and develop the related estimates of fair value. Accordingly, the estimates presented herein are not necessarily indicative of the amounts that could be realized upon disposition of the financial instruments. The use of different market assumptions or estimation methodologies may have a material impact on the estimated fair value amounts.
Recently Issued Accounting PronouncementsASC Topic 606, Revenue from Contracts with Customers, introduces a new five step model to recognize revenue from customer contracts in an effort to increase consistency and comparability throughout global capital markets and across industries. The model identifies the contract, any separate performance obligations in the contract, determines the transaction price, allocates the transaction price and recognizes revenue when the performance obligations are satisfied. The new standard will apply to Kennedy Wilson’s management and leasing fees (including performance fees), commissions, rental, hotel, and other non-significant sources of revenue effective January 1, 2018. Management has concluded that, with the exception of performance fees, the nature of our revenue streams is such that the requirements are generally satisfied at the time that the fee becomes receivable. Consequently, in place processes for recording
revenue will remain appropriate for these revenue streams. The Company included in its analysis the recognition of performance fees, which are currently estimated under a “most likely amount” methodology that was determined to be an acceptable method under the new Standard. However, the new guidance includes a limitation to the amount of such variable consideration to the extent that it is probable that a significant reversal in the amount of cumulative revenue recognized will not occur when the uncertainty associated with the variable consideration is subsequently resolved. Because various conditions may occur subsequent to a given measurement date, this threshold will not likely be met until later in an investments cycle than under the current guidance. In connection with ASC Topic 606 transition guidance, the Company plans to reflect the cumulative effect through the date of adoption as an adjustment to retained earnings and as such will not impact net income nor will it have a material impact on the Company’s statement of financial position.
ASC Subtopic 310-20, Other Income- Gains and Losses from the Derecognition of Nonfinancial Assets (“Subtopic 610-20”) will impact how sales of real estate are reported. After review of Subtopic 610-20, management concluded that the new standard will not have a significant impact on the amount, timing or classification of real estate sales in the financial statements or related disclosures. This conclusion is based on the Company’s current business mix and general approach to sales of real estate which are generally completed without seller financing or continuing involvement that would indicate that a performance obligation is not met at the time the transaction closes. The Company’s analysis included evaluation of an in-process development project that will be completed later in 2018 and found that while the evaluation is different under the new Standard, the recognition will require recording the gain on the sale of the land and the development component, as separate performance obligations, under a percentage of completion methodology. However, this conclusion is identical to the manner of reporting the gain on the sale of this real estate under the currently applicable Standard. Consequently, there will be no significant impact upon this unusually structured sale nor any of the other sales already completed.
In February 2015, the FASB issued ASU 2015-02, Consolidation (Topic 810): Amendments to the Consolidation Analysis and was adopted by Kennedy Wilson on January 1, 2016. The new standard makes certain changes to both the variable interest model and the voting model, including changes to (1) the identification of variable interests (fees
Management’s Discussion and Analysis of Financial Condition and Results of Operations (continued)

70 Kennedy Wilson Annual Report 2017 Kennedy Wilson Annual Report 2017 71
paid to a decision maker or service provider), (2) the variable interest entity characteristics for a limited partnership or similar entity and (3) the primary beneficiary determination. The adoption of ASU 2015-02 did not result in any changes to the Company’s conclusions regarding the consolidation of investments under the new standard. The Company identified several entities, already consolidated under the previous standard but not considered VIEs, which under the new standard, are considered VIEs and will continue to be consolidated. KWE was determined to be a VIE under the new standard as were nine other less significant consolidated investments, all with the same partner and sharing similar legal structures. However, because the Company’s analysis concludes that the Company is the primary beneficiary of those entities, they continue to be consolidated.
In April 2015, the FASB issued ASU 2015-03, Simplifying the Presentation of Debt Issuance Costs, to reduce the complexity of financial statement presentation pursuant to which debt issuance costs will be presented as a direct deduction from the carrying amount of debt liabilities as opposed to a deferred charge recognized as an asset. ASU 2015-03 is required to be adopted for fiscal years beginning after December 15, 2015. ASU 2015-03 became effective for Kennedy Wilson beginning January 1, 2016. The adoption of this standard did not have a material impact on the consolidated financial statements.
In February 2016, the FASB issued ASU 2016-02, Leases (Topic 842), which sets out the principles for the recognition, measurement, presentation and disclosure of leases for both parties to a contract (i.e., lessees and lessors). The new standard requires lessees to apply a dual approach, classifying leases as either finance or operating leases based on the principle of whether or not the lease is effectively a financed purchase by the lessee. This classification will determine whether lease expense is recognized based on an effective interest method or on a straight-line basis over the term of the lease. A lessee is also required to record a right-of-use asset and a lease liability for all leases with a term of greater than 12 months regardless of their classification. Leases with a term of 12 months or less will be accounted for similar to existing guidance for operating leases today. The new standard requires lessors to account for leases using an approach that is substantially equivalent to existing guidance for sales-type leases, direct financing leases and operating leases. ASU 2016-02 is required to be adopted for fiscal years beginning after December 15, 2018. Because Kennedy Wilson’s existing operating lease commitments are not material and the accounting for leases by the lessor is
substantially unchanged, the Company does not expect the ASU to have a significant impact on its results of operations or financial position.
In March 2016, the FASB issued ASU 2016-07, Simplifying the Transition to the Equity Method of Accounting, which eliminates the requirement for an investor to retroactively apply the equity method when its increase in ownership interest (or degree of influence) in an investee triggers equity method accounting. ASU 2016-07 is effective for all entities in fiscal years beginning after December 15, 2016. The Company does not expect the ASU to have a significant impact on Kennedy Wilson’s consolidated financial statements.
On March 30, 2016, the FASB issued ASU 2016-09, Improvements to Employee Share-Based Payment Accounting, which is intended to improve the accounting for share-based payment transactions as part of the FASB’s simplification initiative. The ASU changes seven aspects of the accounting for share-based payment award transactions, including: (1) accounting for income taxes; (2) classification of excess tax benefits on the statement of cash flows; (3) forfeitures; (4) minimum statutory tax withholding requirements; (5) classification of employee taxes paid on the statement of cash flows when an employer withholds shares for tax-withholding purposes; (6) practical expedient - expected term (nonpublic only); and (7) intrinsic value (nonpublic only).
ASU 2016-09 requires excess tax benefits and deficiencies to be recognized as a component of income tax expense rather than equity. An excess tax benefit (windfall) arises when the value of the share-based award on the vesting date is higher than the fair value on the grant date. A tax deficiency (shortfall) arises when the fair value on vesting date is lower than the fair value on the grant date. In addition, ASU 2016-09 eliminated the requirement for excess tax benefits from share-based compensation to reduce current taxes payable prior to being recognized in the financial statement. The inclusion of excess tax benefits and deficiencies as a component of our income tax expense will increase volatility within the Company’s tax provision for income taxes as the amount of excess tax benefits or deficiencies from stock-based compensation awards is from now on dependent upon the Company’s stock price on the date the awards vest.
On January 1, 2017, Kennedy Wilson adopted ASU 2016-09 under the modified retrospective approach and recorded the cumulative impact of the accounting change through a reduction to the accumulated deficit of $9.3 million. This amount represents the cumulative excess tax benefits related
to share-based compensation as of December 31, 2016 which had not been reflected as a deferred tax asset. As a result of adoption of ASU 2016-09, the excess tax benefits were reclassified to net operating loss carryover, resulting in an increase in our deferred tax asset by $9.3 million as of January 1, 2017.
In August 2016, the FASB issued ASU 2016-15, Classification of Certain Cash Receipts and Cash Payments, which addresses eight classification issues related to the statement of cash flows: (a) debt prepayment or debt extinguishment costs, (b) settlement of zero-coupon bonds, (c) contingent consideration payments made after a business combination (d) proceeds from the settlement of insurance claims, (e) proceeds from the settlement of corporate-owned life insurance policies, including bank-owned life insurance policies, (f) distributions received from equity method investees, (g) beneficial interests in securitization transactions, and (h) separately identifiable cash flows and application of the predominance principle. ASU 2016-15 is required to be adopted for public entities for fiscal years beginning after December 15, 2017. The Company does not expect the ASU to have a significant impact on Kennedy Wilson’s consolidated financial statements.
In January 2017, the FASB issued ASU 2017-01, Business Combinations (Topic 805): Clarifying the Definition of a Business. The ASU clarifies the definition of a business. The three elements of a business (inputs, processes, and outputs) has not changed, however, the amendment provides a framework to assist entities in evaluating whether these elements are present. The amended framework is not expected to materially impact the Company’s financial statements. However, the amendment also includes a provision that when substantially all of the fair value of the gross assets acquired (or disposed of) is concentrated in a single identifiable asset or a group of similar identifiable assets, the set is not a business. Therefore, Real estate acquisitions generally will no longer be considered a business and consequently not be accounted for under Topic 805. The Company has evaluated the likely impacts noting that (1) acquisition related costs will no longer
be expensed as incurred and (2) regardless of the market value of a property at the acquisition date, acquisition related gains will no longer be recorded. ASU 2017-01 is required to be adopted for public entities for fiscal years beginning after December 15, 2017. The Company does not expect the ASU to have a significant impact on Kennedy Wilson’s consolidated financial statements except that the Company may no longer record acquisition related gains when acquiring controlling interests in real estate investments.
In January 2017, the FASB issued ASU 2017-04, which requires an entity to no longer perform a hypothetical purchase price allocation to measure goodwill impairment. Instead, impairment will be measured using the difference between the carrying amount and the fair value of the reporting unit. ASU 2017-04 is required to be adopted for public entities that are SEC filers, for annual and interim periods in fiscal years beginning after December 15, 2019. The Company does not expect the ASU to have a significant impact on Kennedy Wilson’s consolidated financial statements.
In August 2017, the FASB issued ASU 2017-12 which changes the recognition and presentation requirements of hedge accounting, including: eliminating the requirement to separately measure and report hedge ineffectiveness, and presenting all items that affect earnings in the same income statement line item as the hedged item. The ASU also provides new alternatives for (a) applying hedge accounting to additional hedging strategies, (b) measuring the hedged item in fair value hedges of interest rate risk, (c) reducing the cost and complexity of applying hedge accounting by easing the requirements for effectiveness testing, hedge documentation and application of the critical terms match method, and (d) reducing the risk of material error correction if a company applies the shortcut method inappropriately. This ASU is effective for public business entities, for annual and interim periods in fiscal years beginning after December 15, 2018. The Company does not expect the ASU to have a significant impact on Kennedy Wilson’s consolidated financial statements.
Management’s Discussion and Analysis of Financial Condition and Results of Operations (continued)

72 Kennedy Wilson Annual Report 2017 Kennedy Wilson Annual Report 2017 73
Report of Independent Registered Public Accounting Firm
The Board of Directors and Stockholders Kennedy-Wilson Holdings, Inc.:
Opinion on the Consolidated Financial Statements—We have audited the accompanying consolidated balance sheets of Kennedy-Wilson Holdings, Inc. and subsidiaries (the “Company”) as of December 31, 2017 and 2016, the related consolidated statements of operations, comprehensive income, equity, and cash flows for each of the years in the three-year period ended December 31, 2017, and the related notes and financial statement schedules III and IV (collectively, the “consolidated financial statements”). In our opinion, the consolidated financial statements present fairly, in all material respects, the financial position of the Company as of December 31, 2017 and 2016, and the results of its operations and its cash flows for each of the years in the three-year period ended December 31, 2017, in conformity with U.S. generally accepted accounting principles.
We also have audited, in accordance with the standards of the Public Company Accounting Oversight Board (United States) (“PCAOB”), the Company’s internal control over financial reporting as of December 31, 2017, based on criteria established in Internal Control - Integrated Framework (2013) issued by the Committee of Sponsoring Organizations of the Treadway Commission, and our report dated February 26, 2018 expressed an unqualified opinion on the effectiveness of the Company’s internal control over financial reporting.
Basis for Opinion—These consolidated financial statements are the responsibility of the Company’s management. Our responsibility is to express an opinion on these consolidated financial statements based on our audits. We are a public
The Board of Directors and Stockholders Kennedy-Wilson Holdings, Inc.:
Opinion on Internal Control Over Financial Reporting—We have audited Kennedy-Wilson Holdings, Inc. and subsidiaries’ (the “Company”) internal control over financial reporting as of December 31, 2017, based on criteria established in Internal Control - Integrated Framework (2013) issued by the Committee of Sponsoring Organizations of the Treadway Commission. In our opinion, the Company maintained, in all material respects, effective internal control over financial reporting as of December 31, 2017, based on criteria established in Internal Control - Integrated Framework (2013) issued by the Committee of Sponsoring Organizations of the Treadway Commission.
We also have audited, in accordance with the standards of the Public Company Accounting Oversight Board (United States) (“PCAOB”), the consolidated balance sheets of the Company as of December 31, 2017 and 2016, the related consolidated statements of operations, comprehensive income, equity, and cash flows for each of the years in the three-year period ended December 31, 2017, and the related notes and financial statement schedules III and IV (collectively, the “consolidated financial statements”), and our report dated February 26, 2018 expressed an unqualified opinion on those consolidated financial statements.
Basis for Opinion—The Company’s management is responsible for maintaining effective internal control over financial reporting and for its assessment of the effectiveness of internal control over financial reporting, included in the accompanying Management’s Report on Internal Control over Financial Reporting. Our responsibility is to express an opinion on the Company’s internal control over financial reporting based on our audit. We are a public accounting firm registered with the PCAOB and are required to be independent with respect to the Company in accordance with the U.S. federal securities laws and the applicable rules and regulations of the Securities and Exchange Commission and the PCAOB.
We conducted our audit in accordance with the standards of the PCAOB. Those standards require that we plan and perform the audit to obtain reasonable assurance about
accounting firm registered with the PCAOB and are required to be independent with respect to the Company in accordance with the U.S. federal securities laws and the applicable rules and regulations of the Securities and Exchange Commission and the PCAOB.
We conducted our audits in accordance with the standards of the PCAOB. Those standards require that we plan and perform the audit to obtain reasonable assurance about whether the consolidated financial statements are free of material misstatement, whether due to error or fraud. Our audits included performing procedures to assess the risks of material misstatement of the consolidated financial statements, whether due to error or fraud, and performing procedures that respond to those risks. Such procedures included examining, on a test basis, evidence regarding the amounts and disclosures in the consolidated financial statements. Our audits also included evaluating the accounting principles used and significant estimates made by management, as well as evaluating the overall presentation of the consolidated financial statements. We believe that our audits provide a reasonable basis for our opinion.
/s/ KPMG LLP
We have served as the Company’s auditor since 2002.
Los Angeles, California
February 26, 2018
whether effective internal control over financial reporting was maintained in all material respects. Our audit of internal control over financial reporting included obtaining an understanding of internal control over financial reporting, assessing the risk that a material weakness exists, and testing and evaluating the design and operating effectiveness of internal control based on the assessed risk. Our audit also included performing such other procedures as we considered necessary in the circumstances. We believe that our audit provides a reasonable basis for our opinion.
Definition and Limitations of Internal Control Over Financial Reporting—A company’s internal control over financial reporting is a process designed to provide reasonable assurance regarding the reliability of financial reporting and the preparation of financial statements for external purposes in accordance with generally accepted accounting principles. A company’s internal control over financial reporting includes those policies and procedures that (1) pertain to the maintenance of records that, in reasonable detail, accurately and fairly reflect the transactions and dispositions of the assets of the company; (2) provide reasonable assurance that transactions are recorded as necessary to permit preparation of financial statements in accordance with generally accepted accounting principles, and that receipts and expenditures of the company are being made only in accordance with authorizations of management and directors of the company; and (3) provide reasonable assurance regarding prevention or timely detection of unauthorized acquisition, use, or disposition of the company’s assets that could have a material effect on the financial statements.
Because of its inherent limitations, internal control over financial reporting may not prevent or detect misstatements. Also, projections of any evaluation of effectiveness to future periods are subject to the risk that controls may become inadequate because of changes in conditions, or that the degree of compliance with the policies or procedures may deteriorate.
/s/ KPMG LLP
Los Angeles, California
February 26, 2018

74 Kennedy Wilson Annual Report 2017 Kennedy Wilson Annual Report 2017 75
Consolidated Balance Sheets Consolidated Statements of Operations
(Dollars in millions) December 31,
2017 2016A s s e t s
Cash and cash equivalents $ 351.3 $ 885.7Accounts receivable (including $5.2 and $3.0 of related party) 62.7 44.0Loan purchases and originations 84.7 87.7Real estate and acquired in place lease values (net of accumulated depreciation and amortization of $552.2 and $374.3) 6,443.7 5,814.2Unconsolidated investments (including $346.1 and $329.4 at fair value) 486.4 555.6Other assets 296.0 269.4
T o ta l a s s e t s 1 $ 7,724.8 $ 7,656.6
Liabilities
Accounts payable $ 19.5 $ 11.2
Accrued expenses and other liabilities 465.9 412.1
Mortgage debt 3,156.6 2,770.4
KW unsecured debt 1,179.4 934.1
KWE unsecured bonds 1,325.9 1,185.7Total liabilities 1 6,147.3 5,313.5
Equity
Common Stock, 151,561,284 and 115,740,906 shares issued outstanding as of December 31, 2017 and December 31, 2016 — —Additional paid-in capital 1,883.3 1,231.4Accumulated deficit (90.6) (112.2)Accumulated other comprehensive loss (427.1) (71.2)
Total Kennedy-Wilson Holdings, Inc. shareholders equity 1,365.6 1,048.0Noncontrolling interests 211.9 1,295.1Total equity 1,577.5 2,343.1Total liabilities and equity $ 7,724.8 $ 7,656.6
( 1) The assets and liabilities as of December 31, 2017 include $904.4 million (including cash held by consolidated investments of $39.1 million and real estate and acquired in place lease values, net of accumulated depreciation and amortization of $789.1 million) and $510.0 million (including investment debt of $475.3 million), respectively, from consolidated variable interest entities (“VIEs”). The assets and liabilities as of December 31, 2016 include $4.5 billion (including cash held by consolidated investments of $584.2 million and real estate and acquired in place lease values, net of accumulated depreciation and amortization of $3.6 billion) and $2.7 billion (including investment debt of $2.4 billion), respectively, from VIEs. These assets can only be used to settle obligations of the consolidated VIEs, and the liabilities do not have recourse to the Company.
See accompanying notes to consolidated financial statements.
(Dollars in millions, except per share data) Year ended December 31,
2017 2016 2015
Revenue
Rental $ 504.7 $ 485.9 $ 404.8
Hotel 127.5 116.2 106.4
Sale of real estate 111.5 29.3 3.7Investment management, property services, and research fees (includes $20.8, $28.9, and $37.8 million of related party fees, respectively) 51.7 59.4 69.3
Loan purchases, loan originations, and other 15.2 12.6 19.5
Total revenue 810.6 703.4 603.7
Operating expenses
Rental operating 151.2 135.4 108.0
Hotel operating 100.3 96.3 89.9
Cost of real estate sold 80.2 22.1 2.6
Commission and marketing 7.2 8.0 7.3
Compensation and related 177.2 186.5 154.8
General and administrative 42.2 45.4 43.8
Depreciation and amortization 212.5 198.2 166.3
Total operating expenses 770.8 691.9 572.7
Income from unconsolidated investments 69.0 126.6 97.4
Operating income 108.8 138.1 128.4
Non-operating income expense
Gain on sale of real estate 226.7 130.7 72.4
Acquisition-related gains — 16.2 108.1
Acquisition-related expenses (4.4) (9.5) (37.3)
Interest expense (217.7) (191.6) (156.7)
Other income (loss) 8.3 6.6 (2.5)
Income before benefit from provision for income taxes 121.7 90.5 112.4
Benefit from (provision for) income taxes 16.3 (14.0) (53.4)
N e t income 138.0 76.5 59.0
Net (income) loss attributable to the noncontrolling interests (37.5) (70.9) 15.7
Preferred dividends and accretion of preferred stock issuance costs — (2.8) (3.6)
Net income attributable to Kennedy-Wilson Holdings, Inc. common shareholders $ 100.5 $ 2.8 $ 71.1
Basic Earnings per share
Income per basic $ 0.83 $ 0.01 $ 0.66
Weighted average shares outstanding for basic 119,147,192 109,094,530 103,261,513
Diluted Earnings per share
Income per diluted $ 0.83 $ 0.01 $ 0.66
Weighted average shares outstanding for diluted 119,147,192 109,094,530 109,553,728
Dividends declared per common share $ 0.70 $ 0.56 $ 0.48
See accompanying notes to consolidated financial statements.

76 Kennedy Wilson Annual Report 2017 Kennedy Wilson Annual Report 2017 77
Consolidated Statements of Comprehensive Income
(Dollars in millions) Year ended December 31,
2017 2016 2015
Net income $ 138.0 $ 76.5 $ 59.0
Other comprehensive income (loss), net of tax:
Unrealized gain on marketable securities 0.2 0.1 0.1
Unrealized foreign currency translation gain (loss) 155.3 (164.1) (138.3)
Amounts reclassified out of AOCI during the period 2.0 3.4 9.7
Unrealized currency derivative contracts (loss) gain (68.3) (100.1) 6.3
Total other comprehensive income (loss) for the period 89.2 (260.7) (122.2)
Comprehensive income (loss) 227.2 (184.2) (63.2)
Comprehensive (income) loss attributable to noncontrolling interests (124.2) 166.3 118.4
Comprehensive (loss) income attributable to Kennedy-Wilson Holdings, Inc. $ 103.0 $ (17.9) $ 55.2
See accompanying notes to consolidated financial statements.
Consolidated Statements of Equity
AdditionalAccumulated
Other
Preferred Stock Common Stock Paid-in Retained Comprehensive Noncontrolling
(Dollars in millions, except share amounts) Shares Amount Shares Amount Capital Earnings Income Interests Total
Balance at January 1, 2015 132,550 — 96,091,446 $ — $ 991.3 $ (62.0) $ (28.2) $ 2,142.8 $ 3,043.9
Issuance of 8,625,000 shares, net — — 8,625,000 — 215.0 — — — 215.0
Shares forfeited — — (57,148) — — — — — —
RSG Grants — — 1,754,750 — — — — — —
Shares retired due to RSG Vesting — — (435,415) — (11.4) — — — (11.4)
Conversion of preferred stock to common stock — — 8,554,948 — — — — — —
Stock based compensation (100,000) — — — 30.8 — — — 30.8
Other comprehensive income (loss) Unrealized foreign currency translation loss, net of tax — — — — — — (27.5) (92.0) (119.5) Unrealized foreign currency derivative contract gain (loss), net of tax — — — — 8.0 (10.7) (2.7)
Preferred stock dividends — — — — — (3.6) — — (3.6)
Common stock dividends — — — — — (53.3) — — (53.3)
Net income (loss) — — — — — 74.7 — (15.7) 59.0Acquisition of Kennedy Wilson Europe (KWE) shares from noncontrolling interest holders — — — — — — — (68.4) (68.4)Contributions from noncontrolling interests, excluding KWE — — — — — — — 14.5 14.5
Distributions to noncontrolling interests — — — — — — — (239.2) (239.2)
Balance, December 31, 2015 32,550 — 114,533,581 — 1,225.7 (44.2) (47.7) 1,731.3 2,865.1
Shares forfeited — — (31,900) — — — — — —
Conversion of preferred stock to common stock (32,550) — 3,366,973 — — — — — —
RSG Grants — — 1,006,750 — — — — — —
Shares retired due to RSG Vesting — — (693,942) — (14.7) — — — (14.7)Shares retired due to common stock repurchase program — — (2,440,556) — (43.2) (6.9) — — (50.1)
Stock based compensation — — — — 65.1 — — — 65.1
Other comprehensive income (loss) Unrealized foreign currency translation loss, net of tax — — — — — — (28.7) (131.6) (160.3) Unrealized foreign currency derivative contract gain (loss), net of tax — — — — — — 5.1 (105.6) (100.5)
Unrealized gains on marketable securities — — — — — — 0.1 — 0.1
Preferred stock dividends — — — — — (2.8) — — (2.8)
Common stock dividends — — — — — (63.9) — — (63.9)
Net income — — — — — 5.6 — 70.9 76.5Acquisition of Kennedy Wilson Europe (KWE) shares from noncontrolling interest holders — — — — — — — (196.9) (196.9)Acquisition of noncontrolling interests from consolidated entity — — — — (1.5) — — 1.5 —Contributions from noncontrolling interests, excluding KWE — — — — — — — 42.1 42.1
Distributions to noncontrolling interests — — — — — — — (116.6) (116.6)

78 Kennedy Wilson Annual Report 2017 Kennedy Wilson Annual Report 2017 79
Consolidated Statements of Equity (continued)
Additional Paid-in Capital
Retained Earnings
(Accumulated Deficit)
Accumulated Other
Comprehensive Income Total
Preferred Stock Common Stock Noncontrolling Interests(Dollars in millions, except share amounts) Shares Amount Shares Amount
Balance, December 31, 2016 — $ — 115,740,906 $ — $ 1,231.4 $ (112.2) $ (71.2) $ 1,295.1 2,343.1Cumulative effect of ASU 2016-09 adoption(1) — — — — — 9.3 — — 9.3
Shares forfeited — — (57,000) — — — — — —
Restricted stock grants (RSG) — — 1,756,750 — — — — — —Shares retired due to RSG Vesting — — (1,460,251) — (37.9) — — — (37.9)Shares retired due to common stock repurchase program — — (1,645,816) — (29.1) (0.8) — — (29.9)
KWE Acquisition — — 37,226,695 — 680.7 — (358.4) (1,145.5) (823.2)
Stock based compensation — — — — 38.2 — — — 38.2Other comprehensive income (loss) Unrealized foreign currency translation gains, net of tax — — — — — — 52.0 106.4 158.4 Unrealized foreign currency derivative contract loss, net of tax — — — — — — (49.7) (19.7) (69.4) Unrealized gains on marketable securities — — — — — — 0.2 — 0.2
Common stock dividends — — — — — (87.4) — — (87.4)
Net income — — — — — 100.5 — 37.5 138.0Acquisition of Kennedy Wilson Europe (KWE) shares from noncontrolling interest holders — — — — — — — (3.3) (3.3)Contributions from noncontrolling interests, excluding KWE — — — — — — — 47.4 47.4Distributions to noncontrolling interests — — — — — — — (106.0) (106.0)
Balance, December 31, 2017 — $ — 151,561,284 $ — $ 1,883.3 $ (90.6) $ (427.1) $ 211.9 $ 1,577.5
See accompanying notes to consolidated financial statements.
Consolidated Statements of Cash Flows
(Dollars in millions) Year ended December 31,
2017 2016 2015Cash ows from operating activities: Net income $ 138.0 $ 76.5 $ 59.0 Adjustments to reconcile net income to net cash provided by (used in) operating activities: Net gain from sale of real estate (258.0) (137.9) (70.7) Acquisition-related gains — (16.2) (108.1) Depreciation and amortization 212.5 198.2 166.3 Above/below and straight-line rent amortization (10.2) (7.1) 0.6 Provision for deferred income taxes (24.5) 8.8 24.4 Amortization of deferred loan costs 12.3 12.3 8.2 Amortization of discount and accretion of premium on issuance of the senior notes payable 0.4 (2.1) (8.6) Unrealized net (gains) losses on derivatives 11.1 (6.5) 3.4 Income from unconsolidated investments (69.0) (126.6) (97.2) Accretion of interest income on loans (12.1) (11.7) (8.9) Stock compensation expense 38.2 65.1 30.8 Operating distributions from unconsolidated investments 85.7 62.8 78.8 Operating distributions from loans 6.4 32.7 9.7 Change in assets and liabilities: Accounts receivable (13.9) (22.9) 2.0 Other assets (14.9) (10.9) (14.8) Accrued expenses and other liabilities (29.0) (11.6) 103.3 Net cash provided by operating activities 73.0 102.9 178.2Cash ows from investing activities: Additions to loans — (16.1) (235.8) Collections of loans 16.9 146.9 27.8 Nonrefundable escrow deposits — — (3.8) Net proceeds from sale of real estate 659.1 540.1 622.6 Purchases of and additions to real estate (814.3) (949.6) (1,927.6) Investment in marketable securities (0.8) (3.2) (5.0) Proceeds from sale of marketable securities 1.1 — 6.2 Investing distributions from unconsolidated investments 133.4 89.6 180.0 Contributions to unconsolidated investments (79.9) (124.9) (184.3) Proceeds from settlement of foreign currency derivative contracts (2.8) 38.6 41.5 Purchases of foreign currency derivative contracts (0.4) (8.1) (5.2) Additions to development project asset (19.4) — — Proceeds from development project asset 36.9 — — Net cash used in investing activities (70.2) (286.7) (1,483.6)Cash ow from financing activities: Borrowings under senior notes payable — 250.0 — Repayment of senior notes payable (55.0) — — Costs associated with KWE Transaction (55.8) — — Borrowings under lines of credit 800.0 125.0 95.0 Repayment of lines of credit (500.0) (125.0) (220.0) Borrowings under investment debt 848.3 1,189.7 2,087.9 Repayment of investment debt (684.7) (608.1) (681.1) Debt issue costs (9.5) (10.8) (21.7) Issuance of common stock — — 215.0 Repurchase of common stock (67.7) (64.8) (11.4) Cash paid to acquire noncontrolling interest in KWE (719.8) — — Dividends paid (59.2) (64.8) (51.8) Acquisition of noncontrolling interests (3.3) (196.9) (68.4) Contributions from noncontrolling interests 47.4 42.1 14.5 Distributions to noncontrolling interests (106.0) (116.6) (239.2) Net cash used in provided by financing activities (565.3) 419.8 1,118.8 Effect of currency exchange rate changes on cash and cash equivalents 28.1 (81.9) (19.5) Net change in cash and cash equivalents (534.4) 154.1 (206.1) Cash and cash equivalents, beginning of year 885.7 731.6 937.7
Cash and cash equivalents, end of year $ 351.3 $ 885.7 $ 731.6
See accompanying notes to consolidated financial statements.

80 Kennedy Wilson Annual Report 2017 Kennedy Wilson Annual Report 2017 81
Notes to Consolidated Financial Statements December 31, 2017, 2016 and 2015
Supplemental cash flow information:Year ended December 31,
(Dollars in millions) 2017 2016 2015
Cash paid for:
Interest(1) $ 206.7 $ 170.7 $ 133.5
Income taxes(2) 16.1 10.7 3.0
( 1) $38.5 million, $57.8 million, and $38.6 million attributable to noncontrolling interests for the years ended December 31, 2017, 2016, and 2015.( 2) $12.0 million, $8.5 million, $2.5 million attributable to noncontrolling interests for the years ended December 31, 2017, 2016, and 2015.
Consolidated Statements of Cash Flows (continued)
Supplemental disclosure of non-cash investing and financing activities:During the year ended December 31, 2017, the Company issued 37,226,695 shares of KWH common stock as part of the KWE Transaction.
The Series B Preferred Stock converted into 3,366,973 common shares on December 28, 2016 at a price of $9.67 per share. The Company paid $0.7 million of dividends at conversion for dividends that would have been accrued up to the mandatory conversion date. On May 19, 2015, all 100,000 outstanding shares of the Series A Preferred Stock were mandatorily converted into an aggregate of 8,554,948 shares of the Company’s common stock, $0.0001 par value per share, based on a conversion price of approximately $11.69 per share of Common Stock.
During the year ended December 31, 2016, the Company acquired additional equity interests in a residential development project and a retail property in the Western
United States that were previously unconsolidated. Subsequent to gaining control and consolidating Kona Village, Kennedy Wilson sold a 50% equity interest to a strategic partner, resulting in shared control, and, accordingly, the Company accounts for its investment under the equity method as of December 31, 2016. During the year ended December 31, 2015, KWE foreclosed on four notes secured by office buildings located in Dublin, Ireland and the Company acquired additional equity interests in multifamily and commercial properties in the Western United States that were previously unconsolidated. The assets and liabilities of these properties were consolidated in Kennedy Wilson’s financial statements at fair value in accordance with FASB ASC Topic 805 Business Combinations. As the fair value of Kennedy Wilson’s interests in these properties were in excess of their carrying value of their ownership interest, Kennedy Wilson recorded acquisition-related gains of $16.2 million and $108.1 million, during the year ended December 31, 2016 and 2015, respectively. See Note 4 for more detail.
Note 1—OrganizationKennedy-Wilson Holdings, Inc. (“KWH,” NYSE: KW), a Delaware corporation and its wholly owned and consolidated subsidiaries (collectively the “Company” or “Kennedy Wilson”), is a global real estate investment company. We own, operate, and invest in real estate both on our own and through our investment management platform. We focus on multifamily and commercial properties located in the Western U.S., UK, Ireland, Spain, Italy and Japan. To complement our investment business, the Company also provides real estate services primarily to financial services clients.
Note 2—Basis of Presentation and Summary of Significant Accounting PoliciesBASIS OF PRESENTATION—The consolidated financial statements include the accounts of Kennedy Wilson and voting interest entities which it controls. All significant intercompany balances and transactions have been eliminated in consolidation. In addition, Kennedy Wilson evaluates its relationships with other entities to identify whether they are variable interest entities (“VIE”) as defined by Financial Accounting Standards Board (“FASB”) Accounting Standards Codification (“ASC”) Subtopic 810 – Consolidation and to assess whether it is the primary beneficiary of such entities. In determining whether Kennedy Wilson is the primary beneficiary of a VIE, qualitative and quantitative factors are considered, including, but not limited to: the amount and characteristics of Kennedy Wilson’s investment; the obligation or likelihood for Kennedy Wilson to provide financial support; Kennedy Wilson’s ability to control or significantly influence key decisions for the VIE; and the similarity with and significance to the business activities of Kennedy Wilson. Significant judgments related to these determinations include estimates about the future fair values and performance of real estate held by these VIEs and general market conditions.
KWE Acquisition—On October 20, 2017, KWH completed its acquisition of all the outstanding shares (other than shares owned by KWH or its subsidiaries or held in treasury) of KWE by way of a court-sanctioned scheme of arrangement under Article 125 of the Companies (Jersey) Law (the “KWE Acquisition”). KWE shareholders received an aggregate consideration in the Transaction of approximately 37,226,695 shares of KWH common stock, par value $0.0001 per share, and approximately £528.6 million ($697.2 million) in cash. Of the cash consideration received by KWE shareholders in connection with the Transaction,
£288.3 million ($380.3 million) was paid by KWH and £240.3 million ($316.9 million) was paid by KWE through a special distribution.
The KWE Acquisition was accounted for in accordance with ASC 810, Consolidation-Overall-Changes in Parent’s Ownership Interest in a Subsidiary (ASC 810). Because KWH controls KWE both before and after the Transaction, the change in KWH’s ownership interest in KWE will be accounted for as an equity transaction and no gain or loss will be recognized in KWH’s consolidated statements of operations resulting from the KWE Acquisition. Transaction costs associated with the acquisition will be recorded as a reduction of equity as well.
USE OF ESTIMATES—The preparation of the accompanying consolidated financial statements in conformity with U.S. generally accepted accounting principles (“GAAP”) requires management to make estimates and assumptions about future events. These estimates and the underlying assumptions affect the amounts of assets and liabilities reported, disclosure about contingent assets and liabilities, and reported amounts of revenues and expenses. Management evaluates its estimates and assumptions on an ongoing basis using historical experience and other factors, including the current economic environment, which management believes to be reasonable under the circumstances. Management adjusts such estimates and assumptions when facts and circumstances dictate. As future events and their effects cannot be determined with precision, actual results could differ significantly from these estimates. Changes in those estimates will be reflected in the financial statements in future periods.
REVENUE RECOGNITION—Revenue consists of management and leasing fees (including performance fees), commissions, rental and hotel income, sales of real estate and loan income.
Management fees are primarily comprised of investment management, property services, and research fees. Investment management fees are earned from limited partners of funds, co-investments, or separate accounts and are generally based on a fixed percentage of committed capital or net asset value. Property services fees are earned for managing the operations of real estate assets and are generally based on a fixed percentage of the revenues generated from the respective real estate assets. Research fees are earned from consulting arrangements. These fees are recognized as revenue ratably over the period that the respective services are performed. The Company

82 Kennedy Wilson Annual Report 2017 Kennedy Wilson Annual Report 2017 83
provides investment management and property services on investments it also has an ownership interest in. Fees earned on consolidated properties are eliminated in consolidation and fees on unconsolidated investments are eliminated for the portion that relate to the Company’s ownership interest. During the year ended December 31, 2017, $26.3 million were eliminated in consolidation.
KWE was externally managed by one of the Company’s wholly-owned subsidiaries (“KWE Manager”) pursuant to an investment management agreement in which capacity Kennedy Wilson was entitled to receive certain management and performance fees. KWE Manager was paid an annual management fee (payable quarterly in arrears) equal to 1% of KWE’s adjusted net asset value (EPRA NAV). The management fee payable to KWE Manager was paid half in cash and half in shares of KWE. KW Manager earned $16.0 million in management fees for the year ended December 31, 2017 which is eliminated in consolidation due to the Company’s consolidation of KWE.
Performance fees or carried interest are allocated to the general partner, special limited partner or asset manager of Kennedy Wilson’s real estate funds and loan pool participations based on the cumulative performance of the fund and loan pools and are subject to preferred return thresholds of the limited partners and participants. At the end of each reporting period, Kennedy Wilson calculates the performance fee that would be due as if the fair value of the underlying investments were realized as of such date, irrespective of whether such amounts have been realized. As the fair value of underlying investments varies between reporting periods, it is necessary to make adjustments to amounts recorded as performance fees to reflect either (a) positive performance resulting in an increase in the performance fee allocated to the general partner or asset manager or (b) negative performance that would cause the amount due to Kennedy Wilson to be less than the amount previously recognized as revenue, resulting in a negative adjustment to performance fees allocated to the general partner or asset manager. Substantially all of the performance fees are recognized in investment management fees in our consolidated statements of operations. Total performances fees recognized to date through December 31, 2017 that may be reversed in future periods if there is negative fund performance totaled $32.9 million. Performance fees recognized during the years ended December 31, 2017, 2016, and 2015 were $5.6 million, $13.0 million and $18.0 million and the amounts that have not been received are included in other assets in the accompanying consolidated balance sheet.
Commissions primarily consist of acquisition fees, auction and real estate sales commissions, leasing commissions, and consulting fees. Acquisition fees are earned for identifying and closing investments on behalf of investors and are based on a fixed percentage of the acquisition price. Acquisition fees are recognized upon the successful completion of an acquisition after all required services have been performed. In the case of auction and real estate sales commissions, the revenue is generally recognized when escrow closes. In accordance with the guidelines established for Reporting Revenue Gross as a Principal versus Net as an Agent in the ASC Subtopic 605-45, Kennedy Wilson records commission revenues and expenses on a gross basis. Of the criteria listed in the Subtopic 605-45, Kennedy Wilson is the primary obligor in the transaction, does not have inventory risk, performs all or part of the service, has credit risk, and has wide latitude in establishing the price of services rendered and discretion in selection of agents and determination of service specifications. Leasing fees that are payable upon tenant occupancy, payment of rent or other events beyond Kennedy Wilson’s control are recognized upon the occurrence of such events.
Rental income from operating leases is generally recognized on a straight-line basis over the terms of the leases. Hotel income is earned when rooms are occupied or goods and services have been delivered or rendered.
Sales of real estate are recognized when title to the real property passes to the buyer and there is no continuing involvement in the real property. Kennedy Wilson follows the requirements for profit recognition as set forth by the Sale of Real Estate ASC Subtopic 360-20.
Interest income from investments in loans acquired at a discount are recognized using the effective interest method. Interest income from investments in loans which Kennedy Wilson originates are recognized at the stated interest rate. When a loan or loans are acquired with deteriorated credit quality primarily for the rewards of collateral ownership, such loans are accounted for as loans until Kennedy Wilson is in possession of the collateral. However, accrual of income is not recorded during the conversion period under ASC Subtopic 310-30-25. Income is recognized to the extent that cash is received from the loan.
REAL ESTATE ACQUISITIONS—The purchase price of acquired properties is recorded to land, buildings and building improvements and intangible lease value (value of above-market and below-market leases, acquired in-place lease values, and tenant relationships, if any) based on their respective estimated fair values in accordance with Business
Combinations ASC Subtopics 805-10. Acquisition-related costs are expensed as incurred.
The valuations of real estate are based on management estimates of the real estate assets using income and market approaches. The indebtedness securing the real estate are valued, in part, based on third party valuations and management estimates also using an income approach.
UNCONSOLIDATED INVESTMENTS—Kennedy Wilson has a number of joint venture interests that were formed to acquire, manage, and/or sell real estate and invest in loan pools and discounted loan portfolios. Investments in unconsolidated investments are accounted for under the equity method of accounting as Kennedy Wilson can exercise significant influence, but does not have the ability to control the unconsolidated investment. An investment in an unconsolidated investment is recorded at its initial investment and is increased or decreased by Kennedy Wilson’s share of income or loss, plus additional contributions and less distributions. A decline in the value of an unconsolidated investment that is other than temporary is recognized when evidence indicates that such a decline has occurred in accordance with Equity Method Investments ASC Subtopic 323-10.
Profits on the sale of real estate held by unconsolidated investments in which Kennedy Wilson has continuing involvement are deferred until such time that the continuing involvement has been concluded and all the risks and rewards of ownership have passed to the buyer. Profit on sales to unconsolidated investments in which Kennedy Wilson retains an equity ownership interest results in partial sales treatment in accordance with Sale of Real Estate ASC Subtopic 360-20, thus deferring a portion of the gain as a result of Kennedy Wilson’s continuing ownership percentage in the unconsolidated investment.
Kennedy Wilson records its investments in certain commingled funds it manages and sponsors (“the Funds”) that are investment companies under the Investment Companies ASC Subtopic 946-10, based upon the net assets that would be allocated to its interests in the Funds assuming the Funds were to liquidate their investments at fair value as of the reporting date. Thus, the Funds reflect their investments at fair value, with unrealized gains and losses resulting from changes in fair value reflected in their earnings. Kennedy Wilson has retained the specialized accounting for the Funds pursuant to Retention of Specialized Accounting for Investments in Consolidation
ASC Subtopic 323-10 in recording its equity in joint venture income from the Funds.
Additionally, Kennedy Wilson elected the fair value option for seventeen investments in unconsolidated investment entities. Due to the nature of these investments, Kennedy Wilson elected to record these investments at fair value in order to report the value in the underlying investments in the results of our current operations.
DISTRIBUTIONS FROM UNCONSOLIDATED INVESTMENTS—The Company utilizes the “look-through” approach, distributions are reported under operating cash flow unless the facts and circumstances of a specific distribution clearly indicate that it is a return of capital (e.g., a liquidating dividend or distribution of the proceeds from unconsolidated investments’ sale of assets), in which case it is reported as an investing activity. This enables Kennedy Wilson to look to the nature and source of the distribution received and classify it appropriately between operating and investing activities on the statement of cash flows based upon the source.
FAIR VALUE MEASUREMENTS—Kennedy Wilson accounts for fair value measurements of financial assets and financial liabilities and for fair value measurements of non-financial items that are recognized or disclosed at fair value in the financial statements on a recurring basis under the provisions of Fair Value Measurements ASC Subtopic 820-10. Subtopic 820-10 defines fair value as the price that would be received to sell an asset or paid to transfer a liability in an orderly transaction between market participants at the measurement date. When estimating fair value in the absence of an orderly transaction between market participants, valuations of real estate are based on management estimates of the real estate assets using income and market approaches. The indebtedness securing the real estate and the investments in debt securities are valued, in part, based on third party valuations and management estimates also using an income approach.
FAIR VALUE OF FINANCIAL INSTRUMENTS—The estimated fair value of financial instruments is determined using available market information and appropriate valuation methodologies. Considerable judgment, however, is necessary to interpret market data and develop the related estimates of fair value. Accordingly, the estimates presented herein are not necessarily indicative of the amounts that could be realized upon disposition of the financial instruments. The use of different market assumptions or
Notes to Consolidated Financial Statements (continued) December 31, 2017, 2016 and 2015

84 Kennedy Wilson Annual Report 2017 Kennedy Wilson Annual Report 2017 85
estimation methodologies may have a material impact on the estimated fair value amounts.
NONCONTROLLING INTERESTS—Noncontrolling interests are reported within equity as a separate component of Kennedy Wilson’s equity in accordance with Noncontrolling Interests in Consolidated Financial Statements ASC Subtopic 810-10. Revenues, expenses, gains, losses, net income or loss, and other comprehensive income are reported in the consolidated statements of operations at the consolidated amounts and net income and comprehensive income attributable to noncontrolling interests are separately stated. Management fees earned by KWE Manager for managing KWE were eliminated in consolidation however the amount attributable to the noncontrolling interest holders of KWE were recognized through net income (loss) attributable to noncontrolling interest holders.
FOREIGN CURRENCIES—The financial statements of subsidiaries located outside the United States are measured using the local currency as the functional currency. The assets and liabilities of these subsidiaries are translated at the rates of exchange at the balance sheet date, and income and expenses are translated at the average monthly rate. The foreign currencies include the Euro and the British pound sterling. Cumulative translation adjustments, to the extent not included in cumulative net income, are included in the consolidated statements of equity and comprehensive income as a component of accumulated other comprehensive income. The Company hedges its investments in foreign subsidiaries with forward and option contracts as discussed below.
At December 31, 2017, approximately 49% of our investment account is invested through our foreign platforms in their local currencies. Investment level debt and operational costs of our platforms are generally incurred in local currencies. Fluctuations in foreign exchanges rates may have a significant impact on the results of our operations. In order to manage the effect of these fluctuations, we generally hedge our book equity exposure to foreign currencies through currency forward contracts and options. We typically hedge 50%-100% of the book equity exposure to these foreign currencies.
DERIVATIVE INSTRUMENTS AND HEDGING ACTIVITIES—Kennedy Wilson has derivatives to reduce its exposure to foreign currencies. All derivative instruments are recognized as either assets or liabilities in the balance sheet at their respective fair values. For derivatives designated in hedging relationships, changes in fair value of cash flow hedges
or net investment hedges are recognized in accumulated other comprehensive income, to the extent the derivative is effective at offsetting the changes in the item being hedged until the hedged item affects earnings.
GOODWILL—Goodwill results from the difference between the purchase price and the fair value of net assets acquired based upon the purchase method of accounting for business combinations. In accordance with Accounting for Goodwill ASC Subtopic 350-20, goodwill is reviewed for impairment on an annual basis. The Company performs its annual review of impairment at year end and when a triggering event occurs between annual year end reviews. As a result of the evaluation performed as described above, Kennedy Wilson has determined that there was no impairment of goodwill as of December 31, 2017, 2016 and 2015.
CASH AND CASH EQUIVALENTS—Cash and cash equivalents consist of cash and all highly liquid investments purchased with maturities of three months or less. Cash and cash equivalents are invested in institutions insured by government agencies. Certain accounts contain balances in excess of the insured limits. Kennedy Wilson’s operations and financial position are affected by fluctuations in currency exchange rates between the euro and British pound sterling against the U.S. Dollar.
LONG-LIVED ASSETS—Kennedy Wilson reviews its long-lived assets (excluding goodwill) whenever events or changes in circumstances indicate that the carrying amount of an asset may not be recoverable in accordance with Impairment of Long-Lived Assets ASC Subtopic 360-10. Recoverability of assets to be held and used is measured by a comparison of the carrying amount of an asset to estimated undiscounted future cash flows expected to be generated by the asset. If the carrying amount of an asset exceeds its estimated undiscounted future cash flows, an impairment charge is recognized in the amount by which the carrying amount of the asset exceeds the fair value of the asset. Assets to be disposed of are presented separately in the balance sheet and reported at the lower of the carrying amount or fair value less costs to sell, and are no longer depreciated. The assets and liabilities of the assets to be disposed of are classified as held for sale and would be presented separately in the appropriate asset and liability sections of the balance sheet.
ACCOUNTS RECEIVABLE—Accounts receivable are recorded at the contractual amount as determined by the underlying agreements and do not bear interest. An allowance for doubtful accounts is provided when Kennedy Wilson
determines there are probable credit losses in Kennedy Wilson’s existing accounts receivable and is determined based on historical experience. Kennedy Wilson reviews its accounts receivable for probable credit losses on a quarterly basis. As of December 31, 2017, Kennedy Wilson had an immaterial allowance for doubtful accounts and during the years ended December 31, 2017 and 2016.
CONCENTRATION OF CREDIT RISK—Financial instruments that subject Kennedy Wilson to credit risk consist primarily of accounts and notes receivable, cash equivalents and derivative instruments. Credit risk is generally diversified due to the large number of entities composing Kennedy Wilson’s customer base and their geographic dispersion throughout the United States, the United Kingdom, Ireland, Spain, Italy and Japan. Kennedy Wilson performs ongoing credit evaluations of its customers and debtors.
EARNINGS PER SHARE—Basic earnings per share is computed based upon the weighted average number of shares of common stock outstanding during the periods presented. Diluted earnings per share is computed based upon the weighted average number of shares of common stock and potentially dilutive securities outstanding during the periods presented. The dilutive impact of potentially dilutive securities including convertible securities, and unvested stock which were outstanding during the period. Unvested stock are calculated by the “treasury stock” method and the convertible securities under the “if converted” method.
COMPREHENSIVE (LOSS) INCOME—Comprehensive (loss) income consists of net income (loss) and other comprehensive income (loss). In the accompanying consolidated balance sheets, accumulated other comprehensive income consists of foreign currency translation adjustments and unrealized gains (losses) on available for sale securities and derivative instruments.
REPURCHASE OF EQUITY INSTRUMENTS—Upon the decision to retire repurchased equity instruments, Kennedy Wilson records the retirement as a reduction to additional paid in capital for the amount that shares were initially issued at with the excess paid going to retained earnings.
SHARE-BASED PAYMENT ARRANGEMENTS—Kennedy Wilson accounts for its share-based payment arrangements under the provisions of Share-Based Payments ASC Subtopic 718-10. Compensation cost for employee service received in exchange for an award of equity instruments is based on the grant-date fair value of the share-based award that is ultimately settled in equity of Kennedy Wilson. The cost of employee services is recognized over the period
during which an employee provides service in exchange for the share-based payment award. Share-based payment arrangements with only services conditions that vest ratably over the requisite service period are recognized on the straight-line basis and performance awards that vest ratably are recognized on a tranche by tranche basis over the performance period.
INCOME TAXES—Income taxes are accounted for under the asset and liability method. Deferred tax assets and liabilities are recognized for the future tax consequences attributable to differences between the financial statement carrying amounts of existing assets and liabilities and their respective tax bases and operating loss and tax credit carryforwards. Deferred tax assets and liabilities are measured using enacted tax rates expected to apply to taxable income in the years in which those temporary differences are expected to be recovered or settled. The effect on deferred tax assets and liabilities of a change in tax rates is recognized in income in the period that includes the enactment date. In accordance with Accounting for Uncertainty in Income Taxes ASC Subtopic 740-10, Kennedy Wilson recognizes the effect of income tax positions only if those positions are more likely than not of being sustained. Recognized income tax positions are measured at the largest amount that is greater than 50% likely of being realized. Changes in recognition or measurement are reflected in the period in which the change in judgment occurs.
Kennedy Wilson records interest related to unrecognized tax benefits in interest expense and penalties in general and administrative expenses.
RECENT ACCOUNTING PRONOUNCEMENTS—ASC Topic 606, Revenue from Contracts with Customers, introduces a new five step model to recognize revenue from customer contracts in an effort to increase consistency and comparability throughout global capital markets and across industries. The model identifies the contract, any separate performance obligations in the contract, determines the transaction price, allocates the transaction price and recognizes revenue when the performance obligations are satisfied. The new standard will apply to Kennedy Wilson’s management and leasing fees (including performance fees), commissions, rental, hotel, and other non-significant sources of revenue effective January 1, 2018. Management has concluded that, with the exception of performance fees, the nature of our revenue streams is such that the requirements are generally satisfied at the time that the fee becomes receivable. Consequently, we do not expect significant changes in the pattern and timing of revenue recognition for
Notes to Consolidated Financial Statements (continued) December 31, 2017, 2016 and 2015

86 Kennedy Wilson Annual Report 2017 Kennedy Wilson Annual Report 2017 87
these revenue streams. The Company included in its analysis the recognition of performance fees, which are currently estimated under a “most likely amount” methodology that was determined to be an acceptable method under ASC Topic 606. However, the new guidance includes a limitation to the amount of such variable consideration to the extent that it is probable that a significant reversal in the amount of cumulative revenue recognized will not occur when the uncertainty associated with the variable consideration is subsequently resolved. Because various conditions may occur subsequent to a given measurement date, this threshold will not likely be met until later in an investment’s cycle than under the current guidance. In connection with ASC Topic 606 transition guidance, the Company plans to reflect the cumulative effect through the date of adoption as an adjustment to retained earnings and as such will not impact net income nor will it have a material impact on the Company’s financial position.
ASC Subtopic 310-20, Other Income - Gains and Losses from the Derecognition of Nonfinancial Assets (“Subtopic 610-20”) will impact how sales of real estate are reported. After review of Subtopic 610-20, management concluded that the new standard will not have a significant impact on the amount, timing or classification of real estate sales in the financial statements or related disclosures. This conclusion is based on the Company’s current business mix and general approach to sales of real estate which are generally completed without seller financing or continuing involvement that would indicate that a performance obligation is not met at the time the transaction closes. The Company’s analysis included evaluation of an in-process development project that will be completed later in 2018 and found that while the evaluation is different under Subtopic 610-20, the recognition will require recording the gain on the sale of the land and the development component, as separate performance obligations, under a percentage of completion methodology. However, this conclusion is identical to the manner of reporting the gain on the sale of this real estate under current U.S. GAAP. Consequently, there will be no significant impact upon this sale nor any of the other sales already completed.
In February 2015, the FASB issued ASU 2015-02, Consolidation (Topic 810): Amendments to the Consolidation Analysis and was adopted by Kennedy Wilson on January 1, 2016. The new standard makes certain changes to both the variable interest model and the voting model, including changes to (1) the identification of variable interests (fees paid to a decision maker or service provider), (2) the variable
interest entity characteristics for a limited partnership or similar entity and (3) the primary beneficiary determination. The adoption of ASU 2015-02 did not result in any changes to the Company’s conclusions regarding the consolidation of investments under the new standard. The Company identified several entities, already consolidated under the previous standard but not considered VIEs, which under the new standard, are considered VIEs and will continue to be consolidated. KWE was determined to be a VIE under the new standard as were nine other less significant consolidated investments, all with the same partner and sharing similar legal structures. However, because the Company’s analysis concludes that the Company is the primary beneficiary of those entities, they continue to be consolidated.
In April 2015, the FASB issued ASU 2015-03, Simplifying the Presentation of Debt Issuance Costs, to reduce the complexity of financial statement presentation pursuant to which debt issuance costs will be presented as a direct deduction from the carrying amount of debt liabilities as opposed to a deferred charge recognized as an asset. ASU 2015-03 is required to be adopted for fiscal years beginning after December 15, 2015. ASU 2015-03 became effective for Kennedy Wilson beginning January 1, 2016. The adoption of this standard did not have a material impact on the consolidated financial statements.
In February 2016, the FASB issued ASU 2016-02, Leases (Topic 842), which sets out the principles for the recognition, measurement, presentation and disclosure of leases for both parties to a contract (i.e., lessees and lessors). The new standard requires lessees to apply a dual approach, classifying leases as either finance or operating leases based on the principle of whether or not the lease is effectively a financed purchase by the lessee. This classification will determine whether lease expense is recognized based on an effective interest method or on a straight-line basis over the term of the lease. A lessee is also required to record a right-of-use asset and a lease liability for all leases with a term of greater than 12 months regardless of their classification. Leases with a term of 12 months or less will be accounted for similar to existing guidance for operating leases today. The new standard requires lessors to account for leases using an approach that is substantially equivalent to existing guidance for sales-type leases, direct financing leases and operating leases. ASU 2016-02 is required to be adopted for fiscal years beginning after December 15, 2018. Because Kennedy Wilson’s existing operating lease commitments are not material and the accounting for leases by the lessor is
Notes to Consolidated Financial Statements (continued) December 31, 2017, 2016 and 2015
substantially unchanged, the Company does not expect the ASU to have a significant impact on its results of operations or financial position.
In March 2016, the FASB issued ASU 2016-07, Simplifying the Transition to the Equity Method of Accounting, which eliminates the requirement for an investor to retroactively apply the equity method when its increase in ownership interest (or degree of influence) in an investee triggers equity method accounting. ASU 2016-07 is effective for all entities in fiscal years beginning after December 15, 2016. The Company does not expect the ASU to have a significant impact on Kennedy Wilson’s consolidated financial statements.
On March 30, 2016, the FASB issued ASU 2016-09, Improvements to Employee Share-Based Payment Accounting, which is intended to improve the accounting for share-based payment transactions as part of the FASB’s simplification initiative. The ASU changes seven aspects of the accounting for share-based payment award transactions, including: (1) accounting for income taxes; (2) classification of excess tax benefits on the statement of cash flows; (3) forfeitures; (4) minimum statutory tax withholding requirements; (5) classification of employee taxes paid on the statement of cash flows when an employer withholds shares for tax-withholding purposes; (6) practical expedient - expected term (nonpublic only); and (7) intrinsic value (nonpublic only).
ASU 2016-09 requires excess tax benefits and deficiencies to be recognized as a component of income tax expense rather than equity. An excess tax benefit (windfall) arises when the value of the share-based award on the vesting date is higher than the fair value on the grant date. A tax deficiency (shortfall) arises when the fair value on vesting date is lower than the fair value on the grant date. In addition, ASU 2016-09 eliminated the requirement for excess tax benefits from share-based compensation to reduce current taxes payable prior to being recognized in the financial statement. The inclusion of excess tax benefits and deficiencies as a component of our income tax expense will increase volatility within the Company’s tax provision for income taxes as the amount of excess tax benefits or deficiencies from stock-based compensation awards is from now on dependent upon the Company’s stock price on the date the awards vest.
On January 1, 2017, Kennedy Wilson adopted ASU 2016-09 under the modified retrospective approach and recorded the cumulative impact of the accounting change through a reduction to the accumulated deficit of $9.3 million. This amount represents the cumulative excess tax benefits related to share-based compensation as of December 31, 2016
which had not been reflected as a deferred tax asset. As a result of adoption of ASU 2016-09, the excess tax benefits were reclassified to net operating loss carryover, resulting in an increase in our deferred tax asset by $9.3 million as of January 1, 2017.
In August 2016, the FASB issued ASU 2016-15, Classification of Certain Cash Receipts and Cash Payments, which addresses eight classification issues related to the statement of cash flows: (a) debt prepayment or debt extinguishment costs, (b) settlement of zero-coupon bonds, (c) contingent consideration payments made after a business combination (d) proceeds from the settlement of insurance claims, (e) proceeds from the settlement of corporate-owned life insurance policies, including bank-owned life insurance policies, (f) distributions received from equity method investees, (g) beneficial interests in securitization transactions, and (h) separately identifiable cash flows and application of the predominance principle. ASU 2016-15 is required to be adopted for public entities for fiscal years beginning after December 15, 2017. The Company does not expect the ASU to have a significant impact on Kennedy Wilson’s consolidated financial statements.
In November 2016, the FASB issue ASU 2016-18, Statement of Cash Flows: Restricted Cash, which clarifies how restricted cash and restricted cash equivalents should be presented on the statement of cash flows. The new guidance requires entities to include restricted cash and restricted cash equivalents as a component of the beginning and ending cash and cash equivalent balances on the statement of cash flows. ASU 2016-18 is required to be adopted for public entities for fiscal years beginning after December 15, 2017. The Company does not expect the ASU to have a significant impact on Kennedy Wilson’s consolidated financial statements.
In January 2017, the FASB issued ASU 2017-01, Business Combinations (Topic 805): Clarifying the Definition of a Business. The ASU clarifies the definition of a business. The three elements of a business (inputs, processes, and outputs) has not changed, however, the amendment provides a framework to assist entities in evaluating whether these elements are present. The amended framework is not expected to materially impact the Company’s financial statements. However, the amendment also includes a provision that when substantially all of the fair value of the gross assets acquired (or disposed of) is concentrated in a single identifiable asset or a group of similar identifiable assets, the set is not a business. Therefore, real estate acquisitions generally will no longer be considered a business and consequently not be accounted for under Topic 805.

88 Kennedy Wilson Annual Report 2017 Kennedy Wilson Annual Report 2017 89
Interest Income from Notes Receivable—Kennedy Wilson recognized interest income on loans of $15.2 million, $12.6 million, and $19.5 million during the years ended December 31, 2017, 2016 and 2015.
Note 4—Real Estate and Acquired in Place Lease ValueThe following table summarizes the Company’s investment in consolidated real estate properties at December 31, 2017 and 2016:
December 31,
(Dollars in millions) 2017 2016Land $ 1,509.4 $ 1,383.2Buildings 4,558.0 4,048.7Building improvements 511.2 373.5Acquired in-place lease values 417.3 383.1
6,995.9 6,188.5Less accumulated depreciation and amortization (552.2) (374.3)Real estate and acquired in place
lease values, net of depreciation and amortization $ 6, 443.7 $ 5, 8 14.2
Notes to Consolidated Financial Statements (continued) December 31, 2017, 2016 and 2015
The Company has evaluated the likely impacts noting that (1) acquisition related costs will no longer be expensed as incurred and (2) regardless of the market value of a property at the acquisition date, acquisition related gains will no longer be recorded. ASU 2017-01 is required to be adopted for public entities for fiscal years beginning after December 15, 2017.
In January 2017, the FASB issued ASU 2017-04, which requires an entity to no longer perform a hypothetical purchase price allocation to measure goodwill impairment. Instead, impairment will be measured using the difference between the carrying amount and the fair value of the reporting unit. ASU 2017-04 is required to be adopted for public entities that are SEC filers, for annual and interim periods in fiscal years beginning after December 15, 2019. The Company does not expect the ASU to have a significant impact on Kennedy Wilson’s consolidated financial statements.
In August 2017, the FASB issued ASU 2017-12 which changes the recognition and presentation requirements of hedge accounting, including: eliminating the requirement to separately measure and report hedge ineffectiveness, and presenting all items that affect earnings in the same income statement line item as the hedged item. The ASU also provides new alternatives for (a) applying hedge accounting to additional hedging strategies, (b) measuring the hedged item in fair value hedges of interest rate risk, (c) reducing the cost and complexity of applying hedge accounting by easing the requirements for effectiveness testing, hedge documentation and application of the critical terms match method, and (d) reducing the risk of material error correction if a company applies the shortcut method inappropriately. This ASU is effective for public business entities, for annual and interim periods in fiscal years beginning after December 15, 2018. The Company does not expect the ASU to have a significant impact on Kennedy Wilson’s consolidated financial statements.
The FASB did not issue any other ASUs during the year ended December 31, 2017 that the Company expects to be applicable and have a material impact on the Company’s financial position or results of operations.
RECLASSIFICATIONS—Certain balances included in prior years’ financial statements have been reclassified to conform with the current year’s presentation.
Note 3—Loan Purchases and OriginationsKennedy Wilson’s investment in loan purchases and originations was $84.7 million and $87.7 million at December 31, 2017 and December 31, 2016, respectively.
During the year ended December 31, 2017, Kennedy Wilson collected, in full, approximately $6.4 million on a loan secured by an office property in San Diego, CA.
During the year ended December 31, 2017, KWE sold one loan within a portfolio secured by a hotel in the United Kingdom and received proceeds of $10.5 million. Additionally, KWE received $6.4 million of distributions related to the remaining six loans within the portfolio secured by six hotels throughout the United Kingdom.
During the year ended December 31, 2016, Kennedy Wilson originated a loan secured by a beach-front hotel located in Waimea, Hawaii for $4.5 million. Additionally, a loan of approximately $4.9 million secured by a Class A office building in Burbank, CA was collected in full.
During the year ended December 31, 2016, KWE sold a tranche of five loans secured by five assets in the United Kingdom, which had a carrying value of $138.5 million, and recognized a gain of $6.9 million. Additionally, KWE received $25.4 million of distributions related to its eight loans secured by eight hotels located throughout the United Kingdom.
Kona Village—During the year ended December 31, 2015, KWH originated a loan to an existing joint venture for $38.7 million. With the loan, the joint venture purchased a note (the “Note”) secured by the iconic Kona Village Resort (“Kona Village”, or the Project) in Kona, Hawaii for the same $38.7 million. During the year ended December 31, 2016, the Note was converted to into equity interests in the Project. The Note had a carrying value of $46.3 million at the time of conversion. Subsequent to conversion, Kennedy Wilson purchased the equity partners’ interests and consolidated the investment. Subsequent to consolidating the investment, Kennedy Wilson sold a 50% equity interest in Kona Village to a strategic partner, resulting in shared control, and, accordingly, the Company accounts for its investment under the equity method as of December 31, 2017. Kona Village is currently in the re-development stage.
Real property, including land, buildings, and building improvements, are included in real estate and are generally stated at cost. Buildings and building improvements are depreciated on the straight-line method over their estimated lives not to exceed 40 years. Acquired in-place lease values are recorded at their estimated fair value and depreciated over their respective weighted-average lease term which was 8.5 years at December 31, 2017.
Depreciation and amortization expense on buildings, building improvements and acquired in-place lease values for the years ended December 31, 2017, 2016 and 2015 was $198.9 million, $181.6 million and $157.3 million, respectively.
Consolidated Acquisitions—The purchase of property is recorded to land, buildings, building improvements, and intangible lease value (including the value of above-market and below-market leases, acquired in-place lease values, and tenant relationships, if any) based on their respective estimated fair values. The purchase price generally approximates the fair value of the properties as acquisitions are generally transacted with third-party willing sellers.
During the year ended December 31, 2017, Kennedy Wilson acquired the following consolidated properties:
(Dollars in millions) Preliminary Purchase Price Allocation at Acquisition(1)
Location Description Land Building
Acquired in-place lease
values(2)Investment
debt NCI
KWH Shareholders’
EquityWestern U.S. Two retail centers, six multifamily and
one commercial property $ 99.3 $ 427.9 $ 24.1 $ 312.3 $ 3.8 $ 235.1Ireland One development project, one office
and one multifamily 28.7 58.8 — — 4.9 83.8
$ 128.0 $ 486.7 $ 24.1 $ 312.3 $ 8.7 $ 318.9
( 1) Excludes acquisition expenses and net other assets. The purchase price allocations for properties acquired during the year ended December 31, 2017 are based on preliminary measurements of fair value that are subject to change. These allocations represent the Company’s current best estimates of fair value and will be finalized within one year.
( 2) Includes above- and below-market leases in this table. Above- and below-market leases are part of other assets and accrued expenses and other liabilities.
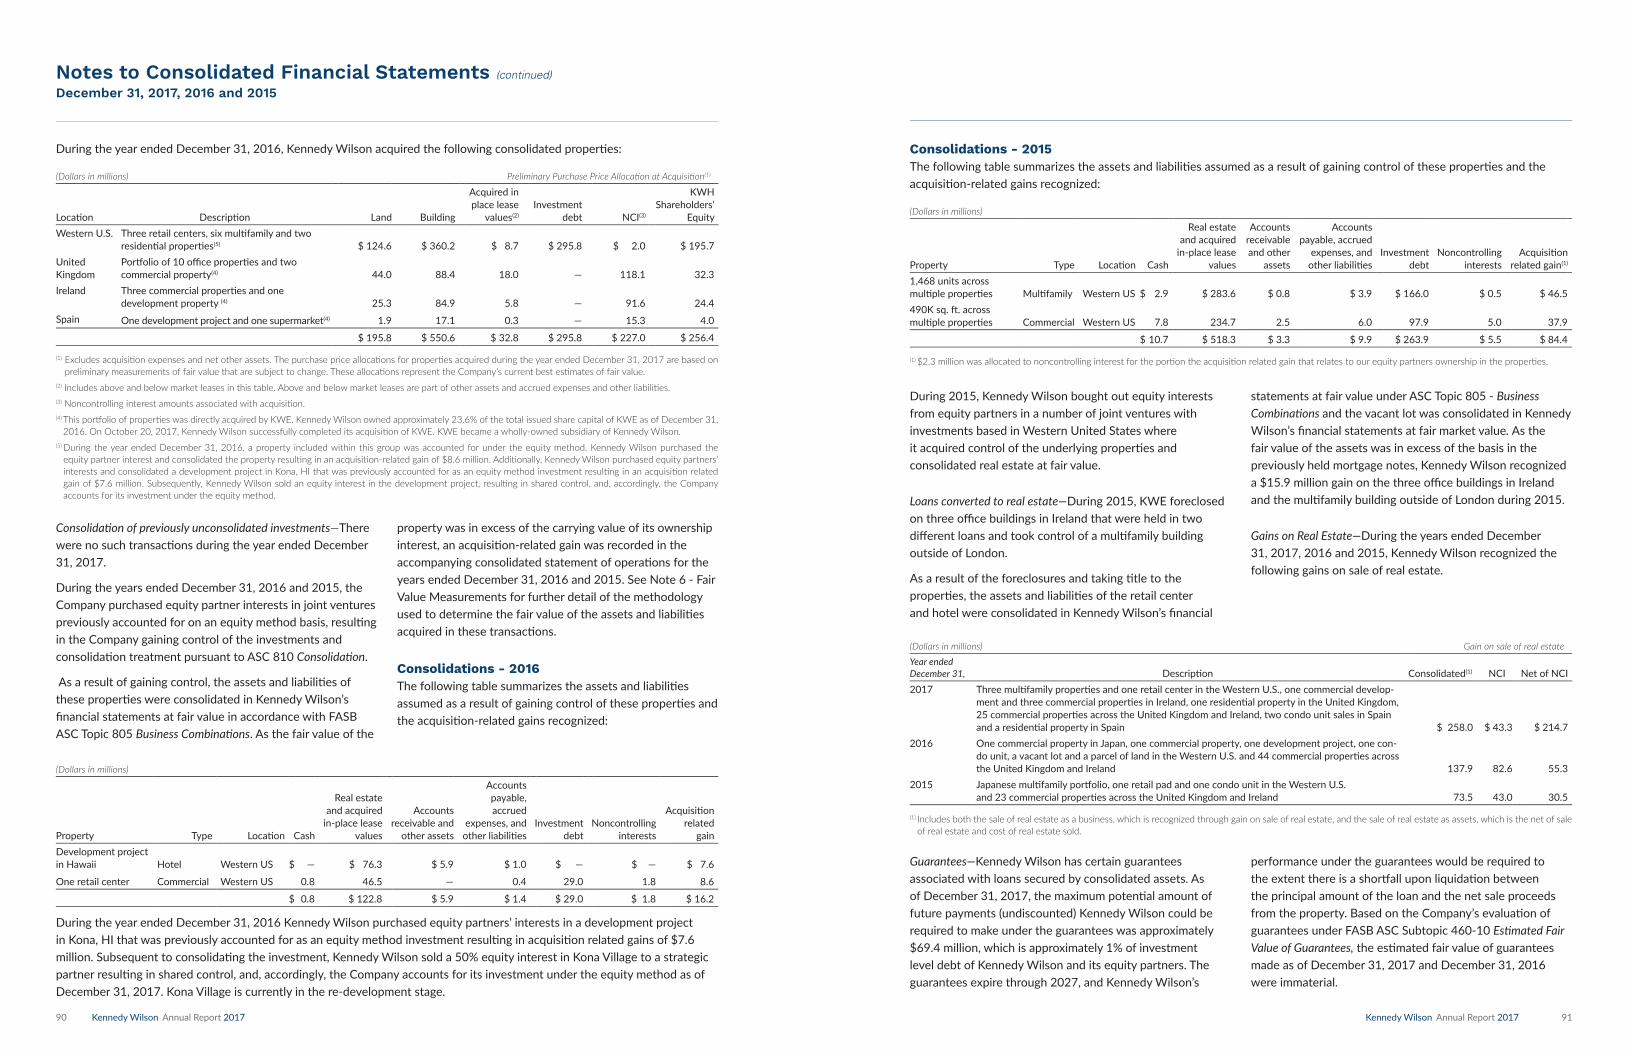
90 Kennedy Wilson Annual Report 2017 Kennedy Wilson Annual Report 2017 91
During the year ended December 31, 2016, Kennedy Wilson acquired the following consolidated properties:
(Dollars in millions) Preliminary Purchase Price Allocation at Acquisition(1)
Location Description Land Building
Acquired in place lease
values(2)Investment
debt NCI(3)
KWH Shareholders’
EquityWestern U.S. Three retail centers, six multifamily and two
residential properties(5) $ 124.6 $ 360.2 $ 8.7 $ 295.8 $ 2.0 $ 195.7United Kingdom
Portfolio of 10 office properties and two commercial property(4) 44.0 88.4 18.0 — 118.1 32.3
Ireland Three commercial properties and one development property (4) 25.3 84.9 5.8 — 91.6 24.4
Spain One development project and one supermarket(4) 1.9 17.1 0.3 — 15.3 4.0
$ 195.8 $ 550.6 $ 32.8 $ 295.8 $ 227.0 $ 256.4
( 1) Excludes acquisition expenses and net other assets. The purchase price allocations for properties acquired during the year ended December 31, 2017 are based on preliminary measurements of fair value that are subject to change. These allocations represent the Company’s current best estimates of fair value.
( 2) Includes above and below market leases in this table. Above and below market leases are part of other assets and accrued expenses and other liabilities.( 3) Noncontrolling interest amounts associated with acquisition.(4) This portfolio of properties was directly acquired by KWE. Kennedy Wilson owned approximately 23.6% of the total issued share capital of KWE as of December 31,
2016. On October 20, 2017, Kennedy Wilson successfully completed its acquisition of KWE. KWE became a wholly-owned subsidiary of Kennedy Wilson. (5) During the year ended December 31, 2016, a property included within this group was accounted for under the equity method. Kennedy Wilson purchased the
equity partner interest and consolidated the property resulting in an acquisition-related gain of $8.6 million. Additionally, Kennedy Wilson purchased equity partners’ interests and consolidated a development project in Kona, HI that was previously accounted for as an equity method investment resulting in an acquisition related gain of $7.6 million. Subsequently, Kennedy Wilson sold an equity interest in the development project, resulting in shared control, and, accordingly, the Company accounts for its investment under the equity method.
Consolidations - 2015The following table summarizes the assets and liabilities assumed as a result of gaining control of these properties and the acquisition-related gains recognized:
(Dollars in millions)
Property Type Location Cash
Real estate and acquired
in-place lease values
Accounts receivable and other
assets
Accounts payable, accrued
expenses, and other liabilities
Investment debt
Noncontrolling interests
Acquisition related gain(1)
1,468 units across multiple properties Multifamily Western US $ 2.9 $ 283.6 $ 0.8 $ 3.9 $ 166.0 $ 0.5 $ 46.5490K sq. ft. across multiple properties Commercial Western US 7.8 234.7 2.5 6.0 97.9 5.0 37.9
$ 10.7 $ 518.3 $ 3.3 $ 9.9 $ 263.9 $ 5.5 $ 84.4
( 1) $2.3 million was allocated to noncontrolling interest for the portion the acquisition related gain that relates to our equity partners ownership in the properties.
Notes to Consolidated Financial Statements (continued) December 31, 2017, 2016 and 2015
Consolidation of previously unconsolidated investments—There were no such transactions during the year ended December 31, 2017.
During the years ended December 31, 2016 and 2015, the Company purchased equity partner interests in joint ventures previously accounted for on an equity method basis, resulting in the Company gaining control of the investments and consolidation treatment pursuant to ASC 810 Consolidation.
As a result of gaining control, the assets and liabilities of these properties were consolidated in Kennedy Wilson’s financial statements at fair value in accordance with FASB ASC Topic 805 Business Combinations. As the fair value of the
property was in excess of the carrying value of its ownership interest, an acquisition-related gain was recorded in the accompanying consolidated statement of operations for the years ended December 31, 2016 and 2015. See Note 6 - Fair Value Measurements for further detail of the methodology used to determine the fair value of the assets and liabilities acquired in these transactions.
Consolidations - 2016The following table summarizes the assets and liabilities assumed as a result of gaining control of these properties and the acquisition-related gains recognized:
(Dollars in millions)
Property Type Location Cash
Real estate and acquired
in-place lease values
Accounts receivable and
other assets
Accounts payable, accrued
expenses, and other liabilities
Investment debt
Noncontrolling interests
Acquisition related
gainDevelopment project in Hawaii Hotel Western US $ — $ 76.3 $ 5.9 $ 1.0 $ — $ — $ 7.6
One retail center Commercial Western US 0.8 46.5 — 0.4 29.0 1.8 8.6
$ 0.8 $ 122.8 $ 5.9 $ 1.4 $ 29.0 $ 1.8 $ 16.2
During the year ended December 31, 2016 Kennedy Wilson purchased equity partners’ interests in a development project in Kona, HI that was previously accounted for as an equity method investment resulting in acquisition related gains of $7.6 million. Subsequent to consolidating the investment, Kennedy Wilson sold a 50% equity interest in Kona Village to a strategic partner resulting in shared control, and, accordingly, the Company accounts for its investment under the equity method as of December 31, 2017. Kona Village is currently in the re-development stage.
During 2015, Kennedy Wilson bought out equity interests from equity partners in a number of joint ventures with investments based in Western United States where it acquired control of the underlying properties and consolidated real estate at fair value.
Loans converted to real estate—During 2015, KWE foreclosed on three office buildings in Ireland that were held in two different loans and took control of a multifamily building outside of London.
As a result of the foreclosures and taking title to the properties, the assets and liabilities of the retail center and hotel were consolidated in Kennedy Wilson’s financial
statements at fair value under ASC Topic 805 - Business Combinations and the vacant lot was consolidated in Kennedy Wilson’s financial statements at fair market value. As the fair value of the assets was in excess of the basis in the previously held mortgage notes, Kennedy Wilson recognized a $15.9 million gain on the three office buildings in Ireland and the multifamily building outside of London during 2015.
Gains on Real Estate—During the years ended December 31, 2017, 2016 and 2015, Kennedy Wilson recognized the following gains on sale of real estate.
(Dollars in millions) Gain on sale of real estate
Year ended December 31, Description Consolidated(1) NCI Net of NCI2017 Three multifamily properties and one retail center in the Western U.S., one commercial develop-
ment and three commercial properties in Ireland, one residential property in the United Kingdom, 25 commercial properties across the United Kingdom and Ireland, two condo unit sales in Spain and a residential property in Spain $ 258.0 $ 43.3 $ 214.7
2016 One commercial property in Japan, one commercial property, one development project, one con-do unit, a vacant lot and a parcel of land in the Western U.S. and 44 commercial properties across the United Kingdom and Ireland 137.9 82.6 55.3
2015 Japanese multifamily portfolio, one retail pad and one condo unit in the Western U.S. and 23 commercial properties across the United Kingdom and Ireland 73.5 43.0 30.5
( 1) Includes both the sale of real estate as a business, which is recognized through gain on sale of real estate, and the sale of real estate as assets, which is the net of sale of real estate and cost of real estate sold.
Guarantees—Kennedy Wilson has certain guarantees associated with loans secured by consolidated assets. As of December 31, 2017, the maximum potential amount of future payments (undiscounted) Kennedy Wilson could be required to make under the guarantees was approximately $69.4 million, which is approximately 1% of investment level debt of Kennedy Wilson and its equity partners. The guarantees expire through 2027, and Kennedy Wilson’s
performance under the guarantees would be required to the extent there is a shortfall upon liquidation between the principal amount of the loan and the net sale proceeds from the property. Based on the Company’s evaluation of guarantees under FASB ASC Subtopic 460-10 Estimated Fair Value of Guarantees, the estimated fair value of guarantees made as of December 31, 2017 and December 31, 2016 were immaterial.

92 Kennedy Wilson Annual Report 2017 Kennedy Wilson Annual Report 2017 93
Pro Forma Results of Operations—The results of operations of the assets acquired have been included in our consolidated financial statements since the date of the acquisitions. The Company’s unaudited pro forma results have been prepared for comparative purposes only and do not purport to be indicative of the results of operations that would have
occurred had these acquisition been consummated at the beginning of the periods presented.
The unaudited pro forma data presented below assumes that the acquisitions during the year ended December 31, 2017 occurred as of January 1, 2016.
partially offset by distributions from asset sales by Funds IV and V. Residential and Other investments decreased due to the sales of a servicing platform in Spain, a residential development project, four vacant lots and a residential home.
Vintage Housing Holdings (“VHH”)—During the second quarter of 2015, the Company purchased a noncontrolling interest for $78.7 million in VHH and elected the fair value option (“FV Option”), an existing venture that holds controlling interests in over 30 syndicated limited partnerships (“LPs”) that own multifamily properties via a traditional low-income housing tax credit (“LIHTC”) structure in the Western United States. The remaining interest is held by one non-affiliated entity who is appointed as the manager. Neither party controls VHH, and, accordingly, the Company accounts for its investment under the equity method using the fair value option. As of December 31, 2017 and 2016, the carrying value in VHH was $114.8 million and $84.2 million, respectively.
The LPs generate cash flow through their controlling interests in entities owning multifamily housing that is predominantly structured with LIHTCs. As mentioned, the Company has elected the fair value option on its
unconsolidated investment in VHH. For the years ended December 31, 2017, 2016, and 2015 the Company recognized a total of $19.4 million, $24.3 million, and $14.0 million fair value gains through equity income, respectively. The fair value gains were primarily generated from acquisitions and dilution from resyndications in which VHH dissolves an existing partnership and recapitalizes into a new partnership with tax-exempt bonds and tax credits which are sold to a new tax credit LP partner and, in many cases, yields cash back to VHH. Upon resyndication, VHH retains a GP interest in the partnership and receives various future streams of cashflows including; development fees, asset management fees, other GP management fees and distributions from operations. Since the investment is accounted for under the fair value option, operating distributions are recorded as equity income. See Note 6 for additional details. The Company has recognized $6.7 million in equity income related to operating distributions during the year.
Income from Unconsolidated Investments—The following table presents income from unconsolidated investments recognized by Kennedy Wilson during the years ended December 31, 2017, 2016 and 2015:
Notes to Consolidated Financial Statements (continued) December 31, 2017, 2016 and 2015
Unaudited
Year Ended December 31,
(Dollars in millions, except for per share data) 2017 2016
Pro forma revenues $ 835.0 $ 740.2
Pro forma net income 150.1 99.5
Pro forma net income attributable to Kennedy-Wilson Holdings, Inc. common shareholders 111.9 24.8
Pro forma net income per share:
Basic $ 0.94 $ 0.23
Diluted $ 0.94 $ 0.23
Note 5—Unconsolidated InvestmentsKennedy Wilson has a number of joint venture interests, generally ranging from 5% to 50%, that were formed to acquire, manage, develop, service and/or sell real estate and invest in loan pools and discounted loan portfolios. Kennedy Wilson has significant influence over these entities, but not
control, and accordingly, these investments are accounted for under the equity method.
Joint Venture Holdings—The following table details Kennedy Wilson’s investments in joint ventures by investment type and geographic location as of December 31, 2017:
(Dollars in millions) Multifamily Commercial FundsResidential and
Other Total
Western U.S. $ 199.7 $ 39.4 $ 55.1 $ 179.8 $ 474.0
United Kingdom — 9.9 — — 9.9
Spain — — — — —
Japan 2.5 — — — 2.5
T o ta l 202.2 $ 49.3 $ 55.1 $ 179.8 $ 48 6.4
The following table details our investments in joint ventures by investment type and geographic location as of December 31, 2016:
(Dollars in millions) Multifamily Commercial FundsResidential and
Other Total
Western U.S. $ 168.6 $ 51.6 $ 47.0 $ 252.6 $ 519.8
United Kingdom — 13.8 — — 13.8
Spain — — — 15.9 15.9
Japan 6.1 — — — 6.1
T o ta l $ 174.7 $ 65.4 47.0 $ 268 .5 $ 555.6
During the year ended December 31, 2017, multifamily investments increased due to investments in five new multifamily properties in the Western United States, which was partially offset by the sale of 51 properties (49 of which were in the 5% interest we hold in a Japanese portfolio) in the
Western United States and Japan. Commercial investments decreased due to the sale of two office properties in the Western United States and equity losses from unconsolidated investments in the United Kingdom. Fund investments increased due to contributions to Fund V, which were
Year Ended December 31,
(Dollars in millions) 2017 2016 2015
Equity in joint venture income $ 30.4 $ 70.5 $ 58.2
Equity in joint venture income - fair value 38.6 56.6 34.9
Interest (loss) income recognized(1) — (0.5) 4.3
6 .0 $ 126.6 $ 97.4( 1) Related to loan pools, all of which were fully resolved as of December 31, 2017.
The Company recognized realized gains on sales of joint venture investments mainly on multifamily and office properties located in the Western United States during the year. The Company sold 51 multifamily (49 of which were in the 5% interest we hold in a Japanese portfolio), two office properties, a residential development project, four lots, and a residential home during 2017, resulting in a gain of $14.0 million. The remaining $16.3 million in income from unconsolidated investments is related to operating performance.
In addition to the above, the Company recognized fair value gains during the year related to acquisitions and dilution from resyndications in VHH, sales in a condo project, and improved property performance by FV Option investments and investments held within our Funds totaling $38.6 million. The decrease in income from unconsolidated investments
during 2017 compared to 2016 and 2015 is primarily related to prior period asset sales.
Income from unconsolidated investments during 2016 relates to realized gains on sales of joint venture investments mainly multifamily properties located in the Western United States during the year. In addition to the sales, equity in joint venture income during 2016 relates primarily to fair value gains during the year relating to dilution from resyndications in VHH, sales in a condo project, and improved property performance by investments held within our Funds totaling $56.6 million.
Income from unconsolidated investments during 2015 primarily relates to realized gains on sales of joint venture investments mainly multifamily properties located in the Western United States during the year. In addition to the sales, income from unconsolidated investments during 2015 relates primarily

94 Kennedy Wilson Annual Report 2017 Kennedy Wilson Annual Report 2017 95
to fair value gains during the year relating to dilution from resyndications in VHH, entitlements achieved on development projects, and commencing the sales process on a for sale condo project as well as improved property performance by investments held within our Funds totaling $34.9 million.
Consolidation Considerations—The Company determines the appropriate accounting method with respect to all investments that are not VIEs based on the control-based framework (controlled entities are consolidated) provided by the consolidations guidance in FASB ASC Topic 810. The Company accounts for joint ventures where it is deemed that the Company does not have control through the equity method of accounting while entities the Company controls are consolidated in Kennedy Wilson’s financial statements.
Changes in Control—There was no such activity in 2017.
During 2016, Kennedy Wilson bought out equity interests from equity partners in two joint ventures which consisted of a 216,000 square foot retail building in Orem, Utah and a development project in Kona, Hawaii. Subsequently, Kennedy Wilson sold a 50% equity interest in the development project
in Kona, Hawaii, resulting in shared control, and, accordingly, the Company accounts for its investment under the equity method.
During 2015, Kennedy Wilson bought out equity interests from equity partners in a number of joint ventures based in Western United States which consisted of 1,468 units across multiple multifamily properties and 490,000 square feet across multiple commercial properties.
See Note 4 for more discussion on the impact of consolidation. All of the above investments were accounted for and are presented as unconsolidated investments in the prior periods.
Contributions to Joint Ventures—During the years ended December 31, 2017, 2016 and 2015, Kennedy Wilson made $79.9 million, $124.9 million, and $184.3 million, respectively, in contributions to new and existing joint venture investments.
See the table below for a breakdown of contributions to new joint venture investments for the years ended December 31, 2017, 2016 and 2015:
Investing distributions resulted from the sales of multifamily properties in the Western United States and Japan, commercial properties in the Western United States, a servicing platform in Spain, and homes in residential development projects in the Western United States, and the refinancing of property level debt. Operating distributions resulted from operating cash flow generated by the joint venture investments.
Capital Commitments—As of December 31, 2017, Kennedy Wilson had unfulfilled capital commitments totaling $63.6 million to four of its joint ventures under the respective operating agreements. The Company may be called upon to contribute additional capital to joint ventures in satisfaction of such capital commitment obligations.
Note 6—Fair Value Measurements and the Fair Value OptionThe following table presents fair value measurements (including items that are required to be measured at fair value and items for which the fair value option has been elected) as of December 31, 2017:
(Dollars in millions) Level 1 Level 2 Level 3 TotalUnconsolidated investments $ — $ — $ 346.1 $ 346.1
Marketable securities 7.5 — — 7.5Net currency derivative contracts — (100.9) — (100.9)
T o t a l $ 7.5 $ 100. $ 346.1 $ 252.7
The following table presents fair value measurements (including items that are required to be measured at fair value and items for which the fair value option has been elected) as of December 31, 2016:
(Dollars in millions) Level 1 Level 2 Level 3 Total
Unconsolidated investments $ — $ — $ 329.4 $ 329.4
Marketable securities 7.5 — — 7.5Net currency derivative contracts — (47.2) — (47.2)
T o t a l $ 7.5 $ 47.2 $ 329.4 $ 28 9.7
Unconsolidated Investments—Kennedy Wilson elected to use the fair value option (“FV Option”) for 17 unconsolidated investments to more accurately reflect the timing of the value in the underlying investments and report those changes in current operations. Kennedy Wilson’s investment balance in the FV Option investments was $291.0 million and
Notes to Consolidated Financial Statements (continued) December 31, 2017, 2016 and 2015
Years Ended December 31,
(Dollars in millions) 2017 2016 2015
Investment Type RegionNo. of
PropertiesInitial
ContributionNo. of
PropertiesInitial
ContributionNo. of
PropertiesInitial
Contribution
Multifamily Western U.S. 5 $ 13.9 1 $ 19.9 31 $ 80.5
Commercial Western U.S. — — 1 13.4 1 9.1
Residential Western U.S. — — 1 1.0 4 1.4
Residential Japan — — — — 50 6.2
Other Western U.S. 2 1.8 1 2.1 1 2.0
T o ta l 7 $ 15.7 4 $ 36.4 8 7 $ 99.2
In addition to the capital contributions above to new joint venture investments, the Company contributed $64.2 million, $88.5 million and $85.1 million to existing joint ventures to pay off external debt, fund our share of a development project and for working capital needs, during the years ended December 31, 2017, 2016 and 2015, respectively.
Distributions from Joint Ventures—The following table details cash distributions by investment type and geographic location for the year ended December 31, 2017:
Multifamily Commercial Funds Residential and Other T o t a l
(Dollars in millions) Operating Investing Operating Investing Operating Investing Operating Investing Operating Investing
Western U.S. $ 26.1 $ 26.1 $ 6.5 $ 15.3 $ 4.0 $ 5.7 $ 42.6 $ 64.1 $ 79.2 $ 111.2
United Kingdom — — 2.3 — — — — — 2.3 —
Spain — — — — — — 4.0 17.3 4.0 17.3
Japan 0.2 4.9 — — — — — — 0.2 4.9T o ta l $ 26.3 31.0 $ 8 .8 $ 15.3 4.0 $ 5.7 $ 46.6 $ 8 1.4 $ 8 5.7 $ 133.4
$282.4 million at December 31, 2017 and 2016, respectively, which are included in unconsolidated investments in the accompanying balance sheets.
Additionally, Kennedy Wilson records its investments in KW Property Fund III, L.P. (“Fund III”), Kennedy Wilson Real Estate Fund IV, and Kennedy Wilson Real Estate Fund V, LP (collectively, the “Funds”) based upon the net assets that would be allocated to its interests in the Funds assuming the Funds were to liquidate their investments at fair value as of the reporting date. Fund III sold its final investments and made its final distribution during the year ended December 31, 2017. The Company’s investment balance in the Funds was $55.1 million and $47.0 million at December 31, 2017 and 2016, respectively, which is included in unconsolidated investments in the accompanying consolidated balance sheets. As of December 31, 2017, the Company had unfunded capital commitments to the Funds in the amount of $9.0 million under the respective operating agreements.
In estimating fair value of real estate held by the Funds and the 17 FV Option investments, the Company considers significant unobservable inputs such as capitalization and discount rates.
The following table summarizes the Company’s investments in unconsolidated investments held at fair value by type:
(Dollars in millions) December 31, 2017 December 31, 2016
FV Option $ 291.0 $ 282.4Funds 55.1 47.0T o t a l $ 346.1 $ 329.4
The following table presents changes in Level 3 investments, investments in investment companies and investments in joint ventures that elected the fair value option, for the years ended December 31:
(Dollars in millions) 2017 2016 2015
Beginning balance $ 329.4 $ 223.8 $ 95.2
Unrealized and realized gains 53.2 65.7 42.3
Unrealized and realized losses (1.1) — (0.1)
Contributions 58.1 76.3 128.5
Distributions (117.0) (75.3) (41.0)
Other 23.5 38.9 (1.1)Ending Balance $ 346.1 $ 329.4 $ 223.8
The change in unrealized and realized gains and losses are included in income from unconsolidated investments in the accompanying consolidated statements of operations.

96 Kennedy Wilson Annual Report 2017 Kennedy Wilson Annual Report 2017 97
The change in unrealized gains and losses on Level 3 investments during 2017 and 2016 for investments still held as of December 31, 2017 and 2016 were gains of $36.0 million and $49.5 million, respectively.
In estimating fair value of real estate held by the Funds, 17 unconsolidated investments that elected the fair value option investments, and the value of the real estate consolidated (as further described in Note 4), the Company considers significant inputs such as capitalization and discount rates. The table below describes the range of inputs used as of December 31, 2017 for real estate assets:
Estimated Rates Used For
Capitalization Rates Discount Rates
Office 4.50% — 7.25% 6.75% — 8.00%
Retail 5.75% — 9.50% 7.25% — 11.50%
Multifamily 4.75% — 7.75% 8.00% — 9.75%
Residential N/A 6.00% — 12.00%
Hotel 6.50% 10.50%
In valuing indebtedness, Kennedy Wilson considers significant inputs such as the term of the debt, value of collateral, market loan-to-value ratios, market interest rates and spreads, and credit quality of investment entities. The credit spreads used by Kennedy Wilson for these types of investments range from 1.55% to 3.46%.
The accuracy of estimating fair value for investments utilizing unobservable inputs cannot be determined with precision, cannot be substantiated by comparison to quoted prices in active markets, and may not be realized in a current sale or immediate settlement of the asset or liability. Additionally, there are inherent uncertainties in any fair value measurement technique, and changes in the underlying assumptions used, including cap rates, discount rates, liquidity risks, and estimates of future cash flows, could significantly affect the fair value measurement amounts.
Marketable Securities—Marketable securities include Kennedy Wilson’s investment in publicly traded equity securities and fixed income investments. The fixed income portfolio consists mainly of U.S. government and investment grade corporate
bonds. The carrying value of marketable securities is a Level 1 valuation as the fair value is based off of unadjusted quoted market prices in active markets for identical securities.
Currency derivative contracts—Kennedy Wilson uses foreign currency derivative contracts such as forward contracts and options to manage its foreign currency risk exposure against the effects of a portion of its certain non-U.S. dollar denominated currency net investments. Foreign currency options are valued using a variant of the Black-Scholes model tailored for currency derivatives and the foreign currency forward contracts are valued based on the difference between the contract rate and the forward rate at maturity of the underlying currency applied to the notional value in the underlying currency discounted at a market rate for similar risks. Although the Company has determined that the majority of the inputs used to value its currency derivative contracts fall within Level 2 of the fair value hierarchy, the counterparty risk adjustments associated with the currency derivative contracts utilize Level 3 inputs. However, as of December 31, 2017, Kennedy Wilson assessed the significance of the impact of the counterparty valuation adjustments on the overall valuation of its derivative positions and determined that the counterparty valuation adjustments are not significant to the overall valuation of its derivative. As a result, we have determined that our derivative valuation in its entirety be classified in Level 2 of the fair value hierarchy.
Changes in fair value are recorded in other comprehensive income in the accompanying consolidated statements of comprehensive income (loss) as the portion of the currency forward and option contracts used to hedge currency exposure of its certain consolidated subsidiaries qualifies as a net investment hedge under FASB ASC Topic 815.
The fair value of the derivative instruments held as of December 31, 2017 are reported in other assets for hedge assets and included in accrued expenses and other liabilities for hedge liabilities on the accompanying consolidated balance sheet. See Note 13 for a complete discussion on other comprehensive income including currency forward and option contracts and foreign currency translations.
The table below details the currency forward contracts and currency option contracts Kennedy Wilson had as of December 31, 2017:
(Dollars in millions) December 31, 2017 Year Ended December 31, 2017
Currency HedgedUnderlying
Currency Notional Hedge Asset Hedge Liability
Change in Unrealized Gains
(Losses)Realized Gains
(Losses)Cash Received
(Paid)
OutstandingEUR USD € 130.0 $ 0.3 $ (7.1) $ (10.7) $ — $ —EUR(1) GBP € 360.0 — (77.0) (17.7) — —EUR(1)(2) GBP — — — (22.0) — —GBP USD £ 540.7 2.1 (19.2) (20.4) — (0.4)GBP(3) USD — — — — (10.8) —Total Outstanding 2.4 (103.3) (70.8) (10.8) (0.4)SettledEUR(4) USD — — (1.8) 1.8 —Yen USD — — — — (0.1)GBP USD — — (5.4) 0.2 (2.7)Total Settled — — (7.2) 2.0 (2.8)Total $ 2.4 $ (103.3) $ (78.0) $ (8.8) $ (3.2)
( 1) Hedge is held by KWE on its wholly-owned subsidiaries.( 2) Relates to KWE’s Euro Medium Term Note. See discussion in Note 8.( 3) Relates to derivative arrangements on GBP escrow cash that is held by Kennedy Wilson relating to the KWE Transaction. Hedges were non-designated so changes
in value went through statement of operations. Derivative losses are offset by realized foreign currency exchange gains on translation of cash. After the transaction hedges were re-designated as net investment hedges on Kennedy Wilson’s investment in KWE and subsequent changes will go through other comprehensive income. Please review results together with foreign currency movements in Note 13.
(4) Underlying investment was sold by Kennedy Wilson. Historical amounts within other comprehensive income were reclassified to the statement of operations at time of sale.
Notes to Consolidated Financial Statements (continued) December 31, 2017, 2016 and 2015
The gains recognized through other comprehensive income will remain in accumulated other comprehensive income until the underlying investments they were hedging are substantially liquidated by Kennedy Wilson.
Fair Value of Financial Instruments—The carrying amounts of cash and cash equivalents, accounts receivable including related party receivables, accounts payable, accrued expenses and other liabilities, accrued salaries and benefits, and deferred and accrued income taxes approximate fair value due to their short-term maturities. The carrying value of loans (excluding related party loans as they are presumed not to be an arm’s length transaction) approximates fair value as the terms are similar to loans with similar characteristics available in the market.
Debt liabilities are accounted for at face value plus net unamortized debt premiums and any fair value adjustments as part of business combinations. The fair value as of December 31, 2017 and 2016 for mortgages, KW unsecured debt, and KWE unsecured bonds were estimated to be approximately $5.8 billion and $5.0 billion, respectively, based on a comparison of the yield that would be required in a current transaction, taking into consideration the risk of the underlying collateral and the Company’s credit risk to the current yield of a similar security, compared to their carrying value of $5.7 billion and $4.9 billion as of December 31, 2017 and 2016, respectively. The inputs used to value mortgages, KW unsecured debt, and KWE unsecured bonds are based on observable inputs for similar assets and quoted prices in markets that are not active and are therefore determined to be level 2 inputs.

98 Kennedy Wilson Annual Report 2017 Kennedy Wilson Annual Report 2017 99
NOTE 7—OTHER ASSETSOther assets consist of the following:
D e c e m b e r 31,
(Dollars in millions) 2017 2016Above-market leases, net of accumulated amortization of $44.3 million and $28.1 million at December 31, 2017 and 2016, respectively $ 63.1 $ 72.4
Development project asset 55.3 —Office furniture and equipment net of accumulated depreciation of $35.8 million and $24.4 million at December 31, 2017 and 2016, respectively 44.3 25.4
Accrued performance fees 32.9 27.3
Straight line rent 24.0 11.7
Goodwill 23.9 23.9
Prepaid expenses 13.3 10.2
Other, net of accumulated amortization of $2.6 million and $2.3 million at December 31, 2017 and 2016, respectively 10.7 10.0Leasing commissions, net of accumulated amortization of $2.2 million and $1.7 million at December 31, 2017 and 2016, respectively 10.1 7.4Marketable securities 7.5 7.5VAT receivable 5.0 23.2Deposits 3.5 1.8Hedge assets 2.4 20.2Deferred tax asset, net — 28.4Other Assets $ 2 6.0 $ 269.4
Note 8—Mortgage Debt
The following table details mortgage debt secured by Kennedy Wilson’s consolidated properties as of December 31, 2017 and 2016:
(Dollars in millions)
Carrying amount of investment debt as of
December 31,(1)
Investment Debt by Product Type Region 2017 2016
Multifamily(1) Western U.S. $ 1,227.5 $ 1,180.8
Commercial(1)(2) United Kingdom 583.2 616.9
Commercial(1)(2) Ireland 505.0 331.5
Commercial Western U.S. 370.6 290.2
Multifamily(1)(2) Ireland 263.2 159.3
Commercial(2) Spain 95.5 84.4
Hotel Ireland 86.4 75.7
Hotel Western U.S. 49.1 49.8Mortgage debt (excluding loan fees)(1)(2) 3,180.5 2,788.6
Unamortized loan fees (23.9) (18.2)
Total Investment Debt $ 3, 156.6 $ 2,770.4( 1) The investment debt payable balances include unamortized debt premiums
(discounts). Debt premiums (discounts) represent the difference between the fair value of debt and the principal value of debt assumed in various acquisitions and are amortized into interest expense over the remaining term of the related debt in a manner that approximates the effective interest method. The unamortized loan premium as of December 31, 2017 and 2016 was $2.4 million and $5.0 million, respectively.
( 2) KWE is a wholly-owned subsidiary as of December 31, 2017. Kennedy Wilson owned approximately 23.6% of the total issued share capital of KWE as of December 31, 2016.
The investment debt had a weighted average interest rate of 3.35% and 3.33% per annum as of December 31, 2017 and 2016, respectively. As of December 31, 2017, 74% of Kennedy Wilson’s property level debt was fixed rate, 8% was floating rate with interest caps and 18% was floating rate without interest caps, compared to 75% fixed rate, 15% floating rate with interest caps and 10% floating rate without interest caps, as of December 31, 2016.
Mortgage Loan Transactions and Maturities—During the year ended December 31, 2017, nine acquisitions were partially financed with mortgages, nine existing mortgages were refinanced, and one investment acquired supplemental financing. See Note 4 for more detail on the acquisitions and the investment debt associated with them.
Notes to Consolidated Financial Statements (continued) December 31, 2017, 2016 and 2015
Depreciation and amortization expense related to the above depreciable assets were $13.6 million, $16.6 million, and $9.0 million for the years ended December 31, 2017, 2016 and 2015, respectively.
Development Project Asset—On May 12, 2017, Kennedy Wilson and its equity partners (the “Capital Dock JV”) sold 200 Capital Dock, a 130,000 sq ft. office building under construction in Dublin, Ireland. Concurrent with the transaction, the Capital Dock JV entered into a development agreement with the buyer to complete the construction of 200 Capital Dock. The development agreement provides that upon certain events (including the insolvency of the Capital Dock JV and certain delivery deadlines not being met), the buyer may exercise a right to take over the construction of the project.
The transaction has been reported based on ASC Topic 360-20. Because adequate initial investment by the buyer was not collected at June 30, 2017 the transaction was initially recorded under the installment method. The installment method apportioned each cash receipt between cost recovered and profit in the same ratio as total cost and total profit bear to the sales value.
During the quarter ended September 30, 2017 additional cash collections from the buyer resulted in the initial investment criteria being met and the full accrual method was applied to the recognition of profit on the land. Because the construction process is not complete but the cost and profit are reasonably estimated, the guidance of Topic 360-20 requires the use of the percentage-of-completion method for the sale of the building going forward.
Using the approaches described above, there was $91.6 million of sale of real estate and $64.1 million of cost of real estate sold reported in the consolidated statement of operations related to the sale of 200 Capital Dock during the year ended December 31, 2017. Consequently the “development project asset” represents the basis which has not yet been relieved under the percentage of completion method.
The remaining revenue and cost will be reported under the percentage-of-completion method through completion of construction, which is expected to continue until the third quarter of 2018. In the event that the buyer exercises its right to take over the construction of the project, the Capital Dock JV will receive a reduced amount of proceeds from this transaction.
The aggregate maturities of mortgage loans subsequent to December 31, 2017 are as follows:
(Dollars in millions) Aggregate Maturities2018 $ 67.72019 356.62020 164.32021 159.42022 434.9Thereafter 1,995.2
3,178.1Debt premium 2.4Unamortized loan fees (23.9)Total Investment Debt $ 3, 156.6
Note 9—KW Unsecured Debt
The following table details KW unsecured debt as of December 31, 2017 and 2016:
December 31,
(Dollars in millions) 2017 2016Credit Facility $ 300.0 $ —Senior Notes(1) 898.1 952.8KW Unsecured Debt 1,198.1 952.8Unamortized loan fees (18.7) (18.7)Total KW Unsecured Debt $ 1, 179.4 $ 934.1( 1) The senior notes balances include unamortized debt premiums (discounts).
Debt premiums (discounts) represent the difference between the fair value of debt and the principal value of debt assumed in various acquisitions and are amortized into interest expense over the remaining term of the related debt in a manner that approximates the effective interest method. The unamortized loan premium (discount) as of December 31, 2017 and 2016 was $(1.9) million and $(2.2) million, respectively.
Borrowings Under Credit Facilities—On October 3, 2017, Kennedy-Wilson, Inc. (the “Borrower”), a wholly-owned subsidiary of Kennedy-Wilson Holdings, Inc. (the “Company”), KWH and certain subsidiaries of the Company (the “Subsidiary Guarantors”) entered into an Escrow Agreement with a syndicate of lenders (the “Lenders”), Bank of America, N.A. (“BofA”), as administrative agent and Merrill Lynch, Pierce, Fenner & Smith Incorporated (“Merrill”), JPMorgan Chase Bank, N.A. (“JPM”) and U.S. Bank National Association, as joint lead arrangers and joint bookrunners, pursuant to which the parties delivered executed signature pages to a $700 million unsecured revolving credit and term loan facility (the “A&R Facility”), which amended and restated the Borrower’s existing revolving credit facility.

100 Kennedy Wilson Annual Report 2017 Kennedy Wilson Annual Report 2017 101
The A&R Facility is comprised of a $500 million revolving line of credit and a $200 million term loan facility. Loans under the revolving line of credit bear interest at a rate equal to LIBOR plus between 1.75% and 2.75%, depending on the consolidated leverage ratio as of the applicable measurement date. Loans under the term loan facility bear interest at a rate equal to LIBOR plus between 1.65% and 2.65%, depending on the consolidated leverage ratio as of the applicable measurement date. The A&R Facility has a maturity date of March 31, 2021. Subject to certain conditions precedent and at the Borrower’s option, the maturity date of the A&R Facility may be extended by one year. At closing, the Company drew the full term loan amount of $200.0 million, borrowed $200.0 million under the A&R Facility’s revolving line, and repaid the $350.0 million outstanding on the existing revolving credit facility.
On December 10, 2015, the Borrower entered into a $475 million unsecured revolving credit facility (the “KW Revolving Facility”) with a syndicate of lenders including JPMorgan Chase Bank, N.A., Deutsche Bank AG New York Branch, U.S. Bank N.A., East West Bank, Fifth Third Bank, The Governor and Company of the Bank of Ireland, Compass Bank, City National Bank, and Bank of America, N.A., as administrative agent and letter of credit issuer. Loans under the KW Revolving Facility bear interest at a rate equal to LIBOR plus 2.50% or 3.00%, depending on the consolidated leverage ratio as of the applicable measurement date, and have a maturity date of December 10, 2018. In October 2017, the KW Revolving Facility was amended and restated, which resulted in the A&R Facility.
The A&R Facility has certain covenants as defined within its Amended and Restated Credit Agreement, Dated as of October 20, 2017 (the “Credit Agreement”) that, among other things, limit the Company and certain of its subsidiaries’ ability to incur additional indebtedness, repurchase capital stock or debt, sell assets or subsidiary stock, create or permit liens on assets, engage in transactions with affiliates, enter into sale/leaseback transactions, issue subsidiary equity and enter into consolidations or mergers. The Credit Agreement requires the Company to maintain (i) a maximum consolidated leverage ratio (as defined in the Credit Agreement) of not greater than 65%, measured as of the last day of each fiscal quarter, (ii) a minimum fixed charge coverage ratio (as defined in the Credit Agreement) of not less than 1.70 to 1.00, measured as of the last day of each fiscal quarter for the period of four full fiscal quarters then ended, (iii) a minimum consolidated tangible net worth equal to or greater than the sum of $1,066,775,300 plus an
amount equal to fifty percent (50%) of net equity proceeds received by the Company after the date of the most recent financial statements that are available as of the Closing Date, measured as of the last day of each fiscal quarter, (iv) a maximum recourse leverage ratio (as defined in the Credit Agreement) of not greater than an amount equal to consolidated tangible net worth as of the measurement date multiplied by 1.5, measured as of the last day of each fiscal quarter, (v) a maximum secured recourse leverage ratio (as defined in the Credit Agreement) of not greater than an amount equal to 3.5% of consolidated total asset value (as defined in the Credit Agreement) and $300,351,000, (vi) a maximum adjusted secured leverage ratio (as defined in the Credit Agreement) of not greater than 55%, measured as of the last day of each fiscal quarter, and (vii) liquidity (as defined in the Credit Agreement) of at least $75.0 million.
As of December 31, 2017, the Company’s consolidated leverage ratio was 63.1%, its fixed charge coverage ratio was 3.1 to 1.00, its consolidated tangible net worth was $1,954.5 million, its adjusted secured leverage ratio was 37.9%, its secured recourse leverage ratio was 0.8%, its recourse leverage ratio was 0.65, and liquidity was $358.8 million. The obligations of the Borrower pursuant to the Credit Agreement are guaranteed by the Company and certain wholly-owned subsidiaries of the Company.
During the year ended December 31, 2017, the Borrower drew $400.0 million and repaid $100.0 million on the A&R Facility to fund acquisitions. The maximum amount drawn on the A&R Facility at any one point during the year ended December 31, 2017 was $550.0 million. As of December 31, 2017, the Company had an outstanding balance of $300.0 million on the A&R Facility with $400.0 million available to be drawn under the revolving credit facility.
During the year ended December 31, 2017, the Borrower drew and repaid $400.0 million on the KW Revolving Facility to fund acquisitions. The maximum amount drawn on the KW Revolving Facility at any one point during the year ended December 31, 2017 was $375.0 million. As noted above, the KW Revolving Facility was amended and restated, which resulted in the A&R Facility.
The average outstanding borrowings under credit facilities was $285.2 million during the year ended December 31, 2017.
Senior Notes—In August 2016, Kennedy Wilson, Inc., (the “Issuer”) completed an additional public offering of $250 million aggregate principal amount of 5.875% Senior Notes
due 2024 (the “Notes”). The Notes were issued as additional notes under the indenture pursuant to which the Issuer previously issued $650 million aggregate principal amount of its 5.875% Senior Notes due 2024 (the “Initial Notes”). The Notes have substantially identical terms as the Initial Notes and will be treated as a single series with the Initial Notes under the indenture. The Notes were issued and sold at a public offering price of 100.0% of their principal amount, plus accrued interest from, and including, April 1, 2016.
In December 2017, the Company redeemed the 2042 Notes bearing an interest rate of 7.75% in full at a redemption price equal to 100% of the principal amount.
The indentures governing the Notes contain various restrictive covenants, including, among others, limitations on the Company’s ability and the ability of certain of the Company’s subsidiaries to incur or guarantee additional indebtedness, make restricted payments, pay dividends or make any other distributions from restricted subsidiaries, redeem or repurchase capital stock, sell assets or subsidiary stocks, engage in transactions with affiliates, create or permit liens on assets, enter into sale/leaseback transactions, and enter into consolidations or mergers. The indentures governing the Notes limit the ability of Kennedy Wilson and its restricted subsidiaries to incur additional indebtedness if, on the date of such incurrence and after giving effect to the new indebtedness, the maximum balance sheet leverage ratio (as defined in the indenture) is greater than 1.50 to 1.00. This ratio is measured at the time of incurrence of additional indebtedness. As of December 31, 2017, the maximum balance sheet leverage ratio was 0.94 to 1.00. See Note 18 for the guarantor and non-guarantor financial statements.
Note 10—KWE Unsecured Bonds
The following table details KWE unsecured bonds as of December 31, 2017 and 2016:
December 31,
(Dollars in millions) 2017 2016
KWE Bonds $ 675.6 $ 616.8
KWE Euro Medium Term Note Programme 655.7 575.6
KWE Unsecured Bonds (excluding loan fees)(1)(2) 1,331.3 1,192.4
Unamortized loan fees (5.4) (6.7)
Total KWE Unsecured Bonds $ 1, 325.9 $ 1, 18 5.7
( 1) The KWE unsecured bonds balances include unamortized debt premiums (discounts). Debt premiums (discounts) represent the difference between the fair value of debt and the principal value of debt assumed in various acquisitions and are amortized into interest expense over the remaining term of the related debt in a manner that approximates the effective interest method. The unamortized loan premium (discount) as of December 31, 2017 and 2016 was $(4.3) million and $(4.1) million, respectively.
( 2) KWE is a wholly-owned subsidiary as of December 31, 2017. Kennedy Wilson owned approximately 23.6% of the total issued share capital of KWE as of December 31, 2016.
During the second quarter of 2015, KWE completed its inaugural bond offering of approximately $405.3 million (based on December 31, 2017 rates) (£300 million) in 3.95% fixed-rate senior unsecured bonds due 2022. During the third quarter of 2016, KWE completed an additional offering of approximately $270.3 million (based on December 31, 2017 rates) (£200 million) in 3.95% fixed-rate senior unsecured bonds due 2022. KWE effectively reduced the interest rate to 3.35% as a result of it entering into swap arrangements to convert 50% of the proceeds into Euros.
In addition, during the fourth quarter of 2015, KWE established a £2.0 billion (approximately $2.7 billion based on December 31, 2017 rates) Euro Medium Term Note (“EMTN”) Programme. Under the EMTN Programme, KWE may issue, from time to time, up to £2.0 billion of various types of debt securities in certain markets and currencies. During the fourth quarter of 2015 and second quarter of 2016, KWE drew down under its EMTN Programme, with the issuances of senior unsecured notes for an aggregate principal amount of approximately $660.3 million (based on December 31, 2017 rates) (€550 million) (the “KWE Notes”). The KWE Notes were issued at a discount and have a carrying value of $655.7 million with an annual fixed coupon of 3.25%, and mature in 2025. As KWE invests proceeds from the KWE Notes to fund equity investments in new euro denominated assets, KWE designates the KWE Notes as net investment hedges under FASB ASC Topic 815. Subsequent fluctuations in foreign currency rates that impact the carrying value of the KWE Notes are recorded to accumulated other comprehensive income. During the year ended December 31, 2017, Kennedy Wilson recognized a loss of $22.0 million in accumulated other comprehensive income due to the strengthening of the euro against the GBP during the period. The KWE Notes rank pari passu with the KWE Bonds, and are subject to the same restrictive covenants.
The trust deed that governs the bonds contain various restrictive covenants for KWE, including, among others, limitations on KWE’s and its material subsidiaries’ ability to provide certain negative pledges. The trust deed limits the ability of KWE and its subsidiaries to incur additional indebtedness if, on the date of such incurrence and after giving effect to the incurrence of the new indebtedness, (1) KWE’s consolidated net indebtedness (as defined in the trust deed) would exceed 60% of KWE’s total assets
Notes to Consolidated Financial Statements (continued) December 31, 2017, 2016 and 2015

102 Kennedy Wilson Annual Report 2017 Kennedy Wilson Annual Report 2017 103
(as calculated pursuant to the terms of the trust deed); and (2) KWE’s consolidated secured indebtedness (as defined in the trust deed) would exceed 50% of KWE’s total assets (as calculated pursuant to the terms of the trust deed). The trust deed also requires KWE, as of each reporting date, to maintain an interest coverage ratio (as defined in the trust deed) of at least 1.50 to 1.00 and have unencumbered assets of no less than 125% of its unsecured indebtedness (as defined in the trust deed). As of December 31, 2017, KWE was in compliance with these covenants.
KWE had an unsecured floating rate revolving debt facility (“KWE Facility”) with Bank of America Merrill Lynch, Deutsche Bank, and J.P. Morgan Chase of approximately $304.0 million (based on December 31, 2017 rates) (£225 million). On October 20, 2017, the KWE Facility was terminated in conjunction with the Transaction. Refer to Note 2 for further detail.
Note 11—Related Party Transactions
Related party revenue is fees and other income received from investments in which we have an ownership interest, excluding amounts eliminated in consolidation discussed below. Kennedy Wilson earned related party fees of $20.8 million, $28.9 million and $37.8 million for the periods ended December 31, 2017, 2016 and 2015, respectively. Included in these related party fees are promote fees on investments the Company also has an ownership interest in. See performance fee discussion in revenue recognition section of Note 2 for more detail.
The Company provides management and property services on properties in which it also has an ownership interest. Fees earned on consolidated properties are eliminated in consolidation and fees on unconsolidated investments are eliminated for the portion that relate to the Company’s ownership interest. During the years ended December 31, 2017, 2016 and 2015 fees of $26.3 million, $36.9 million and $75.0 million were eliminated in consolidation.
Note 12—Income Taxes
The table below represents a geographical breakdown of book income (loss) before the provision for income taxes:
Year ended December 31,
(Dollars in millions) 2017 2016 2015
Domestic $ 90.6 $33.9 $ 61.2
Foreign 31.1 56.6 51.2
T o ta l $ 121.7 $ 0. $ 112.4
The U.S. and foreign components of (benefit from) provision for income taxes consisted of the following components. However, it is not reflective of the cash tax results of the Company.
Year ended December 31,
(Dollars in millions) 2017 2016 2015Federal
Current $ (0.3) $ (0.8) $ 0.2Deferred (17.9) 17.0 13.2
(18.2) 16.2 13.4State
Current 0.1 0.1 —Deferred (3.1) 2.8 0.3
(3.0) 2.9 0.3Foreign
Current 8.4 5.8 31.9Deferred (3.5) (10.9) 7.8
4.9 (5.1) 39.7
T o t a l $ 16.3 $ 14.0 $ 53.4 A reconciliation of the statutory federal income tax rate of 35% with Kennedy Wilson’s effective income tax rate is as follows:
Year ended December 31,
(Dollars in millions) 2017 2016 2015Tax computed at the statutory rate $ 42.6 $ 31.7 $ 39.3Tax Reform federal rate change (44.8) — —Tax deduction in excess of book compensation from restricted stock vesting (3.7) — —Foreign permanent differences, primarily non-deductible depreciation, amortization and acquisition-related expenses in the United Kingdom 6.1 6.5 13.7Sale of KWR, investment basis difference — — 10.6Effect of foreign tax operations, net of foreign tax credits 1.6 1.1 (3.8)Noncontrolling interests (15.0) (25.8) (2.8)Adjustment to investment basis — — 1.4Non-vested stock expense — — 1.0State income taxes, net of federal benefit (3.8) 2.8 (1.5)Other 0.7 (2.3) (4.5)
Provision for benefit from income taxes $ 16.3 $ 14.0 $ 53.4
Cumulative tax effects of temporary differences are shown below at December 31, 2017 and 2016:
Year ended December 31,
(Dollars in millions) 2017 2016Deferred tax assets:
Foreign currency translation $ 11.9 $ 131.9Net operating loss carryforward and credits 103.7 85.2
Stock option expense 5.2 19.5
Hedging transactions 8.1 —
Marketable securities 0.1 0.4Accrued reserves 0.1 0.1
Total deferred tax assets 129.1 237.1
Valuation allowance (32.7) (29.9)
Net deferred tax assets 96.4 207.2
Deferred tax liabilities:Investment basis, depreciation, amortization and reserve differences 119.8 157.6Hedging transactions — 5.0Prepaid expenses and other 9.2 13.9Capitalized interest 1.4 2.3
Total deferred tax liabilities 130.4 178.8
Deferred tax asset liability , net 34.0 $ 28 .4
U.S. tax reform legislation, commonly referred to as the Tax Cuts and Jobs Act (the “Tax Bill”), was signed into law on December 22, 2017. The Tax Bill amends a range of U.S. federal tax rules applicable to individuals, businesses and international taxation. These changes include lowering the federal corporate income tax rate from 35% to 21% and imposing a repatriation tax on deemed repatriated earnings of foreign subsidiaries. During the fourth quarter of 2017, the Company we adjusted our net U.S. deferred tax liability down to the new federal tax rate and recorded a $44.8 million tax benefit. Due to the nature of our business operations, a majority of our foreign income is taxed currently in the U.S. For those foreign subsidiaries where there is no current U.S. tax inclusion, we have estimated that no repatriation tax is due as those foreign subsidiaries do not have aggregate positive unrepatriated foreign earnings. While we were able to make a reasonable, provisional estimate of the impact of the reduction in the U.S. corporate tax rate and other provisions that may have a significant impact to the Company, the final impact of the Tax Bill may differ from our estimates due to additional guidance that might be issued
by the IRS, Treasury Regulations or state taxing authorities and changes in our assumptions and interpretations. We are continuing to assess the changes from and gather information related to Tax Bill in order to finalize our provisional estimates and to assess the impact of Tax Bill in future periods.
As of December 31, 2017, Kennedy Wilson had federal net operating losses of $146.3 million. These net operating losses begin to expire in the year 2031. As of December 31, 2017, there were also California net operating loss carryforwards of approximately $146.7 million. The California net operating losses begin to expire in the year 2028. In addition, Kennedy Wilson has $9.1 million of other state net operating losses. As of December 31, 2017, Kennedy Wilson had $224.8 million of foreign net operating losses carryforwards which have no expiration date. The Company has foreign tax credits of $17.3 million which begin to expire in 2023.
The Company’s valuation allowance on deferred tax assets increased by $2.8 million in 2017 and decreased by $7.8 million in 2016. The increase in 2017 principally relates to additional foreign net operating losses that not more-likely-than not to be realized. The decrease in 2016 principally related to a release in our valuation allowance as update forecasts indicated that certain net operating losses in the United Kingdom were more-likely-than-not realizable.
There were no gross unrecognized tax benefits at December 31, 2017 and 2016. Management has considered the likelihood and significance of possible penalties associated with Kennedy Wilson’s current and intended filing positions and has determined, based on its assessment, that such penalties, if any, would not be significant.
Kennedy Wilson’s federal and state income tax returns remain open to examination for the years 2014 through 2016 and 2013 through 2016, respectively. However, due to the existence of prior year loss carryovers, the IRS may examine any tax years for which the carryovers are used to offset future taxable income. Our foreign subsidiaries’ tax returns remain open to examination for the years 2013 through 2016. The Spanish loss carryovers of $49.0 million may be subject to tax examination for a period of 10 years from the period in which such losses were generated.
Notes to Consolidated Financial Statements (continued) December 31, 2017, 2016 and 2015

104 Kennedy Wilson Annual Report 2017 Kennedy Wilson Annual Report 2017 105
Note 13—Commitments and Contingencies
Future minimum lease payments under scheduled operating leases that have initial or remaining noncancelable terms in excess of one year are as follows:
(Dollars in millions)
Year ending December 31,
2018 $ 2.8
2019 2.1
2020 1.8
2021 1.4
2022 1.2
Thereafter 0.4
Total minimum payments $ 9.7
Rental expense was $4.3 million, $4.4 million, and $4.4 million for the years ended December 31, 2017, 2016 and 2015, respectively, and is included in general and administrative expense in the accompanying consolidated statements of operations.
GUARANTEES—Kennedy Wilson has certain guarantees associated with loans secured by consolidated assets. As of December 31, 2017, the maximum potential amount of future payments (undiscounted) Kennedy Wilson could be required to make under the guarantees was approximately $69.4 million, which is approximately 1% of investment level debt of Kennedy Wilson and its equity partners. The guarantees expire through 2027 and Kennedy Wilson’s performance under the guarantees would be required to the extent there is a shortfall in liquidation between the principal amount of the loan and the net sale proceeds of the property. Based on the Company’s evaluation of guarantees under FASB ASC Subtopic 460-10 Estimated Fair Value of Guarantees, the estimated fair value of guarantees made as of December 31, 2017 and December 31, 2016 were immaterial.
CAPITAL COMMITMENTS—As of December 31, 2017 and 2016, the Company has unfunded capital commitments of $63.6 million and $24.7 million to its joint ventures under the respective operating agreements. The Company may be called upon to contribute additional capital to joint ventures in satisfaction of the Company’s capital commitment obligations.
LITIGATION—Kennedy Wilson is currently a defendant in certain routine litigation arising in the ordinary course of business. It is the opinion of management and legal counsel
that the outcome of these actions will not have a material effect on the financial statements taken as a whole.
Note 14—Stock Compensation Plans
In June 2012, Kennedy Wilson adopted and its shareholders approved the Amended and Restated 2009 Equity Participation Plan (the “Amended and Restated Plan”) under which an additional 3.2 million shares of common stock have been reserved for restricted stock grants to officers, employees, non-employee directors and consultants. The terms of the awards granted under the 2009 Amended and Restated Equity Participation Plan were set by the Company’s compensation committee at its discretion. During the year ended December 31, 2012, 3.2 million shares of restricted common stock were granted under the Amended and Restated Plan along with 5,000 shares which remained under the original plan. The shares that were granted vest over five years with 40% vesting ratably in the first four years of the award period and the remaining 60% in the fifth year of the award period. Vesting of the restricted share awards is contingent upon the expected achievement of a performance target in each year of the award period with the initial vesting of the first 10% in January 2013. The performance targets were achieved for 2012, 2013, 2014, 2015 and 2016. From inception of the plan through December 31, 2017, 3,015,252 shares have vested and 137,248 shares have been forfeited. The Company re-granted the forfeited shares to certain employees.
In July 2014, Kennedy Wilson adopted and its shareholders approved the Amended and Restated 2009 Equity Participation Plan under which an additional 6.0 million shares of common stock have been reserved for restricted stock grants to officers, employees, non-employee directors and consultants. There were no shares granted under the 2009 Amended and Restated Equity Participation Plan during the year ended December 31, 2017. During the year ended December 31, 2016, 2015 and 2014, 1.0 million, 1.7 million and 3.3 million, respectively, of restricted common stock were granted under the 2009 Amended and Restated Equity Participation Plan. The terms of the awards granted under the Amended and Restated Plan were set by the Company’s compensation committee at its discretion. The shares will vest ratably over a three, four or five-year year period based on the achievement of certain performance targets. The performance periods will be measured for the awards will be the Company’s fiscal years ending from December 31, 2014 through December 31, 2020. The shares which were granted with a three-year vesting period
have a three-year sale restriction period upon vesting. Due to the lack of marketability of these shares with the three-year sale restriction period upon vesting, a 15% discount was applied to the grant price these shares when computing stock compensation expense. From inception of the plan through December 31, 2017, 3,397,906 shares have vested and 121,300 have been forfeited. As of December 31, 2017, there was $33.8 million of unrecognized compensation cost for the Amended and Restated Plan related to unvested restricted shares which will vest over the next three years.
In June 2017, Kennedy Wilson adopted and its shareholders approved the Second Amended and Restated 2009 Equity Participation Plan under which an additional 14,945,000 shares of common stock have been reserved for restricted stock grants to officers, employees, non-employee directors and consultants. During the year ended December 31, 2017, the Compensation Committee of the Board of Directors approved the total grant of 1.7 million shares of performance-based restricted shares of Company common stock subject to vesting based on the Company’s total shareholder return (the “TSR restricted shares”), performance-based restricted shares of Company common stock subject to vesting based on the Company’s return on equity (the “ROE restricted shares”), and time-based restricted shares of Company common stock (the “time-based restricted shares”) (collectively, the “awards”), under the Company’s Second Amended and Restated 2009 Equity Participation Plan. Up to 100% of the TSR restricted shares will be eligible to vest based on the MSCI Index Relative Performance during the performance period, with the actual number of TSR restricted shares that vest and cease to be subject to restrictions with respect to the performance period determined by multiplying (i) the total number of TSR restricted shares subject to the award by (ii) the applicable vesting percentage. Up to one-third of the total ROE restricted shares will be eligible to vest with respect to each Company fiscal year of the performance period (each, a “performance year”) to the extent that the Company satisfies the return on equity goals for such performance year. One-third of the time-based restricted shares will vest on each of the first three anniversaries of the grant date. Stock-based compensation expense are based on the fair values on the date of grant for the ROE restricted shares and time-based restricted shares. Certain ROE restricted shares and time-based restricted shares were granted with
a three-year sale restriction period upon vesting. Due to the lack of marketability of these shares with the three-year sale restriction period upon vesting, a 12.5% discount was applied to the grant price of these shares when computing stock compensation expense. The fair value of the TSR restricted shares are estimated using a Monte Carlo simulation. From inception of the plan through December 31, 2017, no shares have been vested or forfeited. As of December 31, 2017, there was $22.1 million of unrecognized compensation cost for the Second Amended and Restated Plan related to unvested shares which will vest over the next three years.
Upon vesting, the restricted stock granted to employees discussed directly above is net share-settled to cover the withholding tax. Shares that vested during the years ended December 31, 2017, 2016 and 2015 were net-share settled such that the Company withheld shares with value equivalent to the employees’ minimum statutory obligation for the applicable income and other employment taxes, and remitted the cash to the appropriate taxing authorities. The total shares withheld during the years ended December 31, 2017, 2016 and 2015 were 1,460,251 shares, 693,942 shares, and 435,415 shares respectively, and were based on the value of the restricted stock on the respective vesting dates as determined by the Company’s closing stock price. During the years ended December 31, 2017, 2016 and 2015, total payments for the employees’ tax obligations to the taxing authorities were $37.9 million, $14.7 million, and $11.4 million respectively. These figures are reflected as a financing activity on the accompanying consolidated statements of cash flows.
During the years ended December 31, 2017, 2016 and 2015, Kennedy Wilson recognized $38.4 million, $65.1 million and $30.8 million of compensation expense related to the vesting of restricted common stock and is included in compensation and related expense in the accompanying consolidated statements of operations. The increase in stock compensation in 2016 is mainly due to $26.5 million or 60% of the expense of the restricted stock that was granted in 2012 under our Amended and Restated 2009 Equity Participation Plan being incurred during April 2016 to March 2017 due to performance criteria being met for this period. A portion of the increase was also attributed to the restricted stock that was granted during the fourth quarter of 2015 and during 2016.
Notes to Consolidated Financial Statements (continued) December 31, 2017, 2016 and 2015

106 Kennedy Wilson Annual Report 2017 Kennedy Wilson Annual Report 2017 107
The following table sets forth activity under the Equity Plan and Amended and Restated Plan:
S h a r es
Nonvested at December 31, 2015 6,274,345
Granted 1,006,750
Vested (1,526,731)
Forfeited (31,900)
Nonvested at December 31, 2016 5,722,464
Granted 1,756,750
Vested (3,285,671)
Forfeited (57,000)
Nonvested at December 31, 2017 4,136,543
Employee Benefit Arrangements—Kennedy Wilson has a qualified plan under the provisions of Section 401(k) of the Internal Revenue Code. Under this plan, participants are able to make salary deferral contributions of up to 75% of their total compensation, up to a specified maximum. The 401(k) plan also includes provisions which authorize Kennedy Wilson to make discretionary contributions. During the years ended December 31, 2017, 2016 and 2015, Kennedy Wilson made matching contributions of $0.3 million and $0.3 million, and $0.3 million respectively to this plan and they are included in compensation and related expenses in the accompanying consolidated statements of operations.
Note 15—Equity
Common Stock Repurchase Program—On February 25, 2016, Kennedy Wilson announced the authorization of a stock repurchase program for up to $100 million. Repurchases under the program may be made in the open market, in privately negotiated transactions or otherwise, with the amount and timing of repurchases depending on market conditions and subject to the Company’s discretion. Under the program, Kennedy Wilson has repurchased and retired 4,086,372 shares for $79.9 million.
KWE Acquisition—On October 20, 2017, the Company completed its acquisition of all of the outstanding shares (other than shares owned by the Company or its subsidiaries or held in treasury) of KWE for $719.8 million in cash and issued 37,226,695 shares of KWH to shareholders of KWE
Dividend Distributions—Kennedy Wilson declared and paid the following cash dividends on its common and preferred stock:
(Dollars in millions)Year Ended
December 31, 2017Year Ended
December 31, 2016
Declared Paid Declared Paid
Preferred Stock Series B(1) — — 2.8 2.8Total Preferred Stock — — 2.8 2.8Common Stock 87.4 59.2 63.9 62.0Total(2) $ 8 7.4 $ 59.2 $ 66.7 $ 64.8
Notes to Consolidated Financial Statements (continued) December 31, 2017, 2016 and 2015
stock. The KWE Acquisition was accounted for in accordance with ASC 810, Consolidation-Overall-Changes in Parent’s Ownership Interest in a Subsidiary (ASC 810). Because KWH controls KWE both before and after the Transaction, the change in KWH’s ownership interest in KWE was accounted for as an equity transaction and no gain or loss was recognized in KWH’s consolidated statements of operations resulting from the KWE Acquisition.
The amount of cash paid and shares issued was greater than carrying value of noncontrolling interest in KWE as of the date of the transaction. The premium paid to the noncontrolling interest holders over their carrying value was recorded additional paid in capital. The Company also was required to record inception to date unrealized foreign currency translation and foreign currency derivative contract losses that had previously been allocated to noncontrolling interest holders accumulated other comprehensive income with a corresponding entry to additional paid in capital which resulted in no net impact to Kennedy Wilson’s shareholder’s equity. Furthermore, transactions costs associated with the acquisition were recorded as a reduction of additional paid in capital.
Preferred Stock—During 2010, Kennedy Wilson issued two series of Convertible Cumulative Preferred Stock (together, the “Preferred Stock”) at 1,000 per share, Series A (100,000 shares) and Series B (32,550 shares), for total proceeds less issuance costs of $99.8 million and $32.5 million.
The Series A Preferred Stock converted into 8,554,948 common shares on May 19, 2015 at a price of $11.69 per share. The Series B Preferred Stock converted into 3,366,973 common shares on December 28, 2016 at a price of $9.67 per share at the option of the holder. The Series B Preferred Stock was convertible into common stock at any time at the option of the holder on or after May 3, 2017 (the “Optional Conversion Date”) and prior to November 3, 2018 and would have been mandatorily convertible into common stock on November 3, 2018. Due to the early conversion, Kennedy Wilson agreed to pay the holders an aggregate of $0.7 million, which represents dividends that would have accrued on all outstanding Series B preferred stock through the Optional Conversion Date.
( 1) The decrease in Series B dividends during the current year is due to the early conversion of the Series B preferred stock during the fourth quarter of 2016. See discussion above.
( 2) The difference between declared and paid is the amount accrued on the consolidated balance sheets.
Accumulated Other Comprehensive Income—The following table summarizes the changes in each component of accumulated other comprehensive income (loss) (“AOCI”), net of taxes:
(Dollars in millions)Foreign Currency
Translation
Foreign Currency Derivative Contracts
Marketable Securities
Total Accumulated Other Comprehensive
Income
Balance at December 31, 2016 $ (98.6) $ 27.5 $ (0.1) $ (71.2)
Unrealized gains (losses), arising during the period 212.4 (76.2) 0.3 136.5
Amounts reclassified out of AOCI during the period 3.1 (1.1) — 2.0
Taxes on unrealized (losses) gains, arising during the period (57.1) 7.9 (0.1) (49.3)
Noncontrolling interest (106.4) 19.7 — (86.7)
Balance of Kennedy Wilson s share at December 31, 2017 46.6 22.2 0.1 6 .7
The local currencies for our interests in foreign operations include the euro and the British pound sterling. The related amounts on our balance sheets are translated into U.S. dollars at the exchange rates at the respective financial statement date, while amounts on our statements of operations are translated at the average exchange rates during the respective period. The increase in the unrealized gains on foreign currency translation is a result of the strengthening of the euro and British pound sterling against the U.S. dollar during the year ended December 31, 2017.
In order to manage currency fluctuations, Kennedy Wilson entered into currency derivative contracts to manage its exposure to currency fluctuations between its functional currency (U.S. dollar) and the functional currency (Euro and GBP) of certain of its wholly-owned and consolidated subsidiaries. See note 6 for a more detailed discussion of Kennedy Wilson’s currency derivative contracts.
As discussed throughout this report, we are required under U.S. GAAP to consolidate certain non-wholly owned subsidiaries or investments that we control. As such, our financial statements reflect currency translation adjustments and related hedging activities on a gross basis. In many instances, these fluctuations are not reflective of the actual foreign currency exposure of the underlying consolidated
subsidiary. The impact of this nuance will decrease going forward due to the KWE Transaction.
Noncontrolling Interests—Noncontrolling interests consist of the ownership interests of noncontrolling shareholders in consolidated subsidiaries, and are presented separately on Kennedy Wilson’s balance sheet. As of December 31, 2017 and 2016 the Company has noncontrolling interest of $211.9 million and $1.3 billion, respectively. The decrease in noncontrolling interests during 2017 is due to the KWE Acquisition. Additionally, the balance also decreased due to distributions to noncontrolling interests of $106.0 million. The Company also allocated $37.5 million of income, $86.7 million of other comprehensive losses and received contributions of $47.4 million to noncontrolling interest holders.
Note 16—Earnings Per Share
In accordance with FASB ASC Topic 260-10-45 Earnings Per Share, the Company uses the two-class method to calculate earnings per share. Basic earnings per share is calculated based on dividends declared (“distributed earnings”) and the rights of common shares and participating securities in any undistributed earnings, which represents net

108 Kennedy Wilson Annual Report 2017 Kennedy Wilson Annual Report 2017 109
income remaining after deduction of dividends declared during the period. Participating securities, which include unvested restricted stock, are included in the computation of earnings per share pursuant to the two-class method. The undistributed earnings are allocated to all outstanding common shares and participating securities based on the relative percentage of each security to the total number of outstanding securities. Basic earnings per common share and participating securities represent the summation of the distributed and undistributed earnings per common share and participating security divided by the total weighted average number of common shares outstanding and the total weighted average number of participating securities outstanding during the respective periods. We only
included in the investment segment. The fees earned from related parties are included in the IMRES segment.
KW Investments—We invest our capital in real estate assets and loans secured by real estate either on our own or through our investment management platform. When we have partners, we are typically the general partner in the arrangement with a promoted interest in the profits of our investments beyond our ownership percentage. The Company has an average ownership interest across all investments of approximately 62% as of December 31, 2017. Our equity partners include public shareholders, financial institutions, foundations, endowments, high net worth individuals and other institutional investors. See the “Business Segments” section in Item 1 for a more detailed discussion of the different components of the KW Investments segment.
KW Investment Management and Real Estate Services (IMRES)—IMRES encompasses the Company fee generating businesses which includes both the Company’s investment management platform as well as the Company’s third-party services business. The Company’s clients include financial institutions, institutional investors, insurance companies, developers, builders, government agencies and prior to the KWE Transaction shareholders of KWE. IMRES has five main lines of business: investment management, property services, research, brokerage, and auction and conventional sales. These five business lines generate revenue for us through fees and commissions. See the “Business Segments” section in Item 1 for a more detailed discussion of the different components of the IMRES segment.
The Company manages approximately 53.1 million square feet of properties for the Company and its investment partners (including KWE) in the United States, Europe, and Asia, which includes assets we have ownership interests in and third party owned assets. With 25 offices throughout the United States, the United Kingdom, Ireland, Jersey, Spain and Japan, we have the capabilities and resources to provide property services to real estate owners as well as the experience, as a real estate investor, to understand client concerns. The managers of IMRES have an extensive track record in their respective lines of business and in the real estate community as a whole. Their knowledge and relationships are an excellent driver of businesses through the services business as well as on the investment front.
Additionally, IMRES plays a critical role in supporting our investment strategy by providing local market intelligence and real-time data for evaluating investments, generating proprietary transaction flow and creating value through efficient implementation of asset management or repositioning strategies.
No single third-party client accounted for 10% or more of Kennedy Wilson’s revenue during any period presented in these financial statements.
The following tables summarize the income and expense activity by segment for the years ended December 31, 2017, 2016 and 2015 and total assets as of December 31, 2017 and 2016.
Notes to Consolidated Financial Statements (continued) December 31, 2017, 2016 and 2015
present the earnings per share attributable to the common shareholders.
Net losses, after deducting the dividends to participating securities, are allocated in full to the common shares since the participating security holders do not have an obligation to share in the losses, based on the contractual rights and obligations of the participating securities. The following is a summary of the elements used in calculating basic and diluted income (loss) per share for the years ended December 31, 2017, 2016 and 2015:
The following table sets forth the computation of basic and diluted earnings per share:
Year ended December 31,
(Dollars in millions, except share amounts and per share data) 2017 2016 2015
Net income attributable to Kennedy-Wilson Holdings, Inc. common shareholders $ 100.5 $ 2.8 $ 71.1Net income and dividends allocated to participating securities (1.1) (1.7) (2.9)Net income attributable to Kennedy-Wilson Holdings, Inc. common shareholders, net of allocation to participating securities 99.4 1.1 68.2Dividends declared on common shares (86.5) (62.3) (51.1)
Undistributed earnings (losses) attributable to Kennedy-Wilson Holdings, Inc. common shareholders $ 12.9 $ (61.2) $ 17.1Distributed earnings per share $ 0.70 $ 0.56 $ 0.48Undistributed earnings (losses) per share 0.13 (0.55) 0.18Income per basic 0.83 0.01 0.66
Income per diluted $ 0.83 $ 0.01 $ 0.66
Weighted-average shares outstanding for basic 119,147,192 109,094,530 103,261,513Weighted average shares outstanding for diluted 119,147,192 109,094,530 109,553,728Dividends declared per common share $ 0.70 $ 0.56 $ 0.48
There was a total of 1,080,092 potentially dilutive securities during the year ended December 31, 2017 that have not been included in the diluted weighted average shares as they are anti-dilutive. During December 31, 2016, 3,259,345 potentially dilutive securities were not included in the diluted weighted average shares as they were anti-dilutive. During December 31, 2015, 6,292,215 potentially dilutive securities were all dilutive to earnings per share. Potentially anti-dilutive securities include preferred stock and unvested restricted stock grants.
Note 17—Segment Information
Kennedy Wilson is a global real estate investment company. The Company owns, operates, and invests in real estate both on its own and through our investment management platform. To complement its investment business, the Company also provides real estate services primarily to financial services clients.
Kennedy Wilson’s segment disclosure with respect to the determination of segment profit or loss and segment assets is based on these two core segments: KW Investments and KW Investment Management and Real Estate Services (IMRES). KW Investments invests in multifamily, office, retail, industrial and residential properties as well as loans secured by real estate. IMRES provides a full array of real estate-related services to investors and lenders, with a strong focus on financial institution-based clients. Kennedy Wilson’s segment disclosure with respect to the determination of segment profit or loss and segment assets is based on these services and investments.
Substantially all of the revenue—related party was generated via inter-segment activity for the years ended December 31, 2017, 2016 and 2015. Generally, this revenue consists of fees earned on investments in which Kennedy Wilson also has an ownership interest. The amounts representing investments with related parties and non-affiliates are

110 Kennedy Wilson Annual Report 2017 Kennedy Wilson Annual Report 2017 111
Year Ended December 31,
(Dollars in millions) 2017 2016 2015
Investments
Rental $ 504.7 $ 485.9 $ 404.8
Hotel 127.5 116.2 106.4
Sale of real estate 111.5 29.3 3.7
Loans and other income 15.2 12.6 19.5
Total revenue 758.9 644.0 534.4
Depreciation and amortization (212.2) (198.2) (166.3)
Operating Expenses (433.8) (345.2) (283.3)
Income from unconsolidated investments 66.4 122.8 93.6
Operating Income 179.3 223.4 178.4
Gain on sale of real estate 226.7 130.7 72.4
Acquisition-related gains — 16.2 108.1
Acquisition-related expenses (4.4) (9.5) (37.3)
Interest expense (145.6) (137.4) (108.8)
Other (5.1) (1.2) (2.5)
Income before benefit from income taxes 250.9 222.2 210.3
(Provision for) benefit from income taxes (4.8) 5.0 (23.4)
Net income 246.1 227.2 186.9
Net (income) loss attributable to the non-controlling interests (37.5) (70.9) 15.3
Net income attributable to Kennedy-Wilson Holdings, Inc. common shareholders 20 .6 $ 156.3 202.2
Year Ended December 31,
(Dollars in millions) 2017 2016 2015
Investment Management and Real Estate ServicesInvestment management, property services, and research fees (includes $20.8, $28.9, and $37.8 million of related party fees, respectively) $ 51.7 $ 59.4 $ 69.3
Total revenue 51.7 59.4 69.3
Depreciation and amortization (0.3) — —
Operating expenses (54.3) (54.9) (69.7)
Income from unconsolidated investments 2.6 3.8 3.8
Net Income (0.3) 8.3 3.4
Net loss attributable to the noncontrolling interests — — 0.4
Net income attributable to Kennedy-Wilson Holdings, Inc. common shareholders 0.3 $ 8 .3 $ 3.8
Year Ended December 31,
(Dollars in millions) 2017 2016 2015
C o r po r a t e
Operating expenses $ (70.2) $ (93.6) $ (53.4)
Operating loss (70.2) (93.6) (53.4)
Interest expense (72.1) (54.2) (47.9)
Other 13.4 7.8 —Loss before benefit from (provision for) income taxes (128.9) (140.0) (101.3)
Benefit from (provision for) income taxes 21.1 (19.0) (30.0)
Net loss (107.8) (159.0) (131.3)
Preferred dividends and accretion of preferred stock issuance costs — (2.8) (3.6)
Net loss attributable to Kennedy-Wilson Holdings, Inc. common shareholders $ 107. $ 161. $ 134.
Year Ended December 31,
(Dollars in millions) 2017 2016 2015
Consolidated
Rental $ 504.7 $ 485.9 $ 404.8
Hotel 127.5 116.2 106.4
Sale of real estate 111.5 29.3 3.7Investment management, property services, and research fees (includes $20.8, $28.9, and $37.8 million of related party fees, respectively) 51.7 59.4 69.3
Loans purchases, loan originations, and other 15.2 12.6 19.5
Total revenue 810.6 703.4 603.7
Operating expenses 558.3 493.7 406.4
Depreciation and amortization 212.5 198.2 166.3
Total operating expenses 770.8 691.9 572.7
Income from unconsolidated investments 69.0 126.6 97.4
Operating income 108.8 138.1 128.4
Gain on sale of real estate 226.7 130.7 72.4
Acquisition-related gains — 16.2 108.1
Acquisition-related expenses (4.4) (9.5) (37.3)
Interest expense (217.7) (191.6) (156.7)
Other 8.3 6.6 (2.5)
Income before benefit from (provision for) income taxes 121.7 90.5 112.4
Benefit from (provision for) income taxes 16.3 (14.0) (53.4)
Net income 138.0 76.5 59.0
Net (income) loss attributable to the noncontrolling interests (37.5) (70.9) 15.7
Preferred dividends and accretion of preferred stock issuance costs — (2.8) (3.6)
Net income (loss) attributable to Kennedy-Wilson Holdings, Inc. common shareholders $ 100. $ 2.8 $ 71.1
Notes to Consolidated Financial Statements (continued) December 31, 2017, 2016 and 2015
December 31,
(Dollars in millions) 2017 2016A s s e t sInvestments $ 7,563.7 $7,375.5Services 70.5 78.1Corporate 90.6 203.0T o t a l a s s e t s $ 7, 724.8 $ 7, 656.6
December 31,
(Dollars in millions) 2017 2016 2015
Expenditures for long lived assetsInvestments $ (814.3) $ (949.6) $ (1,927.6)
Geographic Information:
The revenue shown in the table below is allocated based upon the country in which services are performed.
Year Ended December 31,
(Dollars in millions) 2017 2016 2015United States $ 316.3 $ 304.1 $ 229.3Europe 493.3 397.2 361.1Japan 1.0 2.1 13.3Total revenue $ 10.6 $ 703.4 $ 603.7
Note 18—Guarantor and Non-Guarantor Financial Statements
The following consolidating financial information and condensed consolidating financial information includes:
(1) Condensed consolidating balance sheets as of December 31, 2017 and 2016, respectively; consolidating statements of operations and comprehensive (loss) income for the years ended December 31, 2017, 2016 and 2015, respectively; and condensed consolidating statements of cash flows for the years ended December 31, 2017, 2016 and 2015, respectively, of (a) Kennedy-Wilson Holdings, Inc. on an unconsolidated basis as the parent (and guarantor), (b) Kennedy-Wilson, Inc., as the subsidiary issuer, (c) the guarantor subsidiaries, (d) the non-guarantor subsidiaries and (e) Kennedy-Wilson Holdings, Inc. on a consolidated basis; and
(2) Elimination entries necessary to consolidate Kennedy-Wilson Holdings, Inc., as the parent guarantor, with Kennedy-Wilson, Inc. and its guarantor and non-guarantor subsidiaries

112 Kennedy Wilson Annual Report 2017 Kennedy Wilson Annual Report 2017 113
Kennedy Wilson owns 100% of all of the guarantor subsidiaries, and, as a result, in accordance with Rule 3-10(d) of Regulation S-X promulgated by the SEC, no separate
Condensed Consolidating Balance Sheetas of December 31, 2016
(Dollars in millions) ParentKennedy-
Wilson, Inc.Guarantor
SubsidiariesNon-guarantor
Subsidiaries EliminationConsolidated
Total
A s s e t s
Cash and cash equivalents $ — $ 106.0 $ 45.4 $ 734.3 $ — $ 885.7
Accounts receivable — — 10.2 33.8 — 44.0
Loan purchases and originations — 0.3 12.1 75.3 — 87.7 Real estate and acquired in place lease values, net of accumulated depreciation and amortization — — 1,482.5 4,331.7 — 5,814.2
Unconsolidated investments — 18.8 380.0 156.8 — 555.6
Investments in and advances to consolidated subsidiaries 1,063.8 2,073.1 1,171.7 — (4,308.6) —
Other assets — 0.2 66.9 202.3 — 269.4
T o t a l a s s e t s $1,063.8 $ 2,198.4 $ 3,168.8 $ 5,534.2 $ (4,308.6) $ 7,656.6
Liabilities
Accounts Payable $ — $ 0.5 $ 1.6 $ 9.1 $ — $ 11.2
Accrued expenses and other liabilities 15.8 200.0 157.2 39.1 — 412.1
Mortgage debt — — 936.8 1,833.6 — 2,770.4
KW unsecured debt — 934.1 — — — 934.1
KWE unsecured bonds — — — 1,185.7 — 1,185.7
Total liabilities 15.8 1,134.6 1,095.6 3,067.5 — 5,313.5
Equity
Kennedy-Wilson Holdings, Inc. shareholders’ equity 1,048.0 1,063.8 2,073.2 1,171.6 (4,308.6) 1,048.0
Noncontrolling interests — — — 1,295.1 — 1,295.1
Total equity 1,048.0 1,063.8 2,073.2 2,466.7 (4,308.6) 2,343.1
Total liabilities and equity $1,063.8 $ 2,198.4 $ 3,168.8 $ 5,534.2 $ (4,308.6) $ 7,656.6
Notes to Consolidated Financial Statements (continued) December 31, 2017, 2016 and 2015
financial statements are required for these subsidiaries as of December 31, 2017 or 2016 and for the years ended December 31, 2017, 2016 or 2015.
Condensed Consolidating Balance Sheetas of December 31, 2017
(Dollars in millions) ParentKennedy-
Wilson, Inc.Guarantor
SubsidiariesNon-guarantor
Subsidiaries EliminationConsolidated
Total
A s s e t s Cash and cash equivalents $ — $ 33.4 $ 54.9 $ 263.0 $ — $ 351.3 Accounts receivable — 0.9 10.1 51.7 — 62.7 Loan purchases and originations — — 5.8 78.9 — 84.7 Real estate and acquired in place lease values, net of accumulated depreciation and amortization — — 1,750.0 4,693.7 — 6,443.7 Unconsolidated investments — 20.2 298.3 167.9 — 486.4 Investments in and advances to consolidated subsidiaries 1,394.5 2,642.1 1,629.4 — (5,666.0) — Other assets — — 73.1 222.9 — 296.0T o ta l a s s e t s $1,394.5 $ 2,696.6 $ 3,821.6 $ 5,478.1 $(5,666.0) $ 7,724.8
Liabilities Accounts Payable — 0.8 2.5 16.2 — 19.5 Accrued expenses and other liabilities 28.9 121.9 39.7 275.4 465.9 Mortgage debt — — 1,137.3 2,019.3 3,156.6 KW unsecured debt — 1,179.4 — — — 1,179.4 KWE unsecured bonds — — — 1,325.9 — 1,325.9Total liabilities 28.9 1,302.1 1,179.5 3,636.8 — 6,147.3
Equity Kennedy-Wilson Holdings, Inc. shareholders’ equity 1,365.6 1,394.5 2,642.1 1,629.4 (5,666.0) 1,365.6 Noncontrolling interests — — — 211.9 — 211.9Total equity 1,365.6 1,394.5 2,642.1 1,841.3 (5,666.0) 1,577.5Total liabilities and equity $1,394.5 $ 2,696.6 $ 3,821.6 $ 5,478.1 $(5,666.0) $ 7,724.8

114 Kennedy Wilson Annual Report 2017 Kennedy Wilson Annual Report 2017 115
Consolidating Statement of OperationsFor the Year Ended December 31, 2017
(Dollars in millions) ParentKennedy-
Wilson, Inc.Guarantor
SubsidiariesNon-guarantor
Subsidiaries EliminationConsolidated
TotalRevenue Rental $ — $ — $ 143.9 $ 360.8 $ — $ 504.7 Hotel — — — 127.5 — 127.5 Sale of real estate — — 2.3 109.2 — 111.5 Investment management, property services, and research fees — — 43.4 8.3 — 51.7 Loan purchases, loan originations, and other — — 0.5 14.7 — 15.2Total revenue — — 190.1 620.5 — 810.6
Operating expenses Rental operating — — 54.7 96.5 — 151.2 Hotel operating — — — 100.3 — 100.3 Cost of real estate sold — — 1.8 78.4 — 80.2 Commission and marketing — — 7.0 0.2 — 7.2 Compensation and related 38.4 78.3 52.8 7.7 — 177.2 General and administrative — 14.0 17.6 10.6 — 42.2 Depreciation and amortization — 1.4 50.1 161.0 — 212.5
Total operating expenses 38.4 93.7 184.0 454.7 — 770.8 Income from unconsolidated investments — 3.7 33.0 32.3 — 69.0 Income from consolidated subsidiaries 176.4 307.5 256.2 — (740.1) —
Operating income 138.0 217.5 295.3 198.1 (740.1) 108.8Non-operating income expense Gain on sale of real estate — — 46.6 180.1 — 226.7 Acquisition-related gains — — — — — — Acquisition-related expenses — — (1.3) (3.1) — (4.4) Interest expense — (72.1) (38.0) (107.6) — (217.7) Other income — 9.9 1.6 (3.2) — 8.3
Income before provision from income taxes 138.0 155.3 304.2 264.3 (740.1) 121.7 Benefit from (provision for) income taxes — 21.1 3.3 (8.1) — 16.3
Net income 138.0 176.4 307.5 256.2 (740.1) 138.0 Net loss attributable to the noncontrolling interests — — — (37.5) — (37.5)
Net income a ributable to Kennedy-Wilson Holdings, Inc. 138.0 176.4 307.5 218.7 (740.1) 100.5
Preferred dividends and accretion of preferred stock issuance costs — — — — — —Net income a ributable to Kennedy-Wilson Holdings, Inc.
common shareholders $138.0 $ 176.4 $ 307.5 $ 218.7 $ (740.1) $ 100.5
Consolidating Statement of OperationsFor the Year Ended December 31, 2016
(Dollars in millions) ParentKennedy-
Wilson, Inc.Guarantor
SubsidiariesNon-guarantor
Subsidiaries EliminationConsolidated
TotalRevenue Rental $ — $ — $ 114.0 $ 371.9 $ — $ 485.9 Hotel — — — 116.2 — 116.2 Sale of real estate — — 12.2 17.1 — 29.3 Investment management, property services, and research fees — — 53.7 5.7 — 59.4 Loan purchases, loan originations, and other — 0.1 1.1 11.4 — 12.6Total revenue — 0.1 181.0 522.3 — 703.4
Operating expenses Rental operating — — 48.7 86.7 — 135.4 Hotel operating — — — 96.3 — 96.3 Cost of real estate sold — — 9.6 12.5 — 22.1 Commission and marketing — — 7.3 0.7 — 8.0 Compensation and related 65.1 66.4 47.5 7.5 — 186.5 General and administrative — 15.9 16.3 13.2 — 45.4 Depreciation and amortization — 1.3 39.5 157.4 — 198.2
Total operating expenses 65.1 83.6 168.9 374.3 — 691.9 Income from unconsolidated investments — 5.6 64.0 57.0 — 126.6 Income from consolidated subsidiaries 141.6 285.1 204.9 — (631.6) —
Operating income 76.5 207.2 281.0 205.0 (631.6) 138.1Non-operating income expense Gain on sale of real estate — — 19.6 111.1 — 130.7 Acquisition-related gains — — 7.6 8.6 — 16.2 Acquisition-related expenses — — (2.3) (7.2) — (9.5) Interest expense — (54.2) (25.4) (112.0) — (191.6)
Other income (loss) — 7.7 (2.7) 1.6 — 6.6
Income before benefit from income taxes 76.5 160.7 277.8 207.1 (631.6) 90.5 Provision for income taxes — (19.1) 7.3 (2.2) — (14.0)
Net income 76.5 141.6 285.1 204.9 (631.6) 76.5 Net income attributable to the noncontrolling interests — — — (70.9) — (70.9)
Net income a ributable to Kennedy-Wilson Holdings, Inc. 76.5 141.6 285.1 134.0 (631.6) 5.6 Preferred dividends and accretion of preferred stock issuance costs (2.8) — — — — (2.8)
Net income a ributable to Kennedy-Wilson Holdings, Inc. common shareholders $73.7 $ 141.6 $ 285.1 $ 134.0 $ (631.6) $ 2.8
Notes to Consolidated Financial Statements (continued) December 31, 2017, 2016 and 2015

116 Kennedy Wilson Annual Report 2017 Kennedy Wilson Annual Report 2017 117
Consolidating Statement of OperationsFor the Year Ended December 31, 2015
(Dollars in millions) ParentKennedy-
Wilson, Inc.Guarantor
Subsidiaries (1)Non-guarantor
Subsidiaries EliminationConsolidated
TotalRevenue Rental — — 65.4 339.4 — 404.8 Hotel — — — 106.4 — 106.4 Sale of real estate — — — 3.7 — 3.7 Investment management, property services, and research fees — — 66.1 3.2 — 69.3 Loan purchases, loan originations, and other — 0.1 1.2 18.2 — 19.5Total revenue — 0.1 132.7 470.9 — 603.7Operating expenses Rental operating — — 25.3 82.7 — 108.0 Hotel operating — — — 89.9 — 89.9 Cost of real estate sold — — — 2.6 — 2.6 Commission and marketing — 1.6 4.6 1.1 — 7.3 Compensation and related 30.8 50.1 65.4 8.5 — 154.8 General and administrative — 15.0 16.7 12.1 — 43.8 Depreciation and amortization — 0.8 20.8 144.7 — 166.3Total operating expenses 30.8 67.5 132.8 341.6 — 572.7 Income from unconsolidated investments — 0.4 79.3 17.7 — 97.4 Income from consolidated subsidiaries 89.8 220.1 95.9 — (405.8) —
Operating income 59.0 153.1 175.1 147.0 (405.8) 128.4Non-operating income expense Gain on sale of real estate — — 0.1 72.3 — 72.4 Acquisition-related gains — — 70.0 38.1 — 108.1 Acquisition-related expenses — (0.8) (0.7) (35.8) — (37.3) Interest expense — (47.9) (15.8) (93.0) — (156.7) Other income (loss) — 1.0 (1.7) (1.8) — (2.5)
Income before provision for income taxes 59.0 105.4 227.0 126.8 (405.8) 112.4 Provision for income taxes — (15.6) (6.9) (30.9) — (53.4)
Net income 59.0 89.8 220.1 95.9 (405.8) 59.0 Net income attributable to the noncontrolling interests — — — 15.7 — 15.7
Net income a ributable to Kennedy-Wilson Holdings, Inc. 59.0 89.8 220.1 111.6 (405.8) 74.7 Preferred dividends and accretion of preferred stock issuance costs (3.6) — — — — (3.6)
Net income loss a ributable to Kennedy-Wilson Holdings, Inc. common shareholders $55.4 $ 89.8 $ 220.1 $ 111.6 $ (405.8) $ 71.1
Consolidated Statement of Comprehensive Income For the Year Ended December 31, 2017
(Dollars in millions) ParentKennedy-
Wilson, Inc.Guarantor
SubsidiariesNon-guarantor
Subsidiaries EliminationConsolidated
T o t a l
Net income loss $ 138.0 $ 176.4 $ 307.5 $ 256.2 $ (740.1) $ 138.0
Other comprehensive income (loss), net of tax:
Unrealized gain on marketable securities 0.2 0.2 — — (0.2) 0.2
Unrealized foreign currency translation gain 155.3 155.3 30.6 458.7 (644.6) 155.3Amounts reclassified from accumulated other comprehensive income 2.0 2.0 — 2.0 (4.0) 2.0
Unrealized forward contract forward currency loss (68.3) (68.3) (21.9) (46.4) 136.6 (68.3)
Total other comprehensive income for the period $ 89.2 $ 89.2 $ 8.7 $ 414.3 $ (512.2) $ 89.2
Comprehensive income 227.2 265.6 316.2 670.5 (1,252.3) 227.2Comprehensive income attributable to noncontrolling interests — — — (124.2) — (124.2)Comprehensive income a ributable to Kennedy-Wilson
Holdings, Inc. $ 227.2 $ 265.6 $ 316.2 $ 546.3 1,2 2.3 103.0
Consolidated Statement of Comprehensive Income For the Year Ended December 31, 2016
(Dollars in millions) ParentKennedy-
Wilson, Inc.Guarantor
SubsidiariesNon-guarantor
Subsidiaries EliminationConsolidated
T o t a l
Net income loss $ 76.5 $ 141.6 $ 285.1 $ 204.9 $ (631.6) $ 76.5
Other comprehensive income (loss), net of tax:
Unrealized gain on marketable securities 0.1 0.1 — — (0.1) 0.1
Unrealized foreign currency translation loss (164.1) (164.1) (23.1) (161.9) 349.1 (164.1)Amounts reclassified from accumulated other comprehensive income 3.4 3.4 — 3.4 (6.8) 3.4
Unrealized forward contract forward currency (loss) gain (100.1) (100.1) 21.3 (121.4) 200.2 (100.1)
Total other comprehensive (loss) income for the period (260.7) (260.7) (1.8) (279.9) 542.4 (260.7)
Comprehensive income (loss) $ (184.2) $ (119.1) $ 283.3 $ (75.0) $ (89.2) $ (184.2)
Comprehensive loss attributable to noncontrolling interests — — — 166.3 — 166.3Comprehensive income loss a ributable to Kennedy-
Wilson Holdings, Inc. $ 1 4.2 11 .1 $ 28 3.3 $ 91.3 .2 17.
Notes to Consolidated Financial Statements (continued) December 31, 2017, 2016 and 2015
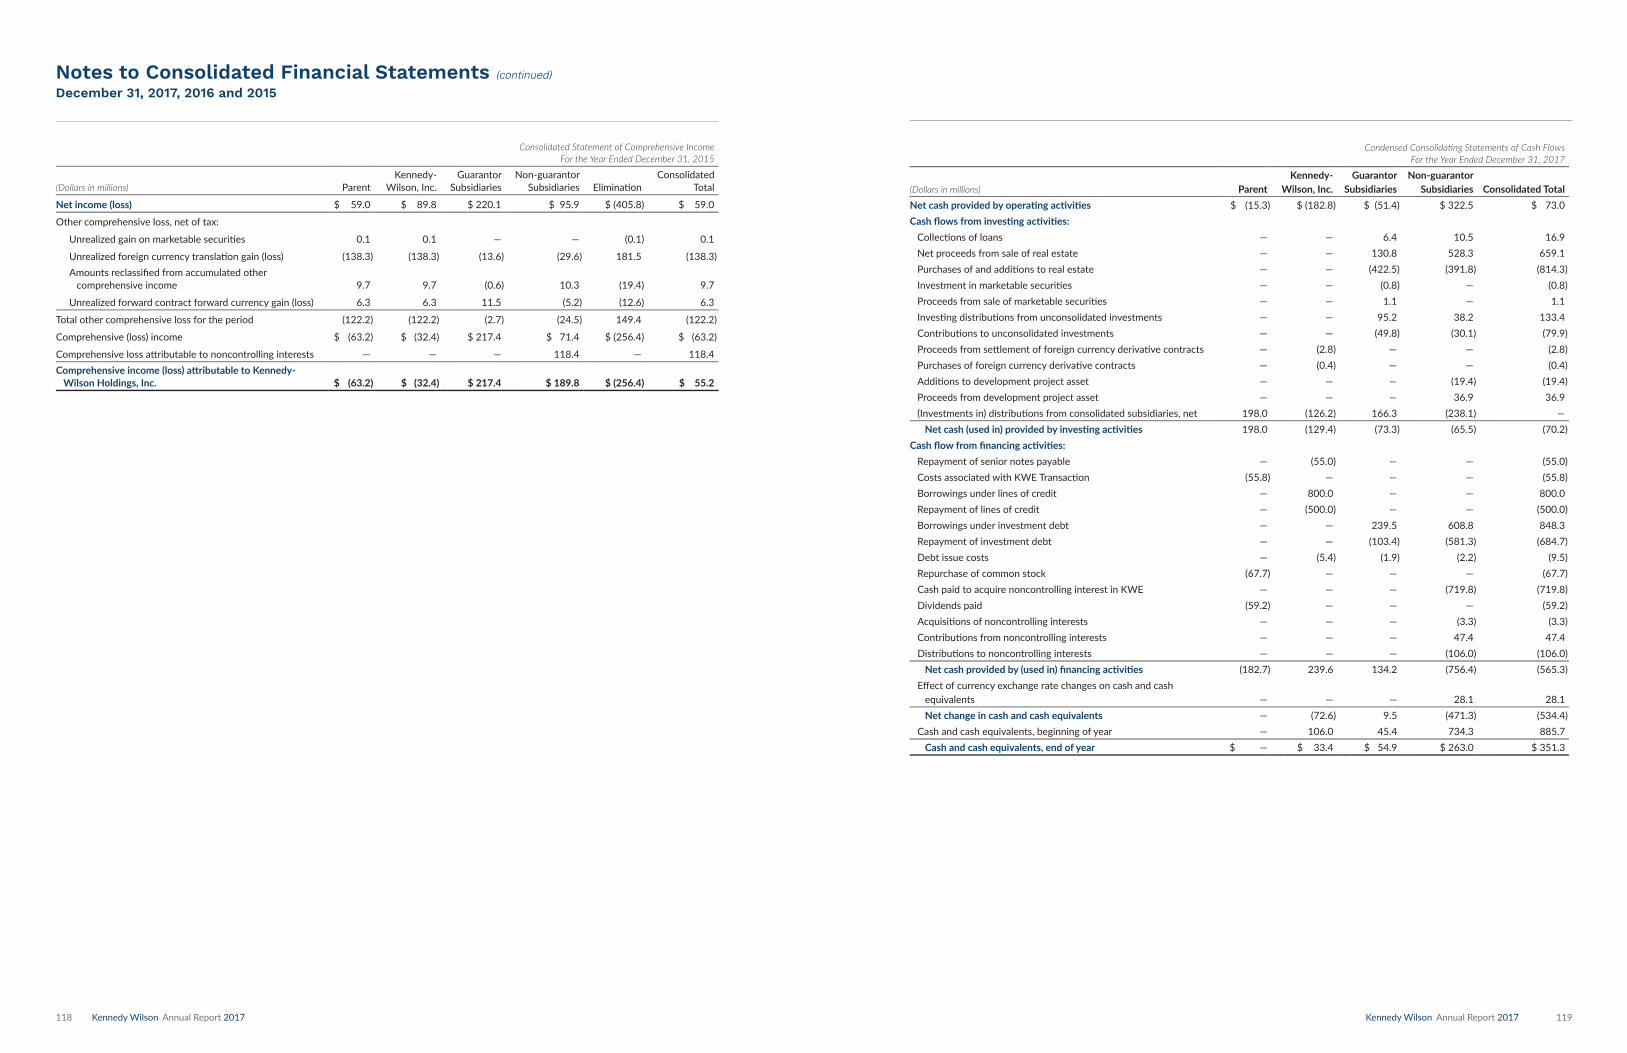
118 Kennedy Wilson Annual Report 2017 Kennedy Wilson Annual Report 2017 119
Consolidated Statement of Comprehensive Income For the Year Ended December 31, 2015
(Dollars in millions) ParentKennedy-
Wilson, Inc.Guarantor
SubsidiariesNon-guarantor
Subsidiaries EliminationConsolidated
Total
Net income loss $ 59.0 $ 89.8 $ 220.1 $ 95.9 $ (405.8) $ 59.0
Other comprehensive loss, net of tax:
Unrealized gain on marketable securities 0.1 0.1 — — (0.1) 0.1
Unrealized foreign currency translation gain (loss) (138.3) (138.3) (13.6) (29.6) 181.5 (138.3)Amounts reclassified from accumulated other comprehensive income 9.7 9.7 (0.6) 10.3 (19.4) 9.7
Unrealized forward contract forward currency gain (loss) 6.3 6.3 11.5 (5.2) (12.6) 6.3
Total other comprehensive loss for the period (122.2) (122.2) (2.7) (24.5) 149.4 (122.2)
Comprehensive (loss) income $ (63.2) $ (32.4) $ 217.4 $ 71.4 $ (256.4) $ (63.2)
Comprehensive loss attributable to noncontrolling interests — — — 118.4 — 118.4Comprehensive income loss a ributable to Kennedy-
Wilson Holdings, Inc. $ 63.2 32.4 $ 217.4 $ 18 9.8 2 6.4 $ 55.2
Notes to Consolidated Financial Statements (continued) December 31, 2017, 2016 and 2015
Condensed Consolidating Statements of Cash FlowsFor the Year Ended December 31, 2017
(Dollars in millions) ParentKennedy-
Wilson, Inc.Guarantor
SubsidiariesNon-guarantor
Subsidiaries Consolidated TotalNet cash provided by operating activities $ (15.3) $ (182.8) $ (51.4) $ 322.5 $ 73.0Cash ows from investing activities: Collections of loans — — 6.4 10.5 16.9 Net proceeds from sale of real estate — — 130.8 528.3 659.1 Purchases of and additions to real estate — — (422.5) (391.8) (814.3) Investment in marketable securities — — (0.8) — (0.8) Proceeds from sale of marketable securities — — 1.1 — 1.1 Investing distributions from unconsolidated investments — — 95.2 38.2 133.4 Contributions to unconsolidated investments — — (49.8) (30.1) (79.9) Proceeds from settlement of foreign currency derivative contracts — (2.8) — — (2.8) Purchases of foreign currency derivative contracts — (0.4) — — (0.4) Additions to development project asset — — — (19.4) (19.4) Proceeds from development project asset — — — 36.9 36.9 (Investments in) distributions from consolidated subsidiaries, net 198.0 (126.2) 166.3 (238.1) — Net cash used in provided by investing activities 198.0 (129.4) (73.3) (65.5) (70.2)Cash ow from financing activities: Repayment of senior notes payable — (55.0) — — (55.0) Costs associated with KWE Transaction (55.8) — — — (55.8) Borrowings under lines of credit — 800.0 — — 800.0 Repayment of lines of credit — (500.0) — — (500.0) Borrowings under investment debt — — 239.5 608.8 848.3 Repayment of investment debt — — (103.4) (581.3) (684.7) Debt issue costs — (5.4) (1.9) (2.2) (9.5) Repurchase of common stock (67.7) — — — (67.7) Cash paid to acquire noncontrolling interest in KWE — — — (719.8) (719.8) Dividends paid (59.2) — — — (59.2) Acquisitions of noncontrolling interests — — — (3.3) (3.3) Contributions from noncontrolling interests — — — 47.4 47.4 Distributions to noncontrolling interests — — — (106.0) (106.0) Net cash provided by used in financing activities (182.7) 239.6 134.2 (756.4) (565.3) Effect of currency exchange rate changes on cash and cash equivalents — — — 28.1 28.1 Net change in cash and cash equivalents — (72.6) 9.5 (471.3) (534.4) Cash and cash equivalents, beginning of year — 106.0 45.4 734.3 885.7 Cash and cash equivalents, end of year $ — $ 33.4 $ 54.9 $ 263.0 $ 351.3

120 Kennedy Wilson Annual Report 2017 Kennedy Wilson Annual Report 2017 121
Condensed Consolidating Statements of Cash FlowsFor the Year Ended December 31, 2016
(Dollars in millions) ParentKennedy-
Wilson, Inc.Guarantor
SubsidiariesNon-guarantor
Subsidiaries Consolidated TotalNet cash used in provided by operating activities: $ (0.2) $ (207.9) $ 102.2 $ 208.8 $ 102.9Cash ows from investing activities: Additions to loans — (11.6) (4.5) — (16.1) Collections of loans — 6.6 4.9 135.4 146.9 Net proceeds from sale of real estate — — 109.2 430.9 540.1 Purchases of and additions to real estate — — (404.2) (545.4) (949.6) Investment in marketable securities — — (3.2) — (3.2) Investing distributions from unconsolidated investments — 54.5 35.1 89.6 Contributions to unconsolidated investments — (1.0) (104.4) (19.5) (124.9) Proceeds from settlement of foreign currency derivative contracts — 38.6 — — 38.6 Purchases of foreign currency derivative contracts — (8.1) — — (8.1) (Investments in) distributions from consolidated subsidiaries, net 129.8 (36.9) (95.4) 2.5 — Net cash used in provided by investing activities 129.8 (12.4) (443.1) 39.0 (286.7)Cash ow from financing activities: Borrowings under senior notes payable — 250.0 — — 250.0 Borrowings under lines of credit — 125.0 — — 125.0 Repayment of lines of credit — (125.0) — — (125.0) Borrowings under investment debt — — 530.9 658.8 1,189.7 Repayment of investment debt — — (179.5) (428.6) (608.1) Debt issue costs — (3.9) (2.1) (4.8) (10.8) Repurchase of common stock (64.8) — — — (64.8) Dividends paid (64.8) — — — (64.8) Acquisitions of noncontrolling interests — — — (196.9) (196.9) Contributions from noncontrolling interests — — — 42.1 42.1 Distributions from noncontrolling interests — — — (116.6) (116.6) Net cash provided by financing activities (129.6) 246.1 349.3 (46.0) 419.8 Effect of currency exchange rate changes on cash and cash equivalents — — — (81.9) (81.9) Net change in cash and cash equivalents — 25.8 8.4 119.9 154.1Cash and cash equivalents, beginning of year — 80.2 37.0 614.4 731.6 Cash and cash equivalents, end of year $ — $ 106.0 $ 45.4 $ 734.3 $ 885.7
Notes to Consolidated Financial Statements (continued) December 31, 2017, 2016 and 2015
Condensed Consolidating Statements of Cash FlowsFor the Year Ended December 31, 2015
(Dollars in millions) ParentKennedy-
Wilson, Inc.Guarantor
SubsidiariesNon-guarantor
Subsidiaries Consolidated TotalNet cash provided by used in operating activities: $ 5.3 $ 67.4 $ 105.4 $ 0.1 $ 178.2Cash ows from investing activities: Additions to loans — (41.0) — (194.8) (235.8) Settlements of loans — — 8.8 19.0 27.8 Net proceeds from sale of real estate — — — 622.6 622.6 Purchases of and additions to real estate — — (220.3) (1,707.3) (1,927.6) Nonrefundable escrow deposits — — — (3.8) (3.8) Investment in marketable securities — — (5.0) — (5.0) Proceeds from sale of marketable securities — — 6.2 — 6.2 Distributions from unconsolidated investments — — 83.1 96.9 180.0 Contributions to unconsolidated investments — (2.9) (81.5) (99.9) (184.3) Proceeds from settlement of foreign currency derivative contracts — 23.4 — 18.1 41.5 Purchases of foreign currency derivative contracts — (3.6) — (1.6) (5.2) (Investments in) distributions from consolidated subsidiaries, net (157.1) 128.4 (40.0) 68.7 —
Net cash used in provided by investing activities (157.1) 104.3 (248.7) (1,182.1) (1,483.6)Cash ow from financing activities: Borrowings under lines of credit — 95.0 — — 95.0 Repayment of lines of credit — (220.0) — — (220.0) Borrowings under investment debt — — 168.1 1,919.8 2,087.9 Repayment of investment debt — — (7.4) (673.7) (681.1) Debt issuance costs — (4.7) (1.4) (15.6) (21.7) Issuance of common stock 215.0 — — — 215.0 Repurchase of common stock (11.4) — — — (11.4) Dividends paid (51.8) — — — (51.8) Acquisitions of noncontrolling interests — — — (68.4) (68.4) Contributions from noncontrolling interests — — — 14.5 14.5 Distributions from noncontrolling interests — — — (239.2) (239.2)
Net cash provided by used in financing activities 151.8 (129.7) 159.3 937.4 1,118.8 Effect of currency exchange rate changes on cash and cash equivalents — — — (19.5) (19.5)
Net change in cash and cash equivalents — 42.0 16.0 (264.1) (206.1)Cash and cash equivalents, beginning of year — 38.2 21.0 878.5 937.7
Cash and cash equivalents, end of year $ — $ 80.2 $ 37.0 $ 614.4 $ 731.6

122 Kennedy Wilson Annual Report 2017 Kennedy Wilson Annual Report 2017 123
Note 19—Unaudited Quarterly InformationYear ended December 31, 2017
(Dollars in millions, except earnings per share amounts)Fourth
QuarterThird
QuarterSecond Quarter
First Quarter
Revenues $ 181.5 $ 277.2 $ 177.8 $ 174.2
Operating expenses 206.0 231.2 178.3 155.4
Income from unconsolidated investments 20.2 12.9 13.4 22.6
Operating (loss) income (4.3) 58.9 12.9 41.4
Non-operating (expenses) income 92.5 (52.8) 17.7 (44.4)
Income (loss) before provision for income taxes 88.2 6.1 30.6 (3.0)
(Provision for) benefit from income taxes 17.2 3.7 (8.8) 4.2
Net income (loss) 105.4 9.8 21.8 1.2
Net (income) loss attributable to noncontrolling interests (6.2) (18.7) (12.4) (0.2)
Preferred stock dividends and accretion of issuance costs — — — —Net (loss) income attributable to Kennedy-Wilson Holdings, Inc. common shareholders $ 99.2 $ (8.9) $ 9.4 $ 1.0
Basic (loss) earnings per share $ 0.69 $ (0.08) $ 0.08 $ —
Diluted (loss) earnings per share $ 0.69 $ (0.08) $ 0.08 $ —
Year ended December 31, 2016
(Dollars in millions, except earnings per share amounts)Fourth
QuarterThird
QuarterSecond Quarter
First Quarter
Revenues $ 180.4 $ 174.3 $ 176.5 $ 172.2
Operating expenses 194.3 166.1 168.6 162.9
Income from unconsolidated investments 67.3 31.7 8.4 19.2
Operating income (loss) 53.4 39.9 16.3 28.5
Non-operating (expenses) income 3.7 (21.3) (22.4) (7.6)
Income (loss) before provision for income taxes 57.1 18.6 (6.1) 20.9
(Provision for) benefit from income taxes (11.9) (5.5) 3.9 (0.5)
Net income (loss) 45.2 13.1 (2.2) 20.4
Net (income) loss attributable to noncontrolling interests (29.6) (15.1) 1.1 (27.3)
Preferred stock dividends and accretion of issuance costs (1.2) (0.5) (0.5) (0.6)Net (loss) income attributable to Kennedy-Wilson Holdings, Inc. common shareholders $ 14.4 $ (2.5) $ (1.6) $ (7.5)
Basic (loss) earnings per share $ 0.13 $ (0.03) $ (0.02) $ (0.07)
Diluted (loss) earnings per share $ 0.13 $ (0.03) $ (0.02) $ (0.07)
Note 20—Subsequent EventsDuring the first quarter, the Company drew an additional $75.0 million on the A&R Facility. There is $375.0 million outstanding with $325.0 million available to be drawn.
The Company evaluated subsequent events through the date these financial statements were issued. The Company concluded that no other subsequent events have occurred that would require disclosure in the consolidated financial statements.
Notes to Consolidated Financial Statements (continued) December 31, 2017, 2016 and 2015

124 Kennedy Wilson Annual Report 2017 Kennedy Wilson Annual Report 2017 125
Performance Graph
The graph below compares the cumulative total return of our common stock from December 31, 2012 through December 31, 2017, with the comparable cumulative return of companies comprising the S&P 500 Index and the MSCI World Real Estate Index. The graph plots the growth in value of an initial investment of $100 in each of our common stock, the S&P 500 Index, and the MSCI World Real Estate Index for the five-year period ended December 31, 2017, and assumes reinvestment of all dividends, if any, paid on the securities. The stock price performance shown on the graph is not necessarily indicative of future price performance.
$250.00
$200.00 KW
S&P 500
MSCI WorldReal EstateIndex
$150.00
$100.00
$50.00
12/3
1/20
122/
28/2
013
4/30
/201
36/
30/2
013
8/31
/201
310
/31/
2013
12/3
1/20
132/
28/2
014
4/30
/201
46/
30/2
014
8/31
/201
4
10/3
1/20
14
12/3
1/20
142/
28/2
015
4/30
/201
56/
30/2
015
8/31
/201
510
/31/
2015
12/3
1/20
15
2/29
/201
6
4/30
/201
6
6/30
/201
6
8/31
/201
6
10/3
1/20
1612
/31/
2016
2/28
/201
74/
30/2
017
6/30
/201
7
8/31
/201
7
10/3
1/20
1712
/31/
2017
$-
Kennedy Wilson uses the MSCI World Real Estate Index, includes international real estate companies as a comparable measure. The information under this caption, “Performance Graph,” is deemed not to be incorporated by reference into any filings under the Securities Act of 1933, as amended, or the Securities Exchange Act of 1934, as amended, except to the extent that such filing specifically states otherwise.
Purchases of Equity Securities by the Company and A liated Purchasers in the Fourth Quarter of 2017
Unregistered Sales of Equity Securities and Use of Proceeds
MonthsTotal Number of
Shares PurchasedAverage Price Paid
per Share
Total Number of Shares Purchased as Part of
Publicly Announced Plan(1)
Maximum Amount that May Yet be Purchased
Under the Plan(1)
January 1 - January 31, 2016 — $ — — $ 100,000,000February 1 - February 29, 2016 — — — 100,000,000March 1 - March 31, 2016 240,000 20.74 240,000 95,022,013April 1 - April 30, 2016 — — 240,000 95,022,013May 1 - May 31, 2016 676,073 20.22 916,073 81,350,503June 1 - June 30, 2016 505,179 18.53 1,421,252 71,990,945July 1 - July 31, 2016 32,585 18.00 1,453,837 71,404,578August 1 - October 31, 2016 — — 1,453,837 71,404,578November 1 - November 30, 2016 545,768 22.24 1,999,605 59,267,713December 1 - December 31, 2016 440,951 21.06 2,440,556 49,981,041January 1 - January 31, 2017 77,155 20.00 2,517,711 48,438,200February 1 - October 31, 2017 — — 2,517,711 48,438,200November 1 - November 30, 2017 428,055 19.22 2,945,766 40,212,250December 1 - December 31, 2017 1,140,606 17.51 4,086,372 20,239,515T o ta l 4,0 6,372 $ 19.52 4,0 6,372 20,23 , 1
( 1) On February 25, 2016, our board of directors authorized us to repurchase up to $100 million of its common shares, from time to time, subject to market conditions. The program expired on February 25, 2018.
Market for Registrant’s Common Equity, Related Stockholder Matters and Issuer Purchases of Equity Securities
Stock Price Information
Our common stock trades on the NYSE under the symbol “KW.” The following table sets forth, for the calendar quarter indicated, the high and low sales prices per share of common stock as reported on the NYSE. The quotations listed below reflect inter dealer prices, without retail markup, markdown or commission and may not necessarily represent actual transactions.
Common Stock
High LowFiscal year 2017Quarter ended March 31, 2017 $ 22.65 $ 19.95Quarter ended June 30, 2017 22.65 17.95Quarter ended September 30, 2017 20.60 18.10Quarter ended December 31, 2017 20.15 17.15Fiscal year 2016Quarter ended March 31, 2016 24.26 15.74Quarter ended June 30, 2016 22.64 17.29Quarter ended September 30, 2016 23.77 17.93Quarter ended December 31, 2016 23.00 20.00
Holders
As of February 23, 2018, we had approximately 148 holders of record of our common stock.
Dividends
We declared and paid quarterly dividends of $0.17 per share for the first three quarters of 2017 and $0.19 per share for the fourth quarter of 2017. During 2016, we declared and paid quarterly dividends of $0.14 per share for all four quarters.
Cumulative dividends on our Series B Preferred Stock accrued at an annual rate of 6.452% of the liquidation preference, subject to adjustment under certain circumstances. On December 28, 2016, the Company issued an aggregate of 3,366,973 shares of Common Stock in settlement of the conversion of all outstanding shares of Series B Preferred Stock. As of December 31, 2016 there was no Preferred Stock outstanding. The Company paid $0.7 million of dividends at conversion for dividends that would have been accrued up to the mandatory conversion date.
The declaration and payment of any future dividends is at the sole discretion of our board of directors and will depend on, among other things, our operating results, overall financial condition, capital requirements and general business conditions.
Amounts shown in millions
Aggregate dividends declared since inception Preferred Common Total
2009 $ 3.2 $ — $ 3.2
2010 4.5 — 4.5
2011 8.7 5.7 14.4
2012 8.1 11.7 19.8
2013 8.1 21.8 29.9
2014 8.1 33.7 41.8
2015 3.6 53.3 56.9
2016 2.8 63.9 66.7
2017 — 87.4 87.4
T o t a l $ 47.1 $ 277.5 $ 324.6
Recent Sales of Unregistered Securities
None
Equity Compensation Plan Information
See Item 12—“Security Ownership of Certain Beneficial Owners and Management and Related Stockholder Matters.”

126 Kennedy Wilson Annual Report 2017 Kennedy Wilson Annual Report 2017 127
Forward-Looking Statements
Statements made by us in this report and in other reports and statements released by us that are not historical facts constitute “forward-looking statements” within the meaning of Section 27A of the Securities Act of 1933, as amended (the “Securities Act”) and Section 21E of the Securities Exchange Act of 1934, as amended (the “Exchange Act”). These forward-looking statements are necessarily estimates reflecting the judgment of our senior management based on our current estimates, expectations, forecasts and projections and include comments that express our current opinions about trends and factors that may impact future operating results. Disclosures that use words such as “believe,” “may,” “anticipate,” “estimate,” “intend,” “could,” “plan,” “expect,” “project” or the negative of these, as well as similar expressions, are intended to identify forward-looking statements.
Forward-looking statements are not guarantees of future performance, rely on a number of assumptions concerning future events, many of which are outside of our control, and involve known and unknown risks and uncertainties that could cause our actual results, performance or achievement, or industry results, to differ materially from any future results, performance or achievements, expressed or implied by such forward-looking statements. Although we believe that our plans, intentions, expectations, strategies and prospects as reflected in or suggested by those forward-looking statements are reasonable, we do not guarantee that the transactions and events described will happen as described (or that they will happen at all). For a further discussion of these and other factors that could impact our future results, performance or transactions, please carefully read “Risk Factors” in Part I, Item 1A below in addition to the following factors:
• disruptions in general economic and business conditions, particularly in geographies where our business may be concentrated;
• volatility and disruption of the capital and credit markets, higher interest rates, higher loan costs, less desirable loan terms and a reduction in the availability of mortgage loans, all of which could increase costs and could limit our ability to acquire additional real estate assets;
• high levels of unemployment and general slowdowns in commercial activity;
• our leverage and ability to refinance existing indebtedness or incur additional indebtedness;
• an increase in our debt service obligations;
• our ability to generate a sufficient amount of cash to satisfy working capital requirements and to service our existing and future indebtedness;
• our ability to achieve improvements in operating efficiency;
• foreign currency fluctuations;
• performance of our foreign currency hedge and similar instruments;
• adverse changes in the securities markets;
• our ability to retain our senior management and attract and retain qualified and experienced employees;
• changes in tax laws in the United States (including those made by the Tax Cuts and Jobs Act enacted in December 2017), Ireland, United Kingdom, Spain, Italy or Japan that reduce or eliminate deductions or other tax benefits we receive;
• our ability to repatriate investment funds in a tax-efficient manner;
• future acquisitions may not be available at favorable prices or upon advantageous terms and conditions;
• costs relating to the acquisition of assets we may acquire could be higher than anticipated;
• our ability to retain major clients and renew related contracts; and
• trends in use of large, full-service commercial real estate providers.
Any such forward-looking statements, whether made in this report or elsewhere, should be considered in the context of the various disclosures made by us about our businesses including, without limitation, the risk factors discussed in this Annual Report. Except as required under the federal securities laws and the rules and regulations of the U.S. Securities and Exchange Commission (the “SEC”), we do not have any intention or obligation to update publicly any forward-looking statements, whether as a result of new information, future events, changes in assumptions, or otherwise. Please refer to “Non-GAAP Measures and Certain Definitions” for definitions of certain terms used throughout this report.
Reconciliation of Non-GAAP Measures
Years Ended December 31,
(Dollars in millions) 2017 2016 2015 2014 2013
Net income $ 138.0 $ 76.5 $ 59.0 $ 90.1 $ 13.9
Non-GAAP adjustments:
Add back:
Interest expense 217.7 191.6 155.7 103.4 51.7
Early extinguishment of corporate debt — — 1.0 27.3 —
Kennedy Wilson’s share of interest expense included in investment in unconsolidated investments 23.0 23.0 28.1
35.5 45.0
Depreciation and amortization 212.5 198.2 166.3 104.5 17.4
Kennedy Wilson’s share of depreciation and amortization included in unconsolidated investments 16.2 20.8 28.1
47.1 46.7
Provision for (benefit from) income taxes (16.3) 14.0 53.4 32.4 2.9
Share-based compensation 38.4 65.1 30.8 15.8 7.5
EBITDA attributable to noncontrolling interests(1) (173.8) (239.3) (151.2) (138.3) (26.0)
Adjusted EBITDA 2 $ 455.7 $ 349.9 $ 371.2 $ 317.8 $ 159.1( 1) ( 2) See “Non-GAAP Measures and Certain Definitions” for definitions and discussion of Adjusted EBITDA.
Years Ended December 31,
(Dollars in millions) 2017 2016 2015 2014 2013
Net income $ 138.0 $ 76.5 $ 59.0 $ 90.1 $ 13.9
Non-GAAP adjustments:
Add back:
Depreciation and amortization 212.5 198.2 166.3 104.5 17.4
Kennedy Wilson's share of depreciation and amortization included in unconsolidated investments 16.2 20.8 28.1
47.1 46.7
Share-based compensation 38.4 65.1 30.8 15.8 7.5
Net income attributable to the noncontrolling interests, before depreciation and amortization(1) (117.8) (169.3) (76.0) (123.8) (24.4)
One-time tax remeasurement (44.8) — — — —
Adjusted Net Income 2 $ 242.5 $ 191.3 $ 20 .2 $ 133.7 $ 61.1( 1) ( 2) See “Non-GAAP Measures and Certain Definitions” for definitions and discussion of Adjusted Net Income.
Years Ended December 31,
(Dollars in millions) 2017 2016 2015 2014 2013
Investment management, property services and research fees(1) $ 51.7 $ 59.4 $ 69.3 $ 82.6 $ 68.1
Non-GAAP adjustments:
Add back:
Fees eliminated in consolidation 26.3 36.9 75.0 21.6 4.3
Kennedy Wilson's share of fees in unconsolidated service businesses 8.6 12.6 13.9 16.8 —
Adjusted Fees $ 8 6.6 $ 10 . $ 158 .2 $ 121.0 $ 72.4( 1) Amounts previously presented as Management and leasing fees and commissions on prior period statement of operations. Amounts above represent total of fees and
commissions from prior periods.
This page intentionally left blank
BOARD OF DIRECTORS
William J. McMorrowChairman and Chief Executive Officer
Norman CreightonRetired President and Chief Executive Officer Imperial Bank (Now Comerica)
Cathy HendricksonRetired President and Chief Executive Officer Bay Cities National Bank (Now Opus Bank)
David A. MinellaManaging Member Minella Capital Management LLC
Kent Y. MoutonExecutive Vice President and General Counsel
Mary L. RicksPresident and Chief Executive Officer Kennedy Wilson Europe
Jerry R. SolomonRetired CPA
John TaylorRetired Audit Partner KPMG LLP
Sanaz ZaimiHead of Global FICC Sales Bank of America Merrill Lynch
Stanley ZaxRetired Chairman Zenith National Insurance Corporation
EXECUTIVE OFFICERS
William J. McMorrowChairman and Chief Executive Officer
Justin EnbodyChief Financial Officer
Mary L. RicksPresident and Chief Executive Officer Kennedy Wilson Europe
Matt WindischExecutive Vice President
Kent Y. MoutonExecutive Vice President and General Counsel
In Ku LeeSenior Vice President and Deputy General Counsel
CORPORATE INFORMATION
Certain of the matters discussed herein are discussed more fully in our filings with the Securities and Exchange Commission, including our Annual Report on Form 10-K. We filed our Annual Report on Form 10-K for the year ended December 31, 2017, with the SEC on February 27, 2018, which, in the section titled “Risk Factors,” contains a detailed discussion of risks and uncertainties that could cause actual results and events to differ materially from any forward-looking statements contained herein.
Ann
ual R
epor
t Des
ign
by B
ig P
ivot
Par
tner
s /
ww
w.b
igpi
vot.n
et
CORPORATE HEADQUARTERS151 South El Camino Drive Beverly Hills, CA 90212 +1 (310) 887-6400
ANNUAL MEETINGBeverly Wilshire 9500 Wilshire Blvd. Beverly Hills, CA 90212 9 a.m., Thursday, June 14, 2018
STOCK LISTINGNew York Stock Exchange Symbol “KW”
TRANSFER AGENTContinental Stock Transfer 17 Battery Pl., 8th Floor New York, NY 10004 +1 (212) 509-4000
INDEPENDENT AUDITORSKPMG LLP
LEGAL COUNSELLatham & Watkins LLP
INVESTOR INFORMATIONA copy of our Annual Report on Form 10-K, as filed with the SEC, will be furnished to shareholders and interested investors free of charge upon written request to us at 151 South El Camino Drive, Beverly Hills, CA 90212, Attention: Daven Bhavsar, CFA / Director of Investor Relations
FOR MORE INFORMATIONFor more information on Kennedy Wilson, please visit our website at www.kennedywilson.com

O U R L O C A T I O N S
151 SOUTH EL CAMINO DRIVE | BEVERLY HILLS, CA 90212 | TEL: +1 310-887-6400 | WWW.KENNEDYWILSON.COM
U.S.
Bellevue 3055 112th Ave. NE, Suite 125 Bellevue, WA 98004
Beverly Hills (U.S. Corporate Headquarters) 151. S. El Camino Drive Beverly Hills, CA 90212
Chicago 150 S. Wacker Dr., Suite 2725 Chicago, IL 60606
Concord 1850 Gateway Blvd., Suite 130 Concord, CA 94520
Dallas 6688 N. Central Expressway, Suite 550 Dallas, TX 75206
Danville 675 Hartz Ave., Suite 206 Danville, CA 94526
Denver 9233 Park Meadows Drive Lone Tree, CO 80124
Honolulu 1003 Bishop Street, Suite 1820 Honolulu, HI 96813
Houston 2700 Post Oak Blvd., Suite 4100 Houston, TX 77056
Las Vegas 8395 W. Sunset, Suite 140 Las Vegas, NV 89113
New York 315 West 36th Street New York, NY 10018
Orange County 3200 Bristol Street, Suite 640 Costa Mesa, CA 92626
Philadelphia Three Logan Square 1717 Arch St., Suite 700 Philadelphia, PA 19103
Philadelphia 1101 Market Street Suite 105 Philadelphia, PA 19107
Phoenix 8700 East Via de Ventura Suite 205 Scottsdale, AZ 85258
Phoenix 7375 E. 6th Ave., Suite 6 Scottsdale, AZ 85251
Sacramento 1860 Howe Ave., Suite 445 Sacramento, CA 95825
San Diego 420 Stevens Avenue, Suite 120 Solana Beach,CA 92075
San Francisco 300 California St., 2nd Floor San Francisco, CA 94104
JAPAN
Tokyo Kennedy Wilson Investment Company, Ltd. Toranomon Mitsui Bldg. 14th Floor 3-8-1 Kasumigaseki Chiyoda-ku Tokyo 101-0013 Japan
EUROPE
Dublin 33 Sir John Rogerson’s Quay Dublin 2, Ireland
London (Europe Corporate Headquarters) 50 Grosvenor Hill London, England W1K 3QT
Luxembourg 21, rue Philippe II Luxembourg L-2340
Madrid C/ Fernando El Santo 17 3º Izq. 28010 Madrid, Spain
St. Helier 29 Broad Street St. Helier, Jersey JE2 3RR Channel Islands
Chicago
Houston
Phoenix
Bellevue
SacramentoDanville
ConcordDenverSan Francisco
Beverly HillsCorporate
Headquarters
Costa MesaLas Vegas
San Diego
Honolulu
Tokyo
Dallas
Dublin London
Madrid
St. Helier Luxembourg
New YorkPhiladelphia


![APNIC Annual Report by Paul Wilson [APRICOT 2015]](https://img.pdfslide.net/doc/110x75/55cf293fbb61ebb7668b45df/apnic-annual-report-by-paul-wilson-apricot-2015.jpg)