Embed Size (px)
Citation preview
ANNUALREPORT
2017
CO
NT
EN
TS
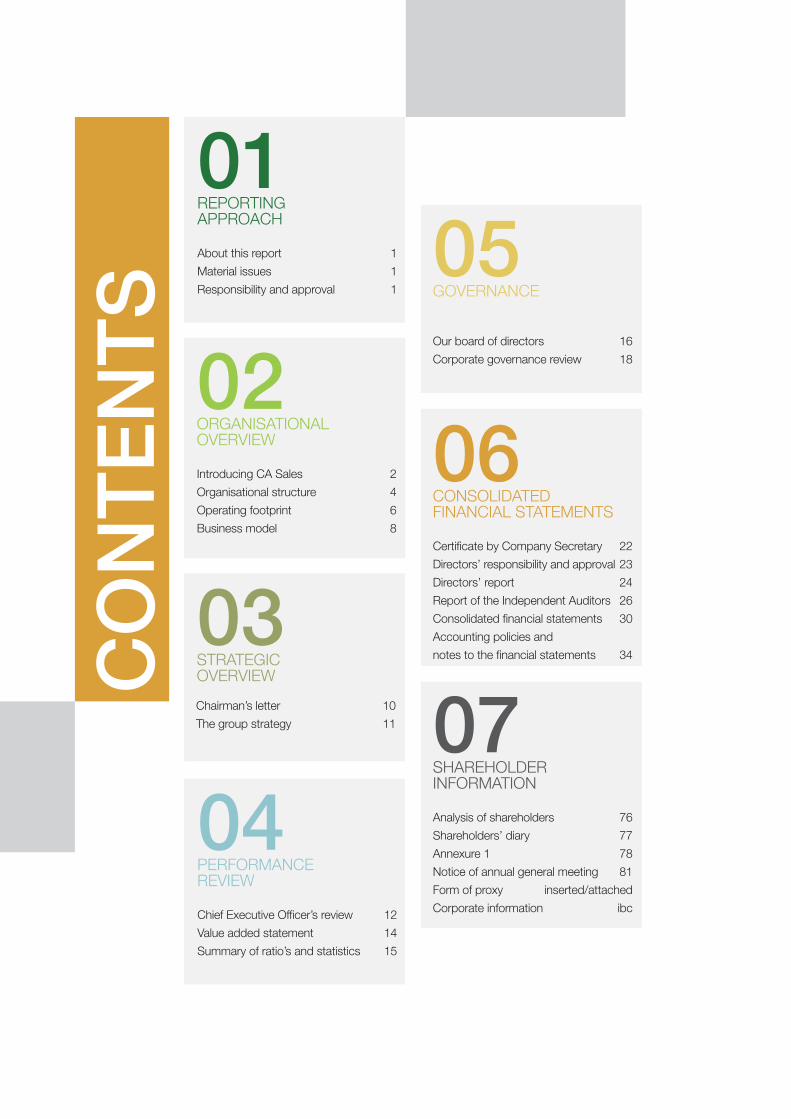
03STRATEGIC OVERVIEW
01REPORTING APPROACH
About this report 1
Material issues 1
Responsibility and approval 1
04PERFORMANCE REVIEW
Chief Executive Officer’s review 12
Value added statement 14
Summary of ratio’s and statistics 15
02ORGANISATIONAL OVERVIEW
Introducing CA Sales 2
Organisational structure 4
Operating footprint 6
Business model 8
05GOVERNANCE
Our board of directors 16
Corporate governance review 18
06CONSOLIDATED FINANCIAL STATEMENTS
Certificate by Company Secretary 22
Directors’ responsibility and approval 23
Directors’ report 24
Report of the Independent Auditors 26
Consolidated financial statements 30
Accounting policies and
notes to the financial statements 34
07SHAREHOLDERINFORMATION
Analysis of shareholders 76
Shareholders’ diary 77
Annexure 1 78
Notice of annual general meeting 81
Form of proxy inserted/attached
Corporate information ibc
Chairman’s letter 10
The group strategy 11
CA SALES HOLDINGS ANNUAL REPORT 2017
1
Reporting approach
ABOUT THIS REPORT The board of directors of CA Sales Holdings Limited (“CA Sales” or “the group” or “the company”) is pleased to present the group’s first annual report as a listed company, for the year ended 31 December 2017. The company’s shares were listed on the 4 Africa Exchange (4AX) and the Botswana Stock Exchange (BSE), on 7 and 9 November 2017, respectively.
The report has been prepared taking into consideration the principles and practices contained in the South African King Code of Governance Principles 2016 (King IV). The consolidated annual financial statements have been prepared in accordance with International Financial Reporting Standards (IFRS) and the South African Companies Act. Also taking into account the listings requirements of the BSE and 4AX.
The primary objective of this report is to provide a greater understanding of the group’s strategy, governance, performance and prospects in the context of its external environment as well as its creation of value over the short, medium and long-term.
This report offers stakeholders a more holistic view of CA Sales’ operations and provides insight on both financial and non-financial matters for the year ended 31 December 2017.
As the concepts and practices of reporting develop, management will aim to improve disclosures and application as deemed appropriate.
MATERIAL ISSUESCA Sales Holdings defines materiality of issues for reporting purposes as issues that substantially affect the group’s ability to create and sustain value over the short, medium and long-term. The group is in the process of refining the process of identifying and prioritising material issues as part of the strategy development of the group.
In the interim, the material issues identified are:
• Retention of major principals and customers
• Foreign exchange fluctuations
• Consumer spending and confidence
• Key management retention
• Working capital management
RESPONSIBILITY AND APPROVALThe audit and risk committee (ARC) and board of directors (board) acknowledge their responsibility to ensure the integrity of the report. The board has accordingly applied its mind to the report and in the opinion of the ARC and the board, the report addresses all material issues and fairly presents the performance of the organisation and its impact. The board authorised the report for release.
CA SALES HOLDINGS ANNUAL REPORT 2017
2
INTRODUCING CA SALES
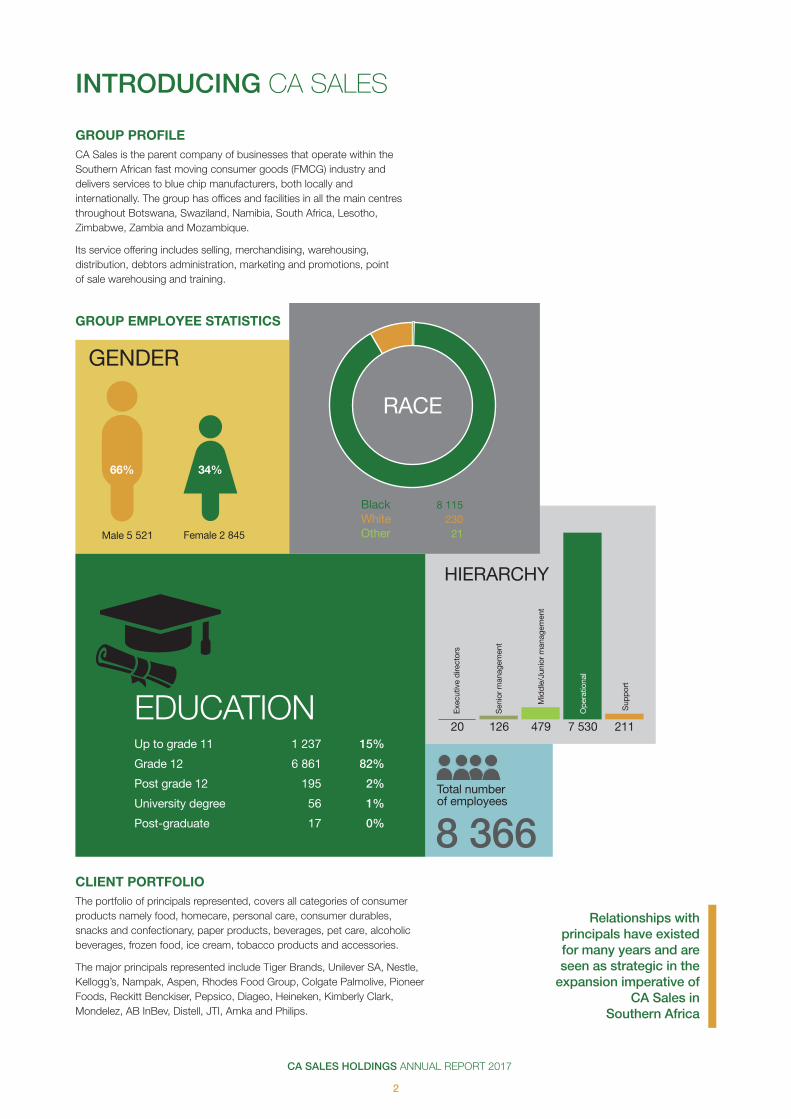
GROUP PROFILECA Sales is the parent company of businesses that operate within the Southern African fast moving consumer goods (FMCG) industry and delivers services to blue chip manufacturers, both locally and internationally. The group has offices and facilities in all the main centres throughout Botswana, Swaziland, Namibia, South Africa, Lesotho, Zimbabwe, Zambia and Mozambique.
Its service offering includes selling, merchandising, warehousing, distribution, debtors administration, marketing and promotions, point of sale warehousing and training.
CLIENT PORTFOLIOThe portfolio of principals represented, covers all categories of consumer products namely food, homecare, personal care, consumer durables, snacks and confectionary, paper products, beverages, pet care, alcoholic beverages, frozen food, ice cream, tobacco products and accessories.
The major principals represented include Tiger Brands, Unilever SA, Nestle, Kellogg’s, Nampak, Aspen, Rhodes Food Group, Colgate Palmolive, Pioneer Foods, Reckitt Benckiser, Pepsico, Diageo, Heineken, Kimberly Clark, Mondelez, AB InBev, Distell, JTI, Amka and Philips.
GROUP EMPLOYEE STATISTICS
66%
Male 5 521
34%
Female 2 845
GENDER
HIERARCHY
EDUCATION
Black 8 115White 230 Other 21
RACE
Relationships with principals have existed for many years and are seen as strategic in the
expansion imperative of CA Sales in
Southern Africa
Up to grade 11 1 237 15%
Grade 12 6 861 82%
Post grade 12 195 2%
University degree 56 1%
Post-graduate 17 0%
Total number of employees
8 366
Exe
cutiv
e di
rect
ors
Sen
ior
man
agem
ent
Mid
dle/
Juni
or m
anag
emen
t
Ope
ratio
nal
Sup
por
t
20 126 479 7 530 211
CA SALES HOLDINGS ANNUAL REPORT 2017
3
Organisational overview
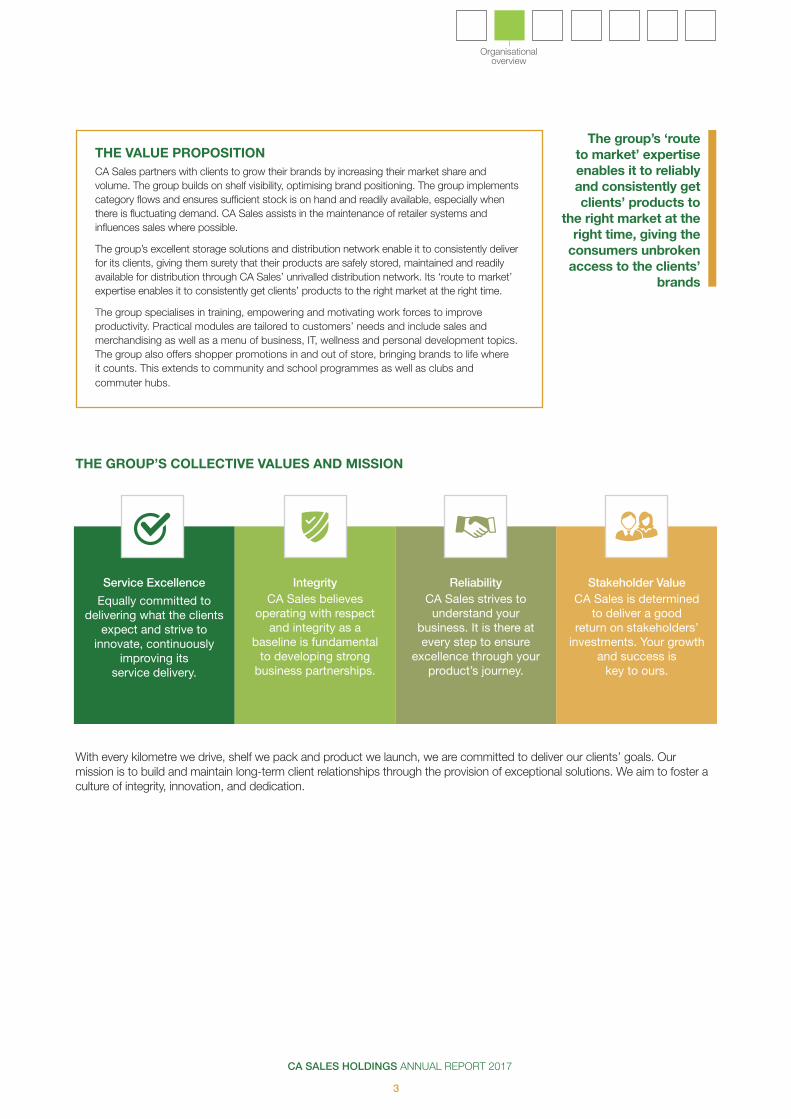
THE GROUP’S COLLECTIVE VALUES AND MISSION
With every kilometre we drive, shelf we pack and product we launch, we are committed to deliver our clients’ goals. Our mission is to build and maintain long-term client relationships through the provision of exceptional solutions. We aim to foster a culture of integrity, innovation, and dedication.
THE VALUE PROPOSITIONCA Sales partners with clients to grow their brands by increasing their market share and volume. The group builds on shelf visibility, optimising brand positioning. The group implements category flows and ensures sufficient stock is on hand and readily available, especially when there is fluctuating demand. CA Sales assists in the maintenance of retailer systems and influences sales where possible.
The group’s excellent storage solutions and distribution network enable it to consistently deliver for its clients, giving them surety that their products are safely stored, maintained and readily available for distribution through CA Sales’ unrivalled distribution network. Its ‘route to market’ expertise enables it to consistently get clients’ products to the right market at the right time.
The group specialises in training, empowering and motivating work forces to improve productivity. Practical modules are tailored to customers’ needs and include sales and merchandising as well as a menu of business, IT, wellness and personal development topics. The group also offers shopper promotions in and out of store, bringing brands to life where it counts. This extends to community and school programmes as well as clubs and commuter hubs.
Service Excellence
Equally committed to delivering what the clients
expect and strive to innovate, continuously
improving its service delivery.
IntegrityCA Sales believes
operating with respect and integrity as a
baseline is fundamental to developing strong
business partnerships.
ReliabilityCA Sales strives to
understand your business. It is there at every step to ensure
excellence through your product’s journey.
Stakeholder ValueCA Sales is determined
to deliver a good return on stakeholders’
investments. Your growth and success is
key to ours.
The group’s ‘route to market’ expertise enables it to reliably and consistently get clients’ products to
the right market at the right time, giving the
consumers unbroken access to the clients’
brands
CA SALES HOLDINGS ANNUAL REPORT 2017
4
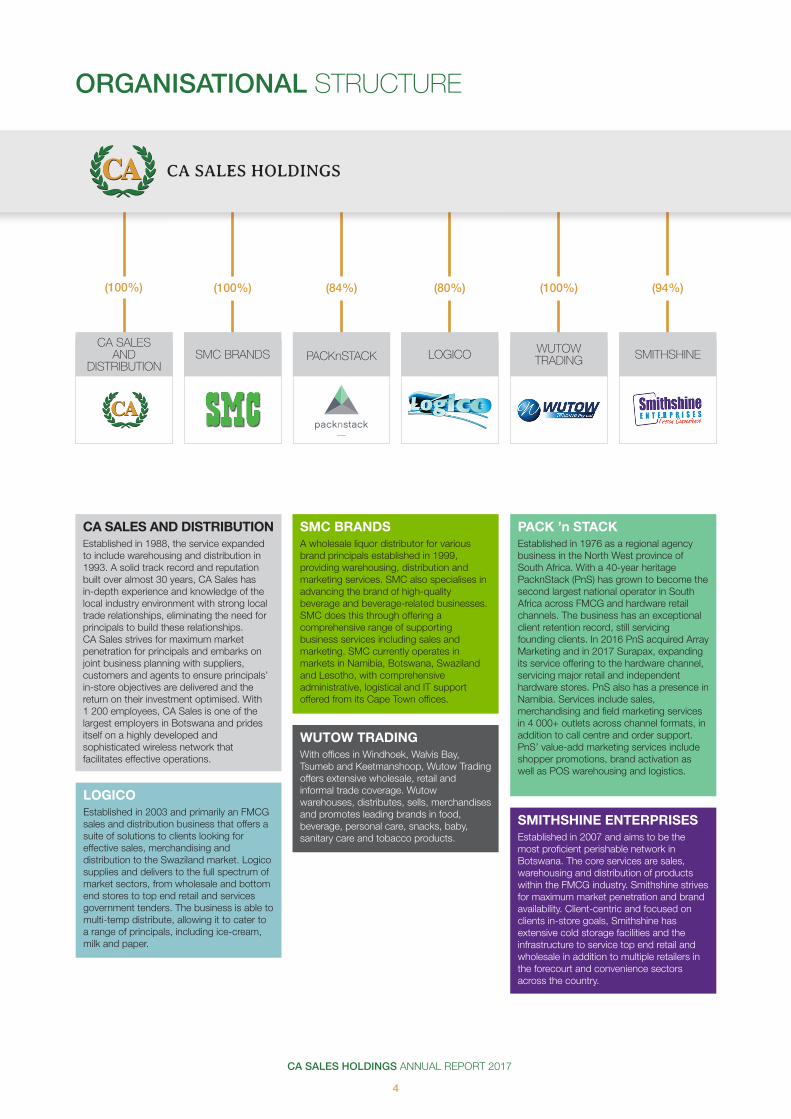
CA SALES AND DISTRIBUTIONEstablished in 1988, the service expanded to include warehousing and distribution in 1993. A solid track record and reputation built over almost 30 years, CA Sales has in-depth experience and knowledge of the local industry environment with strong local trade relationships, eliminating the need for principals to build these relationships. CA Sales strives for maximum market penetration for principals and embarks on joint business planning with suppliers, customers and agents to ensure principals’ in-store objectives are delivered and the return on their investment optimised. With 1 200 employees, CA Sales is one of the largest employers in Botswana and prides itself on a highly developed and sophisticated wireless network that facilitates effective operations.
LOGICO Established in 2003 and primarily an FMCG sales and distribution business that offers a suite of solutions to clients looking for effective sales, merchandising and distribution to the Swaziland market. Logico supplies and delivers to the full spectrum of market sectors, from wholesale and bottom end stores to top end retail and services government tenders. The business is able to multi-temp distribute, allowing it to cater to a range of principals, including ice-cream, milk and paper.
SMC BRANDS A wholesale liquor distributor for various brand principals established in 1999, providing warehousing, distribution and marketing services. SMC also specialises in advancing the brand of high-quality beverage and beverage-related businesses. SMC does this through offering a comprehensive range of supporting business services including sales and marketing. SMC currently operates in markets in Namibia, Botswana, Swaziland and Lesotho, with comprehensive administrative, logistical and IT support offered from its Cape Town offices.
PACK ’n STACK Established in 1976 as a regional agency business in the North West province of South Africa. With a 40-year heritage PacknStack (PnS) has grown to become the second largest national operator in South Africa across FMCG and hardware retail channels. The business has an exceptional client retention record, still servicing founding clients. In 2016 PnS acquired Array Marketing and in 2017 Surapax, expanding its service offering to the hardware channel, servicing major retail and independent hardware stores. PnS also has a presence in Namibia. Services include sales, merchandising and field marketing services in 4 000+ outlets across channel formats, in addition to call centre and order support. PnS’ value-add marketing services include shopper promotions, brand activation as well as POS warehousing and logistics.
SMITHSHINE ENTERPRISES Established in 2007 and aims to be the most proficient perishable network in Botswana. The core services are sales, warehousing and distribution of products within the FMCG industry. Smithshine strives for maximum market penetration and brand availability. Client-centric and focused on clients in-store goals, Smithshine has extensive cold storage facilities and the infrastructure to service top end retail and wholesale in addition to multiple retailers in the forecourt and convenience sectors across the country.
ORGANISATIONAL STRUCTURE
(100%) (100%) (84%) (80%) (100%)
SMITHSHINEWUTOW TRADINGLOGICO
CA SALES AND
DISTRIBUTIONSMC BRANDS PACKnSTACK
(94%)
WUTOW TRADING With offices in Windhoek, Walvis Bay, Tsumeb and Keetmanshoop, Wutow Trading offers extensive wholesale, retail and informal trade coverage. Wutow warehouses, distributes, sells, merchandises and promotes leading brands in food, beverage, personal care, snacks, baby, sanitary care and tobacco products.
CA SALES HOLDINGS ANNUAL REPORT 2017
5
Organisational overview
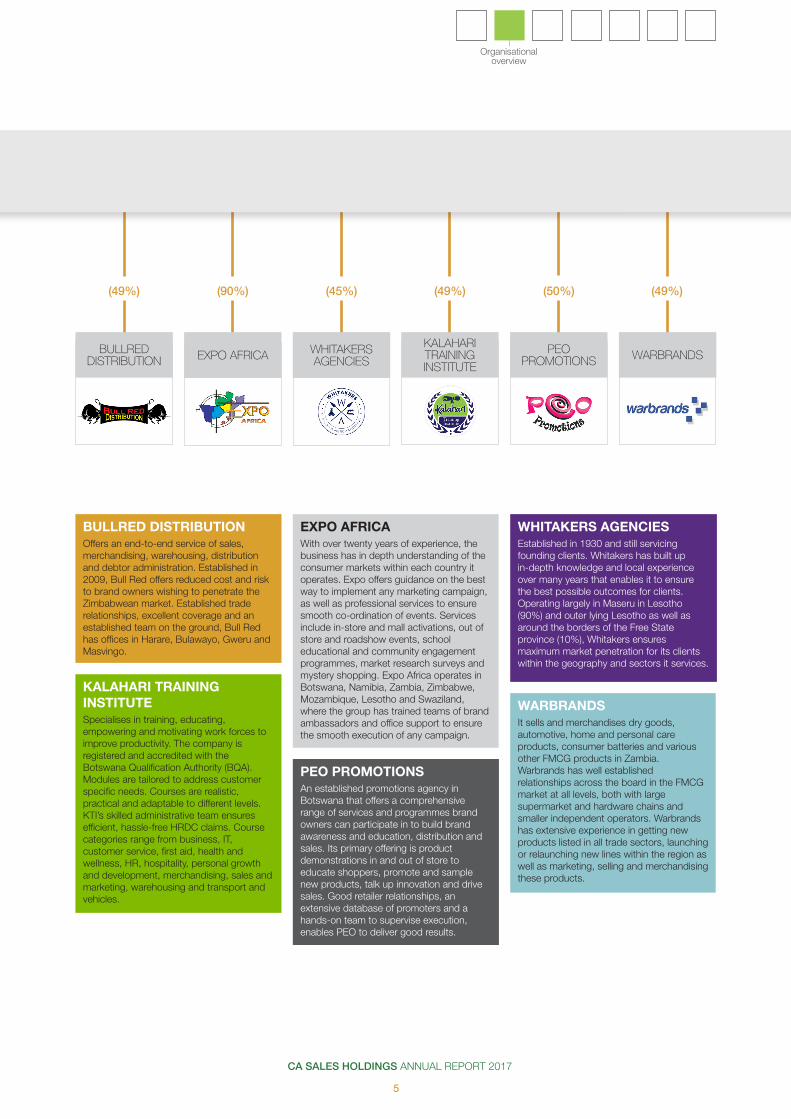
BULLRED DISTRIBUTION Offers an end-to-end service of sales, merchandising, warehousing, distribution and debtor administration. Established in 2009, Bull Red offers reduced cost and risk to brand owners wishing to penetrate the Zimbabwean market. Established trade relationships, excellent coverage and an established team on the ground, Bull Red has offices in Harare, Bulawayo, Gweru and Masvingo.
KALAHARI TRAINING INSTITUTE Specialises in training, educating, empowering and motivating work forces to improve productivity. The company is registered and accredited with the Botswana Qualification Authority (BQA). Modules are tailored to address customer specific needs. Courses are realistic, practical and adaptable to different levels. KTI’s skilled administrative team ensures efficient, hassle-free HRDC claims. Course categories range from business, IT, customer service, first aid, health and wellness, HR, hospitality, personal growth and development, merchandising, sales and marketing, warehousing and transport and vehicles.
PEO PROMOTIONS An established promotions agency in Botswana that offers a comprehensive range of services and programmes brand owners can participate in to build brand awareness and education, distribution and sales. Its primary offering is product demonstrations in and out of store to educate shoppers, promote and sample new products, talk up innovation and drive sales. Good retailer relationships, an extensive database of promoters and a hands-on team to supervise execution, enables PEO to deliver good results.
EXPO AFRICAWith over twenty years of experience, the business has in depth understanding of the consumer markets within each country it operates. Expo offers guidance on the best way to implement any marketing campaign, as well as professional services to ensure smooth co-ordination of events. Services include in-store and mall activations, out of store and roadshow events, school educational and community engagement programmes, market research surveys and mystery shopping. Expo Africa operates in Botswana, Namibia, Zambia, Zimbabwe, Mozambique, Lesotho and Swaziland, where the group has trained teams of brand ambassadors and office support to ensure the smooth execution of any campaign.
WARBRANDS It sells and merchandises dry goods, automotive, home and personal care products, consumer batteries and various other FMCG products in Zambia. Warbrands has well established relationships across the board in the FMCG market at all levels, both with large supermarket and hardware chains and smaller independent operators. Warbrands has extensive experience in getting new products listed in all trade sectors, launching or relaunching new lines within the region as well as marketing, selling and merchandising these products.
WARBRANDS
(45%) (49%)(90%)(49%)
PEOPROMOTIONS
KALAHARI TRAINING INSTITUTE
WHITAKERS AGENCIESEXPO AFRICA BULLRED
DISTRIBUTION
(50%) (49%)
WHITAKERS AGENCIES Established in 1930 and still servicing founding clients. Whitakers has built up in-depth knowledge and local experience over many years that enables it to ensure the best possible outcomes for clients. Operating largely in Maseru in Lesotho (90%) and outer lying Lesotho as well as around the borders of the Free State province (10%), Whitakers ensures maximum market penetration for its clients within the geography and sectors it services.

CA SALES HOLDINGS ANNUAL REPORT 2017
6
OPERATING FOOTPRINT
Namibia
South Africa
Botswana
Zimbabwe
Zambia
Lesotho
Swaziland
Mozambique
SmithshineE N T E R P R I S E S
Frozen Convenience
The group has facilities in all the main city centres throughout South Africa, Botswana, Swaziland, Namibia, Zimbabwe, Zambia, Mozambique and Lesotho and continuously investigates acquisition opportunities to expand in current operational countries and northwards of its current footprint.
CA SALES HOLDINGS ANNUAL REPORT 2017
7
Organisational overview
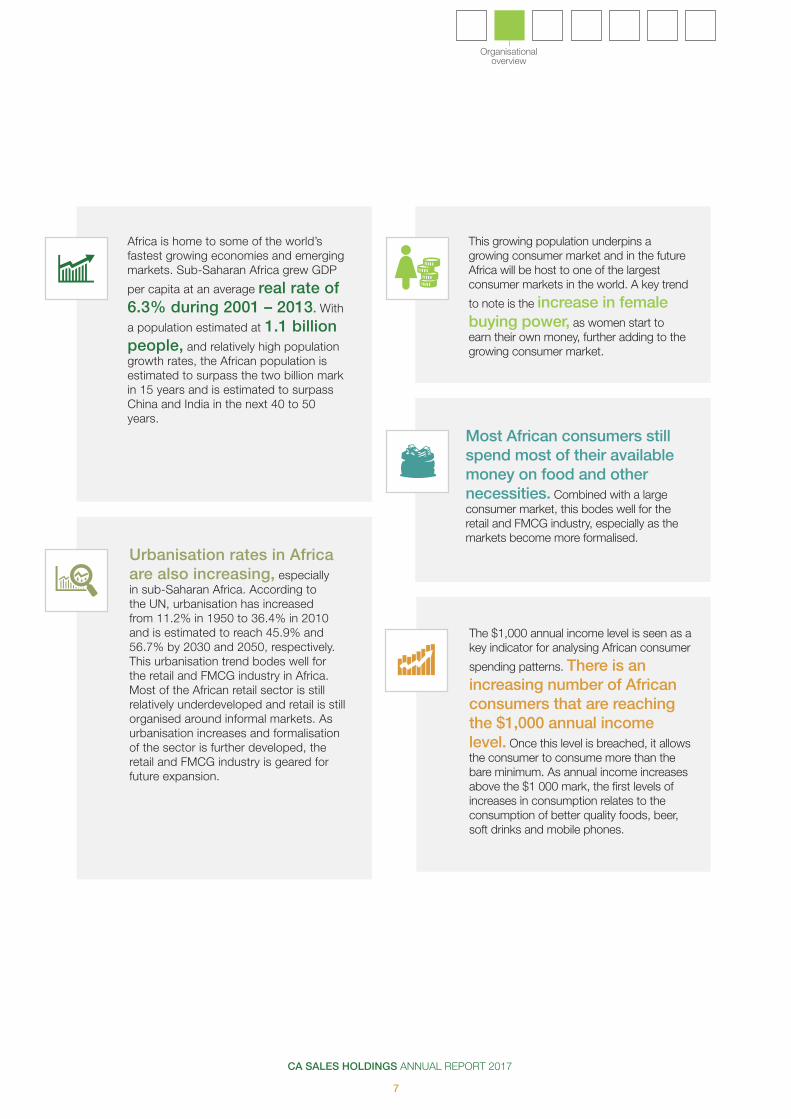
Africa is home to some of the world’s fastest growing economies and emerging markets. Sub-Saharan Africa grew GDP
per capita at an average real rate of 6.3% during 2001 – 2013. With
a population estimated at 1.1 billion people, and relatively high population growth rates, the African population is estimated to surpass the two billion mark in 15 years and is estimated to surpass China and India in the next 40 to 50 years.
This growing population underpins a growing consumer market and in the future Africa will be host to one of the largest consumer markets in the world. A key trend
to note is the increase in female buying power, as women start to earn their own money, further adding to the growing consumer market.
Urbanisation rates in Africa are also increasing, especially in sub-Saharan Africa. According to the UN, urbanisation has increased from 11.2% in 1950 to 36.4% in 2010 and is estimated to reach 45.9% and 56.7% by 2030 and 2050, respectively. This urbanisation trend bodes well for the retail and FMCG industry in Africa. Most of the African retail sector is still relatively underdeveloped and retail is still organised around informal markets. As urbanisation increases and formalisation of the sector is further developed, the retail and FMCG industry is geared for future expansion.
Most African consumers still spend most of their available money on food and other necessities. Combined with a large consumer market, this bodes well for the retail and FMCG industry, especially as the markets become more formalised.
The $1,000 annual income level is seen as a key indicator for analysing African consumer
spending patterns. There is an increasing number of African consumers that are reaching the $1,000 annual income level. Once this level is breached, it allows the consumer to consume more than the bare minimum. As annual income increases above the $1 000 mark, the first levels of increases in consumption relates to the consumption of better quality foods, beer, soft drinks and mobile phones.
CA SALES HOLDINGS ANNUAL REPORT 2017
8
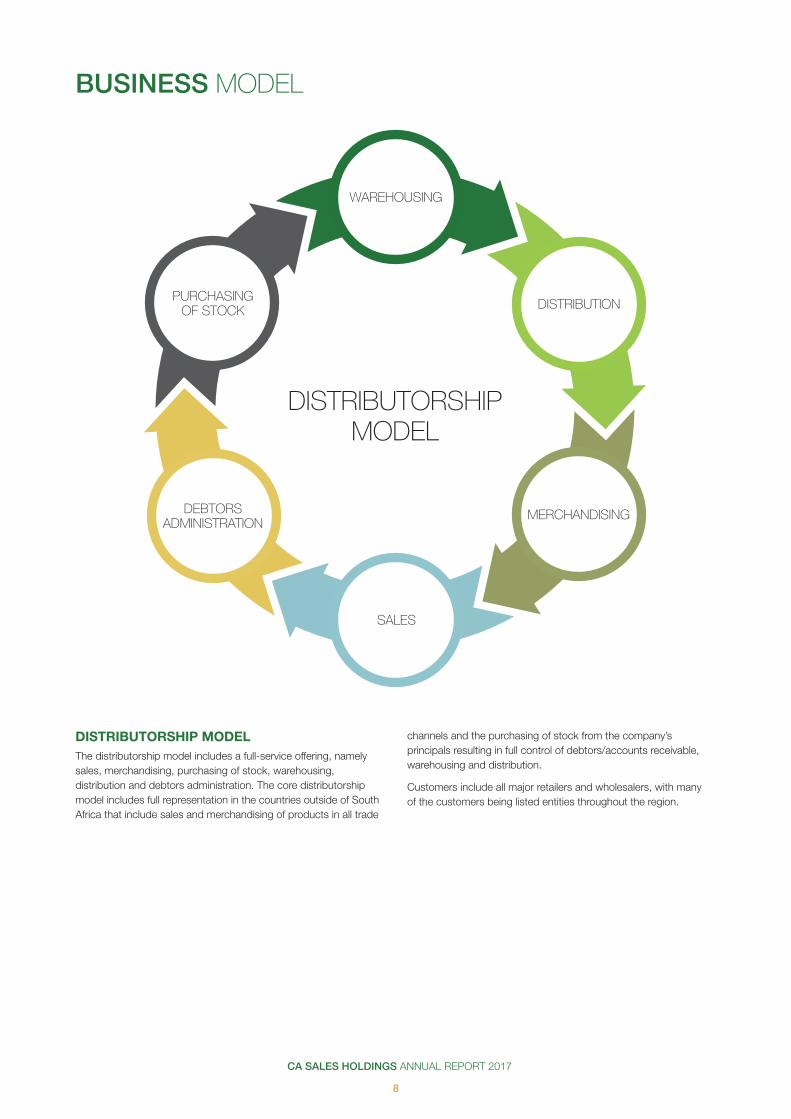
DISTRIBUTORSHIP MODELThe distributorship model includes a full-service offering, namely sales, merchandising, purchasing of stock, warehousing, distribution and debtors administration. The core distributorship model includes full representation in the countries outside of South Africa that include sales and merchandising of products in all trade
BUSINESS MODEL
WAREHOUSING
DISTRIBUTORSHIPMODEL
PURCHASING OF STOCK DISTRIBUTION
MERCHANDISING
SALES
DEBTORS ADMINISTRATION
channels and the purchasing of stock from the company’s principals resulting in full control of debtors/accounts receivable, warehousing and distribution.
Customers include all major retailers and wholesalers, with many of the customers being listed entities throughout the region.
CA SALES HOLDINGS ANNUAL REPORT 2017
9
Organisational overview
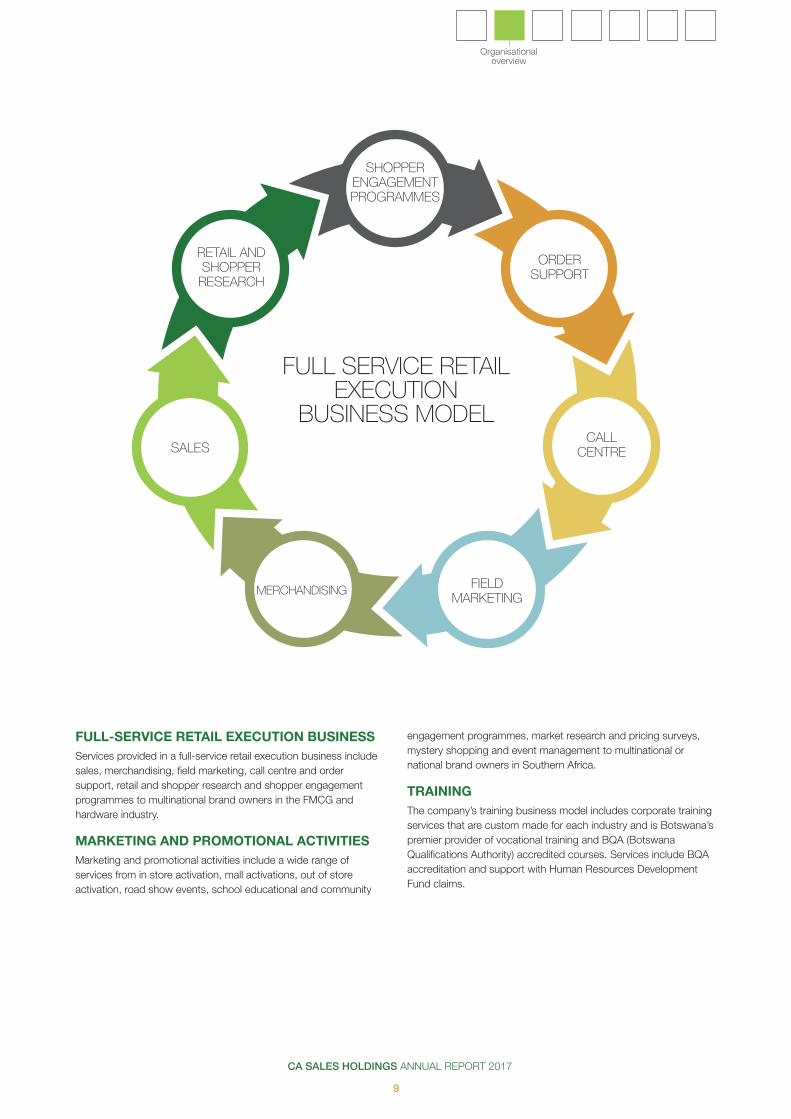
FULL-SERVICE RETAIL EXECUTION BUSINESSServices provided in a full-service retail execution business include sales, merchandising, field marketing, call centre and order support, retail and shopper research and shopper engagement programmes to multinational brand owners in the FMCG and hardware industry.
MARKETING AND PROMOTIONAL ACTIVITIESMarketing and promotional activities include a wide range of services from in store activation, mall activations, out of store activation, road show events, school educational and community
engagement programmes, market research and pricing surveys, mystery shopping and event management to multinational or national brand owners in Southern Africa.
TRAININGThe company’s training business model includes corporate training services that are custom made for each industry and is Botswana’s premier provider of vocational training and BQA (Botswana Qualifications Authority) accredited courses. Services include BQA accreditation and support with Human Resources Development Fund claims.
FULL SERVICE RETAIL EXECUTION
BUSINESS MODEL
SHOPPER ENGAGEMENT PROGRAMMES
ORDER SUPPORT
CALL CENTRE
FIELD MARKETING
MERCHANDISING
SALES
RETAIL AND SHOPPER
RESEARCH
CA SALES HOLDINGS ANNUAL REPORT 2017
10
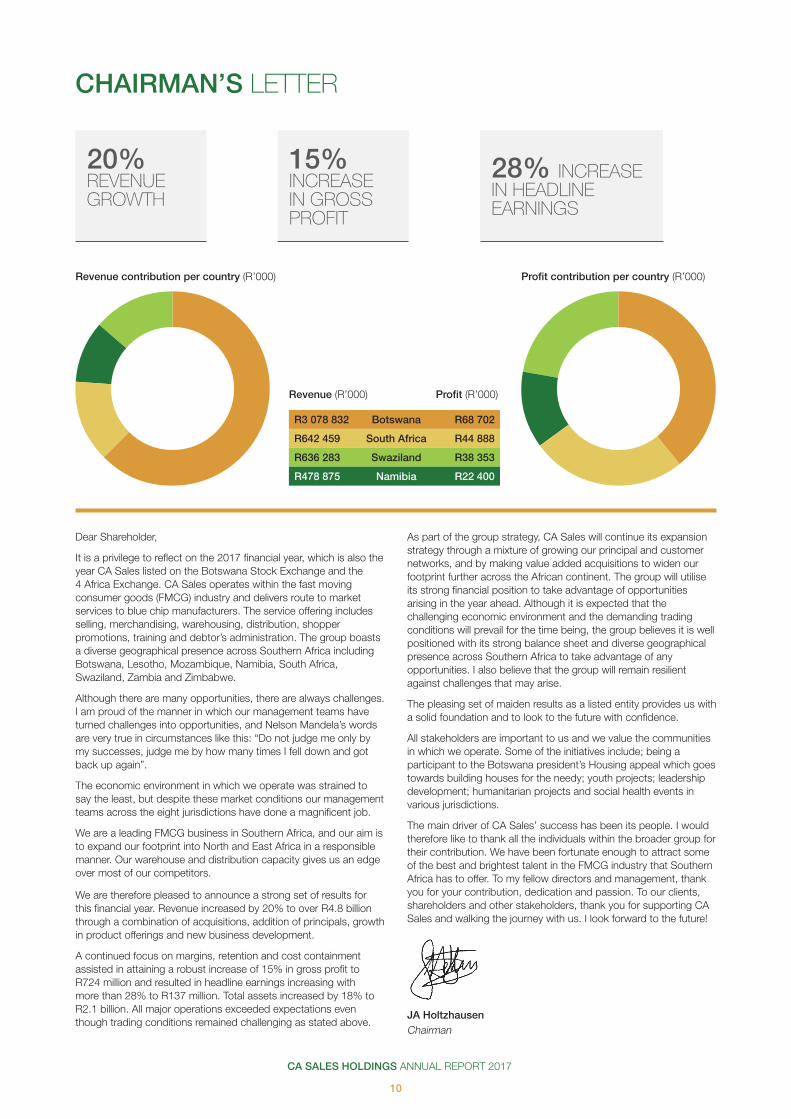
Dear Shareholder,
It is a privilege to reflect on the 2017 financial year, which is also the year CA Sales listed on the Botswana Stock Exchange and the 4 Africa Exchange. CA Sales operates within the fast moving consumer goods (FMCG) industry and delivers route to market services to blue chip manufacturers. The service offering includes selling, merchandising, warehousing, distribution, shopper promotions, training and debtor’s administration. The group boasts a diverse geographical presence across Southern Africa including Botswana, Lesotho, Mozambique, Namibia, South Africa, Swaziland, Zambia and Zimbabwe.
Although there are many opportunities, there are always challenges. I am proud of the manner in which our management teams have turned challenges into opportunities, and Nelson Mandela’s words are very true in circumstances like this: “Do not judge me only by my successes, judge me by how many times I fell down and got back up again”.
The economic environment in which we operate was strained to say the least, but despite these market conditions our management teams across the eight jurisdictions have done a magnificent job.
We are a leading FMCG business in Southern Africa, and our aim is to expand our footprint into North and East Africa in a responsible manner. Our warehouse and distribution capacity gives us an edge over most of our competitors.
We are therefore pleased to announce a strong set of results for this financial year. Revenue increased by 20% to over R4.8 billion through a combination of acquisitions, addition of principals, growth in product offerings and new business development.
A continued focus on margins, retention and cost containment assisted in attaining a robust increase of 15% in gross profit to R724 million and resulted in headline earnings increasing with more than 28% to R137 million. Total assets increased by 18% to R2.1 billion. All major operations exceeded expectations even though trading conditions remained challenging as stated above.
CHAIRMAN’S LETTER
As part of the group strategy, CA Sales will continue its expansion strategy through a mixture of growing our principal and customer networks, and by making value added acquisitions to widen our footprint further across the African continent. The group will utilise its strong financial position to take advantage of opportunities arising in the year ahead. Although it is expected that the challenging economic environment and the demanding trading conditions will prevail for the time being, the group believes it is well positioned with its strong balance sheet and diverse geographical presence across Southern Africa to take advantage of any opportunities. I also believe that the group will remain resilient against challenges that may arise.
The pleasing set of maiden results as a listed entity provides us with a solid foundation and to look to the future with confidence.
All stakeholders are important to us and we value the communities in which we operate. Some of the initiatives include; being a participant to the Botswana president’s Housing appeal which goes towards building houses for the needy; youth projects; leadership development; humanitarian projects and social health events in various jurisdictions.
The main driver of CA Sales’ success has been its people. I would therefore like to thank all the individuals within the broader group for their contribution. We have been fortunate enough to attract some of the best and brightest talent in the FMCG industry that Southern Africa has to offer. To my fellow directors and management, thank you for your contribution, dedication and passion. To our clients, shareholders and other stakeholders, thank you for supporting CA Sales and walking the journey with us. I look forward to the future!
JA HoltzhausenChairman
Revenue contribution per country (R’000)
R3 078 832 Botswana R68 702
R642 459 South Africa R44 888
R636 283 Swaziland R38 353
R478 875 Namibia R22 400
Profit contribution per country (R’000)
20% REVENUE GROWTH
15% INCREASE IN GROSS PROFIT
28% INCREASE IN HEADLINE EARNINGS
Revenue (R’000) Profit (R’000)
CA SALES HOLDINGS ANNUAL REPORT 2017
11
Strategicoverview
Profit contribution per country (R’000)
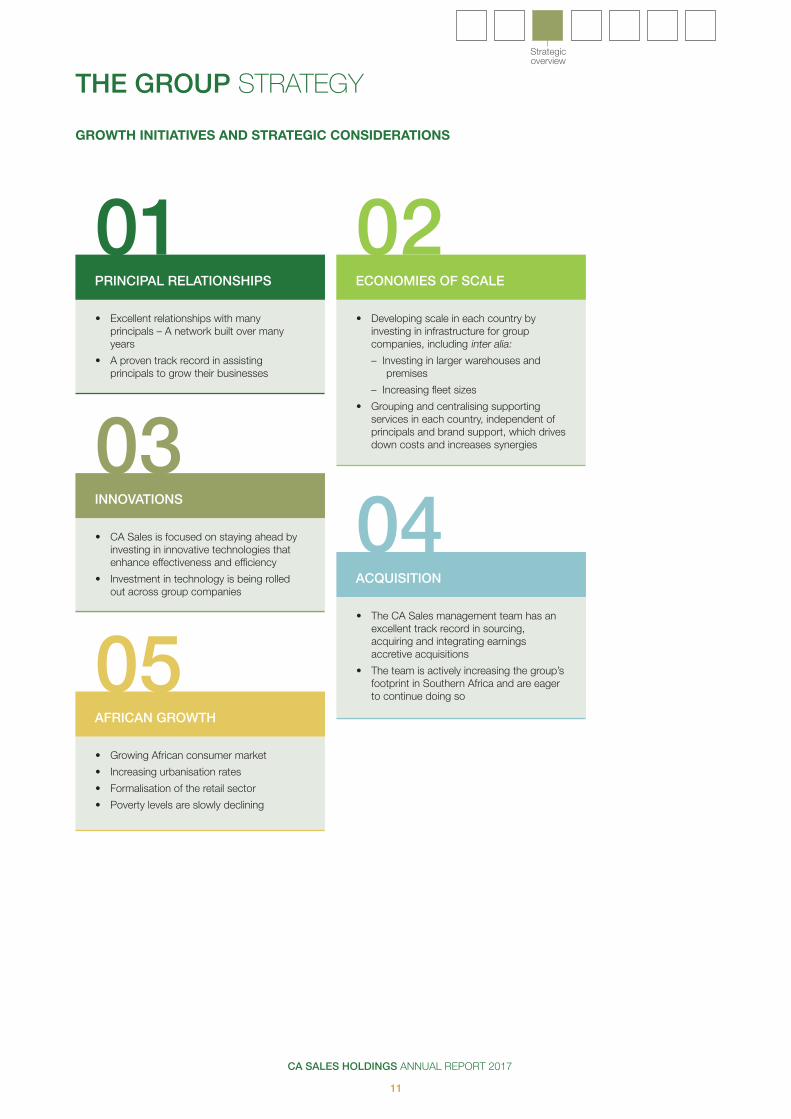
THE GROUP STRATEGY
GROWTH INITIATIVES AND STRATEGIC CONSIDERATIONS
01
03
05
04
02• Excellent relationships with many
principals – A network built over many years
• A proven track record in assisting principals to grow their businesses
• CA Sales is focused on staying ahead by investing in innovative technologies that enhance effectiveness and efficiency
• Investment in technology is being rolled out across group companies
• Growing African consumer market
• Increasing urbanisation rates
• Formalisation of the retail sector
• Poverty levels are slowly declining
• The CA Sales management team has an excellent track record in sourcing, acquiring and integrating earnings accretive acquisitions
• The team is actively increasing the group’s footprint in Southern Africa and are eager to continue doing so
• Developing scale in each country by investing in infrastructure for group companies, including inter alia:
– Investing in larger warehouses and premises
– Increasing fleet sizes
• Grouping and centralising supporting services in each country, independent of principals and brand support, which drives down costs and increases synergies
PRINCIPAL RELATIONSHIPS
INNOVATIONS
AFRICAN GROWTH
ACQUISITION
ECONOMIES OF SCALE

CA SALES HOLDINGS ANNUAL REPORT 2017
12
CHIEF EXECUTIVE OFFICER’S REVIEW
OVERVIEWThe year under review can best be described as extremely satisfactory. The group’s listing on the Botswana Stock Exchange and the 4 Africa Exchange towards the end of 2017 was a fitting end to a good year.
The group is fortunate in that we are privileged to manage so many wonderful brands in our portfolio. These brands are market leaders which have assisted us in achieving the top line growth despite difficult trading conditions.
Even with slowing GDP growth rates in many of our markets, rising inflation and lower consumer demand, the group was able to achieve its operational and financial objectives during the year. Focus on costs continue to pay dividends.
Improving our service to our clients remains top priority. Our experience and expertise in sales, merchandising and distribution enable us to provide integrated solutions with increased operational efficiency to add value to our clients.
The focus on growth by way of acquisitions continued. The group acquired a significant shareholding in a distributor in Zambia, increasing our presence to eight countries in Southern Africa.
A strategic decision was also made to increase our shareholding in Pack ‘n Stack in South Africa and Logico in Swaziland to 84% and 80% respectively. In addition, it diversified its service offering further by making strategic acquisitions in the marketing and promotions sector. This will create unique opportunities within the group going forward.
FINANCIAL PERFORMANCEThe group’s financial performance during the year illustrates how uniquely it is positioned to have enabled us to produce very good results, notwithstanding economic headwinds in most of the markets we operate in. All major operations performed above expectation.
INCOME STATEMENTRevenue increased by 20% to over R4.8 billion from R4.0 billion. A continued focus on margin retention and cost containment assisted in attaining a robust increase in gross profit of 15% to R723.6 million and over 28% in headline earnings to R136.8 million from R106.4 million.
Income from associates are up from the previous year’s losses due to breakeven levels reached by Wutow Trading, which went through a business re-engineering exercise.
Finance income increased to R13.2 million from R4.9 million as a once-off preference dividend of R6.1 million was received from an incentive scheme realised as part of the listings. Finance costs of R16.1 million are at a healthy group interest cover ratio of 14 up from the previous year’s cover of 12.
The effective group tax rate increased from 23.6% to 24.9% due to the increased profits of the major operations in the different jurisdictions.
FINANCIAL POSITIONIntangible assets rose to R566.6 million primarily due to the acquisition of Expo Africa for R23.7 million and Surapax for R16.5 million.
The movement in investments accounted for using the equity method is due to the step up in shareholding of Wutow, from associate to subsidiary, valued at R14.2 million and the acquisition of Warbrands Zambia for R11.9 million.
The deferred income tax assets increase of R 6.5 million relates mainly to the consolidation of Wutow who had an assessed tax loss at take-on.
FIVE YEAR REVIEWfor the year ended 31 December 2017 2017 2016 2015 2014 2013 R’000 R’000 R’000 R’000 R’000
Consolidated income statements Revenue 4 838 511 4 030 606 3 585 284 2 491 915 1 903 376 Profit before tax and income from associates 228 352 183 924 139 811 101 433 (10 501)Share of results from associated companies 464 (5 274) 12 187 16 345 12 470
Profit before income tax 228 816 178 650 151 998 117 778 1 969 Income tax (56 969) (42 227) (34 739) (15 155) (93)
Profit for the year from continuing operations 171 847 136 423 117 259 102 623 1 876 Owners of the parent 144 737 109 882 87 257 93 056 1 876 Non-controlling interests 27 110 26 541 30 002 9 567 –
Net working capital increased to R596.2 million from R312.2 million. This is as a result of an increase in trade receivables of R250.5 million and an increase in inventories of R35.7 million. This is due to the seasonal cycle where trade volumes are higher over the last three months of the year.
Net borrowings (total borrowings less cash and cash equivalents) increased to R100.4 million. The main reason was the funding of the seasonal increased working capital. Long-term borrowings consist of finance leases on motor vehicles.
The share capital of the group increased with the issue of additional shares to raise BWP 50 million and shares issued to the shareholders of Logico and Pack ’n Stack to increase the group’s shareholding in the subsidiaries.
The non-controlling interest in the group decreased to R41.8 million from R66.7 million partly due to the group’s increase in the shareholding of Logico from 55% to 80% and in Pack ’n Stack from 67% to 84%.
CA SALES HOLDINGS ANNUAL REPORT 2017
13
Performancereview
CASH FLOWCash generated from operating activities decreased to R41.7 million from R258.3 million in the previous year due to the net outflow of working capital at year-end of R222.4 million.
Total cash outflow from acquisitions was R136.4 million for the year. The outflow relates mainly to the acquisition of Expo Africa, Surapax, Peo, Warbrands, step up of Wutow and the increases in shareholding of Logico and Pack ’n Stack.
Cash inflow from borrowings of R138 million relates to short-term borrowings utilised for seasonal working capital.
As a result of the group’s performance, the company declared a dividend of 5.99 cents per share on 23 March 2018.
CA Sales is pleased with the strong set of financial results for the year ending 31 December 2017 and the healthy platform it sets for future growth.
OPERATIONAL PERFORMANCEDISTRIBUTORSHIPSBotswana and SwazilandThe major businesses in Botswana and Swaziland have performed above expectation for the period. Margins have continued to come under pressure, particularly due to the increased costs of distribution in order to maintain service levels to customers. This has been offset to some degree by strong top line growth during the period. Cost focus remained a key issue and several innovative plans will be implemented in order to manage costs going forward. These businesses face the challenge of protecting their margins, which are already the lowest in the group.
A phase of low price increases linked to inflation may see some upside in the new year as the businesses might be able to capitalise on stock buy-in against these price increases.
Renewed focus on the frozen business in Botswana paid off with new principals gained during the year. Profitability in this business also increased significantly on the back of higher margins achieved.
NamibiaThe economic downturn in Namibia has affected consumer spending negatively during 2017. This had a negative impact on our businesses in Namibia.
Branded goods, in especially the liquor segment, were severely affected by consumers switching to lower cost brands and buying on lower priced deals, eroding the brand equity of high end liquor products.
The once lucrative shoppers from Angola have not returned and it is not predicted that they will do so in the foreseeable future.
New management has been appointed at Wutow Trading and results have already improved in a relatively short period. This business should return positive results going forward.
ZimbabweThe unavailability of foreign currency is creating havoc in the Zimbabwean market as distributors are not able to pay for goods imported into Zimbabwe. This is likely to continue for some time to come.
LesothoLesotho remains a relatively small market as most goods are traded in from South Africa. Our businesses performed well in a difficult market created by political instability during the year.
ZambiaThe group expanded its footprint into Zambia by acquiring a 49% shareholding in Warbrands Zambia towards the end of 2017. The focus will be to add value-adding principals to the basket during the next few months.
SALES AND MERCHANDISING
The strategy of actively pursuing brand owners of food, paid off with two leading food manufacturers gained during the year. In addition, several other category leading clients were successfully added, or contracts renewed during 2017. This provides an extremely solid base for Pack ’n Stack going forward. The additional business also enabled Pack ’n Stack to broaden its service offering in the pharmacy channel during 2017.
A further strategic objective achieved during 2017 was that of channel broadening into the hardware channel. The acquisitions of Array Marketing and Surapax provides a solid foundation to expand further into the hardware channel.
Capability building, in terms of Human Resources and Technology, remains a serious challenge facing the sales and merchandising industry in general. Therefore, it has been identified as a strategic imperative and a dedicated team with sufficient resources has been allocated to evolve our people and systems to ensure Pack ’n Stack remains an integral part of its clients’ success.
PROMOTIONS AND BRAND ACTIVATIONS
With the acquisitions of Expo Africa and PEO Promotions it fulfilled the strategic imperative of entering the promotions and brand activations market and thereby further diversifying the group’s service offering. These businesses are well positioned within its respective market segments to add value to our clients and further strengthen our already strong relationships.
PROSPECTSThe lower published inflation numbers in the region may well be a positive sign for the regional economy. Consumers are however likely to remain under pressure which might lead to decreased spending in certain categories.
Renewed optimism in South Africa, Botswana and Zimbabwe due to leadership changes should lead to more stable markets and hopefully increased consumer spending in general.
The group’s diversified portfolio should enable it to deliver sustainable results going forward.
It remains a strategic imperative to continue along the acquisition and expansion trail to enhance shareholder returns whilst focusing on extracting optimum value from the existing portfolio of businesses. The group will continue to invest in Africa and will actively seek further acquisitions, also in countries we do not currently operate in.
The group is well positioned to make the most of any opportunity that might present itself. It has a strong healthy balance sheet and has an unrivalled management team in the region.
APPRECIATIONMy gratitude is due to all our staff throughout the group whose resolve in dealing with difficult conditions during the year was outstanding. We believe and trust they will prove to be resilient in the year ahead.
A particular thanks to my executive committee colleagues that assisted and supported me in my new role as group CEO. It is a privilege to work with such a dedicated and committed group of people.
FW Britz
Chief Executive Officer
CA SALES HOLDINGS ANNUAL REPORT 2017
14
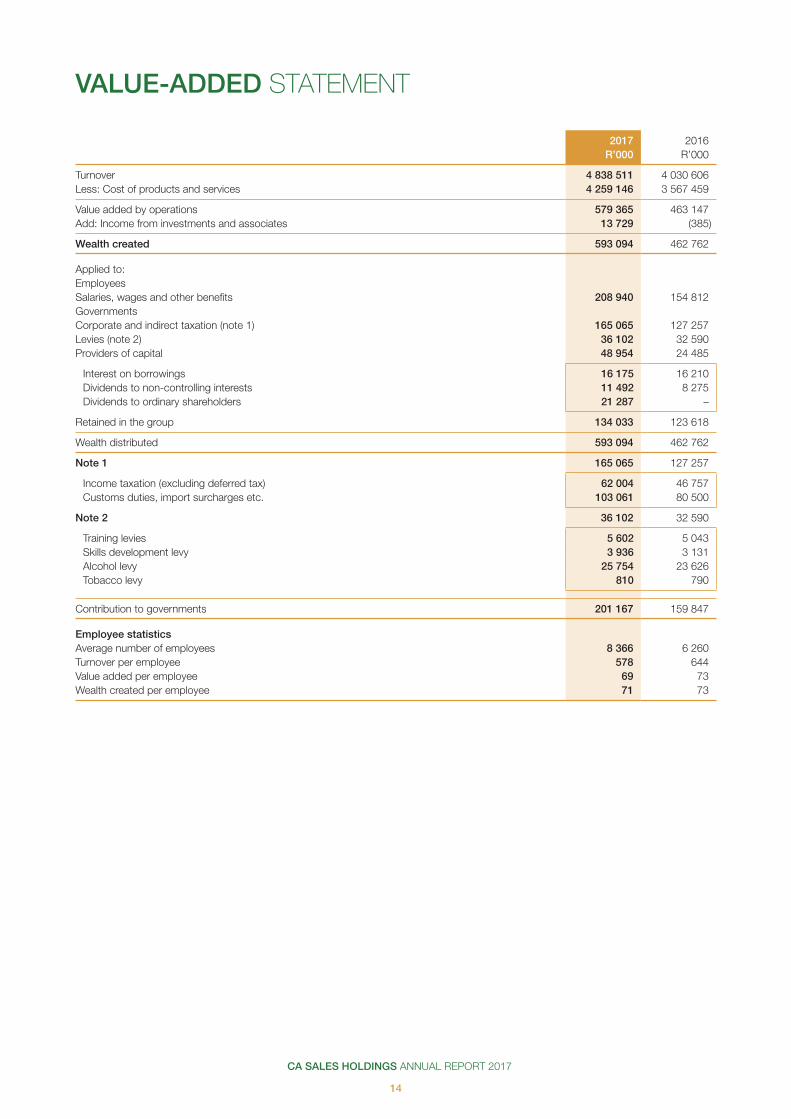
VALUE-ADDED STATEMENT
2017 2016 R’000 R’000
Turnover 4 838 511 4 030 606 Less: Cost of products and services 4 259 146 3 567 459
Value added by operations 579 365 463 147Add: Income from investments and associates 13 729 (385)
Wealth created 593 094 462 762
Applied to:EmployeesSalaries, wages and other benefits 208 940 154 812GovernmentsCorporate and indirect taxation (note 1) 165 065 127 257 Levies (note 2) 36 102 32 590 Providers of capital 48 954 24 485
Interest on borrowings 16 175 16 210 Dividends to non-controlling interests 11 492 8 275 Dividends to ordinary shareholders 21 287 –
Retained in the group 134 033 123 618
Wealth distributed 593 094 462 762
Note 1 165 065 127 257
Income taxation (excluding deferred tax) 62 004 46 757 Customs duties, import surcharges etc. 103 061 80 500
Note 2 36 102 32 590
Training levies 5 602 5 043 Skills development levy 3 936 3 131 Alcohol levy 25 754 23 626 Tobacco levy 810 790
Contribution to governments 201 167 159 847
Employee statisticsAverage number of employees 8 366 6 260 Turnover per employee 578 644 Value added per employee 69 73 Wealth created per employee 71 73

CA SALES HOLDINGS ANNUAL REPORT 2017
15
Performancereview
SUMMARY OF RATIOS AND STATISTICS
2017 2016
Ordinary share performance Number of ordinary shares upon which headline earnings per share is based (000) 411 940 405 401 Headline earnings per ordinary share (cents) 33.23 26.26 Dividends paid per ordinary share (cents) 5.25 3.57 Dividend cover (times) 5.29 5.16 Net asset value per ordinary share (rand) 2.57 2.37
Profitability and asset management Asset turnover (times) 2.31 2.27 Working capital per R1 000 turnover (rand) 123.22 77.47 Operating margin (%) 3.55 3.38 Effective taxation rate (%) 24.90 23.64 Return on equity (%) 14.52 13.30
Financing Current ratio 2.00 1.53 Net interest cover (times) 10.62 8.42
Economic indicators Key closing exchange rates at 31 December vs ZAR – USD 12.3828 13.7392– Botswana pula (BWP) 1.2580 1.2820– Mozambican metical (MZN) 0.2112 –– Zambian kwacha (ZMW) 1.2486 –
Stock exchange statistics (since 9 November 2017) Market price per share (Botswana thebe) – year end 351 – highest 351 – lowest 345Number of transactions 41 Number of shares traded 8 916 547 Value of shares traded (BWP’000) 30 778Number of shares traded as a percentage of total issued shares (%) 2 Price earnings ratio at year end 13.29Market capitalisation at year end (BWP’000) 1 560 667

CA SALES HOLDINGS ANNUAL REPORT 2017
16
JOHAN HOLTZHAUSEN 47South AfricanB.luris (Cum laude) LLB, HDip Tax Non-executive ChairmanAppointment: 8 December 2011
Johan has extensive FMCG experience. He was a non-executive director of CIC Holdings Limited (“CIC”) (listed in Namibia and later in South Africa). He is the CEO of PSG Capital and also a director of various companies including PSG Group Limited.
Johan is an admitted attorney and a member of the Law Society with over 19 years of corporate finance experience. Before he joined PSG Capital, he was appointed by the Minister of Finance as a chairperson of the Special Income Tax Court for Gauteng. He has been involved with numerous listings, mergers and acquisitions, cross border transactions (including most SADC countries), and prominent BEE and private equity transactions in South Africa and abroad.
Johan is also a member of the JSE Issuer Services Advisory Committee.
FRANS BRITZ 51South AfricanCA(SA)Chief Executive OfficerAppointment: 8 December 2011
Frans was previously the financial director of JSE listed companies DigiCore Holdings Limited, Rectron Holdings Limited and CIC Holdings Limited. He joined the group in 2011 as chief financial officer and has been involved in FMCG related businesses for more than 16 years.
NICO DE WAAL 42South AfricanBEng (Mech) (Cum laude), MBANon-executive directorAppointment: 8 December 2011
Nico started his career as an engineer with Baker Hughes Inc. (USA) in Scotland and the Middle East in the oil and gas exploration industry (1998-2000). He then specialised in strategy and operations work as a management consultant at McKinsey & Co. (2001 to 2007) and also at SAB Miller (2008 to 2010). Nico joined the PSG Group in 2011 and is currently the CEO of PSG Alpha.
TREVOR ROGERS 66South AfricanNon-executive directorAppointment: 6 June 2012
Trevor has over 40 years of experience in the FMCG industry. He held various positions at Tiger Brands for over 15 years and was Managing Director of Fattis and Monis.
He then joined Bolux Milling, Botswana as CEO before joining CIC in 2000.
CIC was listed on the Johannesburg Stock Exchange and Trevor was the CEO until the group was sold to Imperial Holdings Limited in 2011.
He was appointed CEO of CA Sales in 2012 until his retirement in March 2017.
Trevor has extensive knowledge of the industry with a deep understanding of both the manufacturing side, managing brand leaders, as well as 17 years of experience in the distribution agency business in African markets.
BADAL PATEL 36BritishCA(UK)Non-executive directorAppointment: 6 November 2014
Badal is a UK based Chartered Accountant with over 15 years of extensive business experience ranging from banking, mergers and acquisitions, investment management, financial analysis, audit and assurance, business and compliance consulting. He currently performs financial and business consulting work for a leading African commodity supply chain group.
Badal spent his early career at PwC where he gained broad exposure to a variety of leading global companies operating across the technology, consumer goods, logistics and manufacturing industries. Following this he then moved into Banking where he spent five years at RBS Plc in the structured credit derivatives business unit, leading, implementing and delivering a number of large project initiatives aimed at automation, efficiency savings and improved controls and procedures.
Badal studied Mechanical Engineering and Business Finance at University College London and London School of Economics.
JEAN CRAVEN 46South AfricanBCom Accounting Alternate director to B PatelAppointment: 17 April 2012
Jean holds an accounting degree from the University of Stellenbosch in South Africa.
Jean has more than 18 years of experience in building and managing commodity trading businesses at leading South African financial institutions.
His commodities business was one of the first active participants in the South African Commodity Futures Exchange and Jean served on the South African Futures Exchange advisory panel for many years. Prior to founding Barak, Jean built and led a new team at Standard Bank that covered structured commodity finance, physical and derivative trading as well as agricultural and bio-fuel project finance.
Previously, Jean worked for Rand Merchant Bank (part of the First Rand Group) heading up a team that completed the first successful USD1 billion grain securitisation in the world. This same team also set up the third largest crop insurance company in Africa to mitigate weather risk on farmer production loans for the First Rand Retail Bank.
OUR BOARD OF DIRECTORS
CA SALES HOLDINGS ANNUAL REPORT 2017
17
Governance
ELIAS MASILELA 53South AfricanBA (Social Sciences), MSc (Economic Policy and Analysis)Independent non-executive directorAppointment: 7 November 2017
Elias is executive chairman of DNA Economics and a part-time commissioner on the National Planning Commission. Elias also holds various other positions, including, inter alia:
• Director of the South African Savings Institute; and
• Founder member of the Financial Sector Charter Council.
Elias has also held various other positions including inter alia:• Former member of the Advisory Board of
the Faculty of Economic and Management Sciences at the University of Pretoria;
• Chief Executive Officer of the Public Investment Commission (PIC);
• Director of the South African Reserve Bank;
• Senior positions with Sanlam and the Central Bank of Swaziland; and
• Deputy Director General of the South African National Treasury.
Elias holds a Bachelor of Arts degree in Social Sciences (Economics and Statistics) from the University of Swaziland and a Master of Sciences in Economic Policy and Analysis from the Addis Ababa University.
He has lectured at a number of academic institutions and has written widely on the subject of economic policy.
REGINA SIKALESELE-VAKA 51BotswananBLawsIndependent non-executive directorAppointment: 7 November 2017Resignation: 13 April 2018
Regina is a renowned leader who is currently the CEO of Bona Life, which she founded in 2014 and co-owns with the Botswana Public Officers Pension Fund.
A lawyer by training, her three-decade career spans from practicing as a private attorney to the corporate world where she attained leadership roles as:
• Chief Executive Officer at Motor Vehicle Accident Fund;
• Chief Executive Officer of the largest life insurance company, Botswana Life
• Group Chief Executive Officer of Botswana Insurance Holding Limited
• Chairman of the Government-owned Mineral Development Company of Botswana
• Chairman of the Botswana Stock Exchange.
Her corporate governance experience as a director of blue chip BSE listed companies including:
• FNB Botswana;
• FNB Foundation;
• BIHL Foundation;
• Sechaba Breweries Limited;
• Sefalana;
• ENGEN Botswana;
• G4S;
• MVA Fund;
• University of Botswana Council; and
• BOCCIM/Business Botswana.
BLACKIE MAROLE 65BotswananMA (Economics)Independent non-executive directorAppointment: 7 November 2017
Blackie holds a Master of Arts Degree in Economics from Williams College, Massachusetts, United States. He also holds a Bachelor of Arts Degree in Economics from the University of Botswana, and an Economic Institute Diploma with the University of Colorado.
An Economist by profession, Blackie spent 21 years of his career in the civil service where he reached the highest post in the Ministry of Energy, Water and Minerals Resources as its Permanent Secretary. He was also the CEO of Debswana.
Blackie has provided oversight as director and/or chairman of the various prestigious national and international boards, including inter alia:
• African Energy Resources; Associated Fund Administrators (AFA);
• Debswana Diamond Company;
• Debswana Pension Fund Board of Trustees;
• Botswana Power Corporation;
• Water Utilities Corporation;
• De Beers Centenary AG/De Beers Consolidated Mines;
• BCL Limited; and
• Barclays Bank of Botswana.
CA SALES HOLDINGS ANNUAL REPORT 2017
18
CORPORATE GOVERNANCE REVIEW
Sound corporate governance is an integral part of the group’s success in achieving its strategic objective to create sustainable value, as per the strategy. The board plays a pivotal role in strategy planning and establishes clear benchmarks to measure the group’s strategic objectives. The board of directors is accountable and responsible for the performance and affairs of the company. CA Sales’ board of directors is committed to implementing sound corporate governance principles.
BOARD OF DIRECTORSThe board comprises directors who bring a diverse range of industry knowledge and experience to the board and exercise their judgement freely and independently. The board sets strategic objectives, monitors and reviews management’s performance, and embeds a culture of ethical leadership in the group. It delegates to management and committees, certain functions to assist it in properly discharging its duties.
Every committee has terms of reference and a work plan that are reviewed annually, and the directors confirm that all committees functioned in line with these terms of reference during the year. Committee members have the required skills to execute each mandate.
The board met four times during the year.
BOARD COMPOSITIONThe board has seven directors, comprising six non-executive directors and one executive director. Board composition is of enormous importance and there are three critical dimensions:
• Creating the right balance of skills and experience
• Maintaining a strong level of independence and objectivity and
• Ensuring that all directors have sufficient knowledge of the company and the context in which it operates.
DIRECTOR CHANGESThe names of the directors serving at the end of the year under review and their biographical details are set out on pages 16 to 17.
The board appointed three independent non-executive directors on 7 November 2017 as part of the listing on the Botswana Stock Exchange and 4 Africa Exchange. One of these directors resigned on 13 April 2018.
THE CHIEF EXECUTIVE OFFICER The CEO, Frans Britz, reports to the board. He is responsible for overseeing execution of the board-approved strategic direction and objectives of CA Sales. The CEO is not a member of the audit and risk, the social and ethics or remuneration committees, but attends meetings by invitation.
AUDIT AND RISK COMMITTEEThe audit and risk committee (ARC) oversees financial reporting and the effectiveness of the risk management process, as well as policies and internal controls regarding the findings of the external auditors. It executes all statutory duties in terms of section 94 of the South African Companies Act and complies with all legislative and regulatory requirements. It operates in accordance with the South African Companies Act and the King Code on corporate governance.
The ARC currently comprises two non-executive directors, namely Nico de Waal and Badal Patel. New members will be nominated and appointed at the next annual general meeting to be held on 25 June 2018.
Focus areas for 2018• King IV implementation
• Mandatory audit firm rotation proposal
• Appointment of internal auditors/a risk compliance officer
• Risk management
The ARC met twice during the year.
Company secretary
All directors have unlimited access to the services of the company secretary.
The company secretary ensures the proper administration of proceedings and matters relating to the board, the company and shareholders, in line with applicable legislation and procedures.
The company secretary is responsible for the submission of the annual compliance certificate to the BSE and 4AX.
The company secretary is the secretary at all meetings of the board and board sub-committees.
Internal audit
The group is in the process of determining the structure of the internal audit function and the appointment of an internal audit and risk compliance officer. The internal audit function will provide independent assurance on the adequacy and effectiveness of the system of internal controls that maintain significant business risks at an acceptable level. The purpose, authority and responsibility of the internal audit function will be consistent with the Institute of Internal Auditors’ definition of internal auditing and to the principles of King IV.
External audit
PricewaterhouseCooper Inc., the external auditors, provide stakeholders with an independent opinion on the annual financial statements of the group and company.
SOCIAL AND ETHICS COMMITTEEIn line with the requirements of the South African Companies Act, CA Sales will establish a social and ethics committee within 12 months of its listing, to act as the company’s social conscience and take into account public and stakeholder interests in the company’s operations.
The CA Sales social and ethics committee members will be responsible for monitoring the company’s activities, having regard to any relevant legislation, legal requirements and prevailing codes of best practice with matters relating to, inter alia:
• Social and economic development;
• Good corporate citizenship;
• The environment, health and public safety;
• Consumer relationships; and
• Labour and employment
CA SALES HOLDINGS ANNUAL REPORT 2017
19
Governance
REMUNERATION COMMITTEEThe remuneration committee comprises Johan Holtzhausen and Elias Masilela both being non-executive directors. The committee was set up after the financial year end and will meet when required. The committee members are responsible for assisting the board to ensure the group’s reward and remuneration policies are aligned to its objective of value creation and benchmarked to ensure fairness and competitiveness.
The committee will, on the board’s behalf:
• Approve remuneration strategies and policies designed to attract, motivate and retain employees, senior management and directors in achieving the group strategy to create value
• Recommend the remuneration policy and implementation reports to shareholders
• Recommend non-executive directors’ fees for approval by shareholders
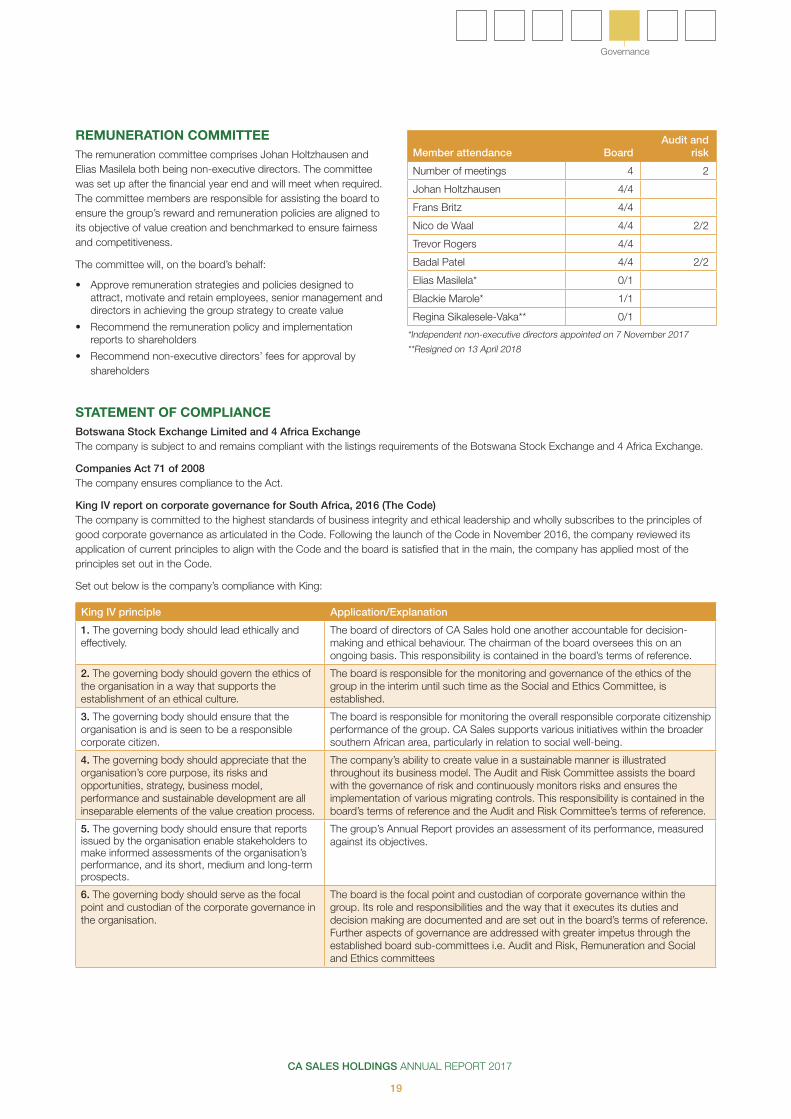
Member attendance BoardAudit and
risk
Number of meetings 4 2
Johan Holtzhausen 4/4
Frans Britz 4/4
Nico de Waal 4/4 2/2
Trevor Rogers 4/4
Badal Patel 4/4 2/2
Elias Masilela* 0/1
Blackie Marole* 1/1
Regina Sikalesele-Vaka** 0/1
*Independent non-executive directors appointed on 7 November 2017
**Resigned on 13 April 2018
STATEMENT OF COMPLIANCEBotswana Stock Exchange Limited and 4 Africa ExchangeThe company is subject to and remains compliant with the listings requirements of the Botswana Stock Exchange and 4 Africa Exchange.
Companies Act 71 of 2008The company ensures compliance to the Act.
King IV report on corporate governance for South Africa, 2016 (The Code)The company is committed to the highest standards of business integrity and ethical leadership and wholly subscribes to the principles of good corporate governance as articulated in the Code. Following the launch of the Code in November 2016, the company reviewed its application of current principles to align with the Code and the board is satisfied that in the main, the company has applied most of the principles set out in the Code.
Set out below is the company’s compliance with King:
King IV principle Application/Explanation
1. The governing body should lead ethically and effectively.
The board of directors of CA Sales hold one another accountable for decision-making and ethical behaviour. The chairman of the board oversees this on an ongoing basis. This responsibility is contained in the board’s terms of reference.
2. The governing body should govern the ethics of the organisation in a way that supports the establishment of an ethical culture.
The board is responsible for the monitoring and governance of the ethics of the group in the interim until such time as the Social and Ethics Committee, is established.
3. The governing body should ensure that the organisation is and is seen to be a responsible corporate citizen.
The board is responsible for monitoring the overall responsible corporate citizenship performance of the group. CA Sales supports various initiatives within the broader southern African area, particularly in relation to social well-being.
4. The governing body should appreciate that the organisation’s core purpose, its risks and opportunities, strategy, business model, performance and sustainable development are all inseparable elements of the value creation process.
The company’s ability to create value in a sustainable manner is illustrated throughout its business model. The Audit and Risk Committee assists the board with the governance of risk and continuously monitors risks and ensures the implementation of various migrating controls. This responsibility is contained in the board’s terms of reference and the Audit and Risk Committee’s terms of reference.
5. The governing body should ensure that reports issued by the organisation enable stakeholders to make informed assessments of the organisation’s performance, and its short, medium and long-term prospects.
The group’s Annual Report provides an assessment of its performance, measured against its objectives.
6. The governing body should serve as the focal point and custodian of the corporate governance in the organisation.
The board is the focal point and custodian of corporate governance within the group. Its role and responsibilities and the way that it executes its duties and decision making are documented and are set out in the board’s terms of reference. Further aspects of governance are addressed with greater impetus through the established board sub-committees i.e. Audit and Risk, Remuneration and Social and Ethics committees
CA SALES HOLDINGS ANNUAL REPORT 2017
20
King IV principle Application/Explanation
7. The governing body should comprise the appropriate balance of knowledge, skills, experience, diversity and independence for it to discharge its governance role and responsibilities objectively and effectively.
The board and its sub-committees consider on an annual basis, its composition in terms of balance of skills, experience, diversity, independence and knowledge and whether this enables it to effectively discharge its role and responsibilities. The board is satisfied that there is a balance of skills, experience, diversity, independence and knowledge needed to discharge its role and responsibilities. Through the annual self-assessment of the board and its sub-committees, the knowledge and skills set are evaluated and improved where required. Furthermore, where necessary the subject matter experts are available for matters requiring specialised guidance.
8. The governing body should ensure that its arrangements for delegation within its own structures promote independent judgement and assist with balance of power and the effective discharge of its duties.
There is a clear balance of power to ensure that no individual/s have undue decision-making powers. The Audit and Risk Committee is satisfied that the auditor is independent and non-audit services are not performed and the audit firm has been appointed with the designated audit partner having oversight of the audit. The Chief Financial Officer oversees the finance function and is assisted by suitably qualified staff. An internal audit function is not in place yet as reliance is placed on management to ensure controls are in place. In the future this will however be considered. An assessment of the effectiveness of the Chief Financial Officer’s performance is conducted annually by the Audit and Risk Committee which has been confirmed in the report of the ARC.
9. The governing body should ensure that the evaluation of its own performance and that of its committees, its chair and its individual members, support continued improvement in its performance and effectiveness.
The board and all sub-committees’ terms of reference now includes the onus of annual assessments. Assessments of the performance of the board, its sub-committees and the company secretary are conducted annually by way of internal evaluation processes.
10. The governing body should ensure that the appointment of, and delegation to, management contribute to role clarity and effective exercise of authority and responsibilities.
A detailed Delegation of Authority policy and framework indicate matters reserved for the board and senior management. The board is satisfied that the group is appropriately resourced and that its delegation to management contributes to an effective arrangement by which authority and responsibilities are exercised.
11. The governing body should govern risk in a way that supports the organisation in setting and achieving its strategic objectives.
The Audit and Risk Committee assists the board with the governance of risk. The board is aware of the importance of risk management as it is linked to the strategy, performance and sustainability of the group. The Audit and Risk Committee implements processes by which the risks to the sustainability of the business are identified and managed within acceptable parameters. The Audit and Risk Committee delegates to management to continuously identify, assess, mitigate and manage risks within the existing operating environment. Mitigating controls are in place to address these risks which are monitored on a continuous basis.
12. The governing body should govern technology and information in a way that supports the organisation setting and achieving its strategic objectives.
The board, together with the Audit and Risk Committee, oversees the governance of information technology. The board is aware of the importance of technology and information in relation to the group’s strategy.
13. The governing body should govern compliance with applicable laws and adopted, non-binding rules, codes and standards in a way that supports the organisation being ethical and a good corporate citizen.
The board assisted by the company secretary monitors compliance with the various regulations the group is subject to. There are no material penalties, sanctions or fines for contraventions of, or non-compliance with, regulatory obligations.
CORPORATE GOVERNANCE REVIEW CONTINUED
CA SALES HOLDINGS ANNUAL REPORT 2017
21
Governance
King IV principle Application/Explanation
14. The governing body should ensure that the organisation remunerates fairly, responsibly and transparently so as to promote the achievement of strategic objectives and positive outcomes in the short, medium and long term.
The Remuneration Committee, assisted by the CEO’s of the underlying businesses ensure that staff are remunerated fairly, responsibly, transparently and in line with industry standards so as to promote the creation of value in a sustainable manner.
15. The governing body should ensure that assurance services and functions enable an effective control environment, and that these support the integrity of information for internal decision-making and of the organisation’s external reports.
The board is satisfied that the CEO and CFO provide assurance that an adequate and effective control environment exists and on the integrity of reports for better decision-making.
16. In the execution of its governance roles and responsibilities, the governing body should adopt a stakeholder-inclusive approach that balances the needs, interests and expectations of material stakeholders in the best interests of the organisation over time.
Various stakeholder groups have been identified and the board balances their legitimate and reasonable needs, interests and expectations.
17. The governing body of an institutional investor organisation should ensure that responsible investment is practiced by the organisation to promote the good governance and the creation of value by the companies in which it invests.
N/A – CA Sales is not an institutional investor.
REPORT OF THE AUDIT AND RISK COMMITTEEfor the year ended 31 December 2017
The audit and risk committee (“the committee”) reports that it has considered the matters set out in the South African Companies Act, and is satisfied with the independence and objectivity of the external auditor, PricewaterhouseCoopers Inc. The committee has considered and recommended the fees payable to the external auditor and is satisfied with the extent of non-audit related services performed.
The committee has satisfied itself that the financial function, including the chief financial officer, have the appropriate expertise, experience and resources, and is satisfied that the internal financial controls of the company are working effectively.
A board-approved audit and risk committee charter stipulating, inter alia, the committee’s composition and duties and responsibilities, has been adopted. The committee is satisfied that it complied with the responsibilities as set out in the audit and risk committee charter as well as relevant legal and regulatory responsibilities.
Based on the information and explanations given by management and discussions with the independent external auditor regarding the results of their audit, the committee is satisfied that there was no material breakdown in the internal financial controls during the financial year under review.
The committee has evaluated the annual financial statements of the company and group for the year ended 31 December 2017, and based on the information provided to the committee, considers that the company and group companies comply, in all material respects, with the requirements of the South African Companies Act and International Financial Reporting Standards.
PN de Waal
Chairman of Audit and Risk Committee
CA SALES HOLDINGS ANNUAL REPORT 2017
22
These annual financial statements have been prepared under the supervision of FJ Reichert, CA(SA), acting group chief financial officer.
GOING CONCERNThe financial statements have been prepared on the basis of accounting policies applicable to a going concern. This basis presumes that funds will be available to finance future operations and that the realisation of assets and settlement of liabilities, contingent obligations and commitments will occur in the ordinary course of business.
CERTIFICATE BY COMPANY SECRETARYfor the year ended 31 December 2017
NOTICE IN TERMS OF SECTION 29 OF THE COMPANIES ACT, ACT 71 OF 2008, AS AMENDED (“THE ACT”)These annual financial statements have been audited in compliance with the Act. These annual financial statements have been prepared under the supervision of FJ Reichert, CA(SA), acting group chief financial officer.
SECRETARIAL CERTIFICATIONIn accordance with section 88 of the Companies Act, for the year ended 31 December 2017, it is hereby certified that the company and its subsidiaries have lodged with the Companies and Intellectual Property Commission all such returns that are required of a public company in terms of the Act and that such returns are true, correct and up to date.
FJ ReichertCompany secretary
25 May 2018
PREPARATION OF ANNUAL FINANCIAL STATEMENTSfor the year ended 31 December 2017
CA SALES HOLDINGS ANNUAL REPORT 2017
23
Consolidated financial statements
The directors are required in terms of the Companies Act, 71 of 2008, to maintain adequate accounting records and are responsible for the content and integrity of the financial statements and related financial information included in this report. It is their responsibility to ensure that the financial statements fairly present the state of affairs of the company as at the end of the financial year and the results of its operations and cash flows for the period then ended, in conformity with International Financial Reporting Standards. The external auditors are engaged to express an independent opinion on the financial statements.
The financial statements are prepared in accordance with International Financial Reporting Standards and are based upon appropriate accounting policies consistently applied and supported by reasonable and prudent judgements and estimates.
The directors acknowledge that they are ultimately responsible for the system of internal financial control established by the company and place considerable importance on maintaining a strong control environment. To enable the directors to meet these responsibilities, the directors set standards for internal control aimed at reducing the risk of error or loss in a cost-effective manner. The standards include the proper delegation of responsibilities within a clearly defined framework effective accounting procedures and adequate segregation of duties to ensure an acceptable level of risk. These controls are monitored throughout the company and all employees are required to maintain the highest ethical standards in ensuring the company’s business is conducted in a manner that in all reasonable circumstances is above reproach. The focus of risk management in the company is on identifying, assessing, managing and monitoring all known forms of risk across the company. While operating risk cannot be fully eliminated, the company endeavours to minimise it by ensuring that appropriate infrastructure, controls, systems and ethical behaviour are applied and managed within predetermined procedures and constraints.
The code of Corporate Practice and Conduct has been integrated into the group's strategies and operations.
The directors are of the opinion, based on the information and explanations given by management, that the system of internal control provides reasonable assurance that the financial records may be relied on for the preparation of the financial statements. However, any system of internal financial control can provide only reasonable, and not absolute, assurance against material misstatement or loss.
The directors have reviewed the company’s cash flow forecast for the year to 31 December 2018 and, in the light of this review and the current financial position, they are satisfied that the company has or has access to adequate resources to continue in operational existence for the foreseeable future.
The external auditors are responsible for independently reviewing and reporting on the company’s financial statements. The financial statements have been examined by the company’s external auditors and their report is presented on pages 26 to 28.
The external auditors were given unrestricted access to all financial records and related data, including minutes of all meetings of shareholders, the board of directors and sub-committees of the board. The directors believe that all representations made to the independent auditors during their audit are valid and appropriate.
The annual financial statements set out on pages 30 to 75, which have been prepared on the going concern basis, were approved by the directors on 25 May and are signed on its behalf by:
JA Holtzhausen FW BritzChairman Chief executive officer
25 May 2018
STATEMENT OF RESPONSIBILITY BY THE BOARD OF DIRECTORSfor the year ended 31 December 2017

CA SALES HOLDINGS ANNUAL REPORT 2017
24
NATURE OF BUSINESSCA Sales operates within the fast-moving consumer goods industry and delivers route-to-market services to blue chip manufacturers. The service offering includes selling, merchandising, warehousing, distribution, shopper promotions, training and debtor’s administration. The group has diverse geographical presence across Southern Africa including in Botswana, Lesotho, Mozambique, Namibia, South Africa, Swaziland, Zambia and Zimbabwe.
OPERATING RESULTSRevenue increased by 17% to over R4.7 billion through a combination of acquisitions, addition of principals, growth in product offerings and new business development. A continued focus on margin retention and cost containment assisted in attaining a robust increase of 15% in gross profit to R723.6 million, net profit after taxation increased by 26% to R171.8 million (2016: R136.4 million) and over 28% in headline earnings to R136.9 million.
The operating results and state of affairs of the company are fully set out in the attached statement of comprehensive income and statement of financial position, statement of cash flows, statement of changes in equity and notes thereto.
The distributor footprint was further expanded into Zambia, opening a new territory for the group. In addition, an acquisition in the marketing and promotions industry expanded the group’s current service offering. The group made three acquisitions during the year under review. For detail of acquisitions see note 24. There were four transactions where shares were bought from minorities. For this detail, see notes 5 and 24.
SHARE CAPITALDetails of the authorised and issued share capital appear in note 11 to the financial statements.
On 8 August 2017, the shareholders resolved to split the number of shares in issue on a ratio of 1 400 shares for every share held. In addition, the shareholders also resolved to increase the authorised share capital of the company from 1 000 000 shares to 2 000 000 000 shares.
On 7 November 2017, the company was listed on the 4AX Stock Exchange and on 9 November 2017 on the Botswana Stock Exchange. Additional shares were issued to new shareholders together with shares issued in exchange for increased shareholding in subsidiaries. 39 million shares were issued at a value of R132.6 million net of capitalised listing fees.
DIVIDENDSA final dividend of 5.99 (2016: 5.25) cents (or BWP equivalent) per share in respect of the year ended 31 December 2017 was declared on Friday, 23 March 2018, for payment to the ordinary shareholders of the company at the close of business on Friday, 20 April 2018. In line with the company’s dividend policy, the dividend was maintained at approximately 20% of the headline earnings. The number of issued shares at the declaration date is 444 634 430. The dividend has been declared from income reserves.
As per the double tax agreement between Botswana and South Africa, withholding tax of 15% is deducted from dividends distributed to shareholders registered on the Botswana Stock Exchange. This dividend is treated as a foreign dividend. In respect of shareholders registered on the 4AX Stock Exchange, the dividends payable is subject to withholding tax as required under the South African Income Tax Act, resulting in a net dividend of 4.792 cents per share.
The last date to trade was Friday, 13 April 2018 and trading ex-dividend commenced on 16 April 2018.
GOING CONCERNThe financial statements have been prepared on the basis of accounting policies applicable to a going concern. This basis presumes that funds will be available to finance future operations and that the realisation of assets and settlement of liabilities, contingent obligations and commitments will occur in the ordinary course of business.
DIRECTORSDetail of the directors are listed on pages 16 and 17 of the annual report.
The shareholding of directors in the ordinary issued share capital of CA Sales Holdings Ltd as at 31 December 2017 was as follows:
2017 2016Indirect shareholding Number % Number %
TP Rogers 4 097 940 0.9 5 322 1.8FW Britz 4 097 940 0.9 5 322 1.8
Total 8 195 880 1.8 10 644 3.7
There was a share split in 2017 (note 11)
Subsequent to year-end, TP Rogers and FW Britz exercised share options, in April 2018 and received 3 885 720 ordinary shares directly held. TP Rogers disposed of 1 943 028 shares in May 2018.
DIRECTORS’ REPORT
CA SALES HOLDINGS ANNUAL REPORT 2017
25
Consolidated financial statements
BOARD COMMITTEES AND ATTENDANCERefer to page 19 of this annual report.
EVENTS AFTER BALANCE-SHEET DATECA Sales is finalising the purchase of warehouses in Botswana. These will grow its asset base in Botswana and show its commitment to invest in the country. There were no other significant events that occurred after the reporting date that require adjustment to or disclosure in the consolidated annual financial statements for the year ended 31 December 2017.
AUDITORPricewaterhouseCoopers Inc. will continue in office in accordance with section 90 of the South African Companies Act.
SECRETARYThe secretary of the company is FJ Reichert.

CA SALES HOLDINGS ANNUAL REPORT 2017
26
REPORT ON THE AUDIT OF THE CONSOLIDATED AND SEPARATE FINANCIAL STATEMENTS
OUR OPINIONIn our opinion, the consolidated and separate financial statements present fairly, in all material respects, the consolidated and separate financial position of CA Sales Holdings Limited (the Company) and its subsidiaries (together the Group) as at 31 December 2017, and its consolidated and separate financial performance and its consolidated and separate cash flows for the year then ended in accordance with International Financial Reporting Standards and the requirements of the Companies Act of South Africa.
WHAT WE HAVE AUDITEDCA Sales Holdings Limited’s consolidated and separate financial statements set out on pages 30 to 75 comprise:
• the consolidated and separate statements of financial position as at 31 December 2017;
• the consolidated and separate statements of comprehensive income for the year then ended;
• the consolidated and separate statements of changes in equity for the year then ended;
• the consolidated and separate statements of cash flows for the year then ended; and
• the notes to the financial statements, which include a summary of significant accounting policies.
BASIS FOR OPINIONWe conducted our audit in accordance with International Standards on Auditing (ISAs). Our responsibilities under those standards are further described in the Auditor’s responsibilities for the audit of the consolidated and separate financial statements section of our report.
We believe that the audit evidence we have obtained is sufficient and appropriate to provide a basis for our opinion.
INDEPENDENCEWe are independent of the Group in accordance with the Independent Regulatory Board for Auditors Code of Professional Conduct for Registered Auditors (IRBA Code) and other independence requirements applicable to performing audits of financial statements in South Africa. We have fulfilled our other ethical responsibilities in accordance with the IRBA Code and in accordance with other ethical requirements applicable to performing audits in South Africa. The IRBA Code is consistent with the International Ethics Standards Board for Accountants Code of Ethics for Professional Accountants (Parts A and B).
OUR AUDIT APPROACHOVERVIEW
Overall group materiality• Overall group materiality: R11.5 million, which represents 5% of profit before tax.
Group audit scope• We have performed full scope audits over the four financially significant components.
Key audit matters• Impairment assessment of cash generating units (CGUs); and
• Wutow Step Up Acquisition
As part of designing our audit, we determined materiality and assessed the risks of material misstatement in the consolidated and separate financial statements. In particular, we considered where the directors made subjective judgements; for example, in respect of significant accounting estimates that involved making assumptions and considering future events that are inherently uncertain. As in all of our audits, we also addressed the risk of management override of internal controls, including among other matters, consideration of whether there was evidence of bias that represented a risk of material misstatement due to fraud.
MATERIALITYThe scope of our audit was influenced by our application of materiality. An audit is designed to obtain reasonable assurance whether the financial statements are free from material misstatement. Misstatements may arise due to fraud or error. They are considered material if individually or in aggregate, they could reasonably be expected to influence the economic decisions of users taken on the basis of the consolidated financial statements.
Based on our professional judgement, we determined certain quantitative thresholds for materiality, including the overall group materiality for the consolidated financial statements as a whole as set out in the table below. These, together with qualitative considerations, helped us to determine the scope of our audit and the nature, timing and extent of our audit procedures and to evaluate the effect of misstatements, both individually and in aggregate on the financial statements as a whole.
REPORT OF THE INDEPENDENT AUDITORSto the Shareholders of CA Sales Holdings Limited
Materiality
Group scoping
Key audit matters
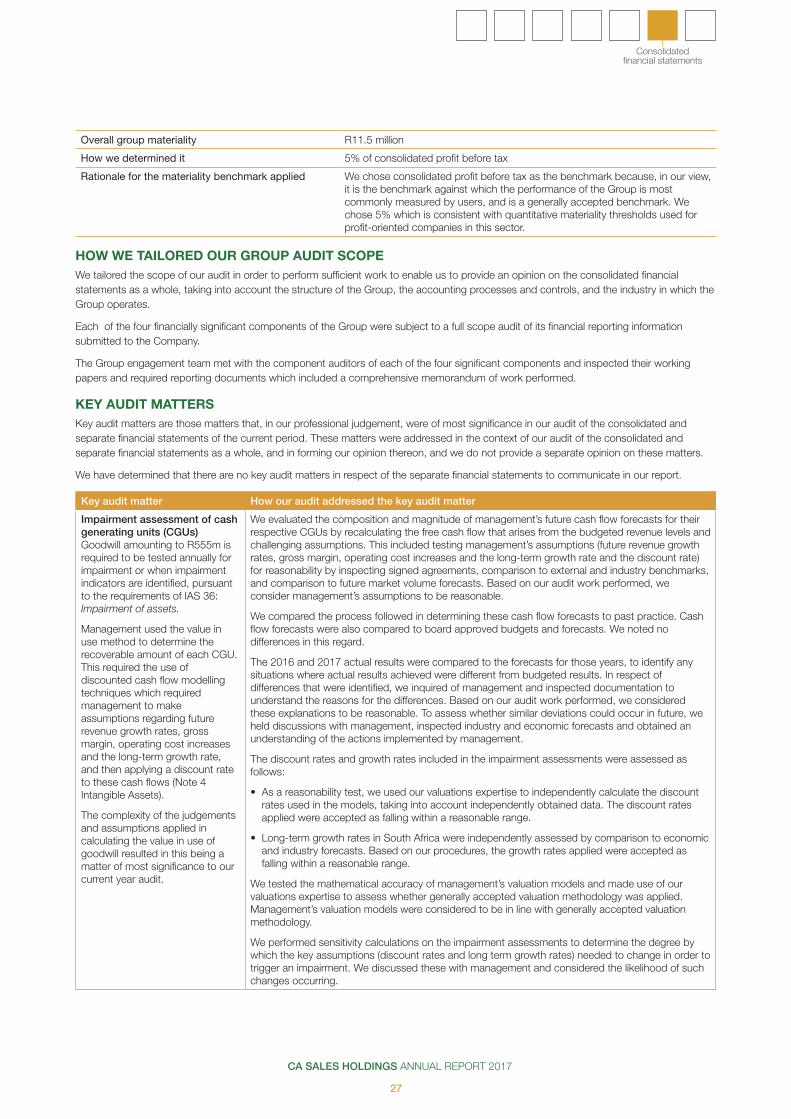
CA SALES HOLDINGS ANNUAL REPORT 2017
27
Consolidated financial statements
Overall group materiality R11.5 million
How we determined it 5% of consolidated profit before tax
Rationale for the materiality benchmark applied We chose consolidated profit before tax as the benchmark because, in our view, it is the benchmark against which the performance of the Group is most commonly measured by users, and is a generally accepted benchmark. We chose 5% which is consistent with quantitative materiality thresholds used for profit-oriented companies in this sector.
HOW WE TAILORED OUR GROUP AUDIT SCOPE We tailored the scope of our audit in order to perform sufficient work to enable us to provide an opinion on the consolidated financial statements as a whole, taking into account the structure of the Group, the accounting processes and controls, and the industry in which the Group operates.
Each of the four financially significant components of the Group were subject to a full scope audit of its financial reporting information submitted to the Company.
The Group engagement team met with the component auditors of each of the four significant components and inspected their working papers and required reporting documents which included a comprehensive memorandum of work performed.
KEY AUDIT MATTERSKey audit matters are those matters that, in our professional judgement, were of most significance in our audit of the consolidated and separate financial statements of the current period. These matters were addressed in the context of our audit of the consolidated and separate financial statements as a whole, and in forming our opinion thereon, and we do not provide a separate opinion on these matters.
We have determined that there are no key audit matters in respect of the separate financial statements to communicate in our report.
Key audit matter How our audit addressed the key audit matter
Impairment assessment of cash generating units (CGUs)Goodwill amounting to R555m is required to be tested annually for impairment or when impairment indicators are identified, pursuant to the requirements of IAS 36: Impairment of assets.
Management used the value in use method to determine the recoverable amount of each CGU. This required the use of discounted cash flow modelling techniques which required management to make assumptions regarding future revenue growth rates, gross margin, operating cost increases and the long-term growth rate, and then applying a discount rate to these cash flows (Note 4 Intangible Assets).
The complexity of the judgements and assumptions applied in calculating the value in use of goodwill resulted in this being a matter of most significance to our current year audit.
We evaluated the composition and magnitude of management’s future cash flow forecasts for their respective CGUs by recalculating the free cash flow that arises from the budgeted revenue levels and challenging assumptions. This included testing management’s assumptions (future revenue growth rates, gross margin, operating cost increases and the long-term growth rate and the discount rate) for reasonability by inspecting signed agreements, comparison to external and industry benchmarks, and comparison to future market volume forecasts. Based on our audit work performed, we consider management’s assumptions to be reasonable.
We compared the process followed in determining these cash flow forecasts to past practice. Cash flow forecasts were also compared to board approved budgets and forecasts. We noted no differences in this regard.
The 2016 and 2017 actual results were compared to the forecasts for those years, to identify any situations where actual results achieved were different from budgeted results. In respect of differences that were identified, we inquired of management and inspected documentation to understand the reasons for the differences. Based on our audit work performed, we considered these explanations to be reasonable. To assess whether similar deviations could occur in future, we held discussions with management, inspected industry and economic forecasts and obtained an understanding of the actions implemented by management.
The discount rates and growth rates included in the impairment assessments were assessed as follows:
• As a reasonability test, we used our valuations expertise to independently calculate the discount rates used in the models, taking into account independently obtained data. The discount rates applied were accepted as falling within a reasonable range.
• Long-term growth rates in South Africa were independently assessed by comparison to economic and industry forecasts. Based on our procedures, the growth rates applied were accepted as falling within a reasonable range.
We tested the mathematical accuracy of management’s valuation models and made use of our valuations expertise to assess whether generally accepted valuation methodology was applied. Management’s valuation models were considered to be in line with generally accepted valuation methodology.
We performed sensitivity calculations on the impairment assessments to determine the degree by which the key assumptions (discount rates and long term growth rates) needed to change in order to trigger an impairment. We discussed these with management and considered the likelihood of such changes occurring.
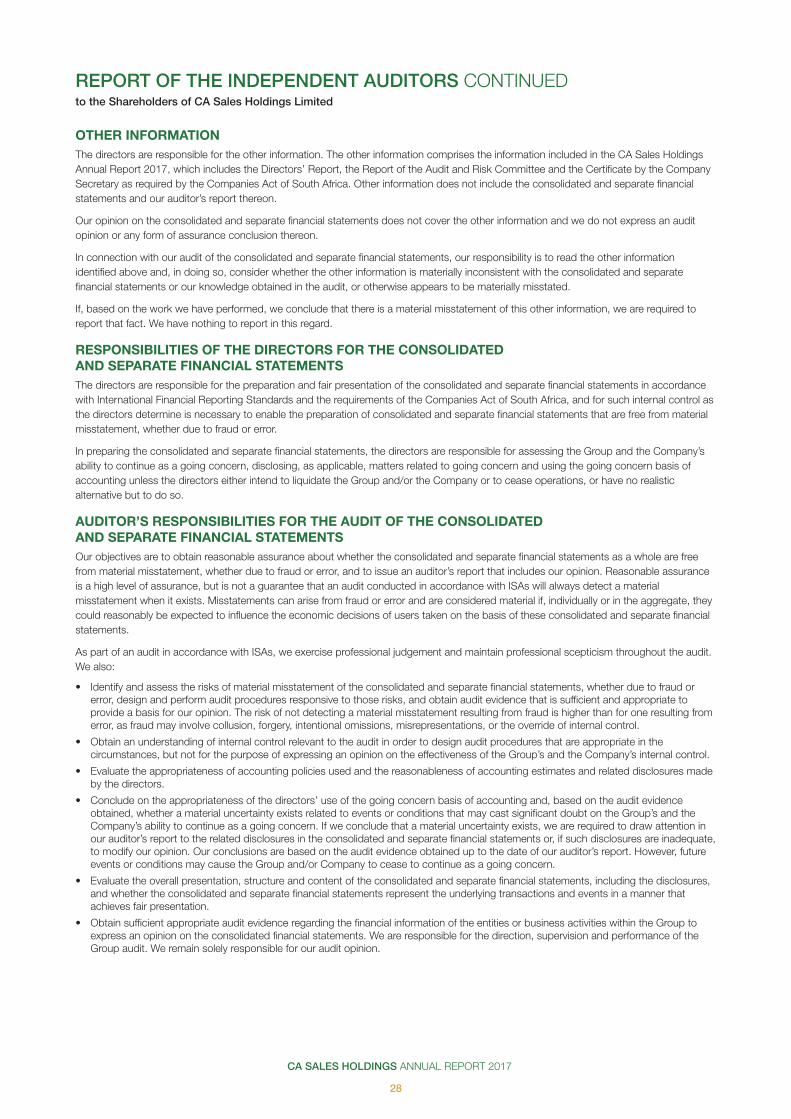
CA SALES HOLDINGS ANNUAL REPORT 2017
28
OTHER INFORMATIONThe directors are responsible for the other information. The other information comprises the information included in the CA Sales Holdings Annual Report 2017, which includes the Directors’ Report, the Report of the Audit and Risk Committee and the Certificate by the Company Secretary as required by the Companies Act of South Africa. Other information does not include the consolidated and separate financial statements and our auditor’s report thereon.
Our opinion on the consolidated and separate financial statements does not cover the other information and we do not express an audit opinion or any form of assurance conclusion thereon.
In connection with our audit of the consolidated and separate financial statements, our responsibility is to read the other information identified above and, in doing so, consider whether the other information is materially inconsistent with the consolidated and separate financial statements or our knowledge obtained in the audit, or otherwise appears to be materially misstated.
If, based on the work we have performed, we conclude that there is a material misstatement of this other information, we are required to report that fact. We have nothing to report in this regard.
RESPONSIBILITIES OF THE DIRECTORS FOR THE CONSOLIDATED AND SEPARATE FINANCIAL STATEMENTSThe directors are responsible for the preparation and fair presentation of the consolidated and separate financial statements in accordance with International Financial Reporting Standards and the requirements of the Companies Act of South Africa, and for such internal control as the directors determine is necessary to enable the preparation of consolidated and separate financial statements that are free from material misstatement, whether due to fraud or error.
In preparing the consolidated and separate financial statements, the directors are responsible for assessing the Group and the Company’s ability to continue as a going concern, disclosing, as applicable, matters related to going concern and using the going concern basis of accounting unless the directors either intend to liquidate the Group and/or the Company or to cease operations, or have no realistic alternative but to do so.
AUDITOR’S RESPONSIBILITIES FOR THE AUDIT OF THE CONSOLIDATED AND SEPARATE FINANCIAL STATEMENTSOur objectives are to obtain reasonable assurance about whether the consolidated and separate financial statements as a whole are free from material misstatement, whether due to fraud or error, and to issue an auditor’s report that includes our opinion. Reasonable assurance is a high level of assurance, but is not a guarantee that an audit conducted in accordance with ISAs will always detect a material misstatement when it exists. Misstatements can arise from fraud or error and are considered material if, individually or in the aggregate, they could reasonably be expected to influence the economic decisions of users taken on the basis of these consolidated and separate financial statements.
As part of an audit in accordance with ISAs, we exercise professional judgement and maintain professional scepticism throughout the audit. We also:
• Identify and assess the risks of material misstatement of the consolidated and separate financial statements, whether due to fraud or error, design and perform audit procedures responsive to those risks, and obtain audit evidence that is sufficient and appropriate to provide a basis for our opinion. The risk of not detecting a material misstatement resulting from fraud is higher than for one resulting from error, as fraud may involve collusion, forgery, intentional omissions, misrepresentations, or the override of internal control.
• Obtain an understanding of internal control relevant to the audit in order to design audit procedures that are appropriate in the circumstances, but not for the purpose of expressing an opinion on the effectiveness of the Group’s and the Company’s internal control.
• Evaluate the appropriateness of accounting policies used and the reasonableness of accounting estimates and related disclosures made by the directors.
• Conclude on the appropriateness of the directors’ use of the going concern basis of accounting and, based on the audit evidence obtained, whether a material uncertainty exists related to events or conditions that may cast significant doubt on the Group’s and the Company’s ability to continue as a going concern. If we conclude that a material uncertainty exists, we are required to draw attention in our auditor’s report to the related disclosures in the consolidated and separate financial statements or, if such disclosures are inadequate, to modify our opinion. Our conclusions are based on the audit evidence obtained up to the date of our auditor’s report. However, future events or conditions may cause the Group and/or Company to cease to continue as a going concern.
• Evaluate the overall presentation, structure and content of the consolidated and separate financial statements, including the disclosures, and whether the consolidated and separate financial statements represent the underlying transactions and events in a manner that achieves fair presentation.
• Obtain sufficient appropriate audit evidence regarding the financial information of the entities or business activities within the Group to express an opinion on the consolidated financial statements. We are responsible for the direction, supervision and performance of the Group audit. We remain solely responsible for our audit opinion.
REPORT OF THE INDEPENDENT AUDITORS CONTINUEDto the Shareholders of CA Sales Holdings Limited

CA SALES HOLDINGS ANNUAL REPORT 2017
29
Consolidated financial statements
We communicate with the directors regarding, among other matters, the planned scope and timing of the audit and significant audit findings, including any significant deficiencies in internal control that we identify during our audit.
We also provide the directors with a statement that we have complied with relevant ethical requirements regarding independence, and to communicate with them all relationships and other matters that may reasonably be thought to bear on our independence, and where applicable, related safeguards.
From the matters communicated with the directors, we determine those matters that were of most significance in the audit of the consolidated and separate financial statements of the current period and are therefore the key audit matters. We describe these matters in our auditor’s report unless law or regulation precludes public disclosure about the matter or when, in extremely rare circumstances, we determine that a matter should not be communicated in our report because the adverse consequences of doing so would reasonably be expected to outweigh the public interest benefits of such communication.
REPORT ON OTHER LEGAL AND REGULATORY REQUIREMENTS In terms of the IRBA Rule published in Government Gazette Number 39475 dated 4 December 2015, we report that PricewaterhouseCoopers Inc. has been the auditor of CA Sales Holdings Limited for five years.
PricewaterhouseCoopers Inc. Director: Isak BuysRegistered Auditor
4 Lisbon Lane, Waterfall CityJukskei, 2090
25 May 2018
REPORT OF THE INDEPENDENT AUDITORS CONTINUEDto the Shareholders of CA Sales Holdings Limited
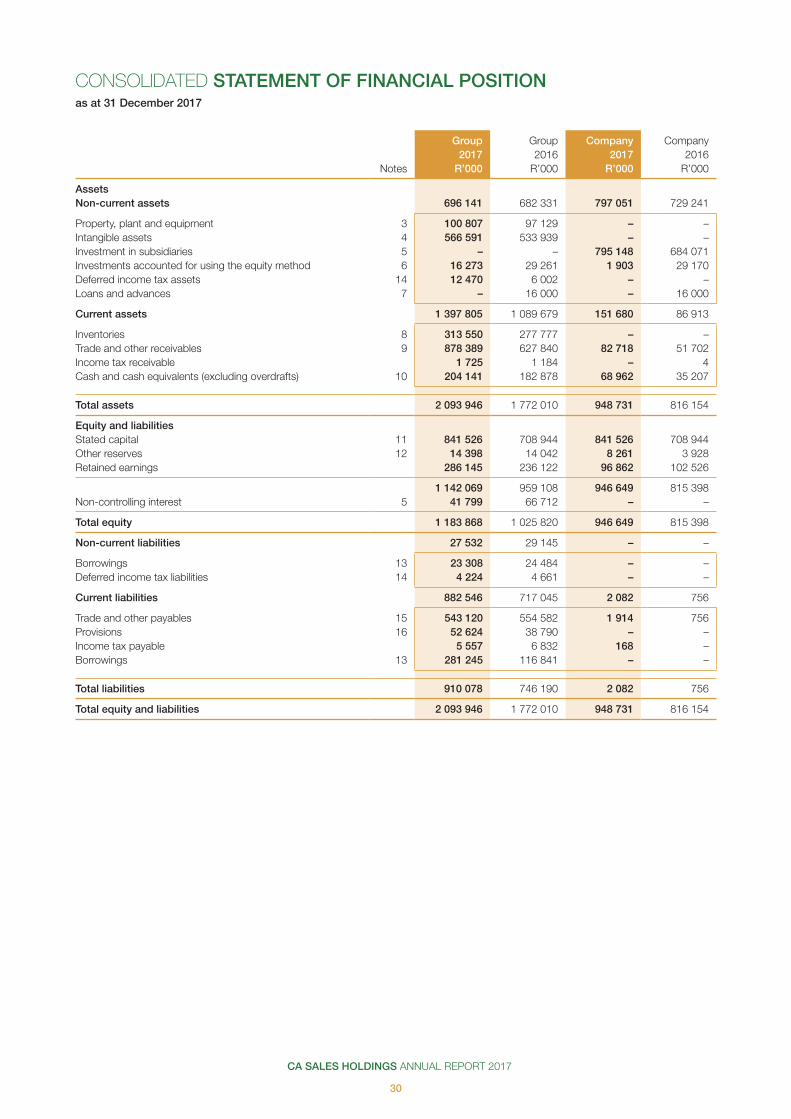
CA SALES HOLDINGS ANNUAL REPORT 2017
30
CONSOLIDATED STATEMENT OF FINANCIAL POSITIONas at 31 December 2017
Group Group Company Company2017 2016 2017 2016
Notes R’000 R’000 R’000 R’000
AssetsNon-current assets 696 141 682 331 797 051 729 241
Property, plant and equipment 3 100 807 97 129 – – Intangible assets 4 566 591 533 939 – – Investment in subsidiaries 5 – – 795 148 684 071 Investments accounted for using the equity method 6 16 273 29 261 1 903 29 170 Deferred income tax assets 14 12 470 6 002 – – Loans and advances 7 – 16 000 – 16 000
Current assets 1 397 805 1 089 679 151 680 86 913
Inventories 8 313 550 277 777 – – Trade and other receivables 9 878 389 627 840 82 718 51 702 Income tax receivable 1 725 1 184 – 4 Cash and cash equivalents (excluding overdrafts) 10 204 141 182 878 68 962 35 207
Total assets 2 093 946 1 772 010 948 731 816 154
Equity and liabilitiesStated capital 11 841 526 708 944 841 526 708 944 Other reserves 12 14 398 14 042 8 261 3 928 Retained earnings 286 145 236 122 96 862 102 526
1 142 069 959 108 946 649 815 398 Non-controlling interest 5 41 799 66 712 – –
Total equity 1 183 868 1 025 820 946 649 815 398
Non-current liabilities 27 532 29 145 – –
Borrowings 13 23 308 24 484 – – Deferred income tax liabilities 14 4 224 4 661 – –
Current liabilities 882 546 717 045 2 082 756
Trade and other payables 15 543 120 554 582 1 914 756 Provisions 16 52 624 38 790 – – Income tax payable 5 557 6 832 168 – Borrowings 13 281 245 116 841 – –
Total liabilities 910 078 746 190 2 082 756
Total equity and liabilities 2 093 946 1 772 010 948 731 816 154
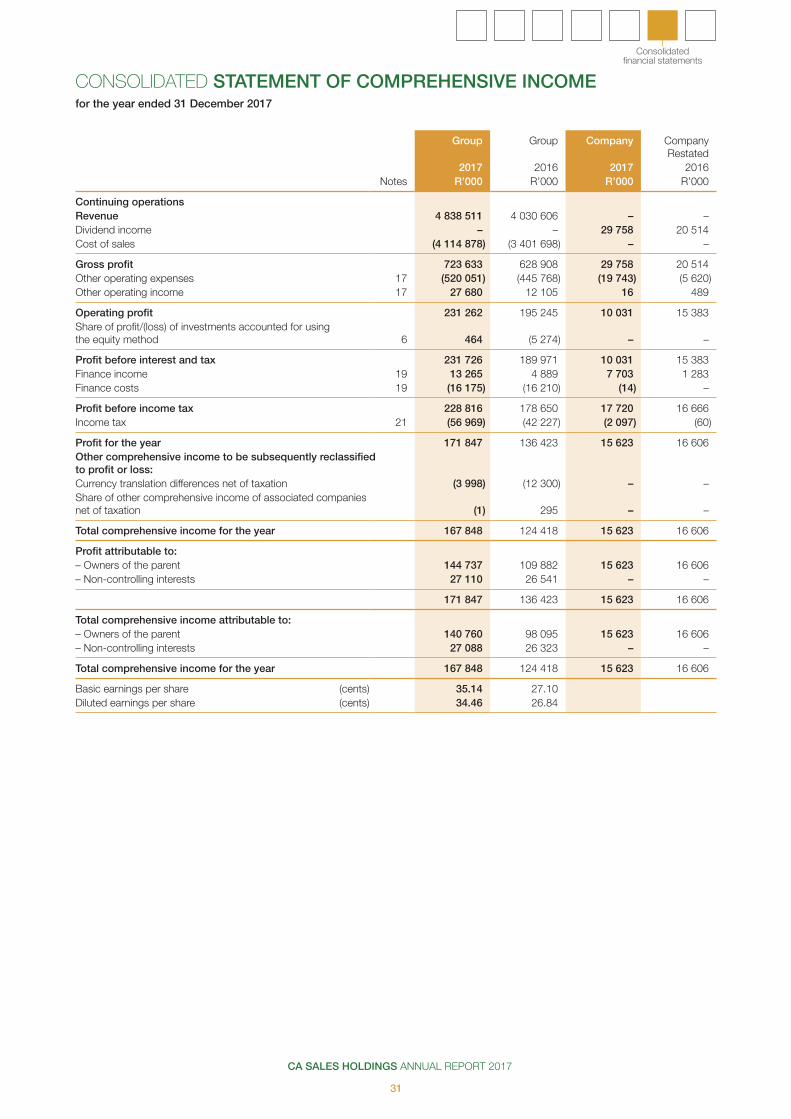
CA SALES HOLDINGS ANNUAL REPORT 2017
31
Consolidated financial statements
CONSOLIDATED STATEMENT OF COMPREHENSIVE INCOMEfor the year ended 31 December 2017
Group Group Company CompanyRestated
2017 2016 2017 2016Notes R’000 R’000 R’000 R’000
Continuing operationsRevenue 4 838 511 4 030 606 – – Dividend income – – 29 758 20 514 Cost of sales (4 114 878) (3 401 698) – –
Gross profit 723 633 628 908 29 758 20 514Other operating expenses 17 (520 051) (445 768) (19 743) (5 620)Other operating income 17 27 680 12 105 16 489
Operating profit 231 262 195 245 10 031 15 383 Share of profit/(loss) of investments accounted for using the equity method 6 464 (5 274) – –
Profit before interest and tax 231 726 189 971 10 031 15 383 Finance income 19 13 265 4 889 7 703 1 283 Finance costs 19 (16 175) (16 210) (14) –
Profit before income tax 228 816 178 650 17 720 16 666 Income tax 21 (56 969) (42 227) (2 097) (60)
Profit for the year 171 847 136 423 15 623 16 606 Other comprehensive income to be subsequently reclassified to profit or loss:Currency translation differences net of taxation (3 998) (12 300) – – Share of other comprehensive income of associated companies net of taxation (1) 295 – –
Total comprehensive income for the year 167 848 124 418 15 623 16 606
Profit attributable to:– Owners of the parent 144 737 109 882 15 623 16 606 – Non-controlling interests 27 110 26 541 – –
171 847 136 423 15 623 16 606
Total comprehensive income attributable to:– Owners of the parent 140 760 98 095 15 623 16 606 – Non-controlling interests 27 088 26 323 – –
Total comprehensive income for the year 167 848 124 418 15 623 16 606
Basic earnings per share (cents) 35.14 27.10 Diluted earnings per share (cents) 34.46 26.84
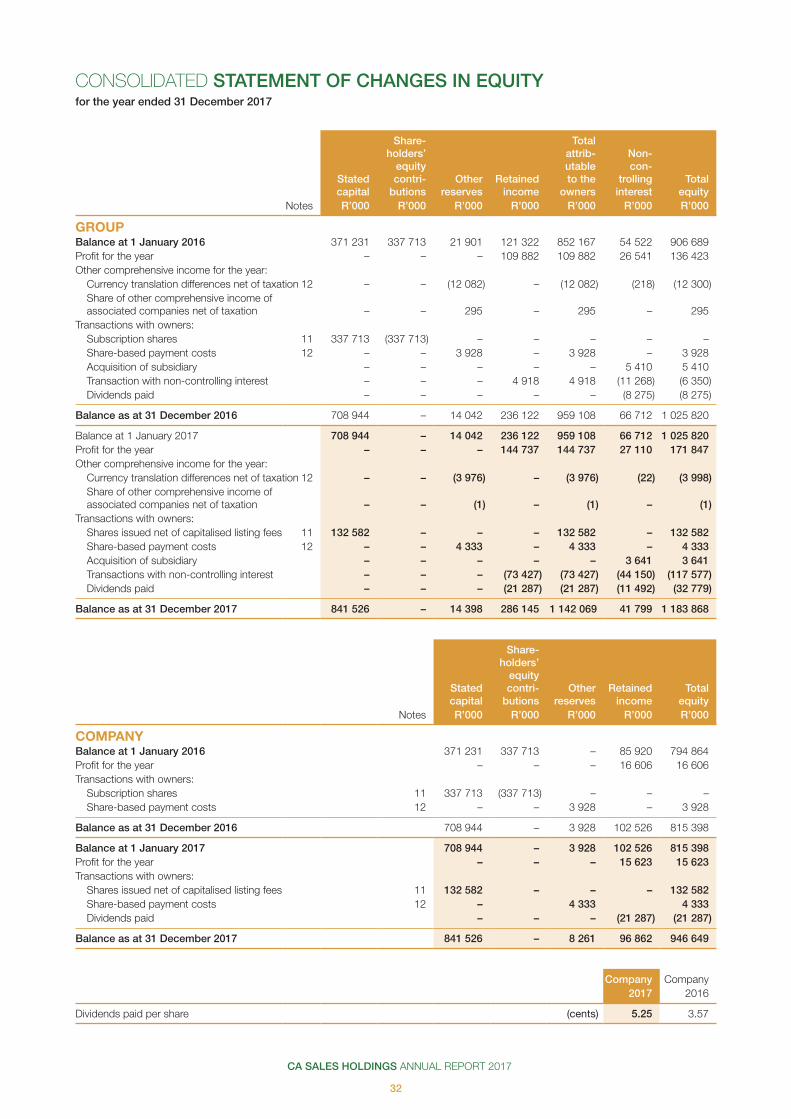
CA SALES HOLDINGS ANNUAL REPORT 2017
32
Stated capital
Share-holders’
equity contri-butions
Other reserves
Retained income
Total attrib-utable to the
owners
Non-con-
trolling interest
Total equity
Notes R’000 R’000 R’000 R’000 R’000 R’000 R’000
GROUPBalance at 1 January 2016 371 231 337 713 21 901 121 322 852 167 54 522 906 689 Profit for the year – – – 109 882 109 882 26 541 136 423 Other comprehensive income for the year:
Currency translation differences net of taxation 12 – – (12 082) – (12 082) (218) (12 300)Share of other comprehensive income of associated companies net of taxation – – 295 – 295 – 295
Transactions with owners:Subscription shares 11 337 713 (337 713) – – – – – Share-based payment costs 12 – – 3 928 – 3 928 – 3 928 Acquisition of subsidiary – – – – – 5 410 5 410 Transaction with non-controlling interest – – – 4 918 4 918 (11 268) (6 350)Dividends paid – – – – – (8 275) (8 275)
Balance as at 31 December 2016 708 944 – 14 042 236 122 959 108 66 712 1 025 820
Balance at 1 January 2017 708 944 – 14 042 236 122 959 108 66 712 1 025 820 Profit for the year – – – 144 737 144 737 27 110 171 847 Other comprehensive income for the year:
Currency translation differences net of taxation 12 – – (3 976) – (3 976) (22) (3 998)Share of other comprehensive income of associated companies net of taxation – – (1) – (1) – (1)
Transactions with owners:Shares issued net of capitalised listing fees 11 132 582 – – – 132 582 – 132 582 Share-based payment costs 12 – – 4 333 – 4 333 – 4 333 Acquisition of subsidiary – – – – – 3 641 3 641 Transactions with non-controlling interest – – – (73 427) (73 427) (44 150) (117 577)Dividends paid – – – (21 287) (21 287) (11 492) (32 779)
Balance as at 31 December 2017 841 526 – 14 398 286 145 1 142 069 41 799 1 183 868
Stated capital
Share-holders’
equity contri-butions
Other reserves
Retained income
Total equity
Notes R’000 R’000 R’000 R’000 R’000
COMPANYBalance at 1 January 2016 371 231 337 713 – 85 920 794 864 Profit for the year – – – 16 606 16 606 Transactions with owners:
Subscription shares 11 337 713 (337 713) – – – Share-based payment costs 12 – – 3 928 – 3 928
Balance as at 31 December 2016 708 944 – 3 928 102 526 815 398
Balance at 1 January 2017 708 944 – 3 928 102 526 815 398 Profit for the year – – – 15 623 15 623 Transactions with owners:
Shares issued net of capitalised listing fees 11 132 582 – – – 132 582 Share-based payment costs 12 – 4 333 4 333 Dividends paid – – – (21 287) (21 287)
Balance as at 31 December 2017 841 526 – 8 261 96 862 946 649
Company Company2017 2016
Dividends paid per share (cents) 5.25 3.57
CONSOLIDATED STATEMENT OF CHANGES IN EQUITYfor the year ended 31 December 2017
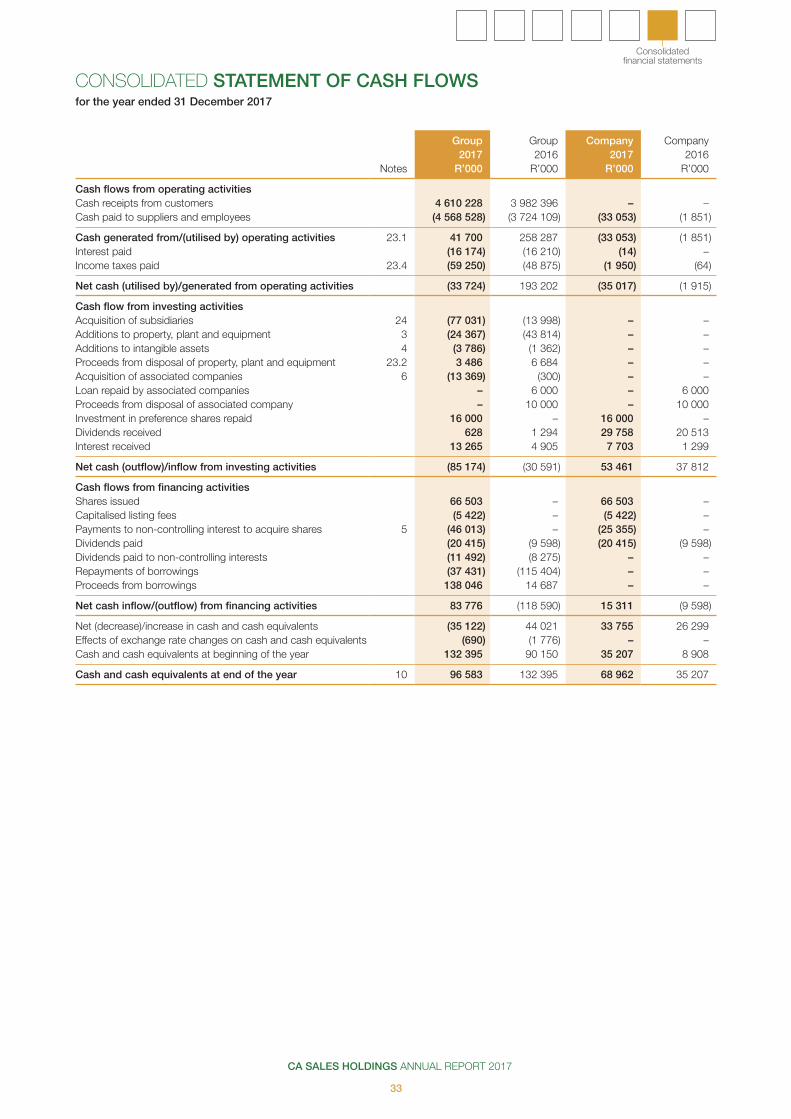
CA SALES HOLDINGS ANNUAL REPORT 2017
33
Consolidated financial statements
CONSOLIDATED STATEMENT OF CASH FLOWSfor the year ended 31 December 2017
Group Group Company Company2017 2016 2017 2016
Notes R’000 R’000 R’000 R’000
Cash flows from operating activitiesCash receipts from customers 4 610 228 3 982 396 – – Cash paid to suppliers and employees (4 568 528) (3 724 109) (33 053) (1 851)
Cash generated from/(utilised by) operating activities 23.1 41 700 258 287 (33 053) (1 851)Interest paid (16 174) (16 210) (14) – Income taxes paid 23.4 (59 250) (48 875) (1 950) (64)
Net cash (utilised by)/generated from operating activities (33 724) 193 202 (35 017) (1 915)
Cash flow from investing activitiesAcquisition of subsidiaries 24 (77 031) (13 998) – – Additions to property, plant and equipment 3 (24 367) (43 814) – – Additions to intangible assets 4 (3 786) (1 362) – – Proceeds from disposal of property, plant and equipment 23.2 3 486 6 684 – – Acquisition of associated companies 6 (13 369) (300) – –Loan repaid by associated companies – 6 000 – 6 000 Proceeds from disposal of associated company – 10 000 – 10 000 Investment in preference shares repaid 16 000 – 16 000 – Dividends received 628 1 294 29 758 20 513 Interest received 13 265 4 905 7 703 1 299
Net cash (outflow)/inflow from investing activities (85 174) (30 591) 53 461 37 812
Cash flows from financing activitiesShares issued 66 503 – 66 503 – Capitalised listing fees (5 422) – (5 422) –Payments to non-controlling interest to acquire shares 5 (46 013) – (25 355) –Dividends paid (20 415) (9 598) (20 415) (9 598)Dividends paid to non-controlling interests (11 492) (8 275) – – Repayments of borrowings (37 431) (115 404) – – Proceeds from borrowings 138 046 14 687 – –
Net cash inflow/(outflow) from financing activities 83 776 (118 590) 15 311 (9 598)
Net (decrease)/increase in cash and cash equivalents (35 122) 44 021 33 755 26 299 Effects of exchange rate changes on cash and cash equivalents (690) (1 776) – – Cash and cash equivalents at beginning of the year 132 395 90 150 35 207 8 908
Cash and cash equivalents at end of the year 10 96 583 132 395 68 962 35 207
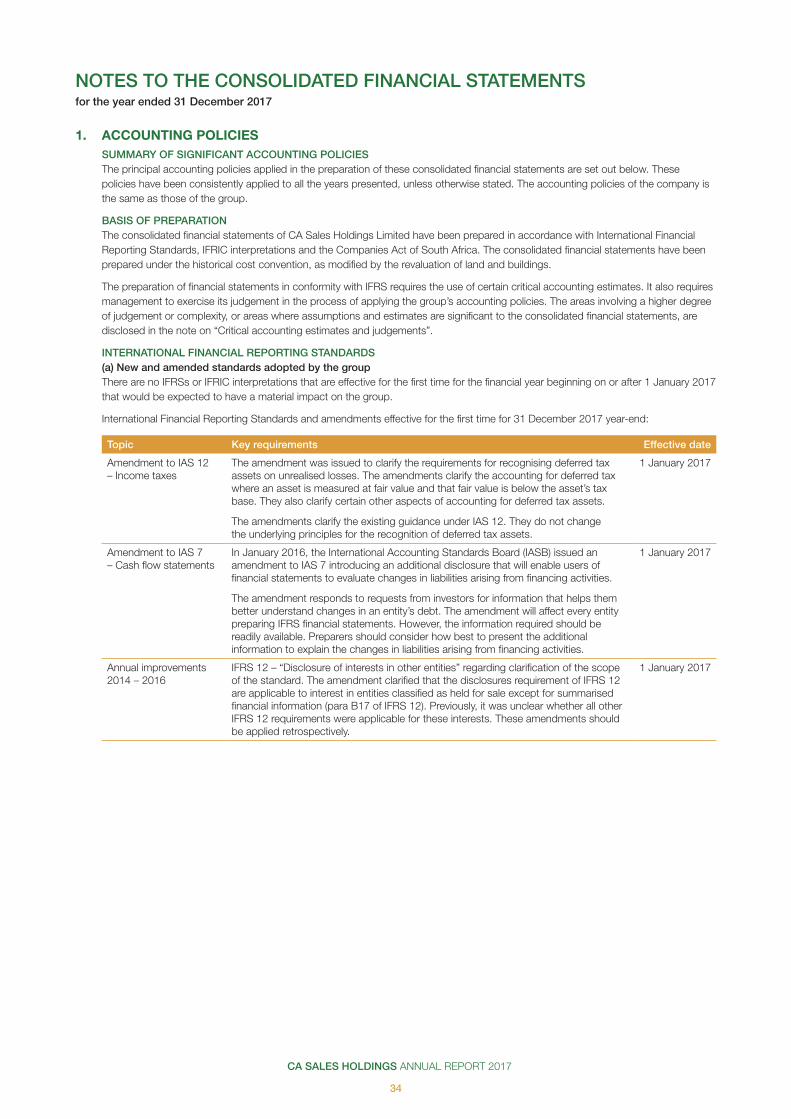
CA SALES HOLDINGS ANNUAL REPORT 2017
34
1. ACCOUNTING POLICIES SUMMARY OF SIGNIFICANT ACCOUNTING POLICIES The principal accounting policies applied in the preparation of these consolidated financial statements are set out below. These
policies have been consistently applied to all the years presented, unless otherwise stated. The accounting policies of the company is the same as those of the group.
BASIS OF PREPARATION The consolidated financial statements of CA Sales Holdings Limited have been prepared in accordance with International Financial
Reporting Standards, IFRIC interpretations and the Companies Act of South Africa. The consolidated financial statements have been prepared under the historical cost convention, as modified by the revaluation of land and buildings.
The preparation of financial statements in conformity with IFRS requires the use of certain critical accounting estimates. It also requires management to exercise its judgement in the process of applying the group’s accounting policies. The areas involving a higher degree of judgement or complexity, or areas where assumptions and estimates are significant to the consolidated financial statements, are disclosed in the note on “Critical accounting estimates and judgements”.
INTERNATIONAL FINANCIAL REPORTING STANDARDS (a) New and amended standards adopted by the group There are no IFRSs or IFRIC interpretations that are effective for the first time for the financial year beginning on or after 1 January 2017
that would be expected to have a material impact on the group.
International Financial Reporting Standards and amendments effective for the first time for 31 December 2017 year-end:
Topic Key requirements Effective date
Amendment to IAS 12 – Income taxes
The amendment was issued to clarify the requirements for recognising deferred tax assets on unrealised losses. The amendments clarify the accounting for deferred tax where an asset is measured at fair value and that fair value is below the asset’s tax base. They also clarify certain other aspects of accounting for deferred tax assets.
The amendments clarify the existing guidance under IAS 12. They do not change the underlying principles for the recognition of deferred tax assets.
1 January 2017
Amendment to IAS 7 – Cash flow statements
In January 2016, the International Accounting Standards Board (IASB) issued an amendment to IAS 7 introducing an additional disclosure that will enable users of financial statements to evaluate changes in liabilities arising from financing activities.
The amendment responds to requests from investors for information that helps them better understand changes in an entity’s debt. The amendment will affect every entity preparing IFRS financial statements. However, the information required should be readily available. Preparers should consider how best to present the additional information to explain the changes in liabilities arising from financing activities.
1 January 2017
Annual improvements 2014 – 2016
IFRS 12 – “Disclosure of interests in other entities” regarding clarification of the scope of the standard. The amendment clarified that the disclosures requirement of IFRS 12 are applicable to interest in entities classified as held for sale except for summarised financial information (para B17 of IFRS 12). Previously, it was unclear whether all other IFRS 12 requirements were applicable for these interests. These amendments should be applied retrospectively.
1 January 2017
NOTES TO THE CONSOLIDATED FINANCIAL STATEMENTSfor the year ended 31 December 2017

CA SALES HOLDINGS ANNUAL REPORT 2017
35
Consolidated financial statements
INTERNATIONAL FINANCIAL REPORTING STANDARDS CONTINUEDInternational Financial Reporting Standards, interpretations and amendments issued but not effective for 31 December 2017 year-end:
Topic Key requirements Effective date
IFRS 9 – Financial Instruments (2009 and 2010)
• Financial liabilities
• Derecognition of financial instruments
• Financial assets
This standard replaces the guidance in IAS 39. It includes requirements on the classification and measurement of financial assets and liabilities; it also includes an expected credit losses model that replaces the current incurred loss impairment model.
The IASB has amended IFRS 9 to align hedge accounting more closely with an entity’s risk management. The revised standard also establishes a more principles-based approach to hedge accounting and addresses inconsistencies and weaknesses in the current model in IAS 39.
Early adoption of the above requirements has specific transitional rules that need to be followed. Entities can elect to apply IFRS 9 for any of the following:
• The own credit risk requirements for financial liabilities.
• Classification and measurement (C&M) requirements for financial assets.
• C&M requirements for financial assets and financial liabilities.
• The full current version of IFRS 9 (that is, C&M requirements for financial assets and financial liabilities and hedge accounting).
The transitional provisions described above are likely to change once the IASB completes all phases of IFRS 9.
This standard will be adopted in the 2018 financial year. The group will not be restating comparatives. It is not expected that the requirements for classification and measurement for the group will change significantly. The group is considering using a provision matrix to calculate its expected credit loss. There is a possibility that impairment losses will be higher and more volatile because of the requirement to recognise impairment earlier and incorporate forward-looking information.
1 January 2018
IFRS 15 – Revenue from contracts with customers
The FASB and IASB issued their long awaited converged standard on revenue recognition on 29 May 2014. It is a single, comprehensive revenue recognition model for all contracts with customers to achieve greater consistency in the recognition and presentation of revenue. Revenue is recognised based on the satisfaction of performance obligations, which occurs when control of good or service transfers to a customer.
The IASB has amended IFRS 15 to clarify the guidance, but there were no major changes to the standard itself. The amendments comprise clarifications of the guidance on identifying performance obligations, accounting for licenses of intellectual property and the principal versus agent assessment (gross versus net revenue presentation). New and amended illustrative examples have been added for each of these areas of guidance. The IASB has also included additional practical expedients related to transition to the new revenue standard.
The standard will be adopted in the 2018 financial year. It is not expected that there will be a change in how the group identifies its customers. The group does not expect to change from a point-in-time to over-time revenue recognition.
1 January 2018
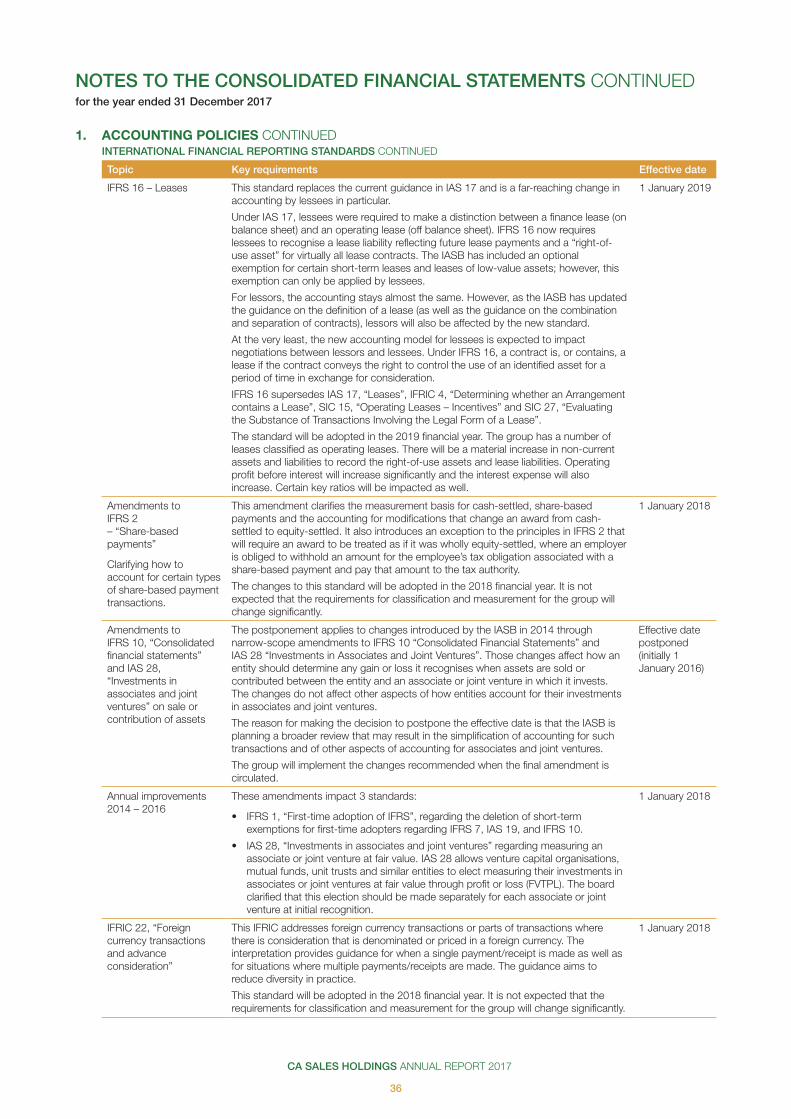
CA SALES HOLDINGS ANNUAL REPORT 2017
36
1. ACCOUNTING POLICIES CONTINUEDINTERNATIONAL FINANCIAL REPORTING STANDARDS CONTINUED
Topic Key requirements Effective date
IFRS 16 – Leases This standard replaces the current guidance in IAS 17 and is a far-reaching change in accounting by lessees in particular.
Under IAS 17, lessees were required to make a distinction between a finance lease (on balance sheet) and an operating lease (off balance sheet). IFRS 16 now requires lessees to recognise a lease liability reflecting future lease payments and a “right-of-use asset” for virtually all lease contracts. The IASB has included an optional exemption for certain short-term leases and leases of low-value assets; however, this exemption can only be applied by lessees.
For lessors, the accounting stays almost the same. However, as the IASB has updated the guidance on the definition of a lease (as well as the guidance on the combination and separation of contracts), lessors will also be affected by the new standard.
At the very least, the new accounting model for lessees is expected to impact negotiations between lessors and lessees. Under IFRS 16, a contract is, or contains, a lease if the contract conveys the right to control the use of an identified asset for a period of time in exchange for consideration.
IFRS 16 supersedes IAS 17, “Leases”, IFRIC 4, “Determining whether an Arrangement contains a Lease”, SIC 15, “Operating Leases – Incentives” and SIC 27, “Evaluating the Substance of Transactions Involving the Legal Form of a Lease”.
The standard will be adopted in the 2019 financial year. The group has a number of leases classified as operating leases. There will be a material increase in non-current assets and liabilities to record the right-of-use assets and lease liabilities. Operating profit before interest will increase significantly and the interest expense will also increase. Certain key ratios will be impacted as well.
1 January 2019
Amendments to IFRS 2 – “Share-basedpayments”
Clarifying how to account for certain types of share-based payment transactions.
This amendment clarifies the measurement basis for cash-settled, share-based payments and the accounting for modifications that change an award from cash-settled to equity-settled. It also introduces an exception to the principles in IFRS 2 that will require an award to be treated as if it was wholly equity-settled, where an employer is obliged to withhold an amount for the employee’s tax obligation associated with a share-based payment and pay that amount to the tax authority.
The changes to this standard will be adopted in the 2018 financial year. It is not expected that the requirements for classification and measurement for the group will change significantly.
1 January 2018
Amendments to IFRS 10, “Consolidated financial statements” and IAS 28, “Investments in associates and joint ventures” on sale or contribution of assets
The postponement applies to changes introduced by the IASB in 2014 through narrow-scope amendments to IFRS 10 “Consolidated Financial Statements” and IAS 28 “Investments in Associates and Joint Ventures”. Those changes affect how an entity should determine any gain or loss it recognises when assets are sold or contributed between the entity and an associate or joint venture in which it invests. The changes do not affect other aspects of how entities account for their investments in associates and joint ventures.
The reason for making the decision to postpone the effective date is that the IASB is planning a broader review that may result in the simplification of accounting for such transactions and of other aspects of accounting for associates and joint ventures.
The group will implement the changes recommended when the final amendment is circulated.
Effective date postponed (initially 1 January 2016)
Annual improvements 2014 – 2016
These amendments impact 3 standards:
• IFRS 1, “First-time adoption of IFRS”, regarding the deletion of short-term exemptions for first-time adopters regarding IFRS 7, IAS 19, and IFRS 10.
• IAS 28, “Investments in associates and joint ventures” regarding measuring an associate or joint venture at fair value. IAS 28 allows venture capital organisations, mutual funds, unit trusts and similar entities to elect measuring their investments in associates or joint ventures at fair value through profit or loss (FVTPL). The board clarified that this election should be made separately for each associate or joint venture at initial recognition.
1 January 2018
IFRIC 22, “Foreign currency transactions and advance consideration”
This IFRIC addresses foreign currency transactions or parts of transactions where there is consideration that is denominated or priced in a foreign currency. The interpretation provides guidance for when a single payment/receipt is made as well as for situations where multiple payments/receipts are made. The guidance aims to reduce diversity in practice.
This standard will be adopted in the 2018 financial year. It is not expected that the requirements for classification and measurement for the group will change significantly.
1 January 2018
NOTES TO THE CONSOLIDATED FINANCIAL STATEMENTS CONTINUEDfor the year ended 31 December 2017
CA SALES HOLDINGS ANNUAL REPORT 2017
37
Consolidated financial statements
INTERNATIONAL FINANCIAL REPORTING STANDARDS CONTINUED
Topic Key requirements Effective date
IFRIC 23, “Uncertainty over income tax treatments”
IFRIC 23 provides a framework to consider, recognise and measure the accounting impact of tax uncertainties. The interpretation provides specific guidance in several areas where previously IAS 12 was silent. The interpretation also explains when to reconsider the accounting for a tax uncertainty. Most entities will have developed a model to account for tax uncertainties in the absence of specific guidance in IAS 12. These models might, in some circumstances, be inconsistent with IFRIC 23 and the impact on tax accounting could be material. Management should assess the existing models against the specific guidance in the interpretation and consider the impact on income tax accounting.
This standard will be adopted in the 2019 financial year. It is not expected that the requirements for classification and measurement for the group will change significantly.
1 January 2019
CONSOLIDATION Group financial statements The group annual financial statements comprise those of the company, its subsidiaries and associated companies.
Subsidiaries Subsidiaries are all entities (including structured entities) over which the group has control. The group controls an entity when the
group is exposed to, or has rights to variable returns from its involvement with the entity and has the ability to affect those returns through its power over the entity. Subsidiaries are fully consolidated from the date on which control is transferred to the group. They are deconsolidated from the date that control ceases.
The acquisition method of accounting is used to account for business combinations by the group. The consideration transferred for the acquisition of a subsidiary is the fair values of the assets transferred, the liabilities incurred, and the equity interests issued by the group. The consideration transferred includes the fair value of any asset or liability resulting from a contingent consideration arrangement. Acquisition-related costs are expensed as incurred. Identifiable assets acquired, and liabilities and contingent liabilities assumed in a business combination are measured initially at their fair values at the acquisition date. On an acquisition-by-acquisition basis, the group recognises any non-controlling interest in the acquiree either at fair value or at the non-controlling interest’s proportionate share of the acquiree’s net assets.
If the business combination is achieved in stages, the acquisition date carrying value of the acquirer’s previously held equity interest in the acquiree is remeasured to fair value at the acquisition date; any gains or losses arising from such remeasurement are recognised in profit or loss.
Any contingent consideration to be transferred by the group is recognised at fair value at the acquisition date. Subsequent changes to the fair value of the contingent consideration that is deemed to be an asset or liability is recognised in accordance with IAS 39 either in profit or loss or as a change to other comprehensive income. Contingent consideration that is classified as equity is not remeasured, and its subsequent settlement is accounted for within equity.
Investments in subsidiaries in the company’s stand-alone financial statements are accounted for at cost less impairment. These investments include any inter-group loans receivable, which represent by nature a further investment in the subsidiary. Cost is adjusted to reflect changes in consideration arising from contingent consideration amendments. Direct attributable costs of investment are expensed as incurred.
The excess of the consideration transferred, the amount of any non-controlling interest in the acquiree and the acquisition date fair value of any previous equity interest in the acquiree over the fair value of the identifiable net assets acquired is recorded as goodwill. If the total of consideration transferred, non-controlling interest recognised and previously held interest measured is less than the fair value of the net assets of the subsidiary acquired in the case of a bargain purchase, the difference is recognised directly in the income statement.
Inter-company transactions, balances and unrealised gains on transactions between group companies are eliminated. Unrealised losses are also eliminated. In addition, unrealised losses are considered to be an indicator of impairment. Accounting policies of subsidiaries have been changed, where necessary, to ensure consistency with the policies adopted by the group.
Transactions and non-controlling interests The group treats transactions with non-controlling interests that do not result in loss of control, as transactions with equity owners of
the group. Purchases from non-controlling interests are recorded in equity. Gains or losses on disposals to non-controlling interests are also recorded in equity.
When the group ceases to have control or significant influence, any retained interest in the entity is remeasured at its fair value, with the change in carrying amount recognised in profit or loss. The fair value is the initial carrying amount for the purposes of subsequently accounting for the retained interest as an associate, joint venture or financial asset. In addition, any amounts previously recognised in other comprehensive income in respect of that entity are accounted for as if the group had directly disposed of the related assets or liabilities. This may mean that amounts previously recognised in other comprehensive income are reclassified to profit or loss.
CA SALES HOLDINGS ANNUAL REPORT 2017
38
1. ACCOUNTING POLICIES CONTINUED Associated companies Associated companies are all entities over which the group has significant influence but not control, generally accompanying a
shareholding of between 20% and 50% of the voting rights. Investments in associated companies are accounted for by the equity method of accounting and are initially recognised at cost. The group’s investment in associated companies includes goodwill identified on acquisition, net of any accumulated impairment loss.
Where equity securities are transferred to investment in associated companies upon gaining significant influence (“step acquisition”), the investment is transferred at its fair value. Goodwill is calculated at each stage of step acquisitions.
Certain associated companies have year-ends that differ from that of the group. The results of associated companies are accounted for according to the equity method, based on their most recent published audited financial statements or latest management information. Equity accounting involves recognising the group’s share of its associated companies’ post-acquisition profits or losses in the income statement, and its share of post-acquisition movements in other comprehensive income and movements in other reserves, in the statement of comprehensive income. The cumulative post-acquisition movements are adjusted against the carrying amount of the investment. When the group’s share of losses in an associated company equals or exceeds its interest in the associated company including any other unsecured receivables, the group does not recognise further losses, unless it has incurred legal or constructive obligations or made payments on behalf of the associated company.
Unrealised gains on transactions between the group and its associated companies are eliminated to the extent of the group’s interest in the associated companies. Unrealised losses are also eliminated unless the transaction provides evidence of an impairment of the asset transferred. Cross-holdings between the group and its associates are eliminated in accordance with normal consolidation procedure. Associates’ accounting policies have been changed, where necessary, to ensure consistency with the policies adopted by the group.
Dilution gains and losses arising in investment in associated companies are recognised in the income statement.
After applying the equity method, investments in associated companies are tested for impairment whenever events or changes in circumstances indicate that the carrying amount may not be recoverable. An impairment loss is recognised for the amount by which the asset’s carrying value exceeds its recoverable amount. The recoverable amount is the higher of an asset’s fair value less costs to sell and value in use.
If the ownership interest in an associated company is reduced but significant influence is retained, only a proportionate share of the amounts previously recognised in other comprehensive income are reclassified to profit or loss where appropriate.
Loans to associated companies are disclosed as part of the carrying amount of the investment.
The company accounts for investment in associated companies at cost less provision for impairment.
FOREIGN CURRENCY TRANSLATION Functional and presentation currency Items included in the financial statements of each of the group’s entities are measured using the currency of the primary economic
environment in which the entity operates (the “functional currency”). The consolidated financial statements are presented in South African rand, which is the company’s functional and the group’s presentation currency. All financial information presented in South African rand has been rounded to the nearest thousand.
Transactions and balances Foreign currency transactions are translated into the functional currency using the exchange rates prevailing at the dates of the
transactions or valuation where items are remeasured. Foreign exchange gains and losses resulting from the settlement of such transactions and from the translation at year-end exchange rates of monetary assets and liabilities denominated in foreign currencies are recognised in the statement of comprehensive income.
Foreign exchange gains and losses that relate to borrowings and cash and cash equivalents are presented in the statement of comprehensive income within “finance income or expense”. All other foreign exchange gains and losses are presented in the statement of comprehensive income within “Other operating income or expenses – net”.
Group companies The results and financial position of all the group entities (none of which has the currency of a hyperinflationary economy) that have a
functional currency different from the presentation currency are translated into the presentation currency as follows:
• Income and expenses are translated at average exchange rates (unless this average is not a reasonable approximation of the cumulative effect of the rates prevailing on the transaction dates, in which case income and expenses are translated at the dates of the transactions).
• Assets and liabilities are translated at the closing rate at the date of the statement of financial position.
• All resulting exchange differences are recognised in the statement of comprehensive income and as a separate component of equity.
NOTES TO THE CONSOLIDATED FINANCIAL STATEMENTS CONTINUEDfor the year ended 31 December 2017
CA SALES HOLDINGS ANNUAL REPORT 2017
39
Consolidated financial statements
SEGMENT REPORTING The group has reportable segments that comprise the structure used by the chief operating decision-maker (CODM) to make key
operating decisions and assess performance. The group’s reportable segments are operating segments that are differentiated by the country in which it operates.
The group evaluates the performance of its reportable segments based on operating profit. The group accounts for intersegment sales and transfers as if the sales and transfers were entered into under the same terms and conditions as would have been entered into in a market-related transaction.
The financial information of the group’s reportable segments is reported to the CODM for purposes of making decisions about allocating resources to the segment and assessing its performance.
A number of segments are included in the “Other countries” segment as they individually don’t meet the qualitative thresholds indicated in IFRS 8 Operating Segments.
PROPERTY, PLANT AND EQUIPMENT Property, plant and equipment are stated at historical cost less accumulated depreciation and impairment. Cost includes expenditure
that is directly attributable to the acquisition of the items.
Subsequent costs are included in the asset’s carrying amount or recognised as a separate asset, as appropriate, only when it is probable that future economic benefits associated with the item will flow to the group and the cost of the item can be measured reliably. All other repairs and maintenance are charged to the income statement during the financial period in which they are incurred.
Depreciation is calculated on the straight-line method at rates considered appropriate to reduce book values to estimated residual values over the useful lives of the assets, as follows:
Office equipment 3 to10 years Computer equipment 3 to 5 years Vehicles, plant and machinery 4 to 10 years
The assets’ residual values and useful lives are reviewed, and adjusted if appropriate, at each reporting date.
An asset’s carrying amount is written down immediately to its recoverable amount if the asset’s carrying amount is greater than its estimated recoverable amount.
Any gain or loss on the disposal or retirement of an item of property, plant and equipment is determined as the difference between the sales proceeds and the carrying amount of the asset and is recognised in profit or loss.
INTANGIBLE ASSETS Goodwill Goodwill represents the excess of the cost of an acquisition over the fair value of the group’s share of the net identifiable assets of the
acquired subsidiary/associated company undertaking at the date of acquisition. Goodwill is reported in the statement of financial position as an intangible asset. Goodwill on acquisition of associated companies is included in investments in associated companies. Goodwill is tested annually for impairment and is carried at cost less accumulated impairment losses. Impairment losses on goodwill are not reversed. Gains and losses on the disposal of an entity include the carrying amount of goodwill relating to the entity sold.
Goodwill is allocated to cash-generating units for the purpose of impairment testing. The allocation is made to those cash-generating units or groups of cash-generating units that are expected to benefit from the business combination in which the goodwill arose. The groups of cash-generating units are not larger than operating segments.
An excess of the acquirer’s interest in the net fair value of the acquiree’s identifiable assets, liabilities and contingent liabilities arises where the net assets of a subsidiary or associate at the date of acquisition, fairly valued, exceed the cost of the acquisition. This excess arising on acquisitions is taken directly to income.
Customer lists Contractual customer relationships acquired in a business combination are recognised at fair value at the acquisition date. The
contractual customer relations have a finite useful life and are carried at cost less accumulated amortisation. Amortisation is calculated using the straight-line method over their estimated useful lives ranging between two and five years or using an attrition rate ranging between three and five years, which reflect the expected life of the book of business acquired. The carrying amount is reviewed for impairment when an impairment indicator is identified.
CA SALES HOLDINGS ANNUAL REPORT 2017
40
1. ACCOUNTING POLICIES CONTINUED Computer software and other internally generated intangible assets Costs associated with maintaining computer software programmes and other internally generated intangible assets are recognised as
an expense as incurred. Development costs that are directly attributable to the design and testing of identifiable and unique items controlled by the group, are recognised as intangible assets when all of the following criteria are met:
• it is technically feasible to complete the item so that it will be available for use;
• management intends to complete the item and use or sell it;
• there is an ability to use or sell the item;
• it can be demonstrated how the item will generate probable future economic benefits;
• adequate technical, financial and other resources to complete the development and to use or sell the item are available; and
• the expenditure attributable to the item during its development can be reliably measured.
Directly attributable costs that are capitalised as part of such items include development employee costs and an appropriate portion of relevant overheads. Other development expenditures that do not meet these criteria are recognised as an expense as incurred. Development costs previously recognised as an expense are not recognised as an asset in a subsequent period. These intangible assets are amortised using the straight-line method over their estimated useful lives, which range between two and 10 years.
IMPAIRMENT OF NON-FINANCIAL ASSETS Assets that have an indefinite useful life are not subject to amortisation and are tested annually for impairment. Assets that are subject
to amortisation or depreciation are tested for impairment whenever events or changes in circumstances indicate that the carrying amount may not be recoverable. An impairment loss is recognised for the amount by which the asset’s carrying amount exceeds its recoverable amount. The recoverable amount is the higher of an asset’s fair value less costs to sell and value in use. For the purposes of assessing impairment, assets are grouped at the lowest levels for which there are separately identifiable cash flows (cash-generating units). Non-financial assets other than goodwill that suffered an impairment are reviewed for possible reversal of the impairment at each reporting date.
FINANCIAL ASSETS Classification The group classifies its financial assets into the loans and receivables category. The classification depends on the purpose for which
the financial assets were acquired. Management determines the classification of its financial assets at initial recognition.
Loans and receivables Loans and receivables are non-derivative financial assets with fixed or determinable payments that are not quoted in an active market.
They are included in current assets, except for maturities greater than 12 months after the end of the reporting period. These are classified as non-current assets. The group’s loans and receivables comprise “trade and other receivables” and “cash and cash equivalents” in the balance sheet (notes 9 and 10).
Recognition and measurement Purchases and sales of financial assets are recognised on trade date – the date on which the group commits to purchase or sell the
asset. Financial assets are initially recognised at fair value. Financial assets are derecognised when the rights to receive cash flows from the financial assets have expired or have been transferred and the group has transferred substantially all risks and rewards of ownership.
If the market for a financial asset is not active, the group establishes fair value by using valuation techniques. These include the use of recent arm’s length transactions, reference to other instruments that are substantially the same, and discounted cash flow analysis refined to reflect the issuer’s specific circumstances.
Loans and receivables are carried at amortised cost using the effective-interest method. Specific provisions are made against identified doubtful receivables.
Loans advanced to associated companies and subsidiaries, which are interest-free with no repayment terms, are carried at amortised cost using the effective-interest method.
The group does not apply hedge accounting.
Impairment of financial assets (a) Assets carried at amortised cost The group assesses at the end of each reporting period whether there is objective evidence that a financial asset or group of financial
assets is impaired. A financial asset or a group of financial assets are impaired and impairment losses are incurred only if there is objective evidence of impairment as a result of one or more events that occurred after the initial recognition of the asset (a “loss event”) and that loss event (or events) has an impact on the estimated future cash flows of the financial asset or group of financial assets that can be reliably estimated.
Evidence of impairment may include indications that the debtors or a group of debtors is experiencing significant financial difficulty, default or delinquency in interest or principal payments, the probability that they will enter bankruptcy or other financial reorganisation, and where observable data indicate that there is a measurable decrease in the estimated future cash flows, such as changes in arrears or economic conditions that correlate with defaults.
NOTES TO THE CONSOLIDATED FINANCIAL STATEMENTS CONTINUEDfor the year ended 31 December 2017
CA SALES HOLDINGS ANNUAL REPORT 2017
41
Consolidated financial statements
For the loans and receivables category, the amount of the loss is measured as the difference between the asset’s carrying amount and the present value of estimated future cash flows (excluding future credit losses that have not been incurred) discounted at the financial asset’s original effective interest rate. The carrying amount of the asset is reduced and the amount of the loss is recognised in the statement of comprehensive income. If a loan has a variable interest rate, the discount rate for measuring any impairment loss is the current effective interest rate determined under the contract. As a practical expedient, the group may measure impairment on the basis of an instrument’s fair value using an observable market price.
If, in a subsequent period, the amount of the impairment loss decreases, and the decrease can be related objectively to an event occurring after the impairment was recognised (such as an improvement in the debtor’s credit rating), the reversal of the previously recognised impairment loss is recognised in the statement of comprehensive income.
INVENTORIES Inventories are valued at the lower of cost and net realisable value. Cost is substantially determined on the first-in first-out basis and
includes expenditure in acquiring and transporting the inventory to its present location net of discount and rebates received.
Net realisable value is the estimated selling price in the ordinary course of business, less estimated selling expenses.
TRADE RECEIVABLES Trade receivables are amounts due from customers for merchandise sold or services performed in the ordinary course of business.
If collection is expected in one year or less, they are classified as current assets. If not, they are presented as non-current assets.
Trade receivables are recognised initially at fair value and subsequently measured at amortised cost using the effective interest method, less provision for impairment. A provision for impairment of trade receivables is established when there is objective evidence that the group will not be able to collect all amounts due according to the original terms of the receivables. Significant financial difficulties of the debtor, probability that the debtor will enter bankruptcy or financial reorganisation, and default or delinquency in payments are considered indicators that the trade receivable is impaired. The amount of the provision is the difference between the asset’s carrying amount and the present value of estimated future cash flows, discounted at the effective interest rate. The carrying amount of the asset is reduced through the use of an allowance account, and the amount of the loss is recognised in the statement of comprehensive income. Receivables for which an impairment provision was recognised are written off against the provision when there is no expectation of recovering additional cash. Subsequent recoveries of amounts previously written off are credited in the statement of comprehensive income.
CASH AND CASH EQUIVALENTS Cash and cash equivalents include cash on hand and other deposits held at call with banks. Bank overdrafts are included within
borrowings in current liabilities on the statement of financial position.
STATED CAPITAL Stated capital consists solely of ordinary share capital. Ordinary shares are classified as equity. Incremental costs directly attributable to
the issue of equity instruments are shown in equity as a deduction from the proceeds, net of tax.
FINANCIAL LIABILITIES A financial liability is any liability that is a contractual obligation to deliver cash or another financial asset to another entity. Financial
liabilities include borrowings, accrual for other liabilities and charges, contingent considerations and trade and other payables.
BORROWINGS Borrowings are recognised initially at fair value, net of transaction costs incurred. Borrowings are subsequently stated at amortised
cost; any difference between the proceeds (net of transaction costs) and the redemption value is recognised in the statement of comprehensive income over the period of the borrowings using the effective-interest method.
Fees paid on the establishment of loan facilities are recognised as transaction costs of the loan to the extent that it is probable that some or all of the facility will be drawn down. In this case, the fee is deferred until the draw-down occurs. To the extent that there is no evidence that it is probable that some or all of the facility will be drawn down, the fee is capitalised as a pre-payment for liquidity services and amortised over the period of the facility to which it relates.
TRADE PAYABLES Trade payables are obligations to pay for goods or services that have been acquired in the ordinary course of business from suppliers.
Accounts payable are classified as current liabilities if payment is due within one year or less. If not, they are presented as non-current liabilities.
Trade payables are recognised initially at fair value and subsequently measured at amortised cost using the effective interest method.
CA SALES HOLDINGS ANNUAL REPORT 2017
42
1. ACCOUNTING POLICIES CONTINUED PROVISIONS Provisions are recognised when:
• the group has a present legal or constructive obligation as a result of past events;
• it is more likely than not that an outflow of resources will be required to settle the obligation; and
• the amount has been reliably estimated.
Provisions are measured at the present value of the expenditures expected to be required to settle the obligation using a pre-tax rate that reflects current market assessments of the time value of money and the risks specific to the obligation. The increase in the provision due to passage of time is recognised as an interest expense.
LEASES Leases in which a significant portion of the risks and rewards of ownership are retained by the lessor are classified as operating leases.
Payments made under operating leases are charged to the statement of comprehensive income on a straight-line basis over the period of the lease.
The group leases certain property, plant and equipment. Leases of property, plant and equipment where the group has substantially all the risks and rewards of ownership are classified as finance leases. Finance leases are capitalised at the lease’s commencement at the lower of the fair value of the leased property and the present value of the minimum lease payments.
Each lease payment is allocated between the liability and finance charges. The corresponding rental obligations, net of finance charges, are included in borrowings. The interest element of the finance cost is charged to the statement of comprehensive income over the lease period so as to produce a constant periodic rate of interest on the remaining balance of the liability for each period. The property, plant and equipment acquired under finance leases are depreciated over the shorter of the useful life of the asset and the lease term.
CURRENT AND DEFERRED INCOME TAX The tax expense for the period comprises current and deferred tax. Tax is recognised in the statement of comprehensive income,
except to the extent that it relates to items recognised in other comprehensive income or directly in equity. In this case the tax is also recognised in other comprehensive income or directly in equity, respectively.
The current income tax charge is calculated on the basis of the tax laws enacted or substantively enacted at the statement of financial position date in the countries where the company’s subsidiaries and associates operate and generate taxable income. Management periodically evaluates positions taken in tax returns with respect to situations in which applicable tax regulation is subject to interpretation. It establishes provisions where appropriate on the basis of amounts expected to be paid to the tax authorities.
Deferred income tax is recognised, using the liability method, on temporary differences arising between the tax bases of assets and liabilities and their carrying amounts in the financial statements. However, the deferred income tax is not accounted for if it arises from initial recognition of an asset or liability in a transaction other than a business combination that at the time of the transaction affects neither accounting nor taxable profit or loss. Deferred income tax is determined using tax rates (and laws) that have been enacted or substantially enacted by the statement of financial position date and are expected to apply when the related deferred income tax asset is realised or the deferred income tax liability is settled.
Deferred income tax assets are recognised only to the extent that it is probable that future taxable profit will be available against which the temporary differences can be utilised.
Deferred income tax is provided on temporary differences arising on investments in subsidiaries and associates, except where the timing of the reversal of the temporary difference is controlled by the group and it is probable that the temporary difference will not reverse in the foreseeable future.
Deferred income tax assets and liabilities are offset when there is a legally enforceable right to offset current tax assets against current tax liabilities and when the deferred income tax assets and liabilities relate to income taxes levied by the same taxation authority on either the taxable entity or different taxable entities where there is an intention to settle the balances on a net basis.
Dividend withholding tax is not levied on the company but on the beneficial owner of the share and accordingly does not require recognition in profit or loss. Dividends tax withheld by the company on dividends paid to its shareholders (who do not qualify for an exemption from dividends tax) and payable at the reporting date to the South African Revenue Service (where applicable) is included in trade and other payables in the statement of financial position.
EMPLOYEE BENEFITS Annual leave Employee entitlements to annual leave are recognised when they accrue to employees. An accrual is made for the estimated annual
leave as a result of services rendered by employees up to the reporting date.
Profit-sharing and bonus plans The group recognises a liability and an expense for bonus plans and profit-sharing, where contractually obliged, or where there is a
past practice that has created a constructive obligation.
NOTES TO THE CONSOLIDATED FINANCIAL STATEMENTS CONTINUEDfor the year ended 31 December 2017

CA SALES HOLDINGS ANNUAL REPORT 2017
43
Consolidated financial statements
Botswana severance benefits For employees who are citizens of Botswana, the group has implemented the requirements of the Botswana Labour Act relating to a
severance benefit scheme. For employees who are non-citizens of Botswana, the group pays gratuity in accordance with the respective contracts of employment.
Share-based compensation CA Sales Holdings Limited operates a single equity-settled share-based payment scheme.
For the share incentive schemes, the fair value of the executive services received in exchange for the grant of the scheme shares/share options, less the amount paid by the executive, is recognised as an expense. The total amount to be expensed over the vesting period, which is four years, is determined by reference to the fair value of the scheme shares/share options granted, excluding the impact of any non-market vesting conditions. Non-market vesting conditions are included in assumptions about the number of scheme shares/share options that are expected to become exercisable. At each reporting date, the entity revises its estimates of the number of scheme shares/share options that are expected to become exercisable. It recognises the impact of the revision of original estimates, if any, in the income statement, and a corresponding adjustment to equity over the remaining vesting period.
If the group cancels or settles a grant of equity instruments during the vesting period, the group accounts for the cancellation or settlement of the grant and recognises immediately the amount that otherwise would have been recognised for services received over the remainder of the vesting period.
The share-based payment costs are recognised in the income statement and a share-based payment reserve is recognised as part of equity and represents the fair value at grant date of the shares/share options that will be delivered on vesting.
REVENUE RECOGNITION Revenue is measured at the fair value of the consideration received or receivable, and represents amounts receivable for goods and
services supplied, stated net of discounts (including settlement discounts), returns and value added taxes. The group recognises revenue when the amount of revenue can be reliably measured; when it is probable that future economic benefits will flow to the entity; and when specific criteria have been met for each of the group’s activities, as described below. The group bases its estimate of return on historical results, taking into consideration the type of customer, the type of transaction and the specifics of each arrangement.
Sale of goods The sale of goods is recognised when a group entity has delivered products to the customer, the customer has accepted the products
and all risks and rewards associated with them, there is no further group management involvement in the products and collectability of the related receivables is reasonably assured.
Sale of goods – retail Sale of goods are recognised when the group sells a product to the customer. Retail sales are usually paid for in cash or by credit card.
Sale of services Sale of services are recognised in the accounting period in which the services are rendered, by reference to completion of the specific
transaction assessed on the basis of actual service provided as a proportion of the total services to be provided.
DIVIDEND INCOME Dividends are recognised as income, when the group’s right to receive payment has been established.
INTEREST INCOME Interest income is recognised using the effective interest method. When a loan and receivable is impaired, the group reduces the
carrying amount to its recoverable amount, being the estimated future cash flow discounted at the original effective interest rate of the instrument and continues unwinding the discount as interest income. Interest income on impaired loan and receivables is recognised using the original effective interest rate.
DIVIDEND DISTRIBUTION Dividend distribution to the company’s shareholders is recognised as a liability in the group’s financial statements in the period in which
the dividends are approved by the company’s shareholders.
HEADLINE EARNINGS AND EARNINGS PER SHARE Headline earnings is earnings as determined by IAS 33, excluding “separately identifiable remeasurements” (as defined in SAICA
Circular 2/2015), net of related tax (both current and deferred) and related non-controlling interest, other than remeasurements specifically included in headline earnings “included remeasurements” (as defined in SAICA Circular 2/2015).
Basic earnings per share is expressed in cents and is based on the net profit attributable to ordinary shareholders divided by the weighted average number of shares in issue during the year, excluding ordinary shares purchased by the company (treasury shares).
Diluted earnings per share is calculated by adjusting the weighted average number of ordinary shares outstanding to assume conversion of all dilutive potential ordinary shares (incentive shares).
CA SALES HOLDINGS ANNUAL REPORT 2017
44
1. ACCOUNTING POLICIES CONTINUED CRITICAL ACCOUNTING ESTIMATES AND JUDGEMENTS Estimates and judgements are continually evaluated and are based on historical experience and other factors, including expectations
of future events that are believed to be reasonable under the circumstances.
The group makes estimates and assumptions that affect the reported amounts of assets and liabilities within the next financial year. Estimates and judgements are continually evaluated and based on historical experience and other factors, including expectations of future events that are believed to be reasonable under circumstances.
Estimated impairment of goodwill The group tests annually whether goodwill has suffered any impairment, in accordance with the accounting policy on goodwill. The
recoverable amounts of cash-generating units have been determined based on value-in-use and fair value less cost to sell calculations. These calculations require the use of estimates (see note 4 for further detail and disclosure of estimates used).
Impairment of investment in associated companies An impairment of investment in associated companies is considered when the fair value is below its carrying value. In determination of
whether the decline is significant or prolonged, the following factors may be considered: the financial health of the investee, sector performance, changes in operational and financing cash flow.
An impairment loss is recognised for the amount by which the investment in associated company’s carrying amount exceeds its recoverable amount. The recoverable amount is the higher of an asset’s fair value less costs to sell and value in use. The value in use is calculated with reference to the assumptions set out below.
An asset’s fair value less costs to sell is determined with reference to its market price, and its value in use is determined with reference to assessing the fair value of underlying investments or valuation techniques. Valuation techniques used include applying a market-related price/earnings ratio, ranging between 4 and 8, to operational earnings or performing discounted cash flow models to the expected cash flows. The assumptions used in performing discounted cash flow models include a weighted average cost of capital (discount rate), growth rate, terminal growth rate and risk-free rate to determine the value of the asset. If the assumptions used are considered to be significant further disclose is performed in the notes for intangible assets.
The directors are satisfied that the group’s investment in associated companies are fairly stated. Refer to note 6 for further detail.
Recognition of intangible assets With a business combination all identifiable assets are recognised at their respective fair values in the consolidated financial
statements. The fair values of intangible assets acquired through business combinations are determined by using a discounted cash flow valuation method. The discount rate is based on the long-term risk-free rate with risk premiums added for market and other company and asset-specific risks.
Customer lists acquired through business combinations or acquisitions are valued on acquisition using discounted cash flow methodology based on assumptions and estimates regarding future revenue growth, weighted cost of capital, marketing costs and other economic factors affecting the value in use of these intangible assets. These assumptions reflect management’s best estimates but are subject to inherent uncertainties, which may not be controlled by management.
The cost of customer lists is amortised over their estimated useful lives. The remaining useful lives of intangible assets are re-assessed annually. If the estimate of the remaining useful lives changes, the remaining carrying values are amortised prospectively over that revised remaining useful life.
The main assumptions used in the valuation of key customer lists are the useful lives of these assets and the future profitability and cancellation rate of the underlying revenue streams. The useful life of a key customer list is estimated based on the cancellation experience of the existing business and the useful life of customer lists of other players in the market. For the key customer lists, the group recognised a useful life between two and five years and an average cancellation rate of between 10% and 12% were assumed.
Future profit margins, used in determining customer contracts and relationships values, were consistent with the margins applied in determining the fair value of the related investment. Refer to the intangible assets accounting policy and note 4 for further detail.
Income taxes The group is subject to income taxes in numerous jurisdictions. Significant judgement is required in determining the provision for
income taxes. There are many transactions and calculations for which the ultimate tax determination is uncertain. The group recognises liabilities for anticipated tax audit issues based on estimates of whether additional taxes will be due. Where the final tax outcome of these matters is different from the amounts that were initially recorded, such differences will impact the current and deferred income tax in the period in which such determination is made.
NOTES TO THE CONSOLIDATED FINANCIAL STATEMENTS CONTINUEDfor the year ended 31 December 2017
CA SALES HOLDINGS ANNUAL REPORT 2017
45
Consolidated financial statements
2. FINANCIAL RISK MANAGEMENT2.1 FINANCIAL RISK FACTORS
The group's activities expose it to a variety of financial risks: market risk (including currency risk and fair value interest rate risk), credit risk and liquidity risk. The group’s overall risk management programme focuses on the unpredictability of financial markets and seeks to minimise potential adverse effects on the group's financial performance.
Risk management is carried out by each major entity within the group under policies approved by the respective boards of directors. Each major entity’s board of directors provides principles for overall risk management, as well as policies covering specific areas, such as foreign exchange risk, interest rate risk, credit risk, use of derivative financial instruments and non-derivative financial instruments and investment of excess liquidity.
Financial instruments are grouped into the following classes in order to facilitate effective financial risk management and disclosure in terms of IFRS 7 Financial Instruments: Disclosures.
Group Group Company Company2017 2016 2017 2016
R’000 R’000 R’000 R’000
Classes of financial assetsTrade receivables 842 364 614 081 – – Amount receivable from related parties – – 82 718 51 702 Sundry debtors 9 252 7 774 – –
Total receivables 851 616 621 855 82 718 51 702
Loans and advances – 16 000 – 16 000 Loans to associated companies 1 327 3 788 – 3 788
Loans and other receivables 1 327 19 788 – 19 788
Cash and cash equivalents 204 141 182 878 68 962 35 207
Total financial assets – IFRS 7 1 057 084 824 521 151 680 106 697
Classes of financial liabilitiesBank overdrafts 107 558 50 483 – – Loans 196 995 90 842 – –
Total borrowings 304 553 141 325 – –
Accounts payable and accruals 523 540 540 058 159 – Contingent consideration 4 073 – – – Amount due to related parties – – 481 354
Total trade and other payables 527 613 540 058 640 354
Total financial liabilities – IFRS 7 832 166 681 383 640 354
Financial instruments by category Group Company
Loans and Loans andreceivables Total receivables Total
Assets as per statement of financial position R’000 R’000 R’000 R’000
2017Loans to associated companies 1 327 1 327 – –Receivables 851 616 851 616 82 718 82 718 Cash and cash equivalents 204 141 204 141 68 962 68 962
1 057 084 1 057 084 151 680 151 680
2016Loans and advances 16 000 16 000 16 000 16 000 Loans to associated companies 3 788 3 788 3 788 3 788 Receivables 621 855 621 855 51 702 51 702 Cash and cash equivalents 182 878 182 878 35 207 35 207
824 521 824 521 106 697 106 697
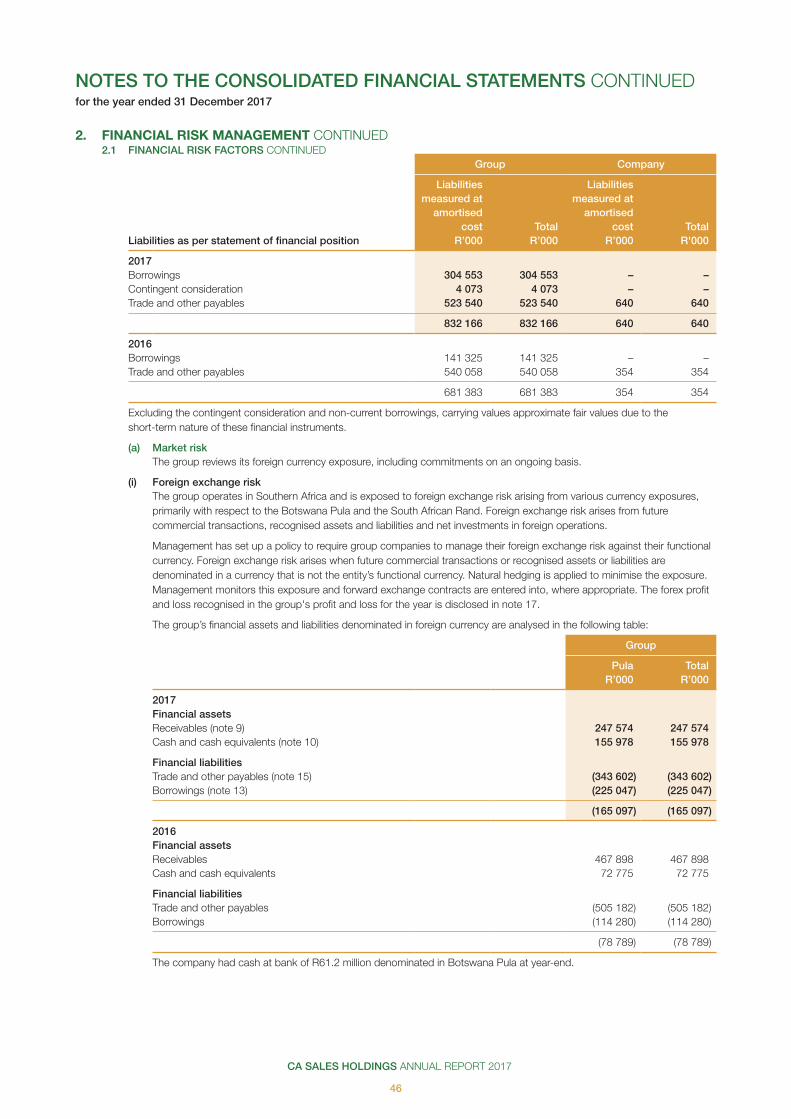
CA SALES HOLDINGS ANNUAL REPORT 2017
46
NOTES TO THE CONSOLIDATED FINANCIAL STATEMENTS CONTINUEDfor the year ended 31 December 2017
2. FINANCIAL RISK MANAGEMENT CONTINUED2.1 FINANCIAL RISK FACTORS CONTINUED
Group Company
Liabilities Liabilities measured at measured at
amortised amortisedcost Total cost Total
Liabilities as per statement of financial position R’000 R’000 R’000 R'000
2017Borrowings 304 553 304 553 – –Contingent consideration 4 073 4 073 – –Trade and other payables 523 540 523 540 640 640
832 166 832 166 640 640
2016Borrowings 141 325 141 325 – –Trade and other payables 540 058 540 058 354 354
681 383 681 383 354 354
Excluding the contingent consideration and non-current borrowings, carrying values approximate fair values due to the short-term nature of these financial instruments.
(a) Market riskThe group reviews its foreign currency exposure, including commitments on an ongoing basis.
(i) Foreign exchange riskThe group operates in Southern Africa and is exposed to foreign exchange risk arising from various currency exposures, primarily with respect to the Botswana Pula and the South African Rand. Foreign exchange risk arises from future commercial transactions, recognised assets and liabilities and net investments in foreign operations.
Management has set up a policy to require group companies to manage their foreign exchange risk against their functional currency. Foreign exchange risk arises when future commercial transactions or recognised assets or liabilities are denominated in a currency that is not the entity’s functional currency. Natural hedging is applied to minimise the exposure. Management monitors this exposure and forward exchange contracts are entered into, where appropriate. The forex profit and loss recognised in the group's profit and loss for the year is disclosed in note 17.
The group’s financial assets and liabilities denominated in foreign currency are analysed in the following table:
Group
Pula TotalR’000 R’000
2017Financial assetsReceivables (note 9) 247 574 247 574 Cash and cash equivalents (note 10) 155 978 155 978
Financial liabilitiesTrade and other payables (note 15) (343 602) (343 602)Borrowings (note 13) (225 047) (225 047)
(165 097) (165 097)
2016Financial assetsReceivables 467 898 467 898 Cash and cash equivalents 72 775 72 775
Financial liabilitiesTrade and other payables (505 182) (505 182)Borrowings (114 280) (114 280)
(78 789) (78 789)
The company had cash at bank of R61.2 million denominated in Botswana Pula at year-end.
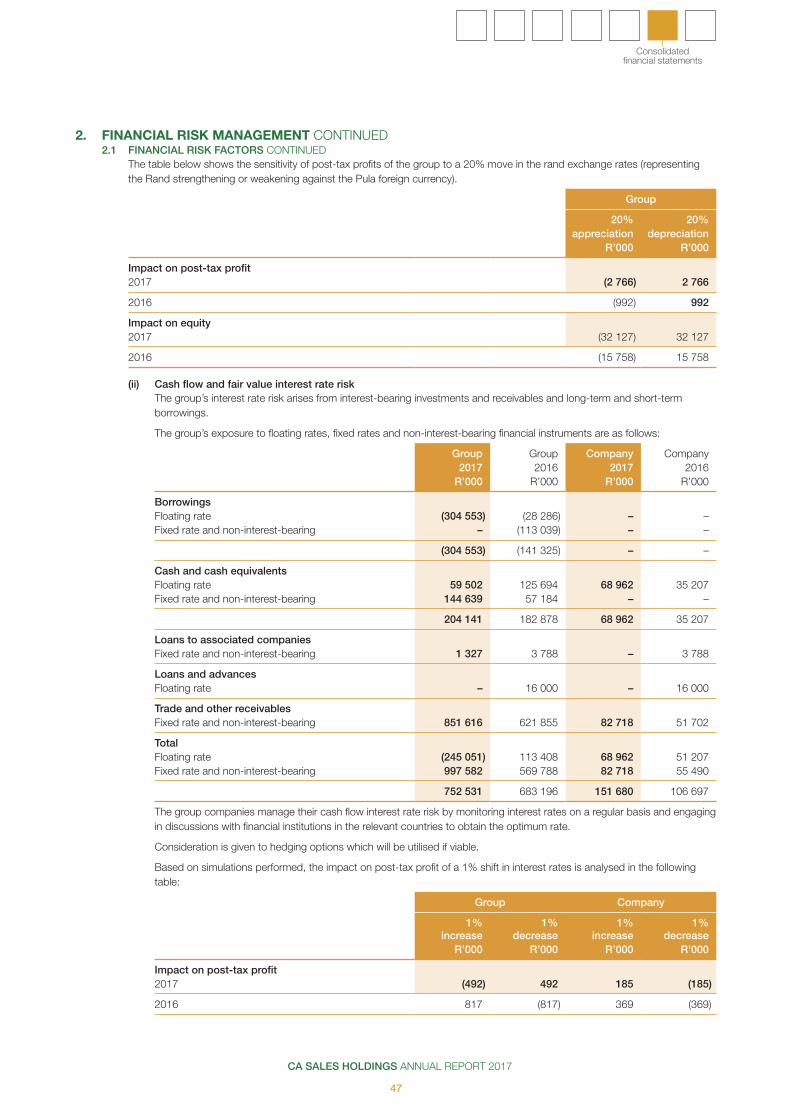
CA SALES HOLDINGS ANNUAL REPORT 2017
47
Consolidated financial statements
2. FINANCIAL RISK MANAGEMENT CONTINUED2.1 FINANCIAL RISK FACTORS CONTINUED
The table below shows the sensitivity of post-tax profits of the group to a 20% move in the rand exchange rates (representing the Rand strengthening or weakening against the Pula foreign currency).
Group
20% 20%appreciation depreciation
R’000 R’000
Impact on post-tax profit2017 (2 766) 2 766
2016 (992) 992
Impact on equity2017 (32 127) 32 127
2016 (15 758) 15 758
(ii) Cash flow and fair value interest rate riskThe group’s interest rate risk arises from interest-bearing investments and receivables and long-term and short-term borrowings.
The group’s exposure to floating rates, fixed rates and non-interest-bearing financial instruments are as follows:
Group Group Company Company2017 2016 2017 2016
R’000 R’000 R’000 R’000
BorrowingsFloating rate (304 553) (28 286) – –Fixed rate and non-interest-bearing – (113 039) – –
(304 553) (141 325) – –
Cash and cash equivalentsFloating rate 59 502 125 694 68 962 35 207 Fixed rate and non-interest-bearing 144 639 57 184 – –
204 141 182 878 68 962 35 207
Loans to associated companiesFixed rate and non-interest-bearing 1 327 3 788 – 3 788
Loans and advancesFloating rate – 16 000 – 16 000
Trade and other receivablesFixed rate and non-interest-bearing 851 616 621 855 82 718 51 702
TotalFloating rate (245 051) 113 408 68 962 51 207 Fixed rate and non-interest-bearing 997 582 569 788 82 718 55 490
752 531 683 196 151 680 106 697
The group companies manage their cash flow interest rate risk by monitoring interest rates on a regular basis and engaging in discussions with financial institutions in the relevant countries to obtain the optimum rate.
Consideration is given to hedging options which will be utilised if viable.
Based on simulations performed, the impact on post-tax profit of a 1% shift in interest rates is analysed in the following table:
Group Company
1% increase
1% decrease
1% increase
1% decrease
R’000 R’000 R’000 R’000
Impact on post-tax profit2017 (492) 492 185 (185)
2016 817 (817) 369 (369)
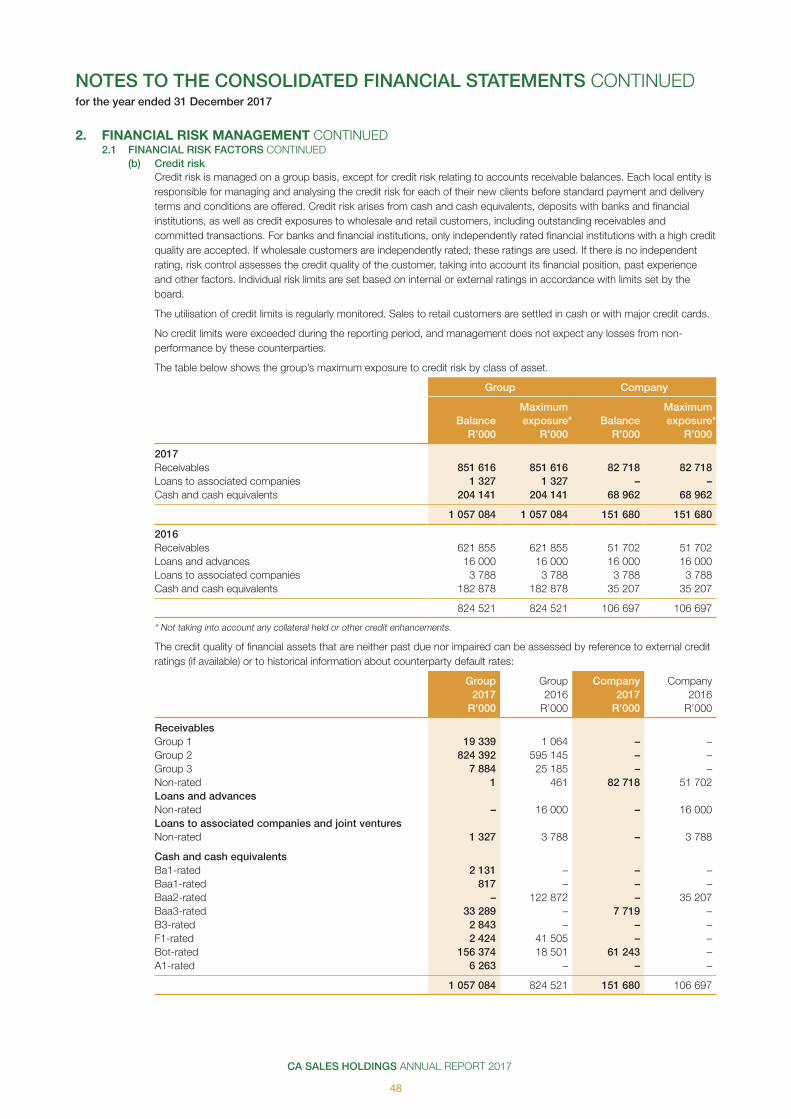
CA SALES HOLDINGS ANNUAL REPORT 2017
48
2. FINANCIAL RISK MANAGEMENT CONTINUED2.1 FINANCIAL RISK FACTORS CONTINUED
(b) Credit riskCredit risk is managed on a group basis, except for credit risk relating to accounts receivable balances. Each local entity is responsible for managing and analysing the credit risk for each of their new clients before standard payment and delivery terms and conditions are offered. Credit risk arises from cash and cash equivalents, deposits with banks and financial institutions, as well as credit exposures to wholesale and retail customers, including outstanding receivables and committed transactions. For banks and financial institutions, only independently rated financial institutions with a high credit quality are accepted. If wholesale customers are independently rated, these ratings are used. If there is no independent rating, risk control assesses the credit quality of the customer, taking into account its financial position, past experience and other factors. Individual risk limits are set based on internal or external ratings in accordance with limits set by the board.
The utilisation of credit limits is regularly monitored. Sales to retail customers are settled in cash or with major credit cards.
No credit limits were exceeded during the reporting period, and management does not expect any losses from non-performance by these counterparties.
The table below shows the group’s maximum exposure to credit risk by class of asset.
Group Company
Maximum MaximumBalance exposure* Balance exposure*
R’000 R’000 R’000 R’000
2017Receivables 851 616 851 616 82 718 82 718 Loans to associated companies 1 327 1 327 – – Cash and cash equivalents 204 141 204 141 68 962 68 962
1 057 084 1 057 084 151 680 151 680
2016Receivables 621 855 621 855 51 702 51 702 Loans and advances 16 000 16 000 16 000 16 000 Loans to associated companies 3 788 3 788 3 788 3 788 Cash and cash equivalents 182 878 182 878 35 207 35 207
824 521 824 521 106 697 106 697
* Not taking into account any collateral held or other credit enhancements.
The credit quality of financial assets that are neither past due nor impaired can be assessed by reference to external credit ratings (if available) or to historical information about counterparty default rates:
Group Group Company Company2017 2016 2017 2016
R’000 R’000 R’000 R’000
ReceivablesGroup 1 19 339 1 064 – –Group 2 824 392 595 145 – –Group 3 7 884 25 185 – –Non-rated 1 461 82 718 51 702 Loans and advancesNon-rated – 16 000 – 16 000 Loans to associated companies and joint venturesNon-rated 1 327 3 788 – 3 788
Cash and cash equivalentsBa1-rated 2 131 – – –Baa1-rated 817 – – –Baa2-rated – 122 872 – 35 207 Baa3-rated 33 289 – 7 719 –B3-rated 2 843 – – –F1-rated 2 424 41 505 – – Bot-rated 156 374 18 501 61 243 – A1-rated 6 263 – – –
1 057 084 824 521 151 680 106 697
NOTES TO THE CONSOLIDATED FINANCIAL STATEMENTS CONTINUEDfor the year ended 31 December 2017
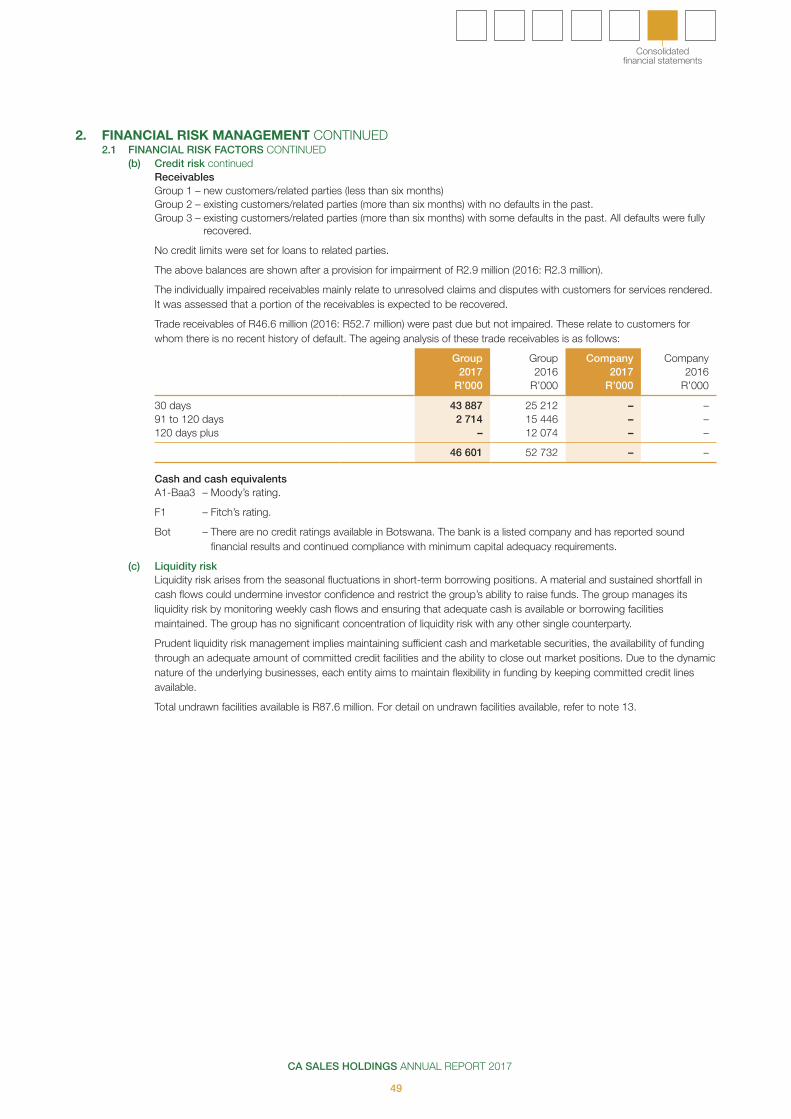
CA SALES HOLDINGS ANNUAL REPORT 2017
49
Consolidated financial statements
2. FINANCIAL RISK MANAGEMENT CONTINUED2.1 FINANCIAL RISK FACTORS CONTINUED
(b) Credit risk continuedReceivablesGroup 1 – new customers/related parties (less than six months)Group 2 – existing customers/related parties (more than six months) with no defaults in the past.Group 3 – existing customers/related parties (more than six months) with some defaults in the past. All defaults were fully
recovered.
No credit limits were set for loans to related parties.
The above balances are shown after a provision for impairment of R2.9 million (2016: R2.3 million).
The individually impaired receivables mainly relate to unresolved claims and disputes with customers for services rendered. It was assessed that a portion of the receivables is expected to be recovered.
Trade receivables of R46.6 million (2016: R52.7 million) were past due but not impaired. These relate to customers for whom there is no recent history of default. The ageing analysis of these trade receivables is as follows:
Group Group Company Company2017 2016 2017 2016
R’000 R’000 R’000 R’000
30 days 43 887 25 212 – – 91 to 120 days 2 714 15 446 – – 120 days plus – 12 074 – –
46 601 52 732 – –
Cash and cash equivalentsA1-Baa3 – Moody’s rating.
F1 – Fitch’s rating.
Bot – There are no credit ratings available in Botswana. The bank is a listed company and has reported sound financial results and continued compliance with minimum capital adequacy requirements.
(c) Liquidity riskLiquidity risk arises from the seasonal fluctuations in short-term borrowing positions. A material and sustained shortfall in cash flows could undermine investor confidence and restrict the group’s ability to raise funds. The group manages its liquidity risk by monitoring weekly cash flows and ensuring that adequate cash is available or borrowing facilities maintained. The group has no significant concentration of liquidity risk with any other single counterparty.
Prudent liquidity risk management implies maintaining sufficient cash and marketable securities, the availability of funding through an adequate amount of committed credit facilities and the ability to close out market positions. Due to the dynamic nature of the underlying businesses, each entity aims to maintain flexibility in funding by keeping committed credit lines available.
Total undrawn facilities available is R87.6 million. For detail on undrawn facilities available, refer to note 13.
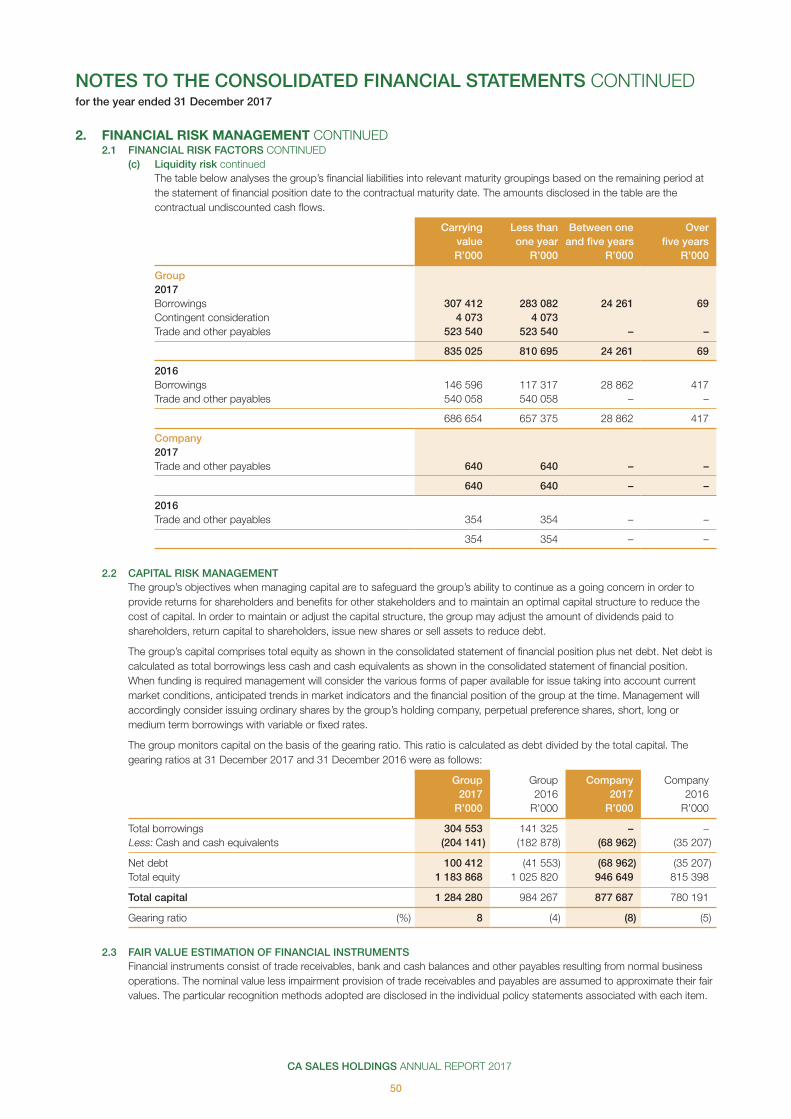
CA SALES HOLDINGS ANNUAL REPORT 2017
50
2. FINANCIAL RISK MANAGEMENT CONTINUED2.1 FINANCIAL RISK FACTORS CONTINUED
(c) Liquidity risk continuedThe table below analyses the group’s financial liabilities into relevant maturity groupings based on the remaining period at the statement of financial position date to the contractual maturity date. The amounts disclosed in the table are the contractual undiscounted cash flows.
Carrying Less than Between one Overvalue one year and five years five yearsR’000 R’000 R’000 R’000
Group2017Borrowings 307 412 283 082 24 261 69 Contingent consideration 4 073 4 073 Trade and other payables 523 540 523 540 – –
835 025 810 695 24 261 69
2016Borrowings 146 596 117 317 28 862 417 Trade and other payables 540 058 540 058 – –
686 654 657 375 28 862 417
Company2017Trade and other payables 640 640 – –
640 640 – –
2016Trade and other payables 354 354 – –
354 354 – –
2.2 CAPITAL RISK MANAGEMENTThe group’s objectives when managing capital are to safeguard the group’s ability to continue as a going concern in order to provide returns for shareholders and benefits for other stakeholders and to maintain an optimal capital structure to reduce the cost of capital. In order to maintain or adjust the capital structure, the group may adjust the amount of dividends paid to shareholders, return capital to shareholders, issue new shares or sell assets to reduce debt.
The group’s capital comprises total equity as shown in the consolidated statement of financial position plus net debt. Net debt is calculated as total borrowings less cash and cash equivalents as shown in the consolidated statement of financial position. When funding is required management will consider the various forms of paper available for issue taking into account current market conditions, anticipated trends in market indicators and the financial position of the group at the time. Management will accordingly consider issuing ordinary shares by the group’s holding company, perpetual preference shares, short, long or medium term borrowings with variable or fixed rates.
The group monitors capital on the basis of the gearing ratio. This ratio is calculated as debt divided by the total capital. The gearing ratios at 31 December 2017 and 31 December 2016 were as follows:
Group Group Company Company2017 2016 2017 2016
R’000 R’000 R’000 R’000
Total borrowings 304 553 141 325 – –Less: Cash and cash equivalents (204 141) (182 878) (68 962) (35 207)
Net debt 100 412 (41 553) (68 962) (35 207)Total equity 1 183 868 1 025 820 946 649 815 398
Total capital 1 284 280 984 267 877 687 780 191
Gearing ratio (%) 8 (4) (8) (5)
2.3 FAIR VALUE ESTIMATION OF FINANCIAL INSTRUMENTSFinancial instruments consist of trade receivables, bank and cash balances and other payables resulting from normal business operations. The nominal value less impairment provision of trade receivables and payables are assumed to approximate their fair values. The particular recognition methods adopted are disclosed in the individual policy statements associated with each item.
NOTES TO THE CONSOLIDATED FINANCIAL STATEMENTS CONTINUEDfor the year ended 31 December 2017

CA SALES HOLDINGS ANNUAL REPORT 2017
51
Consolidated financial statements
Vehicles, Officeplant and equipment Computer Leasehold
machinery and other equipment property TotalR’000 R’000 R’000 R’000 R’000
3. PROPERTY, PLANT AND EQUIPMENTGroup2017At the end of the yearCost or valuation 243 448 26 934 33 498 38 303 918 Accumulated depreciation (164 901) (14 401) (23 791) (18) (203 111)
Net book value 78 547 12 533 9 707 20 100 807
Reconciliation of net book value:Opening net book value 74 812 12 617 9 700 – 97 129 Exchange differences 262 (1 184) (62) – (984)Additions 18 824 837 4 668 38 24 367 Disposals (1 815) (7) (185) – (2 007)Subsidiaries acquired 4 001 2 798 484 – 7 283 Depreciation (17 537) (2 528) (4 898) (18) (24 981)
Closing net book value 78 547 12 533 9 707 20 100 807
Leased assets included above comprise:Cost of capitalised finance leases 36 993 954 4 480 38 42 465 Accumulated depreciation (19 695) (288) (2 856) (18) (22 857)
Net book value 17 298 666 1 624 20 19 608
2016At the end of the yearCost or valuation 221 983 25 903 30 669 – 278 555 Accumulated depreciation (147 171) (13 286) (20 969) – (181 426)
Net book value 74 812 12 617 9 700 – 97 129
Reconciliation of net book value:Opening net book value 63 244 11 340 10 061 – 84 645 Exchange differences (3 953) 1 609 (1 420) – (3 764)Additions 36 195 2 163 5 456 – 43 814 Disposals (4 241) (25) – – (4 266)Subsidiaries acquired 3 888 54 46 – 3 988 Depreciation (20 321) (2 524) (4 443) – (27 288)
Closing net book value 74 812 12 617 9 700 – 97 129
Leased assets included above comprise:Cost of capitalised finance leases 80 869 2 402 4 103 – 87 374 Accumulated depreciation (33 116) (445) (2 139) – (35 700)
Net book value 47 753 1 957 1 964 – 51 674
The company does not have any property, plant and equipment.
The group companies lease various vehicles and machinery under non-cancellable finance lease agreements. The lease terms are between three and five years, and the assets are owned by the group companies.
A register with full detail of property, plant and equipment is available at each company’s registered office.
Refer to note 13 for detail of property, plant and equipment encumbered as security for borrowings from financial institutions.
No major change in the nature of property, plant and equipment or change in the policy regarding the use thereof took place during the financial year.
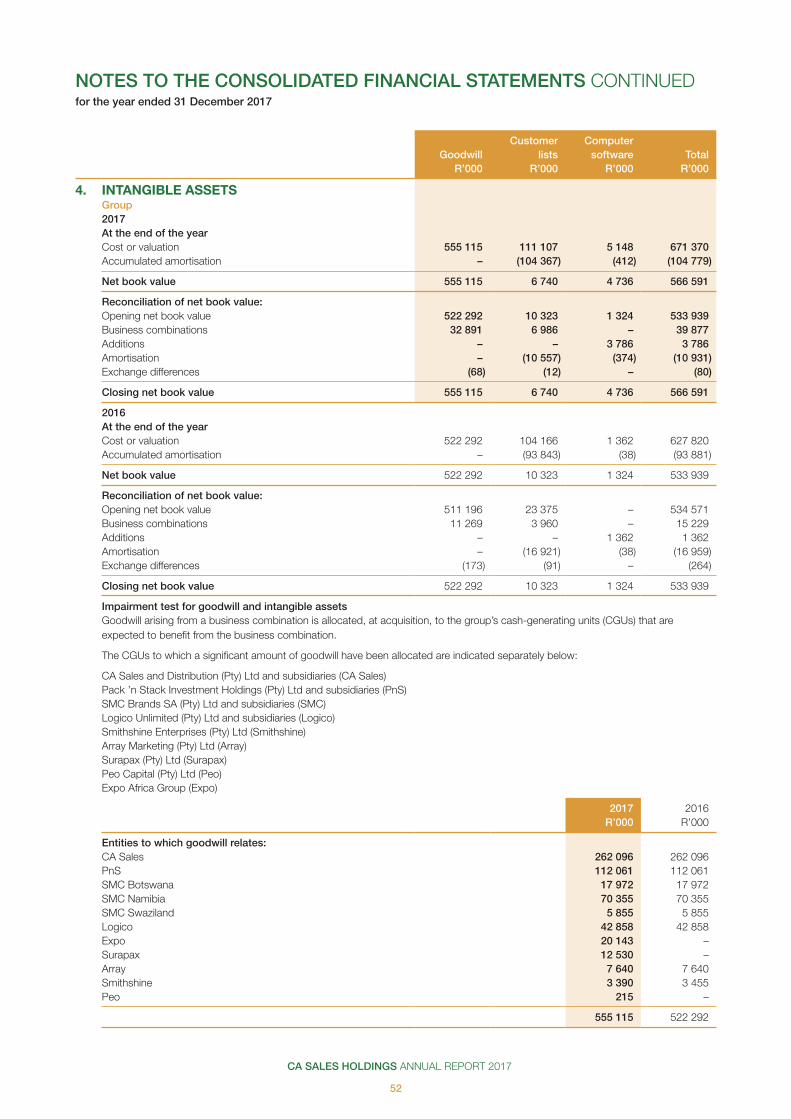
CA SALES HOLDINGS ANNUAL REPORT 2017
52
Customer Computer Goodwill lists software Total
R’000 R’000 R’000 R’000
4. INTANGIBLE ASSETSGroup2017At the end of the yearCost or valuation 555 115 111 107 5 148 671 370 Accumulated amortisation – (104 367) (412) (104 779)
Net book value 555 115 6 740 4 736 566 591
Reconciliation of net book value:Opening net book value 522 292 10 323 1 324 533 939 Business combinations 32 891 6 986 – 39 877 Additions – – 3 786 3 786 Amortisation – (10 557) (374) (10 931)Exchange differences (68) (12) – (80)
Closing net book value 555 115 6 740 4 736 566 591
2016At the end of the yearCost or valuation 522 292 104 166 1 362 627 820 Accumulated amortisation – (93 843) (38) (93 881)
Net book value 522 292 10 323 1 324 533 939
Reconciliation of net book value:Opening net book value 511 196 23 375 – 534 571 Business combinations 11 269 3 960 – 15 229 Additions – – 1 362 1 362 Amortisation – (16 921) (38) (16 959)Exchange differences (173) (91) – (264)
Closing net book value 522 292 10 323 1 324 533 939
Impairment test for goodwill and intangible assetsGoodwill arising from a business combination is allocated, at acquisition, to the group’s cash-generating units (CGUs) that are expected to benefit from the business combination.
The CGUs to which a significant amount of goodwill have been allocated are indicated separately below:
CA Sales and Distribution (Pty) Ltd and subsidiaries (CA Sales)Pack ’n Stack Investment Holdings (Pty) Ltd and subsidiaries (PnS)SMC Brands SA (Pty) Ltd and subsidiaries (SMC)Logico Unlimited (Pty) Ltd and subsidiaries (Logico)Smithshine Enterprises (Pty) Ltd (Smithshine)Array Marketing (Pty) Ltd (Array)Surapax (Pty) Ltd (Surapax)Peo Capital (Pty) Ltd (Peo)Expo Africa Group (Expo)
2017 2016R’000 R’000
Entities to which goodwill relates:CA Sales 262 096 262 096 PnS 112 061 112 061 SMC Botswana 17 972 17 972 SMC Namibia 70 355 70 355 SMC Swaziland 5 855 5 855 Logico 42 858 42 858 Expo 20 143 – Surapax 12 530 –Array 7 640 7 640 Smithshine 3 390 3 455 Peo 215 –
555 115 522 292
NOTES TO THE CONSOLIDATED FINANCIAL STATEMENTS CONTINUEDfor the year ended 31 December 2017
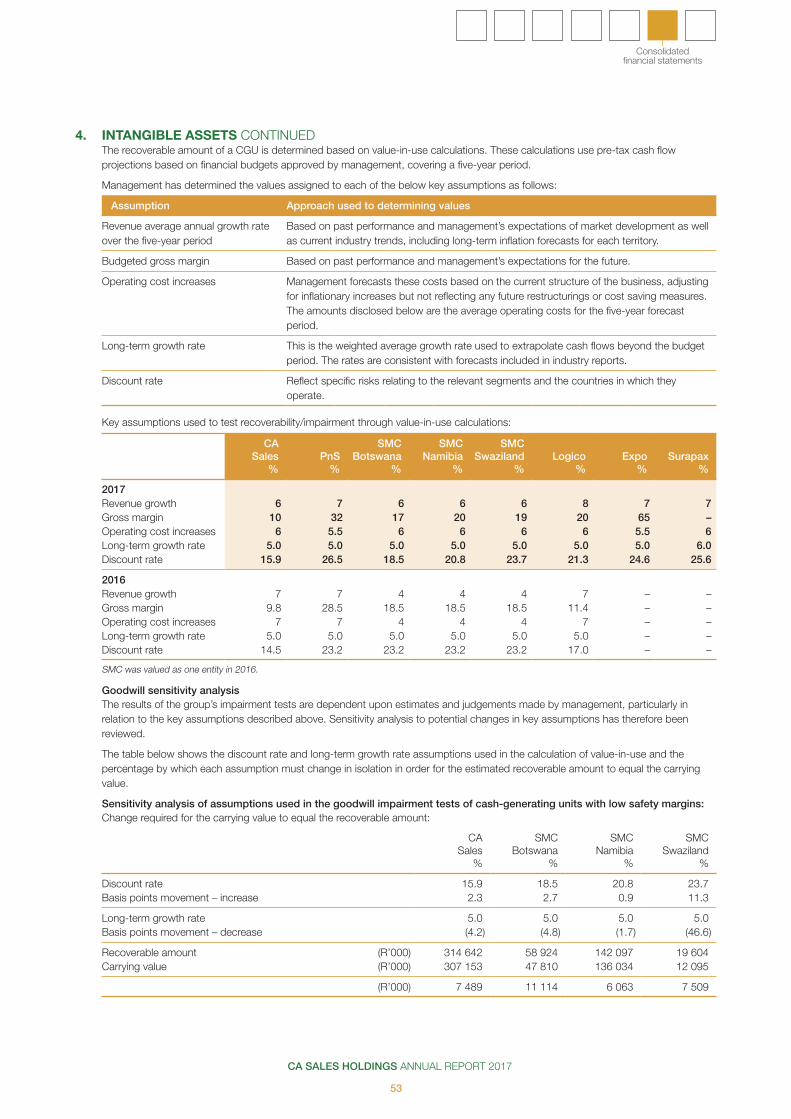
CA SALES HOLDINGS ANNUAL REPORT 2017
53
Consolidated financial statements
4. INTANGIBLE ASSETS CONTINUEDThe recoverable amount of a CGU is determined based on value-in-use calculations. These calculations use pre-tax cash flow projections based on financial budgets approved by management, covering a five-year period.
Management has determined the values assigned to each of the below key assumptions as follows:
Assumption Approach used to determining values
Revenue average annual growth rate over the five-year period
Based on past performance and management’s expectations of market development as well as current industry trends, including long-term inflation forecasts for each territory.
Budgeted gross margin Based on past performance and management’s expectations for the future.
Operating cost increases Management forecasts these costs based on the current structure of the business, adjusting for inflationary increases but not reflecting any future restructurings or cost saving measures. The amounts disclosed below are the average operating costs for the five-year forecast period.
Long-term growth rate This is the weighted average growth rate used to extrapolate cash flows beyond the budget period. The rates are consistent with forecasts included in industry reports.
Discount rate Reflect specific risks relating to the relevant segments and the countries in which they operate.
Key assumptions used to test recoverability/impairment through value-in-use calculations:
CA Sales
%
SMC Botswana
%
SMC Namibia
%
SMC Swaziland
%
Discount rate 15.9 18.5 20.8 23.7Basis points movement – increase 2.3 2.7 0.9 11.3
Long-term growth rate 5.0 5.0 5.0 5.0Basis points movement – decrease (4.2) (4.8) (1.7) (46.6)
Recoverable amount (R’000) 314 642 58 924 142 097 19 604Carrying value (R’000) 307 153 47 810 136 034 12 095
(R’000) 7 489 11 114 6 063 7 509
CA Sales
%PnS
%
SMC Botswana
%
SMC Namibia
%
SMC Swaziland
%Logico
%Expo
%Surapax
%
2017Revenue growth 6 7 6 6 6 8 7 7Gross margin 10 32 17 20 19 20 65 –Operating cost increases 6 5.5 6 6 6 6 5.5 6Long-term growth rate 5.0 5.0 5.0 5.0 5.0 5.0 5.0 6.0Discount rate 15.9 26.5 18.5 20.8 23.7 21.3 24.6 25.6
2016Revenue growth 7 7 4 4 4 7 – – Gross margin 9.8 28.5 18.5 18.5 18.5 11.4 – – Operating cost increases 7 7 4 4 4 7 – – Long-term growth rate 5.0 5.0 5.0 5.0 5.0 5.0 – – Discount rate 14.5 23.2 23.2 23.2 23.2 17.0 – –
SMC was valued as one entity in 2016.
Goodwill sensitivity analysisThe results of the group’s impairment tests are dependent upon estimates and judgements made by management, particularly in relation to the key assumptions described above. Sensitivity analysis to potential changes in key assumptions has therefore been reviewed.
The table below shows the discount rate and long-term growth rate assumptions used in the calculation of value-in-use and the percentage by which each assumption must change in isolation in order for the estimated recoverable amount to equal the carrying value.
Sensitivity analysis of assumptions used in the goodwill impairment tests of cash-generating units with low safety margins:Change required for the carrying value to equal the recoverable amount:
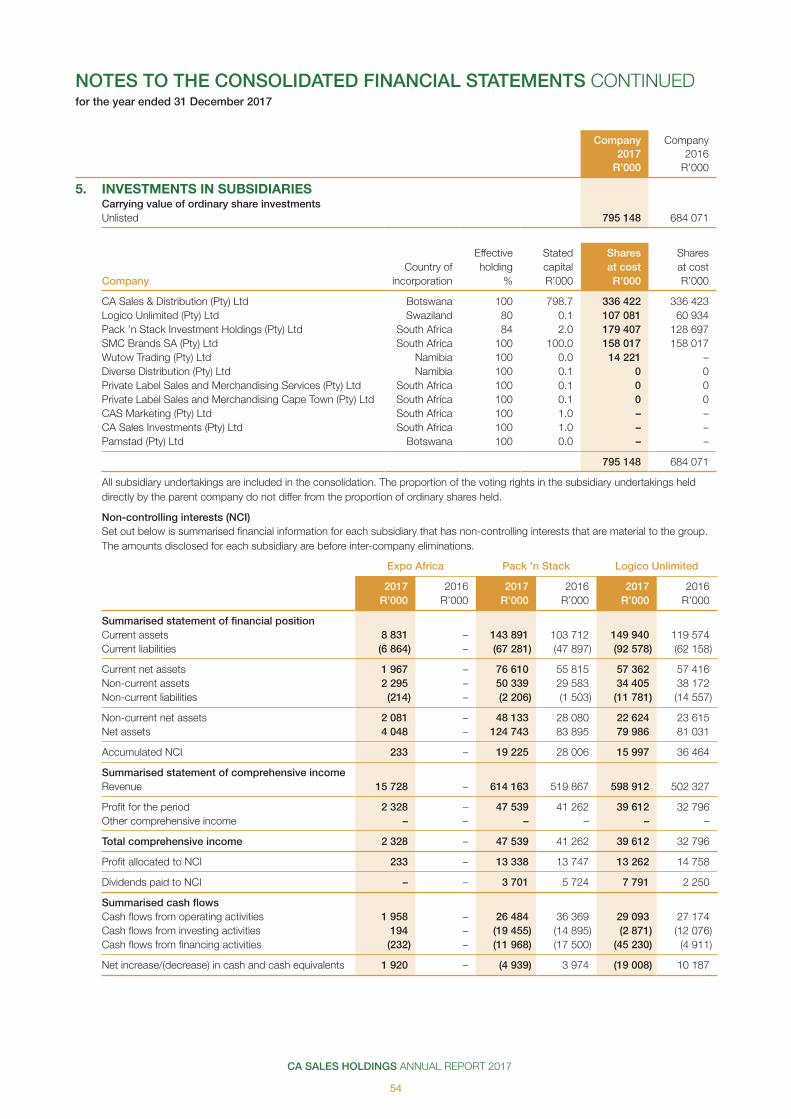
CA SALES HOLDINGS ANNUAL REPORT 2017
54
Company Company2017 2016
R’000 R’000
5. INVESTMENTS IN SUBSIDIARIESCarrying value of ordinary share investmentsUnlisted 795 148 684 071
Effective Stated Shares Shares Country of holding capital at cost at cost
Company incorporation % R’000 R’000 R’000
CA Sales & Distribution (Pty) Ltd Botswana 100 798.7 336 422 336 423 Logico Unlimited (Pty) Ltd Swaziland 80 0.1 107 081 60 934 Pack ’n Stack Investment Holdings (Pty) Ltd South Africa 84 2.0 179 407 128 697 SMC Brands SA (Pty) Ltd South Africa 100 100.0 158 017 158 017 Wutow Trading (Pty) Ltd Namibia 100 0.0 14 221 –Diverse Distribution (Pty) Ltd Namibia 100 0.1 0 0 Private Label Sales and Merchandising Services (Pty) Ltd South Africa 100 0.1 0 0 Private Label Sales and Merchandising Cape Town (Pty) Ltd South Africa 100 0.1 0 0 CAS Marketing (Pty) Ltd South Africa 100 1.0 – – CA Sales Investments (Pty) Ltd South Africa 100 1.0 – – Pamstad (Pty) Ltd Botswana 100 0.0 – –
795 148 684 071
All subsidiary undertakings are included in the consolidation. The proportion of the voting rights in the subsidiary undertakings held directly by the parent company do not differ from the proportion of ordinary shares held.
Non-controlling interests (NCI)Set out below is summarised financial information for each subsidiary that has non-controlling interests that are material to the group. The amounts disclosed for each subsidiary are before inter-company eliminations.
Expo Africa Pack ’n Stack Logico Unlimited
2017 2016 2017 2016 2017 2016R’000 R’000 R’000 R’000 R’000 R’000
Summarised statement of financial positionCurrent assets 8 831 – 143 891 103 712 149 940 119 574 Current liabilities (6 864) – (67 281) (47 897) (92 578) (62 158)
Current net assets 1 967 – 76 610 55 815 57 362 57 416 Non-current assets 2 295 – 50 339 29 583 34 405 38 172 Non-current liabilities (214) – (2 206) (1 503) (11 781) (14 557)
Non-current net assets 2 081 – 48 133 28 080 22 624 23 615Net assets 4 048 – 124 743 83 895 79 986 81 031
Accumulated NCI 233 – 19 225 28 006 15 997 36 464
Summarised statement of comprehensive incomeRevenue 15 728 – 614 163 519 867 598 912 502 327
Profit for the period 2 328 – 47 539 41 262 39 612 32 796 Other comprehensive income – – – – – –
Total comprehensive income 2 328 – 47 539 41 262 39 612 32 796
Profit allocated to NCI 233 – 13 338 13 747 13 262 14 758
Dividends paid to NCI – – 3 701 5 724 7 791 2 250
Summarised cash flowsCash flows from operating activities 1 958 – 26 484 36 369 29 093 27 174 Cash flows from investing activities 194 – (19 455) (14 895) (2 871) (12 076)Cash flows from financing activities (232) – (11 968) (17 500) (45 230) (4 911)
Net increase/(decrease) in cash and cash equivalents 1 920 – (4 939) 3 974 (19 008) 10 187
NOTES TO THE CONSOLIDATED FINANCIAL STATEMENTS CONTINUEDfor the year ended 31 December 2017
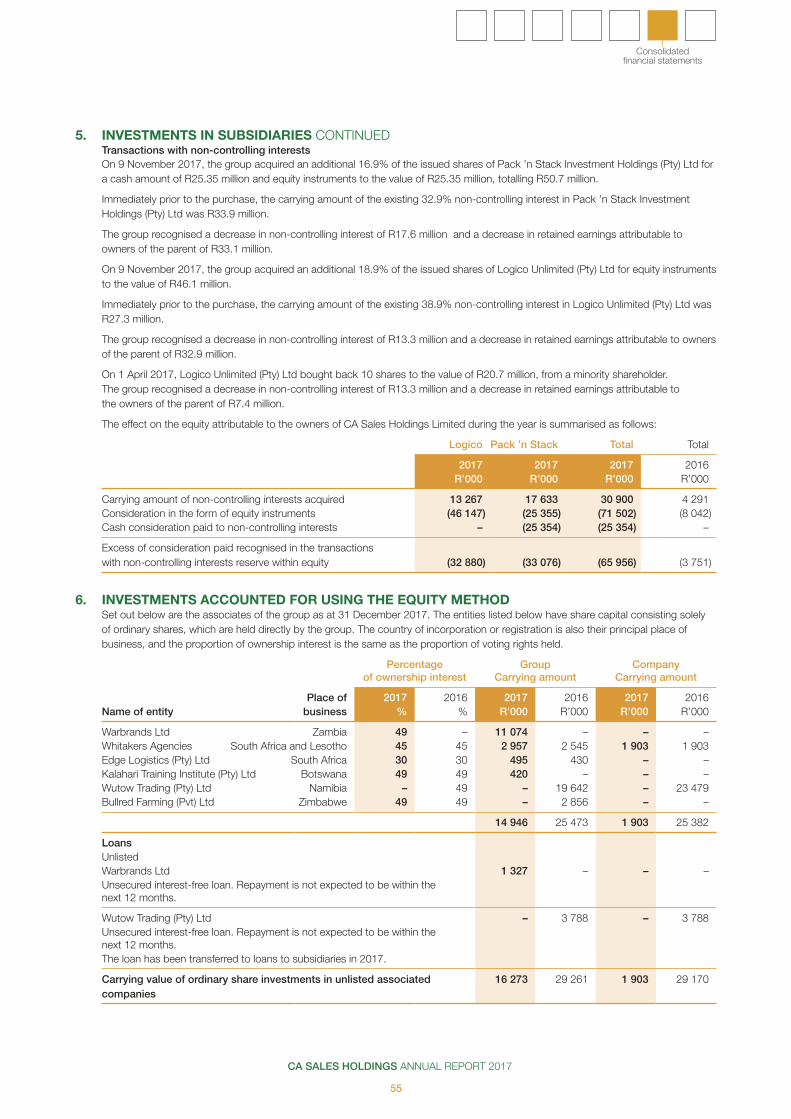
CA SALES HOLDINGS ANNUAL REPORT 2017
55
Consolidated financial statements
5. INVESTMENTS IN SUBSIDIARIES CONTINUEDTransactions with non-controlling interestsOn 9 November 2017, the group acquired an additional 16.9% of the issued shares of Pack ’n Stack Investment Holdings (Pty) Ltd for a cash amount of R25.35 million and equity instruments to the value of R25.35 million, totalling R50.7 million.
Immediately prior to the purchase, the carrying amount of the existing 32.9% non-controlling interest in Pack ’n Stack Investment Holdings (Pty) Ltd was R33.9 million.
The group recognised a decrease in non-controlling interest of R17.6 million and a decrease in retained earnings attributable to owners of the parent of R33.1 million.
On 9 November 2017, the group acquired an additional 18.9% of the issued shares of Logico Unlimited (Pty) Ltd for equity instruments to the value of R46.1 million.
Immediately prior to the purchase, the carrying amount of the existing 38.9% non-controlling interest in Logico Unlimited (Pty) Ltd was R27.3 million.
The group recognised a decrease in non-controlling interest of R13.3 million and a decrease in retained earnings attributable to owners of the parent of R32.9 million.
On 1 April 2017, Logico Unlimited (Pty) Ltd bought back 10 shares to the value of R20.7 million, from a minority shareholder. The group recognised a decrease in non-controlling interest of R13.3 million and a decrease in retained earnings attributable to the owners of the parent of R7.4 million.
The effect on the equity attributable to the owners of CA Sales Holdings Limited during the year is summarised as follows:
Logico Pack ’n Stack Total Total
2017 2017 2017 2016R’000 R’000 R’000 R’000
Carrying amount of non-controlling interests acquired 13 267 17 633 30 900 4 291 Consideration in the form of equity instruments (46 147) (25 355) (71 502) (8 042)Cash consideration paid to non-controlling interests – (25 354) (25 354) –
Excess of consideration paid recognised in the transactions with non-controlling interests reserve within equity (32 880) (33 076) (65 956) (3 751)
6. INVESTMENTS ACCOUNTED FOR USING THE EQUITY METHODSet out below are the associates of the group as at 31 December 2017. The entities listed below have share capital consisting solely of ordinary shares, which are held directly by the group. The country of incorporation or registration is also their principal place of business, and the proportion of ownership interest is the same as the proportion of voting rights held.
Percentageof ownership interest
GroupCarrying amount
CompanyCarrying amount
Place of 2017 2016 2017 2016 2017 2016Name of entity business % % R’000 R’000 R’000 R’000
Warbrands Ltd Zambia 49 – 11 074 – – –Whitakers Agencies South Africa and Lesotho 45 45 2 957 2 545 1 903 1 903 Edge Logistics (Pty) Ltd South Africa 30 30 495 430 – –Kalahari Training Institute (Pty) Ltd Botswana 49 49 420 – – –Wutow Trading (Pty) Ltd Namibia – 49 – 19 642 – 23 479 Bullred Farming (Pvt) Ltd Zimbabwe 49 49 – 2 856 – –
14 946 25 473 1 903 25 382
LoansUnlistedWarbrands Ltd 1 327 – – – Unsecured interest-free loan. Repayment is not expected to be within the next 12 months.
Wutow Trading (Pty) Ltd – 3 788 – 3 788 Unsecured interest-free loan. Repayment is not expected to be within the next 12 months.The loan has been transferred to loans to subsidiaries in 2017.
Carrying value of ordinary share investments in unlisted associated companies
16 273 29 261 1 903 29 170
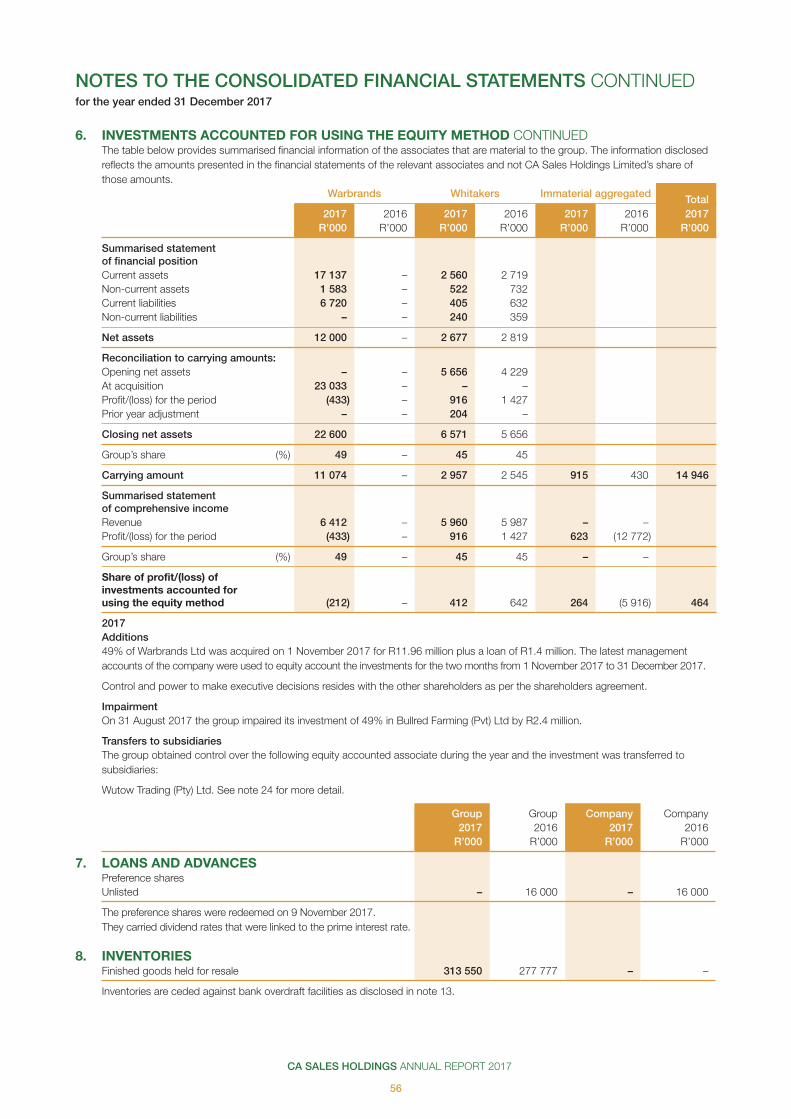
CA SALES HOLDINGS ANNUAL REPORT 2017
56
6. INVESTMENTS ACCOUNTED FOR USING THE EQUITY METHOD CONTINUEDThe table below provides summarised financial information of the associates that are material to the group. The information disclosed reflects the amounts presented in the financial statements of the relevant associates and not CA Sales Holdings Limited’s share of those amounts.
Warbrands Whitakers Immaterial aggregated Total 2017 2016 2017 2016 2017 2016 2017
R’000 R’000 R’000 R’000 R’000 R’000 R’000
Summarised statement of financial positionCurrent assets 17 137 – 2 560 2 719 Non-current assets 1 583 – 522 732 Current liabilities 6 720 – 405 632 Non-current liabilities – – 240 359
Net assets 12 000 – 2 677 2 819
Reconciliation to carrying amounts:Opening net assets – – 5 656 4 229 At acquisition 23 033 – – –Profit/(loss) for the period (433) – 916 1 427 Prior year adjustment – – 204 –
Closing net assets 22 600 6 571 5 656
Group’s share (%) 49 – 45 45
Carrying amount 11 074 – 2 957 2 545 915 430 14 946
Summarised statement of comprehensive incomeRevenue 6 412 – 5 960 5 987 – –Profit/(loss) for the period (433) – 916 1 427 623 (12 772)
Group’s share (%) 49 – 45 45 – –
Share of profit/(loss) of investments accounted for using the equity method (212) – 412 642 264 (5 916) 464
2017Additions49% of Warbrands Ltd was acquired on 1 November 2017 for R11.96 million plus a loan of R1.4 million. The latest management accounts of the company were used to equity account the investments for the two months from 1 November 2017 to 31 December 2017.
Control and power to make executive decisions resides with the other shareholders as per the shareholders agreement.
ImpairmentOn 31 August 2017 the group impaired its investment of 49% in Bullred Farming (Pvt) Ltd by R2.4 million.
Transfers to subsidiariesThe group obtained control over the following equity accounted associate during the year and the investment was transferred to subsidiaries:
Wutow Trading (Pty) Ltd. See note 24 for more detail.
NOTES TO THE CONSOLIDATED FINANCIAL STATEMENTS CONTINUEDfor the year ended 31 December 2017
Group Group Company Company2017 2016 2017 2016
R’000 R’000 R’000 R’000
7. LOANS AND ADVANCESPreference sharesUnlisted – 16 000 – 16 000
The preference shares were redeemed on 9 November 2017. They carried dividend rates that were linked to the prime interest rate.
8. INVENTORIESFinished goods held for resale 313 550 277 777 – –
Inventories are ceded against bank overdraft facilities as disclosed in note 13.

CA SALES HOLDINGS ANNUAL REPORT 2017
57
Consolidated financial statements
Group Group Company Company2017 2016 2017 2016
R’000 R’000 R’000 R’000
9. TRADE AND OTHER RECEIVABLESTrade receivables 845 279 616 341 – – Less: provision for impairment of trade receivables (2 915) (2 260) – –
Trade receivables 842 364 614 081 – – Receivables from related parties – – 82 718 51 702 Vat receivable 24 664 4 475 – – Deposits 4 882 3 467 – – Prepayments 2 109 1 510 – – Other receivables 4 370 4 307 – –
878 389 627 840 82 718 51 702
Current portion 878 389 627 840 82 718 51 702
Trade receivables of R842.4 million (2016: R614.1 million) were fully performing.
The carrying amounts of the group’s trade and other receivables are denominated in the following currencies:Rand (ZAR), Namibian Dollar (NAD) and Emalangeni (SZL) 630 815 159 942 82 718 51 702 Botswana Pula (BWP) 247 574 467 898 – –
878 389 627 840 82 718 51 702
The Namibian Dollar (NAD) and Emalangeni (SZL) is currently at a ratio of one to one to the Rand.
Trade receivables of R2.9 million (2016: R2.3 million) were impaired.
The ageing of these receivables is as follows:Over six months 2 915 2 260 – –
Movements on the group provision for impairment of trade receivables are as follows:At 1 January 2 260 1 970 – –Provision for receivables impairment 673 315 – –Other (18) (25) – –
At 31 December 2 915 2 260 – –
The creation and release of provision for impaired receivables have been included in “other operating expenses” in the statement of comprehensive income (note 17) and the criteria for the creation and write off is explained in the accounting policies.
The other classes within trade and other receivables do not contain impaired assets.
The maximum exposure to credit risk at the reporting date is the carrying value of each class of receivables mentioned above. The group does not hold any collateral as security.
Group Group Company Company2017 2016 2017 2016
R’000 R’000 R’000 R’000
10. CASH AND CASH EQUIVALENTSCash at bank and in hand 202 935 147 040 68 962 35 207 Short-term bank deposits 1 206 35 838 – –
204 141 182 878 68 962 35 207
Cash and cash equivalents include the following for the purposes of the statement of cash flows:Cash and cash equivalents 204 141 182 878 68 962 35 207 Bank overdrafts (107 558) (50 483) – –
96 583 132 395 68 962 35 207
The carrying amounts of the group’s cash and cash equivalents are denominated in the following currencies:Rand (ZAR), Namibian Dollar (NAD) and Emalangeni (SZL) 48 163 110 103 7 719 35 207 Botswana Pula (BWP) 155 978 72 775 61 243 –
96 583 132 395 68 962 35 207

CA SALES HOLDINGS ANNUAL REPORT 2017
58
NOTES TO THE CONSOLIDATED FINANCIAL STATEMENTS CONTINUEDfor the year ended 31 December 2017
Group and Company
2017 2016Number Number
11. STATED CAPITALAuthorised sharesOrdinary shares with no par value 2 000 000 000 1 000 000
2017 2016Number Number 2017 2016
Issued shares of shares of shares R’000 R’000
Balance at beginning of the year 289 572 200 000 708 944 371 231 Subscription shares – 89 572 – 337 713 Share split 405 111 228 – – –Shares issued 39 233 630 – 138 004 –Transaction costs arising on shares listing – – (5 422) –
Balance at end of the year 444 634 430 289 572 841 526 708 944
On 8 August 2017, the shareholders resolved, to split the number of shares in issue on a ratio of 1 400 shares for every share held. In addition, the shareholders also resolved to increase the authorised share capital of the company from 1 000 000 shares to 2 000 000 000 shares.
Substantial shareholders above 5%Pursuant to the provisions of section 56 of the South African Companies Act, the following shareholders held directly and indirectly equal to or in excess of 5% of the issued share capital as at 31 December 2017:
Shareholder nameTotal
shareholding %
PSG Alpha Investments (Pty) Ltd 214 057 200 48,1 Kgori Capital Nominees and Funds 39 244 149 9,6 Export Marketing Investments (Pty) Ltd 42 200 690 9,5 FNB Nominees 36 287 595 7,2
Total 331 789 634 74,4
Share incentive schemeCA Sales Holdings Limited operated a single equity-settled share incentive scheme, being the share option scheme. In terms of the scheme, shares/share options are granted to executive directors.
In terms of the aforementioned scheme, shares/share options are allocated to participants on the grant date at fair value. The settlement of the purchase consideration payable by the executive in terms of the shares granted occurs when options are exercised.
The total equity-settled share-based payment charge recognised in the statement of comprehensive income amounted to R4.3 million. This charge, net of the related tax effect, was debited to the statement of comprehensive income and credited to other reserves (refer note 12).
Type of arrangement Executive share option schemeBefore
share split
Date granted 1 January 2015Number granted 16 216 200 11 583 Contractual life 4 years Vesting conditions 25% per year Estimated fair value of each share option granted R2.42 R3 384
The estimated fair value was calculated by applying a binomial option pricing model.
Binomial option pricing model inputShare price at grand date R1.86 R2 604.00 Exercise price R1.86 R2 604.00Expected volatility 29.46%Expected dividend yield 2.03%Contractual life 4 yearsRisk-free interest rate 6.59%
To allow for the effects of early exercise, it was assumed that the executives would exercise the options after vesting date when the share price was the same as the exercise price. Volatility was calculated using similar businesses listed on the JSE’s share average volatility, as the company’s shares were not traded in public; the company expects the volatility of its share price to be the same as similar companies that are listed.
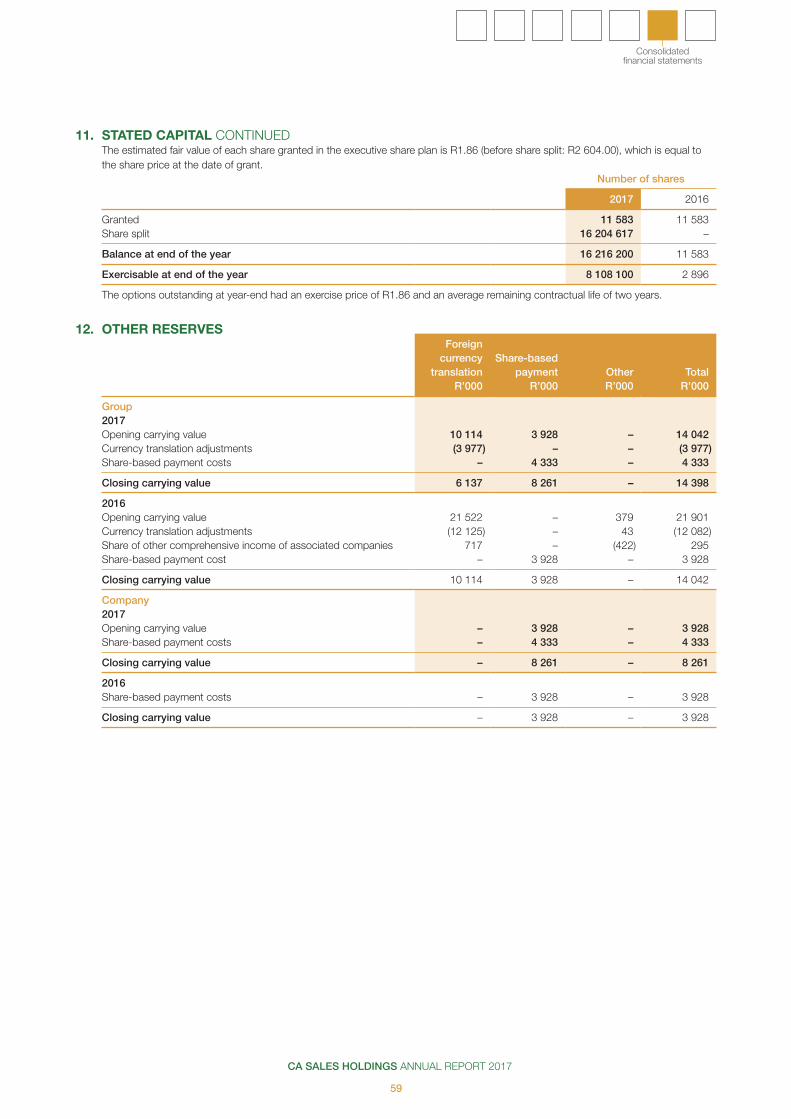
CA SALES HOLDINGS ANNUAL REPORT 2017
59
Consolidated financial statements
11. STATED CAPITAL CONTINUEDThe estimated fair value of each share granted in the executive share plan is R1.86 (before share split: R2 604.00), which is equal to the share price at the date of grant.
Number of shares
2017 2016
Granted 11 583 11 583 Share split 16 204 617 –
Balance at end of the year 16 216 200 11 583
Exercisable at end of the year 8 108 100 2 896
The options outstanding at year-end had an exercise price of R1.86 and an average remaining contractual life of two years.
12. OTHER RESERVESForeign
currency Share-basedtranslation payment Other Total
R’000 R’000 R’000 R’000
Group2017Opening carrying value 10 114 3 928 – 14 042 Currency translation adjustments (3 977) – – (3 977)Share-based payment costs – 4 333 – 4 333
Closing carrying value 6 137 8 261 – 14 398
2016Opening carrying value 21 522 – 379 21 901 Currency translation adjustments (12 125) – 43 (12 082)Share of other comprehensive income of associated companies 717 – (422) 295 Share-based payment cost – 3 928 – 3 928
Closing carrying value 10 114 3 928 – 14 042
Company2017Opening carrying value – 3 928 – 3 928 Share-based payment costs – 4 333 – 4 333
Closing carrying value – 8 261 – 8 261
2016Share-based payment costs – 3 928 – 3 928
Closing carrying value – 3 928 – 3 928
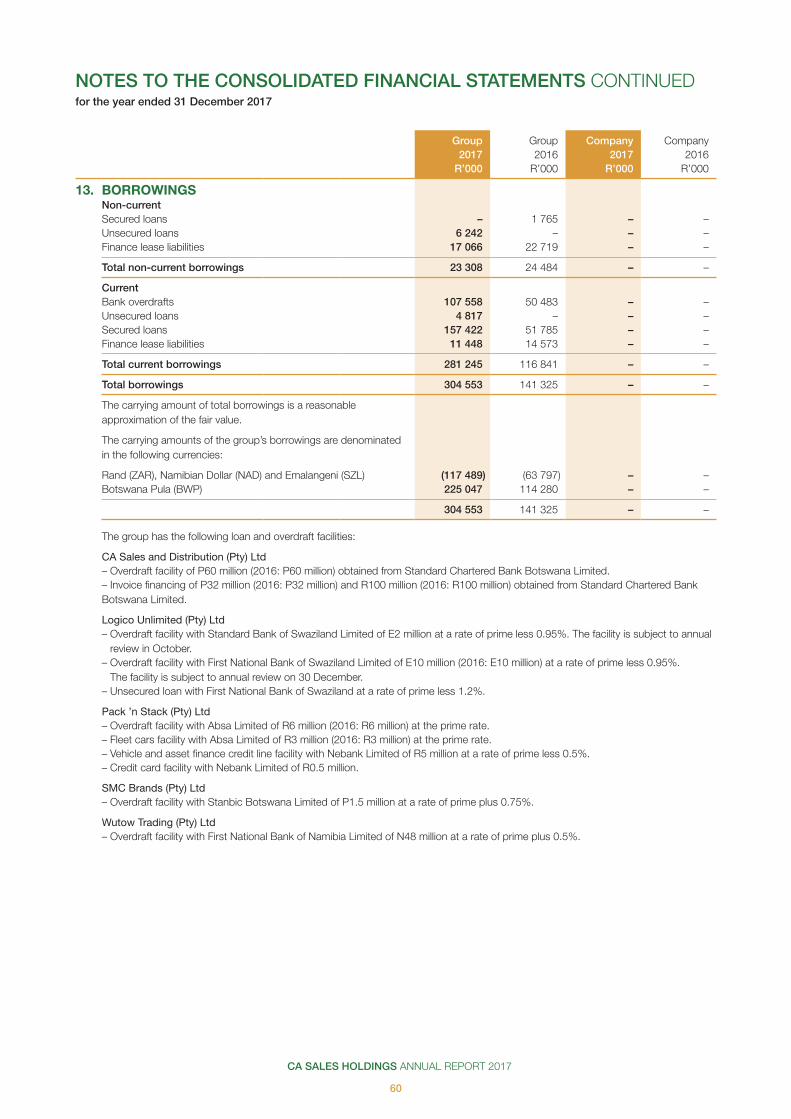
CA SALES HOLDINGS ANNUAL REPORT 2017
60
NOTES TO THE CONSOLIDATED FINANCIAL STATEMENTS CONTINUEDfor the year ended 31 December 2017
Group Group Company Company2017 2016 2017 2016
R’000 R’000 R’000 R’000
13. BORROWINGSNon-currentSecured loans – 1 765 – –Unsecured loans 6 242 – – –Finance lease liabilities 17 066 22 719 – –
Total non-current borrowings 23 308 24 484 – –
CurrentBank overdrafts 107 558 50 483 – –Unsecured loans 4 817 – – –Secured loans 157 422 51 785 – – Finance lease liabilities 11 448 14 573 – –
Total current borrowings 281 245 116 841 – –
Total borrowings 304 553 141 325 – –
The carrying amount of total borrowings is a reasonable approximation of the fair value.
The carrying amounts of the group’s borrowings are denominated in the following currencies:
Rand (ZAR), Namibian Dollar (NAD) and Emalangeni (SZL) (117 489) (63 797) – – Botswana Pula (BWP) 225 047 114 280 – –
304 553 141 325 – –
The group has the following loan and overdraft facilities:
CA Sales and Distribution (Pty) Ltd– Overdraft facility of P60 million (2016: P60 million) obtained from Standard Chartered Bank Botswana Limited.– Invoice financing of P32 million (2016: P32 million) and R100 million (2016: R100 million) obtained from Standard Chartered Bank Botswana Limited.
Logico Unlimited (Pty) Ltd– Overdraft facility with Standard Bank of Swaziland Limited of E2 million at a rate of prime less 0.95%. The facility is subject to annual
review in October.– Overdraft facility with First National Bank of Swaziland Limited of E10 million (2016: E10 million) at a rate of prime less 0.95%.
The facility is subject to annual review on 30 December.– Unsecured loan with First National Bank of Swaziland at a rate of prime less 1.2%.
Pack ’n Stack (Pty) Ltd– Overdraft facility with Absa Limited of R6 million (2016: R6 million) at the prime rate. – Fleet cars facility with Absa Limited of R3 million (2016: R3 million) at the prime rate.– Vehicle and asset finance credit line facility with Nebank Limited of R5 million at a rate of prime less 0.5%.– Credit card facility with Nebank Limited of R0.5 million.
SMC Brands (Pty) Ltd– Overdraft facility with Stanbic Botswana Limited of P1.5 million at a rate of prime plus 0.75%.
Wutow Trading (Pty) Ltd– Overdraft facility with First National Bank of Namibia Limited of N48 million at a rate of prime plus 0.5%.
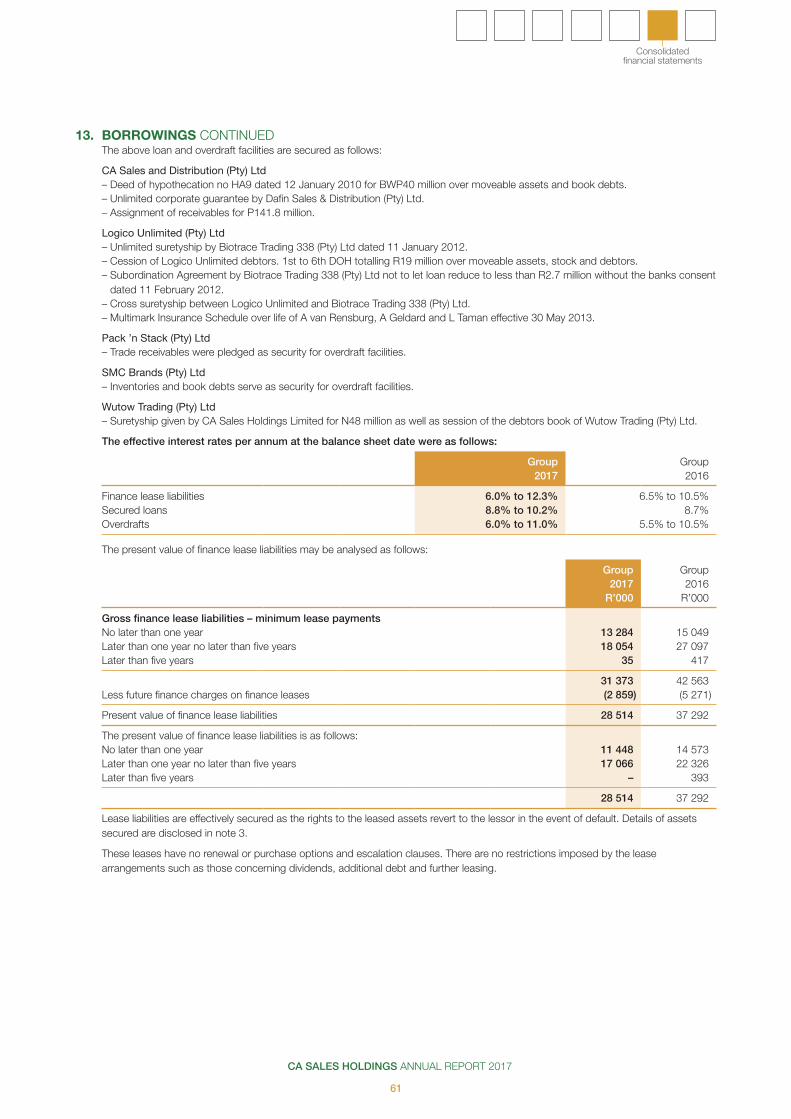
CA SALES HOLDINGS ANNUAL REPORT 2017
61
Consolidated financial statements
13. BORROWINGS CONTINUEDThe above loan and overdraft facilities are secured as follows:
CA Sales and Distribution (Pty) Ltd– Deed of hypothecation no HA9 dated 12 January 2010 for BWP40 million over moveable assets and book debts.– Unlimited corporate guarantee by Dafin Sales & Distribution (Pty) Ltd.– Assignment of receivables for P141.8 million.
Logico Unlimited (Pty) Ltd– Unlimited suretyship by Biotrace Trading 338 (Pty) Ltd dated 11 January 2012.– Cession of Logico Unlimited debtors. 1st to 6th DOH totalling R19 million over moveable assets, stock and debtors.– Subordination Agreement by Biotrace Trading 338 (Pty) Ltd not to let loan reduce to less than R2.7 million without the banks consent
dated 11 February 2012.– Cross suretyship between Logico Unlimited and Biotrace Trading 338 (Pty) Ltd.– Multimark Insurance Schedule over life of A van Rensburg, A Geldard and L Taman effective 30 May 2013.
Pack ’n Stack (Pty) Ltd– Trade receivables were pledged as security for overdraft facilities.
SMC Brands (Pty) Ltd– Inventories and book debts serve as security for overdraft facilities.
Wutow Trading (Pty) Ltd– Suretyship given by CA Sales Holdings Limited for N48 million as well as session of the debtors book of Wutow Trading (Pty) Ltd.
The effective interest rates per annum at the balance sheet date were as follows:
Group Group2017 2016
Finance lease liabilities 6.0% to 12.3% 6.5% to 10.5%Secured loans 8.8% to 10.2% 8.7%Overdrafts 6.0% to 11.0% 5.5% to 10.5%
The present value of finance lease liabilities may be analysed as follows:
Group Group2017 2016
R’000 R’000
Gross finance lease liabilities – minimum lease paymentsNo later than one year 13 284 15 049 Later than one year no later than five years 18 054 27 097 Later than five years 35 417
31 373 42 563 Less future finance charges on finance leases (2 859) (5 271)
Present value of finance lease liabilities 28 514 37 292
The present value of finance lease liabilities is as follows:No later than one year 11 448 14 573Later than one year no later than five years 17 066 22 326 Later than five years – 393
28 514 37 292
Lease liabilities are effectively secured as the rights to the leased assets revert to the lessor in the event of default. Details of assets secured are disclosed in note 3.
These leases have no renewal or purchase options and escalation clauses. There are no restrictions imposed by the lease arrangements such as those concerning dividends, additional debt and further leasing.
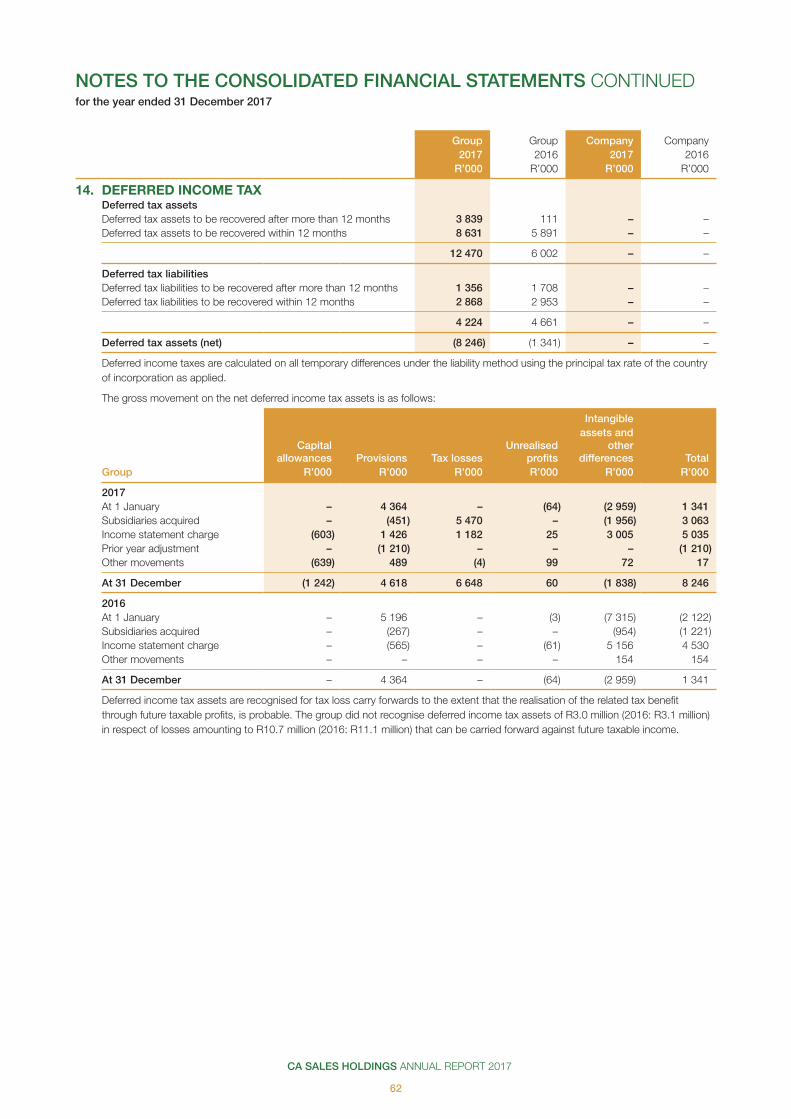
CA SALES HOLDINGS ANNUAL REPORT 2017
62
Group Group Company Company2017 2016 2017 2016
R’000 R’000 R’000 R’000
14. DEFERRED INCOME TAXDeferred tax assetsDeferred tax assets to be recovered after more than 12 months 3 839 111 – – Deferred tax assets to be recovered within 12 months 8 631 5 891 – –
12 470 6 002 – –
Deferred tax liabilitiesDeferred tax liabilities to be recovered after more than 12 months 1 356 1 708 – – Deferred tax liabilities to be recovered within 12 months 2 868 2 953 – –
4 224 4 661 – –
Deferred tax assets (net) (8 246) (1 341) – –
Deferred income taxes are calculated on all temporary differences under the liability method using the principal tax rate of the country of incorporation as applied.
The gross movement on the net deferred income tax assets is as follows:
Intangible
Capital allowances Provisions Tax losses
Unrealised profits
assets andother
differences TotalGroup R’000 R’000 R’000 R’000 R’000 R’000
2017At 1 January – 4 364 – (64) (2 959) 1 341 Subsidiaries acquired – (451) 5 470 – (1 956) 3 063 Income statement charge (603) 1 426 1 182 25 3 005 5 035 Prior year adjustment – (1 210) – – – (1 210)Other movements (639) 489 (4) 99 72 17
At 31 December (1 242) 4 618 6 648 60 (1 838) 8 246
2016At 1 January – 5 196 – (3) (7 315) (2 122)Subsidiaries acquired – (267) – – (954) (1 221)Income statement charge – (565) – (61) 5 156 4 530 Other movements – – – – 154 154
At 31 December – 4 364 – (64) (2 959) 1 341
Deferred income tax assets are recognised for tax loss carry forwards to the extent that the realisation of the related tax benefit through future taxable profits, is probable. The group did not recognise deferred income tax assets of R3.0 million (2016: R3.1 million) in respect of losses amounting to R10.7 million (2016: R11.1 million) that can be carried forward against future taxable income.
NOTES TO THE CONSOLIDATED FINANCIAL STATEMENTS CONTINUEDfor the year ended 31 December 2017

CA SALES HOLDINGS ANNUAL REPORT 2017
63
Consolidated financial statements
Group Group Company Company2017 2016 2017 2016
R’000 R’000 R’000 R’000
15. TRADE AND OTHER PAYABLESTrade payables 480 507 517 606 5 – Amounts due to related parties (note 26) – – 481 354 Dividends payable 2 774 402 1 274 402 VAT payable 15 507 8 398 – – Deferred payments 5 470 – – – Contingent consideration 4 073 – – –Accrued expenses 34 789 28 176 154 –
543 120 554 582 1 914 756
Current portion 543 120 554 582 1 914 756
The carrying amounts of the group’s trade and other payables are denominated in the following currencies:Rand (ZAR), Namibian Dollar (NAD) and Emalangeni (SZL) 199 518 49 400 1 914 756Botswana Pula (BWP) 343 602 505 182 – –
543 120 554 582 1 914 756
16. PROVISIONS
Severancebenefit Bonuses Leave pay Other Total
Group R’000 R’000 R’000 R’000 R’000
Opening balance 6 893 16 793 13 030 2 074 38 790 Charged to statement of comprehensive income 3 861 37 587 1 603 (1 271) 41 780 Utilised during the year – (27 608) (2 044) (894) (30 546)Subsidiaries acquired 10 567 1 011 1 450 3 038 Other (211) (159) (53) (15) (438)
Closing balance 10 553 27 180 13 547 1 344 52 624
Severance benefit schemeFor employees who are citizens of Botswana, the group has implemented the requirements of the Botswana Labour Act relating to a severance benefit scheme. For employees who are non-citizens of Botswana, the group pays gratuity in accordance with the respective contracts of employment.
Bonus provisionsThe group recognises a liability and an expense for bonuses based on a formula that takes into consideration the profit attributable to the company’s shareholders after certain adjustments. The group recognises a provision where contractually obliged or where there is a past practice that has created a constructive obligation.
Leave pay provisionThe leave obligations cover the group’s liability for annual leave. The current portion of this liability includes all of the provided annual leave.
OtherThe group recognises a provision for stock write down.
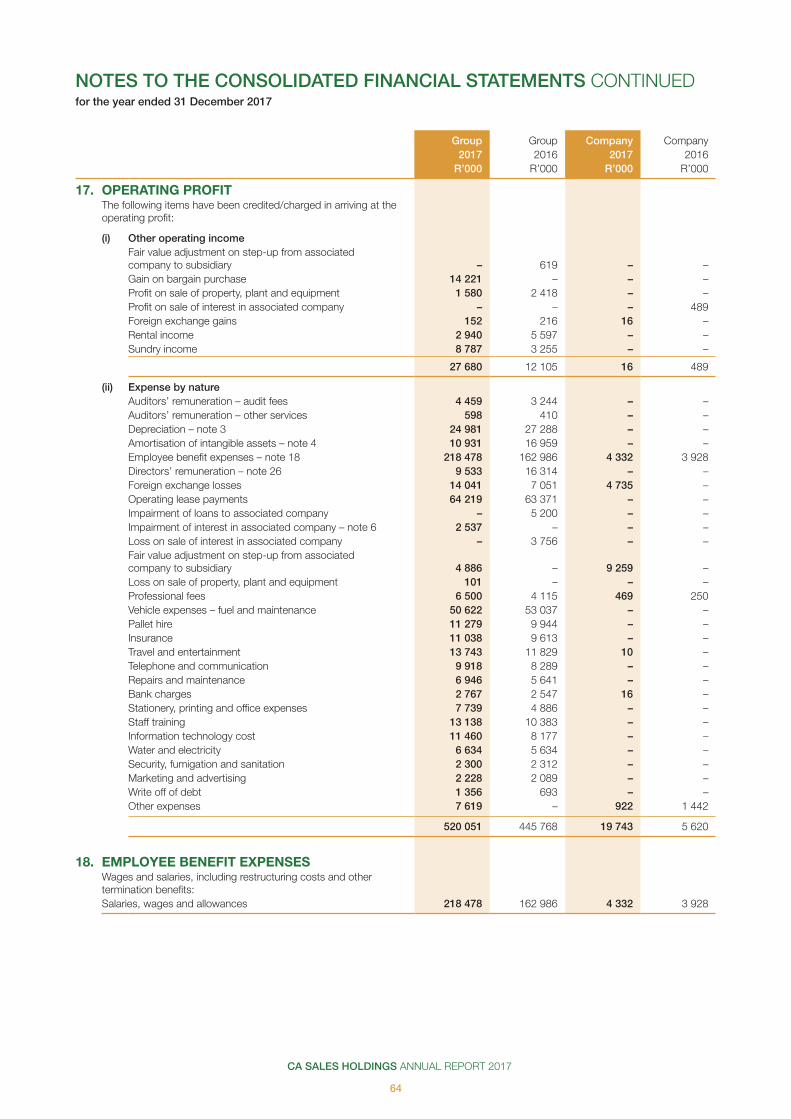
CA SALES HOLDINGS ANNUAL REPORT 2017
64
NOTES TO THE CONSOLIDATED FINANCIAL STATEMENTS CONTINUEDfor the year ended 31 December 2017
Group Group Company Company2017 2016 2017 2016
R’000 R’000 R’000 R’000
17. OPERATING PROFITThe following items have been credited/charged in arriving at the operating profit:
(i) Other operating incomeFair value adjustment on step-up from associated company to subsidiary – 619 – – Gain on bargain purchase 14 221 – – –Profit on sale of property, plant and equipment 1 580 2 418 – – Profit on sale of interest in associated company – – – 489 Foreign exchange gains 152 216 16 – Rental income 2 940 5 597 – –Sundry income 8 787 3 255 – –
27 680 12 105 16 489
(ii) Expense by natureAuditors’ remuneration – audit fees 4 459 3 244 – – Auditors’ remuneration – other services 598 410 – – Depreciation – note 3 24 981 27 288 – – Amortisation of intangible assets – note 4 10 931 16 959 – – Employee benefit expenses – note 18 218 478 162 986 4 332 3 928 Directors’ remuneration – note 26 9 533 16 314 – –Foreign exchange losses 14 041 7 051 4 735 – Operating lease payments 64 219 63 371 – –Impairment of loans to associated company – 5 200 – – Impairment of interest in associated company – note 6 2 537 – – –Loss on sale of interest in associated company – 3 756 – – Fair value adjustment on step-up from associated company to subsidiary 4 886 – 9 259 – Loss on sale of property, plant and equipment 101 – – –Professional fees 6 500 4 115 469 250 Vehicle expenses – fuel and maintenance 50 622 53 037 – – Pallet hire 11 279 9 944 – – Insurance 11 038 9 613 – – Travel and entertainment 13 743 11 829 10 – Telephone and communication 9 918 8 289 – – Repairs and maintenance 6 946 5 641 – – Bank charges 2 767 2 547 16 – Stationery, printing and office expenses 7 739 4 886 – – Staff training 13 138 10 383 – –Information technology cost 11 460 8 177 – – Water and electricity 6 634 5 634 – – Security, fumigation and sanitation 2 300 2 312 – – Marketing and advertising 2 228 2 089 – – Write off of debt 1 356 693 – – Other expenses 7 619 – 922 1 442
520 051 445 768 19 743 5 620
18. EMPLOYEE BENEFIT EXPENSESWages and salaries, including restructuring costs and other termination benefits:Salaries, wages and allowances 218 478 162 986 4 332 3 928
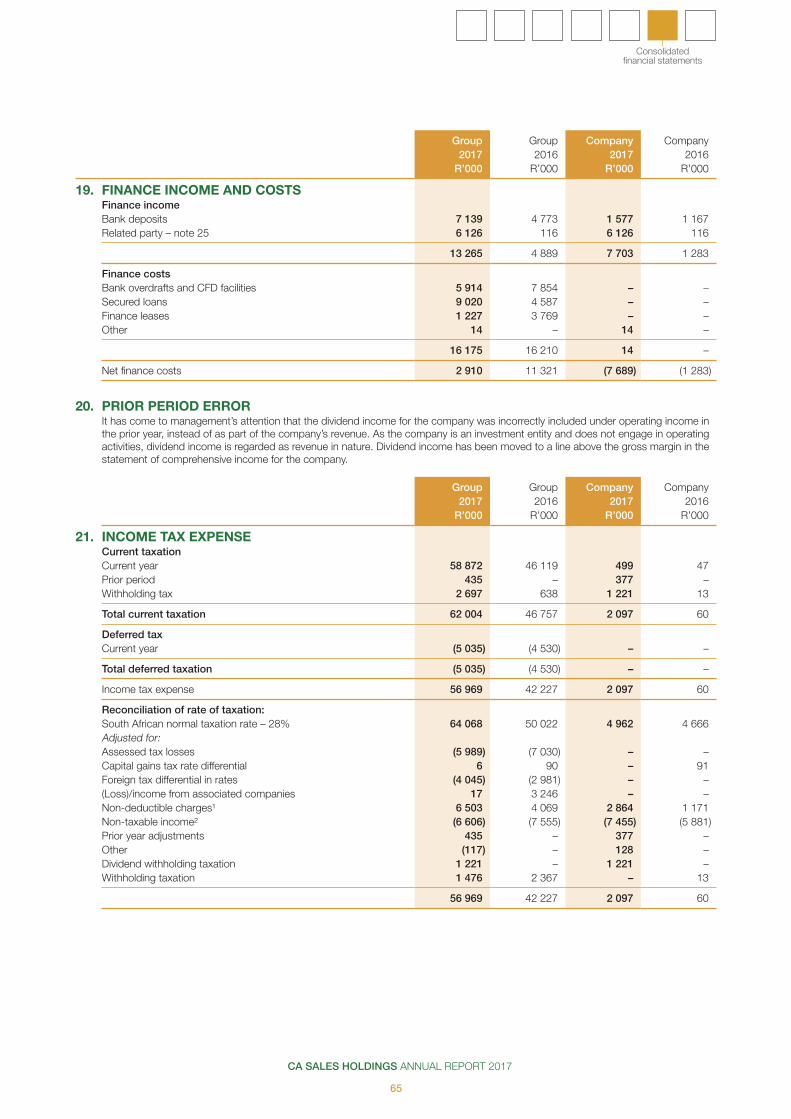
CA SALES HOLDINGS ANNUAL REPORT 2017
65
Consolidated financial statements
Group Group Company Company2017 2016 2017 2016
R’000 R’000 R’000 R’000
19. FINANCE INCOME AND COSTSFinance incomeBank deposits 7 139 4 773 1 577 1 167 Related party – note 25 6 126 116 6 126 116
13 265 4 889 7 703 1 283
Finance costsBank overdrafts and CFD facilities 5 914 7 854 – – Secured loans 9 020 4 587 – – Finance leases 1 227 3 769 – – Other 14 – 14 –
16 175 16 210 14 –
Net finance costs 2 910 11 321 (7 689) (1 283)
20. PRIOR PERIOD ERRORIt has come to management’s attention that the dividend income for the company was incorrectly included under operating income in the prior year, instead of as part of the company’s revenue. As the company is an investment entity and does not engage in operating activities, dividend income is regarded as revenue in nature. Dividend income has been moved to a line above the gross margin in the statement of comprehensive income for the company.
Group Group Company Company2017 2016 2017 2016
R’000 R’000 R’000 R’000
21. INCOME TAX EXPENSECurrent taxationCurrent year 58 872 46 119 499 47 Prior period 435 – 377 –Withholding tax 2 697 638 1 221 13
Total current taxation 62 004 46 757 2 097 60
Deferred taxCurrent year (5 035) (4 530) – –
Total deferred taxation (5 035) (4 530) – –
Income tax expense 56 969 42 227 2 097 60
Reconciliation of rate of taxation:South African normal taxation rate – 28% 64 068 50 022 4 962 4 666 Adjusted for:Assessed tax losses (5 989) (7 030) – – Capital gains tax rate differential 6 90 – 91 Foreign tax differential in rates (4 045) (2 981) – –(Loss)/income from associated companies 17 3 246 – – Non-deductible charges¹ 6 503 4 069 2 864 1 171Non-taxable income² (6 606) (7 555) (7 455) (5 881)Prior year adjustments 435 – 377 – Other (117) – 128 – Dividend withholding taxation 1 221 – 1 221 – Withholding taxation 1 476 2 367 – 13
56 969 42 227 2 097 60
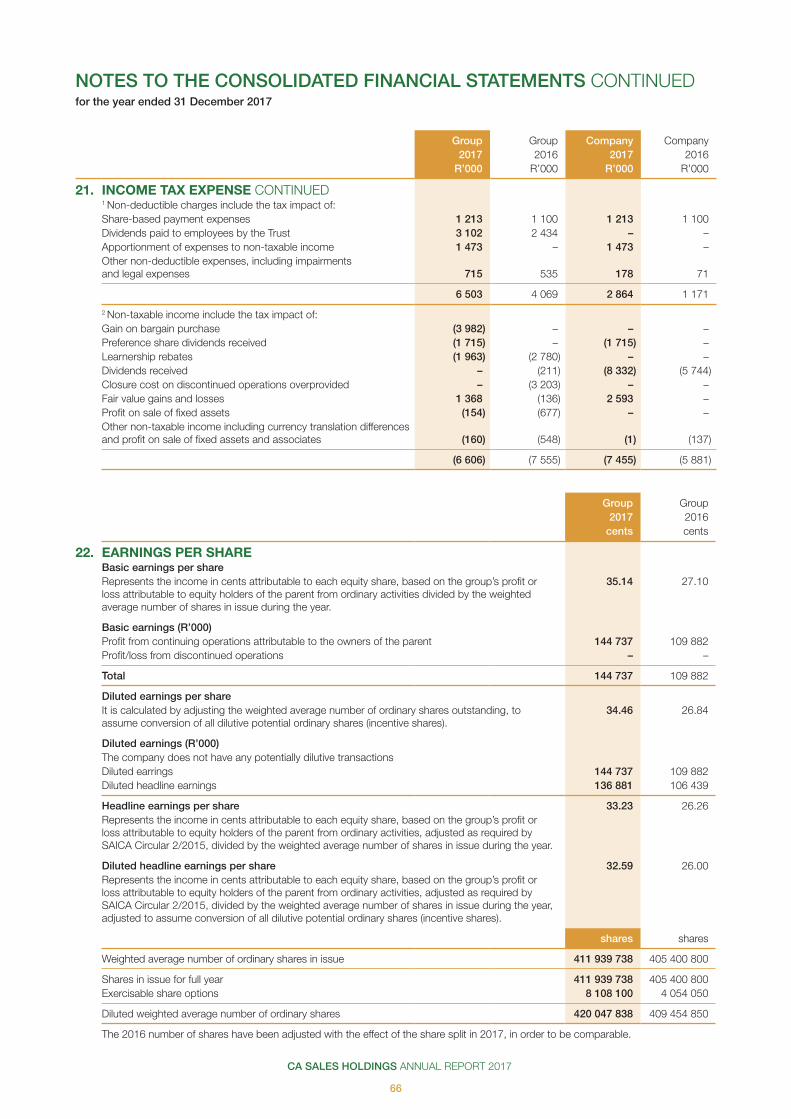
CA SALES HOLDINGS ANNUAL REPORT 2017
66
Group Group Company Company2017 2016 2017 2016
R’000 R’000 R’000 R’000
21. INCOME TAX EXPENSE CONTINUED1 Non-deductible charges include the tax impact of:Share-based payment expenses 1 213 1 100 1 213 1 100 Dividends paid to employees by the Trust 3 102 2 434 – –Apportionment of expenses to non-taxable income 1 473 – 1 473 – Other non-deductible expenses, including impairments and legal expenses 715 535 178 71
6 503 4 069 2 864 1 171
2 Non-taxable income include the tax impact of:Gain on bargain purchase (3 982) – – – Preference share dividends received (1 715) – (1 715) – Learnership rebates (1 963) (2 780) – – Dividends received – (211) (8 332) (5 744)Closure cost on discontinued operations overprovided – (3 203) – – Fair value gains and losses 1 368 (136) 2 593 – Profit on sale of fixed assets (154) (677) – – Other non-taxable income including currency translation differences and profit on sale of fixed assets and associates (160) (548) (1) (137)
(6 606) (7 555) (7 455) (5 881)
Group Group2017 2016
cents cents
22. EARNINGS PER SHARE Basic earnings per shareRepresents the income in cents attributable to each equity share, based on the group’s profit or loss attributable to equity holders of the parent from ordinary activities divided by the weighted average number of shares in issue during the year.
35.14 27.10
Basic earnings (R’000)Profit from continuing operations attributable to the owners of the parent 144 737 109 882Profit/loss from discontinued operations – –
Total 144 737 109 882
Diluted earnings per shareIt is calculated by adjusting the weighted average number of ordinary shares outstanding, to assume conversion of all dilutive potential ordinary shares (incentive shares).
34.46 26.84
Diluted earnings (R’000)The company does not have any potentially dilutive transactionsDiluted earrings 144 737 109 882Diluted headline earnings 136 881 106 439
Headline earnings per share 33.23 26.26 Represents the income in cents attributable to each equity share, based on the group’s profit or loss attributable to equity holders of the parent from ordinary activities, adjusted as required by SAICA Circular 2/2015, divided by the weighted average number of shares in issue during the year.
Diluted headline earnings per share 32.59 26.00 Represents the income in cents attributable to each equity share, based on the group’s profit or loss attributable to equity holders of the parent from ordinary activities, adjusted as required by SAICA Circular 2/2015, divided by the weighted average number of shares in issue during the year, adjusted to assume conversion of all dilutive potential ordinary shares (incentive shares).
shares shares
Weighted average number of ordinary shares in issue 411 939 738 405 400 800
Shares in issue for full year 411 939 738 405 400 800 Exercisable share options 8 108 100 4 054 050
Diluted weighted average number of ordinary shares 420 047 838 409 454 850
The 2016 number of shares have been adjusted with the effect of the share split in 2017, in order to be comparable.
NOTES TO THE CONSOLIDATED FINANCIAL STATEMENTS CONTINUEDfor the year ended 31 December 2017

CA SALES HOLDINGS ANNUAL REPORT 2017
67
Consolidated financial statements
2017 2016
Gross Net Gross NetR’000 R’000 R’000 R’000
22. EARNINGS PER SHARE CONTINUEDProfit attributable to ordinary shareholders of the parent – 144 737 – 109 882
Adjustments:Net loss on sale of associated companies – – 3 757 3 848 Closure cost on discontinued operations overprovided – – (11 438) (11 438)Impairment of investment in associates 2 537 2 537 6 000 6 000 Profit on sale of property, plant and equipment (1 479) (1 058) (2 418) (1 234)Fair value adjustment on step-up from associated company to subsidiary 4 886 4 886 (619) (619)Gain on bargain purchase (14 221) (14 221) – –
Headline earnings 136 881 106 439
Group Group Company Company2017 2016 2017 2016
R’000 R’000 R’000 R’000
23. NOTES TO THE CASH FLOW STATEMENT23.1 CASH GENERATED FROM OPERATIONS
Profit before income tax including discontinued operations 228 816 178 650 17 720 16 666
Adjustments for:Depreciation 24 981 27 288 – – Amortisation 10 931 16 959 – – Profit on disposal of property, plant and equipment (1 479) (2 418) – – Loss/(profit) on disposal of associated company – 3 756 – (489)Dividends received – – (29 758) (20 514)Finance income (13 265) (4 889) (7 703) (1 283)Finance costs 16 175 16 210 14 – Fair value adjustment on step-up from associated company to subsidiary 4 886 (619) 9 259 – Gain on bargain purchase (14 221) – – –Impairment of equity-accounted investments 2 537 6 000 – – Share of profit from associated companies (464) 5 570 – – Share-based payment expense 4 333 3 928 4 333 –Other 844 1 705 152 3 928
264 074 252 140 (5 983) (1 692)
Changes in working capitalInventories (6 142) 16 590 – – Trade and other receivables (183 767) (36 886) – – Inter-group loans payable – loans paid – – (27 229) (692)Trade and other payables (32 465) 26 443 159 533
(222 374) 6 147 (27 070) (159)
Cash generated from/(utilised by) operating activities 41 700 258 287 (33 053) (1 851)
23.2 PROCEEDS FROM DISPOSAL OF PROPERTY, PLANT AND EQUIPMENT In the statement of cash flows, proceeds from sale of property, plant and equipment comprise:Net book value 2 007 4 266 – – Profit on disposal of property, plant and equipment 1 479 2 418 – –
3 486 6 684 – –

CA SALES HOLDINGS ANNUAL REPORT 2017
68
Group Group Company Company2017 2016 2017 2016
R’000 R’000 R’000 R’000
23. NOTES TO THE CASH FLOW STATEMENT CONTINUED23.3 NET DEBT RECONCILIATION
Cash and cash equivalents excluding bank overdraft 204 141 182 878 68 962 35 207 Bank overdrafts (107 558) (50 483) – – Current borrowings (162 239) (51 785) – – Non-current borrowings (6 242) (1 765) – – Current finance leases (11 448) (14 573) – – Non-current finance leases (17 066) (22 719) – –
Net debt (100 412) 41 553 68 962 35 207
Other assets Liabilities from financing activities
Cash including overdraft
Current finance leases
Non-current finance
leases Current
borrowings Non-current borrowings Total
Group R’000 R’000 R’000 R’000 R’000 R’000
Net debt as at 1 January 2017 132 395 (14 573) (22 719) (51 785) (1 765) 41 553 Cash flows 7 862 14 573 (3 637) 51 785 (163 335) (92 752)Acquisitions (42 985) – (2 158) – (7 091) (52 234)Foreign exchange adjustments (690) – – 3 710 – 3 020Other non-cash movements – (11 448) 11 448 (165 949) 165 949 –
Net debt as at 31 December 2017 96 583 (11 448) (17 066) (162 239) (6 242) (100 412)
Group Group Company Company2017 2016 2017 2016
R’000 R’000 R’000 R’000
23.4 TAXATION PAIDCharge to profit and loss (56 969) (42 227) (2 097) (60)Movement in deferred taxation (5 035) (4 530) – –Movement in net taxation 2 754 (2 118) 147 (4)
(59 250) (48 875) (1 950) (64)
NOTES TO THE CONSOLIDATED FINANCIAL STATEMENTS CONTINUEDfor the year ended 31 December 2017
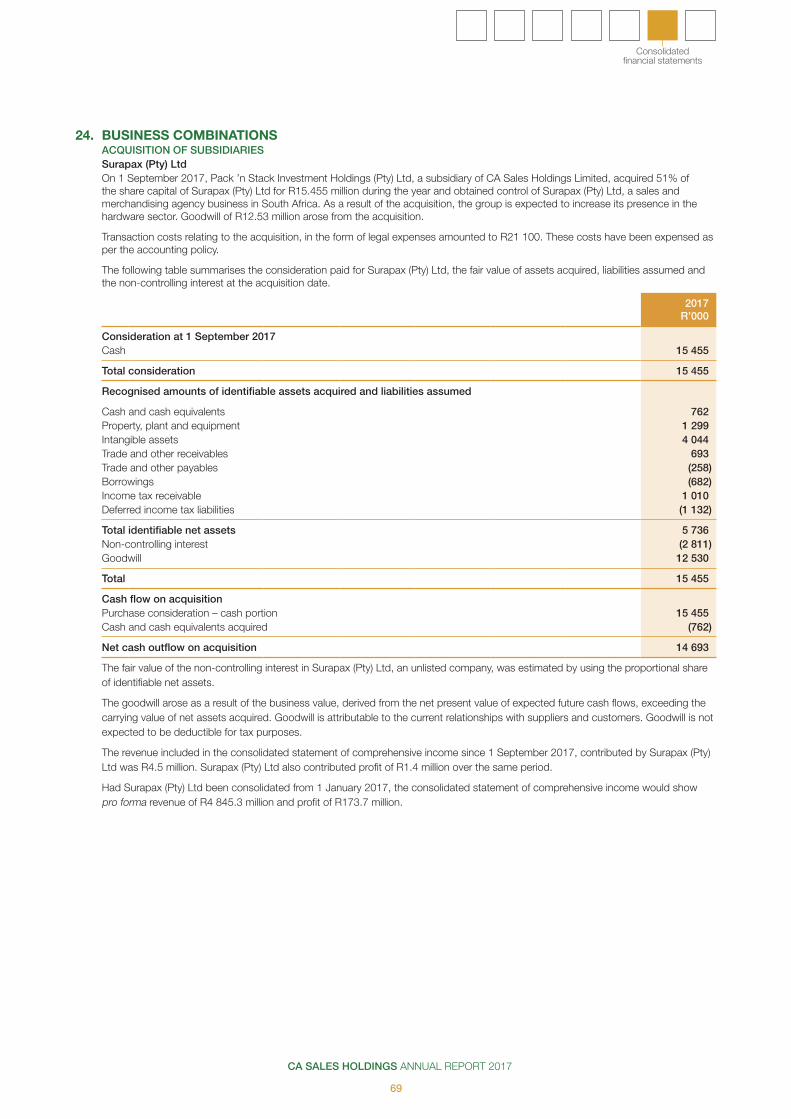
CA SALES HOLDINGS ANNUAL REPORT 2017
69
Consolidated financial statements
24. BUSINESS COMBINATIONSACQUISITION OF SUBSIDIARIESSurapax (Pty) LtdOn 1 September 2017, Pack ’n Stack Investment Holdings (Pty) Ltd, a subsidiary of CA Sales Holdings Limited, acquired 51% of the share capital of Surapax (Pty) Ltd for R15.455 million during the year and obtained control of Surapax (Pty) Ltd, a sales and merchandising agency business in South Africa. As a result of the acquisition, the group is expected to increase its presence in the hardware sector. Goodwill of R12.53 million arose from the acquisition.
Transaction costs relating to the acquisition, in the form of legal expenses amounted to R21 100. These costs have been expensed as per the accounting policy.
The following table summarises the consideration paid for Surapax (Pty) Ltd, the fair value of assets acquired, liabilities assumed and the non-controlling interest at the acquisition date.
2017R’000
Consideration at 1 September 2017Cash 15 455
Total consideration 15 455
Recognised amounts of identifiable assets acquired and liabilities assumed
Cash and cash equivalents 762 Property, plant and equipment 1 299 Intangible assets 4 044 Trade and other receivables 693 Trade and other payables (258)Borrowings (682)Income tax receivable 1 010 Deferred income tax liabilities (1 132)
Total identifiable net assets 5 736 Non-controlling interest (2 811)Goodwill 12 530
Total 15 455
Cash flow on acquisitionPurchase consideration – cash portion 15 455 Cash and cash equivalents acquired (762)
Net cash outflow on acquisition 14 693
The fair value of the non-controlling interest in Surapax (Pty) Ltd, an unlisted company, was estimated by using the proportional share of identifiable net assets.
The goodwill arose as a result of the business value, derived from the net present value of expected future cash flows, exceeding the carrying value of net assets acquired. Goodwill is attributable to the current relationships with suppliers and customers. Goodwill is not expected to be deductible for tax purposes.
The revenue included in the consolidated statement of comprehensive income since 1 September 2017, contributed by Surapax (Pty) Ltd was R4.5 million. Surapax (Pty) Ltd also contributed profit of R1.4 million over the same period.
Had Surapax (Pty) Ltd been consolidated from 1 January 2017, the consolidated statement of comprehensive income would show pro forma revenue of R4 845.3 million and profit of R173.7 million.
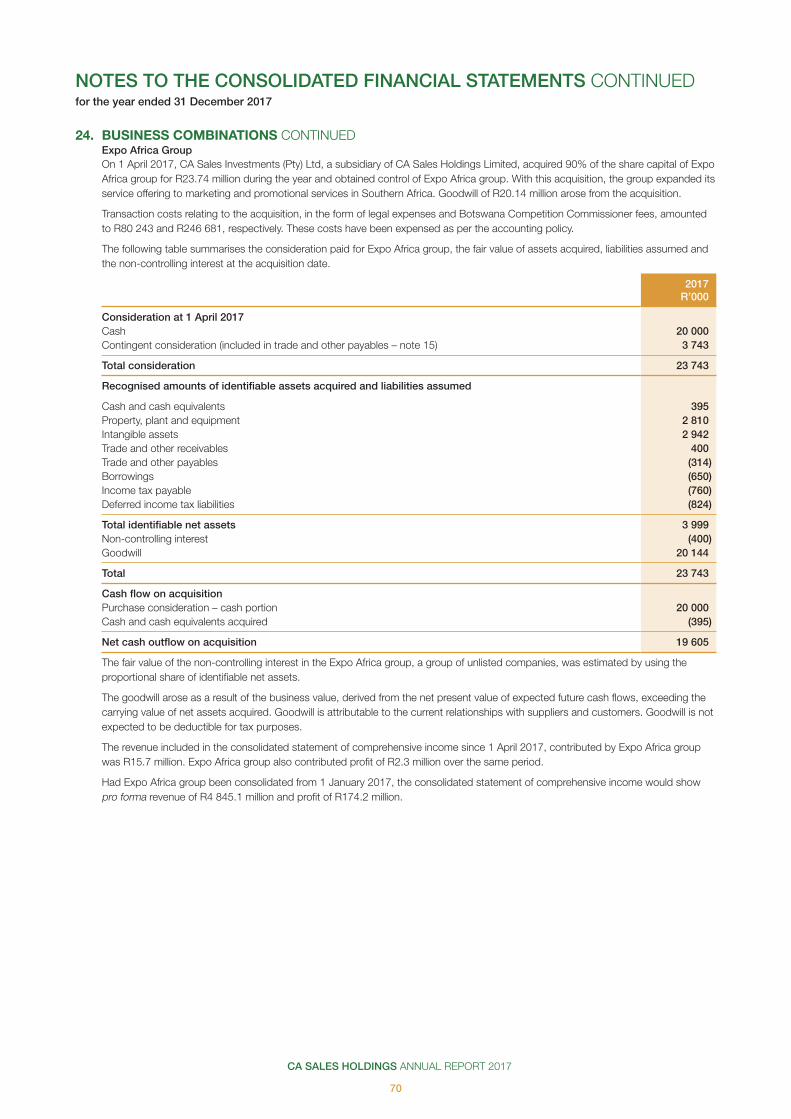
CA SALES HOLDINGS ANNUAL REPORT 2017
70
24. BUSINESS COMBINATIONS CONTINUEDExpo Africa GroupOn 1 April 2017, CA Sales Investments (Pty) Ltd, a subsidiary of CA Sales Holdings Limited, acquired 90% of the share capital of Expo Africa group for R23.74 million during the year and obtained control of Expo Africa group. With this acquisition, the group expanded its service offering to marketing and promotional services in Southern Africa. Goodwill of R20.14 million arose from the acquisition.
Transaction costs relating to the acquisition, in the form of legal expenses and Botswana Competition Commissioner fees, amounted to R80 243 and R246 681, respectively. These costs have been expensed as per the accounting policy.
The following table summarises the consideration paid for Expo Africa group, the fair value of assets acquired, liabilities assumed and the non-controlling interest at the acquisition date.
2017R’000
Consideration at 1 April 2017Cash 20 000 Contingent consideration (included in trade and other payables – note 15) 3 743
Total consideration 23 743
Recognised amounts of identifiable assets acquired and liabilities assumed
Cash and cash equivalents 395 Property, plant and equipment 2 810 Intangible assets 2 942 Trade and other receivables 400 Trade and other payables (314)Borrowings (650)Income tax payable (760)Deferred income tax liabilities (824)
Total identifiable net assets 3 999 Non-controlling interest (400)Goodwill 20 144
Total 23 743
Cash flow on acquisitionPurchase consideration – cash portion 20 000 Cash and cash equivalents acquired (395)
Net cash outflow on acquisition 19 605
The fair value of the non-controlling interest in the Expo Africa group, a group of unlisted companies, was estimated by using the proportional share of identifiable net assets.
The goodwill arose as a result of the business value, derived from the net present value of expected future cash flows, exceeding the carrying value of net assets acquired. Goodwill is attributable to the current relationships with suppliers and customers. Goodwill is not expected to be deductible for tax purposes.
The revenue included in the consolidated statement of comprehensive income since 1 April 2017, contributed by Expo Africa group was R15.7 million. Expo Africa group also contributed profit of R2.3 million over the same period.
Had Expo Africa group been consolidated from 1 January 2017, the consolidated statement of comprehensive income would show pro forma revenue of R4 845.1 million and profit of R174.2 million.
NOTES TO THE CONSOLIDATED FINANCIAL STATEMENTS CONTINUEDfor the year ended 31 December 2017
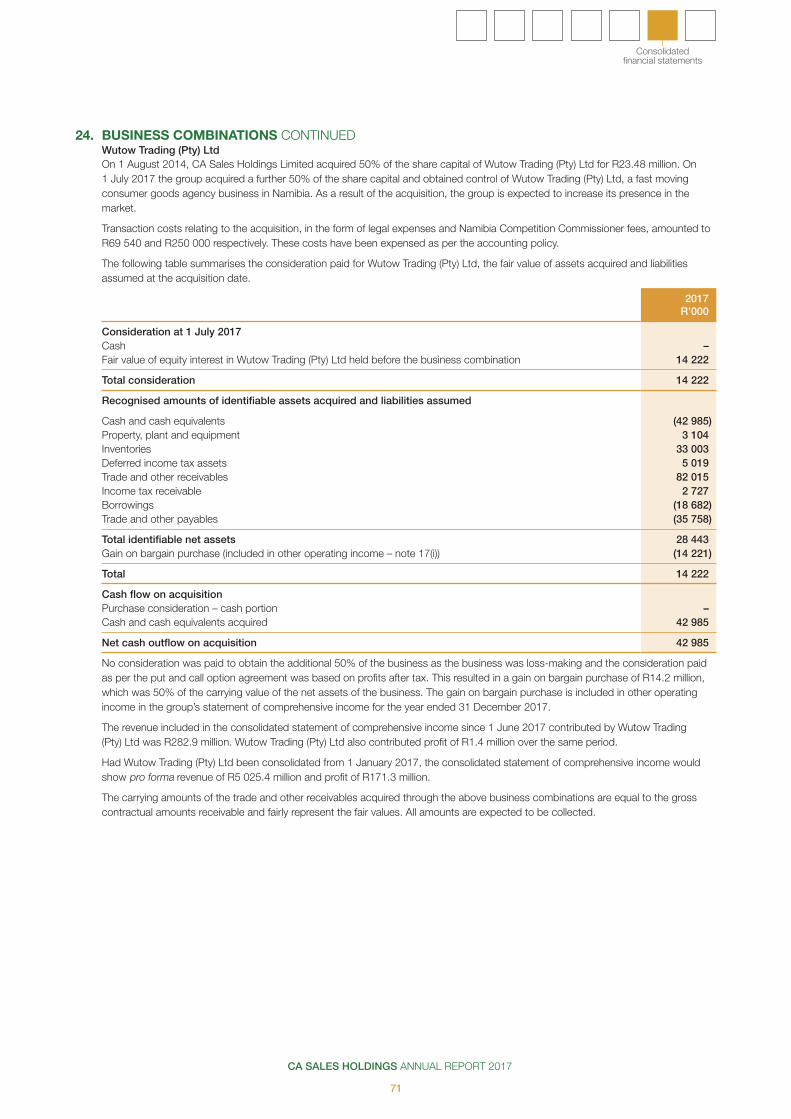
CA SALES HOLDINGS ANNUAL REPORT 2017
71
Consolidated financial statements
24. BUSINESS COMBINATIONS CONTINUEDWutow Trading (Pty) LtdOn 1 August 2014, CA Sales Holdings Limited acquired 50% of the share capital of Wutow Trading (Pty) Ltd for R23.48 million. On 1 July 2017 the group acquired a further 50% of the share capital and obtained control of Wutow Trading (Pty) Ltd, a fast moving consumer goods agency business in Namibia. As a result of the acquisition, the group is expected to increase its presence in the market.
Transaction costs relating to the acquisition, in the form of legal expenses and Namibia Competition Commissioner fees, amounted to R69 540 and R250 000 respectively. These costs have been expensed as per the accounting policy.
The following table summarises the consideration paid for Wutow Trading (Pty) Ltd, the fair value of assets acquired and liabilities assumed at the acquisition date.
2017R’000
Consideration at 1 July 2017Cash – Fair value of equity interest in Wutow Trading (Pty) Ltd held before the business combination 14 222
Total consideration 14 222
Recognised amounts of identifiable assets acquired and liabilities assumed
Cash and cash equivalents (42 985)Property, plant and equipment 3 104 Inventories 33 003 Deferred income tax assets 5 019 Trade and other receivables 82 015 Income tax receivable 2 727 Borrowings (18 682)Trade and other payables (35 758)
Total identifiable net assets 28 443 Gain on bargain purchase (included in other operating income – note 17(i)) (14 221)
Total 14 222
Cash flow on acquisitionPurchase consideration – cash portion – Cash and cash equivalents acquired 42 985
Net cash outflow on acquisition 42 985
No consideration was paid to obtain the additional 50% of the business as the business was loss-making and the consideration paid as per the put and call option agreement was based on profits after tax. This resulted in a gain on bargain purchase of R14.2 million, which was 50% of the carrying value of the net assets of the business. The gain on bargain purchase is included in other operating income in the group’s statement of comprehensive income for the year ended 31 December 2017.
The revenue included in the consolidated statement of comprehensive income since 1 June 2017 contributed by Wutow Trading (Pty) Ltd was R282.9 million. Wutow Trading (Pty) Ltd also contributed profit of R1.4 million over the same period.
Had Wutow Trading (Pty) Ltd been consolidated from 1 January 2017, the consolidated statement of comprehensive income would show pro forma revenue of R5 025.4 million and profit of R171.3 million.
The carrying amounts of the trade and other receivables acquired through the above business combinations are equal to the gross contractual amounts receivable and fairly represent the fair values. All amounts are expected to be collected.

CA SALES HOLDINGS ANNUAL REPORT 2017
72
NOTES TO THE CONSOLIDATED FINANCIAL STATEMENTS CONTINUEDfor the year ended 31 December 2017
25. RELATED PARTY TRANSACTIONS Parent PSG Group Limited is the ultimate holding company of CA Sales Holdings group.
Subsidiaries CA Sales and Distribution (Pty) Ltd Diverse Distribution and Marketing Services (Pty) Ltd Private Label Sales and Merchandisings Services (Pty) Ltd CAS Marketing (Pty) Ltd Pamstad (Pty) Ltd CA Sales Investments (Pty) Ltd Logico Unlimited (Pty) Ltd Pack ’n Stack Investment Holdings (Pty) Ltd SMC Brands SA (Pty) Ltd Wutow Trading (Pty) Ltd
Associated companies and joint ventures Whitakers Agencies (Pty) Ltd Whitakers Agencies (Lesotho) (Pty) Ltd
Subsidiaries of PSG Group PSG Capital (Pty) Ltd PSG Corporate Services (Pty) Ltd PSG Alpha Investments (Pty) Ltd
Key management personnel Key management personnel include the members of the board, members of the group’s executive committee, divisional general
managers as well as the immediate subordinates of such managers. Non-executive directors are included in the definition of key management personnel as well as any close family members of such persons and any entity over which key management exercise control, joint control or significant influence. Close members of family are those family members who may be expected to influence, or be influenced, by that person in their dealings with CA Sales Group. They include the person’s domestic partner and children, the children of the person’s domestic partner, and dependants of the person or the person’s domestic partner.

CA SALES HOLDINGS ANNUAL REPORT 2017
73
Consolidated financial statements
Group Group Company Company2017 2016 2017 2016
R’000 R’000 R’000 R’000
25. RELATED PARTY TRANSACTIONS CONTINUEDTransactions and balancesDuring the financial year the company and its subsidiaries conducted the following transactions with joint ventures, associates, parties exercising significant influence and key management personnel.
Finance incomeInterest received Wutow Trading (Pty) Ltd – 116 – 116 Interest received Repassen 21 (Pty) Ltd 3 063 – 3 063 – Interest received Rose Bridge 15 (Pty) Ltd 3 063 – 2 063 –
Other operating expensesRent PSG Capital (Pty) Ltd 412 411 – – IT Services PSG Corporate Services (Pty) Ltd 81 71 – – Listing expenses PSG Capital (Pty) Ltd 54 – – – Management fees CAS Marketing (Pty) Ltd – – 684 1 436
Stated capitalCapitalised listing expenses PSG Capital (Pty) Ltd 5 422 – 5 422 –
Amounts due from related parties
Loan to associates – equity accountedWutow Trading (Pty) Ltd – 3 788 – 3 788
Trade receivablesCA Sales and Distribution (Pty) Ltd – – 35 991 36 216 CAS Marketing (Pty) Ltd – – 15 539 15 485Wutow Trading (Pty) Ltd – – 11 188 – CA Sales Investments (Pty) Ltd – – 20 000 –
Amounts due to related parties
Trade payablesPrivate Label Sales and Merchandisings Services (Pty) Ltd – – 354 354 Pack ’n Stack Investment Holdings (Pty) Ltd – – 127 –
Investments and loansPreference shares inRepassen 21 (Pty) Ltd Management member – FW Britz – 8 000 – 8 000 Preference shares inRose Bridge 15 (Pty) Ltd Director– TP Rogers
– 8 000 – 8 000 Key management compensationSalaries and other short-term employee benefits – note 26 9 533 16 314 – –
Related party transactions were made on terms equivalent to those that prevail in arm’s length transactions.

CA SALES HOLDINGS ANNUAL REPORT 2017
74
26. DIRECTORS’ REMUNERATION
Salary Bonus Total (R’000) (R’000) (R’000)
Executive directors2017T Rogers 3 723 1 500 5 223 F Britz 2 810 1 500 4 310
6 533 3 000 9 533
2016T Rogers 3 586 5 195 8 781F Britz 2 338 5 195 7 533
5 924 10 390 16 314
Key management personnelF Reichert2017 1 323 200 1 523
2016 1 161 500 1 661
No payments were made during the year to non-executive directors.
27. CONTINGENT LIABILITIESThere were no contingencies and commitments which require adjustments to or disclosure in these financial statements.
28. EVENTS AFTER BALANCE SHEET DATEThe group is finalising the purchase of warehouses in Botswana. These will grow its asset base in Botswana and show its commitment to invest in the country. The company declared a dividend of 5.99 cents per share on 23 March 2018. There were no other significant events that occurred after the reporting date that require adjustment to or disclosure in the consolidated annual financial statements for the year ended 31 December 2017.
29. OPERATING LEASE COMMITMENTSThe group leases various offices and warehouses under non-cancellable operating leases expiring within one to five years. The leases have varying terms, escalation clauses and renewal rights. On renewal, the terms of the leases are renegotiated.
The future aggregate minimum lease payments under non-cancellable operating lease commitments are as follows:
Group Group2017 2016
R’000 R’000
Operating leases – premisesNot later than one year 50 634 42 668 Later than one year and not later than five years 29 084 88 436 Later than five years – –
79 719 131 104
Operating leases – office and computer equipmentNo later than one year 473 804 Later than one year and no later than five years 112 368
585 1 172
Operating leases – vehicles and plantNo later than one year 14 152 4 577 Later than one year and no later than five years 25 432 306
39 584 4 883
The company does not have any operating lease commitments.
There are no purchase options or restrictions imposed by the lease arrangements such as those concerning dividends, additional debt and further leasing.
30. GOING CONCERNThe financial statements have been prepared on the basis of accounting policies applicable to a going concern.
This basis presumes that funds will be available to finance future operations and that the realisation of assets and settlement of liabilities, contingent obligations and commitments will occur in the ordinary course of business.
NOTES TO THE CONSOLIDATED FINANCIAL STATEMENTS CONTINUEDfor the year ended 31 December 2017
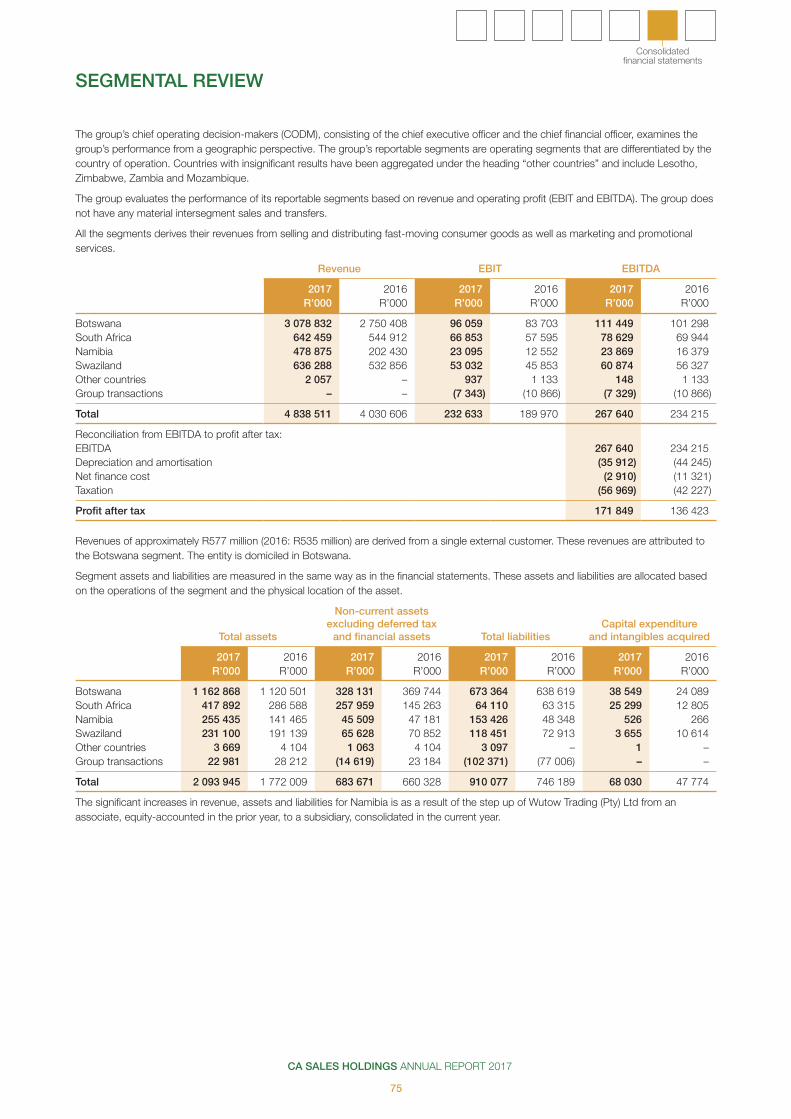
CA SALES HOLDINGS ANNUAL REPORT 2017
75
Consolidated financial statements
The group’s chief operating decision-makers (CODM), consisting of the chief executive officer and the chief financial officer, examines the group’s performance from a geographic perspective. The group’s reportable segments are operating segments that are differentiated by the country of operation. Countries with insignificant results have been aggregated under the heading “other countries” and include Lesotho, Zimbabwe, Zambia and Mozambique.
The group evaluates the performance of its reportable segments based on revenue and operating profit (EBIT and EBITDA). The group does not have any material intersegment sales and transfers.
All the segments derives their revenues from selling and distributing fast-moving consumer goods as well as marketing and promotional services.
Revenue EBIT EBITDA
2017 2016 2017 2016 2017 2016R’000 R’000 R’000 R’000 R’000 R’000
Botswana 3 078 832 2 750 408 96 059 83 703 111 449 101 298 South Africa 642 459 544 912 66 853 57 595 78 629 69 944 Namibia 478 875 202 430 23 095 12 552 23 869 16 379 Swaziland 636 288 532 856 53 032 45 853 60 874 56 327 Other countries 2 057 – 937 1 133 148 1 133 Group transactions – – (7 343) (10 866) (7 329) (10 866)
Total 4 838 511 4 030 606 232 633 189 970 267 640 234 215
Reconciliation from EBITDA to profit after tax:EBITDA 267 640 234 215 Depreciation and amortisation (35 912) (44 245)Net finance cost (2 910) (11 321)Taxation (56 969) (42 227)
Profit after tax 171 849 136 423
Revenues of approximately R577 million (2016: R535 million) are derived from a single external customer. These revenues are attributed to the Botswana segment. The entity is domiciled in Botswana.
Segment assets and liabilities are measured in the same way as in the financial statements. These assets and liabilities are allocated based on the operations of the segment and the physical location of the asset.
Total assets
Non-current assets excluding deferred tax
and financial assets Total liabilitiesCapital expenditure
and intangibles acquired
2017 2016 2017 2016 2017 2016 2017 2016R’000 R’000 R’000 R’000 R’000 R’000 R’000 R’000
Botswana 1 162 868 1 120 501 328 131 369 744 673 364 638 619 38 549 24 089 South Africa 417 892 286 588 257 959 145 263 64 110 63 315 25 299 12 805 Namibia 255 435 141 465 45 509 47 181 153 426 48 348 526 266 Swaziland 231 100 191 139 65 628 70 852 118 451 72 913 3 655 10 614 Other countries 3 669 4 104 1 063 4 104 3 097 – 1 –Group transactions 22 981 28 212 (14 619) 23 184 (102 371) (77 006) – –
Total 2 093 945 1 772 009 683 671 660 328 910 077 746 189 68 030 47 774
The significant increases in revenue, assets and liabilities for Namibia is as a result of the step up of Wutow Trading (Pty) Ltd from an associate, equity-accounted in the prior year, to a subsidiary, consolidated in the current year.
SEGMENTAL REVIEW
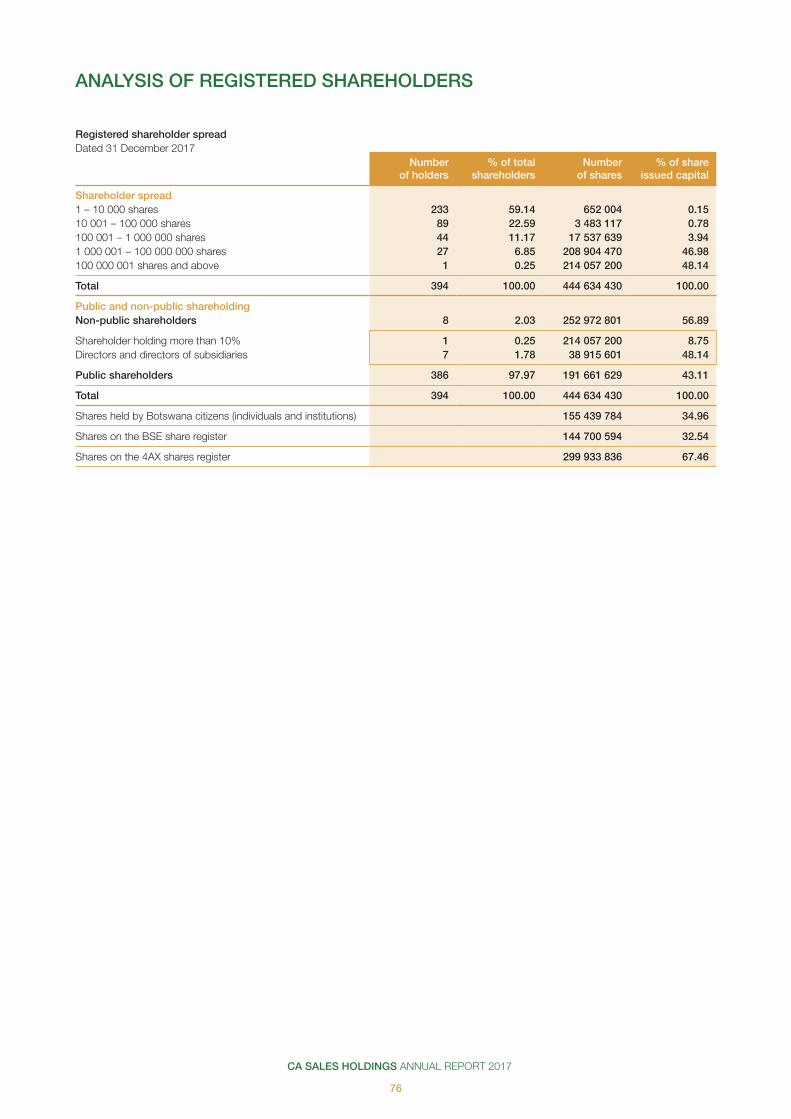
CA SALES HOLDINGS ANNUAL REPORT 2017
76
ANALYSIS OF REGISTERED SHAREHOLDERS
Registered shareholder spreadDated 31 December 2017
Number of holders
% of total shareholders
Number of shares
% of share issued capital
Shareholder spread1 – 10 000 shares 233 59.14 652 004 0.15 10 001 – 100 000 shares 89 22.59 3 483 117 0.78 100 001 – 1 000 000 shares 44 11.17 17 537 639 3.94 1 000 001 – 100 000 000 shares 27 6.85 208 904 470 46.98 100 000 001 shares and above 1 0.25 214 057 200 48.14
Total 394 100.00 444 634 430 100.00
Public and non-public shareholdingNon-public shareholders 8 2.03 252 972 801 56.89
Shareholder holding more than 10% 1 0.25 214 057 200 8.75Directors and directors of subsidiaries 7 1.78 38 915 601 48.14
Public shareholders 386 97.97 191 661 629 43.11
Total 394 100.00 444 634 430 100.00
Shares held by Botswana citizens (individuals and institutions) 155 439 784 34.96
Shares on the BSE share register 144 700 594 32.54
Shares on the 4AX shares register 299 933 836 67.46
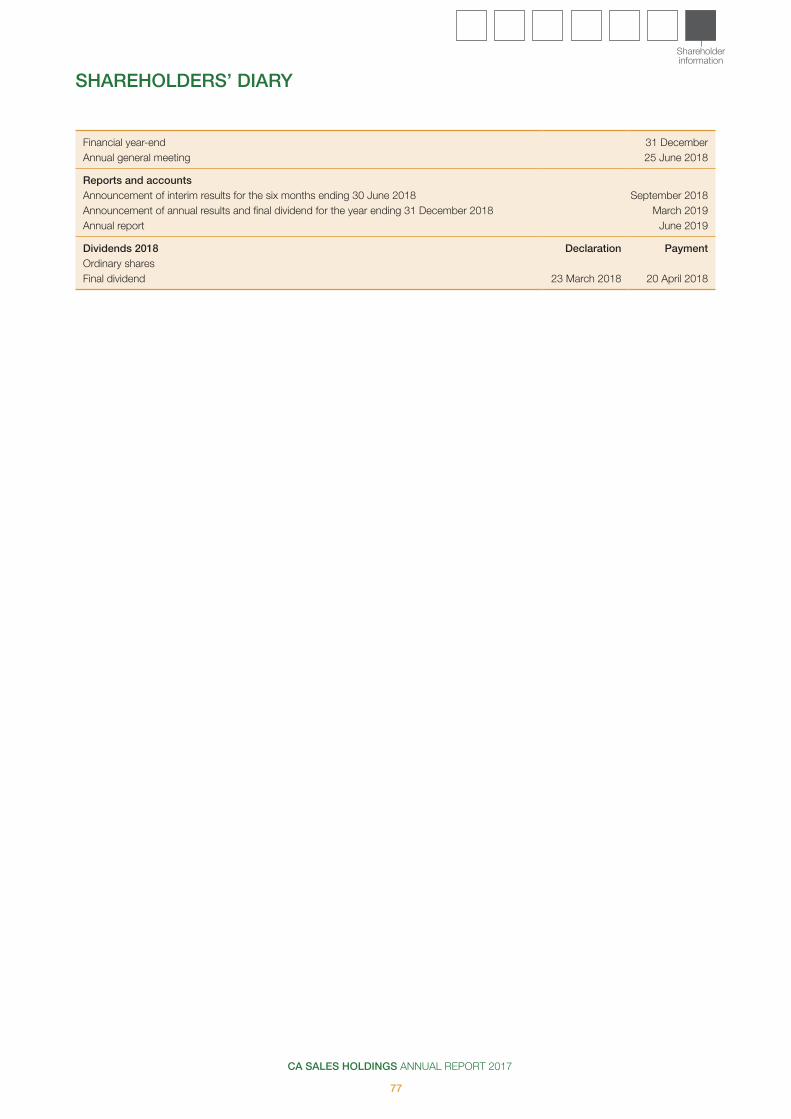
CA SALES HOLDINGS ANNUAL REPORT 2017
77
Shareholder information
Financial year-end 31 DecemberAnnual general meeting 25 June 2018
Reports and accountsAnnouncement of interim results for the six months ending 30 June 2018 September 2018Announcement of annual results and final dividend for the year ending 31 December 2018 March 2019Annual report June 2019
Dividends 2018 Declaration PaymentOrdinary sharesFinal dividend 23 March 2018 20 April 2018
SHAREHOLDERS’ DIARY
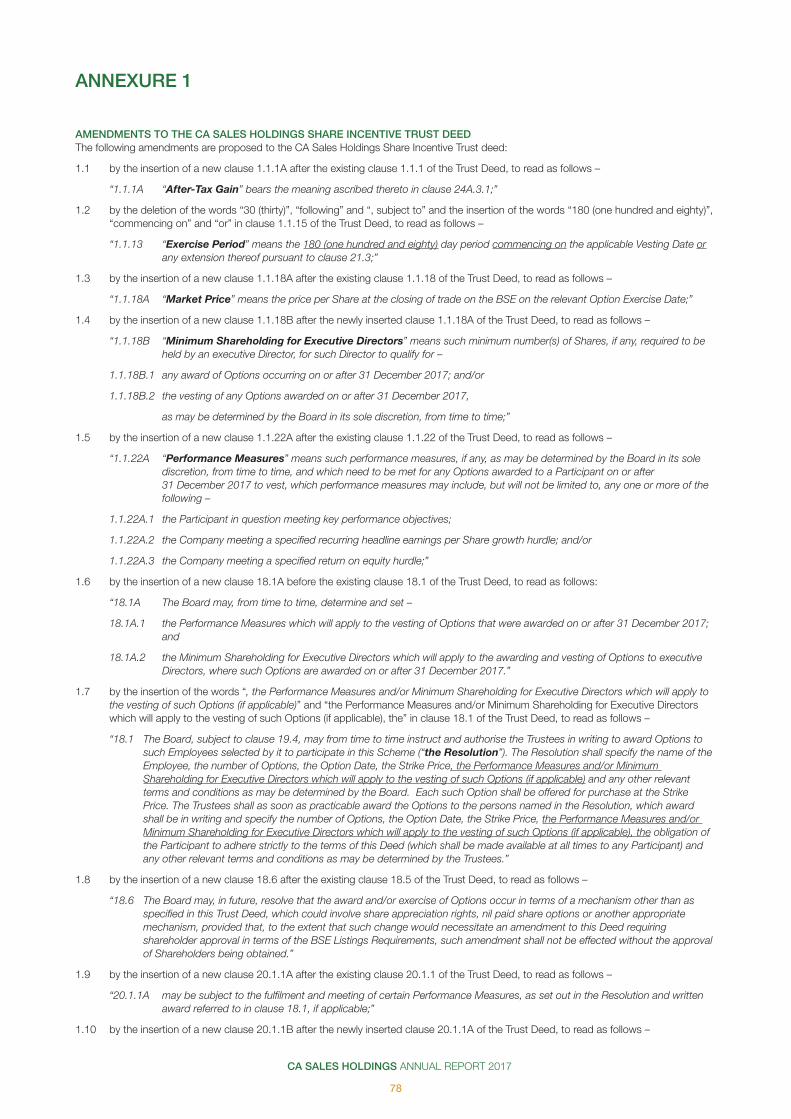
CA SALES HOLDINGS ANNUAL REPORT 2017
78
AMENDMENTS TO THE CA SALES HOLDINGS SHARE INCENTIVE TRUST DEEDThe following amendments are proposed to the CA Sales Holdings Share Incentive Trust deed:
1.1 by the insertion of a new clause 1.1.1A after the existing clause 1.1.1 of the Trust Deed, to read as follows –
“1.1.1A “After-Tax Gain” bears the meaning ascribed thereto in clause 24A.3.1;”
1.2 by the deletion of the words “30 (thirty)”, “following” and “, subject to” and the insertion of the words “180 (one hundred and eighty)”, “commencing on” and “or” in clause 1.1.15 of the Trust Deed, to read as follows –
“1.1.13 “Exercise Period” means the 180 (one hundred and eighty) day period commencing on the applicable Vesting Date or any extension thereof pursuant to clause 21.3;”
1.3 by the insertion of a new clause 1.1.18A after the existing clause 1.1.18 of the Trust Deed, to read as follows –
“1.1.18A “Market Price” means the price per Share at the closing of trade on the BSE on the relevant Option Exercise Date;”
1.4 by the insertion of a new clause 1.1.18B after the newly inserted clause 1.1.18A of the Trust Deed, to read as follows –
“1.1.18B “Minimum Shareholding for Executive Directors” means such minimum number(s) of Shares, if any, required to be held by an executive Director, for such Director to qualify for –
1.1.18B.1 any award of Options occurring on or after 31 December 2017; and/or
1.1.18B.2 the vesting of any Options awarded on or after 31 December 2017,
as may be determined by the Board in its sole discretion, from time to time;”
1.5 by the insertion of a new clause 1.1.22A after the existing clause 1.1.22 of the Trust Deed, to read as follows –
“1.1.22A “Performance Measures” means such performance measures, if any, as may be determined by the Board in its sole discretion, from time to time, and which need to be met for any Options awarded to a Participant on or after 31 December 2017 to vest, which performance measures may include, but will not be limited to, any one or more of the following –
1.1.22A.1 the Participant in question meeting key performance objectives;
1.1.22A.2 the Company meeting a specified recurring headline earnings per Share growth hurdle; and/or
1.1.22A.3 the Company meeting a specified return on equity hurdle;”
1.6 by the insertion of a new clause 18.1A before the existing clause 18.1 of the Trust Deed, to read as follows:
“18.1A The Board may, from time to time, determine and set –
18.1A.1 the Performance Measures which will apply to the vesting of Options that were awarded on or after 31 December 2017; and
18.1A.2 the Minimum Shareholding for Executive Directors which will apply to the awarding and vesting of Options to executive Directors, where such Options are awarded on or after 31 December 2017.”
1.7 by the insertion of the words “, the Performance Measures and/or Minimum Shareholding for Executive Directors which will apply to the vesting of such Options (if applicable)” and “the Performance Measures and/or Minimum Shareholding for Executive Directors which will apply to the vesting of such Options (if applicable), the” in clause 18.1 of the Trust Deed, to read as follows –
“18.1 The Board, subject to clause 19.4, may from time to time instruct and authorise the Trustees in writing to award Options to such Employees selected by it to participate in this Scheme (“the Resolution”). The Resolution shall specify the name of the Employee, the number of Options, the Option Date, the Strike Price, the Performance Measures and/or Minimum Shareholding for Executive Directors which will apply to the vesting of such Options (if applicable) and any other relevant terms and conditions as may be determined by the Board. Each such Option shall be offered for purchase at the Strike Price. The Trustees shall as soon as practicable award the Options to the persons named in the Resolution, which award shall be in writing and specify the number of Options, the Option Date, the Strike Price, the Performance Measures and/or Minimum Shareholding for Executive Directors which will apply to the vesting of such Options (if applicable), the obligation of the Participant to adhere strictly to the terms of this Deed (which shall be made available at all times to any Participant) and any other relevant terms and conditions as may be determined by the Trustees.”
1.8 by the insertion of a new clause 18.6 after the existing clause 18.5 of the Trust Deed, to read as follows –
“18.6 The Board may, in future, resolve that the award and/or exercise of Options occur in terms of a mechanism other than as specified in this Trust Deed, which could involve share appreciation rights, nil paid share options or another appropriate mechanism, provided that, to the extent that such change would necessitate an amendment to this Deed requiring shareholder approval in terms of the BSE Listings Requirements, such amendment shall not be effected without the approval of Shareholders being obtained.”
1.9 by the insertion of a new clause 20.1.1A after the existing clause 20.1.1 of the Trust Deed, to read as follows –
“20.1.1A may be subject to the fulfilment and meeting of certain Performance Measures, as set out in the Resolution and written award referred to in clause 18.1, if applicable;”
1.10 by the insertion of a new clause 20.1.1B after the newly inserted clause 20.1.1A of the Trust Deed, to read as follows –
ANNEXURE 1
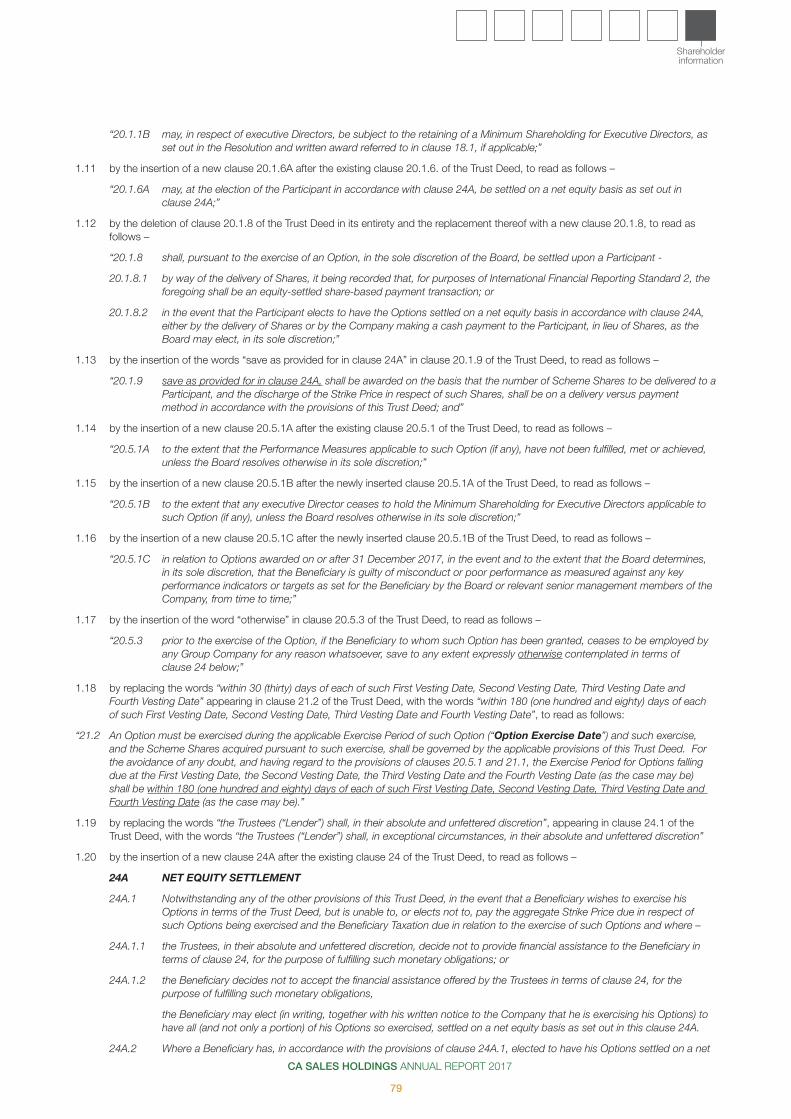
CA SALES HOLDINGS ANNUAL REPORT 2017
79
Shareholder information
“20.1.1B may, in respect of executive Directors, be subject to the retaining of a Minimum Shareholding for Executive Directors, as set out in the Resolution and written award referred to in clause 18.1, if applicable;”
1.11 by the insertion of a new clause 20.1.6A after the existing clause 20.1.6. of the Trust Deed, to read as follows –
“20.1.6A may, at the election of the Participant in accordance with clause 24A, be settled on a net equity basis as set out in clause 24A;”
1.12 by the deletion of clause 20.1.8 of the Trust Deed in its entirety and the replacement thereof with a new clause 20.1.8, to read as follows –
“20.1.8 shall, pursuant to the exercise of an Option, in the sole discretion of the Board, be settled upon a Participant -
20.1.8.1 by way of the delivery of Shares, it being recorded that, for purposes of International Financial Reporting Standard 2, the foregoing shall be an equity-settled share-based payment transaction; or
20.1.8.2 in the event that the Participant elects to have the Options settled on a net equity basis in accordance with clause 24A, either by the delivery of Shares or by the Company making a cash payment to the Participant, in lieu of Shares, as the Board may elect, in its sole discretion;”
1.13 by the insertion of the words “save as provided for in clause 24A” in clause 20.1.9 of the Trust Deed, to read as follows –
“20.1.9 save as provided for in clause 24A, shall be awarded on the basis that the number of Scheme Shares to be delivered to a Participant, and the discharge of the Strike Price in respect of such Shares, shall be on a delivery versus payment method in accordance with the provisions of this Trust Deed; and”
1.14 by the insertion of a new clause 20.5.1A after the existing clause 20.5.1 of the Trust Deed, to read as follows –
“20.5.1A to the extent that the Performance Measures applicable to such Option (if any), have not been fulfilled, met or achieved, unless the Board resolves otherwise in its sole discretion;”
1.15 by the insertion of a new clause 20.5.1B after the newly inserted clause 20.5.1A of the Trust Deed, to read as follows –
“20.5.1B to the extent that any executive Director ceases to hold the Minimum Shareholding for Executive Directors applicable to such Option (if any), unless the Board resolves otherwise in its sole discretion;”
1.16 by the insertion of a new clause 20.5.1C after the newly inserted clause 20.5.1B of the Trust Deed, to read as follows –
“20.5.1C in relation to Options awarded on or after 31 December 2017, in the event and to the extent that the Board determines, in its sole discretion, that the Beneficiary is guilty of misconduct or poor performance as measured against any key performance indicators or targets as set for the Beneficiary by the Board or relevant senior management members of the Company, from time to time;”
1.17 by the insertion of the word “otherwise” in clause 20.5.3 of the Trust Deed, to read as follows –
“20.5.3 prior to the exercise of the Option, if the Beneficiary to whom such Option has been granted, ceases to be employed by any Group Company for any reason whatsoever, save to any extent expressly otherwise contemplated in terms of clause 24 below;”
1.18 by replacing the words “within 30 (thirty) days of each of such First Vesting Date, Second Vesting Date, Third Vesting Date and Fourth Vesting Date” appearing in clause 21.2 of the Trust Deed, with the words “within 180 (one hundred and eighty) days of each of such First Vesting Date, Second Vesting Date, Third Vesting Date and Fourth Vesting Date”, to read as follows:
“21.2 An Option must be exercised during the applicable Exercise Period of such Option (“Option Exercise Date”) and such exercise, and the Scheme Shares acquired pursuant to such exercise, shall be governed by the applicable provisions of this Trust Deed. For the avoidance of any doubt, and having regard to the provisions of clauses 20.5.1 and 21.1, the Exercise Period for Options falling due at the First Vesting Date, the Second Vesting Date, the Third Vesting Date and the Fourth Vesting Date (as the case may be) shall be within 180 (one hundred and eighty) days of each of such First Vesting Date, Second Vesting Date, Third Vesting Date and Fourth Vesting Date (as the case may be).”
1.19 by replacing the words “the Trustees (“Lender”) shall, in their absolute and unfettered discretion”, appearing in clause 24.1 of the Trust Deed, with the words “the Trustees (“Lender”) shall, in exceptional circumstances, in their absolute and unfettered discretion”
1.20 by the insertion of a new clause 24A after the existing clause 24 of the Trust Deed, to read as follows –
24A NET EQUITY SETTLEMENT
24A.1 Notwithstanding any of the other provisions of this Trust Deed, in the event that a Beneficiary wishes to exercise his Options in terms of the Trust Deed, but is unable to, or elects not to, pay the aggregate Strike Price due in respect of such Options being exercised and the Beneficiary Taxation due in relation to the exercise of such Options and where –
24A.1.1 the Trustees, in their absolute and unfettered discretion, decide not to provide financial assistance to the Beneficiary in terms of clause 24, for the purpose of fulfilling such monetary obligations; or
24A.1.2 the Beneficiary decides not to accept the financial assistance offered by the Trustees in terms of clause 24, for the purpose of fulfilling such monetary obligations,
the Beneficiary may elect (in writing, together with his written notice to the Company that he is exercising his Options) to have all (and not only a portion) of his Options so exercised, settled on a net equity basis as set out in this clause 24A.
24A.2 Where a Beneficiary has, in accordance with the provisions of clause 24A.1, elected to have his Options settled on a net

CA SALES HOLDINGS ANNUAL REPORT 2017
80
equity basis in accordance with the provisions of clause 24.A.1 above, the Company will settle –
24A.2.1 the Beneficiary’s After-Tax Gain through the issue or other transfer of fully paid Shares to the Beneficiary or by making a cash payment in lieu of Shares to the Beneficiary, as may be determined by the Board in its sole discretion; and
24A.2.2 the Beneficiary Taxation due in respect of the Options being exercised, on behalf of the Beneficiary.
24A.3 The “After Tax Gain” of the Beneficiary will be determined as follows –
24A.3.1 First, the “Taxable Gain” of the Beneficiary will be determined using the following formula –
Taxable Gain = Market Value – Strike Value
Where
Market Value = the number of Options exercised x by the Market Price per Share on the Option Exercise Date
Strike Value = the number of Options exercised x by the Strike Price per Share
24A.3.1 Next, the “After-Tax Gain” will determined using the following formula –
After-Tax Gain = Taxable Gain – Tax Payable
The “Tax Payable” will be calculated on the Taxable Gain based on the applicable income tax rate which applies to the Beneficiary.
24A.4 The After-Tax Gain will then be settled by the Company, either by making a cash payment to the Beneficiary in lieu of Shares, or by the issue and allotment of such number of Shares by the Company, or by the transfer of such number of Shares by the Trust, within 5 business days following the relevant Option Exercise Date, as determined using the formula set out below, as may be elected by the Board in its sole discretion –
Number of Shares = After-Tax Gain / Market Price Per Share on the Option Exercise Date
Rounded to the nearest full number, as no fractions of Shares will be issued.
24A.5 For the avoidance of doubt, an illustrative example is set out below:
Net settlement
Full settlement when Options exercised at
Strike Price
1 Number of Options exercised 100 1002 Strike Price per Share R150 R1503 Strike Value (1 x 2) R15 000 R15 0004 Market Price per Share R220 R2205 Market Value (1 x 4) R22 000 R22 0006 Taxable Gain (5 – 3) R7 000 R7 0007 Tax rate applicable 45% 45%8 Tax Payable (6 x 7) R3 150 R3 1509 After-Tax Gain (6 – 8) R3 850 R3 85010 Total Strike Value & Tax Payable in cash by Participant (3 + 8) n/a R18 15011 Number of Shares to be issued if not settled by way of a cash payment
(9/4) 18 n/a12 Market Value R3 850 R22 00013 Less: Strike Value & Tax Payable by Participant (10) n/a 18 15014 Upside to Participant on date of settlement R3 850 R3 850
ANNEXURE 1 CONTINUED

CA SALES HOLDINGS ANNUAL REPORT 2017
81
Shareholder information
Notice is hereby given of the annual general meeting of shareholders of CA Sales Holdings Limited (“CA Sales” or “the company”) to be held at the offices of CA Sales and Distribution, 2nd Floor, Boardroom, Portion 867, Commerce Park, Gaborone, Botswana, on 25 June 2018, at 11h00 (“the AGM”).
PURPOSEThe purpose of the AGM is to transact the business set out in the agenda below.
AGENDA• Presentation of the audited annual financial statements of the company, including the reports of the directors for the year ended
31 December 2017. The annual report, of which this notice forms part, contains the summary consolidated financial statements and the aforementioned reports. The annual financial statements, including the unmodified audit opinion, are available on CA Sales’ website at www.casholdings.co.za, or may be requested and obtained in person, at no charge, at the registered office of CA Sales during office hours.
• To consider and, if deemed fit, approve, with or without modification, the following ordinary resolutions:
Note: For any of the ordinary resolutions numbers 1 to 7 (inclusive) to be adopted, more than 50% of the voting rights exercised on each such ordinary resolution must be exercised in favour thereof. For ordinary resolution number 8 to be adopted, at least 75% of the voting rights exercised on such ordinary resolution must be exercised in favour thereof.
1. RETIREMENT AND RE-ELECTION OF DIRECTOR ORDINARY RESOLUTION NUMBER 1 “Resolved that Mr PN De Waal, who retires by rotation in terms of the memorandum of incorporation of the company and, being
eligible, offers himself for re-election, be and is hereby re-elected as director.”
The reason for ordinary resolution number 1 is that the memorandum of incorporation of the company and to the extent applicable, the South African Companies Act, 71 of 2008, as amended (“the Companies Act”), require that a component of the non-executive directors rotate at every annual general meeting of the company and, being eligible, may offer themselves for re-election as directors.
A summary of Mr PN De Waal’s curriculum vitae has been included on page 16 of the annual report.
2. CONFIRMATION OF APPOINTMENT OF DIRECTORS ORDINARY RESOLUTION NUMBER 2 “Resolved that shareholders confirm the appointment of Mr B Marole as a director of the company in terms of the company’s MOI.”
ORDINARY RESOLUTION NUMBER 3 “Resolved that shareholders confirm the appointment of Mr E Masilela as a director of the company in terms of the company’s MOI.”
Reason for and effect of ordinary resolutions numbers 2 and 3 The reason for ordinary resolutions 2 and 3 is that the MOI of the company and the Companies Act require that any director appointed
by the board be confirmed by the shareholders at the AGM. Brief curriculum vitaes of each of the directors up for confirmation appear on page 17 of the annual report.
3. APPOINTMENT OF THE MEMBERS OF THE AUDIT AND RISK COMMITTEE OF THE COMPANY Note: For avoidance of doubt, all references to the audit and risk committee of the company is a reference to the audit committee as contemplated in the
Companies Act.
3.1 ORDINARY RESOLUTION NUMBER 4 “Resolved that Mr E Masilela, being eligible, be and is hereby re-appointed as a member of the audit and risk committee of the
company, as recommended by the board of directors of the company, until the next annual general meeting of the company.”
3.2 ORDINARY RESOLUTION NUMBER 5 “Resolved that Mr B Patel, being eligible, be and is hereby appointed as a member of the audit and risk committee of the
company, as recommended by the board of directors of the company, until the next annual general meeting of the company.”
CA SALES HOLDINGS LIMITED(Incorporated in the Republic of South Africa)(Registration number 2011/143100/06)Botswana registration number: EX2017/18292Share code: CAS ISIN: ZAE400000036(“CA Sales” or “the company”)
NOTICE OF ANNUAL GENERAL MEETING
CA SALES HOLDINGS ANNUAL REPORT 2017
82
3.3 ORDINARY RESOLUTION NUMBER 6 “Resolved that Mr B Marole, being eligible, be and is hereby re-appointed as a member of the audit and risk committee of the
company, as recommended by the board of directors of the company, until the next annual general meeting of the company.”
The reason for ordinary resolutions numbers 4 to 6 (inclusive) is that the company, being a public listed company, must appoint an audit committee and the Companies Act requires that the members of such audit committee be appointed, or re-appointed, as the case may be, at each annual general meeting of a company. Brief curriculum vitaes of each of the directors up for reappointment to the audit and risk committee appear on pages 16 and 17 of the annual report.
4. RE-APPOINTMENT OF AUDITOR ORDINARY RESOLUTION NUMBER 7 “Resolved that PricewaterhouseCoopers Inc be and is hereby re-appointed as auditor of the company for the ensuing year on the
recommendation of the audit and risk committee of the company.”
The reason for ordinary resolution number 7 is that the company, being a public listed company, must have its financial results audited and such auditor must be appointed or re-appointed each year at the annual general meeting of the company as required by the Companies Act.
5. GENERAL AUTHORITY TO ISSUE ORDINARY SHARES FOR CASH ORDINARY RESOLUTION NUMBER 8 “Resolved that the directors of the company be and are hereby authorised, by way of a general authority, to allot and issue any of the
company’s unissued shares for cash as they in their discretion may deem fit, without restriction, subject to the provisions of the company’s memorandum of incorporation, the Companies Act and the Listings Requirements of the BSE and 4AX (“Listings Requirements”), provided that:
• the approval shall be valid until the date of the next annual general meeting of the company, provided it shall not extend beyond 15 months from the date of this resolution;
• the general issues of shares for cash in the aggregate in any one financial year may not exceed 10% of the company’s issued share capital (number of securities) of that class, provided that such issues shall not in aggregate in any 36-month period (each of which commences on the first day of the financial year of the company) exceed 15% of the company’s issued share capital of that class (in this calculation, the securities of a particular class will be aggregated with the securities which are compulsorily convertible into securities of that class; and, in the case of the issue of compulsorily convertible securities, aggregated with the securities of that class into which they are compulsorily convertible). The number of securities of a class which may be issued shall be based on the number of securities of that class in issue at the date of such application less any securities of the class issued during the current financial year or current and preceding two financial years (as applicable) provided that any securities of that class to be issued pursuant to a rights issue (announced and irrevocable and underwritten) or acquisition (concluded up to the date of application) may be included as though they were securities in issue at the date of application. As at the date of this notice of AGM, 10% of the company’s issued ordinary share capital (net of treasury shares) amounts to 44 852 015 ordinary shares;
• in determining the price at which an issue of shares will be made in terms of this authority, the maximum discount permitted will be 10% of the weighted average traded price of such shares, as determined over the 30 business days prior to the date that the price of the issue is agreed between the company and the party subscribing for the securities. The BSE will be consulted for a ruling if the securities have not traded in such 30 business day period;
• any such issue will only be made to public shareholders as defined in the Listings Requirements and not to related parties;
• any such issue will only be comprised of securities of a class already in issue or, if this is not the case, will be limited to such securities or rights that are convertible into a class already in issue; and
• in the event that the securities issued represent, on a cumulative basis, 5% or more of the number of securities in issue prior to that issue, an announcement containing the full details of such issue shall be published on X-News and the 4AX portal.”
For listed entities wishing to issue shares for cash (other than issues by way of rights offers, in consideration for acquisitions and/or to duly approved share incentive schemes), it is necessary for the board of the company to obtain the prior authority of the shareholders in accordance with the Listings Requirements and the memorandum of incorporation of the company. Accordingly, the reason for ordinary resolution number 8 is to obtain a general authority from shareholders to issue shares for cash in compliance with the Listings Requirements and the memorandum of incorporation of the company.
For this resolution to be adopted, at least 75% of the shareholders present in person or by proxy and entitled to vote on this resolution at the AGM must cast their vote in favour of this resolution.
• To consider and, if deemed fit, pass, with or without modification, the following special resolutions:
Note: For any of the special resolutions numbers 1 to 4 to be adopted, at least 75% of the voting rights exercised on each special resolution must be exercised in favour thereof.
NOTICE OF ANNUAL GENERAL MEETING CONTINUED

CA SALES HOLDINGS ANNUAL REPORT 2017
83
Shareholder information
6. AMENDMENTS TO THE CA SALES HOLDINGS SHARE INCENTIVE TRUST DEED ORDINARY RESOLUTION NUMBER 9“Resolved that the existing trust deed of the CA Sales Holdings Share Incentive Trust, which contains the terms of and governs the company’s share incentive scheme (“Trust Deed”), be amended as set out in Annexure 1 to this notice of AGM.”
The reason for ordinary resolution number 9 is to obtain the prior approval of shareholders to amend the Trust Deed. Although not obliged to do so, the Company has decided to submit these changes to the Trust Deed to shareholders for approval. The changes are aimed at refreshing and updating the scheme rules, given market trends, and should benefit shareholders. The effect of ordinary resolution number 9, if passed, will be that the proposed amendments to the Trust Deed are approved.
For this resolution to be adopted at least 50% of the shareholders present in person or by proxy and entitled to vote on this resolution at the AGM must cast their vote in favour of this resolution.
A copy of the current Trust Deed is available for inspection by shareholders at the company’s registered address.
7. REMUNERATION OF NON-EXECUTIVE DIRECTORS SPECIAL RESOLUTION NUMBER 1 “Resolved, in terms of section 66(9) of the Companies Act, that the company be and is hereby authorised to remunerate its directors
for their services as directors on the basis set out below, provided that this authority will be valid until the next annual general meeting of the company:
Fee per meeting
Board meeting1 R20 000Audit committee meeting R15 000Remuneration committee meeting R10 000
1 If the company only holds three board meetings a year, the fee due per meeting attended for that year will be R25 000.
The reason for special resolution number 1 is for the company to obtain the approval of shareholders by way of a special resolution for the payment of remuneration to its non-executive directors in accordance with the requirements of the Companies Act.
The effect of special resolution number 1 is that the company will be able to pay its non-executive directors for the services they render to the company as directors without requiring further shareholder approval until the next annual general meeting of the company.
8. INTER-COMPANY FINANCIAL ASSISTANCE 8.1 SPECIAL RESOLUTION NUMBER 2: INTER-COMPANY FINANCIAL ASSISTANCE “Resolved, in terms of section 45(3)(a)(ii) of the Companies Act, as a general approval, that the board of the company be and is
hereby authorised to approve that the company provides any direct or indirect financial assistance (“financial assistance” will herein have the meaning attributed to it in section 45(1) of the Companies Act) that the board of the company may deem fit to any company or corporation that is related or inter-related (“related” or “inter-related” will herein have the meaning attributed to it in section 2 of the Companies Act) to the company, on the terms and conditions and for amounts that the board of the company may determine, provided that the aforementioned approval shall be valid until the date of the next annual general meeting of the company.”
The reason for and effect of special resolution number 2 is to grant the directors of the company the authority, until the next annual general meeting of the company, to provide direct or indirect financial assistance to any company or corporation which is related or inter-related to the company. This means that the company is, inter alia, authorised to grant loans to its subsidiaries and to guarantee the debt of its subsidiaries.
8.2 SPECIAL RESOLUTION NUMBER 3: FINANCIAL ASSISTANCE FOR THE SUBSCRIPTION AND/OR PURCHASE OF SHARES IN THE COMPANY OR A RELATED OR INTER-RELATED COMPANY
“Resolved, in terms of section 44(3)(a)(ii) of the Companies Act, as a general approval, that the board of the company be and is hereby authorised to approve that the company provides any direct or indirect financial assistance (“financial assistance” will herein have the meaning attributed to it in sections 44(1) and 44(2) of the Companies Act) that the board of the company may deem fit to any company or corporation that is related or inter-related to the company (“related” or “inter-related” will herein have the meaning attributed to it in section 2 of the Companies Act) and/or to any financier who provides funding by subscribing for preference shares or other securities in the company or any company or corporation that is related or inter-related to the company, on the terms and conditions and for amounts that the board of the company may determine for the purpose of, or in connection with the subscription of any option, or any shares or other securities, issued or to be issued by the company or a related or inter-related company or corporation, or for the purchase of any shares or securities of the company or a related or inter-related company or corporation, provided that the aforementioned approval shall be valid until the date of the next annual general meeting of the company.”

CA SALES HOLDINGS ANNUAL REPORT 2017
84
The reason for and effect of special resolution number 3 is to grant the directors the authority, until the next annual general meeting of the company, to provide financial assistance to any company or corporation which is related or inter-related to the company and/or to any financier for the purpose of or in connection with the subscription or purchase of options, shares or other securities in the company or any related or inter-related company or corporation. This means that the company is authorised, inter alia, to grant loans to its subsidiaries and to guarantee and furnish security for the debt of its subsidiaries where any such financial assistance is directly or indirectly related to a party subscribing for options, shares or securities in the company or its subsidiaries. A typical example of where the company may rely on this authority is where a subsidiary raised funds by way of issuing preference shares and the third-party funder requires the company to furnish security, by way of a guarantee or otherwise, for the obligations of its subsidiary to the third-party funder arising from the issue of the preference shares. The company has no immediate plans to use this authority and is simply obtaining same in the interests of prudence and good corporate governance should the unforeseen need arise to use the authority.
In terms of and pursuant to the provisions of sections 44 and 45 of the Companies Act, the directors of the company confirm that the board will satisfy itself, after considering all reasonably foreseeable financial circumstances of the company, that immediately after providing any financial assistance as contemplated in special resolution numbers 2 and 3 above:
• the assets of the company (fairly valued) will equal or exceed the liabilities of the company (fairly valued) (taking into consideration the reasonably foreseeable contingent assets and liabilities of the company);
• the company will be able to pay its debts as they become due in the ordinary course of business for a period of 12 months;
• the terms under which any financial assistance is proposed to be provided, will be fair and reasonable to the company; and
• all relevant conditions and restrictions (if any) relating to the granting of financial assistance by the company as contained in the company’s memorandum of incorporation have been met.
9. SHARE REPURCHASES BY THE COMPANY AND ITS SUBSIDIARIES SPECIAL RESOLUTION NUMBER 4: SHARE BUY-BACK BY CA SALES AND ITS SUBSIDIARIES “Resolved, as a special resolution, that the company and the subsidiaries of the company be and are hereby authorised, as a general
approval, to repurchase any of the shares issued by the company, upon such terms and conditions and in such amounts as the directors may from time to time determine, but subject to the provisions of sections 46 and 48 of the Companies Act, the memorandum of incorporation of the company and the 4AX Listings Requirements, including, inter alia, that:
• the general repurchase of the shares may only be implemented through the open market;
• this general authority shall only be valid until the next annual general meeting of the company, provided that it shall not extend beyond 15 months from the date of this resolution;
• an announcement must be published as soon as the company has acquired shares constituting, on a cumulative basis, 3% of the number of shares in issue prior to the acquisition, pursuant to which the aforesaid 3% threshold is reached, containing full details thereof, as well as for each 3% in aggregate of the initial number of shares acquired thereafter;
• the general authority to repurchase is limited to a maximum of 450 million shares;
• a resolution has been passed by the board of directors approving the purchase, that the company has satisfied the solvency and liquidity test as defined in the Companies Act and that, since the solvency and liquidity test was applied, there have been no material changes to the financial position of the company and its subsidiaries (“the group”);
• the general repurchase is authorised by the company’s memorandum of incorporation;
• repurchases must not be made at a price more than R5 or the BWP equivalent; and
• the company may not effect a repurchase which will result in the company not complying with the 4AX minimum number and percentage of securities held by the public on the date of the repurchase, as contemplated in terms of paragraph 6.26 of the 4AX Listings Requirements.”
The reason for and effect of special resolution number 4 is to grant the directors a general authority in terms of its memorandum of incorporation and the 4AX Listings Requirements for the acquisition by the company or by a subsidiary of the company of shares issued by the company on the basis reflected in special resolution number 4. The company has no immediate plans to use this authority and is simply obtaining same in the interests of prudence and good corporate governance should the unforeseen need arise to use the authority.
In terms of section 48(2)(b)(i) of the Companies Act, subsidiaries may not hold more than 10%, in aggregate, of the number of the issued shares of a company. For the avoidance of doubt, a pro rata repurchase by the company from all its shareholders will not require shareholder approval, save to the extent as may be required by the Companies Act.
10. OTHER BUSINESS To transact such other business as may be transacted at an annual general meeting or raised by shareholders with or without advance
notice to the company.
INFORMATION RELATING TO THE SPECIAL RESOLUTIONS 1. The directors of the company or its subsidiaries will only utilise the general authority to repurchase shares of the company as set
out in special resolution number 4 to the extent that the directors, after considering the maximum number of shares to be purchased, are of the opinion that the position of the group would not be compromised as to the following:
NOTICE OF ANNUAL GENERAL MEETING CONTINUED
CA SALES HOLDINGS ANNUAL REPORT 2017
85
Shareholder information
• the group’s ability in the ordinary course of business to pay its debts for a period of 12 months after the date of the AGM and for a period of 12 months after the repurchase;
• the consolidated assets of the group will at the time of the AGM and at the time of making such determination be in excess of the consolidated liabilities of the group. The assets and liabilities should be recognised and measured in accordance with the accounting policies used in the latest audited annual financial statements of the group;
• the ordinary capital and reserves of the group after the repurchase will remain adequate for the purpose of the business of the group for a period of 12 months after the AGM and after the date of the share repurchase; and
• the working capital available to the group after the repurchase will be sufficient for the group’s requirements for a period of 12 months after the date of the notice of the AGM.
General information in respect of major shareholders, material changes and the share capital of the company is contained in the annual report of which this notice forms part, as well as the full set of annual financial statements, being available on CA Sales’ website at www.casholdings.co.za or which may be requested and obtained in person, at no charge, at the registered office of CA Sales during office hours.
2. The directors, whose names appear on pages 16 and 17 of the annual report of which this notice forms part, collectively and individually accept full responsibility for the accuracy of the information given and certify that to the best of their knowledge and belief there are no facts that have been omitted which would make any statement false or misleading, and that all reasonable enquiries to ascertain such facts have been made and that this notice of AGM contains all information required by the Listings Requirements.
3. Special resolutions numbers 2, 3 and 4 are renewals of resolutions taken at the previous annual general meeting held on 31 August 2017.
VOTING1. The date on which shareholders must be recorded in the share register for purposes of being entitled to attend and vote at the AGM is
1 June 2018, with the last day to trade being 29 May 2018. The finalisation date will be 25 May 2018
2. Meeting participants will be required to provide proof of identification to the reasonable satisfaction of the chairman of the AGM and must accordingly bring a copy of their identity document, passport or driver’s licence to the AGM. If in doubt as to whether any document will be regarded as satisfactory proof of identification, meeting participants should contact the transfer secretary for guidance.
3. Shareholders entitled to attend and vote at the AGM may appoint one or more proxies to attend, speak and vote thereat in their stead. A proxy need not be a shareholder of the company. A form of proxy, which sets out the relevant instructions for its completion, is enclosed for use by a certificated shareholder or own-name registered dematerialised shareholder who wishes to be represented at the AGM. Completion of a form of proxy will not preclude such shareholder from attending and voting (in preference to that shareholder’s proxy) at the AGM.
4. The instrument appointing a proxy and the authority (if any) under which it is signed must reach the transfer secretary of the company at the address provided on the inside back cover of this annual report by no later than 12:00 on 21 June 2018 provided that any form of proxy not delivered to the transfer secretary by this time may be handed to the chairman of the AGM at any time before the appointed proxy exercises any shareholder rights at the AGM.
5. Dematerialised shareholders, other than own-name registered dematerialised shareholders, who wish to attend the AGM in person, will need to request their central securities depository participant (“CSDP”) or broker to provide them with the necessary authority (i.e. letter of representation) in terms of the custody agreement entered into between such shareholders and the CSDP or broker.
6. Dematerialised shareholders, other than own-name registered dematerialised shareholders, who are unable to attend the AGM and who wish to be represented thereat, must provide their CSDP or broker with their voting instructions in terms of the custody agreement entered into between themselves and the CSDP or broker in the manner and time stipulated therein.
7. Shareholders present in person, by proxy or by authorised representative shall, on a show of hands, have one vote each and, on a poll, will have one vote in respect of each share held.
By order of the board
FJ ReichertCompany secretary
Stellenbosch25 May 2018

CA SALES HOLDINGS ANNUAL REPORT 2017
86
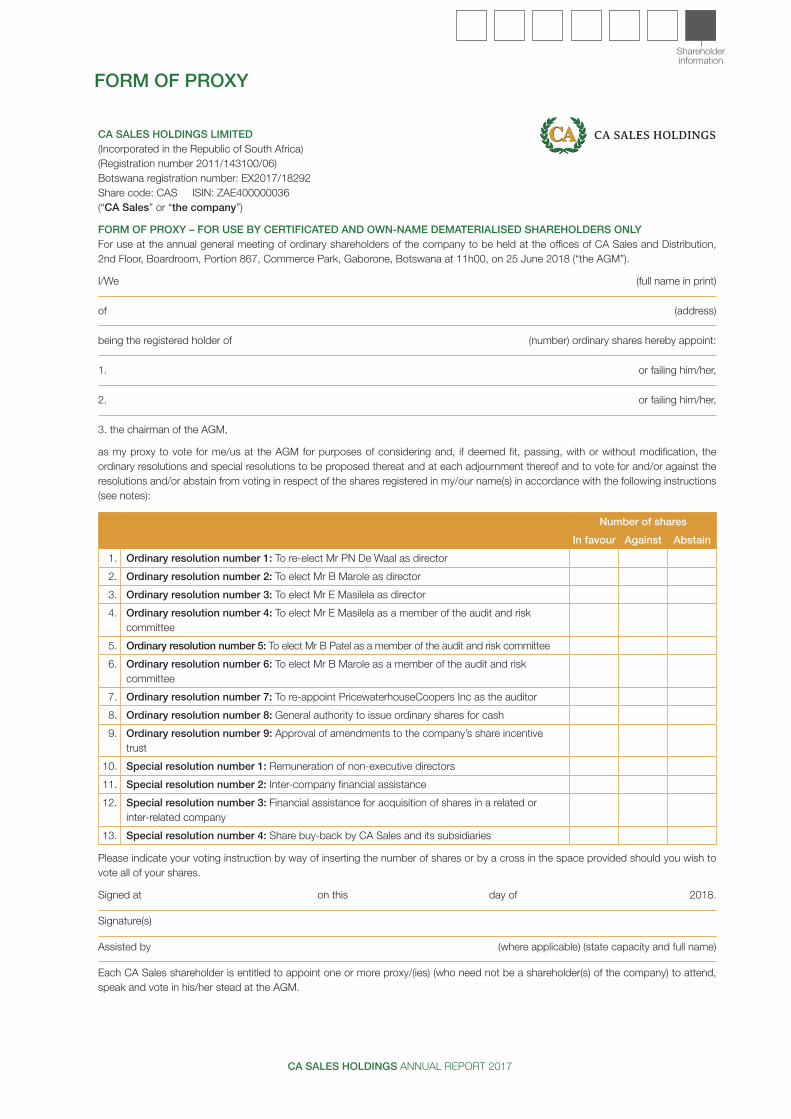
CA SALES HOLDINGS ANNUAL REPORT 2017
Shareholder information
FORM OF PROXY
CA SALES HOLDINGS LIMITED(Incorporated in the Republic of South Africa)(Registration number 2011/143100/06)Botswana registration number: EX2017/18292Share code: CAS ISIN: ZAE400000036(“CA Sales” or “the company”)
FORM OF PROXY – FOR USE BY CERTIFICATED AND OWN-NAME DEMATERIALISED SHAREHOLDERS ONLY For use at the annual general meeting of ordinary shareholders of the company to be held at the offices of CA Sales and Distribution, 2nd Floor, Boardroom, Portion 867, Commerce Park, Gaborone, Botswana at 11h00, on 25 June 2018 (“the AGM”).
I/We (full name in print)
of (address)
being the registered holder of (number) ordinary shares hereby appoint:
1. or failing him/her,
2. or failing him/her,
3. the chairman of the AGM,
as my proxy to vote for me/us at the AGM for purposes of considering and, if deemed fit, passing, with or without modification, the ordinary resolutions and special resolutions to be proposed thereat and at each adjournment thereof and to vote for and/or against the resolutions and/or abstain from voting in respect of the shares registered in my/our name(s) in accordance with the following instructions (see notes):
Number of shares
In favour Against Abstain
1. Ordinary resolution number 1: To re-elect Mr PN De Waal as director
2. Ordinary resolution number 2: To elect Mr B Marole as director
3. Ordinary resolution number 3: To elect Mr E Masilela as director
4. Ordinary resolution number 4: To elect Mr E Masilela as a member of the audit and risk committee
5. Ordinary resolution number 5: To elect Mr B Patel as a member of the audit and risk committee
6. Ordinary resolution number 6: To elect Mr B Marole as a member of the audit and risk committee
7. Ordinary resolution number 7: To re-appoint PricewaterhouseCoopers Inc as the auditor
8. Ordinary resolution number 8: General authority to issue ordinary shares for cash
9. Ordinary resolution number 9: Approval of amendments to the company’s share incentive trust
10. Special resolution number 1: Remuneration of non-executive directors
11. Special resolution number 2: Inter-company financial assistance
12. Special resolution number 3: Financial assistance for acquisition of shares in a related or inter-related company
13. Special resolution number 4: Share buy-back by CA Sales and its subsidiaries
Please indicate your voting instruction by way of inserting the number of shares or by a cross in the space provided should you wish to vote all of your shares.
Signed at on this day of 2018.
Signature(s)
Assisted by (where applicable) (state capacity and full name)
Each CA Sales shareholder is entitled to appoint one or more proxy/(ies) (who need not be a shareholder(s) of the company) to attend, speak and vote in his/her stead at the AGM.
CA SALES HOLDINGS ANNUAL REPORT 2017
NOTES TO THE FORM OF PROXY
1. A CA Sales shareholder may insert the name of a proxy or the names of two alternative proxies of the shareholder’s choice in the space(s) provided, with or without deleting “the chairman of the AGM”. The person whose name appears first on the form of proxy and who is present at the AGM will be entitled to act as proxy to the exclusion of those whose names follow.
2. A CA Sales shareholder’s instructions to the proxy must be indicated by the insertion of the relevant number of shares to be voted on behalf of that shareholder in the appropriate box provided or by the insertion of a cross if all shares should be voted on behalf of that shareholder. Failure to comply with the above will be deemed to authorise the chairman of the AGM, if he/she is the authorised proxy, to vote in favour of the resolutions at the AGM, or any other proxy to vote or to abstain from voting at the AGM as he/she deems fit, in respect of all the shares concerned. A shareholder or his/her proxy is not obliged to use all the votes exercisable by the shareholder or his/her proxy, but the total of the votes cast and in respect whereof abstentions are recorded may not exceed the total of the votes exercisable by the shareholder or his/her proxy.
3. When there are joint registered holders of any shares, any one of such persons may vote at the AGM in respect of such shares as if he/she was solely entitled thereto, but, if more than one of such joint holders be present or represented at any AGM, that one of the said persons whose name stands first in the register in respect of such shares or his/her proxy, as the case may be, shall alone be entitled to vote in respect thereof. Several executors or administrators of a deceased shareholder, in whose name any shares stand, shall be deemed joint holders thereof.
4. Forms of proxy must be completed and returned to be received by the transfer secretary of the company:
Shares listed on BSE Shares listed on 4AX Grant Thornton, Botswana 4 Africa Exchange Registry Acumen Park, Plot 50370 Postnet Suite 532 Fairground, Gaborone Private Bag X51, Bryanston, 2021 (PO Box 1157, Gaborone, Botswana) Email: [email protected]
by no later than 12h00 on 21 June 2018, provided that any form of proxy not delivered to the transfer secretary by this time may be handed to the chairman of the AGM at any time prior to the commencement of the AGM.
5. Any alteration or correction made to this form of proxy must be initialled by the signatory/(ies).
6. Documentary evidence establishing the authority of a person signing this form of proxy in a representative capacity must be attached to this form of proxy unless previously recorded by the company’s transfer secretary or waived by the chairman of the AGM.
7. The completion and lodging of this form of proxy will not preclude the relevant shareholder from attending the AGM and speaking and voting in person thereat to the exclusion of any proxy appointed in terms hereof, should such shareholder wish to do so.
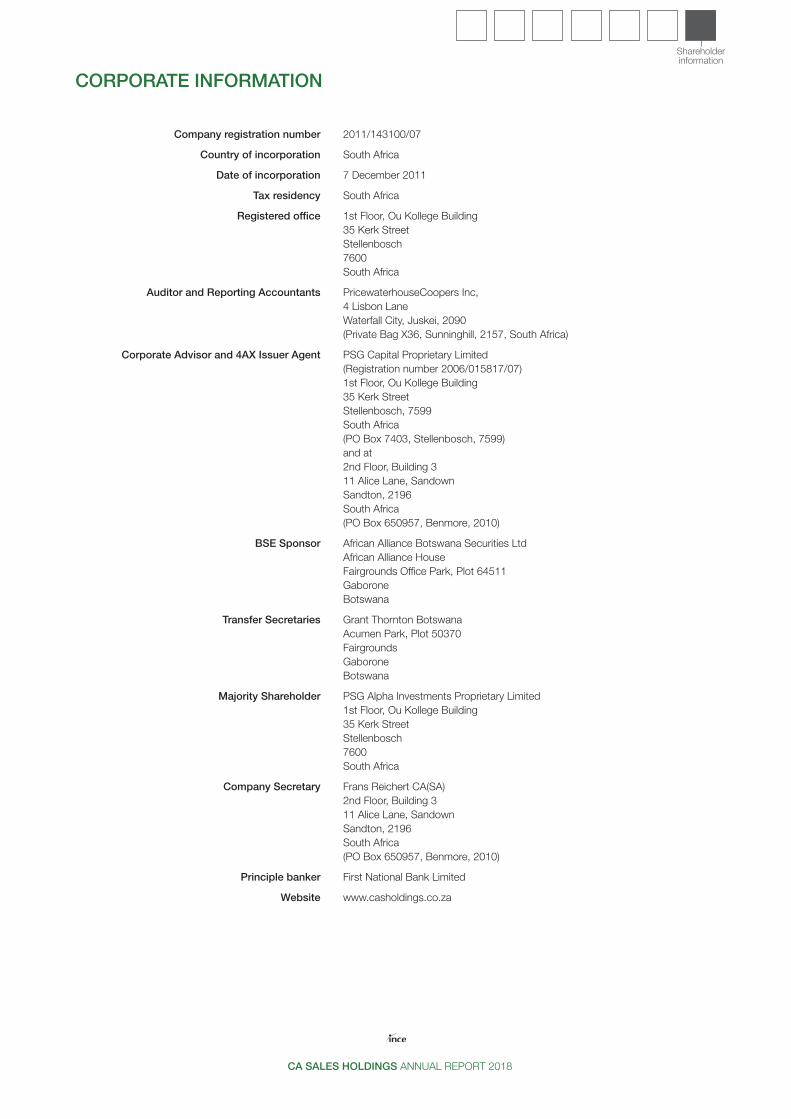
Shareholder information
CA SALES HOLDINGS ANNUAL REPORT 2018
Company registration number 2011/143100/07
Country of incorporation South Africa
Date of incorporation 7 December 2011
Tax residency South Africa
Registered office 1st Floor, Ou Kollege Building35 Kerk StreetStellenbosch7600South Africa
Auditor and Reporting Accountants PricewaterhouseCoopers Inc,4 Lisbon LaneWaterfall City, Juskei, 2090(Private Bag X36, Sunninghill, 2157, South Africa)
Corporate Advisor and 4AX Issuer Agent PSG Capital Proprietary Limited(Registration number 2006/015817/07)1st Floor, Ou Kollege Building35 Kerk StreetStellenbosch, 7599South Africa(PO Box 7403, Stellenbosch, 7599) and at2nd Floor, Building 311 Alice Lane, SandownSandton, 2196South Africa(PO Box 650957, Benmore, 2010)
BSE Sponsor African Alliance Botswana Securities LtdAfrican Alliance HouseFairgrounds Office Park, Plot 64511GaboroneBotswana
Transfer Secretaries Grant Thornton BotswanaAcumen Park, Plot 50370FairgroundsGaboroneBotswana
Majority Shareholder PSG Alpha Investments Proprietary Limited1st Floor, Ou Kollege Building35 Kerk StreetStellenbosch7600South Africa
Company Secretary Frans Reichert CA(SA)2nd Floor, Building 311 Alice Lane, SandownSandton, 2196South Africa(PO Box 650957, Benmore, 2010)
Principle banker First National Bank Limited
Website www.casholdings.co.za
CORPORATE INFORMATION

www.casholdings.co.za