Embed Size (px)
Citation preview
Annual Report 2017
Annual R
eport | 2017
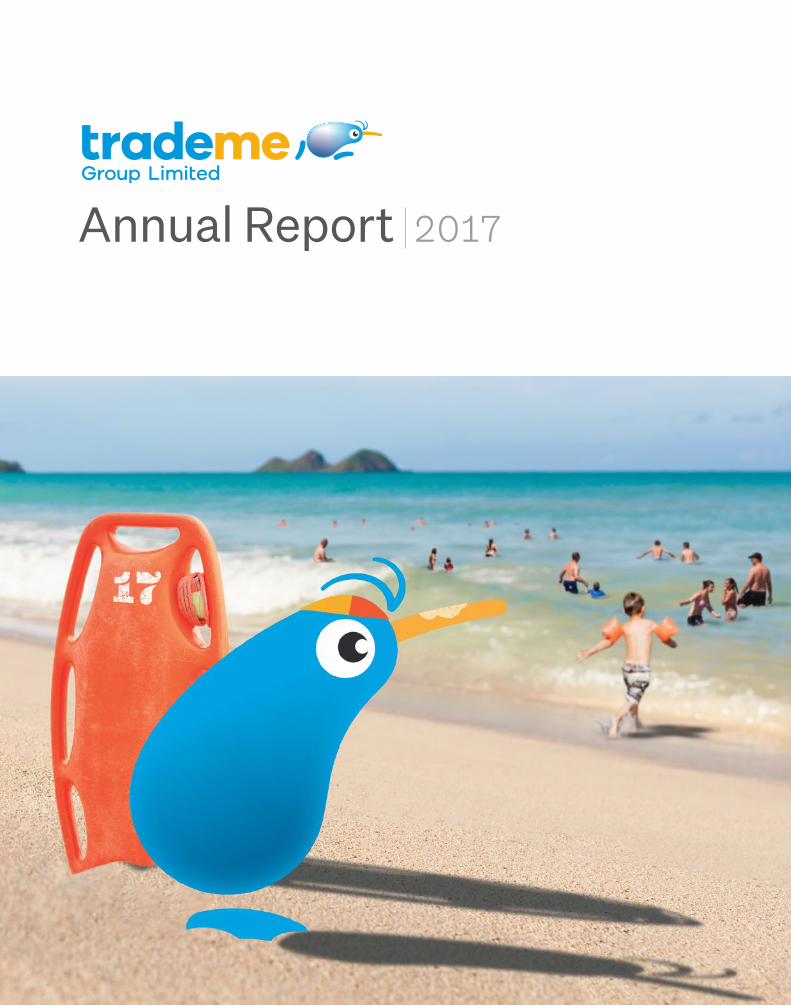
David Kirk will host shareholders at the Trade Me AGM on Thursday 9 November in Wellington.
The notice of meeting and agenda will be mailed to shareholders in early October 2017.
This report is dated 24 August 2017 and is signed on behalf of the Board of directors of Trade Me Group by:
David Kirk Joanna Perry Chairman Director
For more investor information about Trade Me Group, please visit the Trade Me investor relations website at investors.trademe.co.nz
2017 Annual shareholder meeting of Trade Me Group
Annual Shareholder Meeting
TRADE ME GROUP ANNUAL REPORT 2017 1
Table of contents
Jargon buster 2
Highlights 3
The year in review 14
Chairman’s report 16
CEO’s report 20
Business Update 24
Executive team profiles 26
The Trade Me values 30
Directors’ report 31
Director profiles 32
Corporate governance 34
Financial statements 51
Directory 80
2017 highlights:
Financial statements:
Chairman’s report:
Directory:
CEO’s report:
Directors’ report:
3
51 80
16 20
31
5 big things from F17
our important financial information
a letter from David Kirk
our websites & other info
the rundown from Jon Macdonald
Board profiles, governance & disclosures
2
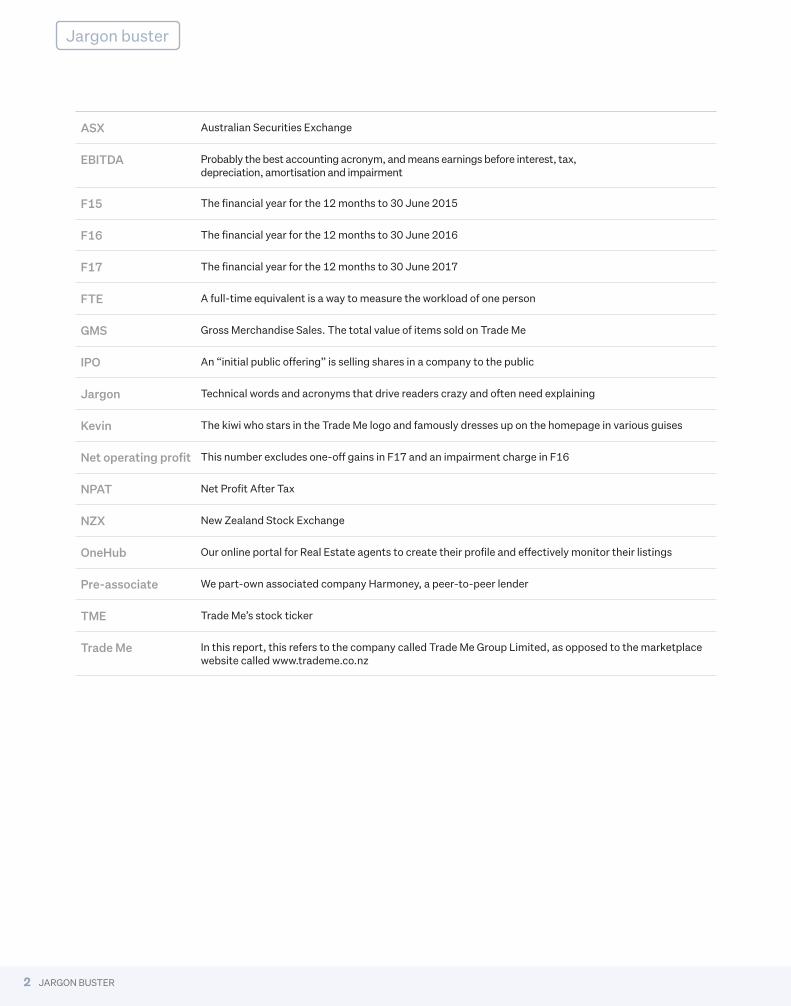
ASX Australian Securities Exchange
EBITDA Probably the best accounting acronym, and means earnings before interest, tax, depreciation, amortisation and impairment
F15 The financial year for the 12 months to 30 June 2015
F16 The financial year for the 12 months to 30 June 2016
F17 The financial year for the 12 months to 30 June 2017
FTE A full-time equivalent is a way to measure the workload of one person
GMS Gross Merchandise Sales. The total value of items sold on Trade Me
IPO An “initial public offering” is selling shares in a company to the public
Jargon Technical words and acronyms that drive readers crazy and often need explaining
Kevin The kiwi who stars in the Trade Me logo and famously dresses up on the homepage in various guises
Net operating profit This number excludes one-off gains in F17 and an impairment charge in F16
NPAT Net Profit After Tax
NZX New Zealand Stock Exchange
OneHub Our online portal for Real Estate agents to create their profile and effectively monitor their listings
Pre-associate We part-own associated company Harmoney, a peer-to-peer lender
TME Trade Me’s stock ticker
Trade Me In this report, this refers to the company called Trade Me Group Limited, as opposed to the marketplace website called www.trademe.co.nz
JARGON BUSTER
Jargon buster

33
Highlights
TRADE ME GROUP ANNUAL REPORT 2017
HIGHLIGHTS4
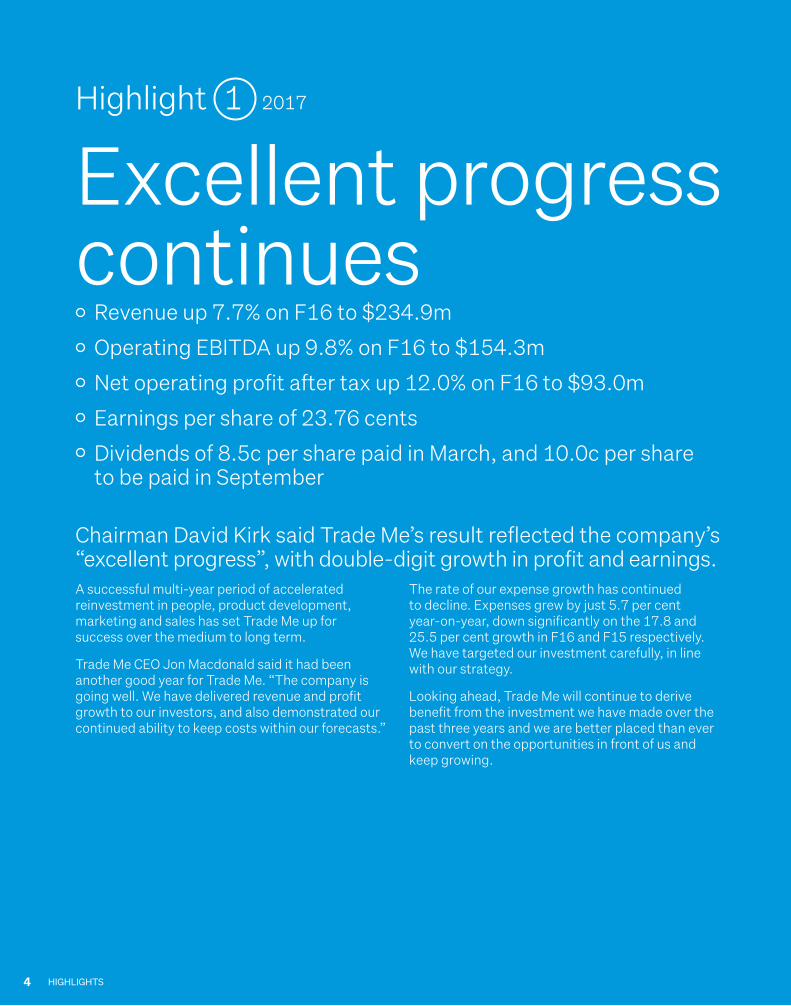
Excellent progress continues
Revenue up 7.7% on F16 to $234.9m
Operating EBITDA up 9.8% on F16 to $154.3m
Net operating profit after tax up 12.0% on F16 to $93.0m
Earnings per share of 23.76 cents
Dividends of 8.5c per share paid in March, and 10.0c per share to be paid in September
Chairman David Kirk said Trade Me’s result reflected the company’s “excellent progress”, with double-digit growth in profit and earnings.A successful multi-year period of accelerated reinvestment in people, product development, marketing and sales has set Trade Me up for success over the medium to long term.
Trade Me CEO Jon Macdonald said it had been another good year for Trade Me. “The company is going well. We have delivered revenue and profit growth to our investors, and also demonstrated our continued ability to keep costs within our forecasts.”
The rate of our expense growth has continued to decline. Expenses grew by just 5.7 per cent year-on-year, down significantly on the 17.8 and 25.5 per cent growth in F16 and F15 respectively. We have targeted our investment carefully, in line with our strategy.
Looking ahead, Trade Me will continue to derive benefit from the investment we have made over the past three years and we are better placed than ever to convert on the opportunities in front of us and keep growing.
Highlight 1 2017

TRADE ME GROUP ANNUAL REPORT 2017 5
HIGHLIGHTS6
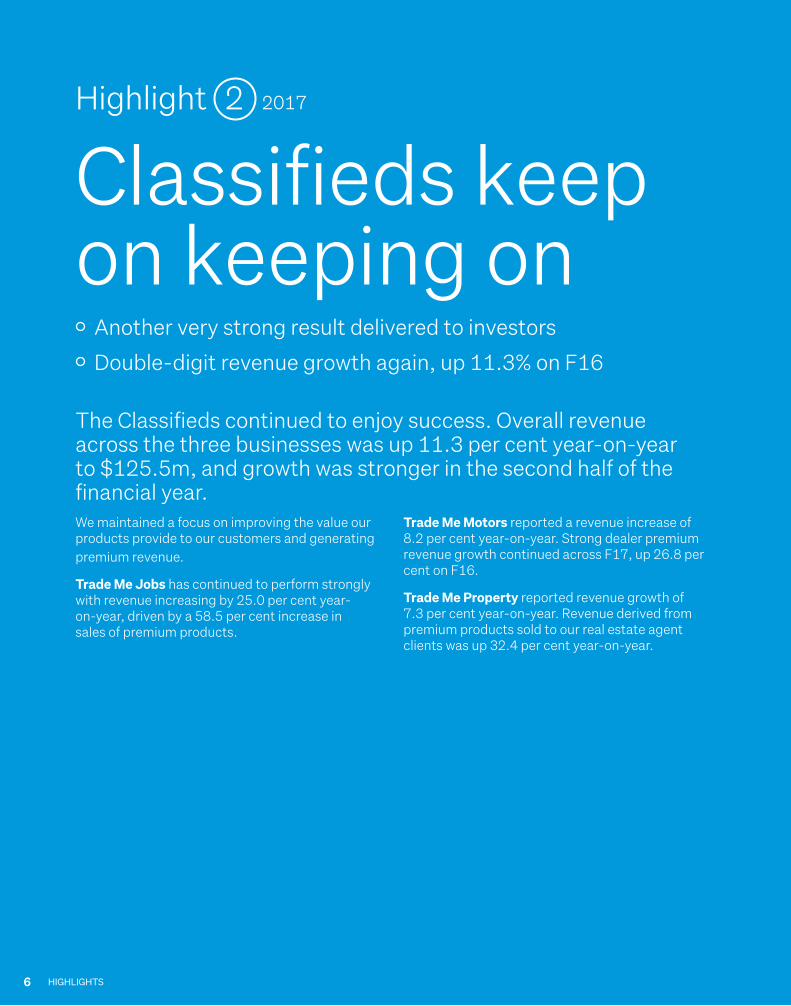
Classifieds keep on keeping on
Another very strong result delivered to investors
Double-digit revenue growth again, up 11.3% on F16
The Classifieds continued to enjoy success. Overall revenue across the three businesses was up 11.3 per cent year-on-year to $125.5m, and growth was stronger in the second half of the financial year.We maintained a focus on improving the value our products provide to our customers and generating premium revenue.
Trade Me Jobs has continued to perform strongly with revenue increasing by 25.0 per cent year- on-year, driven by a 58.5 per cent increase in sales of premium products.
Trade Me Motors reported a revenue increase of 8.2 per cent year-on-year. Strong dealer premium revenue growth continued across F17, up 26.8 per cent on F16.
Trade Me Property reported revenue growth of 7.3 per cent year-on-year. Revenue derived from premium products sold to our real estate agent clients was up 32.4 per cent year-on-year.
Highlight 2 2017

7 TRADE ME GROUP ANNUAL REPORT 2017
Marketplace shows good growth
Dedicated ‘new goods’ and ‘secondhand goods’ teams established
Revenue up 7.1% on F16
We’re rapt to see ongoing growth in our General Items marketplace. Revenue was up again this year, following on from revenue growth of 3.5 per cent last year.Over the year we’ve introduced several new initiatives and product changes. This included Buyer Protection and Seller Protection, both of which are aimed at enhancing trust in trading onsite.
We’ve also been focused on making buying and selling easier. For example, we’ve started suggesting categories and start prices to sellers when they list. Our ‘Book a courier’ service is also going well.
We’re under way with plans to set up dedicated teams focused on the distinct business-to- consumer (‘new goods’) and consumer-to- consumer (‘secondhand goods’) markets.
Highlight 3 2017
HIGHLIGHTS8

9 TRADE ME GROUP ANNUAL REPORT 2017
New thingsProperty Insights a big hit
Enhancing trust with Buyer and Seller Protection
Book a courier passes the 500,000 bookings milestone
Proposed acquisition of Motorcentral under way
We have released a suite of products, services and initiatives across Trade Me in F17.Property Insights, our tool that provides free information for more than 1.6 million residential properties, has proven very popular and we recently added map based search to this product. We have also launched a property agent directory, showcasing agents’ talents and helping vendors with a tailored agent recommendation.
Over in our General Items marketplace, the introduction of Buyer Protection was very well-received. We also reminded sellers of the safeguards we have in place under the banner of Seller Protection. We’ve completed an integration with a company called Magento to make it easier for sellers using their products to pipe their listings onto Trade Me. The ‘Book a courier’ service is going from strength-to-strength and has recently surpassed 500,000 bookings. We’re also excited about the imminent arrival of Afterpay onsite, an interest-free deferred payment product.
The Trade Me Jobs team also put in a big effort improving our Apple (iOS) and Android mobile apps.
In July 2017, we announced our intention to acquire Christchurch-based Limelight Software, the operator of the cloud-based automotive dealer management platform Motorcentral. The Trade Me Motors team is very excited about prospects for this business, and eagerly awaiting clearance from the Commerce Commission.
Highlight 4 2017
HIGHLIGHTS10

11 TRADE ME GROUP ANNUAL REPORT 2017
HIGHLIGHTS12
543 people at Trade Me
Big hiring plans for Christchurch
Simon West appointed as a director
Trade Me founder Sam Morgan departed the Board
Annie Brown joined as our inaugural Chief People Officer
The number of staff at Trade Me has grown from 509 (487 FTEs) as at 31 July 2016 to 543 (512 FTEs) as at 31 July 2017. We’re very proud of our contribution to New Zealand as an employer.The majority of our people are still based in our Wellington headquarters, but we now have more than 150 on deck in Auckland. We also have big hiring plans for the South Island, and will be strengthening our presence in Christchurch considerably over the course of F18.
There have been several recent changes to our Executive team. Annie Brown joined as our first Chief People Officer in June 2017. A month later we made several other changes based on our strategic priorities, and to assist with our continued growth. This saw Alan Clark (Head of Trade Me Motors) and Jeremy Wade (Head of Trade Me Jobs) join the executive management team, Trent Mankelow
appointed as our inaugural Chief Customer Officer, and the creation of a new Chief Product and Technology Officer role.
There was one change to the Trade Me board in December 2016, with Auckland-based Simon West appointed as an independent director. Simon has extensive experience in retail and technology businesses, and is currently the executive director of Max Fashions.
Also in December, we farewelled our founder Sam Morgan as an independent director, a move foreshadowed to shareholders at the annual meeting in November.
Highlight 5 2017
HIGHLIGHTS12
TRADE ME GROUP ANNUAL REPORT 2017 1313 TRADE ME GROUP ANNUAL REPORT 2017
14 THE YEAR IN REVIEW
2017
2016
OctoberSeptemberAugustJuly
The year in review
January February March
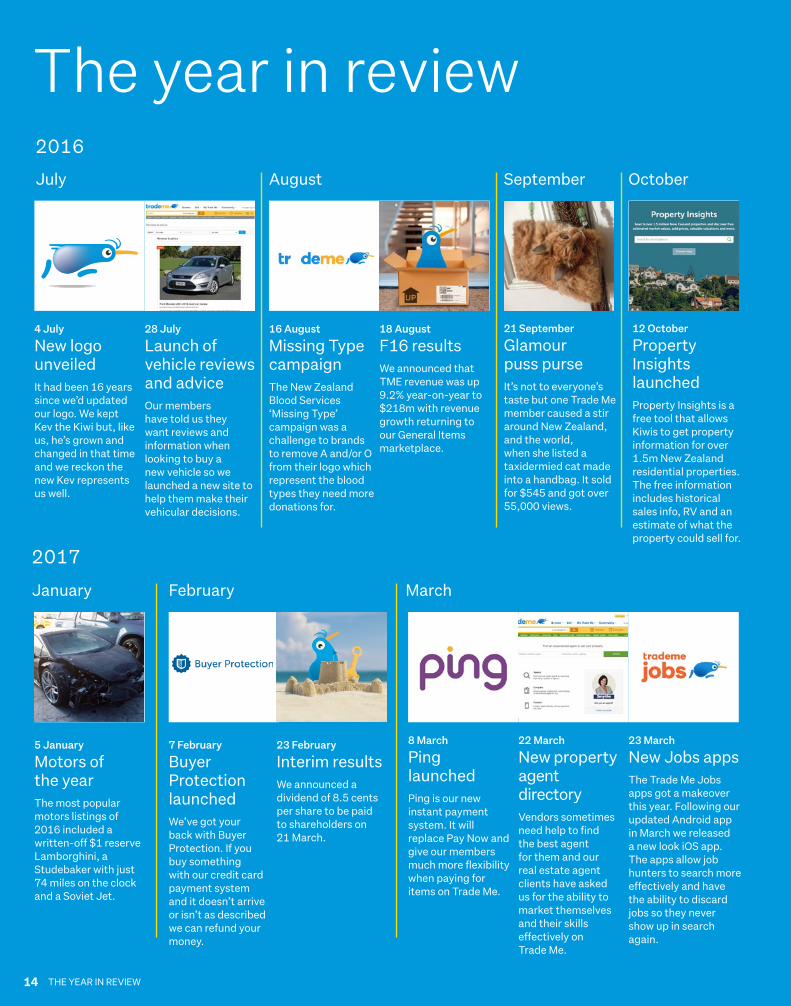
4 July
New logo unveiledIt had been 16 years since we’d updated our logo. We kept Kev the Kiwi but, like us, he’s grown and changed in that time and we reckon the new Kev represents us well.
5 January
Motors of the yearThe most popular motors listings of 2016 included a written-off $1 reserve Lamborghini, a Studebaker with just 74 miles on the clock and a Soviet Jet.
28 July
Launch of vehicle reviews and adviceOur members have told us they want reviews and information when looking to buy a new vehicle so we launched a new site to help them make their vehicular decisions.
7 February
Buyer Protection launchedWe’ve got your back with Buyer Protection. If you buy something with our credit card payment system and it doesn’t arrive or isn’t as described we can refund your money.
23 February
Interim resultsWe announced a dividend of 8.5 cents per share to be paid to shareholders on 21 March.
16 August
Missing Type campaignThe New Zealand Blood Services ‘Missing Type’ campaign was a challenge to brands to remove A and/or O from their logo which represent the blood types they need more donations for.
18 August
F16 resultsWe announced that TME revenue was up 9.2% year-on-year to $218m with revenue growth returning to our General Items marketplace.
23 March
New Jobs appsThe Trade Me Jobs apps got a makeover this year. Following our updated Android app in March we released a new look iOS app. The apps allow job hunters to search more effectively and have the ability to discard jobs so they never show up in search again.
8 March
Ping launchedPing is our new instant payment system. It will replace Pay Now and give our members much more flexibility when paying for items on Trade Me.
22 March
New property agent directoryVendors sometimes need help to find the best agent for them and our real estate agent clients have asked us for the ability to market themselves and their skills effectively on Trade Me.
12 October
Property Insights launchedProperty Insights is a free tool that allows Kiwis to get property information for over 1.5m New Zealand residential properties. The free information includes historical sales info, RV and an estimate of what the property could sell for.
21 September
Glamour puss purseIt’s not to everyone’s taste but one Trade Me member caused a stir around New Zealand, and the world, when she listed a taxidermied cat made into a handbag. It sold for $545 and got over 55,000 views.
TRADE ME GROUP ANNUAL REPORT 2017 15
DecemberNovember
April
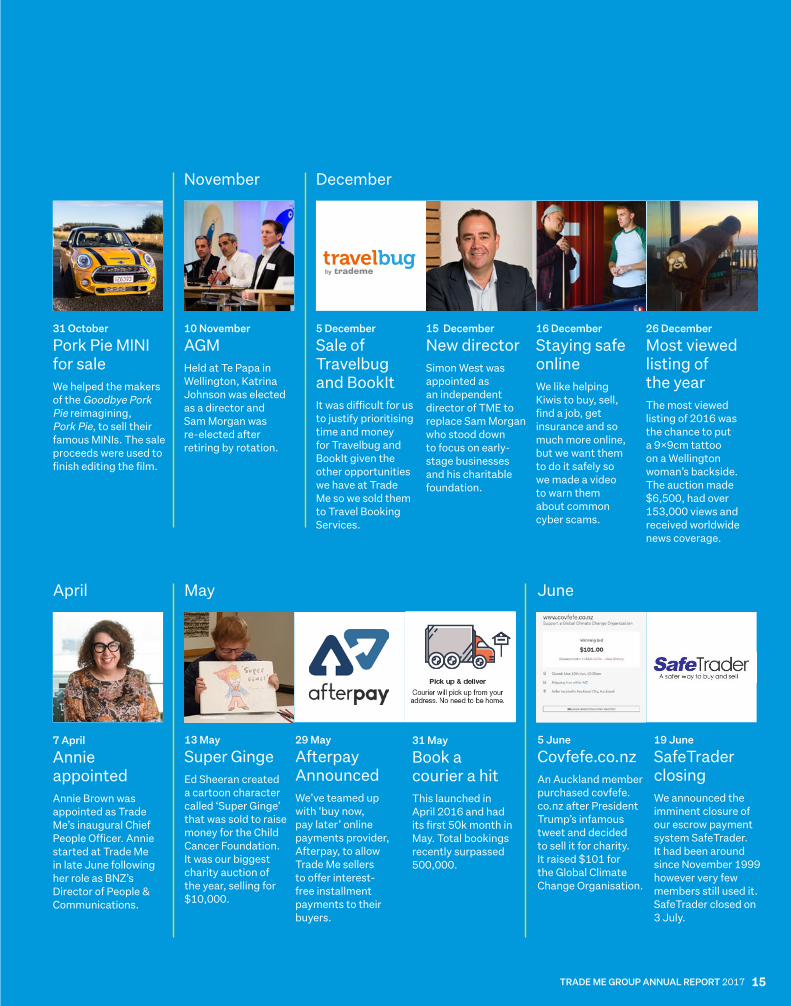
7 April
Annie appointedAnnie Brown was appointed as Trade Me’s inaugural Chief People Officer. Annie started at Trade Me in late June following her role as BNZ’s Director of People & Communications.
10 November
AGMHeld at Te Papa in Wellington, Katrina Johnson was elected as a director and Sam Morgan was re-elected after retiring by rotation.
31 October
Pork Pie MINI for saleWe helped the makers of the Goodbye Pork Pie reimagining, Pork Pie, to sell their famous MINIs. The sale proceeds were used to finish editing the film.
May
13 May
Super GingeEd Sheeran created a cartoon character called ‘Super Ginge’ that was sold to raise money for the Child Cancer Foundation. It was our biggest charity auction of the year, selling for $10,000.
29 May
Afterpay AnnouncedWe’ve teamed up with ‘buy now, pay later’ online payments provider, Afterpay, to allow Trade Me sellers to offer interest-free installment payments to their buyers.
5 June
Covfefe.co.nzAn Auckland member purchased covfefe.co.nz after President Trump’s infamous tweet and decided to sell it for charity. It raised $101 for the Global Climate Change Organisation.
19 June
SafeTrader closingWe announced the imminent closure of our escrow payment system SafeTrader. It had been around since November 1999 however very few members still used it. SafeTrader closed on 3 July.
June
31 May
Book a courier a hitThis launched in April 2016 and had its first 50k month in May. Total bookings recently surpassed 500,000.
5 December
Sale of Travelbug and BookItIt was difficult for us to justify prioritising time and money for Travelbug and BookIt given the other opportunities we have at Trade Me so we sold them to Travel Booking Services.
15 December
New directorSimon West was appointed as an independent director of TME to replace Sam Morgan who stood down to focus on early-stage businesses and his charitable foundation.
16 December
Staying safe onlineWe like helping Kiwis to buy, sell, find a job, get insurance and so much more online, but we want them to do it safely so we made a video to warn them about common cyber scams.
26 December
Most viewed listing of the yearThe most viewed listing of 2016 was the chance to put a 9x9cm tattoo on a Wellington woman’s backside. The auction made $6,500, had over 153,000 views and received worldwide news coverage.
16
Letter to Trade Me shareholders
CHAIRMAN’S REPORT
Chairman’s report
TRADE ME GROUP ANNUAL REPORT 2017 17
Dear shareholders,
The net operating profit achieved by Trade Me in the 2017 financial year was $93.0m. This is 12.0% more than last year, and a new record for us. Earnings per share grew by 25.9% in the year.The final dividend for 2017 will be 10.0 cents per share. Added to our interim dividend of 8.5 cents per share, the total dividend payment for 2017 is 18.5 cents per share – an increase of 10% on 2016. The final dividend will be payable to shareholders on our register as at 8 September 2017 and the dividend will be paid on 19 September 2017.
Revenue in 2017 grew by 7.7%. Our Classified businesses grew strongly, growth in our Marketplace business continued and our other businesses (advertising, payments, travel, dating and insurance) were flat year on year. In this latter group of smaller businesses, our payments business is showing encouraging growth, advertising continues to do well and we still see opportunities in insurance comparison and online insurance broking. Our dating business continues to battle global competitors.
There is more on the performance of all our businesses, particularly the Marketplace and Classified businesses, in the Business Update section of this report.
Trade Me operates in changing and competitive markets. Our Marketplace and Classified businesses are characterised, and to an extent protected, by scale, brand, trust and network economics. These are powerful competitive advantages, but like all established businesses, Trade Me remains vulnerable to new competitors.
There are two types of competitor we need to be on the lookout for. The first is the competitor who has the same type of offer as we do, but offers more in the way of scale, brand, trust or network economics than we do. This sort of business competes head-to-head with the same business model and type of offer to consumers. The prospective competitor we have our eye on here is Amazon which will compete with our Marketplace business.
Amazon is, we understand, planning to establish operations on the ground in Australia later in 2018. We won’t be able to match Amazon for product breadth or on price for all products, but in many other aspects of the experience of buying and selling online we can be highly competitive. This includes on-platform user experience – search, recommendations, checkout, payments, listing ease, inventory management and so on – and off-platform user experience – principally logistics and payments. Our local brand, the trust we have built with New Zealanders over the last
18 years and our local network economics will remain powerful competitive advantages.
The second type of competitor we need to be aware of is the competitor who comes up with a different type of offer to ours. We have seen (and continue to see) many competitors with different types of business models aimed at our Marketplace and Classified businesses. Some are based on building local communities, others on selling through social networks, others purely mobile, still others focused on subsets of a total market. We cannot predict exactly what the next challenge will be or where it will come from so we remain alert, agile and ready to respond quickly and try new things. In the meantime, the best defence against these potentially disruptive competitors is to do as good a job as possible for our customers.
CEO Jon Macdonald talks in some depth about our strengths, why we can be confident about our future, and what we’re doing to compete and grow as these big global companies become more active in our part of the world.
In December 2016, Sam Morgan, founder of Trade Me and a director since the IPO of Trade Me late in 2011, retired from the Board. Sam has been an excellent director of the company. We thank him for all he has contributed and wish him well with all his other interests, including his early stage business investments and charitable foundations.
Our local brand, the trust we have built with New Zealanders over the last 18 years and our local network economics will remain powerful competitive advantages.
18
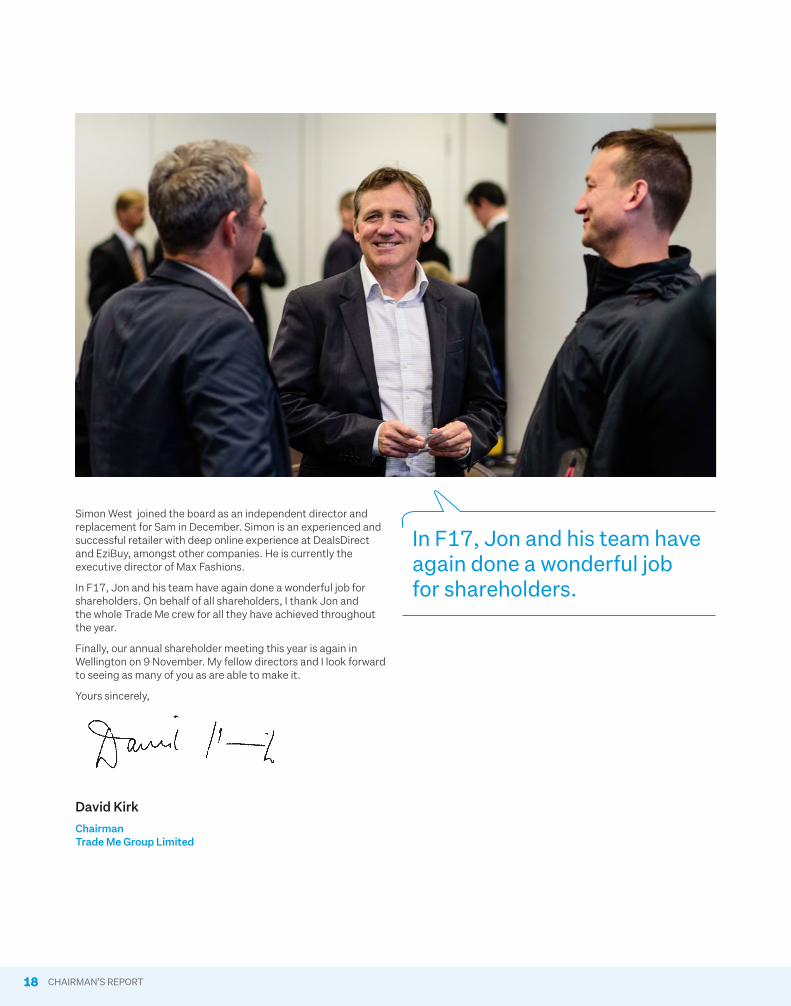
Simon West joined the board as an independent director and replacement for Sam in December. Simon is an experienced and successful retailer with deep online experience at DealsDirect and EziBuy, amongst other companies. He is currently the executive director of Max Fashions.
In F17, Jon and his team have again done a wonderful job for shareholders. On behalf of all shareholders, I thank Jon and the whole Trade Me crew for all they have achieved throughout the year.
Finally, our annual shareholder meeting this year is again in Wellington on 9 November. My fellow directors and I look forward to seeing as many of you as are able to make it.
Yours sincerely,
18 CHAIRMAN’S REPORT
David Kirk
Chairman Trade Me Group Limited
In F17, Jon and his team have again done a wonderful job for shareholders.

TRADE ME GROUP ANNUAL REPORT 2017 19
20
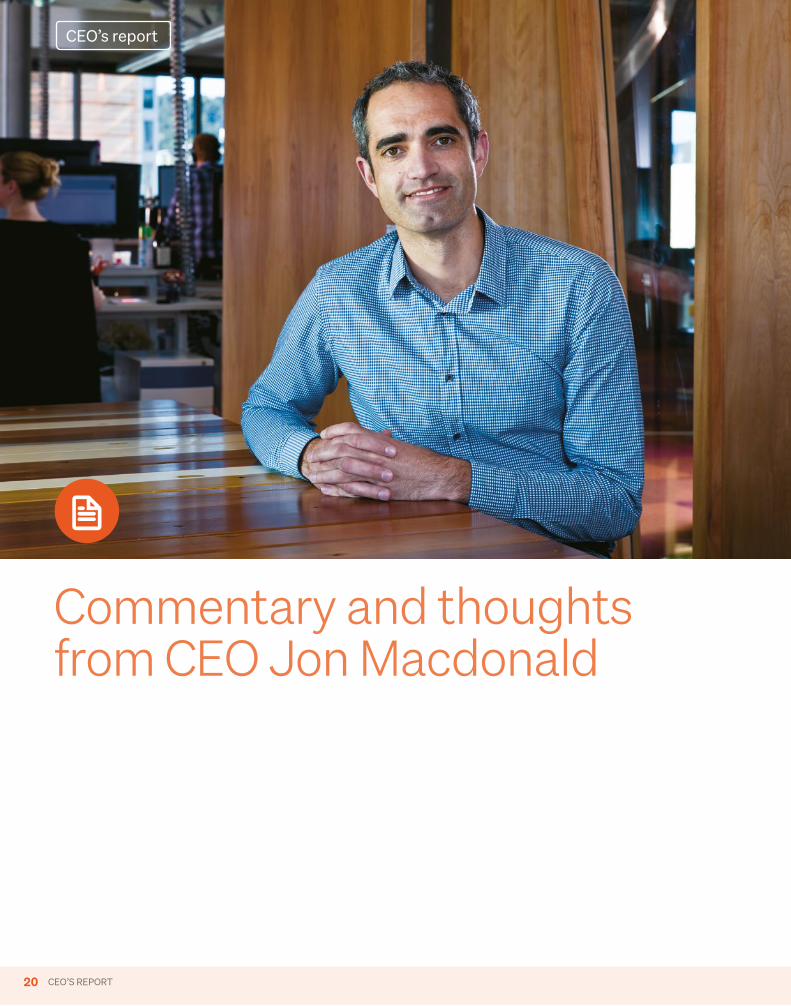
Commentary and thoughts from CEO Jon Macdonald
CEO’S REPORT
CEO’s report
TRADE ME GROUP ANNUAL REPORT 2017 21
Dear fellow shareholder,
I aim to answer two key questions in this letter. First, why are we excited about Trade Me’s prospects? Second, how can we compete with global players like Facebook and Amazon?
To answer these questions, it’s useful to look at our history, Trade Me today, and our prospects over the short and long term.
Our historyOver the last ten years Trade Me has fundamentally changed several times over. Our revenue has grown from $80m to $235m. Our headcount has grown from 100 to 550. Now over 800,000 Kiwis visit Trade Me each day, with two-thirds of our visits via a wide variety of mobile devices.
We help those people by connecting them to undertake a transaction or enter a relationship. That might be buying or selling something on our marketplace, looking for a new car or house, or finding a job. Through this we deliver on our vision: making life better for Kiwis through online experiences they love.
There’s a lot of other good things that we’ve done for New Zealand too. We’ve created a host of budding entrepreneurs and have over 2,000 small business operators selling onsite. We’ve empowered consumers and given them unprecedented choice and transparency. We’ve saved a mountain of goods from landfills. We’ve helped a plethora of charities with direct financial contribution, support through charity auctions, and free or subsidised advertising (we field up to 40 queries a week on this front, and since 2011 we’ve had a full-time charities coordinator).
We’ve tried a bunch of things that haven’t worked too – but any regrets are centred on not trying more, or not stopping things earlier once we sensed they don’t have a long-term future.
Trade Me todayTrade Me is a vibrant and well-loved business. We have many strengths, or sources of competitive advantage:
• Local scale. We have a large and engaged community of buyers, sellers and advertisers. This gives us brand awareness and affection, with the strength and value of our network proportionate to the number of participants – a key concept that underpins the attractiveness of leading marketplaces around the world.
• Local trust. We have worked hard to earn the New Zealand public’s trust through our day-to-day actions (like our careful approach to privacy and openness, demonstrated by our annual Transparency Report).
• Local insights. We have rare and comprehensive insight into the behaviour and preferences of Kiwis, with data that spans many people and touches so many significant life events. We’re using this information intelligently and carefully, along with the advances in data science, to improve the experience and value we offer in unique ways.
• Breadth across New Zealand. We span a portfolio of sectors – retail, automotive, real estate, employment, insurance, services and others – with a single unified brand, platform and understanding of our customers. Through this cohesive approach, the whole is much greater than the sum of the parts.
• Kiwi affection. Finally, we have a special place in the hearts of New Zealanders – nearly everyone has their Trade Me story, where they’ve been surprised or delighted, by finding something they didn’t think they’d find, selling something for a lot more cash than they expected, or meeting a like-minded person when completing the trade.
Our prospectsWe have huge opportunity in front of us, but we also have bigger, stronger and more active competitors than we’ve had at any time in Trade Me’s history – including three global competitors making their presence felt in our local markets: Facebook, Amazon and Alibaba.
It’s easy to claim these companies are too big and too good to compete against, but if you take that outlook, we were doomed and would never have achieved our success to date. We would have been swamped by eBay 15 years ago. We’d never have grown against Seek’s dominant position when we entered the employment market, and we’d have been overrun by global free classified sites that took hold in much of the world.
So, how can we compete and grow in the face of global behemoths at one end of the competitive spectrum, and all manner of start-ups and potential disrupters at the other?
First, we need to know our customers and local market intimately, and be a better fit than any global player can. This comes from a mixture of art and science.
The science is to use our rich data to uniquely tailor our offering to our consumers, and to provide those customers with personalised, friction-free experiences. We’re hugely excited about the potential in our data, and are increasingly using
22 CEO’S REPORT
machine learning to improve the lives of our users, or to improve our own operations.
The art is us building relationships through strong account management and relationships with our trade customers (retailers, real estate agents, recruiters, car dealers and other advertisers) and through good customer support for our buyers (using both people and technology).
We want to keep nurturing our relationship with New Zealand. We have a good base, having recently being named in the top 10 most influential brands by Ipsos, and most loved NZ brands by Colmar Brunton.
Second, we need to broaden our offering to be as useful and relevant as possible in a local context.
We’ve been doing this with good success already – both organically, and through acquisition and partnership.
For example, our ‘Book a courier’ service has reached 500,000 parcels sent (which amplifies a key advantage of speedy local shipping compared with offshore companies), and we’re looking forward to the launch of Afterpay onsite to allow buyers to pay in four simple instalments.
We’ve announced the intended acquisition of Motorcentral, who provide inventory management systems to dealers. This will help us provide a broader offering to our dealer customers.
This strengthens our core and better ensures we’re solving the problems of Kiwi consumers and businesses, which is tough to do with a broad-reaching global approach. Additionally, it expands our addressable market well beyond the immediate opportunity, into new markets within the ecosystems of our current businesses.
Third, we need to be fast, accurate and effective with all that we do, and especially with what we build.
We’ll never have bigger teams than our global competitors, but we’ve never had their numbers. Instead, we’ve focused on accurately building the core functionality that Kiwis need, and made our user experiences simple, engaging, trusted and enjoyable.
It’s a dirty little secret within tech companies that it’s very difficult to draw a straight line between tech effort put in, what is built, and the ultimate benefit to customers or the company. Often bigger teams are slower, more cumbersome, and less efficient.
While we apply our own creative thought, we can also see what bigger overseas peers and competitors are doing, and bring the best of it into our own plans – applying a fast-follower approach to amplify our effectiveness.
We are extremely efficient and effective as an organisation (evident in our strong margins), and we’re embarking now on our next round of organisational improvements to keep our edge.
On top of this, we’re further building out our team, and anticipate hiring over 50 people over the coming year. We expect that up to 30 of these will be technology roles based in Christchurch. I’m very excited about us expanding the small but high-performing office down there, and to be able to support the Christchurch economy.
Our marketplace
These three principles translate to different actions and areas of focus across Trade Me. For example, in our marketplace we are clear on our consumer proposition across the four key retail pillars of range, price, experience and trust:
• Our broad and unique range is due to our new and used goods mix and our 200,000 monthly sellers. We have over four and a half million different items for sale, and includes uniquely local and hard-to-ship inventory that is tricky for global players to replicate.
• Our transparent platform encourages strong price competition, and the increasing number of international sellers on Trade Me means better access to great global pricing.
• We’re tirelessly improving buyer experience through big projects like Afterpay or ‘Book a courier’ and many incremental improvements like search and recommendations. We release improvements to our websites most days of the week.
• We’re highly trusted but we’ve further improved Trade Me with our Buyer Protection programme. We have 24/7 customer support and strong relationships with the NZ Police and government agencies.
We’re working every day to improve each of these key retail pillars, in a way that is unique to us, that plays to our own strengths, and isn’t easily replicated by anyone – regardless of their size. We have three areas in particular that we will give a lot of attention in the coming year:
• New goods selection. We’re bringing on sellers and inventory at a faster rate than ever before, through sales effort, aggregator partnerships and integrations with the likes of Magento and Shopify’s e-commerce platforms. This will help strengthen range and price on Trade Me.
• Core experience. While Trade Me doesn’t necessarily look state of the art in aesthetics, we have strong suits in ease-of-use and customer engagement that have proved extremely powerful. We have a particular focus on search and “findability” which becomes increasingly important as we bring on more inventory.
• Building preference. It’s important that buyers think about Trade Me as their first option for online purchases. We are making plans around subscription and loyalty, and talking with a range of potential partners though it’s too early to give a firm steer on our intentions just yet.
With speedy and accurate execution in these three areas, along with the continuous improvement across the board, our Marketplace will keep growing in activity and relevance for New Zealanders.
In financial terms, new goods on Trade Me is a relatively small part of our business at around 12% of our revenue. We do expect to keep growing Marketplace revenue, however that growth is likely to come in waves, produced by our bigger initiatives, with lulls in between those waves.
TRADE ME GROUP ANNUAL REPORT 2017 23
Jon Macdonald
CEO Trade Me Group Limited
We also see a lot of growth in the wider market. Online retail is only 8% of total retail in New Zealand, and greater activity from global players will accelerate growth in online retail for all of us. There’s a lot of headroom here – we can double the proportion of online retail and still be behind other developed countries – for example the Office for UK National Statistics reports that online retail has reached 16% of total retail in the United Kingdom.
Our classifieds
Our classifieds businesses (Motors, Property and Jobs) have been doing really well, with good consistent growth over the last few years.
The opportunity in the near term is in us better understanding our customers, and helping them better advertise their own brands and their inventory. We have great momentum with this already – with the revenue from our ‘premium’ promotional products to our trade customers up over 30% last year.
This helps us to facilitate the transition of advertising in print media to online – a big structural opportunity for us. For example, we estimate that at least half the money spent advertising residential real estate still goes into print media. New Zealand lags the world with this – in comparison, these days closer to 20% goes to print in Australia.
In the medium term, the opportunity is for us to build out the breadth of our offering. To continue the example of Trade Me Property, this helps us move the remaining spend that still sits in print advertising, and facilitates a shift into other interesting revenue pools such as finance, insurance, and utilities leads.
As with our Marketplace, we keep an eye out for global players in our Classifieds, and in particular see LinkedIn, Indeed and most recently Google doing interesting things on recruitment advertising. But we’re better equipped than ever to compete against them – with strong momentum in Trade Me Jobs (with revenue up 25% last year, primarily off great advertising volumes), and work afoot to expand our offering towards candidate profiles and ultimately more intelligent matching between prospective employers and employees.
The long term
We’re hugely excited at the opportunity that sits within our existing activities and the broader offering we’re building.
Beyond this, we look to other sectors where our online marketplace model may come into play, with the structural migration toward online from a traditional format. We’re particularly interested in big New Zealand markets where there are stodgy players and old-school business models ripe for transition to more efficient, transparent and democratic online platforms.
Looking beyond 10 years, there will be big changes to technology and consumer habits but our core activity – connecting people and helping them with a transaction or relationship – will persist just as marketplaces have thrived through thousands of years of human development.
We think about how our marketplaces will evolve – including things like short-term worker placement or on-the-fly renting of autonomous vehicles – and there is always that need for marketplaces that efficiently match supply with demand.
It’s our job to walk and chew gum – to provide the most value to our customers and to grow our returns to shareholders, while keeping an eye on the future and these new opportunities and threats as they develop.
We’re up to this task. It starts with having a clear understanding of our purpose and what we’re good at, and then relies on us having the culture, capacity and drive to experiment, fail at some things, succeed at others, and ultimately innovate to keep growing and stay relevant.
While we’re a lot smaller than some of our global competitors, Trade Me today is a wonderful size. We’re big enough to do things at scale and have a big impact on New Zealand. But still small enough to have good cohesion and low bureaucracy, and be a place where individuals with drive can shape the business.
We will be smart, accurate and effective. We will intimately understand our local market and our customers. We will relentlessly continue to improve our offering, while trying new things. I’m confident and excited about our prospects and the growth we can achieve.
Thank you for your continued support.
Sincerely,
24
Business UpdateThe year to 30 June 2017 has been another one of excellent progress for Trade Me. We are very pleased to deliver another strong result to our 8,827 shareholders, and we’re proud this is consistent with our guidance to you over the year.As we noted at our interim announcement in February, we completed a successful multi-year period of accelerated reinvestment in people, product development, marketing and sales to set Trade Me up for success over the medium to long term.
The company is going well. We have delivered revenue and profit growth to our investors, and have demonstrated our continued ability to keep costs within our forecasts.
The numbersIn F17, Trade Me’s revenue continued to grow strongly to a new record of $234.9m, up 7.7 per cent on F16’s $218.0m. In the second half of F17, revenue grew by 6.7 per cent year-on-year.
Across F17, we’ve also seen the rate of our expense growth (including cost of sales) continue to decline. Expenses grew by just 5.7 per cent year-on-year, down significantly on the 17.8 and 25.5 per cent growth in F16 and F15 respectively. We have been careful to target our investment in line with our strategy.
Our reported EBITDA for F17 was $155.7m, up 10.8 per cent year-on-year, a solid improvement on last year’s year-on-year growth of 4.5 per cent. Excluding the losses from our stake in peer-to-peer lending start-up Harmoney, EBITDA was up 9.8 per cent year-on-year (compared with 5.1 per cent YoY in F16).
Trade Me’s net operating profit after tax was up 12.0 per cent year-on-year to $93.0m, well ahead of last year’s net operating profit of $83.0m (which in turn was up 3.5 per cent on F15). The investment we’ve made over the past few years has begun to come to fruition.
Earnings per share for F17 was 23.76 cents, up from 18.87 cents a year ago. A fully imputed final dividend of 10.0 cents per share will be paid on 19 September 2017. This follows on from the fully imputed interim dividend of 8.5 cents per share paid on 21 March 2017.
Operating performanceWe’re rapt to see sustained growth in the General Items marketplace business. Revenue was up 7.1 per cent year-on-year, following on from revenue growth of 3.5 per cent between F15 and F16.
Over the year we’ve introduced Buyer Protection and Seller Protection, both of which are aimed at enhancing trust in trading onsite. We’ve also been focused on making buying and selling
easier. For example, we’ve started suggesting categories and start prices to sellers when they list, and recently completed an integration with a company called Magento to make it easier for sellers using their products to pipe their listings onto Trade Me.
Our ‘Book a courier’ service is going from strength-to-strength and has recently surpassed 500,000 bookings. We’re excited about the imminent arrival of Afterpay onsite, an interest-free deferred payment product that has been very popular in its home base of Australia.
The Classifieds continued to enjoy success. Overall revenue across the three businesses was up 11.3 per cent year-on-year to $125.5m, with stronger growth in the second half of the financial year. We maintained a focus on generating premium revenue and improving the value our products provide to our customers.
Trade Me Jobs has continued to perform strongly with revenue increasing by 25.0 per cent year-on-year. The team has been doing an excellent job, bolstered by the tailwinds of the strong New Zealand employment market, and a big effort improving our Apple (iOS) and Android mobile apps. The revenue lift was driven by 58.5 per cent year-on-year growth in premium products.
Trade Me Motors, the market leader and our largest classified vertical, reported a revenue increase of 8.2 per cent year-on-year. Strong dealer premium revenue growth has continued across F17, up 26.8 per cent year-on-year. This has been driven by a strong sales effort, new premium products and some price changes to increase yield and volume. MotorWeb has also been doing well in Australia.
Trade Me Property reported revenue growth of 7.3 per cent year-on-year. ‘For sale’ listing volumes remain challenging, in a tight property market. Revenue derived from premium products sold to our agency clients was up 32.4 per cent year-on-year, helped by the launch of our new Premium carousel. Property Insights, our tool that provides free property information for more than 1.6m New Zealand residential properties, has proven very popular. More recently we have launched an agent directory, showcasing agents’ talents and providing vendors with a tailored agent recommendation.
In the Other category comprising our advertising, travel, dating, insurance and payments businesses, revenue was down 1.4 per cent year-on-year. However we saw revenue in our Payments business (comprising Paystation and Pay Now) increase by 18.5 per cent year-on-year.
BUSINESS UPDATE
Business Update
TRADE ME GROUP ANNUAL REPORT 2017 25
Investments and divestmentsWe continue to look for opportunities to invest and divest in line with our strategy.
We sold our accommodation website Travelbug (launched in 2007) and online booking engine BookIt (acquired in 2010) to a Hamilton company in December 2016. We found it increasingly difficult to justify prioritising time and money for these businesses given the other opportunities we have across Trade Me.
In July 2017 we announced our intention to acquire Christchurch-based Limelight Software, the operator of the cloud-based automotive dealer management platform Motorcentral. The Motorcentral platform includes inventory management, customer relationship management, advertising plug-ins and website functions. We are very excited about prospects for this business, and eagerly awaiting clearance from the Commerce Commission.
We closed down our escrow payment service SafeTrader in July 2017, 18 years after it was released. With ecommerce moving into the mainstream, and the introduction of Buyer Protection, Ping and Pay Now, the need for this service has diminished.
BrandWe are proud of our strong, trusted, well-known and much-loved brand. We were recently named in the top 10 most influential domestic New Zealand brands by Ipsos for the third consecutive year, and the ninth most loved NZ brand in research from Colmar Brunton in September 2016.
Over the past two years we have done a lot of work to better understand how Trade Me is perceived. We want to develop our brand, make it more consistent, and make sure we’re protecting and nurturing it as best we can.
Part of that work manifested in a new, refreshed Trade Me logo in July 2016, kicking off a wider visual refresh. Later that month we launched an advertising campaign highlighting Trade Me’s role as an inextricable part of life for New Zealanders.
We again led the way with our annual transparency report released in July 2017, disclosing how we deal with requests from Government agencies for Trade Me members’ data. To date, no other local Kiwi company has produced a transparency report.
PeopleThe number of staff at Trade Me has grown from 509 (487 FTEs) as at 31 July 2016 to 543 (512 FTEs) as at 31 July 2017. The majority of staff are still based in our Wellington headquarters, but we now have more than 150 people in Auckland. We have big hiring plans for the South Island, and will be strengthening our presence in Christchurch considerably over the course of F18.
In April 2017, we announced Annie Brown would be joining our Exec team as our first Chief People Officer, joining us from BNZ where she was Director of People & Communications. Annie started at Trade Me in June.
We announced several changes to the Exec team in July 2017, based on our strategic priorities, and to assist with our continued growth:
• Alan Clark (Head of Trade Me Motors) and Jeremy Wade (Head of Trade Me Jobs) joined the Executive team, reflecting the scale and importance of these classifieds’ businesses;
• Trent Mankelow was appointed as our inaugural Chief Customer Officer, moving into the new role having been Trade Me’s Chief Product Officer since October 2014; and
• In September 2017 Mark Rees will start with us as our new Chief Product and Technology Officer. His role will be to deliver on tech and product priorities, bringing together our product development, data and technology platforms. Our current General Manager of Platform and Operations, Dave Wasley, is in an acting role until September.
Dave will be moving on from Trade Me later in the year, along with our Head of Commercial Jimmy McGee. Both have been fantastic contributors to Trade Me, and have been here for more than a decade apiece. I would like to thank both Dave and Jimmy for their huge and meaningful parts in shaping this company.
OutlookWe have delivered a return to good profit growth in F17, and the investment made in prior years has resulted in a fundamentally stronger business. Looking ahead to F18, we expect total revenue growth similar to that reported in F17, however a soft property listing market means there is some downside risk.
With our targeted investment plans, we intend to invest at a rate slightly above revenue growth in F18, but we still expect to deliver year-on-year EBITDA and operating NPAT growth in F18, albeit at lower growth rates than F17 due to that higher level of investment.
Trade Me is a great business. We will continue to derive benefit from the investment we have made over the past three years, and we are better placed than ever to convert on the opportunities in front of us and keep growing.
26 EXECUTIVE TEAM PROFILES
Executive team profiles
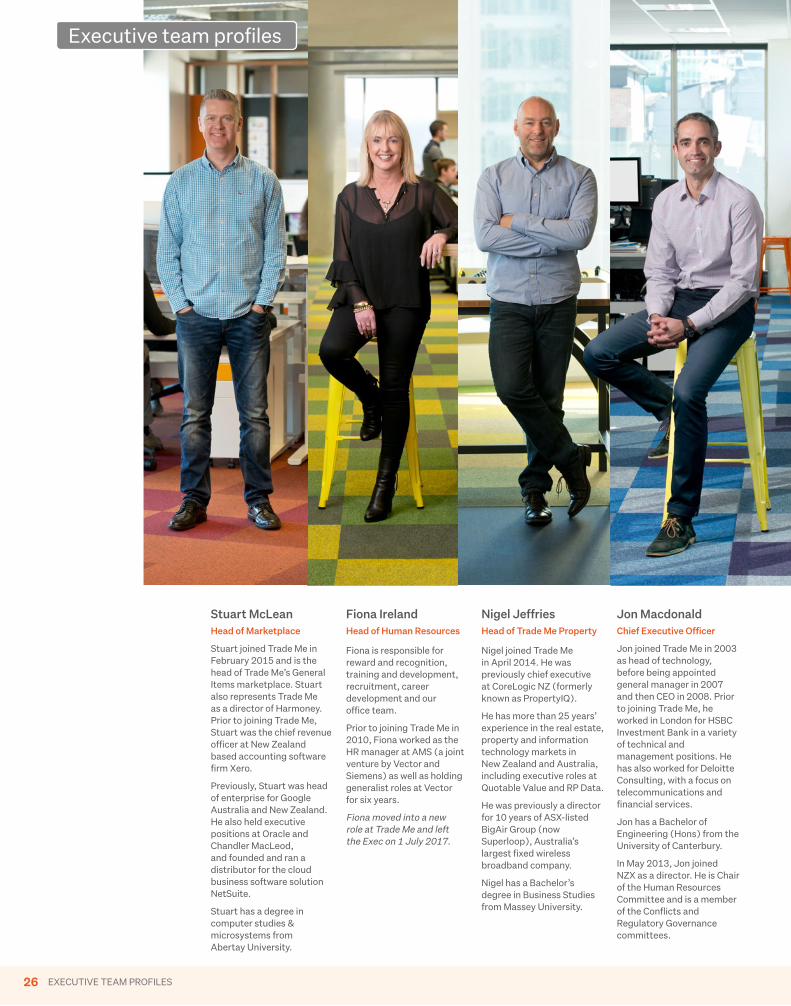
Stuart McLean Head of Marketplace
Stuart joined Trade Me in February 2015 and is the head of Trade Me’s General Items marketplace. Stuart also represents Trade Me as a director of Harmoney. Prior to joining Trade Me, Stuart was the chief revenue officer at New Zealand based accounting software firm Xero.
Previously, Stuart was head of enterprise for Google Australia and New Zealand. He also held executive positions at Oracle and Chandler MacLeod, and founded and ran a distributor for the cloud business software solution NetSuite.
Stuart has a degree in computer studies & microsystems from Abertay University.
Fiona Ireland Head of Human Resources
Fiona is responsible for reward and recognition, training and development, recruitment, career development and our office team.
Prior to joining Trade Me in 2010, Fiona worked as the HR manager at AMS (a joint venture by Vector and Siemens) as well as holding generalist roles at Vector for six years.
Fiona moved into a new role at Trade Me and left the Exec on 1 July 2017.
Nigel Jeffries Head of Trade Me Property
Nigel joined Trade Me in April 2014. He was previously chief executive at CoreLogic NZ (formerly known as PropertyIQ).
He has more than 25 years’ experience in the real estate, property and information technology markets in New Zealand and Australia, including executive roles at Quotable Value and RP Data.
He was previously a director for 10 years of ASX-listed BigAir Group (now Superloop), Australia’s largest fixed wireless broadband company.
Nigel has a Bachelor’s degree in Business Studies from Massey University.
Jon Macdonald Chief Executive Officer
Jon joined Trade Me in 2003 as head of technology, before being appointed general manager in 2007 and then CEO in 2008. Prior to joining Trade Me, he worked in London for HSBC Investment Bank in a variety of technical and management positions. He has also worked for Deloitte Consulting, with a focus on telecommunications and financial services.
Jon has a Bachelor of Engineering (Hons) from the University of Canterbury.
In May 2013, Jon joined NZX as a director. He is Chair of the Human Resources Committee and is a member of the Conflicts and Regulatory Governance committees.
TRADE ME GROUP ANNUAL REPORT 2017 27
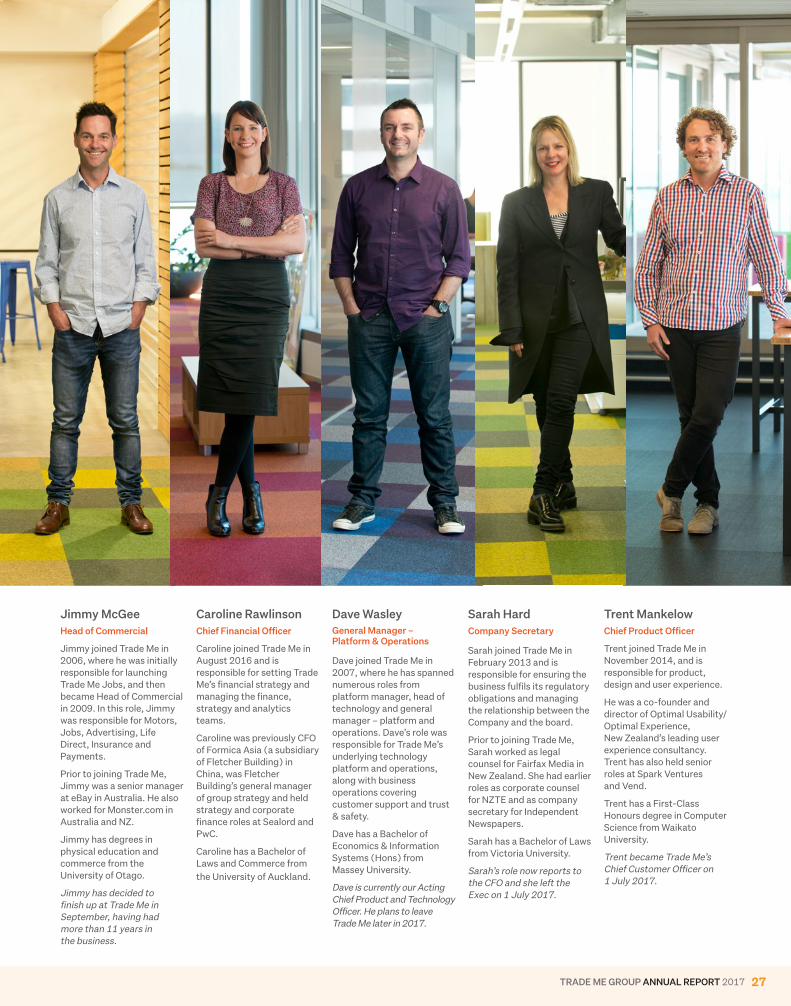
Jimmy McGee Head of Commercial
Jimmy joined Trade Me in 2006, where he was initially responsible for launching Trade Me Jobs, and then became Head of Commercial in 2009. In this role, Jimmy was responsible for Motors, Jobs, Advertising, Life Direct, Insurance and Payments.
Prior to joining Trade Me, Jimmy was a senior manager at eBay in Australia. He also worked for Monster.com in Australia and NZ.
Jimmy has degrees in physical education and commerce from the University of Otago.
Jimmy has decided to finish up at Trade Me in September, having had more than 11 years in the business.
Caroline Rawlinson Chief Financial Officer
Caroline joined Trade Me in August 2016 and is responsible for setting Trade Me’s financial strategy and managing the finance, strategy and analytics teams.
Caroline was previously CFO of Formica Asia (a subsidiary of Fletcher Building) in China, was Fletcher Building’s general manager of group strategy and held strategy and corporate finance roles at Sealord and PwC.
Caroline has a Bachelor of Laws and Commerce from the University of Auckland.
Dave WasleyGeneral Manager – Platform & Operations
Dave joined Trade Me in 2007, where he has spanned numerous roles from platform manager, head of technology and general manager – platform and operations. Dave’s role was responsible for Trade Me’s underlying technology platform and operations, along with business operations covering customer support and trust & safety.
Dave has a Bachelor of Economics & Information Systems (Hons) from Massey University.
Dave is currently our Acting Chief Product and Technology Officer. He plans to leave Trade Me later in 2017.
Sarah Hard Company Secretary
Sarah joined Trade Me in February 2013 and is responsible for ensuring the business fulfils its regulatory obligations and managing the relationship between the Company and the board.
Prior to joining Trade Me, Sarah worked as legal counsel for Fairfax Media in New Zealand. She had earlier roles as corporate counsel for NZTE and as company secretary for Independent Newspapers.
Sarah has a Bachelor of Laws from Victoria University.
Sarah’s role now reports to the CFO and she left the Exec on 1 July 2017.
Trent Mankelow Chief Product Officer
Trent joined Trade Me in November 2014, and is responsible for product, design and user experience.
He was a co-founder and director of Optimal Usability/Optimal Experience, New Zealand’s leading user experience consultancy. Trent has also held senior roles at Spark Ventures and Vend.
Trent has a First-Class Honours degree in Computer Science from Waikato University.
Trent became Trade Me’s Chief Customer Officer on 1 July 2017.
28 CORPORATE GOVERNANCE
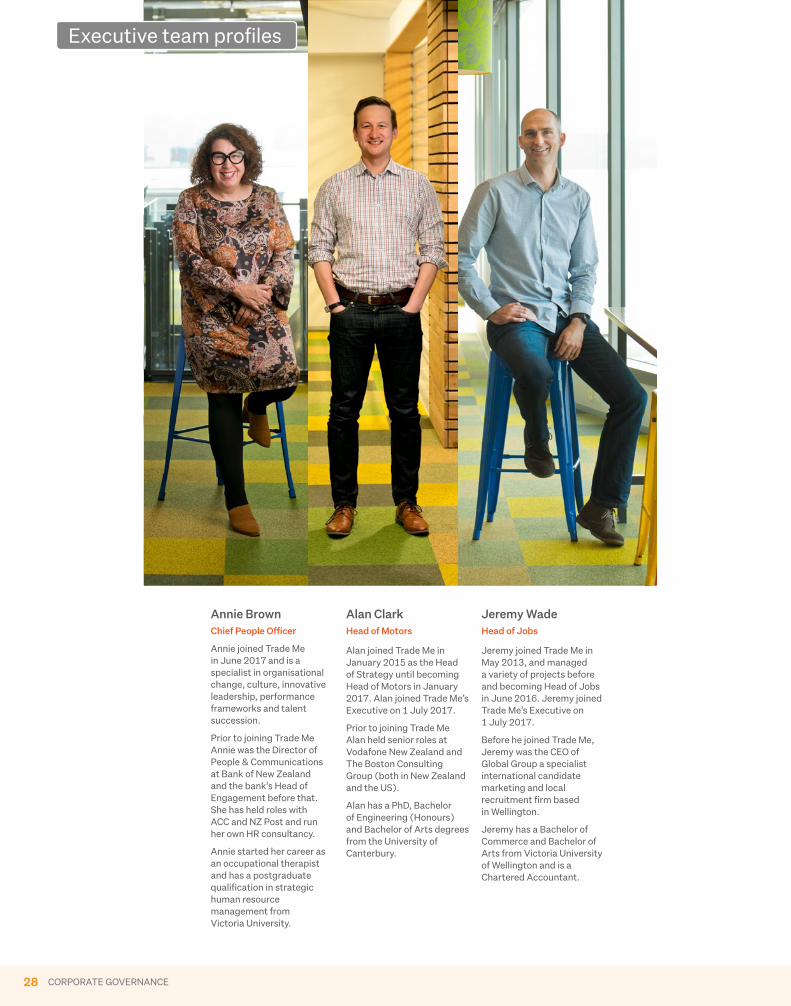
Executive team profiles
Annie Brown Chief People Officer
Annie joined Trade Me in June 2017 and is a specialist in organisational change, culture, innovative leadership, performance frameworks and talent succession.
Prior to joining Trade Me Annie was the Director of People & Communications at Bank of New Zealand and the bank’s Head of Engagement before that. She has held roles with ACC and NZ Post and run her own HR consultancy.
Annie started her career as an occupational therapist and has a postgraduate qualification in strategic human resource management from Victoria University.
Alan Clark Head of Motors
Alan joined Trade Me in January 2015 as the Head of Strategy until becoming Head of Motors in January 2017. Alan joined Trade Me’s Executive on 1 July 2017.
Prior to joining Trade Me Alan held senior roles at Vodafone New Zealand and The Boston Consulting Group (both in New Zealand and the US).
Alan has a PhD, Bachelor of Engineering (Honours) and Bachelor of Arts degrees from the University of Canterbury.
Jeremy Wade Head of Jobs
Jeremy joined Trade Me in May 2013, and managed a variety of projects before and becoming Head of Jobs in June 2016. Jeremy joined Trade Me’s Executive on 1 July 2017.
Before he joined Trade Me, Jeremy was the CEO of Global Group a specialist international candidate marketing and local recruitment firm based in Wellington.
Jeremy has a Bachelor of Commerce and Bachelor of Arts from Victoria University of Wellington and is a Chartered Accountant.

TRADE ME GROUP ANNUAL REPORT 2017 29
30
The Trade Me valuesWho are we? We are Trade Me.Our vision is to make life better for Kiwis though online experiences they love.
We’re part of an exciting industry and we have great prospects. We’re a fun place to work. But regardless of our past successes, we understand that our future depends on continuing to be relevant, useful and good value to our members.
We’re also a commercial enterprise, and as such we need to provide a return to our owners. Our owners are retail investors (people who have bought shares) and institutional investors (funds of money from the public).
We make money through charging fees for our services and through advertising. We aim to set our fees responsibly, and at a sustainable level that provides great value to our customers. We aim to display our advertising in a responsible way too, minimising disruption to our users.
Our seven valuesWe’ve identified seven values that do a pretty good job of summing up what’s important to us, and who we aim to be.
THE TRADE ME VALUES
Deliver awesome online experiencesOur products and services are focused on empowering consumers. As well as delivering awesomeness, we also aim to build things that are well-designed, easy to use, reliable and genuinely add value to our community.
Decide & act on meritWe have a healthy disregard for hierarchy in our decision-making. We prefer to rely on data and good judgment; we measure everything. We value fearlessness and fairness in representing a point of view.
Hire & grow great peopleWe work hard to hire the right people. We value energy, optimism, flexibility, creativity, and a non-serious streak. We’re informal but focussed, and much more interested in ideas and execution than the clothes people wear. We celebrate together when we do well.
Don’t be a dickThis means what it says. It’s all about treating people with respect, being responsible and keeping a sense of humour.
Be entrepreneurialWe are always innovating, and we like doing things fast. We value optimism, and we look for opportunities in change. We’re not afraid to try things and fail, as we’re more concerned with learning than dishing out blame.
Care about our communityWe care about our members, our clients, our shareholders, and our staff. We are willing to empathise, listen, and engage in conversations (but not smother them). We are a good citizen, and committed to making meaningful contributions where we can. We like to help.
Be trusted & straight upWe rely on being a trusted place for people to visit online. We must remain authentic, honest, and always front up to explain our position in a non-robotic way. Inside the business, we trust our staff and we encourage them to share their thoughts early.
7
6
5
4
3
2
1
Trade Me values
TRADE ME GROUP ANNUAL REPORT 2017 31
Directors’ reportDirector profiles 32
Corporate governance 34
Principle 1 — Ethical standards 34
Principle 2 — Board composition and performance 34
Principle 3 — Board Committees 37
Principle 4 — Reporting and disclosure 38
Principle 5 — Remuneration 39
Principle 6 — Risk management 41
Principle 7 — Auditors 43
Principle 8 — Shareholder relations 43
Disclosures 44
Share registry 44
Further information online 49
TRADE ME GROUP ANNUAL REPORT 2017 31
32 DIRECTOR PROFILES
Director profiles
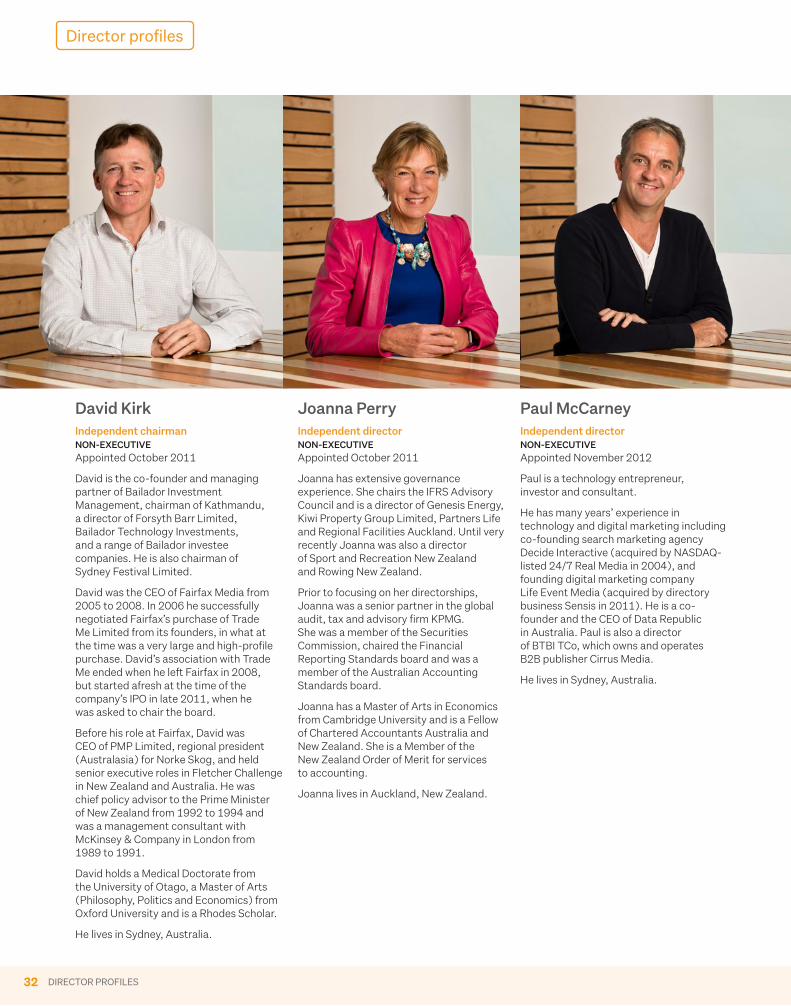
David KirkIndependent chairman NON-EXECUTIVE Appointed October 2011
David is the co-founder and managing partner of Bailador Investment Management, chairman of Kathmandu, a director of Forsyth Barr Limited, Bailador Technology Investments, and a range of Bailador investee companies. He is also chairman of Sydney Festival Limited.
David was the CEO of Fairfax Media from 2005 to 2008. In 2006 he successfully negotiated Fairfax’s purchase of Trade Me Limited from its founders, in what at the time was a very large and high-profile purchase. David’s association with Trade Me ended when he left Fairfax in 2008, but started afresh at the time of the company’s IPO in late 2011, when he was asked to chair the board.
Before his role at Fairfax, David was CEO of PMP Limited, regional president (Australasia) for Norke Skog, and held senior executive roles in Fletcher Challenge in New Zealand and Australia. He was chief policy advisor to the Prime Minister of New Zealand from 1992 to 1994 and was a management consultant with McKinsey & Company in London from 1989 to 1991.
David holds a Medical Doctorate from the University of Otago, a Master of Arts (Philosophy, Politics and Economics) from Oxford University and is a Rhodes Scholar.
He lives in Sydney, Australia.
Joanna PerryIndependent director NON-EXECUTIVE Appointed October 2011
Joanna has extensive governance experience. She chairs the IFRS Advisory Council and is a director of Genesis Energy, Kiwi Property Group Limited, Partners Life and Regional Facilities Auckland. Until very recently Joanna was also a director of Sport and Recreation New Zealand and Rowing New Zealand.
Prior to focusing on her directorships, Joanna was a senior partner in the global audit, tax and advisory firm KPMG. She was a member of the Securities Commission, chaired the Financial Reporting Standards board and was a member of the Australian Accounting Standards board.
Joanna has a Master of Arts in Economics from Cambridge University and is a Fellow of Chartered Accountants Australia and New Zealand. She is a Member of the New Zealand Order of Merit for services to accounting.
Joanna lives in Auckland, New Zealand.
Paul McCarneyIndependent director NON-EXECUTIVE Appointed November 2012
Paul is a technology entrepreneur, investor and consultant.
He has many years’ experience in technology and digital marketing including co-founding search marketing agency Decide Interactive (acquired by NASDAQ-listed 24/7 Real Media in 2004), and founding digital marketing company Life Event Media (acquired by directory business Sensis in 2011). He is a co-founder and the CEO of Data Republic in Australia. Paul is also a director of BTBI TCo, which owns and operates B2B publisher Cirrus Media.
He lives in Sydney, Australia.
TRADE ME GROUP ANNUAL REPORT 2017 33
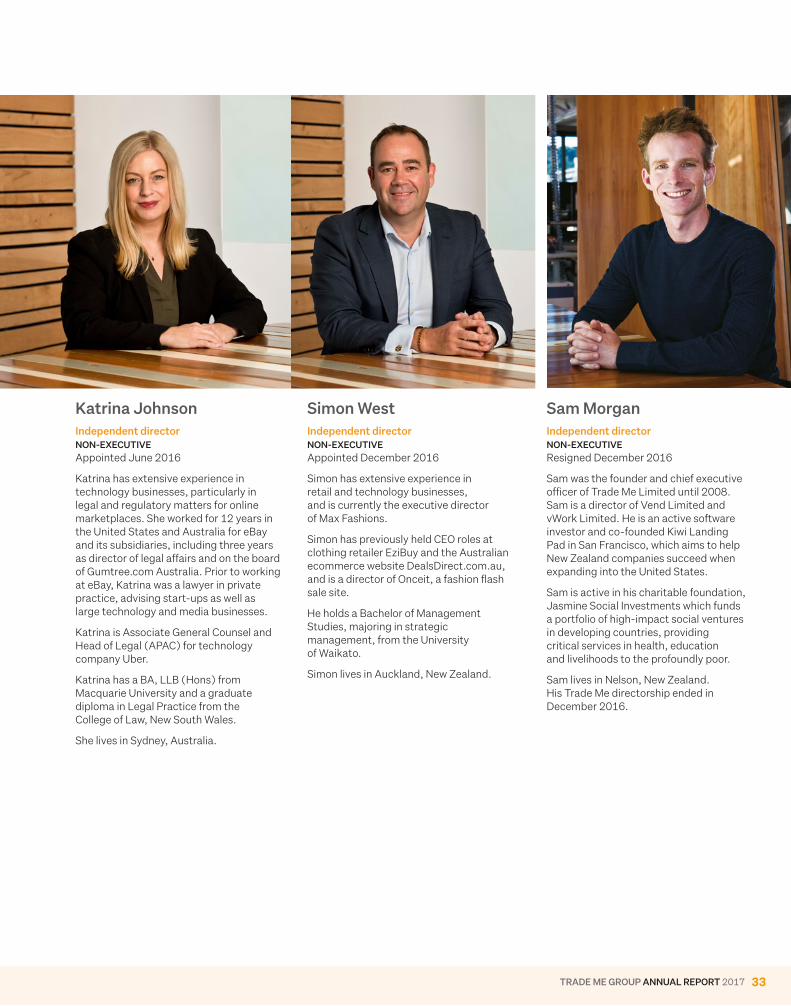
Simon WestIndependent director NON-EXECUTIVE Appointed December 2016
Simon has extensive experience in retail and technology businesses, and is currently the executive director of Max Fashions.
Simon has previously held CEO roles at clothing retailer EziBuy and the Australian ecommerce website DealsDirect.com.au, and is a director of Onceit, a fashion flash sale site.
He holds a Bachelor of Management Studies, majoring in strategic management, from the University of Waikato.
Simon lives in Auckland, New Zealand.
Sam MorganIndependent director NON-EXECUTIVE Resigned December 2016
Sam was the founder and chief executive officer of Trade Me Limited until 2008. Sam is a director of Vend Limited and vWork Limited. He is an active software investor and co-founded Kiwi Landing Pad in San Francisco, which aims to help New Zealand companies succeed when expanding into the United States.
Sam is active in his charitable foundation, Jasmine Social Investments which funds a portfolio of high-impact social ventures in developing countries, providing critical services in health, education and livelihoods to the profoundly poor.
Sam lives in Nelson, New Zealand. His Trade Me directorship ended in December 2016.
Katrina JohnsonIndependent director NON-EXECUTIVE Appointed June 2016
Katrina has extensive experience in technology businesses, particularly in legal and regulatory matters for online marketplaces. She worked for 12 years in the United States and Australia for eBay and its subsidiaries, including three years as director of legal affairs and on the board of Gumtree.com Australia. Prior to working at eBay, Katrina was a lawyer in private practice, advising start-ups as well as large technology and media businesses.
Katrina is Associate General Counsel and Head of Legal (APAC) for technology company Uber.
Katrina has a BA, LLB (Hons) from Macquarie University and a graduate diploma in Legal Practice from the College of Law, New South Wales.
She lives in Sydney, Australia.
34 CORPORATE GOVERNANCE
Corporate governance
Corporate governance information
On Trade Me’s investor relations website (investors.trademe.co.nz), you will find the following corporate governance documents referred to in this section:
• Constitution
• Trade Me Board Charter
• Audit and Risk Management Committee Charter
• Human Resources and Compensation Committee Charter
• External Audit Independence Policy
• Code of Conduct
• Diversity Guidelines
• Securities Trading Policy
• Market Disclosure Policy
• Risk Management Policy
Corporate governance statement
Trade Me Group Limited is a New Zealand company. Its shares are quoted on the New Zealand and Australian Stock Exchanges. Trade Me became a foreign exempt listed issuer on ASX in December 2016. Though we are no longer required to specifically report against the majority of the ASX Listing Rules or the ASX Corporate Governance Council’s Governance Principles and Recommendations, they are relevant to us as guidance.
We are reporting against the Principles and Recommendations in the the NZX Corporate Governance Code 2017 (the NZX Code). This statement is current to 30 June 2017, and has been approved by the directors of Trade Me Group Limited.
NZX Code
Principle 1
Code of Ethical Behaviour: Directors should set high standards of ethical behaviour, model this behaviour and hold management accountable for delivering these standards throughout the organisation.
Code of conductTrade Me has a Code of Conduct, setting out the ethical and behavioural standards expected of directors of Trade Me, and of Trade Me staff. Directors and staff are also expected to uphold the Trade Me values (see page 30).
WhistleblowingOur Code of Conduct includes specific direction on action to be taken by a person who suspects a breach of the Code. We’ve provided for confidential and protected communications to a mailbox accessible only by the CEO and HR Manager; or alternatively to a mailbox accessible only by the Chair of the Audit & Risk Management Committee.
Avoiding conflicts of interestWe update the board at each meeting on changes in our interests and any potential conflicts, and we review the interests register kept by the Company Secretary at least 6-monthly. The register records relevant transactions and our disclosures of interests. A copy of the directors’ interests register is found on page 47.
Trading in securitiesWe’re restricted as directors from trading in Trade Me shares under New Zealand law and by Trade Me’s financial product dealing policy (referred to as the Securities Trading Policy). This policy applies to both directors and designated senior employees. The policy details “blackout periods” where trading is forbidden, as well as a process for authorisation at other times.
We believe our interests and those of shareholders should be aligned. The board’s Charter sets out that each director should hold Trade Me shares to a value of at least $100,000. Directors may take up to three years after appointment to acquire that holding, in open trading periods under the Securities Trading Policy.
Our current shareholdings are set out on page 49.
Principle 2
Board composition and performance: To ensure an effective board there should be a balance of independence, skills, knowledge, experience and perspectives.
Board compositionThe structure of our board and its governance arrangements are set out in the Company’s Constitution, and in the board’s written Charter setting out the board’s roles and responsibilities.
The management and control of the business of Trade Me is vested in the board. The Charter sets out the matters reserved for our decision making including (amongst other key matters):
• the establishment of the Company’s overall strategic direction and strategic plans.
Management is responsible for implementing the strategic objectives, operating within the risk appetite we have set as a board, and for all other aspects of the day-to-day running of the Company.
We delegate the day-to-day leadership and management of the Company to the CEO. The delegations are set out in the board Charter and in a Delegated Authority framework, which also sets out authority levels for types of commitments that the Company’s management can make.
Trade Me can have between three and ten directors on the board, and there are five directors at present, all independent. We have no executive directors. Each director has signed a written agreement with the Company.
The directors are David Kirk (chairman), Katrina Johnson, Paul McCarney, Joanna Perry and Simon West. Sam Morgan was a director until December 2016, resigning after 5 years of excellent service as a director and many prior years, through to 2008, as Trade Me’s founder and CEO.
TRADE ME GROUP ANNUAL REPORT 2017 35
After Sam’s resignation we were pleased that Simon West accepted our invitation to join the board. Simon will stand for election at the Annual Meeting in November 2017.
Profiles of all the directors, and the dates of their appointment, can be found on page 32.
As the board is small, all directors have been engaged to date in decisions about prospective new directors, and we no longer have a Nominations Committee. We make appropriate pre-appointment checks on the background and suitability of all directors. We’re conscious of the need for diversity of thought and in 2016 engaged external consultants to help with director search, to identify a broad range of candidates for the two vacancies which arose on the board.
Board meetingsBetween 1 July 2016 and 30 June 2017 we held 10 board meetings (8 in person and 2 by audio conference), and a separate strategy meeting.
All meetings were attended by all the directors (or committee members) as appropriate, other than these board meetings, which the director named was unable to attend:
• September 2016 – Sam Morgan
• March 2017 – Katrina Johnson (attended part board meeting)
• June 2017 – Joanna Perry (attended part board meeting)
Board compositionWe formally consider the board’s composition each year at our annual performance review. We believe our respective skills and experience to be complementary, appropriate for the Company, balanced and reasonably diverse. Our directors have expertise and experience in strategy development and implementation, executive leadership, acquisitions and divestment, venture capital, technology, data, corporate responsibility, governance, legal and regulatory matters, public policy, and finance (including the assessment of financial controls).
We have two female directors, out of a board of five, and have had that same gender mix since the Company’s IPO. Our directors range in age from 41 to 60.
As a matter of board policy, Trade Me directors have a term of six years from the date of appointment or election. After six years, the board will consider whether the director should be invited to stand for re-election. One-third of the directors retire by rotation annually in accordance with the applicable Listing Rules.
Diversity PolicyThe Company fosters an inclusive working environment that promotes employment equity and workforce diversity at all levels, including within the executive team and board. The Diversity Guidelines are available on the investor relations website.
In August 2016, the board considered and approved the following minimum gender diversity targets for the F17 year (which were the same as for F16 and the preceding year):
• 33% of the board should be female
• 33% of the Executive Team and Senior Management Team should be female
• 50% of all employees should be female
In F17 we exceeded our gender targets at both board and senior management/executive level.
The gender breakdown at Trade Me as at 30 June 2017 was as follows:
F16 Women
F16Men
F16 Total F16 %
F17Women
F17 Men
F17 Total F17 %
Board 2 3 5 40% 2 3 5 40%
Executive (“officers”) 2 7 9 22% 3 6 9 33%
Senior management 13 26 39 33% 15 22 37 40%
Exec and SMT together 15 33 48 31% 18 28 46 39%
All employees 184 319 503 37% 218 330 548 39%
36 CORPORATE GOVERNANCE
The Senior Management team is defined as direct reports to the Executive team.
In F15 Trade Me established a Diversity project group to explore initiatives to improve the gender balance in the Company, as an initial focus, and we have previously reported on the initiatives undertaken, including a “blind recruiting” pilot, where gender indicators were completely removed from CVs sent to hiring managers; an initial screening tool for Customer Support roles that tests applicants online before their CVs are viewed, and the use of a tool to review our own recruitment advertising for use of language that may inadvertently discourage applications from women. We have continued to use the latter two tools in our recruitment.
The Company has maintained and embedded its staff training around unconscious bias and is examining pay parity as part of a wider remuneration benchmarking project.
Since we’ve become more transparent about flexible working arrangements, we have seen a number of adjustments to days or hours or place of work, and to leave. Thirty-five employees have moved to new flexible arrangements this year.
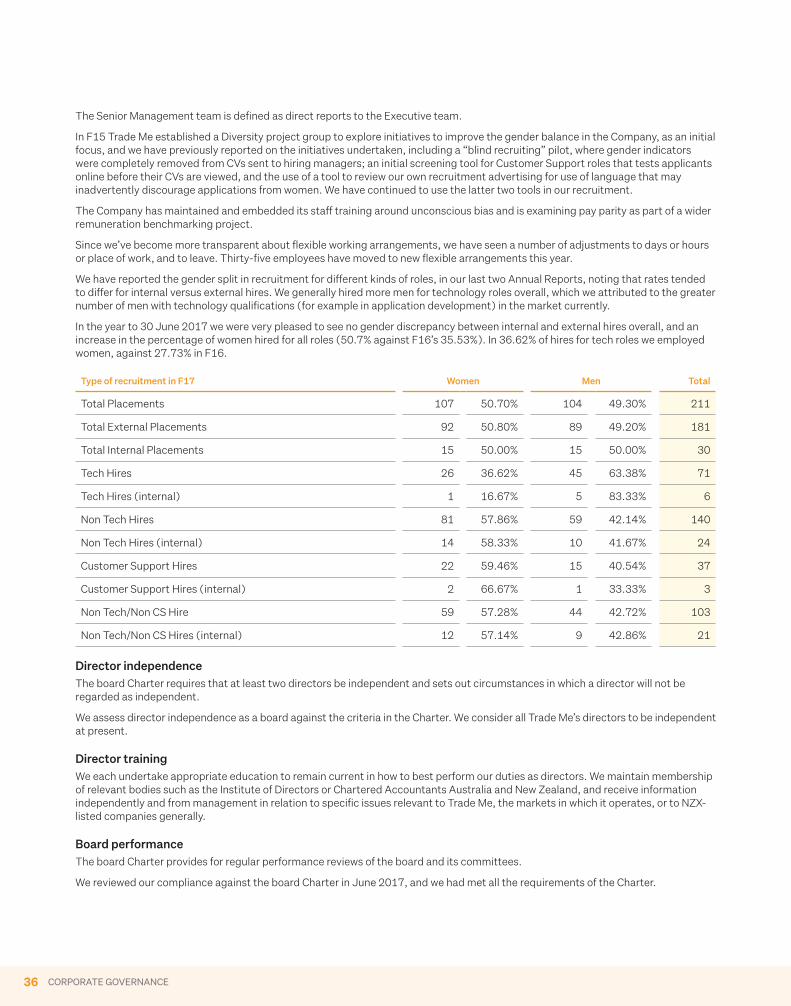
We have reported the gender split in recruitment for different kinds of roles, in our last two Annual Reports, noting that rates tended to differ for internal versus external hires. We generally hired more men for technology roles overall, which we attributed to the greater number of men with technology qualifications (for example in application development) in the market currently.
In the year to 30 June 2017 we were very pleased to see no gender discrepancy between internal and external hires overall, and an increase in the percentage of women hired for all roles (50.7% against F16’s 35.53%). In 36.62% of hires for tech roles we employed women, against 27.73% in F16.
Type of recruitment in F17 Women Men Total
Total Placements 107 50.70% 104 49.30% 211
Total External Placements 92 50.80% 89 49.20% 181
Total Internal Placements 15 50.00% 15 50.00% 30
Tech Hires 26 36.62% 45 63.38% 71
Tech Hires (internal) 1 16.67% 5 83.33% 6
Non Tech Hires 81 57.86% 59 42.14% 140
Non Tech Hires (internal) 14 58.33% 10 41.67% 24
Customer Support Hires 22 59.46% 15 40.54% 37
Customer Support Hires (internal) 2 66.67% 1 33.33% 3
Non Tech/Non CS Hire 59 57.28% 44 42.72% 103
Non Tech/Non CS Hires (internal) 12 57.14% 9 42.86% 21
Director independenceThe board Charter requires that at least two directors be independent and sets out circumstances in which a director will not be regarded as independent.
We assess director independence as a board against the criteria in the Charter. We consider all Trade Me’s directors to be independent at present.
Director trainingWe each undertake appropriate education to remain current in how to best perform our duties as directors. We maintain membership of relevant bodies such as the Institute of Directors or Chartered Accountants Australia and New Zealand, and receive information independently and from management in relation to specific issues relevant to Trade Me, the markets in which it operates, or to NZX-listed companies generally.
Board performanceThe board Charter provides for regular performance reviews of the board and its committees.
We reviewed our compliance against the board Charter in June 2017, and we had met all the requirements of the Charter.
TRADE ME GROUP ANNUAL REPORT 2017 37
We generally review annually how the board is performing. In the last year we had two new directors join the board – Katrina Johnson in late June 2016 and Simon West in December 2016, so the usual review cycle was suspended. We are beginning the review process again in August 2017. Our review process comprises individual interviews between directors and the chairman, with directors and the executive team completing an evaluation questionnaire relating to board and committee composition and performance. Responses are anonymised, reported back to directors and discussed at a board meeting. We have found this effective to date and it has helped us to refine our strategy setting processes, and the information provided in board papers. We are a small board and to date haven’t engaged an external facilitator – we are satisfied that the board and its committees are operating well and that the performance process we’ve used is both effective and suited to the company.
Principle 3
Board committees: The board should use committees where this will enhance its effectiveness in key areas while still retaining board responsibility.Our board committees review and consider in detail the policies and strategies developed by management. They examine proposals and make recommendations to the board. They don’t take action or make decisions on behalf of the board unless specifically mandated to do so. A committee or an individual director can engage independent legal counsel at Trade Me’s expense with the prior approval of the chairman.
During the F17 year Trade Me’s standing board committees were:
• Audit & Risk Management committee
• Human Resources & Compensation committee
All recommendations and deliberations on the appointment of directors were undertaken by the full board. The Independent Directors’ committee (established when Fairfax Media had a significant shareholding and two directors on the board) has not been required for some years – all our directors are independent.
The Nominations Committee and Independent Directors’ Committee were disestablished with effect from June 2017.
Audit & Risk Management committee:Joanna Perry (chair), David Kirk, Katrina Johnson.
All the members of the committee are independent directors.
In accordance with the NZX Code the Audit & Risk Management Committee is chaired by an independent director, Joanna Perry, who is not the Chair of the board. Joanna is a professional director, a Fellow of Chartered Accountants Australia and New Zealand and Chair of the IFRS Advisory Council.
The committee’s Charter is set out on the investor relations website. We evaluate the performance of the committee against its Charter annually.
The committee met seven times in the year to 30 June 2017. Management attend meetings only at the invitation of the committee, and the committee meets with the external auditors with management excluded, regularly.
Human Resources & Compensation committee:David Kirk (chair), Paul McCarney, Sam Morgan (to November 2016), Joanna Perry, Simon West (from June 2017)
All of the members of the Committee are independent directors.
The committee met on two occasions in the year to 30 June 2017. Some matters which would normally be considered by the committee were addressed by the full board.
This committee has oversight of health and safety systems and processes at Trade Me, in addition to matters of recruitment, retention and remuneration. The HR & Compensation committee’s Charter is on the investor relations website.
Other committee mattersWe occasionally appoint a committee of directors to consider or approve a specific proposal or action, if the timing of meetings or availability of directors means the matter cannot be considered by the full board. Their deliberations and decisions are reported back to the board not later than the next meeting following.
We considered late in 2015 the protocols that would apply in the event we received notice of a takeover offer, including the establishment of a committee of independent directors to oversee the offer, take specialist advice and ensure compliance with all the company’s obligations under the Takeovers Code. We have not formally documented those protocols but propose to do so in the next six months.
38 CORPORATE GOVERNANCE
Principle 4
Reporting and disclosure: The board should demand integrity in financial reporting and in the timeliness and balance of corporate disclosures.
Financial reportingThe board is responsible overall for ensuring the integrity of the Company’s reporting to shareholders, including for financial statements that comply with generally accepted accounting practice.
The board’s Audit & Risk Management committee oversees the quality, reliability and accuracy of the financial statements and related documents (the Audit & Risk Management committee’s role is described fully in its Charter). In doing so the committee make enquiries of management and external auditors (including requiring management representations) so that we can be satisfied as to the validity and accuracy of all aspects of Trade Me’s financial reporting.
The CEO and CFO certify to the board in relation to Trade Me’s financial statements, including (as has been required by ASX) certifying that the integrity of the financial statements is founded on a sound system of risk management and internal compliance and control which implements the policies of the board, and that the Company’s risk management and internal control systems, to the extent they relate to financial reporting, are operating effectively in all material respects.
Trade Me has worked hard to improve the clarity and readability of its financial statements, while continuing to maintain all the requirements of the financial reporting standards.
Non-financial reportingWe haven’t adopted a formal environmental, social and governance (ESG) reporting framework at this time. Trade Me’s assessment of exposure to non-financial risks, including economic, environmental and social sustainability risks, is woven into the Comprehensive and Key Risk assessments that we refer to under Principle 6.
Disclosure to the marketWe have a written disclosure policy – the Market Disclosure Policy, found on our investor relations site. It sets out requirements for full and timely disclosure to the market of material issues, so all stakeholders have equal access to information.
The board reviews and approves material announcements. We also specifically consider with management at each board meeting whether there are any issues which might require disclosure to the market under the NZX and ASX continuous disclosure requirements.
Information for investorsTrade Me’s investor relations website includes the Company’s presentations, reports, announcements, and media releases, as well as the Charters and guidelines referred to in this section. The Annual Report is available in electronic and hard copy format.
Trade Me’s annual meeting will be held on 9 November 2017 in Wellington. We welcome shareholders’ attendance and questions. The external auditors, EY, will be there and will be available to answer questions about the audit and the audit report. A Notice of Meeting will be sent to shareholders in October.
TRADE ME GROUP ANNUAL REPORT 2017 39
Principle 5
Remuneration: The remuneration of directors and executives should be transparent, fair and reasonable.
Directors’ remunerationThe total remuneration pool for Trade Me’s directors was set at $800,000 per annum at the Annual Meeting in October 2013.
For the financial year the annual fees paid to directors were:
• Chairman $215,000 (including all committee responsibilities)
• Directors $95,000
• Chair of the Audit & Risk Management committee $25,000
• Chair of the Human Resources & Compensation committee $15,000
• Members of a committee (except chair) $10,000
Directors on multiple committees receive fees for membership of each committee.
The last increase in directors’ fees was made with effect from 1 July 2016.
Our directors’ fees for F17 are set out on page 46.
No retirement fees have been paid by Trade Me to directors at any time.
Remuneration of employeesTrade Me aims to have a remuneration framework and policies to attract and retain talented and motivated people. The Company wants to:
• Be recognised as a great place to work, and attract, retain and motivate high-performing individuals.
• Align employee incentives with the achievement of good business performance and shareholder return.
• Recognise and reward individual success, while encouraging teamwork and a high-performance culture.
• Be competitive in the labour market.
• Be fair, consistent and easy to understand.
• Be true to one of Trade Me’s core values: hiring and growing great people.
Trade Me employee remunerationWe use market data to determine competitive salary and total remuneration levels for all staff. We make allowances for individual performance, scarcity of skills, internal relativities and specific business needs. Trade Me is operating in a growth industry, and we have a skilled and mobile workforce. We achieve scale through technology, so the difference a high-performing employee can make is amplified, and we want to ensure these people are identified so we can retain them.
All employees have fixed remuneration plus the potential to earn a Short Term Incentive (STI). Senior employees may also be invited to participate in the Long-Term Incentive (LTI) scheme described below and in Note 14 to the financial statements.
CEO remunerationJon Macdonald’s employment agreement for his role as CEO commenced on 26 February 2008. His agreement reflects appropriate standard conditions for a chief executive of a listed company.
Jon’s remuneration is a combination of fixed salary, KiwiSaver and incentive arrangements.
The incentives are an STI component set at 30% of base salary, linked to specific financial and non-financial targets set annually by the board, and an LTI component, in restricted shares under the company’s LTI scheme. He is currently allocated LTI shares to the value of 45% of his fixed annual remuneration annually. The performance hurdles applicable to those LTI shares are detailed in Note 14.
Jon’s fixed salary for the year to 30 June 2017 was $740,000. Performance for the purposes of the STI component has not yet been assessed, and will be paid in August 2017 for the F17 year.
Jon had 220,950 restricted shares in the LTI Scheme at 30 June 2017. Those shares have vesting dates respectively in October 2017, 2018 and 2019. Vesting at each date is dependent on the Company meeting its performance hurdles for the prior 3 year period, and on him remaining an employee at the applicable vesting date.
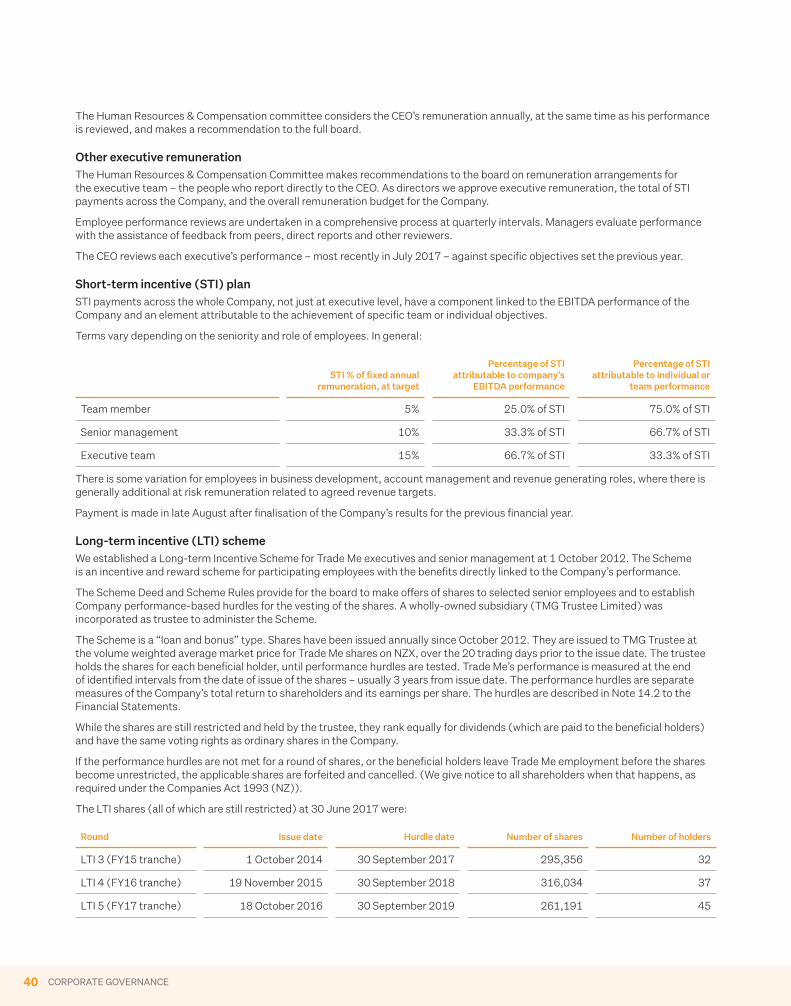
40 CORPORATE GOVERNANCE
The Human Resources & Compensation committee considers the CEO’s remuneration annually, at the same time as his performance is reviewed, and makes a recommendation to the full board.
Other executive remunerationThe Human Resources & Compensation Committee makes recommendations to the board on remuneration arrangements for the executive team – the people who report directly to the CEO. As directors we approve executive remuneration, the total of STI payments across the Company, and the overall remuneration budget for the Company.
Employee performance reviews are undertaken in a comprehensive process at quarterly intervals. Managers evaluate performance with the assistance of feedback from peers, direct reports and other reviewers.
The CEO reviews each executive’s performance – most recently in July 2017 – against specific objectives set the previous year.
Short-term incentive (STI) planSTI payments across the whole Company, not just at executive level, have a component linked to the EBITDA performance of the Company and an element attributable to the achievement of specific team or individual objectives.
Terms vary depending on the seniority and role of employees. In general:
STI % of fixed annual remuneration, at target
Percentage of STI attributable to company’s
EBITDA performance
Percentage of STI attributable to individual or
team performance
Team member 5% 25.0% of STI 75.0% of STI
Senior management 10% 33.3% of STI 66.7% of STI
Executive team 15% 66.7% of STI 33.3% of STI
There is some variation for employees in business development, account management and revenue generating roles, where there is generally additional at risk remuneration related to agreed revenue targets.
Payment is made in late August after finalisation of the Company’s results for the previous financial year.
Long-term incentive (LTI) schemeWe established a Long-term Incentive Scheme for Trade Me executives and senior management at 1 October 2012. The Scheme is an incentive and reward scheme for participating employees with the benefits directly linked to the Company’s performance.
The Scheme Deed and Scheme Rules provide for the board to make offers of shares to selected senior employees and to establish Company performance-based hurdles for the vesting of the shares. A wholly-owned subsidiary (TMG Trustee Limited) was incorporated as trustee to administer the Scheme.
The Scheme is a “loan and bonus” type. Shares have been issued annually since October 2012. They are issued to TMG Trustee at the volume weighted average market price for Trade Me shares on NZX, over the 20 trading days prior to the issue date. The trustee holds the shares for each beneficial holder, until performance hurdles are tested. Trade Me’s performance is measured at the end of identified intervals from the date of issue of the shares – usually 3 years from issue date. The performance hurdles are separate measures of the Company’s total return to shareholders and its earnings per share. The hurdles are described in Note 14.2 to the Financial Statements.
While the shares are still restricted and held by the trustee, they rank equally for dividends (which are paid to the beneficial holders) and have the same voting rights as ordinary shares in the Company.
If the performance hurdles are not met for a round of shares, or the beneficial holders leave Trade Me employment before the shares become unrestricted, the applicable shares are forfeited and cancelled. (We give notice to all shareholders when that happens, as required under the Companies Act 1993 (NZ)).
The LTI shares (all of which are still restricted) at 30 June 2017 were:
Round Issue date Hurdle date Number of shares Number of holders
LTI 3 (FY15 tranche) 1 October 2014 30 September 2017 295,356 32
LTI 4 (FY16 tranche) 19 November 2015 30 September 2018 316,034 37
LTI 5 (FY17 tranche) 18 October 2016 30 September 2019 261,191 45
TRADE ME GROUP ANNUAL REPORT 2017 41
Principle 6
Risk management: Directors should have a sound understanding of the material risks faced by the issuer and how to manage them. The board should regularly verify that the issuer has appropriate processes that identify and manage potential and material risks.Trade Me has a risk management framework in place to identify, oversee, manage and control risk. That framework includes a risk management policy (available on the Company’s investor relations website) and an implementation structure. The risk management framework was put in place in 2013 and was most recently reviewed in June 2017.
Directors have also been provided with specific and detailed presentations from management in particular risk areas, on a regular basis.
Trade Me doesn’t have an internal audit function. Management reports at least annually to the Audit & Risk Management committee on improvements and changes to internal controls in relation to the finance function, and undertakes specific quality review projects, identified by the CFO, the scope of which are approved in advance by the Audit & Risk Management Committee.
Non-financial reportingAs part of its risk review and management work, directors consider a range of non-financial risks, particularly economic, social and governance (ESG) risks:
Brand and reputationTrade Me relies on strong and growing ongoing consumer confidence in the internet as an efficient, simple, safe and trusted channel. The Company’s reputation and recognisable brand are valuable components of its business, and underpin users’ trust in its websites. Adverse events including issues with fraudulent or other illegal activity on or in connection with its websites, a breach of privacy, sustained or repeated site outages, a failure to effectively address customer disputes or a loss of customer data could damage Trade Me’s reputation. To defend against that risk, Trade Me takes a wide range of steps to protect against fraudulent activity, security breaches and outages. We work hard to communicate clearly, effectively and honestly with members.
Disruption of information systems, and securityTrade Me is dependent on the technology systems, servers, networks, hardware and software that it has in place. The systems could be vulnerable to unauthorised access, viruses, human error, natural disasters, communications failure, sabotage or terrorism. To defend against those risks the Company has implemented security measures, disaster recovery, systems redundancy, and backup procedures.
Threat of disruptive models, technology changes and competitionOnline and mobile technology continues to advance rapidly and this could affect Trade Me’s ability to retain its existing community of members, maintain and increase its existing level of listings, or implement its growth strategies. The effects of future technological change can’t be completely predicted.
We also compete against a broad range of industry participants including domestic and international media companies, online retailers, and niche market operators.
We’ve taken action to keep enhancing our products, to build on Trade Me’s strong brand and reputation, and to build and invest in a portfolio of businesses to manage those risks.
Environmental sustainabilityThe fundamental premise of the Trade Me used goods marketplace business is the reuse and recycling of goods by members – one person sells their unwanted goods to another.
This year we’ve taken some early steps to look at how sustainable it is to buy and sell on Trade Me, testing this in our fridges category. Fridges contain gases that, if not disposed of properly, can leak into the environment.
Over the past nine years (where we had a good level of detailed data) more than 200,000 Trade Me members have bought and sold fridges on Trade Me. We provided our data in this category to a group of independent experts experienced in assessing sustainability initiatives. The panel estimated the number of fridges that could have ended up in landfill if they hadn’t been disposed of properly. They concluded that by giving their fridges an extended life on Trade Me our members have saved an estimated 32,292 tonnes of CO2 from release into the atmosphere from incorrect disposal, saved an estimated 18,000 fridges from entering landfills around the country and saved $4.2m in environmental costs. To put that in real terms, to remove that amount of CO2 from the environment would take a year for a 3,754 hectare forest of mature trees (9–10 years old). The environmental costs are saved by Councils who can prolong the life of their landfills, earn recycling revenue, foster local jobs in addition to the wider environmental benefit of keeping gas emissions from entering our atmosphere.
42 CORPORATE GOVERNANCE
Used goods is only one part of the business. As a corporate Trade Me has relatively low environmental impacts. The vast majority of our negative impact arises from energy consumption in our offices, and emissions from travel. As employee numbers have grown, more travel has been required between New Zealand and the markets where suppliers are based, between the Company’s offices in Wellington, Christchurch and Auckland, and locally to maintain communication with key customers.
Since 2014 we have provided full data annually to Ernst & Young to prepare a Greenhouse Gases (GHG) Emissions Profile for our travel and other energy consumption. We buy carbon credits to fully offset carbon emissions, each year.
Our total GHG inventory for the 2015 calendar year (reported in our 2016 Annual Report) was 670 tonnes CO2-e (split 368 tCo2-e to travel, vehicles and landfill waste; and 306 tCO2-e to power consumption). This year we are publishing our Annual Report before the GHG profile is available. We will report on our investor relations site when we have the 2016 year results.
Social sustainabilityTrade Me’s values (referred to under Principle 1) are a statement of our culture of ethical corporate conduct.
Trade Me has long been active in promoting the interests of consumers. We have played a key part in the development of legislation to extend consumer protections to online auctions, and for a safe harbour regime under the Harmful Digital Communications Act.
A number of government agencies consult with Trade Me to identify the best means to ensure that legislation, regulation and guidance is practical and effective in a digital environment.
Our team is active in policing listings that cause issues of principle for consumers, although it’s not a straightforward exercise to make a call on some types of listings – like the resale of tickets to sporting events not covered by the major events legislation, or the sale of firearms online. We engage actively in the debate on those issues with members, media and government.
We try to have an employment environment that is healthy and safe, fun and responsible. We’re proud that Trade Me has been a finalist for the best employer in our category in the IBM Kenexa workplace engagement survey for the last six years consecutively.
Our customers and members have multiple means of communication with the Company – through the Customer Support team by email or phone, on Trade Me’s message boards on the site, on Trade Me’s social media pages, and in person at shareholder meetings.
CommunityTrade Me’s commitment to sponsorship and philanthropy is preserved within our values (“Care about our community”) and is part of being a good Kiwi company. We think it is important for Trade Me members to be part of a community with a generous spirit and that the wider public feels good about doing business with a company that helps out with worthy causes. Trade Me supports organisations or events that are family-orientated and familiar to Kiwis, and aligned with its vision and values.
A key strength when we work with charities and other organisations is our ability to leverage our platform to help those enterprises reach a wide audience. Trade Me offers a perfect opportunity to give charitable listings exposure.
On the charities and good causes front, we field up to 40 queries a week from around the country, and since 2011 we’ve had a full-time charities co-ordinator. For larger organisations and campaigns, our support may extend to publicity, pro bono advertising and social media promotion. For smaller campaigns, an acknowledgement that the organisation is doing something worthwhile by refunding their auction success fees is always appreciated.
In F17, nearly $214,000 in success fees was returned to charities around the country, and approximately 27.5m ad impressions were provided to deserving organisations pro bono. Trade Me Jobs also provided charities with a 33 per cent discount on 1,970 job listings.
Trade Me has had a formal relationship with Plunket since 2005. Plunket is a charitable organisation that relies on donations to provide support services to parents and families. We also work closely to support actual feathered kiwis through national charity Kiwis for kiwi, raising funds and awareness to support kiwi conservation projects. When placing a listing on Trade Me, sellers can choose to round up their success fee to the nearest dollar and donate the difference to either Plunket or Kiwis for kiwi – this tool raised more than $50,000 for these two charities in F17.
We support One Percent Collective as a business partner. This organisation takes the hassle out of regular charitable giving by asking Kiwis to donate up to one per cent of their income for distribution amongst their six partner charities. Donors can select to choose the amount and frequency of their donations to any or all of these charities. We support by promoting the OPC message.
We have partnered with the Starship Foundation for the Starship Spring Clean initiative for the last six years. This platform allows sellers to pledge funds to Starship from the sale of their items – and get their success fees refunded.
Trade Me also supports The Special Children’s Christmas Party (with a donation and volunteers) and a multitude of other one-off events and causes.
In terms of sponsorship, we are biased towards things where the overall equation is better than just writing a cheque. In F17 we supported a wide range of events and initiatives including Wellington Zoo, Code Camp, DevMob, Product Tank, Gather 2016, Codemania, Workchoice Day, WDCNZ, Webstock, NetHui, NodeBots and Summer of Tech.
TRADE ME GROUP ANNUAL REPORT 2017 43
Trade Me also provides free, public Wi-Fi in Wellington (waterfront) and Christchurch (Re:Start Mall).
Health and Safety RiskTrade Me is a relatively low-risk, office based business–its most common risk is of trips or falls in the office, or accidents in vehicles, for staff who are account managers. Lost time injury in the business has historically been a very rare occurrence. We’re conscious though that stress may affect some employees and we provide access to an entirely confidential counselling service outside Trade Me, which is free to employees.
The Human Resources & Compensation committee is responsible for reviewing, monitoring and making recommendations to the board on Trade Me’s health and safety risk management generally. The committee ensures that the systems used to identify and manage health and safety risks are fit for purpose, are being effectively implemented, regularly reviewed and improved. The committee reviewed the health and safety risks in the business and plans to control or mitigate those risks, in 2016. Since then the employee Health and Safety committee has reported to each board meeting on any incident or issue, and on the Company’s ongoing actions to minimise health and safety risk.
The frequency of incidents has been very low so the HR & Compensation Committee has not required LTIFR or TRIFR reporting to date. In the year to 30 June 2017, the Company recorded 18 work-related accidents, including those involving Trade Me’s social sports teams, and none required any time off work.
Principle 7
Auditors: The board should ensure the quality and independence of the external audit process.We have an Audit Independence Policy that requires the external auditor to be independent and to be seen as independent. We’re satisfied that there is no relationship between the auditor and Trade Me or any related person at this time, that could compromise the auditor’s independence. We also obtain confirmation of independence formally from the auditor.
To ensure full and frank dialogue amongst the Audit & Risk Management committee and the auditors, the auditor’s senior representatives meet separately with the Audit & Risk Management committee (without management present) at least twice a year, including immediately before finalisation and release of our half-year and full-year financial results to the market.
Non-audit workThe Audit Independence Policy sets out restrictions on non-audit work that can be performed by the auditor. In F17 there were no occasions where the audit firm did specific non-audit work.
Our policy requires the rotation of the senior audit partner and review partner at least every five years, and we are fully compliant.
Principle 8
Shareholder rights and relations: The board should respect the rights of shareholders and foster constructive relationships with shareholders that encourage them to engage with the issuer.Our investor relations website is the key place for Trade Me’s financial and operational information, and for its important corporate governance documents. It’s updated immediately on any announcement being made to the market.
Trade Me keeps shareholders informed through periodic reporting to NZX and ASX, and through its continuous disclosure. We provide briefings and presentations to media and analysts (which are made immediately available on the investor relations website), and communicate with shareholders through our annual and half-year reports and shareholder meetings, as well as through a range of releases to media on Trade Me matters which we believe will interest shareholders and our members.
We encourage shareholders to refer to the investor relations website, and to receive annual and half-year reports electronically but hard copies of the reports can readily be obtained from the share registrar, Link Market Services Limited. We take care to write all shareholder communications in a clear and straightforward way and to limit our use of jargon.
Our results presentations are webcast and are published immediately on our investor relations site.
We have so far held the Annual Meeting in Wellington, which is the Company’s base, with all directors and the executive team present. To date we have had a physical rather than virtual Annual Meetings, recognising that for some shareholders this is the best opportunity to engage personally with the board, but we are open to other arrangements.
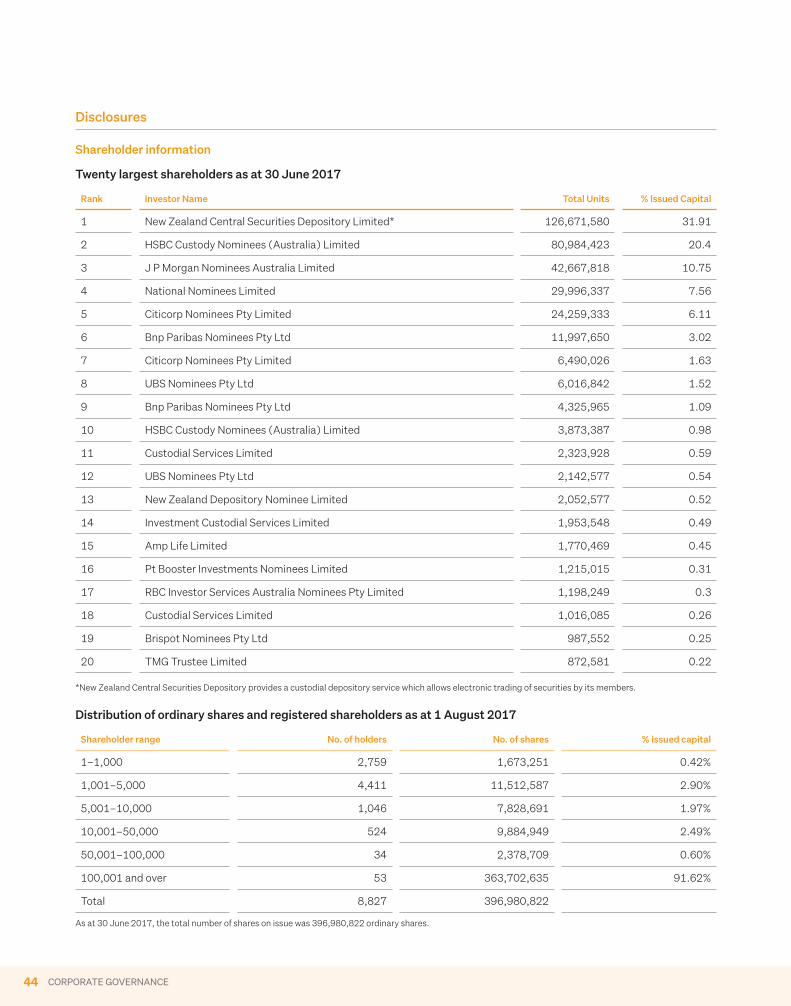
44 CORPORATE GOVERNANCE
Disclosures
Shareholder information
Twenty largest shareholders as at 30 June 2017
Rank Investor Name Total Units % Issued Capital
1 New Zealand Central Securities Depository Limited* 126,671,580 31.91
2 HSBC Custody Nominees (Australia) Limited 80,984,423 20.4
3 J P Morgan Nominees Australia Limited 42,667,818 10.75
4 National Nominees Limited 29,996,337 7.56
5 Citicorp Nominees Pty Limited 24,259,333 6.11
6 Bnp Paribas Nominees Pty Ltd 11,997,650 3.02
7 Citicorp Nominees Pty Limited 6,490,026 1.63
8 UBS Nominees Pty Ltd 6,016,842 1.52
9 Bnp Paribas Nominees Pty Ltd 4,325,965 1.09
10 HSBC Custody Nominees (Australia) Limited 3,873,387 0.98
11 Custodial Services Limited 2,323,928 0.59
12 UBS Nominees Pty Ltd 2,142,577 0.54
13 New Zealand Depository Nominee Limited 2,052,577 0.52
14 Investment Custodial Services Limited 1,953,548 0.49
15 Amp Life Limited 1,770,469 0.45
16 Pt Booster Investments Nominees Limited 1,215,015 0.31
17 RBC Investor Services Australia Nominees Pty Limited 1,198,249 0.3
18 Custodial Services Limited 1,016,085 0.26
19 Brispot Nominees Pty Ltd 987,552 0.25
20 TMG Trustee Limited 872,581 0.22 *New Zealand Central Securities Depository provides a custodial depository service which allows electronic trading of securities by its members.
Distribution of ordinary shares and registered shareholders as at 1 August 2017
Shareholder range No. of holders No. of shares % issued capital
1–1,000 2,759 1,673,251 0.42%
1,001–5,000 4,411 11,512,587 2.90%
5,001–10,000 1,046 7,828,691 1.97%
10,001–50,000 524 9,884,949 2.49%
50,001–100,000 34 2,378,709 0.60%
100,001 and over 53 363,702,635 91.62%
Total 8,827 396,980,822
As at 30 June 2017, the total number of shares on issue was 396,980,822 ordinary shares.
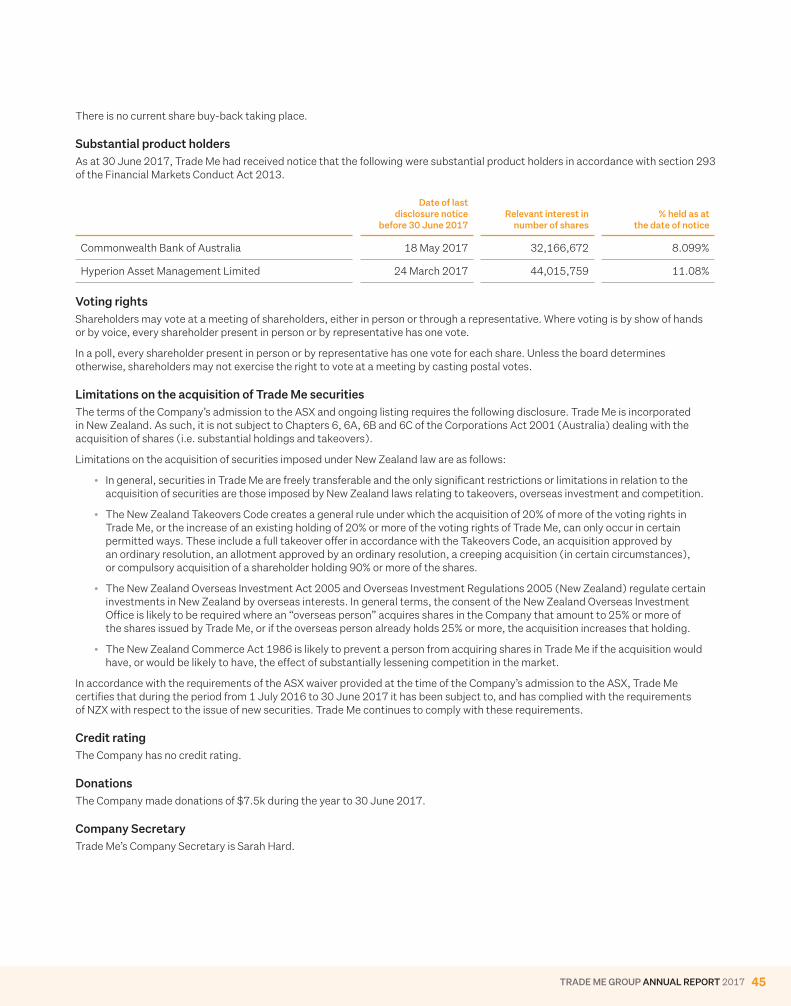
TRADE ME GROUP ANNUAL REPORT 2017 45
There is no current share buy-back taking place.
Substantial product holdersAs at 30 June 2017, Trade Me had received notice that the following were substantial product holders in accordance with section 293 of the Financial Markets Conduct Act 2013.
Date of last disclosure notice
before 30 June 2017Relevant interest in
number of shares% held as at
the date of notice
Commonwealth Bank of Australia 18 May 2017 32,166,672 8.099%
Hyperion Asset Management Limited 24 March 2017 44,015,759 11.08%
Voting rightsShareholders may vote at a meeting of shareholders, either in person or through a representative. Where voting is by show of hands or by voice, every shareholder present in person or by representative has one vote.
In a poll, every shareholder present in person or by representative has one vote for each share. Unless the board determines otherwise, shareholders may not exercise the right to vote at a meeting by casting postal votes.
Limitations on the acquisition of Trade Me securitiesThe terms of the Company’s admission to the ASX and ongoing listing requires the following disclosure. Trade Me is incorporated in New Zealand. As such, it is not subject to Chapters 6, 6A, 6B and 6C of the Corporations Act 2001 (Australia) dealing with the acquisition of shares (i.e. substantial holdings and takeovers).
Limitations on the acquisition of securities imposed under New Zealand law are as follows:
• In general, securities in Trade Me are freely transferable and the only significant restrictions or limitations in relation to the acquisition of securities are those imposed by New Zealand laws relating to takeovers, overseas investment and competition.
• The New Zealand Takeovers Code creates a general rule under which the acquisition of 20% of more of the voting rights in Trade Me, or the increase of an existing holding of 20% or more of the voting rights of Trade Me, can only occur in certain permitted ways. These include a full takeover offer in accordance with the Takeovers Code, an acquisition approved by an ordinary resolution, an allotment approved by an ordinary resolution, a creeping acquisition (in certain circumstances), or compulsory acquisition of a shareholder holding 90% or more of the shares.
• The New Zealand Overseas Investment Act 2005 and Overseas Investment Regulations 2005 (New Zealand) regulate certain investments in New Zealand by overseas interests. In general terms, the consent of the New Zealand Overseas Investment Office is likely to be required where an “overseas person” acquires shares in the Company that amount to 25% or more of the shares issued by Trade Me, or if the overseas person already holds 25% or more, the acquisition increases that holding.
• The New Zealand Commerce Act 1986 is likely to prevent a person from acquiring shares in Trade Me if the acquisition would have, or would be likely to have, the effect of substantially lessening competition in the market.
In accordance with the requirements of the ASX waiver provided at the time of the Company’s admission to the ASX, Trade Me certifies that during the period from 1 July 2016 to 30 June 2017 it has been subject to, and has complied with the requirements of NZX with respect to the issue of new securities. Trade Me continues to comply with these requirements.
Credit ratingThe Company has no credit rating.
DonationsThe Company made donations of $7.5k during the year to 30 June 2017.
Company SecretaryTrade Me’s Company Secretary is Sarah Hard.
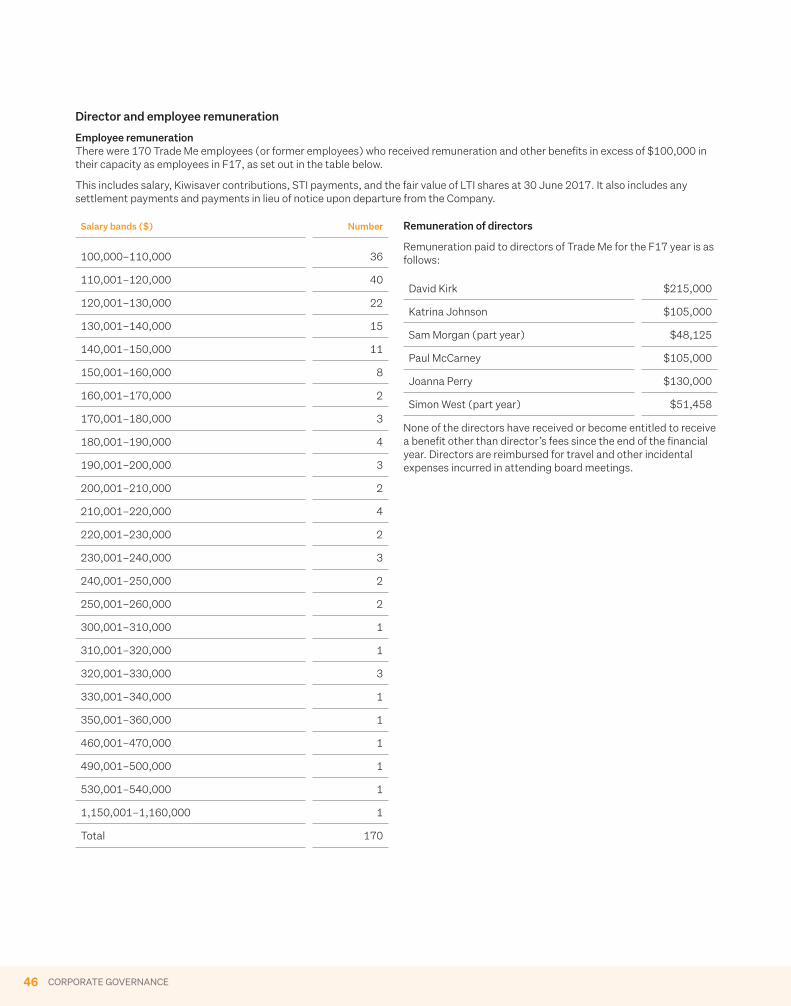
46 CORPORATE GOVERNANCE
Director and employee remuneration
Employee remunerationThere were 170 Trade Me employees (or former employees) who received remuneration and other benefits in excess of $100,000 in their capacity as employees in F17, as set out in the table below.
This includes salary, Kiwisaver contributions, STI payments, and the fair value of LTI shares at 30 June 2017. It also includes any settlement payments and payments in lieu of notice upon departure from the Company.
Salary bands ($) Number
100,000–110,000 36
110,001–120,000 40
120,001–130,000 22
130,001–140,000 15
140,001–150,000 11
150,001–160,000 8
160,001–170,000 2
170,001–180,000 3
180,001–190,000 4
190,001–200,000 3
200,001–210,000 2
210,001–220,000 4
220,001–230,000 2
230,001–240,000 3
240,001–250,000 2
250,001–260,000 2
300,001–310,000 1
310,001–320,000 1
320,001–330,000 3
330,001–340,000 1
350,001–360,000 1
460,001–470,000 1
490,001–500,000 1
530,001–540,000 1
1,150,001–1,160,000 1
Total 170
Remuneration of directors
Remuneration paid to directors of Trade Me for the F17 year is as follows:
David Kirk $215,000
Katrina Johnson $105,000
Sam Morgan (part year) $48,125
Paul McCarney $105,000
Joanna Perry $130,000
Simon West (part year) $51,458
None of the directors have received or become entitled to receive a benefit other than director’s fees since the end of the financial year. Directors are reimbursed for travel and other incidental expenses incurred in attending board meetings.
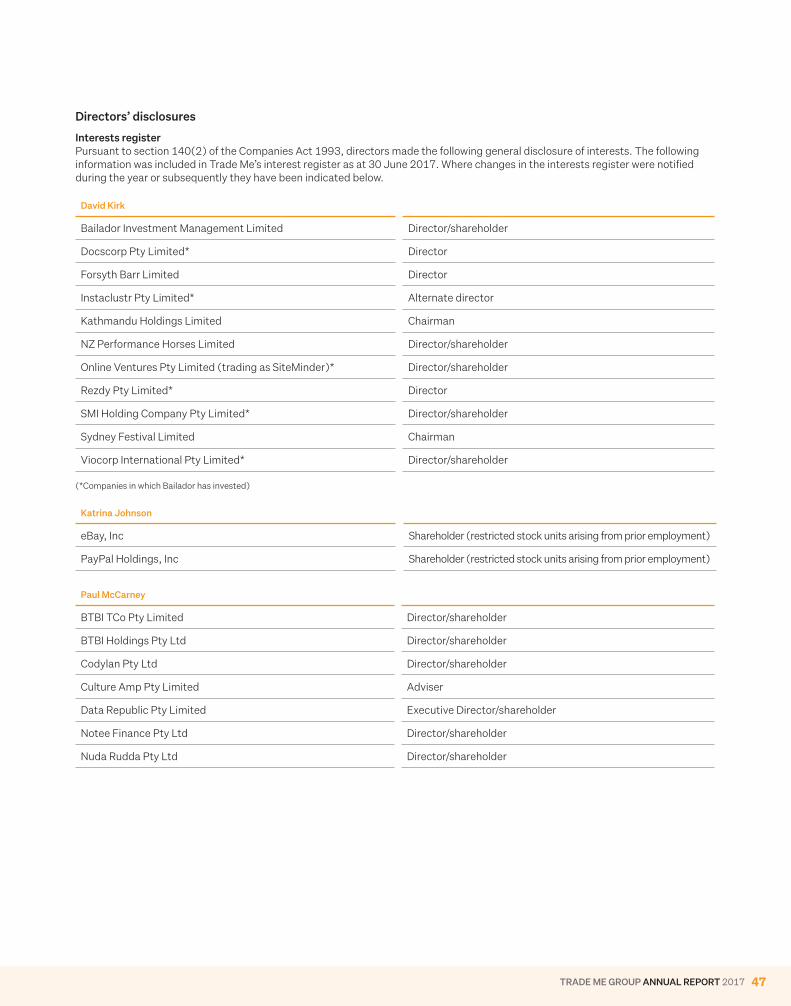
TRADE ME GROUP ANNUAL REPORT 2017 47
Directors’ disclosures
Interests registerPursuant to section 140(2) of the Companies Act 1993, directors made the following general disclosure of interests. The following information was included in Trade Me’s interest register as at 30 June 2017. Where changes in the interests register were notified during the year or subsequently they have been indicated below.
David Kirk
Bailador Investment Management Limited Director/shareholder
Docscorp Pty Limited* Director
Forsyth Barr Limited Director
Instaclustr Pty Limited* Alternate director
Kathmandu Holdings Limited Chairman
NZ Performance Horses Limited Director/shareholder
Online Ventures Pty Limited (trading as SiteMinder)* Director/shareholder
Rezdy Pty Limited* Director
SMI Holding Company Pty Limited* Director/shareholder
Sydney Festival Limited Chairman
Viocorp International Pty Limited* Director/shareholder (*Companies in which Bailador has invested)
Katrina Johnson
eBay, Inc Shareholder (restricted stock units arising from prior employment)
PayPal Holdings, Inc Shareholder (restricted stock units arising from prior employment)
Paul McCarney
BTBI TCo Pty Limited Director/shareholder
BTBI Holdings Pty Ltd Director/shareholder
Codylan Pty Ltd Director/shareholder
Culture Amp Pty Limited Adviser
Data Republic Pty Limited Executive Director/shareholder
Notee Finance Pty Ltd Director/shareholder
Nuda Rudda Pty Ltd Director/shareholder
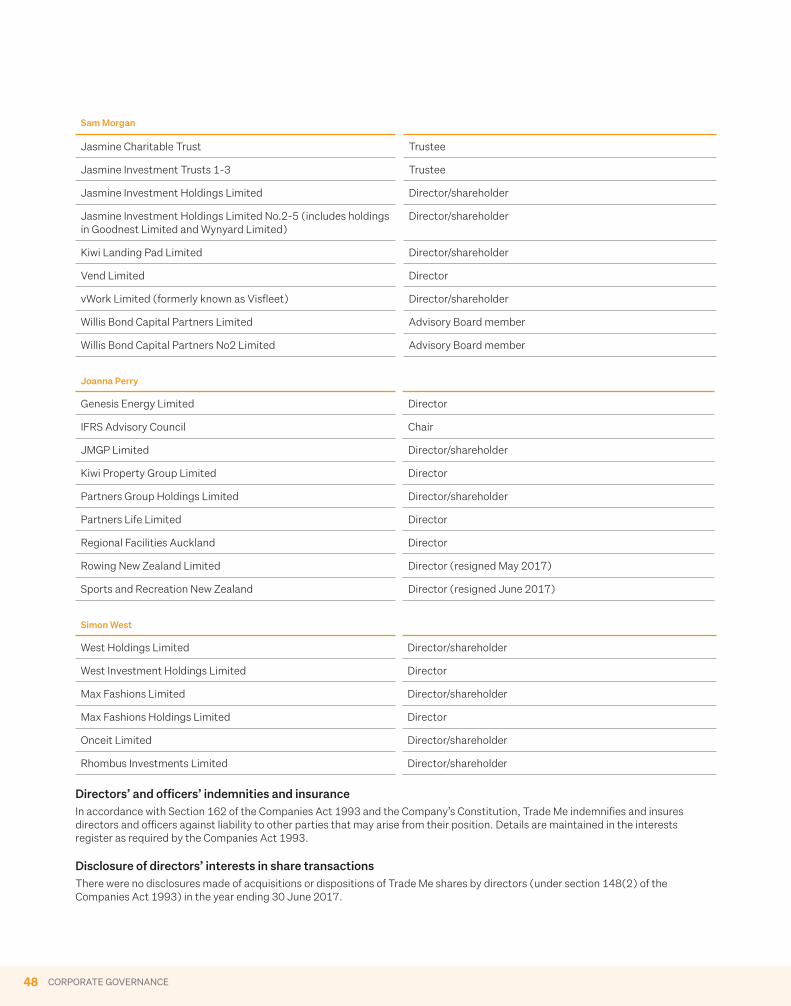
48 CORPORATE GOVERNANCE
Sam Morgan
Jasmine Charitable Trust Trustee
Jasmine Investment Trusts 1-3 Trustee
Jasmine Investment Holdings Limited Director/shareholder
Jasmine Investment Holdings Limited No.2-5 (includes holdings in Goodnest Limited and Wynyard Limited)
Director/shareholder
Kiwi Landing Pad Limited Director/shareholder
Vend Limited Director
vWork Limited (formerly known as Visfleet) Director/shareholder
Willis Bond Capital Partners Limited Advisory Board member
Willis Bond Capital Partners No2 Limited Advisory Board member
Joanna Perry
Genesis Energy Limited Director
IFRS Advisory Council Chair
JMGP Limited Director/shareholder
Kiwi Property Group Limited Director
Partners Group Holdings Limited Director/shareholder
Partners Life Limited Director
Regional Facilities Auckland Director
Rowing New Zealand Limited Director (resigned May 2017)
Sports and Recreation New Zealand Director (resigned June 2017)
Simon West
West Holdings Limited Director/shareholder
West Investment Holdings Limited Director
Max Fashions Limited Director/shareholder
Max Fashions Holdings Limited Director
Onceit Limited Director/shareholder
Rhombus Investments Limited Director/shareholder
Directors’ and officers’ indemnities and insuranceIn accordance with Section 162 of the Companies Act 1993 and the Company’s Constitution, Trade Me indemnifies and insures directors and officers against liability to other parties that may arise from their position. Details are maintained in the interests register as required by the Companies Act 1993.
Disclosure of directors’ interests in share transactionsThere were no disclosures made of acquisitions or dispositions of Trade Me shares by directors (under section 148(2) of the Companies Act 1993) in the year ending 30 June 2017.
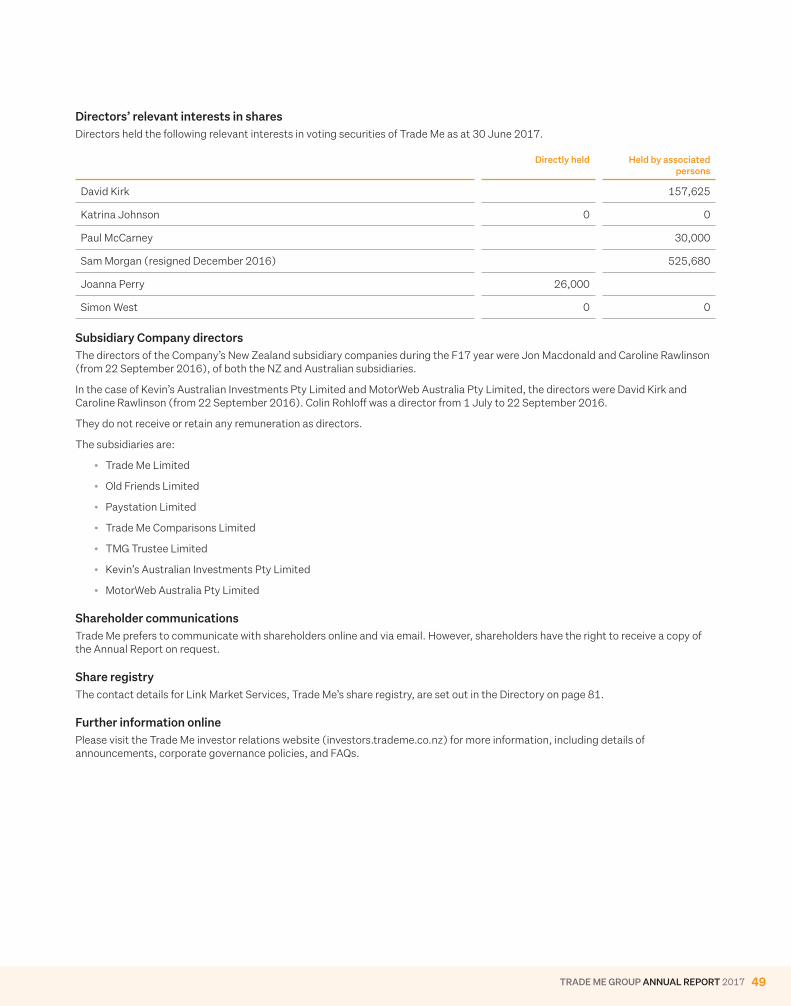
TRADE ME GROUP ANNUAL REPORT 2017 49
Directors’ relevant interests in sharesDirectors held the following relevant interests in voting securities of Trade Me as at 30 June 2017.
Directly held Held by associated persons
David Kirk 157,625
Katrina Johnson 0 0
Paul McCarney 30,000
Sam Morgan (resigned December 2016) 525,680
Joanna Perry 26,000
Simon West 0 0
Subsidiary Company directorsThe directors of the Company’s New Zealand subsidiary companies during the F17 year were Jon Macdonald and Caroline Rawlinson (from 22 September 2016), of both the NZ and Australian subsidiaries.
In the case of Kevin’s Australian Investments Pty Limited and MotorWeb Australia Pty Limited, the directors were David Kirk and Caroline Rawlinson (from 22 September 2016). Colin Rohloff was a director from 1 July to 22 September 2016.
They do not receive or retain any remuneration as directors.
The subsidiaries are:
• Trade Me Limited
• Old Friends Limited
• Paystation Limited
• Trade Me Comparisons Limited
• TMG Trustee Limited
• Kevin’s Australian Investments Pty Limited
• MotorWeb Australia Pty Limited
Shareholder communicationsTrade Me prefers to communicate with shareholders online and via email. However, shareholders have the right to receive a copy of the Annual Report on request.
Share registryThe contact details for Link Market Services, Trade Me’s share registry, are set out in the Directory on page 81.
Further information onlinePlease visit the Trade Me investor relations website (investors.trademe.co.nz) for more information, including details of announcements, corporate governance policies, and FAQs.

50 CORPORATE GOVERNANCE
TRADE ME GROUP ANNUAL REPORT 2017 51 TRADE ME GROUP ANNUAL REPORT 2017 51
Financial statements for the year ended 30 June 2017
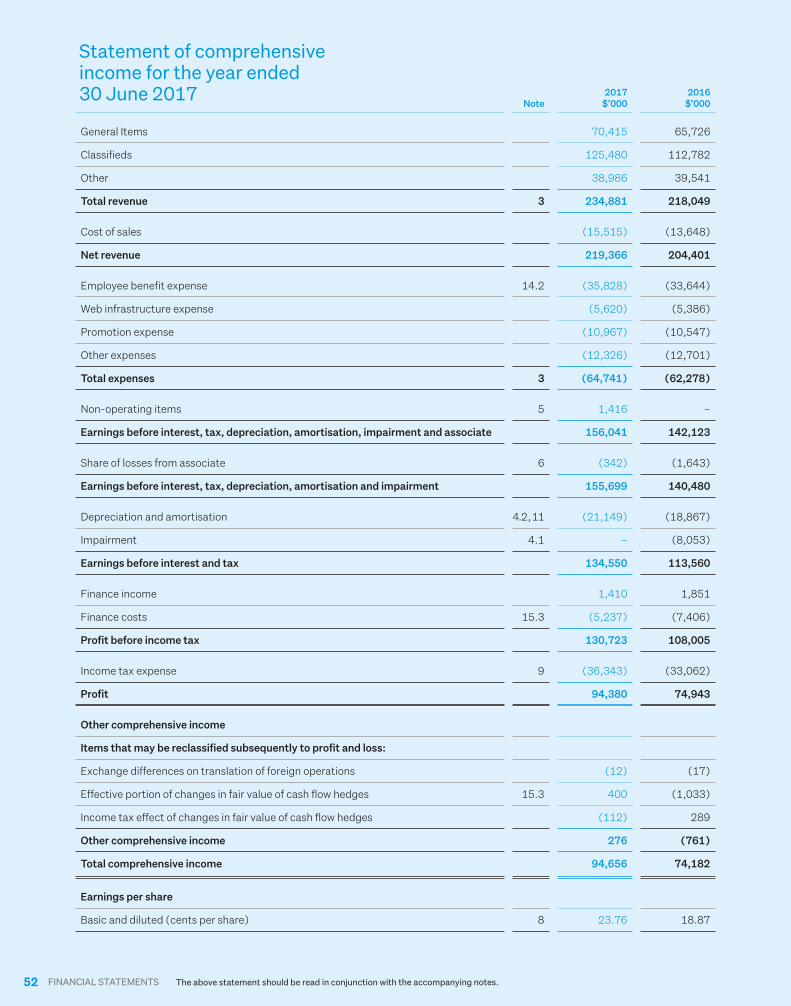
52 FINANCIAL STATEMENTS
Statement of comprehensive income for the year ended 30 June 2017
The above statement should be read in conjunction with the accompanying notes.
Note2017
$’0002016
$’000
General Items 70,415 65,726
Classifieds 125,480 112,782
Other 38,986 39,541
Total revenue 3 234,881 218,049
Cost of sales (15,515) (13,648)
Net revenue 219,366 204,401
Employee benefit expense 14.2 (35,828) (33,644)
Web infrastructure expense (5,620) (5,386)
Promotion expense (10,967) (10,547)
Other expenses (12,326) (12,701)
Total expenses 3 (64,741) (62,278)
Non-operating items 5 1,416 –
Earnings before interest, tax, depreciation, amortisation, impairment and associate 156,041 142,123
Share of losses from associate 6 (342) (1,643)
Earnings before interest, tax, depreciation, amortisation and impairment 155,699 140,480
Depreciation and amortisation 4.2, 11 (21,149) (18,867)
Impairment 4.1 – (8,053)
Earnings before interest and tax 134,550 113,560
Finance income 1,410 1,851
Finance costs 15.3 (5,237) (7,406)
Profit before income tax 130,723 108,005
Income tax expense 9 (36,343) (33,062)
Profit 94,380 74,943
Other comprehensive income
Items that may be reclassified subsequently to profit and loss:
Exchange differences on translation of foreign operations (12) (17)
Effective portion of changes in fair value of cash flow hedges 15.3 400 (1,033)
Income tax effect of changes in fair value of cash flow hedges (112) 289
Other comprehensive income 276 (761)
Total comprehensive income 94,656 74,182
Earnings per share
Basic and diluted (cents per share) 8 23.76 18.87
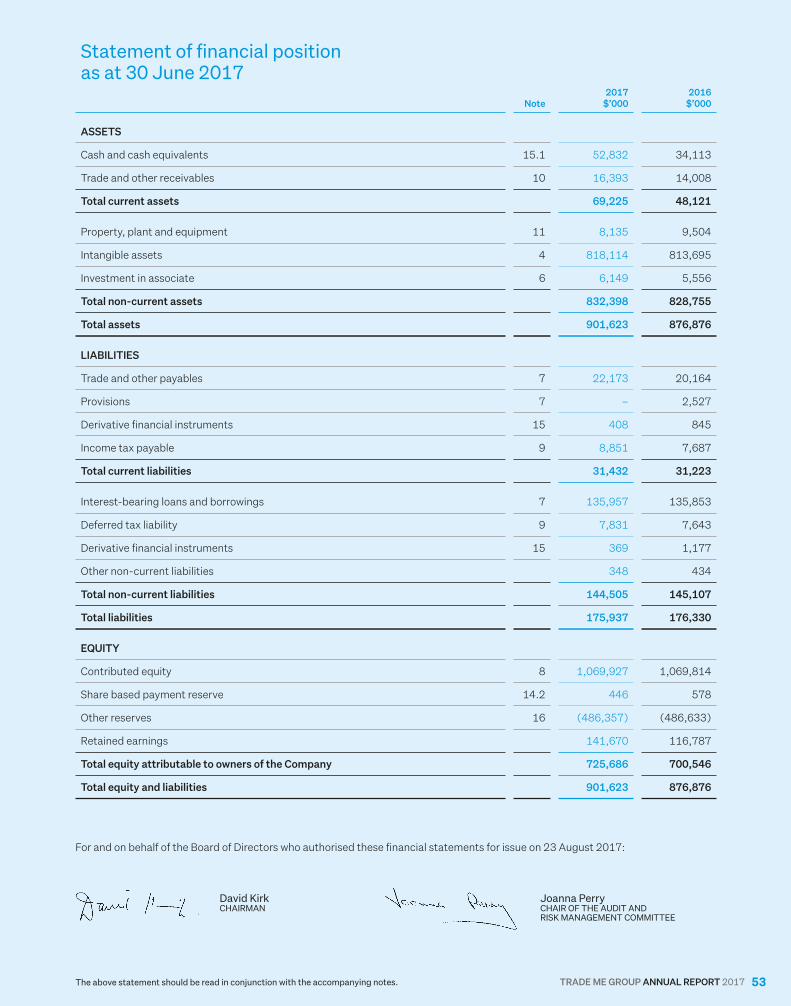
TRADE ME GROUP ANNUAL REPORT 2017 53
Statement of financial position as at 30 June 2017
The above statement should be read in conjunction with the accompanying notes.
Joanna Perry CHAIR OF THE AUDIT AND RISK MANAGEMENT COMMITTEE
David Kirk CHAIRMAN
For and on behalf of the Board of Directors who authorised these financial statements for issue on 23 August 2017:
Note2017
$’0002016
$’000
ASSETS
Cash and cash equivalents 15.1 52,832 34,113
Trade and other receivables 10 16,393 14,008
Total current assets 69,225 48,121
Property, plant and equipment 11 8,135 9,504
Intangible assets 4 818,114 813,695
Investment in associate 6 6,149 5,556
Total non-current assets 832,398 828,755
Total assets 901,623 876,876
LIABILITIES
Trade and other payables 7 22,173 20,164
Provisions 7 – 2,527
Derivative financial instruments 15 408 845
Income tax payable 9 8,851 7,687
Total current liabilities 31,432 31,223
Interest-bearing loans and borrowings 7 135,957 135,853
Deferred tax liability 9 7,831 7,643
Derivative financial instruments 15 369 1,177
Other non-current liabilities 348 434
Total non-current liabilities 144,505 145,107
Total liabilities 175,937 176,330
EQUITY
Contributed equity 8 1,069,927 1,069,814
Share based payment reserve 14.2 446 578
Other reserves 16 (486,357) (486,633)
Retained earnings 141,670 116,787
Total equity attributable to owners of the Company 725,686 700,546
Total equity and liabilities 901,623 876,876
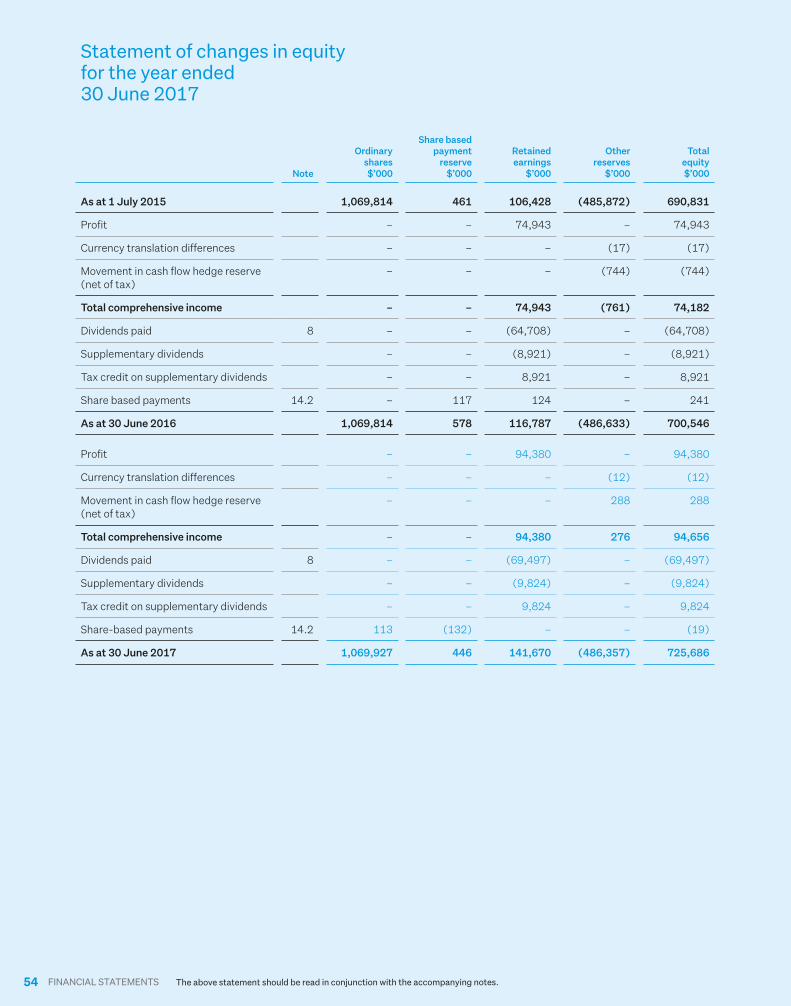
54 FINANCIAL STATEMENTS
Statement of changes in equity for the year ended 30 June 2017
The above statement should be read in conjunction with the accompanying notes.
Note
Ordinary shares $’000
Share based payment
reserve $’000
Retained earnings
$’000
Other reserves
$’000
Total equity $’000
As at 1 July 2015 1,069,814 461 106,428 (485,872) 690,831
Profit – – 74,943 – 74,943
Currency translation differences – – – (17) (17)
Movement in cash flow hedge reserve (net of tax)
– – – (744) (744)
Total comprehensive income – – 74,943 (761) 74,182
Dividends paid 8 – – (64,708) – (64,708)
Supplementary dividends – – (8,921) – (8,921)
Tax credit on supplementary dividends – – 8,921 – 8,921
Share based payments 14.2 – 117 124 – 241
As at 30 June 2016 1,069,814 578 116,787 (486,633) 700,546
Profit – – 94,380 – 94,380
Currency translation differences – – – (12) (12)
Movement in cash flow hedge reserve (net of tax)
– – – 288 288
Total comprehensive income – – 94,380 276 94,656
Dividends paid 8 – – (69,497) – (69,497)
Supplementary dividends – – (9,824) – (9,824)
Tax credit on supplementary dividends – – 9,824 – 9,824
Share-based payments 14.2 113 (132) – – (19)
As at 30 June 2017 1,069,927 446 141,670 (486,357) 725,686
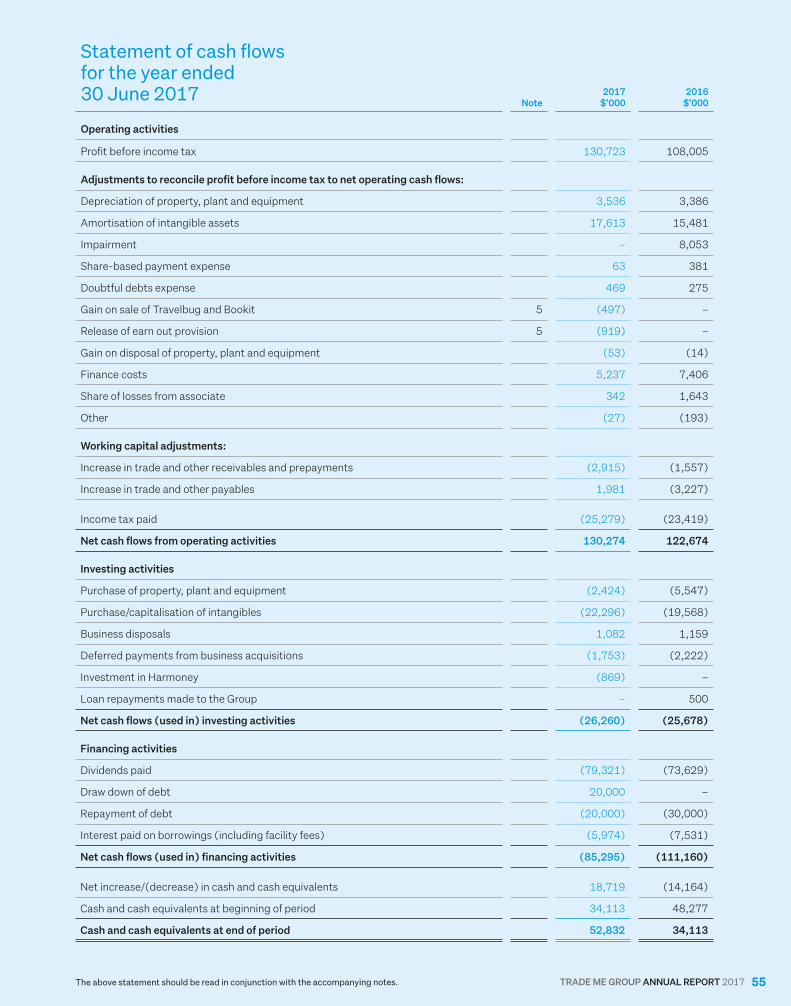
TRADE ME GROUP ANNUAL REPORT 2017 55
Statement of cash flows for the year ended 30 June 2017
The above statement should be read in conjunction with the accompanying notes.
Note2017
$’0002016
$’000
Operating activities
Profit before income tax 130,723 108,005
Adjustments to reconcile profit before income tax to net operating cash flows:
Depreciation of property, plant and equipment 3,536 3,386
Amortisation of intangible assets 17,613 15,481
Impairment – 8,053
Share-based payment expense 63 381
Doubtful debts expense 469 275
Gain on sale of Travelbug and Bookit 5 (497) –
Release of earn out provision 5 (919) –
Gain on disposal of property, plant and equipment (53) (14)
Finance costs 5,237 7,406
Share of losses from associate 342 1,643
Other (27) (193)
Working capital adjustments:
Increase in trade and other receivables and prepayments (2,915) (1,557)
Increase in trade and other payables 1,981 (3,227)
Income tax paid (25,279) (23,419)
Net cash flows from operating activities 130,274 122,674
Investing activities
Purchase of property, plant and equipment (2,424) (5,547)
Purchase/capitalisation of intangibles (22,296) (19,568)
Business disposals 1,082 1,159
Deferred payments from business acquisitions (1,753) (2,222)
Investment in Harmoney (869) –
Loan repayments made to the Group – 500
Net cash flows (used in) investing activities (26,260) (25,678)
Financing activities
Dividends paid (79,321) (73,629)
Draw down of debt 20,000 –
Repayment of debt (20,000) (30,000)
Interest paid on borrowings (including facility fees) (5,974) (7,531)
Net cash flows (used in) financing activities (85,295) (111,160)
Net increase/(decrease) in cash and cash equivalents 18,719 (14,164)
Cash and cash equivalents at beginning of period 34,113 48,277
Cash and cash equivalents at end of period 52,832 34,113
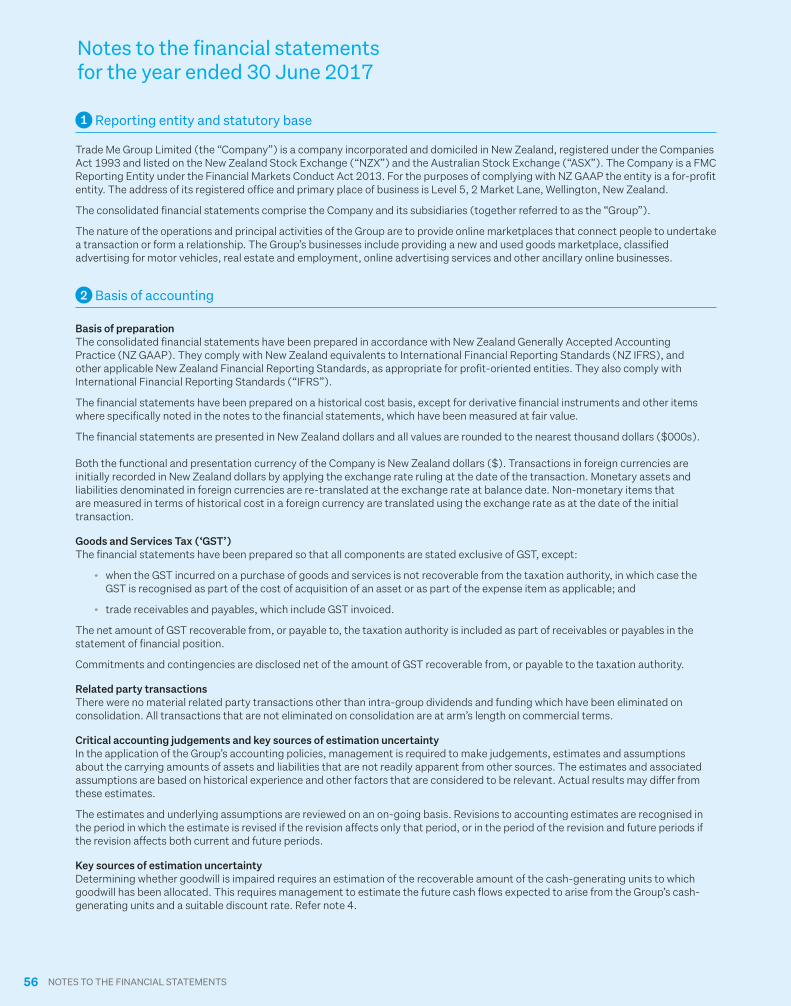
56 NOTES TO THE FINANCIAL STATEMENTS
1 Reporting entity and statutory base
Trade Me Group Limited (the “Company”) is a company incorporated and domiciled in New Zealand, registered under the Companies Act 1993 and listed on the New Zealand Stock Exchange (“NZX”) and the Australian Stock Exchange (“ASX”). The Company is a FMC Reporting Entity under the Financial Markets Conduct Act 2013. For the purposes of complying with NZ GAAP the entity is a for-profit entity. The address of its registered office and primary place of business is Level 5, 2 Market Lane, Wellington, New Zealand.
The consolidated financial statements comprise the Company and its subsidiaries (together referred to as the “Group”).
The nature of the operations and principal activities of the Group are to provide online marketplaces that connect people to undertake a transaction or form a relationship. The Group’s businesses include providing a new and used goods marketplace, classified advertising for motor vehicles, real estate and employment, online advertising services and other ancillary online businesses.
2 Basis of accounting
Basis of preparationThe consolidated financial statements have been prepared in accordance with New Zealand Generally Accepted Accounting Practice (NZ GAAP). They comply with New Zealand equivalents to International Financial Reporting Standards (NZ IFRS), and other applicable New Zealand Financial Reporting Standards, as appropriate for profit-oriented entities. They also comply with International Financial Reporting Standards (“IFRS”).
The financial statements have been prepared on a historical cost basis, except for derivative financial instruments and other items where specifically noted in the notes to the financial statements, which have been measured at fair value.
The financial statements are presented in New Zealand dollars and all values are rounded to the nearest thousand dollars ($000s). Both the functional and presentation currency of the Company is New Zealand dollars ($). Transactions in foreign currencies are initially recorded in New Zealand dollars by applying the exchange rate ruling at the date of the transaction. Monetary assets and liabilities denominated in foreign currencies are re-translated at the exchange rate at balance date. Non-monetary items that are measured in terms of historical cost in a foreign currency are translated using the exchange rate as at the date of the initial transaction.
Goods and Services Tax (‘GST’)The financial statements have been prepared so that all components are stated exclusive of GST, except:
• when the GST incurred on a purchase of goods and services is not recoverable from the taxation authority, in which case the GST is recognised as part of the cost of acquisition of an asset or as part of the expense item as applicable; and
• trade receivables and payables, which include GST invoiced.
The net amount of GST recoverable from, or payable to, the taxation authority is included as part of receivables or payables in the statement of financial position.
Commitments and contingencies are disclosed net of the amount of GST recoverable from, or payable to the taxation authority.
Related party transactionsThere were no material related party transactions other than intra-group dividends and funding which have been eliminated on consolidation. All transactions that are not eliminated on consolidation are at arm’s length on commercial terms.
Critical accounting judgements and key sources of estimation uncertaintyIn the application of the Group’s accounting policies, management is required to make judgements, estimates and assumptions about the carrying amounts of assets and liabilities that are not readily apparent from other sources. The estimates and associated assumptions are based on historical experience and other factors that are considered to be relevant. Actual results may differ from these estimates.
The estimates and underlying assumptions are reviewed on an on-going basis. Revisions to accounting estimates are recognised in the period in which the estimate is revised if the revision affects only that period, or in the period of the revision and future periods if the revision affects both current and future periods.
Key sources of estimation uncertaintyDetermining whether goodwill is impaired requires an estimation of the recoverable amount of the cash-generating units to which goodwill has been allocated. This requires management to estimate the future cash flows expected to arise from the Group’s cash-generating units and a suitable discount rate. Refer note 4.
Notes to the financial statements for the year ended 30 June 2017
TRADE ME GROUP ANNUAL REPORT 2017 57
The Group’s process for calculating the amount of internally developed platform costs to be capitalised is judgemental and involves estimating the hours which employees spend developing the platform, and determining the costs attributable to that time. A margin is added to employees’ salary costs to account for indirect costs attributable to the development. This margin is reviewed annually to ensure it remains appropriate. The useful life used to amortise capitalised platform development costs is estimated based on historical experience as well as anticipation of future events which may impact their life. The useful life represents management’s view of the expected term over which the Group will receive benefits from the development and is regularly reviewed for appropriateness. Refer note 4.
Basis of consolidationThe consolidated financial statements incorporate the financial statements of the Company and entities controlled by the Company (its subsidiaries) as at the reporting date. Control is achieved where the Company is exposed to, or has rights to, variable returns from its involvement with the entity and has the ability to affect those returns through its power over the entity.
The results of subsidiaries acquired or disposed of during the year are included in profit or loss from the effective date of acquisition or up to the effective date of disposal, as appropriate.
All intra-group transactions, balances, income and expenses are eliminated in full on consolidation.
Changes in accounting policiesDuring the year, the IFRS Interpretations Committee (IFRIC) considered the expected manner of recovery of an indefinite-life intangible asset for the purposes of measuring deferred tax. In light of the IFRIC interpretation, the Group has reassessed the expected manner of recovery of the carrying amount of the indefinite life brand asset. The Group expects to recover the carrying amount of the asset through use rather than through sale. Under this revised interpretation, when the brand asset was initially recognised on the Group’s statement of financial position in 2006, a deferred tax liability should have been recognised. In accordance with NZ IAS 8, Accounting Policies, Changes in Accounting Estimates and Errors, the Group has retrospectively recognised an additional $9.1m deferred tax liability on the brand asset with the corresponding debit entry being recognised as an increase in the goodwill asset at that time. This change has no impact on the statement of comprehensive income.
New standards, amendments and interpretationsOther than the change in accounting policy referred to above, there are no standards or interpretations that are effective for the first time this year that have had an impact on the Group.
New standards, amendments and interpretations issued but not effective for the financial year beginning 1 July 2016 and not early adopted New standards, amendments and interpretations issued by the International Accounting Standards Board (IASB) and the External Reporting Board in New Zealand (XRB) have been published that will be mandatory for the Group’s accounting periods beginning after 1 July 2017. None of these standards have been early adopted by the Group. The relevant new standards, amendments and interpretations include:
NZ IFRS 15, ‘Revenue from Contracts with Customers’This standard deals with revenue recognition providing a single comprehensive principles-based five step model to be applied to all contracts with customers. The standard replaces NZ IAS 18 Revenue and related interpretations and is effective for annual periods beginning on or after 1 January 2018 with early adoption permitted. Trade Me will adopt the standard for the financial year ending 30 June 2019.
Management have reviewed each revenue stream to determine the impact of NZ IFRS 15 and assessed that many revenue streams are not impacted given the short-term nature of our services. Revenue streams impacted are listing fees and some premium fees where listing lengths extend beyond 30 days. Management have assessed the potential impact of NZ IFRS 15 and concluded that circa 2% of revenue would be deferred at any point in time. Management will update the analysis periodically to determine what, if any, adjustment will be required prior to the first reporting date of 30 June 2019.
NZ IFRS 9 ‘Financial Instruments’This standard addresses the classification, measurement and recognition of financial assets and financial liabilities and replaces the guidance in NZ IAS 39 that relates to the classification and measurement of financial instruments.
The standard is effective for accounting periods beginning on or after 1 January 2018 with early adoption permitted. Management have assessed the impact of NZ IFRS 9 and consider there will be no material impact on the financial statements given the nature of the Group’s financial instruments.
NZ IFRS 16 ‘Leases’ This standard requires a lessee to recognise a lease liability reflecting the future lease payments and a ‘right-of-use asset’ for substantively all lease contracts. The standard is effective for accounting periods beginning on or after 1 January 2019 with early adoption permitted. Trade Me will adopt the standard for the financial year ending 30 June 2020.

58 NOTES TO THE FINANCIAL STATEMENTS
Management have assessed the impact of NZ IFRS 16 on the Group’s financial statements and if NZ IFRS 16 had come into effect for the current financial year, an additional $13.2m lease liability and right-of-use asset would have been recognised in the Group’s statement of financial position.
Other amendments to accounting standardsThere are other standards, amendments and interpretations which have been approved but are not yet effective. The Group expects to adopt these when they become mandatory. None are expected to materially impact the Group’s financial statements.
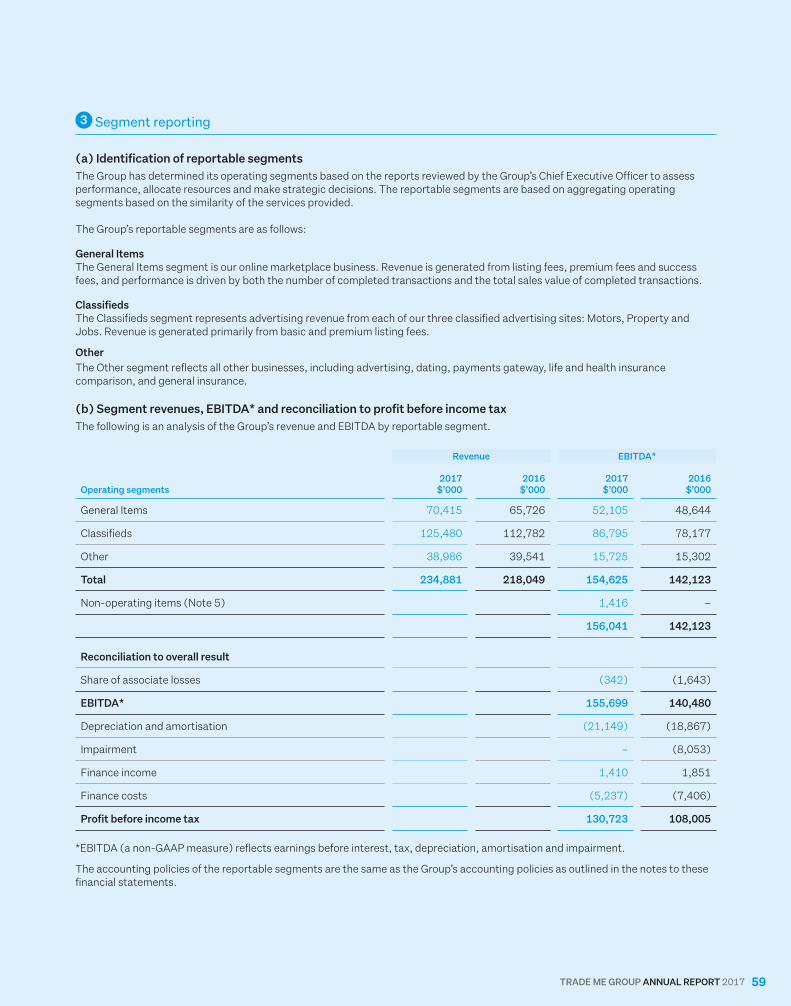
TRADE ME GROUP ANNUAL REPORT 2017 59
3 Segment reporting
(a) Identification of reportable segmentsThe Group has determined its operating segments based on the reports reviewed by the Group’s Chief Executive Officer to assess performance, allocate resources and make strategic decisions. The reportable segments are based on aggregating operating segments based on the similarity of the services provided. The Group’s reportable segments are as follows:
General Items The General Items segment is our online marketplace business. Revenue is generated from listing fees, premium fees and success fees, and performance is driven by both the number of completed transactions and the total sales value of completed transactions.
Classifieds The Classifieds segment represents advertising revenue from each of our three classified advertising sites: Motors, Property and Jobs. Revenue is generated primarily from basic and premium listing fees.
Other The Other segment reflects all other businesses, including advertising, dating, payments gateway, life and health insurance comparison, and general insurance.
(b) Segment revenues, EBITDA* and reconciliation to profit before income taxThe following is an analysis of the Group’s revenue and EBITDA by reportable segment.
Revenue EBITDA*
Operating segments2017
$’0002016
$’0002017
$’000 2016
$’000
General Items 70,415 65,726 52,105 48,644
Classifieds 125,480 112,782 86,795 78,177
Other 38,986 39,541 15,725 15,302
Total 234,881 218,049 154,625 142,123
Non-operating items (Note 5) 1,416 –
156,041 142,123
Reconciliation to overall result
Share of associate losses (342) (1,643)
EBITDA* 155,699 140,480
Depreciation and amortisation (21,149) (18,867)
Impairment – (8,053)
Finance income 1,410 1,851
Finance costs (5,237) (7,406)
Profit before income tax 130,723 108,005 *EBITDA (a non-GAAP measure) reflects earnings before interest, tax, depreciation, amortisation and impairment.
The accounting policies of the reportable segments are the same as the Group’s accounting policies as outlined in the notes to these financial statements.
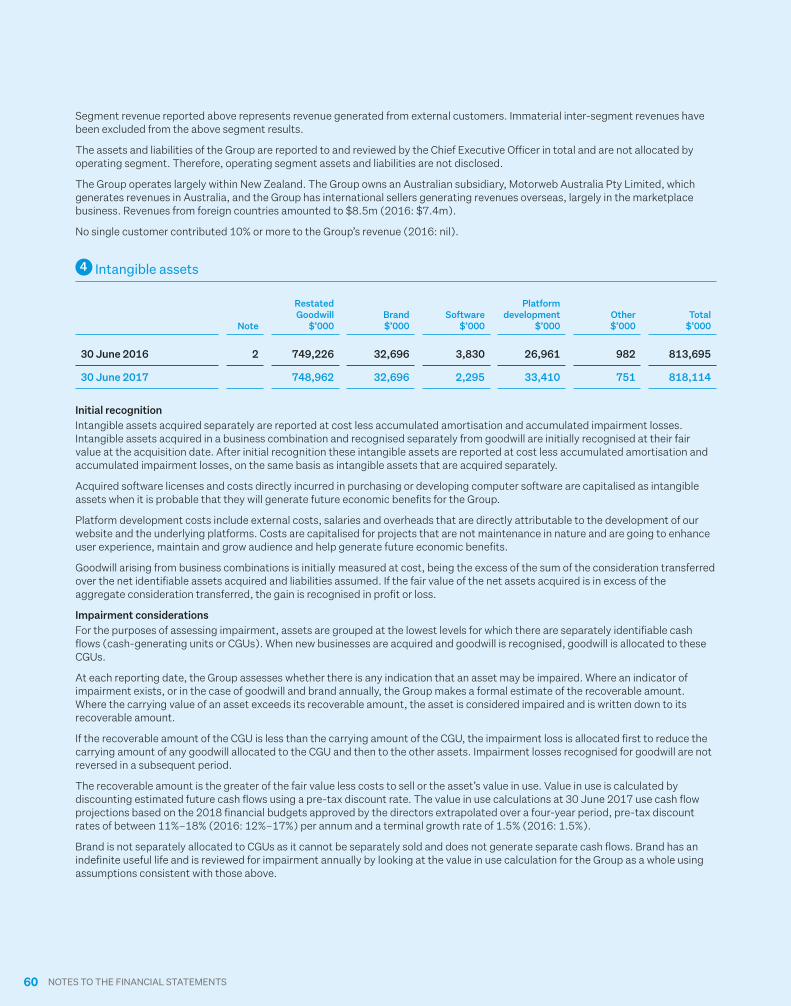
60 NOTES TO THE FINANCIAL STATEMENTS
Segment revenue reported above represents revenue generated from external customers. Immaterial inter-segment revenues have been excluded from the above segment results.
The assets and liabilities of the Group are reported to and reviewed by the Chief Executive Officer in total and are not allocated by operating segment. Therefore, operating segment assets and liabilities are not disclosed.
The Group operates largely within New Zealand. The Group owns an Australian subsidiary, Motorweb Australia Pty Limited, which generates revenues in Australia, and the Group has international sellers generating revenues overseas, largely in the marketplace business. Revenues from foreign countries amounted to $8.5m (2016: $7.4m).
No single customer contributed 10% or more to the Group’s revenue (2016: nil).
4 Intangible assets
Note
Restated Goodwill
$’000Brand $’000
Software $’000
Platform development
$’000Other $’000
Total $’000
30 June 2016 2 749,226 32,696 3,830 26,961 982 813,695
30 June 2017 748,962 32,696 2,295 33,410 751 818,114
Initial recognitionIntangible assets acquired separately are reported at cost less accumulated amortisation and accumulated impairment losses. Intangible assets acquired in a business combination and recognised separately from goodwill are initially recognised at their fair value at the acquisition date. After initial recognition these intangible assets are reported at cost less accumulated amortisation and accumulated impairment losses, on the same basis as intangible assets that are acquired separately.
Acquired software licenses and costs directly incurred in purchasing or developing computer software are capitalised as intangible assets when it is probable that they will generate future economic benefits for the Group.
Platform development costs include external costs, salaries and overheads that are directly attributable to the development of our website and the underlying platforms. Costs are capitalised for projects that are not maintenance in nature and are going to enhance user experience, maintain and grow audience and help generate future economic benefits.
Goodwill arising from business combinations is initially measured at cost, being the excess of the sum of the consideration transferred over the net identifiable assets acquired and liabilities assumed. If the fair value of the net assets acquired is in excess of the aggregate consideration transferred, the gain is recognised in profit or loss.
Impairment considerationsFor the purposes of assessing impairment, assets are grouped at the lowest levels for which there are separately identifiable cash flows (cash-generating units or CGUs). When new businesses are acquired and goodwill is recognised, goodwill is allocated to these CGUs.
At each reporting date, the Group assesses whether there is any indication that an asset may be impaired. Where an indicator of impairment exists, or in the case of goodwill and brand annually, the Group makes a formal estimate of the recoverable amount. Where the carrying value of an asset exceeds its recoverable amount, the asset is considered impaired and is written down to its recoverable amount.
If the recoverable amount of the CGU is less than the carrying amount of the CGU, the impairment loss is allocated first to reduce the carrying amount of any goodwill allocated to the CGU and then to the other assets. Impairment losses recognised for goodwill are not reversed in a subsequent period.
The recoverable amount is the greater of the fair value less costs to sell or the asset’s value in use. Value in use is calculated by discounting estimated future cash flows using a pre-tax discount rate. The value in use calculations at 30 June 2017 use cash flow projections based on the 2018 financial budgets approved by the directors extrapolated over a four-year period, pre-tax discount rates of between 11%–18% (2016: 12%–17%) per annum and a terminal growth rate of 1.5% (2016: 1.5%).
Brand is not separately allocated to CGUs as it cannot be separately sold and does not generate separate cash flows. Brand has an indefinite useful life and is reviewed for impairment annually by looking at the value in use calculation for the Group as a whole using assumptions consistent with those above.
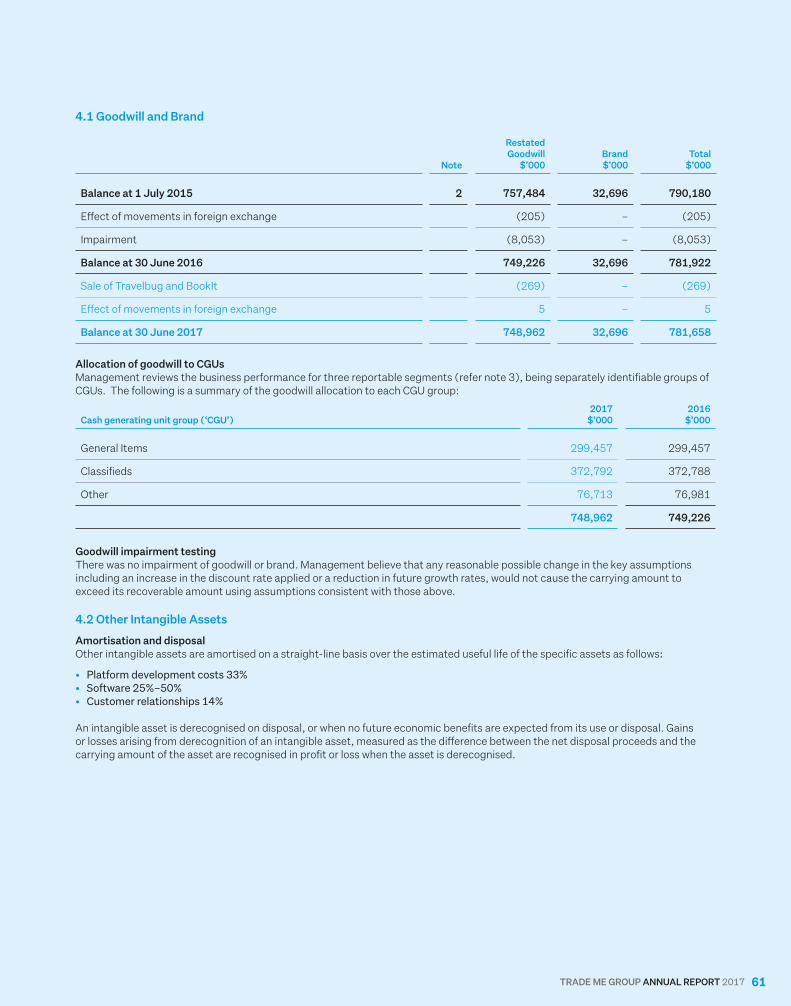
TRADE ME GROUP ANNUAL REPORT 2017 61
4.1 Goodwill and Brand
Note
Restated Goodwill
$’000Brand $’000
Total $’000
Balance at 1 July 2015 2 757,484 32,696 790,180
Effect of movements in foreign exchange (205) – (205)
Impairment (8,053) – (8,053)
Balance at 30 June 2016 749,226 32,696 781,922
Sale of Travelbug and BookIt (269) – (269)
Effect of movements in foreign exchange 5 – 5
Balance at 30 June 2017 748,962 32,696 781,658 Allocation of goodwill to CGUsManagement reviews the business performance for three reportable segments (refer note 3), being separately identifiable groups of CGUs. The following is a summary of the goodwill allocation to each CGU group:
Cash generating unit group (‘CGU’)2017
$’0002016
$’000
General Items 299,457 299,457
Classifieds 372,792 372,788
Other 76,713 76,981
748,962 749,226
Goodwill impairment testingThere was no impairment of goodwill or brand. Management believe that any reasonable possible change in the key assumptions including an increase in the discount rate applied or a reduction in future growth rates, would not cause the carrying amount to exceed its recoverable amount using assumptions consistent with those above.
4.2 Other Intangible Assets
Amortisation and disposalOther intangible assets are amortised on a straight-line basis over the estimated useful life of the specific assets as follows:
• Platform development costs 33% • Software 25%–50%• Customer relationships 14% An intangible asset is derecognised on disposal, or when no future economic benefits are expected from its use or disposal. Gains or losses arising from derecognition of an intangible asset, measured as the difference between the net disposal proceeds and the carrying amount of the asset are recognised in profit or loss when the asset is derecognised.
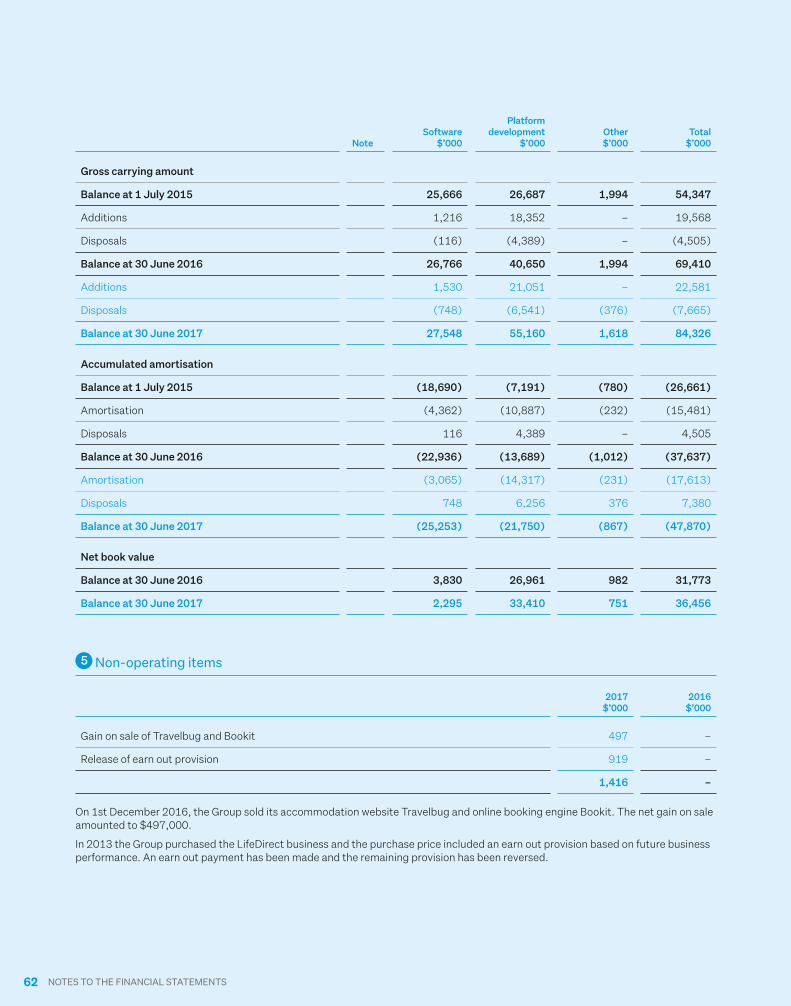
62 NOTES TO THE FINANCIAL STATEMENTS
NoteSoftware
$’000
Platform development
$’000Other $’000
Total $’000
Gross carrying amount
Balance at 1 July 2015 25,666 26,687 1,994 54,347
Additions 1,216 18,352 – 19,568
Disposals (116) (4,389) – (4,505)
Balance at 30 June 2016 26,766 40,650 1,994 69,410
Additions 1,530 21,051 – 22,581
Disposals (748) (6,541) (376) (7,665)
Balance at 30 June 2017 27,548 55,160 1,618 84,326
Accumulated amortisation
Balance at 1 July 2015 (18,690) (7,191) (780) (26,661)
Amortisation (4,362) (10,887) (232) (15,481)
Disposals 116 4,389 – 4,505
Balance at 30 June 2016 (22,936) (13,689) (1,012) (37,637)
Amortisation (3,065) (14,317) (231) (17,613)
Disposals 748 6,256 376 7,380
Balance at 30 June 2017 (25,253) (21,750) (867) (47,870)
Net book value
Balance at 30 June 2016 3,830 26,961 982 31,773
Balance at 30 June 2017 2,295 33,410 751 36,456
5 Non-operating items
2017 $’000
2016 $’000
Gain on sale of Travelbug and Bookit 497 –
Release of earn out provision 919 –
1,416 –
On 1st December 2016, the Group sold its accommodation website Travelbug and online booking engine Bookit. The net gain on sale amounted to $497,000.
In 2013 the Group purchased the LifeDirect business and the purchase price included an earn out provision based on future business performance. An earn out payment has been made and the remaining provision has been reversed.
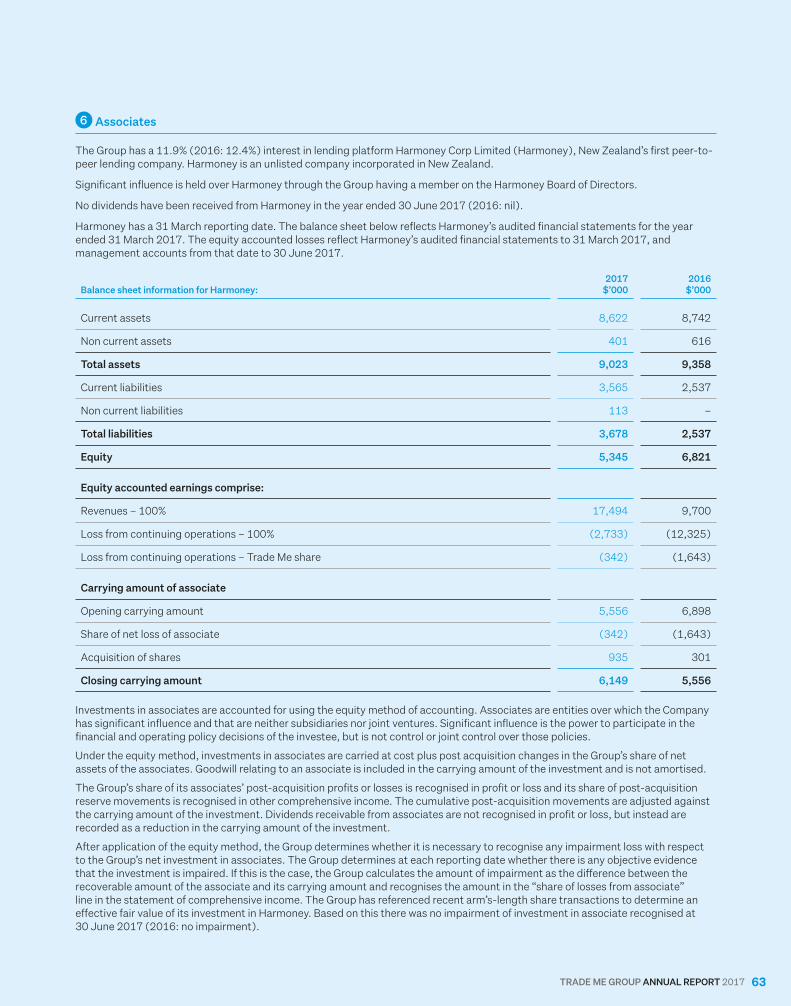
TRADE ME GROUP ANNUAL REPORT 2017 63
6 Associates
The Group has a 11.9% (2016: 12.4%) interest in lending platform Harmoney Corp Limited (Harmoney), New Zealand’s first peer-to-peer lending company. Harmoney is an unlisted company incorporated in New Zealand.
Significant influence is held over Harmoney through the Group having a member on the Harmoney Board of Directors.
No dividends have been received from Harmoney in the year ended 30 June 2017 (2016: nil).
Harmoney has a 31 March reporting date. The balance sheet below reflects Harmoney’s audited financial statements for the year ended 31 March 2017. The equity accounted losses reflect Harmoney’s audited financial statements to 31 March 2017, and management accounts from that date to 30 June 2017.
Balance sheet information for Harmoney:2017
$’000 2016 $’000
Current assets 8,622 8,742
Non current assets 401 616
Total assets 9,023 9,358
Current liabilities 3,565 2,537
Non current liabilities 113 –
Total liabilities 3,678 2,537
Equity 5,345 6,821
Equity accounted earnings comprise:
Revenues – 100% 17,494 9,700
Loss from continuing operations – 100% (2,733) (12,325)
Loss from continuing operations – Trade Me share (342) (1,643)
Carrying amount of associate
Opening carrying amount 5,556 6,898
Share of net loss of associate (342) (1,643)
Acquisition of shares 935 301
Closing carrying amount 6,149 5,556
Investments in associates are accounted for using the equity method of accounting. Associates are entities over which the Company has significant influence and that are neither subsidiaries nor joint ventures. Significant influence is the power to participate in the financial and operating policy decisions of the investee, but is not control or joint control over those policies.
Under the equity method, investments in associates are carried at cost plus post acquisition changes in the Group’s share of net assets of the associates. Goodwill relating to an associate is included in the carrying amount of the investment and is not amortised.
The Group’s share of its associates’ post-acquisition profits or losses is recognised in profit or loss and its share of post-acquisition reserve movements is recognised in other comprehensive income. The cumulative post-acquisition movements are adjusted against the carrying amount of the investment. Dividends receivable from associates are not recognised in profit or loss, but instead are recorded as a reduction in the carrying amount of the investment.
After application of the equity method, the Group determines whether it is necessary to recognise any impairment loss with respect to the Group’s net investment in associates. The Group determines at each reporting date whether there is any objective evidence that the investment is impaired. If this is the case, the Group calculates the amount of impairment as the difference between the recoverable amount of the associate and its carrying amount and recognises the amount in the “share of losses from associate” line in the statement of comprehensive income. The Group has referenced recent arm’s-length share transactions to determine an effective fair value of its investment in Harmoney. Based on this there was no impairment of investment in associate recognised at 30 June 2017 (2016: no impairment).
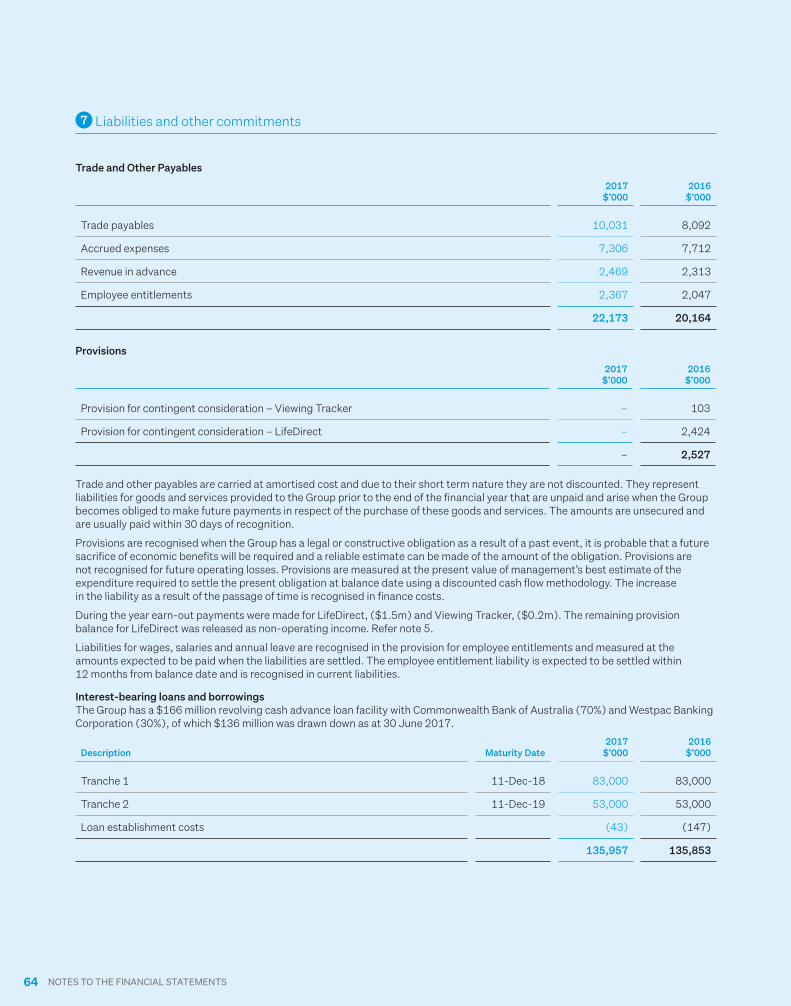
64 NOTES TO THE FINANCIAL STATEMENTS
7 Liabilities and other commitments
Trade and Other Payables
2017 $’000
2016 $’000
Trade payables 10,031 8,092
Accrued expenses 7,306 7,712
Revenue in advance 2,469 2,313
Employee entitlements 2,367 2,047
22,173 20,164
Provisions
2017 $’000
2016 $’000
Provision for contingent consideration – Viewing Tracker – 103
Provision for contingent consideration – LifeDirect – 2,424
– 2,527
Trade and other payables are carried at amortised cost and due to their short term nature they are not discounted. They represent liabilities for goods and services provided to the Group prior to the end of the financial year that are unpaid and arise when the Group becomes obliged to make future payments in respect of the purchase of these goods and services. The amounts are unsecured and are usually paid within 30 days of recognition.
Provisions are recognised when the Group has a legal or constructive obligation as a result of a past event, it is probable that a future sacrifice of economic benefits will be required and a reliable estimate can be made of the amount of the obligation. Provisions are not recognised for future operating losses. Provisions are measured at the present value of management’s best estimate of the expenditure required to settle the present obligation at balance date using a discounted cash flow methodology. The increase in the liability as a result of the passage of time is recognised in finance costs.
During the year earn-out payments were made for LifeDirect, ($1.5m) and Viewing Tracker, ($0.2m). The remaining provision balance for LifeDirect was released as non-operating income. Refer note 5.
Liabilities for wages, salaries and annual leave are recognised in the provision for employee entitlements and measured at the amounts expected to be paid when the liabilities are settled. The employee entitlement liability is expected to be settled within 12 months from balance date and is recognised in current liabilities.
Interest-bearing loans and borrowingsThe Group has a $166 million revolving cash advance loan facility with Commonwealth Bank of Australia (70%) and Westpac Banking Corporation (30%), of which $136 million was drawn down as at 30 June 2017.
Description Maturity Date2017
$’0002016
$’000
Tranche 1 11-Dec-18 83,000 83,000
Tranche 2 11-Dec-19 53,000 53,000
Loan establishment costs (43) (147)
135,957 135,853
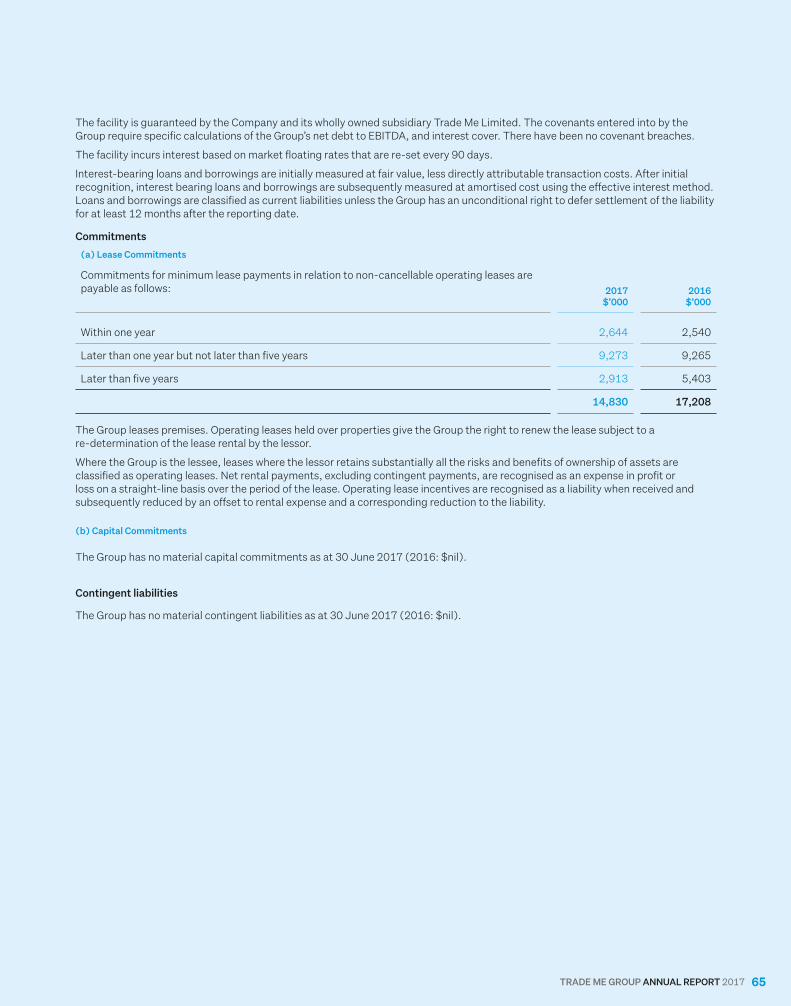
TRADE ME GROUP ANNUAL REPORT 2017 65
The facility is guaranteed by the Company and its wholly owned subsidiary Trade Me Limited. The covenants entered into by the Group require specific calculations of the Group’s net debt to EBITDA, and interest cover. There have been no covenant breaches.
The facility incurs interest based on market floating rates that are re-set every 90 days.
Interest-bearing loans and borrowings are initially measured at fair value, less directly attributable transaction costs. After initial recognition, interest bearing loans and borrowings are subsequently measured at amortised cost using the effective interest method. Loans and borrowings are classified as current liabilities unless the Group has an unconditional right to defer settlement of the liability for at least 12 months after the reporting date.
Commitments
(a) Lease Commitments
Commitments for minimum lease payments in relation to non-cancellable operating leases are payable as follows: 2017
$’0002016
$’000
Within one year 2,644 2,540
Later than one year but not later than five years 9,273 9,265
Later than five years 2,913 5,403
14,830 17,208
The Group leases premises. Operating leases held over properties give the Group the right to renew the lease subject to a re-determination of the lease rental by the lessor.
Where the Group is the lessee, leases where the lessor retains substantially all the risks and benefits of ownership of assets are classified as operating leases. Net rental payments, excluding contingent payments, are recognised as an expense in profit or loss on a straight-line basis over the period of the lease. Operating lease incentives are recognised as a liability when received and subsequently reduced by an offset to rental expense and a corresponding reduction to the liability.
(b) Capital Commitments The Group has no material capital commitments as at 30 June 2017 (2016: $nil).
Contingent liabilities
The Group has no material contingent liabilities as at 30 June 2017 (2016: $nil).
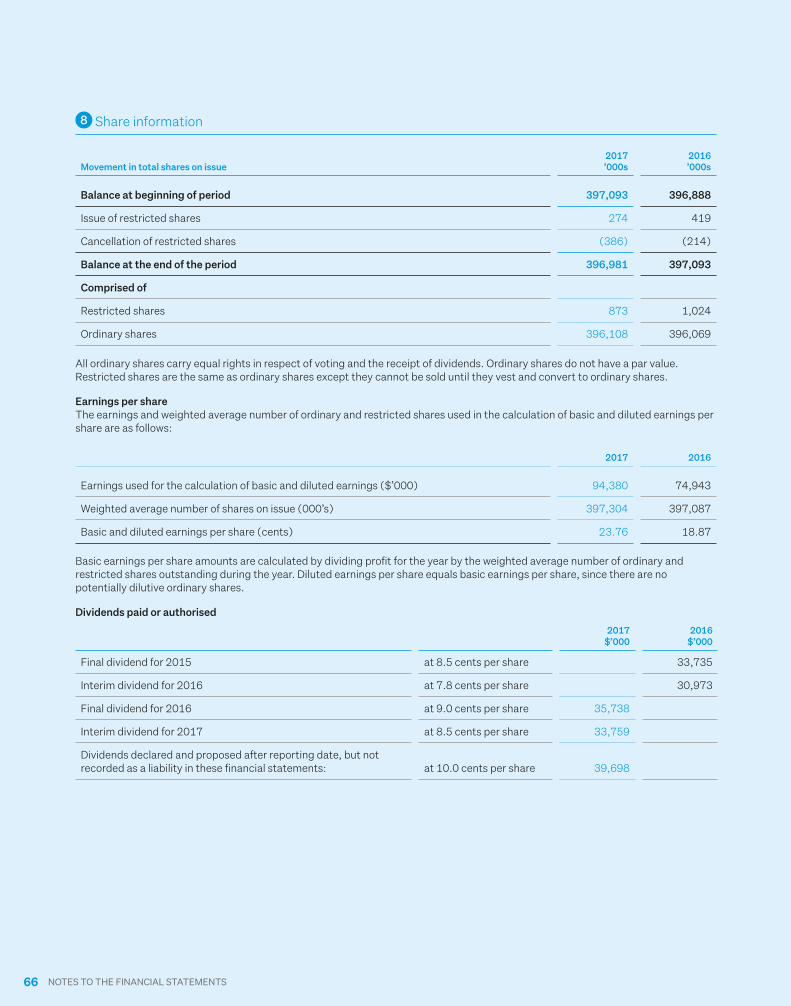
66 NOTES TO THE FINANCIAL STATEMENTS
8 Share information
Movement in total shares on issue 2017 ’000s
2016 ’000s
Balance at beginning of period 397,093 396,888
Issue of restricted shares 274 419
Cancellation of restricted shares (386) (214)
Balance at the end of the period 396,981 397,093
Comprised of
Restricted shares 873 1,024
Ordinary shares 396,108 396,069
All ordinary shares carry equal rights in respect of voting and the receipt of dividends. Ordinary shares do not have a par value. Restricted shares are the same as ordinary shares except they cannot be sold until they vest and convert to ordinary shares.
Earnings per shareThe earnings and weighted average number of ordinary and restricted shares used in the calculation of basic and diluted earnings per share are as follows:
2017 2016
Earnings used for the calculation of basic and diluted earnings ($’000) 94,380 74,943
Weighted average number of shares on issue (000’s) 397,304 397,087
Basic and diluted earnings per share (cents) 23.76 18.87 Basic earnings per share amounts are calculated by dividing profit for the year by the weighted average number of ordinary and restricted shares outstanding during the year. Diluted earnings per share equals basic earnings per share, since there are no potentially dilutive ordinary shares.
Dividends paid or authorised
2017 $’000
2016 $’000
Final dividend for 2015 at 8.5 cents per share 33,735
Interim dividend for 2016 at 7.8 cents per share 30,973
Final dividend for 2016 at 9.0 cents per share 35,738
Interim dividend for 2017 at 8.5 cents per share 33,759
Dividends declared and proposed after reporting date, but not recorded as a liability in these financial statements: at 10.0 cents per share 39,698
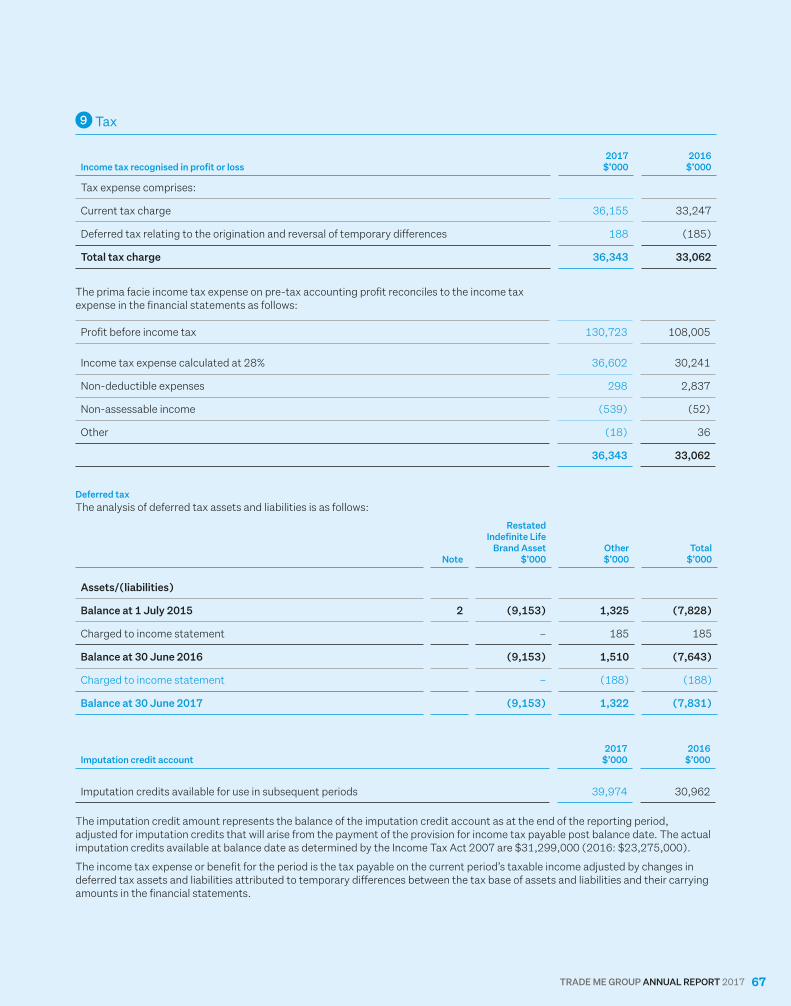
TRADE ME GROUP ANNUAL REPORT 2017 67
9 Tax
Income tax recognised in profit or loss 2017 $’000
2016 $’000
Tax expense comprises:
Current tax charge 36,155 33,247
Deferred tax relating to the origination and reversal of temporary differences 188 (185)
Total tax charge 36,343 33,062
The prima facie income tax expense on pre-tax accounting profit reconciles to the income tax expense in the financial statements as follows:
Profit before income tax 130,723 108,005
Income tax expense calculated at 28% 36,602 30,241
Non-deductible expenses 298 2,837
Non-assessable income (539) (52)
Other (18) 36
36,343 33,062
Deferred taxThe analysis of deferred tax assets and liabilities is as follows:
Note
Restated Indefinite Life
Brand Asset $’000
Other $’000
Total $’000
Assets/(liabilities)
Balance at 1 July 2015 2 (9,153) 1,325 (7,828)
Charged to income statement – 185 185
Balance at 30 June 2016 (9,153) 1,510 (7,643)
Charged to income statement – (188) (188)
Balance at 30 June 2017 (9,153) 1,322 (7,831)
Imputation credit account 2017 $’000
2016 $’000
Imputation credits available for use in subsequent periods 39,974 30,962
The imputation credit amount represents the balance of the imputation credit account as at the end of the reporting period, adjusted for imputation credits that will arise from the payment of the provision for income tax payable post balance date. The actual imputation credits available at balance date as determined by the Income Tax Act 2007 are $31,299,000 (2016: $23,275,000).
The income tax expense or benefit for the period is the tax payable on the current period’s taxable income adjusted by changes in deferred tax assets and liabilities attributed to temporary differences between the tax base of assets and liabilities and their carrying amounts in the financial statements.
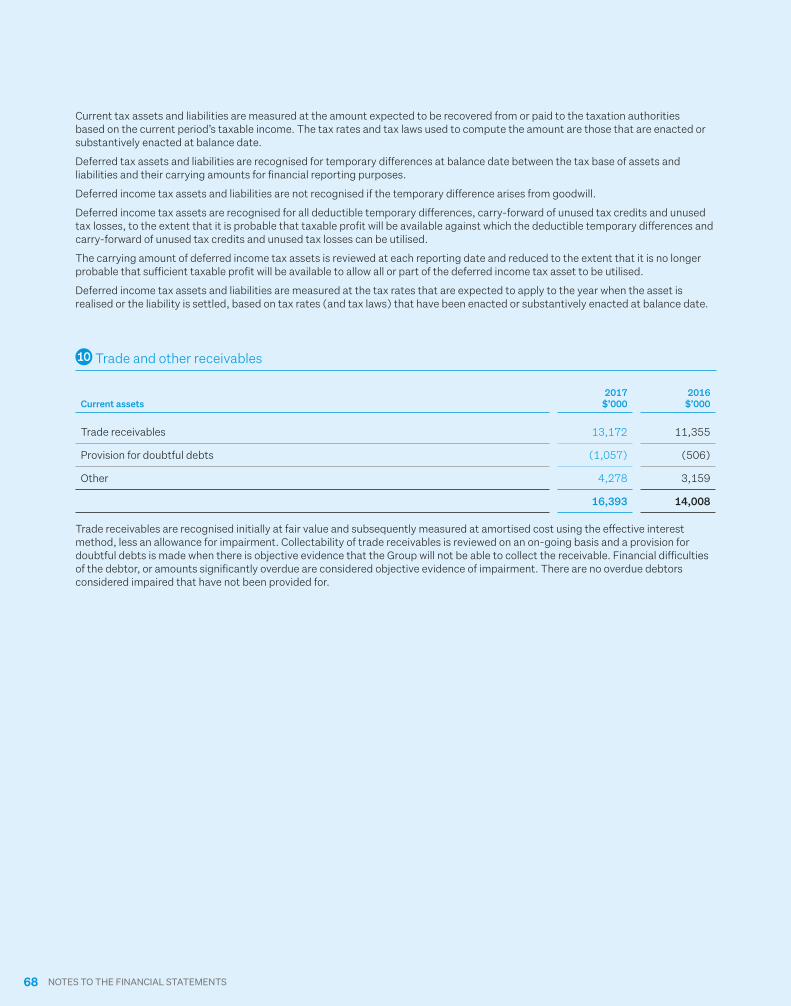
68 NOTES TO THE FINANCIAL STATEMENTS
Current tax assets and liabilities are measured at the amount expected to be recovered from or paid to the taxation authorities based on the current period’s taxable income. The tax rates and tax laws used to compute the amount are those that are enacted or substantively enacted at balance date.
Deferred tax assets and liabilities are recognised for temporary differences at balance date between the tax base of assets and liabilities and their carrying amounts for financial reporting purposes.
Deferred income tax assets and liabilities are not recognised if the temporary difference arises from goodwill.
Deferred income tax assets are recognised for all deductible temporary differences, carry-forward of unused tax credits and unused tax losses, to the extent that it is probable that taxable profit will be available against which the deductible temporary differences and carry-forward of unused tax credits and unused tax losses can be utilised.
The carrying amount of deferred income tax assets is reviewed at each reporting date and reduced to the extent that it is no longer probable that sufficient taxable profit will be available to allow all or part of the deferred income tax asset to be utilised.
Deferred income tax assets and liabilities are measured at the tax rates that are expected to apply to the year when the asset is realised or the liability is settled, based on tax rates (and tax laws) that have been enacted or substantively enacted at balance date.
10 Trade and other receivables
Current assets2017
$’0002016
$’000
Trade receivables 13,172 11,355
Provision for doubtful debts (1,057) (506)
Other 4,278 3,159
16,393 14,008
Trade receivables are recognised initially at fair value and subsequently measured at amortised cost using the effective interest method, less an allowance for impairment. Collectability of trade receivables is reviewed on an on-going basis and a provision for doubtful debts is made when there is objective evidence that the Group will not be able to collect the receivable. Financial difficulties of the debtor, or amounts significantly overdue are considered objective evidence of impairment. There are no overdue debtors considered impaired that have not been provided for.
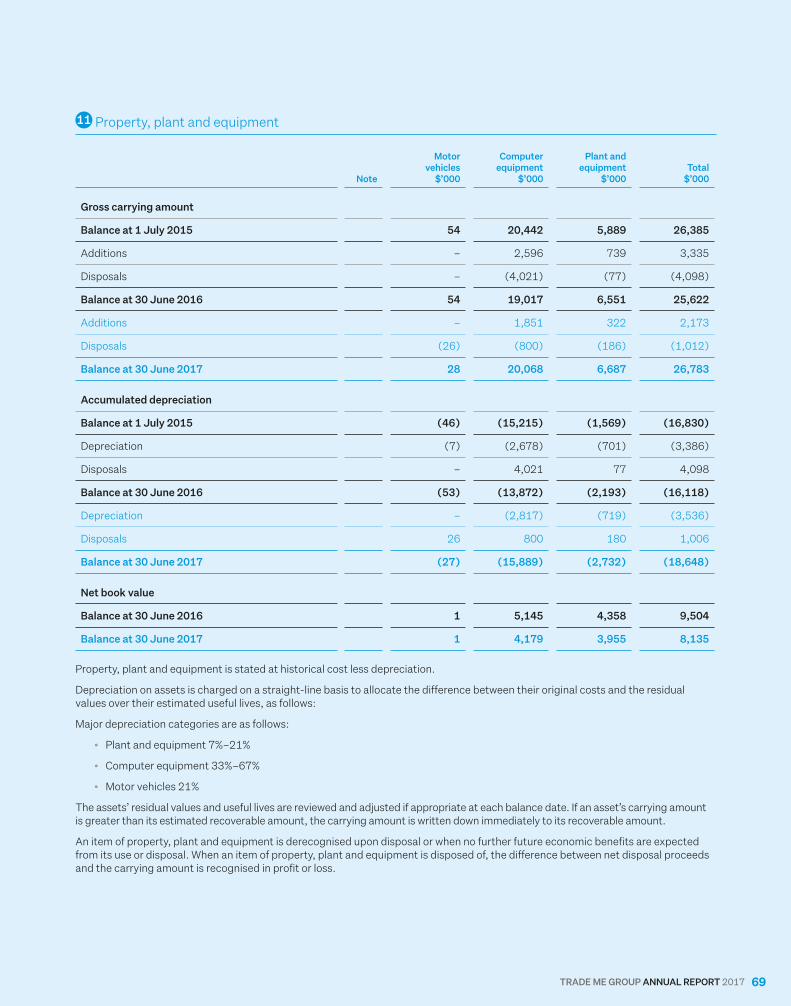
TRADE ME GROUP ANNUAL REPORT 2017 69
11 Property, plant and equipment
Note
Motor vehicles
$’000
Computer equipment
$’000
Plant and equipment
$’000Total
$’000
Gross carrying amount
Balance at 1 July 2015 54 20,442 5,889 26,385
Additions – 2,596 739 3,335
Disposals – (4,021) (77) (4,098)
Balance at 30 June 2016 54 19,017 6,551 25,622
Additions – 1,851 322 2,173
Disposals (26) (800) (186) (1,012)
Balance at 30 June 2017 28 20,068 6,687 26,783
Accumulated depreciation
Balance at 1 July 2015 (46) (15,215) (1,569) (16,830)
Depreciation (7) (2,678) (701) (3,386)
Disposals – 4,021 77 4,098
Balance at 30 June 2016 (53) (13,872) (2,193) (16,118)
Depreciation – (2,817) (719) (3,536)
Disposals 26 800 180 1,006
Balance at 30 June 2017 (27) (15,889) (2,732) (18,648)
Net book value
Balance at 30 June 2016 1 5,145 4,358 9,504
Balance at 30 June 2017 1 4,179 3,955 8,135
Property, plant and equipment is stated at historical cost less depreciation.
Depreciation on assets is charged on a straight-line basis to allocate the difference between their original costs and the residual values over their estimated useful lives, as follows:
Major depreciation categories are as follows:
• Plant and equipment 7%–21%
• Computer equipment 33%–67%
• Motor vehicles 21%
The assets’ residual values and useful lives are reviewed and adjusted if appropriate at each balance date. If an asset’s carrying amount is greater than its estimated recoverable amount, the carrying amount is written down immediately to its recoverable amount.
An item of property, plant and equipment is derecognised upon disposal or when no further future economic benefits are expected from its use or disposal. When an item of property, plant and equipment is disposed of, the difference between net disposal proceeds and the carrying amount is recognised in profit or loss.
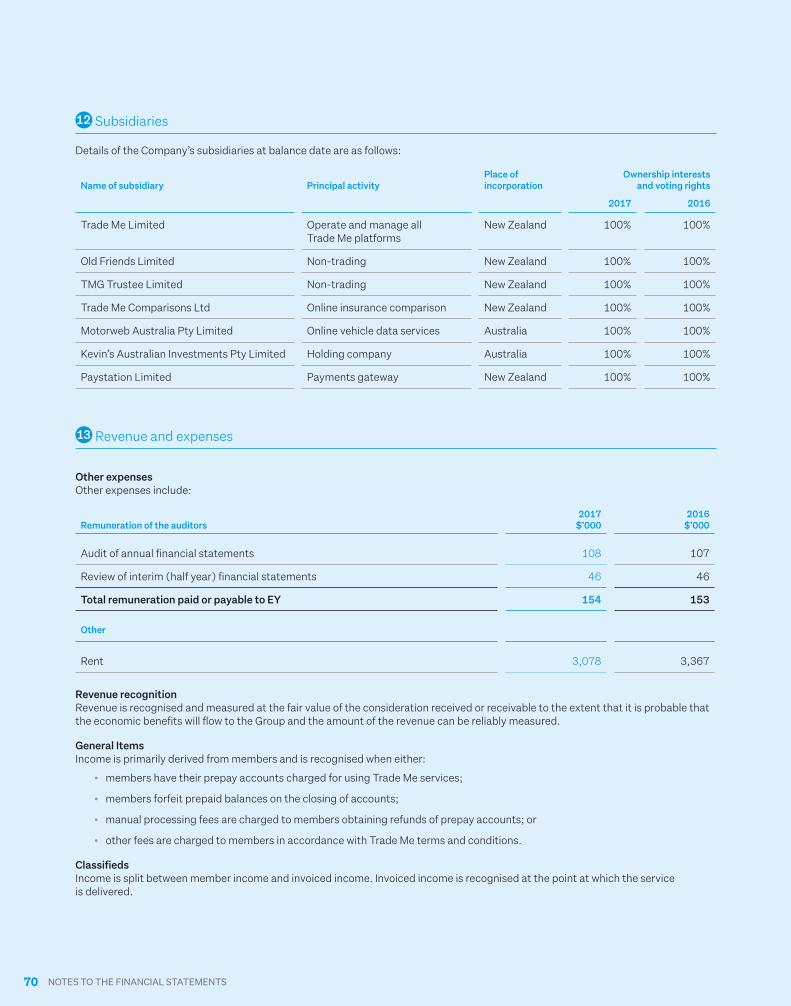
70 NOTES TO THE FINANCIAL STATEMENTS
12 Subsidiaries
Details of the Company’s subsidiaries at balance date are as follows:
Name of subsidiary Principal activityPlace of incorporation
Ownership interests and voting rights
2017 2016
Trade Me Limited Operate and manage all Trade Me platforms
New Zealand 100% 100%
Old Friends Limited Non-trading New Zealand 100% 100%
TMG Trustee Limited Non-trading New Zealand 100% 100%
Trade Me Comparisons Ltd Online insurance comparison New Zealand 100% 100%
Motorweb Australia Pty Limited Online vehicle data services Australia 100% 100%
Kevin’s Australian Investments Pty Limited Holding company Australia 100% 100%
Paystation Limited Payments gateway New Zealand 100% 100%
13 Revenue and expenses
Other expensesOther expenses include:
Remuneration of the auditors2017
$’0002016
$’000
Audit of annual financial statements 108 107
Review of interim (half year) financial statements 46 46
Total remuneration paid or payable to EY 154 153
Other
Rent 3,078 3,367
Revenue recognitionRevenue is recognised and measured at the fair value of the consideration received or receivable to the extent that it is probable that the economic benefits will flow to the Group and the amount of the revenue can be reliably measured.
General ItemsIncome is primarily derived from members and is recognised when either:
• members have their prepay accounts charged for using Trade Me services;
• members forfeit prepaid balances on the closing of accounts;
• manual processing fees are charged to members obtaining refunds of prepay accounts; or
• other fees are charged to members in accordance with Trade Me terms and conditions.
ClassifiedsIncome is split between member income and invoiced income. Invoiced income is recognised at the point at which the service is delivered.
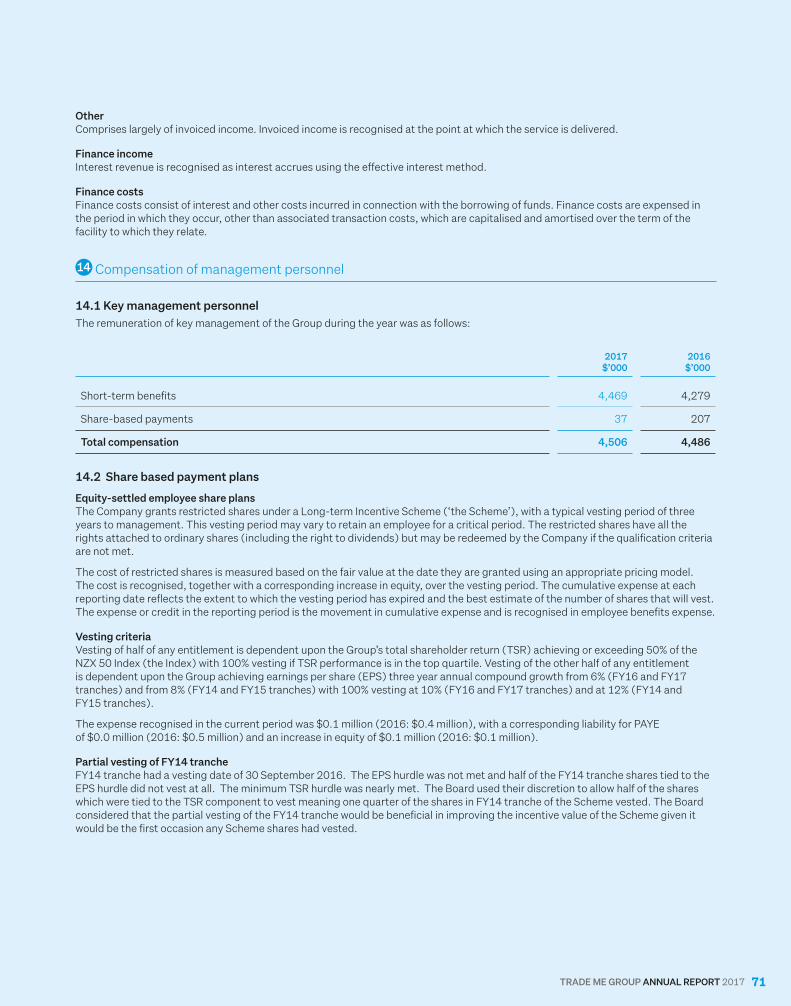
TRADE ME GROUP ANNUAL REPORT 2017 71
OtherComprises largely of invoiced income. Invoiced income is recognised at the point at which the service is delivered.
Finance incomeInterest revenue is recognised as interest accrues using the effective interest method.
Finance costs Finance costs consist of interest and other costs incurred in connection with the borrowing of funds. Finance costs are expensed in the period in which they occur, other than associated transaction costs, which are capitalised and amortised over the term of the facility to which they relate.
14 Compensation of management personnel
14.1 Key management personnel The remuneration of key management of the Group during the year was as follows:
2017 $’000
2016 $’000
Short-term benefits 4,469 4,279
Share-based payments 37 207
Total compensation 4,506 4,486
14.2 Share based payment plans
Equity-settled employee share plansThe Company grants restricted shares under a Long-term Incentive Scheme (‘the Scheme’), with a typical vesting period of three years to management. This vesting period may vary to retain an employee for a critical period. The restricted shares have all the rights attached to ordinary shares (including the right to dividends) but may be redeemed by the Company if the qualification criteria are not met.
The cost of restricted shares is measured based on the fair value at the date they are granted using an appropriate pricing model. The cost is recognised, together with a corresponding increase in equity, over the vesting period. The cumulative expense at each reporting date reflects the extent to which the vesting period has expired and the best estimate of the number of shares that will vest. The expense or credit in the reporting period is the movement in cumulative expense and is recognised in employee benefits expense.
Vesting criteriaVesting of half of any entitlement is dependent upon the Group’s total shareholder return (TSR) achieving or exceeding 50% of the NZX 50 Index (the Index) with 100% vesting if TSR performance is in the top quartile. Vesting of the other half of any entitlement is dependent upon the Group achieving earnings per share (EPS) three year annual compound growth from 6% (FY16 and FY17 tranches) and from 8% (FY14 and FY15 tranches) with 100% vesting at 10% (FY16 and FY17 tranches) and at 12% (FY14 and FY15 tranches).
The expense recognised in the current period was $0.1 million (2016: $0.4 million), with a corresponding liability for PAYE of $0.0 million (2016: $0.5 million) and an increase in equity of $0.1 million (2016: $0.1 million).
Partial vesting of FY14 trancheFY14 tranche had a vesting date of 30 September 2016. The EPS hurdle was not met and half of the FY14 tranche shares tied to the EPS hurdle did not vest at all. The minimum TSR hurdle was nearly met. The Board used their discretion to allow half of the shares which were tied to the TSR component to vest meaning one quarter of the shares in FY14 tranche of the Scheme vested. The Board considered that the partial vesting of the FY14 tranche would be beneficial in improving the incentive value of the Scheme given it would be the first occasion any Scheme shares had vested.
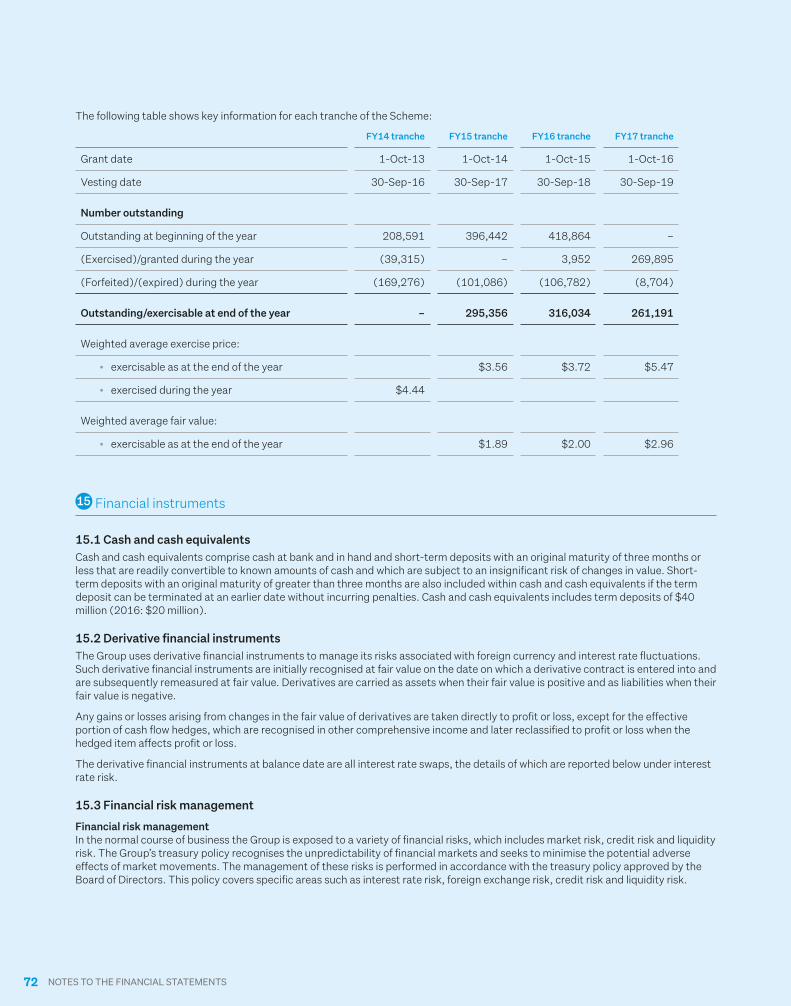
72 NOTES TO THE FINANCIAL STATEMENTS
The following table shows key information for each tranche of the Scheme:
FY14 tranche FY15 tranche FY16 tranche FY17 tranche
Grant date 1-Oct-13 1-Oct-14 1-Oct-15 1-Oct-16
Vesting date 30-Sep-16 30-Sep-17 30-Sep-18 30-Sep-19
Number outstanding
Outstanding at beginning of the year 208,591 396,442 418,864 –
(Exercised)/granted during the year (39,315) – 3,952 269,895
(Forfeited)/(expired) during the year (169,276) (101,086) (106,782) (8,704)
Outstanding/exercisable at end of the year – 295,356 316,034 261,191
Weighted average exercise price:
• exercisable as at the end of the year $3.56 $3.72 $5.47
• exercised during the year $4.44
Weighted average fair value:
• exercisable as at the end of the year $1.89 $2.00 $2.96
15 Financial instruments
15.1 Cash and cash equivalents Cash and cash equivalents comprise cash at bank and in hand and short-term deposits with an original maturity of three months or less that are readily convertible to known amounts of cash and which are subject to an insignificant risk of changes in value. Short-term deposits with an original maturity of greater than three months are also included within cash and cash equivalents if the term deposit can be terminated at an earlier date without incurring penalties. Cash and cash equivalents includes term deposits of $40 million (2016: $20 million).
15.2 Derivative financial instrumentsThe Group uses derivative financial instruments to manage its risks associated with foreign currency and interest rate fluctuations. Such derivative financial instruments are initially recognised at fair value on the date on which a derivative contract is entered into and are subsequently remeasured at fair value. Derivatives are carried as assets when their fair value is positive and as liabilities when their fair value is negative.
Any gains or losses arising from changes in the fair value of derivatives are taken directly to profit or loss, except for the effective portion of cash flow hedges, which are recognised in other comprehensive income and later reclassified to profit or loss when the hedged item affects profit or loss.
The derivative financial instruments at balance date are all interest rate swaps, the details of which are reported below under interest rate risk.
15.3 Financial risk management
Financial risk managementIn the normal course of business the Group is exposed to a variety of financial risks, which includes market risk, credit risk and liquidity risk. The Group’s treasury policy recognises the unpredictability of financial markets and seeks to minimise the potential adverse effects of market movements. The management of these risks is performed in accordance with the treasury policy approved by the Board of Directors. This policy covers specific areas such as interest rate risk, foreign exchange risk, credit risk and liquidity risk.
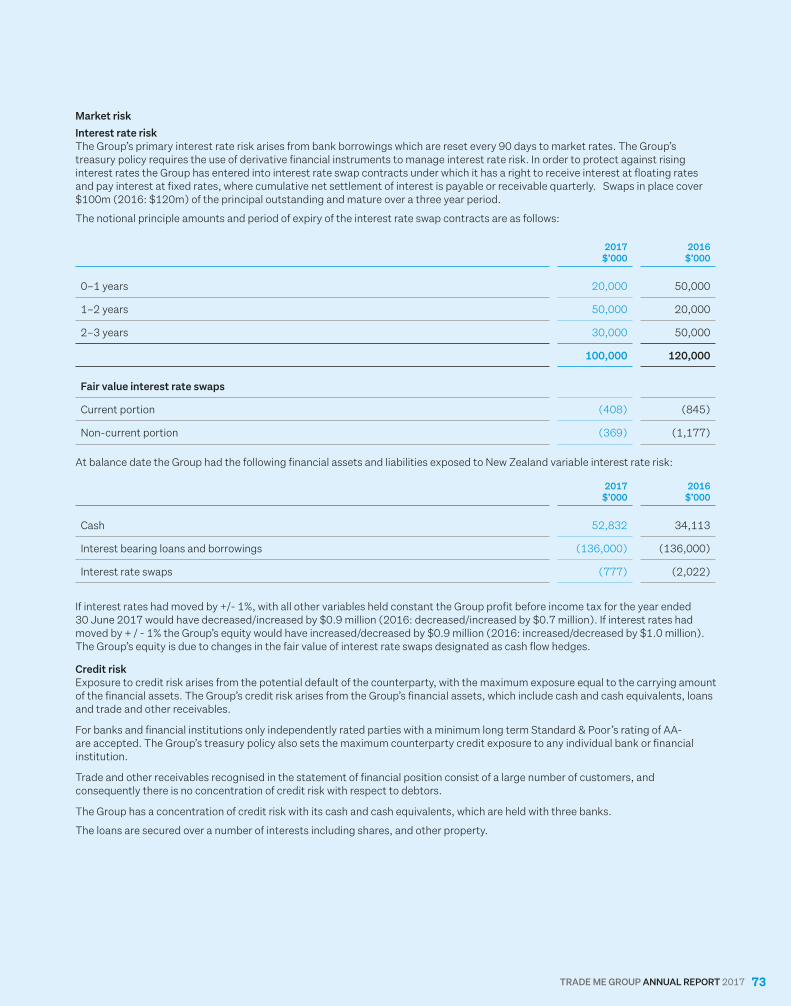
TRADE ME GROUP ANNUAL REPORT 2017 73
Market risk
Interest rate riskThe Group’s primary interest rate risk arises from bank borrowings which are reset every 90 days to market rates. The Group’s treasury policy requires the use of derivative financial instruments to manage interest rate risk. In order to protect against rising interest rates the Group has entered into interest rate swap contracts under which it has a right to receive interest at floating rates and pay interest at fixed rates, where cumulative net settlement of interest is payable or receivable quarterly. Swaps in place cover $100m (2016: $120m) of the principal outstanding and mature over a three year period.
The notional principle amounts and period of expiry of the interest rate swap contracts are as follows:
2017 $’000
2016 $’000
0–1 years 20,000 50,000
1–2 years 50,000 20,000
2–3 years 30,000 50,000
100,000 120,000
Fair value interest rate swaps
Current portion (408) (845)
Non-current portion (369) (1,177)
At balance date the Group had the following financial assets and liabilities exposed to New Zealand variable interest rate risk:
2017 $’000
2016 $’000
Cash 52,832 34,113
Interest bearing loans and borrowings (136,000) (136,000)
Interest rate swaps (777) (2,022)
If interest rates had moved by +/- 1%, with all other variables held constant the Group profit before income tax for the year ended 30 June 2017 would have decreased/increased by $0.9 million (2016: decreased/increased by $0.7 million). If interest rates had moved by + / - 1% the Group’s equity would have increased/decreased by $0.9 million (2016: increased/decreased by $1.0 million). The Group’s equity is due to changes in the fair value of interest rate swaps designated as cash flow hedges.
Credit riskExposure to credit risk arises from the potential default of the counterparty, with the maximum exposure equal to the carrying amount of the financial assets. The Group’s credit risk arises from the Group’s financial assets, which include cash and cash equivalents, loans and trade and other receivables.
For banks and financial institutions only independently rated parties with a minimum long term Standard & Poor’s rating of AA- are accepted. The Group’s treasury policy also sets the maximum counterparty credit exposure to any individual bank or financial institution.
Trade and other receivables recognised in the statement of financial position consist of a large number of customers, and consequently there is no concentration of credit risk with respect to debtors.
The Group has a concentration of credit risk with its cash and cash equivalents, which are held with three banks.
The loans are secured over a number of interests including shares, and other property.
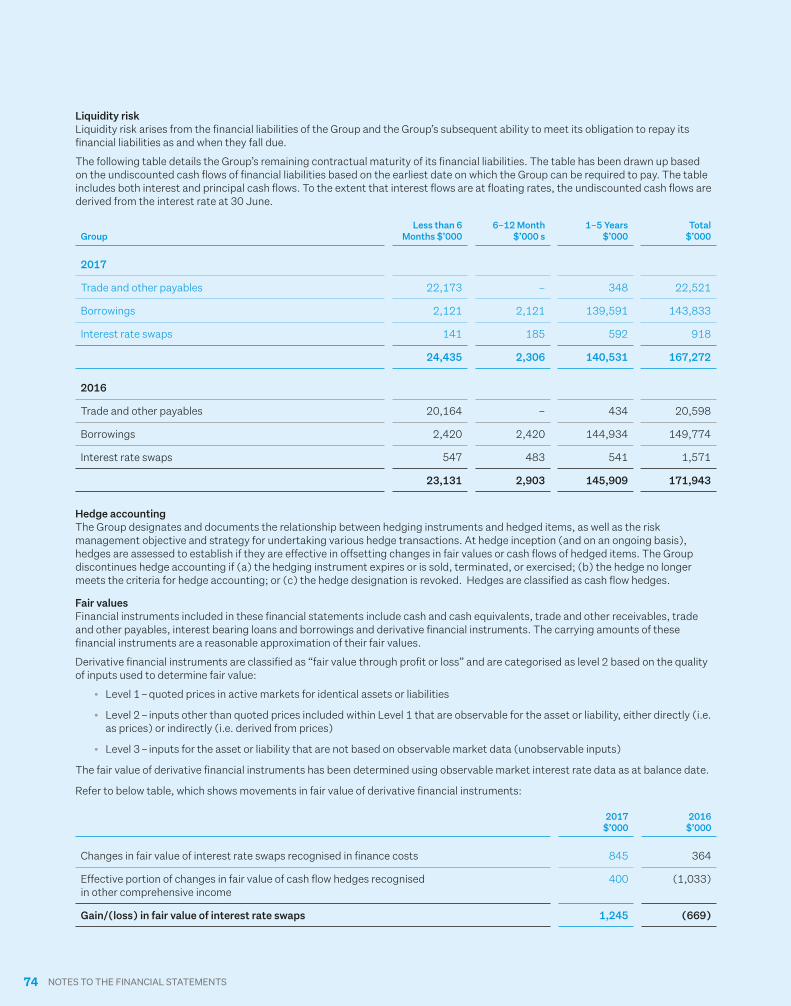
74 NOTES TO THE FINANCIAL STATEMENTS
Liquidity riskLiquidity risk arises from the financial liabilities of the Group and the Group’s subsequent ability to meet its obligation to repay its financial liabilities as and when they fall due.
The following table details the Group’s remaining contractual maturity of its financial liabilities. The table has been drawn up based on the undiscounted cash flows of financial liabilities based on the earliest date on which the Group can be required to pay. The table includes both interest and principal cash flows. To the extent that interest flows are at floating rates, the undiscounted cash flows are derived from the interest rate at 30 June.
GroupLess than 6
Months $’0006–12 Month
$’000 s1–5 Years
$’000Total
$’000
2017
Trade and other payables 22,173 – 348 22,521
Borrowings 2,121 2,121 139,591 143,833
Interest rate swaps 141 185 592 918
24,435 2,306 140,531 167,272
2016
Trade and other payables 20,164 – 434 20,598
Borrowings 2,420 2,420 144,934 149,774
Interest rate swaps 547 483 541 1,571
23,131 2,903 145,909 171,943
Hedge accountingThe Group designates and documents the relationship between hedging instruments and hedged items, as well as the risk management objective and strategy for undertaking various hedge transactions. At hedge inception (and on an ongoing basis), hedges are assessed to establish if they are effective in offsetting changes in fair values or cash flows of hedged items. The Group discontinues hedge accounting if (a) the hedging instrument expires or is sold, terminated, or exercised; (b) the hedge no longer meets the criteria for hedge accounting; or (c) the hedge designation is revoked. Hedges are classified as cash flow hedges.
Fair valuesFinancial instruments included in these financial statements include cash and cash equivalents, trade and other receivables, trade and other payables, interest bearing loans and borrowings and derivative financial instruments. The carrying amounts of these financial instruments are a reasonable approximation of their fair values.
Derivative financial instruments are classified as “fair value through profit or loss” and are categorised as level 2 based on the quality of inputs used to determine fair value:
• Level 1 – quoted prices in active markets for identical assets or liabilities
• Level 2 – inputs other than quoted prices included within Level 1 that are observable for the asset or liability, either directly (i.e. as prices) or indirectly (i.e. derived from prices)
• Level 3 – inputs for the asset or liability that are not based on observable market data (unobservable inputs)
The fair value of derivative financial instruments has been determined using observable market interest rate data as at balance date.
Refer to below table, which shows movements in fair value of derivative financial instruments:
2017 $’000
2016 $’000
Changes in fair value of interest rate swaps recognised in finance costs 845 364
Effective portion of changes in fair value of cash flow hedges recognised in other comprehensive income
400 (1,033)
Gain/(loss) in fair value of interest rate swaps 1,245 (669)
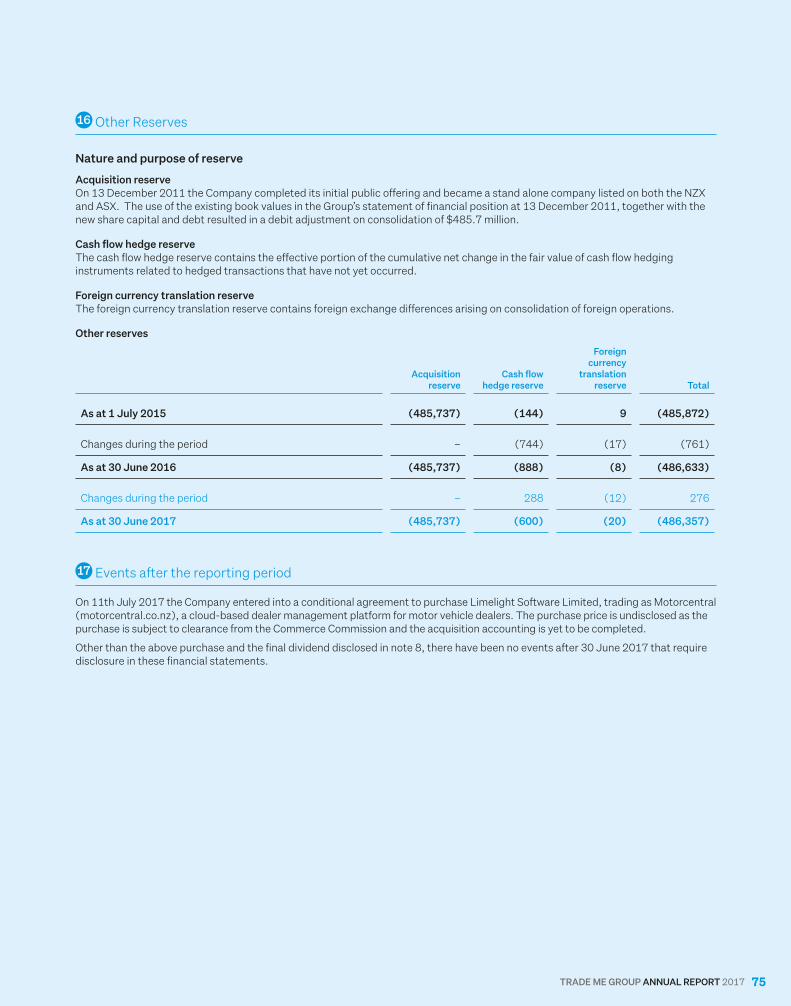
TRADE ME GROUP ANNUAL REPORT 2017 75
16 Other Reserves
Nature and purpose of reserve
Acquisition reserveOn 13 December 2011 the Company completed its initial public offering and became a stand alone company listed on both the NZX and ASX. The use of the existing book values in the Group’s statement of financial position at 13 December 2011, together with the new share capital and debt resulted in a debit adjustment on consolidation of $485.7 million.
Cash flow hedge reserveThe cash flow hedge reserve contains the effective portion of the cumulative net change in the fair value of cash flow hedging instruments related to hedged transactions that have not yet occurred.
Foreign currency translation reserveThe foreign currency translation reserve contains foreign exchange differences arising on consolidation of foreign operations.
Other reserves
Acquisition reserve
Cash flow hedge reserve
Foreign currency
translation reserve Total
As at 1 July 2015 (485,737) (144) 9 (485,872)
Changes during the period – (744) (17) (761)
As at 30 June 2016 (485,737) (888) (8) (486,633)
Changes during the period – 288 (12) 276
As at 30 June 2017 (485,737) (600) (20) (486,357)
17 Events after the reporting period
On 11th July 2017 the Company entered into a conditional agreement to purchase Limelight Software Limited, trading as Motorcentral (motorcentral.co.nz), a cloud-based dealer management platform for motor vehicle dealers. The purchase price is undisclosed as the purchase is subject to clearance from the Commerce Commission and the acquisition accounting is yet to be completed.
Other than the above purchase and the final dividend disclosed in note 8, there have been no events after 30 June 2017 that require disclosure in these financial statements.
76
Chartered Accountants
Independent auditor’s report
INDEPENDENT AUDITOR’S REPORT
Independent Auditor’s Report to the Shareholders of Trade Me Group Limited
Report on the Audit of the Financial Statements
OpinionWe have audited the financial statements of Trade Me Group Limited (“the company”) and its subsidiaries (together “the group”) on pages 52 to 75, which comprise:
• The consolidated statement of financial position of the group as at 30 June 2017,• The consolidated statement of comprehensive income of the group,• The consolidated statement of changes in equity of the group;• The consolidated statement of cash flows of the group for the year then ended, and• The notes to the consolidated financial statements including a summary of significant accounting policies.
In our opinion, the consolidated financial statements on pages 52 to 75 present fairly, in all material respects, the consolidated financial position of the group as at 30 June 2017 and its consolidated financial performance and cash flows for the year then ended in accordance with New Zealand equivalents to International Financial Reporting Standards and International Financial Reporting Standards.
This report is made solely to the company’s shareholders, as a body. Our audit has been undertaken so that we might state to the company’s shareholders those matters we are required to state to them in an auditor’s report and for no other purpose. To the fullest extent permitted by law, we do not accept or assume responsibility to anyone other than the company and the company’s shareholders as a body, for our audit work, for this report, or for the opinions we have formed.
Basis for OpinionWe conducted our audit in accordance with International Standards on Auditing (New Zealand). Our responsibilities under those standards are further described in the Auditor’s Responsibilities for the Audit of the Financial Statements section of our report.
We are independent of the group in accordance with Professional and Ethical Standard 1 (revised) Code of Ethics for Assurance Practitioners issued by the New Zealand Auditing and Assurance Standards Board, and we have fulfilled our other ethical responsibilities in accordance with these requirements.
We believe that the audit evidence we have obtained is sufficient and appropriate to provide a basis for our opinion.
Other than in our capacity as auditor we have no relationship with, or interest in, the company or any of its subsidiaries. Partners and employees of our firm may deal with the group on normal terms within the ordinary course of trading activities of the business of the group.
Key Audit MattersKey audit matters are those matters that, in our professional judgment, were of most significance in our audit of the consolidated financial statements of the current year. These matters were addressed in the context of our audit of the consolidated financial statements as a whole, and in forming our opinion thereon, but we do not provide a separate opinion on these matters. For each matter below, our description of how our audit addressed the matter is provided in that context.
We have fulfilled the responsibilities described in the Auditor’s Responsibilities for the Audit of the Financial Statements section of our report, including in relation to these matters. Accordingly, our audit included the performance of procedures designed to respond to our assessment of the risks of material misstatement of the financial statements. The results of our audit procedures, including the procedures performed to address the matters below, provide the basis for our audit opinion on the accompanying consolidated financial statements.
TRADE ME GROUP ANNUAL REPORT 2017 77
1. Testing of Goodwill & Brand for Impairment
Why significant How our audit addressed the key audit matter
Refer to Note 4 of the financial statements.
Goodwill and Brand assets have been recognised in the Group financial statements with a value of $781.7 million. These assets make up a significant portion (87%) of the Group’s total assets.
The cash generating units identified by the Group to which Goodwill has been allocated for impairment testing represent 11 identifiable revenue generating operational segments which, for management purposes, are allocated to three reportable segments.
As required by NZ IAS 38 Intangible Assets, the Group tests indefinite life intangible assets such as goodwill and brands for impairment annually in accordance with NZ IAS 36 Impairment of Assets.
This impairment assessment requires judgment. The key judgment is considered to be in relation to the forecast operational performance of the component parts of the Group. Other judgments are the related discount rates and the terminal value growth rates.
Our work focused on understanding the overall calculation and methodology of the Group’s impairment assessment, as well as examining significant inputs at an appropriate level for each component of goodwill and brand. In obtaining sufficient audit evidence for each component we:
• assessed the process of determining the cash generating units and considered whether the business has changed requiring these to be re-assessed;
• assessed the earnings forecasts included in the impairment test model with reference to actual historical earnings;
• tested, with involvement from our valuation specialists, the impairment calculations within the impairment model including the application of discounting of future cash flows, the calculation of terminal values and the utilisation of actual net asset values for testing;
• involved our valuation specialists to assess the growth rates, including the terminal value and discount factors applied in consideration of relevant comparators;
• performed a sensitivity analysis for movements in key assumptions used in the calculation; and
• evaluated the adequacy of the related financial statement disclosures.
2. Capitalised Platform Development Costs
Why significant How our audit addressed the key audit matter
Refer to Note 4 of the financial statements.
The Group capitalises costs for internally developed software and then amortises the software over its estimated useful life. In the year to 30 June 2017, $21 million of costs were capitalised to Platform Development costs resulting in $33.4 million of net book value being recognised as an asset in the statement of financial position of the Group. $14.3 million of amortisation costs were recognised in the statement of comprehensive income for the year ended 30 June 2017.
The Group’s process for calculating the amount of internally developed platform costs to be capitalised is judgmental and involves estimating the hours which staff spend developing software and determining the costs attributable to that time.
The Group’s assessment of the economic useful life of the software is judgmental, taking into consideration the best available evidence on market developments, the nature of the developments capitalised, the approach adopted in development and the demand for the underlying services recognised by the Group.
Our work on capitalised platform development costs focused on the Group’s process for identifying relevant projects that contributed to the value of the capitalised platform development costs, capturing hours relevant to internally developed software and the calculation of the directly attributable cost of these hours. We also focused on the amortisation period established for those costs. In obtaining sufficient audit evidence, we:
• Checked the job descriptions for a sample of staff that had time capitalised in the period to assess whether they were appropriately included in the cost of internally developed software;
• Understood a sample of projects which were assessed as being capital in nature and assessed these against the requirements for capitalisation in accordance with NZ IAS 38 Intangible Assets;
• Checked the cost rates applied to staff hours back to supporting payroll information drawn from the payroll business process over which we assessed the design and operating effectiveness of relevant controls;
• Substantiated the costing of a sample of other (non-payroll) directly attributable costs;
• Checked the timeliness of capitalisation of projects considering whether this reflects the economic utilisation of the asset;
• Assessed the period of time over which development costs are amortised in consideration of the economic renewal period required for this development; and
• Performed a recalculation of the amortisation expense based on the carrying value of each capitalised item and the assessed useful economic life.
78 INDEPENDENT AUDITOR’S REPORT
Information Other than the Financial Statements and Auditor’s ReportThe directors of the company are responsible for the Annual Report, which includes information other than the consolidated financial statements and audit report.
Our opinion on the consolidated financial statements does not cover the other information and we do not express any form of assurance conclusion thereon.
In connection with our audit of the consolidated financial statements, our responsibility is to read the other information and, in doing so, consider whether the other information is materially inconsistent with the consolidated financial statements or our knowledge obtained during the audit, or otherwise appears to be materially misstated.
If, based upon the work we have performed, we conclude that there is a material misstatement of this other information, we are required to report that fact. We have nothing to report in this regard.
Directors’ Responsibilities for the Financial StatementsThe directors are responsible on behalf of the entity for the preparation and fair presentation of the consolidated financial statements in accordance with New Zealand equivalents to International Financial Reporting Standards and International Financial Reporting Standards, and for such internal control as the directors determine is necessary to enable the preparation of financial statements that are free from material misstatement, whether due to fraud or error.
In preparing the consolidated financial statements, the directors are responsible for assessing the group’s ability to continue as a going concern, disclosing, as applicable, matters related to going concern and using the going concern basis of accounting unless the directors either intend to liquidate the group or cease operations, or have no realistic alternative but to do so.
Auditor’s Responsibilities for the Audit of the Financial StatementsOur objectives are to obtain reasonable assurance about whether the consolidated financial statements as a whole are free from material misstatement, whether due to fraud or error, and to issue an auditor’s report that includes our opinion. Reasonable assurance is a high level of assurance, but is not a guarantee that an audit conducted in accordance with International Standards on Auditing (New Zealand) will always detect a material misstatement when it exists. Misstatements can arise from fraud or error and are considered material if, individually or in the aggregate, they could reasonably be expected to influence the economic decisions of users taken on the basis of these consolidated financial statements.
A further description of the auditor’s responsibilities for the audit of the financial statements is located at External Reporting Board’s website: https://www.xrb.govt.nz/standards-for-assurance-practitioners/auditors-responsibilities. This description forms part of our auditor’s report.
The engagement partner on the audit resulting in this independent auditor’s report is Stuart Mutch.
Wellington
23 August 2017

TRADE ME GROUP ANNUAL REPORT 2017 79
80 DIRECTORY
Directory
www.findsomeone.co.nz www.paystation.co.nzwww.motorweb.co.nz
www.holidayhouses.co.nz
www.trademe.co.nz www.trademe.co.nz/motors www.trademe.co.nz/property
www.trademe.co.nz/jobs www.trademeinsurance.co.nz www.lifedirect.co.nz
Stock exchange listingsTrade Me Group Limited shares are listed on the NZ Stock Exchange and the Australian Stock Exchange (Listing code: TME)
Registered officeTrade Me Group Limited Level 5 2 Market Lane Wellington 6011 New Zealand
Level 5, 1 Darling Island Road Pyrmont, NSW 2009 Australia
NZ Company Number: 3590412 ARBN: 154 115 723 Investor informationinvestors.trademe.co.nz
Board of directors• David Edward Kirk (Chairman) • Paul Milton McCarney • Joanna Mary Gordon Perry • Katrina Louise Johnson • Simon Blair West (appointed 15 December) • Samuel Gareth Morgan (resigned 15 December)
Auditor EY 100 Willis Street Wellington 6011 New Zealand
Share registrar Link Market Services Limited Level 7, Zurich House 21 Queen Street Auckland 1010 New Zealand
Shareholder enquiriesChanges of address, payment instructions and investment portfolios can be viewed and updated online:
https://investorcentre.linkmarketservices.co.nz/
Otherwise, please contact Link Market Services here:
New Zealand
0800 990 057 or (+64) 9 375 5998 [email protected]
Australia
For other investor enquiries, please email: [email protected]
TRADE ME GROUP ANNUAL REPORT 2017 81