Embed Size (px)
Citation preview

Louisa, living with epilepsy
Annual Report 2017

AT UCB, we aspire to be the patient-
preferred biotech leader.
To achieve this goal, UCB has become an
innovation-driven global biopharmaceutical
company creating value for patients, the
company, its shareholders and society
in general.
Our work has an impact on the lives of many
people. Every UCB employee is committed
to follow the strict regulatory standards for
research, development, manufacturing and
distribution of our products to ensure we
meet all safety, quality, regulatory, legal and
environmental requirements.
In an ever-changing and more complex
environment, UCB’s patient value strategy is
the best route to achieve this ambition and
long-term success.
2
WE CONDUCTED
OVER 95 CLINICAL TRIALS
INVOLVING 6 400 PATIENTS
WE REACHED OUR
FINANCIAL TARGETS
€ 4.53 BILLION REVENUE € 1.38 BILLION RECURRING EBITDA
WE INVESTED
1 057 MILLION IN R&D, 23% OF OUR REVENUE
7 478 EMPLOYEES FOCUSED ON CREATING VALUE FOR PATIENTS
MORE THAN
2 935 000PATIENTS USED OUR CORE
MEDICINES CIMZIA®, VIMPAT®, KEPPRA®, BRIVIACT® & NEUPRO®
OF THESE,
87% ARE PROUD
TO WORK FOR UCB
EVEN THOUGH PRODUCTION
INCREASED, OUR ECOLOGICAL
FOOTPRINT CONTINUES TO DECREASE
Quality & Assurance Summit 2017
Dressed in white (like bones), the Quality Assurance
Department gathered to "Find our Common Ground"
and learned about exciting cutting edge technology
taking place at UCB to have romosozumab reaching
patients living with osteoporosis.
3 UCB Annual Report 2017

Kenichiro, living with rheumatoid arthritis 4

LETTER TO OUR STAKEHOLDERS
01Dear shareholders, partners, colleagues and those
living with severe diseases,
In an increasingly constrained external world where
innovation is essential, we confirm our patient value
strategy to drive UCB’s future success and
sustainable growth.
UCB achieved strong results in 2017. On top of our
fourth consecutive year of revenue and earnings
growth, we also achieved our recurring EBITDA/
revenue target of 30% - one year earlier. Our ability
to build an increasingly differentiated pipeline was
demonstrated with key results for Cimzia® in women
of child bearing age, Evenity™, padsevonil and
bimekizumab. We further strengthened our scientific
platforms. However, 2017 also delivered both external
and internal challenges that led to share price volatility
during 2017.
Externally, the shift from volume to value is translating
at differing speed and in heterogeneous ways across
health systems. In addition, several advances in
science led to increasing numbers of innovative
products being launched, which further pressures
healthcare system costs, resulting in decreasing return
on pharmaceutical R&D investment.
Internally, EvenityTM results confirmed unprecedented
efficacy although a numeric safety imbalance in ARCH
presented an unforeseen challenge. The positive
bimekizumab Phase 2b results and padsevonil proof of
concept results lead to accelerated Phase 3 programs.
While supporting UCB’s long-term sustainability,
at the same time, it put pressure on resources in
the short-term.
UCB achieved strong results in 2017
In the last year, UCB delivered 9% revenue growth,
i.e. € 4.53 billion, the recurring EBITDA amounted to
€ 1.38 billion, and we achieved - one year earlier than
originally planned - our objective of a 30% recurring
EBITDA / revenue margin.
Our key medicines continued to grow. Based on its
differentiated profile, Cimzia® is keeping up well in
a competitive environment. Vimpat®, Keppra® and
Briviact® reached more and more patients living with
epilepsy, thanks to new indications and launches
in new countries. Based on its strong performance,
we increased our peak sales guidance for Briviact®
in the year before patent expiry (2026) from € 450
to € 600million. Neupro® in Parkinson’s disease
performed as planned.
In 2017, key R&D results demonstrated our focus
on increasingly differentiated solutions that show
the promise of advancing the standard of care:
EvenityTM results confirmed unprecedented efficacy;
bimekizumab achieved positive and competitive
Phase 2b results in psoriasis, psoriatic arthritis and
ankylosing spondylitis patients, and we started the
Phase 3 program in psoriasis; padsevonil achieved
positive proof of concept in highly refractory epilepsy
patients and started Phase 2b in February 2018;
Cimzia® now offers a unique solution to women of
child-bearing age.
In May, the ARCH results completed the set of data
proving Evenity™ efficacy superiority over the current
standard-of-care. It also presented an unforeseen
challenge: a numeric imbalance in cardiovascular
5 UCB Annual Report 2017

Caroline, living with psoriatic arthritis
events. To understand this safety signal which was
not observed in the FRAME study, a comprehensive
evaluation is underway. Filing of the marketing
authorization application with the European authorities
occurred as planned at the end of 2017.
To continuously enhance our research capabilities,
UCB acquired Beryllium LLC, a small-size research-
based company in Boston, MA (U.S.) specializing in
protein expression and structural biology. UCB also
created a venture fund to support promising but very
early or higher risk assets, approaches or technologies
underlining UCB’s ability to deeply connect with
external science and to complement our scientific
capabilities in dialogue with new partners.
New patient support programs were launched or
expanded. UCBCares®, a single customer care
point bringing value to patients and health care
professionals who contact our company, was
implemented across France, Germany, Italy, Spain
and the U.K. In the U.S., UCB Assist connects epilepsy
patients with a dedicated case manager to help them.
2018 and beyond: growth, sustainability and profitability
In this context, UCB’s patient value strategy is and
remains the best route to achieve long-term success.
Our key medicines will continue to grow and will
reach more patients through additional launches
in new indications or regional expansion. We will
continue to invest above the industry average in R&D
to deliver breakthrough medicines with compelling
value propositions for patients, healthcare professionals
and payers and securing UCB long-term sustainability.
Thanks to its strong financial foundations, UCB will be
able to selectively use its financial and strategic flexibility
to complement its internal pipeline with external
innovative assets, programs or platforms through
partnerships, licenses or acquisitions.
While in the short term we will increase our
investments maximizing our new growth drivers for the
time after 2021 and to foster long term sustainability
we are committed to return to competitive profitability
after this and increase our recurring EBITDA/revenue
ratio to 31% in 2021. For 2018, we target revenue in the
range of € 4.5 to € 4.6 billion, a recurring EBITDA of
approximately € 1.3 to € 1.4 billion and a Core EPS of
€ 4.30- 4.70 per share.
6

UCB's ambition is to be the
Patient-Preferred Biotech Leader
creating patient value for specific
populations through unique
outcomes, the best individual
experience, and improving as
many of these lives as possible
Jean-Christophe Tellier,
Chief Executive Officer
Thanks to the support of the Board, the guidance of
the Executive Committee and – most importantly
– the commitment of all UCB employees, UCB has
successfully transformed into a leading biotech
company, inspired by patients and driven by science.
Our trajectory and achievements in recent years,
including growth of strategic therapeutic products
while divesting non-core assets or activities,
provides a solid base for further, sustainable expansion
and growth.
Evelyn du Monceau,
Chair of the Board
"We are very pleased that - after achieving our
net debt / recurring EBITDA target of 1:1 two years
earlier in 2016 - we achieved our 30% recurring
EBITDA / revenue ratio target - also one year earlier
than guided - based on the strong growth of our
core products. The next years are now dedicated
to accelerate growth drivers for the time after
2021 while we reconfirm our commitment to
competitive profitability in the mid-term."
For more information, refer to: 01 Letter to the stakeholders 5
Strategy 8
UCB people 10
Risk management 12
R&D & pipeline projects 14
Immunology products & projects 16
Neurology products & projects 18
Bone project 20
Environment overview 22
Financials overview 24
2017 milestones 26
02 Management report of the Board
of Directors 29
Corporate governance statement 30
Business performance review 70
03 Consolidated financial statements 83
04 Notes to the consolidated
financial statements 90
05 Responsibility statement 178
06 Report of the statutory auditor 181
07 Abbreviated statutory financial
statements of UCB SA 188
08 Glossary & references 194
This report is complemented by the UCB 2017
sustainability report available on
https://www.ucb.com/our-company/csr
Jean-Christophe Tellier, CEO
7 UCB Annual Report 2017

STRATEGY
We have integrated the patient insights with science,
translating it into solutions. We now need to ensure
patients have access to UCB solutions. UCB is a global
player and has to adapt to specific dynamics and
stakeholder influences in local patient environments.
UCB’s patient value strategy aims to deliver unique
outcomes and the best patient experience to as many
lives as possible within specific populations where
UCB can lead. UCB will only commercialize assets
where we can lead, and will out-license pipeline assets
in areas where UCB cannot lead or lacks bandwidth.
Our recent performance confirms our ambition. UCB
continues to deliver above-industry growth, with
financials that enable UCB to become the patient-
preferred biotech leader with a healthy balance
between short-term growth and profitability and long-
term sustainability.
PATIENT
SCIENCE
SOLUTION
UCB’s integrated business model starts and ends with the patient. This evolution from the traditional pharma
model is critical for us to remain competitive and sustainable for the long-term in an increasingly complex and
value-focused healthcare environment.
From Solution to PatientWe strive for a unique patient experience,
providing the highest possible benefit.
From Patient to ScienceWe pursue a deep understanding of patient sub-populations to develop an original scientific hypothesis.
From Science to SolutionWe aim to translate scientific hypotheses into
solutions for patients and engage them in the journey.
Everything we do starts with a simple question: "How
will this create value for people living with severe
diseases?". Rather than commencing research from
a scientific point of view, we start with the patient
perspective. This means improving our ability to
stratify patients; implementing a new development
paradigm to improve success rates and efficiency;
tailoring go to market models for specific local patient
environments and implementing value-based access
and pricing.
Innovation is a key component of our strategy on
translating science into clinical differentiation. Because
30% of patients living with epilepsy are not seizure-
free, because patients living with psoriasis expect
more than treatments available so far, because the
ultimate goal is a cure… So many reasons why UCB
continues to invest more than 20% of its revenue
in research and development, “R&D”. Thanks to this
commitment and the many collaborations with
academia, research institutes, small and big (bio)
pharma players, UCB teams have built a strong
pipeline of innovative medicines.
8

We are progressing on our growth path with our three strategic phases:
GROW & PREPARE PHASE (2015)
• We build up on Cimzia®, Vimpat®,
Keppra®, Briviact® and Neupro®;
• We carefully prepare bringing
Evenity™ (romosozumab) to
people at high risk of fracture due
to osteoporosis;
• We carry on broadening our
early and late-stage pipeline.
ACCELERATE & EXPAND PHASE (2019)
• We accelerate uptake of Briviact®
while maximizing the potential
of Cimzia®, Vimpat®, Keppra®
and Neupro®;
• We invest into new growth
drivers in our late-stage R&D
pipeline (Evenity™, bimekizumab,
padsevonil) and emphasize the
innovation focus in our early
pipeline - complemented by
selected external opportunities.
BREAKTHROUGH & LEAD PHASE (2022)
• We mitigate the loss of exclusivity
for Cimzia®, Vimpat®,
and Neupro® by continuing
growth from Briviact® and new
growth drivers;
• We successfully launch
breakthrough products and
accelerate growth.
Victoria, living with psoriasis
9 UCB Annual Report 2017

UCB PEOPLE Creating patient value is what inspires us, drives
our actions and allows us to be more agile in an
ever-challenging world. Integrating the patient at
every level of our operating model is our way to
create unique and sustainable value and we believe
every one of us can have an impact, wherever in the
world, whatever our role.
Ensuring a diverse and inclusive environment at UCB
is important for our patient value culture. Given the
span of our activities and our global footprint, diversity
is a given at UCB. Mentioning diversity immediately
triggers the gender topic. At UCB, we have a 50 / 50
representation of women and men companywide,
and a 31 / 69 ratio of women to men at the Board level.
However, diversity is much more than gender, race
or age (innate characteristics); it is about education,
beliefs and experience (acquired characteristics).
Collaborating with colleagues from different horizons
is a gift and also has its challenges: working easily
across nations, cultures and education sometimes is
not a given. In 2017, we continued to raise awareness
around conscious and unconscious bias by organizing
28% BELGIUM
8% GERMANY8% U.K.
6% SWITZERLAND
8% EUROPE - OTHERS
10% CHINA
11% INTERNATIONAL MARKETS6% JAPAN
15% UNITED STATES
EMPLOYE
ES
- R
EG
ION
SPLIT
several initiatives in multiple sites. UCB is determined
to accelerate diversity and inclusion, anchoring it in
our company culture.
Almost every aspect of our activities is regulated:
beginning with drug discovery and acquisition, and
continuing on through testing, development, product
registration, manufacturing, pricing, shipment,
advertising, sale and use. The UCB values and code of
conduct provide a framework which helps us navigate
Thierry and Michael, UCB
10

9% ARE BELOW 30
65% ARE BETWEEN 30-49
26% ARE OVER 50
32% JOINED IN THE LAST 3 YEARS
32% HAVE WORKED FOR UCB BETWEEN 4-9 YEARS
36% HAVE WORKED FOR UCB FOR MORE THAN 10 YEARS
EMPLOY
EE
S -
AG
E SPLIT
EMPLOYE
ES
- T
EN
UR
E SPLIT
through the challenging and evolving business and
legal environments.
The code of conduct outlines general principles of
business conduct and ethics that help guide every
UCB colleague and UCB’s partners throughout
the world when making decisions. It covers UCB
employees' rights (equal treatment, data privacy,
freedom of association, HS&E, etc.), obligations
(pharmacovigilance, business ethics, insider
information, antitrust, corruption, social media and
IT security) as well as whistle blower procedures.
For more information, refer to:
• 2017 sustainability report
• UCB code of conduct: https://www.ucb.com/_up/
ucb_com_ir/documents/UCB_Code_v21_
January_2015.pdf
• https://www.ucb.com/careers/your-career
Lydie, UCB
11 UCB Annual Report 2017

MANAGING RISKTO ADD VALUE AT UCB
Achieving effective risk management is not just
about identifying and responding to risks. It is about
creating a solid foundation of both understanding
the risk environment and embedding a framework
that facilitates action on the uncertainties that may
impact us most.
In our journey to elevate risk management at UCB,
Risk2Value continues to advance the integration of
risk principles into the organization. This enables the
support of our strategic priorities while upholding our
patient value principles.
Framework and Governance
In 2017, UCB continued to build upon the Risk2Value
framework. Utilizing the key representatives from all
business areas, we have worked to strengthen the
importance of managing the right risks. Our process
of risk management initiates within each business area
and its leadership team, is aggregated, refined and
communicated via the Risk2Value table and
its members.
To ensure we are prioritizing risks that have impact to
our values and obligations, risks may be measured on
one or more of three scales:
• Impact on financial assumptions that comprise
UCB’s near-term and long-term forecasts (Financial
Impact Scale)
• Impact on the trust of those that regulate or rely
on us; and the welfare of our employees and
communities (Reputation & Welfare Impact Scale)
• Impact on the value we provide our patients with
(Patient Value Impact Scale)
Top risks are connected to the strategic priorities
and an understanding of how the risk is trending is
communicated to both our Executive Committee
and our Board of Directors.
Oversight
The management and review, and advisement on
risks and decision making is an active and dynamic
process. Our Executive Committee reviews these risks
on a regular basis in collaboration with the Risk2Value
table. We maintain strong connectivity to our Board
of Directors/Audit Committee and bring feedback into
the organization.
UCB demonstrates its commitment to managing risk
by creating accountability at the top. All key risks are
owned by a member of the Executive Committee,
and that member is accountable for understanding
its nature and driving actions to manage the risk.
The Global Internal Audit function is responsible for
independently and regularly reviewing and validating
the risk management process in UCB and jointly
agreeing with the business functions on actions to
respond to enterprise-level risks.
As the risks we face are dynamic and changing in
nature, our approach to management of these risks
is also dynamic. We continue to learn and grow to
integrate risk thinking into the organization. The risks
illustrated represent the top items for 2017 / 2018.
12

Top risks for 2017 and beyond
COMPETITION FROM BIOSIMILARS
Biosimilars entrants, adoption and market impact are
increasing globally, with a complex interplay of 1) payer
and regulatory frameworks 2) stakeholder attitudes
3) manufacturer and commercialization capabilities and
4) competitor responses. UCB supports increasing access
of biologics to patients who may benefit from them,
and to providing a superior overall value proposition in
specific patient populations.
PRICING & ACCESS PRESSURES AND CHANGES
Managing pharmaceutical expenditure continues to
be a priority for healthcare providers globally, and
manufacturers continue to look for new ways to offer
their solutions at sustainable and equitable prices. In the
U.S., pharmaceutical pricing continues to be a major
focus at both the federal and state level. Payers are now
increasing their use of value assessment frameworks to
inform their formulary decisions.
CYBER SECURITY
In an increasingly complex and evolving IT landscape,
Cybersecurity incidents like data breaches could lead to
reputational or financial impact, as well as
operational disruption.
INTELLECTUAL PROPERTY
Intellectual Property rights (IP) are essential to foster
innovation in rapidly evolving R&D paradigms and a
politically challenging environment. UCB must protect
its intellectual property rights, be proactively aware of
the competitive landscape and engage in external policy
debates around IP and access.
BIOLOGICS SUPPLY
In the hyper competitive market to deliver new biologic
drug products, there is limited capacity both internally
and with external suppliers. This presents the potential
for real challenges in securing supply to meet both UCB’s
develoment needs and supporting our future patients.
UCB focuses on offering solutions meeting the unique
needs of specific patient subpopulations. We continue
to pursue a strategy of differentiation as an innovator
company with a value-focused pipeline and brands
which offer demonstrable superior patient outcome at
a competitive total unit cost of care.
By establishing a patient-centered view of value,
alongside a commitment to affordable access for
patients, UCB continues to engage with stakeholders
globally to meet the needs of all our patients.
UCB has also established an executive and leadership
team-level committee to increase our ability to
monitor and engage with the U.S. policy ecosystem,
including federal and state governments and agencies,
to continue to deliver on our vision of making a
difference for people living with severe diseases.
UCB has a security strategy and a comprehensive
security program in place that assures the proper
prevention, detection and response controls are in
place. The program includes, for example, continuous
monitoring and analytics, intrusion incident detection
and response, security testing and user awareness
training and campaigns.
UCB enhanced the focus of its IP strategies on core
innovation and global patient-focused solutions. We
continue to efficiently defend our IP with litigation
wins on Vimpat® (U.K.) and Neupro® (U.S.). With our
recently recruited IP policy experts, we have taken our
engagement on external policy to the next level.
UCB has developed a biologics supply strategy to
expand internal capacity as well as secure external
supply partners. This strategy will maximize flexibility
to assure we can deliver on the needs of patients for
UCB’s future biologic portfolio.
UCB’s response
UCB Annual Report 201713
R&D
We start - and end - with the patient. Integrating
the reality of patients living with neurological and
immunological disorders into our daily life enables
us to develop a better understanding of the various
expressions of a disease and to embed the real
needs of specific patient groups in our science and
innovation process.
Patients play a more active role in their healthcare, the
use of artificial intelligence continues to rise and will
impact treating patients as well as drug discovery.
UCB increasingly employs digital solutions throughout
the value chain:
• applying analytics for discovery research;
• improving study design, efficiency and patient
experience in clinical trials;
• using digital solutions to enhance or complement
marketed drugs to improve patient outcomes and
experience and, thus, increase value for patients.
After connecting patients’ insight with science, we
translate scientific hypotheses into differentiated
solutions for patients and engage them in the journey.
We carefully design clinical trials, with a robust proof
of concept and clear milestones that enable us to
make solid data-driven decisions. Participating in
clinical trials is also part of the journey for some
patients. Listening to their experience, we challenge
the complexity of studies to reduce the burden
for patients and investigator sites, accelerate study
conduct and lower costs.
Thanks to innovative data extrapolation, UCB did
not have to conduct dedicated clinical studies to
gain regulatory approval in the U.S. for Briviact® in
monotherapy, and Vimpat® for children aged 4 and
older. This approach enables patients to get faster
access to new treatment options.
To leverage the power of "big data" enabling
physicians to make evidence-based decisions when
discussing treatment options with patients living with
epilepsy, UCB has partnered with Georgia Tech (U.S.)
for a new predictive analytic platform.
UCB is successfully deploying solutions “beyond
the pill”: new devices such as the autoclick® or ava®
for Cimzia® to facilitate administration and help
patients managing their disease, support programs
to assist patients navigate through the insurance/
reimbursement hurdles, etc.
Innovation will be critical to deliver differentiation. It
might arise from the expertise within the organization,
as well as from collaboration with the external world
through developing networks and the ability to
connect with science, academic biotech start-ups,
everywhere they are. Over the years, UCB has built
up a strong network; further enhanced by the UCB
Venture Fund which gives us the opportunity to invest
in innovative life science and healthcare companies
at a very early stage. This openness to the external
world is not limited to science, it is also developed
with all stakeholders involved in delivering value for
the patient.
UCB’s R&D strategy is very clear:
• Strengthen current research technology platforms
and add new ones;
• Strengthen areas where UCB can lead through
new assets;
• Progress molecules in-house if we can be a
category leader delivering value for patients, for
example in our core therapeutic areas: immunology
and neurology. In other cases, we use other routes
to reach patients: partnering, out-licensing, spin-off
or divesting.
14

UCB Annual Report 2017
Phase 1 Phase 2 Phase 3 Filing
Evenity™ (romosozumab)
osteoporosis
bimekizumab (IL17 A/F)
psoriasis Phase 3 results: end 2019
psoriatic arthritis Phase 3 start: H2 2018
ankylosing spondylitis Phase 3 start: H2 2018
dapirolizumab pegol (CD40L antibody)
systemic lupus erythematosus Phase 2b results: Q4 2018
(Partner: Biogen)
padsevonil (PPSI)
highly drug-resistant epilepsy Phase 2b results: H1 2020
seletalisib (PI3K δ inhibitor)
Sjögren’s syndrome + APDS1 (Phase 1b) Phase 2a results: Q3 2018
rozanolixizumab (FcRn)
immune thrombocytopenia + MG2 Phase 2a results: H2 2018
UCB4144 / VR942 - asthma (Partner: Vectura)
UCB6673; UCB7858; UCB0159
UCB3491; UCB0599
Rosanne, mother of child living with epilepsy
bone immunology neurology 1 APDS - Activated PI3K Delta Syndrome2 MG – myasthenia gravis
15

IMMUNOLOGY
UCB started its endeavor into immunology in 2004
with the acquisition of Celltech, a leading British
biotech company.
Building on core expertise in biologics, Cimzia®
(certolizumab pegol) was developed and first made
available to patients living with Crohn‘s disease (2008),
followed by rheumatoid arthritis (2009), psoriatic
arthritis and ankylosing spondylitis (2013). All of these
inflammatory diseases have one thing in common:
the immune system mistakenly attacks the tissues it
is supposed to protect - the gut (Crohn’s), the joints
(rheumatoid arthritis), the joints and skin (psoriatic
arthritis) and the spine (ankylosing spondylitis).
Recognizing an unmet need for female patients of
child bearing age and the unique structure of Cimzia®,
UCB now offers an additional and unique solution:
Cimzia® is the first anti-TNF treatment option in
Europe that could be considered for women living
with a chronic rheumatic disease in both pregnancy
and breastfeeding.
The latest development for patients targets psoriasis,
a common skin condition affecting 125 million people
worldwide, 2-3% of the world’s population1. When
spending time with patients living with psoriasis and
psoriatic arthritis, the Immunology team learned that
their journey is one of duality, layering physical impact
with emotional experience. Pending approval from the
U.S. and European health authorities, Cimzia® might
become available to people living with psoriasis in
those regions by the summer of 2018.
The next innovative discovery in the execution of our
patient value strategy - connecting the unmet needs
of patients with innovative science - is bimekizumab,
a dual cytokine inhibitor targeting both IL-17A and
IL-17F, currently in clinical development. Within UCB’s
core antibody discovery platform, bimekizumab was
designed via a rational, structure-based approach to
build dual specificity and high affinity for both IL-17A
and IL-17F. We are now clinically testing the novel
hypothesis that neutralizing IL-17F in addition to
IL-17A can deliver superior outcomes for psoriasis and
spondyloarthritis patients.
Based on the Phase 2b results in psoriasis, psoriatic
arthirtis and ankylosing spondylitis, bimekizumab
shows potential to bring significant, differentiated
value to patients. We are committed to rapidly
advancing our Phase 3 clinical programs across the
different indications, and to progressing our portfolio
of future innovative solutions for patients with
autoimmune diseases and unmet needs.
For more information, refer to:
• R&D update on pages 72-73
• References on pages 195
• https://www.ucb.com/disease-areas
• https://www.ucb.com/our-products
16

Elisabeth, living with axial spondyloarthritis
REACHING MORE THAN
110 000patients living with rheumatoid arthritis,
psoriatic arthritis, axial spondyloarthritis /
ankylosing spondylitis or Crohn’s disease
Cimzia®
Label update for potential use during
pregnancy and breastfeeding (EU)
Potential approval in psoriasis (U.S. & EU)
Phase 3 results in non-radiographic axial
spondyloarthritis (U.S.)
Phase 3 results in psoriasis /
psoriatic arthritis (Japan)
Net sales to reach ≥ € 1.5 billion
Loss of exclusivity (U.S. & EU)
Loss of exclusivity (Japan)
2018
2020
2024
2026
Phase 3 start in
• psoriatic arthritis
• ankylosing spondylitis
Phase 3 results in psoriasis
2018
2019
might be a valuable novel treatment
for patients living with psoriasis,
psoriatic arthritis or ankylosing spondylitis
bimekizumab
UCB Annual Report 201717

NEUROLOGY
Brain diseases affect 1 in 6 people around the
world1. The range of conditions – and the impact on
patients – affecting the central nervous system is
wide and unlocking the science behind them is hard.
At UCB, we are committed to delivering value to
patients and looking for new ways to help patients
living with neurological diseases.
One area where UCB has been working in for
decades is epilepsy. While it is the most common
serious neurological condition – defined by recurrent
seizures – it manifests itself in different ways for
different patients. To date, more than 30 different
types of seizures have been identified2.
For patients, seizure types and frequency vary greatly.
Some are short, like muscle jerks, while others
are prolonged convulsions. Some patients may
experience them rarely, while others battle seizures
multiple times per day. Focal seizures start in just one
part of the brain, while generalized seizures are the
result of simultaneous abnormal activity of the whole
brain. For patients battling epilepsy, regaining control –
and getting seizures under control – is often a primary
goal leading to a higher quality of life3.
We have come a long way in treatment. Today,
nearly 60% of patients newly diagnosed with epilepsy
become seizure free with their first anti-epileptic drug4.
But for 1 in 3 patients, seizures remain uncontrolled2.
These are the great challenges we continue to
tackle. Breakthrough science and technology can
help unlock better ways to care for and treat patients
living with epilepsy. Whether it is contributing to find
a therapy that works for an individual patient faster or
finding new ways to treat the root cause of disease,
we are committed to continuing to unlock the science
and find new ways to improve the lives of patients.
During the past 20 years, UCB has made a major
contribution to improving epilepsy care by bringing
different treatment options to patients and
healthcare professionals: Keppra® (levetiracetam) in
2000, Vimpat® (lacosamide) in 2008 and Briviact®
(brivaracetam) in 2016. Thanks to new indications
(pediatric, monotherapy) and launches in new
countries, UCB medicines enabled more and more
patients to live more independently from epilepsy.
Unfortunately, there are still thousands of patients who
either do not have access to treatments, or have not
found the right drug… so UCB teams keep searching!
Our R&D colleagues are progressing with molecules
like padsevonil for highly refractory epilepsy and
radiprodil for infantile spasms while others investigate
external options. In partnership with the Georgia
Institute of Technology, we are developing eliprio™,
a program that harnesses predictive analytics and
machine learning to personalize epilepsy treatment.
UCB celebrated the first decade of the launch of
Neupro® (rotigotine transdermal patch) in Europe,
addressing the needs of patients living with Parkinson’s
disease and restless legs syndrome.
We are committed to empower patients with
neurological conditions to live the life they choose,
through differentiated and meaningful solutions,
ultimately advancing the standard of care. We will
focus on strengthening our leadership in epilepsy
through drug and complementary technology
solutions and optimizing our impact in
movement disorders.
For more information, refer to:
• R&D update on pages 72-73
• References on pages 195
• https://www.ucb.com/disease-areas
• https://www.ucb.com/our-products
18
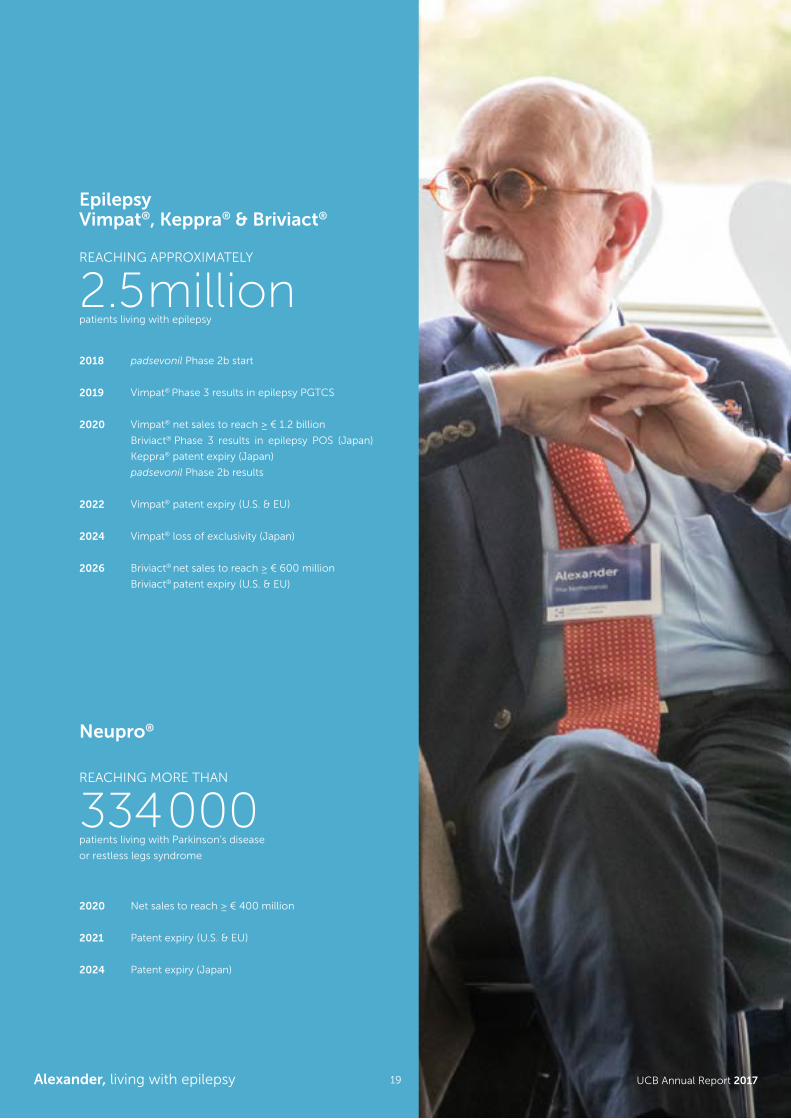
padsevonil Phase 2b start
Vimpat® Phase 3 results in epilepsy PGTCS
Vimpat® net sales to reach ≥ € 1.2 billion
Briviact® Phase 3 results in epilepsy POS (Japan)
Keppra® patent expiry (Japan)
padsevonil Phase 2b results
Vimpat® patent expiry (U.S. & EU)
Vimpat® loss of exclusivity (Japan)
Briviact® net sales to reach ≥ € 600 million
Briviact® patent expiry (U.S. & EU)
2018
2019
2020
2022
2024
2026
REACHING APPROXIMATELY
2.5 millionpatients living with epilepsy
EpilepsyVimpat®, Keppra® & Briviact®
Net sales to reach ≥ € 400 million
Patent expiry (U.S. & EU)
Patent expiry (Japan)
2020
2021
2024
REACHING MORE THAN
334 000patients living with Parkinson’s disease
or restless legs syndrome
Neupro®
Alexander, living with epilepsy UCB Annual Report 201719

BONE
Whilst our bones grow very quickly in size,
density and strength through childhood, our bodies
experience a progressive loss of bone mass in
adulthood, leading to brittle bones and an increased
risk of fracture. This condition in which bones
become more porous over time making them more
likely to break has a name: osteoporosis.
Fragility fractures due to osteoporosis are a major
public health concern. Almost 9 million fractures
happen every year1. A fragility fracture can be a life-
changing event, making it harder to get around and do
things independently. For example, after a hip fracture:
• 10-20% of patients require a long-term
nursing home;
• 40% of individuals cannot walk alone;
• 80% cannot perform basic activities such
as shopping2.
UCB is supporting patients, carers, healthcare
professionals, policy makers and the general public to
help raise the profile of this silent disease, and make
fracture prevention a global health priority. Since
2004, Amgen and UCB have worked together to
research and develop Evenity™ (romosozumab), an
investigational bone-forming monoclonal antibody. It
is being evaluated for its potential to reduce the risk of
fractures in an extensive global Phase 3 program..
A robust clinical development program has been
completed, studying over 12 000 patients in
43 countries. Four key studies evaluated the efficacy
and safety of romosozumab for 12 months followed
by an antiresorber in men and postmenopausal
women at risk for fracture.
• FRAME is a placebo-controlled study that evaluated
7 180 postmenopausal women with post-
menopausal osteoporosis. Results were published
in The New England Journal of Medicine3 in
September 2016.
• ARCH is an active comparator study in 4 093
postmenopausal women with osteoporosis at high
risk for fracture. Results were published in The New
England Journal of Medicine4 in September 2017.
• BRIDGE is placebo-controlled study of 245 men
aged 55-90 years with osteoporosis. Results were
presented at ACR5 in November 2016.
• STRUCTURE is an active comparator study in
436 postmenopausal women with osteoporosis
transitioning from bisphosphonate therapy. Results
were published in The Lancet6 in July 2017.
Based on this substantial data set, Evenity™ is currently
under regulatory review in the U.S., Canada, Japan,
Australia, Brazil, Switzerland, and the EU.
For more information, refer to: • R&D update on pages 72-73
• References on pages 195
• https://www.ucb.com/disease-areas/Osteoporosis
Evenity™ is the trade name of romosozumab which has been provisionally approved by the U.S. Food & Drug Administration (FDA) and the European Medicines Agency (EMA).
20
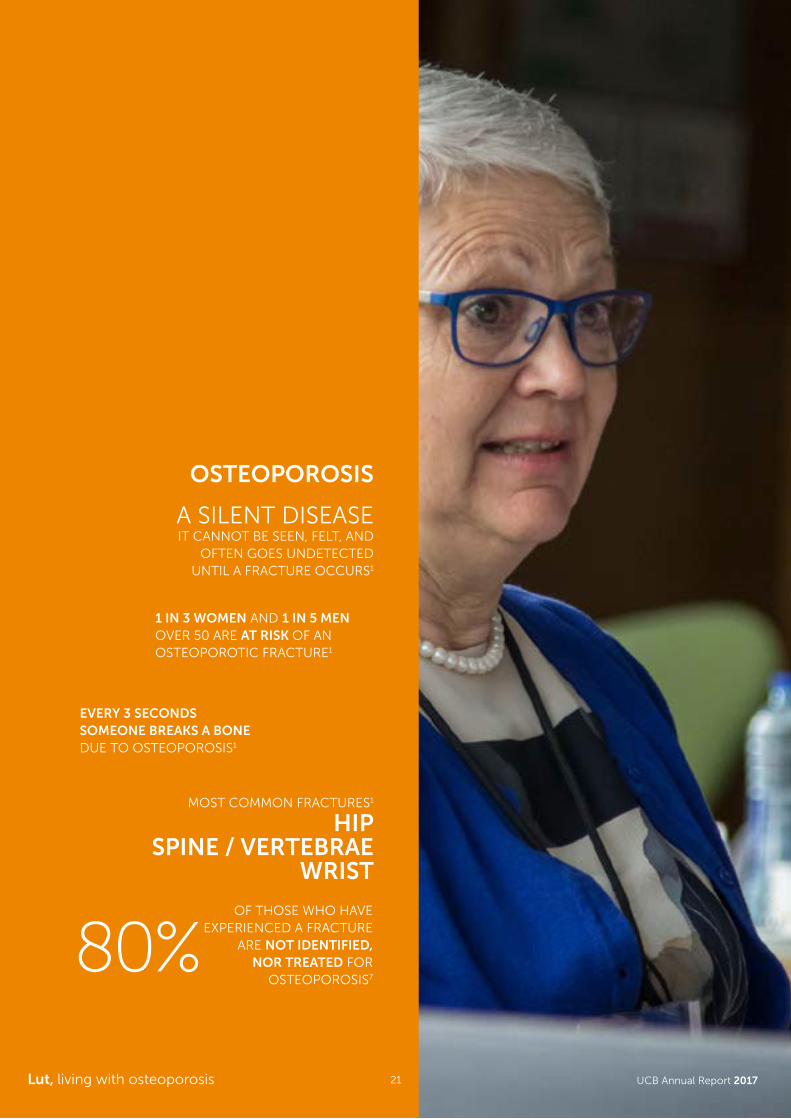
Lut, living with osteoporosis
OSTEOPOROSIS
A SILENT DISEASE IT CANNOT BE SEEN, FELT, AND
OFTEN GOES UNDETECTED UNTIL A FRACTURE OCCURS1
EVERY 3 SECONDS SOMEONE BREAKS A BONE DUE TO OSTEOPOROSIS1
MOST COMMON FRACTURES1
HIP SPINE / VERTEBRAE
WRIST
OF THOSE WHO HAVE EXPERIENCED A FRACTURE
ARE NOT IDENTIFIED, NOR TREATED FOR
OSTEOPOROSIS7
1 IN 3 WOMEN AND 1 IN 5 MENOVER 50 ARE AT RISK OF AN OSTEOPOROTIC FRACTURE1
80%
UCB Annual Report 201721

ENVIRONMENT
All our activities have an impact on the environment. At UCB, we take our responsibility to the planet very seriously.
We commit to reducing our ecological footprint
with the thinking that it does not make sense to
provide our patients with solutions for their diseases,
on the one hand, while on the other, destroying
the environment they live in.
For the past 10 years, we have made progress in this
direction by improving our buildings and processes,
raising awareness and encouraging greener
behaviors. In 2015, UCB set ambitious targets to be
reached by 2030:
• Become carbon neutral by reducing the emissions
by 35% and compensating those we cannot reduce;
• Reduce water consumption by 20%;
• Reduce waste generation by 25%.
Our Green Strategy currently focuses on the activities
we can directly control and sets clear, absolute
milestones to measure our progress. Confirming our
commitment to meeting the COP21 ambition, UCB
joined the Science Based Target Initiative to fight
climate change.
22

2013 2014 2015 2016 2017
Scope covered1 85% 85% 86% 86% 90%
CO2 emissions (tons) 2 79 770 66 100 112 415 94 002 87 746
Scope 1 - Direct CO2 emissions 34 733 37 573 28 415 26 871
Scope 2 - Indirect CO2 emissions 31 367 28 108 10 936 5 888
Scope 3 - Other indirect greenhouse gas (GHG) emissions N.A. N.A. 46 734 54 651 54 987
Water (m³) 810 579 782 633 804 360 704 310 663 359
Waste (tons) 9 146 9 654 9 746 8 712 7 090
Waste recovered 93% 94% 95% 97% 91%
Energy (MegaJoules) 1 243 344 1 089 739 1 137 502 854 906 810 771
Electricity from renewable sources 50% 59% 59% 80% 92%
Beyond the scope change1, factors which influenced consumption are:
• increased production and research activities;
• variations in climatological conditions (with an impact on the need for cooling/heating);
• implementation of saving programs.
For more information, refer to:
• 2017 sustainability report
• https://www.ucb.com/our-company/green-strategy
2018
Finetune the methodology to
better capture UCB impact
Support reforestation programs in the Democratic Republic of Congo and Ethiopia
2020
Reduce emissions
by 5%
2025
Reduce emissions
by 20%
2030REDUCE
EMISSIONS BY
35%
2030REDUCE WATER CONSUMPTION BY
2030REDUCE WASTE PRODUCTION BY
CO2
1 Environment data are consolidated for all manufacturing and research sites, HQ, and affiliates from China, India, Italy, Japan, Germany, Mexico and the U.S.; 2017 data also include Brazil and Russia. Scope changes:
• 2013: divestiture of production sites in Rochester, NY (U.S.) and Vapi (India). Production capacity increased in Seymour (U.S.) and Shannon (Ireland). Opening of a new pilot bio-plant in Braine-l’Alleud (Belgium)
• 2015: Divestiture of the Kremers Urban operation including production site in Seymour, IN (U.S.). Startup of the bioplant in Bulle (Switzerland) • 2016: Divestiture of the production site in Shannon (Ireland) • 2017: Acquisition of Berryllium in Boston, MA (U.S.)2 In the course of 2018, the UCB HS&E team will fine-tune its methodology to better capture CO
2 emissions.
• Scope 1 emissions do not yet include the emissions of UCB’s car fleet; • Scope 3 emissions due to business travel are included as of 2015
20% 25%
23 UCB Annual Report 2017

FINANCIALSOver the recent years, UCB delivered continuous growth and built up strong financial foundations.
The growth drivers were our core products – now accounting for 86% of UCB’s 2017 net sales - driving margin
improvements to competitive levels - achieving the 30% ratio one year ahead of guidance -supported by continuously
improved reallocation of resources as well as tight cost management.
€ million 2013 2014 2015 2016 (restated1) 2017
Revenue 3 133 3 344 3 876 4 147 4 530
Net sales 2 801 2 938 3 512 3 827 4 182
Core products net sales 1 898 2 133 2 758 3 162 3 579
Operating expenses 1 871 1 912 2 142 2 150 2 200
Research and development expenses 886 928 1 037 1 020 1 057
R&D expense/revenue ratio 28% 28% 27% 24% 23%
Recurring EBITDA 28% 609 821 1 031 1 375
Recurring EBITDA/revenue ratio 17% 18% 21% 25% 30%
Profit attributable to UCB shareholders 160 209 623 520 753
Core EPS (€ per non-diluted share) 1.24 1.69 2.17 3.19 4.82
Net debt 1 998 1 611 921 838 525
Net debt/recurring EBITDA ratio 3.73 2.65 1.12 0.84 0.38
Cash flow from continuing operations 267 537 204 726 896
Capital expenditure (including intangible assets) 344 161 146 138 209
Susanne, living with ankylosing spondylitis
1 Restated for IFRS 15 implementation
24
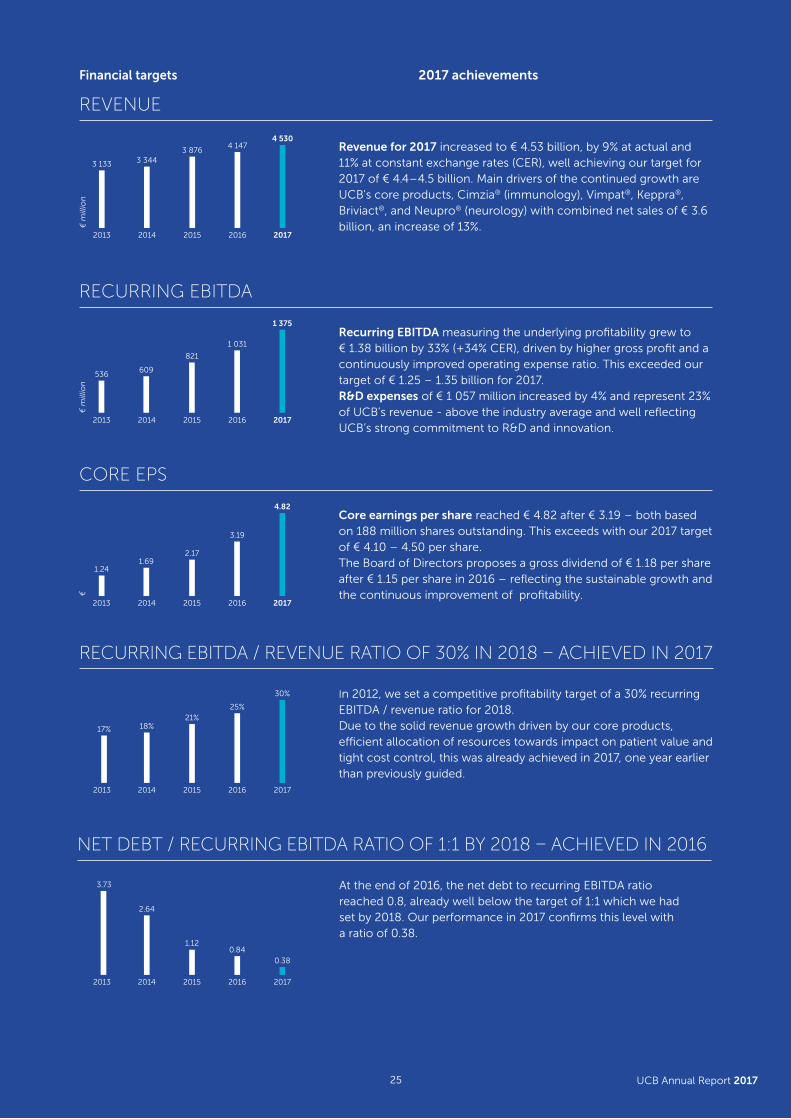
Financial targets
REVENUE
Revenue for 2017 increased to € 4.53 billion, by 9% at actual and 11% at constant exchange rates (CER), well achieving our target for 2017 of € 4.4 – 4.5 billion. Main drivers of the continued growth are UCB's core products, Cimzia® (immunology), Vimpat®, Keppra®, Briviact®, and Neupro® (neurology) with combined net sales of € 3.6 billion, an increase of 13%.
RECURRING EBITDA
Recurring EBITDA measuring the underlying profitability grew to € 1.38 billion by 33% (+34% CER), driven by higher gross profit and a continuously improved operating expense ratio. This exceeded our target of € 1.25 – 1.35 billion for 2017.R&D expenses of € 1 057 million increased by 4% and represent 23% of UCB’s revenue - above the industry average and well reflecting UCB’s strong commitment to R&D and innovation.
RECURRING EBITDA / REVENUE RATIO OF 30% IN 2018 – ACHIEVED IN 2017
In 2012, we set a competitive profitability target of a 30% recurring EBITDA / revenue ratio for 2018. Due to the solid revenue growth driven by our core products, efficient allocation of resources towards impact on patient value and tight cost control, this was already achieved in 2017, one year earlier than previously guided.
NET DEBT / RECURRING EBITDA RATIO OF 1:1 BY 2018 – ACHIEVED IN 2016
At the end of 2016, the net debt to recurring EBITDA ratio reached 0.8, already well below the target of 1:1 which we had set by 2018. Our performance in 2017 confirms this level with a ratio of 0.38.
CORE EPS
Core earnings per share reached € 4.82 after € 3.19 – both based on 188 million shares outstanding. This exceeds with our 2017 target of € 4.10 – 4.50 per share.The Board of Directors proposes a gross dividend of € 1.18 per share after € 1.15 per share in 2016 – reflecting the sustainable growth and the continuous improvement of profitability.
3 133
536
1.24
3 344
609
1.69
3 876
821
2.17
4 147
1 031
3.19
4 530
1 375
4.82
25%
0.84
30%
0.38
21%
1.12
18%
2.64
17%
3.73
2017
2017
2017
2017
2017
2016
2016
2016
2016
2016
2015
2015
2015
2015
2015
2014
2014
2014
2014
2014
2013
2013
2013
2013
2013
€ m
illio
n€
mill
ion
€2017 achievements
25 UCB Annual Report 2017

JANUARYCimzia®:
• Phase 3 results in psoriasis
• CRIB Phase 4 results
Briviact®:
filing in epilepsy POS - monotherapy (U.S.)
Creation of UCB Ventures:
to invest in innovative life sciences and healthcare companies
FEBRUARYCimzia®:
Phase 3 start in psoriasis and psoriatic arthritis (Japan)
padsevonil:
Phase 2a (proof of concept) topline results
Partnership with Chattem:
approval of Xyzal® as OTC treatment (U.S.) triggering
payments of USD 75 million to be paid over 10 years
MARCHCimzia®:
complete response letter in juvenile idiopathic arthritis (U.S.)
Vimpat®:
• U.S. Patent and Trademark Office confirmed
validity of U.S. patent RE38,551
• filing in epilepsy POS pediatric (U.S.)
• Phase 3 results in epilepsy POS pediatric -
adjunctive therapy
rozanolixizumab:
Phase 2a start in myasthenia gravis
APRILCimzia®:
CHMP positive opinion on dose dispenser cartridge for ava®
electronic injection device (EU)
Partnership with Q-State Biosciences:
to develop novel therapeutics for epilepsy
Board of Directors:
• Evelyn du Monceau appointed as Chair
• Pierre Gurdjian appointed as Vice-Chair
Executive Committee:
Charl van Zyl joined as Head of Patient Value Operations
2017MILESTONES
Daphnee, UCB 26

MAYCimzia®:
filing of CRIB and CRADLE studies (EU)
Evenity™:
ARCH Phase 3 topline results in osteoporosis in
postmenopausal women
JUNECimzia®:
filing of CRIB and CRADLE results (U.S.)
bimekizumab add-on to Cimzia®:
Phase 2a topline results in rheumatoid arthritis
Acquisition of Beryllium LLC:
specializing in protein expression and structural biology
Partnership with Pfizer:
approval of Besponsa® (inotuzumab ozogamicin) in acute
lymphoblastic leukemia (EU)
Partnerships with CO2Logic and WeForest:
2 sustainability organizations dedicated to re-forestation and
environment protection
JULYVimpat®:
CHMP positive opinion in epilepsy POS pediatric (EU)
Briviact®:
• filing in epilepsy POS pediatric (U.S.)
• filing in epilepsy POS pediatric - adjunctive therapy (EU)
Evenity™:
• complete response letter in osteoporosis (U.S.)
• publication of STRUCTURE Phase 3 study in the
The Lancet
bimekizumab:
positive Phase 2b results in psoriasis
AUGUSTCimzia®:
filing in psoriasis (EU)
Vimpat®:
approval in epilepsy POS - monotherapy (Japan)
Keppra®:
approval of intravenous formulation (China)
Briviact®:
Phase 3 start in epilepsy POS - adjunctive therapy (Japan)
Partnership with Pfizer:
approval of Besponsa® in acute lymphoblastic
leukemia (U.S.)
SEPTEMBERCimzia®:
FDA approval of manufacturing site in Bulle (Switzerland)
Vimpat®:
approval in epilepsy POS pediatric (EU)
Briviact®:
approval in epilepsy POS - monotherapy (U.S.)
Evenity™:
• publication of ARCH Phase 3 study in the New England
Journal of Medicine
• presentation of ARCH Phase 3 study at ASBMR congress
Executive Committee:
Jean-Luc Fleurial joined as Head of Talent & Company
Reputation
OCTOBERCimzia®:
filing in psoriasis (U.S.)
Executive Committee:
• Dhaval Patel joined as Head of NewMedicines™
• Alexander Moscho joined as Head of Corporate Strategy
& Business Development
UCB joined the Science Based Target Initiative to fight
climate change
UCB won the ‘Outstanding Intelligent Enterprise’ award,
part of the Corporate IT Awards 2017
NOVEMBERCimzia®:
Dermira and UCB agreed to end their collaboration
agreement
Vimpat®:
approval in epilepsy POS pediatric (U.S.)
DECEMBERbimekizumab:
• positive Phase 2b results in ankylosing spondylitis
• positive Phase 2b results in psoriatic arthritis
• Phase 3 start in psoriasis
rozanolixizumab:
positive proof of concept in immune thrombocytopenia
For more information, refer to: • R&D update on pages 72-73
POS: Partial onset seizures, also known as focal seizures
CHMP: European Medicines Agency’s (EMA’s) Committee for Medicinal Products for Human Use
Evenity™ is the trade name of romosozumab which has been provisionally approved by the U.S. Food & Drug Administration (FDA) and the European Medicines Agency (EMA).
27 UCB Annual Report 2017

Peter, caregiver 28

MANAGEMENT REPORT OF THE BOARD OF DIRECTORS
02
Corporate Governance Statement 30
Business Performance Review 70
29 UCB Annual Report 2017

CORPORATE GOVERNANCE STATEMENT
Anna and Xavier, UCB
As a Belgian-headquartered company with a commitment to the highest standards of corporate governance, the Board of Directors (the “Board”) of UCB SA/NV (“UCB”) adopted a Charter of Corporate Governance (the “Charter”) in October 2005, as required by the Belgian Code on Corporate Governance (first edition, 2004). Pursuant to article 96, section 1, 1° of the Belgian Companies Code, UCB follows the principles of the 2009 Belgian Code on Corporate Governance (the “Corporate Governance Code”), taking into account the specific international aspects of UCB¹.
The Charter is available on the UCB website at www.ucb.com/investors/UCB-Governance and describes the main aspects of the corporate governance of UCB, including its governance structure and the terms of reference of the Board, as well as those of its committees and the Executive Committee, and of the shareholders meetings. The Charter is updated from time to time during the year and annually reviewed by the Board to be in line with the applicable Laws and regulations, the Corporate Governance Code and their interpretation.
In accordance with the Belgian Companies Code and with the Corporate Governance Code, the following pages provide factual information about the corporate governance of UCB. This includes changes to the corporate governance of UCB, together with relevant events that occurred in 2017, such as changes in UCB’s capital or shareholder structure, the amendments in the governance and in the composition of the Board as well as the committees, the main features of UCB’s internal control and risk management systems, and the remuneration report. It also includes explanations, where applicable, of any deviations from the Corporate Governance Code.1 The “2009 Belgian Code on Corporate Governance” is available on the website of the Belgian Corporate Governance Committee (http://www.corporategovernancecommittee.be)
30

Directors and AuditorsSituation as of 1 January 2018
Board of Directors• Evelyn du Monceau, Chair• Pierre L. Gurdjian, Vice Chair• Jean-Christophe Tellier, Executive Director and CEO • Alice Dautry, Director• Kay Davies, Director• Albrecht De Graeve, Director• Roch Doliveux, Director• Charles-Antoine Janssen, Director• Cyril Janssen, Director • Viviane Monges, Director• Norman J. Ornstein, Director• Cédric van Rijckevorsel, Director• Ulf Wiinberg, Director
Secretary of the Board of Directors• Xavier Michel, Vice President and Secretary General
Statutory Auditor• PwC Bedrijfsrevisoren BV CVBA/Réviseurs
d’Entreprises SC SCRL, with permanent representative SC SPRL Romain Seffer, represented by Mr. Romain Seffer, registered auditor
Honorary Directors• Karel Boone, Honorary Chair• Mark Eyskens, Honorary Chair• Georges Jacobs de Hagen, Honorary Chair• Daniel Janssen, Honorary Deputy Chair• Gerhard Mayr, Honorary Chair• Prince Lorenz of Belgium• Alan Blinken• Arnoud de Pret• Michel Didisheim• Peter Fellner• Guy Keutgen• Jean-Pierre Kinet• Paul Etienne Maes• Tom McKillop• Gaëtan van de Werve• Jean-Louis Vanherweghem• Bridget van Rijckevorsel
Honorary Chairmen of the Executive Committee• Roch Doliveux• Georges Jacobs de Hagen• Daniel Janssen• Paul Etienne Maes
31 UCB Annual Report 2017

PIERRE L. GURDJIAN Vice Chair of the BoardIndependent Director
1961 – Belgian
EVELYN du MONCEAUChair of the Board
1950 – Belgian
EXPERIENCESenior Partner at McKinsey and Co. where he was active for nearly three decades
and senior professional in the field of Philanthropy and Education
MAIN EXTERNAL APPOINTMENTS • President of the Board of the Université Libre de Bruxelles
• Member of the Board of Lhoist
EXPERIENCEOver 30 years in the industrial sector, through several Board mandates
and holding companies
MAIN EXTERNAL APPOINTMENTS • Member of the Board of Financière de Tubize SA
• Member of the Board of Solvay SA
• Member of the Compensation and Nomination Committees of Solvay SA
UCB BOARD • Member since 2016
• Member of the Governance,
Nomination and Compensation
Committee since 2016
• End of term: 2020
UCB BOARD • Member since 1984
• Chair of the Board since 2017
• Vice Chair of the Board from 2006 to 2017
• Chair of the Governance, Nomination and
Compensation Committee since 2006
• End of term: 2019
BOARD OF DIRECTORS
32

JEAN-CHRISTOPHE TELLIERExecutive Director
1959 – French
ALICE DAUTRY Independent Director
1950 – French
UCB BOARD • Member since 2015
• Member of the Scientific Committee since 2015
• End of term: 2019
EXPERIENCEOver 30 years in the scientific domain, mainly with Institut
Pasteur of which she was the president (2005-2013)
MAIN EXTERNAL APPOINTMENTS • Member of the Board of Trustees of Institute of Science and
Technology (Austria)
• Member of the Supervisory Board of KLM
UCB BOARD • Member since 2014
• Chair of the Scientific Committee since 2014
• Member of the Governance, Nomination and
Compensation Committee since 2017
• End of term: 2018
EXPERIENCEOver 20 years in scientific research at Oxford University
MAIN EXTERNAL APPOINTMENTS • Director of Biotech Growth Trust
• Director of Genomics England
UCB BOARD• Member since 2014
• End of term: 2018
EXPERIENCEOver 25 years in the pharmaceutical sector,
with Ipsen and Novartis where he held several
senior executive positions
MAIN EXTERNAL APPOINTMENTS • Vice-President and President Elect of the EFPIA
• Chairman of the Innovation Board Sponsored
Committee (EFPIA)
• Deputy Chair of the IMI Governing Board
• Member of the Board of BIO
• Member of the Board of PhRMA
• Member of the Board of WELBIO
KAY DAVIES Independent Director
1951 – British
33 UCB Annual Report 2017

ALBRECHT DE GRAEVEIndependent Director
1955 – Belgian
CHARLES-ANTOINE JANSSEN Director
1971 – Belgian
CYRIL JANSSEN Director
1971 – Belgian
ROCH DOLIVEUX Director
1956 – French
UCB BOARD• Member since 2010
• Member (since 2010) and Chairman (since 2015) of the
Audit Committee
• End of term: 2021
EXPERIENCEOver 30 years in global operations in various industry
sectors (Alcatel, VRT and Bekaert)
MAIN EXTERNAL APPOINTMENTS • Chairman of the Board of Bekaert NV
• Chairman of the Board of Telenet NV
• Chairman of the Board of Sibelco NV
UCB BOARD • Member since 2017
• End of term: 2021
EXPERIENCE Over 30 years in the pharmaceuticals with 10 years
as UCB’s Chief Executive Officer and Chairman of the
Executive Committee
MAIN EXTERNAL APPOINTMENTS • Chairman of the GLG Healthcare Institute
• Chairman of the Board of the Pierre Fabre Group
• Member of the Board of Stryker Corporation
• Chairman of the Board of the Vlerick Business School
• Chairman of the Caring Entrepreneurship Fund
(King Baudouin Foundation)
UCB BOARD • Member since 2012
• Member of the Audit Committee since 2015
• End of term: 2020
EXPERIENCEOver 20 years in operations, including UCB where he held
several management positions, now managing private equity
and impact investing activities
MAIN EXTERNAL APPOINTMENTS • Member of the Board of Financière de Tubize SA
• Managing Partner at Kois Invest
• Co-founder, Board member, IC member and advisory
Board member of various private companies, non-profit
organizations and private equity funds
UCB BOARD • Member since 2015
• End of term: 2019
EXPERIENCEOver 20 years in project management and supporting
SME’s, through several Board mandates, funds and
holding companies
MAIN EXTERNAL APPOINTMENTS • Member of the Board of Financière de Tubize SA
• Member of the Board of Financière Eric Janssen
34

VIVIANE MONGES Independent Director
1963 – French
CÉDRIC van RIJCKEVORSEL Director
1970 – Belgian
NORMAN J. ORNSTEIN Independent Director
1948 – American
ULF WIINBERGIndependent Director
1958 – Danish / Swedish
UCB BOARD • Member since 2017
• End of term: 2021
EXPERIENCE 30 years in Finance functions mostly in the pharmaceutical
industry (Wyeth, Novartis, Galderma)
MAIN EXTERNAL APPOINTMENTS • Member of the strategic Board of Neomedlight
UCB BOARD• Member since 2014
• End of term: 2018
EXPERIENCEOver 20 years in the banking and financial sector,
mainly with IDS Capital
MAIN EXTERNAL APPOINTMENTS • Member of the Board of Financière de Tubize SA
• Member of the Board of Barnfin SA
• Managing Director and Founder of IDS Capital
(Switzerland and U.K.)
UCB BOARD • Member since 2008
• End of term: 2019
EXPERIENCEOver 40 years as scholar and analyst of American
politics and policy
MAIN EXTERNAL APPOINTMENTS • Chairman of Campaign Legal Center
• Resident Scholar, American Enterprise Institute
UCB BOARD • Member since 2016
• Member of the Audit Committee since 2016
• End of term: 2020
EXPERIENCEAlmost 20 years of senior leadership experience
in pharmaceutical companies and healthcare
industry associations
MAIN EXTERNAL APPOINTMENTS • Member of the Board of Alfa Laval
• Member of the Board of Agenus
• Member of the Board and CEO acting of Hansa Medical
35 UCB Annual Report 2017
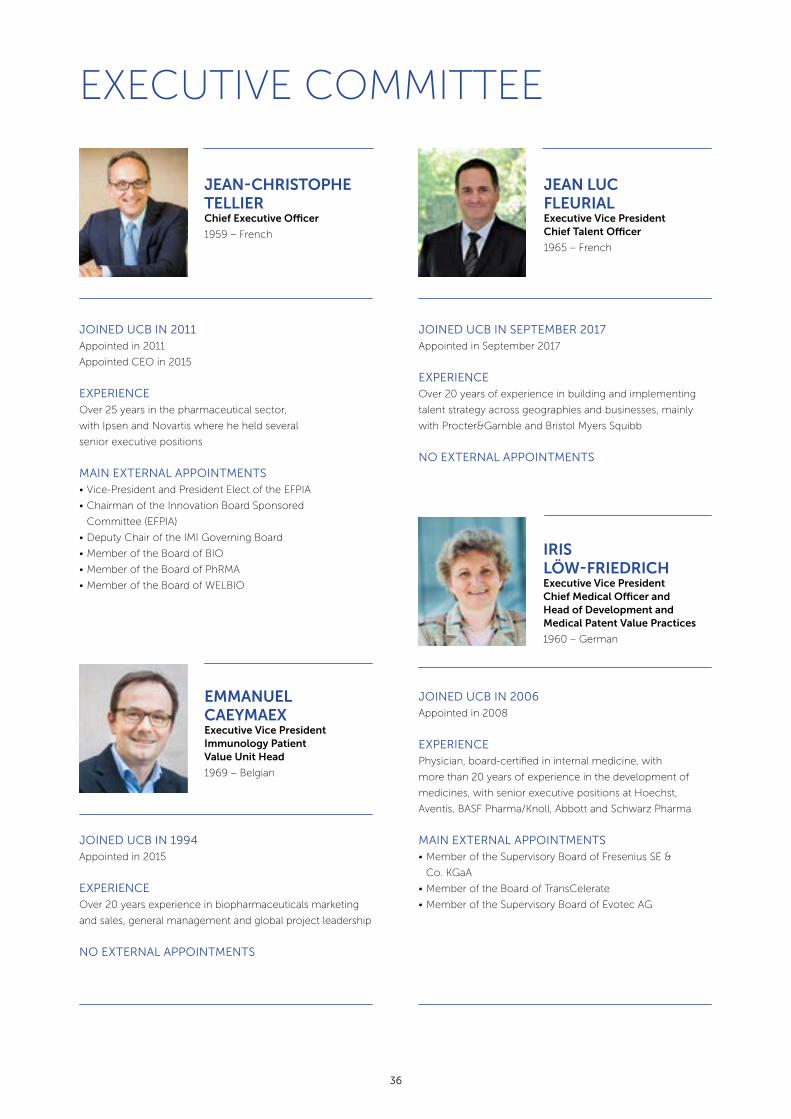
JOINED UCB IN 2006Appointed in 2008
EXPERIENCEPhysician, board-certified in internal medicine, with
more than 20 years of experience in the development of
medicines, with senior executive positions at Hoechst,
Aventis, BASF Pharma/Knoll, Abbott and Schwarz Pharma
MAIN EXTERNAL APPOINTMENTS• Member of the Supervisory Board of Fresenius SE &
Co. KGaA
• Member of the Board of TransCelerate
• Member of the Supervisory Board of Evotec AG
EXECUTIVE COMMITTEE
JEAN-CHRISTOPHE TELLIERChief Executive Officer
1959 – French
JEAN LUC FLEURIAL Executive Vice President Chief Talent Officer
1965 – French
EMMANUEL CAEYMAEX Executive Vice President Immunology Patient Value Unit Head
1969 – Belgian
IRIS LÖW-FRIEDRICHExecutive Vice President Chief Medical Officer and Head of Development and Medical Patent Value Practices
1960 – German
JOINED UCB IN 2011Appointed in 2011
Appointed CEO in 2015
EXPERIENCEOver 25 years in the pharmaceutical sector,
with Ipsen and Novartis where he held several
senior executive positions
MAIN EXTERNAL APPOINTMENTS • Vice-President and President Elect of the EFPIA
• Chairman of the Innovation Board Sponsored
Committee (EFPIA)
• Deputy Chair of the IMI Governing Board
• Member of the Board of BIO
• Member of the Board of PhRMA
• Member of the Board of WELBIO
JOINED UCB IN SEPTEMBER 2017 Appointed in September 2017
EXPERIENCE Over 20 years of experience in building and implementing
talent strategy across geographies and businesses, mainly
with Procter&Gamble and Bristol Myers Squibb
NO EXTERNAL APPOINTMENTS
JOINED UCB IN 1994Appointed in 2015
EXPERIENCEOver 20 years experience in biopharmaceuticals marketing
and sales, general management and global project leadership
NO EXTERNAL APPOINTMENTS
36

ALEXANDER MOSCHO Executive Vice President Chief Strategy Officer
1970 – German
PASCALE RICHETTAExecutive Vice President Bone Patient Value Unit Head
1959 – French
ANNA S. RICHOExecutive Vice President General Counsel
1960 – American
DHAVAL PATEL Executive Vice President Chief Scientific Officer
1961 – American
JOINED UCB IN OCTOBER 2017 Appointed in October 2017
EXPERIENCE Over 20 years of experience in corporate global strategy
and portfolio management, as well as innovation and
investment projects
NO EXTERNAL APPOINTMENTS
JOINED UCB IN 2016Appointed in 2016
EXPERIENCEOver 20 years of experience in the pharma and biotech
industry with Ipsen, GSK, Abbott and Abbvie
MAIN EXTERNAL APPOINTMENTS• Member of the Board of Capio
JOINED UCB IN 2012Appointed in 2012
EXPERIENCEOver 25 years in the biopharmaceutical and medical device
sectors with Amgen and Baxter Healthcare Corp., where she
held several senior executive positions
NO EXTERNAL APPOINTMENTS
JOINED UCB IN OCTOBER 2017 Appointed in October 2017
EXPERIENCE Over 30 years of experience in R&D and in immunology
more specifically with Novartis and in the academic world
at Duke University Medical Center and the University of
North Carolina
MAIN EXTERNAL APPOINTMENTS • Member of the Board of Inflazome
• Member of the Board of Anokion
• Member of the Board of Kanyos Bio
• Clinical Professor at University of North Carolina
at Chapel Hill
37 UCB Annual Report 2017

BHARAT TEWARIEExecutive Vice President Chief Marketing Officer
1961 – Dutch
CHARL van ZYL Executive Vice President Chief Operating Officer
1967 - British / South African
JEFF WRENExecutive Vice President Neurology Patient Value Unit Head
1963 – American
DETLEF THIELGENExecutive Vice President Chief Financial Officer
1960 – German
JOINED UCB IN 2015Appointed in 2015
EXPERIENCEPhysician, with more than 25 years experience in the pharma
and biotech industry with Boehringer Ingelheim, F. Hoffman
La Roche, Merck Serono and EMD Serono in several senior
executive positions in The Netherlands, Germany, Switzerland
and the U.S.
NO EXTERNAL APPOINTMENTS
JOINED UCB IN MARCH 2017 Appointed in March 2017
EXPERIENCE Almost 20 years of experience across the healthcare value
chain, including Business Development and Licensing,
Manufacturing, Marketing and Sales and Research &
Clinical Development
NO EXTERNAL APPOINTMENTS
JOINED UCB IN 2010Appointed in 2015
EXPERIENCEOver 25 years in the pharmaceutical sector, with Sepracor
(now Sunovian) and TAP Pharmaceuticals, in senior positions
spanning sales, marketing, and managed markets
NO EXTERNAL APPOINTMENTS
JOINED UCB IN 2006Appointed in 2007
EXPERIENCEMore than 25 years in the pharma industry with Schwarz Pharma
and UCB, where he held several senior executive positions
NO EXTERNAL APPOINTMENTS
38
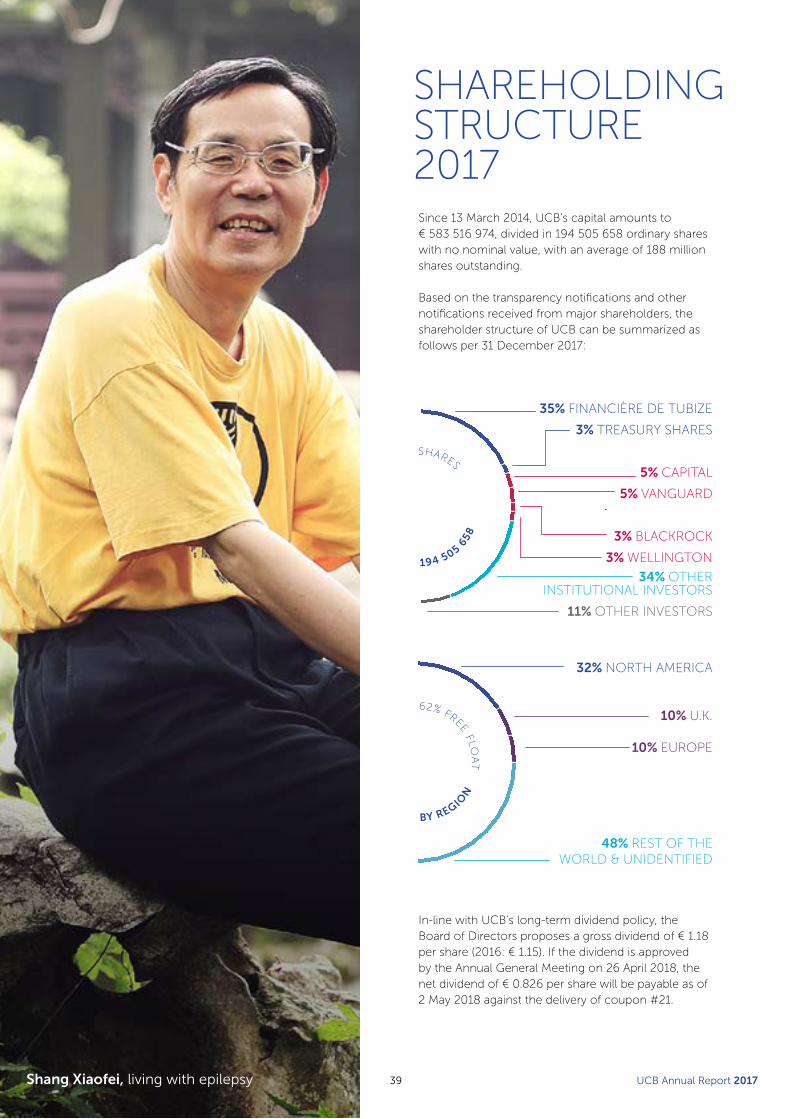
Shang Xiaofei, living with epilepsy
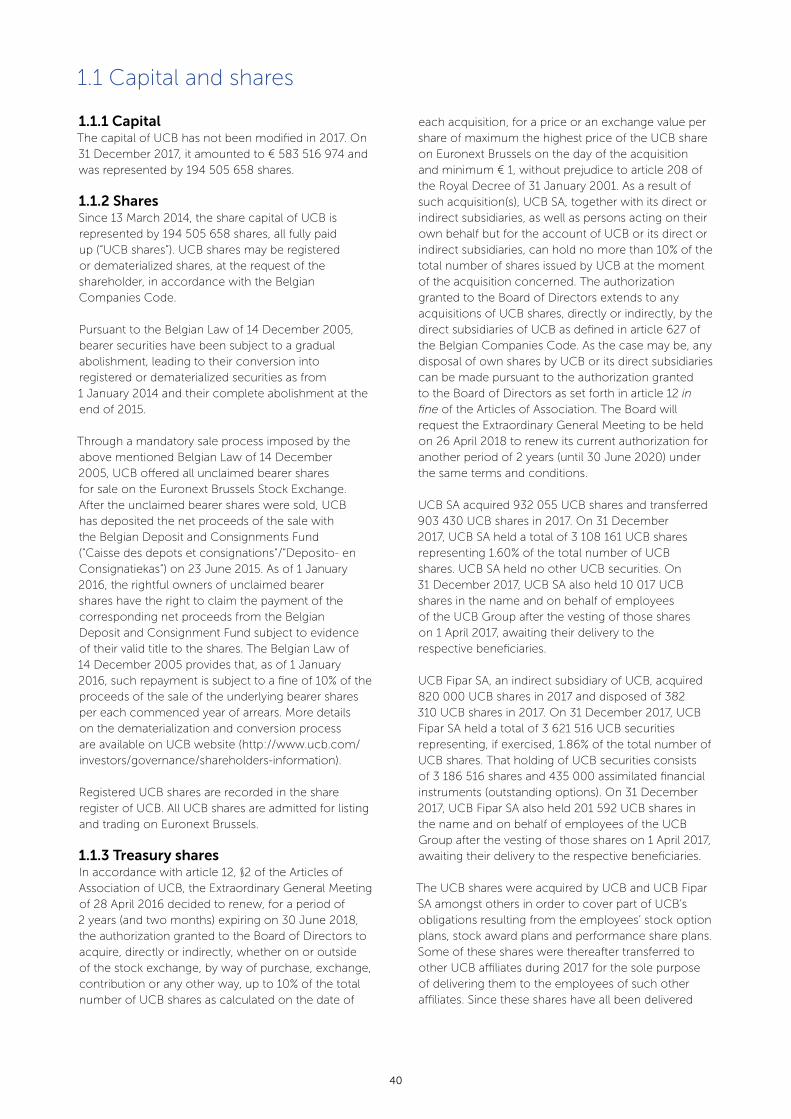
SHAREHOLDING STRUCTURE 2017Since 13 March 2014, UCB’s capital amounts to € 583 516 974, divided in 194 505 658 ordinary shares with no nominal value, with an average of 188 million shares outstanding.
Based on the transparency notifications and other notifications received from major shareholders, the shareholder structure of UCB can be summarized as follows per 31 December 2017:
SHARES
62% FREE FLOA
T
194 505 658
BY REGION
In-line with UCB’s long-term dividend policy, the Board of Directors proposes a gross dividend of € 1.18 per share (2016: € 1.15). If the dividend is approved by the Annual General Meeting on 26 April 2018, the net dividend of € 0.826 per share will be payable as of 2 May 2018 against the delivery of coupon #21.
35% FINANCIÈRE DE TUBIZE
3% TREASURY SHARES
5% CAPITAL
5% VANGUARD
3% BLACKROCK
3% WELLINGTON
34% OTHER INSTITUTIONAL INVESTORS
11% OTHER INVESTORS
32% NORTH AMERICA
10% U.K.
10% EUROPE
48% REST OF THE WORLD & UNIDENTIFIED
39 UCB Annual Report 2017
1.1 Capital and shares
1.1.1 CapitalThe capital of UCB has not been modified in 2017. On 31 December 2017, it amounted to € 583 516 974 and was represented by 194 505 658 shares.
1.1.2 SharesSince 13 March 2014, the share capital of UCB is represented by 194 505 658 shares, all fully paid up (“UCB shares”). UCB shares may be registered or dematerialized shares, at the request of the shareholder, in accordance with the Belgian Companies Code.
Pursuant to the Belgian Law of 14 December 2005, bearer securities have been subject to a gradual abolishment, leading to their conversion into registered or dematerialized securities as from 1 January 2014 and their complete abolishment at the end of 2015.
Through a mandatory sale process imposed by the above mentioned Belgian Law of 14 December 2005, UCB offered all unclaimed bearer shares for sale on the Euronext Brussels Stock Exchange. After the unclaimed bearer shares were sold, UCB has deposited the net proceeds of the sale with the Belgian Deposit and Consignments Fund (“Caisse des depots et consignations“/“Deposito- en Consignatiekas“) on 23 June 2015. As of 1 January 2016, the rightful owners of unclaimed bearer shares have the right to claim the payment of the corresponding net proceeds from the Belgian Deposit and Consignment Fund subject to evidence of their valid title to the shares. The Belgian Law of 14 December 2005 provides that, as of 1 January 2016, such repayment is subject to a fine of 10% of the proceeds of the sale of the underlying bearer shares per each commenced year of arrears. More details on the dematerialization and conversion process are available on UCB website (http://www.ucb.com/investors/governance/shareholders-information).
Registered UCB shares are recorded in the share register of UCB. All UCB shares are admitted for listing and trading on Euronext Brussels.
1.1.3 Treasury shares In accordance with article 12, §2 of the Articles of Association of UCB, the Extraordinary General Meeting of 28 April 2016 decided to renew, for a period of 2 years (and two months) expiring on 30 June 2018, the authorization granted to the Board of Directors to acquire, directly or indirectly, whether on or outside of the stock exchange, by way of purchase, exchange, contribution or any other way, up to 10% of the total number of UCB shares as calculated on the date of
each acquisition, for a price or an exchange value per share of maximum the highest price of the UCB share on Euronext Brussels on the day of the acquisition and minimum € 1, without prejudice to article 208 of the Royal Decree of 31 January 2001. As a result of such acquisition(s), UCB SA, together with its direct or indirect subsidiaries, as well as persons acting on their own behalf but for the account of UCB or its direct or indirect subsidiaries, can hold no more than 10% of the total number of shares issued by UCB at the moment of the acquisition concerned. The authorization granted to the Board of Directors extends to any acquisitions of UCB shares, directly or indirectly, by the direct subsidiaries of UCB as defined in article 627 of the Belgian Companies Code. As the case may be, any disposal of own shares by UCB or its direct subsidiaries can be made pursuant to the authorization granted to the Board of Directors as set forth in article 12 in fine of the Articles of Association. The Board will request the Extraordinary General Meeting to be held on 26 April 2018 to renew its current authorization for another period of 2 years (until 30 June 2020) under the same terms and conditions.
UCB SA acquired 932 055 UCB shares and transferred 903 430 UCB shares in 2017. On 31 December 2017, UCB SA held a total of 3 108 161 UCB shares representing 1.60% of the total number of UCB shares. UCB SA held no other UCB securities. On 31 December 2017, UCB SA also held 10 017 UCB shares in the name and on behalf of employees of the UCB Group after the vesting of those shares on 1 April 2017, awaiting their delivery to the respective beneficiaries.
UCB Fipar SA, an indirect subsidiary of UCB, acquired 820 000 UCB shares in 2017 and disposed of 382 310 UCB shares in 2017. On 31 December 2017, UCB Fipar SA held a total of 3 621 516 UCB securities representing, if exercised, 1.86% of the total number of UCB shares. That holding of UCB securities consists of 3 186 516 shares and 435 000 assimilated financial instruments (outstanding options). On 31 December 2017, UCB Fipar SA also held 201 592 UCB shares in the name and on behalf of employees of the UCB Group after the vesting of those shares on 1 April 2017, awaiting their delivery to the respective beneficiaries.
The UCB shares were acquired by UCB and UCB Fipar SA amongst others in order to cover part of UCB’s obligations resulting from the employees’ stock option plans, stock award plans and performance share plans. Some of these shares were thereafter transferred to other UCB affiliates during 2017 for the sole purpose of delivering them to the employees of such other affiliates. Since these shares have all been delivered
40

to eligible employees, none of such other affiliates is still holding UCB shares on 31 December 2017. For additional details, please refer to note [26.3 Treasury shares].
1.1.4 Authorized capital The Extraordinary General Meeting of 28 April 2016 decided to renew the authorization to the Board (and to amend the Articles of Association accordingly), for a period of 2 years, to increase the share capital, amongst other by way of the issuance of shares, convertible bonds or warrants, in one or more transactions, within the limits set by the Belgian Company Code,
i. with up to 5% of the share capital calculated at the time of the decision of the Board to make use of this authorization, in the event of a capital increase with cancellation or limitation of the preferential subscription rights of the shareholders (whether or not for the benefit of one or more specific persons who are not employees of the company or of its subsidiaries);
ii. with up to 10% of the share capital calculated at the time of the decision of the Board to make use of this authorization, in the event of a capital increase without cancellation or limitation of the preferential subscription rights of the existing shareholders.
In any event, the total amount by which the Board may increase the share capital by a combination of the authorizations set forth in (i) and (ii) above, is limited to 10% of the share capital at the time of the decision of the Board to make use of this authorization.
The Board is moreover expressly authorized to make use of this mandate, within the limits as set out under (i) and (ii) above, for the following operations:
1. a capital increase or the issuance of convertible bonds or warrants with cancellation or limitation of the preferential subscription rights of the existing shareholders;
2. a capital increase or the issuance of convertible bonds with cancellation or limitation of the preferential subscription rights of the existing shareholders for the benefit of one or more specific persons who are not employees of the company or of its subsidiaries;
3. a capital increase by incorporation of reserves. Any such capital increase may take any and all form, including, but not limited to, contributions in cash or in kind, with or without share premium, the incorporation of reserves and/or share premiums and/or profits carried forward, to the maximum extent permitted by the Law.
Any decision of the Board to use this authorization requires a 75% majority within the Board.
The Board is empowered, with full power of substitution, to amend the Articles of Association to reflect the capital increases resulting from the exercise of its authorization.
The Board will request the Extraordinary General Meeting of 26 April 2018 to renew its current authorization for another period of 2 years under the same terms and conditions.
41 UCB Annual Report 2017
Altaï Invest SA is controlled by Evelyn du Monceau, born Evelyn Janssen. Barnfin SA is controlled by Bridget van Rijckevorsel.
The reference shareholders of Tubize, belonging to the Janssen family, act in concert, i.e. they have entered into a shareholders’ agreement concerning the concerted exercise of their voting rights in order to pursue a sustainable common policy with regard to Tubize and concerning the possession, acquisition or transfer of voting securities cf. article 3, §1, 13°, a), b) and c) of the Law on the disclosure of large shareholdings and article 3, §1, 5°, a) and b) of the Law on public takeover bids.
1.2.2 Transparency declarations During 2017, UCB received the following transparency notifications:• On 9 January 2017, UCB sent a transparency
notification to the Financial Services and Markets Authority (“FSMA”), providing an annual update on the transactions in UCB shares and assimilated financial instruments by UCB SA and its indirect subsidiary UCB Fipar SA and confirming that UCB SA had crossed downward the lowest threshold of 3% on a consolidated basis. On 10 March 2017, UCB sent a new transparency declaration to the FSMA following the crossing of the 3% threshold (on a consolidated basis).
• UCB received transparency notifications from Wellington Management Group LLP dated 4 January, 22 February, 27 February and 18 August 2017 respectively. The last notification stated that Wellington Management Group LLP, including the holdings of its affiliates, as of 16 August 2017, owned 5 118 453 UCB shares with voting rights, representing 2.63% of the total number of shares issued by UCB.
• UCB received transparency notifications from BlackRock, Inc., dated 12 January, 18 January, 19 January, 27 January, 30 January, 2 February, 3 February, 13 February, 20 February, 22 February, 23 February, 28 February, 2 March, 10 March, 13 March, 15 May, 17 May, 18 May, 19 May, 22 May, 24 May, 30 May, 31 May, 1 June and 2 June 2017 respectively. The last notification stated that BlackRock, Inc., including the holding of its affiliates, as of 1 June 2017, owned 5 836 096 UCB shares with voting rights, representing 3.00% of the total number of shares issued by UCB.
• UCB received transparency notifications from The Capital Group Companies, Inc., dated 6 March, 18 May, 30 May, 28 July (with rectification on 2 August) and 12 October 2017 respectively. The last notification stated that The Capital Group Companies, Inc., including the holding of its affiliates, as of 11 October 2017, owned 9 721 375 shares UCB shares with voting rights, representing 4.99% of the total number of shares issued by UCB
.
Altaï Invest SA is controlled by Evelyn du Monceau, born Evelyn Janssen. Barnfin SA is controlled by Bridget van
1.2 Shareholders and shareholders structure
1.2.1 Reference shareholderThe main shareholder of UCB is Financière de Tubize SA (also referred to herein as the “Reference Shareholder” or “Tubize”), a Belgian company listed on Euronext Brussels, holding 68 076 981 UCB shares on a total number of 194 505 658 (i.e. 35.00%) as at 31 December 2017.
Based on the transparency declarations received by Tubize and, as the case may be, more recent public disclosures, the shareholder structure of Tubize per 31 December 2017 can be summarized as follows:
CONCERT OUTSIDE CONCERT TOTAL
Voting Rights % Voting
Rights % Voting Rights %
Financière Eric Janssen SPRL 8 525 014 19.14% 1 988 800 4.46% 10 513 814 23.60%
Daniel Janssen 5 881 677 13.20% - - 5 881 677 13.20%
Altaï Invest SA 4 969 795 11.16% 11 500 0.03% 4 981 295 11.18%
Barnfin SA 3 899 833 8.75% - - 3 899 833 8.75%
Jean van Rijckevorsel 7 744 0.02% - - 7 744 0.02%
Total voting rights held by the reference shareholders 23 284 063 52.27% 2 000 300 2.52% 25 299 331 56.79%
Other shareholders - - 19 249 267 43.21% 19 249 267 43.21%
Total voting rights 23 284 063 52.27% 21 264 535 47.73% 44 548 598 100.00%
42

On 25 January 2018, UCB received a transparency declaration from Tubize, mentioning that Tubize received confirmation on 19 January 2018 that the agreement to act in concert with Schwarz was terminated. UCB received a similar notification from Schwarz on 29 January 2018.
All these notifications as well as more recent notifications received in 2018 can be found on UCB’s website.
1.2.3 Relationship with and between shareholdersPlease refer to note 42.2 for an overview of the relationship of UCB with shareholders. Furthermore, UCB is not aware of any agreements between its shareholders, apart from the information mentioned below.
With respect to its shareholding in UCB, Tubize was acting in concert with Schwarz, i.e. they had entered into an agreement concerning the concerted exercise of their voting rights in order to pursue a sustainable common policy with regard to UCB and concerning the possession, acquisition or transfer of voting securities (cf. article 3, §1, 13°, b) and c) of the Law on the disclosure of large shareholdings and article 3, §1, 5°, b) of the Law on public takeover bids).
UCB has received notifications pursuant to article 74, §7 of the Law of 1 April 2007 on public takeover bids from Tubize, Schwarz and UCB Fipar SA respectively on 22 November 2007, 11 December 2007 and 28 December 2007. On 28 August 2017, UCB received an updated notification pursuant to article 74, §8 of the Law on public takeover bids from Tubize and Schwarz (this notification is available on UCB website), in which is declared that:
• Tubize and Schwarz were acting in concert;• since 31 July 2016, Tubize did not acquire any
UCB shares; • on 31 July 2017, Tubize held 68 076 981 UCB shares
on a total number of 194 505 658 (i.e. 35.00%);• on 31 July 2017, Schwarz held 2 021 404 UCB
shares on a total number of 194 505 658 (i.e. 1.04%).
As mentioned in section 1.2.2. above, UCB received on 25 January 2018 a transparency notification from Tubize mentioning that Tubize received confirmation on 19 January 2018 of the termination of the agreement to act in concert with Schwarz, and a transparency notification from Schwarz confirming this information on 29 January 2018.
1.2.4 Shareholder structureApart from the notifications mentioned above under 1.2.2 and 1.2.3 as well as the notification made in 2014 by Vanguard Health Care Fund reflected in the table on the next page, UCB and its subsidiaries also hold UCB shares.
The remaining UCB shares are held by the public.
Please find on the next page an overview of the large shareholdings of UCB (including assimilated financial instruments), taking into account the shareholders’ register of UCB, the transparency notifications received pursuant to the Law of 2 May 2007 on the disclosure of large shareholdings, the notification received pursuant to article 74, §8 of the Law of 1 April 2007 on public takeover bids, the notifications to the FSMA pursuant to the Law of 2 August 2002 on the supervision of the financial sector and the financial services and as the case may be, more recent public disclosures (situation as per 19 January 2018).
43 UCB Annual Report 2017
1.2.5 General meeting of shareholdersIn accordance with the Articles of Association, the Annual General Meeting takes place on the last Thursday of April at 11.00 AM CET. In 2018, this will be on 26 April.
The rules on the agenda, the procedure for convening meetings, admittance to the meetings, the procedure
on the exercise of voting rights and other details can be found in the Articles of Association and in the Corporate Governance Charter, which are available on the UCB website (http://www.ucb.com/investors/UCB-Governance).
SITUATION AS PER 19 JANUARY 2018
Share capital € 583 516 974 13 March 2014
Total number of voting 194 505 658 13 March 2014
1 Financière de Tubize SA (“Tubize”)
securities carrying voting rights (shares) 68 076 981 35.00% 19 January 2018
2 UCB SA/NV
securities carrying voting rights (shares) 3 108 161 1.60% 31 December 2017
assimilated financial instruments (options)1 0 0.00% 6 March 2017
assimilated financial instruments (other)1 0 0.00% 18 December 2015
Total 3 108 161 1.60%
3 UCB Fipar SA
securities carrying voting rights (shares) 3 186 516 1.64% 31 December 2017
assimilated financial instruments (options)1 435 000 0.22% 3 June 2015
assimilated financial instruments (other)1 0 0.00% 25 December 2015
Total 3 621 516 1.86%
UCB SA/NV + UCB Fipar SA²
securities carrying voting rights (shares) 6 294 677 3.24%
assimilated financial instruments (options)1 435 000 0.22%
assimilated financial instruments (other)1 0 0.00%
Total 6 729 677 3.46%
Free float³ (securities carrying voting rights (shares)) 120 134 000 61.67%
4 The Capital Group Companies Inc.
securities carrying voting rights (shares) 9 721 375 4.998% 11 October 2017
5 Vanguard Health Care Fund
securities carrying voting rights (shares) 9 741 353 5.01% 28 October 2014
6 BlackRock Inc.
securities carrying voting rights (shares) 5 836 096 3.00% 1 June 2017
(all percentages are calculated on the basis of the current total number of voting rights)1 Assimilated financial instruments within the meaning of article 6 of the Royal Decree of 14 February 2008 on the disclosure of large shareholders, which, if exercised, grant an additional voting right: i.e., securities, options, futures, swaps, interest term agreements and other derivatives concerning existing securities carrying voting rights that grant their holder the right to acquire such securities carrying voting rights pursuant to an agreement that is binding under the applicable law and only on the holders’ own initiative.
2 UCB SA/NV indirectly controls UCB Fipar SA | article 6, §5, 2° and article 9, §3, 2° of the Law on the disclosure of large shareholdings.3 Free float being the UCB shares not held by the reference shareholder (Tubize), UCB SA/NV or UCB Fipar SA. Only securities carrying voting rights (shares) held by these entities
are taken into account for this calculation, to the exclusion of assimilated financial instruments.
44

1.3 Board of Directors and Board Committees
1.3.1 Board of DirectorsCOMPOSITION OF THE BOARD AND INDEPENDENT DIRECTORSAs of the general meeting held on 27 April 2017, the board of directors was composed as follows
First appointed as Director
End of term of office
Independent Director
Evelyn du Monceau, Chair 1984 2019
Pierre L. Gurdjian, Vice Chair 2016 2020 x
Jean-Christophe Tellier, Executive Director and CEO
2014 2018
Alice Dautry 2015 2019 x
Kay Davies 2014 2018 x
Albrecht De Graeve 2010 2021 x
Roch Doliveux 2017 2021
Charles-Antoine Janssen 2012 2020
Cyril Janssen 2015 2019
Viviane Monges 2017 2021 x
Norman J. Ornstein 2008 2019 x
Cédric van Rijckevorsel 2014 2018
Ulf Wiinberg 2016 2020 x
Viviane Monges was appointed as independent Director at the General Meeting of 27 April 2017, replacing Harriet Edelman who resigned for personal reasons. At the same time, the mandate of Gerhard Mayr, Chair of the Board, was expiring and was not renewed, Gerhard Mayr having reached the age limit. The mandate of Albrecht De Graeve (independent Director) was renewed for a new term of 4 years, and Roch Doliveux was appointed as Director.
Alice Dautry, Kay Davies, Albrecht De Graeve, Viviane Monges, Pierre Gurdjian, Norman Ornstein and Ulf Wiinberg all qualify as independent Directors and meet the independence criteria as set forth by article 526ter of the Belgian Companies Code, the Board and the Corporate Governance Code.
Evelyn du Monceau, Charles-Antoine Janssen, Cyril Janssen and Cédric van Rijckevorsel are representatives of the Reference Shareholder and, as such, are not eligible to qualify as independent Director. Roch Doliveux was the CEO of UCB from 2005 until 31 December 2014. For this reason he does not qualify as independent Director in accordance with the criteria set forth by article 526ter of the Belgian Companies Code. The mandates
of Kay Davies, Jean-Christophe Tellier and Cédric van Rijckevorsel will expire at the General Meeting of 26 April 2018.
Upon recommendation of the GNCC, the Board of Directors will propose to the General Meeting of 26 April 2018:
• the renewal of the mandate of Kay Davies as independent Director for a new term of 4 years;
• the renewal of the mandates of Jean-Christophe Tellier and Cédric van Rijckevorsel as Director for a new term of 4 years.
In accordance with the information provided to the Company, Kay Davies meets the independence criteria stipulated by article 526ter of the Belgian Companies Code, the Board and the Corporate Governance Code. If re-elected, she will continue to be the Chair of the Scientific Committee as well as a member of the GNCC.
Upon confirmation of the above renewals by the General Meeting of 26 April 2018, and by decision of the Board upon recommendation of the GNCC, Mrs. Viviane Monges, independent Director, will become member of the Audit Committee. As a result, the composition of the Audit Committee will be brought to 4 members amongst which 3 will be independent, including the Chair. The composition of the other special Board Committees (GNCC and Scientific Committee) will not change.
As a result of the above mentioned renewals, the Board will continue to be composed of a majority of independent non-executive Directors in 2018. Jean-Christophe Tellier is the only executive Director (CEO). The GNCC and the Audit Committee will also continue to be composed of a majority of independent Directors. On top, the Audit Committee will still be chaired by Albrecht De Graeve, independent Director.
The Board of Directors of UCB is composed of 1/3rd of women, in compliance with article 518bis §1 of the Belgian Companies Code1.
1 The Board is and will still be composed of 4 women out of a total of 13 members. In accordance with article 518bis § 1 of the Belgian Companies Code setting the minimum required number of directors of the other gender to 1/3rd (i.e. women in the case of UCB), such minimum number should be rounded up to the closest entire number (13/3 = 4.33, the closest entire number being therefore 4).
45 UCB Annual Report 2017
FUNCTIONING OF THE BOARDIn 2017, the Board met six times, including for its annual off site strategic meeting (October). The attendance rate of its members was as follows:
Gerhard Mayr, Chair1 2/2
Evelyn du Monceau, Chair 6/6
Pierre L. Gurdjian, Vice Chair 6/6
Jean-Christophe Tellier, Executive Director 6/6
Alice Dautry 6/6
Kay Davies 6/6
Albrecht De Graeve 5/6
Roch Doliveux2 4/4
Harriet Edelman1 2/2
Charles-Antoine Janssen 6/6
Cyril Janssen 6/6
Viviane Monges2 4/4
Norman J. Ornstein 6/6
Cédric van Rijckevorsel 6/6
Ulf Wiinberg 5/6
1 Until 27 April 2017
2 As from 27 April 2017 (appointment by the General Meeting of 27 April 2017)
In addition to its ordinary meetings, the Board also had one exceptional meeting (held by conference call) and one decision by unanimous written consent to decide on urgent or important matters. During the year, the Board also had several calls to be informed or updated on important projects or matters. All Board members were duly present or represented at these Board conference calls or meetings.
During 2017, the Board’s main areas of discussion, review and decisions included: the strategy of UCB and investments, the reports of the Audit Committee, the Scientific Committee and the GNCC, Corporate Governance and (re)organization of UCB, risk and risk management (including the “Risk to Value approach” and a Cyber security review), succession planning, the appointments reserved to the Board, the remuneration and Long-Term Incentives Plan policies, the financial statements and financial reporting, business development and M&A projects, including but not limited to R&D contracts, investments, license agreements, as well as the reports and resolution proposals to the General Meeting as published in the invitations to the General Meeting in compliance with the Belgian Companies Code.
There were no transactions or contractual relationships in 2017 between UCB, including its affiliated companies, and a member of the Board, giving rise to conflicts of interest, except as reported in section 1.9 below.
During 2017, the Board ensured an induction program for its new Directors to cover UCB organization and activities as well as the various areas of expertise required in a biopharmaceutical company.
Since 2014 and twice a year (July and December Board meetings), the Board also holds a special session where the executive member (the CEO) is not present.
Xavier Michel (Vice President and Secretary General) is acting as secretary of the Board of Directors.
ASSESSMENT OF THE BOARDIn accordance with its Charter (section 3.5), the Board is to conduct an (internal) assessment on a regular basis and at least every other year. In 2017, the Board conducted a full Board internal assessment, the results of which will be analyzed in the course of the first half of 2018. Appropriate action will be taken to implement the main outcomes of the assessment.
1.3.2 Board committees AUDIT COMMITTEE The Board has set up an Audit Committee whose functioning and terms of reference are in accordance with the Belgian Companies Code, the Corporate Governance Code and the Charter. It is composed of a majority of independent Directors, all non-executive Directors, and is chaired by Albrecht De Graeve, also independent Director. All members have the competences in audit and accounting matters as required in accordance with article 526bis of the Belgian Companies Code.
End of term
of office
Independent
Director
Attendance
rate
Albrecht De Graeve, Chair 2021 x 100%
Charles-Antoine Janssen 2020 x 100%
Ulf Wiinberg 2020 x 75%
The Audit Committee met four times in 2017. Each Audit Committee meeting includes separate private sessions attended solely by the internal and external auditors respectively without management presence. As necessary, the external auditors attended all or part of each Audit Committee meeting.
The Audit Committee meetings were also attended by Detlef Thielgen (Executive Vice President and Chief Financial Officer), Doug Gingerella (Senior Vice President Global Internal Audit/M&A) and Xavier Michel (Vice President and Secretary General), who acts as secretary of the Audit Committee.
46

The meetings were also partly attended on regular basis by Jean-Christophe Tellier (CEO), Raf Remijsen (Head of Treasury & Risk Management) for subjects relating to treasury and financial risk management, Thomas Debeys (Head of Tax) for tax updates, Caroline Vancoillie (Chief Accountant Officer) for accounting matters, Anna Richo (Executive Vice President and General Counsel) for litigation and risk management topics, Aaron Bartlone (Senior Vice President Corporate QA HSE and Patient Safety) and Michael Malone (Head of Risk to Value) for risk management topics, Veronique Gendarme (Head of Global Benefits) for pension related matters and Cristina Bautista (Senior Director Global Internal Audit) for global internal audit matters. The Audit Committee also had a special session focusing on IT internal controls and security with Herman De Prins (CIO) and another one on financial internal controls. It also reviewed and approved a new version of the UCB Dealing Code.
In 2017, and in accordance with its terms of reference (see the Charter available on the UCB website), the Audit Committee monitored the financial reporting process (including the financial statements); internal control and risk management systems of UCB and their effectiveness; the internal audit and its effectiveness; the Audit Plan and resulting achievements; the statutory audit of the annual and consolidated accounts; and the independence of the external auditor including the provision of additional services to UCB, which the Audit Committee reviewed and for which it authorized the fees. In addition, the Audit Committee reviewed corporate restructuring projects, global risk management (including cyber & IT risks, litigation and tax review, as well as the UCB Group global risk mapping and policy), impairment and equity value of subsidiaries, pensions schemes and liabilities, new IFRS rules, other new tax or accounting treatments and the external auditor satisfaction surveys. It also supervised the process for the renewal of the mandate of the external Auditor for a new period of 3 years, to be submitted to the approval of the Annual Shareholders Meeting of 26 April 2018.
GOVERNANCE, NOMINATION AND COMPENSATION COMMITTEEThe Board has set up a Governance, Nomination and Compensation Committee, whose composition, functioning and terms of reference are in accordance with the Belgian Companies Code and the Corporate Governance Code.
The composition of the GNCC is currently as follows:
End of term of office
Independent Director
Attendance rate
Evelyn du Monceau, Chair
2019 100%
Kay Davies 2018 x 100%
Pierre L. Gurdjian 2020 x 100%
The GNCC met two times in 2017. The committee was attended by Jean-Christophe Tellier (CEO), except when discussing issues relating to him, and by Fabrice Enderlin and his successor Jean-Luc Fleurial (Chief Talent Officer), who have been acting as secretary of the GNCC, except when discussing issues relating to them and to CEO compensation.
In 2017, and in accordance with its terms of reference (see the Charter available on the UCB website), the GNCC reviewed the appointment proposals to be submitted to Board approval (Board and Executive management as well as senior management positions), the performance of the Executive Committee members and their remuneration. It also proposed and reviewed the succession planning and new appointments of the members of the Board, the Executive Committee and senior executives. It reviewed and made relevant proposals or recommendations to the Board with respect to the future composition of the Board, to be effective as from the General Meeting of 26 April 2018. It reviewed and submitted to Board approval the remuneration policy, the long-term incentives to be granted to the management (including the CEO) and the performance criteria to which these grants were linked. The GNCC made an overall review of the Corporate Governance at UCB, including an annual report on Corporate Governance to the Board. It also ensures the conduct of the full Board evaluation in 2017 as well as the follow up on the outcome of the Board evaluation which was carried out in 2016. It reviewed and approved a new version of the UCB Dealing Code.
After the General Meeting of 2017, Kay Davies has replaced Harriet Edelman as independent Director in the GNCC.
A majority of the members of the GNCC meets the independence criteria stipulated by article 526ter of the Belgian Companies Code, the Board and the Corporate Governance Code, and all members have the competencies and the expertise required in matters of remuneration policies as required by article 526quater, §2 of the Belgian Companies Code.
47 UCB Annual Report 2017

SCIENTIFIC COMMITTEEThe Scientific Committee assists the Board in its review of the quality of UCB R&D science and its competitive standing. The Scientific Committee is composed of members who have scientific and medical expertise and who are currently all independent.
End of term of office
Independent Director
Attendance rate
Kay Davies, Chair 2018 x 100%
Alice Dautry 2019 x 100%
They meet regularly with Ismail Kola and his successor Dhaval Patel, the Patient Value Unit New Medicines™ Head and Chief Scientific Officer. The members of the Scientific Committee are also closely involved in the activities of the Scientific Advisory Board (SAB) of UCB, composed of external leading scientific medical experts. The SAB was created in September 2005 by the Executive Committee to critically review the R&D activities of UCB, provide scientific appraisal and strategic input as to the best way for UCB to become a thriving biopharmaceutical leader and to advise the Executive Committee on the strategic choices related to early stage R&D and R&D technology. The Scientific Committee reports to the Board on the SAB’s appraisal of UCB’s research activities and strategic orientations.
1.3.3 Executive CommitteeCOMPOSITION AND FUNCTIONING OF THE EXECUTIVE COMMITTEEAs of 1 October 2017, the composition of the Executive Committee was as follows:
• Jean-Christophe Tellier, CEO and Chair of the Executive Committee
• Emmanuel Caeymaex, Head of Patient Value Unit Immunology
• Jean-Luc Fleurial, Chief Talent & Company Reputation
• Iris Löw-Friedrich, Head of Patient Value Practices Development and Medical & Chief Medical Officer
• Alexander Moscho, Head of Corporate Strategy & Business Development
• Dhaval Patel, Head of Patient Value Unit New Medicines™ & Chief Scientific Officer
• Pascale Richetta, Head of Patient Value Unit Bone• Anna Richo, General Counsel & Head of Legal,
IP and Ethics & Compliance• Bharat Tewarie, Head of Patient Value Practices
Marketing & Patient Access• Detlef Thielgen, Chief Financial Officer & Head
of Finance, IT & Purchasing• Charl van Zyl, Head of Patient Value Operations• Jeff Wren, Head of Patient Value Unit Neurology
Fabrice Enderlin, Head of Talent, decided to leave and Ismail Kola, Head of Patient Value Unit New Medicines™ and Chief Scientific Officer, retired during 2017. Both left UCB with effect as at 31 December 2017.
As of 1 January 2017, Bharat Tewarie and Detlef Thielgen have headed the Patient Value Operations ad interim. As of 1 March 2017, Charl van Zyl has been appointed to replace Mark McDade as Head of Patient Value Operations. As of 1 September 2017, Jean-Luc Fleurial joined the Executive Committee to replace Fabrice Enderlin (having left the Executive Committee with effect on 1 July 2017 and having left UCB as at 31 December 2017).
Dr. Dhaval Patel joined the Executive Committee as of 1 October 2017, replacing Dr. Ismail Kola as Head of Patient Value Unit New Medicines™ and Chief Scientific Officer. Dr. Ismail Kola stepped out of the Executive Committee as of 1 July 2017 and retired from UCB with effect as at 31 December 2017.
Alexander Moscho also joined the Executive Committee as of 1 October 2017 as Head of Corporate Strategy & Business Development, a new function within the Executive Committee.
In 2017, the Executive Committee met two to three days a month.
There were no transactions or contractual relationships in 2017 between UCB, including its affiliates, and a member of the Executive Committee.
The functioning, competences and delegation of authority of the Executive Committee are further described in the UCB Corporate Governance Charter.
1.3.4 Diversity & inclusionThis section includes the information required pursuant to new article 96, §2, 6° of the Belgian Companies Code (as amended by the law of 3 September 2017, implementing in Belgium law the EU Directive 2014/95 dated 22 October 2014 as regards disclosure of non-financial and diversity information by certain large undertakings and groups).
Diversity at UCB is defined as the collective richness of people’s unique backgrounds, life and cultural experiences.
At UCB, diversity and inclusion is intrinsically linked with our UCB culture: it is consistent with UCB’s sense of purpose, strategies and values. Our cultural intelligence is a critical enabler in the value we bring to our patients.
48
Whereas diversity in itself will not necessarily create greater value, bringing diverse thoughts and perspectives to work effectively together and to create an environment where diverse ideas and dialogue are welcome, enable UCB staff to fully contribute to the creation of patient value.
In recent years, we have accelerated our commitment to diversity and inclusion by raising awareness across the organization. Specifically for leadership, we have focused on:
• Highlighting the importance of diversity and inclusion in our key HR processes, such as recruitment and talent management
• Simulating gender balance scenarios in our management succession planning
• Measuring employee’s opinions on UCB’s diversity and inclusion culture through our regular Employee Engagement Survey
• Ensuring a well-rounded senior leadership pipeline that has been exposed to diverse professional and cultural experiences
For the Board of Directors, we strictly follow all legal requirements in Belgium and have integrated these into our Board recruitment and nomination process. When replacements or appointments for the Board are considered, UCB systematically takes into account how it will enhance gender diversity of the Board. The Board is currently made up of 4 women and 9 men, with 5 nationalities represented. The chair of the Board is also female.
For the Executive Committee, we monitor and make recommendations but do not have a formal diversity policy. Today, our executives come from a diverse education and multi-disciplinary professional backgrounds. The committee is made up of 3 women and 9 men, with 8 nationalities represented. The size of our executive committee also reflects our belief that this is the best guarantee for diversity in experience, knowledge and ability.
Our approach today is not to formalize diversity and inclusion in a set of policies, but to actively promote a culture and practice of diversity and inclusion.
1.4 Remuneration report
The remuneration report describes UCB’s executive and non-executive director remuneration philosophy and policies and how executive compensation levels are set considering individual and company performance. The GNCC oversees our executive and non-executive director compensation policies and plans. The Committee’s roles and responsibilities are described in the Corporate Governance Charter adopted by our Board of Directors.
REMUNERATION FOR NON-EXECUTIVE DIRECTORSUCB’s Board members are compensated for their services through a cash-based compensation program. The level of pay has been set based on benchmarks which include the remuneration of Board members of comparable European biopharmaceutical companies.
The Board members’ pay consists of a fixed annual payment for the Board and committee membership which can vary based on the specific mandate. Board members also receive a fee per meeting attended with the exception of the Chair of the Board who receives only a fixed annual payment. The annual payments are pro-rated according to the number of months served as an active Board member during the calendar year. No long-term equity incentives nor other form of variable pay are granted. An update to the level of pay was approved at the General Meeting of shareholders of 25 April 2013. The remuneration levels for UCB Board members are set as follows:
Annual fees• Chair of the Board – € 210 000 • Vice Chair – € 105 000 • Directors – € 70 000
Board attendance fees• Chair of the Board – no fee (included in annual fees)• Vice Chair – € 1 500 per meeting • Directors – € 1 000 per meeting
Audit / scientific advisory committee (annual fees - no meeting fees)• Chair of the Committees – € 30 000 • Members of the Committees – € 20 000
Governance, Nomination and Compensation Committee (annual fees – no meeting fees)• Chair of the Committee – € 20 000 • Members of the Committee – € 15 000
49 UCB Annual Report 2017
In application of these rules the total remuneration of the members of the Board including committee fees for 2017 was as follows:
ATTENDANCE RATE
FIXED REMUNERATION
AS DIRECTOR
BOARD ATTENDANCE
FEESREMUNERATION AS COMMITTEE MEMBER TOTAL
Audit Committee GNCC Scientific
Committee
Gerhard Mayr, Chair1 2/2 € 70 000 € 70 000
Evelyn du Monceau, Chair2 & 3 6/6 € 175 000 € 3 000 € 20 000 € 198 000
Pierre L. Gurdjian, Vice Chair2 & 3 6/6 € 93 333 € 8 000 € 15 000 € 116 333
Alice Dautry 6/6 € 70 000 € 6 000 € 20 000 € 96 000
Kay Davies 6/6 € 70 000 € 6 000 € 10 000 € 30 000 € 116 000
Albrecht De Graeve 5/6 € 70 000 € 5 000 € 30 000 € 105 000
Roch Doliveux2 4/4 € 46 667 € 4 000 € 50 667
Harriet Edelman¹ 2/2 € 23 333 € 2 000 € 5 000 € 30 333
Charles-Antoine Janssen 6/6 € 70 000 € 6 000 € 20 000 € 96 000
Cyril Janssen 6/6 € 70 000 € 6 000 € 76 000
Viviane Monges² 4/4 € 46 667 € 4 000 € 50 667
Norman J. Ornstein 6/6 € 70 000 € 6 000 € 76 000
Jean-Christophe Tellier, Executive Director 6/6 € 70 000 € 6 000 € 76 000
Cédric van Rijckevorsel 6/6 € 70 000 € 6 000 € 76 000
Ulf Wiinberg 5/6 € 70 000 € 5 000 € 20 000 € 95 000
1 Until 27 April 2017
2 As from 27 April 2017 (appointment by the General Meeting)
3 Given change of role during 2017, remuneration is calculated accordingly pro rata temporis
1.4.1 UCB’s reward principles UCB is a global biopharmaceutical company focusing on creating value for people living with severe conditions. To help us achieve our goals we require an engaged workforce working closely together to create superior and sustainable value for patients. Our compensation plans are aimed at driving and rewarding outstanding performance and innovation while aligning our employees to our patient value ambition. Our Global Reward program is built around the following principles:
• to provide a strong motivation for delivering on our strategy being the achievement of our patient-value goals;
• to link employee remuneration to both individual contribution and to our collective successes;
• to recognize and reward sustained high performance while requiring behaviors that are fully aligned with our patient value principles;
• to be fair and equitable according to market practices;
• and to enable UCB to attract, engage and retain the right talents.
To ensure that pay appropriately reflects performance
variable pay constitutes the most significant component of total remuneration for our Executive Committee team. UCB’s variable pay programs are directly linked to both short-term achievements and long-term individual and company performance to ensure a balanced focus on financial results, company sustainability and value creation for our stakeholders.
1.4.2 The UCB Executive Remuneration PolicyThe remuneration policy for members of the Executive Committee is set by the Board on the basis of recommendations by the GNCC. The GNCC meets at least twice per year during which time it:
• considers the market factors affecting the company’s current and future pay practices;
• evaluates the effectiveness of our remuneration policies in recognizing performance and determines the appropriate evolution of the plans;
• reviews the financial targets of the different performance-based compensation programs;
• determines the compensation levels of UCB’s management team in view of their individual roles, competencies and performance.
50

The GNCC ensures that the reward programs applicable to the members of the Executive Committee, including equity incentives, pension schemes and other benefits, are fair and appropriate to attract, retain and motivate the Executive Committee team.
1.4.3 Statement on the remuneration policy applied to the reported year: remuneration for executive directorsThis section covers the competitive positioning strategy that UCB adopts against the market in which it operates. It also describes our executive compensation structure, the purpose of the different elements of pay and the link between pay and performance.
BENCHMARK FOR OUR REWARD PROGRAMIn line with our total reward principles our executive remuneration must be reasonable in view of the company economics and the relevant practices of comparable global biopharmaceutical companies. The GNCC regularly considers the appropriate mix and level of cash and equity awards to offer to its executives based on recommendations from the Talent and Company Reputation department. These recommendations are reviewed with our independent compensation consultant, Willis Towers Watson, to ensure the market competitiveness of our total direct compensation and to take into consideration market trends affecting our sector. An individual market assessment is typically conducted every other year to assess the competitiveness of the total direct compensation components for each executive. The compensation package is composed of two main elements:
• a fixed compensation element: base salary• a variable compensation element: consisting of a
bonus and long-term incentives
The CEO and Executive Committee target total direct compensation mix is as follows:
UCB benchmarks its executive total compensation against a defined comparator group of international companies within the biopharmaceutical sector (companies with pharmaceutical and/or biotechnology activities). In the benchmark we take a focused approach to peer companies in Europe as well as the U.S. The companies in our peer group vary in size and therapeutic area. We typically
41%
30%
26%
26%
33%
42%
Executive Committee
CEO
SALARY BONUS LTI
0 20 40 60 80 100
target peer companies that are fully-integrated biopharmaceuticals operating in a complex research-driven environment and including development and commercialization capabilities. Where possible we aim to include companies competing in the same therapeutic areas. While we target companies that broadly reflect UCB’s size, company size is not the primary factor as regression analysis is also used to adjust data to UCB’s size.
The composition of our compensation peer group is monitored regularly and adjusted when appropriate, for instance when industry consolidation leads to less robust benchmarking.
UCB’s competitive positioning policy is to target median pay levels of this comparator group for all elements of total direct compensation. The actual compensation for each individual is determined considering their experience in relation to the benchmark as well as their impact on company performance.
COMPENSATION ELEMENTS AND PAY FOR PERFORMANCEOur compensation program compensates executives for their responsibilities as well as individual and corporate performance. Both the short-term (bonus) and long-term incentives take into account performance against targets which are set by the Board. Throughout the performance period, the ongoing achievements are monitored and at the moment of vesting or payout, the final results are validated by the corporate finance department before final approval by the Audit Committee and the Board.
The total direct compensation (base salary, bonus and long-term incentives) is highly variable depending on individual and corporate performance as illustrated below. A bonus will only be due if an acceptable threshold of company and/or individual performance is achieved. To reach 100% of bonus a stretched target must be met and only with very exceptional company and individual performance can the maximum be achieved. The pay for performance impact can be illustrated as follows for the CEO and is described in more detail later in this section:
CEO THEORETICAL PAY OPPORTUNITY
In addition to the base salary and performance-related incentive pay, our executives are eligible for a range of benefits and perquisites. The remuneration structure
Max.
Min.
On target performance
100%
BASE SALARY
VARIABLE PAY
51 UCB Annual Report 2017

is in line with market compensation practices and fully aligned with Belgian corporate governance legislation and European regulations on executive compensation.
The GNCC makes compensation proposals for the CEO to the Board. The CEO provides compensation recommendations for the other Executive Committee members to the GNCC for endorsement.
Below we describe how each element of remuneration is determined and how performance is embedded in the variable components.
FIXED COMPENSATION COMPONENT: BASE SALARYThe target base salary is defined in relation to the specific job dimensions and the median level of base salary that the market typically pays for such a role. The actual base salary level of the individual depends on the extent to which he/ she impacts the business and their level of skill and experience. The evolution of base salary depends on the individual’s level of sustained performance and the evolution of the benchmark. Annual increases are largely in line with average salary movements across the wider workforce in the applicable geography.
VARIABLE COMPENSATION COMPONENTSTarget variable compensation levels (bonus and long-term incentives or “LTI”) are set considering the median market level of our compensation peer group. These targets are subject to the application of performance multipliers which consider company performance, individual results as well as individual behaviors and a holistic consideration of long-term value creation for our patients.
VARIABLE COMPENSATION: BONUSThe bonus is designed to reward employees for the performance of the company and of the individual over a time horizon of one year. The bonus target is subject to a double performance multiplier which consists of corporate and individual performance multipliers. The mechanism provides a direct link between individual contribution and company performance which are considered to be interdependent. The calculation mechanism delivers significant value when both company and individual performance are excellent. Conversely if company and/or individual performance levels are lower than expectations this is reflected through significantly diminished value.
UCB considers annual Recurring Earnings Before Interest Tax Depreciation and Amortization (“REBITDA”) as the short-term corporate performance metric for its executives and for the wider workforce. The Corporate Performance Multiplier (“CPM”) is defined by the percentage of actual REBITDA versus the budget, at constant exchange rates, translated into a
payout curve which ensures that only an acceptable range of performance is rewarded. The target is set at a level that the GNCC considers to be suitably challenging. A threshold is set at a level that is deemed to be the minimum acceptable level of performance, and as the target is stretched, the maximum can only be reached if truly exceptional performance is attained. The payout curve for senior management is currently set as follows:
Recurring EBITDA vs. target Payout
<85% 0%
85% 30%
93% 90%
100% 100%
106% 110%
113% 150%
The target set for 2017 REBITDA implied a double-digit increase on the previous year’s target, at constant exchange rates.
As the bonus calculation is based on a double multiplier, a CPM of 0% results in there being no bonus payout, regardless of individual performance.
The Individual Performance Multiplier (“IPM”) is defined considering the extent to which annual objectives have been met as well as the behaviors demonstrated by the individual evaluated against UCB’s Patient Value principles. Again the IPM can be 0% and can reach a maximum of 175% of target for very exceptional performance.
The objectives for the CEO are proposed by the GNCC for approval by the Board of Directors. The GNCC proposes the Individual Performance Multiplier (“IPM”) for the CEO to the Board based on the performance assessment at the end of the year. The CEO proposes the IPM for each of the other Executive Committee members to the GNCC for endorsement. In discussing individual performance the GNCC considers the achievement of the financial and quantitative objectives of the CEO as well as the non-financial aspects.
For the CEO and the Executive Committee the evaluation includes the extent to which the individuals have carried out their duties in line with UCB’s Patient Value principles and expected leadership behaviors. Below are the criteria which are evaluated for each Executive Committee member:
• Specific business achievements• Strategic input and vision• Team leadership• Executive Committee team membership• Impact
52

The target bonus is set at 90% of base salary for the CEO and 65% for the other Executive Committee members in line with market practices.
Each executive has the opportunity to exceed the targets when both company and individual performance are outstanding or to have a reduced payout compared to the target if either corporate or individual performance is not reaching expected levels.
VARIABLE COMPENSATION: LONG-TERM INCENTIVES (LTI)To ensure sustainable performance, our Upper Management remuneration practice links a significant portion of equity-based compensation to mid-term and long-term company financial and non-financial strategic goals. The LTI program is benchmarked against European biopharmaceutical company practices. It is a three-tiered incentive program which includes a stock option plan, a free share plan (stock award) and a performance share plan. Eligibility for participation in the LTI Plans is at the Board’s discretion.
The long-term incentive target is expressed as a percentage of base pay. At target levels long-term incentives represent 140% of base pay for the CEO (increased from 120% previously due to evolutions observed in the competitive landscape) and 80% for the other Executive Committee members. The actual grant size is adjusted in view of individual performance considering a mix of short-term achievements and the impact on long-term value creation. The resulting value is translated into a number of long-term incentives using the binomial value of each award and spread across our long-term incentive vehicles based on the following allocation:
STOCK OPTIONSThe Stock Option Plans allows the beneficiary to purchase a UCB share at a certain price following a defined vesting period. The vesting period is typically three years from the date of grant but can be longer depending on local practices. Once vested, stock
options can be exercised when the share price exceeds the grant price and thus executives are incentivized to increase the share price over the vesting period. In the U.S., Stock Appreciation Rights are granted instead of stock options. These follow the same vesting rules as the Stock Option Plans but are settled in cash rather than in shares according to the appreciation in value of UCB stock. All stock options and stock appreciation rights expire on their tenth anniversary from the date of grant. The grant price is fixed on the grant date without further discount on the underlying UCB share price. For executives holding a Belgian contract taxes are due at the moment of grant based on the underlying value of the options.
STOCK AWARDSThe Stock Award Plans provide conditional rights to UCB common stock fulfilled upon remaining in employment with UCB three years after the grant date. The vesting period is three years from the date of grant. Executives are incentivized to increase the company share price over the vesting period to optimize the value of their stock awards at the moment of vesting. In some countries delivery of the award may also be made in phantom shares (an award the value of which is based on the evolution of the share price but which is settled in cash on a pre-determined vesting date) depending on the local legislative environment.
PERFORMANCE SHARE PLANThe Performance Share Plan aims at rewarding senior executives for specific achievements aligned with company strategic priorities. Performance shares are grants of UCB common stock to the senior executive group for which certain pre-established companywide targets must be met at the time of vesting to trigger payout. The performance criteria and targets are defined by the Board upon proposal of the GNCC at the time of grant. The metrics used in this plan must be relevant to company and stakeholders interests while being within the influence and control of our executives. They also must be measurable over the plan’s time horizon.
The vesting period is three years. The number of shares awarded is adjusted at the end of the vesting period based on the company’s performance against its goals. If actual company performance is below a specified threshold or the beneficiary leaves prior to vesting then no shares are awarded. The maximum award is 150% of the original grant which is due if results are significantly above the original targets. The target is set at a level which is sufficiently stretched and the maximum is linked to performance that would be considered exceptional.
35% PERFORMANCE SHARES
30% STOCK OPTIONS
35% STOCK AWARDS
LONG
-TE
RM
INC
EN
TIVES
53 UCB Annual Report 2017
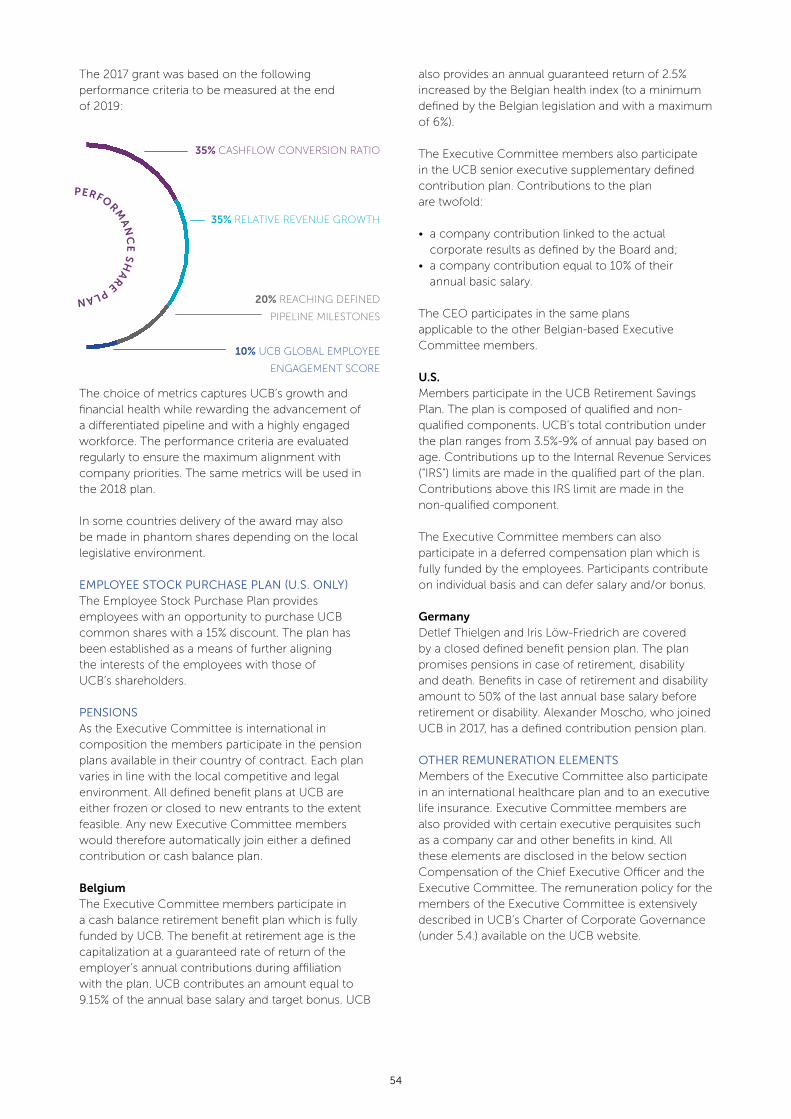
The 2017 grant was based on the following performance criteria to be measured at the end of 2019:
The choice of metrics captures UCB’s growth and financial health while rewarding the advancement of a differentiated pipeline and with a highly engaged workforce. The performance criteria are evaluated regularly to ensure the maximum alignment with company priorities. The same metrics will be used in the 2018 plan.
In some countries delivery of the award may also be made in phantom shares depending on the local legislative environment.
EMPLOYEE STOCK PURCHASE PLAN (U.S. ONLY) The Employee Stock Purchase Plan provides employees with an opportunity to purchase UCB common shares with a 15% discount. The plan has been established as a means of further aligning the interests of the employees with those of UCB’s shareholders.
PENSIONSAs the Executive Committee is international in composition the members participate in the pension plans available in their country of contract. Each plan varies in line with the local competitive and legal environment. All defined benefit plans at UCB are either frozen or closed to new entrants to the extent feasible. Any new Executive Committee members would therefore automatically join either a defined contribution or cash balance plan.
BelgiumThe Executive Committee members participate in a cash balance retirement benefit plan which is fully funded by UCB. The benefit at retirement age is the capitalization at a guaranteed rate of return of the employer’s annual contributions during affiliation with the plan. UCB contributes an amount equal to 9.15% of the annual base salary and target bonus. UCB
also provides an annual guaranteed return of 2.5% increased by the Belgian health index (to a minimum defined by the Belgian legislation and with a maximum of 6%).
The Executive Committee members also participate in the UCB senior executive supplementary defined contribution plan. Contributions to the plan are twofold:
• a company contribution linked to the actual corporate results as defined by the Board and;
• a company contribution equal to 10% of their annual basic salary.
The CEO participates in the same plans applicable to the other Belgian-based Executive Committee members.
U.S.Members participate in the UCB Retirement Savings Plan. The plan is composed of qualified and non-qualified components. UCB’s total contribution under the plan ranges from 3.5%-9% of annual pay based on age. Contributions up to the Internal Revenue Services (“IRS”) limits are made in the qualified part of the plan. Contributions above this IRS limit are made in the non-qualified component.
The Executive Committee members can also participate in a deferred compensation plan which is fully funded by the employees. Participants contribute on individual basis and can defer salary and/or bonus.
GermanyDetlef Thielgen and Iris Löw-Friedrich are covered by a closed defined benefit pension plan. The plan promises pensions in case of retirement, disability and death. Benefits in case of retirement and disability amount to 50% of the last annual base salary before retirement or disability. Alexander Moscho, who joined UCB in 2017, has a defined contribution pension plan.
OTHER REMUNERATION ELEMENTSMembers of the Executive Committee also participate in an international healthcare plan and to an executive life insurance. Executive Committee members are also provided with certain executive perquisites such as a company car and other benefits in kind. All these elements are disclosed in the below section Compensation of the Chief Executive Officer and the Executive Committee. The remuneration policy for the members of the Executive Committee is extensively described in UCB’s Charter of Corporate Governance (under 5.4.) available on the UCB website.
35 %
35
%
20%10
%
35% CASHFLOW CONVERSION RATIO
35% RELATIVE REVENUE GROWTH
20% REACHING DEFINED
PIPELINE MILESTONES
10% UCB GLOBAL EMPLOYEE
ENGAGEMENT SCORE
PERFORMA
NC
E S
HA
R
E PLAN
54

TERMINATION ARRANGEMENTSGiven the international character of our Executive Committee as well as the dispersal of our various activities across different geographies our members have agreements governed by different legal jurisdictions.
A Belgian service contract was established during 2014 for Jean-Christophe Tellier and maintains similar termination conditions to those that were in place under his previous U.S. employment agreement comprising a lump sum equal to 18 months base compensation plus the average of the actual bonuses paid for the three previous years in case the contract is terminated by the company or in case of a change of control of UCB.
Several Executive Committee agreements (Emmanuel Caeymaex, Fabrice Enderlin, Ismail Kola, Iris Löw-Friedrich and Detlef Thielgen) were signed before the entry into force of the Belgian Corporate Governance law of 6 April 2010 which limits the level of termination indemnities.
Detlef Thielgen and Emmanuel Caeymaex have no specific termination provisions in their Belgian contracts. In case of involuntary termination, local employment law and practices would apply.
Jean-Luc Fleurial, Dhavalkumar Patel, Pascale Richetta, Bharat Tewarie and Charl van Zyl have Belgian employment contracts and each has a termination clause which would entitle them to a severance payment of 12 months base salary and bonus in case the contract is terminated by the company or in case of a change of control of UCB.
Iris Löw-Friedrich and Alexander Moscho both have a German employment agreement which provides a six months’ notice period and a termination indemnity equal to one year base salary and bonus.
Anna Richo is covered by a U.S. employment agreement which contains a clause allowing for a severance payment equal to 18-month base salary and bonus should there be an involuntary termination of the employment agreement or in case of change of control in UCB.
Jeff Wren, who holds a U.S. employment agreement, has a termination clause which would entitle him to a severance payment of 12 months base salary in case the contract is terminated by the company.
Fabrice Enderlin decided to leave UCB and Ismail Kola retired from service, both at the end of 2017. No severance payments were due.
1.4.4 Remuneration policy as of 2018The GNCC continues to monitor the Upper Management Compensation policy. While analysis will be carried out on the global competitiveness of variable pay, no amendments are currently planned in 2018.
1.4.5 Compensation of the Chief Executive Officer and the Executive CommitteeThe remuneration of the CEO as described above is composed of base salary short-term and long-term incentives as well as perqusites and benefits In addition he is entitled to a director fees as a Board member of UCB SA. The remuneration granted directly or indirectly to the CEO by UCB or any other of its affiliates in 2017 amounted to:• Base salary: € 1 037 917;• Short-term incentive (bonus) paid in 2018 and
relating to the financial year 2017: € 1 536 217;• Long-term incentives (number of UCB shares and
options): see section below;• Other components of the remuneration such as the
cost of pension and insurance coverage, the value of fringe benefits and other contractual obligations: € 860 601 thereof € 357 286 being the retirement benefit (based on service cost).
The CEO’s total compensation (base salary + bonus + LTI) for 2017 amounts to € 4 339 393 (excluding pension contributions and other benefits).
OTHER MEMBERS OF THE EXECUTIVE COMMITTEEThe amount of compensation stated below reflects the amount the Executive Committee members have earned in 2017 based on their effective period in service as Executive Committee members (see above section “Composition of the Executive Committee”).
The remuneration and other benefits granted directly or indirectly on a global basis to all the other members of the Executive Committee by the company or any other affiliate belonging to the group in 2017 amount to:• Base salaries (earned in 2017): € 5 933 960;• Short-term incentive (bonus) paid in 2018 and
relating to financial year 2017: € 4 534 030;• Long-term incentive (number of UCB shares and
options): see section below;• Other components of the remuneration such as
the cost of pension and insurance coverage, the value of other fringe benefits and other contractual obligations: € 5 882 382 thereof € 3 195 779 being the amount of retirement benefit (based on service cost).
The aggregated Executive Committee compensation (base salary + bonus + LTI) for 2017 amounts to: € 19 268 154 (excluding pension contributions and other benefits).
55 UCB Annual Report 2017
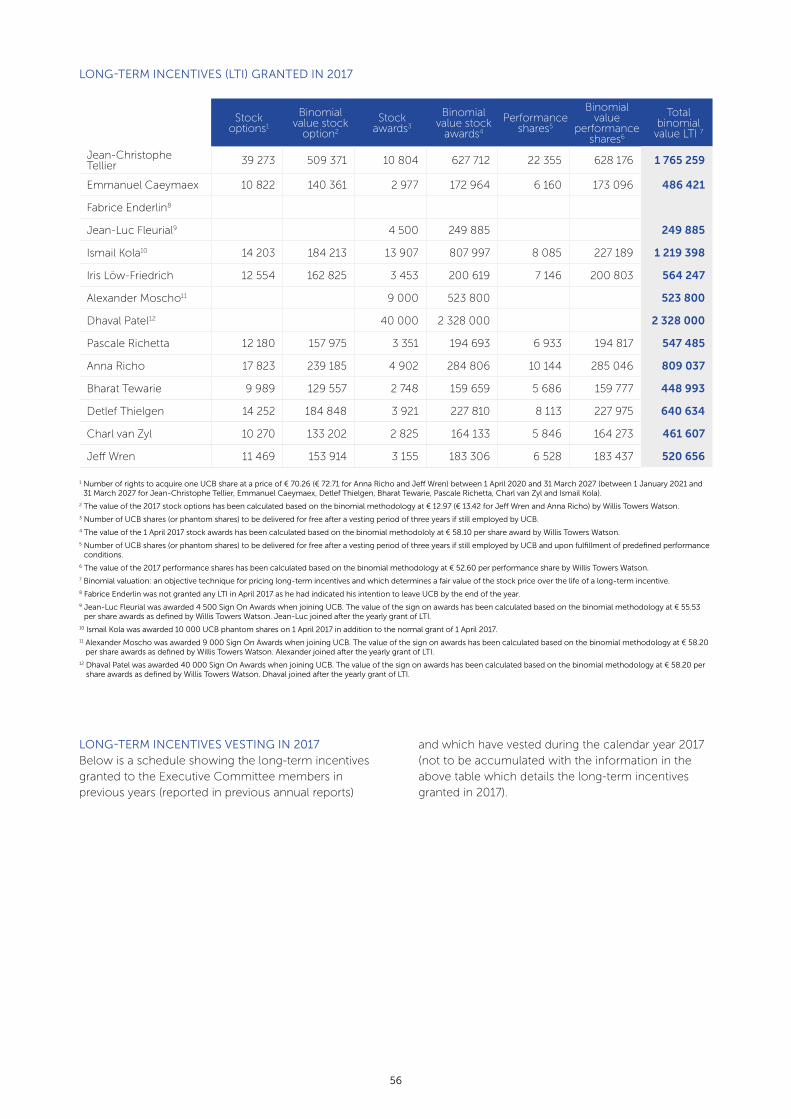
LONG-TERM INCENTIVES (LTI) GRANTED IN 2017
Stock options1
Binomial value stock
option2
Stock awards3
Binomial value stock
awards4
Performance shares5
Binomial value
performance shares6
Total binomial
value LTI 7
Jean-Christophe Tellier 39 273 509 371 10 804 627 712 22 355 628 176 1 765 259
Emmanuel Caeymaex 10 822 140 361 2 977 172 964 6 160 173 096 486 421
Fabrice Enderlin8
Jean-Luc Fleurial9 4 500 249 885 249 885
Ismail Kola10 14 203 184 213 13 907 807 997 8 085 227 189 1 219 398
Iris Löw-Friedrich 12 554 162 825 3 453 200 619 7 146 200 803 564 247
Alexander Moscho11 9 000 523 800 523 800
Dhaval Patel12 40 000 2 328 000 2 328 000
Pascale Richetta 12 180 157 975 3 351 194 693 6 933 194 817 547 485
Anna Richo 17 823 239 185 4 902 284 806 10 144 285 046 809 037
Bharat Tewarie 9 989 129 557 2 748 159 659 5 686 159 777 448 993
Detlef Thielgen 14 252 184 848 3 921 227 810 8 113 227 975 640 634
Charl van Zyl 10 270 133 202 2 825 164 133 5 846 164 273 461 607
Jeff Wren 11 469 153 914 3 155 183 306 6 528 183 437 520 656
1 Number of rights to acquire one UCB share at a price of € 70.26 (€ 72.71 for Anna Richo and Jeff Wren) between 1 April 2020 and 31 March 2027 (between 1 January 2021 and 31 March 2027 for Jean-Christophe Tellier, Emmanuel Caeymaex, Detlef Thielgen, Bharat Tewarie, Pascale Richetta, Charl van Zyl and Ismail Kola).
2 The value of the 2017 stock options has been calculated based on the binomial methodology at € 12.97 (€ 13.42 for Jeff Wren and Anna Richo) by Willis Towers Watson.3 Number of UCB shares (or phantom shares) to be delivered for free after a vesting period of three years if still employed by UCB.4 The value of the 1 April 2017 stock awards has been calculated based on the binomial methodololy at € 58.10 per share award by Willis Towers Watson.5 Number of UCB shares (or phantom shares) to be delivered for free after a vesting period of three years if still employed by UCB and upon fulfillment of predefined performance
conditions.6 The value of the 2017 performance shares has been calculated based on the binomial methodology at € 52.60 per performance share by Willis Towers Watson.7 Binomial valuation: an objective technique for pricing long-term incentives and which determines a fair value of the stock price over the life of a long-term incentive.8 Fabrice Enderlin was not granted any LTI in April 2017 as he had indicated his intention to leave UCB by the end of the year.9 Jean-Luc Fleurial was awarded 4 500 Sign On Awards when joining UCB. The value of the sign on awards has been calculated based on the binomial methodology at € 55.53
per share awards as defined by Willis Towers Watson. Jean-Luc joined after the yearly grant of LTI.10 Ismail Kola was awarded 10 000 UCB phantom shares on 1 April 2017 in addition to the normal grant of 1 April 2017.11 Alexander Moscho was awarded 9 000 Sign On Awards when joining UCB. The value of the sign on awards has been calculated based on the binomial methodology at € 58.20
per share awards as defined by Willis Towers Watson. Alexander joined after the yearly grant of LTI.12 Dhaval Patel was awarded 40 000 Sign On Awards when joining UCB. The value of the sign on awards has been calculated based on the binomial methodology at € 58.20 per
share awards as defined by Willis Towers Watson. Dhaval joined after the yearly grant of LTI.
LONG-TERM INCENTIVES VESTING IN 2017Below is a schedule showing the long-term incentives granted to the Executive Committee members in previous years (reported in previous annual reports)
and which have vested during the calendar year 2017 (not to be accumulated with the information in the above table which details the long-term incentives granted in 2017).
56

STOCK OPTIONS STOCK AWARDS PERFORMANCE SHARES
Number vested (not exercised)2
Number exercised3
Number vested
Total value upon vesting
(€)
Total number of shares
vested
Shares vested (% of granted
shares)8
Total value upon
vesting (€)
Jean-Christophe Tellier 30 656 7 916 573 712 16 136 125% 1 461 821
Emmanuel Caeymaex 6 000 1 483 107 480 3 024 125% 273 956
Fabrice Enderlin 12 170 15 000 4 749 344 184 9 680 125% 876 948
Jean-Luc Fleurial1
Ismail Kola7 18 560 50 000 41 680 2 863 265 27 418 125% 2 107 308
Iris Löw-Friedrich4 15 666 11 100 9 045 648 979 8 245 125% 739 473
Alexander Moscho1
Dhaval Patel1
Pascale Richetta1, 5 15 000 970 950
Anna Richo 15 434 19 476 3 985 288 813 8 123 125% 735 893
Bharat Tewarie1, 6 4 000 283 720
Detlef Thielgen 14 904 12 092 876 368 9 361 125% 848 048
Charl van Zyl1
Jeff Wren 7 513 11 941 787 974 3 956 125% 358 389
1 Jean-Luc Fleurial,Charl van Zyl, Alexander Moscho, Dhaval Patel, Pascale Richetta and Bharat Tewarie joined UCB after the 2014 LTI grant.2 The stock options granted to Iris Löw-Friedrich on 1 April 2014 vested on 1 April 2017 and have an exercise price of € 58.12. The stock appreciation rights granted to Anna Richo, Jeff Wren and Jean-Christophe Tellier on 1 April 2014 vested on 1 April 2017 and have an exercise price of € 58.12. The stock options granted to Detlef Thielgen, Ismail Kola, Emmanuel Caeymaex and Fabrice Enderlin on 1 April 2013 vested on 1 January 2017 and have an exercise price of € 48.69.
3 Fabrice Enderlin exercised stock options granted to him on April 1, 2012 with an exercise price of € 32.36. Ismail Kola exercised stock options granted to him on April 1, 2010 with an exercise price of € 31.62; stock options granted to him on April 1, 2011 with an exercise price of € 26.72; stock options granted to him on April 1, 2012 with an exercise price of € 32.36; stock options granted to him on April 1, 2013 with an exercise price of € 48.69. Iris Löw-Friedrich exercised stock options granted to her on April 1, 2007 with an exercise price of € 43.57; stock options granted to her on April 1, 2008 with an exercise price of € 22.01. Anna Richo exercised Stock Appreciation Rights granted to her on April 1, 2013 with an exercise price of € 49.80.
4 Upon vesting on April 1, 2017, the UCB share had a value of € 72.475, which represents the market value of the shares delivered on the vesting date determined as the average of the high and the low price of UCB shares on that date For Iris Löw-Friedrich the UCB share had a value of € 71.75, which represents the low price of the UCB shares on that date (according to the German tax legislation).
5 Upon vesting on February 1, 2017, of the sign on award granted to Pascale Richetta and o fthe special recognition award to Jeff Wren, the UCB share had a value of € 64.73, which represents the market value of the shares delivered on the vesting date determined as the average of the high and the low price of UCB shares on that date.
6 Upon vesting on March 16, 2017, of the sign on award granted to Bharat Tewarie, the UCB share had a value of € 70.93, which represents the market value of the shares delivered on the vesting date determined as the average of the high and the low price of UCB shares on that date.
7 Ismail Kola left on retirement end of 2017. Based on the Stock Award and the Performance Share plan rules the awards granted in 2015 vested in full and the awards granted in 2016 and 2017 were reduced pro rata temporis and vested in cash on December 31, 2017. 41 417 awards were delivered to him on that date. The UCB share had a value of € 66 385, which represents the market value of the shares delivered on the vesting date determined as the average of the high and the low price of UCB shares.
8 The Performance Shares granted in 2014 were paid out at 125% based on the results achieved vs the performance conditions set at grant.
2018 LONG-TERM INCENTIVE GRANTUCB’s policy is to grant a number of long-term incentives based on the Individual performance for the performance year as well as a consideration of individual impact on long-term value creation. The grant is made on 1 April, following the close of the performance year. The grant size is based on a
valuation and share price defined in the policy. The actual grant value is only known on 1 April based on the share price on that day. Below can be found the number of options and awards to be granted on 1 April 2018. The resulting grant value will be reported in next year's report.
57 UCB Annual Report 2017

1.5 Main features of the internal control and risk management systems of UCB
1.5.1 Internal controlAs the governing body of UCB, the Board provides entrepreneurial leadership to UCB and is responsible for approving the strategy, goals and objectives of the company. This includes overseeing the establishment, implementation and review of a prudent and effective system of internal controls, as described herein, as well as the risk management processes as further described in 1.5.2 below.
The Audit Committee assists the Board in its responsibility of monitoring the internal control and risk management processes established by the management of UCB and the UCB Group as a whole; the effectiveness of the overall internal control processes of UCB; the overall financial reporting process; the external auditor (including its appointment procedure); and the Global Internal Audit function and its effectiveness.
UCB management is responsible for establishing and maintaining adequate internal controls to provide reasonable assurance regarding the achievement of objectives of the reliable nature of financial information, compliance with relevant laws and regulations, and performance of the internal control processes (control environment, risk/control system and monitoring) within UCB in the most efficient manner. The internal controls process is monitored worldwide by the Internal Control function in an automated manner for system access and segregation of duties, process control-self assessment testing, and continuous controls monitoring. Information
systems are developed to support UCB’s long-term objectives and are managed by a professionally staffed Information Management team.
As an important component of managements system of internal controls, UCB updates its business plan on an annual basis and prepares a detailed annual budget for each financial year that is considered and approved by the Board. A management reporting system is in place, providing management with financial and operational performance measurement indicators. Management accounts are prepared monthly to cover each major area of the business. Variances from plan and previous forecasts are analyzed, explained and acted on in a timely manner. In addition to regular Board discussions, meetings are held at least monthly by the Executive Committee to discuss performance, with specific projects being discussed as and when required.
The Global Internal Audit function provides independent, objective assurance services designed to evaluate, add value and improve the internal control environment and operations of UCB by bringing a systematic, disciplined approach to the evaluation of, and recommending enhancements to the governance, compliance, internal control, and risk management processes of UCB.
The Global Internal Audit group undertakes an Audit Plan of financial, compliance and operational audits and reviews, as reviewed and approved by the Audit Committee and covering relevant company activities.
Stock options 2018 Stock awards 2018 Performance shares 2018
Jean-Christophe Tellier 44 741 12 561 20 745
Emmanuel Caeymaex 11 741 3 296 5 444
Jean-Luc Fleurial 7 519 2 111 3 486
Iris Löw-Friedrich 14 472 4 063 6 710
Alexander Moscho 8 647 2 428 4 009
Dhaval Patel 15 273 4 288 7 082
Pascale Richetta 13 088 3 675 6 069
Anna Richo 16 883 4 740 7 828
Bharat Tewarie 10 734 3 014 4 977
Detlef Thielgen 15 166 4 258 7 032
Charl van Zyl 13 929 3 911 6 459
Jeff Wren 11 077 3 110 5 136
58
The program includes independent reviews of the systems of internal control and risk management. The findings and the status of corrective actions taken to address these are regularly reported in writing to the Executive Committee and the status of the completion of the Audit Plan as well as a summary of the findings and the status of corrective actions are reported in writing to the Audit Committee at least twice per year.
UCB has adopted formal procedures focused on internal controls over financial reporting, referred to as the Transparency Directive process. This process is intended to help minimize the risk of selective disclosure; to help ensure that all material information disclosures made by UCB to its investors, creditors and regulators are accurate, complete, timely and fairly present the condition of UCB; and to help ensure adequate disclosure of material financial and non-financial information and significant events, transactions and risks.
The process consists of a number of activities. Identified key contributors in the internal control process, which include all Executive Committee members, are required to certify in writing that they understand and have complied with the requirements of UCB related to the financial reporting process, including providing reasonable assurance of effective and efficient operations, reliable financial information and compliance with Laws and regulations. To promote their understanding of the broad range of potential issues, a detailed checklist is provided to them to complete and to assist them in their certification. In addition, a detailed worldwide desk review of Sales, Credits, Accounts Receivables, Trade Inventories, Accruals, Provisions, Reserves and Payments is performed, and the Finance Directors/representatives of all individual entities are required to acknowledge in writing that their financial reporting in these areas is based on reliable data and that their results are properly stated in accordance with requirements.
These procedures are coordinated by the Global Internal Audit function in advance of the issuance of the half-year and annual accounts. The results of the procedures are reviewed with the Chief Accounting Office, as well as Finance, the Legal Department and the External Auditors. Appropriate follow-up of any potential issues identified is performed and consideration of adjustments to reported financial information or disclosures is evaluated. The results of these procedures are reviewed with the CEO and the CFO, and subsequently with the Audit Committee, prior to the publication of the accounts.
1.5.2 Risk managementA global Risk Management policy, applicable for the whole UCB Group and its affiliates worldwide, describes the commitment of UCB to provide an effective risk management system across the UCB Group in order to minimize exposure to threats that could impact UCB’s ability to achieve corporate objectives.
The Board is responsible for approving the strategy, goals and objectives of the UCB Group and overseeing the establishment, implementation and review of the risk management system of the UCB Group.
The Board is assisted by the Audit Committee in its responsibility for the appreciation of risk management. The Audit Committee examines on a regular basis the areas where risks could significantly affect the financial situation or reputation of the UCB Group. The Audit Committee monitors the overall risk management process of UCB.
The Risk2Value Table, consisting of senior management representatives of all business functions and reporting to the Executive Committee, provides strategic leadership that endorses the enterprise level risk assessment and prioritization process that drives the establishment of risk mitigation plans within all business functions and operations, supported by an enterprise risk management system to effectively assess, report and manage actual or potential risks or exposures. The top risks of the organization are owned by a member of the Executive Committee to ensure accountability and priority.
The Head of Enterprise Risk Management provides periodic status updates directly to the Executive Committee and, on a periodic basis, to the Audit Committee as well as to the Board. The Executive Committee is responsible for implementing the risk management strategy and objectives, and the Global Internal Audit function is responsible for independently and regularly reviewing as well as validating the risk management process in UCB and jointly agreeing with the business functions on actions to mitigate and control assessed risks.
59 UCB Annual Report 2017

1.7 External audit
1.6 Private investment transactions and trading in UCB shares
The General Meeting held on 30 April 2015 renewed the mandate of PwC Bedrijfsrevisoren BV CVBA/Reviseurs d’Entreprises SC SCRL as External Auditors for UCB for the legal term of 3 years. The permanent representative designated by PwC for UCB in Belgium is Mr. Romain Seffer (currently via SC SPRL Romain Seffer).
PwC has been appointed as External Auditor in the affiliates of the UCB Group worldwide. The Board will propose the renewal of the mandate of PwC as
External Auditors for UCB for a new term of three (3) years to the General Meeting to be held on 26 April 2018. This proposal is in line with the transitional provisions of the Regulation (EU) No 537/2014 of the European Parliament and of the Council of 16 April 2014 on specific requirements regarding statutory audit of public-interest entities.
The 2017 fees paid by UCB to its External Auditors amounted to:
The Board has approved a Dealing Code to prevent insider trading offences and market abuse, particularly during the periods preceding the publication of results or information that would likely have an effect on the price of UCB securities or, as the case may be, the price of the securities issued by a third party company.
During 2016, a new Dealing Code has been approved by the Board to reflect the rules of the new EU Regulation No 596/2014 on Market Abuse, Directive 2014/57/EU on criminal sanctions for market abuse and the Belgian Law of 2 August 2002 on the supervision of the financial sector and on financial services, as amended by the Law of 27 June 2016, which entered into force on 3 July 2016. During 2017, UCB reviewed the Dealing Code and updated it to reflect new legislation and to include considerations relating to ethics in accordance with our Patient Value Strategy.
The Dealing Code includes rules for Directors, executive management and key employees which prohibit the dealing in UCB shares or other financial instruments related to the UCB share for a designated period preceding the announcement of its financial results (so-called “closed periods”). It further prohibits trading in UCB shares or other related securities for persons who are, or may soon be, in possession of inside information.
The Board has appointed Anna Richo, Executive Vice President and General Counsel, together with Xavier Michel, Vice President and Secretary General, acting separately, as Insider Trading Compliance Officers whose duties and responsibilities are defined in the Dealing Code.
In accordance with the Dealing Code, the Company has further established the list of Persons Discharging Managerial Responsibilities (Directors and members of the Executive Committee) and the list of key employees, who have to inform and obtain prior clearance from the Insider Trading Compliance Officer(s) for the transactions on UCB shares and related securities they intend to make for their own account. Dealings in the Company securities by the Persons Discharging Managerial Responsibilities as well as the Persons closely associated therewith also need to be reported to the Financial Services and Market Authority (FSMA), the Belgian market supervisory authority. The procedure for such reporting and the duties relating thereto are also reflected in UCB Dealing Code.
The Dealing Code is available on the UCB website: www.ucb.com/investors/UCB-Governance.
2017 – ACTUAL Audit Other attestation missions Tax services
Other missions external to the audit
TOTAL
PwC (Belgium-statutory auditor) € 685 842 € 151 497 - € 60 290 € 897 629
PwC other related networks € 1 461 947 € 128 173 € 70 794 € 638 900 € 2 299 814
Total € 2 147 789 € 279 670 € 70 794 € 699 190 € 3 197 443
60

1.8 Information requested under article 34 of the royal decree of 14 november 2007
The following elements may have an impact in the event of a takeover bid:
1.8.1 UCB’s capital structure, with an indication of the different classes of shares and, for each class of shares, the rights and obligations attached to it and the percentage of total share capital that it represents on 31 december 2017As from 13 march 2014, the share capital of UCB amounts to € 583 516 974, represented by 194 505 658 shares of no par value, fully paid up. All UCB shares are entitled to the same rights. There are no different classes of UCB shares (see section 1.1.2).
1.8.2 Restrictions, either legal or prescribed by the articles of association, on the transfer of securities Restrictions on the transfer of securities only apply to not fully paid up shares according to article 11 of UCB’s articles of association (the “articles of association”) as follows:
(“…)
B) any shareholder holding shares not fully paid who wishes to transfer all or part of his shareholding, should notify his intention by registered letter to the Board of directors, indicating the name of the candidate to be approved, the number of shares offered for sale, the price and the proposed terms of sale.
The Board of directors may, by registered letter, oppose this sale within a month of such notification, by presenting another candidate as purchaser to the selling shareholder. The candidate proposed by the Board will have a right of pre-emption on the shares offered for sale, unless the proposed seller withdraws from the sale within 15 days.
The right of pre-emption will be exercisable at a unit price corresponding to the lower of the two following amounts:
• The average closing price of a UCB ordinary share on the “continuous trading market” of euronext brussels in the 30 stock exchange working days preceding the notification under the preceding paragraph, reduced by the amount still to be paid up;
• The unit price offered by the third party proposed for approval.
The above-mentioned notification by the Board of directors shall be taken as notification of the exercise of the right of pre-emption in the name and for the account of the purchasing candidate presented by the Board. The price will be payable within the month of this notification without prejudice to any more favorable conditions offered by the third party presented for approval.
C) if the Board does not reply within the period of a month from notification set out in the first paragraph of subsection b) above, the sale may take place on conditions no less favorable than those set out in the above-mentioned notification for the benefit of the candidate presented for approval.
(...”)
To date, the capital of UCB is fully paid up.
1.8.3 Holders of any securities with special control rights and a description of those rightsThere are no such securities.
1.8.4 System of control of any employee share scheme where the control rights are not exercised directly by the employeesThere is no such system.
1.8.5 Restrictions, either legal or prescribed by the articles of association, on the exercise of voting rightsThe existing UCB shares entitle holders thereof to vote at the General Meeting.
According to article 38 of the Articles of Association, the following restrictions apply:
“Each share gives the right to one vote.
Any person or entity who acquires or subscribes to beneficial ownership in shares, whether registered or not, in the capital of the company, conferring a right to vote, will be obliged to declare within the period required by law, the number of shares purchased or subscribed for, together with the total number of shares held, when such number in total exceeds a proportion of 3% of the total voting rights exercisable, before any possible reduction, at a General Meeting. The same procedure will have to be followed each time that the person obliged to make the initial declaration mentioned above increases his voting strength up to 5%, 7.5%, 10% And subsequently for each additional 5% of the total voting rights
61 UCB Annual Report 2017

acquired as defined above or when following the sale of shares, his voting rights fall below one of the limits specified above. The same notification requirements will apply to any instrument, option, future swap, interest term agreement and other derivative granting its holder the right to acquire existing securities carrying voting rights pursuant to a formal agreement (i.e. an agreement that is binding pursuant to the applicable law) and only on the holders’ own initiative. In order for the notification requirements to apply, the holder must either have an unconditional right to acquire existing securities carrying voting rights or be able to make free use of its right to acquire them. A right to acquire securities carrying voting rights is considered to be unconditional if it depends merely on an event that can be caused to happen or prevented from happening by the holder of the right. These notifications will occur according to the modalities described in the legislation applicable to the disclosure of large shareholdings in issuers whose securities are admitted to trading on a regulated market. Failure to respect this statutory requirement will be able to be penalized in the manner laid down by article 516 of the Belgian Companies Code. No-one may at a General Meeting cast a greater number of votes than those relating to such shares as he has, in accordance with the above paragraph, declared himself to be holding, at least twenty days before the date of the Meeting.”
The voting rights attached to UCB shares held by UCB or by its direct or indirect subsidiaries are, as a matter of law, suspended.
1.8.6 Agreements between shareholders which are known to UCB and may result in restrictions on the transfer of securities and/or the exercise of voting rightsUCB has no knowledge of agreements which may result in restrictions on the transfer of its securities and/or the exercise of voting rights. UCB received notification on 25 January 2018 of the termination of the concert agreement between Tubize and Schwarz.
1.8.7.A Rules governing the appointment and replacement of Board membersUnder the articles of association:
“The company shall be managed by a Board of directors having at least three members, whether shareholders or not, appointed for four years by the general meeting and at all times subject to dismissal by the General Meeting.
Outgoing directors are eligible for re-election. The period of office of outgoing directors, who are not re-appointed, ceases immediately on the closing of the Ordinary General Meeting.
The General Meeting shall determine the fixed or variable remuneration of the directors and the value of their attendance vouchers, to be charged to operating expenses.”
The General Meeting decides by a simple majority of votes on these matters. The rules relating to the composition of the Board of directors are detailed in section 3.2 of the Corporate Governance Charter as follows:
(“…)
COMPOSITION OF THE BOARD OF DIRECTORSThe Board is of the opinion that a number of between ten and fifteen members is appropriate for efficient decision-making on the one hand, and contribution of experience and knowledge from different fields on the other hand. Such a number also allows for changes to the Board’s composition to be managed without undue disruption. This is way within the provisions of the law and the Articles of Association of UCB from which the Board shall be composed of at least three members. The General Meeting of Shareholders decides on the number of Directors, upon proposal of the Board.
A large majority of the Board members are non- executive directors.
The curricula vitae of the directors and directorship candidates are available for consultation on the UCB’s website (www.ucb.com). These curricula vitae mention, for each director, the directorships in other listed companies.
Appointment of Directors The directors are appointed by the General Meeting of Shareholders, following a proposal by the Board, and upon recommendation of the GNCC.
In proposing candidates at the general meeting of shareholders, the Board takes particular account of the following criteria:
• A large majority of the directors are non-executive Board members;
• At least three non-executive directors are independent in accordance with the legal criteria, and those adopted by the Board;
• No single director or group of directors may dominate decision-making;
• The composition of the Board guarantees diversity and contribution of experience, knowledge and ability required for UCB’s specialist international activities; and
• Candidates are fully available to carry out their functions and do not take more than five directorships in listed companies.
62

The GNCC gathers information, allowing the Board to ensure that the criteria set out above have been met at the time of the appointments and renewals and during the term of office.
For each new directorship appointment, the GNCC performs an assessment of existing and required abilities, knowledge and experience on the Board. The profile of the ideal candidate is drawn up on the basis of this assessment and proposed to the Board for discussion and definition.
When the profile is established, the GNCC selects candidates that fit the profile in consultation with the Board members (including the Chair of the Executive Committee) and possibly using a recruitment firm. Recommendation of final candidates is made by the GNCC to the Board. The Board decides on the proposals to be submitted to Shareholders’ approval.
Duration of mandates and age limitDirectors are appointed by the General Meeting of Shareholders for a four-year term, and their terms may be renewed.
Moreover, an age limit of seventy has been stipulated. A director shall give up his/her current term the day of the Annual General Meeting of Shareholders following his/her 70th birthday. The Board may propose exceptions to that rule.
Procedure for appointment, renewal of termsThe process of appointment and re-election of directors is run by the Board, which strives to maintain an optimum level of abilities and experience within UCB and its Board.
The proposals for appointment, renewal, resignation or possible retirement of a director are examined by the Board based on a recommendation from the GNCC. The GNCC assesses for each of the directors who are candidate for re-election at the next General Meeting of Shareholders, their commitment and effectiveness and makes recommendations to the Board regarding their re-election.
Special attention is given to the evaluation of the Chair of the Board and the Chairs of the Board Committees.
The assessment is conducted by the Chair of the GNCC and the Vice-Chair of the Board or another member of the GNCC, who have meetings with each of the Directors in their capacity as a Director and, as the case may be, as Chair or member of a Board Committee. For the Chair of the Board and of the GNCC, the assessment is conducted by the Vice-Chair of the Board and a senior independent Director. The sessions are based on a questionnaire and cover the Director’s role in the governance of the Company
and the effectiveness of the Board, and, amongst others, how they evaluate their commitment, contribution and constructive involvement in the discussions and decision-making.
Feedback is given to the GNCC who then reports to the Board, and makes recommendations as to the proposed re-election.
The Board submits to the General Meeting of Shareholders its proposals concerning the appointments, renewals, resignations or possible retirement of directors. These proposals are communicated to the general meeting of shareholders as part of the agenda of the relevant shareholders meeting.
The General Meeting of Shareholders resolves on the proposals of the Board in this area by a majority of the votes.
In the event of a vacancy during a term, the Board is empowered to fill the post and to allow its decision to be ratified at the next General Meeting of Shareholders.
Proposals for appointment state whether or not the candidate is proposed as an executive director, define the term proposed for the mandate (i.e., Not more than four years, in accordance with the articles of association), and indicate the place where all useful information in relation to the professional qualifications of the candidate, in addition to the main functions and directorships of the candidate, may be obtained or consulted.
The Board also indicates whether or not the candidate meets the independence criteria, in particular those stipulated in article 526ter company code, such as the fact that a director, in order to qualify as “independent” may not hold a mandate for more than three consecutive terms (with a maximum of twelve years). In case the director meets the independence criteria, a proposal will be submitted to the general meeting of shareholders to acknowledge such independent character. The proposals for appointment are available on the UCB website (www.ucb.com).
(...”)
The charter additionally stipulates that a director qualifies as independent if he or she has not had business or other relations with the UCB group which could compromise his/her independent judgment. In the assessment of this criterion, significant status as customer, supplier or shareholder of the UCB group is taken into consideration by the Board on an individual basis.
63 UCB Annual Report 2017

1.8.7.B Rules governing the amendment of UCB’s articles of associationThe rules governing the amendment of the articles of association are set by the Belgian Companies Code.
The decision to amend the articles of association has to be made by a General Meeting, provided that at least 50% of the share capital of UCB is present or represented at the meeting, in principle with a majority of 75% of the votes cast.
If the attendance quorum is not met at the first extraordinary General Meeting, a second general meeting can be convened and will decide without any attendance quorum having to be reached.
In exceptional circumstances (for example amendment of the object of the company, changing of rights of securities), additional attendance and voting quor requirements may be applicable.
1.8.8 Powers of the Board of directors, in particular to issue or buy back sharesPowers of the Board are those defined by the Belgian Companies Code and by the Articles of Association.
The terms of reference of the Board and the responsibilities that the Board has reserved to itself are further described in the charter as follows:
(“...)
The Board is UCB’s governing body.
It has the power to take decisions on all matters which the Law does not expressly attribute to the General Meeting of Shareholders. The Board acts collegially.
The roles and responsibilities and the functioning of the Board are determined by the UCB’s Articles of Association and by the terms of reference of the Board and the Board’s committees that are described in this charter.
Among the matters over which it may, by law, take decisions, the Board has reserved key areas for itself, and has delegated wide powers of administration to an Executive Committee (see point 5).
It did not opt to create a management committee in the sense of the article 524 of the Belgian Companies Code, since it preferred not to permanently delegate the powers granted to it by the law nor the general representation of UCB.
The Board’s role is to provide entrepreneurial leadership of UCB within a framework of prudent and
effective controls which enables risks to be assessed and managed. The Board sets UCB’s strategic aims, ensures that the necessary financial and human resources are in place for UCB to meet its objectives and reviews management performance. The Board sets UCB’s values and standards and ensures that its obligations to its shareholders and other stakeholders are understood and met. It takes collegiate responsibility for sound exercise of its authority and powers.
The powers the Board has reserved for itself concern mainly the following, and to this end it also receives all the information required in relation to each of them:
1 Defining UCB’s mission, values and strategy, risk tolerance and key policies;
2 Monitoring of: • management’s performance and
implementation of the company’s strategy, • the effectiveness of the Board’s committees, • the performance of the external auditor;3 Appointment or removal: • from among its members, of the Chair of
the Board, after a consultation of all Board members conducted by a member of the Governance, Nomination & Compensation Committee (“GNCC”) other than the Chair of such Committee, it being understood that the consultation will be conducted by the Chair of the Board and of the GNCC when it relates to his/her succession planning,
• from among its members, of the Chair and members of the Audit Committee, of the GNCC and of the members of the Scientific Committee,
• of the Chair of the Executive Committee following a proposal by the GNCC,
• of members of the Executive Committee following a proposal by the GNCC, and recommendation by the Chair of the Executive Committee,
• of persons in major external bodies or companies and of persons outside UCB requested to represent UCB at certain subsidiaries, on the recommendation of the Chair of the Executive Committee,
• reviews the succession planning for the Chair of the Executive Committee and the other Executive Committee members, as proposed by the GNCC;
4 For endorsement, appointment or removal of senior executives on the recommendation of the Chair of the Executive Committee;
5 Ensure the integrity and timely disclosure of the financial statements of the UCB group and UCB and of material financial and non-financial information to shareholders and financial markets;
64

6 Approve the framework of internal control and risk management set up by the executive management and controlled by the internal audit with direct access to the Audit Committee;
7 Preparation of the General Meeting of Shareholders and of the decisions proposed to be considered at the Meeting;
8 Executive management structure and general organization of UCB (and of the UCB group);
9 Approval of the annual budget (including the R&D program and the capital plan) and any increase in the overall annual budget (including the R&D program and the capital plan);
10 The long-term or major finance operations;11 Creating, establishing, closing, settling or
transferring subsidiaries, branches, production locations or major divisions exceeding € 20 million and involving third parties;
12 Allotment, merger, acquisition, division, purchase, sale or pledging of assets (other than assets referred to under sub-section 13 below), instruments and shares, equity and equity-like investments, in and out- licensing of intellectual property and product divestments, joint-ventures, of a value exceeding € 20 million and involving third parties;
13 Purchase, sale or pledging of real estate property assets to a value exceeding € 50 million and real estate leases over a period exceeding 9 years for an aggregate amount of expenditures exceeding € 20 million;
14 The terms and conditions of plans for the grant of stock and stock options to employees;
15 To be informed, at the end of every semester, of the charitable donations in excess of € 10 000 YTD to each single beneficiary;
16 At the request of the Chair of the Executive Committee, the Board may also be asked to pronounce in the event of diverging opinions among a majority of the members of the Executive Committee and its Chair.
(...”)
As described under section 1.1.4 above, the Extraordinary General Meeting of 28 april 2016 decided to renew the authorization to the Board (and to amend the Articles of Association accordingly), for another period of 2 years, to increase the share capital, amongst other by way of the issuance of shares, convertible bonds or warrants, in one or more transactions, within the limits set by the Belgian Companies Code,
i. With up to 5% of the share capital calculated at the time of the decision of the Board to make use of this authorization, in the event of a capital increase with cancellation or limitation of the preferential subscription rights of the shareholders (whether or not for the benefit of one or more specific
persons who are not employees of the company or of its subsidiaries);
ii. With up to 10% of the share capital calculated at the time of the decision of the Board to make use of this authorization, in the event of a capital increase without cancellation or limitation of the preferential subscription rights of the existing shareholders. In any event, the total amount by which the Board may increase the share capital by a combination of the authorizations set forth in (i) and (ii) above, is limited to 10% of the share capital at the time of the decision of the Board to make use of this authorization.
The Board is moreover expressly authorized to make use of this mandate, within the limits as set out under (i) and (ii) above, for the following operations:
1. A capital increase or the issuance of convertible bonds or warrants with cancellation or limitation of the preferential subscription rights of the existing shareholders;
2. A capital increase or the issuance of convertible bonds with cancellation or limitation of the preferential subscription rights of the existing shareholders for the benefit of one or more specific persons who are not employees of the company or of its subsidiaries;
3. A capital increase by incorporation of reserves.
Any such capital increase may take any and all form, including, but not limited to, contributions in cash or in kind, with or without share premium, the incorporation of reserves and/or share premiums and/or profits carried forward, to the maximum extent permitted by the Law.
Any decision of the Board to use this authorization requires a 75% majority within the Board.
The Board is empowered, with full power of substitution, to amend the Articles of Association to reflect the capital increases resulting from the exercise of its authorization. A proposal to renew these authorization, under the same terms, conditions and duration will be submitted by the Board to the approval of the Extraordinary General Meeting to be held on 26 April 2018 (at the same time as the Annual General Meeting).
65 UCB Annual Report 2017

1.8.9 Significant agreements to which UCB is a party and which take effect, alter or terminate upon a change of control of UCB following a takeover bid, and the effects thereof, except where their nature is such that their disclosure would be seriously prejudicial to UCB; this exception shall not apply where UCB is specifically obliged to disclose such information on the basis of other legal requirements• Facility agreement in the amount of € 1 billion
between, amongst others, UCB SA/NV, BNP Paribas Fortis SA/NV, Commerzbank Aktiengesellschaft, filiale Luxembourg, ING Bank N.V. and Mizuho Bank Europe N.V. as coordinating bookrunners, Banco Santander, S.A., Bank of America Merrill Lynch International Limited, The Bank of Tokyo-Mitsubishi UFJ, Ltd., Barclays Bank PLC, BNP Paribas Fortis SA/NV, Commerzbank Aktiengesellschaft, filiale Luxemburg, Crédit Agricole Corporate and Investment Bank, HSBC Bank PLC, Belgian branch, ING Bank N.V., Intesa SanPaolo Bank Luxembourg S.A., Amsterdam branch, KBC Bank NV, Mizuho Bank Europe N.V., Sumitomo Mitsui Banking Corporation and The Royal Bank of Scotland PLC, as mandated lead arrangers, and Wells Fargo Bank International Unlimited Company as lead arranger, dated 14 November 2009 (as amended and restated on 30 November 2010, on 7 October 2011, on 9 January 2014 and for the last time on 9 January 2018), which change of control clause was last approved by the General Meeting of 24 April 2014, according to which any and all of the lenders can, in certain circumstances, cancel their commitments and require repayment of their participations in the loans, together with accrued interests and all other amounts accrued and outstanding thereunder, following a change of control of UCB SA/NV. The General Meeting of 26 April 2018 will be asked to approve the change of control clause as foreseen in the amended and restated facility agreement per 9 January 2018.
• Euro Medium Term Note Program dated 6 March 2013, with last update of the base prospectus per 10 March 2015, for an amount of up to € 3 billion (the “EMTN Program”), providing for a change of control clause (condition 5 (e) (i)) under which, for any Notes issued thereunder where a change of control put clause is included in the relevant final terms, any holder of such Note and following a change of control of UCB SA/NV, has a right to redeem that Note by exercising such put right, and as such change of control clause has been approved by the General Meetings of 25 April 2013, 24 April 2014, 30 April 2015, 28 April 2016 and 27 April 2017. The following notes have been issued under the EMTN Program by UCB NV/ SA and are subject to the above described change of control clause:
• Retail bond 3.75% due 27 march 2020 in the amount € 250 million issued on 27 march 2013;
• Institutional bond 4.125% due 4 january 2021 in the amount of € 350 million issued on 4 october 2013;
• Institutional private placement bond 3.292% due 28 november 2019 in the amount of € 55 million issued on 28 november 2013;
• Institutional private placement bond 3.284% due 17 december 2019 in the amount of € 20 million issued on 10 december 2013;
• Institutional bond 1.875% due 2 april 2022 in the amount of € 350 million issued on 2 april 2015.
Pursuant to article 556 of the Belgian Companies Code, the above described change of control clause provided for in the EMTN Program of 6 March 2013 has been approved by the General Meetings of 25 April 2013, 24 April 2014, 30 April 2015, 28 April 2016 and 27 April 2017 in respect of any series of Notes to be issued under the EMTN Program within the 12 months following such General Meetings of 25 April 2013, 24 April 2014, 30 April 2015, 28 April 2016 and 27 April 2017 respectively and to which such change of control has been made applicable.
A similar approval will be submitted to the General Meeting of 26 April 2018 in respect of any series of Notes to be issued under the EMTN Program from 26 April 2018 until 25 April 2019, if any, and to which, as the case may be, such change of control would be made applicable.
• Senior unsecured retail bonds of UCB SA/NV issued on 2 October 2013 and maturing 2 October 2023 in the amount of € 175 717 000 bearing a 5.125% Fixed rate, and which states that in case of change of control (as defined in the terms and conditions of the offering) the bondholders have the right to require the issuer to redeem such bonds. This change of control clause was approved at the general meeting of 24 april 2014.
• Facility agreement in the amount of € 150 million between UCB Lux S.A. as borrower, UCB SA/NV as promoter and guarantor, and the European Investment Bank (“EIB”) dated 9 May 2012, as amended, restated and assigned to UCB SA/NV as Borrower on 20 October 2016 with effect as of 21 November 2016, which change of control clause was approved by the General Meeting of 26 April 2012.
• Facility agreement in the amount of € 100 million between UCB Lux S.A. As borrower, UCB SA/NV as promoter and guarantor, and the EIB dated 15 april 2013, as amended, restated and assigned to UCB SA/NV as borrower on 20 october 2016 with effect as of 24 october 2016, of which the change of control clause was approved by the general meeting of 25 april 2013.
66
• Facility agreement in the amount of € 75 million / USD 100 million between UCB SA/NV as borrower and the EIB, dated 16 June 2014, as amended and restated on 20 October 2016 with effect as of 21 October 2016, of which the change of control clause was approved by the General Meeting of 24 April 2014, and whereby the loan, together with accrued interests and all other amount accrued and outstanding thereunder, could in certain circumstances become immediately due and payable – at the discretion of the EIB – following a change of control of UCB SA/NV.
• EIB co-development agreement in the amount of € 75 million entered with the EIB and of which the change of control clause has been approved by the General Meeting of 24 April 2014 and whereby such agreement can be terminated by the EIB in the event of a change of control of UCB SA/NV and UCB SA/NV may be bound to pay a termination payment corresponding, depending on the circumstances, to all, part of or an increased amount (capped at up to 110%) of the funding received from the EIB.
• The UCB stock awards and performance share plans by which UCB shares are granted annually by UCB to certain employees according to grade and performance criteria, vest according to the rules of both plans after three years, upon condition that its beneficiary remains in continuous employment with the UCB group. They also vest upon change of control or merger.
• On 31 December 2017, the following number of stock awards and performance shares
are outstanding: • 2 132 336 Stock awards, of which 626 728 will vest
in 2018; • 361 361 Performance shares, of which 103 375 will
vest in 2018.The General Meeting of 26 April 2018 will be asked to approve this change of control clause in accordance with Article 556 of the Company Code.
The change of control clauses in the Executive Committee members’ contract, as further described in the Remuneration Report (section 1.4.3).
1.8.10 Agreements between UCB and its Board members or employees providing for compensation if the Board members resign or are made redundant without valid reason or if the employment of the employees ceases because of a takeover bid• For more details, see section 1.4.3 on the main
contractual terms on hiring and termination arrangements for the CEO and members of the Executive Committee. No other agreements provide for a specific compensation of Board members in case of termination because of a takeover bid.
• In addition to the Executive Committee members identified in section 1.4.3, two employees in the U.S. and one outside the U.S. benefit from a change of control clause that guarantees their termination compensation if the employment of the employee ceases because of a public takeover bid.
1.9 Application of article 523 of the companies code
EXCERPT FROM THE MINUTES OF THE MEETING OF THE BOARD HELD ON 22 FEBRUARY 2017Article 523 of the Belgian Companies Code was applied by the Board of 22 February 2017 in the context of the decisions relating to the CEO remuneration, the performance bonus and LTI grants (relevant excerpt from the minutes of the meeting):
(“…)
Prior to any deliberation or decision by the Board of Directors concerning the approval of the CEO bonus based on 2016 performance, the CEO 2017 base salary and the CEO 2017 LTI grant including (stock options, stock awards and performance shares), as well as the approval of the 2016 bonus payout and LTI vesting and of the 2017 LTI plans, metrics and grants, Jean-Christophe Tellier stated that he had a direct or indirect financial interest in the implementation of said decisions. In accordance with Art. 523 of the Company Code, he withdrew from the meeting of
the Board of Directors in order not to participate in the deliberation and the vote relating to these issues. The Board of Directors established that Art. 523 of the Company Code was applicable to these operations.
(…)
CORPORATE RESULTS 2016 BONUS PAYOUT/LTI AWARD VESTING AND 2017 TARGETS Decision: After review, the Board overall approved the recommendations of the Governance, Nomination and Compensation Committee (“GNCC”) relating to (i) the 2016 bonus payout based on the year end 2016 results (REBITDA), (ii) the REBITDA target for 2017 bonus payout and (iii) the metrics used for the Performance Share Plan 2017-2019 (payout 2020). It further endorsed the vesting (and total payout) in 2017 relating to the 2014-2016 Performance Share Plan as well as the stock award vesting for the 2014-2016 plan.
67 UCB Annual Report 2017

UCB LONG-TERM INCENTIVES GRANTS IN 2017Decision: Upon recommendation of the GNCC, the Board unanimously approved the following Long-Term Incentive Plans and the main terms and conditions thereof:
• UCB stock option plan 2017: issue of 826,000 stock options (target + 15% to take into account performance differentiation) in 2017 (in principle on 1 April 2017 unless exceptional circumstances) for approximately 350 employees (not taking into consideration employees hired or promoted to eligible levels between 1 January 2017 and 1 April 2017); The exercise price of these options will be the lower of (i) the average of the closing price over the 30 calendar days preceding the offer (i.e. in principle from 2-31 March 2017) or (ii) the closing price of the day preceding the offer (in principle 31 March 2017). UCB will determine a different exercise price for those eligible employees subject to legislation which require a different exercise price [...]. Stock options will have a vesting period of 3 years as of the date of grant, except for countries where this is not allowed or less favorable.
• Stock awards and PSP grants 2017–2019: allocation of an initial amount of 1 054 000 shares of which:
• an estimated number of 891 000 shares to eligible employees, namely to about 1 650 colleagues (excluding new hires and promoted employees up to and including 1 April 2017), according to the applicable allocation criteria (target +15% to take into account performance differentiation). These free shares will be allocated if and when the eligible employees are still employed with the UCB Group 3 years after the grant of awards,
• an estimated number of 163 000 shares to upper management employees for the Performance Share Plan 2017, namely to about 52 individuals, according to the applicable allocation criteria. These free
shares will be delivered after a 3 year vesting period and the number of shares actually allocated will vary from 0% to 150% of the number of shares initially granted depending on the level of achievement of the performance conditions set by the Board of UCB SA/NV at the moment of the grant;
• It was acknowledged that the financial impact of the granting of options for the Company is linked to the difference between the purchase price of own shares by the company and the price of resale of these same shares to the beneficiary upon exercise of the options. For the stock awards and the PSP, the financial impact corresponds to the value of the UCB shares at the time of vesting;
• The Board further decided to delegate all powers to the members of the Executive Committee, acting jointly two by two and with faculty of sub-delegation, to do whatever is necessary, required or useful to execute and implement the above decisions, including the finalization of all required documentation, the actual grant decision, the final terms and conditions and modalities of the plans and incentives.
CEO COMPENSATION AND LTI Decision: Upon recommendation of the GNCC, the Board unanimously approved the following:
• CEO base salary as of 1 March 2017: € 1 046 220 (against € 996 400 in 2016);
• CEO bonus pay-out 2017 (performance 2016): € 1 226 409;
• CEO LTI 2017: • stock options: 39 273 (3 years and 8 months
vesting); • stock awards: 10 804 (3 years vesting); • performance shares: 22 355 (3 years vesting).
(...”)
68

1.10 Application of article 96, §2, section 2 of the Belgian Companies Code (deviation from the Code)
Provision 2.9 (guideline): the Secretary of the Board reports to the General Counsel, instead of to the Chair of the Board, since the Corporate Secretariat, led by the Secretary of the Board, forms part of the legal department within UCB. In accordance
with the Charter of Corporate Governance, the members of the Board have however individual access to the Secretary’s assistance for all Board or company’s matters.
69 UCB Annual Report 2017

Louisa, living with epilepsy
BUSINESS PERFORMANCE REVIEW
2.1 Key highlights
• 2017 revenue increased by 9% to € 4 530 million. Net sales went up to € 4 182 million (+9%). This growth was driven by the continued performance of the core products in immunology, Cimzia®, the epilepsy franchise: Vimpat®, Keppra® and the launch of Briviact®, as well as the Parkinson drug Neupro®. Royalty income and fees reached € 108 million. Other revenue increased to € 240 million mainly due to the one-time other revenue of € 56 million for out-licensing the OTC-allergy drug Xyzal®.
• Recurring EBITDA grew to € 1 375 million by 33%, reflecting sustainable net sales growth, an improved gross margin and a continued under-proportional growth of operating expenses thanks to resources reallocation and optimization as well as cost control.
• Profit reached € 771 million from € 542 million, of which € 753 million is attributable to UCB shareholders after € 520 million in 2016.
• Core EPS went up to € 4.82 from € 3.19 in 2016.
70

ACTUAL¹ VARIANCE
€ million 2017 2016
(Restated)Actual
rates CER²
Revenue 4 530 4 147 9% 11%
Net sales 4 182 3 827 9% 11%
Royalty income and fees 108 125 -13% -10%
Other revenue 240 195 23% 23%
Gross profit 3 330 2 945 13% 15%
Marketing and selling expenses - 940 - 938 0% 2%
Research and development expenses -1 057 -1 020 4% 5%
General and administrative expenses - 192 - 184 4% 5%
Other operating income/expenses (-) - 11 - 7 44% 59%
Recurring EBIT (REBIT) 1 130 796 42% 43%
Non-recurring income/expenses (-) - 43 80 >-100% >-100%
EBIT (operating profit) 1 087 876 24% 25%
Net financial expenses - 99 - 112 -12% -11%
Profit before income taxes 988 764 29% 30%
Income tax expenses - 218 - 199 9% 10%
Profit from continuing operations 770 565 36% 37%
Profit/loss (-) from discontinued operations 1 - 23 >-100% >-100%
Profit 771 542 42% 43%
Attributable to UCB shareholders 753 520 45% 46%
Attributable to non-controlling interests 18 22 -17% -16%
Recurring EBITDA 1 375 1 031 33% 34%
Capital expenditure (including intangible assets) 209 138 51%
Net financial debt 525 838 -37%
Operating cash flow from continuing operations 896 726 23%
Weighted average number of shares – non diluted (million) 188 188 0%
EPS (€ per weighted average number of shares – non diluted) 4.00 2.76 45% -4%
Core EPS (€ per weighted average number of shares – non diluted) 4.82 3.19 51% 52%
This Business Performance Review is based on the consolidated financial statements for the UCB Group of companies prepared in accordance with IFRS. The separate statutory financial statements of UCB SA prepared in accordance with Belgian Generally Accepted Accounting Principles, together with the report of the Board of Directors to the General Assembly of Shareholders, as well as the auditors’ report, will be filed at the National Bank of Belgium within the statutory periods, and be available on request or on our website.
Scope change: As a result of the divestment of the activities Films (September 2004), Surface Specialties (February 2005), and the divestiture of Kremers Urban Pharmaceuticals Inc. (November 2015), UCB reports the results from those activities as a part of profit from discontinued operations.
Recurring and non-recurring: Transactions and decisions of a one-time nature that affect UCB’s results are shown separately (“non-recurring” items). Besides EBIT (earnings before interest and taxes or operating profit), a line for “recurring EBIT” (REBIT or recurring operating profit), reflecting the on-going profitability of the company’s biopharmaceutical activities, is included. The recurring EBIT is equal to the line “operating profit before impairment, restructuring and other income and expenses” reported in the consolidated financial statements.
Core EPS is the core profit, or the profit attributable to the UCB shareholders, adjusted for the after-tax impact of non-recurring items, the financial one-offs, the after-tax contribution from discontinued operations and the after-tax amortization of intangibles linked to sales, per non-dilutive weighted average number of shares.
1. Due to rounding, some financial data may not add up in the tables included in this management report. 2016 financials were restated after IFRS 15 implementation.
2. CER: constant exchange rates
71 UCB Annual Report 2017
2.2 Key events1
1 From 1 January 2017 up to the publication date of this report.
There have been a number of key events that have affected or will affect UCB financially:
Important agreements/initiatives• January / February 2017 – As part of its innovation
strategy, UCB has committed to invest an additional USD 20 million in venture funds investing in innovative life sciences and healthcare companies.
• February 2017 – Following the approval by the U.S. Food and Drug Administration of Xyzal® Allergy 24HR as an over-the-counter (OTC) treatment for the relief of symptoms associated with seasonal and year-round allergies, UCB is entitled to guaranteed payments for a total amount of USD 75 million to be paid over ten years by Chattem Inc., a Sanofi company, due to the out-licensing agreement for Xyzal® in the OTC field in the U.S. that was concluded in 2015.
• March 2017 - the U.S. Patent and Trademark Office confirmed the validity of U.S. patent RE38,551 related to Vimpat® in the Inter Partes Review proceedings.
• April 2017 - UCB and Q-State Biosciences entered into a multi-year therapeutics discovery collaboration. The joint program will employ a precision-medicine approach to the development of novel therapeutics for epilepsy, and particularly genetically defined subtypes of childhood epilepsy.
• June 2017 - UCB has acquired the remaining 73% stake in Beryllium LLC and now owns 100%. Beryllium LLC is a research company specializing in protein expression and structural biology, enhancing UCB’s capabilities in protein engineering and structural biology. (For further information, please see Note 7).
• Since June and August 2017, Besponsa® (inotuzumab ozogamicin) is approved in the EU and U.S. respectively for the treatment of adults with relapsed or refractory B-cell precursor acute lymphoblastic leukemia (ALL). Besponsa® originates from a collaboration between Pfizer Inc. and UCB. Pfizer has sole responsibility for all manufacturing and clinical development activities for this molecule. Upon commercialization UCB is entitled to receive royalties.
• November 2017 - Dermira, Inc. and UCB have agreed to end their development and commercialization agreement for Cimzia® in psoriasis. Pending regulatory approval, UCB will bring Cimzia® to people living with psoriasis worldwide. UCB paid to Dermira USD 11.0 million by 13 November 2017 and will pay, upon approval of Cimzia® in psoriasis in the U.S., an additional USD 39.0 million. Dermira is obligated to reimburse UCB for up to USD 10.0 million of development costs incurred by UCB in connection with the
development of Cimzia® between 1 January 2018 and 30 June 2018.
• February 2018 - UCB and an investor syndicate led by Novo Seeds announced launching Syndesi Therapeutics to develop novel therapeutics for cognitive disorders. Syndesi Therapeutics has exclusively licensed a first-in-class small molecule program from UCB. A series A investment totaling € 17 million will fund the clinical development of the lead compound up to early proof-of-concept in humans.
Regulatory update and pipeline progressNEUROLOGY• In January 2017, UCB filed a supplemental New
Drug Application with the U.S. authorities for Briviact® (brivaracetam) as monotherapy in the treatment of partial-onset seizures in patients 16 years of age and older with epilepsy and was approved in the U.S. in September. In July, UCB filed a marketing authorization in the EU for Briviact® for children with epilepsy of 4 years of age and older, for the adjunctive treatment of partial-onset seizures and with the U.S. authorities for the monotherapy and adjunctive treatment.
• In February, the Phase 2a study with padsevonil (UCB0942) - aimed at highly drug resistant epilepsy patients, who failed four anti-epileptic drugs and have at least four seizures/week - showed positive top line results and will progress into further development. Detailed results were presented at the American Epilepsy Society (AES) Annual Meeting in December 2017. Phase 2b started in February 2018 with first results expected in H1 2020.
• In March, Vimpat® (lacosamide) was filed in the U.S. for children living with partial-onset epilepsy at 4 years and older, based on extrapolation of data from adult patients. In September and November, Vimpat® was approved in the EU and the U.S. respectively for the treatment of partial onset epilepsy in children from 4 to 16 years of age.
Also in March, Vimpat® in a Phase 3 study achieved positive results as adjunctive therapy in patients with epilepsy (partial-onset seizure; ≥ 4 to <17 years of age). Detailed results will be presented at future scientific meetings and will be submitted to regulatory authorities.
In August, the Japanese health authorities approved Vimpat® for use as monotherapy for partial-onset seizure in adult patients with epilepsy. In January 2018, UCB filed Vimpat® for pediatric patients living with partial-onset epilepsy from 4 years of age and older in Japan.
72
• In March, a Phase 2a study started with rozanolixizumab (UCB7665) in myasthenia gravis (MG), a rare, debilitating neurological auto-immune disease. First results are expected in H2 2018.
All other clinical development programs in neurology are continuing as planned.
IMMUNOLOGY• UCB and its partner Dermira submitted a marketing
application to EU and U.S. regulatory authorities for Cimzia® (certolizumab pegol) in psoriasis which were accepted for filing in August and October, respectively.
In February, to support line extension for Japan, a Phase 3 study evaluating Cimzia® in adult patients with psoriasis and psoriatic arthritis started with first results expected in Q3 2018.
In March 2017, the FDA issued a “complete response letter” in connection with the review of a proposed new indication for Cimzia® to treat polyarticular juvenile idiopathic arthritis (pJIA). The FDA letter concerns the reliability of the submitted pharmacokinetic data. UCB is working with the FDA to agree on next steps to bring Cimzia® to juvenile patients, with no impact on any other Cimzia® program.
Data from the CRIB and CRADLE studies for women of child-bearing age were filed with the European and U.S. health authorities, in Q2 2017. CRIB was evaluating the transfer of Cimzia® from the mother to the infant via the placenta while CRADLE was a study evaluating the concentration of Cimzia® in mature breast milk of lactating mothers. In December 2017, the European Medicines Agency approved a label change for Cimzia®, making it the first anti-TNF treatment option that could be considered for women with chronic inflammatory disease throughout the pregnancy journey.
• In July, positive results from a Phase 2b study in patients with psoriasis were reached for bimekizumab: At week 12, up to 79% of patients achieved at least 90% skin clearance, and up to 60% of patients achieved complete skin clearance (PASI100). In December, positive results in ankylosing spondylitis (AS) were reported for bimekizumab showing statistical significance in multiple dose groups: the Phase 2b study achieved the primary endpoint (ASAS40), with up to 47% of patients receiving bimekizumab achieving at least 40% improvement in AS symptoms, versus 13% of patients receiving placebo, at week 12. Also in December, positive top line results from the Phase 2b study in psoriatric arthritis (PsA) were obtained: bimekizumab showed impressive joint and skin responses for these patients. The study achieved a stringent primary endpoint, with up to
46% of PsA patients who received bimekizumab experiencing at least 50% improvement in PsA joint symptoms (ACR50), versus 7% with placebo, at week 12. Among patients with active skin lesions (BSA ≥3), up to 65% of patients who received bimekizumab also experienced at least 90% skin clearance (PASI90) versus 7% of patients who received placebo. These results were achieved in a mixed patient population, both biologic naïve and previously biologic exposed patients. UCB advanced the bimekizumab Phase 3 clinical development program with the first Phase 3 study in psoriasis starting in December 2017; topline results from this program are expected at the end of 2019.
• In December, rozanolixizumab (UCB7665) reached “proof of concept” in patients with immune thrombocytopenia (ITP) based on positive Phase 2a results in the two initial dose arms. Recruitment for higher doses is ongoing with further results expected in Q3 2018.
All other clinical development programs in immunoloy are continuing as planned.
BONE• In May, UCB and Amgen announced that the
Evenity™ (romosozumab) ARCH study met both primary endpoints and the key secondary endpoints. At the primary analysis, treatment with romosozumab for 12 months followed by alendronate significantly reduced the incidence of new vertebral fractures through 24 months, clinical fractures (primary endpoints) and non-vertebral fractures (key secondary endpoint) in postmenopausal women with osteoporosis at high risk for fracture, compared to alendronate alone. An imbalance in positively adjudicated cardiovascular serious adverse events was observed as a new safety signal.
In July, the U.S. authorities issued a Complete Response Letter for the Biologics License Application for Evenity™ as a treatment for postmenopausal women with osteoporosis. Upon receiving the CRL, 12 months to respond with the requested data were granted. Amgen and UCB continue to evaluate all registrational Phase 3 clinical trial safety data to ensure to have the most comprehensive view and understanding of the cardiovascular safety signal observed in the active comparator ARCH study and not in the placebo controlled FRAME study.
In December, the European Medicines Agency accepted the Marketing Authorization Application (MAA) for Evenity™ (romosozumab) for the treatment of osteoporosis in postmenopausal women and in men at increased risk of fracture, filed by UCB and Amgen.
73 UCB Annual Report 2017

2.3 Net sales by productTotal net sales in 2017 increased to € 4 182 million, 9% higher than last year or +11% at constant exchange rates (CER).
ACTUAL VARIANCE
€ million 2017 2016 (Restated¹) Actual rates CER
Immunology / Cimzia® 1 424 1 304 9% 11%
Neurology
Vimpat® 976 822 19% 21%
Keppra® 778 720 8% 11%
Briviact® 87 18 > 100% > 100%
Neupro® 314 298 5% 7%
Established brands
Zyrtec® 103 117 -12% -11%
Xyzal® 104 101 3% 6%
venlafaxine ER 0 89 -100% -100%
Other products 368 377 -3% -1%
Net sales before hedging 4 154 3 846 8% 10%
Designated hedges reclassified to net sales 28 - 19 >-100%
Total net sales 4 182 3 827 9% 11%1 After reclassification due to IFRS 15
Core productsCimzia® (certolizumab pegol) for patients living with autoimmune and inflammatory TNF mediated diseases, net sales increased in a competitive market environment to € 1 424 million (+9%), driven by differentiation.
Vimpat® (lacosamide) net sales went up to € 976 million (+19%) showing sustainable, double-digit growth in all markets where Vimpat® is available to people living with epilepsy, including patients in Japan since September 2016.
Keppra® (levetiracetam), also for epilepsy, had net sales of € 778 million (8%). Mainly driven by the growth in international markets, namely Japan.
Briviact® (brivaracetam) available for people living with epilepsy during 2016, reached net sales of € 87 million after € 18 million in 2016. Hence, UCB’s epilepsy franchise reached net sales of € 1.8 billion, a plus of 18%.
Neupro® (rotigotine), the patch for Parkinson’s disease, reached net sales of € 314 million (+5%), mainly due to the sustainable growth in Europe and the U.S.
Established brandsZyrtec® (cetirizine, including Zyrtec®-D/Cirrus®) and Xyzal® (levocetirizine), both for allergy, net sales declined to € 103 million (-12%), respectively increased to € 104 million (3%), due to generic competition.
34% CIMZIA®
23% VIMPAT®
19% KEPPRA®
2% BRIVIACT® 8% NEUPRO®
14% ESTABLISHED BRANDS
THERAPEUT
IC B
RE
AK
DO
WN
€ 4 154MILLION NET SALES
(excluding hedging)
2017
Venlafaxine ER (venlafaxine hydrochloride extended release) for the treatment of depressive and anxiety disorders was divested in November 2016.
Other products: Net sales for other established brands decreased by 3% to € 368 million mainly due to the divestiture of the nitrate business in 2016.
Designated hedges reclassified to net sales were positive with € 28 million reflecting UCB’s realized transactional hedging activities which have to be recognized in the “net sales” line according to IFRS. These are mainly related to the U.S. Dollar, the Japanese Yen, the British Pound and the Swiss Franc.
74

2.4 Net sales by geographical area
ACTUAL VARIANCE ACTUAL RATES VARIANCE CER
€ million 2017 2016 (Restated¹) € million % € million %
Net sales U.S. 2 069 1 877 191 10% 230 12%
Cimzia® 918 846 72 8% 89 11%
Vimpat® 746 629 117 19% 131 21%
Keppra® 232 216 16 7% 20 9%
Neupro® 96 85 11 13% 13 15%
Briviact® 63 11 52 >100% 53 >100%
Established brands
venlafaxine ER 0 89 - 89 -100% - 89 -100%
Other 14 1 13 >100% 13 >100%
Net sales Europe 1 288 1 224 64 5% 72 6%
Cimzia® 370 339 31 9% 35 10%
Keppra® 235 237 - 3 -1% - 2 -1%
Neupro® 168 161 7 4% 7 5%
Vimpat® 177 152 26 17% 26 17%
Briviact® 22 7 15 >100% 16 >100%
Established brands
Zyrtec® 52 63 - 11 -17% - 11 -18%
Xyzal® 29 30 - 1 -4% - 1 -4%
Other 235 235 0 0% 2 1%
Net sales international markets 798 745 53 7% 77 10%
Keppra® 311 267 45 17% 58 22%
Cimzia® 136 118 18 15% 21 18%
Vimpat® 53 42 11 27% 12 28%
Neupro® 50 52 - 2 -4% 0 0%
Briviact® 1 0 1 N/A 1 N/A
Established brands
Zyrtec® (including Cirrus®) 52 54 - 3 -5% - 2 -4%
Xyzal® 74 68 6 9% 9 13%
Other 120 144 - 24 -17% - 22 -15%
Net sales before hedging 4 154 3 846 308 8% 379 10%
Designated hedges reclassified to net sales 28 - 19 47 > -100%
Total net sales 4 182 3 827 355 9% 404 11%
1 After reclassification due to IFRS 15
75 UCB Annual Report 2017
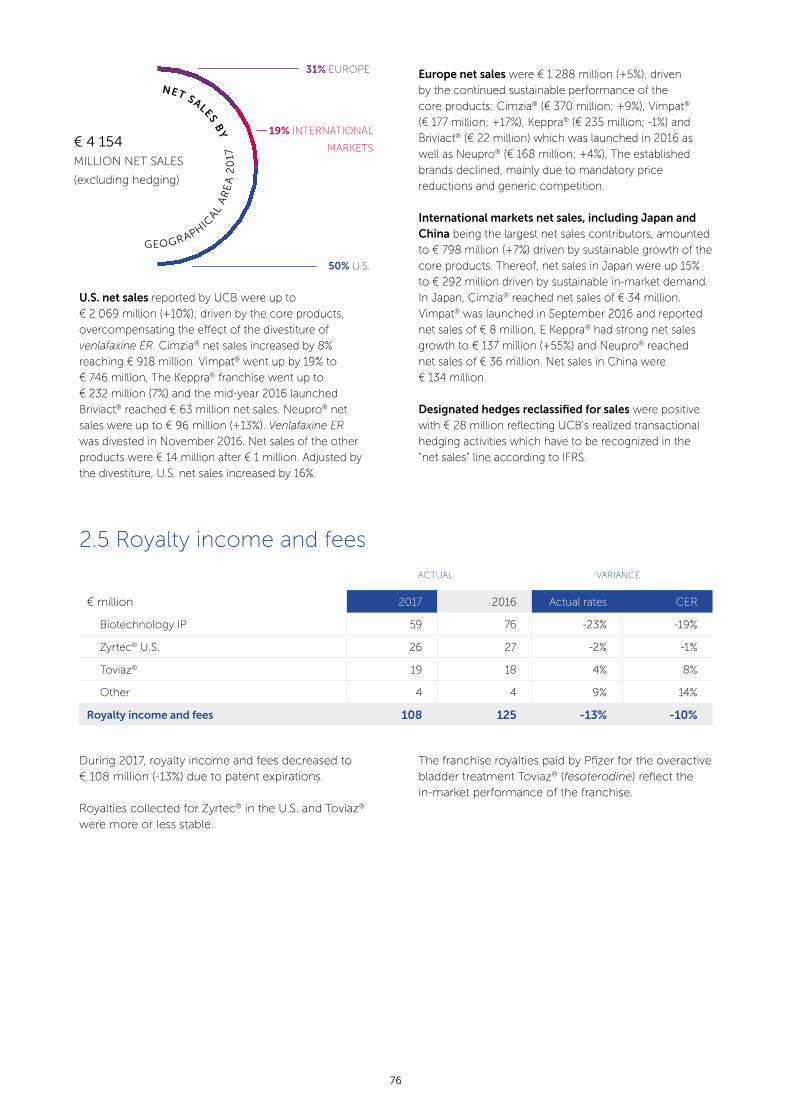
U.S. net sales reported by UCB were up to € 2 069 million (+10%); driven by the core products, overcompensating the effect of the divestiture of venlafaxine ER. Cimzia® net sales increased by 8% reaching € 918 million. Vimpat® went up by 19% to € 746 million, The Keppra® franchise went up to € 232 million (7%) and the mid-year 2016 launched Briviact® reached € 63 million net sales. Neupro® net sales were up to € 96 million (+13%). Venlafaxine ER was divested in November 2016. Net sales of the other products were € 14 million after € 1 million. Adjusted by the divestiture, U.S. net sales increased by 16%.
31% EUROPE
19% INTERNATIONAL
MARKETS
50% U.S.
NET SALES BY
€ 4 154MILLION NET SALES
(excluding hedging)
GEOGRAPHICA
L A
RE
A 2
017
Europe net sales were € 1 288 million (+5%), driven by the continued sustainable performance of the core products: Cimzia® (€ 370 million; +9%), Vimpat® (€ 177 million; +17%), Keppra® (€ 235 million; -1%) and Briviact® (€ 22 million) which was launched in 2016 as well as Neupro® (€ 168 million; +4%). The established brands declined, mainly due to mandatory price reductions and generic competition.
International markets net sales, including Japan and China being the largest net sales contributors, amounted to € 798 million (+7%) driven by sustainable growth of the core products. Thereof, net sales in Japan were up 15% to € 292 million driven by sustainable in-market demand. In Japan, Cimzia® reached net sales of € 34 million. Vimpat® was launched in September 2016 and reported net sales of € 8 million, E Keppra® had strong net sales growth to € 137 million (+55%) and Neupro® reached net sales of € 36 million. Net sales in China were € 134 million.
Designated hedges reclassified for sales were positive with € 28 million reflecting UCB’s realized transactional hedging activities which have to be recognized in the “net sales” line according to IFRS.
2.5 Royalty income and fees
ACTUAL VARIANCE
€ million 2017 2016 Actual rates CER
Biotechnology IP 59 76 -23% -19%
Zyrtec® U.S. 26 27 -2% -1%
Toviaz® 19 18 4% 8%
Other 4 4 9% 14%
Royalty income and fees 108 125 -13% -10%
During 2017, royalty income and fees decreased to € 108 million (-13%) due to patent expirations.
Royalties collected for Zyrtec® in the U.S. and Toviaz® were more or less stable.
The franchise royalties paid by Pfizer for the overactive bladder treatment Toviaz® (fesoterodine) reflect the in-market performance of the franchise.
76
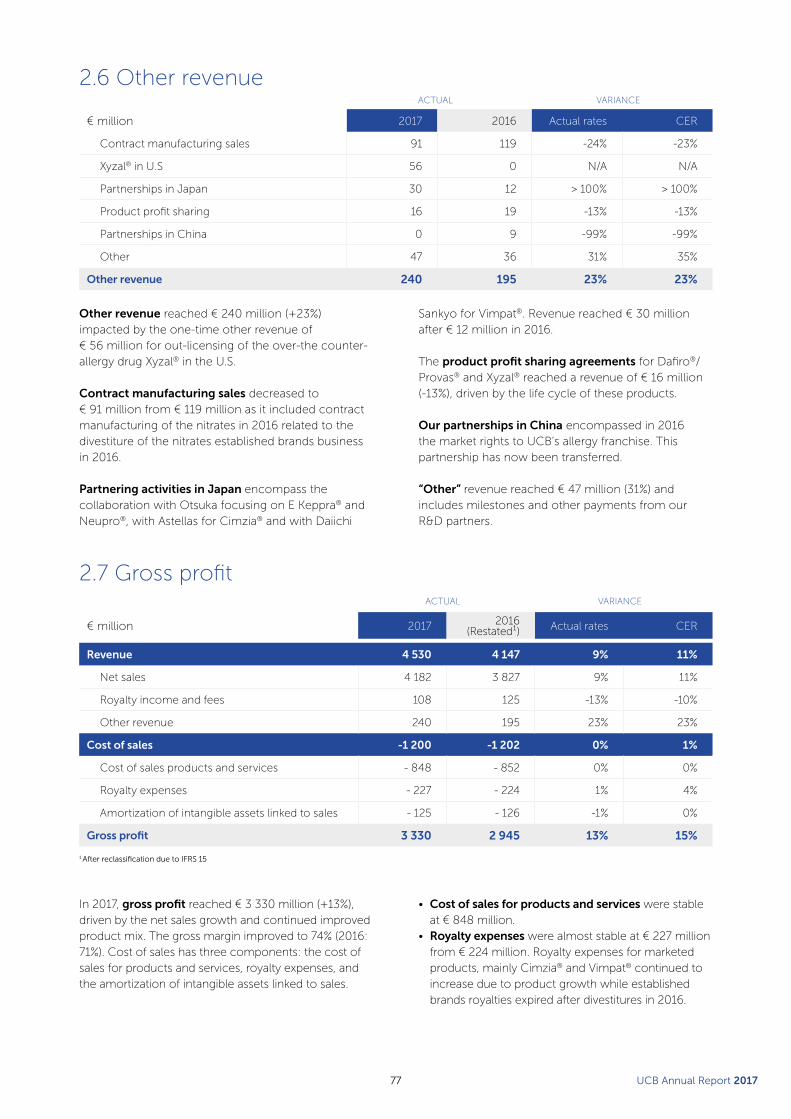
2.6 Other revenueACTUAL VARIANCE
€ million 2017 2016 Actual rates CER
Contract manufacturing sales 91 119 -24% -23%
Xyzal® in U.S 56 0 N/A N/A
Partnerships in Japan 30 12 > 100% > 100%
Product profit sharing 16 19 -13% -13%
Partnerships in China 0 9 -99% -99%
Other 47 36 31% 35%
Other revenue 240 195 23% 23%
Other revenue reached € 240 million (+23%) impacted by the one-time other revenue of € 56 million for out-licensing of the over-the counter-allergy drug Xyzal® in the U.S.
Contract manufacturing sales decreased to € 91 million from € 119 million as it included contract manufacturing of the nitrates in 2016 related to the divestiture of the nitrates established brands business in 2016.
Partnering activities in Japan encompass the collaboration with Otsuka focusing on E Keppra® and Neupro®, with Astellas for Cimzia® and with Daiichi
Sankyo for Vimpat®. Revenue reached € 30 million after € 12 million in 2016.
The product profit sharing agreements for Dafiro®/Provas® and Xyzal® reached a revenue of € 16 million (-13%), driven by the life cycle of these products.
Our partnerships in China encompassed in 2016 the market rights to UCB’s allergy franchise. This partnership has now been transferred.
“Other” revenue reached € 47 million (31%) and includes milestones and other payments from our R&D partners.
2.7 Gross profitACTUAL VARIANCE
€ million 2017 2016 (Restated¹) Actual rates CER
Revenue 4 530 4 147 9% 11%
Net sales 4 182 3 827 9% 11%
Royalty income and fees 108 125 -13% -10%
Other revenue 240 195 23% 23%
Cost of sales -1 200 -1 202 0% 1%
Cost of sales products and services - 848 - 852 0% 0%
Royalty expenses - 227 - 224 1% 4%
Amortization of intangible assets linked to sales - 125 - 126 -1% 0%
Gross profit 3 330 2 945 13% 15%
1 After reclassification due to IFRS 15
In 2017, gross profit reached € 3 330 million (+13%), driven by the net sales growth and continued improved product mix. The gross margin improved to 74% (2016: 71%). Cost of sales has three components: the cost of sales for products and services, royalty expenses, and the amortization of intangible assets linked to sales.
• Cost of sales for products and services were stable at € 848 million.
• Royalty expenses were almost stable at € 227 million from € 224 million. Royalty expenses for marketed products, mainly Cimzia® and Vimpat® continued to increase due to product growth while established brands royalties expired after divestitures in 2016.
77 UCB Annual Report 2017
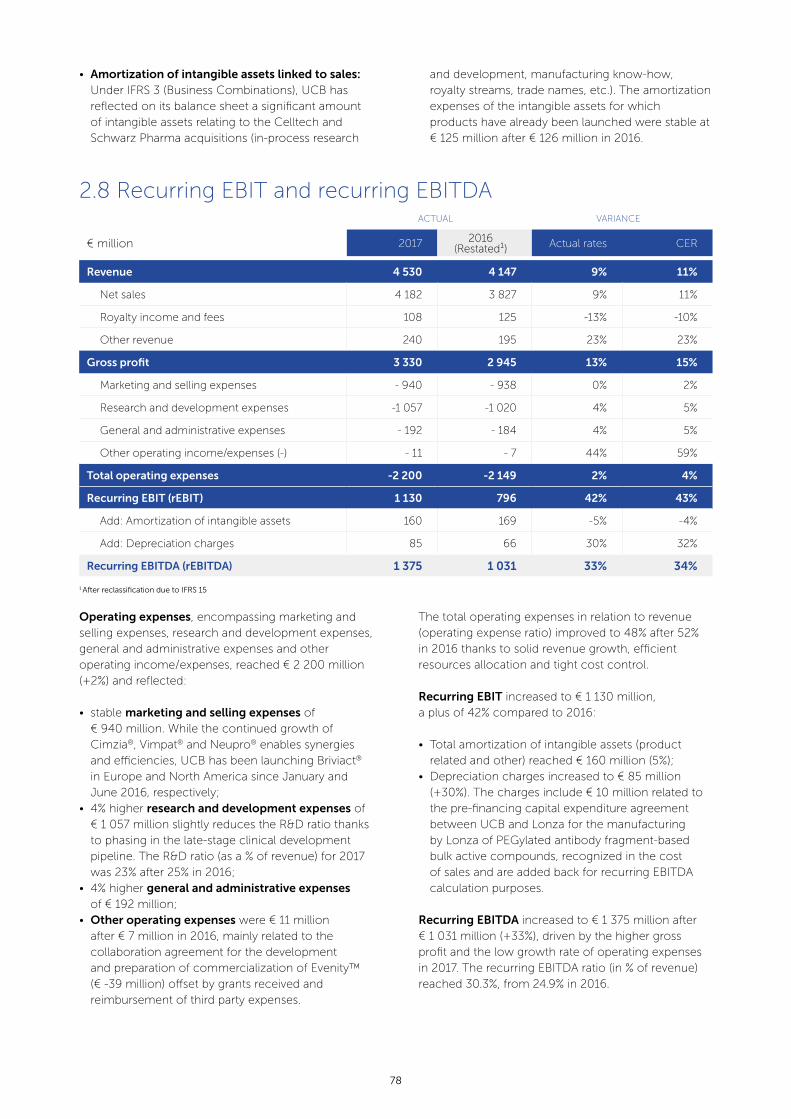
• Amortization of intangible assets linked to sales: Under IFRS 3 (Business Combinations), UCB has reflected on its balance sheet a significant amount of intangible assets relating to the Celltech and Schwarz Pharma acquisitions (in-process research
and development, manufacturing know-how, royalty streams, trade names, etc.). The amortization expenses of the intangible assets for which products have already been launched were stable at € 125 million after € 126 million in 2016.
2.8 Recurring EBIT and recurring EBITDAACTUAL VARIANCE
€ million 2017 2016 (Restated¹) Actual rates CER
Revenue 4 530 4 147 9% 11%
Net sales 4 182 3 827 9% 11%
Royalty income and fees 108 125 -13% -10%
Other revenue 240 195 23% 23%
Gross profit 3 330 2 945 13% 15%
Marketing and selling expenses - 940 - 938 0% 2%
Research and development expenses -1 057 -1 020 4% 5%
General and administrative expenses - 192 - 184 4% 5%
Other operating income/expenses (-) - 11 - 7 44% 59%
Total operating expenses -2 200 -2 149 2% 4%
Recurring EBIT (rEBIT) 1 130 796 42% 43%
Add: Amortization of intangible assets 160 169 -5% -4%
Add: Depreciation charges 85 66 30% 32%
Recurring EBITDA (rEBITDA) 1 375 1 031 33% 34%
1 After reclassification due to IFRS 15
Operating expenses, encompassing marketing and selling expenses, research and development expenses, general and administrative expenses and other operating income/expenses, reached € 2 200 million (+2%) and reflected:
• stable marketing and selling expenses of € 940 million. While the continued growth of Cimzia®, Vimpat® and Neupro® enables synergies and efficiencies, UCB has been launching Briviact® in Europe and North America since January and June 2016, respectively;
• 4% higher research and development expenses of € 1 057 million slightly reduces the R&D ratio thanks to phasing in the late-stage clinical development pipeline. The R&D ratio (as a % of revenue) for 2017 was 23% after 25% in 2016;
• 4% higher general and administrative expenses of € 192 million;
• Other operating expenses were € 11 million after € 7 million in 2016, mainly related to the collaboration agreement for the development and preparation of commercialization of Evenity™ (€ -39 million) offset by grants received and reimbursement of third party expenses.
The total operating expenses in relation to revenue (operating expense ratio) improved to 48% after 52% in 2016 thanks to solid revenue growth, efficient resources allocation and tight cost control.
Recurring EBIT increased to € 1 130 million, a plus of 42% compared to 2016:
• Total amortization of intangible assets (product related and other) reached € 160 million (5%);
• Depreciation charges increased to € 85 million (+30%). The charges include € 10 million related to the pre-financing capital expenditure agreement between UCB and Lonza for the manufacturing by Lonza of PEGylated antibody fragment-based bulk active compounds, recognized in the cost of sales and are added back for recurring EBITDA calculation purposes.
Recurring EBITDA increased to € 1 375 million after € 1 031 million (+33%), driven by the higher gross profit and the low growth rate of operating expenses in 2017. The recurring EBITDA ratio (in % of revenue) reached 30.3%, from 24.9% in 2016.
78

2.9 ProfitACTUAL VARIANCE
€ million 2017 2016 Actual rates CER
Recurring EBIT 1 130 796 42% 43%
Impairment charges -1 -12 -90% -92%
Restructuring expenses -23 -33 -31% -30%
Gain on disposals 3 171 -99% -99%
Other non-recurring income/expenses (-) -22 -46 -56% -56%
Total non-recurring income/expenses (-) -43 80 >-100% >-100%
EBIT (operating profit) 1 087 876 24% 25%
Net financial expenses (-) -99 -112 -12% -11%
Result from associates 0 0 N/A N/A
Profit before income taxes 988 764 29% 30%
Income tax expenses -218 -199 9% 10%
Profit from continuing operations 770 565 36% 38%
Profit/loss (-) from discontinued operations 1 -23 >-100% >-100%
Profit 771 542 42% 43%
Attributable to UCB shareholders 753 520 45% 46%
Attributable to non-controlling interests 18 22 -17% -16%
Profit attributable to UCB shareholders 753 520 45% 46%
Total non-recurring income/expenses (-) reached € 43 million pre-tax expenses, compared to € 80 million pre-tax income in 2016. The main driver of this expense is related to restructuring and litigation expenses. The 2016 non-recurring items included the divestitures of UCB’s nitrates established brands as well as the divestiture of venlafaxine ER in the U.S.
Net financial expenses decreased to € 99 million from € 112 million. In 2016, the expenses included the € 28 million impairment of the Lannett warrant (in connection with the Kremers Urban divestiture).
Income tax expenses were € 218 million compared to € 199 million in 2016. The average effective tax rate on recurring activities was 22.1% compared to 26.0% in
2016. The effective tax rate 2017 has decreased from the previous year following tax audit settlements.
Profit/loss from discontinued operations reached a profit of € 1 million after a loss of € 23 million in 2016, reflecting activities related to the divestment of Kremers Urban.
The profit of the Group amounted to € 771 million (after € 542 million), of which € 753 million is attributable to UCB shareholders and € 18 million to non-controlling interests. For 2016, profit reached € 542 million, of which € 520 million were attributable to UCB shareholders and € 22 million to non-controlling interests.
79 UCB Annual Report 2017

2.10 Core EPSACTUAL VARIANCE
€ million 2017 2016 Actual rates CER
Profit 771 542 42% 43%
Attributable to UCB shareholders 753 520 45% 46%
Attributable to non-controlling interests 18 22 -17% -16%
Profit attributable to UCB shareholders 753 520 45% 46%
Total non-recurring income (-)/expenses 43 - 80 >-100% >-100%
Income tax on non-recurring expenses (-)/credit 12 15 -11% -11%
Financial one-off income (-)/expenses 0 23 -100% -100%
Income tax on financial one-off income/expenses (-) 0 - 1 -100% -100%
Profit (-)/loss from discontinued operations - 1 23 >-100% >-100%
Amortization of intangibles linked to sales 125 126 -1% 0%
Income tax on amortization of intangibles linked to sales - 25 - 26 -5% -5%
Core profit attributable to UCB shareholders 907 600 51% 52%
Weighted average number of shares (million) 188 188 0%
Core EPS attributable to UCB shareholders (€) 4.82 3.19 51% 52%
The profit attributable to UCB shareholders, adjusted for the after-tax impact of non-recurring items, the financial one-offs, the after-tax contribution from discontinued operations and the net amortization of intangibles linked to sales, reached € 907 million
(+51%), leading to a core earnings per share (EPS) of € 4.82, compared to € 3.19 in 2016, per non-dilutive weighted average number of shares of 188 million and 188 million, respectively.
2.11 Capital expenditure
2.12 Balance sheet
The intangible assets decreased by € 58 million from € 875 million at 31 December 2016 to € 817 million at 31 December 2017. This includes the ongoing amortization of the intangible assets (€ 160 million), the disposal of intangibles of the nitrates business, partially offset by additions through in-licensing, software and capitalized eligible development costs.
Goodwill went down from € 5 178 million at 31 December 2016 to € 4 838 million mainly stemming from a weaker U.S. dollar and British pound compared to December 2016.
Other non-current assets decreased by € 243 million, driven by a decrease in deferred tax assets, after tax reforms in the U.S., U.K. and Belgium.
In 2017, the tangible capital expenditure resulting from UCB biopharmaceutical activities amounted to € 100 million (2016: € 108 million). The 2017 capital expenditures related mainly to upgrade of the biological plant in Bulle (Switzerland), IT hardware and other plant & equipment.
Acquisition of intangible assets reached € 109 million in 2017 (2016: € 30 million) related to in-licensing deals, software and capitalized eligible development
costs, including € 29 million related to Dermira.
In addition, as foreseen in the agreement between UCB and Lonza for the manufacturing by Lonza of PEGylated antibody fragment-based bulk active compounds, UCB has participated in the pre-financing of the related capital expenditure. Depreciation charges on this investment are recognized in the cost of goods sold and is added back for recurring EBITDA calculation purposes.
80

2.14 Outlook 2018
2.13 Cash flow statement
The current assets increase from € 2 331 million as of 31 December 2016 to € 2 677 million as of 31 December 2017 and relates to slightly higher working capital and increased cash positions.
UCB’s shareholders’ equity, at € 5 736 million, showed an increase of € 259 million between 31 December 2016 and 31 December 2017. The important changes stem from the net profit after non-controlling interests (€ 753 million), the cash-flow hedges (€ 110 million), offset with the U.S. dollar and British pound currency translation (€ -352 million), the dividend payments (€ -220 million) and the acquisition of own shares (€ -119 million).
The non-current liabilities amounted to € 2 232 million, a minor decrease of € 85 million.
The current liabilities amounted to € 1 949 million, down € 469 million, due to decrease of income tax payables related to tax audits and the trade payables.
The net debt decreased by € 314 million from € 838 million as of end December 2016 to € 525 million as per end December 2017, and mainly relates to the underlying net profitability, offset by the dividend payment on the 2016 results and the acquisition of own shares. The net debt to recurring EBITDA ratio for 2017 reached 0.38 after 0.81 for 2016.
The evolution of cash flow generated by bio- pharmaceuticals activities is affected by the following:
• Cash flow from operating activities amounted to € 927 million, of which € 896 million from continuing operations, compared to € 726 million in 2016 and stemming from underlying net profitability.
• Cash flow from investing activities showed an outflow of € 228 million (continuing operations), compared to € 133 million inflow in 2016. It is related to upgrade / maintenance of plants, in-licensing deals, capitalized eligible develoment costs and venture funds.
• Cash flow from financing activities has an outflow of € 402 million, which includes the dividend paid to UCB shareholders (€ 217 million), the acquisition of treasury shares (€ 105 million) and the repayment of short term borrowings (€ 26 million).
For 2018, UCB expects the continued growth of its core products driving company growth. UCB will also advance its development pipeline to offer potential new solutions for patients and complement existing pipeline assets with external opportunities.
2018 revenue is expected to reach approximately € 4.5–4.6 billion. Recurring EBITDA in the range
of € 1.3 –1.4 billion. Core earnings per share are therefore expected in the range of € 4.30 – 4.70 based on an average of 188 million shares outstanding.
The figures for the outlook 2018 as mentioned above are calculated on the same basis as the actual figures for 2017.
81 UCB Annual Report 2017

Kristof, living with axial spondyloarthritis 82

CONSOLIDATED FINANCIAL STATEMENTS
03
1. Consolidated income statement
2. Consolidated statement of comprehensive income
3. Consolidated statement of financial position
4. Consolidated statement of cash flows
5. Consolidated statement of changes in equity
84
85
86
87
89
83 UCB Annual Report 2017

1 Consolidated income statement
For the year ended 31 December
€ million Note 2017 2016 (Restated¹)
Continuing operations
Net sales 5 4 182 3 827
Royalty income and fees 108 125
Other revenue 9 240 195
Revenue 4 530 4 147
Cost of sales -1 200 -1 202
Gross profit 3 330 2 945
Marketing and selling expenses -940 -938
Research and development expenses -1 057 -1 020
General and administrative expenses -192 -184
Other operating income/expenses (-) 12 -11 -7
Operating profit before impairment, restructuring and other income and expenses 1 130 796
Impairment of non-financial assets 13 -1 -12
Restructuring expenses 14 -23 -33
Other income/expenses (-) 15 -19 125
Operating profit 1 087 876
Financial income 16 15 62
Financial expenses 16 -114 -174
Share of loss of associates 0 -0
Profit before income taxes 988 764
Income tax expense 17 -218 -199
Profit from continuing operations 770 565
Discontinued operations
Profit/loss (-) from discontinued operations 8 1 -23
Profit 771 542
Attributable to:
Equity holders of UCB SA 753 520
Non-controlling interests 18 22
Basic earnings per share (€)
from continuing operations 39 3.99 2.88
from discontinued operations 39 0.01 -0.12
Total basic earnings per share 4.00 2.76
Diluted earnings per share (€)
from continuing operations 39 3.99 2.88
from discontinued operations 39 0.01 -0.12
Total diluted earnings per share 4.00 2.76
1 After reclassification due to IFRS 15
84

2 Consolidated statement of comprehensive income
For the year ended 31 December
€ million Note 2017 2016
Profit for the period 771 542
Other comprehensive income
Items to be reclassified to profit or loss in subsequent periods:
• Net gain/loss (-) on available for sale financial assets -12 -1
• Exchange differences on translation of foreign operations -340 -53
• Effective portion of gains/losses (-) on cash flow hedges 157 -17
• Income tax relating to the components of other comprehensive income to be reclassified to profit or loss in subsequent periods -47 13
Items not to be reclassified to profit or loss in subsequent periods:
• Remeasurement of defined benefit obligation 32 27 -107
• Income tax relating to the components of other comprehensive income not to be reclassified to profit or loss in subsequent periods -18 18
Other comprehensive income/loss (-) for the period, net of tax -233 -147
Total comprehensive income for the period, net of tax 538 395
Attributable to:
• Equity holders of UCB SA 508 376
• Non-controlling interests 30 19
Total comprehensive income for the period, net of tax 538 395
85 UCB Annual Report 2017

3 Consolidated statement of financial position€ million Note 2017 2016
Assets
Non-current assets
Intangible assets 19 817 875
Goodwill 20 4 838 5 178
Property, plant and equipment 21 673 678
Deferred income tax assets 31 715 953
Financial and other assets (including derivative financial instruments) 22 197 197
Total non-current assets 7 240 7 881
Current assets
Inventories 23 597 578
Trade and other receivables 24 809 884
Income tax receivables 12 5
Financial and other assets (including derivative financial instruments) 22 194 86
Cash and cash equivalents 25 1 049 761
Assets of disposal group classified as held for sale 8.2 16 17
Total current assets 2 677 2 331
Total assets 9 917 10 212
Equity and liabilities
Equity
Capital and reserves attributable to UCB shareholders 26 5 813 5 584
Non-controlling interests 22.6 -77 -107
Total equity 5 736 5 477
Non-current liabilities
Borrowings 28 303 331
Bonds 29 1 231 1 243
Other financial liabilities (including derivative financial instruments) 30 57 94
Deferred income tax liabilities 31 53 10
Employee benefits 32 441 479
Provisions 1 33 121 105
Trade and other liabilities 34 26 55
Total non-current liabilities 2 232 2 317
Current liabilities
Borrowings 28 39 27
Bonds 29 0 0
Other financial liabilities (including derivative financial instruments) 30 53 142
Provisions 33 37 61
Trade and other liabilities 34 1 724 1 860
Income tax payables 35 96 328
Liabilities of disposal group classified as held for sale 8.2 0 0
Total current liabilities 1 949 2 418
Total liabilities 4 181 4 735
Total equity and liabilities 9 917 10 212
86

4 Consolidated statement of cash flows
For the year ended 31 December
€ million Note 2017 2016
Profit for the year attributable to UCB shareholders 753 520
Non-controlling interests 18 22
Adjustment for profit (-)/loss from discontinued operations 8 0 23
Adjustment for non-cash transactions 36 150 216
Adjustment for items to disclose separately under operating cash flow 36 218 199
Adjustment for items to disclose under investing and financing cash flows 36 35 -129
Change in working capital 36 -79 46
Interest received 16 16 17
Cash flow generated from operations 1 111 914
Tax paid during the period -184 -487
Net cash flow used in (-)/generated by operating activities:
From continuing operations 896 726
From discontinued operations 31 -299
Net cash flow generated by operating activities 927 427
Acquisition of property, plant and equipment 21 -100 -108
Acquisition of intangible assets 19 -109 -30
Acquisition of subsidiaries, net of cash acquired -7 0
Acquisition of other investments -17 -2
Sub-total acquisitions -233 -140
Proceeds from sale of intangible assets 0 2
Proceeds from sale of property, plant and equipment 0 2
Proceeds from sale of subsidiaries, net of cash disposed 8 0 191
Proceeds from sale of other activities, net of cash disposed 2 260
Proceeds from sale of other investments 3 2
Dividends received 0 0
Sub-total disposals 5 457
Net cash flow used in (-)/generated by investing activities:
From continuing operations -228 133
From discontinued operations 0 184
Net cash flow used in (-) / generated by investing activities -228 317
87 UCB Annual Report 2017

Redemption of perpetual subordinated bond 26.2 0 -300
Proceeds from issuance of bonds 29.3 0 0
Repayment of bonds (-) 29.3 0 -500
Proceeds from borrowings 28 19 0
Repayments of borrowings (-) 28 -45 -107
Payment of finance lease liabilities 28 -1 -1
Acquisition (-)/disposal of treasury shares 26 -105 -49
Dividend paid to UCB shareholders, net of dividend paid on own shares 26.2, 40 -217 -231
Interest paid 16 -53 -79
Net cash flow used in (-)/generated by financing activities:
From continuing operations -402 -1 267
From discontinued operations 0 0
Net cash flow used in financing activities -402 -1 267
Net increase/decrease (-) in cash and cash equivalents 297 -523
From continuing operations 266 -408
From discontinued operations 31 -115
Net cash and cash equivalents at the beginning of the period 756 1 277
Effect of exchange rate fluctuations -31 2
Net cash and cash equivalents at the end of the period 1 022 756
88

5 Consolidated statement of changes in equity2017 – € million Attributed to equity holders of UCB SA
Shar
e c
apita
l an
d
shar
e p
rem
ium
Hyb
rid c
apita
l
Treas
ury
sh
ares
Reta
ined
ear
nin
gs
Oth
er
rese
rves
Cu
mu
lativ
e
tran
slat
ion
ad
just
men
ts
Ava
ilab
le f
or
sale
fin
anci
al a
ssets
Cas
h fl
ow
h
ed
ges
Tota
l
No
n-c
on
tro
llin
g
inte
rest
s
Tota
l st
ock
ho
lders
' eq
uity
Balance at 1 January 2017 2 614 0 -283 3 263 -164 132 42 -20 5 584 -107 5 477
Profit for the period 753 753 18 771
Other comprehensive income/loss (-) 9 -352 -12 110 -245 12 -233
Total comprehensive income 753 9 -352 -12 110 508 30 538
Dividends (Note 40) -217 -217 -217
Share-based payments (Note 27) 60 60 60
Transfer between reserves 45 -45 0 0
Treasury shares (Note 26) -119 -119 -119
Repayment of capital 0 0
Other movements -3 -3 -3
Balance at 31 December 2017 2 614 0 -357 3 811 -155 -220 30 90 5 813 -77 5 736
2016 – € million Attributed to equity holders of UCB SA
Shar
e c
apita
l an
d
shar
e p
rem
ium
Hyb
rid c
apita
l
Treas
ury
sh
ares
Reta
ined
ear
nin
gs
Oth
er
rese
rves
Cu
mu
lativ
e
tran
slat
ion
ad
just
men
ts
Ava
ilab
le f
or
sale
fin
anci
al a
ssets
Cas
h fl
ow
h
ed
ges
Tota
l
No
n-c
on
tro
llin
g
inte
rest
s
Tota
l st
ock
ho
lders
' eq
uity
Balance at 1 January 2016 2 614 295 -295 2 915 -66 182 43 -16 5 672 -126 5 546
Profit for the period 520 520 22 542
Other comprehensive income/loss (-) -89 -50 -1 -4 -144 -3 -147
Total comprehensive income 520 -89 -50 -1 -4 376 19 395
Dividends (Note 40) -207 -207 -207
Share-based payments (Note 27) 52 52 52
Transfer between reserves 5 16 -12 -9 0 0
Treasury shares (Note 26) -4 -4 -4
Repayment of capital -300 -300 -300
Dividend to shareholders of perpetual subordinated bonds (Note 26)
-5 -5 -5
Balance at 31 December 2016 2 614 0 -283 3 263 -164 132 42 -20 5 584 -107 5 477
89 UCB Annual Report 2017

NOTES TO THE CONSOLIDATED FINANCIAL STATEMENTS
04
Therese, living with ankylosing spondylitis90
1. General information 92
2. Summary of significant accounting policies 92
3. Critical judgements and accounting estimates 110
4. Financial risk management 113
5. Segment reporting 121
6. Revenue from contracts with customers 122
7. Business combination 125
8. Discontinued operations and assets of
disposal group classified as held for sale 126
9. Other revenues 127
10. Operating expenses by nature 128
11. Employee benefit expense 128
12. Other operating income/expenses 129
13. Impairment of non-financial assets 130
14. Restructuring expenses 130
15. Other income/expenses 130
16. Financial income and
financial expenses 131
17. Income tax expense (-)/credit 132
18. Components of other
comprehensive income 134
19. Intangible assets 134
20. Goodwill 136
21. Property, plant and equipment 137
22. Financial and other assets 138
23. Inventories 140
24. Trade and other receivables 141
25. Cash and cash equivalents 142
26. Capital and reserves 143
27. Share-based payments 144
28. Borrowings 149
29. Bonds 151
30. Other financial liabilities 152
31. Deferred tax assets and liabilities 153
32. Employee benefits 155
33. Provisions 160
34. Trade and other liabilities 161
35. Income tax payables 162
36. Note to the consolidated statement
of cash flows 163
37. Financial instruments by category 164
38. Derivative financial instruments 165
39. Earnings per share 167
40. Dividend per share 168
41. Commitments and contingencies 168
42. Related party transactions 171
43. Events after the balance sheet date 174
44. UCB companies (fully consolidated) 174
UCB Annual Report 201791

1 General informationUCB SA/NV (UCB or the Company) and its subsidiaries
(together the Group) is a global biopharmaceutical
company focused on severe diseases in three
therapeutic areas namely Neurology, Immunology
and Bone.
The consolidated financial statements of
the Company as at and for the year ended
31 December 2017 comprise the Company and its
subsidiaries. Within the Group, UCB Pharma SA and
UCB S.R.O, both wholly owned subsidiaries, have
branches in the U.K. and Slovakia, respectively, that are
integrated into their accounts.
UCB SA/NV, the parent company, is a limited liability
company incorporated and domiciled in Belgium.
The registered office is at 60, Allée de la Recherche,
B-1070 Brussels, Belgium. UCB SA is listed on
the Euronext Brussels Stock Exchange.
The Board of Directors approved these consolidated
financial statements and the statutory financial
statements of UCB SA for issue on 21 February 2018.
The shareholders will be requested to approve the
statutory financial statements of UCB SA at their
annual meeting on 26 April 2018.
2 Summary of significant accounting policiesThe accounting policies applied in the preparation of
these consolidated financial statements are set out
below. These policies have been consistently applied
to all the years presented, unless otherwise stated.
2.1 Basis of preparationThe consolidated financial statements of the
Company have been prepared in accordance with
International Financial Reporting Standards (IFRS)
and interpretations issued by the IFRS Interpretations
Committee (IFRS IC) as endorsed by the European
Union as of 31 December 2017.
The consolidated financial statements have been
prepared using the historical cost convention, except
that certain items including available for sale financial
assets, derivative financial instruments and liabilities for
cash-settled share based payment arrangements are
measured at fair value.
The preparation of consolidated financial statements
in conformity with IFRS requires the use of certain
critical accounting estimates. It also requires
management to exercise its judgement in the process
of applying the Group accounting policies. The areas
involving a higher degree of judgement or complexity,
or areas where assumptions and estimates are
significant to the consolidated financial statements are
disclosed in Note 3.
2.2 Changes in accounting policy and disclosuresThe Group has decided to apply IFRS 15 Revenue from
Contracts with Customers (issued in May 2014) as
from 1 January 2017 onwards.
In accordance with the transition provisions in IFRS 15
the new rules have been adopted retrospectively
and comparatives for the 2016 financial year have
been restated. Following practical expedients have
been used: for completed contracts with variable
consideration, the transaction price at the contract
completion date was used, non-disclosure of
the transaction price allocated to the remaining
performance obligations and explanation of when
these amounts are expected to be recognized in
revenue for all reporting periods presented before
1 January 2017.
Following the application of IFRS 15 Revenue from
Contracts with Customers, the accounting policies
for revenue were revised. See Note 2.7 for the revised
accounting policies for revenue.
A number of amendments and annual improvements
to standards are mandatory for the first time for the
financial year beginning 1 January 2017. However,
the Group does not have to change its accounting
policies or make retrospective adjustments as a result
of adopting these amendments and improvements
to the standards. Additional information that allows
to understand the changes in liabilities arising from
financing activities, as required by the amendments
to IAS 7 Cash flow statements, is disclosed in notes
28 and 29.
The clarifications to IFRS 15 Revenue from Contracts
with Customers (issued in April 2016) and effective
as of 1 January 2018 have been early adopted as
from 2017 although the effect of the early adoption
compared to an adoption as per 1 January 2018 is
92

nihil as the Group did not make use of the additional
practical expedients on transition and as other
amendments merely concern clarifications on the
existing guidance of IFRS 15.
2.2.1 IMPACT OF THE CHANGES IN ACCOUNTING
POLICIES DUE TO THE APPLICATION OF
IFRS 15 REVENUE FROM CONTRACTS WITH
CUSTOMERS ON THE CONSOLIDATED
INCOME STATEMENT FOR 2016
As a result of the application of the revised accounting
policies due to the application of IFRS 15 Revenue
from Contracts with Customers on a full retrospective
basis, following reclassifications were done in the
consolidated income statement for 2016:
• Reclassification of government levies such as claw
backs, paybacks and U.S. Branded Prescription Drug
fee from other operating expenses and sales and
marketing expenses to net sales for a total amount
of € 57 million. Under IFRS 15, the transaction
price should exclude any amounts collected on
behalf of third parties such as the government or
governmental institutions. Therefore, these levies
have been reclassified to net sales.
• Reclassification of commissions paid to customers
from marketing and selling expenses to net sales
for an amount of € 29 million as under IFRS 15,
these commissions are assessed as being part of the
transaction price.
• Reclassification of fees paid to customers and agents
for distinct services from net sales to marketing and
selling expenses for an amount of € 55 million.
There was no major impact on the Consolidated
statement of financial position as per 1 January 2016.
In the table below the impact of the application
of IFRS 15 on the Consolidated income statement
is presented.
93 UCB Annual Report 2017

€ millionAs originally presented
Reclassifications due to IFRS 15 As restated
Continuing operations
Net Sales 3 858 - 31 3 827
Royalty income and fees 125 125
Other revenue 195 195
Revenue 4 178 - 31 4 147
Cost of sales -1 202 -1 202
Gross profit 2 976 - 31 2 945
Marketing and selling expenses - 940 2 - 938
Research and development expenses -1 020 -1 020
General and administrative expenses - 184 - 184
Other operating income/expenses (-) - 36 29 - 7
Operating profit before impairment, restructuring 796 0 796
Impairment of non-financial assets - 12 - 12
Restructuring expenses - 33 - 33
Other income/expenses (-) 125 125
Operating profit 876 0 876
Financial income 62 62
Financial expenses - 174 - 174
Net financial expenses (-) - 112 0 - 112
Share of loss of associates 0 0
Profit before income taxes 764 0 764
Income tax expense - 199 - 199
Profit from continuing operations 565 0 565
Discontinued operations
Profit/loss (-) from discontinued operations
Profit 542 0 542
Attributable to:
Equity holders of UCB SA 520 0 520
Non-controlling interests 22 0 22
Basic earnings per share (€)
from continuing operations 2.88 2.88
from discontinued operations - 0.12 - 0.12
Total basic earnings per share 2.76 2.76
Diluted earnings per share (€)
from continuing operations 2.88 2.88
from discontinued operations - 0.12 - 0.12
Total diluted earnings per share 2.76 2.76
94

2.3 New standards and amendments to standards not yet adoptedCertain new standards and amendments to existing
standards have been issued by the IASB but are
not effective for the financial year beginning on
1 January 2017 and have not been early adopted
by the Group.
• IFRS 9 Financial instruments addresses the
classification, measurement and de-recognition of
financial assets and financial liabilities, introduces
new rules for hedge accounting and a new
impairment model for financial assets. The standard
is effective as from 1 January 2018 onwards. The
Group does not expect a major impact from the
application of IFRS 9 on the Group’s consolidated
financial statements.
• IFRS 16 Leases is effective as from 1 January 2019
and specifies how to recognize, measure, present
and disclose leases. The new standard provides
a single lessee accounting model, requiring the
recognition of assets and liabilities for all leases,
unless the lease term is 12 months or less or the
underlying asset has a low value. Lessor accounting
remains largely unchanged from IAS 17.
The Group intends to early adopt IFRS 16 Leases as
from 1 January 2018.
On adoption of IFRS 16, the Group will recognize
lease liabilities in relation to leases which have been
classified previously as ‘operating leases’ under the
principles of IAS 17 Leases. These liabilities will be
measured at the present value of the remaining lease
payments, discounted using the group’s incremental
borrowing rate as of 1 January 2018. In accordance
with the transition provisions in IFRS 16, the new rules
for lease accounting will be adopted retrospectively
with the cumulative effect of initially applying the new
standard recognized on 1 January 2018 (ie. limited
retrospective application). Comparatives for the 2017
financial year will not be restated for IFRS 16. The
associated right-of-use assets will be measured at an
amount equal to the lease liability, adjusted by the
amount of any related restoration provision.
In applying IFRS 16 for the first time, the Group will
use the following practical expedients permitted by
the standard:
• the use of a single discount rate to a portfolio of
leases with reasonably similar characteristics;
• the exclusion of initial direct costs for the
measurement of the right-of-use asset at the date of
initial application;
• the use of hindsight in determining the lease term
where the contract contains options to extend or
terminate the lease;
• for contracts entered into before 1 January 2018,
the Group has not reassessed whether the contract
is, or contains, a lease. The Group does not apply
IFRS 16 to contracts that were not previously
identified as containing a lease applying IAS 17
and IFRIC 4.
The Group estimates that the increase in financial
liabilities, following the application of IFRS 16, is not
expected to exceed 10% of gross debt. The impact on
the income statement is not expected to exceed 1% of
profit before income taxes.
There are no other standards or amendments to
standards that are not yet effective and that would be
expected to have a material impact on the Group’s
consolidated financial statements.
2.4 Consolidation2.4.1 SUBSIDIARIES
Subsidiaries are all entities (including structured
entities) over which the Group has control. The Group
controls an entity when the Group is exposed to, or
has rights to, variable returns from its involvement with
the entity and has the ability to affect those returns
through its power over the entity. Subsidiaries are
fully consolidated from the date on which control is
transferred to the Group. They are de-consolidated
from the date that control ceases.
The Group uses the acquisition method of
accounting to account for business combinations.
The consideration transferred for the acquisition of
a subsidiary is the fair value of the assets transferred,
the liabilities incurred and the equity interests issued
by the Group. The consideration transferred includes
the fair value of any asset or liability resulting from
a contingent consideration agreement. Acquisition-
related costs are expensed as incurred. Identifiable
assets acquired and liabilities and contingent liabilities
assumed in a business combination are measured
initially at their fair values at acquisition date. On an
acquisition-by-acquisition basis, the Group recognizes
any non-controlling interest in the acquiree either
at fair value or at the non-controlling interest’s
proportionate share of the acquiree’s net assets.
95 UCB Annual Report 2017

Any contingent consideration to be transferred by the
Group is recognized at fair value at the acquisition
date. Subsequent changes to the fair value of the
contingent consideration that is deemed to be
an asset or liability is recognized in profit or loss.
Contingent consideration that is classified as equity
is not remeasured, and its subsequent settlement is
accounted for within equity.
Goodwill is initially measured as the excess of the
aggregate of the consideration transferred and the
fair value of non-controlling interest over the net
identifiable assets acquired and liabilities assumed. If
this consideration is lower than the fair value of the
net assets of the subsidiary acquired, the difference is
recognized in profit or loss.
Inter-company transactions, balances and unrealized
gains on transactions between Group companies
are eliminated. Unrealized losses are also eliminated
unless the transaction provides evidence of an
impairment of the asset transferred. Accounting
policies of subsidiaries have been changed where
necessary to ensure consistency with the policies
adopted by the Group.
2.4.2 CHANGES IN OWNERSHIP INTERESTS
IN SUBSIDIARIES WITHOUT CHANGE
OF CONTROL
The Group treats transactions with non-controlling
interests that do not result in a loss of control as
transactions with equity owners of the Group.
For purchases from non-controlling interests, the
difference between any consideration paid and the
relevant share acquired of the carrying value of net
assets of the subsidiary is recorded in equity. Gains or
losses on disposals to non-controlling interests are
also recorded in equity.
2.4.3 DISPOSAL OF SUBSIDIARIES
When the Group ceases to have control, any retained
interest in the entity is remeasured to its fair value, with
the change in carrying amount recognized in profit
or loss. The fair value is the initial carrying amount
for the purposes of subsequently accounting for
the retained interest as an associate, joint venture or
financial asset. In addition, any amounts previously
recognized in other comprehensive income in respect
of that entity are accounted for as if the Group had
directly disposed of the related assets or liabilities.
This may mean that amounts previously recognized in
other comprehensive income are reclassified to profit
or loss.
2.4.4 ASSOCIATES
Associates are all entities over which the Group
has significant influence but not control, generally
accompanying a shareholding of between 20%-50%
of the voting rights. Investments in associates are
accounted for using the equity method of accounting
and are initially recognized at cost and the carrying
amount is increased or decreased to recognize the
investor’s share of the profit or loss of the investee
after the date of acquisition. The Group’s investment in
associates includes goodwill identified on acquisition.
When the Group ceases to equity account for an
investment because of a loss of significant influence,
any retained interest in the entity is remeasured to
its fair value with the change in carrying amount
recognized in profit or loss. The fair value becomes
the initial carrying amount for the purposes of
subsequently accounting for the retained interest as
a financial asset. In addition, any amounts previously
recognized in other comprehensive income in respect
of that entity are accounted for as if the Group had
directly disposed of the related assets or liabilities.
This may mean that amounts previously recognized in
other comprehensive income are reclassified to profit
or loss where appropriate.
If the ownership interest in an associate is reduced but
significant influence is retained, only a proportionate
share of the amounts previously recognized in other
comprehensive income are classified to profit or loss
where appropriate.
The Group share of its associates’ post-acquisition
profits or losses is recognized in the income
statement, and its share of post-acquisition
movements in other comprehensive income is
recognized in other comprehensive income with a
corresponding adjustment to the carrying amount
of the investment. The cumulative post-acquisition
movements are adjusted against the carrying amount
of the investment. When the Group’s share of losses
in an associate equals or exceeds its interest in the
associate, including any other unsecured receivables,
the Group does not recognize further losses, unless it
has incurred obligations or made payments on behalf
of the associate.
The carrying amount of investments in associates
is tested for impairment in accordance with the
policy described in note 2.10. Unrealized gains on
transactions between the Group and its associates
are eliminated to the extent of the Group’s interest in
the associates. Unrealized losses are also eliminated
96

unless the transaction provides evidence of an
impairment of the asset transferred. Accounting
policies of associates have been changed where
necessary to ensure consistency with the policies
adopted by the Group.
Dilution gains and losses arising in investments in
associates are recognized in the income statement.
2.4.5 INTERESTS IN JOINT OPERATIONS
A joint operation is a joint arrangement whereby the
parties, or joint operators that have joint control of the
arrangement, have rights to the assets, and obligations
for the liabilities, relating to the arrangement. Joint
control is the contractually agreed sharing of control
of an arrangement, which exists only when decisions
about the relevant activities require the unanimous
consent of the parties sharing control.
When conducting activities under joint operations,
the Group recognizes in relation to its interest in
a joint operation:
• its assets, including its share of any assets
held jointly;
• its liabilities, including its share of any liability
incurred jointly;
• its revenue from the sale of its share of the output
arising from the joint operations;
• its share of the revenue from the sale of the output
by the joint operation;
• its expenses, including its share of any expenses
incurred jointly.
When a Group entity transacts with a joint operation
in which a Group entity is a joint operator, the Group
is considered to be conducting the transaction with
the other parties to the joint operation, and gains and
losses resulting from the transactions are recognized
in the Group’s consolidated financial statements only
to the extent of the other parties’ interests in the
joint operation.
2.5 SEGMENT REPORTING
The Group’s activities are in one segment,
Biopharmaceuticals. There are no other significant
classes of business, either singularly or in aggregate.
The Chief Operating Decision Makers, being the
Executive Committee, review the operating results
and operating plans, and make resource allocation
decisions on a company-wide basis; therefore UCB
operates as one segment.
2.6 Foreign currency translationThe following important exchange rates were used
in preparing the consolidated financial statements:
CLOSING RATE AVERAGE RATE
2017 2016 2017 2016
USD 1.202 1.055 1.127 1.106
JPY 135.360 123.040 126.409 120.054
GBP 0.889 0.854 0.876 0.817
CHF 1.170 1.073 1.110 1.090
The closing rates represent spot rates as at
31 December 2017 and 31 December 2016.
2.6.1 FUNCTIONAL AND PRESENTATION CURRENCY
Items included in the individual financial statements
of each of the Group’s entities are measured using
the currency of the primary economic environment
in which the entity operates (the functional currency).
The consolidated financial statements are presented
in euro (€), which is the functional currency of
the Company, and the presentation currency of
the Group.
2.6.2 TRANSACTIONS AND BALANCES
Foreign currency transactions are translated into
the functional currency using the exchange rates
prevailing at the date of the transactions. Foreign
exchange gains and losses resulting from the
settlement of such transactions and from the
translation at year-end exchange rates of monetary
assets and liabilities denominated in foreign currencies
are recognized in the income statement under
Financial income or Financial expenses, except when
deferred in other comprehensive income as qualifying
cash flow hedges and qualifying net investment
hedges or when attributable to part of the net
investment in a foreign operation.
Changes in the fair value of monetary securities
denominated in foreign currency classified as available
for sale are analyzed between translation differences
resulting from changes in the amortized cost of the
security and other changes in the carrying amount of
the security. Translation differences related to changes
in the amortized cost are recognized in profit or
loss, and other changes in the carrying amount are
recognized in other comprehensive income.
Non-monetary items that are measured at fair value in
a foreign currency are translated using the exchange
rates at the date when the fair value was determined.
Translation differences on assets and liabilities carried
97 UCB Annual Report 2017
at fair value are reported as part of the fair value
gain or loss. For example, translation differences on
non-monetary assets such as equities classified as
available-for-sale financial assets are recognized in
other comprehensive income.
2.6.3 GROUP COMPANIES
The results and financial position of all Group entities
(none of which has the currency of a hyperinflationary
economy) that have a functional currency different
from the presentation currency are translated into the
presentation currency as follows:
• assets and liabilities for each balance sheet
presented are translated at the closing rate at the
date of that balance sheet;
• income and expenses for each income statement
are translated at average exchange rates (unless
this average is not a reasonable approximation
of the cumulative effect of the rates prevailing on
the transaction dates, in which case income and
expenses are translated at the rate on the dates
of the transactions); and
• all resulting exchange differences are recognized
in other comprehensive income (referred to as
“cumulative translation adjustments”).
On consolidation, exchange difference arising
from the translation of the net investment in
foreign operations, and of borrowings and other
currency instruments designated as hedges of such
investments, are taken to other comprehensive
income. When a foreign operation is partially or wholly
disposed of or sold, exchange differences that were
recorded in equity are recognized in the income
statement as part of the gain or loss on sale.
Goodwill and fair value adjustments arising on the
acquisition of a foreign entity are treated as assets
and liabilities of the foreign entity and translated at the
closing rate.
2.7 RevenueRevenue is recognized when control of a good or
service transfers to a customer.
2.7.1 NET SALES
Net sales encompass revenue recognized
resulting from transferring control over products
to the customer.
The amount of revenue recognized is the amount
allocated to the satisfied performance obligation
taking into account variable consideration. The
estimated amount of variable consideration is
included in the transaction price only to the extent
that it is highly probable that a significant reversal
in the amount of cumulative revenue recognized
will not occur when the uncertainty associated
with the variable consideration is subsequently
resolved. Variable consideration that is included in
the transaction price relates to sales returns, rebates,
trade and cash discounts, charge-backs granted to
various customers that are part of commercial and
governmental contractual arrangements or other
reimbursement programs, including the U.S. Medicaid
Drug Rebate program, the U.S. Federal Medicare
program and others as well as the U.S. Branded
Prescription Drug Fee. A liability is recognized for
expected sales returns, rebates, trade and cash
discounts, charge-backs or other reimbursements
payable directly or indirectly to customers in relation
to sales made until the end of the reporting period.
Payment terms can differ from contract to contract
but no element of financing is deemed present.
Therefore the transaction price is not adjusted for
the effects of a significant financing component. A
receivable is recognized as soon as control over the
products is transferred to the customer as this is the
point in time that the consideration is unconditional
because only the passage of time is required before
the payment is due.
The transaction price is adjusted for any consideration
payable to the customer (directly or indirectly) that is
economically linked to the revenue contract unless
the payment is for distinct services received from
the customer. In the latter case, the fair value of the
services received is estimated and accounted for as
part of marketing and selling expenses.
The amount of variable consideration is estimated
on the basis of historical experience and the specific
terms in the individual agreements.
Net sales are presented net of value added tax, other
sales related taxes or any other amounts collected on
behalf of third parties.
2.7.2 ROYALTY INCOME
Sales-based royalties resulting from the out-licensing
of IP are recognized as the subsequent underlying
sales occur provided that the related performance
obligation has been satisfied by then.
2.7.3 OTHER REVENUE
Other revenue comprises revenue generated through
out-licensing and profit-sharing agreements as well as
98

contract manufacturing agreements. The underlying
performance obligations can be satisfied at a point in
time or over time depending on the specific situation.
For performance obligations satisfied over time,
revenue is recognized based on a pattern that best
reflects the transfer of control of the service to the
customer. Usually this progress is measured by an
input method whereby costs incurred and hours
expended relative to total costs expected to be
incurred and total hours expected to be expended are
used as a basis.
Any variable consideration that is promised in
exchange of a license of IP and that is based upon
achieving certain sales targets, is accounted for in the
same way as sales-based royalties i.e. at the moment
the related sales occur provided that the related
performance obligation has been satisfied.
Any variable consideration such as a development
milestone payment that is promised in exchange
for development services or the license of IP, is only
included in the transaction price as from the moment
the achievement of the related milestone event is
highly probable, which then results in a catch up of
revenue at that moment for any performances up till
that moment.
Any upfront payments or license fees for which there
are subsequent performance obligations, are initially
reported as deferred revenue and are recognized as
revenue when performance obligations are satisfied
over the period of the development collaboration or
manufacturing obligation.
2.7.4 INTEREST INCOME
Interest is recognized on a time proportion basis that
takes into account the effective yield on the asset.
2.7.5 DIVIDEND INCOME
Dividends are recognized when the shareholder’s right
to receive the payment is established.
2.8 Cost of salesCost of sales includes primarily the direct production
costs, related production overheads and the
amortization of the related intangible assets as well
as services rendered. Start-up costs are expensed as
incurred. Royalty expenses directly linked to goods
sold are included in “cost of goods sold”.
2.9 Research and development2.9.1 INTERNALLY-GENERATED INTANGIBLE ASSETS,
RESEARCH AND DEVELOPMENT EXPENDITURE
All internal research costs are expensed as incurred.
Internal development expenditure is capitalized only
if it meets the recognition criteria of IAS 38 Intangible
Assets. Due to long development periods and
significant uncertainties related to the development
of new products (such as the risks related to the
outcome of clinical trials as well as the likelihood
of regulatory approval), internal development costs
generally do not qualify for capitalization as intangible
assets. At 31 December 2017, no internal development
expenditures have met the recognition criteria.
2.9.2 ACQUIRED INTANGIBLE ASSETS
Payments for acquired in-process research and
development projects obtained through in-licensing
arrangements, business combinations or separate
asset purchases are capitalized as intangible assets
provided that they are separately identifiable,
controlled by the Group and expected to provide
future economic benefits. As the probability criterion
in IAS 38 is always considered to be satisfied for
separately acquired research and development assets
and the amount of the payments is determinable,
upfront and milestone payments to third parties for
pharmaceutical products or compounds for which
regulatory marketing approval has not yet been
obtained are recognized as intangible assets, and
amortized on a straight-line basis over their useful
lives from the date on which the products are
launched for sale.
2.10 Impairment of non-financial assetsAt each reporting date, the Group reviews the
carrying amounts of its intangible assets, goodwill,
property, plant and equipment and investments
in associates to determine whether there is any
indication of impairment. If any such indication exists,
the recoverable amount of the asset is estimated
in order to determine the extent of the impairment
loss. Irrespective of whether there is an indication
of impairment, an impairment assessment of the
intangibles not yet available for use and goodwill is
carried out annually. These assets are not amortized.
An impairment loss is recognized for the amount
by which the asset’s carrying amount exceeds its
recoverable amount.
Where it is not possible to estimate the recoverable
amount of an individual asset, the Group estimates the
recoverable amount of the cash-generating unit (CGU)
to which the asset belongs. The recoverable amount is
99 UCB Annual Report 2017
the higher of an asset’s fair value less costs to sell and
value in use. To determine the value in use, the Group
uses estimates of future cash flows generated by the
asset or the CGU, using the same methods as those
used in the initial measurement of the asset or the
CGU on the basis of the medium-term plans of each
business activity. Estimated cash flows are discounted
using an appropriate rate that reflects current market
assessments of the time value of money and the risks
specific to the asset or the CGU.
An impairment loss is recognized directly in the
income statement under the “impairment of non-
financial assets” caption. Non-financial assets other
than goodwill that suffered an impairment are
reviewed for possible reversal of the impairment at
each reporting date. The reversal of the impairment is
recognized in the income statement. An impairment
loss is reversed only to the extent that the asset’s
carrying amount does not exceed the carrying
amount that would have been determined, net of
depreciation or amortization, if no impairment loss
had been recognized. Impairment losses on goodwill
are never reversed.
Intangible assets are assessed for impairment either
on a compound by compound basis or by indication
where applicable.
2.11 Restructuring expenses, other income and expensesThe expenses made by the Group in order to be
better positioned to face the economic environment
in which it operates are presented in the income
statement as “restructuring expenses”.
The gains and losses arising upon the sale of
intangible assets other than development stage assets
or property, plant and equipment as well as increases
or reversals of provisions for litigations, other than
tax litigations or litigations related to discontinued
operations, are presented in the income statement as
“other income and expenses”.
2.12 Income taxesThe tax expense for the period comprises current
and deferred income taxes. Tax expense is
recognized in the income statement except to the
extent that it relates to items recognized in other
comprehensive income or directly in equity. In the
case of items recognized in other comprehensive
income or in equity, the tax is also recognized
in other comprehensive income or directly in
equity, respectively.
For the accounting policies related to R&D tax credits
we refer to 2.13.2 under Government grants.
The current income tax charge is calculated on the
basis of the tax laws enacted or substantively enacted
at the balance sheet date in the countries where
the Company’s subsidiaries operate and generate
taxable income.
Current tax assets and tax liabilities are offset if there
is a legally enforceable right to offset and intention
either to settle on a net basis, or to realize the asset
and settle the liability simultaneously.
Deferred income tax is recognized, using the liability
method, on temporary differences arising between
the carrying amounts of assets and liabilities in
the consolidated financial statements and the
corresponding tax bases used in the computation
of taxable profit.
Deferred income tax liabilities are generally recognized
for all taxable temporary differences and deferred
income tax assets are recognized to the extent that it
is probable that future taxable profits will be available
against which deductible temporary differences,
carried forward tax credits or carried forward losses
can be utilized. Deferred income tax is not accounted
for if it arises from the initial recognition of goodwill
or from the initial recognition of an asset or liability in
a transaction (other than in a business combination)
that at the time of the transaction affects neither
accounting nor taxable profit.
The carrying amount of deferred income tax assets is
reviewed at each balance sheet date and reduced to
the extent that it is no longer probable that sufficient
taxable profits will be available to allow all or part of
the asset to be recovered.
Deferred income tax is calculated at the tax rates that
are expected to apply in the period when the liability is
settled or the asset realized. The Group only considers
substantively enacted tax laws when estimating the
amount of deferred taxes to be recognized. Deferred
tax assets and liabilities are not discounted.
Deferred tax liabilities and assets are not recognized
for temporary differences between the carrying
amount and tax bases of investments in foreign
operations where the Company is able to control the
timing of the reversal of the temporary differences and
it is probable that the differences will not reverse in the
foreseeable future.
100
Deferred tax assets and liabilities are only offset if
there is a legally enforceable right to offset current
tax liabilities and assets and the deferred income
taxes relate to the same taxable entity and the same
taxation authority.
2.13 Government grantsGrants from the government are recognized at their
fair value where there is a reasonable assurance that
the grant will be received and the Group will comply
with all attached conditions.
2.13.1 RECOVERABLE CASH PAYMENTS RECEIVED
FROM THE GOVERNMENT
The Group receives cash payments from the
government to partially finance certain research and
development projects. The cash payments received
from the government are repayable in cash only if
the Group decides to exploit and commercialize the
results of the research phase of the related project.
If the Group decides not to proceed with the results
from the research phase, the cash payments are not
repayable. In this case the rights to the research need
to be transferred to the government. When the Group
receives these cash payments, these are accounted
for as other non-current liabilities. Only at the moment
when there is reasonable assurance that the Group
will not have to reimburse the cash payments, these
cash payments are accounted for as government
grants and taken up in “other operating income”. More
specifically, this is at the moment the government
confirms the receipt of the research results and its
agreement with the Group’s decision not to proceed
with the research.
2.13.2 R&D TAX CREDIT
The R&D tax credit is considered as a government
grant related to assets if no additional relevant
requirements are to be met that are not directly
related to the asset. The tax credit is taken in profit and
loss in line with the costs it is intended to compensate.
If the tax credit is received to compensate research
and development expenses that are not capitalized,
the R&D tax credit is recognized in P&L at the same
moment as the research and development expenses
as a credit to the line “Research and development
expenses”. If the tax credit is received to compensate
amortizations on intangible assets eg. licenses, the
R&D tax credit is recognized in profit and loss over
the (remaining) useful life of the asset and reported as
“Other operating income”.
The part of the R&D tax credit that can not be
deducted from the taxable income is accounted for as
a deferred tax asset. The part of the R&D tax credit that
can be deducted from taxable income is debited to
the current income tax liability. If the R&D tax credit is
not refundable by the tax authorities, the recoverability
of the deferred tax asset is assessed on a regular basis
as for the other deferred tax assets.
2.14 Intangible assets2.14.1 PATENTS, LICENSES, TRADEMARKS
AND OTHER INTANGIBLE ASSETS
Patents, licenses, trademarks and other intangible
assets (collectively referred to as “intangible assets”)
are shown at historical cost. Intangible assets acquired
in a business combination are recognized at fair value
at the acquisition date.
Intangible assets (except for goodwill) are amortized
over their useful lives on a straight-line basis as from
the moment they are available for use (i.e., in case of
a license related to a compound or product, when
the product (containing the compound) is launched
for sale). Estimated useful life is based on the lower of
the contract life or the economic useful life (generally
between 5 to 20 years). Intangible assets (except for
goodwill) are considered to have a finite economic
useful life; therefore no intangible assets with an
indefinite life have been identified.
2.14.2 COMPUTER SOFTWARE
Acquired computer software licenses are capitalized
on the basis of the costs incurred to acquire and
bring to use the specific software. These costs are
amortized over their estimated useful lives (3 to 5
years) on a straight-line basis.
2.15 GoodwillGoodwill arises on the acquisition of subsidiaries
and associates and represents the excess of the
consideration transferred over the Group’s interest in
the net fair value of the net identifiable assets, liabilities
and contingent liabilities of the acquiree and the fair
value of the non-controlling interest in the acquiree.
Goodwill is initially recognized as an asset at cost
and is subsequently carried at cost less accumulated
impairment losses. Goodwill related to the acquisition
of subsidiaries is presented separately on the face of
the balance sheet, whereas goodwill arising upon
acquisition of associated companies is included in the
investment in associated companies.
101 UCB Annual Report 2017

UCB operates as one segment and has one cash
generating unit for the purpose of impairment testing.
As goodwill is considered to have an indefinite life, it
is tested for impairment annually, and whenever there
is an indication that it may be impaired, by comparing
its carrying amount with its recoverable amount. If the
recoverable amount of the cash-generating unit is less
than the carrying amount of the unit, the impairment
loss is allocated first to reduce the carrying amount
of any goodwill allocated to the unit and then to the
other assets of the unit pro rata on the basis of the
carrying amount of each asset in the unit. Impairment
losses on goodwill are not reversed.
On disposal of a subsidiary or an associate, the
attributable amount of goodwill is included in the
determination of the profit or loss on disposal of
the entity.
In the event that the fair value of the identifiable assets,
liabilities and contingent liabilities exceeds the cost of
the business combination, the excess remaining after
reassessment is recognized directly in profit or loss.
2.16 Property, plant and equipmentAll property, plant and equipment are carried at
cost less accumulated depreciation and impairment
losses except for property, plant and equipment
under construction, which is carried at cost less
accumulated impairment losses. Cost includes all
directly attributable costs of bringing the asset to its
working condition for its intended use.
Purchased software that is integral to the functionality
of the related equipment is capitalized as part of
that equipment.
Borrowing costs directly attributable to the acquisition,
construction or production of a qualifying asset are
capitalized as part of the cost of that asset.
Subsequent costs are included in the asset’s
carrying amount or recognized as a separate asset,
as appropriate, only when it is probable that future
economic benefits associated with the item will
flow to the Group and the cost of the item can be
measured reliably. All other repairs and maintenance
are expensed as they are incurred.
Depreciation is calculated using the straight-line
method to allocate the cost of assets, other than land
and properties under construction, to their residual
values over their estimated useful lives. Depreciation
commences when the asset is ready to be used. Land
is not depreciated.
The residual value and the useful life of an asset
are reviewed at least at each financial year-end
and, if expectations differ from previous estimates,
the change(s) is(are) accounted for as a change
in an accounting estimate in accordance with
IAS 8 Accounting Policies, Changes in Accounting
Estimates and Errors.
The following useful lives are applicable to the main
property, plant and equipment categories:
• Buildings 20-33 years
• Machinery 7-15 years
• Laboratory equipment 7 years
• Prototype equipment 3 years
• Furniture and fixtures 7 years
• Vehicles 5-7 years
• Computer equipment 3 years
• Asset held under finance lease shorter of asset’s
useful life and leasing term
Gains and losses on disposals are determined by
comparing the proceeds from disposal with the
carrying amount and are recognized under “other
income and expenses” in the income statement.
Investment property is indicative of land and buildings
held to earn rentals. Such assets are initially carried
at cost and depreciated on a straight-line basis over
their estimated useful lives. The underlying useful
lives correspond to those of self-used tangible assets.
Given the insignificant amount of investment property,
it is not separately presented in the balance sheet.
2.17 LeasesLeases are classified as finance leases when the terms
of the lease transfer substantially all the risks and
rewards of ownership to the lessee. All other leases
are classified as operating leases.
2.17.1 FINANCE LEASES
Assets held under finance leases are recognized as
assets of the Group at the lower of their fair value and
the present value of the minimum lease payments less
cumulative depreciation and impairment losses. The
corresponding liability to the lessor is included in the
balance sheet as obligations under finance leases.
Lease payments are apportioned between finance
charges and reduction of the lease obligation so as to
achieve a constant rate of interest on the remaining
102

balance of the liability. Finance charges are recognized
in the income statement.
The depreciable amount of a leased asset is allocated
to each accounting period during the period of
expected use on a systematic basis consistent with the
depreciation policy the Group adopts for depreciable
assets that are owned.
If there is reasonable certainty that the Group will
obtain ownership by the end of the lease term, the
period of expected use is the useful life of the asset;
otherwise the asset is depreciated over the shorter of
the lease term and its useful life.
2.17.2 OPERATING LEASES
Lease payments under an operating lease are
recognized in the income statement on a straight-
line basis over the term of the relevant lease. Benefits
received and receivable as an incentive to enter into
an operating lease are also spread on a straight-line
basis over the lease term.
2.18 Financial assets2.18.1 CLASSIFICATION
The Group classifies its financial assets in the
following categories: at fair value through profit or
loss, loans and receivables, and available for sale. The
classification depends on the purpose for which the
financial assets were acquired.
Management determines the classification of its
financial assets at initial recognition.
2.18.2 FINANCIAL ASSETS AT FAIR VALUE
THROUGH PROFIT OR LOSS
An instrument is classified at fair value through
profit or loss if it is held for trading or is designated
as such upon initial recognition. Financial assets
are designated at fair value through profit or loss if
the Group manages such investments and makes
purchase and sale decisions based on their fair value
in accordance with the Group financial market risk
management policy. Derivative financial instruments
are also categorized as held for trading unless they
are designated as hedges.
2.18.3 LOANS AND RECEIVABLES
Loans and receivables are non-derivative financial
assets with fixed or determinable payments that are
not quoted in an active market. They are included
in current assets, except for maturities greater than
12 months after the balance sheet date. These are
classified as non-current assets.
2.18.4 AVAILABLE FOR SALE FINANCIAL ASSETS
Available for sale financial assets are non-derivative
financial assets that are either designated in this
category or not classified in any of the other
categories. They are included in non-current
assets unless management intends to dispose of
the investment within 12 months of the balance
sheet date.
2.18.5 RECOGNITION AND MEASUREMENT
Regular purchases and sales of financial assets are
recognized on the trade date – the date on which
the Group commits to purchase or sell the asset.
Investments are initially recognized at fair value
plus transaction costs for all financial assets not
carried at fair value through profit or loss. Financial
assets at fair value through profit or loss are initially
recognized at fair value and the transaction costs are
expensed in the income statement. Financial assets
are derecognized when the rights to receive cash
flows from the investments have expired or have been
transferred and the Group has transferred substantially
all risks and rewards of ownership. Available for
sale financial assets and financial assets at fair value
through profit or loss are subsequently carried at fair
value. Loans and receivables are carried at amortized
cost using the effective interest method, less any
impairment losses.
The fair value of listed investments is based on
current bid prices. If the market for a financial asset
is not active (and for unlisted securities), the Group
establishes fair value by using valuation techniques
unless it concerns equity instruments that do not
have a quoted price in an active market and for which
the fair value can not be measured reliably. These
instruments are measured at cost.
Gains or losses arising from changes in the fair value
of the financial assets at fair value through profit or
loss category are recognized in the income statement
in the period in which they arise while gains or losses
arising from changes in the fair value of available
for sale financial assets are recognized directly in
other comprehensive income except for translation
differences related to changes in the amortized cost
of monetary securities which are recognized in profit
or loss. On disposal/impairment of available-for-sale
financial assets, any cumulative gains or losses that
have been deferred in equity are recycled to the
income statement.
103 UCB Annual Report 2017

2.19 Impairment of financial assets2.19.1 ASSETS CARRIED AT AMORTIZED COST
The Group assesses at the end of each reporting
period whether there is objective evidence that a
financial asset or group of financial assets is impaired.
A financial asset or a group of financial assets is
impaired and impairment losses are incurred only if
there is objective evidence of impairment as a result
of one or more events that occurred after the initial
recognition of the asset (a “loss event”) and that loss
event (or events) has an impact on the estimated
future cash flows of the financial asset or group of
financial assets that can be reliably estimated.
The criteria that the Group uses to determine
that there is objective evidence of an impairment
loss include:
• significant financial difficulty of the issuer or obligor;
• a breach of contract, such as default or delinquency
in interest or principal payments;
• the Group, for economic or legal reasons relating
to the borrower’s financial difficulty, granting to the
borrower a concession that the lender would not
otherwise consider;
• it becomes probable that the borrower will enter
bankruptcy or other financial reorganization;
• the disappearance of an active market for that
financial asset because of financial difficulties; or
• observable data indicating that there is a measurable
decrease in the estimated future cash flows.
The Group first assesses whether objective evidence
of impairment exists. For loans and receivables
category, the amount of loss is measured as the
difference between the asset’s carrying amount and
the present value of estimated future cash flows
(excluding future credit losses that have not been
incurred) discounted at the financial asset’s original
effective interest rate. The carrying amount of the
asset is reduced and the amount of the loss is
recognized in the consolidated income statement. If
a loan has a variable interest rate, the discount rate
for measuring any impairment loss is the current
effective interest rate determined under the contract.
As a practical expedient, the Group may measure
impairment on the basis of an instrument’s fair value
using an observable market price.
If, in a subsequent period, the amount of the
impairment loss decreases and the decrease can be
related objectively to an event occurring after the
impairment was recognized (such as an improvement
in the debtor’s credit rating), the reversal of the
previously recognized impairment loss is recognized
in the consolidated income statement.
2.19.2 ASSETS CLASSIFIED AS AVAILABLE FOR SALE
The Group assesses at the end of each reporting
period whether there is objective evidence that
a financial asset or a group of financial assets is
impaired. For debt securities, the Group uses the
criteria referred to above. If, in a subsequent period,
the fair value of a debt instrument classified as
available for sale increases and the increase can be
objectively related to an event occurring after the
impairment loss was recognized in profit or loss, the
impairment loss is reversed through the consolidated
income statement.
In the case of equity investments classified as available
for sale, a significant or prolonged decline in the fair
value of the security below its cost is also evidence
that the asset is impaired. If any such evidence exists
for available for sale financial assets, the cumulative
loss – measured as the difference between the
acquisition cost and the current fair value, less any
impairment loss on that financial asset previously
recognized in profit or loss – is removed from equity
and recognized in profit or loss. Impairment losses
recognized in the consolidated income statement
on equity instruments are not reversed through the
consolidated income statement.
2.20 Derivative financial instruments and hedging activitiesThe Group uses derivative financial instruments to
hedge its exposure to foreign exchange and interest
rate risks arising from operational, financing and
investment activities. The Group does not engage in
speculative transactions.
Derivative financial instruments are initially recorded
at fair value and attributable transaction costs are
recognized in the income statement when incurred.
Derivative financial instruments are subsequently
remeasured at their fair value.
The Group includes the credit and the non-
performance risks into its valuation techniques
leading to non-material impact on derivative valuation
resulting from credit or debit margin adjustments
made on counterparts with who financial market
transactions are contracted.
The method of recognizing the resulting gains or
losses depends on whether the derivative financial
instrument is designated as a hedging instrument
104

and if so, the nature of the item being hedged. The
Group designates derivative financial instruments
as either cash flow hedges, fair value hedges or net
investment hedges.
The Group documents at inception of the transaction
the relationship between the hedging instrument and
the hedged items, as well as its risk management
objectives and strategy for undertaking various
hedging transactions. The Group also documents
its assessment, both at hedge inception and on an
on-going basis, as to whether the derivative financial
instruments that are used in hedging transactions are
highly effective in offsetting changes in fair values or
cash flows of hedged items.
The full fair value of a hedging derivative financial
instrument is classified as a non-current asset or
liability when the remaining maturity of the hedged
item is more than 12 months and as a current asset
or liability when the remaining maturity of the hedged
item is less than 12 months.
Embedded derivative financial instruments are
separated from the host contract and accounted for
separately if the economic characteristics and risks
of the host contract and the embedded derivative
financial instrument are not closely related, a separate
instrument with the same terms as the embedded
derivative financial instrument would meet the
definition of a derivative financial instrument, and the
combined instrument is not measured at fair value
through profit or loss.
2.20.1 CASH FLOW HEDGES
The effective portion of changes in the fair value of
derivative financial instruments that are designated
and qualify as cash flow hedges is recognized in other
comprehensive income. The gain or loss relating to
the ineffective portion is recognized immediately
in the income statement within “Financial income/
Financial expenses”.
Amounts accumulated in other comprehensive
income are reclassified to profit or loss in the
periods when the hedged item affects profit or
loss on the same line of the income statement
where the designated hedged item affects profit
or loss. However, if the cash flow hedge of a firm
commitment or forecasted transaction results in
the recognition of a non-financial asset or a non-
financial liability, then, at the time the asset or liability
is recognized, the associated gains or losses on the
derivative financial instrument that had previously
been recognized in equity are included in the initial
measurement of the asset or liability. If the cash
flow hedge of a forecast transaction subsequently
results in the recognition of a financial asset or a
financial liability, the associated gains or losses that
were recognized directly in equity are reclassified to
the income statement in the same period or periods
during which the asset acquired or liability assumed
affects the income statement.
A cash flow hedge relationship is discontinued
prospectively if the hedge fails the effectiveness
test, the hedging instrument is sold, terminated or
exercised, management revokes the designation
or the forecasted transactions is no longer highly
probable. Where a forecasted transaction is no longer
highly probable but still expected to occur, hedging
gains and losses previously deferred in equity remain
in equity until the transaction affects profit or loss.
Once the forecasted transaction is no longer expected
to occur, any gain or loss is released immediately to
the income statement.
2.20.2 FAIR VALUE HEDGES
Changes in the fair value of derivative financial
instruments that are designated and qualify as fair
value hedges are recorded in the income statement
under “Financial income/Financial expenses”, together
with any changes in the fair value of the hedged asset
or liability that are attributable to the hedged risk.
2.20.3 NET INVESTMENT HEDGES
HHedges of net investments in foreign operations
are accounted for similarly to cash flow hedges. Any
gain or loss on the hedging instrument relating to the
effective portion of the hedge is recognized in other
comprehensive income; the gain or loss relating to
the ineffective portion is recognized immediately
in the income statement within “Financial income/
Financial expenses”. Gains and losses accumulated in
equity are recycled to the income statement when the
foreign operation is (partially) disposed of or sold.
2.20.4 DERIVATIVE FINANCIAL INSTRUMENTS THAT
DO NOT QUALIFY FOR HEDGE ACCOUNTING
Certain derivative financial instruments do not qualify
for hedge accounting. Changes in the fair value of any
derivative financial instruments that do not qualify for
hedge accounting are recognized immediately in the
income statement within “Financial income/
Financial expenses”.
105 UCB Annual Report 2017

2.21 InventoriesRaw materials, consumables, goods purchased
for resale, work in progress and finished goods are
valued at the lower of cost and net realizable value.
Cost is determined using the weighted average cost
method. The cost of work in progress and finished
goods comprises all the costs of conversion and other
costs incurred in bringing the inventories to their
present location and condition. The conversion costs
include the cost of production and the related fixed
and variable production overhead costs (including
depreciation charges).
Net realizable value represents the estimated selling
price less all estimated costs of completion and costs
to be incurred in marketing, selling and distribution.
2.22 Trade receivablesTrade receivables are recognized initially at fair value,
and are subsequently measured at amortized cost
using the effective interest rate method, less provision
for impairment.
2.23 Cash and cash equivalentsFor the purpose of presentation in the Statement
of Cash Flows, cash and cash equivalents comprise
cash on hand and demand deposits and other short-
term highly liquid investments with original maturities
of three months or less that are readily convertible
to known amounts of cash and which are subject
to an insignificant risk of changes in value, and
bank overdrafts. Bank overdrafts are shown within
borrowings in current liabilities in the balance sheet.
2.24 Non-current assets (or disposal groups) held for sale and discontinued operationsA discontinued operation is a component of the
company that either has been disposed of, or that
is classified as held for sale. It must either: represent
a major separate line of business or geographical
area of operations; be part of a single coordinated
disposal plan; or be a subsidiary acquired exclusively
with a view to resale.
Intercompany transactions between continuing
and discontinued operations are eliminated against
continuing operations.
Non-current assets or a disposal group are classified
as held for sale when their carrying amount is to be
recovered principally through a sale transaction and a
sale is considered highly probable. Non-current assets
and disposal groups are measured at the lower of the
carrying amount and fair value less costs to sell if their
carrying amount will be recovered principally through
a sale transaction rather than through continuing use.
Impairment losses upon initial classification as held for
sale are recognized in the income statement. Non-
current assets classified as held for sale are neither
depreciated nor amortized.
2.25 Share capital2.25.1 ORDINARY SHARES
Ordinary shares are classified as equity. Incremental
costs directly attributable to the issue of new shares
or options are shown in equity as a deduction, net
of tax, from the proceeds. The Company did not
issue any preference or mandatory redeemable
preference shares.
2.25.2 TREASURY SHARES
When any Group company purchases the Company’s
equity share capital (treasury shares), the consideration
paid, including attributable direct costs (net of income
taxes) is deducted from the equity attributable to
the Company’s equity holders until the shares are
cancelled or sold. Where such shares are subsequently
sold, any consideration received, net of any directly
attributable incremental transaction costs and the
related income tax effects, is included in equity
attributable to the Company’s equity holders.
2.25.3 HYBRID CAPITAL
The perpetual subordinated bonds issued by the
Company in 2011 meet the conditions of an equity
instrument as defined under IAS 32 Financial
Instruments: Presentation and therefore, these
instruments are accounted for as “Hybrid capital”
which is part of the equity of the Group.
The interests on these bonds are reflected as a
“dividend” to shareholders in the statement of
changes in equity.
2.26 Bonds and borrowingsBonds, borrowings and overdrafts are initially
measured at fair value, net of transaction costs
incurred, and are subsequently measured at
amortized cost, using the effective interest rate
method. Any difference between the proceeds
(net of transaction costs) and the settlement or
redemption of borrowings is recognized over the
term of the borrowings in accordance with the Group
accounting policy.
106
Borrowings are classified as current liabilities unless
the Group has an unconditional right to defer
settlement of the liability for at least 12 months
after the balance sheet date.
2.27 Compound financial instrumentsCompound financial instruments issued by the Group
comprise convertible bonds that can be converted
into ordinary shares at the option of the Issuer. The
number of shares to be issued does not vary with
changes in their fair value. In the past, due to the
existence of the option by the Issuer to redeem in
cash, such convertible bonds were separated into a
debt and a derivative component.
Upon initial recognition of the bond, the fair value
of the debt component was determined based on
the present value of the contractually determined
stream of cash flows discounted at the rate of interest
applied at that time by the market to instruments of
comparable credit status and providing substantially
the same cash flows, on the same terms, but without
the conversion option.
Subsequent to initial recognition, the debt component
is measured based on its amortized cost, using the
effective interest method.
The remainder of the proceeds was allocated to
the conversion option and recognized within “other
derivatives”. Subsequent to initial recognition, the
derivative component was measured at fair value,
with all gains and losses upon re-measurement being
recognized in the income statement.
As a result of the Board’s decision in 2010 to revoke
UCB’s rights related to the cash settlement option,
the derivative component was reclassified to equity
based on its fair value at the date of revocation. The
equity component was reclassified to share premium
upon the conversion of the remaining convertible
bonds in 2014.
Transaction costs that are directly attributable to the
bond offering and incremental, are included in the
calculation of the amortized cost, using the effective
interest method, and are amortized through the
income statement over the life of the instrument.
2.28 Trade payablesTrade payables are initially measured at fair value and
are subsequently measured at amortized cost using
the effective interest method.
2.29 Employee benefits2.29.1 PENSION OBLIGATIONS
The Group operates various post-employment
schemes, including both defined benefit and defined
contribution pension plans.
A defined contribution plan is a pension plan under
which the Group pays fixed contributions into a
separate entity and has no legal or constructive
obligations to pay further contributions in the event
that the fund does not hold sufficient assets to pay all
employees the benefits relating to employee service
in the current and prior periods. Obligations for
contributions to defined contribution pension plans
are recognized as an employee benefit expense in the
consolidated income statement when they are due.
Prepaid contributions are recognized as an asset to
the extent that a cash refund or a reduction in future
payments is available.
Typically defined benefit plans define an amount
of pension benefit that an employee will receive on
retirement, usually dependent on one or more factors
such as age, years of service and compensation. The
liability recognized in the consolidated statement of
financial position in respect of defined benefit pension
plans is the present value of the defined benefit
obligation less the fair value of plan assets. Any surplus
resulting from this calculation is limited to the present
value of any economic benefits available in the form
of refunds from the plans or reductions in future
contributions to the plans.
The defined benefit obligation is calculated by
independent actuaries using the Projected Unit
Credit Method. A full actuarial valuation based on
updated personnel information is performed at least
every three years. Additionally, if the net fluctuation
recognized on the balance sheet is more than 10%
from one year to the next due to plan circumstances
(significant membership changes, modification to
plan, etc.), a full actuarial valuation is also required.
For years where a full actuarial valuation is not
required, projections (known as “roll-forwards”) from
the previous year with updated assumptions (discount
rate, salary increase, turnover) is used. For these “roll-
forward” valuations, the individual employee data from
the last full valuation date are used taking into account
assumptions for salary increases and possibly turnover.
All valuations measure liabilities at the applicable
balance sheet date and the market value of retirement
plan assets are also reported at this date regardless
of whether a full or a “roll-forward” valuation
107 UCB Annual Report 2017
is performed.
The present value of the defined benefit obligation
is determined by discounting the estimated future
cash outflows using yields on high quality corporate
bonds that have maturity dates approximating the
terms of the related Group obligations and that are
denominated in the same currency in which the
benefits are expected to be paid.
Remeasurement comprising of actuarial gains and
losses, the effect of the asset ceiling (if applicable)
and the return on plan assets (excluding interest)
are recognized immediately in the statement of
financial position with a charge or credit to other
comprehensive income in the period in which
they occur. Remeasurement recorded in other
comprehensive income is not recycled. However,
the entity may transfer those amounts recognized
in other comprehensive income within equity. Past
service cost is recognized in profit or loss in the period
of plan amendment. Net-interest is calculated by
applying the discount rate to the net defined benefit
liability or asset. Defined benefit costs are split into
three categories:
• service cost, past-service cost, gains and losses
on curtailments and settlements;
• net-interest expense or income;
• remeasurement.
The Group presents the first two components of
defined benefit costs in the line item “employee
benefits expense” in its consolidated income
statement (by nature of expenses aggregation). Net-
interest expense or income is presented as part of the
Operating profit. Curtailments gains and losses are
accounted for as past-service cost. Remeasurements
are recorded in other comprehensive income.
2.29.2 OTHER POST-RETIREMENT
EMPLOYEE BENEFITS
Some Group companies provide post-retirement
healthcare benefits to their retirees. The Group’s
net obligation is the amount of future benefits that
employees have earned in return for their service in
the current and prior periods. The expected costs
of these benefits are accrued over the period of
employment using the same methodology used for
defined benefit plans.
2.29.3 TERMINATION BENEFITS
Termination benefits are payable when employment
is terminated before the normal retirement date, or
when an employee accepts voluntary redundancy
in exchange for these benefits. The Group recognizes
termination benefits when it is demonstrably
committed to either: terminating the employment
of current employees according to a detailed formal
plan without possibility of withdrawal; or providing
termination benefits as a result of an offer made to
encourage voluntary redundancy. Benefits falling due
more than 12 months after balance sheet date are
discounted to present value.
2.29.4 OTHER LONG-TERM EMPLOYEE BENEFITS
The liabilities for jubilee premiums and long service
awards are measured as the present value of expected
future payments to be made in respect of services
provided by employees up to the end of the reporting
period using the projected unit credit method.
Consideration is given to expected future wage and
salary levels, experience of employee departures and
periods of service. Expected future payments are
discounted using yields on high quality corporate
bonds with terms and currencies that match, as
closely as possible, the estimated future cash
outflows. Remeasurements as a result of experience
adjustments and changes in actuarial assumptions are
recognized in profit or loss.
2.29.5 PROFIT-SHARING AND BONUS PLANS
The Group recognizes a liability and an expense for
bonuses and profit-sharing, based on a formula that
takes into consideration the profit attributable to the
company’s shareholders after certain adjustments.
The Group recognizes a provision where contractually
obliged or where there is a past practice that has
created a constructive obligation and a reliable
estimate of the obligation can be made.
2.29.6 SHARE-BASED PAYMENTS
The Group operates several equity-settled and cash-
settled share-based compensation plans.
The fair value of the employee services received in
exchange for the grant of stock options is recognized
as an expense. The total amount to be expensed is
determined by reference to the fair value of the stock
options granted, excluding the impact of any service
and non-market performance vesting conditions (for
example profitability, remaining an employee of the
entity over a specified time period).
Service and non-market vesting conditions are
included in the assumptions about the number of
options that are expected to vest. The total amount
expensed is recognized over the vesting period, which
108
is the period over which all the specified vesting
conditions are to be satisfied.
The fair value of the stock option plan is measured
at the grant date using the Black-Scholes valuation
model which takes into account the expected life and
cancellation rate of the options. At each balance sheet
date, the entity revises its estimates of the number
of options that are expected to vest. It recognizes
the impact of the revision to original estimates, if
any, in the income statement, with a corresponding
adjustment to equity.
The proceeds received net of any directly attributable
transaction costs are credited to share capital (nominal
value) and share premium when the options are
exercised. The fair value of the amount payable to
employees in respect of share appreciation rights,
phantom share option, share award and performance
share plans, which are settled in cash, is recognized
as an expense, with a corresponding increase in
liabilities, over the period that the employees become
unconditionally entitled to payment. The liability
is re-measured at each balance sheet date and at
settlement date.
Any changes in the fair value of the liability
are recognized as personnel expenses in the
income statement.
2.30 ProvisionsProvisions are recognized in the balance sheet when:
• there is a present obligation (legal or constructive)
as a result of a past event;
• it is probable that an outflow of resources
embodying economic benefits will be required to
settle the obligation; and
• a reliable estimate can be made of the amount
of the obligation.
The amount recognized as a provision is the best
estimate of the expenditure required to settle
the present obligation at the balance sheet date.
Provisions are measured at the present value of the
expenditures expected to be required to settle the
obligation using a discount rate that reflects current
market assessments of the time value of money and
the risks specific to the obligation. The increase in the
provision due to the passage of time is recognized as
interest expense.
A restructuring provision is recognized when the
Group has a detailed formal plan and has raised a valid
expectation in those affected that it will carry out the
restructuring by starting to implement that plan or
announcing its main features to those affected by it.
109 UCB Annual Report 2017
3 Critical judgements and accounting estimatesEstimates and judgements are continuously
evaluated and are based on historical experience
and other factors, including expectations of future
events that are believed to be reasonable under
the circumstances.
3.1 Critical judgements in applying the group accounting policies3.1.1 REVENUE RECOGNITION
Due to the changes in accounting policies resulting
from the application of IFRS 15, the critical judgments
in applying the group accounting policies relating to
revenue recognition were adapted as follows:
The Group is also party to out-licensing agreements,
which can involve upfront payments, development
milestones, sales milestones and royalties that may
occur over several years and involve certain future
contract liabilities. For all out-licensing agreements
whereby a license is transferred with other goods or
services, the Group first makes an assessment about
whether or not the license is to be considered as a
distinct performance obligation or not. If the transfer of
the license is considered to be a separate performance
obligation, revenue relating to the transfer of the
license is recognized at a point in time or over time
depending on the nature of the license. Revenues are
only recognized over time if the Group is performing
development, manufacturing or other activities that
could significantly affect the IP transferred, hereby
exposing the licensee to the effects of these activities
when these activities do not represent a separate
service. If the Group assesses that these conditions
are not fulfilled, revenue resulting from out-licensing
agreements is recognized at the moment control over
the license is transferred. If revenues are recognized
over time and in case the input method is assessed
as the best method to reflect the transfer of control
of the service to the customer, some judgement
may be required in applying this method especially in
estimating the total costs and hours to be incurred. In
this case the Group uses its best estimate based on past
experience and actual knowledge and progress of the
service to be provided. Estimates are reassessed on a
continuous basis. Seen the activities of the Group, in
most cases, the input method provides the most faithful
depiction of the transfer of the service to the customer.
For licenses that are bundled with other services (e.g.
development or manufacturing services) the Group
will apply judgment to assess whether the combined
performance obligation is satisfied at a point in time
or over time. If revenue is recognized over time, the
Group will apply judgment in determining the period
over which the services are provided. The Group will
also apply judgment when allocating the components
of the transaction price to the different performance
obligations in case the out-licensing agreement
includes other performance obligations in addition to
the transfer of the license. Revenue recognition for out-
licensing agreements is therefore based on the specific
conditions of each out-licensing agreement. This
might result in cash receipts being initially recognized
as contract liabilities and then released to revenue in
subsequent accounting periods based on the different
conditions specified in the agreement.
3.1.2 DISCONTINUED OPERATIONS
Operations that are classified as held for sale or have
been disposed of, are presented as discontinued
operations in the consolidated income statement
when the operations represent a major separate line
of business or geographical area of operations, are
part of a single coordinated disposal plan or represent
a subsidiary acquired exclusively with a view to resale.
The assessment on what is a major separate line of
business is done on a case by case basis and depends
on the size of the operations in terms of revenues,
gross profit or total value of assets and liabilities
compared to the total operations of the Group.
3.2 Critical accounting estimates and assumptionsThe preparation of the financial statements in
conformity with IFRS as adopted for use by the
European Union requires management to make
estimates and assumptions that affect the reported
amounts of assets and liabilities and disclosure of
contingent assets and liabilities at the date of the
financial statements and the reported amounts of
revenue and expenses during the reporting period.
Management bases its estimates on historical
experience and various other assumptions that are
reasonable under the circumstances, the results
of which form the basis for making the reported
amounts of revenue and expenses that may not be
readily apparent from other sources. Actual results will
by definition not equal those estimates. Estimates and
assumptions are reviewed periodically and the effects
of revisions are reflected in the financial statements in
the period they are determined to be necessary.
110
3.2.1 SALES ALLOWANCES
The Group has accruals for expected sales returns,
chargebacks and other rebates, including the U.S.
Medicaid Drug Rebate program and the U.S. Federal
Medicare program, and similar rebates in other
countries. Such estimates are based on analyses of
existing contractual obligations or legislation, historical
trends and the Group experience. After assessment of
the Management, the total accruals for these items are
adequate, based upon currently available information
and interpretation of relevant regulations. As these
deductions are based on management estimates, the
actual deductions might differ from these estimates.
Such differences could impact the accruals recognized
in the balance sheet in future periods and consequently
the level of sales recognized in the income statement
in future period, as there is often a time lag of several
months between the recording of the estimate and the
final accounting of the sales allowances. In general, the
discounts, rebates and other deductions shown on the
invoice are accounted for as an immediate deduction
from gross sales in the income statement. The sales
returns, chargebacks, rebates and discounts that are
not mentioned on the invoice are estimated, deducted
from sales and presented on the balance sheet in the
appropriate accrual account and deducted from sales.
All sales allowances are considered as being part of
the variable consideration included in the transaction
price. The amount of variable consideration included
in the transaction price is determined so that the total
transaction price is the price estimated by management
as not being constrained.
3.2.2 INTANGIBLE ASSETS AND GOODWILL
The Group has intangible assets with a carrying amount
of € 817 million (Note 19) and goodwill with a carrying
amount of € 4 838 million (Note 20). Intangible assets
are amortized over their useful lives on a straight-line
basis as from the moment they are available for use (i.e.
when related products are launched for sale).
Management estimates that the useful life for acquired
in-progress R&D compounds equates to the period
these compounds benefit from patent protection or
data exclusivity. For the intangible assets acquired
through a business combination and which comprises
compounds that are marketed but for which no patent
protection or data exclusivity exists, management
estimates that the useful life equates to the period in
which these compounds will realize substantially all the
cash contributions.
These intangible assets and goodwill are regularly
reviewed for impairment and whenever there
is an indication that an impairment might exist.
The intangible assets that are not yet available for
use and goodwill are subject to at least annual
impairment testing.
To assess if there is any impairment, estimates are
made of the future cash flows expected to result from
the use of these assets and their eventual disposal.
These estimated cash flows are then adjusted to the
present value using an appropriate discount rate that
reflects the risks and uncertainties associated with the
forecasted cash flows. Actual outcomes could vary
significantly from such estimates of discounted future
cash flows. Factors such as the entrance or absence
of competition, technical obsolescence or lower than
expected rights could result in shortened useful lives
and impairments.
The Group applied the following key assumptions
for the “value in use” calculations required for the
impairment testing of intangible assets and goodwill at
year-end:
• growth rate for terminal value: 3.0%
• discount rate in respect of goodwill and
Intangibles related to marketed products: 6.62%
• discount rate in respect of Intangibles
related to pipeline products: 13.0%
Since the cash flows also take into account tax
expenses, a post-tax discount rate is used in the
impairment testing.
Management estimates that the use of the post-tax
discount rate approximates the results of using a pre-tax
rate applied to pre-tax cash flows.
3.2.3 ENVIRONMENTAL PROVISIONS
The Group has provisions for environmental
remediation costs, which are disclosed in Note 33.
The most significant elements of the environmental
provisions consist of costs to fully clean and refurbish
contaminated sites and to treat contamination at
certain other sites, mainly related to the discontinued
chemical and films activities of the Group.
Future remediation expenses are affected by a number
of uncertainties that include, amongst others, the
detection of previously unknown contaminated sites,
the method and extent of remediation, the percentage
of waste attributable to the Group, and the financial
capabilities of the other potentially responsible
parties. Given the inherent difficulties in estimating
the liabilities in this area, it cannot be guaranteed
111 UCB Annual Report 2017

that additional costs will not be incurred beyond the
amounts currently accrued. The effect of resolution of
environmental matters on results of operations cannot
be predicted due to uncertainty concerning both the
amount and timing of future expenditures and the
results of future operations. Such changes that arise
could impact the provisions recognized in the balance
sheet in the future.
3.2.4 EMPLOYEE BENEFITS
The Group currently has many defined benefit plans,
which are disclosed in Note 32. The calculation of
the assets or liabilities related to these plans is based
upon statistical and actuarial assumptions. This is in
particular the case for the present value of the defined
benefit obligation which is impacted by assumptions
on discount rates used to arrive at the present value
of future pension liabilities, and assumptions on future
increases in salaries and benefits.
Furthermore, the Group uses statistically-based
assumptions covering areas such as future withdrawals
of participants from the plans and estimates of life
expectancy. The actuarial assumptions used might
differ materially from actual results due to changes
in market and economic conditions, higher or lower
employee turnover, longer or shorter life spans
of participants, and other changes in the factors
being assessed.
These differences could impact the assets or liabilities
recognized in the balance sheet in future periods.
3.2.5 TAX POSITIONS
The Group operates in multiple jurisdictions with often
complex legal and tax regulatory environments. The
income tax positions taken are considered by the
Group to be supportable and are intended to withstand
challenge from tax authorities. However, it is accepted
that some of the positions are uncertain and include
interpretations of complex tax laws as well as transfer
pricing considerations which could be disputed by
tax authorities. The Group judges these positions
individually on their technical merits with no offset or
aggregation between positions and this on a regular
basis using all the information available (legislation, case
law, regulations, established practice and authoritative
doctrine). A liability is recorded for each item that is
not probable of being sustained on examination by
the tax authorities based on all relevant information.
The liability is calculated by the Group as the best
estimate of the current tax it expects to pay using the
Group’s best judgement of the likely outcomes of such
examinations. These estimates are based on facts and
circumstances existing at the end of the reporting
period. The tax liability and income tax expense include
expected penalties and late payment interests arising
from tax disputes. An asset for tax audit adjustments is
recorded when the Group considers it probable, based
on the technical merits of the tax case, that a Mutual
Agreement or Arbitration Procedure may provide for a
corresponding adjustment in one or more jurisdictions.
The asset is calculated as the expected value of
the recoverability in corporate income taxes in the
concerning jurisdiction upon completion of the Mutual
Agreement or Arbitration Procedure.
The Group has recognized net deferred tax assets of
€ 662 million (Note 31). The recognition of deferred
tax assets is based upon whether it is probable that
sufficient taxable profits will be available in the future
against which the reversal of temporary differences
can be used. Where the temporary differences relate
to losses, the availability of the losses to offset against
forecasted taxable profits is also considered. For 2017,
the Group also took into account the tax reform in
Belgium, United States and UK.
Significant items on which management has exercised
judgement include recognition on the balance sheet
of deferred tax assets relating to losses in jurisdictions
where losses have been incurred in prior periods but
where profits now arise and are forecasted to do so for
the foreseeable future. Management has used its best
estimate of the correct value of asset to recognize in
such cases, which includes a judgement on the length
of the future time period to use in such assessments.
These judgments are made on a case by case basis
taking into account the origin and nature of the
expected revenues on an entity-by-entity basis, but this
time period in most cases does not exceed five years.
Differences in forecasted taxable profits and actual
profitability or a downgrade in future forecasted taxable
profits could impact the deferred tax assets recognized
in future periods.
No material deferred tax assets are recognized for
entities that are currently still lossmaking. Significant
items on which the Group has exercised accounting
estimation and judgement include also tax liabilities
related to audits arising in key jurisdictions. The
Group engages constructively with the tax authorities
and relevant government representatives. Where
appropriate, we engage advisors and legal counsel to
obtain opinions on tax legislation and principles.
112
4 Financial risk management The Group is exposed to various financial risks
arising from its underlying operations and corporate
finance activities.
These financial risks are market risk (including
currency risk, interest risk and price risk), credit risk and
liquidity risk.
This note presents information about the Group
exposure to the above-mentioned risks, the Group
policies and processes for managing these risks and
Group management of capital. Risk management is
carried out by the Group Treasury department under
policies approved by the Financial Risk Management
Committee (FRMC).
The FRMC has been established and includes the
Chief Financial Officer, Chief Accounting Officer
and the heads of the Financial Control department,
Internal Audit department, Tax department and
Treasury and Risk department. The FRMC is
responsible for:
• reviewing the results of UCB risk assessment;
• approval of the recommended risk
management strategies;
• monitoring compliance with the financial market risk
management policy;
• approval of policy changes; and
• reporting to the Audit Committee.
The Group financial risk management policies
established by the FRMC need to identify and analyze
the risks faced by the Group, to set appropriate risk
limits and controls and to monitor risks and adherence
to limits. Risk management policies are reviewed by
the FRMC on a semi-annual basis to reflect changes in
market conditions and the Group’s activities.
4.1 Market riskMarket risk is the risk that changes in market prices,
such as foreign exchange rates, interest rates and
equity prices will affect the Group income statement
or the value of its holdings of financial instruments.
The objective of market risk management is to
manage and control market risk exposures. The
Group enters into derivative financial instruments
and also incurs financial liabilities in order to manage
market risk. Where possible, the Group seeks to apply
hedge accounting in order to manage volatility in
the income statement. It is the Group policy and
practice not to enter into derivative transactions for
speculative purposes.
4.1.1 FOREIGN EXCHANGE RISK
The Group operates across the world and is exposed
to movements in foreign currencies affecting its
net income and financial position, as expressed
in euro. The Group actively monitors its currency
exposures, and when appropriate, enters into
transactions with the aim of preserving the value of
assets and anticipated transactions. The Group uses
forward contracts, foreign exchange options and
cross-currency swaps to hedge certain committed
and anticipated foreign exchange flows and
financing transactions.
The instruments purchased to hedge transaction
exposure are primarily denominated in U.S. dollar,
GB pound, Japanese yen and Swiss franc, the
currencies where the Group has its most important
exposures. The Group’s financial risk management
policy is to hedge for a period of minimum 6 and
maximum 26 months of anticipated cash flows
primarily derived from sales, royalties or out-licensing
revenues provided that no natural hedges exist.
The Group has certain investments in foreign
operations, whose net assets are exposed to foreign
currency translation risk.
The effect of translation exposure arising from the
consolidation of the foreign currency denominated
financial statements of the Group foreign subsidiaries
as well as from assimilated net foreign investment
positions is shown as a cumulative translation
adjustment in the Group consolidated statement of
changes in equity.
4.1.2 EFFECT OF CURRENCY FLUCTUATIONS
At 31 December 2017, if the euro had strengthened
or weakened by 10% against the following currencies
with all other variables being held constant, the impact
on equity and post-tax profit for the year, based on the
outstanding currency balances and hedge instruments
at that date, would have been as follows:
113 UCB Annual Report 2017

€ million
Change in rate. strenghtening/
weakening (-) EUR
Impact on equity: loss (-) / gain
Impact on income statement:
loss (-) / gain
At 31 December 2017
USD +10% -94 -6
-10% 115 7
GBP +10% -33 -4
-10% 40 5
CHF +10% -50 -2
-10% 61 3
JPY +10% 12 -2
-10% -15 2
€ million
Change in rate. strenghtening/
weakening (-) EUR
Impact on equity: loss (-) / gain
Impact on income statement:
loss (-) / gain
At 31 December 2016
USD +10% -118 1
-10% 144 -1
GBP +10% -45 2
-10% 55 -2
CHF +10% -55 -4
-10% 67 4
JPY +10% 15 2
-10% -18 -3
4.1.3 INTEREST RATE RISK
Changes in interest rates may cause variations in
interest income and expenses resulting from interest-
bearing assets and liabilities. In addition, they can
affect the market value of certain financial assets,
liabilities and instruments as described in the following
section on market risk of financial assets. The interest
rates on the Group’s major debt instruments are both
fixed and floating, as described in Notes 28 and 29.
The Group uses interest rate derivatives to manage its
interest rate risk, as described in Note 38.
The Group designates derivative financial instruments
(interest rate swaps) as hedging instruments, under
fair value hedges, to fixed rate financial assets and
liabilities. Both the derivative financial instrument
and the hedged item are accounted for at fair value
through profit or loss.
In 2017, changes in fair value resulting from interest
rate derivatives designated to the floating rate liabilities
of the Group have been accounted for through equity
under IAS 39.
4.1.4 EFFECT OF INTEREST RATE FLUCTUATIONS
A 100 basis points increase in interest rates at balance
sheet date would have increased equity by € 1 million
(2016: € 3 million); a 100 basis points decrease
in interest rates would have decreased equity by
€ 1 million (2016: € 3 million).
A 100 basis points increase in interest rates at balance
sheet date would have increased profit and loss by
€ 0 million (2016: € 0 million); a 100 basis points
decrease in interest rates would have decreased profit
and loss by € 0 million (2016: € 0 million).
4.1.5 OTHER MARKET PRICE RISK
Changes in the market value of certain financial
assets and derivative financial instruments can
affect the income or the financial position of the
Group. Financial long-term assets, if any, are held for
contractual purposes, and marketable securities, if any,
are mainly held for regulatory purposes. The risk of
loss in value is managed by reviews prior to investing
and continuous monitoring of the performance of
investments and changes in their risk profile.
Investments in equities, bonds, debentures and other
fixed income instruments are entered into on the basis
of guidelines with regard to liquidity and credit rating.
Amounts subject to market price risk are rather
immaterial and therefore the impact on equity or the
114

income statement of a reasonable change of this
market price risk is assumed to be negligible.
Similar to 2016, during 2017 the Group traded
on treasury shares, which were accounted for
through equity.
4.2 Credit riskCredit risk arises from the possibility that the
counterparty to a transaction may be unable or
unwilling to meet its obligations causing a financial
loss to the Group. Trade receivables are subject to
a policy of active risk management, which focuses
on the assessment of country risk, credit availability,
on-going credit evaluation and account monitoring
procedures. There are certain concentrations
within trade receivables of counterparty credit risk,
particularly in the U.S., due to the sales via wholesalers
(Note 24).
For some credit exposures in critical countries, such
as certain Southern European countries, the Group
has obtained credit insurance.
In the U.S. and China (since 2014), the Group entered
into a trade receivable financing agreement that
qualifies for derecognition. According to the terms
and conditions of the agreement UCB does not retain
any non-payment or further late payment risk relating
to the transferred trade receivables.
The exposure of other financial assets to credit risk
is controlled by setting a policy for limiting credit
exposure to high quality counterparties, regular
reviews of credit ratings, and setting defined limits
for each individual counterparty. The criteria set by
Group Treasury for their investment policy are based
on generally considered high quality long term credit
ratings and 5 years Credit Default Swap rate.
Where appropriate to reduce exposure, netting
agreements under an ISDA (International Swaps and
Derivatives Association) master agreement are signed
with the respective counterparties. The maximum
exposure to credit risk resulting from financial
activities, without considering netting agreements, is
equal to the carrying amount of financial assets plus
the positive fair value of derivative instruments.
4.3 Liquidity riskLiquidity risk is the risk that the Group will not be able
to meet its financial obligations as they fall due. The
Group’s approach to managing liquidity is to ensure,
as far as possible, that it will always have sufficient
liquidity to meet its liabilities when due, under normal
circumstances without incurring unacceptable losses
or risking damage to the Group reputation.
The Group maintains sufficient reserves of cash and
readily realizable marketable securities to meet its
liquidity requirements at all times. In addition, the
Group has certain unutilized revolving committed
facilities at its disposal.
At the balance sheet date, the Group had the
following sources of liquidity available:
• cash and cash equivalents (Note 25): € 1 049 million
(2016: € 761 million)
• marketable non-equity securities (Note 22):
€ 0 million (2016: € 3 million)
• unutilized credit facilities and undrawn available
amount under finance contract (Note 28):
€ 72 million (2016: € 81 million), linear digressive
since 2016 until 2025
• unutilized revolving credit facilities (Note 28):
€ 1 billion (2016: € 1 billion); the existing € 1 billion
syndicated committed revolving credit facility of the
Group, maturing in 2021 was undrawn per end 2017
The table below analyses the contractual maturities
of the Group financial liabilities into relevant
maturity groupings based on the remaining period
at the balance sheet date to the contractual
maturity date, excluding the impact of netting. The
amounts mentioned below with respect to the
financial derivatives are indicative of the contractual
undiscounted cash flows.
115 UCB Annual Report 2017

€ million Note TotalContractual
cash flow
Less than
1 year
Between 1 and
2 years
Between 2 and
5 yearsOver
5 years
At 31 December 2017
Bank Borrowings and other long term loans 28 311 311 11 21 279 0
Debentures and other short term loans 28 0 0 0 0 0 0
Finance lease liabilities 28 5 5 2 2 1 0
Retail bond maturing in 2023 29 188 230 9 9 27 185
Institutional Eurobond maturing in 2022 29 349 384 7 7 370 0
Institutional Eurobond maturing in 2021 29 365 407 14 14 379 0
Retail bond maturing in 2020 29 254 277 9 9 259 0
EMTN notes maturing in 2019 29 75 79 2 77 0 0
Trade and other liabilities 34 1 750 1 750 1 724 10 15 1
Bank overdrafts 28 26 26 26 0 0 0
Interest rate swaps 63 63 14 14 31 4
Forward exchange contracts used for hedging purposes
Outflow 2 753 2 753 2 753 0 0 0
Inflow 2 848 2 848 2 848 0 0 0
Forward exchange contracts and other derivative financial instruments at fair value through profit or loss
Outflow 2 460 2 460 2 460 0 0 0
Inflow 2 455 2 455 2 455 0 0 0
€ million Note TotalContractual
cash flow
Less than
1 year
Between 1 and
2 years
Between 2 and
5 yearsOver
5 years
At 31 December 2016
Bank Borrowings and other long term loans 28 338 338 12 0 326 0
Debentures and other short term loans 28 8 8 8 0 0 0
Finance lease liabilities 28 7 7 2 2 3 0
Retail bond maturing in 2023 29 192 239 9 9 27 194
Institutional Eurobond maturing in 2022 29 350 389 7 7 20 355
Institutional Eurobond maturing in 2021 29 370 422 14 14 394 0
Retail bond maturing in 2020 29 256 288 9 9 270 0
EMTN notes maturing in 2019 29 75 82 2 2 78 0
Trade and other liabilities 34 1 915 1 915 1 860 30 23 2
Bank overdrafts 28 5 5 5 0 0 0
Interest rate swaps 74 74 12 14 38 10
Forward exchange contracts used for hedging purposes
Outflow 3 559 3 559 3 559 0 0 0
Inflow 3 518 3 518 3 518 0 0 0
Forward exchange contracts and other derivative financial instruments at fair value through profit or loss
Outflow 1 255 1 255 1 127 128 0 0
Inflow 1 235 1 235 1 109 126 0 0
116

4.4 Capital risk managementThe Group policy with respect to managing capital is
to safeguard the Group’s ability to continue as a going
concern in order to provide returns to shareholders
and benefits to patients and to reduce the Group
external debt further, in order to obtain a capital
structure that is consistent with others in the industry.
€ million 2017 2016
Total borrowings (Note 28) 342 358
Bonds (Note 29) 1 231 1 243
Less: cash and cash equivalents (Note 25), available for sale debt securities (Note 22) and cash collateral related to the financial lease obligation -1 049 - 764
Net debt 525 838
Total equity 5 736 5 477
Total financial capital 6 260 6 315
Gearing ratio 8% 13%
4.5 Fair value estimationThe fair value of financial instruments traded in active
markets (such as available for sale financial assets)
is based on quoted market prices at the balance
sheet date.
The fair value of financial instruments that are not
traded in an active market is determined by using
established valuation techniques such as option
pricing models and estimated discounted values of
cash flows. The Group uses a variety of methods
and makes assumptions that are based on market
conditions and the credit and the non-performance
risks existing at each balance sheet date.
Quoted market prices are used for long-term debt.
Other techniques, such as estimated discounted
cash flows, are used to determine fair value for the
remaining financial instruments. The fair value of the
interest rate swaps is calculated as the present value
of the estimated future cash flows. The fair value of
the forward exchange contract is determined using
discounted value of the exchanged amounts in
currencies, converted at the prevailing spot rate at the
balance sheet date.
The carrying amount less impairment provision of
trade receivables and trade payables is assumed to
approximate their fair values. The fair value of financial
liabilities for disclosure purposes is estimated by
discounting the future contractual cash flows at the
current market interest rates that is available to the
Group for similar financial instruments.
4.5.1 FAIR VALUE HIERARCHY
IFRS 7 requires disclosure of fair value measurements
by level of the following hierarchy:
• Level 1: quoted (unadjusted) prices in active markets
for identical assets or liabilities;
• Level 2: other techniques for which all inputs which
have a significant effect on the recorded fair value
are observable, either directly or indirectly;
• Level 3: techniques which use inputs which have a
significant effect on the recorded fair value that are
not based on observable market data.
All fair value measurements disclosed are recurring.
117 UCB Annual Report 2017
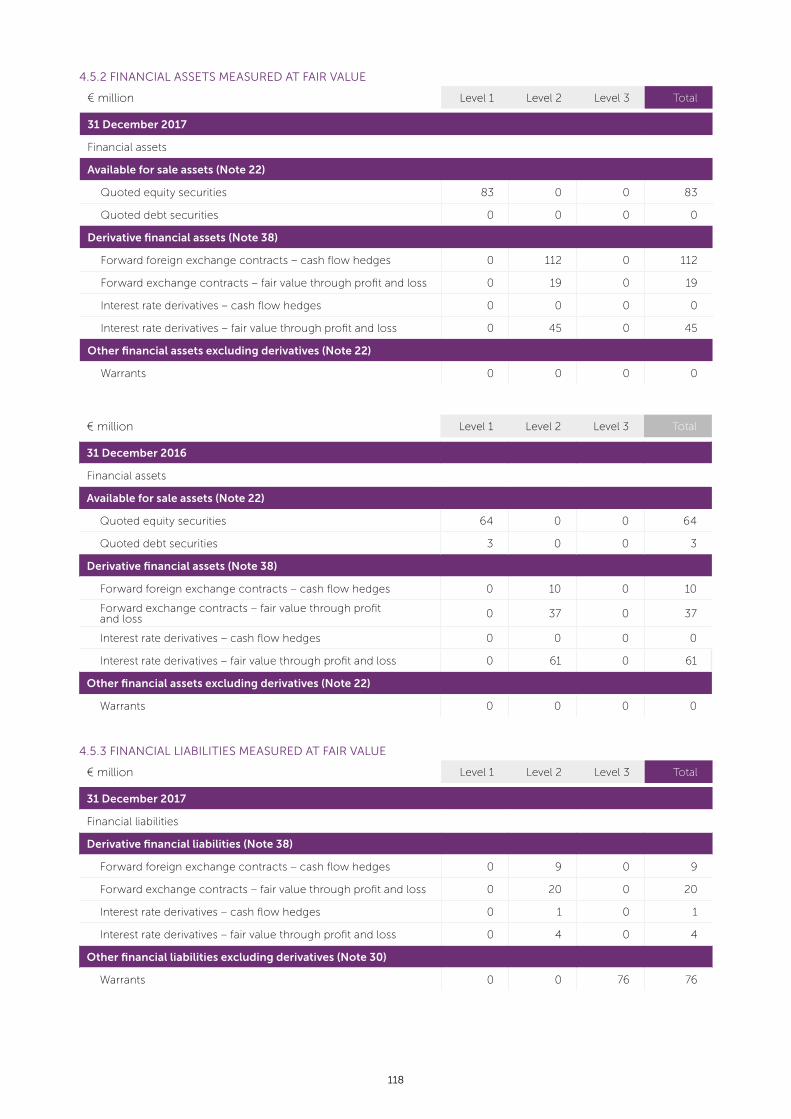
4.5.2 FINANCIAL ASSETS MEASURED AT FAIR VALUE
€ million Level 1 Level 2 Level 3 Total
31 December 2017
Financial assets
Available for sale assets (Note 22)
Quoted equity securities 83 0 0 83
Quoted debt securities 0 0 0 0
Derivative financial assets (Note 38)
Forward foreign exchange contracts – cash flow hedges 0 112 0 112
Forward exchange contracts – fair value through profit and loss 0 19 0 19
Interest rate derivatives – cash flow hedges 0 0 0 0
Interest rate derivatives – fair value through profit and loss 0 45 0 45
Other financial assets excluding derivatives (Note 22)
Warrants 0 0 0 0
€ million Level 1 Level 2 Level 3 Total
31 December 2016
Financial assets
Available for sale assets (Note 22)
Quoted equity securities 64 0 0 64
Quoted debt securities 3 0 0 3
Derivative financial assets (Note 38)
Forward foreign exchange contracts – cash flow hedges 0 10 0 10
Forward exchange contracts – fair value through profit and loss 0 37 0 37
Interest rate derivatives – cash flow hedges 0 0 0 0
Interest rate derivatives – fair value through profit and loss 0 61 0 61
Other financial assets excluding derivatives (Note 22)
Warrants 0 0 0 0
4.5.3 FINANCIAL LIABILITIES MEASURED AT FAIR VALUE
€ million Level 1 Level 2 Level 3 Total
31 December 2017
Financial liabilities
Derivative financial liabilities (Note 38)
Forward foreign exchange contracts – cash flow hedges 0 9 0 9
Forward exchange contracts – fair value through profit and loss 0 20 0 20
Interest rate derivatives – cash flow hedges 0 1 0 1
Interest rate derivatives – fair value through profit and loss 0 4 0 4
Other financial liabilities excluding derivatives (Note 30)
Warrants 0 0 76 76
118

€ million Level 1 Level 2 Level 3 Total
31 December 2016
Financial liabilities
Derivative financial liabilities (Note 38)
Forward foreign exchange contracts – cash flow hedges 0 51 0 51
Forward exchange contracts – fair value through profit and loss 0 50 0 50
Interest rate derivatives – cash flow hedges 0 2 0 2
Interest rate derivatives – fair value through profit and loss 0 6 0 6
Other financial liabilities excluding derivatives (Note 30)
Warrants 0 0 127 127
During the reporting period ending 31 December 2017,
there were no transfers between Level 1 and Level 2
fair value measurements, and no transfers into and out
of Level 3 fair value measurements.
Fair value measurements categorized within Level 2
of the fair value hierarchy are calculated using either
the “Discounted cash flow” or the “Black-Scholes”
method (for FX options only) and market data
publicly available.
The fair value of the warrants received pursuant to the
sale of Kremers Urban Pharmaceuticals Inc. (“KU”) in
2015 (Note 8) was determined using a “Black-Scholes”
Model. The warrants were valued at € 29 million as
per 31 December 2015. Due to the declining share
price of Lannett Company Inc., an impairment was
accounted for in 2016 on these warrants in order to
reduce the net carrying amount of these warrants
down to € 0 (Note 16).
The fair value of the warrants issued by a subsidiary
is determined using a discounted net present value
model of the probabilized cash outflows. There
has not been any change in valuation technique
compared to last year. The valuation is prepared by
the Finance Team on a monthly basis and reviewed by
the Executive Committee. The value of the warrants
is based on the profitability of the subsidiary and
the key assumptions used in the valuation model
include unobservable inputs for forecasted net sales,
milestone events and discount rate. The discount
rate used amounts to 8.2%. An increase/decrease in
net sales of 10% would lead to an increase/decrease
of the fair value of the warrants with 0% (2016: 0%).
A decrease/increase in the discount rate with 1%
would lead to an increase/decrease of the fair value
of the warrants with 1% (2016: 2%). The change in
fair value, recognized in profit and loss, amounts to
€ 11 million (2016 € 8 million) and is accounted for in
other financial expenses (Note 16).
The following table presents the changes in Level 3 instruments:
€ million Warrants Total
1 January 2016 162 162
Cash purchase of additional warrants 0 0
Cash settlement of warrants - 46 - 46
Effect of changes in fair value recognized in profit and loss 8 8
Effect of movements in exchange rates 3 3
31 December 2016 127 127
Cash purchase of additional warrants 0 0
Cash settlement of warrants - 48 - 48
Effect of changes in fair value recognized in profit and loss 11 11
Effect of movements in exchange rates - 13 - 13
31 December 2017 76 76
119 UCB Annual Report 2017

4.6 Offsetting financial assets and financial liabilitiesWhile the Group has amounts subject to an
enforceable master netting arrangement or similar
agreements, financial assets and financial liabilities are
reported gross on the statement of financial position
as the requirements are not met to report them net.
The reconciliations below depict the amounts subject
to an enforceable master netting arrangement or
similar agreement that have not been netted on the
statement of financial position.
The table below shows financial assets subject to
enforceable master netting arrangements:
€ million
Gross financial assets in the statement of
financial position
Related amounts not set off in the statement of financial position
Net amountsFinancial
instrumentsCash collateral
received
31 December 2017
Derivatives 176 31 0 145
Other 0 0 0 0
Total 176 31 0 145
The table below shows financial liabilities subject to enforceable master netting arrangements:
€ million
Gross financial liabilities in the
statement of financial position
Related amounts not set off in the statement of financial position
Net amountsFinancial
instrumentsCash collateral
received
31 December 2017
Derivatives 34 31 0 3
Other 0 0 0 0
Total 34 31 0 3
ISDA master agreements (International Swaps and
Derivatives Association) have been signed with the
respective counterparties allowing offsetting of
financial assets and liabilities. This is applicable to the
fair value settlement in case of default, but it is not
applicable at the closing date 31 December 2017.
The table below shows financial assets subject to
enforceable master netting arrangements:
€ million
Gross financial assets in the statement of
financial position
Related amounts not set off in the statement of financial position
Net amountsFinancial
instrumentsCash collateral
received
31 December 2016
Derivatives 108 55 0 53
Other 0 0 0 0
Total 108 55 0 53
The table below shows financial liabilities subject to enforceable master netting arrangements:
€ million
Gross financial liabilities in the
statement of financial position
Related amounts not set off in the statement of financial position
Net amountsFinancial
instrumentsCash collateral
received
31 December 2016
Derivatives 109 55 0 54
Other 0 0 0 0
Total 109 55 0 54
120

5 Segment reporting The Group’s activities are in one
segment, Biopharmaceuticals.
There are no other significant classes of business,
either singularly or in aggregate. The Chief Operating
Decision Makers, that being the Executive Committee,
review the operating results and operating plans, and
make resource allocation decisions on a company-
wide basis, therefore UCB operates as one segment.
Enterprise-wide disclosures about product sales,
geographic areas and revenues from major customers
are presented below.
5.1 Product sales informationNet sales consist of the following:
€ million 2017 2016 (Restated)1
Cimzia® 1 424 1 304
Vimpat® 976 822
Keppra® (including Keppra® XR) 778 720
Neupro® 314 298
Xyzal® 104 101
Zyrtec® (including Zyrtec-D®/Cirrus®) 103 117
Briviact® 87 18
Nootropil® 44 46
venlaflaxine ER 0 89
Other products 324 331
Designated hedges reclassified to net sales 28 - 19
Total net sales 4 182 3 827
1 After reclassifications due to IFRS 15
5.2 Geographic informationThe table below shows sales in each geographic market in which customers are located:
€ million 2017 2016 (Restated)¹
U.S. 2 069 1 877
Europe – other (excluding Belgium) 322 316
Germany 319 290
Japan 292 254
Spain 175 160
France (including French territories) 161 158
Italy 141 138
China 134 142
U.K. and Ireland 133 129
Belgium 37 33
Other countries 371 349
Designated hedges reclassified to net sales 28 - 19
Total net sales 4 182 3 827
1 After reclassifications due to IFRS 15
121 UCB Annual Report 2017

The table below illustrates the property, plant and equipment in each geographic market in which the
assets are located:
€ million 2017 2016
Switzerland 298 300
Belgium 260 269
U.K. and Ireland 40 45
U.S. 32 29
Japan 23 13
China 12 13
Germany 2 3
Brazil 2 2
Other countries 4 4
Total 673 678
5.3 Information about major customersUCB has 1 customer which individually accounts for
more than 17% of the total net sales at the end of 2017.
In the U.S., sales to 3 wholesalers accounted for
approximately 74% of U.S. sales (2016: 83%).
6 Revenue from contracts with customers
The Group has recognized the following amounts relating to revenue in the consolidated income statement:
€ million2017 2016
(Restated)¹
Revenue from contracts with customers 4 493 4 120
Revenue from agreements whereby risks and rewards are shared 37 27
Total revenue 4 530 4 147
1 After reclassifications due to IFRS 15
122

6.1 Disaggregation of revenue from contracts with customers
ACTUAL TIMING OF REVENUE RECOGNITION
€ million2017 2016
(Restated)1 2017 2016 (Restated)1
At a point in time
Over time
At a point in time Over time
Net sales U.S. 2 069 1 877 2 069 0 1 877 0
Cimzia® 918 846 918 0 846 0
Vimpat® 746 629 746 0 629 0
Keppra® 232 216 232 0 216 0
Neupro® 96 85 96 0 85 0
Briviact® 63 11 63 0 11 0
Established brands 14 90 14 0 90 0
Net sales Europe 1 288 1 224 1 288 0 1 224 0
Cimzia® 370 339 370 0 339 0
Keppra® 235 237 235 0 237 0
Neupro® 168 161 168 0 161 0
Vimpat® 177 152 177 0 152 0
Briviact® 22 7 22 0 7 0
Established brands 316 328 316 0 328 0
Net sales international markets 798 745 798 0 745 0
Keppra® 311 267 311 0 267 0
Cimzia® 136 118 136 0 118 0
Vimpat® 53 42 53 0 42 0
Neupro® 50 52 50 0 52 0
Briviact® 1 0 1 0 0 0
Established brands 246 266 246 0 266 0
Net sales before hedging 4 154 3 846 4 154 0 3 846 0
Designated hedges reclassified to net sales 28 - 19 28 0 - 19 0
Total net sales 4 182 3 827 4 182 0 3 827 0
Royalty income and fees 108 125 108 0 125 0
Contract manufacturing revenues 91 119 91 0 119 0
Income from licensing deals (upfront payments, development milestones, sales milestones)
100 36 73 27 15 21
Revenue resulting from services & other deliveries 12 13 0 12 4 9
Total other revenue 203 168 164 39 138 30
Total revenue from contracts with customers 4 493 4 120 4 454 39 4 090 30
1 After reclassifications due to IFRS 15
123 UCB Annual Report 2017
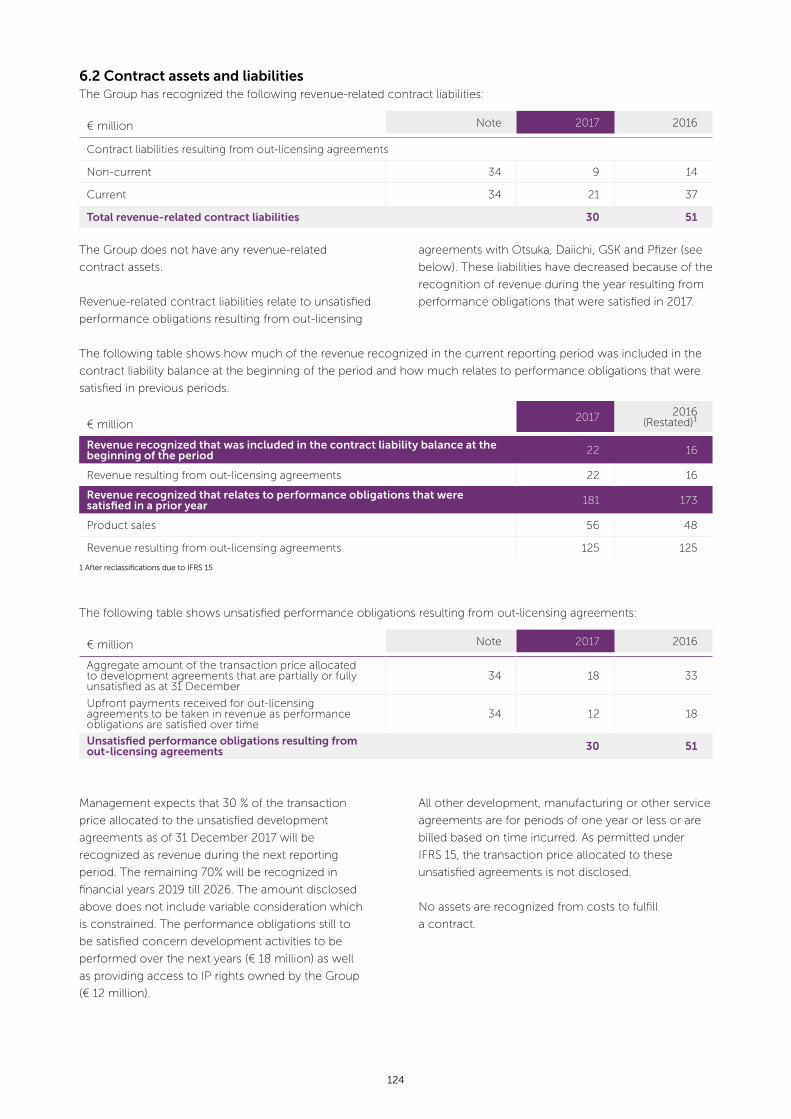
6.2 Contract assets and liabilitiesThe Group has recognized the following revenue-related contract liabilities:
€ million Note 2017 2016
Contract liabilities resulting from out-licensing agreements
Non-current 34 9 14
Current 34 21 37
Total revenue-related contract liabilities 30 51
The Group does not have any revenue-related
contract assets.
Revenue-related contract liabilities relate to unsatisfied
performance obligations resulting from out-licensing
agreements with Otsuka, Daiichi, GSK and Pfizer (see
below). These liabilities have decreased because of the
recognition of revenue during the year resulting from
performance obligations that were satisfied in 2017.
The following table shows how much of the revenue recognized in the current reporting period was included in the
contract liability balance at the beginning of the period and how much relates to performance obligations that were
satisfied in previous periods.
€ million2017 2016
(Restated)¹
Revenue recognized that was included in the contract liability balance at the beginning of the period 22 16
Revenue resulting from out-licensing agreements 22 16
Revenue recognized that relates to performance obligations that were satisfied in a prior year 181 173
Product sales 56 48
Revenue resulting from out-licensing agreements 125 125
1 After reclassifications due to IFRS 15
The following table shows unsatisfied performance obligations resulting from out-licensing agreements:
€ million Note 2017 2016
Aggregate amount of the transaction price allocated to development agreements that are partially or fully unsatisfied as at 31 December
34 18 33
Upfront payments received for out-licensing agreements to be taken in revenue as performance obligations are satisfied over time
34 12 18
Unsatisfied performance obligations resulting from out-licensing agreements 30 51
Management expects that 30 % of the transaction
price allocated to the unsatisfied development
agreements as of 31 December 2017 will be
recognized as revenue during the next reporting
period. The remaining 70% will be recognized in
financial years 2019 till 2026. The amount disclosed
above does not include variable consideration which
is constrained. The performance obligations still to
be satisfied concern development activities to be
performed over the next years (€ 18 million) as well
as providing access to IP rights owned by the Group
(€ 12 million).
All other development, manufacturing or other service
agreements are for periods of one year or less or are
billed based on time incurred. As permitted under
IFRS 15, the transaction price allocated to these
unsatisfied agreements is not disclosed.
No assets are recognized from costs to fulfill
a contract.
124

7 Business combination
On 2 June 2017, UCB increased its 27% equity stake
in Beryllium LLC to full ownership. Beryllium LLC is
a research-based company specializing in protein
expression and structural biology, located in
Bainbridge, Washington and Bedford, Massachusetts
(U.S.). UCB has already been successfully partnering
with Beryllium LLC for several years and acquired
a 27% stake in the company in 2014. The acquisition of
Beryllium LLC will enable UCB to boost its capabilities
in protein engineering and structural biology, which
will benefit UCB’s existing and future discovery
pipeline. Beryllium LLC will also explore and develop
its promising micro RNA targeting platform. UCB
increased its equity stake to 100% of the issued and
outstanding shares of Beryllium LLC by paying a net
amount of € 7 million to Beryllium LLC’s external
shareholders, after € 7 million was reimbursed to
UCB as consideration for the series A preferred
units held by UCB in Beryllium LLC since 2014,
including accrued dividends. UCB performed an
initial purchase price allocation (see table below).
However, the initial accounting for the business
combination is not complete yet as some information
relating to the recoverability of tax losses carried
forward is not finalized. The goodwill represents
expected synergies with UCB’s super network
and core antibody and small molecule discovery
approach, as well as skilled workforce. Goodwill is
not expected to be tax deductible. Adjustments due
to the initial purchase price allocation mainly relate to
identification of intangible assets such as the micro
RNA targeting platform, customers contracts, research
knowledge and standard operating procedures. The
fair value of acquired receivables is estimated at
€ 1 million. All contractual cash flows are expected
to be collected. No contingent liabilities have been
identified. Acquisition related costs for an amount of
€ 1 million have been recorded under Other Expenses.
No major gain or loss was recognized as a result of
the re-measuring to fair value of the equity interest
in Beryllium LLC held by UCB before the business
combination. The amounts of revenue and profit or
loss of Beryllium LLC included in the consolidated
income statement for the reporting period since
the acquisition are not material. The amounts of
revenue and profit or loss for Beryllium LLC (excluding
intercompany amounts with UCB) assuming the
acquisition date would have been 1 January 2017 are
also not material.
€ million
Initial opening balance sheet
Adjustments due to initial
purchase price allocation
Adjusted opening balance
sheet (not final yet)
Total acquisition value 7 0 7
Cash consideration paid (net) 7 7
Contingent consideration 0 0
Settlement of receivable on Beryllium LLC at recorded amount 4 4
Fair value of previously held investment 4 4
Recognized amounts of identifiable assets acquired and liabilities assumed - 2 - 4 - 6
Non-current assets - 2 - 4 - 6
Current assets - 2 - 2
Non-current liabilities 2 2
Current liabilities 0 0
Goodwill 13 - 4 9
125 UCB Annual Report 2017

8 Discontinued operations and assets of disposal group classified as held for sale
8.1 Discontinued operationsOn 2 September 2015, UCB concluded an agreement
with Lannett Company, Inc. (“Lannett”) for the sale of
its U.S. specialty generics subsidiary, Kremers Urban
Pharmaceuticals Inc. (“KU”). The sale was closed on
25 November 2015.
The profit from discontinued operations of € 1 million
for 2017 includes a € 1 million loss for costs from
the sale of KU. Discontinued operations also include
the partial reversal of provisions related to the legacy
films and chemical activities for € 2 million. The loss
from discontinued operations for 2016 includes a
€ 16 million loss for adjustments of proceeds and deal
costs from the sale of KU and an additional € 8 million
tax expense on the gain resulting from the sale of KU.
The cash flows from discontinued operations have
been separately disclosed on the cash flow statement.
In 2017 there was a cash inflow of € 31 million, mainly
related to the receipt of proceeds that had previously
been deferred until the outcome of a tax ruling.
8.2 Assets and liabilities of disposal group classified as held for saleThe assets of disposal group classified as held for sale
as per 31 December 2017 relate to the Monheim site
in Germany. In 2016 UCB decided to dispose of the
site and enter into a leaseback agreement for that
part of the site that is currently used by UCB. As per
year-end, negotiations were ongoing with the buyer.
No impairment loss has been accounted for on these
assets. The assets of the disposal group classified as
held for sale as per 31 December 2016 also related to
the Monheim site.
Detail of assets of disposal group classified as held for
sale as per 31 December 2017 and 2016:
€ million 2017 2016
Property, plant and equipment 16 16
Inventories - 1
Assets classified as held for sale 16 17
126

9 Other revenues
€ million 2017 2016
Revenue generated by means of profit-sharing agreements 16 19
Upfront payments, milestone payments and reimbursements 133 57
Contract manufacturing revenues 91 119
Total other revenue 240 195
The revenue generated through profit-sharing
agreements relates mainly to revenue from the co-
promotion of Dafiro®, Provas®, Xyzal®
During 2017, UCB received milestone payments and
reimbursements from different parties, mainly:
• One-time revenue of € 56 million for the out-
licensing of the over-the-counter allergy drug
Xyzal® in the U.S.
• Sanofi for collaboration and development of
innovative anti-inflammatory small molecules;
• Otsuka for co-development of E Keppra® and
Neupro® in Japan;
• Daiichi Sankyo for Vimpat® in Japan;
• Biogen for multiple sclerosis and hemophilia
therapies in Asia.
The revenue from contract manufacturing activities
is mainly linked to the toll manufacturing agreements
entered into after the divestiture of the nitrates
in 2016, and with GSK in 2009.
127 UCB Annual Report 2017

10 Operating expenses by nature The table below illustrates certain items of expense recognized in the income statement using a classification based
on their nature within the Group:
€ million Note 2017 2016
Employee benefit expenses 11 1 200 1 092
Depreciation of property, plant and equipment 21 74 73
Amortization of intangible assets 19 160 159
Impairment of non-financial assets (net) 13 1 12
Total 1 435 1 336
11 Employee benefit expense
€ million Note 2017 2016
Wages and salaries 790 696
Social security costs 121 96
Post-employment benefits – defined benefit plans 32 72 60
Post-employment benefits – defined contribution plans 25 99
Share-based payments to employees and directors 27 88 26
Insurance 47 40
Other employee benefits 57 75
Total employee benefit expense 1 200 1 092
The total employee benefit expense has been
allocated along functional lines within the income
statement. Other employee benefits consist mainly of
termination benefits, severance payments, and other
long-term/short-term disability benefits.
Headcount at 31 December 2017 2016
Hourly Paid 3 8
Monthly Paid 3 139 3 354
Management 4 336 4 201
Total 7 478 7 563
Further information regarding post-employment benefits and share-based payments can be found in Notes 27 and 32.
128

12 Other operating income/expenses
€ million 2017 2016 (Restated)¹
Amortization of non-production related intangible assets 0 0
Provisions 5 - 13
Impairment trade receivable - 4 - 2
Reimbursement by third parties for development expenses 8 3
Grants received 14 15
Collaboration agreement for the development and commercialization of Evenity™ - 39 0
Other income / expenses (-) 5 - 10
Total other operating income / expenses - 11 - 7
1 After reclassifications due to IFRS 15
The result of the collaboration agreement with
Amgen for the development and commercialization
of Evenity™ amounted to € -39 million expenses. As
from 2017 onwards, all recharges of development
and preparation of commercialization expenses
to / from Amgen are classified as other operating
income / expenses. In 2016, the net recharges for
development expenses for an amount of € -38 million
were presented as part of research and development
expenses. The net recharges for commercialization
expenses for an amount of € -8 million were
presented as part of marketing and selling expenses.
The equivalent total net recharges as per 31 December
2017 consisted of € -17 million marketing and selling
expenses and € -22 million development expenses.
In 2016, the other expenses related to Branded
Prescription Drug fee in the U.S. of € -29 million were
reclassified to net sales due to application of IFRS 15
(see Note 2.2.1).
129 UCB Annual Report 2017
13 Impairment of non-financial assetsA review of the recoverable amounts of the Group’s
assets resulted in the recognition of impairment
charges amounting to € 1 million (2016: € 12 million).
Impairment charges of € 6 million related to narcotic
cough suppressants were recognized in the year. In
addition, an impairment of € 1 million was concluded
in respect of Metadate®. Furthermore, the impairment
on inotuzumab ozogamicin, out-licensed to Pfizer,
for an amount of € 6 million that had been accounted
for in 2013, was reversed as Pfizer announced that
the European Commission has approved Besponsa®
(inotuzumab ozogamicin) as monotherapy for the
treatment of adults with relapsed or refractory Acute
Lymphoblastic Leukemia (ALL). In 2016, impairment
charges of € 12 million were recognized, mainly
related to pre-clinical oncology molecules).
No impairment charges for Group property,
plant and equipment were recognized in 2017
(2016: € 0 million).
No reasonably possible change in a key assumption
on which management has based its determination
of the assets recoverable amounts would
cause the assets carrying amount to exceed its
recoverable amount.
14 Restructuring expenses
15 Other income/expenses Total other income/expense amounted to an expense
of € 19 million (2016: income of € 125 million) and is
comprised of the following items:
• Other income of € 3 million in 2017 compared
to € 171 million in 2016. This mainly relates to
additional proceeds received in respect of the
disposal of the nitrates business (cardiovascular
products) to Merus Labs International Inc. In 2016,
the income related to the disposal of the nitrates
business as well as the disposal of venlafaxine ER to
Osmotica Pharmaceuticals Corp.
• Other expenses amounted to € 22 million
(2016: € 46 million) in 2017 and mainly relate to
legal fees related to intellectual property.
The restructuring expenses for the year ended
31 December 2017 amount to € 23 million
(2016: € 33 million) and are related to new
organization models and business discontinuation.
In 2016, the restructuring expenses were mainly
related to reorganization and optimization.
130

16 Financial income and financial expensesThe net financial expenses for the year amounted to € 99 million (2016: € 112 million). The breakdown of the financial
expenses and financial income is as follows:
FINANCIAL EXPENSES
€ million 2017 2016
Interest expenses on:
Retail bonds - 25 - 25
Institutional Eurobonds - 17 - 44
Other borrowings - 14 - 18
Financial charges on finance leases 0 0
Impairment of equity securities and other financial assets 0 - 21
Net loss on interest rate derivatives 0 - 7
Net foreign exchange losses - 44 - 44
Net other financial expenses - 14 - 15
Total financial expenses - 114 - 174
FINANCIAL INCOME
€ million 2017 2016
Interest income on:
Bank deposits 1 18
Interest rate derivatives 13 15
Net fair value gain on foreign exchange derivatives 1 29
Total financial income 15 62
The net other financial expenses include € 11 million
expenses related to the changes in fair value of the
warrants linked to the structured entity Edev Sàrl
(€ -8 million in 2016) (Note 4.5.3).
The impairment of equity securities and other financial
assets in 2016 is mainly related to fair value and
impairment losses on the warrant received pursuant
to the sale of KU for an amount of € 29 million
compensated by a gain on the sale of shares for an
amount of € 7 million.
131 UCB Annual Report 2017

17 Income tax expense (-)/credit
€ million 2017 2016
Current income taxes 16 -284
Deferred income taxes -234 85
Total income tax expense (-)/credit -218 -199
€ million 2017 2016
Profit before income taxes 988 764
Income tax expense (-) calculated at domestic tax rates applicable in the respective countries -206 -175
Theoretical income tax rate 21% 23%
Reported current income tax 16 -284
Reported deferred income tax -234 85
Total reported tax charge -218 -199
Effective income tax rate 22% 26%
Difference between theoretical and reported tax -12 -24
Expenses non-deductible for tax purposes -34 -44
Non-taxable income 8 30
Decrease of liabilities for uncertain tax positions 181 8
Effect of previously unrecognized tax credits and losses used in the period 43 24
Tax credits 37 23
Variation in tax rates -124 5
Effect of reversal of previously recognised deferred tax assets on tax losses - -87
Current tax adjustments related to prior years 35 2
Deferred tax adjustments related to prior years -71 59
Net effect of previously unrecognised deferred tax assets and non-recognition of current year deferred tax assets -89 -39
Withholding tax -2 -4
Other taxes 3 -1
Total difference between theoretical and reported income tax -12 -24
The Group operates internationally, implying being
subject to income taxes in many different tax
jurisdictions. The income tax expense on the Group’s
profit before tax differ from the theoretical amount
that would arise using the weighted average tax rate
applicable to profits (losses) of the consolidated
companies. Income taxes recognized in the income
statement can be detailed as follows:
132

The theoretical income tax rate has slightly reduced
from the prior year due to the reduction of corporate
tax rates in a number of jurisdictions in which UCB
operates and a shift in the income mix between the
different territories in which the group is active.
The effective tax rate of 22% is below the prior year
effective tax rate and is composed of a current tax
credit and a deferred tax charge. The key drivers for
the rate can be summarized as follows:
Current Tax:
• A significant reduction of reserves for uncertain tax
positions arising from the completion of tax audits
in key jurisdictions or expiry of statute of limitations
and further recognition of assets for Mutual
Agreement Procedure / Arbitrage.
Deferred Tax:
• The impact of tax reforms in key jurisdictions
with the reduction in the US federal corporate
income tax rate from 35% to 21% having the most
significant impact.
• In line with prior years, there was an increase
to the tax rate in respect of losses generated in
the period for which no deferred tax asset has
been recognized.
The impact of the US tax reform impacted the
deferred income tax charge for € 119 million
resulting from the remeasurement of rebates &
returns (€ 62 million), inventory (€ 66 million) and
others (€ -10 million). The Belgian tax reform had a
less significant impact on the group. Deferred tax
balances have been remeasured at the new tax rates
and tax loss balances were subject to recoverability
testing based on the new loss limitation rules. The
UK tax reform did not result in any derecognition
of deferred tax losses. The deferred tax assets
recognized in respect of the losses were updated
following an agreement between the Belgian and UK
tax authorities.
FACTORS AFFECTING THE TAX CHARGE IN
FUTURE YEARS
The Group is aware of many factors that could
impact the future effective tax rate of the Group, in
particular the profit/losses mix between different
territories in which the group operates, the amount
of unrecognized losses that in future can be brought
onto the balance sheet and the outcome of future
tax audits.
Changes to tax legislation in jurisdictions where the
Group operates as well as the impact of European
& international tax rules such as the OECD’s Base
Erosion & Profit Shifting framework (‘BEPS’) may also
have a major impact.
Following the implementation of the BEPS framework
in the countries in which UCB operates, the Group
is consistently assessing its tax position in view of
understanding the risk of double taxation, and impacts
on tax rates, tax incentives and the carrying value of
deferred taxes.
Corporate restructuring, acquisitions and disposals,
future planning as well as legislative changes may also
impact the Group’s future tax charge.
The Group is specifically paying attention to
the following:
Belgium: Per end of December 2017, a major Belgian
tax law change was enacted. This tax law change
introduces a gradual tax rate decrease from 33.99%
down to 25% in 2020. Compensating measures,
including a 70% loss limitation rule, were enacted at
the same time. The tax law change should have a
positive impact on current taxes due in the longer run.
The application of an innovation income deduction
and the new laws on Belgian tax consolidation are
further assessed by Belgian management in 2018
and onwards.
U.S.: Due to the US tax reform, management
expects that current taxes in US will be decreasing
in the future. There is close follow-up of the other
new measures to ensure that the impact on UCB is
accurately captured.
133 UCB Annual Report 2017

19 Intangible assets
2017 Trademarks, patents and
licencesOther Total
€ million
Gross carrying amount at 1 January 2 278 396 2 674
Additions 73 31 104
Disposals - 3 - 15 - 18
Business Combinations 5 0 5
Transfer from one heading to another 295 - 68 227
Divestments 0 0 0
Transfer to assets held for sale 0 0 0
Effect of movements in exchange rates - 123 - 2 - 125
Gross carrying amount at 31 December 2 525 342 2 867
Accumulated amortization and impairment losses at 1 January -1 489 - 310 -1 799
Amortization charge for the year - 604 444 - 160
Disposals 1 15 16
Impairment losses recognized in the income statement - 1 0 - 1
Transfer from one heading to another 163 - 366 - 203
Divestments 0 0 0
Transfer to assets held for sale 0 0 0
Effect of movements in exchange rates 93 4 97
Accumulated amortization and impairment losses at 31 December -1 837 - 213 -2 050
Net carrying amount at 31 December 688 129 817
18 Components of other comprehensive income (OCI)
1 January 2016
Movements 2016
net of tax
31 December
2016
Movements 2017
net of tax
31 December
2017€ million
Items of OCI to be reclassified to profit or loss in subsequent periods: 208 -55 153 -254 -101
Cumulative translation adjustments 182 -50 132 -352 -220
Available for sale financial assets 42 -1 41 -12 29
Cash flow hedges -16 -4 -20 110 90
Items of OCI not to be reclassified to profit or loss in subsequent periods: -264 -89 -353 9 -344
Remeasurement of defined benefit obligation -264 -89 -353 9 -344
Total other comprehensive income attributed to equity holders -56 -144 -200 -245 -445
134

The Group amortises all intangible assets once
they are placed in service. The amortization of
intangible assets is allocated to cost of sales for all
intangible assets that are related to compounds. The
amortization charges related to software are allocated
to the functions that use this software.
The majority of the Group intangible assets arose
from previous acquisitions. During 2017, the Group
acquired intangible assets totalling € 104 million
(2016: € 71 million). These additions are related to
in-licencing deals, software and capitalized eligible
development costs, including the fourth milestone
and final payment paid by UCB for € 29 million to
Dermira relating to the Phase 3 clinical program that
was designed to evaluate the efficacy and safety of
Cimzia® in adult patients with moderate-to-severe
chronic plaque psoriasis. There were also additions
totaling € 23 million relating to the capitalization of
external development expenses for post approval
studies. UCB also acquired intangibles totalling
€ 5 million as part of the acquisition of the remaining
shareholding in Beryllium LLC.
Disposals in the period were mainly in respect of
software. In 2016 UCB divested the nitrates products,
including related intangibles, accounting for the
majority of disposals in that year.
During the year, the Group recognized total
impairment charges of € 1 million (2016: € 12 million)
which consisted of the impairment of narcotic cough
suppressants (€ 6 million) and Metadate® (€ 1 million).
There was also the reversal of the impairment in
inotuzumab ozomagicin, an outlicensed asset for
an amount of € 6 million. In 2016, the impairment of
€ 12 million related mainly to pre-clinical oncology
molecules. The impairment charges are detailed in
Note 13 and have been presented in the income
statement under the caption “Impairment of non-
financial assets”.
Other intangible assets are primarily comprised of
software and in process development projects. The
in—process development project assets are not
amortized until they are available for use (i.e. when
related products are launched for sale) and transferred
to the licences caption. Other intangible assets also
include software and other intangibles.
2016Trademarks, patents and
licencesOther Total
€ million
Gross carrying amount at 1 January 2 397 387 2 784
Additions 17 54 71
Disposals - 32 - 15 - 47
Transfer from one heading to another - 17 - 33 - 50
Transfer to assets held for sale - 31 0 - 31
Effect of movements in exchange rates - 56 3 - 53
Gross carrying amount at 31 December 2 278 396 2 674
Accumulated amortization and impairment losses at 1 January -1 468 - 261 -1 729
Amortization charge for the year - 111 - 48 - 159
Disposals 29 10 39
Impairment losses recognized in the income statement - 12 0 - 12
Transfer from one heading to another 12 - 12 0
Transfer to assets held for sale 18 0 18
Effect of movements in exchange rates 43 1 43
Accumulated amortization and impairment losses at 31 December -1 489 - 310 -1 799
Net carrying amount at 31 December 789 86 875
135 UCB Annual Report 2017

The Group tests goodwill for impairment annually
or more frequently if there are indications that
goodwill might be impaired. For the purpose of
the impairment testing, the Group operates as one
segment, Biopharmaceuticals, and has one single cash
generating unit (CGU), which represents the lowest
level at which the goodwill is monitored.
The recoverable amount of the CGU is determined
based on the value-in-use calculations and the
methodology applied for performing the impairment
testing has not been modified compared to 2016.
KEY ASSUMPTIONS
The calculations performed are based on the cash
flow projections as derived from the financials
underlying the 10-year strategic plan approved by
management and Board of Directors. Given the
nature of the industry, the long-term projections are
used to fully model the appropriate product lifecycles
based on the patent expiry and therapeutic area.
These long-term projections, which are based on
past performance and management’s expectations of
market developments, are adjusted for specific risks
and include:
• the revenue growth rates of newly
launched products;
• the probability of reaching commercial stage for
new products and or indications;
• the probability of success of future product launches
and the expected dates thereof;
• the post-patent expiry erosion.
There were no significant changes to these key
assumptions when comparing to 2016, except for the
assumptions relating to launch probabilities, which
were adapted taking into account latest developments.
Cash flows beyond the projected forecasted period
(terminal value) are extrapolated using an estimated
growth rate of 3% (2016: 3%). The growth rate does
not exceed the long-term average growth rate for
the relevant territories in which the CGU operates.
The Group has most of its revenue and expenses
in EUR and USD based countries. The following
important exchange rates were used in preparing the
future cash flows:
10 years projection 2016
USD 1.10 - 1.25 1.11 - 1.28
GBP 0.87 - 0.90 0.81 - 0.87
JPY 120 130
CHF 1.06 - 1.00 1.09 - 1.02
Starting from risk free short term LIBOR EUR 6 months
and long term EU generic government bonds
20 years (2016: 20 years), the discount rates applied
are determined based on the weighted average cost
of capital for DCF models, including the 20 year
(2016: 20 year) benchmark cost of debt and equity,
adjusted to reflect the specific asset and country
risks associated with the CGU. Given the industry, the
Group used a discount rate for marketed products
of 6.62% (2016: 7%) and for pipeline products 13.0%
(2016: 13.0%). Marketed products are products that are
sold in the market as per year-end, these comprise our
products Cimzia®, Vimpat®, Neupro®,Keppra®, Briviact®
and other products (Zyrtec®, Xyzal® and others).
Pipeline products are products that are not sold yet in
the market as per year- end (eg. Evenity™). A different
discount rate is used for pipeline products as the
risks related to these products are higher than for the
products that are already in the market. The discount
rates are reviewed at least annually.
Since after-tax cash flows are incorporated into the
calculation of the value-in-use of the CGU, a post-tax
discount rate is used in order to remain consistent.
The use of the post-tax discount rate approximates
the result of using a pre-tax rate applied to pre-tax
cash flows. A tax rate between 12% and 25% was used
(2016: 28%).
20 Goodwill € million 2017 2016
Cost at 1 January 5 178 5 164
Acquisition 9 0
Effect of movements in exchange rates - 349 14
Net book value at 31 December 4 838 5 178
136

SENSITIVITY ANALYSIS
Based on the above, management assessed that no
reasonable change in any of the key assumptions for
the determination of the recoverable amount would
cause the carrying value of the CGU to materially
exceed its recoverable amount. For information
purposes, the sensitivity analysis using a 0% perpetual
growth rate combined with an overall discount rate
below 12.7% would not result in an impairment of
the goodwill.
21 Property, plant and equipment
2017 Land and buildings
Plant and machinery
Office, computer
equipment, vehicles
and other
Assets under construction Total
€ million
Gross carrying amount at 1 January 542 784 112 85 1 523
Additions 3 16 4 105 128
Business combinations 0 2 0 0 2
Disposals 9 - 16 3 - 1 - 5
Transfers from one heading to another - 21 19 4 - 50 - 48
Transfer to assets held for sale - 31 - 1 - 1 0 - 33
Effect of movements in exchange rates - 27 - 36 - 5 - 5 - 73
Gross carrying amount at 31 December 475 768 117 134 1 494
Accumulated depreciation at 1 January - 288 - 457 - 98 - 2 - 845
Depreciation charge for the year - 20 - 46 - 8 0 - 74
Disposals - 9 15 - 2 0 4
Transfers from one heading to another 23 1 0 0 24
Transfer to assets held for sale 31 1 1 0 33
Effect of movements in exchange rates 13 22 2 0 37
Accumulated depreciation at 31 December - 250 - 464 - 105 - 2 - 821
Net carrying amount at 31 December 225 304 12 132 673
2016 Land and buildings
Plant and machinery
Office, computer
equipment, vehicles
and other
Assets under construction Total
€ million
Gross carrying amount at 1 January 624 871 116 41 1 652
Additions 2 11 3 54 70
Disposals 0 - 6 - 2 0 - 8
Transfers from one heading to another - 65 - 87 - 3 - 10 - 165
Transfer to assets held for sale - 16 0 0 0 - 16
Effect of movements in exchange rates - 3 - 5 - 2 0 - 10
Gross carrying amount at 31 December 542 784 112 85 1 523
Accumulated depreciation at 1 January - 336 - 555 - 101 - 9 -1 001
Depreciation charge for the year - 22 - 44 - 7 0 - 73
Disposals 0 5 2 0 7
Transfers from one heading to another 67 134 6 7 214
Effect of movements in exchange rates 3 3 2 0 8
Accumulated depreciation at 31 December - 288 - 457 - 98 - 2 - 845
Net carrying amount at 31 December 254 327 14 83 678
137 UCB Annual Report 2017
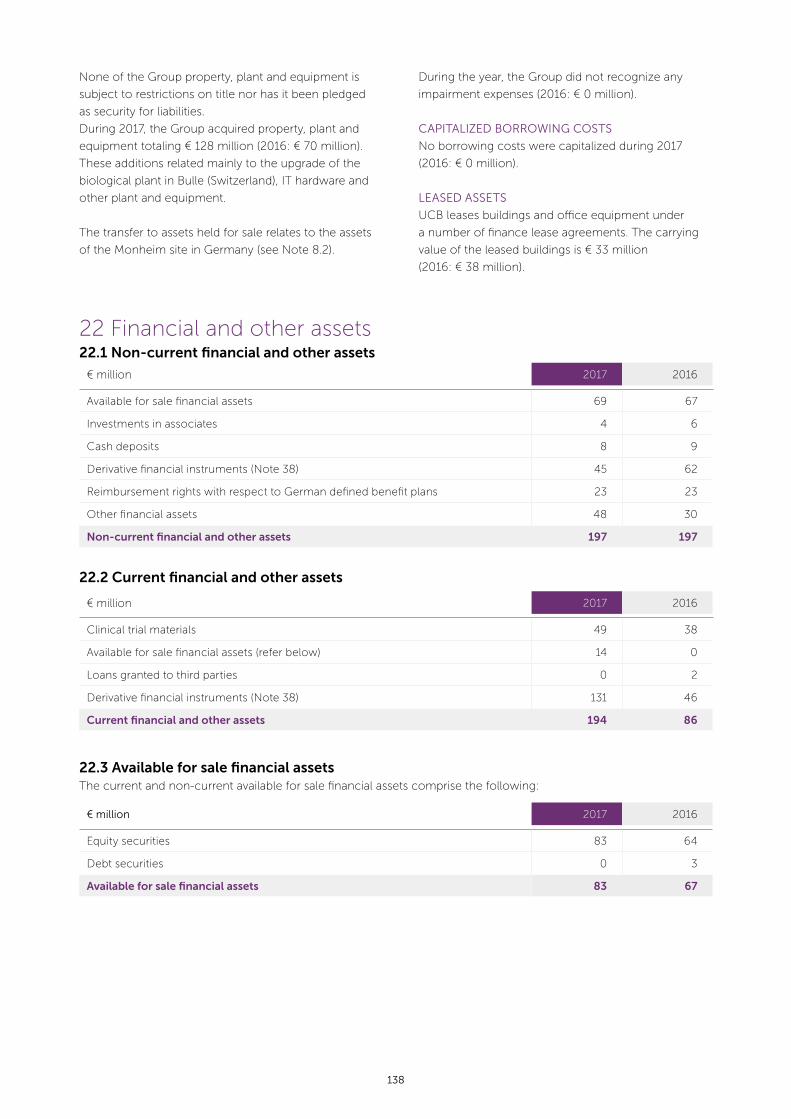
22 Financial and other assets 22.1 Non-current financial and other assets
€ million 2017 2016
Available for sale financial assets 69 67
Investments in associates 4 6
Cash deposits 8 9
Derivative financial instruments (Note 38) 45 62
Reimbursement rights with respect to German defined benefit plans 23 23
Other financial assets 48 30
Non-current financial and other assets 197 197
22.2 Current financial and other assets
€ million 2017 2016
Clinical trial materials 49 38
Available for sale financial assets (refer below) 14 0
Loans granted to third parties 0 2
Derivative financial instruments (Note 38) 131 46
Current financial and other assets 194 86
22.3 Available for sale financial assetsThe current and non-current available for sale financial assets comprise the following:
€ million 2017 2016
Equity securities 83 64
Debt securities 0 3
Available for sale financial assets 83 67
None of the Group property, plant and equipment is
subject to restrictions on title nor has it been pledged
as security for liabilities.
During 2017, the Group acquired property, plant and
equipment totaling € 128 million (2016: € 70 million).
These additions related mainly to the upgrade of the
biological plant in Bulle (Switzerland), IT hardware and
other plant and equipment.
The transfer to assets held for sale relates to the assets
of the Monheim site in Germany (see Note 8.2).
During the year, the Group did not recognize any
impairment expenses (2016: € 0 million).
CAPITALIZED BORROWING COSTS
No borrowing costs were capitalized during 2017
(2016: € 0 million).
LEASED ASSETS
UCB leases buildings and office equipment under
a number of finance lease agreements. The carrying
value of the leased buildings is € 33 million
(2016: € 38 million).
138
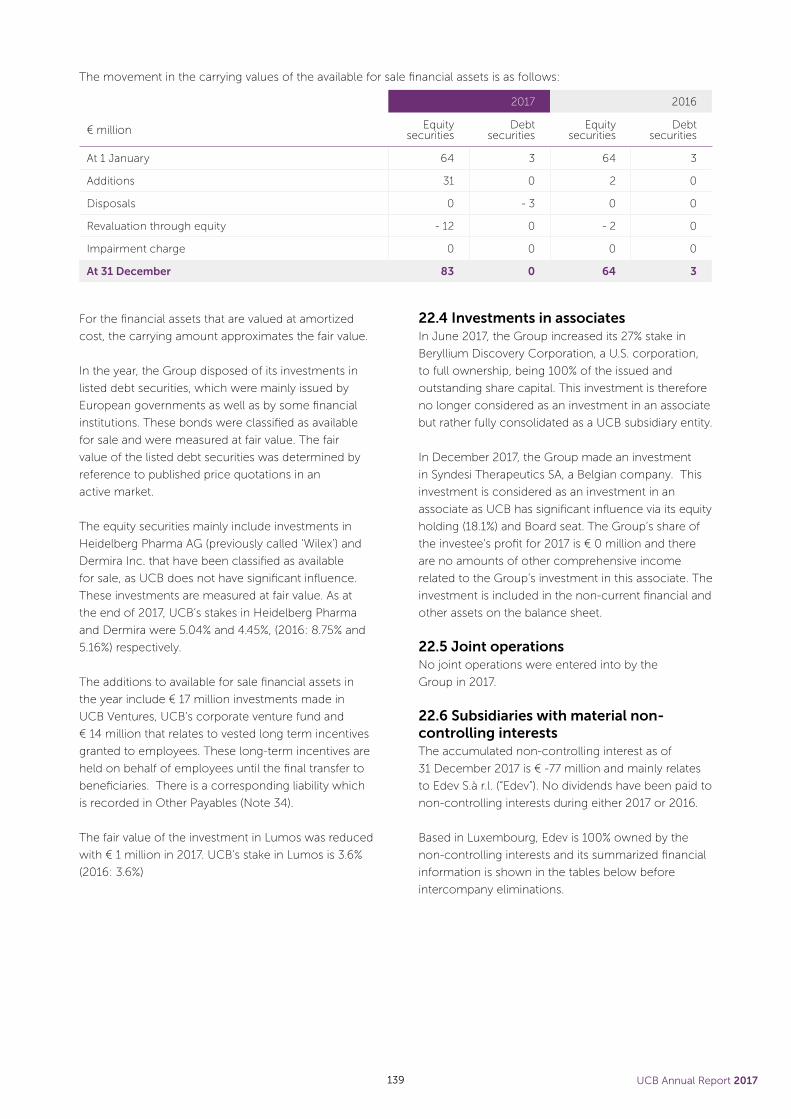
The movement in the carrying values of the available for sale financial assets is as follows:
2017 2016
€ million Equity securities
Debt securities
Equity securities
Debt securities
At 1 January 64 3 64 3
Additions 31 0 2 0
Disposals 0 - 3 0 0
Revaluation through equity - 12 0 - 2 0
Impairment charge 0 0 0 0
At 31 December 83 0 64 3
For the financial assets that are valued at amortized
cost, the carrying amount approximates the fair value.
In the year, the Group disposed of its investments in
listed debt securities, which were mainly issued by
European governments as well as by some financial
institutions. These bonds were classified as available
for sale and were measured at fair value. The fair
value of the listed debt securities was determined by
reference to published price quotations in an
active market.
The equity securities mainly include investments in
Heidelberg Pharma AG (previously called ‘Wilex’) and
Dermira Inc. that have been classified as available
for sale, as UCB does not have significant influence.
These investments are measured at fair value. As at
the end of 2017, UCB’s stakes in Heidelberg Pharma
and Dermira were 5.04% and 4.45%, (2016: 8.75% and
5.16%) respectively.
The additions to available for sale financial assets in
the year include € 17 million investments made in
UCB Ventures, UCB’s corporate venture fund and
€ 14 million that relates to vested long term incentives
granted to employees. These long-term incentives are
held on behalf of employees until the final transfer to
beneficiaries. There is a corresponding liability which
is recorded in Other Payables (Note 34).
The fair value of the investment in Lumos was reduced
with € 1 million in 2017. UCB’s stake in Lumos is 3.6%
(2016: 3.6%)
22.4 Investments in associatesIn June 2017, the Group increased its 27% stake in
Beryllium Discovery Corporation, a U.S. corporation,
to full ownership, being 100% of the issued and
outstanding share capital. This investment is therefore
no longer considered as an investment in an associate
but rather fully consolidated as a UCB subsidiary entity.
In December 2017, the Group made an investment
in Syndesi Therapeutics SA, a Belgian company. This
investment is considered as an investment in an
associate as UCB has significant influence via its equity
holding (18.1%) and Board seat. The Group’s share of
the investee’s profit for 2017 is € 0 million and there
are no amounts of other comprehensive income
related to the Group’s investment in this associate. The
investment is included in the non-current financial and
other assets on the balance sheet.
22.5 Joint operationsNo joint operations were entered into by the
Group in 2017.
22.6 Subsidiaries with material non-controlling interestsThe accumulated non-controlling interest as of
31 December 2017 is € -77 million and mainly relates
to Edev S.à r.l. (“Edev”). No dividends have been paid to
non-controlling interests during either 2017 or 2016.
Based in Luxembourg, Edev is 100% owned by the
non-controlling interests and its summarized financial
information is shown in the tables below before
intercompany eliminations.
139 UCB Annual Report 2017

23 Inventories € million 2017 2016
Raw materials and consumables 97 80
Work in progress 362 437
Finished goods 135 50
Goods purchased for resale 3 11
Inventories 597 578
The cost of inventories recognized as an expense and
included in “cost of sales” amounted to € 713 million
(2016: € 731 million). There are no inventories pledged
for security, nor is there any inventory stated at net
realizable value. The write-down on inventories
amounted to € 21 million in 2017 (2016: € 16 million)
and has been included in cost of sales. Total inventory
increased by € 19 million. There were increases in
inventories of Cimzia®, Keppra® and Vimpat®.
Summarized statement of financial position:
€ million 2017 2016
Non-current assets 0 0
Current assets 0 21
Total assets 0 21
Non-current liabilities 52 87
Current liabilities 24 40
Total liabilities 76 127
Non-controlling interest -76 -106
Summarized income statement:
€ million 2017 2016
Revenue 30 30
Expenses -12 -8
Profit (loss) attributable to the non-controlling interests 18 22
Total comprehensive income (loss) attributable to the non-controlling interests 30 19
Summarized cash flow statement:
€ million 2017 2016
Net cash inflow (outflow) from operating activities 0 0
Net cash inflow (outflow) from investing activities 0 0
Net cash inflow (outflow) from financing activities 0 0
Net cash inflow (outflow) 0 0
140

24 Trade and other receivables € million 2017 2016
Trade receivables 583 636
Less: provision for impairment -8 -6
Trade receivables – net 575 630
VAT receivable 56 57
Interest receivables 10 10
Prepaid expenses 83 71
Accrued income 6 7
Other receivables 63 80
Royalty receivables 16 29
Trade and other receivables 809 884
The carrying amount of trade and other receivables
approximates their fair values. With respect to trade
receivables, the fair value is estimated to be the
carrying amount less the provision for impairment
and for all other receivables the carrying value
approximates fair value given the short-term maturity
of these amounts. There is some concentration of
credit risk with respect to trade receivables. For some
credit exposures in critical countries, such as the
Southern European countries, the Group obtained
credit insurance. The Group co-operates with
dedicated wholesalers in certain countries. The largest
outstanding trade receivable in 2017 from a single
customer is 17% (2016: 13%) from McKesson Corp. U.S.
The aging analysis of the Group trade receivables at year-end is as follows:
€ million 2017 2016
Gross carrying
amountsImpairment
Gross carrying
amountsImpairment
Not past due 505 0 598 0
Past due – less than one month 57 -1 20 -1
Past due more than one month and not more than three months 6 0 10 0
Past due more than three months and not more than six months 4 0 2 0
Past due more than six months and not more than one year 5 -3 1 -1
Past due more than one year 6 -4 5 -4
Total 583 -8 636 -6
Based on historical default rates, the Group believes
that no provision for impairment is necessary in
respect of trade receivables not past due. This
concerns 87% (2016: 94%) of the outstanding balance
at the balance sheet date.
141 UCB Annual Report 2017

The movement in the provision for impairment in respect of trade receivables is shown below:
€ million 2017 2016
Balance at 1 January -6 -6
Impairment charge recognized in the income statement -5 -1
Utilization/reversal of provision for impairment 3 1
Effects of movements in exchange rates 0 0
Balance at 31 December -8 -6
The other classes within trade and other receivables do not contain impaired assets.
The carrying amounts of the Group trade and other receivables are denominated in the following currencies:
€ million 2017 2016
EUR 360 287
USD 226 305
JPY 20 33
GBP 42 62
CNY 31 41
CHF 22 23
KRW 9 9
Other currencies 99 124
Trade and other receivables 809 884
The maximum exposure to credit risk at the reporting
date is the fair value of each class of receivable
mentioned above.
The Group does not hold any collateral as security.
25 Cash and cash equivalents € million 2017 2016
Short-term bank deposits 856 541
Cash at bank and on hand 193 220
Cash and cash equivalents (excluding bank overdrafts) 1 049 761
Cash and short-term deposits of € 23 million are held
in countries with restrictive regulations on exporting
capital from the country other than via normal
dividends, such as China, India, Korea and Thailand.
As Edev is 100% owned by non-controlling interests,
its cash balance of € 0.2 million is restricted for use in
settling its own obligations.
142
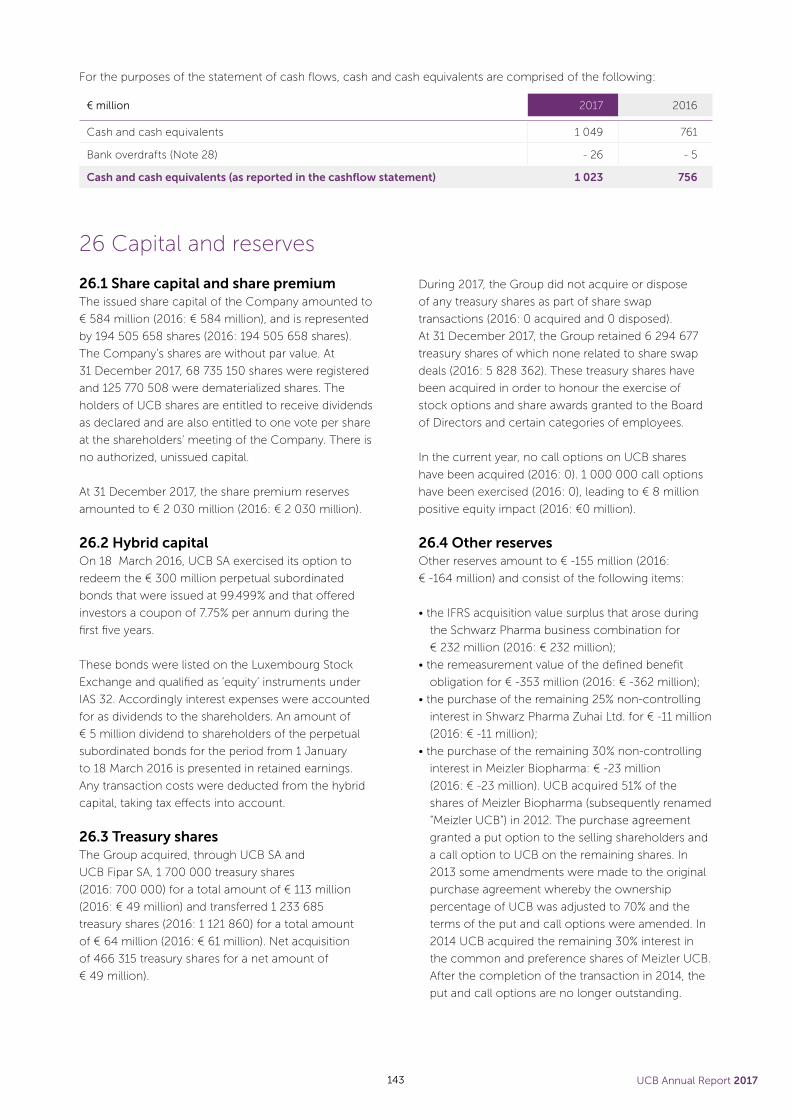
For the purposes of the statement of cash flows, cash and cash equivalents are comprised of the following:
€ million 2017 2016
Cash and cash equivalents 1 049 761
Bank overdrafts (Note 28) - 26 - 5
Cash and cash equivalents (as reported in the cashflow statement) 1 023 756
26 Capital and reserves
26.1 Share capital and share premiumThe issued share capital of the Company amounted to
€ 584 million (2016: € 584 million), and is represented
by 194 505 658 shares (2016: 194 505 658 shares).
The Company’s shares are without par value. At
31 December 2017, 68 735 150 shares were registered
and 125 770 508 were dematerialized shares. The
holders of UCB shares are entitled to receive dividends
as declared and are also entitled to one vote per share
at the shareholders’ meeting of the Company. There is
no authorized, unissued capital.
At 31 December 2017, the share premium reserves
amounted to € 2 030 million (2016: € 2 030 million).
26.2 Hybrid capitalOn 18 March 2016, UCB SA exercised its option to
redeem the € 300 million perpetual subordinated
bonds that were issued at 99.499% and that offered
investors a coupon of 7.75% per annum during the
first five years.
These bonds were listed on the Luxembourg Stock
Exchange and qualified as ‘equity’ instruments under
IAS 32. Accordingly interest expenses were accounted
for as dividends to the shareholders. An amount of
€ 5 million dividend to shareholders of the perpetual
subordinated bonds for the period from 1 January
to 18 March 2016 is presented in retained earnings.
Any transaction costs were deducted from the hybrid
capital, taking tax effects into account.
26.3 Treasury sharesThe Group acquired, through UCB SA and
UCB Fipar SA, 1 700 000 treasury shares
(2016: 700 000) for a total amount of € 113 million
(2016: € 49 million) and transferred 1 233 685
treasury shares (2016: 1 121 860) for a total amount
of € 64 million (2016: € 61 million). Net acquisition
of 466 315 treasury shares for a net amount of
€ 49 million).
During 2017, the Group did not acquire or dispose
of any treasury shares as part of share swap
transactions (2016: 0 acquired and 0 disposed).
At 31 December 2017, the Group retained 6 294 677
treasury shares of which none related to share swap
deals (2016: 5 828 362). These treasury shares have
been acquired in order to honour the exercise of
stock options and share awards granted to the Board
of Directors and certain categories of employees.
In the current year, no call options on UCB shares
have been acquired (2016: 0). 1 000 000 call options
have been exercised (2016: 0), leading to € 8 million
positive equity impact (2016: €0 million).
26.4 Other reservesOther reserves amount to € -155 million (2016:
€ -164 million) and consist of the following items:
• the IFRS acquisition value surplus that arose during
the Schwarz Pharma business combination for
€ 232 million (2016: € 232 million);
• the remeasurement value of the defined benefit
obligation for € -353 million (2016: € -362 million);
• the purchase of the remaining 25% non-controlling
interest in Shwarz Pharma Zuhai Ltd. for € -11 million
(2016: € -11 million);
• the purchase of the remaining 30% non-controlling
interest in Meizler Biopharma: € -23 million
(2016: € -23 million). UCB acquired 51% of the
shares of Meizler Biopharma (subsequently renamed
“Meizler UCB”) in 2012. The purchase agreement
granted a put option to the selling shareholders and
a call option to UCB on the remaining shares. In
2013 some amendments were made to the original
purchase agreement whereby the ownership
percentage of UCB was adjusted to 70% and the
terms of the put and call options were amended. In
2014 UCB acquired the remaining 30% interest in
the common and preference shares of Meizler UCB.
After the completion of the transaction in 2014, the
put and call options are no longer outstanding.
143 UCB Annual Report 2017

26.5 Cumulative translation adjustmentsThe cumulative translation adjustments reserve
represents the cumulative currency translation
differences relating to the consolidation of Group
companies that use functional currencies other
than the euro as well as any unrealized cumulative
foreign exchange gains or losses resulting from net
investment hedges.
27 Share-based payments The Group operates several equity-based and cash-
based compensation plans, including a stock option
plan, a stock appreciation rights plan, a stock award
plan and a performance share plan to compensate
employees for services rendered.
The stock option plan, the stock award plan and the
performance share plan are equity-settled, whereas
the stock appreciation rights plan is a cash-settled
plan. Besides these plans, the Group also operates
employee stock purchase plans in the U.K. and the
U.S. and phantom share plans. The expenses incurred
for these plans are immaterial.
27.1 tock option plan and stock appreciation rights planThe Governance, Nomination and Compensation
Committee (GNCC) granted options on UCB SA
shares to the Executive Committee members, the
senior executives and the senior directors of the UCB
Group. The exercise price of the granted options
under these plans is equal to the lowest of the
following two values:
• the average of the closing price of the UCB shares
on Euronext Brussels, during the 30 days preceding
the offer; or
• the closing price of the UCB shares on Euronext
Brussels the day before the grant.
A different exercise price is determined for those
eligible employees subject to legislation which
requires a different exercise price in order to benefit
from reduced taxation. The options become
exercisable after a vesting period of three years, except
for those eligible employees subject to legislation
which requires a longer vesting period in order to
benefit from reduced taxation. If an employee leaves
the Group, his/her options usually lapse upon expiry
of a period of six months. Options do not lapse in
case of death or retirement and in case of involuntary
termination when taxes have been paid upon grant.
The Group has no obligation to repurchase or settle
the options in cash.
The options are not transferable (except in case
of death).
The Stock Appreciation Rights (S.A.R.’s) plan has similar
characteristics to the stock option plan, except that it
is reserved for UCB employees in the U.S. This plan is
cash-settled.
27.2 Stock award planThe GNCC granted free UCB SA shares to the
Executive Committee members, the senior executives
and the senior and middle management of the UCB
Group. The free shares have service conditions
attached to them whereby beneficiaries are required
to remain in service for three years post grant date.
Stock awards lapse upon leaving the Group, except
upon leaving on retirement or death in which case
they vest immediately. The beneficiary is not entitled
to dividends during the vesting period.
27.3 Performance share planThe GNCC granted performance shares to senior
executives for specific achievements aligned with
company strategic priorities. The performance shares
are conditional on the beneficiary completing three
years of service (the vesting period) and the number
of shares awarded is adjusted at the end of the vesting
period based on the company’s performance against
its goals.
Performance Shares lapse upon leaving the Group,
except upon leaving on retirement or death in which
case they vest immediately. The beneficiary is not
entitled to dividends during the vesting period.
144
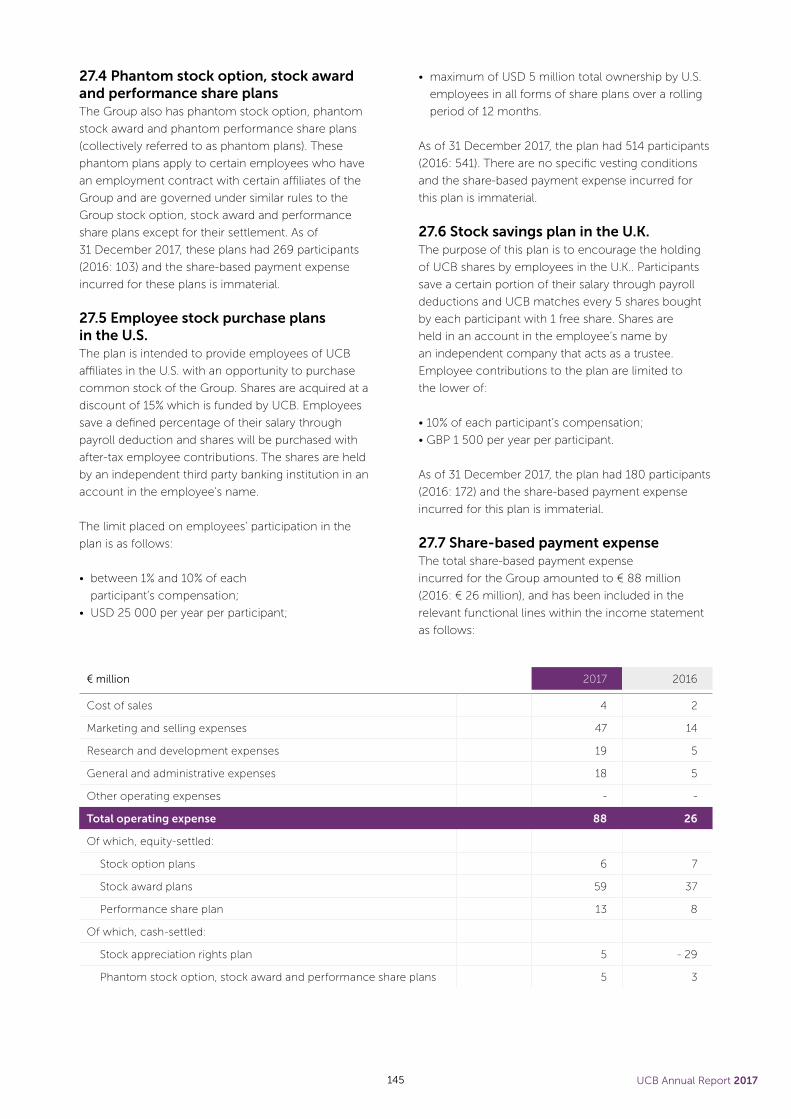
27.4 Phantom stock option, stock award and performance share plansThe Group also has phantom stock option, phantom
stock award and phantom performance share plans
(collectively referred to as phantom plans). These
phantom plans apply to certain employees who have
an employment contract with certain affiliates of the
Group and are governed under similar rules to the
Group stock option, stock award and performance
share plans except for their settlement. As of
31 December 2017, these plans had 269 participants
(2016: 103) and the share-based payment expense
incurred for these plans is immaterial.
27.5 Employee stock purchase plans in the U.S.The plan is intended to provide employees of UCB
affiliates in the U.S. with an opportunity to purchase
common stock of the Group. Shares are acquired at a
discount of 15% which is funded by UCB. Employees
save a defined percentage of their salary through
payroll deduction and shares will be purchased with
after-tax employee contributions. The shares are held
by an independent third party banking institution in an
account in the employee’s name.
The limit placed on employees’ participation in the
plan is as follows:
• between 1% and 10% of each
participant’s compensation;
• USD 25 000 per year per participant;
• maximum of USD 5 million total ownership by U.S.
employees in all forms of share plans over a rolling
period of 12 months.
As of 31 December 2017, the plan had 514 participants
(2016: 541). There are no specific vesting conditions
and the share-based payment expense incurred for
this plan is immaterial.
27.6 Stock savings plan in the U.K.The purpose of this plan is to encourage the holding
of UCB shares by employees in the U.K.. Participants
save a certain portion of their salary through payroll
deductions and UCB matches every 5 shares bought
by each participant with 1 free share. Shares are
held in an account in the employee’s name by
an independent company that acts as a trustee.
Employee contributions to the plan are limited to
the lower of:
• 10% of each participant’s compensation;
• GBP 1 500 per year per participant.
As of 31 December 2017, the plan had 180 participants
(2016: 172) and the share-based payment expense
incurred for this plan is immaterial.
27.7 Share-based payment expenseThe total share-based payment expense
incurred for the Group amounted to € 88 million
(2016: € 26 million), and has been included in the
relevant functional lines within the income statement
as follows:
€ million 2017 2016
Cost of sales 4 2
Marketing and selling expenses 47 14
Research and development expenses 19 5
General and administrative expenses 18 5
Other operating expenses - -
Total operating expense 88 26
Of which, equity-settled:
Stock option plans 6 7
Stock award plans 59 37
Performance share plan 13 8
Of which, cash-settled:
Stock appreciation rights plan 5 - 29
Phantom stock option, stock award and performance share plans 5 3
145 UCB Annual Report 2017

27.8 Stock option plansThe movements in the number of stock options outstanding and their related weighted average exercise prices as at
31 December are:
2017 2016
Weighted average
fair value (€)
Weighted average exercise price (€)
Number of stock options
Weighted average
fair value (€)
Weighted average exercise price (€)
Number of stock options
Outstanding at 1 January 9.66 44.40 5 312 229 9.40 41.30 5 858 395
+ New options granted 12.79 70.29 501 278 11.62 67.23 502 213
(-) Options forfeited 10.49 58.49 60 880 11.07 58.62 50 706
(-) Options exercised 9.43 38.67 823 317 8.91 36.90 971 794
(-) Options expired 9.14 43.57 81 700 7.70 40.16 25 879
(-) Options converted in phantom plans 10.93 45.04 40 400
Outstanding at 31 December 10.01 47.91 4 807 210 9.66 44.40 5 312 229
Number of options fully vested:
At 1 January 3 326 315 2 418 789
At 31 December 3 011 624 3 326 315
The stock options outstanding as at 31 December 2017 with the following last exercise dates and exercise prices are:
Last exercise date Range of exercise prices (€) Number of stock options
31 March 2018 [22.01 - 25.73] 117 860
31 March 2019 [21.38 - 22.75] 163 100
31 March 2020 31.62 272 636
31 March 2021 [25.32 - 26.80] 465 700
31 March 2022 32.36 860 257
31 March 2023 [48.69 - 49.80] 1 024 297
31 March 2024 58.12 451 459
31 March 2025 67.35 478 172
31 March 2026 67.23 475 951
31 March 2027 [70.26 - 72.71] 497 778
Total outstanding 4 807 210
The fair value has been determined based on the
Black-Scholes valuation model.
The volatility was determined primarily by reference
to historically observed share prices of UCB over
the last five years. The probability of early exercise
is reflected in the expected life of the options. The
expected forfeiture rate is based on actual turnover
of employees for categories eligible for stock
option compensation.
146
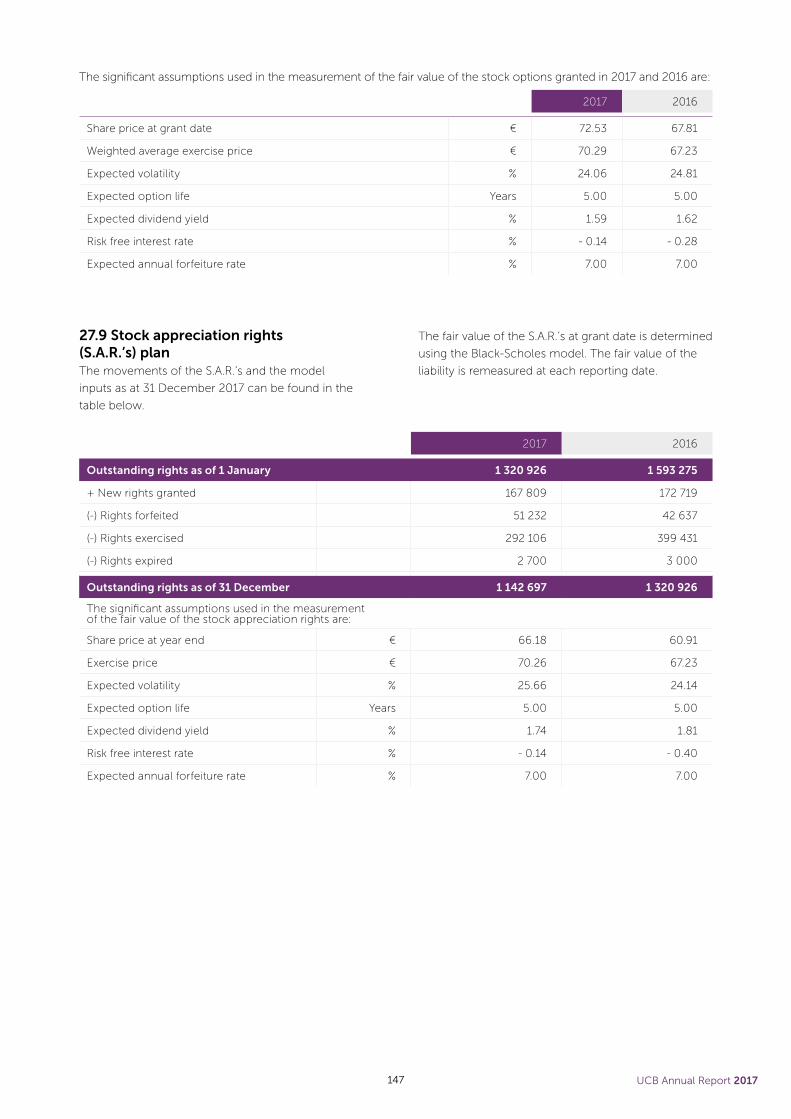
The significant assumptions used in the measurement of the fair value of the stock options granted in 2017 and 2016 are:
2017 2016
Share price at grant date € 72.53 67.81
Weighted average exercise price € 70.29 67.23
Expected volatility % 24.06 24.81
Expected option life Years 5.00 5.00
Expected dividend yield % 1.59 1.62
Risk free interest rate % - 0.14 - 0.28
Expected annual forfeiture rate % 7.00 7.00
27.9 Stock appreciation rights (S.A.R.’s) planThe movements of the S.A.R.’s and the model
inputs as at 31 December 2017 can be found in the
table below.
The fair value of the S.A.R.’s at grant date is determined
using the Black-Scholes model. The fair value of the
liability is remeasured at each reporting date.
2017 2016
Outstanding rights as of 1 January 1 320 926 1 593 275
+ New rights granted 167 809 172 719
(-) Rights forfeited 51 232 42 637
(-) Rights exercised 292 106 399 431
(-) Rights expired 2 700 3 000
Outstanding rights as of 31 December 1 142 697 1 320 926
The significant assumptions used in the measurement of the fair value of the stock appreciation rights are:
Share price at year end € 66.18 60.91
Exercise price € 70.26 67.23
Expected volatility % 25.66 24.14
Expected option life Years 5.00 5.00
Expected dividend yield % 1.74 1.81
Risk free interest rate % - 0.14 - 0.40
Expected annual forfeiture rate % 7.00 7.00
147 UCB Annual Report 2017

27.10 Stock Award PlansThe share-based payment expense related to these stock awards is spread over the vesting period of three years.
The beneficiaries are not entitled to dividends during the vesting period. The movement in the number of stock
awards outstanding at 31 December is as follows:
2017 2016
Number of stock awards
Weighted average
fair value (€)
Number of stock awards
Weighted average
fair value (€)
Outstanding at 1 January 1 850 490 64.76 1 346 175 62.16
+ New stock awards granted 865 475 72.26 736 579 67.81
(-) Awards forfeited 123 441 68.21 113 702 64.11
(-) Awards converted in phantom plans 44 729 63.09 -
(-) Awards vested and paid out 582 350 58.99 118 562 54.88
Outstanding at 31 December 1 965 445 69.59 1 850 490 64.76
27.11 Performance share plansThe movement in the number of performance shares outstanding at 31 December is as follows:
2017 2016
Number of shares
Weighted average
fair value (€)
Number of shares
Weighted average
fair value (€)
Outstanding at 1 January 322 861 63.92 355 881 58.12
+ New performance shares granted 152 653 72.53 122 708 65.58
+ Shares converted from pension plan 77 714 64.61 - -
(-) Performance shares forfeited 28 561 68.65 36 981 56.88
(-) Performance shares vested 189 700 59.43 118 747 51.81
Outstanding at 31 December 334 967 69.66 322 861 63.92
148

28 Borrowings The carrying amounts and fair values of borrowings are as follows:
CASH FLOWS NON-CASH CHANGES
€ million 2016From
Financing activities
Increase/ Decrease in cash
Transfer Non-
Current to Current
Foreign Exchange Movement
Other 2017
Non-current
Bank borrowings 326 0 0 - 19 - 7 0 300
Other long-term loans 0 0 0 0 0 0 0
Finance leases 5 0 0 - 2 0 0 3
Total non-current borrowings 331 0 0 - 21 - 7 0 303
Current
Bank overdrafts 5 0 23 0 - 2 0 26
Current portion of bank borrowings 12 - 18 0 19 - 3 1 11
Debentures and other short-term loans 8 - 8 0 0 0 0 0
Finance leases 2 - 2 0 2 0 0 2
Total current borrowings 27 - 28 23 21 - 5 1 39
Total borrowings 358 - 28 23 0 - 12 1 342
28.1 BorrowingsOn 31 December 2017 the Groups weighted average
interest rate was 3.03% (2016: 3.00%) prior to hedging.
The floating interest rate payments are subject to
designated cash flow hedges and fixed interest rate
payments are subject to designated fair value hedges,
thereby fixing the weighted average interest rate for
the Group at 2.19% (2016: 2.31%) post hedging. The
fees paid for the arrangement of the bonds (Note 29),
and the amended facilities agreement are amortized
over the life of the instruments.
Where applicable under hedge accounting, the fair
value of the non-current borrowings is determined
based on the present value of the payments
associated with the debt instruments, using the
applicable yield curve and UCB credit spread for the
various different currencies.
Since the bank borrowings are at a floating interest
rate that is reset every six months, the carrying amount
of the bank borrowings equates to its fair value.
With respect to the current borrowings, the carrying
amounts approximate their fair values as the effect of
discounting is considered to be insignificant.
UCB did not draw (2016: € 0 million) on the € 1 billion
syndicated revolving facility expiring 9 January 2021.
In January 2018, the facility has been amended and
extended till January 9th, 2023 (including the option
to request further extensions of the maturity date by
two additional years).
The Group has access to certain committed and non-
committed bilateral credit facilities. In this respect, per
end of 2017 an aggregated amount of € 72 million
was undrawn on the committed bilateral facility
(2016: € 81 million).
Please refer to Note 4.3 for the maturity analysis of the
Group borrowings (excluding other financial liabilities).
149 UCB Annual Report 2017

The carrying amounts of the Group borrowings are denominated in the following currencies:
€ million 2017 2016
EUR 244 243
USD 67 95
Other 0 0
Total interest bearing loans by currency 311 338
Bank overdrafts – USD 22 4
Bank overdrafts – other 4 1
Debentures and other short term loans – EUR 0 0
Debentures and other short term loans – other 0 8
Finance lease liabilities – EUR 5 7
Total borrowings 342 358
28.2 Finance lease liabilities – minimum lease payments
€ million 2017 2016
Amounts payable under finance leases:
1 year or less 2 2
1-2 years 2 2
2-5 years 1 3
More than 5 years 0 0
Present value of finance lease liabilities 5 7
Less: amount due for settlement within 12 months 2 2
Amount due for settlement after 12 months 3 5
Management considers that the carrying value of the Group finance lease liabilities approximate their fair value.
150

29 BondsThe carrying amounts and fair values of bonds are as follows:
CARRYING AMOUNT FAIR VALUE
€ million Coupon rate
Maturity date 2016 Cash
FlowsFair Value changes
Other movements 2017 2016 2017
Retail Bond 5.125% 2023 192 0 -4 0 188 215 209
Institutional Eurobond 1.875% 2022 350 0 -1 0 349 358 362
Institutional Eurobond 4.125% 2021 370 0 -6 1 365 394 387
Retail Bond 3.750% 2020 256 0 -2 0 254 273 268
EMTN Note1 3.284% 2019 20 0 0 0 20 20 20
EMTN Note1 3.292% 2019 55 0 0 0 55 55 55
Total bonds 1 243 0 -13 1 1 231 1 315 1 301
Of which:
Non-current 1 243 0 -13 1 1 231 1 315 1 301
Current 0 0 0 0 0 0 0
Derivatives used for hedging -51 0 13 0 -38
Of which:
Non-current assets (-) - 57 0 15 0 - 42
Non-current liabilities (+) 6 0 -2 0 4
1 EMTN: Euro Medium Term Note. The fair value of the EMTN Notes cannot be accurately determined given the limited liquidity in secondary market trading for these notes, and is for reporting purposes replaced by the carrying value.
29.1 Retail bondsMATURING IN 2023:
During October 2009, UCB completed a public offering
of € 750 million fixed rate bonds, carrying a coupon
and an effective interest rate of 5.75% per annum,
and aimed at retail investors.
During September 2013, UCB launched an
unconditional public exchange offer for a maximum
of € 250 million out of the € 750 million retail bonds
maturing in November 2014 and having a gross coupon
of 5.75%. The existing bondholders had the opportunity
to exchange their existing bonds against newly issued
bonds maturing October 2023 in an exchange ratio
of 1 to 1. These bonds carry a coupon of 5.125% per
annum while their effective interest rate is 5.398%
per annum.
At the end of the exchange period, 175 717 existing
bonds were tendered in the exchange offer,
representing a nominal amount of € 176 million.
The 175 717 new bonds were issued in October 2013
and have been listed on Euronext Brussels. The existing
bonds exchanged in the exchange offer were cancelled
by UCB. The outstanding 574 283 of the retail bonds
matured and have been redeemed in November 2014.
MATURING IN 2020:
In March 2013, UCB completed a public offering of
€ 250 million bonds, in the form of a retail public
offering in Belgium under its established EMTN
program. The bonds were issued at 101.875% of the
nominal value. The retail bond has a coupon of 3.75%
per annum and an effective interest rate of 3.444% per
annum. The bonds have been listed on the regulated
market of Euronext Brussels.
29.2 Institutional eurobondsMATURED IN 2016:
In December 2009, UCB completed an offering of
€ 500 million senior unsecured bonds, due in 2016
and aimed at institutional investors. The bonds were
issued at 99.635% and have been redeemed at 100%
of their principal amount on December 10, 2016.
These bonds carried a coupon of 5.75% per annum
while their effective interest rate was 5.8150% per
annum. The bonds had been listed on the Luxembourg
stock exchange.
MATURING IN 2021:
In September 2013, UCB completed an offering of
€ 350 million senior unsecured bonds, due January
2021, issued under its EMTN program. The Bonds
were issued at 99.944% in October 2013 and will be
151 UCB Annual Report 2017

30 Other financial liabilities CARRYING AMOUNT FAIR VALUE
€ million 2017 2016 2017 2016
Non-current
Derivative financial instruments (Note 38) 5 7 5 7
Other financial liabilities 52 87 52 87
Total non-current other financial liabilities 57 94 57 94
Current
Derivative financial instruments (Note 38) 29 102 29 102
Other financial liabilities 24 40 24 40
Total current other financial liabilities 53 142 53 142
Total other financial liabilities 110 236 110 236
The other financial liabilities include € 76 million (2016:
€ 127 million) resulting from the issuance of warrants
to the shareholders of Edev Sàrl (note 4.5.3).
redeemed at 100% of their principal amount. These
bonds carry a coupon of 4.125% per annum while their
effective interest rate is 4.317% per annum. The bonds
have been listed on Euronext Brussels.
MATURING IN 2022:
In April 2015, UCB completed an offering of
€ 350 million senior unsecured bonds, due April 2022,
issued under its EMTN program. The Bonds were issued
at 99.877% in April 2015 and will be redeemed at 100%
of their principal amount. These bonds carry a coupon
of 1.875% per annum while their effective interest rate
is 2.073% per annum. The bonds have been listed on
Euronext Brussels.
29.3 EMTN notesMATURING IN 2019:
In November 2013, UCB completed an offering of
€ 55 million Euro Medium Term Notes (‘EMTN’), due
in 2019. The notes were issued at 100% and will be
redeemed at 100% of their principal amount. These
notes carry a coupon of 3.292% per annum while their
effective interest rate is 3.384% per annum. The notes
have been listed on Euronext Brussels.
MATURING IN 2019:
In December 2013, UCB completed an offering of
€ 20 million EMTN notes, due in 2019. The notes
were issued at 100% and will be redeemed at 100% of
their principal amount. These notes carry a coupon of
3.284% per annum while their effective interest rate
is 3.356% per annum. The notes have been listed on
Euronext Brussels.
29.4 Fair value hedgesThe Group designates derivative financial instruments
under fair value hedges to the Retail Bonds and
Institutional Eurobonds. The change in the carrying
amount of the bonds is fully attributable to the change
in the fair value of the hedged portion of the bonds,
and is almost fully offset by a change in fair value of
the corresponding derivative financial instrument.
152

31 Deferred tax assets and liabilities 31.1 Recognized deferred tax assets and liabilities
€ million2016 Acquisition/
DisposalsR&D
Adjustment
Current Year
Movement
OCI - Cash flow
hedges
OCI - Pensions
Effect of movements in exchange
rate
2017
Intangible assets - 111 0 0 32 0 0 6 - 73
Property, plant and equipment - 18 0 0 - 3 0 0 1 - 20
Inventories 251 0 0 - 85 0 0 0 166
Trade and other receivables 54 2 0 - 22 0 0 - 1 33
Employee benefits 72 0 0 0 0 - 18 - 2 52
Provisions 39 0 0 - 24 0 0 0 15
Other short-term liabilities - 264 0 0 69 - 47 0 - 22 - 264
Net lease assets/liabilities 0 0 0 0 0 0 0 0
Unused tax losses 593 0 0 - 205 0 0 - 6 382
Unused tax credits 327 0 41 4 0 0 - 1 371
Total net deferred tax assets 943 2 41 - 234 - 47 - 18 - 25 662
€ million2015 Acquisition/
DisposalsR&D
Adjustment
Current Year
Movement
OCI - Cash flow
hedges
OCI - Pensions
Effect of movements in exchange
rate
2016
Intangible assets - 144 0 0 32 0 0 1 - 111
Property, plant and equipment - 9 0 0 - 9 0 0 0 - 18
Inventories 190 0 0 61 0 0 0 251
Trade and other receivables 60 0 0 - 7 0 0 1 54
Employee benefits 88 0 0 - 30 0 13 1 72
Provisions 26 0 0 13 0 0 0 39
Other short-term liabilities - 526 0 0 243 13 0 6 - 264
Net lease assets/liabilities 0 0 0 0 0 0 0 0
Unused tax losses 832 0 0 - 215 0 0 - 24 593
Unused tax credits 278 0 53 - 3 0 0 - 1 327
Total net deferred tax assets 795 0 53 85 13 13 - 16 943
Total deferred tax assets of € 662 million have been
recognized as at 31 December 2017. Based upon
the level of past taxable income and projected
future taxable profits over the periods in which the
deductible temporary differences are estimated to
reverse, the Group believes it is probable that the
benefits of the recognized deferred tax assets will
be realized.
The Group saw an overall decrease of the deferred
tax recognized. This is predominantly driven by tax
reforms, mainly in the U.S., U.K. and Belgium.
TAX REFORMS
Substantive enactment of tax law changes in Belgium,
U.K. and U.S. were assessed for deferred tax purposes.
For U.S., deferred tax balances were remeasured at the
newly enacted tax rate of 21%, resulting in a substantial
decrease of deferred tax assets on returns & rebates
153 UCB Annual Report 2017

(€ 62 million), group inventory (€ 66 million) and
others (€ 10 million). For Belgium and U.K., deferred
tax balances were remeasured taking into account
newly applicable loss limitation rules and declining
corporate income tax rates. Other enacted provisions
of the concerning tax law changes will only apply as
from 2018 and no judgement was required for these
measures on the 2017 balances.
R&D TAX CREDITS
The group recorded increased deferred tax assets
on R&D tax credits. The total deferred tax asset in
respect of R&D tax credits at year end is € 372 million
(2016: € 324 million) which will result in an actual cash
tax benefit in future periods.
DEFERRED TAX ASSETS ON LOSSES
A deferred tax asset of € 382 million
(2016: € 593 million) has been recognized in respect
of tax losses carried forward totaling € 1.58 billion
(2016: € 2.19 billion) as the Group has concluded that
the relevant entities will continue to generate taxable
profits in the foreseeable future against which these
losses can be used. These losses have arisen in a
number of jurisdictions in which UCB operates and do
not expire. This period has seen further recognition
of losses and tax credits previously unrecognized, as
entities in Germany and the U.K. which historically
generated losses are demonstrating increasing
profitability as well evidence of generating sufficient
levels of future taxable profits to justify the recognition
of these assets. Undiscounted forecasts have been
used to assess the availability of future taxable profits.
31.2 Unused tax lossesAs of 31 December 2017, the Group also had
€ 2 013 million (2016: € 1 709 million) of gross
unused tax losses for which no deferred tax asset is
recognized in the balance sheet. These tax losses
carried forward do not expire.
Based on current forecasts and current legislation,
the majority of these losses will be fully utilized within
10 years but it has been decided to not recognize a
deferred tax asset on these losses for now given the
long-term nature of these forecasts.
31.3 Temporary differences for which no deferred tax asset or deferred tax liability is recognizedDeferred tax assets are recognized on temporary
differences carried forward that represent income
likely to be realized in the foreseeable future.
Deferred tax assets amounting to € 497 million
(2016: € 684 million) in respect of unutilized tax credits
and intangible assets have not been recognized in
view of the uncertain character of the recovery.
No deferred tax liabilities are recognized for taxable
temporary differences arising on investments in
subsidiaries. Following the Belgian tax reform
as enacted, inbound dividends will as from
1 January 2018 be subject to 100% participation
exemption. No future tax effects are to be recognized.
There is an additional unrecognized deferred tax
liability of € 229 million (2016: € 456 million) in respect
of an internal reorganization which occurred in 2014.
The tax liability will only materialize on disposal
of the relevant asset, an event which is controlled
by UCB and for which there are no plans in the
foreseeable future.
31.4 Deferred tax directly recognized in OCI
€ million 2017 2016
Deferred tax on pensions - 18 13
Deferred tax on effective portion of changes in fair value of cash flow hedges - 47 13
Deferred tax directly recognized in OCI - 65 26
154

32 Employee benefits Most employees are covered by retirement benefit
plans sponsored by Group companies. The nature
of such plans varies according to legal regulations,
fiscal requirements and economic conditions of the
countries in which the employees are employed. The
Group operates both defined contribution plans and
defined benefit plans.
32.1 Defined contribution plansPost-employment benefit plans are classified as
“defined contribution” plans if the Group pays fixed
contributions into a separate fund or to a third
party financial institution and has no other legal or
constructive obligation to pay further contributions.
Therefore, no assets or liabilities are recognized in
the Group balance sheet in respect of such plans,
apart from regular prepayments and accruals of
contributions. For the Belgian defined contribution
plans, UCB is required by law to guarantee a minimum
return on employee and employer contributions. As
a consequence these plans are considered defined
benefit plans. Where reliable estimates can be
made for material plans, they are valued using the
projected unit credit method under IAS 19. These
plans are aggregated with the results for other defined
benefit plans.
32.2 Defined benefit plansThe Group operates several defined benefit plans.
The benefits granted include mainly pension benefits,
jubilee premiums and termination indemnities.
The benefits are granted according to local market
practice and regulations.
These plans are either unfunded or funded via
outside pension funds or insurance companies. For
(partially) funded plans, the assets of the plans are
held separately in funds under the control of the
trustees. Where a plan is unfunded, notably for the
major defined benefit plans in Germany, a liability for
the obligation is recorded in the Group balance sheet.
For funded plans, the Group is liable for the deficits
between the fair value of the plan assets and the
present value of the benefit obligations. Accordingly,
a liability (or an asset when the plan is over-funded)
is recorded in the Group consolidated statement of
financial position. Independent actuaries assess all
main plans annually.
The Group analyses the Value at Risk on its balance
sheet and profit and loss accounts linked to its defined
benefits plans. Target risk level in terms of a one-year
consolidated balance sheet and profit and loss Value
at Risk measures are defined annually based on UCB
risk tolerance thresholds.
For UCB, the main risks linked to its defined benefit
obligations are discount rate, inflation and longevity.
The majority of the risks lays within Belgium, Germany
and the U.K. It should be noted that longevity is
not considered as a risk for the plans in Belgium as
benefits are either paid as a lump sum or externalized
before being paid as an annuity.
Over the last years, UCB has performed various de-
risking projects:
• In the U.K., UCB completed the buy-out of two of
its four pension schemes by securing the benefits
of all members of the schemes with an insurance
company. UCB does, therefore, no longer have
any liabilities towards any members of those
two schemes. The British Pension Scheme and
the Dumfries Pension Scheme were bought out,
respectively, on 1 October 2015 and December
2017. The buy-out of the third Pension Scheme, the
Bridgewater Pension Scheme will be completed
in 2018.
• For the U.K. Celltech Pension and Insurance Scheme,
the focus, since 2012, is on de-risking progressively
from a 50% growth / 50% bonds allocation to a
10% growth / 90% bonds allocation. Today the
growth / bonds allocation is around 30% / 70%.
• Finally, as part of its de-risking strategy, UCB has
decided to terminate the U.S. Defined Benefit plan
by offering lump sum to members and transferring
the remaining liabilities to an insurance company.
The termination of this plan was completed in
December 2017.
For the Belgian pension plan, the focus remains
on the diversification of the assets. In 2015, the
Belgian Pension Board implemented the Mercer
“Global Investment Solution” in order to improve the
diversification of the assets and investment managers
while keeping a close control on risk.
155 UCB Annual Report 2017

€ million 2017 2016
Present value of defined benefit obligation 1 040 1 124
Fair value of plan assets - 629 - 675
Funded status – Deficit 411 449
Effect of asset ceiling 1 1
Net liability arising from defined benefit obligation 412 450
Add: Liability with respect to cash settled share based payments (Note 27) 29 29
Total employee benefit liabilities 441 479
Of which:
Portion recognized in non-current liabilities 441 479
Portion recognized in non-current assets 0 0
91% of the net liability arising from defined benefit
obligations is related to defined benefit pension
obligations in Belgium, Germany and the U.K.
The amount recognized in the consolidated statement of financial position arising from the Group’s obligation
in respect of its defined benefit plan is as follows:
156
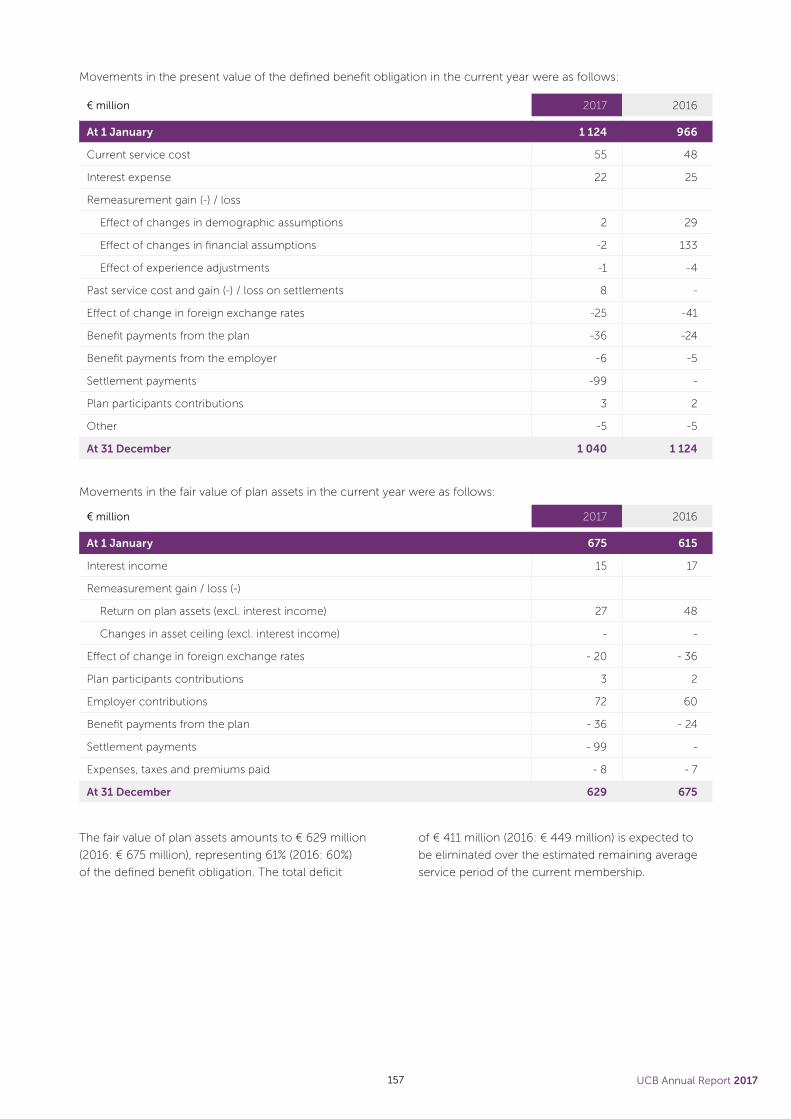
The fair value of plan assets amounts to € 629 million
(2016: € 675 million), representing 61% (2016: 60%)
of the defined benefit obligation. The total deficit
of € 411 million (2016: € 449 million) is expected to
be eliminated over the estimated remaining average
service period of the current membership.
Movements in the present value of the defined benefit obligation in the current year were as follows:
€ million 2017 2016
At 1 January 1 124 966
Current service cost 55 48
Interest expense 22 25
Remeasurement gain (-) / loss
Effect of changes in demographic assumptions 2 29
Effect of changes in financial assumptions -2 133
Effect of experience adjustments -1 -4
Past service cost and gain (-) / loss on settlements 8 -
Effect of change in foreign exchange rates -25 -41
Benefit payments from the plan -36 -24
Benefit payments from the employer -6 -5
Settlement payments -99 -
Plan participants contributions 3 2
Other -5 -5
At 31 December 1 040 1 124
Movements in the fair value of plan assets in the current year were as follows:
€ million 2017 2016
At 1 January 675 615
Interest income 15 17
Remeasurement gain / loss (-)
Return on plan assets (excl. interest income) 27 48
Changes in asset ceiling (excl. interest income) - -
Effect of change in foreign exchange rates - 20 - 36
Plan participants contributions 3 2
Employer contributions 72 60
Benefit payments from the plan - 36 - 24
Settlement payments - 99 -
Expenses, taxes and premiums paid - 8 - 7
At 31 December 629 675
157 UCB Annual Report 2017

The amounts recognized in the consolidated income statement and in the consolidated statement of comprehensive
income in respect of those defined benefit plans are as follows:
€ million 2017 2016
Total service cost (incl. past service cost and gain (-)/loss from settlements) 63 48
Net interest cost 7 8
Remeasurement of other long term benefits - 1
Administrative expenses and taxes 2 3
Components of defined benefit costs recorded in income statement 72 60
Remeasurements gain (-)/loss 0
Effect of changes in demographic assumptions 2 27
Effect of changes in financial assumptions - 2 132
Effect of experience adjustments - 1 - 4
Return on plan assets (excluding interest income) - 26 - 48
Changes in the asset ceiling (excluding interest income) - -
Components of defined benefit costs recorded in OCI - 27 107
Total components of defined benefit cost 45 167
The total service cost, the net interest expense,
the remeasurement of other long term benefits,
administrative expenses and taxes for the year are
included in the employee benefit expenses in the
consolidated income statement. 92% of the defined
benefit costs recorded in the income statement are
relating to defined benefit pension plans in Belgium,
U.S., U.K. and Switzerland. The remeasurement on
the net defined benefit liability is included in the
statement of comprehensive income as part of other
comprehensive income. Total remeasurements
evolved from a loss of € 107 million in 2016 to a gain
of € 27 million in 2017 mainly as a result of a smaller
decrease in discount rate in 2017 compared to 2016
and a decrease in inflation rate in U.K. compared
to 2016.
The split of the recognized expense by functional line is as follows:
€ million 2017 2016
Cost of sales 15 15
Marketing and selling expenses 8 8
Research and development expenses 26 28
General and administrative expenses 23 9
Other income and expenses - -
Total 72 60
The actual return on plan assets is € 26 million
(2016: € 48 million) and the actual return on
reimbursement rights is € 0 million (2016: € 0 million).
158

Significant actuarial assumptions for the determination
of the defined obligation are discount rate and
inflation. The sensitivity analyses below have been
determined based on reasonably possible changes
of the assumptions occurring at the end of the
reporting period.
• If the discount rate would be 50 basis points higher
(lower), the defined benefit obligation would
decrease by € 83 million (increase by € 89 million) if
all other assumptions were held constant.
• If the inflation rate would increase (decrease) by
25 basis points, the defined benefit obligation would
increase by € 35 million (decrease by € 34 million) if
all other assumptions were held constant.
The figures above do not take account any
interrelationships between the assumptions, especially
between the discount rate, expected salary increases
and inflation rates.
The Group’s subsidiaries should fund the entitlements
expected to be earned on a yearly basis. Funding
usually follows local actuarial requirements and in this
framework, the discount rate is set on a risk-free rate.
Underfunding linked to past service are met by setting
up recovery plans and investment strategies based
on plan’s demographics, appropriate time periods
for amortization of past service liability, projected
salary increase and the financial capabilities of the
local company.
EUROZONE U.K. U.S. OTHER
2017 2016 2017 2016 2017 2016 2017 2016
Discount rate 1.61% 1.70% 2.60% 2.68% 3.40% 4.00% 0.68% 0.55%
Inflation 1.75% 1.75% 3.20% 3.50% N/A N/A N/A N/A
Virtually all equity and debt instruments have quoted
prices in active markets. Properties can be classified as
Level 3 instruments based on the definitions in IFRS 13
Fair Value Measurement.
The assets held in the funds do not contain any direct
investment in UCB Group shares, nor any property
occupied by, or other assets used by the Group, though
this does not exclude UCB shares being included in
mutual investment fund type investments. The principal
weighted average actuarial assumptions used for the
purposes of the actuarial valuations were as follows:
The major categories of plan assets at the end of the reporting period, are as follows:
€ million 2017 2016
Cash and cash equivalent 12 50
Equity instruments 143 126
Europe 57 46
U.S. 32 35
Rest of the World 54 45
Debt instruments 195 163
Corporate bonds 83 41
Government bonds 46 60
Other 66 62
Properties 9 8
Qualifying insurance policies 133 162
Investment funds 113 151
Other 24 15
Total 629 675
159 UCB Annual Report 2017

33 Provisions
The movements in provisions have been disclosed below:
€ million Environment Restructuring Other Total
At 1 January 2017 20 26 120 166
Arising during the year 0 16 32 48
Unused amounts reversed - 1 - 2 - 12 - 15
Transfer from one heading to another 0 1 - 1 0
Effect of movements in exchange rates 0 0 - 3 - 3
Utilized during the year 0 - 23 - 15 - 38
At 31 December 2017 19 18 121 158
Non-current portion 18 3 100 121
Current portion 1 15 21 37
Total provisions 19 18 121 158
33.1 Environmental provisionsUCB has retained certain environmental liabilities
which were mainly related to the divestiture of Films
and Surface Specialties in the past. These liabilities
relate to the divested sites on which UCB has retained
full responsibility in accordance with the contractual
terms agreed upon with Cytec Industries Inc. In 2017
part of the environmental provisions related to the
Films business was reversed.
33.2 Restructuring provisionsThe restructuring provisions arising during 2017 are
related to European optimization and reorganization.
The utilization is also mainly related to earlier
reorganizations, particularly in Southern Europe.
33.3 Other provisionsOther provisions relate mainly to:
• provisions for litigations that comprise mainly
provisions where UCB or a subsidiary is or might be
a defendant against claims of previous employees;
• product liability provisions that pertain to the risks
related to the normal course of business and for
which the Group might be liable by selling these
kinds of drugs. UCB is currently defendant in
several product liability cases in France in respect
of Distilbène, a former product of the UCB Group.
The claimants in these actions claim that their
mothers took Distilbène during their pregnancy and
that as a result of this they suffered bodily injuries.
The provision in respect of Distilbène decreased by
The average duration of the benefit obligation
at the end of the reporting period is 16.95 years
(2016: 16.38 years). This number can be subdivided
into the duration related to:
• Eurozone: 15.32 years (2016: 15.13 years);
• U.K.: 19.74 years (2016: 18.85 years);
• U.S.: 0 years (2016: 16.39 years);
• Other: 19.33 years (2016: 20.52 years).
The Group expects to make a contribution of
€ 47 million to the defined benefit plans during the
next financial year.
ALM (asset-liability matching) studies are typically
performed every 3 years. Within those studies,
investment strategies are analyzed in terms of risk-
and-return profiles. An ALM study was completed in
Belgium in 2016, which resulted in a slight reallocation
of the assets.
In setting up the long-term investment strategy of the
scheme, the investment committee focuses on some
key principles defined by the Group such as:
• maintaining a balance between the level of
contributions acceptable to UCB and the level of
investment risk relative to the liabilities;
• reducing the volatility through investment
diversification; and
• the degree of investment risk should depend on the
financial state of the schemes and liability profiles.
160

€ 1 million to a total of € 68 million to reflect the
net estimated future cash outflows. The provision
was discounted using a discount rate of 0.79%. If
the discount rate would be 25 basis points higher
(lower), the provision would decrease (increase) by
€ 2 million;
• provisions related to toll manufacturing agreements
and ongoing audits (€ 26 million).
An assessment is performed with respect to the
above-mentioned risks together with the Group legal
advisers and experts in the different domains.
34 Trade and other liabilities
34.1 Non-current trade and other liabilities
€ million 2017 2016
Non-current liabilities linked to project financing 0 22
Other payables 26 33
Total non-current trade and other liabilities 26 55
34.2 Current trade and other liabilities
€ million 2017 2016
Trade payables 281 274
Invoices to receive 121 135
Taxes payable, other than income tax 73 76
Payroll and social security liabilities 208 152
Other payables 36 49
Current liabilities linked to project financing 0 48
Deferred income linked to development agreements 18 33
Other deferred income 55 73
Royalties payables 77 69
Rebates/discounts and other sales allowances payable 549 616
Accrued interest 31 32
Other accrued expenses 275 303
Total current trade and other liabilities 1 724 1 860
161 UCB Annual Report 2017

The vast majority of the trade and other liabilities are
classified as current and consequently the carrying
amounts of the total trade and other liabilities is
assumed to be a reasonable approximation of
fair value.
“Rebates/discounts and other sales allowances
payable” include rebates, chargebacks, discounts
and accruals for product returns relating to products
sold in the U.S. to various customers that are part
of commercial and governmental contractual
arrangements or other reimbursement programs,
including the U.S. Medicaid Drug Rebate program,
the U.S. Federal Medicare program and others. The
sales returns and allowances are recorded in the same
period as the underlying sales as a deduction to sales.
Per management assessment, the total accruals
for these items are adequate, based upon currently
available information and interpretation of
relevant regulations.
As these deductions are based on management
estimates, the actual deductions might differ from
these estimates. Such differences could impact the
accruals recognized in the balance sheet in future
periods and consequently the level of sales recognized
in the income statement in future periods, as there
is often a time lag of several months between the
recording of the estimate and the final accounting of
the sales deductions.
The accruals are reviewed and adjusted regularly
in light of contractual and legal obligations,
historical trends, past experience and projected
market conditions.
All returns, chargebacks, rebates and discounts that
are not mentioned on the invoice are estimated,
deducted from sales and presented on the balance
sheet in the appropriate accrual account. The estimate
for future product returns is based on several factors,
including: historical return rates, expiration date
by product, return rate by closed batches, actual
returns processed among others, as well as any other
specifically-identified anticipated returns due to known
factors such as the loss of patent exclusivity, product
recalls and discontinuances, or a changing competitive
environment. Adjustments to these accruals may be
required in the future based on revised estimates to
our assumptions, which would have an impact on
our consolidated results of operations. The U.S. sales
return and allowance liability that is included as part
of the rebates and discounts payable liability balance
amounts to € 445 million as per 31 December 2017
(31 December 2016: € 540 million).
35 Income tax payablesIncome tax payables include liabilities for uncertain
tax positions for an amount of € 55 million
(2016: € 231 million). Liabilities for uncertain tax
positions are recorded when the Group considers
it probable that a tax position taken is unlikely to be
sustained if challenged by the tax authorities. The
assessment is done for each liability separately and
the resulting liability is the Group’s best estimate of
the expected exposure in the event of a tax authority
challenge. See Note 3.2.5 for more details on the
Group’s assessment of uncertain tax positions.
UCB faces tax audits in a number of countries where it
has activities. The issues under discussion are in some
cases complex and such audits can take a number
of years to resolve. Any liability booked in respect of
these audits is calculated by the Group as the best
estimate of the current tax it expects to pay using the
Group’s best judgment of the most likely outcome of
such examinations.
The liabilities for uncertain tax positions have
decreased substantially over 2017. There has been
a decrease in 2017 of liabilities relating to the
continuing operations of € 176 million arising from the
completion of tax audits in the second half of 2017 or
expiry of statute of limitations and further recognition
of assets for Mutual Agreement Procedure / Arbitration
Procedure.
UCB has recorded assets for tax relief in a number of
jurisdictions for an amount of € 15 million. Assets are
only recorded in case it is considered probable that
corresponding adjustments will be allowed following
Mutual Agreement or Arbitration Procedure. See
Note 3.2.5 for more details on the Group’s assessment
of assets for tax audit corrections.
The Group expects initialization of new tax audits in
a number of jurisdictions in 2018. The Group strictly
follows up on the liabilities for uncertain tax positions
which are recorded per end 2017.
162

€ million Note 2017 2016
Adjustment for non-cash transactions 150 216
Depreciation and amortization 10, 21, 19 234 232
Impairment/reversal (-) charges 10, 13 1 41
Equity settled share based payment expense 8 31
Other non-cash transactions in the income statement - 76 - 65
Adjustment IAS 39 16 - 1 - 11
Unrealized exchange gain (-)/losses 6 - 11
Change in provisions and employee benefits - 17 - 13
Change in inventories and bad debt provisions - 5 12
Adjustment for items to disclose separately under operating cash flow 218 199
Tax charge of the period from continuing operations 17 218 199
Adjustment for items to disclose under investing and financing cash flows 35 - 129
Gain (-)/loss on disposal of fixed assets - 2 - 183
Dividend income (-)/expenses 0 0
Interest income (-)/charge 37 54
Change in working capital
Inventories movement per consolidated balance sheet - 19 - 12
Trade and other receivables and other assets movement per consolidated balance sheet 95 - 54
Trade and other payables movement per consolidated balance sheet - 140 151
As it appears in the consolidated balance sheet and corrected by: - 64 85
Non-cash items1 - 116 - 54
Change in inventories and bad debt provisions disclosed separately under operating cash flow 5 - 6
Change in interest receivable / payable disclosed separately under operating cash flow 2 0
Change in dividend receivable disclosed separately under investing cash flow 0 0
Change in dividend payable disclosed separately under financing cash flow 0 23
Currency translation adjustments 94 - 2
As it appears in the consolidated cash flow statement -79 46
1 Non-cash items are mainly linked to transfers from one heading to another, non-cash movements linked to affiliate’s revaluation from Fx currencies and other movements linked to entry/exit in consolidation scope or merge of entities.
36 Note to the consolidated statement of cash flowsThe cash flow statement identifies operating, investing
and financing activities for the period.
UCB uses the indirect method for the operating cash
flows. The net profit and loss is adjusted for:
• the effects of non-cash transactions such as
depreciation and amortization, impairment losses,
provisions, mark-to-market, etc., and the variance
in working capital;
• items of income or expense associated with
investing or financing cash flows.
Important non-cash transactions for 2017 mainly
relate to € 46 million for a receivable relating to
the outlicensing of Xyzal® and R&D tax credits for
€ 71 million for which the cash benefit will be received
in later years.
Important non-cash transactions for 2016 relate to the
impairment of the Lannett warrant for € 28 million and
R&D tax credits for € 65 million.
163 UCB Annual Report 2017

37 Financial instruments by category
€ million31 December 2017
Assets as per balance sheet NoteLoans and
receivables
Assets at fair value through
the profit and loss
Derivatives used for
cash flow hedging
Available for sale Total
Financial assets and other assets (excluding derivative financial instruments and associates)
22 128 0 0 83 211
Derivative financial assets 38 0 64 112 0 176
Trade and other receivables (including prepaid expenses) 24 809 0 0 0 809
Cash and cash equivalents 25 1 049 0 0 0 1 049
Total 1 986 64 112 83 2 245
€ million31 December 2017
Liabilities as per balance sheet Note
Liabilities at fair value through the
profit and loss
Derivatives used for
cash flow hedging
Other financial
liabilities at amortized
cost Total
Borrowings 28 0 0 342 342
Bonds 29 38 0 1 193 1 231
Derivative financial liabilities 38 24 10 0 34
Trade and other liabilities 34 0 0 1 750 1 750
Other financial liabilities (excluding derivative financial instruments) 30 76 0 0 76
Total 138 10 3 285 3 433
€ million31 December 2016
Assets as per balance sheet NoteLoans and
receivables
Assets at fair value through
the profit and loss
Derivatives used for
cash flow hedging
Available for sale Total
Financial assets and other assets (excluding derivative financial instruments and associates)
22 102 0 0 67 169
Derivative financial assets 38 0 98 10 0 108
Trade and other receivables (including prepaid expenses) 24 884 0 0 0 884
Cash and cash equivalents 25 761 0 0 0 761
Total 1 747 98 10 67 1 922
€ million31 December 2016
Liabilities as per balance sheet Note
Liabilities at fair value through the
profit and loss
Derivatives used for
cash flow hedging
Other financial
liabilities at amortized
cost Total
Borrowings 28 0 0 358 358
Bonds 29 51 0 1 192 1 243
Derivative financial liabilities 38 56 53 0 109
Trade and other liabilities 34 0 0 1 915 1 915
Other financial liabilities (excluding derivative financial instruments) 30 127 0 0 127
Total 234 53 3 465 3 752
164

38 Derivative financial instruments ASSETS LIABILITIES
€ million 2017 2016 2017 2016
Forward foreign exchange contracts – cash flow hedges 112 10 9 51
Forward foreign exchange contracts – fair value through profit and loss 19 37 20 50
Interest rate derivatives – cash flow hedges 0 0 1 2
Interest rate derivatives – fair value through profit and loss 45 61 4 6
Total 176 108 34 109
Of which:
Non-current (Notes 22 and 30) 45 62 5 7
Current (Notes 22 and 30) 131 46 29 102
The full fair value of a hedging derivative is classified as
a non-current asset or liability if the remaining maturity
of the hedged item is more than 12 months, and as a
current asset or liability, if the maturity of the hedged
item is less than 12 months.
The cash flow hedges entered into by the Group were
assessed to be highly effective and over 2017, a net
unrealized gain of € 110 million (2016: net unrealized
loss of € 4 million) after deferred taxes was included
in equity in respect of these contracts. These gains/
losses will be recycled to the profit or loss in the
period during which the hedged forecast transactions
affect the profit or loss.
The ineffective portion recognized in the profit or
loss that arises from cash flow hedges amounts to
€ 0 million (2016: € 0 million).
38.1 Foreign currency derivativesThe Group policy with respect to the use of financial
derivative contracts is described in Note 4 “Financial
Risk Management”.
The Group entered into several forward foreign
exchange contracts in order to hedge a portion of
highly probable future sales and royalty income,
expected to occur in 2018 and 2019.
The fair values of the foreign currency derivative
contracts are as follows:
ASSETS LIABILITIES
€ million 2017 2016 2017 2016
USD 111 18 17 67
GBP 2 19 3 22
JPY 13 7 0 4
CHF 0 2 8 1
RUB 0 0 0 1
Other currencies 5 2 1 6
Total foreign currency derivatives 131 47 29 101
165 UCB Annual Report 2017

The net foreign currency derivatives maturity analysis is noted below:
€ million 2017 2016
1 year or less 102 - 55
1-5 years 0 1
Beyond 5 years 0 0
Total foreign currency derivatives – net asset/net liability (-) 102 - 54
The following table shows the split of foreign currency derivatives by currency of denomination
(currencies sold view) as at 31 December 2017:
Notional amounts in € million
USD GBP EUR JPY CHF Other currencies Total
Forward contracts 1 059 33 309 155 46 213 1 815
Currency swaps 1 022 539 1 639 92 14 91 3 397
Option/collar 0 0 0 0 0 0 0
Total 2 081 572 1 948 247 60 304 5 212
Contract type
Nominal values of contracts
(million)
Average rate (- is payer /
+ is receiver)
Plus margin of points
(- is payer/ + is receiver)
For periods from / to
Floating interest receipts
IRS EUR 200 1.53% 4-Oct-13 4-Jan-21 -EURIBOR 3M
IRS EUR 150 1.59% 4-Oct-13 4-Jan-21 -EURIBOR 3M
IRS EUR 250 1.36% 27-Nov-13 27-Mar-20 -EURIBOR 3M
IRS EUR 175 1.91% 27-Nov-13 2-Oct-23 -EURIBOR 3M
IRS EUR 150 -1.12% 27-Mar-14 27-Mar-20 EURIBOR 3M
IRS USD 100 -1.97% 20-Nov-14 22-Nov-21 USD LIBOR 3 M
IRS EUR 100 0.44% 17-Dec-15 2-Apr-22 -EURIBOR 6M
IRS EUR 100 0.45% 17-Dec-15 2-Apr-22 -EURIBOR 6M
CCIRS USD 230 -USD LIBOR 3 M -0.16% 27-Nov-13 2-Oct-23 EURIBOR 3M
CCIRS EUR 205 USD LIBOR 3 M 0.45% 2-Apr-16 2-Oct-23 -EURIBOR 3M
38.2 Interest rate derivativesThe Group uses various interest rate derivative
contracts to manage its exposure to interest rate
movements on its borrowings. The re-pricing dates
and amortization characteristics are aligned with those
of the fixed rate bonds. The outstanding interest rate
derivative contracts are as follows:
38.3 Hedge of net investment in a foreign entityAny unrealized cumulative foreign exchange gains or
losses resulting from net investment hedges are taken
up under Cumulative Translation Adjustments. These
unrealized gains and losses will remain in equity and
will only be recycled to profit or loss when the Group
no longer holds the underlying assets.
166

39 Earnings per share 39.1 Basic earnings per share
€ 2017 2016
From continuing operations 3.99 2.88
From discontinued operations 0.01 - 0.12
Basic earnings per share 4.00 2.76
Basic earnings per share is calculated by dividing the
profit attributable to shareholders of the Company
by the weighted average number of ordinary
shares in issue during the year, excluding ordinary
shares purchased by the Company and held as
treasury shares.
39.2 Diluted earnings per share
€ 2017 2016
From continuing operations 3.99 2.88
From discontinued operations 0.01 - 0.12
Diluted earning per share 4.00 2.76
39.3 EarningsThe calculation of the basic and diluted earnings per share attributable to the ordinary equity holders of the parent
is based on the following data:
BASIC
€ million 2017 2016
Profit from continuing operations attributable to shareholders of UCB SA 752 543
Profit from discontinued operations 1 - 23
Profit attributable to shareholders of UCB SA 753 520
DILUTED
€ million 2017 2016
Profit from continuing operations attributable to shareholders of UCB SA 752 543
Profit from discontinued operations 1 - 23
Profit attributable to shareholders of UCB SA 753 520
39.4 Number of shares
In thousands of shares 2017 2016
Weighted average number of ordinary shares for basic earnings per share 188 281 188 365
Weighted average number of ordinary shares for diluted earnings per share 188 281 188 365
167 UCB Annual Report 2017

40 Dividend per share
41 Commitments and contingencies 41.1 Operating lease commitmentsThe future aggregate minimum lease payments under non-cancellable operating leases are as follows:
€ million2017 2016
Less than 1 year 35 25
Between 1 and 5 years 53 72
More than 5 years 2 7
Total 90 104
The Group has a number of non-cancellable
operating leases primarily related to company cars and
office spaces.
Lease payments are increased annually to
reflect market conditions. None of the leases
include contingent rentals. In 2017 € 42 million
(2016: € 39 million) was recognized as an expense in
the income statement in respect of operating leases.
41.2 Capital and other commitmentsAt 31 December 2017, the Group has committed to
spend € 63 million (2016: € 69 million) mainly with
respect to expected capital expenditures on milestone
payments on collaboration agreements.
UCB has entered into long-term development
agreements with various pharmaceutical enterprises,
clinical trial operators and financial investors. Such
collaboration agreements may include milestone
payments which are dependent on successful clinical
development or on meeting specified sales targets.
The table below sets out the maximum that would be
paid if all milestones, however unlikely, are achieved
but excludes variable royalty payments based on unit
sales and amounts accrued for milestones already
achieved. The amounts are not risk-adjusted or
discounted and the timing of the payments is based
on the Group’s current best estimate of achievement
of the relevant milestones.
The gross dividends paid in 2017 and 2016 were
€ 220 million (€ 1.15 per share) and € 210 million
(€ 1.10 per share) respectively.
A dividend in respect of the year ended
31 December 2017 of € 1.18 per share, amounting to a
total dividend of € 226 million,
is to be proposed at the annual general meeting of the
shareholders on 26 April 2018.
In accordance with IAS 10, events after the reporting
period, the proposed dividend has not been
recognized as a liability at year-end.
€ million 2017 2016
Less than one year 58 76
Between one and five years 101 170
More than five years 860 776
Total 1 019 1 022
UCB has concluded several agreements with Contract
Manufacturing Organizations for the supply of its
products. Total outstanding commitments towards
these CMOs amount to € 447 million as per end
of 2017 (2016: € 390 million).
As part of UCB’s innovation strategy, UCB has
established a corporate venture fund, UCB Ventures.
The main objectives of the fund are to add breadth to
UCB’s innovation ecosystem, to create a window on
new technologies, products, platforms and channels
to augment or complement UCB’s existing activities,
to develop network and strategic relationships in
168

the venture capital investor community to identify
opportunities that UCB might not otherwise
see. Within this framework UCB has outstanding
commitments at the end of 2017 for a total amount
of USD 22 million relating to investments in venture
capital funds.
41.3 GuaranteesGuarantees arising in the normal course of business
are not expected to result in any material financial loss.
41.4 ContingenciesThe Group continues to be actively involved in
litigations, claims and investigations. The on-going
matters could result in liabilities, civil and criminal
penalties, loss of product exclusivity and other costs,
fines and expenses associated with findings adverse
to UCB’s interests. Potential cash outflows reflected
in a provision might be fully or partially off-set by
insurance in certain circumstances. UCB has not
established provisions for potential damage awards for
certain additional legal claims against our subsidiaries
if UCB currently believes that a payment is either not
probable or cannot be reliably estimated.
1. INTELLECTUAL PROPERTY MATTERS
(SELECTED MATTERS)
Vimpat®
• Delaware District Court Litigation: In June 2013,
UCB filed suit in the District Court of Delaware,
against 16 defendants, who were seeking approval
of their generic versions of Vimpat®. The defendants
filed paragraph IV certifications challenging, among
other things, the validity of the RE38,551 (‘551)
Vimpat® patent. On 12 August 2016, Judge Stark
ruled in UCB’s favor and upheld the validity of the
patent. The defendants have appealed the ruling
to the Court of Appeals for the Federal Circuit. An
Oral Argument took place on 8 August 2017.
• Inter Partes Review (IPR): In November 2015,
Argentum Pharmaceuticals filed a petition for an
IPR before the U.S. Patent and Trademark Office
(USPTO) and Patent Trial and Appeal Board (PTAB),
seeking to invalidate the Vimpat® ‘551 patent.
In May 2016, the PTAB instituted the review. Mylan,
Breckenridge, and Alembic have joined the IPR.
On 22 March 2017, the PTAB upheld the validity
of the ‘551 patent. Argentum did not appeal the
decision, but Mylan, Breckenridge, and Alembic
have appealed the decision to the Court of Appeals
for the Federal Circuit. Appeal is on-going.
• Ex Parte Reexamination: In March 2016, Argentum
Pharmaceuticals filed an ex parte reexamination
request before the Patent Trial and Appeal Board
(PTAB), seeking to invalidate the Vimpat® ‘551 patent.
On 16 June 2016, the USPTO granted the request
for the reexamination. On 7 December 2016, the
USPTO issued its first non-final office action. UCB
provided its substantive response in July 2017. The
reexamination is on-going.
• Accord U.K. Litigation: In July, 2016, Accord
Healthcare filed a legal action before the United
Kingdom High Court, requesting a declaration
of invalidity and revocation of European Patent
(U.K.) 0 888 829, disclosing and claiming
lacosamide. In November 2017, Judge Birrs issued
his decision in UCB’s favor, confirming the validity of
the UK part of the European patent. Accord recently
appealed the decision to UK Court of Appeal.
• Zydus II Delaware District Court Litigation:
In October 2016, UCB filed suit in the District Court
of Delaware, against Zydus Pharmaceuticals, who
is seeking approval of its second generic version
of Vimpat®. The defendant filed a paragraph IV
certification challenging, among other things, the
validity of the ‘551 Vimpat® patent. Zydus was a
defendant in the original Vimpat® litigation noted
above. Zydus has filed a motion to stay this litigation
pending the outcome of the Vimpat® litigation
noted above, the pending IPR and the stayed
reexamination. We have informed the Court of the
favorable IPR decision. No decision on the motion
has been rendered to date.
• Accord Netherlands Litigation: On 29 June 2017,
Accord filed a writ before the District Court
of The Hague, seeking to invalidate the Dutch
Vimpat® patent and SPC. Trial is scheduled for
5 October 2018.
• Accord and Teva German Litigation: In the
summer of 2017, Accord Healthcare and Teva filed
nullity actions in the German Patent Court,
seeking to invalidate the German part of the
European Vimpat® patent/SPC. No hearing date is
scheduled yet.
• Accord Italian Litigation: In October 2017,
Accord filed a nullity action against the Italian part of
the European Vimpat® Patent in the Court of Milano.
No trial date has been scheduled.
• Laboratorios Normon, Spanish Litigation:
In October 2017, UCB was notified by the Court of
Barcelona that a nullity action against the Spanish
part of the European Vimpat® Patent was filed
by Laboratorios Normon, S.A. No trial date has
been scheduled.
169 UCB Annual Report 2017
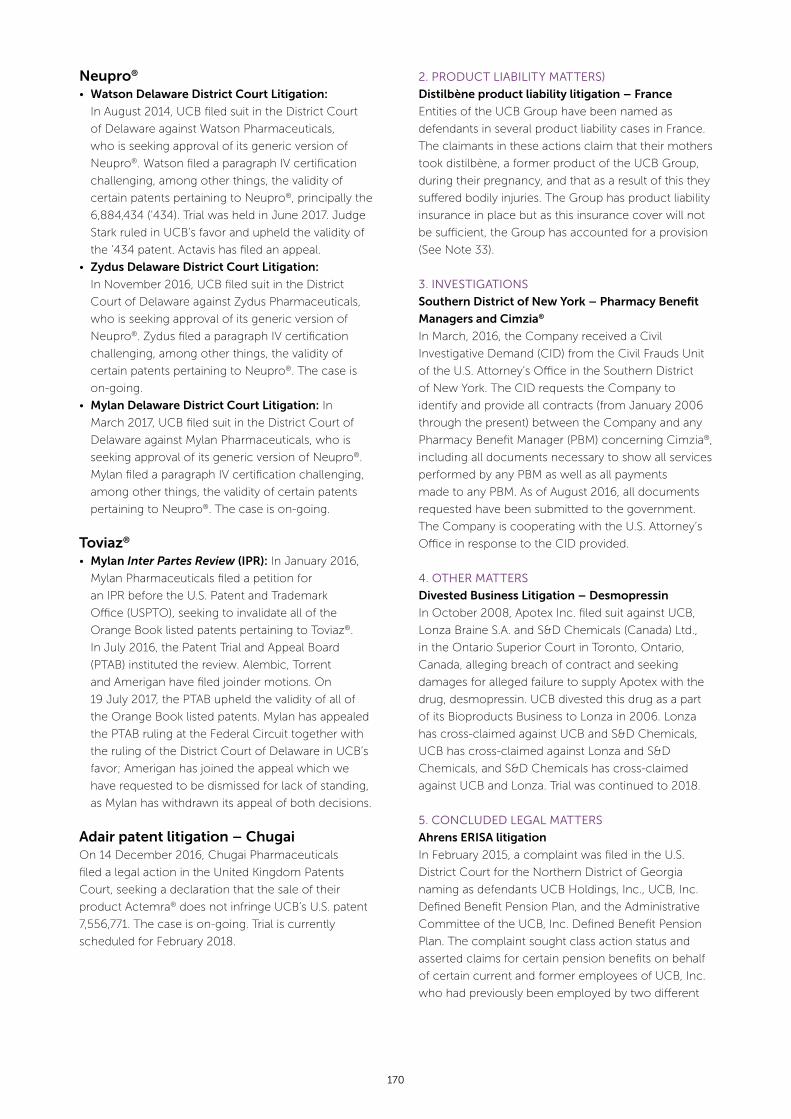
Neupro®
• Watson Delaware District Court Litigation:
In August 2014, UCB filed suit in the District Court
of Delaware against Watson Pharmaceuticals,
who is seeking approval of its generic version of
Neupro®. Watson filed a paragraph IV certification
challenging, among other things, the validity of
certain patents pertaining to Neupro®, principally the
6,884,434 (‘434). Trial was held in June 2017. Judge
Stark ruled in UCB’s favor and upheld the validity of
the ‘434 patent. Actavis has filed an appeal.
• Zydus Delaware District Court Litigation:
In November 2016, UCB filed suit in the District
Court of Delaware against Zydus Pharmaceuticals,
who is seeking approval of its generic version of
Neupro®. Zydus filed a paragraph IV certification
challenging, among other things, the validity of
certain patents pertaining to Neupro®. The case is
on-going.
• Mylan Delaware District Court Litigation: In
March 2017, UCB filed suit in the District Court of
Delaware against Mylan Pharmaceuticals, who is
seeking approval of its generic version of Neupro®.
Mylan filed a paragraph IV certification challenging,
among other things, the validity of certain patents
pertaining to Neupro®. The case is on-going.
Toviaz®
• Mylan Inter Partes Review (IPR): In January 2016,
Mylan Pharmaceuticals filed a petition for
an IPR before the U.S. Patent and Trademark
Office (USPTO), seeking to invalidate all of the
Orange Book listed patents pertaining to Toviaz®.
In July 2016, the Patent Trial and Appeal Board
(PTAB) instituted the review. Alembic, Torrent
and Amerigan have filed joinder motions. On
19 July 2017, the PTAB upheld the validity of all of
the Orange Book listed patents. Mylan has appealed
the PTAB ruling at the Federal Circuit together with
the ruling of the District Court of Delaware in UCB’s
favor; Amerigan has joined the appeal which we
have requested to be dismissed for lack of standing,
as Mylan has withdrawn its appeal of both decisions.
Adair patent litigation – ChugaiOn 14 December 2016, Chugai Pharmaceuticals
filed a legal action in the United Kingdom Patents
Court, seeking a declaration that the sale of their
product Actemra® does not infringe UCB’s U.S. patent
7,556,771. The case is on-going. Trial is currently
scheduled for February 2018.
2. PRODUCT LIABILITY MATTERS)
Distilbène product liability litigation – France
Entities of the UCB Group have been named as
defendants in several product liability cases in France.
The claimants in these actions claim that their mothers
took distilbène, a former product of the UCB Group,
during their pregnancy, and that as a result of this they
suffered bodily injuries. The Group has product liability
insurance in place but as this insurance cover will not
be sufficient, the Group has accounted for a provision
(See Note 33).
3. INVESTIGATIONS
Southern District of New York – Pharmacy Benefit
Managers and Cimzia®
In March, 2016, the Company received a Civil
Investigative Demand (CID) from the Civil Frauds Unit
of the U.S. Attorney’s Office in the Southern District
of New York. The CID requests the Company to
identify and provide all contracts (from January 2006
through the present) between the Company and any
Pharmacy Benefit Manager (PBM) concerning Cimzia®,
including all documents necessary to show all services
performed by any PBM as well as all payments
made to any PBM. As of August 2016, all documents
requested have been submitted to the government.
The Company is cooperating with the U.S. Attorney’s
Office in response to the CID provided.
4. OTHER MATTERS
Divested Business Litigation – Desmopressin
In October 2008, Apotex Inc. filed suit against UCB,
Lonza Braine S.A. and S&D Chemicals (Canada) Ltd.,
in the Ontario Superior Court in Toronto, Ontario,
Canada, alleging breach of contract and seeking
damages for alleged failure to supply Apotex with the
drug, desmopressin. UCB divested this drug as a part
of its Bioproducts Business to Lonza in 2006. Lonza
has cross-claimed against UCB and S&D Chemicals,
UCB has cross-claimed against Lonza and S&D
Chemicals, and S&D Chemicals has cross-claimed
against UCB and Lonza. Trial was continued to 2018.
5. CONCLUDED LEGAL MATTERS
Ahrens ERISA litigation
In February 2015, a complaint was filed in the U.S.
District Court for the Northern District of Georgia
naming as defendants UCB Holdings, Inc., UCB, Inc.
Defined Benefit Pension Plan, and the Administrative
Committee of the UCB, Inc. Defined Benefit Pension
Plan. The complaint sought class action status and
asserted claims for certain pension benefits on behalf
of certain current and former employees of UCB, Inc.
who had previously been employed by two different
170

predecessor companies which were acquired by
UCB, Inc. in the 1990s. On 6 January 2016, the court
granted UCB’s motion to dismiss five of the ten claims
in the case. The matter was successfully mediated
in August 2016 and on 19 May 2017, the court granted
the motion for approval of the settlement. The Order
became non-appealable on 19 June 2017. Payments
have been made to all eligible class members. The
case is closed.
Mylan Delaware District Court Litigation
In January 2015, UCB filed suit in the District
Court of Delaware against Mylan Pharmaceuticals,
who is seeking approval of its generic version of
Toviaz®. Mylan filed a late paragraph IV certification
challenging, among other things, the validity of certain
patents pertaining to Toviaz®. In the United States,
Toviaz® is distributed by Pfizer. On 26 January 2017,
Judge Sleet ruled in Pfizer/UCB’s favor and upheld the
validity of all of the Orange Book listed patents. Mylan
did not appeal the ruling.
New York Attorney General – Medicaid Rebates
On 22 June 2015, the Company received a subpoena
from the New York Attorney General’s Office,
Medicaid Fraud Control Unit (“NYAG”), seeking
documents pertaining to alleged underpayment of
Medicaid rebates for certain periods between 2002-
2005. In March, 2017, UCB learned the government
declined to intervene in the case the plaintiff dismissed
his case with prejudice. This matter is closed.
Torrent Delaware District Court Litigation
In February 2017, UCB filed suit in the District Court
of Delaware against Torrent Pharmaceuticals Ltd.
and Torrent Pharma Inc., who is seeking approval
of its generic version of Toviaz®. Torrent filed a late
paragraph IV certification challenging, among other
things, the validity of certain patents pertaining to
Toviaz®. In the United States, Toviaz® is distributed
by Pfizer. In June 2013, UCB filed its first lawsuit
defending the validity of certain Toviaz® patents,
against nine generic companies, and on 20 April 2016,
Judge Sleet ruled in Pfizer/UCB’s favor upholding
the validity of all of the Orange Book listed patents.
None of the defendants appealed the ruling. The
second lawsuit UCB filed defending certain Toviaz®
patents was the Mylan case noted above, where
Judge Sleet ruled again in Pfizer/UCB’s favor
on 26 January 2017, and Mylan did not appeal this
ruling. In September 2017 Torrent converted its ANDA
to Par. III (seeking FDA approval only after patent
expiry) whereupon Judge Sleet moved to dismiss
our complaint.
Reglan® product liability litigation
Settlement of all Reglan® product liability cases was
finalized in Q4 2017. The settlement amount was fully
covered by insurance.
42 Related party transactions 42.1 Intra-group sales and servicesDuring the financial years ended 31 December 2017
and 2016, all intra-UCB Group transactions were
carried out based on assessments of mutual
economic benefit to the parties involved, and the
applicable conditions were established in accordance
with criteria of at arm’s length negotiations and fair
dealing, and with a view to creating value for the entire
UCB Group. Conditions governing intra-UCB Group
transactions were similar to conditions governing
third-party transactions.
With regard to the sale of intermediary and finished
products, these criteria were accompanied by
the principle of increasing each party’s respective
production cost by an at arm’s length profit margin.
With regard to intra-UCB Group services rendered,
these criteria are accompanied by the principle
of charging fees sufficient to cover each party’s
respective incurred costs and an at arm’s length
mark-up. Intra-Group transactions carried out within
the UCB Group constitute standard transactions for a
biopharmaceutical Group. These transactions include
the purchase and sale of intermediary and finished
medical products, deposits and loans for UCB Group
affiliates as well as centralized functions and activities
carried out by the UCB Group in order to optimize
operations through economies of scale and scope.
42.2 Financial transactions with related parties other than UCB SA affiliates
During 2017 there have been no financial transactions
with other related parties other than affiliates of
UCB SA.
42.3 Key management compensationKey management compensation as disclosed below
comprises compensation recognized in the income
statement for members of the Board of Directors and
the Executive Committee, for the portion of the year
where they exercised their mandate.
171 UCB Annual Report 2017

€ million 2017 2016
Short-term employee benefits 18 13
Termination benefits 0 0
Post-employment benefits 4 4
Share-based payments 11 10
Total key management compensation 33 27
Short-term employee benefits include salaries
(including social security contributions), bonuses
earned during the year, car leasing and other
allowances where applicable. Share-based
compensation includes the amortization over the
vesting period of the fair value of equity instruments
granted, and comprises share options, share awards
and performance shares as further explained in Note
27. The termination benefits contain all compensated
amounts, including benefits in kind and deferred
compensation. There have been no loans granted
by the Company or a subsidiary of the Group to any
Director or officer of the Group, nor any guarantees
given with respect hereto.
42.4 Shareholders and shareholders structureThe main shareholder of UCB is Financière de
Tubize SA (also referred to herein as the “Reference
Shareholder” or “Tubize”), a Belgian company listed
on Euronext Brussels, holding 68 076 981 UCB shares
on a total number of 194 505 658 (i.e. 35.00%) as at
31 December 2017.
Based on the transparency declarations received by
Tubize and, as the case may be, more recent public
disclosures, the shareholder structure of Tubize per
31 December 2017 can be summarized as follows:
Concert Outside Concert Total
VOTING RIGHTS % VOTING RIGHTS % VOTING RIGHTS %
Financière Eric Janssen SPRL 8 525 014 19.14% 1 988 800 4.46% 10 513 814 23.60%
Daniel Janssen 5 881 677 13.20% - - 5 881 677 13.20%
Altaï Invest SA 4 969 795 11.16% 11 500 0.03% 4 981 295 11.18%
Barnfin SA 3 899 833 8.75% - - 3 899 833 8.75%
Jean van Rijckevorsel 7 744 0.02% - - 7 744 0.02%
Total voting rights held by the reference shareholders 23 284 063 52.27% 2 000 300 2.52% 25 299 331 56.79%
Other shareholders - - 19 249 267 43.21% 19 249 267 43.21%
Total voting rights 23 284 063 52.27% 21 264 535 47.73% 44 548 598 100.00%
Altaï Invest SA is controlled by Evelyn du Monceau,
born Evelyn Janssen. Barnfin SA is controlled by
Bridget van Rijckevorsel, born Paule Bridget Janssen.
The reference shareholders of Tubize, belonging
to the Janssen family, act in concert, i.e. they have
entered into a shareholders’ agreement concerning
the concerted exercise of their voting rights in order
to pursue a sustainable common policy with regard
to Tubize and concerning the possession, acquisition
or transfer of voting securities cf. article 3, §1, 13°,
a), b) and c) of the Law on the disclosure of large
shareholdings and article 3, §1, 5°, a) and b) of the Law
on public takeover bids.
With respect to its shareholding in UCB, Tubize was
acting in concert with Schwarz, i.e. they have entered
into an agreement concerning the concerted exercise
of their voting rights in order to pursue a sustainable
common policy with regard to UCB and concerning
the possession, acquisition or transfer of voting
securities (cf. article 3, §1, 13°, b) and c) of the Law on
the disclosure of large shareholdings and article 3, §1,
5°, b) of the Law on public takeover bids).
UCB received on 25 January 2018 a transparency
notification from Tubize mentioning that Tubize
received confirmation on 19 January 2018 of the
termination of the agreement to act in concert
172

with Schwarz, and a transparency notification
from Schwarz confirming this information on
29 January 2018.
UCB and its subsidiaries also hold UCB shares
(see below for an overview of their shareholdings
at 19 January 2018). The remaining UCB shares are
held by the public.
Please find below an overview of the large
shareholdings of UCB (including assimilated financial
instruments) on the basis of the transparency
notifications received pursuant to the law of
2 May 2007, on the disclosure of large shareholdings
(situation as at 19 January 2018):
UCB controlling and major shareholdings on 19 January 2018
SITUATION AS PER 19 JANUARY 2018
Share capital € 583 516 974 13 March 2014
Total number of voting 194 505 658 13 March 2014
1 Financière de Tubize SA (“Tubize”)
securities carrying voting rights (shares) 68 076 981 35.00% 19 January 2018
2 UCB SA/NV
securities carrying voting rights (shares) 3 108 161 1.60% 31 December 2017
assimilated financial instruments (options)1 0 0.00% 6 March 2017
assimilated financial instruments (other)1 0 0.00% 18 December 2015
Total 3 108 161 1.60%
3 UCB Fipar SA
securities carrying voting rights (shares) 3 186 516 1.64% 31 December 2017
assimilated financial instruments (options)1 435 000 0.22% 3 June 2015
assimilated financial instruments (other)1 0 0.00% 25 December 2015
Total 3 621 516 1.86%
UCB SA/NV + UCB Fipar SA²
securities carrying voting rights (shares) 6 294 677 3.24%
assimilated financial instruments (options)1 435 000 0.22%
assimilated financial instruments (other)1 0 0.00%
Total 6 729 677 3.46%
Free float³ (securities carrying voting rights (shares)) 120 134 000 61.67%
4 The Capital Group Companies Inc.
securities carrying voting rights (shares) 9 721 375 4.998% 11 October 2017
5 Vanguard Health Care Fund
securities carrying voting rights (shares) 9 741 353 5.01% 28 October 2014
6 BlackRock Inc.
securities carrying voting rights (shares) 5 836 096 3.00% 1 June 2017
(all percentages are calculated on the basis of the current total number of voting rights)1 Assimilated financial instruments within the meaning of article 6 of the Royal Decree of 14 February 2008 on the disclosure of large shareholders, which, if exercised, grant an additional voting right: i.e., securities, options, futures, swaps, interest term agreements and other derivatives concerning existing securities carrying voting rights that grant their holder the right to acquire such securities carrying voting rights pursuant to an agreement that is binding under the applicable law and only on the holders’ own initiative.
2 UCB SA/NV indirectly controls UCB Fipar SA | article 6, §5, 2° and article 9, §3, 2° of the Law on the disclosure of large shareholdings.3 Free float being the UCB shares not held by the reference shareholder (Tubize), UCB SA/NV or UCB Fipar SA. Only securities carrying voting rights (shares) held by these entities
are taken into account for this calculation, to the exclusion of assimilated financial instruments.
173 UCB Annual Report 2017

43 Events after the balance sheet date • There are no major after balance sheet events to report.
44 UCB companies (fully consolidated)Name and office Holding Controlling partner
AUSTRALIA
UCB Australia Pty. Ltd. – Level 1, 1155 Malvern Road – 3144 Malvern, Victoria 100% UCB SA
AUSTRIA
UCB Pharma Gesellschaft m.b.H. – Twin Tower, Wienerbergstrasse 11/12a, 1110 Wien 100% UCB Finance NV
BELGIUM
UCB Fipar SA – Allée de la Recherche, 60 – 1070 Brussels (BE0403.198.811) 100% UCB Belgium SA
UCB Biopharma SPRL – Allée de la Recherche, 60 – 1070 Brussels (BE0543.573.053) 100% UCB Pharma SA
UCB Belgium SA – Allée de la Recherche, 60 – 1070 Brussels (BE0402.040.254) 100% UCB Pharma SA
UCB Pharma SA – Allée de la Recherche, 60 – 1070 Brussels (BE0403.096.168) 100% UCB SA
Sifar SA – Allée de la Recherche, 60 – 1070 Brussels (BE0453.612.580) 100% UCB Finance NV
UCB Ventures SA – Allée de la Recherche, 60 – 1070 Brussels (BE0667 816 096) 100% UCB SA
UCB Ventures Belgium SA – Allée de la Recherche, 60 – 1070 Brussels (BE0668 388 891) 100% UCB Ventures SA
BRAZIL
UCB Farma Brasil Ltda 1 – Av. Brigadeiro Faria Limal Itaim Bibi – CEP: 04538-132 Sao Paulo 100% UCB SA
UCB Biopharma Ltda – Av. Brigadeiro Faria Limal Itaim Bibi – CEP: 04538-132 SaoPaulo 100% UCB SA
BULGARIA
UCB Bulgaria EOOD – 15, Ljubata Str., Fl. 4 apt. 10-11, Lozenetz, Sofia 1407 100% UCB SA
CANADA
UCB Canada Inc. – 2060 Winston Park Drive, Suite 401 – ON L6H5R7 Oakville 100% UCB Hondings Inc
CHINA
UCB Trading (Shanghai) Co Ltd – Suite 317, 439 No.1 Fu Te Road West, Shanghai (Pilot Free Trade Zone) 100% UCB SA
UCB Pharma (Hong Kong) Ltd – Unit 3713-18,37F, Tower 1, Millenium City 5, 388 Kwun Tong Road, Kwun Tong, Kowloon, Hong Kong 100% UCB Pharma GmbH
UCB Pharma (Zhuhai) Company Ltd – Section A., Workshop, No.3 Science & Technology 05th Road, Innovation Coast, National Hi-Tech Industrial Development Zone – Zhuhai Guangdong Province
100% UCB Pharma GmbH
CZECH REPUBLIC
UCB S.R.O. – Thámova 13 – 186 00 Praha 8 100% UCB SA
DENMARK
UCB Nordic AS – Edvard Thomsens Vej 14, 7 – 2300 Copenhagen 100% UCB Finance NV
FINLAND
UCB Pharma Oy Finland – Bertel Jungin aukio 5 , 6.krs – 02600 Espoo 100% UCB Finance NV
174

Name and office Holding Controlling partner
FRANCE
UCB Pharma SA – Défense Ouest 420, rue d’Estienne d’Orves – 92700 Colombes 100% UCB SA
GERMANY
UCB Pharma GmbH – Alfred-Nobel-Strasse 10 – 40789 Monheim am Rhein 100% UCB GmbH
UCB GmbH – Alfred-Nobel-Strasse 10 – 40789 Monheim am Rhein 100% UCB Finance NV
UCB BioSciences GmbH – Alfred-Nobel-Strasse 10 – 40789 Monheim am Rhein 100% UCB Pharma GmbH
Sanol GmbH 1 – Alfred-Nobel-Strasse 10 – 40789 Monheim am Rhein 100% UCB Pharma GmbH
UCB Innere Medizin GmbH & Co. KG – Alfred-Nobel-Strasse 10 – 40789 Monheim am Rhein 100% UCB Pharma GmbH
UCB Primary Care GmbH – Alfred-Nobel-Strasse 10 – 40789 Monheim am Rhein 100% UCB Pharma GmbH
GREECE
UCB A.E. – 63 Agiou Dimitriou Street – 17456 Alimos – Athens 100% UCB SA
HUNGARY
UCB Hungary Ltd – Obuda Gate Building Arpád Fejedelem ùtja 26-28 – 1023 Budapest 100% UCB SA
INDIA
UCB India Private Ltd – 504, Peninsula Corporate Park, Ganpatrao Kadam Marg, Lower Parel – 400 013 Mumbai 100% UCB SA
Uni-Mediflex Private Ltd – 504, Peninsula Corporate Park, Ganpatrao Kadam Marg, Lower Parel – 400 013 Mumbai 100% UCB SA
IRELAND
UCB (Pharma) Ireland Ltd – United Drug House Magna Drive, Magna Business Park, City West Road – Dublin 24 100% UCB SA
UCB Manufacturing Ireland Ltd – Shannon Industrial Estate – Shannon, County Clare 100% UCB SA
ITALY
UCB Pharma SpA – Via Varesina 162 – 20166 Milano 100% UCB SA
JAPAN
UCB Japan Co Ltd – Shinjuku Grand Tower, 8-17-1 Nishi-Shinjuku 160-0023 Shinjuku, Tokyo 100% UCB SA
LUXEMBOURG
Edev Sàrl – Rue Eugène Ruppert, 5C – 2453 Luxembourg 0% N/A
Phase III Development Company Sàrl2 – Avenue de la Gare, 41 – 1611 Luxembourg 0% N/A
MALAYSIA
UCB Trading (Malaysia) Sdn. Bhd. – Level 21, Suite 21.01, The Gardens South Tower, Mid Valley City, Lingkaran Syed Putra, 59200 Kuala Lumpur 100% UCB SA
MEXICO
UCB de Mexico SA de C.V. – Homero #440, 7fl Col. Chapultepec Morales – 11570 Mexico D.F. 100% UCB SA
Vedim SA de C.V. – Homero #440, 7fl Col. Chapultepec Morales – 11570 Mexico D.F. 100% Sifar SA
NETHERLANDS
UCB Finance N.V. – Hoge Mosten 2 – 4822 NH Breda 100% UCB SA
UCB Pharma B.V. (Netherlands) – Hoge Mosten 2 – 4822 NH Breda 100% UCB Finance NV
175 UCB Annual Report 2017

Name and office Holding Controlling partner
NORWAY
UCB Pharma A.S. – Grini Naeringspark 8b – 1361 Osteras, Baerum 100% UCB Finance NV
POLAND
Vedim Sp. z.o.o. – Ul. Kruczkowskiego 8 – 00-380 Warszawa 100% Sifar SA
UCB Pharma Sp. z.o.o. – Ul. Kruczkowskiego 8 – 00-380 Warszawa 100% UCB SA
PORTUGAL
UCB Pharma (Produtos Farmaceuticos) Lda – Rua Victor Câmara, Edifício Q 60, D. Maria I, Piso 1, Fracção D, Quinta da Fonte, 2770-229 Paço de Arcos 100% UCB SA
ROMANIA
UCB Pharma Romania S.R.L. – 40-44 Banu Antonache, 4th fl., district 1 – 011665 Bucharest 100% UCB SA
RUSSIA
UCB Pharma LLC – Shturvaluaya 5 bldg 1 – 125364 Moscow 100% UCB SA
UCB Pharma Logistics LLC – Perevedenovky pereulok 13 bldg 21 – 105082 Moscow 100% UCB SA
SINGAPORE
UCB Trading (SG) Pte. Ltd. – 8 Marina Boulevard #05-02, Marina Bay Financial Centre Tower 1, 18981 Singapore 100% UCB SA
SOUTH KOREA
UCB Korea Co Ltd. – 4th Fl., A+ Asset Tower, 369 Gangnam-daero, Seocho-gu, 06621 Seoul 100% UCB SA
SPAIN
Vedim Pharma SA – Plaza de Manuel Gómez Moreno, s/n, Edificio Bronce, 5th floor – 28020 Madrid 100% UCB SA
UCB Pharma SA – Plaza de Manuel Gómez Moreno, s/n, Edificio Bronce, 5th floor – 28020 Madrid 100% Vedim Pharma SA
SWEDEN
UCB Pharma AB (Sweden) – Klarabergsgatan 29 – 111 21 Stockholm 100% UCB Finance NV
SWITZERLAND
UCB Farchim SA (A.G. – Ltd.) – ZI de Planchy, Chemin de Croix Blanche 10 – 1630 Bulle 100% UCB Investissements
SA
UCB Investissements SA – ZI de Planchy, Chemin de Croix Blanche 10 – 1630 Bulle 100% UCB Finance NV
Doutors Réassurance SA – ZI de Planchy, Chemin de Croix Blanche 10 – 1630 Bulle 100% UCB Investissements SA
UCB-Pharma AG – ZI de Planchy, Chemin de Croix Blanche 10 – 1630 Bulle 100% UCB Investissements SA
Medeva Pharma Suisse SA – Chemin de Croix Blanche 10 – 1630 Bulle 100% UCB Investissements SA
UCB Medical Devices SA – ZI de Planchy, Chemin de Croix Blanche 10 – 1630 Bulle 100% UCB Investissements SA
TAIWAN
UCB Pharmaceuticals (Taiwan) Ltd – 12F.-2, No.88, Dunhua N. Rd., Songshan Dist. – 10595 Taipei 100% UCB SA
THAILAND
UCB Trading (Thailand) Ltd – 98 Sathorn Square, 37/F, Room 3780, North Sathorn Road, Khwaeng Silom, Khet Bangrak – 10500 Bangkok 100% UCB SA
176
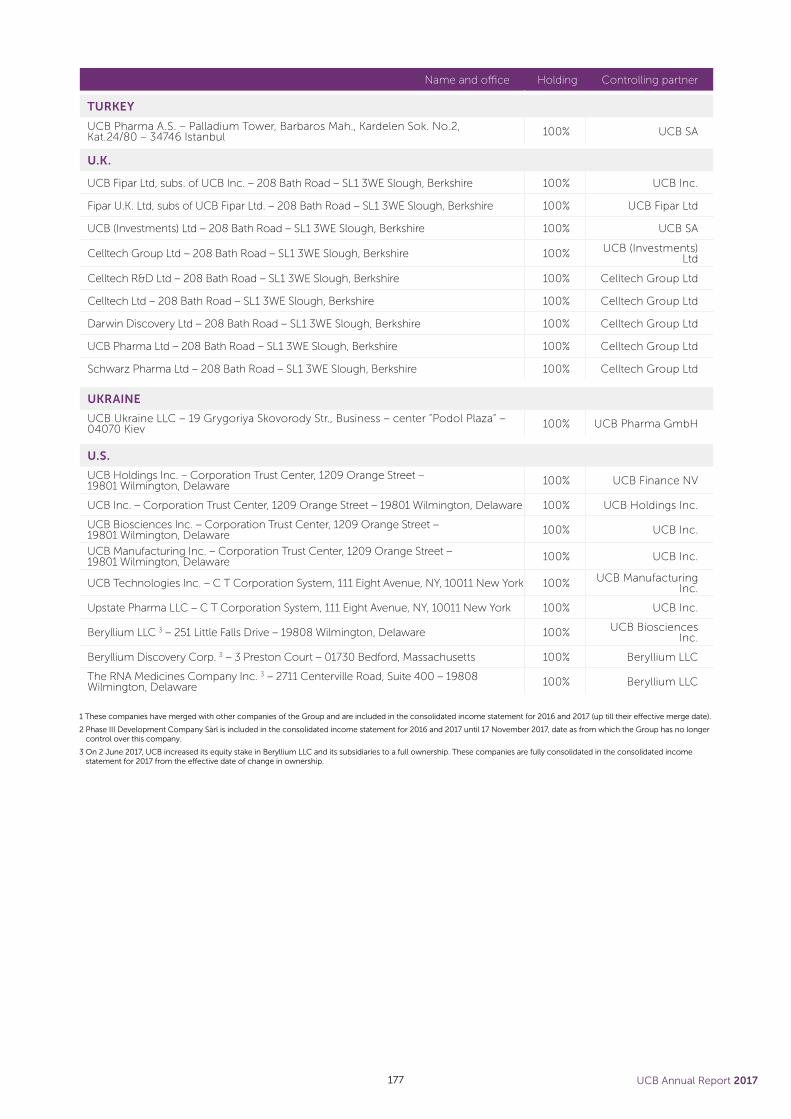
Name and office Holding Controlling partner
TURKEY
UCB Pharma A.S. – Palladium Tower, Barbaros Mah., Kardelen Sok. No.2, Kat.24/80 – 34746 Istanbul 100% UCB SA
U.K.
UCB Fipar Ltd, subs. of UCB Inc. – 208 Bath Road – SL1 3WE Slough, Berkshire 100% UCB Inc.
Fipar U.K. Ltd, subs of UCB Fipar Ltd. – 208 Bath Road – SL1 3WE Slough, Berkshire 100% UCB Fipar Ltd
UCB (Investments) Ltd – 208 Bath Road – SL1 3WE Slough, Berkshire 100% UCB SA
Celltech Group Ltd – 208 Bath Road – SL1 3WE Slough, Berkshire 100% UCB (Investments) Ltd
Celltech R&D Ltd – 208 Bath Road – SL1 3WE Slough, Berkshire 100% Celltech Group Ltd
Celltech Ltd – 208 Bath Road – SL1 3WE Slough, Berkshire 100% Celltech Group Ltd
Darwin Discovery Ltd – 208 Bath Road – SL1 3WE Slough, Berkshire 100% Celltech Group Ltd
UCB Pharma Ltd – 208 Bath Road – SL1 3WE Slough, Berkshire 100% Celltech Group Ltd
Schwarz Pharma Ltd – 208 Bath Road – SL1 3WE Slough, Berkshire 100% Celltech Group Ltd
UKRAINE
UCB Ukraine LLC – 19 Grygoriya Skovorody Str., Business – center ”Podol Plaza” – 04070 Kiev 100% UCB Pharma GmbH
U.S.
UCB Holdings Inc. – Corporation Trust Center, 1209 Orange Street – 19801 Wilmington, Delaware 100% UCB Finance NV
UCB Inc. – Corporation Trust Center, 1209 Orange Street – 19801 Wilmington, Delaware 100% UCB Holdings Inc.
UCB Biosciences Inc. – Corporation Trust Center, 1209 Orange Street – 19801 Wilmington, Delaware 100% UCB Inc.
UCB Manufacturing Inc. – Corporation Trust Center, 1209 Orange Street – 19801 Wilmington, Delaware 100% UCB Inc.
UCB Technologies Inc. – C T Corporation System, 111 Eight Avenue, NY, 10011 New York 100% UCB Manufacturing Inc.
Upstate Pharma LLC – C T Corporation System, 111 Eight Avenue, NY, 10011 New York 100% UCB Inc.
Beryllium LLC 3 – 251 Little Falls Drive – 19808 Wilmington, Delaware 100% UCB Biosciences Inc.
Beryllium Discovery Corp. 3 – 3 Preston Court – 01730 Bedford, Massachusetts 100% Beryllium LLC
The RNA Medicines Company Inc. 3 – 2711 Centerville Road, Suite 400 – 19808 Wilmington, Delaware 100% Beryllium LLC
1 These companies have merged with other companies of the Group and are included in the consolidated income statement for 2016 and 2017 (up till their effective merge date).
2 Phase III Development Company Sàrl is included in the consolidated income statement for 2016 and 2017 until 17 November 2017, date as from which the Group has no longer control over this company.
3 On 2 June 2017, UCB increased its equity stake in Beryllium LLC and its subsidiaries to a full ownership. These companies are fully consolidated in the consolidated income statement for 2017 from the effective date of change in ownership.
177 UCB Annual Report 2017

Bernd, living with rheumatoid arthritis and ankylosing spondylitis
RESPONSIBILITY STATEMENT
05
178

We hereby confirm that, to the best of our
knowledge, the consolidated financial statements as
of 31 December 2017, prepared in accordance with
International Financial Reporting standards (IFRS), as
adopted by the European Union, and with the legal
requirements applicable in Belgium, give a true and
fair view of the assets, liabilities, financial position and
profit or loss of the company and the undertakings
included in the consolidation as a whole, and that
the management report includes a fair review of the
development and performance of the business and
the position of the company and the undertakings
included in the consolidation taken as a whole,
together with a description of the principal risks
and uncertainties that they face.
Signed by Jean-Christophe Tellier (CEO) and Detlef
Thielgen (CFO) on behalf of the Board of Directors.
179 UCB Annual Report 2017

Rebecca, living with rheumatoid arthritis 180

STATUTORY AUDITOR’S REPORT TO THE GENERAL SHAREHOLDERS’ MEETING OF UCB SA/NV FOR THE YEAR ENDED 31 DECEMBER 2017
06
We present to you our statutory auditor’s
report in the context of our statutory audit of
the consolidated accounts of your company
(the “Company”) and its subsidiaries (jointly
“the Group”). This report includes our report
on the audit of the consolidated accounts, as
well as the report on other legal and regulatory
requirements. These reports form part of an
integrated whole and are indivisible.
We have been appointed as statutory
auditor by the general meeting d.d. 30 April
2015, following the proposal formulated
by the board of directors and following the
recommendation by the audit committee
and the proposal formulated by the works’
council. Our mandate will expire on the date
of the general meeting which will deliberate
on the consolidated accounts prepared on
31 December 2017. We have performed the
statutory audit of the consolidated accounts
of UCB SA/NV for 21 consecutive years.
181 UCB Annual Report 2017
6.1.1 Unqualified opinionWe have performed the statutory audit of the
Group’s consolidated accounts, which comprise
the consolidated statement of financial position
as at 31 December 2017, the consolidated income
statement and other comprehensive income, the
consolidated statement of changes in equity and the
consolidated statement of cash flows for the year
then ended, and notes to the consolidated financial
statements, including a summary of significant
accounting policies, and which is characterised by a
consolidated statement of financial position total of
EUR 9 917 million and a profit for the year (attributable
to equity holders) of EUR 753 million.
In our opinion, the consolidated accounts give a
true and fair view of the group’s net equity and
consolidated financial position as at 31 December
2017 and of its consolidated financial performance
and its consolidated cash flows for the year then
ended, in accordance with International Financial
Reporting Standards (“IFRS”) as adopted by the
European Union and with the legal and regulatory
requirements applicable in Belgium.
6.1.2 Basis for unqualified opinionWe conducted our audit in accordance with
International Standards on Auditing (ISAs). Our
responsibilities under those standards are further
described in the Statutory auditor’s responsibilities for
the audit of the consolidated accounts section of our
report. We have fulfilled our ethical responsibilities
in accordance with the ethical requirements that are
relevant to our audit of the consolidated accounts
in Belgium, including the requirements related to
independence.
We have obtained from the board of directors and
Company officials the explanations and information
necessary for performing our audit. We believe that
the audit evidence we have obtained is sufficient and
appropriate to provide a basis for our opinion.
6.1.3 Key audit mattersKey audit matters are those matters that, in our
professional judgment, were of most significance in
our audit of the consolidated accounts of the current
period. These matters were addressed in the context of
our audit of the consolidated accounts as a whole, and
in forming our opinion thereon, and we do not provide
a separate opinion on these matters.
Significant judgements and estimates in sales
rebates, discounts and returns adjustments
recognised in the US (refer to Notes 2.2, 2.7.1
3.2.1 and 34.2).
AREA OF FOCUS
In the U.S., the UCB Group sells products to
various customers that are part of commercial and
governmental contractual arrangements or other
reimbursement programmes (Medicaid, Medicare or
equivalent scheme).This process leads to significant
adjustments to the gross sales in the form of rebates,
chargebacks, discounts and product returns. At
year-end significant amounts of these unsettled
adjustments are recorded as accruals in the balance
sheet. The process for determining these accruals
is complex and depends on contract terms and
regulation, as well as forecasts of sales volumes
by channel and estimates on expected returns of
products. As disclosed in Note 34.2, the amount of
the accruals at 31 December 2017 is EUR 445 million
(EUR 540 million as per 31 December 2016). We also
evaluated whether appropriate revenue recognition
policies were consistent with IFRSs as adopted by the
European Union.
HOW OUR AUDIT ADDRESSED THE AREA OF FOCUS
Our testing focused on the accruals for sales rebates,
chargebacks, discounts and product returns recognised
at the year-end as the process for these accruals
involves the use of large volumes of data, regarding
sales volumes and discounts from multiple sources,
which, taken together, require significant management
judgement in a complex US healthcare environment.
We obtained management’s calculations of the
accruals for sales rebates, chargebacks, discounts and
product returns and tested the inputs into the accrual
calculations. We performed the following procedures:
• We assessed the completeness and accuracy of the
accruals by understanding and testing the process
management used to calculate and record the year-
end balances.
• We tested the mathematical accuracy of the year-
end balances and compared such amounts to
our own independently developed expectations
(substantive analytics). Our independent expectations
were developed based on sales figures, historical
rebate invoices received, adjusted for current
volumes, rebate rates as included in sales contracts
6.1 Report on the audit of the consolidated accounts
182

and agreements with third parties and adjusted for
any Company or industry specific factors.
• We assessed the key judgements and assumptions
within management’s analysis and we considered
other known factors such as generic entrants and
government, legal or regulatory information, as
applicable. We assessed the assumptions used to
determine the standard lag times for commercial
rebates, Medicare rebates, Medicaid rebates, cash
discounts, chargebacks and returns.
• We examined third party statements and data
such as external data, we sampled rebate and
chargeback invoices processed subsequently to year
end and we assessed management’s estimates of
channel inventory.
• We performed look back tests that compared
accruals recognised in previous periods to actual
rebates, chargebacks, discounts or returns received
in order to test management’s historical accuracy in
calculating these accruals.
• We have also assessed the accounting impacts of the
implementation of IFRS 15 as detailed
in Note 2.2.
In determining the appropriateness of the revenue
recognition policy in accordance with IFRS 15
applied by management in calculating sales rebates,
chargebacks, discounts and product returns under
contractual and regulatory requirements, there is
room for judgement. We did not identify any material
differences between our independent expectations
and the accruals and we found the judgements made
by management to be reasonable. Also, the policies
applied are consistent in all material respects with IFRSs
as adopted by the European Union.
Carrying value of goodwill and intangible assets
(refer to Notes 2.10, 2.14, 2.15, 3.2.2, 13, 19 and 20)
AREA OF FOCUS
The UCB Group has EUR 817 million of intangible
assets (31 December 2016 – EUR 875 million),
comprising significant licenses, patents and
acquired trademarks. In addition, the Group has
EUR 4 838 million of goodwill at 31 December 2016
(31 December 2016 – EUR 5 178 million).
The carrying values of goodwill and intangible assets
are contingent on future cash flows and if these cash
flows do not meet the Group’s expectations, there is
risk that the assets will be impaired. The impairment
reviews performed by the Group contain a number
of significant judgements and estimates including
revenue growth, the success of new product launches,
patent expiry dates, profit margins, terminal values
and discount rate. Changes in these assumptions
might lead to a change in the carrying value of
intangible assets and goodwill. The Group has one
cash generating unit (“CGU”), Biopharmaceuticals, for
goodwill impairment testing purposes.
HOW OUR AUDIT ADDRESSED THE AREA OF FOCUS
We obtained the UCB Group’s impairment evaluation
analyses and tested the reasonableness of the
methodology and the key assumptions, including profit
and cash flow growth, terminal values, the impact
of the expiry of patents, pricing impacts, potential
product obsolescence, the probability of success
for pipeline products and the selection of discount
rates. We have assessed management’s substantiation
of its assumptions, including comparing relevant
assumptions to industry and economic forecasts.
In doing this, we worked with our internal valuation
specialists. We have also evaluated the process to
prepare the Groups strategic plan that was approved by
UCB’s board of directors.
We obtained and evaluated management’s sensitivity
analyses to ascertain the impact of reasonably possible
changes in key assumptions and we performed our
own independent sensitivity calculations to quantify
the downside changes to management’s models
required to result in impairment. We also assessed
the reasonability of the forecasted discounted
cash flows by comparing those to the Group’s
market capitalisation.
As a result of our work, we determined that the level
of impairment charge recorded in 2017 (on intangible
assets) for EUR 1 million (see Note 13) is appropriate
and is based on the recoverable amount of the
respective intangible assets. For those intangible
assets and goodwill where management determined
that no impairment has to be recognised, we found
that management’s judgements were supported
by reasonable assumptions that would require
unreasonable downside changes before any material
impairment was necessary.
In respect of the Biopharmaceuticals CGU, we
confirmed that this is the lowest level at which
management monitors goodwill for internal purposes,
that it is consistent with how the Group’s results
and financial position are reported to the executive
committee and the board of directors and that it thus
complies with IFRS as adopted by the European Union.
183 UCB Annual Report 2017

Recognition of deferred tax assets (and uncertain
tax positions) (refer to Notes 2.12, 3.2.5, 31 and 35)
AREA OF FOCUS
The UCB Group has significant tax losses from past
business performance. There is inherent uncertainty
involved assessing both the availability of losses and
tax credits and in forecasting future taxable profits,
which determines the extent to which deferred tax
assets are recognised. Additionally, the availability and
the amount of the tax losses and tax credits can be
impacted by ongoing tax audits. At 31 December 2017,
the Group has recognised EUR 715 million of deferred
tax assets (31 December 2016 – EUR 953 million).
The process for the determination of deferred tax
assets is complex and involves a significant amount
of judgement.
The group operates in a complex multinational tax
environment and there are open tax and transfer
pricing matters with tax authorities. Judgement is
required in assessing the level of provisions required
in respect of uncertain tax positions. At 31 December
2017, the Group has recognised provisions of
EUR 55 million in respect of uncertain tax positions
(31 December 2016 – EUR 231 million). The decrease
in provisions for uncertain tax positions is explained by
the conclusion of several tax audits in the course of
2017 in different jurisdictions.
HOW OUR AUDIT ADDRESSED THE AREA OF FOCUS
We evaluated the appropriateness of the
management’s key assumptions and estimates, in
particular the likelihood of generating sufficient future
taxable profits to support the recognition of deferred
tax assets.
We evaluated the possible effects of tax audit
outcomes on the availability of tax losses and tax
credits (and the need for recognizing a provision for
uncertain tax positions, if deemed necessary).
We considered the status of recent and current tax
authority audits, the outcome of previous audits,
the judgemental positions taken in tax returns and
current year estimates and developments in the
tax environment.
In conjunction with our own specialists in International
Tax, we assessed and evaluated the correspondence
with the relevant tax authorities and certain third
party tax opinions. Based on this information, we
analysed and challenged the assumptions used by
management to determine tax provisions.
We assessed whether the UCB Group’s disclosures
about the sensitivity of the recognition of deferred
tax assets to reasonably possible changes in key
assumptions reflected the associated inherent risks
and the disclosures in respect of tax and uncertain
tax positions.
As a result of our work, we determined that
management’s conclusions on the recognition
of deferred tax assets and its recoverability are
appropriate. We also determined that the provisions
for uncertain tax positions and the related disclosures
are acceptable.
Ongoing litigation, claims and regulatory
investigations (refer to Notes 2.30, 3.2.3, 33 and 41)
AREA OF FOCUS
The pharmaceutical industry is a highly regulated
industry, which increases the inherent risk for litigation,
claims and regulatory investigations. The UCB Group
is engaged in a number of legal actions, including
product liability, commercial litigation and regulatory
investigations, which could have a material impact on
the financial statements.
We focused on this area because the outcome of
such legal actions is uncertain and the positions taken
by the management are based on the application
of material judgement and estimation. Accordingly,
unexpected adverse outcomes of such legal actions
could materially impact the Group’s reported profits
and balance sheet position or future cash flows.
At 31 December 2017, the Group held provisions of
EUR 121 million (31 December 2016 – EUR 120 million)
among others in respect of actual legal actions
brought against the Group and disclosures have been
made in Note 33 in relation to these provisions, as well
as the disclosure of contingent liabilities in Note 41
relating to ongoing regulatory investigations or legal
claims where the directors believe to have meritorious
defences against the claims.
As disclosed in Notes 33 and 41, the Group is involved
in several product liability cases related to the product
Distilbène. In 2015, a provision was recognised for
EUR 50 million representing the expected future
cash flows exceeding the insurance coverage and is
considered as a significant estimate. This provision
amounts to EUR 68 million as at 31 December 2017.
184

HOW OUR AUDIT ADDRESSED THE AREA OF FOCUS
We discussed actual or pending legal and regulatory
claims with the Group’s General Counsel to update
our understanding of the status of each case.
We established our own expectation of the likely
outcome and tested substantively the amount
provided (e.g. Distilbène) by evaluating the
assumptions used in measuring the provision by
discussion and by reference to the actual (similar)
court decisions, to available documentation such
as correspondence with external legal counsels and
by obtaining independent confirmations from the
external legal counsels.
We considered the completeness of legal and
regulatory matters through inquiry with the Group’s
General Counsel and by reading minutes of meetings
of the executive committee and the board of
directors, and did not identify any other legal matters
that had not already been disclosed to us.
We evaluated the assumptions regarding the
measurement of the provision related to the Distilbène
product of EUR 68 million (31 December 2016 –
EUR 69 million) liability by reference to the actual
court decisions for closed Distilbène cases. We
discussed with UCB’s management and assessed the
assumptions used.
Our testing did not identify any material misstatements
in the provisions recorded. We found that in the
context of the Group financial statements, the
judgements made by management and the provisions
recorded are reasonable and the disclosures relating
to legal and regulatory matters, provisions and
contingent liabilities in Notes 33 and 41 were in
accordance with the requirements of IFRSs as adopted
by the European Union.
Post-employment benefit provisions (refer to
Notes 2.29, 3.2.4 and 32)
AREA OF FOCUS
The UCB Group has different employee benefit
schemes around the world of which the most
significant and with the most potential for
misstatement are in the UK, Belgium, Germany and
the US. Significant estimates are made in valuing post-
retirement defined benefit plans and small changes
in the assumptions and estimates used, of which the
main ones are discount rate, inflation and longevity,
could have a significant impact on the results and the
financial position of the Group as disclosed in Note 32.
The total amount of the post-retirement benefit
provisions recognized at 31 December 2017 amounts
to EUR 412 million (31 December 2016 – EUR
450 million), consisting of a total defined benefit
obligation of EUR 1.040 million (31 December 2016
– EUR 1 124 million) offset by total plan assets of EUR
629 million (31 December 2016 – EUR 675 million).
HOW OUR AUDIT ADDRESSED THE AREA OF FOCUS
With the involvement of our internal actuarial
specialists, we have challenged the key assumptions
being mainly the discount rate, inflation rate, mortality
/ life expectancy, inflation rates and future salary
increases. We have compared the key assumptions
used against our internal benchmarks and externally
derived data.
We have performed audit procedures on the fair value
of plan assets, the determination of the defined benefit
obligation and the underlying census data.
Based on our procedures performed, we consider
management’s assumptions and the resulting
valuation of the employee benefit obligation to be
within a reasonable range. We have assessed and
agreed with the adequacy of the disclosures in
Note 32 in respect of post-retirement benefits.
6.1.4 Responsibilities of the Board of Directors for the consolidated accountsThe board of directors is responsible for the
preparation of consolidated accounts that give a
true and fair view in accordance with International
Financial Reporting Standards as adopted by the
European Union and with the legal and regulatory
requirements applicable in Belgium, and for such
internal control as the board of directors determines
is necessary to enable the preparation of consolidated
accounts that are free from material misstatement,
whether due to fraud or error.
In preparing the consolidated accounts, the board
of directors is responsible for assessing the Group’s
ability to continue as a going concern, disclosing, as
applicable, matters related to going concern and using
the going concern basis of accounting unless the
board of directors either intends to liquidate the Group
or to cease operations, or has no realistic alternative
but to do so.
185 UCB Annual Report 2017
6.1.5 Statutory auditor’s responsibilities for the audit of the consolidated accountsOur objectives are to obtain reasonable assurance
about whether the consolidated accounts as a whole
are free from material misstatement, whether due to
fraud or error, and to issue an auditor’s report that
includes our opinion. Reasonable assurance is a high
level of assurance, but is not a guarantee that an audit
conducted in accordance with ISAs will always detect
a material misstatement when it exists. Misstatements
can arise from fraud or error and are considered
material if, individually or in the aggregate, they could
reasonably be expected to influence the economic
decisions of users taken on the basis of these
consolidated accounts.
As part of an audit in accordance with ISAs, we
exercise professional judgment and maintain
professional scepticism throughout the audit. We also:
• Identify and assess the risks of material misstatement
of the consolidated accounts, whether due to
fraud or error, design and perform audit procedures
responsive to those risks, and obtain audit evidence
that is sufficient and appropriate to provide a
basis for our opinion. The risk of not detecting a
material misstatement resulting from fraud is higher
than for one resulting from error, as fraud may
involve collusion, forgery, intentional omissions,
misrepresentations, or the override of
internal control.
• Obtain an understanding of internal control relevant
to the audit in order to design audit procedures
that are appropriate in the circumstances, but not
for the purpose of expressing an opinion on the
effectiveness of the Group’s internal control.
• Evaluate the appropriateness of accounting policies
used and the reasonableness of accounting
estimates and related disclosures made by the
board of directors.
• Conclude on the appropriateness of the board
of directors’ use of the going concern basis of
accounting and, based on the audit evidence
obtained, whether a material uncertainty exists
related to events or conditions that may cast
significant doubt on the Group’s ability to continue
as a going concern. If we conclude that a material
uncertainty exists, we are required to draw attention
in our statutory auditor’s report to the related
disclosures in the consolidated accounts or, if such
disclosures are inadequate, to modify our opinion.
Our conclusions are based on the audit evidence
obtained up to the date of our statutory auditor’s
report. However, future events or conditions may
cause the Group to cease to continue as a
going concern.
• Evaluate the overall presentation, structure and
content of the consolidated accounts, including the
disclosures, and whether the consolidated accounts
represent the underlying transactions and events in
a manner that achieves fair presentation.
• Obtain sufficient and appropriate audit evidence
regarding the financial information of the entities or
business activities within the Group to express an
opinion on the consolidated financial statements.
We are responsible for the direction, supervision and
performance of the group audit. We remain solely
responsible for our audit opinion.
We communicate with the audit committee regarding,
among other matters, the planned scope and timing
of the audit and significant audit findings, including
any significant deficiencies in internal control that we
identify during our audit.
We also provide the audit committee with a
statement that we have complied with relevant
ethical requirements regarding independence, and to
communicate with them all relationships and other
matters that may reasonably be thought to bear on
our independence, and where applicable,
related safeguards.
From the matters communicated with the audit
committee, we determine those matters that were
of most significance in the audit of the consolidated
accounts of the current period and are therefore the
key audit matters. We describe these matters in our
auditor’s report unless law or regulation precludes
public disclosure about the matter or when, in
extremely rare circumstances, we determine that a
matter should not be communicated in our report
because the adverse consequences of doing so
would reasonably be expected to outweigh the public
interest benefits of such communication.
186

6.2 Report on other legal and regulatory requirements6.2.1 Responsibilities of the Board of DirectorsThe Board of Directors is responsible for the
preparation and the content of the director’s report
on the consolidated accounts, the separate report on
non-financial information and the other information
included in the annual report.
6.2.2 Statutory auditor’s responsibilitiesIn the context of our mandate and in accordance
with the Belgian standard (Revised) which is
complementary to the International Standards
on Auditing (ISAs) as applicable in Belgium, our
responsibility is to verify, in all material respects, the
directors’ report on the consolidated accounts and the
other information included in the annual report, and
to report on these matters.
6.2.3 Aspects related to the directors’ report on the consolidated accounts and to other information included in the annual reportIn our opinion, after having performed specific
procedures in relation to the directors’ report on the
consolidated accounts and the other information
included in the annual report, this report is consistent
with the consolidated accounts for the year under
audit, and is prepared in accordance with the
article 119 of the Companies’ Code.
In the context of our audit of the consolidated
accounts, we are also responsible for considering,
in particular based on the knowledge acquired
resulting from the audit, whether the directors’
report on the consolidated accounts and the other
information included in the annual report on the
consolidated accounts is materially misstated or
contains information which is inadequately disclosed
or otherwise misleading. In light of the procedures we
have performed, there are no material misstatements
we have to report to you. We do not express any form
of assurance conclusion on this annual report.
The non-financial information is included in a separate
report (“UCB Sustainability Report”). The report of
non-financial information contains the information
required by virtue of article 119, §2 of the Companies’
Code, and agrees with the consolidated accounts
for the same year. The Company has prepared the
non-financial information, based on the Global
Reporting Initiative (GRI) G4. However, we do not
express an opinion as to whether the non-financial
information has been prepared, in all material aspects,
in accordance with the GRI G4 as disclosed in the
consolidated accounts. Furthermore, we do not
express assurance on individual elements included in
this non-financial information.
6.2.4 Statement related to independence• We did not provide services which are incompatible
with the statutory audit of the consolidated
accounts and we remained independent of the
Company in the course of our mandate.
• The fees for additional services which are
compatible with the statutory audit of the
consolidated accounts referred to in article 134 of
the Companies’ Code are correctly disclosed and
itemized in the notes to the consolidated accounts.
6.2.4 Other statements• This report is consistent with the additional report to
the audit committee referred to in article 11 of the
Regulation (EU) N° 537/2014.
Brussels, 21 February 2018
The Statutory Auditor
PwC Reviseurs d’Entreprises sccrl /
Bedrijfsrevisoren bcvba
Represented by
Romain Seffer*
Registered Auditor
*Romain Seffer SC SPRL
Board Member, represented by its permanent representative,
Romain Seffer
187 UCB Annual Report 2017

ABBREVIATED STATUTORY FINANCIAL STATEMENTS OF UCB SA
07
Hanneke, living with osteoporosis 188

1 Introduction In accordance with the Belgian Companies Code,
it has been decided to present an abbreviated version
of the statutory financial statements of UCB SA.
The statutory financial statements of UCB SA are
prepared in accordance with Belgian Generally
Accepted Accounting Principles.
It should be noted that only the consolidated financial
statements as presented above, present a true and fair
view of the financial position and performance of the
UCB Group.
The statutory auditor has issued an unqualified
audit opinion and certify that the non-consolidated
financial statements of UCB SA for the year ended
31 December 2017 give a true and fair view of
the financial position and results of UCB SA in
accordance with all legal and regulatory dispositions.
In accordance with the legislation, these separate
financial statements, together with the management
report of the Board of Directors to the general
assembly of shareholders, as well as the auditor’s
report will be filed at the National Bank of Belgium
within the statutory periods.
These documents are available on our website
www.ucb.com or on simple request, addressed to:
UCB SA
Corporate Communication
Allée de la Recherche 60
B-1070 Brussels (Belgium)
189 UCB Annual Report 2017
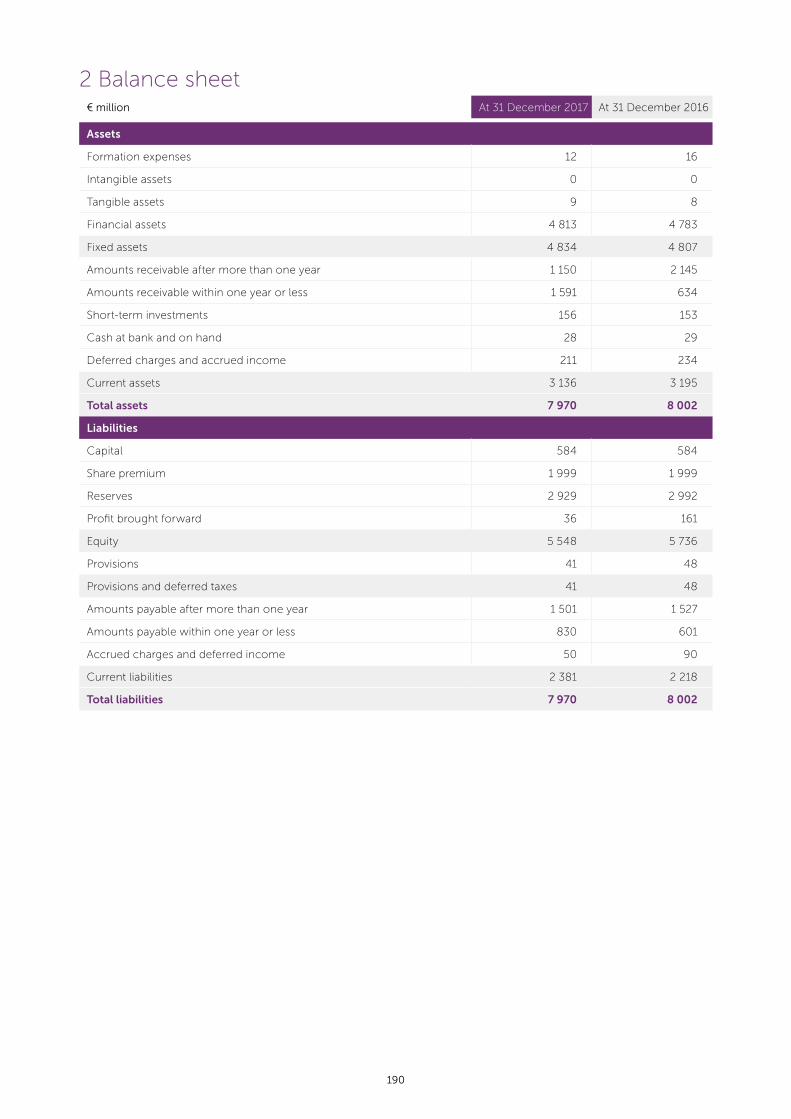
2 Balance sheet € million At 31 December 2017 At 31 December 2016
Assets
Formation expenses 12 16
Intangible assets 0 0
Tangible assets 9 8
Financial assets 4 813 4 783
Fixed assets 4 834 4 807
Amounts receivable after more than one year 1 150 2 145
Amounts receivable within one year or less 1 591 634
Short-term investments 156 153
Cash at bank and on hand 28 29
Deferred charges and accrued income 211 234
Current assets 3 136 3 195
Total assets 7 970 8 002
Liabilities
Capital 584 584
Share premium 1 999 1 999
Reserves 2 929 2 992
Profit brought forward 36 161
Equity 5 548 5 736
Provisions 41 48
Provisions and deferred taxes 41 48
Amounts payable after more than one year 1 501 1 527
Amounts payable within one year or less 830 601
Accrued charges and deferred income 50 90
Current liabilities 2 381 2 218
Total liabilities 7 970 8 002
190

3 Income statement€ million At 31 December 2017 At 31 December 2016
Operating income 77 71
Operating charges -131 -118
Operating result -54 -47
Financial income 181 473
Financial charges -91 -264
Financial result 90 209
Profit before income taxes 36 162
Income taxes 0 -1
Profit for the year available for appropriation 36 161
Following the Royal Decree of 18 December 2015
holding implementation of Directive 2013/34/EU
of 26 June 2013 on the annual and consolidated
financial statements and related reports of certain
types of undertakings, that amended the RD of
30 January 2001 implementing the Companies Code,
the exceptional results are now shown as part of
operating result or financial result depending on the
nature of the amounts.
191 UCB Annual Report 2017

4 Appropriation account € million At 31 December 2017 At 31 December 2016
Profit for the period available for appropriation 36 161
Profit brought forward from previous year 0 0
Profit to be appropriated 36 161
To legal reserve 0 0
To other reserves 0 0
Withdrawal from capital and reserves 190 59
From capital and share premium account 0 0
From reserves 190 59
Appropriation to capital and reserves 0 0
Profit to be carried forward 0 0
Result to be carried forward 0 0
Dividends -226 -220
Profit to be distributed -226 -220
If the proposed allocation of the profit is approved, the total gross dividend will be fixed at: € 1.18 € 1.15
If the proposed allocation of profit is approved and taking into account the tax regulations, the total net dividend off withholding tax per share will be fixed at:
€ 0.826 € 0.805
The activities of UCB SA generated in 2017 a net
profit of € 36 million after income taxes. The amount
available for distribution is € 36 million.
The issued share capital of UCB SA is represented
by 194 505 658 shares without par value as per
31 December 2017.
Per 31 December 2017, UCB SA owns 3 108 161
own shares in order to honour the exercise of share
options and share awards granted to the Board of
Directors and certain categories of employees.
The Board of Directors proposes to pay a gross
dividend of € 1.18 per share. If this dividend proposal
is approved by the General Meeting on 26 April 2018,
the net dividend of € 0.826 per share will be payable
as of 2 May 2018 against the delivery of coupon
#21. The shares held by UCB SA are not entitled
to a dividend. Per 31 December 2017, 191 397 497
UCB shares are entitled to a dividend, representing
a total distribution of € 226 million. This amount
may fluctuate depending the number of UCB shares
held by UCB SA on the dividend approval date. The
Board of Directors will communicate at the general
meeting the total number of UCB shares entitled to a
dividend and will submit the aggregate amount to be
distributed for approval. The annual accounts of 2017
will be adapted accordingly.
192

5 Summary of significant accounting principlesThe Board of Directors made the following decisions
in accordance with the Article 28 of the Royal
Decree of 30 January 2001 on implementing the
company code.
5.1 Tangible assetsTangible assets purchased from third parties have been
included in the balance sheet at purchase price; assets
manufactured by the company itself have been valued
at cost. The purchase price or cost is depreciated on
a straight-line basis considering “pro rata temporis”.
The depreciation rates are as follows:
• Administrative buildings 3%
• Industrial buildings 5%
• Tools 15%
• Furniture and office machinery 15%
• Vehicles 20%
• Computer equipment and office machines 33.3%
• Prototype equipment 33.3%
5.2 Financial assetsUCB shareholdings have been valued in accordance
with the proportion held in the shareholders’ equity of
the UCB companies concerned.
Shareholdings not part of the UCB companies are
valued at cost. An impairment is booked whenever the
valuation shows a permanent loss in realizable value.
5.3 Receivables and liabilitiesThey are shown at their book value. Receivables have
been written down if their repayment, when due,
is entirely or partly uncertain and doubtful.
5.4 Assets and commitments expressed in foreign currenciesForeign currency transactions are accounted
for at the exchange rates prevailing at the date of
the transactions.
Non-monetary assets and liabilities (intangible and
tangible assets, shareholdings), denominated in
foreign currencies, are translated at the foreign
exchange rate prevailing at the date of the transaction.
Monetary assets and liabilities denominated in foreign
currencies are translated at balance sheet date rate.
Realised and unrealised exchange differences on
foreign currency transactions are recognised in the
income statement.
5.5 ProvisionsAll the risks born by the company have been
the subject of provisions reviewed each year, in
accordance with the rules of prudence, good faith and
sincerity. Provisions are recorded at normal value.
5.6 Foreign currenciesDerivatives are accounted for at fair value through P&L
unless the derivative has no offsetting exposure in the
stand-alone financial statements, in which case, the
derivative will only be disclosed as off-balance sheet
commitment not affecting the balance sheet and/or
income statement accounts. The amount disclosed as
off balance sheet commitment will be in line with the
IFRS methodology. Additionally, the effective portion
of changes in the fair value of the derivative financial
instruments that are designated and qualify as cash
flow hedges, are classified on the same line in the
income statement or balance sheet as the hedged
item once the hedged item affects profit or loss or
results in the recognition of a non-financial asset
or liability.
5.7 Fair value adjustments on loans being acquiredLoans that have been acquired are recognized in
the balance sheet at nominal value. All differences
between the nominal value and the acquisition value
are recognized on an accrual account and taken in
the income statement pro rate temporis on a linear
basis over the remaining duration of the loans.
193 UCB Annual Report 2017

GLOSSARY OF TERMSCER
Constant exchange rates
Core EPS/Core earnings per share
Profit attributable to UCB shareholders, adjusted
for the after-tax impact of non-recurring items, the
financial one-off items, the non-recurring income
taxes, the after-tax contribution from discontinued
operations and the after-tax amortization of
intangibles linked to sales, divided by the non-dilutive
weighted average number of shares.
Core products
Cimzia®, Vimpat®, Keppra®, Briviact® and Neupro®.
CPM
The Corporate Performance Multiplier is one of the
2 multipliers defining the bonus payout. It is based on
the company’s meeting corporate targets.
EBIT/Earnings Before Interest and Taxes
Operating profit as mentioned in the consolidated
financial statements.
EMA/European Medicines Agency
Agency responsible for the evaluation of medicinal
products designed to protect and promote human
and animal health. www.emea.europa.eu.
EPS
Earnings per share.
Estalished brands.
Portfolio of 150 post-patent, high-quality medicines,
with proven value for patients and doctors since
many years.
FDA/U.S. Food and Drug Administration
Agency within the U.S. Department of Health
and Human Services is responsible for protecting and
promoting the nation’s health www.fda.gov.
Financial one-off items
Gains and losses arising upon the sale of non-
current financial assets (other than derivatives and
reimbursement rights with respect to defined benefit
plans) as well as impairment losses accounted for on
these financial assets are considered as financial one-
off items.
FRMC
Financial Risk Management Committee
IPM
Individual Performance Multiplier, one of the
2 multipliers defining the bonus payout. It considers
a combination of individual results achieved and
behaviors demonstrated.
KU
Kremers Urban, specialty generic pharmaceutical
company in the U.S., divested in November 2015.
LTI
Long-Term Incentives aim at motivating and retaining
key talent over a period of at least 3 years. They align
employee rewards with company and patient goals,
providing increased financial benefits as the company
grows. At UCB, this includes Stock Awards, Stock
Options and Performance Shares.
Net dividend
The amount a shareholder of UCB will receive after
principal deduction of Belgian withholding tax, which
is currently 30%. Lower withholding tax rates may be
applicable for certain categories of investors.
Net financial debt
Non-current and current borrowings, bonds and
bank overdrafts less available for sale debt securities,
restricted cash deposit with respect to financial lease
agreements, cash and cash equivalents.
OCI
Other comprehensive income
PBM
Pharmacy Benefit Manager
PGTCS
Primary generalized tonic-clonic seizures.
PMDA/PHARMACEUTICALS AND MEDICAL
DEVICES AGENCY
Japanese regulatory agency in charge of protecting
the public health by assuring safety, efficacy and
quality of pharmaceuticals and medical devices. http://
www.pmda.go.jp/english.
194
POS
Partial onset seizures, also known as focal seizures.
PSP
Performance Share Plan which awards a grant of
UCB common stock to qualifying executives. The
awards vest three years after grant, pending certain
conditions, including meeting pre-established
companywide targets.
Recurring EBIT (REBIT)
Operating profit adjusted for impairment charges,
restructuring expenses, and other income
and expenses.
Recurring EBITDA (REBITDA/Recurring
Earnings Before Interest, Taxes, Depreciation
and Amortization charges)
Operating profit adjusted for amortization,
depreciation, impairment charges, restructuring
expenses and other income and expenses.
Risk2Value
This ability to consider risk – upside and downside,
and to take risk-informed rather than risk constrained
decisions when planning and implementing patient
value strategies is what we call”.
Weighted average number of ordinary shares
Number of ordinary shares outstanding at the
beginning of a given period, adjusted by the number
of shares bought back or issued during the period,
multiplied by a time-weighting factor.
Working capital
Includes inventories, trade and other receivables
and trade and other payables, both due within
and after 12 months.
REFERENCESImmunology pages
1. Mayo Clinic. Psoriasis Overview. http://www.
mayoclinic.org/diseases-conditions/psoriasis/
basics/definition/con-20030838 - Accessed 23
January 2018
2. IFPA - International Federation of Psoriasis
Association - Facts about psoriasis - Available on
http://www.worldpsoriasisday.com/web/page.
aspx?refid=130 - Accessed 6 February 2018
Neurology pages
1. United Nation news centre. - http://
www.un.org/apps/news/story.
asp?newsid=21689&cr=neurological#.
WmcVqmyouUm - Accessed 23 January 2018
2. National Institute of Neurological Disorders and
Stroke - https://www.ninds.nih.gov/Disorders/
Patient-Caregiver-Education/Hope-Through-
Research/Epilepsies-and-Seizures-Hope-
Through#3109_8 Accessed 23 January 2018
3. Epilepsy Foundation - https://www.epilepsy.
com/learn/about-epilepsy-basics/what-epilepsy -
Accessed 13 February 2018
4. Kwan P., Brodie M.J. - Early identification of
refractory epilepsy - New England Journal of
Medicine 2000; 342(5):314–9
Bone pages
1. International Osteoporosis Foundation - What
you need to know about osteoporosis factsheet -
https://www.iofbonehealth.org/sites/default/files/
media/PDFs/Fact%20Sheets/fact_sheet-what_you_
need_to_know_about_osteoporosis.pdf - Accessed
6 February 2018
2. International Osteoporosis Foundation - The
Global Burden of Osteoporosis - https://www.
iofbonehealth.org/sites/default/files/media/PDFs/
Fact%20Sheets/2014-factsheet-osteoporosis-A4.pdf
- Accessed 23 January 2018
3. New England Journal of Medicine 2016; 375(16):
1532-1543 20
4. New England Journal of Medicine 2017; 377(15):
1417-1427
5. Arthritis and Rheumatology 2016; 68(Suppl10): 321
6. Lancet 2017; 390 (10102): 1585-1594
7. Nguyen TV, Center JR, Eisman JA (2004)
Osteoporosis: underrated, underdiagnosed and
undertreated. Med J Aust 180:S18.
195 UCB Annual Report 2017
Financial calendar25 April 2018 Interim report (3 months)
26 April 2018 Annual general meeting
26 July 2018 2018 half-year financial results
Forward-looking statements
This Annual Report contains forward-looking
statements, including, without limitation, statements
containing the words “believes”, “anticipates”,
“expects”, “intends”, “plans”, “seeks”, “estimates”, “may”,
“will”, and “continue” and similar expressions. These
forward-looking statements are based on current
plans, estimates and beliefs of management. By their
nature, such forward-looking statements are not
guarantees of future performance and are subject
to known and unknown risks, uncertainties, and
assumptions which might cause the actual results,
financial condition, performance or achievements
of UCB, or industry results, to be materially different
from any future results, performance, or achievements
expressed or implied by such forward-looking
statements contained in this Annual Report.
Important factors that could result in such differences
include but are not limited to: changes in general
economic, business and competitive conditions, the
inability to obtain necessary regulatory approvals or
to obtain them on acceptable terms, costs associated
with research and development, changes in the
prospects for products in the pipeline or under
development by UCB, effects of future judicial
decisions or governmental investigations, product
liability claims, challenges to patent protection for
products or product candidates, changes in laws or
regulations, exchange rate fluctuations, changes or
uncertainties in tax laws or the administration of such
laws and hiring and retention of its employees. There
is no guarantee that new product candidates in the
pipeline will progress to product approval or that new
indications for existing products will be developed and
approved. Products or potential products which are
the subject of partnerships, joint ventures or licensing
collaborations may be subject to differences between
the partners. Also, UCB or others could discover
safety, side effects or manufacturing problems with
its products after they are marketed. Moreover, sales
may be impacted by international and domestic
trends toward managed care and health care cost
containment and the reimbursement policies imposed
by third-party payers as well as legislation affecting
biopharmaceutical pricing and reimbursement.
Given these uncertainties, the public is cautioned
not to place any undue reliance on such forward-
looking statements. These forward-looking statements
are made only as of the date of this Annual Report.
UCB expressly disclaims any obligation to update
any such forward-looking statements in this Annual
Report to reflect any change in its expectations with
regard thereto or any change in events, conditions,
for circumstances on which any such statement is
based, unless such statement is required pursuant to
applicable laws and regulations.
Report languagePursuant to Belgian Law, UCB is required to prepare
its Annual Report in French and Dutch. UCB has also
made this report available in English.
Availability of the Annual ReportThe Annual Report is available on the investor
website of UCB (https://www.ucb.com/investors).
It is complemented by a separate Sustainability
Report, containing non-financial information, which
is available on the CSR section of the UCB website
(https://www.ucb.com/our-company/csr).
Other information on the website of UCB or on any
other website, does not form part of this Annual
Report..
196

ContactInvestor Relations
Antje Witte,
VP Investor Relations
Tel.: +32 2 559 9414
E-mail: [email protected]
Communications
France Nivelle,
VP Global Communication
and Change Support
Tel.: +32 2 559 9178
E-mail: [email protected]
Corporate Societal Responsibility
Dirk Teuwen,
VP Corporate
Societal Responsibility
Tel.: +32 2 559 9161
E-mail: [email protected]
197 UCB Annual Report 2017


![Review Viral clearance for biopharmaceutical downstream ... · Viral clearance for biopharmaceutical downstream processes ... [13]. Hence a panel of ... Viral clearance for biopharmaceutical](https://img.pdfslide.net/doc/110x75/5ad5f65c7f8b9a5d058dd2b7/review-viral-clearance-for-biopharmaceutical-downstream-clearance-for-biopharmaceutical.jpg)