Embed Size (px)
Citation preview
231
Letter from the Chair of the Compensation Committee 232
Compensation design 237
Compensation governance 239
Executive Board compensation for 2018 241
ExecutiveBoardcompensation designfor 2019 249
Board of Directors compensation 251
Group compensation 255
Report of the Statutory Auditor 264
V – Compensation
232 Compensation
Compensation
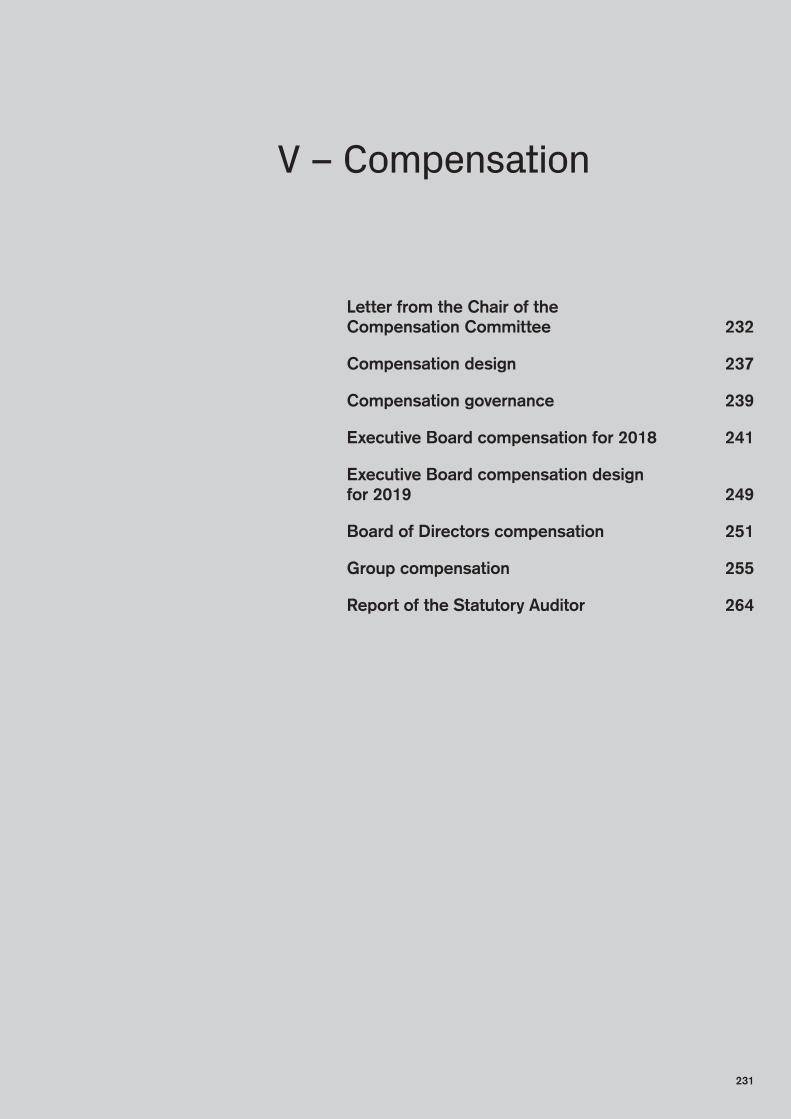
Letter from the Chair of the Compensation Committee
Kai S. NargolwalaChair of the Compensation Committee
Dear shareholders
As Chair of the Compensation Committee of the Board of Direc-tors (Compensation Committee), I am pleased to present to you the 2018 Compensation Report. The changes that we introduced last year to the structure and presentation of the report were well received, and we have retained and built on this approach for the 2018 Compensation Report.
Key compensation and performance highlights
For 2018, the Compensation Committee reviewed not only the performance during the year, but also the level of achievement of the three-year restructuring program over the years 2016, 2017 and 2018. When the program was announced in October 2015, there were three main objectives. Firstly, there were some urgent matters to be addressed, namely the capital position, the abso-lute level of risk, and the cost base. Secondly, the Group defined
a strategy to be a leading wealth manager with strong invest-ment banking capabilities for sustainable, compliant and profitable growth. Thirdly, the goal was to significantly upgrade our risk and compliance controls and to improve our culture. Some of the ways in which senior management has successfully addressed these objectives are reflected in the table and charts below, as well as in the following Group performance highlights: p Achieved first annual post-tax profit since 2014, with
CHF 2.02 billion of net income attributable to shareholders; p Significantly strengthened the Group’s capital position, with
a look-through common equity tier 1 (CET1) ratio of 12.6% at the end of 2018 compared with 11.4% at the end of 2015, and as demonstrated by the launch of the Group’s share buy-back program of up to CHF 1.5 billion for 2019;
p Reduced the adjusted operating cost base by CHF 4.6 billion since 2015, exceeding the target of costs below CHF 17 bil-lion for 2018. This protected the Group’s returns and profit-ability as revenues came under pressure in the second half of 2018 due to market conditions;
p Successfully closed the Strategic Resolution Unit and sig-nificantly de-risked the Global Markets businesses, which positioned the Group well to weather the widening of credit spreads in the fourth quarter of 2018;
p Rebalanced the Group’s activities to shift capital towards the Wealth Management-related and Investment Banking & Capi-tal Markets businesses, which typically generate higher returns and are less volatile; and
p Took a number of steps to improve risk and compliance controls, including increasing our headcount in compliance, decreasing the number of high severity compliance incidents, implementing a single client view, and introducing other mea-sures focused on further enhancing the conduct and ethics culture of the Group.
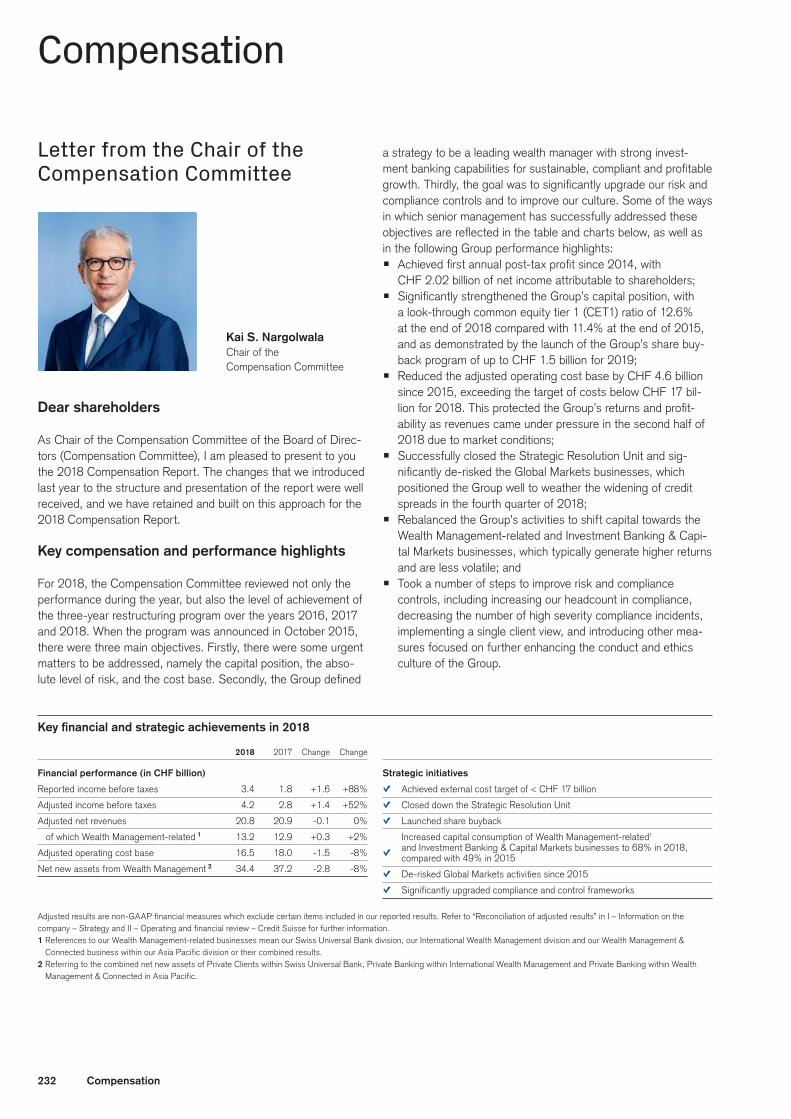
Keyfinancialandstrategicachievementsin2018
2018 2017 Change Change
Financial performance (in CHF billion)
Reported income before taxes 3.4 1.8 +1.6 +88%
Adjusted income before taxes 4.2 2.8 +1.4 +52%
Adjusted net revenues 20.8 20.9 -0.1 0%
of which Wealth Management-related 1 13.2 12.9 +0.3 +2%
Adjusted operating cost base 16.5 18.0 -1.5 -8%
Net new assets from Wealth Management 2 34.4 37.2 -2.8 -8%
Strategic initiatives
Ç Achieved external cost target of < CHF 17 billion
Ç Closed down the Strategic Resolution Unit
Ç Launched share buyback
Increased capital consumption of Wealth Management-related1 and Investment Banking & Capital Markets businesses to 68% in 2018, Ç compared with 49% in 2015
Ç De-risked Global Markets activities since 2015
Ç Significantly upgraded compliance and control frameworks
Adjusted results are non-GAAP financial measures which exclude certain items included in our reported results. Refer to “Reconciliation of adjusted results” in I – Information on the company – Strategy and II – Operating and financial review – Credit Suisse for further information.1 References to our Wealth Management-related businesses mean our Swiss Universal Bank division, our International Wealth Management division and our Wealth Management &
Connected business within our Asia Pacific division or their combined results.2 Referring to the combined net new assets of Private Clients within Swiss Universal Bank, Private Banking within International Wealth Management and Private Banking within Wealth
Management & Connected in Asia Pacific.
233Compensation
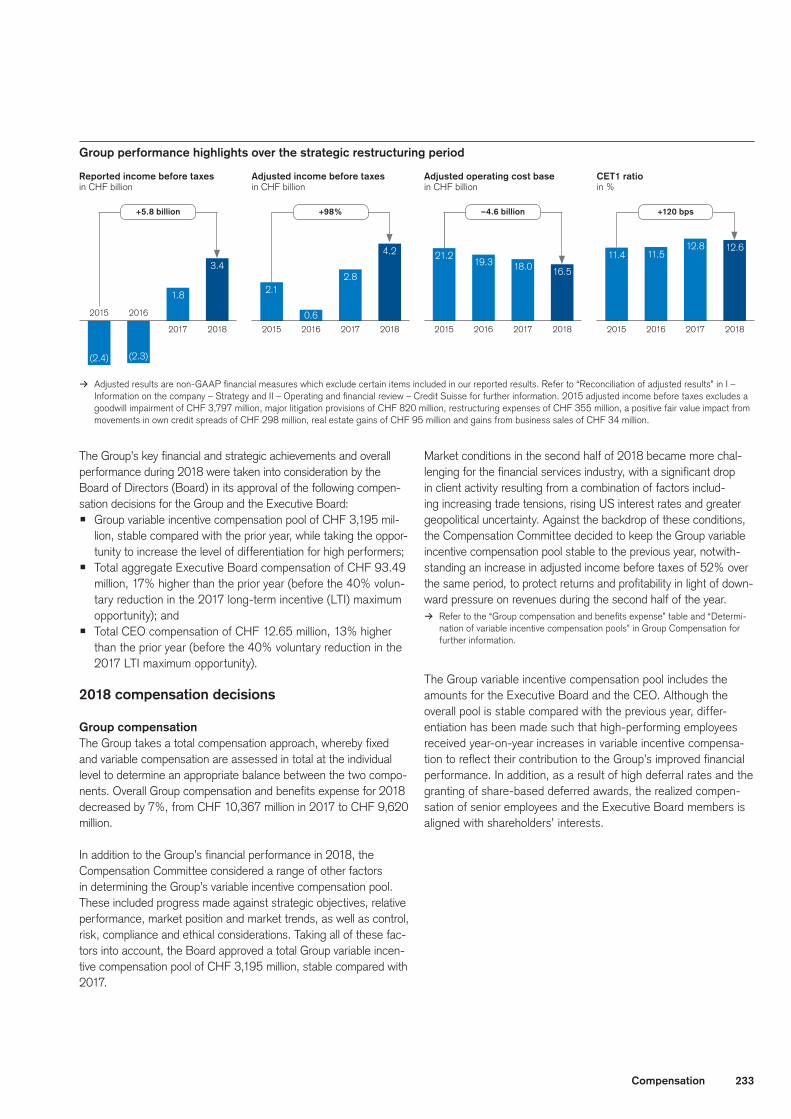
+5.8 billion +98% –4.6 billion +120 bps
Reported income before taxes in CHF billion
Adjusted operating cost base in CHF billion
Adjusted income before taxes in CHF billion
CET1 ratio in %
Group performance highlights over the strategic restructuring period
(2.4)
2.1
21.2 11.4
(2.3)
0.6
19.311.5
1.8
2.818.0
12.8
3.4
4.2
16.5
12.6
2015
2015 2015 2015
2016
2016 2016 20162017 2017 2017 20172018 2018 2018 2018
> Adjusted results are non-GAAP financial measures which exclude certain items included in our reported results. Refer to “Reconciliation of adjusted results” in I – Information on the company – Strategy and II – Operating and financial review – Credit Suisse for further information. 2015 adjusted income before taxes excludes a goodwill impairment of CHF 3,797 million, major litigation provisions of CHF 820 million, restructuring expenses of CHF 355 million, a positive fair value impact from movements in own credit spreads of CHF 298 million, real estate gains of CHF 95 million and gains from business sales of CHF 34 million.
The Group’s key financial and strategic achievements and overall performance during 2018 were taken into consideration by the Board of Directors (Board) in its approval of the following compen-sation decisions for the Group and the Executive Board: p Group variable incentive compensation pool of CHF 3,195 mil-
lion, stable compared with the prior year, while taking the oppor-tunity to increase the level of differentiation for high performers;
p Total aggregate Executive Board compensation of CHF 93.49 million, 17% higher than the prior year (before the 40% volun-tary reduction in the 2017 long-term incentive (LTI) maximum opportunity); and
p Total CEO compensation of CHF 12.65 million, 13% higher than the prior year (before the 40% voluntary reduction in the 2017 LTI maximum opportunity).
2018 compensation decisions
Group compensationThe Group takes a total compensation approach, whereby fixed and variable compensation are assessed in total at the individual level to determine an appropriate balance between the two compo-nents. Overall Group compensation and benefits expense for 2018 decreased by 7%, from CHF 10,367 million in 2017 to CHF 9,620 million.
In addition to the Group’s financial performance in 2018, the Compensation Committee considered a range of other factors in determining the Group’s variable incentive compensation pool. These included progress made against strategic objectives, relative performance, market position and market trends, as well as control, risk, compliance and ethical considerations. Taking all of these fac-tors into account, the Board approved a total Group variable incen-tive compensation pool of CHF 3,195 million, stable compared with 2017.
Market conditions in the second half of 2018 became more chal-lenging for the financial services industry, with a significant drop in client activity resulting from a combination of factors includ-ing increasing trade tensions, rising US interest rates and greater geopolitical uncertainty. Against the backdrop of these conditions, the Compensation Committee decided to keep the Group variable incentive compensation pool stable to the previous year, notwith-standing an increase in adjusted income before taxes of 52% over the same period, to protect returns and profitability in light of down-ward pressure on revenues during the second half of the year.
> Refer to the “Group compensation and benefits expense” table and “Determi-nation of variable incentive compensation pools” in Group Compensation for further information.
The Group variable incentive compensation pool includes the amounts for the Executive Board and the CEO. Although the overall pool is stable compared with the previous year, differ-entiation has been made such that high-performing employees received year-on-year increases in variable incentive compensa-tion to reflect their contribution to the Group’s improved financial performance. In addition, as a result of high deferral rates and the granting of share-based deferred awards, the realized compen-sation of senior employees and the Executive Board members is aligned with shareholders’ interests.
234 Compensation
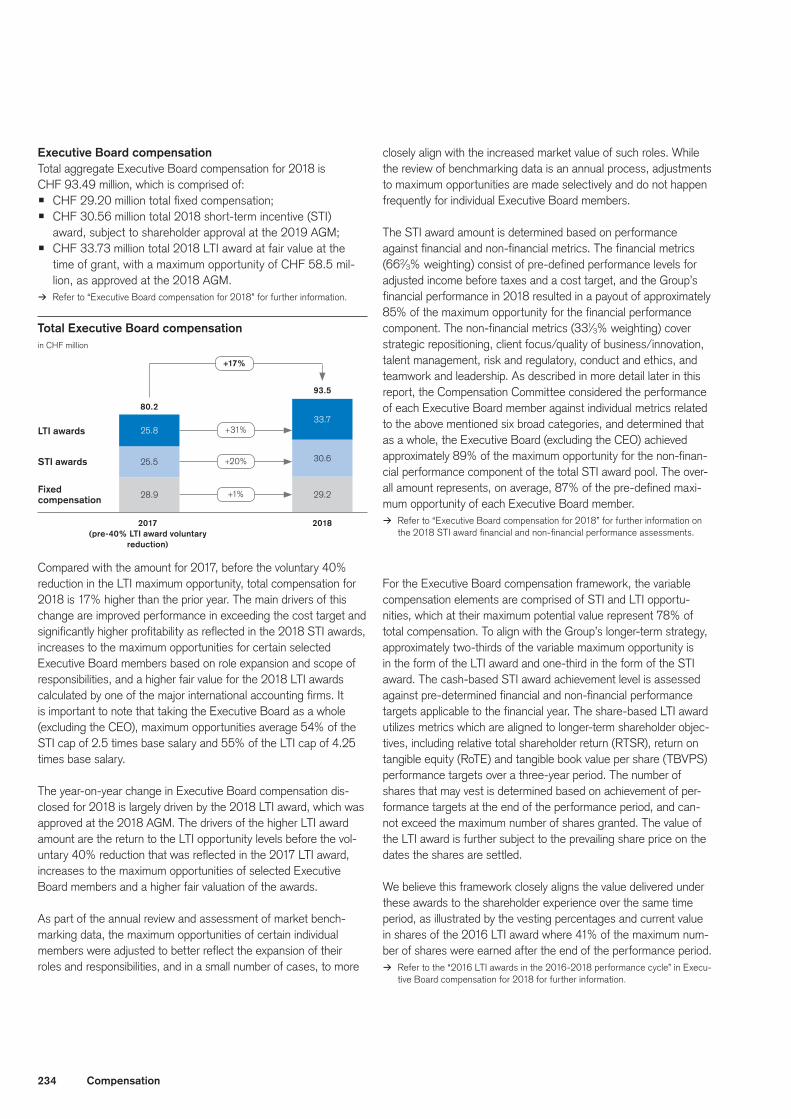
Total Executive Board compensation in CHF million
+1%
+20%
+31%
30.6
33.7
25.5
80.2
93.5
25.8
28.9Fixed compensation
STI awards
LTI awards
29.2
+17%
2017 (pre-40% LTI award voluntary
reduction)
2018
Executive Board compensationTotal aggregate Executive Board compensation for 2018 is CHF 93.49 million, which is comprised of: p CHF 29.20 million total fixed compensation; p CHF 30.56 million total 2018 short-term incentive (STI)
award, subject to shareholder approval at the 2019 AGM; p CHF 33.73 million total 2018 LTI award at fair value at the
time of grant, with a maximum opportunity of CHF 58.5 mil-lion, as approved at the 2018 AGM.
> Refer to “Executive Board compensation for 2018” for further information.
Compared with the amount for 2017, before the voluntary 40% reduction in the LTI maximum opportunity, total compensation for 2018 is 17% higher than the prior year. The main drivers of this change are improved performance in exceeding the cost target and significantly higher profitability as reflected in the 2018 STI awards, increases to the maximum opportunities for certain selected Executive Board members based on role expansion and scope of responsibilities, and a higher fair value for the 2018 LTI awards calculated by one of the major international accounting firms. It is important to note that taking the Executive Board as a whole (excluding the CEO), maximum opportunities average 54% of the STI cap of 2.5 times base salary and 55% of the LTI cap of 4.25 times base salary.
The year-on-year change in Executive Board compensation dis-closed for 2018 is largely driven by the 2018 LTI award, which was approved at the 2018 AGM. The drivers of the higher LTI award amount are the return to the LTI opportunity levels before the vol-untary 40% reduction that was reflected in the 2017 LTI award, increases to the maximum opportunities of selected Executive Board members and a higher fair valuation of the awards.
As part of the annual review and assessment of market bench-marking data, the maximum opportunities of certain individual members were adjusted to better reflect the expansion of their roles and responsibilities, and in a small number of cases, to more
closely align with the increased market value of such roles. While the review of benchmarking data is an annual process, adjustments to maximum opportunities are made selectively and do not happen frequently for individual Executive Board members.
The STI award amount is determined based on performance against financial and non-financial metrics. The financial metrics (662⁄3% weighting) consist of pre-defined performance levels for adjusted income before taxes and a cost target, and the Group’s financial performance in 2018 resulted in a payout of approximately 85% of the maximum opportunity for the financial performance component. The non-financial metrics (331⁄3% weighting) cover strategic repositioning, client focus/quality of business/innovation, talent management, risk and regulatory, conduct and ethics, and teamwork and leadership. As described in more detail later in this report, the Compensation Committee considered the performance of each Executive Board member against individual metrics related to the above mentioned six broad categories, and determined that as a whole, the Executive Board (excluding the CEO) achieved approximately 89% of the maximum opportunity for the non-finan-cial performance component of the total STI award pool. The over-all amount represents, on average, 87% of the pre-defined maxi-mum opportunity of each Executive Board member.
> Refer to “Executive Board compensation for 2018” for further information on the 2018 STI award financial and non-financial performance assessments.
For the Executive Board compensation framework, the variable compensation elements are comprised of STI and LTI opportu-nities, which at their maximum potential value represent 78% of total compensation. To align with the Group’s longer-term strategy, approximately two-thirds of the variable maximum opportunity is in the form of the LTI award and one-third in the form of the STI award. The cash-based STI award achievement level is assessed against pre-determined financial and non-financial performance targets applicable to the financial year. The share-based LTI award utilizes metrics which are aligned to longer-term shareholder objec-tives, including relative total shareholder return (RTSR), return on tangible equity (RoTE) and tangible book value per share (TBVPS) performance targets over a three-year period. The number of shares that may vest is determined based on achievement of per-formance targets at the end of the performance period, and can-not exceed the maximum number of shares granted. The value of the LTI award is further subject to the prevailing share price on the dates the shares are settled.
We believe this framework closely aligns the value delivered under these awards to the shareholder experience over the same time period, as illustrated by the vesting percentages and current value in shares of the 2016 LTI award where 41% of the maximum num-ber of shares were earned after the end of the performance period.
> Refer to the “2016 LTI awards in the 2016-2018 performance cycle” in Execu-tive Board compensation for 2018 for further information.
235Compensation
CEO compensationFollowing a review of Executive Board compensation at the beginning of 2018, the Compensation Committee considered the overall Executive Board compensation design to be appropriate, but recommended an adjustment, which was approved by the Board, to increase the Group CEO’s STI maximum opportunity by CHF 1.0 million, from 1.5 times base salary to 1.83 times base salary for 2018. This adjustment is designed to acknowledge the strong performance of Mr. Thiam over the course of his tenure to date and the successful execution of the three-year restructuring program. It represents the first change to Mr. Thiam’s maximum opportunity levels since his appointment in 2015. Aside from the CEO, no changes were made to the overall cap on the 2018 STI maximum opportunity for the Executive Board.
Mr. Thiam’s proposed total compensation for 2018 of CHF 12.65 million is 13% higher than it was for the prior year, before the vol-untary reduction in his 2017 LTI award. This is mainly driven by improved performance, the increase in his STI award maximum opportunity and the higher fair value for the 2018 LTI award, with no change to the LTI maximum opportunity.
> Refer to “Compensation of the CEO and the highest paid Executive Board member” in Executive Board compensation for 2018 for further information.
Board of Directors compensationNo changes were made to the Board’s compensation framework for 2018, which continues to be based on a fixed fee structure with pre-defined fees for Board membership, committee mem-bership and chairing a committee. The fee amounts are set at levels comparable with those at other leading Swiss companies and global financial services firms. With the exception of the Chairman, 50% of the Group-level Board fees are paid in Group shares, subject to blocking restrictions for four years. In line with industry practice, Board fees are not linked to the financial perfor-mance of the Group. Fees for specific Board leadership roles are reviewed periodically and adjusted as required. Base Board fees have been unchanged for over 10 years. In the past few years, the Chairman has voluntarily waived all or part of his chair fee. For the 2018 AGM to 2019 AGM period, the Chairman’s com-pensation has returned to the previously approved level, in light of the completion of the Group’s restructuring program and return to profitability. Total board fees, including subsidiary board fees, for the 2018 AGM to 2019 AGM period are within the approved amount and 2% higher than the prior period, primarily reflecting an additional Board member.
> Refer to “Board of Directors compensation” for further information.
Annual review of our compensation framework
During 2018, the Compensation Committee conducted its annual review of the overall compensation framework at Credit Suisse, to ensure that it remains fit for purpose and aligned with the objec-tives of our compensation strategy. In particular, the Compensa-tion Committee assessed the extent to which the framework (i) aligns pay and performance, (ii) supports a performance culture
based on merit, (iii) attracts, retains, rewards and motivates the talented individuals needed for our long-term success as a client-focused and capital-efficient business, (iv) recognizes and rewards excellent short- and long-term performance, and (v) aligns with the Group’s values. In addition, the Compensation Committee reviewed market developments to assess whether current practices remain appropriately competitive. As a result of this review, it determined that the overall compensation frame-work continues to be appropriate for 2019. No changes to its structure are therefore proposed, aside from updating some of the STI performance metrics and performance target levels for the STI and LTI awards in relation to the Executive Board.
2019 STI and LTI awardsFor the 2019 STI awards, we have updated the measures to more appropriately reflect the Group’s strategy after the restructuring period and the achievement of our previously communicated cost target in 2018. As such, the performance criteria for the 2019 STI awards will consist of adjusted income before taxes (331⁄3% weighting), reported RoTE (331⁄3% weighting) and a non-financial assessment (331⁄3% weighting). RoTE is a key measure of return generation and therefore its inclusion as a performance metric for the STI award, focused on the 2019 financial year, comple-ments the RoTE measure in the LTI award which is measured as an average over a three-year period. Following the successful completion of our three-year cost reduction program, cost man-agement remains an important aspect of our strategy and will be captured by the adjusted income before taxes metric rather than a specific cost target. This update of the performance metrics ensures that management is focused on, and will be rewarded for, successful delivery of our key priorities for 2019.
For the 2019 LTI awards, no changes have been made to the design or the performance metrics, since they continue to reflect the longer-term strategy of the Group. However, the AGM pro-posal put forward for shareholder approval will be based on the fair value of the 2019 LTI awards at grant date, instead of the maximum opportunity. The rationale for using fair value as the basis for shareholder approval is to align the proposal with the disclosure of Executive Board compensation in the Compensation Report. In addition, the fair value of the LTI awards is closer to the historical vesting of such awards than the maximum opportunity. The AGM invitation and accompanying materials will continue to contain the same level of information regarding the LTI award proposal as provided previously.
Following the recently announced changes to the composition of the Executive Board, the aggregate maximum opportunity for the 2019 LTI awards will be CHF 57.5 million, slightly below the 2018 level, resulting from modifications to the scope of the roles for the incoming members. Further, the two departing Executive Board members will not be granted any entitlements they have with respect to the 2019 STI and LTI awards in their roles as Execu-tive Board members.
236 Compensation
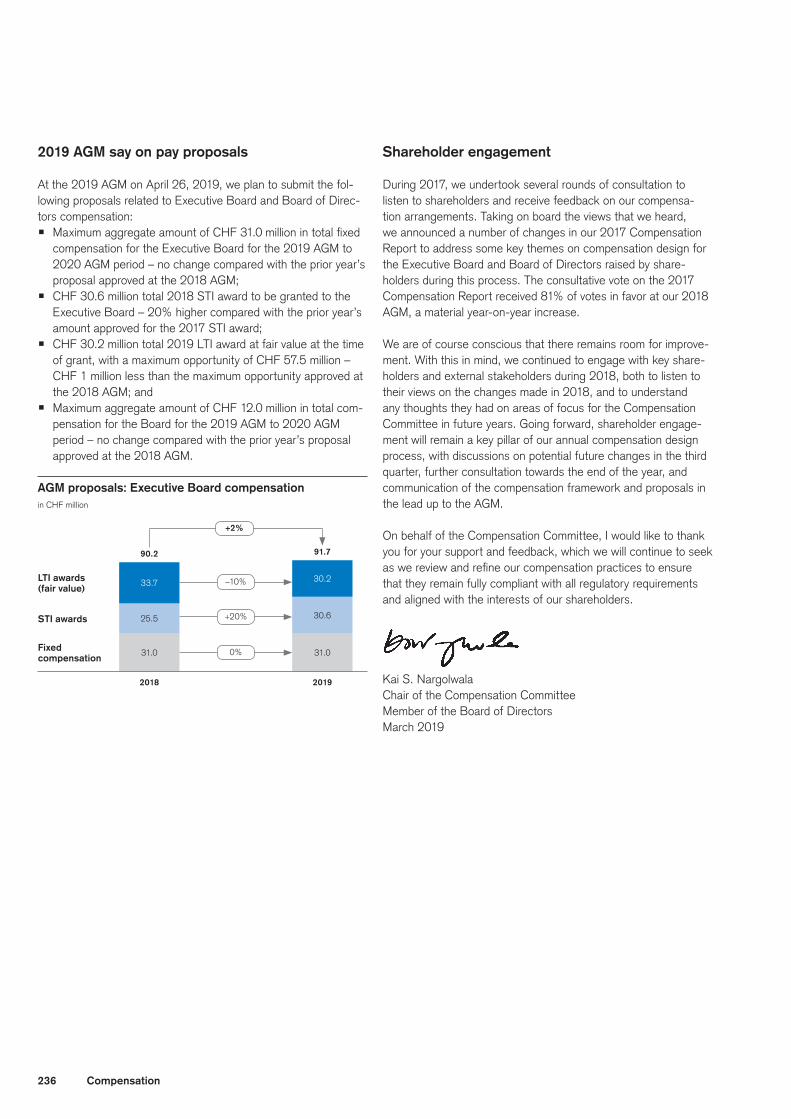
AGM proposals: Executive Board compensationin CHF million
0%
+20%
–10%
30.6
30.2
25.5
33.7
31.0
STI awards
LTI awards (fair value)
31.0
2018 2019
90.2 91.7
+2%
Fixed compensation
2019 AGM say on pay proposals
At the 2019 AGM on April 26, 2019, we plan to submit the fol-lowing proposals related to Executive Board and Board of Direc-tors compensation:p Maximum aggregate amount of CHF 31.0 million in total fixed
compensation for the Executive Board for the 2019 AGM to 2020 AGM period – no change compared with the prior year’s proposal approved at the 2018 AGM;
p CHF 30.6 million total 2018 STI award to be granted to the Executive Board – 20% higher compared with the prior year’s amount approved for the 2017 STI award;
p CHF 30.2 million total 2019 LTI award at fair value at the time of grant, with a maximum opportunity of CHF 57.5 million – CHF 1 million less than the maximum opportunity approved at the 2018 AGM; and
p Maximum aggregate amount of CHF 12.0 million in total com-pensation for the Board for the 2019 AGM to 2020 AGM period – no change compared with the prior year’s proposal approved at the 2018 AGM.
Shareholder engagement
During 2017, we undertook several rounds of consultation to listen to shareholders and receive feedback on our compensa-tion arrangements. Taking on board the views that we heard, we announced a number of changes in our 2017 Compensation Report to address some key themes on compensation design for the Executive Board and Board of Directors raised by share-holders during this process. The consultative vote on the 2017 Compensation Report received 81% of votes in favor at our 2018 AGM, a material year-on-year increase.
We are of course conscious that there remains room for improve-ment. With this in mind, we continued to engage with key share-holders and external stakeholders during 2018, both to listen to their views on the changes made in 2018, and to understand any thoughts they had on areas of focus for the Compensation Committee in future years. Going forward, shareholder engage-ment will remain a key pillar of our annual compensation design process, with discussions on potential future changes in the third quarter, further consultation towards the end of the year, and communication of the compensation framework and proposals in the lead up to the AGM.
On behalf of the Compensation Committee, I would like to thank you for your support and feedback, which we will continue to seek as we review and refine our compensation practices to ensure that they remain fully compliant with all regulatory requirements and aligned with the interests of our shareholders.
Kai S. NargolwalaChair of the Compensation CommitteeMember of the Board of DirectorsMarch 2019
237Compensation
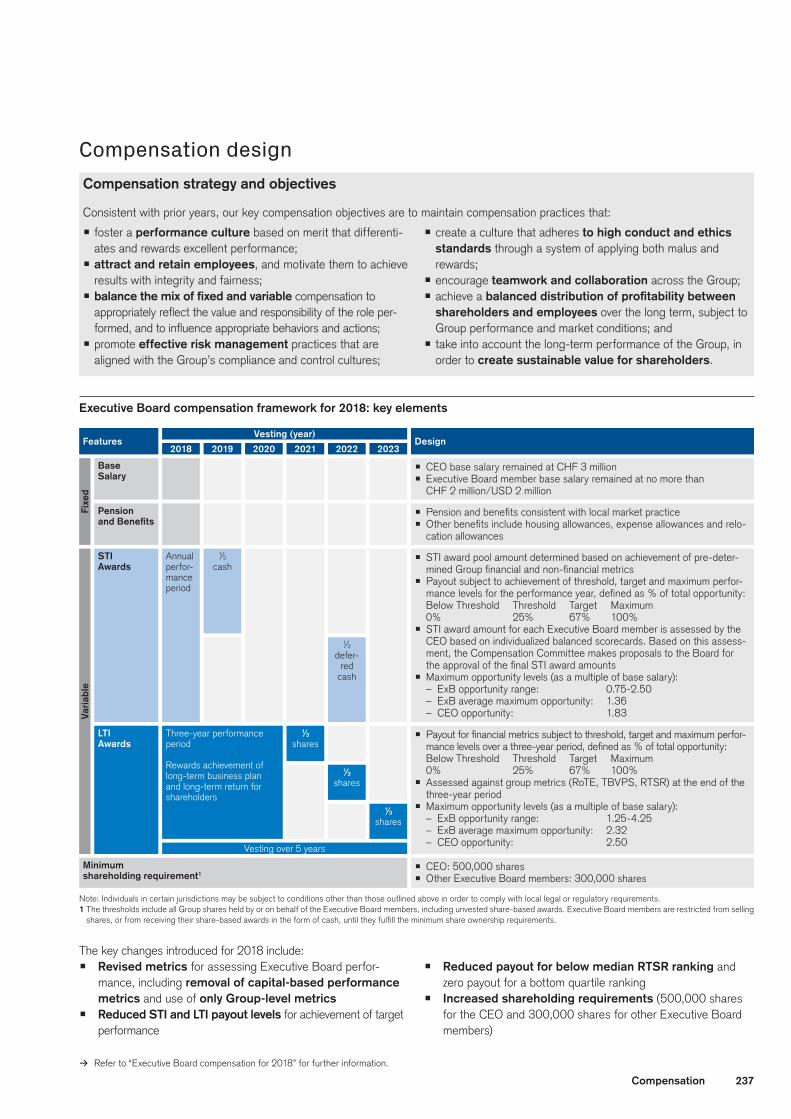
Features DesignVesting (year)
2018 2019 2020 2021 2022 2023
Base Salary
Pension andBenefits
STI Awards
LTI Awards
Minimum shareholding requirement1
Annual perfor-mance period
Three-year performance period Rewards achievement of long-term business plan and long-term return for shareholders
1⁄2 cash
1⁄3 shares
1⁄3 shares
1⁄3 shares
1⁄2 defer-
red cash
p CEO base salary remained at CHF 3 million p Executive Board member base salary remained at no more than
CHF 2 million/USD 2 million
p Pension and benefits consistent with local market practicep Other benefits include housing allowances, expense allowances and relo-
cation allowances
p Payout for financial metrics subject to threshold, target and maximum perfor-mance levels over a three-year period, defined as % of total opportunity: Below Threshold Threshold Target Maximum 0% 25% 67% 100%
p Assessed against group metrics (RoTE, TBVPS, RTSR) at the end of the three-year period
p Maximum opportunity levels (as a multiple of base salary):– ExB opportunity range: 1.25-4.25– ExB average maximum opportunity: 2.32– CEO opportunity: 2.50
p CEO: 500,000 sharesp Other Executive Board members: 300,000 shares
Fixe
dVa
riab
le
Vesting over 5 years
Note: Individuals in certain jurisdictions may be subject to conditions other than those outlined above in order to comply with local legal or regulatory requirements.1 The thresholds include all Group shares held by or on behalf of the Executive Board members, including unvested share-based awards. Executive Board members are restricted from selling
shares, or from receiving their share-based awards in the form of cash, until they fulfill the minimum share ownership requirements.
p STI award pool amount determined based on achievement of pre-deter-mined Group financial and non-financial metrics
p Payout subject to achievement of threshold, target and maximum perfor-mance levels for the performance year, defined as % of total opportunity: Below Threshold Threshold Target Maximum 0% 25% 67% 100%
p STI award amount for each Executive Board member is assessed by the CEO based on individualized balanced scorecards. Based on this assess-ment, the Compensation Committee makes proposals to the Board for the approval of the final STI award amounts
p Maximum opportunity levels (as a multiple of base salary):– ExB opportunity range: 0.75-2.50– ExB average maximum opportunity: 1.36– CEO opportunity: 1.83
Compensation design Compensation strategy and objectives
Consistent with prior years, our key compensation objectives are to maintain compensation practices that:
p foster a performance culture based on merit that differenti-ates and rewards excellent performance;
p attract and retain employees, and motivate them to achieve results with integrity and fairness;
p balance the mix of fixed and variable compensation to appropriately reflect the value and responsibility of the role per-formed, and to influence appropriate behaviors and actions;
p promote effective risk management practices that are aligned with the Group’s compliance and control cultures;
p create a culture that adheres to high conduct and ethics standards through a system of applying both malus and rewards;
p encourage teamwork and collaboration across the Group; p achieve a balanceddistributionofprofitabilitybetween
shareholders and employees over the long term, subject to Group performance and market conditions; and
p take into account the long-term performance of the Group, in order to create sustainable value for shareholders.
Executive Board compensation framework for 2018: key elements
The key changes introduced for 2018 include: p Revised metrics for assessing Executive Board perfor-
mance, including removal of capital-based performance metrics and use of only Group-level metrics
p Reduced STI and LTI payout levels for achievement of target performance
p Reduced payout for below median RTSR ranking and zero payout for a bottom quartile ranking
p Increased shareholding requirements (500,000 shares for the CEO and 300,000 shares for other Executive Board members)
> Refer to “Executive Board compensation for 2018” for further information.
238 Compensation
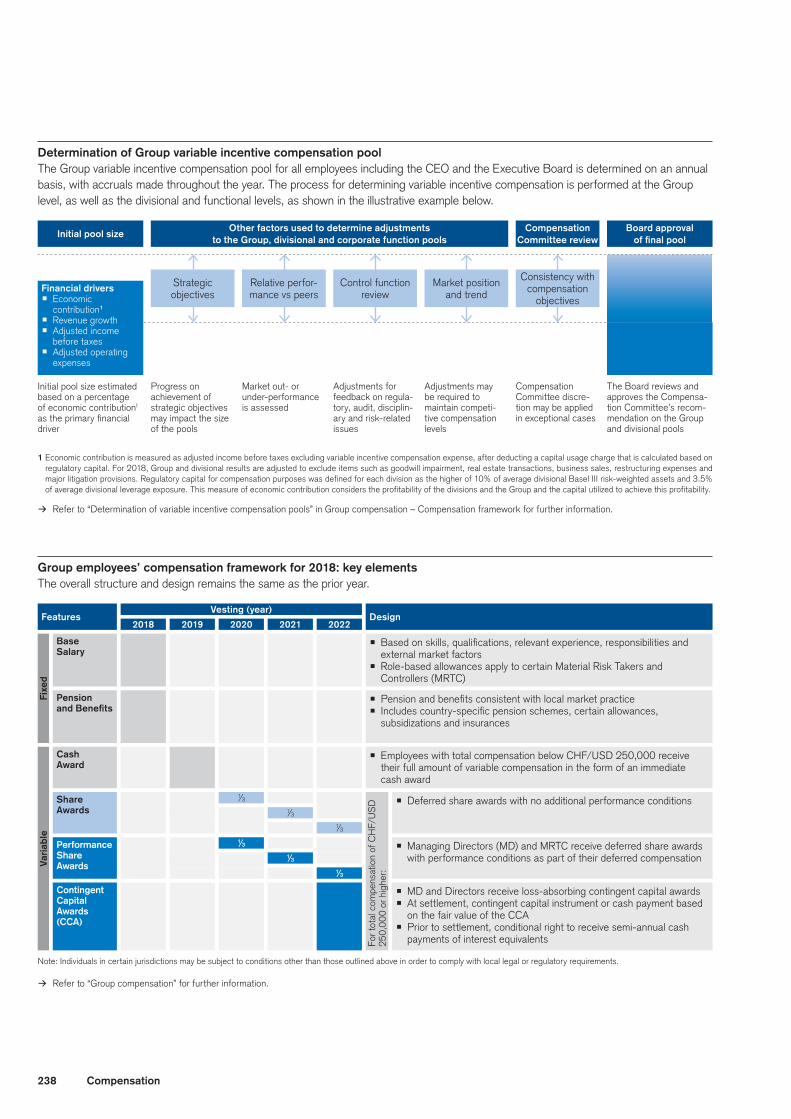
Financial driversp Economic
contribution1
p Revenue growth p Adjusted income
before taxesp Adjusted operating
expenses
Initial pool size
Initial pool size estimated based on a percentage of economic contribution1 as the primary financial driver
Progress on achievement of strategic objectives may impact the size of the pools
Market out- or under-performance is assessed
Adjustments for feedback on regula-tory, audit, disciplin-ary and risk-related issues
Adjustments may be required to maintain competi-tive compensation levels
Compensation Committee discre-tion may be applied in exceptional cases
The Board reviews and approves the Compensa-tion Committee’s recom-mendation on the Group and divisional pools
Board approval offinalpool
Other factors used to determine adjustments to the Group, divisional and corporate function pools
Compensation Committee review
Relative perfor-mance vs peers
Control function review
Market position and trend
Consistency with compensation
objectives
Strategic objectives
1 Economic contribution is measured as adjusted income before taxes excluding variable incentive compensation expense, after deducting a capital usage charge that is calculated based on regulatory capital. For 2018, Group and divisional results are adjusted to exclude items such as goodwill impairment, real estate transactions, business sales, restructuring expenses and major litigation provisions. Regulatory capital for compensation purposes was defined for each division as the higher of 10% of average divisional Basel III risk-weighted assets and 3.5% of average divisional leverage exposure. This measure of economic contribution considers the profitability of the divisions and the Group and the capital utilized to achieve this profitability.
Features DesignVesting (year)
2018 2019 2020 2021 2022
Base Salary
Pension andBenefits
Cash Award
Share Awards
Performance Share Awards
Contingent Capital Awards (CCA)
1⁄3
1⁄3
1⁄3
1⁄3
1⁄3
1⁄3
p Based on skills, qualifications, relevant experience, responsibilities and external market factors
p Role-based allowances apply to certain Material Risk Takers and Controllers (MRTC)
p Pension and benefits consistent with local market practicep Includes country-specific pension schemes, certain allowances,
subsidizations and insurances
p Employees with total compensation below CHF/USD 250,000 receive their full amount of variable compensation in the form of an immediate cash award
p Deferred share awards with no additional performance conditions
p Managing Directors (MD) and MRTC receive deferred share awards with performance conditions as part of their deferred compensation
p MD and Directors receive loss-absorbing contingent capital awardsp At settlement, contingent capital instrument or cash payment based
on the fair value of the CCAp Prior to settlement, conditional right to receive semi-annual cash
payments of interest equivalents
Fixe
dVa
riab
le
For t
otal
com
pens
atio
n of
CH
F/U
SD
25
0,0
00
or h
ighe
r:
Note: Individuals in certain jurisdictions may be subject to conditions other than those outlined above in order to comply with local legal or regulatory requirements.
Determination of Group variable incentive compensation poolThe Group variable incentive compensation pool for all employees including the CEO and the Executive Board is determined on an annual basis, with accruals made throughout the year. The process for determining variable incentive compensation is performed at the Group level, as well as the divisional and functional levels, as shown in the illustrative example below.
> Refer to “Determination of variable incentive compensation pools” in Group compensation – Compensation framework for further information.
Group employees’ compensation framework for 2018: key elementsThe overall structure and design remains the same as the prior year.
> Refer to “Group compensation” for further information.
239Compensation
Compensation governanceThe Compensation Committee
The Compensation Committee is the supervisory and governing body for compensation policies, practices and plans. In designing and setting compensation, the Compensation Committee aims to make decisions in the best interests of the Group and also to align the interests of the Group’s employees to those of share-holders. The Compensation Committee reviews proposals regard-ing Group, Executive Board and Board compensation, and makes recommendations to the Board for approval. Total Executive Board compensation and Board compensation are also subject to shareholder approval pursuant to the Swiss Ordinance Against Excessive Compensation with respect to Listed Stock Corpora-tions (Compensation Ordinance) and the Articles of Association of Credit Suisse Group AG (AoA).
The Compensation Committee consists of at least three members of the Board, all of whom must be independent. The members during 2018 were Kai S. Nargolwala (Chair), Iris Bohnet, Andreas N. Koopmann and Alexandre Zeller. The Board has applied the independence criteria of the SIX Swiss Exchange Directive on Information relating to Corporate Governance, Swiss Financial
Market Supervisory Authority FINMA (FINMA), the Swiss Code of Best Practice for Corporate Governance, and the listing stan-dards of the New York Stock Exchange (NYSE) and the Nasdaq Stock Market (Nasdaq), in determining that all of these individuals are independent.
> Refer to “Independence” in IV – Corporate Governance – Board of Directors for more information on how the Group determines the independence of its Board members.
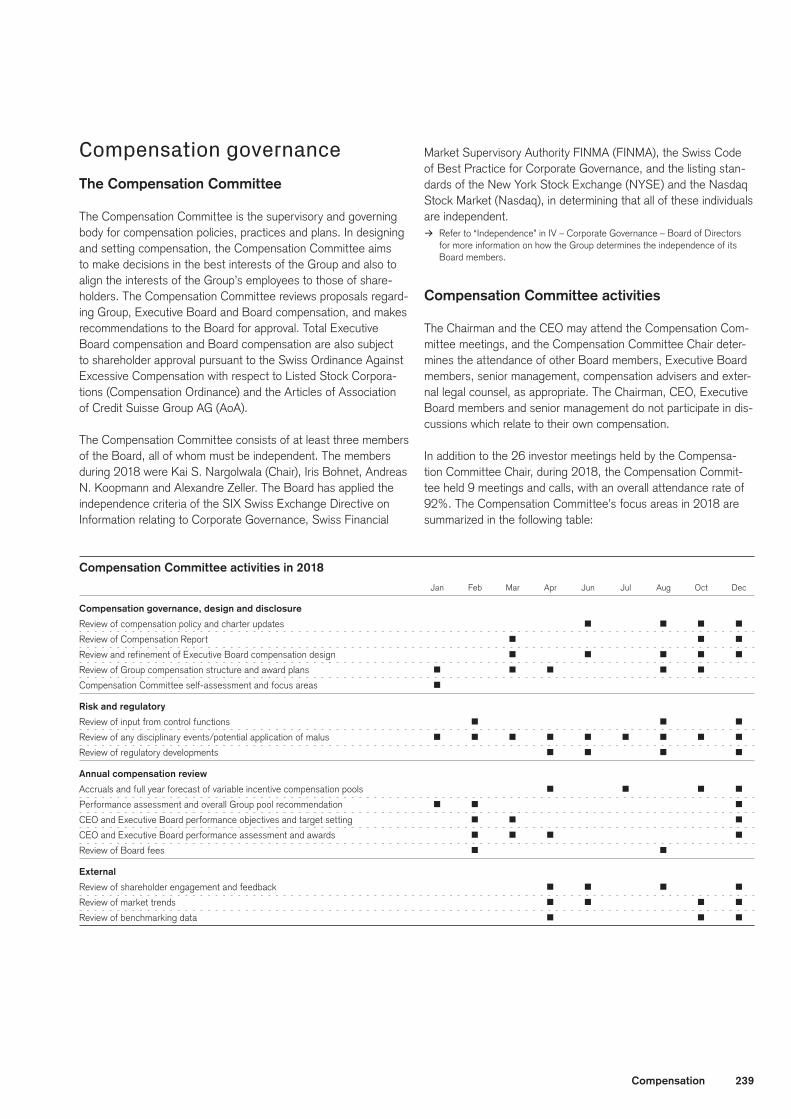
Compensation Committee activities
The Chairman and the CEO may attend the Compensation Com-mittee meetings, and the Compensation Committee Chair deter-mines the attendance of other Board members, Executive Board members, senior management, compensation advisers and exter-nal legal counsel, as appropriate. The Chairman, CEO, Executive Board members and senior management do not participate in dis-cussions which relate to their own compensation.
In addition to the 26 investor meetings held by the Compensa-tion Committee Chair, during 2018, the Compensation Commit-tee held 9 meetings and calls, with an overall attendance rate of 92%. The Compensation Committee’s focus areas in 2018 are summarized in the following table:
Compensation Committee activities in 2018 Jan Feb Mar Apr Jun Jul Aug Oct Dec
Compensation governance, design and disclosure
Review of compensation policy and charter updates p p p pReview of Compensation Report p p pReview and refinement of Executive Board compensation design p p p p pReview of Group compensation structure and award plans p p p p p Compensation Committee self-assessment and focus areas p
Risk and regulatory
Review of input from control functions p p pReview of any disciplinary events/potential application of malus p p p p p p p p pReview of regulatory developments p p p p
Annual compensation review
Accruals and full year forecast of variable incentive compensation pools p p p pPerformance assessment and overall Group pool recommendation p p pCEO and Executive Board performance objectives and target setting p p pCEO and Executive Board performance assessment and awards p p p pReview of Board fees p p
External
Review of shareholder engagement and feedback p p p pReview of market trends p p p pReview of benchmarking data p p p
240 Compensation
Advisers to the Compensation Committee
The Compensation Committee is authorized to retain external advisers to provide support as it carries out its responsibilities. Deloitte LLP (Deloitte) has been retained to assist the Compen-sation Committee in ensuring that the Group’s compensation pro-grams remain competitive, responsive to regulatory developments and in line with the compensation policy. Deloitte has appointed a senior consultant to advise the Compensation Committee. Apart from assisting the Compensation Committee, this senior consultant does not provide any other services to the Group. The Compensation Committee also obtained external legal advice dur-ing 2018 on various matters relating to compensation policy and design. Prior to appointment, the Compensation Committee con-ducted an independence assessment of its advisers pursuant to the rules of the US Securities and Exchange Commission (SEC) and the listing standards of the NYSE and the Nasdaq.
Other aspects of compensation governance
Compensation policy The compensation policy applies to all employees and compensa-tion plans of the Group. It contains a detailed description of the Group’s compensation principles and objectives as well as the compensation programs. It also sets out the standards and pro-cesses relating to the development, management, implementa-tion and governance of compensation. The compensation policy is available at credit-suisse.com/compensationpolicy.
Approval authorityThe approval authorities for setting the compensation policy and compensation for different groups of employees are defined in the Group’s Organizational Guidelines and Regulations (OGR) and the Compensation Committee charter available at credit-suisse.com/governance. Compensation
Action Committee Board
Establish or change the Group’s compensation policy R A
Establish or change compensation plans R A
Set variable incentive compensation pools for the
Group and the divisions R A
Determine Executive Board compensation,
including for the CEO R A 1
Determine Board compensation,
including for the Chairman R A 1
Determine compensation for the Head of Internal Audit A 2 n/a
Determine compensation for MRTC and
other selected members of management A n/a
R = recommendation; A = approval1 Subject to shareholder approval requirement pursuant to the Compensation Ordinance
and the AoA.2 In consultation with the Audit Committee Chair.
Risk and control considerationsDuring its annual review of the Group’s performance, the Com-pensation Committee considers input from the Risk Committee
Chair with respect to risk considerations, and the Audit Com-mittee Chair with respect to internal control considerations. The Compensation Committee also considers input from various cor-porate functions including Compliance and Regulatory Affairs, General Counsel, Human Resources, Internal Audit, Product Control and Risk Management, regarding control and compliance issues and any breaches of relevant rules and regulations or the Group’s Code of Conduct.
To meet regulatory guidelines regarding employees engaged in risk-taking activities, the Compensation Committee reviews and approves the compensation for employees identified as Mate-rial Risk Takers and Controllers (MRTC). The Risk Committee is involved in the review process for MRTC compensation.
> Refer to “Focus on risk and control“ in Group compensation for further information.
In order to ensure that the above functions can perform their oversight of risk and control activities effectively, the total amount of the variable incentive compensation pool for the corporate functions is not linked to the performance of the particular divi-sions that employees of the corporate functions support or over-see, but takes into account the Group-wide financial perfor-mance, measured in the form of Group economic contribution and non-financial factors. Therefore, employees working in the corporate functions, including those performing control functions, are remunerated independently from the performance of the busi-nesses they oversee and support. As with the business divisions, the assessment of the corporate functions takes into account risk, control, compliance and ethical considerations and relative performance compared to peers, as well as the market and regu-latory environment.
> Refer to “Determination of the variable incentive compensation pools” in Group compensation for further information.
Performance criteria and target setting At the beginning of the year, as part of the annual compensation review, the Compensation Committee defines the performance criteria and performance targets that will be applied to deter-mine the Executive Board’s variable incentive compensation. For the STI awards, the performance criteria and performance levels are set on an annual basis, and are designed to reward progress towards the achievement of the Group’s annual objectives in the financial and strategic plan. For the LTI awards, the performance criteria and performance levels are set for a prospective three-year period, designed to reward achievement of the longer term business plan and the enhancement of shareholder returns. In setting the threshold, target and maximum performance levels, the Compensation Committee takes into account the Group’s ambitious financial plan, prior-year performance, analyst expecta-tions and any publicly stated targets, in order to set performance levels which are challenging and motivating for the Executive Board. The performance criteria and performance levels are pre-sented to the Board for approval before implementation.
241Compensation
Executive Board compensation for 2018Compensation outcomes for 2018
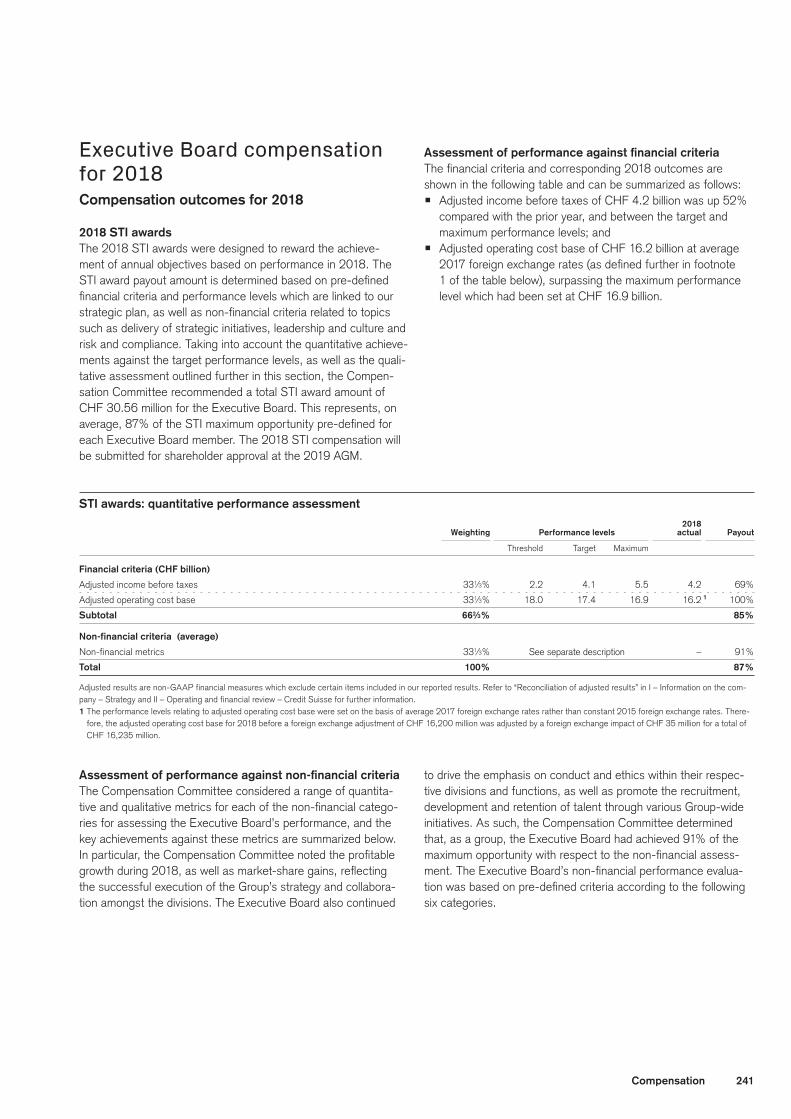
2018 STI awardsThe 2018 STI awards were designed to reward the achieve-ment of annual objectives based on performance in 2018. The STI award payout amount is determined based on pre-defined financial criteria and performance levels which are linked to our strategic plan, as well as non-financial criteria related to topics such as delivery of strategic initiatives, leadership and culture and risk and compliance. Taking into account the quantitative achieve-ments against the target performance levels, as well as the quali-tative assessment outlined further in this section, the Compen-sation Committee recommended a total STI award amount of CHF 30.56 million for the Executive Board. This represents, on average, 87% of the STI maximum opportunity pre-defined for each Executive Board member. The 2018 STI compensation will be submitted for shareholder approval at the 2019 AGM.
AssessmentofperformanceagainstfinancialcriteriaThe financial criteria and corresponding 2018 outcomes are shown in the following table and can be summarized as follows:p Adjusted income before taxes of CHF 4.2 billion was up 52%
compared with the prior year, and between the target and maximum performance levels; and
p Adjusted operating cost base of CHF 16.2 billion at average 2017 foreign exchange rates (as defined further in footnote 1 of the table below), surpassing the maximum performance level which had been set at CHF 16.9 billion.
STI awards: quantitative performance assessment 2018 Weighting Performance levels actual Payout
Threshold Target Maximum
Financial criteria (CHF billion)
Adjusted income before taxes 331⁄3% 2.2 4.1 5.5 4.2 69%
Adjusted operating cost base 331⁄3% 18.0 17.4 16.9 16.2 1 100%
Subtotal 662⁄3% 85%
Non-financial criteria (average)
Non-financial metrics 331⁄3% See separate description – 91%
Total 100% 87%
Adjusted results are non-GAAP financial measures which exclude certain items included in our reported results. Refer to “Reconciliation of adjusted results” in I – Information on the com-pany – Strategy and II – Operating and financial review – Credit Suisse for further information.1 The performance levels relating to adjusted operating cost base were set on the basis of average 2017 foreign exchange rates rather than constant 2015 foreign exchange rates. There-
fore, the adjusted operating cost base for 2018 before a foreign exchange adjustment of CHF 16,200 million was adjusted by a foreign exchange impact of CHF 35 million for a total of CHF 16,235 million.
Assessmentofperformanceagainstnon-financialcriteriaThe Compensation Committee considered a range of quantita-tive and qualitative metrics for each of the non-financial catego-ries for assessing the Executive Board’s performance, and the key achievements against these metrics are summarized below. In particular, the Compensation Committee noted the profitable growth during 2018, as well as market-share gains, reflecting the successful execution of the Group’s strategy and collabora-tion amongst the divisions. The Executive Board also continued
to drive the emphasis on conduct and ethics within their respec-tive divisions and functions, as well as promote the recruitment, development and retention of talent through various Group-wide initiatives. As such, the Compensation Committee determined that, as a group, the Executive Board had achieved 91% of the maximum opportunity with respect to the non-financial assess-ment. The Executive Board’s non-financial performance evalua-tion was based on pre-defined criteria according to the following six categories.
242 Compensation
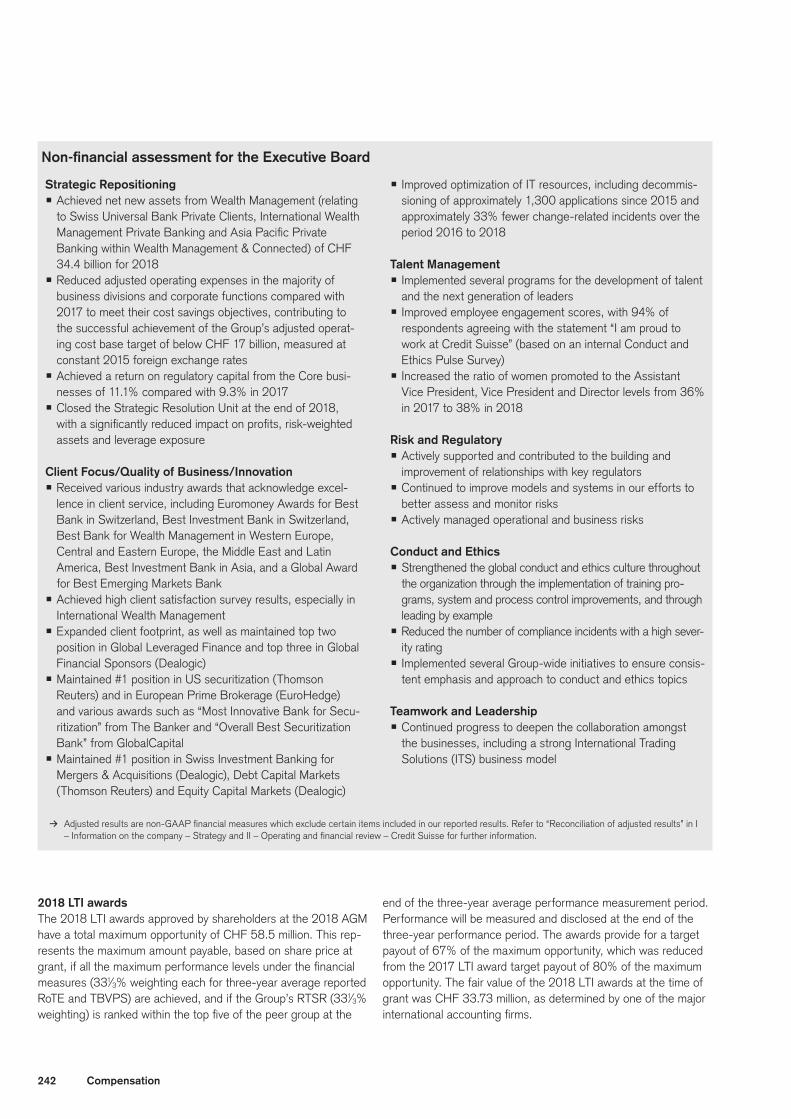
Non-financialassessmentfortheExecutiveBoard
Strategic Repositioningp Achieved net new assets from Wealth Management (relating
to Swiss Universal Bank Private Clients, International Wealth Management Private Banking and Asia Pacific Private Banking within Wealth Management & Connected) of CHF 34.4 billion for 2018
p Reduced adjusted operating expenses in the majority of business divisions and corporate functions compared with 2017 to meet their cost savings objectives, contributing to the successful achievement of the Group’s adjusted operat-ing cost base target of below CHF 17 billion, measured at constant 2015 foreign exchange rates
p Achieved a return on regulatory capital from the Core busi-nesses of 11.1% compared with 9.3% in 2017
p Closed the Strategic Resolution Unit at the end of 2018, with a significantly reduced impact on profits, risk-weighted assets and leverage exposure
Client Focus/Quality of Business/Innovationp Received various industry awards that acknowledge excel-
lence in client service, including Euromoney Awards for Best Bank in Switzerland, Best Investment Bank in Switzerland, Best Bank for Wealth Management in Western Europe, Central and Eastern Europe, the Middle East and Latin America, Best Investment Bank in Asia, and a Global Award for Best Emerging Markets Bank
p Achieved high client satisfaction survey results, especially in International Wealth Management
p Expanded client footprint, as well as maintained top two position in Global Leveraged Finance and top three in Global Financial Sponsors (Dealogic)
p Maintained #1 position in US securitization (Thomson Reuters) and in European Prime Brokerage (EuroHedge) and various awards such as “Most Innovative Bank for Secu-ritization” from The Banker and “Overall Best Securitization Bank” from GlobalCapital
p Maintained #1 position in Swiss Investment Banking for Mergers & Acquisitions (Dealogic), Debt Capital Markets (Thomson Reuters) and Equity Capital Markets (Dealogic)
p Improved optimization of IT resources, including decommis-sioning of approximately 1,300 applications since 2015 and approximately 33% fewer change-related incidents over the period 2016 to 2018
Talent Managementp Implemented several programs for the development of talent
and the next generation of leadersp Improved employee engagement scores, with 94% of
respondents agreeing with the statement “I am proud to work at Credit Suisse” (based on an internal Conduct and Ethics Pulse Survey)
p Increased the ratio of women promoted to the Assistant Vice President, Vice President and Director levels from 36% in 2017 to 38% in 2018
Risk and Regulatoryp Actively supported and contributed to the building and
improvement of relationships with key regulatorsp Continued to improve models and systems in our efforts to
better assess and monitor risksp Actively managed operational and business risks
Conduct and Ethicsp Strengthened the global conduct and ethics culture throughout
the organization through the implementation of training pro-grams, system and process control improvements, and through leading by example
p Reduced the number of compliance incidents with a high sever-ity rating
p Implemented several Group-wide initiatives to ensure consis-tent emphasis and approach to conduct and ethics topics
Teamwork and Leadershipp Continued progress to deepen the collaboration amongst
the businesses, including a strong International Trading Solutions (ITS) business model
> Adjusted results are non-GAAP financial measures which exclude certain items included in our reported results. Refer to “Reconciliation of adjusted results” in I – Information on the company – Strategy and II – Operating and financial review – Credit Suisse for further information.
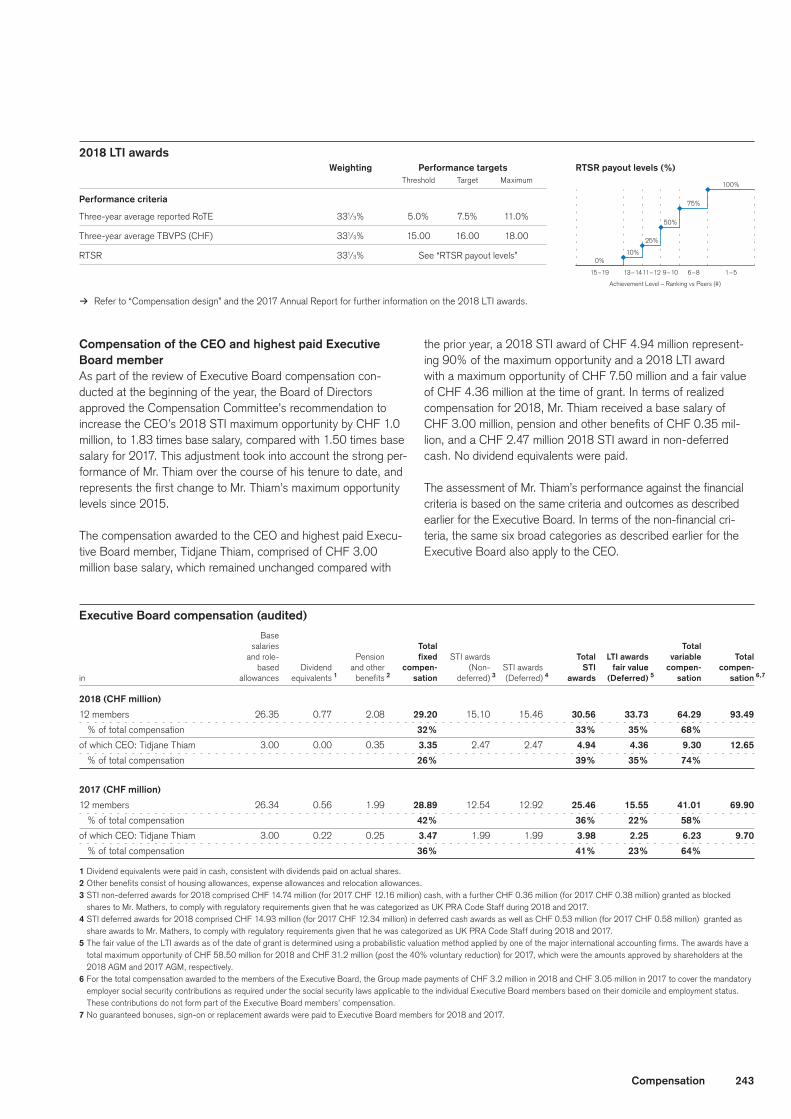
2018 LTI awardsThe 2018 LTI awards approved by shareholders at the 2018 AGM have a total maximum opportunity of CHF 58.5 million. This rep-resents the maximum amount payable, based on share price at grant, if all the maximum performance levels under the financial measures (331⁄3% weighting each for three-year average reported RoTE and TBVPS) are achieved, and if the Group’s RTSR (331⁄3% weighting) is ranked within the top five of the peer group at the
end of the three-year average performance measurement period. Performance will be measured and disclosed at the end of the three-year performance period. The awards provide for a target payout of 67% of the maximum opportunity, which was reduced from the 2017 LTI award target payout of 80% of the maximum opportunity. The fair value of the 2018 LTI awards at the time of grant was CHF 33.73 million, as determined by one of the major international accounting firms.
243Compensation
RTSR payout levels (%)
100%
75%
50%
25%
10%0%
15 – 19 9 – 1013 – 14 6 – 811 – 12 1 – 5
Achievement Level – Ranking vs Peers (#)
Weighting Performance targets Threshold Target Maximum
Performance criteria
Three-year average reported RoTE 331/3% 5.0% 7.5% 11.0%
Three-year average TBVPS (CHF) 331/3% 15.00 16.00 18.00
RTSR 331/3% See “RTSR payout levels”
2018 LTI awards
> Refer to “Compensation design” and the 2017 Annual Report for further information on the 2018 LTI awards.
Compensation of the CEO and highest paid Executive Board member As part of the review of Executive Board compensation con-ducted at the beginning of the year, the Board of Directors approved the Compensation Committee’s recommendation to increase the CEO’s 2018 STI maximum opportunity by CHF 1.0 million, to 1.83 times base salary, compared with 1.50 times base salary for 2017. This adjustment took into account the strong per-formance of Mr. Thiam over the course of his tenure to date, and represents the first change to Mr. Thiam’s maximum opportunity levels since 2015.
The compensation awarded to the CEO and highest paid Execu-tive Board member, Tidjane Thiam, comprised of CHF 3.00 million base salary, which remained unchanged compared with
the prior year, a 2018 STI award of CHF 4.94 million represent-ing 90% of the maximum opportunity and a 2018 LTI award with a maximum opportunity of CHF 7.50 million and a fair value of CHF 4.36 million at the time of grant. In terms of realized compensation for 2018, Mr. Thiam received a base salary of CHF 3.00 million, pension and other benefits of CHF 0.35 mil-lion, and a CHF 2.47 million 2018 STI award in non-deferred cash. No dividend equivalents were paid.
The assessment of Mr. Thiam’s performance against the financial criteria is based on the same criteria and outcomes as described earlier for the Executive Board. In terms of the non-financial cri-teria, the same six broad categories as described earlier for the Executive Board also apply to the CEO.
Executive Board compensation (audited) Base
salaries Total Total
and role- Pension fixed STI awards Total LTI awards variable Total based Dividend and other compen- (Non- STI awards STI fair value compen- compen-
in allowances equivalents 1 benefits 2 sation deferred) 3 (Deferred) 4 awards (Deferred) 5 sation sation 6,7
2018 (CHF million)
12 members 26.35 0.77 2.08 29.20 15.10 15.46 30.56 33.73 64.29 93.49
% of total compensation 32% 33% 35% 68%
of which CEO: Tidjane Thiam 3.00 0.00 0.35 3.35 2.47 2.47 4.94 4.36 9.30 12.65
% of total compensation 26% 39% 35% 74%
2017 (CHF million)
12 members 26.34 0.56 1.99 28.89 12.54 12.92 25.46 15.55 41.01 69.90
% of total compensation 42% 36% 22% 58%
of which CEO: Tidjane Thiam 3.00 0.22 0.25 3.47 1.99 1.99 3.98 2.25 6.23 9.70
% of total compensation 36% 41% 23% 64%
1 Dividend equivalents were paid in cash, consistent with dividends paid on actual shares.2 Other benefits consist of housing allowances, expense allowances and relocation allowances.3 STI non-deferred awards for 2018 comprised CHF 14.74 million (for 2017 CHF 12.16 million) cash, with a further CHF 0.36 million (for 2017 CHF 0.38 million) granted as blocked
shares to Mr. Mathers, to comply with regulatory requirements given that he was categorized as UK PRA Code Staff during 2018 and 2017.4 STI deferred awards for 2018 comprised CHF 14.93 million (for 2017 CHF 12.34 million) in deferred cash awards as well as CHF 0.53 million (for 2017 CHF 0.58 million) granted as
share awards to Mr. Mathers, to comply with regulatory requirements given that he was categorized as UK PRA Code Staff during 2018 and 2017.5 The fair value of the LTI awards as of the date of grant is determined using a probabilistic valuation method applied by one of the major international accounting firms. The awards have a
total maximum opportunity of CHF 58.50 million for 2018 and CHF 31.2 million (post the 40% voluntary reduction) for 2017, which were the amounts approved by shareholders at the 2018 AGM and 2017 AGM, respectively.
6 For the total compensation awarded to the members of the Executive Board, the Group made payments of CHF 3.2 million in 2018 and CHF 3.05 million in 2017 to cover the mandatory employer social security contributions as required under the social security laws applicable to the individual Executive Board members based on their domicile and employment status. These contributions do not form part of the Executive Board members’ compensation.
7 No guaranteed bonuses, sign-on or replacement awards were paid to Executive Board members for 2018 and 2017.
244 Compensation
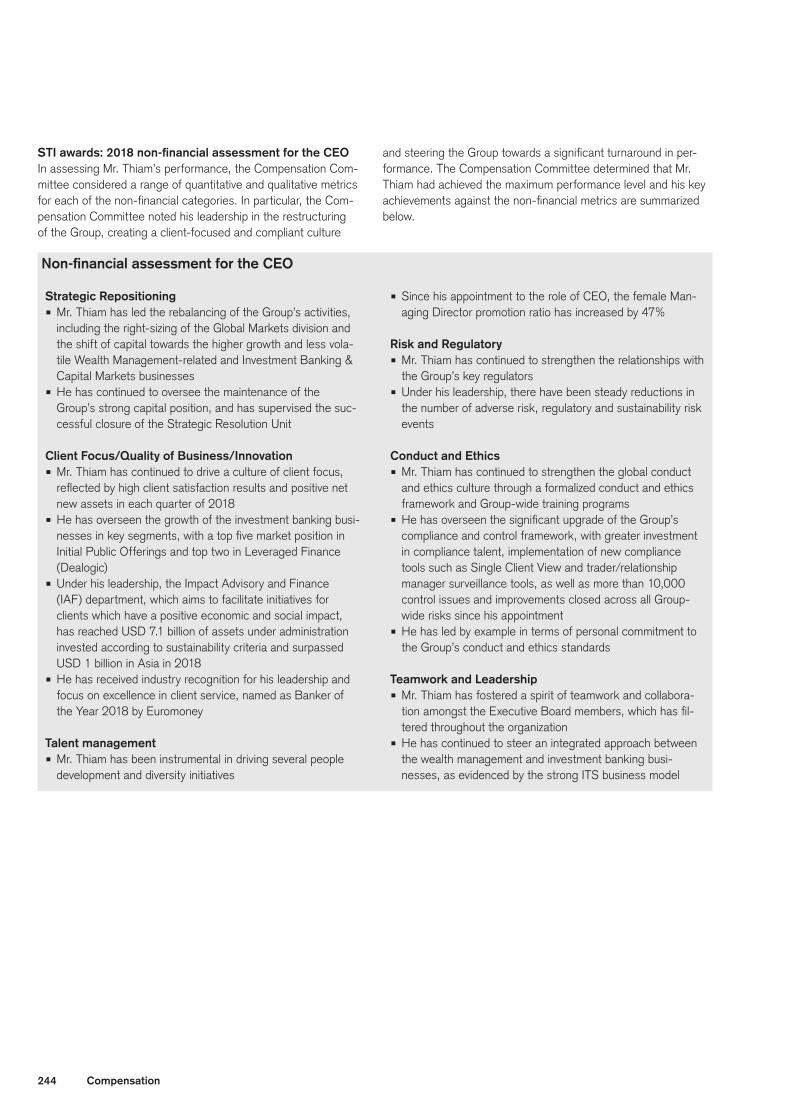
STIawards:2018non-financialassessmentfortheCEOIn assessing Mr. Thiam’s performance, the Compensation Com-mittee considered a range of quantitative and qualitative metrics for each of the non-financial categories. In particular, the Com-pensation Committee noted his leadership in the restructuring of the Group, creating a client-focused and compliant culture
and steering the Group towards a significant turnaround in per-formance. The Compensation Committee determined that Mr. Thiam had achieved the maximum performance level and his key achievements against the non-financial metrics are summarized below.
Non-financialassessmentfortheCEO
Strategic Repositioningp Mr. Thiam has led the rebalancing of the Group’s activities,
including the right-sizing of the Global Markets division and the shift of capital towards the higher growth and less vola-tile Wealth Management-related and Investment Banking & Capital Markets businesses
p He has continued to oversee the maintenance of the Group’s strong capital position, and has supervised the suc-cessful closure of the Strategic Resolution Unit
Client Focus/Quality of Business/Innovationp Mr. Thiam has continued to drive a culture of client focus,
reflected by high client satisfaction results and positive net new assets in each quarter of 2018
p He has overseen the growth of the investment banking busi-nesses in key segments, with a top five market position in Initial Public Offerings and top two in Leveraged Finance (Dealogic)
p Under his leadership, the Impact Advisory and Finance (IAF) department, which aims to facilitate initiatives for clients which have a positive economic and social impact, has reached USD 7.1 billion of assets under administration invested according to sustainability criteria and surpassed USD 1 billion in Asia in 2018
p He has received industry recognition for his leadership and focus on excellence in client service, named as Banker of the Year 2018 by Euromoney
Talent management p Mr. Thiam has been instrumental in driving several people
development and diversity initiatives
p Since his appointment to the role of CEO, the female Man-aging Director promotion ratio has increased by 47%
Risk and Regulatoryp Mr. Thiam has continued to strengthen the relationships with
the Group’s key regulators p Under his leadership, there have been steady reductions in
the number of adverse risk, regulatory and sustainability risk events
Conduct and Ethics p Mr. Thiam has continued to strengthen the global conduct
and ethics culture through a formalized conduct and ethics framework and Group-wide training programs
p He has overseen the significant upgrade of the Group’s compliance and control framework, with greater investment in compliance talent, implementation of new compliance tools such as Single Client View and trader/relationship manager surveillance tools, as well as more than 10,000 control issues and improvements closed across all Group-wide risks since his appointment
p He has led by example in terms of personal commitment to the Group’s conduct and ethics standards
Teamwork and Leadershipp Mr. Thiam has fostered a spirit of teamwork and collabora-
tion amongst the Executive Board members, which has fil-tered throughout the organization
p He has continued to steer an integrated approach between the wealth management and investment banking busi-nesses, as evidenced by the strong ITS business model
245Compensation
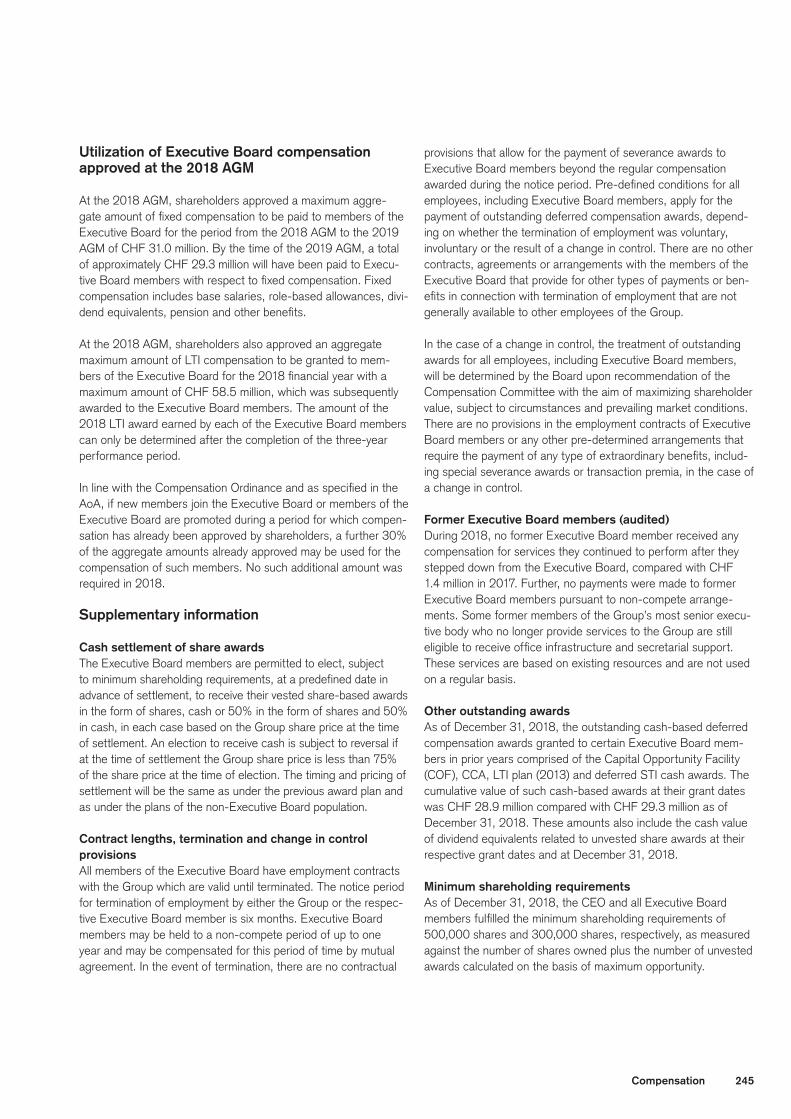
Utilization of Executive Board compensation approved at the 2018 AGM
At the 2018 AGM, shareholders approved a maximum aggre-gate amount of fixed compensation to be paid to members of the Executive Board for the period from the 2018 AGM to the 2019 AGM of CHF 31.0 million. By the time of the 2019 AGM, a total of approximately CHF 29.3 million will have been paid to Execu-tive Board members with respect to fixed compensation. Fixed compensation includes base salaries, role-based allowances, divi-dend equivalents, pension and other benefits.
At the 2018 AGM, shareholders also approved an aggregate maximum amount of LTI compensation to be granted to mem-bers of the Executive Board for the 2018 financial year with a maximum amount of CHF 58.5 million, which was subsequently awarded to the Executive Board members. The amount of the 2018 LTI award earned by each of the Executive Board members can only be determined after the completion of the three-year performance period.
In line with the Compensation Ordinance and as specified in the AoA, if new members join the Executive Board or members of the Executive Board are promoted during a period for which compen-sation has already been approved by shareholders, a further 30% of the aggregate amounts already approved may be used for the compensation of such members. No such additional amount was required in 2018.
Supplementary information
Cash settlement of share awardsThe Executive Board members are permitted to elect, subject to minimum shareholding requirements, at a predefined date in advance of settlement, to receive their vested share-based awards in the form of shares, cash or 50% in the form of shares and 50% in cash, in each case based on the Group share price at the time of settlement. An election to receive cash is subject to reversal if at the time of settlement the Group share price is less than 75% of the share price at the time of election. The timing and pricing of settlement will be the same as under the previous award plan and as under the plans of the non-Executive Board population.
Contract lengths, termination and change in control provisions All members of the Executive Board have employment contracts with the Group which are valid until terminated. The notice period for termination of employment by either the Group or the respec-tive Executive Board member is six months. Executive Board members may be held to a non-compete period of up to one year and may be compensated for this period of time by mutual agreement. In the event of termination, there are no contractual
provisions that allow for the payment of severance awards to Executive Board members beyond the regular compensation awarded during the notice period. Pre-defined conditions for all employees, including Executive Board members, apply for the payment of outstanding deferred compensation awards, depend-ing on whether the termination of employment was voluntary, involuntary or the result of a change in control. There are no other contracts, agreements or arrangements with the members of the Executive Board that provide for other types of payments or ben-efits in connection with termination of employment that are not generally available to other employees of the Group.
In the case of a change in control, the treatment of outstanding awards for all employees, including Executive Board members, will be determined by the Board upon recommendation of the Compensation Committee with the aim of maximizing shareholder value, subject to circumstances and prevailing market conditions. There are no provisions in the employment contracts of Executive Board members or any other pre-determined arrangements that require the payment of any type of extraordinary benefits, includ-ing special severance awards or transaction premia, in the case of a change in control.
Former Executive Board members (audited)During 2018, no former Executive Board member received any compensation for services they continued to perform after they stepped down from the Executive Board, compared with CHF 1.4 million in 2017. Further, no payments were made to former Executive Board members pursuant to non-compete arrange-ments. Some former members of the Group’s most senior execu-tive body who no longer provide services to the Group are still eligible to receive office infrastructure and secretarial support. These services are based on existing resources and are not used on a regular basis.
Other outstanding awards As of December 31, 2018, the outstanding cash-based deferred compensation awards granted to certain Executive Board mem-bers in prior years comprised of the Capital Opportunity Facility (COF), CCA, LTI plan (2013) and deferred STI cash awards. The cumulative value of such cash-based awards at their grant dates was CHF 28.9 million compared with CHF 29.3 million as of December 31, 2018. These amounts also include the cash value of dividend equivalents related to unvested share awards at their respective grant dates and at December 31, 2018.
Minimum shareholding requirements As of December 31, 2018, the CEO and all Executive Board members fulfilled the minimum shareholding requirements of 500,000 shares and 300,000 shares, respectively, as measured against the number of shares owned plus the number of unvested awards calculated on the basis of maximum opportunity.
246 Compensation
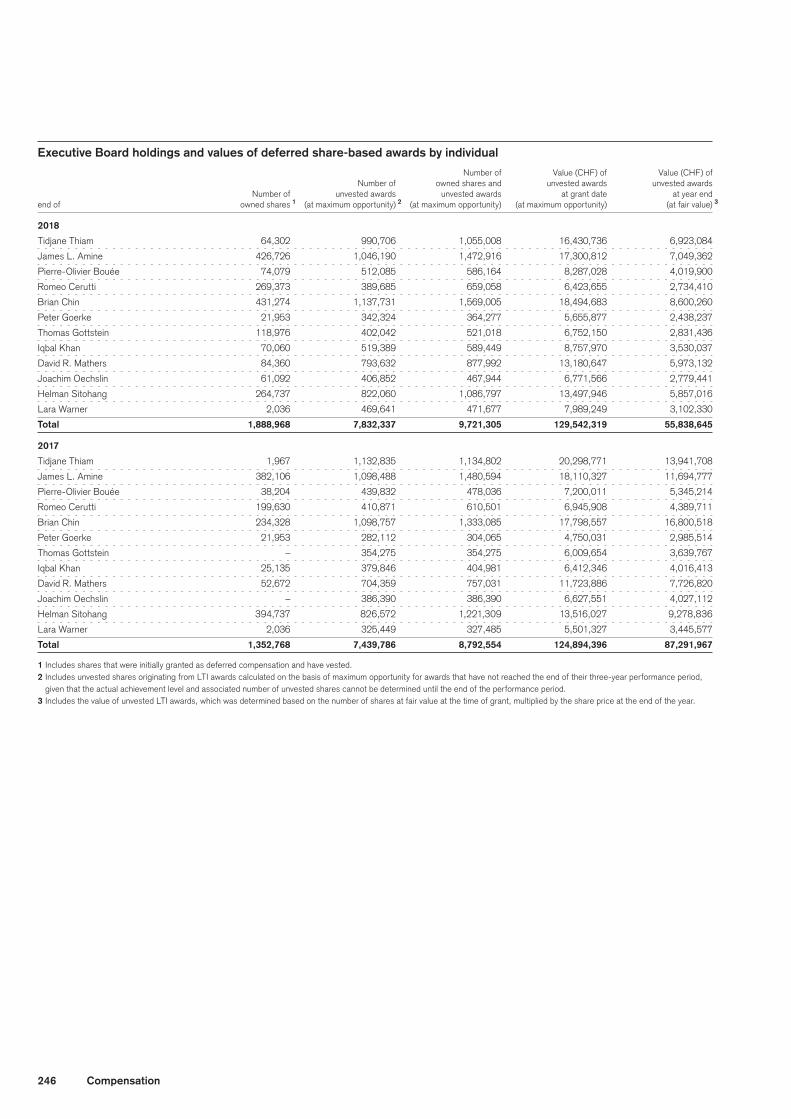
Executive Board holdings and values of deferred share-based awards by individual Number of Value (CHF) of Value (CHF) of Number of owned shares and unvested awards unvested awards Number of unvested awards unvested awards at grant date at year end
end of owned shares 1 (at maximum opportunity) 2 (at maximum opportunity) (at maximum opportunity) (at fair value) 3
2018
Tidjane Thiam 64,302 990,706 1,055,008 16,430,736 6,923,084
James L. Amine 426,726 1,046,190 1,472,916 17,300,812 7,049,362
Pierre-Olivier Bouée 74,079 512,085 586,164 8,287,028 4,019,900
Romeo Cerutti 269,373 389,685 659,058 6,423,655 2,734,410
Brian Chin 431,274 1,137,731 1,569,005 18,494,683 8,600,260
Peter Goerke 21,953 342,324 364,277 5,655,877 2,438,237
Thomas Gottstein 118,976 402,042 521,018 6,752,150 2,831,436
Iqbal Khan 70,060 519,389 589,449 8,757,970 3,530,037
David R. Mathers 84,360 793,632 877,992 13,180,647 5,973,132
Joachim Oechslin 61,092 406,852 467,944 6,771,566 2,779,441
Helman Sitohang 264,737 822,060 1,086,797 13,497,946 5,857,016
Lara Warner 2,036 469,641 471,677 7,989,249 3,102,330
Total 1,888,968 7,832,337 9,721,305 129,542,319 55,838,645
2017
Tidjane Thiam 1,967 1,132,835 1,134,802 20,298,771 13,941,708
James L. Amine 382,106 1,098,488 1,480,594 18,110,327 11,694,777
Pierre-Olivier Bouée 38,204 439,832 478,036 7,200,011 5,345,214
Romeo Cerutti 199,630 410,871 610,501 6,945,908 4,389,711
Brian Chin 234,328 1,098,757 1,333,085 17,798,557 16,800,518
Peter Goerke 21,953 282,112 304,065 4,750,031 2,985,514
Thomas Gottstein – 354,275 354,275 6,009,654 3,639,767
Iqbal Khan 25,135 379,846 404,981 6,412,346 4,016,413
David R. Mathers 52,672 704,359 757,031 11,723,886 7,726,820
Joachim Oechslin – 386,390 386,390 6,627,551 4,027,112
Helman Sitohang 394,737 826,572 1,221,309 13,516,027 9,278,836
Lara Warner 2,036 325,449 327,485 5,501,327 3,445,577
Total 1,352,768 7,439,786 8,792,554 124,894,396 87,291,967
1 Includes shares that were initially granted as deferred compensation and have vested.2 Includes unvested shares originating from LTI awards calculated on the basis of maximum opportunity for awards that have not reached the end of their three-year performance period,
given that the actual achievement level and associated number of unvested shares cannot be determined until the end of the performance period.3 Includes the value of unvested LTI awards, which was determined based on the number of shares at fair value at the time of grant, multiplied by the share price at the end of the year.
247Compensation
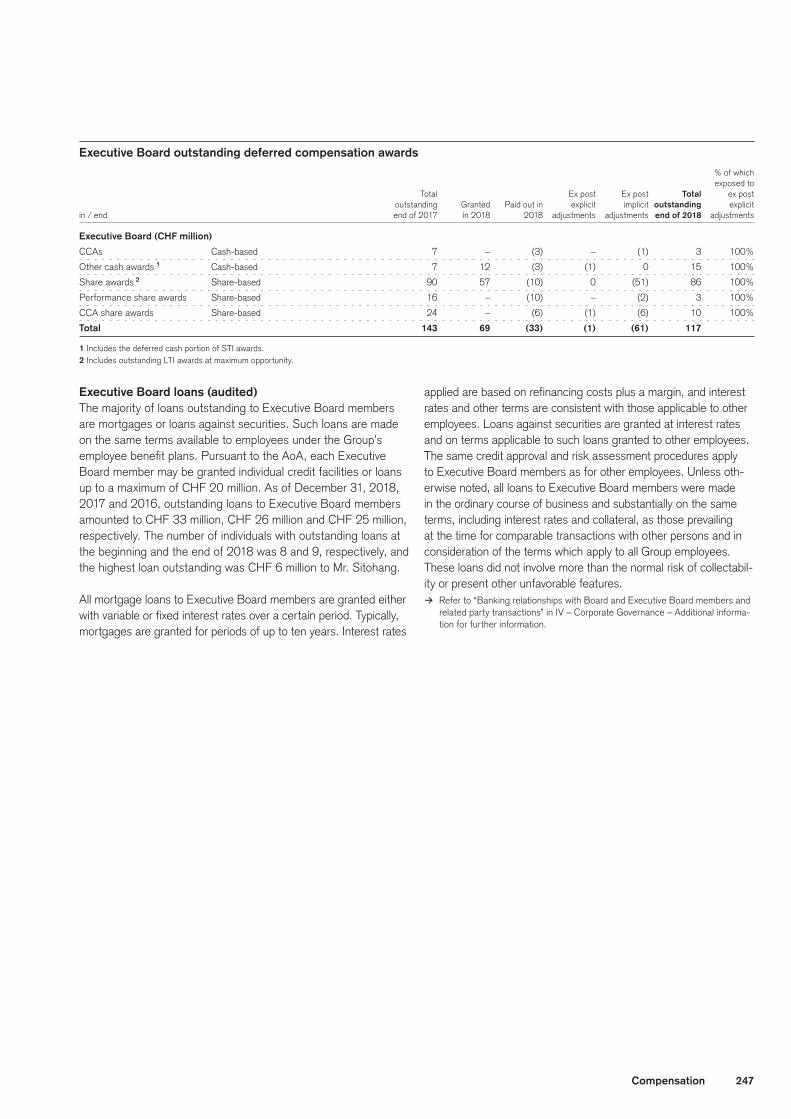
Executive Board outstanding deferred compensation awards % of which
exposed to
Total Ex post Ex post Total ex post outstanding Granted Paid out in explicit implicit outstanding explicit
in / end end of 2017 in 2018 2018 adjustments adjustments end of 2018 adjustments
Executive Board (CHF million)
CCAs Cash-based 7 – (3) – (1) 3 100%
Other cash awards 1 Cash-based 7 12 (3) (1) 0 15 100%
Share awards 2 Share-based 90 57 (10) 0 (51) 86 100%
Performance share awards Share-based 16 – (10) – (2) 3 100%
CCA share awards Share-based 24 – (6) (1) (6) 10 100%
Total 143 69 (33) (1) (61) 117
1 Includes the deferred cash portion of STI awards.2 Includes outstanding LTI awards at maximum opportunity.
Executive Board loans (audited)The majority of loans outstanding to Executive Board members are mortgages or loans against securities. Such loans are made on the same terms available to employees under the Group’s employee benefit plans. Pursuant to the AoA, each Executive Board member may be granted individual credit facilities or loans up to a maximum of CHF 20 million. As of December 31, 2018, 2017 and 2016, outstanding loans to Executive Board members amounted to CHF 33 million, CHF 26 million and CHF 25 million, respectively. The number of individuals with outstanding loans at the beginning and the end of 2018 was 8 and 9, respectively, and the highest loan outstanding was CHF 6 million to Mr. Sitohang.
All mortgage loans to Executive Board members are granted either with variable or fixed interest rates over a certain period. Typically, mortgages are granted for periods of up to ten years. Interest rates
applied are based on refinancing costs plus a margin, and interest rates and other terms are consistent with those applicable to other employees. Loans against securities are granted at interest rates and on terms applicable to such loans granted to other employees. The same credit approval and risk assessment procedures apply to Executive Board members as for other employees. Unless oth-erwise noted, all loans to Executive Board members were made in the ordinary course of business and substantially on the same terms, including interest rates and collateral, as those prevailing at the time for comparable transactions with other persons and in consideration of the terms which apply to all Group employees. These loans did not involve more than the normal risk of collectabil-ity or present other unfavorable features.
> Refer to “Banking relationships with Board and Executive Board members and related party transactions” in IV – Corporate Governance – Additional informa-tion for further information.
248 Compensation
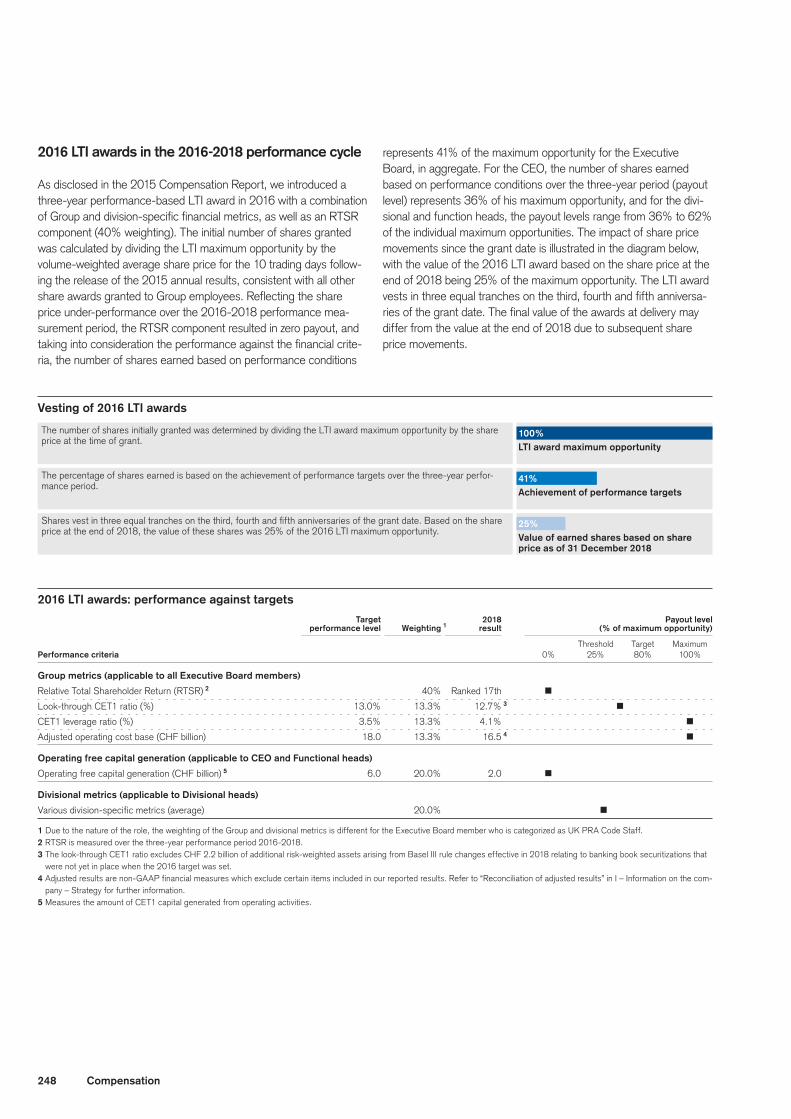
Vesting of 2016 LTI awards
The number of shares initially granted was determined by dividing the LTI award maximum opportunity by the share price at the time of grant.
The percentage of shares earned is based on the achievement of performance targets over the three-year perfor-mance period.
Shares vest in three equal tranches on the third, fourth and fifth anniversaries of the grant date. Based on the share price at the end of 2018, the value of these shares was 25% of the 2016 LTI maximum opportunity.
100%LTI award maximum opportunity
Achievement of performance targets
Value of earned shares based on share price as of 31 December 2018
41%
25%
2016 LTI awards in the 2016-2018 performance cycle
As disclosed in the 2015 Compensation Report, we introduced a three-year performance-based LTI award in 2016 with a combination of Group and division-specific financial metrics, as well as an RTSR component (40% weighting). The initial number of shares granted was calculated by dividing the LTI maximum opportunity by the volume-weighted average share price for the 10 trading days follow-ing the release of the 2015 annual results, consistent with all other share awards granted to Group employees. Reflecting the share price under-performance over the 2016-2018 performance mea-surement period, the RTSR component resulted in zero payout, and taking into consideration the performance against the financial crite-ria, the number of shares earned based on performance conditions
represents 41% of the maximum opportunity for the Executive Board, in aggregate. For the CEO, the number of shares earned based on performance conditions over the three-year period (payout level) represents 36% of his maximum opportunity, and for the divi-sional and function heads, the payout levels range from 36% to 62% of the individual maximum opportunities. The impact of share price movements since the grant date is illustrated in the diagram below, with the value of the 2016 LTI award based on the share price at the end of 2018 being 25% of the maximum opportunity. The LTI award vests in three equal tranches on the third, fourth and fifth anniversa-ries of the grant date. The final value of the awards at delivery may differ from the value at the end of 2018 due to subsequent share price movements.
2016 LTI awards: performance against targets Target 2018 Payout level performance level Weighting 1 result (% of maximum opportunity) Threshold Target MaximumPerformance criteria 0% 25% 80% 100%
Group metrics (applicable to all Executive Board members)
Relative Total Shareholder Return (RTSR) 2 40% Ranked 17th p
Look-through CET1 ratio (%) 13.0% 13.3% 12.7% 3 p
CET1 leverage ratio (%) 3.5% 13.3% 4.1% pAdjusted operating cost base (CHF billion) 18.0 13.3% 16.5 4 p
Operating free capital generation (applicable to CEO and Functional heads)
Operating free capital generation (CHF billion) 5 6.0 20.0% 2.0 p
Divisional metrics (applicable to Divisional heads)
Various division-specific metrics (average) 20.0% p
1 Due to the nature of the role, the weighting of the Group and divisional metrics is different for the Executive Board member who is categorized as UK PRA Code Staff.2 RTSR is measured over the three-year performance period 2016-2018.3 The look-through CET1 ratio excludes CHF 2.2 billion of additional risk-weighted assets arising from Basel III rule changes effective in 2018 relating to banking book securitizations that
were not yet in place when the 2016 target was set.4 Adjusted results are non-GAAP financial measures which exclude certain items included in our reported results. Refer to “Reconciliation of adjusted results” in I – Information on the com-
pany – Strategy for further information.5 Measures the amount of CET1 capital generated from operating activities.
249Compensation
Element
Fixed compensation
STI awards
LTI awards
Shareholding requirements1
Changes implemented in 2018
p No change to base salaries
p Introduction of STI award pool, with the total pool amount determined based on achievement of pre-determined financial criteria and non-financial criteria
p Metrics revised to promote greater focus on Group-level financial metrics and removal of capital-based performance metrics
p Financial criteria (weighted 662⁄3%): Group adjusted2 income before taxes and a cost target2
p Non-financialcriteria (weighted 331⁄3%): six broad categories, comprising strategic repositioning; client focus/quality of business/innovation; talent management; risk and regulatory; conduct and ethics; and teamwork and leadership
p Target payout level: 67% of the maximum opportunity
p Revised metrics for assessing performance that focus on Group only metrics and removal of capital-based performance metrics
p Financial criteria (weighted 662⁄3%): Group three-year average reported RoTE3 and TBVPS3
p RTSR (weighted 331⁄3%): zero payout for bottom quartile ranking, weighting reduced from 50%
p Target payout level: 67% of the maximum opportunity
p CEO minimum shareholding requirement: 500,000 shares, increased from 350,000 shares
p Executive Board member minimum shareholding requirement: 300,000 shares, increased from 150,000 shares
2019 design
p No changes
p Financial criteria (weighted 662⁄3%): adjusted2 income before taxes and Group reported RoTE3 , both for the performance year 2019
p No changes
p No changes
1 The thresholds include all Group shares held by or on behalf of the Executive Board members, including unvested share-based awards. Executive Board members are restricted from selling shares, or from receiving their share-based awards in the form of cash, until they fulfill the minimum share ownership requirements.
2 Adjusted results are non-GAAP financial measures which exclude certain items included in our reported results.3 Non-GAAP financial measure.
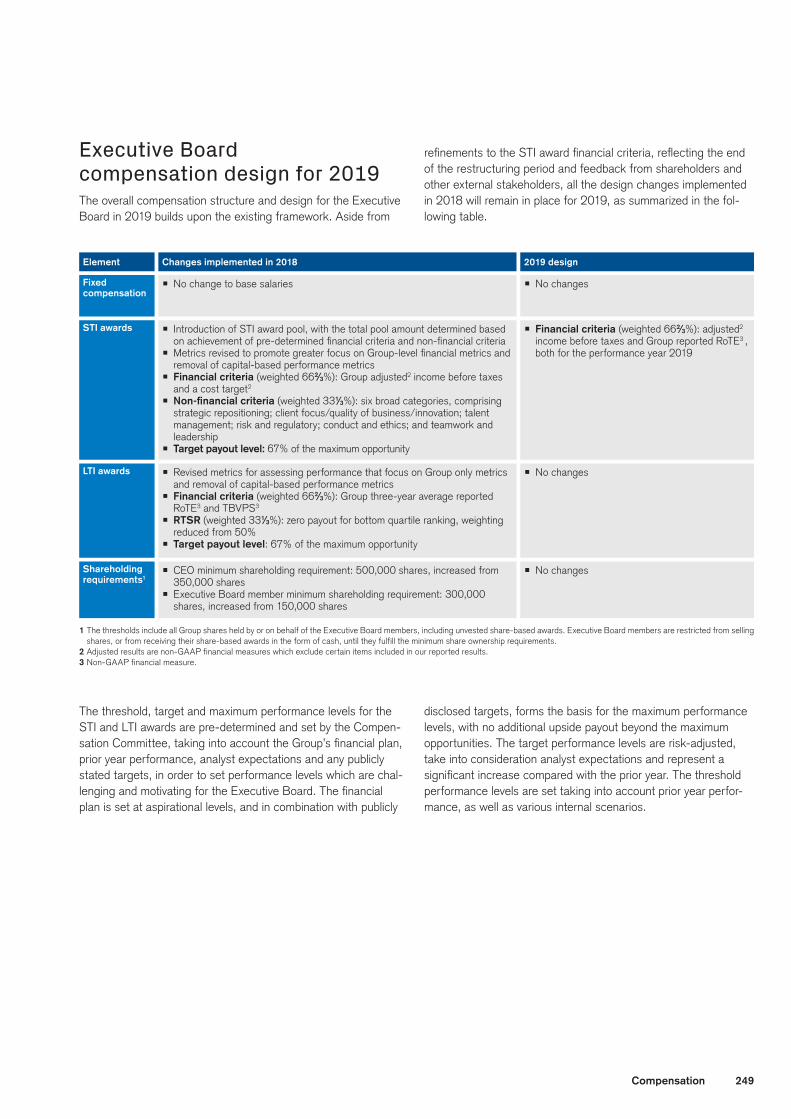
Executive Board compensation design for 2019 The overall compensation structure and design for the Executive Board in 2019 builds upon the existing framework. Aside from
refinements to the STI award financial criteria, reflecting the end of the restructuring period and feedback from shareholders and other external stakeholders, all the design changes implemented in 2018 will remain in place for 2019, as summarized in the fol-lowing table.
The threshold, target and maximum performance levels for the STI and LTI awards are pre-determined and set by the Compen-sation Committee, taking into account the Group’s financial plan, prior year performance, analyst expectations and any publicly stated targets, in order to set performance levels which are chal-lenging and motivating for the Executive Board. The financial plan is set at aspirational levels, and in combination with publicly
disclosed targets, forms the basis for the maximum performance levels, with no additional upside payout beyond the maximum opportunities. The target performance levels are risk-adjusted, take into consideration analyst expectations and represent a significant increase compared with the prior year. The threshold performance levels are set taking into account prior year perfor-mance, as well as various internal scenarios.
250 Compensation
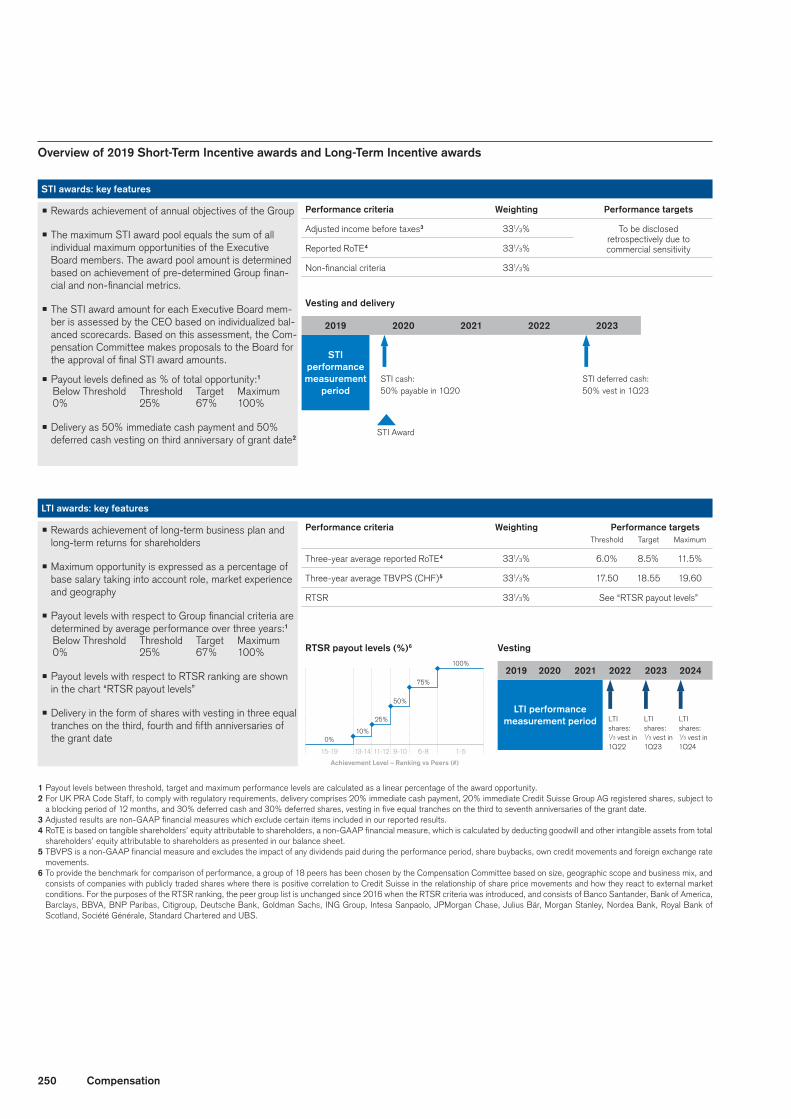
p Rewards achievement of annual objectives of the Group
p The maximum STI award pool equals the sum of all individual maximum opportunities of the Executive Board members. The award pool amount is determined based on achievement of pre-determined Group finan-cial and non-financial metrics.
p The STI award amount for each Executive Board mem-ber is assessed by the CEO based on individuali zed bal-anced scorecards. Based on this assessment, the Com-pensation Committee makes proposals to the Board for the approval of final STI award amounts.
p Payout levels defined as % of total opportunity:1 Below Threshold Threshold Target Maximum 0% 25% 67% 100%
p Delivery as 50% immediate cash payment and 50% deferred cash vesting on third anniversary of grant date2
Overview of 2019 Short-Term Incentive awards and Long-Term Incentive awards
STI awards: key features
Vesting and delivery
STI performance measurement
periodSTI cash: 50% payable in 1Q20
STI Award
STI deferred cash: 50% vest in 1Q23
Performance criteria Weighting Performance targets
Adjusted income before taxes3 331/3% To be disclosed
Reported RoTE4 331/3% retrospectively due to
Non-financial criteria 331/3%
commercial sensitivity
2019 2020 2021 2022 2023
p Rewards achievement of long-term business plan and long-term returns for shareholders
p Maximum opportunity is expressed as a percentage of base salary taking into account role, market experience and geography
p Payout levels with respect to Group financial criteria are determined by average performance over three years:1 Below Threshold Threshold Target Maximum 0% 25% 67% 100%
p Payout levels with respect to RTSR ranking are shown in the chart “RTSR payout levels”
p Delivery in the form of shares with vesting in three equal tranches on the third, fourth and fifth anniversaries of the grant date
LTI awards: key features
1 Payout levels between threshold, target and maximum performance levels are calculated as a linear percentage of the award opportunity. 2 For UK PRA Code Staff, to comply with regulatory requirements, delivery comprises 20% immediate cash payment, 20% immediate Credit Suisse Group AG registered shares, subject to
a blocking period of 12 months, and 30% deferred cash and 30% deferred shares, vesting in five equal tranches on the third to seventh anniversaries of the grant date.3 Adjusted results are non-GAAP financial measures which exclude certain items included in our reported results.4 RoTE is based on tangible shareholders’ equity attributable to shareholders, a non-GAAP financial measure, which is calculated by deducting goodwill and other intangible assets from total
shareholders’ equity attributable to shareholders as presented in our balance sheet. 5 TBVPS is a non-GAAP financial measure and excludes the impact of any dividends paid during the performance period, share buybacks, own credit movements and foreign exchange rate
movements. 6 To provide the benchmark for comparison of performance, a group of 18 peers has been chosen by the Compensation Committee based on size, geographic scope and business mix, and
consists of companies with publicly traded shares where there is positive correlation to Credit Suisse in the relationship of share price movements and how they react to external market conditions. For the purposes of the RTSR ranking, the peer group list is unchanged since 2016 when the RTSR criteria was introduced, and consists of Banco Santander, Bank of America, Barclays, BBVA, BNP Paribas, Citigroup, Deutsche Bank, Goldman Sachs, ING Group, Intesa Sanpaolo, JPMorgan Chase, Julius Bär, Morgan Stanley, Nordea Bank, Royal Bank of Scotland, Société Générale, Standard Chartered and UBS.
RTSR payout levels (%)6
100%
75%
50%
25%
10%0%
15-19 9-1013-14 6-811-12 1-5
Achievement Level – Ranking vs Peers (#)
Performance criteria Weighting Performance targets Threshold Target Maximum
Three-year average reported RoTE4 331/3% 6.0% 8.5% 11.5%
Three-year average TBVPS (CHF)5 331/3% 17.50 18.55 19.60
RTSR 331/3% See “RTSR payout levels”
Vesting
LTI performance measurement period LTI
shares: 1/3 vest in 1Q22
LTI shares: 1/3 vest in 1Q23
LTI shares: 1/3 vest in 1Q24
2019 2020 2021 2022 2023 2024
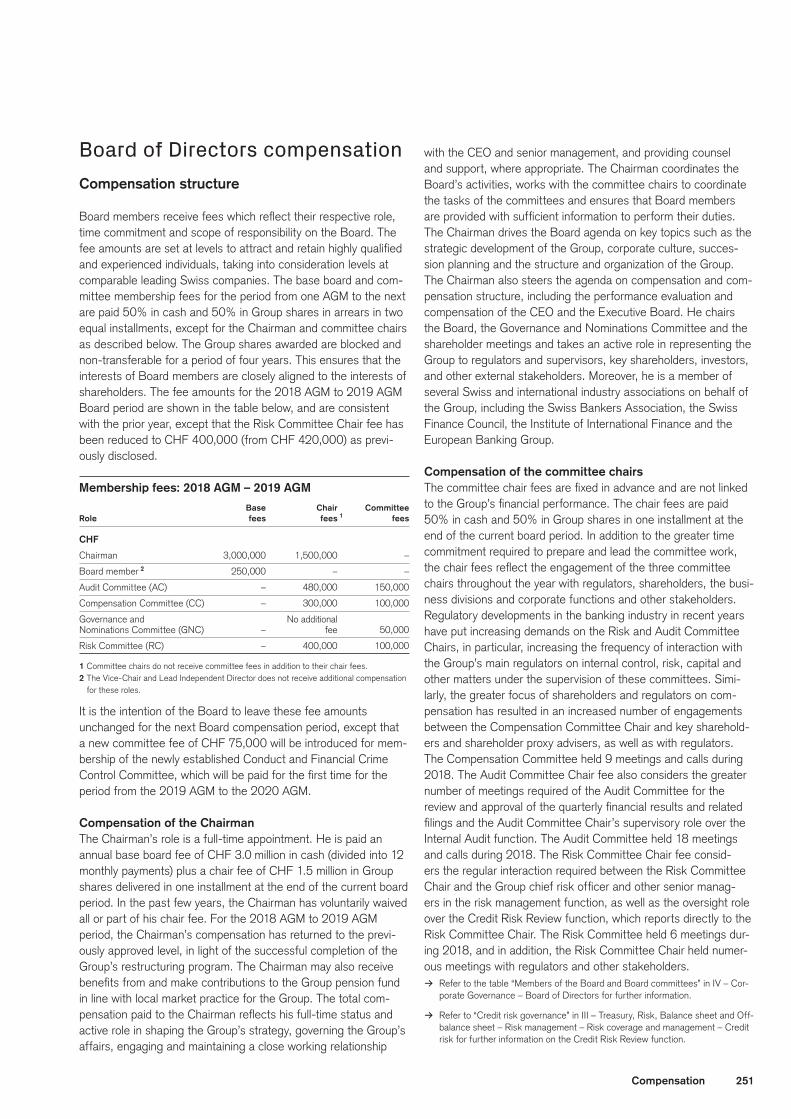
251Compensation
Board of Directors compensationCompensation structure
Board members receive fees which reflect their respective role, time commitment and scope of responsibility on the Board. The fee amounts are set at levels to attract and retain highly qualified and experienced individuals, taking into consideration levels at comparable leading Swiss companies. The base board and com-mittee membership fees for the period from one AGM to the next are paid 50% in cash and 50% in Group shares in arrears in two equal installments, except for the Chairman and committee chairs as described below. The Group shares awarded are blocked and non-transferable for a period of four years. This ensures that the interests of Board members are closely aligned to the interests of shareholders. The fee amounts for the 2018 AGM to 2019 AGM Board period are shown in the table below, and are consistent with the prior year, except that the Risk Committee Chair fee has been reduced to CHF 400,000 (from CHF 420,000) as previ-ously disclosed.
Membership fees: 2018 AGM – 2019 AGM Base Chair Committee
Role fees fees 1 fees
CHF
Chairman 3,000,000 1,500,000 –
Board member 2 250,000 – –
Audit Committee (AC) – 480,000 150,000
Compensation Committee (CC) – 300,000 100,000
Governance and No additional
Nominations Committee (GNC) – fee 50,000
Risk Committee (RC) – 400,000 100,000
1 Committee chairs do not receive committee fees in addition to their chair fees.2 The Vice-Chair and Lead Independent Director does not receive additional compensation
for these roles.
It is the intention of the Board to leave these fee amounts unchanged for the next Board compensation period, except that a new committee fee of CHF 75,000 will be introduced for mem-bership of the newly established Conduct and Financial Crime Control Committee, which will be paid for the first time for the period from the 2019 AGM to the 2020 AGM.
Compensation of the ChairmanThe Chairman’s role is a full-time appointment. He is paid an annual base board fee of CHF 3.0 million in cash (divided into 12 monthly payments) plus a chair fee of CHF 1.5 million in Group shares delivered in one installment at the end of the current board period. In the past few years, the Chairman has voluntarily waived all or part of his chair fee. For the 2018 AGM to 2019 AGM period, the Chairman’s compensation has returned to the previ-ously approved level, in light of the successful completion of the Group’s restructuring program. The Chairman may also receive benefits from and make contributions to the Group pension fund in line with local market practice for the Group. The total com-pensation paid to the Chairman reflects his full-time status and active role in shaping the Group’s strategy, governing the Group’s affairs, engaging and maintaining a close working relationship
with the CEO and senior management, and providing counsel and support, where appropriate. The Chairman coordinates the Board’s activities, works with the committee chairs to coordinate the tasks of the committees and ensures that Board members are provided with sufficient information to perform their duties. The Chairman drives the Board agenda on key topics such as the strategic development of the Group, corporate culture, succes-sion planning and the structure and organization of the Group. The Chairman also steers the agenda on compensation and com-pensation structure, including the performance evaluation and compensation of the CEO and the Executive Board. He chairs the Board, the Governance and Nominations Committee and the shareholder meetings and takes an active role in representing the Group to regulators and supervisors, key shareholders, investors, and other external stakeholders. Moreover, he is a member of several Swiss and international industry associations on behalf of the Group, including the Swiss Bankers Association, the Swiss Finance Council, the Institute of International Finance and the European Banking Group.
Compensation of the committee chairsThe committee chair fees are fixed in advance and are not linked to the Group’s financial performance. The chair fees are paid 50% in cash and 50% in Group shares in one installment at the end of the current board period. In addition to the greater time commitment required to prepare and lead the committee work, the chair fees reflect the engagement of the three committee chairs throughout the year with regulators, shareholders, the busi-ness divisions and corporate functions and other stakeholders. Regulatory developments in the banking industry in recent years have put increasing demands on the Risk and Audit Committee Chairs, in particular, increasing the frequency of interaction with the Group’s main regulators on internal control, risk, capital and other matters under the supervision of these committees. Simi-larly, the greater focus of shareholders and regulators on com-pensation has resulted in an increased number of engagements between the Compensation Committee Chair and key sharehold-ers and shareholder proxy advisers, as well as with regulators. The Compensation Committee held 9 meetings and calls during 2018. The Audit Committee Chair fee also considers the greater number of meetings required of the Audit Committee for the review and approval of the quarterly financial results and related filings and the Audit Committee Chair’s supervisory role over the Internal Audit function. The Audit Committee held 18 meetings and calls during 2018. The Risk Committee Chair fee consid-ers the regular interaction required between the Risk Committee Chair and the Group chief risk officer and other senior manag-ers in the risk management function, as well as the oversight role over the Credit Risk Review function, which reports directly to the Risk Committee Chair. The Risk Committee held 6 meetings dur-ing 2018, and in addition, the Risk Committee Chair held numer-ous meetings with regulators and other stakeholders.
> Refer to the table “Members of the Board and Board committees” in IV – Cor-porate Governance – Board of Directors for further information.
> Refer to “Credit risk governance” in III – Treasury, Risk, Balance sheet and Off-balance sheet – Risk management – Risk coverage and management – Credit risk for further information on the Credit Risk Review function.
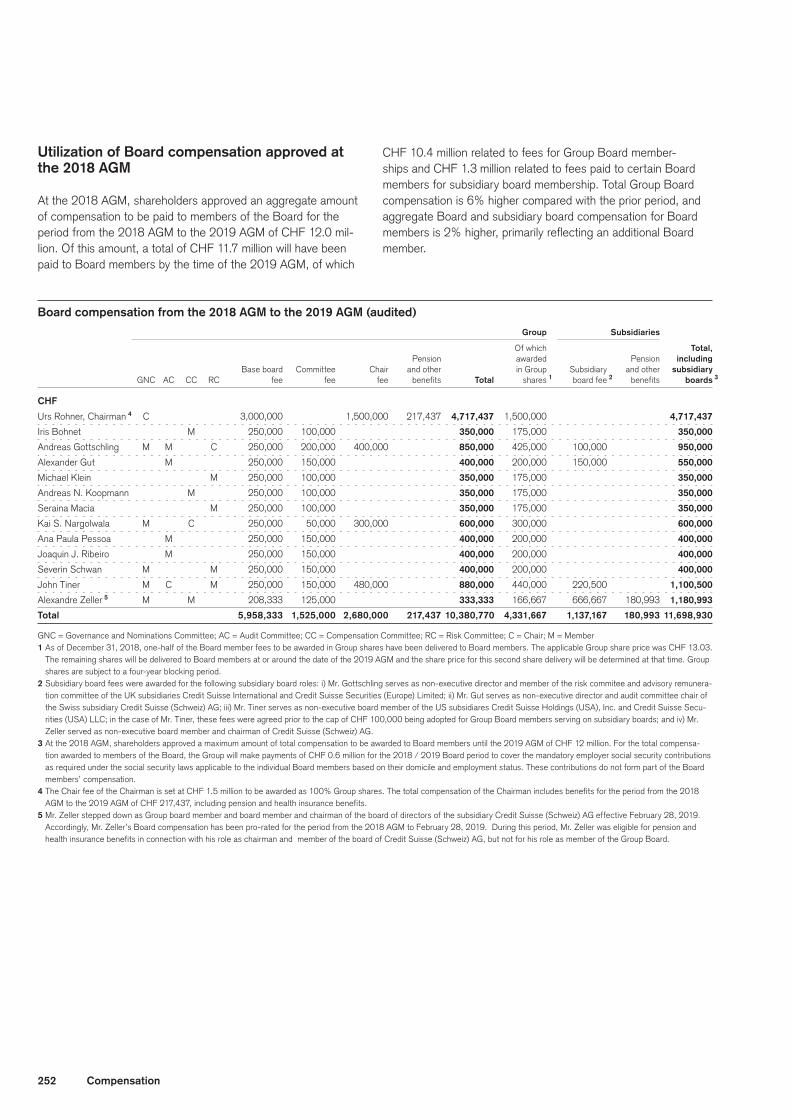
252 Compensation
Utilization of Board compensation approved at the 2018 AGM
At the 2018 AGM, shareholders approved an aggregate amount of compensation to be paid to members of the Board for the period from the 2018 AGM to the 2019 AGM of CHF 12.0 mil-lion. Of this amount, a total of CHF 11.7 million will have been paid to Board members by the time of the 2019 AGM, of which
CHF 10.4 million related to fees for Group Board member-ships and CHF 1.3 million related to fees paid to certain Board members for subsidiary board membership. Total Group Board compensation is 6% higher compared with the prior period, and aggregate Board and subsidiary board compensation for Board members is 2% higher, primarily reflecting an additional Board member.
Board compensation from the 2018 AGM to the 2019 AGM (audited) Group Subsidiaries
Of which Total, Pension awarded Pension including
Base board Committee Chair and other in Group Subsidiary and other subsidiary
GNC AC CC RC fee fee fee benefits Total shares 1 board fee 2 benefits boards 3
CHF
Urs Rohner, Chairman 4 C 3,000,000 1,500,000 217,437 4,717,437 1,500,000 4,717,437
Iris Bohnet M 250,000 100,000 350,000 175,000 350,000
Andreas Gottschling M M C 250,000 200,000 400,000 850,000 425,000 100,000 950,000
Alexander Gut M 250,000 150,000 400,000 200,000 150,000 550,000
Michael Klein M 250,000 100,000 350,000 175,000 350,000
Andreas N. Koopmann M 250,000 100,000 350,000 175,000 350,000
Seraina Macia M 250,000 100,000 350,000 175,000 350,000
Kai S. Nargolwala M C 250,000 50,000 300,000 600,000 300,000 600,000
Ana Paula Pessoa M 250,000 150,000 400,000 200,000 400,000
Joaquin J. Ribeiro M 250,000 150,000 400,000 200,000 400,000
Severin Schwan M M 250,000 150,000 400,000 200,000 400,000
John Tiner M C M 250,000 150,000 480,000 880,000 440,000 220,500 1,100,500
Alexandre Zeller 5 M M 208,333 125,000 333,333 166,667 666,667 180,993 1,180,993
Total 5,958,333 1,525,000 2,680,000 217,437 10,380,770 4,331,667 1,137,167 180,993 11,698,930
GNC = Governance and Nominations Committee; AC = Audit Committee; CC = Compensation Committee; RC = Risk Committee; C = Chair; M = Member1 As of December 31, 2018, one-half of the Board member fees to be awarded in Group shares have been delivered to Board members. The applicable Group share price was CHF 13.03.
The remaining shares will be delivered to Board members at or around the date of the 2019 AGM and the share price for this second share delivery will be determined at that time. Group shares are subject to a four-year blocking period.
2 Subsidiary board fees were awarded for the following subsidiary board roles: i) Mr. Gottschling serves as non-executive director and member of the risk commitee and advisory remunera-tion committee of the UK subsidiaries Credit Suisse International and Credit Suisse Securities (Europe) Limited; ii) Mr. Gut serves as non-executive director and audit committee chair of the Swiss subsidiary Credit Suisse (Schweiz) AG; iii) Mr. Tiner serves as non-executive board member of the US subsidiares Credit Suisse Holdings (USA), Inc. and Credit Suisse Secu-rities (USA) LLC; in the case of Mr. Tiner, these fees were agreed prior to the cap of CHF 100,000 being adopted for Group Board members serving on subsidiary boards; and iv) Mr. Zeller served as non-executive board member and chairman of Credit Suisse (Schweiz) AG.
3 At the 2018 AGM, shareholders approved a maximum amount of total compensation to be awarded to Board members until the 2019 AGM of CHF 12 million. For the total compensa-tion awarded to members of the Board, the Group will make payments of CHF 0.6 million for the 2018 / 2019 Board period to cover the mandatory employer social security contributions as required under the social security laws applicable to the individual Board members based on their domicile and employment status. These contributions do not form part of the Board members’ compensation.
4 The Chair fee of the Chairman is set at CHF 1.5 million to be awarded as 100% Group shares. The total compensation of the Chairman includes benefits for the period from the 2018 AGM to the 2019 AGM of CHF 217,437, including pension and health insurance benefits.
5 Mr. Zeller stepped down as Group board member and board member and chairman of the board of directors of the subsidiary Credit Suisse (Schweiz) AG effective February 28, 2019. Accordingly, Mr. Zeller’s Board compensation has been pro-rated for the period from the 2018 AGM to February 28, 2019. During this period, Mr. Zeller was eligible for pension and health insurance benefits in connection with his role as chairman and member of the board of Credit Suisse (Schweiz) AG, but not for his role as member of the Group Board.
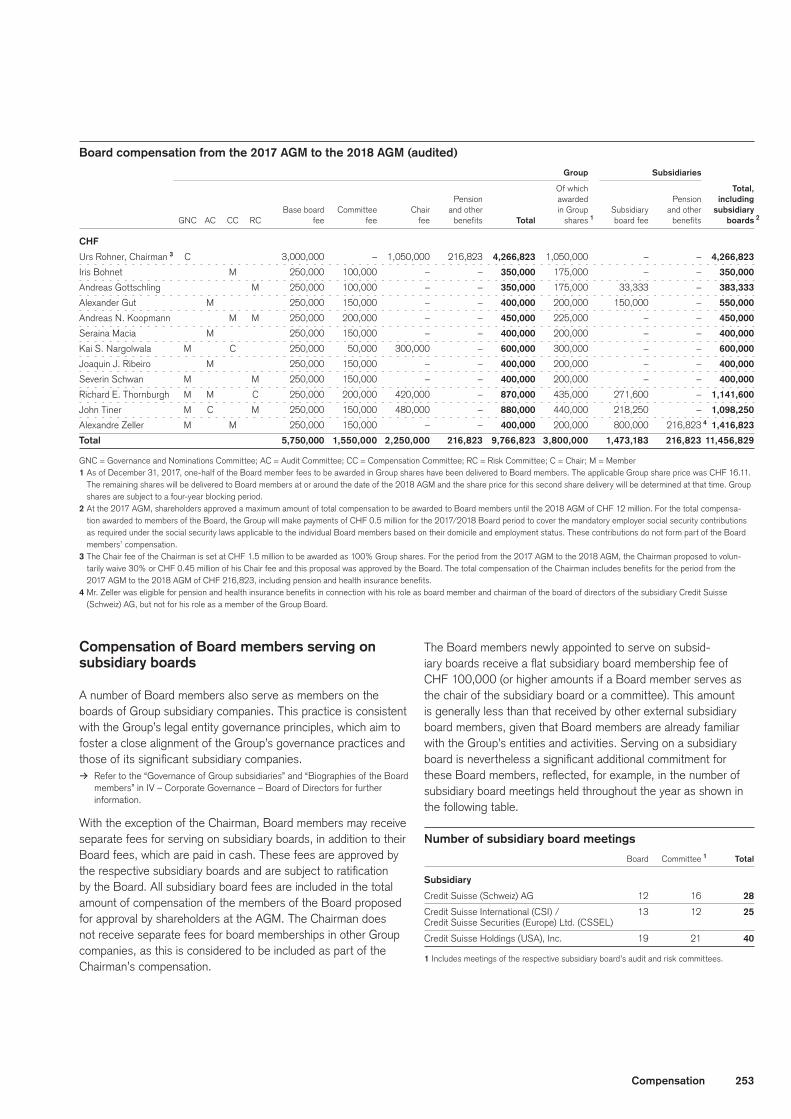
253Compensation
Board compensation from the 2017 AGM to the 2018 AGM (audited) Group Subsidiaries
Of which Total, Pension awarded Pension including
Base board Committee Chair and other in Group Subsidiary and other subsidiary
GNC AC CC RC fee fee fee benefits Total shares 1 board fee benefits boards 2
CHF
Urs Rohner, Chairman 3 C 3,000,000 – 1,050,000 216,823 4,266,823 1,050,000 – – 4,266,823
Iris Bohnet M 250,000 100,000 – – 350,000 175,000 – – 350,000
Andreas Gottschling M 250,000 100,000 – – 350,000 175,000 33,333 – 383,333
Alexander Gut M 250,000 150,000 – – 400,000 200,000 150,000 – 550,000
Andreas N. Koopmann M M 250,000 200,000 – – 450,000 225,000 – – 450,000
Seraina Macia M 250,000 150,000 – – 400,000 200,000 – – 400,000
Kai S. Nargolwala M C 250,000 50,000 300,000 – 600,000 300,000 – – 600,000
Joaquin J. Ribeiro M 250,000 150,000 – – 400,000 200,000 – – 400,000
Severin Schwan M M 250,000 150,000 – – 400,000 200,000 – – 400,000
Richard E. Thornburgh M M C 250,000 200,000 420,000 – 870,000 435,000 271,600 – 1,141,600
John Tiner M C M 250,000 150,000 480,000 – 880,000 440,000 218,250 – 1,098,250
Alexandre Zeller M M 250,000 150,000 – – 400,000 200,000 800,000 216,823 4 1,416,823
Total 5,750,000 1,550,000 2,250,000 216,823 9,766,823 3,800,000 1,473,183 216,823 11,456,829
GNC = Governance and Nominations Committee; AC = Audit Committee; CC = Compensation Committee; RC = Risk Committee; C = Chair; M = Member1 As of December 31, 2017, one-half of the Board member fees to be awarded in Group shares have been delivered to Board members. The applicable Group share price was CHF 16.11.
The remaining shares will be delivered to Board members at or around the date of the 2018 AGM and the share price for this second share delivery will be determined at that time. Group shares are subject to a four-year blocking period.
2 At the 2017 AGM, shareholders approved a maximum amount of total compensation to be awarded to Board members until the 2018 AGM of CHF 12 million. For the total compensa-tion awarded to members of the Board, the Group will make payments of CHF 0.5 million for the 2017/2018 Board period to cover the mandatory employer social security contributions as required under the social security laws applicable to the individual Board members based on their domicile and employment status. These contributions do not form part of the Board members’ compensation.
3 The Chair fee of the Chairman is set at CHF 1.5 million to be awarded as 100% Group shares. For the period from the 2017 AGM to the 2018 AGM, the Chairman proposed to volun-tarily waive 30% or CHF 0.45 million of his Chair fee and this proposal was approved by the Board. The total compensation of the Chairman includes benefits for the period from the 2017 AGM to the 2018 AGM of CHF 216,823, including pension and health insurance benefits.
4 Mr. Zeller was eligible for pension and health insurance benefits in connection with his role as board member and chairman of the board of directors of the subsidiary Credit Suisse (Schweiz) AG, but not for his role as a member of the Group Board.
Compensation of Board members serving on subsidiary boards
A number of Board members also serve as members on the boards of Group subsidiary companies. This practice is consistent with the Group’s legal entity governance principles, which aim to foster a close alignment of the Group’s governance practices and those of its significant subsidiary companies.
> Refer to the “Governance of Group subsidiaries” and “Biographies of the Board members” in IV – Corporate Governance – Board of Directors for further information.
With the exception of the Chairman, Board members may receive separate fees for serving on subsidiary boards, in addition to their Board fees, which are paid in cash. These fees are approved by the respective subsidiary boards and are subject to ratification by the Board. All subsidiary board fees are included in the total amount of compensation of the members of the Board proposed for approval by shareholders at the AGM. The Chairman does not receive separate fees for board memberships in other Group companies, as this is considered to be included as part of the Chairman’s compensation.
The Board members newly appointed to serve on subsid-iary boards receive a flat subsidiary board membership fee of CHF 100,000 (or higher amounts if a Board member serves as the chair of the subsidiary board or a committee). This amount is generally less than that received by other external subsidiary board members, given that Board members are already familiar with the Group’s entities and activities. Serving on a subsidiary board is nevertheless a significant additional commitment for these Board members, reflected, for example, in the number of subsidiary board meetings held throughout the year as shown in the following table.
Number of subsidiary board meetings Board Committee 1 Total
Subsidiary
Credit Suisse (Schweiz) AG 12 16 28
Credit Suisse International (CSI) / 13 12 25
Credit Suisse Securities (Europe) Ltd. (CSSEL)
Credit Suisse Holdings (USA), Inc. 19 21 40
1 Includes meetings of the respective subsidiary board’s audit and risk committees.
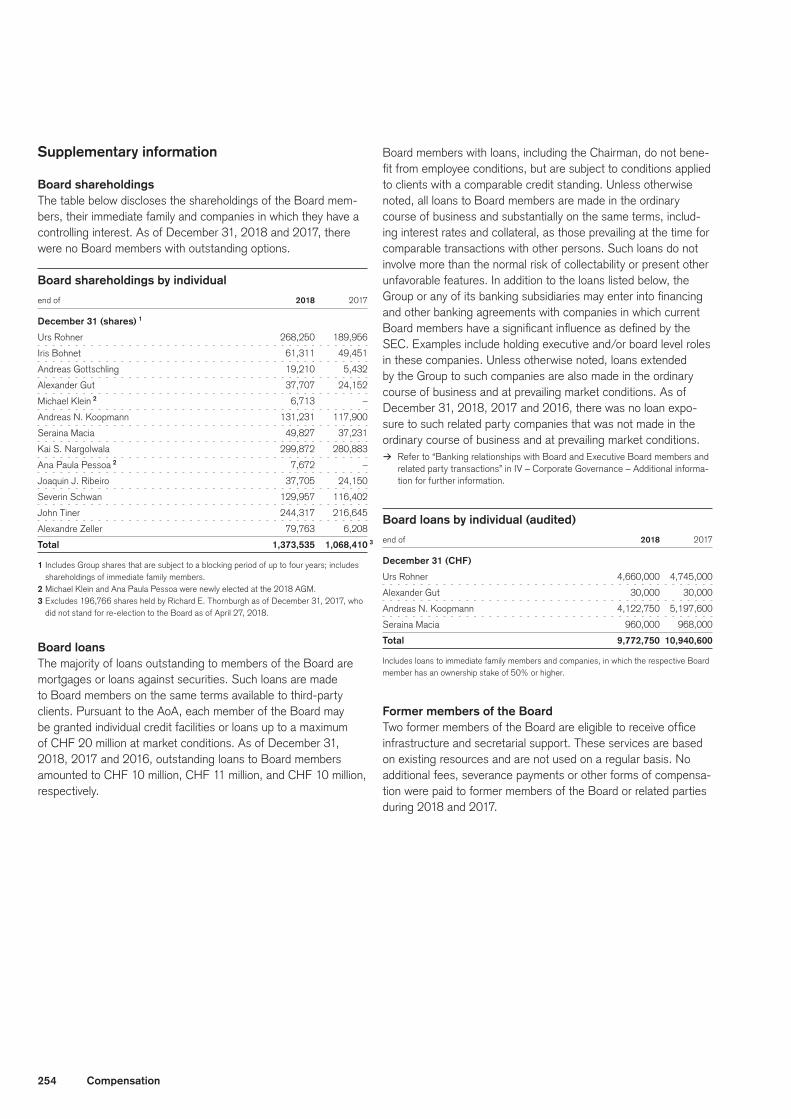
254 Compensation
Supplementary information
Board shareholdingsThe table below discloses the shareholdings of the Board mem-bers, their immediate family and companies in which they have a controlling interest. As of December 31, 2018 and 2017, there were no Board members with outstanding options.
Board shareholdings by individual
end of 2018 2017
December 31 (shares) 1
Urs Rohner 268,250 189,956
Iris Bohnet 61,311 49,451
Andreas Gottschling 19,210 5,432
Alexander Gut 37,707 24,152
Michael Klein 2 6,713 –
Andreas N. Koopmann 131,231 117,900
Seraina Macia 49,827 37,231
Kai S. Nargolwala 299,872 280,883
Ana Paula Pessoa 2 7,672 –
Joaquin J. Ribeiro 37,705 24,150
Severin Schwan 129,957 116,402
John Tiner 244,317 216,645
Alexandre Zeller 79,763 6,208
Total 1,373,535 1,068,410 3
1 Includes Group shares that are subject to a blocking period of up to four years; includes shareholdings of immediate family members.
2 Michael Klein and Ana Paula Pessoa were newly elected at the 2018 AGM.3 Excludes 196,766 shares held by Richard E. Thornburgh as of December 31, 2017, who
did not stand for re-election to the Board as of April 27, 2018.
Board loansThe majority of loans outstanding to members of the Board are mortgages or loans against securities. Such loans are made to Board members on the same terms available to third-party clients. Pursuant to the AoA, each member of the Board may be granted individual credit facilities or loans up to a maximum of CHF 20 million at market conditions. As of December 31, 2018, 2017 and 2016, outstanding loans to Board members amounted to CHF 10 million, CHF 11 million, and CHF 10 million, respectively.
Board members with loans, including the Chairman, do not bene-fit from employee conditions, but are subject to conditions applied to clients with a comparable credit standing. Unless otherwise noted, all loans to Board members are made in the ordinary course of business and substantially on the same terms, includ-ing interest rates and collateral, as those prevailing at the time for comparable transactions with other persons. Such loans do not involve more than the normal risk of collectability or present other unfavorable features. In addition to the loans listed below, the Group or any of its banking subsidiaries may enter into financing and other banking agreements with companies in which current Board members have a significant influence as defined by the SEC. Examples include holding executive and/or board level roles in these companies. Unless otherwise noted, loans extended by the Group to such companies are also made in the ordinary course of business and at prevailing market conditions. As of December 31, 2018, 2017 and 2016, there was no loan expo-sure to such related party companies that was not made in the ordinary course of business and at prevailing market conditions.
> Refer to “Banking relationships with Board and Executive Board members and related party transactions” in IV – Corporate Governance – Additional informa-tion for further information.
Board loans by individual (audited)
end of 2018 2017
December 31 (CHF)
Urs Rohner 4,660,000 4,745,000
Alexander Gut 30,000 30,000
Andreas N. Koopmann 4,122,750 5,197,600
Seraina Macia 960,000 968,000
Total 9,772,750 10,940,600
Includes loans to immediate family members and companies, in which the respective Board member has an ownership stake of 50% or higher.
Former members of the BoardTwo former members of the Board are eligible to receive office infrastructure and secretarial support. These services are based on existing resources and are not used on a regular basis. No additional fees, severance payments or other forms of compensa-tion were paid to former members of the Board or related parties during 2018 and 2017.
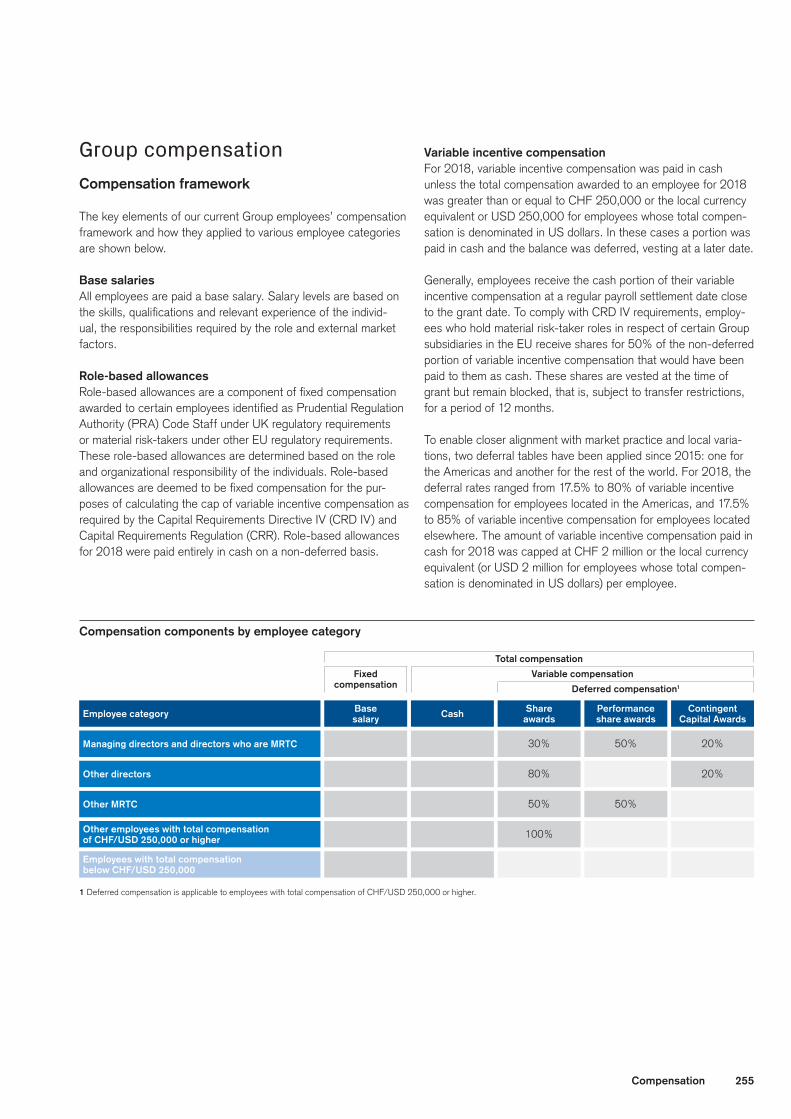
255Compensation
1 Deferred compensation is applicable to employees with total compensation of CHF/USD 250,000 or higher.
Employee category
Managing directors and directors who are MRTC
Other directors
Other MRTC
Base salary Cash Share
awards
30%
80%
50%
100%
Performance share awards
50%
50%
Contingent Capital Awards
20%
20%
Deferred compensation1
Variable compensation
Total compensation
Fixed compensation
Employees with total compensation below CHF/USD 250,000
Other employees with total compen sation of CHF/USD 250,000 or higher
Group compensationCompensation framework
The key elements of our current Group employees’ compensation framework and how they applied to various employee categories are shown below.
Base salariesAll employees are paid a base salary. Salary levels are based on the skills, qualifications and relevant experience of the individ-ual, the responsibilities required by the role and external market factors.
Role-based allowancesRole-based allowances are a component of fixed compensation awarded to certain employees identified as Prudential Regulation Authority (PRA) Code Staff under UK regulatory requirements or material risk-takers under other EU regulatory requirements. These role-based allowances are determined based on the role and organizational responsibility of the individuals. Role-based allowances are deemed to be fixed compensation for the pur-poses of calculating the cap of variable incentive compensation as required by the Capital Requirements Directive IV (CRD IV) and Capital Requirements Regulation (CRR). Role-based allowances for 2018 were paid entirely in cash on a non-deferred basis.
Variable incentive compensation For 2018, variable incentive compensation was paid in cash unless the total compensation awarded to an employee for 2018 was greater than or equal to CHF 250,000 or the local currency equivalent or USD 250,000 for employees whose total compen-sation is denominated in US dollars. In these cases a portion was paid in cash and the balance was deferred, vesting at a later date.
Generally, employees receive the cash portion of their variable incentive compensation at a regular payroll settlement date close to the grant date. To comply with CRD IV requirements, employ-ees who hold material risk-taker roles in respect of certain Group subsidiaries in the EU receive shares for 50% of the non-deferred portion of variable incentive compensation that would have been paid to them as cash. These shares are vested at the time of grant but remain blocked, that is, subject to transfer restrictions, for a period of 12 months.
To enable closer alignment with market practice and local varia-tions, two deferral tables have been applied since 2015: one for the Americas and another for the rest of the world. For 2018, the deferral rates ranged from 17.5% to 80% of variable incentive compensation for employees located in the Americas, and 17.5% to 85% of variable incentive compensation for employees located elsewhere. The amount of variable incentive compensation paid in cash for 2018 was capped at CHF 2 million or the local currency equivalent (or USD 2 million for employees whose total compen-sation is denominated in US dollars) per employee.
Compensation components by employee category
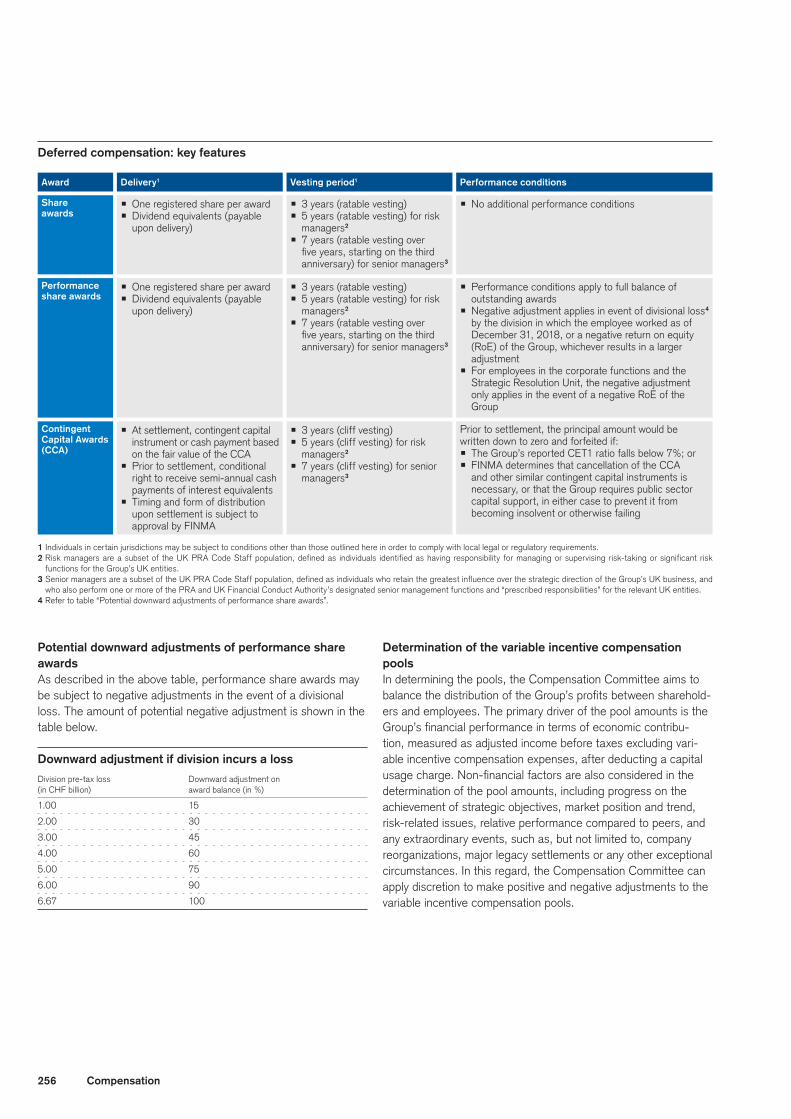
256 Compensation
Award
Share awards
Performance share awards
Contingent Capital Awards (CCA)
Delivery1 Vesting period1
p One registered share per awardp Dividend equivalents (payable
upon delivery)
p One registered share per awardp Dividend equivalents (payable
upon delivery)
p At settlement, contingent capital instrument or cash payment based on the fair value of the CCA
p Prior to settlement, conditional right to receive semi-annual cash payments of interest equivalents
p Timing and form of distribution upon settlement is subject to approval by FINMA
p 3 years (ratable vesting)p 5 years (ratable vesting) for risk
managers2
p 7 years (ratable vesting over five years, starting on the third anniversary) for senior managers3
p 3 years (ratable vesting)p 5 years (ratable vesting) for risk
managers2
p 7 years (ratable vesting over five years, starting on the third anniversary) for senior managers3
p 3 years (cliff vesting)p 5 years (cliff vesting) for risk
managers2
p 7 years (cliff vesting) for senior managers3
Performance conditions
p No additional performance conditions
p Performance conditions apply to full balance of outstanding awards
p Negative adjustment applies in event of divisional loss4 by the division in which the employee worked as of December 31, 2018, or a negative return on equity (RoE) of the Group, whichever results in a larger adjustment
p For employees in the corporate functions and the Strategic Resolution Unit, the negative adjustment only applies in the event of a negative RoE of the Group
Prior to settlement, the principal amount would be written down to zero and forfeited if:p The Group’s reported CET1 ratio falls below 7%; or p FINMA determines that cancellation of the CCA
and other similar contingent capital instruments is necessary, or that the Group requires public sector capital support, in either case to prevent it from becoming insolvent or otherwise failing
1 Individuals in certain jurisdictions may be subject to conditions other than those outlined here in order to comply with local legal or regulatory requirements.2 Risk managers are a subset of the UK PRA Code Staff population, defined as individuals identified as having responsibility for managing or supervising risk-taking or significant risk
functions for the Group’s UK entities. 3 Senior managers are a subset of the UK PRA Code Staff population, defined as individuals who retain the greatest influence over the strategic direction of the Group’s UK business, and
who also perform one or more of the PRA and UK Financial Conduct Authority’s designated senior management functions and “prescribed responsibilities” for the relevant UK entities. 4 Refer to table “Potential downward adjustments of performance share awards”.
Deferred compensation: key features
Potential downward adjustments of performance share awards As described in the above table, performance share awards may be subject to negative adjustments in the event of a divisional loss. The amount of potential negative adjustment is shown in the table below.
Downward adjustment if division incurs a loss
Division pre-tax loss Downward adjustment on
(in CHF billion) award balance (in %)
1.00 15
2.00 30
3.00 45
4.00 60
5.00 75
6.00 90
6.67 100
Determination of the variable incentive compensation poolsIn determining the pools, the Compensation Committee aims to balance the distribution of the Group’s profits between sharehold-ers and employees. The primary driver of the pool amounts is the Group’s financial performance in terms of economic contribu-tion, measured as adjusted income before taxes excluding vari-able incentive compensation expenses, after deducting a capital usage charge. Non-financial factors are also considered in the determination of the pool amounts, including progress on the achievement of strategic objectives, market position and trend, risk-related issues, relative performance compared to peers, and any extraordinary events, such as, but not limited to, company reorganizations, major legacy settlements or any other exceptional circumstances. In this regard, the Compensation Committee can apply discretion to make positive and negative adjustments to the variable incentive compensation pools.
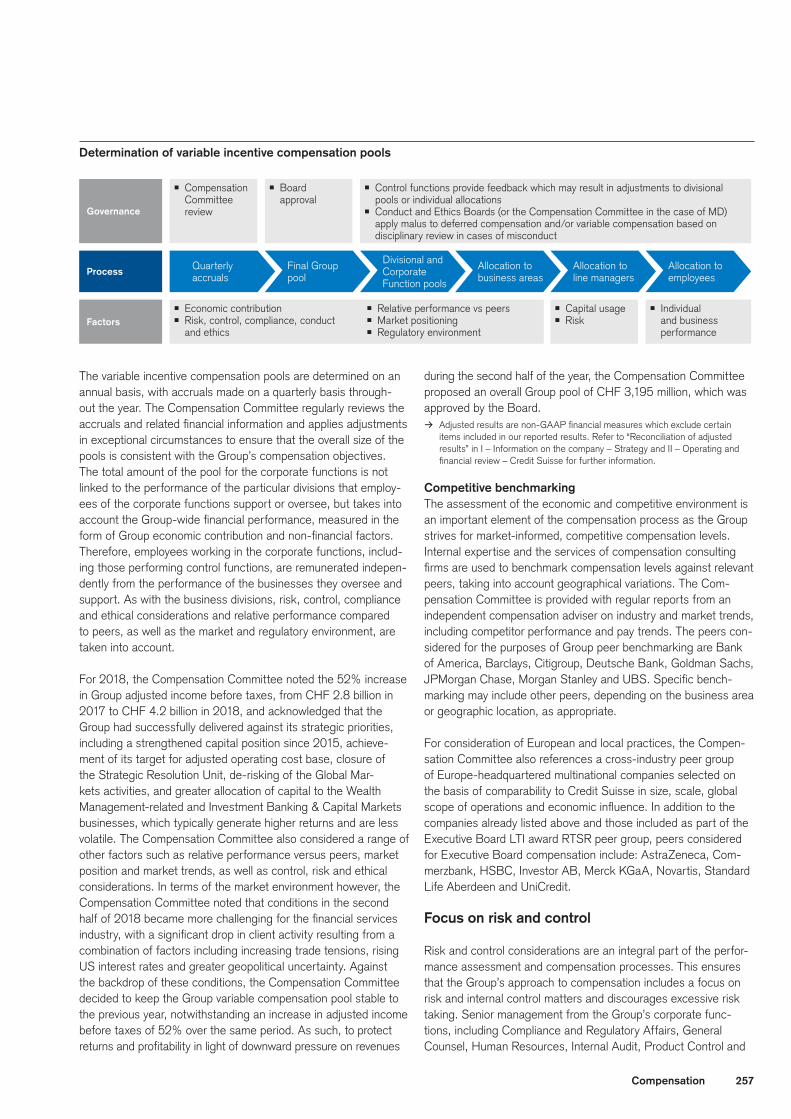
257Compensation
Determination of variable incentive compensation pools
Process
Factors
Governance
p Compensation Committee review
p Economic contributionp Risk, control, compliance, conduct
and ethics
p Relative performance vs peersp Market positioningp Regulatory environment
p Board approval
p Capital usagep Risk
p Individual and business performance
p Control functions provide feedback which may result in adjustments to divisional pools or individual allocations
p Conduct and Ethics Boards (or the Compensation Committee in the case of MD) apply malus to deferred compensation and/or variable compensation based on disciplinary review in cases of misconduct
Quarterly accruals
Final Group pool
Divisional and Corporate Function pools
Allocation to business areas
Allocation to line managers
Allocation to employees
The variable incentive compensation pools are determined on an annual basis, with accruals made on a quarterly basis through-out the year. The Compensation Committee regularly reviews the accruals and related financial information and applies adjustments in exceptional circumstances to ensure that the overall size of the pools is consistent with the Group’s compensation objectives. The total amount of the pool for the corporate functions is not linked to the performance of the particular divisions that employ-ees of the corporate functions support or oversee, but takes into account the Group-wide financial performance, measured in the form of Group economic contribution and non-financial factors. Therefore, employees working in the corporate functions, includ-ing those performing control functions, are remunerated indepen-dently from the performance of the businesses they oversee and support. As with the business divisions, risk, control, compliance and ethical considerations and relative performance compared to peers, as well as the market and regulatory environment, are taken into account.
For 2018, the Compensation Committee noted the 52% increase in Group adjusted income before taxes, from CHF 2.8 billion in 2017 to CHF 4.2 billion in 2018, and acknowledged that the Group had successfully delivered against its strategic priorities, including a strengthened capital position since 2015, achieve-ment of its target for adjusted operating cost base, closure of the Strategic Resolution Unit, de-risking of the Global Mar-kets activities, and greater allocation of capital to the Wealth Management-related and Investment Banking & Capital Markets businesses, which typically generate higher returns and are less volatile. The Compensation Committee also considered a range of other factors such as relative performance versus peers, market position and market trends, as well as control, risk and ethical considerations. In terms of the market environment however, the Compensation Committee noted that conditions in the second half of 2018 became more challenging for the financial services industry, with a significant drop in client activity resulting from a combination of factors including increasing trade tensions, rising US interest rates and greater geopolitical uncertainty. Against the backdrop of these conditions, the Compensation Committee decided to keep the Group variable compensation pool stable to the previous year, notwithstanding an increase in adjusted income before taxes of 52% over the same period. As such, to protect returns and profitability in light of downward pressure on revenues
during the second half of the year, the Compensation Committee proposed an overall Group pool of CHF 3,195 million, which was approved by the Board.
> Adjusted results are non-GAAP financial measures which exclude certain items included in our reported results. Refer to “Reconciliation of adjusted results” in I – Information on the company – Strategy and II – Operating and financial review – Credit Suisse for further information.
Competitive benchmarkingThe assessment of the economic and competitive environment is an important element of the compensation process as the Group strives for market-informed, competitive compensation levels. Internal expertise and the services of compensation consulting firms are used to benchmark compensation levels against relevant peers, taking into account geographical variations. The Com-pensation Committee is provided with regular reports from an independent compensation adviser on industry and market trends, including competitor performance and pay trends. The peers con-sidered for the purposes of Group peer benchmarking are Bank of America, Barclays, Citigroup, Deutsche Bank, Goldman Sachs, JPMorgan Chase, Morgan Stanley and UBS. Specific bench-marking may include other peers, depending on the business area or geographic location, as appropriate.
For consideration of European and local practices, the Compen-sation Committee also references a cross-industry peer group of Europe-headquartered multinational companies selected on the basis of comparability to Credit Suisse in size, scale, global scope of operations and economic influence. In addition to the companies already listed above and those included as part of the Executive Board LTI award RTSR peer group, peers considered for Executive Board compensation include: AstraZeneca, Com-merzbank, HSBC, Investor AB, Merck KGaA, Novartis, Standard Life Aberdeen and UniCredit.
Focus on risk and control
Risk and control considerations are an integral part of the perfor-mance assessment and compensation processes. This ensures that the Group’s approach to compensation includes a focus on risk and internal control matters and discourages excessive risk taking. Senior management from the Group’s corporate func-tions, including Compliance and Regulatory Affairs, General Counsel, Human Resources, Internal Audit, Product Control and
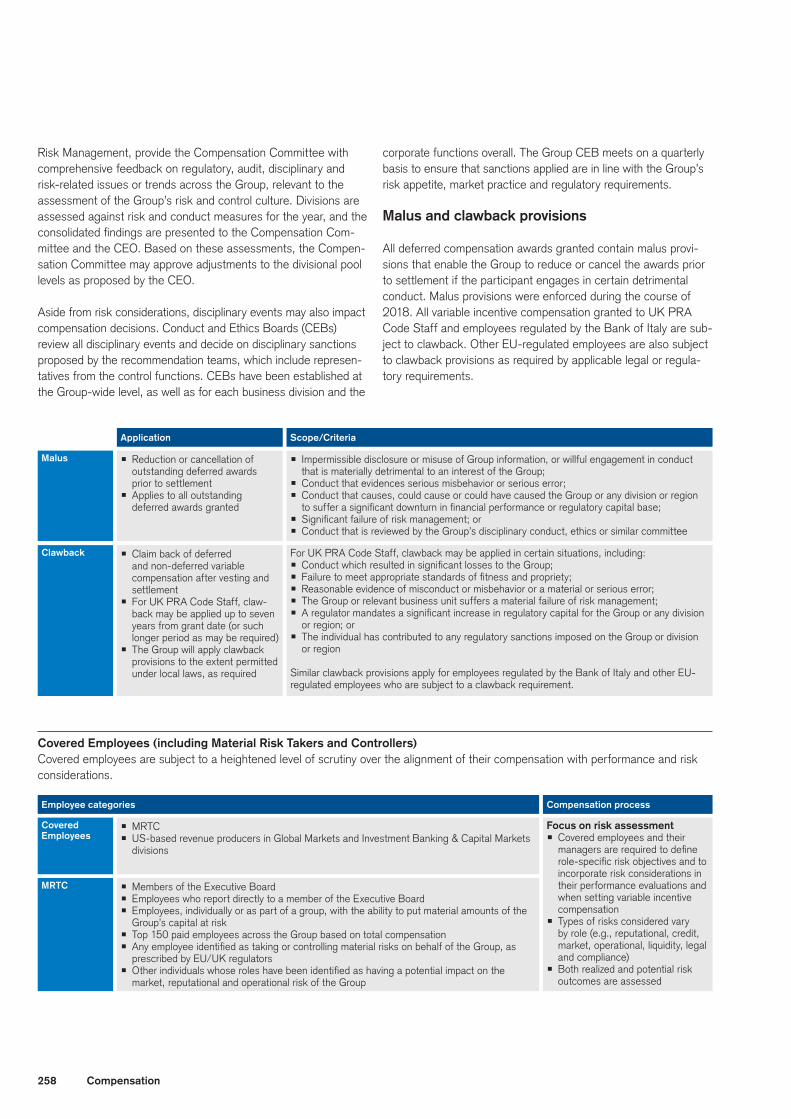
258 Compensation
Malus
Clawback
Application Scope/Criteria
p Reduction or cancellation of outstanding deferred awards prior to settlement
p Applies to all outstanding deferred awards granted
p Claim back of deferred and non-deferred variable compensation after vesting and settlement
p For UK PRA Code Staff, claw-back may be applied up to seven years from grant date (or such longer period as may be required)
p The Group will apply clawback provisions to the extent permitted under local laws, as required
p Impermissible disclosure or misuse of Group information, or willful engagement in conduct that is materially detrimental to an interest of the Group;
p Conduct that evidences serious misbehavior or serious error; p Conduct that causes, could cause or could have caused the Group or any division or region
to suffer a significant downturn in financial performance or regulatory capital base;p Significant failure of risk management; or p Conduct that is reviewed by the Group’s disciplinary conduct, ethics or similar committee
For UK PRA Code Staff, clawback may be applied in certain situations, including:p Conduct which resulted in significant losses to the Group; p Failure to meet appropriate standards of fitness and propriety;p Reasonable evidence of misconduct or misbehavior or a material or serious error;p The Group or relevant business unit suffers a material failure of risk management; p A regulator mandates a significant increase in regulatory capital for the Group or any division
or region; orp The individual has contributed to any regulatory sanctions imposed on the Group or division
or region
Similar clawback provisions apply for employees regulated by the Bank of Italy and other EU-regulated employees who are subject to a clawback requirement.
Covered Employees
MRTC
Employee categories Compensation process
p MRTCp US-based revenue producers in Global Markets and Investment Banking & Capital Markets
divisions
p Members of the Executive Boardp Employees who report directly to a member of the Executive Boardp Employees, individually or as part of a group, with the ability to put material amounts of the
Group’s capital at riskp Top 150 paid employees across the Group based on total compensation p Any employee identified as taking or controlling material risks on behalf of the Group, as
prescribed by EU/UK regulatorsp Other individuals whose roles have been identified as having a potential impact on the
market, reputational and operational risk of the Group
Focus on risk assessment p Covered employees and their
managers are required to define role- specific risk objectives and to incorporate risk considerations in their performance evaluations and when setting variable incentive compensation
p Types of risks considered vary by role (e.g., reputational, credit, market, operational, liquidity, legal and compliance)
p Both realized and potential risk outcomes are assessed
Risk Management, provide the Compensation Committee with comprehensive feedback on regulatory, audit, disciplinary and risk-related issues or trends across the Group, relevant to the assessment of the Group’s risk and control culture. Divisions are assessed against risk and conduct measures for the year, and the consolidated findings are presented to the Compensation Com-mittee and the CEO. Based on these assessments, the Compen-sation Committee may approve adjustments to the divisional pool levels as proposed by the CEO.
Aside from risk considerations, disciplinary events may also impact compensation decisions. Conduct and Ethics Boards (CEBs) review all disciplinary events and decide on disciplinary sanctions proposed by the recommendation teams, which include represen-tatives from the control functions. CEBs have been established at the Group-wide level, as well as for each business division and the
corporate functions overall. The Group CEB meets on a quarterly basis to ensure that sanctions applied are in line with the Group’s risk appetite, market practice and regulatory requirements.
Malus and clawback provisions
All deferred compensation awards granted contain malus provi-sions that enable the Group to reduce or cancel the awards prior to settlement if the participant engages in certain detrimental conduct. Malus provisions were enforced during the course of 2018. All variable incentive compensation granted to UK PRA Code Staff and employees regulated by the Bank of Italy are sub-ject to clawback. Other EU-regulated employees are also subject to clawback provisions as required by applicable legal or regula-tory requirements.
Covered Employees (including Material Risk Takers and Controllers)Covered employees are subject to a heightened level of scrutiny over the alignment of their compensation with performance and risk considerations.
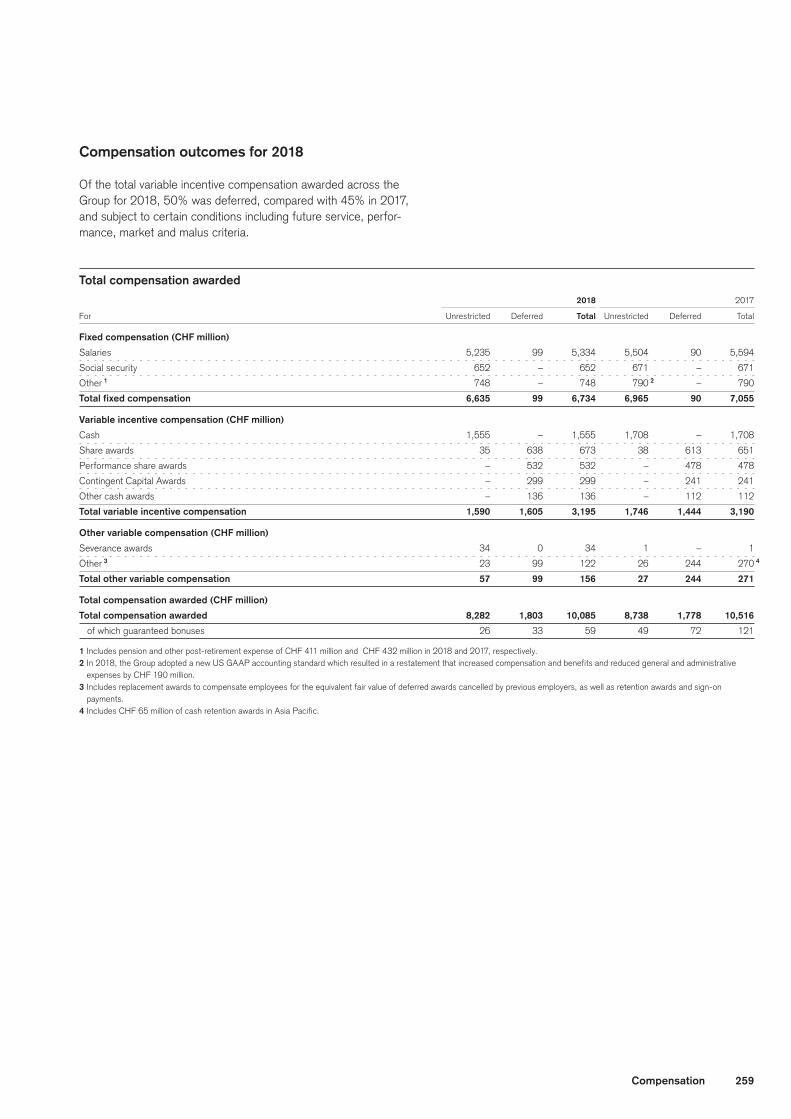
259Compensation
Compensation outcomes for 2018
Of the total variable incentive compensation awarded across the Group for 2018, 50% was deferred, compared with 45% in 2017, and subject to certain conditions including future service, perfor-mance, market and malus criteria.
Total compensation awarded
2018 2017
For Unrestricted Deferred Total Unrestricted Deferred Total
Fixed compensation (CHF million)
Salaries 5,235 99 5,334 5,504 90 5,594
Social security 652 – 652 671 – 671
Other 1 748 – 748 790 2 – 790
Total fixed compensation 6,635 99 6,734 6,965 90 7,055
Variable incentive compensation (CHF million)
Cash 1,555 – 1,555 1,708 – 1,708
Share awards 35 638 673 38 613 651
Performance share awards – 532 532 – 478 478
Contingent Capital Awards – 299 299 – 241 241
Other cash awards – 136 136 – 112 112
Total variable incentive compensation 1,590 1,605 3,195 1,746 1,444 3,190
Other variable compensation (CHF million)
Severance awards 34 0 34 1 – 1
Other 3 23 99 122 26 244 270 4
Total other variable compensation 57 99 156 27 244 271
Total compensation awarded (CHF million)
Total compensation awarded 8,282 1,803 10,085 8,738 1,778 10,516
of which guaranteed bonuses 26 33 59 49 72 121
1 Includes pension and other post-retirement expense of CHF 411 million and CHF 432 million in 2018 and 2017, respectively.2 In 2018, the Group adopted a new US GAAP accounting standard which resulted in a restatement that increased compensation and benefits and reduced general and administrative
expenses by CHF 190 million.3 Includes replacement awards to compensate employees for the equivalent fair value of deferred awards cancelled by previous employers, as well as retention awards and sign-on
payments.4 Includes CHF 65 million of cash retention awards in Asia Pacific.
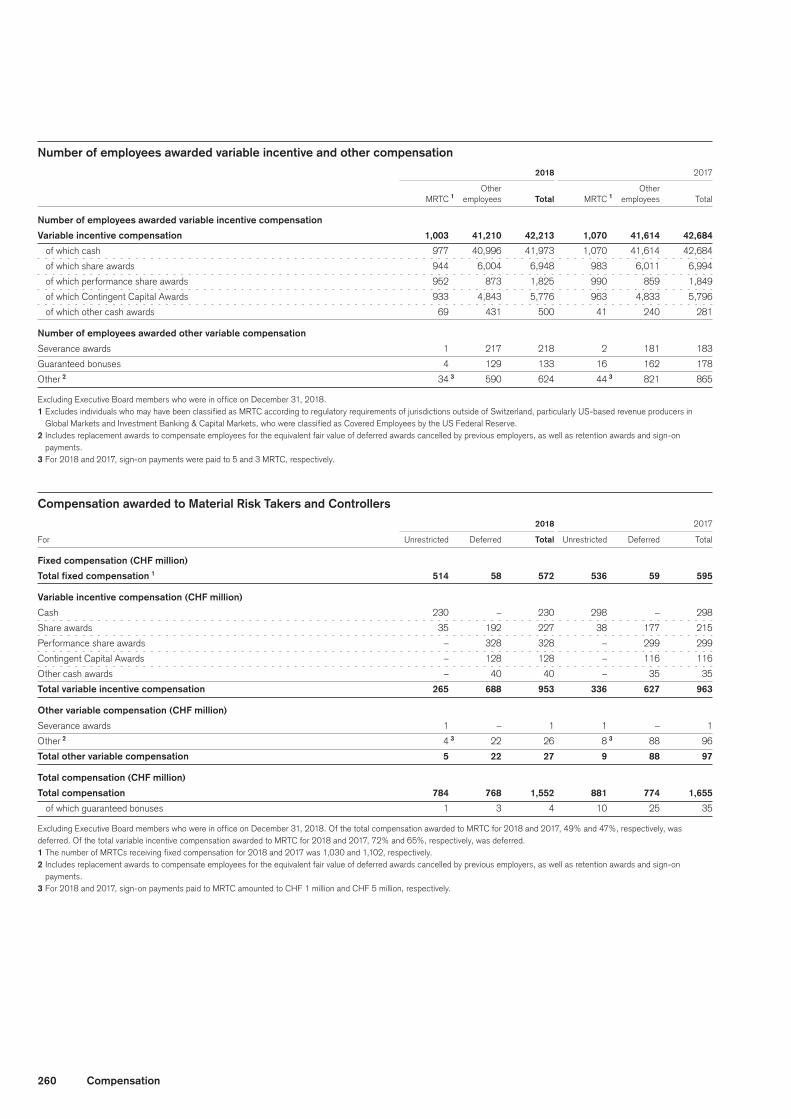
260 Compensation
Number of employees awarded variable incentive and other compensation
2018 2017
Other Other
MRTC 1 employees Total MRTC 1 employees Total
Number of employees awarded variable incentive compensation
Variable incentive compensation 1,003 41,210 42,213 1,070 41,614 42,684
of which cash 977 40,996 41,973 1,070 41,614 42,684
of which share awards 944 6,004 6,948 983 6,011 6,994
of which performance share awards 952 873 1,825 990 859 1,849
of which Contingent Capital Awards 933 4,843 5,776 963 4,833 5,796
of which other cash awards 69 431 500 41 240 281
Number of employees awarded other variable compensation
Severance awards 1 217 218 2 181 183
Guaranteed bonuses 4 129 133 16 162 178
Other 2 34 3 590 624 44 3 821 865
Excluding Executive Board members who were in office on December 31, 2018.1 Excludes individuals who may have been classified as MRTC according to regulatory requirements of jurisdictions outside of Switzerland, particularly US-based revenue producers in
Global Markets and Investment Banking & Capital Markets, who were classified as Covered Employees by the US Federal Reserve.2 Includes replacement awards to compensate employees for the equivalent fair value of deferred awards cancelled by previous employers, as well as retention awards and sign-on
payments.3 For 2018 and 2017, sign-on payments were paid to 5 and 3 MRTC, respectively.
Compensation awarded to Material Risk Takers and Controllers
2018 2017
For Unrestricted Deferred Total Unrestricted Deferred Total
Fixed compensation (CHF million)
Total fixed compensation 1 514 58 572 536 59 595
Variable incentive compensation (CHF million)
Cash 230 – 230 298 – 298
Share awards 35 192 227 38 177 215
Performance share awards – 328 328 – 299 299
Contingent Capital Awards – 128 128 – 116 116
Other cash awards – 40 40 – 35 35
Total variable incentive compensation 265 688 953 336 627 963
Other variable compensation (CHF million)
Severance awards 1 – 1 1 – 1
Other 2 4 3 22 26 8 3 88 96
Total other variable compensation 5 22 27 9 88 97
Total compensation (CHF million)
Total compensation 784 768 1,552 881 774 1,655
of which guaranteed bonuses 1 3 4 10 25 35
Excluding Executive Board members who were in office on December 31, 2018. Of the total compensation awarded to MRTC for 2018 and 2017, 49% and 47%, respectively, was deferred. Of the total variable incentive compensation awarded to MRTC for 2018 and 2017, 72% and 65%, respectively, was deferred.1 The number of MRTCs receiving fixed compensation for 2018 and 2017 was 1,030 and 1,102, respectively.2 Includes replacement awards to compensate employees for the equivalent fair value of deferred awards cancelled by previous employers, as well as retention awards and sign-on
payments.3 For 2018 and 2017, sign-on payments paid to MRTC amounted to CHF 1 million and CHF 5 million, respectively.
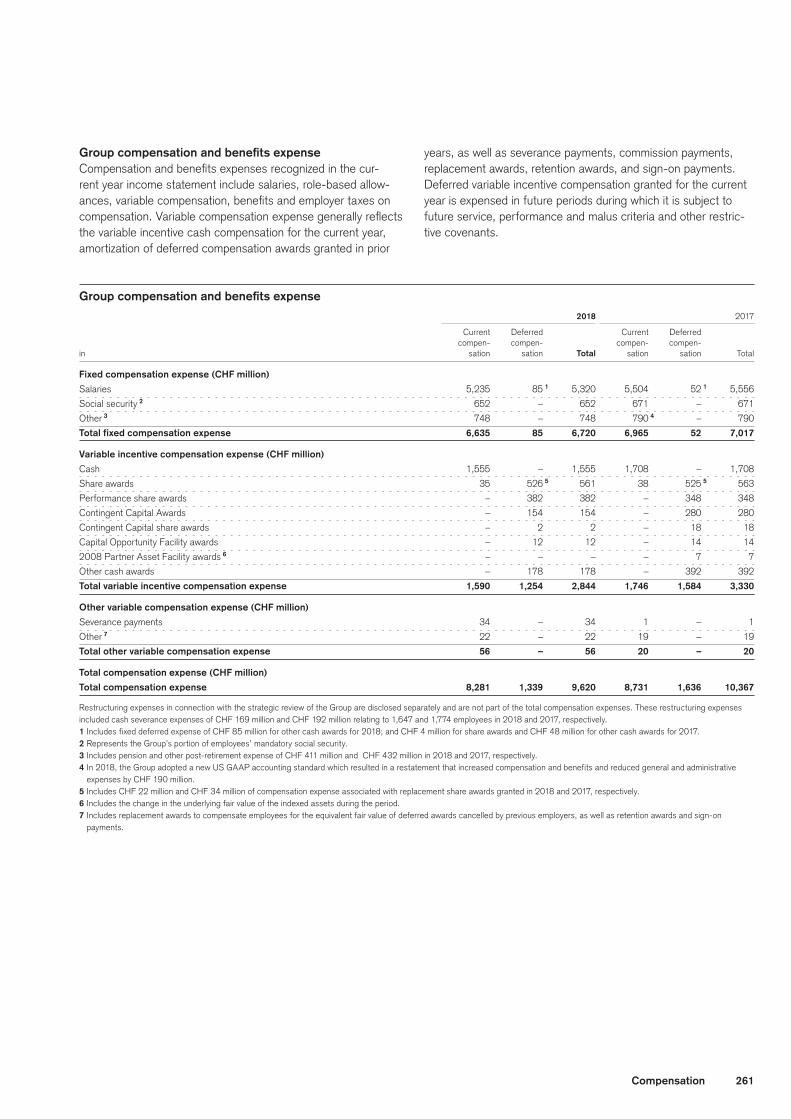
261Compensation
GroupcompensationandbenefitsexpenseCompensation and benefits expenses recognized in the cur-rent year income statement include salaries, role-based allow-ances, variable compensation, benefits and employer taxes on compensation. Variable compensation expense generally reflects the variable incentive cash compensation for the current year, amortization of deferred compensation awards granted in prior
years, as well as severance payments, commission payments, replacement awards, retention awards, and sign-on payments. Deferred variable incentive compensation granted for the current year is expensed in future periods during which it is subject to future service, performance and malus criteria and other restric-tive covenants.
Groupcompensationandbenefitsexpense
2018 2017
Current Deferred Current Deferred
compen- compen- compen- compen-
in sation sation Total sation sation Total
Fixed compensation expense (CHF million)
Salaries 5,235 85 1 5,320 5,504 52 1 5,556
Social security 2 652 – 652 671 – 671
Other 3 748 – 748 790 4 – 790
Total fixed compensation expense 6,635 85 6,720 6,965 52 7,017
Variable incentive compensation expense (CHF million)
Cash 1,555 – 1,555 1,708 – 1,708
Share awards 35 526 5 561 38 525 5 563
Performance share awards – 382 382 – 348 348
Contingent Capital Awards – 154 154 – 280 280
Contingent Capital share awards – 2 2 – 18 18
Capital Opportunity Facility awards – 12 12 – 14 14
2008 Partner Asset Facility awards 6 – – – – 7 7
Other cash awards – 178 178 – 392 392
Total variable incentive compensation expense 1,590 1,254 2,844 1,746 1,584 3,330
Other variable compensation expense (CHF million)
Severance payments 34 – 34 1 – 1
Other 7 22 – 22 19 – 19
Total other variable compensation expense 56 – 56 20 – 20
Total compensation expense (CHF million)
Total compensation expense 8,281 1,339 9,620 8,731 1,636 10,367
Restructuring expenses in connection with the strategic review of the Group are disclosed separately and are not part of the total compensation expenses. These restructuring expenses included cash severance expenses of CHF 169 million and CHF 192 million relating to 1,647 and 1,774 employees in 2018 and 2017, respectively.1 Includes fixed deferred expense of CHF 85 million for other cash awards for 2018; and CHF 4 million for share awards and CHF 48 million for other cash awards for 2017.2 Represents the Group’s portion of employees’ mandatory social security.3 Includes pension and other post-retirement expense of CHF 411 million and CHF 432 million in 2018 and 2017, respectively.4 In 2018, the Group adopted a new US GAAP accounting standard which resulted in a restatement that increased compensation and benefits and reduced general and administrative
expenses by CHF 190 million.5 Includes CHF 22 million and CHF 34 million of compensation expense associated with replacement share awards granted in 2018 and 2017, respectively.6 Includes the change in the underlying fair value of the indexed assets during the period.7 Includes replacement awards to compensate employees for the equivalent fair value of deferred awards cancelled by previous employers, as well as retention awards and sign-on
payments.
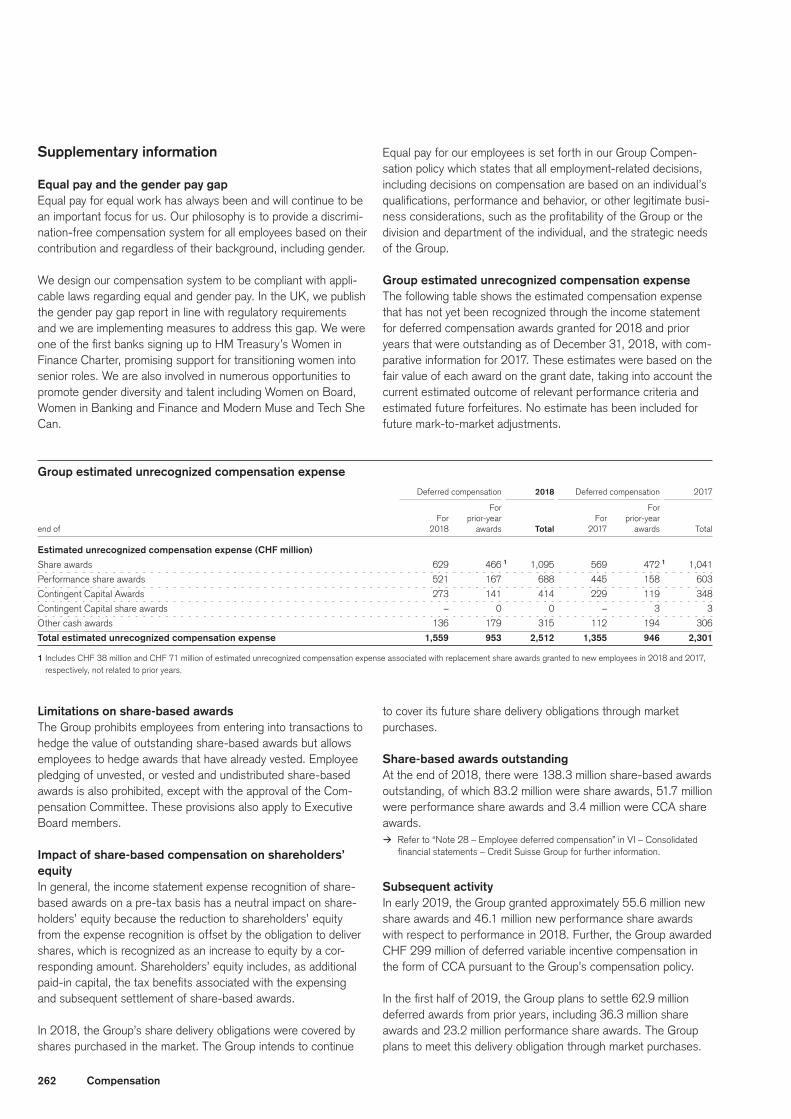
262 Compensation
Supplementary information
Equal pay and the gender pay gapEqual pay for equal work has always been and will continue to be an important focus for us. Our philosophy is to provide a discrimi-nation-free compensation system for all employees based on their contribution and regardless of their background, including gender.
We design our compensation system to be compliant with appli-cable laws regarding equal and gender pay. In the UK, we publish the gender pay gap report in line with regulatory requirements and we are implementing measures to address this gap. We were one of the first banks signing up to HM Treasury’s Women in Finance Charter, promising support for transitioning women into senior roles. We are also involved in numerous opportunities to promote gender diversity and talent including Women on Board, Women in Banking and Finance and Modern Muse and Tech She Can.
Equal pay for our employees is set forth in our Group Compen-sation policy which states that all employment-related decisions, including decisions on compensation are based on an individual’s qualifications, performance and behavior, or other legitimate busi-ness considerations, such as the profitability of the Group or the division and department of the individual, and the strategic needs of the Group.
Group estimated unrecognized compensation expenseThe following table shows the estimated compensation expense that has not yet been recognized through the income statement for deferred compensation awards granted for 2018 and prior years that were outstanding as of December 31, 2018, with com-parative information for 2017. These estimates were based on the fair value of each award on the grant date, taking into account the current estimated outcome of relevant performance criteria and estimated future forfeitures. No estimate has been included for future mark-to-market adjustments.
Group estimated unrecognized compensation expense
Deferred compensation 2018 Deferred compensation 2017
For For
For prior-year For prior-year
end of 2018 awards Total 2017 awards Total
Estimated unrecognized compensation expense (CHF million)
Share awards 629 466 1 1,095 569 472 1 1,041
Performance share awards 521 167 688 445 158 603
Contingent Capital Awards 273 141 414 229 119 348
Contingent Capital share awards – 0 0 – 3 3
Other cash awards 136 179 315 112 194 306
Total estimated unrecognized compensation expense 1,559 953 2,512 1,355 946 2,301
1 Includes CHF 38 million and CHF 71 million of estimated unrecognized compensation expense associated with replacement share awards granted to new employees in 2018 and 2017, respectively, not related to prior years.
Limitations on share-based awardsThe Group prohibits employees from entering into transactions to hedge the value of outstanding share-based awards but allows employees to hedge awards that have already vested. Employee pledging of unvested, or vested and undistributed share-based awards is also prohibited, except with the approval of the Com-pensation Committee. These provisions also apply to Executive Board members.
Impact of share-based compensation on shareholders’ equityIn general, the income statement expense recognition of share-based awards on a pre-tax basis has a neutral impact on share-holders’ equity because the reduction to shareholders’ equity from the expense recognition is offset by the obligation to deliver shares, which is recognized as an increase to equity by a cor-responding amount. Shareholders’ equity includes, as additional paid-in capital, the tax benefits associated with the expensing and subsequent settlement of share-based awards.
In 2018, the Group’s share delivery obligations were covered by shares purchased in the market. The Group intends to continue
to cover its future share delivery obligations through market purchases.
Share-based awards outstandingAt the end of 2018, there were 138.3 million share-based awards outstanding, of which 83.2 million were share awards, 51.7 million were performance share awards and 3.4 million were CCA share awards.
> Refer to “Note 28 – Employee deferred compensation” in VI – Consolidated financial statements – Credit Suisse Group for further information.
Subsequent activityIn early 2019, the Group granted approximately 55.6 million new share awards and 46.1 million new performance share awards with respect to performance in 2018. Further, the Group awarded CHF 299 million of deferred variable incentive compensation in the form of CCA pursuant to the Group’s compensation policy.
In the first half of 2019, the Group plans to settle 62.9 million deferred awards from prior years, including 36.3 million share awards and 23.2 million performance share awards. The Group plans to meet this delivery obligation through market purchases.
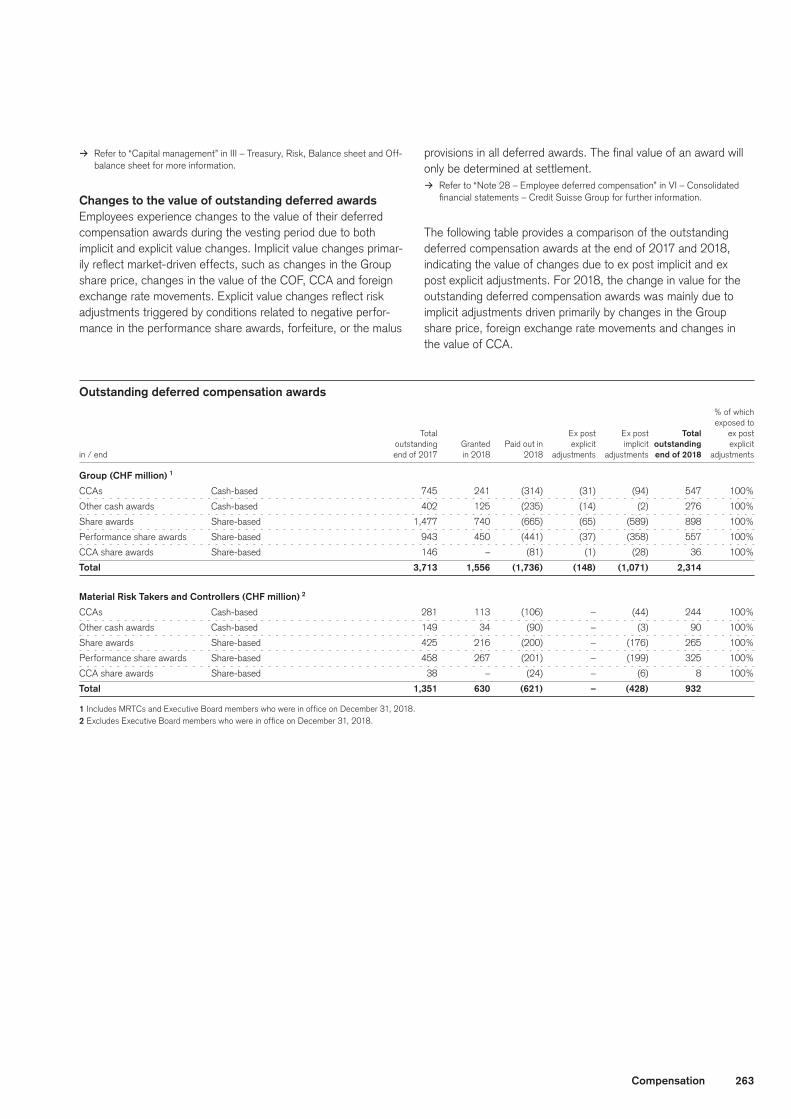
263Compensation
> Refer to “Capital management” in III – Treasury, Risk, Balance sheet and Off-balance sheet for more information.
Changes to the value of outstanding deferred awardsEmployees experience changes to the value of their deferred compensation awards during the vesting period due to both implicit and explicit value changes. Implicit value changes primar-ily reflect market-driven effects, such as changes in the Group share price, changes in the value of the COF, CCA and foreign exchange rate movements. Explicit value changes reflect risk adjustments triggered by conditions related to negative perfor-mance in the performance share awards, forfeiture, or the malus
provisions in all deferred awards. The final value of an award will only be determined at settlement.
> Refer to “Note 28 – Employee deferred compensation” in VI – Consolidated financial statements – Credit Suisse Group for further information.
The following table provides a comparison of the outstanding deferred compensation awards at the end of 2017 and 2018, indicating the value of changes due to ex post implicit and ex post explicit adjustments. For 2018, the change in value for the outstanding deferred compensation awards was mainly due to implicit adjustments driven primarily by changes in the Group share price, foreign exchange rate movements and changes in the value of CCA.
Outstanding deferred compensation awards % of which
exposed to
Total Ex post Ex post Total ex post outstanding Granted Paid out in explicit implicit outstanding explicit
in / end end of 2017 in 2018 2018 adjustments adjustments end of 2018 adjustments
Group (CHF million) 1
CCAs Cash-based 745 241 (314) (31) (94) 547 100%
Other cash awards Cash-based 402 125 (235) (14) (2) 276 100%
Share awards Share-based 1,477 740 (665) (65) (589) 898 100%
Performance share awards Share-based 943 450 (441) (37) (358) 557 100%
CCA share awards Share-based 146 – (81) (1) (28) 36 100%
Total 3,713 1,556 (1,736) (148) (1,071) 2,314
Material Risk Takers and Controllers (CHF million) 2
CCAs Cash-based 281 113 (106) – (44) 244 100%
Other cash awards Cash-based 149 34 (90) – (3) 90 100%
Share awards Share-based 425 216 (200) – (176) 265 100%
Performance share awards Share-based 458 267 (201) – (199) 325 100%
CCA share awards Share-based 38 – (24) – (6) 8 100%
Total 1,351 630 (621) – (428) 932
1 Includes MRTCs and Executive Board members who were in office on December 31, 2018.2 Excludes Executive Board members who were in office on December 31, 2018.
264 Compensation
D
KPMG AG, Badenerstrasse 172, PO Box, CH-8036 Zurich
KPMG AG is a subsidiary of KPMG Holding AG, which is a member of the KPMG network of independent firms affiliated with KPMG International Cooperative (“KPMG International”), a Swiss legal entity. All rights reserved.
Report of the Statutory Auditor To the General Meeting of Shareholders of Credit Suisse Group AG, Zurich
_____________________________________________________________________
We have audited the accompanying compensation report dated March 22, 2019 of Credit Suisse Group AG (the “Group”) for the year ended December 31, 2018. The audit was limited to the information according to articles 14-16 of the Ordinance against Excessive Compensation in Stock Exchange Listed Companies (the “Ordinance”) contained in the sections marked with (audited) on pages 243 to 254 of the compensation report.
Responsibility of the Board of Directors
The Board of Directors is responsible for the preparation and overall fair presentation of the compensation report in accordance with Swiss law and the Ordinance. The Board of Directors is also responsible for designing the compensation system and defining individual compensation packages.
Auditor's Responsibility
Our responsibility is to express an opinion on the accompanying compensation report. We conducted our audit in accordance with Swiss Auditing Standards. Those standards require that we comply with ethical requirements and plan and perform the audit to obtain reasonable assurance about whether the compensation report complies with Swiss law and articles 14 – 16 of the Ordinance.
An audit involves performing procedures to obtain audit evidence on the disclosures made in the compensation report with regard to compensation, loans and credits in accordance with articles 14 – 16 of the Ordinance. The procedures selected depend on the auditor’s judgment, including the assessment of the risks of material misstatements in the compensation report, whether due to fraud or error. This audit also includes evaluating the reasonableness of the methods applied to value components of compensation, as well as assessing the overall presentation of the compensation report.
We believe that the audit evidence we have obtained is sufficient and appropriate to provide a basis for our opinion.
Opinion
In our opinion, the compensation report for the year ended December 31, 2018 of the Group complies with Swiss law and articles 14 – 16 of the Ordinance.
KPMG AG
Nicholas Edmonds Ralph DichtLicensed Audit Expert Licensed Audit ExpertAuditor in Charge
Zurich, SwitzerlandMarch 22, 2019