Embed Size (px)
Citation preview
Annual Report 2018

This Annual Report is published in German and English. In case of doubt or conflict, the German language version will prevail.
Shareholders’ letter 4
Company information 7
Supervisory Board report 9
Supervisory Board and Board of Directors 17
Annual review 2018 20
Corporate Governance report and
statement on Corporate Governance
22
The LEONI share 36
Group Management Report 41
Principles of the Group 43
Business and underlying conditions 49
Business report 53
Reports by division / Segment report 66
Other indicators
(incl. non-financial information statement)
74
Risk and opportunity report 94
Supplementary report 108
Forecast 109
Compensation report 114
Disclosures pursuant to Sections 289a (1) and 315a (1)
of the German Commercial Code as well as explanatory report
for fiscal 2018
123
Consolidated financial statements 131
Consolidated income statement 133
Consolidated statement of comprehensive income 134
Consolidated statement of cash flows 135
Consolidated statement of financial position 136
Consolidated statement of changes in equity 137
Notes 138
Scope of consolidation 226
Independent auditor’s report 228
Responsibility statement 236
Additional information 237
Extract from the financial statement of LEONI AG 239
Appropriation of profits 241
Ten-year overview 242
Glossary 244

LEONI is a global provider of products, solutions and services for energy and data management in the automotive sector and other industries.
The value chain encompasses wires, optical fibers, standardised cables, special cables and assembled systems as well as intelligent products and smart services.
As an innovation partner and solutions provider, LEONI supports its customers with pronounced development and systems expertise.

4 | www.leoni.com
Dear shareholders,
2018 was a year of two halves for LEONI: With the tailwind of a buoyant market, our business per-
formed well and partly somewhat better than expected in the first six months. In the second half, the
setting for the automotive and component supply industry became considerably gloomier. Interna-
tional trade disputes, the uncertainty about Brexit, a weaker economy in China and the effects of the
WLTP testing procedure curbed the car markets and therefore also the demand for LEONI product.
The ramp-up of production for a high-volume vehicle model for which LEONI will be supplying prod-
uct and internal factors, such as advance spending on new customer projects, increased raw material
prices and a less favourable product mix in the Wire & Cable Solutions Division, additionally exerted
greater-than-expected pressure on our result. The situation aggravated substantially in the fourth
quarter, especially so in the Wiring Systems Division. Extensive problems arose with a large-scale
production start at our new facility in Mexico, meaning that we could ensure supply to our customer
only at major, additional cost. Furthermore, the performance of some other wiring systems plants
deteriorated, and savings targets were not met to the expected extent.
Overall, the LEONI Group generated a slight sales increase and income of € 5.1 billion, but earnings
before interest and taxes were down significantly to a very disappointing figure of € 144 million.
It was therefore substantially short of the previous year’s corresponding figure of € 227 million, which
included non-recurring income of € 30 million, and also significantly below the forecast that was
adjusted as recently as the autumn. This weaker earnings situation and the ongoing, heavy capital
expenditure also weighed on our free cash flow, which declined from a positive figure of € 11 million
to a negative one of € 147 million. Considering the cash flow situation and the debt ratio, the Board
of Directors and the Supervisory Board intend to deviate from their previous dividend policy and will
propose to shareholders at the 2019 Annual General Meeting that the dividend for fiscal 2018
be suspended.
We shall be concentrating fully on stabilising the Company’s performance so that we can return to a
normal dividend level as quickly as possible. Fundamentally, LEONI has all the building blocks in place:
our most important market, the automotive sector, is characterised by such areas of innovation as
electromobility, autonomous driving and digitalization, which provide LEONI with great opportunity.
And our own foundations are strong: first and foremost, our more than 92,000 staff worldwide, whose
tremendous know-how and enthusiasm for our products and solutions cannot be overestimated.
On behalf of the entire Board of Directors, I would like to sincerely thank them for their commitment.
Another mainstay is close and trusting, in some cases decades-long collaboration with our customers.
Thanks to our global footprint, we have a very much regionally-moulded understanding of custom-
ers and simultaneously an efficient development and production network. There is also our growing
systems expertise, which enables us to develop and launch innovative, customised solutions.
Shareholders’ letter

| 5| Shareholders’ letter
Nuremberg, 26 February 2019
Aldo Kamper
CEO and President
›› Aldo Kamper CEO and President
LEONI does not expect the market to provide any tailwind this year. Macroeconomic conditions will probably
remain challenging. Above all, however, we still face major challenges in ensuring the execution of our large
order backlog in the Wiring Systems Division. In 2019, too, this will require ongoing, heavy pre-production
spending and investment as well as underpinning of growth based on the orders already booked. In addition,
there will be completion of the Wire & Cable Solutions Division's Factory of the Future in Roth, Germany, mean-
ing that our capital expenditure ratio will again be at a level of around 5 percent. At our new wiring systems
facility in Mexico, for which we have already applied initial and immediate stabilisation measures, we must
again anticipate extensive, exceptional charges at least in the first half of the year. To resolve our problems with
transparency and timely provision of information in our internal reporting system, we are stepping up installa-
tion of an SAP system, especially in the area of finance, that will incur additional costs.
Against this backdrop, we project consolidated sales of € 5.2 billion and another decrease in earnings to
between € 100 and 130 million for 2019. This does not yet include spending on our VALUE 21 programme.
We announced this performance and strategy-enhancement programme in the autumn of 2018 to stabilise
our business, improve the basis for healthy growth, profitability and cash generation as well as to sharpen our
focus on the future markets of electromobility, autonomous driving and digitalization. Our surprisingly poor
performance in the fourth quarter underscores the need for comprehensive measures to improve and for the
actions already launched. It is a matter of raising the potential for optimisation in both divisions – from the pro-
duction processes to their procurement, distribution and administrative structures as well as the IT landscape
and through to working capital management. The key is that these actions are comprehensive and structured;
are stringently followed up and have lasting effect. We have targeted a timeframe of three years.
Building on stabilisation of our business and improved performance, we will then work on fleshing out
our strategy to develop LEONI into a leading provider of intelligent energy and data management solutions.
Enhancement of systems expertise will provide both our Wiring Systems Division and Wire & Cable Solutions
Division with great prospects. In our Wiring Systems Division, whose business growth has recently signifi-
cantly outpaced the market, we shall in future be more selective in accepting new projects with respect to
their profitability. Initially, we intend thereby to raise the quality of earnings and cash flow as well as to limit
expansion-related risks.
With these measures, we will firstly direct LEONI onto a calmer, more reliable track and then a clearly profit-
oriented course towards being a provider of intelligent energy and data management solutions. Even though
we expect our business to bottom out in 2019, we are convinced that our market and our inherent strengths
provide excellent foundations for lastingly successful performance. LEONI’s entire team will be working with
focus and great determination on making sure that the commitment you, our esteemed shareholders, have
shown LEONI is also rewarded again.

6 | www.leoni.com

| 7
Company information

8 | www.leoni.com
Company information
Supervisory Board report 9
Supervisory Board and Board of Directors 17
Annual review 2018 20
Corporate Governance report and
statement on Corporate Governance
22
The LEONI share 36

| 9| Company information
Supervisory Board report
Dear Sir or Madam,
The Supervisory Board of LEONI AG dealt in depth with the situation and performance of the group of
companies in fiscal 2018.
We diligently and dutifully fulfilled our tasks in accordance with statutory requirements, the provisions of
the Company’s Articles of Association, the German Corporate Governance Code and our rules of procedure,
continuously advising the Board of Directors on its management of the Company and overseeing its work.
The collaboration between the Supervisory Board and the Board of Directors was at all times constructive,
open and defined by mutual trust. The Board of Directors informed us regularly, immediately and compre-
hensively, both in writing and verbally, about all matters pertinent to LEONI. In particular, this included the
strategy, planning, operating performance as well as the Group’s current situation including its risk situation.
The Board of Directors explained any deviation in business performance from the prepared planning in detail
and involved the Supervisory Board in decisions of material importance. This also applied to the time after this
reporting period ended when an unexpectedly sharp deterioration of earnings became evident.
We discussed all important matters thoroughly during our meetings of the Supervisory Board. The Board
of Directors provided us with corresponding, comprehensive written reports in advance. The Supervisory
Board's approval was obtained so far as this was required for certain measures in accordance with the rules of
procedure. Key matters subject to approval included various investment projects, the establishment of a joint
venture as well as authorisation for a new financing plan, which comprised a large syndicated loan and issuing
more borrower’s note loans. These decisions were on each occasion preceded by in-depth discussions, which
were normally based on a corresponding submission or presentation from the Board of Directors.
The Board of Directors and the Supervisory Board also kept in close touch at all times outside their meetings.
The chairmen of both boards consulted regularly, also at short notice and as warranted by events, on any
matters requiring agreement. The number of fixed dates was raised significantly to onboard the new CEO.
The entire Supervisory Board was informed in detail of the content of these discussions during its next meet-
ing at the latest.
Main topics of discussion by the Supervisory Board
The Supervisory Board held six regular meetings during the 2018 financial year; specifically, on 30 January,
15 March, 3 May, 20 July, 18 September and 13 December. In addition, it met in an executive session to discuss
matters without the members of the Board of Directors on 26 November 2018.
The employee representatives held a preliminary discussion prior to each Supervisory Board meeting.
The shareholder representatives also held prior discussions on 3 May and 13 December 2018. The Super visory
Board was quorate on each occasion. One member had excused their absence from each of the three regular
meetings and in one session a member could only participate part of the time for an important reason.
Supervisory Board report
›› Dr.-Ing. Klaus Probst,Chairman of the Supervisory Board
10 | www.leoni.com
Apart from the executive session, all members of the Board of Directors attended each of the meetings so far
as these did not cover topics requiring that they absent themselves. These topics included deliberations on
Board of Directors matters, further clearing up of the fraud case uncovered in 2016 as well as the Supervisory
Board’s efficiency audit.
The matters discussed during the scheduled meetings regularly included the general business situation of
the Group and both divisions, the financial situation based on the income statement and the balance sheet as
well as key investments and development in terms of the number of employees. In particular, we considered
the performance in terms of earnings and cash flow that fell significantly short of expectations from the third
quarter as well as the necessary reactions. The Board of Directors launched a performance and strategy pro-
gramme (VALUE 21) that we discussed thoroughly on the Strategy Committee, but also during our meeting on
13 December 2018. The programme is focused on operations as well as on measures to improve earnings qual-
ity and the liquidity situation. Yet, in the same vein, the programme also has a strategic dimension. Above all,
this includes limiting growth in the Wiring Systems Division to a degree that is organisationally and financially
attainable as well as proactively managing portfolios with respect to the two divisions’ various business areas
more than in the past. Both of the programme’s aspects will occupy us even more in the upcoming reporting
period.
Another key topic involved the Supervisory Board’s efficiency audit, which was carried out with outside
support during the year under report and which yielded various recommendations for action, which were
geared to streamlining the Board’s work and preparing for decision-making by the entire Board. In addition,
there were such other measures as the introduction of a planning calendar, an annual strategy seminar and
a Corporate Office. Specific implementation of these measures was approved during the executive session.
Further details on this topic can be found in the Corporate Governance report.
The subject matter of the reporting period’s first meeting on 30 January 2018 included, alongside regular
agenda items, approval to set up a fourth LEONI facility in Mexico. Another key item involved the appointment
to the vacant position of Chief Executive Officer following the departure of Dieter Bellé effective 31 January
2018. Having previously carried out a widespread selection process considering both internal and external
candidates, we decided to fill the position with an outsider and to focus on a candidate with whom final talks
about the succession based on predetermined parameters were to be held by the next meeting. At the same
time, we approved a new, interim allocation of responsibilities for the period from 1 February 2018 until the
future CEO assumed office. This decision divided the departments among the three remaining members,
establishing that they were to manage the Company with equal authority. Chief Financial Officer Karl Gades-
mann was appointed as acting spokesman for the Board of Directors and as Labour Director. We furthermore
extended the mandate of Board member Bruno Fankhauser, whose contract would have expired at the end of
2018, until 31 December 2023. Elements of Board of Directors compensation were a further discussion point:
we determined the targets for the short-term component of 2018 Board of Directors compensation. We fur-
thermore decided upon the regular review of Board of Directors compensation to make adjustments to Board
member contracts, which ensure equal treatment of the Board members as well as in their compensation and

| 11| Company information
Supervisory Board report
retirement benefit. With respect to its composition, the Supervisory Board approved changes to its compe-
tence profile and discussed amendments to the diversity concept for the Board of Directors and the Super-
visory Board. We also sought information on the status of the Internal Control System; of risk management
and of the Internal Audit and Compliance departments, of the trend in selling and administrative costs within
the LEONI Group as well as the process for selecting the auditors as of the 2019 financial year. In addition, we
looked at the oneLEONI project, which is intended to pool Group-wide skills and responsibility and serves, in
division-overarching initiatives, to harmonise and standardise key processes as well as the progress in various
projects of the IT department.
During the Supervisory Board’s meeting on 15 March 2018, the members appointed Aldo Kamper as the new
Chief Executive Officer of LEONI AG effective 1 October 2018. It was furthermore agreed to conduct talks with
him about possibly assuming office sooner. Moreover, presentation, scrutiny and adoption of the financial
statements and the summarised management report for LEONI AG and the Group for the 2017 financial year
constituted a focal point of this meeting. Both sets of statements were approved without any objection after
detailed deliberation. The Supervisory Board also discussed the 2017 annual report including the Supervisory
Board report, the Corporate Governance report and the compensation report as well as the dividend proposal
and the agenda for the Annual General Meeting on 3 May 2018. The Board also decided to carry out the pend-
ing efficiency audit with external support and to mandate Ernst & Young as the chosen consultants. Further
items involved the risk aggregation for the years 2018 through 2022, the performance of Program Manage-
ment and the pending, major projects of the Wiring Systems Division as well as the new financing plan for
the LEONI Group, whereupon we approved signing of a syndicated loan by circular resolution at the end of
May 2018. The Board of Directors also informed us on the status of the (meanwhile retracted) lawsuit against
the election of Dr Klaus Probst as a member of the Company’s Supervisory Board by shareholders at the 2017
Annual General Meeting, licence management and various organisational changes within LEONI AG.
The third regular meeting of the Supervisory Board took place on 3 May 2018 after the Annual General Meet-
ing. Primarily, we dealt with the strategic development of the Wire & Cable Solutions Division and approved
the establishment of a joint venture for production of single-mode fibers. We furthermore authorised an
increase in the amount to be invested in the Factory of the Future and the total allowance for additions to
tangible assets in the 2018 financial year. In addition, we decided on a new version of the rules of procedure
for the Board of Directors and on optimisation of our corporate governance with respect to decision-making
and implementation. Detailed in this respect can be found in the Corporate Governance report.
On 20 July 2018, the Supervisory Board again obtained information on the status of the oneLEONI project,
realignment of the Corporate Strategy, Corporate Taxes and Corporate Process Management departments, the
latest developments concerning diversity and succession management, the new, global power-of-attorney
guideline as well as the LEONI OnFire programme, which aims to create a more agile corporate culture. Prior
to the meeting, an agreement was furthermore reached with Aldo Kamper’s existing employer on his earlier
departure, whereupon it was decided to bring his appointment forward to 1 September 2018 as well as to
end Karl Gadesmann’s temporary role and the interim allocation of responsibilities on the Board of Directors
as of that date. The Supervisory Board also received update on the implementation status of the actions
Changes in personnel ›› page 15
Corporate Governance report ›› page 22

12 | www.leoni.com
recommended by the BDO consulting firm, which it had commissioned to conduct a review of the Corporate
Finance and Treasury departments because of the fraud case uncovered in August 2016. In addition, we once
again addressed licence management and approval for certain personnel-related decisions made by the
Board of Directors at the level of senior management (Level 1 of the Group-wide grading system). We adopted
an amendment to the rules of procedure for the Board of Directors to make the latter part of the duties of
the Personnel Committee in future cases. Finally, we learned about the initial suggestions arising from the
efficiency audit with Ernst & Young.
During the Supervisory Board’s meeting on 18 September 2018, which was held at our facility in Kitzingen,
Germany, the Board approved the new allocation of responsibilities presented by the Board of Directors.
Details in this respect can be found in the Corporate Governance report. We also approved the placement of
borrower’s note loans to increase financial flexibility. Based on the Audit Committee’s recommendation for
selection, the Supervisory Board furthermore decided to propose Deloitte GmbH Wirtschaftsprüfungsge-
sellschaft as auditors for fiscal 2019 to shareholders at the 2019 Annual General Meeting. Additional items
included an update on the joint venture authorised in May 2018, on the status of clearing up the fraud case,
on the Sustainability Report, on the Safety, Health & Environment department, on implementation of the
suggestions in the BDO report for action with respect to the 2016 fraud case, on Iran-related business as well
as on the performance of the LEONI share and its switch from the MDAX to the SDAX. Finally, we discussed
Ernst & Young’s closing report on the efficiency audit and the resulting conclusions, and we obtained an initial
preview of work on a holistic Group strategy.
During the executive session, which was held on 26 November 2018, we decided on measures to apply the
actions recommended by Ernst & Young arising from the Supervisory Board’s efficiency audit. Information in
this respect can be found in the Corporate Governance report.
The main focus of the Supervisory Board’s meeting of 13 December 2018 was on the planning for fiscal 2019,
the medium-term planning for 2020 and the subsequent years as well as the investment planning for 2019.
Following comprehensive and constructive discussion, the members of the Board of Directors and of the
Supervisory Board agreed to revise the presented planning as well as the medium-term planning by the
January meeting to thereby take into account the latest knowledge of market and performance develop-
ments. Similarly, setting of the targets for fiscal 2019 Board of Directors compensation was postponed to the
next meeting as this would be extrapolated from the corresponding planning. At the same time and following
constructive discussion, we approved 90 percent of the amount of investment proposed for the 2019 financial
year to be able to decide on the remaining share once the planning was finalised. Another focal point involved
the CEO’s first status report on preparing the VALUE 21 performance and strategy programme, which we
subsequently discussed thoroughly. Upon the Audit Committee’s recommendation, the Supervisory Board
also approved the report by Ernst & Young on the findings of the audit of LEONI AG’s systems to adhere to
requirements concerning the signing of financial derivatives in accordance with Section 20 (1) of the German
Securities Trading Act (WpHG) 2017 in its previous version and decided to update the Company’s declara-
tion pertaining to the German Corporate Governance Code pursuant to Section 161 of the German Public
Stock Corporation Act (AktG). This is included in the statement on Corporate Governance. We also agreed to
updates to the diversity concept for the Board of Directors and the Supervisory Board as well as amendment
of the competence profile and the targets for composition of the Supervisory Board. Additional resolutions
concerned the gender ratio and fulfilment of the target quotas for the Board of Directors and the Supervisory
Board. Information in this regard is contained in the statement on Corporate Governance. There were also
Corporate Governance report ›› page 22
Corporate Governance report ›› page 22
Statement on Corporate Governance ›› page 30

| 13| Company information
Supervisory Board report
planned changes to the management board of a division and amendments to our rules of procedure, which
resulted from the prior resolutions on the diversity concept and the competence profile as well as the findings
of the external efficiency audit, such as revision of the Strategy Committee’s role. The latter included new
composition of the committee, which we carried out in a corresponding election. Further information on
this is contained in the Corporate Governance report and the section on the Supervisory Board and Board
of Directors. Another topic, finally, involved the Board of Directors’ reporting on the status of the IDW audits
PS 980, 981, 982 and 983 in the Compliance, Risk Management, Internal Control System and Internal Audit
departments.
An unexpectedly sharp deterioration of earnings became apparent after the period under report ended,
which prompted us immediately upon finding this out to work hard on addressing cause and effect as well as
applying instant actions and other measures going beyond the VALUE 21 programme discussed to date.
Work of the committees
The Supervisory Board of LEONI AG formed an Audit Committee, a Personnel Committee, a Nomination Com-
mittee and a Strategy Committee. These governance bodies prepare the topics to be addressed by the entire
Supervisory Board and the resolutions on which the Board is to vote during its meetings. The composition
of the committees is described in the section headed Supervisory Board and Board of Directors, while the
Corporate Governance report provides information on the duties of the committees. Decision-making powers
of the Supervisory Board are transferred to the committees to the extent permitted by law. In addition, there
is the Arbitration Committee in compliance with Section 27 (3) of Germany's Co-determination Act (MitbestG).
The committee chairmen reported regularly on their work during the Supervisory Board meetings.
The Audit Committee convened for six regular meetings and one extraordinary meeting during the year
under report. It dealt in depth with the 2017 financial statements and consolidated financial statements, the
management and quarterly reports, the findings of the audit as well as the six-month report and prepared
for nomination of the auditors for the 2018 financial year. Other topics covered the oversight and approval of
permissible non-auditing services, the status of the external audit of the Governance, Risk and Compliance
departments, the non-financial Group information statement, the findings of the IT audit as well as applica-
tion of the new General Data Protection Regulation. The committee also once again addressed the actions
recommended by the BDO consulting firm, which was commissioned by the Supervisory Board in 2016
because of the fraud case, and prepared the decision-making on the change of auditors for the 2019 financial
year. It furthermore obtained up-to-date reports from the departments for Compliance, Information Security,
Internal Control System, Risk Management, Taxes as well as safety at work, health and environmental protec-
tion at LEONI.
The Personnel Committee met on four occasions in 2018, one of which in the form of a conference call.
Primarily, the committee worked on the appointment of a new chief executive officer.
The Strategy Committee held three meetings during the past financial year. The principal topic was the
strategy of the Group and of the two divisions. The committee furthermore worked on the strategic footprint
planning of the Wiring Systems Division and the Wire & Cable Solutions Division’s strategy in the data center
market. Another focal point involved review of the committee’s position and remit, which ultimately led to
proposing to the Supervisory Board that, among other things, the responsibilities of the Strategy Committee
Supervisory Board and Board of Directors ›› page 17
Corporate Governance report ›› page 22
Changes in personnel ›› page 15
Corporate Governance report ›› page 22
Supervisory Board and Board of Directors ›› page 17

14 | www.leoni.com
be more explicit and that this be embedded in the rules of procedure. During its final meeting, members
thoroughly discussed the new, annual strategy process, the introduction of a Group-wide M&A process, the
Corporate Development Plan for the 2019 financial year as well as the VALUE 21 performance and strategy
programme.
There was no cause for either a meeting of the Nomination Committee or convening of the Arbitration Com-
mittee pursuant to Section 27 (3) of Germany’s Co-determination Act (MitbestG) during the reporting period.
Corporate Governance and Declaration of Conformity
The Supervisory Board again dealt in detail with Corporate Governance at LEONI, taking the German Corpo-
rate Governance Code as its guide, during the year under report. The Declaration of Conformity pursuant to
Section 161 of the German Stock Corporation Act was updated in December 2018. With one exception, LEONI
fulfils all the recommendations of the Code in its current version. Further details can be found in the current
version of the Declaration of Conformity. This is included in the Corporate Governance report and statement
on Corporate Governance.
Audit of the annual financial statements
Upon the proposal by the Supervisory Board, which followed an Audit Committee recommendation, the
Annual General Meeting of LEONI AG’s shareholders on 3 May 2018 appointed Ernst & Young GmbH auditing
company of Stuttgart as auditors for the 2018 financial year. The company audited and granted an unquali-
fied certificate for the 2018 financial statements and the management report of LEONI AG as well as the
consolidated financial statements and the Group management report. Ernst & Young have been auditors for
the LEONI Group since 1987. The auditors responsible pursuant to Section 319a (1) sentence 4 of the German
Commercial Code (HGB) were Udo Schuberth (starting with the 2013 financial statements) and Gero Schütz
(starting with the 2012 financial statements). Ernst & Young had confirmed to the Chairman of the Supervisory
Board and to the Audit Committee, before the Supervisory Board proposed the firm as auditors at the Annual
General Meeting, that there are no circumstances that might compromise their independence or raise doubts
about their independence. Ernst & Young also declared the extent to which, in the preceding financial year,
services for the Company other than the audit were either performed or contractually agreed for the subse-
quent year.
The provisions of the German Commercial Code were applied to prepare the financial statements and the
management report of LEONI AG. The International Financial Reporting Standards (IFRS) as they apply in the
European Union as well as, additionally, the commercial law provisions under Section 315e (1) of the Ger-
man Commercial Code (HGB) were applied to prepare the consolidated financial statements and the Group
management report. The audit was conducted in accordance with Section 317 of the German Commercial
Code (HGB) while observing the German principles of true and fair annual accounting of the Institute of Public
Auditors in Germany, Incorporated Association (IDW). The auditors stated that the management reports
appropriately describe the situation of LEONI AG and of the Group as well as the opportunities for and risks
to future performance. The review of the risk management system as part of the audit found that the Board
of Directors has taken suitable measures in keeping with those required under Section 91 (2) of the German
Stock Corporation Act (AktG) to set up a monitoring system, and that this monitoring system is suited to early
detection of developments that might threaten the Company's continued existence.
Statement on Corporate Governance ›› page 30

| 15| Company information
Supervisory Board report
As part of its review, the Supervisory Board also reviewed the non-financial Group information statement that
was to be prepared pursuant to Section 315b of the German Commercial Code (HGB) and found that it fulfils
the existing requirements and no objections are to be raised. An external audit had previously confirmed that
nothing was found that might cause the auditors to conclude that the non-financial Group information state-
ment was not prepared in all material respects in accordance with Section 315c of the German Commercial
Code (HGB).
The annual financial statements of the Company and of the Group, the management reports (including the
non-financial Group statement) and the audit reports were available to all members of the Supervisory Board
in good time. The Audit Committee pre-examined these documents during its meeting on 27 February 2019
and reported to the Supervisory Board in this regard during the latter’s regular meeting on 28 February 2019.
We subsequently discussed the financial statements and reports in depth. The auditing company's repre-
sentatives took part in both meetings, provided information on the findings of their audits and were avail-
able to provide additional information. In particular, the findings of key audit matters for LEONI AG and the
Group were presented: (I) recoverability of loans to associated companies and of receivables from associated
companies, (II) Impairment test of goodwill and intangible assets and property, plant and equipment as well
as (III) Income taxes – Recognition and measurement of deferred tax assets. The audit did not give rise to any
objections.
The Supervisory Board approved the findings of the audit of the financial statements. The final result of the
audits by the Audit Committee and the Supervisory Board of the annual financial statements and manage-
ment reports of LEONI AG and the Group did not give rise to any objections. We approved the annual financial
statements of LEONI AG and the consolidated financial statements for fiscal 2018 as prepared by the Board of
Directors. The financial statements of LEONI AG have thus been duly adopted. The Supervisory Board supports
the Board of Directors' suggestion to deviate from the Company’s previous dividend policy and propose to
shareholders at the 2019 Annual General Meeting not to pay out a dividend from the distributable profit of
LEONI AG for the 2018 financial year.
Changes in personnel
Dieter Bellé, LEONI AG’s Chief Financial Officer from the year 2000 and its Chief Executive Officer from 2015,
left the Company on 31 January 2018 with the Supervisory Board’s agreement. We once again thank him
sincerely for his many years of successful work for and his great commitment to the Company. The Supervisory
Board appointed Aldo Kamper as LEONI AG’s new CEO on 15 March 2018. Kamper, who has an MBA as well as
profound experience in the industrial and automotive segments, assumed his office on 1 September 2018.
CFO Karl Gadesmann took on the role of spokesperson for the Board of Directors and Labour Director on an
interim basis from 1 February to 31 August 2018. The Supervisory Board expressly thanks him for this addi-
tional commitment.
On 13 December 2018, Carmen Schwarz resigned her mandate as a member of LEONI AG’s Supervisory Board
by mutual agreement effective 13 January 2019. She is to be succeeded by Janine Heide, secretary of the IG
Metall trade union at its Aachen office and resident in Bad Camberg. The application for her judicial appoint-
ment pursuant to Section 104 of the German Stock Corporation Act (AktG) was submitted to the Nuremberg
16 | www.leoni.com
local court on 19 December 2018. Janine Heide was appointed a member of the Supervisory Board as an
employee representative (trade union representative) by a resolution on 15 January 2019. The Supervisory
Board thanks Carmen Schwarz for her commitment and her personal dedication as member of the Super-
visory Board. At the same time, it wishes Janine Heide every success in her new job.
Thanks to the Board of Directors and staff
The Supervisory Board thanks all members of the Board of Directors as well as staff for their commitment in
the 2018 financial year, which presented LEONI with major challenges. In 2019, our Company will once again
be operating in a demanding setting and will be additionally challenged by our newly launched VALUE 21
performance and strategy programme. The Supervisory Board wishes the Board of Directors and all members
of staff every success with these impending tasks.
Nuremberg, 28 February 2019
Dr Klaus Probst
Chairman of the Supervisory Board

| 17| Company information
Supervisory Board and Board of Directors
Members of the Supervisory Board Memberships of other statutory supervisory boards in Germany or of comparable domestic and foreign corporate governance bodies of economic entities
Chairman of the Supervisory Board
Dr.-Ing. Klaus Probst | 65 | Heroldsberg former President & CEO of LEONI AG, retired
Grammer AG, Amberg (market-listed, chairman)
Zapp AG, Ratingen (not market-listed, ordinary member)
1st Deputy Chairman of the Supervisory Board
Franz Spieß 1 | 62 | Büchenbach 1st senior authorised signatory of the IG Metall trade union’s office Schwabach
—
2nd Deputy Chairman of the Supervisory Board
Dr Werner Lang | 51 | ErgersheimManaging Director of the MEKRA Lang group of companies, Ergersheim
MEKRA Lang Otomotiv Yan Sanayi A. S., Ankara, Turkey (not market-listed, chairman of the administrative board)
Changchun MEKRA Lang FAWAY Vehicle Mirror Co, Ltd., Changchun, China (not market-listed, ordinary member of the administrative board)
MEKRArus LLC. Ulyanovsk, Russia (not market-listed, chairman of the Supervisory Board)
Dr Elisabetta Castiglioni | 54 | London Managing Director and CEO at A1 Digital International GmbH, Vienna, Austria
Euskaltel S.A., Derio, Spain (market-listed, ordinary member of the Board of Directors)
A1 Telekom Austria AG, Vienna, Austria (not market-listed, ordinary member of the Supervisory Board)
Wolfgang Dehen | 65 | Donaustauf former CEO of Osram Licht AG, retired
TÜV SÜD AG, Munich (not market-listed, ordinary member)
Mark Dischner1 | 45 | Greding Chairman of the General Works Council of LEONI AG
Sparkasse Mittelfranken-Süd (not market-listed, member of the administrative board)
Dr Ulrike Friese-Dormann | 48 | Munich Lawyer, partner at Milbank LLP, Munich
—
Karl-Heinz Lach 1 | 60 | Eschweiler Workforce council chairman at LEONI Kerpen GmbH, Stolberg
—
Richard Paglia 1 | 52 | Allersberg Senior Vice President Global Purchasing Wire and Cable Solutions Division
—
Prof. Dr Christian Rödl | 49 | Nuremberg Lawyer, tax consultant, managing partner at Rödl & Partner, Nuremberg
Herrenknecht AG, Schwanau (not market-listed, ordinary member)
UVEX Winter Holding GmbH & Co. KG (not market-listed, member of the board of shareholders)
Until 13/01/2019 Carmen Schwarz 1 | 44 | Ahaus First authorized representative IG Metall trade union, Arnsberg office
—
Inge Zellermaier 1 | 55 | Allersberg Paramedic, LEONI Kabel GmbH
—
1 Employee representative
Supervisory Board and Board of Directors
Committees of the Supervisory Board
Arbitration Committee pursuant to Article 27 (3) of Germany’s Co-determination Act (MitbestG)
Dr Klaus Probst (Chairman), Franz Spieß, Dr Werner Lang, Inge Zellermaier
Audit Committee Prof. Dr Christian Rödl (Chairman), Richard Paglia, Dr Klaus Probst, Franz Spieß
Personnel Committee Dr Klaus Probst (Chairman), Franz Spieß, Wolfgang Dehen, Mark Dischner
Nomination Committee Dr Klaus Probst (Chairman), Dr Ulrike Friese-Dormann, Dr Werner Lang
Strategy Committee Wolfgang Dehen (Chairman), Dr Elisabetta Castiglioni, , Karl-Heinz Lach, Richard Paglia, Dr Klaus Probst, Inge Zellermaier
Supervisory Board

18 | www.leoni.com
Aldo Kamper
CEO as well as Labour Director,
member of the Board of Directors
since 1 September 2018
Aldo Kamper (48) studied business administration
in Germany, the Netherlands and the United States.
He joined OSRAM as Controller in 1994. Various
positions at OSRAM Opto Semiconductors GmbH
followed; among others as Vice President & General
Manager of the LED and Specialty Lighting divisions.
He became CEO of Osram Semiconductors GmbH
in 2010. He has been the CEO of LEONI AG since 1
September 2018.
Karl Gadesmann
Chief Financial Officer,
member of the Board of Directors
since 1 October 2016
Karl Gadesmann (56) has a degree in business
administration and started his career as tax consult-
ant, auditor and partner at PricewaterhouseCoopers.
From 2008, he took on various management tasks
within the finance department of the Volkswagen
Group. He subsequently served as CFO for the MAN
Group as well as for Dräxlmaier, an automotive
component supplier. He has been with LEONI AG as
CFO since 2016.
Board of Directors

| 19
Martin Stüttem
is in charge of the Wiring Systems Division,
member of the Board of Directors
since 1 April 2017
Martin Stüttem (52) graduated in mechanical engi-
neering and, from 1994, held various senior positions
at Zeuna Stärker, Arvin Meritor and EMCON Tech-
nologies. In 2010, he moved to Faurecia where, after
various management roles, he was most recently
Vice President, Europe Division. Since 1 April 2017,
he has been a member of the Board of Directors of
LEONI AG with responsibility for the Wiring Systems
Division.
Bruno Fankhauser
is in charge of the Wire & Cable Solutions Division,
member of the Board of Directors
since 1 February 2016
Bruno Fankhauser(47) studied business administra-
tion at the University of Bern, Switzerland and,
following commercial positions within the Ascom
Group, was appointed Managing Director of Typon
Holding AG. In 2001, he joined the Studer Group as
Chief Financial Officer, taking over as Chief Executive
Officer in 2004. In 2006, he moved to the Manage-
ment Board of the Wire & Cable Solutions Division
of LEONI AG. He was appointed to the Board of
Directors in 2016.

20 | www.leoni.com
January
LEONI’s President & CEO Dieter Bellé
retires early on 31 January 2018
With the Supervisory Board’s understanding,
Dieter Bellé resigned his mandate as member
and chairman of the Board of Directors effective
31 January 2018 and left the Board at that time.
February
LEONI decides to appoint
outside candidate as CEO
The Supervisory Board announced that it would
fill the CEO position that was vacant from 1 Febru-
ary 2018 with an external candidate. CFO Karl
Gadesmann acted as spokesperson for the Board
of Directors until the future CEO took office.
March
Launch of LEONiQ key technology
Under the motto of “From black box to customer
dashboard”, LEONI presented its LEONiQ key tech-
nology at the Hanover Trade Fair: an intelligent
cable technology that can record and evaluate
such parameters as temperature and mechani-
cal stress along any given cable system. LEONiQ
makes energy and data flows more efficient,
secure and available. This does not just make the
connected intelligent, but also connectivity itself.
April
LEONI opens third wiring systems plant
in Serbia
In the city of Niš, LEONI officially opened its third
wiring systems plant in Serbia. On a production
space of approx. 20,000 m², the plant will make
cable harnesses for one of the global manufactur-
ers of premium vehicles. LEONI is investing about
€ 22 million in the production facility, which will
create about 2,200 jobs by the end of 2019.
June
Topping-out of the Factory of the Future
With the topping-out ceremony upon shell
construction of its Factory of the Future, LEONI set
the next milestone on the way to its competence
centre in Roth, Germany. Starting in 2019 and
among other functions, the site will serve the
development of state-of-the-art data cables for
autonomous driving and solutions for even safer,
more efficient and more reliable power distribu-
tion in electric vehicles. Once the main building
is completed, the existing production in Roth will
also gradually be relocated to the new site from
2019.
LEONI strengthens Group financing
with syndicated loan
The Group’s financing was realigned by agreeing
a credit line amounting to € 750 million and a term
of at least five years. This first syndicated loan for
LEONI, which was agreed with eight well-known
banks, replaced bilateral credit lines and provides
us with flexible, financial scope for further busi-
ness growth.
Collaboration with PARC
LEONI agreed collaboration with the PARC
research and development company, which
belongs to Xerox Corporation, to support its own
digitalization solutions. PARC provides trail-blazing
technologies in the areas of condition monitoring,
predictive maintenance, system analysis, artificial
intelligence as well as embedded sensor technol-
ogy – and will thereby give LEONI important impe-
tus for innovations in the field of energy and data
solutions. Initial, joint research work is concentrat-
ing on realising intelligent cable systems.
Annual review
2018

| 21| Company information
Annual review
November
LEONI launches its VALUE 21 performance
and strategy programme
With VALUE 21, LEONI initiated a comprehensive,
well structured, stringent and long-lasting strat-
egy and performance enhancement programme.
The objective is to sharpen the future corporate
strategy, direct the Company towards healthy
growth and improve both earnings quality and
liquidity.
Borrower’s note loans successfully placed
Among strong investor demand, LEONI issued
a borrower’s note loan on attractive terms. The
offering was significantly oversubscribed, mean-
ing that, instead of the originally planned € 200
million, a total of € 331 million with terms of five
to ten years was placed. The proceeds will serve
as long-term finance for the Group.
September
Aldo Kamper joins as LEONI’s
new CEO
Aldo Kamper, an internationally experienced
executive, took over as chairman of LEONI’s Board
of Directors and will contribute his profound expe-
rience in the industrial and automotive segments
as well as support the Group’s strategic develop-
ment. The Dutchman, who was previously CEO of
Osram Opto Semiconductors, is commercially and
technologically minded in equal measure and will
focus on innovation as well as profitable growth.
Switch into the SDAX
LEONI switched into the SDAX following Deutsche
Börse’s realignment of its indices. The criteria for
remaining in the MDAX are no longer met because
of the LEONI share’s weak performance and the
therefore significantly reduced market capitalisa-
tion.
October
Strategic partnership with Diehl
LEONI agreed to collaborate with Diehl, the
Nuremberg-based technology group, in the
growth market of electromobility. This strategic
partnership is focused on battery systems for
electric and hybrid vehicles. By pooling their
expertise in wiring, connector systems, battery
and heat management on the one hand and cell
contact systems on the other, both companies will
in future be able to offer system solutions for high-
voltage battery systems in e-vehicles.
LEONI adjusts guidance for 2018
LEONI lowered its targets for 2018 given the
increasingly volatile market setting and persis-
tently heavy pre-production costs. The adjusted
forecast covers consolidated sales, earnings before
interest and taxes as well as, especially, free cash
flow. Along with reduced amounts of product
called forward by customers and pre-production
spending on future customer projects, this also
reflected higher raw material prices and the wind-
down of production for a vehicle model supplied
on a large scale.

22 | www.leoni.com
Corporate Governance report andand statement on Corporate Governance
Corporate Governance report pursuant to Section 3.10 of the Code
LEONI pursues the objective of responsible and transparent corporate governance based on statutory rules,
LEONI AG’s Articles of Association, the rules of procedure for the Board of Directors and Supervisory Board,
and the German Corporate Governance Code (‘Code’), which are considered in all decision-making processes.
In compliance with the legal requirements for a German public company, LEONI AG has a dual management
system that is characterised by the separation of personnel between the Board of Directors as the executive
and corporate business management body and the Supervisory Board as the corporate monitoring body.
Shareholders and Annual General Meeting
Each share in LEONI AG on principle grants one vote. During the Annual General Meeting, all our sharehold-
ers were able to exercise their equal voting rights themselves or by their nominated proxies and enter into a
dialogue with the members of both the Board of Directors and Supervisory Board on any agenda items. The
invitation to the Annual General Meeting as well as the legally required reports and documents including the
annual report are readily accessible for the shareholders on the Company's website together with the agenda
in German as well as mostly also English. All other relevant information is published on LEONI’s website and
sent out upon request. Both the attendance and the voting results are published on the internet after the
Annual General Meeting.
To make it easier for shareholders not in attendance to exercise their rights, voting right representatives
are available during the Annual General Meeting to cast these votes as instructed. On the day of the Annual
General Meeting, the internet service will be available on the website, subject to its technical availability, until
the end of the general debate. Shareholders can also grant, amend or revoke power of proxy and instructions
to the proxies appointed by the Company by using the internet service.
The CEO’s speech and a presentation shown at the same time can be followed on the internet. This presenta-
tion will be available on our website www.leoni.com until the next Annual General Meeting.
Leadership and management by the Board of Directors
The Board of Directors is responsible for leading and managing LEONI AG. It acts in the interests of the
Company with the aim of raising its enterprise value on a lasting basis. To do so, the Board develops a suitable
strategy, agrees it with the Supervisory Board and ensures its implementation. Its duties also include effective
opportunity and risk management as well as controlling and ensuring of compliance (observance of legal
requirements and guidelines within the Company) throughout the Group.
The law and rules of procedure govern the collaboration and division of duties among members of the Board.
The latter was revised during the reporting period, among other aims to enhance the principle of collegiality,
adjust the list of transactions requiring approval and reassign responsibility for organisational and staffing
decisions. The allocation of responsibilities was also updated because of the changes described hereinafter
and adjusted to the respective composition.
LEONI website ›› www.leoni.com

| 23| Company information
Corporate Governance report and statement on Corporate Governance
The composition of the Board of Directors changed as follows in the 2018 financial year: On 31 January 2018,
Dieter Bellé, in agreement with the Supervisory Board, resigned as member and chairman of the Board of
Directors. The Supervisory Board decided to fill the CEO position that was vacant from 1 February 2018 with
an outside candidate and, on 15 March 2018, appointed Aldo Kamper as the new CEO and Labour Director. He
assumed his mandate, which initially runs to 31 December 2021, on 1 September 2018. Until he took office,
Karl Gadesmann temporarily acted as spokesman for the Board of Directors and as Labour Director alongside
his role as CFO.
The Board of Directors thus had the following members in 2018:
Bruno Fankhauser, Business economist (licentiatus rerum politicarum), 47
First appointed: 2016 Appointed until: 31/12/2023
Areas of responsibility: Head of the Wire & Cable Solutions Division, the Corporate Digitalization department (from 18/09/2018) as well as the Corporate Marketing department (until 18/09/2018)
Karl Gadesmann, Graduate in business administration, 56
First appointed: 2016 Appointed until: 31/12/2019
Areas of responsibility: Chief Financial Officer (CFO); head of the Corporate Accounting, Corporate Controlling, Corporate Data Protection, Corporate Finance & Treasury (new designation from 18/09/2018), Corporate Information Management, Corporate Information Security, Corporate Investor Relations (until 18/09/2018), Corporate Process Management (until 18/09/2018), Corporate Risk & Insurance, Corporate Taxes, Quality & Knowledge Management (until 18/09/2018), Purchasing & Facility Management and Corporate Internal Audit (01/02/2018 until 31/08/2018 and from 18/09/2018) departments; in the period from 01/02/2018 to 31/08/2018 also spokes-man for the Board of Directors, Labour Director and head of the Corporate Legal, Corporate Compliance, Corporate Strategy, Corporate Communications, Corporate Human Resources Management and Human Resources departments
Aldo Kamper, (MBA), 48
First appointed: 01/09/2018 Appointed until: 31/12/2021
Areas of responsibility: Chief Executive Officer (CEO) and Labour Director as well as, from 01/09/2018, head of the Corporate Communications, Corporate Compliance, Corporate Human Resources Manage-ment, Human Resources, Corporate Legal and Corporate Strategy departments as well as, from 18/09/2018, head of the Corporate Marketing and Corporate Investor Relations depart-ments
Martin Stüttem, Graduate of engineering, 52
First appointed: 2017 Appointed until: 31/12/2020
Areas of responsibility: Head of the Wiring Systems Division and of the Corporate Sustainability department as well as, from 18/09/2018, head of the Corporate Process Management, Corporate Quality & SHE Management and Quality & Knowledge Management departments
Dieter Bellé, Graduate in business administration, 62
First appointed: 2000 Appointed until: 31/01/2018
Areas of responsibility: until 31/01/2018, Chief Executive Officer (CEO) and Labour Director as well as head of the Corporate Legal, Corporate Compliance, Corporate Strategy, Corporate Communications, Corporate Internal Audit, Corporate Human Resources Management and Human Resources departments
All the information on the system for compensating members of the Board of Directors is contained in the
compensation report. Compensation report›› page 114

24 | www.leoni.com
Further measures to improve corporate governance in the Group were applied in 2018. Among other
changes, we revised the allocation of responsibilities in the management companies of the two divisions by
setting up corresponding management boards under company law. This impacted on the articles of associa-
tion, especially so the rules of procedure of these companies. Adoption of a global guideline regarding powers
of representation and signing also improved the execution of decisions.
Work of the Supervisory Board
The Supervisory Board of LEONI AG monitors and advises the Board of Directors in running the Company.
Its work is governed by the law, the Articles of Association, the Code and rules of procedure. The rules of pro-
cedure were slightly revised in 2018, especially with respect to the work and composition of the Supervisory
Board of LEONI AG as well as the work and composition of some of its committees.
In accordance with the German Co-determination Act, the Supervisory Board has an equal number of six
members representing employees and six members representing shareholders. Its composition is in line with
the latest Code requirements concerning diversity and appropriate participation of women as well as other
criteria that ensure qualified monitoring of and advice to the Board of Directors of LEONI AG. The Supervisory
Board formulated a competence profile with targets for its composition, which is part of the Board’s rules
of procedure. This calls for the members who can successfully perform the duties of a supervisory board
member of an industrial group that operates internationally based on their experience, professional expertise,
independence, commitment, integrity and personality. It furthermore devised a diversity concept for the
composition of the Board of Directors and the Supervisory Board. This concept was updated in 2018 and the
competence profile for composition of the Supervisory Board was also adjusted. Information in this regard is
to be found in the Corporate Governance statement.
LEONI AG’s Supervisory Board now comprises members who fulfil the conditions described above. The suf-
ficient diversity with respect to differing career backgrounds, professional expertise and experience in accord-
ance with the objectives for composition of the Supervisory Board is also given. More information on the
composition of the Supervisory Board is to be found in the section headed Corporate Governance statement.
All shareholder representatives are independent within the meaning of Sections 5.4.1 and 5.4.2 of the Code.
In particular, they are not in any personal or business relationship with LEONI AG, its corporate bodies, a
controlling shareholder or an affiliated company, which may provide the basis for material and not merely
temporary conflict of interests. In the opinion of the Supervisory Board, Dr Werner Lang’s role as managing
director of Lang Verwaltungsgesellschaft mbH, the general partner of MEKRA Lang GmbH & Co. KG, a LEONI AG
customer, does not constitute such a conflict of interest. The Supervisory Board members do not exercise
directorships or similar positions or advisory tasks for important competitors of the LEONI Group. No member
of the Supervisory Board was older than 70 years when elected or has been on the Board for longer than
15 years.
Apart from these general criteria, the following requirements for the entire Board with respect to specific pro-
fessional expertise are also fulfilled: At least one member has experience in the global corporate environment
as well as knowledge of the regions and markets of importance to LEONI. At least one member has expertise
in the automotive (supply) industry as well as experience with disruptive market developments. At least one
independent member of the Supervisory Board furthermore has specialist expertise in the respective areas
Statement on Corporate Governance ›› page 30

| 25| Company information
Corporate Governance report and statement on Corporate Governance
of accounting and auditing (financial expert) and more profound knowledge in the areas of international
company law, compliance, risk management, antitrust law, the capital market as well as M&A. Altogether, the
members of the Supervisory Board are familiar with the sector in which the Company operates. With respect
to the proportion of women on the Supervisory Board, we refer to stipulations pursuant to Sections 76(4) and
111(5) of the German Stock Corporation Act (AktG) in the Corporate Governance statement.
The members of LEONI AG’s Supervisory Board each hold a maximum of three other supervisory board
mandates at other companies or on supervisory bodies of companies that impose comparable requirements.
A precise overview of the mandates held by all Supervisory Board members is provided in the section headed
Supervisory Board and Board of Directors in the Annual Report.
To increase the efficiency of the Supervisory Board's work, an Audit Committee, Personnel Committee, Nomi-
nation Committee, Arbitration Committee and Strategy Committee are established, which, apart from the
Nomination Committee and Arbitration Committee, met regularly during the year under report. The respec-
tive committee chairmen report during the Supervisory Board meetings on the work of their committees.
The Audit Committee has four members to be elected by the Supervisory Board – of whom two shareholder
representatives and two employee representatives – one of whom the Supervisory Board appoints as chair-
man. The committee meets at least four times a year. The Audit Committee’s chairman, Prof. Dr Christian Rödl,
is independent and not simultaneously the chairman of the Supervisory Board; as a financial expert, he has
professional knowledge in the fields of accounting and auditing. He has not been a member of LEONI AG’s
Board of Directors in recent years. The Audit Committee’s task is to discuss and scrutinise in advance the
annual financial statements, the consolidated financial statements, the management report and the Group
management report, the report of the Board of Directors on relationships with affiliated companies (depend-
ency report) as well as the Board of Directors’ dividend proposal. The Audit Committee furthermore discusses
the half-year and any quarterly financial reports with the Board of Directors. It considers matters concerning
accounting and compliance, risk management, internal auditing and the Internal Control System including
testing the effectiveness of the systems and measures that are respectively in place. The Audit Committee
prepares the Supervisory Board’s proposal to the shareholders at the Annual General Meeting for nomination
of the auditors and presents the Supervisory Board with a correspondingly reasoned recommendation. It fur-
thermore verifies the independence of the auditors and obtains the corresponding declaration of independ-
ence. It issues the audit mandate to the auditing company and agrees the fees with said auditors, determines
the focal areas of the audit and monitors the auditing.
Alongside the chairman of the Supervisory Board as Committee chairperson, the Personnel Committee
comprises his or her first deputy and as well as one Supervisory Board member elected as proposed by each
of the shareholder and employee representatives. It meets at least twice a year. Its main tasks are to advise on
the appointment and recall of the members of the Board of Directors, the compensation system for the Board
of Directors, the principal elements of the employment contracts of the members of the Board of Directors as
well as approving contracts with Supervisory Board members in accordance with Section 114 of the German
Stock Corporation Act (AktG). The Personnel Committee’s remit was broadened during the year under report.
It now also judges on the approval for the Board of Directors’ personnel-related decisions at the level of senior
management (Level 1 of the Group-wide grading system).
Statement on Corporate Governance ›› page 30
Supervisory Board and Board of Directors ›› page 17

26 | www.leoni.com
The Nomination Committee has two further, shareholder-representative members in addition to the Supervi-
sory Board chairman, who also chairs the committee. It is the committee’s task to make recommendations to
the Supervisory Board for its proposals to shareholders at the Annual General Meeting of suitable candidates
to be elected to the Board on the shareholder side. The judgement on a candidate is made based on the
competence profile prepared by the entire Supervisory Board, the targets concerning the Board’s composition
with respect to the diversity concept and a questionnaire.
To perform the duties set out in Section 31 (3), sentence 1 of Germany’s Co-determination Act (MitbestG), the
Supervisory Board has formed an Arbitration Committee pursuant to Section 27 (3) of the Co-determination
Act that comprises the Supervisory Board chairman, his deputy as well as one member of the shareholder and
one member of the employee side, each elected by a majority of votes of the Supervisory Board members on
the employee and shareholder sides.
The Strategy Committee’s role was revised during the reporting period. The Strategy Committee now com-
prises three members of the Supervisory Board to be elected from each of the shareholder representatives
and employee representatives. The Supervisory Board elects a member to be the committee’s chairman. The
committee convenes at least twice per calendar year in addition to the whole committee’s annual strategy
meeting. Th Strategy Committee’s duties were also revised. It deals in an advisory and preparatory capacity
with the corporate strategy. Its principal tasks comprise advising the Board of Directors on the Company’s
strategic development and scrutiny thereof, preparing strategy meetings and decisions of the Supervisory
Board on matters requiring consent concerning acquisitions, divestments, capital expenditure, organisational
changes and restructuring as well as advising the Board of Directors on matters involving the corporate
strategy and on projects of strategic relevance. The Strategy Committee’s composition changed following the
meeting of the Supervisory Board on 13 December 2018.
The section headed Supervisory Board and Board of Directors in the Annual Report provides information on
the composition of the committees.
The Supervisory Board reviews the efficiency of its work on a regular basis. The efficiency audit took place in
the 2018 financial year with the outside support of Ernst & Young in the form of a self-evaluation by question-
naire and complementary interviews with all Supervisory Board members. Based on the subsequent findings,
the Supervisory Board decided to apply specific, recommended actions to raise efficiency. This included hold-
ing an annual meeting without the Board of Directors (executive session) to regularly review self-image and
role perception, the setting up of a Corporate Office to further professionalise, the assignment to the Person-
nel Committee to review the system for compensating members of the Board of Directors and the assignment
to the Nomination Committee to once again consider the competence profile, the allocation of responsibilities
and the competence matrix in the upcoming reporting year as well as to offer annual training for members of
the Supervisory Board.
The latter was a particular concern because the Supervisory Board considers further education to be an
important element of its work. As far as required, the Company gives the Board’s members adequate support
in seeking, as is their personal responsibility, the training and further education required to perform their
duties. According to the currently applicable Articles of Association, this also includes assumption of commen-
surate costs.
Supervisory Board and Board of Directors ›› page 17

| 27| Company information
Corporate Governance report and statement on Corporate Governance
Further details of the way the Supervisory Board works as well as on the number and principal topics of
the committee meetings in 2018 are comprehensively presented in the Supervisory Board report.
The Supervisory Board’s composition changed to the extent that Carmen Schwarz declared on 13 Decem -
ber 2018 that she would be resigning her mandate by mutual agreement effective at the end of the day on
13 January 2019. Janine Heide succeeded her as a member of the Supervisory Board and an employee repre-
sentative (trade union representative). She was appointed by a ruling of the local court of Nuremberg pursu-
ant to Section 104 of the German Stock Corporation Act (AktG) on 15 January 2019. Details are contained in
the Supervisory Board report. The compensation report provides information on the breakdown and amount
of compensation for Supervisory Board members.
Collaboration between the Board of Directors and Supervisory Board
The Board of Directors and Supervisory Board of LEONI AG collaborated closely and in mutual trust for the
benefit of the Company in 2018. The Supervisory Board actively assisted and monitored the Board of Directors
in its work. During the Supervisory Board meetings, the Board of Directors and Supervisory Board members
discuss all key strategic decisions as well as transactions requiring consent extensively, openly and based
on maintaining strict confidentiality. The Board of Directors keeps the Supervisory Board comprehensively
informed on a regular and up-to-date basis about all relevant matters as well as the planning, business perfor-
mance, the risk situation and the compliance measures.
In addition to the Supervisory Board meetings in which the members of the Board of Directors were present,
the chairmen of the two boards regularly, also on short notice and as warranted by events, discuss all relevant,
current matters. The Supervisory Board report also contains additional information on the collaboration
between the Board of Directors and the Supervisory Board.
D&O insurance with an excess, which for the event of any single claim for damages involves at least 10 percent
and a maximum of one and a half times the individual member’s fixed annual compensation, was in place for
members of the Board of Directors and the Supervisory Board during the year under report.
Compliance
LEONI AG’s Compliance Management System is an elementary part of our commitment to entrepreneurial
action. The objective is to prevent misconduct, avoid liability risks and to protect the Company’s reputation.
The Compliance Management System has three mainstays (prevent, detect and react), which in turn comprise
a large number of processes, guidelines and measures. Details in this regard are to be found in the Group
management report. Again, during the year under report, the Board of Directors dealt with the organisation
and further development of all compliance matters and ensured implementation of the necessary measures.
It regularly informed the Supervisory Board on the latest status. The latter monitored the corresponding
activities. Furthermore, the Audit Committee regularly dealt with the content, organisation and further
development of compliance.
Supervisory Board report ›› page 9
Compensation report›› Seite 114
Supervisory Board report ›› page 9
Group management report ›› page 41

28 | www.leoni.com
Transparency
LEONI AG informs its shareholders, the shareholder associations, financial analysts, the media and the
interested public equally, promptly and comprehensively about the Company's performance and significant
events, for which the Company makes use of a wide variety of media. All mandatory publications as well as
extensive supplementary information are always made available without delay on LEONI’s website. The pub-
lications, such as ad hoc announcements, media releases, interim and annual reports, are in every case issued
in both German and English. LEONI AG always also broadcasts conference calls as well as the annual balance
sheet press conference and the analyst conference live on the internet, where audio and video recordings are
easily accessible for a limited period. The latest fiscal calendar, which provides information on the dates for all
key releases and events, can also be viewed on the website.
Accounting and audit of financial statements
LEONI AG’s consolidated financial statements for fiscal 2018 as well as its condensed consolidated interim
financial statements in the half-year report are prepared in accordance with the International Financial
Reporting Standards (IFRS). The individual financial statements of LEONI AG conform to the requirements of
the German Commercial Code (HGB) and the German Stock Corporation Act (AktG) as well as supplementary
provisions of the Articles of Association.
On 3 May 2018, the Annual General Meeting appointed accountants Ernst & Young GmbH of Stuttgart as the
auditors for the year under report. The nomination was preceded by an examination of independence. It was
furthermore agreed with the auditor that the latter would inform the Supervisory Board without delay of find-
ings and occurrences material to its duties that arise during execution of the audit. Accordingly, the auditors
are obliged to advise the Supervisory Board, or note it in their audit report, if facts are discovered that point
to incorrectness in the declaration pursuant to the Code submitted by the Board of Directors and the Supervi-
sory Board. The audit for the 2018 financial year did not give any cause in this regard.
The auditors are given only limited mandate to provide non-audit services. Where necessary, certain non-
audit services are itemised and authorised to a limited degree subject to prior approval. The content and
extent of provided non-audit services are monitored.
During fiscal 2018, the Audit Committee thoroughly prepared for the change of auditors for the financial
year and in accordance with the intended requirements and steps. The Audit Committee recommended
to the Supervisory Board that the latter propose to shareholders at the Annual General Meeting to choose
either PricewaterhouseCoopers GmbH Wirtschaftsprüfungsgesellschaft of Frankfurt or Deloitte GmbH
Wirtschaftsprüfungsgesellschaft of Munich as auditors and, in so doing, expressed a reasoned preference to
the Super visory Board for Deloitte GmbH Wirtschaftsprüfungsgesellschaft of Munich. On this basis, the Super-
visory Board decided to propose Deloitte GmbH Wirtschaftsprüfungsgesellschaft as auditors for fiscal 2019 to
shareholders at the 2019 Annual General Meeting.
| 29| Company information
Corporate Governance report and statement on Corporate Governance
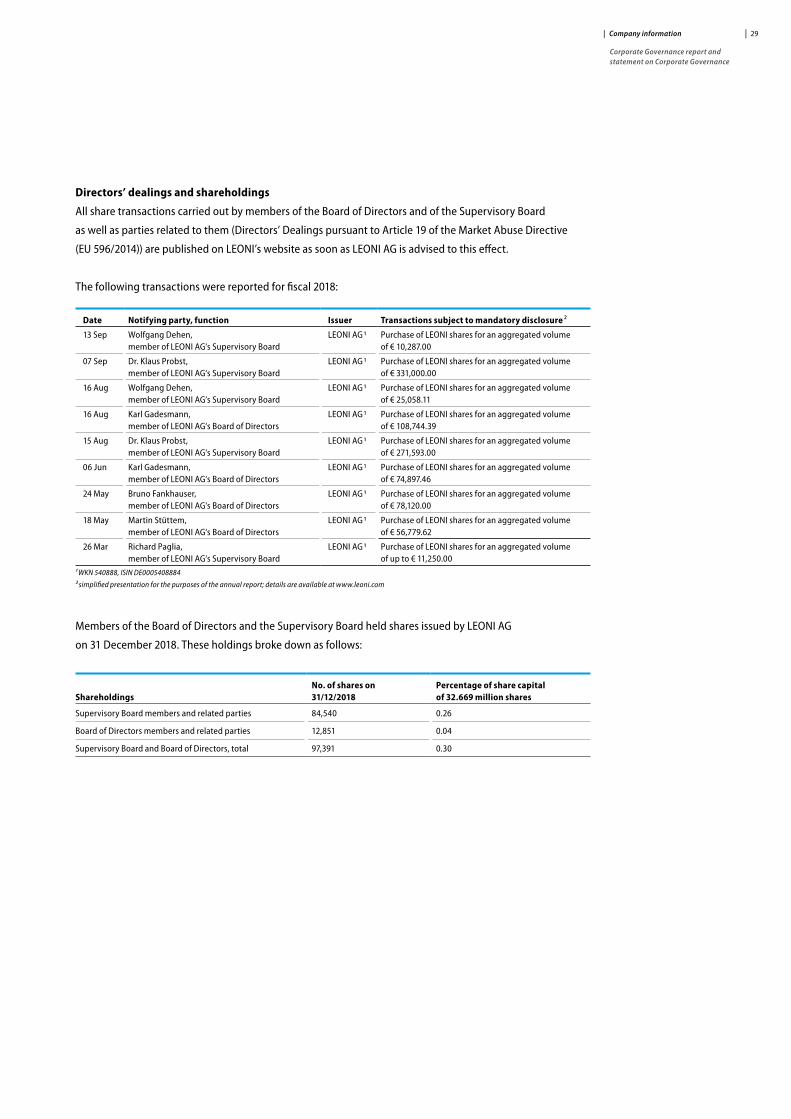
Directors’ dealings and shareholdings
All share transactions carried out by members of the Board of Directors and of the Supervisory Board
as well as parties related to them (Directors’ Dealings pursuant to Article 19 of the Market Abuse Directive
(EU 596/2014)) are published on LEONI’s website as soon as LEONI AG is advised to this effect.
The following transactions were reported for fiscal 2018:
Date Notifying party, function Issuer Transactions subject to mandatory disclosure ²
13 Sep Wolfgang Dehen, member of LEONI AG‘s Supervisory Board
LEONI AG 1 Purchase of LEONI shares for an aggregated volume of € 10,287.00
07 Sep Dr. Klaus Probst, member of LEONI AG‘s Supervisory Board
LEONI AG 1 Purchase of LEONI shares for an aggregated volume of € 331,000.00
16 Aug Wolfgang Dehen, member of LEONI AG‘s Supervisory Board
LEONI AG 1 Purchase of LEONI shares for an aggregated volume of € 25,058.11
16 Aug Karl Gadesmann, member of LEONI AG‘s Board of Directors
LEONI AG 1 Purchase of LEONI shares for an aggregated volume of € 108,744.39
15 Aug Dr. Klaus Probst, member of LEONI AG‘s Supervisory Board
LEONI AG 1 Purchase of LEONI shares for an aggregated volume of € 271,593.00
06 Jun Karl Gadesmann, member of LEONI AG‘s Board of Directors
LEONI AG 1 Purchase of LEONI shares for an aggregated volume of € 74,897.46
24 May Bruno Fankhauser, member of LEONI AG‘s Board of Directors
LEONI AG 1 Purchase of LEONI shares for an aggregated volume of € 78,120.00
18 May Martin Stüttem, member of LEONI AG‘s Board of Directors
LEONI AG 1 Purchase of LEONI shares for an aggregated volume of € 56,779.62
26 Mar Richard Paglia, member of LEONI AG‘s Supervisory Board
LEONI AG 1 Purchase of LEONI shares for an aggregated volume of up to € 11,250.00
¹ WKN 540888, ISIN DE0005408884
² simplified presentation for the purposes of the annual report; details are available at www.leoni.com
Members of the Board of Directors and the Supervisory Board held shares issued by LEONI AG
on 31 December 2018. These holdings broke down as follows:
ShareholdingsNo. of shares on 31/12/2018
Percentage of share capital of 32.669 million shares
Supervisory Board members and related parties 84,540 0.26
Board of Directors members and related parties 12,851 0.04
Supervisory Board and Board of Directors, total 97,391 0.30

30 | www.leoni.com
Statement on Corporate Governance pursuant to Sections 289f and 315d HGB 1
Declaration by the Board of Directors and the Supervisory Board of LEONI AG on the
recommendations of the ‘Government Commission on the German Corporate Governance Code’
pursuant to Section 161 of the German Stock Corporation Act (AktG)
Since issuing its last Declaration of Conformity on 12 December 2017, LEONI AG has complied with all the
recommendations of the German Corporate Governance Code (‘Code’) in the version of 7 February 2017 as
published by the Federal Ministry of Justice in the official part of the Federal Gazette on 24 April 2017 with
the exception stated below and will comply with the recommendations of the Code with the exception stated
below in the future.
In accordance with its duties, the Supervisory Board of LEONI AG concerns itself with the appropriateness of
the compensation of the Board of Directors, giving consideration to the periodic developments of the com-
pany-internal salary and wage structures, however, without applying the recommendation in section 4.2.2 (2),
sentence 3 of the Code in a targeted and structured way. It is the conviction of the Supervisory Board that ear-
lier practice and statutory specifications in accordance with Section 87 of the German Stock Corporation Act
(AktG) suffice for determining the compensation for the members of the Board of Directors in consideration
of normal compensation. Standards of comparison are only beneficial if they are realistic, provide a basis for
orientation, and allow sufficient leeway for considerations to be made on a case-by-case basis. It is the opinion
of the Supervisory Board that the Code’s recommendation in Section 4.2.2. (2) sentence 3 does not satisfy
these requirements in the case of a company such as LEONI, where the majority of the workforce is employed
in non-European countries. A delineation of the upper management and the relevant workforce would, in the
opinion of the Supervisory Board, be subject to manipulation and ultimately arbitrary, and would not result in
standards of comparison that are more comprehensible. Therefore, the recommendation does not serve as an
efficient tool for determining the compensation of the Board of Directors.
Nuremberg, 13 December 2018
LEONI AG
For the Board of Directors For the Supervisory Board
Aldo Kamper Dr.-Ing. Klaus Probst
1 The statement on Corporate Governance pursuant to Sections 289f and 315d of the German Commercial Code (HGB) is part of the Group management report. According to Section 317 (2) sentence 6 of the German Commercial Code (HGB), the auditors are not required to include disclosures pursuant to Sections 289f (2) and (5) as well as Section 315d HGB in their audit; in that respect the audit is required only to determine whether these disclosures have been made.

| 31| Company information
Corporate Governance report and statement on Corporate Governance
Suggestions of the Code
LEONI AG voluntarily complies with the non-obligatory suggestions of the Code with the following exception.
Deviating from Section 4.2.3 (2), final sentence of the Code, the remuneration system for the members of
LEONI AG’s Board of Directors stipulates that the Board members shall receive annual instalments of the
multi-year bonus on the compensation for members of the Board of Directors equalling 50 percent of the
annual amount. Paid instalments must be repaid at the end of the relevant three-year period if a correspond-
ing multi-year bonus is not achieved. Further information on the system applicable since 1 January 2015 for
compensating members of the Board of Directors is contained in the compensation report.
Other Corporate Governance practices
LEONI’s Corporate Governance is aligned with recognised external standards and various own sets of rules
in addition to the legal requirements and the Code. These include the UN Global Compact and the Diversity
Charter as well as such internal guidelines as the LEONI Code of Conduct and the occupational health and
safety as well as environmental protection policy for the LEONI Group, which can be viewed on LEONI AG's
website.
Description of the way the Board of Directors and Supervisory Board work
as well as the composition and procedures of the Supervisory Board’s committees
The composition of the Supervisory Board’s committees is to be found in the section of the Annual Report
headed Supervisory Board and Board of Directors. Further information on the tasks and procedures of the
Board of Directors and Supervisory Board as well as the latter’s committees are contained in the Corporate
Governance report under the headings ‘Leadership and management by the Board of Directors’ as well as
‘Work of the Supervisory Board’. Information on the duties and procedures of the Board of Directors and
Supervisory Board as well as their composition and that of the Supervisory Board’s committees can also
be accessed on LEONI AG's website.
Diversity
LEONI regards diversity as a key success factor for the Company’s future viability.
Diversity concept for the Board of Directors and Supervisory Board
Applied diversity is a strategic success factor. Different career and educational backgrounds facilitate the
fulfilment of duties and obligations in accordance with statutory requirements, the provisions of the Com-
pany’s Articles of Association and rules of procedure. The Company’s increasing internationalisation requires
leadership of diversely composed teams. Without this capability and experience it would impossible to take
appropriate account of cultural backgrounds within the Group. A balanced age structure ensures regular
regeneration, and simultaneously that knowledge as well as career and life experience are retained for as long
as possible in the Company’s interest. Gender diversity is, in turn, the resolute continuation of the initiatives
launched by the Board of Directors to raise the proportion of women in management positions. LEONI’s activ-
ity aims to raise the awareness especially of managers but also staff of this topic, among other means with
mentoring programmes, e-learning courses and targeted training schemes.
Compensation report›› page 114
Supervisory Board and Board of Directors ›› page 17
Corporate Governance report ›› page 22
LEONI website ›› www.leoni.com
LEONI website ›› www.leoni.com

32 | www.leoni.com
Corporate Governance report ›› page 22
Diversity concept for composition of the Board of Directors
LEONI has set itself the target of having a 15-percent proportion of women on the Board of Directors. The
Company has, for the Board of Directors’ composition, prepared a competence profile as well as a diversity
concept, which is to serve as a guideline for future appointments.
The criteria are ■ appropriate consideration of women ■ diversity in terms of cultural and regional origins as well as religion ■ experience in the global corporate environment as well as knowledge of the regions and markets of
importance to LEONI ■ experience with disruptive market developments ■ variety of career backgrounds, experience and mindset ■ equal consideration of external and internal candidates when selecting recruits ■ age: balanced age structure within set parameters for standard retirement age at the time of appointment
(currently 65th year)
Manner of implementation with respect to the competence profile and diversity
Implementation of this concept is ensured principally by involving the Supervisory Board in the strategic,
financial and current situation of the Company as well as its organisation, as is stipulated by statutory require-
ments, the provisions of the Company’s Articles of Association and rules of procedure. Allocation of respon-
sibilities, appointment and succession planning for the Board of Directors are part of the Supervisory Board’s
duties. The Board of Directors reports regularly during the Supervisory Board’s meetings on diversity as well
as the development and potential of managers within the Group. The aforementioned criteria are further-
more considered in the decisions of the Personnel Committee and the Supervisory Board when it comes to
recruiting internal or external candidates for positions on the Board of Directors, but also for the first manage-
ment level below the Board of Directors now that the latter is subject to the Personnel Committee’s approval.
Implementation of the above-mentioned aspects is ensured in the following ways, among others:
■ reporting on the personnel and succession planning for the Board of Directors and the first management
level incl. step-in solutions (emergency plan) and personnel planning geared to the Group’s strategy ■ scanning of the market for suitable candidates for the Board of Directors as well as the first and second
management level with the involvement of experienced recruitment consultants conducting targeted
searches for managers who meet the above criteria ■ promoting own employees for the first and second management level while considering knowledge,
experience and diversity aspects to establish the foundations needed in house for future appointments to
Board of Directors positions
In the opinion of both the Supervisory Board and Board of Directors, the measures initiated are suitable for
appropriately considering the aspect of diversity early in the staff selection and promotion process in the
future as well as for embedding a fitting breakdown of experience and age on the Board of Directors.
Status of meeting the targets with respect to the competence profile
and diversity on the Board of Directors
All the criteria described above were considered during the process of widely searching, both inside and
outside the Company, for a new managing director of the Wiring Systems Division in the 2017 financial year.

| 33| Company information
Corporate Governance report and statement on Corporate Governance
However, the targeted proportion of women was not achieved because, in the opinion of the Supervisory
Board, the appointed male applicant was best suited for the position to be filled.
The new appointment to the position of Chief Executive Officer in fiscal 2018 was also based on a widespread
external and internal search process during which the aforementioned criteria were considered in the choice
made. In the opinion of the Supervisory Board, the CEO contributes to diversity on the Board of Directors
with his background and career. However, the targeted quota of women was not met in this case either. In the
opinion of the Supervisory Board, the appointed male candidate was best suited for the position to be filled.
Information on Aldo Kamper and all other members of the Board of Directors can be viewed in their resumes,
which are posted on the LEONI AG's website.
Diversity concept for composition of the Supervisory Board
The Supervisory Board is to be composed in such a way that it ensures qualified oversight of and advice for
the Board of Directors. Accordingly, the Supervisory Board has established a competence profile, a diversity
concept and independence criteria in which integrity, commitment and professionalism play a key role.
Competence profile
Candidates who are proposed for election to the Supervisory Board should be able, based on their knowledge,
capabilities and experience, to perform the duties of a supervisory board member of a group of companies
that operates internationally and also to outwardly represent the group well.
The intention is that the Supervisory Board as a whole has all the knowledge and experience needed to
execute its tasks – this applies especially to knowledge and experience that is of importance to LEONI ■ general corporate governance ■ sectors, markets, regions, business areas and models ■ new technologies (especially also information technology and digitalization) ■ production and distribution ■ procurement, logistics and finance ■ law (including compliance) ■ human resources ■ leadership in a company that operates internationally
At least one member of the Supervisory Board is to have expertise in the fields of accounting and auditing
as well as particular knowledge and experience covering internal control procedures.
Any pending new appointment should be reconciled with which of the listed knowledge criteria the Super-
visory Board is to be enhanced.
Diversity
The aim is to have a sufficient diversity on the Supervisory Board that is in keeping with being able to suc-
cessfully master tasks in an international setting involving mixed-gender teams and thereby also to be a role
model for the Company as a whole. Considering consistency and regeneration with respect to (impending)
appointments is intended to contribute to sustainability and fresh impetus.
LEONI website ›› www.leoni.com

34 | www.leoni.com
The criteria are ■ appropriate consideration of women for the Supervisory Board and its committees ■ diversity in terms of cultural and regional origins as well as religion ■ experience in the global corporate environment as well as knowledge of the regions and markets
of importance to LEONI ■ experience with disruptive market developments ■ variety of career backgrounds, experience and mindset ■ age: balanced age structure within framework parameters for standard retirement age (70th year)
at the time of election ■ standard 15-year limit for membership of the Supervisory Board
The objective is to appropriately consider the aspect of diversity early in the selection process as well
as to embed a fitting breakdown of experience and age on the Supervisory Board.
Independence
All shareholder representatives should be independent within the meaning of Sections 5.4.1 and 5.4.2 of the
German Corporate Governance Code. In particular, they should not be in any personal or business relationship
with LEONI AG, its corporate bodies, a controlling shareholder or an affiliated company, which may provide
the basis for material and not merely temporary conflict of interests.
Conflicts of interest should be avoided, for example, by ensuring that no directorships or similar positions or
advisory tasks for important competitors of LEONI are exercised.
Supervisory Board members should have sufficient time to perform their mandate to be able to do so with the
requisite regularity and diligence.
Not more than two former members of LEONI AG’s Board of Directors should be members of the Supervisory
Board.
The aforementioned points are, in the Supervisory Board’s view, suitable tools for fulfilling the objectives
described above. The election of employee representatives according to the requirements of Germany’s
Co-determination Act also contributes to having a diversity of career backgrounds.
Manner of implementation with respect to competence profile, diversity and independence
Statutory requirements, the Company’s rules of procedure and Declaration of Conformity pursuant to Section
161 of the German Stock Corporation Act (AktG) underpin the realisation of these objectives. The Nomination
Committee with its work on appointment of shareholder representatives and regular efficiency audits also
supports these aims.
Implementation of the above-mentioned aspects is furthermore ensured in the following ways: ■ regular efficiency audits within the framework of a self and external evaluation ■ scanning the market for suitable candidates for Supervisory Board mandates with the involvement of
experienced recruitment consultants ■ exchange of information with the Board of Directors and management levels with respect to diversity
(regular reporting on the Supervisory Board) ■ onboarding programme for new members of the Supervisory Board

| 35| Company information
Corporate Governance report and statement on Corporate Governance
Status of implementing the targets with respect to the competence profile,
diversity and independence of Supervisory Board members
■ The Supervisory Board meets the aforementioned targets in its present composition ■ The Supervisory Board members have the professional and personal qualifications deemed necessary as
well as the knowledge, capabilities and experience of importance to LEONI as set out in the competence
profile ■ The targeted diversity on the Supervisory Board is appropriately considered by, for example, the fact
that the Board had four female members in fiscal 2018, two of whom on the shareholder side and two on
the employee side. The minimum proportion rule in accordance with Section 96 (2), sentence 1 of the
German Stock Corporation Act (AktG) is thereby fulfilled. The resumes of its members that are published
on LEONI AG's website and updated annually also show the diversity of the professional and educational
backgrounds of the Board’s individual members. Furthermore, no member of the Supervisory Board is
older than 70 years or has been on the Board for longer than 15 years. ■ The Supervisory Board also has an appropriate number of independent members.
Stipulations pursuant to Sections 76 (4) and 111 (5) of the German Stock Corporation Act (AktG)
Section 111 (5) of the German Stock Corporation Act (AktG) provides that the supervisory board of a listed
stock corporation must set target quotas for the number of women on the Board of Directors. Pursuant to
Section 76 (4) of the German Stock Corporation Act (AktG), the Board of Directors must furthermore set target
quotas for women on the two management levels below the Board of Directors. According to Section 96 (2)
of the German Stock Corporation Act (AktG), LEONI’s Supervisory Board must furthermore have a quota of at
least 30 percent women and men each.
On the Supervisory Board, the mandatory quota is fulfilled on both the shareholder and employee sides
of the Board as both sides have two female members.
In setting its target quotas for the Board of Directors and the two management levels below the Board of
Directors, LEONI AG has, as a technically oriented company, considered sector-specific circumstances as well
as the current proportion of women in the workforce. The Supervisory Board has targeted a quota for the
Board of Directors of 15 percent to be reached by 30 June 2022. This target quota is currently not met because
the Board of Directors has four men and no women as members.
For the next two management levels below the Board of Directors, the Board of Directors had set target
quotas of 15 percent for both levels to be met by 30 June 2022. In the past financial year, there was no staffing
change on the first management level below the Board of Directors. Despite an intensive search, no suitable
female candidate could be identified in the second management level for appointments in 2018. As of 31 Dec-
ember 2018, no women were employed on the first management level. At the second level, the proportion of
women was 10.5 percent as of December 31, 2018. The target quota has thereby not been achieved on both
management levels.
LEONI website ›› www.leoni.com

36 | www.leoni.com
Jan Feb Mar Apr May Jun Jul Aug Sep Oct Nov Dec
110
100
90
80
70
60
50
40
LEONI
SDAX
MDAX
DAXsubsector- index Auto Parts & Equipment
Indexed 30 December 2017
Share price performance 2018
The LEONI share
Overview of key LEONI share data
First listed on 1 January 1923
Ticker symbol LEO
ISIN DE0005408884
WKN DE540888
Class of shares Ordinary bearer shares with no par value
Market segment Prime Standard
Indices SDAX
Share capital € 32,669,000
Number of shares 32,669,000
Sobering stock market in 2018
On the whole, equity market performance was disappointing worldwide in the past year. The trade dispute
between the United States and China, waning Chinese economic growth and the Federal Reserve’s rate hike
in the US dampened the mood at many stock exchanges. The Dow Jones Industrial Index shed 6 percent over
the year. China’s leading Shanghai Composite index even lost as much as 25 percent in value.
European equities furthermore reflected the weight of declining economic forecasts as well as the uncertainty
concerning Brexit and Italy’s fiscal policy. The Euro Stoxx 50 dropped by 14 percent in 2018.
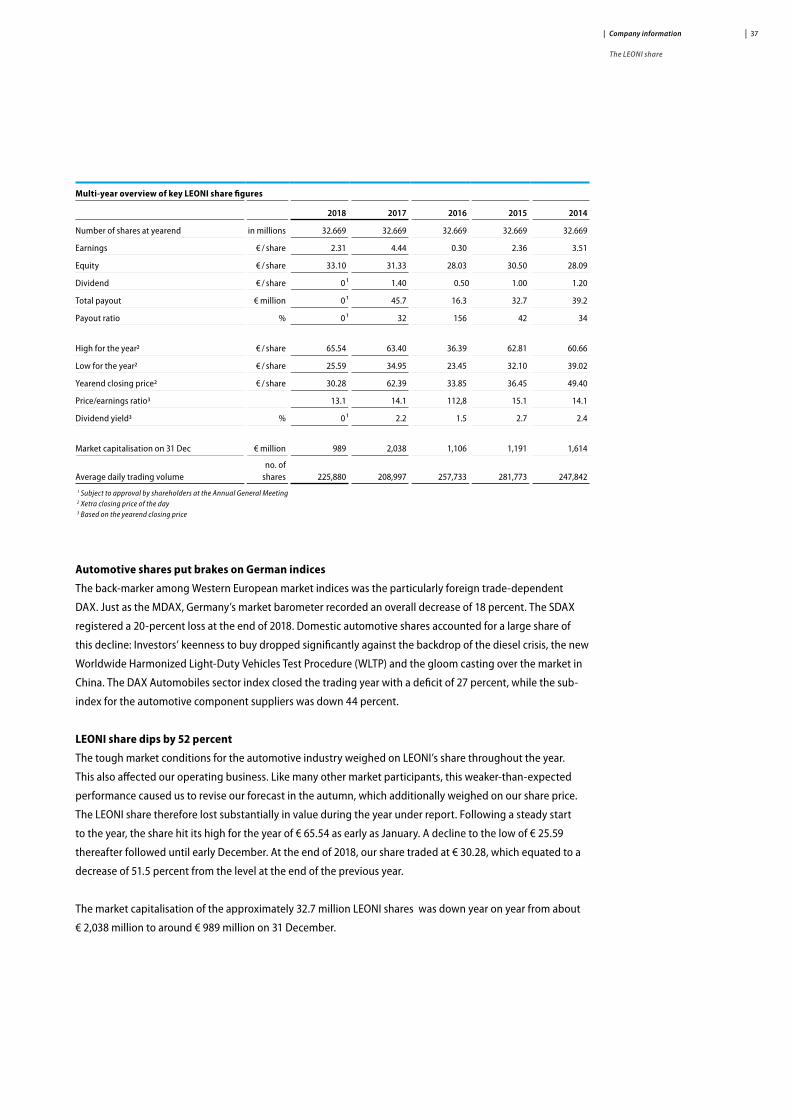
| 37| Company information
The LEONI share
Multi-year overview of key LEONI share figures
2018 2017 2016 2015 2014
Number of shares at yearend in millions 32.669 32.669 32.669 32.669 32.669
Earnings € / share 2.31 4.44 0.30 2.36 3.51
Equity € / share 33.10 31.33 28.03 30.50 28.09
Dividend € / share 0 ¹ 1.40 0.50 1.00 1.20
Total payout € million 0 ¹ 45.7 16.3 32.7 39.2
Payout ratio % 0 ¹ 32 156 42 34
High for the year2 € / share 65.54 63.40 36.39 62.81 60.66
Low for the year2 € / share 25.59 34.95 23.45 32.10 39.02
Yearend closing price2 € / share 30.28 62.39 33.85 36.45 49.40
Price/earnings ratio3 13.1 14.1 112,8 15.1 14.1
Dividend yield3 % 0 ¹ 2.2 1.5 2.7 2.4
Market capitalisation on 31 Dec € million 989 2,038 1,106 1,191 1,614
Average daily trading volumeno. of
shares 225,880 208,997 257,733 281,773 247,8421 Subject to approval by shareholders at the Annual General Meeting 2 Xetra closing price of the day 3 Based on the yearend closing price
Automotive shares put brakes on German indices
The back-marker among Western European market indices was the particularly foreign trade-dependent
DAX. Just as the MDAX, Germany’s market barometer recorded an overall decrease of 18 percent. The SDAX
registered a 20-percent loss at the end of 2018. Domestic automotive shares accounted for a large share of
this decline: Investors’ keenness to buy dropped significantly against the backdrop of the diesel crisis, the new
Worldwide Harmonized Light-Duty Vehicles Test Procedure (WLTP) and the gloom casting over the market in
China. The DAX Automobiles sector index closed the trading year with a deficit of 27 percent, while the sub-
index for the automotive component suppliers was down 44 percent.
LEONI share dips by 52 percent
The tough market conditions for the automotive industry weighed on LEONI’s share throughout the year.
This also affected our operating business. Like many other market participants, this weaker-than-expected
performance caused us to revise our forecast in the autumn, which additionally weighed on our share price.
The LEONI share therefore lost substantially in value during the year under report. Following a steady start
to the year, the share hit its high for the year of € 65.54 as early as January. A decline to the low of € 25.59
thereafter followed until early December. At the end of 2018, our share traded at € 30.28, which equated to a
decrease of 51.5 percent from the level at the end of the previous year.
The market capitalisation of the approximately 32.7 million LEONI shares was down year on year from about
€ 2,038 million to around € 989 million on 31 December.

38 | www.leoni.com
Trading in LEONI shares
A total of about 56.9 million LEONI shares were traded on the Frankfurt Stock Exchange and in the XETRA
electronic trading system in 2018, up from 53.1 million shares in the previous year. On average, 225,880 shares
changed hands per trading day (previous year: 208,997). The total trading volume was approximately
€ 2,418 million in 2018 (previous year: € 2,597 million).
Switch into the SDAX
Due to a new Deutsche Börse ruling, which, since the end of September, also includes the TecDAX shares in
the other indices, there were changes in their composition. The MDAX was enlarged by ten places with the
addition of 13 shares. The performance of LEONI’s share and its therefore substantially smaller market capitali-
sation meant that the criteria for remaining in the MDAX were no longer met. LEONI has therefore been listed
on the SDAX since 24 September 2018.
Shareholder structure and voting rights announcements
The breakdown of LEONI shareholders remained largely stable in 2018. All of our roughly 32.7 million shares
continued to be in free float. As in the preceding years, institutional investors held approximately two thirds
of the shares and private investors the remaining third. The majority of LEONI shares, i.e. about 60 percent,
continued to be in the hands of German shareholders. The remainder was evenly distributed across the rest of
Europe, where it is concentrated in the United Kingdom, as well as the United States.
According to the voting rights announcements received in the previous year pursuant to Section 21 (1) of the
German Securities Trading (WpHG), the following institutional investors had holdings subject to additional
mandatory notification at the end of 2018: Union Investment Privatfonds GmbH (Germany): less than 5 per-
cent; Pierer Industrie AG (Austria), Dimensional Holdings Inc. (USA), Universal-Investment-Gesellschaft mbH
(Germany), Hans Wilms Beteiligungs-GmbH (Germany), State of Norway (Norway), Schroders Group (United
Kingdom) and State Street Corporation (USA): more than 3 percent. All voting rights announcements received
during the 2018 financial year as well as earlier disclosures can be viewed on our website.
Dividend policy
As a rule, LEONI's strategy provides for a payout to shareholders of around one-third of consolidated net
income. The Company plans to deviate from this dividend policy given the currently unsatisfactory cash flow
situation and debt ratio. The Board of Directors and Supervisory Board will therefore propose to shareholders
at the Annual General Meeting that no dividend be paid for 2018 (previous year: € 1.40 per share).
Ratings of the LEONI share
As in the previous year, specialists representing 19 banks and investment firms regularly analysed and rated
our Company during the year under report (as at the beginning of January 2019). The majority of these profes-
sional investors continued to judge an investment in LEONI favourably: seven financial analysts issued buy
ratings (‘outperform’), while nine recommended to hold our share (‘neutral’). Three institutions advised to sell.
LEONI website ›› www.leoni.com

| 39| Company information
The LEONI share
Dividend Euro
2.00
1.50
1.00
0.50
0
1.20 1.00 0.50 1.40 0.001
2014 2015 2016 2017 2018
1 subject to approval by shareholders at the Annual General Meeting
Analyst coverage as at 8 January 2019
Bankhaus Lampe Landesbank Baden-Württemberg
Commerzbank MainFirst
Credit Suisse Metzler
Deutsche Bank Nord LB
DZ Bank ODDO BHF
HSBC Pareto
Hauck & Aufhäuser Quirin Privatbank
Independent Research UBS
J.P. Morgan Warburg Research
Kepler Cheuvreux
Stepped up investor relations work
In keeping with good Corporate Governance, LEONI attaches great importance to transparency and close
communication with shareholders and stakeholders. We advise our shareholders, analysts and other financial
market players, the media as well as the interested public equally, thoroughly and promptly on the Company’s
current and projected performance.
Dividend yield 1 %
6.0
4.0
2.0
0
2.4 2.7 1.5 2.2 0.02
2014 2015 2016 2017 2018
1 based on yearend closing price 2 subject to approval by shareholders at the Annual General Meeting

40 | www.leoni.com
One-on-one dialogue with the aforementioned target groups gained importance in the past year against the
backdrop of our business underperforming expectations. Generally, the Board of Directors regularly partici-
pates in investor conferences and presentations. At the annual balance sheet press conference as well as ana-
lyst and investor conference when the annual report is presented, we provide information on performance,
strategy and prospects. A separate conference call for analysts and business journalists takes place on each
occasion for the release of our quarterly figures. In the year under report, the presentation on performance
in the third quarter was followed by an analyst breakfast and dinner, during which the new Chief Executive
Officer introduced himself personally. For the 2019 financial year, we are planning a Capital Market Day during
which we will be providing, among other information, details of our new VALUE 21 performance and strategy
programme.
We also present LEONI regularly at a large number of investor conferences with international attendance as
well as roadshows in Europe and the United States. In addition, members of the Board of Directors meet for
one-on-one dialogue with analysts, investors and media representatives.
The members of the Board of Directors engage in direct dialogue with the shareholders at the Annual General
Meeting. In 2018, attendance and voting at the meeting were recorded digitally for the first time. We are also
making increasing use of the possibilities provided by digitalization in advance of the meeting. For instance,
via the https://www.leoni.com/en/agm2019/ link, our shareholders can register to receive the invitation to the
2019 Annual General Meeting electronically.
Our website gives shareholders and interested parties the opportunity to follow all of the balance sheet press
conference, the analyst and investor events as well as the conference calls live on the internet. Furthermore,
the presentations given during these events and the Annual General Meeting can be viewed there for a
limited period. All such relevant publications as ad hoc announcements, media releases as well as annual and
interim reports are also available on our website. In addition, there is extensive data and background informa-
tion on our Company and LEONI’s share. This includes basic information as well as current analyst recommen-
dations and the applicable fiscal calendar.
LEONI website ›› www.leoni.com

Group management report
| 41

42 | www.leoni.com
Group Management Report
Principles of the Group 43
Business and underlying conditions 49
Business report 53
Reports by division / Segment report 66
Other indicators
(incl. non-financial information statement)
74
Risk and opportunity report 94
Supplementary report 108
Forecast 109
Compensation report 114
Disclosures pursuant to Sections 289a (1) and 315a (1)
of the German Commercial Code as well as explanatory report
for fiscal 2018
123

| 43| Group management report
Principles of the Group
Business model
Principles of the Group
Business model
LEONI is a global provider of products, solutions and services for energy and data management in the auto-
motive sector and other industries. Our portfolio comprises wires and optical fibers, cables and cable systems
as well as related components, connectors and services. On these foundations, we are increasingly offering
our customers intelligent energy and data management solutions for vehicles and industrial applications.
Product and services range
Cable harnesses
Cables & assembly
Fiber Optics
Wires & strands
Services / training
Services
Power supply systems
Sensor technology
Wiring systems
(Intelligent) charging cables
(electronic) Power distribution
Automotive Ethernet solutions
High-voltage solutions
Battery cables
Cable harness module
Innovative conductor materials
Cables, cable harnesses, wiring systems & components
Intelligent products & systems
Smart services & solutions
LEONI’s business is organised by two divisions (or segments):
The Wiring Systems Division (WSD) is one of the world’s largest providers of complete wiring systems and
customised cable harnesses for the motor vehicle industry. Its products and services comprise development
and production of sophisticated cable harnesses through to integrated wiring systems, high-voltage (HV)
wiring systems for hybrid and electric vehicles, energy distribution components and special connectors. As
systems providers, we cover the entire spectrum from design through to series production as well as com-
plementary services. In so doing, we are increasingly positioning ourselves as a provider of vehicle data and
energy management solutions to supply our customers with innovative products and services covering the
automotive megatrends of electromobility (EMO), connectivity and autonomous driving. We are also reinforc-
ing our expertise in the fields of electronics and software to enhance our position as a systems supplier.
The Wire & Cable Solutions Division (WCS)is a leading manufacturer of wire and cable systems that, as part
of its strategic transformation, is gradually developing into a provider of secure and intelligent energy
transmission and data management system solutions. Its range of products and services encompasses wires,
strands and optical fibers, standardised cables, special cables and fully assembled systems as well as related
services for customers in the automotive, capital goods, medical technology, telecommunications, energy and
infrastructure industries. The focus is on technologically sophisticated products as well as customer-specific

44 | www.leoni.com
applications for niche markets. The portfolio is continually being expanded to include intelligent cables and
cable systems, software solutions as well as smart services to take advantage of the opportunities for LEONI
arising from digitalization and other global megatrends.
Principal facilities and changes in the scope of consolidation
The LEONI Group comprises LEONI AG and the two divisions with corresponding subsidiaries. At the end of
2018, LEONI was, with 72 subsidiaries (previous year: 72) and 99 production facilities (previous year: 94) in
32 countries, located in Asia, the Americas and EMEA (Europe, Middle East and Africa). The Wiring Systems
Division had two domestic and 30 foreign companies, eight of which were located in Asia, six in the Americas
and 16 in the EMEA region. The Wire & Cable Solutions Division accounted for 13 domestic and 23 foreign
companies, of which four in Asia and seven in the Americas as well as twelve in the EMEA region. Furthermore,
four subsidiaries operate in the EMEA region for both divisions. In addition, there is LEONI AG as the holding
company. There was no significant change to the scope of consolidation in 2018.
Organisational structure
LEONI AG acts as the holding and management company. It performs overarching tasks for the LEONI Group
with its corporate functions. The structure of the two divisions is guided by their respective customer groups
and markets, subdivided into business groups and business units. In the Wiring Systems Division, a Sales
Board consisting of ten Business Units (BUs) with global operations looks directly after the customers in
Europe, Asia and the Americas and simultaneously coordinates the placing of orders with the plants, which
are responsible for quality and cost efficiency while adhering to set standards. In addition, there are three,
BU-overarching Tech Centers, which provide our business units with innovative products and services involv-
ing electromobility, components as well as energy and data management. The Sales Board is the interface
for these products, which means that our customers have only one contact partner for the high-voltage and
conventional wiring system as well as component businesses. Additionally, there are Central Functions for the
senior management level and the supporting functions. The worldwide production network of the Wiring
Systems Division comprises production facilities in numerous countries, above all in China, Mexico, North
Africa and Eastern Europe. The locations are chosen strictly based on cost benefit and logistical requirements,
and they are situated as near to our customers as possible.
The organisational structure of Wire & Cable Solutions Division follows its core, strategic markets, which,
alongside the automotive sector, include industrial automation, robotics, medical technology, energy and
data infrastructure projects as well as transport and renewable energies. These target groups are cultivated
by Business Groups (BGs): BG Automotive Cable Solutions for the automotive industry and by BG Industrial
Solutions for the industrial business. In addition, there is BG Wire Products & Solutions with a wide portfolio
of wires, high-flex copper strands and braided copper tapes for applications in both industry and the auto-
motive sector. The trailblazing electromobility segment is providing this BG with increasing growth potential
in connection with high-voltage solutions as well as battery technology.

| 45| Group management report
Principles of the Group
Principal facilities and changes in the scope of consolidation
Organisational structure
Customers and markets
The operating business of the Wire & Cable Solutions Division is handled by a total of 17 business units. There
are furthermore commercial and technical/operational support functions as well as a Digital Solutions Group,
which drives the digital transformation and the division’s development towards becoming a solutions pro-
vider. The state-of-the-art WCS production facilities are located in 14 countries in western and eastern Europe,
the Americas as well as Asia. They are located not only in strategically favourable proximity to our customers,
but also in key growth regions of the core markets being cultivated.
Customers and markets
The LEONI Group’s customers principally include motor vehicle manufacturers and their suppliers. This
customer group provided about 83 percent of LEONI’s total sales in 2018 (previous year: 82 percent). With
sales to the five largest customers we generated a business volume of approx. € 2.0 billion during the period
under report (previous year: € 1.9 billion), which equated to about 39 percent of consolidated sales (previous
year: 38 percent).
The Wiring Systems Division supplies the leading carmakers worldwide, from the small to compact and mid-
range car brackets and up to models in the premium and luxury segments. In addition, the commercial vehicle
industry is of major importance. There are furthermore manufacturers of agricultural and special as well as
leisure vehicles. Our components, cable harnesses and wiring systems are created during the design and
development phase of a new vehicle in close collaboration with the respective customer. We maintain close,
trusting relationships with our customers based on our extensive, specific know-how in the areas of develop-
ment, production and distribution of wiring systems as well as our high quality and reliability.
The customer base of the Wire & Cable Solutions Division comprises nearly all the wiring system manu facturers
that operate worldwide and many other automotive component suppliers as well as internationally leading
providers from a wide variety of capital goods industries, in particular the medical and communications
technology, the infrastructure sector, robotics and railway engineering as well as in the renewable energy
and major industrial project markets. We maintain long-standing and close relationships with our customers
and are in faithful contact with them, especially via our sales and development departments. Increasingly, our
customers also include OEMs in a wide range of different industrial sectors that operate globally and are keen
to work with us as a solutions provider in a partner-like relationship.
In regional terms, the European, American and Asian markets are of greatest significance to LEONI. Europe
– including the Middle East and Africa (EMEA) – is LEONI’s most important market with a share of about
70 percent (previous year: 69 percent) of sales. The Americas account for approximately 16 percent (previous
year: 15 percent) and Asia for about 15 percent (previous year: 16 percent).
46 | www.leoni.com
Competitive situation and advantages
The Wiring Systems Division is Europe’s leading producer of cable harnesses and wiring systems. We rank
4th worldwide, according to calculations by the Automotive Wiring Harness Market. Our most significant
competitors are Aptiv, Sumitomo and Yazaki. Alongside our good, internationally competitive position also
in the electromobility and alternative drivetrain segments, our business success is based on great power of
innovation and a high real net output ratio, comprehensive logistics and system expertise as well as devel-
opment centres spread worldwide with proximity to the customer. Another key factor involves our global
production network with standardised processes as well as the fact that a high proportion of our production is
at locations with favourable wage costs. Our very broad international positioning as well as the large number
of vehicle manufacturers and brands supplied not only diminish the exposure to regional market cycles, but
also enable us to take advantage of global growth opportunities.
The Wire & Cable Solutions Division, which is a leading cables business in Europe, is the technology and
market leader in many of its target areas. In some product segments, such as data and special cables for the
car industry and cable systems for robotic engineering, we regard ourselves as global market leaders. We
also command leading positions in the market for cables for particular industrial applications; for example,
in mechanical engineering, measurement and control technology as well as medical technology. Our good
competitive position is principally based on a vertically strongly integrated value chain, core skills developed
over decades such as a broad understanding of raw materials and know-how concerning input materials,
engineering and applications as well as command of technologically sophisticated manufacturing processes.
Our increasingly international presence and stronger positioning as a provider of intelligent and secure
energy transmission and data management system solutions give us additional competitive advantages.
Strategy
Our corporate strategy aims to develop LEONI into a leading provider of intelligent energy and data man-
agement system solutions. The Group and its two divisions consequently share the vision of ‘passion for
intelligent energy and data solutions’. ‘Passion’ stands for full commitment and fervour with respect to the
up coming tasks. ‘Intelligent’ expresses that LEONI’s products offer the customer added value thanks to
additional, smart properties. ‘Energy and data’ are the two areas in which LEONI operates with great exper-
tise – the transmission of energy and data. And ‘solutions’ highlight the trend of increasingly supporting our
customers as a solutions and systems provider.
In the fourth quarter of 2018, LEONI announced a comprehensive performance and strategy-enhancement
programme called VALUE 21 for its entire group. The objective is to improve the basis for healthy growth,
profitability and cash generation as well as to sharpen our focus on the future markets of digitalization,
electromobility and autonomous driving. Vertical integration towards being a more comprehensive systems
provider will give both our Wiring Systems Division and Wire & Cable Solutions Division good prospects for
growth. We therefore intend to broaden the range of products and services in both divisions to offer custom-
ers added value and thereby position ourselves as a partner of increasing importance to them.

| 47| Group management report
Principles of the Group
Competitive situation and advantages
Strategy
Rigorous implementation of a three-year performance-enhancement programme in both divisions and
within LEONI AG, which aims to lastingly boost profitability and cash flow, constitutes the precondition for
this strategic development. The following, corresponding measures were determined at the end of 2018:
■ Raising operational excellence, among other means by optimising processes in our plants and realising
synergies as well as harmonising our purchasing, particularly where it is indirect; ■ Reviewing distribution and administrative structures as well as costs; ■ More restrictive working capital management; ■ Benchmarking our capex ratio for longer term fixed assets, ■ Establishing more modern, efficient IT systems and processes through resolute harmonisation.
Given the differing structures and market orientation of the two divisions, the measures to boost performance
will be specifically tailored to the divisions. The same applies to specifying our strategy:
The objective of the Wiring Systems Division is, with its tailor-made wiring systems and cable harnesses in
the automotive sector, to increasingly position itself as provider of vehicle data and energy management
solutions with great understanding of a vehicle’s overall system. The division will therefore offer its customers
an extended portfolio of innovative products and services. Forming the basis for this is our C.A.R.E.S.
innovation strategy, which defines the five key areas of innovation for intelligent energy and data solutions in
tomorrow’s cars: connected mobility, autonomous mobility, revolutionizing productivity, electrified mobility as
well as intelligent solutions & services. In so doing, we will increasingly act as a strategic partner and systems
supplier. We are furthermore enhancing our expertise in the fields of electronics and software. And we are
also forging ahead with the digitalization of our processes. In the electromobility segment, we are aiming
for a leading position with our portfolio by providing cable harnesses for all voltage levels and intelligent
distribution systems.
In the case of the Wiring Systems Division, specifying the strategy by means of VALUE 21 provides, in particu-
lar, that market opportunities are given even greater priority in future and that the choice of new projects is
based even more on earnings quality and cash flow. The initial aim with such focused growth is to improve
cash flow and the EBIT margin, as well as to establish the conditions for further development towards being a
systems provider.
The Wire & Cable Solutions Division’s strategy is, in the automotive market segment, to bolster its leading
position in standard and special automotive cables as well as charging cables for electric cars and to decisively
enhance as well as upgrade this with new digitalization and solution offerings. The focus is on stepped-up,
joint development work with customers, the use of innovative technologies to generate crucial added benefit
on the product side as well as intelligent cable solutions with integrated sensors, electronics and software
for such future technologies as electromobility. Here we are focusing, among other things, on cable solutions
for charging infrastructure, high-voltage systems and battery connections. In the industrial market segment,
the Wire & Cable Solutions Division’s strategy is aimed at becoming a leading provider of solutions for the
energy and data megatrends by way of digital, functional simulation, system integration and creating learning
systems. We are investing in corresponding expertise and technologies and are gradually expanding our
48 | www.leoni.com
range of products and services in the direction of intelligent solutions. To generate more added value for our
customers, we also intend to establish new business models in the areas of intelligent cable solutions and
smart services. Further objectives include a sharper focus on growth markets by means of resolute portfolio
management as well as better use of our global footprint to address OEM customers that operate worldwide.
We also want to continuously improve our operational excellence.
In the context of VALUE 21, we are planning in particular to focus the WCS Division clearly on strategic core
markets. The objective is to expand the more profitable business and, with the released resources, to facilitate
further development towards being a systems provider.
Corporate Governance (statements pursuant to Sections 289f and 315d of the German Commercial Code (HGB))
LEONI’s corporate governance is geared to the principles of the German Corporate Governance Code. The
Board of Directors is responsible for corporate governance. Its work is monitored by the Supervisory Board.
The Board of Directors determines Group strategy and, together with those in charge of the divisions and the
individual business units, measures suited to strategy implementation. Further information is contained in
the Corporate Governance report and the statement on Corporate Governance pursuant to Sections 289f and
315d of the German Commercial Code (HGB), which is publicly accessible on the Company’s website. Details
of the compensation for members of the Board of Directors and Supervisory Boards are presented in the
compensation report.
Governance of the operating business
The operating business is governed by the key figures of sales, earnings before interest and taxes (EBIT),
capital employed as well as free cash flow. We measure the respective target attainment by the benchmarks of
Return on Sales (EBIT margin), Return on Capital Employed (ROCE) and Free Cash Flow (FCF). Specific informa-
tion on performance in terms of these indicators in the past financial year is contained in the section headed
Overview of LEONI’s performance. The targets for the 2019 financial year are presented in the forecast.
LEONI website ›› www.leoni.com
Compensation report ›› page 114 et seq.
Overview of LEONI’s performance ›› page 53 et seq.
Forecast ›› page 109 et seq.

| 49| Group management report
Principles of the Group Corporate Governance (statements
pursuant to Sections 289f and 315d of the German Commercial Code (HGB)
Governance of the operating business
Business and underlying conditions
Macroeconomic setting
Business and underlying conditions
Macroeconomic setting
Increasing gloom cast over the global economy in the course of 2018. The main curtailing factors were the
United States’ restrictive trade policy involving import duties as well as the waning momentum in the Chinese
economy. The conflict between the EU and the Italian government as well as lack of clarity concerning Brexit
caused additional uncertainty in Europe. The hike in the US key interest rate also put mounting pressure on
the currencies of some emerging countries. The subdued sentiment was reflected in the global Purchasing
Managers’ Index and worldwide industrial output, both of which gradually declined during the year.
In the second half, particularly the economies in the eurozone, the United Kingdom, Japan and some emerg-
ing countries lost pace considerably. The International Monetary Fund (IMF), which originally projected
3.9 percent global economic growth for 2018,subsequently revised its forecast in the autumn to 3.7 percent
(previous year: 3.8 percent).
The IMF reaffirmed this estimate in its current World Economic Outlook of January 2019. As in the preced-
ing years, the developing and emerging countries provided the strongest impetus, with gross domestic
product up by 4.6 percent overall (previous year: 4.7 percent). Despite its weakening, China accounted for a
major share of this with its 6.6 percent growth. In India, the increase was an even stronger one of 7.3 percent,
whereas Brazil and Russia were up only slightly.
The industrialised countries raised their GDP by an overall 2.3 percent (previous year: 2.4 percent). The United
States set the pace with a gain of 2.9 percent. By contrast, growth in the eurozone was curbed significantly,
especially so in Italy, France and Germany.
Global economic growth 2017 to 2019 %
2017
2018e
2019e
Source: IMF
3.8
3.7
3.5

50 | www.leoni.com
2018 economic growth in selected regions
India
China
USA
Eurozone
Russia
Brazil
Japan
7.3
6.6
2.9
1.8
1.7
1.3
0.9
0 2 4 6 8 %
Source: IMF, estimate
Business by sector
The trade dispute and the weaker economic performance in China also affected the international automotive
industry. The German Association of the Automotive Industry (VDA) estimates that new registrations on the
global car market in 2018 were flat at about the previous year’s level with approximately 85 million vehicles.
In Europe, the number is likely to have increased moderately, while having been stable in the Americas and
down somewhat in China.
Output of passenger cars and light commercial vehicles was also roughly at the previous year’s level in the
reporting period. The IHS Automotive market research institute says that some 95 million vehicles again came
off the line worldwide. A slightly larger number of units in the Americas meanwhile offset the marginally
lower output in Asia and the EMEA region. Broken down by vehicle type, the total number of cars produced
was down a little from the previous year, while output of light commercial vehicles was up slightly. Production
of cars with alternative drive technologies rose by 35 percent across all regions, with this trend having been
especially dynamic in the Americas and EMEA region.
Output of cars and light commercial vehicles by region 2018e 2017
Asia
EMEA1
Americas
49.9
24.8
20.5
50.0
24.8
20.4
0 10 20 30 40 50 Million units
1 Europe, Middle East and Africa Source: IHS Automotive
Output of cars and light commercial vehicles by region in % 2018
Americas 21.5
Asia 52.5
EMEA 1 26.0
1 Europe, Middle East and Africa Source: IHS Automotive

| 51| Group management report
Business and underlying conditions
Business by sector
Other factors
The manufacturers of heavy commercial vehicles raised their output by 3 percent worldwide, according to
IHS Automotive projections. The growth was especially strong in the United States at a rate of 14 percent.
The number of heavy commercial vehicles made in Asia was up by 1 percent, whereas there was a marginal
decrease of 0.3 percent in the EMEA region. Based on our own observations, business involving cable har-
nesses for trucks and engines as well as agricultural machinery performed well in Europe and the NAFTA area,
which are especially important to LEONI. In the construction machinery segment, demand was up primarily in
the NAFTA area and Asia.
Output of heavy commercial vehicles by region 2018e 2017
Asia
EMEA1
Americas
2.4
0.6
0.7
2.4
0.6
0.6
0 0.5 1 1.5 2 2.5 Million units
1 Europe, Middle East and Africa Source: IHS Automotive
The German Electrical and Electronic Manufacturers’ Association (ZVEI) estimates that the global electrical
goods market grew by 5 percent in 2018, with gains likely to have been at a more dynamic 7 percent in the
emerging countries as opposed to a 3 percent increase in the industrialised nations. Demand rose most
strongly in Asia, followed by the Americas and Europe. In Germany, the sector picked up by an estimated
4 percent in 2018. Among the segments of importance to LEONI, electric drives expanded by 6 percent, while
other areas of automation as well as the electromedicine, communications and information technology seg-
ments were each up by 5 percent.
In the mechanical engineering sector, the German Engineering Federation (VDMA) estimates that sales were
up by 3 percent worldwide in the past year. In the key manufacturing countries of Germany, Japan and the
United States, the sector benefited from the high utilisation of the industry’s capacity and a growing trend
towards automation, resulting in above-average gains of between 4 and 5 percent in this segment. By contrast,
mechanical engineering in China was up by just 2 percent.
Other factors
The macroeconomic and sector-specific conditions are of major significance to LEONI’s business performance.
A range of other factors also play important roles:
The prices of commodities, especially of copper, exert an appreciable influence on our sales. We largely pass
on the fluctuations in the copper price to our customers through contractual agreements, albeit usually with
a time lag. A change in the price of copper will therefore normally result initially in a corresponding effect
on LEONI’s sales without notable impact on earnings. On the balance sheet, there may – depending on the
price of copper – be write-downs on inventory or provisions to cover contingent losses on partial quantities
of inventory. The same applies to the raw material of silver, which is used primarily in the refining of wire
products. By contrast, the trend in energy prices does not have any major group-wide impact on LEONI.
Procurement ›› page 74 et seq.

52 | www.leoni.com
Personnel costs are another very significant influencing factor in the countries in which we produce. They are
considered in decisions on choices of location, as are reliable legal and political conditions as well as favourable
transport options.
We keep a very close eye on the political situation in the countries of importance to us; countries where we
produce and sell. The risk and opportunity report contains corresponding information.
Alongside the respective national legislation of the countries in which we have a presence, the legal factors
that are of importance for LEONI also include international laws. The stricter CO2 emission limits, for example,
exert indirect influence as they increase demand from the automotive industry for cables, cable harnesses
and wiring systems that are particularly lightweight or lend themselves to alternative drive technologies. This
results in the increasing use of sensors and control units, which in turn leads to an additional need for wiring.
Exchange-rate fluctuations can have an impact on sales, which we reduce through appropriate hedging
transactions. If exchange-rate parities change substantially, however, they might nevertheless have an effect
on results.
Risk and opportunity report ›› page 94 et seq.
Notes ›› page 138 et seq.

| 53| Group management report
Business report
Overview of LEONI’s performance / General statement on the economic situation and comparison with the forecast
Business report
Overview of LEONI’s performance / General statement on the economic situation and comparison with the forecast
Group key figures
Actual 2017
figures 1
First forecast
for 2018
Updated forecast
for 2018
Actual 2018
figures
Consolidated sales € billion 4,9 at least 5.0 approx. 5.0 5.1
EBIT € million 227 215 – 235 196 144
Capital expenditure € million 281 5 % of sales² 5 % of sales² 6 % of sales²
Free cash flow € million 11 positive down to (150) (147)1 Prior-year figures adjusted 2 Excl. investment in the Factory of the Future
LEONI increased its consolidated sales to € 5.1 billion in 2018 (previous year: € 4.9 billion), of which the Wiring
Systems Division provided € 3.2 billion (previous year: € 3.1 billion) and the Wire & Cable Solutions Division
contributed € 1.9 billion (previous year: € 1.9 billion). Consolidated earnings before interest and taxes (EBIT)
amounted to € 144 million (previous year, including non-recurring income: € 227 million). The Wiring Systems
Division accounted for € 80 million of this total (previous year: € 118 million) and the Wire & Cable Solutions
Division € 66 million (previous year, including non-recurring income: € 105 million). Group-wide, capital
investment increased to € 343 million (excl. spending on the Factory of the Future: € 308 million) and free cash
flow diminished to negative € 147 million (previous year: positive € 11 million).
In the first half of 2018, LEONI’s business initially performed better than expected. Thanks to the persistently
vibrant business involving wiring systems, cable harnesses and special cables for the automotive industry,
consolidated sales rose somewhat more strongly than anticipated, prompting an increase in August 2018 in
the full-year sales forecast from € 5.0 to 5.1 billion. Mounting uncertainties in our sector, due especially to
international trade disputes, the impending Brexit, the Chinese market slowing down and the impact of the
WLTP testing procedure, caused the automotive industry to adjust its production planning from the mid-year
mark. The amount of product called forward by the European carmakers from LEONI consequently declined.
In addition, there was the commencing production ramp-down of a high-volume vehicle model we supplied
for, which is why we recorded a sales decrease in the second half of the year.
Alongside the smaller amount of business, advance spending on our production network to secure future
growth, higher raw material prices as well as unsatisfactory operating performance in the Wiring Systems
Division weighed on second-half earnings significantly more than expected. At the same time, the flattening
trend of business and the increase in production costs involving the large capital investment resulted in a
substantial decrease in free cash flow. For these reasons, LEONI adjusted its Group forecast in October: for sales
from € 5.1 to 5.0 billion; consolidated EBIT from a range of € 215 million to € 235 million to about € 196 million
and free cash flow from a positive figure down to a negative one of as much as € 150 million. In terms of sales
and free cash flow, these figures were exceeded slightly and matched, respectively, for the year as a whole.

54 | www.leoni.com
The projection for earnings before interest and taxes, on the other hand, was clearly missed because substan-
tially larger-than-planned start-up costs (at a new wiring systems facility in Mexico, among other locations),
a deterioration in operating performance and unattained savings targets in the Wiring Systems Division
weighed unexpectedly heavily on earnings in the fourth quarter. The Group-wide 2018 capital expenditure
ratio (excluding spending on the Factory of the Future) of 6 percent exceeded expectations.
Overall, the Board of Directors judged the LEONI Group’s asset situation at the time this report was prepared
to be solid, but the earnings and cash flow situation to be very much unsatisfactory. To counteract these
developments, the Board of Directors of LEONI AG applied measures and launched the VALUE 21 performance
and strategy programme to achieve sustained, gainful growth, an increase in profitability and positive cash
generation. The section headed strategy contains information in this regard. Our surprisingly poor perfor-
mance in the fourth quarter underscores the necessity of the measures described therein to improve perfor-
mance and transparency as early as 2019.
Sales and earnings
Consolidated sales up slightly to € 5.1 billion
Underpinned by the minor, overall sales growth of its two divisions, LEONI’s consolidated sales rose by nearly
4 percent, or € 176 million, to € 5,101 million in 2018. Organically, LEONI grew by € 259 million or 5 percent. In
addition, there was a positive effect of € 40 million from change in the price of copper, which was more than
offset by negative effects totalling € 123 million from changes in exchange rates as well as in the scope of
consolidation.
Group sales performance
€ million
%
2017 1 sales 4,925
Organic growth 259 5.3
Effects of changes in the scope of consolidation (47) (1.0)
Currency translation effects (76) (1.5)
Copper price effects 40 0.8
2018 sales 5,101 3.61 Prior-year figures adjusted
Breakdown by region presents the following picture: Sales in the EMEA region rose by 4 percent to
€ 3,551 million and in the Americas they were up 6 percent to € 794 million. In Asia, the disposal of Busi-
ness Group Electrical Appliance Assemblies that was completed in the previous year resulted in a 1 percent
decrease to € 756 million.
Strategy ›› page 46 et seq.

| 55| Group management report
Business report
Sales and earnings
Consolidated sales
2014
2015
2016
20171
2018
4,103
4,503
4,431
4,925
5,101
0 1,000 2,000 3,000 4,000 5,000 6,000 € million
¹ Prior-year figures adjusted
Consolidated sales by quarter 2018 20171
Q1
Q2
Q3
Q4
1,327
1,326
1,205
1,242
1,222
1,242
1,187
1,275
0 500 1,000 1,500 € million
¹ Prior-year figures adjusted
Consolidated sales by division in % 2018 20171
Wire & Cable Solutions 37.9 37.8 Wiring Systems 62.1 62.2
¹ Prior-year figures adjusted
Consolidated sales by region in % 2018 2017
Asia 14.8 15.6 EMEA total 69.6 69.2
1 Germany 27.2 27.7
Americas 15.6 15.2 2 Rest of Europe 26.6 27.0
3 Eastern Europe 14.6 13.2
4 Africa 1.0 0.9
5 Rest of EMEA 0.2 0.4
1
245
3

56 | www.leoni.com
Group EBIT down to € 144 million
The LEONI Group’s cost of sales increased by disproportionately more than business volume at a rate of
4 percent to € 4,285 million in 2018 due above all to higher-than-planned ramp-up costs and the poorer
performance of various facilities. Gross profit on sales consequently decreased to € 816 million (previous year:
€ 823 million) and the gross margin contracted from 16.7 percent to 16.0 percent. Gains that mostly stemmed
from negotiations with suppliers and customers meanwhile had a positive effect.
Selling expenses increased by 9 percent to € 264 million. This reflected particularly the exceptional freight
charges in the Wiring Systems Division, the increased volume of sales as well as impairment of trade receiva-
bles. General administrative costs increased by 5 percent to € 286 million. Extensive pre-production spending
on future projects starts drove research and development costs up by 16 percent to € 150 million.
Other operating income, which included the proceeds of about € 8 million from having sold buildings of a
subsidiary in China, diminished considerably from € 46 million to € 30 million in the period under report. In
the previous year, this item included substantial non-recurring income totalling € 30 million through the gain
on deconsolidation from the disposal of Business Group Electrical Appliance Assemblies as well as insurance
compensation. Other operating expenses increased from € 19 million to € 25 million due, among other factors,
to amortisation of an item of goodwill. Income from associated companies and joint ventures, which stemmed
mainly from our joint venture in Langfang, China, was up marginally to € 23 million.
Consolidated EBIT totalled € 144 million in 2018, down from € 227 million in the previous year. After deduct-
ing the financial result including the investment result, which improved from a loss of € 25 million to one of
€ 23 million because of more favourable borrowing terms, earnings before taxes (EBT) came to € 121 million
(previous year: € 202 million). Considering the tax rate, which rose to 39 percent in 2018 primarily because of
not having recognised deferred tax assets against current losses, LEONI reported consolidated net income of
€ 73 million, down from € 146 million in fiscal 2017.
Group EBIT
2014
2015
2016
20171
2018
183
151
79
227
144
0 50 100 150 200 250 € million
¹ Prior-year figures adjusted

| 57| Group management report
Business report
Sales and earnings
Group EBIT by quarter 2018 20171
Q1
Q2
Q3
Q4
63
62
38
(19)
56
87
45
40
– 20 0 20 40 60 80 € million
1 Prior-year figures adjusted
Adjusted Group EBIT 1 € million
2018
2017 2
EBIT 144 227
EBIT margin % 2.8 4.6
Effect of purchase price allocation (PPA) 6 11
Restructuring expenses / income (1) 0
Insurance compensation 0 (5)
Effect of deconsolidation (1) (24)
Adjusted EBIT 148 209
Adjusted EBIT margin 2.9 4.21 Earnings adjusted for the impact of revaluation as part of allocating the prices of the major acquisitions, restructuring, capital gains on the disposal of businesses
and income from business combinations including related derivatives as well as the insurance compensation related to the fraud case2 Prior-year figures adjusted
Value creation
The LEONI Group generated net added value of € 1,265 million in 2018 versus € 1,286 million in the previous
year. It presents our own output and is calculated based on sales revenues and other operating income less
cost of materials, depreciation/amortisation and other advance payments. By far the largest proportion of the
value created during the year under report, namely 89 percent, was spent on our staff in the form of personnel
costs and social security contributions. Our creditors received 2 percent and government 4 percent, while a
further 6 percent was retained.

58 | www.leoni.com
Value creation € million
2018
2017 5
Accruement
Sales revenues 5,101 4,925
Other income 30 46
Cost of materials (2,998) (2,881)
Depreciation / amortisation (159) (150)
Advance payments (709) (655)
Net value added 1,265 1,286
Distribution
to staff (personnel costs, social security contributions) 1,120 1,059
to the Company (retained income) 1 73 100
to shareholders (dividend) 2 0 46
to government (income taxes) 3 48 57
to creditors (financial result) 4 24 25
Net value added 1,265 1,2861 Consolidated net income less dividend2 Subject to approval by shareholders at the Annual General Meeting3 Income taxes only (excl. excise, property and transaction taxes as well as social security contributions)4 Excl. other investment income5 Prior-year figures adjusted
Financial situation
The LEONI Group attaches importance to a permanently solid, balanced finance structure. The aim is to maintain
an equity ratio of at least 35 percent. We strive with our key financial figures for investment grade in the internal
rankings of our core banks. We use the capital market to cover our long-term need for finance. We obtain short-
term finance via credit lines from core banks.
Deutsche Bundesbank has rated LEONI as an eligible borrower for more than a decade. No official rating exists
because this would, in our view, not create any additional value at present. LEONI’s loan agreements do not
include any financial covenants.
Generally speaking, we aim to finance planned business growth from our operating cash flow. Details on
capital management are contained in the notes. Notes ›› page 138 et seq.

| 59| Group management report
Business report
Financial situation
Financial and liquidity management
The LEONI Group’s financial management is handled centrally by the LEONI AG holding company. It ascertains
the capital requirement at group level and takes the required financing measures for the entire group of com-
panies. In exceptional cases we have recourse to regional, special finance deals. The key objectives of financial
management are safeguarding the Group’s liquidity worldwide, optimising finance costs and revenue as well
as controlling and minimising currency and interest rate risks. We use a wide range of instruments to keep our
exposure to individual markets or types of finance as low as possible. Generally speaking, LEONI pursues long-
term collaboration with international banks that is based on mutual trust. Group subsidiaries are financed
mostly in their functional currency. The principal financial liabilities in 2018 were denominated in euros, Indian
rupees, South Korean won and US dollars.
We manage the liquidity of the LEONI Group via a cash pooling system with pools in the home countries of
the currencies of most importance to the Group. Furthermore, LEONI AG executes the bulk of the payments
for the Group.
To be able to reliably meet all our financial obligations at any time, we use such capital market instruments as
bonds and borrower’s note loans at the corporate level for the whole Group and obtain credit lines in sufficient
amounts.
The off-balance-sheet instruments leasing and factoring, which we use to improve liquidity, are also managed
at head office. Factoring, in particular, is an important addition to the other instruments for short-term
liquidity management thanks to its flexibility in terms of the sales performance and the associated borrow-
ing requirement. At the end of 2018, factoring reduced trade receivables by € 200 million (previous year:
€ 194 million). Of the other liabilities, € 39 million (previous year: € 36 million) was due to the receipt of pay-
ment on receivables that were sold within factoring agreements. Moreover, reverse factoring trans actions are
used for supplier financing in connection with copper procurement. As at 31 December 2018, trade liabilities
amounting to € 171 million (previous year: € 186 million) were transferred to factoring companies in the con-
text of signed reverse factoring agreements. Details on leasing as well as hedging of interest rate and currency
risks are contained in the notes.
Successful short and long-term refinancing
In 2018, LEONI realigned its Group financing, ensuring the Company’s long-term funding. In June, the Company
agreed a credit line amounting to € 750 million and a term of at least five years with eight well-known banks.
We thereby replaced bilateral credit lines and created flexible scope for future growth. The Company placed
borrower’s note loans worth € 331 million in November to cover the planned, long-term financing require-
ments. Terms of five to ten years provide assurance that sufficient capital will be available to invest in exten-
sive projects that have a similarly long lifespan. The borrower’s note loans were signed on favourable terms
that comprise deals involving both fixed and variable interest rates. In return, two loans totalling € 125 million
that matured in 2018 were repaid on time.
Notes ›› page 138 et seq.
Notes ›› page 138 et seq.

60 | www.leoni.com
Dividend policy
As a rule, LEONI’s strategy provides for a payout to shareholders of around one-third of consolidated net
income in order to meet shareholder expectations in the form of an appropriate dividend and to ensure
sufficient liquidity is available for the Company’s development through profit retention. The Company plans
to deviate from this dividend policy given the currently unsatisfactory cash flow situation and debt ratio.
The Board of Directors and Supervisory Board will therefore propose to shareholders at the Annual General
Meeting that no dividend be paid for 2018 (previous year: € 1.40 per share). We intend to return to pay-out in
keeping with our fundamental dividend policy as soon as possible.
Cost of capital and ROCE
The weighted average cost of capital (WACC) for the LEONI Group amounted to 5.29 percent in 2018 (previous
year: 7.59 percent). The return on capital employed (ROCE) stood at 8.3 percent (previous year: 14.5 percent).
Calculation of the return on capital employed € million
2018
2017 2
EBIT 144 227
Intangible assets 76 65
Goodwill 140 147
Property, plant and equipment 1,206 1,052
Inventories 609 597
Trade receivables 625 610
Other 653 490
Total assets 3,310 2,960
Trade liabilities 957 909
Other liabilities and received payments up to 1 year 308 251
Other 192 180
Total equity and liabilities 1,457 1,341
Capital employed on the reporting date 1,853 1,619
Capital employed, annual average 1 1,736 1,561
ROCE 8.3 % 14.5 %1 Calculation of the annual average is based on the past two annual reporting dates 2 Prior-year figures adjusted

| 61| Group management report
Business report
Financial situation
Calculation of Group WACC
2018
2017
Risk-free interest 1.25 % 1.25 %
Market risk premium 6.5 % 6.5 %
Beta factor 1.36 1.42
Cost of equity after tax 10.09 % 10.48 %
Borrowing costs before tax 1.71 % 1.84 %
Tax rate 28.00 % 0.48 % 28.00 % 0.52 %
Borrowing costs after tax 1.23 % 1.32 %
Equity proportion 45.80 % 68.44 %
Proportion of borrowed funds 54.20 % 31.56 %
Cost of capital after taxes (WACC) 5.29 % 7.59 %
Return on capital employed
%
30
20
10
0
13.7 10.0 5.1 14.5 8.3
2014 2015 2016 2017 ¹ 2018
1 Prior-year figures adjusted
Free cash flow down to negative € 147 million
In the year under report, cash provided by operating activities of the LEONI Group decreased from
€ 245 million to € 152 million. The disappointing profitability was the chiefly responsible factor.
Due to the extensive measures to expand capacity, there was more investment spending in 2018, of
€ 298 million, than in the same period of 2017 (previous year: € 234 million). Furthermore, the previous year’s
like-for-like figure included non-recurring income of € 37 million from having sold Business Group Electrical
Appliance Assemblies. Free cash flow came to negative € 147 million, down from positive € 11 million in the
previous year.
Cash provided by financing activity amounted to € 115 million (previous year: outflow of € 36 million). This
large cash inflow stems from the refinancing executed in the autumn.
In summary and after taking exchange rate-related changes into account, the LEONI Group’s cash and cash
equivalents decreased to € 152 million at the end of 2018 (previous year: € 185 million).
Sales and earnings ›› page 54 et seq.
Capital expenditure ›› page 62 et seq.
Successful short and long-term refinancing ›› page 59

62 | www.leoni.com
Operating cash flow
2014
2015
2016
2017
2018
181
228
175
245
152
0 50 100 150 200 250 € million
Consolidated statement of cash flows (abridged version) / Calculation of free cash flow
€ million
2018
2017
Cash flows from operating activities 152 245
Cash flows from capital investment activities (298) (234)
Free cash flow (147) 11
Cash flows from financing activities 115 (36)
Change in cash and cash equivalents (32) (25)
Cash and cash equivalents on 31 December 152 185
Free cash flow
2014
2015
2016
2017
2018
(38)
(5)
(28)
11
(147)
– 200 – 100 0 100 € million
Capital expenditure raised to € 343 million
The LEONI Group’s capital investment in property, plant and equipment as well as intangible assets was up by
22 percent to € 343 million in 2018. The largest share of € 272 million was spent in the EMEA region, followed
by € 44 million in the Americas and € 28 million in Asia.
The Wiring Systems Division accounted for € 205 million as opposed to € 164 million in the comparison year,
mostly for advance spending on the production network to underpin future growth. The investment thus
involved primarily construction of new plants and expansion of existing ones in China, Morocco, Mexico,
Serbia, Tunisia and Ukraine, among other locations. Information on the plants opened in 2018 is contained in
the segment report. Segment report ›› page 66 et seq.

| 63| Group management report
Business report
Financial situation
The Wire & Cable Solutions Division invested € 114 million in property, plant and equipment as well as
intangible assets in 2018, up from € 108 million in 2017. One of the focal areas was expanding capacity for
special automotive cables in the Americas, Asia and Eastern Europe, among other reasons because of the
growing demand for cables for electric vehicles. Investment furthermore involved expansion of production
for customised cable solutions for the medical technology sector in Canada. Construction of our Factory of
the Future in Roth, Germany was another focus for investment. This will become the Wire & Cable Solutions
Division’s centre of expertise where, among other products, we will be developing and making state-of-the-
art data cables for autonomous driving and solutions for even safer, more efficient and more reliable power
distribution in electric vehicles. Starting in 2019, after the main building is completed, our existing production
in Roth will gradually be relocated to the new site. In 2018, we also invested in the ongoing upgrade of our
product portfolio by integrating digital intelligence as well as related elements of the technology platform in
connection with LEONiQ.
The capital expenditure of LEONI AG, which increased from € 10 million to € 24 million, involved primarily new
software licences and the IT infrastructure.
Capital expenditure Wiring Systems Wire & Cable Soultions LEONI AG
2014
2015
2016
2017
2018
139 68 9216
248
211
281
343
168 68 11
135 65 10
164 108 10
205 114 24
0 100 200 300 € million
LEONI Group capital expenditure by region in % 2018 2017
Asia 8.1 10.6 EMEA total 79.2 80.3
Americas 12.7 9.1 1 Germany 33.9 31.0
2 Eastern Europe 27.0 29.3
3 Africa 15.7 16.7
4 Rest of EMEA 2.6 3.3
1
2
4
3

64 | www.leoni.com
Net financial liabilities rise to € 613 million
The LEONI Group’s net financial liabilities were up from € 406 million to € 613 million in 2018, which equates
to leverage (net financial liabilities / EBITDA) of 2.0 after 1.1 in fiscal 2017. Gearing (net financial liabilities as a
percentage of equity) increased from 39 percent to 57 percent.
Calculation of net financial liabilities € million
2018
2017
Change
Cash and cash equivalents 152 185 (33)
Current financial liabilities (177) (254) 77
Non-current financial liabilities (588) (337) (251)
Net financial position (613) (406) (207)
Equity and net financial liabilities / Gearing Net financial liabilities Equity Gearing
2014
2015
2016
20171
2018
316 918
322 996
404 917
406 1,042
613 1,081
34
32
44
39
57
0 500 1,000 1,500 € million %
1 Prior-year figures adjusted
Asset situation
The LEONI consolidated balance sheet as at 31 December 2018 was enlarged by 10 percent to € 3,462 million.
The key factor on the asset side involved non-current assets, which accumulated by a total of 18 percent
to € 1,742 million. As a consequence of extensive investment, property, plant and equipment was up by
15 percent to € 1,206 million. The intangible assets, which rose from € 64 million to € 76 million, reflected
a master agreement covering new SAP licences. There was also an increase in contract assets pursuant to
IFRS 15 from € 61 million to € 79 million as well as in other non-current assets from € 61 million to € 145 million
because of substantial pre-production spending on major customer projects.
Overall, current assets increased by 3 percent to € 1,719 million. In particular, the reason was the item other
current assets, which grew from € 125 million to € 170 million due especially to greater VAT receivables. Further-
more, trade receivables and other financial assets increased by about 4 percent to € 674 million because of
the expansion of business. Inventories, by contrast, remained virtually stable at € 609 million (previous year:
€ 597 million). Cash and cash equivalents diminished by 18 percent to € 152 million.
Financial situation ›› page 58 et seq.
Notes ›› page 138 et seq.
Financial situation ›› page 58 et seq.

| 65| Group management report
Business report
Asset situation
On the liabilities side, the increase in non-current liabilities from € 626 million to € 882 million led to an
improvement in the maturity profile. The main reason for this was the increase in non-current financial
liabilities from € 337 million to € 588 million in the wake of the Company’s successful, long-term refinancing.
Current liabilities, on the other hand, were up only marginally to € 1,498 million. Here, the current financial
liabilities reduced from € 254 million to € 177 million by scheduled principal payments were offset primarily
by the business-induced, 11 percent increase to € 1,084 million in trade liabilities and other financial liabilities.
Overall, equity increased slightly from € 1,042 million to € 1,081 million. This was due to the rise by 3 percent
to € 807 million in retained earnings as well as the increase in accumulated other comprehensive income, prin-
cipally because of positive effects of measuring pensions and cash flow hedges (from negative € 72 million to
negative € 55 million). The still solid equity ratio came to 31.2 percent on 31 December 2018 (previous year:
33.1 percent).
Asset and capital breakdown
€ million
31/12/2018
31/12/2017 1
Current assets 1,719 1,668
Non-current assets 1,742 1,477
Total assets 3,462 3,145
Current liabilities 1,498 1,477
Non-current liabilities 882 626
Equity 1,081 1,042
Total equity and liabilities 3,462 3,1451 Prior-year figures adjusted
Equity ratio
%
40
30
20
10
0
34.4 35.1 31.1 33.1 31.2
2014 2015 2016 2017 ¹ 2018
1 Prior-year figures adjusted
Off-balance sheet assets
Alongside the assets presented in the consolidated balance sheet, the Group also uses intangible assets,
which are not permitted to be entered on the balance sheet because of the applicable accounting require-
ments. Mainly, these are primary customer and supplier relationships, production know-how, organisation
and process-related advantages as well as brand and human capital. Use was furthermore made of leased or
rented assets that are not to be entered on the balance sheet because of the chosen contractual structure.
Financial situation ›› page 58 et seq.

66 | www.leoni.com
Reports by division / Segment report
Wiring Systems Division
Strategically important projects in 2018
The Wiring Systems Division stepped up its activity in the areas of electromobility as well as energy and data
management during the year under report. It also commissioned several new facilities to prepare for start-
ing new customer projects. The most important of the projects in 2018 are described below. The section on
research & development contains information on major development plans.
Growing EMO activity
LEONI further expanded its activity in the electromobility (EMO) segment in 2018. We broadened our range of
high-voltage components, especially involving HV storage, and supported various, major European car makers
in depth as development partners in new EMO projects. Alongside modular electrification kits for various
models, we also worked on equipping a self-driving electric vehicle for the first time. Furthermore, we once
again booked various orders to supply standard equipment for new electric vehicles. Supply for the Audi e-tron
technology platform is a highlight among the EMO production starts in 2018.
Energy and data management: Strategic partnership with Diehl
In October, LEONI agreed a strategic partnership with the Diehl Group covering battery systems for electric
and hybrid vehicles. We will in future be working together on energy and data transmission as well as heat
management across the entire value creation process. The partnership’s aim is to build on the skills of the two
companies and to offer customers system solutions for electromobility from a single source.
New plants opened in Serbia, Tunisia and China
We opened various new facilities during the period under report because of the numerous, pending new
projects for our customers: LEONI’s third wiring systems plant in Serbia was officially opened in April. At the
production facility in Niš, southern Serbia we make cable harnesses for the vehicles of a European premium
carmaker. In July and October, we furthermore commissioned two additional plants in Tunisia, which will also
be supplying the European motor vehicle industry. The new plants are located in Manzel Hayet and Sidi Bou
Ali. In addition, the second wiring systems plant of our joint venture in Langfang, China went into operation
in May. It makes wiring systems for a European-Chinese joint venture.
Research & Development ›› page 82 et seq.

| 67| Group management report
Reports by division / Segment report
Wiring Systems Division
Performance in 2018
Key figures Wiring Systems
2018
2017 2
Change
in %
External sales € million 3,168 3,064 3.4
EBIT € million 80 118 (32.8)
Adjusted EBIT 1 € million 84 129 (34.9)
Return on sales % 2.5 3.9 —
Capital expenditure € million 205 164 25.0
Employees (as at 31 December) Number 83,381 77,909 7.01 Earnings adjusted for the impact of revaluation as part of allocating the prices of the major acquisitions, restructuring, capital gains on the disposal of businesses
and income from business combinations including related derivatives2 Prior-year figures adjusted
Sales rise to € 3.2 billion
The Wiring Systems Division’s external sales rose by 3 percent, or € 104 million, to € 3,168 million in 2018. This
growth was generated organically. The changed copper price produced a slight, positive effect, whereas cur-
rency translation effects involving principally the US dollar, renminbi and Russian rouble reduced sales.
Wiring Systems sales performance
€ million
%
2017 1 sales 3,064
Organic growth 135 4.4
Currency translation effects (44) (1.4)
Copper price effects 12 0.4
2018 sales 3,168 3.41 Prior-year figures adjusted
Wiring systems and cable harnesses for the international automotive industry continued to be the mainstay
of sales. The business is spread among a large number of vehicle manufacturers and models. After performing
better than planned in the first half of 2018, sales were down in the second half because of the tough market
setting. The waning momentum of the car markets in China and Europe had a particular impact. In addition,
there were the effects of the new WLTP procedure for measuring consumption, the impending Brexit as well
as less product called forward for volume models approaching the end of their production runs. By contrast,
the amount of business involving cable harnesses for the commercial vehicle industry was up significantly
throughout the reporting period.
By region, sales in the EMEA (Europe, Middle East and Africa) region and Asia were up by 3 percent each
to € 2,406 million and € 413 million, respectively. In the Americas we generated an 8 percent increase to
€ 349 million.

68 | www.leoni.com
Wiring Systems external sales
2014
2015
2016
20171
2018
2,400
2,668
2,690
3,064
3,168
0 500 1,000 1,500 2,000 2,500 3,000 3,500 € million
1 Prior-year figures adjusted
Wiring Systems external sales by quarter 2018 20171
Q1
Q2
Q3
Q4
842
829
725
772
747
780
731
806
0 200 400 600 800 1,000 € million
1 Prior-year figures adjusted
Significant production starts in the EMO segment
In 2018, we started to supply cable harnesses for the low voltage and high voltage systems of various electric
vehicles. Among other things, we commenced production for the e-mobility platform of a European premium
carmaker. We are also equipping the Audi e-tron technology platform with both the entire low-voltage wiring
system and the high-voltage cable harness. Furthermore, we began making cable harnesses and wiring
systems in China and the Americas for a new vehicle model of a US customer. In addition, there were various
production starts for the commercial vehicle industry.
Earnings decline to € 80 million
The earnings before interest and taxes of the Wiring Systems Division dropped from € 118 million to
€ 80 million in the period under report. This decrease was due mainly to higher-than-planned ramp-up costs,
which were incurred particularly in the fourth quarter upon starting up a large-scale project at our new plant
in Mexico. Efficiency enhancements in series operations at other plants also fell short of expectations and
savings targets were not met. Gains from negotiations with suppliers and customers as well as the sale of
buildings in China exerted an opposing effect.

| 69| Group management report
Reports by division / Segment report
Wiring Systems Division
Wiring Systems EBIT
2014
2015
2016
20171
2018
105
87
36
119
80
0 50 100 150 € million
1 Prior-year figures adjusted
Adjusted Wiring Systems EBIT 1 € million
2018
2017 2
EBIT 80 118
EBIT margin % 2.5 3.9
Effect of purchase price allocation (PPA) 5 11
Restructuring expenses / income (1) 0
Adjusted EBIT 84 129
Adjusted EBIT margin 2.7 4.2¹ Earnings adjusted for the impact of revaluation as part of allocating the prices of the major acquisitions, restructuring, capital gains on the disposal of businesses
and income from business combinations including related derivatives2 Prior-year figures adjusted
Order receipts: growing proportion for electric vehicles
The Wiring Systems Division booked extensive new orders worth € 4.1 billion in 2018. In the previous year,
this figure, which is dependent on the cyclical order activity of our customers, reached a record level of about
€ 7 billion. The proportion of orders accounted for by projects involving vehicles with electric and hybrid
drive, which came to € 1.1 billion in 2018 (previous year: € 1.5 billion), therefore rose to about 27 percent.
A European premium carmaker ordered wiring systems for various compact and upper mid-range vehicles.
Some of these vehicles will have conventional engines, while others will be launched with both conventional
and electric power. For the first time, we were furthermore commissioned to provide the battery internal wir-
ing for a model, meaning that we succeeded in entering this trailblazing market segment. There were likewise
several additional orders from the European commercial vehicle industry, including engine cable harnesses
for new truck models.
At the end of December 2018, the Wiring Systems Division’s order backlog covering the entire term of the
projects was up by more than 13 percent year on year to € 24.4 billion (previous year: € 21.6 billion). Cable har-
nesses for electric and hybrid vehicles accounted for € 5.5 billion of this figure (previous € billion: € 4.4 billion).
The exact scope and timing of deliveries will be determined by the actual call-forwards of our customers.

70 | www.leoni.com
Wire & Cable Solutions Division
Strategically important projects in 2018
The Wire & Cable Solutions Division developed its digital solutions as well as the related technology platform
and corresponding business models further in 2018. We also made progress in this area through various
collaboration agreements. The key milestones during the year under report are described below. The section
on research & development contains more information on strategically important development plans.
Launch of LEONiQ
In March, we publicly presented LEONiQ, a digital key technology to make energy and data flows in cable
systems more secure, reliable and intelligent. LEONiQ can record and evaluate such differing parameters as
temperature and mechanical stress along a given cable system. This will make it possible, for example, to pre-
emptively service a large number of cable systems and lower the risk of unexpected outage in the transmis-
sion of energy and data. LEONIQ is meanwhile many times less costly – while simultaneously requiring much
less installation space – than comparable, technical solutions.
Collaboration with Microsoft
Among others, we are collaborating with Microsoft to evaluate the readings generated by LEONiQ. We are
using Microsoft’s Azure Sphere platform as a bridge between new, digital solutions and our customer applica-
tions. Both partners are contributing key skills to this collaboration: LEONI with the development of intelligent
cable systems; Microsoft by securing the microcontroller and the cloud environment. Azure Sphere’s multi-
layered security concept gives customers added confidence in LEONiQ and is an important foundation for
linking security and function-relevant cable systems with the cloud.
Strategic collaboration with PARC
In June 2018, LEONI agreed a strategic collaboration with PARC, the research and development company
based in Palo Alto, California. PARC, a Xerox Corporation company, has trail-blazing technologies in the areas
of condition monitoring, system analysis, artificial intelligence and embedded sensor technology. With this
collaboration, we have established a key foundation within the context of digital transformation especially for
developing algorithms for predictive and preventive maintenance of intelligent cable systems.
First LEONiQ application showcases
At various trade fairs during the year under report, we already showcased initial examples for application
of LEONiQ: in the automotive sector, we presented a liquid-cooled charging cable that is monitored using
LEONiQ. In addition, there were intelligent cable systems for such industrial applications as dresspacks of
robots and production lines, which actively monitor their condition and thereby raise the uptime of equip-
ment.
Research & Development ›› page 82 et seq.
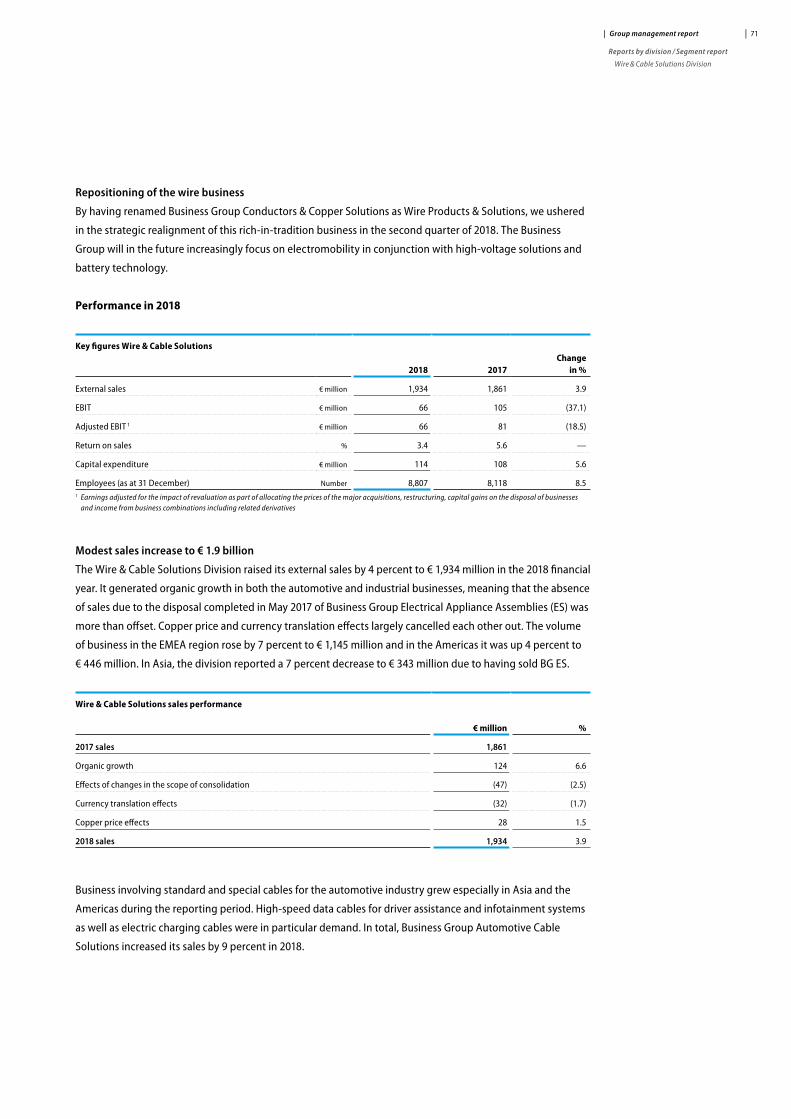
| 71| Group management report
Reports by division / Segment report
Wire & Cable Solutions Division
Repositioning of the wire business
By having renamed Business Group Conductors & Copper Solutions as Wire Products & Solutions, we ushered
in the strategic realignment of this rich-in-tradition business in the second quarter of 2018. The Business
Group will in the future increasingly focus on electromobility in conjunction with high-voltage solutions and
battery technology.
Performance in 2018
Key figures Wire & Cable Solutions
2018
2017
Change
in %
External sales € million 1,934 1,861 3.9
EBIT € million 66 105 (37.1)
Adjusted EBIT 1 € million 66 81 (18.5)
Return on sales % 3.4 5.6 —
Capital expenditure € million 114 108 5.6
Employees (as at 31 December) Number 8,807 8,118 8.51 Earnings adjusted for the impact of revaluation as part of allocating the prices of the major acquisitions, restructuring, capital gains on the disposal of businesses
and income from business combinations including related derivatives
Modest sales increase to € 1.9 billion
The Wire & Cable Solutions Division raised its external sales by 4 percent to € 1,934 million in the 2018 financial
year. It generated organic growth in both the automotive and industrial businesses, meaning that the absence
of sales due to the disposal completed in May 2017 of Business Group Electrical Appliance Assemblies (ES) was
more than offset. Copper price and currency translation effects largely cancelled each other out. The volume
of business in the EMEA region rose by 7 percent to € 1,145 million and in the Americas it was up 4 percent to
€ 446 million. In Asia, the division reported a 7 percent decrease to € 343 million due to having sold BG ES.
Wire & Cable Solutions sales performance
€ million
%
2017 sales 1,861
Organic growth 124 6.6
Effects of changes in the scope of consolidation (47) (2.5)
Currency translation effects (32) (1.7)
Copper price effects 28 1.5
2018 sales 1,934 3.9
Business involving standard and special cables for the automotive industry grew especially in Asia and the
Americas during the reporting period. High-speed data cables for driver assistance and infotainment systems
as well as electric charging cables were in particular demand. In total, Business Group Automotive Cable
Solutions increased its sales by 9 percent in 2018.

72 | www.leoni.com
In Business Group Industrial Solutions, the volume of business was up by 4 percent. We generated gains
especially with cables and solutions for automation and drive technology; for the transport industry as well as
for energy and infrastructure projects. By contrast, demand for cables for petrochemical plant remained weak,
meaning that we were again compelled during the year under report to adjust the corresponding structures
and capacity to the amount of business accordingly. As the business involving assembly of solar modules also
continued to perform unsatisfactorily, we are considering a restructuring of our Business Unit Solar in China
with the intention of concentrating on production of solar cables.
Wire & Cable Solutions external sales
2014
2015
2016
2017
2018
1,704
1,835
1,742
1,861
1,934
0 500 1,000 1,500 2,000 € million
Wire & Cable Solutions Division external sales by quarter 2018 2017
Q1
Q2
Q3
Q4
486
498
480
470
475
462
456
469
0 200 400 600 € million
Earnings down to € 66 million
The Wire & Cable Solutions Division’s earnings before interest and taxes amounted to € 66 million in 2018 as
opposed to € 105 million in the previous year, although this comparative figure includes the non-recurring
gain of € 24 million on deconsolidation of Business Group Electrical Appliance Assemblies. The deterioration
of earnings during the year under report was due, among other factors, to an unfavourable product mix and
charges arising from measurement of copper inventories as at the reporting date. Significantly increased
raw material prices were also reflected above all in plastics as well as advance expenditure on digitalizing
our range of products and services. Furthermore, insufficient utilisation of some of Business Unit Industrial
Projects’ plant capacity, partly due to delays on orders, exerted adverse effect on earnings.

| 73| Group management report
Reports by division / Segment report
Wire & Cable Solutions Division
Wire & Cable Solutions EBIT
2014
2015
2016
2017
2018
78
64
84
105
66
0 50 100 150 € million
Adjusted Wire & Cable Solutions EBIT 1 € million
2018
2017
EBIT 66 105
EBIT margin % 3.4 5.6
Effect of purchase price allocation (PPA) 1 1
Effect of deconsolidation (1) (24)
Adjusted EBIT 66 81
Adjusted EBIT margin 3.4 4.31 Earnings adjusted for the impact of revaluation as part of allocating the prices of the major acquisitions, restructuring, capital gains on the disposal of businesses
and income from business combinations including related derivatives
New orders worth € 1.9 billion
The order receipts of the Wire & Cable Solutions Division were up 3 percent to € 1,942 million in 2018 (previous
year: € 1,884 million), which equated to a book-to-bill ratio of approximately 1. Among other work, Business
Group Automotive Cable Solutions was commissioned to supply data cables for multimedia and safety appli-
cations as well as charging cables for the electric vehicles of various manufacturers. Business Group Industrial
Solutions booked important orders from the railway industry. On the one hand, they involve infrastructure
cables for Swiss Federal Railways; secondly, we succeeded in entering the significant US market with an order
for special cables for regional trains.
Volkswagen also awarded an important new contract at the end of 2018: LEONI will equip the carmaker with
innovative dresspack solutions for 1,300 robots that will be used at the plant in Zwickau for manufacturing
electric vehicles. We are supporting our customer considerably in the switchover of this production facility
from combustion-engine cars to a pure e-mobility site.

74 | www.leoni.com
Other indicators (incl. non-financial information statement)
Procurement
We purchase mostly metals, plastics and components to make our products; their procurement is of major
significance for the LEONI Group’s cost of materials. This item’s Group-wide total came to € 2,998 million in
2018 (previous year: € 2,881 million), which works out to a ratio of cost of materials to sales of 58.8 percent
(previous year: 58.5 percent).
Copper price subject to significant fluctuation
In the Wire & Cable Solutions Division, the cost of materials amounted to € 1,415 million in the period under
report (previous year: € 1,329 million), or 66.1 percent of the segment’s sales (previous year: 64.3 percent).
Copper continued in 2018 to be the most important raw material with an annual volume of more than 150,000
tonnes, which we source from major strategic suppliers. Its price is geared to that quoted on the London
Metal Exchange. The copper price again fluctuated sharply in 2018: it initially dipped considerably in the first
quarter. A steep upward move began at the end of March, peaking at the year’s highest price of € 625.63 per
100 kg at the beginning of June. Thereafter, the copper price dipped rapidly until mid-July, but stabilised later
on in the third quarter. The low of € 509.79 per 100 kg was reached in mid-September. Copper averaged a
price of € 559.34 per 100 kg in the year under report, which was up marginally on the previous year’s € 552.95
per 100 kg. Such other metals as nickel, silver and tin round off the portfolio. Nickel appreciated by 25 percent
during the reporting period, while the prices of silver and tin were down by 12 percent and 4 percent, respec-
tively.
Jan Feb Mar Apr May Jun Jul Aug Sep Oct Nov Dec
625
600
575
550
525
500
Development of copper price 2017 / 2018 (low DEL price) € / 100 kgDEL prices 2018
2018 annual average 559 € / 100 kg
High on 8/6/2018 626 € / 100 kg
Low on 17/9/2018 510 € / 100 kg
DEL prices 2017
2017 annual average 553 € / 100 kg
High on 28/12/2017 612 € / 100 kg
Low on 6/6/2017 500 € / 100 kg

| 75| Group management report
Other indicators (incl. non-financial information statement)
Procurement
Great pressure on supply of polymers
The likewise growing volumes of such standard polymers as polyvinyl chloride and polyethylene compounds,
of which well over 50,000 tons were consumed, accounted for the second-largest proportion of the
WCS Division’s cost of materials in 2018. In addition, there were such special insulation materials as thermo-
plastic elastomers, fluoropolymers, polyurethane and silicone.
Given the economy’s ongoing, good performance, the prices of standard polymers remained at unabatedly
high levels over the course of the year. Supply was difficult at times, due among other factors to the low water
levels of the Rhine. The drought persisted over an extended period, thereby making waterways unnavigable
and also causing an ongoing and considerable rise in transport costs during the year.
The shortage of special insulation materials that was already perceptible in the previous year aggravated
further in the year under report. The supply pressure drove up prices by 20 percent and by well over
100 percent. We are expanding our portfolio of suppliers even more rigorously to address this more than tight
supply situation.
High worldwide demand for components
The cost of materials in the Wiring Systems Division amounted to € 1,794 million in the period under report
(previous year: € 1,761 million), which corresponded to 56.6 percent of the division’s sales (previous year:
57.5 percent). As in the preceding years, connectors were the most important group of materials with a
41 percent share of total expenses, followed by cables and conductors with 36 percent and fixings with
9 percent; electronic components accounted for 8 percent and injection moulded parts for a 6 percent share.
The Wiring Systems Division buys cables and conductors for its production of wiring systems mostly from the
Wire & Cable Solutions Division, but it also uses third-party suppliers. Such components as connectors and
fixings continue to be procured largely from third parties, for which LEONI frequently works with suppliers
that are stipulated by customers in the automotive industry as part of being awarded the contract. The high
capacity utilisation among such upstream suppliers as copper tape manufacturers and refining operations,
which continued particularly in the first half of 2018, as well as the persistently heavy demand led to shortages
especially of connectors during the year under report. In addition, there was an aggravating shortage of
plastic raw material. Generally speaking, we respond to supply bottlenecks and price increases with intensive,
global negotiations with suppliers, new technologies and substitution. During the reporting period, we again
succeeded in making savings by comparing terms internationally within the framework of our worldwide
procurement management as well as by starting the sourcing process earlier.

76 | www.leoni.com
Employees
92,549 employees Group-wide
The LEONI Group’s core workforce increased by 6,209 people year on year to 92,549 employees at the end of
2018. Both divisions recruited new staff. By far the largest proportion of LEONI’s workforce – 87,476 people
(previous year: 81,753) or 94.5 percent (previous year: 94.7 percent) – was employed outside Germany. LEONI
had 5,073 employees in Germany (previous year: 4,587). Group-wide, 8.9 percent of staff (previous year:
8.6 percent) worked in high wage countries and 91.1 percent (previous year: 91.4 percent) worked in low- wage
countries.
In the Wiring Systems Division, the number of staff rose by 5,472 people in the reporting period to 83,381
employees, of which about two thirds in skilled-trade jobs. The principal trigger for this growth was the
expansion of our operations at a new facility in Mexico as well as additional wiring system projects for cars
and commercial vehicles in Serbia and Mexico. Countereffects stemmed mainly from Romania where the
workforce contracted due to expiring projects, relocation of production to Ukraine and Serbia as well as
optimised production processes.
The number of employees in the Wire & Cable Solutions Division rose by 689 to 8,807 people in 2018, of
whom about 60 percent in skilled-trade jobs. New staff were recruited mainly at various facilities in Germany,
for production of special automotive cables in China as well as Slovakia, where we set up another assembly
operation in the industrial business.
The LEONI AG holding company had 361 employees on 31 December 2018, i.e. 48 more people than on the
same date one year earlier.
Group-wide, LEONI had 20,892 people working on temporary employment contracts at the end of 2018 (previ-
ous year: 19,312) and a further 4,331 people (previous year: 5,626) on contracts with manpower agencies,
thereby enabling quick response to fluctuation in demand, among other things.
LEONI’s workforce in Germany had an average age of 41 years in 2018 (previous year: 42) and they averaged
eleven years with the Company (previous year: twelve). During the period under report, 17 employees cele-
brated their 25th anniversary with the Company (previous year: 52). The ratio of people with disabilities stood
at 3.4 percent (previous year: 3.5 percent). 493 people (previous year: 420) worked part-time at LEONI and a
further 124 were in partial retirement (previous year: 116).
The coordination on all key staffing decisions as well as the close and trusting collaboration with the in some
cases newly elected or appointed employee representatives on the European, German and local levels were
continued in 2018.

| 77| Group management report
Other indicators (incl. non-financial information statement)
Employees
Group employees as of 31 December
2014
2015
2016
2017
2018
67,988
74,018
79,037
86,340
92,549
0 20,000 40,000 60,000 80,000 100,000
Employees by division in % as of 31 December 2018 2017
LEONI AG 0.4 0.4
Wire & Cable Solutions 9.5 9.4 Wiring Systems 90.1 90.2
Employees by region in % as of 31 December 2018 2017
Asia 5.0 5.7 EMEA total 80.0 83.3
Americas 14.9 11.0 1 Africa 36.0 37.4
2 Eastern Europe 35.8 38.0
3 Germany 5.5 5.4
4 Rest of EMEA 2.7 2.5
143
2
Trend in the number of employees by wage region low wage countries high wage countries as of 31 December
2014
2015
2016
2017
2018
61,254 6,73467,988
74,018
79,037
86,340
92,549
66,957 7,061
71,948 7,089
78,916 7,424
84,327 8,222
0 20,000 40,000 60,000 80,000 100,000

78 | www.leoni.com
Human resource strategy and organisation
The principal objective of LEONI’s human resource strategy is to make sure the Company is positioned as an
attractive employer in the future, too, as well as to support realisation of its corporate vision and strategy
especially with respect to the targeted, ongoing, worldwide growth as well as the digital transformation.
The task is, on the one hand, to assist efficient execution of the existing business and, on the other hand, to
develop a viable, organisational and cultural setting for innovation and change. The HR performance portfolio
was broadened accordingly in the past year.
Significant progress was made in 2018 on the way towards a modern HR function that is characterised by
‘Digital HR’. For instance, a pilot group (Germany and USA/Canada) ran a new talent management process for
the first time, which is fully mapped in a modern, easy-to-operate, cloud-based IT system (SAP SuccessFac-
tors). The process comprises an annual, skills-based staff performance interview, a summarised performance
and potential assessment as well as, provided the employee agrees, gauging of the assessment by managers
as well as strategic succession planning. We thereby retain valuable staff members within our Company and
develop leadership skills, enabling us to fill key positions quickly as and when required. With targeted promo-
tion plans, we ensure the availability of suitable successors and also support non-linear career paths.
Furthermore, in the same integrated cloud solution we installed the ‘Learning’ module and introduced it
worldwide for all mandatory training sessions. This modern learning management system forms the basis for
systematically and flexibly expanding the virtual training schemes on offer to managers and staff as well as to
be able to offer appealing learning options regardless of place and time. Training administration and organisa-
tion can be efficiently executed in a user-friendly way, and integration with the talent management process
facilitates intelligent promotion of managers and staff.
We have realigned our entire HR/IT strategy based on the positive experience and feedback from the workforce
on these two models. Together with the IT department, market developments as well as LEONI’s HR/IT land-
scape were evaluated and SAP’s SuccessFactors was decided upon as an integrated, globally leading system
for HR administration, organisation management, performance assessment as well as talent and learning
management.
In the wake of consolidating IT solutions, we furthermore switched the accounting and time management of
all facilities in Romania with a total of 16,000 employees to an integrated SAP system. We also relocated other
administrative processes from the facilities to the Shared Service Center in Cluj, Romania and made organisa-
tional as well as process-related preparations for likewise centralising accounting there in 2019.
Company suggestion scheme
In order to themselves proactively shape their Company and contribute to its success, our employees again in
2018 participated in managing ideas. Worldwide, about 14,000 suggestions for improvement were deemed
useful and implemented (previous year: approx. 17,000). This concerned all areas of the Company and ranged
from process optimisation to product improvement and through to energy savings.

| 79| Group management report
Other indicators (incl. non-financial information statement)
Employees
For 2019, we are planning to install a new ideas management platform for all LEONI locations worldwide.
The objectives are to have motivated participation by employees taking personal responsibility; prompt,
unbureaucratic and comprehensible review of the submitted suggestions, high transparency and appro-
priateness during the assessment and rewarding, realisation of the submitted suggestions as promptly and
straightforwardly as possible, and ongoing exchange of ideas within the Group. A corresponding, generally
binding rule is currently being worked out for Germany together employee representatives.
Flexible working-time models
LEONI staff can take advantage of a range of flexible working-time arrangements, like part-time, flexitime
and trust-based working, job-sharing and teleworking. Our aim is to enable our employees to achieve a
better work-like balance. During the year under report, we made working time more flexible and introduced
employee-friendly shift models at various of our facilities.
Training and starting a career
On 31 December 2018, LEONI had 167 young apprentices in Germany learning for a career (previous year: 158).
The number of trainee managers who are completing a twin-track university course at LEONI was 27 in the
year under report (previous year: 29).
Number of apprentices in Germany as of 31 December
2014
2015
2016
2017
2018
166
146
166
158
167
0 50 100 150 200
Their archetypal training in ten commercial and trade apprenticeship schemes took place in state-of-the-art
classrooms and, in some cases, in our own training workshops. To promote the international outlook of our
junior staff, we expanded the range of internships on offer to apprentices at more locations outside Germany.
This measure is supported by the National Agency for Education in Europe through the ‘Erasmus+’ scheme.
Within the framework of our ‘Young Talents@LEONI’ initiative, we stepped up our activity to gain young staff
through apprenticeship and studies at our facility in Kitzingen during the year under report. It advertised
15 apprenticeship and study places, which will be filled from September 2019. At our location in Roth, two
refugees were taken on from introductory training into the second apprenticeship year to qualify as machine
and equipment operators. Two corresponding places are again planned there for 2019 and 2020. We prepared
in 2018 for resumption of apprenticeship training in Nuremberg: from September 2019, two future IT special-
ists will be learning their skills there.

80 | www.leoni.com
We are also expanding our location-overarching collaboration and networking on instructors and people in
charge of training, with a joint action day among other measures.
LEONI again awarded very good performance at school and in examination results in 2018 to give young
people starting on their career additional motivation. Young LEONI employees, based in Friesoythe, Kitzingen
and Roth among other locations, also received awards from outside the Company.
By way of the scholarship scheme of our facility in Roth, Germany, we promote and support former appren-
tices as well as graduates of a twin-track course of study who have performed exceptionally well and have
discernible career potential, thereby making a proactive contribution to enhancing a team of qualified and
motivated staff with specialist skills. The focal areas are the key technologies for the Company’s future success
and qualifications that contribute to attaining our strategic corporate targets. Among other skills, these
include technician training in the areas of electromobility and electrical engineering as well as bachelor’s and
master’s degree courses in plastics technology and mechanical engineering. In 2018, another course of study
was added at the University of Applied Sciences in Nuremberg, namely electrical engineering and information
technology.
To make it easier for young people starting at LEONI, we also extended our offering as part of the introductory
week for new apprentices and students with joint activities of our facilities in Bavaria, i.e. in Kitzingen, Roth,
Weissenburg and Georgensgmünd.
Our measures outside Germany were also stepped up, especially so in China: New, local partnerships were
established for our Technical Training Center in Changzhou and a pilot project for a six-month ‘Skilled
Operator Training’ compact course was launched. We also moved into new facilities and created an organi-
sational connection to staff development. Collaboration with the Moroccan Ministry of Education to create a
total 30,000 apprenticeship places together with other wiring system manufacturers was also continued.
Recruitment of young people and human resource marketing
During the year under report, LEONI again collaborated closely with schools and universities to interest
suitable young candidates in the Company. Alongside about 25 university and corporate networking fairs
in Germany, we participated in similar events in numerous other countries where LEONI is represented; for
example in Egypt, the United Kingdom, Morocco, Switzerland, Serbia and Tunisia. In Egypt, LEONI also again
offered a Summer Internship Program, which enabled students to get to know the Company, and broadened
its cooperation with various universities. Contact with universities in Serbia was stepped up significantly:
Alongside successful programmes for students, which have been ongoing for several years already with vari-
ous faculties, LEONI started to collaborate extensively with the University of Niš.
Within the framework of the Scholarship Germany programme and a similar scheme for Switzerland, LEONI AG
sponsored 20 scholars at five universities in the past year. Numerous students also completed internships,
worked as student trainees or wrote their final papers at LEONI. As in the preceding years, we also again

| 81| Group management report
Other indicators (incl. non-financial information statement)
Employees
supported wide-ranging university initiatives and cooperated with universities in various areas. Among other
things, we stepped up our collaboration with the University of Würzburg-Schweinfurt. For crossover between
academic learning and practical application, we continued to support an endowment professorship focused
on wiring systems and also organised numerous trade presentations at universities and high schools.
To draw young people’s attention to training at LEONI, we again hosted an Apprenticeships Evening at our
facility in Roth, Germany in 2018. It gave more than 800 youngsters the opportunity to familiarise themselves
with LEONI as a possible employer.
To raise perception of LEONI as a global employer of choice, we introduced the TALEO international applicant
tracking system as well as our LEONI employer branding plan in more countries. We furthermore stepped up
our social media activity in North Africa, the Americas and Eastern Europe, among other places, to address
applicants directly and provide information on job vacancies.
Staff training and advancement
Our employees are key to the success and progress of our Company. It is essential to have the right person at
the right time in the right place to achieve our global objectives.
With respect to training and advanced learning, our focus in 2018 was on our international activity, which
was stepped up significantly: Key milestones involved the first, worldwide LEONI Learning Conference, which
took place in April 2018 in Romania, setting up a global network for training and advanced learning as well
as worldwide introduction of the ‘Success Factors’ e-learning platform. Among other things, this comprises
a greater range of training opportunities, extended functionalities and the pilot project of a mandatory
compliance e-learning course. Our ‘Shift Leader Training’ best-practice concept, which represents a modular,
hands-on and easy-to-apply training curriculum based on the experience and challenges of our shift lead-
ers, was also developed further, adapted to local requirements and piloted in the components section at our
plant in Arad, Romania. The service portfolios offered by the Center of Expertise Learning & Development and
the LEONI Academy were also introduced. The common objective of these two units is to support all those
responsible for training, teaching and advanced instruction within the Group. For instance, global standards
and templates for the qualification processes are prepared and are, in regional ‘Collection Workshops’, aligned
with and integrated in local requirements. A viable network for providing mutual support and exchanging
ideas, expert knowledge and solutions is furthermore being set up and expanded. To identify additional
improvement potential, we furthermore determined the support requirements of our worldwide Training
Community, for example in the areas of Shift Leader Training, onboarding standards and e-learning.
Other important steps involved devising a developing programme for WSD Commercial Managing Directors,
expansion of the ‘Management beyond Standards’ training scheme for plant managers in the ‘Plant Manager
Development Program’ and the new ‘Solution Selling’ training scheme as support for selling innovative
products and solutions related to digitalization.
82 | www.leoni.com
In Germany, we established the ‘Training Team Deutschland’ for location and division-overarching harmoni-
sation of the advanced training processes as well as joint mentoring of managers and staff. Our employees in
Germany could again take advantage of a wide range of advanced training opportunities, especially in-house
training in the areas of trade, leadership and management skills, soft skills, project management, IT, languages
and physical health. As required, the Company offered additional outside seminars, particularly to acquire
specialist and methodology expertise. Thanks to resolute location and division-overarching collaboration and
the associated synergies, we registered roughly twice as many training participants in Germany in 2018 than
in the previous year, without there having been a significant increase in the number of courses. This was made
possible through Germany-wide pooling of qualification requirements as well as synchronising the underlying
processes.
In cooperation with the responsible departments, we devised and introduced numerous training and
development programmes, such as the development programme for the Commercial Directors, the globally
standardised, in-house training of our WSD project managers and the ‘Solution Selling’ training scheme for
the WCS Division’s sales organisation.
Research & Development
R&D objectives
LEONI conducts in-depth research and development (R&D) work. The objective is to develop new products
and solutions in order to further enhance our leading competitive position in many markets as well as to
develop additional customer groups. We are increasingly concentrating on intelligent energy and data man-
agement solutions for the motor vehicle sector and other industries.
Organisation
The responsibility for research and development work lies with the two business divisions and their specialist
departments. The Wiring Systems Division operates development centres in, among other countries, China,
Germany, France, the United Kingdom, South Korea and the United States. The WSD head office department in
Kitzingen provides, together with its international network, project-related support for the business units and
works on advance development jointly with the customer. In 2018, we established a new TechCenter Energy &
Data Solutions to boost our positioning as a strategic partner to the automotive industry for intelligent energy
and data management solutions. The entire development network was also interlinked more closely, and the
core skills of the individual facilities were more clearly defined.
In the Wire & Cable Solutions Division, which also has a division-wide, customer-oriented and efficient devel-
opment network, operational R&D work is performed in the respective Business Groups. In addition, there are
centres of expertise in Germany and Switzerland as well as corporate units devoted to strategic technology
and innovation management, advance development, patent management and optimising production. Merit-
ing special mention in this respect is the corporate Digital Solutions Group, which makes a key contribution
to driving the WCS Division’s digital transformation and further development towards becoming a leading

| 83| Group management report
Other indicators (incl. non-financial information statement)
Research & Development
provider of intelligent and secure energy transmission and data management system solutions. In 2018, two
Centers of Expertise (CoE) were set up within the DSG: the CoE Embedded Systems based in Nuremberg and
the CoE Digital Functional Simulation & Data Analytics, whose work is based mostly in Zurich. They support
the operating units Group-wide in executing technology projects. In total, the number of DSG staff was more
than doubled, whereby we also accumulated initial skills in the field of electronic components. We further-
more raised our shareholding in Adaptricity AG, which has been enhancing our digital solutions know-how
since 2017, from two third to 76 percent.
There are many fields of close collaboration between the R&D specialists of our two divisions. LEONI can
thereby combine a wide variety of specialist expertise for specific tasks, thus achieving synergies at an early
stage also in the interests of customers. During the year under report, we stepped up joint advance develop-
ment work in the two divisions to be able to position ourselves even better as development partners to our
customers.
Focal areas of development
The Wiring Systems Division’s R&D work in 2018 was increasingly in line with the focal areas of our C.A.R.E.S.
innovation strategy: connected mobility, autonomous mobility, revolutionizing productivity, electrified
mobility as well as intelligent solutions & services. These areas are also playing an increasingly important role
in project-related development of customised wiring systems. The focus was on autonomous mobility, in
particular. This new vehicle function requires a higher degree of functional safety systems in compliance with
the ISO 26262 standard, and the wiring system is a key part of that.
During the year under report, the Wire & Cable Solutions Division worked hard on further developing its
digital solutions as well as the related technology platform and corresponding business models, especially
with its LEONiQ key technology. Among other activity, the corresponding work concerned microelectronics
to connect intelligent cable systems to the cloud, the necessary cloud infrastructure as well as corresponding
algorithms to analyse data. Automotive Ethernet for transmitting data in vehicles was another focal area. This
technology, which facilitates flexible linking of electronic components and driver assistance systems with
an increasing data transfer requirement, is a basic element of wiring systems for autonomous driving. We
also worked on liquid-cooled HPC (High Power Charging) cables for electric vehicles. The objective is, with
higher charging currents, to achieve user-friendly charging times and cycles that correspond to drivers’ usual
tank-filling habits, and simultaneously to make the conductor cross section as small as possible. In the Fiber
Optics unit, the primary focus was on fiber-based lighting solutions for vehicles. Among other products, we
developed cables for factory automation and robotics that withstand extreme movement stress, as well as
dresspack solutions.
Segment report ›› page 66 et seq.
Results of R&D work ›› page 84 et seq.
Results of R&D work ›› page 84 et seq.

84 | www.leoni.com
R&D spending up to € 150 million in 2018
The LEONI Group increased its spending on research and development by around 16 percent to € 150 million
in 2018, which works out to 2.9 percent of consolidated sales (previous year: 2.6 percent). Assets furthermore
included € 0.7 million in capitalised development costs (previous year: € 1.0 million).
The R&D expenditure of the Wiring Systems Division came to € 133 million (previous year: € 113 million), or
4.2 percent of the division’s sales (previous year: 3.7 percent). In the Wire & Cable Solutions Division, devel-
opment costs amounted to € 19 million (previous year: € 17 million), which equated to 1.0 percent of the
segment’s sales (previous year: 0.8 percent).
On 31 December 2018, 2,259 employees (previous year: 1,698), or 2.4 percent (previous year: 2.0 percent) of
the Group’s workforce, worked in R&D. Of that total, 415 people (previous year: 420) worked in the Wire &
Cable Solutions Division and 1,844 (previous year: 1,278) in the Wiring Systems Division. The increase shown is
due largely to a recording change.
R&D spending in the Group
2014
2015
2016
2017
2018
109
120
134
129
150
0 50 100 150 € million
R&D spending as a proportion of consolidated sales %
4
3
2
1
0
2.7 2.7 3.0 2.6 2.9
2014 2015 2016 2017 2018
Results of R&D work
In 2018, LEONI again completed various customer-specific development projects and took innovative
products to the marketability stage. The number of registered proprietary rights came to 60 patents and
utility models (previous year: 82), of which 19 from the Wiring Systems Division (previous year 18) and 41 from
the Wire & Cable Solutions Division (previous year 64). Information on key new projects of the past year is
presented below:

| 85| Group management report
Other indicators (incl. non-financial information statement)
Research & Development
Intelligent components and system solutions for highly automated mobility – During the year under report,
LEONI developed intelligent components for high-availability and thereby fail-safe power wiring systems,
which are a key element for autonomous driving. Prototypes of these new kinds of products have already
been tested, meaning that we can start to develop specific series applications in 2019. We furthermore
extended our range of products for highly automated mobility with corresponding system solutions, safety
concepts as well as testing methods for safety-critical requirements in the power wiring system.
Expansion of e-mobility portfolio – In the electromobility segment, we presented various new components
for high-voltage wiring systems, such as charging sockets and HV distributors. In addition, we worked particu-
larly on broadening our product range for HV storage. LEONI already supplies wiring products, such as sensor
cable looms and module interconnectors, for this purpose. The plan is to add HV junction boxes and new
kinds of solutions in the field of cell and module interconnectors in the future.
Enhancing system development expertise in the energy and data field – Our system development exper-
tise was also significantly advanced in 2018 towards becoming a fully-fledged solutions provider in the field of
energy and data for the automotive industry. In design projects together with our customers, we worked on
new kinds of vehicle platforms for e-mobility and on highly-automated mobility. Corresponding solutions are
to be launched starting in 2025.
Milestone on the way to fully automated production processes – To optimise our production processes, we
developed a concept and initial, prototypical system components that will in future enable fully automated
production of sub-wiring systems. With this technology, we will achieve another unique selling point for
LEONI.
Weight and space-optimised axle wiring – To combine the wiring of several sensor applications near the
vehicle axle – for example electronic parking brake, wheel speed sensors, brake wear indicator and active
suspension system – in one bulk cable, we developed various customised cable solutions that are especially
lightweight and space-saving in 2018. Corresponding products are already being shipped; given the mount-
ing demands on such cables, our development work simultaneously continues.
LEONiQ for intelligent charging cables – At international trade fairs we presented a liquid-cooled charging
cable for electric vehicles that can be monitored with our new LEONiQ technology. The cooling allows high
charging currents without having to substantially enlarge the charging cable’s cross section. With the help of
LEONiQ, cable temperature and any penetration of liquid can be identified and monitored to make the system
safer, more reliable and more efficient.
LEONiQ for industrial applications – We also presented examples of LEONiQ application for the industrial
segment during the year under report: intelligent dresspack systems and drag chains that supply robots and
production plant with power as well as ensure the connection to the control system and the sensors. To raise
plant uptime and avoid costly, unplanned production outages due to faults, intelligent LEONiQ cable systems
are used to actively monitor, analyse and convey their condition.

86 | www.leoni.com
Adaptricity.plan – In October, we launched the Adaptricity.plan planning software, which enables power
utilities to adopt digital grid planning including such dynamic operating equipment as batteries, e-vehicles
and photovoltaic plant. The new software stands out especially because it is easy to operate as well as capable
of being integrated in other software systems.
Development projects and collaboration
Both of our divisions again participated in various, in some cases subsidised development projects during the
year under report. Together with well-known partners we worked, for example, on the Optiflex programme to
optimise distribution of power from decentralised generation. LEONI is also involved in a trailblazing project
to develop the next generation of application-neutral wiring, which is subsidised by the German Federal
Ministry for Economic Affairs and Energy. The purpose is to research the maximum transmission capacity and
range of multi-pair copper cables to meet the growing infrastructure requirement of increasingly digitalized
processes. There was no notable acquisition of know-how in the context of collaborating with outside institu-
tions.
In 2018, we furthermore entered into a range of promising agreements on development collaboration; among
others, with such companies as Microsoft, PARC and Diehl. LEONI is also a member of such varied initiatives
as the ‘Automotive Cluster’ of Bayern Innovativ, the Bavarian centre for technology transfer, and the ‘eNOVA
Strategy Board for Electric Mobility’ to exchange ideas on the latest technological trends with other compa-
nies and the scientific community. We also continued our development partnership with a team participating
in the international ‘Formula Student’ universities design competition.
Non-financial Group information statement (pursuant to Section 315b of the German Commercial Code (HGB))
Corporate sustainability (CS) has especially high priority for LEONI. We understand this to mean both sustained,
i.e. long term and profit-oriented, business growth and assumption of social as well as ecological responsibil-
ity. The objective is to bring the demands stemming from these three requirements into balance. Hereinafter
we report in accordance with Section 315b of the German Commercial Code (HGB) and the corresponding
requirements of the German Accounting Standard (DRS) 20 on the principal, non-financial aspects – according
to the German CSR Directive Implementation Act (CSR-RUG) they are environmental, social and employee
matters as well as respect of human rights and combating corruption as well as bribery – which are required
for understanding the business performance, results and situation of the LEONI Group as well as the impact of
our business activity on these aspects.
We follow the German Sustainability Code as well as ten key principles of the UN Global Compact, which we
joined in 2011, in reporting our non-financial information. There are furthermore LEONI-specific guidelines
to which we align our actions with respect to various non-financial aspects. These include our Safety, Health
& Environment (SHE) policy as well as the LEONI Code of Conduct and the LEONI Social Charter, which apply
Group-wide and are accessible on LEONI’s website.
Segment report ›› page 66 et seq.
LEONI website ›› www.leoni.com
| 87| Group management report
Other indicators (incl. non-financial information statement) Non-financial Group information statement
(pursuant to Section 315b of the German Commercial Code (HGB))
Inclusion of the Board of Directors
The member of Board of Directors responsible for the Corporate Sustainability department is kept informed
of current developments concerning all relevant, non-financial aspects by regular exchange of information
with the heads of division responsible for corporate sustainability and is closely involved in material decisions.
There are furthermore meetings of the Sustainability Steering Committee with all Corporate Central Functions
under the responsibility of the Board member, during which non-financial matters at LEONI are continually
processed. It is furthermore the task of the Sustainability Steering Committee, which met four times in 2018,
to determine the Company’s strategic sustainability orientation and to take corresponding long-term deci-
sions.
Materiality analysis and summary of the relevant topics
In 2017, we carried out a comprehensive materiality analysis according to the CSR-RUG for the first time.
Another assessment and review during the year under report produced the following: ■ Employee matters with the focal points of diversity, employee satisfaction as well as occupational health
and safety; ■ Environmental matters with the focal points of environmental management, energy consumption and
CO2 emissions as well as resource and materials efficiency; ■ Respect of human rights both within the LEONI Group and the supply chain based on the Social Charter and
the key principles of the UN Global Compact as well as ■ Compliance and combating corruption as well as bribery.
This management report does not report on social matters because of the lacking correlation with our core
business. Our annual Sustainability Report, which is simultaneously our UN Global Compact Communication
on Progress and is accessible on our website, contains further information on corporate sustainability at LEONI
that goes beyond the legal requirements. This 2018 Sustainability Report will be issued in the second quarter
of 2019.
CSR Orientation 2030
In 2018, our Corporate Sustainability department together with the responsible specialist departments pre-
pared our CSR Orientation 2030 – a strategic framework for comprehensive, structured and rigorous further
development of the key non-financial matters at LEONI through to the year 2030. It stipulates the individual
targets, measures and key performance indicators (KPIs). The Board of Directors approved the CSR Orientation
2030 in January 2019.
Business model and non-financial risks
The LEONI Group’s business model is comprehensively described in the section headed Principles of the
Group.
Our multi-stage risk management system is set up to systematically identify risks early as well as to analyse
and assess them with respect to the probability of occurrence and effects. This also considers risks stemming
from non-financial aspects. Risks within the meaning of the CSR-RUG were not identified. Based on our latest
assessment, there are no highly probable risks with seriously adverse consequences relating to these aspects.
LEONI website ›› www.leoni.com

88 | www.leoni.com
Employee matters
LEONI strives to provide its employees with interesting jobs that involve a high degree of personal responsibil-
ity in a motivating, encouraging and constructive work environment in order, as an attractive employer, to
find skilled and committed employees as well as to retain them within the Company. In this regard, diversity
and employee satisfaction are key success factors for our Company’s future viability. It is furthermore our
stated aim to fulfil high standards of occupational health and safety Group-wide. The LEONI Group employed
92,549 people worldwide at the end of 2018 (previous year: 86,340).
Diversity
We regard diversity – with respect to gender, age, cultural background, ethnic as well as career backgrounds
and mindset – as key to being able to master the tasks and challenges that are becoming ever more complex
in heterogeneous teams. Our focus in this respect is on senior management and here especially on promoting
women and their appropriate participation in senior management as well as on greater internationalisation
and raising the mobility of skills and functions.
There are numerous actions at LEONI, especially in Germany, to resolutely promote women in senior manage-
ment because about 80 percent of these positions (of a total 93 worldwide) are based at German companies
of the LEONI Group. For instance, we support women with potential by providing targeted qualifications and
with such mentoring as the development programme for female (junior) managers of the Bavarian Industry
Association. Our recruitment consultants are called upon to identify and introduce female candidates for
all positions to be filled. Another way to enhance equality of women and men is to establish conditions that
recognise different lifestyles, such as flexible working time, greater options for working part time or in a home
office.
In 2018, women held 6.5 percent (previous year: likewise 6.5 percent) of the senior management positions
within the LEONI Group worldwide. About 54 percent of LEONI’s total global workforce was female (previous
year: likewise 54 percent). Our objective is to significantly increase the proportion in senior management
over the long term while maintaining the balanced ratio in the overall workforce. Further internationalisation
of management is supported with international employee development conferences, workshops and inter-
cultural awareness training, which were again expanded during the year under report.
A precondition for targeted raising of mobility in terms of both location and skills was established with the
introduction of global talent management. Within the framework of staff performance interviews, which take
place Group-wide while applying the same principles, managers and staff systematically discuss potential
advancement and career steps also in other areas of specialisation and/or countries. The results of these
discussions form the basis for our succession and career planning, especially for senior management.
Employee satisfaction
LEONI endeavours worldwide to provide a working environment for all its employees that is free of discrimi-
nation in both recruitment and during employment, as well as to ensure the freedom of association and the
right to collective bargaining. A blanket ban on discrimination is therefore embedded in our Code of Conduct

| 89| Group management report
Other indicators (incl. non-financial information statement) Non-financial Group information statement
(pursuant to Section 315b of the German Commercial Code (HGB))
and in LEONI’s Social Charter, among other places. The Social Charter aims to support employees in gaining
qualifications and to adhere at least to the respective national standards with respect to compensation and
minimum wages, safety at work and health protection as well as working and holiday times.
Strategic staff surveys, together with systematic follow-up processes, are an important tool for measuring
and assessing the sustained commitment of employees in a company. The follow-up processes stimulate and
maintain dialogue within the company, meaning that our strengths as an employer, but also our improvement
potential, can be identified and specific weaknesses can be systematically addressed. In 2017, this tool was
standardised for the first time and run Company-wide as the new Voice@LEONI staff survey. About 57,000
employees from 29 countries participated in the staff survey (67 percent). The findings were evaluated in 2018
and managers together with their teams worldwide decided on more than 900 specific changes, which are
being systematically followed up via a platform. We furthermore used the findings to extrapolate targeted,
overarching measures in, for instance, management training and also within the context of a global initiative
to develop ideas for changes to collaboration and management to shape our corporate culture.
Again in 2018, there was outside affirmation of LEONI’s attractiveness as an employer: The Top Employers
Institute certified LEONI as a ‘Top Employer Germany’ alongside other companies.
Occupational health and safety
Promoting occupational health and safety as well as adhering to respective standards is a key objective of our
SHE policy, which applies Group-wide. The specific principles for action that it contains with respect to these
matters are: ■ Socially and ecologically responsible action is a core corporate objective. ■ Occupational safety, health and environmental protection are part of any management responsibility. ■ Avoiding injury to or illness of our employees by preventive detection of risks and averting of threat. ■ Adhering to all legal obligations concerning environmental protection, safety at work and other require-
ments. The applicable national standards are minimum requirements in this respect. ■ Establishing and promoting mutual trust through dialogue with all concerned interest groups.
Furthermore, the OneSHE network established in 2017, which is composed of those responsible for SHE
regionally in both divisions, during the year under report established initial, common minimum SHE standards
and documents such as the SHE compliance standards, accident reporting templates and risk assessment for
both divisions. The OneSHE network is currently working on an emergency management standard. Given the
high importance of occupational health and safety, a SHE department at corporate level is to be set up in the
future.
We set the following division-overarching targets for safety at work, health protection and emergency
management for 2018: ■ Group-wide recording of accidents at work. ■ Group-wide recording of all activity at the facilities concerning health and safety at work.

90 | www.leoni.com
An IT-supported process for the Corporate Sustainability department launched in 2017 forms an important
basis in this respect. Facts on occupational health and safety, the environment, social responsibility and sustain-
ability measures are centrally recorded using questionnaires. They survey both quantitative and qualitative
data from 84 facilities. All operating facilities as well as research and administrative locations with more than
50 staff are included. Apart from environmental data, which is recorded quarterly, all other data is surveyed
annually. This data forms a key basis for discussion on the further, Group-wide strategic direction for sustain-
ability management.
During the year under report, the number of work accidents stood1 at 0.67 per 100 employees. Various occu-
pational health and safety initiatives were run at our facilities in 2018, for which there are location-specific
focal areas. This ranges from safety training through to medical check-ups.
We are increasingly applying the internationally recognised OHSAS 18001 standard to ensure the health and
safety of our employees. At the end of 2018, eleven locations Group-wide were certified to this standard,
which corresponded to about 13 percent of all facilities queried. A further 14 locations are to be added by
2020.
Environmental matters
LEONI recognises its ecological responsibility and regards environmental protection as an important corpo-
rate objective. Our environmental management is geared to keeping the impact of all our processes on nature
as low as possible. In particular, we strive to achieve reduction in energy consumption and the associated
CO2 emissions as our contribution to climate protection as well as a high degree of resource and materials
efficiency. This matter is currently being managed in the respective business divisions.
We are running several initiatives to raise employees’ awareness of their responsibility concerning ecologi-
cal aspects. We furthermore aim to promote staff awareness of this issue with integrated training sessions
on environmental protection at our facilities. Environmental protection at LEONI is to be underpinned by a
preventive approach in line with the UN Global Compact. Alongside embedding environmental protection as
a key corporate objective in our Code of Conduct, we have formulated a Group-wide SHE policy on the subject
of ecology with the following operational principles: ■ Ongoing improvement of environmental protection measures. ■ Reduction of the environmental impact of our products and processes within the confines of what is
economically and technically feasible. ■ Efficient use of environmental resources and energy. ■ Avoidance of waste comes before waste separation and disposal. ■ Adhering to all legal obligations concerning environmental protection, safety at work and other require-
ments. The applicable national standards are minimum requirements in this respect.
Environmental management
At most of our facilities, we run environmental management systems in line with such internationally recog-
nised standards as ISO 14001, EMAS and ISO 50001 to establish suitable foundations on which to realise these
principles and to be able to monitor the ecological impact of our activity.
¹ By international standard, accidents must be reported from the first day of incapacity.

| 91| Group management report
Other indicators (incl. non-financial information statement) Non-financial Group information statement
(pursuant to Section 315b of the German Commercial Code (HGB))
The Wiring Systems Division set itself the target during the year under report to have all existing, operating
units ISO 14001 certified by the end of 2019. Newly built plants are to be audited within two years. Long-term,
all facilities of the WCS Division are also to gradually be audited to this standard.
At the end of 2018, 70 percent of our facilities queried were ISO 14001 certified. Furthermore, 6 percent of our
facilities queried fulfil the ISO 50001 standard for energy management systems and 6 percent of our facilities
queried have subjected themselves to the EU’s Eco-Management and Audit Scheme (EMAS).
Energy consumption and CO2 emissions
As a contribution to climate protection and in line with our principle of making efficient use of environmental
resources and energy, we have set ourselves the target of a 1.5 percent reduction from the 2016 level in
the energy consumed in absolute terms at our respective production facilities by 2020 . Such a reduction in
energy consumption is simultaneously a key condition for lowering CO2 emissions. Accordingly, each plant
must, while considering the differing set-ups and peculiarities in terms of infrastructure, define and apply a
suitable energy efficiency project.
For example, a distributor switch to optimise lighting was installed at the Wiring Systems Division’s facility in
Tieling, China in 2018. Temperature control in the production area was improved for efficient use of natural gas.
WSD building projects that are in keeping with our internal guideline were furthermore planned. For instance,
like the production facility that already exists there, the second plant in Mérida, Mexico is to be fitted with
solar panels to cover about one third of the entire power requirement.
Various energy efficiency measures were likewise applied in the WCS Division, such as optimisation of the
production and consumption of compressed air as well as conversion of the lighting to LED technology at our
facility in Jena, Germany.
During the year under report, the LEONI Group’s energy consumption in absolute terms stood at 511,958 MWh
(previous year: 515,207 MWh).
Resource and material efficiency
LEONI’s operations require a lot of resources. In addition, copper, for example, is one of the key resources in
electromobility and will gain significance in the years ahead. Our reporting has therefore been extended in
2018 compared with the previous year.
A variety of materials are used for our products and solutions, especially so copper and polymers. Copper, for
example, which is one of the principal components in our products, provides very good preconditions for
recycling at LEONI. There are various projects to optimise resource efficiency; for instance the development of
ultra-thin automotive cables with reduced insulation wall thickness and simulation of wiring system archi-
tectures to optimise the cross sections of cables. The following section on respect of human rights provides
information on our efforts to avoid the use of conflict minerals.

92 | www.leoni.com
We also continue to deem our waste management plan based on the incurred waste quantity and the
proportion recycled annually to be significant with respect to resource and material efficiency. Generally
speaking, there are clear guidelines in both divisions that prioritise avoidance of waste. Group-wide, we have
set ourselves the target of a 2 percent reduction in the waste quantity at our respective production facilities
by 2020 as opposed to the 2016 figures. To the extent that it is not possible to avoid waste, recycling has clear
priority over disposal at LEONI.
Respect of human rights
The LEONI Group commits itself to the protection of internationally recognised human rights. Management,
all staff and our suppliers are called upon to prevent modern slavery and human trafficking in our business
activities. Our Code of Conduct as well as the LEONI Social Charter stipulate that any forced or compulsory
labour is prohibited at LEONI. In a statement on the UK Modern Slavery Act published in 2017, which LEONI
unreservedly supports, we likewise explicitly declare that we do not tolerate any violations of human rights
and will unmistakably sanction any violations.
As part of our Modern Slavery Prevention project, we are currently, under the direction of our Corporate
Sustainability department, developing a system to prevent human rights violations within the LEONI Group
and our supply chain. In line with the German federal government’s National Action Plan on Business and
Human Rights to apply the UN principles for commerce and human rights, LEONI prepared a plan for develop-
ing the existing elements in this regard further during the year under report. Furthermore, a department-
overarching analysis is to record and assess potentially adverse effects on respect of human rights at our
facilities and within our supply chain. The objective is also to establish a platform for submitting anonymous
complaints at Group level.
LEONI requires its suppliers to act sustainably and, in particular, to respect human rights. Our general terms
and conditions oblige all suppliers to observe our Social Charter and/or the principles of the UN Global
Compact. In 2018, the content of the WCS Division’s supplier questionnaire was aligned with that of the WSD.
A new supplier to either division will thus be approved only if the supplier accepts our Social Charter or the
principles of the UN Global Compact. LEONI is entitled to terminate the business relationship immediately
when any serious and repeated breaches of the principles stipulated therein come to light. No material
breaches were found in 2018.
LEONI furthermore endeavours to prevent the use of conflict minerals, which are mined with disregard for
human rights, and requires suppliers not to supply any components with raw materials from the Democratic
Republic of the Congo or its neighbouring states. This is set out in a Group-wide guideline on conflict miner-
als, which is operationally applied in the two divisions. Since 2014, we have voluntarily informed customers

| 93| Group management report
Other indicators (incl. non-financial information statement) Non-financial Group information statement
(pursuant to Section 315b of the German Commercial Code (HGB))
using a standardised template pursuant to the U.S. Dodd-Frank Wall Street and Consumer Protection Act
on the extent to which our products contain such conflict minerals as gold, tantalum, tin or tungsten that
stem from mines or smelting works in certain African countries. We ask our customers annually to furnish the
necessary information in this regard. We thereby facilitate the traceability of these substances as well as the
transparency of the supply chain and support our customers in fulfilling their corresponding requirements.
Compliance and combating corruption as well as bribery
LEONI commits all its employees to responsible, honest and rule-compliant conduct with the intention of
observing all laws and avoiding any cases of corruption. The LEONI Code of Conduct and our anti-corruption
guidelines contain corresponding rules. To ensure this, LEONI has a systematic Compliance Management
System, which contains a number of rules on preventing corruption. Our guideline for combating corruption
and bribery as well as our compliance guideline for business partners were updated during the period under
report. A newly formulated compliance guideline for donations and sponsorship complements the existing
set of rules.
We furthermore introduced a Compliance Management Dashboard for staff in 2018. Among other things, it
provides guidelines for information and confirmation, distributes training materials, runs compliance checks
of business partners as well as documents and approves gifts, invitations, donations and sponsorship. With
this Dashboard, the corresponding processes and procedures are now available digitally.
To enhance understanding of the values presented in the LEONI Code of Conduct, we also established the
Living Code in 2018: an internal, interactive information platform that simultaneously serves as a training
platform for the LEONI Code of Conduct. It conveys the most important compliance principles for staff using
examples, explanatory videos, charts, check-lists, links etc. Among other subjects, the training developed for
the Living Code comprises anti-corruption and is obligatory for any employee with a Windows account and
internet access. About 11,000 members of staff have completed this training since August 2018, meaning that
74 percent of the target group has been trained.
All managers on the highest tiers and other relevant groups of staff (e.g. purchasing and sales) must further-
more take a special e-learning course on anti-corruption. These e-learning courses must be taken regularly at
intervals of two to three years.
Indications of possible infringements of internal anti-corruption guidelines or of laws are resolved and – so far
as the indication is confirmed – penalised.

94 | www.leoni.com
Risk and opportunity report
Risk policy
As a company with an international outlook and operating accordingly, LEONI is confronted with risks and
opportunities. Risks and opportunities are promptly made transparent using a systematic approach that
follows the three-lines-of-defence model. Risks and opportunities are defined as possible deviation from
the planned result. Our objective is to deliberately accept risks only when the associated opportunities can
simultaneously make an appropriate contribution to enterprise value and any possible threat to continued
existence can be ruled out with a probability bordering on certainty.
Risk management system
LEONI has a multi-stage risk management system that is rounded off with other, supporting control systems.
This Group-wide system encompasses the Chief Risk & Internal Control Officer (CRIO) and three area Business
Partner Risk & Opportunity (BRO) officers reporting directly to the CRIO as well as Controlling and the
managers involved in the operations of all relevant business areas. Risk aggregation by means of Monte Carlo
simulation is applied for early identification of developments that might threaten the Company’s continued
existence (cf. Section 91 (2) of the German Stock Corporation Act (AktG)). The CRIO unit that reports directly
to the CFO is in charge of monitoring and coordinating the risk management process at the corporate level. It
also determines and describes the Group’s overall risk situation.
Risk management is integrated in the existing planning, controlling as well as information systems and covers
all companies in the LEONI Group worldwide. Together with the internal control and the compliance manage-
ment system, which has likewise been established worldwide, it is part of the 2nd line of defence. Alongside
risk management in the narrower sense, which is the result of legal requirements, the Company furthermore
has a system that goes beyond the minimum standards under German law for monitoring risks, which also
evaluates material information from all management systems with respect to opportunities as well as risks
and makes it transparent (risk management in the wider sense).
Opportunity management – Opportunity management at LEONI is a firm component of the risk manage-
ment process and the GRC (Governance, Risk Management & Compliance) software used. Not only the risks
(threats), but also the opportunities are systematically identified as deviations from the planned outcome. The
opportunity reporting is performed in line with monthly risk reporting and with the help of the GRC software
down to the entity level.
| 95| Group management report
Risk and opportunity report
Risk policy
Risk management system
Risk identification and assessment – Our risk analysis involves promptly and systematically identifying risks
and opportunities as well as analysing and assessing the significant risks and opportunities with respect to the
probability of occurrence and quantitative effects.
To identify and assess risks, expert panels initiated on a top-down basis by the CRIO and BROs are held on
identified risk and opportunity developments with the operational managers and in annual risk summit meet-
ings for the holding company and the divisions. In these risk summits, the findings of the prior risk interviews
with the operational management of each business group / business unit and significant central functions as
well as expert panel meetings held during the year are considered. This activity is accompanied by monthly
risk assessments within the GRC software for material risks and opportunities as well as by the Corporate Risk
Committee, which meets quarterly.
The risk summit meetings take stock of the risks and opportunities of the divisions and of the Group and
update this if need be; they run training sessions and estimate the likely range of market fluctuation (e.g. sales,
capital, procurement and human resource market fluctuation). Discussions on risk are regularly held with
management of the local subsidiaries concerning process-related risks and opportunities.
The responsibility for managing risk and realising opportunity always remains with respective operational
management. Risk management functioning as an independent business partner supports the division’s
operational management and controlling in this process of identifying and quantifying possible effects on
income and mitigating measures.
Various probability distribution forecasts that are appropriate in view of the respective circumstances are
used for quantitative description of the material risks and opportunities. Apart from a description of risks
and opportunities by probability of occurrence and potential loss, use is made accordingly of, for example,
triangular distribution and normal distribution (specific to market fluctuation).
An aggregation of the risks by means of Monte Carlo simulation is made for early identification of develop-
ments that might threaten the Company’s continued existence and to determine the overall risk. The risk
aggregation includes the respective net risks, meaning the risks based on consideration of the risk mitigation
measures applied; it determines the extent of LEONI’s overall risk.
The Monte Carlo simulation involves once a year allocating the effects of the Company’s most significant indi-
vidual risks on an aggregated basis to the corresponding items of the forecast income statement and balance
sheet. Several tens of thousands possible risk-related future scenarios are run in independent simulations. The
entirety of all the simulation runs provides a representative sample of all possible risk scenarios within the
Group with respect to the probability of overindebtedness and illiquidity.
Risk reporting and monitoring – By way of the quarterly risk reporting to the entire Board of Directors, an
assessment of the risk situation based on the net risks larger than € 10 million (in line with the risk matrix in the
section headed Opportunity and risk situation) is made and discussed with the Board of Directors. In addition,
such net risks together with the risk aggregation are reported to the Supervisory Board annually. The risk
report will furthermore be updated (ad hoc announcement) if there is any material change in the Company’s
risk profile.

96 | www.leoni.com
Risk reporting is carried out once a month up to the corporate level with the help of SAP’s GRC risk manage-
ment module that is linked with our ERM (enterprise resource management) and controlling system. The
Board of Directors is furthermore given supplementary risk analyses on commercial decisions pertinent to the
Supervisory Board (e.g. acquisitions, significant customer projects or important investments).
Process improvement – On the Corporate Risk Management Committee, the Business Partner Risk & Oppor-
tunity officers, under the chairmanship of the CRIO, exchange information with the principal risk managers on,
among other aspects, process improvements and ensuring the effectiveness of the risk management system;
the latter is also reviewed by the Audit Committee as well as regularly by the Internal Audit department. The
risk early-warning system is also assessed as part of the annual review by the auditors.
The external audit begun in the summer of 2017 of the system for managing the risk of the core areas of
treasury, human resources and financial statement closing process pursuant to the IDW 981 auditing standard
was continued during the period under report. The appropriateness test was successfully completed on
30 April 2018. The test for effectiveness is to be completed by March 2019.
Further development of the risk management system in 2018: ■ Introduction of more key performance indicators on the effectiveness and completeness
of the risk-minimising measures; ■ Introduction of supplementary risk check-lists for key risk areas and processes; ■ Successful appropriateness test pursuant to the IDW 981 auditing standard and execution
of the effectiveness test at various facilities; ■ Increased use of expert panels initiated top-down; ■ More on-site training on the risk management system; ■ Introduction of system-supported workflow alerts.
Internal Control System
As already outlined under risk management, a company’s senior executive is responsible as operating
management for the design and functioning of the internal control system – as the 1st line of defence. The
Internal Control System (ICS) as a Corporate Function, which is the 2nd line of defence, is another subsection
for which the CRIO is responsible. This subsection of the ICS is responsible for the strategic direction and
growth based on systematic and global, organisational rules; it advises the operational management of the
legal entities based on expert knowledge and helps in monitoring the operating effectiveness of the internal
control system on all levels of the company. The SAP GRC Process Control module presents the ICS uniformly
and facilitates various kinds of reporting in real time.

| 97| Group management report
Risk and opportunity report
Internal Control System
Among other things together with the risk and compliance management system, the ICS’ task is to establish
a control system through systematic and organisational rules that ■ ensures reliable and efficient processes; ■ safeguards the Company with all its assets for shareholders and stakeholders and ■ considers rules in a manner compliant with the law.
LEONI’s Internal Control System comprises the principles, procedures and measures introduced by manage-
ment to ensure the effectiveness and profitability of the business activity, the correctness and reliability of
both internal and external accounting as well as the adherence to the legal requirements material to the
Company.
This is to be achieved through the interaction of manual through to automated controls if possible of a
preventive nature or, if not otherwise efficiently possible, of an exposing nature. Control activity by a wide
variety of internal and external offices is intended to ensure that the ICS is, through permanent monitoring
and testing, continuously developed further in a risk-oriented manner and that identified weaknesses are
addressed structurally and in good time. At LEONI, this is done with the help of SAP’s GRC software, which is
available worldwide.
Together with risk management, the Internal Control System likewise supports identification of procedural,
inherent risks through to uncovering of weaknesses and avoiding fraud.
The principles underlying the ICS are the four-eyes principle as a minimum requirement or, so far as possible
and stipulated, the separation of functions principle with the authority of a person / function clearly defined,
the transparency principle and, in keeping with the spirit of German data protection, data economy with
respect to necessary information.
In so doing, LEONI pursues a strategy of executing control processes in their entirely and not to limit them
just to accounting-related controls and/or risks; among others, strategic / market, operating and compliance
controls are also incorporated alongside the accounting-related controls. The Corporate Internal Control
Committee carries out audits of all control matters and processes involving the ICS with respect to being up
to date, complete and effective. This comprises the key persons responsible for processes, the Internal Control
Managers, the CRIO and is led by the Internal Control Officer (ICO).
Accounting process – The Board of Directors bears overall responsibility for the internal control and risk
management system with respect to the accounting process in the Group. All business segments and units are
bound by a firmly defined management and reporting organisation. The principles, the operational and organi-
sational structure as well as the processes of the accounting-related internal control and risk management
system are laid down in an internal guideline that is updated at regular intervals to include the latest external

98 | www.leoni.com
and in-house developments. With respect to the accounting process, we deem such features of the internal
control and risk management system to be significant that could materially influence the accounting and
overall information provided in the financial statements and consolidated financial statements including the
management report and the group management report. In particular, this involves the following elements: ■ Identification of key areas of risk and control of relevance to the accounting process; ■ Monitoring controls for supervising the accounting process and their findings at the level of the Board of
Directors and of the strategic business areas; ■ Preventive control measures in financial management and accounting as well as in operating performance-
related business processes, the principal information for preparing the financial statements and consoli-
dated financial statements including the management report and the group management report, including
function separation and predefined approval processes in relevant units; ■ Measures that ensure proper IT-supported processing of accounting-related facts and data; ■ Measures for monitoring the accounting-related internal control and risk management system.
Reporting – Formal reporting is done quarterly on the Corporate Internal Control Committee to the CFO.
Reporting is based on the assessments submitted via the GRC software by operating management. Time-
independent individual reporting is furthermore also possible at any time by means of the system support
facility.
Process improvement – The Audit Committee regularly examines the internal control system’s effectiveness.
This may involve the auditors presenting weaknesses in the accounting-related internal control systems found
during the annual audit. Furthermore, the Internal Audit department (3rd line of defence) on a random basis
checks the process of the Internal Control System (2nd line of defence). The external audit for the core areas of
treasury, human resources and financial statement closing process of the Internal Control System pursuant to
the IDW 981 auditing standard is scheduled for 2019 / 2020.
Further development of the Internal Control System in 2018: ■ Expansion to five regional ICS experts in China, Mexico, Tunisia, Romania and Russia; ■ On-site training on the Internal Control System at all key facilities; ■ WebEx training sessions for all local subsidiaries; ■ Further roll-out of SAP Financial Closing Cockpits for the entire Group.

| 99| Group management report
Risk and opportunity report
Compliance Management System
Compliance Management System
LEONI has a comprehensive compliance management system to ensure and check responsible, rule-compliant
conduct. The responsible head of the Corporate Compliance department (Chief Compliance Officer) reports
directly to the President & CEO of LEONI AG and has reporting lines to the Chairman of the Supervisory Board
as well as the Chairman of the Supervisory Board’s Audit Committee.
The Compliance Management System is run by the Corporate Compliance department at the Group parent
company level and by the regional compliance officers in Germany / Switzerland, EMEA, the Americas and
Asia. At the level of the individual subsidiaries, locations or countries where LEONI operates, compliance
coordinators complete LEONI’s compliance network. The compliance coordinators support the Corporate
Compliance organisation as well as the local management that is responsible for compliance in its subsidiary
in implementing the compliance measures.
LEONI’s Compliance Management System (CMS) breaks down into the three areas of prevent, detect and react,
which involves the following:
Compliance Management System
Prevent Detect React
Rules / requirements: guidelines, procedures, processes
Regular risk assessment Whistleblowing management
Training: e-Learning, workshops, classroom instructions
Compliance quality reviews Special investigations
Advice: helpdesk / support
Whistleblower system Sanctions / consequences
Compliance due diligence Process improvements
Communication, reporting
Risk analysis
Prevent: Measures to avoid infringement of law comprise particularly the introduction of specific guidelines,
rules and processes, conducting of tailored e-learning and classroom instruction as well as providing the busi-
ness groups and units with specialist advice on compliance.
Detect: A digital whistleblower system has been set up and compliance quality reviews are regularly con-
ducted to detect any increased compliance risks or possible infringements at an early stage. As a key element
of preventive early detection, we have also implemented a comprehensive process for compliance due
diligence reviews of certain business partners and business activities.
React: Indications of misconduct will initially be assessed and, if required, will be resolved in the context of
either internal or external investigations. The reaction to infringements of compliance comprises, among
other action, resolute sanctioning of misconduct as well as improving the processes to ensure rule-compliant
conduct.

100 | www.leoni.com
The CMS is the basis for ensuring LEONI’s compliance objectives, which are: ■ Observing the legal standards and rules of the LEONI Group ■ Protecting the Company against financial and non-financial loss ■ Protecting the corporate bodies and staff against penalties and liability ■ Establishing transparency across communication, whistleblowing systems and reporting ■ Setting up an effective (risk-minimising) and efficient compliance management system that conforms
to international standards ■ Zero tolerance concerning non-observance of the compliance objectives
The Compliance Management System is continually improved and developed based on these fundamental
aims, which blend with the Group’s strategy and objectives.
Measures and process improvements – Further measures to reduce compliance risks were applied and
existing measures as well as processes were improved in 2018.
One key project involved developing and implementing the Living Code. This interactive information and
training platform on the LEONI Code of Conduct gives employees the opportunity to look more closely into
the content of this Code of Conduct published in 2017 (via examples, video clips, charts and check-lists); to
draw rapidly on relevant information (e.g. through linking of guidelines) and to find the right contact for
any questions. Staff must furthermore test their knowledge by doing a Living Code Quiz. To also embed the
content of the LEONI Code of Conduct that applies internally in our supply chain and in relevant business
relationships, a project was launched during the year under report to prepare and set up a Business Partner
Code of Conduct, with the aim of completing this by mid-2019.
As part of the regular review of our compliance guidelines, the rules on combating corruption and bribery
as well as on compliance due diligence pertaining to business partners were updated and complemented
with rules on donations and sponsorship. The contents of these new or updated rules, the rules on avoid-
ing breaches of competition law and the measures under our Compliance Management System as well as
their documentation on the Compliance Management Dashboard were the subject of classroom instruction
provided globally.
Another focal point concerning improvement of the effectiveness and efficiency of the measures was intro-
duction of the Compliance Management Dashboard (CMD) as the central documentation and processing
tool. Numerous compliance processes and procedures are thereby available in digital form and events are
transparently documented. The CMD facilitates, for example, distributing compliance information specifically
to individual staff members or groups of staff as well as to obtain confirmation from those employees. Among
other benefits, that simplifies distribution of compliance guidelines and training details as well as the related
documentation. It furthermore runs such processes as the compliance reviews of business partners, ranging
from internal and external information gathering to obtaining the business partner’s self-audit and through
to the auditing and approval process. Gifts, invitations, donations and sponsorship are also documented and
approved on the CMD. More compliance processes and measures will in future be covered on the CMD.

| 101| Group management report
Risk and opportunity report
Opportunity and risk situation
The external audit begun in December of 2017 of the Compliance Management System for the core areas of
anti-corruption and competition law pursuant to the IDW 980 auditing standard was continued during the
period under report. The first two parts of the three-part audit were successfully completed on 30 June 2018.
The review of effectiveness as the third part of the audit is to be fully concluded by mid-2019.
As part of the agenda to continually improve the Compliance Management System, work will continue in 2019
on interlinking the governance, risk and compliance functions as well as integrating compliance measures and
controls in existing business processes. As a significant step in this regard, a Governance, Risk and Compliance
Committee was set up during the year under report, which supports improvement of governance and compli-
ance, integration of current and future measures as well as the harmonisation of processes.
Opportunity and risk situation
The opportunity and risk situation reports on the material opportunities and risks according to the matrix
below. The matrix also illustrates the breakdown (number) of the described risks larger than € 10 million:
Loss potential (net risk)
Probability of occurrence < 10 million Euro 10 to 100 million Euro > 100 million Euro
> 50 %
> 10 % up to 50 %
- Project and performance risks - Impairment - Cyclical fluctuation / No-deal Brexit - Pressure to cut prices - Copper price fluctuation - Exchange rates
up to 10 %
- Compliance risks - Risk of bad debt losses - Loss of a customer - Product liability / recall - Fluctuation in personnel costs
Break in the supply chain to a customer
low risk medium risk high risk
Hereinafter we present the principal opportunity as well as risk categories without rating their significance.
Strategic and market-related
Location / country risks – The LEONI Group’s policy on choice of location is geared closely to the require-
ments of our customers, which LEONI follows into foreign markets. The pressure on prices and costs compels
us towards disproportionately large increases in production capacity located in low-wage countries. This
means that customers in many instances must be supplied across several national boundaries. There are also
political risks in some countries, for example in North Africa, Mexico, Turkey, South Korea and the Ukraine.
Unstable political conditions could at any time result in unrest and also strikes at our production facilities in

102 | www.leoni.com
those locations, or in closed seaports and airports. The option of temporary supply from production facilities
in other, non-affected countries is severely limited because of the customised products in the Wiring Systems
Division. Just-in-time and just-in-sequence delivery as well as the single-source principle of some custom-
ers extend the reach of this risk further. Relocation is possible only with a corresponding lead time neces-
sitated by setting up the required production capacity and recruitment. That is why we offer our customers
the option of supply from two facilities in different countries. In many cases, however, our customers have
decided for economic reasons to continue to share the risk of 100 percent supply from one country. A break
in the supply chain to the customer, due for example to unrest, cybercrime or natural disasters, could result
in a supply bottleneck persisting several weeks. Owing to the size it has attained, LEONI operates a consider-
able number of production facilities worldwide, which have backup capacity as is prudent and accepted
by the carmakers. Furthermore, preventive measures have been applied at all production facilities and are
documented in a global emergency plan. These range from a round-the-clock guard service to extensive fire
protection systems. Furthermore, no LEONI facility is located in an area known to be under extreme threat of
earthquakes, flooding or other natural disasters.
Risks and opportunities due to the economic cycle / No-deal Brexit – Customers in the automotive industry
and among its suppliers account for the bulk of LEONI’s consolidated sales. The current business performance
of this sector therefore has great influence on LEONI’s business volume and earnings. LEONI has accordingly
prepared for any cyclical slump in sales by making its cost structure even more flexible.
A disorderly exit by the United Kingdom from the EU (no-deal Brexit) could have adverse effect on the sales
of our customers in the country; lead to rising customs duty and clearance costs as well as to depreciation of
the pound. We are monitoring the ongoing exit negotiations closely and are, together with our customers,
preparing for a no-deal Brexit. However, it must be assumed that, in the event of a no-deal Brexit, it will not be
possible for LEONI either to avoid major fallout.
Generally speaking, LEONI has the opportunity to generate more sales than expected in the markets it targets
by outperforming the overall market and correspondingly rising demand.
Risks due to pressure to cut prices – LEONI supplies its products to markets that are characterised by fierce
competition. The trend that continues to prevail in the automotive industry towards sharing development
costs with suppliers and unexpectedly substantial, but necessary price concessions therefore constitute a risk.
Risks due to copper price fluctuation – LEONI uses copper as a key input material in both of its business
divisions. The global market price of this raw material, which is subject to significant fluctuation, therefore
exerts a major influence on the cost of materials in the Group, which is why this is regarded as a separate risk.
If the price of copper rises for a protracted period, the lag in passing this cost on to our customers can exert an
adverse earnings effect on the reporting date. Any substantial drop in demand could, if there is a simultane-
ous dip in the price of copper, lead to us having to sell at lower prices some of our copper inventory bought

| 103| Group management report
Risk and opportunity report
Opportunity and risk situation
forward at higher prices. This would likewise exert an adverse effect on earnings. We purchase copper forward
only with a corresponding hedged item to safeguard the invoicing plan agreed with our customers. If the
price has fallen sharply up to the reporting date, copper inventories may be exposed to the risk of devaluation.
A shortage of copper stocks could lead to supply bottlenecks and higher copper prices. LEONI prefers long-
term and direct supply relationships with copper suppliers to avoid supply bottlenecks.
Risks and opportunities due to fluctuation in the cost of materials (excluding copper) – Rising demand
could lead to increases in the costs of our most important raw materials. This can result in demands for higher
prices and therefore in increased procurement costs for the corresponding components, and it can further-
more also entail supply bottlenecks in the event of shortages. International competition among our suppliers
has hitherto enabled us to largely avoid any increases in the cost of materials. Contact systems, which consist
of plastic casings and metal contacts, are made mostly with tools stemming from a single source due either
to customer requirements or economic considerations. A more favourable trend in commodity prices would
benefit LEONI’s cost-of-materials ratio and therefore its margins.
Risks and opportunities due to digitalization – Digitalization (Internet of Things, Industry 4.0) entails risks
that could lead to new competitors or substitution of existing solutions. Yet new trends in technology and
society simultaneously present LEONI with good growth opportunities – especially the progressing digitaliza-
tion in all walks of life and therefore also in many of LEONI’s customer sectors. In general, other global trends
of importance to LEONI – such as mobility, energy and data management, environmental awareness and
shortage of resources as well as industrialisation and automation – also present the Company with additional
expansion opportunities in many areas. For instance, the growing interest among motorists in hybrid and
electric drive systems as well as electrical and electronic innovations in vehicles can exert a positive effect on
our future performance.
Operational
Risks due to new customer projects – Apart from the project-overarching risks, such as the location / country
risks and fluctuation in personnel costs, there are also project-specific cost risks. These can, due to special
measures to safeguard our customers’ production starts during the ramp-up phase or, for example, miscal-
culation, impact on the whole term of a project. Failure to ensure that the many annual production starts are
on schedule and according to the requirements of our customers could have serious consequences for future
business.
Risks due to information technology – Running a company like LEONI that operates on a global scale is only
possible with the help of sophisticated IT systems. Constant readiness to supply goods and services – especially
to the automotive industry that frequently calls for either just-in-time or just-in-sequence delivery – also
depends on availability of the IT systems and their data at all times. Serious disruption such as system outages,
attacks on our networks, loss or corrupting of data could result in a break in the supply chain to the customer.
LEONI therefore constantly works at optimising its IT system, in terms of both concept and operation. One

104 | www.leoni.com
example of this is having a second, backup computer centre as an emergency system. The threats to our infor-
mation security are furthermore mounting because of the globally increasing professionalism of computer
crime. Like other, major international companies, we are exposed to vigorous cyber-attacks by experienced
adversaries who are supported by organised crime and countries that conduct industrial espionage. An
Information Security and Data Protection Officer who reports directly to the Board of Directors demonstrates
the very high priority given to security of our information systems and networks, as well as to safeguarding
the confidentiality, availability and dependability of our data. To minimise these risks, we apply a range of
measures including staff training as well as monitoring our networks and information systems by means, for
example, of firewalls and virus scanners. A cyber security insurance policy covers the residual risk.
Risks due to product liability / recall – LEONI’s output is used primarily for technically sophisticated products
and equipment with high safety standards. A failure could have far-reaching consequences ranging from
downtime costs to contractual penalties and through to personal injury claims. We minimise the associated
product liability risks by taking effective measures as part of process safety and quality management. All
plants are ISO 9001 certified and some, depending on the customer group they supply, have such additional
certification as IATF 16949 (automotive industry), EN/AS 9100 (aerospace) and ISO 13485 (medical technology).
There is also insurance cover for operating, product and environmental liability as well as for product recalls.
Product liability cases and recalls are reported without delay, by means of an implemented workflow alert
within SAP GRC, to all concerned units so as to ensure a structured emergency management system.
Risks due to loss of a customer – The loss of one or several major customers we supply could temporarily
result in losses of earnings / contributions to profit and additional capacity adjustment costs. We have reduced
our exposure to a small number of major customers in the Wiring Systems Division with a broader, international
customer base. The lengthy contract periods, which usually cover the lifespan of a particular vehicle model
range, as well as having established very close and stable customer-supplier relationships, for instance by way
of comprehensive development work and outstanding service in terms of delivery, mean that there would
normally be early notice of losing a customer and would allow for consequent measures to be applied in good
time.
Risks due to fluctuation in personnel costs – The growing shortage of skilled people in Germany, changes
in the availability of personnel and the resulting rise in wage and salary costs at labour-intensive production
locations in Eastern Europe, North Africa and Asia present human resource management with particular chal-
lenges. In addition, there is the large extent of production in countries with low wage levels. Surges can occur
in this respect due to minimum wage hikes. Effort has been stepped up to increase staff advancement – for
example with internal programmes to provide employees with further qualifications and aimed at integration
as well as offering a wide range of social benefits – to maintain the ability to recruit and retain staff by being
an attractive employer.

| 105| Group management report
Risk and opportunity report
Opportunity and risk situation
Operational opportunities – The LEONI Group’s operating strengths include its leading position in the most
important markets across Europe, our global footprint in terms of distribution, development and production
as well as our broad, international customer base. These factors enable us to benefit globally from favour-
able market trends. LEONI also focuses sharply on core products and markets, has a consistently high level of
expertise along the entire value chain and covers an extensive portfolio of technology. Finally, the collabora-
tion between our two business divisions in the context of a complementary value chain creates synergies
that provide LEONI with opportunity not only to reduce costs, but also to expand. The forecast contains more
information in the specific opportunities of the two divisions.
Financial
Risks due to receivables / liquidity – The loss of receivables from a major customer presents a risk. As a pre-
caution, all customers with whom the LEONI Group intends to conclude business on a credit basis are subject
to credit screening. Regular analysis of receivables and the structure of the receivables facilitates ongoing
monitoring of the risk. For selected customers true sale factoring serves as a further tool to reduce the risk of
default.
To back its plans for growth LEONI uses, alongside the existing, long-term borrower’s note loans, ample short
and long-term loan commitments from banks, mainly in the form of the recently signed syndicated loan and
conventional lines of credit. In addition, stringent cash pooling is used to safeguard liquidity. The most impor-
tant cash flows in the Group are managed and handled by LEONI AG at head office. If, in the event of a crisis
for example, the in-house rating of our core banks for LEONI were to drop below investment grade, this would
probably mean increased cost on any required loans, which might not be provided in the desired amount. The
Group monitors its current liquidity situation on a daily basis. Monthly, currency-specific, rolling liquidity plan-
ning for respective periods of 12 months is used to manage future liquidity requirement. The planning takes
into consideration the terms of the finance and the financial assets (e.g. receivables, other financial assets) as
well as the expected cash flows from business activity.
Risks due to impairment – LEONI subjects assets and goodwill to impairment testing based on the IFRS
accounting rules. An increase in the discount rate and/or worsening of earning prospects would cause the risk
of impairment to rise.
Risks and opportunities due to acquisitions – Risks stemming from planned acquisitions are systemically
identified and quantified as part of the respective due diligence examination of the acquisition target. Risk
management studies the implications of these risks for the Company’s overall risk in advance of any decision
to acquire. Any acquisition simultaneously entails opportunities to be realised.
Risks and opportunities due to interest rates – A change in the risk premium on the capital-market interest
rate can raise refinancing costs.
Forecast ›› page 109 et seq.

106 | www.leoni.com
Risks due to pension obligations – The phase of low interest rates could also impact on LEONI’s pension
funds by causing an increased outflow of funds to reduce any shortfall as prescribed by local regulations.
Risks and opportunities due to exchange rates – We conduct business mainly in euros or in the local cur-
rency of the respective country. However, we are increasingly faced with currency risks due to the globalisa-
tion of the markets. In the Group’s holding company, LEONI AG, the Corporate Finance & Treasury department
is responsible for foreign exchange in collaboration with a currency committee and reports these to corporate
risk management. Hedging transactions are executed in line with the existing underlying transactions or the
planned transactions. Selection of the hedging instrument to be used is based on regular, in-depth analysis
of the underlying transaction to be hedged. The objective is to limit the impact of exchange rate variation on
net income. Apart from the actual hedging transactions, we primarily take advantage of the option of netting
foreign currency items within the Group to hedge our operating business activity. As a further currency-
hedging measure, as a matter of principle we finance our foreign subsidiaries in their respective functional
currencies by way of refinancing in the corresponding currency. Economic currency risks furthermore stem
from the effects on the price competitiveness of individual facilities (plants) as a consequence of changes in
the exchange rate.
Fluctuating exchange rates can, for amounts not hedged with forward contracts, result in a positive effect.
Further details on these financial risks are contained in the notes.
Compliance
Risks due to compliance infringements – In principle, compliance infringements could entail substantial
fines, loss of reputation and claims for damages. Depending on the country, imprisonment of managers and
involved staff is also possible. LEONI minimises such risks due to infringements of law and guidelines with an
effective compliance management system.
Risks due to corruption – As previously reported, internal compliance-related investigations in 2015 gave rise
to the suspicion of illegal conduct in connection with at least one agent who was commissioned by a LEONI
Group company belonging to the WCS Division. The matter concerns unexplained commission payments
on transactions particularly with Asian customers. LEONI proactively reported this suspicion to the German
authorities in 2016 and continued in 2016 and 2017 to resolve the matter in close collaboration with the
investigating authorities. At the beginning of 2017, the authorities launched several investigation proceedings
against former and current senior managers and staff. Both the internal investigations to resolve these matters
and the external investigations were largely completed by the end of 2017.
In 2017, LEONI reached an agreement in a settlement with the tax authorities on the underlying matter and
the tax deductibility of commission payments.
Notes ›› page 138 et seq.

| 107| Group management report
Risk and opportunity report
Opportunity and risk situation
The proceedings against eight former and current employees and directors of a LEONI company were con-
cluded at the end of 2018 and the beginning of 2019, respectively.
There were and are no proceedings against LEONI AG or the concerned Group subsidiaries in connection with
this matter.
Risks due to competition law – As reported, several civil proceedings in the form of class action lawsuits have
been initiated against LEONI and other wiring systems manufacturers due to alleged breaches of competition
law in the United States and Canada since October 2011. LEONI was able to conclude all these proceedings
in the 2016 and 2017 financial years without any acceptance of liability by way of settlement agreements.
In the United States, there are now just a few proceedings pending involving individual claimants, which,
from today’s perspective, are likely to have far less impact than the hitherto concluded proceedings. LEONI
therefore expects to be able to conclude these outstanding proceedings as well in the near future.
In November 2015, the Brazilian competition authority initiated proceedings against a LEONI company as well
as other wiring system manufacturers, presumably in connection with the cartel proceedings before the
European Commission that were already concluded in 2013. The authority is investigating alleged breaches of
Brazilian competition law. LEONI cooperated with the responsible authorities and ended the proceedings by
agreeing to pay a fine. The corresponding expense was already considered in the 2017 financial statements.
Risks due to (fake CEO) fraud – As reported, LEONI fell victim in August 2016 to fraudulent acts involving
the use of falsified documents and identities as well as the use of electronic communication channels. As a
consequence, a total of approx. € 40 million was transferred from the Company to accounts outside Germany.
The Board of Directors continued during the year under report to push and monitor work on clearing up the
fraud case at various levels. This included the ongoing efforts to recover the stolen funds as well as coop-
eration with national and international investigating authorities to bring the perpetrators to justice. It was
likewise important to the Board of Directors to continue initiatives intended to derive measures and processes
from the fraud case to effectively reduce future risks due to such a matter or similar ones. With this stipulation,
the Board of Directors not only once again raised IT security and ensured lasting awareness among staff,
management and departments. External reviews or audits of various functions that are rated as especially
sensitive or pertinent to the control and management of risks were furthermore continued. The findings
from these audits are being acted upon. In some areas the Board of Directors also required managers to be
replaced. During the year under report, furthermore, the Board of Directors forged further ahead with assert-
ing claims for damages under civil law after completion of the external analysis and assessment of possible
breaches of duty. The latter is in line with claims asserted by the Supervisory Board with respect to members
of the Board of Directors.
108 | www.leoni.com
The measures applied may be summarised as follows: ■ Investigations and asset tracing: The investigations of the authorities in the concerned countries were
continued during the year under report and are still ongoing. LEONI continues to support the authorities in
finding and clarifying the facts. LEONI also continued its own measures to trace money flows and to recover
the funds. Assets totalling about € 327 k (€ 125 k on 31 December 2017) have so far been recovered. The
measures to recover the assets are ongoing. ■ Assertion of claims for damages: Based on an opinion issued by the Baker McKenzie law firm, the Board
of Directors decided to assert further claims for compensation for the loss LEONI AG incurred and reported
the fraud case to LEONI AG’s D&O insurers. The assertion and enforcement of claims against employees are
ongoing. It is not yet possible to comment on progress and prospects of success. ■ Insurance payouts: LEONI obtained a payout of € 5 million from its existing fidelity insurance policy. During
the year under report, the Board of Directors submitted more claims for compensation to the fidelity insur-
ance provider. Examination and assertion of the claims are ongoing. It is not yet possible to comment on
progress and prospects of success.
Risks due to corporate governance violations – In general, there is the risk that corporate governance bodies
and / or staff infringe laws, internal guidelines or the standards of good corporate governance recognised by
LEONI.
Risks due to export control and duties – Political and regulatory changes involving, for example, export
regulations, customs regulations or embargoes, could affect our business activity in some national markets
and compromise our financial position and performance. Any infringements could entail fines, sanctions as
well as loss of reputation and claims for damages. We therefore make sure of resolutely observing the cor-
responding regulations.
The Board of Directors’ assessment of the overall situation
In the opinion of the Board of Directors, the risk to the LEONI Group increased further for 2019 in relation to
projects because of the large volume of orders. The biggest risk continues to be a break in the supply chain to
a customer.
The risk aggregation shows that developments which might threaten the Company’s continued existence can
be ruled out with a probability bordering on certainty during the planning period. The Company’s risk cover
potential is sufficient to safeguard its continued existence.
Supplementary report
There were no events of special significance and with material impact on the LEONI Group’s earnings, financial
and asset situation occurring after close of the financial year and until this report was signed.

| 109| Group management report
Supplementary report
Forecast
Business and underlying conditions
Forecast
Business and underlying conditions
Macroeconomic setting
The International Monetary Fund estimates that the global economy will weaken more in 2019 than assumed
as recently as in the autumn of 2018. At the beginning of the year, the IMF scaled back is forecast for 2019
global economic growth from 3.7 percent to 3.5 percent. The reasons it stated are that some economies
underperformed expectations in the second half of 2018, for example in Italy because of its unclear political
circumstances and in Turkey, which was hit by an economic slump, but also in Germany where the intro-
duction of new emission testing procedures led to decline in automotive industry output. Risks also stem
from the possibly escalating trade dispute between the United States and China as well as the consequently
less dynamic Chinese economy and the threat of a no-deal Brexit. The increased uncertainty on the financial
markets and the more restrictive monetary policy of the major central banks could also exert a dampening
effect on the global economy.
Overall, the industrialised countries should grow by 2.0 percent this year, with the United States contributing
most. From today’s perspective on the other hand, the eurozone and Japan will generate below-par expan-
sion. The developing and emerging countries are projected to grow by 4.5 percent, underpinned mostly by
India and China, which should generate disproportionately strong gains despite the slowdown that is to be
anticipated.
Global economic growth 2018 to 2020 %
2018e
2019e
2020e
Source: IMF
3.7
3.5
3.6
2019 economic growth in selected regions
India
China
USA
Brazil
Eurozone
Russia
Japan
7.5
6.2
2.5
2.5
1.6
1.6
1.1
0 2 4 6 8 %
Source: IMF (estimate)

110 | www.leoni.com
Business by sector
The multifarious macroeconomic risks, especially the impending Brexit as well as the possible weakening in
the Chinese economy, are also weighing on the automotive industry. In addition, there are sector-specific
factors like the diesel crisis, driving restrictions and the threat of import duties. The German Association of
the Automotive Industry (VDA) nevertheless estimates that the motor vehicle market will grow by 1 percent
to approximately 86 million new cars globally in 2019. The VDA expects to see a 2 percent increase in China,
whereas the sales figures in Europe and the Americas will probably be at the previous year’s level. IHS
Automotive calculates that the output of cars and light commercial vehicles is likely to be up by 2 percent
worldwide this year. Increases are expected in all the major production regions, while the Americas and Asia
are likely to perform more dynamically than the EMEA area. The output of vehicles with alternative drive
technologies will again very much outpace the overall market. Double-digit rates of growth are expected in
all regions, which adds up to a 51 percent global increase in output. Alongside the rising proportion of electric
and hybrid vehicles, such trends as autonomous driving, the use of artificial intelligence and new usage
concepts like car-sharing will change the world’s motor vehicle market. For this reason, the significance of
strategic collaboration of vehicle manufacturers and suppliers with companies outside the sector is increasing.
Output of cars and light commercial vehicles by region 2019e 2018e
Asia
EMEA1
Americas
51.2
24.8
20.9
49.9
24.8
20.5
0 10 20 30 40 50 Million units
1 Europe, Middle East and Africa Source: IHS Automotive
IHS Automotive forecasts that the number of manufactured heavy commercial vehicles will be down by
3 percent in 2019. Yet this decline should be due solely to significantly lower production quantities in Asia,
whereas marginal growth is to be expected in the Americas and considerable gains are likely in the EMEA
region. Such a trend is in line with our own estimates, according to which business involving trucks as well
as the corresponding engines and agricultural machinery in the European and NAFTA markets, which are of
major significance to us, should perform well or least steadily. We anticipate a global uptrend for construction
machinery.
Output of heavy commercial vehicles by region 2019e 2018e
Asia
EMEA1
Americas
2.3
0.6
0.7
2.4
0.6
0.7
0 0.5 1 1.5 2 2.5 Million units
1 Europe, Middle East and Africa Source: IHS Automotive

| 111| Group management report
Forecast
Business performance and future direction
For the global market of the electrical goods industry, the German Electrical and Electronic Manufacturers’
Association (ZVEI) projects growth of 4 percent this year, which will again be underpinned mainly by the
emerging countries. From today’s perspective, the sector will expand by 5 percent in Asia; by 4 percent in the
Americas and by 3 percent in Europe. The ZVEI forecasts a 3 percent increase for the German market. Among
the segments of importance to LEONI, electromedicine as well as measurement technology and process auto-
mation should slightly outperform the market. Other automation business and communications techno logy
are likely to expand in line with the overall market, while the information technology business is expected to
be a little weaker.
In the mechanical engineering sector, the German Engineering Federation (VDMA) anticipates a global sales
increase of 2 percent in 2019. This slower pace of growth is spread evenly by region: In both Germany and
the EU as a whole, just as in Japan and the United States, sales should increase by 2 percent. Only in China is
somewhat better growth of 3 percent to be expected.
Business performance and future direction
The LEONI Group’s business performance
LEONI regards itself as facing an uncertain economic setting this year, however especially major in-house
challenges. Alongside the extensive capital investment to fulfil existing orders as well as rising wage costs,
particularly so in Eastern Europe, the problematic start of a project in Mexico will also exert further strain
from today’s perspective. Against this backdrop, the Board of Directors projects LEONI’s 2019 consolidated
sales at about € 5.2 billion and consolidated EBIT before the impact of the VALUE 21 performance and
strategy programme to come to between € 100 million and € 130 million. Based on this planning for 2019, the
Company will not meet its previous medium-term targets for 2020.
The forecast is based on the following premises: The underlying macroeconomic conditions, the prices of the
most important commodities for the LEONI Group – for copper we have budgeted an average price of € 5.20
per kg – and exchange-rate parities should be in line with our expectations in 2019. For personnel costs we
estimate country-specific rates of increase, which are based on our many years of experience in these regions.
Possible acquisitions or divestments have not been taken into account.
Performance of the Wiring Systems Division
The external sales of the Wiring Systems Division will probably amount to around € 3.2 billion in 2019. For
EBIT we project a figure ranging from € 40 million to € 60 million. In months ahead, we shall be concentrating
on stabilising the division’s business especially at the new facility in Mexico, where we initially deployed a
group of experts to support the local team and rapidly raise efficiency. In addition, there is even more rigorous
cost discipline by way of tougher measures under the VALUE 21 programme.
Generally speaking, the Wiring Systems Division has good prospects especially involving products and solu-
tions for energy and data management in vehicles as well as in the electromobility segment. We will therefore
step up our activity in these areas further in 2019. The objectives also include more strategic partnerships in
the areas of high-voltage components and connectors, automation solutions and data cable production.
Group strategy ›› page 46 et seq.
Macroeconomic setting ›› page 109 et seq.

112 | www.leoni.com
1 Before VALUE21-related effects
We will be expanding our production capacity further this year to cover the numerous, pending customer
projects. The focus for capital investment will be on new plants and facility expansion in China, Mexico,
Serbia, Tunisia and Ukraine.
Performance of the Wire & Cable Solutions Division
The Wire & Cable Solutions Division has budgeted for external sales of about € 2.0 billion in fiscal 2019.
The segment’s EBIT should, from today’s perspective, amount to between € 60 million and € 70 million.
This division will also apply additional measures under the VALUE 21 programme to improve profitability.
Regardless of the currently difficult situation, we foresee good opportunities for the division by maintaining
and broadening our digitalization strategy as well as in the areas of autonomous driving and electromobility.
The Digital Solutions Group therefore plans to execute further LEONiQ key projects in 2019 to gain initial
contracts to series produce this intelligent cable solution. The corresponding strategic partnerships are to
be enhanced especially with respect to international marketing.
In 2019, we shall again expand our capacity to produce special automotive cables worldwide to bolster our
position as a major partner to the motor vehicle industry. We furthermore intend to set up production of
charging cables for electric vehicles in Mexico. Other investment focal points are the Factory of the Future,
which will go into operation this year, as well as production of customised cable solutions for the medical
technology sector in Germany.
Financial and asset situation
The financial and asset situation of the LEONI Group in 2019 will again be marked by the still heavy advance
spending on expanding the production network. With respect to free cash flow, we anticipate a figure at the
2018¹ level (including beneficial effect of the new IFRS 16 leasing standard). Liquidity remains assured thanks
to the concluded long-term finance and the extensive credit lines.
Procurement
Fiscal 2019 is likely to present another challenging situation on our procurement markets. As part of the
VALUE 21 programme launched at the end of 2018, we will comprehensively analyse and optimise our pur-
chasing and supplier structures this year.
Particularly in the Wiring Systems Division it will be a matter of ensuring supply globally despite the persisting,
heavy worldwide demand and simultaneously cutting costs. In the Wire & Cable Solutions Division, we will
furthermore work even harder division-wide in our cross-functional Category Teams on design-to-cost and
value-based engineering projects.

| 113| Group management report
Forecast
Business performance and future direction
1 Before VALUE21-related effects² Incl. positive IFRS 16-related effects
Employees
From today’s perspective and given steadily rising sales, the number of the LEONI Group’s employees will
increase further in 2019. New recruits will be required above all in the Wiring Systems Division in connection
with starting various project for our customers, especially in the Americas, Eastern Europe and North Africa.
The workforce in the Wire & Cable Solutions Division is to remain largely unchanged.
Research & Development
Development work in the Wiring Systems Division will continue to be aligned with our C.A.R.E.S. automotive
strategy in 2019. At the forefront of this will be broadening of the strategic partnership started in 2018 with
Diehl in the battery systems segment. The plans also include further developing through to market readiness
of intelligent system components for energy solutions as well as advancing the existing concepts for con-
nected mobility further and translating these into firm development projects. Another key area of attention
will be expanding and enhancing the partner network. In the Wire & Cable Solutions Division, the focus will
be on establishing more strategic collaboration agreements, especially to permanently improve skills and
penetrate the market for digital solutions involving LEONiQ. In the factory automation segment, we will
be working on, for example, products and solutions for industrial data intelligence to achieve data-based
increase in plant effectiveness, preventive maintenance and product optimisation.
Compliance
As part of the agenda to continually improve the Compliance Management System, work will continue in 2019
on interlinking the governance, risk and compliance functions as well as integrating compliance measures and
controls in existing business processes.
General statement on future growth
LEONI faces major, in-house challenges in 2019, especially so in its Wiring Systems Division. To master these,
we will forge ahead at full pace with and expand the measures initiated in 2018 to improve the earnings and
cash flow situation as part of our comprehensive performance and strategy-enhancement programme. The
Board of Directors estimates this year’s consolidated sales at about € 5.2 billion, EBIT of between € 100 million
and 130 million¹ as well as free cash flow at the 2018¹ level (including positive IFRS 16-related effects).
Notwithstanding the currently difficult earnings and cash flow situation, we still have good opportunities in
both divisions, based especially on our planned, further development towards being a systems provider for
intelligent data and energy management solutions.
LEONI Group forecast Actual
2018 figures
Forecast for 2019
Consolidated sales € billion 5.1 approx. 5.2
EBIT € million 144 100 – 130 ¹
Free cash flow € million (147) at pre-year level ¹,²

114 | www.leoni.com
Compensation report
This compensation report describes the main features of the system for compensating the members of
the Board of Directors and explains the structure as well as the amount of individual member income. Also
described are the details of benefits that have been promised to members of the Board of Directors for the
event of termination of their mandate as well as the principles for and amounts of compensation for members
of the Supervisory Board.
The compensation report follows the recommendations of the German Corporate Governance Code (GCGC
or Code) and contains disclosures required by the German Commercial Code (HGB), The German Accounting
Standard (DRS) and the International Financial Reporting Standards (IFRS).
Compensation for the Board of Directors
The Supervisory Board of LEONI AG diligently and regularly considers, pursuant to Section 87 of the German
Stock Corporation Act, the appropriateness of the compensation for members of the Board of Directors.
This involves discussion and inclusion in the review of the individual components and their effect on future
compensation for members of the Board of Directors. This analysis also comprises a comparison with DAX and
MDAX companies as well as consideration of the wage and salary structure within the Company. However,
it does not consider the ratio of Board of Directors compensation to the compensation for senior manage -
ment and the workforce as a whole, also over time, as provided for in Section 4.2.2 (2) Sentence 3 of Code.
The current Declaration of Conformity explains this deviation in detail.
Basic principles of the compensation system
The system for compensating the Board of Directors that is valid for the reporting period has been in force
since 1 January 2015 and applies until 31 December 2023. It is aimed towards establishing incentives for suc-
cessful and long-term business growth and increase in enterprise value, in which the members of the Board of
Directors are to participate. Exceptional performance is to be rewarded; any failure to meet targets is to result
in a considerable reduction of compensation.
In accordance with the Code, we hereinafter explain the principles of the system for compensating the mem-
bers of LEONI AG’s Board of Directors and the specific structure of the individual components. The table below
provides an overview of the structure and system:
Declaration of Conformity ›› page 30

| 115| Group management report
Compensation report
Compensation for the Board of Directors
Component Measurement basis Corridor Precondition for payment Payment
1. Fixed compensation Fixed salary, Benefits in kind / Fringe benefits
Function, responsibility, duration of Board membership, standard
Firmly agreed for the term of the contract
Contractual stipulation Monthly
2. Short-term compensation component Annual bonus
Task, performance, consolidated net income + EBIT margin
0 to 110 % [ Target fully met = 100 % ]
1-year planning, target attainment
100 % per annum in the subsequent year
3. Medium-term compensation component Multi-year bonus
Task, performance, consolidated net income
0 to 115 % [ Target fully met = 100 % ]
3-year planning, target attainment on a 3-year average at least 50 %
50 % in the 4th year
4. Long-term compensation component Long-term bonus, bonus account
Task, performance, EVA and share appreciation
0 up to cap; penalty rule
Contractual stipulation Once a year in the subsequent year; 50 % of which converted into LEONI shares with a 50-month holding period
5. Pension, disability and other benefits Accrued pension rights
Pensionable fixed salary years of service on the Board, defined-contribution plan
Fixed amount Retirement, disability
—
Fixed compensation
The fixed component is a firm, annual amount of basic compensation that is paid in equal monthly instal-
ments. As all the other compensation components are variable and can drop to nil, the fixed component is the
minimum amount of Board of Directors compensation. It is commensurate with the amounts paid by other
MDAX companies.
Variable components
In addition to the fixed compensation, there are three variable compensation components, each of which
have upper limits in absolute terms and can drop to nil. The weighting between the short and medium-term
components is approx. 50/50.
Short-term compensation component – annual bonus: An annual bonus will be assessed depending on
the net income generated, whereas amounts that exceed 110 percent (cap) of the net income budgeted in
the planning for the year will be disregarded. The assessed annual bonus can rise by another 10 percent
provided the Group generates an EBIT margin of more than 7.5 percent. Assessment of the annual bonus will
be discounted by 10 percent for EBIT margins that are less than 4.5 percent but not below 3.5 percent. Should
the Group generate an EBIT margin of less than 3.5 percent, the discount on the assessed annual bonus will
be 30 percent. In each year of the contract term the annual bonus will have an upper limit in absolute terms; it
will be paid in cash and can drop to nil.
Medium-term compensation component – multi-year bonus: The multi-year bonus is geared, depending
on the respective year’s net income, to the results of a three-year period, while amounts that exceed
115 percent (cap) of the budgeted annual net income amounts will be disregarded. Payment is made in the
fourth year after expiry of the three-year period and only if the (arithmetic) average degree of target attain-
ment for the three-year period is at least 50 percent.
116 | www.leoni.com
50 percent of the annual amount will be paid in the respective subsequent year as an instalment. If the (arith-
metic) average degree of target attainment for the three-year period of at least 50 percent is not achieved, the
multi-year bonus is forfeited in full, meaning that instalments already paid must be refunded. The multi-year
bonus thus conforms to the sustainability requirement set out in both the VorstAG and the Code. In each year
of the contract term the multi-year bonus will have an upper limit in absolute terms; it will be paid in cash and
can drop to nil.
Long-term compensation component: A long-term compensation component that takes adequate account
of the economic value added (EVA) and the Company’s market capitalisation is intended to further strengthen
sustained, positive business performance. It is, for one financial year, paid up to a contractually agreed cap.
Any excess is retained in a bonus account and serves as credit for the subsequent period. If the Company’s
performance is negative in a financial year, this will be charged to any credit in the bonus account, which
can drop to nil. If the long-term compensation component for a financial year does not reach the cap, it will
be topped up with any credit held in the bonus account. Of the gross amount paid out, 50 percent must
be invested in LEONI shares that must be retained for a period of 50 months, thereby conforming to the
48-month minimum holding period prescribed by the VorstAG.
Absolute upper limit: The total compensation, which is the sum of the fixed, short-term, medium-term and
long-term components, has, as do the short-term, medium-term and long-term components themselves, an
absolute upper limit for each member of the Board of Directors in each year of their contract term.
The total compensation is commensurate with that paid by other MDAX companies and other companies of
similar size. It takes account of both good and poor performance. Furthermore, the individual components
do not tempt the Board of Directors to take inappropriate risk. An internationally recognised compensation
expert oversaw the preparation of the compensation structure and confirmed its conformity with the legisla-
tion including the Code. The Supervisory Board assured itself of the expert’s independence. In summary, it
may be concluded that compensation for the members of LEONI’s Board of Directors meets the requirements
of both the VorstAG and Code and is set up for sustainability.
Pension, disability and other benefits
In the event of temporary work incapacity due to illness or other reasons, for which the member of the Board
of Directors is not responsible, the compensation will, depending on the contractual agreement, continue to
be paid for a period of nine months, at most up to termination of the employment contract.
Provided this has been agreed based on an individual contract, there is a pension commitment to the member
of the Board of Directors. This commitment encompasses disability, surviving dependents’ and retirement
benefits. Specifically, this means that:
In the event of permanent work incapacity, the member of the Board of Directors will receive a disability pen-
sion. If the member of the Board of Directors dies, the surviving dependents will be paid pensions.

| 117| Group management report
Compensation report
Compensation for the Board of Directors
For plans up to the end of 2014 there is, following the end of their 65th (or 63rd with agreed discounts) year of
age, an entitlement to payment of retirement benefits, which are computed according to the period of service
on the Board of Directors and the pensionable fixed salary. Pensionable is defined as a contractually agreed
proportion of the final fixed salary.
An age-related and surviving dependents’ defined contribution pension is granted for plans from
1 September 2018. This involves, in the case of first-time plans, there being for each member of the Board
of Directors an absolute limit to the benefit to be paid for each year of the contract term. The retirement
benefit system is set up in such a way that the standard retirement age is 67 years and at the earliest 63 years
subject to accepting discounts on the pension. In the event of being incapacitated, the member of the Board
of Directors will receive a disability pension if his/her contract of employment terminates as a consequence
of disability after their Board of Directors service contract has come into force and before the end of their
63rd year of age.
The disability and other benefits granted to members of LEONI AG’s Board of Directors are also commensurate
with those of other MDAX companies.
Miscellaneous
Severance payments upon premature termination of Board of Directors duties in the absence of a material
reason are limited to two years’ compensation and shall not be more than the annual compensation for the
balance of the employment contract (severance cap pursuant to the Code).
In the event of a change of control, the members of the Board of Directors have, so far as contractually agreed,
the right to terminate for material reason and shall be entitled to severance payment. This is limited to a maxi-
mum of three years’ compensation (150 percent of the severance cap pursuant to the Code) and shall even in
this event not exceed the annual compensation for the balance of the employment contract.
Cost of compensation in 2018
The compensation for members of the Board of Directors is presented in line with the reference tables of the
Code. This involves differentiation between the benefits granted to members of the Board of Directors on the
one hand and what is paid to them on the other hand.

118 | www.leoni.com
¹ For the 2018 financial year, the member of the Board of Directors used his right to convert his entitlement to a performance-related bonus payment to enlarge a personal pension by deferring compensation into entitlement to a corporate age-related and surviving dependents’ defined benefit pension in the form of a direct commitment. The service costs were therefore increased by this amount.
Aldo Kamper President / CEO
(from 1 September 2018)
Dieter Bellé President / CEO
(until 31 January 2018)
Martin Stüttem Member of the Board of Directors
(from 1 April 2017)
Bruno Fankhauser Member of the Board of Directors
(from 1 February 2016)
Karl Gadesmann Chief Financial Officer / CFO
(from 1 October 2016)
Total
2017 2018 2017 2018 2017 2018 2017 2018 2017 2018 2017 2018
GRANTED BENEFITS € ‘000 min max min max min max min max min max
1. Total compensation pursuant to GCGC
Components not performance-related
Fixed compensation 250 250 250 750 63 63 63 338 475 475 475 450 475 475 475 450 475 475 475 1,988 1,738
Fringe benefits 22 22 22 35 3 3 3 23 27 27 27 45 47 47 47 24 25 25 25 127 124
Total 272 272 272 785 66 66 66 360 502 502 502 495 522 522 522 474 500 500 500 2,114 1,862
Performance-related components (targets)
Short-term compensation component (100 %) 255 255 309 500 46 46 46 366 532 0 672 488 532 0 672 488 532 0 672 1,841 1,897
Medium-term compensation component (100 %) 270 270 311 508 48 48 48 511 552 0 634 521 552 0 634 552 552 0 634 2,092 1,974
Long-term compensation component (100 %) 133 133 133 400 33 33 33 113 200 0 200 150 200 0 200 150 200 0 200 813 766
Total 658 658 753 1,408 127 127 127 989 1,284 0 1,506 1,159 1,284 0 1,506 1,189 1,284 0 1,506 4,745 4,637
Service costs 125¹ 125 125 562 107 107 107 0 0 0 0 0 0 0 0 0 0 0 0 562 232
Total compensation pursuant to GCGC 1,055 1,055 1,150 2,755 300 300 300 1,349 1,786 502 2,008 1,654 1,806 522 2,028 1,664 1,784 500 2,006 7,421 6,731
2. Reconciliation of the compensation from GCGC to IFRS (Expenses)
Total compensation pursuant to GCGC 1,055 2,755 300 1,349 1,786 1,654 1,806 1,664 1,784 7,421 6,731
Short-term compensation component: – Target (100 %) + actual compensation
(255) 255
(500)550
(46)46
(366)402
(532)190
(488) 536
(532)190
(488) 536
(532)190
(1,841)2,025
(1,897)870
Medium-term compensation component: – Target (100 %) + entitlement to compensation based on actual target attainment – Income from repayments and reversal of provisions
(270)255
0
(508)575
0
(48)48
0
(511) 420
0
(552)271
0
(521) 561
0
(552)271
0
(552) 561
0
(552)271
0
(2,092)2,117
0
(1,974)1,116
0
Long-term compensation component: – Target pursuant to GCGC + actual expenses for the financial year – Income from reversal of provisions
(133)133
0
(400)433
0
(33)33
0
(113)544
0
(200)0
(400)
(150) 350
0
(200)0
(200)
(150) 550
0
(200)0
(400)
(813)1,877
0
(766)166
(1,000)
Settlement for premature contract termination 0 1,138 0 0 0 0 0 0 0 1,138 0
Expenses of the compensation pursuant to IFRS 1,040 4,042 300 1,727 562 1,942 782 2,121 561 9,832 3,246
3. Reconciliation of the compensation from GCGC to HGB (Art. 314)
Total compensation pursuant to GCGC 1,055 2,755 300 1,349 1,786 1,654 1,806 1,664 1,784 7,421 6,731
Short-term compensation component: – Target (100 %) + actual compensation
(255)255
(500)550
(46)46
(366) 402
(532)190
(488) 536
(532)190
(488) 536
(532)190
(1,841)2,025
(1,897)870
Medium-term compensation component: – Target (100 %) + entitlement to compensation based on actual target attainment – compensation components for which the condition precedent has not yet been fulfilled + compensation components for which the condition precedent has been fulfilled
(270)255
0
0
(508)575
0
0
(48)48
0
0
(511) 420
(420)
0
(552)271
(271)
0
(521)
561
(561)
0
(552)
271
(271)
0
(552) 561
(561)
0
(552)271
(271)
0
(2,092)2,117
(1,542)
0
(1,974)1,116
(813)
0
Long-term compensation component: ± deviation from the target – service costs
0(31)
0 (562)
0 (107)
0 0
(200) 0
0 0
(200)0
0 0
(200) 0
0(562)
(600)(138)
Compensation pursuant to HGB (Art. 314) 1,009 2,310 193 875 691 1,181 711 1,161 690 5,526 3,295
ALLOCATIONS € ‘000
Components not performance-related
Fixed compensation 250 750 63 338 475 450 475 450 475 1,988 1,738
Fringe benefits 22 35 3 23 27 45 47 24 25 127 124
Total 272 785 66 361 502 495 522 474 500 2,114 1,862
Performance-related components (actual figures)
Short-term compensation component 255 550 46 402 190 536 190 536 190 2,025 870
Medium-term compensation component 128 575 48 210 135 280 135 280 135 1,346 581
Long-term compensation component 133 400 33 113 0 150 0 150 0 813 166
Total 516 1,525 127 725 325 967 325 967 325 4,183 1,618
Service costs 125¹ 562 107 0 0 0 0 0 0 562 232
Total compensation pursuant to GCGC 913 2,872 300 1,085 827 1,461 847 1,441 825 6,859 3,711

| 119| Group management report
Compensation report
Compensation for the Board of DirectorsAldo Kamper President / CEO
(from 1 September 2018)
Dieter Bellé President / CEO
(until 31 January 2018)
Martin Stüttem Member of the Board of Directors
(from 1 April 2017)
Bruno Fankhauser Member of the Board of Directors
(from 1 February 2016)
Karl Gadesmann Chief Financial Officer / CFO
(from 1 October 2016)
Total
2017 2018 2017 2018 2017 2018 2017 2018 2017 2018 2017 2018
GRANTED BENEFITS € ‘000 min max min max min max min max min max
1. Total compensation pursuant to GCGC
Components not performance-related
Fixed compensation 250 250 250 750 63 63 63 338 475 475 475 450 475 475 475 450 475 475 475 1,988 1,738
Fringe benefits 22 22 22 35 3 3 3 23 27 27 27 45 47 47 47 24 25 25 25 127 124
Total 272 272 272 785 66 66 66 360 502 502 502 495 522 522 522 474 500 500 500 2,114 1,862
Performance-related components (targets)
Short-term compensation component (100 %) 255 255 309 500 46 46 46 366 532 0 672 488 532 0 672 488 532 0 672 1,841 1,897
Medium-term compensation component (100 %) 270 270 311 508 48 48 48 511 552 0 634 521 552 0 634 552 552 0 634 2,092 1,974
Long-term compensation component (100 %) 133 133 133 400 33 33 33 113 200 0 200 150 200 0 200 150 200 0 200 813 766
Total 658 658 753 1,408 127 127 127 989 1,284 0 1,506 1,159 1,284 0 1,506 1,189 1,284 0 1,506 4,745 4,637
Service costs 125¹ 125 125 562 107 107 107 0 0 0 0 0 0 0 0 0 0 0 0 562 232
Total compensation pursuant to GCGC 1,055 1,055 1,150 2,755 300 300 300 1,349 1,786 502 2,008 1,654 1,806 522 2,028 1,664 1,784 500 2,006 7,421 6,731
2. Reconciliation of the compensation from GCGC to IFRS (Expenses)
Total compensation pursuant to GCGC 1,055 2,755 300 1,349 1,786 1,654 1,806 1,664 1,784 7,421 6,731
Short-term compensation component: – Target (100 %) + actual compensation
(255) 255
(500)550
(46)46
(366)402
(532)190
(488) 536
(532)190
(488) 536
(532)190
(1,841)2,025
(1,897)870
Medium-term compensation component: – Target (100 %) + entitlement to compensation based on actual target attainment – Income from repayments and reversal of provisions
(270)255
0
(508)575
0
(48)48
0
(511) 420
0
(552)271
0
(521) 561
0
(552)271
0
(552) 561
0
(552)271
0
(2,092)2,117
0
(1,974)1,116
0
Long-term compensation component: – Target pursuant to GCGC + actual expenses for the financial year – Income from reversal of provisions
(133)133
0
(400)433
0
(33)33
0
(113)544
0
(200)0
(400)
(150) 350
0
(200)0
(200)
(150) 550
0
(200)0
(400)
(813)1,877
0
(766)166
(1,000)
Settlement for premature contract termination 0 1,138 0 0 0 0 0 0 0 1,138 0
Expenses of the compensation pursuant to IFRS 1,040 4,042 300 1,727 562 1,942 782 2,121 561 9,832 3,246
3. Reconciliation of the compensation from GCGC to HGB (Art. 314)
Total compensation pursuant to GCGC 1,055 2,755 300 1,349 1,786 1,654 1,806 1,664 1,784 7,421 6,731
Short-term compensation component: – Target (100 %) + actual compensation
(255)255
(500)550
(46)46
(366) 402
(532)190
(488) 536
(532)190
(488) 536
(532)190
(1,841)2,025
(1,897)870
Medium-term compensation component: – Target (100 %) + entitlement to compensation based on actual target attainment – compensation components for which the condition precedent has not yet been fulfilled + compensation components for which the condition precedent has been fulfilled
(270)255
0
0
(508)575
0
0
(48)48
0
0
(511) 420
(420)
0
(552)271
(271)
0
(521)
561
(561)
0
(552)
271
(271)
0
(552) 561
(561)
0
(552)271
(271)
0
(2,092)2,117
(1,542)
0
(1,974)1,116
(813)
0
Long-term compensation component: ± deviation from the target – service costs
0(31)
0 (562)
0 (107)
0 0
(200) 0
0 0
(200)0
0 0
(200) 0
0(562)
(600)(138)
Compensation pursuant to HGB (Art. 314) 1,009 2,310 193 875 691 1,181 711 1,161 690 5,526 3,295
ALLOCATIONS € ‘000
Components not performance-related
Fixed compensation 250 750 63 338 475 450 475 450 475 1,988 1,738
Fringe benefits 22 35 3 23 27 45 47 24 25 127 124
Total 272 785 66 361 502 495 522 474 500 2,114 1,862
Performance-related components (actual figures)
Short-term compensation component 255 550 46 402 190 536 190 536 190 2,025 870
Medium-term compensation component 128 575 48 210 135 280 135 280 135 1,346 581
Long-term compensation component 133 400 33 113 0 150 0 150 0 813 166
Total 516 1,525 127 725 325 967 325 967 325 4,183 1,618
Service costs 125¹ 562 107 0 0 0 0 0 0 562 232
Total compensation pursuant to GCGC 913 2,872 300 1,085 827 1,461 847 1,441 825 6,859 3,711

120 | www.leoni.com
The ‘granted benefits’ table presents, in the compensation for members of the Board of Directors pursuant to
GCGC, which benefits the members would have been granted for 100 percent target fulfilment and which
individually attainable upper and lower limits would have applied. This total compensation (GCGC) would
have corresponded to an amount of € 6,731 k in fiscal 2018 (previous year: € 7,421 k). As this involves budgeted
figures that would only have been matched in the event of 100 percent target fulfilment, these figures must
be reconciled with the business performance that actually occurred and conditions precedent. A distinction
must be made here between reconciliation of the compensation (pursuant to GCGC) with IFRS and with
Section 314 of the German Commercial Code (HGB). Any corresponding adjustment amounts versus the
budgeted figures pertaining to all variable compensation components are reported in these reconciliations.
This then results in the actually granted benefits pursuant to IFRS or Section 314 HGB.
The compensation pursuant to IFRS in the financial year amounted to € 3,246 k in 2018 (previous year:
€ 9,832 k) and pursuant to Section 314 HGB consequently to € 3,295 k (previous year: € 5,526 k).
The change in compensation pursuant to IFRS and HGB is attributable especially to the lower payment of vari-
able compensation components for 2018 in contrast to 2017. The compensation pursuant to IFRS additionally
reflects the settlement payment (provision in 2017) made to Dieter Bellé due to the premature termination of
his contract and the absence in large part of his compensation in 2018.
The termination agreement reached between LEONI AG and Mr Dieter Bellé provides for a further settlement
payment to Mr Bellé after the end of his period of office in the amount of € 3,222.9 k (salary up the regular
end of his period of office on 31/12/2019) in the event that no claims are asserted against Mr Bellé or the D&O
insurer due to the CEO fraud, or it is established by a judicial decision with the authority of res judicata that
there are no claims for compensation to be asserted against Mr Bellé due to the CEO fraud. The further settle-
ment payment will not come to bear in the event of a settlement between the Company and the D&O insurer.
The 'receipts’ table shows what cash amounts the members of the Board of Directors received or will receive
from the individual compensation components according to the GCGC. In total, the members of the Board
of Directors will be paid compensation for their service on the Board of € 3,711 k for the 2018 financial year
(previous year: € 6,859 k). Other compensation comprises the non-monetary benefits in the use of company
cars and top-ups on insurance policies.
The fiscal 2018 expense for Board of Directors members’ disability and other benefits excluding deferred
compensation amounted to € 138 k (previous year: € 562 k). The defined benefit obligation came to € 41 k
(previous year: € 6,362 k). The individual figures are presented in the table below.
Pension commitments (excl. deferred compensation) € ‘000
Service costs Defined benefit obligation
2017 2018 2017 2018
Dieter Bellé 1 562 107 6,362 0
Aldo Kamper 2 31 0 41
Total 562 138 6,362 411 Commitment to payment of an age-related, disability and surviving dependents’ pension, which is computed according to the pensionable fixed salary. From 2018, the defined benefit obligation is presented under the details for former members of the Board of Directors.² Commitment to payment of a disability pension, which is computed according to the fixed salary.

| 121| Group management report
Compensation report
Supervisory Board compensation
The disability and other benefit expenses in principle comprise service costs and past service costs pursuant
to IFRS. The defined benefit obligation (DBO) corresponds to the scope of obligations pursuant to IFRS.
Supervisory Board compensation
The Articles of Association govern compensation for members of the Supervisory Board. A system of fixed
compensation has applied for members of LEONI AG’s Supervisory Board since 1 January 2013. It stipulates a
fixed amount of € 85 k per ordinary member of the Supervisory Board. The chairperson receives double this
amount and the deputy chairpersons receive one and a half times the amount. The compensation for commit-
tee work (Personnel, Audit, Strategy and Nomination Committees) comes to € 8 k per ordinary member and to
€ 16 k per committee chairperson. It is paid only if the committee meets at least once in the year. Attendance
of Supervisory Board and Audit Committee meetings will be paid for in the amount of € 1,000 per meeting and
Supervisory Board member, with a maximum of ten meetings to be taken into consideration per financial year.
The maximum overall compensation possible for Supervisory Board members including committee work and
attendance money comes to € 1,534 k.

122 | www.leoni.com
Cost of compensation in 2018
€ ‘000
Fixed compensation
(net)Attendance
money
Compensation for committee
work Other Total
Dr Klaus Probst 1 2018 170 10 32 0 212
2017 109 8 32 0.2 149
Dr Werner Rupp 2 2018 0 0 0 0 0
2017 58 5 48 0.1 111
Franz Spieß 3 2018 128 10 16 0.0 154
2017 128 10 16 0.4 154
Prof. Dr-Ing. Klaus Wucherer 4 2018 0 0 0 0 0
2017 47 3 32 0 82
Dr Werner Lang 5 2018 128 6 16 0 150
2017 112 9 21 0.1 142
Gabriele Bauer 6 2018 0 0 0 0 0
2017 31 4 16 — 51
Dr Elisabetta Castiglioni 7 2018 85 7 8 2.9 103
2017 54 4 8 2.4 69
Wolfgang Dehen 7 2018 85 7 16 0 108
2017 54 5 16 0 75
Mark Dischner 7 2018 85 7 8 0.0 100
2017 54 5 8 0.3 68
Dr Ulrike Friese-Dormann 2018 85 7 0 1.5 93
2017 85 6 0 1.0 92
Josef Häring 6 2018 0 0 0 0 0
2017 31 4 0 — 35
Ingrid Hofmann 6 2018 0 0 0 0 0
2017 31 3 8 — 42
Karl-Heinz Lach 2018 85 7 8 0 100
2017 85 9 8 0.2 102
Richard Paglia 2018 85 10 16 — 111
2017 85 10 16 — 111
Prof. Dr Christian Rödl 2018 85 10 16 — 111
2017 85 10 16 — 111
Carmen Schwarz 7 2018 85 5 8 0.1 98
2017 54 3 8 0.3 66
Helmut Wirtz 6 2018 0 0 0 0 0
2017 31 4 8 1.2 44
Inge Zellermaier 7 2018 85 7 0 0 92
2017 54 5 0 0 59
Total 2018 1,190 93 144 5 1,432
2017 1,189 107 261 6 1,563
Addition of the individual payments in € thousands may deviate from the reported totals due to rounding.1 Chairman of the Supervisory Board from 11/05/2017 2 Chairman of the Supervisory Board until 03/05/20173 1st Deputy Chairman of the Supervisory Board 4 2nd Deputy Chairman of the Supervisory Board until 11/05/20175 2nd Deputy Chairman of the Supervisory Board from 11/05/20176 Member of the Supervisory Board until 11/05/2017 7 Member of the Supervisory Board from 11/05/2017

| 123| Group management report
Disclosures pursuant to Sections 289a (1) and 315a (1) of the German Commercial Code (HGB) as well as explanatory report for fiscal 2018
Disclosures pursuant to Sections 289a (1) and 315a (1) of the German Commercial Code (HGB) as well as explanatory report for fiscal 2018
Composition of the share capital: The Company’s share capital amounted to € 32,669,000.00 on 31 Decem-
ber 2018 (previous year: € 32,669,000.00). This is divided into 32,669,000 registered no-par-value shares. The
shares are paid up in full. According to Article 4 2) of the Articles of Association, the shareholder’s right to
securitise his, her or its shareholding is precluded so far as securitisation is not required under the rules of a
stock market on which the shares are then admitted. With respect to LEONI AG, Section 67 (2) sentence 1 of
the German Stock Corporation Act defines as shareholders only those persons or entities entered in the share
register.
All shares are subject to the same rights and obligations. The individual rights and obligations of the share-
holders are stipulated by the requirements of the German Stock Corporation Act, especially so its Sections 12,
53a et seq., 118 et seq. and 186.
Constraints concerning the voting rights or the transfer of shares: Each share provides one vote at the
Annual General Meeting and is key to the shareholders’ share of the profit. Treasury shares held by the
Company, from which the Company does not derive any rights, are excluded from this principle. In the cases
described in Section 136 of the German Stock Corporation Act, the voting rights of the affected shares are
nullified by law. Infringements of reporting obligations as defined by Sections 33 (1, 2), 38 (1) and 39 (1) of the
German Securities Trading Act (WpHG) may, under Section 44 of the German Securities Trading Act, lead to
rights from shares and also the voting right not existing, at least temporarily.
LEONI AG is not aware of any other constraints affecting voting rights, especially so any contractual con-
straints. Legal requirements apply to the exercise of voting rights by shareholder associations as well as by
financial institutions and persons otherwise granted proxy. In particular, Section 135 of the German Stock
Corporation Act (AktG) applies.
Transfer constraints exist in so far as shares that members of the Board of Directors and executives receive or
have received in the context of a long-term incentive programme are subject to a holding period of 50 months.
LEONI AG has not received report or become otherwise aware of any shareholdings, either direct or indirect,
that exceed 10 percent of the voting rights.
Nor are there any shares with special entitlements that grant control rights.
The control of voting rights in the case of shareholding employees who do not directly exercise their
control rights: So far as employees are shareholders, they are entitled to directly exercise the control rights
associated with their shares in accordance with the Articles of Association and the law.

124 | www.leoni.com
Statutory provisions and rules in the Articles of Association on the appointment and recall of members
of the Board of Directors and on changes to the Articles of Association: The appointment and recall of
members of the Board of Directors is governed by Sections 84 and 85 of the German Stock Corporation Act
as well as in Section 31 of Germany’s Co-determination Act. Pursuant to Article 5 (1) of the Articles of Associa-
tion, the Board of Directors has at least two members. Furthermore, pursuant to Article 5 (2) sentence 1 of the
Articles of Association, the Supervisory Board appoints the members of the Board of Directors and determines
their number. It is entitled to appoint deputy members of the Board of Directors as well as a chairperson and a
deputy chairperson of the Board of Directors (Article 5 (2) sentence 2, 3 of the Articles of Association).
Sections 119 (1) no. 5 and 179 (1) of the German Stock Corporation Act stipulate that any amendment of
the Articles of Association requires a shareholder resolution at the Annual General Meeting. Pursuant to
Section 179 (1) sentence 2 of the German Stock Corporation Act and Article 19 of the Articles of Association,
the Supervisory Board is entitled to adopt amendments and additions to the Articles of Association that
pertain only to that version. Furthermore, the Supervisory Board is authorised pursuant to Art. 4 (5), subpara. 5
of the Articles of Association to amend the version of the Articles of Association in line with the exercise
either in full or in part of an increase in share capital by exercise of authorised capital 2017 and after expiry of
the term of authorisation. Furthermore, the Board was authorised by a shareholder resolution at the Annual
General Meeting on 7 May 2015 to amend the Articles of Association in line with the respective utilisation of
authorised capital 2015 and after expiry of the term of authorisation.
The Annual General Meeting adopts its resolutions by a simple majority of votes and, to the extent that a
majority of shares is required, with a simple majority of shares, unless bindingly provided otherwise by law or
by the Articles of Association or by Section 103 (1) P. 2 of the German Stock Corporation Act (Article 16 (3 P. 3)
of the Articles of Association). Therefore, shareholder resolutions at the Annual General Meeting that amend
the Articles of Association also require, in addition to a simple majority of the votes, the majority of the share
capital represented upon adoption of the resolution, provided no greater majority is required by law.
Powers of the Board of Directors to issue or buy back shares:
Purchase of treasury shares – The Company’s Board of Directors is authorised, in the cases stipulated in
Section 71 of the German Stock Corporation Act, to buy back own shares and to sell shares bought back. A
shareholder resolution at the Annual General Meeting on 7 May 2015 pursuant to Section 71 (1) section 8 of
the German Stock Corporation Act authorised the Board of Directors of LEONI AG, with the approval of the
Supervisory Board, until 6 May 2020 to acquire own shares accounting for a pro-rated amount of the share
capital totalling no more than 10 percent of the existing share capital at the time of this authorisation taking
effect or – if this amount is smaller – at the time when this authorisation is exercised. At no time may the total
of shares acquired by virtue of this authorisation and other shares of the Company already acquired and still
held by the Company or attributable to it pursuant to Sections 71d and 71e of the German Stock Corporation
Act (AktG) exceed 10 percent of the Company’s share capital. The purchase may also be made through entities
that are dependent on or are majority-owned by the Company or by third parties for the account of an entity
that is dependent on or majority-owned by the Company. Such purchase may only be made via the stock
market or by means of a public purchase offer made to all shareholders and must satisfy the principle of equal
treatment of the shareholders. The authorisation may be used in full or several partial amounts spread across

| 125| Group management report
Disclosures pursuant to Sections 289a (1) and 315a (1) of the German Commercial Code (HGB) as well as explanatory report for fiscal 2018
several purchase times. The Board of Directors is authorised to use the treasury shares acquired on the basis of
this authorisation for all legally permitted purposes, including those stated in the authorisation. Shareholders
at the Annual General Meeting authorised the Board of Directors to do as follows with the shares acquired on
the basis of this authorisation:
1. To resell them through means other than the stock market or by offer to all shareholders, on condition that
the acquired shares are sold for cash and at a price that is not significantly lower than the market price for
Company shares of the same category at the time of sale. This authorisation to exercise is limited to shares
accounting for a pro-rated amount of the share capital totalling no more than 10 percent of the Company’s
share capital, neither at the time of this authorisation taking effect nor – if this amount is smaller – at the
time when this authorisation is exercised. Further details are contained in the authorisation granted by the
Annual General Meeting.
2. To transfer them to third parties provided this is done for the purpose of acquiring businesses, parts of
businesses or shares in businesses or other assets or for executing business combinations.
3. To fulfil subscription or conversion rights, which arise from exercise of option or conversion rights or ful-
filment of option exercise or conversion obligations, which were granted or imposed as part of the issue of
warrant-linked or convertible bonds, profit-sharing rights or participating bonds (or combinations of these
instruments) of the company or its group companies.
4. To transfer them to employees of the Company or to employees or board members of subordinated,
affiliated companies within the meaning of Sections 15 et seq. of the German Stock Corporation Act.
5. To redeem them without any further resolution by the Annual General Meeting. Any such redemption may
also be carried out without a reduction of capital by adjusting the pro-rata share of the other no-par-value
shares in the Company’s share capital. In this case, the Board of Directors is authorised to adjust the number
of no-par-value shares stated in the Articles of Association.
6. To pay a scrip dividend.
If the acquired treasury shares are used for one of the purposes stated in Fig. 1 to 4 of this section, shareholders’
rights to subscribe shall be excluded. If the acquired treasury shares are used for the purpose stated in Fig. 6,
the Board of Directors is authorised to exclude the right to subscribe. If the acquired treasury shares are sold
via the stock market, there is no shareholders’ right to subscribe either. In the event of disposal of acquired
treasury shares by means of a public offer to the shareholders, which is made based on upholding the principle
of equal treatment, the Board of Directors is authorised to exclude the subscription right of shareholders for
fractional amounts.
The Board of Directors may make use of the authorisations in Fig. 1 to 4 and 6 only with the approval of the
Supervisory Board. The Supervisory Board may furthermore stipulate that the Board of Directors’ measures on
the basis of this authorisation are executed only with its approval.

126 | www.leoni.com
No use of this authorisation has been made to date. The Company did not hold any treasury shares on
31 December 2018, nor did it on 31 December 2017.
Authorised capital – The Board of Directors is authorised pursuant to Article 4 (5) of the Articles of Associa-
tion to increase the Company’s share capital by up to €16,334,500.00 on or before 10 May 2022 with the
Supervisory Board’s approval by issuing up to 16,334,500 new bearer shares, each with a pro-rated share
of €1.00 in the share capital, on a cash and/or non-cash basis once or repeatedly (authorised capital 2017).
Shareholders must be granted a right to subscribe. However, the Board of Directors is authorised pursuant
to Art. 4 (5) subpara. 2 of the Articles of Association, with the approval of the Supervisory Board, to rule out
shareholders’ subscription rights in the cases of:
1. A capital increase for cash, if the issue price of the new shares is not materially – within the meaning of
Section 203 (1) and (2), Section 186 (3) sentence 4 of the German Stock Corporation Act – below the market
price of already market-listed shares of the Company of the same type and with the same status at the time
the issue price is set, which is to take place as soon as possible after the new bearer shares are placed. This
exclusion of the subscription rights shall in total not exceed 10 percent of the Company’s share capital, with
the lowest amount of Company share capital at the following three times being decisive: on 11 May 2017,
at the time this authorisation comes into effect or at the time it is exercised. More detail is contained in
Article 4 (5) subpara. 2 (first bullet) of the Articles of Association.
2. A capital on a non-cash basis, especially to be able to offer new shares to third parties in the context of
business combinations or furthermore for the purpose (also indirect) of acquiring businesses, operations,
parts of businesses or shares in businesses or other assets or rights to acquire assets including receivables
from the company or its group subsidiaries.
3. If this is necessary to grant the holders of convertible bonds and/or warrant-linked bonds or participation
rights that were or will be issued by the Company or by its direct or indirect group companies a subscription
right to new shares to the extent of their entitlement after the exercise of the conversion or option right or
after fulfilment of the conversion obligation.
4. In order to exclude fractional amounts from the right of subscription.
The pro-rated amount of the share capital accounted for by the shares to be issued while excluding the
shareholders’ subscription rights shall in total not exceed 10 percent of the Company’s existing share capital
at the time the resolution is passed at the Annual General Meeting. More detail is contained in Article 4 (5)
subpara. 3 of the Articles of Association.

| 127| Group management report
Disclosures pursuant to Sections 289a (1) and 315a (1) of the German Commercial Code (HGB) as well as explanatory report for fiscal 2018
Contingent capital – The Board of Directors is authorised, based on the shareholder resolution at the Annual
General Meeting on 7 May 2015 and Article 4 (6) of the Articles of Association, with the approval of the
Supervisory Board, until 6 May 2020 once or several times to issue warrant-linked or convertible bonds, profit-
sharing rights or participating bonds (or combination of these instruments; collectively referred to as ‘bonds’)
with a total par value of up to € 500,000,000 and to grant the holders the respective partial debentures with
the same rights warrant-linked or conversion rights for registered Company shares with a pro-rated amount
of the share capital totalling up to € 6,533,800.00 in accordance with the warrant-linked or convertible bond
terms. More detail is contained in the authorisation resolution.
The legal right to subscribe to bonds is granted to shareholders in the manner that the bonds are taken on by
a bank or the members of a banking syndicate or by a company of equal standing as defined by Section 186
(5) Sentence 1 of the German Public Stock Corporation Act (AktG) with the obligation that they be offered
to shareholders for subscription. The Board of Directors is authorised, however, with the approval of the
Supervisory Board to:
1. Exempt maximum amounts, which might arise due to the subscription ratio, from the subscription right of
the shareholders and also to exclude subscription right to the extent required so that holders of previously
issued bonds with warrant-linked or conversion rights, or warrant-linked or conversion obligations may be
granted right to subscription in the amount that would be due to them after exercising their warrant-linked
or conversion rights, or fulfilling their warrant-linked or conversion obligations as shareholders.
2. Fully exclude the right of shareholders to subscribe to bonds issued for cash, with warrant-linked or
conversion rights or with warrant-linked or conversion obligations if the Board of Directors concludes,
after due examination, that the issue price of the bonds does not fall substantially below their theoretical
market value, calculated in accordance with recognised, particularly financial mathematical methods. This
authorisation to exclude the subscription right shall apply to bonds with warrant-linked / conversion rights
or warrant-linked / conversion obligations for shares accounting for a pro-rated amount of the share capital
totalling no more than 10 percent of the Company’s share capital, neither at the time of the authorisation
taking effect nor – if this amount is smaller – at the time when the authorisation is exercised. This upper
limit of 10 percent of the share capital is reduced by the pro-rated amount of the share capital accounted
for by those shares issued or sold during the term of this authorisation while excluding the subscription
right pursuant to or in accordance with Section 186 (3) sentence 4 of the German Stock Corporation Act;
the other details being contained in the authorisation resolution.
3. So far as profit sharing rights or participating bonds are issued without warrant-linked rights / conversion
rights or warrant-linked / conversion obligations, shareholder subscription rights may be excluded entirely
if these profit sharing rights or participating bonds are structured in the same way as bonds, i.e. they do not
provide any membership rights in the company, they do not grant any share of liquidation proceeds and
the yield is not calculated on the basis of the amount of net income, the distributable profit or the dividend.

128 | www.leoni.com
In this case the interest and the issue amount of the profit sharing rights or participating bonds must also
correspond with the market terms prevailing at the time of the issue. An issue of bonds that excludes
subscription rights under this authorisation may only be exercised so far as the amount of the new shares
to be issued on the basis of such bonds, together with the shares that are issued by the Company during
the term of this authorisation under another authorisation with exclusion of the shareholders’ right to
subscribe, or are to be issued on the basis of such bonds during the term of this authorisation and exclusion
of the shareholders’ right to subscribe, must not exceed 20 percent of the Company’s current share capital
at the time this authorisation takes effect.
The Company’s share capital was divided by up to € 6,533,800 into as many as 6,533,800 registered (no-par-
value) shares (contingent capital 2015). The contingent capital increase is only to be performed to the extent
that option and/or conversion rights are exercised, or that those obliged to exercise the option and/or convert
have met their option exercise and/or conversion obligation, or so far as the Company exercises its right under
such instruments either entirely or partially to grant shares in the Company instead of paying the cash amount
due and provided no other forms of fulfilment are used. More detail is contained in Article 4 (6) of the Articles
of Association.
Agreements of the Company that are conditional upon a change of control as a result of a takeover bid:
In the event of a change of control as a result of a takeover bid, the borrower’s note loans placed in 2012,
2013 and 2015, which were still held in the total amount of € 305 million on 31 December 2018, as well as the
other loan agreements may be called in immediately. Likewise, the lenders involved in the borrower’s note
loans placed in 2018 in the total amount of € 331 million can, in the event of a change of control, reclaim their
respective shares of the loan, however, at the Company’s request, not until after a negotiation period of up to
60 days has expired.
Under the 2018 syndicated loan agreement providing a revolving credit facility in the total amount of
€ 750 million, the lenders are entitled to terminate and require repayment in the event of a change of control.
Similar to the borrower’s note loans placed in 2018, this termination right cannot, if the Company’s so
requests, be exercised until after a negotiation period of up to 60 days has expired.
The right to termination and repayment pertaining to the loans concerned is, under both the borrower’s note
loans placed in 2018 and the syndicated loan agreement, afforded to each lender individually for their respec-
tive share of the loan or facility. Under the syndicated loan agreement, each lender individually is furthermore
entitled, following a change of control, to refuse to pay out any further loans (with the exception of cashless
roll-over loans).
Furthermore, in the event of a change of control, some of the major customers, suppliers as well as other joint
venture partners also have the right to terminate contractual agreements with the Company prematurely.

| 129| Group management report
Disclosures pursuant to Sections 289a (1) and 315a (1) of the German Commercial Code (HGB) as well as explanatory report for fiscal 2018
Agreements on compensation that the Company has reached with members of the Board of Directors or
staff for the event of a takeover bid: The service contracts of two members of the Board of Directors contain
a change-of-control clause. In the event that the Company receives notification pursuant to Article 33 (1)
sentence 1 of the German Securities Trading Act (WpHG) whereby the party obliged to report declares that
they have reached or exceeded 30 percent or 50 percent of the voting rights in the Company, or notification pur-
suant to Article 35 WpHG stating that a shareholder has taken control of the Company as defined by Article 29
WpHG, the corresponding member of the Board of Directors is entitled to terminate his or her contract of
employment with a notice period of three months to the end of the calendar month and to resign from his
or her office as a member of the Board of Directors with the same notice period. The Board member is in this
case entitled to payment of a settlement for the remaining term of his or her contract of employment. This is
to be based on an amount of annual compensation that comprises (1) the average fixed compensation of the
most recently ended and the current financial year, (2) the average annual bonus for the most recently ended
financial year and the annual bonus budgeted for the current financial year, (3) the average of the notional
annual bonus from the most recently ended financial year and the notional annual bonus budgeted for the
current financial year as well as (4) the average of the share bonus for the most recently ended financial year
and 80 percent of the maximum payable amount for the share bonus of the current financial year. Such settle-
ment is limited to three years’ compensation and shall not exceed the annual compensation for the balance of
the employment contract. There shall be no entitlement to a settlement if the change of control takes effect
within twelve months prior to the start of the corresponding Board of Directors member’s retirement, or the
service contract would automatically have ended within the next six months regardless of a change of control,
or if the Company extraordinarily terminates the contract for good cause. More information is to be found in
the compensation report. Compensation report ›› page 114 et seq.
Aldo Kamper Bruno Fankhauser Karl Gadesmann Martin Stüttem
Nuremberg, 22 February 2019
LEONI AG
The Board of Directors


Consolidated financial statements
| 131

132 | www.leoni.com
Consolidated financial statements
Consolidated income statement 133
Consolidated statement of comprehensive income 134
Consolidated statement of cash flows 135
Consolidated statement of financial position 136
Consolidated statement of changes in equity 137
Notes 138
Scope of consolidation 226
Independent auditor’s report 228
Responsibility statement 236

| 133| Consolidated financial statements
Consolidated income statement
€ ‘000 01/01/ to 31/12/ Notes 2018 2017
Sales 5,101,123 4,925,297
Cost of sales (4,284,953) (4,102,067)
Gross profit on sales 816,170 823,230
Selling expenses (264,214) (243,448)
General and administration expenses (285,721) (273,264)
Research and development expenses (150,248) (129,088)
Other operating income [ 6 ] [ 7 ] 29,774 45,734
Other operating expenses [ 6 ] (24,714) (18,844)
Result from associated companies and joint ventures [ 19 ] 23,206 22,842
EBIT 144,253 227,162
Finance revenue [ 8 ] 545 1,011
Finance costs [ 8 ] (24,060) (26,117)
Other income from share investments 184 167
Income before taxes 120,922 202,223
Income taxes [ 9 ] (47,677) (56,715)
Net income 73,245 145,508
attributable to: Equity holders of the parent company 75,626 146,607
Non-controlling interests (2,381) (1,099)
Earnings per share (basic and diluted) in Euro [ 30 ] 2.31 4.49
Weighted average shares outstanding (basic and diluted) [ 30 ] 32,669,000 32,669,000¹Prior-year figures adjusted
Consolidated income statement

134 | www.leoni.com
€ ‘000 01/01/ to 31/12/ Notes 2018 2017
Net income 73,245 145,508
Other comprehensive income
Items that cannot be reclassified to the income statement:
Actuarial gains or losses on defined benefit plans 11,592 9,042
Income taxes applying to items of other comprehensive income that are not reclassified 489 (335)
Share of the actuarial gains and losses that pertain to associates and joint ventures 15 32
Items that can be reclassified to the income statement:
Cumulative translation adjustments
Losses and gains arising during the period (852) (38,882)
Less reclassification adjustments included in the income statement 0 (1,914)
Total cumulative translation adjustments (852) (40,796)
Cash flow hedges
Gains and losses arising during the period 8,389 4,322
Less reclassification adjustments included in the income statement (1,668) 10,525
Less reclassification adjustments in the statement of financial position (6) 101
Total cash flow hedges 6,715 14,948
Parts of the items that can be reclassified to the income statement, which pertain to associates and joint ventures
(21) (823)
Income taxes applying to items of other comprehensive income that are reclassified (471) (3,409)
Other comprehensive income (after taxes) [ 10 ] 17,467 (21,341)
Total comprehensive income 90,712 124,167
attributable to: Equity holders of the parent company 93,068 125,773
non-controlling interests (2,356) (1,606)1 Prior-year figures adjusted
Consolidated statement of comprehensive income

| 135| Consolidated financial statements
Consolidated statement of comprehensive income
Consolidated statement of cash flows
Consolidated statement of cash flows
€ ‘000 01/01/ to 31/12/ 2018 2017 ¹
Net income 73,245 145,508
Adjustments to reconcile cash provided by operating activities:
Income taxes 47,677 56,715
Net interest 23,298 23,263
Dividend income (168) (183)
Depreciation and amortisation 158,590 149,524
Impairment of non-current assets 6,830 2,780
Non-cash result from associated companies and joint ventures (23,222) (22,826)
Result of asset disposals (10,147) (1,892)
Effect of deconsolidation (1,086) (24,256)
Change in operating assets and liabilities
Change in receivables and other financial assets (40,130) (71,622)
Change in inventories (12,594) (86,141)
Change in other assets (82,696 (22,754)
Change in restructuring provisions (3,567) (15,660)
Change in other provisions (6,761) (10,497)
Change in liabilities 60,481 160,574
Income taxes paid (49,264) (39,695
Interest paid (6,972) (4,475
Interest received 283 296
Dividends received 17,715 5,982
Cash flows from operating activities 151,512 244,641
Capital expenditures for intangible assets and property, plant and equipment (315,681) (275,195)
Acquisitions of subsidiaries less assumed cash and cash equivalents 0 (1,139
of which: Purchase price € 0 k (previous year: € 3,479 k)
Assumed cash and cash equivalents 0 T€ (previous year: € 2.340 k)
Cash receipts from disposal of assets 17,267 6,105
Income from the disposal of a business operation / subsidiaries less cash and cash equivalents paid 0 36,653
thereof: Disposal proceeds € 0 k (previous year: € 53.740 k)
Cash and cash equivalents paid € 0 k (previous year: € 17.087 k)
Cash flows from capital investment activities (298,414 (233,576
Cash receipts from acceptance of financial debts 763,180 102,297
Cash repayments of financial debts (588,720) (105,516)
Payments to non-controlling interests 45 0
Interest paid (13,677 (15,308)
Dividends paid by LEONI AG (45,737 (16,335)
Dividends paid for non-controlling interests 0 (1,024)
Cash flows from financing activities 115,091 (35,886
Change of cash and cash equivalents (31,811) (24,821)
Currency adjustment (1,519) (7,395)
Cash and cash equivalents at beginning of period 185,084 217,300
of which carried on the balance sheet under the item ‘assets held for sale’ 0 8,387
of which carried on the balance sheet under the item ‘cash and cash equivalents’ 185,084 208,913
Cash and cash equivalents at end of period 151,754 185,084
¹ Prior-year figures adjusted

136 | www.leoni.com
Consolidated statement of financial position
Assets € ‘000 Notes 31/12/2018 31/12/2017 ¹
Cash and cash equivalents 151,754 185,084
Trade accounts receivable and other financial assets [ 12 ] 673,655 648,082
Other assets [ 13 ] 170,326 124,842
Receivables from income taxes 19,084 11,171
Inventories [ 14 ] 609,290 596,696
Contract assets [ 6 ] 95,181 102,112
Total current assets 1,719,290 1,667,987
Property, plant and equipment [ 15 ] 1,206,316 1,052,337
Intangible assets [ 16 ] 75,871 64,486
Goodwill [ 18 ] 140,221 146,682
Shares in associated companies and joint ventures [ 19 ] 33,359 34,059
Contract assets [ 6 ] 78,762 60,535
Other financial assets 6,452 7,349
Deferred taxes [ 10 ] 56,136 50,220
Other assets 145,121 60,943
Total non-current assets 1,742,238 1,476,611
Total assets 3,461,528 3,144,598
Equity and liabilities € ‘000 Notes 31/12/2018 31/12/2017
Current financial debts and current proportion of long-term financial debts [ 20 ] 176,550 254,373
Trade accounts payable and other financial liabilities [ 21 ] 1,084,343 974,884
Income taxes payable 22,218 25,541
Other current liabilities [ 22 ] 190,169 188,592
Provisions [ 23 ] 24,538 33,404
Total current liabilities 1,497,818 1,476,794
Long-term financial debts [ 20 ] 587,880 336,947
Long-term financial liabilities 29,860 27,585
Other non-current liabilities 10,605 11,716
Pension provisions [ 24 ] 158,904 170,792
Other provisions [ 23 ] 35,509 33,298
Deferred taxes [ 10 ] 59,514 45,580
Total non-current liabilities 882,272 625,918
Share capital [ 25 ] 32,669 32,669
Additional paid-in capital [ 25 ] 290,887 290,887
Retained earnings [ 25 ] 806,742 782,263
Accumulated other comprehensive income (54,797) (72,239)
Equity holders of the parent company 1,075,501 1,033,580
Non-controlling interests 5,937 8,306
Total equity [ 25 ] 1,081,438 1,041,886
Total equity and liabilities 3,461,528 3,144,5981 Prior-year figures adjusted

| 137| Consolidated financial statements
Consolidated statement of financial position
Consolidated statement of changes in equity
Consolidated statement of changes in equity
Accumulated other comprehensive income
€ ‘000 Share capital
Additionalpaid-incapital
Retainedearnings
Cumulativetranslation
adjustmentsCash flow
hedges
Actuarial gains
and losses
Equityholders ofthe parent
company
Non- controlling
interests Total
31 December 2016 32,669 290,887 635,243 84,906 (14,914) (121,352) 907,439 9,725 917,164
Adjustment IFRS 15 16,748 (45) 16,703 16,703
1 January 20171 32,669 290,887 651,991 84,861 (14,914) (121,352) 924,142 9,725 933,867
Net income 146,607 146,607 (1,099) 145,508
Other comprehensive income (41,111) 11,539 8,738 (20,834 ( 507) (21,341)
Total comprehensive income 125,773 (1,606) 124,167
Dividend payment (16,335) (16,335) (1,024) (17,359)
Purchase of non- controlling interests 1,342 1,342
Disposal of non- controlling interests (131) (131)
31 December 20171 32,669 290,887 782,263 43,750 (3,375) (112,614) 1,033,580 8,306 1,041,886
31 December 20171 32,669 290,887 782,263 43,750 (3,375) (112,614) 1,033,580 8,306 1,041,886
Adjustment IFRS 9 (5,410 (5,410) (58) (5,468)
1 January 2018 32,669 290,887 776,853 43,750 (3,375) (112,614) 1,028,170 8,248 1,036,418
Net income 75,626 75,626 (2,381 73,245
Other comprehensive income ( 898) 6,244 12,096 17,442 25 17,467
Total comprehensive income 93,068 (2,356) 90,712
Dividend payment (45,737) (45,737) 0 (45,737)
Payment to non-controlling interests 45 45
31 December 2018 32,669 290,887 806,742 42,852 2,869 (100,518) 1,075,501 5,937 1,081,4381 Prior-year figures adjusted

138 | www.leoni.com
Notes
Principles
LEONI AG (‘LEONI’, the ‘Group’ or the ‘Company’) was founded in Germany under the name of Leonische
Werke Roth-Nürnberg, Aktiengesellschaft by an agreement dated 23 April 1917 and was entered in the
commercial register on 2 February 1918. LEONI AG is registered with the District Court of Nuremberg under
number HRB 202. The Company is based in Nuremberg, at Marienstrasse 7. The Group’s principal activities are
described in Note 5.
These consolidated financial statements of LEONI AG have been prepared based on Section 315a of the German
Commercial Code (HGB – “Consolidated Financial Statements pursuant to the International Financial Report-
ing Standards“) in accordance with the International Financial Reporting Standards (IFRS) and the associated
interpretations (SIC/IFRIC interpretations) as obliged to by Directive (EU) no. 1606/2002 of the European
Parliament and of the Council concerning the adoption of international accounting standards in the European
Union. The term IFRS also covers the still valid International Accounting Standards (IAS).
LEONI AG’s consolidated financial statements on 31 December 2018 have been prepared in euros. Except
where stated otherwise, all amounts are presented in thousands of euros (“€ k”). The balance sheet is struc-
tured by term, while the income statement is prepared using the function of expense method. The statement
of comprehensive income is issued in two related presentations. Where the balance sheet and income state-
ment items are summarised to improve clarity of presentation, they are shown separately in the Notes.
The accounting and valuation methods applied in the consolidated financial statements on 31 December 2018
are in line with those of the previous year with the exception of the new IFRS requirements applied for the first
time in the 2018 financial year. These are explained under Note 2.
The Board of Directors on 22 February 2019 authorised the presented consolidated financial statements for
the year ended 31 December 2018 for submission to the Supervisory Board.
The consolidated financial statements will be published in the electronic Federal Gazette (Bundesanzeiger)
under number HRB 202.

| 139| Consolidated financial statements
Notes
Principles
1 | Principles of consolidation as well as summary of key accounting and valuation methods
1 | Principles of consolidation as well as summary of key accounting and valuation methods
The consolidated financial statements have been prepared on a historical cost basis, except for derivative
financial instruments and financial assets in the form of debt and equity instruments as well as contingent
considerations (previous year: available-for-sale financial assets), which are measured at fair value.
Principles of consolidation
The consolidated financial statements include the accounts of LEONI AG and of all subsidiaries that are either
directly or indirectly controlled by LEONI AG. The Group controls an investee when it is exposed, or has rights,
to variable returns from its involvement with the investee and can affect those returns through its power over
the investee. In particular, the Group controls an investee if, and only if, it has all the following elements: ■ power over the investee, i.e. the Group has existing rights that give it the ability to direct the relevant activi-
ties (the activities that significantly affect the investee’s returns) ■ exposure, or rights, to variable returns from its involvement with the investee ■ the ability to use its power over the investee to affect the amount of the investor’s returns
If facts or circumstances indicate that one or several of the three elements of control have changed, the Group
must reassess whether it controls an investee.
Subsidiaries are fully consolidated from the time of acquisition, i.e. from the time when the Group has acquired
control over the subsidiary. Inclusion in the consolidated financial statements ends as soon as LEONI no longer
has control. A change in the ownership share of a subsidiary is, without loss of control, accounted for as an
equity transaction. Losses are allocated to the non-controlling interests even when this results in a negative
balance.
The financial statements of the subsidiaries are prepared using uniform accounting policies on the same
balance sheet date as the financial statements of the parent company. All intercompany balances, income,
expenses as well as unrealised profits, losses and dividends from intercompany transactions are eliminated in
full.
All business combinations are accounted for using the acquisition method based on applying the require-
ments of IFRS 3. The cost of an acquisition is measured as the aggregate of the consideration transferred,
measured at acquisition date fair value and the amount of any non-controlling interest in the acquiree. For
each business combination, the acquirer measures the non-controlling interest in the acquiree either at fair
value or at the proportionate share of the acquiree’s identifiable net assets.
Acquisition-related costs are expensed.

140 | www.leoni.com
Any contingent consideration to be transferred by the acquirer will be recognised at fair value at the acquisi-
tion date. Subsequent changes in the fair value of a contingent consideration, which is deemed to be an asset
or liability, will be recognised in accordance with IFRS 9 (previous year: IAS 39) either in profit or loss or in
other comprehensive income. If the contingent consideration is classified as equity, it should not be remeas-
ured until it is finally settled within equity.
If the business combination is achieved in stages, the acquisition date fair value of the acquirer’s previously
held equity interest in the acquiree is remeasured to fair value at the acquisition date through profit or loss.
Goodwill arises and is upon initial consolidation measured at cost if the consideration transferred and the
amount recognised for non-controlling interest exceeds the fair value of the net identifiable assets acquired
and liabilities assumed. If this transferred consideration is lower than the fair value of the net assets of the sub-
sidiary acquired, the difference is recognised in profit or loss. After goodwill is first accounted for, it is tested
for impairment according to IAS 36 at least once a year, which may lead to an impairment loss (impairment-
only approach).
Shares in associated companies and joint ventures
It is an associated business when LEONI can exert significant influence over its operating and financial poli-
cies but does not control or jointly control the decision-making processes. This is in principle the case when
between 20 and 50 percent of the voting rights are held.
A joint venture is a joint arrangement whereby the parties that have joint control of the arrangement have
rights to the net assets of the joint venture. Joint control is the contractually agreed sharing of control of an
arrangement, which exists only when decisions about the relevant activities require the unanimous consent of
the parties sharing control.
The considerations to determine significant influence or joint control are comparable with those to determine
control of subsidiaries.
Shares in associated companies and in joint venture companies are accounted for under the equity method.
The shares are valued with their purchase price on the acquisition date, which is increased or reduced respec-
tively in the subsequent periods for any changes in net assets of the company such as the proportionate share
of net income or loss and by received dividends. The proportionate net income or loss is determined using
the accounting policies described in this Note. In line with the treatment of fully consolidated subsidiaries,
the goodwill included in the carrying amount of companies accounted for under the equity method is no
longer amortised either. Instead of a test for impairment of equity method goodwill, the whole investment

| 141| Consolidated financial statements
Notes
Principles
1 | Principles of consolidation as well as summary of key accounting and valuation methods
accounted for under the equity method is reviewed for impairment according to IAS 36, provided there are
indications according to IFRS 9 (previous year: IAS 39) of additional impairment loss. The Group determines on
each balance sheet date whether there are objectively discernible indications that the investment in an associ-
ated company or joint venture might be impaired. If this is the case, the difference between the fair value of
the investment and the carrying amount is expensed as an impairment loss.
The financial statements of the associates and of the joint ventures are prepared using uniform accounting
policies on the same balance sheet date as the financial statements of the parent company.
Foreign currency translation
These consolidated financial statements are prepared in the presentation currency, the euro, which is the
functional currency of the group parent company, LEONI AG. The financial statements of the foreign subsidi-
aries included in the consolidated financial statements with a functional currency other than the euro, are,
under IAS 21, translated into the Group currency, the euro, according to the functional currency concept.
The functional currency of the individual subsidiaries is the currency of the primary economic environment
in which the company operates. The financial statements prepared in the respective functional currency of
the subsidiary are translated using the closing rate method, i.e. the assets and liabilities are translated from
the functional currency to the presentation currency at the closing exchange rate on the balance sheet date,
while the statements of income are translated using annual average exchange rates (arithmetic average of
the monthly average exchange rates). Any differences arising from the translation of assets and liabilities
compared with the previous year’s translation as well as translation differences between the income state-
ment and the statement of financial position are recorded in other comprehensive income. On the disposal of
a foreign operation, the cumulative amount of the exchange differences in the other comprehensive income
relating to that foreign operation is recognised in the income statement when the gain or loss on disposal is
recognised.
A foreign currency transaction, i.e. a transaction entered into by a consolidated company in a currency other
than its functional currency, is recorded, on initial recognition in the functional currency, by applying to the
foreign currency amount the spot exchange rate between the functional currency and the foreign currency
at the date of the transaction. In the subsequent periods, monetary assets and liabilities are revalued using
the closing rate at each balance sheet date. The resulting currency differences are recorded in the income
statement. Non-monetary items are still carried at the transaction rate, or, if they are measured at fair value
in a foreign currency are translated using the exchange rates at the date when the fair value was determined.
Exchange gains or losses that arise from measurement of monetary, principally intra-group items are allocated
to operating income (EBIT) to the extent that they involve exchange gains or losses directly related to an
operating transaction.

142 | www.leoni.com
The exchange rates of the companies material to the consolidated financial statements have changed as
follows:
Average exchange rate at balance sheet date 1 euro in foreign currency units
Country Currency ISO Code 31/12/2018 31/12/2017
Brazil Real BRL 4.45010 3.96950
China Renminbi Yuan CNY 7.88650 7.79810
United Kingdom Pound GBP 0.89680 0.88730
Korea Won KRW 1,277.90000 1,278.52000
Mexico Peso MXN 22.53000 23.59000
Poland Zloty PLN 4.29900 4.17600
Romania Leu RON 4.66300 4.65930
Russian Federation Rubel RUB 79.95000 69.32000
Switzerland Swiss Franc CHF 1.12700 1.17000
USA Dollar USD 1.14570 1.19900
Annual average exchange rate 1 euro in foreign currency units
Country Currency ISO Code 2018 2017
Brazil Real BRL 4.29960 3.62362
China Renminbi Yuan CNY 7.81497 7.62873
United Kingdom Pound GBP 0.88586 0.87470
Korea Won KRW 1,295.12231 1,275.59538
Mexico Peso MXN 22.68872 21.44338
Poland Zloty PLN 4.26069 4.25723
Romania Leu RON 4.65537 4.57129
Russian Federation Rubel RUB 73.87808 66.04808
Switzerland Swiss Franc CHF 1.15243 1.11315
USA Dollar USD 1.18044 1.13048
Measurement of fair value
The Group measures various assets at their fair value on each balance sheet date. Fair value is the price that an
entity would receive to sell an asset or be paid to transfer a liability in an orderly transaction between market
participants at the measurement date. When measuring fair value, it is assumed that the business transaction
takes place either on the principal market or, if there is no principal market, on the most advantageous market
for the asset or the liability. The Group must have access to the principal market or the most advantageous
market.
The fair value of an asset or a liability is measured on the assumptions on which market participants would
base their pricing of the asset or the liability. This assumes that the market participants act in their best busi-
ness interest.
A fair value measurement of a non-financial asset takes account of the market participant’s ability, through
the asset's highest and best use or through its sale to another market participant who finds the asset's highest

| 143| Consolidated financial statements
Notes
Principles
1 | Principles of consolidation as well as summary of key accounting and valuation methods
and best use, to generate economic benefit. The Group applies valuation techniques appropriate in the circum-
stances and for which sufficient data are available to measure fair value, maximising the use of observable
inputs and minimising the use of unobservable inputs.
All assets and liabilities for which fair value is ascertained or presented in the financial statements are catego-
rised into the fair value hierarchies described hereinafter, based on the lowest level input that is significant to
the entire measurement of fair value:
Level 1: (Non-adjusted) prices quoted in active markets for identical assets or liabilities
Level 2: A valuation technique whereby the lowest level input that is significant to the entire measurement of
fair value is directly or indirectly observable on the market
Level 3: A valuation technique whereby the lowest level input that is significant to the entire measurement of
fair value is not observable on the market
In the case of assets and liabilities that are recognised in the financial statements on a recurring basis, the
Group ascertains whether any reclassification of the hierarchy levels has taken place by, at the end of each
reporting period, reviewing the classification based on the lowest level input that is significant to the entire
measurement of fair value.
The services of outside appraisers are used in some individual cases to value significant assets as well as such
significant liabilities as contingent considerations. The Group analyses as at each reporting date the value
of assets and liabilities that must, in accordance with the Group’s accounting policies, be remeasured or
re assessed. This analysis involves a review of the significant inputs that were applied to the previous valuation.
Revenue recognition
LEONI generates revenues with products and services for energy and data management in the automotive
sector and other industries. Income from contracts with customers is recognised when control of the goods
or services is transferred to the customer. Such sales revenues are as a matter of principle recognised in
the amount of the consideration to which the Group expects to be entitled in exchange for those goods or
services.
Income from the sales of goods in the Wire & Cable Solutions Division is recognised at the time when control
is transferred to the customer.
The granted payment terms are normally 30 to 90 days from the date of delivery.
In the Wiring Systems Division, sales revenues are generated from development work performed prior to sup-
plying customers in the car and commercial vehicle industry and subsequent series production and supply,
each of which represent separate performance obligations.

144 | www.leoni.com
The products supplied are typically customised, i.e. made to order within master agreement arrangements,
without any option for alternative use. The master agreement covers the period of series production (approx.
5 – 7 years), but a binding commitment in the sense of an enforceable right to supply a specific quantity is
not created until the customer places an order. Together with the respective order, the master agreement
represents the contract within the meaning of IFRS 15.9. Without contractual minimum order quantities there
is only one transaction price for the current order.
When determining the transaction price, the Group considers the impact of variable considerations in the
form of discounts and possibly considerations to be paid to a customer in the form of nomination fees.
With some customers, LEONI has an enforceable right to payment for the performance completed to date. The
conditions for revenue and income recognition over a period of time are thereby met. Revenue and income
for the goods concerned are consequently recognised over a period of time, together with presentation under
contract assets.
If LEONI does not have an enforceable right to payment for the performance completed to date, the sales
revenues are recognised at the time when control is transferred to the customer. This is generally the case
upon delivery of the products. The payment terms granted within the framework of series supply are normally
30 to 120 days from the date of delivery.
Payments that have a direct, causal link with obtaining of the contract and represent an anticipated discount
for future business volume (known as nomination fees) are capitalised and presented under other assets. The
capitalised amount is recognised using the agreed unit numbers to reduce revenue.
The development services performed by the Wiring Systems Division prior to series supply are also provided
over a period of time as the customer receives the benefit from the Group’s service and simultaneously makes
use of it. To determine progress versus complete fulfilment of its performance obligation, LEONI applies an
input-based method together with presentation under contract assets. The estimate of variable compensation
for development services in the form of partial or full amortisation via the parts price of the series is limited to
the total of costs without margin due to the immanent project risks.
The existing warranty obligations qualify as assurance type warranties and therefore do not constitute sepa-
rate performance obligations. They are therefore accounted for according to the rules for other provisions.

| 145| Consolidated financial statements
Notes
Principles
1 | Principles of consolidation as well as summary of key accounting and valuation methods
Interest and dividend income
Interest income is recognised as interest accrues. By using the effective interest rate method this means that
the interest income recognised is the amount produced by using the effective interest rate. This is the rate
that exactly discounts estimated future cash flows through the expected life of the financial instrument to the
net carrying amount of the financial asset. Interest income from financial assets that are held for the purposes
of liquidity management is presented under finance revenues.
Dividend income is recognised when the shareholder’s right to receive payment is established.
Research and development costs
Research costs are expensed as incurred.
Development costs are expensed as incurred unless they relate to customer-specific development contracts
accounted for pursuant to IFRS 15, or they meet the criteria of IAS 38 for capitalisation as an intangible asset.
Government grants
A government grant is recognised when there is sufficient assurance that the grant will be received and
that the enterprise will comply with the conditions attaching to it. Expense-related grants are recognised as
income on a systematic basis over the periods necessary to match them with the associated costs. Grants for
an asset are deducted from the cost of the asset.
Factoring
Some trade receivables, mainly from carmakers and their suppliers, are sold to factoring companies to realise
cash receipts early. Such receivables are derecognised from the consolidated balance sheet at the time of
sale because the risk of default is transferred to the purchaser. The security deposit assessed by the factor is
recognised in current other financial assets. The liabilities from cash receipts for sold receivables are reported
under other financial liabilities.
Reverse factoring
Reverse factoring transactions are used to finance suppliers in connection with copper procurement. These
agreements are used mainly to take advantage of longer payment terms. There is no effect, however, either in
terms of recognition or under civil law that would entail reclassification of the trade liabilities to another type
of liability on the balance sheet.

146 | www.leoni.com
Inventories
Inventories encompass raw materials, production supplies and goods purchased as well as work in progress
and finished goods. They are stated at the lower of cost and the net realisable value. Raw materials, produc-
tion supplies as well as goods purchased are evaluated at cost using the weighted average cost formula or
at the lower net realisable value on the balance sheet date. The net realisable value is computed based on
the estimated selling price in the normal course of business less the estimated costs of completion and the
estimated costs necessary to make the sale. Costs of conversion of work in progress and finished products
comprise, alongside the direct costs of production material and production wages, proportionate material
and production overhead costs based on standard capacity.
Property, plant and equipment
Property, plant and equipment is, upon initial recognition, valued at cost. Attributable borrowing costs
are capitalised as part of the cost of a qualifying asset pursuant to IAS 23. A qualifying asset is an asset that
necessarily takes a substantial period of time to get ready for its intended use. Government grants for capital
investments reduce the cost of those assets for which the grant was awarded. In the subsequent periods,
property, plant and equipment is carried at cost less accumulated depreciation. It is depreciated over its prob-
able economic life. Immovable assets are mostly depreciated on a straight-line basis and movable assets are,
depending on their type of use, depreciated using either the straight-line method or, if so required by their
actual use, the declining method. When carrying out larger-scale maintenance, the costs are recognised in the
carrying amount of the item of property, plant or equipment, provided that recognition criteria are met.
The following useful lives are assumed for depreciation:
Buildings and facilities max. 50 years
Machinery and equipment max. 15 years
Factory and office equipment max. 10 years
Computer hardware 3 – 5 years
Leased installations are depreciated on a straight-line basis over the respective shorter period of the term of
the lease or the estimated ordinary useful life.
A property, plant or equipment is derecognised either when it is disposed of or when no further economic
benefit is to be expected from either the use or disposal of the asset. The gains or losses resulting from
derecognition are determined as the difference between the net disposal proceeds and the carrying amount
and are, in the period in which the asset is derecognised, recorded in the income statement.
The residual values of the assets, useful lives and depreciation methods are reviewed at the end of the finan-
cial year, and if necessary adjusted.

| 147| Consolidated financial statements
Notes
Principles
1 | Principles of consolidation as well as summary of key accounting and valuation methods
Contract assets
A contract asset is the entitlement to consideration in exchange for goods or services that were transferred to
a customer. If LEONI fulfils its contractual obligations by transferring goods or services to a customer before
the customer pays the consideration or before the payment is due, a contract asset is recognised for the
contingent entitlement to consideration.
Leases
Leases are classified as either finance or operating. Leasing transactions whereby LEONI is the lessee and bears
all substantial risks and rewards typical of ownership from use of the leased asset are accounted for as finance
leases. Accordingly, the lessee capitalises the leased asset and records the corresponding lease obligation
on the balance sheet at the fair value of the leased property or, if lower, at the present value of the minimum
lease payments. The leased asset is depreciated over its economic life. If there is no reasonable certainty at the
beginning of the lease that the Group will obtain ownership, the leased asset is depreciated in full over the
shorter of the two periods of the expected useful life and the term of the lease. Lease payments are appor-
tioned between the finance charges and reduction of the lease liability so as to achieve a constant rate of
interest on the remaining balance of the liability. Finance charges are recognised in the income statement. All
other leasing agreements entered into by LEONI, as a lessee, are accounted for as operating leases. The lease
payments are expensed on a straight-line basis over the lease term.
Whether an arrangement contains a lease is determined based on the arrangement’s economic substance
at the time it was concluded and requires an assessment whether meeting the contractual arrangement
depends on the use of a certain asset or certain assets and whether the arrangement gives the right to use the
asset.
Intangible assets
Intangible assets comprise patents, software, licenses and similar rights, as well as customer relationships,
brands, technology and production know-how acquired in the context of business combinations. An intan-
gible asset that results from development expenditure is capitalised if a newly developed product or process
can be clearly defined, is technically feasible and is intended for either own use or for sale. Capitalisation also
assumes that the development expenses can with a sufficient degree of likelihood be covered with future
inflow of cash and cash equivalents and the other IAS 38.57 criteria are met.
Intangible assets acquired separately are, upon initial recognition, valued at cost. The costs of intangible
assets acquired as part of business combinations equal their fair values as at the date of acquisition. In the
subsequent periods, intangible assets are carried at their cost less any accumulated depreciation and any
accumulated impairment losses. Measurement in the subsequent periods should differentiate between
intangible assets with a finite useful life and with an indefinite useful life.

148 | www.leoni.com
According to IAS 38, intangible assets with a finite useful life must be amortised over their useful life. The
Company therefore, in accordance with these requirements, amortises development costs capitalised as
assets on a straight-line basis and amortises other intangible assets with a finite useful life on a straight-line
basis over their useful lives to their estimated residual values, which is normally nil. Other intangible assets
with a finite useful life are mainly software licenses with an estimated useful life of three to 10 years as well
as customer relationships with useful lives of two to 23 years as well as technology and production know-
how with a useful life of two to 15 years, in both cases acquired in the context of business combinations. The
amortisation method and the amortisation period for an intangible asset with a finite useful life are reviewed,
at least, at the end of each financial year. Any changes to the amortisation method and the amortisation
period due to revision of the expected useful life or the expected use of the asset’s future economic benefit
are treated as changes in estimates.
According to IAS 38, intangible assets with an indefinite useful life have no longer been amortised; instead such
intangible assets must, according to IAS 36, be reviewed for impairment at least annually and written down
to their lower recoverable amount. The review is carried out as at 31 October of each year according to the
same principles as in the case of goodwill. The remarks below therefore apply accordingly. Intangible assets
with an indefinite useful life are reviewed once a year to determine whether the estimate of assessment of an
indefinite useful life is still justified. If this is not the case, the assessment is prospectively changed from an
indefinite to a definite useful life. LEONI recorded brands acquired in the context of business combinations as
intangible assets with an indefinite useful life.
Intangible assets are derecognised when they are disposed of or when no further economic benefit is to be
expected from either their use or disposal.
Goodwill
Goodwill from a business combination is, upon initial recognition, measured at cost calculated as the excess of
the transferred consideration over the identifiable assets acquired and liabilities assumed. After initial recogni-
tion, goodwill is measured at the acquisition cost less any accumulated impairment losses.
Goodwill is not amortised; instead it is in line with the requirements of IAS 36 reviewed for impairment at
least once a year. The Group reviews the goodwill for impairment annually as at 31 October. A review also
takes place if events or circumstances indicate that there might be an impairment loss. For the purpose of
the impairment test, goodwill acquired in the context of a business combination is, from the acquisition date,
to be allocated to the Group’s cash-generating units expected to benefit from the synergies of the busi-
ness combination. This applies regardless of whether other assets or liabilities of the acquired business are
allocated to these cash-generating units. Goodwill is tested at the level of the cash-generating unit to which

| 149| Consolidated financial statements
Notes
Principles
1 | Principles of consolidation as well as summary of key accounting and valuation methods
it is allocated by comparing the carrying amount of the cash-generating unit or units with the recoverable
amount. Impairment has occurred if the carrying amount exceeds the recoverable amount, requiring a write-
down to the recoverable amount. The recoverable amount corresponds to the higher of the two amounts
from the fair value less cost to sell and value in use. The value in use of a cash-generating unit is defined as the
present value of projected cash flows to the Company from the cash-generating unit. To determine the value
in use, the projected cash flows are discounted to their present value based on a discount rate before tax that
reflects current market assessments of the time value of money and the risks specific to the cash-generating
unit. An appropriate valuation model is applied to determine the fair value less cost to sell. This is based on
valuation multiples, discounted cash-flow valuation models, stock market prices and other available indicators
of the fair value.
Later reversal based on disappearance of the reason for a goodwill impairment recorded in previous financial
years or interim reporting periods is not permitted.
Impairment testing of intangible assets and of property, plant and equipment
An assessment is made at each balance sheet date whether there are any indications that an impairment loss
may have occurred. If there are such indications, the recoverable amount of the asset is determined and com-
pared with its carrying amount. The system for and effects of this review are in line with the test of goodwill
(see comments on goodwill above).
If specific cash flows generated largely independently from other assets or groups of assets cannot be
allocated to the individual assets, they are tested for impairment based on the smallest, overriding cash-
generating unit of assets.
If the reasons for applying the impairment charge have disappeared, the write-down on the asset is reversed.
Such reversal is limited to the amount that would have resulted when taking amortisation or impairment into
account.
Regardless of whether there is evidence of impairment, a corresponding test for impairment is applied once a
year to both intangible assets that are not yet ready for use and intangible assets with an indefinite useful life.

150 | www.leoni.com
Financial instruments
LEONI has applied the new IFRS 9 Standard since 1 January 2018 and has, for the transition, opted for the
modified, retrospective method without adjusting the comparative period. The accounting and valuation
methods under IFRS 9 are therefore described for this financial year and, so far as they deviate, according to
IAS 39 for the previous year.
A financial instrument is any contract that gives rise to both a financial asset of one enterprise and a financial
liability or equity instrument of another enterprise. Financial instruments recorded as either financial assets
or financial liabilities are as a matter of principle presented separately. They are reported on a net basis only
where a right of set-off with respect to the amounts exists at the present time and it is intended to settle net.
Financial instruments are recognised as soon as LEONI becomes a contracting party to the financial instrument.
In the case of regular way purchases or sales in the context of a contract whose conditions provide for the
asset to be delivered within a period of time that is normally determined by the rules or conventions of the
respective market, the settlement date, i.e. the date on which the asset is supplied to or by LEONI, is pertinent
to initial recognition as well as derecognition.
Financial assets comprise particularly cash and cash equivalents, trade receivables as well as other originated
loans and receivables, equity investments, both primary and derivative financial assets held for trading
purposes as well as financial instruments held to maturity (only in the previous year according to IAS 39).
Financial liabilities normally provide a claim for return in cash or another financial asset. These comprise
particularly bonds and other securitised liabilities, trade liabilities, liabilities to banks, liabilities under finance
leases, borrower’s note loans and derivative financial liabilities.
Financial assets are derecognised when one of the three following conditions is met: ■ The contractual rights to receive the cash flows from a financial asset are extinguished. ■ Although the Group retains the rights to receive the cash flows from financial assets, it assumes a contractual
obligation to immediately pay the cash flows to a third party in the context of an agreement that meets the
requirements of IFRS 9.3.2.5 (“pass-through arrangement”; previous year: IAS 39.19). ■ The Group has transferred its contractual rights to receive the cash flows from a financial asset and substan-
tially all the risks and rewards incident to ownership of the financial asset have thereby been transferred, or
alternatively when control of the financial asset has been transferred.

| 151| Consolidated financial statements
Notes
Principles
1 | Principles of consolidation as well as summary of key accounting and valuation methods
Cash receipts from the sale of receivables that were not yet passed on to the buyer of the receivables on the
balance sheet date are reported under other financial liabilities.
Financial liabilities are derecognised when the obligation underlying the liability has been met, terminated or
extinguished.
Financial instruments are initially recognised at their fair value. The assumption or issue of directly attribut-
able transaction costs is considered when determining the carrying amount if the financial instruments are
not measured at fair value through profit or loss.
For measurement subsequent to initial recognition the financial instruments are allocated to one of the
measurement categories listed in IFRS 9 (previous year: IAS 39) to which they are designated at the time of
their initial recognition.
Financial assets
Since 1 January 2018, financial assets have been classified according to IFRS 9 based on the Group’s business
model for managing financial assets and the properties of the contractual cash flows of the financial assets.
Since 1 January 2018, financial assets have been divided into the following categories according to IFRS 9:
■ Financial assets remeasured to fair value through profit or loss (FVTPL)
This category comprises financial assets held for trading and financial assets that were, upon initial recogni-
tion, designated as financial assets at fair value through profit or loss, or financial assets that must be
measured at fair value. Financial assets are classified as held for trading if they are acquired and held with a
view to disposal in the near future. Derivatives, including embedded derivatives recognised separately, are
also classified as held for trading except for such derivatives that were designated as a hedging instrument
and are effective as such. Financial assets with cash flows that do not exclusively represent repayments and
interest are, regardless of business model, classified as at fair value through profit or loss and measured
accordingly.
Gains or losses on financial assets of this category are recognised in the income statement.
In the 2018 financial year, the Company neither classified any primary financial assets as held for trading,
nor did it make use of the option to designate financial assets at fair value through profit or loss upon their
initial recognition.
According to IFRS 9, all equity instruments are as a matter of principle measured at fair value. The gains or
losses resulting from measurement at fair value are recognised through profit or loss in the income state-
ment. The Group currently does not make any use of the option to classify equity instruments at fair value
through profit or loss for those equity instruments it has elected to present in other comprehensive income.

152 | www.leoni.com
■ Financial assets at amortised cost (AC)
The Group measures financial assets (debt instruments) at amortised cost when the following conditions
are fulfilled:
– the financial asset is held in the context of a business model that intends to hold financial assets to
collect contractual cash flows and
– the contract terms of the financial assets lead to cash flows at fixed points of time and which exclusively
represents repayments and interest on the principal amount outstanding.
Gains or losses are recognised in the income statement when the asset is derecognised, modified or
impaired.
Cash and cash equivalents
Cash and cash equivalents comprise cash in hand, cheques and immediately disposable bank deposits with
an original maturity of three months or less. Cash is recognised at par value.
Impairment of financial assets (IFRS 9 since 1 January 2018)
The Group applies the simplified impairment method of IFRS 9 to trade receivables and contract assets, and
recognises the expected losses over the full lifetime. The Group therefore does not follow up changes in the
credit risk, instead recognising a risk provision based on the full lifetime ECLs on each reporting date. The
expected losses are determined using an impairment matrix by grouping the principal types of receivables
according to their risk ratings, which represent the ability of customers to settle amounts due as contracted.
The allocations to the default risk categories are made principally based on external ratings of the key custom-
ers that consider forward-looking estimates. The risks pertaining to all other customers were included using
an across-the board approach to determine the risk rating. Calculation of expected losses is based on the
probability of default in line with the default risk category.
The Group assumes a default on a financial asset when contractual payments are substantially overdue. In
certain cases, it may also assume a default on a financial asset when internal or external information indicates
it is unlikely that the Group will receive the outstanding contractual amount before all the credit protection
it holds is considered. A financial asset is derecognised when there is no reasonable expectation that the
contractual cash flows will be realised.
The general impairment method of IFRS 9 must be applied to bank deposits as well as other financial assets
subject to the impairment requirements. The Group therefore monitors the creditworthiness of its business
partners to detect any significant increase in the risk of default. Upon initial recognition, such financial instru-
ments are allocated to Level 1. The expected loss corresponds to the value that could arise from potential
default events within the next 12 months after the reporting date. The potential impairment expense identi-
fied was insignificant, however.

| 153| Consolidated financial statements
Notes
Principles
1 | Principles of consolidation as well as summary of key accounting and valuation methods
Until 31 December 2017, the Group’s financial assets were divided into the following categories
according to IAS 39:
■ Financial assets remeasured to fair value through profit or loss
This category comprised financial assets held for trading (FAHft) and financial assets that were, upon initial
recognition, designated as financial assets at fair value through profit or loss (FVtPL). Financial assets were
classified as held for trading if they were acquired and held with a view to disposal in the near future.
Derivatives, including embedded derivatives recognised separately, were also classified as held for trading
except for such derivatives that were designated as a hedging instrument and were effective as such.
Gains or losses on financial assets of this category were recognised in the income statement.
In the previous year, the Company classified neither any primary financial assets as held for trading, nor did
it make use of the option to designate financial assets at fair value through profit or loss upon their initial
recognition.
■ Loans and receivables
Loans and receivables are non-derivative financial assets with fixed or determinable payments that were
not quoted in an active market. Following initial recognition, loans and receivables were measured at
amortised cost using the effective interest rate method less any impairment.
Valuation allowances were made when receivables were uncollectible or probably uncollectible and a reliable
estimate of the valuation allowance could be made. There was need for valuation allowance when there
are objectively discernible indications such as receivables overdue for a prolonged period, initiation of
foreclosure measures, looming default or overindebtedness as well as insolvency proceedings having been
applied for or commenced. Trade receivables with usual payment terms, which normally did not exceed the
twelve months, are therefore recognised at the nominal amount, less appropriate allowances. Receivables
that do not bear interest or bear below market interest rates and had an expected term of more than one
year were discounted with the discount subsequently amortised to interest income over the term of the
receivable. Impairment of trade receivables as well as receivables from long-term development contracts
was recognised in separate impairment accounts. Impairment losses of all other financial assets were
recognised directly.
Gains or losses were recognised in the income statement when the loans and receivables were derecog-
nised or impaired, as well as through the amortisation process.
154 | www.leoni.com
■ Available-for-sale financial assets
Available-for-sale financial assets (AfS) are non-derivative financial assets that are designated as available
for sale and were not classified in one of the aforementioned categories. They had to be measured at their
fair value. The gains or losses resulting from valuation at fair value were recorded separately as accumulated
other comprehensive income within equity. If there were significant loss events or, in the case of equity
instruments, losses ongoing over a longer period, this would be expensed accordingly in the income state-
ment. The Group assumed there to be a significant loss event involving impairment of more than 20 percent
and prolonged decline in value of equity instruments to be probable when there was continued loss in
value over a period of twelve months. Later reversals of impairment on available-for-sale financial assets
are as a matter of principle recorded as accumulated other comprehensive income. Only in the case of debt
instruments were reversals recognised in the income statement up to the original amount of impairment,
with any amounts above that recorded as accumulated other comprehensive income. Provided that there
was no quoted market price in an active market for investments in equity instruments and that their fair
value could not be reliably measured, they were carried at acquisitions cost. A write-down to the present
value of the future cash flows was made in the case of a decline in value other than temporary.
Financial liabilities
Since 1 January 2018, financial liabilities have been divided into the following categories according to IFRS 9:
■ Financial liabilities at fair value through profit or loss (FVTPL)
Financial liabilities that fall into this category are also carried at fair value in the subsequent periods with
the resulting gains or losses recognised in the income statement.
This category comprises financial liabilities held for trading as well as liabilities that were, upon initial
recognition, designated as financial liabilities at fair value through profit or loss. Financial liabilities are clas-
sified as held for trading if they are acquired and held with a view to disposal in the near future. Derivatives,
including embedded derivatives recognised separately, are also classified as held for trading except for such
derivatives that were designated as a hedging instrument and are effective as such.
In the 2018 financial year, the Company did not classify any primary financial liabilities as held for trading,
nor did it make use of the option to designate financial liabilities at fair value through profit or loss upon
their initial recognition.
| 155| Consolidated financial statements
Notes
Principles
1 | Principles of consolidation as well as summary of key accounting and valuation methods
■ Financial liabilities at amortised cost (AC)
All financial liabilities that do not fall into above-mentioned category and are not derivative financial
instruments are measured at amortised cost using the effective interest rate method. In the case of current
liabilities, the amortised cost corresponds to either their repayment or settlement value. Gains or losses are
recognised in the income statement when the liabilities are derecognised or amortised.
Until 31 December 2017, the Group’s financial liabilities were divided into the following categories
according to IAS 39:
Financial liabilities that fell into the category of “financial assets at fair value through profit or loss” were also
carried at fair value in the subsequent periods with the resulting gains or losses recognised in the income
statement.
This category comprised financial liabilities held for trading (FLHfT) as well as liabilities that were, upon initial
recognition, designated as financial liabilities at fair value through profit or loss (FVtPL). Financial liabilities
were classified as held for trading if they were acquired and held with a view to disposal in the near future.
Derivatives, including embedded derivatives recognised separately, were also classified as held for trading
except for such derivatives that were designated as a hedging instrument and were effective as such.
In the previous year, the Company did not classify any primary financial liabilities as held for trading, nor did
it make use of the option to designate financial liabilities at fair value through profit or loss (FVtPL) upon their
initial recognition.
All financial liabilities that did not fall into this category and were not derivative financial instruments were
measured at amortised cost using the effective interest rate method (Financial Liabilities at Amortised Cost –
FLAC). In the case of current liabilities, the amortised cost corresponded to either their repayment or settle-
ment value. Gains or losses were recognised with effect on earnings when the liabilities are derecognised as
well as through the amortisation process.
Derivative financial instruments and hedging activities
Derivative financial instruments entered into by the LEONI Group are recorded at their fair value on the
balance sheet date. Depending on their maturity, derivatives with a positive fair value are reported as current
or non-current other financial assets and derivatives with a negative fair value are reported as current or
non-current other financial liabilities. In general, the Group recognises the changes in fair value of derivative
financial instruments in the income statement. However, the Group records changes in fair value of derivatives
used to hedge anticipated cash flows on firm commitments and forecast transactions in accumulated other
comprehensive income until the hedged item is recognised in the income statement when the requirements
of the standard to apply cash flow hedge accounting are met. The reclassification from accumulated other

156 | www.leoni.com
comprehensive income into earnings occurs in the same period as the underlying transaction takes place and
has effect on net income. The ineffective portions of the fair value changes of those derivatives are recognised
in earnings immediately.
Where interest-rate derivative contracts are concluded to hedge the fair value of a hedged item measured
at amortised cost, the hedging instrument is measured at the fair value and any changes in fair value are
recognised in the income statement under either finance costs or finance revenue.
Commodity future transactions that are settled in cash are recognised as derivatives, changes in the fair value
of which are recognised in the cost of sales.
Contracts entered into for the purpose of receipt or supply of non-financial items according to the Group’s
expected purchase, sale or usage requirements and held as such (own use contracts) are reported not as
derivative financial instruments but as pending transactions.
If hybrid contracts contain embedded derivatives with a financial or non-financial liability as host contract,
such derivatives are reported separately from the host contract when the economic characteristics and risks of
the embedded derivative are not closely related to the economic characteristics and risks of the host contract,
when a separate instrument with the same terms as the embedded derivative were to fulfil the definition
of a derivative and when the hybrid contract is not measured at fair value through profit or loss. The review
whether a contract contains an embedded derivative that must be reported separately from the host contract
is made at the time when the Company became a contracting party. A reassessment is made only when there
are major changes to the terms of the contract that result in a significant change to the cash flows.
Accruals
Accruals are also reported under liabilities. Accruals are liabilities to pay for goods or services that have been
received but have not been paid or invoiced by the supplier.
Pension and other post-employment benefits
The valuation of defined-benefit pension obligations is based upon actuarial computations using the
projected-unit-credit method in accordance with IAS 19. Changes due to the actuarial assumptions or differ-
ences between the actual development and the original assumptions as well as gains or losses on the pension
plan or plan assets (actuarial gains or losses) as a difference between the return on plan assets recorded in net
interest expenses and the actual return are recognised in other comprehensive income. Past service cost is
recognised in the income statement at the time of the change to the plan.

| 157| Consolidated financial statements
Notes
Principles
1 | Principles of consolidation as well as summary of key accounting and valuation methods
The amount recognised as a defined benefit asset or liability comprises the present value of the defined
benefit obligation, less the fair value of plan assets out of which the obligations are to be settled directly. The
value of a defined benefit asset is limited to the present value of any economic benefits available in the form
of refunds from the plan or reductions in future contributions to the plan.
The interest costs relating to the net obligation are presented under finance costs.
Other provisions
Other provisions are recorded when a present legal or constructive obligation to a third party has been
incurred from past events, the payment is probable and the amount can be reasonably estimated. So far as
the Group expects repayment for an accrued provision at least in part for example from an insurance policy,
such repayment is recognised as a separate asset provided the inflow of the repayment is virtually certain.
The provisions are valued according to IAS 37 with the best estimate of the amount of the obligation. Where
provisions do not become due until after one year and a reliable estimate of the payment amounts and dates
is possible, the present value for the non-current proportion is determined on a discounted basis. The unwind-
ing of discount on provisions is recognised under interest expenses.
Obligations to dispose of an asset and to re-cultivate its site or similar obligations must be recognised as a
component of acquisition and production costs and simultaneously recognised as a provision. In the subse-
quent periods this amount added to the asset is to be depreciated over its residual useful life. The best possible
estimate of the payment obligation or provision is accreted to its present value at the end of each period.
Restructuring provisions are recognised when the constructive obligation has arisen according to the criteria
under IAS 37.72. Accruals are not reported under provisions, but rather under liabilities.
Income taxes
The current tax assets and tax liabilities for the current and prior periods are measured at the amount expected
to be recovered from the taxation authority or paid to the taxation authority. Calculation of the amount is
based on the tax rates and tax laws that are applicable to the corresponding period. Uncertain income tax
items for tax years not yet finally assessed are considered at the best possible estimate based on experience.
Deferred tax is, pursuant to IAS 12, formed according to the balance sheet liability method. This provides that
tax assets and liabilities for all temporary differences, apart from the exceptions under IAS 12.15, IAS 12.24,
IAS 12.39 and IAS 12.44, between the carrying amount in the statement of financial position and the amount
for tax purposes as well as for tax loss carryforwards are recognised (temporary concept). Deferred taxes are
158 | www.leoni.com
measured using the currently enacted tax rates in effect during the periods in which the temporary differences
are expected to reverse. The effect on deferred tax assets and liabilities of a change in tax law is recognised
in the period that the law is enacted. Deferred tax assets are applied only to the extent that it is more likely
than not that the tax benefit will be realised. The legally independent entities are assessed individually in
this respect, with any history of loss included in the assessment. Further details are presented in Note 10. The
deferred tax assets and those not recognised are reviewed in this regard on each balance sheet date.
Deferred tax assets and liabilities are offset if they relate to income taxes levied by the same taxation authority
and the Group has a legally enforceable right to set off current tax assets against current tax liabilities.
Income taxes referring to items that are recognised in other comprehensive income are also recognised in
other comprehensive income and not in the income statement.
Earnings per share
Earnings per share are computed in accordance with IAS 33, Earnings per Share. The basic earnings per share
are computed by dividing consolidated net income attributable to the LEONI shareholders by the weighted
average of the number of ordinary shares outstanding during the relevant period. The diluted earnings per
share are computed by dividing consolidated net income attributable to the LEONI shareholders by the total
of the weighted average number of ordinary shares outstanding, plus the weighted average number of securi-
ties that can be converted into ordinary shares. There was no dilution in the reporting periods presented.
Statement of cash flows
The statement of cash flows is classified by operating, investing and financing activities in accordance with
IAS 7. This involves cash flows from operating activities being determined by the indirect method whereby net
profit or loss is adjusted for the effects of transactions of a non-cash nature, any deferrals or accruals of past
or future operating cash receipts or payments, and items of income or expense associated with investing or
financing cash flows. Undistributed income from entities valued under the equity method and exchange gains
or losses reclassified from other comprehensive income to the income statement is principally reported under
"other non-cash expenses and income". Interest paid in connection with working capital management as well
as interest and dividends received are classified as cash flows from operating activities. Interest paid under
financing activities as well as paid dividends are classified as a financing. The cash holdings comprise cash and
cash equivalents. These include cash in hand, cheques and immediately disposable bank deposits with an
original maturity of up to three months. The effect of exchange rate-related changes in value on cash and cash
equivalents is presented separately so that the cash and equivalents at the beginning and end of the period
can be reconciled.
| 159| Consolidated financial statements
Notes
Principles
1 | Principles of consolidation as well as summary of key accounting and valuation methods
Segment reporting
Segment reporting is based on the accounting standard IFRS 8, Operating Segments, following the manage-
ment approach contained therein, which provides for reporting based on the internal organisational and
reporting structure as well as what management uses internally for evaluating segment performance. The
segment reporting and designation therefore follows the internal organisational and reporting structure of
the Group. The Group is organised into business units by products and services for the purpose of Corporate
Governance. The Group therefore has two segments subject to reporting: Wire & Cable Solutions and Wiring
Systems. Management monitors the earnings before interest and taxes (EBIT) separately to take decisions on
allocation of resources and to determine the profitability of the segments. The EBIT is ascertained in line with
the accounting and valuation principles of the consolidated financial statements. It also contains the earnings
from measurement under the equity method of joint ventures and associates.
Key judgments, estimates and assumptions
When preparing the consolidated financial statements, management makes judgements, estimates and
assumptions that influence the amounts of assets, liabilities and contingent liabilities as well as the expense
and income reported on the balance sheet date. The uncertainty that these assumptions and estimates
involve can, however, in future periods cause outcomes that result in major adjustment to the carrying
amounts of the assets and liabilities concerned.
The most significant assumptions concerning the future as well as other key sources of estimation uncertainty
at the balance sheet date, which present a risk that material adjustment to the carrying amounts of the assets
and liabilities will be necessary within the next financial year, are explained hereinafter.
Impairment testing of goodwill, intangible assets and of non-current assets is based on calculation of the
recoverable amount, which is the higher of value in use and fair value less cost to sell. To estimate the value
in use the Group must estimate the probable future cash flows of the cash-generating units to which the
non-current asset or goodwill relates, and moreover choose a reasonable interest rate to compute the present
value of these cash flows (discounted cash flow method). The cash flows are extrapolated from the business
planning for the next five financial years, excluding any restructuring measures to which the Group has not yet
committed and material, future capital expenditure that would raise the performance of the cash-generating
units tested. The business planning is prepared on a bottom-up basis taking targets into account, meaning
that the budgeted figures are prepared in detail for each business unit or business group and subsidiary and
condensed to the segments and the Group as a whole. Key planning assumptions are based on the unit-
sales projections issued by the carmakers. It takes into account price agreements based on experience and
anticipated efficiency enhancements as well as a sales trend based on the strategic outlook. The recoverable
amount is heavily dependent on the projected unit sales and on the discount rate applied under the dis-
counted cash flow method.

160 | www.leoni.com
The estimate of fair value less cost to sell differs from the value in use only through the treatment of the
measured asset as a business operation not belonging to the Group. The assumptions and parameters applied
to ascertain the recoverable amount and the details of the impairment tests are explained more thoroughly in
Notes 17 and 18.
Management must, with respect to accounting for capitalised deferred taxes relating mainly to unused loss
carryforwards, make estimates and judgements concerning the amount of taxable profit available in the
future for use of the loss carryforwards. So far as this has been made sufficiently specific, future tax planning
strategies and the expected timing of the income from it will be considered in the process. Deferred tax
assets are recognised regularly to the extent that deferred tax liabilities in the same amount and with the
same term applicable to them are expected. Furthermore, deferred tax assets are recognised only if future
taxable income is with high probability expected that is sufficient to use the deferred tax assets from loss
carry forwards and temporary differences. For this judgement, the taxable income is extrapolated from the
business planning that has been prepared according to the principles described above. Due to the mounting
un certainty about the future, the period under consideration is normally three years. In the case of entities
in loss situations, deferred tax assets are not recognised until there are signs of a turnaround or it is highly
probable that the future positive results can be generated. Rules on limiting the use of losses (minimum taxa-
tion) are observed when measuring the valuation allowances for deferred tax assets from loss carryforwards.
Further details are presented in Note 10.
The pension expense pertaining to defined benefit plans post employment is determined based upon actu-
arial computations. These measurements are based on assumptions and judgements with respect to discount
rates applied to the net obligation, future wage and salary increases, mortality and future pension increases.
Due to the non-current nature of such plans, such estimates are subject to material uncertainties. Details of
these uncertainties and sensitivities are presented in Note 24.

| 161| Consolidated financial statements
Notes
Principles
2 | New accounting requirements
2 | New accounting requirements
New accounting requirements applied for the first time in the financial year
IFRS 15
IFRS 15, Revenue from Contracts with Customers, is to be first applied to financial years beginning on or after
1 January 2018. LEONI did not make use of the early application option, but rather applied the new Standard
with effect from the set date of it coming into force and chose the fully retrospective method together with
presenting a comparative period.
IFRS 15 replaces IAS 11 Construction Contracts, IAS 18 Revenue as well as the related interpretations and
applies, apart from a few exceptions, to all revenue from contracts with customers. The Standard introduces a
five-step model for recognising revenues from contracts with customers. Under IFRS 15, revenues are recog-
nised in the amount of consideration to which the entity expects to be entitled in exchange for transferring
the promised goods or services to the customer.
IFRS 15 requires entities, when applying each step of the model to contracts with customers, to make judge-
ments and consider all relevant facts and circumstances. The Standard furthermore governs the accounting
for the additional costs of obtaining and fulfilling a contract. Finally, the Standard contains extensive disclo-
sure requirements.
Initial application of IFRS 15 resulted in the following changes to the accounting methods and adjustments to
preceding periods. The affected items are presented below:
Consolidated statement of financial position Assets € ‘000
31/12/2017 pre-
adjustment adjustment
31/12/2017 after
adjustment
01/01/20171pre-
adjustment adjustment
01/01/2017 after
adjustment
Total current assets 1,655,282 12,705 1,667,987 1,588,337 11,528 1,599,865
of which trade receivables and other financial assets 664,700 (16,618) 648,082 584,775 (20,243) 564,532
of which inventories 669,485 (72,789) 596,696 588,273 (72,177) 516,096
of which current contract assets 0 102,112 102,112 0 103,948 103,948
Total non-current assets 1,471,028 5,583 1,476,611 1,358,081 5,175 1,363,256
of which trade receivables from long-term development contracts 60,535 (60,535) 0 53,344 (53,344) 0
of which long-term contract assets 0 60,535 60,535 0 53,344 53,344
of which deferred taxes 50,897 (677) 50,220 61,356 (385) 60,971
of which other assets 54,683 6,260 60,943 43,642 5,560 49,202
Total assets 3,126,310 18,288 3,144,598 2,946,418 16,703 2,963,121
Equity and liabilities € ‘000
Total equity 1,023,598 18,288 1,041,886 917,164 16,703 933,867
of which retained earnings 763,930 18,333 782,263 635,243 16,748 651,991
of which accumulated other comprehensive income (72,194) (45) (72,239) (51,360) (45) (51,405)
of which equity attributable to shareholders in the parent company 1,015,292 18,288 1,033,580 907,439 16,703 924,142
Total equity and liabilities 3,126,310 18,288 3,144,598 2,946,418 16,703 2,963,1211 Previous year’s figure adjusted for allocation of the price to purchase LEONI ZhengAo Automotive Wire Harness Co. Ltd.

162 | www.leoni.com
Consolidated income statement € ‘000 (except information on shares) 1 Jan to 31 Dec
2017 pre-
adjustment adjustment
2017 after
adjustment
Sales 4,922,807 2,490 4,925,297
Cost of sales (4,101,454) (613) (4,102,067)
Gross profit on sales 821,353 1,877 823,230
EBIT 225,285 1,877 227,162
Earnings before taxes 200,346 1,877 202,223
Income taxes (56,423) (292) (56,715)
Consolidated net income 143,923 1,585 145,508
of which: shareholders in the parent company non-controlling interests
145,022 (1,099)
1,585 0
146,607 (1,099)
Earnings per share (basic and diluted) 4.44 0.05 4.49
Weighted average no. of shares outstanding 32,669,000 0 32,669,000
Consolidated statement of cash flows € ‘000 1 Jan to 31 Dec
2017 pre-
adjustment adjustment
2017 after
adjustment
Consolidated net income 143,923 1,585 145,508
Adjustments to reconcile cash provided by operating activities:
of which income taxes of which change in operating assets and liabilities
56,423 292 56,715
of which change in inventories of which change in other assets
(86,753)(20,265)
612(2,489)
(86,141)(22,754)
Cash flows from operating activities 244,641 0 244,641
The changes to the accounting methods due to initial application of IFRS 15 are described hereinafter:
a) There are some changes to the accounting methods upon the sale of goods of the Wiring Systems Division
because some customer-specific products are made without any option for alternative use and LEONI has
a legal right to payment for the services rendered. The conditions for revenue and income recognition
over a period of time are thereby met, whereas revenues were recognised at a point in time under IAS 18.
Revenue and income for the affected goods will consequently be recognised earlier (2017 sales revenues:
€ 1,790 k and 2017 cost of sales: € 613 k) together with presentation under contract assets (contract assets
on 1/1/2017: € 83,705 k and 31/12/2017: € 85,494 k).
b) Development work in the Wiring Systems Division ahead of series supply to customers in the car and com-
mercial vehicle industry is performed over a period of time. On this basis, LEONI will continue to recognise
revenue from these development contracts over a period of time. There is a change to the accounting
methods applied due to now revised presentation of receivables from development contracts under
contract assets (contract assets on 1/1/2017: € 73,587 k and 31/12/2017: € 77,153 k).

| 163| Consolidated financial statements
Notes
Principles
2 | New accounting requirements
c) Subject to specific conditions, IFRS 15 stipulates that payments to customers of the Wiring Systems Division
must be recognised as an asset and amortised in line with the revenue for which these payments are
expected. A change in the accounting methods applied arises insofar as a larger number of payments now
fulfil these conditions (2017 sales revenues: € 700 k, other assets; on 1/1/2017: € 5,560 k and on 31/12/2017:
€ 6,260 k; deferred taxes on 1/1/2017: € 385 k and on 31/12/2017: € 677 k).
IFRS 9, Financial instruments, applies for the first time to financial years beginning on or after 1 January 2018
and supersedes IAS 39, Financial Instruments: Recognition and Measurement. IFRS 9 brings together the three
project phases accounting for financial instruments: Classification and Measurement, Impairment and Hedge
Accounting. LEONI has applied the new Standard since 1 January 2018 and has, for the transition, opted for
the modified, retrospective method without presenting a comparative period.
Effects of applying IFRS 9 for the first time:
Consolidated statement of financial position Assets € ‘000
31/12/20171pre-
adjustment adjustment
01/01/2018 after
adjustment
Total Assets 3,144,598 (5,419) 3,139,179
of which trade receivables 609,761 (4,594) 605,167
of which current contract assets 102,112 (947) 101,165
of which investments in associated companies and joint ventures 34,059 (86) 33,973
of which long-term contract assets 60,535 (1,260) 59,275
of which deferred taxes 50,220 1,468 51,688
Total liabilities and provisions 2,102,712 49 2,102,761
of which deferred taxes 45,580 49 45,629
Total equity 1,041,886 (5,468) 1,036,418
of which retained earnings 782,263 (5,410) 776,853
of which equity attributable to shareholders in the parent company 1,033,580 (5,410) 1,028,170
of which non-controlling interests 8,306 (58) 8,2481 LEONI opted to use the fully retrospective transition method for application of IFRS 15 and has adjusted the comparative period.
Classification and measurement: ■ Derivatives that were measured at fair value will continue to be measured fair value. ■ The Group holds trade receivables and other financial receivables principally to collect the contractual cash
flows that exclusively represent repayments and interest. These instruments are therefore still measured at
amortised cost.
Impairment:
The Group applies the simplified impairment method of IFRS 9 and recognises the losses from trade receiva-
bles as well as contract assets expected over the full lifetime within the scope of IFRS 15. Underlying the new

164 | www.leoni.com
impairment requirements is a more forward-looking model that is based on expected losses. Previously,
impairment was recognised based mainly on losses already incurred. This new impairment model conse-
quently means that expected losses are expensed earlier.
The reduction in trade receivables as well as contract assets by a total of € 6,801 k is the result of applying the
new impairment requirements.
Hedge accounting:
All hedging relationships designated as effective under IAS 39 also meet the hedge-accounting requirements
of IFRS 9. As the general principles for the way hedge accounting is applied do not change, first-time applica-
tion of IFRS 9 does not result in any adoption effects.
The table below shows the original measurement categories according to IAS 39 as at 31 December 2017 and
the new measurement categories according to IFRS 9 at the time of initial application on 1 January 2018 with
the corresponding carrying amounts:
€ ‘000 Measurement category under IAS 39 Measurement category under IFRS 9
Carrying amount
under IAS 39 31/12/20171
Carrying amount
under IFRS 9 01/01/2018
Financial assets
Cash and cash equivalents Loans and Receivables (LaR) Financial assets at amortised cost (AC) 185,084 185,084
Trade receivables Loans and Receivables (LaR) Financial assets at amortised cost (AC) 609,761 605,167
Other financial receivables Loans and Receivables (LaR) Financial assets at amortised cost (AC) 35,476 35,476
Other primary financial assets
Investments Available-for-sale financial assets (AfS)Financial assets at fair value through profit or loss (FVTPL)
1,115 1,115
Derivative financial assets
Derivatives not involving hedging Financial assets held for trading (FAHfT)Financial assets at fair value through profit or loss (FVTPL)
4,323 4,323
Derivatives involving hedging n/a n/a 4,755 4,755
Financial liabilities
Trade liabilitiesFinancial liabilities measured at amortised cost (FLAC)
Financial liabilities at amortised cost (AC)
909,414 909,414
Liabilities to banksFinancial liabilities measured at amortised cost (FLAC)
Financial liabilities at amortised cost (AC)
256,596 256,596
Borrower’s note loansFinancial liabilities measured at amortised cost (FLAC)
Financial liabilities at amortised cost (AC)
333,128 333,128
Other financial liabilitiesFinancial liabilities measured at amortised cost (FLAC)
Financial liabilities at amortised cost (AC)
83,658 83,658
Derivative financial liabilities
Derivatives not involving hedgingFinancial liabilities held for trading (FLHfT)
Financial liabilities at fair value through profit or loss (FVTPL)
4,040 4,040
Derivatives involving hedging n/a n/a 6,953 6,953
1 LEONI opted to use the fully retrospective transition method for application of IFRS 15 and has adjusted the comparative period. . The carrying amounts pursuant to IAS 39 therefore already include the IFRS 15 adjustments. .

| 165| Consolidated financial statements
Notes
Principles
2 | New accounting requirements
Future, new accounting requirements
IFRS 16
In January 2016, the IASB issued the new IFRS 16, which abolishes the previous distinction of leases on the
lessee side between operating and finance leases. For lessors, there will be only minor changes compared
with accounting pursuant to IAS 17 Leases. According to IFRS 16, the lessee recognises a leasing liability for
principally all leases in largely the amount of the present value of the future, firmly agreed lease payments
and simultaneously recognises a corresponding right of use to the leased asset. These changes must be
applied to financial years beginning on or after 1 January 2019.
LEONI will apply the new Standard from the prescribed date of it coming into force. The transition to IFRS 16
will be carried out based on the modified, retrospective method without adjusting the comparative period.
For leased assets of minor value (the leased asset’s new value being less than € 5,000) and for short-term
leases (contract terms of less than twelve months), use is made of easier application by not recording them on
the balance sheet.
The analysis carried out within the Company’s Group-wide project on initial application found that IFRS 16 is
likely to have the following, estimated effects on the components of the consolidated financial statements
and presentation of the financial position and performance:
Statement of financial position:
In the following categories of leases there are, because of the transition effective 1 January 2019, contracts
that were previously recognised as operating leases which will be accounted for as leases within the meaning
of the new Standard: buildings, machinery, motor vehicles as well as factory and office equipment.
As at the time of transition, LEONI recognised rights of use in the amount of the lease liabilities, which were
adjusted for lease payments made in advance. Our analysis found that, on 1 January 2019 and based on the
relevant leases existing on 31 December 2018, lease liabilities and rights of use each amounting to approx.
€ 155 million will probably be recognised on the balance sheet.
Given this balance sheet enlargement, the equity ratio as at 1. January 2019 will contract by about one
percentage point.
Income statement:
Instead of the previous presentation of operating lease expenses in the functional areas, write-downs on the
rights of use in the functional areas as well as interest expenses arising from compounding of lease liabilities
will in future be recognised. The leases existing on 31 December 2018 improved EBIT by nearly € 4 million.

166 | www.leoni.com
Statement of cash flows:
We expect a positive impact on cash flows from operating activities because IFRS 16 requires the interest and
principal payments to be presented under cash flow from financing activities, whereas the payments for oper-
ating leases were previously shown in total under operating cash flow. Cash flows from financing activities will
consequently deteriorate.
IFRIC 23
IFRIC 23, Uncertainty over Income Tax Treatments, was issued in May 2017. The Interpretation is to be applied
to the determination of taxable profit (tax loss), tax bases, unused tax losses, unused tax credits and tax rates,
when there is uncertainty over income tax treatments under IAS 12. Entities are required to use judgement to
determine whether each tax treatment should be considered independently or whether some tax treatments
should be considered together. They must furthermore consider whether it is probable that the relevant
authority will accept each tax treatment (or group of tax treatments) that they used or plan to use in their
income tax filing. IFRIC 23 is to be applied to reporting periods beginning on or after 1 January 2019. Earlier
application is permitted. The Interpretation to be applied in the future is unlikely to exert any material effect
on presentation of the Group’s financial position, performance or cash flow.
The IASB also issued amendments other than the aforementioned updates. These will probably not be
relevant to LEONI and are not mentioned for this reason.
3 | Scope of consolidation
Along with LEONI AG, the consolidated financial statements account for 15 companies in Germany and
57 companies outside Germany in which LEONI AG is entitled, either directly or indirectly, to a majority of
the voting rights.
Number of fully consolidated companies
31/12/2018 31/12/2017
Germany 16 16
Outside 57 57
Total 73 73
During the period under report, the scope of consolidation was enlarged by having established a new
subsidiary in Bulgaria. Furthermore, a subsidiary of the Wiring Systems Division in Portugal that is no longer
operational was liquidated.
A complete list of the fully consolidated subsidiaries as well as of the associates and joint ventures on
31 December 2018 is shown at the end of these notes.

| 167| Consolidated financial statements
Notes
Principles
3 | Scope of consolidation
4 | Acquisitions and disposals of subsidiaries
4 | Acquisitions and disposals of subsidiaries
No subsidiaries were acquired or sold in the 2018 financial year.
On 2 May 2017, LEONI sold its domestic and electrical appliance cables business, i.e. all the shares in its subsidi-
aries EA Cable Assemblies GmbH, LEONI Cable Belgium N.V., LEONI WCS Southeast Europe d.o.o., LEONI Cable
Assemblies Slovakia s.r.o., LEONI Cable (Xiamen) Co., Ltd., LEONI Cable Assemblies (Changzhou) Co., Ltd. and
EA Cable Assemblies (Hong Kong) Co., Ltd. The subsidiaries were deconsolidated on the day of their disposal
as control over them also passed to the purchaser on this date. Pending the final audit of the disposal balance
sheet by the purchaser, the consideration to be paid by the purchaser amounted to € 51,061 k. From the sale,
the Group recognised a gain on deconsolidation totalling € 24,256 k. This included an exchange gain in the
amount of € 1,914 k, which was reclassified from other comprehensive income to the income statement and
presented under other operating income.
The overview below shows the deconsolidated assets and liabilities:
€ ‘000
Deconsolidated upon disposal
Trade receivables 34,331
Inventories 17,958
Other current assets 4,624
Property, plant and equipment 14,669
Other non-current assets 525
Cash and cash equivalents 17,087
Deconsolidated assets 89,194
Trade accounts payable 18,775
Other current liabilities 19,773
Current financial liabilities to LEONI AG 13,271
Non-current financial liabilities 8,619
Other non-current liabilities 37
Deconsolidated liability 60,475
Net assets 28,719
Consideration received 53,740
Purchase price adjustment requirement (2,679)
Deconsolidated net assets (28,719)
Deconsolidated OCI 1,914
Effect of deconsolidation 24,256
In fiscal 2017, the Group took in a payment of € 53,740 k from its sale of this business, which therefore, when
taking the disposed cash and cash equivalents into account, provided the Group with cash of € 36,653 k. The
transaction costs incurred totalled € 1,679 k (of which € 614 k in preceding years).

168 | www.leoni.com
The contractually agreed arbitration proceedings to determine the final purchase price were initiated and
completed in the 2018 financial year. This resulted in a gain of € 1,086 k, which is reported in other operating
income.
In the 2017 financial year, LEONI acquired two thirds of the shares in Zurich-based Adaptricity AG. The company
contributed software-supported consulting services based on expert electrotechnical knowledge to the
Group. The company was first consolidated upon gaining control of it on 15 February 2017. The acquired
business was integrated in the Wire & Cable Solutions Division. The purchase price was € 3,479 k. Taking the
acquired cash and cash equivalents totalling € 2,340 k into account, the cash consideration paid was € 1,139 k.
The acquisition did not incur any material transaction costs.
The overview below shows the fair values of the acquired assets and liabilities on the date of initial consolida-
tion:
€ ‘000
Recognised at acquisition
Cash and cash equivalents 2,340
Trade receivables 34
Inventories 8
Intangible assets 2,261
Total assets 4,643
Trade accounts payable 107
Other liabilities 127
Deferred tax liabilities 381
Total liabilities 615
Net assets 4,028
Non-controlling interests 1,342
Pro-rata net assets 2,686
Purchase price 3,479
Goodwill 793
The purchase price exceeded the sum of pro-rata assets and liabilities, which is why goodwill amounting to
€ 793 k was recognised for the acquired staff and expected synergies.
In the time between LEONI gaining control and 31 December 2017, the acquired business contributed sales
of € 192 k and incurred an after-tax loss of € 1,196 k. The company’s contribution to Group sales and earnings
after taxes would not have been materially different had the acquisition taken place on 1 January.
In fiscal 2016, LEONI signed an agreement to purchase 51 percent of the shares in Wuhan Hengtong
Automotive, a wiring system manufacturer based in Shanghai, China. Given that it was not yet possible to
make a reliable purchase price allocation because of the prevailing commercial structures in fiscal 2016,
provisional fair values of the acquired assets and liabilities on the date of initial consolidation were applied.

| 169| Consolidated financial statements
Notes
Explanations
5 | Segment reporting
As soon as assured knowledge was available, the purchase price was allocated in the 2017 financial year and
the previous year’s figures were adjusted accordingly. The adjustments to inventories came to € 2 million and
for current liabilities they amounted to € 2.7 million as well as various minor effects. The adjustment totalled
€ 0.5 million. The negative goodwill, reversal of which was recognised in the previous year in other operating
income, changed from € 823 k to € 1,333 k.
The company was renamed LEONI ZhengAo Automotive Wire Harness Co. Ltd. in the 2017 financial year.
Explanations
5 | Segment reporting
The Group is organised into business units by products and services for the purpose of Corporate Governance.
The segment reporting follows the internal organisational and reporting structure of the Group. The Group
has two segments subject to reporting:
Wire & Cable Solutions
The Wire & Cable Solutions Division is a leading manufacturer of wire and cable that, as part of its strategic
realignment, is gradually developing into a provider of intelligent and secure energy transmission and data
management system solutions.
Wiring Systems
The development, manufacture and sale of cable harnesses, complete wiring systems as well as related com-
ponents and connectors for the international automotive and supply industry constitute the main business of
the Wiring Systems Division.
Management monitors the earnings before interest and taxes (EBIT) to take decisions on allocation of
resources and to determine the profitability of the units. The EBIT is ascertained in line with the accounting
and valuation principles of the consolidated financial statements. It also contains the earnings from measure-
ment under the equity method of joint ventures and associates.
The ROCE (Return on Capital Employed) is a key return figure on the basis of which management monitors the
profitability of the segments. It is derived from the ratio of EBIT to average Capital Employed (CE), which com-
prises the non-interest-bearing assets less non-interest-bearing liabilities. The calculation uses the amount of
capital employed at its average of the past two annual reporting dates.
Intersegment sales and revenues are generally recorded at values that approximate sales to third parties.

170 | www.leoni.com
The details by segment for the 2018 and 2017 financial years are as follows:
Wire & Cable Solutions Wiring Systems Division Reconciliation LEONI Group
€ ‘000 2018 2017 2018 20171 2018 2017 2018 20171
Gross sales 2,140,547 2,067,220 3,169,434 3,064,358 (208,858) (206,281) 5,101,123 4,925,297
Less intersegment sales 206,960 205,909 1,898 372 (208,858) (206,281) — —
External sales 1,933,587 1,861,311 3,167,536 3,063,986 5,101,123 4,925,297
of which domestic 483,357 426,509 906,647 940,253 0 0 1,390,003 1,366,762
of which foreign 1,450,230 1,434,802 2,260,889 2,123,733 0 0 3,711,119 3,558,535
% foreign proportion 75.0 77.1 71.4 69.3 72.8 72.3
EBIT 65,796 104,576 80,222 118,455 (1,765) 4,131 144,253 227,162
as a percentage of external sales 3.4 5.6 2.5 3.9 2.8 4.6
Financial result and other investment income (23,331) (24,939)
Earnings before taxes 120,922 202,223
Income taxes (47,677) (56,715)
Consolidated net income 73,245 145,508
Earnings from measurement under the equity method 0 0 23,206 22,842 0 0 23,206 22,842
Depreciation / amortisation 45,023 46,544 102,620 93,473 10,947 9,507 158,590 149,524
EBITDA 110,819 151,120 182,842 211,928 9,182 13,638 302,843 376,686
as a percentage of external sales 5.7 8.1 5.8 6.9 5.9 7.6
Total assets/equity 1,725,585 1,574,821 2,349,951 2,142,243 (614,008) (577,885) 3,461,528 3,144,598
Average capital employed 754,281 698,390 997,395 895,730 (15,710) (32,764) 1,735,966 1,561,356
ROCE 8.7 % 15.0 % 8.0 % 13.2 % 8.3 % 14.5 %
Investment in property, plant and equipment as well as intangible assets 114,243 107,788 204,651 163,922 24,002 9,701 342,896 281,411
Acquisitions / investments in financial assets 0 3,479 65 119 0 0 65 3,598
Average number of employees 8,671 8,427 83,359 74,741 343 303 89,373 83,4711 prior-year figures adjusted
Segment information by geographical regions:
EMEA total of which:
Germany Eastern Europe Rest of Europe Rest of EMEA
€ ‘000 2018 2017¹ 2018 2017¹ 2018 2017 2018 2017¹ 2018 2017¹
External sales
Wire & Cable Solutions 1,144,996 1,067,862 483,357 426,509 375,654 364,628 266,052 257,469 19,933 19,256
Wiring Systems 1 2,406,009 2,340,183 906,647 940,253 369,381 284,034 1,091,642 1,074,437 38,339 41,459
3,551,005 3,408,045 1,390,004 1,366,762 745,035 648,662 1,357,694 1,331,906 58,272 60,715
Non-current assets 1,009,624 868,698 317,766 241,425 429,477 392,793 90,550 93,345 171,831 141,135
Americas Asia Reconciliation LEONI Group
€ ‘000 2018 2017 2018 2017 2018 2017 2018 2017¹
External sales
Wire & Cable Solutions 445,926 426,818 342,665 366,631 1,933,587 1,861,311
Wiring Systems 1 348,508 323,434 413,019 400,369 3,167,536 3,063,986
794,434 750,252 755,684 767,000 5,101,123 4,925,297
Non-current assets 141,877 113,206 164,257 168,843 (212) 136 1,315,546 1,150,8831 prior-year figures adjusted

| 171| Consolidated financial statements
Notes
Explanations
6 | Sales
As in the previous year, China accounted for the most significant proportion of consolidated external sales
by national market in Asia with an 11.9 percent (previous year: 11.8 percent) share while, in the Americas, the
United States accounted for 8.7 percent (previous year: 8.6 percent).
The non-current assets segmented by region include the intangible assets and the property, plant and equip-
ment as well as investments in associated companies and joint ventures.
As in the previous year, there were no sales to any one customer accounting for ten percent or more of
consolidated sales.
6 | Sales
LEONI generated the following sales revenues at a point in time and over a period of time:
€ ‘000 2018 20171
Group
Transfer at a point in time 3,031,104 2,994,810
Transfer over a certain period of time 2,070,019 1,930,487
of which development services 75,319 62,930
of which customised products 1,994,699 1,867,557
Sales 5,101,123 4,925,297
Wiring Systems
Transfer at a point in time 1,097,517 1,133,499
Transfer over a certain period of time 2,070,019 1,930,487
of which development services 75,320 62,930
of which customised products 1,994,699 1,867,557
Sales 3,167,536 3,063,986
Wire & Cable Solutions
Transfer at a point in time 1,933,587 1,861,311
Sales 1,933,587 1,861,311
1 prior-year figures adjusted
The performance obligations in the Wire & Cable Solutions Division have terms of less than one year, which is
why use was made of the option not to provide additional disclosures regarding the performance obligations
not yet met in full on the reporting date.
The performance obligations relating to series supply in the Wiring Systems Division have terms of just a
few weeks because of the short notice at which product is called forward, which is why use was made of the
option not to provide additional disclosures regarding the performance obligations not yet met in full on the
reporting date.
The Group expects to recognise the performance obligations from commenced development contracts
remaining on the reporting date as sales revenues within the next two years in the amount of roughly
€ 95 million (previous year: about € 80 million).

172 | www.leoni.com
The contract assets totalling € 173,943 k (previous year: € 162,647 k) broke down as follows:
€ ‘000 2018 20171
Current contract assets 95,181 102,112
Development contracts 12,680 16,618
Customer-specific products without any option for alternative use 82,501 85,494
Long-term contract assets 78,762 60,535
Development contracts 78,762 60,535
1 prior-year figures adjusted
7 | Other operating income and other operating expenses
The other operating income broke down as follows:
€ ‘000 2018 2017
Gains on disposals of property, plant and equipment as well as intangible assets 11,598 3,991
Provision of services for JV in Langfang 5,026 4,273
Government grants 4,473 3,587
Gain on deconsolidation of the domestic and electrical appliance business 1,086 24,256
Insurance compensation for the 2016 fraud case 0 5,000
Other 7,591 4,627
29,774 45,734
In the 2018 financial year, gains on disposals of property, plant and equipment as well as intangible assets
exerted a beneficial effect of € 11,598 k (previous year: € 3,991 k). Most of this stemmed from the sale of the
manufacturing buildings of a facility in China.
Providing services for our joint venture in Langfang generated income of € 5,026 k (previous year: € 4,273 k;
cf. also Note 19 in this regard).
The performance-related government grants of € 4,473 k (previous year: € 3,587 k) were made mostly to boost
the economies in China and Egypt. More detailed explanation of this is to be found in Note 8.
The Company sold its domestic and electrical appliance cables business in fiscal 2017. This yielded gains on
deconsolidating several subsidiaries in the amount of € 24,256 k. Additional income of € 1,086 k was gener-
ated as a result of the arbitration proceedings launched and completed in 2018. In 2017, the Group received
insurance compensation of € 5,000 k in connection with the fraud case uncovered in 2016.

| 173| Consolidated financial statements
Notes
Explanations
7 | Other operating income and other operating expenses
8 | Government grants
The other operating expenses in the amount of € 24,714 k (previous year: € 18,844 k) included exchange losses
in the amount of € 10,912 k (previous year: € 10,092 k).
€ ‘000 2018 2017
Exchange losses 10,912 10,092
Goodwill impairment 6,830 0
Factoring cost 2,958 2,767
Loss on disposals of property, plant and equipment as well as intangible assets 1,527 2,099
Other 2,487 3,886
24,714 18,844
8 | Government grants
The Group obtained various performance-related government grants in the 2018 financial year, which totalled
€ 9,747 k (previous year: € 10,020 k), of which € 5,274 k (previous year: € 6,433 k) was directly offset in the
income statement with the expenses incurred. As in the previous year, this pertained primarily to grants to
cover the costs of starting up a new plant in Mexico. Performance-related grants in the amount of € 4,473 k
(previous year: € 3,587 k), which pertained mainly to the Wiring Systems Division, were furthermore presented
in other operating income. Of this, € 1,378 k (previous year: € 2,792 k) was attributable to the subsidy for
export business in Egypt while another € 1,800 k (previous year: nil) was granted by the Chinese government
to promote business located in the country.
Government grants for capital investment in property, plant and equipment in the amount of € 18,492 k
(previous year: € 23,212 k) were recognised in fiscal 2018, most of which pertained to a wiring systems plant
in Serbia. These were deducted from the costs to purchase and manufacture the related property, plant and
equipment.
The received grants are linked to creating jobs and keeping these for several years, to tax payments and to
achieving a specified sales volume in these companies.

174 | www.leoni.com
9 | Finance revenue and costs
The finance revenues in the amount of € 545 k (previous year: € 1,011 k) involved exclusively interest income.
As in the previous year, they were computed on the basis of the effective interest rate method.
Finance costs broke down as follows:
€ ‘000 2018 2017
Interest expenses 20,451 20,828
Finance cost from pension obligations 3,316 3,427
Other finance costs 293 1,862
Finance costs 24,060 26,117
The interest expenses included interest of € 19,501 k (previous year: € 20,559 k) that was likewise computed on
the basis of the effective interest rate method.
10 | Income taxes
Taxes on income including deferred taxes break down as follows in the income statements for fiscal 2018 and
fiscal 2017:
€ ‘000 2018 20171
Current taxes
Germany 1,704 7,951
Outside 36,904 42,670
38,608 50,621
Deferred taxes
Germany 3,283 1,634
Outside 5,786 4,460
9,069 6,094
Income taxes 47,677 56,715
1 prior-year figures adjusted
In the 2018 financial year, the Group recognised tax expenses of € 47,677 k (previous year: € 56,715 k) in the
income statement. Tax income of € 18 k (previous year: tax expense of € 3,744 k) was recognised in other
comprehensive income.
Deferred tax assets and liabilities should be measured at the tax rates that are expected to apply to the period
when the asset is realised or the liability is settled. For the Group’s German companies, the deferred taxes on
31 December 2018 were calculated using a corporate tax rate of 15 percent, unchanged from the previous

| 175| Consolidated financial statements
Notes
Explanations
9 | Finance revenue and costs
10 | Income taxes
year. A solidarity surcharge of 5.5 percent on the corporate tax as well as an average trade tax rate of 13.8 per-
cent were included as in the previous year. In line with the previous year, the tax rate thus applied to calculate
deferred taxes for German companies amounted to a combined 29.6 percent. For non-German companies the
country-specific, respective tax rates were used.
The table below reconciles the income tax expense or the expected tax expense at the reported tax rate to
the effective income taxes presented in the financial statements for the respective financial year. To calculate
the projected income tax expense, we multiplied the pre-tax earnings by the combined income tax rate in
Germany of 29.6 percent (previous year: 29.6 percent) applicable to the financial year.
2018 2017 1
€ ‘000 % € ‘000 %
Expected tax expense (2018: 29.6 %; 2017: 29.6 %) 35,793 29.6 59,858 29.6
Foreign tax rate differentials (12,883) (10.7) (14,233) (7.0)
Change in valuation allowances on deferred tax assets 18,154 15.0 13,764 6.8
Non-deductible expenses 11,529 9.5 7,012 3.5
Foreign tax at source 1,530 1.3 6,624 3.3
Prior-period tax income / expense 2 0.0 1,244 0.6
Income from equity investments (6,875) (5.7) (6,767) (3.5)
Gain / loss on deconsolidation of disposed businesses 0 0.0 (7,185) (3.6)
Other 428 0.4 (3,603) (1.8)
Effective income taxes / tax rate 47,677 39.4 56,715 28.0
1 prior-year figures adjusted
The year-on-year increase in the tax rate is attributable primarily to not having recognised deferred tax assets
against current losses.
The change in valuation allowances on deferred tax assets in the amount of € 18,154 k (previous year:
€ 13,764 k) in the fiscal year involved particular tax assets not capitalised in the amount of € 22,691 k (previous
year: € 15,562 k). As in the previous year, these valuation allowances concerned primarily deferred tax assets
from loss carryforwards to the extent it is considered more likely than not that such benefits will be used
in future years. In determining the valuation allowance all factors including legal factors and information
available were taken into account. Deferred tax assets, which in preceding periods we applied primarily to
loss carryforwards, were written down in the amount of € 693 k (previous year: € 4 k). The change in valuation
allowances included reversal of valuation allowances on deferred tax assets with effect on the income state-
ment in the negative amount of € 3,363 k (previous year: a negative amount of € 1,423 k). The item included a
negative amount of € 1,867 k (previous year: negative € 379 k) for the use of loss carryforwards for which no
tax assets were recognised in the previous years.
In the case of entities that incurred a tax loss in either the current or previous year, and where the deferred
tax assets on loss carryforwards are not covered by a net deferred tax liability, deferred tax assets on loss
carryforwards were recognised in the amount of € 2,975 k (previous year: € 2,097 k). Based on management’s
assumptions for and estimates of future business performance, which were derived from experience as well
as the currently available information and forecasts, there are convincing, substantial indications that this tax
asset will be realised.

176 | www.leoni.com
Changes to foreign tax rates are recognised in the income statement in a partial amount of € 534 k (previous
year: tax expense of € 2,490 k) in the item Other amounting to € 428 k.
The deferred tax assets and deferred tax liabilities were derived from temporary differences recorded under
the following balance sheet items as well as tax loss carryforwards:
Consolidated statement of financial position
Consolidated income statement
€ ‘000 2018 20171 2018 20171
Inventories 9,551 8,528 1,021 (522)
Accounts receivable and other assets 5,458 1,716 2,365 (2,530)
Property, plant and equipment 3,973 3,139 791 (1,714)
Intangible assets 638 612 26 210
Non-current financial assets 987 435 553 (170)
Tax loss carryforwards 121,271 101,376 22,222 4,844
Liabilities and provisions 27,652 18,025 10,039 (1,755)
Pension provisions 28,886 31,327 (212) (4,177)
Total 198,417 165,158
Valuation allowance (108,145) (96,200) (17,048) (11,730)
Deferred tax assets (before offsetting) 90,271 68,958
Inventories 8,238 8,153 18 (2,423)
Accounts receivable and other assets 8,216 4,058 (4,630) (1,098)
Property, plant and equipment 29,879 27,921 (1,458) 5,508
Intangible assets 12,847 15,246 2,412 2,542
Non-current financial assets 30,547 7,216 (22,899) 729
Liabilities and provisions 3,914 1,713 (2,223) 4,437
Pension provisions 8 10 (47) 1,755
Deferred tax liabilities (before offsetting) 93,650 64,318
Deferred tax income / expense (9,069) (6,094)
Net deferred tax assets / tax liabilities (3,378) 4,640
1 prior-year figures adjusted
No deferred tax assets on temporary differences and tax loss carryforwards were recognised in the amount of
€ 108,145 k (previous year: € 96,200 k) because realisation of the tax assets in the foreseeable future does not
seem sufficiently certain. Due to the modified, retrospective introduction of IFRS 9 (c.f. Note 2), the resulting
deferred taxes were considered in retained earnings not affecting net income.
The net amount of deferred tax assets and liabilities was derived as follows:
Consolidated statement of financial position
€ ‘000 2018 20171
Deferred tax assets 164,281 146,420
Valuation allowance (108,145) (96,200)
Net deferred tax assets 56,136 50,220
Deferred tax liabilities 59,514 45,580
Net deferred tax assets / tax liabilities (3,378) 4,640
1 prior-year figures adjusted

| 177| Consolidated financial statements
Notes
Explanations
10 | Income taxes
Deferred taxes on outside basis differences (differences between the net assets including goodwill of the
subsidiaries and the respective tax value of the shares in these subsidiaries) were not recognised because
reversal of differences arising for example from dividend payments can be managed and no material tax
effects are to be expected in the foreseeable future. Outside basis differences amounted to € 363,633 k on
31 December 2018 (previous year: € 357,812 k).
On the balance sheet date, the Group had foreign income tax but also German corporate tax loss carryfor-
wards totalling € 450,362 k (previous year: € 367,700 k), of which € 330,532 k (previous year: € 240,811 k)
may, based on legislation applicable on the respective reporting date, be carried forward indefinitely and
in unlimited amounts. In Germany, however, losses carried forward may be deducted from income without
restriction up to € 1,000 k only. Any remaining amount of income may be offset by loss carryforwards by
up to 60 percent. The remaining tax losses eligible for limited carryforward pertained exclusively to foreign
subsidiaries and will expire by 2027 at the latest if not utilised.
The table below shows the usability of the loss carryforwards:
€ ‘000 2018
Useable until 2019 877
Useable until 2020 1,744
Useable until 2021 886
Useable until 2022 10,110
Useable until 2023 21,563
Useable until 2024 16,135
Useable until 2025 33,650
Useable until 2026 16,771
Useable until 2027 18,095
The Group’s German trade tax loss carryforwards amounted to € 218,433 k on the balance sheet date (previous
year: € 136,786 k), all of which, based on legislation applicable on the respective balance sheet dates, may be
carried forward indefinitely and in unlimited amounts. The options to offset against future income correspond
to the corporate tax loss carryforwards. There were foreign loss carryforwards for US state tax in the amount
of € 20,925 k on the balance sheet date (previous year: € 16,645 k).
In the financial year, German trade tax loss carryforwards amounting to € 47 k (previous year: € 60 k) and
German corporate tax loss carryforwards amounting to € 47 k (previous year: € 60 k) were utilised. Foreign
income tax loss carryforwards were used in the amount of € 30,638 k (previous year: € 34,448 k). Loss carry-
forwards for US state tax were not used in the financial year (previous year: € 1,473 k).

178 | www.leoni.com
11 | Other comprehensive income
The overview below shows the components of other comprehensive income and the tax effects:
2018 2017
€ ‘000
Pre-tax amount Tax effect Net amount
Pre-tax amount Tax effect Net amount
Change in actuarial gains / losses 11,592 489 12,081 9,042 (335) 8,707
Foreign currency translation adjustments (852) 0 (852) (40,796) 0 (40,796)
Change in unrealised gains / losses on cash flow hedges 6,715 (471) 6,244 14,948 (3,409) 11,539
Changes in the share of other comprehensive income accounted for by associates and joint ventures (6) 0 (6) (791) 0 (791)
Other comprehensive income 17,449 18 17,467 (17,597) (3,744) (21,341)
Actuarial losses decreased by € 11,592 k during the period under report (previous year: of € 9,042 k) because
of gains on all key plan assets due to the increase in the discount rate. In the United Kingdom and Switzerland,
gains on plan assets exerted opposing effects.
Other comprehensive income showed currency translation losses of € 852 k (previous year: losses of
€ 40,796 k) due to translation into the euro reporting currency.
Taking deferred taxes into account, the overall result was other comprehensive income of € 17,467 k (previous
year: negative € 21,341 k).
12 | Accounts receivable and other financial assets
€ ‘000 2018 20171
Trade receivables 625,275 609,761
Receivables to associated companies and joint ventures 15,268 8,857
Other financial assets 33,112 29,464
673,655 648,0821 prior-year figures adjusted
Trade receivables were non-interest bearing. On the balance sheet date, trade receivables were reduced by
factoring amounting to € 199,597 k (previous year: € 194,078 k).

| 179| Consolidated financial statements
Notes
Explanations
11 | Other comprehensive income
12 | Accounts receivable and other financial assets
13 | Other assets
14 | Inventories
The other financial receivables of € 29,413 k (previous year: € 26,616 k) are included in the short and long-term
other financial assets in the amount of € 39,562 k (previous year: € 36,812 k). These items furthermore include
derivative financial assets in the amount of € 9,034 k (previous year: € 9,078 k) as well as equity instruments in
the amount of € 1,116 k (previous year: € 1,115 k).
The maximum risk of loan default corresponded to the carrying amount of the receivables. There were not,
with respect to the neither impaired receivables nor the overdue receivables, any signs on the reporting date
that the debtors will fail to make payment.
13 | Other assets
€ ‘000 2018 2017
Receivables for VAT 111,321 77,972
Prepaid expenses 30,319 16,611
Advance payments 12,177 12,207
Receivables for other taxes 5,207 4,569
Insurance technical reserves 50 1,847
Other assets 11,252 11,636
170,326 124,842
14 | Inventories
€ ‘000 2018 20171
Raw materials and manufacturing supplies 324,396 321,779
Work in progress 96,142 98,463
Finished products and merchandise 188,752 176,454
609,290 596,696
1 prior-year figures adjusted
The amount of impairment of inventories, recognised as expense, was € 23,114 k (previous year: € 19,440 k). As
in the previous year, the fiscal 2018 write-downs on inventory were fully included in the cost of sales.
The inventory recognised as expense in the cost of sales (inventory used) in the financial year amounted to
€ 2,998,025 k (previous year: € 2,880,569 k).
The carrying amount included inventories in the amount of € 41,500 k (previous year: € 28,631 k) that were
measured at net realisable value.
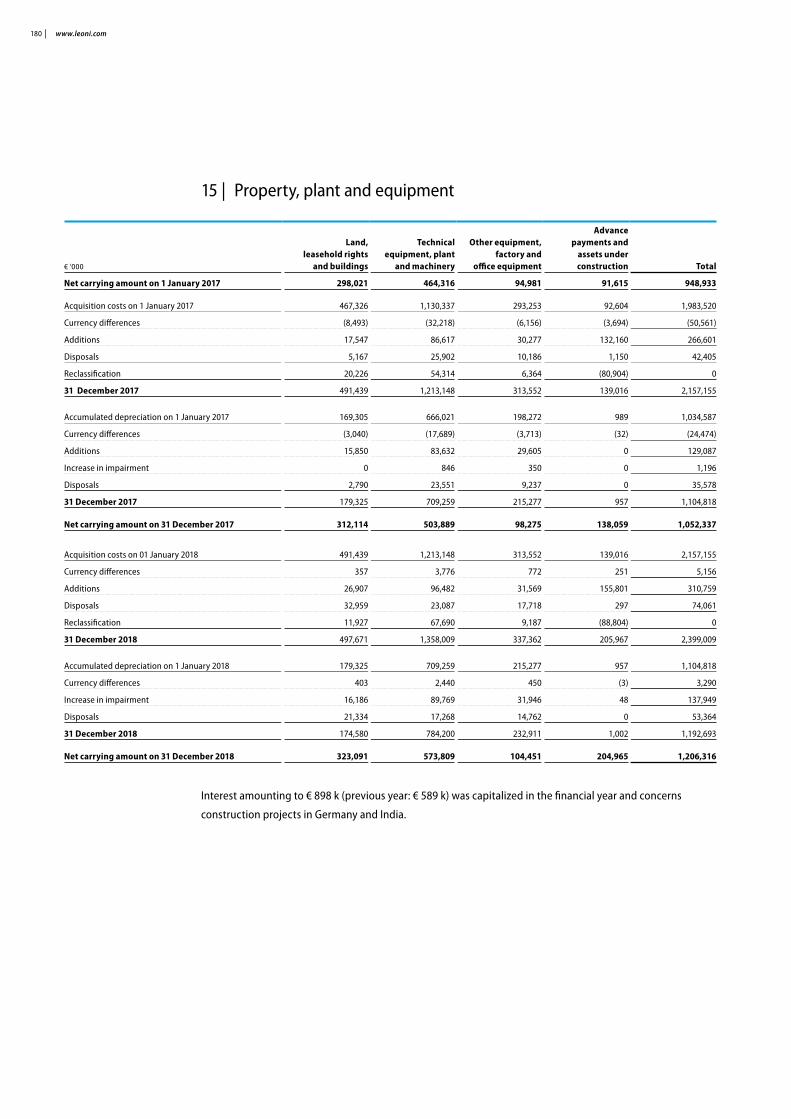
180 | www.leoni.com
15 | Property, plant and equipment
€ ‘000
Land, leasehold rights
and buildings
Technical equipment, plant
and machinery
Other equipment, factory and
office equipment
Advance payments and
assets under construction Total
Net carrying amount on 1 January 2017 298,021 464,316 94,981 91,615 948,933
Acquisition costs on 1 January 2017 467,326 1,130,337 293,253 92,604 1,983,520
Currency differences (8,493) (32,218) (6,156) (3,694) (50,561)
Additions 17,547 86,617 30,277 132,160 266,601
Disposals 5,167 25,902 10,186 1,150 42,405
Reclassification 20,226 54,314 6,364 (80,904) 0
31 December 2017 491,439 1,213,148 313,552 139,016 2,157,155
Accumulated depreciation on 1 January 2017 169,305 666,021 198,272 989 1,034,587
Currency differences (3,040) (17,689) (3,713) (32) (24,474)
Additions 15,850 83,632 29,605 0 129,087
Increase in impairment 0 846 350 0 1,196
Disposals 2,790 23,551 9,237 0 35,578
31 December 2017 179,325 709,259 215,277 957 1,104,818
Net carrying amount on 31 December 2017 312,114 503,889 98,275 138,059 1,052,337
Acquisition costs on 01 January 2018 491,439 1,213,148 313,552 139,016 2,157,155
Currency differences 357 3,776 772 251 5,156
Additions 26,907 96,482 31,569 155,801 310,759
Disposals 32,959 23,087 17,718 297 74,061
Reclassification 11,927 67,690 9,187 (88,804) 0
31 December 2018 497,671 1,358,009 337,362 205,967 2,399,009
Accumulated depreciation on 1 January 2018 179,325 709,259 215,277 957 1,104,818
Currency differences 403 2,440 450 (3) 3,290
Increase in impairment 16,186 89,769 31,946 48 137,949
Disposals 21,334 17,268 14,762 0 53,364
31 December 2018 174,580 784,200 232,911 1,002 1,192,693
Net carrying amount on 31 December 2018 323,091 573,809 104,451 204,965 1,206,316
Interest amounting to € 898 k (previous year: € 589 k) was capitalized in the financial year and concerns
construction projects in Germany and India.

| 181| Consolidated financial statements
Notes
Explanations
15 | Property, plant and equipment
16 | Intangible assets
16 | Intangible assets
€ ‘000
Trademarks, similar rights,
software and other
Customer relationships and
order backlog Development costs Advance payments Total
Net carrying amount on 1 January 2017 34,082 22,223 4,173 10,096 70,574
Acquisition costs on 1 January 2017 123,751 123,789 18,453 10,373 276,366
Currency differences (1,412) (586) (561) (246) (2,805)
Additions 7,729 101 968 6,012 14,810
Additions due to changes in scope of consolidation 0 0 0 2,261 2,261
Disposals 2,291 0 0 318 2,609
Reclassification 6,761 0 33 (6,794) 0
31 December 2017 134,538 123,304 18,893 11,288 288,023
Accumulated amortisation on 1 January 2017 89,669 101,566 14,280 277 205,792
Currency differences (1,070) (418) (499) 1 (1,986)
Additions 11,603 7,781 597 456 20,437
Increase in impairment 1,584 0 0 0 1,584
Disposals 2,290 0 0 0 2,290
31 December 2017 99,496 108,929 14,378 734 223,537
Net carrying amount on 31 December 2017 35,042 14,375 4,515 10,554 64,486
Acquisition costs on 1 January 2018 134,538 123,304 18,893 11,288 288,023
Currency differences 717 39 136 56 948
Additions 22,059 0 651 9,427 32,137
Disposals 0 0 157 217 374
Reclassification 4,001 0 2,708 (6,709) 0
31 December 2018 161,315 123,343 22,231 13,845 320,734
Accumulated amortisation on 01 January 2018 99,496 108,929 14,378 734 223,537
Currency differences 781 68 71 0 920
Additions 12,527 6,295 790 1,029 20,641
Disposals 0 0 67 168 235
31 December 2018 112,804 115,292 15,172 1,595 244,863
Net carrying amount on 31 December 2018 48,511 8,051 7,059 12,250 75,871
The item trademarks and similar rights, software and others included technology as well as non-patented
production know-how acquired in the context of business combinations. The residual value of the technology
and the production know-how amounted to € 3,402 k (previous year: € 4,010 k); the average residual useful
life was about six years. As in the previous year, brands acquired in the context of business combinations were

182 | www.leoni.com
included in the amount of € 1,877 k, which were classified as intangible assets with an indefinite useful life
as there was no foreseeable limit to the use of these brands. The contractual and non-contractual business
relationships obtained in the context of business acquisitions under the item customer relationships and order
backlog had a residual value of € 8,051 k (previous year: € 14,375 k); the average residual useful life of the
customer relationships amounting to € 8,043 k (previous year: € 14,367 k) was about seven years.
Amortisation of intangible assets with a finite useful life was included in the following function costs:
€ ‘000 2018 2017
Cost of sales 8,597 10,230
General and administration expenses 10,671 9,049
Selling expenses 362 703
Research and development expenses 1,011 455
Total 20,641 20,437
There was no appreciation either in this financial year or in the previous year.
17 | Impairment testing of property, plant and equipment as well as intangible assets
Property, plant and equipment as well as intangible assets were tested for impairment where there were
possible signs of depreciation pursuant to IAS 36.13. The brand described in the section below was also tested
for possible impairment as part of the impairment test for intangible assets with an indefinite useful life that
must be carried out at least once a year. For this impairment testing, the expected cash flows were in all cases
extrapolated from the business planning as approved by management for a period of five years. In the impair-
ment tests, the recoverable amount of the respective cash-generating unit was as a matter of principle based
on the fair value less cost to sell and was determined based on the level three parameters pursuant to IFRS 13.
The brand existing within the Wire & Cable Solutions Division was tested for impairment on 31 October. This
was based on an after-tax discount rate of 8.21 percent (previous year: 8.87 percent). The impairment test did
not result in any need for write-down.
The following disclosures refer to cash-generating units that were tested for impairment because there were
indications of impairment.
In the case of a cash-generating unit of the Wire & Cable Solutions Division, the impairment test was based on
an after-tax discount rate of 7.61 percent (previous year: 8.38 percent). The test did not find any need for write-
down. From an increase in the after-tax interest rate by more than 0.12 of a percentage point (previous year:
0.6) the fair value less cost to sell would, all other parameters being equal, drop below the carrying amount.

| 183| Consolidated financial statements
Notes
Explanations
17 | Impairment testing of property, plant and equipment as well as intangible assets
18 | Goodwill
In the previous year, a cash-generating unit in the Wiring Systems Division was tested for impairment based
on the fair values of the individual assets. This found impairment of € 1,196 k, which was expensed in the
previous year. The need for write-down pertained to property, plant and equipment.
18 | Goodwill
Goodwill in the financial year is summarised as follows:
€ ‘000 2018 2017
Acquisition costs on 1 January 149,698 156,103
Accumulated allowance 3,016 8,167
Carrying amount 1 January 146,682 147,935
Additions 0 672
Disposals (6,830) 0
Currency translation differences 368 (1,925)
Carrying amount on 31 December 140,220 146,682
Acquisition costs on 31 December 150,142 149,698
Accumulated allowance 31 December 9,921 3,016
Carrying amount on 31 December 140,221 146,682
In addition to the obligatory impairment tests of all goodwill that must be carried out at least once a year,
the Company carries out additional impairment tests during the financial year where there are indications of
impairment. The obligatory impairment test of all goodwill that must be carried out at least once a year was
executed as at 31 October.
For the purpose of the impairment test, all goodwill was allocated to those cash-generating units or groups of
cash-generating units that benefit from the synergies of the business combinations.
The principal goodwill allocations were as follows: In the Wiring Systems Division, the largest item of goodwill
in the amount unchanged from the previous year of € 66.6 million was allocated at segment level. In the Wire
& Cable Solutions Division, one item of goodwill of € 65.6 million (previous year: € 64.9 million) was allocated
to Business Group Industrial Solutions and goodwill totalling € 4.1 million (previous year: € 4.2 million) was
allocated to Business Group Automotive Cables.
In all the goodwill impairment tests, determination of the recoverable amount was based on the fair value less
cost to sell. The underlying cash flow forecasts are in each case based on the five-year business planning as
approved by the Board of Directors.

184 | www.leoni.com
As in the previous year, cash flows after the five-year period were on principle and for simplification extra-
polated without applying a growth rate. The after-tax discount rates applied were as follows: for the
Wiring Systems Division 7.89 percent (previous year: 8.80 percent), for Business Group Automotive Cables
8.88 percent (previous year: 10.13 percent) and for Business Group Industrial Solutions 7.69 percent (previous
year 8.45 percent).
Within the Wire & Cable Solutions Division, an item of goodwill in the amount of € 65.6 million that is allocated
to Business Group Industrial Solutions was tested for impairment. The after-tax discount rate was 7.69 percent
(previous year: 8.45 percent). Based on the assumptions made, the recoverable amount exceeded the carrying
amount of € 469.7 million by € 195.2 million. From an increase in the discount rate by 2.8 of a percentage point
(previous year: 0.57 of a percentage point) the recoverable amount would, all other parameters being equal,
match the carrying amount.
Likewise within the Wire & Cable Solutions Division, an item of goodwill in the amount of € 4.1 million that is
allocated to Business Group Automotive Cables was also tested for impairment. The after-tax discount rate
in this case was 8.88 percent (previous year: 10.13 percent). Based on the assumptions made, the recoverable
amount exceeded the carrying amount of € 366.6 million by € 118.8 million. From an increase in the discount
rate by 2.23 of a percentage point (previous year: 0.65 of a percentage point) the recoverable amount would,
all other parameters being equal, match the carrying amount.
Within the Wiring Systems Division, an item of goodwill in the amount of € 6.8 million was allocated to a
Business Unit at the time of the test, which was likewise tested for impairment. The after-tax discount rate in
this case was 8.45 percent (previous year: 9.45 percent). Based on the assumptions made, the cash-generating
unit’s carrying amount of € 88.1 million was short of the recoverable amount by € 6.8 million. The allocated
goodwill in the amount of € 6.8 million was amortised in full. There was no need for write-down of any of
the cash-generating unit’s other assets. Deterioration of planning assumptions and valuation parameters
could lead to further impairment of long-term, non-financial assets allocated to the cash-generating unit. An
increase in the discount rate by 0.5 of a percentage point would thus lead to a need for additional impairment
by up to € 6.2 million.
Also within the Wiring Systems Division, an item of goodwill in the amount of € 1.9 million that is allocated to
a Business Unit was likewise tested for impairment. The after-tax discount rate in this case was 8.96 percent
(previous year: 10.37 percent). Based on the assumptions made, the recoverable amount exceeded the carry-
ing amount of € 127.8 million by € 10.5 million.

| 185| Consolidated financial statements
Notes
Explanations
19 | Shares in associated companies and joint ventures
19 | Shares in associated companies and joint ventures
As in the previous year, the shares in associated companies and joint ventures involved primarily LEONI Wiring
Systems Co. Ltd. based in Langfang, China, in which the Group holds a 50 percent stake and which is included
on the consolidated financial statements with this share. The business purpose of this joint venture is the
production of cable harnesses for car model series.
The following key figures may be extrapolated from the financial statements prepared in accordance with
IFRS for the aforementioned, significant joint venture. The figures are stated at 100 percent and do not reflect
LEONI’s share in these amounts. There is furthermore a reconciliation of the pro-rata net assets with the carry-
ing amount of the share held by LEONI in this joint venture.
€ ‘000 2018 2017
Current assets 109,126 99,812
of which cash and cash equivalents 13,496 20,055
Non-current assets 29,780 27,668
Current liabilities 81,965 69,170
of which current financial liabilities 68,482 49,555
Sales 253,590 244,033
Interest income 1,432 566
Interest expenses 0 2,266
Depreciation / amortisation 4,196 8,067
Expenses 189,258 173,543
Earnings before taxes 61,568 60,723
Income tax expense or revenue (15,452) (15,253)
Earnings after taxes 46,116 45,470
Other comprehensive income (42) (1,646)
Total comprehensive income 46,074 43,824
Pro-rata comprehensive income 23,037 21,912
Net assets (excl. goodwill) 56,941 58,310
Pro-rata net assets 28,470 29,155
Pro-rata goodwill 3,972 4,017
Carrying amount of investment 32,442 33,172
Average number of employees 662 608
LEONI received a dividend of € 23,552 k in the financial year (previous year: € 12,004 k) .
The carrying amount of joint ventures and associated companies that are individually not significant was
€ 917 k (previous year: € 887 k).

186 | www.leoni.com
The summarised financial information, based on the values pertaining to LEONI, is presented below:
€ ‘000 2018 2017
Income from continuing operations 152 109
Other earnings after taxes 15 32
Total comprehensive income 167 141
20 | Financial liabilities
The financial liabilities comprised liabilities to banks, notes payable and other loan obligations. They totalled
€ 764,430 k on 31 December 2018 (previous year: € 591,320 k). Current financial liabilities and the short-term
proportion of long-term loans amounted to € 176,550 k on the reporting date (previous year: € 254,373 k).
Non-current financial liabilities increased by € 250,933 k to € 587,880 k, which is due primarily to having issued
new borrower’s note loans.
The overview below shows the existing borrower’s note loans:
Nominal value € ‘000
Carrying amount 31/12/2018
€ ‘000
Payment year Repayment Interest Hedging
instrument
48,500 48,951 2012 matures 2019 fixed income none
25,000 25,890 2013 matures 2020 fixed income Fair value hedge
6,000 6,051 2015 matures 2020 fixed income none
87,000 87,175 2015 matures 2020 variable rate none
77,500 78,147 2015 matures 2020 fixed income none
9,000 9,090 2012 matures 2022 fixed income none
21,000 21,042 2015 matures 2022 variable rate none
19,000 19,198 2015 matures 2022 fixed income none
11,000 10,993 2018 matures 2023 fixed income none
87,000 86,907 2018 matures 2023 variable rate Cash flow hedge
66,500 66,482 2018 matures 2024 fixed income none
87,000 86,923 2018 matures 2024 variable rate Cash flow hedge
12,000 12,174 2015 matures 2025 fixed income none
58,000 58,018 2018 matures 2026 fixed income none
13,500 13,510 2018 matures 2028 fixed income none
8,000 7,996 2018 matures 2028 variable rate Cash flow hedge
Detail of the financial liabilities and hedging instruments is to be found in Note 27.

| 187| Consolidated financial statements
Notes
Explanations
20 | Financial liabilities
21 | Trade payables and other financial liabilities
22 | Other current liabilities
21 | Trade payables and other financial liabilities
€ ‘000 2018 2017
Trade liabilities 956,826 909,414
Liabilities to associated companies and joint ventures 1,477 1,319
Other liabilities 126,040 64,151
1,084,343 974,884
On 31 December 2018, trade liabilities amounting to € 171,254 k (previous year: € 185,852 k) involved reverse
factoring.
Other liabilities included payables amounting to € 39,207 k (previous year: € 35,519 k) from the receipt of pay-
ment on receivables that were sold within factoring contracts.
22 | Other current liabilities
€ ‘000 2018 2017
Liabilities to employees 97,079 116,788
Tax liabilities 46,115 31,718
Liabilities connected with social security 23,612 21,360
Other accruals 23,363 18,726
190,169 188,592

188 | www.leoni.com
23 | Provisions
The changes in provisions are summarised as follows:
€ ‘000 1/1/2018 Usage Dissolution AllocationAllocation of interest
Currency differences 31/12/2018
Current provisions
2018
Non-current
provisions 2018
Current provisions
2017
Non-current
provisions 2017
Personnel-related provisions 25,354 4,094 681 6,854 69 52 27,450 1,388 26,062 1,914 23,440
Provisions for product warranties 13,999 7,212 3,841 6,505 0 (74) 9,525 9,525 0 13,999 0
Other provisions for purchasing and distribution 9,269 3,752 790 4,173 0 (109) 9,009 8,873 136 8,972 297
Restructuring provisions 4,251 2,493 1,217 158 0 15 684 684 0 3,631 620
Other provisions 13,829 1,729 197 1,488 8 20 13,379 4,068 9,311 4,888 8,941
Total 66,702 19,280 6,726 19,178 77 (96) 60,047 24,538 35,509 33,404 33,298
The personnel-related provisions involved mainly long-term provision for anniversary bonuses in the amount
of € 12,762 k (previous year: € 11,673 k) and for partial retirement agreements in Germany in the amount of
€ 8,518 k (previous year: € 7,611 k). The provision for anniversary bonuses is paid out according to the age
structure of the workforce upon the employees’ respective anniversaries of service. Based on the current
workforce, payments will mostly become due in the next 21 years. The payments relating to provisions for
partial retirement will probably be spread over the next six years.
The product warranties were determined based on experience, with goodwill concessions also taken into
account. Provisions were added in the amount of € 6,505 k (previous year: € 6,409 k) for claims under warranty
and/or for compensation in fiscal 2018. These provisions for claims under warranty and/or for compensation
were offset by claims against the insurer in the amount of € 50 k (previous year: € 1,847 k).
There were also provisions for purchasing and distribution to cover onerous contracts in the amount of
€ 4,399 k (previous year: € 4,334 k).
The restructuring provisions in the amount of € 684 k (previous year: € 4,251 k) pertained to the Wiring
Systems Division in the amount of € 440 k (previous year: € 3,398 k) and to the Wire & Cable Solutions Division
in the amount of € 244 k (previous year: € 853 k). Use of restructuring provisions in the amount of € 2,493 k
involved the sums set aside in previous years for severance costs pertaining above all to the Wiring Systems
Division in France.

| 189| Consolidated financial statements
Notes
Explanations
23 | Provisions
24 | Pension provisions
24 | Pension provisions
At LEONI, there are in various countries pension commitments that provide for benefits in the event of
disablement, retirement or death. These principal commitments are limited to our companies in the United
Kingdom, Germany and Switzerland, and are set up as defined benefit plans. The obligations and the plan
assets of the pension plans in these three countries accounted for 97.1 percent (previous year: 97.3 percent)
and 99.2 percent (previous year: 99.2 percent), respectively, of the Group total. The pension plans in the
United Kingdom and Switzerland are managed by legally independent entities, namely the LEONI UK Pension
Scheme and Vorsorgestiftung LEONI Schweiz (LEONI Switzerland Pension Trust).
Germany
In Germany, LEONI grants defined benefits to most employees for the deferral of compensation. Amounts of
deferred compensation earn fixed interest and lead to a claim for fixed lump-sum benefit once entitlement
takes effect. These benefits are covered by capital insurance. The reinsurance policies are qualifying insurance
policies and are therefore recognised as plan assets. The terms of the insurance policies are in line with the
dates when the benefits become due. The interest rate for benefit modules follows the respectively current
maximum rate stipulated by Section 65 of the Insurance Supervision Act (VAG) in conjunction with Section 2
(1) of the Actuarial Reserve Ordinance. It is capped at 6 percent, but currently lies between 4.5 percent and
5 percent because of the persistently low level of interest rates. The pension plan of Leonische Drahtwerke AG,
which was closed to people joining the Company as long ago as 1981, grants pension payments based on year
of service and income at the time of retirement.
Pension obligations of acquired German companies are generally based on eligible compensation levels and/
or ranking within the Company hierarchy and years of service, or on a fixed amount per year of service. All
defined pension plans of acquired companies are closed to new staff.
The plans in Germany are exposed to risks relating primarily to interest rates, longevity and partly also salary
increases.
United Kingdom
In the United Kingdom, there is a defined benefit plan that was set up in the year 2000 and replaced the
pension plan in place until then. Until it was closed to new staff joining in 2008, all employees were able to
participate in this plan. The pension plan is administered by a trust whose board comprises both employer
and employee representatives. There are also outside experts consulting on asset management and actu-
arial matters. The trust determines the contributions to be paid in by LEONI and decides on the additional
contributions to be paid by LEONI in the event of any plan deficit. Due to the persistently low discount rates
that are to be applied for computing pension obligation, the balance of defined benefit obligation and plan

190 | www.leoni.com
assets currently shows a deficit of € 50,964 k (previous year: € 66,626 k), equating to 26.1 percent (previous
year: 31.2 percent) of the defined benefit obligation. Negotiations between LEONI and the trust are conducted
every three years to determine the amounts to be paid in to clear any deficit and the period over which to do
so. In addition to the ongoing contributions, payments of € 4,286 k were made in the financial year (previous
year: € 4,057 k) to clear the deficit.
The amount of committed benefits is based upon the salary of the last year of employment as well as years of
service and contributions of the participants to the fund. Pension adjustments are linked to an inflation index,
reflecting increases in the cost of living.
LEONI is exposed due to these plans in the United Kingdom to risks involving primarily interest rates, invest-
ment, inflation and longevity as well as salary increases.
Switzerland
In Switzerland, there is, alongside the state pension, a statutory obligation to provide employees with pension
insurance, which pays benefits in the event of retirement, disablement and death. This involves a defined
benefit plan that, at LEONI, is managed by the legally independent ‘Vorsorgestiftung LEONI Schweiz’ (LEONI
Switzerland Pension Trust). The trust’s management is incumbent upon the board of trustees, which com-
prises an equal number of employer and employee representatives. The risks relating to longevity, interest
rates and investment are borne exclusively by the trust. The savings contributions to the trust are paid in
equal amounts by the employer and employees. A variety of measures can be applied in the event of any plan
deficit. Alongside the options of reducing the pension payments or increasing the savings contributions, there
is a statutory obligation on companies to pay recapitalisation contributions.
The size of benefit payments is, in the event of disability or death, geared to the amount of income insured, or,
in the case of retirement, depends on the credit balances in nominal savings accounts (old-age credit) at the
time of retirement.
Other countries
In France, there are defined benefit plans in accordance with the country’s legal requirements and other
agreements. The collective agreement of the French metal-working trade union determines the size of the
benefit. It is linked to monthly wages and salaries and depends on years of service.

| 191| Consolidated financial statements
Notes
Explanations
24 | Pension provisions
At the Italian subsidiaries, there are pension plans in accordance with the local legal requirements. These must
be qualified as defined benefit plans pursuant to IAS 19 and were presented accordingly.
Furthermore, there are at some foreign subsidiaries pension-like defined benefit schemes, above all for transi-
tion payments after entering retirement, which were presented as defined benefit plans pursuant to IAS 19
and which were of only minor significance to the Group.
The trend in net pension obligations, which is comprised of the change in the defined benefit obligation and
the change in the fair value of plan assets is as follows:
2018
Change in defined benefit obligations € ‘000 UK Germany Switzerland Other Total
Defined benefit obligations at the beginning of the fiscal year 213,608 121,442 90,167 11,621 436,838
Current service cost 1,772 2,450 1,957 698 6,877
Interest cost 5,024 2,305 641 233 8,203
Actuarial (gains) / losses (18,363) (1,352) (219) 322 (19,612)
Past service cost 985 0 (386) 4 603
Contributions by plan participants 18 2,834 2,131 0 4,983
Currency differences (2,064) 0 3,515 3 1,454
Transfers under Swiss law 0 0 5,148 0 5,148
Benefits paid (5,754) (3,169) (5,960) (613) (15,496)
Defined benefit obligations at the end of the fiscal year 195,226 124,510 96,994 12,268 428,998
Change in plan assets € ‘000 UK Germany Switzerland Other Total
Fair value of plan assets at the beginning of the fiscal year 146,982 39,941 76,919 2,247 266,089
Interest received 3,502 763 547 75 4,887
Return on plan assets (excl. interest income based on discount rate) (4,501) 23 (3,472) (46) (7,996)
Currency differences (1,543) 0 2,945 0 1,402
Contributions by the employer 6,274 414 2,065 407 9,160
Contributions by plan participants 18 2,834 2,131 0 4,983
Administrative costs, fees and taxes (716) 0 0 0 (716)
Transfers under Swiss law 0 0 5,148 0 5,148
Benefits paid (5,754) (737) (5,960) (412) (12,863)
Plan assets at the end of the fiscal year 144,262 43,238 80,323 2,271 270,094
Net liability due to defined benefit plans 50,964 81,272 16,671 9,997 158,904

192 | www.leoni.com
2017
Change in defined benefit obligations € ‘000 UK Germany Switzerland Other Total
Defined benefit obligations at the beginning of the fiscal year 213,851 121,191 96,217 11,645 442,904
Current service cost 1,794 3,073 2,094 1,085 8,046
Interest cost 5,402 2,060 608 256 8,326
Actuarial (gains) / losses 6,656 (4,344) (262) (71) 1,979
Contributions by plan participants 15 2,454 2,090 0 4,559
Currency differences (7,404) 0 (7,989) (28) (15,421)
Acquisition effects 0 0 863 0 863
Transfers under Swiss law 0 0 1,661 0 1,661
Benefits paid (6,706) (2,992) (5,115) (1,266) (16,079)
Defined benefit obligations at the end of the fiscal year 213,608 121,442 90,167 11,621 436,838
Change in plan assets € ‘000 UK Germany Switzerland Other Total
Fair value of plan assets at the beginning of the fiscal year 142,790 37,249 77,502 2,304 259,845
Interest income 3,649 694 490 66 4,899
Return on plan assets (excl. interest income based on discount rate) 6,771 86 4,186 (42) 11,001
Currency differences (5,007) 0 (6,653) (21) (11,681)
Contributions by the employer 6,189 253 2,024 987 9,453
Contributions by plan participants 15 2,454 2,090 0 4,559
Administrative costs, fees and taxes (719) 0 0 0 (719)
Acquisition effects 0 0 734 0 734
Transfers under Swiss law 0 0 1,661 0 1,661
Benefits paid (6,706) (795) (5,115) (1,047) (13,663)
Plan assets at the end of the fiscal year 146,982 39,941 76,919 2,247 266,089
Net liability due to defined benefit plans 66,626 81,501 13,248 9,374 170,749
The pension obligations are presented on the balance sheet as a net liability in the amount of € 158,904 k
(previous year: net liability of € 170,792 k and net asset of € 43 k).
The transfers under Swiss law concern the transfer of the obligation and of the related proportion of plan
assets, known as the vested benefit credit, to the new employer or a suitable financial institution in accor-
dance with the country’s legal requirements.
The defined benefit obligation at the end of the financial year broke down into € 380,852 k (previous year:
€ 387,819 k) in funded obligations and € 48,146 k (previous year: € 49,019 k) in unfunded obligations.

| 193| Consolidated financial statements
Notes
Explanations
24 | Pension provisions
A breakdown of the obligations into the categories of existing and past employees as well as non-vested and
vested benefits is provided in the overview below:
2018 € ‘000 UK Germany Switzerland Other Total
Current employees with non-vested benefits 49,936 63,776 66,109 4,389 184,210
Current employees with vested benefits 0 0 0 7,879 7,879
Former employees with non-vested benefits 69,027 24,853 0 0 93,880
Pensioners 76,263 35,881 30,885 0 143,029
Defined benefit obligations at the end of the fiscal year 195,226 124,510 96,994 12,268 428,998
2017 € ‘000 UK Germany Switzerland Other Total
Current employees with non-vested benefits 62,487 67,752 60,110 4,088 194,437
Current employees with vested benefits 0 0 0 7,533 7,533
Former employees with non-vested benefits 81,774 17,489 0 0 99,263
Pensioners 69,347 36,201 30,057 0 135,605
Defined benefit obligations at the end of the fiscal year 213,608 121,442 90,167 11,621 436,838
The actuarial gains or losses on revaluation were recognised in accumulated other comprehensive income.
The trend in the Group’s actuarial losses, including the share pertaining to associated companies, is presented
in the overview below:
€ ‘000 2018 2017
Actuarial losses at the beginning of the fiscal year 137,976 147,029
Actuarial (gains) / losses
– due to the change in demographic projections 1,461 0
– due to the change in financial estimates (21,135) 2,510
– due to adjustments based on experience 47 (561)
Return on plan assets (excl. interest income based on discount rate) 7,996 (11,002)
Actuarial losses at the end of the fiscal year 126,345 137,976
The assumptions for interest rates, rates of compensation increase and the expected return on plan assets on
which the calculation for defined benefit obligations is based were established for each country as a function
of their respective economic conditions. The discount rate was determined on the basis of top-tier, fixed-
income corporate bonds. This involved referencing bonds that on the reporting date had maturities in line
with the pension obligations and are quoted in the corresponding currency. AA-rated bonds were used as the
basis for data to determine the discount rates.

194 | www.leoni.com
The overview below shows the actuarial assumptions made to calculate the defined benefit obligation:
2018 2017
UK Germany Switzerland Total UK Germany Switzerland Total
Discount rate 2.89 % 2.02 % 0.80 % 2.12 % 2.38 % 1.93 % 0.70 % 1.88 %
Rate of wage and salary increase 3.21 % 2.50 % 1.00 % 2.47 % 3.18 % 2.50 % 1.00 % 2.51 %
Rate of compensation increase 3.07 % 1.75 % 0.00 % 1.91 % 3.05 % 1.75 % 0.00 % 1.98 %
The assumptions made for calculating net periodic pension costs are shown in the table below:
2018 2017
UK Germany Switzerland Total UK Germany Switzerland Total
Discount rate 2.38 % 1.93 % 0.70 % 1.88 % 2.62 % 1.72 % 0.65 % 1.91 %
Rate of wage and salary increase 3.18 % 2.50 % 1.00 % 2.51 % 3.25 % 2.50 % 0.75 % 2.46 %
Rate of compensation increase 3.05 % 1.75 % 0.00 % 1.98 % 3.10 % 1.75 % 0.00 % 1.98 %
The assumed mortality is based on published statistics and historical data in the respective countries. The
valuation of the retirement benefit obligations in the United Kingdom was based on the S2NA mortality table
and updated with the CMI 2017 core model index. The mortality tables used in Germany were the ‘Heubeck-
Richttafeln 2018 G’. These two assessment models were updated in 2018, the impact of which is contained in
the actuarial changes due to demographic assumptions. As in the previous years, the ‘BVG 2015 Generationen-
tafel’ was used in Switzerland.
The discount rate is the key determinant for the amount of net pension obligations. An increase or a decrease
by 1 percentage point has the following impact on the defined benefit obligation:
2018 € ‘000 UK Germany Switzerland Other Total
Defined benefit obligations at the end of the fiscal year 195,226 124,510 96,994 12,268 428,998
Discount rate plus 1 percentage point Change: (29,671) (14,925) (11,746) (1,307) (57,649)
Defined benefit obligations: 165,555 109,585 85,248 10,961 371,349
Discount rate minus 1 percentage point Change: 38,678 18,458 14,923 1,564 73,623
Defined benefit obligations: 233,904 142,968 111,917 13,832 502,621
2017 € ‘000 UK Germany Switzerland Other Total
Defined benefit obligations at the end of the fiscal year 213,608 121,442 90,167 11,621 436,838
Discount rate plus 1 percentage point Change: (36,205) (15,060) (11,173) (1,238) (63,676)
Defined benefit obligations: 177,403 106,382 78,994 10,383 373,162
Discount rate minus 1 percentage point Change: 48,051 18,729 14,205 1,574 82,559
Defined benefit obligations: 261,659 140,171 104,372 13,195 519,397

| 195| Consolidated financial statements
Notes
Explanations
24 | Pension provisions
The assumptions concerning the trends in salaries, pensions and mortality with respect to the pension plan
in the Group have the effect on the defined benefit obligation set out below. It should be noted that a drop in
the pension level is ruled out by law in Switzerland.
2018 2017
€ ‘000 UK Germany Switzerland UK Germany Switzerland
Defined benefit obligations at the end of the fiscal year 195,226 124,510 96,994 213,608 121,442 90,167
Salary trend plus 0.5 percentage point Change (absolute): 2,230 31 194 2,254 29 180
Change (relative): 1.14 % 0.03 % 0.20 % 1.06 % 0.02 % 0.20 %
Salary trend minus 0.5 percentage point Change (absolute): (2,230) (52) (194) (2,254) (28) (180)
Change (relative): (1.14) % (0.04) % (0.20) % (1.06) % (0.02) % (0.20) %
Rate of compensation plus 0.5 percentage point Change (absolute): 13,381 3,655 4,462 16,905 3,794 4,238
Change (relative): 6.85 % 2.94 % 4.60 % 7.91 % 3.12 % 4.70 %
Rate of compensation minus 0.5 percentage point Change (absolute): (12,266) (3,334) n/a (14,651) (3,453) n/a
Change (relative): (6.28) % (2.68) % n/a (6.86) % (2.84) % n/a
Life expectancy plus 1 year Change (absolute): 6,690 2,915 2,231 7,889 2,973 2,164
Change (relative): 3.43 % 2.34 % 2.30 % 3.69 % 2.45 % 2.40 %
The mortality trend is taken into account in the three major pension plans through the use of generation
tables. Calculation of the defined benefit obligation with a one-year rise in life expectancy raises the defined
benefit obligation of the plans as follows: in the United Kingdom by 3.43 percent (previous year: 3.69 percent),
in Germany by 2.34 percent (previous year: 2.45 percent) and in Switzerland by 2.30 percent (previous year:
2.40 percent).
The calculation of sensitivities was, as part of an observation performed on a ceteris paribus basis, based on
changing an assumption, whereas all other assumptions remain unchanged, whereby dependencies between
the assumptions are ruled out. The method for calculating sensitivities is identical to that for calculating the
net pension obligation.
The defined benefit plan expense recognised in comprehensive income comprises the amounts contained in
consolidated net income and in other comprehensive income:
€ ‘000 2018 2017
Current service cost 6,877 8,046
Net interest cost 3,316 3,427
Past service cost 603 0
Administrative costs and taxes related to plan management 716 719
Defined benefit plan expense recognised in consolidated net income 11,512 12,192
Actuarial (gains) / losses (19,627) 1,949
Return on plan assets (excl. interest income based on discount rate) 7,996 (11,002)
Income / expense relating to defined benefit plans recognised in other comprehensive income (11,631) (9,053)
Defined benefit plan expense recognised in comprehensive income (119) 3,139

196 | www.leoni.com
The net interest expense that arose from applying the discount rate to the balance of defined benefit obliga-
tion less plan assets (net pension obligation) was presented under finance costs.
The expense recognised in consolidated net income was contained in the following items of the income
statement:
€ ‘000 2018 2017
Cost of sales 3,311 2,806
General and administration expenses 2,051 1,945
Selling expenses 1,104 1,964
Research and development expenses 1,730 2,050
Finance costs 3,316 3,427
Defined benefit plan expense recognised in consolidated net income 11,512 12,192
Asset-liability matching strategies
At LEONI, the key benefit commitments are, in accordance with the Company’s Articles of Association,
furnished with a benefit reserve that is suited in its nature to funding the benefit payments when they are
due and in the required amount. In the case of the German pension plan this is done exclusively by means
of qualifying life insurance policies that are synchronised in their terms and amounts with the expected
benefit payments. In the case of the pension plans in the United Kingdom and Switzerland, the boards of the
independent trusts ensure adherence to the investment strategies. These strategies are aimed at minimising
potential investment risks, having sufficient funds available at short notice to serve the benefit payments due
and at generating a return that is in line with the market over the long term. Assessments of the investment
portfolio are regularly conducted together with independent, outside specialists in the fields of asset invest-
ment and actuarial policies to review the attainment of strategic targets and for the boards on that basis to
take investment decisions.
The breakdown of plan assets in the various classes is presented in the table below:
2018 € ‘000 %
2017 € ‘000 %
Equity instruments 48,143 17.8 57,311 21.5
Debt instruments 36,330 13.5 33,967 12.8
Property 36,155 13.4 34,803 13.1
of which: prices not quoted on an active market 20,053 7.4 18,814 7.1
Securities funds 82,086 30.4 78,929 29.7
Qualifying insurance policies 43,278 16.0 39,981 15.0
Other plan assets 19,097 7.1 17,754 6.7
of which: prices not quoted on an active market 13,227 4.9 11,891 4.5
Cash and cash equivalents 5,005 1.9 3,344 1.3
Total plan assets 270,094 100.0 266,089 100.0

| 197| Consolidated financial statements
Notes
Explanations
24 | Pension provisions
The plan assets from qualifying insurance policies stemmed almost exclusively from the reinsurance policies
in Germany. Apart from the class comprising cash and cash equivalents, the assets of all other classes stated
involved the plan assets of the pension plans in the United Kingdom and Switzerland, and broke down as
follows:
2018 UK € ‘000 %
Switzerland € ‘000 %
Equity instruments 30,293 21.0 17,848 22.2
Debt instruments 0 0.0 36,330 45.2
Property 20,053 13.9 16,102 20.0
of which: prices not quoted on an active market 20,053 13.9 0 0.0
Securities funds 82,086 56.9 0 0.0
Other plan assets 11,830 8.2 7,267 9.0
of which: prices not quoted on an active market 11,830 8.2 1,397 1.7
Cash and cash equivalents 0 0.0 2,776 3.5
Total plan assets 144,262 100.0 80,323 100.0
2017 UK € ‘000 %
Switzerland € ‘000 %
Equity instruments 34,394 23.4 22,917 29.8
Debt instruments 3,969 2.7 29,998 39.0
Property 18,814 12.8 15,989 20.8
of which: prices not quoted on an active market 18,814 12.8 0 0.0
Securities funds 78,929 53.7 0 0.0
Other plan assets 10,730 7.3 7,024 9.1
of which: prices not quoted on an active market 10,730 7.3 1,161 1.5
Cash and cash equivalents 146 0.1 991 1.3
Total plan assets 146,982 100.0 76,919 100.0
The equity instruments in the United Kingdom and Switzerland comprised investments in equity funds and
direct investments. In each case the funds included equities both based in the country and foreign ones.
The debt instruments held in Switzerland involved both national and foreign corporate and government
bonds. Investment in property in the United Kingdom and Switzerland was transacted exclusively by way of
open-ended property funds. The securities funds in the United Kingdom involved diversified growth funds or
liability-driven investments (LDIs). The other plan assets in the United Kingdom included investments in funds
in which the portfolios comprised foreign utility and transport infrastructure organisations.
The breakdown of plan assets by the stated investment classes corresponds to the targeted investment classes
set out in the statutes of the pension plans. The trustee continuously monitors the investment strategy espe-
cially for the plan in the United Kingdom. The objective is to ensure the best possible congruity with respect
to long-term structure and interest rate as well as inflation sensitivities between pension obligations and
the plan assets (liability-driven investments). The shift in the target allocation away from debt instruments
and towards securities funds started in the previous year was thus continued. Securities funds are expected to
provide more targeted hedging of the inflation and interest rate risk.
LEONI did not make any own use of plan assets.

198 | www.leoni.com
The contributions to plan assets amounted to € 9,160 k and were projected at € 8,600 k for the subsequent
financial year.
A breakdown of pension payments (excluding compensatory effects of payouts from the plans assets) was
presented as follows:
Pension payments made € ‘000
2017 16,079
2018 15,651
Expected pension payments € ‘000
2019 15,991
2020 16,547
2021 16,013
2022 19,270
2023 17,415
2024 – 2028 94,275
Pension payments expected until 2028 179,511
The average, weighted Macaulay duration of benefit obligations was 18 years in the United Kingdom and
14 years in both Germany and Switzerland.
Some non-German companies provide defined contribution plans. In Germany and other countries, state
plans were also recognised under defined contribution plans. The total cost of such contributions amounted
to € 82,349 k in the financial year (previous year: € 88,403 k).
25 | Equity
Share capital
The share capital in the amount of € 32,669 k (previous year: € 32,669 k), which corresponded to the share
capital of LEONI AG, is divided into 32,669,000 (previous year: 32,669,000) no-par-value shares.
Additional paid-in capital
As in the previous year, the additional paid-in capital amounted to € 290,887 k.
Statutory reserve
As in the previous year, the retained earnings included the statutory reserve of LEONI AG in the amount of
€ 1,092 k, which is not available for distribution.
Authorised capital
The Board of Directors is authorised to increase the share capital by up to € 16,334.5 k on or before
10 May 2022 with the Supervisory Board’s approval by once or in partial amounts issuing up to 16,334,500
new bearer shares, each with a pro-rated share of € 1.00 in the share capital, on a cash or non-cash basis.

| 199| Consolidated financial statements
Notes
Explanations
25 | Equity
26 | Contingencies and other obligations
Shareholders must be granted a right to subscribe. However, shareholders at the Annual General Meeting
entitled the Board or Directors, with the approval of the Supervisory Board, to rule out shareholders’ subscrip-
tion rights in cases specified in the Articles of Association.
Contingent capital
Furthermore, the Annual General Meeting on 07 May 2015 authorised the Board of Directors to issue convert-
ible bonds and/or warrant-linked bonds until 6 May 2020. This involved a contingent increase in share capital
by up to € 6,534 k. The contingent capital increase is only to be performed to the extent that option and/
or conversion rights are exercised, or that the holders and/or creditors obliged to convert have met their
conversion obligation, or so far as the Company exercises its right under such instruments either entirely or
partially to grant shares in the Company instead of paying the cash amount due and provided no other forms
of fulfilment are used.
Dividend payment
A dividend for the 2017 financial year of € 45,737 k was paid out in fiscal 2018, equating to a payout of € 1.40
per share entitled to dividend.
Dividend proposal
The Board of Directors and Supervisory Board will propose to shareholders at the Annual General Meeting
to not pay out any dividend from the fiscal 2018 distributable profit of LEONI AG, amounting to € 18,236 k as
determined under the German Commercial Code (HGB) and the German Stock Corporation Act (AktG), and to
allocate the entire distributable profit of € 18,236 k to retained earnings.
26 | Contingencies and other obligations
Lease obligations
The Group leases property, plant and equipment that did not qualify as finance leases under IFRS and
these are therefore classified as operating leases. Leasing expenses amounted to € 42,439 k in the financial
year (previous year: € 38,422 k). The future (undiscounted) minimum rental payments on non-cancellable
operating leases are:
Financial years € ‘000
2019 45,482
2020 36,151
2021 29,373
2022 23,061
2023 18,811
as of 2024 34,704
Total 187,582

200 | www.leoni.com
Purchase order commitments
Purchase order commitments for property, plant and equipment as well as intangible assets amounted
€ 60,008 k on the balance sheet date (previous year: € 51,356 k).
Litigation and claims
Individual LEONI companies are involved in litigation or could be involved in further litigation, which could
entail claims for compensation or other claims. Appropriate amounts with respect to such claims and, where
applicable, claims against the insurers were recognised.
As reported, several civil proceedings in the form of class action lawsuits have been initiated against LEONI
and other wiring systems manufacturers in the United States and Canada since October 2011 due to alleged
breaches of competition law. LEONI was able to conclude all these proceedings in the 2016 and 2017 financial
years without any acceptance of liability by way of settlement agreements. In the USA, there are now just a
few proceedings pending involving individual claimants, which, from today’s perspective, are likely to have far
less impact than the hitherto concluded proceedings. LEONI therefore expects to be able to conclude these
outstanding proceedings as well in the near future.
In November 2015, the Brazilian competition authority initiated proceedings against a LEONI company as well
as other wiring system manufacturers, presumably in connection with the cartel proceedings before the
European Commission that were already concluded in 2013. LEONI cooperated with the responsible authori-
ties and ended the proceedings by paying a fine agreed in a settlement. The corresponding expense was
already considered in the 2017 financial statements.
In July 2017, LEONI AG was presented with the complaint of a shareholder before the District Court of
Nuremberg-Fürth asking for the resolution passed at the Annual General Meeting concerning the election
of Dr.-Ing. Klaus Probst as a member of the Supervisory Board to be revoked. The claimant withdrew the
complaint in September 2018. The election of Dr Probst took effect.
In 2017, another shareholder applied to the District Court of Nuremberg-Fürth for a decision on the composi-
tion of LEONI AG’s Supervisory Board (‘status proceedings’). The court of first instance dismissed the share-
holder’s application in 2018. His appeal against this decision also failed. The decision is therefore legally valid.
The Supervisory Board of LEONI AG is properly composed. A claimant sued for damages of € 12 million with
respect to the alleged breach of the law in connection with having taken over employees in France. LEONI
cannot understand either the reasoning or the calculation of the alleged damages. We therefore still believe
that we will be able to refute the allegations and to bring the proceedings to a successful conclusion.
Other than the above, there have not been any and there are currently no pending lawsuits or court proceed-
ings that have any major impact on LEONI’s business.

| 201| Consolidated financial statements
Notes
Explanations
27 | Risk management and financial derivatives
27 | Risk management and financial derivatives
Overview of financial instruments
The tables below show financial instruments held in the Group on 31 December 2018 and in the previous year:
Recognition according to IFRS 9
€ ‘000
Measurement category in accordance with IFRS 9
Carrying amount
31/12/2018Amortised
cost
Fair value recognised
in equity
Fair value recognised
in profit or loss
Fair value
31/12/2018
Assets
Cash and cash equivalents AC 151,754 151,754 151,754
Trade receivables AC 625,275 625,275 625,275
Other financial receivables AC 44,680 44,680 44,680
Other non-derivative financial assets
Investments FVTPL 1,116 1,116 1,116
Derivative financial assets
Derivatives without a hedging relationship FVTPL 1,202 1,202 1,202
Derivatives with a hedging relationship n/a 7,832 7,832 0 7,832
Equity and Liabilities
Trade payables AC 956,826 956,826 956,826
Liabilities to banks AC 124,303 124,303 124,022
Borrower’s note loans AC 638,549 638,549 645,604
Other financial liabilities AC 147,508 147,508 147,508
Derivative financial liabilities
Derivatives without a hedging relationship FVTPL 7,787 7,787 7,787
Derivatives with a hedging relationship n/a 3,661 3,661 3,661
Of which aggregated by categories in accordance with IFRS 9:
Financial assets at amortised cost AC 821,709 821,709 821,709
Financial assets at fair value through profit or loss FVTPL 2,318 2,318 2,318
Financial liabilities at amortised cost AC 1,867,186 1,867,186 1,873,960
Financial liabilities at fair value through profit or loss FVTPL 7,787 7,787 7,787
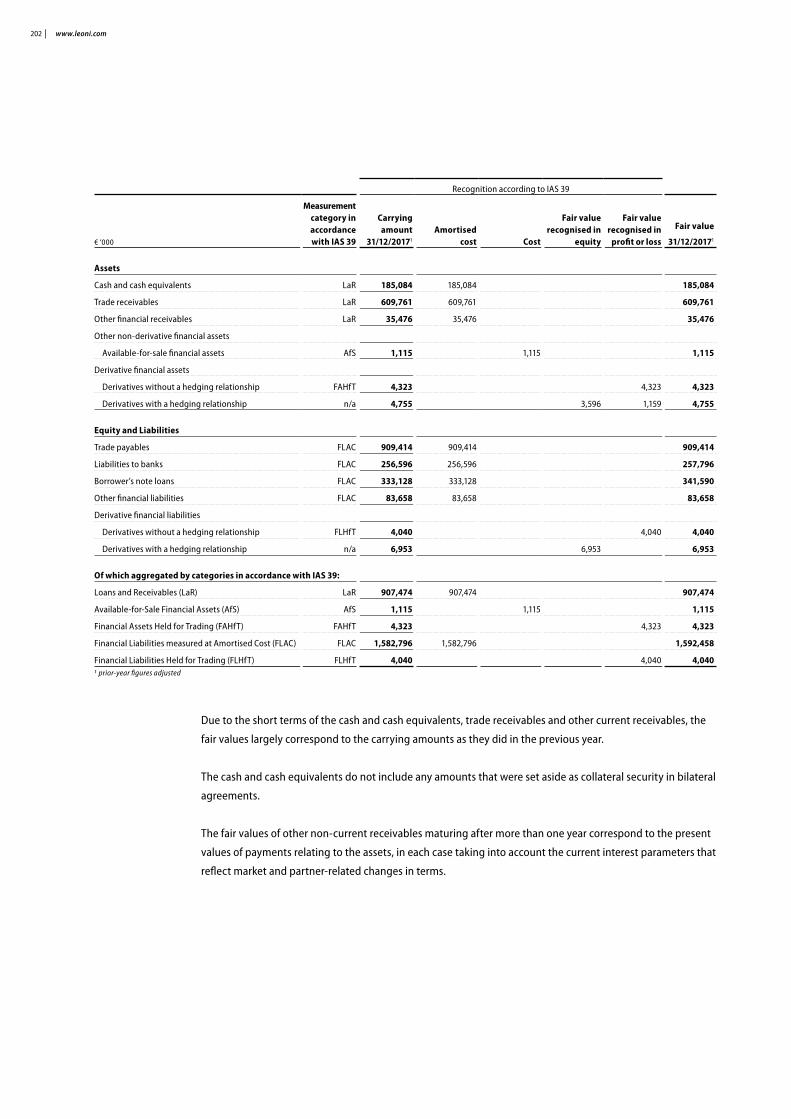
202 | www.leoni.com
Recognition according to IAS 39
€ ‘000
Measurement category in accordance with IAS 39
Carrying amount
31/12/20171
Amortised cost Cost
Fair value recognised in
equity
Fair value recognised in
profit or loss
Fair value
31/12/20171
Assets
Cash and cash equivalents LaR 185,084 185,084 185,084
Trade receivables LaR 609,761 609,761 609,761
Other financial receivables LaR 35,476 35,476 35,476
Other non-derivative financial assets
Available-for-sale financial assets AfS 1,115 1,115 1,115
Derivative financial assets
Derivatives without a hedging relationship FAHfT 4,323 4,323 4,323
Derivatives with a hedging relationship n/a 4,755 3,596 1,159 4,755
Equity and Liabilities
Trade payables FLAC 909,414 909,414 909,414
Liabilities to banks FLAC 256,596 256,596 257,796
Borrower’s note loans FLAC 333,128 333,128 341,590
Other financial liabilities FLAC 83,658 83,658 83,658
Derivative financial liabilities
Derivatives without a hedging relationship FLHfT 4,040 4,040 4,040
Derivatives with a hedging relationship n/a 6,953 6,953 6,953
Of which aggregated by categories in accordance with IAS 39:
Loans and Receivables (LaR) LaR 907,474 907,474 907,474
Available-for-Sale Financial Assets (AfS) AfS 1,115 1,115 1,115
Financial Assets Held for Trading (FAHfT) FAHfT 4,323 4,323 4,323
Financial Liabilities measured at Amortised Cost (FLAC) FLAC 1,582,796 1,582,796 1,592,458
Financial Liabilities Held for Trading (FLHfT) FLHfT 4,040 4,040 4,0401 prior-year figures adjusted
Due to the short terms of the cash and cash equivalents, trade receivables and other current receivables, the
fair values largely correspond to the carrying amounts as they did in the previous year.
The cash and cash equivalents do not include any amounts that were set aside as collateral security in bilateral
agreements.
The fair values of other non-current receivables maturing after more than one year correspond to the present
values of payments relating to the assets, in each case taking into account the current interest parameters that
reflect market and partner-related changes in terms.

| 203| Consolidated financial statements
Notes
Explanations
27 | Risk management and financial derivatives
Trade liabilities and other liabilities usually mature in the short term; the amounts on the balance sheet
represent approximations of their fair value.
The fair values of liabilities to banks, the borrower’s note loans and the other non-current financial liabilities
are determined as the present values of the payments relating to the liabilities based on the respectively
applicable yield curves and taking into account the Group-specific margins. For this reason, the fair values are
to be allocated to hierarchy level 3.
Capital management
The primary objective of LEONI’s capital management is to ensure that it maintains a strong credit rating, a
good equity ratio and appropriate gearing to support its business and increase shareholder value.
The Group manages its capital structure and makes adjustments based on the change in underlying economic
conditions. To maintain and adjust its capital structure, the Group can make adjustments to dividend payouts
to shareholders, repay capital to shareholders or issue new shares. In order to have as broad a range of fund-
ing options as possible, LEONI aims to seek approval during its Annual General Meeting for all anticipatory
resolutions. LEONI controls its capital with gearing. Gearing is defined as the ratio of net financial debts to
equity.
LEONI expects a sustained equity ratio of at least 35 percent. Due to fluctuation in elements of other compre-
hensive income that cannot be influenced, which may for example be caused by actuarial measurement of
pension obligations or differences due to currency translation, the equity ratio could temporarily also drop
below this figure. With respect to gearing, a figure below 50 percent is the target to be met on a lasting basis.
During periods of acquisition this ratio may be temporarily exceeded. In principle, the aim is that capital
spending on organic growth that exceeds the market average can be generated from operating cash flow and
that reducing financial liabilities is possible.
€ ‘000 2018 2017 1
Financial liabilities 764,431 591,320
less cash and cash equivalents (151,754) (185,084)
Net financial liabilities 612,677 406,236
Equity 1,081,438 1,036,418
%
Gearing 57 % 39 %1 prior-year figures adjusted
At the end of fiscal 2018, gearing stood at 57 percent (previous year: 39 percent) which, given virtually
unchanged equity, is attributable to the increase in net financial liabilities.
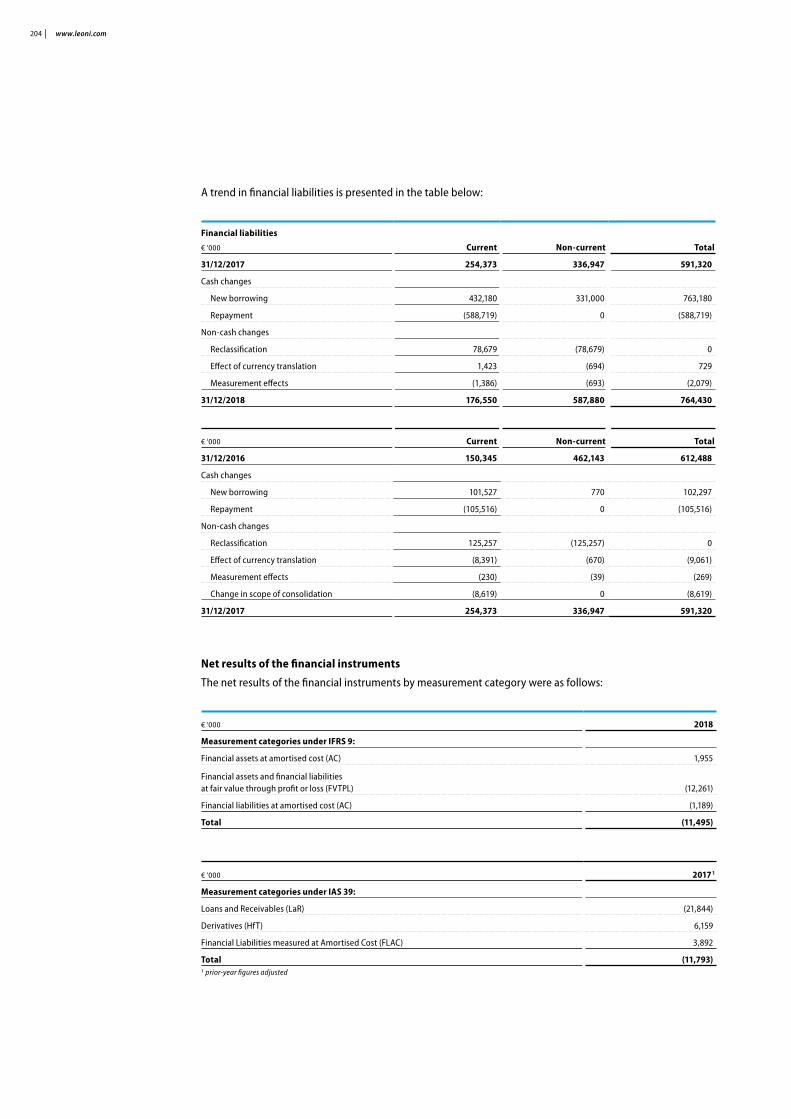
204 | www.leoni.com
A trend in financial liabilities is presented in the table below:
Financial liabilities
€ ‘000 Current Non-current Total
31/12/2017 254,373 336,947 591,320
Cash changes
New borrowing 432,180 331,000 763,180
Repayment (588,719) 0 (588,719)
Non-cash changes
Reclassification 78,679 (78,679) 0
Effect of currency translation 1,423 (694) 729
Measurement effects (1,386) (693) (2,079)
31/12/2018 176,550 587,880 764,430
€ ‘000 Current Non-current Total
31/12/2016 150,345 462,143 612,488
Cash changes
New borrowing 101,527 770 102,297
Repayment (105,516) 0 (105,516)
Non-cash changes
Reclassification 125,257 (125,257) 0
Effect of currency translation (8,391) (670) (9,061)
Measurement effects (230) (39) (269)
Change in scope of consolidation (8,619) 0 (8,619)
31/12/2017 254,373 336,947 591,320
Net results of the financial instruments
The net results of the financial instruments by measurement category were as follows:
€ ‘000 2018
Measurement categories under IFRS 9:
Financial assets at amortised cost (AC) 1,955
Financial assets and financial liabilities at fair value through profit or loss (FVTPL) (12,261)
Financial liabilities at amortised cost (AC) (1,189)
Total (11,495)
€ ‘000 2017 1
Measurement categories under IAS 39:
Loans and Receivables (LaR) (21,844)
Derivatives (HfT) 6,159
Financial Liabilities measured at Amortised Cost (FLAC) 3,892
Total (11,793)1 prior-year figures adjusted

| 205| Consolidated financial statements
Notes
Explanations
27 | Risk management and financial derivatives
Offsetting of financial instruments
LEONI had derivative assets and derivative liabilities vis-à-vis various financial institutions that do not fulfil the
offsetting criteria under IAS 32.42. Accordingly, these derivative financial instruments were presented sepa-
rately in the statement of financial position. However, the concluded master contracts do contain offsetting
agreements in the case of insolvency. The overview below presents the corresponding figures:
31/12/2018 € ‘000
Gross figures Offsetting Net figures
Offsetting agreements Net figures
Other financial assets
Derivatives 9,034 0 9,034 (4,742) 4,292
Other financial liabilities
Derivatives (11,127) 0 (11,127) 4,742 (6,385)
31/12/2017 € ‘000
Gross figures Offsetting Net figures
Offsetting agreements Net figures
Other financial assets
Derivatives 8,279 0 8,279 (4,928) 3,351
Other financial liabilities
Derivatives (10,993) 0 (10,993) 4,928 (6,065)
Cash flow hedge reserve
The table below shows the trend in the cash flow hedge reserve within consolidated equity.
€ ‘000
Cash flow hedge reserve
of which: hedging of
currency risks
of which: hedging of
interest rate risks
01/01/2018 (3,375) (3,375) 0
Change in value of the hedge from:
hedging of sales, cost of sales and investment in property, plant & equipment as well as variable interest of the borrower’s note loan 8,389 8,924 (535)
Reclassification in the income statement (1,668) (1,668) 0
Reclassification in the statement of financial position (6) (6) 0
Tax effect (471) (629) 158
31/12/2018 2,869 3,245 (376)
The underlying hedging transactions are described in the sections on currency and interest rate risks.
This table is presented for the first time in 2018 because the transitional rules under IFRS 9 do not require any
adjustment of the comparative period.

206 | www.leoni.com
Credit risk
The risk of default arises from deposits with banks and financial institutions, the contractual cash flows
from debt instruments, derivative financial instruments with a positive fair value as well as, above all, from
outstanding trade receivables and contract assets.
All customers that conclude business with the Group on a credit basis are subject to credit screening. Regular
analysis of receivables and the structure of the receivables facilitates ongoing monitoring of the risk. Accounts
receivable management is organised in a decentralised way but is controlled by head office, which sets condi-
tions by means of the existing guideline for Group-wide accounts receivable management.
The table below shows the breakdown by region of receivables from customers:
in percentage points 2018 2017
EMEA 59 48
of which: France 13 2
Germany 12 8
Romania 5 3
Hungary 4 5
United Kingdom 4 6
Other 21 24
Asia 26 34
of which: China 21 24
South Korea 2 3
India 1 2
Other 2 5
Americas 15 18
of which: USA 11 14
Other 4 4
The following table shows the size categories of receivables from customers on the balance sheet date:
2018 %
2018 total share in %
2017 %
2017 total share in %
Largest customer 9 9 9 9
Second largest customer 6 6 7 7
Third to fifth largest customers 4 – 5 14 4 – 5 14
Other customers ≤ 4 71 < 4 70

| 207| Consolidated financial statements
Notes
Explanations
27 | Risk management and financial derivatives
The valuation allowances for trade receivables as well as contract assets were as follows:
€ ‘000 2018 2017
Allowances on 1 January in accordance with IAS 39 8,829 10,243
Adjustment for initial application of IFRS 9 6,801 —
Allowances on 1 January in accordance with IFRS 9 15,630 —
Exchange rate differences 109 (85)
Additions (allowances recognised as expense) 6,538 1,499
Usage (581) (848)
Reversal (4,221) (1,980)
Allowances on 31 December 17,475 8,829
The increase in expense resulted mainly from a revised customer rating within the default risk categories.
The gross carrying amounts of and valuation allowances for trade receivables as well as contract assets break
down as follows by default risk category:
€ ‘000
31/12/2018 Size of exposure (gross)
31/12/2018 Valuation allowance
Risk rating
low risk 691,506 8,034
average risk 88,276 1,629
above-average risk 21,437 446
increased and high risk 10,702 2,593
very high risk 86 86
exposures at default 4,687 4,687
Total 816,694 17,475
Contract assets are allocated in full to the ‘low risk’ category of default risk:
This table is presented for the first time in 2018 because the transitional rules under IFRS 9 do not require any
adjustment of the comparative period.

208 | www.leoni.com
The table below shows non-current and current financial receivables that, in the previous year, were neither
impaired nor overdue as well as overdue receivables that were not impaired:
€ ‘000
Carrying amount
of which: on the
reporting date neither
impaired nor overdue
of which: not impaired on the reporting date and overdue in the following periods
Less than 30 days
Between 30 and 60
days
Between 61 and 90
days
Between 91 and 180
days
Between 181 and 360
daysMore than
360 days
31/12/20171
Trade receivables 609,761 561,507 28,439 6,623 3,828 4,236 3,271 2,594
Receivables from associated companies and joint ventures 8,857 8,857 0 0 0 0 0 0
Other financial receivables 26,616 23,615 996 0 1,940 0 0 2
1 prior-year figures adjusted
24 percent (previous year: 21 percent) of all receivables were covered, with insurance limits, by a Group master
policy with a credit insurer or other local credit insurers. Insurance excess amounts were disregarded in deter-
mining the total amount insured. The amount actually insured was consequently slightly below this percent-
age. 43 percent (previous year: 49 percent) of the non-insured receivables involved customers that are exempt
from contractually compulsory cover. The customers exempt from contractually compulsory cover were
mainly major companies in the automotive as well as electronic/electrical engineering sectors. For 33 percent
(previous year: 30 percent) of total receivables there was no cover from a credit insurer.
The table below shows the breakdown of insured and non-insured receivables from customers:
% 2018 2017
Receivables (insured) 24 21
exempt from compulsory cover 43 49
no cover 33 30
The insured subsidiaries must apply for credit insurance limits to the credit insurer for all receivables from
customers that are not exempt from compulsory cover and that exceed the limits specified in the existing
guideline. The following specific conditions apply: LEONI has an obligation to declare exposure to the credit
insurers for all receivables from customers greater than € 50 k. A cover limit can also be obtained for smaller
receivables. Consignment stores and manufacturing risks are covered by blanket insurance. The credit
insurance policy reimburses 90 percent of the insured amount. Measurement and monitoring with respect to
impairment of the non-insured receivables is supported among other things by the credit screening carried
out by the credit insurer and other service providers.

| 209| Consolidated financial statements
Notes
Explanations
27 | Risk management and financial derivatives
The subsidiaries that were not insured will be integrated in the master policy so far as this makes sense from
the aspect of the principal customer base and provided there are no regional or political reasons on the part
of the credit insurer against inclusion. The subsidiaries that cannot be integrated are to be covered via local
credit insurers. Internal credit limits are set for major customers that are exempt from mandatory cover and
other non-insured customers. Limits are applied for without delay, on a decentralised basis and are monitored
by head office accounts receivable management.
For selected customers, true sale factoring serves as a further tool to reduce the risk of default. Customers
with good credit ratings are also included.
Liquidity risk
The Group monitors its current liquidity situation on a daily basis. Monthly, currency-specific, rolling liquid-
ity planning for respective periods of at least twelve months is used to control future liquidity requirement.
The planning takes into consideration the terms of investments and financial assets (e.g. receivables, other
financial assets) as well as the expected cash flows from business activity. In addition, we analyse our existing
finance based on our medium-term planning, which we revise annually. We initiate suitable measures in good
time so far as there is any change in borrowing requirement.
The Group’s objective is to ensure funding in the respectively required currency. Flexibility is maintained by
using overdrafts, loans, leases, factoring, reverse factoring and capital market instruments. A wide variety of
financial instruments is available to LEONI on the capital market, from banks and among suppliers without the
need for an external rating, financial covenants or other collateralisation.
To ensure liquidity, there were on the balance sheet date credit lines from first-rate banks amounting to
€ 909,366 k (previous: € 536,938 k) with terms of up to four years and five months. These credit lines were
drawn via current accounts and fixed deposits in the amount of € 59,920 k (previous year: € 86,776 k). Together
with the short-term proportion of long-term loans, current liabilities to banks amounted to € 123,827 k (previ-
ous year: € 225,409 k).

210 | www.leoni.com
The table below shows the contractually agreed (undiscounted) interest and principal payments pertaining to
the primary financial liabilities as well as the derivative financial instruments with negative fair values:
2018 € ‘000
Carrying amount
31/12/2018Cash flow
2019Cash flow
2020Cash flow
2021 – 2023Cash flow
starting 2024
Non-derivative financial liabilities
Trade payables (956,826) (956,826) 0
Liabilities to banks (124,303) (124,896) (79) (218) (179)
Liabilities on bills of exchange and other financial debts (1,578) (1,578)
Borrower’s note loans (638,549) (57,902) (202,871) (161,230) (252,365)
Other financial liabilities (145,929) (133,370) (10,359) (2,200)
Derivative financial liabilities
Currency derivatives without a hedging relationship (7,465) 376,288 0
(384,640) 0
Currency and interest rate derivatives (3,661) 178,170 9,518
in connection with cash flow hedges (180,605) (10,239) (2,809) (845)
Commodity future transactions (322) (322)
2017 € ‘000
Carrying amount
31/12/2017Cash flow
2018Cash flow
2019Cash flow
2020 – 2022Cash flow
ab 2023
Non-derivative financial liabilities
Trade payables (909,414) (908,322) (1,092)
Liabilities to banks (256,596) (228,489) (31,214) (218) (252)
Liabilities on bills of exchange and other financial debts (1,596) (1,596)
Borrower’s note loans (333,128) (31,202) (53,939) (250,006) (12,720)
Other financial liabilities (82,062) (71,662) (6,400) (4,000)
Derivative financial liabilities
Currency derivatives without a hedging relationship (4,040) 96,379 9,342
(97,458) (12,579)
Currency derivatives in connection with cash flow hedges (6,953) 249,357 11,341
(253,515) (11,318)
All instruments held on the respective balance sheet date and for which payments were already contractually
agreed were also included. Foreign currency amounts were in each case translated at the spot rate on the
reporting date. The variable interest payments pertaining to the financial instruments were determined based
on the interest rates fixed most recently prior to the respective balance sheet date. Financial liabilities repay-
able at any time are always allocated to the earliest period. In the case of the currency derivatives, both the
cash outflow and the cash inflow are presented in the table above for the purpose of transparency.

| 211| Consolidated financial statements
Notes
Explanations
27 | Risk management and financial derivatives
Non-Deliverable Forwards (NDFs) were signed to hedge amounts in currencies that are not freely convertible.
This form of foreign currency transaction involves fulfilment upon maturity being based not on handling the
cash flows in the corresponding currencies, but in the form of a settlement payment.
Currency risks
Although we conduct business mainly in euros or in the local currency of the respective country, we are also
exposed to currency risks due to the globalisation of the markets.
In the Group’s holding company, LEONI AG, the Corporate Finance & Treasury department deals with the
resulting currency risks in collaboration with and based on the conditions set by the currency committee with
respect to limits and terms. Hedging transactions are executed in line with the existing underlying trans-
actions as well as the planned transactions.
Selection of the hedging instrument to be used is based on regular, in-depth analysis of the underlying trans-
action to be hedged. Most of the hedging transactions are in pounds sterling, Chinese yuan, Mexican pesos,
Polish zloty, Romanian leu and US dollars. The objective is to limit the impact of exchange rate variation on net
income. Apart from the actual hedging transactions, we primarily take advantage of the option of netting for-
eign currency items within the Group to hedge our operating business activity. As a further currency-hedging
measure, as a matter of principle we finance our foreign subsidiaries in their respective functional currencies
by way of refinancing in the corresponding currency.
On the balance sheet date, there were currency-hedging transactions amounting to € 1,073,535 k (previous
year: € 743,974 k), maturing within 22 months. The total market value of forward exchange transactions exist-
ing as of the balance sheet date was negative € 2,379 k (previous year: negative € 3,873 k). Forward exchange
transactions amounting to € 492,664 k (previous year: € 396,241 k) met the conditions for hedge accounting
(cash flow hedges). The ones that met the conditions for hedge accounting were all completed in the 2017
and 2018 financial years. Their total fair value of € 3,883 k (previous year: negative € 3,357 k) was recognised in
other comprehensive income. The cash flow from the underlying transactions is expected in the 2019 to 2020
financial years. The changes in fair value recognised in other comprehensive income are derecognised via the
income statement at the time the underlying transaction takes effect.
The remarks below refer to forward exchange transactions that met the conditions for hedge accounting.
There is a commercial relationship between the hedged items and the hedging instruments because the
terms of the forward exchange contracts match the future transactions that will occur with high probability
(this is the case with the nominal amount, currency and probable payment date). The underlying risk of the
forward exchange contracts is identical to the hedged risk components. The Group has therefore stipulated
a 1 to 1 hedge ratio for its hedging relationships.

212 | www.leoni.com
The detailed breakdown of the nominal volumes and the average hedging rates of the forward exchange
transactions that met the conditions for hedge accounting was as follows on the balance sheet date:
Nominal value €’000 Average hedging rates
€ ‘000
Residual term up to 6 months
Residual term 6 months to
1 yearResidual term
1 to 2 years Total Purchase Sale
Assets
Currency contracts 169,914 91,192 41,792 302,899
Forward exchange transactions
EUR – CNY 190 1,147 — 1,337 8.22 8.08
EUR – EGP 14,461 10,607 3,024 28,092 23.45 —
EUR – GBP 10,995 4,884 8,107 23,986 0.91 0.89
EUR – RON 60,433 38,033 6,927 105,393 4.82 —
EUR – USD 7,192 5,455 2,304 14,951 1.19 1.15
EUR – MXN 60,990 14,829 15,695 91,514 20.63 —
Other 15,653 16,237 5,736 37,626
Total equity and liabilities
Currency contracts 101,109 79,099 9,558 189,766
Forward exchange transactions
EUR – CNY 9,180 7,417 101 16,698 8.01 8.22
EUR – GBP 29,795 24,008 970 54,773 0.90 0.91
EUR – RON 12,567 15,784 6,927 35,278 4.77 —
EUR –USD 9,357 4,408 — 13,765 — 1.23
EUR –MXN 24,625 18,380 — 43,005 19.68 —
Other 15,585 9,102 1,560 26,247
These hedging instruments, which LEONI has designated as hedging relationships, had the following impact
on the balance sheet:
€ ‘000
Nominal value
Carrying amount Balance sheet items
Change in value to determine ineffectiveness
Forward exchange transactions 302,898 7,010 current and non-current other financial assets 8,924
Forward exchange transactions 189,767 (3,127) current and non-current other financial liabilities
The fair values of the forward exchange transactions were based on current reference rates observable on
the market and taking into consideration forward premiums or discounts. LEONI takes account of the risk of
non-fulfilment by business partners as well as the risk of non-fulfilment on the part of the Group by determin-
ing correction values, known as credit value adjustments (CVAs) or debt value adjustments (DVAs), based on
applying a premium / discount.

| 213| Consolidated financial statements
Notes
Explanations
27 | Risk management and financial derivatives
The hedged items had the following impact on the balance sheet:
€ ‘000
Change in value to determine ineffectiveness Cash flow hedge reserve
Hedging of sales, cost of sales and investment in property, plant & equipment 8,935 3,245
The hedging relationships had the following impact on the income statement and other comprehensive
income (OCI):
€ ‘000
Gain or loss on hedging recognised in OCI
Ineffectiveness reclassified from OCI to income statement
Item in the income statement
Amount reclassified from OCI to income statement
Item in the income statement
Hedging of sales, cost of sales and investment in property, plant & equipment 8,924 11
Other operating expenses (1,679)
Sales revenues, cost of sales
These tables are presented for the first time in 2018 because the transitional rules under IFRS 9 do not require
any adjustment of the comparative period.
The amounts recognised in other comprehensive income in the context of hedge accounting came to
€ 8,924 k in the financial year (previous year: negative € 4,315 k). An amount of € 1,668 k (previous year:
negative € 10,525 k) was derecognised via the income statement as shown in the table below.
€ ‘000 2018 2017
Sales revenues 394 (2,034)
Cost of sales 1,285 (8,338)
Other operating income / expense (ineffectiveness) (11) (153)
Total 1,668 (10,525)
Other explanations
The currency hedging transactions were signed with first rate commercial banks, meaning that there is no
significant counterparty risk either. This is subject to regular monitoring.
The effectiveness of hedging relationships is determined at the beginning of each hedging relationship and
by regular, prospective assessment to ensure that a commercial relationship exists between the hedged item
and the hedging instrument. Provided the features of the hedging instrument exactly match those of the
hedged item, LEONI makes a qualitative assessment. Otherwise, or if changes in circumstances impact on the
features of the hedged item to the extent that the key features no longer exactly match those of the hedging
instrument, LEONI takes the hypothetical derivative approach to judge effectiveness.

214 | www.leoni.com
When hedging foreign currency transactions, ineffectiveness can arise if the timing of the planned transaction
changes vis-à-vis the original estimate, the hedged item does not occur to the expected extent or if changes
in the default risk of the hedged item or the derivative’s counterparty occur.
Exchange rate sensitivity
Changes in exchange rates that are by prudent judgement essentially possible would affect consolidated
earnings due to the fair values of the monetary assets and liabilities. Additional factors would arise that would
affect equity due to change in fair value in the context of cash flow hedge accounting. We consider the risk of
changes in interest rates arising from the currency derivatives to be immaterial, which is why it is not included
in the assessment.
The table below is based on the exchange rates as at the balance sheet date. It illustrates the impact arising,
from the perspective of the Group companies concerned, from appreciation or devaluation of the foreign
currencies to be taken into account by 10 percent either way versus the respective functional currency. Com-
prehensive income per currency therefore also includes the impact arising from appreciation or devaluation of
the euro for those Group companies where the functional currency is one of those stated in the table.
2018 € ‘000 2017 € ‘000
Changes in exchange rates, equity + 10 % (10) % Changes in exchange rates, equity + 10 % (10) %
EGP 2,983 (2,441) EGP 1,883 (1,540)
USD (3,589) 2,936 USD (3,450) 2,823
CNY 2,526 (2,067) CNY 3,014 (2,467)
RON 15,359 (12,567) RON 20,082 (16,431)
GBP 7,093 (5,803) GBP 1,889 (1,545)
Changes in exchange rates, earnings + 10 % (10) % Changes in exchange rates, earnings + 10 % (10) %
EGP (124) 102 EGP (88) 72
USD (2,075) 1,702 USD 3,687 (3,006)
CNY 291 (240) CNY (918) 751
RON 709 (580) RON (192) 157
GBP (2,348) 1,920 GBP (1,193) 977
Interest rate risks
Depending on the expected trend of interest rates, the LEONI Group uses either fair value hedges or cash flow
hedges.

| 215| Consolidated financial statements
Notes
Explanations
27 | Risk management and financial derivatives
The extent of the LEONI Group's interest rate risk due to borrowing arises from both variable-rate borrower’s
note loans and fixed-interest borrower’s note loans.
Fair value hedge
An interest rate swap was entered into for the borrower’s note loan in the amount of € 25,000 k newly taken
out in November 2013; in the same amount and with the same term to hedge the risk of changes in values.
LEONI AG receives fixed interest on the nominal amount for the interest rate swap and pays a variable interest
rate including a margin. The interest rate swap hedges the fair value of the borrower’s note loan. The residual
term is one year and ten months, and the EURIBOR was agreed as the reference interest rate for one year.
There is a commercial relationship between the hedged item and the hedging instrument because the terms
of the interest rate swap match those of the fixed-interest loan. This applies to the nominal amount, the
maturity, the payment dates and the repricing dates. The underlying risk of the interest rate swap is identical
to the hedged risk component. The Group has therefore stipulated a 1 to 1 hedge ratio for such a hedging
relationship. The Group takes the hypothetical derivative approach to test the effectiveness of the hedging
relationship.
The nominal volume and the average hedging rate of the interest rate swap that met the conditions for hedge
accounting was as follows on the balance sheet date:
Nominal value
Average hedging rate in % based on current fixing€ ‘000
Residual term up to 2 years Total
Assets Interest-rate contract
Interest rate swap 25,000 25,000 2.072
The interest rate swap had the following impact on the balance sheet:
€ ‘000
Nominal value
Carrying amount Balance sheet items
Change in value to determine ineffectiveness
Interest rate swap 25,000 822Non-current other financial assets (340)
The borrower’s note loan designated as in a hedging relationship affected the balance sheet as follows:
€ ‘000
Carrying amount
Amount of the fair value hedge, adjustment of hedged item Balance sheet items
Change in value to determine ineffectiveness
Fixed-interest borrower’s note loans 25,890 882 Current financial liabilities (340)
These tables are presented for the first time in 2018 because the transitional rules under IFRS 9 do not require
any adjustment of the comparative period.

216 | www.leoni.com
The reduction in the fair value of the 2013 interest rate swap excluding accrued interest (clean fair value) by
€ 340 k (previous year: € 384 k) was netted as an expense in the financial result with the corresponding posi-
tive amount from measurement of the borrower’s note loan. There was no ineffectiveness. As in the previous
year, change in fair value of 340 k (2017: € 384 k) was fully recognised in the income statement.
Cash flow hedge
Interest rate swaps to hedge the risk of rate changes were likewise entered into in the same amount and with
the same terms as the variable-rate borrower’s note loans totalling € 182,000 k that were placed in November
2018. LEONI AG receives a variable rate matching the 6-month EURIBOR and pays a fixed amount for these
interest rate swaps. They hedge the future interest payments of the variable-rate borrower’s note loans and
have maximum residual terms of nine years and ten months.
Here, too, there is a commercial relationship between the hedged item and the hedging transaction because
the terms of the interest rate swaps match those of the variable-interest loans. This applies to the nominal
amount, the maturity, the payment dates and the repricing dates. The underlying risk of the interest rate
swaps is identical to the hedged risk components. The Group has therefore stipulated a 1 to 1 hedge ratio for
such a hedging relationship.
The detailed breakdown of the nominal volumes and the average hedging rates of these interest rate swaps
that met the conditions for hedge accounting was as follows on the balance sheet date:
Nominal value
Average hedging rate in % based on current fixing€ ‘000
Residual term up to 2 years
Residual term 2 years to 6 years
Residual term 6 years to 10 years Total
Total equity and liabilities Derivative interest-rate contracts
Interest rate swaps — 174,000 8,000 182,000 0.5161
These hedging instruments, which LEONI has designated as hedging relationships, had the following impact
on the balance sheet:
€ ‘000
Nominal value
Carrying amount Balance sheet items
Change in value to determine ineffectiveness
Interest rate swaps 182,000 (535)Other non-current financial liabilities (535)

| 217| Consolidated financial statements
Notes
Explanations
27 | Risk management and financial derivatives
The hedged items had the following impact on the balance sheet:
€ ‘000
Change in value to determine ineffectiveness Cash flow hedge reserve
Hedging variable interest of the borrower’s note loan (535) (376)
The hedging relationships had the following impact on the income statement and other comprehensive
income (OCI):
€ ‘000
Gain or loss on hedging recognised in OCI
Hedging variable interest of the borrower’s note loan (535)
The negative fair value totalling € 535 k of the new interest rate swaps was recognised in OCI. This resulted in
neither ineffectiveness nor reclassifications in the income statement.
These tables are presented for the first time in 2018 because the transitional rules under IFRS 9 do not require
any adjustment of the comparative period.
Other explanations
The fair values of the interest rate hedging instruments (interest swaps) were based on discounted future
cash flows. The applicable market interest rates and volatilities were used for the maturities of the financial
instruments.
We regard the counterparty risk as being very small because all interest rate derivatives were signed with
national and international commercial banks that have first-class ratings. Counterparty risk is subject to
regular monitoring.
The effectiveness of hedging relationships is determined at the beginning of each hedging relationship and
by regular, prospective assessment to ensure that a commercial relationship exists between the hedged item
and the hedging instrument. Provided the contract modalities of the hedging instrument exactly match those
of the hedged item, LEONI makes a qualitative assessment. Otherwise, or if changes in circumstances impact
on the terms of the hedged item to the extent that the key terms no longer exactly match those of the hedg-
ing instrument, LEONI takes the hypothetical derivative approach to judge effectiveness.
Ineffectiveness can arise from the contract terms differing between the interest rate swap and the hedged
item as well as from credit value/debt value adjustments, which are not offset by changes in the fair value of
the hedged loans.
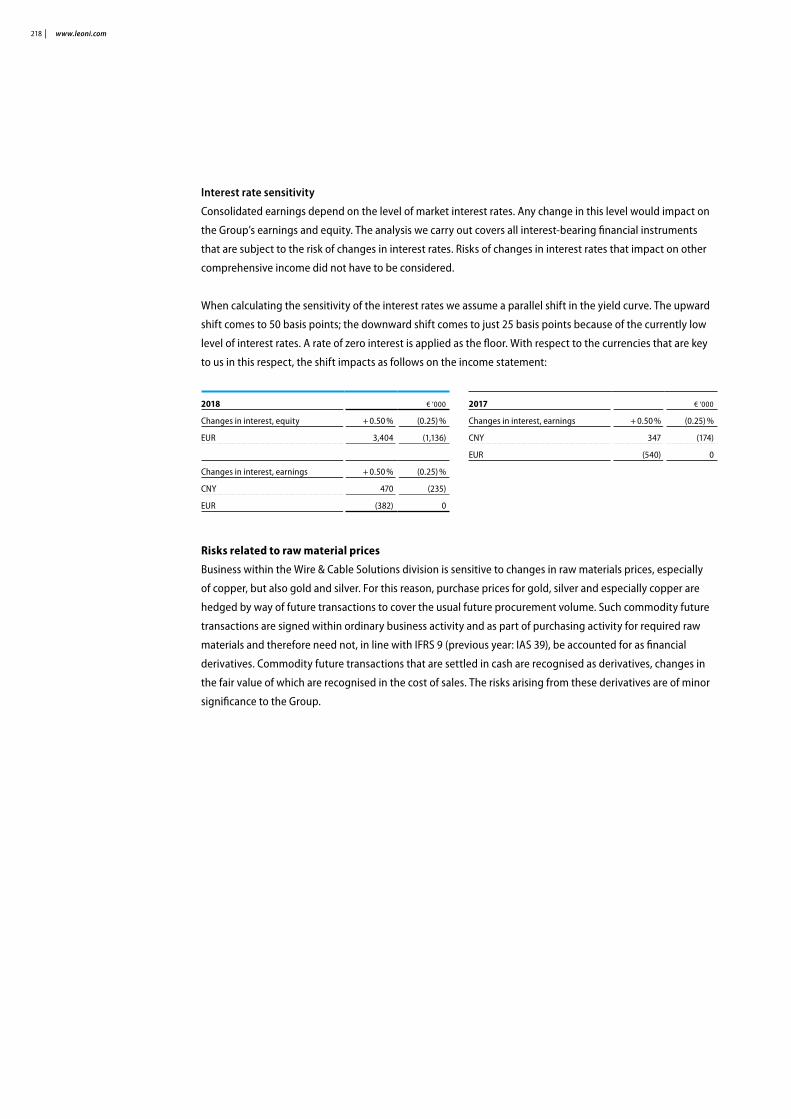
218 | www.leoni.com
Interest rate sensitivity
Consolidated earnings depend on the level of market interest rates. Any change in this level would impact on
the Group’s earnings and equity. The analysis we carry out covers all interest-bearing financial instruments
that are subject to the risk of changes in interest rates. Risks of changes in interest rates that impact on other
comprehensive income did not have to be considered.
When calculating the sensitivity of the interest rates we assume a parallel shift in the yield curve. The upward
shift comes to 50 basis points; the downward shift comes to just 25 basis points because of the currently low
level of interest rates. A rate of zero interest is applied as the floor. With respect to the currencies that are key
to us in this respect, the shift impacts as follows on the income statement:
2018 € ‘000 2017 € ‘000
Changes in interest, equity + 0.50 % (0.25) % Changes in interest, earnings + 0.50 % (0.25) %
EUR 3,404 (1,136) CNY 347 (174)
EUR (540) 0
Changes in interest, earnings + 0.50 % (0.25) %
CNY 470 (235)
EUR (382) 0
Risks related to raw material prices
Business within the Wire & Cable Solutions division is sensitive to changes in raw materials prices, especially
of copper, but also gold and silver. For this reason, purchase prices for gold, silver and especially copper are
hedged by way of future transactions to cover the usual future procurement volume. Such commodity future
transactions are signed within ordinary business activity and as part of purchasing activity for required raw
materials and therefore need not, in line with IFRS 9 (previous year: IAS 39), be accounted for as financial
derivatives. Commodity future transactions that are settled in cash are recognised as derivatives, changes in
the fair value of which are recognised in the cost of sales. The risks arising from these derivatives are of minor
significance to the Group.

| 219| Consolidated financial statements
Notes
Explanations
27 | Risk management and financial derivatives
Derivative financial instruments in the previous year
The detailed breakdown of the fair values of the derivative financial instruments and their nominal volumes
was as follows on 31/12/2017:
€ ‘000
31/12/17 Nominal value
31/12/17 Fair value
Assets
Currency contracts 350,967 7,121
Forward exchange transactions
CNY 5,264 106
GBP 64,843 968
MXN 29,855 1,883
PLN 22,724 384
RON 41,680 114
USD 140,497 2,754
Other 46,104 912
(of which hedge accounting) 129,191 3,596
Derivative interest-rate contracts 25,000 1,159
Interest rate swaps 25,000 1,159
(of which hedge accounting) 25,000 1,159
Commodity future transactions 17,935 799
Total equity and liabilities
Currency contracts 393,007 10,992
Forward exchange transactions
CNY 40,106 540
GBP 52,908 835
MXN 59,513 3,474
PLN 1,796 17
RON 169,418 2,439
USD 18,641 168
Other 50,625 3,519
(of which hedge accounting) 267,050 6,953

220 | www.leoni.com
28 | Measurement of fair value
The measurement of the fair values of assets and liabilities by hierarchy levels was as follows:
31/12/2018 € ‘000
Prices quoted on active markets
(step 1)
Valuation methods where all principal parameters are
based on observable market data (step 2)
Valuation methods where all principal parameters are not based on observable
market data (step 3) Total
Assets measured at fair value
Derivative financial assets
Derivatives without a hedging relationship 0 1,202 0 1,202
Derivatives with a hedging relationship 0 7,832 0 7,832
Liabilities measured at fair value
Derivative financial liabilities
Derivatives without a hedging relationship 322 7,465 0 7,787
Derivatives with a hedging relationship 0 3,661 0 3,661
In neither fiscal 2018 nor the previous year was there any movement between the individual levels.
31/12/2017 € ‘000
Prices quoted on active markets
(step 1)
Valuation methods where all principal parameters are
based on observable market data (step 2)
Valuation methods where all principal parameters are not based on observable
market data (step 3) Total
Assets measured at fair value
Derivative financial assets
Derivatives without a hedging relationship 799 3,524 0 4,323
Derivatives with a hedging relationship 0 4,755 0 4,755
Liabilities measured at fair value
Derivative financial liabilities
Derivatives without a hedging relationship 0 4,040 0 4,040
Derivatives with a hedging relationship 0 6,953 0 6,953

| 221| Consolidated financial statements
Notes
Explanations
28 | Measurement of fair value
29 | Earnings per share
30 | Auditor’s professional fees
29 | Earnings per share
Basic earnings per share are calculated as follows:
2018 2017 1
Total Earnings
Amount per share
Total Earnings
Amount per share
€ ‘000 € € ‘000 €
Numerator: Income before taxes attributable to equity holders of the parent company 123,020 3.77 203,765 6.24
Consolidated net income attributable to equity holders of the parent company 75,626 2.31 146,607 4.49
Denominator: Weighted average number of shares outstanding 32,669,000 32,669,000
1 prior-year figures adjusted
As in the previous year, the number of shares outstanding on 31 December 2018, of 32,669,000, corresponded
to the number of shares issued. As in the previous year, there was no dilution effect in the financial year under
report.
30 | Auditor’s professional fees
The following expenses were recognised in the financial year for work performed by the auditors appointed to
audit the financial statements and consolidated financial statements as at 31 December 2018:
€ ‘000 2018 2017
Audit 1,187 1,442
Tax consulting services 99 321
Other assurance services 100 31
Other payments 148 16
Total 1,534 1,810

222 | www.leoni.com
31 | Personnel expenses and employees
€ ‘000 2018 2017
Wages and salaries 928,698 860,709
Social-security contributions, expenses for pensions and retirement and fringe benefits 191,774 197,851
1,120,472 1,058,560
The latter item includes the following retirement benefit expenses:
€ ‘000 2018 2017
Net periodic pension cost 11,512 12,192
Costs of defined contribution plans 82,349 88,403
93,861 100,595
Annual average number of employees:
2018 2017
Salaried staff 15,419 13,747
Wage earners 73,954 69,724
89,373 83,471
The Group employed 92,549 people on the balance sheet date (previous year 86,340), of which 87,476 worked
outside Germany (previous year: 81,753).

| 223| Consolidated financial statements
Notes
Explanations
31 | Personnel expenses and employees
Other information
32 | Transactions with related parties
Other information
32 | Transactions with related parties
The compensation for management in key positions within the Group comprises the compensation for active
members of the Board of Directors and the Supervisory Board.
The compensation for members of the Board of Directors broke down as follows:
€ ‘000 2018 2017
Benefits due in the short term 2,732 4,139
Other benefits due in the long term 282 3,994
Post-employment benefits 232 562
Payments for premature contract termination 0 1,137
3,246 9,832
The short-term benefits included, along with the fixed compensation, a variable component of € 870 k
(previous year: € 2,025 k). The other benefits due in the long term comprise the medium-term and long-term
compensation components. The long-term compensation component is computed based on the Company's
economic value added (EVA) and the market performance of its share, and is shown in a bonus account. An
amount is paid out annually from this bonus account up to a cap, 50 percent of which members of the Board
of Directors must invest in LEONI shares and which must be retained for a period of 50 months. Poor business
performance will reduce the bonus account (penalty rule), which can drop to nil. The expense for the long-
term compensation component in fiscal 2018 was € 166 k (previous year: € 1,877 k); the reversal of provisions
provided income of € 1,000 k (previous year: € 0 k). A settlement payment of € 1,137 k for the premature
termination of Dieter Bellé contract was included in the previous year. The receipts of the members of the
Board of Directors pursuant to Section 314 (1) no. 6a of the German Commercial Code (HGB) totalled € 3,295 k
(previous year: € 5,526 k).
The compensation for members of the Supervisory Board in the year under report totalled € 1,432 k (previous
year: € 1,563 k). The basic principles of the compensation system and the receipts of individual members of
the Board of Directors and Supervisory Board members are presented in the management report.
Compensation for employee-representative members of the Supervisory Board
The employee representatives on LEONI AG’s Supervisory Board received compensation based on their service
contracts at LEONI. LEONI’s related expenses were € 531 k (previous year: € 490 k). On 31 December 2018, there
were liabilities in the amount of € 38 k (previous year: 52 k) pertaining to service contracts with employee-
representative members of the Supervisory Board.

224 | www.leoni.com
Compensation for former members of the Board of Directors
The receipts in the financial year of former members of the Board of Directors and their surviving dependants
amounted to € 747 k (previous year: € 738 k). There are pension obligations (DBO) vis-à-vis former members of
the Board of Directors and their surviving dependants in the amount of € 20,373 k (previous year: € 14,401 k).
Joint ventures and associates
The Group had business relationships with joint ventures during the financial year. Transactions with these
related parties result from normal trade in goods and services and were concluded on standard market terms.
The extent of these business relationships with related entities and persons is presented in the following
table:
€ ‘000 2018 2017
Trade receivables 15,268 8,725
Trade liabilities 1,477 1,319
Income from disposals and services 10,694 9,220
Purchases and services obtained 2,051 1,960
This includes primarily the business relationships with the joint venture in Langfang, China.
Other relationships with related parties
Dr Werner Lang has been a member of the Supervisory Board since 16 May 2012. He is managing director of
Lang Verwaltungsgesellschaft mbH and thereby of MEKRA Lang GmbH & Co. KG, Ing. H. Lang GmbH & Co. KG,
Lang Technics GmbH & Co. KG as well as Grundstücksgesellschaft Lang GbR. In the 2018 financial year, LEONI
sold product to MEKRA Lang GmbH & Co. KG. in the amount of € 2,636 k (previous year: € 1,673 k). On the
balance sheet date, there were liabilities to this company in the amount of € 205 k (previous year: € 92 k). The
goods were supplied on standard market terms.
Ms Ingrid Hofmann was a member of the Supervisory Board from 12 May 2011 until 11 May 2017. Ms Hofmann
is managing partner of I.K. Hofmann GmbH, a temporary employment business with subsidiaries in Austria,
Czechia, Switzerland and the United States from which LEONI sourced services. These services were invoiced
on standard market terms. In fiscal 2017, services were procured in the amount of € 431 k until the time of her
departure.
There were no other reportable transactions with related parties.

| 225| Consolidated financial statements
Notes
Other information
33 | Declaration pertaining to the German Corporate Governance Code pursuant to Article 161 of the German Public Stock Corporation Act (AktG)
34 | Events after the balance sheet date
33 | Declaration pertaining to the German Corporate Governance Code pursuant to Section 161 of the German Stock Corporation Act (AktG)
In December 2018, the Board of Directors and the Supervisory Board issued the updated declaration of con-
formity pursuant to Section 161 of the German Stock Corporation Act and made this available to shareholders
on a permanent basis by publishing it on the internet (www.leoni.com). The Declaration of Conformity is also
included in the Corporate Governance report, which is published in the 2018 Annual Report.
34 | Events after the balance sheet date
There have been no particular events that might have had a material effect on the Group’s financial position or
performance since the balance sheet date.
Nuremberg, 22 February 2019
LEONI AG
The Board of Directors
Aldo Kamper Bruno Fankhauser Karl Gadesmann Martin Stüttem

226 | www.leoni.com
Scope of consolidation
Ownership in %
I. Consolidated companies
LEONI AG, Nuremberg, Germany
LEONI Kabel GmbH, Nuremberg 1) 100
Haarländer GmbH, Roth 1) 100
KB Kabel Beteiligungs-GmbH, Nuremberg 100
LEONI Cable Assemblies GmbH, Roth 1) 100
LEONI Draht GmbH, Nuremberg 1) 100
LEONI elocab GmbH, Georgensgmünd 1) 100
LEONI Fiber Optics GmbH, Neuhaus-Schierschnitz 1) 100
LEONI HighTemp Solutions GmbH, Halver 1) 100
LEONI Kerpen GmbH, Stolberg 1) 100
LEONI protec cable systems GmbH, Schmalkalden 1) 100
LEONI Special Cables GmbH, Friesoythe 1) 100
j-fiber GmbH, Jena 1) 100
j-plasma GmbH, Jena 1) 100
LEONI Bordnetz-Systeme GmbH, Kitzingen 1) 100
LEONI Kabelsysteme GmbH, Neu-Ulm 1) 100
LEONI CIA Cable Systems S.A.S., Gellainville, France 100
LEONI Furas S.L., Barcelona, Spain 100
LEONI Italy S.r.l., Felizzano (Alessandria), Italy 100
LEONI Kabel Polska sp. z o.o., Kobierzyce, Poland 100
LEONI Kablo ve Teknolojileri Sanayi ve Ticaret Ltd. Sirketi, Mudanya, Turkey 95
LEONI Slovakia spol. s.r.o.,Trencin, Slovakia 100
LEONI Schweiz AG, Däniken, Switzerland 100
LEONI Studer AG, Däniken, Switzerland 100
Adaptricity AG, Zürich, Switzerland 76
LEONI Tailor-Made Cable UK Ltd., Chesterfield, Derbyshire, United Kingdom 100
LEONI Temco Ltd., Cinderford, Gloucestershire, United Kingdom 100
LKH LEONI Kábelgyár Hungária Kft., Hatvan, Hungary 100
neumatic cz, s.r.o., Mírová pod Kozákovem, Czech Republic 100
LEONI Wiring Systems Arad S.R.L., Arad, Romania 100
LEONI Wiring Systems France S.A.S., Montigny le Bretonneux, France 100
LEONI Wiring Systems Pitesti S.R.L., Sat Bascov, Romania 100
LEONI Wiring Systems RO S.R.L., Bistrita-Nasaud, Romania 100
LEONI Systems Spain, S.L.U., Santa Perpetua/Barcelona, Spain 100
LEONI Wiring Systems U.K. Ltd., Newcastle-under-Lyme, Staffordshire, United Kingdom 100
TOV LEONI Wiring Systems UA GmbH, Stryi, Ukraine 100
Leonische Portugal Lda., Lugar de Sao Martinho, Guimaraes, Portugal 100
OOO LEONI RUS, Zavolzhye, Russia 100
LEONI Wiring Systems Southeast d.o.o., Prokuplje, Serbia 100

| 227| Consolidated financial statements
Notes
Scope of consolidation
Ownership in %
LEONI Wiring Systems S.R.L., Chisinau, Moldova 100
LEONI Bulgaria EOOD, Sofia, Bulgaria 100
LEONI Fiber Optics, Inc., Williamsburg, Virginia, USA 100
LEONI (S.E.A.) Pte. Ltd., Singapore 100
LEONI Cable Maroc SARL, Aïn Sebâa, Casablanca, Morocco 100
LEONI Cable (China) Co., Ltd., Changzhou, China 100
LEONI Cable, Inc., Rochester, Michigan, USA 100
LEONI Cable S.A. de C.V., Cuauhtémoc, Chihuahua, Mexico 100
LEONI Cable de Chihuahua S.A. de C.V., Cuauhtémoc, Chihuahua, Mexico 100
LEONI Elocab Ltd., Kitchener, Ontario, Canada 100
LEONI Engineering Products & Services, Inc., Troy, Michigan, USA 100
LEONI Cable Solutions (India) Pvt. Ltd., Pune, India 100
LEONI Wire, Inc., Chicopee, Massachusetts, USA 100
LEONI Wire & Cable Solutions Japan K.K., Nagakuteshi, Japan 100
LEONI Middle East FZE, Dubai, United Arab. Emirates 100
LEONI Automotive do Brasil Ltda., Itú, Saõ Paulo, Brazil 100
LEONI Electrical Systems (Shanghai) Co., Ltd., Shanghai, China 100
LEONI Wiring Systems (Tieling) Co., Ltd., Tieling City, China 100
LEONI Wiring Systems Tunisia SARL, M’Saken-Sousse, Tunisia 100
LEONI Wiring Systems (Changchun) Co., Ltd., Changchun, China 100
LEONI ZhengAo Automotive Wire Harness Co., Ltd., Wuhan City, China (vormals: Wuhan Hengtong Automotive Wire Harness Co., Ltd., Wuhan City, China) 51
LEONI Wiring Systems Ain Sebaa S.A., Aïn Sebâa, Casablanca, Morocco 100
LEONI Wiring Systems Bouskoura S.A., Bouskoura, Casablanca, Morocco 100
LEONI Wiring Systems Berrechid S.A., Bouznika, Morocco 100
LEONI Wiring Systems de Durango S.A. de C.V., Chihuahua, Mexico 100
LEONI Wiring Systems Egypt S.A.E., Nasr City, Kairo, Egypt 100
LEONI Wiring Systems, Inc., Tucson, Arizona, USA 100
LEONI Wiring Systems Mexicana S.A. de C.V., Hermosillo, Mexico 100
LEONI Wiring Systems de Yucatán S.A. de C.V., Mérida, Mexico 100
LEONI Wiring Systems de Paraguay S.R.L., Asunción, Paraguay 100
LEONI Wiring Systems (Pune) Pvt. Ltd., Pune, Maharashtra, India 100
LEONI Wiring Systems Korea, Inc., Busan (Jisa-dong), Korea 100
LEONI Electrical Systems (Jining) Co., Ltd., Jining, China 100
LEONI Electrical Systems (Penglai) Co., Ltd., Penglai, China 100
II. Associated companies and joint ventures
Wiring Systems Division
Intedis GmbH & Co. KG, Würzburg, Germany 50
Intedis Verwaltungs-GmbH, Würzburg, Germany 50
Langfang LEONI Wiring Systems Co., Ltd., Sanhe downtown, China 50
1 Companies that make use of the exemption under Article 264, Section 3 of the German Commercial Code.
228 | www.leoni.com
Independent auditor’s report
To LEONI AG
Report on the audit of the consolidated financial statements and of the group management report
Opinions
We have audited the consolidated financial statements of LEONI AG, Nuremberg, and its subsidiaries (the
Group), which comprise the consolidated income statement , the consolidated statement of comprehensive
income and the consolidated statement of cash flows for the fiscal year from 1 January 2018 to 31 December
2018, the consolidated statement of financial position as of 31 December 2018, the consolidated statement of
changes in equity for the fiscal year from 1 January 2018 to 31 December 2018, and the notes to the consoli-
dated financial statements, including a summary of significant accounting policies. In addition, we have
audited the group management report of LEONI AG for the fiscal year from 1 January 2018 to 31 December
2018. In accordance with the German legal requirements, we have not audited the content of the consolidated
corporate governance statement contained in section 1.7 of the group management report or the non-finan-
cial statement contained in section 5.4 of the group management report.
In our opinion, on the basis of the knowledge obtained in the audit,
■ the accompanying consolidated financial statements comply, in all material respects, with the IFRSs as
adopted by the EU, and the additional requirements of German commercial law pursuant to Sec. 315e (1)
HGB [“Handelsgesetzbuch”: German Commercial Code] and, in compliance with these requirements, give a
true and fair view of the assets, liabilities and financial position of the Group as at 31 December 2018 and of
its financial performance for the fiscal year from 1 January 2018 to 31 December 2018, and
■ the accompanying group management report as a whole provides an appropriate view of the Group’s posi-
tion. In all material respects, this group management report is consistent with the consolidated financial
statements, complies with German legal requirements and appropriately presents the opportunities and
risks of future development. Our opinion on the group management report does not cover the content of
the non-financial statement or the statement on corporate governance referred to above.
Pursuant to Sec. 322 (3) Sentence 1 HGB, we declare that our audit has not led to any reservations relating to
the legal compliance of the consolidated financial statements and of the group management report.
Basis for the opinions
We conducted our audit of the consolidated financial statements and of the group management report in
accordance with Sec. 317 HGB and the EU Audit Regulation (No 537/2014, referred to subsequently as “EU
Audit Regulation”) and in compliance with German Generally Accepted Standards for Financial Statement
Audits promulgated by the Institut der Wirtschaftsprüfer [Institute of Public Auditors in Germany] (IDW).
Our responsibilities under those requirements and principles are further described in the “Auditor’s responsi-
bilities for the audit of the consolidated financial statements and of the group management report” section
Translation from the German language

| 229| Consolidated financial statements
Independent auditor’s report
of our auditor’s report. We are independent of the group entities in accordance with the requirements of
European law and German commercial and professional law, and we have fulfilled our other German profes-
sional responsibilities in accordance with these requirements. In addition, in accordance with Art. 10 (2) f) of
the EU Audit Regulation, we declare that we have not provided non-audit services prohibited under Art. 5 (1)
of the EU Audit Regulation. We believe that the audit evidence we have obtained is sufficient and appropriate
to provide a basis for our opinions on the consolidated financial statements and on the group management
report.
Key audit matters in the audit of the consolidated financial statements
Key audit matters are those matters that, in our professional judgment, were of most significance in our audit
of the consolidated financial statements for the fiscal year from 1 January 2018 to 31 December 2018. These
matters were addressed in the context of our audit of the consolidated financial statements as a whole, and in
forming our opinion thereon; we do not provide a separate opinion on these matters.
Below, we describe what we consider to be the key audit matters:
1) Impairment test of goodwill, intangible assets and property, plant and equipment
Reasons why the matter was determined to be a key audit matter:
In addition to the prescribed annual impairment tests of goodwill and intangible assets with indefinite useful
lives, impairment testing is required for other intangible assets as well as property, plant and equipment if
triggering events occur.
The carrying amounts of goodwill, intangible assets and property, plant and equipment are material and the
impairment test requires significant judgment, such as the estimation of future net cash flows by the execu-
tive directors as well as the discount rate that has been used and is therefore subject to significant uncertainty.
In light of this, the impairment testing of goodwill, intangible assets and property, plant and equipment was a
key audit matter.
Auditor’s response:
The subsidiaries’ business plans are consolidated by division and reviewed by the Board of Directors and the
Supervisory Board of the parent company in a multi-step process. We examined the processes associated with
the review and approval of the business plans as key basis for the impairment tests. Among other things we
discussed with the Board of Directors the demarcation of cash-generating units as well as the definition of
corporate assets and their allocation and assessed their consistency with the internal reporting structure. We
involved our valuation specialists to reperform the calculation and method used in the valuation model and
to derive the WACC and the main assumptions used to calculate future net cash flows. In deriving the WACC,
we especially analyzed whether the peer group is substantiated by financial market data and the executive
directors’ qualitative estimates, evaluated the consistency of financial market data with external sources and
verified the clerical accuracy. We compared the future cash flows used in the calculation with the current five-
year plan, which was approved by the executive directors, comparing it with general and industry-specific

230 | www.leoni.com
market expectations. We also performed our own sensitivity analyses to assess the impairment risk in the case
of a reasonably possible change in one of the significant assumptions. In addition, we assessed the disclosures
in the notes to the consolidated financial statements regarding key judgments and estimates as well as signifi-
cant assumptions on impairment testing of goodwill with respect to the resulting requirements pursuant to
IAS 1 and IAS 36.
Our audit procedures did not lead to any reservations relating to the calculation of potential impairment of
goodwill, intangible assets or property, plant and equipment.
Reference to related disclosures:
Please refer to the disclosures made in note 1 (“Principles of consolidation as well as summary of key
accounting and valuation methods”, in the sections “Measurement of fair value”, “Goodwill” and “Key judg-
ments, estimates and assumptions”), note 17 (“Impairment testing of property, plant and equipment as well as
intangible assets”) and note 18 (“Goodwill”) in the notes to the consolidated financial statements for informa-
tion regarding impairment tests performed.
2) Income taxes– recognition and measurement of deferred tax assets
Reasons why the matter was determined to be a key audit matter:
Deferred tax assets are material for the consolidated financial statements of LEONI AG. Evaluating the appro-
priateness of recognition and the measurement of deferred tax assets requires LEONI to use judgment to
evaluate tax matters and make estimates regarding future tax results, against which unused tax losses can be
offset. In light of this, the evaluation of the appropriateness of recognition and the measurement of deferred
tax assets was a key audit matter.
Auditor’s response:
We examined in particular the underlying processes for the tax group of LEONI AG for the complete recogni-
tion and measurement of deferred taxes.
As part of our substantive audit procedures for the recognition and measurement of deferred taxes arising
from temporary differences and unused tax losses, we compared the loss carryforwards as of the beginning
of the fiscal year against the tax assessment notices on a spot test basis, assessed whether the loss for the
current fiscal year was calculated in accordance with tax law and compared the tax forecasts with the business
plan approved by the executive directors, taking into consideration the ongoing differences between the tax
accounts and the commercial statement of financial position and the non-deductible operating costs and the
applicable country-specific tax laws for the use of unused tax losses. As this requires specialist tax knowledge,
we included internal specialists in the audit team. Our audit procedures did not lead to any reservations
regarding the recognition and measurement of deferred tax assets by the executive directors.
| 231| Consolidated financial statements
Independent auditor’s report
Reference to related disclosures:
Please refer to the disclosures made in note 1 (“Principles of consolidation as well as summary of key
accounting and valuation methods”, in the sections “Income taxes” and “Key judgments, estimates and
assumptions”) and in note 10 (“Income taxes”) in the notes to the consolidated financial statements for infor-
mation provided by the Company regarding the recognition and measurement of deferred tax assets.
Other information
The executive directors or, as the case may be, the Supervisory Board are responsible for the other informa-
tion. The other information comprises:
■ the consolidated non-financial statement ■ the remaining sections of the annual report, except for the audited consolidated financial statements and
group management report as well as our Independent auditor’s report ■ the statement on corporate governance pursuant to Sec. 315d HGB and the corporate governance report
pursuant to no. 3.10 of the German Corporate Governance Code and ■ the responsibility statement pursuant to Sec. 297 (2) Sentence 4 HGB of the consolidated financial state-
ments and the responsibility statement pursuant to Sec. 315 (1) Sentence 5 HGB of the group management
report.
Our opinions on the consolidated financial statements and on the group management report do not cover the
other information, and consequently we do not express an opinion or any other form of assurance conclusion
thereon.
In connection with our audit, our responsibility is to read the other information and, in so doing, to consider
whether the other information
■ is materially inconsistent with the consolidated financial statements, with the group management report or
our knowledge obtained in the audit, or ■ otherwise appears to be materially misstated.
If, based on the work we have performed, we conclude that there is a material misstatement of this other
information, we are required to report that fact.

232 | www.leoni.com
Responsibilities of the executive directors and the Supervisory Board for the consolidated financial statements and the group management report
The executive directors are responsible for the preparation of the consolidated financial statements that
comply, in all material respects, with IFRSs as adopted by the EU and the additional requirements of German
commercial law pursuant to Sec. 315e (1) HGB, and that the consolidated financial statements, in compliance
with these requirements, give a true and fair view of the assets, liabilities, financial position, and financial
performance of the Group. In addition, the executive directors are responsible for such internal control as they
have determined necessary to enable the preparation of consolidated financial statements that are free from
material misstatement, whether due to fraud or error.
In preparing the consolidated financial statements, the executive directors are responsible for assessing the
Group’s ability to continue as a going concern. They also have the responsibility for disclosing, as applicable,
matters related to going concern.
In addition, they are responsible for financial reporting based on the going concern basis of accounting unless
there is an intention to liquidate the Group or to cease operations, or there is no realistic alternative but to do
so.
Furthermore, the executive directors are responsible for the preparation of the group management report
that, as a whole, provides an appropriate view of the Group’s position and is, in all material respects,
consistent with the consolidated financial statements, complies with German legal requirements, and appro-
priately presents the opportunities and risks of future development. In addition, the executive directors are
responsible for such arrangements and measures (systems) as they have considered necessary to enable the
preparation of a group management report that is in accordance with the German legal requirements, and to
be able to provide sufficient appropriate evidence for the assertions in the group management report.
The Supervisory Board is responsible for overseeing the Group’s financial reporting process for the prepara-
tion of the consolidated financial statements and of the group management report.
Auditor’s responsibilities for the audit of the consolidated financial statements and of the group management report
Our objectives are to obtain reasonable assurance about whether the consolidated financial statements as a
whole are free from material misstatement, whether due to fraud or error, and whether the group manage-
ment report as a whole provides an appropriate view of the Group’s position and, in all material respects, is
consistent with the consolidated financial statements and the knowledge obtained in the audit, complies with
the German legal requirements and appropriately presents the opportunities and risks of future development,
as well as to issue an auditor’s report that includes our opinions on the consolidated financial statements and
on the group management report.
| 233| Consolidated financial statements
Independent auditor’s report
Reasonable assurance is a high level of assurance, but is not a guarantee that an audit conducted in accord-
ance with Sec. 317 HGB and the EU Audit Regulation and in compliance with German Generally Accepted
Standards for Financial Statement Audits promulgated by the Institut der Wirtschaftsprüfer (IDW) will always
detect a material misstatement. Misstatements can arise from fraud or error and are considered material if,
individually or in the aggregate, they could reasonably be expected to influence the economic decisions of
users taken on the basis of these consolidated financial statements and this group management report.
We exercise professional judgment and maintain professional skepticism throughout the audit. We also:
■ Identify and assess the risks of material misstatement of the consolidated financial statements and of the
group management report, whether due to fraud or error, design and perform audit procedures respon-
sive to those risks, and obtain audit evidence that is sufficient and appropriate to provide a basis for our
opinions. The risk of not detecting a material misstatement resulting from fraud is higher than for one
resulting from error, as fraud may involve collusion, forgery, intentional omissions, misrepresentations, or
the override of internal control. ■ Obtain an understanding of internal control relevant to the audit of the consolidated financial statements
and of arrangements and measures (systems) relevant to the audit of the group management report in
order to design audit procedures that are appropriate in the circumstances, but not for the purpose of
expressing an opinion on the effectiveness of these systems.
■ Evaluate the appropriateness of accounting policies used by the executive directors and the reasonableness
of estimates made by the executive directors and related disclosures.
■ Conclude on the appropriateness of the executive directors’ use of the going concern basis of account-
ing and, based on the audit evidence obtained, whether a material uncertainty exists related to events
or conditions that may cast significant doubt on the Group’s ability to continue as a going concern. If we
conclude that a material uncertainty exists, we are required to draw attention in the auditor’s report to
the related disclosures in the consolidated financial statements and in the group management report or, if
such disclosures are inadequate, to modify our respective opinions. Our conclusions are based on the audit
evidence obtained up to the date of our auditor’s report. However, future events or conditions may cause
the Group to cease to be able to continue as a going concern.
■ Evaluate the overall presentation, structure and content of the consolidated financial statements, including
the disclosures, and whether the consolidated financial statements present the underlying transactions
and events in a manner that the consolidated financial statements give a true and fair view of the assets
liabilities, financial position and financial performance of the Group in compliance with IFRSs as adopted by
the EU and the additional requirements of German commercial law pursuant to Sec. 315e (1) HGB.
■ Obtain sufficient appropriate audit evidence regarding the financial information of the entities or business
activities within the Group to express opinions on the consolidated financial statements and on the group
management report. We are responsible for the direction, supervision and performance of the group audit.
We remain solely responsible for our audit opinions.

234 | www.leoni.com
■ Evaluate the consistency of the group management report with the consolidated financial statements, its
conformity with [German] law, and the view of the Group’s position it provides.
■ Perform audit procedures on the prospective information presented by the executive directors in the group
management report. On the basis of sufficient appropriate audit evidence we evaluate, in particular, the
significant assumptions used by the executive directors as a basis for the prospective information, and
evaluate the proper derivation of the prospective information from these assumptions. We do not express
a separate opinion on the prospective information and on the assumptions used as a basis. There is a
substantial unavoidable risk that future events will differ materially from the prospective information.
We communicate with those charged with governance regarding, among other matters, the planned scope
and timing of the audit and significant audit findings, including any significant deficiencies in internal control
that we identify during our audit.
We also provide those charged with governance with a statement that we have complied with the relevant
independence requirements, and communicate with them all relationships and other matters that may
reasonably be thought to bear on our independence and where applicable, the related safeguards.
From the matters communicated with those charged with governance, we determine those matters that
were of most significance in the audit of the consolidated financial statements of the current period and are
therefore the key audit matters. We describe these matters in our auditor’s report unless law or regulation
precludes public disclosure about the matter.
Other legal and regulatory requirements
Further information pursuant to Art. 10 of the EU Audit Regulation
We were elected as auditor of the consolidated financial statements by the Annual General Meeting on
3 May 2018. We were engaged by the Supervisory Board on 8 May 2018. We have been the group auditor
of LEONI AG without interruption for at least 31 years.
We declare that the opinions expressed in this auditor’s report are consistent with the additional report to the
audit committee pursuant to Art. 11 of the EU Audit Regulation (long-form audit report).
The fees stated in the table in paragraph (31) of the notes to the consolidated financial statements also include
assurance services with regard to financial and non-financial information not required by law as well as advice
on corporate governance matters.
| 235| Consolidated financial statements
Independent auditor’s report
German Public Auditor responsible for the engagement
The German Public Auditor responsible for the engagement is Udo Schuberth.
Nuremberg, 25 February 2019
Ernst & Young GmbH
Wirtschaftsprüfungsgesellschaft
Schuberth Schütz
Wirtschaftsprüfer [German Public Auditor] Wirtschaftsprüfer [German Public Auditor]

236 | www.leoni.com
Aldo Kamper Bruno Fankhauser Karl Gadesmann Martin Stüttem
Responsibility statement
To the best of our knowledge, and in accordance with the applicable reporting principles, the consolidated
financial statements give a true and fair view of the assets, liabilities, financial position and profit or loss of the
Group, and the Group management report includes a fair review of the development and performance of the
business and the position of the Group, together with a description of the principal opportunities and risks
associated with the expected development of the Group.
Nuremberg, 22 February 2019
LEONI AG
The Board of Directors

Additional information
| 237

238 | www.leoni.com
Additional information
Extract from the financial statement of LEONI AG 239
Appropriation of profits 241
Ten-year overview 242
Glossary 244

| 239| Additional information
Extract from the financial statement of LEONI AG
Extract from the financial statement of LEONI AG
LEONI AG income statement
€ ‘000 01/01/ – 31/12/ under HGB 2018 2017
1. Sales revenues 129,847 108,952
2. Own work capitalised 840 1,043
3. Other operating income 33,858 33,621
4. Cost of materials Cost of purchased services (63,814) (49,544)
5. Personnel expenditure:
a) salaries (37,246) (36,419)
b) social security contributions and expenditure for retirement benefits and support payments (5,096) (4,750)
6. Amortisation of intangible investment assets and depreciation of property, plant and equipment (8,028) (7,639)
7. Other operating expenses (76,005) (66,344)
8. Income from profit transfer agreements 5,251 46,830
9. Investment income 107,951 0
10. Income from financial loans 26,195 22,248
11. Other interest and similar income 8,720 9,045
12. Writedowns on investments (3,282) (23,164)
13. Expenses due to loss assumption (69,756) (18,106)
14. Interest and similar expenses (15,838) (16,072)
15. Income taxes (1,260) (1,891)
16. Earnings after taxes 32,337 (2,190)
17. Other taxes (33) (31)
18. Net loss / income 32,304 (2,221)
19. Earnings brought forward from the previous year 542 999
20. Transfer to other retained earnings 16,152 0
21. Reversal from other retained earnings 0 47,500
22. Retained income 16,694 46,278
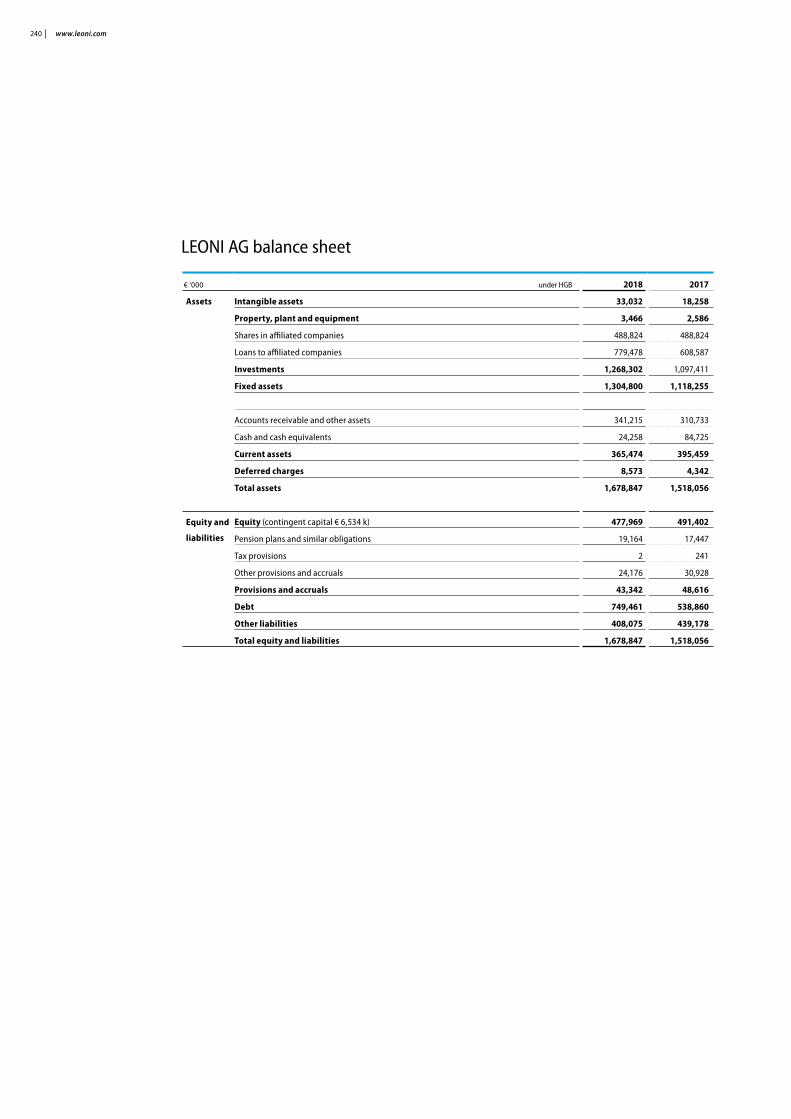
240 | www.leoni.com
€ ‘000 under HGB 2018 2017
Assets Intangible assets 33,032 18,258
Property, plant and equipment 3,466 2,586
Shares in affiliated companies 488,824 488,824
Loans to affiliated companies 779,478 608,587
Investments 1,268,302 1,097,411
Fixed assets 1,304,800 1,118,255
Accounts receivable and other assets 341,215 310,733
Cash and cash equivalents 24,258 84,725
Current assets 365,474 395,459
Deferred charges 8,573 4,342
Total assets 1,678,847 1,518,056
Equity and
liabilities
Equity (contingent capital € 6,534 k) 477,969 491,402
Pension plans and similar obligations 19,164 17,447
Tax provisions 2 241
Other provisions and accruals 24,176 30,928
Provisions and accruals 43,342 48,616
Debt 749,461 538,860
Other liabilities 408,075 439,178
Total equity and liabilities 1,678,847 1,518,056
LEONI AG balance sheet

| 241| Additional information
Extract from the financial statement of LEONI AG
Appropriation of profits
Retained earnings for fiscal 2017 determined
under the German Commercial Code (HGB)
amount to 16,693,636.52 €
We propose to retain the full amount of fiscal-2018 distributable profit in other retained earnings.
Transfer to other retained earnings: 16,693,636.52 €
Nuremberg, 22 February 2019
LEONI AG
The Board of Directors
Appropriation of profits
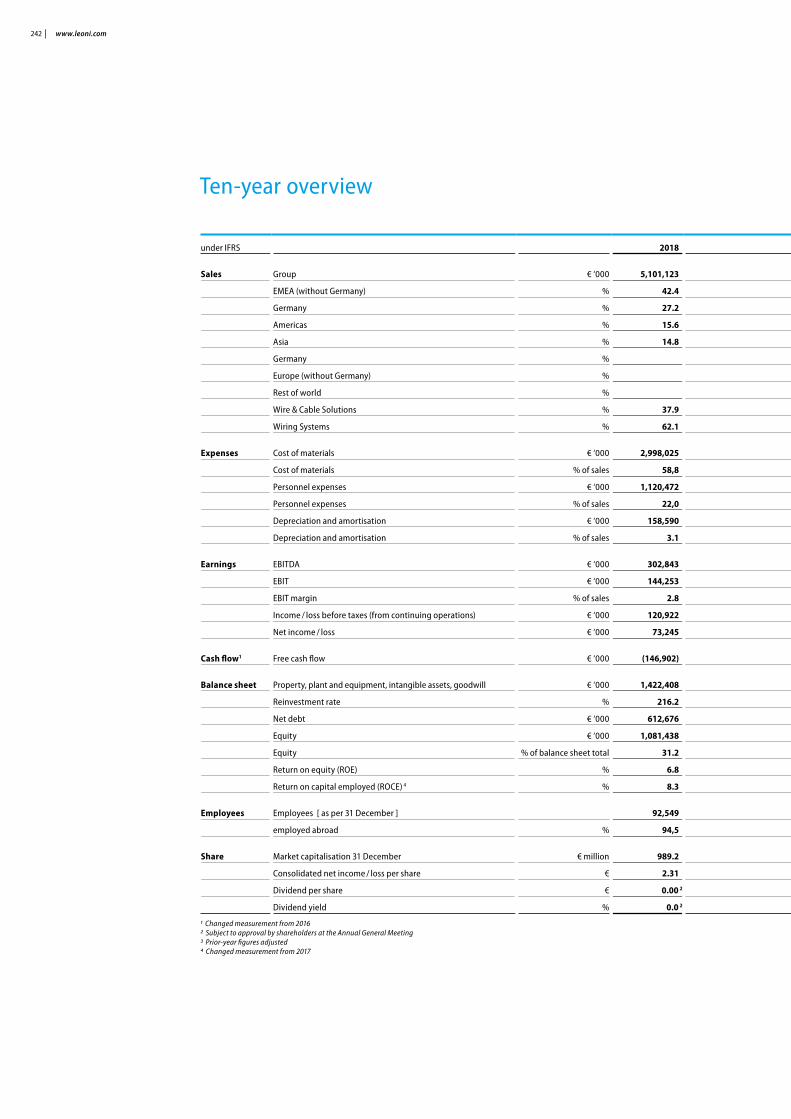
242 | www.leoni.com
under IFRS 2018 2017 3 2016 2015 2014 2013 2012 2011 2010 2009
Sales Group € ‘000 5,101,123 4,925,297 4,431,322 4,502,940 4,103,434 3,917,886 3,809,007 3,701,487 2,955,671 2,160,117
EMEA (without Germany) % 42.4 41.5 40.8 39.9 39.0 40.6 42.9 46.8 46.5
Germany % 27.2 27.7 28.3 25.5 27.0 27.8 27.0 28.8 31.8
Americas % 15.6 15.2 15.8 16.4 15.1 14.7 15.1 12.8 11.2
Asia % 14.8 15.6 15.1 18.2 18.9 16.9 15.0 11.6 10.5
Germany % 34.4
Europe (without Germany) % 42.0
Rest of world % 23.6
Wire & Cable Solutions % 37.9 37.8 39.3 40.7 41.5 40.8 42.1 45.3 44.7 43.3
Wiring Systems % 62.1 62.2 60.7 59.3 58.5 59.2 57.9 54.7 55.3 56.7
Expenses Cost of materials € ‘000 2,998,025 2,880,569 2,554,381 2,675,797 2,436,320 2,354,687 2,294,370 2,238,455 1,738,408 1,253,333
Cost of materials % of sales 58,8 58,5 57.6 59.4 59.4 60.1 60.2 60.5 58.8 58.0
Personnel expenses € ‘000 1,120,472 1,058,560 971,336 925,453 816,751 766,038 730,873 669,119 607,687 530,663
Personnel expenses % of sales 22,0 21,5 21.9 20.6 19.9 19.6 19.2 18.1 20.6 24.6
Depreciation and amortisation € ‘000 158,590 149,524 151,094 147,029 123,392 120,992 116,202 107,045 110,282 111,457
Depreciation and amortisation % of sales 3.1 3.0 3.4 3.3 3.0 3.1 3.1 2.9 3.7 5.2
Earnings EBITDA € ‘000 302,843 376,686 230,247 298,356 305,897 284,137 354,094 344,186 241,006 (4,862)
EBIT € ‘000 144,253 227,162 79,153 151,327 182,505 163,145 237,892 237,141 130,724 (116,319)
EBIT margin % of sales 2.8 4.6 1.8 3.4 4.4 4.2 6.2 6.4 4.4 (5.4)
Income / loss before taxes (from continuing operations) € ‘000 120,922 202,223 54,799 125,859 150,719 131,220 199,326 196,250 89,599 (157,309)
Net income / loss € ‘000 73,245 145,508 11,518 77,269 115,060 105,896 157,049 155,959 67,246 (138,081)
Cash flow1 Free cash flow € ‘000 (146,902) 11,065 (27,494) (5,194) (37,878) 36,788 86,211 119,204 46,785 1,783
Balance sheet Property, plant and equipment, intangible assets, goodwill € ‘000 1,422,408 1,263,505 1,167,442 1,131,546 1,040,410 940,455 917,691 837,693 809,617 796,567
Reinvestment rate % 216.2 188.2 139.5 168.3 174.9 139.2 132.7 128.4 93.5 73.4
Net debt € ‘000 612,676 406,236 403,574 321,565 316,200 256,990 249,169 233,922 444,558 495,367
Equity € ‘000 1,081,438 1,041,886 917,164 996,328 917,755 827,597 783,972 737,481 481,160 369,126
Equity % of balance sheet total 31.2 33.1 31.1 35.1 34.4 34.5 32.9 31.8 23.8 21.0
Return on equity (ROE) % 6.8 14.0 1.3 7.8 12.5 12.8 20.0 21.1 14.0 (37.4)
Return on capital employed (ROCE) 4 % 8.3 14.5 5.1 10.0 13.7 13.4 20.9 24.0 13.9 (12.0)
Employees Employees [ as per 31 December ] 92,549 86,340 79,037 74,018 67,988 61,591 59,393 60,745 55,156 49,822
employed abroad % 94,5 94,6 94.5 94.1 93.7 93.1 93.0 93.4 93.2 92.4
Share Market capitalisation 31 December € million 989.2 2,038.2 1,105.8 1,190.6 1,613.7 1,774.9 932.7 841.2 978.6 485.6
Consolidated net income / loss per share € 2.31 4.49 0.33 2.36 3.51 3.23 4.80 4.99 2.26 (5.04)
Dividend per share € 0.00 2 1.40 0.50 1.00 1.20 1.00 1.50 1.50 0.70 0.00
Dividend yield % 0.0 2 2.2 1.5 2.7 2.4 1.8 5.3 5.8 2.1 0
1 Changed measurement from 20162 Subject to approval by shareholders at the Annual General Meeting3 Prior-year figures adjusted 4 Changed measurement from 2017
Ten-year overview

| 243| Additional information
Ten-year overview
under IFRS 2018 2017 3 2016 2015 2014 2013 2012 2011 2010 2009
Sales Group € ‘000 5,101,123 4,925,297 4,431,322 4,502,940 4,103,434 3,917,886 3,809,007 3,701,487 2,955,671 2,160,117
EMEA (without Germany) % 42.4 41.5 40.8 39.9 39.0 40.6 42.9 46.8 46.5
Germany % 27.2 27.7 28.3 25.5 27.0 27.8 27.0 28.8 31.8
Americas % 15.6 15.2 15.8 16.4 15.1 14.7 15.1 12.8 11.2
Asia % 14.8 15.6 15.1 18.2 18.9 16.9 15.0 11.6 10.5
Germany % 34.4
Europe (without Germany) % 42.0
Rest of world % 23.6
Wire & Cable Solutions % 37.9 37.8 39.3 40.7 41.5 40.8 42.1 45.3 44.7 43.3
Wiring Systems % 62.1 62.2 60.7 59.3 58.5 59.2 57.9 54.7 55.3 56.7
Expenses Cost of materials € ‘000 2,998,025 2,880,569 2,554,381 2,675,797 2,436,320 2,354,687 2,294,370 2,238,455 1,738,408 1,253,333
Cost of materials % of sales 58,8 58,5 57.6 59.4 59.4 60.1 60.2 60.5 58.8 58.0
Personnel expenses € ‘000 1,120,472 1,058,560 971,336 925,453 816,751 766,038 730,873 669,119 607,687 530,663
Personnel expenses % of sales 22,0 21,5 21.9 20.6 19.9 19.6 19.2 18.1 20.6 24.6
Depreciation and amortisation € ‘000 158,590 149,524 151,094 147,029 123,392 120,992 116,202 107,045 110,282 111,457
Depreciation and amortisation % of sales 3.1 3.0 3.4 3.3 3.0 3.1 3.1 2.9 3.7 5.2
Earnings EBITDA € ‘000 302,843 376,686 230,247 298,356 305,897 284,137 354,094 344,186 241,006 (4,862)
EBIT € ‘000 144,253 227,162 79,153 151,327 182,505 163,145 237,892 237,141 130,724 (116,319)
EBIT margin % of sales 2.8 4.6 1.8 3.4 4.4 4.2 6.2 6.4 4.4 (5.4)
Income / loss before taxes (from continuing operations) € ‘000 120,922 202,223 54,799 125,859 150,719 131,220 199,326 196,250 89,599 (157,309)
Net income / loss € ‘000 73,245 145,508 11,518 77,269 115,060 105,896 157,049 155,959 67,246 (138,081)
Cash flow1 Free cash flow € ‘000 (146,902) 11,065 (27,494) (5,194) (37,878) 36,788 86,211 119,204 46,785 1,783
Balance sheet Property, plant and equipment, intangible assets, goodwill € ‘000 1,422,408 1,263,505 1,167,442 1,131,546 1,040,410 940,455 917,691 837,693 809,617 796,567
Reinvestment rate % 216.2 188.2 139.5 168.3 174.9 139.2 132.7 128.4 93.5 73.4
Net debt € ‘000 612,676 406,236 403,574 321,565 316,200 256,990 249,169 233,922 444,558 495,367
Equity € ‘000 1,081,438 1,041,886 917,164 996,328 917,755 827,597 783,972 737,481 481,160 369,126
Equity % of balance sheet total 31.2 33.1 31.1 35.1 34.4 34.5 32.9 31.8 23.8 21.0
Return on equity (ROE) % 6.8 14.0 1.3 7.8 12.5 12.8 20.0 21.1 14.0 (37.4)
Return on capital employed (ROCE) 4 % 8.3 14.5 5.1 10.0 13.7 13.4 20.9 24.0 13.9 (12.0)
Employees Employees [ as per 31 December ] 92,549 86,340 79,037 74,018 67,988 61,591 59,393 60,745 55,156 49,822
employed abroad % 94,5 94,6 94.5 94.1 93.7 93.1 93.0 93.4 93.2 92.4
Share Market capitalisation 31 December € million 989.2 2,038.2 1,105.8 1,190.6 1,613.7 1,774.9 932.7 841.2 978.6 485.6
Consolidated net income / loss per share € 2.31 4.49 0.33 2.36 3.51 3.23 4.80 4.99 2.26 (5.04)
Dividend per share € 0.00 2 1.40 0.50 1.00 1.20 1.00 1.50 1.50 0.70 0.00
Dividend yield % 0.0 2 2.2 1.5 2.7 2.4 1.8 5.3 5.8 2.1 0

244 | www.leoni.com
Glossary
A Alternative drive technologies Power engine with hybrid, electric or fuelcell technology
Asset tracing Identifying, tracking and recovering assets
C Capital employed Non-interest bearing assets less non-interest bearing liabilities
Cash flow Balance of cash inflow and outflow; key figure for assessing financing resources
Cloud Computer network for online-based storage and computer services
Compliance Adherence to legal requirements and corporate guidelines
Corporate Governance Responsible business management
Coverage Regular monitoring of a company by financial analysts
CSR – RUG Corporate Social Responsibility – Guidelines Implementation Law
D D & O insurance Covers the cost of compensation claims made against a business’s directors and key managers (officers)
DEL quote Copper price quote (Deutsche Elektrolyt-Kupfer-Notierung = German electrolyte copper quote)
Derivatives Financial instruments whose price or value depends on the prices of other merchandise
Digitalization The process of converting analogue signals into a digital format so as to electronically save or process them
Due diligence investigation Thorough investigation of risks, e.g. when buying or disposing of businesses
E EBIT Earnings before interest and taxes
EBIT margin EBIT / sales
Economic Value Added (EVA) Increase in enterprise value taking the cost of capital into consideration
EMEA Europe, Middle East and Africa
F Factoring Sale of receivables
Financial covenants Provisions included in a loan agreement
Forward exchange transactions
Hedging transactions to reduce the risks of exchange rate fluctuations
Free cashflow Performance of operating cash flow taking capital expenditures into consideration
G Gearing Ratio of net debt to equity
Global trends Future social developments
H Hedge accounting Reporting of various financial instruments that are in a hedging relationship
I iEVC illuminated Electrical Vehicle charging Cable (illumination indicates charge status for electric and hybrid vehicles)
Impairment tests Review of the value of asset items
Industry 4.0 Digital networking of production with the help of state-of-the-art IT and communica-tions technology
Intelligent cables and systems Cables and cable systems with additional functions that, for example, improve the safety, uptime or the efficiency of the application
Internal Control System (ICS) Principles and procedures to ensure the efficiency of Corporate Governance, the reliability of accounting and adherence to pertinent legal requirements

| 245| Additional information
Glossary
J Just-in-sequence delivery Delivery in the required sequence
Just-in-time delivery Delivery in the required time
L Leverage Ratio of net financial liabilities to equity
M Market segment Area of application for LEONI products and solutions
Monte-Carlo-Simulation Simulation method based on multiple trial runs using random variables
N Net financial liabilities (Net financial debts)
Financial liabilities less cash and cash equivalents
O oneLEONI Strategic approach to transformation in the LEONI Group
OEM customers OEM (original equipment manufacturer) customers
P Power over Ethernet Power supply via an Ethernet cable
R Restructuring expenses Spending on the reorganisation or closure of a facility, especially on severance pay-ments
Return on Sales EBIT/Sales
Reverse factoring Factoring agreement to pre-finance sup-plier liabilities
ROCE Return on capital employed
S Scope of consolidation Totality of the companies that belong to a group and are included in the consolidated financial statements
Segment Division
Smart grid Intelligent power grid
Strand Combination of several single wires
T True Sale Factoring Complete sale of receivables including risk overhang
U UN Global Compact The UN Global Compact is a strategic policy initiative for businesses that are committed to aligning their operations and strategies with ten universally accepted principles in the areas of human rights, labour, environ-ment and anti-corruption
W WACC Weighted Average Cost of Capital
Wiring system A vehicle’s network of electrical/electronic cables including components
WLTP testing procedure Worldwide Harmonised Light Vehicle Test Procedure (for emissions)
Working capital Net current assets (inventories plus trade receivables less trade liabilities)

246 | www.leoni.com
Forward-looking statements
This report contains forward-looking statements that are based on management’s current assumptions and
estimates concerning future trends. Such statements are subject to risk and uncertainty that LEONI cannot
control or precisely assess. Should imponderables occur or assumptions on which these statements are based
prove to be incorrect, actual results could deviate considerably from those described in these statements.
LEONI assumes no obligation to update forward-looking statements to adjust them to events following publi-
cation of this report.
Rounding differences may for arithmetical reasons occur in the tables, charts and references versus the
mathematically precise figures (monetary units, percentages, etc.).

| 247
Key dates
Balance sheet press conference 2019
Analyst and investor conference 2019
19 March 2019, 10:00 hours
Kitzingen
Followed by:
Capital Markets Day
Annual Report 2018
19 March 2019
Annual General Meeting 2019
16 May 2019, 10:00 hours
Nuremberg
Quarterly release
1st quarter 2019
15 May 2019
Interim report
1st half 2019
14 August 2019
Quarterly release
1st – 3rd quarter 2019
13 November 2019
Contact
Investor Relations
Frank Steinhart
Phone +49 911 2023-203
Fax +49 911 2023-10203
Jens von Seckendorff
Phone +49 911 2023-134
Fax +49 911 2023-10134
Denise Pfefferler
Phone +49 911 2023-489
Fax +49 911 2023-10489
E-mail [email protected]

Marienstrasse 7
90402 Nuremberg
Phone +49 911 2023-0
Fax +49 911 2023-455
E-mail [email protected]
www.leoni.com
LEONI AG