Embed Size (px)
Citation preview
ANNUAL REPORT 2018
U N I V E R S I T Y O F O T A G O
UN
IVE
RS
ITY
OF
OT
AG
O | A
NN
UA
L R
EP
OR
T 2
01
8
2018
AnnualReport


1
U N I V E R S I T Y O F O T A G O
2018
AnnualReport

UNIVERSITY OF OTAGO ANNUAL REPORT 2018
2
University of Otago
Leith Street, Dunedin, New ZealandMail PO Box 56, Dunedin 9054, New ZealandTel 64 3 479 1100Email [email protected] otago.ac.nz
ChristchurchUniversity of Otago, Christchurch 2 Riccarton Avenue, Christchurch, New ZealandMail PO Box 4345, Christchurch 8140, New ZealandTel 64 3 364 [email protected]
WellingtonUniversity of Otago, Wellington Mein Street, Newtown, Wellington South, New ZealandMail PO Box 7343, Newtown 6242, New ZealandTel 64 4 385 [email protected]
AucklandUniversity of Otago Auckland Centre385 Queen Street, Auckland, New ZealandMail PO Box 5543, Wellesley Street, Auckland 1141, New ZealandTel 64 9 373 [email protected]
SouthlandCollege of Education, Southland Campus100 Nelson Street, Invercargill, New ZealandMail PO Box 886, Invercargill 9840, New ZealandTel 64 3 211 [email protected]
2

3
Vision
Mission
A research-led University with an international reputation for excellence.
He Whare Wānanga aronui ana ki te rangahau, e rongonui ana i ngā tōpito o te ao i āna tutukinga ikeike.
The University of Otago will create, advance, preserve, promote and apply knowledge, critical thinking and intellectual independence to enhance the understanding, development and well-being of individuals, society and the environment. It will achieve these goals by building on foundations of broad research and teaching capabilities, unique campus learning environments, its nationwide presence and mana, and international links.
Ko tā Te Whare Wānanga o Otāgo he whakawhanake, he pupuri, he whakatairanga hoki i te mātauranga, i te ihomatua tātari kaupapa, i te whakaaroaro motuhake o te tangata, kia hāpai ai te mōhio, te mārama, te hiatotanga, otirā, te oranga o te tangata, o te iwi hoki. Mā te rangahau me te tika mārika o te whakaako, mā te whai wānanga ahurei, mā te whakaū ki tōna mana, me ōna toronga puta noa i te motu, i te ao hoki ēnei whāinga e tutuki.
3

UNIVERSITY OF OTAGO ANNUAL REPORT 2018
44
Contents

5
Vision and Mission 3
University Governance 6
Organisation Chart 7
Council of the University 8
Executive Group 10
Chancellor’s Introduction 12
Vice-Chancellor’s Review 14
Significant Events 18
Excellence in Research 20
Excellence in Teaching 24
Outstanding Student Experiences 28
Outstanding Campus Environments 32
Commitment as a Local, National and Global Citizen 36
Strong External Engagement 40
Sustaining Capability 44
Reporting by Outputs 48
Statement of Service Performance 52
Statement of Resources 62
Equal Opportunities Report 64
Group Entities Report 70
Financial Review 72
Statement of Responsibility 73
Statement of Comprehensive Revenue and Expense 74
Statement of Financial Position 75
Statement of Changes in Equity 76
Statement of Cash Flows 77
Notes to the Financial Statements 79
Independent Auditor’s Report 119
Student Services Fee Report 122
Summary Facts and Figures 124

UNIVERSITY OF OTAGO ANNUAL REPORT 2018
6
Legal StatusThe University was established by the University of Otago Ordinance of the Provincial Council in 1869, the University of Otago Amendment Act 1961 and the Education Act 1989. It is governed by a Council, which appoints the Vice-Chancellor, who is the chief executive and employer of all other staff.
Statutory RoleDefining characteristics of universities in New Zealand, specified in the Education Act 1989, include that their teaching is primarily informed by research, they are repositories of knowledge and expertise, and they accept a role as critic and conscience of society.
The University CouncilThe Council is constituted and empowered according to legislation. Council is chaired by the Chancellor, and comprises appointed, elected and designated members.
Committees of CouncilSpecific committees report directly to Council on matters including financial management and performance, audit, capital development, health and safety, ethics, risk management and statutory compliance. It also has a Treaty of Waitangi committee with equal membership from Ngāi Tahu, and the University may, from time to time, establish special working parties to examine particular issues.
The SenateSenate reports directly to Council, advising it primarily on academic matters as the Academic Board of the University. Senate is convened by the Vice-Chancellor and its membership is drawn mainly from the heads of academic departments. Also included are other senior academics and representatives of other teaching staff and students. It is, in turn, advised by a number of committees and boards.
University Autonomy and Academic FreedomThe Education Act 1989 provides statutory recognition of, and protection for, the institutional autonomy of the University and the academic freedom of its staff and students. In accordance with the Act, the Council and the Vice-Chancellor have a duty to act to preserve and enhance university autonomy and academic freedom.
Governance DocumentsThe University strategic plan, Strategic Direction to 2020, provides a framework for the development of the University.The University Investment Plan outlines the means by which the University will contribute to the Government’s strategies and priorities for tertiary education, and how it will monitor its performance in these matters.
6
University Governance

7
Council
Vice-Chancellor
Deputy Vice-Chancellor
(Academic)
DirectorHuman
Resources
Registrar and Secretaryto the Council
Deputy Vice-Chancellor
(External Engagement)
DirectorMāori
Development
DirectorPlanning and
FundingChief
Operating OfficerChief
Financial Officer
Otago Medical School
School of Biomedical
Sciences
University of Otago,
Christchurch
Dunedin School ofMedicine
University of Otago,
Wellington
School of Physiotherapy
Faculty of Dentistry
School of Pharmacy
Arts & Social Sciences Faculty of Law College of
Education
School of Māori, Pacific and Indigenous
Studies
School of Physical
EducationSciences School of
Surveying
Pro-Vice-Chancellor
(Humanities)
Pro-Vice-Chancellor
(Health Sciences)
Pro-Vice-Chancellor
(Commerce)
Pro-Vice-Chancellor(Sciences)
School of Business
Deputy Vice-Chancellor
(Research & Enterprise)
7
OrganisationChart

UNIVERSITY OF OTAGO ANNUAL REPORT 2018
8
Appointed by the Minister of Education
Mr Stephen J. Higgs(Pro-Chancellor)BCom(Otago) FCA, CFInstD
University of Otago 2018
Dr Royden J. Somerville(Chancellor)QC LLM PhD(Otago) AAMINZ
Council

9
Associate Professor Craig J. MarshallBSc(Hons) PhD(Otago)
Mr Frazer B. Barton BA LLB(Hons)(Otago)
Mr Martin R. DippieCMInstD
Ms L. Carrie Hobson BCom(Hons)(Otago), RGON
Ms P. (Trish) A. OakleyBCom(Otago)
Ms Donna C. Matahaere-AtarikiBA(Otago) MPhil(Massey)
Mr Shane A. Montague-GallagherBA(Hons) PDDipLing(NUI) PDDipSLP(Edin) GDipSustPrac(Otago Poly)
Ms Caitlin F. Barlow-GroomeBCom(Otago)
Mr Malcolm A WongBCom(Otago) FCA
Appointed by the Minister of Education
Elected by General Staff
Elected by Academic Staff
The President, Otago University Students’ Association (ex officio)
Appointed by the University Council
Ex Officio
Professor Harlene Hayne(Vice-Chancellor)ONZM BA HonDSc(Colorado College) MS PhD(Rutgers) FRSNZ
Mr Christan Stoddart(from 1 Oct)BA(Hons)(Otago)
Secretary to Council
9
Ms Jan A. Flood (until 30 Sept)DipPhEd(Otago)

UNIVERSITY OF OTAGO ANNUAL REPORT 2018
10
Vice-Chancellor Professor Harlene HayneONZM BA HonDSc(Colorado College) MS PhD(Rutgers) FRSNZ
Deputy Vice-Chancellor (Academic)Professor Vernon A. SquirePolar Medal BSc(Hons)(Wales) PhD(Camb) DSc(Wales) FRSNZ FIMA CMath FNZMS
Deputy Vice-Chancellor (Research and Enterprise) Professor Richard J. Blaikie BSc(Hons)(Otago) PhD(Camb) FRSNZ MIEEE MInstP CPhys
Deputy Vice-Chancellor (External Engagement) Professor Helen D. Nicholson BSc(Hons) MB ChB MD(Brist)
Chief Operating OfficerMr Stephen W. Willis MHlthSc(Qld UT) MPRM(S Qld) AdvDipPM(Southbank IT) MAIPM MInstD
Pro-Vice-Chancellor (Commerce)Professor Robin D. C. Gauld BA(Hons) MA(Well) PhD(HK)
Pro-Vice-Chancellor (Health Sciences) Professor Peter R. Crampton (until 1 July)
MB ChB MPH PhD(Otago) DipObst(Auck)FAFPHM MRNZCGP
Professor Paul A. Brunton (from 2 July)
MSc PhD(Manc) FDSRCSEd FDSRCS FFGDP(UK)
Pro-Vice-Chancellor (Humanities) Professor Anthony J. Ballantyne BA(Hons)(Otago) PhD(Camb)FRSNZ
Pro-Vice-Chancellor (Sciences) Professor Richard J. Barker BSc(Hons) PhD(Massey)
Director of Human Resources Mr Kevin J. Seales BCom(Cant) MHRINZ
Chief Financial OfficerMs Sharon A. van TurnhoutBCom(Otago) ACA
Director of Māori DevelopmentMr Tuari L. Potiki PGDipHealSc CComPsC(0tago) CertClinSup CertAODCouns (CIT)
Director of Strategy, Analytics and ReportingMr David J. Thomson BA(Hons) MBA(Otago)
Registrar and Secretary to the Council Ms Jan A. Flood (until 30 Sept) DipPhEd(Otago)
Mr Christan J. Stoddart (from 1 Oct)
BA(Hons)(Otago)
10
University of Otago 2018Executive Group

1111

UNIVERSITY OF OTAGO ANNUAL REPORT 2018
12
It is my great pleasure to introduce the University of Otago’s Annual Report for 2018. The information in this report clearly demonstrates that the values of the University, which inform its commitment to excellence in teaching, research and service, have been honoured.
This report highlights Otago’s many successes including those in major external funding rounds, and in national and international rankings; the achievements of our outstanding staff and students; engagement with local, national and international stakeholders; and the significant building programme underway on our campuses.
The University is committed to providing world-class campus environments and facilities to enable our staff and students to excel and, in 2018, had almost $500 million of construction investment either in progress, recently completed or soon to be started. This is, indeed, a major investment in our University’s future and in the cities in which we operate.
Our University has strong links with the Dunedin community and during the year has been collaborating with the Southern Partnership Group in respect of the planning of the major redevelopment of the Dunedin Hospital. The University is also working closely with the group planning the redevelopment of the harbour basin.
2018 was my first year in the role of Chancellor. One of the most satisfying duties the Chancellor undertakes is to personally congratulate Otago’s new graduates on the completion of their studies and as they depart for the next chapter in their lives. In 2018 the University hosted 11 graduation ceremonies in which 3,606 students graduated in person and a further 1,592 in abstentia. It was also a great pleasure to confer honorary degrees on two outstanding Otago alumni: former University of Otago Chancellor Mr John Ward (Doctor of Laws) and distinguished businessman Mr Norman Geary (Doctor of Commerce).
I was fortunate to attend a number of alumni events in New Zealand, as well as in London, Melbourne and Brisbane. Our alumni groups here and around the world continue to provide invaluable support to the University, with growing numbers of alumni choosing to give back to their alma mater. This generosity is very important and I wish to thank everyone who has contributed. Your gifts help us do things that might otherwise not be possible.
“ The ongoing engagement of the wider University community is especially important as we begin our sesquicentennial celebrations in 2019 … This is a significant milestone and, while we will most certainly be celebrating the achievements of the past, it will also be an opportunity for us to look to the future as well.”
12
Chancellor’sIntroduction

13
As covered in depth elsewhere in this report, the University finished 2018 in a healthy financial position. However, as the tertiary sector continues to operate within a constrained funding environment, we must continue to seek new and diverse avenues of funding. A substantial $10 million donation was made to the University in 2018 by esteemed businessman Mr Graeme Hart and his family to help develop a new $28.2 million dental teaching facility in South Auckland. This extraordinarily generous gift will not only make a difference to Otago staff and students, but also to the community in which the new facility will operate.
The ongoing engagement of the wider University community is especially important as we begin our sesquicentennial celebrations in 2019. Founded in 1869, Otago was New Zealand’s first university: it has a distinguished history and much planning has gone into putting together a comprehensive programme of events and celebrations for staff, students, alumni and members of the wider community to enjoy. This is a significant milestone and, while we will most certainly be celebrating the achievements of the past, it will also be an opportunity for us to look to the future as well.
I would like to thank members of Council for their support and hard work over the past year, in particular the new Pro-Chancellor Mr Stephen Higgs. Their commitment has certainly made my first year as Chancellor an easier transition. We welcomed three new members in 2018 – Mr Malcolm Wong, Ms Trish Oakley, and Ms Caitlin Barlow-Groome who served one year as the OUSA representative. At the end of the year we also farewelled two long-serving members – Ms Donna Matahaere-Atariki and Associate Professor Craig Marshall. I would like to pay special tribute to their commitment over the last 10 and eight years respectively. I must also note the retirement of Ms Jan Flood who served as Registrar and Secretary to the Council for 16 years. Her contribution has been immeasurable.
Finally I must acknowledge and thank the Vice-Chancellor and her executive group for their dedicated work over the past 12 months. We have much to celebrate in 2019.
Dr Royden Somerville QCChancellor

UNIVERSITY OF OTAGO ANNUAL REPORT 2018
14
Established in 1869 by a group of determined Scottish colonists who believed that a university education should be available to any capable person who desired it, the University of Otago changed the face of education in New Zealand forever. From small beginnings as this country’s first university, Otago has grown into an institution of local, national and international significance. Reviewing our achievements over 2018 it is clear that we have much to be proud of.
14
Vice-Chancellor’sReview

15
Otago again topped the New Zealand Tertiary Education Commission’s annual Educational Performance Indicators for student performance and retention, and achieved the most successful Marsden funding round ever, gaining around $28.5 million for 41 projects, including 12 Fast-Start grants for our early career researchers. A further $19 million was received in the Health Research Council’s main funding round.
Otago retained its place within the world’s top 300 universities in all the key international rankings, including placing 175th in the QS world rankings, with five individual subject areas in the global top 50, and 15 in the top 100. To put these rankings in context, we are part of a global system that includes over 25,000 higher education institutions, of which around 10,000 are research and teaching institutions similar in purpose to ourselves.
The University also retained its 5-star plus rating – the highest possible – from the QS Stars world university rating system, gaining the maximum result in all of the measured categories including teaching, research, internationalisation, facilities, innovation and inclusiveness.
Excellent results do not come in isolation, but reflect the quality of our researchers, the dedication of our teaching staff, the systems we have in place to ensure the quality of our learning environment and, of course, the commitment of our students who work so hard to achieve to their full potential.
These efforts are canvassed in detail in the following pages of the report, however I would like to pay special tribute to some select successes. Faumuina Associate Professor Fa’afetai Sopoaga became the sixth Otago teacher in seven years to win the Prime Minister’s Supreme Award at the national Tertiary Teaching Excellence awards. This is an outstanding record for Otago and well-deserved recognition for Faumuina, whose exceptional commitment to Pacific students also earned her an endorsement for excellence. One of our most esteemed researchers, Professor Warren Tate, was awarded the prestigious Marsden Medal for his lifetime of outstanding service to science, and the University’s own Distinguished Research Medal was presented to Professor David Craw whose work, over many years, has transformed our understanding of New Zealand geology and the forces at work within it.
The University of Otago has made a strategic commitment to its role as a good local, national and global citizen and I am very proud to see how many of our staff and students are embracing this commitment. Recent surveys show that 88.4% of academic staff dedicated time to community service in the past year and a record 52.5% of graduates had undertaken volunteer work while studying at Otago. In 2018 the University Volunteer Centre reported a record 1,243 new student volunteer registrations, bringing the total number to 4,435.
Staff and students are also embracing the University’s commitment to sustainability which is becoming increasingly embedded across our campuses. In 2018, Otago won the Sustainable Campus Category at the Australasian Green Gown Awards and became the first New Zealand university to sign the international SDG Accord to pursue the United Nations’ Sustainable Development Goals. These goals cover a broad range of issues, including making cities more sustainable, combating climate change, protecting our oceans and forests, and improving health and education. As a university, we recognise our unique role in supporting those goals by nurturing young people as a force for change, fulfilling the need for new knowledge and rigorous debate.
Encouraging and supporting groups under-represented in university study is another cornerstone commitment at Otago. Within a positive year for the University’s enrolments overall, rising by 2.1% to 18,840 EFTS (equivalent full-time students), the numbers of Māori and Pacific students enrolled reached record levels of 11.8% and 5.2% of total domestic EFTS respectively. A particularly important milestone was achieved in December when 76 Māori health professional students graduated. This is the largest ever cohort of such students and will have a significant and widespread impact on New Zealand’s health workforce and the well-being of our communities for decades.
As one of New Zealand’s largest employers, the University has a major impact on the regional and national economies. The latest annual Economic Impact Report estimated that the University directly injected around $967.4 million into the Dunedin economy, with the downstream effects totalling $1.68 billion and supporting around 15,112 jobs. The impact of the University’s activities on the New Zealand economy as a whole was estimated at $1.91 billion. This, in part, reflects the large and complex building programme that is underway on our campuses and will continue into the future with two significant new projects announced in 2018.
The first was a new building for our Christchurch campus. This will be the biggest construction project the University has undertaken, demonstrating our commitment to the campus, the city of Christchurch and its people. The new building’s state-of-the art facilities will enable further growth of the campus’ world-class health science research and education programmes, and provide new opportunities for collaboration with partners in the Christchurch Health Precinct. The proximity of the University to hospital facilities is one of our key advantages and we thus welcomed the Government’s approval of an inner-city site for Dunedin’s new hospital. The chosen site is close to the University of Otago precinct and our medical and health-related facilities, enabling the close relationship we have enjoyed for many decades to continue.
15
“Excellent results do not come in isolation, but reflect the quality of our researchers, the dedication of our teaching staff, the
systems we have in place to ensure the quality of our learning environment and, of course, the commitment of our students
who work so hard to achieve to their full potential.”

UNIVERSITY OF OTAGO ANNUAL REPORT 2018
16
A second significant project announced in 2018 was a dental teaching facility and patient treatment clinic in South Auckland. This new building will not only provide unique training opportunities for our students, it will also have a real impact on the health and well-being of the local community by offering accessible dental treatment, following the same model that has been so successful at the Dental School in Dunedin. The University was delighted by a $10 million donation from New Zealand businessman and philanthropist Mr Graeme Hart and his wife Robyn to help develop this facility. This is the largest gift in the University’s history and we are extremely grateful for the Harts’ generosity and foresight in giving to this important project.
The University ended 2018 in a sound financial position with a higher-than-budgeted surplus of $27 million. Despite our sound position, we cannot be complacent and need to take a long-term view, continuing efforts to diversify our funding base and making sure that our resources are used efficiently and effectively. Full implementation of the institution-wide Support Services Review (SSR) is expected to be completed towards the end of 2020. The SSR Steering Group made the decision to make structural changes first, focusing on appointments to key leadership roles and providing certainty to staff as early as possible. New services and processes are being introduced and this will continue as the shared services model is fully established. This review is important for the ongoing sustainability of the University and I appreciate the contribution professional staff have made to the process. I would like to welcome newcomers to the University as well as existing staff to their new roles.
I would also like to acknowledge our students. Over a number of years the University has undertaken a concerted programme to reduce anti-social behaviour within our student community. Initiatives such as the introduction of Campus Watch and the Code of Student Conduct, CCTV cameras and proactive campaigns by the Proctor and the Otago University Students’ Association to educate students are proving effective in targeting issues such as fire-lighting, glass-breaking and flat initiations. Our discipline statistics show a significant and steady downward trend, with a 14.2% drop in recorded incidents compared to 2017. While there is still work to do, I am delighted that, for the first time in many years, no discipline cases were referred to me. This has been a community effort and signals a change in attitude among students and they deserve recognition for this turn-around.
The University of Otago is unique in New Zealand for its collegiate lifestyle. With more than 85% of our students coming from outside Dunedin we take seriously our commitment to providing excellent pastoral care and rich student experiences
that foster both academic excellence and positive personal development. For most, the “Otago Experience” begins in one of our 15 residential colleges and, for those who spend their first year living at home, boarding or flatting, we offer the Locals programme. Introduced as a pilot orientation programme in 2011, Locals is now firmly established with more than 450 students joining in 2018. Providing academic support, social and volunteering opportunities, Locals helps to ensure that all students can benefit from our collegiate culture. Similarly, we want to ensure that all students have the best opportunities possible to succeed. To this end we have expanded our first-year University transition programmes to create an Office of Student Success that will work collaboratively across the University to make sure every student is equipped with the “tools” they need to make the most of their time at Otago.
I have no doubt that those who made the extraordinarily bold decision to establish a university in Dunedin in 1869 would now see their vision as a great success. We will be celebrating their foresight during our sesquicentennial celebrations in 2019 and, over the past year (and longer), have been planning an exciting programme of events in which we hope staff, students, the wider University community and members of the public will come together to celebrate our extraordinary achievements as New Zealand’s first university.
Finally I would like to thank the University Council, staff and students for their hard work and support in 2018. In particular, I want to acknowledge two key senior staff who have retired or stepped out of their role. Ms Jan Flood retired after 32 years of dedicated service to the University of Otago, the last 16 as Registrar and Secretary to the Council. Professor Peter Crampton stepped down from his role as the Pro-Vice-Chancellor Health Sciences, but he continues in his role as a Professor, teaching and conducting world-class research in the Division of Health Sciences. Both of these senior leaders have made major contributions to our University.
2019 will be a very special year for us as we mark the 150th anniversary of the University of Otago. Throughout the year, we will celebrate not only our very distinguished past, but we will also set the course for our successful future. I look forward to the exciting months ahead.
Professor Harlene Hayne Vice-Chancellor

1717
UNIVERSITY OF OTAGO ANNUAL REPORT 2018
18
SignificantEvents
Senior appointmentsProfessor Paul Brunton as Pro-Vice-Chancellor, Health Sciences.
Mr David Christensen as the Chief Executive Officer of Otago Innovation Ltd.
Professor Alec Ekeroma as Professor, Obstetrics, Gynaecology and Women’s Health, University of Otago, Wellington.
Dr Martin Gagnon as the Director of Research and Enterprise.
Mr Dean Macaulay as the Director of the Property Services Division.
Associate Professor Janice Murray as Deputy Pro-Vice-Chancellor, Sciences.
Professor Jessica Palmer as Dean, Faculty of Law.
Professor Miguel Quiñones to the Webster Family Chair in Viral Pathogenesis.
Mr Christan Stoddart as Registrar and Secretary to the Council.
Mr David Tapp as the Director of Shared Services.
Professor Barry Taylor as Acting Dean of the Otago Medical School.
Professor Gillian Whalley as Professor, Clinical Sonography / Cardiology, Department of Medicine, Dunedin School of Medicine.
Professorial promotionsSeventeen University of Otago academics were promoted to the position of professor (effective 1 February 2019):Chris Brickell (Department of Sociology, Gender and Social Work); Chris Button (School of Physical Education, Sport and Exercise Sciences); James Crowley (Department of Chemistry); Lisa Ellis (Department of Politics); Peter Fineran (Department of Microbiology and Immunology); Jeremy Krebs (Edgar Diabetes and Obesity Research Centre, UOW); Brent Lovelock (Department of Tourism); Brendan McCane (Department of Computer Science); Alister Neill (Department of Medicine, UOW); Lachy Paterson (Te Tumu: School of Māori, Pacific and Indigenous Studies); Lynette Sadleir (Department of Paediatrics and Child Health, UOW); Michael Schultz (Department of Medicine, DSM); Martin Sellbom (Department of Psychology); Sheila Skeaff (Department of Human Nutrition); Lois Surgenor (Department of Psychological Medicine, UOC); Hazel Tucker (Department of Tourism); Ceri Warnock (Faculty of Law).
18
19
The following staff were promoted to associate professor (effective 1 February 2019): Mikkel Andersen (Department of Physics); Angela Ballantyne (Department of Primary Healthcare and General Practice, UOW); Heather Brooks (Department of Pathology, DSM); David Ciccoricco (Department of English and Linguistics); Tamlin Conner (Department of Psychology); Rebecca Grainger (Departments of Pathology and Molecular Medicine / Medicine, UOW); Kirk Hamilton (Department of Physiology); Peter Jones (Department of Physiology); Douglas Hill (Department of Geography); Stephanie Hughes (Department of Biochemistry); Andrea Insch (Department of Marketing); Lynnette Jones (School of Physical Education, Sport and Exercise Sciences); Kay Siang Khoo (Department of Politics); Joanna Kirman (Department of Microbiology and Immunology); Tobias Langlotz (Department of Information Science); Elizabeth Ledgerwood (Department of Biochemistry); Arlene McDowell (School of Pharmacy); Gisela Sole (School of Physiotherapy); Thomas McLean (Department of English and Linguistics); Miranda Mirosa (Department of Food Sciences); Cecilia Novero (Department of Languages and Cultures); Lianne Parkin (Department of Preventive and Social Medicine, DSM); Candler Rogers (Department of English and Linguistics); Susan Sandretto (College of Education); Hugh Slotten (Department of Media, Film and Communication); Wayne Stephenson (Department of Geography); Maria Stubbe (Department of Primary Healthcare and General Practice, UOW); Nicola Swain (Department of Psychological Medicine, DSM); Gareth Treharne (Department of Psychology); Alexander Tups (Department of Physiology); Sara Walton (Department of Management); Leah Watkins (Department of Marketing); Joanna Williams (Department of Anatomy); Stephanie Woodley (Department of Anatomy).
Research Associate Professors: Kirsten Coppell (Department of Medicine, DSM); Ricci Harris (Department of Public Health, UOW); Jacqueline Keenan (Department of Surgery, UOC); James Stanley (Dean’s Department, UOW); Logan Walker (Department of Pathology, UOC); Yiwen Zheng (Department of Pharmacology and Toxicology).
Emeritus ProfessorsThe status of emeritus professor was awarded to the following academics:Professor Tom Brooking (Department of History and Art History); Professor David Craw (Department of Geology); Professor Brett Delahunt (Department of Pathology and Molecular Medicine, UOW); Professor Pete Ellis (Department of Psychological Medicine, UOW); Professor Wayne Gillett (Department of Women’s and Children’s Health); Professor Charles Higham (Department of Anthropology and Archaeology); Professor Keith Hunter (Department of Chemistry); Professor Peter Kuch (Department of English and Linguistics); Professor Robert McGee (Department of Preventive and Social Medicine); Professor Alison Mercer (Department of Zoology); Professor Andrew Mercer (Department of Microbiology and Immunology); Professor Sarah Romans (Department of Psychological Medicine, UOW); Professor C. Murray Skeaff (Department of Human Nutrition).
HonoursA number of staff were recognised with Honours in 2018. Officer of the New Zealand Order of Merit: Emeritus Professor Helen Leach (Anthropology and Archaeology); Professor Spencer Beasley (Paediatric Surgery, UOC).
Member of the New Zealand Order of Merit: Professor Barbara Brookes (History and Art History); Dr John Guthrie (Marketing); Associate Professor Mike Hilton (Geography); Donna Matahaere- Atariki (University of Otago Council).
Honorary DegreesHonorary degrees were awarded to former University of Otago Chancellor Mr John Ward (Doctor of Laws) and Mr Norman Geary (Doctor of Commerce).
ObituariesEmeritus Professor Ted Corbett (Department of Chemistry).
Dr Geoff Cutfield (School of Medicine).
Dr Adi Alumita Durutalo (Te Tumu, School of Māori, Pacific and Indigenous Studies).
Emeritus Professor David Fergusson (Director, Christchurch Health and Development Study).
Emeritus Professor Keith Hunter (Chemistry, former Pro-Vice-Chancellor Sciences).
Dr John Schofield (Animal Welfare Office).
Ms Lindy Wilson (Division of External Engagement).

UNIVERSITY OF OTAGO ANNUAL REPORT 2018
20
The University of Otago is a large research organisation with comprehensive capabilities, fostering both existing and emerging areas of research strength in its commitment to addressing issues of national and international importance. In 2018 this was highlighted by a number of new research ventures, outstanding success in competitive funding rounds, and the achievements of researchers across the University’s campuses.
20
Excellence in Research

21
$19 millionfor 17 projects from the Health Research Council
$28.5 millionfor 41 projects from the Marsden Fund
12 Fast-Start grants for early-career researchers
Success in major funding rounds:
$5 millionfrom the Endeavour Fund for innovative research
Distinguished Research Medal presented to geologist Professor David Craw
The 2018 Research Group award was won by the Gemmell Lab
Professor Warren Tate received the Marsden Medal

UNIVERSITY OF OTAGO ANNUAL REPORT 2018
22
Developments in 2018 included the launch of Brain Research New Zealand’s Dunedin Dementia Prevention Research Centre as part of a network of three clinics across the country aiming to find ways to prevent or delay the onset of dementia. This is one of the flagship activities of Brain Research New Zealand – Rangahau Roro Aotearoa – co-hosted by the University of Otago. The year also saw the Otago-hosted Dodd-Walls Centre for Quantum and Photonic Technologies take the lead in International Day of Light events, including a special light and sound show illuminating the Auckland Harbour Bridge.
Research at Otago is specifically focused to enhance health, society and the environment, with an increasing emphasis on economic benefit. In 2018 this ranged from the discovery of a gene that sets humans (primates) apart from other mammals, to the discovery of how an anti-cancer virus infects cancer cells, but not normal tissue. This focus was also reinforced with the New Zealand Science Board’s decision to affirm funding for a second five-year period to the two National Science Challenges hosted by Otago – Healthier Lives, aimed at reducing the burden of non-communicable diseases, and Ageing Well, aimed at enhancing well-being, health and social connectedness for older New Zealanders.
In a New Zealand first, the University signed a memorandum of understanding (MOU) with the International Agency for Research on Cancer (IARC). The new relationship will result in further research opportunities as well as putting Otago in an excellent position to take a key role in helping to shape the global cancer agenda.
Otago was recognised as a World Leisure Centre of Excellence which will benefit research and learning in tourism. The University also joined the Global Research Alliance for Sustainable Finance and Investment, alongside 17 other leading universities including Oxford, Cambridge and UC Berkeley.
An Otago team is helping lead a significant $18 million international project to determine the main causes of fever in sub-Saharan Africa and Asia and how they should be treated. It aims to tackle antimicrobial resistance and develop a blueprint for treatment. Another international project, overseen by Otago’s Professor Mark Richards, provided new insights into the death rates and risk predictions of heart failure that could improve heart-care globally.
An Otago-led study into ancient climate change highlighted the risks of oxygen depletion in the Earth’s oceans; a Legal Issues Centre report found that the barriers to legal advice can be too great for many New Zealanders; Psychology researchers identified adventure education as a potential tool to help tackle the mental health challenges facing adolescents in New Zealand; and Otago zoologists have been providing research support to the Predator Free Dunedin project. Work also began on a three-year project to document the knowledge embedded in Te Rā, the last known Māori sail, currently held at the British Museum; and a revolutionary bio-ink for 3-D tissue printing, developed by the Christchurch Regenerative Medicine and Tissue Engineering Group, achieved sales in its first week on the market.
The quality and depth of Otago’s research was again recognised in major contestable funding rounds. The University celebrated the most successful Marsden funding round ever, receiving a total of around $28.5 million for 41 projects, including 12 Fast-Start grants for early-career researchers. The projects are varied and from across a wide range of academic areas. For example, palaeontologist Professor Ewan Fordyce (Geology) received $928,000 to further investigate a “global dark age” in whale evolution; Vice-Chancellor Professor Harlene Hayne (Psychology) received $827,000 for her research into how judicial instructions and questions influence jurors; and Professor Michelle Glass (Pharmacology and Toxicology) received $939,000 to look at human drug discovery approaches to kauri dieback disease.
Researchers from the Dunedin, Wellington and Christchurch campuses were awarded almost $19 million from the Health Research Council’s (HRC) funding round to support 17 world-class studies to improve New Zealanders’ health and well-being. The areas of research include the potential hazards of toxic mould in New Zealand homes (Professor Julian Crane, Medicine, UOW); a randomised controlled trial of prescription drug charges (Professor Pauline Norris, Pharmacy) ; patient response to melanoma immunotherapy (Professor Michael Eccles, Pathology); the management, and impact of osteoarthritis (Professor Haxby Abbott, Surgical Sciences); and the mental health and well-being of Pacific youth in higher education (Faumuina Associate Professor Fa’afetai Sopoaga). The HRC awarded a further $5 million to an Otago team investigating polycystic ovary syndrome in women, led by Professor Rebecca Campbell (Centre for Neuroendocrinology). Another $750,000 was granted for three feasibility studies for studies on psychotherapy and bipolar disorder, vitamin C as treatment for pneumonia, and the elimination of TB among Māori.
Funding totalling around $5 million was received from the government’s Endeavour Fund for innovative Otago research. This included Deputy Vice-Chancellor (Research and Enterprise) Professor Richard Blaikie’s project to develop a cost-effective solution for large-scale production of hydrogen gas; the use of honey bees as biosecurity monitors (Dr Andrew Cridge, Biochemistry); and superhydrophobic lenses as anti-icing agents (Dr Sam Lowery, Physics).
In mid July, Otago submitted 1,537 evidence portfolios (EPs) for review in the six-yearly cycle of the Performance-Based Research Fund (PBRF) Quality Evaluation, the Tertiary Education Commission’s formal research performance assessment. Of these, 290 EPs were submitted by new and emerging researchers. Final panel evaluation of portfolios was completed in December and results are expected to be announced in April 2019.
Fostering a supportive research culture is vital for success and each year the University recognises the outstanding achievements of its staff with a number of significant awards. The 2018 Distinguished Research Medal – the University’s highest honour – was awarded to Professor David Craw (Geology), recognising his advancement of the understanding of New Zealand geology, including demonstrating links between tectonic movement and the movement of mineral deposits, and the effect of tectonics on the development of biological species.
Excellence in Research

23
The 2018 Research Group award was won by the Gemmell Lab, led by Professor Neil Gemmell (Anatomy). This award recognised the lab’s role in the conservation of some of the world’s rarest species, as well as its encouragement of emerging researchers in the field of evolutionary biology, and its generation of some of the most exciting and challenging papers in the field of molecular ecology and evolution. Professor Gemmell was also noteworthy in 2018 for the launch of his high-profile project on measuring the biodiversity in ecosystems using environmental DNA, including a study on Loch Ness in Scotland that attracted significant media attention.
Six rising research stars received Early Career Awards for Distinction in Research: Dr Rosie Brown (Anatomy), Dr Allan Gamble (School of Pharmacy), Dr Tracy Melzer (Medicine, UOC), Dr Robert Odolinski (Surveying), Dr Michael Pankhurst (Anatomy) and Dr Daniel Ribeiro (Physiotherapy). Associate Professor Sian Halcrow (Anatomy) received the University’s Rowheath Trust Award and Carl Smith Medal, which recognises the outstanding scholarly achievement of researchers in the early stages of their career, and was also one of three Otago scientists recognised by the New Zealand Association of Scientists, winning the Hill Tinsley Medal awarded to outstanding young scientists. Professor Warren Tate (Biochemistry) was awarded the prestigious Marsden Medal for a “lifetime of outstanding service” to science and Dr Judith Bateup (Microbiology and Immunology) received the Cranwell Medal for excellence in science communication.
The outstanding achievements of Otago researchers were also recognised by the Royal Society Te Apārangi: Dr Helen Taylor (Anatomy) received the Callaghan Medal; Professor Lisa Matisoo-Smith (Anatomy) was awarded the Mason Durie Medal; the Metge Medal was presented to Associate Professor Suzanne Pitama (Māori / Indigenous Health Institute, UOC); Professor Brett Delahunt (Pathology and Molecular Medicine, UOW) received the Hercus Medal; Emeritus Professor Carolyn Burns (Zoology) was awarded the Thomson Medal; and Professor Barbara Brookes (History and Art History) received the Humanities Aronui Medal.
Professor Tony Merriman (Biochemistry) was awarded a James Cook Fellowship; Dr Jonathan Squire (Physics), Dr Sarah Diermeier (Biochemistry), Dr Lisa Te Morenga (Edgar Diabetes and Obesity Research Centre) and former PhD student Dr Ceridwen Fraser won Rutherford Discovery Fellowships; and Dr Alana Alexander (Anatomy) received a two-year Rutherford Foundation Postdoctoral Fellowship. Curekids Chair in Child Health Research Professor Stephen Robertson and Professor David Bryant (Mathematics and Statistics) were made centenary fellows of the Royal Society of New Zealand.
The annual Health Research Excellence Awards celebrate the ongoing and unique research partnership between the Dunedin School of Medicine and the Southern District Health Board. In 2018 Professor Stephen Robertson received the Dean’s Medal for Research Excellence and Professor Rachael Taylor (Karitane Fellow in Early Childhood Obesity) received the Research Development Investment Prize.
Other staff who received recognition for their research achievements included:Professor Tony Blakely (Public Health, UOW) was awarded the Chaffer Medal by the Otago Postgraduate Medical Society for distinguished performance in health research
Dr Andrew Das (Pathology and Biomedical Science, UOC) won the Roche Translational Cancer Research Fellowship to further his research into leukaemia
Professor Peter Fineran (Microbiology and Immunology) received the UK Microbiology Society’s Fleming Prize, the first New Zealander to win this award
Bowel cancer researcher Professor Frank Frizelle (Surgery, UOC) received an honorary fellowship from the Royal College of Surgeons in Ireland
Professor Neil Gemmell (Anatomy) and Professor Tony Merriman (Biochemistry) received 2018 Fulbright New Zealand Scholar Awards. Professor Gemmell also received the Genetics Society of Australasia MJD White Medal
Professor Lyall Hanton (Chemistry) was made a Fellow of the Royal Society of Chemistry
Professor Liam McIlvanney (Centre for Irish and Scottish Studies) received the McIlvanney Prize for his book The Quaker
Dr Khoon Lim (Orthopaedics and Musculoskeletal Medicine, UOC) , Dr Katie Douglas (Department of Psychological Medicine, UOC) and Dr Rosie Brown (Anatomy) received Sir Charles Hercus Health Research Fellowships
Professor Murray Rae (Theology and Religion) received the Ashton Wylie Mind Body Spirit Literary Award for his book Architecture and Theology: The Art of Place
Professor Lisa Stamp (Medicine, UOC) was awarded the Medicines New Zealand Value of Medicines Award for her research into the management of gout
Dr Reremoana Theodore (National Centre for Lifecourse Research) and Dr Jason Gurney (Public Health, UOW) received two of the inaugural $500,000 Māori Health Research Emerging Leader Fellowships to undertake research aimed at providing better health and well-being for Māori
Dr Stefanie Zollman (Computer Science) won the L’Oréal-UNESCO For Women in Science Fellowship which recognises outstanding scientists globally
HRC Emerging Researcher First Grants were awarded to Dr Kirsty Danielson (Surgery and Anaesthesia, UOW), Dr Rachel Purcell (Surgery, UOC), Dr Sarah Appleby (Medicine, UOC), Dr Aaron Stevens (Pathology, UOC), Dr Kate Thomas (Dunedin School of Medicine) and Dr Rebecca Dyson (Paediatrics and Child Health, UOW).

UNIVERSITY OF OTAGO ANNUAL REPORT 2018
24
The University of Otago’s commitment to teaching excellence was reinforced in 2018 with ongoing success in national and international measures and rankings, the quality of academic programmes and the outstanding performances of teaching staff.
24
Excellence in Teaching

25
18,840 equivalent full-time students up 2.1%
University retained its 5-star plus rating from QS Stars
201 programmes offered
85.8% of students from outside Dunedin
For the 6th time in 7 years, an Otago staff member won the Prime Minister’s Supreme Teaching Award
15 subject areas in the top 100 of QS World University Rankings by subject

UNIVERSITY OF OTAGO ANNUAL REPORT 2018
26
Excellence in Teaching
Once again, the University topped the New Zealand Tertiary Education Commission’s annual Educational Performance Indicators (placing first for three of the four measures and a close second for the other) reflecting the excellence of teaching staff, systems and the learning environment. Otago’s performance measures included a 93% student progression rate to higher level study; a course completion rate of 89%; first-year retention rate of 84%; and qualification completion rate of 74%.
The University retained its 5-star plus rating in the QS Intelligence Unit’s world university performance statistics, gaining the maximum rating in all eight categories – teaching, employability, research, internationalisation, facilities, innovation, inclusiveness, and life sciences and medicine. Otago is one of only five universities in New Zealand and Australia to hold this 5-star plus rating. Otago also maintained its position in the 201-250 band of the influential Times Higher Education World University Rankings; was placed 175th in the 2018 QS World University Rankings; and 10th in Australasia and 217th in the world respectively in the US News World University Rankings.
Highlighting the range and quality of teaching and research across disciplines, 15 Otago subject areas were placed in the top 100 worldwide in the 2018 QS World University Rankings by subject (up from 13 in 2017). Five of these subjects were ranked in the top 40: Physical Education 12th; Dentistry 27th; Archaeology 28th; Anatomy and Physiology 29th ; and Development Studies 39th. QS also rated the Otago MBA among the top 200 MBAs worldwide, taking its ranking to 21–26 in the Asia-Pacific region. Otago’s Online MBA programme was ranked third in the world by London-based CEO Magazine. The Otago Online MBA, established in 2014, is the only online MBA in New Zealand.
The University of Otago was also rated one of the top three best universities to study at internationally by global site Study International, which provides information to students looking to study overseas. This result specifically recognises Otago’s academic integrity and underscores many of Otago’s strengths, especially in the areas of the campus environment, high-quality student experience, interculturalism and cross-cultural dialogue.
Teaching excellence contributes much to this success. For the sixth time in seven years, a University of Otago staff member won the top tertiary teaching award in New Zealand, with Faumuina Associate Professor Fa’afetai Sopoaga, Associate Dean (Pacific) in the Division of Health Sciences receiving the Prime Minister’s Supreme Award at the national Tertiary Teaching Excellence awards. She also received an endorsement for excellence in supporting Pacific learners. Three other Otago academics also received awards: Professor Michelle Thompson-Fawcett (Geography) received a Sustained Excellence Award in the Kaupapa Māori category; and Dr Rebecca Bird (Anatomy) and Associate Professor Sheila Skeaff (Human Nutrition) each received Sustained Excellence Awards in the general category. All four, together with Dr Kristin Hillman (Psychology) also won University of Otago Teaching Excellence Awards.
26

27
The Otago University Students’ Association (OUSA) runs its own teaching excellence awards to acknowledge, on behalf of students, the contribution teachers make to their academic endeavours and future careers, and to encourage best practice. Accountancy lecturer Nicola Beatson was named best teacher, winning the Premier Lecturer award; Dr David Warren (Chemistry) won the Summer School Excellence in Teaching award; and Dr Gareth Treharne (Psychology) received the Disability Awareness and Inclusive Teaching award. Dr Sarah Stein, who is Director of Distance Learning, won the OUSA Supervisor of the Year award; Associate Professor Azam Ali (Food Science and Centre for Material Science and Technology) won the Best New Supervisor award; and Professor Philippa Howden-Chapman (Public Health, UOW) won the inaugural Graduate Research School Dean’s Medal for Contribution to Supervision.
The University’s Higher Education Development Centre provides a number of programmes and services to help foster and encourage this teaching excellence. Ninety-eight workshops were held in 2018 in areas relating to course design, learning facilitation and evaluation, and supervision, attended by 1,264 staff.
2018 was a positive year for the University’s enrolments overall, with EFTS numbers rising by 2.1% to 18,840 EFTS. This total comprised 18,572 University EFTS and a further 268 EFTS for the University’s Foundation Studies subsidiary. Within the University total, strong first year growth (7.2%) led to domestic student enrolments increasing by 262 EFTS (1.6%) and international full-fee enrolments grew by 112 EFTS (7.5%), the third successive year of international full-fee growth at Otago. Foundation Studies enrolments were up overall by nine EFTS (3.3%) due to international growth.
While the United States continued to provide the largest number of Otago’s international students by head count, a notable feature of 2018 was strong growth in enrolments from Malaysia, and increases from other key Asian countries including China, India, Singapore, Indonesia and Vietnam.
The proportion of commencing students attracted from outside the University’s Otago/Southland home catchment increased slightly to 74.3% (2017: 73.3%), with 85.8% coming from outside Dunedin. There were 2,097 Māori students enrolled, representing a record 9.9% of total enrolments (head count) and a record 11.8% of total domestic EFTS. Pacific enrolments were also at an all-time high, with 994 students, representing 4.7% of total enrolments and 5.2% of total domestic EFTS.
The number of postgraduate students was up by 3.3% over 2017 in EFTS, due to strong demand for both postgraduate taught and postgraduate research programmes. Total postgraduate enrolments reached 18.3% of EFTS.
The Distance Learning suite of programmes continued to capitalise on particular areas of Otago expertise. In 2018 there were offerings from all academic divisions, with 379 papers being taught. There were 4,415 paper enrolments in total, equating to 2,406 individual students or 962 EFTS. As in the past, Otago’s Distance Learning programmes were predominantly postgraduate, with diploma, certificate and doctoral students making up 75% of all distance-enrolled students.
The Summer School ran for six weeks from early January to mid-February, offering 55 undergraduate papers from across the teaching divisions. Four papers were taught in other centres and 10 papers were taught by distance. The School attracted 1,621 students (265.2 EFTS), approximately 17% of students studied two papers, 11% were Māori or Pacific Peoples, 33%
had previously studied a Summer School paper, 54% were in their second of third year of study, and 95% rated their Summer School experience as “good, very good, or fantastic”. Another pre-Christmas Summer School ran for five weeks from Monday 12 November, immediately following Semester 2 examinations. The nine papers offered, which included four distance papers, together achieved a total of 379 enrolments (52.1 EFTS).
A total of 201 undergraduate and postgraduate degree, diploma and certificate programmes were offered by the University in 2018. New qualifications included a Diploma in Global Cultures (replacing the Diploma in Language and Culture), a coursework Master of Arts, and a Master of Social and Community Work. The Division of Health Sciences launched a new Bachelor of Health Sciences degree focused on future health care services and delivery. The degree offers students interested in a health career in the unregulated health workforce a pathway into employment or further training, with majors in Community Health Care, Public Health, Māori Health, and Pacific and Global Health.
The School of Physical Education, Sport and Exercise Sciences announced a significant new degree structure to be introduced in 2019. The four-year Bachelor of Physical Education and Bachelor of Applied Science in Sport Technology degrees will be replaced by four three-year majors in the Bachelor of Science, Bachelor of Applied Science and Bachelor of Arts degrees. The new curriculum provides more career-focused qualifications for a quickly evolving field of study.
The Division of Humanities is introducing a new structure with its existing 16 departments replaced by seven overarching academic units. This has been designed to promote greater connectedness and collaboration across the division.
A new Section of Rural Health was established within the Department of General Practice and Rural Health to bring together the existing rural postgraduate programme, rural medical immersion programme and rural research to form a “virtual” campus, demonstrating the University’s commitment to rural health, providing support for staff and students in rural areas and helping to build rural health academic capacity.
In collaboration with a group of leading universities in New Zealand, Australia and the UK, Otago plans to introduce (in 2019) a new admission test for students wanting to study medicine, dentistry and identified clinical science courses. The internationally respected UCAT (Universal Clinical Aptitude Test) will replace UMAT (Undergraduate Medical and Health Sciences Admissions Test). The University also announced plans to develop a new $1.5 million education and research centre at its Southland Campus in Invercargill, in partnership with the Southern District Health Board, to support staff and students in their learning, teaching and research activities.
The University of Otago Library is an essential source of information to enhance research, teaching and learning across the University community. In 2018 the physical collection contained 1,669,456 books and serial items, 163,586 electronic serials, and there was an increase in accessible e-books of over 12% to 953,812.
In the most recent student and graduate opinion surveys 85.9% of respondents reported a positive assessment of the quality of teaching. The University libraries, and information technology and teaching facilities received positive assessments of 98.7% and 95.6% respectively. 92.5% of research degree respondents reported overall satisfaction with the quality of supervision.
UNIVERSITY OF OTAGO ANNUAL REPORT 2018
28
The University of Otago offers a holistic student experience, encompassing academic excellence, as well as social, cultural and sporting activities that help make Otago students independent, work-ready graduates and committed citizens.
28
Outstanding Student Experiences

29
696,073
More than 3,635 students attended student learning workshops
4,435 registered student volunteers
98.7%of students gave a positive assessments of campus safety
14.2% drop in reported misbehaviour incidents
15 residential colleges accommodated 3,482 students
visits to the University’s recreation facilities

UNIVERSITY OF OTAGO ANNUAL REPORT 2018
30
With more than 85% of students coming from outside Dunedin, Otago takes seriously its commitment to pastoral care and to providing outstanding student experiences.
In February 2018 this began with the Prime Minister, the Rt Hon. Jacinda Ardern, welcoming more than 4,000 first-year students at the University’s annual Convocation Ceremony, challenging them to have courage and confidence to achieve to their full potential.
The 15 residential colleges located on or around the University campus are where most students begin their Otago experience. In 2018, these were filled to capacity with a total of 3,482 students, with a further 740 students accommodated in University-owned flats. Around 460 students and parents attended parents’ orientation sessions at the University-owned colleges prior to the academic year starting. These included mini-lectures, campus and faculty tours, and an opportunity for parents to see where their children would be living for the rest of the year.
Pastoral care and academic support are provided through the residential colleges, with the Locals programme offering support, social activities and a sense of community for first-year students living at home, flatting or boarding. From small beginnings in 2013, the Locals programme is now well embedded with more than 450 students joining in 2018.
The University’s academic orientation programme continues to develop. In 2018 the UNIO101 University Transition and Success programme was delivered to more than 2,200 students, an increase of 600 from 2017. The online version, UNIO101 Getting Started at Otago, is available to all undergraduates, providing a wide range of information in one location to help students navigate university life, with topics ranging from academic assistance to information technology and exam preparation.
Building on the success of these, the University has established an Office of Student Success. This office will investigate opportunities and trial initiatives to improve student success across all years of study. Supported by a University-wide team of student-success research leaders, the office will help students to get the most from their time at Otago, both academically and in their personal development. A range of interventions will be developed to support and engage students in collaboration with the Planning and Funding Office, Quality Advancement Unit, residential colleges, academic divisions, Student and Academic Services, the Shared Services Division and the Otago University Students’ Association.
Other support services offered for Otago students include Student Health, Recreation Services, and Disability Information and Support (see page 67), as well as Te Huka Mātauraka (the Māori Centre) and the Pacific Islands Centre (see pages 65-66). In 2018 47,048 appointments were made for Student Health services and there were 696,073 visits to the University’s recreation facilities (primarily Unipol gym).
The University’s Higher Education Development Centre (HEDC) provides free and confidential academic development services to students. In 2018 more than 3,635 students attended student learning workshops and a further 619 students accessed one-to-one consultations to support them in their studies. HEDC’s Peer Assisted Study Sessions (PASS) are correlated with higher mean grades, lower failure and withdrawal rates, and higher retention and graduation rates. In 2018, 1,553 weekly PASS sessions were offered in 33 papers with 15,520 student contact hours.
Outstanding Student Experiences
30

31
The Career Development Centre offers a comprehensive career planning service and in 2018 was voted the best among New Zealand’s eight universities by the New Zealand Association for Graduate Employers (NZAGE). The award was based on results from a survey of graduate recruitment employers and graduates who had secured jobs during the year. In 2018 the centre provided 2,458 one-on-one appointments and hosted 64 employer presentations, four careers fairs, and 313 in-house careers workshops and seminars. The centre piloted an OtagoExtra employability award programme, which received positive feedback and will be launched to the wider University in 2019.
In recent years the University has introduced a number of initiatives to reduce anti-social behaviour within the student community and to help keep students safe, such as the 24/7 Campus Watch service, the Code of Student Conduct and the introduction of CCTV in streets around campus. These initiatives seem to have had a positive impact. In 2018 there was a 14.2% drop in reported incidents and, for the first time in many years, no discipline cases were reported to the Vice-Chancellor.
In May, the University opened a new drop-in centre for students seeking support and guidance related to sexual violence or harassment – Te Whare Tāwharau; a place of shelter. The centre is the first of its kind in New Zealand and is available to provide support and guidance to all members of the University community.
Diversity is celebrated within Otago’s student community. The third annual Cultural Carnival was held in July and OUSA held its annual Diversity Week in August, focusing on educating people about queer identities and issues, and different cultures and abilities. Student groups AAPES (Animals, Aquatic, Plants, Ecological Society), Veganism and Animal Rights Society, Otago Campus Greens and Otago Students for Environmental Action hosted an inaugural Enviro-Week in September with activities focused on sustainability.
The culture of volunteerism also continues to thrive. In the latest graduate opinion survey, 52.5% of respondents indicated they had undertaken volunteer work while studying at Otago. In 2018 the University Volunteer Centre (now Social Impact Studio) worked with 229 community partner organisations and reported 1,243 new student volunteer registrations (the highest since the centre was established in 2014) bringing the total number to 4,435.
Highlights for the year included the Student Volunteer Fair in April attended by 30 student-led and community organisations; A Do Good Day(te), a new initiative in which 800 trees were planted on Signal Hill; VolunTinder in which 713 students “swiped right” for volunteer activities; and a pilot Asia Pacific Inspire programme in which student volunteers delivered a cultural workshop to 75 year-7 and year-8 students. The Aspire mentoring programme completed its fifth year of operation with three schools, 48 children, 55 student volunteers and eight host University departments taking part. More than 400 people attended the Silverline Festival in September, a student-led mental health and well-being event.
Otago students succeeded at the highest levels across a spectrum of activities.
Gabrielle Budd (Medicine) and Stephanie McGimpsey (Biochemistry) were awarded Woolf Fisher Scholarships to study at Cambridge University; PhD student Rachael Baxter received a three-year Cambridge Rutherford Memorial PhD Scholarship from the Royal Society of New Zealand; Geology students Michael Bollen and Sheng Fan gained national scholarships from Antarctic New Zealand; and Anna Clark, Finau Taungapeau and Jade Christiansen received Ministry of Pacific Peoples’ Toloa Tertiary Scholarships.
Arts student Rachel Mitchell received a Prime Minister’s Scholarship for Asia; and Freemasons University Scholarships were presented to Zoe Williams (Microbiology and Immunology), Benedict Fleming (Applied Science), Malcolm Jones (Science) and Bridget Watson (Physiotherapy). Erin Scott and Monique Nees-Kairua (Education) received TeachNZ Kupe Scholarships.
Law students Carolyn Ding, Rebecca Good and Nick White won the World’s Challenge Challenge with their proposal for an innovative electric car charging network app. Commerce student Claudia Grave was a member of a New Zealand Universities team which attended the Heavener Business Case Competition at the University of Florida; law and music student Ihlara McIndoe was chosen by the Aotearoa Youth Leadership Institute to lead a New Zealand youth delegation to the United Nations in March; surveying student Craig MacDonell won an Asia Pacific Spatial Excellence Award for his work mapping Quarantine Island in Otago Harbour; and eight sciences students were awarded Ambassador roles by the Sir Peter Blake Trust – Skye Anderson, Aidan Braid, Adam Currie, Erin Greenwood, Emily Gordon, Sarah Manktelow, Millie Mannering and Lana Young.
Postgraduate student Yasmin Nouri won the New Zealand Three Minute Thesis (3MT) competition and Otago debating students won the Officers Cup for the first time in 20 years at the annual “Easters” debating tournament.
The Otago University Rowing Club continued to excel, with the senior men’s eight winning all three events in its annual series against St Petersburg State University in early September 2018. The Otago University Rugby Football Club won the Ainge Trophy for the seventh straight year. The trophy is awarded to the best club in Dunedin, based on the performance of all its competitive teams, recognising efforts by players and coaches. The University A team was joint winner of the Dunedin Premier Competition Shield (finishing top on points), and the premier colts and women’s team also won their competitions.
In the annual student opinion survey 95.4% of respondents gave a positive assessment of sport and recreation facilities; 98.5% a positive assessment of administrative and support services; 98.7% a positive assessment of personal safety on campus; and 97.9% of residential college respondents gave a positive assessment of their college.

UNIVERSITY OF OTAGO ANNUAL REPORT 2018
32
The University of Otago is committed to providing world-class campus environments for staff, students and visitors. Every campus project reflects a vision for excellence with sustainability embedded as a principle against which all aspects of campus design and operations are measured.
32
Outstanding Campus Environments
33
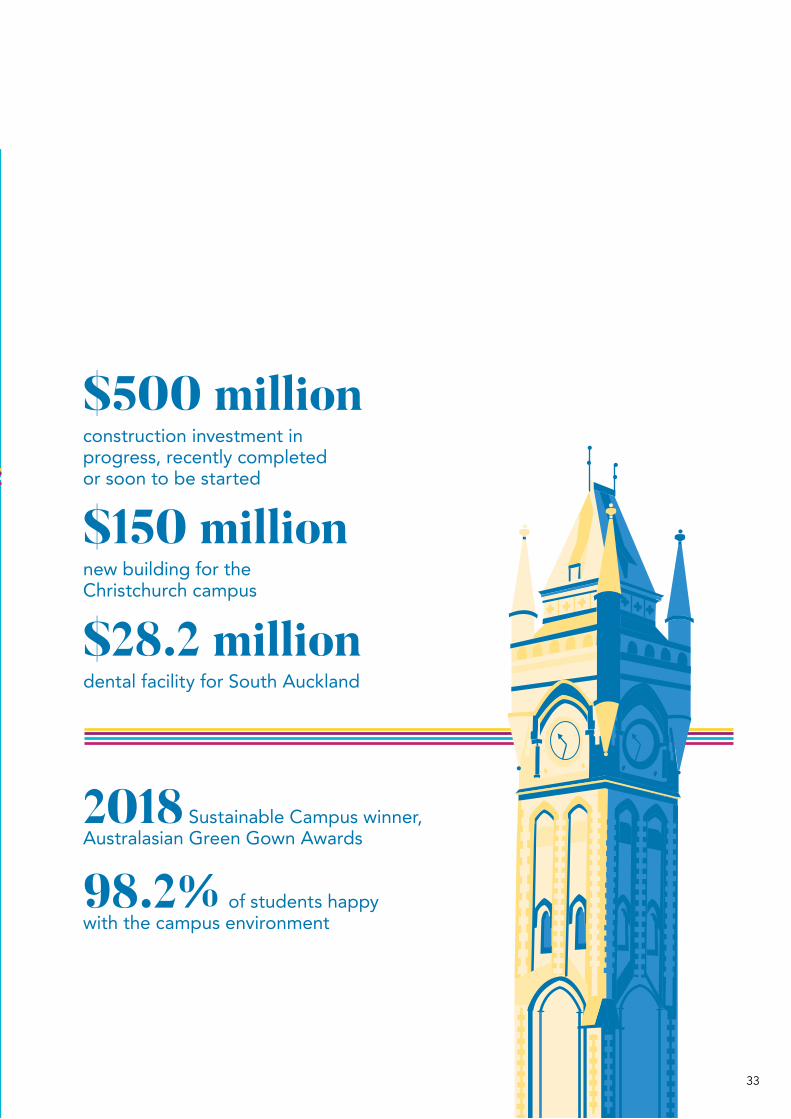
$500 million construction investment in progress, recently completed or soon to be started
$150 million new building for the Christchurch campus
2018 Sustainable Campus winner, Australasian Green Gown Awards
98.2% of students happy with the campus environment
$28.2 million dental facility for South Auckland

UNIVERSITY OF OTAGO ANNUAL REPORT 2018
34
With one of the most significant building programmes in its history well underway, in 2018 the University had almost $500 million of construction investment either in progress, recently completed or soon to be started.
Two significant new projects were confirmed during the year. In September the University announced plans to construct a state-of-the-art building to expand its Christchurch campus. Located on Oxford Terrace, the building will enable growth and provide new opportunities for collaboration with partners in the Christchurch Health Precinct. It has an estimated cost of $150 million and will be the biggest construction project the University has undertaken. Scheduled for completion by 2022, the six-storey building will house much of the health campus’ research and clinical facilities, some teaching facilities, and open up the possibility of other University of Otago health-related courses being taught in Christchurch. When it is completed, the University will refurbish the existing building next to Christchurch Hospital to be used primarily for teaching and clinical research projects.
Plans were also announced for a new dental teaching facility and patient treatment clinic in South Auckland to help meet local health needs, while providing students with wide-ranging learning opportunities. The $28.2 million, two-storey, 32-chair building will be built on land owned by the Counties Manukau District Health Board at its Manukau Super Clinic on Great South Road. A $10 million gift from New Zealand businessman and philanthropist Mr Graeme Hart and his family was announced to help develop this facility (see page 38).
Work began on the University’s $26 million music recording studios project. This comprises the construction of a new building beside the Robertson Library in Union Street East, as well as refurbishing the music suite, teaching wing and tower block at the neighbouring University of Otago College of Education. Features include purpose-built and versatile recording studios, flexible teaching spaces and communal areas that will provide opportunities for academic, commercial and community collaborations.
Construction also began on a new $1.5 million health sciences education and research centre at the University’s Southland campus, which is being developed in partnership with the Southern District Health Board (see page 27).
The $130 million redevelopment of Faculty of Dentistry facilities continued. A new 8,000m2 Clinical Services Building will house operating theatres, specialty and teaching clinics, the primary care unit, and radiography and surgical suites. When this is completed and commissioned in the first quarter of 2019, services will be relocated from the existing Walsh Building to allow its refurbishment. The two buildings will be linked by a 1,800m2 atrium. The project is expected to be completed in mid 2020.
Construction of the $49.8 million four-storey research support facility in Great King Street is well underway and is expected to be finished by the end of 2019.
The refurbished Otago Business School building, formally opened in March, won a National Excellence Award in the Education Facilities category of the Property Council New Zealand Awards. The judges were impressed with the high-quality vision for the $18.5 million redevelopment that has transformed the building, providing much improved functionality. The award reflects the excellent partnership between the Campus Development Division and the Otago Business School, and collaboration with the wider University community.
The $9.1 million redevelopment of the St David II building was completed to house the University’s new Shared Services Division. The building now offers a modern, flexible office environment, with 16 areas designed specifically to accommodate open-plan work space.
Efforts to integrate the University’s Sustainability Framework 2017-2021 across all University activities continued, with priority goals including reducing greenhouse gas emissions by 33% by 2020; improving energy efficiency by 20% by 2025; achieving 100% renewable energy status by 2030; and reducing waste going to landfill by 50% by 2021 (measured against a 2012 baseline).
The University won the 2018 Sustainable Campus category at the Australasian Green Gown Awards, recognising the work done with energy supplier Pioneer Energy to phase out the use of coal to fuel the University’s main heating boiler, replacing this with locally-sourced wood chips by 2020. The Green Gown award scheme is dedicated to recognising excellence in sustainability within the Australasian tertiary education sector, aiming to inspire, promote and support change in operations, curriculum and research.
In another demonstration of the University’s commitment to sustainability, the second rapid charger for electric vehicles in Dunedin was formally opened at the University in October. Located at the corner of St David and Cumberland Streets, the pay-for-use facility is a collaborative effort between ChargeNet, Aurora Energy and the University.
The e-Waste and e-Cycle Centre received 3,055 items in 2018. The centre successfully recycled 1,665 items internally and/or donated them to school and community groups. A total of 1,586 items were disposed of responsibly.
In the latest Student Opinion Survey 98.2% of students reported satisfaction with the general campus environment.
Outstanding Campus Environments

35
Two significant new capital projects were announced in 2018: a substantial new building for the University of Otago,
Christchurch campus (right), and a new dental teaching facility and patient treatment clinic in South Auckland (above).
The refurbished Otago Business School building won a National Excellence Award in the Education Facilities category of the Property Council New Zealand Awards.
35

UNIVERSITY OF OTAGO ANNUAL REPORT 2018
36
The University of Otago is steadfast in its commitment to local, national and international betterment, making a purposeful response to many of the challenges presented by a rapidly changing world through its research, its focus on groups under-represented in University study, its economic impact and community service activities.
36
Commitment as a Local, National and Global Citizen

37
88.4% staff undertook community service activities
Record number of Māori health graduates: 76
The University’s national economic impact is estimated at $1.91 billion
17,000 people took part in New Zealand Marine Studies Centre programmes
3 Science Wānanga delivered

UNIVERSITY OF OTAGO ANNUAL REPORT 2018
38
As highlighted on pages 22-23, the work of Otago researchers focuses on making a positive difference to our local, national and international communities, particularly in areas such as health and well-being, society and the environment. Further demonstrating this strategic commitment to health and well-being, in August 2018 the University announced plans for a new dental teaching facility and patient treatment clinic in South Auckland (see page 34). The $28.2 million facility will help meet the high dental health needs of the local community, while also providing students with wide-ranging learning opportunities. It will follow the long-standing social contract model operated successfully at the Dunedin Dental School, where patients receive treatment provided by students under supervision at a highly accessible cost.
A new dental clinic was also opened alongside a medical clinic at Te Kāika in South Dunedin. Te Kāika is a collaborative venture to provide high-quality, affordable health and social services to Dunedin’s Māori, Pacific and low-income communities, with partners including the University of Otago, Te Putahitanga o Te Wāipounamu (the South Island Whanau Ora commissioning agency), Ngāi Tahu, Arai Te Uru Whare Hauora and the Pacific community. Te Kāika also enables staff and students from the University’s professional schools to teach and learn in a community-based clinical environment. For its significant contributions to Whanau Ora and whanau-centred practice, Te Kāika won the Dame Tariana Turia Award presented at the Toitū Hauora Leadership Summit in September.
The University and Volunteer Service Abroad renewed a memorandum of understanding (MOU), continuing an arrangement through the UniVol programme in which senior students undertake 10-month placements working with communities in developing Pacific nations. The new MOU also provides for collaboration on research projects and for Otago staff to participate as volunteers.
Otago staff and students are actively engaged in community service and volunteering activities (for student volunteering, see page 31). In a survey of academic staff, 88.4% of responders had dedicated time to community service and, on average, this comprised 6.2% of their time. The types of service undertaken included serving on government advisory boards and committees (27.4%); providing services to the public sector (70.5%); giving lectures, talks or presentations to non-university groups (88.4%); holding a post in an organisation or association relevant to their area of expertise (70.5%); editing or serving on the editorial boards of publications (61.1%); and contributing to community projects (65.3%). The value of this service was estimated at $23.5 million.
Through these activities many staff receive national and international recognition. In 2018 these included:
• Professor Phil Bishop (Zoology) who won the top University of Otago Lifetime Achievement Award at the Otago Daily Times Regional Science Awards, recognising his dedication and achievement at the forefront of amphibian conservation
• Associate Professor Rhiannon Braund (Pharmacy) who was made a Fellow of the Pharmaceutical Society of New Zealand for the significant impact she has made on her profession through teaching, research, publishing and governance roles
• Professor Peter Crampton (Health Sciences) who was appointed to a national panel conducting a review of New Zealand’s health and disability system
Commitment as a Local, National and Global Citizen
38

39
• Tourism lecturer Dr Susan Houge Mackenzie who was appointed to the inaugural Tourism Central Otago Advisory Board
• Helen Morrin (Mackenzie Cancer Research Group, UOC) who received a special service award from the International Society for the Biological and Environmental Repositories
• Professor David Murdoch (Dean, University of Otago, Christchurch) who was appointed to the International Council on Adult Immunisation
• Professor Etienne Nel (Geography) who received an award for Service to the Geographical Society recognising his contribution to the editorial board of the society’s journal
• Professor Michelle Thompson-Fawcett (Geography) who received the New Zealand Geographical Society’s highest honour, the 2018 Distinguished New Zealand Geographer Award and Medal, in recognition of her work in Māori and indigenous geography, iwi resource management and development and planning
• Associate Professor Ros Whiting (Accountancy and Finance) was awarded a 2018 Chartered Accountants Australia and New Zealand (CA ANZ) Fellowship for her contribution to the profession of accountancy
• Professor Gary Wilson (Marine Science) who was appointed to a four-year term as Vice-President of the Scientific Committee of Antarctic Research.
The University has a well-established outreach programme. The New Zealand Marine Studies Centre (NZMSC) fosters understanding and conservation of New Zealand’s marine environment through education and community engagement. In 2018 more than 17,000 people took part in the NZMSC programmes. They included 8,167 school students and teachers from the lower South Island who attended curriculum-linked programmes through the centre; 3,160 schools, teachers and community groups who took part in the Aquavan programme; 2,633 interest groups and families who participated in marine experiences; and a further 3,052 school students and teachers who attended outreach programmes in the Nelson/Marlborough/Tasman region.
Sixty-six students from 44 rural/provincial, small and/or lower decile schools from across New Zealand took part in the 2018 Science Academy, attending two one-week camps. Sixteen students identified as Māori and one as Pacific. Eighteen teachers from participating schools took part in two four-day teacher professional development workshops. Three Science Wānanga were delivered in Dunedin, Hastings and Wairoa.
The annual Hands-On at Otago was attended by 389 students from 170 schools from throughout New Zealand: 22% of the attendees were Māori and 9% were Pacific. The students attended 36 different projects hosted by departments and a variety of workshops demonstrating the diversity of classes and activities available at the University of Otago. Around 120 children aged from seven to 11 from around Dunedin took part in a new initiative run by the School of Physical Education, Sport and Exercise Sciences teaching water safety and survival skills in real-world, open-water environments.
The University of Otago is committed to encouraging groups under-represented in University study, particularly Māori and Pacific students. The number of Māori students enrolled in 2018 was 2,097, representing a record 9.9% of total enrolments (head count) and a record 11.8% of total domestic EFTS. Pacific enrolments were also at an all-time high, with 994 students, representing 4.7% of total enrolments and 5.2% of total domestic EFTS.
A significant milestone was achieved in December when the largest ever cohort of Māori health students (76) graduated.
As doctors, physiotherapists, pharmacists, dentists and oral health professionals, these graduates will have a wide-spread positive impact on New Zealand’s health workforce and communities.
Otago launched a new student exchange initiative, Tūrangawaewae, Pokai Whenua, providing opportunities for Māori students to study overseas and be hosted by and welcomed within indigenous communities. The initiative involves seven partner universities from Australia, Canada and the United States. The University also signed an MOU with Dunedin’s Innov8 HQ co-working and event space to provide new opportunities for enterprising young Māori entrepreneurs.
A new sciences scholarship was established for aspiring Māori and Pacific scientists, supporting students to take part in the Summer Research Experience or a Summer Research Internship. This provides a significant opportunity for Māori and Pacific students who are curious about science to learn more about scientific disciplines and their methods.
For more information on Māori and Pacific development, see pages 64-67.
As one of New Zealand’s largest employers, the University makes a significant impact on the regional and national economies. The latest Economic Impact Report, released in 2018, estimated that the University directly injected around $967.4 million into the Dunedin economy, with the downstream effects totalling $1.68 billion and supporting around 15,112 jobs. There were also economic impacts of around $122.1 million, $103.8 million and $4.1 million into the Christchurch, Wellington and Invercargill economies respectively. The total (direct and indirect) impact of the University’s activities on the New Zealand economy was estimated at $1.91 billion.
The University also contributes to the national good, through its library collections, documentary heritage and commitment to the arts. The 2018 arts fellows were: Matthew Smith (Caroline Plummer Fellow in Community Dance); Rhian Gallagher (Robert Burns Fellow); Raymond Huber (University of Otago College of Education/Creative New Zealand Children’s Writer in Residence); Louise Menzies (Frances Hodgkins Fellow); and Dylan Lardelli (Mozart Fellow). The Robert Burns Fellowship marked its 60th anniversary in September, an occasion celebrated with a series of literary events and exhibitions.
Support continued for the University of Otago Sheilah Winn Shakespeare Festival which was held in conjunction with the Shakespeare Globe Centre New Zealand. The annual festival attracted 48 students from secondary schools around the country.
The Hocken Collections is one of the foremost research libraries in New Zealand, its collections comprising 1,137,522 pictures and photographs and 10,415 linear metres of archives. Six exhibitions were held in the Hocken Gallery during 2018; of particular note were “toot floor” by Frances Hodgkins Fellow Campbell Patterson, “Sisters Communing” celebrating the 125th anniversary of women’s suffrage, and “Hand in Hand: Photographers and Painters Alike” which was a tribute to Frances Hodgkins, marking the centenary of her birth. The James Herries Beattie papers – a comprehensive collection of papers detailing Ngāi Tahu practices, from food gathering to childbirth – were inscribed on the UNESCO Memory of the World New Zealand Register.
Four exhibitions were mounted in the Library’s Special Collections, including a celebratory 60th anniversary display “Auld Acquaintances: Celebrating the Robert Burns Fellowship at the University of Otago”. The University of Otago Central Library was ranked 13th on a list of the best libraries in the world – “25 Libraries Every Voracious Reader Must Visit” – compiled by internet news site BuzzFeed.
UNIVERSITY OF OTAGO ANNUAL REPORT 2018
40
The University continued to engage widely during 2018, building on existing relationships and establishing new links with academic, business, professional and alumni groups, nationally and internationally.
Strong External Engagement
40

41
Activities within the Matariki Network of Universities continued to increase
The University now has more than 200 international partnership agreements
742 continuing education events were hosted on Otago’s campuses
A number of new memoranda of understanding were signed, including with the National University of Timor-Leste
Regular contact was maintained with 112,000 alumni

UNIVERSITY OF OTAGO ANNUAL REPORT 2018
42
A number of new alliances were formed during 2018. The University signed an agreement with Shanghai University establishing a Shanghai Sister-Cities High Level Universities League. The consortium of 10 universities from Shanghai’s sister cities will encourage co-operation in the fields of teaching, research and cultural exchange. The University also signed an agreement with Jiangnan University, China, establishing the “Belt and Road” University Alliance for Food Science and Education (BRUA-FSE). The alliance agreement, signed by 49 institutions and universities worldwide, is a response to significant changes in the global food industry and provides a platform for international collaboration on food science and education.
An MOU was signed with the national university of Timor-Leste, Universidade Nacional Timor Lorosa’e (UNTL), formalising a long history of collaboration and a developing partnership to support research and capacity-building between UNTL and Otago’s Global Health Institute. A further 20 MOUs, Student Exchange and Study Abroad Agreements were signed with international universities in countries including China, Japan, Malaysia, USA, Canada, Italy, Spain and Australia. This brings the number of international partnership agreements to more than 200.
Locally the University signed the Dunedin City Council Dunedin Waterfront Development Memorandum of Understanding. Otago is also working with Enterprise Dunedin, Otago Polytechnic, Ngāi Tahu, the Ministry of Business, Innovation and Employment and gaming and technology industry leaders to establish a new Centre of Digital Excellence in Dunedin (CODE), to be funded from the Government’s Provincial Growth Fund. A steering group has been formed to progress a business case for the centre.
Activities are growing within the Matariki Network of Universities (MNU), of which Otago is a founding partner. These included the MNU Global Citizenship Forum which was hosted by Otago in July and attended by delegates from all seven member universities; Otago staff and students attended a Matariki Indigenous Student Mobility programme hosted by Dartmouth College; network discussions are being facilitated in the areas of mental health and the prevention of sexual violence; and Otago researchers continue to engage and collaborate with Matariki colleagues.
Across the wider university, 742 continuing education events were held, including 138 lectures, 414 seminars, 16 inaugural professorial lectures, 75 short courses, 22 symposia and nine conferences. Highlights included the annual Winter Symposium which was expanded to take in five New Zealand centres – Wellington, Invercargill, Queenstown, Christchurch and Auckland. Topics covered were New Zealand and the world: past, present and future; the sustainability of tourism; the future of regional health care; mental health; and the changing face of advertising. In addition to its usual symposia and courses, the 22nd Public Health Summer School (UOW) also offered public health evening lectures on important topical issues: the ongoing relevance of the 1918 influenza pandemic; the future burden of cancer worldwide; and indigenous suicide prevention.
Strong External Engagement
42

43
The 53rd Otago Foreign Policy School, “Asia-Pacific Diplomacy in Transition: Ideas, Issues and Institutions”, brought together an international team of scholars, policy practitioners and observers, and was opened by the Deputy Prime Minister and Minister of Foreign Affairs, the Rt Hon. Winston Peters.
Delegates from across the Pacific region attended a two-day Pacific International Health Symposium hosted by the University of Otago in November. The theme was “Strengthening Partnerships for Pacific Health” with the aim of enhancing networks, fostering collaboration and building capacity in the areas of Pacific health education, service and research, locally and across the region. Also held in November, a “Making Rural History” symposium brought together scholars from around New Zealand and Canada to discuss the intersections between economics, politics and the environment.
The Division of Humanities MindJam event in Queenstown attracted an audience of more than 350. Four staff and visiting William Evans Fellow Professor Susan Lederer (Wisconsin) gave presentations on topics as diverse as artificial intelligence and the future of work, the meaning of whakapapa, and the politics of farming. The biennial New Zealand International Science Festival, themed “Go Beyond”, was held in July with the University as one of the event’s principal sponsors. More than 300 people of many different nationalities also attended the annual Hanami festival organised in conjunction with the Dunedin-Otaru Sister City Society, and the Centre for Science Communication hosted a successful Public Communication of Science and Technology Conference, with over 400 delegates attending. The keynote speaker was NASA and Hubble Scientist Dr Jennifer Wiseman.
Other distinguished guests hosted on the University campuses included the Prime Minister of Samoa Hon. Tuilaepa Sailele Malielegaoi; Nobel Prize winner Dr Alasdair McDowell, of the Howard Hughes Medical Institute at the California Institute of Technology; Swedish Ambassador Par Ahlberger; and UK Secretary of State for Scotland, the Rt Hon. David Mundell MP. Belgian researcher and inaugural Harraway’s 1867 Visiting Professor Marc Hendrickx (Katholieke Universiteit Leuven) shared his knowledge in food science and technology during his two month visit. The 2018 Ratu Sir Kamisese Mara Fellow, Professor Sudesh Mishra, from the University of the South Pacific, was welcomed to Te Tumu: School of Māori, Pacific and Indigenous Studies, during August and September. Delegations from many international institutions including the University of Hawaii at Mānoa, Warsaw School of Economics and Kyoto University were also received on campus.
The University is committed to nurturing long-lasting mutually beneficial relationships with alumni and friends, maintaining regular contact with more than 112,000 people, living here in New Zealand and around the world, via electronic and print communications, including the Otago Magazine and the eConnect alumni electronic newsletter.
Targeted emails – “What’s On for Alumni” – were sent monthly to alumni living in Dunedin, Christchurch, Wellington, Auckland and Central Otago, as well as to other cities and towns where University of Otago-related events were held. Social media – Facebook, Instagram, LinkedIn and Twitter – provided further opportunities for alumni to communicate with each other and to engage directly with the University. During 2018 University of Otago Alumni Facebook page followers grew by 630 followers from 4,681 to 5,311, an annual growth of 13.5%.
The Development and Alumni Relations Office organised 42 alumni events including successful functions in Queenstown, Wanaka, London, Berlin, New York and Toronto. The Development and Alumni Relations Office also assisted with the organisation of 26 alumni reunions in Dunedin and around New Zealand. More than 1,600 alumni attended these reunions and reconnected with their Otago experience. New alumni networks were established in Samoa and Fiji, supporting the goal to increase engagement with our Pacific alumni.
The Development and Alumni Relations Office provided entrance scholarship to 53 recipients in 2018. In most cases the funding supported students’ residential college fees. Donor support also contributed to fellowship and research positions in departments as well as prizes and awards to recognise diligence and tenacity in learning.

UNIVERSITY OF OTAGO ANNUAL REPORT 2018
44
Mindful of the need to evolve to meet the challenges of a changing world, the University of Otago is taking a long-term approach to sustaining its capabilities, seeking new avenues of funding and scrutinising activities and processes to ensure resources are being used effectively.
44
SustainingCapability

45
34 commercial opportunities presented to Otago Innovation Ltd
2,782 participants in HR workshops
$27 million surplus
Otago signs the SDG Accord to pursue the United Nations’ Sustainable Development Goals
$10 million gift to develop new dental facility in South Auckland

UNIVERSITY OF OTAGO ANNUAL REPORT 2018
46
To support the vision of being a research-led University with an international reputation for excellence, it is important to generate sufficient resources and to target those resources effectively. As outlined in further detail in the Financial Review on page 72 the University Group surplus of $27 million was slightly higher than budgeted.
The tertiary sector continues to operate in a constrained funding environment where funding increases set by Government are lower than cost increases faced by the university sector. While the University will start 2019 in a strong financial position the challenges posed by this environment will require careful fiscal management if the high quality of teaching, research and community service is to be maintained and adequate funds are to be provided for future significant capital projects.
The University has continued to seek diverse areas of funding, particularly through entrepreneurial activities and development opportunities. One of the most significant single gifts in the University’s history was announced in 2018. Internationally recognised businessman and philanthropist Mr Graeme Hart and his wife Robyn made a $10 million donation to help develop the new $28.2 million dental teaching facility in South Auckland. This will allow the University to proceed with certainty in the development of a project that will make a positive difference to the well-being of the local communities and provide diverse teaching opportunities for Otago’s dental students.
Thirty four commercial opportunities were presented to Otago Innovation Ltd, the University’s commercialisation company, in 2018 (2017: 49). A new spin-out company, Insitugen Limited, was formed early in the year, enabling the development of brand awareness around commercial applications of androgen assays. A number of existing spin-out companies were successful in raising capital, including Quitta Pty Limited, Techion Holdings, Photonic Innovations, Ubiquitome and Upstream Medical Technologies.
The United States remained a focus for many of these activities. Chitogel, which produces a wound-healing biological gel, secured its first sales into the United States; Ubiquitome Ltd formalised a US distribution agreement for its hand-held diagnostic devices; Quitta is selling smoking-cessation product there; and Photonic Innovations recently secured US investment for its devices which detect ammonia in industrial cold store settings. A number of licences were also agreed with pharmaceutical and other companies worldwide.
Otago Innovation also encourages new ideas from staff. The annual Otago Innovation Ltd Proof of Concept competition attracted 17 entries and was won by Associate Professor Niels Kjærgaard and Dr Amita Deb (Physics) for a proposal that would enable photos and videos to be taken through solid objects. There were two winners in the 2018 Health Sciences Translational Research Group competition: a UOC team’s proposal for a laboratory test to detect inflammation and infection in patients; and a Dunedin-based team’s technique for assessing if medications might be suitable for treating bipolar affective disorder.
To sustain capability the University must respond to the challenges of a changing world and is integrating its Sustainability Framework 2017–2021 across all activities (see page 34). Otago became the first New Zealand university to sign the international SDG Accord to pursue the United Nations’ Sustainable Development Goals, which includes agreeing to involve students and staff in efforts to achieve the accord’s 17 transformational goals by 2030, alongside communities and other external stakeholders.
Scrutinising activities for efficiency and effectiveness is also essential to ensuring Otago’s long-term sustainability. The institution-wide Support Services Review (SSR) is introducing changes that will enable the University to adapt to the complex environment in which it operates. The management of change process that started in October 2017 was largely completed by the end of 2018. As expected, there were a small number of imposed redundancies with the remaining staffing changes achieved via voluntary redundancy and natural attrition. Some long-serving and experienced staff have committed to remaining in positions until their retirement, ensuring institutional knowledge is retained and can be utilised during implementation. Many staff have been appointed to more senior roles and roles in different disciplines, and they are making the most of the opportunity to develop their professional skills and knowledge.
The University recognises the importance of staff engaging in their academic and professional roles. During 2018 Human Resources held a total of 275 workshops, attended by 2,782 participants. The Te Reo language courses continued to be popular with staff: four workshops were held in 2018, attended by 73 participants. The Women in Leadership at Otago programme was attended by 19 participants from three campuses. The three-day Essential Management programme was held five times in 2018, attended by 81 managers, and the Supervisory Skills programme had another successful year with 19 participants. Both of these programmes were supported by bite-sized training opportunities throughout the year.
The formation of AskOtago required the development of a series of workshops that were adapted into the Workplace Fundamentals programme, a series of nine workshops designed for new professional staff. Another new development was Management Fundamentals, a programme of seven workshops designed for new managers and to complement the Essential Management programme. Induction courses were also offered for new academic departmental heads and other nominated leaders (see page 67).
Just as awards for research and teaching excellence are presented each year, the University also recognises the outstanding contributions of its professional staff. The 2018 Award for Exceptional Performance by Professional Staff was presented to Ms Claire Gallop, senior manager client services (based in the Faculty of Dentistry). Three new Health and Safety awards were presented for the first time in 2018: the Excellence Award in Health and Safety (individual) went to Dr Pascal Sirguey, senior lecturer, School of Surveying; Recreation Services won the Excellence Award in Health and Safety (team); and the Excellence Award in Health and Safety (member of the wider health and safety team) went to Anne Vernall, administrator client services (based in the Department of Medicine, Christchurch).
Sustaining Capability

47
A Do Good Day(te): this University Volunteer Centre tree-planting excursion to Signal Hill involved 68 volunteers and 800 new trees.
Vice-Chancellor Professor Harlene Hayne with students
at the 2018 toga party.
47
Photo: Ako Aotearoa
Photo: Sharron Bennett
Faumuina Associate Professor Fa’afetai Sopoaga receives New Zealand’s top tertiary teaching award from the Minister of Education, Hon. Chris Hipkins.
Photo: Sharron Bennett
New Zealand Prime Minister the Rt Hon.
Jacinda Ardern speaks at the University’s 2018
Convocation ceremony at Forsyth Barr Stadium.
47

UNIVERSITY OF OTAGO ANNUAL REPORT 2018
48
Reporting by Outputs
Teaching and learning output
Commerce Health Sciences Humanities
26,911
26,911
5,984
2,157
5,775
1,448
15,364
2,265
27,593
27,593
6,225
2,261
4,361
1,609
14,456
2,318
26,763
26,763
5,770
2,256
4,516
1,204
13,746
2,634
92,645
92,645
21,820
10,185
79,080
112,367
223,452
9,940
106,045
106,045
23,645
12,464
61,631
104,475
202,215
9,393
99,218
99,218
20,136
6,624
67,187
105,227
199,174
11,497
53,613
53,613
9,315
8,763
5,233
13,194
36,505
5,656
54,866
54,866
9,003
8,425
4,747
11,767
33,942
5,569
Campus-based teaching and learning
Total cost of outputs
Research output Postgraduate thesis supervision
Teaching-related research
Project-based research
- University funded
- Externally funded
Total cost of outputs
Community service
Actual $000s
Budget $000s
Last Year $000s
Actual $000s
Budget $000s
Last Year $000s
Actual $000s
Budget $000s

49
Teaching and learning output
Humanities Sciences Service Divisions Total
51,714
51,714
7,340
10,452
4,447
12,165
34,404
6,141
40,986
40,986
12,083
7,146
32,338
35,862
87,429
5,597
42,661
42,661
11,742
7,264
29,383
31,006
79,395
5,677
33,974
33,974
8,097
4,682
43,718
32,094
88,591
5,244
2,700
2,700
20,555
0
187
8
20,750
0
3,034
3,034
19,893
0
108
0
20,001
0
2,971
2,971
19,673
0
371
0
20,044
0
216,855
216,855
69,757
28,251
122,613
162,879
383,500
23,458
234,199
234,199
70,508
30,414
100,230
148,857
350,009
22,957
214,640
214,640
61,016
24,014
120,239
150,690
355,959
25,516
Last Year $000s
Actual $000s
Budget $000s
Last Year $000s
Actual $000s
Budget $000s
Last Year $000s
Actual $000s
Budget $000s
Last Year $000s
Output reporting for the University includes net expenditure by output for each division e.g. community service, teaching and research, based on percentages provided by the divisions. It differs to the Annual Report financial statements in that it presents the University’s output expenditure and excludes expenditure relating from non-output-related activities (such as provision of accommodation services).

UNIVERSITY OF OTAGO ANNUAL REPORT 2018
5050

5151

UNIVERSITY OF OTAGO ANNUAL REPORT 2018
52
# KEY PERFORMANCE INDICATORS 2016 Actual 2017 Actual 2018 Target 2018 Actual
1.1 Increasing the number of quality-assured research 3-year average 3-year average > previous year 3-year average outputs as measured by a three-year rolling average.1 4,712 4,859 5,086
1.2 Increasing research funding from outside sources as 3-year average 3-year average > previous year 3-year average measured by a three-year rolling average. $97.8 million $112.3 million $122.5 million
1.3 Increasing the proportion of postgraduate research 8.6% 8.9% > previous year 9.0% EFTS within University EFTS.2
1.4 Increasing the number of research degree completions 3-year average 3-year average > previous year 3-year average as measured by a three-year rolling average. 554 550 553
1.5 At least 90% of research degree respondents to the 96.2% 92.0% ≥ 90.0% 92.5% Graduate Opinion Survey reporting overall satisfaction with the quality of supervision.
1.6 Rank as one of the top two universities in the annual First in HRC and First in Marsden Top two in both First in HRC and Marsden and Health Research Council (HRC) funding third in Marsden and second funding rounds second in rounds, as measured by the value of grants awarded. in HRC Marsden
1.7 Rank as one of New Zealand’s top two universities in Ranked first Ranked first Ranked in the Ranked first the WFC component of the Nature Publishing Index.3 top two
The University achieved all performance targets relating to this strategic objective.
The increase in the three-year average of quality-assured research outputs reflects the intensification of research activity in the lead up to the 2018 Quality Evaluation PBRF round.
The University had another successful year for securing external research income in 2018 and this is reflected in the $10.2 million (9.1%) increase in the three-year rolling average.
Satisfaction with the quality of research degree supervision again exceeded its performance target in 2018.
The University retained its first place ranking in the Nature Index fractional count component, which measures collaboration in the production of excellent research, and its rank in the top two for value of grants awarded by both the Health Research Council and Marsden Funds.
STRATEGIC OBJECTIVE ONE: EXCELLENCE IN RESEARCH
1. Due to the time required to collate and vet research output data, the outputs reported for this measure are a year in arrears (i.e. outputs reported against 2018 are those published in 2017, etc.). The definition of research outputs for this measure is consistent with that used for PBRF purposes.
2. University EFTS, as referred to for this indicator and elsewhere in the Statement of Objectives, exclude those associated with the University’s Foundation Studies subsidiary except where specifically stated.
3. The Nature Publishing Index WFC (weighted fractional count) measures intensiveness in the production of excellent research.
Statement of Service Performance
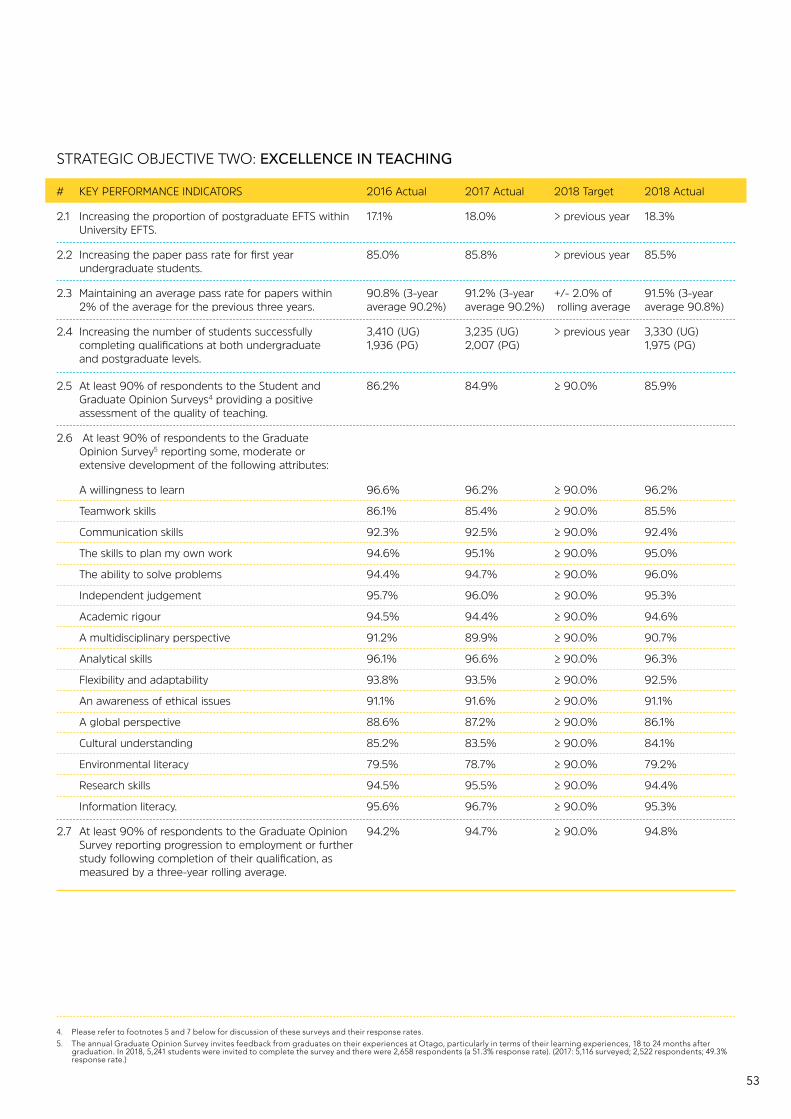
53
# KEY PERFORMANCE INDICATORS 2016 Actual 2017 Actual 2018 Target 2018 Actual
2.1 Increasing the proportion of postgraduate EFTS within 17.1% 18.0% > previous year 18.3% University EFTS.
2.2 Increasing the paper pass rate for first year 85.0% 85.8% > previous year 85.5% undergraduate students.
2.3 Maintaining an average pass rate for papers within 90.8% (3-year 91.2% (3-year +/- 2.0% of 91.5% (3-year 2% of the average for the previous three years. average 90.2%) average 90.2%) rolling average average 90.8%)
2.4 Increasing the number of students successfully 3,410 (UG) 3,235 (UG) > previous year 3,330 (UG) completing qualifications at both undergraduate 1,936 (PG) 2,007 (PG) 1,975 (PG) and postgraduate levels. 2.5 At least 90% of respondents to the Student and 86.2% 84.9% ≥ 90.0% 85.9% Graduate Opinion Surveys4 providing a positive assessment of the quality of teaching.
2.6 At least 90% of respondents to the Graduate Opinion Survey5 reporting some, moderate or extensive development of the following attributes:
A willingness to learn 96.6% 96.2% ≥ 90.0% 96.2%
Teamwork skills 86.1% 85.4% ≥ 90.0% 85.5%
Communication skills 92.3% 92.5% ≥ 90.0% 92.4%
The skills to plan my own work 94.6% 95.1% ≥ 90.0% 95.0%
The ability to solve problems 94.4% 94.7% ≥ 90.0% 96.0%
Independent judgement 95.7% 96.0% ≥ 90.0% 95.3%
Academic rigour 94.5% 94.4% ≥ 90.0% 94.6%
A multidisciplinary perspective 91.2% 89.9% ≥ 90.0% 90.7%
Analytical skills 96.1% 96.6% ≥ 90.0% 96.3%
Flexibility and adaptability 93.8% 93.5% ≥ 90.0% 92.5%
An awareness of ethical issues 91.1% 91.6% ≥ 90.0% 91.1%
A global perspective 88.6% 87.2% ≥ 90.0% 86.1%
Cultural understanding 85.2% 83.5% ≥ 90.0% 84.1%
Environmental literacy 79.5% 78.7% ≥ 90.0% 79.2%
Research skills 94.5% 95.5% ≥ 90.0% 94.4%
Information literacy. 95.6% 96.7% ≥ 90.0% 95.3%
2.7 At least 90% of respondents to the Graduate Opinion 94.2% 94.7% ≥ 90.0% 94.8% Survey reporting progression to employment or further study following completion of their qualification, as measured by a three-year rolling average.
STRATEGIC OBJECTIVE TWO: EXCELLENCE IN TEACHING
4. Please refer to footnotes 5 and 7 below for discussion of these surveys and their response rates.5. The annual Graduate Opinion Survey invites feedback from graduates on their experiences at Otago, particularly in terms of their learning experiences, 18 to 24 months after
graduation. In 2018, 5,241 students were invited to complete the survey and there were 2,658 respondents (a 51.3% response rate). (2017: 5,116 surveyed; 2,522 respondents; 49.3% response rate.)
UNIVERSITY OF OTAGO ANNUAL REPORT 2018
54
Sixteen of the 22 performance targets relating to this strategic objective were achieved. Of those not achieved, one was within 0.4% of its target.
Undergraduate qualification completions increased, up 2.9% from 2017, while there was a slight decrease of 1.6% in postgraduate completions from 2017.
The percentage of respondents positively assessing the quality of teaching at the University improved slightly from 2017, though again remained below target. Improved performance against this measure remains a priority and is supported by the move to online evaluations.
Employment and further study outcomes remain strong, surpassing 2016 and 2017 levels.
Statement of Service Performance continued

55
# KEY PERFORMANCE INDICATORS 2016 Actual 2017 Actual 2018 Target 2018 Actual
3.1 At least 90% of undergraduate degree-level 94.9% 95.3% ≥ 90.0% 95.5% commencing students admitted with NCEA Level 3 or an equivalent qualification.
3.2 At least 90% of residential college respondents to the 97.3% 97.7% ≥ 90.0% 97.9% annual College Resident Survey6 providing a positive assessment of their colleges.
3.3 At least 90% of respondents to the annual Student Opinion Survey7 providing a positive assessment of:
Administrative services and support services 97.2% 98.1% ≥ 90.0% 98.5%
The Student Learning Centre 98.0% 98.5% ≥ 90.0% 99.2%
The helpfulness of staff 92.5% 91.8% ≥ 90.0% 97.1%
Student health and counselling services 90.4% 85.6% ≥ 90.0% 91.6%
The University’s careers advisory service 94.9% 92.2% ≥ 90.0% 91.5%
Support from the Otago University Students’ Association. 96.9% 95.7% ≥ 90.0% 97.4%
3.4 Enrolling a diversified international student population8 constituting up to:
15% of total University EFTS 11.6% 12.1% ≤ 15.0% 12.5%
25% of the international cohort from one country. 20.7% 21.1% ≤ 25.0% 20.4%
The University achieved all targets relating to this strategic objective.
As a residential university, the high satisfaction rating from residential college respondents were especially noteworthy, affirming the value of Otago’s focus in this area.
The proportional increase in international EFTS was due primarily to growth from Malaysia (an increase of 60 students or 24.9% from 2017) along with strong proportional growth from Vietnam (an increase of 13 students or 52.0% from 2017).
STRATEGIC OBJECTIVE THREE: OUTSTANDING STUDENT EXPERIENCES
6 The annual College Resident Survey elicits comprehensive feedback from students on their college residential and Uniflats experience. Each year, all college and Uniflats residents are invited to participate. In 2018 3,910 residents were invited to participate in the survey and 2,364 responded (a 60.5% response rate) (2017: 3,901 surveyed; 2,380 respondents; 61.0% response rate). In previous years, Key Performance Indicator 3.2 and the last item of KPI 4.1 were based on a similar item included in the Support Services component of the Student Opinion Survey (see footnote 7 for response rates).
7 The annual Student Opinion Survey elicits comprehensive feedback from students on both the academic and wide pastoral support aspects of their study at Otago. Each year, students in approximately a quarter of the University’s programmes are invited to participate (so that all departments and programmes are covered in a four-year cycle). In 2018, 5,422 students were invited to complete the Academic Experience component of the survey and there were 2,889 respondents (a 53.3% response rate). (2017: 6,714 surveyed; 3,767 respondents; 56.1% response rate. 2016: 4,078 surveyed; 2,137 respondents; 52.4% response rate.) 4,000 students were invited to complete the Support Services component of the survey. There were 1,879 respondents (a 47.0% response rate). (2017: 4,000 surveyed; 1,901 respondents; 47.5% response rate). In 2017, the Support Services component of the Student Opinion Survey was extensively re-designed to better capture how students experience administrative and support services. As a result some of the items used to calculate the key performance indicators are worded or structured differently from previous years.
8 Including both full-fee international students and those granted domestic student status for fees and funding purposes.

UNIVERSITY OF OTAGO ANNUAL REPORT 2018
56
# KEY PERFORMANCE INDICATORS 2016 Actual 2017 Actual 2018 Target 2018 Actual
4.1 At least 90% of respondents to the annual Student Opinion Survey providing a positive assessment of:
The general campus environment 94.9% 96.8% ≥ 90.0% 98.2%
Personal safety on campus 98.2% 98.2% ≥ 90.0% 98.7%
University libraries 99.0% 98.6% ≥ 90.0% 98.7%
University information technology and teaching facilities 92.5% 92.3% ≥ 90.0% 95.6%
The quality of sport and recreational facilities 97.6% 97.0% ≥ 90.0% 95.4%
University Union, including food and beverage service 91.7% 83.0% ≥ 90.0% 77.9%
Living accommodation provided by the University.9 96.6% 97.8% ≥ 90.0% 98.0%
4.2 Providing learning assistance and/or access to special 656 731 ≥ 500 883 equipment for at least 500 students with a disability affecting study.
4.3 Providing annual funding for capital expenditure no Funding ≥ Funding ≥ Funding ≥ Funding ≥ less than the sum of depreciation and the adjusted depreciation + depreciation + depreciation + depreciation + surplus (i.e. the surplus adjusted for carry forwards, adjusted surplus adjusted surplus adjusted surplus adjusted surplus extraordinary items and capital injections to Group companies).
The University achieved eight out of the nine targets relating to this strategic objective, with the Student Opinion Survey and the College Resident Survey again confirming very high levels of student satisfaction with the campus environment, personal safety, libraries, sport and accommodation.
The University’s Disability Information and Support team continued its broad programme of support for a rapidly increasing number of students with a disability affecting study.
STRATEGIC OBJECTIVE FOUR: OUTSTANDING CAMPUS ENVIRONMENTS
Statement of Service Performance continued
9 For 2018, this feedback was obtained from the University’s College Resident Survey.
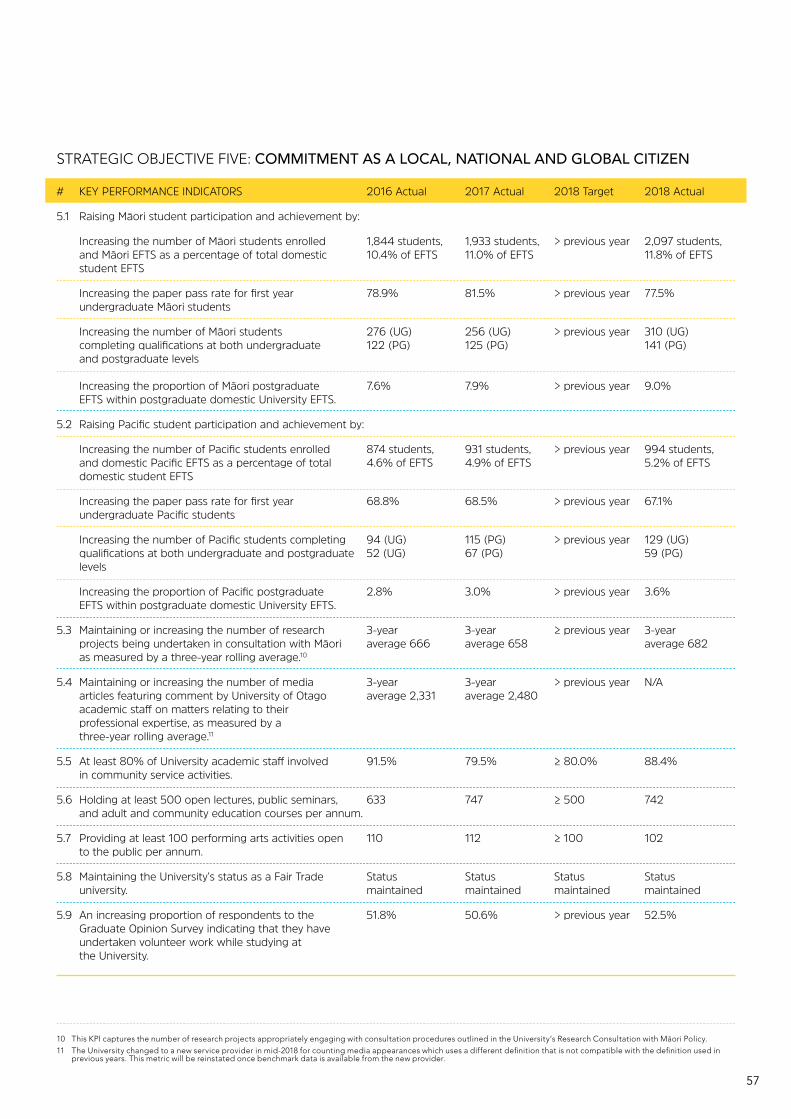
57
# KEY PERFORMANCE INDICATORS 2016 Actual 2017 Actual 2018 Target 2018 Actual
5.1 Raising Māori student participation and achievement by:
Increasing the number of Māori students enrolled 1,844 students, 1,933 students, > previous year 2,097 students, and Māori EFTS as a percentage of total domestic 10.4% of EFTS 11.0% of EFTS 11.8% of EFTS student EFTS
Increasing the paper pass rate for first year 78.9% 81.5% > previous year 77.5% undergraduate Māori students
Increasing the number of Māori students 276 (UG) 256 (UG) > previous year 310 (UG) completing qualifications at both undergraduate 122 (PG) 125 (PG) 141 (PG) and postgraduate levels Increasing the proportion of Māori postgraduate 7.6% 7.9% > previous year 9.0% EFTS within postgraduate domestic University EFTS.
5.2 Raising Pacific student participation and achievement by:
Increasing the number of Pacific students enrolled 874 students, 931 students, > previous year 994 students, and domestic Pacific EFTS as a percentage of total 4.6% of EFTS 4.9% of EFTS 5.2% of EFTS domestic student EFTS
Increasing the paper pass rate for first year 68.8% 68.5% > previous year 67.1% undergraduate Pacific students
Increasing the number of Pacific students completing 94 (UG) 115 (PG) > previous year 129 (UG) qualifications at both undergraduate and postgraduate 52 (UG) 67 (PG) 59 (PG) levels
Increasing the proportion of Pacific postgraduate 2.8% 3.0% > previous year 3.6% EFTS within postgraduate domestic University EFTS.
5.3 Maintaining or increasing the number of research 3-year 3-year ≥ previous year 3-year projects being undertaken in consultation with Māori average 666 average 658 average 682 as measured by a three-year rolling average.10
5.4 Maintaining or increasing the number of media 3-year 3-year > previous year N/A articles featuring comment by University of Otago average 2,331 average 2,480 academic staff on matters relating to their professional expertise, as measured by a three-year rolling average.11
5.5 At least 80% of University academic staff involved 91.5% 79.5% ≥ 80.0% 88.4% in community service activities.
5.6 Holding at least 500 open lectures, public seminars, 633 747 ≥ 500 742 and adult and community education courses per annum.
5.7 Providing at least 100 performing arts activities open 110 112 ≥ 100 102 to the public per annum.
5.8 Maintaining the University’s status as a Fair Trade Status Status Status Status university. maintained maintained maintained maintained
5.9 An increasing proportion of respondents to the 51.8% 50.6% > previous year 52.5% Graduate Opinion Survey indicating that they have undertaken volunteer work while studying at the University.
STRATEGIC OBJECTIVE FIVE: COMMITMENT AS A LOCAL, NATIONAL AND GLOBAL CITIZEN
10 This KPI captures the number of research projects appropriately engaging with consultation procedures outlined in the University’s Research Consultation with Māori Policy.11 The University changed to a new service provider in mid-2018 for counting media appearances which uses a different definition that is not compatible with the definition used in
previous years. This metric will be reinstated once benchmark data is available from the new provider.

UNIVERSITY OF OTAGO ANNUAL REPORT 2018
58
The University achieved 12 of the 15 performance targets in meeting its ambitious commitments as a local, national and international citizen.
The number of Māori student enrolments and Māori EFTS as a proportion of total domestic EFTS were at all-time highs. Māori undergraduate and postgraduate qualification completions were at an all-time high.
Pacific student enrolments and Pacific EFTS as a proportion of total domestic EFTS were also at all-time highs. Pacific first-year course pass rates were down very slightly from 2017, reflecting some of the challenges faced when seeking to increase participation and achievement simultaneously. Pacific undergraduate qualification completions (up from 2017) were at an all-time high, but Pacific postgraduate qualification completions dipped slightly from 2017.
The University remained committed to robust, appropriate research consultation with Māori, and this was managed through the University’s Research Consultation with Māori Policy. 682 (3-year rolling average) research projects were reviewed through this process in 2018, an increase of 3.6% on 2017.
The University has worked hard to encourage civic engagement and leadership among its staff and students. Academic staff involvement in community service activities increased 11.2% from 2017 to 88.4% and the proportion of students undertaking volunteer work again exceeded 50%, up from 2017.
Statement of Service Performance continued

59
# KEY PERFORMANCE INDICATORS 2016 Actual 2017 Actual 2018 Target 2018 Actual
6.1 Hosting at least 650 academic visitors to the University 975 889 ≥ 650 685 per annum.
6.2 At least 25% of academic staff serving on government 33.8% 19.2% ≥ 25.0% 27.4% advisory boards and committees.
6.3 At least 50% of academic staff providing services to 74.6% 68.5% ≥ 50.0% 70.5% public sector departments, statutory authorities, agencies, boards, committees or inquiries, or to non-governmental organisations.
6.4 At least 50% of academic staff holding posts in an 73.2% 72.6% ≥ 50.0% 70.5% organisation or association relevant to their area of professional expertise.
6.5 Increasing the number of students studying abroad 210 193 > previous year 194 on outbound student exchange.
The University achieved all performance targets against this strategic objective.
Underpinning this were high levels of academic staff service on public and private sector boards, committees and other organisational structures. All three targets for external engagement by academic staff were achieved in 2018, following a dip in 2017.
The University achieved its performance target for academic visitors, despite a decline from 2017. Factors underpinning this decline are understood to include a focus on the PBRF quality evaluation round and a number of structural changes during 2018.
The number of students studying abroad on outbound student exchange remained steady.
STRATEGIC OBJECTIVE SIX: STRONG EXTERNAL ENGAGEMENT

UNIVERSITY OF OTAGO ANNUAL REPORT 2018
60
# KEY PERFORMANCE INDICATORS 2016 Actual 2017 Actual 2018 Target 2018 Actual
7.1 Achieving or exceeding the following University and 18,287 & 18,547 18,198 & 18,457 18,312 & 18,582 18,572 & 18,840 University Group EFTS enrolment targets.12
7.2 Achieving a University Group operating surplus of at 4.1% 4.8% ≥ 3.0% of 3.9% least 3% of revenue (excluding extraordinary items). revenue
7.3 Maintaining a liquid ratio of no worse than 1:1. 2.6:1 2.1:1 ≥ 1:1 1.7:1
7.4 Ensuring that net interest paid is no greater than 1.1% 0.6% ≤ 33.3% 0.0% one-third of the operating surplus.
7.5 Increasing the consulting, commercial and $80.1 million $78.3 million ≥ 105.0% of $78.7 million intellectual property income of the University (102.7%) (97.8%) 2017 (100.5%) Group by at least 5% per annum as measured by a three-year rolling average.
7.6 Reducing energy use per m2 of floor space as 3-year average 3-year average < previous year 3-year average measured by a three-year rolling average.13 220.1 kWh/m2 221.4 kWh/m2 223.4 kWh/m2
7.7 Reducing the amount of waste sent to landfill 36.9 kg per 113.8 kg per < previous year 121.1 kg per per capita. person (EFTS person (EFTS person (EFTS and FTE) and FTE) and FTE)
7.8 Reducing greenhouse gas emissions generated 22,809 t C02-e 24,404 t C02-e < previous year 21,175 t C02-e from University activities.14
The University achieved five of the eight performance targets against its capability imperative.
The 0.5% increase in consulting, commercial and intellectual property income fell short of the 5.0% growth target, due largely to the impact of declines in consulting and commercial income for 2016 and 2017 on the three-year rolling average figure.
Energy use per m² has increased slightly from 2017. This was influenced by the addition of Caroline Freeman College and other occupied buildings that require significant heating, and the removal of low energy use storage areas.
There was a slight increase in the amount of waste sent to landfill per capita from 2017 to 2018, due to the indicator scope expanding to include waste generated via monthly clean-up days in the wider tertiary precinct. 2016 figures are not comparable due to reporting errors from the supplier.
The University has a contract with a new waste management provider in place from March 2019 with improved reporting capability.
Extensive commentary on the financial capability indicators is contained elsewhere in the University’s Annual Report.
STRATEGIC OBJECTIVE SEVEN: SUSTAINING CAPABILITY
12 University Group EFTS include those generated by the Foundation Year Programme operated by the University’s wholly-owned Foundation Studies subsidiary.13 Floor space measured by gross area (Dunedin campus only, excluding non-University-owned Residential Colleges). Performance is measured in kilowatt hours per square metre,
which is a standard unit for measuring energy use.14 Building energy emissions for all campuses, excluding non-University-owned colleges, are measured in tonnes of CO2e, or carbon dioxide equivalent, which is a standard unit for
measuring carbon footprints.
Statement of Service Performance continued

6161

UNIVERSITY OF OTAGO ANNUAL REPORT 2018
62
Health and SafetyFormal monitoring and review of health and safety performance was facilitated through monthly reporting from the Health and Safety Compliance Office to the Vice-Chancellor’s Advisory Group, the Health and Safety and Ethics Compliance Committee and the University Council.
In 2018 the national Workers Participation Framework Operational Health and Safety Committee changes were implemented at Otago, increasing employee participation in health and safety management and improvements.
Health and safety systems continue to develop. In 2018 the online health and safety management system, Vault, had 652 users across all campuses. On-site health and safety team inductions were provided to over 1,600 contractors from 276 registered contracting companies.
The University achieved secondary level ACC Accredited Employers Programme status and related health and safety audits were successful with minor corrective actions. Use of the Employee Assistance Programme increased during the implementation of the Support Services Review.
The Occupational Mental Health and Well-being Advisor provided on-site assistance, including mental health training, for all staff. Influenza vaccinations were offered free to all staff, with approximately 2,500 vaccines administered in 2018.
Human ResourcesThe number of staff employed by the University increased slightly in 2018 to total 4,080 in full-time equivalent (FTE) terms (2017: 4,029).
Within the academic ranks, the number of professors decreased by 1 FTE from 221 to 220, and the number of associate professors increased by 14 FTE from 193 to 207 (7.2%).
The number of senior lecturers decreased by 12 FTE from 359 to 347 (-3.3%), while the number of lecturers decreased by 8 FTE from 151 to 143 (-5.3%).
The number of research-only staff on academic contracts increased by 32 FTE from 357 to 389 (9.1%).
Information TechnologyThe volume of off-campus computer and telecommunications network traffic increased from 7,371,800 gigabytes in 2017 to 7,819,583 gigabytes in 2018, primarily due to growth in research data transfers and online media content streaming services.
The number of seating places in student computer laboratories decreased to 850 (2017: 972) due to the closure of a number of computer rooms during building refurbishment. Future state networking services and wireless expansion were delivered to a number of new and existing sites, including a number of residential colleges.
By the end of 2018, a total of 4,221 wireless access points were operating across all campuses, representing a 16% increase on 2017. Peak wireless access increased 46% to 23,062 concurrent connections, and up to 500 concurrent connections to the self-service Guest Wi-Fi were observed on a number of occasions during term time.
Use of the University’s two central data centres (in terms of physical and virtual server counts) increased slightly in 2018. High Capacity Storage volume consumption for 2018 was 7.385 petabyte (2017: 5.679 PB).
Statement of Resources 2018
2,500 ‘flu vaccines administered
4,080 FTE staff Health and safety systems continue to develop
1,669,456items in the Library’s printed collection
22,457Hocken collection items issued
62
Off-campus computer and telecommunications network traffic:7,819,583 gigabytes

63
2018 2017 2016 2015 2014
Full-time Equivalent (FTE) teaching and research staff
Females 567 545 535 522 512Males 640 651 662 668 676
Total 1,207 1,196 1,196 1,190 1,188 Full-time Equivalent (FTE) research-only staff (excludes general research-only staff)
Females 225 198 181 246 240 Males 164 159 155 182 183
Total 389 357 336 429 423
Full-time Equivalent (FTE) professional staff
Females 1,612 1,604 1,489 1,403 1,407Males 872 872 841 781 770
Total 2,484 2,476 2,330 2,184 2,177
Total Staff 4,080 4,029 3,862 3,803 3,788
Summary staff profile
Use of Zoom (the University’s online meeting and desktop videoconferencing system) totalled 6,183,477 minutes in 2018, an increase of 22% from 2017 (4,967,987 minutes).
The popularity of Syncplicity Sync & Share (mobile access technology allowing access to files on multiple client devices) continued to climb, with 3,704 users in 2018 (2017: 3,150 users). The total file storage consumed by Syncplicity users was 56 TB in 2018 (2017: 47.5 TB).
In 2018 the University continued to benefit from its investment in the NeSI (New Zealand eScience Infrastructure) high performance computing infrastructure and support system. Researcher use of NeSI’s resources increased by approximately 35% compared to 2017.
The ITS High Speed Data Transfer system, developed in collaboration with NeSI and REANNZ (Research and Education Advanced Network New Zealand) continued to provide significant support for data intensive research, with over 1.3 petabyte (624 million files) transferred, bound for NeSI’s supercomputers and other research facilities around the globe.
Land, Buildings and Capital Development The land owned by, or held in Crown title for, the University increased by 8,489m² during the year, mostly through the purchase of Otago Polytechnic’s interest in Caroline Freeman College (formerly City College). The University’s net assignable floor space increased by 846m² (0.4%) through refurbishing and reopening the St David II building, which was partially offset by a reduction in leased space.
The refurbishments of the Science 1 building (now Mellor Laboratories) and St David II were completed, and substantial progress was made in constructing a new Clinical Services Building for the Faculty of Dentistry and the new Research Support Facility building (for more information, see page 34).
Library ResourcesThe University of Otago Library continued to evolve as an essential source of information and expertise for the University and the wider community, providing extensive collections, access services, instruction and infrastructure in support of research, teaching and learning. Collaboration between academic and library staff continued to underpin further development of both the physical and online collections.
In 2018, the Library’s printed collection contained 1,669,456 books and serial items (2017: 1,680,316). Electronic resources included 163,586 serials (2017: 169,530) and 953,812 accessible ebooks (2017: 850,783 – an increase of 12.1%). There were 4,584 seating places across the library system (2017: 4,500).
The Hocken Collections is one of the foremost research and heritage collections in New Zealand. The Pictures and Photographs Collection alone includes 1,137,522 items. In 2018, 7,034 researchers visited Hocken in person or made enquiries at a distance and 22,457 collection items were issued. Over 1,090 image reproductions were provided. For further information on the Library’s resources see page 39.

UNIVERSITY OF OTAGO ANNUAL REPORT 2018
64
Equity in educational opportunity and employment are core values of the University, supported by the Māori and Pacific Strategic Frameworks. Strong relationships with iwi and Māori providers are integral to the success of Māori at Otago, and the high value placed on these relationships is exemplified by the University’s
cornerstone memorandum of understanding with Te Rūnanga o Ngāi Tahu, and its formal agreements and activities with other iwi and iwi groups.
The Māori Strategic Framework 2022 was launched in 2017, outlining the University’s commitment to Māori advancement through a set of goals and strategies that seek to increase Māori student and staff participation and success.
The Office of Māori Development has overall leadership in implementing initiatives that foster the success of Māori at Otago. This role includes working closely with other key groups such as the Associate Deans Māori network, Te Huka Mātauraka (the Māori Centre), Te Poutama Māori (the Otago Māori Academic Staff Collective) and the Māori Health Development Workforce Unit.
The Office of Māori Development is also responsible for allocating the Māori component of Tertiary Education Commission equity funding to support initiatives contributing to the recruitment, retention and success of Māori students.
Equal Opportunities Report 2018
2018 2017 2016 2015 2014 Affiliation first all first all first all first all first all
Ngāi Tahu / Kāi Tahu 426 494 391 462 397 466 382 442 396 455
Ngāpuhi 264 375 237 336 217 297 211 280 216 285
Ngāti Porou 143 257 142 245 143 225 139 218 147 226
Tainui 95 177 80 141 84 145 69 124 84 137
Ngāti Maniapoto 63 117 52 99 54 100 50 84 44 74
Ngāti Tūwharetoa 54 114 51 103 51 106 50 90 52 90
Te Arawa 49 88 42 77 28 55 31 44 29 44
Ngāti Kahungunu ki Te Wairoa 48 90 54 93 44 76 45 76 47 81
Ngāti Kahungunu, region unspecified 40 71 39 61 36 55 35 52 32 52
Ngāti Kahungunu ki Heretaunga 40 52 43 54 30 38 31 44 29 44
Ngāti Raukawa 39 60 30 45 24 35 22 33 17 28
Te Atiawa (Taranaki) 37 57 32 48 32 59 34 59 31 58
Ngāti Awa 37 56 38 61 36 52 35 52 28 51
Tūhoe 36 90 31 83 28 72 28 64 26 62
Ngāti Kahungunu ki Wairarapa 34 49 31 48 30 48 27 38 23 38
Te Rarawa 31 65 32 61 30 54 27 55 24 61
Ngāti Whātua 31 57 26 47 23 38 20 37 23 38
Te Ati Haunui-a-Pāpārangi 30 53 28 43 26 37 18 26 18 29
Taranaki 30 39 27 39 21 36 22 34 20 31
Whakatohea 28 47 18 32 18 28 21 33 15 32
Waikato 23 41 19 32 20 32 15 27 17 32
Te Atiawa 20 26 21 26 20 27 20 30 11 18
Ngaiterangi 19 38 26 39 20 33 17 29 21 40
Ngāti Raukawa (Horowhenua/Manawatū) 19 32 20 30 24 39 25 38 32 46
Other 416 978 388 911 360 852 332 810 338 829
Don’t know 45 51 35 42 48 55 53 58 56 62
Total 2,097 n/a 1,933 n/a 1,844 n/a 1,759 n/a 1,776 n/a
Iwi to which students affiliated

65
The University is also strongly committed to broad ongoing engagement with Pacific communities. The Pacific Strategic Framework 2013-2020 formalises this commitment and articulates the University’s goals to improve academic and development outcomes for Pacific students and staff. This work is co-ordinated by the Director of Pacific Development and supported by Associate Deans Pacific and other University staff. The Director of Pacific Development also oversees the allocation of the Tertiary Education Commission’s Pacific Equity Funding for initiatives supporting Pacific student success.
Two members of the Pacific Staff Academic Caucus were honoured in 2018, with Associate Professor Faumuina Tai Sopoaga (Department of Preventive and Social Medicine) receiving the Prime Minister’s Supreme Tertiary Teaching Excellence Award and College of Education Professional Practice Fellow Pauline Smith the Best First Book Award for her debut novel Dawn Raid at the 2018 New Zealand Book Awards for Children and Young Adults. Dr Dianne Sika-Paotonu was also appointed to support the implementation of the Pacific Strategic Framework in the University of Otago Wellington campus and Aiono Professor Alec Ekeroma was the first Pacific person in Australasia to be appointed as a head of a clinical academic department, in Obstetrics, Gynaecology and Women’s Health at the University of Otago, Wellington.
In 2018 Otago’s Pacific researchers secured 36% of dedicated Health Research Council Pacific funding and led or co-led 56% of New Zealand Institute of Pacific Research current projects. Three Pacific students received Ministry for Pacific Peoples Toloa Tertiary Scholarships.
The Pacific Island Students’ Association and additional Pacific alumni chapters in the Cook Islands and Tonga were established. The University also hosted the Prime Minister of Samoa, Hon. Tuilaepa Sailele Malielegaoi, and established a new Memorandum of Understanding between the University and Samoan Government.
Equal Educational OpportunitiesThe University supports the educational aspirations and progress of all students and recognises the importance of identifying and eliminating barriers to entry and successful study. Key elements of the University’s strategy in this area are support and recruitment initiatives for students from groups with recognised educational inequities, particularly Māori and Pacific students, and students with disabilities.
The University’s package of targeted scholarships and awards continued in 2018, with 201 students commencing study on Māori and Pacific Island Entrance Scholarships (2017: 188) and many more Māori and Pacific students securing other Otago entrance scholarships.
The University also concluded its long-standing push to enable “gender diverse” to be recognised as a valid gender option in New Zealand’s tertiary education statistics. This change will take effect from 2019.
MāoriAs noted elsewhere in this Annual Report, the number of equivalent fulltime Māori students enrolled at Otago increased from 1,933 in 2017 to 2,097 in 2018. As a proportion of the University’s total domestic student EFTS, Māori student EFTS increased to an all-time high of 11.8% (2017: 11.0%).
There were 169 Māori students in Health Sciences First Year, 351 studying in undergraduate health professional degrees and 120 in Health Sciences postgraduate study. Māori students now comprise 11.8% of students in health professional programmes, up from 5.1% in 2014.
In 2018, the course pass rate for Māori across the University was 87.7% (2017: 87.5%), the highest since systematic pass rate data by ethnicity has been compiled. Undergraduate qualification completions increased by 21.1% to 310 from 256 in 2017, and postgraduate qualification completions increased 12.8% to 141 from 125 in 2017.
Te Huka Mātauraka, the Māori Centre, experienced an increase in the number of students accessing its academic, cultural and counselling services. Alongside general academic and cultural support, key initiatives included: the Turaka Hou academic orientation programme for first-year Māori students; Kaituitui Mātauraka, the centre’s academic tutorial programme; the SeeTheSolutions online tutorial programme; and the Kā Rikarika ā Tāne programme, with senior student volunteers mentoring first-year students. Māori pre-graduation ceremonies were well attended in 2017, bringing together Māori graduands, whānau and staff in celebration of Māori academic achievement at the University.
Each of the University’s four academic divisions also provided tailored support for Māori students in 2018.
Te Kura Pakihi (Otago Business School) initiatives included a Māori student entrepreneurship pilot with Māori-owned and -operated business hub Innov8 HQ. Commerce students also won the inaugural Māori Business Case competition in Auckland, were awarded internships with Ministry of Foreign Affairs and Trade and received Ngāi Tahu Matakihi scholarships.
Te Wāhanga Matua Mātau Hauora (Division of Health Sciences) programmes included the Te Ara Hauora programme focused on pathways for Māori secondary students into Health Sciences; Tū Kahika, a culturally responsive foundation studies programme; the Te Whakapuāwai Māori Health Sciences First Year programme; and the Tū Tauira Hauora programme for health professional and health sciences undergraduates. Retention and completion rates for Māori students in the Tū Tauira Hauora programme were over 95%. The Bachelor of Health Science was also established in 2018, providing an opportunity for new Māori health papers and a major in Māori health.
Te Kete Aronui (Division of Humanities) student support included the Tauira Māori Transition Programme for first-year Māori students and hui and workshops for students facilitated by divisional and departmental kaiāwhina Māori. Bridging scholarships and summer student bursaries were awarded to Māori students transitioning from undergraduate to postgraduate study.

UNIVERSITY OF OTAGO ANNUAL REPORT 2018
66
Te Rohe a Ahikaroa (Division of Sciences) held three hui in 2018 with their network of departmental kaiāwhina, focusing on implementation of the Māori Strategic Framework, student retention and success, and pastoral care, including a new initiative Te Pae Kotuku to support excellent students through leadership skills, cultural engagement and service. Te Koronga, an initiative to support Māori student research in the sciences, hosted a symposium profiling graduate research excellence and indigenous science research themes and the Outreach team delivered three Science Wānanga to marae in Dunedin, Hastings and Wairoa.
Pacific PeoplesAnother strong intake of first-year Pacific enrolments pushed total Pacific enrolments at Otago to an all-time high of 994 students (2017: 931). Proportionally, Pacific students increased to another all-time high, at 5.2% of total domestic student EFTS (2017: 4.9%).
There were 111 Pacific students in Health Sciences First Year, 161 students in undergraduate health professional degrees and 63 in Health Sciences postgraduate study. Pacific students now comprise 5.4% of students in health professional programmes, up from 2.5% in 2014.
188 Pacific students from across the University successfully completed qualifications in 2018, a small increase on 2017 (182). Undergraduate completions increased slightly while postgraduate completions decreased slightly.
In 2018, the course pass rate for Pacific students was 79.5% (2017: 79.7%). Considerable work must still be done to achieve parity with non-Pacific peers and this is a priority for the University.
The Pacific Islands Centre continued an extensive programme of academic and pastoral support services in 2018, increasing its provision of support across most activities. Key initiatives in 2018 included the Taimane and Dare to Succeed mentoring programmes; the collaborative work of the Le Moana Action Group and Pacific Postgraduate Reference Group; the Pacific Voices Symposium; and supervised study nights. The Fofoa accommodation scheme was offered again in 2018, providing supported flatting accommodation for Pacific students near the Dunedin campus.
The POPO (Pacific Orientation Programme at Otago) Foundation Programme, which operates through the University’s Foundation Studies subsidiary, ran for its seventh year, providing a pathway for students who need additional academic support prior to entering University.
Each of the University’s four academic divisions also provided tailored support for Pacific students in 2018.
The Division of Commerce transformed its Early Intervention Programme for first-year Pacific students to formally include the Pasifika Numeracy Programme, piloted in 2017. “At risk” students, identified through a TEC online numeracy diagnostic assessment, achieved pronounced progress in 2018. Postgraduate students also established a Pacific Commerce Students’ Association.
The Division of Health Sciences appointed Associate Deans (Pacific) in Dentistry and the School of Biomedical Sciences to bring the total to six within the division, as well as a Pacific advisor in Pharmacy. In 2018 these and other Health Sciences Pacific leaders formed the Takiala Pacific Leadership Network, providing strategic leadership, guidance, oversight and support for Pacific and Pacific-related developments, aspirations and activities. The Pacific Islands Research and Student Support Unit provided a suite of comprehensive programmes to support students undertaking Health Sciences First Year, as well as senior students in health professional and allied health programmes.
The Division of Humanities welcomed Inano Walter to the role of Pacific Islands Student Support in 2018. This role supports Pathways to the Humanities, an equity funded mentoring initiative for Dunedin-based Pacific high school students. The division also collaborated with Associate Deans (Pacific) in Commerce and Sciences to develop a programme that strengthens the role of Pacific academic student liaison.
The Division of Sciences increased engagement with Pacific communities in 2018 through its new Pacific Outreach Programme co-ordinator. This role helps youth and their communities to engage with science opportunities and supports those with science aspirations. In 2018 the division collaborated with the Pacific Islands Centre and the School of Biomedical Sciences in pilot programmes targeted at 11-17 year old Pacific youth.
2018 2017 2016 2015 2014
Registered with the centre 906 870 859 792 742
Extra tutorials 130 101 82 88 79
Career advisory services seminar 25 16 17 9 11
Students receiving course advice 1,425 1,320 1,240 4,100 3,084
Pacific postgraduate seminars 9 8 9 11 12
Student gatherings 121 120 165 181 177
Community meetings/consultation 245 185 245 148 124
Community functions attended 45 24 45 83 76
Student consultations 1,680 2,800 2,502 1,094 983
Services provided by the Pacific Islands Centre

67
Links with the Kingdom of Tonga were strengthened with the launch of the Tongan Alumni Network. A delegation travelled to Tonga for the launch and met with public servants, visited the University of the South Pacific Tonga Campus and engaged with local schools.
Disabilities Support The University takes a proactive approach to the recruitment and support of students with disabilities. The Disability Information and Support service takes a lead role in this area, working in conjunction with both academic and administrative departments.
In 2018, the University enrolled 1,600 students who identified as having a disability affecting study (2017: 1,364). Support in the form of learning assistance and/or specialised equipment requiring a specific financial commitment was provided to 883 students with disabilities in 2018 (2017: 731). 1,753 instances of support were provided in the form of note-taking, assistance with examinations, tutoring, and transcription or typing (2017: 1,855), along with many hours of individual consultations provided by a team of trained advisors. The number of student contacts totalled 34,501 in 2018; an increase of 21.4% (2017: 28,414).
Disability Information and Support staff attended various conferences and hosted workshops in 2018 (including New Zealand Sign Language courses), and participated in a number of teaching initiatives and disability awareness-raising events, including the Disability Information and Support Appreciation Awards ceremony, the OUSA Teaching Awards ceremony (at which the Inclusive Teaching Award was presented), and the selection processes for the N.G. Stewart Scholarship and the Donna-Rose McKay Disability Support Scholarship.
The Disability Information and Support team received positive feedback from the 2017 Student Opinion Survey, indicating that more than 90% of respondents were either “extremely satisfied” or “satisfied” with the service. The team strives to provide an outstanding experience for students and are proud to be leaders in the field of disability support in tertiary education.
Equity and Diversity in EmploymentIn 2018 the University was awarded the Rainbow Tick, a continual improvement certification designed to help an organisation ensure it is a safe and welcoming workplace for LGBTTIQ employees.
The Equity Practitioners at Otago Network was established and held its first hui in 2018. The network offers opportunities for equity practitioners across divisions and campuses to share knowledge and best practice, and allows for better collaboration between staff.
The Equity Advisory Committee continued to provide leadership and oversight of the implementation of the Equity and Diversity Strategic Framework.
The third Staff Equity Demographics Report was released to assist with evidence-based decision making. This report was made available to all University staff.
Professional DevelopmentDiversity topics were included in the two main programmes aimed at supervisors and managers in 2018 (the Essential Management Programme and Supervisory Skills) and in the Academic Leadership Development Programme.
The topic of diversity and inclusivity was promoted through a range of workshops, including: Equity at Otago; Creating an Inclusive Environment: Disability Awareness; Customer Diversity; Rainbow Tick Diversity and Inclusivity Training, Mental Health: Face to Face with Student Issues, Pacific Awareness; Te Reo Māori: He Timatanga; and Te Reo Māori: Te Waharoa. The Higher Education Development Centre also offered workshops on the Treaty of Waitangi, Māori Culture, and the Policy for Research Consultation with Māori.
Women in Leadership at Otago provided the opportunity to develop leadership skills for both academic and professional staff women.
Otago University Childcare AssociationSupport for child care continued to be provided through the Otago University Childcare Association, with the University providing a grant to support the association’s early childhood education facilities. Together, the five centres provide education and care for approximately 190 children, of which 90% are children of University staff or students.
Learning assistance support for students with disabilities
2018 2017 2016 2015 2014
Note-taking 745 622 550 506 497
Tutoring 405 354 274 341 310
Transcription/typing 0 0 1 3 3
Reader 0 0 1 1 1
Assistant 0 1 2 3 3
Examination arrangements 603 878 606 486 524
Scanning 0 0 0 0 0
Other 286 214 274 238 292

UNIVERSITY OF OTAGO ANNUAL REPORT 2018
6868

69
69
69 69

UNIVERSITY OF OTAGO ANNUAL REPORT 2018
70
This report has been prepared to provide, within the overall Annual Report, further information on the activitiesandperformanceofthemostsignificantentities that comprise part of the University Group, but sit outside the University parent.
A full list of Group subsidiary entities and associates appears in the Statement of Accounting Policies on page 79 of this Annual Report.
The following have been identified as the most significant of these entities for reporting purposes, and are covered individually below:
The University of Otago Foundation Trust
University of Otago Foundation Studies Limited
Otago Innovation Limited
The University of Otago Foundation TrustOverviewThe University of Otago Foundation Trust (the Trust) was established in 2002. It is a registered charitable trust that receives and administers donations, bequests and sponsorship monies for the University and academic priorities.
The Trust is an umbrella trust consisting of 400 (2017: 391) individual trust funds and one small value trust (controlled by a third party) where the University is the beneficiary. Each fund has specific terms and conditions which outline the purpose for which the funds can be distributed to the University.
The investments are managed by the Board of Trustees, which is appointed by Council. The board holds regular meetings to evaluate the investment performance of the fund and to ensure that the investment objectives are being met. The risks and exposure to individual investments and sectors are regularly monitored and reviewed. The board receives advice from a board-appointed independent external investment advisor who reviews and endorses investment decisions and offers advice on purchases and sales for the portfolio.
All monies received by the Trust are combined for investment purposes, enabling investment risk to be managed through a diversified portfolio. Investments are spread in a balanced portfolio which includes shares, property, bonds and cash.
A detailed investment policy provides guidelines on asset allocation and social responsibility issues and is regularly reviewed by the board.
The investment objectives of the Trust are to ensure that, where appropriate, capital is preserved and increased by an amount at least equal to the rate of inflation, and that an income return of 4.5% is achieved.
As at 31 December 2018 total investments were $208.8 million. Over the last 10 years the trusts have delivered an average return on investment of 7.64% per annum.
2018 AchievementsThe Trusts reported a net deficit of $4.9 million for the year to 31 December 2018. This compares with a budgeted surplus of $6.8 million, and 2017 actual surplus of $17.5 million. The unfavourable variance was primarily driven by unrealised losses on share investments due to market conditions.
The net return on investment for the year was 0.3% compared with a budgeted return of 7.6% and a return of 13.0% in 2017. Distributions to the University were $10.6 million compared with a budget of $10.5 million and actual of $10.4 million in 2017.
University of Otago Foundation Studies LimitedOverviewIncorporated in 1996, University of Otago Foundation Studies Limited (FSL) provides transition pathways to degree-level study at the University of Otago.
FSL comprises two distinct functional areas: Foundation Year and the Language Centre. The Foundation Year prepares students for degree-level study at the University. While originally conceived as a programme primarily for international students, Foundation Year has become increasingly important as a transition pathway for New Zealand students as well. It includes the Tū Kahika Programme for Māori students wishing to prepare for study in the health sciences and its Pacific equivalent, the Pacific Foundation Programme. The Language Centre provides English language tuition to both groups and individuals, almost exclusively to students from overseas of recent resident status. In many cases, that tuition develops students’ English language ability so they can proceed to study at Foundation Year and at the University.
2018 AchievementsIn 2018, the Foundation Year provided academic tuition to 298 individual domestic and international students, generating 268.2 EFTS enrolments. This reflects a slight decline in student numbers (down 2.3%), but an increase in EFTS (up 3.3%) on the previous year. In 2018, the Language Centre provided English language tuition to 117 EFTS. This was a decrease of 21 EFTS (down 15.2%) on the previous year.
FSL generated an overall operating surplus of $754K in 2018, which was lower than the operating surplus of $874K in 2017, as a result of decreased student numbers.
Group Entities Report

71
Otago Innovation LimitedOverviewOtago Innovation Limited (Otago Innovation) was established in 2002. It is a wholly-owned subsidiary of the University that has responsibility for the commercialisation of intellectual property arising from research within the University. Much of Otago Innovation’s commercialisation activity is centred upon medical research and biotechnology innovation. However, an increasing number of ideas are emerging from basic sciences such as chemistry and physics.
Otago Innovation provides business partners, industry and investors with information about current University of Otago projects, their practical applications, their patent status and market potential. Otago Innovation’s commercialisation managers assist with the preparation and implementation of business and marketing plans, assist the commercialisation process, and ensure key proof of concept targets are managed and met.
Otago Innovation also runs an annual Otago Innovation Proof of Concept Grant competition with a $60,000 research grant awarded to the winning University of Otago application. The competition is designed to encourage researchers to think about the possible commercial applications of their research, including what an end product or service might look like and who would buy it. A second competition – the Translational Research Grant ($50,000) – is open to Division of Health Sciences staff and achieves a similar purpose.
2018 AchievementsThirty-four commercial opportunities were presented to Otago Innovation in 2018 (2017: 49). Spin-out companies successful in raising capital during the year included Photonic Innovations Limited, Ubiquitome Limited, Quitta Pty Limited, Techion Holdings Limited, and Upstream Medical Technologies Limited. A new spin-out company, Insitugen Limited was formed early in the year, to enable the development of brand awareness around commercial applications of androgen assays. A number of licences were agreed with pharmaceutical and other companies worldwide, though often under conditions of confidentiality.
The Otago Innovation Group operating result was a deficit of $923K, mainly due to the revaluation of OIL group entities and lower MBIE pre-seed funding.
71

UNIVERSITY OF OTAGO ANNUAL REPORT 2018
72
The University Group, which includes the University of Otago, University of Otago Holdings Limited and the University of Otago Foundation Trust, achieved an operating surplus of $27.0 million for the year, $1.7 million (7%) higher than the budget. This surplus was $7.3 million lower than last year’s Group surplus of $34.2 million largely due to lower returns within the University of Otago Foundation Trust. Returns were down as a result of the poor performance of the financialmarketsworldwide.
This surplus still represented a return of 3.7% on revenue of $727.1 million and 1.3% on equity of $2.0 billion. These results were above the Tertiary Education Commission’s minimum guidelines of 3.0% and 1.2% respectively.
The University’s operating surplus for the year was $40.9 million which was $22.8 million (126%) higher than budget. The primary contributor to the positive variance against budget was a $15.2 million one-off accounting adjustment as a result of the equity distribution from the Dunedin City Tertiary Accommodation Trust (DCTAT) following the University’s purchase of the City College assets. The DCTAT was two-thirds owned by the University; the Otago Polytechnic owned the remaining one-third interest so the equity distribution was largely consolidated out within the University Group result. The remaining University parent positive result against budget was due to higher student enrolments than anticipated.
Capital expenditure was significantly higher than 2017 reflecting the ramp up of construction on major building projects.
The University of Otago Foundation Trust recorded an operating deficit of $5.1 million for the year, against a budgeted surplus of $6.8 million, due to the market downturn noted above. The net return on investment for the year was 0.4% and the average net return over the last 10 years was 7.5%. The University maintains income reserves, so distribution of funds to support University activities was unaffected for 2018.
Other Group entities produced a surplus of $1.1 million for the year. This was $0.7 million higher than budget, mainly due to the revaluation of materials held within the Hocken Collections.
Operating cash flow for the Group for the year was a net inflow of $103.9 million which was 20% higher than the budgeted inflow of $86.2 million. This was largely due to higher student enrolments and an increase in research income received in advance.
The Group continued to invest heavily in fixed assets (mainly buildings). Capital expenditure of $144.7 million was $27.9 million higher than 2017 as several capital projects move through the intensive construction phase, though still $47.2 million lower than budget.
The University continues to fund capital expenditure from operating cashflow, surplus and cash reserves, but is forecasting to commence borrowing for the first time in 2020.
Total assets for the Group were $2.3 billion for the year, an increase of $46.2 million over 2017 mainly due to an increase in fixed assets.
The strong financial performance by the University was underpinned by a welcome increase in student enrolments and strong externally-funded research activity along with a focus on efficient and effective use of University resources.
The University faces the challenge of funding a significant capital expenditure plan covering the next 10 years. Care will be needed to ensure operating cashflows are safeguarded to protect this important component of capital funding.
Sharon van TurnhoutChief Financial Officer
Financial Review 2018

73
For the year ended 31 December 2018
1. The Council and management of the University of Otago and Group accept responsibility for the preparation of the annual financial statements and the Statement of Service Performance and the judgements used in them;
2. The Council and management of the University of Otago accept responsibility for establishing and maintaining a system of internal control designed to provide reasonable assurance as to the integrity and reliability of the financial reporting; and
3. In the opinion of the Council and management of the University of Otago, the annual financial statements and the Statement of Service Performance for the year ended 31 December 2018 fairly reflect the financial position and operations of the University of Otago and Group.
Dr R. J. Somerville QC Professor H. Hayne Chancellor Vice-Chancellor
16 April 2019 16 April 2019
Statement of Responsibility

UNIVERSITY OF OTAGO ANNUAL REPORT 2018
74
Consolidated University Actual Budget Actual Actual Budget Actual 2018 2018 2017 2018 2018 2017 Note $000 $000 $000 $000 $000 $000REVENUE Government grants 4,5 243,554 241,732 237,585 242,261 240,438 236,300
Tuition fees 4 165,352 162,792 157,600 159,993 157,210 152,188
Trust donations 4 6,242 2,977 4,406 - - -
Investment revenue 4,7 7,323 17,294 33,960 5,998 2,014 6,514
Externally funded research 4 133,985 123,555 122,741 133,655 122,789 122,265
Performance-based research funding 4 63,410 63,573 60,201 63,410 63,573 60,201
Distributions from trust funds - - - 10,615 10,522 10,366
Consulting and commercial revenue 4 77,870 76,865 75,588 80,080 77,967 76,767
Sale of intellectual property 660 715 444 161 190 196
Other revenue 28,742 22,822 23,234 38,990 22,044 22,832
Total revenue 4 727,138 712,325 715,759 735,163 696,747 687,629
EXPENDITURE
Salaries - academic 219,025 215,179 210,772 216,842 213,111 208,820
Salaries - professional 165,959 161,439 162,699 162,844 158,222 159,041
Staff-related costs 25,156 25,192 29,730 24,976 24,963 29,510
Consumables and general 135,380 132,819 131,645 135,058 130,896 127,663
Depreciation and amortisation expense 6,12,13 66,162 63,978 61,785 65,980 63,771 61,583
Occupancy costs 42,276 42,543 40,103 42,252 41,786 40,084
Scholarships 45,616 44,864 43,999 45,616 44,864 43,999
Finance costs 7 (8) 482 213 211 482 310
Other expenses 6 607 551 573 454 551 408
Total operating expenditure 700,173 687,047 681,519 694,233 678,646 671,418
Surplus/(deficit) 26,965 25,278 34,240 40,930 18,101 16,211
Share of Associate OCI 1,465 - - - - -
Gain on revaluation of land and buildings - - 211,565 - - 211,565
Total Comprehensive Revenue & Expense 28,430 25,278 245,805 40,930 18,101 227,776
University of Otago Group 28,430 25,278 245,805 40,930 18,101 227,776
Non-controlling interest - - - - - -
28,430 25,278 245,805 40,930 18,101 227,776
Statement of Comprehensive Revenue and ExpenseFor the year ended 31 December 2018
The accompanying notes form part of these financial statements.
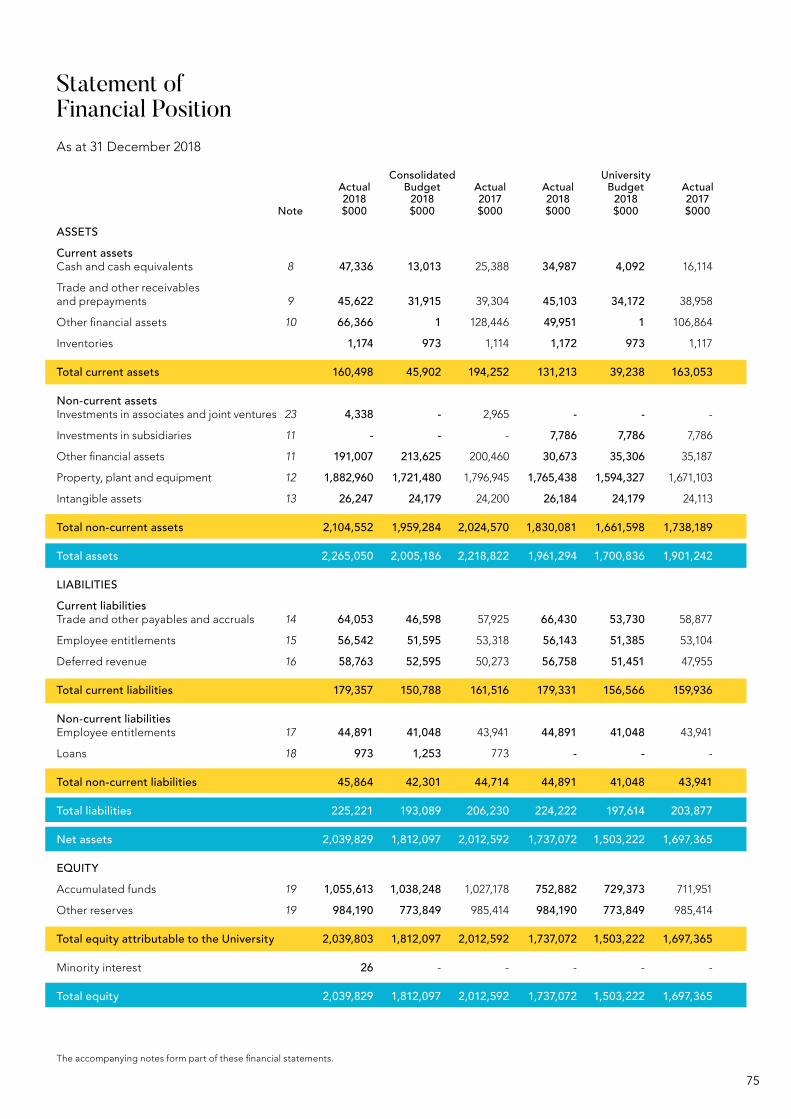
75
Statement of Financial PositionAs at 31 December 2018
The accompanying notes form part of these financial statements.
Consolidated University Actual Budget Actual Actual Budget Actual 2018 2018 2017 2018 2018 2017 Note $000 $000 $000 $000 $000 $000ASSETS Current assets Cash and cash equivalents 8 47,336 13,013 25,388 34,987 4,092 16,114
Trade and other receivables and prepayments 9 45,622 31,915 39,304 45,103 34,172 38,958
Other financial assets 10 66,366 1 128,446 49,951 1 106,864
Inventories 1,174 973 1,114 1,172 973 1,117
Total current assets 160,498 45,902 194,252 131,213 39,238 163,053
Non-current assets Investments in associates and joint ventures 23 4,338 - 2,965 - - -
Investments in subsidiaries 11 - - - 7,786 7,786 7,786
Other financial assets 11 191,007 213,625 200,460 30,673 35,306 35,187
Property, plant and equipment 12 1,882,960 1,721,480 1,796,945 1,765,438 1,594,327 1,671,103
Intangible assets 13 26,247 24,179 24,200 26,184 24,179 24,113
Total non-current assets 2,104,552 1,959,284 2,024,570 1,830,081 1,661,598 1,738,189
Total assets 2,265,050 2,005,186 2,218,822 1,961,294 1,700,836 1,901,242
LIABILITIES
Current liabilities Trade and other payables and accruals 14 64,053 46,598 57,925 66,430 53,730 58,877
Employee entitlements 15 56,542 51,595 53,318 56,143 51,385 53,104
Deferred revenue 16 58,763 52,595 50,273 56,758 51,451 47,955
Total current liabilities 179,357 150,788 161,516 179,331 156,566 159,936
Non-current liabilities Employee entitlements 17 44,891 41,048 43,941 44,891 41,048 43,941
Loans 18 973 1,253 773 - - -
Total non-current liabilities 45,864 42,301 44,714 44,891 41,048 43,941
Total liabilities 225,221 193,089 206,230 224,222 197,614 203,877
Net assets 2,039,829 1,812,097 2,012,592 1,737,072 1,503,222 1,697,365
EQUITY
Accumulated funds 19 1,055,613 1,038,248 1,027,178 752,882 729,373 711,951
Other reserves 19 984,190 773,849 985,414 984,190 773,849 985,414
Total equity attributable to the University 2,039,803 1,812,097 2,012,592 1,737,072 1,503,222 1,697,365
Minority interest 26 - - - - -
Total equity 2,039,829 1,812,097 2,012,592 1,737,072 1,503,222 1,697,365

UNIVERSITY OF OTAGO ANNUAL REPORT 2018
76
Consolidated University Actual Budget Actual Actual Budget Actual 2018 2018 2017 2018 2018 2017 Note $000 $000 $000 $000 $000 $000Balance at 1 January 2,012,597 1,786,819 1,765,972 1,697,365 1,485,121 1,469,594 Total comprehensive revenue and expenses previously reported 28,430 25,278 245,805 40,930 18,101 227,776
Capital injection from non-controlling interest 26 - - - - -
Non-controlling interest derecognised - - 815 - - -
Revaluation adjustment (1,224) - - (1,223) - -
Balance at 31 December 19 2,039,829 1,812,097 2,012,592 1,737,072 1,503,222 1,697,365
University of Otago Group 28,430 25,278 245,805 40,930 18,101 227,776
Total comprehensive revenue & expenses 28,430 25,278 245,805 40,930 18,101 227,776
Statement of Changes in EquityFor the year ended 31 December 2018
The accompanying notes form part of these financial statements.

77
Accounting policy Included in the Statement of Cash Flows is the year end balance - bank and deposits and bank overdraft which consists of cash on hand, bank account balances plus call deposits or call loans that form part of the day-to-day cash management of the University.
The cash flows are classified into three sources:
Operating activities Includes cash received from all income sources of the University and cash payments made for the supply of goods and services. Agency transactions are recognised as receipts and payments in the statements of cash flows given that they flow through the University’s main bank account.
Investing activities The sources and uses of cash in this category include the sale and purchase of long-term investments and purchases of land and buildings and other operational property, plant and equipment. Cash received from the sale of surplus and used assets is also recorded under this heading. Infrastructural assets include new assets and major work undertaken that improves the value of the asset from the depreciated replacement cost recorded in the statement of financial position.
Financing activities Under this category the cash received from new loans raised and the repayment of maturing debt is recorded. Short-term borrowings are loans with a fixed term of less than one year i.e. not repayable at call.
For the year ended 31 December 2018
Statement of Cash Flows
The accompanying notes form part of these financial statements.

UNIVERSITY OF OTAGO ANNUAL REPORT 2018
78
Consolidated University Actual Budget Actual Actual Budget Actual 2018 2018 2017 2018 2018 2017 Note $000 $000 $000 $000 $000 $000
Cash flows from operating activities Subsidies and grants received 304,994 305,305 297,786 303,701 304,014 295,138
Fees and charges received 177,858 175,054 169,923 172,455 169,143 164,427
Interest received 15,912 11,380 18,337 6,562 3,013 8,189
Receipts from other revenue 232,213 216,748 212,587 235,856 223,951 220,807
730,977 708,487 698,633 718,574 700,121 688,561
Payments to suppliers and employees 627,089 622,322 599,165 615,386 614,719 586,902
Net cash flow from operating activities 26 103,888 86,165 99,468 103,188 85,402 101,659
Cash flows from investing activities Receipts from sale of property, plant and equipment 624 28 191 618 18 168
Receipts from sale of investments 95,440 1,752 51,459 59,543 1,357 22,418
96,064 1,780 51,650 60,161 1,375 22,586
Purchase of property, plant and equipment 144,677 191,895 116,823 144,476 191,156 115,618
Acquisition of investments 33,327 - 23,238 - - -
Net cash flow from investing activities (81,940) (190,115) (88,411) (84,315) (189,781) (93,032)
Cash flows from financing activities Repayment of borrowings - - (9) - - -
Net cash flow from financing activities - - (9) - - -
Net (decrease)/increase in cash, cash equivalents and bank overdrafts 21,948 (103,950) 11,048 18,873 (104,379) 8,627
Cash, cash equivalents and bank overdrafts at the beginning of the year 25,388 116,963 14,340 16,114 108,471 7,487
Cash, cash equivalents and bank overdrafts at the end of the year 8 47,336 13,013 25,388 34,987 4,092 16,114
For the year ended 31 December 2018
Statement of Cash Flows continued
The accompanying notes form part of these financial statements.
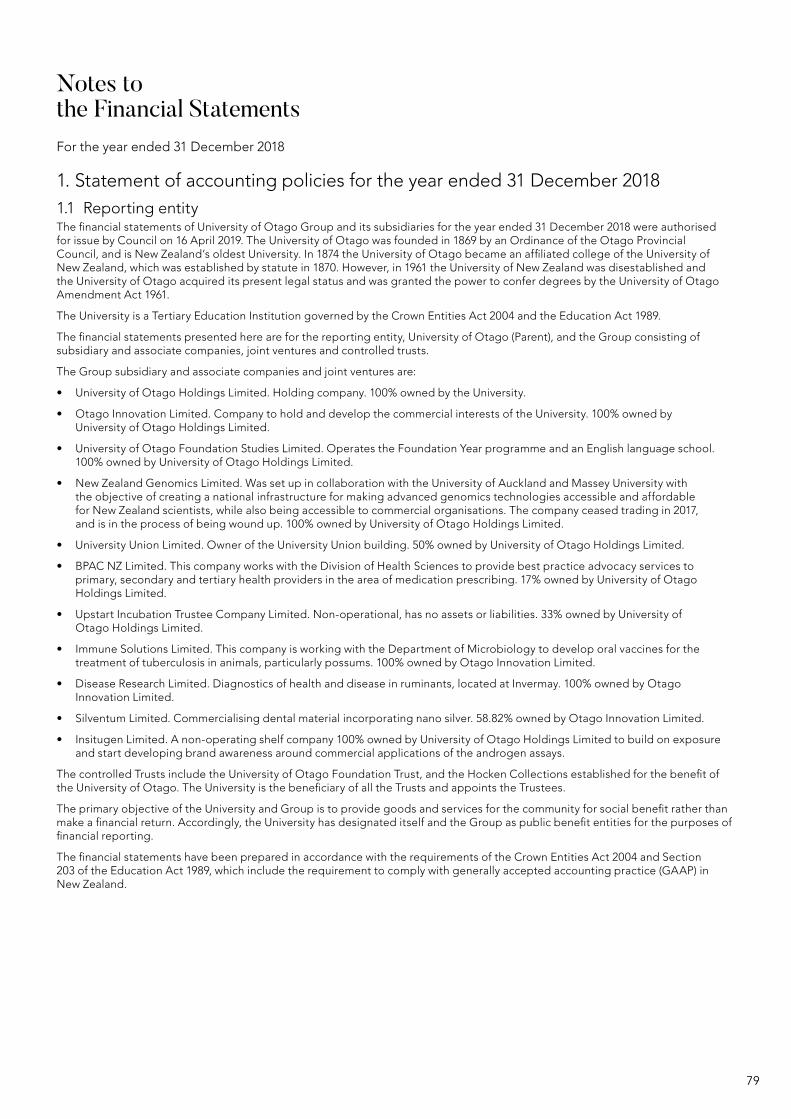
79
1. Statement of accounting policies for the year ended 31 December 2018 1.1 Reporting entity The financial statements of University of Otago Group and its subsidiaries for the year ended 31 December 2018 were authorised for issue by Council on 16 April 2019. The University of Otago was founded in 1869 by an Ordinance of the Otago Provincial Council, and is New Zealand’s oldest University. In 1874 the University of Otago became an affiliated college of the University of New Zealand, which was established by statute in 1870. However, in 1961 the University of New Zealand was disestablished and the University of Otago acquired its present legal status and was granted the power to confer degrees by the University of Otago Amendment Act 1961.
The University is a Tertiary Education Institution governed by the Crown Entities Act 2004 and the Education Act 1989.
The financial statements presented here are for the reporting entity, University of Otago (Parent), and the Group consisting of subsidiary and associate companies, joint ventures and controlled trusts.
The Group subsidiary and associate companies and joint ventures are:
• University of Otago Holdings Limited. Holding company. 100% owned by the University.
• Otago Innovation Limited. Company to hold and develop the commercial interests of the University. 100% owned by University of Otago Holdings Limited.
• University of Otago Foundation Studies Limited. Operates the Foundation Year programme and an English language school. 100% owned by University of Otago Holdings Limited.
• New Zealand Genomics Limited. Was set up in collaboration with the University of Auckland and Massey University with the objective of creating a national infrastructure for making advanced genomics technologies accessible and affordable for New Zealand scientists, while also being accessible to commercial organisations. The company ceased trading in 2017, and is in the process of being wound up. 100% owned by University of Otago Holdings Limited.
• University Union Limited. Owner of the University Union building. 50% owned by University of Otago Holdings Limited.
• BPAC NZ Limited. This company works with the Division of Health Sciences to provide best practice advocacy services to primary, secondary and tertiary health providers in the area of medication prescribing. 17% owned by University of Otago Holdings Limited.
• Upstart Incubation Trustee Company Limited. Non-operational, has no assets or liabilities. 33% owned by University of Otago Holdings Limited.
• Immune Solutions Limited. This company is working with the Department of Microbiology to develop oral vaccines for the treatment of tuberculosis in animals, particularly possums. 100% owned by Otago Innovation Limited.
• Disease Research Limited. Diagnostics of health and disease in ruminants, located at Invermay. 100% owned by Otago Innovation Limited.
• Silventum Limited. Commercialising dental material incorporating nano silver. 58.82% owned by Otago Innovation Limited.
• Insitugen Limited. A non-operating shelf company 100% owned by University of Otago Holdings Limited to build on exposure and start developing brand awareness around commercial applications of the androgen assays.
The controlled Trusts include the University of Otago Foundation Trust, and the Hocken Collections established for the benefit of the University of Otago. The University is the beneficiary of all the Trusts and appoints the Trustees.
The primary objective of the University and Group is to provide goods and services for the community for social benefit rather than make a financial return. Accordingly, the University has designated itself and the Group as public benefit entities for the purposes of financial reporting.
The financial statements have been prepared in accordance with the requirements of the Crown Entities Act 2004 and Section 203 of the Education Act 1989, which include the requirement to comply with generally accepted accounting practice (GAAP) in New Zealand.
For the year ended 31 December 2018
Notes to the Financial Statements

UNIVERSITY OF OTAGO ANNUAL REPORT 2018
80
For the year ended 31 December 2018
Notes to the Financial Statements continued
2. Summary of significant accounting policies The principal accounting policies applied in the preparation of these consolidated financial statements are set out below. These policies have been consistently applied to the opening balance sheets and reporting period to 31 December 2018, unless otherwise stated.
2.1 Basis of preparation The financial statements have been prepared on the going concern basis and the accounting policies have been applied consistently throughout the period unless otherwise stated.
Measurement base The accounting principles followed by the Group are those recognised as appropriate for the measurement and reporting of financial performance and financial position on a historical cost basis, with the exception that certain property, plant and equipment have been revalued and some other financial assets have been shown at fair value.
The financial statements have been prepared in accordance with tier 1 PBE accounting standards. These financial statements comply with PBE accounting standards.
Functional and presentation currencyThe financial statements are presented in New Zealand dollars and all values are rounded to the nearest thousand dollars ($’000). The functional currency of the University and its subsidiaries, associates and joint ventures is New Zealand dollars.
Transactions and balances in foreign currencies are converted at the New Zealand rate of exchange ruling at the date of the transaction and balance date respectively. Foreign exchange gains and losses have been recognised in the surplus or deficit.
Budget figuresThe budget figures have been prepared in accordance with NZ GAAP and are consistent with the accounting policies adopted by the University for the preparation of the financial statements. The budget was approved by Council on 14 November 2017.
Reclassification of prior year balancesWhere the presentation of balances has been changed in the current year, prior year balances have also been reclassified for consistency.
Standards, amendments and interpretations issued that are not yet effective and have not been early adoptedIn January 2017 the External Reporting Board issued PBE IPSAS 35 “Consolidated Financial Statements”. These have not been early adopted by the University and Group.
Other amendmentsWhile there are other amendments issued and not yet effective, the University and Group does not consider these to be relevant and therefore no information has been disclosed about these amendments.
Critical accounting estimates and assumptionsIn preparing these financial statements, estimates and assumptions have been made concerning the future. These estimates and assumptions may differ from the subsequent actual results. Estimates and assumptions are continually evaluated and are based on historical experience and other factors, including expectations or future events that are believed to be reasonable under the circumstances. The estimates and assumptions that have a significant risk of causing a material adjustment to the carrying amounts of assets and liabilities within the next financial year are discussed below.
Property revaluationsNote 12 provides information about the estimates and assumptions exercised in the measurement of revalued land, buildings and infrastructure.
Retirement gratuitiesNote 17 provides information about the estimates and assumptions exercised in the measurement of retirement gratuities.
2.2 Basis of consolidation The consolidated financial statements are prepared adding together like items of assets, liabilities, equity, revenue and expenses on a line-by-line basis. All significant intragroup balances, transactions, revenue and expenses are eliminated on consolidation.
The financial statements include the operations of the University of Otago, its subsidiary and associate companies and its controlled trusts. The subsidiary companies and trusts have been included in the consolidated accounts by line aggregation of assets, liabilities, revenues, expenses and cash flows. Associate companies have been consolidated on an equity accounting basis, which shows the share of the surpluses/deficits in the University’s Statement of Comprehensive Revenue and Expenditure and the share of post-acquisition increases/decreases in net assets in the University’s Statement of Financial Position.
2.3 Income Tax and Goods and Services Tax The University Group is exempt from income tax. Accordingly, no provision has been made for income tax.
The financial statements are prepared on a basis which excludes GST. Accounts receivable and accounts payable are GST inclusive. GST owing to the Inland Revenue Department as at 31 December 2018 is included in trade payables.

81
2.4 ACC Partnership Programme The University belongs to the ACC Partnership Programme at the secondary level whereby the University accepts the management of workplace injuries through rehabilitation, case management, injury prevention and work safety management practices. Under the ACC Partnership Programme, the University is effectively providing accident insurance to employees. The value of this liability represents the expected future payments in relation to accidents and illnesses occurring up to the balance date for which the University has responsibility under the terms of the Partnership Programme.
The liability for claims reported prior to balance date has been determined by assuming that the future experience for each current claim is consistent with historical claim information since the commencement of the programme. The liability for injuries or illnesses that have occurred up to balance date, but not yet reported or not enough reported, has been determined by reference to historical information of the time it takes to report injury or illness.
The value of the liability is measured at the present value of the future payments for which the University has responsibility. The value of the liability includes a risk margin that represents the inherent uncertainty of the present value of the expected future payments. No allowance has been made in the financial statements for an ACC liability, as it is deemed to be immaterial.
3. Financial instruments The Group’s activities expose it to a variety of financial instrument risks, including market risk, credit risk and liquidity risk. The University and Group have a series of policies to manage the risks associated with financial instruments.
To manage and limit the effects of those risks, the University Council has approved policy guidelines and authorised the use of various financial instruments. Compliance is monitored monthly and deviations from the target are reported to the Finance and Budget Committee, the University of Otago Foundation Trust or the Foreign Exchange Risk Management Committee.
(a) Financial instrument categories
The accounting policies for financial instruments have been applied to the line items below:
Consolidated University 2018 2017 2018 2017 $000 $000 $000 $000
FINANCIAL ASSETS Fair value through surplus or deficit – held for tradingListed shares 139,413 155,103 386 443
Unlisted shares 4,241 4,424 - -
Total fair value through surplus or deficit – held for trading 143,654 159,527 386 443
Loans and receivables Cash and cash equivalents 47,337 25,388 34,988 16,114
Receivables 35,309 29,125 34,892 28,890
Other financial assets:
- Term deposits 66,516 121,870 49,500 105,500
- Loans 5,739 11,107 5,739 11,107
- Corporate bonds 41,465 36,401 - -
- Shares in subsidiaries - - 7,786 7,786
- Investment in in-substance subsidiary - - 25,000 25,000
- Investments in associates and joint ventures 4,338 2,965 - -
Total loans and receivables 200,704 226,856 157,905 194,397 FINANCIAL LIABILITIES Financial liabilities at amortised cost Payables 64,053 57,925 66,430 58,877
Loans and leases 973 773 - -
Total financial liabilities at amortised cost 65,026 58,698 66,430 58,877

UNIVERSITY OF OTAGO ANNUAL REPORT 2018
82
(b) Market risk
Currency risk is the risk that the fair value or future cash flows of a financial instrument will fluctuate due to changes in foreign exchange rates.
The University purchases goods and services from overseas exposing it to currency risk. The University of Otago Foundation Trust’s investment portfolio invests in shares and bonds denominated in foreign currency, which also exposes it to currency risk.
The University and Group manage currency risks associated with the purchase of goods and services from overseas that are above specified amounts by entering into forward foreign exchange contracts. This allows the University and Group to fix the New Zealand dollar amount payable prior to the payment date. Hedge accounting is not applied. The Group has a Foreign Exchange Risk Management Committee that oversees this risk by applying the foreign exchange policy approved by Council.
The University of Otago Foundation Trust’s investment portfolio’s exposure to currency risk is mitigated to an extent through diversification of investments across different currencies in accordance with the investment policy.
The Group’s exposure to foreign currency risk at the reporting date was as follows:
2018 2017 USD AUD EUR GBP USD AUD EUR GBP $000 $000 $000 $000 $000 $000 $000 $000
Cash and cash equivalents 2,033 21 232 217 181 87 109 29 foreign bank accounts
Equities 5,879 1,078 7,068 58,748
Price risk Price risk is the risk that the fair value or future cash flows of a financial instrument will fluctuate as a result of changes in market prices. Equity securities price risk arises on listed share investments, which are classified as available for sale investments.
The price sensitivity impact on the surplus is based on a 5% movement in each of the following indexes with all other variables held constant.
Consolidated Impact on the surplus Impact on equity Index Actual Actual Actual Actual 2018 2017 2018 2017 $000 $000 $000 $000
ASX 200 2,685 3,231 2,685 3,231
NZX50 3,848 4,025 3,848 4,025
NYSE International 100 438 499 438 499
Interest rate risk Fair value interest rate risk is the risk that the value of a financial instrument will fluctuate due to changes in market interestrates. Investments issued at fixed rates of interest create exposure to fair value interest rate risk. The University and Groupdo not actively manage their exposure to fair value interest rate risk. Surplus after tax (the Group) Equity (the Group) Movement in interest rate: 2018 2017 2018 2017 $000 $000 $000 $000
0.5% (50 basis points) higher for the year
Interest received 417 472 417 472
Explanation of interest rate risk sensitivity The interest rate sensitivity is based on a reasonable possible movement in interest rates, with all other variables held constant, measured as a basis points (bps) movement. For example, a decrease in 50 bps is equivalent to a decrease in interest rates of 0.5%.
For the year ended 31 December 2018
Notes to the Financial Statements continued

83
(c) Credit risk
The University and Group have no significant concentrations of credit risk. Credit risk is the risk that a third party will default on its obligation to the University and Group, causing the University and Group to incur a deficit. Credit risk arises from cash and cash equivalents, deposits with banks and financial institutions, credit exposures to receivables and other debtors as well as derivative financial instruments.
In the normal course of business, the University and Group are exposed to credit risk from cash and term deposits with banks, debtors and other receivables, corporate bonds, listed shares, other loans and pledged donations. For each of these, the maximum credit exposure is best represented by the carrying amount in the Statement of Financial Position.
The University and Group control the amount of credit exposure to any one financial institution for cash and term deposits by limiting the maximum funds that can be placed on deposit. The maximum deposit that can be held in any single registered bank, where the bank has a Standard and Poor’s credit rating of at least AA-, is 33% of the value of deposits. This reduces to 5% where the bank has a Standard and Poor’s credit rating of at least BBB.
The University and Group hold no collateral or other credit enhancements for financial instruments that give rise to credit risk.
Maximum exposure to credit risk The University and Group’s maximum credit exposures for each class of financial instruments are as follows:
Consolidated University 2018 2017 2018 2017 $000 $000 $000 $000
Cash at bank and term deposits 113,852 147,258 84,488 121,614
Receivables 35,308 29,125 34,892 28,890
Loans 5,739 11,107 5,739 11,107
Corporate bonds 41,465 36,401 - -
Total credit risk 196,364 223,891 125,119 161,611
Credit quality of financial assetsThe credit quality of financial assets that are neither past due nor impaired can be assessed by reference to Standard and Poor’s credit ratings (if available) or to historical information about counter-party default rates.
Impairment of a loan or receivable is established when there is objective evidence that the University and Group will not be able to collect amounts due according to the original terms of the debt. Significant financial difficulties of the debtor, probability that the debtor will enter into bankruptcy and default in payments are considered indicators that the asset is impaired. The amount of the impairment is the difference between the asset’s carrying amount and the present value of estimated future cash flows, discounted using the original effective interest rate. For debtors and other receivables, the carrying amount of the asset is reduced through the use of a provision account and the amount of the loss is recognised in the surplus or deficit. When the receivable is uncollectable, it is written off against the provision account. Overdue receivables that have been renegotiated are reclassified as current (i.e. not past due). For other Financial Assets, impairment losses are recognised directly against the instrument’s carrying amount.
Consolidated University 2018 2017 2018 2017 $000 $000 $000 $000
Counter-parties with credit ratings Cash at bank and term bank deposits
AA- 91,596 132,155 73,488 109,614
A 14,103 7,000 11,000 7,000
BBB 8,051 8,103 - 5,000
Total cash at bank and term deposits 113,750 147,258 84,488 121,614

UNIVERSITY OF OTAGO ANNUAL REPORT 2018
84
Consolidated University 2018 2017 2018 2017 $000 $000 $000 $000
Stock and government bonds
AA+ 1,055 - - -
AA 1,760 1,732 - -
AA- 6,599 11,543 - -
A+ 1,023 1,014 - -
A 1,520 1,529 - -
A- 6,499 4,429 - -
BBB+ 13,573 6,719 - -
BBB 2,945 1,011 - -
BB- - 870 - -
Not rated 6,489 7,554 - -
Total corporate bonds 41,463 36,401 - -
Counter-parties without credit ratings Debtors and other receivables 35,308 29,125 34,892 28,890
Existing counter-party with no defaults in the past 5,739 11,107 5,739 11,107
Total community and related-party loans 41,047 40,232 40,631 39,997
(d) Liquidity risk
Liquidity risk is the risk that the University and the Group will encounter difficulty raising funds to meet commitments as they fall due.
Prudent liquidity risk management implies maintaining sufficient cash and liquid assets, the availability of funding through an adequate amount of committed credit facilities and the ability to close out market positions.
The University and Group manage liquidity risk by continuously monitoring forecast and actual cash flow requirements and matching the maturity profiles of financial assets and liabilities.
Contractual maturity analysis of financial liabilitiesThe table below analyses financial liabilities into relevant maturity groupings based on the remaining period at balance date to the contractual maturity date.
Less than Between Between Over Total Carrying 1 year 1 and 2 2 and 5 5 years contractual amount years years cashflows (assets)/ liabilities $000 $000 $000 $000 $000 $000
CONSOLIDATED 2018
Financial assets Cash and cash equivalents 47,337 - - - 47,337 47,337
Bank term deposits 66,516 - - - 66,516 66,516
Receivables 35,309 - - - 35,309 35,309
Corporate bonds 41,465 - - - 41,465 41,465
Loans 5,738 - - - 5,738 5,738
Total financial assets 196,365 - - - 196,365 196,365
For the year ended 31 December 2018
Notes to the Financial Statements continued

85
Less than Between Between Over Total Carrying 1 year 1 and 2 2 and 5 5 years contractual amount years years cashflows (assets)/ liabilities $000 $000 $000 $000 $000 $000
Financial liabilities Payables and accruals 64,053 - - - 64,053 64,053
Loans - - - 973 973 973
Total financial liabilities 64,053 - - 973 65,026 65,026
CONSOLIDATED 2017
Cash and cash equivalents 25,388 - - - 25,388 25,388
Bank term deposits 119,214 1,523 1,133 - 121,870 121,870
Receivables 29,125 - - - 29,125 29,125
Corporate bonds 7,869 7,862 14,218 6,452 36,401 36,401
Loans 1,364 557 1,692 7,494 11,107 11,107
Total financial assets 182,960 9,942 17,043 13,946 223,891 223,891
Financial liabilities Payables and accruals 57,925 - - - 57,925 57,925
Loans - - - 773 773 773
Total financial liabilities 57,925 - - 773 58,698 58,698
UNIVERSITY 2018
Financial assets Cash and cash equivalents 34,988 - - - 34,988 34,988
Bank term deposits 49,500 - - - 49,500 49,500
Receivables 34,892 - - - 34,892 34,892
Loans 451 444 1,190 3,654 5,739 5,739
Total financial assets 119,831 444 1,190 3,654 125,119 125,119
Financial liabilities
Payables and accruals 66,430 - - - 66,430 66,430
Total financial liabilities 66,430 - - - 66,430 66,430
UNIVERSITY 2017
Financial assets Cash and cash equivalents 16,114 - - - 16,114 16,114
Bank term deposits 105,500 - - - 105,500 105,500
Receivables 28,890 - - - 28,890 28,890
Loans 1,364 557 1,692 7,494 11,107 11,107
Total financial assets 151,868 557 1,692 7,494 161,611 161,611
Financial liabilities Payables and accruals 58,877 - - - 58,877 58,877
Total financial liabilities 58,877 - - - 58,877 58,877

UNIVERSITY OF OTAGO ANNUAL REPORT 2018
86
The table below analyses the Group’s non-derivative financial liabilities and net-settled derivative financial liabilities into relevant maturity groupings based on the remaining period at the Statement of Financial Position date to the contractual maturity date. Derivative financial liabilities are included in the analysis if their contractual maturities are essential for an understanding of the timing of the cash flows. The amounts disclosed in the table are the contractual undiscounted cash flows.
Less than Between Between Between Total Carrying 1 month 1 and 3 3 and 12 1 and 2 amount months months years liabilities $000 $000 $000 $000 $000 $000
CONSOLIDATED - ACTUAL 2018 Forward foreign exchange contracts 1,499 327 - - 1,826 1,826
Less than Between Between Between Total Carrying 1 month 1 and 3 3 and 12 1 and 2 amount months months years liabilities $000 $000 $000 $000 $000 $000
CONSOLIDATED - ACTUAL 2017 Forward foreign exchange contracts 2,661 595 10,401 1,499 15,156 15,156
Less than Between Between Between Total Carrying 1 month 1 and 3 3 and 12 1 and 2 amount months months years liabilities $000 $000 $000 $000 $000 $000
UNIVERSITY - ACTUAL 2018 Forward foreign exchange contracts 1,499 327 - - 1,826 1,826
Less than Between Between Between Total Carrying 1 month 1 and 3 3 and 12 1 and 2 amount months months years liabilities $000 $000 $000 $000 $000 $000
UNIVERSITY - ACTUAL 2017Forward foreign exchange contracts 2,661 595 10,401 1,499 15,156 15,156
For the year ended 31 December 2018
Notes to the Financial Statements continued

87
(e) Fair value estimation
For those instruments recognised at fair value in the statement of financial position, fair values are determined according to the following hierarchy:
• Quoted market price (level 1) – Financial instruments with quoted prices for identical instruments in active markets
• Valuation techniques using observable inputs (level 2) – Financial instruments with quoted prices for similar instruments in active markets or quoted prices for identical or similar instruments in inactive markets and financial instruments valued using models where all significant inputs are observable
• Valuation techniques with significant non-observable inputs (level 3) – Financial instruments valued using models where one or more significant inputs are not observable.
The following table analyses the basis of the valuation of classes of financial instruments measured at fair value in the Statement of Financial Position:
Total Quoted Observable Significant market price inputs non-observable inputs31 DECEMBER 2018 - CONSOLIDATED
Financial assets Cash and cash equivalents 47,337 47,337 - -
Bank term deposits 66,516 66,516 - -
Corporate bonds 41,465 41,465 - -
Listed shares 139,413 - 139,413 -
Investments in associates and joint ventures 4,338 - 4,338 -
Shares in unlisted companies 4,241 - 4,241 -
Loans 5,739 - 5,739 -
Total financial assets 309,049 155,318 153,731 -
Total Quoted Observable Significant market price inputs non-observable inputs31 DECEMBER 2017 - CONSOLIDATED
Financial assets Cash and cash equivalents 25,388 25,388 - -
Bank term deposits 119,214 119,214 - -
Corporate bonds 36,401 36,401 - -
Listed shares 155,103 155,103 - -
Investments in associates and joint ventures 2,965 - 2,965 -
Shares in unlisted companies 4,424 - - 4,424
Loans 11,107 - 11,107 -
Total financial assets 354,602 336,106 14,072 4,424

UNIVERSITY OF OTAGO ANNUAL REPORT 2018
88
Total Quoted Observable Significant market price inputs non-observable inputs31 DECEMBER 2018 - UNIVERSITY
Financial assets Cash and cash equivalents 34,988 34,988 - -
Bank term deposits 49,500 49,500 - -
Listed shares 386 386 - -
Shares in subsidiaries 7,786 - 7,786 -
Investment in in-substance subsidiary 25,000 - 25,000 -
Loans 5,739 - 5,739 -
Total financial assets 123,399 84,874 38,525 -
Total Quoted Observable Significant market price inputs non-observable inputs31 DECEMBER 2017 - UNIVERSITY
Financial assets Cash and cash equivalents 16,114 16,114 - -
Bank term deposits 105,500 105,500 - -
Listed shares 443 443 - -
Shares in subsidiaries 7,786 - 7,786 -
Investment in in-substance subsidiary 25,000 - 25,000 -
Loans 11,107 - 11,107 -
Total financial assets 165,950 122,057 43,893 -
For the year ended 31 December 2018
Notes to the Financial Statements continued

89
4. Revenue summaryAccounting policyGovernment GrantsGovernment grants are recognised as revenue upon completion of services for which the grant was made. Where obligations are attached to a government grant, a liability is recognised. Once the obligation is discharged, the government grant is recognised as revenue.
Student achievement component (SAC) fundingSAC funding is the University’s main source of operational funding from the Tertiary Education Commission (TEC). The University considers SAC funding to be non-exchange and recognises SAC funding as revenue when the course withdrawal date has passed, based on the number of eligible students enrolled in the course at that date and the value of the course.
Tuition feesDomestic student tuition fees are subsidised by government funding and are considered non-exchange. Revenue is recognised when the course withdrawal date has passed, which is when a student is no longer entitled to a refund for withdrawing from the course.
International student tuition fees are accounted for as exchange transactions and recognised as revenue on a course percentage of completion basis. The percentage of completion is measured by reference to the days of the course completed as a proportion of the total course days.
Scholarships awarded by the University that reduce the amount of tuition fees payable by the student are accounted for as an expense and not offset against student tuition fees revenue.
Fees freeThe University considers fees free revenue is non-exchange and recognises revenue when the course withdrawal date has been passed by an eligible student. The University has presented funding received for fees free as part of student fees. This is on the basis that receipts from TEC are for payment on behalf of the student as specified by the relevant funding mechanism. The amount received in 2018 was $24.475 million.
DonationsUnrestricted donations are recognised as revenue upon receipt.
Where the consolidated entity receives a donation with obligations, a liability is recognised. Once the obligation is discharged, the donation is recognised as revenue.
Donated assets are recognised at fair value.
Donations and bequests are recognised as revenue when the right to receive the fund or asset has been established, unless there is an obligation in substance to return the funds if conditions of the donation or bequest are not met. If there is such an obligation, they are initially recorded as revenue in advance when received and recognised as revenue when the conditions are satisfied. Pledges are not recognised as assets or revenue until the pledged item is received.
Research and contractsThe University exercises its judgement in determining whether funding received under a research contract is received in an exchange or non-exchange transaction. In determining whether a research contract is exchange or non-exchange, the University considers factors such as the following:
• Whether the funder has substantive rights to the research output. This is a persuasive indicator of exchange or non-exchange
• How the research funds were obtained. For example, whether through a commercial tender process for specified work or from applying to a more general research funding pool
• Nature of the funder
• Specificity of the research brief or contract.
For an exchange research contract, revenue is recognised on a percentage completion basis. The percentage of completion is measured by reference to the actual research expenditure incurred as a proportion to total expenditure expected to be incurred.
For a non-exchange research contract, the total funding receivable under the contract is recognised as revenue immediately, unless there are substantive conditions in the contract. If there are substantive conditions, revenue is recognised when the conditions are satisfied. A condition could include the requirement to complete research to the satisfaction of the funder, to retain funding or return unspent funds. Revenue for future periods is not recognised where the contract contains substantive termination provisions for failure to comply with the requirements of the contract.
Conditions and termination provisions need to be substantive, which is assessed by considering factors such as contract monitoring mechanisms of the funder and the past practice of the funder.
Judgement is often required in determining the timing of revenue recognition for contracts that span a balance date and multi-year research contracts.

UNIVERSITY OF OTAGO ANNUAL REPORT 2018
90
Other grants receivedOther grants are recognised as revenue when they become receivable unless there is an obligation in substance to return the funds if conditions of the grant are not met. If there is such an obligation, the grants are initially recorded as grants received in advance when received and recognised as revenue when the conditions of the grant are satisfied.
Performance-Based Research Fund (PBRF)The University considers PBRF funding to be non-exchange in nature. PBRF funding is specifically identified by the TEC as being for a funding period as required by section 159YA of the Education Act 1989. The University recognises its confirmed allocation of PBRF funding at the commencement of the specified funding period, which is the same as the University’s financial year. PBRF revenue is measured based on the University’s funding entitlement adjusted for any expected adjustments as part of the final wash-up process. Indicative funding for future periods is not recognised until confirmed for that future period.
Consulting and commercial revenueService income is recognised as revenue throughout the period of delivery of the service.
Revenue from the sale of goods is recognised when the Group has transferred to the buyer the significant risks and rewards of ownership of the goods.
Dividend and interest revenueDividend revenue from investments is recognised when the shareholders’ rights to receive payment have been established. Interest revenue is recognised on a time-proportionate basis using the effective interest rate method.
Accommodation servicesRevenue from the provision of accommodation services is recognised throughout the period of delivery of service.
For the year ended 31 December 2018
Notes to the Financial Statements continued
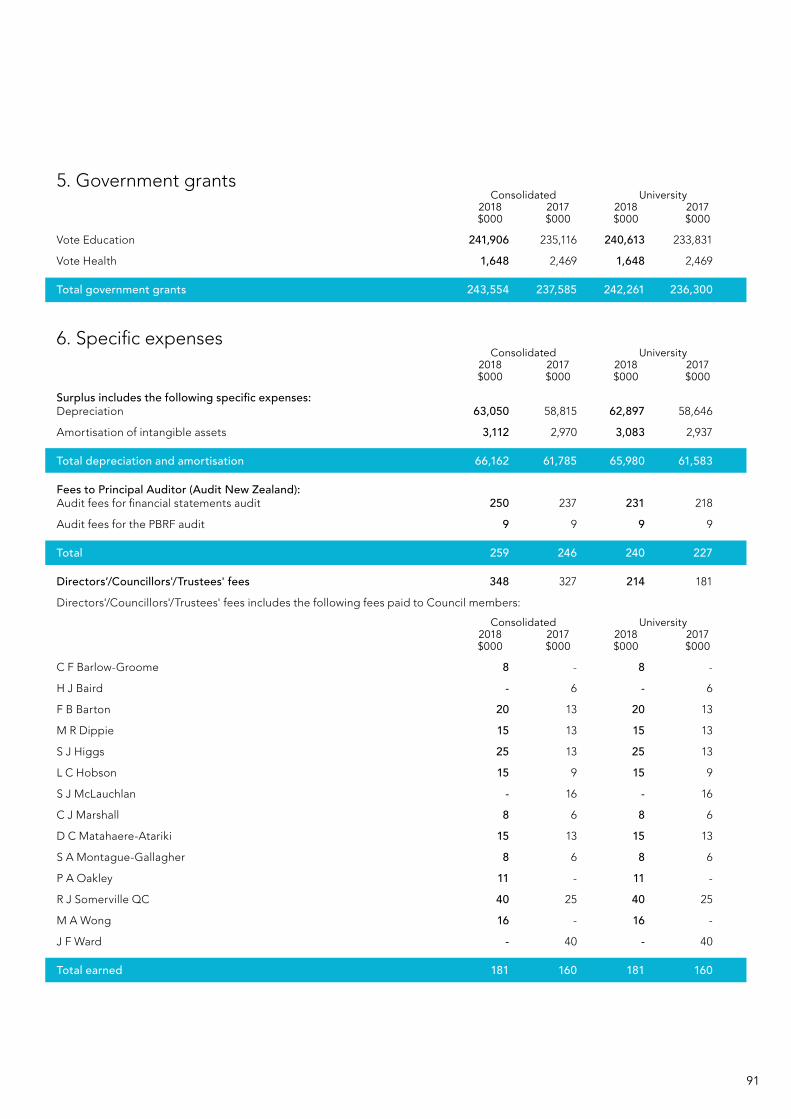
91
5. Government grants Consolidated University 2018 2017 2018 2017 $000 $000 $000 $000
Vote Education 241,906 235,116 240,613 233,831
Vote Health 1,648 2,469 1,648 2,469
Total government grants 243,554 237,585 242,261 236,300
6. Specific expenses Consolidated University 2018 2017 2018 2017 $000 $000 $000 $000
Surplus includes the following specific expenses: Depreciation 63,050 58,815 62,897 58,646
Amortisation of intangible assets 3,112 2,970 3,083 2,937
Total depreciation and amortisation 66,162 61,785 65,980 61,583
Fees to Principal Auditor (Audit New Zealand): Audit fees for financial statements audit 250 237 231 218
Audit fees for the PBRF audit 9 9 9 9
Total 259 246 240 227
Directors’/Councillors'/Trustees' fees 348 327 214 181
Directors'/Councillors'/Trustees' fees includes the following fees paid to Council members:
Consolidated University 2018 2017 2018 2017 $000 $000 $000 $000
C F Barlow-Groome 8 - 8 -
H J Baird - 6 - 6
F B Barton 20 13 20 13
M R Dippie 15 13 15 13
S J Higgs 25 13 25 13
L C Hobson 15 9 15 9
S J McLauchlan - 16 - 16
C J Marshall 8 6 8 6
D C Matahaere-Atariki 15 13 15 13
S A Montague-Gallagher 8 6 8 6
P A Oakley 11 - 11 -
R J Somerville QC 40 25 40 25
M A Wong 16 - 16 -
J F Ward - 40 - 40
Total earned 181 160 181 160

UNIVERSITY OF OTAGO ANNUAL REPORT 2018
92
Consolidated University 2018 2017 2018 2017 $000 $000 $000 $000
Director and Trustee remuneration S J Higgs 18 18 - -
L C Hobson 3 - - -
S J McLauchlan 23 23 - -
P A Oakley 10 - - -
R J Somerville QC 3 3 - -
J F Ward 24 24 - -
81 68 - -
No Council members received compensation or benefits in relation to cessation (2017 Nil) - - - -
262 228 181 160
Rental expense relating to operating leases Minimum lease payments 9,228 9,014 9,213 9,029
Total rental expense relating to operating leases 9,228 9,014 9,213 9,029
7. Finance revenue and finance costs Consolidated University 2018 2017 2018 2017 $000 $000 $000 $000
Finance revenue Interest received 8,447 9,590 5,848 6,741
Realised gain/(loss) on sale of investments 3,701 1,710 - -
Dividends received 4,846 5,518 - -
Gain/(loss) forex unrealised (1,286) 2,316 207 -
Unrealised gain/(loss) on revaluations of investments (8,385) 14,826 (57) (227)
Total finance revenue 7,323 33,960 5,998 6,514
Finance costs Interest paid (8) 213 211 310
Total finance costs (8) 213 211 310
8. Cash and cash equivalentsCash and cash equivalents include cash on hand, deposits held at call with banks, other short-term highly liquid investments with original maturities of three months or less, and bank overdrafts.
Consolidated University 2018 2017 2018 2017 $000 $000 $000 $000
Cash at bank and on hand 19,862 19,389 7,487 11,114
Short-term deposits maturing three months or less from date of acquisitions 27,474 5,999 27,500 5,000
Total cash and cash equivalents 47,336 25,388 34,987 16,114
For the year ended 31 December 2018
Notes to the Financial Statements continued

93
9. Trade and other receivables and prepayments Consolidated University 2018 2017 2018 2017 $000 $000 $000 $000
Trade debtors 13,453 13,982 13,018 13,807
Other receivables 21,855 15,142 21,874 15,083
Prepayments 10,314 10,180 10,211 10,068
Total trade and other receivables and prepayments 45,622 39,304 45,103 38,958
The ageing profile of trade receivables is as follows: At Actual
Current 6,644 7,509 6,568 7,475
2 to 3 months 6,105 6,083 5,787 6,028
> 3 months 704 390 663 304
Total gross trade receivables 13,453 13,982 13,018 13,807
Any impairment or write-offs of trade receivables is based on analysis of past history, and a review of specific debtors’ balances greater than 3 months. Amounts not considered recoverable are written off in the period in which they are identified.
Student fees are invoiced before a course begins or are due upon enrolment if the course has already begun.
Student fee receivables are non-interest bearing and are generally settled 20 days following date of invoice. Therefore, their carrying value approximates their fair value.
Other receivables are non-interest bearing and are generally settled on the 20th of the month following date of invoice. Therefore, the carrying value of other receivables approximates their fair value.
10. Other financial assetsAccounting policyFinancial assets are classified into the following categories for the purpose of measurement:
• fair value through surplus or deficit;
• loans and receivables;
• held-to-maturity investments; and
• fair value through other comprehensive income.
The classification of a financial asset depends on the purpose for which the instrument was acquired.
Financial assets at fair value through surplus or deficitFinancial assets at fair value through surplus or deficit include financial assets held for trading. A financial asset is classified in this category if acquired principally for the purpose of selling in the short-term or it is part of a portfolio of identified financial instruments that are managed together and for which there is evidence of short-term profit-taking.
University investments in its subsidiaries are carried at cost. Investments in associate companies are valued at cost plus the share of retained profits.
Investments held by the Group include State Owned Enterprises stock, local authority stock, bank bonds, commercial bonds and listed equities. The fair values of these investments are based on quoted market prices at balance date.
After initial recognition, financial assets in this category are measured at their fair values with gains or losses on remeasurement recognised in the surplus or deficit.

UNIVERSITY OF OTAGO ANNUAL REPORT 2018
94
Loans and receivablesLoans and receivables are non-derivative financial assets with fixed or determinable payments that are not quoted in an active market. They are included in current assets, except for maturities greater than 12 months after the balance date, which are included in non-current assets.
After initial recognition, they are measured at amortised cost, using the effective interest method, less impairment. Gains and losses when the asset is impaired or derecognised are recognised in the surplus or deficit.
Held-to-maturity investmentsHeld-to-maturity investments are non-derivative financial assets with fixed or determinable payments and fixed maturities and there is the positive intention and ability to hold to maturity. They are included in current assets, except for maturities greater than 12 months after balance date, which are included in non-current assets.
The University and Group have no investments in this category.
Fair value through other comprehensive revenue and expenseFinancial assets at fair value through other comprehensive revenue and expense are those that are designated into the category at initial recognition or are not classified in any of the other categories above. They are included in non-current assets unless management intends to dispose of, or realise the investment within 12 months of balance date.
The University and Group have no investments in this category.
Term deposits Term deposits are initially measured at the amount invested. Where applicable, interest is subsequently accrued and added to the investment balance.
Consolidated University 2018 2017 2018 2017 $000 $000 $000 $000
Current portion Other loans 451 1,364 451 1,364
Short-term deposits 58,249 119,214 49,500 105,500
Corporate bonds 7,666 7,868 - -
Total current portion 66,366 128,446 49,951 106,864
The maturity profile for current other financial assets is as follows:
Consolidated University 2018 2017 2018 2017 $000 $000 $000 $000
Less than 1 yearOther loans 451 1,364 451 1,364
Short-term deposits with maturities of greater than 3 months from acquisition 58,249 119,214 49,500 105,500
Corporate bonds 7,666 7,868 - -
Total current portion 66,366 128,446 49,951 106,864
For the year ended 31 December 2018
Notes to the Financial Statements continued

95
11. Non-current assets - Other financial assets and investments in subsidiaries Consolidated University 2018 2017 2018 2017 $000 $000 $000 $000
Non-current portion Investment in subsidiaries Shares in University of Otago Holdings Ltd 100% owned subsidiary, domiciled in New Zealand Balance date 31 December - - 7,786 7,786
Total investment in subsidiaries - - 7,786 7,786
Investment in other entities Long term bank deposits 8,267 2,657 - -
Loans and receivables 5,287 9,744 5,287 9,744
Corporate bonds 33,799 28,532 - -
47,353 40,933 5,287 9,744
Other listed securities Shares in other companies 139,413 155,103 386 443
139,413 155,103 386 443
Other unlisted securities Equity securities 4,241 4,424 - -
4,241 4,424 - -
Investment in in-substance subsidiary - - 25,000 25,000 University of Otago Foundation Trust: 100% controlled trust, domiciled in New Zealand
- - 25,000 25,000
Total investment in other entities 191,007 200,460 30,673 35,187
The maturity profile for non-current other financial assets is as follows:
Consolidated University 2018 2017 2018 2017 $000 $000 $000 $000
1 to 5 years Other loans 1,634 2,249 1,634 2,249
Short-term deposits with maturities of 1-5 years 8,267 2,657 - -
Corporate bonds 22,139 22,080 - -
More than 5 years Other loans 3,653 7,495 3,653 7,495
Corporate bonds 11,660 6,452 - -
Shares in listed companies 139,413 155,103 386 443
Shares in unlisted companies 4,241 4,424 - -
Shares in subsidiary - - 7,786 7,786
Investment in in-substance subsidiary - - 25,000 25,000
Total term portion 191,007 200,460 38,459 42,973

UNIVERSITY OF OTAGO ANNUAL REPORT 2018
96
Investment in in-substance subsidiary is carried at cost in the parent entity financial statements.
Term deposits
The carrying amount of term deposits approximates their fair value.
BondsBonds are valued at market bid prices.
Investments are carried at fair value through profit or loss and transaction costs are recognised in the Statement of Comprehensive Revenue and Expense.
LoansThe face value of loans is $7.772 million (2017 $11.107 million).
Loans and receivables are non-derivative financial assets with fixed or determinable payments that are not quoted in an active market. Such assets are carried at amortised cost using the effective interest method less any provision for impairment. Gains or losses are recognised in the surplus or deficit when the loans and receivables are derecognised or impaired. These are included in current assets, except for those with maturities greater than 12 months after balance date, which are classified as non-current.
Unlisted sharesUnlisted shares are recognised at fair value.
For investments with no active market, fair values are determined using valuation methods. Investments whose fair values cannot be reliably measured are accounted for at cost and amortised where necessary.
Listed sharesListed shares are recognised at fair value. The fair values of listed shares are determined by reference to published current bid price quotations in an active market.
Investments in quoted shares are initially measured at fair value plus transaction costs.
Interest free loansOther loans are recognised when the loan value is transferred to the other party and contract documents signed. The fair value of these loans is the face value. The University expects the loan repayment instalments to be repaid and the agreements to be honoured.
Total interest free loans outstanding are $7.337 million (2017 $8.484 million). The net present value of these loans at a discount rate of 4.00% is $5.304 million (2017 $6.258 million).
Movements in the carrying value of loans are as follows:
Consolidated University 2018 2017 2018 2017 $000 $000 $000 $000
At 1 January 11,107 12,031 11,107 12,031
Amount of new loans granted during the year 9 1 9 1
Fair value adjustment on initial recognition (2,033) - (2,033) -
Loans repaid during the year (principal and interest) (3,344) (925) (3,344) (925)
At 31 December 5,739 11,107 5,739 11,107
Loans have been advanced to various affiliated Colleges for upgrades of their accommodation facilities for use by students of the University of Otago. Mortgages have been raised over the freehold interest in the properties in each case.
For the year ended 31 December 2018
Notes to the Financial Statements continued

97
12. Property, plant and equipmentAccounting policyThe University’s land and buildings are revalued when there has been a significant movement in the market value or depreciated replacement cost. They were revalued on 31 December 2017 in accordance with “PBE IPSAS 17 Property, Plant and Equipment” and the New Zealand Property Institute’s Valuation Standard 3, “Valuations for Financial Reporting”.
The basis of valuation was as follows:
The valuation was completed by a Registered Valuer employed by the University and has been reviewed by an independent Registered Valuer (Chapman Consultancy (2008) Limited) and confirmed as appropriate for financial reporting purposes;
Land was valued at market value;
Land fair value, using market-based evidence, is based on the highest and best use of the land, with reference to comparable land values;
Restrictions on the University’s ability to sell land are reflected in the valuation to recognise that additional time and costs would be involved in selling any land due to these restrictions;
Specialised buildings and improvements were valued at depreciated replacement cost; and non-specialised buildings and improvements were valued at market value;
Specialised buildings are buildings designed for educational purposes. They are valued using depreciated replacement cost because no reliable market data is available for such buildings.
Depreciated replacement cost is determined using a number of significant assumptions. Significant assumptions used in the December 2017 valuation include:
The replacement costs of the specific assets are adjusted where appropriate for optimisation due to over-design or surplus capacity;
The replacement cost is derived from recent construction contracts of modern equivalent assets and consultation with other valuers and quantity surveyers;
Valuations have been adjusted to take account of known building faults including the need to strengthen some structures and to comply with current fire regulations;
The remaining useful life of assets is estimated after considering factors such as the condition of the asset, future maintenance and replacement plans and experiance with similar buildings;
Straight-line depreciation has been applied in determining the depreciated replacement cost value of the asset;
Non-specialised buildings (for example, residential buildings and storage facilities), are valued at fair value using marked-based evidence. Significant assumptions in the 31 December 2017 valuation include market rents and capitalisation rates.
Key assumptions and special conditions:• Remaining useful lives and other strategic considerations are based on:
• The university’s capital expenditure and strategic asset management plan
• Seismic assessment programme close-out report
• Fire penetrations assessment
• Discussions with facilities managers.
No revaluation was deemed necessary in 2018.
Restrictions on title:Under the Education Act 1989, the University is required to obtain consent from the Ministry of Education to dispose of land and buildings. For plant and equipment, there is an asset disposal limit formula, which provides a limit up to which a Tertiary Education Institution may dispose of plant and equipment without seeking the approval from the Ministry of Education. Detailed information on the asset disposal rules can be found on the Tertiary Education Commission website.
Costs incurred in researching and determining the feasibility of acquiring a fixed asset, prior to final approval to purchase, have been recognised as an expense.
All Crown-owned land and buildings (if any) used by the University are included as part of the University’s assets. Although legal title has not been transferred, the University has assumed all the normal risks and rewards of ownership.
Capital work in progress is valued at cost less impairment and is not depreciated.
Library books and periodicals, with the exception of rare books and special library collections, have been valued at cost less accumulated depreciation less impairment. Library electronic resources in the form of annual subscriptions are written off at the time of purchase.

UNIVERSITY OF OTAGO ANNUAL REPORT 2018
98
Rare books and special library collections were valued as at 31 December 1994 by expert University Library staff, based on the net current value of items following the generally accepted methodology employed by the Alexander Turnbull Library. Any additions to the collection have been valued at cost (Refer Note 29).
The Hocken Library Collections were revalued at 1 January 2006 by an independent Registered Valuer (Peter Webb Galleries). The value represents deemed cost. Any additions since 1 January 2006 have been valued at cost (Refer Note 28).
University artworks were valued at 1 January 2006 by an independent Registered Valuer (Peter Webb Galleries). The value represents deemed cost. Any additions since 1 January 2006 have been valued at cost.
Plant, motor vehicles, equipment and furniture are recorded at cost less accumulated depreciation and impairment losses.
Asset purchases of less than $2,000 are expensed at cost on acquisition, with the exception of furniture and computers which are capitalised regardless of cost.
Impairment - property, plant and equipment that have a finite useful life are reviewed for impairment whenever events or changes in circumstances indicate that an impairment has occurred. Impairment losses are recognised in the Statement of Comprehensive Revenue and Expense.
DepreciationDepreciation is provided on a straight-line basis on all property, plant, and equipment other than land and heritage collections, at rates that will write off the cost (or valuation) of the assets to their estimated residual values over their useful lives. Heritage collections are not depreciated because they are maintained such that they have indefinite or sufficiently long useful lives that any depreciation is considered negligible.
The useful lives and associated depreciation rates of major classes of assets have been estimated as follows:
Class of asset depreciated Estimated useful life Depreciation rates
Buildings and components
Site improvements 50 years 2.0%
Structure including walls 30 to 250 years 0.4% to 3.3%
Roof 25 to 100 years 1.0% to 4.0%
Plumbing 40 to 50 years 2.0% to 2.5%
Lifts 40 years 2.5%
Heating and ventilation 30 to 50 years 2.0% to 3.3%
Fume cupboards 15 years 6.7%
Floor coverings and chattels 10 to 40 years 2.5% to 10.0%
Fit out 30 to 75 years 1.3% to 3.3%
Fire protection 40 to 60 years 1.7% to 2.5%
Electrical 40 to 50 years 2.0% to 2.5%
Data network 20 years 5.0%
Infrastructure 10 to 50 years 2% to 10%
Motor vehicles and trailers 3 to 10 years 10% to 33.3%
Furniture and fittings 5 to 10 years 10% to 20%
Plant and equipment 4 to 60 years 1.7% to 25.0%
Computers and photocopiers 4 to 10 years 10.0% to 25.0%
ipads and similar tablet devices 3 years 33.3%
Library collections 5 to 10 years 10.0% to 20.0%
For the year ended 31 December 2018
Notes to the Financial Statements continued

99
Lib
rary
H
ocke
n
Land
B
uild
ing
s C
omp
uter
s Fu
rnitu
re
Art
wor
ks
boo
ks
colle
ctio
n Ra
re b
ooks
Eq
uip
men
t To
tal
$0
00
$000
$0
00
$000
$0
00
$000
$0
00
$000
$0
00
$000
CONS
OLI
DATE
D 20
17
Gro
ss c
arry
ing
am
oun
t
Co
st
20,2
52
226,
123
58
,611
17
,670
10
,577
15
0,93
1
-
9,87
2
263,
187
75
7,22
3
Valu
atio
n 23
8,61
3
853,
854
-
- -
- -
-
-
1,
092,
467
Balan
ce a
s at 1
Janu
ary 2
017
258,
865
1,0
79,97
7
58,61
1
17,6
70
10,5
77
150,9
31
- 9,8
72
263,1
87
1,84
9,690
Year
end
ed 3
1 De
cem
ber 2
017
Rev
alua
tio
n
9,20
1
113,
200
- -
- -
-
-
-
12
2,40
1
Ad
dit
ions
53
1
90,0
29
5,40
6
1,24
4
319
3,
563
-
57
12
,903
11
4,05
2
Dis
po
sals
-
- (2
,387
) (1
,862
) -
(9,3
03)
-
-
(5,1
79)
(18,
731)
Tran
sfer
s /
adju
stm
ents
-
(3,1
18)
(30)
33
7
- -
-
-
1,53
5 (1
,276
)
Balan
ce a
s at 3
1 De
cem
ber 2
017
268,
597
1,
280,
088
61
,600
17
,389
10
,896
14
5,191
-
9,929
27
2,44
6 2,
066,1
36
CONS
OLI
DATE
D 20
18
Balan
ce a
s at 1
Janu
ary 2
018
268,
597
1,
280,
088
61
,600
17
,389
10
,896
14
5,191
-
9,929
27
2,44
6
2,06
6,136
Ad
dit
ions
5,
956
12
0,54
0
6,67
4
2,00
7
288
2,
738
1,36
1 73
20
,373
16
0,01
0
Dis
po
sals
(3
,303
) (6
,903
) (2
,722
) (1
,844
) -
(6,5
34)
-
-
(9,4
26)
(30,
732)
Ho
cken
no
w li
sted
sep
arat
ely
-
- -
-
- (1
13,5
35)
113,
535
-
-
-
Tran
sfer
s /
adju
stm
ents
-
(204
) (1
3)
172
6
-
-
-
(142
) (1
81)
Balan
ce a
s at 3
1 De
cem
ber 2
018
271,
250
1,
393,
521
65
,539
17
,724
11
,190
27
,860
11
4,89
6
10,0
02
283,
251
2,1
95,2
33

UNIVERSITY OF OTAGO ANNUAL REPORT 2018
100
Lib
rary
H
ocke
n
Land
B
uild
ing
s C
omp
uter
s Fu
rnitu
re
Art
wor
ks
boo
ks
colle
ctio
n Ra
re b
ooks
Eq
uip
men
t To
tal
$0
00
$000
$0
00
$000
$0
00
$000
$0
00
$000
$0
00
$000
CONS
OLI
DATE
D 20
17
Accu
mul
ated
dep
recia
tion
Co
st
- (6
0,34
3)
(43,
301)
(1
0,01
0)
- (2
5,37
7)
- -
(179
,614
) (3
18,6
45)
Balan
ce a
s at 1
Janu
ary 2
017
- (6
0,34
3)
(43,
301)
(10
,010
) -
(25,
377)
-
- (17
9,614
) (3
18,6
45)
Year
end
ed 3
1 De
cem
ber 2
017
Rev
alua
tio
n
- 90
,029
-
- -
- -
-
-
90
,029
Dis
po
sals
-
- 2,
373
1,
818
-
9,30
3
-
- 4,
747
18
,241
Dep
reci
atio
n ch
arg
e (N
ote
6)
- (2
9,78
7)
(5,9
23)
(1,6
42)
- (3
,117
) -
-
(1
8,34
7)
(58,
816)
Tran
sfer
s /
adju
stm
ents
-
- -
- -
- -
-
-
-
Balan
ce a
s at 3
1 De
cem
ber 2
017
- (10
1)
(46,
851)
(9,
834)
-
(19,19
1)
- -
(193,
214)
(2
69,19
1)
CONS
OLI
DATE
D 20
18
Balan
ce a
s at 1
Janu
ary 2
018
- (10
1)
(46,
851)
(9,
834)
-
(19,19
1)
- -
(193,
214)
(2
69,19
1)D
isp
osa
ls
- -
2,68
2
1,77
8
- 6,
534
-
-
8,79
3
19,7
87
Dep
reci
atio
n ch
arg
e (N
ote
6)
- (3
5,28
8)
(5,9
87)
(1,7
57)
- (2
,747
) -
-
(1
7,27
1)
(63,
050)
Tran
sfer
s /
adju
stm
ents
-
102
(5
) -
- -
- -
84
18
1
Balan
ce a
s at 3
1 De
cem
ber 2
018
- (3
5,28
7)
(50,1
61)
(9,81
3)
- (15
,404
) -
- (2
01,6
08)
(312
,273
)
Net
boo
k valu
e
As a
t 1 Ja
nuar
y 201
7 25
8,86
5
1,019
,634
15
,310
7,6
60
10,5
77
125,
554
-
9,872
83
,573
1,
531,0
45
As a
t 31
Dece
mbe
r 201
7 26
8,59
7 1,
279,9
87
14,74
9
7,555
10
,896
12
6,00
0
- 9,9
29
79,2
32
1,796
,945
As a
t 31
Dece
mbe
r 201
8 27
1,25
0
1,35
8,23
4
15,3
78
7,911
11
,190
12
,456
11
4,89
6
10,0
02
81,6
43
1,88
2,960
For the year ended 31 December 2018
Notes to the Financial Statements continued

101
Lib
rary
H
ocke
n
Land
B
uild
ing
s C
omp
uter
s Fu
rnitu
re
Art
wor
ks
boo
ks
colle
ctio
n Ra
re b
ooks
Eq
uip
men
t To
tal
$0
00
$000
$0
00
$000
$0
00
$000
$0
00
$000
$0
00
$000
UNIV
ERSI
TY 2
017
Gros
s car
ryin
g am
ount
C
ost
17
,190
21
9,43
8
58,1
43
17,2
53
10,5
77
38,3
84
-
9,87
2
262,
289
63
3,14
6
Valu
atio
n 23
8,61
3
853,
854
-
- -
- -
-
-
1,
092,
467
Balan
ce a
s at 1
Janu
ary 2
017
255,
803
1,0
73,2
92
58,14
3
17,2
53
10,5
77
38,3
84
- 9,8
72
262,
289
1,7
25,61
3
Year
end
ed 3
1 De
cem
ber 2
017
Rev
alua
tio
n
9,20
1
113,
200
-
- -
- -
-
-
12
2,40
1
Ad
dit
ions
39
7
88,1
30
5,37
3
1,22
5
319
2,
575
-
57
12
,899
11
0,97
5
Dis
po
sals
-
- (2
,332
) (1
,792
) -
(9,3
03)
-
-
(5,1
03)
(18,
530)
Tran
sfer
s /
adju
stm
ents
-
(3,1
18)
(30)
33
7
- -
-
-
1,53
7
(1,2
74)
Balan
ce a
s at 3
1 De
cem
ber 2
017
265,
401
1,
271,
504
61
,154
17
,023
10
,896
31
,656
-
9,929
27
1,62
2
1,939
,185
UNIV
ERSI
TY 2
018
Bal
ance
as
at 1
Jan
uary
201
8 26
5,40
1
1,27
1,50
4
61,1
54
17,0
23
10,8
96
31,6
56
-
9,92
9
271,
622
1,
939,
185
Rev
alua
tio
n -
- -
- -
-
- -
- -
Ad
dit
ions
5,
955
12
0,54
0 6,
629
2,
005
28
8
2,73
8
-
72
20,2
24
158,
451
Dis
po
sals
(3
20)
(468
) (2
,722
) (1
,782
) -
(6,5
34)
-
-
(9,1
99)
(21,
025)
Tran
sfer
s /
adju
stm
ents
-
(203
) (1
1)
173
6
-
-
-
(127
) (1
62)
Balan
ce a
s at 3
1 De
cem
ber 2
018
271,0
36
1,39
1,37
3
65,0
50
17,4
19
11,19
0
27,8
60
- 10
,001
28
2,52
0
2,07
6,44
9
UNIV
ERSI
TY 2
017
Accu
mul
ated
dep
recia
tion
Co
st
- (6
0,28
6)
(42,
927)
(9
,738
) -
(25,
377)
-
-
(1
79,2
12)
(317
,540
)
Balan
ce a
s at 1
Janu
ary 2
017
- (6
0,28
6)
(42,9
27)
(9,73
8)
- (2
5,37
7)
- -
(179,2
12)
(317
,540
)
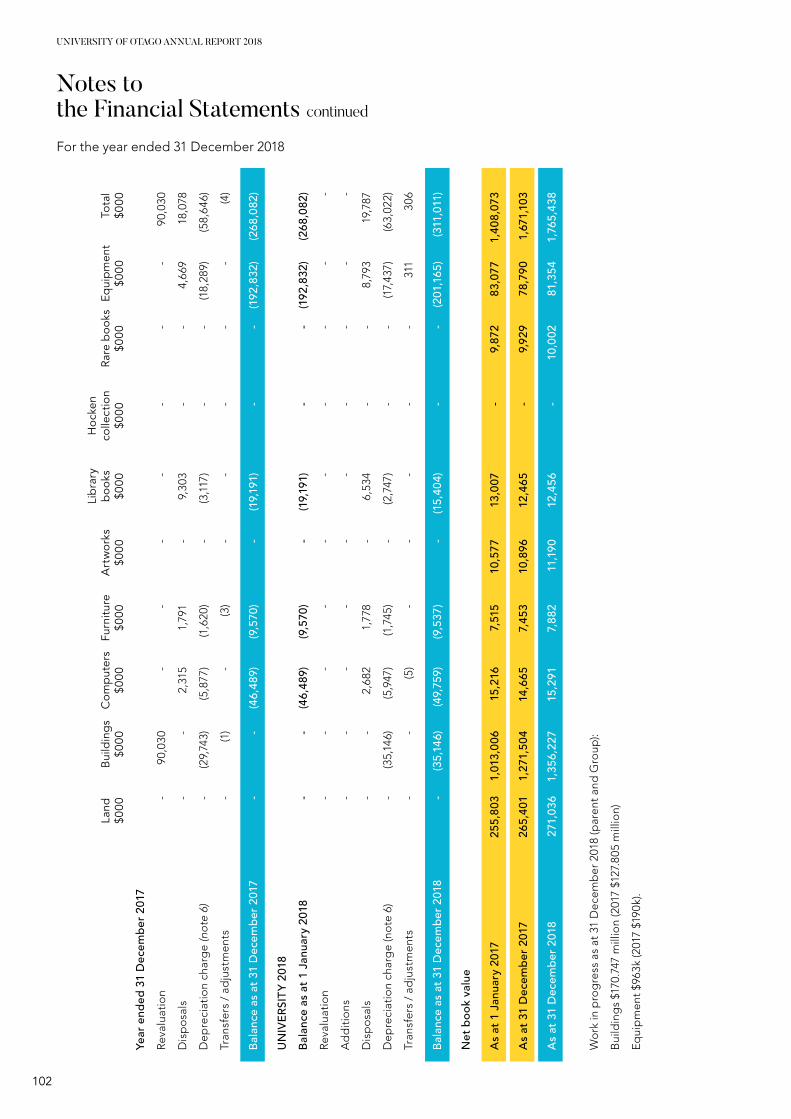
UNIVERSITY OF OTAGO ANNUAL REPORT 2018
102
Lib
rary
H
ocke
n
Land
B
uild
ing
s C
omp
uter
s Fu
rnitu
re
Art
wor
ks
boo
ks
colle
ctio
n Ra
re b
ooks
Eq
uip
men
t To
tal
$0
00
$000
$0
00
$000
$0
00
$000
$0
00
$000
$0
00
$000
Year
end
ed 3
1 De
cem
ber 2
017
Rev
alua
tio
n -
90
,030
-
- -
- -
-
-
90
,030
Dis
po
sals
-
- 2,
315
1,
791
-
9,30
3
-
-
4,66
9
18,0
78
Dep
reci
atio
n ch
arg
e (n
ote
6)
- (2
9,74
3)
(5,8
77)
(1,6
20)
- (3
,117
) -
-
(1
8,28
9)
(58,
646)
Tran
sfer
s /
adju
stm
ents
-
(1)
- (3
) -
- -
-
-
(4)
Balan
ce a
s at 3
1 De
cem
ber 2
017
- -
(46,
489)
(9,
570)
-
(19,19
1)
- -
(192,
832)
(2
68,0
82)
UNIV
ERSI
TY 2
018
Balan
ce a
s at 1
Janu
ary 2
018
- -
(46,
489)
(9,
570)
-
(19,19
1) -
- (19
2,83
2)
(268
,082
)R
eval
uati
on
- -
- -
- -
-
-
-
-
Ad
dit
ions
-
- -
- -
- -
-
-
-
Dis
po
sals
-
- 2,
682
1,
778
-
6,53
4
-
-
8,79
3
19,7
87
Dep
reci
atio
n ch
arg
e (n
ote
6)
- (3
5,14
6)
(5,9
47)
(1,7
45)
- (2
,747
) -
-
(1
7,43
7)
(63,
022)
Tran
sfer
s /
adju
stm
ents
-
- (5
) -
- -
-
-
311
30
6
Balan
ce a
s at 3
1 De
cem
ber 2
018
- (3
5,146
) (4
9,759
) (9,
537)
-
(15,4
04)
- -
(201
,165)
(3
11,0
11)
Net
boo
k valu
e
As a
t 1 Ja
nuar
y 201
7 25
5,80
3
1,013
,006
15
,216
7,5
15
10,5
77
13,0
07
- 9,8
72
83,0
77
1,40
8,07
3
As a
t 31
Dece
mbe
r 201
7 26
5,40
1
1,27
1,50
4
14,6
65
7,453
10
,896
12
,465
-
9,929
78
,790
1,
671,1
03
As a
t 31
Dece
mbe
r 201
8 27
1,036
1,
356,
227
15
,291
7,8
82
11,19
0
12,4
56
- 10
,002
81
,354
1,7
65,4
38 W
ork
in p
rog
ress
as
at 3
1 D
ecem
ber
201
8 (p
aren
t and
Gro
up):
Bui
ldin
gs
$170
.747
mill
ion
(201
7 $1
27.8
05 m
illio
n)
Equi
pm
ent $
963k
(201
7 $1
90k)
.
For the year ended 31 December 2018
Notes to the Financial Statements continued

103
13. Intangible assetsAccounting policyCosts that are directly associated with the development of software for internal use are recognised as an intangible asset. Direct costs include the software development employee costs and an appropriate portion of relevant overheads.
Costs incurred in researching and determining the feasibility of acquiring computer software, prior to final approval to purchase, have been recognised as an expense.
Acquired computer software is capitalised on the basis of the costs incurred to acquire and bring to use the specific software, subsequent to final approval to purchase.
Costs associated with maintaining computer software are recognised as an expense when incurred.
AmortisationThe carrying value of an intangible asset with a finite life is amortised on a straight-line basis over its useful life.
Amortisation begins when the asset is available for use and ceases at the date that the asset is derecognised. The amortisation charge for each period is recognised in the surplus or deficit.
The useful lives and associated amortisation rates of major classes of intangible assets have been estimated as follows:
Class of intangible asset Estimated useful life Amortisation rates
Computer software 3 to 25 years 4% to 33.3%
Computer software $000
CONSOLIDATED 2017
Gross carrying amount Cost 49,351
Balance as at 1 January 2017 49,351
Year ended 31 December 2017
Additions 3,210
Adjustments (117)
Impairment charge -
Disposals (2,011)
Balance as at 31 December 2017 50,433
CONSOLIDATED 2018
Balance as at 1 January 2018 50,433
Additions 4,967
Adjustments 199
Disposals (43)
Balance as at 31 December 2018 55,556

UNIVERSITY OF OTAGO ANNUAL REPORT 2018
104
Computer software $000
CONSOLIDATED 2017
Accumulated amortisation and impairment Cost (23,796)
Balance as at 1 January 2017 (23,796)
Year ended 31 December 2017
Amortisation charge (2,969)
Disposals 532
Balance as at 31 December 2017 (26,233)
CONSOLIDATED 2018
Balance as at 1 January 2018 (26,233) Amortisation charge (3,112)
Disposals 36
Balance as at 31 December 2018 (29,309)
Net book value
As at 1 January 2017 25,555
As at 31 December 2017 24,200
As at 31 December 2018 26,247
UNIVERSITY 2017
Gross carrying amount Cost 48,767
Balance as at 1 January 2017 48,767
Additions 2,023
Adjustments (117)
Transferred to patents -
Impairment charge -
Disposals (539)
Balance as at 31 December 2017 50,134
For the year ended 31 December 2018
Notes to the Financial Statements continued

105
Computer software $000
UNIVERSITY 2018
Balance as at 1 January 2018 50,134
Year ended 31 December 2018
Additions 4,961
Adjustments 200
Impairment charge -
Disposals (43)
Balance as at 31 December 2018 55,252
UNIVERSITY 2017
Accumulated amortisation and impairment Cost (23,591)
Balance as at 1 January 2017 (23,591)
Disposals 507
Amortisation charge (2,937)
Balance as at 31 December 2017 (26,021)
UNIVERSITY 2018
Balance as at 1 January 2018 (26,021)
Year ended 31 December 2018Disposals 36
Amortisation charge (3,083)
Balance as at 31 December 2018 (29,068)
Net book value
As at 1 January 2017 25,176
As at 31 December 2017 24,113
As at 31 December 2018 26,184
Work in progress as at 31 December 2018 (University and Group) was $3.429 million (2017 $1.321 million).

UNIVERSITY OF OTAGO ANNUAL REPORT 2018
106
14. Trade and other payables and accrualsCreditors and other payables are obligations to pay for goods or services that have been acquired in the ordinary course of business from suppliers. They are classified as current liabilities if payment is due within one year or less. If not, they are presented as non-current liabilities.
Payables are non-interest bearing and are settled on the 20th of the month following date of invoice. Therefore, the carrying value of payables approximates their fair value.
Consolidated University 2018 2017 2018 2017 $000 $000 $000 $000
Current Trade payables 13,930 11,651 13,706 11,439
Accruals 26,962 22,843 26,849 20,526
Other payables 23,161 23,431 25,875 26,912
Total creditors and other payables 64,053 57,925 66,430 58,877
15. Current liabilities - employee entitlementsShort-term employee entitlementsEmployee benefits expected to be settled within 12 months after the end of the period in which the employee renders the related service are measured based on accrued entitlements at current rates of pay.
These include salaries and wages accrued up to balance date, annual leave earned to, but not yet taken at balance date.
Defined contribution/benefit schemesEmployer contributions to multi-employer defined benefit plans: Consolidated $2.095 million (2017 $2.209 million), Parent $2.095 million (2017 $2.209 million).
Employer contributions to defined contribution schemes: Consolidated $16.865 million, (2017 $15.652 million), Parent $16.865 million, (2017 $15.652 million).
Consolidated University Actual Actual Actual Actual 2018 2017 2018 2017 $000 $000 $000 $000Current portion Annual leave 30,555 30,795 30,199 30,609
Long service leave 1,014 1,020 1,014 1,020
Retirement gratuities 17,359 17,275 17,359 17,275
Accrued wages 7,614 4,228 7,571 4,200
Total current portion 56,542 53,318 56,143 53,104
16. Current liabilities - deferred revenue Consolidated University 2018 2017 2018 2017 $000 $000 $000 $000
Research funding in advance 42,023 37,523 42,023 37,523
Student fees in advance 13,710 9,739 11,892 7,616
Other income in advance 3,030 3,011 2,843 2,816
Total current liabilities - deferred income 58,763 50,273 56,758 47,955
Deferred revenue from tuition fees includes both liabilities recognised for domestic student fees received for which the course withdrawal date has not yet passed and for international student fees, which is based on the percentage completion of the course. Deferred revenue from research contracts includes both liabilities recognised for research funding with unsatisfied conditions (non-exchange contracts) and liabilities for exchange research funding received in excess of costs incurred to date on the required research.
For the year ended 31 December 2018
Notes to the Financial Statements continued

107
17. Non-current liabilities - employee entitlementsLong-term employee entitlements Employee benefits that are due to be settled beyond 12 months after the end of the period in which the employee renders the related service, such as long service leave and retirement gratuities, have been calculated on an actuarial basis. The calculations are based on:
• likely future entitlements accruing to staff, based on years of service, years to entitlement, the likelihood that staff will reach the point of entitlement, and contractual entitlement information; and
• the present value of the estimated future cash flows.
Sick leave, annual leave, vested long service leave, and non-vested long service leave and retirement gratuities expected to be settled within 12 months of balance date, are classified as a current liability. All other employee entitlements are classified as a non-current liability.
Wages and salaries, annual leave and sick leaveLiabilities for wages and salaries, including non-monetary benefits, annual leave and accumulating sick leave expected to be settled within 12 months of the reporting date are recognised in other payables in respect of employees’ services up to the reporting date and are measured at the amounts expected to be paid when the liabilities are settled. Liabilities for non-accumulating sick leave are recognised when the leave is taken and measured at the rates paid or payable.
Long service leaveThe liability for long service leave is recognised in the provision for employee benefits and measured as the present value of expected future payments to be made in respect of services provided by employees up to the reporting date using the projected unit credit method. Consideration is given to expected future wage and salary levels, experience of employee departures and periods of service. Expected future payments are discounted using market yields at the reporting date on national government bonds with terms to maturity and currency that match, as closely as possible, the estimated future cash outflows.
Retirement benefit obligationsA liability or asset in respect of defined benefit superannuation plans is recognised in the Statement of Financial Position, and is measured as the present value of the defined benefit obligation at the reporting date plus unrecognised actuarial gains (less unrecognised actuarial losses) less the fair value of the superannuation fund’s assets at that date and any unrecognised past service cost. The present value of the defined benefit obligation is based on expected future payments which arise from membership of the fund to the reporting date, calculated annually by independent actuaries using the projected unit credit method. Consideration is given to expected future wage and salary levels, experience of employee departures and periods of service.
The actuarial assessment of retiring gratuities, long service leave and sick leave is performed by Eriksen & Associates Ltd annually.
Critical assumptions: The assumed long run rate of CPI inflation is 2% to which was added .5% per annum for secular salary increases, demographic assumptions were based on the experience of the Government Superannuation Fund and key economic assumptions were taken from prescribed Treasury rates calculated as at 31 December 2018.
Consolidated University 2018 2017 2018 2017 $000 $000 $000 $000
Retirement gratuities 41,925 40,783 41,925 40,783
Long service leave 1,925 2,075 1,925 2,075
Sick Leave 1,041 1,083 1,041 1,083
Total non-current portion 44,891 43,941 44,891 43,941

UNIVERSITY OF OTAGO ANNUAL REPORT 2018
108
18. Non-current liabilities - loans Consolidated University 2018 2017 2018 2017 $000 $000 $000 $000
Loans - external trusts 763 773 - -
Callaghan innovation loan 210 - - -
Total non-current liabilities - loans 973 773 - -
The maturity profile for non-current liabilities is as follows:
Consolidated University 2018 2017 2018 2017 $000 $000 $000 $000
0-1 years - - - -
1-5 years - - - -
More than 5 years 973 773 - -
Total non-current liabilities 973 773 - -
External trust loansNon-current loans represent funds held on behalf of an external trust (the Canterbury Health Care of the Elderly Education Trust) where the University of Otago is not the sole beneficiary on cessation of the trust. The funds from this trust have been invested in the University of Otago Foundation Trust and investment income is allocated to this fund monthly.
Callaghan innovation loanThe unsecured pre-incubation loan from Callaghan Innovation to Upstream Medical Technologies Ltd bears interest of 3% per annum. The loan becomes repayable only once Upstream Medical Technologies begins generating commercial revenue.
For the year ended 31 December 2018
Notes to the Financial Statements continued

109
19. EquityAccounting policyEquity is the community’s interest in the University and is measured as the difference between total assets and total liabilities. Equity is disaggregated and classified into the following components:
• General funds
• Property revaluation reserves.
Property revaluation reserve: This reserve relates to the revaluation of land and buildings to fair value.
The breakdown of accumulated funds and reserves are disclosed as follows:
Consolidated University 2018 2017 2018 2017 $000 $000 $000 $000
Accumulated funds Balance at 1 January 1,027,183 991,699 711,952 695,740
Share of Associate OCI 1,465 - - -
Adjustment - 1,244 - -
Surplus/(deficit) for the year 26,965 34,240 40,930 16,211
Balance at 31 December 1,055,613 1,027,183 752,882 711,951
Consolidated University 2018 2017 2018 2017 $000 $000 $000 $000
Reserves includes Revaluation reserves 985,655 985,414 984,190 985,414
Total reserves 985,655 985,414 984,190 985,414
Revaluation Reserves Balance at 1 January 985,414 773,849 985,414 773,849
Net revaluation adjustment (1,224) 211,565 (1,224) 211,565
Balance at 31 December 984,190 985,414 984,190 985,414

UNIVERSITY OF OTAGO ANNUAL REPORT 2018
110
20. Contingencies Consolidated University 2018 2017 2018 2017 $000 $000 $000 $000Contingent liabilities The University provided a guarantee to the Bank of New Zealand for a bond given by the bank to the Dunedin City Council, over the siting of some temporary buildings. 50 50 50 50
There were several personal grievance and employment related claims against the University. 20 40 20 40
Legal proceedings against the University - - - -
Total contingent liabilities 70 90 70 90
Compensation claimsThere are a number of issues that the University is addressing in order to become fully compliant with the Holidays Act. These issues relate to very specific employment situations where people’s hours of work have varied over the course of a year. Because of the complex nature of the University’s payroll, the rectification of these issues may take some time. The value of this is not yet able to be quantified due to the nature of the issues involved.
Contingent assetsThere are no contingent assets at balance date (2017:Nil)
Pledged donationsTrust pledged donations are recognised as revenue when the funds are received.Total pledged donations outstanding as at 31 December 2018 at face value are $11.343 million (2017 $3.371 million).
Consolidated University 2018 2017 2018 2017 $000 $000 $000 $000
Pledged donations at fair value 2,795 2,754 - -
Total quantifiable contingent assets 2,795 2,754 - -
21. Capital commitments and operating leasesAccounting policyOperating leasesAn operating lease is a lease that does not transfer substantially all the risks and rewards incidental to ownership of an asset.
Lease payments under an operating lease are recognised as an expense on a straight-line basis over the lease term.
Consolidated University 2018 2017 2018 2017 $000 $000 $000 $000Capital commitments Buildings 105,470 139,266 105,470 139,266
Equipment and other 3,427 4,123 3,427 4,123
Total capital commitments 108,897 143,389 108,897 143,389
Capital commitments represent capital expenditure contracted for at balance date, but not yet incurred.
For the year ended 31 December 2018
Notes to the Financial Statements continued

111
Consolidated University 2018 2017 2018 2017 $000 $000 $000 $000Operating leases as lesseeNot later than one year 6,936 5,835 6,882 5,665
Later than one year and not later than five years 4,153 3,950 4,132 3,950
Later than five years 2,396 2,699 2,396 2,699
Total non-cancellable operating leases 13,485 12,484 13,410 12,314 Operating leases “Not later than 1 year” includes accommodation head leases, $3.106 million (2017 $3.087 million).
22. Related-party transactionsThe Government influences the role of the University and Group as well as being a major source of revenue. While the University and Group enter into numerous transactions with Government departments and other Crown agencies, they are on an arm’s length basis and, where those parties are acting in the course of their normal dealings, are not considered to be related party transactions.
Related-party transactions with subsidiaries, associates or joint ventures Consolidated 2018 2017 $000 $000Intra-Group
University of Otago Holdings Limited (UOHL)Dividends received from Foundation Studies Ltd 524 276
Equity advanced to Otago Innovation Limited - 700
Accounting & secretarial services paid to the University of Otago 28 28
UOHL has a current account with the University of Otago. Since 1 January 2008 this account has been interest-bearing, with interest paid by the University at the average rate achieved by the University of Otago on its bank call and term deposits. Interest paid on this current account amounted to 63 66
The balance of the current account at year end was 2,392 1,830
University of Otago Foundation Studies Limited (FSL)FSL enters into transactions with the University of Otago, which are made on normal commercial terms and conditions. During the year FSL purchased goods and services from the University, including building rentals, to the value of 2,153 2,005
At year end the amount owing to the University was - 140
During the year FSL provided goods & services to the University to the value of 2,440 1,693
At the end of the year the amount owing by the University was - -
FSL has invested its surplus funds with the University of Otago. Interest is paid by the University at the average rate achieved by the University on its bank call and term deposits. Interest paid on these funds amounted to 160 115
The balance at year end was 5,066 4,630
Otago Innovation Limited (OIL)OIL enters into transactions with the University of Otago, which are made on normal commercial terms and conditions. During the year OIL purchased goods and services from the University to the value of 950 901
At year end the amount owing to the University was 1,031 418
During the year OIL supplied services to the University to the value of 686 711
At year end the amount owing by the University was 10 5

UNIVERSITY OF OTAGO ANNUAL REPORT 2018
112
Consolidated 2018 2017Immune Solutions Limited (ISL)ISL enters into transactions with the University of Otago, which are made on normal commercial terms and conditions. During the year ISL purchased goods and services from the University to the value of - 15
At year end the amount owing to the University was 37 13
Disease Research Limited (DRL)DRL enters into transactions with the University of Otago, which are made on normal commercial terms and conditions. During the year DRL purchased goods and services from the University to the value of 25 27
At year end the amount owing to the University was 310 161
New Zealand Genomics Limited (NZGL)NZGL enters into transactions with the University of Otago, which are made on normal commercial terms and conditions. During the year NZGL purchased goods and services from the University, including building rental and collaborator payments to the value of - 820
At year end the amount owing to the University was - 33
NZGL provided goods and services to the University of Otago to the value of - 534
At year end the amount owing by the University was - -
University of Otago TrustsThe University of Otago Foundation Trust paid to the University administration fees to the value of 672 672
The University of Otago Foundation Trust distributed to the University an amount of 10,616 10,366
The University of Otago Foundation Trust holds a current account with the University. 3,452 2,432
The University of Otago Foundation Trust received $196k of donations via the University of Otago, for the year ended 31 December 2018 (2017: $35k).
University Union Limited (UUL)During the year the University entered into transactions with UUL, an associate company of UOHL. The transactions were made on commercial terms and conditions. The University paid UUL rent of 294 342
UUL paid the University of Otago ground rent of 147 115
For the year ended 31 December 2018
Notes to the Financial Statements continued

113
Transactions with key management personnelKey management personnel compensation Consolidated 2018 2017 $000 $000Senior Management Team, including the Vice-Chancellor:
Remuneration 3,960 4,125
Full-time equivalent 14 16
There are close family members of key management personnel employed by the University and Group. The terms and conditions of those arrangements are no more favourable than the University and Group would have adopted if there were no relationship to key management personnel.
All members of the Vice Chancellor’s Advisory Group were included as key management personnel.
Councillor’s fees: consolidated $180k (2017 $160k), parent $180k (2017 $160k).
Directors fees: consolidated $78k (2017 $68k), parent (nil) (2017 nil).
No provision has been required, nor any expense recognised for impairment of receivables, for any loans or other receivables to related parties (2017 $nil).
Transactions with members of Council Purchased by Purchased from the University the University 2018 2017 2018 2017 $000 $000 $000 $000
Member of Council OrganisationMr H J Baird University Union Limited (D) - 393 - 871 University Bookshop (Otago) Limited (D) - 134 - 4 Otago University Students’ Association (P) - 3,702 - 199
Ms C F Barlow-Groome Otago University Students’ Association (P) 3,633 - 135 - University Bookshop (Otago) Limited (D) 164 - 5 -
Mr F B Barton Anderson Lloyd (D) (P) 316 173 - 4 New Zealand Law Society (Branch President) - 3 - - Presbyterian Support Otago (Trustee) 16 12 - 2
Mr M R Dippie Mitre 10 (New Zealand) Limited (D) 68 29 - -
University of Otago Holdings Limited (D) - - - - (See intragroup note)
Professor H Hayne NZ Vice Chancellors’ Committee Universities - - 161 168 NZ (Committee Member) Otago Innovation Limited (D) (See intragroup note) - - - - University of Otago Foundation Trust (Ex-officio Trustee) - - - - (See intragroup note) University of Otago Holdings Limited (D) - - - - (See intragroup note) International Festival of Environment Science 102 - - - & Technology
Mr S J Higgs Disease Research Limited (D) (See intragroup note) - 104 - - Farmlands Co-Operative Society Ltd (Secretary) 1 2 - - Immune Solutions Ltd (C) (See intragroup note) - - - - Mitern Limited (D) (S) 46 - - - Otago Innovation Ltd (D) (See intragroup note) - - - - University of Otago Foundation Trust (Trustee) - - - - (See intragroup note) University of Otago Holdings Limited (D) - - - - (See intragroup note)Ms L C Hobson University of Otago Foundation Trust (Trustee) - - - - (See intergroup note)
(term completed 31 Dec 2017)
(term 1 Jan 2016 to 31 Dec 2019)
(term 1 Jan 2016 to 31 Dec 2019)
(term 1 Jan 2016 to 31 Dec 2019)
(term 14 Mar 2017to 31 Dec 2018)
(term 1 Jan 2018 to 31 Dec 2018)

UNIVERSITY OF OTAGO ANNUAL REPORT 2018
114
Transactions with members of Council Purchased by Purchased from the University the University 2018 2017 2018 2017 $000 $000 $000 $000
Member of Council OrganisationAssociate Professor Tertiary Education Union Otago - - - 28 C J Marshall (Rep on Ethical Behaviour Committee)
Ms D C Matahaere-Atariki Ministry of Health - NGO Council (C) - 30 - 4,797 Te Whare Pounamu Dunedin Womens Refuge - - 1 1 (Trustee) Te Runanga o Otakou Inc (C) - 39 - - Arai Te Uru Whare Hauora (D) 16 - 3 - Otakou Health Limited (D) 3 593 11 1 Te Runanga o Ngai Tahu (Alternate Rep) - 1 - - (see intragroup note)
Mr S A Montague-Gallagher - - - -
Ms P A Oakley Dunedin International Airport Limited (D) 26 22 - - Forsyth Barr Limited (Employee) (S) 43 15 - - Institute of Directors in New Zealand (Branch Committee) 7 23 - - University of Otago Foundation Studies Limited - - - - (D) (ceased as Director 26 June 2018) (See intragroup note)Dr R J Somerville QC University of Otago Foundation Trust - - - - (Ex-officio Trustee) (See intragroup note) University of Otago Foundation for Malaysia - - 3 - (Ex officio Trustee) University of Otago Holdings Limited (D) - - - - (See intragroup note)Mr M A Wong Cook North & Wong Limited (D) (S) 20 - - -
C = Chairman; D = Director; S = Shareholder; P = President
For the year ended 31 December 2018
Notes to the Financial Statements continued
(term 1 Jan 2016 to 31 Dec 2018)
(term 1 Jan 2016 to 31 Dec 2018)
(term 1 Jan 2016 to 31 Dec 2019)
(term 1 Mar 2018to 31 Dec 2019)
(term 1 Jan 2016 to 31 Dec 2019)
(term 1 Jan 2018to 31 Dec 2021)

115
23. Investments in associates and joint venturesThe Group’s associate investments are accounted for in the Group financial statements using the equity method. An associate is an entity over which the Institute has significant influence and that is neither a subsidiary nor an interest in a joint venture. The investment in an associate is initially recognised at cost and the carrying amount is increased or decreased to recognise the Group’s share of the change in net assets of the associate after the date of acquisition. The Group’s share of the associate’s surplus or deficit of the associate is recognised in the Group surplus or deficit. Distributions received from an associate reduce the carrying amount of the investment in the Group financial statements.
Joint VentureA joint venture is a binding arrangement whereby two or more parties are committed to undertake an activity that is subject to joint control. Joint control is the agreed sharing of control over an activity.
Consolidated 2018 2017 $000 $000
University of Otago Holdings Limited University Union Limited 4,338 2,815
Otakou Health Limited - 150
Total investments in associates and joint ventures 4,338 2,965
Consolidated 2018 2017 $000 $000
University of Otago Holdings Limited's Associates: Name of entity: Unihealth Limited Principal activity: Not operating Ownership: 0% (31 December 2017 - 50%) Balance date: 31 December
Name of entity: University Union Limited Principal activity: Owner of University Union Building, University of Otago Ownership: 50% (31 December 2017 - 50%) Balance date: 31 December Investment at deemed cost 1,992 1,992
Share of increase (decrease) in the net assets of the associate (previous years) 823 764
Share of increase (decrease) in the net assets of the associate (current year) 1,523 59
Total Investment 4,338 2,815
Name of entity: Otakou Health Limited Principal activity: Owner of community health facilityOwnership: 0% (31 December 2017 - 33%)In December 2018 the UOHL Board resolved to transfer 33% shareholding in Otakou Helath Limitedto the other shareholders - -Balance date 31 March - 150
Name of entity: Upstart Incubation Trustee Company Limited Principal activity: This company is not operational, and has no assets or liabilitiesOwnership: 33% (31 December 2017 33%)

UNIVERSITY OF OTAGO ANNUAL REPORT 2018
116
24. Capital managementThe UniversityThe University and Group’s capital is its equity, which comprises general funds and reserves. Equity is represented by net assets. The University is subject to the financial management and accountability provisions of the Education Act 1989, which includes restrictions in relation to: disposing of assets or interests in assets, ability to mortgage or otherwise charge assets or interests in assets, granting leases of land or buildings or parts of buildings, and borrowing.
The University manages its revenues, expenses, assets, liabilities, investments and general financial dealings prudently and in a manner that promotes the current and future interests of the community. The University’s equity is largely managed as a by-product of managing revenues, expenses, assets, liabilities, investments and general financial dealings.
The objective of managing the University’s equity is to ensure that it effectively and efficiently achieves the goals and objectives for which it has been established, while remaining a going concern.
25. Events occurring after the balance dateThere were no significant events after balance date.
26. Reconciliation of net surplus/(deficit) to net cash flow from operating activities Consolidated University Actual Actual Actual Actual 2018 2017 2018 2017 $000 $000 $000 $000
Surplus/(deficit) 26,965 34,240 40,930 16,211
Add/(less) non-cash items Non-cash donations (1,361) (2,847) - -
Non-cash dividends (1,622) (2,033) - -
Share of associate’s surplus 154 (60) - -
Adjustments to staff entitlements 950 6,310 950 6,310
Depreciation and amortisation expense 66,162 61,785 65,980 61,583
Property, plant and equipment impairment 97 410 100 325
Dunedin City Tertiary Accommodation Trust (5,890) (180) (15,610) -
Increase / (decrease) in loans from external trust funds (10) 85 - -
(Gains)/losses in fair value of investments 11,222 (14,826) 2,033 227
Total non-cash items 69,702 48,644 53,453 68,445
Add/(less) movements in working capital items (Increase)/decrease in receivables (4,267) 2,539 (5,409) (646)
(Increase)/decrease in prepayments (1,370) (578) (1,379) 732
(Increase)/decrease in inventory (54) (168) (204) (187)
Increase /(decrease) in payables 838 8,035 4,468 9,284
Increase/(decrease) in funds received in advance 9,434 1,302 9,748 2,337
Increase /(decrease) in employee entitlements 2,640 5,454 1,581 5,483
Net movement in working capital items 7,221 16,584 8,805 17,003
Net cash inflow/(outflow) from operating activities 103,888 99,468 103,188 101,659
For the year ended 31 December 2018
Notes to the Financial Statements continued

117
27. RemunerationEntity employeesAs required by the Companies Act 1993 sec 211 (1) (g), the total annual remuneration, by band, for employees in thegroup companies, as at 31 December 2018 was: Number of employees 2018 2017
$100k - $109k 5 4
$110k - $119k 1 2
$120k - 129k - 1
$130k - $139k 1 1
$140k - $149k 2 1
$150k - $159k 1 1
$160k - $169k 1 2
$180k - $189k - 1
$220k - $229k 1 -
Total employees 12 13
Total remuneration includes non-financial benefits provided to employees.
28. Hocken Collections Consolidated University 2018 2017 2018 2017 $000 $000 $000 $000
Opening balance 118,300 117,087 4,765 4,540
Hocken additions 1,967 1,213 606 225
120,267 118,300 5,371 4,765
being:
Assets held in trust 114,896 113,535 - -
Assets owned by the University 5,371 4,765 5,371 4,765
120,267 118,300 5,371 4,765
The University holds in trust a national archival collection of books and artworks known as the Hocken Collections. Items included in the collections are acquired by gift, bequest and purchase. Items are also accepted on deposit where ownership is retained by the depositor. The University has included the valuation of the owned and deposited items in the total above as it believes that the Hocken Library is in-substance the owner of all items in the collection. The total collections include deposited items valued at $27.197 million (2017 $26.141 million).
29. Rare books and special library collectionsThe University holds a number of gifted collections of books, manuscripts and artworks within the Central, Medical and Dental Libraries. The collections were valued at 31 December 1994, based on net current value, by expert University staff following the generally accepted methodology employed by the Alexander Turnbull Library. The total valuation of the Rare Books and Special Collections is $10.002 million (2017 $9.929 million). Additions at cost in 2018 were $73k (2017 $57k) (see Note 12).

UNIVERSITY OF OTAGO ANNUAL REPORT 2018
118118

119
Opinion We have audited:
• the financial statements of the University and group on pages 74 to 117, that comprise the statement of financial position as at 31 December 2018, the statement of comprehensive revenue and expense, statement of changes in equity and statement of cash flows for the year ended on that date and the notes to the financial statements that include accounting policies and other explanatory information; and
• the statement of service performance of the University and group on pages 52 to 60.
In our opinion:
• the financial statements of the University and group on pages 74 to 117:
~ present fairly, in all material respects:
- the financial position as at 31 December 2018; and
- the financial performance and cash flows for the year then ended; and
~ comply with generally accepted accounting practice in New Zealand in accordance with Tier 1 Public Benefit Entity Standards; and
• the statement of service performance of the University and group on pages 52 to 60 presents fairly, in all material respects, the University and group’s service performance achievements measured against the proposed outcomes described in the investment plan for the year ended 31 December 2018.
Our audit was completed on 16 April 2019. This is the date at which our opinion is expressed. The basis for our opinion is explained below. In addition, we outline the responsibilities of the Council and our responsibilities relating to the financial statements and the statement of service performance, we comment on other information, and we explain our independence.
Basis for our opinionWe carried out our audit in accordance with the Auditor-General’s Auditing Standards, which incorporate the Professional and Ethical Standards and the International Standards on Auditing (New Zealand) issued by the New Zealand Auditing and Assurance Standards Board. Our responsibilities under those standards are further described in the Responsibilities of the auditor section of our report.
We have fulfilled our responsibilities in accordance with the Auditor-General’s Auditing Standards.
We believe that the audit evidence we have obtained is sufficient and appropriate to provide a basis for our opinion.
To the readers of University of Otago and Group’s financial statements and statement of service performance for the year ended 31 December 2018 The Auditor-General is the auditor of University of Otago (the University) and group. TheAuditor-General has appointed me, Andy Burns, using the staff and resources of Audit New Zealand, to carry out the audit ofthefinancialstatementsandstatementofserviceperformance of the University and group on his behalf.
Independent Auditor’s Report

UNIVERSITY OF OTAGO ANNUAL REPORT 2018
120
Responsibilities of the Council for the financial statements and the statement of service performanceThe Council is responsible on behalf of the University and group for preparing financial statements that are fairly presented and that comply with generally accepted accounting practice in New Zealand.
The Council is also responsible on behalf of the University and group for preparing a statement of service performance that is fairly presented.
The Council is responsible for such internal control as it determines is necessary to enable it to prepare financial statements and a statement of service performance that are free from material misstatement, whether due to fraud or error.
In preparing the financial statements and the statement of service performance, the Council is responsible on behalf of the University and group for assessing the University and group’s ability to continue as a going concern. The Council is also responsible for disclosing, as applicable, matters related to going concern and using the going concern basis of accounting, unless the Council intends to liquidate the University and group or to cease operations, or has no realistic alternative but to do so.
The Council’s responsibilities arise from the Crown Entities Act 2004 and the Education Act 1989.
Responsibilities of the auditor for the audit of the financial statements and the statement of service performanceOur objectives are to obtain reasonable assurance about whether the financial statements and the statement of service performance, as a whole, are free from material misstatement, whether due to fraud or error, and to issue an auditor’s report that includes our opinion.
Reasonable assurance is a high level of assurance, but is not a guarantee that an audit carried out in accordance with the Auditor-General’s Auditing Standards will always detect a material misstatement when it exists. Misstatements are differences or omissions of amounts or disclosures, and can arise from fraud or error. Misstatements are considered material if, individually or in the aggregate, they could reasonably be expected to influence the decisions of readers taken on the basis of these financial statements and statement of service performance.
For the budget information reported in the financial statements and the statement of service performance, our procedures were limited to checking that the information agreed to the University and group’s approved budget and Statement of Objectives.
We did not evaluate the security and controls over the electronic publication of the financial statements and the statement of service performance.
As part of an audit in accordance with the Auditor-General’s Auditing Standards, we exercise professional judgement and maintain professional scepticism throughout the audit. Also:
• We identify and assess the risks of material misstatement of the financial statements and the statement of service performance, whether due to fraud or error, design and perform audit procedures responsive to those risks, and obtain audit evidence that is sufficient and appropriate to provide a basis for our opinion. The risk of not detecting a material misstatement resulting from fraud is higher than for one resulting from error, as fraud may involve collusion, forgery, intentional omissions, misrepresentations, or the override of internal control.
• We obtain an understanding of internal control relevant to the audit in order to design audit procedures that are appropriate in the circumstances, but not for the purpose of expressing an opinion on the effectiveness of the University and group’s internal control.
• We evaluate the appropriateness of accounting policies used and the reasonableness of accounting estimates and related disclosures made by the Council.
• We conclude on the appropriateness of the use of the going concern basis of accounting by the Council and, based on the audit evidence obtained, whether a material uncertainty exists related to events or conditions that may cast significant doubt on the University and group’s ability to continue as a going concern. If we conclude that a material uncertainty exists, we are required to draw attention in our auditor’s report to the related disclosures in the financial statements and the statement of service performance or, if such disclosures are inadequate, to modify our opinion. Our conclusions are based on the audit evidence obtained up to the date of our auditor’s report. However, future events or conditions may cause the University and group to cease to continue as a going concern.
• We evaluate the overall presentation, structure and content of the financial statements and the statement of service performance, including the disclosures, and whether the financial statements and the statement of service performance represent the underlying transactions and events in a manner that achieves fair presentation.
121
• We obtain sufficient appropriate audit evidence regarding the financial statements and the statement of service performance of the entities or business activities within the group to express an opinion on the consolidated financial statements and the consolidated statement of service performance. We are responsible for the direction, supervision and performance of the group audit. We remain solely responsible for our audit opinion.
We communicate with the Council regarding, among other matters, the planned scope and timing of the audit and significant audit findings, including any significant deficiencies in internal control that we identify during our audit.
Our responsibilities arise from the Public Audit Act 2001.
Other informationThe Council is responsible for the other information. The other information comprises the information included on pages 1 to 51, 61 to 73 and 122 to 130, but does not include the financial statements and the statement of service performance, and our auditor’s report thereon.
Our opinion on the financial statements and the statement of service performance does not cover the other information and we do not express any form of audit opinion or assurance conclusion thereon.
In connection with our audit of the financial statements and the statement of service performance, our responsibility is to read the other information. In doing so, we consider whether the other information is materially inconsistent with the financial statements and the statement of service performance or our knowledge obtained in the audit, or otherwise appears to be materially misstated. If, based on our work, we conclude that there is a material misstatement of this other information, we are required to report that fact. We have nothing to report in this regard.
IndependenceWe are independent of the University and group in accordance with the independence requirements of the Auditor-General’s Auditing Standards, which incorporate the independence requirements of Professional and Ethical Standard 1 (Revised): Code of Ethics for Assurance Practitioners issued by the New Zealand Auditing and Assurance Standards Board.
Other than the audit, we carried out an assurance engagement reporting on the Vice-Chancellor’s annual declaration on the Performance-Based Research Fund external research income.
We have no relationship with or interests in the University or any of its subsidiaries.
Andy Burns Audit New Zealand On behalf of the Auditor General Dunedin, New Zealand

UNIVERSITY OF OTAGO ANNUAL REPORT 2018
122
This report has been prepared in accordance with clause 6 of the Ministerial Direction on Compulsory Student Services Fees 2014.
This clause requires the University to publish a description of the services funded out of the compulsory student services fee, an income and expenditure statement for each type of student service, the fee charged and the accounting requirements in its Annual Report each year.
Summary The University provides student services and also contracts with third parties to provide services. The Otago University Students’ Association (OUSA) is the principal third-party provider and a comprehensive service level agreement is negotiated each year.
The highest proportion of the fee is spent on health services, and sport, recreation and cultural activities. This is consistent with student feedback on priorities.
The University publishes detailed information on the fees charged, services provided, and opportunities for students to have input and provide feedback on its website. An annual online student services fee survey was again carried out in 2018 to get student feedback on the use of services and priorities for the fee. Levels of satisfaction with the services provided is measured in a variety of ways including as a component of the University’s Annual Student Satisfaction Survey and OUSA’s Annual Student Survey.
Student Services Fee Report
Student Services delivered by the UniversityCareer information, advice and guidance, • Careers advice, guidance, planning, workshops and providing employment employment information information to assist students transitioning from University to the workplace • Opportunities for volunteering Financial support and advice • Student Emergency Fund Health services • Sexual safety, sexual assault support and prevention • Subsidised general practice health care • Specialist mental health support and counselling Sports, recreation and cultural activities • Outdoor trips and activities • Social sport • UNIPOL gym • Unlimited internet use on campus for students’ personal use (internet use for academic purposes is covered by tuition fees).
Student Services delivered by OUSAAdvocacy and legal advice; counselling • Advocacy services; careers (OUSA Support Centre) • Careers guidance through volunteering in conjunction with the University • Education Quality Support Network (through the co-ordination of the system of senate, division, department and class representatives) • Financial support and advice • Pastoral care • Student Job Search • Student Support Centre programmes • Support for Te Roopu (Māori Students’ Association).
Sport, recreation and cultural activities • Art week • Battle of the Bands • Blues and Golds sports and cultural awards • Capping Week and Capping Show • DJ • Healthy Lifestyles programme • International food festival • Market days • Music gigs • Orientation • Postgrad coffee hour • Re-Orientation.

123
Compulsory student Expenses Surplus services fee revenue (deficit) $000s $000s $000s
Advocacy & legal advice 1,290 1,299 (9)
Careers information advice and guidance 679 643 36
Childcare 52 52 -
Counselling 90 87 3
Media 326 326 -
Sports and Recreation Facilities 4,596 4,859 (263)
Health 4,293 5,110 (817)
Total 11,326 12,376 (1,050)
Income and expenditure associated with the provision of these services are separately accounted for in our accounting system. The compulsory student services fee levy charged per Equivalent Full-Time Student is shown below. The amounts include GST.
Dunedin $798.00
Christchurch $153.00
Wellington $124.00
Invercargill $134.00
Sport, recreation and cultural activities • Te Roopu (Māori Students’ Association) (continued) • USNZ level sports and games tournaments • Volunteers.
Student communication activities • Critic magazine • Facebook presence • Onefest • Orientation magazine • Radio One 91FM • Web presence.
Student services provided by the Otago Tertiary Chaplaincy Trust BoardCounselling services; advocacy • Interfaith chaplaincy services and pastoral care.
Student Services delivered by the Otago University Childcare AssociationChildcare services • Pre-school childcare services for students who are parents.

UNIVERSITY OF OTAGO ANNUAL REPORT 2018
124
Summary Facts and Figures
2018 2017 2016 2015 2014STUDENT ENROLMENTS
Equivalent Full-time Students (EFTS)
Commerce 2,829 2,885 2,954 2,928 3,074
Health Sciences 6,483 6,267 6,089 5,871 5,857
Humanities 4,825 4,712 4,807 4,944 5,180
Sciences 4,435 4,334 4,437 4,413 4,458
Subtotal 18,572 18,198 18,287 18,156 18,570
Other Group EFTS* 268 260 259 265 261
Total 18,840 18,457 18,547 18,421 18,830
* Other Group EFTS comprise EFTS enrolled in the Foundation Studies programme of the University subsidiary Foundation Studies Limited.
Enrolment By Qualification Type
PhD 1,399 1,383 1,325 1,307 1,317
Professional doctorates 142 118 86 80 71
Masters 1,360 1,261 1,287 1,224 1,214
Postgraduate diplomas 1,063 1,072 1,016 946 841
Postgraduate certificates 628 690 638 596 547
Graduate diplomas 215 243 294 314 388
Bachelor honours 404 366 385 451 434
Bachelors 14,677 14,448 14,598 14,559 15,136
Undergraduate diplomas 17 20 29 39 60
Undergraduate certificates 0 0 0 0 5
Certificate of proficiency 1,455 1,492 1,493 1,442 1,284
Interest only 5 11 1 4 10
Foundation Studies 298 305 292 316 300
Other 0 0 0 4 6
Total Students 21,108 20,838 20,814 20,601 20,942
Note: Enrolments by qualification type sum to more than the total headcount as students can enrol for more than one qualification type.

125
2018 2017 2016 2015 2014
Gender of Students
Female 12,588 12,272 12,147 11,879 12,004
Male 8,519 8,565 8,665 8,720 8,936
Gender diverse 1 1 2 2 2
Total 21,108 20,838 20,814 20,601 20,942 First-year and Returning Students
First-year 4,023 3,770 4,002 3,738 4,057
Returning 17,085 17,068 16,812 16,863 16,885
Total 21,108 20,838 20,814 20,601 20,942
Ethnicity of Students
European/Pākehā 71.4% 72.4% 73.1% 73.4% 74.3%
Māori 9.9% 9.3% 8.9% 8.5% 8.5%
Asian 20.5% 19.8% 19.2% 18.8% 18.3%
Pacific 4.7% 4.5% 4.2% 3.9% 3.6%
Middle Eastern/Latin American/African 3.6% 3.4% 3.4% 3.6% 3.5%
Other / unknown 3.7% 3.9% 3.7% 3.6% 3.2%
Students who reported more than one ethnic group are counted once in each group reported. This means that the total number of responses for all ethnic groups can be greater than the total number of students who stated their ethnicities. Therefore, totals may be greater than 100%.
Home Area of Students
Dunedin 2,999 3,043 3,127 3,182 3,407
Otago/Southland 1,858 1,860 1,969 2,033 2,213
Remainder of South Island 3,796 3,813 3,903 3,828 3,895
North Island 8,946 8,737 8,570 8,482 8,425
Overseas (including NZ citizens overseas) 3,482 3,348 3,191 3,014 2,938
Unknown 27 37 54 62 64
Total 21,108 20,838 20,814 20,601 20,942
Note: The majority of NZ citizens overseas listed their home area as Australia (184 in 2018). Conversely, 187 of the 321 Australian citizens who enrolled in 2018 were normally resident in New Zealand prior to commencing University study, and so listed a New Zealand home area.

UNIVERSITY OF OTAGO ANNUAL REPORT 2018
126
Summary Facts and Figures continued
2018 2017 2016 2015 2014
International Students
Undergraduate 1,819 1,807 1,810 1,768 1,749
Postgraduate 1,096 1,030 913 824 828
Total 2,915 2,837 2,723 2,592 2,577
International Students by Home Country
United States of America 772 798 721 656 581
China 507 500 490 460 454
Malaysia 301 241 241 255 287
India 133 130 119 103 99
United Kingdom 85 89 87 100 100
Canada 71 67 54 54 66
Singapore 70 68 52 45 45
Germany 59 69 72 62 80
Iran, Islamic Republic of 52 55 53 61 59
Indonesia 43 39 32 20 19
Viet Nam 40 27 25 26 27
Brunei Darussalam 38 41 52 56 61
France 35 46 52 40 39
Japan 35 37 44 51 55
Pakistan 34 27 21 21 11
Thailand 34 31 30 32 32
Norway 34 30 34 25 31
Oman 33 27 30 30 30
Korea, Republic of 29 30 31 32 38
Sri Lanka 29 23 14 10 12
Bangladesh 26 23 16 12 10
Other 455 439 457 444 443
Total 2,915 2,837 2,727 2,595 2,579
Note: Australian, Tokelauan and Cook Islands’ students - whether resident in their home country or New Zealand prior to commencing study – are not counted as international students, and so are not included in the above figures.
Home Area of First-Year Students
Dunedin 573 578 616 554 593
Otago/Southland 462 428 432 416 474
Remainder of South Island 745 714 831 768 876
North Island 1,950 1,794 1,826 1,722 1,882
Overseas (including NZ Citizens Overseas) 293 255 277 263 230
Unknown 0 1 20 15 2
Total 4,023 3,770 4,002 3,738 4,057
Note: The majority of NZ citizens overseas listed their home area as Australia (33 in 2018). Conversely, 32 of the 43 Australian citizens who enrolled in 2018 were normally resident in New Zealand prior to commencing University study, and so listed a New Zealand home area.

127
2018 2017 2016 2015 2014
ACADEMIC ATTAINMENT Number of Programme Completions
Undergraduate diplomas and certificates 130 143 183 168 260
Undergraduate degrees 3,395 3,368 3,467 3,566 3,525
Postgraduate diplomas and certificates 940 969 995 841 732
Postgraduate degrees 1,054 1,056 969 989 912
Total University 5,519 5,536 5,614 5,564 5,429
Commerce graduates 724 700 671 745 724
Health Sciences graduates 1,768 1,674 1,790 1,576 1,464
Humanities graduates 1,099 1,275 1,290 1,419 1,452
Sciences graduates 1,541 1,494 1,475 1,455 1,444
Interdivisional graduates 387 393 388 369 345
Total University 5,519 5,536 5,614 5,564 5,429
Degrees, Diplomas and Certificates Completed per 100 EFTS Enrolled
Commerce 25.6 24.3 22.7 25.4 23.9
Health Sciences 27.3 26.7 29.4 26.8 25.4
Humanities 22.8 27.1 26.8 28.7 34.3
Sciences 34.7 34.5 33.2 33.0 32.8
Total 29.7 30.4 30.7 30.6 29.4 Examination Pass Rates
Commerce 89.6% 88.6% 87.8% 87.7% 85.9%
Health Sciences 95.0% 94.9% 94.2% 93.7% 93.5%
Humanities 92.5% 92.4% 92.1% 91.4% 91.1%
Sciences 87.2% 87.1% 87.7% 87.1% 86.0%
Other (Foundation Studies) 77.2% 76.0% 74.8% 79.3% 81.0%
Total pass rate 91.5% 91.2% 90.8% 90.3% 89.6%

UNIVERSITY OF OTAGO ANNUAL REPORT 2018
128
Summary Facts and Figures continued
2018 2017 2016 2015 2014
STAFF PROFILE Full-Time Equivalent (FTE) Teaching and Research Staff
Female
Vice-Chancellor/senior academic managers 2 2 2 2 2
Professors 53 52 50 42 37
Readers/associate professors 78 74 72 71 61
Senior lecturers 164 168 162 166 176
Lecturers 88 89 87 82 83
Other teaching and teaching/research staff 182 160 161 159 154
Research-only staff 225 198 181 246 240
Total females 792 743 715 769 752
Male
Vice-Chancellor/senior academic managers 6 6 6 6 6
Professors 167 170 178 166 166
Readers/associate professors 129 120 117 108 107
Senior lecturers 183 191 186 191 200
Lecturers 55 62 69 82 85
Other teaching and teaching/research staff 100 104 106 116 112
Research-only staff 164 159 155 182 183
Total males 804 810 817 851 859
Total academic and research-only staff 1,596 1,552 1,532 1,619 1,611
Full-Time Equivalent (FTE) Professional Staff Female
Senior managers 9 9 9 12 13
Professional services, student and community staff 1,197 1,177 1,153 1,053 1,036
Librarians and library assistants 88 93 93 101 110
Research support staff and technicians 318 325 235 236 247
Total females 1,612 1,604 1,489 1,403 1,407
Male
Senior managers 18 18 18 16 17
Professional services, student and community staff 651 651 640 602 587
Librarians and library assistants 24 22 21 24 23
Research support staff and technicians 179 181 162 139 144
Total males 872 872 841 781 770
Total professional staff 2,484 2,476 2,330 2,184 2,177
Total staff 4,080 4,029 3,862 3,803 3,788

129
2018 2017 2016 2015 2014
RESEARCH ACTIVITIES (revised for previous years) Research Outputs Produced
Total publications 5,814 4,917 4,527 5,132 4,477
Note: Publications are shown in the year they are reported in the University’s Research Outputs Report. Actual date of publication or dissemination may differ. Figures for the current year are provisional, subject to final vetting. Figures for previous years are updated as appropriate to account for the impact of vetting. . LAND & BUILDINGS
Land (hectares) Land owned by the University (other than endowment land) 33.9474 33.0985 32.1435 31.7155 33
Land in Crown title for the University 10.7405 10.7405 11.6657 11.6297 12
Endowment land 22,243 22,243 22,244 22,243 22,243
Total freehold land 22,288 22,287 22,288 22,288 22,288
Notes: Property Services have revised and updated their databases: 1. Land owned by the University (other than endowment land) has increased due to the purchase of two properties, partially offset by the sale of one property.
University of Otago Net Assignable Space (floor space in square metres)
Total 220,495 219,784 220,408 224,713 222,589
Notes: 1. Assignable space is defined as the floor area measured from the inside face of the walls and deducting all the common use areas (corridors, toilets, etc.)
and non-inhabitable areas (lifts, stairs, service ducts, etc.). Note, corridors provided within “open plan” offices are considered to be assignable space. 2. Assignable space at University-owned flats and residential colleges totals a further 56,859m².

UNIVERSITY OF OTAGO ANNUAL REPORT 2018
130
2018 2017 2016 2015 2014
LIBRARY Library collection
Books (volumes) 1,231,268 1,224,672 1,217,737 1,216,154 1,212,901
Serials (items) 438,188 455,644 459,541 467,117 493,941
Print serials subscriptions 2,776 2,855 2,915 3,247 3,791
Hocken pictures and photographs 1,137,522 1,136,251 1,131,932 1,131,458 1,130,574
Hocken linear metres of archives 10,415 10,272 10,178 10,034 9,950
Electronic serials available 163,586 169,530 152,490 171,199 164,304
Electronic books available 953,812 850,783 779,443 744,321 672,789
Space
Seating places available 4,584 4,500 4,392 4,388 4,388
INFORMATION TECHNOLOGY
Volume of computer and telecommunication Off-campus network traffic (Gigabytes) 7,819,583 7,371,800 5,078,486 692,958 419,554
KEY FINANCIAL INDICATORS
Value of output per EFTS
Teaching, learning and assessment $11,676 $11,795 $10,623 $11,101 $10,725
Research and postgraduate teaching $20,649 $19,561 $18,451 $16,654 $15,626
Community service $1,263 $1,402 $1,694 $1,711 $1,622
2018 2017 2016 2015 2014 Consolidated Consolidated Consolidated Consolidated Consolidated
Financial indicatorsCurrent ratio (current assets: current liabilities) 0.9 1.2 1.4 1.3 1.2
Liquid ratio (current assets which will result in cashflow: current liabilities which will result in cashflow) 1.7 2.5 3.1 2.7 2.3
Level of debt (debt to equity) 2.2% 2.2% 2.2% 2.1% 2.1%
Increase in net assets 2.4% 14.0% 1.8% 2.2% 14.5%
Return on total assets 1.2% 1.5% 1.6% 1.7% 1.8%
Return on revenue 3.9% 4.8% 4.6% 5.0% 5.2%
Summary Facts and Figures continued

131131

UNIVERSITY OF OTAGO ANNUAL REPORT 2018
132


ANNUAL REPORT 2018
U N I V E R S I T Y O F O T A G O
UN
IVE
RS
ITY
OF
OT
AG
O | A
NN
UA
L R
EP
OR
T 2
01
8
2018
AnnualReport