Embed Size (px)
Citation preview

2019ANNUAL REPORT

Dear Shareholder,
Your Board of Directors is pleased to present the Annual Report of CIM Financial Services Ltd for the year ended 30 September 2019.
This report was approved by the Board on 12 December 2019.
Colin Taylor Mark van BeuningenNon-Executive Director and Chairman Executive Director and Group Chief Executive Officer
This first integrated Annual Report of CIM Financial Services Ltd (‘CFSL’) provides information relating to its strategy, business model, operating context, material risks and opportunities, governance and operational performance for the period 1 October 2018 to 30 September 2019. This report covers CFSL and its subsidiaries (the ‘Cim Group’). Significant events after 30 September 2019 up to the date of approval of this report are also disclosed in the report.
We have been guided by the principles and requirements contained in the IIRC’s International <IR> Framework to produce this report and have used the six <IR> capitals that are relevant to our Group namely:1. Financial 2. Human3. Intellectual4. Social & Natural (regrouped for the purposes of this report).5. Manufactured
As we continue to embed integrated thinking in our business, we will continue to improve the quality of the reporting delivered to our stakeholders.
Our Integrated Report is in compliance with International Financial Reporting Standards, the National Code of Corporate Governance 2016 and the Companies Act 2001.
Our approach to materiality
This report provides information that we believe is of a material nature to the ability of the Group to generate value over the short, medium and long term. In determining our materiality, we have considered our business models, our interactions with our relevant capitals, our operating context, the relevance to our key stakeholders and our business strategies.
Forward looking statements
Certain statements contained in this report relating to the Group are based on the beliefs of the Group’s management as well as assumptions made by and information currently available to the Group’s management. These forward-looking statements are, by their nature, subject to significant risks and uncertainties and are not a guarantee of future performance or developments. Actual results and events may differ materially from information contained in the forward-looking statements.
Report Structure

Table ofContents
Group Structure 02
Cim at a Glance 04
Value Creation Model 06
Financial Highlights 08
Chairman’s Message 12
Directors’ Profiles 14
Group CEO’s Report 22
Senior Management Team 24
Business Review 28
Cim Finance Management Team 30
Corporate Governance Report 38
Human Capital 46
Corporate Social Responsibility 48
Risk Management 50
Other Statutory Disclosures 54
Directors’ Report 55
Secretary’s Certificate 56
Statement of Compliance 57
Independent Auditor’s Report 60
Financial Statements 66
Directors of Subsidiary Companies 158

GroupStructure
FINANCE
CIM FINANCE LTD
CIM FOREX LTD
CIM AGENCIES LTD
MAURITIAN EAGLE LEASING COMPANY
LIMITED
100%
100%
100%
100%
CIM FINANCIAL SERVICES LTD
CIM FINANCIAL SERVICES LTD / ANNUAL REPORT 20192

CIM INTERNATIONAL HOLDINGS LTD
CIM MANAGEMENT SERVICES LTD
CIM ADMINISTRATORS LTD
DODWELL (MAURITIUS) LTD
CIM CSR FUND LTD
CIM SHARED SERVICES LTD
LI & FUNG (MAURITIUS) LTD
CIM LEARNING CENTRE LTD
IVERI GLOBAL LIMITED
IVERI PAYMENT TECHNOLOGIES (PTY) LTD
EVRIPAY
CIM KENYA LTD
CIM ETHIOPIA LTD
EVRIPAY PAYMENT SOLUTIONS LTD
KEY FINANCIAL SERVICES LTD
TOUCHPOINT PAYMENTS PROPRIETARY LTD
BLUE NILE HOLDING LTD
CIM CREDIT KENYA LTD
EVRIPAYZA PROPRIETARY LTD
THE OCEANIC TRUST LTD
CIM INSURANCE AGENCY LTD
INVESTMENTS
100%
100%
100%
100%
40%
40%
100%
100%
100%
100%
100%
100%
49%
49% 75% 25%
100%
100%
100%
85%
32.6%
100%
CIM FINANCIAL SERVICES LTD / ANNUAL REPORT 2019 3

Cim GroupAt A Glance
690MERCHANTS
3 COUNTRIES OF
OPERATION(MAURITUS, RODRIGUES, KENYA)
Over 800EMPLOYEES
FEMALE
79%
FEMALE
33
GENDER
AVERAGE AGE
MALE
21%
MALE
36
100COUNTERS
260,000CLIENTS
CIM FINANCIAL SERVICES LTD / ANNUAL REPORT 20194

Our services
Our values
Factoring
Leasing
Credit Financing
Cards & payments
Insurance Agent
OUR PEOPLE
We nurture our people. We believe that our people are our most valuable asset, the cornerstone of our existence and our growth drivers. We believe engagement thrives in an environment filled with energy, trust, challenge, personal growth and fairness.
COLLABORATION
We work as one. We believe in the power of working together as the only way to progress and evolve towards a better future.
INTEGRITY
We do the right thing. We conduct our business with utmost respect for the highest standards of professional behaviour and ethics.
INNOVATION
We are constantly evolving. We anticipate change and shape it to fit our objectives. We are committed to be at the forefront of a fast moving environment, by always rethinking our products and services to anticipate our customers’ needs.
CUSTOMER CENTRICITY
We see the world through our customers’ eyes. We are dedicated to caring for our customers in a highly proactive way and we are committed to improving their lifestyle.
At the core of our philosophy, Cim Finance has a mission to uplift lives and build better futures for our customers.
CIM FINANCIAL SERVICES LTD / ANNUAL REPORT 2019 5

Value CreationModel
INPUTFINANCIALCAPITAL
• Shareholders’ fund
• Reinvestment
• Debt
FINANCIALCAPITAL
• Optimal funding mix
• Achieving targeted ROE
HUMANCAPITAL
• Diversified competent and engaged workforce
• Continuous development
• Strong leadership team
HUMANCAPITAL
• Employer of choice
• Empowered employees
• Work/life balance
INTELLECTUALCAPITAL
• Branding
• Innovation
• Values
INTELLECTUALCAPITAL
• New products
• Cim Culture
• Strong brand & reputation
STRATEGIC IMPERATIVES
Sustainable growth
Digitalisation
Operational excellence
Customer centricity
CIM FINANCIAL SERVICES LTD / ANNUAL REPORT 20196

• Risk Appetite
• Main Risks
• Risk Response
• Credit facilities to individuals to purchase of mobile phones, consumer electronic goods and furniture
• Personal unsecured loans to individuals to finance of projects or personal requirements
• Credit protection plan to protect customers
OUTCOME
RELATIONSHIPCAPITAL
• Wide network of merchants
• Visa and MasterCard Accreditation
RELATIONSHIPCAPITAL
• Helping our partners to grow their business
MANUFACTUREDCAPITAL
• Proprietary Scorecard
• Network of counters
MANUFACTUREDCAPITAL
• Accessibility
• Sound credit decisions
• Low impairment levels
SOCIAL & NATURALCAPITAL
• Corporate Social Responsibility
• Responsible lender
• Partnership with Government for SMEs
SOCIAL & NATURALCAPITAL
• Responsible lender
• Support to the community
OUR ACTIVITIES & OPERATIONS
against unforeseen circumstances
• Cards and Payment Solutions
• Solutions for the acquisition of vehicles and equipment
• Help SMEs to meet their cashflow needs through our Factoring services
RISK MANAGEMENT FRAMEWORK (please refer to pages 50 to 52)
CIM FINANCIAL SERVICES LTD / ANNUAL REPORT 2019 7

FinancialHighlights
EARNINGS PER SHARE
+35%EPS - FOR CONTINUING
OPERATIONS
+28%TO REACH MUR 1.810 BN
(BEFORE DISCONTINUED OPERATIONS)
+8%TO REACH MUR 0.56
+9%
0.23 3.1%
MU
R
MU
R
NET OPERATING INCOME GROUP PROFIT AFTER TAX
TO REACH MUR 382.7m
TO REACH MUR 0.54
DIVIDEND PER SHARE DIVIDEND YIELD
RS
CIM FINANCIAL SERVICES LTD / ANNUAL REPORT 20198

Consolidated Value Added Statement
Contribution to Group
1,721.7
1,405.9
472.0
146.9
(383.8)
(133.5)
39.9199.0
-500
Finance Investments Groupadjustments
Discontinuedoperations
0
500
1,000
1,500
2,000
432.1378.8
(65.2)(105.4)
78.7
-200
Finance Investments Discontinuedoperations
-100
0
100
200
300
400
500
15.8
Net operating income PAT
GROUP
September 2019 September 2018
MUR m % MUR m %
Value Added Statement
Income 1,810 1,419
Bought-in materials & services (205) (67)
Total value added 1,605 1,352
Applied as follows :
EMPLOYEES
Wages, salaries, bonuses, pensions & other benefits 575 36 466 35
GOVERNMENT
Income Tax 86 5 73 5
PROVIDERS OF CAPITAL
Dividends paid to:
Shareholders of Cim Financial Services 157 10 456 34
Banks & other lenders 388 24 381 28
545 34 837 62
REINVESTED
Depreciation 146 9 62 5
Amortisation 27 2 18 1
Retained Profit 226 14 (104) (8)
399 25 (24) (2)
1,605 100 1,352 100
FY 18FY 19 FY 18FY 19
CIM FINANCIAL SERVICES LTD / ANNUAL REPORT 2019 9

CIM FINANCIAL SERVICES LTD / ANNUAL REPORT 201910

Access to your dreams
CIM FINANCIAL SERVICES LTD / ANNUAL REPORT 2019 11

Dear Shareholder,
I am pleased to report that your Group has delivered a commendable performance during the financial year 2018/2019 with a Group PAT of MUR 382.7m (2018: MUR 352.1m after discontinued activities).
Our finance segment has registered growth of 22% and 14% net operating income and PAT respectively, as compared to last year, and the asset book has increased by 22%, which puts us on the right track for continued growth in the future.
Achievements
Looking back on the year, the process of making CIM Financial Services Ltd (CFSL) a simpler, more focused business was partly achieved with the successful listing of Lavastone Ltd (formerly Cim Property Development Ltd) on the Development and Enterprise Market (‘DEM’) by the end of last year. I am pleased to report that shareholders have been able to freely trade their shares in Lavastone since 14 January 2019, as an example of the additional value that we seek to bring to our shareholders.
Since then, we have focused our efforts on taking steps to consolidate our position in the consumer finance domain, given that we continue to be the leader in the hire purchase sector in Mauritius, as well as the second largest player in the leasing market, further to the acquisition of Mauritius Eagle Leasing Co Limited (MELCO) from IBL in August 2018. Cim Finance is now focusing its development plans on the respective core businesses, namely consumer finance, cards and payment, leasing and factoring activities.
In the light of the changes which the Group has undergone in recent years, the Board of CFSL has sought to simplify the structure of the Group, to reduce Board duplication and costs, while increasing efficiency. We are confident that this will be achieved through the imminent amalgamation of Cim Finance Ltd, Cim Agencies Ltd, Mauritius Eagle Leasing Company Limited, Cim Management Services Ltd and Cim Shared Services Ltd with and into CFSL.
In terms of reinforcing our operations, we have also successfully relocated our head office to the Manhattan Building in Edith Cavell Street, which now gives us much nicer facilities which will enable nicer communication between the employees and this will improve the team cohesion.
Chairman’sMessage
CIM FINANCIAL SERVICES LTD / ANNUAL REPORT 201912
Ambitions
To realise our future ambitions, it is crucial to have the right funding strategy in place and the growing sophistication of the Mauritius financial services sector has enabled us to relinquish our deposit taking licence and to borrow on the market at better rates for less administration. This is the reason which led the Board to approve the implementation of a Medium Term Note Programme (MTNP) as part of our new funding strategy. We are now able to access far more attractive financing opportunities, and we were greatly comforted by the fact that we were seeking to raise MUR 1.2bn through the first tranche of notes under the MTNP but we ended up accepting MUR 2bn and we were even over-subscribed by an important amount, which clearly demonstrates the growing confidence in the market.
As a result of the implementation of our new funding strategy which takes account of market developments, as well as the recent amalgamation, we are on course to deliver upon our objectives to focus on and strengthen our core consumer finance lending business. This will also help us to improve our governance framework and secure more opportunities as a lender on both the local and regional markets.
With regard to our regional activities, we are progressing on track in Kenya, where we are operating under the brand Aspira, using a FinTech model for hire purchase. Our activities in Kenya have already expanded from Nairobi to Mombasa, in a sign of growing momentum.
Future
If we turn to prospects for the future, starting with the wider backdrop in Mauritius, the country has maintained political stability after the general election of 7 November 2019. The outgoing government has renewed its mandate for a further parliamentary term, having secured a comfortable majority in the National Assembly. While Mauritius has significantly improved its score in the World Bank Doing Business report, now ranked in 13th position globally and first in Africa, it will be important to maintain a close eye on legislative and regulatory developments to gauge their impact on the local business community.
In terms of the global picture, we live in a new world where disruption at all levels is occurring, with new ways of doing business becoming the norm. There are continuing challenges at international level, ranging from the trade war between the US and China, the impending US withdrawal from the Paris climate change accord and the potential departure from the WTO which could lead to new tariffs on imports, in Europe Brexit appears to be edging closer, with the final terms still to be confirmed.
As we look ahead to 2020, our watchwords for the group will be consolidation and efficiency. We have come a long way on our journey in recent years, in the light of various restructuring initiatives, and we can now focus fully our efforts on ensuring that our core business of consumer finance goes from strength to strength to enhance shareholder value.
While we have embarked upon an ambitious path, we cannot reach our destination alone. It is only with the support and trust of our shareholders that we will achieve our goals, and I would like to take this opportunity to sincerely thank our shareholders and our other partners for their unflinching support. I would also like to thank our employees for their dedication, my fellow directors for their sound advice and support, and finally our valued customers for their continued loyalty to the Group.
COLIN TAYLOR Non-Executive Director and Chairman
CIM FINANCIAL SERVICES LTD / ANNUAL REPORT 2019 13

Directors’Profiles
COLIN TAYLORNon-Executive Director and Chairman
Colin Taylor holds an MSc in Management from Imperial College, London and a BSc (Hons) in Engineering with Business Studies from Portsmouth Polytechnic.
He is the Chairman and CEO of Taylor Smith Investment, which is a diversified group of companies involved in Marine Services, Logistics and Distribution, Manufacturing, Services and Property.
He is the Honorary Consul of Sweden in Mauritius.
Directorship in other listed companies: Lavastone Ltd
MARK VAN BEUNINGENExecutive Director, Group CEO & Acting Managing Director of Cim Finance Ltd
Mark van Beuningen is currently the Group CEO and Executive Director of CIM Financial Services Ltd. He joined the Group in January 2016 and was the Managing Director of Cim Finance Ltd until 30 September 2017.
Prior to joining Cim Group, Mark worked for the Boston Consulting Group (BCG) in Sydney for two years and then in Johannesburg for four years. Before that he worked in the Structured Products team at Macquarie Funds Group in Sydney and as Audit Manager for KPMG Financial Services Assurance in Cape Town.
Mark holds a Bachelor of Business Science (Hons) in Finance and Accounts from the University of Cape Town and an MBA from the Australian Graduate School of Management. Mark qualified as a Chartered Financial Analyst in 2007 and as a Chartered Accountant (SA) in 2005.
Mark is also the Acting Managing Director of Cim Finance Ltd and is a member of the Group’s Corporate Governance Committee.
Directorship in other listed companies: none.
CIM FINANCIAL SERVICES LTD / ANNUAL REPORT 201914

TERESA CLARKEIndependent Director
Teresa Clarke is the Chair and CEO of Africa.com, a digital media holding company that includes a digital ad network, and iAfrica.com the oldest news portal in South Africa.
She earned three degrees from Harvard University: B.A. in economics (cum laude), MBA and JD. She serves on the board of Change Financial (a publicly traded fintech company in Australia).
Her non-profit activities include the West African Board of the Rhodes Scholarship, the Student Sponsorship Programme of South Africa (chair), and Friends of the Legal Resources Centre (chair). She is also a member of the Council on Foreign Relations. Teresa serves on Cim Group’s Corporate Governance Committee.
Directorship in other listed companies: none.
LOUIS AMEDEE DARGAIndependent Director
Louis Amédée Darga is a Fellow of the Royal Society of Arts (FRSA). He is the Chairperson of the Mauritius Africa Business Club, and is also the Managing Partner of StraConsult, a management and economic development consulting firm.
He was until December 2014 the Chairperson of Enterprise Mauritius. He is a Honorary Fellow of the Institute of Engineers in Mauritius as well as a Fellow of the Mauritius Institute of Directors. He is a former member of parliament in Mauritius, and a former Minister. He also served as Mayor of the town of Curepipe.
He is Chairman of the Southern and Eastern African Trade and Information Network (SEATINI), a member of the African Association of Political Science since 1977 and a former executive member of the organisation. He served from 2005 to 2011 as a Member of the Bureau of the Committee on Human Development and Civil Society of the U.N Economic Commission for Africa.
Amédée is the Chairman of Cim Group’s Risk Management and Audit Committee.
Directorship in other listed companies: Alteo Limited.
CIM FINANCIAL SERVICES LTD / ANNUAL REPORT 2019 15

Directors’Profiles
FAREED JAUNBOCUSIndependent Director
Fareed Jaunbocus is a Chartered Certified Accountant and is currently the CEO of Strategos Ltd, a Mauritian based Management Consulting firm.
As the Partner heading the Strategic Consulting Services of De Chazal Du Mee/Arthur Andersen/BDO (Chartered Accountants) where he worked for some thirty years, Fareed has developed a unique breadth of experience in Management and Project Consulting assignments and Capacity Building. He has a recognised track record of high delivery across various sectors and countries. He has carried out assignments in some fifty countries worldwide, from the USA to China, from Europe to South Africa. The nature of the diversity of projects and assignments undertaken by Fareed results in a pool of highly diversified skills and experiences that allows him to take a value-adding perspective in all assignments and organisations.
Over and above blue chip companies, the private and public sectors, as well as Governments, Fareed is also an accredited services provider to a host of commissioning agencies and international donors including: the African Development Bank, the PTA Bank, the World Bank group, the European Union, the Southern African Development Community (SADC), the Common Market for Eastern and Southern Africa (COMESA), the Indian Ocean Commission (COI), the United States Agency for International Development, the UNDP and other UN agencies.
He has also been and is a Director on several Boards, including the United Nations Advisory Board in New York.
He is also a member of the RMAC of CIM Financial Services Ltd.
Directorship in other listed companies: none.
DAVID SOMENIndependent Director
David Somen holds a Law Degree from Oxford University and an MBA from Harvard Business School.
He is the co-founder and Managing Director of Virtual IT Limited, a UK IT managed services provider, and is also the co-founder and Chairman of Eldama Technologies Limited, one of Kenya’s leading cloud and IT services providers, and a co-founder and director of Serenity Spa, Kenya’s leading spa, wellness and beauty organisation.
Prior to Eldama and Virtual IT, David was the co-founder and Executive Deputy Chairman of AccessKenya Group, Kenya’s leading corporate Internet Services Provider which was listed on the Nairobi Stock Exchange and later sold to Dimension Data Group, and the co-founder and CEO of the LCR Telecom Group, which was sold to NASDAQ listed PRIMUS Telecommunications in 2000. He also has several years’ work experience in London and Hong Kong for McKinsey & Co. David is currently the Chairman of Cim Group’s Corporate Governance Committee and the Chairman of Aspira, Cim’s Kenyan financial services business.
Directorship in other listed companies: none.
CIM FINANCIAL SERVICES LTD / ANNUAL REPORT 201916

PHILIP TAYLORNon-Executive Director
Philip Taylor graduated from the University of Surrey in 1989 after reading Hotel Management.
After completing an MBA in England in 1994, Philip moved back with the Rogers Group in Mauritius, and headed the Rogers Group’s diversified international development. In 2004, Philip left Rogers to set up his own businesses with a focus on the Indian Ocean Islands and Africa.
His involvements over the past few years have been diverse, with a focus on the region’s hospitality and tourism industry. He currently heads the development of a fast growing hospitality technology service “start-up” by the name of www.hospitality-plus.travel.
Philip is the Honorary Consul of Finland in Mauritius.
Philip is a member of the Group’s Corporate Governance Committee.
Directorship in other listed companies: none.
MATTHEW TAYLORNon-Executive Director
Matthew Taylor holds a BSc (Hons) in Retail Management from the University of Surrey.
He joined Rogers in 2000 as Project Manager in the Planning and Development Department. He was the Executive Director Retail of Scott & Co from 2007 to January 2013 and is currently the firm’s CEO.
He is also a member of the RMAC of CIM Financial Services Ltd.
Directorship in other listed companies: Lavastone Ltd.
CIM FINANCIAL SERVICES LTD / ANNUAL REPORT 2019 17

Directors’Profiles
TIM TAYLORNon-Executive Director
Tim Taylor holds a BA (Hons) in Industrial Economics from Nottingham University. He worked in the United Kingdom until 1972 when he returned to Mauritius and joined Rogers & Co.
He became Chief Executive of Rogers in 1999, retiring in December 2006. He was then Non-Executive Chairman of Rogers from 2007 to October 2012.
He is the Chairman of Scott & Co, one of Mauritius’ oldest commercial concerns, and also the Chairman of The BrandHouse Ltd. He is a past Chairman of the National Committee on Corporate Governance and a former President of the Mauritius Chamber of Commerce and Industry. He is Honorary Consul of Norway in Mauritius. He has always had an interest in environmental and conservation issues and has been a member of the Council of the Mauritian Wildlife Foundation since 2006 and President since 2009.
Tim is a member of the Group’s Corporate Governance Committee.
Directorship in other listed companies: Vivo Energy Mauritius Ltd
CIM FINANCIAL SERVICES LTD / ANNUAL REPORT 201918

CIM FINANCIAL SERVICES LTD / ANNUAL REPORT 2019 19

CIM FINANCIAL SERVICES LTD / ANNUAL REPORT 201920

Your goals, our solutions
CIM FINANCIAL SERVICES LTD / ANNUAL REPORT 2019 21

MARK VAN BEUNINGENExecutive Director and
Group CEO
Group CEO’sReport
Cim Group has had a very strong year financially. Group net operating income increased by 28% from MUR 1.4bn in financial year (FY) 2018 to MUR 1.8bn in FY 2019. Profit before discontinued operations (Cim Property) increased by 34% from MUR 273.4m in FY18 to MUR 366.9m in FY19, with total Group profit after tax increasing by 9% from MUR 352.1m to MUR 382.7m over the same period.
Based on the strategic review of the Group which we completed in the 2018 financial year, we decided that Cim Group would be focussed on non-bank financial services. The decision to separately list our property business, now Lavastone Ltd, on the Development and Enterprise Market (‘DEM’) in January 2019 was made in this context.
As stated in last year’s CEO review, at a Group level we also made the decision not to pursue a banking opportunity. We decided that Cim will focus on the development of its core consumer finance business in Mauritius and the region, as well on strengthening our leasing, credit card and factoring propositions. We feel that Cim Finance Ltd is uniquely positioned in the Mauritian market to leverage its strengths in the retail mass market and the SME market. This is particularly the case with its consumer finance proposition where we provide access to finance to more than 260,000 active Mauritian clients.
We have leveraged our investment in Mauritian Eagle Leasing Company Limited (MELCO) acquired from IBL in August 2018 to strengthen our leasing business and as a result we are now the second largest leasing company in Mauritius. MELCO’s leasing portfolio client base and the capabilities of its team have complemented those of Cim Finance Ltd.
We have strengthened our executive team considerably with the following senior executives joining Cim Group during the 2019 financial year: Nick Chin as Group Chief Financial Officer, Sudheer Prabhu as Group Chief Technology Officer, Priya Madhow as Group Head of HR and Kwon Li as Cim Finance Chief Risk Officer.
A key initiative during the year was to review our funding strategy, the result of which was one of the key drivers in our decision to hand back Cim Finance’s deposit taking licence to the Bank of Mauritius. The focus of the funding strategy was to ensure that we strengthened the liability side of Cim Finance’s balance sheet through: better asset and liability duration matching; better aligning Cim Finance’s funding to its predominantly fixed rate asset book (approximately 90% fixed rate); and reducing our liquidity risk.
CIM FINANCIAL SERVICES LTD / ANNUAL REPORT 201922

Given the focus of our funding strategy, as stated above we decided that the best debt instruments to execute against the funding strategy would be bonds. Cim Finance Ltd raised MUR 3.5bn in fixed rate 2-year and 5-year bonds from MCB Bank during the financial year. Given the recent development of the Mauritian debt capital markets, along with our desire to be a price maker when issuing debt and to build out a yield curve for Cim Financial Services Ltd bonds, we have decided to embark on a structured sequence of Medium Term Note (MTN) programmes. Cim Financial Services Ltd launched its first MTN programme in November 2019. The issue was assigned an AA credit rating by CARE Ratings Africa and was the first fixed rate senior unsecured and listed bond issue in Mauritius. We had targeted a raise of MUR 1.2bn, with a Board approved oversubscription of up to MUR 2bn. We had oversubscriptions by a significant amount demonstrating the recognition of the strength of our business and brand.
Bank debt will continue to be a very important part of our funding mix and as such we will continue to work closely with our key banking partners.
We have invested a significant amount of management time in reviewing Cim Finance’s technology strategy with the arrival of our new Group Chief Technology Officer. We have finalised the process of selecting vendors for a new core lending system, as well as key support systems, and will look to implement the new systems during the course of the 2020 and 2021 financial years.
We rolled out the implementation of a digital platform for our consumer finance focussed retail merchant partners that will enable a more efficient and customer centric process for the over 800 merchants where we do not have a point of sale presence.
We have defined a well-articulated digital transformation strategy that we will start implementing in the 2020 financial year. In the first instance we will look to roll out an app to our customers, as we have done in Kenya, to enable them to originate loans digitally on their mobile phones.
We completed our first full year of operations in Kenya during 2019, with our Kenyan business branded as Aspira. We have deployed a fintech-enabled hire purchase (HP) business model through an app that leverages Kenya’s unique mobile digital ecosystem and high consumer awareness of mobile phone app-based lending platforms.
Customers can download the Aspira app onto their phone, apply for an HP loan and be granted a credit decision within two minutes. They can then use their loan to purchase consumer durable goods at Aspira’s consumer electronic and furniture retail partners. Customers are then sent an in-App payment reminder each month and can settle their monthly instalment via an in-App link to M-Pesa (Kenya’s digital money system).
Though conditions are certainly more challenging in Kenya than Mauritius, we are very excited about the opportunity that Kenyan market represents for our consumer finance business.
Structure-wise, we are nearing completion of the amalgamation of Cim Finance Ltd, Mauritian Eagle Leasing Company Ltd, Cim Agencies Ltd, Cim Management Services Ltd and Cim Shared Services Ltd with and into Cim Financial Services Ltd (‘CFSL’). Subject to obtaining the final relevant regulatory approvals, we expect the amalgamation to be completed by the second quarter of financial year 2020. We believe that the amalgamation will simplify decision making and create an organisation focussed on its core businesses, supported by a strong and unitary governance and management structure. The amalgamated CFSL will leverage on the positive brand equity associated with the ‘Cim Finance’ brand, which will be kept as its customer facing brand.
Looking ahead
We have had a very strong 2019 financial year. As highlighted, we are looking to continue investing significantly in our core businesses in Mauritius through significant technology investments, as well as continuing the work we have started in further enhancing our scorecards and process automation as well as our advanced analytics capabilities.
With the recruitment of a new Group Head of HR we are looking to increase our investment in our own people to further enhance our capabilities as well as employee value proposition. The investment in our people will complement the technology investment and continue to better serve evolving customer expectations.
In the 2020 financial year we are looking to focus more on, and strengthen, our Kenyan business where we feel we have core capabilities and strengths, namely in consumer finance for the time being and potentially leasing in the future.
We believe that a well-executed Mauritian and regional strategy will reward shareholders with attractive returns and a strong growth story.
Above all, I would like to thank our valued customers for placing their business with us, our Board and shareholders for their support and our staff for their skill and hard work to make Cim an attractive employer and valued partner to our customers.
MARK VAN BEUNINGENExecutive Director and Group CEO
CIM FINANCIAL SERVICES LTD / ANNUAL REPORT 2019 23

Senior ManagementTeam
NICK CHINChief Financial Officer
Nick Chin has extensive experience in the Banking and Financial Services sector.
Prior to joining Cim Group, Nick occupied the position of Head of Finance at ABC Banking Corporation Ltd for nearly 7 years and previously held senior roles at RBS Insurance, UK and Barclays Capital, UK.
Nick holds a BSc. First Class Honours in Actuarial Science and an MSc. in Applied Statistics (Oxon). He is also member of the Institute of Chartered Accountants in England and Wales (ICAEW). He has been the Chief Financial Officer of Cim Group since January 2019.
PRIYA MADHOWGroup Head of Human Resources
Priya Madhow has more than 20 years of work experience across several jurisdictions for leading International Corporate and Investment Banks, local conglomerates and luxury hotel brands.
She joined Cim Group in July 2019 as the Group Head of Human Resources. Prior to joining Cim Group, Priya worked for The Bank of N.T. Butterfield as Head of Human Resources and at Deutsche Bank as Country Head of Human Resources where she contributed strategically to key global business initiatives and HR projects. She also held executive positions in Insurance and healthcare institutions.
Before joining the Financial Sector, Priya worked extensively in the hospitality industry in Mauritius and her experience in that sector extends to other jurisdictions including Dubai, Singapore, Seychelles and Scotland.
Priya is a Senior Certified Professional of the Society of Human Resources Management and studied at the Institute of Commercial Management and the University of Salford.
CIM FINANCIAL SERVICES LTD / ANNUAL REPORT 201924

AMBRISH MAHARAHAJEChief Operating Officer
Ambrish Maharahaje is an Associate of The Chartered Governance Institute (previously the Institute of Chartered Secretaries and Administrators (UK) (ICSA)) and holds a BSc in Management from the University of Mauritius.
Prior to joining Cim Group, Ambrish worked at the Mauritius Institute of Directors as Executive Secretary and at Rogers and Company Limited as Corporate Manager, Legal Compliance. Before being appointed Chief Operating Officer of Cim Group, Ambrish headed Cim Group’s Corporate Affairs function which comprises of Communications & Investor Relations and Company Secretarial services.
SUDHEER PRABHUChief Technology Officer
Sudheer Prabhu is an experienced technologist with more than 27 years’ experience in banking and non-banking Technology and Operations, having worked with large international Banks like ABN AMRO and Royal Bank of Scotland, as well as working in the Public Sector, Private Sector and multinational corporation and banking environments in India.
He joined Cim Group in June 2019. His most recent experience has been with MauBank in Mauritius as its Chief Information & Digital Officer, where he played a key role in developing and executing MauBank’s Digital Strategy where he brought some of the market first products like ‘Chat Bots’, ‘Online Leasing Lending’ etc. Before that, Sudheer has worked in Fullerton India Credit Co., a non-banking finance company, as its Chief Information Officer.
Sudheer holds a Bachelors degree in Commerce (First Class) from the Karnataka University, India, and a Diploma in Software Technology from NIIT. He is also a junior associate of the Indian Institute of Bankers and a Certified Information Systems Auditor (ISACA, Illinois, USA).
CIM FINANCIAL SERVICES LTD / ANNUAL REPORT 2019 25

CIM FINANCIAL SERVICES LTD / ANNUAL REPORT 201926

Expanding our Horizons
CIM FINANCIAL SERVICES LTD / ANNUAL REPORT 2019 27

BusinessReviewCIM FINANCE
The Finance cluster consists of Cim Finance Ltd, Cim Agencies Ltd, Cim Forex Ltd, and the newly acquired subsidiary Mauritian Eagle Leasing Company Limited, with each business being separately licensed and regulated. Cim Finance Ltd is the largest of the businesses and is regulated both by the Bank of Mauritius and the Financial Services Commission. Cim Finance Ltd plays an important role in the Mauritian economy with the focus of Cim Finance Ltd being very much “mass market” retail and SME financing.
The Finance cluster recorded impressive growth during financial year 2019 (FY19). Net operating income increased by MUR 316m (+22%) from MUR 1.4bn in FY18 to MUR 1.7bn in FY19, with profit after tax increasing by MUR 53m (+14%) from MUR 379m to MUR 432m.
The enhancement of our credit scorecards and automation of a number of our core lending processes in 2018 has benefited Cim Finance and its customers significantly during the 2019 financial year. Straight through processing of the loan application and approval process for HP type loans and personal loans now takes a few minutes. Cim Finance Ltd processes over 600,000 small ticket size loans each year, therefore optimising the efficiency of our lending processes has led to significant improvements in turnaround time and customer satisfaction and, importantly for the business, a large increase in loan volumes.
Cim Finance’s asset (loan) book increased by 21% during the financial year from MUR 10.4bn at 30 September 2018 to MUR 12.5bn at 30 September 2019. Given market conditions, as well as the entry of a new competitor into the market, this was a fantastic achievement and demonstrates the importance of process automation and advanced analytics enhancements to the business.
We implemented an enterprise data warehouse (EDW) in the 2018 financial year and we are now driving advanced analytics off the EDW. This is enabling the management team to obtain real-time insights across different areas of our business that will enable management to make better and quicker business decisions.
Business unit reviews
Cim Finance Ltd has four main business units: Consumer Finance, Leasing, Cards & Payments and Factoring.
Consumer Finance
Cim Finance Ltd started its Consumer Finance activities with the launch of its hire purchase product in 1987. As
highlighted in last year’s review, the significantly reduced hire purchase rate to 12% from 19% since 2015 adversely distorted loan pricing at the lower end of the mass market. This rate is significantly below unsecured personal loans as well as credit card borrowing rates. Since 2016 we have moved away from offering finance via HP contracts and opted to finance retail point-of-sale (POS) purchases via Credit Finance Agreements (CFA) to enable our clients to finance their purchase of consumer electronic goods and furniture.
Despite the market entry of a new competitor, the Consumer Finance business unit has grown from strength to strength with total loan disbursements growing significantly in FY19. Cim Finance’s CFA loan portfolio remains the largest part of the business, comprising close to 50% of the value of the company’s total asset book.
Our unsecured lending product, Cim MoCredit, has now been on the market for four years. Our customers use Cim MoCredit to finance their needs beyond retail financing requirements for life needs such as renovations, weddings and funerals. This is a 4-year loan product vs. the average loan tenure for CFA of 2 years. The unsecured loan portfolio now represents 25% of the value of the company’s total asset book.
Cim Finance’s retail point-of-sale model for its Consumer Finance business unit is a key strength from which we originate customer loans and facilitate monthly instalment repayments. In-store counters grew from 85 at the end of FY18 to 102 at the end of FY19 and we also added one standalone branch in Mahebourg to our existing six branches to enable better customer service. The number of unique individual clients grew from 236,000 at the end of FY18 to 260,000 at the end of FY19.
Leasing
Cim Finance Ltd was one of the pioneers in the Mauritian leasing market, starting leasing operations in 1996. Cim Finance Ltd has grown its leasing book at a compound annual growth rate over the last 5 years of close to 10% per annum: approximately 50% higher growth than the average for the rest of the market combined. We consider leasing to be one of Cim Finance’s core businesses and will look to continue investing into the business.
As mentioned in the Group CEO’s report, we acquired Mauritian Eagle Leasing Company Limited (MELCO) during the FY18 year. The acquisition of MELCO’s leasing book takes Cim Group to second position in terms of finance lease market share in Mauritius. Cim Finance Ltd leasing has traditionally been very strong in the second-hand and
CIM FINANCIAL SERVICES LTD / ANNUAL REPORT 201928

reconditioned car market as well as with SME clients. The acquisition has helped us to strengthen our portfolio with larger corporates, as well as strengthening our position in the operating lease market.
The Leasing business unit has had a strong financial year, growing positively its leasing disbursements in FY19. Cim Finance’s leasing portfolio remains a significant part of the business, comprising 22% of the value of the company’s total asset book.
Cards & Payments
Cim Finance Ltd was the first non-bank financial institution (NBFI) in sub-Saharan Africa to receive MasterCard accreditation in 2005 and we started issuing credit cards shortly thereafter. In 2008 we started debit and credit card acquiring activities. In 2010 we received Visa accreditation and started credit and debit card acquiring for Visa, and in 2011 launched Visa credit cards.
Cim Finance Ltd now has a base of over 60,000 credit card accounts in issue in Mauritius. Cim Finance Ltd has a market share in Mauritius of approximately 20% for both the number of cards in issue as well as the value of outstanding balances.
We believe that enhancing our payments capabilities and proposition is essential to compete in the Mauritian market going forward, especially with the advent of the Mauritius Central Automated Switch (MAUCAS).
We are actively engaging with the Bank of Mauritius on the implications of MAUCAS to ensure that as a company Cim Finance Ltd is well positioned to take advantage of the benefits of the MAUCAS Instant Payment System.
In order to enhance our cards value proposition to our clients, we decided to outsource the processing of our credit card and POS transactions to MCB Group’s subsidiary ICPS. We completed this complex project during the year and we would like to commend the team for their hard work and dedication in doing so.
The Cards & Payments business unit has had a good financial year, taking into account that a significant amount of management time and effort has been spent on managing the outsourcing of card issuing and acquiring processing to ICPS. Issuing spend and acquiring volumes have both experienced increases during the year.
Factoring
Cim Finance Ltd was also a pioneer in Factoring in Mauritius, launching its factoring business in 2004 offering recourse factoring to its domestic customers and launching its non-recourse product in 2006.
The Factoring team provides Cim Finance customers with solutions that help to access the working capital needed to support their business growth by: financing of up to 90% of invoice values; complete sales ledger administration and collections; as well as credit insurance cover of debtors.
Cim Finance’s credit insurer is Coface, headquartered in Paris. Coface has over 4,000 employees in 100 countries. We work closely with Coface, with Coface helping Cim Finance Ltd to anticipate and evaluate the risks of debtors covered by Coface’s credit insurance so that we can make the right business decisions.
Cim Finance is a member of Factor Chain International (FCI), headquartered in Amsterdam. We developed and launched import and export factoring products towards the end of the year and look forward to supporting Mauritian corporates and SMEs with their import and export related working capital needs, leveraging FCl’s global network of members and affiliates.
Factoring disbursements increased satisfactorily in FY19.
Outlook
As discussed in the Group CEO’s review, we will be investing significantly in our core lending systems and key support systems, as well as investing in our digital capabilities with the anticipated launch of our consumer app in FY20. We will also look to further enhance our scorecards and process automation, as well as our advanced analytics capabilities, to help us continue to drive sustainable loan disbursement growth.
The initial focus of our digital lending proposition will be focussed on our core Consumer Finance business and we expect future growth in new customer segments through the digital channels that we will build out.
We have a number of initiatives to strengthen our Leasing proposition in the new and recon car finance lease market and we will aim to strengthen our operating lease proposition.
The Cards & Payments team has a number of initiatives to drive higher Issuing spend in FY20 and we will deploy a new fleet of differentiated POS devices into the market in FY20.
With the support of the SIC SME Export Factoring Scheme, as well as continued collaboration with MEXA and MEXA’s members, we will look to drive growth in our newly launched import and export factoring products.
We will also look to leverage our existing customer base and product set to bring a more compelling SME proposition to market in FY20.
CIM FINANCIAL SERVICES LTD / ANNUAL REPORT 2019 29

Cim Finance Management Team
OUNISHKA CHUCKOWREEHead of Leasing
Ounishka Chuckowree is currently the Head of Leasing of Cim Finance Ltd. She joined the Company in 2017.
Prior to joining Cim Finance Ltd, she has worked for leading stakeholders in the sector including The Mauritius Commercial Bank, State Bank of Mauritius, ABC Banking Corporation and Prudence Leasing Company Ltd. Ounishka has over 10 years work experience within the domestic financial services industry with significant specialisation in sales, client management, marketing, business development and relationship management (retail and a special grooming for corporate clients).
Ounishka is also a director on the Board of Mauritian Eagle Leasing Company Ltd.
Ounishka has completed Level 1 and 2 of ACCA.
LI CHIN SIONG LI YUK LO (also known as Roger Li)Head of Consumer Finance
Roger Li is currently the Head of Consumer Finance. He joined Cim Finance Ltd in 1989.
He is responsible for driving top-line revenue for Cim Finance, ensuring that the strategic priorities of the commercial disciplines are aligned and designed to yield profitable sales, increased market share and enhanced competitiveness.
Roger is a driven brand-builder; he is consumer-centric, a passionate innovator and has a healthy discontent for the status quo.
He holds a Diploma in Management Accounting (CIMA Dip MA). He brings to the position a successful track record of more than 25 years that includes managerial experience in the field of finance, operations, collections and recovery and sales.
Roger has hands-on experience of the counters’ operations and has been fostering professional relationships with merchants to maintain a culture of trust, respect and open communication for continued sales growth.
CIM FINANCIAL SERVICES LTD / ANNUAL REPORT 201930

ANIELLE JIA Head of Factoring
Anielle Jia joined Cim Finance in January 2017, where she now heads up the Cim Finance Factoring business.
Anielle led the engagement with FCI, formerly known as Factors Chain International, for Cim Finance to be an associate member of FCI in 2018. She also led the negotiation with our credit insurer, Coface, that is headquartered in Paris, France.
Anielle has also driven the product development of Import & Export Factoring that has recently been launched by Cim Finance on the Mauritian market.
Prior to joining Cim Finance, Anielle was the Marketing and Sales Executive at MCB Factors Ltd. Anielle headed up the marketing and sales of MCB Factors Ltd in the Mauritian market and was part of the senior executive team. Anielle has over 15 years’ experience in factoring and has been certified by FCI.
ANTHONY SCEALESHead of Cards & Payments
Anthony Sceales is currently Head of Cards & Payments at Cim Finance, having initially joined the Group in June 2016 as Head of Insurance in Cim Agencies.
Anthony has diverse financial services and consulting experience gained in South Africa, Singapore and across the Middle East. Prior to joining Cim Finance Anthony was GM Strategy at Hollard Insurance in South Africa where he also supported distribution of life insurance, and his earlier career included three years of strategy consulting across various industries with Monitor Group in the Middle East & Africa, and five years, moving from Analyst to Senior Manager, at Nedbank Corporate and on the retail side with Capital One / American Express in South Africa.
Anthony holds an MBA with distinction from INSEAD (France), a BBusSci (Hons) in Finance from UCT (South Africa) and has completed CFA Level II.
Anthony is also a Director of Cim Agencies Limited, iVeri Global Limited and iVeri Payment Technologies (Proprietary) Limited.
CIM FINANCIAL SERVICES LTD / ANNUAL REPORT 2019 31

STEPHAN VEE FOUNG HOW POOHead of IT
Stephan How Poo is the Head of IT at Cim Finance Ltd.
He joined the Company in February 2000 as a software analyst programmer and gradually climbed the corporate ladder until promoted to his current position of Head of IT in 2008. Stephan holds a Master of Business Administration with specialisation in Finance and a Bachelors Degree (Hons) in Computer Science and Engineering from the University of Mauritius.
SOO HIM LOW KWAN SANG General Manager Collection and Recovery
Soo Him Low Kwan Sang is a Fellow Member of the Association of Chartered Certified Accountants (UK).
He joined Cim Finance in 1996 and has been in charge of various departments within Cim Finance, namely, leasing, finance, factoring, card and customer accounts. He was an Executive Director of Cim Finance Ltd from 01 October 2014 to 14 October 2017. He has now been the General Manager Collections & Recovery since 01 November 2018.
Cim Finance Management Team
CIM FINANCIAL SERVICES LTD / ANNUAL REPORT 201932

DIANE MAUREL Head of Credit Underwriting
Diane Maurel is currently the Head of Credit Underwriting for Cim Finance Ltd.
She joined the Group in January 2015 as a Senior Analyst for Cim Management Services Ltd and was made the Manager of Corporate Credit for Cim Finance Ltd in February 2016. In 2018 Diane was made the Head of Corporate Credit and then in July 2018, the Head of Credit Underwriting, which also encompassed the retail credit underwriting department.
Prior to joining Cim Group, Diane worked for The Macquarie Bank, in the Macquarie Corporate Asset Finance Division, in Melbourne for two years. Before that she worked at Ford Credit Ltd in roles including Credit Risk and Recovery and Legal.
Diane holds a Bachelor of Business Commerce in Marketing and Economics from Melbourne University and an MBA from Melbourne University.
PRADEEP RAWAHead of Treasury
Pradeep Rawa heads up the Treasury function that he set up within Cim Finance. He joined Cim Finance in September 2009. Prior to joining Cim Finance, Pradeep worked at Deutsche Bank Mauritius for five years. Before that Pradeep worked at State Bank of Mauritius Lease Ltd.
Pradeep holds a BSc (Hons) in Accounting & Finance from University of Mauritius and is a Fellow Member of the Association of Chartered Certified Accountants (FCCA) (UK). He is also a member of MIPA.
Pradeep leads Cim Finance’s relationships with its banking partners and investors in Mauritius and has more than 17 years of experience in the Banking and Financial Services sector.
CIM FINANCIAL SERVICES LTD / ANNUAL REPORT 2019 33

ADRIAN ASHTONHead of Marketing and Communications
Adrian Ashton joined Cim Finance as Head of Marketing and Communications in October 2016.
Adrian has held various senior management positions in marketing and sales departments within companies and agencies in South Africa, Mauritius and Kenya including Apollo Bramwell Hospital, Bramer Asset Management, Amway Global, HabariMedia agency and British American Tobacco. He moved to Cim Finance from Cim Global, where he was responsible for the creation and development of the marketing department.
With his 20 years of experience, Adrian has had exposure in specialist marketing functions covering Online Media, Brand Management, Operations, Business Development, Customer Relationship Management and Sales. Adrian holds a MBA in Innovation & Leadership, a Diploma in Marketing Management and a Professional Diploma in Digital Marketing with the Digital Marketing Institute (DMI) and has been accredited as a Member of the Chartered Institute of Marketing (CIM) in the UK.
KWON LI PAK MANChief Risk Officer
Kwon Li Pak Man joined Cim Finance as Chief Risk Officer in January 2019. He is a seasoned risk professional with a deep understanding of risk disciplines.
He is responsible for leading the Risk Function, defining and overseeing the financial services related risks - Credit, Market, Liquidity and Operational Risk, as well as risk related strategies, policies and processes.
Prior to joining Cim Finance, Kwon was the Head of Risk at SBM Bank (Mauritius) Ltd, where he spent over 18 years and successfully built a robust risk management framework. He also held various senior roles at SBM, spanning from Treasury, Compliance to Risk Management.
Kwon holds an MSc in Business Finance from the Brunel University London and the ACI Dealing Certificate.
Cim Finance Management Team
CIM FINANCIAL SERVICES LTD / ANNUAL REPORT 201934

YUSRA NEEAMUTH RAMPUTTYHead of Internal Audit
Yusra Neeamuth Ramputty holds a Bachelors Degree (Honors) in ‘Accounting with Business Operations Management’ from the London Metropolitan University, UK, and is a Fellow Chartered Certified Accountant.
Her memberships extend to the Institute of Internal Auditors in the UK and the Association of Certified Fraud Examiners. Yusra is also a Certified Internal Auditor.
She joined Cim Finance in March 2018 as Head of Internal Audit. Prior to joining Cim Finance, Yusra worked as Internal Audit Manager in the Internal Audit Department of Bank One Limited for 3 years and as Internal Audit Manager in the Risk Assurance Services department at PwC Mauritius for 8 years, working on a variety of assurance, consulting, and compliance engagements in Mauritius and abroad (mainly in the Indian Ocean Islands and Africa).
VALERIE HOUBERTHead of Compliance
Valerie Houbert is currently the Head of Compliance of Cim Finance Ltd. She joined the company in July 2018.
Valerie has studied in France and received a Master’s Degree in Law from the University of Aix-Marseille III. Her main areas of expertise are in Banking Law, Corporate Finance, Company Law and Commercial Law.
Prior to joining Cim Finance, Valerie worked in the Banking industry for more than 12 years, with extensive experience as senior officer in the Compliance and Legal fields at Standard Chartered Bank Mauritius Limited and Banque des Mascareignes Ltée (now known as BCP Bank Mauritius Ltd).
During her career, Valerie acted as Chairperson of the Mauritius Bankers Association (MBA) Compliance Committee from August 2016 to May 2018.
CIM FINANCIAL SERVICES LTD / ANNUAL REPORT 2019 35

CIM FINANCIAL SERVICES LTD / ANNUAL REPORT 201936

Wherever you want to go, we can help you get there
CIM FINANCIAL SERVICES LTD / ANNUAL REPORT 2019 37

1. COMPLIANCE STATEMENT
CIM Financial Services Ltd (‘CFSL’ or the ‘Company’) is listed on The Stock Exchange of Mauritius and is classified as a public interest entity under the Financial Reporting Act 2004. It is required to adopt and report on its corporate governance practices in accordance with the National Code of Corporate Governance (2016) (the ‘Code’). This corporate governance report sets out how the Code’s principles have been applied throughout the Company.
2. GOVERNANCE STRUCTURE
2.1. The Board
According to the Constitution of the Company, the Board shall consist of a minimum of six and a maximum of twelve directors. During the year under review, the Company was headed by a unitary Board, comprised of nine members under the chairmanship of Mr. Colin Taylor. The Board is composed of four non-executive directors, including the Chairman, one executive director and four independent directors.
The Board assumes responsibility for leading and controlling the organisation, providing strategic guidance, reviewing financial plans and monitoring performance, ensuring that a robust risk management system is in place and providing accurate information to shareholders, the public and regulators. It also ensures that the Company adheres to all legal and regulatory requirements. The Risk Management and Audit Committee assists the Board in fulfilling the responsibilities on risk management and audit-related issues.
The profiles and the full directorship lists of the members of the Board are set out on pages 14 to 18 of the Annual Report. Except for Mr David Somen and Ms Teresa Clarke, all the directors reside in Mauritius.
The Board is of the view that there is an adequate balance between independent, executive and non-executive directors on the Board and that the Board members have the necessary skills, expertise and knowledge to discharge their respective duties and responsibilities effectively. Although there is only one executive director on the Board, the Board is of the view that the input of the Chief Financial Officer who is in attendance at Board meetings provides an appropriate balance to Board deliberations. In terms of
diversity, and although there is already one female director on the Board, the Board will continue to strive to improve its gender balance with the appointment of further female directors.
The Board has adopted an Equal Opportunity Policy pursuant to the requirements of the Equal Opportunities Act 2008. The Policy provides for the promotion of equal opportunity between persons, prohibits discrimination on the ground of status and by victimisation. The Policy sets out the Company’s position on equal opportunity in each and every stage of the employment process and is applicable to all Board members and employees. The Company will regularly review its procedures and selection criteria to ensure that individuals are selected, promoted and treated according to their individual abilities and merits.
The skills set of the members of the Board is set out in the chart below.
Accounting
Commercial and Investment
Financial
International Business and Regional
Risk, Compliance and Legal
44%
56%
100%
89%
100%
CIM FINANCIAL SERVICES LTD / ANNUAL REPORT 2019
Corporate GovernanceReport
38

In accordance with the requirements of the Code, the following documents as approved by the Board are available for consultation purposes on the Company’s website https://www.cim.mu/governance-cfsl.html:
1. Constitution of CFSL
2. Code of Ethics. The Board will regularly monitor and evaluate compliance with the Code of Ethics
3. Position statements of the Chairman and the Company Secretary which provide a clear definition of their respective roles and duties
4. Organisation chart
5. Statement of main accountabilities
6. Nomination and appointment process of directors
The Board has approved on 4 October 2019 a Board Charter which provides the terms of reference of the Board and describes how the Board operates. The Board charter is available for consultation purposes on the Company’s website https://www.cim.mu/governance-cfsl.html.
The Board has also approved on 4 October 2019 the position statement of the Chief Executive Officer of the Company which clearly defines the duties and role of the Chief Executive Officer. The position statement of the Chief Executive Officer is available for consultation purposes on the Company’s website https://www.cim.mu/governance-cfsl.html.
To promote a culture of integrity, the Group has adopted a Whistleblowing policy which provides a channel of effective communication of concerns. Employees are encouraged to report any malpractice of which they become aware. The policy, which is available on the website of Cim Group https://www.cimfinance.mu/en/whistleblowing, outlines the reporting mechanism and the defined process on how reported concerns will be handled and investigated.
The processes and frequency to review, monitor and approve the Board Charter, the organisation’s Code of Ethics, the position statements, the organisational chart and the statement of main accountabilities are determined by the Board and may be delegated to sub-committees, as appropriate.
2.2. Board committees
In line with the Code, the Board has set up a Corporate Governance Committee (CGC), a Risk Management and Audit Committee (RMAC) and a Board Investment Committee (BIC) to assist it in the effective discharge of its duties as well as to provide support and focus on particular matters. The minutes of proceedings of each committee are submitted to the Board for noting.
The CGC oversees all governance issues relating to the business activities of the Company and all its subsidiaries. The CGC is composed of two independent directors, namely Mr. David Somen (Chairman) and Ms Teresa Clarke, two non-executive directors, namely Mr. Tim Taylor and
Mr. Philip Taylor, and one executive director, namely Mr. Mark van Beuningen.
The RMAC oversees the risk and audit-related issues of the Company and its subsidiaries. It also monitors the implementation of the internal audit recommendations as well as the integrity of the Annual Report and the financial statements. The RMAC makes recommendations to the Board with regard to the appointment or removal of the external auditor. Moreover, it reports to the Board on significant financial reporting issues and judgements relating to financial statements. The RMAC is composed of two independent directors, namely Mr. Amédée Darga (Chairman) and Mr. Fareed Jaunbocus, and one non-executive director, namely Mr. Matthew Taylor. All the members of the RMAC are financially literate, with Mr Fareed Jaunbocus being a Chartered Accountant. It is to be noted that, due to the specificity of the credit management sectors, and in keeping with regulatory requirements, a dedicated Risk Management Committee and an Audit Committee have been constituted at the level of Cim Finance Ltd.
The Board Investment Committee (BIC) assists the Board of CFSL in making investment and/or acquisition decisions within the mandate of the Committee. The BIC is composed of two non-executive directors, namely Mr. Colin Taylor (Chairman) and Mr. Tim Taylor, one executive director, namely Mr. Mark van Beuningen, and one independent director, namely Mr. Amédée Darga.
The Board has adopted on 4 October 2019 the position statement of the Chairperson of the Corporate Governance Committee, the position statement of the Chairperson of the Risk Management and Audit Committee and the position statement of the Chairperson of the Board Investment Committee. The said position statements are available for consultation purposes on the Company’s website https://www.cim.mu/governance-cfsl.html.
In accordance with the requirements of the Code, the following documents are available for consultation purposes on the Company’s website https://www.cim.mu/governance-cfsl.html:
• Terms of reference of the Corporate Governance Committee
• Charter of the Risk Management and Audit Committee
• Terms of reference of the Board Investment Committee
The terms of reference of these committees are reviewed on an annual basis by each committee and any proposed amendments are submitted to the Board for approval.
When necessary, other committees are set up by the Board on an ad-hoc basis to consider specific matters.
CIM FINANCIAL SERVICES LTD / ANNUAL REPORT 2019 39

Directors’ attendance at Board and committee meetings as well as their remuneration during the financial year ended 30 September 2019 was as follows:
ATTENDANCE INTERESTS REMUNERATION
Board meetings
CGC RMAC BIC Direct%
Indirect%
MUR
TAYLOR, Colin 7/7 n/a n/a 2/2 0.0416 3.49 940,000
CLARKE, Teresa Hillary 6/7 2/3 n/a n/a nil nil 630,000
DARGA, Amédée 6/7 n/a 4/5 2/2 0.0013 nil 830,000
JAUNBOCUS Fareedooddeen 7/7 n/a 5/5 n/a nil nil 710,000
SOMEN, David 7/7 3/3 n/a n/a nil nil 1,061,800
TAYLOR, Matthew 7/7 n/a 5/5 1/1 * 0.0059 1.19 680,000
TAYLOR, Philip 7/7 3/3 n/a n/a nil 3.49 650,000
TAYLOR, Timothy 7/7 3/3 n/a 0/2 0.4108 9.96 660,000
VAN BEUNINGEN, Mark 7/7 3/3 n/a 2/2 nil nil 18,767,212
* as alternate to Timothy Taylor
2.3. Appointment
The Board assumes the responsibilities for succession planning and for the appointment of new directors to the Board. The process for the appointment of directors, which is made in a transparent and formal manner, is available on the website of the company (https://www.cim.mu/governance-cfsl.html).
All directors will stand for re-election by way of separate resolutions at the Annual Meeting of Shareholders of the Company scheduled in February 2020.
2.4. Induction and Orientation
The Board is responsible for the induction of new directors to the Board, a process facilitated by the Company Secretary. The induction programme has been designed to make directors fully aware of their legal duties and to acquaint them with the Company’s structure, strategies, vision, mission and values.
2.5. Professional Development
The Board reviews the professional development needs of directors during the Board evaluation process and directors are encouraged to develop their skills and expertise continuously. They also receive regular updates on the latest trends and legislative acts affecting the business from management and/or other industry experts.
2.6. Board access to information and advice
All directors have access to the Company Secretary to discuss issues or to obtain information on specific areas or items to be considered at Board meetings or any other area they consider appropriate.
Furthermore, directors have access to the Company’s records and the right to request independent professional advice at the Company’s expense.
CIM FINANCIAL SERVICES LTD / ANNUAL REPORT 2019
Corporate Governance Report
40

2.7. Directors’ duties, remuneration and performance
The directors are aware of their legal duties and may seek independent professional or legal advice, at the expense of the Company, in respect of any aspect of their duties and responsibilities.
2.8. Interests of directors and conflicts of interest
All directors, including the Chairman, declare their direct and indirect interests in the shares of the Company as well as their interests in any transaction undertaken by the Company. They also follow the Model Code for Securities Transactions as detailed in Appendix 6 of the Stock Exchange of Mauritius Listing Rules whenever they deal in the shares of the Company. The interests register of the Company is maintained by the Company Secretary and is available for consultation by shareholders upon written request to the Company Secretary.
In addition, the Group has adopted the Related Party Policy of its wholly-owned subsidiary, Cim Finance Ltd, which sets out the basic framework of risk management put in place with regard to the identification, monitoring and reporting of related party transactions. The Policy’s underlying principles are derived from the guidelines of the Bank of Mauritius on related party transactions.
The Code of Ethics of the Group also sets out instances which could lead to a conflict of interest and the procedure for dealing with such potential conflicts.
For the year under review, there were no dealings in the shares of the Company by the directors.
2.9. Information, information technology (IT) and information security policy
The Board oversees information governance within the organisation and ensures that the performance of information and information technology (IT) systems lead to business benefits and create value.
The Group has adopted the IT policies of Cim Finance Ltd as most of the operational activities of the Group are concentrated in Cim Finance Ltd. A Firewall Policy has been implemented to mitigate the risks associated with security threats while a Data Privacy Policy, which complies with the requirements of the Data Protection Act 2017, has been set up to protect and ensure the confidentiality of personal or sensitive personal data. The Group has also adopted the Data Retention and Disposal Policy of Cim Finance. Matters of importance with regard to information security policies
are taken up by the Risk Management and Audit Committee and recommendations are submitted to the Board for approval.
The Board, through its committees, ensures that proper policies have been implemented for the protection of the Company’s information assets. Policies have also been set up to protect the integrity, ensure the confidentiality and control the usage of and access to the information which is essential for the smooth running of the Company’s business activities.
The Group Board approves material investments in information technology and security, as set out in the annual budget, according to the business needs of the Group.
2.10. Board performance review
The Board had resolved that the peer review of the Board directors and a review of the performance of the Board and its committees would be carried out every two years. A questionnaire has been circulated to each director to obtain their point of view on the effectiveness of the Board, to assess their contribution to the Board’s performance and to identify areas of improvement. Once the results have been analysed by the Corporate Governance Committee, they are reported at Board level.
2.11. Directors’ remuneration
Executive directors are not additionally remunerated for serving on the Board of the Company or its committees. Their remuneration packages as employees of the Company, including performance bonuses, are in accordance with market rates.
The remuneration of non-executive directors consists of a mix of attendance and retainer fees.
The remuneration of the executive and non-executive directors are reviewed and recommended for approval by the Board on an annual basis by the Corporate Governance Committee. The non-executive directors are not paid any performance bonuses and there are no long term incentive plans in force within the Group.
The remuneration paid to executive and non-executive directors and/or committee members is set out in the table on page 40.
CIM FINANCIAL SERVICES LTD / ANNUAL REPORT 2019 41

3. RELATIONS WITH SHAREHOLDERS AND OTHER STAKEHOLDERS
The shareholding structure of CFSL as at 30 September 2019 is as follows:
100%
53%
The Company
100%
OthersCim Holdings Ltd (CHL)
Elgin Ltd (Elgin)
47%
To the best of the knowledge of the Company and of its directors, they are not aware of the existence of a shareholders’ agreement affecting the governance of the Company by the Board for the year under review.
The share ownership analysis per holding percentage and categories of shareholders as at 30 September 2019 is as follows:
1 - 50,00050,001 - 250,000250,001 - 500,000Over 500,000
3.8%
86.6%
3.7%5.9%
IndividualsAssurance & InsurancePension & ProvidentInvestment & TrustOther Corporate Bodies
14.4%
60.9%9.8%
5.9%
9.0%
Communication with shareholders and stakeholders has been mainly through the Annual Report, Investors’ Briefings, the published unaudited results, the Annual Meeting of Shareholders, dividends declarations, press communiqués and the website.
The Group interacts with its internal stakeholders, namely its employees, via Workplace, a collaborative platform run by Facebook where employees can communicate via groups to chat with colleagues, which offers the social network’s features in a corporate environment.
The external stakeholders of the Group, namely its customers, suppliers, shareholders and the Government/Regulators and the public, are reached via social media platforms such as Facebook and LinkedIn as well as via advertisements. As and when required, focus groups are held with clients to assess their expectations from the Group. Regular channels of communication are also maintained with the regulators and the Government.
In addition, shareholders are invited annually to the Annual Meeting of Shareholders to approve the financial statements and vote on the re-appointment/appointment of directors and external auditors. The next Annual Meeting of Shareholders (AMS) of the Company is scheduled in February 2020 and shareholders will receive the notice of the AMS at least 21 days prior to the meeting in accordance with the law.
The Annual Report and the notice of the Annual Meeting are published in full on the Company’s website.
CIM FINANCIAL SERVICES LTD / ANNUAL REPORT 2019
Corporate Governance Report
42

4. INTERNAL AUDIT FUNCTION
Governance and structure
The Internal Audit Function of Cim Finance Ltd (CFL) is an independent appraisal and consulting activity that adds value, examines and evaluates activities of the company. A strong internal control system, including an independent and effective Internal Audit Function, is part of sound corporate governance.
The Internal Audit Function of CFL performs audit engagements for CFSL as governed by the Service Level Agreement approved by the Audit Committee of CFL and the Risk Management and Audit Committee (RMAC) of CFSL.
The mission of the Internal Audit Function is to provide vital and independent assurance to the Board and management on the quality of the company’s internal control system, risk management and governance processes. The objectives are to assist members of the Board and management in the effective discharge of their responsibilities.
In line with good governance principles, Internal Audit functionally reports to the RMAC and the Audit Committee on a quarterly basis. Individual working sessions are also conducted with the Audit Committee without the presence of management. The Audit Committee approves the Internal Audit combined plan, resources and evaluates the effectiveness of the Internal Audit Function.
Internal audit assignments are performed in accordance with the Standards for the Professional Practice of Internal Auditing issued by the Institute of Internal Auditors (IIA). Internal audit staff also abide by the Code of Ethics established by the IIA and by Cim Finance Ltd.
In terms of structure, the Internal Audit Function is segregated into two units, namely Risk Based and Consulting units. The Risk Based unit performs assurance engagements in line with the definition of the IIA as well as IT audit engagements. The Consulting unit performs engagements that do not fall within the Risk Based unit scope such as Investigations, Independent reviews, System Development Life Cycle assurance, etc. Both units use a risk based approach when building up the Internal Audit Plan for the year.
The structure, organisation and qualifications of the key members of the internal audit function are listed on the Company’s website.
Independence and objectivity
The Internal Audit Function confirms that independence and objectivity was maintained throughout the year by ensuring the following:
• There was no interference by any element in the company, including matters of audit selection, scope, procedures, frequency, timing, or report content.
• Internal audit staff have no direct operational responsibility or authority over any of the activities audited and hence do not implement internal controls, develop procedures, install systems, prepare records, or engage in any other activity that may impair judgment.
Internal audit staff also refrained from reviewing specific operations for which they were previously responsible; made proper disclosures if independence or objectivity was impaired, or if there was any conflict of interest; have not accepted or given gifts and/or entertainment (as defined by the company’s Gift and Entertainment Procedure) that may impair or be presumed to impair their professional judgment; and were aware of the threat of over-familiarity.
Internal auditors exhibit the highest level of professional objectivity in gathering, evaluating, and communicating information about the activity or process being examined.
Internal Audit assignments
The internal audit plan is developed based on a prioritization of the audit universe using a risk-based methodology, including input of senior management and the Audit Committee. The Head of Internal Audit reviews and adjusts the plan, as necessary, in response to changes in the business, risks, operations, programs, systems, and controls. Any significant deviation from the approved internal audit plan is communicated to senior management and the Audit Committee on a timely manner for approval.
Internal Audit carried out 7 internal audit assignments for Cim Finance Ltd, 4 internal audit assignments for CFSL, 5 IT audit assignments within the Risk Based unit during the year and 14 assignments and 6 high level reviews within the Consulting unit. In addition, follow up audits (review of implementation status of recommendations) were also carried out throughout the year. It is to be noted that the Internal Audit Function, with strict accountability for confidentiality and safeguarding of records and information, was authorized full, free and unrestricted access to any and all of Cim Finance’s records, physical properties, and personnel pertinent to carrying out the audit engagements.
CIM FINANCIAL SERVICES LTD / ANNUAL REPORT 2019 43

5. EXTERNAL AUDIT
The external auditors of the Company and the Group are Ernst & Young (‘EY’) who were first appointed as external auditors at the Annual Meeting of Shareholders held on 31 March 2017.
The selection and appointment of EY as auditors was carried out following a tender issued by the RMAC in November 2016. Following responses received, three external audit firms were shortlisted and presented their proposals before the RMAC, after which EY was recommended for appointment as external auditors.
The RMAC discusses critical policies and external audit issues with EY as and when necessary, and meets them at least once a year without management being present.
The RMAC assesses the effectiveness of the external audit process via feedback received from the management team and the chairmen of the other audit committees of the Group. Areas of improvement are thereafter discussed with the external auditor.
The Group has implemented a policy for the provision of non-audit service by the external auditor. The objectives of the policy are:
• To ensure that neither the nature of service nor the level of reliance placed on it by the Group could be perceived to impair the independence and objectivity of the external auditor’s opinion on financial statements.
• To establish a straightforward and transparent process and reporting mechanism to enable the RMAC to monitor and control the independence of the external auditors and compliance with this policy.
• To avoid unnecessary restrictions on the purchase of services from the external auditors who are expected to provide a higher quality and a more cost effective service than other providers.
For the year under review, the fees paid to the external auditors for non-audit work are set out on page 54. To guarantee objectivity and independence, the Board ensures that the team providing non-audit services is different from the one providing audit services.
6. HUMAN RESOURCES
The human resource initiatives of the Group are set out on pages 46 to 47.
7. PROFILES OF SENIOR MANAGEMENT TEAM
The profiles of the senior management team can be found on pages 24 to 25.
8. OTHER MATTERS
8.1. Related party transactions
Please refer to page 150 of the Annual Report.
8.2. Management agreements
The Company has no management contracts.
8.3. Dividend Policy
An interim dividend is declared in May and paid in June and a final dividend is declared in December and paid in January. The payment of dividends is subject to the net profits of the Company, its cash flow and its needs with regard to capital expenditure.
CIM FINANCIAL SERVICES LTD / ANNUAL REPORT 2019
Corporate Governance Report
44

8.4. Donations
The Company did not make any political donations during the year under review.
8.5. Corporate social responsibility (CSR) and environmental issues
Cim CSR Fund Ltd was set up on 12 April 2016 under the laws of Mauritius pursuant to the Companies Act 2001. Cim CSR Fund Ltd receives annual statutory contributions from all entities within the Group for the purposes of corporate social responsibility (“CSR”).
The Group’s CSR activities, which reflect its commitment to creating sustainable value for the social, environmental and economic well-being of society, are set out on pages 48 to 49.
Information on the major projects undertaken by Cim CSR Fund Ltd is available for consultation at https://www.cim.mu/corporate-engagement.html.
Tioumitra MaharahajeFor Cim Administrators LtdCompany Secretary
12 December 2019
CIM FINANCIAL SERVICES LTD / ANNUAL REPORT 2019 45

Our employees are the greatest asset to our organisation, the cornerstones of our existence and the company’s growth drivers. We believe engagement is created in an environment filled with energy, trust, challenge, personal growth and fairness.
Cim HR serves as a strategic partner and a control function in managing the overall human resources. It endeavours to provide clear frameworks aligned with the Group’s vision and business initiatives.
Employee Development
Ensuring the holistic development of our human resources and having capable leaders are critical to Cim. The Cim Learning journey has been recalibrated this year with a strong focus on Customer Centricity, alignment to the role and profession while maintaining a continued focus on Mandatory and Regulatory courses.
We have enabled different flagship learning platforms to promote self-directed learning that creates end-to-end blended learning programmes.
People are key to our success and we are committed to retain, develop and hire the right talent to deliver upon our business strategy. Internal mobility is crucial to support the uniqueness of our business while we maintain a balance in buying talent externally. To ensure consistency across all our Core People Processes, the Cim competency framework and the organisational capabilities form the foundation of our DNA and further strengthen our uniqueness in our Talent Management Framework.
Building pipeline of future leaders
We are preparing future leaders to step into critical roles as part of our ongoing commitment to recognise and reward potential internal talents. Our Bespoke programme is designed around three key areas: Leading Self, Leading Others and Leading the Business in partnership with reputed international universities, together with other development initiatives to support this commitment. This model will further equip our upcoming leaders with vital capabilities to lead a committed workforce and ensure business continuity.
Future of Work
Digitalisation is equally a key element of HR strategy as it is for the business. HR is offering and introducing a number of digital applications aiming to provide the right tools for HR practitioners and to improve the end user’s experience while
using HR-related platforms. Digitalisation has, by and large, streamlined data mining and enhanced analytics, hence providing management insights on a real-time basis. Data-driven decisions and culture remain the foundation of future of work.
In line with our vision to provide a seamless integrated HR service to our internal client, the payroll function is now managed internally by a dedicated team.
Emerging Young Talent Initiatives
We have partnered with higher learning institutions (Middlesex University) to provide insights to fresh graduates. This saw our Group CEO, Mark van Beuningen, presenting his views on ‘Life after Graduation’. With a student base of more than 30 nationalities, this proved a valuable session for students involved and helped promote Cim Finance as an employer of choice within the Mauritian and Kenyan markets.
Cim Finance was also the main sponsor of the ‘Middlesex National Secondary School Competition’ which saw entrants from 11 Colleges across the island presenting their views to a panel of judges on the ‘The future of Mauritius with the Metro Express – Economical, Social and Innovative Impacts’. This was not only an opportunity for students to showcase their presentation skills but to also take part in an important debate. This again helped us promote our employer brand by reinforcing the importance that Cim Finance places on education and the youth of Mauritius.
Continuing with our commitment to furthering education, we offer scholarships to the children of our employees. In 2017, Cim Finance started offering 2 Scholarships per year to the children of our loyal customers to attend the African Leadership College (ALC). This Scholarship allows these students to gain access to premium higher education that they would not, under normal circumstances, have access to. It also provides them with internship opportunities at Cim Finance each year and permanent employment at the end of their studies. 2019 was no different, with an additional 2 students being enrolled at the ALC through this Scholarship programme.
CIM FINANCIAL SERVICES LTD / ANNUAL REPORT 2019
HumanCapital
46

Gender Diversity in the workplace
We promote diversity at our workplace. The ‘Leading Women Programme’ was launched to develop selected senior female leaders within the organisation. This programme is a combined effort between KIP Center for Leadership and Gordon Institute of Business Science – University of Pretoria. The programme equipped our female leaders with advanced leadership skills that optimise their individual performance, channel and maximise their impact within the organisation.
Cim WeCare
We place employee wellbeing at the centre of our value proposition. The WeCare committee has launched several initiatives to drive this proposition over the past year. These initiatives embed our multicultural heritage celebrations and reinforce the value Cim places on an inclusive working environment. Highlights from this year have included Jeux des Iles, Music Day and Zumba.
CIM FINANCIAL SERVICES LTD / ANNUAL REPORT 2019 47

Recreational activities for 115 homeless persons
5 houses under construction/renovation
170 children in a secure environment
RS
EDUCATION
1120 students sensitised to drugs
prevention
MUR 3,355,560 MUR 631,900
ENVIRONMENT
MUR 1,147,908
SOCIALENGAGEMENT
Noyau Social Cite La Cure
Breakfast programme
Cite Cim – Riviere Du Rempart Construction/renovation
plan of houses
Abri De Nuit – Saint Jean and Port Louis
Quality time with homeless persons
“Project – Leader In Me”- Renganaden Seeneevassen
Government School in CassisImprove level of academic
education through various initiatives
Drug prevention Programme
Awareness Programme targeting students & general public
Global Rainbow Foundation
Weekly therapeutic interventions for special needs children
Oasis De PaixInstallation of fire
alarm system
We RecyclePurchase of a vehicle for collecting
& recycling
Mauritian WildlifeProtection of endangered species &
recycling programme
Mission VerteSensitisation programme for
employees and general public
4 bins of 5L collected every
2 months
117 students trained to be future leaders
Reduction of PET bottles in the Black River Region
Preservation of threatened
Mauritian species
50 engaged social workers 20 teachers coached
Therapeutic aid to 20 children
CIM FINANCIAL SERVICES LTD / ANNUAL REPORT 2019
Corporate socialResponsibility
48

“Get Connected” Drug Use Prevention Programme
“…We must also reckon that the fight against drug use cannot be effective if it is not anchored by a national effort. Which is why it is my belief that every component of our society, from corporates to individuals and NGOs, needs to be actively involved in the fight against drug use…” (Extract from speech of Mr Colin Taylor, Chairman, at the launch of the Get Connected Programme).
One of the CSR programmes which has been at the heart of our commitment to better the lives of our fellow citizens is the Drug Prevention Use programme (‘Get Connected’) launched by the Group in collaboration with the Ministry of Education, Human Resources, Tertiary Education and Scientific Research (MoEHRTESR) and the United Nations Office on Drugs and Crime (UNODC).
“Get Connected” is a skills-based programme targeting 12-14 year old school children in Mauritius inspired and adapted from the European Union Unplugged Programme. It is in line with the United UNODC’s International Standards on Drug Use Prevention. The kick-off of the programme in January 2019 was preceded by the sensitisation of the top leadership of the Ministry of Education, Human Resources, Tertiary Education and Scientific Research (MoEHRTESR) and Rectors and Managers of Secondary Schools on the programme.
Input from the sensitisation programme was used to further customise the programme for the Mauritian setting and 40 Educational Psychologists, Ministry of Health personnel and the staff of two NGOs were trained through a ‘Train the Trainers’ initiative. The programme was officially launched by the Prime Minister in the presence of four other Ministers.
In Phase 1, the programme was implemented in 24 colleges, with another 23 colleges used as control schools for evaluation purposes. Pre-tests were conducted in all 47 schools and post-tests were done at the end of the 12-week implementation period. Some anecdotal impacts have already been noted by those implementing the programme. The full evaluation
of Phase 1 will be conducted in January 2020 to allow for a 12-month post-programme impact maturation.
Following the successful implementation of the programme, the Prime Minister and Minister of Finance in his Budget Speech 2019-2020 mentioned that “The drug use prevention programme which is currently in place in 48 schools will be extended to all secondary schools”. This meant national coverage for a school drug use prevention programme.
Phase 2 of the programme will be implemented in all 148 secondary schools in Mauritius, both private and public, and is planned to start in January 2020. 296 teachers/educators will be trained in November 2019 (2 per school) and will then be responsible for the implementation of the programme under the supervision of those already trained.
This programme illustrates the combination of a number of critical elements which are essential for the success and impact of a programme, namely the highest political support together with the necessary budgetary allocation for national scale-up, backing a solid evidence-based prevention science and a trained and dedicated workforce.
Once educated on these risks, our teenagers can in turn become advocates of drug use prevention and help curb the alarming rate at which our youth are falling prey to the scourge of drugs.
Launch of 'Get Connected' programme in the presence of the Prime Minister of Mauritius
CIM FINANCIAL SERVICES LTD / ANNUAL REPORT 2019 49

RISK OVERVIEW
Risk Management is fundamental to Cim Group’s strategy, profitability and to the day-to-day management of its risk-taking activities. The strategy is well-informed and shaped by an understanding of the risk landscape, including a range of significant risks and uncertainties in the external economic, competitive and regulatory environment.
Any identified inherent risks to the core business activities are managed through an integrated Enterprise Risk Management (ERM) framework with the objective of adopting a prudent and disciplined approach whilst striking an appropriate balance between risk and return. The key risk types include credit risk, market risk, liquidity risk, funding risk, business risk, operational risk and reputational risk, and these are managed effectively through an internal governance process and the use of risk management tools and processes.
The Board is fully committed to establishing a sound system of risk oversight in relation to risk management, adherence to internal policies and compliance with the prudential regulatory and legal requirements.
STRATEGY AND BUSINESS OBJECTIVES(stakeholders expectations)
Risk Appetite Framework incorporating Board approved top-down risk appetite statements
Capital Management
Ensures adequate capital is available
at all times to implement future
strategy and protect us from unexpected loss
Credit Risk management
Assesses the credit worthiness of our customer’s
ability to repay its contractual
obligations
Market Risk management
Assesses the risk that the future interest income deteriorates if market rates
change
Funding & Liquidity risk management
Ensures the Group can finance its
liquidity needs through diverse funding sources in accordance
with its strategy
Non-financial risks
Ensures we respond to risk in a timely and effective way
and implement appropriate
control measures to ensure business integrity
Reporting
We seek to provide reliable
information both internally and externally
through improved reporting and data
management
Our approach to identification and impact assessment aims to ensure that the Group mitigates the impact of these risks on its financial results, long-term strategic goals and reputation.
CIM FINANCIAL SERVICES LTD / ANNUAL REPORT 2019
RiskManagement
50
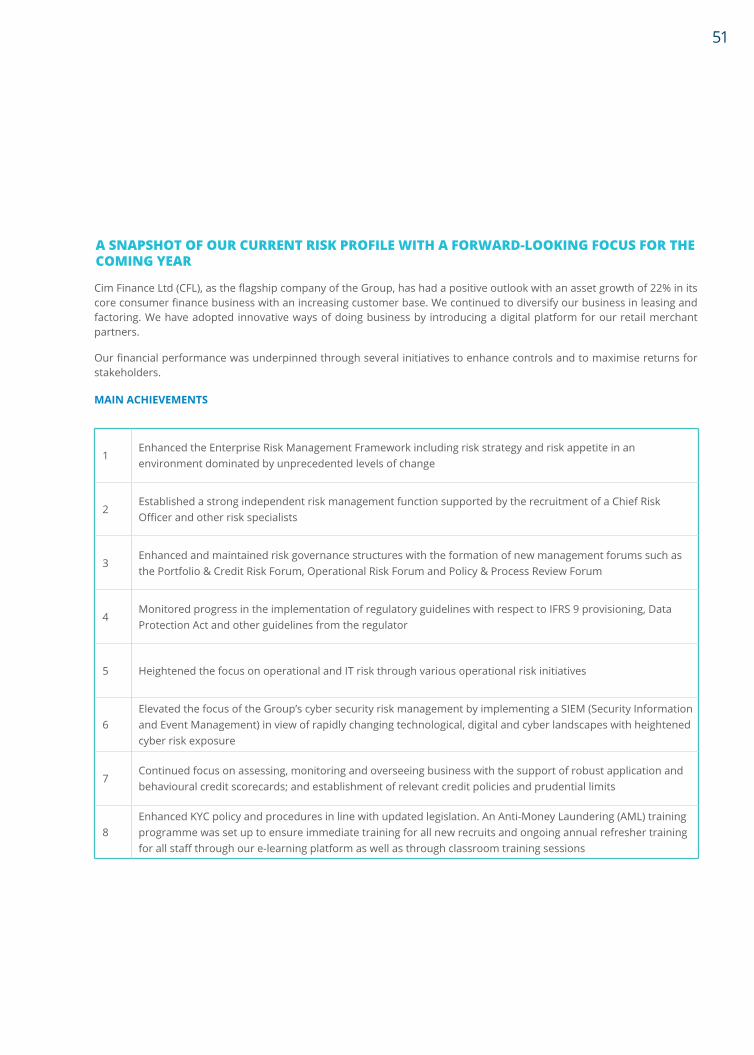
A SNAPSHOT OF OUR CURRENT RISK PROFILE WITH A FORWARD-LOOKING FOCUS FOR THE COMING YEAR
Cim Finance Ltd (CFL), as the flagship company of the Group, has had a positive outlook with an asset growth of 22% in its core consumer finance business with an increasing customer base. We continued to diversify our business in leasing and factoring. We have adopted innovative ways of doing business by introducing a digital platform for our retail merchant partners.
Our financial performance was underpinned through several initiatives to enhance controls and to maximise returns for stakeholders.
MAIN ACHIEVEMENTS
1Enhanced the Enterprise Risk Management Framework including risk strategy and risk appetite in an environment dominated by unprecedented levels of change
2Established a strong independent risk management function supported by the recruitment of a Chief Risk Officer and other risk specialists
3Enhanced and maintained risk governance structures with the formation of new management forums such as the Portfolio & Credit Risk Forum, Operational Risk Forum and Policy & Process Review Forum
4Monitored progress in the implementation of regulatory guidelines with respect to IFRS 9 provisioning, Data Protection Act and other guidelines from the regulator
5 Heightened the focus on operational and IT risk through various operational risk initiatives
6Elevated the focus of the Group’s cyber security risk management by implementing a SIEM (Security Information and Event Management) in view of rapidly changing technological, digital and cyber landscapes with heightened cyber risk exposure
7Continued focus on assessing, monitoring and overseeing business with the support of robust application and behavioural credit scorecards; and establishment of relevant credit policies and prudential limits
8Enhanced KYC policy and procedures in line with updated legislation. An Anti-Money Laundering (AML) training programme was set up to ensure immediate training for all new recruits and ongoing annual refresher training for all staff through our e-learning platform as well as through classroom training sessions
51

FOCUS FOR 2020 AND BEYOND
1 To operationalise risk appetite management to become a “living and breathing” part of the organisation
2To continue the ongoing efforts to review the suite of internal policies, risk limits and triggers and optimise processes to better align them with the evolving business requirements
3
To further strengthen the credit granting environment by ;• improving the underwriting standards and streamlining the origination processes across corporate & SME
segments• improving turnaround time by maintaining a well-calibrated scorecard for consumer finance• establishing a comprehensive and effective credit-grading system for non-retail customers
4To further enhance the cyber security technical capabilities to protect the CFL infrastructure from external threats and to provide training to staff on how to identify and protect against cyber related threats such as phishing and social engineering.
5To strengthen existing business continuity efforts in order to build up further resilience in cases of disaster or any effect of uncertainty on the achievement of business objectives.
6To invest in data analytics for better measurement of business performance, including transaction monitoring and fraud detection capabilities
CIM FINANCIAL SERVICES LTD / ANNUAL REPORT 2019
Risk Management
52

53CIM FINANCIAL SERVICES LTD / ANNUAL REPORT 2019

CIM FINANCIAL SERVICES LTD / ANNUAL REPORT 201954
OTHER STATUTORY DISCLOSURES Directors’ remuneration and benefits
2019 2018 MURm MURm
Directors of Cim Financial Services 1 Executive (1 in 2018) 18.8 16.1 8 Non Executive (8 in 2018) 6.2 5.8
Directors of Subsidiary companies 9 Executive (9 in 2018) 38.3 38.8 10 Non Executive (10 in 2018) 4.9 3.5
Donations GROUP COMPANY
2019 2018 2019 2018MURm MURm MURm MURm
CSR 12.1 13.4 - - Donations (charitable) - 1.0 - -
Auditors’ feesGROUP COMPANY
2019 2018 2019 2018MURm MURm MURm MURm
Audit fees paid to :EY 3.7 2.7 0.7 0.6 BDO 1.0 0.1 - -
Fees paid for other services provided by :EY 0.7 2.1 0.2 - BDO 0.3 - - -
The audit fees of 2019 include the audit of financial statements of subsidiaries on surrender of deposit taking licences.

CIM FINANCIAL SERVICES LTD / ANNUAL REPORT 2019 55
DIRECTORS’ REPORT(a) Financial statements
The directors of CIM Financial Services Ltd (the ‘Company’) are responsible for the integrity of the audited financial statements of the Group and the Company and the objectivity of the other information presented in these statements.
The Board confirms that, in preparing the audited financial statements, it has:
(i). selected suitable accounting policies and applied them consistently;
(ii). made judgements and estimates that are reasonable and prudent;
(iii). stated whether applicable accounting standards have been followed, subject to any material departures explained in the financial statements;
(iv). kept proper accounting records which disclose with reasonable accuracy at any time the financial position of the Company;
(v). safeguarded the assets of the Company by maintaining internal accounting and administrative control systems and procedures; and
(vi). taken reasonable steps for the prevention and detection of fraud and other irregularities.
(b) Going concern statement
On the basis of current projections, we are confident that the Group and the Company has adequate resources to continue operating for the foreseeable future and consider that it is appropriate that the going concern basis in preparing the financial statements be adopted.
(c) Internal control and risk management
The Board is responsible for the system of Internal Control and Risk Management for the Company and its subsidiaries. The Group is committed to maintaining continuously a sound system of risk management and adequate control procedures with a view to safeguarding the assets of the Group.
The Board believes that the Group’s systems of internal control and risk management provide reasonable assurance that control and risk issues are identified, reported on and dealt with appropriately.
(d) Donations
The Company did not make any political contributions in this financial year. For details on the charitable donations made by the Company, please refer to page 54.
(e) Governance
The Board strives to apply the principles of good governance within the Company and its subsidiaries.
(f) Audited Financial Statements
The audited financial statements of the Group and the Company which appear on pages 66 to 157 were approved by the Board on 12 December 2019 and are signed on their behalf by:
Colin Taylor Mark van BeuningenChairman Executive Director and Group Chief Executive Officer

SECRETARY’S CERTIFICATE
In my capacity as Company Secretary of CIM Financial Services Ltd (the ‘Company’), I hereby confirm that, to the best of my knowledge and belief, the Company has filed with the Registrar of Companies, for the financial year ended 30 September 2019, all such returns as are required of the Company under the Companies Act 2001.
Tioumitra Maharahaje
For Cim Administrators Ltd
Company Secretary
12 December 2019
CIM FINANCIAL SERVICES LTD / ANNUAL REPORT 201956

STATEMENT OF COMPLIANCE(SECTION 75 (3) OF THE FINANCIAL REPORTING ACT)
Name of PIE: CIM Financial Services Ltd
Reporting Period: FINANCIAL YEAR 2018-2019
CIM Financial Services Ltd is a public interest entity and is, as such, required to adopt corporate governance principles in accordance with the National Code of Corporate Governance (2016) (the ‘Code’).
Throughout the year ended 30 September 2019, to the best of the Board’s knowledge, CIM Financial Services Ltd has complied with the principles of the Code. Cim Financial Services Ltd has applied all the principles set out in the Code and explained how these principles have been applied.
SIGNED BY:
Colin Taylor Mark van BeuningenChairman Executive Director and Group Chief Executive Officer
12 December 2019 12 December 2019
CIM FINANCIAL SERVICES LTD / ANNUAL REPORT 2019 57

CIM FINANCIAL SERVICES LTD / ANNUAL REPORT 201958

Improve your cash flow with
factoring
CIM FINANCIAL SERVICES LTD / ANNUAL REPORT 2019 59

INDEPENDENT AUDITORS’ REPORTTO THE MEMBERS OF CIM FINANCIAL SERVICES LTD
CIM FINANCIAL SERVICES LTD / ANNUAL REPORT 201960
REPORT ON THE AUDIT OF THE FINANCIAL STATEMENTS
Opinion
We have audited the financial statements of CIM Financial Services Ltd (the “Company”) and its subsidiaries (the “Group”) set out on pages 66 to 157 which comprise the statements of financial position as at 30 September 2019, and the statements of profit or loss and other comprehensive income, statements of changes in equity and statements of cash flows for the year then ended, and notes to the financial statements, including significant accounting policies.
In our opinion, the financial statements give a true and fair view of the financial position of the Group and the Company as at 30 September 2019, and of their financial performance and their cash flows for the year then ended in accordance with International Financial Reporting Standards and comply with the Companies Act 2001, and the Financial Reporting Act 2004.
Basis for Opinion
We conducted our audit in accordance with International Standards on Auditing (ISAs). Our responsibilities under those standards are further described in the Auditor’s Responsibilities for the Audit of the Consolidated Financial Statements section of our report. We are independent of the Group and the Company in accordance with the
International Ethics Standards Board for Accountant’s Code of Ethics for Professional Accountants (IESBA Code), and we have fulfilled our other ethical responsibilities in accordance with the IESBA Code. We believe that the audit evidence we have obtained is sufficient and appropriate to provide a basis for our opinion.
Key Audit Matters
Key audit matters are those matters that, in our professional judgement, were of most significance in our audit of the financial statements of the current period. These matters were addressed in the context of our audit of the financial statements as a whole, and in forming our opinion thereon, and we do not provide a separate opinion on these matters. For each matter below, our description of how our audit addressed the matter is provided in that context.
We have fulfilled the responsibilities described in the Auditor’s responsibilities for the audit of the financial statements section of our report, including in relation to these matters. Accordingly, our audit included the performance of procedures designed to respond to our assessment of the risks of material misstatement of the financial statements. The results of our audit procedures, including the procedures performed to address the matters below, provide the basis for our audit opinion on the accompanying financial statements.

CIM FINANCIAL SERVICES LTD / ANNUAL REPORT 2019 61
REPORT ON THE AUDIT OF THE FINANCIAL STATEMENTS (CONTINUED)
Key Audit Matter How the matter was addressed in the audit
Expected Credit Losses (ECL) – Impaired Facilities
IFRS 9 was implemented by the Group on October 1, 2018. This new standard required the Group to recognise Expected Credit Losses (ECL) on net investment in leases and other credit agreements, and loans and advances (collectively referred to as “Facilities”) which involves significant judgement and estimates to be made by the Group.
The carrying value of the facilities may be materially misstated if judgements or estimates made by the Group are inappropriate.
The Group’s facilities stood at MUR 12,478 million at 30 September 2019 and these facilities are subject to allowance for credit losses of MUR 597 million for impaired facilities and MUR 73 million for non-impaired facilities respectively.
In accordance with IFRS 9, a financial asset is considered credit impaired when one or more events that have a detrimental impact on the estimated future cash flows of that financial asset have occurred.
Identification of credit impaired facilities and determination of the expected credit losses thereon involves significant judgement, estimates and assumptions regarding (i) the determination of whether a facility is credit impaired and (ii) in estimating the expected recoverability of the Group from the obligors. This also includes an estimate of what the Group can realise from the collaterals it holds as security on the impaired facilities.
We performed audit procedures on the balances at October 1, 2018 to gain assurance on the transition from IAS 39. This included evaluating the accounting interpretations for compliance with IFRS 9 and testing the adjustments and disclosures made on transition.
We reviewed and assessed the design of the controls over the identification of facilities that are credit-impaired and the related calculations of expected credit losses, including the quality of underlying data and systems. This included the criteria definition of performing and non-performing credit facilities, model governance, data accuracy and completeness, credit monitoring, individual provisions and production of journal entries and disclosures.
We evaluated whether facilities that are credit-impaired have been properly identified by management through:
• Reviewing the minutes of the Debtors Monitoring Committee;
• Obtaining facilities` arrears reports and testing that arrears exceeding 90 days are included in the stage 3 impairment assessment of the ECL models; and
• Identifying facilities meeting certain criteria such as financial difficulties of the borrower, restructured loans, insufficient collaterals and exposures to sectors in decline.
Where exposures were determined to be credit-impaired our procedures involved assessing the reasonability of the estimate of the expected future cash flows used in measuring the ECL which include the following:
• We independently assessed the provisioning methodologies and policies and formed an independent view on the levels of provisions booked based on the detailed loan and counterparty information contained in the credit files;
• Where exposures are collateralised, we evaluated the Group’s legal right to the collateral, as well as the appropriateness of the valuations in relation to ECL determination; and
• Where cash flows for large credits include the realisable value of collateral securing the credit, the value of such collateral is based on the opinion of independent and qualified appraisers. We thus assessed the independence and the qualifications of the appraisers.
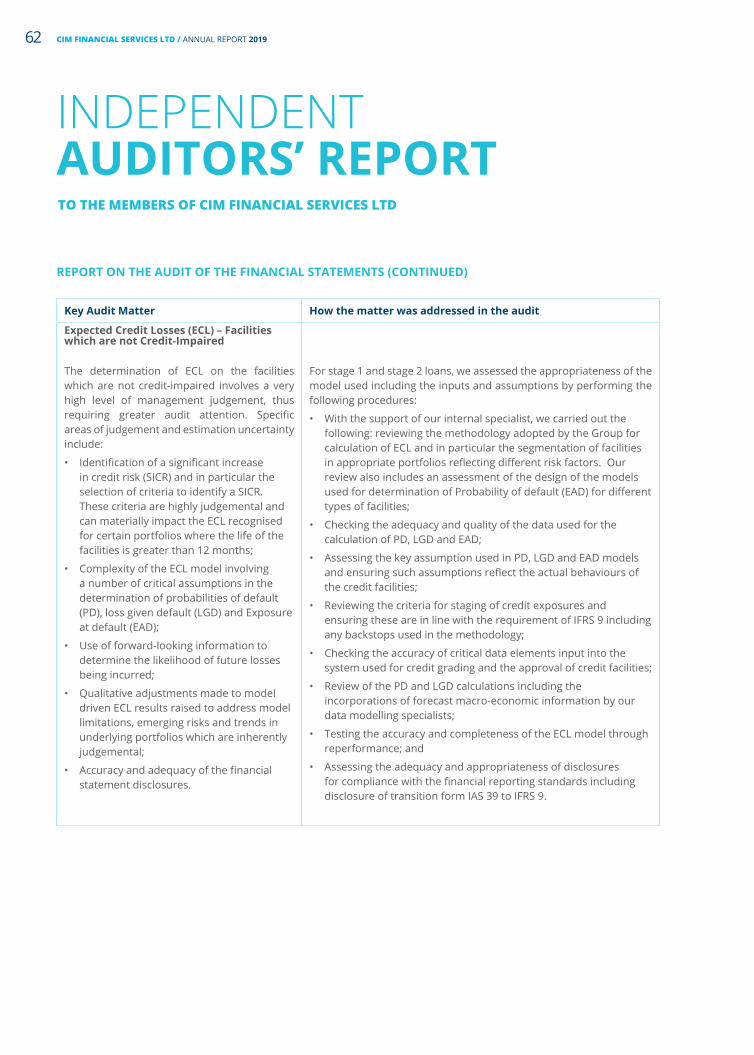
INDEPENDENT AUDITORS’ REPORTTO THE MEMBERS OF CIM FINANCIAL SERVICES LTD
CIM FINANCIAL SERVICES LTD / ANNUAL REPORT 201962
REPORT ON THE AUDIT OF THE FINANCIAL STATEMENTS (CONTINUED)
Key Audit Matter How the matter was addressed in the audit
Expected Credit Losses (ECL) – Facilities which are not Credit-Impaired
The determination of ECL on the facilities which are not credit-impaired involves a very high level of management judgement, thus requiring greater audit attention. Specific areas of judgement and estimation uncertainty include:
• Identification of a significant increase in credit risk (SICR) and in particular the selection of criteria to identify a SICR. These criteria are highly judgemental and can materially impact the ECL recognised for certain portfolios where the life of the facilities is greater than 12 months;
• Complexity of the ECL model involving a number of critical assumptions in the determination of probabilities of default (PD), loss given default (LGD) and Exposure at default (EAD);
• Use of forward-looking information to determine the likelihood of future losses being incurred;
• Qualitative adjustments made to model driven ECL results raised to address model limitations, emerging risks and trends in underlying portfolios which are inherently judgemental;
• Accuracy and adequacy of the financial statement disclosures.
For stage 1 and stage 2 loans, we assessed the appropriateness of the model used including the inputs and assumptions by performing the following procedures:
• With the support of our internal specialist, we carried out the following: reviewing the methodology adopted by the Group for calculation of ECL and in particular the segmentation of facilities in appropriate portfolios reflecting different risk factors. Our review also includes an assessment of the design of the models used for determination of Probability of default (EAD) for different types of facilities;
• Checking the adequacy and quality of the data used for the calculation of PD, LGD and EAD;
• Assessing the key assumption used in PD, LGD and EAD models and ensuring such assumptions reflect the actual behaviours of the credit facilities;
• Reviewing the criteria for staging of credit exposures and ensuring these are in line with the requirement of IFRS 9 including any backstops used in the methodology;
• Checking the accuracy of critical data elements input into the system used for credit grading and the approval of credit facilities;
• Review of the PD and LGD calculations including the incorporations of forecast macro-economic information by our data modelling specialists;
• Testing the accuracy and completeness of the ECL model through reperformance; and
• Assessing the adequacy and appropriateness of disclosures for compliance with the financial reporting standards including disclosure of transition form IAS 39 to IFRS 9.

CIM FINANCIAL SERVICES LTD / ANNUAL REPORT 2019 63
REPORT ON THE AUDIT OF THE FINANCIAL STATEMENTS (CONTINUED)
Other Information
The directors are responsible for the other information. The other information comprises the reports set out from pages 2 to 59 which includes, among others, the Chairman’s message, Group CEO’s Report, Business Review, Corporate Governance Report, Risk Management Report, Other Statutory Disclosures, Directors’ Report, the Secretary’s Certificate as required by the Companies Act 2001, and the Directors of Subsidiary Companies on pages 158 to 159, but does not include the financial statements and our auditor’s report thereon.
Our opinion on the financial statements does not cover the other information, and other than the corporate governance report, we do not express any form of assurance conclusion thereon.
In connection with our audit of the financial statements, our responsibility is to read the other information and, in doing so, consider whether the other information is materially inconsistent with the financial statements or our knowledge obtained in the audit, or otherwise appears to be materially misstated. If, based on the work we have performed on the other information obtained prior to the date of this auditor’s report, we conclude that there is a material misstatement of this other information, we are required to report that fact. We have nothing to report in this regard.
Corporate Governance Report
The Directors are responsible for preparing the Corporate Governance Report. Our responsibility under the Financial Reporting Act is to report on the Compliance with the Code of Corporate Governance disclosed in the Annual Report and assess the explanations given for non-compliance with any requirement of the Code. From our assessment of the disclosures made on corporate governance in the Annual Report, the Group has, pursuant to section 75 of the Financial Reporting Act, complied with the requirements of the Code.
Responsibilities of the Directors for the Financial Statements
The directors are responsible for the preparation and fair presentation of the financial statements in accordance with International Financial Reporting Standards and the requirements of the Companies Act 2001 and the Financial Reporting Act 2004, and for such internal control as the directors determine is necessary to enable the preparation of financial statements that are free from material misstatement, whether due to fraud or error.
In preparing the financial statements, the directors are responsible for assessing the Group and Company’s ability to continue as a going concern, disclosing, as applicable, matters related to going concern and using the going concern basis of accounting unless the directors either intend to liquidate the Group and or the Company or to cease operations, or have no realistic alternative but to do so.

INDEPENDENT AUDITORS’ REPORTTO THE MEMBERS OF CIM FINANCIAL SERVICES LTD
CIM FINANCIAL SERVICES LTD / ANNUAL REPORT 201964
REPORT ON THE AUDIT OF THE FINANCIAL STATEMENTS (CONTINUED)
Auditor’s Responsibilities for the Audit of the Financial Statements
Our objectives are to obtain reasonable assurance about whether the financial statements as a whole are free from material misstatement, whether due to fraud or error, and to issue an auditor’s report that includes our opinion. Reasonable assurance is a high level of assurance, but is not a guarantee that an audit conducted in accordance with ISAs will always detect a material misstatement when it exists. Misstatements can arise from fraud or error and are considered material if, individually or in the aggregate, they could reasonably be expected to influence the economic decisions of users taken on the basis of these financial statements.
As part of an audit in accordance with ISAs, we exercise professional judgement and maintain professional scepticism throughout the audit. We also:
• Identify and assess the risks of material misstatement of the financial statements, whether due to fraud or error, design and perform audit procedures responsive to those risks, and obtain audit evidence that is sufficient and appropriate to provide a basis for our opinion. The risk of not detecting a material misstatement resulting from fraud is higher than for one resulting from error, as fraud may involve collusion, forgery, intentional omissions, misrepresentations, or the override of internal control.
• Obtain an understanding of internal control relevant to the audit in order to design audit procedures that are appropriate in the circumstances, but not for the purpose of expressing an opinion on the effectiveness of the Group and the Company’s internal control.
• Evaluate the appropriateness of accounting policies used and the reasonableness of accounting estimates and related disclosures made by the directors.
• Conclude on the appropriateness of the director’s use of the going concern basis of accounting and based on the audit evidence obtained, whether a material uncertainty exists related to events or conditions that may cast significant doubt on the Group’s and Company’s ability to continue as a going concern. If we conclude that a material uncertainty exists, we are required to draw attention in our auditor’s report to the related disclosures in the financial statements or, if such disclosures are inadequate, to modify our opinion. Our conclusions are based on the audit evidence obtained up to the date of our auditor’s report. However, future events or conditions may cause the Group or the Company to cease to continue as a going concern.
• Evaluate the overall presentation, structure and content of the financial statements, including the disclosures, and whether the financial statements represent the underlying transactions and events in a manner that achieves fair presentation.
• Obtain sufficient appropriate audit evidence regarding the financial information of the entities or business activities within the Group and the Company to express an opinion on the Group’s and Company’s financial statements. We are responsible for the direction, supervision and performance of the group audit. We remain solely responsible for our audit opinion.

CIM FINANCIAL SERVICES LTD / ANNUAL REPORT 2019 65
REPORT ON THE AUDIT OF THE FINANCIAL STATEMENTS (CONTINUED)
Responsibilities of the Directors for the Financial Statements (Continued)
We communicate with the directors regarding, among other matters, the planned scope and timing of the audit and significant audit findings, including any significant deficiencies in internal control that we identify during our audit.
We also provide the directors with a statement that we have complied with relevant ethical requirements regarding independence, and to communicate with them all relationships and other matters that may reasonably be thought to bear on our independence, and where applicable, related safeguards.
From the matters communicated with the directors, we determine those matters that were of most significance in the audit of the consolidated financial statements of the current period and are therefore the key audit matters. We describe these matters in our auditor’s report unless law or regulation precludes public disclosure about the matter or when, in extremely rare circumstances, we determine that a matter should not be communicated in our report because the adverse consequences of doing so would reasonably be expected to outweigh the public interest benefits of such communication.
Use of our report
This report is made solely to the Company’s members, as a body, in accordance with Section 205 of the Companies Act 2001. Our audit work has been undertaken so that we might state to the Company’s members those matters we are required to state to them in an auditor’s report and for no other purpose. To the fullest extent permitted by law, we do not accept or assume responsibility to anyone other than the Company and the Company’s members, as a body, for our audit work, for this report, or for the opinions we have formed.
REPORT ON OTHER LEGAL AND REGULATORY REQUIREMENTS
Companies Act 2001
We have no relationship with or interests in the Company other than in our capacity as auditors, tax advisors and dealings in the ordinary course of business.
We have obtained all the information and explanations we have required.
In our opinion, proper accounting records have been kept by the Company as far as it appears from our examination of those records.
ERNST & YOUNGEbène, Mauritius
LI KUNE LAN POOKIM, F.C.A, F.C.C.ALicensed by FRC
12 December 2019

Statements of Profit or Loss30 SEPTEMBER 2019
GROUP COMPANYNOTES Sep-19 Sep-18 Sep-19 Sep-18
Continuing Operations MUR m MUR m MUR m MUR m
Interest income Interest income using EIR method 549.8 454.7 87.8 121.8 Other interest income 5(a) 892.8 734.5 30.8 18.3 Interest expense 5(b) (388.2) (381.3) (39.3) (108.7)Net interest income 1,054.4 807.9 79.3 31.4 Fee and commission income 6 541.1 539.4 - - Investment income - - 311.9 65.0 Other operating income 7 214.4 72.0 7.8 (30.3)
755.5 611.4 319.7 34.7 Net operating income 1,809.9 1,419.3 399.0 66.1 Operating expensesEmployee benefit expenses 8 (574.6) (465.7) (11.4) (9.2)Depreciation (146.2) (61.8) - - Amortisation (26.8) (17.9) - - Other operating expenses 9 (400.4) (318.4) (25.6) (40.7)
(1,148.0) (863.8) (37.0) (49.9)Operating profit before impairment 661.9 555.5 362.0 16.2
Allowance for credit impairment 10 (180.9) (214.3) (5.8) - Impairment of investment - (0.6) (55.7) (0.6)
(180.9) (214.9) (61.5) (0.6)Operating profit 481.0 340.6 300.5 15.6 Foreign exchange gain/(loss) 4.4 (9.3) 3.9 (11.1)Share of results of associates 21 (a) (32.3) (14.7) - -
453.1 316.6 304.4 4.5
Net gain on business combination 34 - 29.5 - - Profit before tax from continuing operations 453.1 346.1 304.4 4.5 Income tax expense 11(a) (86.2) (72.7) (2.7) - Profit for the year from continuing
operations 366.9 273.4 301.7 4.5
Discontinued operationsProfit after tax for the year from discontinued
operations 35 15.8 78.7 - - Profit for the year 382.7 352.1 301.7 4.5
Attributable to:Equity holders of the parentProfit for the year from continuing operations 366.9 272.7 301.7 4.5 Profit for the year from discontinued
operations 15.8 78.7 - - 382.7 351.4 301.7 4.5
Non controlling interestsProfit for the year from continuing operations - 0.7 - -
- 0.7 - -
382.7 352.1 301.7 4.5
Basic/diluted earnings per share from continuing operations 32 MUR. 0.54 0.40 0.44 0.01
Basic/diluted earnings per share 32 MUR. 0.56 0.52 0.44 0.01
The notes on pages 72 to 157 form an integral part of these financial statements.
Auditors’ report on pages 60 to 65.
CIM FINANCIAL SERVICES LTD / ANNUAL REPORT 201966

Statements of Comprehensive Income30 SEPTEMBER 2019
GROUP COMPANYNOTES Sep-19 Sep-18 Sep-19 Sep-18
MUR m MUR m MUR m MUR mProfit for the year 382.7 352.1 301.7 4.5
Other comprehensive income 12
Items that will not be reclassified to profit or lossGain on revaluation of land and buildings, net of
tax - 8.0 - - Remeasurement of post employment benefit,
net of tax (9.2) (16.3) (0.3) (4.5)
Items that may be reclassified subsequently to profit or loss
Exchange difference on translation of foreign entities (1.6) (0.3) - -
Movement in reserves of associates 21(a) 6.7 (0.9) - - Other comprehensive income for the year,
net of tax (4.1) (9.5) (0.3) (4.5)Total comprehensive income for the year,
net of tax 378.6 342.6 301.4 -
Attributable to:Owners of the parent 378.6 338.2 301.4 301.4Non controlling interests - 4.4 - -
378.6 342.6 301.4 -
The notes on pages 72 to 157 form an integral part of these financial statements.
Auditors’ report on pages 60 to 65.
CIM FINANCIAL SERVICES LTD / ANNUAL REPORT 2019 67

Statements of Financial Position30 SEPTEMBER 2019
GROUP COMPANYNOTES Sep-19 Sep-18 Sep-19 Sep-18
MUR m MUR m MUR m MUR mASSETSCash and bank balances 13 444.5 526.1 12.6 107.9 Deposits with banks 14 507.0 1,026.0 - 524.5 Net investment in leases and other credit
agreements 15 8,769.1 7,637.7 - - Loans and advances 16 3,708.7 2,865.6 2,991.9 1,105.5 Investments in financial assets 17 8.9 1,598.9 0.8 1,590.9 Other assets 18 435.3 676.1 200.4 948.0 Inventories 19 3.7 5.6 - - Investments in subsidiaries 20 - - 1,130.3 1,922.8 Investments in associates 21 141.0 177.5 10.4 16.2 Investment properties 22 - 1,216.5 - 33.5 Property, plant and equipment 23 638.9 1,585.8 - - Intangible assets 24 88.3 106.7 0.1 0.1 Income tax assets 11 18.3 - - - Post employment benefit assets 25 - 7.2 - - Deferred tax assets 26 47.1 83.0 - - Total assets 14,810.8 17,512.7 4,346.5 6,249.4
LIABILITIESDeposits from customers 27 - 3,426.6 - - Other borrowed funds 28 9,094.8 5,949.8 1,203.3 1,396.9 Other liabilities 29 1,438.7 1,341.4 3.8 131.1 Income tax liabilities 11(b) 6.1 33.0 2.7 - Post employment benefit liabilities 25 94.4 87.6 37.7 40.9 Deferred tax liabilities 26 1.3 28.4 - - Total liabilities 10,635.3 10,866.8 1,247.5 1,568.9
EQUITYStated capital 31 680.5 680.5 680.5 680.5 Retained earnings 2,983.7 4,999.9 2,422.6 4,003.8 Revaluation and other reserves 511.3 646.1 (4.1) (3.8)Equity attributable to owners of the parent 4,175.5 6,326.5 3,099.0 4,680.5 Non controlling interests - 319.4 - - Total equity 4,175.5 6,645.9 3,099.0 4,680.5 Total equity and liabilities 14,810.8 17,512.7 4,346.5 6,249.4
These financial statements have been approved for issue by the Board of Directors on 12 December 2019.
Colin Taylor Mark Van Beuningen
Non-Executive Director and Chairman Executive Director and Group Chief Executive
The notes on pages 72 to 157 form an integral part of these financial statements.
Auditors’ report on pages 60 to 65.
CIM FINANCIAL SERVICES LTD / ANNUAL REPORT 201968

Statements of Changes in Equity30 SEPTEMBER 2019
NOTES Stated capital
Capital reserves
Revaluation
reserves Other
reserves Retained earnings
Actuarial losses
Attributable to owners
of the parent
Non controlling interests
Total equity
MUR m MUR m MUR m MUR m MUR m MUR m MUR m MUR m MUR mGROUP
At 1 October 2018 680.5 494.7 172.6 (7.5) 4,999.9 (13.7) 6,326.5 319.4 6,645.9 Impact of adopting
IFRS 9 - - - - 2.8 - 2.8 - 2.8 Restated balance 680.5 494.7 172.6 (7.5) 5,002.7 (13.7) 6,329.3 319.4 6,648.7 Profit for the year - - - - 382.7 - 382.7 - 382.7 Other comprehensive
income for the year - - - 5.1 - (9.2) (4.1) - (4.1)Total comprehensive
income for the year - - - 5.1 382.7 (9.2) 378.6 - 378.6 Dividends - - - - (156.5) - (156.5) - (156.5)Distribution of non
cash assets to owners - - (172.6) - (2,203.3) - (2,375.9) (319.4) (2,695.3)
Transfers - 41.9 - - (41.9) - - - - Total transactions
with owners of parent - 41.9 (172.6) - (2,401.7) - (2,532.4) (319.4) (2,851.8)
At 30 September 2019 680.5 536.6 - (2.4) 2,983.7 (22.9) 4,175.5 - 4,175.5
Stated capital
Capital reserves
Revaluation
reserves Other
reserves Retained earnings
Actuarial losses
Attributable to owners
of the parent
Non controlling interests
Total equity
MUR m MUR m MUR m MUR m MUR m MUR m MUR m MUR m MUR m
At 1 October 2017 680.5 426.1 168.3 (4.9) 5,171.6 2.6 6,444.2 315.0 6,759.2 Profit/(loss) for the
year - - - - 351.4 - 351.4 0.7 352.1 Other comprehensive
income for the year - - 4.3 (1.2) - (16.3) (13.2) 3.7 (9.5)Total comprehensive
income for the year - - 4.3 (1.2) 351.4 (16.3) 338.2 4.4 342.6 Dividends - - - - (455.9) - (455.9) - (455.9)Transfers - 68.6 - (1.4) (67.2) - - - - Total transactions
with owners of parent - 68.6 - (1.4) (523.1) - (455.9) - (455.9)
At 30 September 2018 680.5 494.7 172.6 (7.5) 4,999.9 (13.7) 6,326.5 319.4 6,645.9
The explanatory notes on pages 72 to 157 form an integral part of these financial statements.
Auditors’ report on pages 60 to 65.
CIM FINANCIAL SERVICES LTD / ANNUAL REPORT 2019 69

Statements of Changes in Equity30 SEPTEMBER 2019
NOTES Stated capital
Actuarial reserves
Retained earnings Total equity
MUR m MUR m MUR m MUR mCOMPANYAt 1 October 2018 680.5 (3.8) 4,003.8 4,680.5 Impact of adopting IFRS9 - - (5.3) (5.3)Restated balance 680.5 (3.8) 3,998.5 4,675.2 Profit for the year - - 301.7 301.7 Other comprehensive income 12 - (0.3) - (0.3)Distribution of non cash assets to owners - - (1,721.1) (1,721.1)Dividends 30 - - (156.5) (156.5)At 30 September 2019 680.5 (4.1) 2,422.6 3,099.0
At 1 October 2017 680.5 0.7 4,455.2 5,136.4 Profit for the year - - 4.5 4.5 Other comprehensive income 12 - (4.5) - (4.5)Dividends 30 - - (455.9) (455.9)At 30 September 2018 680.5 (3.8) 4,003.8 4,680.5
The explanatory notes on pages 72 to 157 form an integral part of these financial statements.
Auditors’ report on pages 60 to 65.
CIM FINANCIAL SERVICES LTD / ANNUAL REPORT 201970

Statements of Cash Flows30 SEPTEMBER 2019
GROUP COMPANYNOTES Sep-19 Sep-18 Sep-19 Sep-18
MUR m MUR m MUR m MUR mCASH FLOWS FROM OPERATING ACTIVITIESCash (used in)/generated from operations 33 (2,414.9) (799.2) 264.4 891.0 Income tax paid (83.2) (88.4) - - Net cash flow (used in)/generated from
operating activities (2,498.1) (887.6) 264.4 891.0
CASH FLOWS FROM INVESTING ACTIVITIESDividends received 10.9 - 311.9 65.0 Proceeds from sale of financial assets 8.0 - - - Payment on share application monies - - - (102.5)Purchase of financial assets (8.1) - - - Purchase of property, plant and equipment (297.5) (114.5) - - Proceeds from sale of property, plant and
equipment 33.8 24.7 - - Purchase of intangible assets (53.8) (58.9) - - Purchase of investment properties - (187.2) - - Sale of investment properties - 17.2 - - Acquisition of subsidiary, net of cash acquired 34 - (51.1) - - Investment in subsidiaries 20 - - (200.0) (121.5)Cash distributed from property segment 35 (269.9) - (170.0) - Net cash flow used in investing activities (576.6) (369.8) (58.1) (159.0)
CASH FLOWS FROM FINANCING ACTIVITIESProceeds from other borrowed funds 17,178.0 12,097.7 993.0 1,751.9 Repayment of other borrowed funds (13,842.3) (10,440.5) (1,186.6) (1,975.0)Dividends paid to shareholders of Company (156.5) (455.9) (156.5) (455.9)Net cash flow generated from/(used in)
financing activities 3,179.2 1,201.3 (350.1) (679.0)
Net increase/(decrease) in cash and cash equivalents 104.5 (56.1) (143.8) 53.0
Effect of exchange rate changes on cash and cash equivalents 0.8 (0.3) - (11.1)
Cash and cash equivalents - opening 322.7 379.1 268.9 227.0 Cash and cash equivalents - closing 13 428.0 322.7 125.1 268.9
The explanatory notes on pages 72 to 157 form an integral part of these financial statements.Auditors’ report on pages 60 to 65.
CIM FINANCIAL SERVICES LTD / ANNUAL REPORT 2019 71
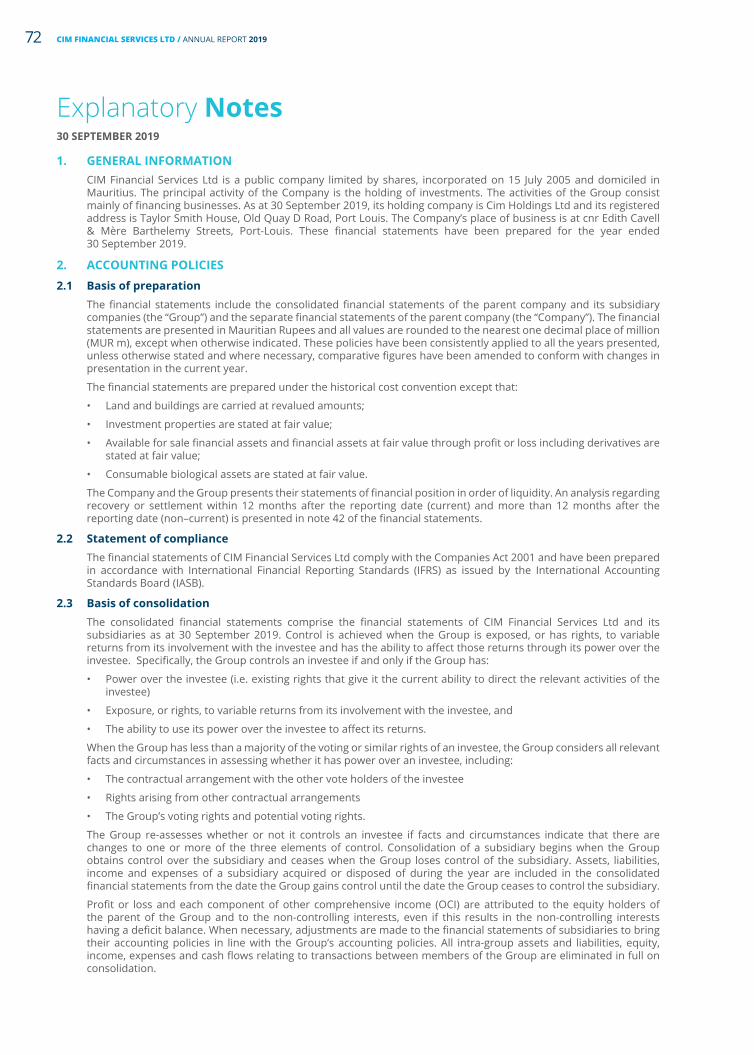
Explanatory Notes30 SEPTEMBER 2019
1. GENERAL INFORMATIONCIM Financial Services Ltd is a public company limited by shares, incorporated on 15 July 2005 and domiciled in Mauritius. The principal activity of the Company is the holding of investments. The activities of the Group consist mainly of financing businesses. As at 30 September 2019, its holding company is Cim Holdings Ltd and its registered address is Taylor Smith House, Old Quay D Road, Port Louis. The Company’s place of business is at cnr Edith Cavell & Mère Barthelemy Streets, Port-Louis. These financial statements have been prepared for the year ended 30 September 2019.
2. ACCOUNTING POLICIES
2.1 Basis of preparationThe financial statements include the consolidated financial statements of the parent company and its subsidiary companies (the “Group”) and the separate financial statements of the parent company (the “Company”). The financial statements are presented in Mauritian Rupees and all values are rounded to the nearest one decimal place of million (MUR m), except when otherwise indicated. These policies have been consistently applied to all the years presented, unless otherwise stated and where necessary, comparative figures have been amended to conform with changes in presentation in the current year.
The financial statements are prepared under the historical cost convention except that:
• Land and buildings are carried at revalued amounts;
• Investment properties are stated at fair value;
• Available for sale financial assets and financial assets at fair value through profit or loss including derivatives are stated at fair value;
• Consumable biological assets are stated at fair value.
The Company and the Group presents their statements of financial position in order of liquidity. An analysis regarding recovery or settlement within 12 months after the reporting date (current) and more than 12 months after the reporting date (non–current) is presented in note 42 of the financial statements.
2.2 Statement of compliance The financial statements of CIM Financial Services Ltd comply with the Companies Act 2001 and have been prepared in accordance with International Financial Reporting Standards (IFRS) as issued by the International Accounting Standards Board (IASB).
2.3 Basis of consolidationThe consolidated financial statements comprise the financial statements of CIM Financial Services Ltd and its subsidiaries as at 30 September 2019. Control is achieved when the Group is exposed, or has rights, to variable returns from its involvement with the investee and has the ability to affect those returns through its power over the investee. Specifically, the Group controls an investee if and only if the Group has:
• Power over the investee (i.e. existing rights that give it the current ability to direct the relevant activities of the investee)
• Exposure, or rights, to variable returns from its involvement with the investee, and
• The ability to use its power over the investee to affect its returns.
When the Group has less than a majority of the voting or similar rights of an investee, the Group considers all relevant facts and circumstances in assessing whether it has power over an investee, including:
• The contractual arrangement with the other vote holders of the investee
• Rights arising from other contractual arrangements
• The Group’s voting rights and potential voting rights.
The Group re-assesses whether or not it controls an investee if facts and circumstances indicate that there are changes to one or more of the three elements of control. Consolidation of a subsidiary begins when the Group obtains control over the subsidiary and ceases when the Group loses control of the subsidiary. Assets, liabilities, income and expenses of a subsidiary acquired or disposed of during the year are included in the consolidated financial statements from the date the Group gains control until the date the Group ceases to control the subsidiary.
Profit or loss and each component of other comprehensive income (OCI) are attributed to the equity holders of the parent of the Group and to the non-controlling interests, even if this results in the non-controlling interests having a deficit balance. When necessary, adjustments are made to the financial statements of subsidiaries to bring their accounting policies in line with the Group’s accounting policies. All intra-group assets and liabilities, equity, income, expenses and cash flows relating to transactions between members of the Group are eliminated in full on consolidation.
CIM FINANCIAL SERVICES LTD / ANNUAL REPORT 201972

Explanatory Notes30 SEPTEMBER 2019
2. ACCOUNTING POLICIES (CONT’D)
2.3 Basis of consolidation (cont’d)A change in the ownership interest of a subsidiary, without a change of control, is accounted for as an equity transaction. If the Group loses control over a subsidiary, it:
• Derecognises the assets (including goodwill) and liabilities of the subsidiary
• Derecognises the carrying amount of any non-controlling interest
• Derecognises the cumulative translation differences, recorded in equity
• Recognises the fair value of the consideration received
• Recognises the fair value of any investment retained
• Recognises any surplus or deficit in profit or loss
• Reclassifies the parent’s share of components previously recognised in other comprehensive income to profit or loss or retained earnings as appropriate.
2.4 Changes in accounting policies and disclosures
New and amended standards and interpretation
The Group applied for the first time certain standards and amendments, which are effective for annual periods beginning on or after 1 October 2018. The Group has not early adopted any other standard, interpretation or amendment that has been issued but is not yet effective.
The nature and the effect of these changes are disclosed below.
IFRS 9 - Financial Instruments
IFRS 9 Financial Instruments was issued in July 2014 and has an effective date of 1 January 2018. IFRS 9 replaces IAS 39 Financial Instruments: Recognition and Measurement, introducing new requirements for the classification and measurement of financial instruments, the recognition and measurement of credit impairment provisions, and providing for a simplified approach to hedge accounting.
The changes in measurement arising on initial application of IFRS 9 have been incorporated through an adjustment to the opening reserves and retained earnings position as at 1 October 2018. Although IFRS 9 has been retrospectively applied, the Group is only permitted to restate comparatives if, and only if, it is possible without the use of hindsight. The Group does not consider it possible to restate comparatives for impairment without the use of hindsight. The Group applied the new rules from 1 October 2018, however, comparatives for previous years have not been restated.
Changes to classification and measurement
To determine the classification and measurement category, IFRS 9 requires all financial assets, except equity instruments and derivatives, to be assessed based on a combination of the Group’s business model for managing the assets and the instruments’ contractual cash flow characteristics.
The IAS 39 measurement categories of financial assets (fair value through profit or loss (FVTPL), available for sale (AFS), held-to-maturity (at amortised cost) have been replaced by:
• Debt instruments at amortised cost;
• Debt instruments at fair value through other comprehensive income (FVTOCI), with gains or losses recycled to profit or loss on derecognition;
• Equity instruments at FVTOCI, with no recycling of gains or losses to profit or loss on derecognition; and
• Financial assets at FVTPL.
Under IFRS 9, embedded derivatives are no longer separated from a host financial asset. Instead, financial assets are classified based on business model and their contractual terms. The accounting for derivatives embedded in financial liabilities and in non-financial host contracts has not changed.
The accounting for financial liabilities remains largely the same as it was under IAS 39, except for the treatment of gains or losses arising from an entity’s own credit risk relating to liabilities designated at FVTPL. Such movements are presented in OCI with no subsequent reclassification to the income statement.
The Group’s cash and bank balances, deposits with banks, loans and advances, government bonds, clearing accounts and other receivables are held to collect contractual cash flows and give rise to cash flows representing solely payments of principal and interest. The Group analysed the contractual cash flow characteristics of those instruments and concluded that they meet the criteria for amortised cost measurement under IFRS, therefore those financial instruments continue to be measured at amortised cost.
CIM FINANCIAL SERVICES LTD / ANNUAL REPORT 2019 73

Explanatory Notes30 SEPTEMBER 2019
2. ACCOUNTING POLICIES (CONT’D)
2.4 CHANGES IN ACCOUNTING POLICIES AND DISCLOSURES (CONT’D)
New and amended standards and interpretation (Cont’d)
IFRS 9 - Financial Instruments (Cont’d)
Changes to classification and measurement (Cont’d)
The investments in equity instruments previously classified as available for sale investments were reclassified as financial assets at fair value through profit or loss. The debt instruments which were previously classified at fair value through profit or loss continued to be recognised as such under IFRS 9. The Group also held currency forwards and swaps which are continued to be recognised as derivatives and recognised as financial assets or financial liabilities at FVTPL.
Net finance lease receivables, hire purchase and other credit agreements are not impacted as they are not in the scope of the recognition and measurement under IFRS 9.
Changes to the impairment calculation
The adoption of IFRS 9 has fundamentally changed the Group’s accounting for loan loss impairments by replacing IAS 39’s incurred loss approach with a forward-looking expected credit loss (ECL) approach. IFRS 9 requires the Group to record an allowance for ECLs for all loans and other debt financial assets not held at FVTPL, together with loan commitments, financial guarantee contracts and lease receivables under IAS 17 Leases. The allowance is based on the ECLs associated with the probability of default in the next twelve months unless there has been a significant increase in credit risk since origination.
Impact on IFRS 9 adoption
THE GROUP IAS 39 Measurement Re-measurement IFRS 9Category Amount ECL Others Amount Category
Financial assets MUR M MUR M MUR M MUR MCash and bank balances L&R 526.1 - - 526.1 AC Deposit with banks L&R 1,026.0 (1.3) - 1,024.7 AC Net investment in leases and
other credit agreements N/A 7,637.7 (10.9) - 7,626.8 N/A Loans and advances L&R 2,865.6 15.3 - 2,880.9 ACInvestment in financial assets
Equity investments AFS 1.2 - - 1.2 FVTPLGovernment bonds L&R 8.0 - - 8.0 ACDebt instruments FVTPL 1,589.7 - - 1,589.7 FVTPL
Other assets Trade and other receivables L & R 605.5 (0.2) - 605.3 AC
14,259.8 2.9 - 14,262.7 Deferred tax impact (0.1)Impact on retained earnings 2.8
Financial liabilitiesDeposits from customers AC 3,426.6 - - 3,426.6 AC Other borrowed funds AC 5,949.8 - - 5,949.8 AC Other liabilities
Trade and other payables AC 1,200.6 - - 1,200.6 ACForeign currency derivatives FVTPL 20.0 - - 20.0 FVTPL
10,597.0 - - 10,597.0
L&R: Loans and receivables
N/A: Not applicable
AFS: Available for sale
FVTPL: Fair value through profit or loss
AC: Amortised cost
CIM FINANCIAL SERVICES LTD / ANNUAL REPORT 201974

Explanatory Notes30 SEPTEMBER 2019
2. ACCOUNTING POLICIES (CONT’D)
2.4 CHANGES IN ACCOUNTING POLICIES AND DISCLOSURES (CONT’D)
New and amended standards and interpretation (Cont’d)
IFRS 9 - Financial Instruments (Cont’d)
Impact on IFRS 9 adoption (Cont’d)
THE COMPANY IAS 39 Measurement Re-measurement IFRS 9Category Amount ECL Others Amount Category
Financial assets MUR M MUR M MUR M MUR MCash and bank balances L&R 107.9 - - 107.9 AC Deposit with banks L&R 524.5 (0.7) - 523.8 AC Loans and advances L&R 1,105.5 (3.7) - 1,101.8 ACInvestment in financial assets - Equity investments AFS 1.2 - - 1.2 FVTPLDebts instruments designated at
FVTPL FVTPL 1,589.7 - - 1,589.7 FVTPLOther assets - Receivables L & R 373.0 (0.9) - 372.1 AC
3,701.8 (5.3) - 3,696.5 Deferred tax impact - Impact on retained earnings (5.3)
Financial liabilitiesOther borrowed funds AC 1,396.9 - - 1,396.9 AC Other liabilitiesTrade and other payables AC 111.1 - - 111.1 ACForeign currency derivatives FVTPL 20.0 - - 20.0 FVTPL
1,528.0 - - 1,528.0
L&R: Loans and receivables
N/A: Not applicable
AFS: Available for sale
FVTPL: Fair value through profit or loss
AC: Amortised cost
IFRS 15 - Revenue from Contracts with Customers
IFRS 15 issued in May 2014, and amended in April 2016, establishes a five-step model to account for revenue arising from contracts with customers. Under IFRS 15, revenue is recognised at an amount that reflects the consideration to which an entity expects to be entitled in exchange for transferring goods or services to a customer.
The new revenue standard supersedes all current revenue recognition requirements under IFRS. Either a full retrospective application or a modified retrospective application is required for annual periods beginning on or after 1 January 2018. Early adoption is permitted. The Group adopted the new standard on the required effective date using the modified retrospective approach. No major impact was noted from the adoption of IFRS 15 given that the main revenue streams of the Group do not fall under the scope of IFRS 15.
CIM FINANCIAL SERVICES LTD / ANNUAL REPORT 2019 75

Explanatory Notes30 SEPTEMBER 2019
2. ACCOUNTING POLICIES (CONT’D)
2.4 CHANGES IN ACCOUNTING POLICIES AND DISCLOSURES (CONT’D)
New and amended standards and interpretation (Cont’d)
IFRS 7 - Financial Instruments (Revised)
To reflect the differences between IFRS 9 and IAS 39, IFRS 7 Financial Instruments: Disclosures were updated, and the Group has adopted it, together with IFRS 9, for the year beginning 1 October 2018. Changes include transition disclosures which are shown in Note 2.4; detailed qualitative and quantitative information about the ECL calculations such as the assumptions and inputs used are set out in Note 4.1(d).
Reconciliations from opening to closing ECL allowances are presented in Notes 15 and 16. IFRS 7 also requires additional and more detailed disclosures for hedge accounting even for entities opting to continue to apply the hedge accounting requirements of IAS 39. The Group does not apply hedge accounting.
IFRIC 22 Foreign currency transactions and advance consideration
The Interpretation clarifies that, in determining the spot exchange rate to use on initial recognition of the related asset, expense or income (or part of it) on the derecognition of a non-monetary asset or non-monetary liability relating to advance consideration, the date of the transaction is the date on which an entity initially recognises the non-monetary asset or non-monetary liability arising from the advance consideration. If there are multiple payments or receipts in advance, then the Group must determine the date of the transactions for each payment or receipt of advance consideration. This Interpretation does not have any impact on the Group’s financial statements.
2.5 New or revised standards and interpretationsAt the date of authorisation of these financial statements, the following relevant new and revised Standards were in issue but effective on annual periods beginning on or after the respective dates as indicated:
IAS 1 Presentation of Financial Statements – Amendments regarding the definition of material (effective 1 January 2020)
IAS 8 Accounting Policies, Changes in Accounting Estimates and Errors – Amendments regarding the definition of material (effective 1 January 2020)
IAS 12 Income Taxes - Amendments resulting from Annual Improvements 2015-2017 Cycle (income tax consequences of payments on financial instruments classified as equity) (effective 1 January 2019)
IAS 19 Employee Benefits - Amendments regarding plan amendments, curtailments or settlements (effective 1 January 2019)
IAS 23 Borrowing Costs - Amendments resulting from Annual Improvements 2015-2017 Cycle (borrowings costs eligible for capitalisation) (effective 1 January 2019)
IAS 28 Investments in Associates and Joint Ventures - Amendments regarding the sale or contribution between an investor and its associates or joint ventures (deferred indefinitely)
IAS 28 Investments in Associates and Joint Ventures - Amendments regarding long-term interests in associates and joint ventures (effective 1 January 2019)
IAS 39 Financial Instruments: Recognition and Measurement - Amendments to permit an entity to elect to continue to apply the hedge accounting requirements in IAS 39 for a fair value hedge of the interest rate exposure of a portion of a portfolio of financial assets or financial liabilities when IFRS 9 is applied and to extend the fair value option to certain contracts that meet the ‘own case’ scope exception (applies when IFRS 9 is applied)
IFRS 3 Business Combinations - Amendments resulting from Annual Improvements 2015–2017 Cycle (remeasurement of previously held interest) (effective 1 January 2019)
Definition of a business - Amendments to IFRS 3
IFRS 9 Financial Instruments - Amendments regarding prepayment features with negative compensation and modifications of financial liabilities (effective 1 January 2019)
IFRS 10 Consolidated Financial Statements - Amendments regarding the sale or contribution of assets between an investor and its associate or joint venture (deferred indefinitely)
IFRS 11 Joint Arrangements - Amendments resulting from Annual Improvements 2015–2017 Cycle (remeasurement of previously held interest) (effective 1 January 2019)
IFRS 16 Leases - Original issue (effective 1 January 2019)
IFRS 17 Insurance Contracts - Original issue (effective 1 January 2021)
IFRIC 23 Uncertainty over Income Tax Treatments (effective 1 January 2019)
CIM FINANCIAL SERVICES LTD / ANNUAL REPORT 201976

Explanatory Notes30 SEPTEMBER 2019
2. ACCOUNTING POLICIES (CONT’D)
2.5 New or revised standards and interpretations (Cont’d)
IFRS 16 Leases
The IASB issued the new standard for accounting for leases - IFRS 16 Leases in January 2016. The new standard does not significantly change the accounting for leases for lessors. However, it does require lessees to recognise most leases on their balance sheets as lease liabilities, with the corresponding right-of-use assets. Lessees must apply a single model for all recognised leases, but will have the option not to recognise ‘short-term’ leases and leases of ‘low-value’ assets. Generally, the profit or loss recognition pattern for recognised leases will be similar to today’s finance lease accounting, with interest and depreciation expense recognised separately in the statement of profit or loss. IFRS 16 is effective for annual periods beginning on or after 1 January 2019. The Group is currently assessing the impact of IFRS 16 on its financial statements.
The Group has operating leases principally on office spaces where it is the lessee. The Group plans to adopt IFRS 16 retrospectively with the cumulative effect of initial application recognised as an adjustment to the opening balance of retained earnings. The Group will elect to apply the standard to contracts that were previously identified as leases applying IAS 17 and IFRIC 4. Right of use assets along with lease liabilities shall be recognised on the statement of financial position at 1 October 2019.
2.6 Significant accounting policies
(a) Business combinations and goodwill
Business combinations are accounted for using the acquisition method. The cost of an acquisition is measured as the aggregate of the consideration transferred, which is measured at acquisition date fair value, and the amount of any non-controlling interests in the acquiree. For each business combination, the Group elects whether to measure the non-controlling interests in the acquiree at fair value or at the proportionate share of the acquiree’s identifiable net assets.
Acquisition-related costs are expensed as incurred.
When the Group acquires a business, it assesses the financial assets and liabilities assumed for appropriate classification and designation in accordance with the contractual terms, economic circumstances and pertinent conditions as at the acquisition date. This includes the separation of embedded derivatives in host contracts by the acquiree.
Any contingent consideration to be transferred by the acquirer will be recognised at fair value at the acquisition date.
Contingent consideration is classified as an asset or liability that is a financial instrument and within the scope of IAS 39.
Financial Instruments: Recognition and Measurement is measured at fair value with the changes in fair value recognised in profit or loss. Goodwill is initially measured at cost (being the excess of the aggregate of the consideration transferred and the amount recognised for non-controlling interests and any previous interest held over the net identifiable assets acquired and liabilities assumed). If the fair value of the net assets acquired is in excess of the aggregate consideration transferred, the Group re-assesses whether it has correctly identified all of the assets acquired and all of the liabilities assumed and reviews the procedures used to measure the amounts to be recognised at the acquisition date. If the reassessment still results in an excess of the fair value of net assets acquired over the aggregate consideration transferred, then the gain is recognised in profit or loss. After initial recognition, goodwill is measured at cost less any accumulated impairment losses. For the purpose of impairment testing, goodwill acquired in a business combination is, from the acquisition date, allocated to each of the Group’s cash-generating units that are expected to benefit from the combination, irrespective of whether other assets or liabilities of the acquiree are assigned to those units.
Where goodwill has been allocated to a cash-generating unit (CGU) and part of the operation within that unit is disposed of, the goodwill associated with the disposed operation is included in the carrying amount of the operation when determining the gain or loss on disposal. Goodwill disposed in these circumstances is measured based on the relative values of the disposed operation and the portion of the cash-generating unit retained.
(b) Investments in subsidiaries
Subsidiaries are fully consolidated in the Group’s financial statements from the date control is obtained by the Group until the date that control ceases.
Separate financial statements of the investor
In the separate financial statements of the Company, investments in subsidiaries are carried at cost, net of any impairment.
Where the carrying amount of an investment is greater than its estimated recoverable amount, it is written down immediately to its recoverable amount and the difference is recognised in profit or loss. Upon disposal of the investment, the difference between the net disposal proceeds and the carrying amount is recognised in profit or loss.
CIM FINANCIAL SERVICES LTD / ANNUAL REPORT 2019 77
Explanatory Notes30 SEPTEMBER 2019
2. ACCOUNTING POLICIES (CONT’D)
2.6 Significant accounting policies (Cont’d)
(c) Investments in associates
An associate is an entity over which the Group has significant influence but not control, or joint control, generally accompanying a shareholding between 20% and 50% of the voting rights.
Separate financial statements of the investor
In the separate financial statements of the investor, investments in associates are carried at cost (which includes transaction costs). Where the carrying amount of an investment is greater than its estimated recoverable amount, it is written down immediately to its recoverable amount and the difference is recognised in profit or loss. Upon disposal of the investment, the difference between the net disposal proceeds and the carrying amount is recognised in profit or loss.
Consolidated financial statements
The Group’s investments in its associate are accounted for using the equity method. Under the equity method, the investment in an associate is initially recognised at cost. The carrying amount of the investment is adjusted to recognise changes in the Group’s share of net assets of the associate since the acquisition date. Goodwill relating to the associate is included in the carrying amount of the investment and is not tested for impairment separately.
The statement of profit or loss reflects the Group’s share of the results of operations of the associates.
Any change in OCI of those investees is presented as part of the Group’s OCI. In addition, when there has been a change recognised directly in the equity of the associate, the Group recognises its share of any changes, when applicable, in the statement of changes in equity. Unrealised gains and losses resulting from transactions between the Group and the associate are eliminated to the extent of the interest in the associate.
The aggregate of the Group’s share of profit or loss of associates is shown on the face of the statement of profit or loss outside operating profit and represents profit or loss after tax and non-controlling interests in the subsidiaries of the associate.
The financial statements of the associates are prepared for the same reporting period as the Group. When necessary, adjustments are made to bring the accounting policies in line with those of the Group.
After application of the equity method, the Group determines whether it is necessary to recognise an impairment loss on its investment in its associate. At each reporting date, the Group determines whether there is objective evidence that the investment in the associate is impaired. If there is such evidence, the Group calculates the amount of impairment as the difference between the recoverable amount of the associate and its carrying value, and then recognises the loss as ‘Share of result of associate’ in the statement of profit or loss.
Upon loss of significant influence over the associate, the Group measures and recognises any retained investment at its fair value. Any difference between the carrying amount of the associate upon loss of significant influence and the fair value of the retained investment and proceeds from disposal is recognised in profit or loss.
CIM FINANCIAL SERVICES LTD / ANNUAL REPORT 201978

Explanatory Notes30 SEPTEMBER 2019
2. ACCOUNTING POLICIES (CONT’D)
2.6 Significant accounting policies (Cont’d)
(d) Recognition of income
Policy effective prior to 1 October 2018
Revenue is recognised to the extent that it is probable that the economic benefits will flow to the Group and the revenue can be reliably measured, regardless of when the payment is received. Revenue is measured at the fair value of the consideration received or receivable stated net of discounts, returns, value added taxes, rebates and other similar allowances.
The specific recognition criteria described below must also be met before revenue is recognised.
Interest and similar income
For all financial instruments measured at amortised cost, interest income is recorded using the effective interest rate (EIR). The EIR is the rate that exactly discounts the estimated future cash receipts over the expected life of the financial instrument or a shorter period, where appropriate, to the net carrying amount of the financial asset. Fees that the Group considers to be an integral part of these financial instruments are recognised in the EIR.
Earnings from finance leases are recognised over the term of the lease using the net investment method, which reflects a constant periodic rate of return.
Commissions or discounts received from merchants on financing of credit agreements are initially recognised and presented in other liabilities in the statement of financial position. The release to profit or loss is recognised in fee and commission income in the statement of profit or loss.
Rental income
Rental income is recognised in accordance with the substance of the relevant agreement. Rental income from operating leases net of value added taxes is recognised on a straight line basis over the lease term.
Dividend income
Dividend income is recognised when the Group’s right to receive the payment is established.
Rendering of services
Revenue from rendering of services is recognised in the accounting period in which services are rendered. Management fees are recognised as the services are provided.
Policy effective as from 1 October 2018
Revenue is measured based on the consideration specified in a contract with a customer and excludes amounts collected on behalf of third parties. The Group recognises revenue when it transfers control over a product or service to a customer.
Fee and commission income
The Group earns fee and commission income from the financial services it provides to its customers. Fee and commission income is recognised at an amount that reflects the consideration to which the Group expects to be entitled in exchange for providing the services.
The performance obligations, as well as the timing of their satisfaction, are identified, and determined, at the inception of the contract. The Group’s revenue contracts do not typically include multiple performance obligations.
CIM FINANCIAL SERVICES LTD / ANNUAL REPORT 2019 79

Explanatory Notes30 SEPTEMBER 2019
2. ACCOUNTING POLICIES (CONT’D)
2.6 Significant accounting policies (Cont’d)
(d) Recognition of income (Cont’d)
Policy effective as from 1 October 2018 (Cont’d)
Fees relating to card activities
The Group provides its customers with credit card processing services (i.e. authorisation and settlement of transactions) where it is entitled to a fee for each transaction. These services represent a single performance obligation comprised of a series of distinct daily services that are substantially the same and have the same pattern of transfer over the contract period. The fees vary based on the number of transactions processed and are structured as either a fixed rate per transaction processed or at a fixed percentage of the underlying cardholder transaction. The variable fees are allocated to each distinct day, based on the number and value of transactions processed that day, and the allocated revenue is recognised as the entity performs. Revenue from these fees are recognised over time.
Factoring fees
The Group provides factoring services to its customers and receives fees at a percentage for each transaction agreed with the counterparties. The performance obligation is satisfied at the acceptance of the invoice for which it provides the factoring service and the revenue is recognised at this point.
Interest and similar income
For all financial instruments measured at amortised cost, interest income is recorded using the effective interest rate (EIR). The EIR is the rate that exactly discounts the estimated future cash receipts over the expected life of the financial instrument or a shorter period, where appropriate, to the net carrying amount of the financial asset. Fees that the Group considers to be an integral part of these financial instruments are recognised in the EIR.
Earnings from finance leases are recognised over the term of the lease using the net investment method, which reflects a constant periodic rate of return.
Commissions or discounts received from merchants on financing of credit agreements are initially recognised and presented in other liabilities in the statement of financial position. The release to profit or loss is recognised in fee and commission income in the statement of profit or loss.
Rental income
Rental income is recognised in accordance with the substance of the relevant agreement. Rental income from operating leases net of value added taxes is recognised on a straight line basis over the lease term.
Dividend income
Dividend income is recognised when the Group’s right to receive the payment is established.
Management and administration fees
Revenue from management and administration services are recognised over time as the services are received and consumed simultaneously.
(e) Foreign currencies
(i) Functional and presentation currency
Items included in the financial statements of each of the Group’s entities are measured using Mauritian Rupee, the currency of the primary economic environment in which the entity operates (“functional currency”). The consolidated and separate financial statements are presented in Mauritian Rupees, which is the Company’s functional currency. All amounts are in million, rounded to one decimal place except as otherwise stated.
(ii) Transactions and balances
Foreign currency transactions are translated into Mauritian Rupees using exchange rates prevailing at the dates of the transactions. Foreign exchange gains and losses resulting from the settlement of such transactions and from the translation at year-end exchange rates of monetary assets and liabilities denominated in foreign currencies are recognised in profit or loss, except when deferred in other comprehensive income as qualifying cash flow hedges.
Non-monetary items that are measured at historical cost in a foreign currency are translated using the exchange rate at the date of the transaction.
Non-monetary items that are measured at fair value in a foreign currency are translated using the exchange rates at the date the fair value was determined.
Translation differences on non-monetary financial assets, such as equities classified as available for sale, are included in other comprehensive income.
CIM FINANCIAL SERVICES LTD / ANNUAL REPORT 201980

Explanatory Notes30 SEPTEMBER 2019
2. ACCOUNTING POLICIES (CONT’D)
2.6 Significant accounting policies (Cont’d)
(e) Foreign currencies (Cont’d)
(iii) Group companies
The results and financial position of the Group entities that have a functional currency different from Mauritian Rupee are translated into the presentation currency as follows:
• assets and liabilities for each statement of financial position presented are translated at the closing rate at the reporting date;
• income and expenses for each statement representing profit or loss and other comprehensive income are translated at average exchange rates;
• all resulting exchange differences are recognised in other comprehensive income;
• Goodwill and fair value adjustments arising on the acquisition of a foreign entity are treated as assets and liabilities of the foreign entity and translated at the closing rate.
• On disposal of foreign entities, such translation differences are recognised in the profit or loss as part of the gain or loss.
(f) Inventories
Inventories consisting of consumable card and stamps are valued at lower of cost and net realisable value.
Cost is determined at the weighted average method. The cost of finished goods and work in progress comprises raw materials, direct labour, other direct costs and related production overheads, but excludes interest expenses. Net realisable value is the estimate of the selling price in the ordinary course of business, less the costs of completion and selling expenses.
(g) Leases
The determination of whether an arrangement is a lease, or contains a lease, is based on the substance of the arrangement and requires an assessment of whether the fulfilment of the arrangement is dependent on the use of a specific asset or assets or whether the arrangement conveys a right to use the asset.
Leases are classified as finance leases where the terms of the lease transfer substantially all the risks and rewards of ownership to the lessee. All other leases are classified as operating leases. Leases also include contracts for the hire of an asset that contain a provision giving the hirer an option to acquire title to the asset upon the fulfilment of agreed conditions.
(i) Finance leases - lessor
Finance leases granted are accounted for in the statement of financial position as investment at an amount equal to the net investment in the leases, after deduction of allowances for credit losses. The difference between the gross receivable and the present value of the receivable is recognised as unearned finance income. Lease income is recognised over the term of the lease using the net investment method, which reflects a constant periodic rate of return.
(ii) Operating leases - lessor
Assets leased out under operating leases are included in property, plant and equipment in the statement of financial position. They are depreciated over their expected useful lives on a basis consistent with similar assets. Rental income is recognised in profit or loss on a straight line basis over the lease term.
(iii) Finance leases - lessee
Assets acquired under finance leases are accounted for at the present value of the minimum lease payments and depreciated over their estimated useful lives. A corresponding liability is recorded as outstanding lease obligations. Lease payments are apportioned between the liability and the finance charge so as to achieve a constant periodic rate of interest on the outstanding lease obligations. Leased assets are depreciated over the shorter of the useful life of the asset and the lease terms.
(iv) Operating leases - lessee
Payments made under operating leases (net of any incentives received from the lessor) are charged to the profit or loss on a straight-line basis over the period of the lease.
(h) Investment properties
Investment properties held to earn rentals or for capital appreciation or both and not occupied by the Group are measured initially at cost, including transaction costs. Subsequent to initial recognition, investment properties are carried at fair value representing open-market value determined annually by the directors or external valuers or with sufficient regularity to ensure that investment properties are always stated at fair value. Changes in fair values are included in profit or loss in the period in which they arise.
CIM FINANCIAL SERVICES LTD / ANNUAL REPORT 2019 81
Explanatory Notes30 SEPTEMBER 2019
2. ACCOUNTING POLICIES (CONT’D)
2.6 Significant accounting policies (Cont’d)
(h) Investment properties (Cont’d)
Investment properties are derecognised when they are disposed of or when the investment properties are permanently withdrawn from use and no future economic benefit is expected from its disposal. The difference between the net disposal proceeds and the carrying amount of the asset is recognised in profit or loss in the period of derecognition.
Transfers are made to (or from) investment property only when there is a change in use. For a transfer from investment property to owner-occupied property, the deemed cost for subsequent accounting is the fair value at the date of change in use. If owner-occupied property becomes an investment property, the Group accounts for such property in accordance with the policy stated under property, plant and equipment up to the date of change in use.
(i) Property, plant and equipment
Plant and equipment is stated at cost, net of accumulated depreciation and accumulated impairment losses, if any. Such cost includes the cost of replacing part of the property, plant and equipment and borrowing costs for long-term construction projects if the recognition criteria are met. When significant parts of the property, plant and equipment are required to be replaced at intervals, the Group recognises such parts as individual assets with specific useful lives and depreciation, respectively. Likewise, when a major inspection is performed, its cost is recognised in the carrying amount of the property, plant and equipment as a replacement if the recognition criteria are satisfied. All other repairs and maintenance costs are recognised in profit or loss as incurred.
An item of property, plant and equipment and any significant part initially recognised is derecognised upon disposal or when no future economic benefits are expected from its use or disposal. Any gain or loss arising on derecognition of the asset (calculated as the difference between the net disposal proceeds and the carrying amount of the asset) is included in profit or loss when the asset is derecognised.
Property, which consists of land and buildings held for use in the production or supply of goods or services or for administrative purposes, are stated in the statement of financial position at fair value less accumulated depreciation and impairment losses. Valuations of land and buildings are performed on a regular basis.
Increases in the carrying amount arising on revaluation of land and buildings are credited to other comprehensive income and shown as revaluation reserves in shareholder’s equity. Decreases that offset previous increases of the same amount are charged in other comprehensive income and debited against revaluation reserves in equity; all other decreases are charged to profit or loss.
An asset’s carrying amount is written down immediately to its recoverable amount if the asset’s carrying amount is greater than its estimated recoverable amount.
Gains and losses on disposal are determined by comparing the proceeds with the carrying amount and are recognised in profit or loss. When revalued assets are sold, the amounts previously included in revaluation reserves are transferred to retained earnings.
Depreciation on property, plant and equipment are calculated on the straight line method to write off the costs or revalued amounts of the assets to their residual values as follows:
Annual percentage (%)Buildings 2 – 4Improvement to buildings 15 – 100 Plant & equipment 15 – 25 Vehicles 15 – 25Items of plant and equipment costing less than MUR 30,000 are recognised as expense in profit or loss in the year of acquisition.
Land is not depreciated.
The assets’ residual values, useful lives and depreciation method are reviewed and adjusted prospectively, if appropriate, at the end of each reporting period.
CIM FINANCIAL SERVICES LTD / ANNUAL REPORT 201982

Explanatory Notes30 SEPTEMBER 2019
2. ACCOUNTING POLICIES (CONT’D)
2.6 Significant accounting policies (Cont’d)
(j) Intangible assets
Intangible assets acquired separately are measured on initial recognition at cost. The cost of intangible assets acquired in a business combination is their fair value at the date of acquisition. Following initial recognition, intangible assets are carried at cost less any accumulated amortisation and accumulated impairment losses. Internally generated intangibles, excluding capitalised development costs, are not capitalised and the related expenditure is reflected in profit or loss in the period in which the expenditure is incurred. The useful lives of intangible assets are assessed as either finite or indefinite.
Intangible assets with finite lives are amortised over the useful economic life and assessed for impairment whenever there is an indication that the intangible asset may be impaired. The amortisation period and the amortisation method for an intangible asset with a finite useful life are reviewed at least at the end of each reporting period. Changes in the expected useful life or the expected pattern of consumption of future economic benefits embodied in the asset are considered to modify the amortisation period or method, as appropriate, and are treated as changes in accounting estimates. The amortisation expense on intangible assets with finite lives is recognised in the statement of profit or loss.
The amortisation rates on computer software vary from 12% to 50% per annum. Leasehold right on property is amortised over the shorter of the economic life of the asset or the period of the lease.
Gains or losses arising from derecognition of an intangible asset are measured as the difference between the net disposal proceeds and the carrying amount of the asset and are recognised in the statement of profit or loss when the asset is derecognised.
(k) Current and deferred income tax
(i) Current Income Tax
Current income tax assets and liabilities are measured at the amount expected to be recovered from or paid to the taxation authorities. The tax rates and tax laws used to compute the amount are those that are enacted or substantively enacted at the reporting date in the countries where the Group operates and generates taxable income.
Current income tax relating to items recognised directly in equity is recognised in equity and not in profit or loss. Management periodically evaluates positions taken in the tax returns with respect to situations in which applicable tax regulations are subject to interpretation and establishes provisions where appropriate.
(ii) Deferred Income Tax
Deferred tax is provided in full, using the liability method, on temporary differences arising between the tax bases of assets and liabilities and their carrying amounts in the financial statements.
Deferred tax liabilities are recognised for all taxable temporary differences, except:
• Where the deferred tax liability arises from the initial recognition of goodwill or of an asset or liability in a transaction that is not a business combination and, at the time of the transaction, affects neither the accounting profit nor taxable profit or loss
• In respect of taxable temporary differences associated with investments in subsidiaries, where the timing of the reversal of the temporary differences can be controlled and it is probable that the temporary differences will not reverse in the foreseeable future.
The carrying amount of deferred tax assets is reviewed at each reporting date and reduced to the extent that it is no longer probable that sufficient taxable profit will be available to allow all or part of the deferred tax asset to be utilised. Unrecognised deferred tax assets are reassessed at each reporting date and are recognised to the extent that it becomes probable that future taxable profit will allow the deferred tax asset to be recovered.
Deferred tax assets and liabilities are measured at the tax rates that are expected to apply in the year when the asset is realised or the liability is settled, based on tax rates (and tax laws) that have been enacted or substantively enacted at the reporting date.
Current and deferred taxes are recognised as income tax benefits or expenses in profit or loss except for tax related to items recognised in equity or other comprehensive income which are recognised in correlation to the underlying transaction.
For the purpose of measuring deferred tax liabilities and deferred tax assets for investment properties that are measured using the fair value model, the carrying amounts of such properties are presumed to be recovered entirely through sale, unless the presumption is rebutted. The presumption is rebutted when the investment property is depreciable and is held within a business model whose objective is to consume substantially all of the economic benefits embodied in the investment property over time rather than through sale.
Deferred tax assets and deferred tax liabilities are offset if a legally enforceable right exists to set off current tax assets against current tax liabilities and the deferred taxes relate to the same taxable entity and the same taxation authority.
CIM FINANCIAL SERVICES LTD / ANNUAL REPORT 2019 83

Explanatory Notes30 SEPTEMBER 2019
2. ACCOUNTING POLICIES (CONT’D)
2.6 Significant accounting policies (Cont’d)
(k) Current and deferred income tax (Cont’d)
(iii) Corporate Social Responsibility (CSR) Tax
Entities in the Group are required to set up a Corporate Social Responsibility (CSR) Fund of 2.0 percent of its taxable profit of the preceding year. If the amount spent on CSR activities is less than the amount provided under the Fund, the difference is payable to the tax authorities as a tax (“CSR tax”). The CSR tax is included in income tax expense and the net amount of CSR fund payable is included in other liabilities in the statements of financial position.
(iv) Value Added Tax
Revenue, expenses and assets are recognised net of the amount of value added tax except:
• Where the value added tax incurred on a purchase of asset or service is not recoverable from the taxation authority, in which case, the value added tax is recognised as part of the cost of acquisition of the asset of as part of the expense item as applicable.
• Receivables and payables that are stated with the amount of value added tax included.
• The net amount of value added taxes recoverable from or payable to the taxation authority is included as part of receivable or payables in the statement of financial position.
(l) Impairment of non-financial assets
The Group assesses, at each reporting date, whether there is an indication that an asset may be impaired. If any indication exists, or when annual impairment testing for an asset is required, the Group estimates the asset’s recoverable amount.
An asset’s recoverable amount is the higher of an asset’s or CGU’s fair value less costs of disposal and its value in use. The recoverable amount is determined for an individual asset, unless the asset does not generate cash inflows that are largely independent of those from other assets or groups of assets. When the carrying amount of an asset or CGU exceeds its recoverable amount, the asset is considered impaired and is written down to its recoverable amount.
In assessing value in use, the estimated future cash flows are discounted to their present value using a pre-tax discount rate that reflects current market assessments of the time value of money and the risks specific to the asset. In determining fair value less costs of disposal, recent market transactions are taken into account. If no such transactions can be identified, an appropriate valuation model is used. These calculations are corroborated by valuation multiples, quoted share prices for publicly traded companies or other available fair value indicators as available.
The Group bases its impairment calculation on detailed budgets and forecast calculations, which are prepared separately for each of the Group’s CGUs to which the individual assets are allocated. These budgets and forecast calculations generally cover a period of five years. A long-term growth rate is calculated and applied to project future cash flows after the fifth year.
For assets excluding goodwill, an assessment is made at each reporting date to determine whether there is an indication that previously recognised impairment losses no longer exist or have decreased. If such indication exists, the Group estimates the asset’s or CGU’s recoverable amount. A previously recognised impairment loss is reversed only if there has been a change in the assumptions used to determine the asset’s recoverable amount since the last impairment loss was recognised. The reversal is limited so that the carrying amount of the asset does not exceed its recoverable amount, nor exceed the carrying amount that would have been determined, net of depreciation, had no impairment loss been recognised for the asset in prior years. Such reversal is recognised in the statement of profit or loss unless the asset is carried at a revalued amount, in which case, the reversal is treated as a revaluation increase.
CIM FINANCIAL SERVICES LTD / ANNUAL REPORT 201984

Explanatory Notes30 SEPTEMBER 2019
2. ACCOUNTING POLICIES (CONT’D)
2.6 Significant accounting policies (Cont’d)
(m) Post employment benefits
(i) State plan and defined contribution pension plans
A defined contribution plan is a pension plan under which the Group pays fixed contributions into a separate entity. The Group has no legal or constructive obligations to pay further contributions if the fund does not hold sufficient assets to pay all employees the benefits relating to employee service in the current and prior periods. Contributions to the National Pension Scheme and the Group’s defined contribution pension plan are expensed to profit or loss in the period in which they fall due.
(ii) Defined benefit pension plans and other retirement benefits
The following pension benefits are also in place:
• The Group contributes to a pension plan in respect of some employees who have a No Worse Off Guarantee (NWOG) that their benefits would not be worse than what they would have earned under a previous defined benefit plan.
• The Group recognises a net liability for employees whose benefits under the current pension plan are not expected to fully offset the retirement gratuity obligations under the Employment Rights Act 2008.
• The Group recognises a liability in respect of employees who are not members of any supplementary pension plan and are entitled to retirement gratuities under the Employment Rights Act 2008.
• The Group recognises a liability in respect of pensions paid out of the Group’s cash flow for some former employees.
A defined benefit plan is a pension plan that is not a defined contribution plan. Typically, defined benefit plans define an amount of pension benefit that an employee will receive on retirement usually dependent on one or more factors such as age, years of service and compensation.
The liability recognised in the statement of financial position in respect of defined benefit pension plans is the present value of the defined benefit obligation at the end of the reporting period less the fair value of plan assets. The defined benefit obligation is calculated annually by independent actuaries using the projected unit credit method.
Remeasurement of the net defined benefit liability, which comprises actuarial gains and losses arising from experience adjustments and changes in actuarial assumptions, the return on plan assets (excluding interest) and the effect of the asset ceiling (if any, excluding interest) is recognised immediately in other comprehensive income in the period in which they occur. Remeasurements recognised in other comprehensive income shall not be reclassified to profit or loss in the subsequent period.
The Group determines the net interest expense on the net defined benefit liability for the period by applying the discount rate used to measure the defined benefit obligation at the beginning of the annual period to the net defined benefit liability, taking into account any changes in the net defined liability during the period as a result of contributions and benefit payments. Net interest expense is recognised in profit or loss.
Service costs comprising current service cost, past service cost, as well as gains and losses on curtailments and settlements are recognised immediately in profit or loss.
For employees who are not covered or who are insufficiently covered by the current pension plan, the net present value of gratuity on retirement payable under the Employment Rights Act 2008 (as amended) is calculated by an actuary and provided for. The obligations arising under this item are not funded.
CIM FINANCIAL SERVICES LTD / ANNUAL REPORT 2019 85

Explanatory Notes30 SEPTEMBER 2019
2. ACCOUNTING POLICIES (CONT’D)
2.6 Significant accounting policies (Cont’d)
(m) Post employment benefits (Cont’d)
(iii) Gratuity on retirement
The net present value of gratuity on retirement payable under the Employment Rights Act 2008 (as amended) has been provided for in respect of those employees who are not covered or who are insufficiently covered by the above retirement benefit plan. The obligations arising under this item are not funded. The Employment Rights Act stipulates that the gratuity paid on retirement should be based on the remuneration (which is inclusive of payment for extra work, productivity bonus, attendance bonus, commission in return for services and any other regular payment) of the employee instead of the earnings. The amount due per year of service is 15 days remuneration based on a month of 26 days (15/26).
(n) Financial instruments - Initial recognition and subsequent measurement
(i) Date of recognition
Financial assets and liabilities, with the exception of deposits from customers and other borrowed funds, are initially recognised on the trade date, i.e. the date that the Group becomes a party to the contractual provisions of the instrument. Deposits from customers and other borrowed funds are recognised when funds reach the Group’s account.
(ii) Initial measurement of financial instruments
The classification of financial instruments at initial recognition depends on their contractual terms and the business model for managing the instruments. All financial instruments are measured initially at their fair value, except in the case of financial assets and financial liabilities recorded at FVTPL transaction costs are added to, or subtracted from, this amount. When the fair value of financial instruments at initial recognition differs from the transaction price, the Group accounts for the Day 1 profit or loss, as described below.
(iii) Day 1 profit or loss
When the transaction price differs from the fair value of other observable current market transactions in the same instrument, or based on a valuation technique with the variables including only data from observable markets, the Group immediately recognises the difference between the transaction price and fair value (a Day 1 profit or loss) in net trading income. In cases where fair value is determined using data which is not observable, the difference between the transaction price and model value is only recognised in profit or loss when the inputs become observable, or when the instrument is derecognised.
(iv) Measurement categories of financial assets and liabilities
As from 1 October 2018, the Company classifies all of its financial assets based on the business model for managing the assets and the asset’s contractual terms, measured at either:
• Amortised cost
• Fair value through other comprehensive income (FVTOCI);
• Fair value through profit or loss (FVTPL).
The Company does not hold any financial assets measured at FVTOCI. The measurement of amortised cost is explained in note (n)(v) and fair value through profit of loss is explained in note (n)(x).
Before 1 October 2018, the Company’s financial assets were classified as loans and receivables measured at amortised costs, financial assets at fair value through profit or loss and available for sale financial assets.
The Group’s financial liabilities were measured at amortised cost except for derivatives which are classified as financial assets at fair value through profit or loss.
CIM FINANCIAL SERVICES LTD / ANNUAL REPORT 201986

Explanatory Notes30 SEPTEMBER 2019
2. ACCOUNTING POLICIES (CONT’D)
2.6 Significant accounting policies (Cont’d)
(n) Financial instruments - Initial recognition and subsequent measurement (Cont’d)
(v) Due from banks, loans and advances and receivables
Before 1 October 2018, balances due from banks and loans, advances to customers and receivables consisted of non-derivative financial assets with fixed or determinable payments that are not quoted in an active market.
After initial measurement, amounts due from these financial assets are subsequently measured at amortised cost using the EIR methodology, less allowances for impairment. Amortised cost is calculated by taking into account any discount or premium on acquisition and fees and costs that are an integral part of EIR. Therefore, the Group recognises interest income using a rate of return that represents the best estimate of a constant rate of return over the expected behavioural life of the loan, hence, recognising the effect of potentially different interest rates charged at various stages, and other characteristics of the product life cycle (prepayments, penalty interest and charges).
If expectations are revised the adjustment is booked as a positive or negative adjustment to the carrying amount in the balance sheet with an increase or reduction in interest income. The adjustment is subsequently amortised through interest and similar income in profit or loss.
From 1 October 2018, the Company only measures amounts due from banks, loans and advances to customers, receivables and financial investments at amortised cost if both of the following conditions are met:
• The financial asset is held within a business model with the objective to hold financial assets in order to collect contractual cash flows.
• The contractual terms of the financial asset give rise on specified dates to cash flows that are solely payments of principal and interest (SPPI) on the principal amount outstanding.
(vi) Effective interest rate
The effective interest rate (EIR) is the rate that exactly discounts estimated future cash payments or receipts through the expected life of the financial instrument or, when appropriate a shorter period, to the net carrying amount of the financial asset or financial liability. The amortised cost of the financial asset or financial liability is adjusted if the Group revises its estimates of payments or receipts. The adjusted amortised cost is calculated based on the original or latest re-estimated EIR and the change is recorded as ‘interest income’ for financial assets and ‘interest expense’ for financial liabilities.
(vii) Business model assessment
An assessment of the objective of a business model in which an asset is held at a portfolio level is made because this best reflects the way the business is managed and information is provided to management. The information considered includes:
• the stated policies and objectives for the portfolio and the operation of those policies in practice. In particular, whether management’s strategy focuses on earning contractual interest revenue, maintaining a particular interest rate profile, matching the duration of the financial assets to the duration of the liabilities that are funding those assets or realising cash flows through the sale of the assets;
• how the performance of the portfolio is evaluated and reported to the management; the risks that affect the performance of the business model (and the financial assets held within that business model) and how those risks are managed;
• how managers of the business are compensated – e.g. whether compensation is based on the fair value of the assets managed or the contractual cash flows collected; and
• the frequency, volume and timing of sales in prior periods, the reasons for such sales and its expectations about future sales activity. However, information about sales activity is not considered in isolation, but as part of an overall assessment of how the stated objective for managing the financial assets is achieved and how cash flows are realised.
Financial assets that are held for trading or managed and whose performance is evaluated on a fair value basis are measured at FVTPL because they are neither held to collect contractual cash flows nor held both to collect contractual cash flows and to sell financial assets.
CIM FINANCIAL SERVICES LTD / ANNUAL REPORT 2019 87

Explanatory Notes30 SEPTEMBER 2019
2. ACCOUNTING POLICIES (CONT’D)
2.6 Significant accounting policies (Cont’d)
(n) Financial instruments - Initial recognition and subsequent measurement (Cont’d)
(viii) Solely Payments of Principal and Interest (SPPI) test
Assessment of whether contractual cash flows are solely payments of principal and interest.
For the purposes of this assessment, ‘principal’ is defined as the fair value of the financial asset on initial recognition. ‘Interest’ is defined as consideration for the time value of money and for the credit risk associated with the principal amount outstanding during a particular period of time and for other basic lending risks and costs (e.g. liquidity risk and administrative costs), as well as profit margin.
In assessing whether the contractual cash flows are solely payments of principal and interest, the Company considers the contractual terms of the instrument. This includes assessing whether the financial asset contains a contractual term that could change the timing or amount of contractual cash flows such that it would not meet this condition.
(ix) Available for sale investments – policy effective prior to 1 October 2018
Available for sale investments included equity securities. Equity investments classified as available for sale are those which are neither classified as held for trading nor designated at FVTPL.
After initial measurement, available for sale financial investments are subsequently measured at fair value. Unrealised gains and losses are recognised in other comprehensive income in equity. When the investment is disposed of, the cumulative gain or loss previously recognised in equity is recognised in profit or loss. Dividends earned whilst holding available for sale financial investments are recognised in profit or loss when the right of the payment has been established. The losses arising from impairment of such investments are recognised in profit or loss.
(x) Financial assets at fair value through profit or loss
Financial assets at fair value through profit or loss prior 1 October 2018 included financial assets held for trading and financial assets designated upon initial recognition at fair value through profit or loss. Financial assets are classified as held for trading if they are acquired for the purpose of selling or repurchasing in the near term. Derivatives, including separated embedded derivatives, are also classified as held for trading unless they are designated as effective hedging instruments as defined by IAS 39.
Subsequent to 1 October 2018, financial assets at fair value through profit or loss include financial assets held for trading, financial assets designated upon initial recognition at fair value through profit or loss, or financial assets mandatorily required to be measured at fair value. Financial assets are classified as held for trading if they are acquired for the purpose of selling or repurchasing in the near term. Derivatives, including separated embedded derivatives, are also classified as held for trading unless they are designated as effective hedging instruments. Financial assets with cash flows that are not solely payments of principal and interest are classified and measured at fair value through profit or loss, irrespective of the business model. Notwithstanding the criteria for debt instruments to be classified at amortised cost or at fair value through OCI, as described above, debt instruments may be designated at fair value through profit or loss on initial recognition if doing so eliminates, or significantly reduces, an accounting mismatch.
Financial assets at fair value through profit or loss are carried in the statement of financial position at fair value with net changes in fair value presented at other operating income in the statement of profit or loss. Derivatives are carried as financial assets when the fair value is positive and as financial liabilities when the fair value is negative.
(xi) Deposit from customers and other borrowed funds
Financial instruments issued by the Group that are not held for trading or designated at FVTPL are classified as liabilities as either deposit from customers or other borrowed funds, where the substance of the contractual arrangement results in the Group having an obligation either to deliver cash or another financial asset to the holder, or to satisfy the obligation other than by the exchange of a fixed amount of cash or another financial asset for a fixed number of own equity shares.
After initial measurement, deposit from customers and other borrowed funds are subsequently measured at amortised cost using the EIR. Amortised cost is calculated by taking into account any discount or premium on the issue and costs that are an integral part of the EIR.
Borrowing costs consist of interest and other costs that an entity incurs in connection with the borrowing of funds.
CIM FINANCIAL SERVICES LTD / ANNUAL REPORT 201988

Explanatory Notes30 SEPTEMBER 2019
2. ACCOUNTING POLICIES (CONT’D)
2.6 Significant accounting policies (Cont’d)
(o) Derecognition of financial assets and financial liabilities
(i) Financial assets
A financial asset (or, where applicable a part of a financial asset or part of a group of similar financial assets) is derecognised when the rights to receive cash flows from the asset have expired. The Group also derecognises the assets if it has both transferred the asset, and the transfer qualifies for derecognition. The Group has transferred the asset if, and only if, either it has transferred its contractual rights to receive cash flows from the asset or it retains the rights to the cash flow. It retains the rights to the cash flows, but has assumed an obligation to pay the received cash flows in full without material delay to a third party under a ‘pass–through’ arrangement.
Pass-through arrangements are transactions when the Group retains the contractual rights to receive the cash flows of a financial asset (the ‘original asset’), but assumes a contractual obligation to pay those cash flows to one or more entities (the ‘eventual recipients’), when all of the following three conditions are met:
• the Group has no obligation to pay amounts to the eventual recipients unless it has collected equivalent amounts from the original asset, excluding short-term advances by the entity with the right of full recovery of the amount lent plus accrued interest at market rates
• the Group cannot sell or pledge the original asset other than as security to the eventual recipients for the obligation to pay them cash flows
• the Group has to remit any cash flows it collects on behalf of the eventual recipients without material delay. In addition, the Group is not entitled to reinvest such cash flows, except for investments in cash or cash equivalents during the short settlement period from the collection date to the date of required remittance to the eventual recipients, and interest earned on such investments is passed to the eventual recipients.
A transfer only qualifies for derecognition if:
• the Group has transferred substantially all the risks and rewards of the asset
• the Group has neither transferred nor retained substantially all the risks and rewards of the asset, but has transferred control of the asset.
In relation to the above, the Group considers the control to be transferred if, and only if, the transferee has the practical ability to sell the asset in its entirety to an unrelated third party and is able to exercise that ability unilaterally and without needing to impose additional restrictions on the transfer.
When the Group has transferred its rights to receive cash flows from an asset or has entered into a pass–through arrangement, and has neither transferred nor retained substantially all of the risks and rewards of the asset nor transferred control of the asset, the asset is recognised to the extent of the Group’s continuing involvement in it. In that case, the Group also recognises an associated liability. The transferred asset and the associated liability are measured on a basis that reflects the rights and obligations that the Group has retained.
Continuing involvement that takes the form of a guarantee over the transferred asset is measured at the lower of the original carrying amount of the asset and the maximum amount of consideration that the Group could be required to repay.
The Group also derecognises a financial asset, in particular, a loan to customer when the terms and conditions have been renegotiated to the extent that it substantially became a new loan, with the difference, i.e. difference between the original loan’s carrying amount and the new loan’s carrying amount (present value), recognised as impairment in the profit or loss.
(ii) Financial Liabilities
A financial liability is derecognised when the obligation under the liability is discharged, cancelled or expires. Where an existing financial liability is replaced by another from the same lender on substantially different terms, or the terms of an existing liability are substantially modified, such an exchange or modification is treated as a derecognition of the original liability and the recognition of a new liability. The difference between the carrying value of the original financial liability and the consideration paid is recognised in profit or loss.
CIM FINANCIAL SERVICES LTD / ANNUAL REPORT 2019 89

Explanatory Notes30 SEPTEMBER 2019
2. ACCOUNTING POLICIES (CONT’D)
2.6 Significant accounting policies (Cont’d)
(p) Determination of fair value
In order to show how fair values have been derived, financial instruments are classified based on a hierarchy of valuation techniques, as summarised below:
Level 1 financial instruments − Those where the inputs used in the valuation are unadjusted quoted prices from active markets for identical assets or liabilities that the Group has access to at the measurement date. The Group considers markets as active only if there are sufficient trading activities with regards to the volume and liquidity of the identical assets or liabilities and when there are binding and exercisable price quotes available at the reporting date.
Level 2 financial instruments − Those where the inputs that are used for valuation and are significant are derived from directly or indirectly observable market data available over the entire period of the instrument’s life. Such inputs include quoted prices for similar assets or liabilities in active markets, quoted prices for identical instruments in inactive markets and observable inputs other than quoted prices such as interest rates and yield curves, implied volatilities, and credit spreads. In addition, adjustments may be required for the condition or location of the asset or the extent to which it relates to items that are comparable to the valued instrument. However, if such adjustments are based on unobservable inputs which are significant to the entire measurement, the Group will classify the instruments as Level 3.
Level 3 financial instruments − Those that include one or more unobservable inputs that are significant to the measurement as whole.
For assets and liabilities that are recognised in the financial statements at fair value on a recurring basis, the Group determines whether transfers have occurred between levels in the hierarchy by re-assessing categorisation (based on the lowest level input that is significant to the fair value measurement as a whole) at the end of each reporting period.
The Group’s management determines the policies and procedures for both recurring fair value measurement, such as investment properties, unquoted available for sale financial assets and derivatives, and for non-recurring measurement, such as assets acquired and liabilities assumed in a business combination.
External valuers are involved for valuation of significant assets, such as properties. Involvement of external valuers is determined annually by management. Selection criteria include market knowledge, reputation, independence and whether professional standards are maintained. Management decides, after discussions with the Group’s external valuers, which valuation techniques and inputs to use for each case.
At each reporting date, management analyses the movements in the values of assets and liabilities which are required to be remeasured or re-assessed according to the Group’s accounting policies. For this analysis, management verifies the major inputs applied in the latest valuation by agreeing the information in the valuation computation to contracts and other relevant documents. Management, in conjunction with the Group’s external valuers, also compares the change in the fair value of each asset and liability with relevant external sources to determine whether the change is reasonable.
CIM FINANCIAL SERVICES LTD / ANNUAL REPORT 201990

Explanatory Notes30 SEPTEMBER 2019
2. ACCOUNTING POLICIES (CONT’D)
2.6 Significant accounting policies (Cont’d)
(q) Impairment of financial assets (Policy applicable as from 1 October 2018)
(i) Overview of ECL principles
The adoption of IFRS 9 has fundamentally changed the Group’s loan loss impairment method by replacing IAS 39’s incurred loss approach with a forward-looking ECL approach. From October 1, 2018, the Company’s has been recording the allowance for expected credit losses for all loans and other debt financial assets not held at FVTPL, together with loan commitments and as well as lease receivables and hire purchase and other credit agreements, in this section all referred to as ‘financial instruments’. Equity instruments are not subject to impairment under IFRS 9.The ECL allowance is based on the credit losses expected to arise over the life of the asset (the lifetime expected credit loss or LTECL), unless there has been no significant increase in credit risk since origination, in which case the allowance is based on the 12 months’ expected credit loss (12mECL) as outlined in Note (q).(ii). The Company’s policies for determining if there has been a significant increase in credit risk are set out in Note 4.1(d).The 12mECL is the portion of LTECLs that represent the ECLs that result from default events on a financial instrument that are possible within the 12 months after the reporting date.Both LTECLs and 12mECLs are calculated on either an individual basis or a collective basis, depending on the nature of the underlying portfolio of financial instruments. The Company’s policy for grouping financial assets measured on a collective basis is explained in Note 4.1(d).The Group has established a policy to perform an assessment, at the end of each reporting period, of whether a financial instrument’s credit risk has increased significantly since initial recognition, by considering the change in the risk of default occurring over the remaining life of the financial instrument. This is further explained in Note 4.1(d).Based on the above process, the Company groups its loans into Stage 1, Stage 2, Stage 3 as described below:• Stage 1: When loans are first recognised, the Company recognises an allowance based on 12mECLs. Stage 1 loans
also include facilities where the credit risk has improved and the loan has been reclassified from Stage 2.• Stage 2: When a loan has shown a significant increase in credit risk since origination, the Company records an
allowance for the LTECLs. Stage 2 loans also include facilities where the credit risk has improved and the loan has been reclassified from Stage 3.
• Stage 3: Loans considered credit-impaired (as outlined in Note 4.1(d)). The Company records an allowance for the LTECLs.
(ii) The calculation of ECLsFor financial assets for which the Company has no reasonable expectations of recovering either the entire outstanding amount, or a proportion thereof, the gross carrying amount of the financial asset is reduced. This is considered a (partial) derecognition of the financial asset.Expected Credit losses are computed to measure the expected cash shortfalls, discounted at the original EIR. A cash shortfall is the difference between the cash flows that are due to an entity in accordance with the contract and the cash flows that the entity expects to receive.The mechanics of the ECL calculations are outlined below and the key elements are as follows:PD The Probability of Default is an estimate of the likelihood of default over a given time horizon. A default may
only happen at a certain time over the assessed period, if the facility has not been previously derecognised and is still in the portfolio. The concept of PDs is further explained in Note 4.1(d).
EAD The Exposure at Default is an estimate of the exposure at a future default date, taking into account expected changes in the exposure after the reporting date, including repayments of principal and interest, whether scheduled by contract or otherwise, expected drawdowns on committed facilities, and accrued interest from missed payments. The EAD is further explained in Note 4.1(d).
LGD The Loss Given Default is an estimate of the loss arising in the case where a default occurs at a given time. It is based on the difference between the contractual cash flows due and those that the lender would expect to receive, including from the realisation of any collateral. It is usually expressed as a percentage of the EAD. The LGD is further explained in Note 4.1(d).
Expected Credit losses are computed as unbiased, probability weighted amounts which are determined by evaluating a range of reasonably possible outcomes, the time value of money, and considering all reasonable and supportable information including that which is forward-looking. It also incorporates how defaulted loans are expected to be recovered, including the probability that the loans will cure and the value of collateral or the amount that might be received for selling the asset.The Group considered various methodologies including pooling, statistical, structural and reduced form. Taking into consideration, the large quantum of data, statistical regression model has been adopted for determining how the characteristic of an obligor affect its estimated PD. It also allow the analysis of macro-economic variable on the PD.The maximum period for which the credit losses are determined is the contractual life of a financial instrument unless the Company has the legal right to call it earlier.
CIM FINANCIAL SERVICES LTD / ANNUAL REPORT 2019 91

Explanatory Notes30 SEPTEMBER 2019
2. ACCOUNTING POLICIES (CONT’D)
2.6 Significant accounting policies (Cont’d)
(q) Impairment of financial assets (Policy applicable as from October 1, 2018) (cont’d)
(ii) The calculation of ECLs (cont’d)
Impairment losses and releases are accounted for and disclosed separately from modification losses or gains that are accounted for as an adjustment of the financial asset’s gross carrying value.
Provisions for ECLs for undrawn lease commitments are assessed as having been included within lease receivable. The calculation of ECLs (including the ECLs related to the undrawn element) of revolving facilities is explained in Note 2.3 (q)(iii).
The mechanics of the ECL method are summarised below:
Stage 1 The 12mECL is calculated as the portion of LTECLs that represent the ECLs that result from default events on a financial instrument that are possible within the 12 months after the reporting date. The Company calculates the 12mECL allowance based on the expectation of a default occurring in the 12 months following the reporting date. These expected 12-month default probabilities are applied to a forecast EAD and multiplied by the expected LGD and discounted by an approximation to the original EIR. This calculation is made for each of the four scenarios, as explained above.
Stage 2 When a loan has shown a significant increase in credit risk since origination, the Group records an allowance for the LTECLs. The mechanics are similar to those explained above, including the use of multiple scenarios, but PDs and LGDs are estimated over the lifetime of the instrument. The expected cash shortfalls are discounted by an approximation to the original EIR.
Stage 3 For loans considered credit-impaired (as defined in Note 4.1(d)), the Group recognises the lifetime expected credit losses for these loans. The method is similar to that for Stage 2 assets, with the PD set at 100%.
Undrawn commitments When estimating LTECLs for undrawn commitments, the Group estimates the expected portion of the commitment that will be drawn down over its expected life. The ECL is then based on the present value of the expected shortfalls in cash flows if the facility is drawn down. The expected cash shortfalls are discounted at an approximation to the expected EIR on the loan.
(iii) Credit card and other revolving facilities
For factoring debtors and credit card facilities that include both a loan and an undrawn commitment component, the Group measures ECL over a period longer than the maximum contractual period if the Group’s contractual ability to demand repayment and cancel the undrawn commitment does not limit the Group’s exposure to credit losses to the contractual notice period. These facilities do not have a fixed term or repayment structure and are managed on a collective basis. The Group can cancel them with immediate effect but this contractual right is not enforced in the normal day-to-day management, but only when the Group becomes aware of an increase in credit risk at the facility level. This longer period is estimated taking into account the credit risk management actions that the Company expects to take and that serve to mitigate ECL. These include a reduction in limits, cancellation of the facility and/or turning the outstanding balance into a loan with fixed repayment terms. For revolving facilities that include both a loan and an undrawn commitment, ECLs are calculated and presented together with the loan.
(iv) Forward looking information
In its ECL models, the Company relies on a broad range of forward looking information as economic inputs, such as:
• GDP growth
• Inflation rates
The inputs and models used for calculating ECLs may not always capture all characteristics of the market at the date of the financial statements. To reflect this, qualitative adjustments or overlays are occasionally made as temporary adjustments when such differences are significantly material. Detailed information about these inputs are provided in Note 3(a).
(v) Collateral valuation
The Group seeks to use collateral, where possible, to mitigate its risks on financial assets. The collateral comes in various forms such as cash, securities, guarantees, real estate, receivables, other non-financial assets and credit enhancements such as netting agreements. The fair value of collateral is generally assessed, at a minimum, at inception and when the Company determines there is a requirement to do so.
To the extent possible, the Group uses active market data for valuing financial assets held as collateral. Other financial assets which do not have readily determinable market values are valued using models. Non-financial collateral, such as real estate, is valued based on data provided by independent surveyors.
CIM FINANCIAL SERVICES LTD / ANNUAL REPORT 201992

Explanatory Notes30 SEPTEMBER 2019
2. ACCOUNTING POLICIES (CONT’D)
2.6 Significant accounting policies (Cont’d)
(q) Impairment of financial assets (Policy applicable as from 1 October 2018) (cont’d)
(vi) Write-offs
The Company’s accounting policy under IFRS 9 remains the same as it was under IAS 39. Financial assets are written off either partially or in their entirety only when the Company has stopped pursuing the recovery. If the amount to be written off is greater than the accumulated loss allowance, the difference is first treated as an addition to the allowance that is then applied against the gross carrying amount. Any subsequent recoveries are credited to credit loss expense.
(r) Impairment of financial assets (Policy applicable before 1 October 2018)
The Group assesses at each reporting date whether there is any objective evidence that a financial asset or a group of financial assets is impaired. A financial asset, or a group of financial assets, is deemed to be impaired if, and only if, there is objective evidence of impairment as a result of one or more events that have occurred after the initial recognition of the asset (an incurred loss event) and that loss event (or events) has an impact on the estimated future cash flows of the financial asset or the group of financial assets that can be reliably estimated.
Evidence of impairment may include: indications that the borrower or a group of borrowers is experiencing significant financial difficulty; the probability that they will enter bankruptcy or other financial reorganisation; default or delinquency in interest or principal payments; and where observable data indicates that there is a measurable decrease in the estimated future cash flows, such as changes in arrears or economic conditions that correlate with defaults.
For financial assets carried at amortised cost, the Group first assesses whether impairment exists individually for financial assets that are individually significant, or collectively for financial assets that are not individually significant.
If the Group determines that no objective evidence of impairment exists for an individually assessed financial asset, whether significant or not, it includes the asset in a group of financial assets with similar credit risk characteristics and collectively assesses them for impairment. Assets that are individually assessed for impairment and for which an impairment loss is, or continues to be, recognised are not included in a collective assessment of impairment.
The amount of any impairment loss identified is measured as the difference between the asset’s carrying amount and the present value of estimated future cash flows (excluding future expected credit losses that have not yet been incurred). The present value of the estimated future cash flows is discounted at the financial asset’s original EIR.
The carrying amount of the asset is reduced through the use of an allowance account and the loss is recognised in the statement of profit or loss. Interest income (recorded as finance income in the statement of profit or loss) continues to be accrued on the reduced carrying amount using the rate of interest used to discount the future cash flows for the purpose of measuring the impairment loss. Loans, together with the associated allowance, are written off when there is no realistic prospect of future recovery and all collateral has been realised or has been transferred to the Group. If, in a subsequent year, the amount of the estimated impairment loss increases or decreases because of an event occurring after the impairment was recognised, the previously recognised impairment loss is increased or reduced by adjusting the allowance account. If a write-off is later recovered, the recovery is credited to profit or loss.
The Group’s impairment loss provision is established to recognise incurred impairment losses either on specific assets or within a portfolio of financial assets. Individually impaired financial assets are those against which individual impairment provisions have been raised. Portfolio impairment provision covers the inherent losses in the portfolio that exist at the reporting date, but have not been individually identified.
(ii) Available for sale investments
For available for sale financial investments, the Group assesses at each reporting date whether there is objective evidence that an investment is impaired.
In the case of equity investments classified as available for sale, objective evidence would include a significant or prolonged decline in the fair value of the investment below its cost. ‘Significant’ is evaluated against the original cost of the investment and ‘prolonged’ against the period in which the fair value has been below its original cost. When there is evidence of impairment, the cumulative loss – measured as the difference between the acquisition cost and the current fair value, less any impairment loss on that investment previously recognised in profit or loss – is removed from other comprehensive income and recognised in the statement of profit or loss. Impairment losses on equity investments are not reversed through profit or loss; increases in their fair value after impairment are recognised in other comprehensive income.
The determination of what is ‘significant’ or ‘prolonged’ requires judgement. In making this judgement, the Group evaluates, among other factors, the duration or extent to which the fair value of an investment is less than its cost.
CIM FINANCIAL SERVICES LTD / ANNUAL REPORT 2019 93

Explanatory Notes30 SEPTEMBER 2019
2. ACCOUNTING POLICIES (CONT’D)
2.6 Significant accounting policies (Cont’d)
(s) Offsetting of financial instruments
Financial assets and financial liabilities are offset and the net amount is reported in the statement of financial position if there is a currently enforceable legal right to offset the recognised amounts and there is an intention to settle on a net basis, to realise the assets and settle the liabilities simultaneously.
(t) Cash and cash equivalents
For the purpose of the statement of cash flows, cash and cash equivalents include cash in hand and at bank, deposits held at call with banks, other short-term highly liquid investments with original maturities of three months or less, bank overdrafts and loans at call. Cash and cash equivalents were classified as loans and receivables under IAS 39 and as financial asset at amortised cost under IFRS 9.
Bank overdrafts are shown within borrowings in the statement of financial position and loans at call are included in other assets when receivable and in other liabilities when payable.
(u) Stated capital
Ordinary shares are classified as equity. Incremental costs directly attributable to the issue of new shares or options are shown in equity as deduction, net of taxes, from proceeds. Where any Company purchases its equity share capital (treasury shares), the consideration paid, including any directly attributable incremental costs (net of income taxes) is deducted from equity attributable to the Group’s equity holders until the shares are cancelled or reissued. When such shares are subsequently reissued, any net consideration received is included in equity attributable to the Company’s equity holders.
(v) Segment reporting
Segment information presented relates to operating segments that engage in business activities for which revenues are earned and expenses incurred.
(w) Dividend distribution
Dividend distribution to the Group’s shareholders is recognised as a liability in the financial statements and deducted from equity in the period in which the dividends are declared.
(x) Biological assets
Consumable biological assets are stated at their fair value less costs to sell and relates to livestock.
(y) Non-current assets and disposal group held for sale or distribution and discontinued operations
The Group classifies non-current assets and disposal groups as held for sale or distribution if their carrying amounts will be recovered principally through a sale transaction rather than through continuing use or the Group is committed to distribute the asset or disposal group to the shareholders. Non-current assets and disposal groups classified as held for sale or distribution are measured at the lower of their carrying amount and fair value less costs to sell. Costs to sell are the incremental costs directly attributable to the disposal of an asset (disposal group), excluding finance costs and income tax expense.
The criteria for held for sale classification is regarded as met only when the sale is highly probable and the asset or disposal group is available for immediate sale in its present condition. In order to be classified as held for distribution, the asset or disposal group must be available for immediate distribution in its present condition and the distribution must be highly probable. Actions required to complete the sale or distribution should indicate that it is unlikely that significant changes to the sale or distribution will be made or that the decision to sell or distribute will be withdrawn. Management must be committed to the plan to sell or distribute the asset and the sale expected to be completed within one year from the date of the classification.
Property, plant and equipment and intangible assets are not depreciated or amortised once classified as held for sale.
Assets and liabilities classified as held for sale are presented separately as current items in the statement of financial position.
A disposal group qualifies as a discontinued operation if it is a component of an entity that either has been disposed of, or is classified as held for sale or distribution, and:
• Represents a separate major line of business or geographical area of operations
• Is part of a single co-ordinated plan to dispose of a separate major line of business or geographical area of operations; or
• Is a subsidiary acquired exclusively with a view to resale.
Discontinued operations are excluded from the results of continuing operations and are presented as a single amount as profit or loss after tax from discontinued operations in the statement of profit or loss.
CIM FINANCIAL SERVICES LTD / ANNUAL REPORT 201994

Explanatory Notes30 SEPTEMBER 2019
3. SIGNIFICANT ACCOUNTING ESTIMATES AND JUDGEMENTSThe preparation of the Group’s financial statements requires management to make judgements, estimates and assumptions that affect the reported amounts of revenues, expenses, assets and liabilities, and the accompanying disclosures, and the disclosure of contingent liabilities. Uncertainty about these assumptions and estimates could result in outcomes that require a material adjustment to the carrying amount of assets or liabilities affected in future periods.
In the process of applying the Group’s accounting policies, management has made the following judgements and assumptions concerning the future and other key sources of estimation uncertainty at the reporting date, that have a significant risk of causing a material adjustment to the carrying amounts of assets and liabilities within the next financial year. Existing circumstances and assumptions about future developments may change due to circumstances beyond the Group’s control and are reflected in the assumptions if and when they occur.
Items with the most significant effect on the amounts recognised in the financial statements with substantial management judgement and/or estimates are collated below:
Going concern
The Group’s management has made an assessment of its ability to continue as a going concern and is satisfied that it has the resources to continue in business for the foreseeable future. Furthermore, management is not aware of any material uncertainties that may cast significant doubt on the Group’s ability to continue as a going concern. Therefore, the financial statements continue to be prepared on the going concern basis.
Fair value estimation
The fair value of financial instruments is the price that would be received to sell an asset or paid to transfer a liability in an orderly transaction in the principal (or most advantageous) market at the measurement date under current market conditions (i.e. an exit price) regardless of whether that price is directly observable or estimated using another valuation technique. When the fair values of financial assets and financial liabilities recorded in the statement of financial position cannot be derived from active markets, they are determined using a variety of valuation techniques that include the use of valuation models. The inputs to these models are taken from observable markets where possible, but where this is not feasible, estimation is required in establishing fair values.
Impairment of non-financial assets
Assets are considered for impairment if there is a reason to believe that impairment may be necessary. Future cash flows expected to be generated by an asset or cash-generating assets are projected, taking into account market conditions and the expected useful lives of the assets. The present value of these cash flows, determined using an appropriate discount rate, is compared to the current net asset value and, if lower, the assets are impaired to the present value. The impairment loss is first allocated to goodwill and then to the other assets of a cash-generating unit.
Impairment losses on loans and advances, and leases and other credit agreements
Policy applicable from 1 October 2018
The measurement of impairment losses under IFRS 9 across all categories of financial assets requires judgement, in particular, the estimation of the amount and timing of future cash flows and collateral values when determining impairment losses and the assessment of a significant increase in credit risk. These estimates are driven by a number of factors, changes in which can result in different levels of allowances.
The Group’s ECL calculations are outputs of complex models with a number of underlying assumptions regarding the choice of variable inputs and their interdependencies. Elements of the ECL models that are considered accounting judgements and estimates include:
• The Company’s criteria for assessing if there has been a significant increase in credit risk and so allowances for financial assets should be measured on a LTECL basis and the qualitative assessment
• The segmentation of financial assets when their ECL is assessed on a collective basis
• Development of ECL models, including the various formulas and the choice of inputs
• Determination of associations between macroeconomic scenarios and economic inputs, such as GDP, inflation rate and collateral values, and the effect on PDs, EADs and LGDs
• Selection of forward-looking macroeconomic scenarios and their probability weightings, to derive the economic inputs into the ECL models.
It has been the Group’s policy to regularly review its models in the context of actual loss experience and adjust when necessary.
Impairment losses on financial assets is explained in Note 4.1(d).
CIM FINANCIAL SERVICES LTD / ANNUAL REPORT 2019 95

Explanatory Notes30 SEPTEMBER 2019
3. SIGNIFICANT ACCOUNTING ESTIMATES AND JUDGEMENTS (CONT’D)
Impairment losses on loans and advances, and leases and other credit agreements (Cont’d)
Policy applicable before 1 October 2018
The Company’s impairment methodology for assets carried at amortised cost results in the recording of provisions for impairment is as follows:
• Specific impairment by reviewing individually significant or specifically identified exposures at each reporting date to assess whether an impairment loss should be recorded in profit or loss.
• Collective impairment for individually not significant exposures and incurred but not yet identified losses (IBNI) assumptions. All assumptions are reviewed at each reporting date.
All categories include an element of management’s judgement, in particular for the estimation of the amount and timing of future cash flows and collaterals values when determining impairment losses. These estimates are driven by a number of factors, the changing of which can result in different levels of allowances. Additionally, judgements around the inputs and calibration of the collective and IBNI models include the criteria for the identification of smaller homogenous portfolios, the effect of concentrations of risks and economic data (including the repayment trends, collateral values and the performance of different individual groups, bankruptcy trends) and for determination of the emergence period. The methodology and assumptions are reviewed regularly in the context of actual loss experienced.
Valuation of properties
The Group carries its investment properties at fair value, with changes in fair value being recognised in profit or loss. In addition, it measures land and buildings at revalued amounts with changes in fair value being recognised in Other Comprehensive Income. The Group engaged independent valuation specialists to determine fair value. The valuers used depreciated replacement cost approach for buildings and the sales comparison approach for land.
The key assumptions used to determine the fair value are further explained in Notes 22 and 23.
Pension Benefits
The cost of the defined benefit pension plan and other post-employment medical benefits and the present value of the pension obligation are determined using actuarial valuations. An actuarial valuation involves making various assumptions that may differ from actual developments in the future. These include the determination of the discount rate, future salary increases, mortality rates and future pension increases. Due to the complexities involved in the valuation and its long-term nature, a defined benefit obligation is highly sensitive to changes in these.
Deferred tax assets
Deferred tax assets are recognised in respect of deductible temporary differences to the extent that it is probable that future taxable profit will be available which these temporary differences can be utilised. Judgement is required to determine the amount of deferred tax assets that can be recognised, based on the likely timing and level of future taxable profits, together with future tax-planning strategies.
The investment properties consisting of land and buildings are held within a business model whose objective is to consume substantially all of the economic benefits embodied in the building over time through rental, rather than through sale. The presumption that the Group will recover the carrying amount of the investment properties entirely through sale is rebutted for the buildings which are depreciable. Accordingly deferred tax has been provided for on the fair value gain arising on the building. However, since the land is not depreciable, the recovery through sale would not be rebutted for the land. No deferred tax has been recognised on the land as there is no capital gains tax imposed on sale of land.
Asset lives and residual values
Property, plant and equipment are depreciated over their useful lives taking into account residual values, where appropriate. The actual lives of the assets and residual values are assessed annually and may vary depending on a number of factors. In reassessing asset lives, factors such as technological innovation, product life cycles and maintenance programmes are taken into account. Residual value assessments consider issues such as future market conditions, the remaining life of the asset and projected disposal values. Consideration is also given to the extent of current profits and losses on the disposal of similar assets.
Classification of lease
The extent to which risks and rewards incidental to ownership of a leased asset lie with the lessor or the lessee determined the classification of the lease. A lease is classified as an operating lease if it does not transfer substantially all the risks and rewards incidental to ownership. The major considerations that the Company takes into account in determining the classification of a lease as a finance lease include the transfer of ownership to the lessee at the end of the lease, the option to purchase the asset at a price significantly lower than the fair value, the present value of minimum lease payment is almost the fair value of the leased asset, and the lease term covers the major part of the economic life of the asset.
The Group distinguishes other credit agreements from finance lease based on the nature of the underlying asset being financed, the terms of the financing arrangements, and the timing of transfer of title of the assets.
CIM FINANCIAL SERVICES LTD / ANNUAL REPORT 201996

Explanatory Notes30 SEPTEMBER 2019
4. FINANCIAL RISK MANAGEMENTWhilst risk is inherent in normal activities, it is managed through an integrated risk management framework, including ongoing identification, measurement and monitoring, subject to risk limits and other controls. This process of risk management is critical to the Group’s continuing profitability and each individual within the Group is accountable for the risk exposures relating to his or her responsibilities. The Group is exposed to credit risk, liquidity risk and market risk, the latter being subdivided into trading and non–trading risks. It is also subject to country risk and various operating and business risks.
The Group’s risk management policies are designed to identify and analyse these risks, to set appropriate risk limits and control, and to monitor the risks and adherence to limits by means of reliable and up-to-date administrative and information systems.
The Group regularly reviews its risk management policies and systems to reflect changes in markets, products and emerging best practice. The Board recognises the critical importance of having efficient and effective risk management policies and systems in place. To this end, there is a clear organisational structure with delegated authorities and responsibilities from the Board to Board Committees, executives and senior management. Individual responsibility and accountability are designed to deliver a disciplined, conservative and constructive culture of risk management and control.
A description of the significant financial risk factors is given below together with the risk management policies applicable.
4.1 Financial risk factors
The Group’s activities expose it to a variety of financial risks, which consist of market risk, credit risk and liquidity risk. Market risk includes foreign currency risk, interest rate risk and equity price risk.
The Group’s overall risk management programme focuses on the unpredictability of financial markets and seeks to minimise potential adverse effects on the financial performance of the Group. The Group covers to the extent possible exposures through certain hedging operations. Written principles have been established throughout the Group for overall risk management, as well as written policies covering specific areas, such as foreign exchange risk, interest rate risk, credit risk and investing excess liquidity.
(a) Foreign exchange risk
The Group operates internationally and is exposed to foreign exchange risk arising from various currency exposures primarily with respect to certain major currencies. Entities in the Group use forward contracts to mitigate their exposure to foreign currency risk. Each subsidiary is responsible for managing the net position in each currency by using the relevant strategy, under advice from the Group’s Treasury.
The Group holds foreign currency forwards and swaps. Swaps are contractual agreements between two parties to exchange streams of payments over time based on specified notional amounts, in relation to movements in a specified underlying index.
CIM FINANCIAL SERVICES LTD / ANNUAL REPORT 2019 97

Explanatory Notes30 SEPTEMBER 2019
4 FINANCIAL RISK MANAGEMENT (CONT’D)
4.1 Financial risk factors (cont’d)
(a) Foreign exchange risk (Cont’d)
The currency profile of the Group’s and the Company’s financial assets and financial liabilities is set out below:
Equivalent in MUR m Equivalent in MUR mGROUP COMPANY
EURO USDMUR & others Total EURO USD MUR Total
30 September 2019Financial assetsCash and bank balances 38.3 28.5 377.7 444.5 - 5.0 7.6 12.6 Deposits with banks - - 507.0 507.0 - - - - Net investment in leases and
other credit agreements 32.0 8.7 8,728.4 8,769.1 - - - - Loans and advances 1.1 4.2 3,703.4 3,708.7 - - 2,991.9 2,991.9 Investments in financial
assets - - 8.9 8.9 - - 0.8 0.8 Other assets - 3.6 393.0 396.6 - - 200.4 200.4
71.4 45.0 13,718.4 13,834.8 - 5.0 3,200.7 3,205.7 Financial liabilitiesDeposits from customers - - - - - - - - Other borrowed funds 8.7 0.8 9,085.3 9,094.8 - - 1,203.3 1,203.3 Other liabilities 7.8 15.7 1,233.0 1,256.5 - - 3.8 3.8
16.5 16.5 10,318.3 10,351.3 - - 1,207.1 1,207.1 Net exposure 54.9 28.5 3,400.1 3,483.5 - 5.0 1,993.6 1,998.6
30 September 2018Financial assetsCash and bank balances 7.5 140.6 378.0 526.1 - 104.8 3.1 107.9 Deposits with banks 32.0 524.5 469.5 1,026.0 - 524.5 - 524.5 Net investment in leases and
other credit agreements 35.2 8.9 7,593.6 7,637.7 - - - - Loans and advances - 2.0 2,863.6 2,865.6 - - 1,105.5 1,105.5 Investments in financial
assets - 1,589.7 9.2 1,598.9 - 1,589.7 1.2 1,590.9 Other assets - 167.9 437.6 605.5 - - 373.0 373.0
74.7 2,433.6 11,751.5 14,259.8 - 2,219.0 1,482.8 3,701.8 Financial liabilitiesDeposits from customers - - 3,426.6 3,426.6 - - - - Other borrowed funds 30.2 9.5 5,910.1 5,949.8 - - 1,396.9 1,396.9 Other liabilities 54.0 50.1 1,116.5 1,220.6 - 20.0 111.1 131.1
84.2 59.6 10,453.2 10,597.0 - 20.0 1,508.0 1,528.0 Net exposure (9.5) 2,374.0 1,298.3 3,662.8 - 2,199.0 (25.2) 2,173.8
Other assets and other liabilities includes foreign currency derivatives
MUR and others consists of financial assets and liabilities denominated in the functional currency of the respective entities of the Group
CIM FINANCIAL SERVICES LTD / ANNUAL REPORT 201998

Explanatory Notes30 SEPTEMBER 2019
4. FINANCIAL RISK MANAGEMENT (CONT’D)
4.1 Financial risk factors (cont’d)
(a) Foreign exchange risk (cont’d)
The sensitivity of the profit before tax with regards to the Group’s financial assets and liabilities and the USD to Mauritian Rupee and EURO to Mauritian Rupee exchange rate is shown below.
If Mauritian Rupee had weakened/strengthened by 3% against USD and EURO respectively, the financial impact would be as follows:
GROUP COMPANYSep-19 Sep-18 Sep-19 Sep-18
MUR m MUR m MUR m MUR mEffect on profit before tax 2.5 70.9 0.2 66.0
(b) Interest rate risk
Interest rate risk arises from the possibility that changes in interest rates will affect future cash flows or fair value of financial instruments.The Group’s exposure to interest rate risk relates primarily to its borrowings and lendings with floating interest rates.
The Group mitigates its interest rate risk by having a mixed portfolio of fixed and variable interest bearing lendings and borrowings. For a significant part of the existing interest bearing assets and liabilities, the Group’s income and operating cash flows are mostly independent of changes in market interest rates as the interest rates on leases and other credit agreements, loans and advances, and deposits from customers are mostly fixed.
For those lendings and borrowings with floating interest rates, the Group ensures that the losses that may be created or reduced following interest margins change are not significant by setting limits on the level of mismatch in interest rate repricing that may be undertaken.
The sensitivity of the profit before tax to a reasonably possible change in interest rate of + or - 50 basis points (2018: +/- 50 basis points), with all other variables held constant is shown below. The sensitivity has been based on the net exposure of financial assets and liabilities at the reporting date. These changes are considered to be reasonably possible based on observations of current market conditions.
GROUP COMPANYSep-19 Sep-18 Sep-19 Sep-18
MUR m MUR m MUR m MUR mEffect on profit before tax and equity 2.5 14.7 1.4 5.8
(c) Equity price risk
Equity price risk is the risk that the fair value of equity securities fluctuates as a result of the changes in the prices of those securities. The Group is not exposed to significant equity price risks as it does not have any significant equity financial assets.
(d) Credit risk
Credit risk is defined as the potential that a borrower or counterparty will fail to meet its obligations in accordance with agreed terms. Credit risk in the Group arises mainly from various forms of lending from all its core activities covering all the credit portfolios; credit facilities, money lending, credit cards, factoring, and leasing as well as deposits and balances held with banks. The effective management of credit risk is a critical component of risk management and essential to the long-term success of the organisation. The Risk Management Committee has oversight of the management of the credit risk framework.
The objective of the Group’s credit risk management framework is to ensure all material credit risks to which the organisation is exposed are identified, measured, managed, monitored, mitigated and reported on a consistent basis.
This requires careful consideration of proposed extensions of credit, the setting of specific limits, monitoring during the life of the exposure, active use of credit mitigation tools and a disciplined approach to recognising credit impairment. The Group’s credit processes are designed with the aim of combining an appropriate level of authority in its credit approval processes with timely and responsible decision-making and customer services. Within the powers to act granted by the Board of Directors, credits are approved by decision making authorities at different levels in the organisation depending on the riskiness and the credit exposure of the customer.
The Group’s credit risk management framework incorporates governing principles that are defined in a series of credit-related policies and standards, which are further applied to more specific operating procedures.
CIM FINANCIAL SERVICES LTD / ANNUAL REPORT 2019 99

Explanatory Notes30 SEPTEMBER 2019
4. FINANCIAL RISK MANAGEMENT (CONT’D)
4.1 Financial risk factors (cont’d)
(d) Credit risk (cont’d)
The Group’s policies and procedures include the setting of limits on the amount of risk it is willing to accept for individual counterparties and industry concentrations, by monitoring exposures in relation to such limits. The Group maintains a credit risk grading to categorise exposures according to their risk of default. Large credit risk exposures are subject to regular monitoring through the Debtors Monitoring Committee on a monthly basis for closer attention and action to be taken, when appropriate.
The Group has no significant concentration of credit risk, with exposure spread over a large number of customers and counterparties. The proportion of leases of the Group contracted with Corporates is 59% and 41% are with individuals.
Leases and other credit agreements granted are also effectively secured as the rights to the leased assets revert to the lessor in the event of default. The majority of the assets financed under lease are motor vehicles with the remaining being various types of equipment. The period normally varies between 3 to 7 years for leases and between 1 to 4 years for other credit agreements; and the interest is principally at fixed rates.
The Group also makes the calculations of credit impairment in accordance with the guidelines of the Bank of Mauritius and where the amounts calculated are in excess of the ECL, the difference is recognised as an appropriation of retained earnings to general risk reserve.
Impairment assessment (Policy applicable from 1 October 2018)
Definition of default and cure
The Group considers default of a financial asset for the purpose of determining expected credit losses, that is credit impaired assets classified in stage 3, when:
• Instalments of principal and/or interest are due from an obligor and remain unpaid for 90 days or more; and/or
• The Group considers that the obligor is ‘unlikely to pay’ its credit obligations in full, without recourse to actions such as realising security (if held).
The indicators for unlikeliness to pay include the following:
i. The Group puts the credit obligation on non-accrual status.
ii. The Group makes account-specific provision resulting from a significant perceived decline in credit quality subsequent to the Group granting the credit facility.
iii. The Group sells other credit obligations from the same counterparty at a material credit-related economic loss.
iv. The Group consents to a distressed restructuring of the credit obligation where this is likely to result in a diminished financial obligation caused by the material forgiveness, or postponement, of principal, interest or, where relevant.
v. The Group has filed for the debtor’s bankruptcy or a similar order in respect of the obligor’s credit obligation to the Group.
vi. The debtor has sought or has been placed in bankruptcy or similar protection where this would avoid or delay repayment of the credit obligation to the financial institution.
For financial assets within stage 2, these can only be transferred to stage 1 when they are no longer considered to have experienced a significant increase in credit risk. Where a significant increase in credit risk was determined using quantitative measures, the instruments will automatically transfer back to stage 1 when the criteria are no longer met. Where instruments were transferred to stage 2 due to assessment of qualitative factors, the issues that led to the reclassification must be cured before the instruments can be reclassified to stage 1.
It is the Group’s policy to consider a financial instrument as ‘cured’ and therefore re-classified out of Stage 3 when none of the default criteria have been present for at least six consecutive months. The decision whether to classify an asset as Stage 2 or Stage 1 once cured depends on the updated credit grade, at the time of the cure, and whether this indicates there has been a significant increase in credit risk compared to initial recognition.
The calculation of the Expected Credit Losses
Expected Credit losses are computed as probability weighted amounts which are determined by evaluating a range of reasonably possible outcomes, the time value of money, and considering the reasonable and supportable information including that which is forward-looking. The Group made use of logistic regression techniques to determined the PD, LGD and EAD where adequate default data was available.
CIM FINANCIAL SERVICES LTD / ANNUAL REPORT 2019100

Explanatory Notes30 SEPTEMBER 2019
4. FINANCIAL RISK MANAGEMENT (CONT’D)
4.1 Financial risk factors (cont’d)
(d) Credit risk (cont’d)
Impairment assessment (Policy applicable from 1 October 2018) (Cont’d)
The calculation of the Expected Credit Losses (Cont’d)
The period over which cash flows are determined is generally limited to the maximum contractual period for which the Group is exposed to credit risk, with the exception of credit cards - the maximum period for which the credit losses are determined is the contractual life of a financial instrument unless the Group has the legal right to call it earlier. These expected cash flows are discounted using the effective interest rate on the financial instruments.
ECL for financial assets classified under stage 3 is measured at the individual obligor level except for individually insignificant facilities with similar risk characteristics which are grouped together and the ECL is determined based on history of losses.
Probability of Default The probability of default (PD) refers to the likelihood that a borrower will default over a particular time horizon. The PD of an obligor is a fundamental risk parameter in credit risk analysis and depends on obligor specific characteristics as well as on macroeconomic risk factors. The Group has adopted the IFRS 9 macroeconomic sensitive model for PD computation, which is based on following set of assumptions:
Assumption Description
Default observationAn obligor is assumed to enter default state in any month wherein it
crosses 90 days past due. Any observation following such default has been excluded
Macro-sensitive PD PD is assumed to be sensitive to changes in macroeconomic conditions
PD term structure
The PD term structure is computed for a period of next 5 years and considered constant above this horizon. The basis for the assumption is validated by the convergence of macroeconomic forecasts post the 5 year period
There are two levels of PD relevant for ECL calculation:
12-month PD – This represents the estimated probability of default occurring within the next 12 months from the reporting date
Lifetime PDs – This represents the estimated probability of a default occurring over the remaining life of the financial instrument and may be further broken down into marginal probabilities for smaller time periods within the remaining life.
The PD models were derived using logistic regression. As part of the modelling phase, the variables having the most significant predictive default power were identified using the information value statistics. Variables were shortlisted based on their significance in predictive default and possible combinations were assessed using multifactor analysis to achieve the best-fit model. The performance of the final models was assessed to test the fit of the estimated PD curves against the historical default rate.
Loss Given Default
By definition, loss given default refers to the magnitude of the likely loss on a given facility in the event of default. It takes into account the loss of principal, interest foregone and workout expenses.
CIM has derived estimates of LGD for Stage 1 and Stage 2 exposures using the Cured LGD methodology for its credit facilities as adequate historical information was available. The LGD methodology takes into consideration recoveries through insurance covers and value of collaterals. The models were derived using logistic regression and yielded to statistically significant estimates. Where historical data was insufficient for modelling, Basel estimates of loss given default for unsecured exposures were applied.
Exposure at Default
The exposure at default (EAD) refers to the gross carrying amount of the financial instruments in the event of obligor default. For Stage 1 exposures, the EAD is derived based on possible default events within 12 months. For Stage 2 exposures, the exposure at default is considered for events over the lifetime of the instruments.
The EAD framework adopted by the Company considers two separate methods dependent on the underlying financial asset; the current exposure method for deposit with banks, leases, hire purchase and other credit agreements, and loan and advances except for revolving facilities such as factoring debtors and off-balance sheet items where the credit conversion factor approach is used. Under the current exposure method, the expected outstanding exposure is derived from the expected future cash flows as the best estimate of EAD. The credit conversion factor method takes into account the sum of the actual outstanding exposure and expected drawdown until default as the best estimate of EAD.
CIM FINANCIAL SERVICES LTD / ANNUAL REPORT 2019 101

Explanatory Notes30 SEPTEMBER 2019
4. FINANCIAL RISK MANAGEMENT (CONT’D)
4.1 Financial risk factors (cont’d)
(d) Credit risk (cont’d)
Impairment assessment (Policy applicable from 1 October 2018) (Cont’d)
Forward looking information
Forward-looking economic assumptions are incorporated into ECL models. The Company has taken into account GDP growth rate forecasts when deriving the expected credit losses. This variable was significant in the models that were built. The GDP forecasts are constantly updated with new estimates and are sourced from reputed local and international organisations.
Credit qualityFor stage classification, the Group utilises a combination of quantitative and qualitative factors to determine whether the credit risk of a borrower has increased significantly since initial recognition.
Exposures are considered to have resulted in a significant increase in credit risk and are moved to stage 2 when:
On a quantitative basis, the days past due (dpd) indicator is employed and exposures above 30 dpd are classified under Stage 2.
On a qualitative basis, accounts show signs of deteriorating early warning indicators (such as default on covenants), macroeconomic factors and external market information where relevant.
The Group maintains a credit risk rating based on the days past due and the obligor is categorised as follows:
Risk rating Description
Performing None of the facilities of the obligor have been due for more than 30 days
Watchlist Any one of the facilities granted to the obligor has been in arrears for more than 30 days but is not considered to be credit-impaired
Non-performingAny one of the facilities granted to the obligor has been in arrears for
more than 90 days or the obligor is unlikely to pay its credit obligations in full, without recourse to actions such as realising security.
Write-offs
Financial assets are written off either partially or in their entirety only when there is no reasonable expectation of recovery such as the death or liquidation of a debtor. If the amount to be written off is greater than the accumulated loss allowance, the difference is first treated as an addition to the allowance that is then applied against the gross carrying amount. It constitutes a derecognition event. Any subsequent recoveries are credited to the credit loss expense.
Modified loansSometimes the Group makes concessions or modifications to the original terms of loans as a response to the borrower’s financial difficulties, rather than taking possession or to otherwise enforce disposal/repossession of collateral. Indicators of financial difficulties include default on covenants, bankruptcy, or significant concerns raised. Once the terms have been renegotiated, any impairment is measured using the original interest rates as calculated before the modification of terms.
These accounts are classified as high risk and derecognition decisions and classifications between stage 2 and stage 3 are determined on a case-by-case basis. If the accounts were impaired, they will be closely monitored until it is collected or written off. And if the accounts were classified in the underperforming category, the Group will reassess whether there has been a significant increase in credit risk.
Once an account has been classified as forborne, it will remain forborne for a minimum probation period of 6 months. In order for the accounts to be reclassified out of the forborne category, the customer has to meet all of the following criteria:
• All of its facilities has to be considered performing;
• The minimum probation of period of 6 months has passed; and
• Regular payments have been made in accordance with the terms and conditions agreed
If modifications are substantial either quantitatively or qualitatively, the loan is derecognised as explained under write offs.
CIM FINANCIAL SERVICES LTD / ANNUAL REPORT 2019102

Explanatory Notes30 SEPTEMBER 2019
4. FINANCIAL RISK MANAGEMENT (CONT’D)
4.1 Financial risk factors (cont’d)
(d) Credit risk (cont’d)
Impairment assessment (Policy applicable from 1 October 2018) (Cont’d)
Grouping financial assets measured on a collective basis
The Group calculates ECL on a collective basis for all assets classified under stage 1 and stage 2.
The Group combines these exposures into smaller homogeneous portfolios, based on a combination of internal and external characteristics of the facilities which are described below.
The Group considers the customer type for grouping of the portfolio which are grouped under Corporate customers or individuals.
For individual lendings which include retail leasing, credit facilities, hire purchase and other credit agreements, and card customers, the groupings are as follows:
• Product type
• Age band
• Salary band
For corporate lendings which include factoring, corporate leasing, and corporate loans, the grouping are as follows:
• Product type
• Industry sector
CIM FINANCIAL SERVICES LTD / ANNUAL REPORT 2019 103

Explanatory Notes30 SEPTEMBER 2019
4. FINANCIAL RISK MANAGEMENT (CONT’D)
4.1 Financial risk factors (cont’d)
(d) Credit risk (Cont’d)
Maximum exposure to credit risk
The maximum exposure to credit risk at the reporting date equals the carrying amount of the respective financial assets and is as follows:
GROUP COMPANYSep-19 Sep-18 Sep-19 Sep-18
MUR m MUR m MUR m MUR mBank balances and cash 444.5 526.1 12.6 107.9 Deposits with banks 507.0 1,026.0 - 524.5 Net investment in leases and other credit agreements 8,769.1 7,637.7 - - Loans and advances 3,708.7 2,865.6 2,991.9 1,105.5 Investments in financial assets 8.1 1,597.7 - 1,597.7 Other assets 376.6 605.5 200.4 373.0
13,814.0 14,258.6 3,204.9 3,708.6
The Group held collaterals on finance lease which include heavy equipments, vehicles and other equipments. The fair value of collaterals of impaired lease facilities is estimated at MUR 95.1m (2018: MUR 159m).
The Group may recover amounts not settled by the debtors from the customers for factoring facilities with recourse while the non-recourse factoring facilities are insured. Other credit agreements and loans with exposure of MUR 7,407m (2018: MUR6,641m) are mitigated by insurance covers which are directly linked to the facilities and entered at the same time of the credit origination. Other credit agreements also contain the right for the Group to recover the collateral which the Company estimated not to be significant at recovery. Other credit agreements also contain the exposure in respect of credit cards is not backed by collaterals.
(e) Liquidity risk
Liquidity risk is the risk that the Group will encounter difficulty in meeting obligations associated with financial liabilities that are settled by delivering cash or another financial asset. Liquidity risk arises because of the possibility that the Group might be unable to meet its payment obligations when they fall due as a result of mismatches in the timing of the cash flows under both normal and stress circumstances. Such scenarios could occur when funding needed for illiquid asset positions is not available to the Group on acceptable terms. To limit this risk, management has arranged for diversified funding sources including deposits from customers and keeping committed credit facilities with banks. The Group also maintains a certain level of cash and deposits with banks to cater for its liquidity needs.
CIM FINANCIAL SERVICES LTD / ANNUAL REPORT 2019104

Explanatory Notes30 SEPTEMBER 2019
4. FINANCIAL RISK MANAGEMENT (CONT’D)
4.1 Financial risk factors (cont’d)
(e) Liquidity risk (Cont’d)
Contractual maturities of undiscounted cash flows of financial assets and liabilities
GROUP
Up to 1 year 1 to 5 years Over 5 years Total30 September 2019 MUR m MUR m MUR m MUR mAssetsCash and bank balances 444.5 - - 444.5 Deposits with banks 19.1 528.8 - 547.9 Net investment in leases and other credit agreements 5,164.2 5,226.6 135.5 10,526.3 Loans and advances 2,259.7 2,406.8 35.2 4,701.7 Investments in financial assets - 8.1 - 8.1 Other assets 376.6 - - 376.6 Total assets 8,264.1 8,170.3 170.7 16,605.1
LiabilitiesDeposits from customers - - - - Other borrowed funds 4,841.9 4,578.2 - 9,420.1 Other liabilities 1,256.5 - - 1,256.5 Total liabilities 6,098.4 4,578.2 - 10,676.6 Net liquidity gap 2,165.7 3,592.1 170.7 5,928.5
GROUP
Up to 1 year 1 to 5 years Over 5 years Total30 September 2018 MUR m MUR m MUR m MUR mAssetsCash and bank balances 526.1 - - 526.1 Deposits with banks 548.4 489.1 57.3 1,094.8 Net investment in leases and other credit agreements 4,875.3 4,104.3 85.1 9,064.7 Loans and advances 1,790.2 1,748.0 42.0 3,580.2 Investments in financial assets 1,598.2 - 1.2 1,599.4 Other assets 605.5 - - 605.5 Total assets 9,943.7 6,341.4 185.6 16,470.7
LiabilitiesDeposits from customers 1,308.8 2,750.5 - 4,059.3 Other borrowed funds 5,052.8 999.7 - 6,052.5 Other liabilities 1,220.6 - - 1,220.6 Total liabilities 7,582.2 3,750.2 - 11,332.4 Net liquidity gap 2,361.5 2,591.2 185.6 5,138.3
CIM FINANCIAL SERVICES LTD / ANNUAL REPORT 2019 105

Explanatory Notes30 SEPTEMBER 2019
4. FINANCIAL RISK MANAGEMENT (CONT’D)
4.1 Financial risk factors (cont’d)
(e) Liquidity risk (Cont’d)
Contractual maturities of undiscounted cash flows of financial assets and liabilities (Cont’d)
COMPANY
Up to 1 year 1 to 5 years Over 5 years Total30 September 2019 MUR m MUR m MUR m MUR mAssetsCash and bank balances 12.6 - - 12.6 Deposits with banks - - - - Loans and advances 2,813.2 182.3 - 2,995.5 Investments in financial assets - - - - Other assets 200.4 - - 200.4 Total assets 3,026.2 182.3 - 3,208.5
LiabilitiesOther borrowed funds 1,213.5 - - 1,213.5 Other liabilities 3.8 - - 3.8 Total liabilities 1,217.3 - - 1,217.3 Net liquidity gap 1,808.9 182.3 - 1,991.2
COMPANY
Up to 1 year 1 to 5 years Over 5 years Total30 September 2018 MUR m MUR m MUR m MUR mAssetsCash and bank balances 107.9 - - 107.9 Deposits with banks 527.9 - - 527.9 Loans and advances 1,046.7 96.7 - 1,143.4 Investments in financial assets 1,589.7 - 1.2 1,590.9 Other assets 373.0 - - 373.0 Total assets 3,645.2 96.7 1.2 3,743.1
LiabilitiesOther borrowed funds 1,407.6 - - 1,407.6 Other liabilities 131.1 - - 131.1 Total liabilities 1,538.7 - - 1,538.7 Net liquidity gap 2,106.5 96.7 1.2 2,204.4
CIM FINANCIAL SERVICES LTD / ANNUAL REPORT 2019106

Explanatory Notes30 SEPTEMBER 2019
4. FINANCIAL RISK MANAGEMENT (CONT’D)
4.2 Capital management
The primary objective of the Group’s and the Company’s capital management is to maximise shareholders’ value. The Company aims at distributing an adequate dividend whilst ensuring that sufficient resources are maintained to continue as a going concern and for expansion.
The Group and the Company manage their capital structure and make adjustments in the light of changes in economic conditions and the requirements of the financial covenants. To maintain or adjust the capital structure, the Group may adjust the dividend payment to shareholders, return capital to shareholders or issue new shares.
The ratio of net debt to equity is used to monitor capital and the ratio is kept at a reasonable level. For the purpose of capital management, net debt includes deposits from customers and other borrowed funds net of cash and bank balances. Equity consists of stated capital, retained earnings and other reserves.
There were no changes in the Company’s approach to capital risk management during the year.
GROUP COMPANYSep-19 Sep-18 Sep-19 Sep-18
MUR m MUR m MUR m MUR mDebt (note 27 and 28) 9,094.8 9,376.4 1,203.3 1,396.9 Less: Bank balances & cash (note 13) (444.5) (526.1) (12.6) (107.9)
8,650.3 8,850.3 1,190.7 1,289.0
Equity 4,175.5 6,326.5 3,099.0 4,680.5
Net debt/equity ratio 2.1 1.4 0.4 0.3
One of the Group’s subsidiaries has to comply with the capital requirements set by the Bank of Mauritius, which include maintaining a minimum capital requirement of MUR 200m and minimum capital adequacy ratio of 10%. The capital requirements were met by the subsidiary.
5. NET INTEREST INCOME(a) Interest income GROUP COMPANY
Sep-19 Sep-18 Sep-19 Sep-18MUR m MUR m MUR m MUR m
Interest income using EIR methodCredit facilities 391.7 249.5 - - Corporate credit facilities 13.5 21.8 87.8 96.1 Credit Cards 78.6 87.2 - - Factoring 16.0 13.5 - - Placements with financial institutions 50.0 82.7 - 25.7
549.8 454.7 87.8 121.8 Other interest incomeFinance leases 210.1 184.2 - - Other credit agreements 682.7 550.3 - - Debt at FVTPL - - 30.8 18.3
892.8 734.5 30.8 18.3
1,442.6 1,189.2 118.6 140.1
(b) Interest expense GROUP COMPANYSep-19 Sep-18 Sep-19 Sep-18
MUR m MUR m MUR m MUR mBank overdrafts 1.6 1.8 - - Bank loans and other loans 386.6 354.7 32.7 83.9 Other finance costs - 24.8 6.6 24.8
388.2 381.3 39.3 108.7 Net interest income 1,054.4 807.9 79.3 31.4
CIM FINANCIAL SERVICES LTD / ANNUAL REPORT 2019 107
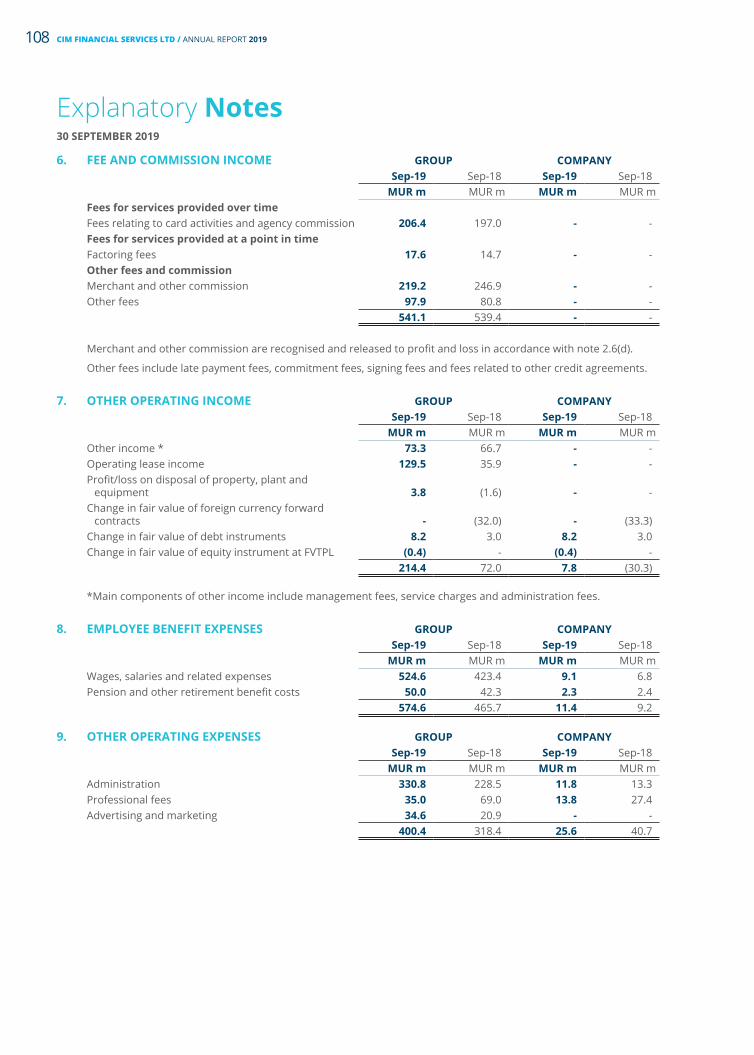
Explanatory Notes30 SEPTEMBER 2019
6. FEE AND COMMISSION INCOME GROUP COMPANYSep-19 Sep-18 Sep-19 Sep-18
MUR m MUR m MUR m MUR mFees for services provided over timeFees relating to card activities and agency commission 206.4 197.0 - - Fees for services provided at a point in time Factoring fees 17.6 14.7 - - Other fees and commissionMerchant and other commission 219.2 246.9 - - Other fees 97.9 80.8 - -
541.1 539.4 - -
Merchant and other commission are recognised and released to profit and loss in accordance with note 2.6(d).
Other fees include late payment fees, commitment fees, signing fees and fees related to other credit agreements.
7. OTHER OPERATING INCOME GROUP COMPANYSep-19 Sep-18 Sep-19 Sep-18
MUR m MUR m MUR m MUR mOther income * 73.3 66.7 - - Operating lease income 129.5 35.9 - - Profit/loss on disposal of property, plant and
equipment 3.8 (1.6) - - Change in fair value of foreign currency forward
contracts - (32.0) - (33.3)Change in fair value of debt instruments 8.2 3.0 8.2 3.0 Change in fair value of equity instrument at FVTPL (0.4) - (0.4) -
214.4 72.0 7.8 (30.3)
*Main components of other income include management fees, service charges and administration fees.
8. EMPLOYEE BENEFIT EXPENSES GROUP COMPANYSep-19 Sep-18 Sep-19 Sep-18
MUR m MUR m MUR m MUR mWages, salaries and related expenses 524.6 423.4 9.1 6.8 Pension and other retirement benefit costs 50.0 42.3 2.3 2.4
574.6 465.7 11.4 9.2
9. OTHER OPERATING EXPENSES GROUP COMPANYSep-19 Sep-18 Sep-19 Sep-18
MUR m MUR m MUR m MUR mAdministration 330.8 228.5 11.8 13.3 Professional fees 35.0 69.0 13.8 27.4 Advertising and marketing 34.6 20.9 - -
400.4 318.4 25.6 40.7
CIM FINANCIAL SERVICES LTD / ANNUAL REPORT 2019108

Explanatory Notes30 SEPTEMBER 2019
10. ALLOWANCE FOR CREDIT IMPAIRMENT GROUP COMPANYSep-19 Sep-18 Sep-19 Sep-18
MUR m MUR m MUR m MUR mNet provision for credit impairment - Leases (6.2) (1.5) - - - Other credit agreements 124.6 153.5 - - Loans and advances- Credit facilities 54.5 52.2 - - - Corporate credit facilities 11.1 - 6.4 - - Factoring receivables 1.7 - - - - Card receivables 13.9 14.8 - - Others- Deposit (0.7) - (0.7) - - Others 0.7 - 0.1 - Bad debts recovered- Leases (0.6) (0.2) - - - Other credit agreements (12.9) (3.0) - - - Loans and advances (5.2) (1.5) - -
180.9 214.3 5.8 -
11. TAXATION GROUP COMPANYSep-19 Sep-18 Sep-19 Sep-18
(a) Income tax expense/(credit) MUR m MUR m MUR m MUR mCurrent income tax at 15% (2018:15%) 44.6 82.5 2.7 - Corporate Social Responsibility tax at 2% (2018 : 2%) 5.6 11.1 - - (Under)/over provision in previous year (1.1) 1.7 - - Deferred tax (credit) / expense 37.1 (22.6) - - Income tax expense 86.2 72.7 2.7 -
The tax charge shown in profit or loss differs from the tax charge that would apply if all profits had been charged at the Company’s statutory rate. A reconciliation between the tax expense and the accounting profit at 17% is as follows:
CIM FINANCIAL SERVICES LTD / ANNUAL REPORT 2019 109
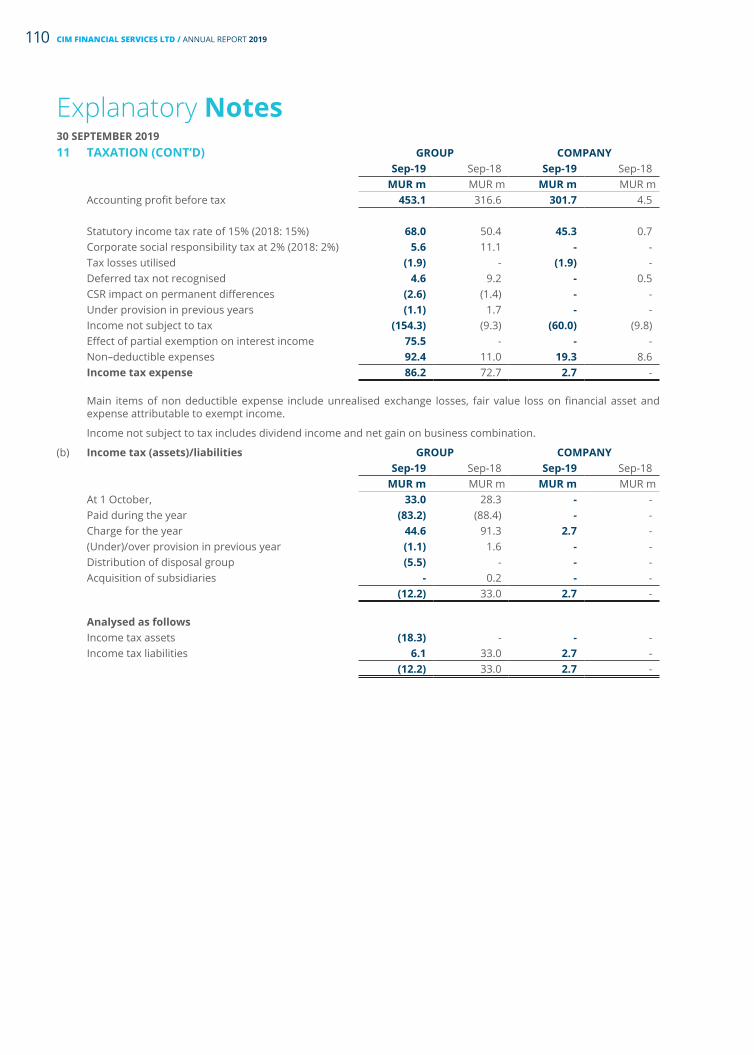
Explanatory Notes30 SEPTEMBER 201911 TAXATION (CONT’D) GROUP COMPANY
Sep-19 Sep-18 Sep-19 Sep-18MUR m MUR m MUR m MUR m
Accounting profit before tax 453.1 316.6 301.7 4.5
Statutory income tax rate of 15% (2018: 15%) 68.0 50.4 45.3 0.7 Corporate social responsibility tax at 2% (2018: 2%) 5.6 11.1 - - Tax losses utilised (1.9) - (1.9) - Deferred tax not recognised 4.6 9.2 - 0.5 CSR impact on permanent differences (2.6) (1.4) - - Under provision in previous years (1.1) 1.7 - - Income not subject to tax (154.3) (9.3) (60.0) (9.8)Effect of partial exemption on interest income 75.5 - - - Non–deductible expenses 92.4 11.0 19.3 8.6 Income tax expense 86.2 72.7 2.7 -
Main items of non deductible expense include unrealised exchange losses, fair value loss on financial asset and expense attributable to exempt income.
Income not subject to tax includes dividend income and net gain on business combination.
(b) Income tax (assets)/liabilities GROUP COMPANYSep-19 Sep-18 Sep-19 Sep-18
MUR m MUR m MUR m MUR mAt 1 October, 33.0 28.3 - - Paid during the year (83.2) (88.4) - - Charge for the year 44.6 91.3 2.7 - (Under)/over provision in previous year (1.1) 1.6 - - Distribution of disposal group (5.5) - - - Acquisition of subsidiaries - 0.2 - -
(12.2) 33.0 2.7 -
Analysed as followsIncome tax assets (18.3) - - - Income tax liabilities 6.1 33.0 2.7 -
(12.2) 33.0 2.7 -
CIM FINANCIAL SERVICES LTD / ANNUAL REPORT 2019110

Explanatory Notes30 SEPTEMBER 2019
12. OTHER COMPREHENSIVE INCOMETranslation
ReserveRevaluation
ReserveActuarial
Reserve TotalMUR m MUR m MUR m MUR m
GROUPYear ended 30 September 2019Items that will not be reclassified to profit or lossRemeasurement of post employment benefit (note 25) - - (9.7) (9.7)Deferred tax on remeasurement of post employment
benefit( note 26) - - 0.5 0.5 - - (9.2) (9.2)
Items that may be reclassified subsequently to profit or lossExchange difference on translation of foreign entities (1.6) - - (1.6)Movement in reserves of associates ( note 21(a)) 6.7 - - 6.7
5.1 - - 5.1 Other comprehensive income for the year, net of
tax 5.1 - (9.2) (4.1)
Translation Reserve
Revaluation Reserve
Actuarial Reserve Total
MUR m MUR m MUR m MUR mGROUPYear ended 30 September 2018Items that will not be reclassified to profit or lossGain on revaluation of land and buildings - 8.0 - 8.0 Deferred tax on gain on revaluation of land and
buildings - - - - Remeasurement of post employment benefit (note 25) - - (13.2) (13.2)Deferred tax on remeasurement of post employment
benefit - - (3.1) (3.1) - 8.0 (16.3) (8.3)
Items that may be reclassified subsequently to profit or lossExchange difference on translation of foreign entities (0.3) - - (0.3)Movement in reserves of associates (0.9) - - (0.9)
(1.2) - - (1.2)Other comprehensive income for the year, net of
tax (1.2) 8.0 (16.3) (9.5)
CIM FINANCIAL SERVICES LTD / ANNUAL REPORT 2019 111

Explanatory Notes30 SEPTEMBER 2019
12. OTHER COMPREHENSIVE INCOME (CONT’D)Actuarial
ReserveCOMPANY MUR mYear ended 30 September 2019Items that will not be reclassified to profit or lossRemeasurement of post employment benefit (note 25) (0.3)
(0.3)Year ended 30 September 2018Items that may be reclassified subsequently to profit or lossRemeasurement of post employment benefit (note 25) (4.5)
(4.5)
Translation reserve
The translation reserve comprises all foreign currency differences arising from the translation of the financial statements.
Actuarial reserve
The actuarial reserve represents the cumulative remeasurement of defined benefit obligation recognised.
13. CASH AND CASH EQUIVALENTS GROUP COMPANYSep-19 Sep-18 Sep-19 Sep-18
MUR m MUR m MUR m MUR mCash and bank balances 444.5 526.1 12.6 107.9 Loans at call receivable (note 18) - - 112.5 161.0 Bank overdrafts (note 28) (16.5) (203.4) - - Cash and cash equivalents 428.0 322.7 125.1 268.9
The bank overdrafts are secured by floating charges on the assets of the borrowing companies.
The rate of interest varies between 4.90 % and 6.95% (2018: 5.05% and 6.95%).
14. DEPOSITS WITH BANKS GROUP COMPANYSep-19 Sep-18 Sep-19 Sep-18
MUR m MUR m MUR m MUR m
Deposit with banks 507.6 1,026.0 - 524.5 Expected credit loss (0.6) - - -
507.0 1,026.0 - 524.5
The deposit with banks are analysed as follows:
Current 9.0 530.0 - 524.5 Non current 498.0 496.0 - -
507.0 1,026.0 - 524.5
GROUP COMPANYGross
carrying amount ECL
Gross carrying amount ECL
Stage1 Stage1 Stage1 Stage1MUR m MUR m MUR m MUR m
At 1 October 2018 1,026.0 1.3 524.5 0.7 Additions 6.1 - - - Repayments (524.5) (0.7) (524.5) (0.7)At 30 September 2019 507.6 0.6 - -
The above deposits carry interest rates ranging between 3.65% and 4.30% and have maturity dates ranging from January 2019 to June 2023. All the deposits are performing and classified under stage 1.
CIM FINANCIAL SERVICES LTD / ANNUAL REPORT 2019112

Explanatory Notes30 SEPTEMBER 2019
15. NET INVESTMENT IN LEASES AND OTHER CREDIT AGREEMENTS
GROUPFinance
leasesOther credit agreements Total
MUR m MUR m MUR m30 September 2019Gross investmentWithin one year 1,293.1 3,915.4 5,208.5 After one year and before five years 2,375.1 2,885.9 5,261.0 After five years 136.2 - 136.2
3,804.4 6,801.3 10,605.7 Unearned future finance income (503.8) (859.7) (1,363.5)
3,300.6 5,941.6 9,242.2 Expected credit loss/allowance for credit impairment (119.3) (353.8) (473.1)
3,181.3 5,587.8 8,769.1
Present value of minimum lease payments analysed as followsWithin one year 1,076.0 3,359.8 4,435.8 After one year and before five years 2,095.6 2,581.8 4,677.4 After five years 129.00 - 129.0
3,300.6 5,941.6 9,242.2
Net investment in leases
Credit quality
The table below shows the credit quality and the maximum exposure to credit risk based on the Group’s internal credit rating system and year end stage classification. The amounts presented are gross of impairment allowances. Details of the Group’s internal grading system and policies on whether ECL allowances are calculated on an individual or collective basis are set out in Note 4.1 (d).
2019Stage 1 Stage 2 Stage 3 TOTALMUR m MUR m MUR m MUR m
Performing 2,887.0 - - 2,887.0 Watchlist - 238.2 - 238.2 Non-performing - - 175.4 175.4
2,887.0 238.2 175.4 3,300.6
Gross carrying amountAn analysis of changes in the gross carrying amount and the corresponding ECL allowances in relation to finance
leases is as follows:2019
Stage 1 Stage 2 Stage 3 TOTALMUR m MUR m MUR m MUR m
At 1 October 2018 2,684.3 227.1 243.5 3,154.9New assets originated or purchased 1,219.5 74.7 5.8 1,300.0 Assets derecognised or repaid (excluding write offs) (974.2) (87.8) (88.3) (1,150.3)Transfers to Stage 1 92.5 (70.6) (21.9) - Transfers to Stage 2 (104.8) 110.8 (6.0) - Transfers to Stage 3 (30.3) (16.0) 46.3 - Amounts written off - - (4.0) (4.0) At 30 September 2019 2,887.0 238.2 175.4 3,300.6
CIM FINANCIAL SERVICES LTD / ANNUAL REPORT 2019 113

Explanatory Notes30 SEPTEMBER 2019
15. NET INVESTMENT IN LEASES AND OTHER CREDIT AGREEMENTS (CONT’D)Expected credit loss
2019GROUP Stage 1 Stage 2 Stage 3 TOTAL
MUR m MUR m MUR m MUR mAt 1 October 2018 21.0 2.4 106.1 129.5 New assets originated or purchased 9.2 2.3 7.0 18.5 Assets derecognised or repaid (excluding write offs) (8.2) (1.4) (26.2) (35.8)Transfers to Stage 1 5.5 (1.1) (4.4) - Transfers to Stage 2 (0.7) 1.8 (1.1) - Transfers to Stage 3 (0.3) (0.2) 0.5 - Transferred between stages (4.5) (0.5) 16.1 11.1 Amounts written off - - (4.0) (4.0)At 30 September 2019 22.0 3.3 94.0 119.3
Other credit agreements
The table below shows the credit quality and the maximum exposure to credit risk based on the Group’s internal credit rating system and year end stage classification. The amounts presented are gross of impairment allowances. Details of the Group’ s internal grading system and policies on whether ECL allowances are calculated on an individual or collective basis are set out in Note 4.1 (d).
2019Stage 1 Stage 2 Stage 3 TOTALMUR m MUR m MUR m MUR m
Performing 4,680.3 - - 4,680.3 Watchlist - 617.9 - 617.9 Non-performing - - 643.4 643.4
4,680.3 617.9 643.4 5,941.6
Gross carrying amount
An analysis of changes in the gross carrying amount and the corresponding ECL allowances in relation to finance leases and other credit agreements is as follows:
2019Stage 1 Stage 2 Stage 3 TOTALMUR m MUR m MUR m MUR m
At 1 October 2018 3,891.0 487.9 522.8 4,901.7 New assets originated or purchased 3,560.4 418.1 182.4 4,160.9 Assets derecognised or repaid (excluding write offs) (2,569.1) (314.3) (166.5) (3,049.9)Transfers to Stage 1 69.8 (63.5) (6.3) - Transfers to Stage 2 (155.1) 160.1 (5.0) - Transfers to Stage 3 (116.7) (70.4) 187.1 - Amounts written off - - (71.1) (71.1)At 30 September 2019 4,680.3 617.9 643.4 5,941.6
Expected credit loss
2019Stage 1 Stage 2 Stage 3 TOTALMUR m MUR m MUR m MUR m
At 1 October 2018 11.6 2.0 286.7 300.3 New assets originated or purchased 10.8 2.1 28.1 41.0 Assets derecognised or repaid (excluding write offs) (7.7) (1.4) (41.0) (50.1)Transfers to Stage 1 0.2 (0.2) - - Transfers to Stage 2 (0.5) 0.6 (0.1) - Transfers to Stage 3 (0.4) (0.3) 0.7 - Impact of year end ECL of exposures transferred
between stages - - 133.7 133.7 Amounts written off - - (71.1) (71.1)At 30 September 2019 14.0 2.8 337.0 353.8
CIM FINANCIAL SERVICES LTD / ANNUAL REPORT 2019114

Explanatory Notes30 SEPTEMBER 2019
15. NET INVESTMENT IN LEASES AND OTHER CREDIT AGREEMENTS (CONT’D)
GROUPFinance
leasesOther credit agreements Total
MUR m MUR m MUR m30 September 2018Gross investmentWithin one year 1,296.0 3,579.3 4,875.3 After one year and before five years 2,207.7 1,896.6 4,104.3 After five years 85.1 - 85.1
3,588.8 5,475.9 9,064.7 Unearned future finance income (433.9) (574.2) (1,008.1)
3,154.9 4,901.7 8,056.6 Expected credit loss/allowance for credit impairmentPortfolio provision (29.6) (80.8) (110.4)Specific provision (82.3) (226.2) (308.5)
3,043.0 4,594.7 7,637.7
Present value of minimum lease payments analysed as followsWithin one year 1,108.4 3,179.3 4,287.7 After one year and before five years 1,965.8 1,722.4 3,688.2 After five years 80.7 - 80.7
3,154.9 4,901.7 8,056.6
Finance leases
Other credit agreements Total
MUR m MUR m MUR mAllowance for credit impairmentPortfolio provisionAt 1 October 2017 23.7 80.3 104.0 Net provision for credit impairment - 0.5 0.5 Acquisition of subsidiary 5.9 - 5.9 At 30 September 2018 29.6 80.8 110.4
Specific ProvisionAt 1 October 2017 26.2 157.4 183.6 Opening balance on acquisition 61.8 - 61.8 Net provision for credit impairment (2.5) 152.9 150.4 Amounts written off (3.2) (84.1) (87.3)At 30 September 2018 82.3 226.2 308.5
CIM FINANCIAL SERVICES LTD / ANNUAL REPORT 2019 115
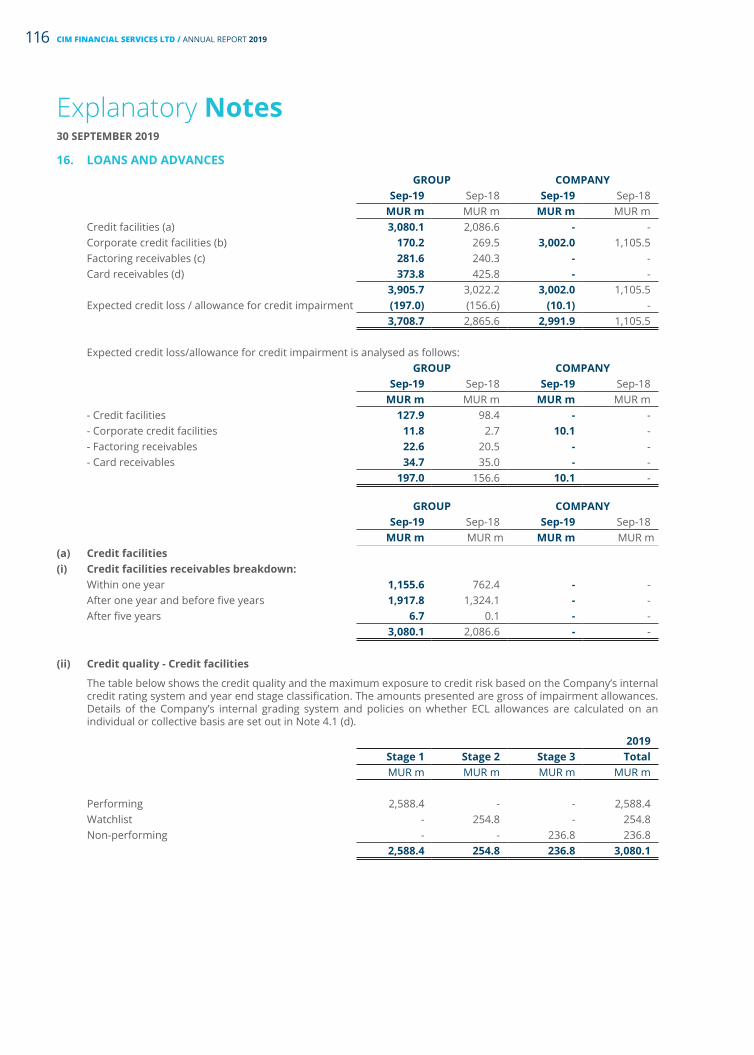
Explanatory Notes30 SEPTEMBER 2019
16. LOANS AND ADVANCESGROUP COMPANY
Sep-19 Sep-18 Sep-19 Sep-18MUR m MUR m MUR m MUR m
Credit facilities (a) 3,080.1 2,086.6 - - Corporate credit facilities (b) 170.2 269.5 3,002.0 1,105.5 Factoring receivables (c) 281.6 240.3 - - Card receivables (d) 373.8 425.8 - -
3,905.7 3,022.2 3,002.0 1,105.5 Expected credit loss / allowance for credit impairment (197.0) (156.6) (10.1) -
3,708.7 2,865.6 2,991.9 1,105.5
Expected credit loss/allowance for credit impairment is analysed as follows:GROUP COMPANY
Sep-19 Sep-18 Sep-19 Sep-18MUR m MUR m MUR m MUR m
- Credit facilities 127.9 98.4 - - - Corporate credit facilities 11.8 2.7 10.1 - - Factoring receivables 22.6 20.5 - - - Card receivables 34.7 35.0 - -
197.0 156.6 10.1 -
GROUP COMPANYSep-19 Sep-18 Sep-19 Sep-18
MUR m MUR m MUR m MUR m(a) Credit facilities (i) Credit facilities receivables breakdown:
Within one year 1,155.6 762.4 - - After one year and before five years 1,917.8 1,324.1 - - After five years 6.7 0.1 - -
3,080.1 2,086.6 - -
(ii) Credit quality - Credit facilities
The table below shows the credit quality and the maximum exposure to credit risk based on the Company’s internal credit rating system and year end stage classification. The amounts presented are gross of impairment allowances. Details of the Company’s internal grading system and policies on whether ECL allowances are calculated on an individual or collective basis are set out in Note 4.1 (d).
2019Stage 1 Stage 2 Stage 3 TotalMUR m MUR m MUR m MUR m
Performing 2,588.4 - - 2,588.4 Watchlist - 254.8 - 254.8 Non-performing - - 236.8 236.8
2,588.4 254.8 236.8 3,080.1
CIM FINANCIAL SERVICES LTD / ANNUAL REPORT 2019116

Explanatory Notes30 SEPTEMBER 2019
16. LOANS AND ADVANCES (CONT’D)(a) Credit facilities (cont’d)
(iii) Gross carrying amount - Credit facilities
An analysis of changes in the gross carrying amount and the corresponding ECL allowances in relation to Credit facilities is as follows:
2019Stage 1 Stage 2 Stage 3 TotalMUR m MUR m MUR m MUR m
At 1 October 2018 1,753.9 136.4 196.3 2,086.6New assets originated 1,685.9 139.4 59.7 1,885.0 Assets derecognised or repaid (excluding write offs) (766.0) (57.3) (55.9) (879.2)Transfers to Stage 1 45.3 (35.4) (9.9) - Transfers to Stage 2 (81.6) 94.9 (13.3) - Transfers to Stage 3 (49.1) (23.2) 71.6 (0.7)Amounts written off - - (11.7) (11.7)
At 30 September 2019 2,588.4 254.8 236.8 3,080.1
(iv) Expected credit loss - Credit facilities
2019Stage 1 Stage 2 Stage 3 TotalMUR m MUR m MUR m MUR m
At 1 October 2018 4.6 0.7 79.8 85.1 New assets originated 12.2 8.6 12.8 33.6 Assets derecognised or repaid (excluding write offs) (2.0) (0.4) (42.2) (44.6)Transfers to Stage 1 0.1 (0.1) - - Transfers to Stage 2 (0.2) 5.3 (5.1) - Transfers to Stage 3 (0.1) (0.1) 0.2 - Impact on ECL of stage transfers - 0.1 65.4 65.5 Amounts written off - - (11.7) (11.7)
At 30 September 2019 14.6 14.1 99.2 127.9
(b) Corporate loans
(i) Corporate loans receivables breakdown:
GROUP COMPANYSep-19 Sep-18 Sep-19 Sep-18
MUR m MUR m MUR m MUR mWithin one year 50.0 85.1 2,819.7 1,036.4 After one year and before five years 95.6 147.0 182.3 69.1 After five years 24.6 37.4 - -
170.2 269.5 3,002.0 1,105.5
(ii) Credit quality - Corporate Credit facility
The table below shows the credit quality and the maximum exposure to credit risk based on the Group’s internal credit rating system and year end stage classification. The amounts presented are gross of impairment allowances. Details of the Group’s internal grading system and policies on whether ECL allowances are calculated on an individual or collective basis are set out in Note 4.1 (d).
2019Stage 1 Stage 2 Stage 3 TotalMUR m MUR m MUR m MUR m
Performing 112.6 - - 112.6 Watchlist - - - - Non-performing - - 57.6 57.6
112.6 - 57.6 170.2
CIM FINANCIAL SERVICES LTD / ANNUAL REPORT 2019 117

Explanatory Notes30 SEPTEMBER 2019
16. LOANS AND ADVANCES (CONT’D)(b) Corporate credit facilities (cont’d)
(iii) Gross carrying amount - Corporate credit facilities
An analysis of changes in the gross carrying amount and the corresponding ECL allowances in relation to Corporate Credit facilities is as follows:
2019Stage 1 Stage 2 Stage 3 TotalMUR m MUR m MUR m MUR m
At 1 October 2018 152.8 54.5 62.2 269.5 New assets originated 4.0 - 2.0 6.0 Assets derecognised or repaid (excluding write offs) (44.2) (24.9) (36.2) (105.3)Transfers to Stage 1 - - - - Transfers to Stage 2 - - - - Transfers to Stage 3 - (29.6) 29.6 - Amounts written off - - - - At 30 September 2019 112.6 - 57.6 170.2
(iv) Expected credit loss - Corporate credit facilities
2019Stage 1 Stage 2 Stage 3 TotalMUR m MUR m MUR m MUR m
At 1 October 2018 0.3 0.3 0.1 0.7 New assets originated - - - - Assets derecognised or repaid (excluding write offs) (0.2) (0.2) - (0.4)Transfers to Stage 1 - - - - Transfers to Stage 2 - - - - Transfers to Stage 3 - (0.1) 0.1 - Impact on ECL of stage transfers - - 11.5 11.5 Amounts written off - - - - At 30 September 2019 0.1 - 11.7 11.8
(v) Company - Corporate Credit Facilities
Gross Carrying Amount ECLStage 1 Stage 1MUR m MUR m
At 1 October 2018 1,105.5 3.7 Addition 1,896.5 6.4 At 30 September 2019 3,002.0 10.1
CIM FINANCIAL SERVICES LTD / ANNUAL REPORT 2019118

Explanatory Notes30 SEPTEMBER 2019
16. LOANS AND ADVANCES (CONT’D)
(c) Factoring receivables
GROUP COMPANYSep-19 Sep-18 Sep-19 Sep-18
MUR m MUR m MUR m MUR mReceivable from customers 430.6 363.3 - - Fund of guarantee (149.0) (123.0) - -
281.6 240.3 - -
Fund of guarantee represents the portion of the receivables from customers for which the Group has not financed.
(i) Credit quality - Factoring receivables
The table below shows the credit quality and the maximum exposure to credit risk based on the Group’s internal credit rating system and year end stage classification. The amounts presented are gross of impairment allowances. Details of the Group’s internal grading system and policies on whether ECL allowances are calculated on an individual or collective basis are set out in Note 4.1 (d).
2019Stage 1 Stage 2 Stage 3 TOTALMUR m MUR m MUR m MUR m
Performing - - - - Watchlist - 261.1 - 261.1 Non-performing - - 20.5 20.5
- 261.1 20.5 281.6
(ii) Gross carrying amount - Factoring debtors
An analysis of changes in the gross carrying amount and the corresponding ECL allowances in relation to Credit facilities is as follows:
2019Stage 1 Stage 2 Stage 3 TOTALMUR m MUR m MUR m MUR m
At 1 October 2018 - 215.0 25.2 240.2 New assets originated or purchased - 92.8 - 92.8 Assets derecognised or repaid (excluding write offs) - (46.7) (4.7) (51.4) Additional ECL charge - - - - Transfers to Stage 1 - - - - Transfers to Stage 2 - - - - Transfers to Stage 3 - - - - Amounts written off - - - - At 30 September 2019 - 261.1 20.5 281.6
CIM FINANCIAL SERVICES LTD / ANNUAL REPORT 2019 119

Explanatory Notes30 SEPTEMBER 2019
16. LOANS AND ADVANCES (CONT’D)
(c) Factoring receivable (cont’d)
(iii) Expected credit loss - Factoring receivables
2019Stage 1 Stage 2 Stage 3 TOTALMUR m MUR m MUR m MUR m
At 1 October 2018 - 2.6 18.3 20.9 New assets originated - 0.5 5.8 6.3 Assets derecognised or repaid (excluding write offs) - (1.0) (3.6) (4.6) Additional ECL charge - - - - Transfers to Stage 2 - - - - Transfers to Stage 3 - - - - Impact of year end ECL of exposures transferred
between stages - - - - Amounts written off - - - - At 30 September 2019 - 2.1 20.5 22.6
(d) Card receivables
Card receivables are receivable within 3 months.
(i) Credit quality - Card receivables
The table below shows the credit quality and the maximum exposure to credit risk based on the Group’s internal credit rating system and year end stage classification. The amounts presented are gross of impairment allowances. Details of the Group’s internal grading system and policies on whether ECL allowances are calculated on an individual or collective basis are set out in Note 4.1 (d).
2019Stage 1 Stage 2 Stage 3 TOTALMUR m MUR m MUR m MUR m
Performing 231.1 - - 231.1 Watchlist - 76.7 - 76.7 Non-performing - - 66.0 66.0
231.1 76.7 66.0 373.8
CIM FINANCIAL SERVICES LTD / ANNUAL REPORT 2019120

Explanatory Notes30 SEPTEMBER 2019
16 LOANS AND ADVANCES (CONT’D)
(d) Card receivables (cont’d)
(ii) Gross carrying amount - Card receivables
An analysis of changes in the gross carrying amount and the corresponding ECL allowances in relation to Credit facilities is as follows:
2019Stage 1 Stage 2 Stage 3 TOTALMUR m MUR m MUR m MUR m
At 1 October 2018 251.6 106.4 67.8 425.8 New assets originated or purchased 29.7 3.4 4.1 37.2 Assets derecognised or repaid (excluding write offs) (44.6) (17.0) (13.8) (75.4) Transfers to Stage 1 39.4 (36.9) (2.5) - Transfers to Stage 2 (36.7) 40.1 (3.4) - Transfers to Stage 3 (8.3) (19.3) 27.6 - Amounts written off - - (13.8) (13.8) At 30 September 2019 231.1 76.7 66.0 373.8
(iii) Expected credit loss - Card receivables (cont’d)
2019Stage 1 Stage 2 Stage 3 TOTALMUR m MUR m MUR m MUR m
At 1 October 2018 0.4 0.2 34.0 34.6 New assets originated or purchased 0.1 0.1 2.2 2.4 Assets derecognised or repaid (excluding write offs) - - - - Transfers to Stage 1 0.2 (0.1) (0.1) - Transfers to Stage 2 (0.1) 0.3 (0.2) - Transfers to Stage 3 - - - - ECL movement on transfer (0.2) (0.4) 12.1 11.5 Amounts written off - - (13.8) (13.8) At 30 September 2019 0.4 0.1 34.2 34.7
(e) Movements on the provision for impairment prior to 1 October 2018 are as follows:
GROUPCredit
facilitiesCorporate
loansFactoring
receivablesCard
receivables TotalMUR m MUR m MUR m MUR m MUR m
At 1 October 2017 49.5 2.7 20.8 46.5 119.5 Charge for the year 52.2 - - 14.8 67.0 Amounts written off (3.3) - (0.3) (26.3) (29.9)At 30 September 2018 98.4 2.7 20.5 35.0 156.6
Made up of :Specific provision 71.4 - 18.3 24.8 114.5 Portfolio provision 27.0 2.7 2.2 10.2 42.1
98.4 2.7 20.5 35.0 156.6
CIM FINANCIAL SERVICES LTD / ANNUAL REPORT 2019 121

Explanatory Notes30 SEPTEMBER 2019
17. INVESTMENT IN FINANCIAL ASSETSGROUP COMPANY
Sep-19 Sep-18 Sep-19 Sep-18MUR m MUR m MUR m MUR m
Available for sale investments (a) - 1.2 - 1.2 Equity instruments at FVTPL (b) 0.8 - 0.8 -Government bonds 8.1 8.0 - - Debt instruments at FVTPL (c) - 1,589.7 - 1,589.7
8.9 1,598.9 0.8 1,590.9
GROUP COMPANYSep-19 Sep-18 Sep-19 Sep-18
MUR m MUR m MUR m MUR m(a) Available for sale investments Level 3 Level 3 Level 3 Level 3
Non currentAvailable for sale investmentsAt 1 October 1.2 1.8 1.2 1.8 Transfer to equity instruments at FVTPL (1.2) - (1.2) - Impairment charge - (0.6) - (0.6)At 30 September - 1.2 - 1.2
The Company has an available for sale investment in a company based in India. Each year a fair value assessment of the investment is done using the Net Assets Approach.
The Net Assets Approach uses the following technique: The value of the investee is determined on the basis of the value of the assets and liabilities as disclosed in its financial statements as at the reporting date. The carrying amount is adjusted for the increase or decrease in the net asset value of the investee.
Impairment charge has been recognised as the fall in net assets has been prolonged. The investment has been transferred to equity instruments at FVTPL on adoption of IFRS 9.
GROUP COMPANYSep-19 Sep-18 Sep-19 Sep-18
MUR m MUR m MUR m MUR m(b) Equity instruments at FVTPL Level 3 Level 3 Level 3 Level 3
Non currentAt 1 October - - - - Transfer from available for sale investment 1.2 - 1.2 - Fair value loss (0.4) - (0.4) - At 30 September 0.8 - 0.8 -
GROUP / COMPANYSep-19 Sep-18
MUR m MUR m(c) Debt instruments at fair value through profit or loss Level 1 Level 1
At 1 October 1,589.7 - Additions - 1,591.2 Disposals (1,597.9) (18.2)Fair value gain 8.2 3.0 Interest accrued - 13.7 At 30 September - 1,589.7
The fair values of the quoted bond and notes have been based on price quotations at the reporting date and are classified under level 1 of the fair value hierarchy. These bond and notes carried interest of fixed rates.
CIM FINANCIAL SERVICES LTD / ANNUAL REPORT 2019122

Explanatory Notes30 SEPTEMBER 2019
18. OTHER ASSETSGROUP COMPANY
Sep-19 Sep-18 Sep-19 Sep-18MUR m MUR m MUR m MUR m
Trade receivables (a) - 1.9 - - Prepayments 58.7 67.4 - - Share application monies - - - 575.0 Other receivables 376.6 603.6 33.5 167.2 Consumer biological assets (b) - 3.2 - -
435.3 676.1 33.5 742.2
Receivable from subsidiaries (c) - - 55.4 44.8 Loan at call to subsidiaries (c) - - 112.5 161.0 Expected credit loss (c) - - (1.0) -
- - 166.9 205.8 435.3 676.1 200.4 948.0
The carrying amount of other assets approximate their fair values due to their short term nature.
(a) Ageing of trade receivables
GROUP
Less than 3 months
3 to 6 months
More than 6 months Total
2018 MUR m MUR m MUR m MUR mTrade receivables 1.3 - 0.6 1.9 Less impairment - - - -
1.3 - 0.6 1.9
CIM FINANCIAL SERVICES LTD / ANNUAL REPORT 2019 123

Explanatory Notes30 SEPTEMBER 2019
18. OTHER ASSETS (CONT’D)(b) Consumable biological assets Sep-19 Sep-18
GROUP MUR m MUR mLivestockAt 1 October 3.2 2.0 Additions - 1.8 Cost of sales - (1.1)Distribution of disposal group (3.2) - Gain arising from changes in fair value - 0.5 At 30 September - 3.2
(c) Receivable from subsidiariesReceivables from subsidiary and related companies are unsecured and carry an interest rate ranging from 4.3% to 8.5%. An analysis of the changes in the gross carrying amounts and the corresponding ECL allowance is as follows :
Receivables from subsidiaries
Gross carrying amount ECLStage 1 Stage 1MUR m MUR m
At 1 October 2018 44.8 0.4Additions 10.6 0.1At 30 September 2019 55.4 0.5
Loan at call to subsidiaries
Gross carrying amount ECLStage 1 Stage 1MUR m MUR m
At 1 October 2018 161.0 0.5Additions 24.5 0.2Repayments (73.0) (0.2)At 30 September 2019 112.5 0.5
The share application monies relate to contribution towards equity shares in subsidiaries which were not yet issued by the subsidiaries at 30 September 2018. The shares were issued during the year. The share application monies include MUR 102.5m of cash injection during the year and MUR 472.5m transferred from loans and advances.
19. INVENTORIESSep-19 Sep-18
GROUP MUR m MUR mCostConsumables 3.7 5.6
20. INVESTMENT IN SUBSIDIARIESSep-19 Sep-18
COMPANY MUR m MUR m
At 1 October 1,922.8 1,786.5 Additions 978.5 205.8 Share buyback - (69.5)Impairment (49.9) - Distribution of investments (1,721.1) - At 30 September 1,130.3 1,922.8
Additions during the year include MUR 608.5M of non cash consideration.
In December 2018, all the Companies held in the property segment were restructured under Lavastone Ltd and the shares held by the Company in Lavastone Ltd were distributed to the shareholders of the Company.
Impairment charged during the year pertains to Cim International Holding Ltd which has been written down to its recoverable amount.
CIM FINANCIAL SERVICES LTD / ANNUAL REPORT 2019124

Expl
anat
ory
Not
es30
SEP
TEM
BER
2019
20.
INVE
STM
ENT
IN S
UBS
IDIA
RIES
(CO
NT’
D)
(a)
Det
ails
per
tain
ing
to t
he s
ubsi
diar
ies
Prop
orti
on o
f dir
ect
owne
rshi
p (%
)Pr
opor
tion
of i
ndir
ect
owne
rshi
p (%
)Pr
opor
tion
ow
ners
hip
by
non
cont
rolli
ng in
tere
st (%
)N
ame
of s
ubsi
diar
ies
Prin
cipa
l act
ivit
ySe
p-19
Sep-
18Se
p-19
Sep-
18Se
p-19
Sep-
18Fi
nanc
e
Cim
Fin
ance
Ltd
Cr
edit
card
bus
ines
s, fa
ctor
ing,
co
nsum
er fi
nanc
e, le
asin
g 1
00.0
1
00.0
-
- -
- Ci
m F
orex
Ltd
Fore
x de
aler
100
.0
100
.0
- -
- -
Cim
Age
ncie
s Lt
dIn
sura
nce
agen
t 1
00.0
1
00.0
-
- -
- M
auri
tian
Eagl
e Le
asin
g Co
mpa
ny L
tdLe
asin
g 1
00.0
1
00.0
-
- -
-
Inve
stm
ents
- -
Cim
Ken
ya L
tdH
oldi
ng c
ompa
ny 1
00.0
1
00.0
-
- -
- Ci
m C
redi
t Ken
ya L
tdPr
ovis
ion
of r
etai
l cre
dit
- -
100
.0
100
.0
- -
Cim
Insu
ranc
e Ag
ency
Ltd
Insu
ranc
e ag
ent
- -
100
.0
100
.0
- -
Cim
Inte
rnat
iona
l Hol
ding
s Lt
d In
vest
men
t hol
ding
100
.0
100
.0
- -
- -
Cim
Adm
inis
trat
ors
Ltd
Secr
etar
ial s
ervi
ces
100
.0
100
.0
- -
- -
Cim
Eth
iopi
a Lt
dIn
vest
men
t hol
ding
- -
100
.0
100
.0
- -
Key
Fina
ncia
l Ser
vice
s Lt
dIn
vest
men
t hol
ding
- -
100
.0
100
.0
- -
The
Oce
anic
Tru
st C
o. L
tdCo
rpor
ate
trus
tee
- -
100
.0
100
.0
- -
Prop
erty
Lava
ston
e Lt
d ((n
ote
(i))
Prop
erty
- 1
00.0
-
- -
- La
vast
one
Prop
ertie
s Lt
d ((n
ote
(i))
Prop
erty
- -
- 1
00.0
-
- So
uth
Wes
t Saf
ari G
roup
Ltd
((no
te (i
))Pr
oper
ty -
1.3
-
52.
3 -
46.
4 Le
Mor
ne D
evel
opm
ent C
orp
Ltd
((not
e (i)
)Pr
oper
ty -
31.
0 -
29.
0 -
20.
0 Sa
n Pa
olo
Ltd
((not
e (i)
)Pr
oper
ty -
59.
2 -
- -
40.
8 SW
TD B
is L
td ((
note
(i))
Prop
erty
- 1
00.0
-
- -
- Pl
ato
Hol
ding
s Lt
d ((n
ote
(i))
Prop
erty
- -
- 1
00.0
-
- Ed
ith C
avel
l Pro
pert
ies
Ltd
((not
e (i)
)Pr
oper
ty -
100
.0
- -
- -
La Je
tee
Ltd
((not
e (i)
)Pr
oper
ty -
- -
53.
6 -
- Pi
er9
Ltd
((not
e (i)
)Pr
oper
ty -
- -
53.
6 -
- B5
9 Lt
d ((n
ote
(i))
Prop
erty
- -
- 1
00.0
-
- Th
e Be
lle M
are
SPV
Ltd
((not
e (i)
)D
orm
ant
- -
- 1
00.0
-
-
Oth
ers
Cim
Lea
rnin
g Ce
ntre
Ltd
Inve
stm
ent h
oldi
ng 1
00.0
1
00.0
-
- -
- Ci
m M
anag
emen
t Ser
vice
s Lt
dM
anag
emen
t ser
vice
s 1
00.0
1
00.0
-
- -
- Ci
m S
hare
d Se
rvic
es L
td
Supp
ort a
ctiv
ities
100
.0
100
.0
- -
- -
Evri
pay
Dor
man
t 1
00.0
1
00.0
-
- -
-
The
abov
e su
bsid
iari
es a
re in
corp
orat
ed in
Mau
ritiu
s ex
cept
for
Cim
Cre
dit K
enya
Ltd
and
Cim
Insu
ranc
e Ag
ency
Ltd
whi
ch a
re in
corp
orat
ed in
Ken
ya.
Not
e (i)
- Su
bsid
iari
es d
istr
ibut
ed a
s no
n ca
sh a
sset
s to
ow
ners
dur
ing
the
year
(ref
er to
not
e 35
)
CIM FINANCIAL SERVICES LTD / ANNUAL REPORT 2019 125

Explanatory Notes30 SEPTEMBER 2019
20. INVESTMENT IN SUBSIDIARIES (CONT’D)
(b) Summarised financial information on subsidiaries with material non controlling interests
South West Safari Group
Ltd
Le Morne Development
Corp Ltd San Paolo LtdMUR m MUR m MUR m
2018Current assets 28.3 13.2 - Non current assets 532.0 315.2 0.6 Current liabilities 22.7 5.1 0.1 Non current liabilities 97.8 35.6 - Revenue 2.6 1.0 - Profit/(loss) 3.9 (2.6) (0.1)Other comprehensive income 7.9 - - Total comprehensive income 11.8 (2.6) (0.1)Cash flow used in operating activities 19.6 0.3 - Cash flow from investing activities (22.8) - - Cash flow from financing activities 5.1 - - Net increase in cash and cash equivalents 1.9 0.3 -
Profit/(loss) allocated to non controlling interests 1.8 (1.1) - Carrying amounts of non controlling interests 204.1 115.1 0.2
CIM FINANCIAL SERVICES LTD / ANNUAL REPORT 2019126

Expl
anat
ory
Not
es30
SEP
TEM
BER
2019
21.
INVE
STM
ENT
IN A
SSO
CIA
TES
GRO
UP
COM
PAN
YSe
p-19
Sep-
18Se
p-19
Sep-
18(a
)M
ovem
ent
in in
vest
men
t in
ass
ocia
tes
MU
R m
MU
R m
MU
R m
MU
R m
At 1
Oct
ober
177
.5
193
.1
16.
2 1
6.2
Addi
tions
- -
- -
Shar
e of
res
ults
: S
hare
of l
oss
of a
ssoc
iate
s (0
.5)
(8.3
) -
- I
mpa
irm
ent c
harg
ed (4
0.9)
(6.4
) (5
.8)
- I
mpa
irm
ent r
ever
sal
9.1
-
- -
Mov
emen
t in
othe
r re
serv
es 6
.7
(0.9
) -
- D
ivid
ends
(10.
9) -
- -
At 3
0 Se
ptem
ber
141
.0
177
.5
10.
4 1
6.2
Impa
irm
ent r
ever
sal h
as b
een
reco
gnis
ed o
n Li
& F
ung
(Mau
ritiu
s) L
td r
ever
sing
the
exce
ss o
f net
ass
et o
ver
acqu
isiti
on p
rice
.
The
impa
irm
ent c
harg
e pe
rtai
ns to
iVer
i Pay
men
t Tec
hnol
ogie
s Pr
opri
etar
y Lt
d. T
he c
arry
ing
valu
e of
the
inve
stm
ent o
f the
inve
stm
ent h
as b
een
impa
ired
to b
ring
the
valu
e to
its
reco
vera
ble
amou
nts.
(b)
Det
ails
of t
he a
ssoc
iate
s
Det
ails
of t
he a
ssoc
iate
s at
the
repo
rtin
g da
te a
re a
s fo
llow
s:
Nam
ePr
inci
pal a
ctiv
ity
Prin
cipa
l pla
ce
of b
usin
ess
Coun
try
of
inco
rpor
atio
n
Prop
orti
on o
f dir
ect
owne
rshi
p (%
)Pr
opor
tion
of i
ndir
ect
owne
rshi
p (%
)U
nquo
ted
Sep-
19Se
p-18
Sep-
19Se
p-18
Li &
Fun
g (M
auri
tius)
Ltd
Buyi
ng a
gent
Mau
ritiu
sM
auri
tius
40.
0 40
.0 -
- D
odw
ell (
Mau
ritiu
s) L
tdBu
ying
age
ntM
auri
tius
Hon
g Ko
ng 4
0.0
40.0
- -
iVer
i Pay
men
t Tec
hnol
ogie
s Pr
opri
etar
y Lt
dPa
ymen
t sol
utio
ns p
rovi
der
Sout
h Af
rica
Sout
h Af
rica
- -
49.
0 4
9.0
Touc
hpoi
nt P
aym
ent P
ropr
ieta
ry L
imite
dPa
ymen
t sol
utio
ns p
rovi
der
Sout
h Af
rica
Sout
h Af
rica
- -
41.
7 4
1.7
evri
Pay
ZA (P
ropr
ieta
ry) L
tdD
orm
ant
Sout
h Af
rica
Sout
h Af
rica
- -
49.
0 4
9.0
iVer
i Glo
bal L
imite
dSo
ftw
are
solu
tions
pro
vide
rM
auri
tius
Mau
ritiu
s -
- 4
9.0
49.
0 Bl
ue N
ile H
oldi
ng L
tdIn
vest
men
t hol
ding
Mau
ritiu
sM
auri
tius
- -
32.
6 3
2.6
(i)Al
l of t
he a
bove
ass
ocia
tes
are
acco
unte
d fo
r us
ing
the
equi
ty m
etho
d in
the
cons
olid
ated
fina
ncia
l sta
tem
ents
.
CIM FINANCIAL SERVICES LTD / ANNUAL REPORT 2019 127

Explanatory Notes30 SEPTEMBER 2019
21. INVESTMENT IN ASSOCIATES (CONT’D)(c) Summarised financial information in respect of the Group’s associates
2019
Li & Fung (Mauritius) Ltd - Group
**
iVeri Payment Technologies
Proprietary Ltd
Touchpoint Payment
Proprietary Limited
iVeri Global Limited
Blue Nile Holding Ltd
MUR m MUR m MUR m MUR m MUR mCurrent assets 27.1 30.5 27.1 16.7 340.0 Non current assets 0.1 6.1 0.8 - - Current liabilities (1.3) (9.8) (7.8) (7.7) (0.3)Net assets 25.9 26.8 20.1 9.0 339.7Ownership interest 40% 49% 42% 49% 33%Share of net assets 10.4 13.1 8.4 4.4 110.7Goodwill (10.4) 6.6 (2.3) - 0.1 Carrying value of associates - 19.7 6.1 4.4 110.8
Revenue 2.0 74.7 59.9 7.7 - Profit/(loss) for the year (0.6) 3.6 0.4 (2.5) (2.9)Other comprehensive income for the
year 0.1 (0.1) (0.3) 0.7 19.7 Total comprehensive income for the
year (0.5) 3.5 0.1 (1.8) 16.8
Group’s share of (loss)/profit for the year (0.3) 1.8 0.2 (1.2) (1.0)
Group’s share of total comprehensive income for the year (0.2) 1.7 0.1 (0.9) 5.5
Dividend received during the year (10.9) - - - -
** Figures include Li & Fung Ltd and Dodwell Ltd
eVripay ZA (Proprietary) ltd is dormant and the financial information is negligible.
CIM FINANCIAL SERVICES LTD / ANNUAL REPORT 2019128

Explanatory Notes30 SEPTEMBER 2019
21. INVESTMENT IN ASSOCIATES (CONT’D)(c) Summarised financial information in respect of the Group’s associates (Cont'd)
2018
Li & Fung (Mauritius)
Ltd - Group **
iVeri Payment Technologies Proprietary
Ltd
Touchpoint Payment
Proprietary Limited
iVeri Global Limited
Blue Nile Holding Ltd
MUR m MUR m MUR m MUR m MUR mCurrent assets 56.7 25.9 0.4 - 323.3Non current assets - 10.0 22.0 13.6 - Current liabilities (2.9) (12.6) (2.4) (2.7) (0.2)Net assets 53.8 23.3 20 10.9 323.1 Ownership interest 40% 49% 42% 49% 33%Share of net assets 21.5 11.4 8.3 5.3 105.3Goodwill (19.5) 47.4 (2.3) - - Carrying value of associates 2.0 58.8 6.0 5.3 105.3
Revenue 3.7 - - 7.2 - Profit/(loss) for the year 1.2 (5.6) 4.8 (3.6) (19.3)Other comprehensive income for the
year (1.2) (0.7) (0.1) - - Total comprehensive income for the
year - (6.3) 4.7 (3.6) (19.3)
Group's share of profit/(loss) for the year 0.5 (2.7) 2.0 (1.8) (6.3)
Group's share of total comprehensive income for the year - (3.1) 2.0 (1.8) (6.3)
Dividend received during the year - - - - -
CIM FINANCIAL SERVICES LTD / ANNUAL REPORT 2019 129

Explanatory Notes30 SEPTEMBER 2019
22. INVESTMENT PROPERTIESGROUP COMPANY
Sep-19 Sep-18 Sep-19 Sep-18MUR m MUR m MUR m MUR m
At 1 October 1,216.5 1,039.2 33.5 33.5 Additions - 187.2 - - Fair value gain - 29.6 - - Disposal - (17.2) (33.5) - Transfer (note 23) - (22.3) - - Distribution of disposal group (note 35) (1,216.5) - - - At 30 September - 1,216.5 - 33.5
The Group’s and Company’s investment properties at 30 September 2018 were accounted at their fair value based on a valuation done by JPW International Property Consultants and Gexim Real Estate Ltd, two independent chartered valuers.
The different valuation methods used are:
(i) Direct Market Comparison Approach or Sales Comparison Approach
(ii) Depreciated Replacement Cost Approach.
Details of the Group and Company’s investment properties, which are classified as level 3 on the fair value hierarchy, are as follows:
GROUP COMPANYSep-19 Sep-18 Sep-19 Sep-18
MUR m MUR m MUR m MUR mLand - 782.3 - - Buildings - 434.2 - 33.5
- 1,216.5 - 33.5
Significant unobservable valuation input: RangeSep-18
Land - Price per Square Metre 2,000 - 55,000Buildings - Price per Square Metre 8,000 - 85,000
Significant increases/(decreases) in estimated price per square metre in isolation would result in a proportionate higher/(lower) fair value.
The following have been recognised in profit or loss:
GROUP COMPANYSep-19 Sep-18 Sep-19 Sep-18
MUR m MUR m MUR m MUR mRental income - 99.4 - - Direct operating expenses arising from investment
properties that generate rental income - 22.7 - - Direct operating expenses that did not generate rental
income - 9.3 - -
CIM FINANCIAL SERVICES LTD / ANNUAL REPORT 2019130
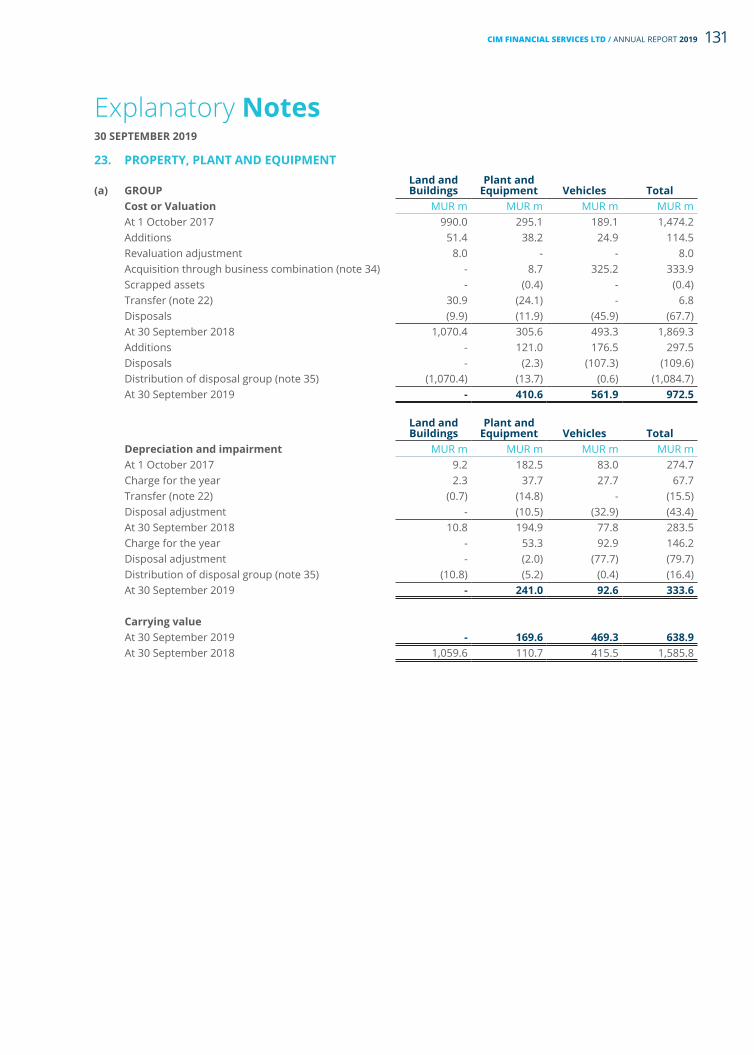
Explanatory Notes30 SEPTEMBER 2019
23. PROPERTY, PLANT AND EQUIPMENT
(a) GROUPLand and Buildings
Plant and Equipment Vehicles Total
Cost or Valuation MUR m MUR m MUR m MUR mAt 1 October 2017 990.0 295.1 189.1 1,474.2 Additions 51.4 38.2 24.9 114.5 Revaluation adjustment 8.0 - - 8.0 Acquisition through business combination (note 34) - 8.7 325.2 333.9 Scrapped assets - (0.4) - (0.4)Transfer (note 22) 30.9 (24.1) - 6.8 Disposals (9.9) (11.9) (45.9) (67.7)At 30 September 2018 1,070.4 305.6 493.3 1,869.3 Additions - 121.0 176.5 297.5 Disposals - (2.3) (107.3) (109.6)Distribution of disposal group (note 35) (1,070.4) (13.7) (0.6) (1,084.7)At 30 September 2019 - 410.6 561.9 972.5
Land and Buildings
Plant and Equipment Vehicles Total
Depreciation and impairment MUR m MUR m MUR m MUR m At 1 October 2017 9.2 182.5 83.0 274.7 Charge for the year 2.3 37.7 27.7 67.7 Transfer (note 22) (0.7) (14.8) - (15.5)Disposal adjustment - (10.5) (32.9) (43.4)At 30 September 2018 10.8 194.9 77.8 283.5 Charge for the year - 53.3 92.9 146.2 Disposal adjustment - (2.0) (77.7) (79.7)Distribution of disposal group (note 35) (10.8) (5.2) (0.4) (16.4)At 30 September 2019 - 241.0 92.6 333.6
Carrying valueAt 30 September 2019 - 169.6 469.3 638.9 At 30 September 2018 1,059.6 110.7 415.5 1,585.8
CIM FINANCIAL SERVICES LTD / ANNUAL REPORT 2019 131
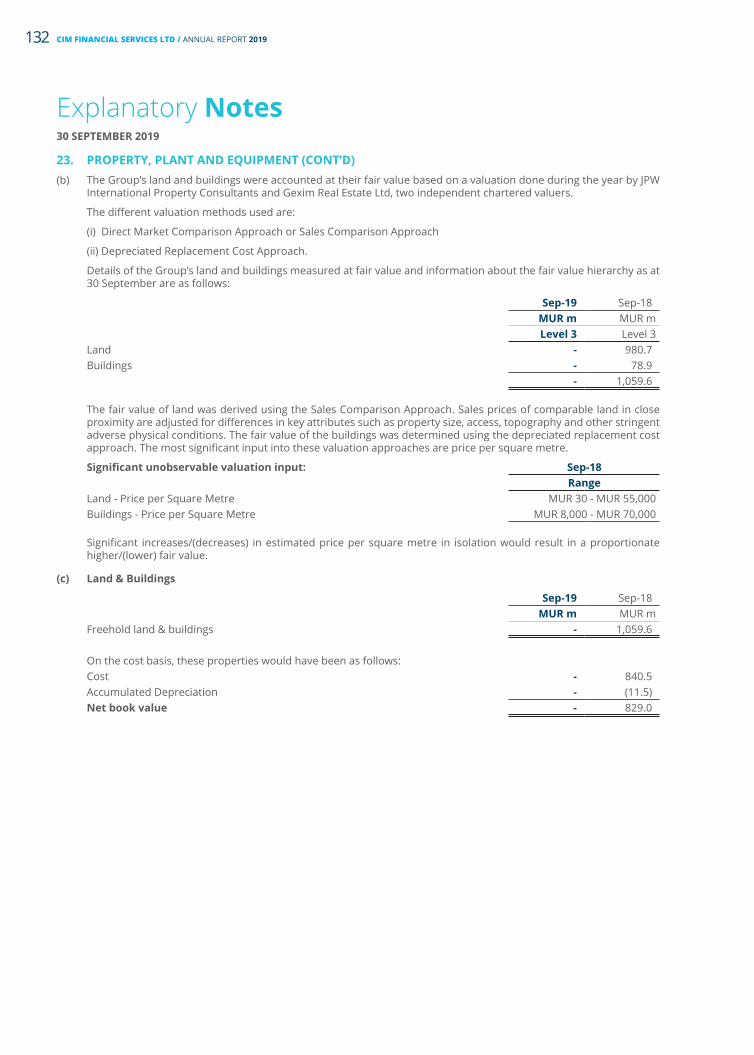
Explanatory Notes30 SEPTEMBER 2019
23. PROPERTY, PLANT AND EQUIPMENT (CONT’D)(b) The Group’s land and buildings were accounted at their fair value based on a valuation done during the year by JPW
International Property Consultants and Gexim Real Estate Ltd, two independent chartered valuers.
The different valuation methods used are:
(i) Direct Market Comparison Approach or Sales Comparison Approach
(ii) Depreciated Replacement Cost Approach.
Details of the Group’s land and buildings measured at fair value and information about the fair value hierarchy as at 30 September are as follows:
Sep-19 Sep-18MUR m MUR mLevel 3 Level 3
Land - 980.7 Buildings - 78.9
- 1,059.6
The fair value of land was derived using the Sales Comparison Approach. Sales prices of comparable land in close proximity are adjusted for differences in key attributes such as property size, access, topography and other stringent adverse physical conditions. The fair value of the buildings was determined using the depreciated replacement cost approach. The most significant input into these valuation approaches are price per square metre.
Significant unobservable valuation input: Sep-18Range
Land - Price per Square Metre MUR 30 - MUR 55,000Buildings - Price per Square Metre MUR 8,000 - MUR 70,000
Significant increases/(decreases) in estimated price per square metre in isolation would result in a proportionate higher/(lower) fair value.
(c) Land & Buildings
Sep-19 Sep-18MUR m MUR m
Freehold land & buildings - 1,059.6
On the cost basis, these properties would have been as follows:Cost - 840.5 Accumulated Depreciation - (11.5)Net book value - 829.0
CIM FINANCIAL SERVICES LTD / ANNUAL REPORT 2019132
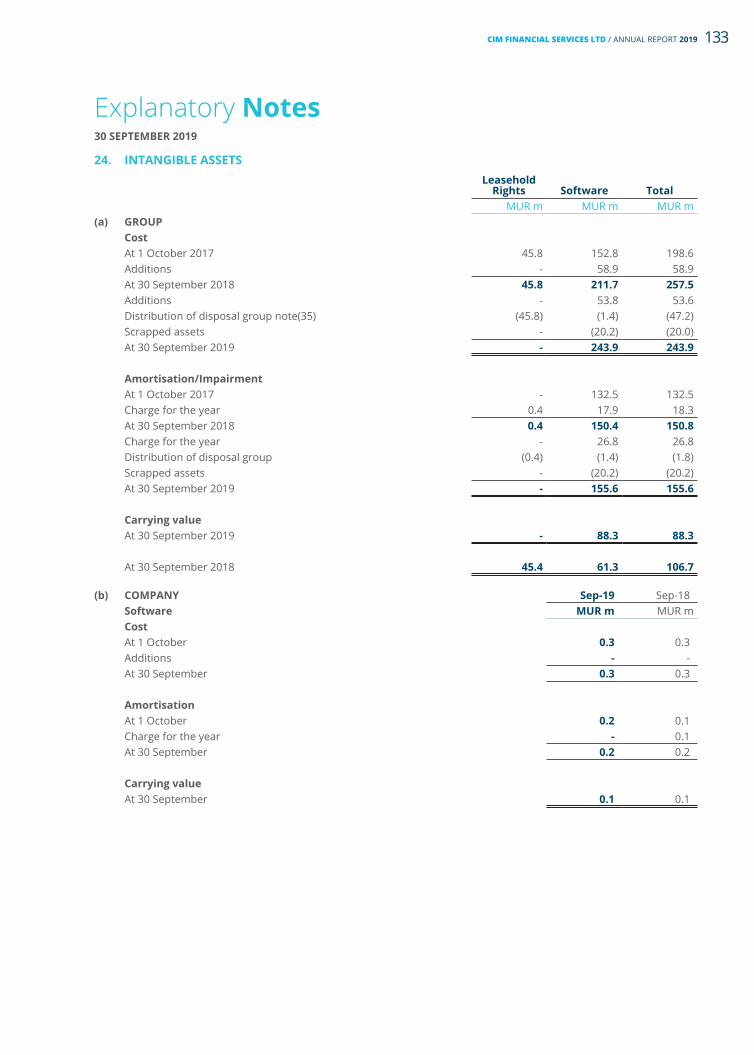
Explanatory Notes30 SEPTEMBER 2019
24. INTANGIBLE ASSETSLeasehold
Rights Software TotalMUR m MUR m MUR m
(a) GROUPCostAt 1 October 2017 45.8 152.8 198.6 Additions - 58.9 58.9 At 30 September 2018 45.8 211.7 257.5 Additions - 53.8 53.6 Distribution of disposal group note(35) (45.8) (1.4) (47.2)Scrapped assets - (20.2) (20.0)At 30 September 2019 - 243.9 243.9
Amortisation/ImpairmentAt 1 October 2017 - 132.5 132.5 Charge for the year 0.4 17.9 18.3 At 30 September 2018 0.4 150.4 150.8 Charge for the year - 26.8 26.8 Distribution of disposal group (0.4) (1.4) (1.8)Scrapped assets - (20.2) (20.2)At 30 September 2019 - 155.6 155.6
Carrying valueAt 30 September 2019 - 88.3 88.3
At 30 September 2018 45.4 61.3 106.7
(b) COMPANY Sep-19 Sep-18Software MUR m MUR mCostAt 1 October 0.3 0.3 Additions - -At 30 September 0.3 0.3
AmortisationAt 1 October 0.2 0.1 Charge for the year - 0.1 At 30 September 0.2 0.2
Carrying valueAt 30 September 0.1 0.1
CIM FINANCIAL SERVICES LTD / ANNUAL REPORT 2019 133

Explanatory Notes30 SEPTEMBER 2019
25. POST EMPLOYMENT BENEFIT ASSETS/LIABILITIESGROUP COMPANY
Sep-19 Sep-18 Sep-19 Sep-18MUR m MUR m MUR m MUR m
Amounts recognised in the Statements of Financial Position:
Pension benefits (a) 1.1 (7.2) - - Unfunded pension schemes (b) 37.7 40.9 37.7 40.9 Other retirement benefits (c) 55.6 46.7 - -
94.4 80.4 37.7 40.9
Analysed as follows:Non current assets - 7.2 - - Non current liabilities (94.4) (87.6) (37.7) (40.9)
(94.4) (80.4) (37.7) (40.9)
Amounts charged/(credited) to profit or loss:Pension benefits (a) 1.9 (0.4) - - Unfunded pension schemes (b) 2.4 2.4 2.4 2.4 Other retirement benefits (c) 7.5 7.0 - - Total included in employee benefit expense 11.8 9.0 2.4 2.4
Amounts charged to other comprehensive income:Pension benefits (a) 8.0 7.2 - - Unfunded pension schemes (b) 0.3 4.5 0.3 4.5 Other retirement benefits (c) 1.4 1.5 - -
9.7 13.2 0.3 4.5
CIM FINANCIAL SERVICES LTD / ANNUAL REPORT 2019134

Explanatory Notes30 SEPTEMBER 2019
25. POST EMPLOYMENT BENEFIT ASSETS/LIABILITIES (CONT’D)
(a) Pension benefits
The Group operates a final salary defined benefit pension plan for some employees. The assets are held separately from the Group under the control of the Management Committee of Rogers Money Purchase Retirement Fund (RMPRF). The Group contributes to the pension plan in respect of some employees who have a No Worse Off Guarantee (NWOG) so that their benefits would not be worse than what they would have earned under a previous defined benefit plan.
GROUPSep-19 Sep-18
MUR m MUR m(i) Amounts recognised in the Statements of Financial Position are as follows:
Present value of funded obligations 46.6 34.4 Fair value of plan assets (45.5) (41.6)Liability/(assets) in the Statements of Financial Position 1.1 (7.2)
The reconciliation of the opening balances to the closing balances for the net defined benefit liability is as follows:
At 1 October (7.2) (6.8)Charged/(credited) to profit or loss 1.9 (0.4)Charged to other comprehensive income 8.0 7.2 Contributions paid (1.6) (7.2)At 30 September 1.1 (7.2)
(ii) Amounts recognised in profit or loss and other comprehensive income are as follows:
Service cost:Current service cost 1.4 1.2 Past service cost 1.0 (1.2)Net interest (0.5) (0.4)Components of amount recognised in profit or loss 1.9 (0.4)Return on plan assets above interest cost 0.2 (2.1)Liability experience loss 1.0 6.8 Liability loss due to change in financial assumptions 6.8 2.5 Components of amount recognised in other comprehensive income 8.0 7.2
CIM FINANCIAL SERVICES LTD / ANNUAL REPORT 2019 135

Explanatory Notes30 SEPTEMBER 2019
25. POST EMPLOYMENT BENEFIT ASSETS/LIABILITIES (CONT’D)GROUP
Sep-19 Sep-18MUR m MUR m
(a) Pension benefits (cont’d)(iii) Movements in the defined benefit obligations over the year is as follows:
At 1 October 34.4 25.5 Current service cost 1.4 1.2 Past service cost 1.0 (1.2)Interest expense 2.1 1.6 Benefits paid on settlement - 1.0 Other benefits paid (0.1) (3.0)Liability experience loss 1.0 6.8 Liability loss/(gain) due to change in financial assumptions 6.8 2.5 At 30 September 46.6 34.4
(iv) Movements in the fair value of plan assets over the year is as follows:At 1 October 41.6 32.3 Interest income 2.6 2.0 Employer contribution 1.6 7.2 Benefits paid (0.1) (2.0)Return on plan assets excluding interest income (0.2) 2.1 At 30 September 45.5 41.6
(v) Sensitivity analysis on defined benefit obligation at end of yearIncrease due to 1% decrease in discount rate 20.6 17.2 Decrease due to 1% increase in discount rate 16.5 13.7
The above sensitivity analysis has been carried out by recalculating the present value of obligation at the end of the period after increasing or decreasing the discount rate while leaving all other assumptions unchanged. The results are particularly sensitive to a change in the discount rate due to the nature of the liabilities being the difference between a minimum defined benefit liability and the projected defined contribution liabilities, the latter being MUR 52.7M as at 30 September 2019. Any similar variation in the other assumptions would have shown smaller variations in the defined benefit obligation.
The sensitivity analysis may not be representative of the actual change in the defined benefit obligation as it is unlikely that the change in assumptions would occur in isolation of one another as some of the assumptions may be correlated.
GROUPSep-19 Sep-18
% %(vi) Allocation of plan assets at end of year:
Equity - local quoted 20 26Equity - overseas quoted 36 37Debt - local unquoted 7 2Debt - overseas quoted 26 27Property - local 2 3Cash and other 9 5
100 100
(vii) Future cashflows
- The funding policy is to pay contributions to an external legal entity at the rate recommended by the entity’s actuaries.
- Expected employer contributions to post-employment benefit plans for the year ending 30 September 2020 are MUR 1.8m.
- The average duration of the defined benefit obligations ranges between 5 years and 12 years.
CIM FINANCIAL SERVICES LTD / ANNUAL REPORT 2019136

Explanatory Notes30 SEPTEMBER 2019
25. POST EMPLOYMENT BENEFIT ASSETS/LIABILITIES (CONT’D)GROUP
(a) Pension Benefits (cont’d) Sep-19 Sep-18(viii) Principal actuarial assumptions at end of year:
Discount rate 5.9% 6.2%Future salary increases 4.0% 4.7%Future pension increases 1.1% 0.5%Average retirement age (ARA) 60 60Average life expectancy for:- Male at ARA 19.5 years 19.5 years- Female at ARA 24.2 years 24.2 years
The plan exposes the Group to normal risks associated with defined benefit pension plans such as investment, interest, longevity and salary risks.
- Investment risk
The plan liability is calculated using a discount rate determined by reference to government bond yields; if the return on plan assets is below this rate, it will create a plan deficit and if it is higher, it will create a plan surplus. Currently the Plan has a relatively balanced investment in equity securities, debt instruments and real estate to leverage the return generated by the plan assets.
- Interest risk
A decrease in the bond interest rate will increase the plan liability; however, this may be partially offset by an increase in the return on the plan’s debt investments and a decrease in inflationary pressures on salary and pension increases.
- Longevity risk
The plan liability is calculated by reference to the best estimate of the mortality of plan participants both during and after their employment. An increase in the life expectancy of the plan participants will increase the plan liability.
- Salary risk
The plan liability is calculated by reference to the future projected salaries of plan participants. As such, an increase in the salary of the plan participants above the assumed rate will increase the plan liability whereas an increase below the assumed rate will decrease the liability.
There has been no plan amendment, curtailment or settlement during the year.
CIM FINANCIAL SERVICES LTD / ANNUAL REPORT 2019 137

Explanatory Notes30 SEPTEMBER 2019
25. POST EMPLOYMENT BENEFIT ASSETS/LIABILITIES (CONT’D)
(b) Unfunded pension schemes
Unfunded pension schemes comprise of pensions paid out of cash flow.
GROUP COMPANYSep-19 Sep-18 Sep-19 Sep-18
MUR m MUR m MUR m MUR m(i) Amounts recognised in the Statements of Financial
Position are as follows:Present value of unfunded obligation 37.7 40.9 37.7 40.9 Liability in the Statements of Financial Position 37.7 40.9 37.7 40.9
(ii) Amounts recognised in profit or loss and other comprehensive income are as follows:Net interest on net defined benefit liability 2.4 2.4 2.4 2.4 Components of amount recognised in profit or loss 2.4 2.4 2.4 2.4 Liability experience (gain)/loss (0.3) 3.9 (0.3) 3.9 Liability loss due to change in financial assumptions 0.6 0.6 0.6 0.6 Components of amount recognised in other comprehensive income 0.3 4.5 0.3 4.5
(iii) Movements in liability recognised in Statements of Financial Position:At 1 October 40.9 40.2 40.9 40.2 Interest expense 2.4 2.4 2.4 2.4 Past service cost transferred - - - -Other benefits paid (5.9) (6.2) (5.9) (6.2)Liability experience (gain)/loss (0.3) 3.9 (0.3) 3.9 Liability loss due to change in financial assumptions 0.6 0.6 0.6 0.6 At 30 September 37.7 40.9 37.7 40.9
(iv) Sensitivity Analysis on defined benefit obligation at end of periodIncrease due to 1% decrease in discount rate 2.2 2.3 2.0 2.3 Decrease due to 1% increase in discount rate 2.0 2.1 2.0 2.1
The above sensitivity analysis has been carried out by recalculating the present value of the obligation at the end of the period after increasing or decreasing the discount rate while leaving all other assumptions unchanged. Any similar variation in the other assumptions would have shown smaller variations in the defined benefit obligation.
The sensitivity analysis may not be representative of the actual change in the defined benefit obligation as it is unlikely that the change in assumptions would occur in isolation of one another as some of the assumptions may be correlated.
CIM FINANCIAL SERVICES LTD / ANNUAL REPORT 2019138

Explanatory Notes30 SEPTEMBER 2019
25. POST EMPLOYMENT BENEFIT ASSETS/LIABILITIES (CONT’D)
(b) Unfunded pension schemes (cont’d)
(v) Future cash flows
- The funding policy is to pay benefits out of the Group’s cashflow as and when due.
- Expected employer contributions to post-employment benefit plans for the year ending 30 September 2019 are MUR 6.0m.
- The weighted average duration of the defined benefit obligations is 5 years.
Sep-19 Sep-18MUR m MUR m
(vi) Principal actuarial assumptions at end of year:Discount rate 5.9% 6.2%Future pension increases 2.0% 2.0%Average retirement age (ARA) 60 60Average life expectancy for:- Male at ARA 19.5 years 19.5 years- Female at ARA 24.2 years 24.2 years
(c) Other retirement benefits
Other retirement benefits comprise full and residual retirement gratuities.
GROUPSep-19 Sep-18
MUR m MUR m(i) Amounts recognised in the Statements of Financial Position are as follows:
Present value of unfunded obligation 55.6 46.7 Liability in the Statements of Financial Position 55.6 46.7
(ii)Amounts recognised in profit or loss and other comprehensive income are as
follows:Service cost:Current service cost 4.8 4.6 Past service cost (0.2) -Net interest on net defined benefit liability 2.9 2.4 Components of amount recognised in profit or loss 7.5 7.0 Liability experience loss 3.7 0.4 Liability (gain)/loss due to change in financial assumptions (2.3) 1.1 Components of amount recognised in other comprehensive income 1.4 1.5
CIM FINANCIAL SERVICES LTD / ANNUAL REPORT 2019 139

Explanatory Notes30 SEPTEMBER 2019
25. POST EMPLOYMENT BENEFIT ASSETS/LIABILITIES (CONT’D)GROUP
Sep-19 Sep-18MUR m MUR m
(c) Other retirement benefits (cont’d)(iii) Movements in liability recognised in Statements of Financial Position:
At 1 October 46.7 37.5 Current service cost 4.8 4.6 Past service cost (0.2) -Interest expense 2.9 2.4 Liability experience loss 3.7 0.4 Liability loss due to change in financial assumptions (2.3) 1.1 Acquisition of subsidiary (note 34) - 0.7 At 30 September 55.6 46.7
(iv) Sensitivity Analysis on defined benefit obligation at end of periodIncrease due to 1% decrease in discount rate 10.6 9.6 Decrease due to 1% increase in discount rate 9.0 7.9
The above sensitivity analysis has been carried out by recalculating the present value of obligation at the end of the period after increasing or decreasing the discount rate while leaving all other assumptions unchanged. Any similar variation in the other assumptions would have shown smaller variations in the defined benefit obligation.
The sensitivity analysis may not be representative of the actual change in the defined benefit obligation as it is unlikely that the change in assumptions would occur in isolation of one another as some of the assumptions may be correlated.
In relation to the residual retirement gratuities, the results are particularly sensitive to a change in the discount rate due to the nature of liabilities being the difference between the pure retirement gratuities under the Employment Rights Act 2008 and the deductions allowable, being five times the annual pension provided and half the lump sum received by the member at retirement from the pension fund with reference to the Company’s share of contributions. The latter’s amount is MUR 94.9m as at 30 September 2019.
(v) Future cashflows
- The funding policy is to pay benefits out of the Group’s cashflow as and when due.
- Expected employer contributions to post-employment benefit plans for the year ending 30 September 2020 are MUR 0.8m.
- The weighted average duration of the defined benefit obligations ranges between 12 years and 29 years.
GROUPSep-19 Sep-18
(vi) Principal actuarial assumptions at end of year: MUR m MUR mDiscount rate 5.9% 6.20%-6.60%Future salary increases 4.0% 4.00%-4.70%Future pension increases 0-1.1% 0.5%Average retirement age (ARA) 60 60 Average life expectancy for:- Male at ARA 19.5 years 19.5 years- Female at ARA 24.2 years 24.2 years
(d) Contribution to the defined contribution plans amounted to MUR 14.0 m (2018: MUR 15.5m).
CIM FINANCIAL SERVICES LTD / ANNUAL REPORT 2019140

Explanatory Notes30 SEPTEMBER 2019
26. DEFERRED TAXATIONDeferred income tax is calculated on all temporary differences under the liability method at 17% (2018: 17%).
There is a legally enforceable right to offset current tax assets against current tax liabilities and deferred income tax assets and liabilities when the deferred income taxes relate to the same fiscal authority. The following amounts are shown in the Statement of Financial Position:
GROUP COMPANYSep-19 Sep-18 Sep-19 Sep-18
MUR m MUR m MUR m MUR mDeferred tax assets 47.1 83.0 - -Deferred tax liabilities (1.3) (28.4) - -
45.8 54.6 - -
At the end of the reporting period, the Group had unused tax losses of MUR 19.1m (2018: MUR 72.4m) available for offset against future profit on which no deferred tax has been recognised due to unpredictability of future taxable profit streams to utilise these losses. The expiry of the Group’s tax losses are MUR 0.4m in 2021, MUR 0.8m in 2022, MUR 2.3m in 2023 and MUR 15.6m in 2024.
Deferred tax assets/(liabilities)
GROUP
Impairment allowance
Post employment
benefit
Fair Value Gains and
Others
Accelerated tax
depreciation Tax losses TotalAt 1 October 2017 69.2 (1.3) (13.3) (14.7) - 39.9 Credit/(charge) to profit or
loss 17.2 7.2 (5.6) (1.7) - 17.1 Charge to other
comprehensive income - (3.1) - - - (3.1)Acquisition of subsidiary - - - 0.7 - 0.7 At 30 September 2018 86.4 2.8 (18.9) (15.7) - 54.6 Impact on adoption of IFRS 9 (0.1) - - - - (0.1)(Charge)/credit to profit or
loss (46.3) (2.3) - 3.8 7.7 (37.1)Credit to comprehensive
income (note 12) - 0.5 - - - 0.5 Exchange difference - - - - (0.6) (0.6)Distribution of disposal goup - - 18.9 9.6 - 28.5 At 30 September 2019 40.0 1.0 - (2.3) 7.1 45.8
CIM FINANCIAL SERVICES LTD / ANNUAL REPORT 2019 141

Explanatory Notes30 SEPTEMBER 2019
27. DEPOSITS FROM CUSTOMERSGROUP Sep-19 Sep-18
MUR m MUR mTime deposits with remaining term to maturityRetail customersWithin 3 months - 75.0 Over 3 up to 6 months - 140.5 Over 6 up to 12 months - 287.8 Over 1 up to 5 years - 1,007.7
- 1,511.0
Corporate customersWithin 3 months - 20.4 Over 3 up to 6 months - 214.1 Over 6 up to 12 months - 261.3 Over 1 up to 5 years - 1,281.3
- 1,777.1
Deposits - capital element - 3,288.1 Interest payable - 138.5
- 3,426.6
28. OTHER BORROWED FUNDSGROUP COMPANY
Sep-19 Sep-18 Sep-19 Sep-18MUR m MUR m MUR m MUR m
(a) Non currentBank and other borrowings - Secured (d) 4,280.8 924.6 - -Bank and other borrowings - Unsecured 5.7 21.1 - -
4,286.5 945.7 - -
CurrentBank overdrafts (note 13) 16.5 203.4 - -Bank and other borrowings - Secured (d) 3,749.5 3,638.2 - 225.7 Bank and other borrowings - Unsecured 1,042.3 1,162.5 1,203.3 1,171.2
4,808.3 5,004.1 1,203.3 1,396.9
Total 9,094.8 5,949.8 1,203.3 1,396.9
CIM FINANCIAL SERVICES LTD / ANNUAL REPORT 2019142

Explanatory Notes30 SEPTEMBER 2019
28. OTHER BORROWED FUNDS (CONT’D)GROUP COMPANY
Sep-19 Sep-18 Sep-19 Sep-18(b) Non current borrowings analysed as follows: MUR m MUR m MUR m MUR m
Repayable otherwise than by instalments: After one year and before two years Others 2.5 16.2 - - After two years and before three years Others 3.2 531.0 - - After three years and before five years Others - 360.9 - - After five years - 27.3 - - Repayable by instalments: After one year and before two years 3,112.0 4.6 - - After two years and before three years 131.4 2.5 - - After three years and before five years 1,037.4 3.2 - - After five years - - - -
4,286.5 945.7 - -
GROUP COMPANYSep-19 Sep-18 Sep-19 Sep-18
% % % %(c) The effective interest rates at the end of the reporting
period were as follows:Bank overdrafts 4.90- 6.95 5.05- 6.95 - - Bank and other borrowings - Secured 3.25 - 5.40 3.20 - 6.75 - 5.55 - 5.85 Bank and other borrowings - Unsecured 0.75 - 4.80 0.75 - 4.25 3.45- 3.70 3.55 - 4.20
CIM FINANCIAL SERVICES LTD / ANNUAL REPORT 2019 143

Explanatory Notes30 SEPTEMBER 2019
28. OTHER BORROWED FUNDS (CONT’D)(d) The secured bank and other borrowings are secured by floating charges over the respective assets of the relevant
companies of the Group.
(e) The carrying amounts of the other borrowed funds are denominated in the following currencies:
GROUP COMPANYSep-19 Sep-18 Sep-19 Sep-18
MUR m MUR m MUR m MUR m
MUR and others 9,085.3 5,910.2 1,203.3 1,396.9 EURO 8.7 30.1 - -USD 0.8 9.5 - -
9,094.8 5,949.8 1,203.3 1,396.9
Changes in liabilities arising from financing activities
GROUP COMPANYSep-19 Sep-18 Sep-19 Sep-18
MUR m MUR m MUR m MUR mAt 1 October 5,746.4 4,057.9 1,396.9 1,620.0 Proceeds 17,177.9 12,097.7 993.0 1,751.9 Repayments (13,842.2) (10,440.5) (1,186.6) (1,975.0)Distribution of disposal group (note 35) (3.8) - - -Acquisition of subsidiary - 33.3 - - Foreign exchange difference - (2.0) - - At 30 September 9,078.3 5,746.4 1,203.3 1,396.9
29. OTHER LIABILITIESGROUP COMPANY
Sep-19 Sep-18 Sep-19 Sep-18MUR m MUR m MUR m MUR m
Trade payables 513.8 525.2 - - Accruals 95.2 69.7 3.6 2.9 Other payables 647.5 605.7 0.2 84.4 Deferred income 182.2 120.8 - - Foreign currency derivatives - 20.0 - 20.0
1,438.7 1,341.4 3.8 107.3 Amount payable to subsidiaries - - - 23.8
1,438.7 1,341.4 3.8 131.1
The carrying amount of the payables is considered as a reasonable approximation of fair value due to their short term nature.
Trade payable and other payable are secured, interest free and payable within 3 months. Deferred income includes merchant discount which is recognised and released to profit or loss in accordance to note 2.6(d).
CIM FINANCIAL SERVICES LTD / ANNUAL REPORT 2019144

Explanatory Notes30 SEPTEMBER 2019
30. DIVIDENDSCOMPANY
Sep-19 Sep-18MUR m MUR m
Amounts recognised as distributions to equity holders in the year:Final dividends payable of MUR0.15 per share (2018: MUR0.60) 102.1 408.3 Interim dividends of MUR0.08 per share (2018: MUR0.07 per share) 54.4 47.6
156.5 455.9
The shares held by the Company in Lavastone Ltd were declared as dividend in specie on 14 December 2018 refer to Note 35 for further details.
31. EQUITY
Stated Capital
COMPANY2019 & 2018
No of sharesOrdinary
sharesMillion MUR m
No par value shares 680.5 680.5
The Company has issued 680,522,310 shares of no par value issued at the reporting date. All shares are fully paid and carry equal voting rights. The ordinary shares are classified as equity.
Capital Reserves
The capital reserves relate to the statutory appropriation of retained earnings and the excess of allowance for credit impairment computed in accordance with the requirements of the Bank of Mauritius over expected credit losses/provision for impairment computed in accordance with IFRS 9/IAS 39.
Actuarial Losses
Actuarial losses arise on remeasurement of net defined benefit liability. Remeasurement of the net defined benefit liability, which comprises actuarial gains and losses arising from experience adjustments and changes in actuarial assumptions, the return on plan assets (excluding interest) and the effect of the asset ceiling (if any, excluding interest), is recognised immediately in other comprehensive income in the period in which they occur. Remeasurements recognised in other comprehensive income shall not be reclassified to profit or loss in subsequent periods.
Retained Earnings
Retained earnings arise from the accumulation of profits from the profit or loss less any dividends payable for the period. It also accounts for any adjustments arising on Group consolidation or transfer to Capital reserves by a subsidiary.
Other Reserves
Reserves not dealt in above are accounted as other reserves.
CIM FINANCIAL SERVICES LTD / ANNUAL REPORT 2019 145

Explanatory Notes30 SEPTEMBER 2019
32. EARNINGS PER SHAREGROUP COMPANY
Sep-19 Sep-18 Sep-19 Sep-18MUR m MUR m MUR m MUR m
Profit for the year from continuing operations 366.9 272.7 301.7 4.5 Profit for the year from discontinued operations 15.8 78.7 - -Profit attributable to owners of the parent 382.7 351.4 301.7 4.5 Number of shares used in calculation 680,522,310 680,522,310 680,522,310 680,522,310Basic/diluted earnings per share from continuing
activities MUR 0.54 0.40 0.44 0.01Basic/diluted earnings per share from
discontinued activities MUR 0.02 0.12 - - Basic/diluted earnings per share MUR 0.56 0.52 0.44 0.01
33. NOTES TO THE STATEMENTS OF CASH FLOWSGROUP COMPANY
Sep-19 Sep-18 Sep-19 Sep-18MUR m MUR m MUR m MUR m
(a) Cash generated from operationsProfit before taxation from continuing operations 453.1 346.1 304.4 4.5 Profit before taxation from discontinuing operations 20.0 95.3 - -Depreciation 146.2 67.7 - -Amortisation 26.8 18.3 - 0.1 Impairment of investment - 0.6 55.7 0.6 Fair value change on investment properties - (29.6) - -Net gain on business combination - (29.5) - -Net provision for credit impairment 180.9 214.3 5.8 -Profit on disposal of property, plant and equipment (3.9) - - -Investment income - - (311.9) (65.0)Foreign exchange gain/loss (4.4) (2.0) - 11.1 Fair value movement on financial assets 0.4 12.0 0.4 33.3 Fair value movement on debt instruments (8.2) (3.0) (8.2) (3.0)Share of results of associates 32.3 14.7 - -Post employment benefit 4.3 (4.4) (3.5) (3.8)
847.5 700.5 42.7 (22.2)Changes in working capitalRepayment of deposit from customers (3,426.6) (496.5) - -Deposit with banks 518.4 1,764.3 524.5 1,731.6 Inventories 1.9 2.6 - -Net investment in finance leases and other credit
agreements (1,268.1) (537.0) - -Loan and advances (889.0) (563.5) (1,896.4) 716.6 Investment in financial assets 1,597.9 (1,586.7) 1,597.9 (1,586.7)Other assets 361.2 (124.4) 123.2 52.4 Other liabilities (158.1) 41.5 (127.5) (0.7)Cash (used in)/generated from operations (2,414.9) (799.2) 264.4 891.0
(b) Operational cash flows from interestInterest income received during the year 1,420.3 1,163.5 118.6 140.1 Interest expense paid during the year (387.4) (354.3) (39.3) (108.7)
CIM FINANCIAL SERVICES LTD / ANNUAL REPORT 2019146

Explanatory Notes30 SEPTEMBER 2019
34. BUSINESS COMBINATION AND ACQUISITION OF NON CONTROLLING INTERESTS
Acquisition of subsidiary
In August 2018, the Group acquired 100% of the share capital and voting rights of The Mauritian Eagle Leasing Company Limited (‘MELCO’) in view of the expansion of the Group’s operation.
MELCO is an unlisted company based in Mauritius and operating in the leasing and deposit taking business.
The following table summarises the purchase consideration and the fair value of the identifiable amounts of the assets acquired and liabilities assumed at the acquisition date:
Consideration MUR mCash Consideration 121.5 Payable 84.3 Total consideration 205.8 Fair value of net assets acquired (235.3)Net gain on business combination (29.5)Recognised amounts of identifiable assets acquired and liabilities assumedCash and cash equivalents 70.4 Net investment in lease 639.8 Property, plant and equipment 333.9 Deposits with bank 51.4 Deferred tax asset 0.7 Other assets 5.2 Deposits from customers (788.8)Long term loans (33.3)Other liabilities (43.1)Current tax liabilities (0.2)Post employment benefit (0.7)
235.3 Net cash outflow on acquisition of subsidiaryConsideration paid in cash 121.5 Cash and cash equivalent balances acquired with the subsidiary (70.4)
51.1
The fair value of the net investment in lease amounted to MUR 639.8m; the gross amount was MUR 771.1m, out of which MUR 55.8m is not expected to be collected.
The net gain on business combination resulted from a higher fair value of the identifiable assets acquired and liabilities assumed compared to the acquisition costs. The net gain on business combination is presented separately on the statement of profit or loss.
The transaction included a contingent element for equal risk sharing between the seller and the Group relating to the recovery of certain non-performing leases over the recovery period agreed by both parties.
The Group estimated that no settlement would be required at the end of the recovery period and therefore the fair value has been determined to be nil.
For the financial year ended 30 September 2018, MELCO contributed MUR 12.2m of revenue and MUR 2.2m of profit before tax from continuing operations from the date of acquisition.
Had the acquired subsidiary been consolidated from 1 October 2017, the revenue from continuing operation for the year ended 30 September 2018 of the Group would have been MUR 1,338.6m and the profit after tax from continuing operations would have been MUR 336.4m.
Acquisition related costs of MUR 4.4m were recognised in operating expenses.
CIM FINANCIAL SERVICES LTD / ANNUAL REPORT 2019 147

Explanatory Notes30 SEPTEMBER 2019
35. DISCONTINUED OPERATIONS AND DISTRIBUTION OF DISPOSAL GROUP TO OWNERSThe Board of CIM Financial Services Ltd had deliberated and resolved the spinning off of the property segment of the Group to the shareholders of the Company with the eventual listing on the Development and Enterprise Market (DEM) of the Stock Exchange of Mauritius. In view of that, the Group embarked on the project of restructuring all the entities of the property segment under a single holding company which is Lavastone Ltd (previously known as CIM Property Development Ltd).
In December 2018, the Group proceeded with the restructuring of the property segment whereby all the entities under the property segment were restructured under Lavastone Ltd and share were issued by Lavastone Ltd to CIM Financial Services Ltd.
On 14 December 2018, CIM Financial Services Ltd declared a dividend in specie of all the shares it held in Lavastone Ltd. The carrying amount of the investment in Lavastone Ltd in the Company’s financial statements at the date of distribution amounted to MUR 1,721.1m (Note 20).
The results of the disposal group distributed in the Group’s financial statements are as follows:
Sep-19 Sep-18MUR m MUR m
Revenue 40.2 163.7Expenses (19.9) (67.7)Operating income 20.3 96.0Finance costs (0.3) (0.7)Profit before tax 20.0 95.3Income tax expense (4.2) (16.6)Profit after tax 15.8 78.7 Profit on disposal of subsidiaries - - Profit after tax for the year from discontinued operations 15.8 78.7 Basic/diluted earnings per share from discontinued operations 0.02 0.12
Sep-19Analysis of assets and liabilities of disposal group distributed MUR mAssetsProperty, plant and equipment 1,068.3 Investment properties 1,216.5 Intangible assets 45.4 Cash and cash equivalent 269.9 Other assets 319.8
2,919.9 LiabilitiesOther borrowed funds 3.8 Current tax liabilities 5.5 Deferred taxation 28.5 Other liabilities 186.8
224.6 Net assets of disposal group distributed 2,695.3
The net cash flows arising on the discontinued operations are as follows:
Sep-19 Sep-18MUR m MUR m
Operating 15.8 636.8Investing - (438.9)Financing 170.0 (116.2)Net cash inflow 185.8 81.7
CIM FINANCIAL SERVICES LTD / ANNUAL REPORT 2019148

Explanatory Notes30 SEPTEMBER 2019
36. COMMITMENTS GROUP
Sep-19 Sep-18MUR m MUR m
Operating lease - where the Group is the lessorThe Group has entered into Operating leases for motor vehicles, equipment and
investment properties consisting of buildings for rental. These leases have terms ranging from 1 to 10 years.
The future minimum lease receivable under operating leases are as follows: Within one year 149.9 220.8 After one year and before five years 326.8 482.4 Later than 5 years 32.0 114.8
508.7 818.0
37. EVENTS AFTER THE REPORTING DATEThe parent company, CIM Financial Services Ltd, has resolved for an amalgamation together with a number of its subsidiaries with the objective of streamlining the structure of the group. The entities concerned are Cim Finance Ltd, Cim Agencies Ltd, Mauritian Eagle Leasing Company Limited, Cim Management Services Ltd, and Cim Shared Services Ltd. The amalgamation is not yet effective and will be subject to regulatory approvals.
In October 2019, the Group raised MUR 2billion by way of senior unsecured fixed rate notes through a private placement.
38. CONTINGENT LIABILITIESGROUP & COMPANY
Sep-19 Sep-18MUR m MUR m
Corporate guarantees on behalf of subsidiary 20.0 20.0 20.0 20.0
At 30 September 2019, the Company had contingent liabilities in respect of guarantees from which it is anticipated that no material liabilities would arise. The Company has given corporate guarantees amounting to MUR 20m (2018: MUR 20m) on behalf of one subsidiary company.
CIM FINANCIAL SERVICES LTD / ANNUAL REPORT 2019 149

Explanatory Notes30 SEPTEMBER 2019
39. RELATED PARTY TRANSACTIONS(a) During the year the Group transacted with related parties.
Transactions which are not dealt with elsewhere in the financial statements are as follows:
GROUP COMPANYSep-19 Sep-18 Sep-19 Sep-18
MUR m MUR m MUR m MUR mInterest income and other incomeSubsidiaries - - 87.8 121.8 Purchase of goods & services fromCompanies with common shareholders 8.0 18.0 0.2 0.1 Purchase of plant and equipmentCompanies with common shareholders 70.5 - - - Dividend incomeSubsidiaries - - 301.0 65.0 Associates 10.9 - 10.9 - Financial chargesSubsidiaries - - 6.6 3.3 Loans payable toSubsidiaries - - 170.0 107.0 Loans and leases receivable fromCompanies with common shareholders - 111.5 - - Subsidiaries - - 2,991.9 1,105.5 Amount owed byCompanies with common shareholders 120.6 0.6 33.5 - Subsidiaries - - 166.9 780.8 Amount owed toCompanies with common shareholders 63.6 - - - Subsidiaries - - - 23.8 Remuneration of key management personnelShort term employee benefit 179.7 121.7 6.2 6.8 Long term employee benefit 7.3 7.0 - - Post employment benefit - 15.8 - -
CIM FINANCIAL SERVICES LTD / ANNUAL REPORT 2019150

Explanatory Notes30 SEPTEMBER 2019
40. BUSINESS SEGMENTS
Finance InvestmentsGroup
eliminationDiscontinued
operations TotalMUR m MUR m MUR m MUR m MUR m
Year ended 30 September 2019Gross operating income 2,153.8 522.7 (478.4) - 2,198.1 Interest expense (432.1) (50.7) 94.6 - (388.2)Net operating income 1,721.7 472.0 (383.8) - 1,809.9 Operating expenses (1,023.6) (508.2) 383.8 - (1,148.0)Operating profit before impairment 698.1 (36.2) - - 661.9 Allowance for credit impairment (155.0) (25.9) - (180.9)Operating profit 543.1 (62.1) - - 481.0 Foreign exchange gain 1.1 3.3 - - 4.4 Share of loss of associates - (32.3) - - (32.3) Profit/(loss) before tax 544.2 (91.1) - - 453.1 Income tax (expense)/credit (112.1) 25.9 - - (86.2)Profit for the year from continuing operations 432.1 (65.2) - - 366.9 Profit for the year from discontinued
operations - - - 15.8 15.8 Profit for the year 432.1 (65.2) - 15.8 382.7
Assets 14,934.9 3,533.7 (3,657.8) - 14,810.8 Liabilities 12,715.8 1,577.3 (3,657.8) - 10,635.3 Capital expenditure 323.1 7.7 - - 330.8 Investments in associates - 141.0 - - 141.0 Depreciation & amortisation 161.5 13.3 (1.8) - 173.0
CIM FINANCIAL SERVICES LTD / ANNUAL REPORT 2019 151

Explanatory Notes30 SEPTEMBER 2019
40. BUSINESS SEGMENTS (CONT’D)
Finance InvestmentsGroup
eliminationDiscontinued
operations TotalMUR m MUR m MUR m MUR m MUR m
Year ended 30 September 2018Gross operating income 1,757.0 258.5 (214.9) - 1,800.6 Interest expense (351.1) (111.6) 81.4 - (381.3)Net operating income 1,405.9 146.9 (133.5) - 1,419.3 Operating expenses (737.9) (259.4) 133.5 - (863.8)Operating profit before impairment 668.0 (112.5) - - 555.5 Net impairment of financial assets (213.3) (1.6) - - (214.9)Operating profit 454.7 (114.1) - - 340.6 Foreign exchange gain/(loss) 0.4 (9.7) - - (9.3)Net gain on business combination - 29.5 - - 29.5 Share of loss of associates - (14.7) - - (14.7)
455.1 (109.0) - - 346.1 Income tax (expense)/credit (76.3) 3.6 - - (72.7)Profit for the year from continuing
operations 378.8 (105.4) - - 273.4 Profit for the year from discontinued
operations - - - 78.7 78.7 Profit for the year 378.8 (105.4) - 78.7 352.1
Assets 12,633.0 4,573.6 (2,624.4) 2,930.5 17,512.7 Liabilities 10,720.0 1,733.3 (2,624.4) 1,037.9 10,866.8 Capital expenditure 97.3 22.8 - 52.4 172.5 Investments in associates - 177.5 - - 177.5 Depreciation & amortisation 71.5 8.2 - - 79.7
For management purposes, the Group is organised into two business segments based on the products and services as follows:
Finance - consumer credit, leasing, card acquiring and issuing, factoring, deposit taking and foreign exchange dealing.
Investments - strategy monitoring, support to SBUs, performance monitoring and statutory reporting.
No operating segments have been aggregated to form the above reportable operating segments.
During the year ended 30 September 2019, the Group has distributed its non cash assets in the property segment and has therefore disclosed this segment as discontinued operations.
Transfer prices between operating segments are based on the Group’s pricing framework.
Geographical information Sep-19 Sep-18Revenue MUR m MUR m- From customers in Mauritius 2,176.9 1,799.3 - from customers in foreign countries 21.2 1.3
2,198.1 1,800.6 Non-current assets*- located in Mauritius 716.1 2,894.6 - located in foreign countries 14.8 20.0
730.9 2,914.6
* Non-current assets exclude financial instruments, deferred tax assets and post employment benefit assets.
41. IMMEDIATE AND ULTIMATE HOLDING COMPANYThe immediate holding and ultimate holding companies of CIM Financial Services Ltd are Cim Holdings Ltd and Elgin Ltd respectively. Both companies are incorporated in Mauritius.
CIM FINANCIAL SERVICES LTD / ANNUAL REPORT 2019152

COMPANY Sep-19 Sep-18Within 12
monthsAfter 12 months Total
Within 12 months
After 12 months Total
MUR m MUR m MUR m MUR m MUR m MUR mASSETSCash and bank balances 12.6 - 12.6 107.9 - 107.9 Deposits with banks - - - 524.5 - 524.5 Loans and advances 2,809.6 182.3 2,991.9 1,036.4 69.1 1,105.5 Investments in financial assets 0.8 - 0.8 1,589.7 1.2 1,590.9 Other assets 200.4 - 200.4 948.0 - 948.0 Investments in subsidiaries - 1,130.3 1,130.3 - 1,922.8 1,922.8 Investments in associates - 10.4 10.4 - 16.2 16.2 Investment properties - - - - 33.5 33.5 Intangible assets - 0.1 0.1 - 0.1 0.1 Total assets 3,023.4 1,323.1 4,346.5 4,206.5 2,042.9 6,249.4 LIABILITIESOther borrowed funds 1,203.3 - 1,203.3 1,396.9 - 1,396.9 Other liabilities 3.8 - 3.8 131.1 - 131.1 Income tax liabilities 2.7 - 2.7 - - -Post employment benefit liabilities - 37.7 37.7 - 40.9 40.9 Total liabilities 1,209.8 37.7 1,247.5 1,528.0 40.9 1,568.9
Explanatory Notes30 SEPTEMBER 2019
42. MATURITY ANALYSIS OF ASSET AND LIABILITIES
GROUP Sep-19 Sep-18Within 12
monthsAfter 12 months Total
Within 12 months
After 12 months Total
MUR m MUR m MUR m MUR m MUR m MUR mASSETSCash and bank balances 444.5 - 444.5 526.1 - 526.1 Deposits with banks 9.0 498.0 507.0 530.0 496.0 1,026.0 Net investment in leases and other
credit agreements 4,435.8 4,333.3 8,769.1 3,979.2 3,658.5 7,637.7 Loans and advances 1,752.3 1,956.4 3,708.7 1,386.7 1,478.9 2,865.6 Investments in financial assets - 8.9 8.9 1,597.7 1.2 1,598.9 Other assets 435.3 - 435.3 676.1 - 676.1 Inventories 3.7 - 3.7 5.6 - 5.6 Investments in associates - 141.0 141.0 - 177.5 177.5 Investment properties - - - - 1,216.5 1,216.5 Property, plant and equipment - 638.9 638.9 - 1,585.8 1,585.8 Intangible assets - 88.3 88.3 - 106.7 106.7 Income tax assets 18.3 - 18.3 - - -Post employment benefit assets - - - - 7.2 7.2 Deferred tax assets - 47.1 47.1 - 83.0 83.0 Total assets 7,098.9 7,711.9 14,810.8 8,701.4 8,811.3 17,512.7 LIABILITIESDeposits from customers - - - 1,137.6 2,289.0 3,426.6 Other borrowed funds 4,808.3 4,286.5 9,094.8 5,004.1 945.7 5,949.8 Other liabilities 1,438.7 - 1,438.7 1,341.4 - 1,341.4 Income tax liabilities 6.1 - 6.1 33.0 - 33.0 Post employment benefit liabilities - 94.4 94.4 - 87.6 87.6 Deferred tax liabilities - 1.3 1.3 - 28.4 28.4 Total liabilities 6,253.1 4,382.2 10,635.3 7,516.1 3,350.7 10,866.8
CIM FINANCIAL SERVICES LTD / ANNUAL REPORT 2019 153

Explanatory notes30 SEPTEMBER 2019
43. FAIR VALUE OF FINANCIAL INSTRUMENTSExcept for financial assets and liabilities at fair value through profit or loss, the Group does not measure its financial assets and financial liabilities at fair value. The table below shows, by class of financial instruments, the comparison of their carrying amounts with their fair values. These fair values are calculated for disclosure purposes only.
Carrying amounts
Fair value30 September 2019 Level 1 Level 2 Level 3 Total
MUR m MUR m MUR m MUR m MUR mFinancial assets not measured at fair
valueNet investment in leases and other
credit agreements 8,769.1 - - 8,905.5 8,905.5 Loans and advances Credit facilities 2,952.2 - - 2,957.8 2,957.8 Corporate credit facilities 158.4 - - 164.1 164.1
11,879.7 - - 12,027.4 12,027.4
Financial liabilities not measured at fair value
Other borrowed funds 9,094.8 - - 9,094.8 9,094.8 9,094.8 - - 9,094.8 9,094.8
Financial instruments for which the fair value approximates the carrying amount
Financial assetsCash at bank balances 444.5 Deposits with banks 507.0 Loans and advances Factoring receivables 259.0 Card receivables 339.1 Investment in financial assets 8.9 Other assets 376.6
Financial liabilitiesOther liabilities 1,670.8
CIM FINANCIAL SERVICES LTD / ANNUAL REPORT 2019154

Explanatory notes30 SEPTEMBER 2019
43. FAIR VALUE OF FINANCIAL INSTRUMENTS (CONT’D)
Carrying amounts
Fair value30 September 2018 Level 1 Level 2 Level 3 Total
MUR m MUR m MUR m MUR m MUR mFinancial assets not measured at fair
valueNet investment in leases and other
credit agreements 7,637.7 - - 7,663.4 7,663.4 Loans and advances Credit facilities 1,988.2 - - 2,000.6 2,000.6 Corporate credit facilities 266.8 - - 268.7 268.7 Investments in financial assets - - - - -
9,892.7 - - 9,932.7 9,932.7
Financial liabilities measured at fair value
Foreign currency derivatives - - - - - Financial liabilities not measured at
fair valueDeposits from customers 3,426.6 - - 3,561.6 3,561.6 Other borrowed funds 5,949.8 - - 5,949.8 5,949.8
9,376.4 - - 9,511.4 9,511.4
Financial instruments for which the fair value approximates the carrying amount
Financial assetsCash at bank balances 526.1Deposits with banks 1,026.0 Loans and advances Factoring receivables 219.8 Card receivables 390.8 Investment in financial assets 1,598.9 Other assets 605.5
Financial liabilitiesOther liabilities 1,220.6
For financial assets and financial liabilities that have a short-term maturity, the carrying amounts, which are net of impairment, represent a reasonable approximation of their fair value. Such instruments include cash and bank balances, deposits with banks, factoring and card receivables and other liabilities.
The fair value of the net investment in leases and and other credit agreements, credit facilities, corporate credit facilities (included in loans and advances), deposits from customers and other borrowed funds are estimated using cash flow models discounted at the relevant discount rate taking into consideration credit risk, foreign exchange risk, of default and loss given default estimates. As a result, these balances fall under Level 3 of the fair value hierarchy. Market observable data is used when appropriate and when such data is not available, the Company uses historical experience. The discount rates used represent the market rates.
Refer to Note 17 for further details regarding financial assets measured at fair value.
The Companies financial assets and liabilities approximates its fair value as at 30 September 2019.
CIM FINANCIAL SERVICES LTD / ANNUAL REPORT 2019 155

Explanatory notes30 SEPTEMBER 2019
44. CLASSIFICATION OF FINANCIAL INSTRUMENTS
Categories of financial instruments
The table below shows the financial assets and liabilities of the Group and the Company classified according to the categories under IFRS 9 and IAS 39 respectively.
30 September 2019Categories under IFRS 9
GROUP COMPANY
Financial assets
Assets at fair value through profit or loss
Assets at amortised
costs Total
Assets at fair value through profit or loss
Assets at amortised
costs TotalMUR m MUR m MUR m MUR m MUR m MUR m
Cash and bank balances - 444.5 444.5 - 12.6 12.6 Deposits with banks - 507.0 507.0 - - - Loans and advances - 3,708.7 3,708.7 - 2,991.9 2,991.9 Investments in financial
assets 0.8 8.1 8.9 0.8 - 0.8 Other assets - 376.6 376.6 - 200.4 200.4
0.8 5,044.9 5,045.7 0.8 3,204.9 3,205.7
GROUP COMPANY
Financial liabilties
Liabilities at fair value
through profit or loss
Liabilities at amortised
cost Total
Liabilities at fair value
through profit or loss
Liabilities at amortised
cost TotalMUR m MUR m MUR m MUR m MUR m MUR m
Other borrowed funds - 9,094.8 9,094.8 - 1,203.3 1,203.3Other liabilities - 1,256.5 1,256.5 - 3.8 3.8
- 10,351.3 10,351.3 - 1,207.1 1,207.1
30 September 2018Categories under IAS 39
GROUP COMPANY
Financial assets
Assets at fair value through
profit or lossAvailable for sale
Loans and receivables Total
Assets at fair value through
profit or lossAvailable for
sale Loans and
receivables TotalMUR m MUR m MUR m MUR m MUR m MUR m MUR m MUR m
Cash and bank balances - - 526.1 526.1 - - 107.9 107.9 Deposits with banks - - 1,026.0 1,026.0 - - 524.5 524.5 Loans and advances - - 2,865.6 2,865.6 - - 1,105.5 1,105.5 Investments in financial
assets 1,589.7 1.2 8.0 1,598.9 1,589.7 1.2 - 1,590.9 Other assets - - 605.5 605.5 - - 373.0 373.0
1,589.7 1.2 5,031.2 6,622.1 1,589.7 1.2 2,110.9 3,701.8
GROUP COMPANY
Financial liabilties
Liabilities at fair value
through profit or loss
Liabilities at amortised
cost Total
Liabilities at fair value
through profit or loss
Liabilities at amortised
cost TotalMUR m MUR m MUR m MUR m MUR m MUR m
Deposits from customers - 3,426.6 3,426.6 - - - Other borrowed funds - 5,949.8 5,949.8 - 1,396.9 1,396.9 Other liabilities 20.0 1,200.6 1,220.6 20.0 111.1 131.1
20.0 10,577.0 10,597.0 20.0 1,508.0 1,528.0
CIM FINANCIAL SERVICES LTD / ANNUAL REPORT 2019156

Explanatory Notes30 SEPTEMBER 2019
45. FINANCIAL SUMMARYGROUP Sep-19 Sep-18 Sep-17
MUR m MUR m MUR mStatements of Profit or Loss and Other Comprehensive Income from continuing operationsInterest income 1,442.6 1,189.2 1,042.4 Interest expense (388.2) (381.3) (352.1)Net interest income/(expense) 1,054.4 807.9 690.3 Fee and commission income 541.1 539.4 566.3 Other income 214.4 72.0 325.1 Net operating income 1,809.9 1,419.3 1,581.7 Operating expenses (1,148.0) (863.8) (874.4)Operating profit before impairment 661.9 555.5 707.3 Allowance for impairment (180.9) (214.3) (186.9)Impairment of investment - (0.6) -Share of results of associates (32.3) (14.7) (5.6)Foreign exchange loss 4.4 (9.3) (117.0)Share of result of joint venture - - - Profit before non-recurring items 453.1 316.6 397.8 Non-recurring items:Gain on disposal of subsidiary company - - 13.7 Net gain on business combination - 29.5 - Profit before taxation 453.1 346.1 411.5 Income tax expense (86.2) (72.7) (107.3)Profit for the year from continuing operations 366.9 273.4 304.2 Other comprehensive income for the year, net of tax (4.1) (9.5) 56.4 Total comprehensive income from continuing for the year 362.8 263.9 360.6 Profit for the year from discontinued operations 15.8 78.7 2,645.4 Profit for the year 378.6 342.6 3,006.0
Profit attributable to:Owners of the parent 382.7 351.4 2,956.2 Non controlling interests - 0.7 (6.6)
382.7 352.1 2,949.6 Total comprehensive income attributable to:Owners of the parent 378.6 338.2 3,001.6 Non controlling interests - 4.4 4.4
378.6 342.6 3,006.0
Earnings per share 0.54 0.52 4.35Earnings per share from continuing operations 0.56 0.40 0.46Statements of Financial PositionAssets 14,810.8 17,512.7 15,368.0 Stated capital 680.5 680.5 680.5 Retained earnings 2,983.7 4,999.9 5,171.6 Other reserves 511.3 646.1 592.1 Non controlling interests - 319.4 315.0 Liabilities 10,635.3 10,866.8 8,608.8
14,810.8 17,512.7 15,368.0 Stated CapitalNumber of ordinary shares - issued and fully paid Units 680,522,310 680,522,310 680,522,310
CIM FINANCIAL SERVICES LTD / ANNUAL REPORT 2019 157
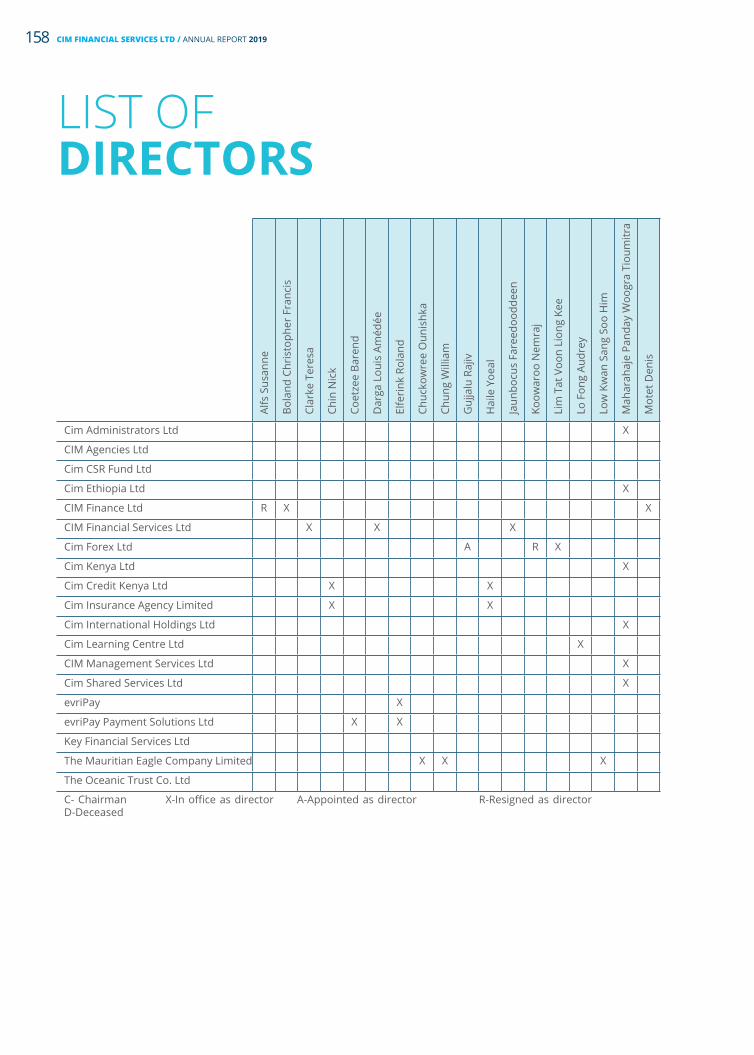
LIST OF DIRECTORS
Alfs
Sus
anne
Bola
nd C
hris
toph
er F
ranc
is
Clar
ke T
eres
a
Chin
Nic
k
Coet
zee
Bare
nd
Dar
ga L
ouis
Am
édée
Elfe
rink
Rol
and
Chuc
kow
ree
Oun
ishk
a
Chun
g W
illia
m
Guj
jalu
Raj
iv
Hai
le Y
oeal
Jaun
bocu
s Fa
reed
oodd
een
Koow
aroo
Nem
raj
Lim
Tat
Voo
n Li
ong
Kee
Lo F
ong
Audr
ey
Low
Kw
an S
ang
Soo
Him
Mah
arah
aje
Pand
ay W
oogr
a Ti
oum
itra
Mot
et D
enis
Pari
anen
Soo
paya
Ram
tool
a As
hraf
Sath
an D
avin
a
Scea
les
Anth
ony
Patr
ick
Niv
en
Som
en D
avid
Tape
sar
Raj
Tayl
or C
olin
Geo
ffre
y
Tayl
or A
lexa
nder
Mat
thew
Tayl
or P
hilip
Sim
on
Tayl
or S
ebas
tian
Callu
m
Tayl
or T
imot
hy
Tim
ol A
isha
Vagh
jee
Man
oj
Van
Beun
inge
n M
ark
Vaud
in N
icol
as
Vict
oire
Gia
nella
Yen
Bern
and
Cim Administrators Ltd X X
CIM Agencies Ltd X X
Cim CSR Fund Ltd X X X
Cim Ethiopia Ltd X X
CIM Finance Ltd R X X X X C X
CIM Financial Services Ltd X X X X C X X X X
Cim Forex Ltd A R X X X X
Cim Kenya Ltd X X
Cim Credit Kenya Ltd X X X X
Cim Insurance Agency Limited X X X X
Cim International Holdings Ltd X X
Cim Learning Centre Ltd X X
CIM Management Services Ltd X X
Cim Shared Services Ltd X X X
evriPay X X A X
evriPay Payment Solutions Ltd X X X
Key Financial Services Ltd X
The Mauritian Eagle Company Limited X X X X X X X X X
The Oceanic Trust Co. Ltd X
C- Chairman X-In office as director A-Appointed as director R-Resigned as director D-Deceased
CIM FINANCIAL SERVICES LTD / ANNUAL REPORT 2019158

Alfs
Sus
anne
Bola
nd C
hris
toph
er F
ranc
is
Clar
ke T
eres
a
Chin
Nic
k
Coet
zee
Bare
nd
Dar
ga L
ouis
Am
édée
Elfe
rink
Rol
and
Chuc
kow
ree
Oun
ishk
a
Chun
g W
illia
m
Guj
jalu
Raj
iv
Hai
le Y
oeal
Jaun
bocu
s Fa
reed
oodd
een
Koow
aroo
Nem
raj
Lim
Tat
Voo
n Li
ong
Kee
Lo F
ong
Audr
ey
Low
Kw
an S
ang
Soo
Him
Mah
arah
aje
Pand
ay W
oogr
a Ti
oum
itra
Mot
et D
enis
Pari
anen
Soo
paya
Ram
tool
a As
hraf
Sath
an D
avin
a
Scea
les
Anth
ony
Patr
ick
Niv
en
Som
en D
avid
Tape
sar
Raj
Tayl
or C
olin
Geo
ffre
y
Tayl
or A
lexa
nder
Mat
thew
Tayl
or P
hilip
Sim
on
Tayl
or S
ebas
tian
Callu
m
Tayl
or T
imot
hy
Tim
ol A
isha
Vagh
jee
Man
oj
Van
Beun
inge
n M
ark
Vaud
in N
icol
as
Vict
oire
Gia
nella
Yen
Bern
and
Cim Administrators Ltd X X
CIM Agencies Ltd X X
Cim CSR Fund Ltd X X X
Cim Ethiopia Ltd X X
CIM Finance Ltd R X X X X C X
CIM Financial Services Ltd X X X X C X X X X
Cim Forex Ltd A R X X X X
Cim Kenya Ltd X X
Cim Credit Kenya Ltd X X X X
Cim Insurance Agency Limited X X X X
Cim International Holdings Ltd X X
Cim Learning Centre Ltd X X
CIM Management Services Ltd X X
Cim Shared Services Ltd X X X
evriPay X X A X
evriPay Payment Solutions Ltd X X X
Key Financial Services Ltd X
The Mauritian Eagle Company Limited X X X X X X X X X
The Oceanic Trust Co. Ltd X
C- Chairman X-In office as director A-Appointed as director R-Resigned as director D-Deceased
CIM FINANCIAL SERVICES LTD / ANNUAL REPORT 2019 159

NOTES


CIM Financial Services Ltd c/r Edith Cavell & Mère Barthélemy Streets. Port Louis MauritiusTel: +230 213 7676 Email: [email protected]
www.cim.mu