Embed Size (px)
Citation preview
2019 Annual Report
The Bank of Iwate, Ltd. Annual Report 2019

― 1 ―
Sachio Taguchi
President
Message from the President
Thank you very much for your continued patronage of the Bank of Iwate. In April 2019 we began implementing our new medium-term management plan “Iwagin Frontier Plan – To the Next” (the “Plan”), which will last for a period of four years. The theme of the Plan is “pursuing CSV to build a future with the region.” CSV stands for “Creating Shared Value,” and by confronting the various issues facing our region head on as we execute the Plan, and endeavoring to resolve them, we aim to create shared value and achieve growth for both the community and the Bank. The environment surrounding the Bank is becoming increasingly uncertain, as not only is the local economy shrinking due to a declining population and a shortage of successors, but we are also faced with challenges such as the continuation of negative interest-rate policy by the Bank of Japan and entry into the financial business by firms from other sectors. To tackle this situation and establish co-prosperity with our region, based on which we do the bulk of our business, our executives and employees are all working together to execute various measures in accordance with the Plan. Our corporate message, “Trust, and beyond,” embodies our commitment to gaining the confidence of our customers and then taking that one step further to build a strong relationship of trust with them. Our executives and employees will be working together to make sure that we remain a bank that local customers trust and choose, so we truly hope that we can count on your continued support and patronage.
― 2 ―
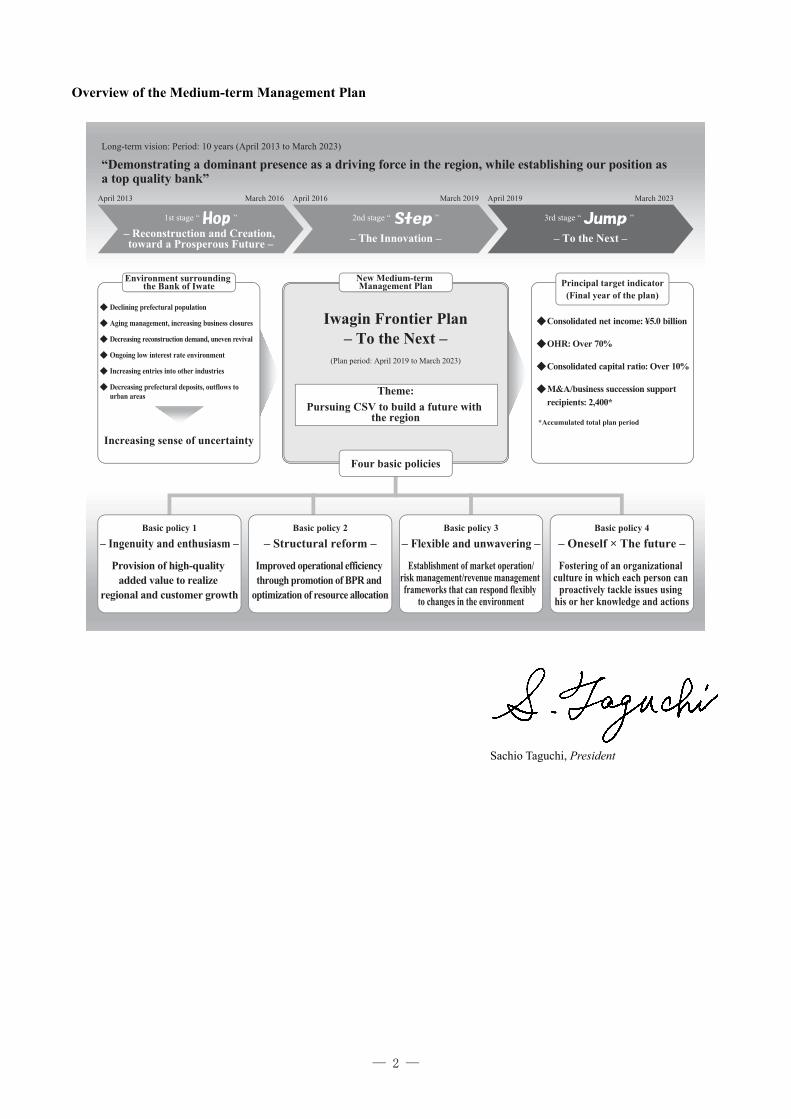
Overview of the Medium-term Management Plan
Sachio Taguchi, President
― 3 ―
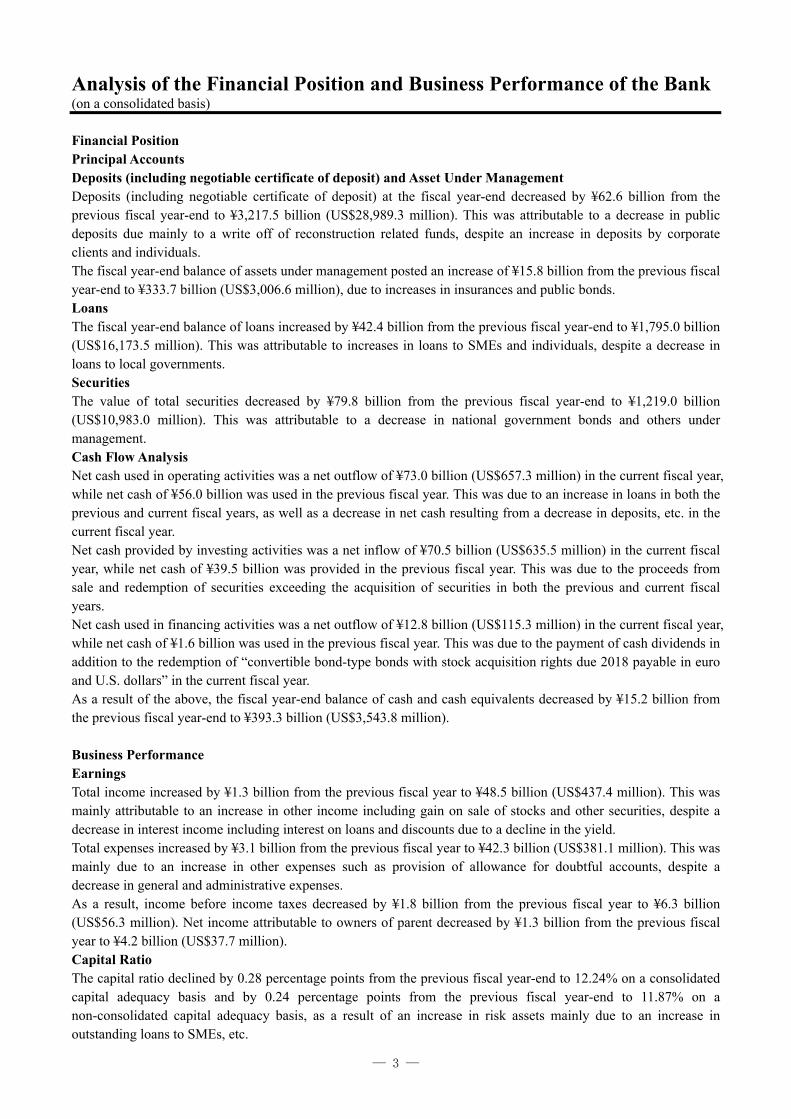
Analysis of the Financial Position and Business Performance of the Bank (on a consolidated basis)
Financial Position Principal Accounts Deposits (including negotiable certificate of deposit) and Asset Under Management Deposits (including negotiable certificate of deposit) at the fiscal year-end decreased by ¥62.6 billion from the previous fiscal year-end to ¥3,217.5 billion (US$28,989.3 million). This was attributable to a decrease in public deposits due mainly to a write off of reconstruction related funds, despite an increase in deposits by corporate clients and individuals. The fiscal year-end balance of assets under management posted an increase of ¥15.8 billion from the previous fiscal year-end to ¥333.7 billion (US$3,006.6 million), due to increases in insurances and public bonds. Loans The fiscal year-end balance of loans increased by ¥42.4 billion from the previous fiscal year-end to ¥1,795.0 billion (US$16,173.5 million). This was attributable to increases in loans to SMEs and individuals, despite a decrease in loans to local governments. Securities The value of total securities decreased by ¥79.8 billion from the previous fiscal year-end to ¥1,219.0 billion (US$10,983.0 million). This was attributable to a decrease in national government bonds and others under management. Cash Flow Analysis Net cash used in operating activities was a net outflow of ¥73.0 billion (US$657.3 million) in the current fiscal year, while net cash of ¥56.0 billion was used in the previous fiscal year. This was due to an increase in loans in both the previous and current fiscal years, as well as a decrease in net cash resulting from a decrease in deposits, etc. in the current fiscal year. Net cash provided by investing activities was a net inflow of ¥70.5 billion (US$635.5 million) in the current fiscal year, while net cash of ¥39.5 billion was provided in the previous fiscal year. This was due to the proceeds from sale and redemption of securities exceeding the acquisition of securities in both the previous and current fiscal years. Net cash used in financing activities was a net outflow of ¥12.8 billion (US$115.3 million) in the current fiscal year, while net cash of ¥1.6 billion was used in the previous fiscal year. This was due to the payment of cash dividends in addition to the redemption of “convertible bond-type bonds with stock acquisition rights due 2018 payable in euro and U.S. dollars” in the current fiscal year. As a result of the above, the fiscal year-end balance of cash and cash equivalents decreased by ¥15.2 billion from the previous fiscal year-end to ¥393.3 billion (US$3,543.8 million). Business Performance Earnings Total income increased by ¥1.3 billion from the previous fiscal year to ¥48.5 billion (US$437.4 million). This was mainly attributable to an increase in other income including gain on sale of stocks and other securities, despite a decrease in interest income including interest on loans and discounts due to a decline in the yield. Total expenses increased by ¥3.1 billion from the previous fiscal year to ¥42.3 billion (US$381.1 million). This was mainly due to an increase in other expenses such as provision of allowance for doubtful accounts, despite a decrease in general and administrative expenses. As a result, income before income taxes decreased by ¥1.8 billion from the previous fiscal year to ¥6.3 billion (US$56.3 million). Net income attributable to owners of parent decreased by ¥1.3 billion from the previous fiscal year to ¥4.2 billion (US$37.7 million). Capital Ratio The capital ratio declined by 0.28 percentage points from the previous fiscal year-end to 12.24% on a consolidated capital adequacy basis and by 0.24 percentage points from the previous fiscal year-end to 11.87% on a non-consolidated capital adequacy basis, as a result of an increase in risk assets mainly due to an increase in outstanding loans to SMEs, etc.
― 4 ―
Corporate Governance
■ Basic approach
Ever since its establishment, the management of the Bank has been based on the fundamental mission
objectives of contributing to the development of the regional community and ensuring the financial soundness
of the Bank under all circumstances. Even in today’s rapidly changing business environment, in order to fulfill
the duties expected of us as the leading bank in our region, by all stakeholders including our business partners
and shareholders, we take complete responsibility for our management decisions and aim to establish the
highest standard of corporate governance that includes improved management transparency and strengthened
oversight functions.
■ Corporate governance structure
The Bank, pursuant to the resolution on the partial amendments to the Articles of Incorporation at the General
Meeting of Shareholders held on June 22, 2018, transitioned to a company with Audit & Supervisory
Committee. By transitioning to a company with Audit & Supervisory Committee, the Bank shall strive to
further improve its corporate value through the enhancement of its corporate governance system by installing
an Audit & Supervisory Committee, over half of whose members are Outside Directors, and strengthening
oversight functions through the voting rights on the Board of Directors and the right to voice opinions on
executive appointments and dismissals held by the Directors serving as Audit & Supervisory Committee
Members.
■ Board of Directors
The Board of Directors comprises a total of fifteen Directors, including ten Directors who are not serving as
Audit & Supervisory Committee Members, three of whom are Outside Directors, and five Directors serving as
Audit & Supervisory Committee Members, three of whom are Outside Directors. Outside Directors currently
account for 40% of the Board of Directors. Additionally, two female Outside Directors have been appointed.
■ Audit & Supervisory Committee
Directors serving as Audit & Supervisory Committee Members hold voting rights on the Board of Directors
and are delegated certain business execution responsibilities, in addition to the auditing authority. The Audit &
Supervisory Committee collaborates closely with the internal audit division and the Accounting Auditors to
maintain and enhance audit quality, as well as conducts effective and efficient audits by appointing Standing
Audit & Supervisory Committee Members and assigning support staff.
■ Executive Committee and Compliance Committee
The Bank has established the Executive Committee and the Compliance Committee as mechanisms that
discuss and decide the matters referred by the Board of Directors. The Bank is planning to reinforce its
organization with a greater emphasis on compliance by having the Compliance Committee, rather than the
Executive Committee, discuss important matters relating to compliance.
■ Nomination and Compensation Advisory Committee
The Nomination and Compensation Advisory Committee has been established as an advisory body to the
Board of Directors to improve the transparency and objectivity regarding decisions on the nomination and
compensation of Directors. The Bank stipulates that the Nomination and Compensation Advisory Committee
comprises a total of five members, including two Representative Directors and three Outside Directors
(Directors who are not serving as Audit & Supervisory Committee Members), so that the majority is made up
of Outside Directors, and that an Outside Director serves as chairman.
― 5 ―
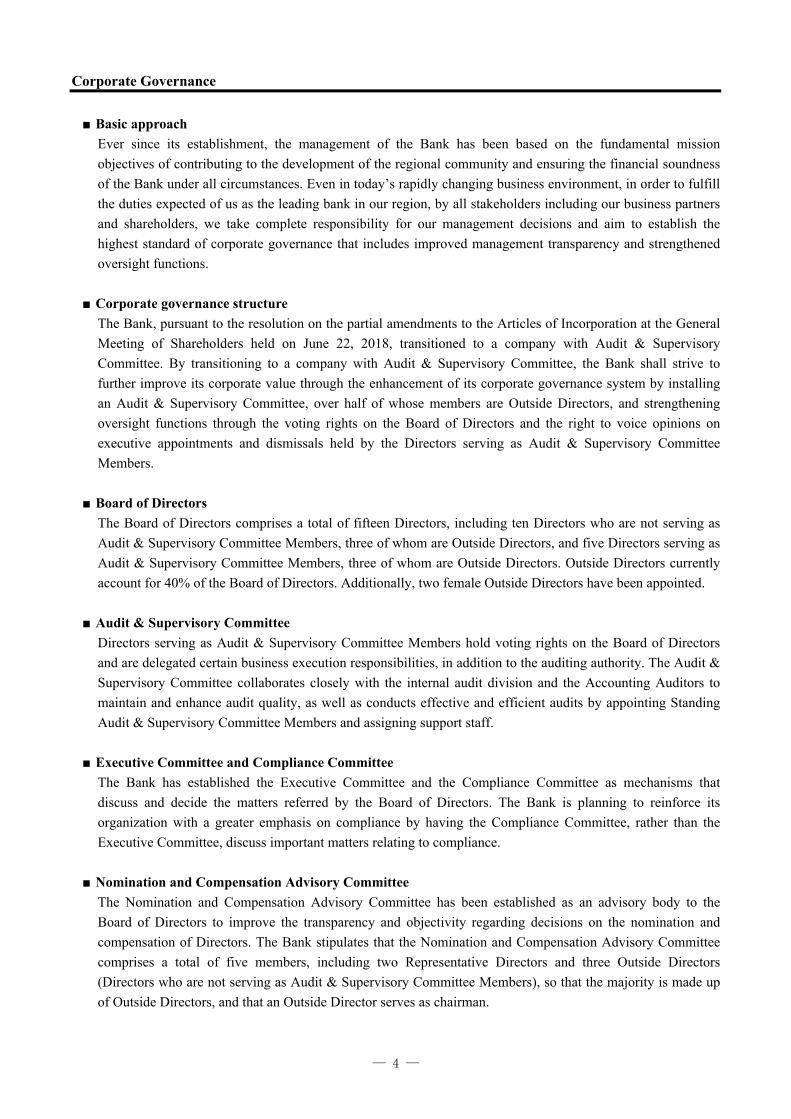
■ Enrichment of information disclosure activities
In compliance with relevant laws and regulations, the Bank strives to disclose accurate management
information in a timely manner and to enrich the content of the information that it discloses so that valuable
information can be viewed in a timely manner via the Bank’s website.
The Bank also actively makes efforts on investor relations to earn the confidence of business partners and the
market and corporate responsibility aimed at customers of the community.
[Corporate governance structure]
Directors serving as Audit &
Supervisory Committee Members
General Meeting of Shareholders
Directors not serving as
Audit & Supervisory Committee Members
Compliance Committee
ALM Committee
Credit Risk Committee
Business branches, Head Office, subsidiaries, etc.
Operational Risk Committee
Customer Interest Protection Committee
Audit and oversight
Appointment/dismissal Appointment/dismissal
Reports
Reports References and reports on important items
Visiting audit and monitoring
Nomination and Compensation
Advisory Committee
Involvement and advice Audit & Supervisory Committee
Board of Directors Appointment/dismissal
Reports
Coordination
Reports
Accounting
Auditors
Executive Committee Audit Division
Coordination Instructions and orders
Coordination

― 6 ―
・Board of Directors (As of July 23, 2019)
Chairman Masahiro Takahashi
President Sachio Taguchi
Managing Director Shigeki Miura Managing Director Motomu Sato
Managing Director (General Manager of General Planning Division)
Yasushi Sasaki Managing Director Kensei Ishikawa
Managing Director (General Manager of Personnel Division)
Yasutaka Kakiki Director (Outside Director) Hiroshi Miura
Director (Outside Director) Atsushi Takahashi
Director (Outside Director) Fumio Ube
Director serving as an Audit & Supervisory Committee Member (Standing)
Yuji Chiba Director serving as an Audit & Supervisory Committee Member (Outside Director)
Shinobu Obara
Director serving as an Audit & Supervisory Committee Member (Outside Director)
Mizuhiko Yoshida
Director serving as an Audit & Supervisory Committee Member (Outside Director)
Etsuko Sugawara
Managing Executive Officer / General Manager of Sendai Office
Katsuhiro Kawamura
Executive Officer / General Manager of Corporate Strategy Division
Yasuhiro Sasaki
Executive Officer / General Manager of Retail Strategy Division
Shinji Niisato Executive Officer / General Manager of Tokyo Office
Toru Iwayama
Executive Officer / General Manager of Mizusawa Branch
Satoshi Ito Executive Officer / General Manager of Head Office
Shinei Kishi

― 7 ―
・Organization (As of July 1, 2019)
Executive Committee
General Meeting of Shareholders
Board of Directors
President
Managing Directors Executive Officers
Chairman
CS
Prom
otion Office
Custom
er Response C
enter
Audit D
ivision
General S
ecretariat
Tokyo Liaison O
ffice
Public R
elations and CS
R O
ffice
Profit M
anagement O
ffice
General A
ffairs Division
Com
pliance Office
Risk M
anagement D
ivision
System
s Division
Operations C
oncentration Center
Financial P
roducts Managem
ent Office
Business M
anagement D
ivision
Personal L
oan Center
Corporate F
inancial Support O
ffice
Loan S
upervision Division
International Business O
ffice
General P
lanning Division
Personnel D
ivision
Hum
an Resources D
evelopment O
ffice
Corporate S
trategy Division
Public A
ffairs and Regional R
evitalization Office
Retail S
trategy Division
Direct B
anking Center
Credit C
ard Center
Morioka L
oan Plaza
Financial M
arkets Division
Head O
ffice
Local O
ffice
Hachinohe O
ffice
Sendai O
ffice
Tokyo Office
Branches
Affiliate Subsidiaries
Iwagin Jigyo S
ouzou Capital
Co.,L
td.
Iwagin B
usiness Service C
o.,L
td.
Iwagin L
ease Data C
o., Ltd.
Iwagin D
C C
ard Co., L
td. Iw
agin C
redit S
ervice C
o.,L
td.
Nomination and Compensation Advisory Committee Nomination and Compensation Advisory Committee Audit & Supervisory Committee
― 8 ―
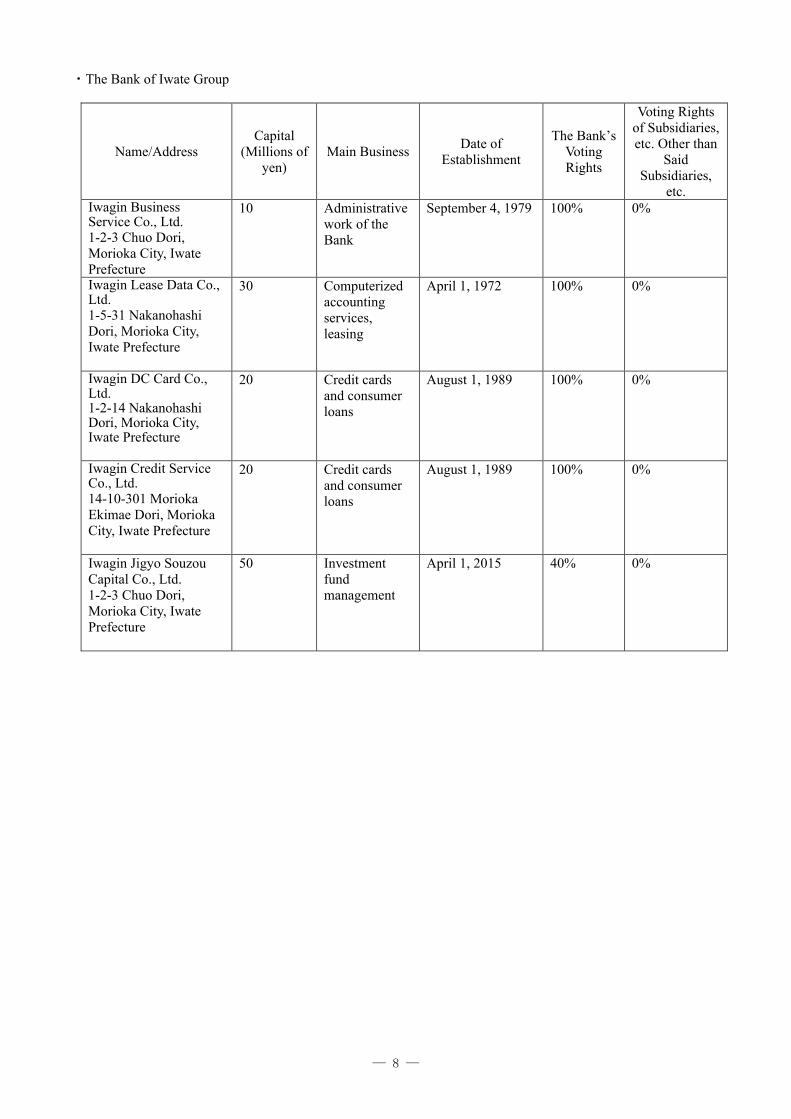
・The Bank of Iwate Group
Name/Address Capital
(Millions of yen)
Main Business Date of
Establishment
The Bank’s Voting Rights
Voting Rights of Subsidiaries, etc. Other than
Said Subsidiaries,
etc. Iwagin Business Service Co., Ltd. 1-2-3 Chuo Dori, Morioka City, Iwate Prefecture
10 Administrative work of the Bank
September 4, 1979 100% 0%
Iwagin Lease Data Co., Ltd. 1-5-31 Nakanohashi Dori, Morioka City, Iwate Prefecture
30 Computerized accounting services, leasing
April 1, 1972 100% 0%
Iwagin DC Card Co., Ltd. 1-2-14 Nakanohashi Dori, Morioka City, Iwate Prefecture
20 Credit cards and consumer loans
August 1, 1989 100% 0%
Iwagin Credit Service Co., Ltd. 14-10-301 Morioka Ekimae Dori, Morioka City, Iwate Prefecture
20 Credit cards and consumer loans
August 1, 1989 100% 0%
Iwagin Jigyo Souzou Capital Co., Ltd. 1-2-3 Chuo Dori, Morioka City, Iwate Prefecture
50 Investment fund management
April 1, 2015 40% 0%

― 9 ―
Efforts towards Regional ESG Issues In order to establish co-prosperity with our region, within which we do the bulk of our business, we will further strengthen our functions to solve various issues in the region, while increasing our adaptability to changes in the surrounding business environment, as part of “pursuing CSV to build a future with the region,” the theme of our new medium-term management plan that we began implementing in April 2019. In addition, we will aim to create mutually shared value for both the region and the Bank by making efforts to resolve various issues in the region.
ESG and SDGs are concepts and goals aimed at creating a sustainable regional society. Accordingly, when implementing CSV (Creating Shared Value) with the region, the Bank will proactively adopt ESG and SDGs concepts and goals, aiming to enhance our functions that contribute to solving local issues.
CSV stands for “Creating Shared Value.” Environment ■ Proactive responses to financing for renewable energies
- We will proactively respond to financing for renewable energies that utilize abundant regional resources. Renewable energy financing executed in FY2018 was a total of ¥5.14 billion*.
* Results of project financing for renewable energies ■ Efforts to protect the local natural environment and enhance brands
- We support efforts aimed at “securing the stability of raw timber” and “enhancing the lacquer brand” of Ninohe City, which boasts around 70% of the production of lacquer in Japan.
- In September 2017, we signed the “Lacquer Forest Building Partnership Agreement,” and as a partner company, acquired our own lacquer forest (nicknamed the “IWAGIN URUSHI NO SATO”). We are planting lacquer seedlings with local junior high school students and utilizing it in learning about nature conservation.
― 10 ―
Social ■ Efforts that contribute to the sustainability of local companies and the
development of educational environments in local schools, etc., through our main business activities
● “Backup Plan” financing with special waiver of principal during times of earthquake disasters
- The Bank does the bulk of its business in areas that were affected by the Great East Japan Earthquake. We actively support our local business partners in enhancing countermeasures for earthquakes that cannot be avoided. The cumulative amount executed as of March 31, 2019: ¥2.4 billion/33 companies (from January 2018)
● The Bank of Iwate donation loan “Cheering for Iwate” - We are contributing to regional revitalization and the activation of local economies by donating some of the
loan interest income to businesses promoted by Iwate Prefecture. The cumulative amount executed as of March 31, 2019: ¥1.0 billion/45 companies (from October 2018)
● Donation-type CSR Private Placement Bonds: The Bank of Iwate “Future-Supporting Private Placement Bonds” - When our business partners issue private placement bonds, the Bank contributes part of the private
placement bond issuance fee as a donation and donates necessary books and sporting goods to elementary, junior, and senior high schools specified by the issuing company. The cumulative amount executed as of March 31, 2019: ¥1.9 billion/13 companies (from February 2017)
■ Efforts to support the growth of children responsible for the future of the region
through financial education - FY2018 financial education activity results
Elementary school students “Visiting lectures on money basics” 12 times
Junior high school students Accepting of workplace visits 8 times
High school students Visiting lectures on finance “MoneyConnection®” 8 times
University students Endowed lectures 2 times
■ Efforts to create local activities
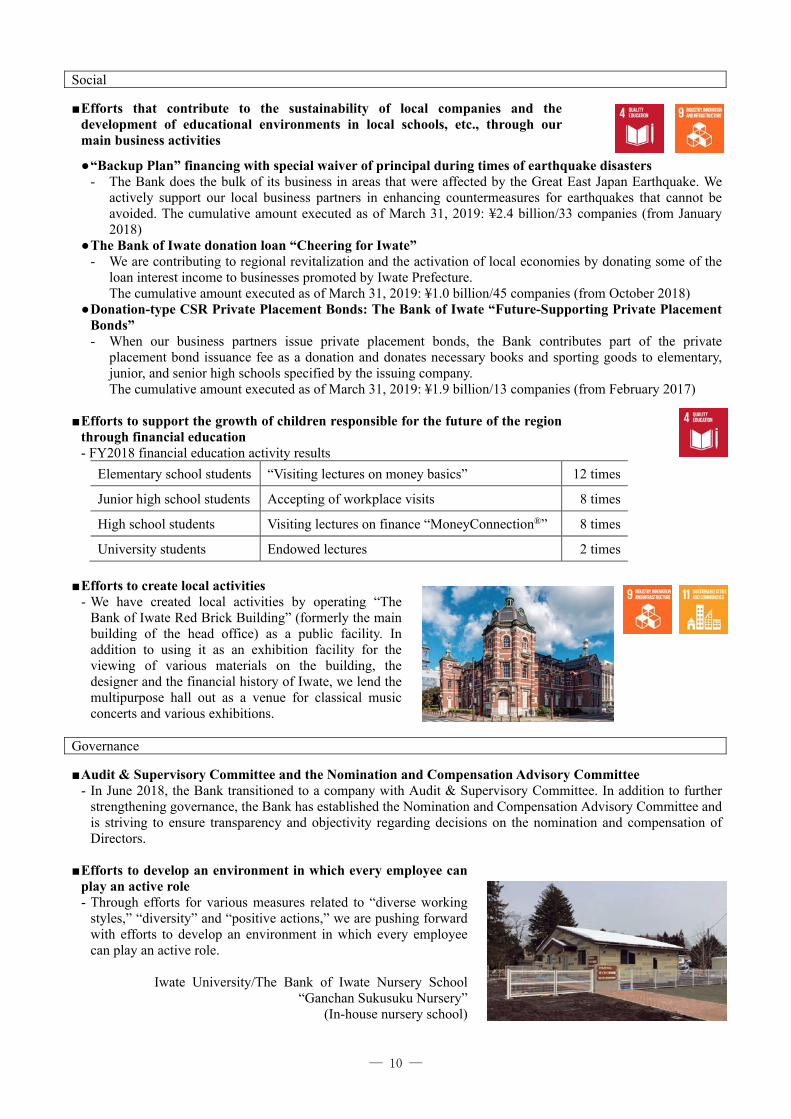
- We have created local activities by operating “The Bank of Iwate Red Brick Building” (formerly the main building of the head office) as a public facility. In addition to using it as an exhibition facility for the viewing of various materials on the building, the designer and the financial history of Iwate, we lend the multipurpose hall out as a venue for classical music concerts and various exhibitions.
Governance ■ Audit & Supervisory Committee and the Nomination and Compensation Advisory Committee
- In June 2018, the Bank transitioned to a company with Audit & Supervisory Committee. In addition to further strengthening governance, the Bank has established the Nomination and Compensation Advisory Committee and is striving to ensure transparency and objectivity regarding decisions on the nomination and compensation of Directors.
■ Efforts to develop an environment in which every employee can
play an active role - Through efforts for various measures related to “diverse working
styles,” “diversity” and “positive actions,” we are pushing forward with efforts to develop an environment in which every employee can play an active role.
Iwate University/The Bank of Iwate Nursery School
“Ganchan Sukusuku Nursery” (In-house nursery school)
― 11 ―
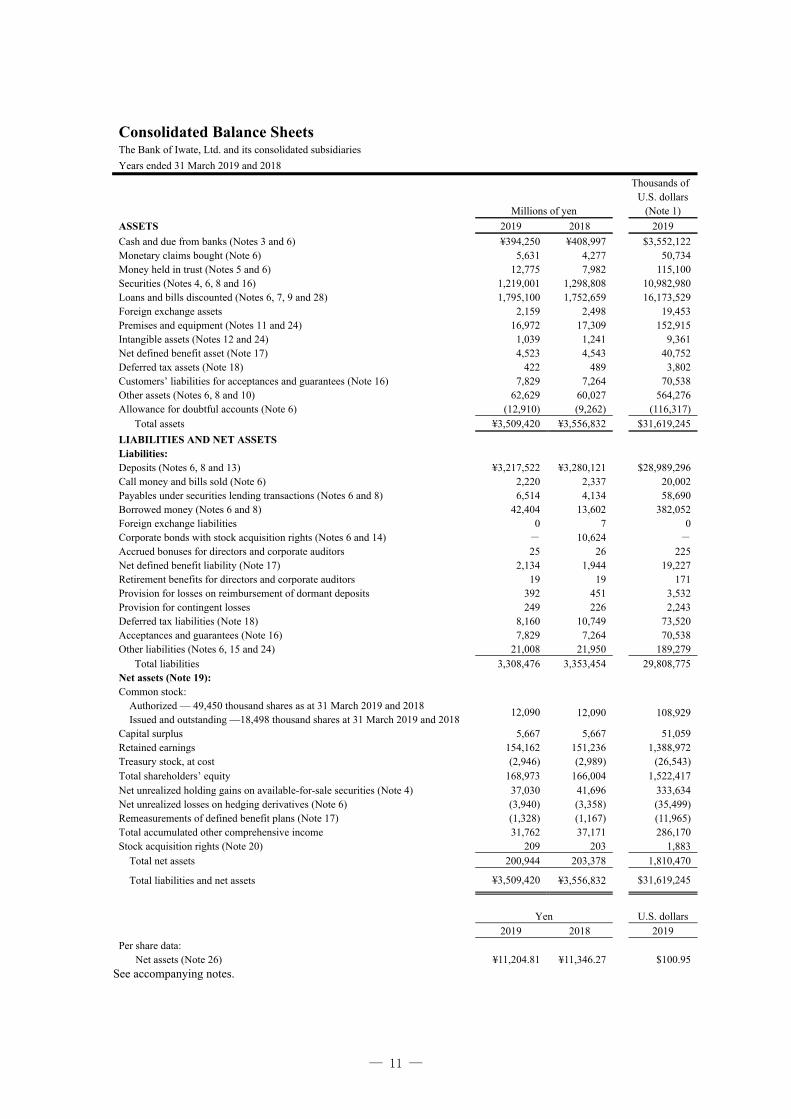
Consolidated Balance Sheets The Bank of Iwate, Ltd. and its consolidated subsidiaries
Years ended 31 March 2019 and 2018
Millions of yen
Thousands of U.S. dollars
(Note 1)
ASSETS 2019 2018 2019
Cash and due from banks (Notes 3 and 6) ¥394,250 ¥408,997 $3,552,122 Monetary claims bought (Note 6) 5,631 4,277 50,734 Money held in trust (Notes 5 and 6) 12,775 7,982 115,100 Securities (Notes 4, 6, 8 and 16) 1,219,001 1,298,808 10,982,980 Loans and bills discounted (Notes 6, 7, 9 and 28) 1,795,100 1,752,659 16,173,529 Foreign exchange assets 2,159 2,498 19,453 Premises and equipment (Notes 11 and 24) 16,972 17,309 152,915 Intangible assets (Notes 12 and 24) 1,039 1,241 9,361 Net defined benefit asset (Note 17) 4,523 4,543 40,752 Deferred tax assets (Note 18) 422 489 3,802 Customers’ liabilities for acceptances and guarantees (Note 16) 7,829 7,264 70,538 Other assets (Notes 6, 8 and 10) 62,629 60,027 564,276 Allowance for doubtful accounts (Note 6) (12,910) (9,262) (116,317) Total assets ¥3,509,420 ¥3,556,832 $31,619,245
LIABILITIES AND NET ASSETS Liabilities: Deposits (Notes 6, 8 and 13) ¥3,217,522 ¥3,280,121 $28,989,296 Call money and bills sold (Note 6) 2,220 2,337 20,002 Payables under securities lending transactions (Notes 6 and 8) 6,514 4,134 58,690 Borrowed money (Notes 6 and 8) 42,404 13,602 382,052 Foreign exchange liabilities 0 7 0 Corporate bonds with stock acquisition rights (Notes 6 and 14) - 10,624 - Accrued bonuses for directors and corporate auditors 25 26 225 Net defined benefit liability (Note 17) 2,134 1,944 19,227 Retirement benefits for directors and corporate auditors 19 19 171 Provision for losses on reimbursement of dormant deposits 392 451 3,532 Provision for contingent losses 249 226 2,243 Deferred tax liabilities (Note 18) 8,160 10,749 73,520 Acceptances and guarantees (Note 16) 7,829 7,264 70,538 Other liabilities (Notes 6, 15 and 24) 21,008 21,950 189,279 Total liabilities 3,308,476 3,353,454 29,808,775 Net assets (Note 19): Common stock: Authorized — 49,450 thousand shares as at 31 March 2019 and 2018 Issued and outstanding —18,498 thousand shares at 31 March 2019 and 2018
12,090 12,090 108,929
Capital surplus 5,667 5,667 51,059 Retained earnings 154,162 151,236 1,388,972 Treasury stock, at cost (2,946) (2,989) (26,543) Total shareholders’ equity 168,973 166,004 1,522,417 Net unrealized holding gains on available-for-sale securities (Note 4) 37,030 41,696 333,634 Net unrealized losses on hedging derivatives (Note 6) (3,940) (3,358) (35,499) Remeasurements of defined benefit plans (Note 17) (1,328) (1,167) (11,965) Total accumulated other comprehensive income 31,762 37,171 286,170 Stock acquisition rights (Note 20) 209 203 1,883 Total net assets 200,944 203,378 1,810,470
Total liabilities and net assets ¥3,509,420 ¥3,556,832 $31,619,245
Yen U.S. dollars 2019 2018 2019 Per share data:
Net assets (Note 26) ¥11,204.81 ¥11,346.27 $100.95 See accompanying notes.
― 12 ―
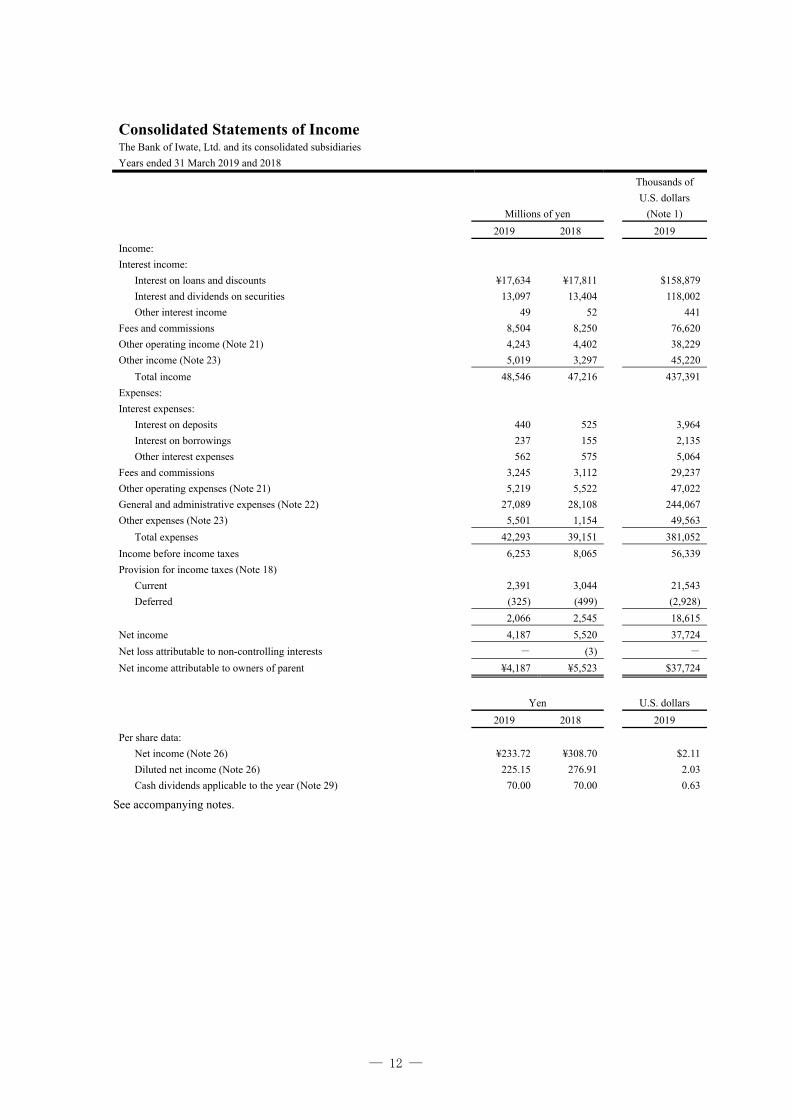
Consolidated Statements of Income The Bank of Iwate, Ltd. and its consolidated subsidiaries
Years ended 31 March 2019 and 2018
Millions of yen
Thousands of
U.S. dollars
(Note 1)
2019 2018 2019
Income:
Interest income:
Interest on loans and discounts ¥17,634 ¥17,811 $158,879
Interest and dividends on securities 13,097 13,404 118,002
Other interest income 49 52 441
Fees and commissions 8,504 8,250 76,620
Other operating income (Note 21) 4,243 4,402 38,229
Other income (Note 23) 5,019 3,297 45,220
Total income 48,546 47,216 437,391
Expenses:
Interest expenses:
Interest on deposits 440 525 3,964
Interest on borrowings 237 155 2,135
Other interest expenses 562 575 5,064
Fees and commissions 3,245 3,112 29,237
Other operating expenses (Note 21) 5,219 5,522 47,022
General and administrative expenses (Note 22) 27,089 28,108 244,067
Other expenses (Note 23) 5,501 1,154 49,563
Total expenses 42,293 39,151 381,052
Income before income taxes 6,253 8,065 56,339
Provision for income taxes (Note 18)
Current 2,391 3,044 21,543
Deferred (325) (499) (2,928)
2,066 2,545 18,615
Net income 4,187 5,520 37,724
Net loss attributable to non-controlling interests - (3) -
Net income attributable to owners of parent ¥4,187 ¥5,523 $37,724
Yen U.S. dollars
2019 2018 2019
Per share data: Net income (Note 26) ¥233.72 ¥308.70 $2.11
Diluted net income (Note 26) 225.15 276.91 2.03
Cash dividends applicable to the year (Note 29) 70.00 70.00 0.63
See accompanying notes.

― 13 ―
Consolidated Statements of Comprehensive Income The Bank of Iwate, Ltd. and its consolidated subsidiaries
Years ended 31 March 2019 and 2018
Millions of yen
Thousands of
U.S. dollars
(Note 1)
2019 2018 2019
Net income ¥4,187 ¥5,520 $37,724
Other comprehensive income (losses): (Note 25):
Net unrealized holding gains (losses) on available-for-sale securities (4,666) 279 (42,039)
Net unrealized gains (losses) on hedging derivatives (Note 6) (582) (3) (5,244)
Remeasurements of defined benefit plans (Note 17) (161) 363 (1,451)
Total other comprehensive income (losses) (5,409) 639 (48,734)
Comprehensive income (losses) ¥(1,222) ¥6,159 $(11,010)
Total comprehensive income (losses) ¥(1,222) ¥6,159 $(11,010)
Attributable to:
Owners of parent (1,222) 6,162 (11,010)
Non-controlling interests - (3) -
See accompanying notes.
― 14 ―
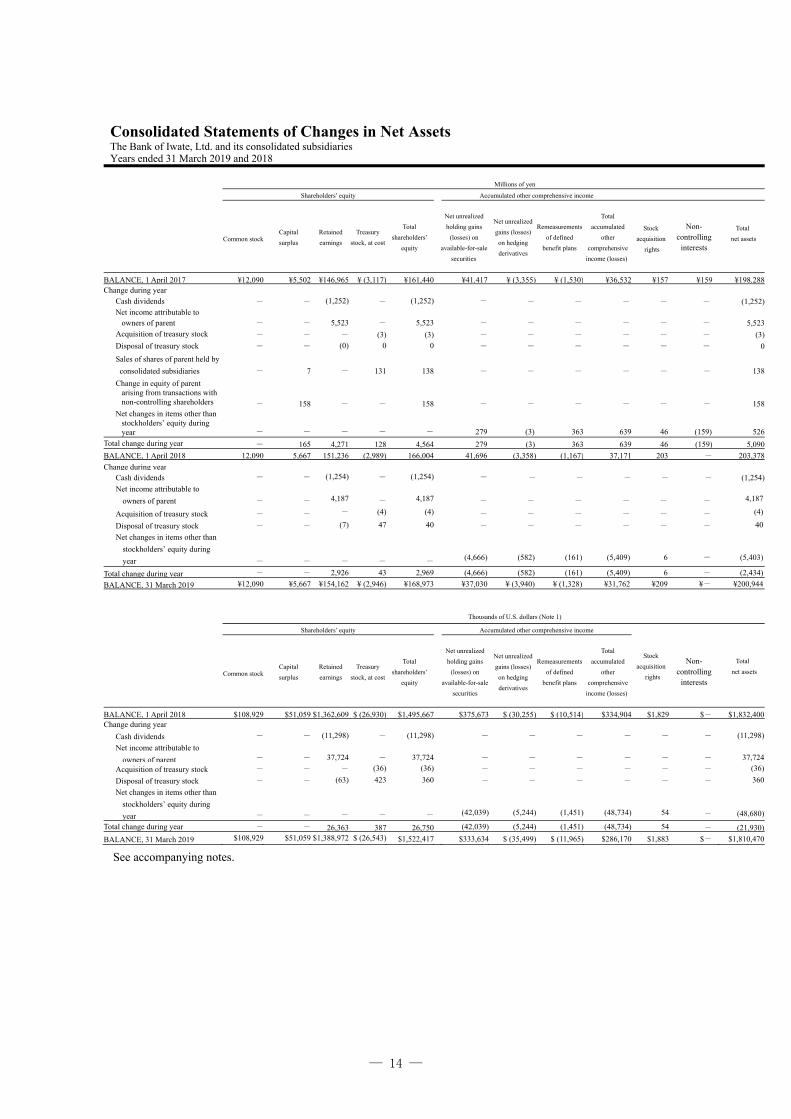
Consolidated Statements of Changes in Net Assets
The Bank of Iwate, Ltd. and its consolidated subsidiaries Years ended 31 March 2019 and 2018
Millions of yen
Shareholders’ equity Accumulated other comprehensive income
Common stock Capital
surplus
Retained
earnings
Treasury
stock, at cost
Total
shareholders’
equity
Net unrealized
holding gains
(losses) on
available-for-sale
securities
Net unrealized
gains (losses)
on hedging
derivatives
Remeasurements
of defined
benefit plans
Total
accumulated
other
comprehensive
income (losses)
Stock
acquisition
rights
Non- controlling
interests
Total
net assets
BALANCE, 1 April 2017 ¥12,090 ¥5,502 ¥146,965 ¥ (3,117) ¥161,440 ¥41,417 ¥ (3,355) ¥ (1,530) ¥36,532 ¥157 ¥159 ¥198,288Change during year Cash dividends - - (1,252) - (1,252) - - - - - - (1,252) Net income attributable to
owners of parent - - 5,523 - 5,523 - - - - - - 5,523 Acquisition of treasury stock - - - (3) (3) - - - - - - (3)
Disposal of treasury stock - - (0) 0 0 - - - - - - 0
Sales of shares of parent held by
consolidated subsidiaries - 7 - 131 138 - - - - - - 138
Change in equity of parent arising from transactions with non-controlling shareholders - 158 - - 158 - - - - - - 158
Net changes in items other than stockholders’ equity during year - - - - - 279 (3) 363 639 46 (159) 526
Total change during year - 165 4,271 128 4,564 279 (3) 363 639 46 (159) 5,090
BALANCE, 1 April 2018 12,090 5,667 151,236 (2,989) 166,004 41,696 (3,358) (1,167) 37,171 203 - 203,378
Change during year Cash dividends - - (1,254) - (1,254) - - - - - - (1,254)
Net income attributable to
owners of parent - - 4,187 - 4,187 - - - - - -
4,187
Acquisition of treasury stock - - - (4) (4) - - - - - - (4)
Disposal of treasury stock - - (7) 47 40 - - - - - - 40
Net changes in items other than
stockholders’ equity during
year - - - - -
(4,666)
(582)
(161)
(5,409)
6
-
(5,403)
Total change during year - - 2,926 43 2,969 (4,666) (582) (161) (5,409) 6 - (2,434)
BALANCE, 31 March 2019 ¥12,090 ¥5,667 ¥154,162 ¥ (2,946) ¥168,973 ¥37,030 ¥ (3,940) ¥ (1,328) ¥31,762 ¥209 ¥- ¥200,944
Thousands of U.S. dollars (Note 1)
Shareholders’ equity Accumulated other comprehensive income
Stock
acquisition
rights
Total
net assets Common stock Capital
surplus
Retained
earnings
Treasury
stock, at cost
Total
shareholders’
equity
Net unrealized
holding gains
(losses) on
available-for-sale
securities
Net unrealized
gains (losses)
on hedging
derivatives
Remeasurements
of defined
benefit plans
Total
accumulated
other
comprehensive
income (losses)
Non- controlling
interests
BALANCE, 1 April 2018 $108,929 $51,059 $1,362,609 $ (26,930) $1,495,667 $375,673 $ (30,255) $ (10,514) $334,904 $1,829 $- $1,832,400 Change during year
Cash dividends - - (11,298) - (11,298) - - - - - - (11,298)
Net income attributable to
owners of parent - - 37,724 - 37,724 - - - - - -
37,724
Acquisition of treasury stock - - - (36) (36) - - - - - - (36)
Disposal of treasury stock - - (63) 423 360 - - - - - - 360
Net changes in items other than
stockholders’ equity during
year - - - - - (42,039) (5,244) (1,451) (48,734) 54
- (48,680)
Total change during year - - 26,363 387 26,750 (42,039) (5,244) (1,451) (48,734) 54 - (21,930)
BALANCE, 31 March 2019 $108,929 $51,059 $1,388,972 $ (26,543) $1,522,417 $333,634 $ (35,499) $ (11,965) $286,170 $1,883 $- $1,810,470
See accompanying notes.

― 15 ―
Consolidated Statements of Cash Flows The Bank of Iwate, Ltd. and its consolidated subsidiaries Years ended 31 March 2019 and 2018
Millions of yen
Thousands of U.S. dollars
(Note 1)
2019 2018 2019
Cash flows from operating activities: Income before income taxes ¥6,253 ¥8,065 $56,339 Adjustments to reconcile income before income taxes to net cash used in operating activities: Depreciation 1,940 2,064 17,479 Impairment losses 76 181 685 Increase (decrease) in allowance for doubtful accounts 3,648 354 32,868 Increase (decrease) in provision for contingent losses 23 (62) 207 Increase (decrease) in accrued bonuses for directors and corporate auditors (1) 0 (9) (Increase) decrease in net defined benefit asset 3 329 27 Increase (decrease) in net defined benefit liability (24) (33) (216) Increase (decrease) in retirement benefits for directors and corporate auditors 0 (1) 0 Increase (decrease) in provision for losses on reimbursement of dormant deposits (60) (118) (541) Interest income (30,780) (31,267) (277,322) Interest expenses 1,239 1,255 11,163 Investment securities (gains) losses, net (3,045) (774) (27,435) (Increase) decrease in money held in trust 182 (160) 1,640 Foreign exchange (gains) losses, net (807) 877 (7,271) (Gains) losses on disposal of premises and equipment 1 37 9 Net (increase) decrease in loans and bills discounted (42,441) (47,909) (382,386) Net increase (decrease) in deposits (123,098) 23,861 (1,109,091) Net increase (decrease) in negotiable certificates of deposit 60,500 (15,139) 545,094 Net increase (decrease) in borrowed money 28,802 (500) 259,501 Net (increase) decrease in due from banks, excluding the Bank of Japan (449) (1) (4,045) Net (increase) decrease in call loans and others (1,354) (1,426) (12,199) Net increase (decrease) in call money and others (118) (3,272) (1,063) Net increase (decrease)in payables under securities lending transactions 2,380 3,004 21,443 Net (increase) decrease in foreign exchange assets 339 (624) 3,054 Net increase (decrease) in foreign exchange liabilities (7) (12) (63) Interest received 31,558 31,910 284,332 Interest paid (1,371) (1,354) (12,353) Other, net (2,626) (24,285) (23,660) Sub-total (69,237) (55,000) (623,813) Income taxes paid (3,740) (1,638) (33,696) Income taxes refunded 20 635 180
Net cash used in operating activities (72,957) (56,003) (657,329) Cash flows from investing activities: Acquisition of securities (660,301) (996,635) (5,949,194) Proceeds from sale of securities 30,230 43,760 272,367 Proceeds from redemption of securities 707,011 997,608 6,370,042 Increase of money held in trust (5,000) (3,000) (45,049) Acquisition of premises and equipment (1,156) (1,828) (10,415) Proceeds from sale of premises and equipment 58 75 523 Payment for retirement of premises and equipment (21) (63) (189) Acquisition of intangible assets (220) (353) (1,982) Payment for asset retirement obligations (63) (30) (568)
Net cash provided by investing activities 70,538 39,534 635,535

― 16 ―
Consolidated Statements of Cash Flows (Continued) The Bank of Iwate, Ltd. and its consolidated subsidiaries Years ended 31 March 2019 and 2018
Millions of yen
Thousands of U.S. dollars
(Note 1)
2019 2018 2019
Cash flows from financing activities:
Redemption of subordinated bonds and corporate bonds with stock acquisition rights (11,054) - (99,595) Repayments of lease obligations (485) (487) (4,370) Cash dividends paid (1,254) (1,252) (11,298) Dividends paid to non-controlling interests - (0) - Payment for acquisition of treasury stock (4) (3) (36) Proceeds from sale of treasury stock 0 0 0
Payment for acquisition of shares of subsidiaries that do not result in change in scope of consolidation - (2) - Proceeds from sale of shares of parent held by subsidiaries - 145 -
Net cash used in financing activities (12,797) (1,599) (115,299) Effect of exchange rate changes on cash and cash equivalents 20 14 180
Net increase (decrease) in cash and cash equivalents (15,196) (18,054) (136,913) Cash and cash equivalents at the beginning of the year 408,527 426,581 3,680,755
Cash and cash equivalents at the end of the year (Note 3) ¥393,331 ¥408,527 $3,543,842
See accompanying notes.

― 17 ―
Notes to Consolidated Financial Statements The Bank of Iwate, Ltd. and its consolidated subsidiaries Years ended 31 March 2019 and 2018
1. BASIS OF PRESENTING CONSOLIDATED FINANCIAL STATEMENTS
The accompanying consolidated financial statements of The Bank of Iwate, Ltd. (the “Bank”) and its consolidated subsidiaries have
been prepared in accordance with the provisions set forth in the Financial Instruments and Exchange Law of Japan, its related
accounting regulations and the Banking Law of Japan, and in conformity with accounting principles generally accepted in Japan
(“Japanese GAAP”), which are different in certain respects as to application and disclosure requirements to International Financial
Reporting Standards.
The accompanying consolidated financial statements have been restructured and translated into English (with some expanded
descriptions) from the consolidated financial statements of the Bank prepared in accordance with Japanese GAAP and filed with the
appropriate Local Finance Bureau of the Ministry of Finance as required by the Financial Instruments and Exchange Law. Some
supplementary information included in the statutory Japanese language consolidated financial statements, but not necessarily
required for fair presentation, is not presented in the accompanying consolidated financial statements.
The translation of the Japanese yen amounts into U.S. dollars is included solely for the convenience of readers, using the prevailing
exchange rate at 31 March 2019, which was ¥110.99 to U.S. $1. The convenience translations should not be construed as
representations that the Japanese yen amounts have been, could have been, or could in the future be converted into U.S. dollars at
this or any other rate of exchange.
2. SIGNIFICANT ACCOUNTING POLICIES
Reporting entity
The consolidated financial statements include the accounts of the Bank and its significant subsidiaries. Japanese GAAP on
consolidated financial statements requires consolidation of all significant investees that are controlled through substantial ownership
of majority voting rights or existence of certain conditions. All significant intercompany transactions and account balances are
eliminated.
A non-consolidated subsidiary is excluded from the scope of consolidation because in terms of its total assets, ordinary income, net
income or loss (amount corresponding to equity), retained earnings (amount corresponding to equity) and accumulated other
comprehensive income or loss (amount corresponding to equity), it has minor impact on the consolidated financial statements even
if it is excluded from the scope of consolidation.
Investments in affiliates over which the Bank has the ability to exercise significant influence in terms of operating and financial
policies of the investees are accounted for by the equity method.
There are no investments in affiliates that are accounted for by the equity method.
A non-consolidated subsidiary and investments in affiliates that are not accounted for by the equity method are excluded from the
scope of equity method because in terms of their net income or loss (amount corresponding to equity), retained earnings (amount
corresponding to equity) and accumulated other comprehensive income or loss (amount corresponding to equity), they have minor
impact on the consolidated financial statements even if they are excluded from the scope of equity method.
Trading account securities and other securities
― 18 ―
Securities are classified as follows based on the purpose: (a) securities held for trading purposes (“trading account securities”), (b)
debt securities intended to be held to maturity (“held-to-maturity debt securities”), (c) equity securities issued by unconsolidated
subsidiaries and affiliated companies, and (d) all other securities that are not classified in any of the above categories
(“available-for-sale securities”).
(a) Trading account securities — National government bonds held for trading purpose are presented as trading account securities.
Trading account securities are stated at fair value (cost of securities sold is calculated using the moving-average method). Gains and
losses realized on disposal and unrealized gains and losses from market value fluctuations are recognized as gains or losses in the
period of the change.
(b) Held-to-maturity debt securities are carried at amortized cost (straight-line method) using the moving-average method.
(c) Equity securities issued by subsidiaries and affiliated companies, which are not consolidated or accounted for by the equity
method, are carried at cost using the moving-average method.
(d) Available-for-sale securities with available fair values are primarily carried at the period end market prices (cost of securities
sold is calculated using the moving-average method).
Securities for which it is extremely difficult to determine the fair value are stated at moving average cost.
Net unrealized holding gains (losses) on these securities, net of applicable income taxes, are reported in a separate component of net
assets.
Available-for-sale securities with available fair values are written down when a significant decline in fair value below the cost of
such securities is deemed to be other than temporary. The amount written down is accounted for as an impairment loss.
Money held in trust
Securities invested as part of trust assets in independently managed money trusts that invest primarily in securities are stated at fair
value.
Derivatives and hedge accounting
The Bank employs forward exchange contracts, currency swaps and interest rate swaps to meet customers’ needs and mitigate
interest rate risks and foreign exchange risks. Derivative financial instruments are stated at fair value.
If derivative financial instruments are used as hedges and meet certain hedging criteria, the Bank defers recognition of gains or
losses resulting from changes in fair value of the derivative financial instruments until the related losses or gains on the hedged
items are recognized (deferral method).
Transactions to hedge against interest rate risks affecting the financial assets and liabilities of the Bank are accounted for using
deferred hedge accounting in accordance with the provisions of “Treatment of Accounting and Auditing of Application of
Accounting Standards for Financial Instruments in the Banking Industry” (Japanese Institute of Certified Public Accountants
(“JICPA”) Industry Audit Committee Report No. 24, 13 February 2002).
Regarding the effectiveness of a hedge, a hedge that is intended to offset the effects of market fluctuations is assessed on a
group-by-group comparison of hedged items and hedging instruments. Both hedged items, including deposits and loans, and
hedging instruments, including interest rate swaps, are classified into groups by remaining maturity period. The effectiveness of a
cash flow hedge is assessed on the basis of the correlation between the base interest rate index of the hedged cash flow and that of
the hedging instrument.
― 19 ―
As for the hedging transactions against currency exchange risks arising from assets and liabilities in foreign currencies, the Bank
applies deferred hedge accounting in accordance with the provisions of “Treatment of Accounting and Auditing Concerning
Accounting for Foreign Currency Transactions in the Banking Industry” (JICPA Industry Audit Committee Report No. 25, 29 July
2002). The Bank assesses the effectiveness of currency swap and foreign exchange swap transactions executed for offsetting the
risks of changes in currency exchange rates by verifying that there exist foreign currency positions of the hedging instruments
corresponding to the foreign currency monetary claims and debts to be hedged.
Certain interest rate swaps that qualify for hedge accounting and meet specific matching criteria are not remeasured at fair values,
but the differential to be paid or received under the swap contracts is recognized as interest expenses or income (exceptional
method).
Depreciation and amortization methods
(1) Premises and equipment (excluding leased assets)
Premises and equipment are stated at cost less accumulated depreciation. The Bank depreciates its premises and equipment under
the declining-balance method over their estimated useful lives. Depreciation of buildings acquired on and after 1 April 1998
(excluding installed facilities) and installed facilities and structures acquired on and after 1 April 2016 by the Bank is computed
under the straight-line method. Estimated useful lives are as follows:
Buildings: 3-30 years
Equipment and furniture: 2-20 years
Consolidated subsidiaries depreciate their premises and equipment primarily under the declining-balance method over their
estimated useful lives.
(2) Intangible assets (excluding leased assets)
The Bank and its consolidated subsidiaries (the “Group”) amortize the intangible assets under the straight-line method over their
estimated useful lives. Costs of computer software developed or obtained for internal use are amortized using the straight-line
method over estimated useful lives of 5 years.
(3) Leased assets
Depreciation and amortization of leased assets pertaining to finance lease transactions other than those that transfer the ownership of
the leased assets to the Group, which are included in “Premises and equipment” and “Intangible assets,” are computed under the
straight-line method. The lease term is equal to the useful life and there is no residual value except where residual value guarantees
are stipulated in lease contracts.
Depreciation of leased assets that transfer the ownership to the Group is computed by the same method used for owned assets.

― 20 ―
Allowance for doubtful accounts
The reserve for loans to borrowers that are classified as legally bankrupt or substantially bankrupt is calculated by deducting the
estimated disposal value of collateral and the amount deemed collectible from guarantees from the book value.
The Bank also provides specific reserves for potentially bankrupt borrowers for an amount deemed necessary based on the loan
balance, less expected collection from disposal of collateral, guarantees and repayment on uncovered portion of the loan from
historical experiences.
For all the other loans, general reserves are provided collectively. The ratio of the general reserves is determined based on the
Bank’s loan loss experience. The above-mentioned allowance for doubtful accounts is made on the basis of the results of a strict
assessment of the quality of all the Bank’s loan assets, using the Bank’s internally established rules for self-assessment.
The allowance for doubtful accounts recorded in consolidated subsidiaries is calculated as follows:
General reserves are provided at an amount deemed necessary considering the historical ratio of loan losses. Specific reserves for
doubtful borrowers are provided at an amount expected to be uncollectable, considering collectability on an individual basis.
Accrued bonuses for directors and corporate auditors
Accrued bonuses for directors and corporate auditors are provided in the amount of the estimated bonuses that are attributable to
each fiscal year.
Retirement benefits for directors and corporate auditors
Retirement benefits for directors and corporate auditors are provided for the future payments of directors’ and corporate auditors’
retirement benefits incurred up to the end of the fiscal year based on the approved internal rule.
Provision for losses on reimbursement of dormant deposits
Provision for losses on reimbursement of dormant deposits that were recorded as profit is provided for the future reimbursement
based on the historical reimbursement experience.
Provision for contingent losses
Provision for contingent losses is provided for estimated future payments related to a risk-share agreement with public credit
guarantee associations for the Bank’s loans guaranteed by the associations. The provision is calculated by expected loss ratios based
on historical foreclosure experiences by the category of the borrowers.
Accounting for retirement benefits
Upon the calculation of projected benefit obligation, the estimated amount of all retirement benefits to be paid at future retirement
dates is allocated by using the benefit formula basis. The Bank has also set up retirement benefit trusts.
Actuarial differences are amortized as income or expenses commencing from the following year under the straight-line method over
10 years, which is determined as the amortization period within a range of estimated remaining service years of the eligible
employees at the time the actuarial differences occur.
The consolidated subsidiaries adopt a simplified method, as allowed for small companies, which is to record retirement benefits
liabilities for an amount assuming all employees would retire at the end of the fiscal year on a voluntary basis.

― 21 ―
Income taxes
Income taxes consist of corporation, enterprise and inhabitants taxes. The provision for income taxes is computed based on the
pretax income of the Bank and each of its consolidated subsidiaries with certain adjustments required for tax purposes.
Deferred tax assets and liabilities are recorded based on the temporary differences between the financial statements and tax bases of
assets and liabilities. The asset and liability approach is used to recognize deferred tax assets and liabilities for the expected future
tax consequences of temporary differences between the carrying amounts of assets and liabilities for financial reporting purposes
and the amounts used for income tax purposes.
Foreign currency translation
Assets and liabilities denominated in foreign currencies are translated into Japanese yen at the exchange rate prevailing at the end of
each year.
Appropriations of retained earnings
Under the Companies Law of Japan, the appropriation of retained earnings with respect to a given financial period is made by
resolution of the shareholders at a general meeting held subsequent to the close of the financial period. The accounts for that period,
therefore, do not reflect such appropriations. See Note 29.
Amounts per share
Net income per share of common stock is computed based on the weighted average number of shares outstanding, excluding
treasury stock, during each year. Diluted net income per share reflects the potential dilution that could occur if stock options to issue
common stock were exercised. Cash dividends per share represent the amounts applicable to the respective years and consist of
interim dividends for the current year and year-end dividends declared after the end of the year.
Consumption taxes
National and local consumption taxes are accounted for with the tax exclusion method.
― 22 ―
Accounting standards that have not been applicable yet
“Accounting Standard for Revenue Recognition” (Accounting Standards Board of Japan (“ASBJ”) Statement No.29, 30 March
2018)
“Implementation Guidance on Accounting Standard for Revenue Recognition” (ASBJ Guidance No.30, 30 March 2018)
(1) Overview
They are comprehensive standards on revenue recognition. Revenue will be recognized based on the following 5 steps.
Step 1: Identify contracts with customers.
Step 2: Identify the performance obligations in the contract.
Step 3: Determine the transaction price.
Step 4: Allocate the transaction price to the performance obligations in the contract.
Step 5: Recognize revenue when (or as) the entity satisfies a performance obligation.
(2) Application date
The Group will apply these accounting standards from the beginning of the fiscal year ending 31 March 2022.
(3) Effects of the application of the standards
The Group is currently assessing the effects of these standards.
3. NOTES TO CONSOLIDATED STATEMENTS OF CASH FLOWS
Cash and cash equivalents
In preparing the consolidated statements of cash flows, cash and due from the Bank of Japan are considered to be cash and cash
equivalents. At 31 March 2019 and 2018, the reconciliation of cash and cash equivalents in the consolidated statements of cash
flows with cash and due from banks in the consolidated balance sheets was as follows:
Millions of yen Thousands of U.S.
dollars
2019 2018 2019
Cash and due from banks ¥394,250 ¥408,997 $3,552,122
Less: Deposits in banks other than the Bank of Japan (919) (470) (8,280)
Cash and cash equivalents ¥393,331 ¥408,527 $3,543,842

― 23 ―
4. SECURITIES
Securities held by the Group at 31 March 2019 and 2018 consisted of the following:
Millions of yen
Thousands of
U.S. dollars
2019 2018 2019
National government bonds ¥239,026 ¥326,976 $2,153,581
Local government bonds 342,427 331,192 3,085,206
Corporate bonds 300,691 301,860 2,709,172
Corporate stocks 44,848 53,131 404,072
Other securities 292,009 285,649 2,630,949
¥1,219,001 ¥1,298,808 $10,982,980
The securities placed under unsecured lending agreements, which borrowers have the right to sell or pledge in the amount of
¥22,100 million ($199,117 thousand) and ¥87,000 million at 31 March 2019 and 2018, respectively, were included in national
government bonds
A. The following tables summarize acquisition costs, book values and fair values of securities with available fair values at 31 March
2019 and 2018:
(a) Held-to-maturity debt securities
Millions of yen
Book value Fair value Difference Gain Loss
At 31 March 2019: ¥26,261 ¥30,726 ¥4,465 ¥4,465 ¥ -
At 31 March 2018: ¥37,368 ¥41,627 ¥4,259 ¥4,260 ¥ (1)
Thousands of U.S. dollars
Book value Fair value Difference Gain Loss
At 31 March 2019: $236,607 $276,836 $40,229 $40,229 $ -
(b) Available-for-sale securities
Securities below include negotiable certificates of deposit classified as cash and due from banks.
Millions of yen
Acquisition cost Book value Difference Gain Loss
At 31 March 2019:
Corporate stocks ¥22,760 ¥43,602 ¥20,842 ¥22,015 ¥(1,173)
Bonds 831,211 859,883 28,672 28,760 (88)
Other 278,389 281,794 3,405 6,668 (3,263)
¥1,132,360 ¥1,185,279 ¥52,919 ¥57,443 ¥(4,524)
At 31 March 2018:
Corporate stocks ¥24,449 ¥51,918 ¥27,469 ¥27,848 ¥(379)
Bonds 900,081 927,467 27,386 27,713 (327)
Other 271,797 276,373 4,576 7,855 (3,279)
¥1,196,327 ¥1,255,758 ¥59,431 ¥63,416 ¥(3,985)
Thousands of U.S. dollars
Acquisition cost Book value Difference Gain Loss
At 31 March 2019:
Corporate stocks $205,064 $392,846 $187,782 $198,351 $(10,569)
Bonds 7,489,062 7,747,392 258,330 259,123 (793)
Other 2,508,235 2,538,913 30,678 60,077 (29,399)
$10,202,361 $10,679,151 $476,790 $517,551 $(40,761)
― 24 ―
B. There were no sales of held-to-maturity debt securities for the years ended 31 March 2019 and 2018.
Total sales of available-for-sale securities in the years ended 31 March 2019 and 2018 amounted to ¥30,229 million ($272,358
thousand) and ¥43,759 million, respectively. The related gains and losses amounted to ¥4,508 million ($40,616 thousand) and ¥206
million ($1,856 thousand), respectively, in 2019, and ¥2,560 million and ¥60 million, respectively, in 2018.
C. Available-for-sale securities written down for the year ended 31 March 2019 amounted to ¥27 million ($243 thousand).
There were no available-for-sale securities written down for the year ended 31 March 2018.
D. Net unrealized holding gains on available-for-sale securities on the consolidated balance sheets at 31 March 2019 and 2018
consisted of the following:
Millions of yen
Thousands of
U.S. dollars
2019 2018 2019
Net unrealized holding gains before deferred tax on:
Available-for-sale securities (Note) ¥52,895 ¥59,432 $476,575
Deferred tax liabilities (15,865) (17,736) (142,941)
Net unrealized holding gains before interests adjustment 37,030 41,696 333,634
Amount equivalent to non-controlling interests - - -
Net unrealized holding gains on available-for-sale securities ¥37,030 ¥41,696 $333,634
Note: The amounts of ¥(24) million ($(216) thousand) and ¥2 million, which are net unrealized holding gains (losses) before
deferred tax on available-for-sale securities that are component assets of investment limited partnerships classified as securities for
which it is extremely difficult to determine the fair values, were included in the balance at 31 March 2019 and 2018, respectively.
E. Equity securities issued by unconsolidated subsidiaries and affiliated companies are as follows:
Millions of yen
Thousands of
U.S. dollars
2019 2018 2019
Shares ¥20 ¥20 $180
Investments 860 916 7,748
5. MONEY HELD IN TRUST
Money held in trust at 31 March 2019 and 2018 consisted of the following:
Millions of yen
Thousands of
U.S. dollars
2019 2018 2019
Money held in trust for trading purposes:
Carrying amount ¥12,775 ¥7,982 $115,100
Realized gains included in earnings - - -

― 25 ―
6. FINANCIAL INSTRUMENTS
(1) Overview
a. Policy for financial instruments
The Group provides financial services, mainly focusing on banking businesses such as deposit taking, grant of loans, trading of
securities and investment in securities, as well as financial services including lease operation and credit card operation.
For its main operations, the Group raises funds through deposits, call money, etc. and applies them to loans receivable and investing
in securities. Therefore, the financial assets and liabilities of the Group tend to be affected by interest rate fluctuations, and are
exposed to risks stemming from changes in financial market environments (interest rate risks and price fluctuation risks), as well as
to risks arising from fund shortage.
The Group manages those risks using the ALM method in order to appropriately control the balance between revenues and risks in
consideration of the status of the financial assets and liabilities, trend of financial markets, policies for fund management and
investment policies. The Group uses derivatives for the purpose of reducing risks, but not for speculative purposes.
b. Types of financial instruments and related risks
The financial assets of the Bank consist mainly of loans for domestic enterprises and individuals and investment securities.
Loans are exposed to credit risks stemming from defaults of borrowers. The largest industrial category of loans as of the current
fiscal year-end was individuals, followed by local governments, real estate industries and leasing more or less all kinds of industries
and manufacturing industries.
Securities are fundamentally constituted of bonds, stocks and investment trusts, which are held for investing purposes,
held-to-maturity purposes and maintaining business relationships, while trading account securities are held for trading purposes.
These are exposed to credit risks of issuers, interest rate risks and risks stemming from fluctuation of market prices.
Liabilities, such as deposits, corporate bonds and call money, are exposed to risks arising from fluctuation of interest rates stemming
from mismatch between interests or periods of assets and liabilities. In addition, these are exposed to risks of fund shortage where
the Bank fails to control cash receipts and disbursement due to unexpected fund outflow and suffers losses from unusual high
interest rates imposed on, as well as market liquidity risks where the Bank fails to raise funds owing to market shrinkage and is
obliged to enter into unusual unfavorable transactions.
Regarding derivative transactions, the Bank enters into interest rate swap contracts in terms of the ALM control and applies hedge
accounting to them as hedging instruments for interest rate risks on loans and bonds as hedged items. The Bank evaluates
effectiveness of the hedge based on accumulated fluctuation of cash flows of hedging instruments and hedged items for the periods
beginning from implementation of the hedging to the date of the evaluation and analysis on them.
Furthermore, there are interest rate swap contracts (hedging instruments) and loans and bonds (hedged items), which are treated
under the exceptional method.
c. Monitoring of credit risks
In accordance with the internal policies of the Bank for managing credit risks arising from loans, each related division monitors
credit worthiness of its customers periodically and due dates and outstanding balances by individual customer. In addition, the Bank
is making efforts to identify and mitigate risks of bad debts from customers who are having financial difficulties.
The results of the above monitoring are regularly reported to the board of directors and the results of monitoring internal rating, loan
― 26 ―
portfolios and quantification of credit risks are reported to the credit risk committee on a quarterly basis. Audit Division strictly
reviews to ensure the monitoring procedures function properly.
Credit risks of issuers of securities and counterparty risks of derivative transactions are controlled through periodic reviews on credit
information and fair value of securities by Financial Markets Division.
d. Monitoring of market risks
(Interest rate risks)
The risks arising from fluctuations in interest rates are controlled using ALM at the ALM committee, with reference to the
discussion at the fund management meeting and interest rate analysis group, through monitoring and analysis of execution of the
ALM and the discussion of future actions. Concretely, the results of the above monitoring are reported on a monthly basis to the
ALM committee using gap analysis or interest rate sensitivity analysis such as BPV and VaR. Derivative instruments such as
interest rate swap contracts to hedge interest rate risks are used in terms of the ALM.
(Foreign currency exchange risks)
Foreign currency swap contracts and foreign currency exchange swap contracts are used in order to control the foreign currency
exchange risks.
(Price fluctuation risks)
In accordance with the internal policies of the Bank on managing market related risks, the risks arising from fluctuation of market
price of investment securities are controlled through a daily VaR based on certain holding periods and confidence interval by
confirming that the quantities of its risk fall under the certain portion of equity capital or not. Upper limits on losses on an
aggregation or a realization basis are defined to control them on a daily basis. These results are reported by Risk Management
Division to the management on a daily basis.
Investments in securities at Financial Markets Division are executed in accordance with invested items and investing guidelines
prescribed in the market business operation standards, the marketing risk management standards and the primary polices on
investing, and controlled through continuous monitoring. The information related to the market environment and the investment
status is reported to the management on a regular basis.
(Derivative transactions)
In conducting derivative transactions, each division responsible for execution of transactions, and evaluation of efficiency of the
hedging and related administration is clearly identified, following the hedge transaction guidelines, the market business operation
standards and the market risk management standards, with setting up segregation of duties and checking systems.
― 27 ―
(Information on volume of market risk)
The Bank employs the variance-covariance method (confidence interval of 99%, observation period of 1 year) in calculating VaR of
deposits, loans receivable and securities (investments in bond, investments in stock, shares held for policy reasons, investments in
trust). The holding period used as a parameter for the calculation is set as 6 months for deposits, loans receivable and shares held for
policy reasons, and 3 months for investments in stock and investments in trust.
The volume of market risk, which is supposed to be estimated losses, at the end of the year ended 31 March 2019 was ¥20,227
million ($182,242 thousand).
For securities, the Bank periodically verifies the effectiveness of risk measurement by a back-testing protocol that compares the
volume under VaR with the amount of actual gains or losses or hypothetical gains or losses on a fixed portfolio. As a result of
conducting the back-testing protocol, the Group supposes the method undertaken to provide a reliable indicator of the market risks.
The method of variance and covariance that the Bank uses to measure the volume under VaR assumes that changes in the market
follow a normal distribution. Accordingly, under conditions subject to changes in the market exceeding the assumption, risks may
be underestimated.
e. Monitoring of liquidity risks
The Bank adequately manages its liquidity risks based on various internal quantitative standards prescribed in liquidity risks
management regulations, monitoring their liquidity positions on a daily basis with minimum fund reserve established twice a year.
f. Supplementary explanation of the estimated fair value of financial instruments
The fair value of financial instruments is based on their quoted market price, if available. When there is no quoted market price
available, the fair value is reasonably estimated. Since various assumptions and factors are reflected in estimating the fair value,
different assumptions and factors could result in different fair values.

― 28 ―
(2) Fair value of financial instruments
The carrying amounts and the estimated fair value of financial instruments at 31 March 2019 and 2018 were as follows.
Millions of yen Thousands of U.S. dollars
2019 2018 2019
Carrying
amounts Fair value
Carrying
amounts Fair value
Carrying
amounts Fair value
Assets:
Cash and due from banks ¥394,250 ¥394,250 ¥408,997 ¥408,997 $3,552,122 $3,552,122
Monetary claims bought 5,446 5,458 4,005 4,024 49,067 49,176
Money held in trust 12,775 12,775 7,982 7,982 115,100 115,100
Securities
Held-to-maturity debt securities 22,262 26,715 34,686 38,926 200,576 240,697
Available-for-sale securities 1,185,279 1,185,279 1,255,758 1,255,758 10,679,151 10,679,151
Loans and bills discounted 1,795,100 1,752,659 16,173,529
Allowance for doubtful accounts (12,442) (8,901) (112,100)
1,782,658 1,787,916 1,743,758 1,747,582 16,061,429 16,108,803
Liabilities:
Deposits 3,217,522 3,217,605 3,280,121 3,280,252 28,989,296 28,990,044
Call money and bills sold 2,220 2,220 2,337 2,337 20,002 20,002
Payables under securities lending
transactions
6,514
6,514
4,134
4,134
58,690
58,690
Borrowed money 42,404 42,404 13,602 13,603 382,052 382,052
Corporate bonds with stock
acquisition rights
-
-
10,624
10,619
-
-
Derivative transactions:
Derivative instruments not
qualifying for hedge accounting
(154)
(154)
182
182
(1,388)
(1,388)
Derivative instruments qualifying
for hedge accounting
(5,661)
(9,429)
(4,826)
(8,200)
(51,005)
(84,954)
(Note 1) Methods to determine the estimated fair value of financial instruments
a. Cash and due from banks
All cash and due from banks are short-term in nature, and therefore their carrying amounts approximate the fair value.
b. Monetary claims bought
As for monetary claims bought whose terms are less than one year, their carrying amounts are supposed to approximate the fair
value, while the fair value of long term claims is based on either quoted market prices or prices provided by the financial institutions
making markets.
c. Money held in trust
For the securities invested as part of trust assets in independently managed money trusts that invest primarily in securities, the fair
value of the equity securities is determined using quoted market prices and the fair value of debt securities is determined using either
quoted market prices or prices provided by the financial institutions that the Group has been dealing with.
d. Held-to-maturity debt securities and available-for-sale securities
The fair values of held-to-maturity debt securities and available-for-sale securities are based on either quoted market prices or prices
provided by the financial institutions making markets in these bonds, etc. The fair values of investments in trust are based on
published net asset value. Private placement bonds are based on the discounted present value, which is calculated by discounting
estimated future cash flows arising from the financial assets.
― 29 ―
e. Loans and bills discounted
Carrying amounts of loans and bills discounted with floating rates, which indicate the short-term market interest rates, are supposed
to approximate the fair value as long as the credit status of the borrower has not largely changed. The fair value of loans and bills
discounted with fixed rates is based on the present value of the total of principal and interest discounted by the interest rate to be
applied if similar new loans were entered into, by the types, self-assessment and the terms. As for loans and bills with short-term
settlement (within a year), their carrying amounts are supposed to approximate the fair value.
The estimated uncollectable amount of loans to borrowers that are classified as legally bankrupt, substantially bankrupt and
potentially bankrupt is based on the estimated disposal value of collateral and the amount deemed collectible from guarantees, and
therefore their carrying amounts after deduction of allowance for doubtful accounts at the closing date are supposed to approximate
the fair value.
Carrying amounts of loans and bills discounted with no specified repayment dates settled, due to some characteristics such as the
outstanding balance not exceeding the value of collateral, are supposed to approximate the fair value, given the estimated repayment
period, interest rates and other conditions.
f. Deposits
The fair value of deposits at notice is based on the payment amount that would be required to pay at the end of the year.
The fair value of time deposits is based on the present value of the total of principal and interest discounted by an interest rate to be
applied if similar new deposits were entered into. As to time deposits with short-term maturities, their carrying amounts
approximate the fair value.
g. Call money and bills sold, and payables under securities lending transactions
Call money and bills sold, and payables under securities lending transactions are short-term in nature, and therefore their carrying
amounts approximate the fair value.
h. Borrowed money
The fair value of borrowed money is based on the present value discounted by an interest rate to be applied if a similar new
borrowing is entered into. As to borrowed money with short-term maturity, its carrying amount approximates the fair value.
i. Corporate bonds with stock acquisition rights
The fair value of corporate bonds is determined using the prices provided by the financial institutions that the Bank has been dealing
with.
j. Derivative transactions
Please refer to the following section of the notes to Derivatives.
(Note 2) The following table summarizes book values of securities for which it is extremely difficult to determine the fair values at
31 March 2019 and 2018:
Millions of yen
Thousands of
U.S. dollars
2019 2018 2019
Available-for-sale securities ¥11,460 ¥8,364 $103,253
Monetary claims bought 185 272 1,667

― 30 ―
(Note 3) Expected collections of assets and payments of liabilities with maturities at 31 March 2019 and 2018 were as follows:
Millions of yen
2019
Within one
year
One to three
years
Three to
five years
Five to
seven years
Seven to
ten years
Over ten
years
Due from banks (*1) ¥368,095 ¥- ¥- ¥- ¥- ¥-
Monetary claims bought 1,447 - - - - 4,184
Securities
Held-to-maturity debt securities - 303 - - 1,985 19,974
Mainly consists of the following:
National bonds - - - - 1,985 19,974
Corporate bonds - 303 - - - -
Available-for-sale securities 162,484 250,840 148,928 125,411 330,666 78,974
Mainly consists of the following:
National bonds 55,527 69,555 9,471 10,519 24,550 47,445
Local government bonds 6,456 28,319 7,087 69,337 210,834 20,394
Corporate bonds 60,060 97,645 70,323 9,905 45,423 8,698
Loans and bills discounted 305,302 366,643 332,910 166,804 126,614 302,053
Deposits 3,102,389 107,608 6,261 1,225 39 -
Call money and bills sold 2,220 - - - - -
Payables under securities lending
transactions
6,514 - - - - -
Borrowed money (*2) 1,861 - 9 12 18 61
Millions of yen
2018
Within one
year
One to three
years
Three to
five years
Five to
seven years
Seven to
ten years
Over ten
years
Due from banks (*1) ¥384,041 ¥- ¥- ¥- ¥- ¥-
Monetary claims bought 1,323 - - - - 2,954
Securities
Held-to-maturity debt securities 10,301 2,430 - - 1,983 19,972
Mainly consists of the following:
National bonds 10,000 - - - 1,983 19,972
Corporate bonds 300 305 - - - -
Available-for-sale securities 175,851 330,054 145,173 74,659 363,722 73,535
Mainly consists of the following:
National bonds 77,547 118,347 14,701 10,686 21,215 52,525
Local government bonds 6,842 30,651 7,388 30,671 245,597 10,043
Corporate bonds 54,724 109,879 82,701 8,848 33,234 4,557
Loans and bills discounted 292,186 420,680 296,541 147,202 131,637 274,173
Deposits 3,160,552 111,678 6,532 278 1,081 -
Call money and bills sold 2,337 - - - - -
Payables under securities lending
transactions
4,134 - - - - -
Borrowed money (*2) 4,762 85 - - - -

― 31 ―
Thousands of U.S. dollars
2019
Within one
year
One to
three years
Three to
five years
Five to
seven years
Seven to
ten years
Over ten
years
Due from banks(*1) $3,316,470 $- $- $- $- $-
Monetary claims bought 13,037 - - - - 37,697
Securities
Held-to-maturity debt securities - 2,730 - - 17,884 179,962
Mainly consists of the following:
National bonds - - - - 17,884 179,962
Corporate bonds - 2,730 - - - -
Available-for-sale securities 1,463,952 2,260,023 1,341,815 1,129,931 2,979,241 711,542
Mainly consists of the following:
National bonds 500,288 626,678 85,332 94,774 221,191 427,471
Local government bonds 58,167 255,149 63,853 624,714 1,899,577 183,746
Corporate bonds 541,130 879,764 633,598 89,242 409,253 78,367
Loans and bills discounted 2,750,716 3,303,388 2,999,459 1,502,874 1,140,769 2,721,443
Deposits 27,951,969 969,529 56,410 11,037 351 -
Call money and bills sold 20,002 - - - - -
Payables under securities lending
transactions
58,690 - - - -
Borrowed money (*2) 16,767 - 81 108 162 550
Notes: *1. Due from banks that does not have maturity is included in the “within one year” column.
*2. Borrowed money is stated for the interest-bearing borrowed money.
Derivatives
As stated in significant accounting policies, the Bank deals in interest rate swaps, currency swaps, and forward exchange contracts.
a. Derivative instruments not qualifying for hedge accounting
Notional amounts, fair values, and unrealized gains (losses) for the years ended 31 March 2019 and 2018 were as follows:
(Currency-related transactions)
Millions of yen Thousands of U.S. dollars
2019 2018 2019
Notional
amounts Fair value
Unrealized
gains
(losses)
Notional
amounts Fair value
Unrealized
gains
(losses)
Notional
amounts Fair value
Unrealized
gains
(losses)
Forward foreign exchange:
Sell ¥21,539 ¥(160) ¥(160) ¥14,529 ¥196 ¥196 $194,063 $(1,442) $(1,442)
Buy 1,987 21 21 384 (14) (14) 17,903 189 189
Notes: 1. Transactions in the above table are revalued at fair value. Unrealized gains (losses) are included in the consolidated
statements of income.
2. The fair value of forward foreign exchange is based on the discounted present value.
― 32 ―
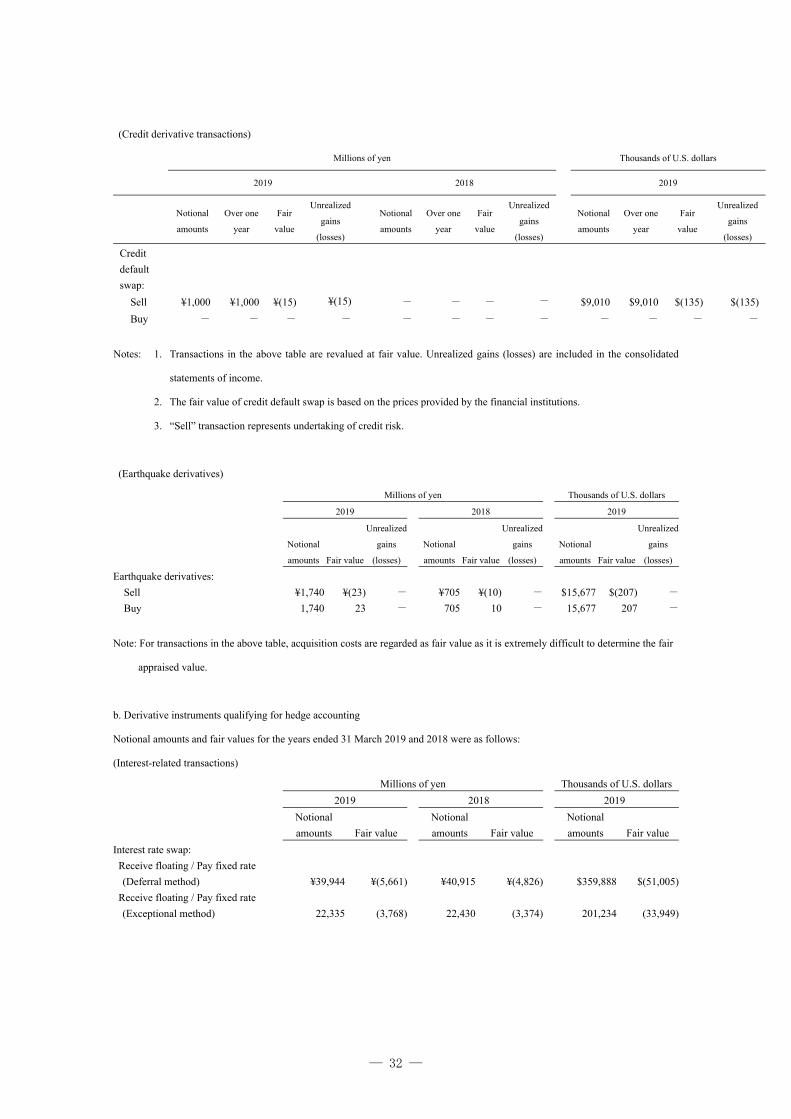
(Credit derivative transactions)
Millions of yen Thousands of U.S. dollars
2019 2018 2019
Notional
amounts
Over one
year
Fair
value
Unrealized
gains
(losses)
Notional
amounts
Over one
year
Fair
value
Unrealized
gains
(losses)
Notional
amounts
Over one
year
Fair
value
Unrealized
gains
(losses)
Credit
default
swap:
Sell ¥1,000 ¥1,000 ¥(15) ¥(15) - - - - $9,010 $9,010 $(135) $(135)
Buy - - - - - - - - - - - -
Notes: 1. Transactions in the above table are revalued at fair value. Unrealized gains (losses) are included in the consolidated
statements of income.
2. The fair value of credit default swap is based on the prices provided by the financial institutions.
3. “Sell” transaction represents undertaking of credit risk.
(Earthquake derivatives)
Millions of yen Thousands of U.S. dollars
2019 2018 2019
Notional
amounts Fair value
Unrealized
gains
(losses)
Notional
amounts Fair value
Unrealized
gains
(losses)
Notional
amounts Fair value
Unrealized
gains
(losses)
Earthquake derivatives:
Sell ¥1,740 ¥(23) - ¥705 ¥(10) - $15,677 $(207) -
Buy 1,740 23 - 705 10 - 15,677 207 -
Note: For transactions in the above table, acquisition costs are regarded as fair value as it is extremely difficult to determine the fair
appraised value.
b. Derivative instruments qualifying for hedge accounting
Notional amounts and fair values for the years ended 31 March 2019 and 2018 were as follows:
(Interest-related transactions)
Millions of yen Thousands of U.S. dollars
2019 2018 2019
Notional
amounts Fair value
Notional
amounts Fair value
Notional
amounts Fair value
Interest rate swap:
Receive floating / Pay fixed rate
(Deferral method) ¥39,944 ¥(5,661) ¥40,915 ¥(4,826) $359,888 $(51,005)
Receive floating / Pay fixed rate
(Exceptional method) 22,335 (3,768) 22,430 (3,374) 201,234 (33,949)
― 33 ―
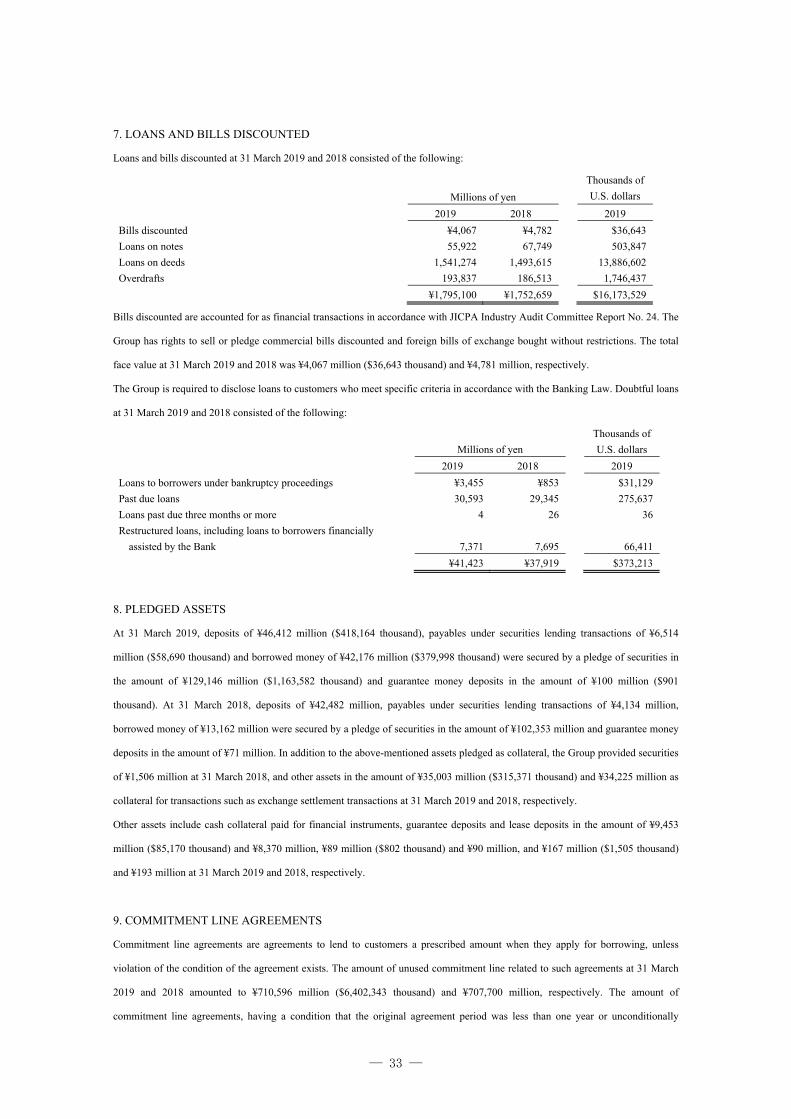
7. LOANS AND BILLS DISCOUNTED
Loans and bills discounted at 31 March 2019 and 2018 consisted of the following:
Millions of yen
Thousands of
U.S. dollars
2019 2018 2019
Bills discounted ¥4,067 ¥4,782 $36,643
Loans on notes 55,922 67,749 503,847
Loans on deeds 1,541,274 1,493,615 13,886,602
Overdrafts 193,837 186,513 1,746,437
¥1,795,100 ¥1,752,659 $16,173,529
Bills discounted are accounted for as financial transactions in accordance with JICPA Industry Audit Committee Report No. 24. The
Group has rights to sell or pledge commercial bills discounted and foreign bills of exchange bought without restrictions. The total
face value at 31 March 2019 and 2018 was ¥4,067 million ($36,643 thousand) and ¥4,781 million, respectively.
The Group is required to disclose loans to customers who meet specific criteria in accordance with the Banking Law. Doubtful loans
at 31 March 2019 and 2018 consisted of the following:
Millions of yen
Thousands of
U.S. dollars
2019 2018 2019
Loans to borrowers under bankruptcy proceedings ¥3,455 ¥853 $31,129
Past due loans 30,593 29,345 275,637
Loans past due three months or more 4 26 36
Restructured loans, including loans to borrowers financially
assisted by the Bank
7,371
7,695
66,411
¥41,423 ¥37,919 $373,213
8. PLEDGED ASSETS
At 31 March 2019, deposits of ¥46,412 million ($418,164 thousand), payables under securities lending transactions of ¥6,514
million ($58,690 thousand) and borrowed money of ¥42,176 million ($379,998 thousand) were secured by a pledge of securities in
the amount of ¥129,146 million ($1,163,582 thousand) and guarantee money deposits in the amount of ¥100 million ($901
thousand). At 31 March 2018, deposits of ¥42,482 million, payables under securities lending transactions of ¥4,134 million,
borrowed money of ¥13,162 million were secured by a pledge of securities in the amount of ¥102,353 million and guarantee money
deposits in the amount of ¥71 million. In addition to the above-mentioned assets pledged as collateral, the Group provided securities
of ¥1,506 million at 31 March 2018, and other assets in the amount of ¥35,003 million ($315,371 thousand) and ¥34,225 million as
collateral for transactions such as exchange settlement transactions at 31 March 2019 and 2018, respectively.
Other assets include cash collateral paid for financial instruments, guarantee deposits and lease deposits in the amount of ¥9,453
million ($85,170 thousand) and ¥8,370 million, ¥89 million ($802 thousand) and ¥90 million, and ¥167 million ($1,505 thousand)
and ¥193 million at 31 March 2019 and 2018, respectively.
9. COMMITMENT LINE AGREEMENTS
Commitment line agreements are agreements to lend to customers a prescribed amount when they apply for borrowing, unless
violation of the condition of the agreement exists. The amount of unused commitment line related to such agreements at 31 March
2019 and 2018 amounted to ¥710,596 million ($6,402,343 thousand) and ¥707,700 million, respectively. The amount of
commitment line agreements, having a condition that the original agreement period was less than one year or unconditionally
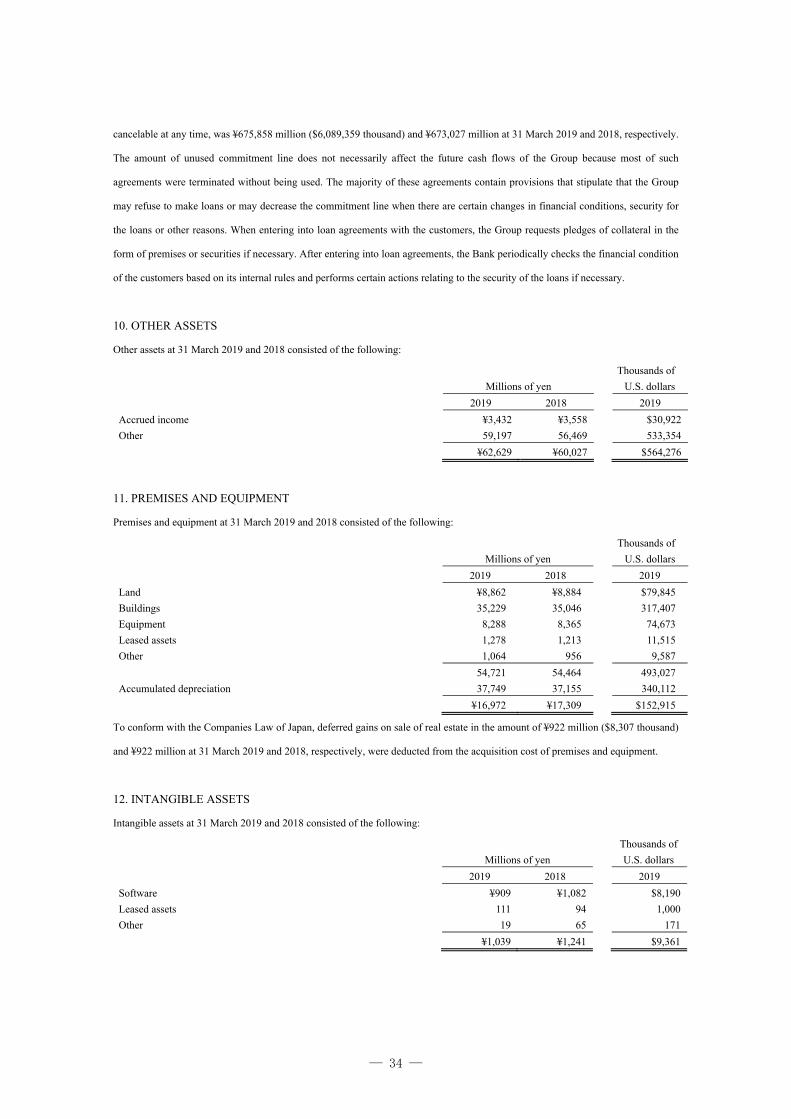
― 34 ―
cancelable at any time, was ¥675,858 million ($6,089,359 thousand) and ¥673,027 million at 31 March 2019 and 2018, respectively.
The amount of unused commitment line does not necessarily affect the future cash flows of the Group because most of such
agreements were terminated without being used. The majority of these agreements contain provisions that stipulate that the Group
may refuse to make loans or may decrease the commitment line when there are certain changes in financial conditions, security for
the loans or other reasons. When entering into loan agreements with the customers, the Group requests pledges of collateral in the
form of premises or securities if necessary. After entering into loan agreements, the Bank periodically checks the financial condition
of the customers based on its internal rules and performs certain actions relating to the security of the loans if necessary.
10. OTHER ASSETS
Other assets at 31 March 2019 and 2018 consisted of the following:
Millions of yen
Thousands of
U.S. dollars
2019 2018 2019
Accrued income ¥3,432 ¥3,558 $30,922
Other 59,197 56,469 533,354
¥62,629 ¥60,027 $564,276
11. PREMISES AND EQUIPMENT
Premises and equipment at 31 March 2019 and 2018 consisted of the following:
Millions of yen
Thousands of
U.S. dollars
2019 2018 2019
Land ¥8,862 ¥8,884 $79,845
Buildings 35,229 35,046 317,407
Equipment 8,288 8,365 74,673
Leased assets 1,278 1,213 11,515
Other 1,064 956 9,587
54,721 54,464 493,027
Accumulated depreciation 37,749 37,155 340,112
¥16,972 ¥17,309 $152,915
To conform with the Companies Law of Japan, deferred gains on sale of real estate in the amount of ¥922 million ($8,307 thousand)
and ¥922 million at 31 March 2019 and 2018, respectively, were deducted from the acquisition cost of premises and equipment.
12. INTANGIBLE ASSETS
Intangible assets at 31 March 2019 and 2018 consisted of the following:
Millions of yen
Thousands of
U.S. dollars
2019 2018 2019
Software ¥909 ¥1,082 $8,190
Leased assets 111 94 1,000
Other 19 65 171
¥1,039 ¥1,241 $9,361

― 35 ―
13. DEPOSITS
Deposits at 31 March 2019 and 2018 consisted of the following:
Millions of yen
Thousands of
U.S. dollars
2019 2018 2019
Current deposits ¥52,090 ¥54,341 $469,321
Ordinary deposits 1,775,199 1,792,480 15,994,225
Deposits at notice 1,493 1,758 13,452
Time deposits 1,048,702 1,157,586 9,448,617
Other deposits 76,192 70,610 686,476
Negotiable certificates of deposit 263,846 203,346 2,377,205
¥3,217,522 ¥3,280,121 $28,989,296
14. CORPORATE BONDS WITH STOCK ACQUISITION RIGHTS
Corporate bonds with stock acquisition rights at 31 March 2019 and 2018 were summarized as follows:
Issued
Millions of yen
Thousands of
U.S. dollars Coupon rate
(%)
Secured or
unsecured Due Name 2019 2018 2019
Zero coupon convertible
bond-type bonds with
stock acquisition
rights due 2018
payable in U.S.
dollars 25 July 2013 - ¥10,624 - Non-interest Unsecured 25 July 2018
15. OTHER LIABILITIES
Other liabilities at 31 March 2019 and 2018 consisted of the following:
Millions of yen
Thousands of
U.S. dollars
2019 2018 2019
Accrued income taxes ¥548 ¥1,927 $4,937
Accrued expenses 2,370 2,588 21,353
Unearned income 487 468 4,388
Lease obligations 1,884 2,058 16,975
Other 15,719 14,909 141,626
¥21,008 ¥21,950 $189,279
16. CONTINGENT LIABILITIES, ACCEPTANCES AND GUARANTEES
All contingent liabilities including letters of credit, acceptances and guarantees are reflected in acceptances and guarantees. As a
contra account, customers’ liabilities for acceptances and guarantees are shown on the asset side, which represent the Group’s right
of indemnity from customers.
The amount of guarantee obligation for privately placed bonds (Financial Instruments and Exchange Law, Article 2, Paragraph 3),
out of bonds included in securities, stands at ¥3,521 million ($31,724 thousand) in 2019 and ¥2,518 million in 2018.
17. EMPLOYEES’ SEVERANCE AND RETIREMENT BENEFITS
The Group has adopted funded and unfunded defined benefit plans to prepare for the employees’ retirement benefits. In addition, as
of 1 April 2016, the Bank transferred part of the defined benefit plans (excluding the portion for vested pensioners in a waiting
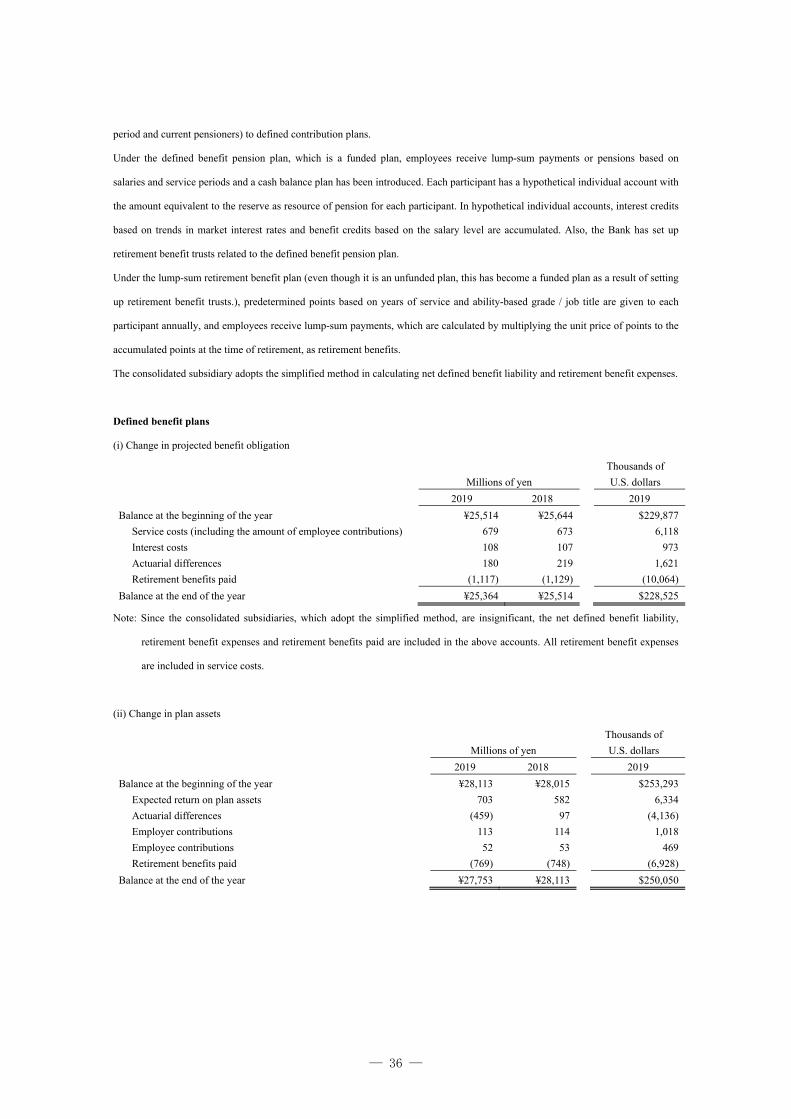
― 36 ―
period and current pensioners) to defined contribution plans.
Under the defined benefit pension plan, which is a funded plan, employees receive lump-sum payments or pensions based on
salaries and service periods and a cash balance plan has been introduced. Each participant has a hypothetical individual account with
the amount equivalent to the reserve as resource of pension for each participant. In hypothetical individual accounts, interest credits
based on trends in market interest rates and benefit credits based on the salary level are accumulated. Also, the Bank has set up
retirement benefit trusts related to the defined benefit pension plan.
Under the lump-sum retirement benefit plan (even though it is an unfunded plan, this has become a funded plan as a result of setting
up retirement benefit trusts.), predetermined points based on years of service and ability-based grade / job title are given to each
participant annually, and employees receive lump-sum payments, which are calculated by multiplying the unit price of points to the
accumulated points at the time of retirement, as retirement benefits.
The consolidated subsidiary adopts the simplified method in calculating net defined benefit liability and retirement benefit expenses.
Defined benefit plans
(i) Change in projected benefit obligation
Millions of yen
Thousands of
U.S. dollars
2019 2018 2019
Balance at the beginning of the year ¥25,514 ¥25,644 $229,877
Service costs (including the amount of employee contributions) 679 673 6,118
Interest costs 108 107 973
Actuarial differences 180 219 1,621
Retirement benefits paid (1,117) (1,129) (10,064)
Balance at the end of the year ¥25,364 ¥25,514 $228,525
Note: Since the consolidated subsidiaries, which adopt the simplified method, are insignificant, the net defined benefit liability,
retirement benefit expenses and retirement benefits paid are included in the above accounts. All retirement benefit expenses
are included in service costs.
(ii) Change in plan assets
Millions of yen
Thousands of
U.S. dollars
2019 2018 2019
Balance at the beginning of the year ¥28,113 ¥28,015 $253,293
Expected return on plan assets 703 582 6,334
Actuarial differences (459) 97 (4,136)
Employer contributions 113 114 1,018
Employee contributions 52 53 469
Retirement benefits paid (769) (748) (6,928)
Balance at the end of the year ¥27,753 ¥28,113 $250,050

― 37 ―
(iii) Reconciliation from projected benefit obligation and plan assets to net defined benefit liability (asset)
Millions of yen
Thousands of
U.S. dollars
2019 2018 2019
Funded projected benefit obligation ¥25,044 ¥25,187 $225,642
Plan assets (27,753) (28,113) (250,050)
(2,709) (2,926) (24,408)
Unfunded projected benefit obligation 320 327 2,883
Net liability (asset) recognized in consolidated balance
sheets
¥(2,389)
¥(2,599)
$(21,525)
Net defined benefit liability 2,134 1,944 19,227
Net defined benefit asset (4,523) (4,543) (40,752)
Net liability (asset) recognized in consolidated balance
sheets
¥(2,389)
¥(2,599)
$(21,525)
Note: The table above includes the plans to which the simplified method is applied.
(iv) Retirement benefit expenses and their breakdown
Millions of yen
Thousands of U.S. dollars
2019 2018 2019
Service costs (excluding the amount of employee contributions) ¥627 ¥620 $5,649
Interest costs 108 107 973
Expected return on plan assets (703) (582) (6,334)
Amortization of actuarial differences 408 645 3,676
Retirement benefit expenses ¥440 ¥790 $3,964
Note: The retirement benefit expenses of the consolidated subsidiaries adopting the simplified method are included in service costs.
(v) Remeasurements of defined benefit plans on other comprehensive income
The component of items recognized in remeasurements of defined benefit plans (pretax) on other comprehensive income was as
follows:
Millions of yen Thousands of
U.S. dollars 2019 2018 2019
Actuarial differences ¥(231) ¥523 $(2,081)
Total ¥(231) ¥523 $(2,081)
(vi) Remeasurements of defined benefit plans on accumulated other comprehensive income
The component of items recognized in remeasurements of defined benefit plans (pretax) on accumulated other comprehensive
income was as follows:
Millions of yen Thousands of
U.S. dollars 2019 2018 2019
Unrecognized actuarial differences ¥ (1,908) ¥ (1,677) $(17,191)
Total ¥ (1,908) ¥ (1,677) $(17,191)
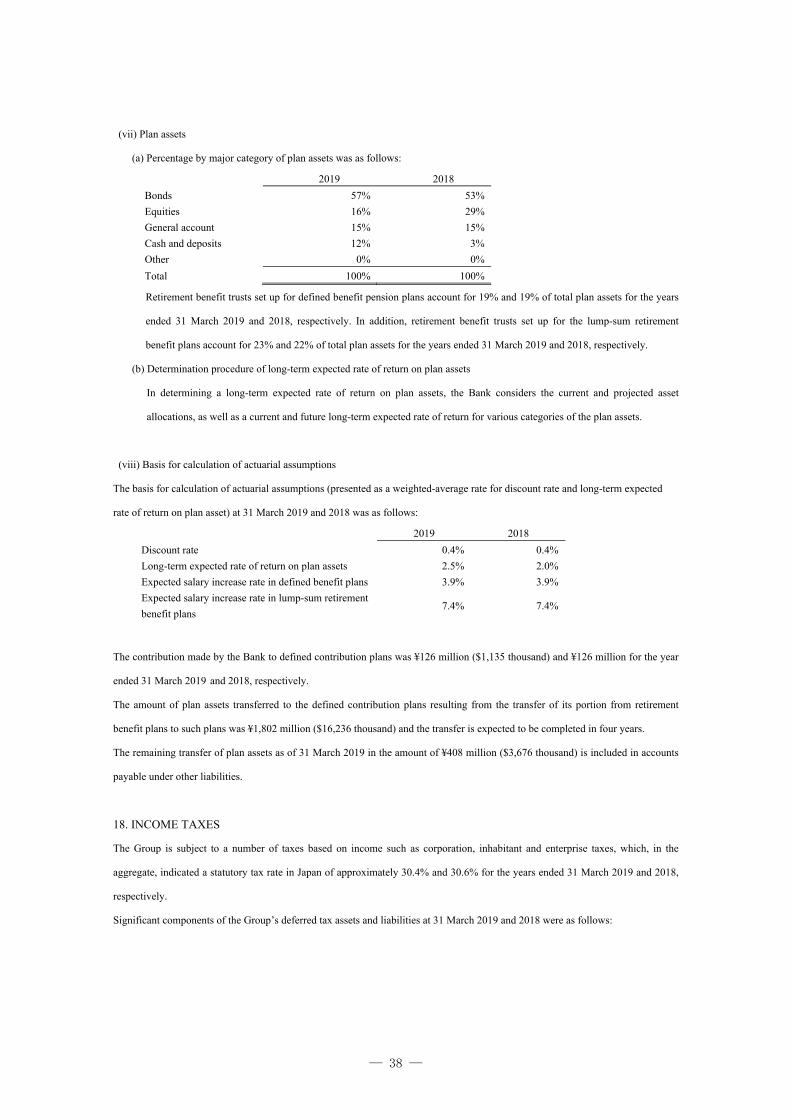
― 38 ―
(vii) Plan assets
(a) Percentage by major category of plan assets was as follows:
2019 2018
Bonds 57% 53%
Equities 16% 29%
General account 15% 15%
Cash and deposits 12% 3%
Other 0% 0%
Total 100% 100%
Retirement benefit trusts set up for defined benefit pension plans account for 19% and 19% of total plan assets for the years
ended 31 March 2019 and 2018, respectively. In addition, retirement benefit trusts set up for the lump-sum retirement
benefit plans account for 23% and 22% of total plan assets for the years ended 31 March 2019 and 2018, respectively.
(b) Determination procedure of long-term expected rate of return on plan assets
In determining a long-term expected rate of return on plan assets, the Bank considers the current and projected asset
allocations, as well as a current and future long-term expected rate of return for various categories of the plan assets.
(viii) Basis for calculation of actuarial assumptions
The basis for calculation of actuarial assumptions (presented as a weighted-average rate for discount rate and long-term expected
rate of return on plan asset) at 31 March 2019 and 2018 was as follows:
2019 2018
Discount rate 0.4% 0.4%
Long-term expected rate of return on plan assets 2.5% 2.0%
Expected salary increase rate in defined benefit plans 3.9% 3.9%
Expected salary increase rate in lump-sum retirement
benefit plans 7.4% 7.4%
The contribution made by the Bank to defined contribution plans was ¥126 million ($1,135 thousand) and ¥126 million for the year
ended 31 March 2019 and 2018, respectively.
The amount of plan assets transferred to the defined contribution plans resulting from the transfer of its portion from retirement
benefit plans to such plans was ¥1,802 million ($16,236 thousand) and the transfer is expected to be completed in four years.
The remaining transfer of plan assets as of 31 March 2019 in the amount of ¥408 million ($3,676 thousand) is included in accounts
payable under other liabilities.
18. INCOME TAXES
The Group is subject to a number of taxes based on income such as corporation, inhabitant and enterprise taxes, which, in the
aggregate, indicated a statutory tax rate in Japan of approximately 30.4% and 30.6% for the years ended 31 March 2019 and 2018,
respectively.
Significant components of the Group’s deferred tax assets and liabilities at 31 March 2019 and 2018 were as follows:
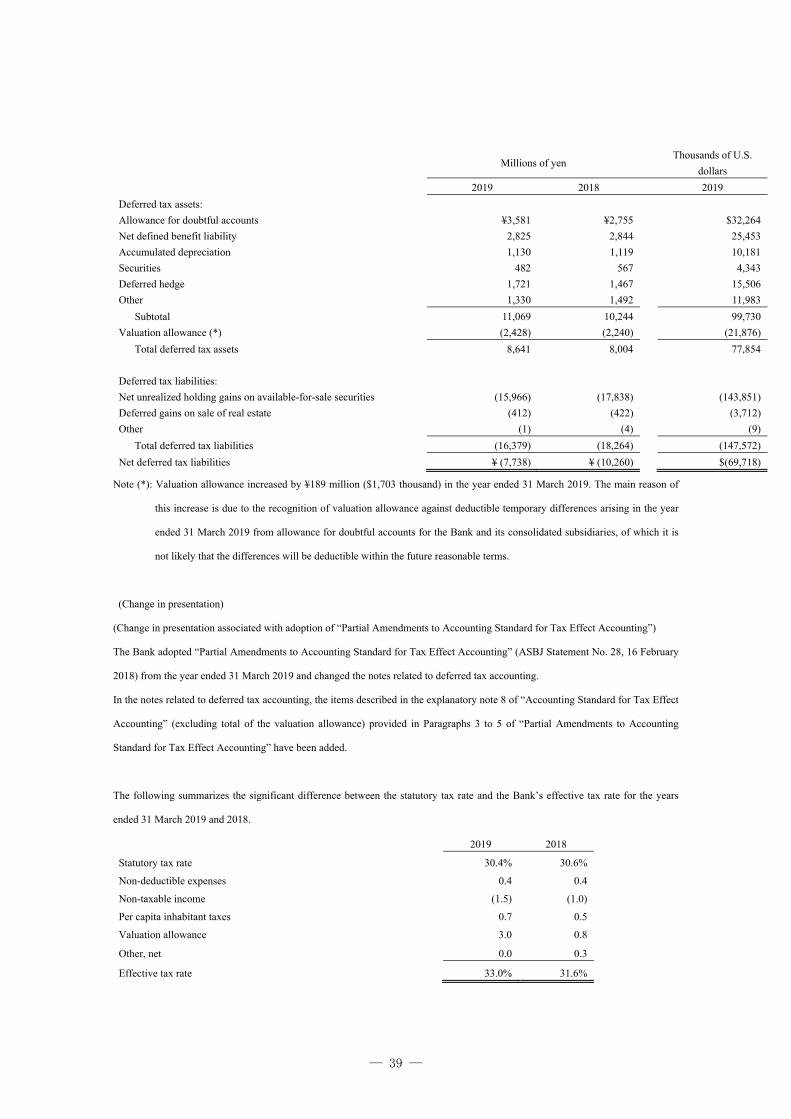
― 39 ―
Millions of yen Thousands of U.S.
dollars
2019 2018 2019
Deferred tax assets:
Allowance for doubtful accounts ¥3,581 ¥2,755 $32,264
Net defined benefit liability 2,825 2,844 25,453
Accumulated depreciation 1,130 1,119 10,181
Securities 482 567 4,343
Deferred hedge 1,721 1,467 15,506
Other 1,330 1,492 11,983
Subtotal 11,069 10,244 99,730
Valuation allowance (*) (2,428) (2,240) (21,876)
Total deferred tax assets 8,641 8,004 77,854
Deferred tax liabilities:
Net unrealized holding gains on available-for-sale securities (15,966) (17,838) (143,851)
Deferred gains on sale of real estate (412) (422) (3,712)
Other (1) (4) (9)
Total deferred tax liabilities (16,379) (18,264) (147,572)
Net deferred tax liabilities ¥ (7,738) ¥ (10,260) $(69,718)
Note (*): Valuation allowance increased by ¥189 million ($1,703 thousand) in the year ended 31 March 2019. The main reason of
this increase is due to the recognition of valuation allowance against deductible temporary differences arising in the year
ended 31 March 2019 from allowance for doubtful accounts for the Bank and its consolidated subsidiaries, of which it is
not likely that the differences will be deductible within the future reasonable terms.
(Change in presentation)
(Change in presentation associated with adoption of “Partial Amendments to Accounting Standard for Tax Effect Accounting”)
The Bank adopted “Partial Amendments to Accounting Standard for Tax Effect Accounting” (ASBJ Statement No. 28, 16 February
2018) from the year ended 31 March 2019 and changed the notes related to deferred tax accounting.
In the notes related to deferred tax accounting, the items described in the explanatory note 8 of “Accounting Standard for Tax Effect
Accounting” (excluding total of the valuation allowance) provided in Paragraphs 3 to 5 of “Partial Amendments to Accounting
Standard for Tax Effect Accounting” have been added.
The following summarizes the significant difference between the statutory tax rate and the Bank’s effective tax rate for the years
ended 31 March 2019 and 2018.
2019 2018
Statutory tax rate 30.4% 30.6%
Non-deductible expenses 0.4 0.4
Non-taxable income (1.5) (1.0)
Per capita inhabitant taxes 0.7 0.5
Valuation allowance 3.0 0.8
Other, net 0.0 0.3
Effective tax rate 33.0% 31.6%
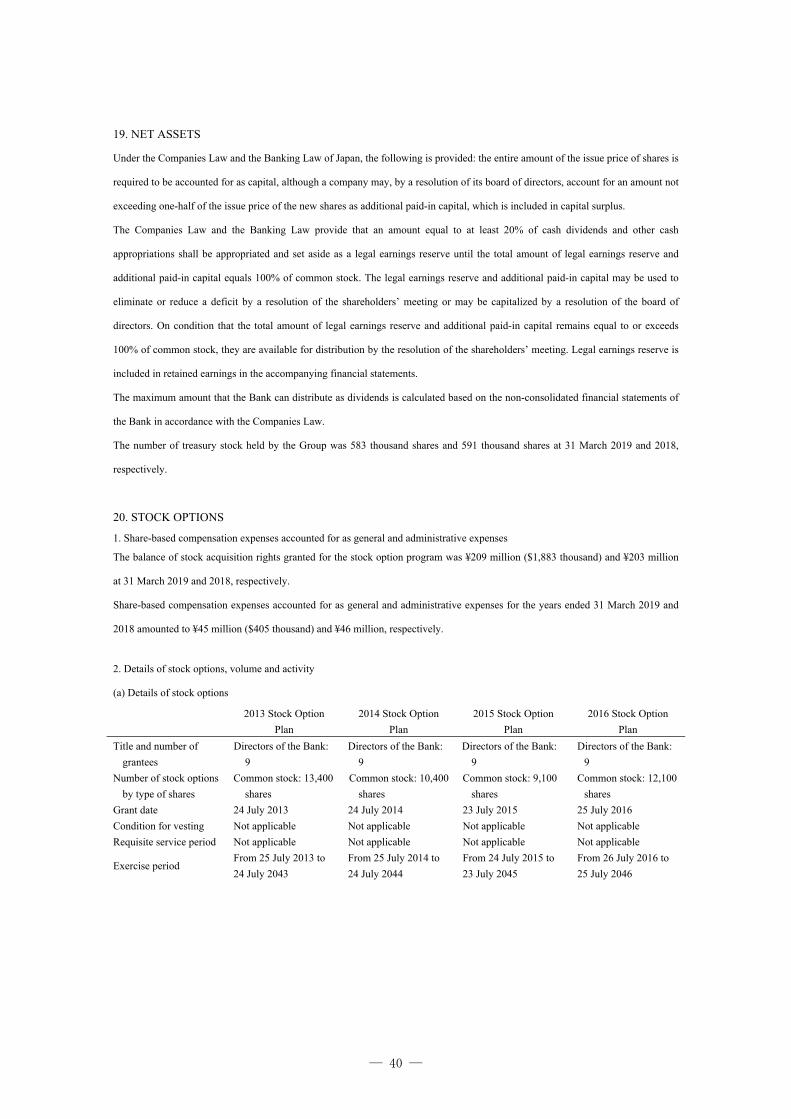
― 40 ―
19. NET ASSETS
Under the Companies Law and the Banking Law of Japan, the following is provided: the entire amount of the issue price of shares is
required to be accounted for as capital, although a company may, by a resolution of its board of directors, account for an amount not
exceeding one-half of the issue price of the new shares as additional paid-in capital, which is included in capital surplus.
The Companies Law and the Banking Law provide that an amount equal to at least 20% of cash dividends and other cash
appropriations shall be appropriated and set aside as a legal earnings reserve until the total amount of legal earnings reserve and
additional paid-in capital equals 100% of common stock. The legal earnings reserve and additional paid-in capital may be used to
eliminate or reduce a deficit by a resolution of the shareholders’ meeting or may be capitalized by a resolution of the board of
directors. On condition that the total amount of legal earnings reserve and additional paid-in capital remains equal to or exceeds
100% of common stock, they are available for distribution by the resolution of the shareholders’ meeting. Legal earnings reserve is
included in retained earnings in the accompanying financial statements.
The maximum amount that the Bank can distribute as dividends is calculated based on the non-consolidated financial statements of
the Bank in accordance with the Companies Law.
The number of treasury stock held by the Group was 583 thousand shares and 591 thousand shares at 31 March 2019 and 2018,
respectively.
20. STOCK OPTIONS
1. Share-based compensation expenses accounted for as general and administrative expenses
The balance of stock acquisition rights granted for the stock option program was ¥209 million ($1,883 thousand) and ¥203 million
at 31 March 2019 and 2018, respectively.
Share-based compensation expenses accounted for as general and administrative expenses for the years ended 31 March 2019 and
2018 amounted to ¥45 million ($405 thousand) and ¥46 million, respectively.
2. Details of stock options, volume and activity
(a) Details of stock options
2013 Stock Option
Plan
2014 Stock Option
Plan
2015 Stock Option
Plan
2016 Stock Option
Plan
Title and number of
grantees
Directors of the Bank:
9
Directors of the Bank:
9
Directors of the Bank:
9
Directors of the Bank:
9
Number of stock options
by type of shares
Common stock: 13,400
shares
Common stock: 10,400
shares
Common stock: 9,100
shares
Common stock: 12,100
shares
Grant date 24 July 2013 24 July 2014 23 July 2015 25 July 2016
Condition for vesting Not applicable Not applicable Not applicable Not applicable
Requisite service period Not applicable Not applicable Not applicable Not applicable
Exercise period From 25 July 2013 to
24 July 2043
From 25 July 2014 to
24 July 2044
From 24 July 2015 to
23 July 2045
From 26 July 2016 to
25 July 2046
― 41 ―
2017 Stock Option
Plan
2018 Stock Option
Plan
Title and number of
grantees
Directors of the Bank:
9
Directors of the Bank:
7
Number of stock options
by type of shares
Common stock: 11,100
shares
Common stock: 10,200
shares
Grant date 26 July 2017 25 July 2018
Condition for vesting Not applicable Not applicable
Requisite service period Not applicable Not applicable
Exercise period From 27 July 2017 to
26 July 2047
From 26 July 2018 to
25 July 2048
Note: Reported in terms of shares of stock.
(b) Volume and activity
The following describes volume and activity that existed during the year ended 31 March 2019. The number of stock options is
reported in terms of shares of stock.
(i) Number of stock options
2013 Stock Option Plan 2014 Stock Option Plan 2015 Stock Option Plan 2016 Stock Option Plan
Before vesting (shares):
At 31 March 2018 9,000 7,800 6,900 12,100
Granted - - - -
Forfeited - - - -
Vested 2,000 1,400 1,200 2,500
Outstanding 7,000 6,400 5,700 9,600
After vesting (shares):
At 31 March 2018 - - - -
Vested 2,000 1,400 1,200 2,500
Exercised 2,000 1,400 1,200 2,500
Forfeited - - - -
Outstanding - - - -
2017 Stock Option Plan 2018 Stock Option Plan
Before vesting (shares):
At 31 March 2018 11,100 -
Granted - 10,200
Forfeited - -
Vested 2,200 -
Outstanding 8,900 10,200
After vesting (shares): - -
At 31 March 2018 - -
Vested 2,200 -
Exercised 2,200 -
Forfeited - -
Outstanding - -
― 42 ―
(ii) Price information
2013 Stock Option 2014 Stock Option 2015 Stock Option 2016 Stock Option
Exercise price ¥1 ($0.01) ¥1 ($0.01) ¥1 ($0.01) ¥1 ($0.01)
Average exercise price ¥4,205 ($37.89) ¥4,205 ($37.89) ¥4,205 ($37.89) ¥4,205 ($37.89)
Fair value at the grant ¥4,119 ($37.11) ¥4,437 ($39.98) ¥5,287 ($47.63) ¥4,032 ($36.33)
2017 Stock Option 2018 Stock Option
Exercise price ¥1 ($0.01) ¥1 ($0.01)
Average exercise price ¥4,205 ($37.89) ¥- ($-)
Fair value at the grant ¥4,178 ($37.64) ¥4,439 ($39.99)
3. Valuation method for fair value of stock options
The valuation methods for fair value of stock options granted in the year ended 31 March 2019 were as follows:
(a) The valuation method: Black-Scholes formula
(b) Major basic numerical values and valuation method
2018 Stock Option Plan
Stock price volatility (*1) 18.6%
Expected years to expiration (*2) 1.6 years
Expected dividends (*3) ¥70 ($0.63) per share
Risk-free interest rate (*4) (0.11)%
Notes:*1. Stock price volatility was calculated based on the actual stock prices from 12 December 2016 to 16 July 2018.
*2. As a rational estimation was difficult due to the insufficient amount of historical data, expected years to expiration
were set up by the estimated average remaining service period.
*3. Expected dividends are determined based on actual dividends for the year ended 31 March 2018.
*4. Risk-free interest rate is Japanese government bond yield corresponding to the expected years to expiration.
4. Estimation method for the vested number of stock options
Since it is difficult to make a reasonable estimate on future forfeited stock options, the actual number of forfeited stock options is
reflected in the estimation.
21. OTHER OPERATING INCOME AND EXPENSES
Other operating income and expenses for the years ended 31 March 2019 and 2018 consisted of the following:
Millions of yen
Thousands of
U.S. dollars
2019 2018 2019
Other operating income:
Gain on trading account securities transactions ¥1 ¥0 $9
Gain on sale of bonds 282 242 2,541
Gain on financial instruments - 25 -
Other 3,960 4,135 35,679
¥4,243 ¥4,402 $38,229
― 43 ―
Millions of yen
Thousands of
U.S. dollars
2019 2018 2019
Other operating expenses:
Loss on sale of foreign bills of exchange ¥486 ¥152 $4,379
Loss on sales of bonds 79 4 712
Loss on redemption of bonds 1,229 1,726 11,073
Loss on financial instruments 14 - 126
Other 3,411 3,640 30,732
¥5,219 ¥5,522 $47,022
22. GENERAL AND ADMINISTRATIVE EXPENSES
General and administrative expenses for the years ended 31 March 2019 and 2018 consisted of the following:
Millions of yen
Thousands of
U.S. dollars
2019 2018 2019
Salaries and allowances ¥11,558 ¥11,762 $104,135
Fringe benefits and welfare 3,043 3,069 27,417
Retirement benefit expenses 565 918 5,091
Depreciation for premises and equipment 1,900 2,033 17,119
Rental expenses 797 817 7,181
Taxes other than income taxes 1,458 1,571 13,136
Deposit insurance premium 989 1,068 8,911
Business outsourcing expenses 2,687 2,691 24,209
Other expenses 4,092 4,179 36,868
¥27,089 ¥28,108 $244,067
23. OTHER INCOME AND EXPENSES
Other income and expenses for the years ended 31 March 2019 and 2018 consisted of the following:
Millions of yen
Thousands of
U.S. dollars
2019 2018 2019
Other income:
Gain on sale of stocks and other securities ¥4,226 ¥2,318 $38,075
Gain on disposal of premises and equipment 25 48 225
Other 768 931 6,920
¥5,019 ¥3,297 $45,220
Millions of yen
Thousands of
U.S. dollars
2019 2018 2019
Other expenses:
Provision of allowance for doubtful accounts ¥ 4,550 ¥ 598 $40,995
Loss on disposal of premises and equipment 26 85 234
Loss on devaluation of stocks and other securities 29 0 261
Loss on sales of stocks and other securities 127 57 1,144
Impairment losses 76 181 685
Loss on money held in trust 203 - 1,829
Loss on transfer of receivables 135 31 1,216
Other 355 202 3,199
¥5,501 ¥1,154 $49,563
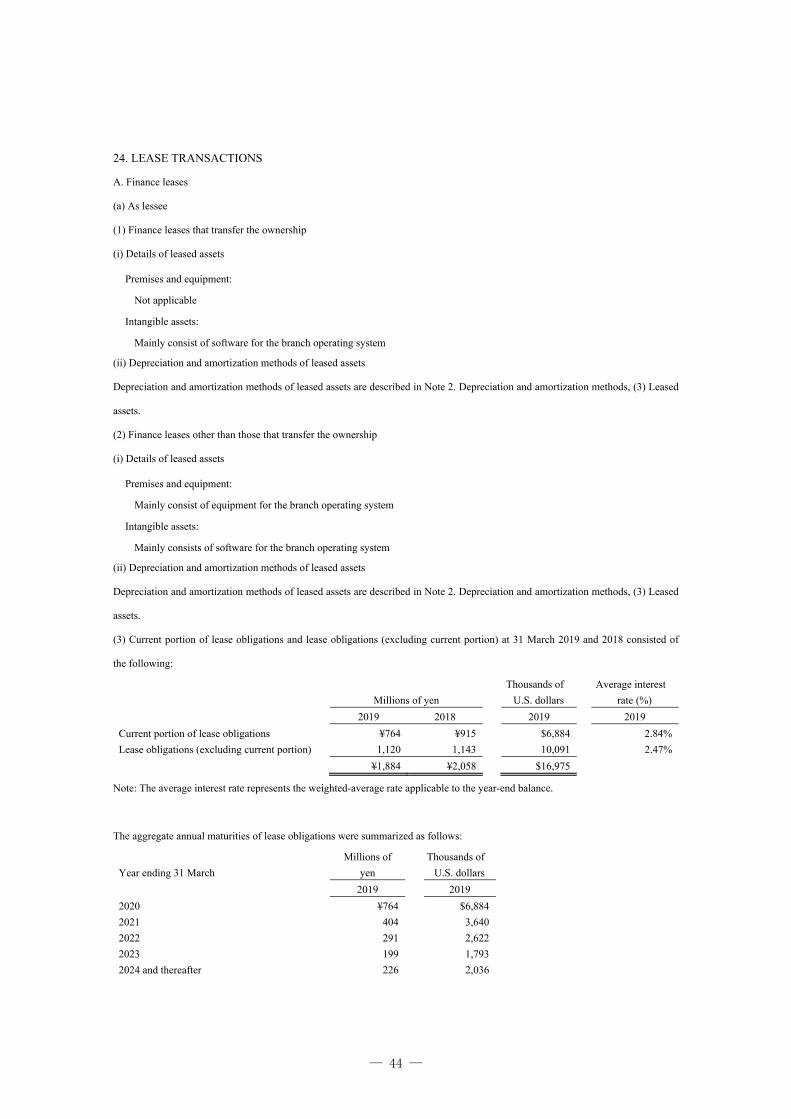
― 44 ―
24. LEASE TRANSACTIONS
A. Finance leases
(a) As lessee
(1) Finance leases that transfer the ownership
(i) Details of leased assets
Premises and equipment:
Not applicable
Intangible assets:
Mainly consist of software for the branch operating system
(ii) Depreciation and amortization methods of leased assets
Depreciation and amortization methods of leased assets are described in Note 2. Depreciation and amortization methods, (3) Leased
assets.
(2) Finance leases other than those that transfer the ownership
(i) Details of leased assets
Premises and equipment:
Mainly consist of equipment for the branch operating system
Intangible assets:
Mainly consists of software for the branch operating system
(ii) Depreciation and amortization methods of leased assets
Depreciation and amortization methods of leased assets are described in Note 2. Depreciation and amortization methods, (3) Leased
assets.
(3) Current portion of lease obligations and lease obligations (excluding current portion) at 31 March 2019 and 2018 consisted of
the following:
Millions of yen
Thousands of
U.S. dollars
Average interest
rate (%)
2019 2018 2019 2019
Current portion of lease obligations ¥764 ¥915 $6,884 2.84%
Lease obligations (excluding current portion) 1,120 1,143 10,091 2.47%
¥1,884 ¥2,058 $16,975
Note: The average interest rate represents the weighted-average rate applicable to the year-end balance.
The aggregate annual maturities of lease obligations were summarized as follows:
Year ending 31 March
Millions of
yen
Thousands of
U.S. dollars
2019 2019
2020 ¥764 $6,884
2021 404 3,640
2022 291 2,622
2023 199 1,793
2024 and thereafter 226 2,036

― 45 ―
Year ending 31 March
Millions of
yen
2018
2019 ¥915
2020 618
2021 258
2022 153
2023 and thereafter 114
B. Operating leases
(a) As lessee
There were no future lease payments under non-cancelable operating leases at 31 March 2019 and 2018.
(b) As lessor
Future lease receivables under non-cancelable operating leases at 31 March 2019 were ¥298 million ($2,685 thousand) including
¥32 million ($288 thousand) due within one year.
Future lease receivables under non-cancelable operating leases at 31 March 2018 were ¥340 million including ¥42 million due
within one year.
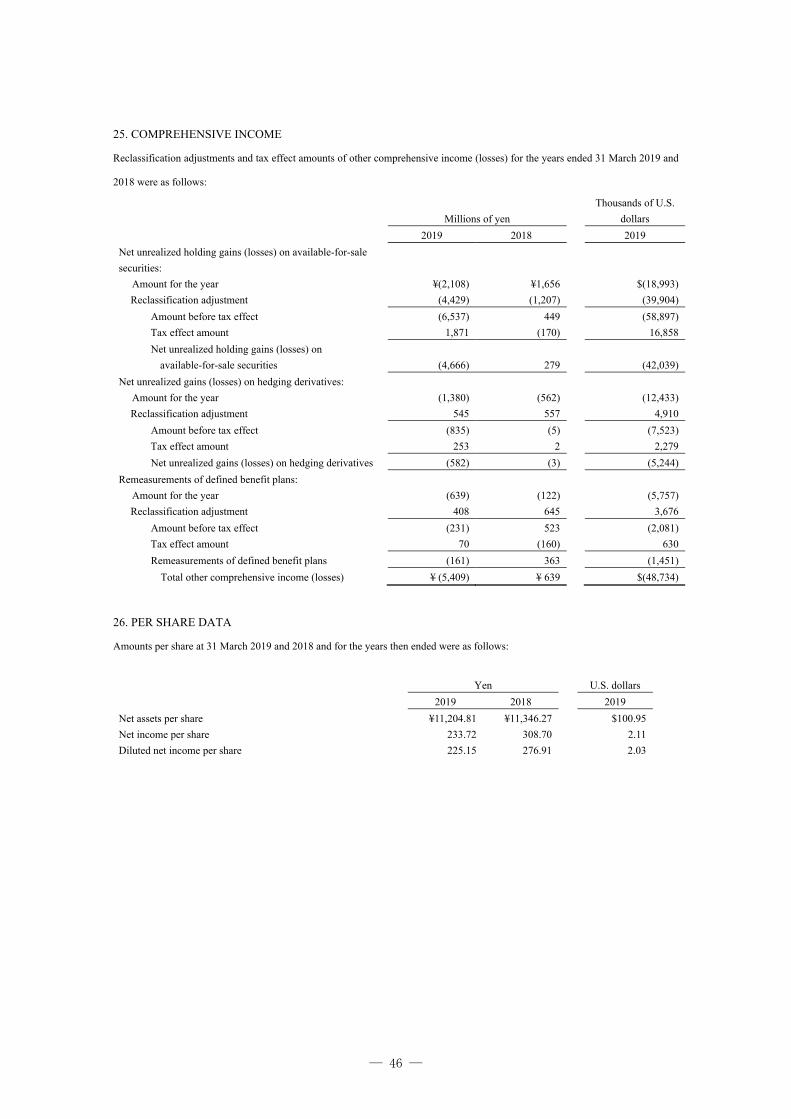
― 46 ―
25. COMPREHENSIVE INCOME
Reclassification adjustments and tax effect amounts of other comprehensive income (losses) for the years ended 31 March 2019 and
2018 were as follows:
Millions of yen
Thousands of U.S.
dollars
2019 2018 2019
Net unrealized holding gains (losses) on available-for-sale
securities:
Amount for the year ¥(2,108) ¥1,656 $(18,993)
Reclassification adjustment (4,429) (1,207) (39,904)
Amount before tax effect (6,537) 449 (58,897)
Tax effect amount 1,871 (170) 16,858
Net unrealized holding gains (losses) on
available-for-sale securities
(4,666)
279
(42,039)
Net unrealized gains (losses) on hedging derivatives:
Amount for the year (1,380) (562) (12,433)
Reclassification adjustment 545 557 4,910
Amount before tax effect (835) (5) (7,523)
Tax effect amount 253 2 2,279
Net unrealized gains (losses) on hedging derivatives (582) (3) (5,244)
Remeasurements of defined benefit plans:
Amount for the year (639) (122) (5,757)
Reclassification adjustment 408 645 3,676
Amount before tax effect (231) 523 (2,081)
Tax effect amount 70 (160) 630
Remeasurements of defined benefit plans (161) 363 (1,451)
Total other comprehensive income (losses) ¥ (5,409) ¥ 639 $(48,734)
26. PER SHARE DATA
Amounts per share at 31 March 2019 and 2018 and for the years then ended were as follows:
Yen
U.S. dollars
2019 2018 2019
Net assets per share ¥11,204.81 ¥11,346.27 $100.95
Net income per share 233.72 308.70 2.11
Diluted net income per share 225.15 276.91 2.03
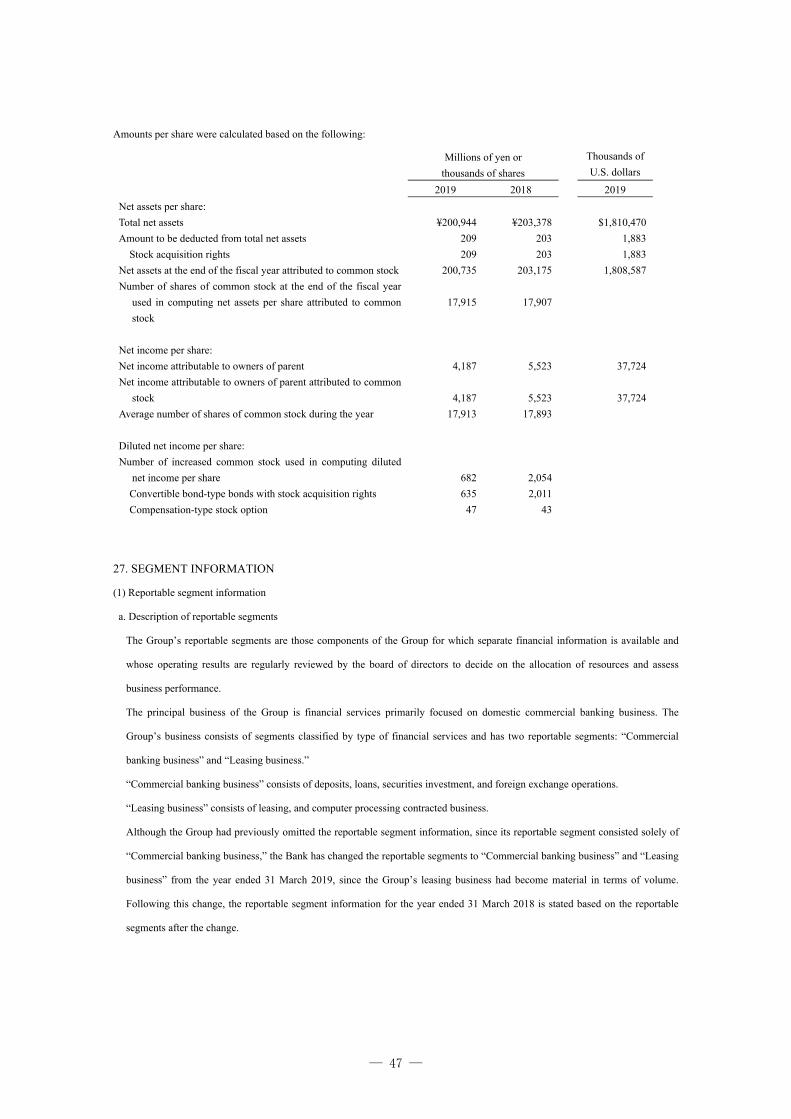
― 47 ―
Amounts per share were calculated based on the following:
Millions of yen or
thousands of shares
Thousands of
U.S. dollars
2019 2018 2019
Net assets per share:
Total net assets ¥200,944 ¥203,378 $1,810,470
Amount to be deducted from total net assets 209 203 1,883
Stock acquisition rights 209 203 1,883
Net assets at the end of the fiscal year attributed to common stock 200,735 203,175 1,808,587
Number of shares of common stock at the end of the fiscal year
used in computing net assets per share attributed to common
stock
17,915
17,907
Net income per share:
Net income attributable to owners of parent 4,187 5,523 37,724
Net income attributable to owners of parent attributed to common
stock 4,187 5,523
37,724
Average number of shares of common stock during the year 17,913 17,893
Diluted net income per share:
Number of increased common stock used in computing diluted
net income per share
682
2,054
Convertible bond-type bonds with stock acquisition rights 635 2,011
Compensation-type stock option 47 43
27. SEGMENT INFORMATION
(1) Reportable segment information
a. Description of reportable segments
The Group’s reportable segments are those components of the Group for which separate financial information is available and
whose operating results are regularly reviewed by the board of directors to decide on the allocation of resources and assess
business performance.
The principal business of the Group is financial services primarily focused on domestic commercial banking business. The
Group’s business consists of segments classified by type of financial services and has two reportable segments: “Commercial
banking business” and “Leasing business.”
“Commercial banking business” consists of deposits, loans, securities investment, and foreign exchange operations.
“Leasing business” consists of leasing, and computer processing contracted business.
Although the Group had previously omitted the reportable segment information, since its reportable segment consisted solely of
“Commercial banking business,” the Bank has changed the reportable segments to “Commercial banking business” and “Leasing
business” from the year ended 31 March 2019, since the Group’s leasing business had become material in terms of volume.
Following this change, the reportable segment information for the year ended 31 March 2018 is stated based on the reportable
segments after the change.
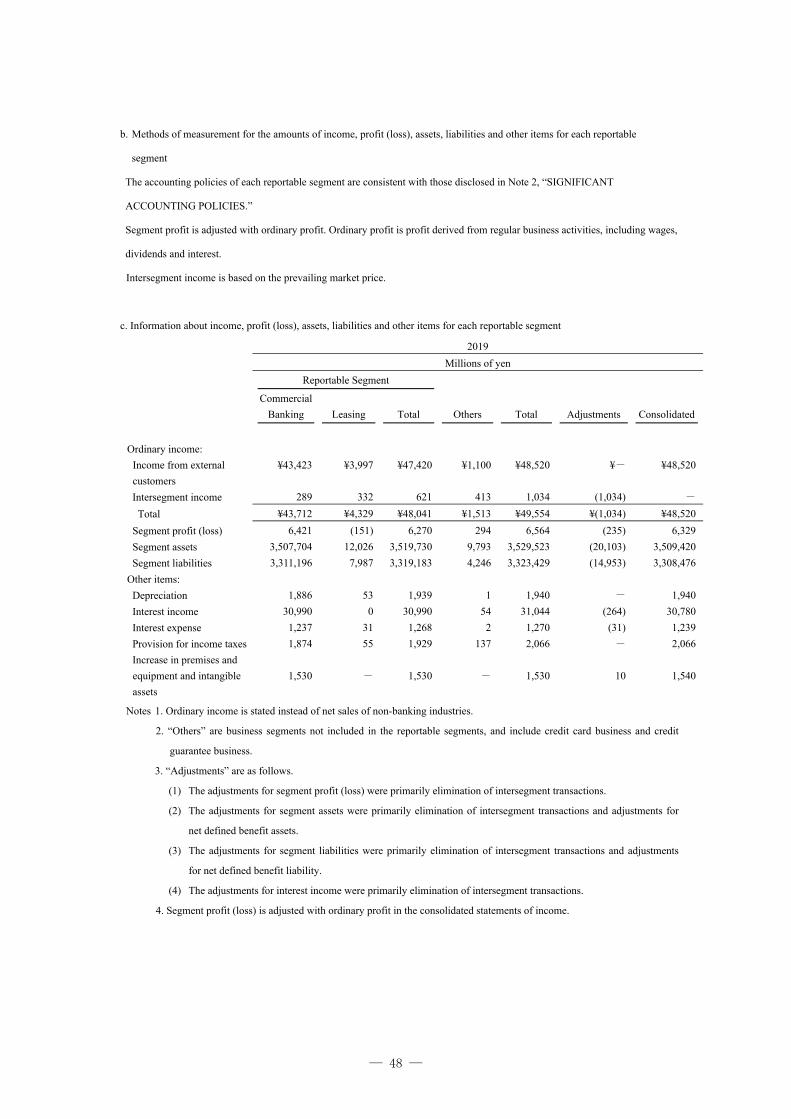
― 48 ―
b. Methods of measurement for the amounts of income, profit (loss), assets, liabilities and other items for each reportable
segment
The accounting policies of each reportable segment are consistent with those disclosed in Note 2, “SIGNIFICANT
ACCOUNTING POLICIES.”
Segment profit is adjusted with ordinary profit. Ordinary profit is profit derived from regular business activities, including wages,
dividends and interest.
Intersegment income is based on the prevailing market price.
c. Information about income, profit (loss), assets, liabilities and other items for each reportable segment
2019
Millions of yen
Reportable Segment
Others Total Adjustments Consolidated
Commercial
Banking Leasing Total
Ordinary income:
Income from external
customers
¥43,423 ¥3,997 ¥47,420 ¥1,100 ¥48,520 ¥- ¥48,520
Intersegment income 289 332 621 413 1,034 (1,034) -
Total ¥43,712 ¥4,329 ¥48,041 ¥1,513 ¥49,554 ¥(1,034) ¥48,520
Segment profit (loss) 6,421 (151) 6,270 294 6,564 (235) 6,329
Segment assets 3,507,704 12,026 3,519,730 9,793 3,529,523 (20,103) 3,509,420
Segment liabilities 3,311,196 7,987 3,319,183 4,246 3,323,429 (14,953) 3,308,476
Other items:
Depreciation 1,886 53 1,939 1 1,940 - 1,940
Interest income 30,990 0 30,990 54 31,044 (264) 30,780
Interest expense 1,237 31 1,268 2 1,270 (31) 1,239
Provision for income taxes 1,874 55 1,929 137 2,066 - 2,066
Increase in premises and
equipment and intangible
assets
1,530 - 1,530 - 1,530 10 1,540
Notes 1. Ordinary income is stated instead of net sales of non-banking industries.
2. “Others” are business segments not included in the reportable segments, and include credit card business and credit
guarantee business.
3. “Adjustments” are as follows.
(1) The adjustments for segment profit (loss) were primarily elimination of intersegment transactions.
(2) The adjustments for segment assets were primarily elimination of intersegment transactions and adjustments for
net defined benefit assets.
(3) The adjustments for segment liabilities were primarily elimination of intersegment transactions and adjustments
for net defined benefit liability.
(4) The adjustments for interest income were primarily elimination of intersegment transactions.
4. Segment profit (loss) is adjusted with ordinary profit in the consolidated statements of income.
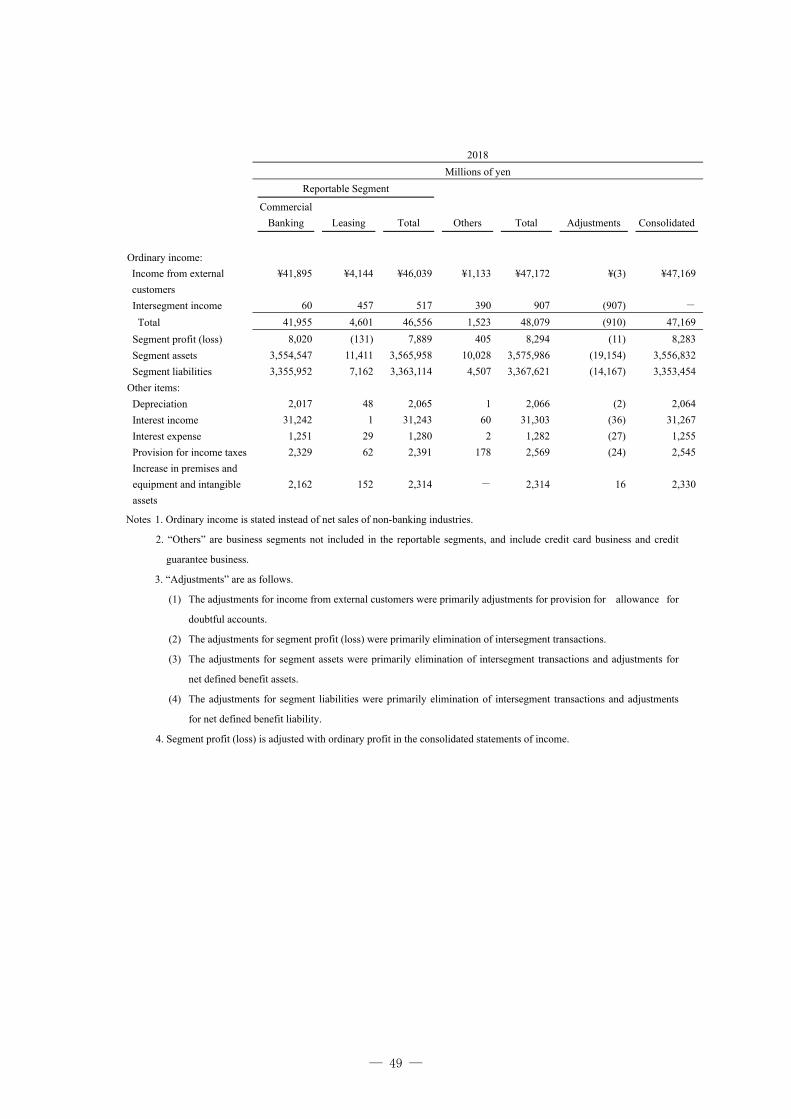
― 49 ―
2018
Millions of yen
Reportable Segment
Others Total Adjustments Consolidated
Commercial
Banking Leasing Total
Ordinary income:
Income from external
customers
¥41,895 ¥4,144 ¥46,039 ¥1,133 ¥47,172 ¥(3) ¥47,169
Intersegment income 60 457 517 390 907 (907) -
Total 41,955 4,601 46,556 1,523 48,079 (910) 47,169
Segment profit (loss) 8,020 (131) 7,889 405 8,294 (11) 8,283
Segment assets 3,554,547 11,411 3,565,958 10,028 3,575,986 (19,154) 3,556,832
Segment liabilities 3,355,952 7,162 3,363,114 4,507 3,367,621 (14,167) 3,353,454
Other items:
Depreciation 2,017 48 2,065 1 2,066 (2) 2,064
Interest income 31,242 1 31,243 60 31,303 (36) 31,267
Interest expense 1,251 29 1,280 2 1,282 (27) 1,255
Provision for income taxes 2,329 62 2,391 178 2,569 (24) 2,545
Increase in premises and
equipment and intangible
assets
2,162 152 2,314 - 2,314 16 2,330
Notes 1. Ordinary income is stated instead of net sales of non-banking industries.
2. “Others” are business segments not included in the reportable segments, and include credit card business and credit
guarantee business.
3. “Adjustments” are as follows.
(1) The adjustments for income from external customers were primarily adjustments for provision for allowance for
doubtful accounts.
(2) The adjustments for segment profit (loss) were primarily elimination of intersegment transactions.
(3) The adjustments for segment assets were primarily elimination of intersegment transactions and adjustments for
net defined benefit assets.
(4) The adjustments for segment liabilities were primarily elimination of intersegment transactions and adjustments
for net defined benefit liability.
4. Segment profit (loss) is adjusted with ordinary profit in the consolidated statements of income.

― 50 ―
2019
Thousands of U.S. dollars
Reportable Segment
Others Total Adjustments Consolidated
Commercial
Banking Leasing Total
Ordinary income:
Income from external
customers
$391,233 $36,012 $427,245 $9,911 $437,156 $- $437,156
Intersegment income 2,604 2,991 5,595 3,721 9,316 (9,316) -
Total $393,837 $39,003 $432,840 $13,632 $446,472 $(9,316) $437,156
Segment profit (loss) 57,852 (1,360) 56,492 2,648 59,140 (2,117) 57,023
Segment assets 31,603,784 108,352 31,712,136 88,233 31,800,369 (181,124) 31,619,245
Segment liabilities 29,833,282 71,961 29,905,243 38,256 29,943,499 (134,724) 29,808,775
Other items:
Depreciation 16,992 478 17,470 9 17,479 - 17,479
Interest income 279,214 0 279,214 487 279,701 (2,379) 277,322
Interest expense 11,145 279 11,424 18 11,442 (279) 11,163
Provision for income taxes 16,884 496 17,380 1,235 18,615 - 18,615
Increase in premises and
equipment and intangible
assets
13,785 - 13,785 - 13,785 90 13,875
(2) Other segment-related information
a. Information by service
Information by service for the years ended 31 March 2019 and 2018 was as follows:
2019
Millions of yen
Banking
Securities
investment Other Total
Ordinary income from external customers ¥17,624 ¥17,605 ¥13,291 ¥48,520
2018
Millions of yen
Banking
Securities
investment Other Total
Ordinary income from external customers ¥17,816 ¥15,964 ¥13,389 ¥47,169
2019
Thousands of U.S. dollars
Banking
Securities
investment Other Total
Ordinary income from external customers $158,789 $158,618 $119,749 $437,156
Note: Ordinary income is stated instead of net sales of non-banking industries.

― 51 ―
b. Information by geographic region
i. Ordinary income
Information on ordinary income from domestic customers for the years ended 31 March 2019 and 2018 was omitted, because the
amount of ordinary income from domestic customers was more than 90% of consolidated ordinary income.
ii. Premises and equipment
Information on premises and equipment for the years ended 31 March 2019 and 2018 was omitted, because there were no premises
and equipment located abroad.
c. Major customers’ segment information
Segment information on major customers was not shown for the years ended 31 March 2019 and 2018, since there was no customer
accounting for more than 10% of ordinary income to customers in the consolidated statements of income.
d. Information on impairment of fixed assets for each reportable segment
2019
Millions of yen
Reportable Segment
Others Total
Commercial
Banking Leasing Total
Impairment losses ¥76 ¥- ¥76 ¥- ¥76
2018
Millions of yen
Reportable Segment
Others Total
Commercial
Banking Leasing Total
Impairment losses ¥181 ¥- ¥181 ¥- ¥181
2019
Thousands of U.S. dollars
Reportable Segment
Others Total
Commercial
Banking Leasing Total
Impairment losses $685 $- $685 $- $685
e. Segment information on amortization of goodwill and its remaining balance
There is no information to be reported on amortization of goodwill and its remaining balance for the years ended 31 March 2019
and 2018.
f. Information on gain on negative goodwill for each reportable segment
There is no information to be reported on gain on negative goodwill for the years ended 31 March 2019 and 2018.
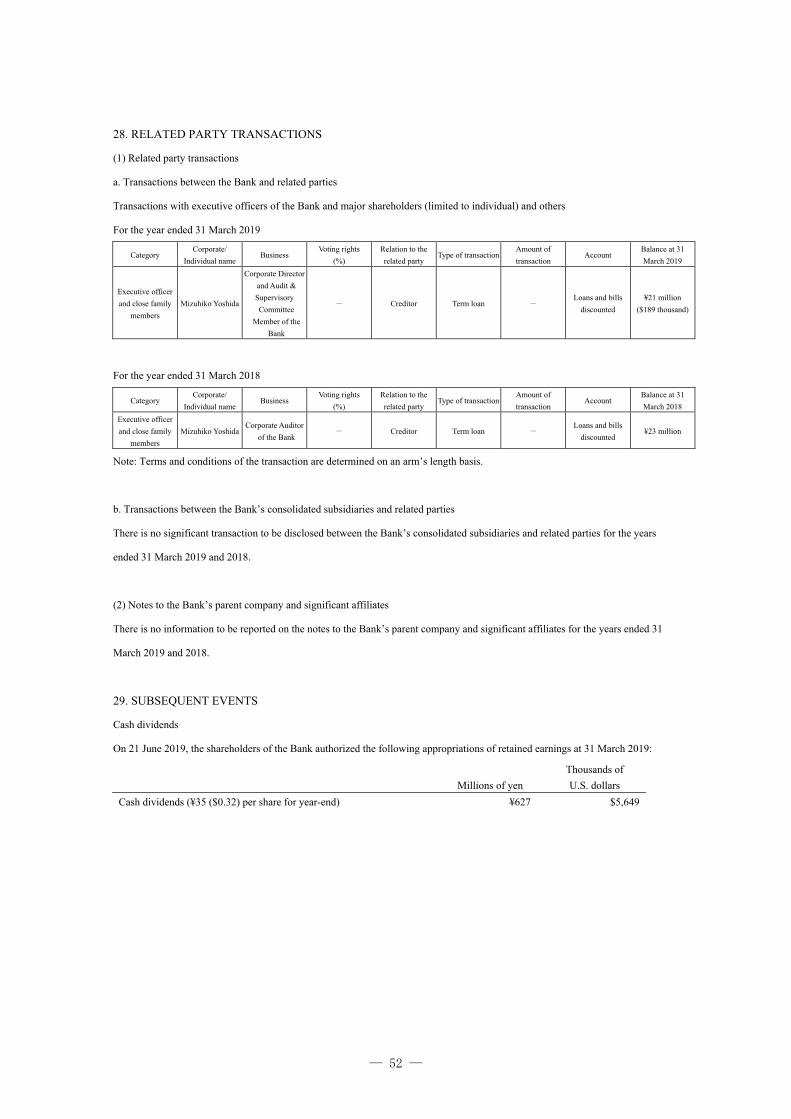
― 52 ―
28. RELATED PARTY TRANSACTIONS
(1) Related party transactions
a. Transactions between the Bank and related parties
Transactions with executive officers of the Bank and major shareholders (limited to individual) and others
For the year ended 31 March 2019
Category Corporate/
Individual name Business
Voting rights
(%)
Relation to the
related party Type of transaction
Amount of
transaction Account
Balance at 31
March 2019
Executive officer
and close family
members
Mizuhiko Yoshida
Corporate Director
and Audit &
Supervisory
Committee
Member of the
Bank
- Creditor Term loan - Loans and bills
discounted
¥21 million
($189 thousand)
For the year ended 31 March 2018
Category Corporate/
Individual name Business
Voting rights
(%)
Relation to the
related party Type of transaction
Amount of
transaction Account
Balance at 31
March 2018
Executive officer
and close family
members
Mizuhiko Yoshida Corporate Auditor
of the Bank - Creditor Term loan -
Loans and bills
discounted ¥23 million
Note: Terms and conditions of the transaction are determined on an arm’s length basis.
b. Transactions between the Bank’s consolidated subsidiaries and related parties
There is no significant transaction to be disclosed between the Bank’s consolidated subsidiaries and related parties for the years
ended 31 March 2019 and 2018.
(2) Notes to the Bank’s parent company and significant affiliates
There is no information to be reported on the notes to the Bank’s parent company and significant affiliates for the years ended 31
March 2019 and 2018.
29. SUBSEQUENT EVENTS
Cash dividends
On 21 June 2019, the shareholders of the Bank authorized the following appropriations of retained earnings at 31 March 2019:
Millions of yen
Thousands of
U.S. dollars
Cash dividends (¥35 ($0.32) per share for year-end) ¥627 $5,649

― 53 ―

The Bank of Iwate, Ltd. 2-3, Chuodori 1-chome, Morioka, Iwate 020-8688, JapanPhone: +81-19-623-1111URL: https://www.iwatebank.co.jp/
General Planning DivisionPublic Relations and CSR Office
2-3, Chuodori 1-chome, Morioka, Iwate 020-8688, JapanPhone: +81-19-623-1111 Fax: +81-19-652-7571SWIFT: BAIWJPJT