Embed Size (px)
Citation preview

Annual Report 2019Nordea Life Assurance Finland Ltd

Annual Report 2019Nordea Life Assurance Finland Ltd 2
Annual Report 2019

Annual Report 2019Nordea Life Assurance Finland Ltd 3
Annual Report 2019
Content
Nordea Life Assurance Finland Ltd is part of the Nordea Group. We build strong and close relationship through our engagement with customers and society. Whenever people strive to their goals and realise their dreams, we are there to provide relevant financial solutions. We are the largest bank in the Nordic region and among the ten largest financial
groups in Europe in terms of total market capitalisation with around 11 million customers, 31,500 employees and 600 branch office locations. The Nordea share is listed on the Nasdaq Stockholm, Nasdaq Helsinki and Nasdaq Copenhagen exchanges.
Nordea Life Assurance Finland LtdKaisaniemenkatu 6, Helsinki FI-00020 NORDEA nordea.fi
Annual Report 2019 4 The 27th year of operation for Nordea Life Assurance Finland Ltd Premium income The investment portfolio of the company in 2019 Challenging year for investment baskets Claims paid Expenditure Personnel Result Technical provisions Estimate of the realisation of the equity principle from 2019 Solvency Risk management Group structure and ownership Future outlook Administration and auditors of Nordea Life Assurance Finland Ltd Proposal of the Board of Directors for distribution of profit Events subsequent to the financial year Nordea Life Assurance Finland Ltd - Financial Statements 8 Profit and loss account 9 Balance sheet 10 Cash flow statement 12 Notes to the Financial Statements 13
Risk Profile 50 Signatures of Report of the Boardof Directors’ and Annual Accounts 54 Auditor’s Report 55Definitions for Key Figures 58

Annual Report 2019Nordea Life Assurance Finland Ltd 4
Annual Report 2019
The 27th year of operation for Nordea Life Assurance Finland LtdIn the Finnish life insurance market, premium income in-creased compared to the previous year. Premium income for Nordea Life Assurance Finland Ltd developed also positively, ending significantly higher level than year before. Unit-linked insurance accounted for the majority of the company’s pre-mium income, as had been expected.
In the spring, the company launched a well-diversified and responsible investment solution to the customers. Nordea Globe Baskets is a solution for the customers who do not want to make investment decisions by themselves and who value responsibility. Globe Baskets aim to impact positively on the environment and society and promote good corpo-rate governance. Globe Baskets are investment baskets that are managed by Nordea Life Assurance Finland and can be linked to capital redemption plan, endowment or individual pension policy under certain conditions.
On October 1st, 2019 the company completed the transfer of the health and accident insurance portfolio to its subsidiary Nordea Insurance Finland Ltd. The transfer did not have any customer impact, as only the insurance coverage company was changed for these customers. The insurance portfolio transfer was completed as a part of a transfer of business, in which the whole non-life insurance business was transferred to Nordea Insurance Finland Ltd, and on top of the insurance portfolio and assets linked to it, two employees were trans-ferred to Nordea Insurance Finland Ltd. Nordea Life Assur-ance Finland Ltd subscribed 3,000 new shares of Nordea Insurance Finland Ltd in a private placement as part of the transfer of business.
During the financial year the company continued simplifying and digitalising business processes and adopting agile devel-opment methods. Simplification of the application field has proceeded according to company’s plans.
The measures taken to lower the risk level of the investment portfolio in the previous financial years and the long-term strategic policy of focusing on unit-linked insurance con-tinued to have a positive effect on the company’s solvency figures. In 2019, owing to the strong solvency, the company credited a higher number of guaranteed-return policies within the scope of the equity principle compared to the dis-tribution target set for the equity principle. Furthermore, the company’s solvency position and the financial statements confirmed for the previous year allowed the payment of a div-idend of EUR 126 million during the last quarter.
During the financial year, the company made for the years 2026–2027 a fixed-term supplement of premium provisions worth EUR 31.0 million concerning endowment policies and pension policies with a fixed calculated interest rate. The fixed-term supplementary reserve will decrease the calcu-lated interest rate of the policies in question to one per cent for a fixed term for the years 2026–2027. Given the fixed-term supplement of premium provisions extending to the end of 2025, made by the company during the previous financial year, the calculated interest rate of the supplement of pre-mium provisions for the policies in question will be one per cent until the end of 2027.
Premium incomeCompared to the previous financial year, the premium income for Nordea Life Assurance Finland Ltd increased, totalling EUR 2,064.2 (1,106.1) million before reinsurers were taken into account.
The share of unit-linked premium income of the total pre-mium income remained at a high level, exceeding 97 per cent of total premium income. In euros, unit-linked premium in-come totalled EUR 2,007.6 (1,039.8) million. The premium in-come of traditional life insurance in turn accounted for EUR 20.5 (20.4) million and the premium income from risk life in-surance policies amounted to EUR 36.1 (45.9) million.
When compared to the previous financial year, the premium income from endowment policies increased, totalling EUR 366.5 (262.9) million. Premium income from capital redemp-tion policies increased from the previous year, totalling EUR 1,596.0 (727.2) million. Premium income from individual pen-sion policies amounted to EUR 65.6 (70.0) million.
The investment portfolio of the company in 2019The long-term strategy of the company has been to keep the total risk of its investment portfolio relatively low. The low risk level of the investment portfolio has been achieved by comprehensively diversifying the portfolio into different as-set classes and by selecting investments for the portfolio that would react independently of one another in various market situations. This strategy was continued in 2019. There were no significant changes in the asset allocation from the previous year. During the year, the exposure to domestic real estate investments, alternative investments and domestic equities were decreased in the company’s investment portfolio.
The performance of the portfolio relative to the risk level was strong. When measured in euros, equities, corporate bonds, and long duration government bonds provided the best re-turns. Return on real estate- and private equity funds as well as short duration government bonds were negative.
At the end of the year, fixed income investments accounted for 70.1 (67.9) per cent. Equities and equity-type investments accounted for 7.8 (9.3) per cent, excluding hedges. The share of real estate investments was 11.5 (13.9) per cent, alternative investments 6.7 (7.5) per cent and cash 4.0 (1.5) per cent.
A successful year for investment baskets2019 was a very successful year for the investment baskets, as the baskets yielded very good profits. Equity investments provided good returns on all markets the whole year, as did the fixed income investments.
In the beginning of April, five new Globe baskets, that are a part of Nordea’s sustainable investment selection, were added to the investment assortment. Future Kasvu and Fu-ture Maltti, investment baskets linked to the Nordea Future product, were merged to the Stable and Growth pension in-vestment baskets on the 25th of November 2019.
Annual Report 2019

Annual Report 2019
Asset Allocation Globe 10, 2019
15 %
55 %
30 %
■ Equities
■ Fixed Income
■ Money Market
Asset Allocation Globe 25, 2019
30 %
50 %
20 %
Asset Allocation Globe 50, 2019
55 %
35 %
10 %
Asset Allocation Globe 75, 2019
80 %
15 %
5 %
Asset Allocation Globe 90, 2019
95 %
4 %
1 %
■ Equities
■ Fixed Income
■ Real Estate
■ Alternative Investments
■ Money Market
Yield Basket 50, 2019
4 %
53 %23 %
14 %
6 %
Yield Basket 75, 2019
4 %
74 %
14 %
7 %
1 %
Return Seeking Basket, 2019
68 %
22 %
9 %
1 %
Safety Seeking Basket, 2019
63 %
6 %
11 %20 %
Yield Basket 2019
9 %
27 %
41 %
15 %
8 %
5Annual Report 2019Nordea Life Assurance Finland Ltd
4 %

Annual Report 2019Nordea Life Assurance Finland Ltd 6
Annual Report 2019
At the end of the year the company’s investment basket as-sortment included the Yield baskets, Allocation baskets, Sta-ble and Growth pension investment baskets, Equity- and Fixed Income index baskets, Real estate basket and Equity baskets. More information on the investment baskets can be found on nordea.fi.
Claims paidClaims paid increased compared to the previous year, total-ling EUR 2,540.6 (1,352.0) million. The amount includes sur-renders, which totalled EUR 2,124.8 (938.7) million. Their share of the technical provisions at the beginning of the year was 15,1 (5.5) per cent. The share of reinsurance was EUR 0.0 (0.0) million.
The risk sums of death, permanent disability for work, seri-ous illness and permanent handicap or permanent disability for work caused by an accident accounted for EUR 7.6 (9.2) million.
ExpenditureThe total expenditure of the company was EUR 39.0 (39.1) million. Sales commissions paid totalled EUR 8.7 (5.5) mil-lion and salaries and social security expenses EUR 13.0 (13.0) million.
PersonnelDuring the financial year, the average number of employees at Nordea Life Assurance Finland Ltd was 165 (160). Women accounted for 58 per cent of the work force and men for 42 per cent.
ResultThe balance on the technical account for 2019 before taxes was EUR 177.2 (203.6) million. Investment income, excluding unit-linked investments, amounted to EUR 65.6 (77.0) million. A total of EUR 2.8 (3.1) million was paid out to customers as bonuses.
Technical provisionsThe technical provision of Nordea Life Assurance Finland Ltd increased by 9,3 per cent, amounting to EUR 17,402.1 (15,926.2) million. The share of the unit-linked provision of the total provision increased slightly, amounting to 89.9 (88.5) per cent .
At the end of the year, the company’s total provision for un-earned premiums was EUR 16,984.7 (15,526.0) million, of which the unit-linked provision accounted for EUR 15,570.9 (14,035.5) million. This includes EUR 195.6 (194.7) million sup-plemental to the technical provision and a provision for un-earned premiums of EUR 2.8 (2.8) million for future bonuses. The provision for claims outstanding was EUR 417.4 (400.2) million at the end of the year.
Estimate of the realisation of the equity principle from 2019During 2019, the levels of return on insurance policies sub-ject to the equity principle were further adjusted to match the general interest rate trends on the market. The level of cus-tomer bonuses paid in 2019 exceeds the level of the yield of a ten-year German government bond, which has averaged -0.2 per cent. Therefore, the insurance policies which are subject to the equity principle were credited by a bonus based on the distribution target for the equity principle.
The notes include a chart that represents the total return given for endowment and pension insurances for the years 2006–2019 as well as the interest rate for the ten-year gov-ernment bonds issued by Germany for the same time period.
SolvencyThe company’s solvency is strong. Equity used in solvency calculation exceeds the equity ratio requirement by a ratio of 1.83.
Nordea Life Assurance Finland Ltd has one subordinated loan worth EUR 70 million issued by Nordea Life Holding AB. The subordinated loan was issued for an undetermined period. The notice period on the part of the creditor is five years and the repayment of the loan is tied to the debtor’s solvency. The annual interest rate is tied to a 12-month reference rate plus a margin of 0.85 percentage points. The amount of interest on the subordinated loan in 2019 was EUR 511,709.72 .
Risk management The objective of risk management is to identify, measure and manage the risks faced by the company.
At the company level, the most significant risks include the risks associated with the business strategy and business en-vironment, investment activity risks, risks associated with the structure of the technical provisions, underwriting risks and operational risks. Potential amendments to legislation may also significantly affect the business environment of the life and pension insurance operations.
The company has a separate Risk Management Department, headed by the Chief Risk Officer (CRO). The CRO develops and directs the risk management practices of the company.
The risk management strategy is updated as necessary – an-nually, at the very least. The strategy contains precisely de-fined principles according to which the risk management measures, follows up on and reports risks to the top executive management. The company has a contingency plan and a business continuity plan, which are tested annually.
Group structure and ownershipNordea Life Assurance Finland Ltd has 150,000 shares, all of which have the same number of votes at the Annual Gen-

Annual Report 2019Nordea Life Assurance Finland Ltd 7
Annual Report 2019
eral Meeting. The minimum share capital, as stated in the Arti-cles of Association, is EUR 20,000,000.00 and the maximum EUR 80,000,000.00. The share capital can be increased or decreased within these limits without revising the Articles of Association. The shares do not have a nominal value and the minimum number of shares is 120,000 and the maximum 480,000. The parent com-pany of Nordea Life Assurance Finland Ltd is Nordea Life Holding AB with a 100 per cent holding. Nordea Life Holding AB, in turn, is wholly-owned by Nordea Bank Abp. The Nordea Life Assurance Finland Group includes 58 (59) Finnish housing and real estate companies as subsidiaries, as well as a non-life company, Nordea Insurance Finland Ltd, wholly-owned by the parent company.
Future outlookThe company’s measures, such as supplements to the total pro-vision for unearned premiums of the endowment and pension in-surance portfolios with a calculated interest rate, keeping the in-vestment portfolio’s risk level moderate and simplification of the business model, have provided the company with a good basis for continuing its stable business in the continuously changing regula-tory environment.
The prolonged low level of interest rates poses challenges for in-vestment operations in particular. We believe, however, that the measures taken considerably enhance the company’s ability to meet its obligations.
As an important strategic initiative, the company continues to up-grade its insurance systems in order to simplify its business opera-tions and to improve the quality of its customer service. Moreover, the company continues to utilise the potential provided by digital-isation in the development of the business processes. These mea-sures provide the preconditions for developing more modern ser-vice packages of higher quality for our customers with the aim to achieve greater customer experiences.
Administration and auditors of Nordea Life Assurance Finland LtdThe Board of Directors of the company is composed of the follow-ing three members:Katja Bergqvist, Head of Life and Pensions, Chairman of the Board, Sara Mella, Vice-Chairman of the Board, Johan Nystedt, Vice-President of Life and Pensions, member of the Board,
The Managing Director of the company is Pekka Luukkanen, M.Sc.
The Chief Actuary of the company is Sari Martikainen, M.Sc, actu-ary approved by the Ministry of Social Affairs and Health.
PricewaterhouseCoopers Oy, an auditing company, was elected as the auditor, with APA Martin Grandell as the principally responsi-ble auditor.
The Annual General Meeting was held on 2 April 2019.
Proposal of the Board of Directors for distribution of profitThe retained earnings of Nordea Life Assurance Fin-land Ltd, including the profit for the financial year of EUR 142,422,104.77, amount to EUR 238,829,701.75. The distribut-able equity capital of Nordea Life Assurance Finland Ltd totals EUR 306,816,214.59.
The Board of Directors proposes that EUR 142,422,104.77 be transferred to the retained earnings account.
Events subsequent to the financial yearNo significant events.

Annual Report 2019
Nordea Life Assurance Finland Ltd 8Financial Statements 2019
Financial Statements 2019
Profit and Loss Account 9 Balance Sheet 10Cash Flow Statement 12
Notes of the Financial Statements 13
Risk Profile 50
Auditor’s Report 54
Signatures of Report of the Board of Directors’ and Annual Accounts 55
Definitions for Key Figures 58
Nordea Life Assurance Finland Ltd

Annual Report 2019
Nordea Life Assurance Finland Ltd Financial Statements 2019 9
Nordea Life Assurance Finland LtdProfit and Loss Account
Technical account 1.1.–31.12.2019 1.1.–31.12.2018
Premium income
Gross premium income 2 064 238 618 1 106 072 240
Reinsurer's share -524 941 2 063 713 677 -600 656 1 105 471 584
Investment income 434 497 887 261 004 225
Unrealised gains on investments 1 941 799 023 132 967 094
Other technical income 0 0
Claims incurred
Claims paid -2 540 575 011 -1 352 043 833
Reinsurer's share 0 0
Change in the provision for unearned premiums -17 178 434 -11 418 808
Of which portfolio transfer 7 833 541
Reinsurer's share 0 -2 565 586 986 0 -1 363 462 641
Change in the provision for unearned premiums
Change in the provision for unearned premiums -1 458 784 129 1 027 499 508
Of which portfolio transfer 1 265 012 0
Reinsurer's share 0 -1 460 049 140 0 1 027 499 508
Net operating expenses -31 557 907 -30 532 813
Investment expenses -204 294 622 -526 882 062
Investment revaluation adjustment -1 298 599 -402 440 793
Balance on technical account 177 223 334 203 624 102
Non-technical account
Investments in associates 0 0
Other profits
Other 648 262 648 262 152 252 152 252
Other expenses
Depreciation in goodwill 0 0
Other -547 374 -547 374 -61 313 -61 313
Direct taxes on ordinary operations
Taxes for the year -34 944 791 -40 219 847
Taxes for the previous years 42 674 -1 327 741
Result for the year 142 422 105 162 167 454

Annual Report 2019
Nordea Life Assurance Finland Ltd 10Financial Statements 2019
Balance Sheet
ASSETS 31.12.2019 31.12.2018
Intangible assets
Intangible rights 0 0
Other expenses with long-term effects 0 0
0 0
Investments
Real estate investments
Real estates and real estate shares 224 638 381 266 813 639
Real estate funds 30 638 996 44 878 790
Loan receivables in Group companies 0 255 277 376 0 311 692 428
Investments in the Group companies and participating interest companies
Shares and participations 5 300 000 5 000 000
Debt securities and loan receivables in Group companies 0 5 300 000 0 5 000 000
Other investmentsShares and participations 318 236 984 364 900 495Debt securities 1 400 430 020 1 404 164 564Deposits 0 1 718 667 004 0 1 769 065 059
1 979 244 381 2 085 757 487
Assets covering unit-linked insurance 15 612 037 647 14 091 000 114
Receivables
Arising from direct insurance operations
Arising from policyholders 3 412 189 4 166 379
Arising from reinsurance operations 10 000 47 000Other receivables 33 585 911 30 907 118
37 008 100 35 120 497
Other assets
Tangible assets 0 0
Cash in hand and at bank 181 464 358 111 517 151
181 464 358 111 517 151
Accrued income
Accrued interest and rent 9 871 806 11 746 984
Other prepayments and accrued income 9 763 684 6 495 182
19 635 489 18 242 166
17 829 389 975 16 341 637 415

Annual Report 2019
Nordea Life Assurance Finland Ltd Financial Statements 2019 11
LIABILITIES 31.12.2019 31.12.2018
Equity capital
Shareholders' equity 24 500 000 24 500 000
Issue premium fund 0 0
Ordinary reserve 0 0
Reserve for invested unrestricted equity 67 986 513 67 986 513
Retained earnings 96 407 597 60 240 143
Profit for the year 142 422 105 162 167 454
Preliminary dividend 0 331 316 215 0 314 894 110
Subordinated loans 70 000 000 70 000 000
Technical provisions
Provision for unearned premiums 1 413 827 349 1 490 489 942
Reinsurer’s share 0 1 413 827 349 0 1 490 489 942
Outstanding claims 345 681 993 339 883 524
Reinsurer’s share 0 345 681 993 0 339 883 524
1 759 509 342 1 830 373 466
Provisions for unit-linked insurance
Technical provisions 15 642 615 317 14 095 788 630
Creditors
Arising from direct insurance operations 3 364 5 463
Arising from reinsurance operations 41 000 199 000
Other creditors 14 134 895 14 179 259 17 279 975 17 484 438
Deferred income 11 769 843 13 096 770
17 829 389 975 16 341 637 415
Balance Sheet

Annual Report 2019
Nordea Life Assurance Finland Ltd 12Financial Statements 2019
Cash Flow Statement
2019 2018
Cash flow from operations
Insurance premiums gained 2 064 992 808 1 107 088 090
Resinsurer’s share -524 941 -600 656
Claims paid -2 537 300 620 -1 348 368 493
Resinsurer’s share 0 0
Interest income paid 8 076 970 14 267 535
Dividend 1 449 203 2 078 855
Other investment income received and other operational income 57 571 902 63 742 030
Personel expense related payments -13 051 347 -12 766 648
Payments on other operative expenses -23 995 987 -48 542 741
Cash flow from business operations before financial items and taxes -442 782 013 -223 102 028
Interest paid and payments on other financing expenses -511 710 -467 707
Direct taxes paid -37 990 834 -40 122 223
Cash flow from operations -481 284 557 -263 691 958
Cash flow from investments
Net investments -2 218 202 212 -1 339 919 658
Capital gains from investments (excl. cash assets) 2 937 527 467 1 730 338 154
Intangible and tangible assets
Other asset investments and income from sales
Cash flow from investments 719 325 256 390 418 496
Cash flow from financial activities
Issue of shares for cash 0 0
Acquisition of own shares 0 0
Disposal of own shares 0 0
Loans drawn down 0 0
Repaid loans 0 0
Dividends paid/Interest on guaranteed equity and other profit distribution
-126 000 000 -126 000 000
Cash flow from financial activities -126 000 000 -126 000 000
Change in funds 112 040 699 726 538
Funds at the start of the year 438 205 978 437 479 440
Funds at the end of the year 550 246 677 438 205 978
Annual Report 2019
Nordea Life Assurance Finland Ltd Financial Statements 2019 13
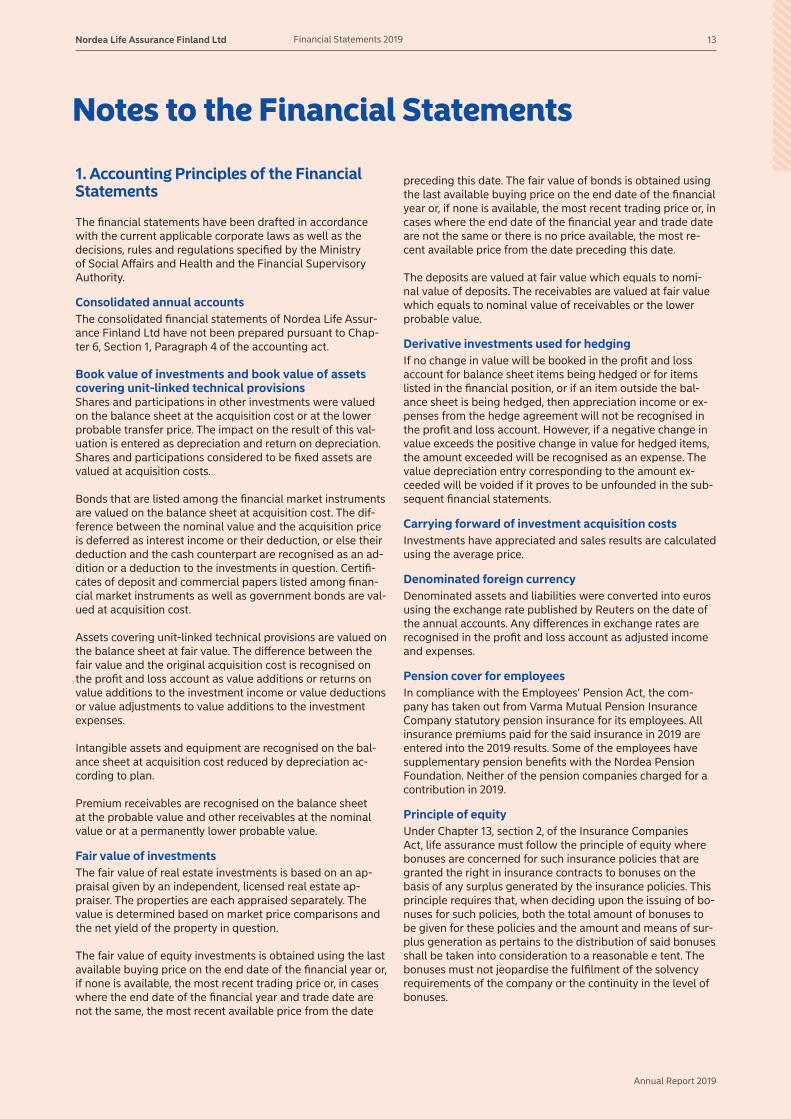
1. Accounting Principles of the Financial Statements
The financial statements have been drafted in accordance with the current applicable corporate laws as well as the decisions, rules and regulations specified by the Ministry of Social Affairs and Health and the Financial Supervisory Authority.
Consolidated annual accountsThe consolidated financial statements of Nordea Life Assur-ance Finland Ltd have not been prepared pursuant to Chap-ter 6, Section 1, Paragraph 4 of the accounting act.
Book value of investments and book value of assets covering unit-linked technical provisionsShares and participations in other investments were valued on the balance sheet at the acquisition cost or at the lower probable transfer price. The impact on the result of this val-uation is entered as depreciation and return on depreciation. Shares and participations considered to be fixed assets are valued at acquisition costs.
Bonds that are listed among the financial market instruments are valued on the balance sheet at acquisition cost. The dif-ference between the nominal value and the acquisition price is deferred as interest income or their deduction, or else their deduction and the cash counterpart are recognised as an ad-dition or a deduction to the investments in question. Certifi-cates of deposit and commercial papers listed among finan-cial market instruments as well as government bonds are val-ued at acquisition cost.
Assets covering unit-linked technical provisions are valued on the balance sheet at fair value. The difference between the fair value and the original acquisition cost is recognised on the profit and loss account as value additions or returns on value additions to the investment income or value deductions or value adjustments to value additions to the investment expenses.
Intangible assets and equipment are recognised on the bal-ance sheet at acquisition cost reduced by depreciation ac-cording to plan.
Premium receivables are recognised on the balance sheet at the probable value and other receivables at the nominal value or at a permanently lower probable value.
Fair value of investmentsThe fair value of real estate investments is based on an ap-praisal given by an independent, licensed real estate ap-praiser. The properties are each appraised separately. The value is determined based on market price comparisons and the net yield of the property in question.
The fair value of equity investments is obtained using the last available buying price on the end date of the financial year or, if none is available, the most recent trading price or, in cases where the end date of the financial year and trade date are not the same, the most recent available price from the date
Notes to the Financial Statements
preceding this date. The fair value of bonds is obtained using the last available buying price on the end date of the financial year or, if none is available, the most recent trading price or, in cases where the end date of the financial year and trade date are not the same or there is no price available, the most re-cent available price from the date preceding this date.
The deposits are valued at fair value which equals to nomi-nal value of deposits. The receivables are valued at fair value which equals to nominal value of receivables or the lower probable value.
Derivative investments used for hedgingIf no change in value will be booked in the profit and loss account for balance sheet items being hedged or for items listed in the financial position, or if an item outside the bal-ance sheet is being hedged, then appreciation income or ex-penses from the hedge agreement will not be recognised in the profit and loss account. However, if a negative change in value exceeds the positive change in value for hedged items, the amount exceeded will be recognised as an expense. The value depreciation entry corresponding to the amount ex-ceeded will be voided if it proves to be unfounded in the sub-sequent financial statements.
Carrying forward of investment acquisition costsInvestments have appreciated and sales results are calculated using the average price.
Denominated foreign currencyDenominated assets and liabilities were converted into euros using the exchange rate published by Reuters on the date of the annual accounts. Any differences in exchange rates are recognised in the profit and loss account as adjusted income and expenses.
Pension cover for employeesIn compliance with the Employees’ Pension Act, the com-pany has taken out from Varma Mutual Pension Insurance Company statutory pension insurance for its employees. All insurance premiums paid for the said insurance in 2019 are entered into the 2019 results. Some of the employees have supplementary pension benefits with the Nordea Pension Foundation. Neither of the pension companies charged for a contribution in 2019.
Principle of equityUnder Chapter 13, section 2, of the Insurance Companies Act, life assurance must follow the principle of equity where bonuses are concerned for such insurance policies that are granted the right in insurance contracts to bonuses on the basis of any surplus generated by the insurance policies. This principle requires that, when deciding upon the issuing of bo-nuses for such policies, both the total amount of bonuses to be given for these policies and the amount and means of sur-plus generation as pertains to the distribution of said bonuses shall be taken into consideration to a reasonable e tent. The bonuses must not jeopardise the fulfilment of the solvency requirements of the company or the continuity in the level of bonuses.

Annual Report 2019
Nordea Life Assurance Finland Ltd 14Financial Statements 2019
The company has defined its target regarding the equity prin-ciple as follows. In the long term, the company aims to reach a bonus level for the insurance policies which include savings and are subject to the equity principle that matches the yield, in normal market conditions, of ten-year government bonds issued by Germany. Regarding risk life insurance policies, the equity principle is applied in the form of increased amount of benefit in connection with the death cover or in the form of premium discounts. Furthermore, the company endeavours over the long term to fulfil the level of required return for the risk capital respective to the owner of the company.
Where granted bonuses are concerned, the company makes every effort to maintain their level by setting a target wherein the level of bonuses will not change significantly from year to year more than is required by the solvency of the company and the prevailing market situation. The company annually monitors the fulfilment of the aforementioned targets. The aforementioned additional bonus targets are not binding and are not part of the insurance policy between the company and the policyholder. The equity principle is not applied to the unit-linked share of the policy.
Additional bonus targets are valid until further notice and the company reserves the right to change the additional bo-nus targets in relation to all the life insurance policies issued. The policyholder is not separately notified about the potential changing of additional bonus targets.
The chart shown in the notes on the financial statements is an exemplary illustration of the overall bonuses for life and pen-sion insurance policies during the period from 2006 to 2019 as well as the reference rates of interest for the same period. The total bonuses issued for the policies have been in accor-dance with the equity principle of the company for additional bonuses.
Preliminary dividendNordea Life Assurance Finland Ltd may apply a preliminary dividend method to its financial statements in which the divi-dend to be paid from the preceding financial year can, under certain circumstances, be entered as income for the dividend recipient for the same financial year in which said dividend is issued. This requires that the company issuing the dividend enters the corresponding amount as a dividend payment lia-bility and equity deduction. The preliminary dividend method has no impact on the taxation of the company paying the dividend.
Calculation principles of technical provisionsThe acquisition costs of individual life assurance and individ-ual pension insurance policies were not zillmerised in this or the previous annual accounts. Fixed calculated interest rate does not apply to unit-linked insurance. The fixed calculated interest rate for capital redemption policies was 0 per cent, and with other policies it was 4.5 per cent, 3.5 per cent, 2.5 per cent or 0 per cent. Policies with a fixed calculated interest rate of 0 per cent had an annual interest of 0.95 per cent on pen-sion insurance and 0.65 per cent on individual life assurance as well as capital redemption policies.
Deferred tax liabilities and assetsThe company has no material deferred tax liabilities or assets.
Changes in 2019 that affected the financial statementNordea Life Assurance Finland Ltd and its subsidiary Nordea Insurance Finland executed a transfer of business between them in 2019. The transfer of business and the insurance port-folio transfer executed as a part of the transfer of business, affected the following figures in the financial statement com-pared to the figures in the comparison year.
• Provision for unearned premiums – the figure decreased due to the transfer of business
• Outstanding claims – the figure decreased due to the transfer of business
• Cash in hand and at bank – the figure decreased due to the transfer of business
• Receivables arising from policyholders – the figure decreased due to the transfer of business
• Other creditors (holiday pay debts) – the figure decreased due to the transfer of business
• Investments in the Group companies and participating interest companies – the figure increased due to the transfer of business

Annual Report 2019
Nordea Life Assurance Finland Ltd Financial Statements 2019 15
2. PREMIUM INCOME 1.1–31.12.2019 1.1–31.12.2018
Direct insurance
Domestic 2 064 238 618 1 106 072 240
EEA state 0 0
Reinsurance
Life assurance 0 0
Gross premium income before outward reinsurance premiums 2 064 238 618 1 106 072 240
3. PREMIUM INCOME FROM DIRECT INSURANCE
Life assurance
Unit-linked individual life assurance 354 022 696 254 267 520
Capital redemption contract 1 596 026 335 727 182 111
Other individual life assurance 48 603 450 54 591 975
Employees' group life assurance
Other group life assurance
Life assurance in total 1 998 652 480 1 036 041 607
0
Pension insurance 0
Unit-linked individual pension insurance 57 661 852 58 401 220
Other individual pension insurance 7 924 285 11 629 413
Unit-linked group pension insurance 0 0
Other group pension insurance 0 0
Pension insurance in total 65 586 138 70 030 633
Total premium income from direct insurance 2 064 238 618 1 106 072 240
Continuous premiums 321 722 854 320 748 822
Lump-sum payments 1 742 515 763 785 323 418
Total premium income from direct insurance 2 064 238 618 1 106 072 240
Premiums from agreements not entitled to bonuses 36 111 405 45 913 861
Premiums from agreements entitled to bonuses 20 533 209 20 362 626
Premiums from unit-linked insurances 2 007 594 003 1 039 795 753
Total premium income from direct insurance 2 064 238 618 1 106 072 240
4. CLAIMS INCURRED
Direct insurance
Life assurance 2 410 478 854 1 227 680 621
Pension insurance 130 085 683 124 363 212
Reinsurance 0 0
Claims paid total 2 540 564 537 1 352 043 833
Of which:
Surrenders 2 124 842 740 938 683 475
Matured savings payable 290 237 398 291 669 588
Other 125 484 399 121 690 770
Total 2 540 564 537 1 352 043 833
Unit-linked insurance’s share of claims paid 2 453 092 203 1 236 164 434
Annual Report 2019
Nordea Life Assurance Finland Ltd 16Financial Statements 2019
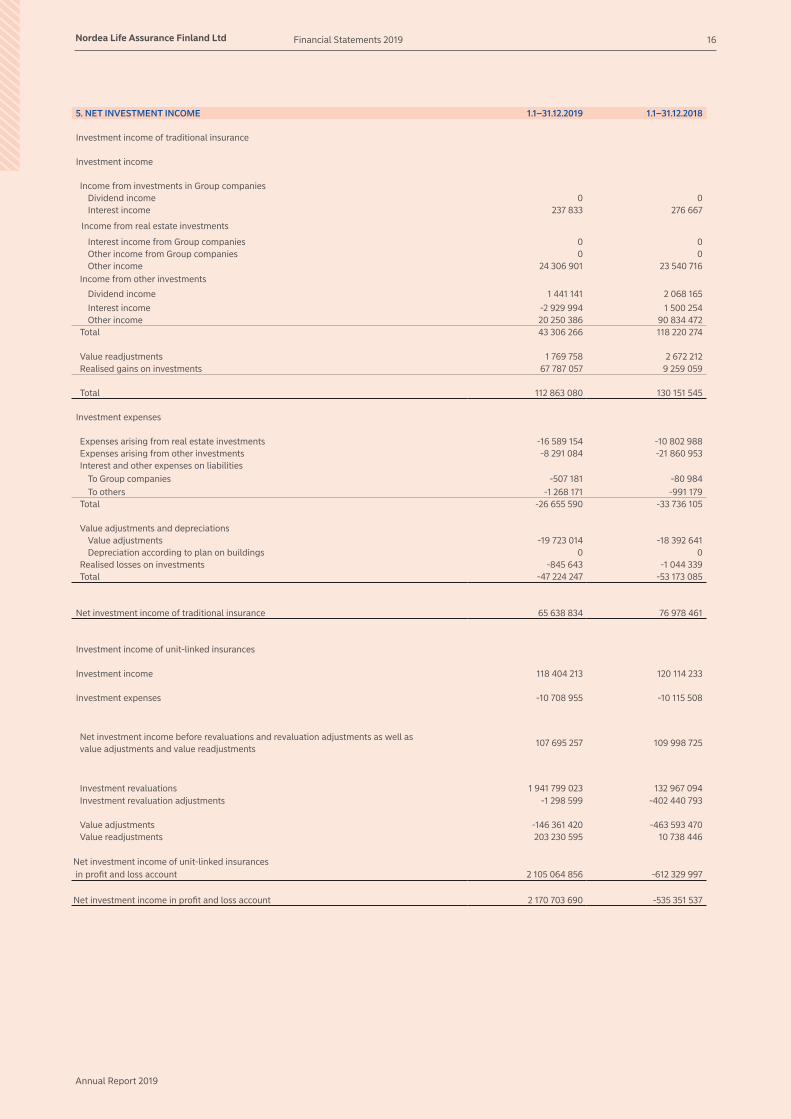
5. NET INVESTMENT INCOME 1.1–31.12.2019 1.1–31.12.2018
Investment income of traditional insurance
Investment income
Income from investments in Group companiesDividend income 0 0Interest income 237 833 276 667
Income from real estate investments
Interest income from Group companies 0 0Other income from Group companies 0 0Other income 24 306 901 23 540 716
Income from other investments
Dividend income 1 441 141 2 068 165
Interest income -2 929 994 1 500 254Other income 20 250 386 90 834 472
Total 43 306 266 118 220 274
Value readjustments 1 769 758 2 672 212Realised gains on investments 67 787 057 9 259 059
Total 112 863 080 130 151 545
Investment expenses
Expenses arising from real estate investments -16 589 154 -10 802 988Expenses arising from other investments -8 291 084 -21 860 953Interest and other expenses on liabilities
To Group companies -507 181 -80 984To others -1 268 171 -991 179
Total -26 655 590 -33 736 105
Value adjustments and depreciationsValue adjustments -19 723 014 -18 392 641Depreciation according to plan on buildings 0 0
Realised losses on investments -845 643 -1 044 339Total -47 224 247 -53 173 085
Net investment income of traditional insurance 65 638 834 76 978 461
Investment income of unit-linked insurances
Investment income 118 404 213 120 114 233
Investment expenses -10 708 955 -10 115 508
Net investment income before revaluations and revaluation adjustments as well asvalue adjustments and value readjustments
107 695 257 109 998 725
Investment revaluations 1 941 799 023 132 967 094Investment revaluation adjustments -1 298 599 -402 440 793
Value adjustments -146 361 420 -463 593 470Value readjustments 203 230 595 10 738 446
Net investment income of unit-linked insurances in profit and loss account 2 105 064 856 -612 329 997
Net investment income in profit and loss account 2 170 703 690 -535 351 537
Annual Report 2019
Nordea Life Assurance Finland Ltd Financial Statements 2019 17
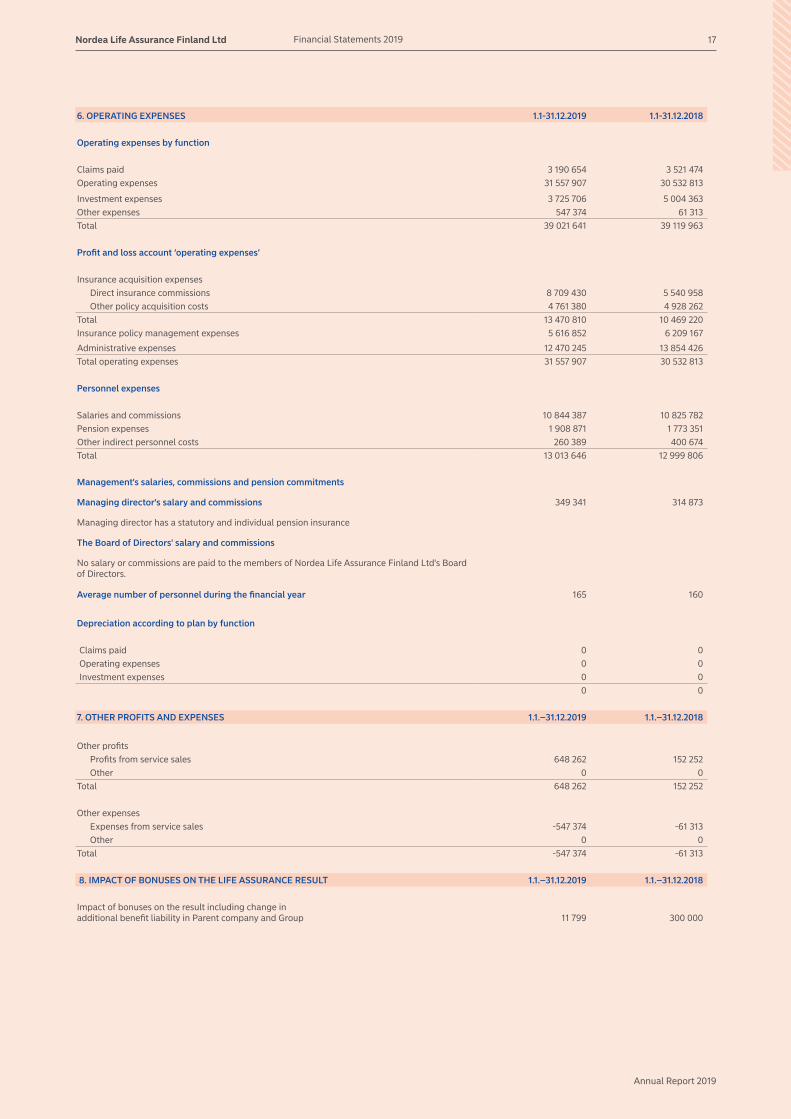
6. OPERATING EXPENSES 1.1-31.12.2019 1.1-31.12.2018
Operating expenses by function
Claims paid 3 190 654 3 521 474Operating expenses 31 557 907 30 532 813
Investment expenses 3 725 706 5 004 363Other expenses 547 374 61 313Total 39 021 641 39 119 963
Profit and loss account ‘operating expenses’
Insurance acquisition expensesDirect insurance commissions 8 709 430 5 540 958Other policy acquisition costs 4 761 380 4 928 262
Total 13 470 810 10 469 220Insurance policy management expenses 5 616 852 6 209 167
Administrative expenses 12 470 245 13 854 426Total operating expenses 31 557 907 30 532 813
Personnel expenses
Salaries and commissions 10 844 387 10 825 782Pension expenses 1 908 871 1 773 351Other indirect personnel costs 260 389 400 674Total 13 013 646 12 999 806
Management's salaries, commissions and pension commitments
Managing director's salary and commissions 349 341 314 873
Managing director has a statutory and individual pension insurance
The Board of Directors' salary and commissions
No salary or commissions are paid to the members of Nordea Life Assurance Finland Ltd's Board of Directors.
Average number of personnel during the financial year 165 160
Depreciation according to plan by function
Claims paid 0 0Operating expenses 0 0Investment expenses 0 0
0 0
7. OTHER PROFITS AND EXPENSES 1.1.–31.12.2019 1.1.–31.12.2018
Other profitsProfits from service sales 648 262 152 252Other 0 0
Total 648 262 152 252
Other expensesExpenses from service sales -547 374 -61 313Other 0 0
Total -547 374 -61 313
8. IMPACT OF BONUSES ON THE LIFE ASSURANCE RESULT 1.1.–31.12.2019 1.1.–31.12.2018
Impact of bonuses on the result including change in additional benefit liability in Parent company and Group 11 799 300 000

Annual Report 2019
Nordea Life Assurance Finland Ltd 18Financial Statements 2019
9. CHANGE IN CALCULATION METHOD FOR TECHNICAL PROVISIONS In 2019, EUR 2,800 thousand was transferred to the provision unearned premiums for assumed additional benefits with regard to individual life assurance, pen-sion insurance and capital redemption plan and the previous provisions discharged EUR 2,788 thousand. Thus a net increase of the provision of unearned pre-miums for assumed additional benefits was EUR 12 thousand. A fund supplement worth EUR 46,839 thousand included in the provision for unearned premiums on 31.12.2018 has been discharged according to calcula-tion methods and its amount in the annual accounts on 31.12.2019 was EUR 43,768 thousand. Fixed term fund supplements were made 2016-2019 as follows: 31.12.2019 EUR 31,000 thousand is due to be discharged during the years 2026–2027. 31.12.2018 EUR 33,800 thousand is due to be discharged during the years 2024–2025. 31.12.2017 EUR 37,800 thousand is due to be discharged during the years 2022–2023 and 31.12.2016 EUR 76,300 thousand is due to be discharged during the years 2019–2021. Therefore, total amount of fixed-term upfront reserve in the 31.12.2019 annual report was EUR 151,800 thousand. For the life insurance policies for individual risk and for group, the covers for 1) permanent disability, 2) critical illness, 3) accidental permanent disability or per-manent handicap, 4) accidental death, permanent disability or permanent handicap, and 5) accidental death or permanent disability were transferred from Nor-dea Life Assurance Finland Ltd to Nordea Insurance Finland Ltd on 1 October 2019. The technical provisions of the transferred portfolio was 9,099 thousand at the time of transfer.
10. INVESTMENTS 2019 2018
Market value and valuation difference on investments
Remainingacquisition cost Book value Market value
Remainingacquisition cost Book value Market value
Real estate investmentsReal estate shares in Group companies 224 638 381 224 638 381 237 820 804 266 813 639 266 813 639 284 084 104Loan receivables from Group companies 0 0 0 0 0 0Real estate funds 30 638 996 30 638 996 30 638 996 44 878 790 44 878 790 44 912 994
Investments in Group companiesShares and participations 5 300 000 5 300 000 5 300 000 5 000 000 5 000 000 5 000 000Debt securities 0 0 0 0 0 0
Other investmentsShares and participations 318 236 984 318 236 984 450 314 698 364 900 495 364 900 495 498 365 537Debt securities 1 400 430 020 1 400 430 020 1 528 480 360 1 404 164 564 1 404 164 564 1 502 772 632Deposits 181 464 358 181 464 358 181 464 358 111 517 151 111 517 151 123 294 166
2 160 708 739 2 160 708 739 2 434 019 216 2 197 274 638 2 197 274 638 2 458 429 433
Other investments include cash in hand and at bank
The remaining acquisition cost of debt securitiesincludes the difference between par value andpurchase price, entered as net interest incomeor a decrease in it (+/-) -10 991 094 -12 780 242
Valuation difference (difference between market value and book value) 273 310 477 261 154 796

Annual Report 2019
Nordea Life Assurance Finland Ltd Financial Statements 2019 19
Group companies 2019
Changes in parent company real estate investments
Real estate shares Loan receivablesfrom companies in
the same Group
Acquisition cost 1.1 266 813 638 0
Increases 69 967 302 0
Decreases -112 142 559 0
Acquisition cost 31.12. 224 638 381 0
Real estate and shares in real estate occupied for own activities
Remaining acquisition cost 7 207 502
Book value 7 207 502
Market value 7 397 609
Subsidiaries owned by the parent company
Subsidiary shares
Acquisition cost 1.1 5 000 000
Increases 300 000
Decreases 0
Acquisition cost 31.12. 5 300 000
Group companies Domicile Holding % Book value
KOY Alfred Helsinki 100 4 012 722
KOY Hitsaajankatu 4 Helsinki 100 2 817 685
KOY Länsituulentie Espoo 100 8 638 556
KOY Vantaan Mestarintie 11 Vantaa 100 3 251 580
KOY Kuortaneenkatu 7 Helsinki 100 7 579 829
Piispankuitti Espoo 100 6 013 815
KOY Lämmittäjänkatu 2 Helsinki 100 4 867 652
KOY Sinikalliontie 9 Espoo 100 2 624 454
KOY Annankatu 27 Helsinki 100 9 587 877
KOY Strömberginkuja 2 Helsinki 100 5 481 551
KOY Espoon Keilaranta 9 A Espoo 100 7 086 326
KOY Kiviaidankatu2 Helsinki 100 29 291 040
KOY Tyynylaavantie 20 Helsinki 100 3 659 011
As Oy Kiltaportti Espoo 100 6 887 236
Kiinteistö Oy Metsäpojankuja 4 Espoo 100 10 342 155
Kiinteistö Oy Oulun Kallisensuora 12 Oulu 100 7 114 927
As Oy Pornaisten Jokilaakso Pornainen 100 3 719 788
As Oy Espoon Ruukinrannantie 24 Espoo 100 2 313 915
Kiinteistö Oy Katajanokan Linnapuisto Helsinki 100 3 945 978
Kiinteistö Oy Sörnäistenkatu 10 Helsinki 100 8 220 980
Kiinteistö Oy Helsingin Hermanninpuisto Helsinki 100 8 517 807
KOY Tampereen Vehmaskoti Tampere 100 13 214 309
Nordea Vakuutus Suomi Oy Helsinki 100 5 300 000
KOY Keskuskatu 1 B Helsinki 100 49 232 307
KOY Helsingin Kaisaniemenkatu 6 Helsinki 100 16 216 880
229 938 380
Annual Report 2019
Nordea Life Assurance Finland Ltd 20Financial Statements 2019
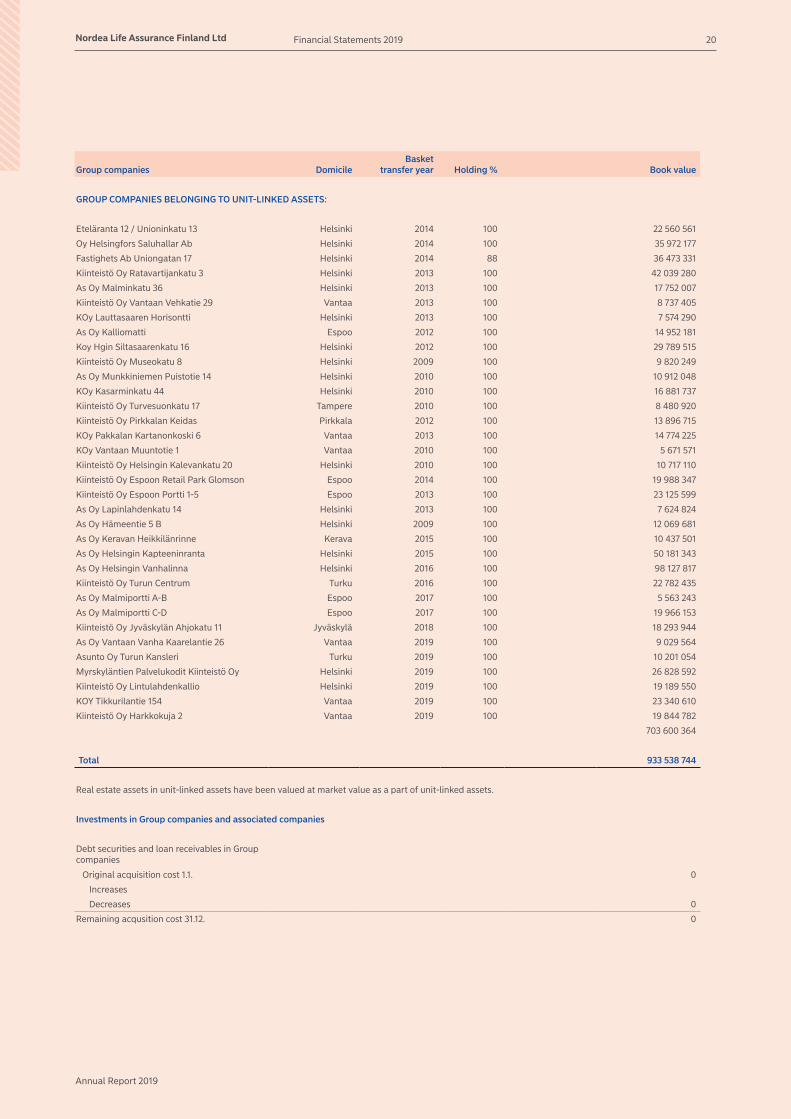
Group companies DomicileBasket
transfer year Holding % Book value
GROUP COMPANIES BELONGING TO UNIT-LINKED ASSETS:
Eteläranta 12 / Unioninkatu 13 Helsinki 2014 100 22 560 561
Oy Helsingfors Saluhallar Ab Helsinki 2014 100 35 972 177
Fastighets Ab Uniongatan 17 Helsinki 2014 88 36 473 331
Kiinteistö Oy Ratavartijankatu 3 Helsinki 2013 100 42 039 280
As Oy Malminkatu 36 Helsinki 2013 100 17 752 007
Kiinteistö Oy Vantaan Vehkatie 29 Vantaa 2013 100 8 737 405
KOy Lauttasaaren Horisontti Helsinki 2013 100 7 574 290
As Oy Kalliomatti Espoo 2012 100 14 952 181
Koy Hgin Siltasaarenkatu 16 Helsinki 2012 100 29 789 515
Kiinteistö Oy Museokatu 8 Helsinki 2009 100 9 820 249
As Oy Munkkiniemen Puistotie 14 Helsinki 2010 100 10 912 048
KOy Kasarminkatu 44 Helsinki 2010 100 16 881 737
Kiinteistö Oy Turvesuonkatu 17 Tampere 2010 100 8 480 920
Kiinteistö Oy Pirkkalan Keidas Pirkkala 2012 100 13 896 715
KOy Pakkalan Kartanonkoski 6 Vantaa 2013 100 14 774 225
KOy Vantaan Muuntotie 1 Vantaa 2010 100 5 671 571
Kiinteistö Oy Helsingin Kalevankatu 20 Helsinki 2010 100 10 717 110
Kiinteistö Oy Espoon Retail Park Glomson Espoo 2014 100 19 988 347
Kiinteistö Oy Espoon Portti 1-5 Espoo 2013 100 23 125 599
As Oy Lapinlahdenkatu 14 Helsinki 2013 100 7 624 824
As Oy Hämeentie 5 B Helsinki 2009 100 12 069 681
As Oy Keravan Heikkilänrinne Kerava 2015 100 10 437 501
As Oy Helsingin Kapteeninranta Helsinki 2015 100 50 181 343
As Oy Helsingin Vanhalinna Helsinki 2016 100 98 127 817
Kiinteistö Oy Turun Centrum Turku 2016 100 22 782 435
As Oy Malmiportti A-B Espoo 2017 100 5 563 243
As Oy Malmiportti C-D Espoo 2017 100 19 966 153
Kiinteistö Oy Jyväskylän Ahjokatu 11 Jyväskylä 2018 100 18 293 944
As Oy Vantaan Vanha Kaarelantie 26 Vantaa 2019 100 9 029 564
Asunto Oy Turun Kansleri Turku 2019 100 10 201 054
Myrskyläntien Palvelukodit Kiinteistö Oy Helsinki 2019 100 26 828 592
Kiinteistö Oy Lintulahdenkallio Helsinki 2019 100 19 189 550
KOY Tikkurilantie 154 Vantaa 2019 100 23 340 610
Kiinteistö Oy Harkkokuja 2 Vantaa 2019 100 19 844 782
703 600 364
Total 933 538 744
Real estate assets in unit-linked assets have been valued at market value as a part of unit-linked assets.
Investments in Group companies and associated companies
Debt securities and loan receivables in Group companies
Original acquisition cost 1.1. 0
Increases
Decreases 0
Remaining acqusition cost 31.12. 0

Annual Report 2019
Nordea Life Assurance Finland Ltd Financial Statements 2019 21
Other investments
Shares and participations
Shares Domicile Holding % Book value Market value
Stora Enso R Finland 0 % 1 240 041 2 071 784
Uponor Finland 0 % 575 691 575 691
YIT-Yhtymä Finland 0 % 288 810 288 810
Caverion Corporation Finland 0 % 278 181 278 181
Terveystalo Plc Finland 0 % 1 220 000 1 395 000
Valmet Corporation Finland 0 % 428 457 1 026 561
Orion B Finland 0 % 443 646 572 981
Asiakastieto Group Plc Finland 0 % 378 241 815 000
Pihlajalinna Plc Finland 0 % 125 286 173 168
Stockmann B Finland 0 % 61 031 61 031
Nokia Finland 0 % 1 279 063 1 279 063
UPM-Kymmene Finland 0 % 1 708 159 3 893 455
Tieto Corporation Finland 0 % 284 546 487 484
Kone B Finland 0 % 1 435 862 3 745 302
Huhtamäki Finland 0 % 392 680 1 301 652
Metso Finland 0 % 1 219 402 1 695 842
Wärtsilä Finland 0 % 1 050 008 1 083 802
Elisa Finland 0 % 543 823 1 305 620
Telia Company FDR Finland 0 % 767 553 767 553
CapMan Finland 0 % 657 900 760 324
Neste Finland 0 % 858 385 3 271 149
Nokian Renkaat Finland 0 % 272 674 272 674
Oriola B Finland 0 % 149 453 149 453
Outotec Finland 0 % 383 087 383 087
Sampo A Finland 0 % 1 403 446 2 377 157
Konecranes Finland 0 % 594 605 671 879
Lassila&Tikanoja Finland 0 % 374 465 378 126
SSAB A Finland 0 % 62 612 62 612
SSAB B Finland 0 % 135 862 135 862
Kemira Finland 0 % 675 459 838 339
Kesko B Finland 0 % 728 095 1 568 681
Cargotec B Finland 0 % 595 017 617 285
Fiskars Finland 0 % 205 512 205 512
Fortum Finland 0 % 2 371 371 2 919 994
Glaston Finland 0 % 109 367 109 367
Total 23 297 788 37 539 481
CDO investments
Goldman Sachs Loan Partners I L.P. Cayman Islands 1 839 24 455
THL Credit Loan Oppurtunity Fund Cayman Islands 113 454 125 290
ICG Heureka Senior Lending Credit Compartment Ireland 20 000 000 20 480 371
Total 20 115 293 20 630 117
Annual Report 2019
Nordea Life Assurance Finland Ltd 22Financial Statements 2019
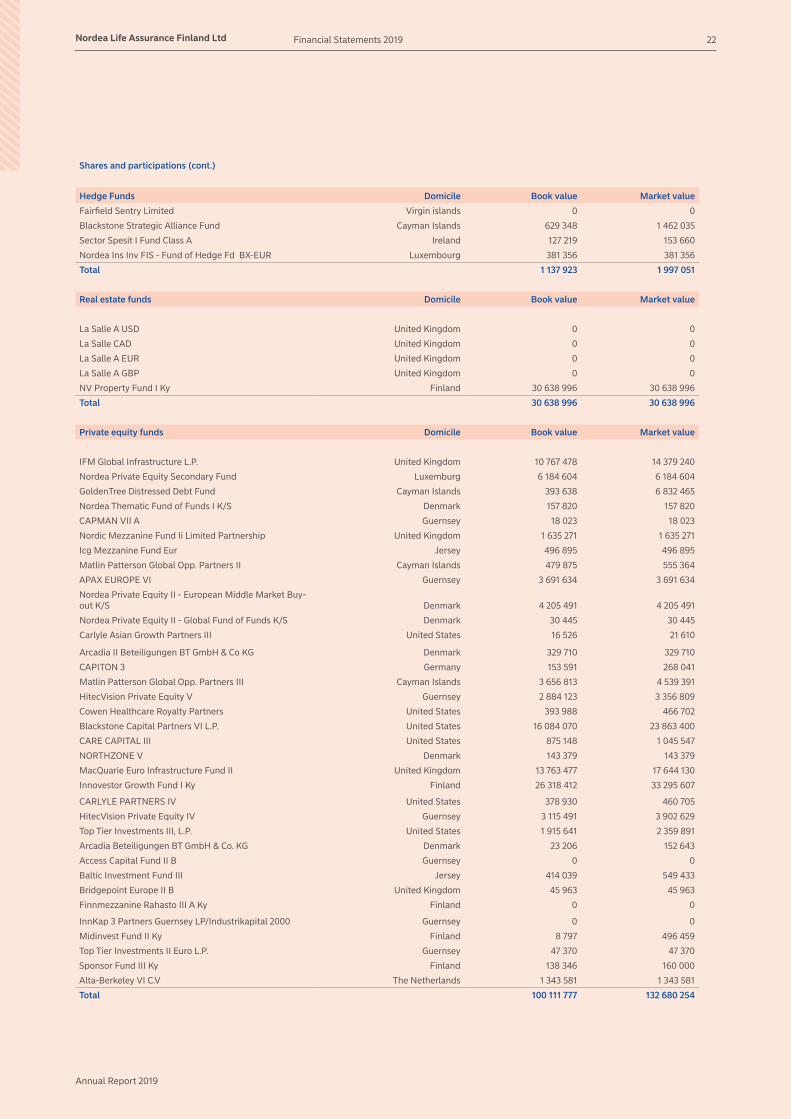
Shares and participations (cont.)
Hedge Funds Domicile Book value Market value
Fairfield Sentry Limited Virgin islands 0 0
Blackstone Strategic Alliance Fund Cayman Islands 629 348 1 462 035
Sector Spesit I Fund Class A Ireland 127 219 153 660
Nordea Ins Inv FIS - Fund of Hedge Fd BX-EUR Luxembourg 381 356 381 356
Total 1 137 923 1 997 051
Real estate funds Domicile Book value Market value
La Salle A USD United Kingdom 0 0
La Salle CAD United Kingdom 0 0
La Salle A EUR United Kingdom 0 0
La Salle A GBP United Kingdom 0 0
NV Property Fund I Ky Finland 30 638 996 30 638 996
Total 30 638 996 30 638 996
Private equity funds Domicile Book value Market value
IFM Global Infrastructure L.P. United Kingdom 10 767 478 14 379 240
Nordea Private Equity Secondary Fund Luxemburg 6 184 604 6 184 604
GoldenTree Distressed Debt Fund Cayman Islands 393 638 6 832 465
Nordea Thematic Fund of Funds I K/S Denmark 157 820 157 820
CAPMAN VII A Guernsey 18 023 18 023
Nordic Mezzanine Fund Ii Limited Partnership United Kingdom 1 635 271 1 635 271
Icg Mezzanine Fund Eur Jersey 496 895 496 895
Matlin Patterson Global Opp. Partners II Cayman Islands 479 875 555 364
APAX EUROPE VI Guernsey 3 691 634 3 691 634
Nordea Private Equity II - European Middle Market Buy-out K/S Denmark 4 205 491 4 205 491
Nordea Private Equity II - Global Fund of Funds K/S Denmark 30 445 30 445
Carlyle Asian Growth Partners III United States 16 526 21 610
Arcadia II Beteiligungen BT GmbH & Co KG Denmark 329 710 329 710
CAPITON 3 Germany 153 591 268 041
Matlin Patterson Global Opp. Partners III Cayman Islands 3 656 813 4 539 391
HitecVision Private Equity V Guernsey 2 884 123 3 356 809
Cowen Healthcare Royalty Partners United States 393 988 466 702
Blackstone Capital Partners VI L.P. United States 16 084 070 23 863 400
CARE CAPITAL III United States 875 148 1 045 547
NORTHZONE V Denmark 143 379 143 379
MacQuarie Euro Infrastructure Fund II United Kingdom 13 763 477 17 644 130
Innovestor Growth Fund I Ky Finland 26 318 412 33 295 607
CARLYLE PARTNERS IV United States 378 930 460 705
HitecVision Private Equity IV Guernsey 3 115 491 3 902 629
Top Tier Investments III, L.P. United States 1 915 641 2 359 891
Arcadia Beteiligungen BT GmbH & Co. KG Denmark 23 206 152 643
Access Capital Fund II B Guernsey 0 0
Baltic Investment Fund III Jersey 414 039 549 433
Bridgepoint Europe II B United Kingdom 45 963 45 963
Finnmezzanine Rahasto III A Ky Finland 0 0
InnKap 3 Partners Guernsey LP/Industrikapital 2000 Guernsey 0 0
Midinvest Fund II Ky Finland 8 797 496 459
Top Tier Investments II Euro L.P. Guernsey 47 370 47 370
Sponsor Fund III Ky Finland 138 346 160 000
Alta-Berkeley VI C.V The Netherlands 1 343 581 1 343 581
Total 100 111 777 132 680 254

Annual Report 2019
Nordea Life Assurance Finland Ltd Financial Statements 2019 23
Shares and participations (cont.)
Equity funds Domicile Book value Market value
Nordea Ins Inv FIS - Global Equity Fd BX-EUR Luxemburg 74 722 052 144 257 481
Total 74 722 052 144 257 481
Money market funds Domicile Book value Market value
Nordea Moderate Yield S Growth Finland 60 195 506 60 195 506
Total 60 195 506 60 195 506
Interest-bearing funds Domicile Book value Market value
Nordea Ins Inv FIS - Covered Bond Fund BX-EUR Luxemburg 109 294 971 170 454 185
Nordea Ins Inv FIS - European corporate Bond Fund BX-EUR Luxemburg 61 502 118 80 440 736
Total 170 797 089 250 894 921
High Yield Domicile Book value Market value
NSIF - Nordea European Senior Loans Fund BX-EUR Luxemburg 14 999 053 15 702 509
OHA U.S. Senior Loan Fund,Class HBX -Shares EUR Luxemburg 20 000 000 21 667 000
Nordea Ins Inv FIS - High Yield Bond Fd BX-EUR Luxemburg 33 821 100 44 698 772
Blackrock Funds I ICAV - Blackrock Global High Yield Ireland 30 000 000 31 134 900
Total 98 820 153 113 203 181

Annual Report 2019
Nordea Life Assurance Finland Ltd 24Financial Statements 2019
Bonds Domicile Book value Market valueBonds, governmentNetherlands Government Bond 0.5% 15-01-2040 The Netherlands 1 434 379 1 511 376Netherlands Government Bond 0.000000% 15-01-2022 The Netherlands 8 106 626 8 094 400Netherlands Government Bond 2.5% 15-01-2033 The Netherlands 6 932 934 6 691 276Kingdom of Belgium Governmen 1.25% 22-04-2033 Belgium 1 990 607 2 257 425Republic of Austria Governme 1.5% 02-11-2086 Austria 1 234 686 1 551 928Republic of Austria Governme 1.5% 20-02-2047 Austria 1 642 874 1 782 041French Republic Government B 0.1% 01-03-2021 France 3 192 700 3 201 166French Republic Government B 1.75% 25-05-2023 France 9 277 159 9 576 328French Republic Government B 1.75% 25-05-2066 France 2 136 240 2 515 052French Republic Government B 0.000000% 25-05-2021 France 4 025 587 4 033 160French Republic Government B 0.000000% 25-11-2029 France 3 533 596 3 410 787French Republic Government B 0.5% 25-05-2029 France 2 020 004 2 085 491French Republic Government B 1.5% 25-05-2050 France 6 583 103 6 649 613French Republic Government B 2% 25-05-2048 France 4 013 501 4 731 794French Republic Government B 3.25% 25-10-2021 France 3 200 605 3 229 348French Republic Government B 0.000000% 25-03-2023 France 4 012 212 4 068 937French Republic Government B 0.75% 25-05-2028 France 8 043 241 8 551 554French Republic Government B 2.5% 25-05-2030 France 3 441 920 3 777 094French Republic Government B 1% 25-05-2027 France 1 503 179 1 631 980French Republic Government B 1.75% 25-06-2039 France 5 390 500 6 215 058French Republic Government B 0.5% 25-05-2026 France 8 362 125 8 907 281French Republic Government B 2.25% 25-10-2022 France 15 167 740 15 391 988French Republic Government B 1.25% 25-05-2036 France 6 779 745 7 611 906French Republic Government B 0.25% 25-11-2026 France 21 249 848 22 100 854French Republic Government B 4% 25-04-2060 France 1 895 312 2 015 106French Republic Government B 3.25% 25-05-2045 France 16 767 850 17 983 511French Republic Government B 5.5% 25-04-2029 France 5 842 394 6 186 497French Republic Government B 4.75% 25-04-2035 France 9 085 152 13 417 643Sweden Government Internatio 0.125% 24-04-2023 Sweden 2 498 516 2 544 103Bundesrepublik Deutschland B 0.25% 15-02-2027 Germany 9 296 734 9 414 657Bundesrepublik Deutschland B 0.5% 15-02-2025 Germany 739 883 738 171Bundesrepublik Deutschland B 3.25% 04-07-2042 Germany 8 849 488 10 086 300Bundesobligation 0.000000% 17-04-2020 Germany 3 005 730 3 005 580Bundesrepublik Deutschland B 0.000000% 15-08-2050 Germany 2 089 237 1 798 800Bundesrepublik Deutschland B 0.25% 15-08-2028 Germany 1 983 309 2 091 344Bundesrepublik Deutschland B 3.25% 04-07-2021 Germany 10 578 070 10 745 836Bundesrepublik Deutschland B 0.5% 15-02-2028 Germany 28 464 021 29 963 075Bundesrepublik Deutschland B 1% 15-08-2025 Germany 2 701 862 2 692 284Bundesrepublik Deutschland B 2.5% 04-07-2044 Germany 537 121 541 320Bundesrepublik Deutschland B 0.000000% 15-08-2026 Germany 28 769 659 29 744 256Bundesrepublik Deutschland B 0.5% 15-02-2026 Germany 11 123 336 11 331 144Bundesrepublik Deutschland B 1% 15-08-2024 Germany 6 412 731 6 443 043Bundesrepublik Deutschland B 4.25% 04-07-2039 Germany 740 609 728 308Bundesrepublik Deutschland B 5.5% 04-01-2031 Germany 12 236 139 13 467 754Bundesrepublik Deutschland B 4% 04-01-2037 Germany 16 642 481 18 558 946Bundesrepublik Deutschland B 1.5% 15-05-2024 Germany 15 987 951 16 476 843Bundesrepublik Deutschland B 2.5% 15-08-2046 Germany 12 419 272 14 189 636Bundesrepublik Deutschland B 1.75% 15-02-2024 Germany 1 733 563 1 753 798Bundesrepublik Deutschland B 4.75% 04-07-2034 Germany 2 346 653 2 335 964Bundesrepublik Deutschland B 2.25% 04-09-2021 Germany 23 847 193 24 279 261Bundesobligation 0.000000% 08-04-2022 Germany 7 112 663 7 097 916Bundesobligation 0.000000% 08-10-2021 Germany 13 929 298 13 951 635Deutsche Bundesrepublik Infl 0.5% 15-04-2030 Germany 6 425 265 6 305 166Finland Government Bond 0.000000% 15-09-2023 Finland 11 500 969 11 699 525Finland Government Bond 0.5% 15-09-2029 Finland 14 118 549 14 109 711Finland Government Bond 3.5% 15-04-2021 Finland 26 293 311 26 947 085Finland Government Bond 1.625% 15-09-2022 Finland 21 217 083 21 276 614Finland Government Bond 0.5% 15-04-2026 Finland 2 016 520 2 096 908Finland Government Bond 2% 15-04-2024 Finland 9 724 439 10 067 109Finland Government Bond 1.125% 15-04-2034 Finland 12 530 678 12 734 500Finland Government Bond 0.000000% 15-04-2022 Finland 10 134 554 10 130 000Finland Government Bond 0.5% 15-09-2027 Finland 14 156 232 14 653 600Finland Government Bond 1.375% 15-04-2047 Finland 7 867 353 9 136 918Finland Government Bond 0.75% 15-04-2031 Finland 7 878 035 8 265 395Finland Government Bond 0.375% 15-09-2020 Finland 10 063 895 10 078 143Finland Government Bond 1.5% 15-04-2023 Finland 15 172 998 16 157 816
Finland Government Bond 3.375% 15-04-2020 Finland 18 711 797 19 148 155Finland Government Bond 2.625% 04-07-2042 Finland 6 389 503 9 047 397
Finland Government Bond 2.75% 04-07-2028 Finland 33 774 910 39 266 661
Total 618 887 434 654 281 272

Annual Report 2019
Nordea Life Assurance Finland Ltd Financial Statements 2019 25
Domicile Book value Market valueBonds, corporate
Argentum Netherlands BV 3.500% MULTI 01-10-2046 The Netherlands 2 502 670 2 584 960
Volkswagen International Fin 4.125% 16-11-2038 The Netherlands 403 411 516 973Urenco Finance NV 2.5% 15-02-2021 The Netherlands 1 819 339 1 889 934Cooperatieve Rabobank UA 6.875% 19-03-2020 The Netherlands 4 294 986 4 537 268Volkswagen Internation 4.625% MULTI Perp FC2028 The Netherlands 300 000 346 261Volkswagen Internation 3.375% MULTI Perp FC2024 The Netherlands 2 301 376 2 385 777Volkswagen Internation 3.750% MULTI Perp FC2021 The Netherlands 4 286 531 4 323 560BMW Finance NV 0.125% 29-11-2021 The Netherlands 3 153 985 3 172 596Urenco Finance NV 2.375% 02-12-2024 The Netherlands 1 653 341 1 698 525Urenco Finance NV 2.25% 05-08-2022 The Netherlands 1 820 298 1 855 567ABN AMRO Bank NV 2.875% MULTI 30-06-2025 The Netherlands 1 104 316 1 111 813LeasePlan Corp NV 0.125% 13-09-2023 The Netherlands 4 207 873 4 166 107Volkswagen Internation 3.875% MULTI Perp FC2027 The Netherlands 99 841 110 367Siemens Financieringsmaatsch 0.000000% 05-09-2021 The Netherlands 840 445 839 561BMW Finance NV 0.000000% 24-03-2023 The Netherlands 3 563 186 3 565 001de Volksbank NV 0.01% 16-09-2024 The Netherlands 1 797 004 1 780 450Sydney Airport Finance Co Pt 1.75% 26-04-2028 Australia 2 956 212 3 198 135Wesfarmers Ltd 1.25% 07-10-2021 Australia 3 231 886 3 298 519KBC Bank NV 0.125% 28-04-2021 Belgium 10 037 840 10 067 316Global Switch Holdings Ltd 2.25% 31-05-2027 Virgin Islands 5 139 602 5 468 303Bankia SA 1.125% 12-11-2026 Spain 1 897 474 1 908 375Bankia SA 3.750% MULTI 15-02-2029 Spain 4 412 997 4 920 854Cloverie PLC for Swiss 6.625% MULTI 01-09-2042 Ireland 2 175 977 2 230 017M&G CREL UK EUR Ireland 3 226 290 3 232 117M&G CREL UK Ireland 5 204 249 5 490 354Cloverie PLC for Zurich Insu 1.5% 15-12-2028 Ireland 794 584 855 870BAT International Finance PL 3.125% 06-03-2029 United Kingdom 971 836 1 084 689Nationwide Building Society 0.75% 29-10-2021 United Kingdom 10 115 020 10 193 110Santander UK PLC 0.25% 09-08-2021 United Kingdom 12 057 887 12 105 187BAT International Finance PL 2.25% 16-01-2030 United Kingdom 1 733 043 1 832 468BP Capital Markets PLC 0.9% 03-07-2024 United Kingdom 1 854 965 1 918 080BP Capital Markets PLC 1.594% 03-07-2028 United Kingdom 2 221 942 2 383 871British Telecommunications P 1.125% 10-03-2023 United Kingdom 3 562 875 3 678 458British Telecommunications P 1.75% 10-03-2026 United Kingdom 843 273 876 667Nationwide Building Society 4.625% 08-02-2021 United Kingdom 7 364 956 7 665 477Motability Operations Group 0.875% 14-03-2025 United Kingdom 2 088 099 2 180 548Motability Operations Group 1.625% 09-06-2023 United Kingdom 2 870 091 3 002 302Barclays Bank UK PLC 4.25% 02-03-2022 United Kingdom 11 031 442 11 324 125Coca-Cola European Partners 0.7% 12-09-2031 United Kingdom 2 203 615 2 155 984Vodafone Group PLC 3.100% MULTI 03-01-2079 United Kingdom 2 356 009 2 621 888Motability Operations Group 0.375% 03-01-2026 United Kingdom 3 452 127 3 436 321GlaxoSmithKline Capital PLC 0.000000% 23-09-2021 United Kingdom 2 394 950 2 394 175Santander UK PLC 0.25% 21-04-2022 United Kingdom 12 126 239 12 138 731NGG Finance PLC 2.125% MULTI 05-09-2082 United Kingdom 2 038 221 2 083 576British Telecommunications P 1.125% 12-09-2029 United Kingdom 1 080 915 1 086 231Societa Iniziative Autostrad 1.625% 08-02-2028 Italy 2 253 678 2 411 171Banca Monte dei Paschi di Si 2% 29-01-2024 Italy 3 061 935 3 270 585Banca Monte dei Paschi di Si 0.875% 08-10-2026 Italy 781 134 783 807Intesa Sanpaolo SpA 1% 19-11-2026 Italy 3 423 873 3 429 211UniCredit SpA 1.250% MULTI 25-06-2025 Italy 2 346 751 2 418 860SES SA 4.75% 11-03-2021 Luxemburg 2 059 111 2 229 250Medtronic Global Holdings SC 0.375% 07-03-2023 Luxemburg 495 751 503 865Medtronic Global Holdings SC 07-03-2021 Luxemburg 847 386 850 186SR-Boligkreditt AS 0.125% 08-09-2021 Norway 5 011 420 5 034 917Avinor AS 1.75% 20-03-2021 Norway 4 769 798 4 885 351Kommunal Landspensjonsk 4.250% MULTI 10-06-2045 Norway 1 977 435 2 246 797Statkraft AS 1.125% 20-03-2025 Norway 996 419 1 042 720Statkraft AS 1.5% 21-09-2023 Norway 3 836 615 3 966 049Avinor AS 1% 29-04-2025 Norway 2 696 700 2 805 010DNB Boligkreditt AS 0.05% 11-01-2022 Norway 3 006 859 3 020 901Telenor ASA 1.125% 31-05-2029 Norway 965 229 1 023 596Telenor ASA 1.75% 31-05-2034 Norway 952 426 1 032 915SpareBank 1 Boligkreditt AS 0.75% 05-09-2022 Norway 12 339 132 12 343 399SpareBank 1 Boligkreditt AS 0.05% 25-01-2022 Norway 15 122 962 15 104 096Sparebanken Vest Boligkredit 0.125% 02-03-2021 Norway 2 006 778 2 012 105TOTAL SA 3.875% MULTI Perp FC2022 France 2 880 088 3 008 582RTE Reseau de Transport d'El 2.875% 12-09-2023 France 835 557 891 053
Orange SA 4.000% MULTI Perp FC2021 France 3 056 336 3 155 491Banque Federative du Credit 0.75% 17-07-2025 France 2 393 609 2 464 641Banque Federative du Credit 1.25% 26-05-2027 France 2 488 798 2 669 544

Annual Report 2019
Nordea Life Assurance Finland Ltd 26Financial Statements 2019
Domicile Book value Market valueBonds, corporateBanque Federative du Credit 2.625% 18-03-2024 France 107 457 112 264Dexia Credit Local SA 1% 18-10-2027 France 1 494 806 1 599 408Dexia Credit Local SA 0.625% 03-02-2024 France 1 496 649 1 553 640AXA SA 3.250% MULTI 28-05-2049 France 727 351 811 788AXA SA 3.941% MULTI Perp FC2024 France 1 545 208 1 782 532AXA SA 5.250% MULTI 16-04-2040 France 157 976 157 733RTE Reseau de Transport d'El 2.125% 27-09-2038 France 297 470 358 687RTE Reseau de Transport d'El 1.625% 27-11-2025 France 1 229 811 1 296 347RTE Reseau de Transport d'El 1.625% 08-10-2024 France 2 021 829 2 143 499Credit Agricole SA/London 1.375% 03-05-2027 France 1 592 458 1 726 754
Credit Agricole SA/London 1% 16-09-2024 France 3 421 605 3 537 986
Credit Agricole SA/London 2.375% 20-05-2024 France 1 383 997 1 444 597Credit Agricole SA/London 1.25% 14-04-2026 France 1 708 280 1 812 918BPCE SFH SA 3.75% 13-09-2021 France 3 199 491 3 241 869Arkea Home Loans SFH SA 4.5% 13-04-2021 France 7 418 768 7 653 360Credit Agricole Assuran 4.750% MULTI 27-09-2048 France 1 448 950 1 615 821Pernod Ricard SA 0.875% 24-10-2031 France 98 769 100 169TOTAL SA 2.250% MULTI Perp FC2021 France 483 054 495 244Orange SA 4.250% MULTI Perp FC2020 France 253 176 259 398Orange SA 1.750% MULTI Perp FC2026 France 396 553 404 580Dexia Credit Local SA 0.25% 02-06-2022 France 10 143 710 10 139 594AXA SA 3.375% MULTI 06-07-2047 France 817 155 823 363AXA SA 3.875% MULTI Perp FC2025 France 423 947 462 373RTE Reseau de Transport d'El 1.125% 09-09-2049 France 1 087 055 1 041 484Pernod Ricard SA 0.5% 24-10-2027 France 99 718 100 161Credit Agricole SA/London 3.125% 05-02-2026 France 119 130 120 040Credit Mutuel Arkea SA 0.375% 03-10-2028 France 1 388 272 1 367 920Credit Mutuel Arkea SA 1.125% 23-05-2029 France 1 200 666 1 255 841Swedish Match AB 0.875% 23-09-2024 Sweden 3 951 779 4 018 688
Swedbank Hypotek AB 0.15% 10-02-2021 Sweden 6 017 732 6 038 553
Swedish Match AB 1.2% 10-11-2025 Sweden 590 718 586 692Lansforsakringar Hypotek AB 0.25% 22-04-2022 Sweden 11 112 270 11 146 257Kreditanstalt fuer Wiederauf 0.25% 15-09-2025 Germany 2 225 771 2 293 943Kreditanstalt fuer Wiederauf 0.05% 28-02-2024 Germany 8 956 972 9 139 816Kreditanstalt fuer Wiederauf 0.125% 04-10-2024 Germany 7 962 803 8 144 948Allianz SE 2.241% MULTI 07-07-2045 Germany 1 292 083 1 299 981Allianz SE 3.375% MULTI Perp FC2024 Germany 2 004 644 2 133 002Volkswagen Leasing GmbH 1% 16-02-2023 Germany 771 560 793 348Volkswagen Leasing GmbH 1.375% 20-01-2025 Germany 122 982 129 512Landesbank Baden-Wuerttember 0.25% 26-10-2021 Germany 5 033 004 5 054 654Erste Abwicklungsanstalt 0.000000% 25-02-2021 Germany 10 023 083 10 046 020Landwirtschaftliche Rentenba 0.000000% 27-11-2029 Germany 10 023 777 9 869 020Commerzbank AG 1% 04-03-2026 Germany 659 874 660 682DZ HYP AG 0.5% 29-07-2022 Germany 15 337 525 15 336 353Kreditanstalt fuer Wiederauf 0.000000% 30-06-2022 Germany 10 121 282 10 101 580Volkswagen Financial Service 2.25% 01-10-2027 Germany 830 587 891 140Deutsche Bahn Finance 1.600% MULTI Perp FC2029 Germany 1 200 000 1 236 882Deutsche Bahn Finance 0.950% MULTI Perp FC2025 Germany 4 001 193 4 047 683Allianz SE 1.301% MULTI 25-09-2049 Germany 1 199 434 1 192 375Allianz SE 5.625% MULTI 17-10-2042 Germany 1 287 985 1 274 148Aareal Bank AG 0.01% 04-07-2022 Germany 9 115 584 9 066 773Volkswagen Bank GmbH 1.25% 01-08-2022 Germany 1 795 293 1 856 868Deutsche Hypothekenbank AG 0.01% 12-09-2022 Germany 10 082 831 10 063 943Commerzbank AG 0.5% 04-12-2026 Germany 2 347 287 2 346 204Volkswagen Leasing GmbH 0.5% 20-06-2022 Germany 915 803 926 385Commerzbank AG 0.625% 28-08-2024 Germany 6 211 857 6 314 356OP Mortgage Bank 1.5% 17-03-2021 Finland 12 233 976 12 407 571Teollisuuden Voima Oyj 2% 08-05-2024 Finland 1 077 720 1 148 230Teollisuuden Voima Oyj 2.125% 04-02-2025 Finland 3 182 429 3 414 939Teollisuuden Voima Oyj 1.125% 09-03-2026 Finland 2 161 900 2 146 414UBS AG/London 0.125% 05-11-2021 Switzerland 1 141 456 1 148 019UBS AG/London 0.625% 23-01-2023 Switzerland 3 884 846 3 975 803Credit Suisse AG/London 1% 07-06-2023 Switzerland 3 190 787 3 293 638Nordea Kredit 1% 01-01-2021 SDRO A 2 Denmark 5 048 334 5 122 960Danfoss A/S 1.375% 23-02-2022 Denmark 6 241 994 6 420 005Danske Bank A/S 0.125% 09-03-2021 Denmark 15 047 440 15 091 978Danske Bank A/S 0.75% 02-06-2023 Denmark 2 431 298 2 487 413
Jyske Bank A/S 2.250% MULTI 05-04-2029 Denmark 1 369 788 1 456 394

Annual Report 2019
Nordea Life Assurance Finland Ltd Financial Statements 2019 27
Domicile Book value Market valueBonds, corporateNykredit Realkredit 1% 01-01-2022 SDO A H Denmark 10 234 025 10 394 126Elering AS 0.875% 03-05-2023 Estonia 2 635 090 2 681 798AT&T Inc 3.15% 04-09-2036 United States 1 266 996 1 456 100AT&T Inc 2.35% 05-09-2029 United States 2 322 809 2 579 842AT&T Inc 1.8% 05-09-2026 United States 1 802 973 1 925 384Wells Fargo & Co 1.5% 24-05-2027 United States 1 688 475 1 816 299Wells Fargo & Co 1% 02-02-2027 United States 2 600 946 2 730 283Bank of America Corp 1.375% 26-03-2025 United States 102 959 108 943Nasdaq Inc 3.875% 07-06-2021 United States 6 026 862 6 302 185Electricite de France 4.000% MULTI Perp FC2024 United States 3 318 249 3 631 673JPMorgan Chase & Co 1.638% MULTI 18-05-2028 United States 2 847 579 3 061 428General Mills Inc 2.1% 16-11-2020 United States 3 314 498 3 360 075Verizon Communications Inc 1.25% 08-04-2030 United States 1 747 187 1 850 996
AT&T Inc 1.8% 14-09-2039 United States 796 748 768 698
Wells Fargo & Co 0.625% 25-03-2030 United States 3 612 485 3 595 596Altria Group Inc 3.125% 15-06-2031 United States 1 203 151 1 369 468Altria Group Inc 2.2% 15-06-2027 United States 1 482 967 1 597 251Altria Group Inc 1.7% 15-06-2025 United States 1 186 019 1 244 566Nasdaq Inc 1.75% 28-03-2029 United States 2 233 210 2 334 961Fidelity National Informatio 0.75% 21-05-2023 United States 536 000 549 136Fidelity National Informatio 1.5% 21-05-2027 United States 607 009 645 614Fidelity National Informatio 2% 21-05-2030 United States 710 682 782 503JPMorgan Chase & Co 1.047% MULTI 04-11-2032 United States 5 148 599 5 188 674JPMorgan Chase & Co 1.001% MULTI 25-07-2031 United States 1 286 000 1 312 456Verizon Communications Inc 1.5% 19-09-2039 United States 292 650 286 170Verizon Communications Inc 0.875% 08-04-2027 United States 1 874 356 1 938 478Moody's Corp 0.95% 25-02-2030 United States 2 937 304 2 964 099
Chubb INA Holdings Inc 0.875% 15-06-2027 United States 2 614 532 2 672 117Total 540 600 352 553 012 023
Equity-linked bonds
Nordea Bank Finland Structured 28-02-2023 B210 Finland 9 949 639 10 096 637
Total 9 949 639 10 096 637

Annual Report 2019
Nordea Life Assurance Finland Ltd 28Financial Statements 2019
Assets covering unit-linked insurance policies
Market value
Funds (=book value)
iShares Emerging Markets Index Fund Ireland 2 590 698
iShares Ultra High Quality Euro Government Bond In Ireland 1 864 019
Wellington Mgmt Fds Ireland PLC-Global Impact Fd T Ireland 9 294 212
Wellington Global Impact D Ireland 334 181
Wellington Mgmt (EUR NR) Emerging Local Debt Ireland 1 341 918
Brown Advisory US Smaller Companies Fund A Ireland 3 201 840
Brown Advisory US Smaller Companies Fund B Ireland 1 901 114
iShares Euro Investment Grade Corporate Bond Ind Ireland 6 270 949
PGIM Funds PLC - PGIM Global Corporate Bond UCITS Ireland 385 548
Blackrock Funds I ICAV - Blackrock Global High Yie Ireland 74 555 481
Legg Mason Royce Smaller Companies A Ireland 274 928
BGI Europe Ex Uk Index Fund Ireland 6 287 118
Man GLG RI European Equity Leaders D C EUR Ireland 10 559
BGI Japan Index Sub Fund (Usd) Ireland 1 206 800
BGI Us Index Sub Fund Ireland 11 197 029
Nordea 1 - Nordic Stars Equity Fund BI-EUR Luxemburg 14 636 835
Nordea 1 - Global Small Cap Fund BI-EUR Luxemburg 4 507 429
Nordea 1 - Global Listed Infrastructure Fd BP-EUR Luxemburg 517 266
Nordea 1 - Low Dur European Covered Bd - BI EUR Luxemburg 1 999 804
Nordea 1 - Global Stable Equity Fd X-EUR Luxemburg 4 885 390
Nordea 1 - Emerging Market Corporate Bond HXE-EUR Luxemburg 38 392 799
Nordea 2 - US High Yield ESG Bond Fund HBI-EUR Luxemburg 5 610 661
Nordea 1 - Low Dur European Covered Bd - BP EUR Luxemburg 279 253
Nordea 1 - US Equity Market Neutral Fund BP-EUR Luxemburg 13 156
Nordea 1 - Global Disruption Fund BP-EUR Luxemburg 175 941
Nordea 2 - Global Enhanced Small Cap Fund BP-EUR Luxemburg 759 459
Nordea 1 - Long Duration US Bond Fund X-EUR Luxemburg 10 494 150
Nordea 1 - European High Yield Stars BF - BP EUR Luxemburg 190 658
Nordea 2 - US High Yield ESG Bond Fund HB-EUR Luxemburg 83 374
Nordea 2 - US Corporate ESG Bond Fund HB-EUR Luxemburg 58 893
Nordea 1 - European Covered Bond BI-EUR Luxemburg 178 504 685
Nordea 1 - Emerging Stars Bond Fund - HB EUR Luxemburg 15 222 624
Nordea 1 - European High Yield Stars BF - X EUR Luxemburg 5 594 301
Nordea 2 - US Corporate ESG Bond Fund HBI-EUR Luxemburg 18 487 834
Nordea 1 - Emerging Stars Equity Fund BI-EUR Luxemburg 31 406 432
Nordea 1 - European Stars Equity Fund - BI EUR Luxemburg 12 179 651
Nordea 1 - North American Stars Equity BI-EUR Luxemburg 20 195 634
Nordea 1 - Global Climate and Envir. Fd BI-EUR Luxemburg 11 184 491
Nordea 1 - European Corporate Stars Bond - X EUR Luxemburg 18 516 981
Nordea 1 - Global Opportunity Fund BP-EUR Luxemburg 762 163
Nordea 1 - Global Gender Diversity Fund BP-EUR Luxemburg 310 940
Nordea 1 - European Corporate Stars Bond - BP EUR Luxemburg 375 163
Nordea 1 - Nordic Stars Equity Fund BP-EUR Luxemburg 1 348 386
Nordea 1 - Global Stars Equity Fund X-EUR Luxemburg 9 261 820
NSIF - Nordea European Senior Loans Fund BX-EUR Luxemburg 26 170 848
Nordea 2 - Japanese Enhanced Equity Fund BP-EUR Luxemburg 525 257
Nordea 2 - European Enhanced Equity Fund BP-EUR Luxemburg 6 709 866
Nordea 2 - Emerging Markets Enhanced Eq Fd BP-EUR Luxemburg 9 325 372
Nordea 1 - Inter HY Bd Fd USD Hedged HXE-EUR Luxemburg 77 388 132
Nordea 1 - Global Stars Equity Fund BI-EUR Luxemburg 25 549 080
Nordea 1 - European Stars Equity Fund - BP EUR Luxemburg 1 309 475
Nordea 1 - European High Yield Bond Fund BI-EUR Luxemburg 82 757 692
Nordea 1 - Flexible Fixed Income Fund BI-EUR Luxemburg 783 240 182
Nordea 2 - Emerging Mkt Hard Ccy Enh Bd HB-EUR Luxemburg 107 828
Nordea 1 - Emerging Mkt Local Debt Fd Plus HB-EUR Luxemburg 26 598
Nordea 1 - Global Stars Equity Fund BP-EUR Luxemburg 8 149 747
Nordea 1 - European Cross Credit fund X-EUR Luxemburg 96 861 310
Nordea 1 - Global Dividend Fund BP-EUR Luxemburg 1 404 410

Annual Report 2019
Nordea Life Assurance Finland Ltd Financial Statements 2019 29
Market value
Funds (=book value)
Nordea 1 - Alpha 10 MA Fund BI-EUR Luxemburg 464 444
Nordea 1 - Global Portfolio Fund BI-EUR Luxemburg 2 843 378
Wellington Emerging Markets Research Equity D EUR Luxemburg 95 204
Wellington Emerging Markets Research Equity D USD Luxemburg 283 950
ING L Health Care Luxemburg 2 474 138
Morgan Stanley Investment Funds - Global Property Luxemburg 2 990 543
Goldman Sachs Asset Management GS US Equity Portfo Luxemburg 813 640
Allianz US Equity Fund Luxemburg 82 066
JPMorgan US Smaller Companies I-USD Luxemburg 29 136 007
East Capital Lux - Russian Fund Luxemburg 220 748
JPMorgan Funds - US Smaller Companies Luxemburg 835 224
Nordea 1 - Low Duration US High Yield HXE-EUR Luxemburg 93 279 650
JPMorgan Funds - Asia Alpha Plus Fund Luxemburg 100 868
Schroder China Opportunities Luxemburg 1 695 352
Nordea 1 - Emerging Markets Small Cap Fund BI-EUR Luxemburg 706 388
Nordea 1 - Global Stable Equity Fd BI-EUR Luxemburg 61 352
Nordea 1 - Emerging Market Focus Equity BP-EUR Luxemburg 1 768 245
T. Rowe Price Japanese Equity Q1-EUR Luxemburg 29 500 190
Nordea 1 - Alpha 10 MA Fund BP-EUR Luxemburg 543 732
Nordea 1 - Low Duration US High Yield HBIE-EUR Luxemburg 361 754
Nordea 1 - European Covered Bond BP-EUR Luxemburg 2 969 200
Nordea 1 - Low Duration US High Yield HBE-EUR Luxemburg 365 840
Nordea 1 - Low Duration US High Yield BP-EUR Luxemburg 1 009 952
Nordea 1 - European Cross Credit fund BP-EUR Luxemburg 1 388 424
Nordea 1 - European Cross Credit fund BI-EUR Luxemburg 14 492 814
Nordea 1 - Emerging Market Corporate Bond HBE-EUR Luxemburg 703 632
T. Rowe Price Global Investment Japanese Equity Fu Luxemburg 1 702 125
JPMorgan Funds - Managed Reserves Fund Luxemburg 707 136
Schroder ISF Euro High Yield Luxemburg 10 502
Schroder International Selection Fund - QEP Global Luxemburg 12 248
Wellington US Research Equity Luxemburg 215 310 737
Nordea 1 - Emerging Wealth Equity Fund BP-EUR Luxemburg 1 186 689
Nordea 1 - Emerging Market Corporate Bond HBIE-EUR Luxemburg 804 235
Nordea 1 - Global Portfolio Fund BP-EUR Luxemburg 4 245 225
Nordea 1 - North American Stars Equity BP-EUR Luxemburg 12 500 156
Nordea 1 - Global Stable Eq Fd-Euro Hedged BP-EUR Luxemburg 30 737 922
Nordea 1 - US Corporate Bond Fund HBE-EUR Luxemburg 3 004 219
Nordea 1 - US Corporate Bond Fund BP-EUR Luxemburg 2 986 301
Nordea 1 - Nordic Ideas Equity Fund BI-EUR Luxemburg 1 288 616
Nordea 1 - North American Value Fund BP-EUR Luxemburg 6 090 975
Nordea 1 - North American Small Cap BP-EUR Luxemburg 2 116 198
Nordea 1 - North American Value Fund HB-EUR Luxemburg 2 216 505
Nordea 1 - North American Small Cap HBE-EUR Luxemburg 431 968
Wellington US Research Equity Fund D EUR Luxemburg 3 603 803
Nordea 1 - Latin American Equity Fund BP-EUR Luxemburg 5 766 063
Nordea 1 - Emerging Stars Equity Fund BP-EUR Luxemburg 17 664 397
Nordea 1 - Global Climate and Envir. Fd BP-EUR Luxemburg 24 970 250
Nordea 1 - Inter HY Bd Fd USD Hedged HBI-EUR Luxemburg 1 650 276
Nordea 1 - Inter HY Bd Fd USD Hedged BP-EUR Luxemburg 1 076 887
Nordea 1 - Global Real Estate Fund BP-EUR Luxemburg 1 244 948
Nordea 1 - Global Real Estate Fund BI-EUR Luxemburg 4 730 238
Nordea 1 - Asia ex Japan Equity Fund BP-EUR Luxemburg 2 466 659
Nordea 1 - European Small and Mid Cap Eq Fd BP-EUR Luxemburg 30 714 628
Nordea Ins Inv FIS European Corp Bd Fd I BX-EUR Luxemburg 5 602 712
OHA U.S. Senior Loan Fund,Class HBX -Shares EUR Luxemburg 43 334 000
BlackRock Global Index Funds - iShare Emerging Mar Luxemburg 53 913 183
Nordea Ins Inv FIS - Covered Bond Fund BX-EUR Luxemburg 235 038 065
Nordea 1 - North American Stars Equity HBE-EUR Luxemburg 8 119 008
Nordea 1 - European Corp Bond Fd Plus X-EUR Luxemburg 55 793 704
Nordea 1 - European Value Fund BP-EUR Luxemburg 18 869 289
Nordea 1 - Nordic Equity Fund BP-EUR Luxemburg 86 648

Annual Report 2019
Nordea Life Assurance Finland Ltd 30Financial Statements 2019 23
Market value
Funds (=book value)
Goldman Sachs Asset Management GS N-11SM Equity Po Luxemburg 117 561
Nordea 1 - US Corporate Bond Fund HBIE-EUR Luxemburg 1 633 211
JPMorgan Europe Select Equity I-EUR Luxemburg 110 532 858
Nordea 1 - US Corporate Bond Fund HXE-EUR Luxemburg 100 326 494
Fidelity European Smaller Companies Fund Acc Luxemburg 80 534
UBS Small Caps Europe B Luxemburg 143 171
BlackRock GF World Energy Fund A2 EUR Luxemburg 307 199
BlackRock GF Euro Markets A2 Luxemburg 25 093
BlackRock Global Funds - World Gold Fund Luxemburg 3 348 781
BlackRock GF US Opportunities A2 EUR Luxemburg 79 809
BlackRock Global Funds - World Financials Fund Luxemburg 144 892
BGF European Luxemburg 117 453
Fidelity Funds - America Fund Luxemburg 186 294
Fidelity America Fund Luxemburg 109 829
Fidelity Funds South East Asia Acc - EUR Luxemburg 47 029
Fidelity Pacific Fund Acc Luxemburg 224 734
Franklin India Fund A Acc. Luxemburg 1 054 933
Franklin MENA Fund Class A (acc) USD Luxemburg 111 887
Goldman Sachs Asset Management Japan Portfolio Luxemburg 148 579
Goldman Sachs Japan Portfolio Luxemburg 220 916
Henderson Gartmore Latin American Fund D1 Luxemburg 177 644
ING European Real Estate X Luxemburg 6 723
JPM Greater China A(acc)-USD Luxemburg 32 876
JPMorgan Europe Select Eq Luxemburg 6 743 270
JPMorgan US Select Eq Luxemburg 7 996 451
Standard Life Global REIT Focus Fund Luxemburg 588 404
Nordea 1 Flexible Fixed Income Fund BP Luxemburg 80 168
Nordea 1 Nordic Ideas Equity BP Luxemburg 140 771
Nordea 1 SICAV - Emerging Markets Small Cap Fund BP Luxemburg 16 557
Nordea 1 SICAV - Global Small Cap Fund Luxemburg 176 099
Nordea 1 SICAV - International High Yield Bond Fund HB Luxemburg 95 707
Nordea Pro Finland I growth Finland 257 807 373
Nordea Pro Euro Bond I growth Finland 523 687 378
Nordea Moderate Yield B growth Finland 17 131 473
Nordea Moderate Yield S growth Finland 135 734 829
Nordea Moderate Yield A growth Finland 6 126 301
Nordea Finland C growth Finland 205 696
Nordea Finland A growth Finland 77 338 240
Nordea Euro Bond I growth Finland 4 581 025
Nordea Euro Bond A growth Finland 25 781 730
Nordea Sustainable Global Moderate Fund A growth Finland 79 650
Nordea Sustainable Global Balanced Fund A growth Finland 65 220
Nordea Sustainable Global Growth Fund A growth Finland 80 643
Nordea Sustainable Equities Global I growth Finland 301 422
Nordea North American Enhanced Fund I growth Finland 1 856 797
Nordea Global Enhanced Fund I growth Finland 1 605 095
Nordea Tactical Asset Allocation Fund I growth Finland 301 835 559
Nordea Sustainable Fixed Income Global A growth Finland 4 490 692
Nordea Sustainable Equities Global Fund A growth Finland 34 394 546
Nordea Euro Short Term Fund I growth Finland 8 518 266
Nordea Finnish Passive Fund I growth Finland 30 999 651
Nordea Inst. Sustainable Global Growth Fund growth Finland 6 874 442
Nordea Global Enhanced Fund growth Finland 31 405 233
Nordea Corporate Sust. Global Balanced Fund growth Finland 1 086 488
Nordea Nordic Fund B growth Finland 1 235 154
Nordea Corporate Bond I growth Finland 212 641 911
Nordea Euro Medium Term Bond Fund A growth Finland 105 170 441
Nordea Corporate Sust. Global Moderate Fund growth Finland 378 628
Nordea Fixed Income Credit Opp. Fund I growth Finland 935 527 292
Nordea Equity Opportunities Fund I growth Finland 902 573 226
Nordea Equity Core Fund I growth Finland 907 238 712
Nordea Corporate Sust. Global Growth Fund growth Finland 164 722
Nordea Inst. Sust. Global Moderate Fund growth Finland 485 952
Nordea North American Enhanced Fund growth Finland 59 566 332
Nordea Institutional AM Conservative growth Finland 7 102 904
Nordea Inst. Sust. Global Balanced Fund growth Finland 2 822 887
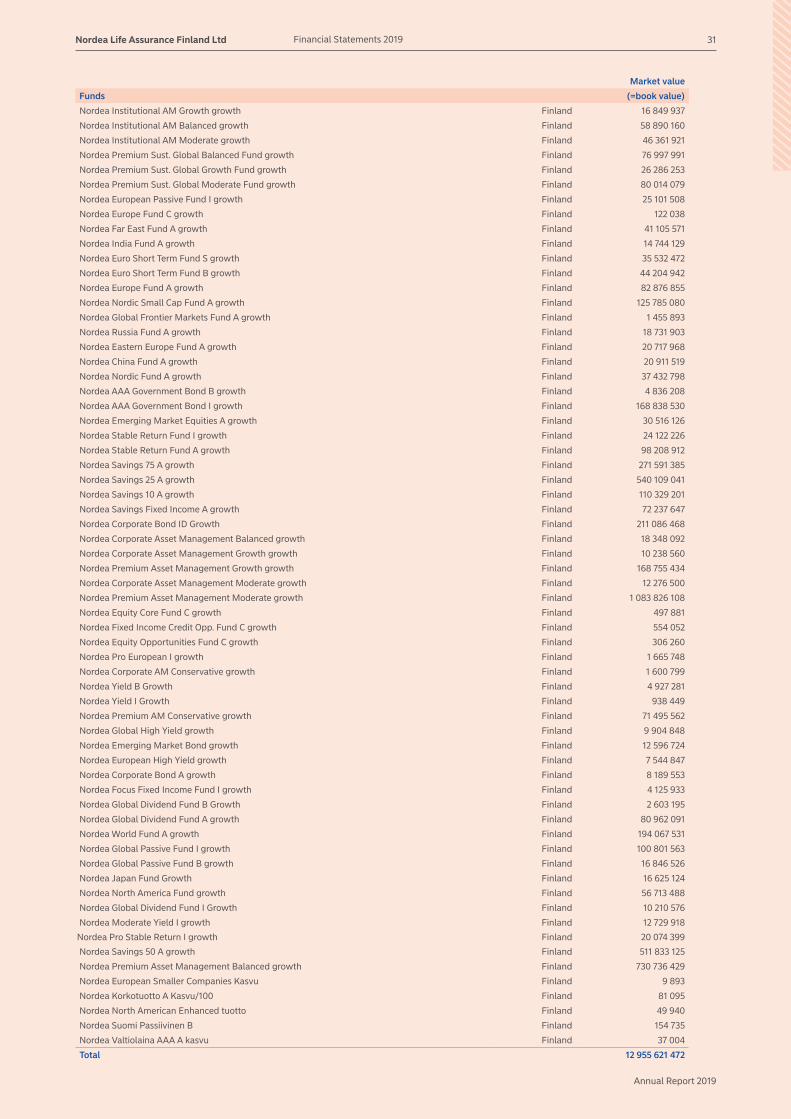
Annual Report 2019
Nordea Life Assurance Finland Ltd Financial Statements 2019 31
Market value
Funds (=book value)
Nordea Institutional AM Growth growth Finland 16 849 937
Nordea Institutional AM Balanced growth Finland 58 890 160
Nordea Institutional AM Moderate growth Finland 46 361 921
Nordea Premium Sust. Global Balanced Fund growth Finland 76 997 991
Nordea Premium Sust. Global Growth Fund growth Finland 26 286 253
Nordea Premium Sust. Global Moderate Fund growth Finland 80 014 079
Nordea European Passive Fund I growth Finland 25 101 508
Nordea Europe Fund C growth Finland 122 038
Nordea Far East Fund A growth Finland 41 105 571
Nordea India Fund A growth Finland 14 744 129
Nordea Euro Short Term Fund S growth Finland 35 532 472
Nordea Euro Short Term Fund B growth Finland 44 204 942
Nordea Europe Fund A growth Finland 82 876 855
Nordea Nordic Small Cap Fund A growth Finland 125 785 080
Nordea Global Frontier Markets Fund A growth Finland 1 455 893
Nordea Russia Fund A growth Finland 18 731 903
Nordea Eastern Europe Fund A growth Finland 20 717 968
Nordea China Fund A growth Finland 20 911 519
Nordea Nordic Fund A growth Finland 37 432 798
Nordea AAA Government Bond B growth Finland 4 836 208
Nordea AAA Government Bond I growth Finland 168 838 530
Nordea Emerging Market Equities A growth Finland 30 516 126
Nordea Stable Return Fund I growth Finland 24 122 226
Nordea Stable Return Fund A growth Finland 98 208 912
Nordea Savings 75 A growth Finland 271 591 385
Nordea Savings 25 A growth Finland 540 109 041
Nordea Savings 10 A growth Finland 110 329 201
Nordea Savings Fixed Income A growth Finland 72 237 647
Nordea Corporate Bond ID Growth Finland 211 086 468
Nordea Corporate Asset Management Balanced growth Finland 18 348 092
Nordea Corporate Asset Management Growth growth Finland 10 238 560
Nordea Premium Asset Management Growth growth Finland 168 755 434
Nordea Corporate Asset Management Moderate growth Finland 12 276 500
Nordea Premium Asset Management Moderate growth Finland 1 083 826 108
Nordea Equity Core Fund C growth Finland 497 881
Nordea Fixed Income Credit Opp. Fund C growth Finland 554 052
Nordea Equity Opportunities Fund C growth Finland 306 260
Nordea Pro European I growth Finland 1 665 748
Nordea Corporate AM Conservative growth Finland 1 600 799
Nordea Yield B Growth Finland 4 927 281
Nordea Yield I Growth Finland 938 449
Nordea Premium AM Conservative growth Finland 71 495 562
Nordea Global High Yield growth Finland 9 904 848
Nordea Emerging Market Bond growth Finland 12 596 724
Nordea European High Yield growth Finland 7 544 847
Nordea Corporate Bond A growth Finland 8 189 553
Nordea Focus Fixed Income Fund I growth Finland 4 125 933
Nordea Global Dividend Fund B Growth Finland 2 603 195
Nordea Global Dividend Fund A growth Finland 80 962 091
Nordea World Fund A growth Finland 194 067 531
Nordea Global Passive Fund I growth Finland 100 801 563
Nordea Global Passive Fund B growth Finland 16 846 526
Nordea Japan Fund Growth Finland 16 625 124
Nordea North America Fund growth Finland 56 713 488
Nordea Global Dividend Fund I Growth Finland 10 210 576
Nordea Moderate Yield I growth Finland 12 729 918
Nordea Pro Stable Return I growth Finland 20 074 399
Nordea Savings 50 A growth Finland 511 833 125
Nordea Premium Asset Management Balanced growth Finland 730 736 429
Nordea European Smaller Companies Kasvu Finland 9 893
Nordea Korkotuotto A Kasvu/100 Finland 81 095
Nordea North American Enhanced tuotto Finland 49 940
Nordea Suomi Passiivinen B Finland 154 735
Nordea Valtiolaina AAA A kasvu Finland 37 004
Total 12 955 621 472

Annual Report 2019
Nordea Life Assurance Finland Ltd 32Financial Statements 2019
Assets covering unit-linked insurance policies
Market value
Shares (=book value)
ABN AMRO Group The Netherlands 15 911Heineken NV The Netherlands 61 685
Unilever NV The Netherlands 51 200
KBC Group SA/NV Belgium 177 356FLEX LNG Ltd Bermuda 27 616Golden Ocean Group Ltd Bermuda 11 798Jinhui Shipping and Transportation Ltd Bermuda 15 937Northern Drilling Bermuda 1 455Odfjell Drill Bermuda 4 976Seadrill Limited Bermuda 426Vostok Emerging Finance Ltd Bermuda 22 501Vostok New Ventures Ltd Shs Bermuda 26 793Ship Finance International LTD Registered Shs Bermuda 12 943Tencent Holdings Ltd Cayman islands 65 018Alibaba Group Holding Ltd Cayman islands 132 168Ctrip.com Intl Cayman islands 18 638iQIYI Inc Cayman islands 2 812Momo Inc Cayman islands 8 901Bakkafrost P/F Faroe Islands 473 601Icon PLC Ireland 246 994BP plc United Kingdom 202 777GlaxoSmithKline PLC Registered Shs United Kingdom 35 167Melrose Industries PLC United Kingdom 11 312Mondi PLC United Kingdom 203 175Prudential PLC United Kingdom 199 020RELX PLC United Kingdom 33 216Rio Tinto PLC United Kingdom 206 809Smiths Group PLC United Kingdom 7 052Vodafone Group PLC United Kingdom 98 166William Hill PLC United Kingdom 28 209AstraZeneca PLC United Kingdom 223 394TechnipFMC PLC United Kingdom 24 761ENEL SpA Italy 207 321Telecom Italia SPA Italy 19 981Andritz AG Austria 174 174Takeda Pharmaceutical Co Ltd ADR Japan 23 569Energy Fuels Inc Canada 11 965Spectra7 Canada 110 666UR-Energy Inc Canada 11 817Lucara Diamond Corp Canada 35 379Lundin Mining Corp Canada 31 477CannTrust Holdings Inc Canada 1 639Restaurant Brands International Inc Canada 48 250Aperam S.A. Luxemburg 31 625Corestate Capital Holding S.A. Luxemburg 37 450Subsea 7 SA Luxemburg 60 901Millicom International Cellular SA Luxemburg 1 505 332Spotify Technology S.A. Luxemburg 26 614Aspire Global Plc Malta 2 111Catena Media Plc Malta 18 810Kindred Group Malta 581 769Teekay Tankers Ltd Registered Shs -A- Marshall Islands 74 586Aker ASA Norway 531 291Aker BP ASA Registered Shs Norway 8 789Aker Solutions Holdings Norway 15 031BW Offshore Ltd Norway 105 191DNO ASA Norway 36 347Elkem Asa Norway 13 441Equinor ASA Norway 41 990Europris ASA Norway 150 210Kongsberg Gruppen ASA Norway 45 120Leroy Seafood Group ASA Norway 30 203NEL Asa Norway 26 308

Annual Report 2019
Nordea Life Assurance Finland Ltd Financial Statements 2019 33
Market valueShares (=book value)Norsk Hydro Asa Norway 6 122Norske Skogindustrier ASA Norway 1Norwegian Air Shuttle ASA Norway 15 309Norwegian Finans Holding ASA Norway 418 444Ocean Yield ASA Norway 7 284Orkla ASA Norway 264 784Petroleum Geo-Services ASA Norway 272 026Prosafe Norway 588Renewable Energy Corp AS Norway 10 860Storebrand ASA Norway 241 267Telenor ASA Norway 28 723TGS-Nopec Geophysical Company ASA Norway 481 895Wilh. Wilhelmsen ASA Norway 19 334XXL ASA Registered Shs Norway 40 972Yara International ASA Norway 70 346Capgemini SE France 249 805Christian Dior SE France 157 320Hermes International SA France 478 456Kering SA France 783 900LVMH Moet Hennessy Louis Vuitton SE France 867 749PSA Peugeot Citroen France 173 425Total SA France 213 564Veolia Environnement SA France 59 200Sotkamo Silver AB Sweden 28 835SSAB Corporation A Sweden 51 142SSAB Corporation B Sweden 1 613 549Telia Company AB Sweden 4 928 389ABB Ltd Sweden 2 392 518Acconeer AB Sweden 9 907Attendo AB Sweden 38 110Autoliv Inc. SDB Sweden 219 962BillerudKorsnas AB Sweden 53 031Bio-Works Technologies AB Sweden 7 677Bjorn Borg AB Sweden 293 811Boliden AB Sweden 185 055Bravida Holding AB Sweden 10 805Castellum AB Registered Shs Sweden 8 129Cibus Nordic Real Estate AB Sweden 91 746Concordia Maritime AB Sweden 27 760Doro AB Sweden 2 766 760Electrolux, AB ser. B Sweden 27 461Elekta AB Sweden 634 889Eltel AB Sweden 61 056Essity AB Sweden 3 042 452Fingerprint Cards AB -B- Sweden 36 097Gapwaves AB -B- Sweden 60 784Gunnebo Ab Sweden 9 530Hamlet Pharma AB Sweden 41 467Hennes & Mauritz AB, H & M Sweden 245 866Husqvarna Ab Sweden 20 428Intrum Justitia AB Sweden 343 043Investment AB Kinnevik -B- Sweden 386 376Investor AB ser. B Sweden 2 674 651J.M. AB Sweden 29 389LeoVegas AB Sweden 16 291Loomis AB Sweden 28 970Modern Times Group MTG AB -B- Sweden 2 538Munters Group Ab Sweden 3 011myFC Holding AB Sweden 10 338NCC B Sweden 188 780NetEnt AB Sweden 39 643
Nobina AB Sweden 11 678
Nordic Entertainment Group AB Sweden 6 871Odd Molly International AB Sweden 1 436OrganoClick AB Sweden 10 147

Annual Report 2019
Nordea Life Assurance Finland Ltd 34Financial Statements 2019
Market valueShares (=book value)PowerCell Sweden AB Sweden 46 852Ratos AB Sweden 246 557Robert Friman International AB Sweden 1 110Saab AB Sweden 817 071SaltX Tech-B Rg I19 Sweden 1 118SaltX Technology Holding AB Sweden 5 667Scandic Hotels Group AB Sweden 5 242Securitas AB ser. B Sweden 1 647 501Skandinaviska Enskilda Banken ser. A Sweden 861 973Svenska Cellulosa AB SCA ser. B Sweden 17 998Swedish Match AB Sweden 1 825 343Swedish Orphan Biovitrum AB Sweden 5 902Tele2 Ab B Sweden 102 218Telefon AB L.M.Ericsson Sweden 9 396Thule Group AB Sweden 31 129Tobii AB Sweden 5 050Trelleborg AB Sweden 1 916 634Unlimited Travel Group UTG AB Sweden 29 406Volvo AB -B- Sweden 2 350 326WntResearch AB Sweden 3 255Adidas AG Germany 145 250Allianz SE Germany 250 802Bayer AG Germany 399 382Bayerische Motoren Werke AG - BMW Germany 108 454Beiersdorf AG Germany 54 213Continental AG Germany 165 051Daimler AG Germany 208 004Deutsche Bank AG Germany 29 778Deutsche Post AG Germany 25 267Deutsche Wohnen AG Germany 21 858Fresenius Germany 20 016Siemens AG Germany 233 520TUI AG Germany 11 395Volkswagen AG - Ordinary Share Germany 29 495Adapteo Oyj Finland 54 701Ahlstrom-Munksjo Oyj Finland 11 094 706Aktia Bank Oyj -A- Finland 88 635Ålandsbanken Abp -B- Finland 2 795 850Alma Media Oyj Finland 244 467Altia Oyj Finland 569 122Apetit Oyj Finland 3 900Aspo Oyj Finland 268 529Aspocomp Group Oyj Finland 720 620Atria Oyj -A- Finland 108 000Basware Corporation Finland 84 491Biohit - Registered Shs -B- Finland 26 560Bittium Corporation Finland 65 910CapMan Oyj -B- Finland 418 888Cargotec Oyj Finland 1 325 166Caverion Oyj Finland 318 222Citycon Oyj Finland 495 902Cleantech Invest Oyj Finland 11 924Componenta Oyj Finland 29 430Consti Group Plc Finland 30 080Cramo Oyj Finland 111 017Detection Technology Plc Finland 3 483 610Digia Oyj Finland 76 978DNA Plc Finland 1 114 190Dovre Group Oyj Finland 20 973Elecster Oyj -A- Finland 380 000Elisa Oyj Finland 1 619 861eQ Oyj Finland 13 020
Evli Bank Oyj -B- Finland 454 678
Exel Composites Oyj Finland 91 044
Fellow Finance Oyj Finland 141 040
Finnair Oyj Finland 140 344
Fiskars Oyj Finland 34 282Fortum Oyj Finland 5 310 448F-Secure Oyj Finland 1 826 767
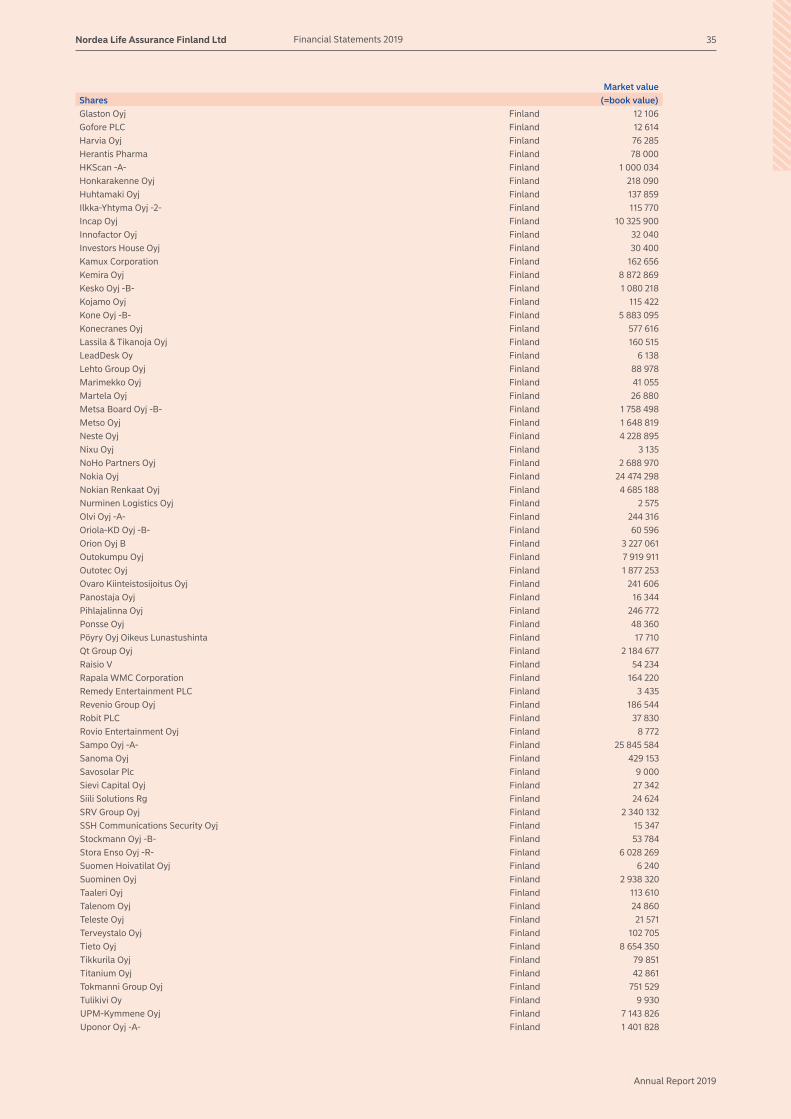
Annual Report 2019
Nordea Life Assurance Finland Ltd Financial Statements 2019 35
Market valueShares (=book value)Glaston Oyj Finland 12 106Gofore PLC Finland 12 614Harvia Oyj Finland 76 285Herantis Pharma Finland 78 000HKScan -A- Finland 1 000 034Honkarakenne Oyj Finland 218 090Huhtamaki Oyj Finland 137 859Ilkka-Yhtyma Oyj -2- Finland 115 770Incap Oyj Finland 10 325 900Innofactor Oyj Finland 32 040Investors House Oyj Finland 30 400Kamux Corporation Finland 162 656Kemira Oyj Finland 8 872 869Kesko Oyj -B- Finland 1 080 218Kojamo Oyj Finland 115 422Kone Oyj -B- Finland 5 883 095Konecranes Oyj Finland 577 616Lassila & Tikanoja Oyj Finland 160 515LeadDesk Oy Finland 6 138Lehto Group Oyj Finland 88 978Marimekko Oyj Finland 41 055Martela Oyj Finland 26 880Metsa Board Oyj -B- Finland 1 758 498Metso Oyj Finland 1 648 819Neste Oyj Finland 4 228 895Nixu Oyj Finland 3 135NoHo Partners Oyj Finland 2 688 970Nokia Oyj Finland 24 474 298Nokian Renkaat Oyj Finland 4 685 188Nurminen Logistics Oyj Finland 2 575Olvi Oyj -A- Finland 244 316Oriola-KD Oyj -B- Finland 60 596Orion Oyj B Finland 3 227 061Outokumpu Oyj Finland 7 919 911Outotec Oyj Finland 1 877 253Ovaro Kiinteistosijoitus Oyj Finland 241 606Panostaja Oyj Finland 16 344Pihlajalinna Oyj Finland 246 772Ponsse Oyj Finland 48 360Pöyry Oyj Oikeus Lunastushinta Finland 17 710Qt Group Oyj Finland 2 184 677Raisio V Finland 54 234Rapala WMC Corporation Finland 164 220Remedy Entertainment PLC Finland 3 435Revenio Group Oyj Finland 186 544Robit PLC Finland 37 830Rovio Entertainment Oyj Finland 8 772Sampo Oyj -A- Finland 25 845 584Sanoma Oyj Finland 429 153Savosolar Plc Finland 9 000Sievi Capital Oyj Finland 27 342Siili Solutions Rg Finland 24 624SRV Group Oyj Finland 2 340 132SSH Communications Security Oyj Finland 15 347Stockmann Oyj -B- Finland 53 784Stora Enso Oyj -R- Finland 6 028 269Suomen Hoivatilat Oyj Finland 6 240Suominen Oyj Finland 2 938 320Taaleri Oyj Finland 113 610Talenom Oyj Finland 24 860Teleste Oyj Finland 21 571Terveystalo Oyj Finland 102 705Tieto Oyj Finland 8 654 350Tikkurila Oyj Finland 79 851Titanium Oyj Finland 42 861Tokmanni Group Oyj Finland 751 529Tulikivi Oy Finland 9 930UPM-Kymmene Oyj Finland 7 143 826Uponor Oyj -A- Finland 1 401 828

Annual Report 2019
Nordea Life Assurance Finland Ltd 36Financial Statements 2019
Market valueShares (=book value)Vaisala Oyj -A- Finland 72 143Valmet Corporation Finland 784 202Verkkokauppa.com Oyj Finland 66 975Viafin Service Oyj Finland 10 152Viking Line Abp Finland 529 200Vincit Plc Finland 132 734VMP Oyj Finland 1 277 772Wärtsilä Corporation Oyj Finland 2 583 916Wulff Group Plc Finland 35 200YIT Oyj Finland 597 413Novartis Inc Switzerland 11 317Roche Holding AG Switzerland 89 940Roche Holding Ltd Switzerland 82 910Initiator Pharma A/S Denmark 11 228Carlsberg A/S B Denmark 360 971Danske Bank A/S Denmark 1 744 476Demant A/S Denmark 1 271 792ISS Shs Denmark 101 697Jyske Bank A/S Registered Shs Denmark 99 914Novo-Nordisk Denmark 4 010 101Pandora A/S Denmark 338 809Rockwool International A/S Denmark 31 721Sydbank A/S Denmark 40 719Topdanmark A/S Denmark 373 885Tryg A/S Denmark 673 629Vestas Wind Systems A/S Denmark 1 102 661Gaming Innovation Group Inc United States 15 917Veoneer Inc. United States 148 696Activision Blizzard Inc United States 10 580Ak Steel Holding Corp United States 5 857Allstate Corp United States 165 503Alphabet Inc -A- United States 309 193Alphabet Inc -C- United States 254 785Amazon.com Inc United States 356 773Apple Inc United States 305 821AT&T Inc United States 69 557Autodesk Inc Rg United States 4 730Bank of America Corporation United States 31 396Best Inc United States 3 464Brinker International Inc United States 200 653Broadcom Inc United States 158 665C.H.Robinson Worldwide Inc United States 126 242Cisco Systems Inc Registered Shs United States 241 475Citigroup Inc Registered Shs United States 213 841Coca-Cola Co United States 95 254Comcast Corporation United States 162 163Corteva Inc - Registered Shs United States 8 943Crown Castle International Corp United States 6 704Crown Holdings Inc United States 13 948CVS Health Corp United States 48 916Danaher Corp United States 15 711Dollar General Corporation Registered Shs United States 13 879Dow Inc United States 22 601DowDuPont Inc United States 21 703EOG Resources Inc United States 3 130
Exxon Mobil Corp United States 194 336
Facebook Inc -A- United States 398 358Ford Motor Co United States 50 390Gardner Denver Holdings Inc United States 6 528General Electric Company United States 7 444Gilead Sciences Inc United States 54 372GW Pharmaceuticals PLC United States 6 357HCA Healthcare Inc United States 226 873HP Inc United States 33 406Johnson & Johnson United States 470 405Kellogg Company United States 14 775Kimberly Clark Corporation United States 171 869
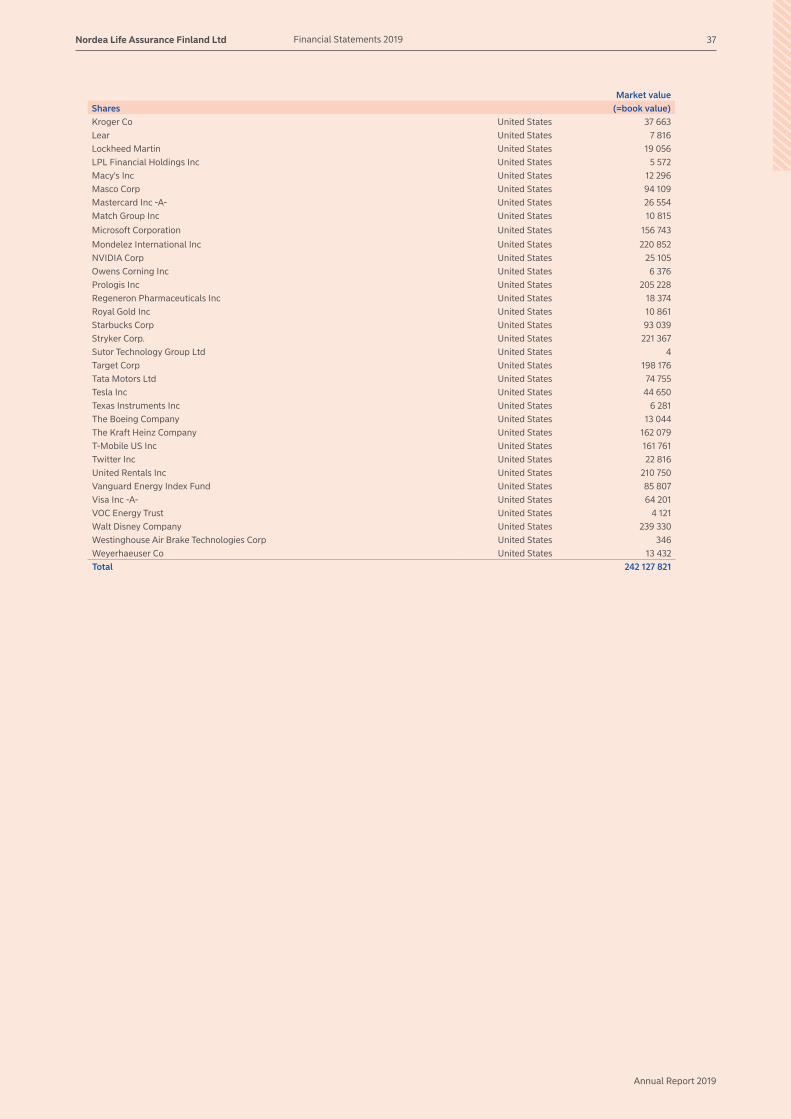
Annual Report 2019
Nordea Life Assurance Finland Ltd Financial Statements 2019 37
Market valueShares (=book value)Kroger Co United States 37 663Lear United States 7 816Lockheed Martin United States 19 056LPL Financial Holdings Inc United States 5 572Macy's Inc United States 12 296Masco Corp United States 94 109Mastercard Inc -A- United States 26 554Match Group Inc United States 10 815
Microsoft Corporation United States 156 743
Mondelez International Inc United States 220 852NVIDIA Corp United States 25 105Owens Corning Inc United States 6 376Prologis Inc United States 205 228Regeneron Pharmaceuticals Inc United States 18 374Royal Gold Inc United States 10 861Starbucks Corp United States 93 039Stryker Corp. United States 221 367Sutor Technology Group Ltd United States 4Target Corp United States 198 176Tata Motors Ltd United States 74 755Tesla Inc United States 44 650Texas Instruments Inc United States 6 281The Boeing Company United States 13 044The Kraft Heinz Company United States 162 079T-Mobile US Inc United States 161 761Twitter Inc United States 22 816United Rentals Inc United States 210 750Vanguard Energy Index Fund United States 85 807Visa Inc -A- United States 64 201VOC Energy Trust United States 4 121Walt Disney Company United States 239 330Westinghouse Air Brake Technologies Corp United States 346Weyerhaeuser Co United States 13 432Total 242 127 821

Annual Report 2019
Assets covering unit-linked insurance policies
Market value
Index-linked bonds (=book value)
C047 Luottotodistus Eurooppa High Yield 9-24 20.01.2025 Finland 66 495
Nordea A530 Yhdistelmätodistus Kiina Pankit 15.7.2021 Finland 926 870
Nordea A750 Luottotodistus Suomi 15.1.2020 Finland 50 065
Nordea A763 Luottotodistus Eurooppa High Yield 15.1.2020 Finland 108 000
Nordea A837 Osaketodistus Öljy-Yhtiöt 15.4.2020 Finland 51 970
Nordea A908 Luottotod. Eur High Yield Kiint&vaiht 15072022 Finland 70 917
Nordea A974 Yhdistelmätodistus Eurooppa Sharpe 15.7.2022 Finland 250 770
Nordea B586 Osaketodistus Suomalaiset Yhtiöt Kert 1.8.2022 Finland 562 352
Nordea B588 Osakeobligaatio Eurooppalaiset Yhtiöt Finland 10 242
Nordea B710 Osaketodistus Suomalaiset Yhtiöt Kupon 25.4.2023 Finland 83 294
Nordea B730 Luottotodistus Pohjois-Amerikka HY VIP 20.1.2023 Finland 252 865
Nordea B762 Korkotodistus Selecta 20.7.2023 Finland 88 448
Nordea B769 Luottotodistus USA HY Ekstra Kertyvä 20.7.2023 Finland 1 092 630
Nordea B789 Korkotodistus Altice 20.7.2023 Finland 260 849
Nordea B790 Korkotodistus Hapag-Lloyd 20.7.2023 Finland 154 405
Nordea B795 Luottotodistus USA HY Ekstra 20.7.2023 Finland 685 881
Nordea B815 Osaketodistus Megatrendit Kuponki Finland 20 681
Nordea B820 Luottotodistus Eurooppa HY Ekstra 20.7.2023 Finland 370 530
Nordea B822 Luottotodistus Eurooppa HY Ekstra 20.7.2023 Finland 578 750
Nordea B831 Osaketodistus Nokia Kertyvä Kuponki Finland 147 139
Nordea B843 Luottotodistus USA HY EKSTRA Finland 1 103 225
Nordea B846 Luottotodistus Eurooppa High Yield 20.1.2024 Finland 2 974 968
Nordea B847 Luottotodistus Eurooppa High Yield 20.1.2024 Finland 3 026 058
Nordea B851 Luottotodistus Eurooppa HY 22.1.2024 Finland 1 102 500
Nordea B875 Osaketodistus Euro Stoxx 50 Osinko Finland 506 900
Nordea B896 Luottotodistus Eurooppa HY 9-24 kert. 22.1.2024 Finland 10 637
Nordea B898 Luottotodistus USA High Yield 15-35 Kertyvä Finland 177 263
Nordea B899 Luottotodistus Eurooppa IG 3-13 Finland 109 136
Nordea B900 Luottotodistus USA IG 3-13 22.1.2024 Finland 54 852
Nordea B909 Korkotodistus Hapag-Lloyd 22.7.2024 Finland 70 498
Nordea B910 Korkotodistus AK Steel 22.7.2024 Finland 245 029
Nordea B911 Korkotodistus Bombardier 22.7.2024 Finland 72 164
Nordea B912 Korkotodistus Altice France 22.7.2024 Finland 65 998
Nordea B945 Korkotodistus Stena 20.7.2024 Finland 708 788
Nordea B948 Luottotodistus Eurooppa High Yield 9-24 Kertyvä Finland 55 783
Nordea B949 Luottotodistus Eurooppa High Yield 9-24 Kertyvä Finland 65 110
Nordea B957 Luottotodistus USA High Yield 15-35 Kertyvä Finland 99 000
Nordea B958 Luottotodistus USA High Yield 15-35 Kertyvä Finland 164 828
Nordea B968 Korkotodistus Jaguar Land Rover 22.7.2024 Finland 49 679
Nordea B969 Korkotodistus Thomas Cook 20.7.2021 Finland 4 056
Nordea C035 Korkotodistus Teva Pharmaceutical 20.1.2025 Finland 95 938
Nordea C048 Luottotodistus Eurooppa HY 9-24 Kertyvä 1/2025 Finland 25 923
Nordea C061 Korkotodistus Tesla 20.1.2025 Finland 38 800
Nordea C070 Osaketodistus Metsä III 22.11.2022 Finland 10 325
Nordea C074 Osaketodistus Pohjoismaat Long-Short 21.11.2022 Finland 92 230
Nordea C077 Osaketodistus Wärtsilä-Nokian Renkaat 8.12.2022 Finland 47 344
Osaketodistus C089 Verkkoyhtiöt Kertyvä Kuponk Finland 23 326
Osaketodistus Metsä II 19.9.2022 Kertyvä Kuponki Finland 63 159
Osaketodistus Metsä Kertyvä Kuponki B929 4.4.2022 Finland 45 892
Osaketodistus Nokian Renkaat Kertyvä Kuponki B874 13.12.2021 Finland 83 535
Osaketodistus Orion-Sampo Kertyvä Kuponki B735 23.5.2023 Finland 19 840
Osaketodistus Outokumpu Teho B941 15.3.2021 Finland 7 695
Osaketodistus Telia Kertyvä Kuponki B939 18.3.2022 Finland 414 420
Osaketodistus USA Rev Twin-win B818 12.10.2020 Finland 110 712
Osaketodistus Verkkoyhtiöt B987 27.5.2022 Finland 34 791
Nordea A299 Korkotodistus Eurooppa High Yield 20.7.2021 Finland 224 710
Nordea B230 Korkotodistus Eurooppa High Yield 20.1.2021 Finland 394 405
Nordea B231 Korkotodistus Pohjois-Amerikka HY 20.1.2021 Finland 302 294
Nordea B298 Korkotod. Pohjois-Amerikka High Yield 20.7.2021 Finland 143 445
Nordea Life Assurance Finland Ltd 38Financial Statements 2019
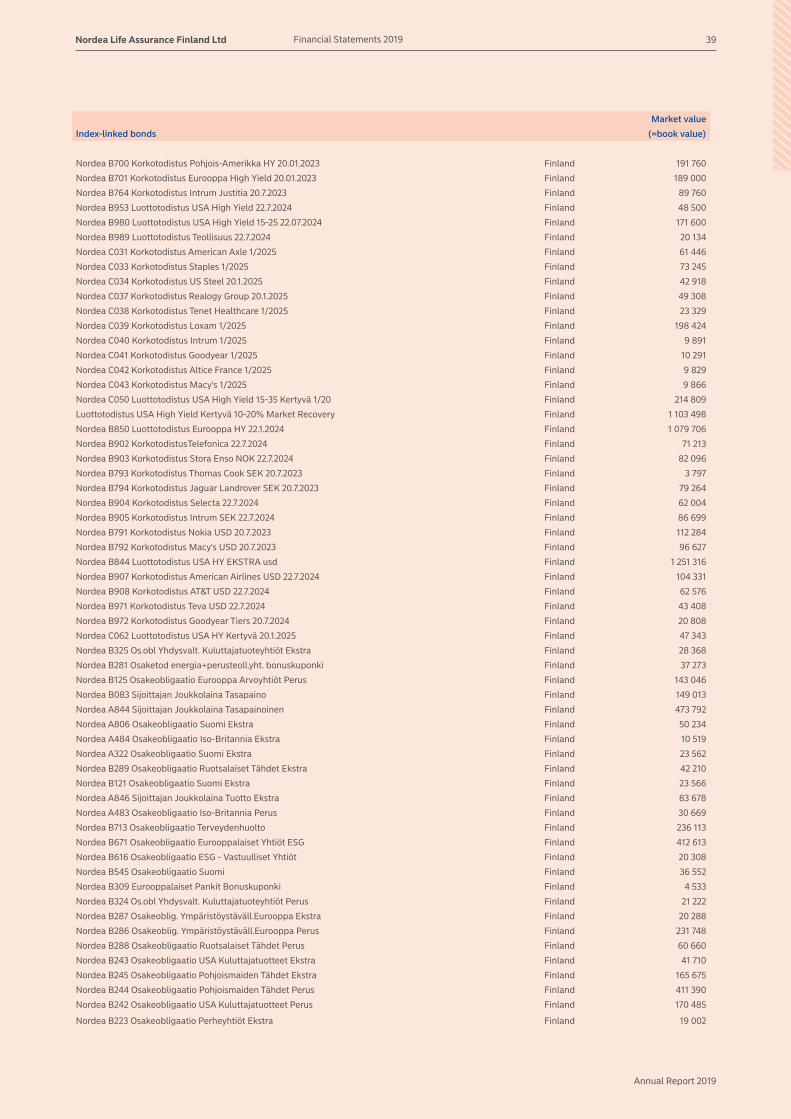
Annual Report 2019
Market value
Index-linked bonds (=book value)
Nordea B700 Korkotodistus Pohjois-Amerikka HY 20.01.2023 Finland 191 760
Nordea B701 Korkotodistus Eurooppa High Yield 20.01.2023 Finland 189 000
Nordea B764 Korkotodistus Intrum Justitia 20.7.2023 Finland 89 760
Nordea B953 Luottotodistus USA High Yield 22.7.2024 Finland 48 500
Nordea B980 Luottotodistus USA High Yield 15-25 22.07.2024 Finland 171 600
Nordea B989 Luottotodistus Teollisuus 22.7.2024 Finland 20 134
Nordea C031 Korkotodistus American Axle 1/2025 Finland 61 446
Nordea C033 Korkotodistus Staples 1/2025 Finland 73 245
Nordea C034 Korkotodistus US Steel 20.1.2025 Finland 42 918
Nordea C037 Korkotodistus Realogy Group 20.1.2025 Finland 49 308
Nordea C038 Korkotodistus Tenet Healthcare 1/2025 Finland 23 329
Nordea C039 Korkotodistus Loxam 1/2025 Finland 198 424
Nordea C040 Korkotodistus Intrum 1/2025 Finland 9 891
Nordea C041 Korkotodistus Goodyear 1/2025 Finland 10 291
Nordea C042 Korkotodistus Altice France 1/2025 Finland 9 829
Nordea C043 Korkotodistus Macy's 1/2025 Finland 9 866
Nordea C050 Luottotodistus USA High Yield 15-35 Kertyvä 1/20 Finland 214 809
Luottotodistus USA High Yield Kertyvä 10-20% Market Recovery Finland 1 103 498
Nordea B850 Luottotodistus Eurooppa HY 22.1.2024 Finland 1 079 706
Nordea B902 KorkotodistusTelefonica 22.7.2024 Finland 71 213
Nordea B903 Korkotodistus Stora Enso NOK 22.7.2024 Finland 82 096
Nordea B793 Korkotodistus Thomas Cook SEK 20.7.2023 Finland 3 797
Nordea B794 Korkotodistus Jaguar Landrover SEK 20.7.2023 Finland 79 264
Nordea B904 Korkotodistus Selecta 22.7.2024 Finland 62 004
Nordea B905 Korkotodistus Intrum SEK 22.7.2024 Finland 86 699
Nordea B791 Korkotodistus Nokia USD 20.7.2023 Finland 112 284
Nordea B792 Korkotodistus Macy's USD 20.7.2023 Finland 96 627
Nordea B844 Luottotodistus USA HY EKSTRA usd Finland 1 251 316
Nordea B907 Korkotodistus American Airlines USD 22.7.2024 Finland 104 331
Nordea B908 Korkotodistus AT&T USD 22.7.2024 Finland 62 576
Nordea B971 Korkotodistus Teva USD 22.7.2024 Finland 43 408
Nordea B972 Korkotodistus Goodyear Tiers 20.7.2024 Finland 20 808
Nordea C062 Luottotodistus USA HY Kertyvä 20.1.2025 Finland 47 343
Nordea B325 Os.obl Yhdysvalt. Kuluttajatuoteyhtiöt Ekstra Finland 28 368
Nordea B281 Osaketod energia+perusteoll.yht. bonuskuponki Finland 37 273
Nordea B125 Osakeobligaatio Eurooppa Arvoyhtiöt Perus Finland 143 046
Nordea B083 Sijoittajan Joukkolaina Tasapaino Finland 149 013
Nordea A844 Sijoittajan Joukkolaina Tasapainoinen Finland 473 792
Nordea A806 Osakeobligaatio Suomi Ekstra Finland 50 234
Nordea A484 Osakeobligaatio Iso-Britannia Ekstra Finland 10 519
Nordea A322 Osakeobligaatio Suomi Ekstra Finland 23 562
Nordea B289 Osakeobligaatio Ruotsalaiset Tähdet Ekstra Finland 42 210
Nordea B121 Osakeobligaatio Suomi Ekstra Finland 23 566
Nordea A846 Sijoittajan Joukkolaina Tuotto Ekstra Finland 83 678
Nordea A483 Osakeobligaatio Iso-Britannia Perus Finland 30 669
Nordea B713 Osakeobligaatio Terveydenhuolto Finland 236 113
Nordea B671 Osakeobligaatio Eurooppalaiset Yhtiöt ESG Finland 412 613
Nordea B616 Osakeobligaatio ESG - Vastuulliset Yhtiöt Finland 20 308
Nordea B545 Osakeobligaatio Suomi Finland 36 552
Nordea B309 Eurooppalaiset Pankit Bonuskuponki Finland 4 533
Nordea B324 Os.obl Yhdysvalt. Kuluttajatuoteyhtiöt Perus Finland 21 222
Nordea B287 Osakeoblig. Ympäristöystäväll.Eurooppa Ekstra Finland 20 288
Nordea B286 Osakeoblig. Ympäristöystäväll.Eurooppa Perus Finland 231 748
Nordea B288 Osakeobligaatio Ruotsalaiset Tähdet Perus Finland 60 660
Nordea B243 Osakeobligaatio USA Kuluttajatuotteet Ekstra Finland 41 710
Nordea B245 Osakeobligaatio Pohjoismaiden Tähdet Ekstra Finland 165 675
Nordea B244 Osakeobligaatio Pohjoismaiden Tähdet Perus Finland 411 390
Nordea B242 Osakeobligaatio USA Kuluttajatuotteet Perus Finland 170 485
Nordea B223 Osakeobligaatio Perheyhtiöt Ekstra Finland 19 002
Nordea Life Assurance Finland Ltd Financial Statements 2019 39

Annual Report 2019
Market value
Index-linked bonds (=book value)
Nordea B225 Osakeobligaatio Terveydenhuolto Ekstra Finland 58 170
Nordea B224 Osakeobligaatio Terveydenhuolto Perus Finland 147 002
Nordea B222 Osakeobligaatio Perheyhtiöt Perus Finland 268 840
Nordea B174 Osakeobligaatio Perheyhtiöt Ekstra Finland 49 572
Nordea B173 Osakeobligaatio Perheyhtiöt Perus Finland 209 124
Nordea B170 Osakeobligaatio Terveydenhuolto Ekstra Finland 31 296
Nordea B169 Osakeobligaatio Terveydenhuolto Perus Finland 199 719
Nordea B126 Osakeobligaatio Eurooppa Arvoyhtiöt Ekstra Finland 206 090
Nordea B120 Osakeobligaatio Suomi Perus Finland 43 884
Nordea B079 Osakeobl Euroopan Tehokkaat Osakkeet Extra Finland 25 065
Nordea B084 Sijoittajan Joukkolaina Tuotto Finland 161 703
Nordea B078 Osakeobl Euroopan Tehokkaat Osakkeet Perus Finland 245 686
Nordea B053 Osakeobligaatio Perheyhtiöt Ekstra Finland 91 231
Nordea B052 Osakeobligaatio Perheyhtiöt Perus Finland 422 375
Nordea A991 Sijoittajan Joukkolaina Tuotto Ekstra Finland 12 592
Nordea B006 Osakeobligaatio Terveydenhoito Ekstra Finland 145 377
Nordea B005 Osakeobligaatio Terveydenhoito Perus Finland 270 648
Nordea A990 Sijoittajan Joukkolaina Tuotto Finland 140 844
Nordea A989 Sijoittajan Joukkolaina Tasapaino Finland 142 402
Nordea A963 Osaketodistus Öljy-yhtiöt Finland 25 125
Nordea A953 Osakeobligaatio Terveydenhuolto Ekstra Finland 230 989
Nordea A952 Osakeobligaatio Terveydenhuolto Perus Finland 637 350
Nordea A890 Osakeobligaatio Öljy-yhtiöt Perus Finland 275 413
Nordea A891 Osakeobligaatio Öljy-yhtiöt Ekstra Finland 35 056
Nordea A845 Sijoittajan Joukkolaina Tuotto Finland 294 450
Nordea A805 Osakeobligaatio Suomi Perus Finland 536 085
Nordea A772 Osakeobligaatio Eurooppa Extra Finland 30 039
Nordea A771 Osakeobligaatio Eurooppa Perus Finland 265 345
Nordea A702 Osakeobligaatio Terveydenhuolto Ekstra Finland 126 095
Nordea A700 Osakeobligaatio Eurooppa Ekstra Finland 124 560
Nordea A699 Osakeobligaatio Eurooppa Perus Finland 32 499
Nordea A701 Osakeobligaatio Terveydenhuolto Perus Finland 167 695
Nordea A646 Osakeobligaatio Saksa Perus Finland 48 780
Nordea A647 Osakeobligaatio Saksa Ekstra Finland 12 207
Nordea A645 Osakeobl Tutk Tähdet Maailma Ekstra Finland 17 042
Nordea A644 Osakeobl Tutk Tähdet Maailma Perus Finland 52 865
Nordea A607 Osakeobligaatio Tutkimuksen Tähdet-Perheyhtiö Finland 496 564
Nordea A608 Osakeobligaatio Tutkimuksen Tähdet-Perheyhtiö Finland 13 281
Nordea A321 Osakeobligaatio Suomi Perus Finland 112 878
Total 33 753 644
Nordea Life Assurance Finland Ltd 40Financial Statements 2019

Annual Report 2019
Assets covering unit-linked insurance policies of parent company
Private equity funds Market value
(=book value)
LCP VI-A (Offshore) Cayman Islands 3 506 765
Bridgepoint Europe III L.P. United Kingdom 7 013 382
STAR II Fund L.P United Kingdom 122 353
IFM Global Infrastructure L.P. United Kingdom 23 965 381
Centerbridge Capital Partners L.P United Kingdom 3 215 505
Nordea Private Equity Secondary Fund Luxemburg 14 430 742
LifeLine Ventures Fund IV Ky Finland 153 908
Bocap SME Finland 2 714 971
MB Equity Fund IV Ky Finland 3 935 351
Maki VC Fund I Ky Finland 1 614 137
Inventure Fund III Ky Finland 1 460 200
Blackstone Capital Partners V United States 1 412 352
The Resolute Fund II L.P United States 5 307 888
Total 68 852 934
Real estate investments
Asunto Oy Helsingin Kapteeninranta Finland 50 181 343
Asunto Oy Helsingin Vanhalinna Finland 98 127 817
Asunto Oy Hämeentie 5 B Finland 12 069 681
Asunto Oy Kalliomatti Finland 14 952 181
Asunto Oy Keravan Heikkilänrinne Finland 10 437 501
Asunto Oy Lapinlahdenkatu 14 Finland 7 624 824
Asunto Oy Malminkatu 36 Finland 17 752 007
Asunto Oy Malmiportti A-B Finland 5 563 243
Asunto Oy Malmiportti C-D Finland 19 966 153
Asunto Oy Munkkiniemen Puistotie 14 Finland 10 912 048
Asunto Oy Vantaan Vanha Kaarelantie 26 Finland 9 029 564
Asunto Oy Turun Kansleri Finland 10 201 054
Kiinteistö Oy Harkkokuja 2 Finland 19 844 782
Kiinteistö Oy Tikkurilantie 154 Finland 23 340 610
Kiinteistö Oy Lintulahdenkallio Finland 19 189 550
Kiinteistö Oy Myrskyläntien Palvelukodit Finland 26 828 592
Kiinteistö Oy Espoon Portti 1-5 Finland 23 125 599
Kiinteistö Oy Espoon Retail Park Glomson Finland 19 988 347
Kiinteistö Oy Eteläranta 12 Finland 22 560 561
Kiinteistö Oy H. Kalevankatu 20 Finland 10 717 110
Kiinteistö Oy Jyväskylän Ahjokatu 11 Finland 18 293 944
Kiinteistö Oy Helsingfors Saluhallar Ab Finland 35 972 177
Kiinteistö Oy Hgin Siltasaarenkatu 16 Finland 29 789 515
Kiinteistö Oy Kasarminkatu 44 Finland 16 881 737
Kiinteistö Oy Lauttasaaren Horisontti Finland 7 574 290
Kiinteistö Oy Museokatu 8 Finland 9 820 249
Kiinteistö Oy Pakkalan Kartanonkoski 6 Finland 14 774 225
Kiinteistö Oy Pirkkalan Keidas Finland 13 896 715
Kiinteistö Oy Ratavartijankatu 3 Finland 42 039 280
Kiinteistö Oy Turun Centrum Finland 22 782 435
Kiinteistö Oy Turvesuonkatu 17 Finland 8 480 920
Kiinteistö Oy Unioninkatu 17 Finland 36 473 331
Kiinteistö Oy Vantaan Muuntotie 1 Finland 5 671 571
Kiinteistö Oy Vantaan Vehkatie 29 Finland 8 737 405
Yhteensä 703 600 364
Nordea Life Assurance Finland Ltd Financial Statements 2019 41

Annual Report 2019
Assets covering unit-linked insurance policies of parent company
Bonds
Telefonica Europe --Notes 2018-Without Fixed Maturity Netherlands 209 443
VW - Notes 2014-Without Fixed Maturity Variable Rate Netherlands 234 917
BW Offshore Ltd Floating Rate 04.12.2023 Bermuda 309 644
Alibaba Group Holding Ltd 3,60 % 2024-11-28 Cayman Islands 187 253
Tesco Plc 5,125% 10.4.2047 United Kingdom 215 261
European Investment Bank 4,75% 19.01.2021 Luxembourg 50 335
B2 Holding ASA 4,25% Variable 14.11.2022 Norway 93 785
B2 Holding ASA 7,5% Variable 8.12.2020 Norway 104 299
Marine Harvest ASA --- Notes 2018-12.06.2023 Floating Rate Norway 102 055
Norske Skogindustrier ASA 2.000% 30.12.2026 Norway 10
Norske Skogindustrier ASA 2.000% 30.12.2115 Norway 154
Norwegian Air Shut 7.25 % 11.12.2019 Norway 94 997
Aker - Bonds 2019-22.11.24 Floating Rate Norway 204 048
Euronav Lux 7,5% 31.5.2022 Norway 184 871
Dometic Group --- 3 % Bonds 2018-13.09.23 Sweden 215 397
Intrum AB 2,75% Notes 15.07.2022 Sweden 205 036
Stena Ab 7,875 % 15.03.2020 Sweden 51 613
Vattenfall AB 3,00% 19.3.2077 Sweden 206 409
Volvo Treasury Ab 4,850% 10.3.2078 Sweden 694 878
Klovern Ab 5,641% 21.6.2023 Sweden 108 462
Deutsche Bank --- Obl. 2014-o.f. Verfall var. Nachrangig Reg Germany 193 389
Ahlstrom-Munks 3.875% Fixed Finland 201 131
Caverion, 3.25 % Bonds 2019-28.03.2023 Finland 106 383
Citycon - Bonds Without Fixed Maturity Fixed/Variable Finland 101 039
HKScan FTFN Finland 521 373
Korkotodistus Aktia 18.09.2029 Finland 90 831
Korkotodistus Hertz 20.7.2023 B763 Finland 40 093
Mandatum Life Floating Rate 4.10.2024 Finland 347 004
NoHO Partners 9,00% 2019-29.03.2022 Finland 1 635 922
OPR-Vakuus --- Without Fixed Maturity Fixed/Floating Rate Finland 954 715
Sampo Fixed/Floating Rate 23.5.2049 Finland 1 028 044
SRV Group 4,875% 27.03.2022 Finland 137 199
Stockmann --- (no min.) 2015-Without Fixed Maturity Floating Finland 96 592
Stockmann 4.75 % 11.01.2022 Finland 101 618
Suominen - 2.5 % Bonds 2017-03.10.22 Finland 99 458
Talvivaara Mining Company PLC 9.750% 4.4.2017 Finland 5
Vapo --- Notes 2016-Without Fixed Maturity Fixed/Floating Ra Finland 105 441
Stora Enso OYJ 1144A 7,25% 15.04.2036 Finland 217 697
Stora Enso OYJ 7,25% 15.04.2036 Finland 216 807
UPM-Kymmene Corp 7,450% 23.11.2027 Finland 171 397
UPM-Kymmene Corp 7,450% 26.11.2027 Finland 112 049
AX V INV1 Holding ApS 5,00% 2022-06-29 Denmark 101 499
Danske Bank- Euro Medium Term Notes 2015-openend Series 556 Denmark 216 469
Dong Energy A/S Notes 2013 W/out Fixed Maturity Variable Sub Denmark 402 227
European Energy AS 5,35 % 23.09.2023 FR Denmark 104 748
Jyske Bank - Bonds 2017-05.04.29 Reg S Fixed/Variable Rate Denmark 212 900
NKT --- Notes 2018-Without Fixed Maturity Reg S Fixed/Floati Denmark 240 314
Avis Budget Car --- 5.5 % Notes 1.4.2023 United States 610
Total 11 229 822
Nordea Life Assurance Finland Ltd 42Financial Statements 2019

Annual Report 2019
Assets covering unit-linked insurance policies of parent company
ETFs
Con DB X-Trackers MSCI WORLD HEALTH CARE INDEX UCITS ETF Ireland 6 790
iSh MSCI USA --- Accum Shs Unhedged USD Ireland 60 352
iShares Ageing Population --- Acc USD Ireland 23 809
iShares Aut&Rob --- Accum Shs USD Ireland 382 479
iShares Core EURO STOXX 50 UCITS ETF Ireland 1 218 711
iShares Core S&P 500 UCITS ETF Ireland 4 806 164
iShares Euro Dividend UCITS ETF Ireland 31 493
iShares EURO STOXX 50 UCITS ETF Ireland 63 196
iShares II PLC - iShares Dow Jones Global Sustainability Scr Ireland 86 560
iShares II PLC - iShares Global Clean Energy UCITS ETF Ireland 32 881
iShares III PLC - iShares Core MSCI Japan IMI UCITS ETF Ireland 275 686
iShares III PLC - iShares Core MSCI World UCITS ETF Ireland 1 193 653
iShares III PLC iShares Core EUR Corp Bond UCITS ETF Ireland 79 907
iShares III PLC iShares Core EUR Govt Bond UCITS ETF Ireland 9 365
iShares IV - iShares MSCI World ESG Screened UCITS ETF Ireland 25 651
iShares IV PLC - iShares Digitalisation UCITS ETF Ireland 169 669
iShares IV PLC - iShares Edge MSCI USA Quality Factor UCITS Ireland 196 734
iShares IV PLC - iShares Edge MSCI World Value Factor UCITS Ireland 8 063
iShares IV PLC - iShares MSCI China A UCITS ETF Ireland 26 931
iShares JPM EM Bond UCITS ETF Ireland 208 987
iShares JPM USD EM Bond EUR Hedged UCITS ETF Ireland 22 608
iShares MSCI EM IMI ESG UCITS ETF Ireland 114 428
iShares MSCI Emerging Markets UCITS ETF Ireland 38 490
iShares MSCI EMU UCITS ETF Ireland 1 030 980
iShares MSCI Europe UCITS ETF Ireland 63 551
iShares PLC - iShares Core FTSE 100 UCITS ETF Ireland 3 015
iShares PLC - iShares Euro High Yield Corp Bond UCITS ETF Ireland 14 330
iShares PLC iShares MSCI AC Far East ex-Japan UCITS ETF Ireland 23 659
iShares PLC - iShares MSCI Europe ex-UK UCITS ETF Ireland 222 048
iShares PLC - iShares S&P 500 UCITS ETF Ireland 234 117
iShares S&P 500 Health Care Sector UCITS ETF Ireland 26 178
iShares STOXX Europe 600 ETF Ireland 618 900
iShares USD Corp Bond UCITS ETF Ireland 31 767
iShares V PLC - iShares S&P 500 Information Technology Secto Ireland 70 863
iShares V PLC - iShares S&P 500 Utilities Sector UCITS ETF Ireland 395 174
iShares VI PLC - iShares Edge MSCI Europe Minimum Volatility Ireland 328 556
iShares VI PLC - iShares Edge MSCI World Minimum Volatility Ireland 277 216
iShares VII PLC - iShares EUR Govt Bond 7-10yr Ireland 9 840
iShares VII PLC - iShares MSCI Russia ADR/GDR UCITS ETF Ireland 20 981
iShares VII PLC - iShares MSCI USA Small Cap UCITS ETF Ireland 55 308
iShares VII PLC - iShares NASDAQ 100 UCITS ETF Ireland 674 786
Xtrackers Russell 2000 UCITS ETF Ireland 80 593
Amundi Index Solutions SICAV - Amundi Msci Em Asia Luxemburg 100 775
DB X-trackers SICAV MSCI Europe Value Factor UCITS ETF (DR) Luxemburg 67 482
DB X-Trackers SICAV Nikkei 225 UCITS ETF Luxemburg 28 901
DB X-Trackers SICAV S&P 500 UCITS ETF Luxemburg 106 876
Xtrackers SICAV - Xtrackers MSCI Brazil UCITS ETF Luxemburg 22 471
Amundi Index Solutions SICAV - Amundi EURO STOXX 50 France 175 468
Multi Units France Sicav - Lyxor World Water UCITS ETF France 26 572
iShares STOXX Europe 600 Basic Resources UCITS ETF Germany 18 570
Seligson & Co OMX Helsinki 25 Exchange Traded Fund Finland 693 350
iShares Dow Jones Industrial Average UCITS ETF United States 537 414
iShares PLC - iShares Core MSCI EM IMI UCITS ETF United States 1 311 261
Invesco Aerospace & Defense ETF United States 64 642
Invesco Dynamic Biotechnology & Genome ETF United States 68 542
Invesco QQQ Trust Series I United States 94 810
Nordea Life Assurance Finland Ltd Financial Statements 2019 43

Annual Report 2019
Assets covering unit-linked insurance policies of parent company
iShares Core S&P Total U.S. Stock Market ETF United States 70 100
iShares MSCI ACWI ETF United States 767 767
iShares MSCI Hong Kong ETF United States 64 038
iShares Russel 2000 Index Fund United States 458 212
iShares Select Dividend ETF United States 163 888
iShares U.S. Aerospace & Defence ETF United States 55 385
Vanguard Health Care Index Fund United States 127 695
Vanguard High Dividend Yield Index Fund ETF United States 128 826
Vanguard Russell 2000 ETF United States 246 586
Total 18 664 100
Certificates/Warrants
Nordea Bank BEAR OMXH X1 ETN Finland 23 275
Total 23 275
Subscription rights
M&G Subscription share United Kingdom 18 018
Total 18 018
Cash at bank and in hand
Bank Accounts Finland 353 082 319
Total 353 082 319
Nordea Life Assurance Finland Ltd 44Financial Statements 2019

Annual Report 2019
11. Assets Covering Unit-Linked Insurance 2019 2018
Original acquisition cost
Market value (=book value)
Original acquisition cost
Market value (=book value)
Shares and participations 12 252 931 215 14 518 018 966 12 476 669 745 13 153 576 314
Debt securities 40 510 342 44 983 466 44 729 602 41 072 111
Deposits 83 446 265 83 446 265 112 101 265 112 101 265
Real estates 674 430 246 703 600 361 579 773 147 596 429 784
Cash in hand and at bank 261 988 589 261 988 589 187 820 641 187 820 641
Total 13 313 306 657 15 612 037 647 13 401 094 400 14 091 000 114
Investments acquired in advance 0 0 0 0
Investments covering technical provisions on unit-linked insurance 13 313 306 657 15 612 037 647 13 401 094 400 14 091 000 114
12. Statement of Changes in Equity Capital 2019
Share capital 31.12. 24 500 000
Issue premium fund 1.1. 0
Transfer to reserve for invested unrestricted capital 0
Issue premium fund 31.12. 0
Ordinary reserve 1.1. 0
Transfer to reserve for invested unrestricted capital 0
Ordinary reserve 31.12. 0
24 500 000
Reserve for invested unrestricted capital 31.12 67 986 513
Retained earnings 1.1. 222 407 597
Retained earnings 31.12. 96 407 597
Profit for the year 142 422 105
Preliminary dividend 0
306 816 215
Equity capital in total 331 316 215
The distributable equity capital in the Nordea Life Assurance Finland Ltd is in total EUR 306,816,214 (290,394,110).
13. Provisions for Unit-Linked Insurance 2019 2018
Technical provisions
Provision for unearned premiums 15 570 907 095 14 035 460 373
Claims outstanding 71 708 222 60 328 257
15 642 615 317 14 095 788 630
14. Subordinated Loans
Subordinated loans 70 000 000 70 000 000
The subordinated loan was issued for an undetermined period. The notice period on the part of the creditor is five years. Repayment of the loan is tied to the debtor’s solvency.
The annual interest rate is tied to a 12-month reference rate, added with an 85 basis point margin. The interest on the subordinated loan in 2019 was EUR 511 709,72. The creditor is Nordea Life Holding AB.
Nordea Life Assurance Finland Ltd Financial Statements 2019 45

Annual Report 2019
15. Off-Balance Sheet Commitments 2019 2018
Investment commitments 122 670 013 114 758 756
Market value of shares lent as a securities loan, total 0 0
Leasing and rental commitments
Amount payable during current financial year 92 194 672 984
Amount payable later 70 343 66 967
Pension liabilities 542 200 137 803
Derivative contracts, hedging
Interest rate derivatives
Forward contracts underlying asset 161 038 800 151 738 800
market value 0 0
Interest rate swaps - -
underlying asset - -
Option contracts market value - -
underlying asset - -
written, market value - -
underlying asset - -
Exchange rate derivatives
Forward contracts underlying asset 68 268 908 75 936 789
market value 268 072 982 827
Equity derivatives
Forward contracts underlying asset 0 91 035 207
market value 0 0
Derivative contracts, non-hedging
Equity derivatives
Option contracts purchased, market value - -
underlying asset - -
written, market value - -
underlying asset - -
Leasing agreements can be cancelled with a notice period of 30 days. The cancellation fee is 30 % of the taxable rent for the period between the return date of the car and the contractual end date.
In addition to statutory pension insurances, Nordea Life Assurance has defined benefit pension plans at Nordea Pension Foundation, and their defined benefit liability has been specified in the pension liabilities section.
Regarding VAT group registration, Nordea Life Assurance Finland Ltd is, with the other members of the Nordea Bank Finland.
Plc tax liability group, jointly and severally liable for the value added tax to be rendered in the accounts in accordance with section 188 of the Value Added Tax Act.
Nordea Life Assurance Finland Ltd 46Financial Statements 2019

Annual Report 2019
15. Off-Balance Sheet Commitments 2019 2018
Investment commitments 122 670 013 114 758 756
Market value of shares lent as a securities loan, total 0 0
Leasing and rental commitments
Amount payable during current financial year 92 194 672 984
Amount payable later 70 343 66 967
Pension liabilities 542 200 137 803
Derivative contracts, hedging
Interest rate derivatives
Forward contracts underlying asset 161 038 800 151 738 800
market value 0 0
Interest rate swaps - -
underlying asset - -
Option contracts market value - -
underlying asset - -
written, market value - -
underlying asset - -
Exchange rate derivatives
Forward contracts underlying asset 68 268 908 75 936 789
market value 268 072 982 827
Equity derivatives
Forward contracts underlying asset 0 91 035 207
market value 0 0
Derivative contracts, non-hedging
Equity derivatives
Option contracts purchased, market value - -
underlying asset - -
written, market value - -
underlying asset - -
Leasing agreements can be cancelled with a notice period of 30 days. The cancellation fee is 30 % of the taxable rent for the period between the return date of the car and the contractual end date.
In addition to statutory pension insurances, Nordea Life Assurance has defined benefit pension plans at Nordea Pension Foundation, and their defined benefit liability has been specified in the pension liabilities section.
Regarding VAT group registration, Nordea Life Assurance Finland Ltd is, with the other members of the Nordea Bank Finland.
Plc tax liability group, jointly and severally liable for the value added tax to be rendered in the accounts in accordance with section 188 of the Value Added Tax Act.
16. Key Figures for General Economic Development 2019 2018 2017 2016 2015
Turnover of life assurance business
Premium income before the reinsurers’ share + investment income and unrealised gains + other income 4 235 590 570 575 725 066 2 177 165 103 2 344 490 133 3 264 980 702
Operating profit or loss
Profit or loss before changes in equalisation provision, additional benefits, lextraordinary items, appropriations and taxes 177 336 020 204 015 042 179 104 679 189 667 611 194 331 693
Total profit or loss
Operating profit or loss +/- changes in valuation differences, fair value and revaluation reserves 204 407 471 149 064 807 181 218 691 148 471 528 86 524 177
Return on assets (%) without unit-linked insurance (at market value)
100 x (Operating profit or loss + interest and other financ-ing expenses + calculated interest
+/- revaluation/revaluation reversed in revaluation or fair value reserve
+/- changes in valuation differences) / (total assets
-technical provisions on unit-linked insurances +/- valua-tion differences on investments)
(average at the beginning and the end of the year) 10,2 % 7,9 % 8,8 % 6,9 % 4,3 %
2019 2018
Investment allocation at market values
Bonds 1 468 284 854 60,3 % 1 467 571 485
Real estate investments 268 459 800 11,0 % 328 997 098
Shares 187 104 096 7,7 % 223 896 145
Alternative investments 268 510 602 11,0 % 279 469 393
Money market investments 60 195 506 2,5 % 35 201 146
Cash in hand and at bank 181 464 358 7,5 % 123 294 166
2 434 019 216 100,0 % 2 458 429 431
Modified duration of bond portfolio 5.6 (previous year 4.7).
Net investment income
Direct net income
Bonds -3 039 244 1 560 781
Real estate investments 7 717 747 12 737 728
Shares -2 797 494 12 966 230
Alternative investments 20 846 740 64 767 594
Money market investments -6 077 072 -7 548 163
Value adjustments in annual accounts 1)
Bonds 13 716 749 2 295 314
Real estate investments -1 457 972 -4 133 807
Shares 31 981 966 1 822 978
Alternative investments -2 280 922 -8 422 878
Money market investments 7 028 335 932 684
Net investment income in the profit and loss account 65 638 834 76 978 461
Changes in valuation differences
Bonds 31 520 486 -2 185 766
Real estate investments -4 116 825 2 512 082
Shares 9 864 530 -24 426 057
Alternative investments -10 196 741 -28 836 365
Money market investments 0 -1 348 064
Net investment income at market values 92 710 284 22 694 289
Net investment income of unit-linked insurances 2 105 064 856 -612 329 997
Investment income from derivatives of total investment income -15 646 302 3 180 1321) Realised gains and losses and other value adjustments in annual accounts
Nordea Life Assurance Finland Ltd Financial Statements 2019 47

Annual Report 2019
17. Key Figures for Life Assurance Company’s Economic Development
2019 2018 2017 2016 2015
Premium income
Premium income before reinsurer’s share 2 064 238 618 1 106 072 240 1 376 387 241 1 388 080 397 2 407 164 464
Operating cost ratio
100 x operating expenses / loading income 51.6 % 46.1 % 39.2 % 36.7 % 42.0 %
100 x operating expenses / total assets 1.1. 0.2 % 0.2 % 0.2 % 0.2 % 0.2 %
18. Profit Analysis 2019 2018
Premium income 2 063 713 677 1 105 471 584
Investment income and expenses, unrealised gains and losses on investments and revaluations 2 170 703 690 -535 351 536
Other technical income 0 0
Claims paid -2 540 575 011 -1 352 043 833
Change in technical provisions before future bonuses and change in equalisation provision -1 475 950 764 1 016 380 700
Of which portfolio transfer 9 098 552 0
Net operating expenses -31 557 907 -30 532 813
Balance on technical account 177 235 133 203 924 102
Other profits 648 262 152 252
Other expenses -547 374 -61 313
Investments in associates 0 0
Operating profit/-loss 177 336 020 204 015 042
Change in equalisation provision
Additional benefits (customer benefits) -11 799 -300 000
Profit/loss before closing entries and taxes 177 324 222 203 715 042
Income tax and other direct taxes -34 902 117 -41 547 588
Minority interest 0 0
Profit for the year 142 422 105 162 167 454
2019 2018
Net investment income on invested capital Income - %
Net investment income at market
value Income - %
Net investment income at market
value
Bonds 2.87 % 42 197 991 0.10 % 1 670 328
Real estate investments 0.50 % 2 142 950 3.20 % 11 116 003
Shares 39.52 % 39 049 002 -3.70 % -9 636 850
Alternative investments 2.65 % 8 369 078 7.20 % 27 508 352
Money market investments 2.48 % 951 263 -11.50 % -7 963 543
Net investment income at market values 3.95 % 92 710 284 0.90 % 22 694 290
Nordea Life Assurance Finland Ltd 48Financial Statements 2019

Annual Report 2019
Nordea Life Assurance Finland Ltd Financial Statements 2019 49
22. Estimate of equity principle realisation in 2019
In 2019, bonuses for the insurance portfolio subject to the equity principle were divided as follows:
Fixed calculated interest rate
Product Calculated interest Customer bonus Total
Endowment insurance 4,50 % 0,00 % 4,50 %
Endowment insurance 3,50 % 0,00 % 3,50 %
Endowment insurance 2,50 % 0,00 % 2,50 %
Pension insurance 4,50 % 0,00 % 4,50 %
Pension insurance 3,50 % 0,00 % 3,50 %
Pension insurance 2,50 % 0,00 % 2,50 %
Capital redemption plan 3,50 % 0,00 % 3,50 %
Capital redemption plan 2,50 % 0,00 % 2,50 %
Calculated interest rate 0%
Product Annual interest Additional interest Total
Endowment insurance 0,40 % 0,25 % 0,65 %
Pension insurance 0,70 % 0,25 % 0,95 %
Capital redemption plan 0,40 % 0,25 % 0,65 %
19. Auditors’ Fees 2019 2018
The auditors' fees per category were
Audit 85 253 150 473
Mandates subject to section 1(2) of the Auditing Act 9 300 0
Tax consultation 0 0
Other services 0 0
Total 94 553 150 473
20. Information about Consolidated Financial Statements
Nordea Bank Abp prepares the consolidated financial statements of the highest entity in which Nordea Life Assurance Finland Ltd belongs. Nordea Bank Abp is domiciled in Helsinki. A copy of Nordea Bank Plc’s consolidated financial statement can be found at www.nordea.com
Nordea Life Holding AB prepares the consolidated financial statements of the lowest entity in which Nordea Life Assurance Finland Ltd belongs. Nor-dea Life Holding AB is fully owned by Nordea Bank Abp. Nordea Life Holding AB:n is domiciled in Stockholm. A copy of Nordea Life Holding´s consoli-dated financial statement can be found from Swedish Companies Registration Office (www.bolagsverket.se)
The consolidated financial statements of Nordea Life Assurance Finland Ltd have not been prepared pursuant to Chapter 6, Section 1, Paragraph 4 of the accounting act.
German government bond 10 Y Endowment Pension
5,00
4,00
3,00
2,00
1,00
0,00
-1,00
%
21. 10-Year interest rate and total customer return 2006–2019
1.1.2006 1.1.2007 1.1.2008 1.1.2009 1.1.2010 1.1.2011 1.1.2012 1.1.2013 1.1.2014 1.1.2015 1.1.2016 1.1.2017 1.1.2018 1.1.2019

Annual Report 2019
Nordea Life Assurance Finland Ltd 50Financial Statements 2019
Risk ProfileThe company is exposed to a variety of risks. These include underwriting, market, credit, liquidity, operational, business and strategic risks, of which the four first ones are directly quantified by the standard formula in the Solvency II regime.
Stress and scenario testingThe Solvency II regime outlines the principles for an effective risk management process. To that process belongs an effec-tive governance around calculating the solvency position as well as an Own Solvency and Risk Assessment (ORSA). The company is producing an own ORSA-report that is submitted to the FI-FSA on an annual basis.
As part of the ORSA process the company performs various stress and scenario tests including:
• Overnight stress and scenario tests• Reverse stress tests • Business risk scenarios • Macro-economic scenarios investigating emerging trends
and stresses testing the resilience of the company to his-torical and potential future macro crises
Stress and scenario testing are discussed by the executive management and the Board
Product structureThe main product groups are those of the Risk products and the others consisting of the Unit-Linked products (policy holder bears the investment risk) and the traditional ones where the company bears the investment risk. The two lat-ter groups together are saving based and can be divided into pensions, life endowments and capital redemption plans (the latter class essentially Unit-Linked based).
The risk products are either loan covers or personal life covers with coverage for death. In the life endowments, the most sig-nificant coverage is that of death.
In the traditional products, various guarantees and crediting principles exist. The older segment operates with positive fixed guarantee levels (4.5%, 3.5% and 2.5%) whereas the newer ones have 0.0% as basic investment guarantee upon which is applied an annually determined bonus rate. That bonus rate was 0.65% during 2019 (for pensions it was even 0.3% higher). In the fi-nancial statements, the company has made fixed term upfront arrangements, resulting in the decrease of fixed calculated in-terest rates (those with 4.5%, 3.5% or 2.5% guarantee) to 1.0% during the years 2020–2027.
Underwriting riskUnderwriting risk is defined as the risk for the company of los-ing value due to changes in the level, trend, or volatility of mor-tality rates, longevity rates, disability rates, surrenders and lapses.
Underwriting risks are primarily controlled using actuarial meth-ods, i.e. through tariffs, rules for acceptance of customers, rein-surance contracts, stress testing, and setting adequate provi-sions for risks.
The underwriting risk is managed through the underwriting pol-icy, a reinsurance programme and a product approval process for new products.
Distribution of technical provisions 31 December 2019
Other 0.0 %
Distribution of technical provisions 31 December 2019
Other 1.7 %
Calculated interest (4.5%)2.0 % Calculated
interest (3.3%)2.9 %
Calculated interest (3.5%)
1.5 %
Calculated interest (2.5%)
0.1 %
Annual interest
2.0 %
Unit-linked89.7 %
Individual Pension Insurance13.9 %
Individual life Insurance 37.3 %
Capital Redemp-tio in Contracts48.8 %

Annual Report 2019
Nordea Life Assurance Finland Ltd Financial Statements 2019 51
Underwriting proceduresUnderwriting is performed in compliance with the company’s underwriting policy for insurance risks as approved by the Board. The policy is established to ensure strong underwrit-ing processes and sound advice to customers. A crucial part of ensuring a healthy and sound business is to assess the risk profile of the customers.
Underwriting procedures ensure fair and ethical treatment of all customers and the acceptance or rejection of individual risks on an informed basis. Sound underwriting enables the company to pool risk efficiently, offer fair premiums to cus-tomers and establish robust reserves and capital. Individual underwriting is used for life and health policies. Depending on the nature of the risk coverage and the level of benefits, underwriting may include a health assessment or financial underwriting.
ReinsuranceThe company’s reinsurance programme is approved by the Board. The program covers individual and aggregate mortal-ity and disability risks, including mortality and disability ca-tastrophe cover. It includes individual risk retention limits and aggregate stop loss covers. Reinsured risks include mortal-ity, disability and mortality catastrophe. The aim of the rein-surance programme is to minimise claims volatility, stabilise annual results, protect own capital and protect the company from underwriting risk concentrations and catastrophes.
The Actuarial Function is responsible for reviewing the rein-surance strategy and program at least annually.
Product approvalThe company has implemented an overall approach to the management of changes which is further described in section Operational Risk. As part of this, a product approval process is in place for new products. This includes the assessment of the potential profitability as well as fit within the company’s risk appetite.
Market riskThe market risk arises at the company mainly due to the mis-match between assets and liabilities and the sensitivity of the values of these assets and liabilities to changes in the level or in the volatility of the market prices or rates.
Measurement and analysis of market riskMarket risk mainly originates from assets backing traditional products due to embedded guarantees, and from the Unit-Linked business segment which generates future profits that are included in the solvency calculation.
Market risks are mainly measured via the Solvency II stan-dard formula, exposure measurement on investment assets, forward-looking balance sheet projections, and stress and sensitivity analysis. Furthermore, the market risks are moni-tored against the risk appetite and risk limits.
Solvency II standard formulaWhen measuring market risk in accordance with the Solvency II standard formula the equity risk, the credit spread risk, the property risk and the currency risk dominate. The interest rate risk is rather limited since the more modern traditional con-tracts are in practice interest rate neutral.
The company is exposed to falls in equity prices through finan-cial guarantees on the traditional portfolio and to reduced ex-pectations of future profits mainly through asset management fees from Unit-Linked portfolios.
The company is exposed to movements in credit spreads via its credit portfolios within the traditional and Unit-Linked portfo-lios. For Unit-Linked portfolios, a widening of credit spreads re-duces market values and thus the expectations of future prof-its. The credit rating distribution of fixed income investments in the traditional portfolio is shown in the table below.
The company holds commercial, industrial and residential properties within its traditional and Unit-Linked portfolios.
The company invests actively in global assets. In the traditional portfolio, virtually all the currency exposure is hedged towards the Euro. Currency risk capital is driven by second-order effects on savings products: a decrease in the local currency value of foreign currency denominated securities decreases future prof-its through a reduced Unit-Linked mass as measured in Euros.
Exposure measurement on investment assetsInvestment portfolios backing policyholder liabilities are mon-itored in terms of exposure to different asset classes and cur-rencies to ensure proper diversification. The company’s in-vestment guidelines and limits determine the strategic asset allocation target as well as the tactical asset allocation limits for the traditional portfolio as set by the Board. There have not been any limit breaches during the reporting period.
AAA 39 %
AA 29 %
A 12 %
BBB 11 %
BB 3 %
B 1 %
CCC or below 0 %
Not rated 4 %
100 %
Fixed income holdings by rating for the traditional portfolio as at 31 December 2019

Annual Report 2019
Nordea Life Assurance Finland Ltd 52Financial Statements 2019
Stress and sensitivity analysisThe company regularly performs stress tests of the balance sheets and buffers to assess the impact of overnight stress. The stress tests are conducted by applying equity and inter-est rate shocks as well as combinations thereof. The com-pany is most sensitive to interest rate movements due to the long-term nature of the business and the results show that the company is resilient to the stresses performed.
As part of the capital management process, the company projects the development of the business including capital plans, and stress test it by using macroeconomic and busi-ness risk scenarios.
Management of market riskThe company manages market risk by balancing short-term and long-term perspectives, competitiveness, legal require-ments, profitability, liquidity, customer and capital consid-erations. In addition, market risks are monitored regularly against the risk appetite and risk limits.
Market risk in the traditional portfolio is mitigated through reducing the mismatch between assets and liabilities. In ad-dition, derivative strategies are used for market risk hedging purposes when needed.
The investment process and the Prudent Person PrincipleThe Prudent Person Principle is integral to the company’s in-vestment process. The company utilizes both bottom-up and top-down approaches to the Prudent Person Principle.
The bottom-up approach is used to address the prudence of each building block, such as a mandate or type of fund. The prudence of each building block is addressed in the invest-ment sourcing process, which consists of four steps: invest-ment due diligence; operational due diligence of asset man-ager; operational requirements for data and valuation; and legal assessment and agreements.
The top-down approach looks at the portfolio as a whole, and ensures that the combination of assets is prudent and is in line with the objective for each portfolio. The top-down approach consists of five steps: specifying asset composi-tion and mix of asset classes; choosing the levels of risks and composition there among; determining the expected risk-return characteristics over the long term; assessing per-formance in various risk scenarios; and balancing short term performance and long-term asset assumptions.
The overall asset sourcing process supports the company’s ability to adhere to the Prudent Person Principle require-ments by only investing in assets for which the company can properly identify measure, monitor, manage and con-trol the resulting risks. The combination of bottom-up and top-down approaches ensure that the investment process is prudent.
The company’s Unit-Linked trading process ensures that the technical provisions related to customers’ Unit-Linked poli-cies are as closely linked as possible to the company’s Unit-Linked assets. The trading of Unit-Linked products within the company is governed by the investment guidelines and limits and monitored as part of risk management activities.
Operational riskOperational risk means the risk of direct or indirect loss, or damaged reputation, resulting from inadequate or failed in-ternal processes, or from people, systems or external events. Regarding capital requirements; operational risk also covers legal risk and compliance risk.
Operational risk is inherent in all activities within the organi-sation, in outsourced activities and in all interactions with ex-ternal parties. Managing operational risks is the day-to-day responsibility of the business and is a proactive discipline, which emphasises training and risk awareness from all em-ployees across the company.
Measurement of operational riskOperational risk is measured through the operational risk ap-petite, incident reporting and stress and scenario testing.
Incident reportingIncidents and security weaknesses are immediately handled in order to minimise damage. Upon detection of an incident, handling the incident has top priority. Unit managers are re-sponsible for the proper handling, documentation and report-ing of incidents. Incident reporting is a Nordea Group-wide process which is performed in the operational and compli-ance risk system. Aggregated incident information is included in regular risk reports to the Executive Management and the Board.
Stress testing and scenario analysisAs an extension of the Risk and Control Self-Assessment (RCSA) process a stress test of the material risks is per-formed. The stress test of operational risks is conducted as a scenario analysis, which tests selected key material risks con-sidered to be highly important to investigate further. The ob-jective is to challenge and extend the company’s present un-derstanding of its operational risk landscape by focusing on risks which could cause large financial losses or other signifi-cant impacts to the company
The RCSA also serves as input for scenarios to include in the continuity and contingency plans, which are tested annually to ensure learning and preparedness.
Management of operational riskThe management of operational risk is centred on the RCSA, Group Level Controls and change management processes.
RCSA The RCSA is an annual self-assessment of operational risk in the business. The RCSA is designed to enhance awareness of risks in the operations, spot weaknesses in controls, and support prioritisation of mitigating actions related to these weaknesses.
The RCSA is focused on current risks that the business faces and also includes an analysis for emerging and anticipated operational risks, resulting from expected changes related to strategic initiatives.

Annual Report 2019
Nordea Life Assurance Finland Ltd Financial Statements 2019 53
Group Level ControlsGroup Level Control (GLC) is an annual process in which the first and second lines of defence assess their compliance with the requirements as specified in Nordea Group Directives.
Managing material changesThe Change Risk Management and Approval process (The CRMA process) consists of an initial materiality assessment and a subsequent risk assessment. The CRMA process is exe-cuted by using the quality and risk assessment (QRA) meth-odology and tools as provided by Nordea Group Operational Risk (GOR). For material Changes, the CRMA process is more extensive and includes the involvement of a number of man-datory stakeholders. Approval process captures all material changes in a unified and disciplined manner. It is applicable to new or materially altered products, services, markets, pro-cesses, IT systems and major changes to the operations and organisation. The QRA is used to analyse risk and quality as-pects related to material changes on a case by case basis, for example new programs, significant changes to organisations, processes and systems. The QRA is performed in order to limit new risks and to ensure disciplined change management. It aims to document decision-making regarding risk and quality aspects connected to changes, explicit responsibility for deci-sions and actions taken, and systematic follow-up. Conduct-ing a QRA is mandatory as part of the change approval pro-cess and mandatory to use when a change or development is run within a programme or project.

Annual Report 2019Nordea Life Assurance Finland Ltd 54
Annual Report 2019
Signatures of Report of the Board of Directors’ and Annual Accounts
Helsinki, 20 February 2020 Katja Bergqvist Sara Mella Chairman of the Board of Directors Vice-Chairman of the Board of Directors
Johan Nystedt Pekka Luukkanen Member of the Board of Directors Managing Director An auditor’s report on the audit has been issued today. Helsinki, 9 March 2020 PricewaterhouseCoopers Oy Authorised Public Accountants
Martin Grandell Authorised Public Accountant

Auditor’s Report (Translation of the Finnish Original)
To the Annual General Meeting of Nordea Life Assurance Finland Ltd.
Report on the Audit of the Financial Statements
OpinionIn our opinion, the financial statements give a true and fair view of the company’s financial performance and financial position in accordance with the laws and regulations gov-erning the preparation of financial statements in Finland and comply with statutory requirements.
Our opinion is consistent with the additional report to the Board of Directors.
What we have auditedWe have audited the financial statements of Nordea Life As-surance Finland Ltd (business identity code 0927072-8) for the year ended 31 December, 2019. The financial statements comprise the balance sheet, income statement, cash flow statement and notes.
Basis for OpinionWe conducted our audit in accordance with good auditing practice in Finland. Our responsibilities under good auditing practice are further described in the Auditor’s Responsibilities for the Audit of Financial Statements section of our report.
We believe that the audit evidence we have obtained is suffi-cient and appropriate to provide a basis for our opinion.
IndependenceWe are independent of the company in accordance with the ethical requirements that are applicable in Finland and are relevant to our audit, and we have fulfilled our other ethical responsibilities in accordance with these requirements.
To the best of our knowledge and belief, the non-audit ser-vices that we have provided to the company are in accor-dance with the applicable law and regulations in Finland and we have not provided non-audit services that are prohib-ited under Article 5(1) of Regulation (EU) No 537/2014. The non-audit services that we have provided are disclosed in note 19 to the Financial Statements.
Most significant assessed risks of material misstatement
Below we have described our assessment of the most signifi-cant risks of material misstatement, including risks of material misstatement due the fraud, and presented a summary of our response to those risks.
Significant risks of material misstatement referred to in EU regulation No 537/2014, point (c) of Article 10 (2) relating to the company’s financial statements
Valuation of investmentRefer to the notes 1 Accounting principles of the financial statements, 5 Net investment income, 10 Investments, 11 As-sets covering company’s unit-linked insurance, 16 Key figures for general economic development, 18 Profit analysis, Risk profile to the financial statements
Valuation of certain kind of investment require manage-ment’s judgement and certain assumptions applied.
Important areas in valuation of investments relate to:• Framework and company’s policies relating to
valuation.• Controls relating to valuation.• Disclosures relating to investments
Actuarial assumptionsRefer to the notes 1 Accounting principles of the financial statements, 9 Change in calculation method for technical provisions, 22 Estimate of equity principle realisation 2018, Risk profile to the financial statements
Technical provisions involves subjective judgments over uncertain future outcomes. The value is based on models where significant judgment is applied in setting economic assumptions, actuarial assumptions as well as customer be-havior. Changes in these assumptions can materially impact the valuation of technical provisions.
How our audit addressed the riskWe assessed the company’s procedures and policies relating to valuation of investments.
Our audit included a combination of testing of internal con-trols over financial reporting and valuation and substantive testing.
In our audit, we assessed and tested the design and operat-ing effectiveness of the controls over: • Classification of investments.• Accuracy of data- and price inputs of investments, rec-
onciliations, approval and monitoring.
We tested a sample of investments to ascertain whether we concur with the valuation of investments.
We assessed the design and tested operating effectiveness of the controls over the process for calculating provisions.
Annual Report 2019Nordea Life Assurance Finland Ltd 55
Annual Report 2019

Our audit also included assessments of applied methods, models and assumptions used in calculating the provisions. We have on a sample basis performed recalculations of the provisions. The audit was carried out by a PwC actuary.
Responsibilities of the Board of Directors and the Managing Director for the Financial Statements
The Board of Directors and the Managing Director are re-sponsible for the preparation of financial statements that give a true and fair view in accordance with the laws and regula-tions governing the preparation of financial statements in Fin-land and comply with statutory requirements. The Board of Directors and the Managing Director are also responsible for such internal control as they determine is necessary to enable the preparation of financial statements that are free from ma-terial misstatement, whether due to fraud or error. In preparing the financial statements, the Board of Directors and the Managing Director are responsible for assessing the company’s ability to continue as a going concern, disclosing, as applicable, matters relating to going concern and using the going concern basis of accounting. The financial statements are prepared using the going concern basis of accounting un-less there is an intention to liquidate the company or to cease operations, or there is no realistic alternative but to do so.
Auditor’s Responsibilities for the Audit of the Financial Statements
Our objectives are to obtain reasonable assurance about whether the financial statements as a whole are free from material misstatement, whether due to fraud or error, and to issue an auditor’s report that includes our opinion. Rea-sonable assurance is a high level of assurance, but is not a guarantee that an audit conducted in accordance with good auditing practice will always detect a material misstatement when it exists. Misstatements can arise from fraud or error and are considered material if, individually or in the aggre-gate, they could reasonably be expected to influence the eco-nomic decisions of users taken on the basis of the financial statements.
As part of an audit in accordance with good auditing practice, we exercise professional judgment and maintain professional skepticism throughout the audit. We also:
• Identify and assess the risks of material misstatement of the financial statements, whether due to fraud or er-ror, design and perform audit procedures responsive to those risks, and obtain audit evidence that is sufficient and appropriate to provide a basis for our opinion. The risk of not detecting a material misstatement resulting from fraud is higher than for one resulting from er-ror, as fraud may involve collusion, forgery, intentional omissions, misrepresentations, or the override of inter-nal control.
• Obtain an understanding of internal control relevant to the audit in order to design audit procedures that are
appropriate in the circumstances, but not for the pur-pose of expressing an opinion on the effectiveness of the company’s internal control.
• Evaluate the appropriateness of accounting policies used and the reasonableness of accounting estimates and related disclosures made by management.
• Conclude on the appropriateness of the Board of Di-rectors’ and the Managing Director’s use of the going concern basis of accounting and based on the audit evidence obtained, whether a material uncertainty exists related to events or conditions that may cast sig-nificant doubt on the company’s ability to continue as a going concern. If we conclude that a material uncer-tainty exists, we are required to draw attention in our auditor’s report to the related disclosures in the finan-cial statements or, if such disclosures are inadequate, to modify our opinion. Our conclusions are based on the audit evidence obtained up to the date of our audi-tor’s report. However, future events or conditions may cause the company to cease to continue as a going concern.
• Evaluate the overall presentation, structure and con-tent of the financial statements, including the disclos-ures, and whether the financial statements represent the underlying transactions and events so that the fi-nancial statements give a true and fair view..
We communicate with those charged with governance re-garding, among other matters, the planned scope and timing of the audit and significant audit findings, including any sig-nificant deficiencies in internal control that we identify during our audit.
Other Reporting Requirements
AppointmentWe were first appointed as auditors by the annual general meeting on 9 April 2015. Our appointment represents a total period of uninterrupted engagement of 5 years.
Other InformationThe Board of Directors and the Managing Director are re-sponsible for the other information. The other information comprises the report of the Board of Directors.
Our opinion on the financial statements does not cover the other information.
In connection with our audit of the financial statements, our responsibility is to read the other information and, in doing so, consider whether the other information is materially inconsis-tent with the financial statements or our knowledge obtained in the audit, or otherwise appears to be materially misstated. Our responsibility also includes considering whether the re-port of the Board of Directors has been prepared in accor-dance with the applicable laws and regulations.
Annual Report 2019Nordea Life Assurance Finland Ltd 56
Annual Report 2019

Helsinki 9 March 2020
PricewaterhouseCoopers OyAuthorised Public Accountants
Martin GrandellAuthorised Public Accountant (KHT)
In our opinion, the information in the report of the Board of Directors is consistent with the information in the finan-cial statements and the report of the Board of Directors has been prepared in accordance with the applicable laws and regulations.
If, based on the work we have performed, we conclude that there is a material misstatement of the report of the Board of Directors, we are required to report that fact. We have noth-ing to report in this regard.
Annual Report 2019Nordea Life Assurance Finland Ltd 57
Annual Report 2019

Annual Report 2019Nordea Life Assurance Finland Ltd 58
Annual Report 2019
Definitions for Key Figures
Operating expensesOperating expenses are expenses arising from the acquisition and man-agement of insurance policies, general administration costs and reinsur-ance fees. Expenses related to claims are included in claims incurred and expenses related to investment expenses.
Operating cost ratioWhen calculating this ratio, expenses arising from claims settlements entered in claims incurred and depreciation on fixed assets are included in the operating expenses. Correspondingly, all loading items are in-cluded in loading income.