Embed Size (px)
Citation preview

ANNUAL REPORT 2020 OF J.P. MORGAN AG
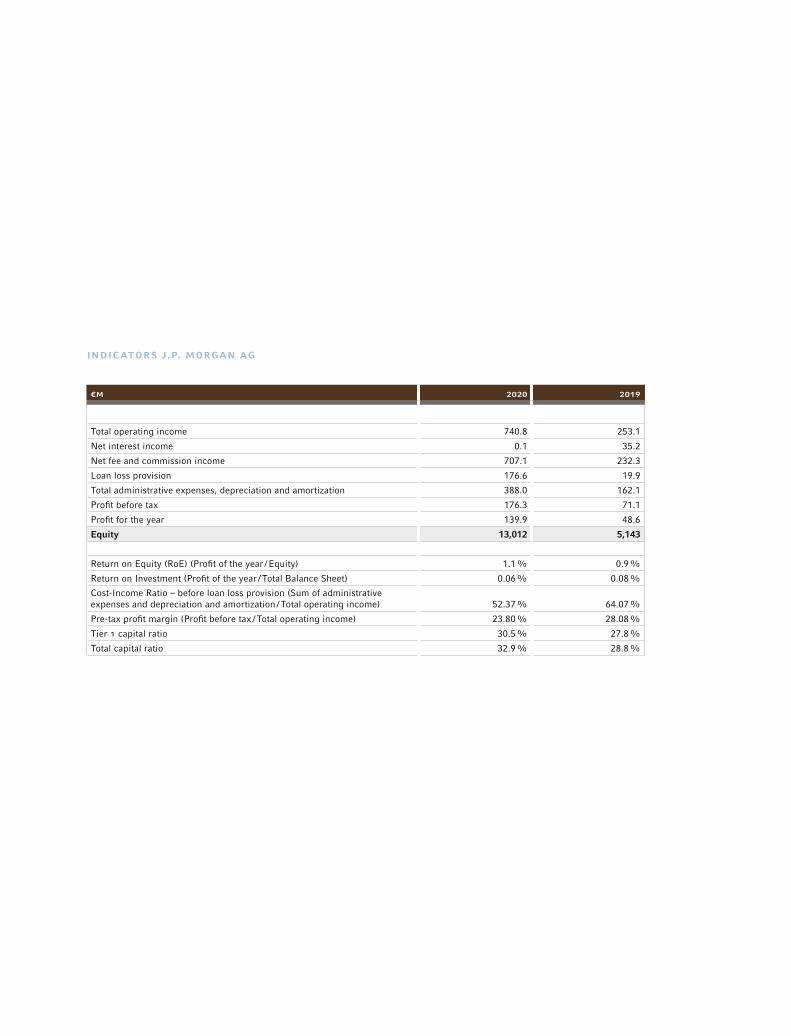
INDICATORS J.P. MORGAN AG
€M 2020 2019
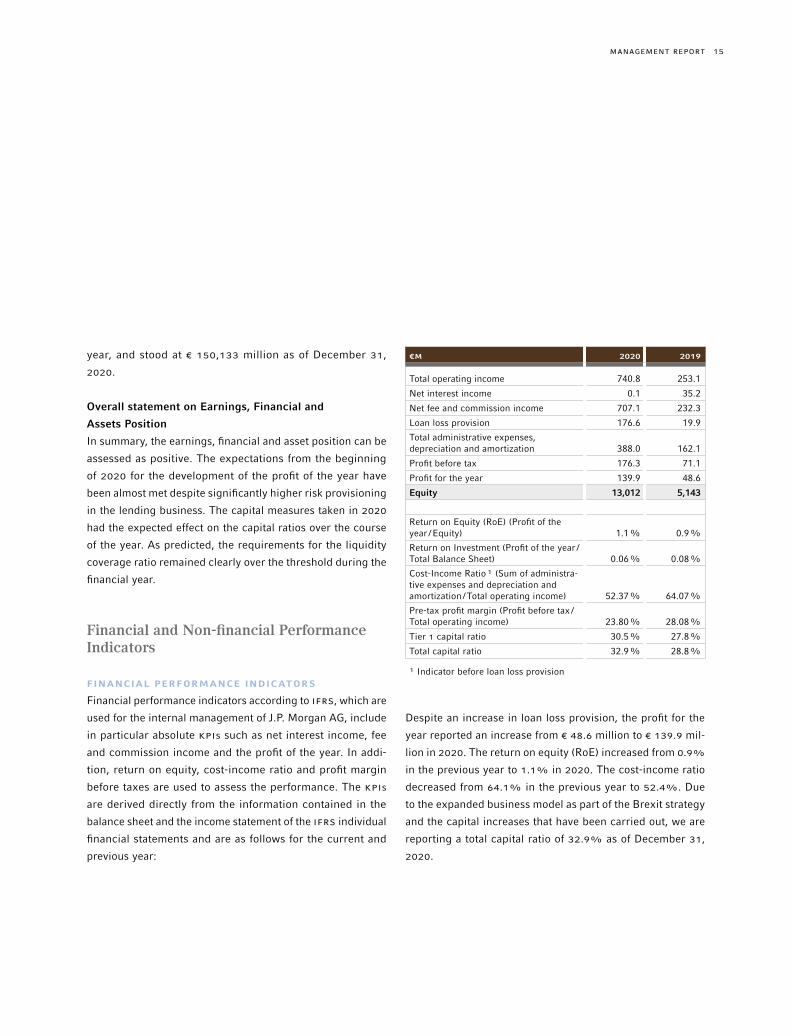
Total operating income 740.8 253.1
Net interest income 0.1 35.2
Net fee and commission income 707.1 232.3
Loan loss provision 176.6 19.9
Total administrative expenses, depreciation and amortization 388.0 162.1
Profit before tax 176.3 71.1
Profit for the year 139.9 48.6
Equity 13,012 5,143
Return on Equity (RoE) (Profit of the year /Equity) 1.1% 0.9%
Return on Investment (Profit of the year /Total Balance Sheet) 0.06% 0.08%
Cost-Income Ratio – before loan loss provision (Sum of administrative expenses and depreciation and amortization /Total operating income) 52.37% 64.07%
Pre-tax profit margin (Profit before tax /Total operating income) 23.80% 28.08%
Tier 1 capital ratio 30.5% 27.8%
Total capital ratio 32.9% 28.8%

CONTENTS
CONTENTS
Annual Report 2020
Management Report 2
Income Statement and
Other Comprehensive Income 64
Balance Sheet 65
Statement of Changes in Equity 66
Cash Flow Statement 67
Notes to the Financial Statement
of J.P. Morgan AG, Frankfurt am Main 68
Independent Auditor’s Report 162
Report of the Supervisory Report 172
Annex: Country-by-Country Reporting 174
Annex: Equal Pay Reporting (unaudited) 176
2 MANAGEMENT REPORT
names of the members of the Management Board and the
Supervisory Board are listed in the appendix.
The various business segments, Banking (consisting of Global
Investment Banking, Wholesale Payments and Lending),
Markets, Securities Services and Commercial Bank, prepare
detailed presentations for the meetings of the Management
Board. These presentations are key to discuss business devel-
opments in the past month and developments in key perfor-
mance indicators (KPIs) as well as in key risk indicators (KrIs)
of the various segments. The Chief Financial Officer (CFO), the
Chief Risk Officer (CrO), the Chief Compliance Officer and the
Head of Internal Audit also provide their up-to-date reports. In
addition, the implementation of the group-wide Brexit strat-
egy by J.P. Morgan AG with regard to client activation, transfer
of assets, capital planning and staffing has been monitored
during the meetings of the Management Board. The Board
meetings are minuted by a member of the legal department.
The Supervisory Board receives an up-to-date summary of the
topics discussed in the Management Board meetings, with a
view to the current status of the discussion and resolutions
in the Management Board for its regular meetings. This sum-
mary contains the essential details of the course of business,
new planned business activities, the financial development,
the ICAAP results of the Bank, the status of the regulatory
dialogue, the status of current projects with focus on the
implementation of the group-wide Brexit strategy, as well as
reports from the 2nd and 3rd Line of Defence functions (risk
and compliance). In addition, the internal audit department
informs the Supervisory Board in writing of the audits carried
out and their results on a quarterly basis.
The Risk Committee of the Supervisory Board met five times
in 2020 and so far once in 2021. It aims to form an opinion
Business and General Conditions
ORGANIZATION AND LEGAL STRUCTURE
J.P. Morgan AG (the “Bank”), with its registered office in
Frankfurt am Main, is an indirectly wholly owned subsidiary
of JPMorgan Chase & Co. with its registered office in Colum-
bus, Ohio, in the United States of America. The Bank has a
full banking license in accordance with Section 1 Para. 1 of
the KWG [Kreditwesengesetz – German Banking Act] and con-
ducts banking business with institutional clients, banks, cor-
porate clients and clients from the public sector. The shares
of J.P. Morgan AG are held directly by the J.P. Morgan Inter-
national Finance Limited with its registered office in Newark,
United States of America.
In fiscal year 2019, a branch of J.P. Morgan AG had been estab-
lished in London. Nine further branches which are located
in Amsterdam, Brussels, Copenhagen, Madrid, Milan, Oslo,
Paris, Stockholm and Warsaw, started operations in 2020. In
addition, J.P. Morgan AG applied for and received regulatory
approval to open another branch in Athens. The opening is
planned for July 2021.
Since October 31, 2020, J.P. Morgan AG has been managed
by a five-person Management Board. The Board of Directors,
which consisted of four members from November 1, 2020 to
March 31, 2021, has been added with another member in
April 2021, who is responsible for the areas of outsourcing,
operations and technology. It is also planned to add at least
one additional member to the board in the course of 2021.
In 2020, the Management Board continued to be supervised
by a six-member Supervisory Board. The Management Board
usually meets on a monthly basis, while the Supervisory Board
meets at least four times a year. The Board of Directors held
nine meetings in 2020 and so far, four meetings in 2021. The
MANAGEMENT rEPOrT AS OF DECEMBEr 31, 2020
3MANAGEMENT REPORT
Forum, Regulatory Change Forum, Change Advisory Forum,
Technology Forum.
The Outsourcing Forum, chaired by the Board-appointed Out-
sourcing Manager, is an integral part of the J.P. Morgan AG’s
Outsourcing Governance Framework, which is responsible for
monitoring the entirety of the outsourcing agreements and
the associated risks. It also focuses on the implementation of
the relevant EBA guidelines. The Regulatory Change Forum,
chaired by the MaRisk Compliance Officer and the Chief
Compliance Officer, is responsible for monitoring regulatory
and legal changes as well as the full implementation of the
those regulations which are classified as being relevant for J.P.
Morgan AG. The Change Advisory Forum monitors the imple-
mentation of new products in accordance with MaRisk as well
as essential change management projects. The Technology
Forum ensures effective control of J.P. Morgan AG’s technology
infrastructure and the monitoring and limitation of the associ-
ated risks and should also ensure compliance with BAIT and
the “EBA Guidelines on ICT and Security Risk Management”.
The Management Board has also mandated the Risk Oversight
Committee, which is chaired by the CrO and which consists of
experts of all significant types of risk, with the following tasks.
It is responsible for setting J.P. Morgan AG’s risk appetite,
for monitoring the risk strategy, developing adequate meth-
ods and procedures for the assessment of the risk-bearing
capacity, for analyzing individual risk events and for regularly
informing the Management Board about the risk profile of
J.P. Morgan AG. In the light of expanded business activities
and the implementation of the new ECB requirements for the
“Internal Capital Adequacy Assessment Process” (“ICAAP”),
the focus of the committee in 2020 laid on the expansion of
risk management capabilities and governance – staff-wise and
methodologically – including the changes to the risk appetite
about the ICAAP results of J.P. Morgan AG and about the devel-
opment of the risk profile across the various risk stripes. In
addition, the Risk Committee is closely involved in the defi-
nition of the recovery scenarios and their analysis. The Audit
Committee of the Supervisory Board usually meets four times
a year, with the auditors participating at least twice a year to
discuss the audit plan, the annual financial statements and
the final results of the statutory audit report. The Compen-
sation Committee of the Supervisory Board met six times in
2020, and the Nomination Committee twice. The meetings
of the Supervisory Board and its committees are minuted by
a member of the legal department or by an external lawyer.
INTERNAL CONTROL SYSTEM
The four segments, Banking, Markets, Securities Services and
Commercial Bank, are managed and supervised by two mem-
bers of the Management Board, the CFO and the CrO.
The Management Board has delegated the monitoring of oper-
ational business activities and the associated operational risks
to the Local Operational Risk & Control Committee (“LOrCC”).
The LOrCC, which is chaired jointly by the CFO and the Loca-
tion Control Manager, acts across segments and is made up of
representatives from each segment, the various control func-
tions and the corporate functions. In its monthly meetings,
the LOrCC deals with the course of business operations, with
errors or problems that have occurred, and with operational
risks that may arise. This enables the LOrCC to (i) identify
operational risks and control aspects, trends or issues that
require escalation in accordance with the applicable criteria,
(ii) ensure the necessary monitoring of operational risks and
control issues, including the recommended remedial action,
and (iii) take the necessary actions in order to address the
identified operational risks accordingly. In addition, the LOrCC
has set up the following four sub-committees: Outsourcing

4 MANAGEMENT REPORT
as well as for the management of significant risks in the Euro
area. In 2020, the focus was on a controlled expansion of J.P.
Morgan AG with regard to the implementation of our orga-
nizational structure and underlying processes, smooth client
migration, transfer of customer portfolios, transfer of risk
assets, capital planning and adequate staffing. In addition,
J.P. Morgan AG continues to be the Group’s central unit for
Euro payments and acts as a depositary and global custodian
bank for the German investment market.
Segment “Banking”
This segment comprises Global Investment Banking, Whole-
sale Payments and Lending.
Global Investment Banking
J.P. Morgan AG went live with the “Global Investment Bank-
ing” (“GIB”) business in 2020, undertaking first pilot transac-
tions across both “Debt Capital Markets” (DCM) and “Equity
Capital Market” (ECM) were completed in the fourth quarter of
2020. This was in preparation for regulated EEA client facing
activity for M&A, ECM and DCM businesses being undertaken
from J.P. Morgan AG effective January 1, 2021. Those cus-
tomer mandates, which had still been closed with J.P. Morgan
Securities plc (“JPMS plc”), based in London, in 2020, were
novated and transferred to J.P. Morgan AG accordingly.
The client base served by the GIB business includes corpo-
rates, governments, insurance companies and other financial
institutions, private equity companies and family / start-up
companies.
The GIB business in J.P. Morgan AG is currently supported by
front office banking staff employeed by J.P. Morgan AG as well
JPMS plc employees, whereby this employment relationship,
especially for the EEA Coverage Banker and the EEA Product
and the associated limit structure to accommodate migrating
business activities. The risk functions have been closely work-
ing with the CFO on this.
In addition, the Management Board has mandated the EU
Asset & Liability Committee, which is chaired by the Trea-
surer of J.P. Morgan AG, to monitor the liquidity and refi-
nancing risk as well as the interest rate risk in the banking
book of the Bank. The focus in 2020 was, in particular, on the
introduction of the “Internal Liquidity Adequacy Assessment
Process” (“ILAAP”). The introduction took place in close coop-
eration with the CrO and CFO, especially taking into account
the effects of the Brexit strategy and the associated transfer
of risk positions.
During the monthly meetings of the Business Control Forums,
which, in most cases, cover the business activities of a line
of business in EMEA and in which sales, operations and con-
trol functions take part, the following aspects are being dis-
cussed: business development, KPIs and KrIs, feedback from
customers, strategic projects, industry trends and changes of
the legal and regulatory environment and its impact on the
respective business area. This enables the Management Board
to promptly identify changes or risks in the course of business
and to take appropriate decisions and actions.
SEGMENTS AND ESSENTIAL PRODUCTS AND
PROCESSES
J.P. Morgan AG is an integral part of the Group and is next
to J.P. Morgan Bank Luxembourg SA one of the two strate-
gic Group entities for the successful implementation of the
Brexit strategy. In the past three years, J.P. Morgan AG has
developed into the primary business unit for business activ-
ities in the areas of Investment Banking and Markets of the
Corporate & Investment Bank for customers based in the EEA
5MANAGEMENT REPORT
effectively. This also includes expansion in the areas of Sales
Finance and Inventory Finance.
Lending
In 2020 during the COVID-19 pandemic, J.P. Morgan AG con-
tinued to support its EEA clients, including private and public
corporates, financial institutions and private equity compa-
nies, by granting further loan commitments. The product
range comprised bilateral loans, syndicated loans and bridge
loans as well as club deals and asset-based lending. Further-
more, J.P. Morgan AG also started providing facility agent and
security trustee services in the fourth quarter of 2020.
At the end of the December 2020, J.P. Morgan AG had out-
standing loan commitments to clients in the amount of € 10.5
billion.
The size of the credit portfolio in J.P. Morgan AG is expected
to grow in 2021 as the Bank plans to gradually take over the
existing loan portfolio for EEA customers that currently still
exists in JPMS plc.
Segment “Markets”
The financial year 2020 was a year of significant changes for
the “Markets” business in J.P. Morgan AG.
The UK’s exit from the EU (“Brexit”) required and still requires
considerable adjustments to the business model in order to
maintain the Group’s current product range and EEA customer
base. Therefore, the focus of the Bank in 2020 was on the
continuous implementation of the necessary adjustments to
the organizational structure and underlying processes in order
to provide an uninterrupted range of services for our custom-
ers especially after January 1, 2021. These changes mainly
consisted of the repapering of the contracts with the impacted
Banker, has already changed from JPMS plc to J.P. Morgan AG
(including its branches) with effect from July 1, 2020. Addi-
tional employees of the Global Investment Bank changed to
J.P. Morgan AG on January 1, 2021.
Wholesale Payments
Wholesale Payments is the business division within the Group
covering Treasury Services and Global Trade, offering our cus-
tomers solutions for payment services, working capital manage-
ment, liquidity management as well as financing and hedging
solutions along the whole value creation chain across different
industry segments and markets. Following the expansion of our
range of products and services in Treasury Services over the
past two years, offering accounts and payment processing in 38
currencies, and the introduction of SEPA Instant, the business
is now focussing on offering open banking solutions and more
efficient coordination of sales channels.
J.P. Morgan AG continues to bear the global responsibility for
group-wide “high-value” payment transactions in Euro. We
expect to deliver our payment handling products and services
in the bulk payment markets centrally from J.P. Morgan AG, in
cooperation with our affiliates in the next few years, to both
corporate customers as well as financial institutions. It is also
our goal to build up our position as the leading Euro-clearer
in TArGET2 and EBA EUrO1 with offers to our multi-national
corporate customers and financial institutions in Germany and
abroad.
In Global Trade we continue to expand our product offering,
especially in our Supply Chain Financing programmes where
we have added ESG-compliant sustainability elements for the
first time in 2020. In addition, we are continuing to work on
expanding our product range in order to be able to cover the
financing and hedging needs of our target client base more

6 MANAGEMENT REPORT
Fixed Income Financing
Fixed Income Financing engages in market maker and enables
customers as well as the Group’s own trading desks to have
access to secured investments financing using a wide variety
of securities and types of collateral.
Securitized Product Group
The Securitized Product Group in J.P. Morgan AG under-
writes, places, finances and makes markets in asset-backed
securities, mortgage-backed securities and private and com-
mercial mortgage loans.
Global Credit
Global Credit Trading acts as a market maker for credit de-
rivatives and bonds for investment Grade, high-yield and dis-
tressed products in the corporate bond market. The Global
Credit Syndicate Desk is responsible for underwriting and
distribution of high-grade and high-yield bonds, as well as
emerging markets bonds to the primary market.
Commodities
Commodities engages in market making and offers hedging
solutions to corporate and institutional customers across a
wide range of commodity products. These products include,
among others, Energy, Metals, Agricultural Commodities
as well as customer-specific products. Instruments traded
include swaps, forwards, vanilla and exotic options, indices
and structured notes.
Currencies & Emerging Markets
Currencies & Emerging Markets also acts as a market maker
and provides liquidity and risk management solutions in
global currency markets and fixed income products from
emerging markets.
clients, the operational activation of customers, the set-up of
market infrastructure providers that are required to enable
day-to-day business operations, the set-up of the Bank as a
primary dealer in selected EEA markets, the migration of the
respective trading books as well as the relocation of the iden-
tified front office and support staff. The full implementation of
the Brexit program is expected to be completed in December
2021. It is planned that J.P. Morgan AG will adopt the role as
the central risk management within the Group for products
with a strong EU nexus.
At the end of 2020, J.P. Morgan AG employed 61 Trading staff
across Frankfurt, Paris and London as well as 103 Markets
Sales employees across Brussels, Frankfurt, London, Madrid,
Milan, Paris and Stockholm.
An overview of the various business areas in the “Markets”
segment is provided below:
– Rates
– Fixed income financing
– Securitized Product Group
– Global Credit
– Commodities
– Currency & Emerging Markets
– Equities (Cash Equities, EDG, Prime Finance, Global
Clearing)
Rates
Global Rates and Rates Exotics act as a market maker, provid-
ing prices and liquidity in G10-debt, OTC interest rate deriva-
tives and exchange-traded futures and options worldwide via
voice or electronic means. Rates Primary Frequent Borrower
also allows for the origination and syndication of high grade
public sector bonds in the primary debt market.

7MANAGEMENT REPORT
Brokerage. Here, the first clients have been transferred to
J.P. Morgan AG over the course of 2020.
The Bank has memberships on all relevant European stock
exchanges and with CCPs. For the majority of European CCPs,
the Group will get the membership of J.P. Morgan AG to han-
dle all Group-wide activities centrally. The Bank has access
to CCPs outside the EEA under indirect clearing agreements
through the memberships of other sister companies within
the Group.
Segment “Securities Services”
In the Group’s global Securities Services business unit,
J.P. Morgan AG acts as a regulated custodian in Germany and
has been offering global custody and custodian services for
institutional clients since 1995.
For its institutional clients (direct investors and invest-
ment funds managed by Kapitalverwaltungsgesellschaften),
J.P. Morgan AG currently safekeeps a total volume of € 353
billion and with net fund assets of € 206 billion belongs once
again to the largest depositaries in Germany at the end of this
year according to the Bundesverband Investment und Asset
Management e.V. (“BVI”).
The custodian, as defined by the German Capital Investment
Code [Kapitalanlagegesetzbuch, KAGB], has a special role
in the investment triangle in protecting investors and fund
assets. In addition to the custody of assets and the mainte-
nance of a current inventory list (with regard to non-custodial
assets), as well as settlement of ordered transactions, one of
the core functions of the custodian is to perform various con-
trol functions to protect the investment assets and the inves-
tors. Within the framework of its control functions, it is the
task of the Bank to supervise the capital management compa-
Cash Equities
The Cash Equities brokerage business encompasses stock
trading on behalf of customers and thus offers institutional
investors access to the global stock markets. The focus is on
the execution of physical cash securities (including stocks and
exchange traded funds (“ETFs”)). The business also trades
futures on stocks, indices and /or ETFs as well as OTC deriva-
tives for hedging purposes. The business focuses on execut-
ing client orders through algorithmic trading platforms and
smart order routing.
Equity Derivatives Group
Equity Derivatives Group, as the second activity within Equi-
ties, engages in market making primarily on equities and equi-
ties related products. It thus provides liquidity in a variety
of products, including linear equity products, listed and OTC
equity derivatives, dividend products and convertible bonds
in major European markets and in South Africa.
Prime Finance
Prime brokerage services include clearing, settlement and
custody of client securities, securities lending and margin
financing (both synthetic and cash). These services are pro-
vided primarily to hedge fund clients. The market making
activities on “Delta One” products include futures, swaps and
exchange traded funds (ETFs).
Global clearing
Since the end of 2018, the Global Clearing business has
been offering the execution and clearing of orders for
exchange-traded derivatives (futures & options) and clearing
services for OTC derivatives for external and internal cus-
tomers via a network of central counterparties (“CCP”). The
range of services in Global Clearing also includes FX Prime
8 MANAGEMENT REPORT
New product areas
As part of the implementation of the group-wide Brexit strat-
egy in order to establish J.P. Morgan AG as the future cen-
tral legal entity for the segments, “Banking” and “Markets”,
within the Corporate & Investment Bank for customers in the
European Union, the Bank had already started in 2019 to sig-
nificantly expand its product range. Efforts continued in 2020
to complete the rollout of all product and service offerings for
both segments as described above.
In 2020 J.P. Morgan AG also started trading Iron Ore futures
on the Dalian Commodities Exchange in China in order to be
able to offer global customers of the group access to these
hedging instruments.
Wholesale Payments continued to supplement its range
of products for treasury services, which had already
been expanded in 2019, during 2020 with the introduc-
tion of Open-Banking services. In addition, Global Trade
has expanded its product offerings especially in the area
of Sales Finance, but also in Supply Chain Financing by
having added ESG-compliant sustainability components to
these products.
MARKETS AND COMPETITIVE POSITION
Segment “Banking”
In 2020, in the area of Investment Banking area which com-
prises M&A, ECM and DCM activities, J.P. Morgan prevailed
with a market share of 9.0% according to Dealogic against
strong competition from European and US investment banks
and was ranked Number 1 with customers based in the Euro-
pean Union.
Thanks to the expanded product range in Wholesale Pay-
ments, Treasury Services, according to Coalition, was able
ny’s day-to-day activity in a timely manner with respect to the
relevant details and to ensures their compliance with statutory
provisions, regulatory standards and contractual provisions. In
addition to regulatory control tasks and services relating to the
custody of securities and settlement of trading transactions,
the Bank also offers its customers other services, such as a
comprehensive reporting system.
As in the previous years, J.P. Morgan AG has given high pri-
ority to the implementation of product and process-related
adjustments as part of its custody and depositary business.
From the perspective of the Management Board, this focus
will enable J.P. Morgan AG to continue to offer the business in
the usual high quality and with a correspondingly unchanged
high level of customer satisfaction, taking into account the
increased customer expectations. In addition to various prod-
uct extensions, for example in the area of reporting and vari-
ous initiatives for automation and digitization, the expansion
of services in the investment fund area is also planned for the
coming year.
Segment “Commercial Bank”
The Commercial Banking (“CB”) business in J.P. Morgan AG
focuses on the following two clients businesses: MMBSI (Mid-
dle Market Banking & Specialized Industries) targets subsid-
iaries of foreign multinational companies headquartered in
the EEA region with sales usually between USD 20 and 500
million, while CCBSI (Corporate Client Banking & Specialized
Industries) has relationships with companies headquartered in
Europe with sales between USD 500 million and USD 2 billion.
The product range includes the provision of Wholesale Pay-
ments, FX, credit and trading solutions, and also traditional
corporate and investment banking products, including DCM,
ECM, M&A and corporate derivatives.

9MANAGEMENT REPORT
The COVID-19 pandemic has reached almost every country in
the world and has led to significant cost burdens for econo-
mies and corporates due to the necessary lockdown measures
to tackle the uncontrolled spread of the virus. Most countries
fell into recession, and significant volatility could be observed
on stock markets. In response to the negative economic effects
of the pandemic, the central banks’ objective was to keep
interest rates at a low level, to make borrowing cheaper and
thus to give the economy a positive boost.
Another topic that had already prevailed in 2019, was the
political process related to Britain’s exit from the European
Union and the extensive preparatory measures in the financial
sector. The financial sector pursued the approach of preparing
for a “hard” Brexit at the end of 2020 without further tran-
sition periods and without any other relief. Accordingly, the
focus of banks and also of J.P. Morgan AG was on the complete
implementation of the structure and process organization as
well as on the intensive dialogue with future target clients.
At the same time, this preparatory process was made more
difficult by ongoing uncertainties regarding the future legal
and regulatory framework and thus regarding market access
between Great Britain and the EU.
Finally, the troubling events in Minneapolis, which sparked
social unrest in the United States and at the same time sparked
a worldwide discussion of racism and a growing awareness
of social equality and diversity, created a high level of uncer-
tainty among investors, also in the face of an extremely heated
election campaign for the 46th US President. In our opinion,
the outcome of the election was able to restore the lost con-
fidence combined with growing optimism.
to increase its market share (based on sales) in Germany,
Austria and Switzerland from 1.8% to 2.5%. With regard
to the Euro-clearing business, J.P. Morgan AG achieved third
place in TArGET2 (according to Bundesbank) in terms of value
and volume in January 2021. The competitive landscape did
not change significantly in 2020.
Segment “Markets”
In the last five years, the Group has built up its leading posi-
tion with clients in the European Union and currently holds a
top 3 position in the following business areas of Rates, Credit
and Equities according to external League Tables ¹.
The strategic direction remains unchanged and aims to
continuously gain market share as a full-service provider
in Markets products and services. Our competitors are dif-
ferent depending on the asset class and very differentiated
in detail. Typically, our competition consists of other US
investment banks as well as some of the major European
banks from Germany, France, Switzerland and the United
Kingdom.
Segment “Securities Services”
According to BVI, J.P. Morgan AG is one of the top 5 custo-
dian banks in terms of assets under custody and has a market
share of approximately 8% of the entire German funds mar-
ket, measured in terms of assets under custody, and even a
market share of 11% in the segment of special funds under
custody, which corresponds to the third place in the ranking.
KEY LEGAL AND ECONOMIC INFLUENCE FACTORS
Three central themes have characterized the financial year
2020. They had a significant impact on economic factors
worldwide and thus also on our customer base across all J.P.
Morgan AG segments.
¹ Coalition Propietary Analytics
10 MANAGEMENT REPORT
Other geopolitical conflicts in Asia and the Middle East as well
as climate change remained on the radar in 2020, but in our
view had no significant impact on the global economy.
According to our assessment, the legal and regulatory envi-
ronment for banks in the EU remained stable in 2020 as gov-
ernments and regulators intended to minimize additional bur-
dens and instead provided temporary relief for the economy
in the light of the severe impact of the COVID-19 pandemic.
Further topics that we have been dealing with since 2019 are
increasing digitization and its effects on our business processes
as well as IT security with a constantly growing threat from
cybercrime. The COVID-19 pandemic and its consequences for
organizations, employees, partners and customers encourage
us to continue on this path for greater digitization and elec-
tronization internally, but also in our interactions with clients.
PERSONNEL DEVELOPMENT
The number of employees at J.P. Morgan AG increased in
2020 from 361 to an average of 626 employees compared to
the previous year.¹ The staff turnover rate was 5%. Of the
total number of employees, 12% took advantage of flexible
work arrangements.
In line with our business concept, we continue to focus on the
quality of new hires in the selection process, and on the contin-
uous training and promoting education programs for our staff.
The J.P. Morgan AG human resources strategy focuses on the
highest quality and diversity of employees, and provides a clear
commitment to align the strategy to the needs of our employees.
The remuneration system of J.P. Morgan AG is integrated into
the remuneration structure for employees in the EMEA region
(“EMEA Remuneration Policy”).
BUSINESS DEVELOPMENT
2020 was a successful year for J.P. Morgan AG. The Bank
was able to successfully complete the transformation from
a transaction bank with a focus on payment processing and
securities services to a strategic legal entity for the Corpo-
rate & Investment Banking Line of Business within the Group
for its customers in the EEA area.
As a result, our dependency on strong interest income has
decreased significantly thanks to the significant increase in
commission and fee income due to the integration of Global
Investment Banking and Markets activities.
2020 was marked by the COVID-19 pandemic, with some
extreme market developments, as observed in March 2020.
Our business development benefited greatly from our stra-
tegic direction. As an operationally stable and financially
strong counterparty for our customers, we were able to pro-
cess a multiple of the volume of a normal business day with
regard to payment orders, securities processing, transfer of
collateral, clearing of exchange-traded derivatives and other
trade transactions without significant disruptions. Therefore,
the financial year 2020 closed with strong growth in sales
and earnings.
In addition, we continued to support our customers by pro-
viding loan commitments that increased to € 10.5 billion by
the end of 2020.
The positive business development in 2020 is ultimately
reflected in a satisfactory pre-tax profit of € 176.3 million
despite an increase in our loan loss provision by € 156.7
million.
¹ This does not include employees that have been seconded or placed on leave or are on parental leave.

11MANAGEMENT REPORT
In financial year 2020, mainly the effects of the COVID-19
pandemic led to an increase in loan loss provisions from
€ 19.9 million in 2019 to € 176.6 million in 2020, which
reflects an increase of € 156.7 million from previous year.
The total administrative expenses and depreciations rose sig-
nificantly by around 139% in 2020, which was mainly due
to the build-up of additional resources and the transfer of
employees to the branches of J.P. Morgan AG and other costs
incurred as part of the Brexit strategy.
Profit for the year increased significantly from € 71.1 million
to € 176.3 million. The annual result in the financial year 2020
amounts to a profit after taxes of € 139.9 million.
This result means a Return on Equity of 1.1% compared to
0.9% in the prior year.
FINANCIAL POSITION (IFRS)Principles and Objectives
The significant increase in trading assets and trading liabil-
ities as a result of the migration of the risk positions in the
trading area as well as the balances at the Deutsche Bundes-
bank need to be mentioned as the main drivers of the balance
sheet development. The balance sheet of J.P. Morgan AG con-
tinues to be impacted by the deposits of its institutional cli-
ents and banks as part of the Euro-clearing business and the
custodian business and continues to show a stable financial
situation in 2020. We enable our customers in the “Securities
Services” segment and the “Wholesale Payments“ segment to
access credit only by granting intraday lines and short-term
overnight overdraft lines in case of incorrect disposition. In
addition, the increase in lending business in the Lending
business area also had an impact on the composition of the
balance sheet.
Earnings, Financial and Assets Position (IFRS)
J.P. Morgan AG’s internal control and regulatory reporting is
based on IFrS. For this reason, after the presentation of the
earnings, financial and asset situation according to IFrS, a
reconciliation for the profit after tax from IFrS to HGB will be
provided and a subsequent presentation of earnings, financial
and asset situation is presented according to HGB as well.
EARNINGS (IFRS)Mainly thanks to the implementation of the Brexit strategy
in the “Banking” and “Markets” segments, and also to the
expansion of business activities in the Wholesale Payments
business division, J.P. Morgan AG succeeded in significantly
increasing net fee and commission income in 2020. In financial
year 2020, the net fee and commission income was € 707.1
million, 204% up compared to the previous year. The net inter-
est income shows a negative trend compared to the previous
year and is reported at € 0.1 million, which is € 35.1 million
lower than previous year. The increase in the balances at the
Deutsche Bundesbank reported under the item cash and cen-
tral bank balances is to be seen as a decisive factor influencing
net interest income. The target figures for 2020 were largely
achieved despite the political uncertainty and the ongoing
COVID-19 pandemic and its effects on loan loss provisions in
the lending business on profit of the year.
The net result from financial assets and liabilities measured
at fair value in the amount of € 33.2 million was in 2020 with
€ 48.2 million significantly above the prior year. This change
is mainly due to the migration of risk positions in the “Mar-
kets” segment.
12 MANAGEMENT REPORT
of 30.5% and a total capital ratio of 32.9% according to the
Crr regulation. With these capital holdings, J.P. Morgan AG
is in a solid position in the view of the Management Board
to provide the required capital underpinning for the existing
business as well as further business activities that J.P. Morgan
AG will take over as part of the implementation of the Group-
wide Brexit strategy. J.P. Morgan AG’s regulatory equity was
made up of the following components as at the reporting date
of December 31, 2020:
Core capital (Tier 1): € 12.643 million in share capital and
reserves
Tier 2 capital: € 1.026 billion from subordinated
loans and issued Tier 2
notes
Off-Balance Sheet Business
In the Lending business, there are irrevocable loan commit-
ments totalling € 10.5 billion related to the transfer of the
lending portfolio in 2019 and new business in this busi-
ness unit. In addition, in the Wholesale Payments business,
J.P. Morgan AG has largely continued to directly collateralize
its own credit risks in the form of contingent liabilities within
the rest of the Group. Furthermore, J.P. Morgan AG concluded
a total return swap for a promissory note for risk hedging and
an interest rate swap with J.P. Morgan Chase Bank, N.A., to
hedge interest rate risks from the securities portfolio.
Against the J.P. Morgan Structured Products BV (JPMSP), J.P.
Morgan AG has issued a guarantee that bonds, warrants and
certificates issued by the sister company and held by third
parties up to a maximum nominal volume of USD 1 billion
are secured against the insolvency of JPMSP. J.P. Morgan
AG is committed to settle payments due to the holders of
The total balance sheet as of December 31, 2020 significantly
increased by 280% compared to the balance sheet as of
December 31, 2019. The main drivers were, on the one hand,
the migration of risk positions in the trading area, which is
reflected in the increase in trading assets and trading liabili-
ties, and, on the other hand, the increase in balances at the
Deutsche Bundesbank.
J.P. Morgan AG was always provided with sufficient liquidity
in 2020. The liquidity coverage ratio of 146.7% as of Decem-
ber 31, 2020 is also significantly above the mandatory mini-
mum rate of 100% which has applied since January 1, 2018.
Capital Structure
The liable equity has increased compared to December 31,
2019 by the profit from prior year which was transferred to
reserves and above all, through the capital increase carried out
in March, September and October 2020 in the form of a simple
additional payment by J.P. Morgan International Finance Lim-
ited as the sole shareholder totalling € 0.9 billion, € 4.3 billion
and € 2.6 billion respectively. In addition, a capital increase
of the Tier 2 capital was carried out in December 2020 by
issuing a subordinated Tier 2 note to J.P. Morgan International
Finance Limited in the amount of € 0.8 billion. The new subor-
dinated Tier 2 notes issued in financial year 2020 have a matu-
rity date of December 3, 2030 and an interest rate based on
the one-month EUrIBOr plus 0.83% with a minimum interest
rate of 0.00% and a monthly interest payment. Furthermore,
there are still two subordinated loans, one from 2009 in the
amount of € 150,000,000 (due date: December 21, 2039) as
well as a further subordinated loan of € 35,790,432 (with an
indefinite term) which in the course of the merger between
J.P. Morgan Beteiligungs- und Verwaltungsgesellschaft mbH
and J.P. Morgan AG was transferred to J.P. Morgan AG. As
of December 31, 2020, this results in a Tier 1 capital ratio
13MANAGEMENT REPORT
These increased the total balance sheet of J.P. Morgan AG
by around 280% compared to the balance sheet date in the
previous year, and stood at € 244,618 million as of Decem-
ber 31, 2020. As of December 31, 2020 the total capital ratio
was 32.9% with the average for 2020 being 34.3%.
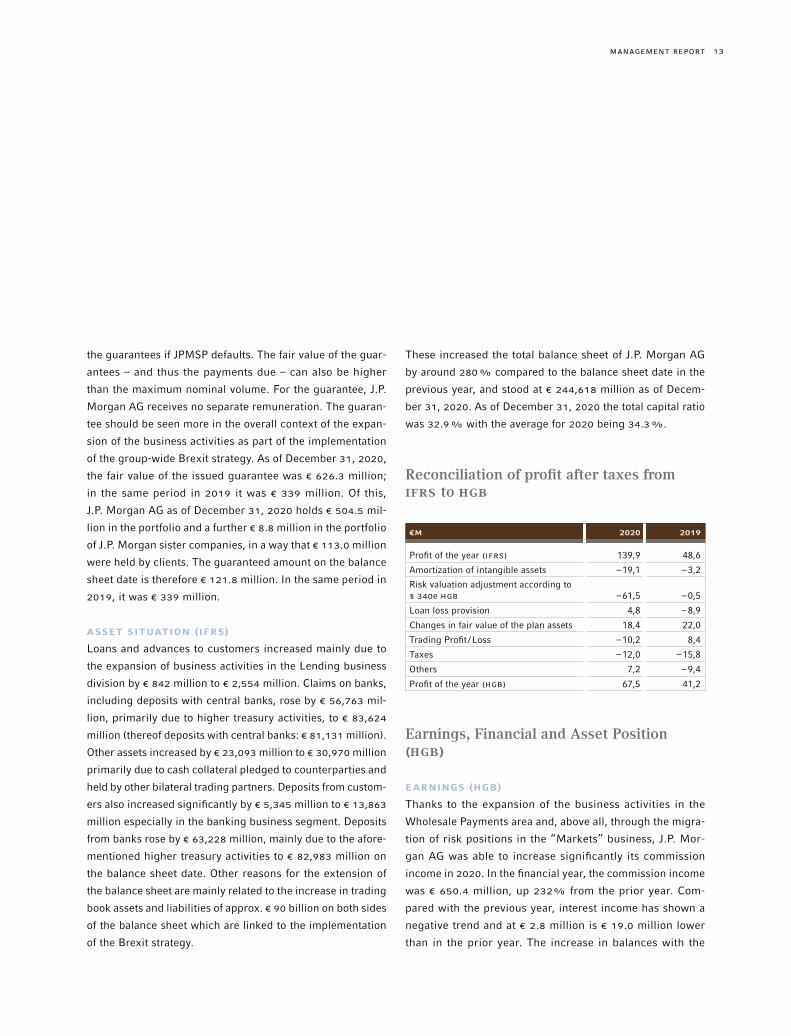
Reconciliation of profit after taxes from IFRS to HGB
€M 2020 2019
Profit of the year (IFrS) 139,9 48,6
Amortization of intangible assets –19,1 –3,2
Risk valuation adjustment according to § 340e HGB –61,5 –0,5
Loan loss provision 4,8 –8,9
Changes in fair value of the plan assets 18,4 22,0
Trading Profit /Loss –10,2 8,4
Taxes –12,0 –15,8
Others 7,2 –9,4
Profit of the year (HGB) 67,5 41,2
Earnings, Financial and Asset Position (HGB)
EARNINGS (HGB)Thanks to the expansion of the business activities in the
Wholesale Payments area and, above all, through the migra-
tion of risk positions in the “Markets” business, J.P. Mor-
gan AG was able to increase significantly its commission
income in 2020. In the financial year, the commission income
was € 650.4 million, up 232% from the prior year. Com-
pared with the previous year, interest income has shown a
negative trend and at € 2.8 million is € 19.0 million lower
than in the prior year. The increase in balances with the
the guarantees if JPMSP defaults. The fair value of the guar-
antees – and thus the payments due – can also be higher
than the maximum nominal volume. For the guarantee, J.P.
Morgan AG receives no separate remuneration. The guaran-
tee should be seen more in the overall context of the expan-
sion of the business activities as part of the implementation
of the group-wide Brexit strategy. As of December 31, 2020,
the fair value of the issued guarantee was € 626.3 million;
in the same period in 2019 it was € 339 million. Of this,
J.P. Morgan AG as of December 31, 2020 holds € 504.5 mil-
lion in the portfolio and a further € 8.8 million in the portfolio
of J.P. Morgan sister companies, in a way that € 113.0 million
were held by clients. The guaranteed amount on the balance
sheet date is therefore € 121.8 million. In the same period in
2019, it was € 339 million.
ASSET SITUATION (IFRS)Loans and advances to customers increased mainly due to
the expansion of business activities in the Lending business
division by € 842 million to € 2,554 million. Claims on banks,
including deposits with central banks, rose by € 56,763 mil-
lion, primarily due to higher treasury activities, to € 83,624
million (thereof deposits with central banks: € 81,131 million).
Other assets increased by € 23,093 million to € 30,970 million
primarily due to cash collateral pledged to counterparties and
held by other bilateral trading partners. Deposits from custom-
ers also increased significantly by € 5,345 million to € 13,863
million especially in the banking business segment. Deposits
from banks rose by € 63,228 million, mainly due to the afore-
mentioned higher treasury activities to € 82,983 million on
the balance sheet date. Other reasons for the extension of
the balance sheet are mainly related to the increase in trading
book assets and liabilities of approx. € 90 billion on both sides
of the balance sheet which are linked to the implementation
of the Brexit strategy.

14 MANAGEMENT REPORT
The main drivers were, on the one hand, the increase in the
positions in the trading portfolio and, on the other hand, the
increase in deposits at the Deutsche Bundesbank.
Capital Structure
The information on the capital structure according to the Ger-
man Commercial Code (HGB) does not differ from the infor-
mation provided in the corresponding IFrS section.
Off-Balance Sheet Business
The information on off-balance sheet transactions does not
differ between IFrS and HGB.
ASSET SITUATION (HGB)Receivables from customers increased by € 5,405 million
to € 8,094 million primarily due to the expansion of busi-
ness activities in the Lending business and the expansion
of business activities as part of the Brexit strategy. Receiv-
ables from banks, including the deposits with central banks
reported under cash reserves, rose by € 56,621 million to
€ 90,032 million (thereof deposits with central banks: € 81,131
million), mainly due to greater treasury activities. Liabilities
to customers increased significantly by € 7,795 million to
€ 16,601 million particularly in the banking business. Lia-
bilities to banks rose by € 42,598 million to € 63,550 million
mainly due to the aforementioned greater treasury activities
on the balance sheet date. Other reasons for the extension
of the balance sheet are mainly related to the increase in
the trading portfolio of approx. € 90 billion on both sides of
the balance sheet which are linked to the implementation
of the Brexit strategy.
The total balance sheet of J.P. Morgan AG has increased by
around 240% compared to the balance sheet of the prior
Deutsche Bundesbank can be seen as a significant impact on
interest earnings. Despite the political uncertainty and the
ongoing COVID-19 pandemic, the budget figures for 2020
were largely achieved in terms of result from operational
business activities.
The result of the trading portfolio in the amount of € –38.5
million was in 2020 with € 31.8 million significantly below
the prior year. This change is mainly due to the migration of
risk positions in the “Markets” business and the associated
increase in the value-at-risk discount.
In the financial year 2020, the effects of the COVID-19
pandemic, in particular, led to an increase in loan loss provi-
sions to € 171.8 million from € 28.8 million in 2019.
The total administrative expenses, depreciation and other
operating expenses rose significantly by around 143% in
2020, which was mainly driven by the buildup of additional
resources and the transfer of employees to the branches of
J.P. Morgan AG and other costs incurred as part of the Brexit
strategy.
This increased earnings from normal business activities from
€ 79.5 million to € 116.0 million. The net income for the finan-
cial year 2020 amounts to € 67.5 million.
FINANCIAL POSITION (HGB)Principles and Objectives
The basic statements about the composition of the balance
sheet do not differ significantly from the statements made in
the relevant IFrS section. The balance sheet as of December 31,
2020 significantly increased from € 44.2 billion to € 150.1 bil-
lion compared to the balance sheet as of December 31, 2019.
15MANAGEMENT REPORT
€M 2020 2019
Total operating income 740.8 253.1
Net interest income 0.1 35.2
Net fee and commission income 707.1 232.3
Loan loss provision 176.6 19.9
Total administrative expenses, depreciation and amortization 388.0 162.1
Profit before tax 176.3 71.1
Profit for the year 139.9 48.6
Equity 13,012 5,143
Return on Equity (RoE) (Profit of the year /Equity) 1.1% 0.9%
Return on Investment (Profit of the year /Total Balance Sheet) 0.06% 0.08%
Cost-Income Ratio ¹ (Sum of administra-tive expenses and depreciation and amortization /Total operating income) 52.37% 64.07%
Pre-tax profit margin (Profit before tax /Total operating income) 23.80% 28.08%
Tier 1 capital ratio 30.5% 27.8%
Total capital ratio 32.9% 28.8%
¹ Indicator before loan loss provision
Despite an increase in loan loss provision, the profit for the
year reported an increase from € 48.6 million to € 139.9 mil-
lion in 2020. The return on equity (RoE) increased from 0.9%
in the previous year to 1.1% in 2020. The cost-income ratio
decreased from 64.1% in the previous year to 52.4%. Due
to the expanded business model as part of the Brexit strategy
and the capital increases that have been carried out, we are
reporting a total capital ratio of 32.9% as of December 31,
2020.
year, and stood at € 150,133 million as of December 31,
2020.
Overall statement on Earnings, Financial and
Assets Position
In summary, the earnings, financial and asset position can be
assessed as positive. The expectations from the beginning
of 2020 for the development of the profit of the year have
been almost met despite significantly higher risk provisioning
in the lending business. The capital measures taken in 2020
had the expected effect on the capital ratios over the course
of the year. As predicted, the requirements for the liquidity
coverage ratio remained clearly over the threshold during the
financial year.
Financial and Non-financial Performance Indicators
FINANCIAL PERFORMANCE INDICATORS
Financial performance indicators according to IFrS, which are
used for the internal management of J.P. Morgan AG, include
in particular absolute KPIs such as net interest income, fee
and commission income and the profit of the year. In addi-
tion, return on equity, cost-income ratio and profit margin
before taxes are used to assess the performance. The KPIs
are derived directly from the information contained in the
balance sheet and the income statement of the IFrS individual
financial statements and are as follows for the current and
previous year:
16 MANAGEMENT REPORT
2020 ¹ 2019
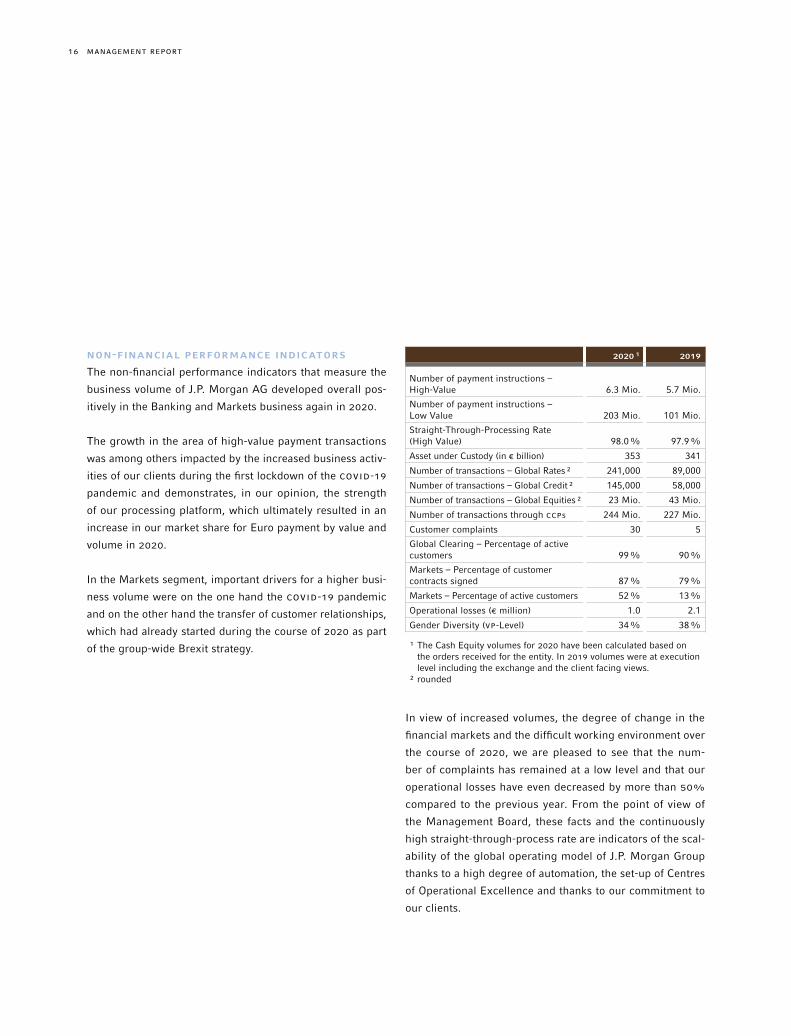
Number of payment instructions – High-Value 6.3 Mio. 5.7 Mio.
Number of payment instructions – Low Value 203 Mio. 101 Mio.
Straight-Through-Processing Rate (High Value) 98.0% 97.9%
Asset under Custody (in € billion) 353 341
Number of transactions – Global Rates ² 241,000 89,000
Number of transactions – Global Credit ² 145,000 58,000
Number of transactions – Global Equities ² 23 Mio. 43 Mio.
Number of transactions through CCPs 244 Mio. 227 Mio.
Customer complaints 30 5
Global Clearing – Percentage of active customers 99% 90%
Markets – Percentage of customer contracts signed 87% 79%
Markets – Percentage of active customers 52% 13%
Operational losses (€ million) 1.0 2.1
Gender Diversity (VP-Level) 34% 38%
¹ The Cash Equity volumes for 2020 have been calculated based on the orders received for the entity. In 2019 volumes were at execution level including the exchange and the client facing views.
² rounded
In view of increased volumes, the degree of change in the
financial markets and the difficult working environment over
the course of 2020, we are pleased to see that the num-
ber of complaints has remained at a low level and that our
operational losses have even decreased by more than 50%
compared to the previous year. From the point of view of
the Management Board, these facts and the continuously
high straight-through-process rate are indicators of the scal-
ability of the global operating model of J.P. Morgan Group
thanks to a high degree of automation, the set-up of Centres
of Operational Excellence and thanks to our commitment to
our clients.
NON-FINANCIAL PERFORMANCE INDICATORS
The non-financial performance indicators that measure the
business volume of J.P. Morgan AG developed overall pos-
itively in the Banking and Markets business again in 2020.
The growth in the area of high-value payment transactions
was among others impacted by the increased business activ-
ities of our clients during the first lockdown of the COVID-19
pandemic and demonstrates, in our opinion, the strength
of our processing platform, which ultimately resulted in an
increase in our market share for Euro payment by value and
volume in 2020.
In the Markets segment, important drivers for a higher busi-
ness volume were on the one hand the COVID-19 pandemic
and on the other hand the transfer of customer relationships,
which had already started during the course of 2020 as part
of the group-wide Brexit strategy.

17MANAGEMENT REPORT
BUSINESS PRINCIPLES “HOW WE DO BUSINESS”
J.P. Morgan AG is fully integrated into the corporate cul-
ture of J.P.Morgan Chase & Co., whose guiding principles
are described by the four pillars of the group-wide business
principles:
– Exceptional Client Service
– Operational Excellence
– A Commitment to Integrity, Fairness and Responsibility
– A Great Team and Winning Culture
Relationships with Related Companies and Persons
We identified our parent company, J.P. Morgan International
Finance Ltd., and also J.P. Morgan Securities plc, JPMorgan
Chase Bank, N.A., as well as the J.P. Morgan Structured Prod-
ucts B.V. as companies closely related to J.P. Morgan AG.
We consider the members of the Management Board and the
Supervisory Board of J.P. Morgan AG and their family mem-
bers as well as related persons.
The following financial transactions are carried out with
related companies:
– Money market transactions, investing and borrowing money
as well as financial guarantees
– Transactions in total return swaps, OTC derivatives and other
trading related positions
– Transactions in the Global Clearing and Cash Equity sector
– Reverse Repos
– Nostro accounts
We also see the 3.5% increase in assets under custody as a fur-
ther signal of trust that our customers have in J.P. Morgan AG.
“Operational Excellence” remains our guiding principle and
is directly linked to our efforts to continuously improve our
technology platform, the internal control systems and the con-
tinuous training of our employees. It is important to us that
we perform an in-depth analysis of our operational errors,
learn from the outcome and draw the necessary conclusions
for the future. For this reason, we are particularly committed
to an open “risk and error culture”.
In 2020, the Management Board paid less attention to the
attrition rate than in the past financial year in view of the
growth in headcount not only in Frankfurt, but in the entire
network of our European branches, while continuing to face
ongoing competition for talent in the financial sector in Frank-
furt as well as in Paris.
Our goals remain the continuous improvement of our working
environment and the determined implementation of a “Great
Team & Winning Culture”. We strive to proactively counter
and eliminate biases and prejudices and to contribute to an
inclusive and diverse environment not only in our workplace
but in all aspects of our lives.
STATEMENT BY COMPANY MANAGEMENT
The Supervisory Board established a target in 2017 of 30%
for inclusion of women for both the Supervisory Board and
the Management Board; the Management Board likewise set
a target of 30% women in 2017 for both senior management
levels. J.P. Morgan AG plans to achieve these targets by June
2022.
18 MANAGEMENT REPORT
the efficacy of the vaccine in the line of emerging new virus
variants and finally with regard to the inconsistent political
responses across Europe balancing the need of increased
mobility and the risk of rising virus reproduction ratios. In
the light of these uncertainties, we are not in a position to issue
a statement about the medium-term effects of the pandemic
over the 2nd half of 2021 and beyond. Essential conditions
for an ongoing and sustainable economic recovery are on one
hand a swift and effective execution of a vaccination strategy
globally and on the other hand the ongoing effectiveness of the
monetary and financial policy measures of central banks and
governments to provide financial support to the economy, sup-
porting global GDP growth which we could observe in the first
two months of 2021, while keeping inflation under control.
Regarding the Bank’s loan portfolio, we are still assuming
slight growth in loan commitments with existing customers
of J.P. Morgan AG. Due to the risk provision already booked
in the amount of € 176.6 million, we are only planning to
increase this by approximately 10% and we do not expect
any significant loan defaults that could have a material impact
on our results.
We continue to closely monitor the spread of the virus and
its impact with the prime objective to protect our own staff
and our ability to service our clients. We are confident that
we have implemented a robust concept globally which we will
continuously adapt in line with the recommendations of the
health authorities and government agencies.
The unresolved trade disputes between the United States
and China remain on our radar. While we expect the new
US administration to bring a change in direction with regard
to foreign affairs, tensions between the US and China will
remain, potentially representing the most important geopolit-
– Provision of subordinated capital
– Purchasing and supplying corporate services
All transactions have been performed on normal market terms.
DECLARATION ON DEPENDENCY COMPANY REPORT
IN ACCORDANCE WITH § 312 GERMAN STOCK
CORPORATION ACT (“AKTG”)
J.P. Morgan AG is a dependent company of J.P. Morgan
International Finance Limited. Since there is no domination
agreement between the companies, the Management Board
of J.P. Morgan AG prepared a report on relationships with
affiliated companies in accordance with § 312 of the German
Stock Corporation Act (“AktG”), which concludes with the
following declaration:
The Management Board declares that J.P. Morgan AG has
received an appropriate consideration for each legal trans-
action in accordance with the circumstances that were known
to it at the time when that individual legal transaction was
entered into or the step undertaken or refrained from, and
was not placed at a disadvantage due to the measure being
taken or refrained from.
Outlook
SIGNIFICANT OPPORTUNITIES AND RISKS FOR THE
UPCOMING FINANCIAL YEAR
One year after the outbreak of the COVID-19 pandemic at the
beginning of 2020, J.P. Morgan AG and the Group continue
to take a prudent view in the light of continued incremental
uncertainty with regard to inconsistent development of infec-
tion rates across Europe, the risk of a 3rd wave and its severity
and duration, the effective distribution of vaccine as well as
19MANAGEMENT REPORT
and many aspects of the future EU-UK relationship remain to
be settled. Especially the absence of “equivalence” rules not
just for the manufacturing industry, but also for the financial
industry, where, for example, the clearing of Euro-denomi-
nated derivatives is one the unresolved matters as the majority
of European clearing activity takes place on London-based
exchanges. During 2021, we expect the EU to continue to
develop the Capital Markets Union. Considering UK’s exit
from the European Union and the expectation for the finan-
cial sector to support the European Member States in dealing
with the economic consequences of the COVID-19 pandemic
by creating effective funding opportunities, we expect new
business opportunities to arise for J.P. Morgan AG.
The cybersecurity outlook for J.P. Morgan AG and the financial
sector for 2021 is determined, in large part, by the continued
socioeconomic volatility that businesses continue to face as
a result of the pandemic. Throughout 2021, it is expected
that nation-state threat actors will continue to conduct cyber
espionage campaigns, while advanced cybercriminal groups
will continue to evolve and adapt in order to maximize their
returns. This includes ransomware attacks which have sig-
nificantly increased and have resulted in higher pay-outs for
threat actors.
In addition we expect attacks targeting the supply chain to
continue and as long as suppliers fail to implement adequate
security controls, the threat will persist in 2021. While J.P.
Morgan AG and the financial sector are not a priority target
for these attacks, the firm’s suppliers could act as a conduit
to systems and data. While we see these as a true risk for
J.P. Morgan AG, we also see this as an opportunity to work
with our clients, suppliers and the industry to mitigate cyber-
security threats.
ical risk over the medium- to long-term. However, we do not
see any immediate negative impact for 2021.
Climate change is a global challenge that has presented – and
will continue to present – risks for businesses and communi-
ties around the world. Since the Paris Agreement in 2015, cli-
mate change has been one of the most important drivers of the
market impacts of ESG factors. The impact will be manifold:
Activities of businesses could be disrupted by the physical
risks from climate change. In addition, these physical changes
may prompt changes in regulations or consumer preferences
which in turn could have significant consequences for the
business models of our clients but also for the business
activities of the Group and more specifically for the business
activities of J.P. Morgan AG. While greenhouse gas emissions
are increasingly being regulated and taxed by governments,
we see and expect to continue to see a trend of most major
economies committing to net-zero targets. As a consequence,
companies with higher emissions might see their cost of doing
business rising and other companies which do not credibly
integrate climate change into their business strategy might
also have impact on their competitive advantage. Climate
change impacts every industry sector, including the financial
industry. We see, on the one hand, new business opportunities
for J.P. Morgan AG to support companies that are thinking
strategically about this transition and that are positioning
themselves to adapt to sustainably focused trends over time.
Also within J.P. Morgan AG this transformation process has
already started. For this purpose, a separate coordination
office has been created that reports directly to the Bank’s CEO.
UK’s exit from the European Union at the end of 2020 hap-
pened with little disruptions to markets. However, we do not
expect this to be the end of the Brexit negotiations, since
most of the trade agreements are subject to periodic review
20 MANAGEMENT REPORT
based in the EEA, we are anticipating a significant increase
in our interest and commission income, with the contribution
increasing 29% from the “Banking” business and 69% from
the “Markets” business. At the same time we expect a signif-
icant increase in our total expenses of over 300%, in view of
a headcount of approx. 1,300 towards the end of the finan-
cial year and in view of the expansion of business activities
that have taken place. Our expectation is that earnings before
taxes will increase significantly again in 2021 and ultimately
lead to a return on equity (RoE) of 2.7% and a rOrAC of 1%.
Regarding the four Segments within J.P. Morgan AG, we see
the following business development:
For the “Banking” segment, we expect the interest and com-
mission income to double, especially through the Global
Investment Banking activities, since this will be the first year
in which we will fully benefit from the implementation of the
group-wide Brexit strategy. For the Wholesale Payments busi-
ness, we see again a good basis for continuing our growth
path in terms of customer acquisition and payment volumes
through a combination of market consolidation and the con-
tinuous expansion of our product offerings. For the loan port-
folio in the Lending business, we are assuming an increase in
interest and commission income of around 20%, also thanks
to anticipated increase in loan commitments, which were in
the past in J.P. Morgan Securities plc.
The “Markets” segment in J.P. Morgan AG has started the new
financial year 2021 with a full range of products for its pros-
pects in the EEA. We therefore expect a significant increase in
transaction volumes and an increase in sales of around 300%
compared to 2020. We are confident that we will benefit from
our determined and timely implementation of the Brexit-re-
lated necessary changes to the organizational structure and
Due to the impact of COVID-19, J.P. Morgan AG increased the
use of remote access and also video conferencing solutions
provided by third parties to facilitate remote work. As a result,
the Bank took additional precautionary measures to mitigate
cybersecurity risk.
We plan to have the implementation of the Brexit program
fully completed by the end of 2021. This includes, on the one
hand, the further transfer of risk assets , for which J.P. Morgan
AG will become the central risk managing legal entity of the
Group in the future, and on the other hand the migration of
trading portfolios of our existing customers who still hold
such portfolios at J.P. Morgan entities in the UK and which
will be newly consolidated in J.P. Morgan AG. Together with
the expansion of our current business activities, we assume
that our total assets could increase by the end of 2021 in a
similar way to the previous year.
As a result, we also expect an increase in risk-weighted assets
(rWA) of up to 75%, primarily driven by newly established
market risk positions and the further expansion of customer
relationships in the “Markets” business and the associated
increase in credit risk. With further planned capital increases
in 2021, we will be able to support these business activities
with the necessary capital to meet the regulatory require-
ments. It is the objective to have a Tier 1 capital ratio of at
least 20% and a total capital ratio of at least 25%. With
regard to our liquidity situation, we consider the Bank to be
comfortably positioned with a liquidity coverage ratio of over
150% for 2021.
With regard to the 2021 earnings situation of J.P. Morgan
AG and due to the implementation of the group-wide Brexit
strategy and the strategic role of the Bank as the primary
legal entity of the Corporate & Investment Bank for customers
21MANAGEMENT REPORT
Capital Requirements Regulation (Crr2), the Bank Recovery
and Resolution Directive (BrrD2) and the Single Resolution
Mechanism Regulation (SrMr2). This will lead to significant
changes in terms of capital and financing requirements, gov-
ernance structures in risk management, reporting, recovery
and resolution planning and in some cases also to the corpo-
rate structures. As a result of these regulatory reforms, the
financial sector will face complex implementation measures
in 2021.
Risk Report 2020
RISK MANAGEMENT
Risk is an inherent part of the business activities of J.P. Mor-
gan AG (“the entity”) and JPMorgan Chase (“the Firm”). When
J.P. Morgan AG extends a loan, advises customers and clients
on their investment decisions, makes markets in securities,
or offers other products or services, it takes on some degree
of risk. The overall objective is to manage its businesses, and
the associated risks, in a manner that balances serving the
interests of its clients, customers and investors and protects
the safety and soundness of the entity and the Firm.
Effective risk management in J.P. Morgan AG requires, among
other things:
– Acceptance of responsibility, including identification and
escalation of risk issues, by all individuals within the entity;
– Ownership of risk identification, assessment, data and man-
agement within each of the lines of business (LOBs) and
Corporate functions; and
– Independent risk governance which is embedded into Firm-
wide structures as appropriate.
underlying processes. We expect continued strong competi-
tion for all of our business activities in Markets. However, it
is also our expectation that we will further expand our market
position and gain further market share in 2021, as some com-
petitors have not yet been able to fully build and adapt their
business model to the new Brexit requirements. It is also our
expectation to further gain market share in 2021 as other
participants adjust to the Brexit requirements, and that height-
ened volatility events become more frequent and severe with
the large volumes of excess liquidity in the financial markets.
Regardless, we do not see any significant systemic changes
in general demand in 2021.
From our point of view, the cost pressure in the “Securities
Services” segment will persist. We are therefore working both
internally and with our customers on the broad automation of
our processes. In addition, we are planning for the renegotia-
tion of supplier contracts and new projects with the objective
of realizing additional economies of scale through a stronger
integration of external specialist providers and through a opti-
mized usage of the group-wide infrastructure. While we are
working on reducing our operating costs, we will continue to
look for opportunities to target new client segments in the Ger-
man market. With a stable interest and commission income,
we expect to be able to improve our pre-tax profit in 2021.
We will continue to expand the “Commercial Bank” segmet
in 2021, resulting in a planned increase in net interest and
commission income of around 50%. Since necessary invest-
ments will also lead to higher costs in 2021 and sustainable
earnings growth only in subsequent years, we assume that
this segment will show a small loss in 2021.
2021 will be also a year of major regulatory reforms, including
Changes to the Capital Requirements Directive (CrD5), the

22 MANAGEMENT REPORT
– Strategic risk is the risk to earnings, capital, liquidity or rep-
utation associated with poorly designed or failed business
plans or inadequate response to changes in the operating
environment.
Impacts of risks are consequences of risks, both quantitative
and qualitative. There may be many consequences of risks man-
ifesting, including quantitative impacts such as a reduction in
earnings and capital, liquidity outflows, and fines or penalties,
or qualitative impacts such as reputation damage, loss of clients
and customers, and regulatory and enforcement actions.
J.P. Morgan AG Risk Strategy
J.P. Morgan AG’s approach to risk management builds on the
Firmwide approach. The principles are set out in the risk strat-
egy. The risk strategy is derived directly from J.P. Morgan AG’s
business strategy. It sets out the principles for risk manage-
ment in J.P. Morgan AG as defined by the Management Board
of J.P. Morgan AG and is approved annually by the Supervisory
Board.
The risk strategy defines how J.P. Morgan AG manages the
risks it has taken as part of its business activities. By limiting
and managing the risks, the entity aims to ensure risk-bearing
capacity and liquidity at all times. The risk strategy covers
all material risks identified by the Risk Inventory and is, if
necessary, further specified for individual risk categories in
the form of partial risk strategies and then made concrete
and operational using policies, frameworks, guidelines and
operating procedures. The completeness and suitability of the
risk strategy is reviewed at least annually based on the J.P.
Morgan AG Business Strategy.
The following principles apply for overall risk management
and monitoring:
The entity and the Firm strive for continual improvement in
their efforts to enhance controls, ongoing employee training
and development, talent retention, and other measures.
RISK GOVERNANCE AND OVERSIGHT
The risk management governance and oversight framework
involves understanding drivers of risks, types of risks, and
impacts of risks.
Drivers of risks are factors that cause a risk to exist. Drivers
of risks include the economic environment, regulatory and
government policy, competitor and market evolution, business
decisions, process and judgment error, deliberate wrongdo-
ing, dysfunctional markets, and natural disasters.
Types of risks are categories by which risks manifest them-
selves. Risks are generally categorized in the following four
risk types:
– Credit and investment risk is the risk associated with the
default or change in credit profile of a client, counterparty
or customer; or loss of principal or a reduction in expected
returns on investments, including consumer credit risk,
wholesale credit risk, and investment portfolio risk.
– Market risk is the risk associated with the effect of changes
in market factors, such as interest and foreign exchange
rates, equity and commodity prices, credit spreads or
implied volatilities, on the value of assets and liabilities held
for both the short and long term.
– Operational risk is the risk of an adverse outcome resulting
from inadequate or failed internal processes or systems;
human factors; or external events impacting processes or
systems; Operational Risk includes compliance, conduct,
legal, and estimations and model risk.
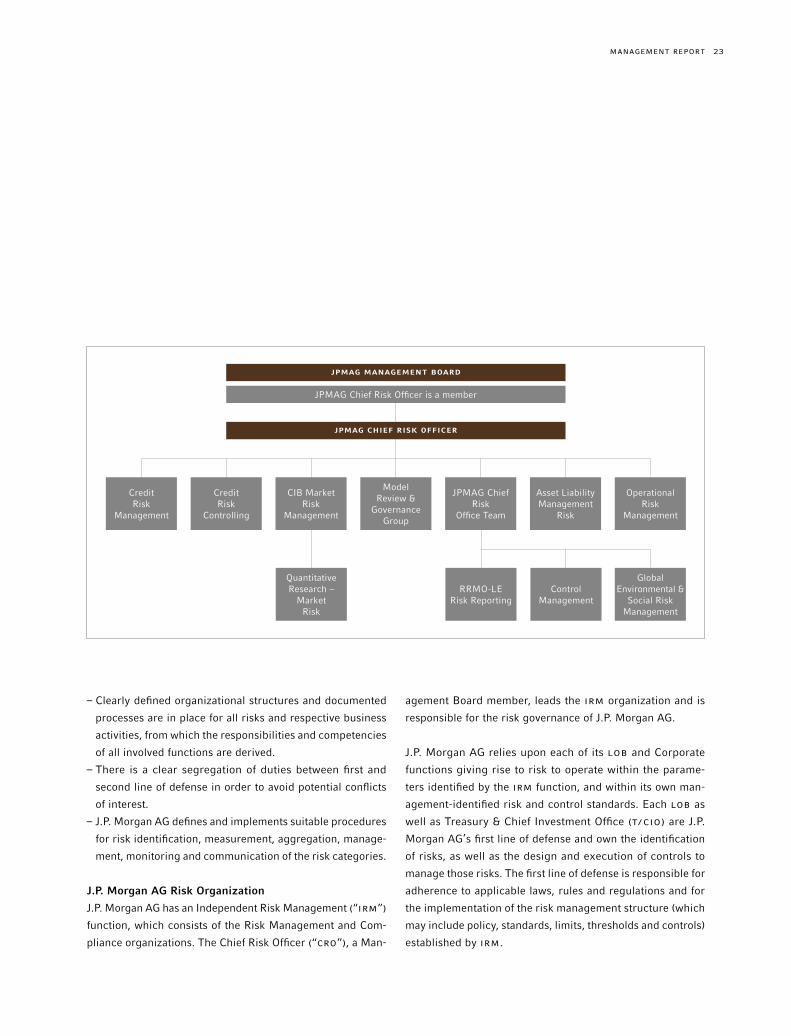
23MANAGEMENT REPORT
agement Board member, leads the IrM organization and is
responsible for the risk governance of J.P. Morgan AG.
J.P. Morgan AG relies upon each of its LOB and Corporate
functions giving rise to risk to operate within the parame-
ters identified by the IrM function, and within its own man-
agement-identified risk and control standards. Each LOB as
well as Treasury & Chief Investment Office (T/CIO) are J.P.
Morgan AG’s first line of defense and own the identification
of risks, as well as the design and execution of controls to
manage those risks. The first line of defense is responsible for
adherence to applicable laws, rules and regulations and for
the implementation of the risk management structure (which
may include policy, standards, limits, thresholds and controls)
established by IrM.
– Clearly defined organizational structures and documented
processes are in place for all risks and respective business
activities, from which the responsibilities and competencies
of all involved functions are derived.
– There is a clear segregation of duties between first and
second line of defense in order to avoid potential conflicts
of interest.
– J.P. Morgan AG defines and implements suitable procedures
for risk identification, measurement, aggregation, manage-
ment, monitoring and communication of the risk categories.
J.P. Morgan AG Risk Organization
J.P. Morgan AG has an Independent Risk Management (“IrM”)
function, which consists of the Risk Management and Com-
pliance organizations. The Chief Risk Officer (“CrO”), a Man-
JPMAG MANAGEMENT BOARD
JPMAG Chief Risk Officer is a member
JPMAG CHIEF RISK OFFICER
Credit Risk
Management
RRMO-LE Risk Reporting
Quantitative Research –
Market Risk
Credit Risk
Controlling
CIB Market Risk
Management
Model Review &
Governance Group
JPMAG Chief Risk
Office Team
Control Management
Global Environmental &
Social Risk Management
Asset Liability Management
Risk
Operational Risk
Management
24 MANAGEMENT REPORT
Based on a delegation by the J.P. Morgan AG Management
Board, the J.P. Morgan AG rOC reviews the entity’s overall
risk situation on a monthly basis in the light of current market
conditions and identifies future risk concerns and mitigation
measures. The rOC provides oversight of any risk issues in
relation to risk-bearing capacity and the J.P. Morgan AG ICAAP
process, where appropriate or required.
If necessary, the J.P. Morgan AG rOC escalates issues to the
Management Board, the Risk Committee of the Supervisory
Board and /or the Supervisory Board of J.P. Morgan AG. The
rOC can escalate to and feeds into the EMEA Risk Committee
in order to ensure that the J.P. Morgan AG risk governance is
closely aligned to the Firmwide governance.
J.P. MORGAN AG RISK MANAGEMENT FRAMEWORK
Risk identification
Part of J.P. Morgan AG’s risk management framework is the
ongoing identification of risks, as well as the design and exe-
cution of controls, inclusive of Risk Management-specified
controls, to manage those risks. To support this activity, J.P.
Morgan AG has established a risk identification framework
which is based on the Firmwide risk identification process. It
is designed to identify material risks inherent to the entity’s
business, catalogue them in a central repository and review
the most material risks on a quarterly basis, respectively
ad-hoc if required by material changes to risk profile.
The classification of individual risk categories as a material
risk is based on whether the occurrence of the risk could have
a serious negative effect on J.P. Morgan AG’s risk-bearing
capacity, liquidity or capital situation.
As per the risk inventory dated December 31, 2020, the follow-
ing risk categories are considered material for J.P. Morgan AG:
The IrM function is independent of the businesses and forms
the second line of defense. The IrM function sets and over-
sees the risk management structure for risk governance, and
independently assesses and challenges the first line of defense
risk management practices. IrM is also responsible for its
own adherence to applicable laws, rules and regulations and
for the implementation of policies and standards established
by IrM with respect to its own processes. The IrM function
sets and oversees various standards for the risk management
governance framework, including risk policy, identification,
measurement, assessment, testing, limit setting (e.g., risk
appetite, thresholds, etc.), monitoring and reporting, and con-
ducts independent challenge of adherence to such standards.
In order to ensure optimal effectiveness and to leverage
Firmwide expertise, J.P. Morgan AG Risk Management is
integrated into Firmwide and EMEA¹ Risk Stripes aiming to
achieve consistency across legal entities.
The Internal Audit function operates independently and per-
forms independent testing and evaluation of processes and
controls across the entity as the third line of defense.
In addition, other functions contribute to the J.P. Morgan AG
control environment, including Finance, Human Resources,
Legal and Control Management.
J.P. Morgan AG’s risk management is structured into risk func-
tions to cover the risk profile of the entity.
The independent status of the IrM function is supported by
a governance structure that provides for escalation of risk
issues to risk senior management, the J.P. Morgan AG Risk
Oversight Committee (rOC), or the J.P. Morgan AG Manage-
ment Board.
¹ Europe, Middle East and Africa

25MANAGEMENT REPORT
In addition to regulatory limits, the Management Board at J.P.
Morgan AG has defined a series of early warning indicators,
which are monitored in a timely manner. Indicators and risk
limits are clearly documented and include inter alia recovery
indicators, credit limits, investment limits, bidding limits, posi-
tion limits, as well as the minimum liquidity of J.P. Morgan AG.
These also consider concentration risks with respect to other
J.P. Morgan entities.
For its monthly meetings, the Management Board receives a
detailed overview of the development of the business areas,
information on financial trends, a detailed risk report as well
as a report from the Corporate functions. The scope of the
quarterly risk report extends considerably beyond the monthly
reporting and presents the risk situation in more detail.
For its meetings, the Supervisory Board receives a current
summary of the topics discussed in the meetings of the Man-
agement Board, including a summary of the risk report.
COVID-19 Pandemic
The adverse economic conditions caused by the pandemic
have had a negative impact on certain of J.P. Morgan AG’s
businesses and results of operations, including increases in
the allowance for credit losses. The pandemic has resulted
in increased reporting cycles, ad-hoc actions and signifi-
cantly expanded regulatory interaction. This is detailed in the
respective individual risk sections.
INTERNAL CAPITAL ADEqUACY ASSESSMENT
PROCESS (ICAAP)
The Internal Capital Adequacy Assessment Process (ICAAP)
including the risk bearing capacity analysis is a key steering
instrument at J.P. Morgan AG with the goal of maintaining,
at all times, an appropriate risk profile, adequate capitaliza-
– Credit risk including wholesale credit risk, and investment
portfolio risk (pension risk),
– Market risk, including interest rate risk in the banking book
(IrrBB),
– Operational risk,
– Strategic risk including capital risk, business risk, and liquid-
ity risk.
Reputation Risk and Country Risk manifest across the risk
types mentioned above and are therefore not considered as
material risk categories individually.
Risk appetite
J.P. Morgan AG has developed a Risk Appetite Framework
that sets out and operationalizes its Risk Strategy. Quantitative
parameters are used to monitor and measure J.P. Morgan AG’s
risk bearing capacity consistent with its stated risk appetite.
Risk appetite is set for the material risks. It is set below risk
capacity which is the maximum level of risk J.P. Morgan AG
could bear without breaching constraints imposed by regula-
tory capital or liquidity requirements, other regulatory restric-
tions, or obligations to third parties which impact capital.
Where applicable, quantitative risk appetite parameters are
expressed as losses under stress for individual risk types
which can be used by risk stripes to propose more granular
limits and policies calibrated to these risk appetite levels.
Risk measurement and reporting
Risk measurement and reporting in J.P. Morgan AG are per-
formed by risk category on a daily (credit, market and liquidity
risk), monthly (IrrBB) or quarterly cycle (operational, busi-
ness and pension risks). The ICAAP is refreshed on a quarterly
basis.
26 MANAGEMENT REPORT
– Risk appetite: J.P. Morgan AG has established a risk appetite
framework which expresses the level of risk the entity is
willing to take to achieve its strategic objectives. Threshold
breaches are subject to a dedicated governance framework
triggering management actions aimed at maintaining capital
adequacy. Further details can be found in the section “Risk
Appetite “.
– Capital planning: Capital planning takes into account risk
appetite thresholds in order to ensure capital adequacy on
an ongoing and a forward-looking basis.
– Stress testing: Adverse scenarios are used, in the capital
planning, to assess the resiliency of the Bank and test its
risk bearing capacity. Capital adequacy metrics both under
the normative and the economic perspective are subject to
regular stress testing to evaluate J.P. Morgan AG’s capital
position and detect key vulnerabilities.
– Reverse stress testing: Reverse stress testing is carried out
annually, as part of the ICAAP, to assess scenarios and cir-
cumstances that would render J.P Morgan AG’s business
model unviable thus enabling the implementation of appro-
priate measures.
– Capital adequacy assessment: Capital adequacy is moni-
tored and reported on an ongoing basis. The monitoring and
assessment are done for the current period as well as the
medium-term perspective. Should an immediate or potential
future capital adequacy issue be identified, the appropriate
measures are implemented. J.P. Morgan AG’s Management
Board produces and signs a Capital Adequacy Statement
(CAS) annually.
Normative Perspective
J.P. Morgan AG can, from a capital adequacy perspective,
comfortably execute its business strategy for 2021–2023.
Further capital injections are planned in 2021 in order to
complete the implementation of the Firm’s Brexit strategy.
tion and thereby ensuring business continuity on an ongoing
basis.
The normative perspective is a multi-year assessment of J.P.
Morgan AG’s ability to meet all capital-related regulatory and
supervisory requirements on an ongoing basis under a base-
line and adverse scenarios.
The economic perspective assesses capital adequacy, cover-
ing all material risks, over a 1-year horizon using internal
quantification methodologies and an internal definition of
economic capital resources.
J.P. Morgan AG’s ICAAP process consists of several building
blocks which fit together to ensure that it is sufficiently cap-
italized to cover the risks that it is exposed to on an ongoing
basis:
– Risk identification and assessment: This forms the basis of
the ICAAP and results in an inventory of risks to which J.P.
Morgan AG is exposed. These risks are assessed for materi-
ality based on defined materiality thresholds. Further details
can be found in the section “Risk Identification”.
– Risk quantification: Risk measuring methods and models are
used to quantify regulatory and economic capital require-
ments for all material risks with the exception of risks that
cannot be adequately covered by capital, e.g., liquidity risk.
– Capital resources: The available capital resources represent
the risk bearing capacity. While the normative perspec-
tive utilizes regulatory capital aligned with Crr rules and
accounting standards, the economic perspective employs
a more conservative definition of capital resources derived
from regulatory capital whereby only capital items capable
of absorbing losses in a business continuity environment
are considered.
27MANAGEMENT REPORT
2020. This risk will increase significantly during the year
2021 due to the planned Equity migrations. The entity will
use both the Delta-Plus method and the scenario approach
to quantify non-delta risks.
– CVA Risk: J.P. Morgan AG currently uses the standardized
approach to calculate a CVA risk charge for OTC deriva-
tives. Both the Internal Model Method (IMM) as well as the
mark-to-market method are used to calculate the exposures
whereby the mark-to-market method will be replaced with
SA-CCr as from June 2021 onwards in line with Crr 2.
– Operational Risk: Operational risk capital requirements are
currently calculated using the Basic Indicator Approach
(BIA).
Economic Perspective
J.P. Morgan AG assesses its internal capital adequacy from an
economic perspective as the ratio of total economic capital
demand to internal capital resources. As per December 31,
2020 utilization stood at 29% compared to 27% a year ear-
lier. The economic capital demand increased by + 172% in
2020 due to the implementation of the Firm’s Brexit strategy.
Over the same period, the internal capital increased by € 7.9
billion driven by Tier 1 capital injections. The economic cap-
ital demand is calculated by the responsible risk functions at
least on a quarterly basis and reported, as part of J.P. Morgan
AG’s risk reporting, to the Management Board.
J.P. Morgan AG does not currently take into account inter-risk
diversification (i. e. between risk types). All risk type-specific
capital demands are added up to J.P. Morgan AG’s total eco-
nomic capital demand.
According to its capital plan, J.P. Morgan AG’s Tier 1 ratio is
not expected to fall below 20% in the next three years with a
total capital ratio of about 32% at year-end 2023.
Capital methodologies in the normative perspective
– Credit Risk and Counterparty Credit Risk: J.P. Morgan AG
applies the standardized approach to calculate its pillar
1 capital requirements for credit risk. External credit rat-
ings are used to determine the credit quality steps and the
associated risk weights based on the exposure class. The
risk weights are then applied to the exposure to derive risk
weighted assets (rWAs).
• For OTC derivatives, both the internal model method
(IMM) and the mark-to-market method are used to cal-
culate exposure until June 2021 when SA-CCr replaces
the mark-to-market method.
• For securities financing and other collateralized trans-
actions, the financial collateral comprehensive method,
including supervisory volatility adjustments, is used to
calculate exposure values.
– Market Risk: J.P. Morgan AG currently uses the standard-
ized approach to calculate its regulatory market risk capital
requirements, which uses a “building block” approach to
calculating each category of market risk:
• Interest Rate Risk: J.P. Morgan AG currently uses the
Maturity approach. Permission has been sought to apply
sensitivity models for interest rate risk beginning in
2021.
• Equity Risk: The standardized approach is used with a
look-through for stock indices for the purposes of spe-
cific and general equity risk.
• Commodity Risk: The maturity ladder approach is used
to calculate capital requirements.
– Non-delta risks (i. e. gamma and vega): J.P. Morgan AG did
not have any material non-delta risks as of December 31,
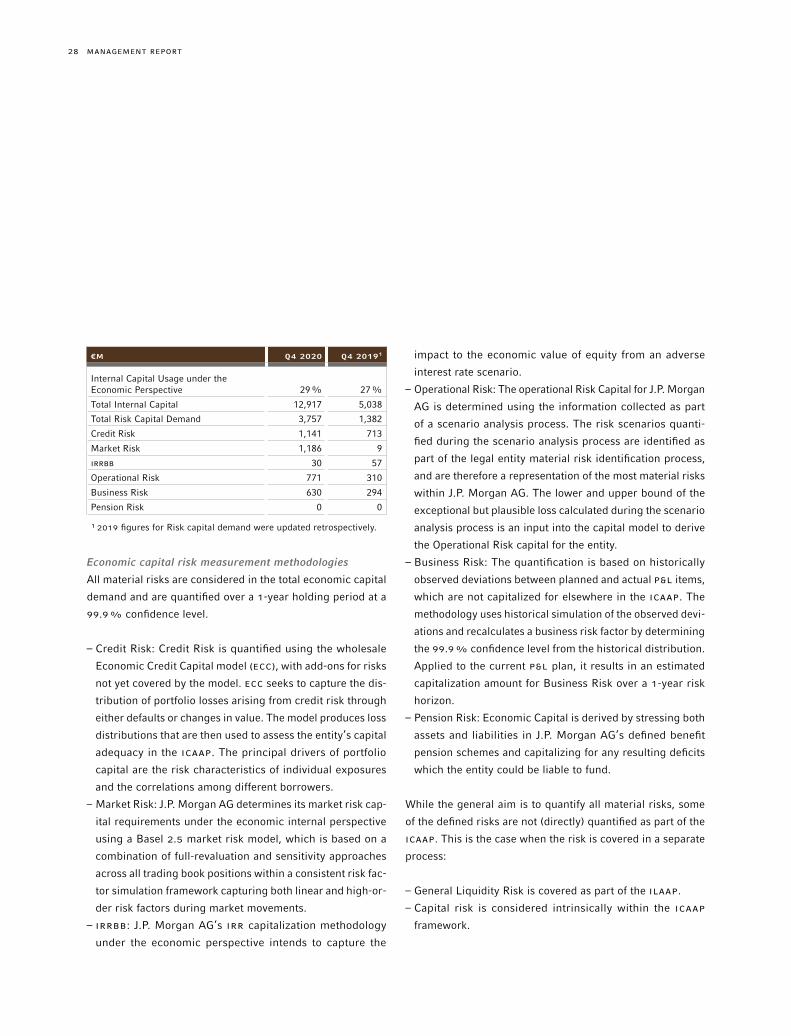
28 MANAGEMENT REPORT
impact to the economic value of equity from an adverse
interest rate scenario.
– Operational Risk: The operational Risk Capital for J.P. Morgan
AG is determined using the information collected as part
of a scenario analysis process. The risk scenarios quanti-
fied during the scenario analysis process are identified as
part of the legal entity material risk identification process,
and are therefore a representation of the most material risks
within J.P. Morgan AG. The lower and upper bound of the
exceptional but plausible loss calculated during the scenario
analysis process is an input into the capital model to derive
the Operational Risk capital for the entity.
– Business Risk: The quantification is based on historically
observed deviations between planned and actual P&L items,
which are not capitalized for elsewhere in the ICAAP. The
methodology uses historical simulation of the observed devi-
ations and recalculates a business risk factor by determining
the 99.9% confidence level from the historical distribution.
Applied to the current P&L plan, it results in an estimated
capitalization amount for Business Risk over a 1-year risk
horizon.
– Pension Risk: Economic Capital is derived by stressing both
assets and liabilities in J.P. Morgan AG’s defined benefit
pension schemes and capitalizing for any resulting deficits
which the entity could be liable to fund.
While the general aim is to quantify all material risks, some
of the defined risks are not (directly) quantified as part of the
ICAAP. This is the case when the risk is covered in a separate
process:
– General Liquidity Risk is covered as part of the ILAAP.
– Capital risk is considered intrinsically within the ICAAP
framework.
€M q4 2020 q4 20191
Internal Capital Usage under the Economic Perspective 29% 27%
Total Internal Capital 12,917 5,038
Total Risk Capital Demand 3,757 1,382
Credit Risk 1,141 713
Market Risk 1,186 9
IrrBB 30 57
Operational Risk 771 310
Business Risk 630 294
Pension Risk 0 0
¹ 2019 figures for Risk capital demand were updated retrospectively.
Economic capital risk measurement methodologies
All material risks are considered in the total economic capital
demand and are quantified over a 1-year holding period at a
99.9% confidence level.
– Credit Risk: Credit Risk is quantified using the wholesale
Economic Credit Capital model (ECC), with add-ons for risks
not yet covered by the model. ECC seeks to capture the dis-
tribution of portfolio losses arising from credit risk through
either defaults or changes in value. The model produces loss
distributions that are then used to assess the entity’s capital
adequacy in the ICAAP. The principal drivers of portfolio
capital are the risk characteristics of individual exposures
and the correlations among different borrowers.
– Market Risk: J.P. Morgan AG determines its market risk cap-
ital requirements under the economic internal perspective
using a Basel 2.5 market risk model, which is based on a
combination of full-revaluation and sensitivity approaches
across all trading book positions within a consistent risk fac-
tor simulation framework capturing both linear and high-or-
der risk factors during market movements.
– IrrBB: J.P. Morgan AG’s Irr capitalization methodology
under the economic perspective intends to capture the

29MANAGEMENT REPORT
materially to € 187.6 million at the end of September, before
reducing slightly to € 151.8 million by year-end. At year-end,
allowance for credit losses of non-performing loan (NPL) was
€ 21.0 million; while charge-offs for the year totalled € 44.2
million, across three of the NPL positions. The continuation
or worsening of the effects of the COVID-19 pandemic on the
macroeconomic environment could result in a further increase
of credit risk in the credit portfolio of J.P. Morgan AG.
Credit Risk management
Credit Risk Management is an independent risk management
function that monitors, measures and manages credit risk in
J.P. Morgan AG and defines credit risk framework and proce-
dures. This includes:
– establishing and maintaining a credit risk management
framework;
– monitoring, measuring and managing credit risk across
all portfolio segments, including transaction and exposure
approval;
– setting portfolio concentration limits;
– assigning and managing credit authorities in connection
with the approval of credit exposure;
– managing criticized exposures and delinquent loans; and
– estimating credit losses and ensuring appropriate credit
risk-based capital management.
The comprehensive Firmwide Credit Risk Framework is sup-
plemented by regional frameworks as required. As such, J.P.
Morgan AG’s Credit Risk Management framework supple-
ments the Firmwide risk policy framework and is approved
by J.P. Morgan AG’s Management Board and the rOC. It spec-
ifies that credit decisions are made on the basis of clearly-de-
fined, separate responsibilities for “Front Office” (“Markt”)
and “Back Office” (“Marktfolge”) as well as the process of
In our view, all risks are adequately covered by capital and
the capital in the entity is of high quality as it mainly consists
of CET1 items.
Internal capital resources
J.P. Morgan AG uses its regulatory own funds as a starting
point for deriving its internal capital. Adjustments are made
for positions that do not reflect the fair value concept under-
lying the economic perspective. Furthermore, capital items
that do not provide loss absorbing capacity in a going concern
situation (e.g., Tier 2 capital) are de-recognized for internal
capital purposes.
RISK CATEGORIES
The following paragraphs provide details of the individual risk
types. The sections contain, apart from risk description, also
the required quantitative and qualitative statements based
on the requirements of the IFrS 7 Financial Instruments Dis-
closures.
Credit risk
Credit risk is the risk associated with the default or change
in credit profile of a client, counterparty or customer. J.P.
Morgan AG is exposed to credit risk through its underwriting,
lending, market-making, capital markets and hedging activi-
ties with and for clients and counterparties, as well as through
its operating services activities (such as clearing), securities
financing activities, investment securities portfolio, and cash
placed with banks.
In 2020, the impacts of the COVID-19 pandemic resulted in
broad-based credit deterioration and an increase in the allow-
ance for credit losses. During the course of the year, Expected
Credit Losses assigned to loans and other lending-related com-
mitments rose to € 65.9 million at the end of March and more
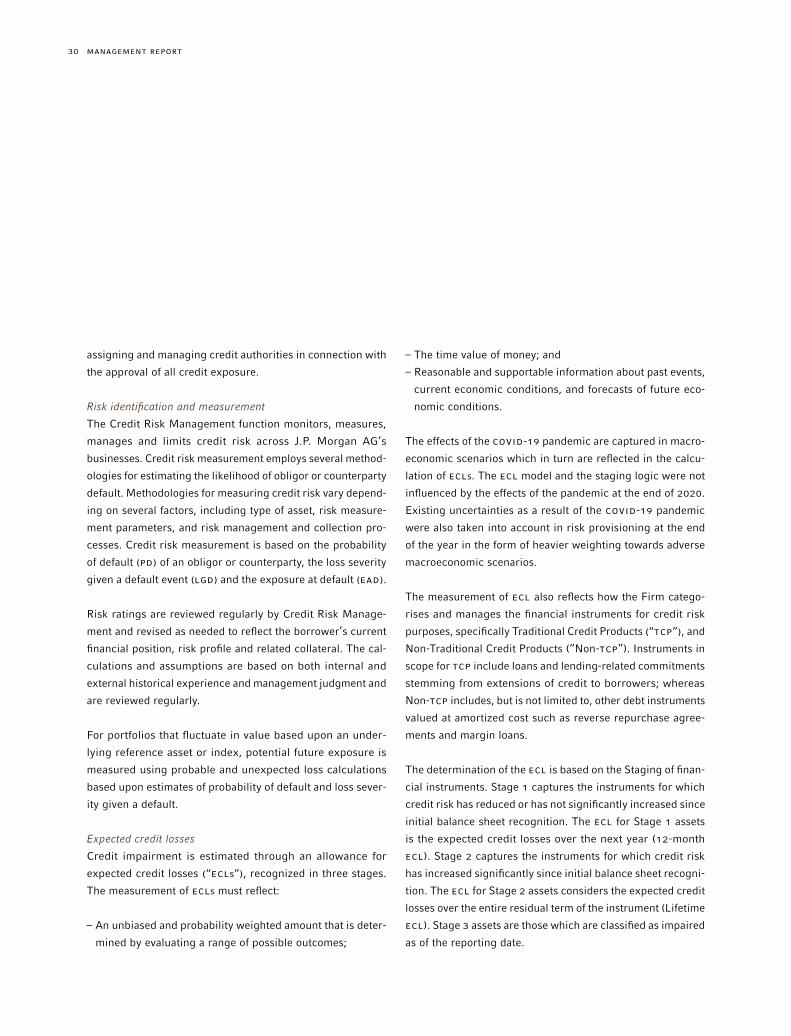
30 MANAGEMENT REPORT
– The time value of money; and
– Reasonable and supportable information about past events,
current economic conditions, and forecasts of future eco-
nomic conditions.
The effects of the COVID-19 pandemic are captured in macro-
economic scenarios which in turn are reflected in the calcu-
lation of ECLs. The ECL model and the staging logic were not
influenced by the effects of the pandemic at the end of 2020.
Existing uncertainties as a result of the COVID-19 pandemic
were also taken into account in risk provisioning at the end
of the year in the form of heavier weighting towards adverse
macroeconomic scenarios.
The measurement of ECL also reflects how the Firm catego-
rises and manages the financial instruments for credit risk
purposes, specifically Traditional Credit Products (“TCP”), and
Non-Traditional Credit Products (“Non-TCP”). Instruments in
scope for TCP include loans and lending-related commitments
stemming from extensions of credit to borrowers; whereas
Non-TCP includes, but is not limited to, other debt instruments
valued at amortized cost such as reverse repurchase agree-
ments and margin loans.
The determination of the ECL is based on the Staging of finan-
cial instruments. Stage 1 captures the instruments for which
credit risk has reduced or has not significantly increased since
initial balance sheet recognition. The ECL for Stage 1 assets
is the expected credit losses over the next year (12-month
ECL). Stage 2 captures the instruments for which credit risk
has increased significantly since initial balance sheet recogni-
tion. The ECL for Stage 2 assets considers the expected credit
losses over the entire residual term of the instrument (Lifetime
ECL). Stage 3 assets are those which are classified as impaired
as of the reporting date.
assigning and managing credit authorities in connection with
the approval of all credit exposure.
Risk identification and measurement
The Credit Risk Management function monitors, measures,
manages and limits credit risk across J.P. Morgan AG’s
businesses. Credit risk measurement employs several method-
ologies for estimating the likelihood of obligor or counterparty
default. Methodologies for measuring credit risk vary depend-
ing on several factors, including type of asset, risk measure-
ment parameters, and risk management and collection pro-
cesses. Credit risk measurement is based on the probability
of default (PD) of an obligor or counterparty, the loss severity
given a default event (LGD) and the exposure at default (EAD).
Risk ratings are reviewed regularly by Credit Risk Manage-
ment and revised as needed to reflect the borrower’s current
financial position, risk profile and related collateral. The cal-
culations and assumptions are based on both internal and
external historical experience and management judgment and
are reviewed regularly.
For portfolios that fluctuate in value based upon an under-
lying reference asset or index, potential future exposure is
measured using probable and unexpected loss calculations
based upon estimates of probability of default and loss sever-
ity given a default.
Expected credit losses
Credit impairment is estimated through an allowance for
expected credit losses (“ECLs”), recognized in three stages.
The measurement of ECLs must reflect:
– An unbiased and probability weighted amount that is deter-
mined by evaluating a range of possible outcomes;
31MANAGEMENT REPORT
The ECL is determined for Stage 1 and Stage 2 customers on
a collective basis using statistical risk parameters. The ECL
for impaired instruments is determined individually on the
basis of individual borrowers. For Stage 3 customers below a
threshold value, the ECL is determined on a collective basis,
using statistical risk parameters, the appropriateness of
which is separately checked and approved. In determining
how exposures should be grouped for collective valuation,
the Bank considers many factors including, but not limited
to, internal credit ratings, loan duration, borrower country,
and industry sector. Internal risk assessments generally cor-
respond to those defined by Standard & Poor’s (“S&P”) and
Moody’s Investors Service.
Discounted Cash Flows (DCF)
An impaired loan’s allowance estimate may be measured
using the present value of expected cash flows, discounted
using the contractual interest rate as of the date the loan was
deemed to be impaired (or, in the case of a restructuring or
another form of concession granted to the borrower, using
the contractual interest rate before that event occurred). This
estimation process must consider multiple scenarios, the time
value of money, and reasonable and supportable information
about past events, current conditions, and forecasts of future
economic conditions. If the present value of expected cash
flows is less than the gross carrying amount of the instrument,
the ECL is equal to the shortfall.
Stress testing
Stress testing is important in measuring and managing credit
risk in J.P. Morgan AG’s credit portfolio. The process assesses
the potential impact of alternative economic and business sce-
narios on estimated credit losses for J.P. Morgan AG.
Economic scenarios and the underlying parameters are
defined centrally, articulated in terms of macroeconomic fac-
tors and applied across the businesses. The stress test results
may indicate credit migration, changes in delinquency trends
and potential losses in the credit portfolio. In addition to the
periodic stress testing processes, management also considers
additional stresses outside these scenarios, including indus-
try and country specific stress scenarios, as necessary. Stress
testing is used to inform decisions on setting risk appetite,
as well as to assess the impact of stress on individual coun-
terparties.
Credit Risk Approval and Control
– Approval of clients: All clients are subject to credit analysis
and financial review by Credit Risk Management before new
business is accepted.
– Establishment of credit lines: All credit exposure must be
approved in advance by a J.P. Morgan AG Credit Officer with
the level of credit authority required by the applicable credit
authority grid. Such approvals, together with details of the
credit limits, are recorded in the Credit Systems.
– In some instances, credit lines can be approved according
to predetermined rules that are subject to annual review by
the appropriate J.P. Morgan AG Credit Officers and the CrO
of J.P. Morgan AG.
– Intraday exposure control: Intraday credit risk arising from
cash payments is captured by the Firm’s intraday exposure
control system. Any exposure which exceeds a facility and
is outside of a tolerance range requires the approval of an
authorized Credit Officer.
Risk monitoring and management
J.P. Morgan AG implements policies and practices developed
by the Firm. The policy framework establishes credit approval
authorities, concentration limits, risk-rating methodologies,

32 MANAGEMENT REPORT
portfolio review parameters and guidelines for management
of distressed exposures.
In addition, certain models, assumptions and inputs used in
evaluating and monitoring credit risk are independently vali-
dated by groups separate from the LOBs.
As part of its management of credit and counterparty credit
exposures, credit risk mitigation techniques are actively used
to reduce the amount of credit risk, to spread the concentration
of risk across the portfolio, and ultimately to ensure efficient
use of capital in compliance with the applicable regulations.
This is accomplished through a number of means, including
receipt of collateral, master netting agreements, guarantees
and credit derivatives and other risk-reduction techniques.
Credit risk is monitored regularly at an aggregate portfo-
lio, industry, and individual client and counterparty level
with established concentration limits that are reviewed and
revised as deemed appropriate by management, typically on
an annual basis. Industry and counterparty limits, as mea-
sured in terms of exposure and economic risk appetite, are
subject to stress-based loss constraints.
In addition, wrong-way risk is actively monitored. This refers
to the risk that exposure to a counterparty is positively cor-
related with the risk of a default by the same counterparty,
which could cause exposure to increase at the same time as the
counterparty’s capacity to meet its obligations is decreasing.
At the start of the COVID-19 pandemic, daily reporting was
produced on new liquidity facility requests, drawdowns under
existing facilities and monitoring of covenant relief or modifi-
cation requests. An early identification of industries affected
by the COVID-19 pandemic was carried out. The economic
development of borrowers of the J.P. Morgan AG in these
industries was continuously monitored and intensified. This
enhanced level of monitoring in coordination between the
front and back office was a basis for proactive engagement
with borrowers in order to determine and monitor their cur-
rent and expected debt servicing ability and their liquidity
requirements. Specific early assessment of clients within
affected industries was conducted followed by a full review
of the loan portfolio. Existing “Watchlist” and Credit Surveil-
lance Review (“CSr”) processes for intensive care were used
in the COVID-19 crisis. The number of customers in the quar-
terly “watchlist” and “CSr” process for intensive support has
multiplied in the COVID-19 pandemic.
In order to efficiently track COVID-19 impacted borrowers,
new facility level flags were implemented in Credit Risk Infra-
structure to identify (i) covenant relief, payment assistance
or other modification of facilities for borrowers financially
impacted by the COVID-19 pandemic; and (ii) facilities pro-
vided to borrowers where specific state support is provided.
This is in addition to other pre-existing flags used to designate
watch list and leveraged finance clients. Use of these flags
augments existing data collection processes and capabilities,
permitting efficient identification, assessment and monitor-
ing of borrower, sector and market trends as needed. During
2020, these flags were assigned to 20 facilities (18 clients)
with an aggregate exposure of $ 599 million as of YE 2020.
In addition to the above-mentioned flags, the Credit Risk
Reporting Tool (“CrrT”) provides the ability for live aggre-
gation of loans and portfolios by isolation of client or facility
level attributes, for example by obligor rating, industry (and
sub-industry), product or geography, permitting J.P. Morgan
33MANAGEMENT REPORT
AG to monitor the risks intrinsic to this crisis, within the port-
folio. A credit risk report is prepared and a forum held on
a monthly basis, attended by the J.P. Morgan AG Head of
Credit and Credit Risk Controlling, where key trends and any
concentrations in the portfolio are highlighted, discussed, and
further investigated as appropriate, with further escalation to
the Risk Oversight Committee (rOC) as deemed appropriate –
in particular, forborne and non-performing loans are escalated
to the rOC on a monthly basis.
Risk reporting
Operational risk reporting is carried out daily (e.g., for over-
drafts), while a monthly credit risk report is used for monitor-
ing credit risk and to support effective decision-making on the
part of J.P. Morgan AG. Monthly reporting includes aggregate
credit exposure, concentration levels and risk profile changes
and is reported regularly to senior members of Credit Risk
Management. Detailed portfolio reporting of industry, clients,
counterparties and customers, product and geographic con-
centrations also occurs monthly, and the appropriateness of
the allowance for credit losses is reviewed by senior manage-
ment at least on a quarterly basis.
Through the risk reporting and governance structure, credit
risk trends and limit exceptions are provided regularly to, and
discussed with, the Risk Oversight Committee, the Head of
Credit Risk and Credit Risk Controlling, the CrO and the Man-
agement Board of directors as appropriate.
In response to the COVID-19 pandemic, the regular reporting
package was supplemented with additional reporting. At the
start of the pandemic, daily reporting was produced on new
liquidity facility requests, drawdowns under existing facilities
and monitoring of covenant relief or modification requests.
Credit Portfolio
J.P. Morgan AG’s credit risk profile continued to evolve signifi-
cantly throughout 2020. As at year end 2020, the credit port-
folio consists of € 17.8 billion primary exposure which is com-
prised of Traditional Credit Products (TCP), Derivatives Risk
Equivalent (DrE) and Securities Risk Equivalent (SrE). DrE
is a measure of derivative exposure intended to be equiva-
lent to the risk of loan exposures. SrE is the primary measure
of credit exposure (i. e. expected plus unexpected potential
loss) on counterparty securities trading, securities financing
and margin lending transactions. The key risk components
as at year end are € 9.4 billion of TCP (committed facilities
and utilizations under advised lines) and € 8.3 billion of DrE.
In 2020, J.P. Morgan AG began to provide a securitization
product offering to its EEA based clients. This client base was
previously covered by JP Morgan’s UK-based entities. A grad-
ual build-up of risk positions is expected in the coming years.
J.P. Morgan AG focuses on the management and diversifica-
tion of its industry exposures, and pays particular attention to
industries with actual or potential credit concerns. The break-
down of the credit portfolio by industry is shown in the table
below. The credit portfolio is considered well diversified by
industry as at December 31, 2020. Asset Managers, Consumer
and Retail, and Technology, Media and Telecoms represent
26.6%, 12.6%, and 9.1% of the portfolio, respectively.
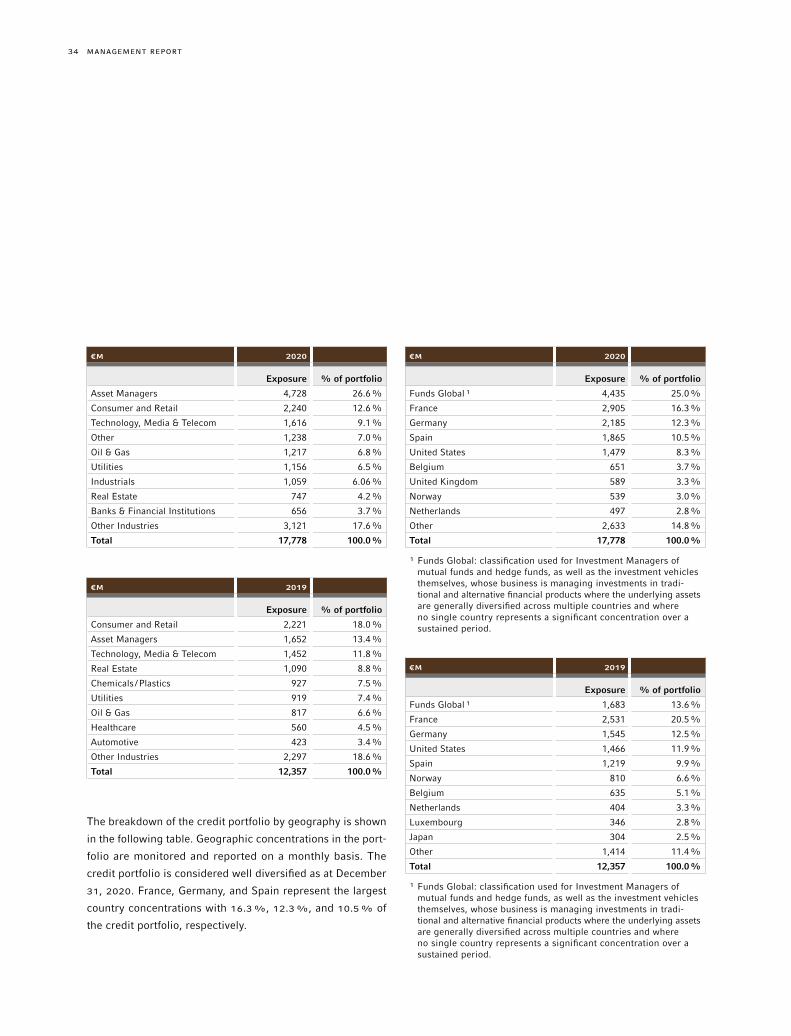
34 MANAGEMENT REPORT
€M 2020
Exposure % of portfolio
Funds Global ¹ 4,435 25.0%
France 2,905 16.3%
Germany 2,185 12.3%
Spain 1,865 10.5%
United States 1,479 8.3%
Belgium 651 3.7%
United Kingdom 589 3.3%
Norway 539 3.0%
Netherlands 497 2.8%
Other 2,633 14.8%
Total 17,778 100.0%
¹ Funds Global: classification used for Investment Managers of mutual funds and hedge funds, as well as the investment vehicles themselves, whose business is managing investments in tradi-tional and alternative financial products where the underlying assets are generally diversified across multiple countries and where no single country represents a significant concentration over a sustained period.
€M 2019
Exposure % of portfolio
Funds Global ¹ 1,683 13.6%
France 2,531 20.5%
Germany 1,545 12.5%
United States 1,466 11.9%
Spain 1,219 9.9%
Norway 810 6.6%
Belgium 635 5.1%
Netherlands 404 3.3%
Luxembourg 346 2.8%
Japan 304 2.5%
Other 1,414 11.4%
Total 12,357 100.0%
¹ Funds Global: classification used for Investment Managers of mutual funds and hedge funds, as well as the investment vehicles themselves, whose business is managing investments in tradi-tional and alternative financial products where the underlying assets are generally diversified across multiple countries and where no single country represents a significant concentration over a sustained period.
€M 2020
Exposure % of portfolio
Asset Managers 4,728 26.6%
Consumer and Retail 2,240 12.6%
Technology, Media & Telecom 1,616 9.1%
Other 1,238 7.0%
Oil & Gas 1,217 6.8%
Utilities 1,156 6.5%
Industrials 1,059 6.06%
Real Estate 747 4.2%
Banks & Financial Institutions 656 3.7%
Other Industries 3,121 17.6%
Total 17,778 100.0%
€M 2019
Exposure % of portfolio
Consumer and Retail 2,221 18.0%
Asset Managers 1,652 13.4%
Technology, Media & Telecom 1,452 11.8%
Real Estate 1,090 8.8%
Chemicals /Plastics 927 7.5%
Utilities 919 7.4%
Oil & Gas 817 6.6%
Healthcare 560 4.5%
Automotive 423 3.4%
Other Industries 2,297 18.6%
Total 12,357 100.0%
The breakdown of the credit portfolio by geography is shown
in the following table. Geographic concentrations in the port-
folio are monitored and reported on a monthly basis. The
credit portfolio is considered well diversified as at December
31, 2020. France, Germany, and Spain represent the largest
country concentrations with 16.3%, 12.3%, and 10.5% of
the credit portfolio, respectively.
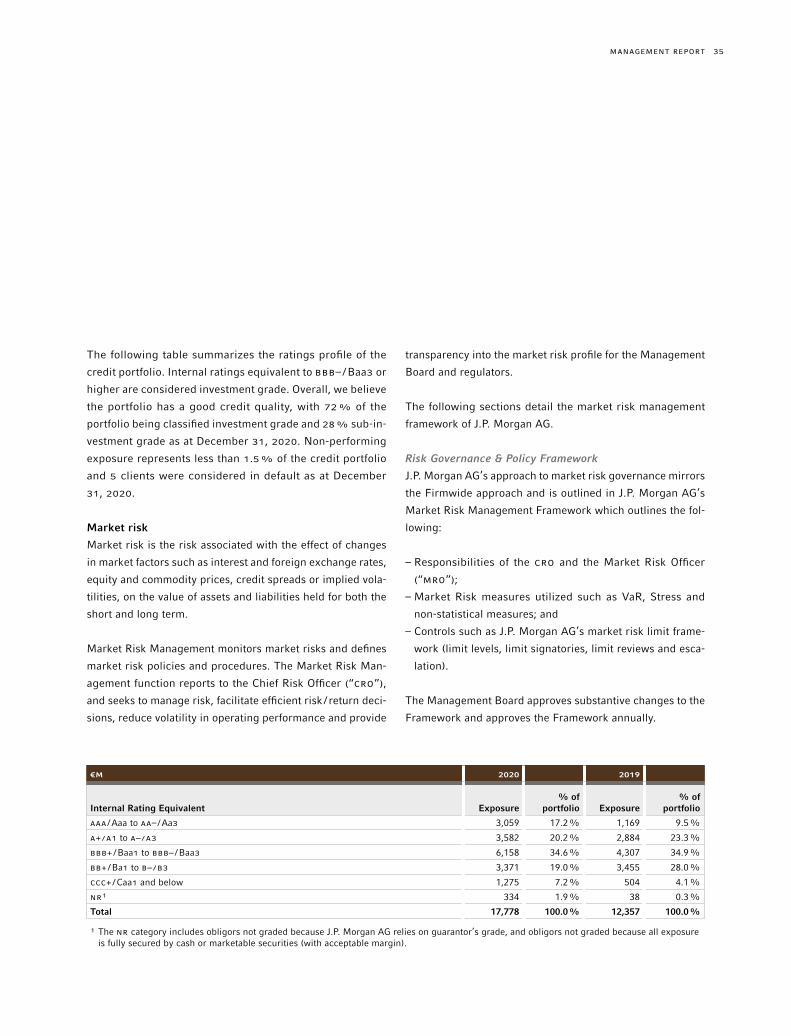
35MANAGEMENT REPORT
transparency into the market risk profile for the Management
Board and regulators.
The following sections detail the market risk management
framework of J.P. Morgan AG.
Risk Governance & Policy Framework
J.P. Morgan AG’s approach to market risk governance mirrors
the Firmwide approach and is outlined in J.P. Morgan AG’s
Market Risk Management Framework which outlines the fol-
lowing:
– Responsibilities of the CrO and the Market Risk Officer
(“MrO”);
– Market Risk measures utilized such as VaR, Stress and
non-statistical measures; and
– Controls such as J.P. Morgan AG’s market risk limit frame-
work (limit levels, limit signatories, limit reviews and esca-
lation).
The Management Board approves substantive changes to the
Framework and approves the Framework annually.
The following table summarizes the ratings profile of the
credit portfolio. Internal ratings equivalent to BBB– / Baa3 or
higher are considered investment grade. Overall, we believe
the portfolio has a good credit quality, with 72% of the
portfolio being classified investment grade and 28% sub-in-
vestment grade as at December 31, 2020. Non-performing
exposure represents less than 1.5% of the credit portfolio
and 5 clients were considered in default as at December
31, 2020.
Market risk
Market risk is the risk associated with the effect of changes
in market factors such as interest and foreign exchange rates,
equity and commodity prices, credit spreads or implied vola-
tilities, on the value of assets and liabilities held for both the
short and long term.
Market Risk Management monitors market risks and defines
market risk policies and procedures. The Market Risk Man-
agement function reports to the Chief Risk Officer (“CrO”),
and seeks to manage risk, facilitate efficient risk / return deci-
sions, reduce volatility in operating performance and provide
€M 2020 2019
Internal Rating Equivalent Exposure% of
portfolio Exposure% of
portfolio
AAA /Aaa to AA– /Aa3 3,059 17.2% 1,169 9.5%
A+ /A1 to A– /A3 3,582 20.2% 2,884 23.3%
BBB+ /Baa1 to BBB– /Baa3 6,158 34.6% 4,307 34.9%
BB+ /Ba1 to B– /B3 3,371 19.0% 3,455 28.0%
CCC+ /Caa1 and below 1,275 7.2% 504 4.1%
Nr¹ 334 1.9% 38 0.3%
Total 17,778 100.0% 12,357 100.0%
¹ The Nr category includes obligors not graded because J.P. Morgan AG relies on guarantor’s grade, and obligors not graded because all exposure is fully secured by cash or marketable securities (with acceptable margin).

36 MANAGEMENT REPORT
addition, based on their reliance on available historical data,
limited time horizons, and other factors, VaR measures are
inherently limited in their ability to measure certain risks
and to predict losses, particularly those associated with
market illiquidity and sudden or severe shifts in market
conditions.
For certain products, specific risk parameters are not cap-
tured in VaR due to the lack of inherent liquidity and avail-
ability of appropriate historical data. The Firm uses prox-
ies to estimate the VaR for these and other products when
daily time series are not available. It is likely that using an
actual price-based time series for these products, if available,
would affect the VaR results presented. The Firm therefore
considers other non-statistical measures such as stress test-
ing, in addition to VaR, to capture and manage its market
risk positions.
The table below shows the result of J.P. Morgan AG’s VaR
measure, using a 95% confidence level.
Currently, J.P. Morgan AG’s market risk profile is predomi-
nantly driven by Credit, Ir and equities-related exposures. Of
the standard stress scenario that J.P. Morgan AG is subject to,
the worst case stress loss during 2020 was primarily driven
by the Eurozone Crisis scenario.
Brexit trade migration to J.P. Morgan AG has commenced
in November 2020, for products with significant EEA nexus.
Risk measurement
There is no single measure to capture market risk and there-
fore J.P. Morgan AG uses various metrics, both statistical and
non-statistical, to assess risk. The appropriate set of risk mea-
sures utilized for a given business activity is tailored based on
business mandate, risk horizon, materiality, market volatility
and other factors.
Value-at-Risk (“VaR”), based on Expected Shortfall
The entity utilizes VaR, a statistical risk measure, to estimate
the potential loss from adverse market moves in the current
market environment.
The VaR framework is employed using historical simulation
based on data for the previous twelve months. The frame-
work’s approach assumes that historical changes in market
values are representative of the distribution of potential out-
comes in the immediate future.
VaR is calculated assuming a one-day holding period and an
expected tail-loss methodology which approximates a 95%
confidence level. VaR provides a consistent framework to mea-
sure risk profiles and levels of diversification across product
types and is used for aggregating risks and monitoring limits
across businesses. These VaR results are reported to senior
management and regulators.
As VaR is based on historical data, it is an imperfect mea-
sure of market risk exposure and potential future losses. In
2020 2019 At December 31
€T Avg. Min Max¹ Avg. Min Max 2020 2019
95% VaR 1,313 25 12,852 108 1 580 9,951 86
¹ Maximum VaR (€ 12,852 thousand) for 2020 was driven by positions in Global Rates and Rates Exotics migrated to J.P. Morgan AG in 2020 as part of the Brexit strategy.

37MANAGEMENT REPORT
Stress testing
Along with VaR, stress testing is an important tool to assess
risk. While VaR reflects the risk of loss due to adverse changes
in markets using recent historical market behavior stress
testing reflects the risk of loss from hypothetical changes in
the value of market risk sensitive positions applied simulta-
neously.
J.P. Morgan AG runs weekly stress tests on market-related risks
across the LOBs using multiple scenarios that assume signif-
icant changes in risk factors such as credit spreads, equity
prices, interest rates, currency rates or commodity prices.
J.P. Morgan AG uses a number of standard scenarios that cap-
ture different risk factors across asset classes including geo-
graphical factors, specific idiosyncratic factors and extreme
tail events. The stress testing framework calculates multiple
magnitudes of potential stress for both market rallies and mar-
ket sell-offs for each risk factor and combines them in multiple
ways to capture different market scenarios. The flexibility of
the stress testing framework allows risk managers to construct
new, specific scenarios that can be used to form decisions
about future possible stress events.
Stress testing complements VaR by allowing risk managers to
shock current market prices to more extreme levels relative to
those historically realized and to stress-test the relationships
between market prices under extreme scenarios. Stress-test
results, trends and qualitative explanations based on current
market risk positions are reported to risk senior manage-
ment, the Management Board, the Segments and Firm, to
allow them to better understand the sensitivity of positions
to certain defined events and to enable them to manage their
risks with more transparency.
As of December 31, 2020, the market risk exposure in J.P.
Morgan AG is driven by:
– Global Credit Trading & Syndicate business (95% VaR:
€ 8.08 million), mainly from activities related to Corporate &
Financial bonds as well as secondary loan facilities within
EEA regulated borrowers and /or counterparties;
– Global Rates & Rates Exotics business (95% VaR: € 5.37
million), mainly from activities related to European gov-
ernment bonds and Quasi-Sovereign issuers, e.g., Agency,
Local, Supranational.
The activities described above are the primary drivers of J.P.
Morgan AG’s market risk exposure as of December 31, 2020.
In addition, J.P. Morgan AG also risk manages equity war-
rants & single stocks with EEA underlyings, local sovereign
bonds (by Poland, Czech Republic, Hungary, Romania) and
securitized loans from other business areas. Minimal com-
modity exposure observed in J.P. Morgan AG as Commodity
trades are typically back-to-backed through J.P. Morgan AG.
J.P. Morgan AG reported the market risk exposure the entity
manages in J.P. Morgan AG Daily Legal Entity Market Risk
Summary (LE-542) report.
Other Business areas of the Segment “Markets” have been
migrating trades into J.P. Morgan AG during the course of
2020 and continue into 2021. Other business areas such as
Currencies & Emerging Markets, Global Equities, Securitized
Products Group and Fixed Income Financing, which have
high EEA nexus activities, have also been migrated into J.P.
Morgan AG during the course of 2020 and continue into 2021.
Due to diversification benefit, J.P. Morgan AG level VaR would
be lower than the simple aggregation of VaR from individual
business areas.

38 MANAGEMENT REPORT
also utilized within specific market contexts and aggregated
across businesses.
J.P. Morgan AG utilizes non-statistical risk measures, such as,
but not limited to, Foreign Exchange Net Open Position (FX
NOP) and Interest Rate Basis Point Value (Ir BPV) to measure
and monitor risk.
Risk Monitoring and Control
Limits
Market risk limits are employed as the primary control to align
J.P. Morgan AG’s market risk with certain quantitative param-
eters within J.P. Morgan AG’s Risk Appetite framework.
Market Risk sets limits and regularly reviews and updates
them as appropriate. Limits that have not been reviewed
within a specified time period by Market Risk are escalated
to senior management.
Limit breaches are required to be reported in a timely man-
ner to limit approvers, which include Market Risk and the
responsible members of the Management Board. In the event
of a limit breach, Market Risk consults with the Management
Board to determine the course of action required to return to
compliance, which may include a reduction in risk in order
to remedy the breach or granting a temporary increase in
limits to accommodate an expected increase in client activity
and /or market volatility. Certain J.P. Morgan AG level limits
that have been breached are escalated to market risk senior
management, the responsible Management Board Members,
the rOC and the Regional Risk Committee.
J.P. Morgan AG’s limits include 95% VaR and Stress as well
as non-statistical measures established for the legal entity in
Multiple stress scenarios are run weekly and these include, but
are not limited to, Equity Collapse, Credit Crisis, Bond Selloff,
Eurozone Crisis, USD Crisis, Oil Crisis and Commodities Sell-
off. The stress results for each scenario are used to understand
the position exposures responsible for those potential losses.
Worst case scenario stress losses are monitored against limits
set at the legal entity and business area level.
The table below shows J. P. Morgan AG’s Stress Testing results
(Worst Case Stress Loss), as of 2020 and 2019 year-end. The
change in stress loss between year-end 2019 and 2020 was
predominantly driven by an increment of trading positions
migrated into J.P. Morgan AG in the 2020 period.
€TDecember 31,
2020December 31,
2019
Worst-Case-Stress Loss –207,362 –4,452
As of December 31, 2020, the worst case scenario was Euro-
zone Crisis with a € 207.4 million stress loss. The key assump-
tions are that the stress test is a one-time, instantaneous event
and that the sale of assets, or adaptive behavior such as hedging
and re-hedging is not modelled. The Eurozone Crisis scenario
models a severe sell-off in all risky assets associated with a num-
ber of Eurozone countries (Greece, Portugal, Spain and Italy),
a large sell-off in risky assets in other European countries, an
orderly contagion into risky assets globally and a flight to quality
rally in G10 interest rates, most pronounced in North America.
Other Non-statistical risk measures
Aside from VaR and stress testing, other specific risk mea-
sures, such as, but not limited to, credit spread sensitivities,
net open positions, basis point values, option sensitivities, are

39MANAGEMENT REPORT
observed during the COVID-19 period. Most of the market
shocks are as severe as the COVID-19 market movements, if
not more severe.
Market Risk continues to review and assess the impact of
the pandemic on market risk through existing market risk
controls closely.
Non-Euro foreign exchange (“FX”) risk
Non-Euro FX risk is the risk that changes in foreign exchange
rates affect the value of J.P. Morgan AG’s assets or liabilities
or future results. J.P. Morgan AG’s functional and presentation
currency is Euro.
J.P. Morgan AG faces mismatches between its Euro functional
currency and the currency in which planned future capital
injections are denominated (USD) or Risk Weighted Assets
(“rWAs”) resulting from non-Euro denominated positions.
This means that unfavourable changes in FX rates can nega-
tively impact the capital ratios of the entity. Non-Euro FX risk
is managed through the stress testing program which is an
important component in managing FX risk, testing J.P. Morgan
AG’s financial resilience in a range of severe economic and
market conditions.
Structural Interest Rate Risk
Structural Interest Rate Risk (Irr), or Interest Rate Risk in the
Banking Book (“IrrBB”), is defined as the risk stemming from
interest rate exposure resulting from traditional banking activ-
ities (accrual accounted positions); these include the exten-
sion of loans and credit facilities, taking deposits and issuing
debt (collectively referred to as “non-trading” activities) and
also the impact from the Treasury and Chief Investment Office
(“T/CIO”) investment portfolio and other related T/CIO activi-
aggregate, and for individual businesses operating out of the
legal entity:
– J.P. Morgan AG’s CEO, CrO and Market Risk Officer (MrO)
are limit approvers of limits for the legal entity in aggregate;
– Appropriate Business area representatives and MrO are sig-
natories to business area specific limits.
Risk Reporting
J.P. Morgan AG has its own set of regular market risk reports,
which include daily notification of limit utilizations and limit
breaches, and, where applicable, granular market risk metrics
which provide transparency into potential risk concentrations.
Concentration Risk
Concentration Risk refers to any significant concentration
of factors (e.g., single name, positions, etc.) that may lead
to financial losses for J.P. Morgan AG. This risk is inherently
measured, monitored and controlled as part of J.P. Morgan AG
market risk management framework and related control. As
described above, J.P. Morgan AG’s market risk profile is pre-
dominantly driven by Credit, Ir and equities-related exposures.
COVID-19 Pandemic
J.P. Morgan AG’s market risk profile during the peak of the
COVID-19 pandemic in the first two quarters of 2020 was not sig-
nificant, given majority of the Brexit migration took place during
the last quarter of 2020. For comparison, J.P. Morgan AG’s 95%
VaR as of March 31, 2020 was € 0.10 million, compared to
December 31, 2020 95% VaR which was € 9.95 million.
Nevertheless, Market Risk Management has monitored the
impact of the COVID-19 pandemic closely. The ICAAP mar-
ket scenarios were reviewed against the market movements
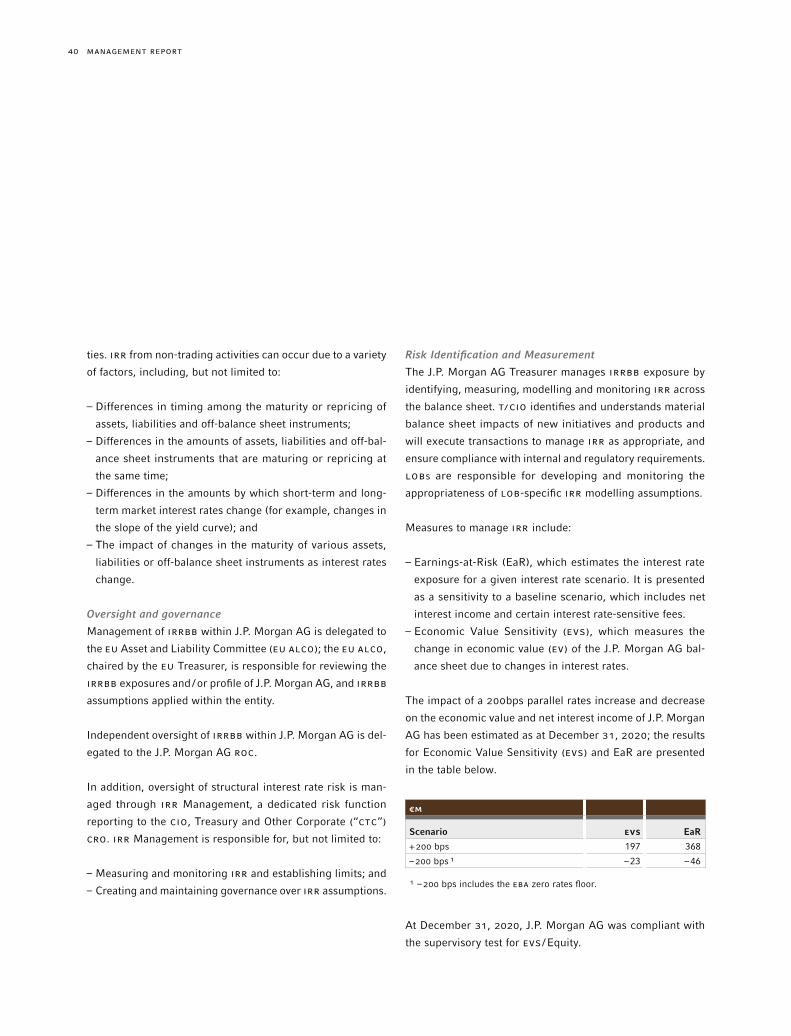
40 MANAGEMENT REPORT
Risk Identification and Measurement
The J.P. Morgan AG Treasurer manages IrrBB exposure by
identifying, measuring, modelling and monitoring Irr across
the balance sheet. T/CIO identifies and understands material
balance sheet impacts of new initiatives and products and
will execute transactions to manage Irr as appropriate, and
ensure compliance with internal and regulatory requirements.
LOBs are responsible for developing and monitoring the
appropriateness of LOB-specific Irr modelling assumptions.
Measures to manage Irr include:
– Earnings-at-Risk (EaR), which estimates the interest rate
exposure for a given interest rate scenario. It is presented
as a sensitivity to a baseline scenario, which includes net
interest income and certain interest rate-sensitive fees.
– Economic Value Sensitivity (EVS), which measures the
change in economic value (EV) of the J.P. Morgan AG bal-
ance sheet due to changes in interest rates.
The impact of a 200bps parallel rates increase and decrease
on the economic value and net interest income of J.P. Morgan
AG has been estimated as at December 31, 2020; the results
for Economic Value Sensitivity (EVS) and EaR are presented
in the table below.
€M
Scenario EVS EaR
+200 bps 197 368
–200 bps ¹ –23 –46
¹ –200 bps includes the EBA zero rates floor.
At December 31, 2020, J.P. Morgan AG was compliant with
the supervisory test for EVS /Equity.
ties. Irr from non-trading activities can occur due to a variety
of factors, including, but not limited to:
– Differences in timing among the maturity or repricing of
assets, liabilities and off-balance sheet instruments;
– Differences in the amounts of assets, liabilities and off-bal-
ance sheet instruments that are maturing or repricing at
the same time;
– Differences in the amounts by which short-term and long-
term market interest rates change (for example, changes in
the slope of the yield curve); and
– The impact of changes in the maturity of various assets,
liabilities or off-balance sheet instruments as interest rates
change.
Oversight and governance
Management of IrrBB within J.P. Morgan AG is delegated to
the EU Asset and Liability Committee (EU ALCO); the EU ALCO,
chaired by the EU Treasurer, is responsible for reviewing the
IrrBB exposures and /or profile of J.P. Morgan AG, and IrrBB
assumptions applied within the entity.
Independent oversight of IrrBB within J.P. Morgan AG is del-
egated to the J.P. Morgan AG rOC.
In addition, oversight of structural interest rate risk is man-
aged through Irr Management, a dedicated risk function
reporting to the CIO, Treasury and Other Corporate (“CTC”)
CrO. Irr Management is responsible for, but not limited to:
– Measuring and monitoring Irr and establishing limits; and
– Creating and maintaining governance over Irr assumptions.
41MANAGEMENT REPORT
Liquidity risk oversight
The Bank has a liquidity risk oversight function whose pri-
mary objective is to provide independent assessment, mea-
surement, monitoring, and control of liquidity risk across the
entity. Liquidity Risk Oversight’s responsibilities include:
– Defining, monitoring and reporting liquidity risk metrics;
– Establishing and monitoring limits and indicators, including
Liquidity Risk Appetite;
– Developing a process to classify, monitor and report limit
breaches;
– Performing independent reviews of liquidity risk manage-
ment processes;
– Monitoring and reporting internal liquidity stress tests as
well as regulatory defined liquidity stress tests;
– Approving or escalating for review new or updated liquidity
stress assumptions; and
– Monitoring liquidity positions, balance sheet variances and
funding activities.
Liquidity management
The J.P. Morgan AG Treasurer is responsible for liquidity
management in J.P. Morgan AG. The primary objectives of
effective liquidity management are to:
– ensure that the core businesses are able to operate in sup-
port of client needs and meet contractual and contingent
financial obligations through normal economic cycles as
well as during stress events; and
– manage an optimal funding mix and availability of liquidity
sources.
As part of the overall liquidity management strategy, liquidity
and funding are managed using a centralized, global approach
in order to:
Liquidity risk
Liquidity risk is the risk that J.P. Morgan AG will be unable to
meet its contractual and contingent financial obligations as
they arise or that it does not have the appropriate amount,
composition and tenor of funding and liquidity to support its
assets and liabilities. The risk arises as a result of the business
activities undertaken by the entity, and is primarily driven by
secured funding outflows, intraday risk contingent outflows
related to derivatives, outflows from third party client deposits
and a drawdown of commitments.
J.P. Morgan AG may be exposed to concentration risk as it per-
tains to major sources of funding and liquidity, e.g., deposits.
The materiality of this risk is considered at a specific client,
counterparty and /or sector level, as part of a quarterly sensi-
tivity analysis of liquidity assumptions.
The J.P. Morgan AG Management Board has ultimate respon-
sibility for liquidity and associated risks within the entity. The
Management Board reviews and establishes an appropriate
level of liquidity risk appetite. The latter steers risk taking
and deployment of liquidity in order to execute the business
strategy and continue to service reasonable client demands
throughout ordinary and stressed but plausible market envi-
ronments, whilst exceeding minimum regulatory liquidity
requirements. The Management Board also reviews and
approves the entity’s liquidity risk management framework.
J.P. Morgan AG has an established liquidity management
framework. The primary objectives of effective liquidity
management are to ensure that J.P Morgan AG is able to
operate in support of client needs, meet contractual and
contingent obligations, to manage an optimal funding mix,
and availability of liquidity sources, including under stressed
conditions.

42 MANAGEMENT REPORT
and “required” amounts of stable funding over a one-year hori-
zon. The European Commission has introduced its legislative
proposal for the NSFr (“EU NSFr”), amending Regulation (EU)
No. 575 /2013. J.P. Morgan AG is expected to comply with the
EU NSFr at a level of 100% from June 28, 2021.
Key ratios monitored for liquidity risk are:
31/12 /2020 31/12 /2019 31/12 /2018
Liquidity Coverage Ratio 147% 222% 155%
Through COVID-19, J.P. Morgan AG did not see any significant
deterioration of its liquidity surplus.
Risk governance and measurement
The committees responsible for liquidity risk governance in
J.P. Morgan AG include the EU Asset and Liability Committee
(“EU ALCO”) and the J.P. Morgan AG Risk Oversight Commit-
tee (“rOC”).
The EU ALCO is responsible for overseeing J.P. Morgan AG’s
asset and liability management activities and the manage-
ment of liquidity risk, balance sheet and interest rate risk, the
oversight of liquidity risk and interest rate risk of EU entities
including J.P. Morgan AG; with a specific focus on balance
sheet and funding management considerations. The EU ALCO
includes representatives of both first and second lines of
defense and is chaired by the EU Treasurer.
Intraday liquidity risk governance
Intraday liquidity risk is managed centrally using the intraday
dashboard (IDL Dashboard). The IDL dashboard provides real-
time transparency into activity at key central banks, financial
market utilities and correspondent banks.
– optimize liquidity sources and uses;
– monitor exposures;
– identify constraints on the transfer of liquidity between
J.P. Morgan AG and other legal entities of the Firm; and
– maintain the appropriate amount of surplus liquidity at a
Firmwide and legal entity level.
In the context of liquidity management, the Treasury and CIO
is responsible for:
– analyzing and understanding the liquidity characteristics of
assets and liabilities, taking into account legal, regulatory,
and operational restrictions;
– developing internal liquidity stress testing assumptions;
– defining and monitoring liquidity strategies, policies, report-
ing and contingency funding plans;
– managing liquidity within approved liquidity risk appetite
tolerances and limits;
– managing compliance with regulatory requirements related
to funding and liquidity risk; and
– setting transfer pricing in accordance with underlying
liquidity characteristics of balance sheet assets and liabili-
ties as well as certain off-balance sheet items.
The primary liquidity requirements applicable to J.P. Morgan
AG are set out in the directly applicable EU legislation, princi-
pally Commission Delegated Regulation 2015/61. The Liquidity
Coverage Ratio (“LCr”) is intended to measure the amount of
“high quality liquid assets (“HQLA”) held by J.P. Morgan AG in
relation to estimated net liquidity outflows within a 30 calendar
day stress period. At December 31, 2020, J.P. Morgan AG was
compliant with the LCr requirement.
The Basel Committee’s final standard for the Net Stable Fund-
ing Ratio (“Basel NSFr”) is intended to measure the “available”

43MANAGEMENT REPORT
the Firm’s contractual financial obligations are met and take
into consideration:
– varying levels of access to unsecured and secured funding
markets;
– estimated non-contractual and contingent cash outflows;
and
– potential impediments to the availability and transferability
of liquidity between jurisdictions and material legal entities
such as regulatory, legal or other restrictions.
Liquidity outflow assumptions are modelled across a range of
time horizons and currency dimensions and contemplate both
market and idiosyncratic stress.
Results of stress tests are considered in the formulation of the
entity’s funding plan and assessment of its liquidity position.
The Parent Company acts as a source of funding for the Firm
through equity and long-term debt issuances, and its interme-
diate holding company, JPMorgan Chase Holdings LLC (the
“IHC”) provides funding support to the ongoing operations of
the Parent Company and its subsidiaries. The Firm maintains
liquidity at the Parent Company, IHC, and operating subsidiar-
ies at levels sufficient to comply with liquidity risk tolerances
and minimum liquidity requirements, and to manage through
periods of stress when access to normal funding sources may
be disrupted.
Contingency funding plan
The Firm’s contingency funding plan (“CFP”), which is
approved by the Firmwide ALCO and the Board Risk Commit-
tee, and its J.P. Morgan AG-specific CFP Addendum, which is
approved by the entity’s Management Board, is a compilation
of procedures and action plans for managing liquidity through
stress events. The CFP incorporates the limits and indicators
The IDL dashboard provides real-time transparency into
activity at key central banks, financial market utilities and
correspondent banks. The IDL dashboard also includes real-
time views into credit extended at a Firmwide level and at a
detailed level for J.P. Morgan AG. The dashboard also pro-
vides various analytical capabilities on the historical data to
help understand trends, averages, extremes and changes in
standard deviation.
The IDL dashboard generates automated alerts should bal-
ances exceed an agreed target balance or should the daily net
movement exceed an agreed tolerance. The target balances
and movement tolerances are defined by Liquidity Risk Over-
sight (“LrO”).
Intraday liquidity alerts may initiate a defined response involv-
ing collaboration from various teams representing mainly
EMEA hub cash management, EMEA Treasury front office, LrO,
impacted LOB, the Intraday Liquidity team and corresponding
J.P. Morgan AG functions. The response process is designed
to quickly understand the drivers of the liquidity alert and
guide management into what action should be taken (if any)
to restore liquidity. There are pre-approved actions to take in
the event of limit breaches.
Internal stress testing
Liquidity stress tests are intended to ensure that J.P. Morgan
AG retains sufficient liquidity under a variety of adverse sce-
narios, including scenarios analyzed as part of recovery and
resolution planning. Stress scenarios are produced for JPMor-
gan Chase & Co. (“Parent Company”) and the Firm’s material
legal entities – including J.P. Morgan AG – on a regular basis,
and other stress tests are performed in response to specific
market events or concerns. Liquidity stress tests assume all of
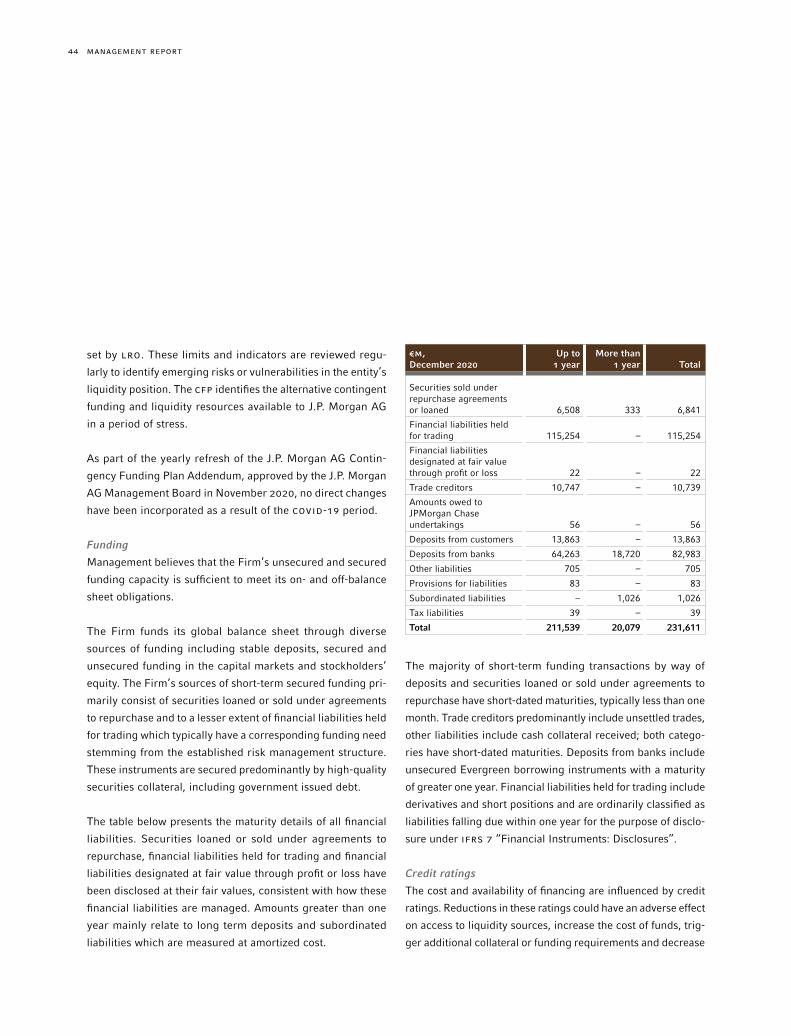
44 MANAGEMENT REPORT
€M, December 2020
Up to 1 year
More than 1 year Total
Securities sold under repurchase agreements or loaned 6,508 333 6,841
Financial liabilities held for trading 115,254 – 115,254
Financial liabilities designated at fair value through profit or loss 22 – 22
Trade creditors 10,747 – 10,739
Amounts owed to JPMorgan Chase undertakings 56 – 56
Deposits from customers 13,863 – 13,863
Deposits from banks 64,263 18,720 82,983
Other liabilities 705 – 705
Provisions for liabilities 83 – 83
Subordinated liabilities – 1,026 1,026
Tax liabilities 39 – 39
Total 211,539 20,079 231,611
The majority of short-term funding transactions by way of
deposits and securities loaned or sold under agreements to
repurchase have short-dated maturities, typically less than one
month. Trade creditors predominantly include unsettled trades,
other liabilities include cash collateral received; both catego-
ries have short-dated maturities. Deposits from banks include
unsecured Evergreen borrowing instruments with a maturity
of greater one year. Financial liabilities held for trading include
derivatives and short positions and are ordinarily classified as
liabilities falling due within one year for the purpose of disclo-
sure under IFrS 7 “Financial Instruments: Disclosures”.
Credit ratings
The cost and availability of financing are influenced by credit
ratings. Reductions in these ratings could have an adverse effect
on access to liquidity sources, increase the cost of funds, trig-
ger additional collateral or funding requirements and decrease
set by LrO. These limits and indicators are reviewed regu-
larly to identify emerging risks or vulnerabilities in the entity’s
liquidity position. The CFP identifies the alternative contingent
funding and liquidity resources available to J.P. Morgan AG
in a period of stress.
As part of the yearly refresh of the J.P. Morgan AG Contin-
gency Funding Plan Addendum, approved by the J.P. Morgan
AG Management Board in November 2020, no direct changes
have been incorporated as a result of the COVID-19 period.
Funding
Management believes that the Firm’s unsecured and secured
funding capacity is sufficient to meet its on- and off-balance
sheet obligations.
The Firm funds its global balance sheet through diverse
sources of funding including stable deposits, secured and
unsecured funding in the capital markets and stockholders’
equity. The Firm’s sources of short-term secured funding pri-
marily consist of securities loaned or sold under agreements
to repurchase and to a lesser extent of financial liabilities held
for trading which typically have a corresponding funding need
stemming from the established risk management structure.
These instruments are secured predominantly by high-quality
securities collateral, including government issued debt.
The table below presents the maturity details of all financial
liabilities. Securities loaned or sold under agreements to
repurchase, financial liabilities held for trading and financial
liabilities designated at fair value through profit or loss have
been disclosed at their fair values, consistent with how these
financial liabilities are managed. Amounts greater than one
year mainly relate to long term deposits and subordinated
liabilities which are measured at amortized cost.

45MANAGEMENT REPORT
nization, which consists of control managers within each LOB
and Corporate, is responsible for the day-to-day execution of
the CCOr Framework and the evaluation of the effectiveness
of their control environments to determine where targeted
remediation efforts may be required.
The Location Operational Risk and Control Committee
(“LOrCC”) receives reports on quality and stability of pro-
cesses, addressing key operational risk issues, focusing on
processes with control concerns, and overseeing control
remediation.
The CCOr Management policy establishes the CCOr Manage-
ment Framework. The CCOr Management Framework is artic-
ulated in the Risk Governance and Oversight Policy. In addi-
tion, the J.P. Morgan AG Operational Risk Manager Guidelines
define the establishment of the second line of defense and the
role of the J.P. Morgan AG Operational Risk Manager (OrM).
New operational risk concerns and actual operational risk
events are escalated, as required, to the LOrCC, as well as
other relevant governance bodies.
The Firm’s Global Chief Compliance Officer (“CCO”) and Firm-
wide Risk Executive (“FrE”) for Operational Risk is responsi-
ble for defining the CCOr Management Framework and estab-
lishing minimum standards for its execution. Operational Risk
Officers (“OrOs”) report to both the LOB Chief Risk Officers
(“CrOs”) and to the FrE for Operational Risk and are indepen-
dent of the respective businesses or functions they oversee.
At J.P. Morgan AG, the OrO reports to the CrO.
The Firm’s CCOr Management policy establishes the CCOr
Management Framework for the Firm. The CCOr Management
Framework is articulated in the Risk Governance and Over-
the number of investors and counterparties willing to lend to
the Firm. The nature and magnitude of the impact of ratings
downgrades depends on numerous contractual and behavioral
factors, which the Firm believes are incorporated in its liquidity
risk and stress testing metrics. J.P. Morgan AG believes that it
maintains sufficient liquidity to withstand a potential decrease
in funding capacity due to ratings downgrades.
Operational Risk Management
Operational risk is the risk of an adverse outcome resulting
from inadequate or failed internal processes or systems,
human factors, or external events impacting the Firm’s pro-
cesses or systems. Operational Risk includes compliance,
conduct, legal, and estimations and model risk.
Operational risk is inherent in the entity’s activities and can
manifest itself in various ways, including fraudulent acts,
business interruptions, cyber-attacks, inappropriate employee
behavior, failure to comply with applicable laws and regula-
tions, inappropriate model application or failure of vendors
to perform in accordance with their agreements. Operational
Risk Management attempts to manage operational risk at
appropriate levels in light of the entity’s financial position,
the characteristics of its businesses, and the markets and reg-
ulatory environments in which it operates.
Operational Risk Management Framework
To monitor and control operational risk, J.P. Morgan AG uti-
lizes the Firm’s Compliance, Conduct, and Operational Risk
(“CCOr”) Management Framework to govern, identify, mea-
sure, monitor and test, manage and report on operational risk.
Operational Risk Governance
LOBs and Corporate functions are responsible for the man-
agement of operational risk. The Control Management Orga-

46 MANAGEMENT REPORT
result from inadequate or failed internal processes or systems,
human factors, or due to external events. They include legal
risk and regulatory fines and exclude business strategy and
reputational risk. The scenario analysis process is an import-
ant tool for assessing the operational risk exposure, thereby
providing a forward-looking view to the Management and
Supervisory Board of potential future losses based on the risk
profile of J.P. Morgan AG.
The outputs from the scenario analysis process are used as
an input into the Capital Model to derive the Operational Risk
Capital for J.P. Morgan AG.
J.P. Morgan AG OrM contributes to the LOB independent risk
assessment by validating that J.P. Morgan AG operational risks
and controls are appropriately included and assessed. Mea-
surements such as operational risk loss events over time and
other key risk and performance indicators are reported to key
governance bodies including, but not limited to the LOrCC.
In addition, J.P. Morgan AG operational risk measurement
includes operational risk capital and operational risk loss pro-
jections under both baseline and stressed conditions.
Operational Risk Monitoring and Testing
The results of risk assessments performed by Operational
Risk and Compliance are leveraged as one of the key criteria
in the independent monitoring and testing of the LOBs and
Corporate’s compliance with laws and regulation. Through
monitoring and testing, Operational Risk and Compliance
independently identify areas of operational risk and tests the
effectiveness of controls within the LOBs and Corporate.
J.P. Morgan AG OrM is directly involved as required in monitor-
ing and testing activities impacting J.P. Morgan AG and lever-
sight Policy which is reviewed and approved by the Board Risk
Committee periodically and is implemented in the J.P. Morgan
AG Operational Risk Framework for J.P. Morgan AG.
Operational Risk Identification
The Firm utilizes a structured risk and control self-assessment
process that is executed by the LOBs and Corporate. As part
of this process, the LOBs and Corporate evaluate the effec-
tiveness of their control environment to assess where controls
have failed, and to determine where remediation efforts may
be required. The Firm’s Operational Risk and Compliance
organization (“Operational Risk and Compliance”) provides
oversight of these activities and may also perform indepen-
dent assessments of significant operational risk events and
areas of concentrated or emerging risk.
J.P. Morgan AG Material Risk identification is facilitated by
J.P. Morgan AG’s second line of defense (including J.P. Morgan
AG OrM) in conjunction with the relevant first line subject
matter experts.
Operational Risk Measurement
Operational Risk and Compliance perform independent risk
assessments of operational risks, which includes assessing
the effectiveness of the control environment and reporting
the results to risk senior management and the Management
Board.
J.P. Morgan AG uses an internal approach to calculate opera-
tional risk capital in the ICAAP leveraging an operational risk
scenario analysis framework.
Operational risk scenarios focus on exceptional but plausible
operational risk events which may or may not have previ-
ously impacted J.P. Morgan AG. Such operational risk events

47MANAGEMENT REPORT
COVID-19 Pandemic
Under the CCOr Management Framework, Operational Risk
and Compliance monitors and assesses COVID-19-related legal
and regulatory developments associated with the Firm’s finan-
cial products and services offered to clients and customers as
part of the existing change management process. The Firm
will continue to review and assess the impact of the pandemic
on operational risk and implement adequate measures as
needed.
The J.P. Morgan AG OrM reports issues and identified risks
to the J.P. Morgan AG CrO and the entity’s rOC as necessary.
This is part of the regular reporting to the J.P. Morgan AG
Management Board.
Details on cybersecurity risk, business and technology resil-
iency risk, compliance risk, payment fraud risk, conduct risk,
legal risk, third-party outsourcing risk, together with estima-
tions and model risk are provided below.
Cybersecurity risk
Cybersecurity risk is the risk of the Firm’s exposure to harm
or loss resulting from misuse or abuse of technology by
malicious actors. Cybersecurity risk is an important and con-
tinuously evolving focus for the Firm and J.P. Morgan AG.
Third parties with which the Firm and J.P. Morgan AG do
business or that facilitate business activities (e. g., vendors,
supply chains, exchanges, clearing houses, central deposito-
ries, and financial intermediaries) are also sources of cyber-
security risk. As with other aspects of technology, J.P. Mor-
gan AG outsources day-to-day operation of its Cybersecurity
controls to the Firm. To protect the confidentiality, integrity
and availability of the Firm’s infrastructure, resources and
information, the Firm maintains a Cybersecurity program
designed to prevent, detect, and respond to cyberattacks
ages the subject matter expertise of LOB and Corporate OrMs
and the central second line of defense testing team as required.
Management of Operational Risk
The operational risk areas or issues identified through moni-
toring and testing are escalated to the LOBs and Corporate to
be remediated through action plans, as needed, to mitigate
operational risk. Operational Risk and Compliance may advise
the LOBs and Corporate in the development and implementa-
tion of action plans.
J.P. Morgan AG OrM is involved in result reviews with the
business as needed and where findings have a direct impact
on the operating environment. In addition, the J.P. Morgan
AG OrM can raise issues in the COrE system as needed to
address any findings arising from CCOr activities, and the
ongoing tracking thereof.
Operational Risk Reporting
Escalation of risks is a fundamental expectation for all employ-
ees at the Firm. Risks identified by Operational Risk and Com-
pliance are escalated to the J.P. Morgan AG Risk Oversight
Committee (rOC) and the Frankfurt Location Operational Risk
and Control Committee, as needed.
Operational Risk and Compliance has established standards
to ensure that consistent operational risk reporting and oper-
ational risk reports are produced on an entity-wide basis as
well as by the LOBs and Corporate.
Reporting includes the evaluation of key risk indicators and
key performance indicators against established thresholds as
well as the assessment of different types of operational risk
against stated risk appetite. The standards reinforce escalation
protocols to Management Board and Supervisory Board.
48 MANAGEMENT REPORT
customers, as applicable. Among other key focus areas, the IrP
is designed to mitigate the risk of insider trading connected
to a Cybersecurity incident and includes various escalation
points. Due to the impact of COVID-19, the Firm increased the
use of remote access and also video conferencing solutions
provided by third parties to facilitate remote work. As a result,
the Firm took additional precautionary measures to mitigate
Cybersecurity risks.
Business and technology resiliency risk
Business disruptions can occur due to forces beyond J.P.
Morgan AG’s control such as the spread of infectious diseases
or pandemics, severe weather, power or telecommunications
loss, accidents, failure of a third party to provide expected
services, cyberattack, flooding, transit strikes, terrorism, or
health emergencies. The safety of employees and customers
is of the highest priority.
The Firmwide resiliency program, which J.P. Morgan AG
leverages, is intended to enable recovery of critical business
functions and supporting assets (i. e., staff, technology and
facilities) in the event of a business interruption. The program
includes governance, awareness training, and testing of recov-
ery strategies, as well as strategic and tactical initiatives to
identify, assess, and manage business interruption and public
safety risks. In connection with the COVID-19 pandemic, the
J.P. Morgan AG decided for some branches to temporarily split
work between the branch and the recovery site, in order to
allow a return to the office that corresponds to the distance
requirement. Throughout 2020, the COVID-19 pandemic and
associated measures for remote work / return to the office were
regularly discussed in permanent crisis management bodies
such as the EMEA Regional Crisis Management Committee
(EMEA rCMT) or the local site incident management commit-
tees (SIMT).
including three 24 hours / 7 days a week Security Operations
Centers. J.P. Morgan AG utilizes this program. The Firm
continues to make significant investments in enhancing its
cyber defense capabilities and to strengthen its partnerships
with the appropriate government and law enforcement agen-
cies and other businesses.
The Firmwide Cybersecurity and Technology controls (CTC)
organization is represented locally through four full time staff
members who provide governance, oversight and local coor-
dination of Cybersecurity-related topics for the entity. The J.P.
Morgan AG CTC manages and monitors a set of entity-specific
controls and metrics to ensure appropriate ongoing monitor-
ing and awareness of Cybersecurity-related risks. In addition,
the role of the information security officer is part of the Oper-
ational Risk Management, the role regularly reports to the
Management Board of J.P. Morgan AG and other committees
within the entity in relation to information security items.
Third party Cybersecurity incidents such as system break-
downs or failures, misconduct by the employees of such
parties, or cyberattacks could affect their ability to deliver a
product or service to the Firm or result in lost or compromised
information of the Firm or its clients. Clients are also sources
of Cybersecurity risk to the Firm, particularly when their
activities and systems are beyond the Firm’s own security
and control systems. However, where Cybersecurity incidents
occur as a result of client failures to maintain the security of
their own systems and processes, clients are responsible for
losses incurred.
The Firm has a Cybersecurity incident response plan (“IrP”)
designed to enable the Firm to respond to attempted Cyberse-
curity incidents, coordinate such responses with law enforce-
ment and other government agencies, and notify clients and
49MANAGEMENT REPORT
Each LOB and Corporate function within J.P. Morgan AG holds
primary ownership and accountability for managing compli-
ance risks. The Compliance Organization (“Compliance”),
which is independent of the LOBs, works closely with the
Management Board to provide independent review, moni-
toring and oversight of business operations with a focus on
compliance with the regulatory obligations applicable to the
offering of the Firm’s products and services to clients and
customers.
Compliance risks relate to a wide variety of legal and regula-
tory obligations, depending on the LOB and the jurisdiction,
and include those related to products and services, rela-
tionships and interactions with clients and customers, and
employee activities. For example, compliance risks include
those associated with anti-money laundering compliance,
trading activities, market conduct, and complying with the
rules and regulations related to the offering of products and
services across jurisdictional borders. Compliance risk is
inherent in the Firm’s and the entity’s activities, including
the risk of failure to exercise an applicable standard of care,
to act in the best interest of clients and customers or to treat
clients and customers fairly.
Other functions provide oversight of significant regulatory
obligations that are specific to their respective areas of
responsibility.
CCOr Management implements policies and standards
designed to govern, identify, measure, monitor and test, man-
age, and report compliance risk.
Governance and oversight
Compliance is led by the J.P. Morgan AG Chief Compliance
Officer (“CCO”) who reports to the entity’s CrO. The entity
Third-party outsourcing risk
The Firm‘s Third-Party Oversight (“TPO”) and Inter-affiliates
Oversight (“IAO”) framework assist J.P. Morgan AG in select-
ing, documenting, onboarding, monitoring and managing
their supplier relationships including services provided by
affiliates. The objectives of the TPO framework are to hold
suppliers to a high level of operational performance and to
mitigate key risks including data loss and business disrup-
tion. The Corporate Third-Party Oversight group is responsible
for Firmwide training, monitoring, reporting and standards.
J.P. Morgan AG governs this through a centralized outsourcing
management which reports directly to the J.P. Morgan AG CFO.
Payment fraud risk
Payment fraud risk is the risk of external and internal parties
unlawfully obtaining personal monetary benefit through mis-
directed or otherwise improper payment. The risk of payment
fraud remains at a heightened level across the industry, par-
ticularly during the current COVID-19 pandemic due to the
use of contingent forms of payment authentication methods,
scams involving the pandemic being perpetrated including
an increase in the level of fraud attempts against consumers.
The complexities of these incidents and the strategies used
by perpetrators continue to evolve. The Firm employs various
controls for managing payment fraud risk as well as providing
employee and client education and awareness trainings. The
Firm’s monitoring of customer behavior to detect new fraud
strategies is periodically evaluated and enhanced in an effort
to mitigate these fraud risks.
Compliance risk
Compliance risk, a subcategory of operational risk, is the risk
of failing to comply with laws, rules, regulations or codes of
conduct and standards of self-regulatory organizations appli-
cable to the business activities of the Firm and the entity.
50 MANAGEMENT REPORT
Overview
Each LOB and Corporate function is accountable for iden-
tifying and managing its conduct risk to provide appropri-
ate engagement, ownership and sustainability of a culture
consistent with the Firm’s How We Do Business Principles
(the “Principles”). The Principles serve as a guide for how
employees are expected to conduct themselves. With the Prin-
ciples serving as a guide, the Firm’s Code sets out the Firm’s
expectations for each employee and provides information and
resources to help employees conduct business ethically and
in compliance with the law everywhere the Firm operates.
For further discussion of the Code, refer to Compliance Risk
Management.
Governance and oversight
The Conduct Risk Program is governed by the CCOr Manage-
ment policy, which establishes the framework for governance,
identification, measurement, monitoring and testing, manage-
ment and reporting of conduct risk in the Firm and the entity.
J.P. Morgan AG utilizes this framework.
Conduct risk management encompasses various aspects of
people management practices, including recruiting, onboard-
ing, training and development, performance management,
promotion and compensation processes. Each LOB, Treasury
and CIO, and designated Corporate functions completes an
assessment of conduct risk periodically, reviews metrics and
issues which may involve conduct risk and provides business
conduct training as appropriate.
Legal risk
Legal risk, a subcategory of operational risk, is the risk of loss
primarily caused by the actual or alleged failure to meet legal
obligations that arise from the rule of law in jurisdictions in
which the Firm operates, agreements with clients and cus-
maintains oversight and coordination of its compliance risk
through the implementation of the CCOr Framework.
Code of Conduct
The Firm has a Code of Conduct (the “Code”). This relates
equally to the employees of J.P. Morgan AG and sets out the
expectation that employees will conduct themselves with
integrity at all times and provides the principles that govern
employee conduct with clients, customers, shareholders and
one another, as well as with the markets and communities in
which the entity does business. The Code requires employees
to promptly report any known or suspected violation of the
Code, any internal Firm policy, or any law or regulation appli-
cable to the Firm’s business. It also requires employees to
report any illegal conduct or conduct that violates the under-
lying principles of the Code, by any of the Firm’s employees,
customers, suppliers, contract workers, business partners, or
agents.
All newly hired employees are assigned Code training and
current employees are periodically assigned Code training
on an ongoing basis. Employees are required to affirm their
compliance with the Code periodically. Employees can report
any potential or actual violations of the Code through the Code
Reporting Hotline by phone or the internet. The Hotline is
administered by an outside service provider. The Code prohib-
its retaliation against anyone who raises an issue or concern
in good faith.
Conduct risk
Conduct risk, a subcategory of operational risk, is the risk that
any action or inaction by an employee or employees could
lead to unfair client or customer outcomes, impact the integ-
rity of the markets in which the entity operates, or compro-
mise the entity’s and the Firm’s reputation.
51MANAGEMENT REPORT
larly report on significant legal matters to the Management
Board.
Legal serves on and advises various committees (including
new business initiative and reputation risk committees) and
advises the LOBs and Corporate functions on potential repu-
tation risk issues.
Estimations and Model risk
Risk definition
Estimations and Model risk, a subcategory of operational
risk, is the potential for adverse consequences from decisions
based on incorrect or misused estimation outputs.
Risk profile
J.P. Morgan AG uses models and other analytical and judg-
ment-based estimations across various businesses and func-
tions. The estimation methods are of varying levels of sophis-
tication and are used for many purposes, such as the valuation
of positions and measurement of risk, assessing regulatory
capital requirements, conducting stress testing, and making
business decisions. As estimations are simplified representa-
tions of real-world relationships, their use presents risk due to
possible flaws in their methodology and numerical routines,
inputs and assumptions, implementation, use, or relationships
between interdependent estimations. Estimations are tiered
based on complexity, exposure and reliance to provide an
indicator of the potential risk posed by the estimation: the
lower the tier, the higher the model risk, with Tier 1 posing
the highest risk and Tier 4 the lowest.
Risk management objectives
J.P. Morgan AGs model risk management objectives are to
identify, monitor, measure where possible and manage model
tomers, and products and services offered by the Firm and
J.P. Morgan AG.
Overview
The Legal function (“Legal”) provides legal services and
advice. Legal is responsible for managing J.P. Morgan AG’s
exposure to legal risk by:
– managing actual and potential litigation and enforcement
matters, including internal reviews and investigations
related to such matters;
– advising on products and services, including contract nego-
tiation and documentation;
– advising on offering and marketing documents and new
business initiatives;
– managing dispute resolution;
– interpreting existing laws, rules and regulations, and advis-
ing on changes thereto;
– advising on advocacy in connection with contemplated and
proposed laws, rules and regulations; and
– providing legal advice to the LOBs and Corporate functions,
including their Operations, Technology and Oversight &
Control functions (first line of defense), Risk Management
and Compliance (second line of defense) and Internal Audit
(third line of defense).
Legal selects, engages and manages outside counsel on all
matters in which outside counsel is engaged. In addition, Legal
advises the Conflicts Office which reviews the Firm’s and J.P.
Morgan AG’s wholesale transactions that may have the poten-
tial to create conflicts of interest for the Firm and the entity.
Governance and oversight
The Head of Legal of J.P. Morgan AG reports to the CEO. The
entity’s Head of Legal and other members of Legal regu-
52 MANAGEMENT REPORT
enhance models in response to changes in the portfolios and
in product and market developments, as well as to capture
improvements in available modelling techniques and systems
capabilities. Model users within J.P. Morgan AG are responsi-
ble for ensuring that any model they use is captured both in
the Firmwide inventory and in the J.P. Morgan AG inventory
and for abiding by the scope and other conditions of the mod-
el’s approval on an ongoing basis.
MrGr is an independent function in the risk management of
J.P. Morgan AG reporting directly to the CrO, and staffed with
personnel to assess model risk independently from Model
Developers and Model users. MrGr resources from other JPM
entities support J.P. Morgan AG MrGr, subject to outsourc-
ing arrangements. In its review of a model, MrGr considers
whether the model is suitable for the specific purposes for
which it will be used. When reviewing a model, MrGr anal-
yses and challenges the model methodology and the reason-
ableness of model assumptions and may perform or require
additional testing, including back-testing of model outcomes.
Model reviews are approved by the appropriate level of man-
agement within MrGr based on the relevant model tier.
Under the J.P. Morgan AG Estimation and Model Risk Manage-
ment policy, MrGr reviews and approves new models, as well
as material changes to existing models, prior to implementation
in the operating environment. In certain circumstances excep-
tions may be granted to the policy to allow a model to be used
prior to review or approval. MrGr may also require the user to
take appropriate actions to mitigate the model risk if it is to be
used in the interim. These actions will depend on the model
and may include, for example, limitation of trading activity.
While models are inherently imprecise, the degree of impre-
cision or uncertainty can be heightened by the market or eco-
risk. To this end, model risk policies and procedures mandate
the following:
– Robust review of models in order to identify model risks;
– Ensure compensating controls are considered where nec-
essary;
– Perform ongoing performance monitoring of models to
ensure that they continue to perform throughout their life;
– Ensure all models are adequately documented and tested.
Approach to risk management
The J.P. Morgan AG Model Risk Governance Framework is
set out in the J.P. Morgan AG Estimations and Model Risk
Management Policy and Procedure and follows the same prin-
ciples and guidelines as laid out in the Firmwide Framework.
The requirements of the policy and certain new model risk
management activities have not been fully implemented yet.
Managing model risk throughout the model life cycle is the
responsibility of multiple constituents, principally the Model
Users, Model Developers, Model Owners, and Model Risk Gov-
ernance and Review Group (“MrGr”). The J.P. Morgan AG Esti-
mations Risk Committee (AGErC), a sub-committee of the J.P.
Morgan AG rOC, is responsible for the oversight of the model risk
and implementation of the model risk framework for the entity.
Model risks are owned by the users of the models within J.P.
Morgan AG based on the specific purposes of such models.
Users and developers of models are responsible for devel-
oping, implementing and testing their models, as well as
referring models to MrGr for review and approval. Once
models have been approved, model users and developers are
responsible for maintaining a robust operating environment,
and must monitor and evaluate the performance of the models
on an ongoing basis. Model users and developers may seek to

53MANAGEMENT REPORT
– Pillar 1 capital requirements: 8 % for total capital and
4.50% for CET 1 capital;
– Pillar 2 capital requirements (SrEP add-on): 3.25% for total
capital and 1.83% for CET1 capital; and
– Combined Buffer Requirements: 2.56% for both total capital
and CET1 capital.
The minimum requirements for total capital decreased in 2020
compared to 2019 mainly due to the decreasing countercy-
clical buffer requirement, which is intended to protect banks
against risks arising when credit growth is excessive from
0.36% to 0.06%. In response to the COVID-19 pandemic,
some of the countries to which J.P. Morgan AG holds material
credit exposure to the private sector reduced their countercy-
clical buffer rates, as a relief measure, resulting in an overall
decrease in the countercyclical buffer requirement.
Regulatory Capital and Ratios
The regulatory capital for J.P. Morgan AG increased by € 8,503
million in 2020 compared to 2019. This was driven by three
capital injections (CET1 capital) to the amount of € 7,725 mil-
lion as well as a Tier 2 capital issuance of € 840 million in 2020
to support growth in business activities. During this period, the
capital requirements increased significantly with risk weighted
assets (rWAs) increasing significantly from € 17,923 million to
€ 41,492 million. The main drivers of the rWA increase are:
– Operational Risk: Increase is driven by a methodological
change in the quantification of operational risk under the
Basic Indicator Approach from using historical revenues to
using forward-looking plan revenues.
– Market Risk: Increase is driven by migrations of risk posi-
tions to J.P. Morgan AG in Q4 2020.
nomic environment. This is particularly true when the current
and forecasted environment is significantly different from
the historical macroeconomic environments upon which the
models were calibrated, as the Firm has experienced during
the COVID-19 pandemic. This uncertainty may necessitate a
greater degree of judgment and analytics to inform adjust-
ments to model outputs than in typical periods.
Capital risk
Capital risk is the risk that J.P. Morgan AG has an insuffi-
cient level and composition of capital to support its business
activities and associated risks during both normal economic
environments and under stressed conditions.
A strong capital position is essential to J.P. Morgan AG’s busi-
ness strategy and competitive position. J.P. Morgan AG’s cap-
ital management strategy focuses on maintaining long-term
stability to enable it to build and invest in market-leading busi-
nesses, even in a highly stressed environment. Prior to making
any decisions on future business activities, the Management
Board considers the implications on J.P. Morgan AG’s capital.
Accordingly, the entity’s Capital Management Framework is
designed to ensure that it is adequately capitalized at all times
primarily in relation to:
– (Minimum) regulatory capital requirements;
– Minimum requirements on the leverage ratio;
– MrEL requirements; and
– Risk appetite as determined by Management and expressed
for example, through the setting of internal capital targets
above minimum levels prescribed by regulation.
Regulatory minimum capital requirements
In 2020, J.P. Morgan AG had to comply with the following
minimum capital requirements consisting of:
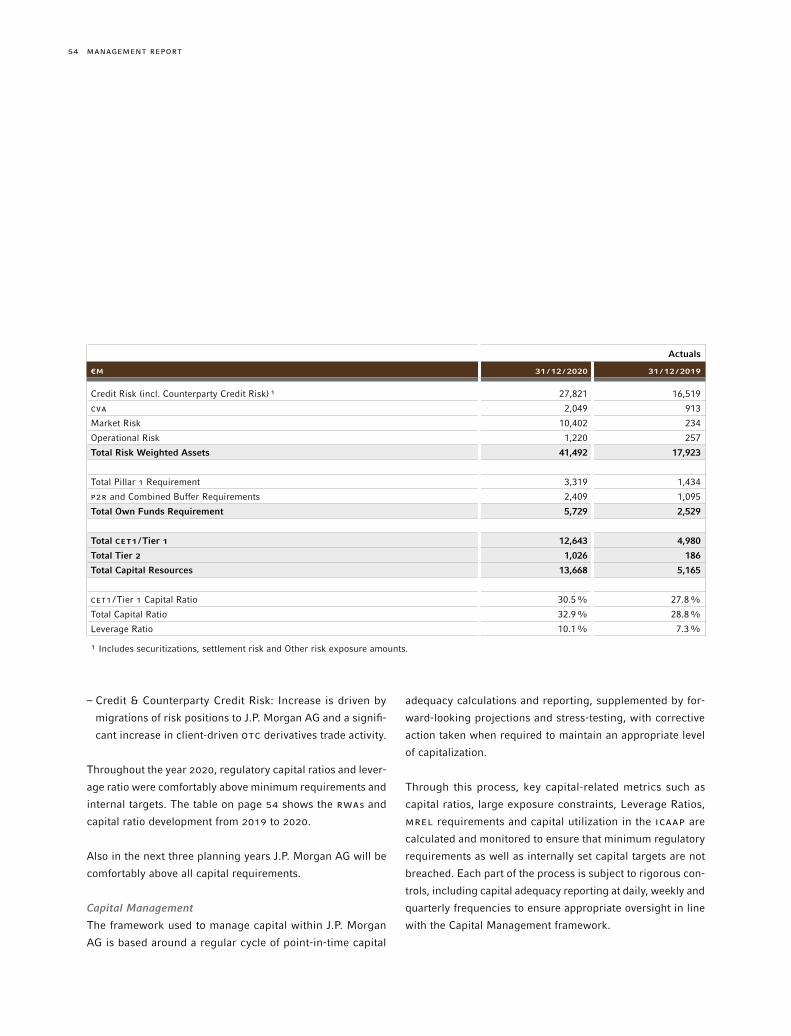
54 MANAGEMENT REPORT
adequacy calculations and reporting, supplemented by for-
ward-looking projections and stress-testing, with corrective
action taken when required to maintain an appropriate level
of capitalization.
Through this process, key capital-related metrics such as
capital ratios, large exposure constraints, Leverage Ratios,
MrEL requirements and capital utilization in the ICAAP are
calculated and monitored to ensure that minimum regulatory
requirements as well as internally set capital targets are not
breached. Each part of the process is subject to rigorous con-
trols, including capital adequacy reporting at daily, weekly and
quarterly frequencies to ensure appropriate oversight in line
with the Capital Management framework.
– Credit & Counterparty Credit Risk: Increase is driven by
migrations of risk positions to J.P. Morgan AG and a signifi-
cant increase in client-driven OTC derivatives trade activity.
Throughout the year 2020, regulatory capital ratios and lever-
age ratio were comfortably above minimum requirements and
internal targets. The table on page 54 shows the rWAs and
capital ratio development from 2019 to 2020.
Also in the next three planning years J.P. Morgan AG will be
comfortably above all capital requirements.
Capital Management
The framework used to manage capital within J.P. Morgan
AG is based around a regular cycle of point-in-time capital
Actuals
€M 31 /12 /2020 31 /12 /2019
Credit Risk (incl. Counterparty Credit Risk) ¹ 27,821 16,519
CVA 2,049 913
Market Risk 10,402 234
Operational Risk 1,220 257
Total Risk Weighted Assets 41,492 17,923
Total Pillar 1 Requirement 3,319 1,434
P2r and Combined Buffer Requirements 2,409 1,095
Total Own Funds Requirement 5,729 2,529
Total CET1 /Tier 1 12,643 4,980
Total Tier 2 1,026 186
Total Capital Resources 13,668 5,165
CET1 /Tier 1 Capital Ratio 30.5% 27.8%
Total Capital Ratio 32.9% 28.8%
Leverage Ratio 10.1% 7.3%
¹ Includes securitizations, settlement risk and Other risk exposure amounts.
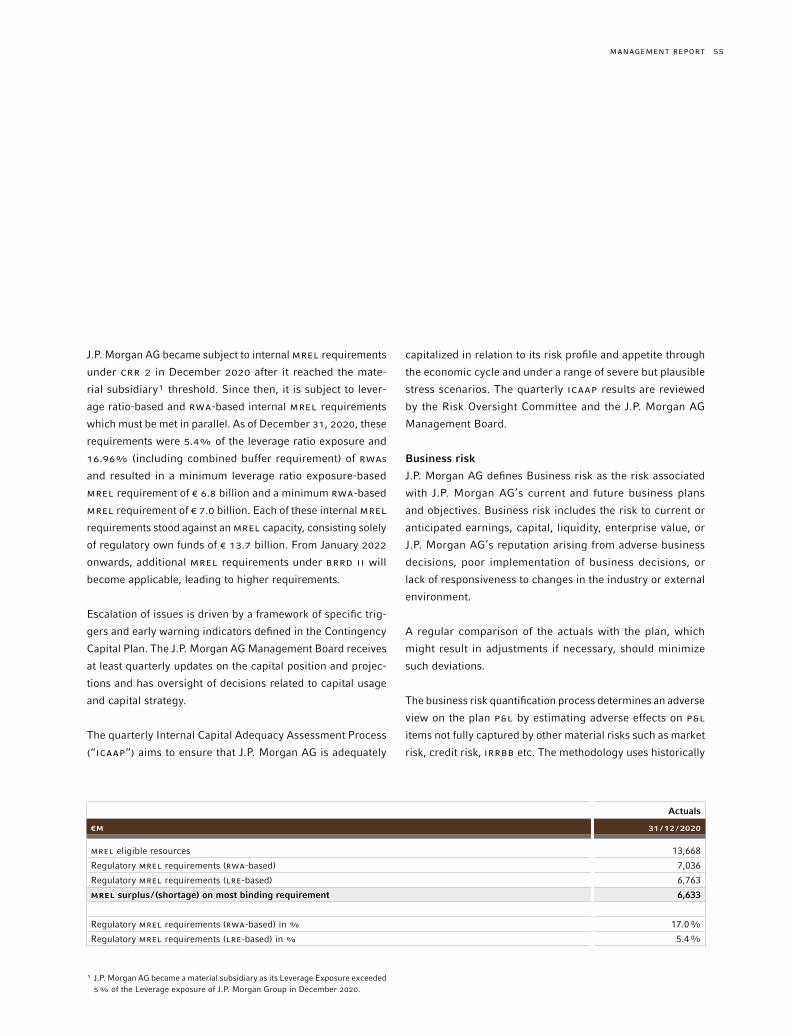
55MANAGEMENT REPORT
capitalized in relation to its risk profile and appetite through
the economic cycle and under a range of severe but plausible
stress scenarios. The quarterly ICAAP results are reviewed
by the Risk Oversight Committee and the J.P. Morgan AG
Management Board.
Business risk
J.P. Morgan AG defines Business risk as the risk associated
with J.P. Morgan AG’s current and future business plans
and objectives. Business risk includes the risk to current or
anticipated earnings, capital, liquidity, enterprise value, or
J.P. Morgan AG’s reputation arising from adverse business
decisions, poor implementation of business decisions, or
lack of responsiveness to changes in the industry or external
environment.
A regular comparison of the actuals with the plan, which
might result in adjustments if necessary, should minimize
such deviations.
The business risk quantification process determines an adverse
view on the plan P&L by estimating adverse effects on P&L
items not fully captured by other material risks such as market
risk, credit risk, IrrBB etc. The methodology uses historically
J.P. Morgan AG became subject to internal MrEL requirements
under Crr 2 in December 2020 after it reached the mate-
rial subsidiary¹ threshold. Since then, it is subject to lever-
age ratio-based and rWA-based internal MrEL requirements
which must be met in parallel. As of December 31, 2020, these
requirements were 5.4% of the leverage ratio exposure and
16.96% (including combined buffer requirement) of rWAs
and resulted in a minimum leverage ratio exposure-based
MrEL requirement of € 6.8 billion and a minimum rWA-based
MrEL requirement of € 7.0 billion. Each of these internal MrEL
requirements stood against an MrEL capacity, consisting solely
of regulatory own funds of € 13.7 billion. From January 2022
onwards, additional MrEL requirements under BrrD II will
become applicable, leading to higher requirements.
Escalation of issues is driven by a framework of specific trig-
gers and early warning indicators defined in the Contingency
Capital Plan. The J.P. Morgan AG Management Board receives
at least quarterly updates on the capital position and projec-
tions and has oversight of decisions related to capital usage
and capital strategy.
The quarterly Internal Capital Adequacy Assessment Process
(“ICAAP”) aims to ensure that J.P. Morgan AG is adequately
Actuals
€M 31 /12 /2020
MrEL eligible resources 13,668
Regulatory MrEL requirements (rWA-based) 7,036
Regulatory MrEL requirements (LrE-based) 6,763
MREL surplus / (shortage) on most binding requirement 6,633
Regulatory MrEL requirements (rWA-based) in % 17.0%
Regulatory MrEL requirements (LrE-based) in % 5.4%
¹ J.P. Morgan AG became a material subsidiary as its Leverage Exposure exceeded 5% of the Leverage exposure of J.P. Morgan Group in December 2020.
56 MANAGEMENT REPORT
Risks manifesting across various risk types
Country risk
J.P. Morgan AG, through its LOBs and Corporate functions,
may be exposed to country risk resulting from financial,
economic, political or other significant developments which
adversely affect the value of the entity’s exposures related to
a particular country or set of countries.
J.P. Morgan AG has implemented a country risk framework
based on the Firmwide approach. Entity specific thresholds for
country risk are monitored monthly and reported to the Risk
Oversight Committee and the Management Board.
Organization and Management
Country Risk Management is an independent risk manage-
ment function that assesses, manages and monitors country
risk and reports to the Firm’s CrO. For J.P. Morgan AG, this
group actively monitors the portfolio of the entity with the
following activities:
– Maintaining policies, procedures and standards consistent
with a comprehensive country risk framework;
– Assigning sovereign ratings, assessing country risks and
establishing risk tolerance relative to a country;
– Measuring and monitoring country risk exposure and stress
across the Firm;
– Managing and approving country limits and reporting trends
and limit breaches to the Management Board;
– Developing surveillance tools, such as signalling models
and ratings indicators, for early identification of potential
country risk concerns; and
– Providing country risk scenario analysis.
observed absolute deviations between planned and actual P&L
figures and computes a business risk factor by determining
the 99.9% confidence level from the empirical distribution.
The business risk factor is applied to the current P&L plan to
obtain an estimate of the economic capital requirements for
business risk over a 1-year horizon. This economic capital
requirement for the Business Risk results together with the
other economic risk categories in the total economic capital
requirement of J.P. Morgan AG.
Pension Risk
J.P. Morgan AG defines Pension risk as the risk caused by
contractual or other liabilities to or with respect to a pension
scheme (whether established for its employees or those of
a related company or otherwise). Pension risk is driven by
market and demographic risk where the pension scheme may
be unable to meet future expected benefit payments. Pension
Risk therefore represents the potential necessity for increased
pension risk provisions.
Risk Governance
J.P. Morgan AG manages Pension Risk with a dedicated pen-
sion governance. This includes regular reporting, a pension
committee and a corresponding investment committee.
Risk Measurement
Pension risk is quantified on the basis of a VaR model with
a 99.9% confidence level and a one year holding period,
semi-annually evaluated by J.P. Morgan AG’s pension admin-
istrator, and taken into account in a separate quantification.
Should this VaR exceed the asset surplus of the pension fund,
this amount will be deducted from the risk-bearing capacity.
57MANAGEMENT REPORT
– Credit derivatives protection purchased and sold is reported
based on the underlying reference entity and is measured
at the notional amount of protection purchased or sold, net
of the fair value of the recognized derivative receivable or
payable. Credit derivatives protection purchased and sold
in market making activities is measured on a net basis,
as such activities often result in selling and purchasing
protection related to the same underlying reference entity;
this reflects the manner in which the Firm manages these
exposures.
Some activities may create contingent or indirect exposure
related to a country (for example, providing clearing services
or secondary exposure to collateral on securities financing
receivables). These exposures are managed in the normal
course of business through the credit, market, and operational
risk governance.
Stress testing
Stress testing is an important component of the country
risk management framework, which aims to estimate and
limit losses arising from a country crisis by measuring the
impact of adverse asset price movements to a country based
on market shocks combined with counterparty-specific
assumptions.
Country Risk Management periodically designs and runs
tailored stress scenarios to test vulnerabilities to individual
countries or sets of countries in response to specific or poten-
tial market events, sector performance concerns, sovereign
actions and geopolitical risks. These stress results are used
to inform potential risk reduction, as necessary.
Sources and measurement
Country exposure includes activity with both government and
private-sector entities in a country. Under the internal coun-
try risk management approach, attribution of exposure to a
specific country is based on the country where the largest
proportion of the assets of the counterparty, issuer, obligor
or guarantor are located or where the largest proportion of
its revenue is derived. This may be different from the domi-
cile (i. e., legal residence) or country of incorporation of the
counterparty, issuer, obligor or guarantor. Country exposures
are generally measured by considering the risk to an immedi-
ate default of the counterparty, issuer, obligor or guarantor,
with zero recovery. Assumptions are sometimes required in
determining the measurement and allocation of country expo-
sure, particularly in the case of certain non-linear or index
exposures. The use of different measurement approaches
or assumptions could affect the amount of reported country
exposure.
Under the internal country risk measurement framework:
– Lending exposures are measured at the total committed
amount (funded and unfunded), net of the allowance for
credit losses and eligible cash and marketable securities
collateral received;
– Deposits are measured as the cash balances placed with
central and commercial banks;
– Securities financing exposures are measured at their receiv-
able balance, net of eligible collateral received;
– Debt and equity securities are measured at the fair value of
all positions, including both long and short positions;
– Counterparty exposure on derivative receivables is mea-
sured at the derivative’s fair value, net of the fair value of
the eligible collateral received;
58 MANAGEMENT REPORT
– Managing the governance infrastructure and processes that
support consistent identification, escalation, management
and monitoring of reputation risk issues Firmwide;
– Providing guidance to LOB Reputation Risk Offices (“rrO”),
as appropriate.
The types of events that give rise to reputation risk are
wide-ranging and could be introduced in various ways,
including by employees, clients, customers and counterpar-
ties. These events could result in financial losses, litigation
and regulatory fines, as well as other damages to the Firm
and J.P. Morgan AG.
Governance and oversight
The Firm’s Reputation Risk Governance policy establishes the
principles for managing reputation risk. J.P. Morgan AG has
adopted these for the management of reputation risk within
the entity. It is the responsibility of employees in each LOB
and Corporate function to consider the reputation of the Firm
and the entity when deciding whether to offer a new prod-
uct, engage in a transaction or client relationship, enter a
new jurisdiction, initiate a business process or other matters.
Increasingly, sustainability, social responsibility and environ-
mental impacts are important considerations in assessing
reputation risk, and are considered as part of reputation risk
governance.
Reputation risk issues deemed material are escalated as
appropriate.
Risk Summary
In our view, a conservative risk policy and solid capital
resources ensure the comfortable risk position of J.P. Morgan
AG going forward. The quantification of the capital demands
COVID-19 Pandemic
Country Risk Management continues to monitor the impact
of the COVID-19 pandemic, leveraging existing stress testing,
exposure reporting and controls, as well as tailored analy-
sis, to assess the extent to which individual countries may be
adversely impacted.
Risk reporting
To enable effective risk management of country risk to
the Firm, country exposure and stress are measured and
reported weekly, and used by Country Risk Management
to identify trends, and monitor high usages and breaches
against limits.
Reputation risk
Reputation risk is the risk that an action or inaction may neg-
atively impact J.P. Morgan AG’s integrity and reduce confi-
dence in the entity’s competence held by various constitu-
ents, including clients, counterparties, customers, investors,
regulators, employees, communities or the broader public.
Organization and management
Reputation Risk Management establishes the governance
framework for managing reputation risk across the Firm.
J.P. Morgan AG manages reputation risk on the basis of the
Firmwide approach. As reputation risk is inherently difficult
to identify, manage, and quantify, an independent reputation
risk management governance function is critical.
Reputation risk management includes the following activities:
– Establishing a Firmwide Reputation Risk Governance policy
and standards consistent with the reputation risk frame-
work;
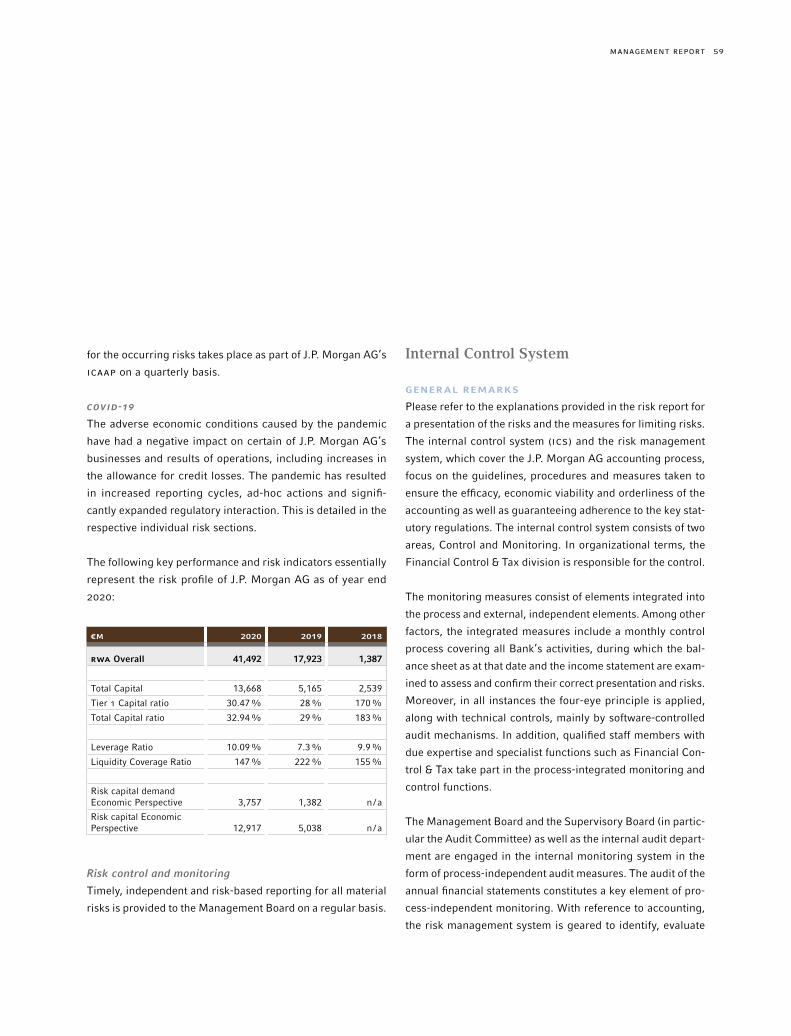
59MANAGEMENT REPORT
Internal Control System
GENERAL REMARKS
Please refer to the explanations provided in the risk report for
a presentation of the risks and the measures for limiting risks.
The internal control system (ICS) and the risk management
system, which cover the J.P. Morgan AG accounting process,
focus on the guidelines, procedures and measures taken to
ensure the efficacy, economic viability and orderliness of the
accounting as well as guaranteeing adherence to the key stat-
utory regulations. The internal control system consists of two
areas, Control and Monitoring. In organizational terms, the
Financial Control & Tax division is responsible for the control.
The monitoring measures consist of elements integrated into
the process and external, independent elements. Among other
factors, the integrated measures include a monthly control
process covering all Bank’s activities, during which the bal-
ance sheet as at that date and the income statement are exam-
ined to assess and confirm their correct presentation and risks.
Moreover, in all instances the four-eye principle is applied,
along with technical controls, mainly by software-controlled
audit mechanisms. In addition, qualified staff members with
due expertise and specialist functions such as Financial Con-
trol & Tax take part in the process-integrated monitoring and
control functions.
The Management Board and the Supervisory Board (in partic-
ular the Audit Committee) as well as the internal audit depart-
ment are engaged in the internal monitoring system in the
form of process-independent audit measures. The audit of the
annual financial statements constitutes a key element of pro-
cess-independent monitoring. With reference to accounting,
the risk management system is geared to identify, evaluate
for the occurring risks takes place as part of J.P. Morgan AG’s
ICAAP on a quarterly basis.
COVID-19
The adverse economic conditions caused by the pandemic
have had a negative impact on certain of J.P. Morgan AG’s
businesses and results of operations, including increases in
the allowance for credit losses. The pandemic has resulted
in increased reporting cycles, ad-hoc actions and signifi-
cantly expanded regulatory interaction. This is detailed in the
respective individual risk sections.
The following key performance and risk indicators essentially
represent the risk profile of J.P. Morgan AG as of year end
2020:
€M 2020 2019 2018
RWA Overall 41,492 17,923 1,387
Total Capital 13,668 5,165 2,539
Tier 1 Capital ratio 30.47% 28% 170%
Total Capital ratio 32.94% 29% 183%
Leverage Ratio 10.09% 7.3% 9.9%
Liquidity Coverage Ratio 147% 222% 155%
Risk capital demand Economic Perspective 3,757 1,382 n /a
Risk capital Economic Perspective 12,917 5,038 n /a
Risk control and monitoring
Timely, independent and risk-based reporting for all material
risks is provided to the Management Board on a regular basis.

60 MANAGEMENT REPORT
requirements and the material information in the annual finan-
cial statements and respectively in the IFrS separate financial
statements.
and communicate risks from faulty bookkeeping, accounting,
and reporting in a timely manner.
IT USE
The software used in the Bank to support accounting pro-
cesses is made up of the IT applications used throughout the
Group. The proper running of programs and interfaces is reg-
ularly assessed and confirmed. As part of the audit of our IT,
the Group auditors check the due operation of the account-
ing-related applications at all computer centre locations. The
general IT system, including that for accounting, is secured
against unauthorized access.
KEY REGULATIONS AND CONTROL ACTIVITIES TO
ENSURE DUE, ORDERLY AND RELIABLE ACCOUNTING
The rules and measures of the internal control system aim to
ensure that business transactions are recorded in compliance
with legal and internal requirements in a timely and complete
manner, and that assets and liabilities within the annual finan-
cial statements are properly estimated, valued and reported.
The booking documentation provides a reliable information
base and a clear paper trail.
In the J.P. Morgan Group, the regulations of the Financial
Accounting Standard Board are applied as uniform valuation
and accounting principles according to US GAAP and supple-
mented and commented on by the Group´s “Accounting Poli-
cies” department. Here, too, stipulations are made with regard
to the Group accounting practices. As part of the preparation
of the annual financial statements according to HGB and the
IFrS individual financial statements for J.P. Morgan AG, a
reconciliation is made from US GAAP to the HGB and IFrS
financial statements. Local work directives regulate the formal

61MANAGEMENT REPORT

62 MANAGEMENT REPORT
Frankfurt am Main, April 12, 2021
J.P. Morgan AG
Frankfurt am Main
The Management Board
STEFAN BEHr NICHOLAS CONrON
GUNNAr rEGIEr BUrKHArD KÜBEL-SOrGEr
CINDYrELLA AMISTADI

Stand-alone Financial Statements of J.P. Morgan AG in Accordance with the International Financial Reporting Standards for the Year ended December 31, 2020
63STAND-ALONE FINANCIAL STATEMENTS
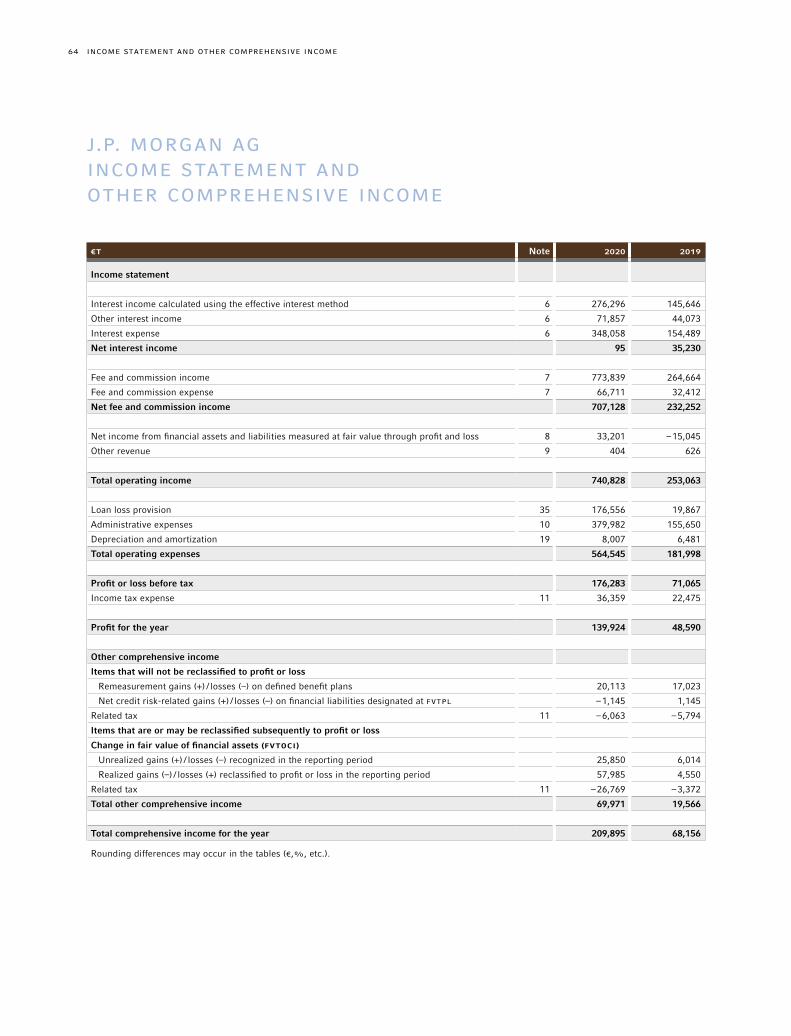
64 INCOME STATEMENT AND OTHEr COMPrEHENSIVE INCOME
J.P. MOrGAN AG INCOME STATEMENT AND OTHEr COMPrEHENSIVE INCOME
€T Note 2020 2019
Income statement
Interest income calculated using the effective interest method 6 276,296 145,646
Other interest income 6 71,857 44,073
Interest expense 6 348,058 154,489
Net interest income 95 35,230
Fee and commission income 7 773,839 264,664
Fee and commission expense 7 66,711 32,412
Net fee and commission income 707,128 232,252
Net income from financial assets and liabilities measured at fair value through profit and loss 8 33,201 –15,045
Other revenue 9 404 626
Total operating income 740,828 253,063
Loan loss provision 35 176,556 19,867
Administrative expenses 10 379,982 155,650
Depreciation and amortization 19 8,007 6,481
Total operating expenses 564,545 181,998
Profit or loss before tax 176,283 71,065
Income tax expense 11 36,359 22,475
Profit for the year 139,924 48,590
Other comprehensive income
Items that will not be reclassified to profit or loss
Remeasurement gains (+) / losses (–) on defined benefit plans 20,113 17,023
Net credit risk-related gains (+) / losses (–) on financial liabilities designated at FVTPL –1,145 1,145
Related tax 11 –6,063 –5,794
Items that are or may be reclassified subsequently to profit or loss
Change in fair value of financial assets (FVTOCI)
Unrealized gains (+) / losses (–) recognized in the reporting period 25,850 6,014
Realized gains (–) / losses (+) reclassified to profit or loss in the reporting period 57,985 4,550
Related tax 11 –26,769 –3,372
Total other comprehensive income 69,971 19,566
Total comprehensive income for the year 209,895 68,156
Rounding differences may occur in the tables (€,%, etc.).
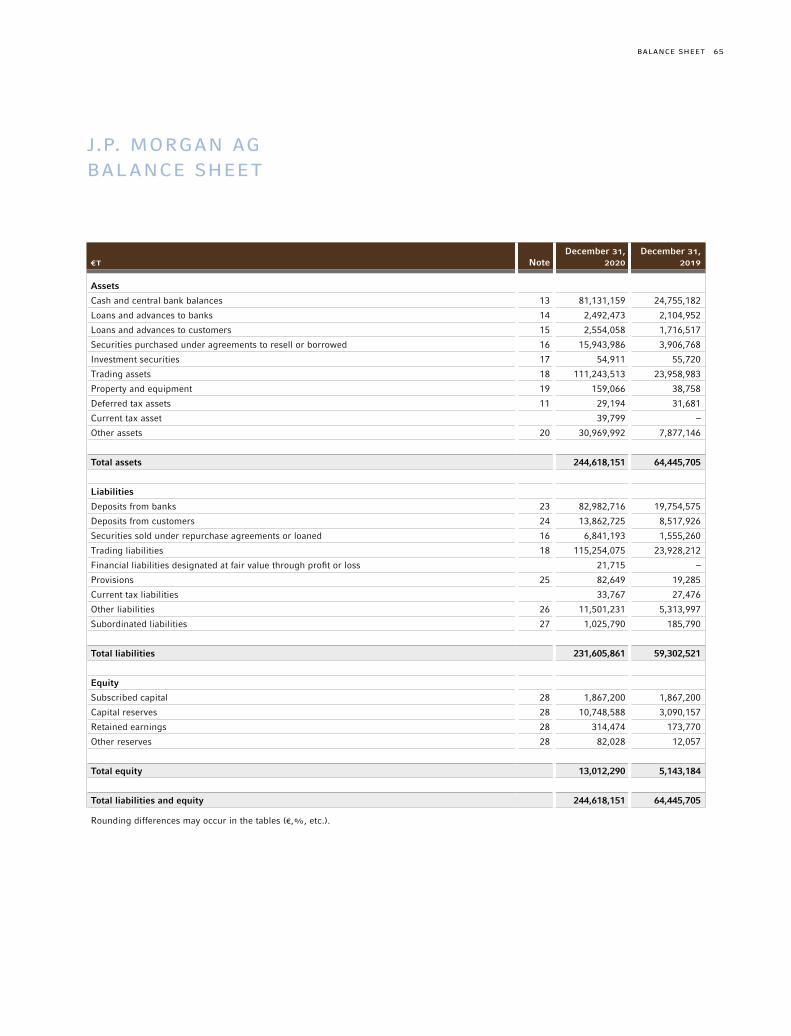
65BALANCE SHEET
J.P. MOrGAN AG BALANCE SHEET
€T NoteDecember 31,
2020December 31,
2019
Assets
Cash and central bank balances 13 81,131,159 24,755,182
Loans and advances to banks 14 2,492,473 2,104,952
Loans and advances to customers 15 2,554,058 1,716,517
Securities purchased under agreements to resell or borrowed 16 15,943,986 3,906,768
Investment securities 17 54,911 55,720
Trading assets 18 111,243,513 23,958,983
Property and equipment 19 159,066 38,758
Deferred tax assets 11 29,194 31,681
Current tax asset 39,799 –
Other assets 20 30,969,992 7,877,146
Total assets 244,618,151 64,445,705
Liabilities
Deposits from banks 23 82,982,716 19,754,575
Deposits from customers 24 13,862,725 8,517,926
Securities sold under repurchase agreements or loaned 16 6,841,193 1,555,260
Trading liabilities 18 115,254,075 23,928,212
Financial liabilities designated at fair value through profit or loss 21,715 –
Provisions 25 82,649 19,285
Current tax liabilities 33,767 27,476
Other liabilities 26 11,501,231 5,313,997
Subordinated liabilities 27 1,025,790 185,790
Total liabilities 231,605,861 59,302,521
Equity
Subscribed capital 28 1,867,200 1,867,200
Capital reserves 28 10,748,588 3,090,157
Retained earnings 28 314,474 173,770
Other reserves 28 82,028 12,057
Total equity 13,012,290 5,143,184
Total liabilities and equity 244,618,151 64,445,705
Rounding differences may occur in the tables (€,%, etc.).
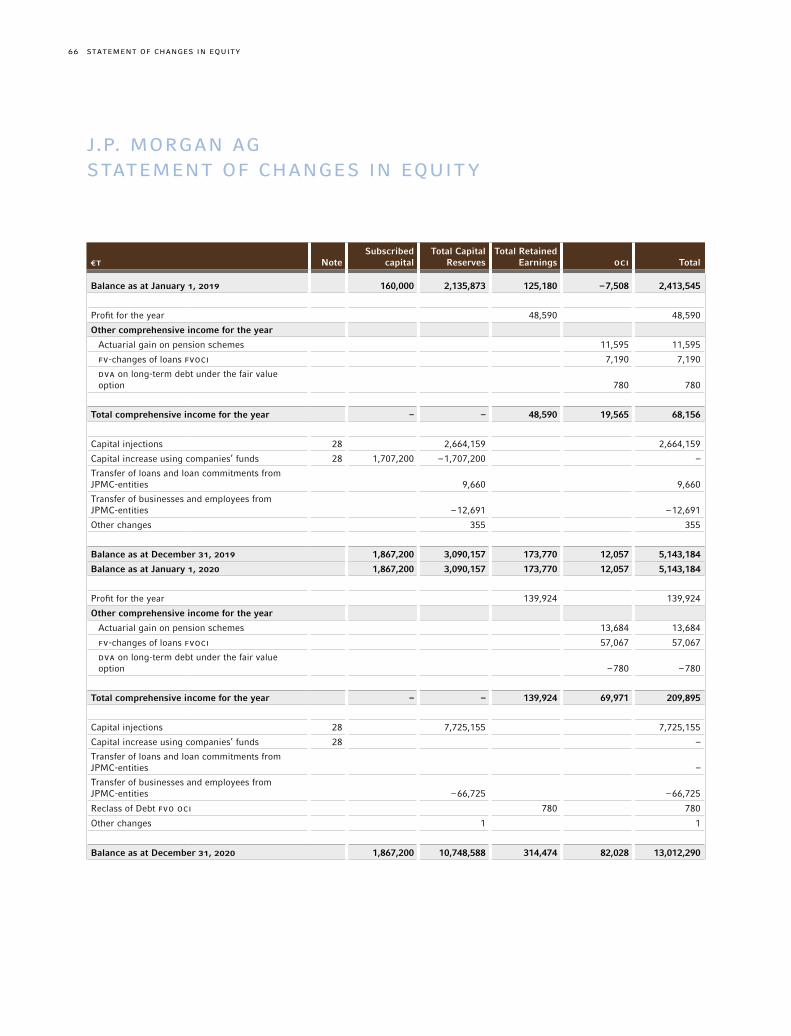
66 STATEMENT OF CHANGES IN EQUITY
€T NoteSubscribed
capitalTotal Capital
ReservesTotal Retained
Earnings OCI Total
Balance as at January 1, 2019 160,000 2,135,873 125,180 –7,508 2,413,545
Profit for the year 48,590 48,590
Other comprehensive income for the year
Actuarial gain on pension schemes 11,595 11,595
FV-changes of loans FVOCI 7,190 7,190
DVA on long-term debt under the fair value option 780 780
Total comprehensive income for the year – – 48,590 19,565 68,156
Capital injections 28 2,664,159 2,664,159
Capital increase using companies’ funds 28 1,707,200 –1,707,200 –
Transfer of loans and loan commitments from JPMC-entities 9,660 9,660
Transfer of businesses and employees from JPMC-entities –12,691 –12,691
Other changes 355 355
Balance as at December 31, 2019 1,867,200 3,090,157 173,770 12,057 5,143,184
Balance as at January 1, 2020 1,867,200 3,090,157 173,770 12,057 5,143,184
Profit for the year 139,924 139,924
Other comprehensive income for the year
Actuarial gain on pension schemes 13,684 13,684
FV-changes of loans FVOCI 57,067 57,067
DVA on long-term debt under the fair value option –780 –780
Total comprehensive income for the year – – 139,924 69,971 209,895
Capital injections 28 7,725,155 7,725,155
Capital increase using companies’ funds 28 –
Transfer of loans and loan commitments from JPMC-entities –
Transfer of businesses and employees from JPMC-entities –66,725 –66,725
Reclass of Debt FVO OCI 780 780
Other changes 1 1
Balance as at December 31, 2020 1,867,200 10,748,588 314,474 82,028 13,012,290
J.P. MOrGAN AG STATEMENT OF CHANGES IN EQUITY
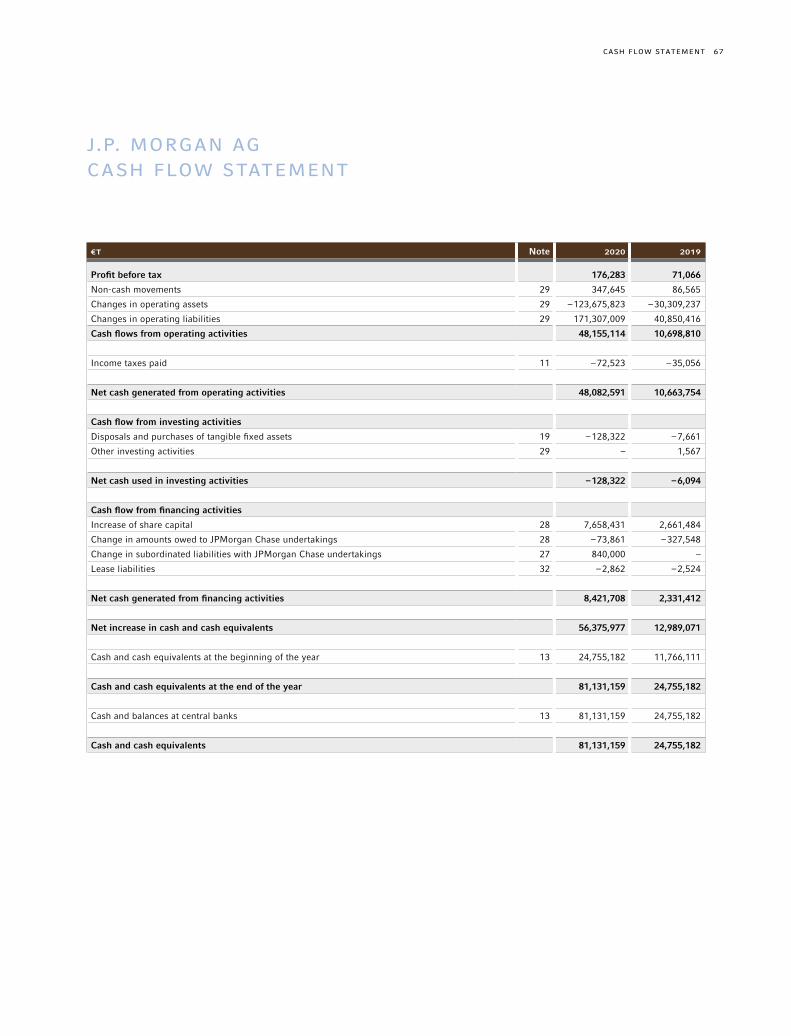
67CASH FLOW STATEMENT
J.P. MOrGAN AG CASH FLOW STATEMENT
€T Note 2020 2019
Profit before tax 176,283 71,066
Non-cash movements 29 347,645 86,565
Changes in operating assets 29 –123,675,823 –30,309,237
Changes in operating liabilities 29 171,307,009 40,850,416
Cash flows from operating activities 48,155,114 10,698,810
Income taxes paid 11 –72,523 –35,056
Net cash generated from operating activities 48,082,591 10,663,754
Cash flow from investing activities
Disposals and purchases of tangible fixed assets 19 –128,322 –7,661
Other investing activities 29 – 1,567
Net cash used in investing activities –128,322 –6,094
Cash flow from financing activities
Increase of share capital 28 7,658,431 2,661,484
Change in amounts owed to JPMorgan Chase undertakings 28 –73,861 –327,548
Change in subordinated liabilities with JPMorgan Chase undertakings 27 840,000 –
Lease liabilities 32 –2,862 –2,524
Net cash generated from financing activities 8,421,708 2,331,412
Net increase in cash and cash equivalents 56,375,977 12,989,071
Cash and cash equivalents at the beginning of the year 13 24,755,182 11,766,111
Cash and cash equivalents at the end of the year 81,131,159 24,755,182
Cash and balances at central banks 13 81,131,159 24,755,182
Cash and cash equivalents 81,131,159 24,755,182

68 NOTES
1. General information 70
2. Basis of preparation 70
3. Accounting and reporting developments 71
4. Material accounting estimates and judgements 72
5. Significant accounting policies 73
5.1. Consolidation 73
5.2. Foreign currency translation 73
5.3. Functional and presentation currency 74
5.4. Financial instruments 74
5.4.1. Financial assets and financial liabilities 74
5.4.2. Interest income and expense 78
5.4.3. Trading profit 78
5.4.4. Impairment of financial assets and
lending-related commitments 78
5.4.5. Modification of loans 79
5.4.6. Derecognition of financial assets and
financial liabilities 79
5.4.7. Write-offs 80
5.5. Fee and commission income and expense 80
5.6. Leases 81
5.7. Fair value 81
5.8. Recognition of deferred day one profit
and loss 82
5.9. Impairment of non-financial assets
5.10. Securities purchased under agreement
to resell and securities sold under
agreement to repurchase 83
5.11. Securities borrowing and securities
lending transactions 83
5.12. Offsetting financial assets and liabilities 83
5.13. Business combinations 84
5.14. Cash and cash equivalents 84
5.15. Current and deferred income tax 84
5.16. Provisions and contingent liabilities 85
5.17. Pensions and other post-retirement
benefits 85
5.18. Share-based payment awards 86
6. Interest income and expense and similar
income and expense 87
7. Net fee and commission income 88
8. Net income from financial assets and
liabilities measured at fair value through
profit and loss 89
9. Other revenues 89
10. Administrative & other expenses 90
11. Income taxes 90
11.1. Amounts recognized in the income
statement 91
11.2. Amounts recognized in OCI 91
11.3. Reconciliation of effective tax rate 91
11.4. Movement in deferred tax balances 92
12. Classification of financial assets and
financial liabilities 93
13. Cash and central bank balances 94
14. Loans and advances to banks 95
15. Loans and advances to customers 95
16. Securities financing agreements 96
17. Investment securities 96
18. Trading assets and liabilities 97
19. Property and equipment 98
20. Other assets 99
21. Pensions 100
NOTES TO THE FINANCIAL STATEMENTS
69NOTES
22. Share-based payments 104
23. Deposits from banks 106
24. Deposits from customers 106
25. Provisions 107
26. Other liabilities 108
27. Subordinated liabilities 108
28. Capital and capital reserves 108
28.1. Subscribed capital, capital reserve and
retained earnings 108
28.2. Accumulative other comprehensive
income 109
29. Notes to the cash flow statement 110
30. Assets and liabilities measured at fair value 111
31. Offsetting financial assets and financial
liabilities 127
32. Leases 128
33. Transfers of financial assets 129
34. Pledged assets and Collateral received 130
35. Credit risk management 131
36. Related party transactions 152
37. Other information 156
37.1. Number of employees 156
37.2. Total remuneration of the active members
of the boards 157
37.3. Total payments to former board members
and their dependents 157
37.4. Fee expenses 157
37.5. Explanatory notes on other financial
commitments 157
37.6. Information on corporate bodies 158
38. Proposed allocation of earnings 159
39. Addendum report 159

NOTES70
1. General information
J.P. Morgan AG (hereafter – the “Bank” or the “Company”), with registered offices in Frankfurt
am Main, is a German stock corporation (Aktiengesellschaft) under German Law registered in
the Trade Register of the Frankfurt District Court under number HrB 16861, which is active in
Germany in the main business segments of Banking (consisting of Global Investment Banking,
Wholesale Payments and Lending), Markets, Securities Services and Commercial Bank. The busi-
ness year 2020 was shaped by the transfer of trading and banking books from JPMorgan Chase &
Co. group entities domiciled in the United Kingdom in consequence of Brexit. The J.P. Morgan AG
is an intermediate 100% subsidiary of JPMorgan Chase & Co. with registered office in Columbus,
Ohio, in the United States of America. The Bank has a full bank licence according to § 1 Para. 1
German Banking Act and pursues the banking business with institutional clients, banks, corporate
clients and public authorities. The shares of J.P. Morgan AG are in full ownership of J.P. Morgan
International Finance with registered office in Newark in the United States of America.
2. Basis of preparation
The stand-alone financial statements for the year ended December 31, 2020 have been prepared
in accordance with the International Financial Reporting Standards (“IFrS”) as applicable in the
EU by the Bank.
The Standards have been applied in preparing the financial statements for the year ended
December 31, 2020, the comparative information presented in these financial statements for
the year ended December 31, 2019 and in the preparation of an opening IFrS Balance Sheet at
January 1, 2019 for the stand-alone financial statements according to IFrS set up for the first
time for business year 2019.
The legally required financial statements of the Bank are further prepared on the basis of the
German Commercial Code (HGB). For the disclosure, the voluntarily prepared stand-alone IFrS
financial statements according to § 325 Para. 2a HGB are utilized.
In order to apply the option according to § 325 Para. 2a sentence 1 HGB to disclose financial
statements set up according to the International Financial Reporting Standards as denominated
in § 315e Para. 1 HGB, in place of financial statements according to HGB, the additional German
commercial law regulations according to § 325 Para. 2a sentence 3 HGB in connection with § 340l
Para. 4 HGB have been followed.
The stand-alone financial statements have been prepared on a going concern basis under the
historical cost convention as modified by the revaluation of certain financial assets and financial

71NOTES
liabilities measured at fair value through profit or loss (FVTPL) or measured at fair value through
other comprehensive income (FVOCI).
The credit risk is described in note 35. Information on the market risk, the liquidity risk and the
operational risk are included in the risk report as part of the Management Report.
3. Accounting and reporting developments
STANDARDS TO BE APPLIED FOR THE FIRST TIME AND REVISED STANDARDS
The following table provides an overview of the standards to be applied for the financial year
2020. There is no significant impact expected from the first time application or the revision of
the standards in the IFrS stand-alone financial statement of the Bank.
Standard /Amendment Application from 1 /1 /2020
Definition of “Material” – Amendments to IAS 1 and IAS 8 1 /1 /2020
Definition of “Business” – Amendments to IFrS 3 1 /1 /2020
Amendments to References to Conceptual Framework in IFrS Standards 1 /1 /2020
Amendment to IFrS 16, “Leases” – COVID-19 related rent concessions 1 /6 /2020
FUTURE STANDARDS NOT YET IMPLEMENTED DURING THE YEAR ENDED
DECEMBER 31, 2020
The following IFrS have been adopted by the EU but were not mandatory to be applied before
January 1, 2020. The future application of these standards is not expected to result in any mate-
rial effects.
Future Standards /AmendmentsApplication in periods beginning on or after
Interest Rate Benchmark Reform – Amendments to IFrS 9, IAS 39 and IFrS 7, Phase 2 1 /1 /2021
Sale of Assets of an Investor to or Contribution to his Associated Entities or Joint Ventures – Amendments to IFrS 10 and IAS 28 n /a ¹
¹ In December 2015, the mandatory first-time application of the changes was postponed to a date to be determined after the end of the research project for the equity method.
The Annual Improvements to IFrS Standards 2018–2020 have an effective date of application
for financial years beginning on or after January 1, 2022. All the changes and amendments not
explicitly mentioned are assessed to not have a significant impact on the financial statements
at present.

NOTES72
4. Material accounting estimates and judgements
The preparation of the financial statements requires management to make judgements, estimates
and assumptions that affect the amounts recognized in the financial statements. The nature of esti-
mation means that actual outcomes could differ from those estimates. The following judgements
have had the most material effect on amounts recognized in the financial statements.
FAIR VALUE MEASUREMENT
The Company carries a significant portion of its assets and liabilities at fair value on a recurring
basis. Estimating fair value often requires the application of judgement. The type and level
of judgement required is largely dependent on the amount of observable market information
available to the Company. For instruments valued using internally developed models that use
significant unobservable inputs that are classified within level 3 of the valuation hierarchy, those
judgements used to estimate the fair value are more material than those required when estimating
the fair value of instruments classified within levels 1 and 2.
To estimate the fair value for an instrument within level 3, management must first determine
the appropriate model to use. In addition, the lack of observability of certain inputs requires the
management board to assess all relevant empirical data in deriving valuation inputs – including,
for example, transaction details, yield curves, interest rates, prepayment rates, default rates,
volatilities, correlations, equity prices, valuations of comparable instruments, foreign exchange
rates and credit curves. For further discussion of the valuation of level 3 instruments, see note 30.
For instruments classified in levels 2 and 3, the management board’s judgement must be applied
to assess the appropriate level of valuation adjustments, the Company’s and counterparty’s cred-
it-worthiness, market funding rates, liquidity considerations, unobservable parameters, and, for
portfolios that meet specified criteria, the size of the net open risk position. The judgements
made are typically affected by the type of product and its specific contractual terms, and the level
of liquidity for the product or within the market as a whole. For further discussion of valuation
adjustments applied by the Company, see note 30.
The use of methodologies or assumptions different than those used by the Company could result
in a different estimate of fair value at the reporting date. For a detailed discussion of the Com-
pany’s valuation process and hierarchy, its determination of fair value for individual financial
instruments, and the potential impact of using reasonable possible alternative assumptions for
the valuations, see note 30.
MEASUREMENT OF THE ExPECTED CREDIT LOSS ALLOWANCE
An expected credit loss allowance (ECL) is required for financial assets measured at amortized
cost and fair value through other comprehensive income as well as lending-related commit-

73NOTES
ments such as loan commitments and financial guarantees. The measurement of ECL requires
the use of complex models and assumptions about future economic conditions and credit
behaviours. Explanation of the inputs, assumptions and estimation techniques used in mea-
suring ECL is further detailed in note 35, which also sets out key sensitivities of the ECL to
changes in these inputs.
A number of judgements are also required in measuring ECL, such as:
– Determining the criteria for identifying when financial instruments have experienced a signifi-
cant increase in credit risk;
– Choosing the appropriate forecasts and assumptions for the measurement of ECL;
– Establishing the number and relative weightings of forward-looking scenarios for each type of
financial instrument /market and the associated ECL; and
– Establishing groups of similar financial assets for the purposes of measuring ECL.
5. Significant accounting policies
The following are the significant accounting policies applied in the preparation of the financial
statements. These policies have been applied consistently in each of the years presented, unless
stated otherwise.
5.1. CONSOLIDATION
The sole shareholder of the Company is J.P. Morgan International Finance Limited, Newark /
Delaware, and its ultimate parent company is JPMorgan Chase & Co., Columbus /Ohio, both
incorporated in the United States of America. The Company is included in the consolidated
financial statements of JPMorgan Chase & Co., which are publicly available.
According to § 290 in relation to § 296 Para. 1 No. 3 HGB, the Company is not required to prepare
group financial statements. For further details we refer to note 18 – Trading assets and liabilities.
5.2. FOREIGN CURRENCY TRANSLATION
Monetary assets and liabilities denominated in foreign currencies are translated in Euro at the
exchange rate on the balance sheet date. Income and expense items denominated in foreign
currencies are translated in Euro at the exchange rate prevailing at the date of the transaction.
Any gains or losses arising on translation are generally recognized in the income statement.
Non-monetary items that are measured based on historical cost in a foreign currency are trans-
lated in Euro at the exchange rate at the date of the transaction.

NOTES74
Non-monetary items denominated in foreign currencies that are stated at fair value are translated
in Euro at the foreign exchange rate when the fair value was determined. Translation differences
arising from non-monetary items measured at fair value are recognized in the income statement,
except for differences arising on FVOCI non-monetary financial assets, which are included in the
financial assets OCI reserve, respectively.
5.3. FUNCTIONAL AND PRESENTATION CURRENCY
Items included in the financial statements of the Company are measured using the currency of
the primary economic environment in which the entity operates (the “functional currency”). Euro
is considered as the functional currency and used as the presentation currency of the Company.
5.4. FINANCIAL INSTRUMENTS
5.4.1. Financial assets and financial liabilities
I. Recognition of financial assets and financial liabilities
The Company recognizes financial assets and financial liabilities when it becomes a party to the
contractual provisions of the instrument. Regular way purchases and sales of financial assets
are recognized on the trade-date, which is the date on which the Company commits to purchase
or sell an asset. Certain margins from clients or margins to central counterparties in the global
clearing business which are related to the clearing of trades at exchanges are not recorded on
balance sheet, because they are not deemed assets or liabilities of the company.
II. Classification and measurement of financial assets and financial liabilities
On initial recognition, financial assets are classified as measured at amortized cost, fair value
through other comprehensive income or fair value through profit or loss. The classification is
based on both the business model for managing the financial assets and their contractual cash
flow characteristics. Factors considered by the Company in determining the business model for
a group of assets include past experience on how the cash flows for these assets were collected,
how the assets’ performance is evaluated and reported to the board of directors, how risks are
assessed and managed, and how senior managers are compensated. This assessment results in
a financial asset being classified in either a “hold to collect”, “hold to collect and sell”, or “other”
business model.
Financial liabilities are measured at fair value on initial recognition and are classified as amortized
cost or fair value through profit or loss (“FVTPL”) for subsequent measurement.
Financial assets and financial liabilities measured at amortized cost
Financial assets are measured at amortized cost if they are held under a business model with
the objective to collect contractual cash flows (“Hold to Collect”) and they have contractual
terms under which cash flows are solely payments of principal and interest (“SPPI”). In making
the SPPI assessment, the Company considers whether the contractual cash flows are consistent

75NOTES
with a basic lending arrangement (i. e., interest includes only consideration for the time value of
money, credit risk, other basic lending risks and a profit margin that is consistent with a basic
lending arrangement). Where the contractual terms introduce exposure to risk or volatility that
are inconsistent with a basic lending arrangement, the related financial asset is classified and
measured at fair value through profit or loss.
Financial assets measured at amortized cost include cash and balances at central banks, loans
and advances to banks, certain loans and advances to customers and certain securities purchased
under agreements to resell.
Financial liabilities are measured at amortized cost unless they are held for trading or are desig-
nated as measured at fair value through profit or loss. Financial liabilities measured at amortized
cost include trade payables, amounts owed to JPMorgan Chase undertakings and certain other
liabilities.
Financial assets and financial liabilities measured at amortized cost are initially recognized at
fair value including transaction costs (which are explained below). The initial amount recognized
is subsequently reduced for principal repayments and for accrued interest using the effective
interest method. In addition, the carrying amount of financial assets is adjusted by recognizing
an expected credit loss allowance through to profit or loss.
The effective interest method is used to allocate interest income or interest expense over the
relevant period. The effective interest rate is the rate that discounts estimated future cash pay-
ments or receipts through the expected life of the financial asset or financial liability or a shorter
period when appropriate, to the net carrying amount of the financial asset or financial liability.
The effective interest rate is established on initial recognition of the financial asset or financial
liability. The calculation of the effective interest rate includes all fees and commissions paid or
received, transaction costs, and discounts or premiums that are an integral part of the effective
interest rate. Transaction costs are incremental costs that are directly attributable to the acqui-
sition, issuance or disposal of a financial asset or financial liability.
Financial assets measured at fair value through other comprehensive income (“FVOCI”)
Financial assets are measured at FVOCI if they are held under a business model with the objec-
tive of both collecting contractual cash flows and selling the financial assets (“Hold to Collect
and Sell”), and they have contractual terms under which cash flows are SPPI. Financial assets
measured at FVOCI include loans and advances that are held within the Company’s Retained
Lending business.
Financial assets measured at FVOCI are initially recognized at fair value, which includes direct
transaction costs. The financial assets are subsequently remeasured at fair value with any changes

NOTES76
presented in other comprehensive income (“OCI”) except for changes attributable to impairment,
interest income and foreign currency exchange gains and losses. Impairment losses and interest
income are measured and presented in profit or loss on the same basis as financial assets mea-
sured at amortized cost.
On derecognition of financial assets measured at FVOCI, the cumulative gains or losses in OCI
are reclassified from equity, and recognized in the income statement.
Financial assets and financial liabilities measured at fair value through profit or loss (mandatory)
Financial assets and financial liabilities are measured at fair value through profit or loss (“FVTPL”)
if they are held for trading. Under IFrS 9, a financial asset or a financial liability is defined as
“held-for-trading” if it is acquired or incurred principally for the purpose of selling or repurchas-
ing it in the near term, or forms part of a portfolio of identified financial instruments that are
managed together and for which there is evidence of a recent actual pattern of short-term profit
taking or it is a derivative. However, such financial instruments are used by the Company predom-
inantly in connection with its “client-driven” market-making and /or for hedging certain assets,
liabilities, positions, cash flows or anticipated transactions (i. e. risk management activities).
Financial assets and financial liabilities held for trading comprise both debt and equity securities,
loans and derivatives.
In addition, certain financial assets that are not held for trading are measured at FVTPL if they
do not meet the criteria to be measured at amortized cost or FVOCI, for example, if the financial
assets are managed on a fair value basis, have contractual cash flows that are not SPPI or are
equity securities. The company has determined that securities purchased under agreement to
resell within the Corporate and Investment Banking portfolios are managed on a fair value basis,
these financial instruments are therefore classified at FVTPL.
Financial instruments measured at FVTPL are initially recognized at fair value in the balance
sheet. Transaction costs and any subsequent fair value gains or losses are recognized in profit
or loss as they arise.
The Company manages cash instruments, in the form of debt and equity securities, and deriva-
tives on a unified basis, including hedging relationships between cash securities and derivatives.
Accordingly, the Company reports the gains and losses on the cash instruments and the gains
and losses on the derivatives on a net basis in trading profits.
Financial assets and financial liabilities designated at fair value through profit or loss
Subject to specific criteria, the Company can designate financial assets and financial liabilities to
be measured at fair value through profit or loss. Designation is only possible when the financial

77NOTES
instrument is initially recognized and cannot be subsequently reclassified. Financial assets can
be designated as measured at fair value through profit or loss only if such designation eliminates
or significantly reduces a measurement or recognition inconsistency. Financial liabilities can be
designated as measured at fair value through profit or loss only if such designation (a) eliminates
or significantly reduces a measurement or recognition inconsistency; or (b) applies to a group
of financial assets, financial liabilities or both that the Company manages and evaluates on a
fair value basis; or (c) relates to an instrument that contains an embedded derivative unless the
embedded derivative does not significantly modify the cash flows required by the contract or when
a similar hybrid instrument is considered that separation of the embedded derivative is prohibited.
Financial assets and financial liabilities that the Company designates as measured at fair value
through profit or loss are recognized at fair value at initial recognition, with transaction costs
being recognized in profit or loss and subsequently measured at fair value. Gains and losses on
financial assets and financial liabilities designated at fair value through profit or loss are recog-
nized in profit or loss as they arise.
Changes in the fair value of financial assets designated as measured at FVTPL are recognized
immediately in profit or loss.
Changes in the fair value of financial liabilities designated as measured at FVTPL are recognized
in profit or loss except for gains / losses attributable to changes in the Company’s own credit risk.
These gains / losses are recognized in OCI unless doing so results in an accounting mismatch with
directly offsetting financial assets measured at fair value through profit or loss.
The Company has designated one debt security to be measured at FVTPL to significantly reduce
measurement inconsistency (i. e. an accounting mismatch), as this financial asset is managed
together with a derivative, which is measured at FVTPL.
The Company has designated certificates of indebtedness (Schuldschein) to be measured at
FVTPL to significantly reduce measurement inconsistencies (i. e. an accounting mismatch), as
these financial liabilities are managed together with either B2B reverse repo or derivatives, which
are measured at FVTPL.
The Company has designated securities sold under agreements to repurchase and securities
loaned within the Company’s Corporate and Investment Banking portfolios to be measured
at FVTPL. These financial liabilities are managed together with securities purchased under
agreements to resell and securities borrowed, which are managed on the fair value basis and
measured at FVTPL. Correspondingly the Company elected to designate these liabilities as
measured at FVTPL to eliminate or significantly reduce measurement inconsistencies (i. e., an
accounting mismatch).

NOTES78
5.4.2. Interest income and expense
Unless a financial asset is credit-impaired, interest income is recognized by applying the effective
interest method to the carrying amount of a financial asset before adjusting for any allowance
for expected credit losses. If a financial asset is credit-impaired, interest income is recognized
by applying the effective interest rate to the carrying amount of the financial asset including any
allowance for expected credit losses.
Interest expense on financial liabilities is recognized by applying the effective interest method
to the amortized cost of financial liabilities.
The effective interest rate is the rate that discounts estimated future cash payments or receipts
through the expected life of the financial asset or financial liability or a shorter period when
appropriate, to the net carrying amount of the financial asset or financial liability. The calculation
includes all fees paid or received between parties to the contract that are an integral part of the
effective interest rate transaction costs, and all other premiums or discounts. The effective interest
rate is established on initial recognition of the financial asset or financial liability.
Interest income on financial assets and financial liabilities measured at amortized cost and FVOCI
are presented separately in interest income calculated using the effective interest method.
Interest generated as a result of negative interest rates is recognized gross, as interest income
or interest expense.
5.4.3. Trading profit
Profits and losses resulting from the purchase and sale of securities and the revaluation of
financial instruments measured at FVTPL are recognized as trading profit on a trade-date basis,
including related transaction costs.
5.4.4. Impairment of financial assets and lending-related commitments
Instruments in scope of TCP include loans, lending-related commitments, and other lending
products stemming from extensions of credit to borrowers. The Company establishes an ECL for
these instruments to ensure they are reflected in the financial statements at the Company’s best
estimate of the net amount expected to be collected. The ECL is determined on in-scope financial
instruments measured at amortized cost or FVOCI. ECL are measured via a portfolio-based (mod-
eled) approach for Stage 1 and 2 assets but are generally measured individually for Stage 3 assets.
ECL are forecasted over the 12-month term (Stage 1) or expected life (Stage 2 or 3) of in-scope
financial instruments, where the forecast horizon includes the reasonable and supportable (r&S)
forecast period (2 years), the one year reversion period and the residual period and considers the
time value of money. In determining the ECL measurement and staging for a financial instrument,

79NOTES
the Company applies the definition of default consistent with the Basel definition of default to
maintain uniformity of the definition across the Firm.
Determining the appropriateness of the allowance is complex and requires judgment by the
management board about the effect of circumstances that are inherently uncertain. Further, esti-
mating the allowance involves consideration of a range of possible outcomes, which management
evaluates to determine its best estimate. Subsequent evaluations of the TCP portfolio, in light of
the circumstances then prevailing, may result in significant changes in the ECL in future periods.
The Company must consider the appropriateness of decisions and judgments regarding meth-
odology and inputs utilized in developing estimates of ECL each reporting period and document
them appropriately.
Note 35 provides more detail for how the expected credit loss allowance is measured.
5.4.5. Modification of loans
The Company may modify terms with borrowers in individual cases. Such modifications com-
prise for example changes in contractual interest rates, extensions or cease of repayments and
in the majority of cases relate to eased covenants. If the respective borrower is not in financial
difficulties, the Company assesses if the modification is substantial or non-substantial based on
certain quantitative and qualitative criteria. One major criterion is whether the present value of
the agreed cash-flows from the loan before and after the modification has changed by more than
10%. If the modification is substantial, the existing loan is derecognized, a new financial asset
is recognized and all existing deferred income and expenses as well as pre-payment fees are
released to income. If the modification is non-substantial, the unamortized net fees are carried
forward as part of the recorded carrying value of the modified loan.
If a borrower is in financial difficulties, it might be in the interest of the Company to grant mod-
ifications in order to avoid the default of a loan or to maximize cash flows from non-performing
loans. In this case, the existing loan remains on the balance sheet and no new loan is recorded.
5.4.6. Derecognition of financial assets and financial liabilities
Financial assets are derecognized when the contractual right to receive cash flows from the asset
has expired, or has been transferred with either of the following conditions met:
a) The Company has transferred substantially all the risks and rewards of the ownership of the
asset; or
b) The Company has neither retained nor transferred substantially all of the risks and rewards;
but it has relinquished control of the asset.

NOTES80
Financial liabilities are derecognized when they are extinguished, that is when the obligation is
discharged, cancelled or expires.
The Company enters from time to time also into certain “pass-through” arrangements whereby
contractual cash flows on a financial asset are passed to a third party. Such financial assets are
derecognized from the balance sheet if the terms of the arrangement oblige the Company to only
pass on contractual cash flows to the third party that are actually received without material delay,
and where the terms of the arrangement also prohibit the Company from selling or pledging the
underlying financial asset.
5.4.7. Write-offs
Wholesale loans recognized as loans and advances on the balance sheet are charged off when
it is highly certain that a loss has been realized. The determination of whether to recognize a
charge-off includes many factors, including the prioritisation of the Company’s claim in bank-
ruptcy, expectations of the workout / restructuring of the loan and valuation of the borrower’s
equity or the loan collateral.
All other financial assets are written off when there is no reasonable expectation of recovery and
the amount of loss can be reasonably estimated or when the asset is past due for a specified
period.
5.5. FEE AND COMMISSION INCOME AND ExPENSE
The Company earns fees and commissions from providing investment banking, lending and
deposit-related services, brokerage services and other commissions.
Investment banking fees
Investment banking revenue includes debt and equity underwriting and advisory fees. Under-
writing fees are recognized as revenue typically upon execution of the client’s transaction. Debt
underwriting fees also include credit arrangement and syndication fees which are recorded as
revenue after satisfying certain retention, timing and yield criteria. Advisory fees are recognized
as revenue typically upon execution of the client’s transaction.
Lending- and deposit-related fees
Lending-related fees include fees earned from loan commitments, standby letters of credit,
financial guarantees, and other loan-servicing activities. Deposit-related fees include fees
earned in lieu of compensating balances, and fees earned from performing cash manage-
ment activities and other deposit account services. Lending- and deposit-related fees in this
revenue category are recognized proportionately over the period in which the related service
is provided.

81NOTES
Other commissions
The Company acts as a broker, facilitating its clients’ purchase and sale of securities and other
financial instruments. It collects and recognizes brokerage commissions as revenue upon occur-
rence of the client transaction. The Company reports certain costs paid to third-party clearing
houses and exchanges net against commission revenue.
Fees and commissions obtained through the Bank’s attribution agreements are recognized when
the underlying contract becomes legally binding or at the agreed due date.
5.6. LEASES
The Company recognizes lease right-of-use (“rOU”) assets and lease liabilities at the lease com-
mencement date. Lease rOU assets are included in property and equipment, and lease liabilities
are included in other liabilities for operating leases in the Company’s balance sheet. The rOU asset
is initially measured at cost, which comprises the initial amount of the lease liability adjusted for
any lease payments made at or before the lease commencement date plus any initial direct costs
incurred and estimated costs for dismantling, removing and restoring as stated and required
by the leasing agreement, less any lease incentives received. The rOU asset is subsequently
amortized on a straight-line basis of the earliest of the two periods of the end of the useful life of
the rOU asset or the lease term. The estimated useful life of the rOU asset is determined on the
same basis as those of the property and equipment. In addition, the rOU asset may be reduced
by impairment losses, if any, and adjusted for certain remeasurements of the lease liability.
The lease liability is initially measured at the present value of the lease payments that are not
paid at the commencement date, discounted using the Company’s incremental borrowing rate.
The lease liability is measured at amortized cost using a constant periodic rate of interest. It is
re-measured when there is a change in leasing rates as a result of a change in a consumer price
index or reference rate, or if the Company changes its assessment of whether it will exercise
an extension or termination option. When the lease liability is re-measured in this way, a corre-
sponding adjustment is made to the carrying amount of the rOU asset, or is recorded in earnings
if the carrying amount of the rOU asset has been reduced to zero.
Short-term leases and leases of low-value assets
The Company has elected to not recognize rOU assets and lease liabilities for leases of low-value
assets and short-term leases of real estate, including equipment, that have a lease term of 12
months or less. The Company recognizes the lease payments associated with these leases as an
expense on a straight-line basis over the lease term.
5.7. FAIR VALUE
Fair value is the price that would be received to sell an asset or paid to transfer a liability in an
orderly transaction between market participants at the measurement date.

NOTES82
Fair values are determined by reference to observable market prices where available and reli-
able. Fair values of financial assets and financial liabilities are based on quoted market prices
or dealer price quotations for financial instruments traded in active markets. Where market
prices are unavailable, fair value is based on valuation models that consider relevant transaction
characteristics. As inputs are used observable or unobservable market parameters, including
but not limited to yield curves, interest rates, volatilities, equity prices, foreign exchange rates
and credit curves. Valuation adjustments may be done to ensure that financial instruments are
recorded at fair value.
For financial assets and liabilities held at fair value, most market parameters in the valuation
model are directly observable. When input values do not directly correspond to the actively
traded market parameters, the model may perform numerical procedures in the pricing such
as interpolation.
The Company classifies its assets and liabilities measured at fair value according to a hier-
archy that has been established under IFrS. The fair value hierarchy is based on the trans-
parency of inputs to the valuation of an asset or liability as of the measurement date. The fair
value hierarchy gives the highest priority to quoted prices (unadjusted) in active markets for
identical assets or liabilities (level 1) and the lowest priority to unobservable inputs (level 3
inputs).
A financial instrument’s categorization within the fair value hierarchy is based on the lowest level
of input that is significant to the fair value measurement.
Further details on fair value measurements are provided in note 30 to the financial statements.
5.8. RECOGNITION OF DEFERRED DAY ONE PROFIT AND LOSS
The Company enters into transactions where fair value is determined using valuation models for
which not all inputs are observable market prices or rates. Such financial instrument is initially
recognized at the transaction cost, although the value obtained from the relevant valuation model
may differ. The difference between the transaction cost and the model value, commonly referred
to as “day one profit and loss”, is not recognized immediately in the income statement when
based on significant unobservable inputs.
The timing of recognition of deferred day one profit and loss is determined for each class of
financial asset and liability. It is either amortized over the life of the transaction, deferred until
the instrument’s fair value can be determined using market observable inputs, or realized through
settlement. The financial instrument is subsequently measured at fair value, adjusted for the
deferred day one profit and loss.

83NOTES
5.9. IMPAIRMENT OF NON-FINANCIAL ASSETS
Non-financial assets that are subject to amortization are reviewed for impairment whenever
events or changes in circumstances indicate that the carrying amount may not be recoverable.
An impairment loss is recognized for the amount by which the asset’s carrying amount exceeds
its recoverable amount. The recoverable amount is the higher of an asset’s fair value less costs
of disposal and value in use. For the purposes of assessing impairment, assets are grouped at
the lowest levels for which there are largely independent cash inflows (cash-generating units).
Prior impairments of non-financial assets (other than goodwill) are reviewed for possible reversal
at each reporting date.
5.10. SECURITIES PURCHASED UNDER AGREEMENT TO RESELL AND SECURITIES
SOLD UNDER AGREEMENT TO REPURCHASE
Securities purchased under agreements to resell, and securities sold under agreements to repur-
chase, are treated as collateralized lending and borrowing transactions respectively. The consid-
eration for the transaction can be in the form of cash or securities. If the consideration for the
purchase or sale of securities is given in cash, the transaction is recorded on the balance sheet
within securities purchased /sold under agreement to resell / repurchase. In a repo transaction,
the bank retains the risks and rewards of the securities sold under repurchase agreement, these
securities are not derecognized from the balance sheet. In a reverse repo transaction, securities
purchased under agreement to resell are not recognized on the balance sheet. The difference
between the sales and repurchase price is treated as interest and accrued over the life of the
agreements.
5.11. SECURITIES BORROWING AND SECURITIES LENDING TRANSACTIONS
Securities borrowing and securities lending transactions require the borrower to deposit cash
or other collateral with the lender. Securities borrowing and securities lending are recorded
at the amount of cash collateral advanced or received. If the consideration is received or
given in the form of securities, the transaction is recorded off balance sheet. Fees received
or paid in connection with securities borrowing and lending are treated as interest income or
interest expense and accrued over the life of the transaction using the effective interest rate
method.
5.12. OFFSETTING FINANCIAL ASSETS AND LIABILITIES
Financial assets and financial liabilities are offset and the net amount reported in the balance sheet
when there is currently a legally enforceable right to offset the recognized amounts and there is
an intention to settle on a net basis or to realize the asset and settle the liability simultaneously.
The legally enforceable right must not be contingent on future events and must be enforceable
in the normal course of business and in the event of default, insolvency or bankruptcy of the
Company or the counterparty.

NOTES84
The Bank uses master netting agreements to mitigate counterparty credit risk in certain trans-
actions, including derivative and securities financing transactions. A master netting agreement
is a single agreement with a counterparty that permits multiple transactions governed by that
agreement to be terminated and settled through a single payment in a single currency in the
event of a default (e.g., bankruptcy, failure to make a required payment or securities transfer or
deliver collateral or margin when due).
Further details on offsetting of financial assets and liabilities are provided in note 31 to the
financial statements.
5.13. BUSINESS COMBINATIONS
Predecessor accounting is applied to transfers of businesses between entities under common
control, where all combining entities are controlled by the same entity before and after the
business acquisition. Assets and liabilities are recognized at their predecessor carrying amounts
(i. e. the carrying amounts of assets and liabilities in the books and records of the transferor
prior to the transfer) with no fair value adjustments. Any difference between the cost of acqui-
sition and the aggregate book value of the assets and liabilities on the date of transfer of the
business is recognized as an adjustment to equity. As a result, no goodwill is recognized from
the business combination.
5.14. CASH AND CASH EqUIVALENTS
Cash and cash equivalents include cash and balances at central banks.
5.15. CURRENT AND DEFERRED INCOME TAx
Current income tax payable is recognized as an expense in the period in which the profits arise.
Income tax recoverable on tax allowable losses is recognized as a current tax asset only to the
extent that it is regarded as recoverable by offset against taxable profits arising in the current
or prior period. Current tax is measured using tax rates and tax laws that have been enacted or
substantively enacted at the balance sheet date.
Deferred tax is recorded, using the liability method, on temporary differences arising from the
differences between the tax bases of assets and liabilities and their carrying amounts in the
financial statements when recognition requirements are met. Deferred tax is determined using
tax rates and legislation enacted or substantively enacted by the balance sheet date, which are
expected to apply when the deferred tax asset is realized or the deferred tax liability is settled.
Deferred tax assets and liabilities are only offset when there is both a legal right and an intention
to settle on a net basis. Current tax and deferred tax are recognized directly in equity if the tax
relates to items that are recognized in the same or a different period in equity. Deferred taxes on
unused carried forward losses are not recognized since there are no tax losses carried forward.

85NOTES
5.16. PROVISIONS AND CONTINGENT LIABILITIES
Provisions are recognized when the Company has a present legal or objective obligation as a
result of past events, it is probable that an outflow of economic benefits will be required to settle
the obligation, and a reliable estimate of the amount of the obligation can be made.
A contingent liability is a possible obligation that arises from past events and whose existence will
be confirmed only by the occurrence or non-occurrence of one or more uncertain future events not
wholly within the control of the Company, or a present obligation that arises from past events but
is not recognized because either an outflow of economic benefits is not probable or the amount
of the obligation cannot be reliably measured. Contingent liabilities are not recognized in the
financial statements; however, disclosure is made unless the probability of settlement is remote.
5.17. PENSIONS AND OTHER POST-RETIREMENT BENEFITS
The Company operates both defined benefit and defined contribution schemes for its employees.
I. Defined contribution scheme
A defined contribution plan is a retirement plan in which the company pays fixed contributions
to a separate company. The Company is not legally or de facto obliged to pay further contribu-
tions if the fund does not have sufficient assets to pay all employees the benefits in connection
with the employee service in the current and in previous periods. Obligations for contributions
to defined contribution pension plans are recognized as an expense and charged to the income
statement on an accrual basis.
II. Defined benefit scheme
For defined benefit pension plans, the service cost for providing retirement benefits to employ-
ees during the year is recognized in the income statement in accordance with IAS 19 “Employee
Benefits”. The pension-related expenses and income are recorded on the basis of expert opin-
ions. The appraisals are prepared by qualified and independent actuaries. This ensures that the
full costs of covering the pension obligations of current and former employees are correctly
recorded.
The liabilities of the defined benefit systems are valued on an actuarial basis. Assets are valued
separately for each plan at their market value, provided that plan assets exist to cover plan liabili-
ties. Any excess of the present value of obligations is capitalized taking into account the so-called
asset ceiling. Any shortfall in plan liabilities is netted as a liability. Current service cost and any
past service cost, along with the expected rate of return on the plan’s assets, less the release of
the discounting of the plan’s liabilities, is charged to the income statement. Actuarial gains and
losses are recognized in full in other comprehensive income in the reporting period in which
they occur and shown in equity in the reporting period in which they occur.

NOTES86
5.18. SHARE-BASED PAYMENT AWARDS
Share-based payment awards may be made to employees of the Company under the Bank’s incen-
tive awards schemes. The fair value of such shares, rights to shares or stock options is measured
during the conditional allocation. This value is recorded as compensation expense for the com-
pany over the period of time that the performance criteria are related to along with employer’s
social security expenses or other payroll taxes. All of the granted awards are equity-settled. The
Company estimates the level of forfeitures and applies this forfeiture rate at the granting date.
Additionally, the Bank takes into account the conditions that must be met before an employee
is eligible for equity instruments under the Bank’s incentive programs. Amortization is acceler-
ated for employees who retire so that the premium is recognized in full as an expense when the
pension entitlement takes effect.
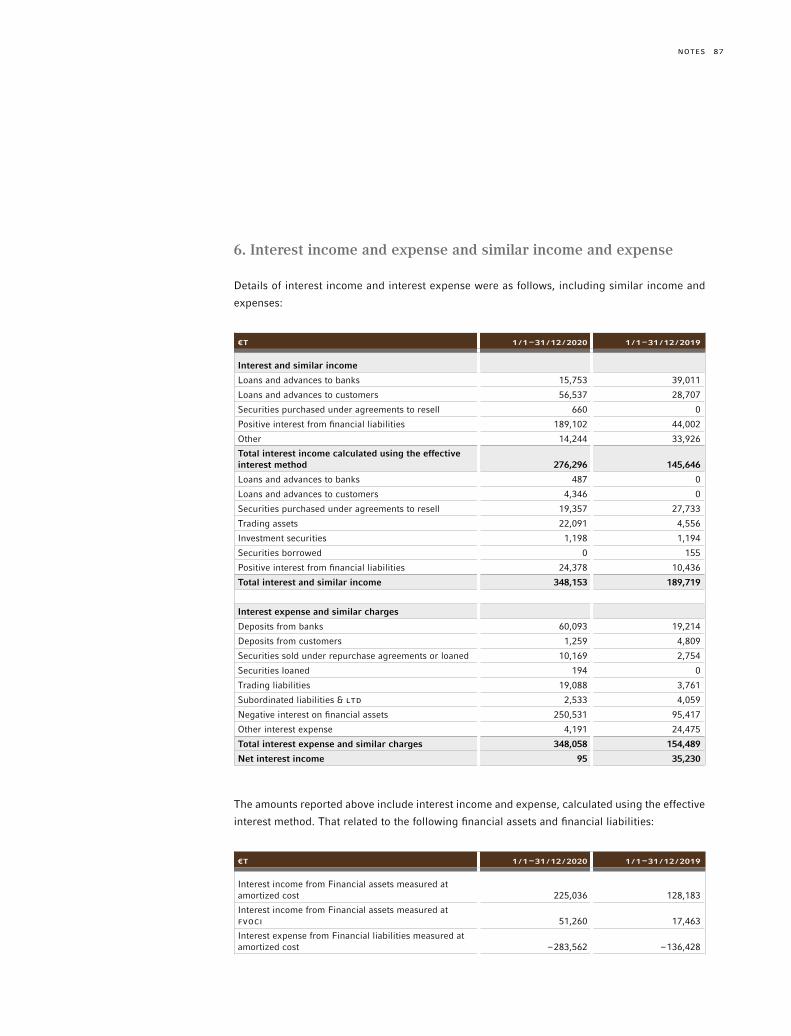
87NOTES
6. Interest income and expense and similar income and expense
Details of interest income and interest expense were as follows, including similar income and
expenses:
€T 1 /1 – 31 /12 /2020 1 /1 – 31 /12 /2019
Interest and similar income
Loans and advances to banks 15,753 39,011
Loans and advances to customers 56,537 28,707
Securities purchased under agreements to resell 660 0
Positive interest from financial liabilities 189,102 44,002
Other 14,244 33,926
Total interest income calculated using the effective interest method 276,296 145,646
Loans and advances to banks 487 0
Loans and advances to customers 4,346 0
Securities purchased under agreements to resell 19,357 27,733
Trading assets 22,091 4,556
Investment securities 1,198 1,194
Securities borrowed 0 155
Positive interest from financial liabilities 24,378 10,436
Total interest and similar income 348,153 189,719
Interest expense and similar charges
Deposits from banks 60,093 19,214
Deposits from customers 1,259 4,809
Securities sold under repurchase agreements or loaned 10,169 2,754
Securities loaned 194 0
Trading liabilities 19,088 3,761
Subordinated liabilities & LTD 2,533 4,059
Negative interest on financial assets 250,531 95,417
Other interest expense 4,191 24,475
Total interest expense and similar charges 348,058 154,489
Net interest income 95 35,230
The amounts reported above include interest income and expense, calculated using the effective
interest method. That related to the following financial assets and financial liabilities:
€T 1 /1 – 31 /12 /2020 1 /1 – 31 /12 /2019
Interest income from Financial assets measured at amortized cost 225,036 128,183
Interest income from Financial assets measured at FVOCI 51,260 17,463
Interest expense from Financial liabilities measured at amortized cost –283,562 –136,428
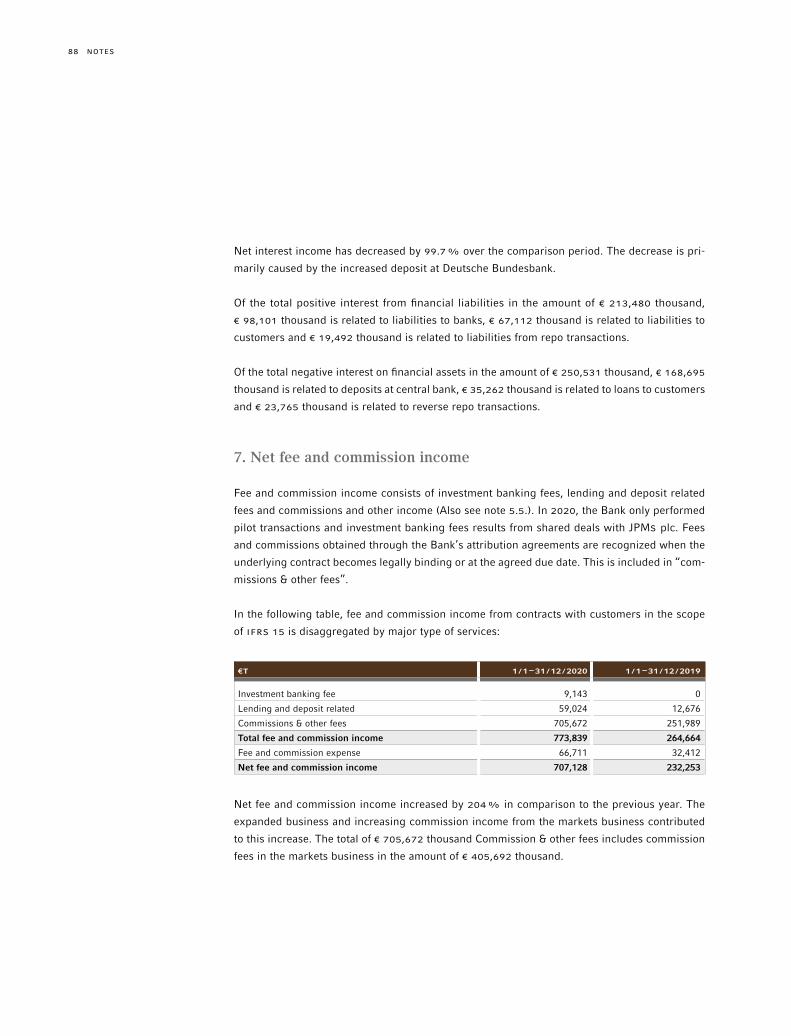
NOTES88
Net interest income has decreased by 99.7% over the comparison period. The decrease is pri-
marily caused by the increased deposit at Deutsche Bundesbank.
Of the total positive interest from financial liabilities in the amount of € 213,480 thousand,
€ 98,101 thousand is related to liabilities to banks, € 67,112 thousand is related to liabilities to
customers and € 19,492 thousand is related to liabilities from repo transactions.
Of the total negative interest on financial assets in the amount of € 250,531 thousand, € 168,695
thousand is related to deposits at central bank, € 35,262 thousand is related to loans to customers
and € 23,765 thousand is related to reverse repo transactions.
7. Net fee and commission income
Fee and commission income consists of investment banking fees, lending and deposit related
fees and commissions and other income (Also see note 5.5.). In 2020, the Bank only performed
pilot transactions and investment banking fees results from shared deals with JPMS plc. Fees
and commissions obtained through the Bank’s attribution agreements are recognized when the
underlying contract becomes legally binding or at the agreed due date. This is included in “com-
missions & other fees”.
In the following table, fee and commission income from contracts with customers in the scope
of IFrS 15 is disaggregated by major type of services:
€T 1 /1 – 31 /12 /2020 1 /1 – 31 /12 /2019
Investment banking fee 9,143 0
Lending and deposit related 59,024 12,676
Commissions & other fees 705,672 251,989
Total fee and commission income 773,839 264,664
Fee and commission expense 66,711 32,412
Net fee and commission income 707,128 232,253
Net fee and commission income increased by 204% in comparison to the previous year. The
expanded business and increasing commission income from the markets business contributed
to this increase. The total of € 705,672 thousand Commission & other fees includes commission
fees in the markets business in the amount of € 405,692 thousand.
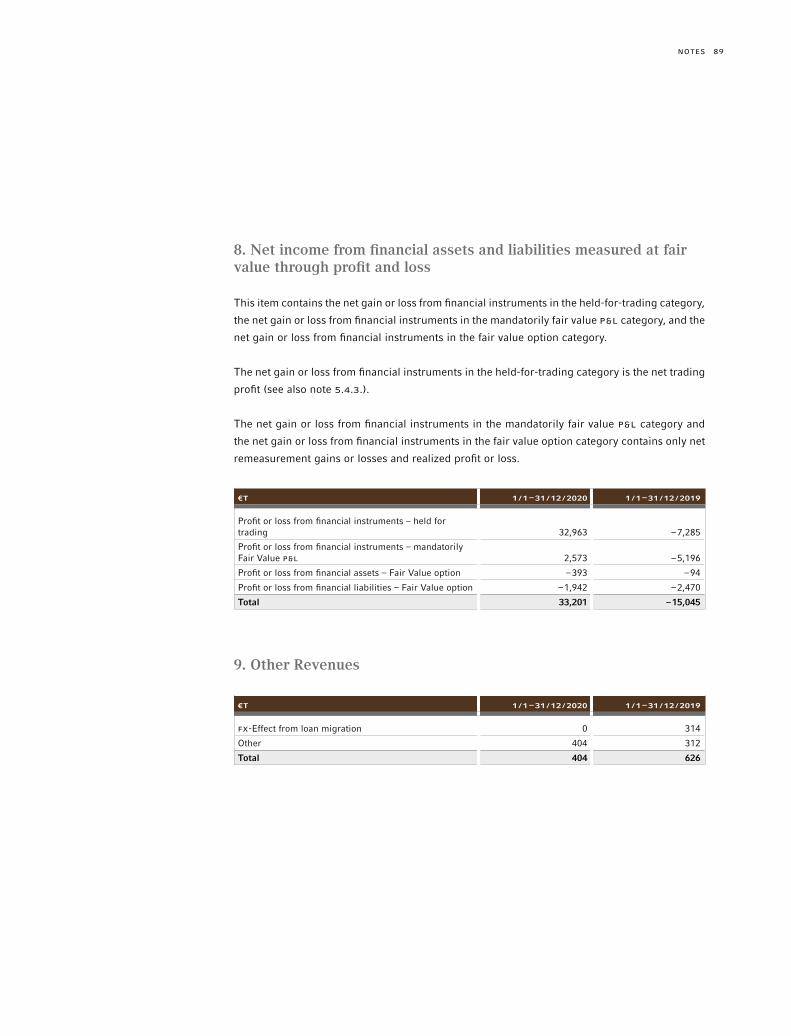
89NOTES
8. Net income from financial assets and liabilities measured at fair value through profit and loss
This item contains the net gain or loss from financial instruments in the held-for-trading category,
the net gain or loss from financial instruments in the mandatorily fair value P&L category, and the
net gain or loss from financial instruments in the fair value option category.
The net gain or loss from financial instruments in the held-for-trading category is the net trading
profit (see also note 5.4.3.).
The net gain or loss from financial instruments in the mandatorily fair value P&L category and
the net gain or loss from financial instruments in the fair value option category contains only net
remeasurement gains or losses and realized profit or loss.
€T 1 /1 – 31 /12 /2020 1 /1 – 31 /12 /2019
Profit or loss from financial instruments – held for trading 32,963 –7,285
Profit or loss from financial instruments – mandatorily Fair Value P&L 2,573 –5,196
Profit or loss from financial assets – Fair Value option –393 –94
Profit or loss from financial liabilities – Fair Value option –1,942 –2,470
Total 33,201 –15,045
9. Other Revenues
€T 1 /1 – 31 /12 /2020 1 /1 – 31 /12 /2019
FX-Effect from loan migration 0 314
Other 404 312
Total 404 626
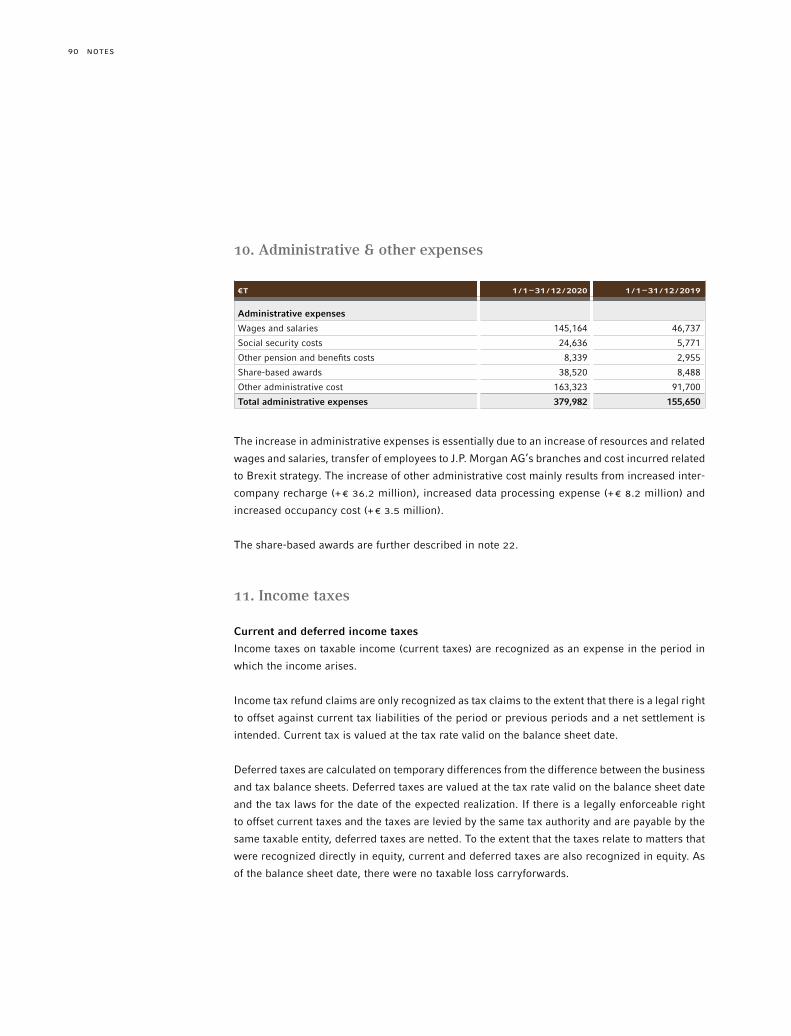
NOTES90
10. Administrative & other expenses
€T 1 /1 – 31 /12 /2020 1 /1 – 31 /12 /2019
Administrative expenses
Wages and salaries 145,164 46,737
Social security costs 24,636 5,771
Other pension and benefits costs 8,339 2,955
Share-based awards 38,520 8,488
Other administrative cost 163,323 91,700
Total administrative expenses 379,982 155,650
The increase in administrative expenses is essentially due to an increase of resources and related
wages and salaries, transfer of employees to J.P. Morgan AG’s branches and cost incurred related
to Brexit strategy. The increase of other administrative cost mainly results from increased inter-
company recharge (+€ 36.2 million), increased data processing expense (+€ 8.2 million) and
increased occupancy cost (+€ 3.5 million).
The share-based awards are further described in note 22.
11. Income taxes
Current and deferred income taxes
Income taxes on taxable income (current taxes) are recognized as an expense in the period in
which the income arises.
Income tax refund claims are only recognized as tax claims to the extent that there is a legal right
to offset against current tax liabilities of the period or previous periods and a net settlement is
intended. Current tax is valued at the tax rate valid on the balance sheet date.
Deferred taxes are calculated on temporary differences from the difference between the business
and tax balance sheets. Deferred taxes are valued at the tax rate valid on the balance sheet date
and the tax laws for the date of the expected realization. If there is a legally enforceable right
to offset current taxes and the taxes are levied by the same tax authority and are payable by the
same taxable entity, deferred taxes are netted. To the extent that the taxes relate to matters that
were recognized directly in equity, current and deferred taxes are also recognized in equity. As
of the balance sheet date, there were no taxable loss carryforwards.
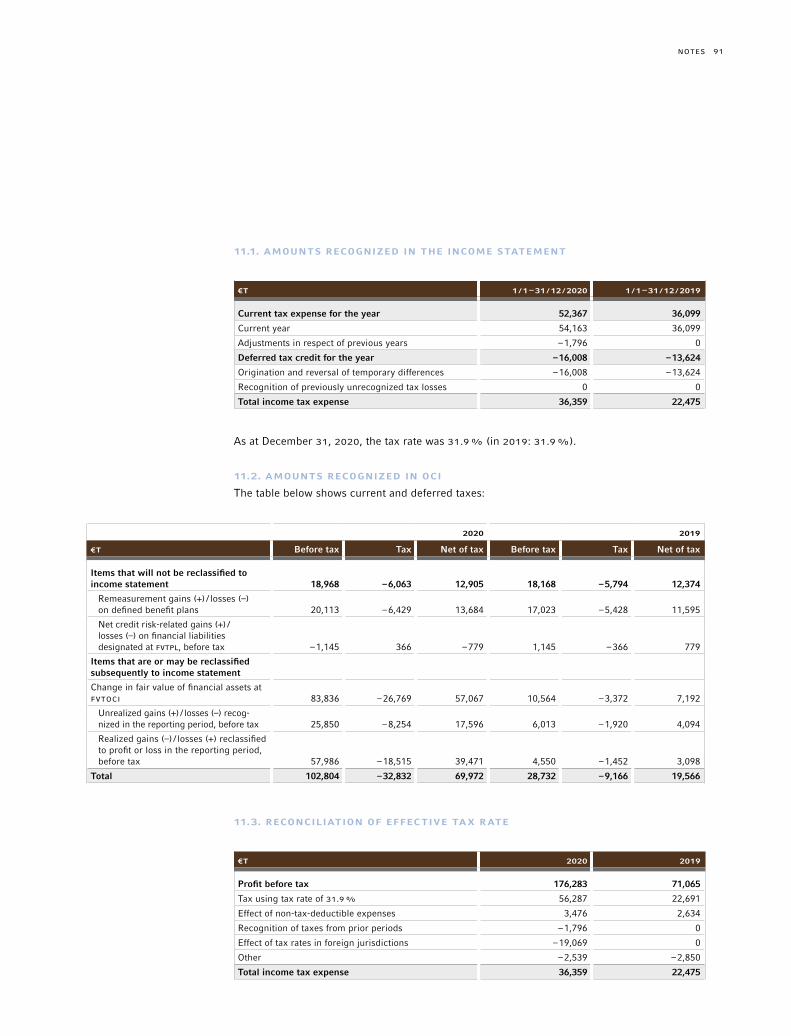
91NOTES
11.1. AMOUNTS RECOGNIZED IN THE INCOME STATEMENT
€T 1 /1 – 31 /12 /2020 1 /1 – 31 /12 /2019
Current tax expense for the year 52,367 36,099
Current year 54,163 36,099
Adjustments in respect of previous years –1,796 0
Deferred tax credit for the year –16,008 –13,624
Origination and reversal of temporary differences –16,008 –13,624
Recognition of previously unrecognized tax losses 0 0
Total income tax expense 36,359 22,475
As at December 31, 2020, the tax rate was 31.9% (in 2019: 31.9%).
11.2. AMOUNTS RECOGNIZED IN OCI
The table below shows current and deferred taxes:
2020 2019
€T Before tax Tax Net of tax Before tax Tax Net of tax
Items that will not be reclassified to income statement 18,968 –6,063 12,905 18,168 –5,794 12,374
Remeasurement gains (+) / losses (–) on defined benefit plans 20,113 –6,429 13,684 17,023 –5,428 11,595
Net credit risk-related gains (+) / losses (–) on financial liabilities designated at FVTPL, before tax –1,145 366 –779 1,145 –366 779
Items that are or may be reclassified subsequently to income statement
Change in fair value of financial assets at FVTOCI 83,836 –26,769 57,067 10,564 –3,372 7,192
Unrealized gains (+) / losses (–) recog-nized in the reporting period, before tax 25,850 –8,254 17,596 6,013 –1,920 4,094
Realized gains (–) / losses (+) reclassified to profit or loss in the reporting period, before tax 57,986 –18,515 39,471 4,550 –1,452 3,098
Total 102,804 –32,832 69,972 28,732 –9,166 19,566
11.3. RECONCILIATION OF EFFECTIVE TAx RATE
€T 2020 2019
Profit before tax 176,283 71,065
Tax using tax rate of 31.9% 56,287 22,691
Effect of non-tax-deductible expenses 3,476 2,634
Recognition of taxes from prior periods –1,796 0
Effect of tax rates in foreign jurisdictions –19,069 0
Other –2,539 –2,850
Total income tax expense 36,359 22,475
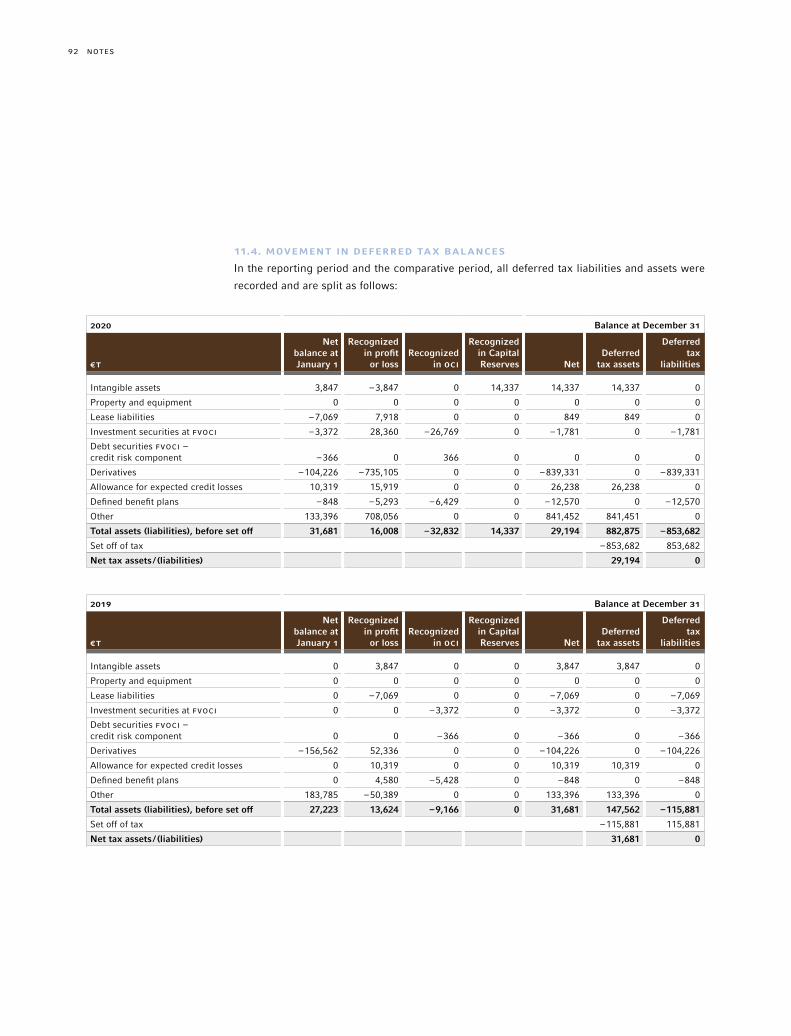
NOTES92
11.4. MOVEMENT IN DEFERRED TAx BALANCES
In the reporting period and the comparative period, all deferred tax liabilities and assets were
recorded and are split as follows:
2020 Balance at December 31
€T
Net balance at January 1
Recognized in profit
or lossRecognized
in OCI
Recognized in Capital Reserves Net
Deferred tax assets
Deferred tax
liabilities
Intangible assets 3,847 –3,847 0 14,337 14,337 14,337 0
Property and equipment 0 0 0 0 0 0 0
Lease liabilities –7,069 7,918 0 0 849 849 0
Investment securities at FVOCI –3,372 28,360 –26,769 0 –1,781 0 –1,781
Debt securities FVOCI – credit risk component –366 0 366 0 0 0 0
Derivatives –104,226 –735,105 0 0 –839,331 0 –839,331
Allowance for expected credit losses 10,319 15,919 0 0 26,238 26,238 0
Defined benefit plans –848 –5,293 –6,429 0 –12,570 0 –12,570
Other 133,396 708,056 0 0 841,452 841,451 0
Total assets (liabilities), before set off 31,681 16,008 –32,832 14,337 29,194 882,875 –853,682
Set off of tax –853,682 853,682
Net tax assets / (liabilities) 29,194 0
2019 Balance at December 31
€T
Net balance at January 1
Recognized in profit
or lossRecognized
in OCI
Recognized in Capital Reserves Net
Deferred tax assets
Deferred tax
liabilities
Intangible assets 0 3,847 0 0 3,847 3,847 0
Property and equipment 0 0 0 0 0 0 0
Lease liabilities 0 –7,069 0 0 –7,069 0 –7,069
Investment securities at FVOCI 0 0 –3,372 0 –3,372 0 –3,372
Debt securities FVOCI – credit risk component 0 0 –366 0 –366 0 –366
Derivatives –156,562 52,336 0 0 –104,226 0 –104,226
Allowance for expected credit losses 0 10,319 0 0 10,319 10,319 0
Defined benefit plans 0 4,580 –5,428 0 –848 0 –848
Other 183,785 –50,389 0 0 133,396 133,396 0
Total assets (liabilities), before set off 27,223 13,624 –9,166 0 31,681 147,562 –115,881
Set off of tax –115,881 115,881
Net tax assets / (liabilities) 31,681 0
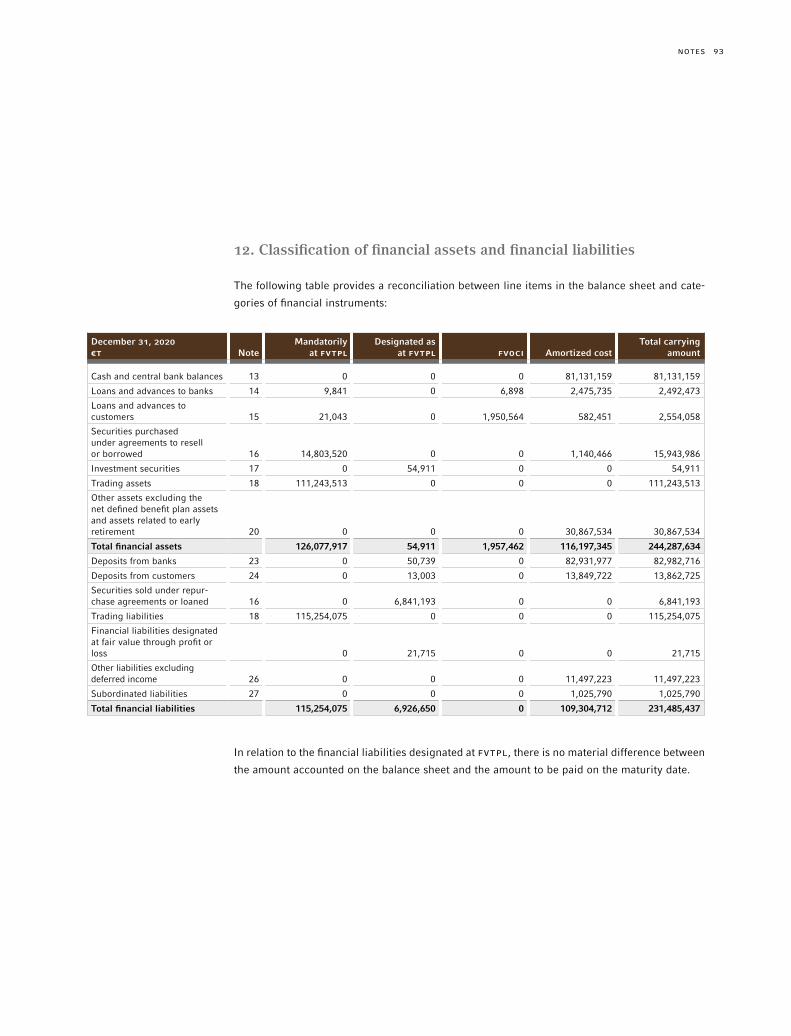
93NOTES
12. Classification of financial assets and financial liabilities
The following table provides a reconciliation between line items in the balance sheet and cate-
gories of financial instruments:
December 31, 2020€T Note
Mandatorily at FVTPL
Designated as at FVTPL FVOCI Amortized cost
Total carrying amount
Cash and central bank balances 13 0 0 0 81,131,159 81,131,159
Loans and advances to banks 14 9,841 0 6,898 2,475,735 2,492,473
Loans and advances to customers 15 21,043 0 1,950,564 582,451 2,554,058
Securities purchased under agreements to resell or borrowed 16 14,803,520 0 0 1,140,466 15,943,986
Investment securities 17 0 54,911 0 0 54,911
Trading assets 18 111,243,513 0 0 0 111,243,513
Other assets excluding the net defined benefit plan assets and assets related to early retirement 20 0 0 0 30,867,534 30,867,534
Total financial assets 126,077,917 54,911 1,957,462 116,197,345 244,287,634
Deposits from banks 23 0 50,739 0 82,931,977 82,982,716
Deposits from customers 24 0 13,003 0 13,849,722 13,862,725
Securities sold under repur-chase agreements or loaned 16 0 6,841,193 0 0 6,841,193
Trading liabilities 18 115,254,075 0 0 0 115,254,075
Financial liabilities designated at fair value through profit or loss 0 21,715 0 0 21,715
Other liabilities excluding deferred income 26 0 0 0 11,497,223 11,497,223
Subordinated liabilities 27 0 0 0 1,025,790 1,025,790
Total financial liabilities 115,254,075 6,926,650 0 109,304,712 231,485,437
In relation to the financial liabilities designated at FVTPL, there is no material difference between
the amount accounted on the balance sheet and the amount to be paid on the maturity date.
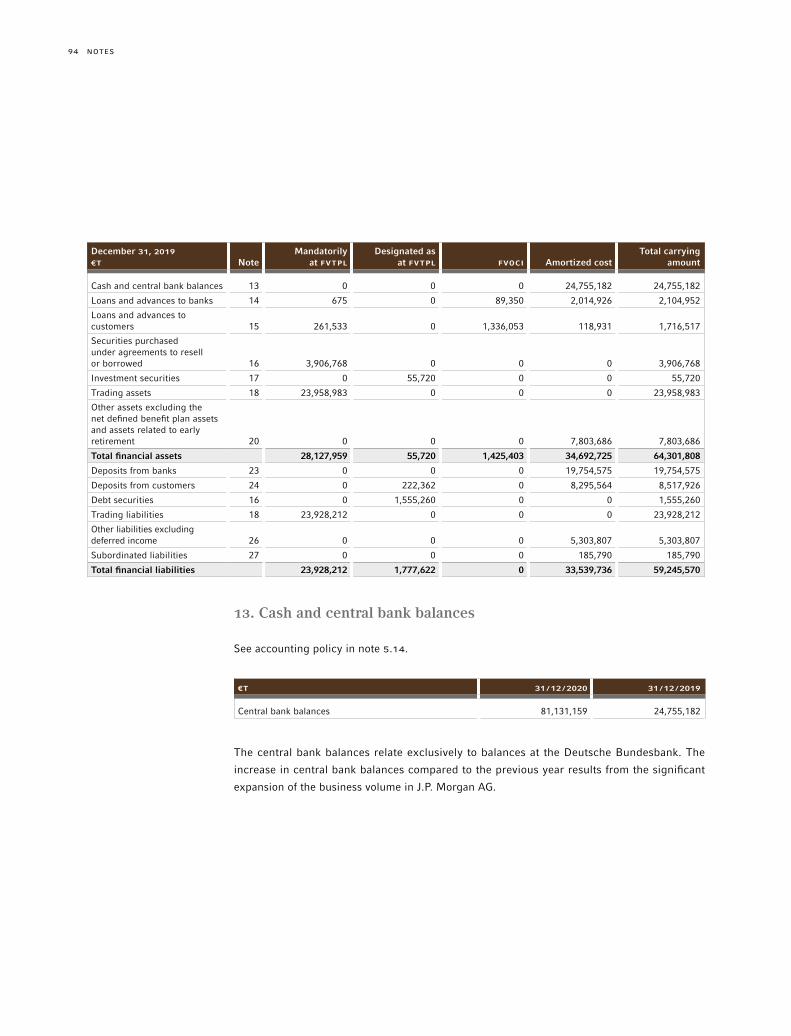
NOTES94
December 31, 2019€T Note
Mandatorily at FVTPL
Designated as at FVTPL FVOCI Amortized cost
Total carrying amount
Cash and central bank balances 13 0 0 0 24,755,182 24,755,182
Loans and advances to banks 14 675 0 89,350 2,014,926 2,104,952
Loans and advances to customers 15 261,533 0 1,336,053 118,931 1,716,517
Securities purchased under agreements to resell or borrowed 16 3,906,768 0 0 0 3,906,768
Investment securities 17 0 55,720 0 0 55,720
Trading assets 18 23,958,983 0 0 0 23,958,983
Other assets excluding the net defined benefit plan assets and assets related to early retirement 20 0 0 0 7,803,686 7,803,686
Total financial assets 28,127,959 55,720 1,425,403 34,692,725 64,301,808
Deposits from banks 23 0 0 0 19,754,575 19,754,575
Deposits from customers 24 0 222,362 0 8,295,564 8,517,926
Debt securities 16 0 1,555,260 0 0 1,555,260
Trading liabilities 18 23,928,212 0 0 0 23,928,212
Other liabilities excluding deferred income 26 0 0 0 5,303,807 5,303,807
Subordinated liabilities 27 0 0 0 185,790 185,790
Total financial liabilities 23,928,212 1,777,622 0 33,539,736 59,245,570
13. Cash and central bank balances
See accounting policy in note 5.14.
€T 31 /12 /2020 31 /12 /2019
Central bank balances 81,131,159 24,755,182
The central bank balances relate exclusively to balances at the Deutsche Bundesbank. The
increase in central bank balances compared to the previous year results from the significant
expansion of the business volume in J.P. Morgan AG.
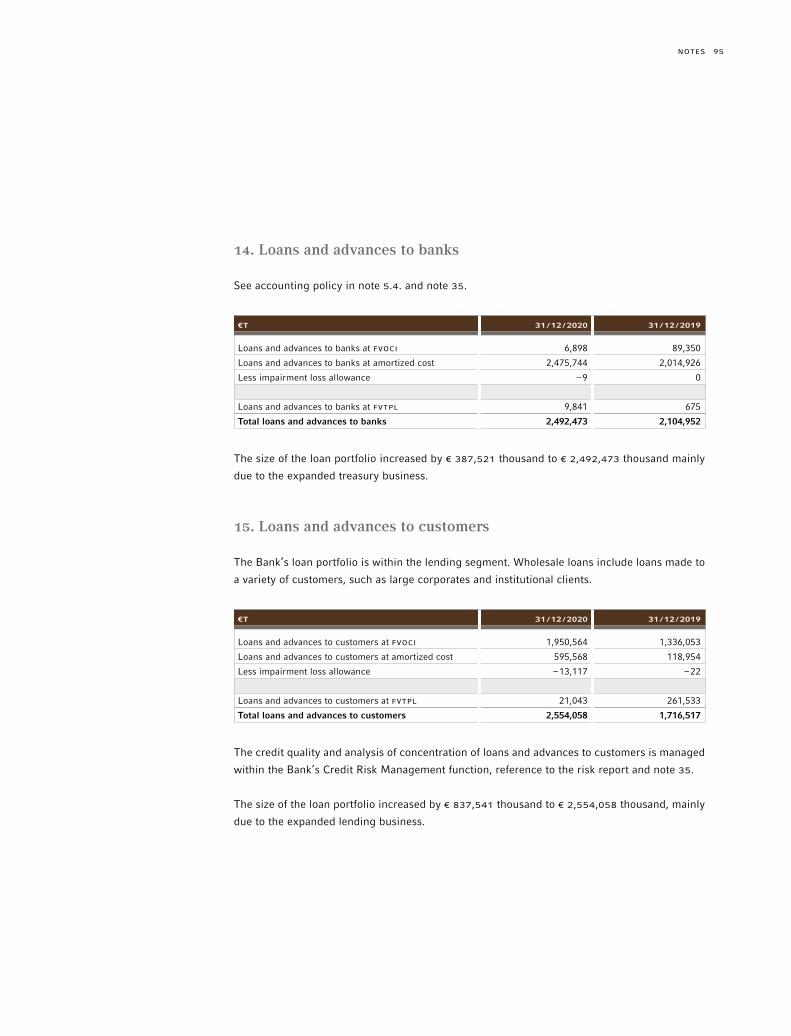
95NOTES
14. Loans and advances to banks
See accounting policy in note 5.4. and note 35.
€T 31 /12 /2020 31 /12 /2019
Loans and advances to banks at FVOCI 6,898 89,350
Loans and advances to banks at amortized cost 2,475,744 2,014,926
Less impairment loss allowance –9 0
Loans and advances to banks at FVTPL 9,841 675
Total loans and advances to banks 2,492,473 2,104,952
The size of the loan portfolio increased by € 387,521 thousand to € 2,492,473 thousand mainly
due to the expanded treasury business.
15. Loans and advances to customers
The Bank’s loan portfolio is within the lending segment. Wholesale loans include loans made to
a variety of customers, such as large corporates and institutional clients.
€T 31 /12 /2020 31 /12 /2019
Loans and advances to customers at FVOCI 1,950,564 1,336,053
Loans and advances to customers at amortized cost 595,568 118,954
Less impairment loss allowance –13,117 –22
Loans and advances to customers at FVTPL 21,043 261,533
Total loans and advances to customers 2,554,058 1,716,517
The credit quality and analysis of concentration of loans and advances to customers is managed
within the Bank’s Credit Risk Management function, reference to the risk report and note 35.
The size of the loan portfolio increased by € 837,541 thousand to € 2,554,058 thousand, mainly
due to the expanded lending business.

NOTES96
16. Securities financing agreements
€T 31 /12 /2020 31 /12 /2019
Securities purchased under agreements to resell 15,392,737 3,865,616
Securities borrowed 551,249 41,152
Securities purchased under agreements to resell or borrowed 15,943,986 3,906,768
Securities sold under agreements to repurchase 6,673,240 1,555,260
Securities loaned 167,953 0
Securities sold under repurchase agreements or loaned 6,841,193 1,555,260
J.P. Morgan AG enters into resale agreements, repurchase agreements, securities borrowing
and securities lending transactions (collectively, “securities financing agreements”) primarily to
facilitate customer’s funding requirements, to finance the company’s inventory positions, acquire
securities to cover short positions and settle other securities obligations.
Securities purchased and securities sold under agreements to resell / repurchase and securities
borrowing and securities lending transactions are generally carried at the amount of the cash
collateral advanced or received.
17. Investment securities
INVESTMENT SECURITIES DESIGNATED AS AT FVTPL
€T 31 /12 /2020 31 /12 /2019
Government bonds 54,911 55,720
The Group has recognized the following changes in fair value of investment securities designated
as at FVTPL:
€T 1 /1 –31 /12 /2020 1 /1 – 31 /12 /2019
Government bonds: Change in fair value attributable to credit risk –387 –112
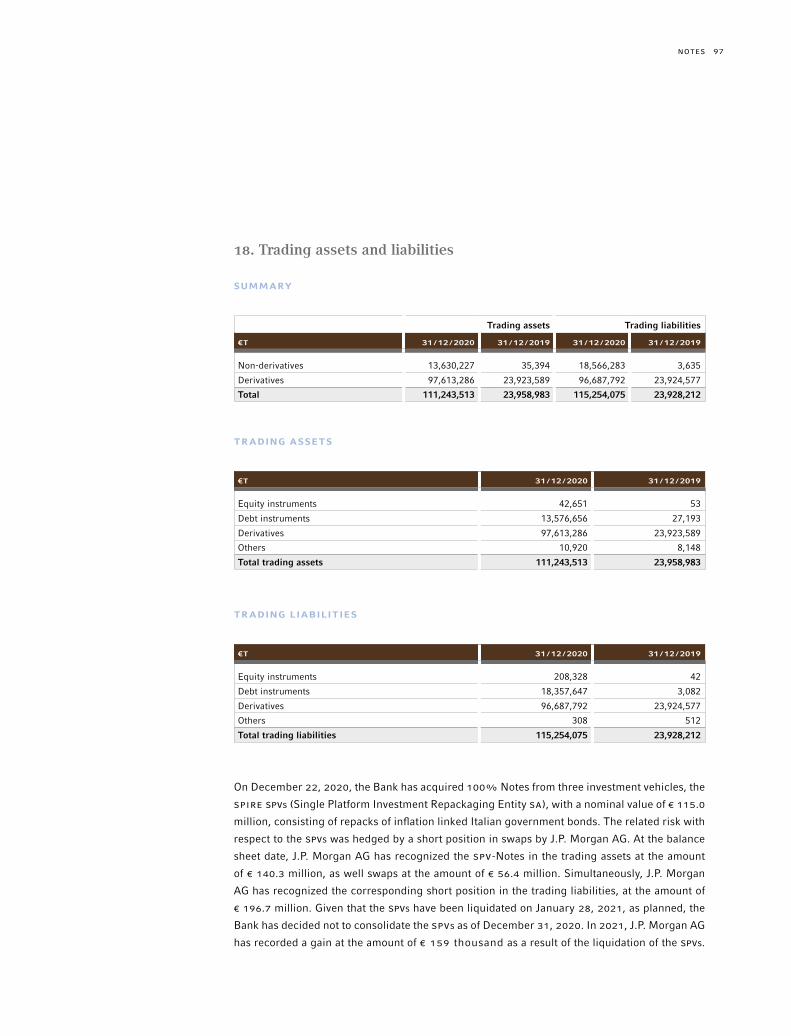
97NOTES
18. Trading assets and liabilities
SUMMARY
Trading assets Trading liabilities
€T 31 /12 /2020 31 /12 /2019 31 /12 /2020 31 /12 /2019
Non-derivatives 13,630,227 35,394 18,566,283 3,635
Derivatives 97,613,286 23,923,589 96,687,792 23,924,577
Total 111,243,513 23,958,983 115,254,075 23,928,212
TRADING ASSETS
€T 31 /12 /2020 31 /12 /2019
Equity instruments 42,651 53
Debt instruments 13,576,656 27,193
Derivatives 97,613,286 23,923,589
Others 10,920 8,148
Total trading assets 111,243,513 23,958,983
TRADING LIABILITIES
€T 31 /12 /2020 31 /12 /2019
Equity instruments 208,328 42
Debt instruments 18,357,647 3,082
Derivatives 96,687,792 23,924,577
Others 308 512
Total trading liabilities 115,254,075 23,928,212
On December 22, 2020, the Bank has acquired 100% Notes from three investment vehicles, the
SPIrE SPVs (Single Platform Investment Repackaging Entity SA), with a nominal value of € 115.0
million, consisting of repacks of inflation linked Italian government bonds. The related risk with
respect to the SPVs was hedged by a short position in swaps by J.P. Morgan AG. At the balance
sheet date, J.P. Morgan AG has recognized the SPV-Notes in the trading assets at the amount
of € 140.3 million, as well swaps at the amount of € 56.4 million. Simultaneously, J.P. Morgan
AG has recognized the corresponding short position in the trading liabilities, at the amount of
€ 196.7 million. Given that the SPVs have been liquidated on January 28, 2021, as planned, the
Bank has decided not to consolidate the SPVs as of December 31, 2020. In 2021, J.P. Morgan AG
has recorded a gain at the amount of € 159 thousand as a result of the liquidation of the SPVs.
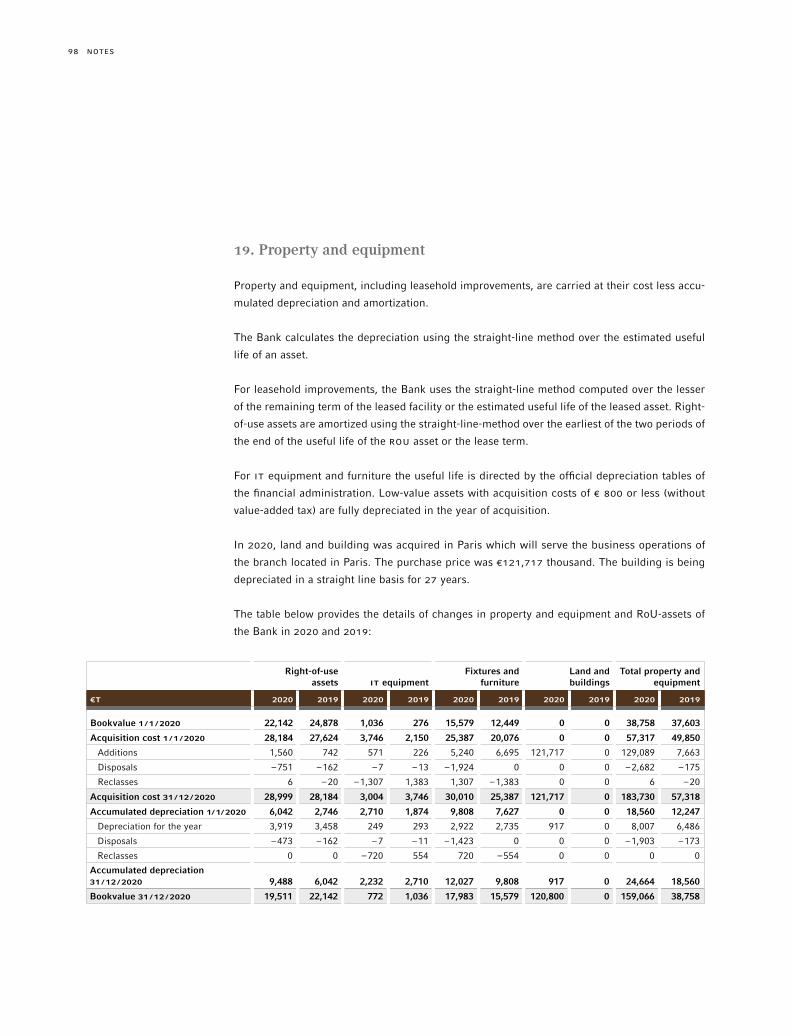
NOTES98
19. Property and equipment
Property and equipment, including leasehold improvements, are carried at their cost less accu-
mulated depreciation and amortization.
The Bank calculates the depreciation using the straight-line method over the estimated useful
life of an asset.
For leasehold improvements, the Bank uses the straight-line method computed over the lesser
of the remaining term of the leased facility or the estimated useful life of the leased asset. Right-
of-use assets are amortized using the straight-line-method over the earliest of the two periods of
the end of the useful life of the rOU asset or the lease term.
For IT equipment and furniture the useful life is directed by the official depreciation tables of
the financial administration. Low-value assets with acquisition costs of € 800 or less (without
value-added tax) are fully depreciated in the year of acquisition.
In 2020, land and building was acquired in Paris which will serve the business operations of
the branch located in Paris. The purchase price was €121,717 thousand. The building is being
depreciated in a straight line basis for 27 years.
The table below provides the details of changes in property and equipment and RoU-assets of
the Bank in 2020 and 2019:
Right-of-use assets IT equipment
Fixtures and furniture
Land and buildings
Total property and equipment
€T 2020 2019 2020 2019 2020 2019 2020 2019 2020 2019
Bookvalue 1 /1 /2020 22,142 24,878 1,036 276 15,579 12,449 0 0 38,758 37,603
Acquisition cost 1 /1 /2020 28,184 27,624 3,746 2,150 25,387 20,076 0 0 57,317 49,850
Additions 1,560 742 571 226 5,240 6,695 121,717 0 129,089 7,663
Disposals –751 –162 –7 –13 –1,924 0 0 0 –2,682 –175
Reclasses 6 –20 –1,307 1,383 1,307 –1,383 0 0 6 –20
Acquisition cost 31 /12 /2020 28,999 28,184 3,004 3,746 30,010 25,387 121,717 0 183,730 57,318
Accumulated depreciation 1/1/2020 6,042 2,746 2,710 1,874 9,808 7,627 0 0 18,560 12,247
Depreciation for the year 3,919 3,458 249 293 2,922 2,735 917 0 8,007 6,486
Disposals –473 –162 –7 –11 –1,423 0 0 0 –1,903 –173
Reclasses 0 0 –720 554 720 –554 0 0 0 0
Accumulated depreciation 31 /12 /2020 9,488 6,042 2,232 2,710 12,027 9,808 917 0 24,664 18,560
Bookvalue 31 /12 /2020 19,511 22,142 772 1,036 17,983 15,579 120,800 0 159,066 38,758
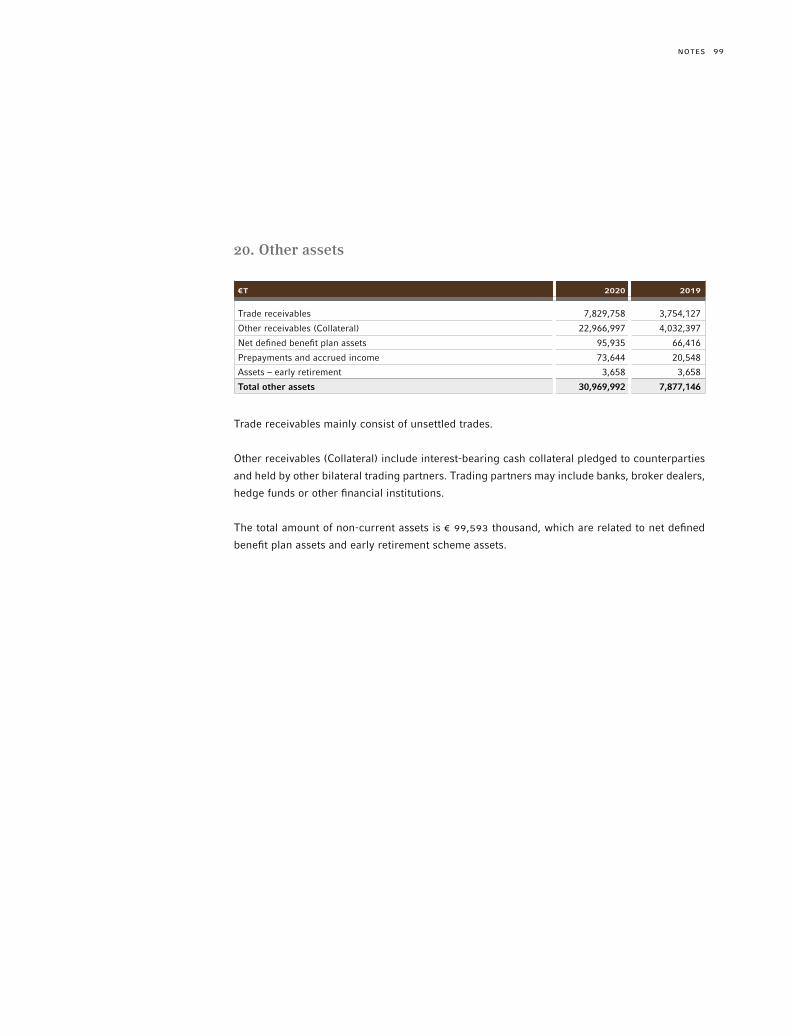
99NOTES
20. Other assets
€T 2020 2019
Trade receivables 7,829,758 3,754,127
Other receivables (Collateral) 22,966,997 4,032,397
Net defined benefit plan assets 95,935 66,416
Prepayments and accrued income 73,644 20,548
Assets – early retirement 3,658 3,658
Total other assets 30,969,992 7,877,146
Trade receivables mainly consist of unsettled trades.
Other receivables (Collateral) include interest-bearing cash collateral pledged to counterparties
and held by other bilateral trading partners. Trading partners may include banks, broker dealers,
hedge funds or other financial institutions.
The total amount of non-current assets is € 99,593 thousand, which are related to net defined
benefit plan assets and early retirement scheme assets.

NOTES100
21. Pensions
DEFINED BENEFITS PENSION PLANS
The Bank is involved in the following defined benefits plans:
– The Flexible Pension Plan (“FPP”) is the principal active plan offered since January 1, 2002.
The plan is jointly funded by the staff and the Bank and results in installment payments to
participants when they reach retirement age. The plan also provides for payments in the event
of disability or death. Plan assets are allocated to mutual funds based on decisions made by
employees about what type of investments they prefer. The payouts are largely linked to the
performance of the selected funds with a guaranteed minimum interest rate. Employees will
only participate in fund performance that is between 70% and 85% above the guaranteed
minimum interest rate, with a factor called “profit participation” being applied.
– The Heritage pension plans consist of five different legacy plans. Financing is based on the
basic monthly salary. The payout is based on the investment returns. The plan also provides
for payments in the event of disability or death. The plan assets are held in an investment fund
that is mainly invested in bonds with an investment grade rating. Some of the plans include
additional insurance coverage.
– The Deferred Incentive Compensation Plans (“DIC”) comprise three further legacy plans. The
plans are funded through performance-based compensation.
– In addition to the aforementioned plans, there are defined benefit plans in the new branches
in Milan, Oslo and Paris. The volume of foreign pension plans is immaterial in an overall com-
parison.
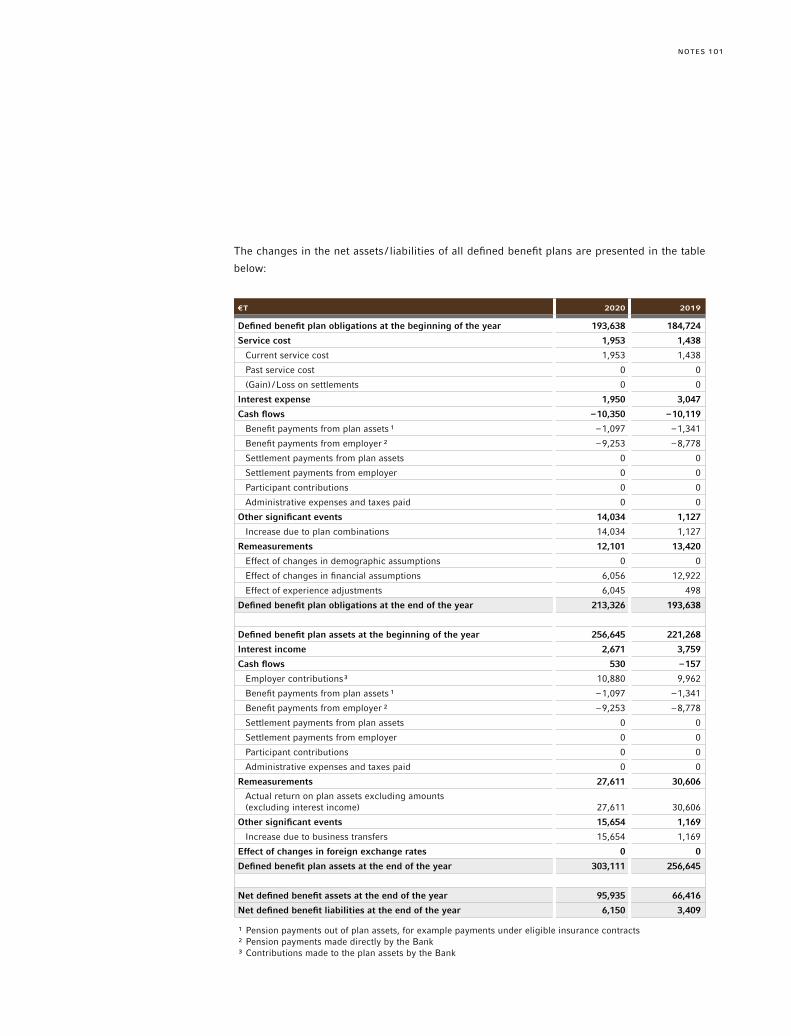
101NOTES
The changes in the net assets / liabilities of all defined benefit plans are presented in the table
below:
€T 2020 2019
Defined benefit plan obligations at the beginning of the year 193,638 184,724
Service cost 1,953 1,438
Current service cost 1,953 1,438
Past service cost 0 0
(Gain) /Loss on settlements 0 0
Interest expense 1,950 3,047
Cash flows –10,350 –10,119
Benefit payments from plan assets ¹ –1,097 –1,341
Benefit payments from employer ² –9,253 –8,778
Settlement payments from plan assets 0 0
Settlement payments from employer 0 0
Participant contributions 0 0
Administrative expenses and taxes paid 0 0
Other significant events 14,034 1,127
Increase due to plan combinations 14,034 1,127
Remeasurements 12,101 13,420
Effect of changes in demographic assumptions 0 0
Effect of changes in financial assumptions 6,056 12,922
Effect of experience adjustments 6,045 498
Defined benefit plan obligations at the end of the year 213,326 193,638
Defined benefit plan assets at the beginning of the year 256,645 221,268
Interest income 2,671 3,759
Cash flows 530 –157
Employer contributions³ 10,880 9,962
Benefit payments from plan assets ¹ –1,097 –1,341
Benefit payments from employer ² –9,253 –8,778
Settlement payments from plan assets 0 0
Settlement payments from employer 0 0
Participant contributions 0 0
Administrative expenses and taxes paid 0 0
Remeasurements 27,611 30,606
Actual return on plan assets excluding amounts (excluding interest income) 27,611 30,606
Other significant events 15,654 1,169
Increase due to business transfers 15,654 1,169
Effect of changes in foreign exchange rates 0 0
Defined benefit plan assets at the end of the year 303,111 256,645
Net defined benefit assets at the end of the year 95,935 66,416
Net defined benefit liabilities at the end of the year 6,150 3,409
¹ Pension payments out of plan assets, for example payments under eligible insurance contracts² Pension payments made directly by the Bank³ Contributions made to the plan assets by the Bank
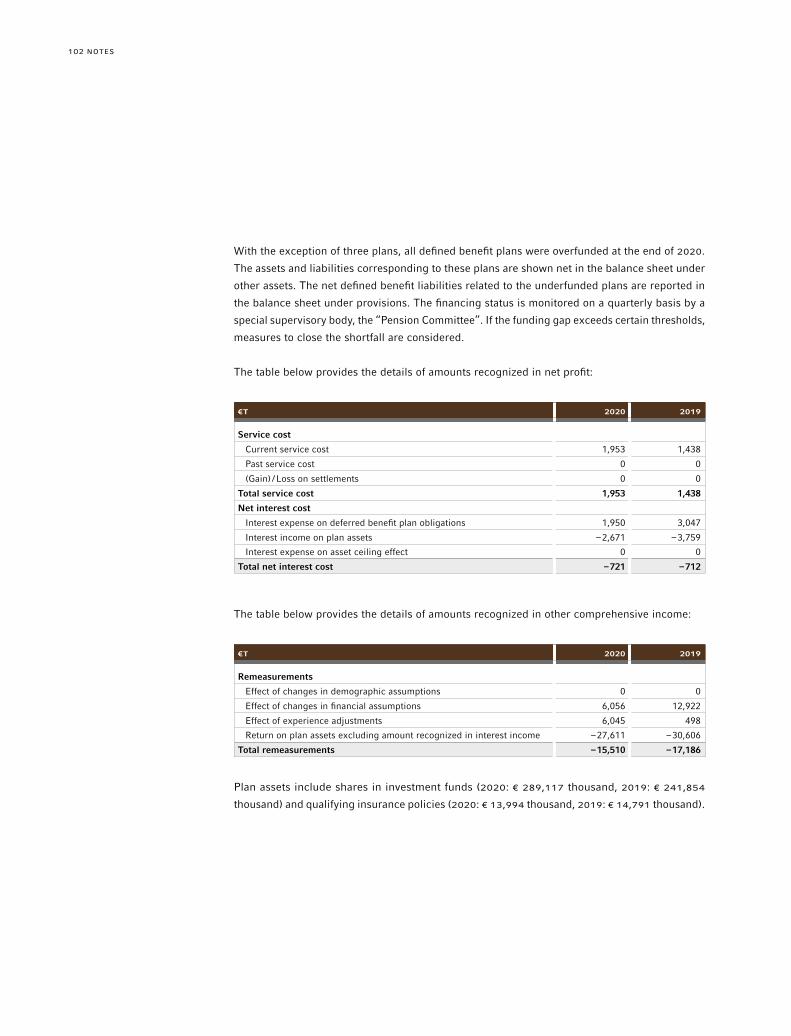
NOTES102
With the exception of three plans, all defined benefit plans were overfunded at the end of 2020.
The assets and liabilities corresponding to these plans are shown net in the balance sheet under
other assets. The net defined benefit liabilities related to the underfunded plans are reported in
the balance sheet under provisions. The financing status is monitored on a quarterly basis by a
special supervisory body, the “Pension Committee”. If the funding gap exceeds certain thresholds,
measures to close the shortfall are considered.
The table below provides the details of amounts recognized in net profit:
€T 2020 2019
Service cost
Current service cost 1,953 1,438
Past service cost 0 0
(Gain) /Loss on settlements 0 0
Total service cost 1,953 1,438
Net interest cost
Interest expense on deferred benefit plan obligations 1,950 3,047
Interest income on plan assets –2,671 –3,759
Interest expense on asset ceiling effect 0 0
Total net interest cost –721 –712
The table below provides the details of amounts recognized in other comprehensive income:
€T 2020 2019
Remeasurements
Effect of changes in demographic assumptions 0 0
Effect of changes in financial assumptions 6,056 12,922
Effect of experience adjustments 6,045 498
Return on plan assets excluding amount recognized in interest income –27,611 –30,606
Total remeasurements –15,510 –17,186
Plan assets include shares in investment funds (2020: € 289,117 thousand, 2019: € 241,854
thousand) and qualifying insurance policies (2020: € 13,994 thousand, 2019: € 14,791 thousand).

103NOTES
The Bank estimates the following effect of its defined benefit plans on its future cash flows:
€T 2020 2019
Expected total benefit payments 100,960 96,905
Year 1 9,084 11,104
Year 2 8,974 8,672
Year 3 9,301 8,804
Year 4 10,089 9,075
Year 5 10,395 9,619
Next 5 years 53,117 49,631
The weighted average duration of the defined benefit obligations was estimated as 10.42 years
for 2019 and 10.03 years for 2020.
ACTUARIAL ASSUMPTIONS
The Bank applied actuarial assumptions in measuring the defined benefits obligations. Further,
the valuation has taken place at the date of financial statements.
– Discount rate: the discount rate is based on the high-grade corporate bond yields in the currency
and timeframe applicable to each plan;
– Salary increase rate: the rate at which the salary of the participants of the defined benefit plans
are expected to increase;
– Pensions-in-payment increase rate: the rate at which pensions that are being paid out are
expected to increase year-on-year;
– Price inflation rate: expected rate of inflation;
– Post-retirement mortality assumption: assumption of longevity after retirement. Mortality
assumptions are based on the tables of Prof. Dr. Klaus Heubeck 2018 G.
In estimating the present value of the defined benefit obligations, the Bank used the following
weighted-average assumptions:
% 31 /12 /2020 31 /12 /2019
Discount rate 0.70% 1.00%
Salary increase rate 3.00% 3.00%
Pensions-in-payment increase rate 1.75% 1.75%
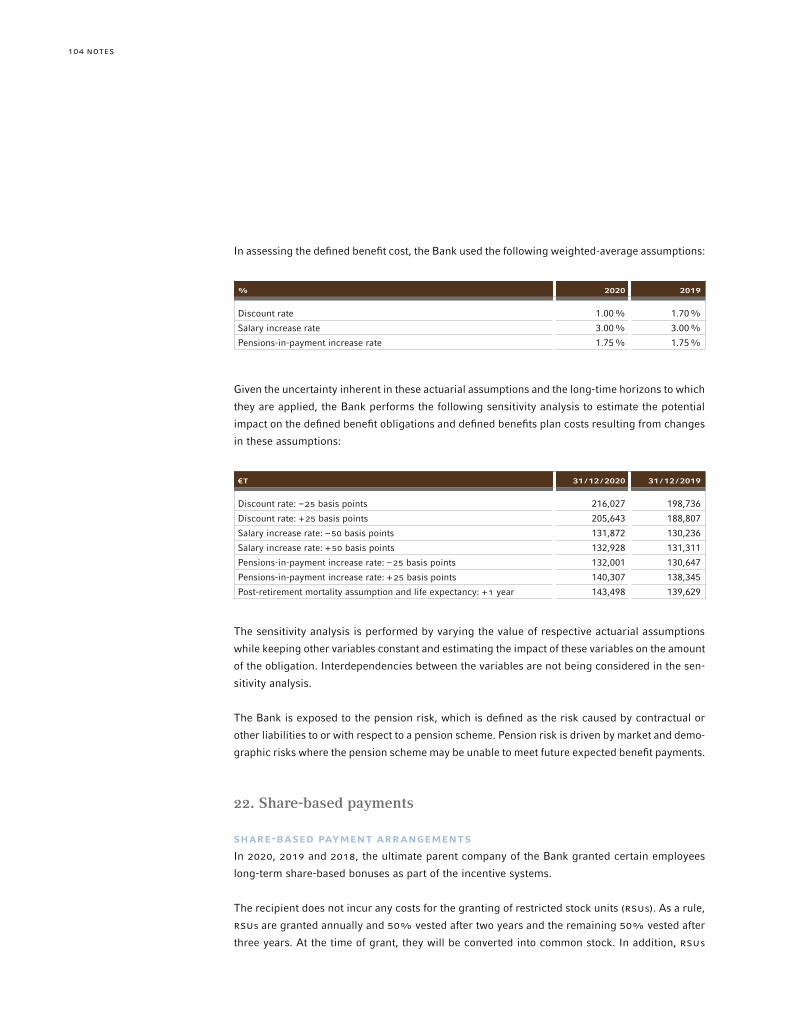
NOTES104
In assessing the defined benefit cost, the Bank used the following weighted-average assumptions:
% 2020 2019
Discount rate 1.00% 1.70%
Salary increase rate 3.00% 3.00%
Pensions-in-payment increase rate 1.75% 1.75%
Given the uncertainty inherent in these actuarial assumptions and the long-time horizons to which
they are applied, the Bank performs the following sensitivity analysis to estimate the potential
impact on the defined benefit obligations and defined benefits plan costs resulting from changes
in these assumptions:
€T 31 /12 /2020 31 /12 /2019
Discount rate: –25 basis points 216,027 198,736
Discount rate: +25 basis points 205,643 188,807
Salary increase rate: –50 basis points 131,872 130,236
Salary increase rate: +50 basis points 132,928 131,311
Pensions-in-payment increase rate: –25 basis points 132,001 130,647
Pensions-in-payment increase rate: +25 basis points 140,307 138,345
Post-retirement mortality assumption and life expectancy: +1 year 143,498 139,629
The sensitivity analysis is performed by varying the value of respective actuarial assumptions
while keeping other variables constant and estimating the impact of these variables on the amount
of the obligation. Interdependencies between the variables are not being considered in the sen-
sitivity analysis.
The Bank is exposed to the pension risk, which is defined as the risk caused by contractual or
other liabilities to or with respect to a pension scheme. Pension risk is driven by market and demo-
graphic risks where the pension scheme may be unable to meet future expected benefit payments.
22. Share-based payments
SHARE-BASED PAYMENT ARRANGEMENTS
In 2020, 2019 and 2018, the ultimate parent company of the Bank granted certain employees
long-term share-based bonuses as part of the incentive systems.
The recipient does not incur any costs for the granting of restricted stock units (rSUs). As a rule,
rSUs are granted annually and 50% vested after two years and the remaining 50% vested after
three years. At the time of grant, they will be converted into common stock. In addition, rSUs
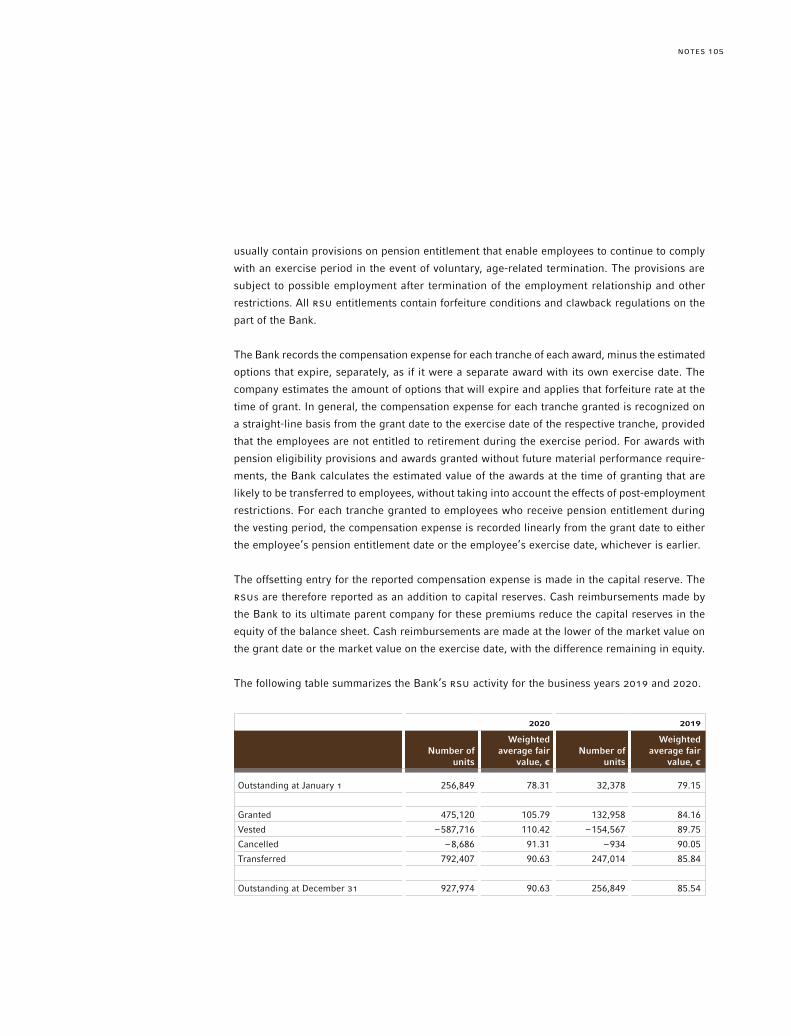
105NOTES
usually contain provisions on pension entitlement that enable employees to continue to comply
with an exercise period in the event of voluntary, age-related termination. The provisions are
subject to possible employment after termination of the employment relationship and other
restrictions. All rSU entitlements contain forfeiture conditions and clawback regulations on the
part of the Bank.
The Bank records the compensation expense for each tranche of each award, minus the estimated
options that expire, separately, as if it were a separate award with its own exercise date. The
company estimates the amount of options that will expire and applies that forfeiture rate at the
time of grant. In general, the compensation expense for each tranche granted is recognized on
a straight-line basis from the grant date to the exercise date of the respective tranche, provided
that the employees are not entitled to retirement during the exercise period. For awards with
pension eligibility provisions and awards granted without future material performance require-
ments, the Bank calculates the estimated value of the awards at the time of granting that are
likely to be transferred to employees, without taking into account the effects of post-employment
restrictions. For each tranche granted to employees who receive pension entitlement during
the vesting period, the compensation expense is recorded linearly from the grant date to either
the employee’s pension entitlement date or the employee’s exercise date, whichever is earlier.
The offsetting entry for the reported compensation expense is made in the capital reserve. The
rSUs are therefore reported as an addition to capital reserves. Cash reimbursements made by
the Bank to its ultimate parent company for these premiums reduce the capital reserves in the
equity of the balance sheet. Cash reimbursements are made at the lower of the market value on
the grant date or the market value on the exercise date, with the difference remaining in equity.
The following table summarizes the Bank’s rSU activity for the business years 2019 and 2020.
2020 2019
Number of units
Weighted average fair
value, €Number of
units
Weighted average fair
value, €
Outstanding at January 1 256,849 78.31 32,378 79.15
Granted 475,120 105.79 132,958 84.16
Vested –587,716 110.42 –154,567 89.75
Cancelled –8,686 91.31 –934 90.05
Transferred 792,407 90.63 247,014 85.84
Outstanding at December 31 927,974 90.63 256,849 85.54
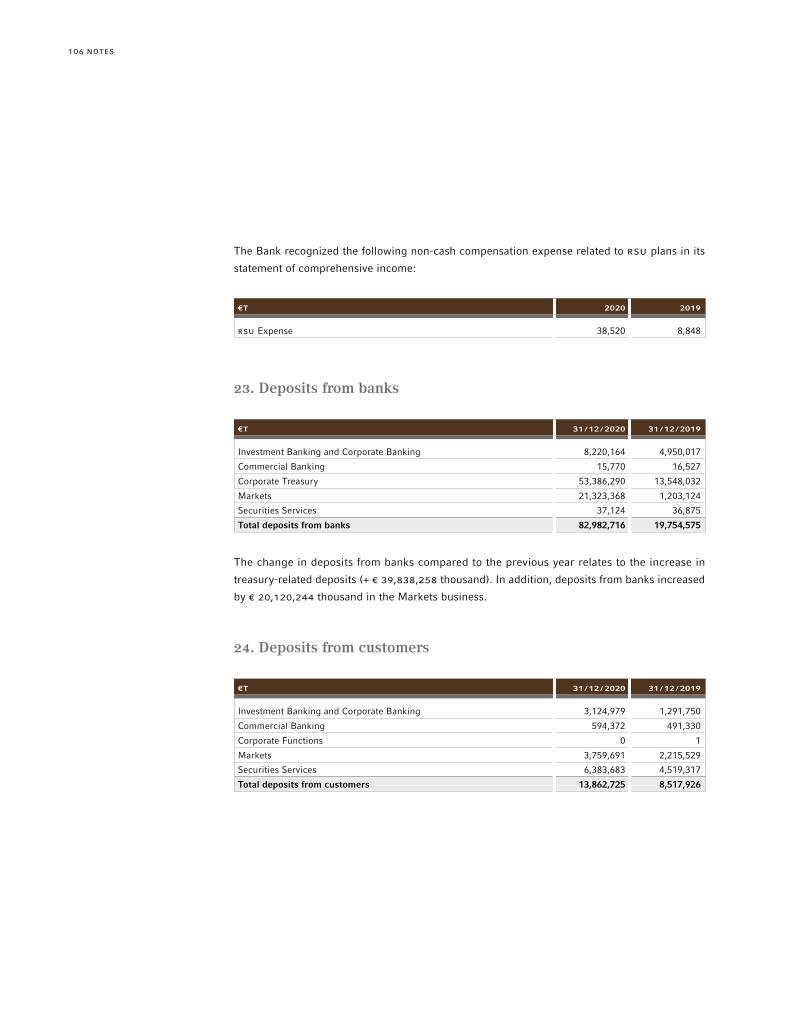
NOTES106
The Bank recognized the following non-cash compensation expense related to rSU plans in its
statement of comprehensive income:
€T 2020 2019
rSU Expense 38,520 8,848
23. Deposits from banks
€T 31 /12 /2020 31 /12 /2019
Investment Banking and Corporate Banking 8,220,164 4,950,017
Commercial Banking 15,770 16,527
Corporate Treasury 53,386,290 13,548,032
Markets 21,323,368 1,203,124
Securities Services 37,124 36,875
Total deposits from banks 82,982,716 19,754,575
The change in deposits from banks compared to the previous year relates to the increase in
treasury-related deposits (+ € 39,838,258 thousand). In addition, deposits from banks increased
by € 20,120,244 thousand in the Markets business.
24. Deposits from customers
€T 31 /12 /2020 31 /12 /2019
Investment Banking and Corporate Banking 3,124,979 1,291,750
Commercial Banking 594,372 491,330
Corporate Functions 0 1
Markets 3,759,691 2,215,529
Securities Services 6,383,683 4,519,317
Total deposits from customers 13,862,725 8,517,926
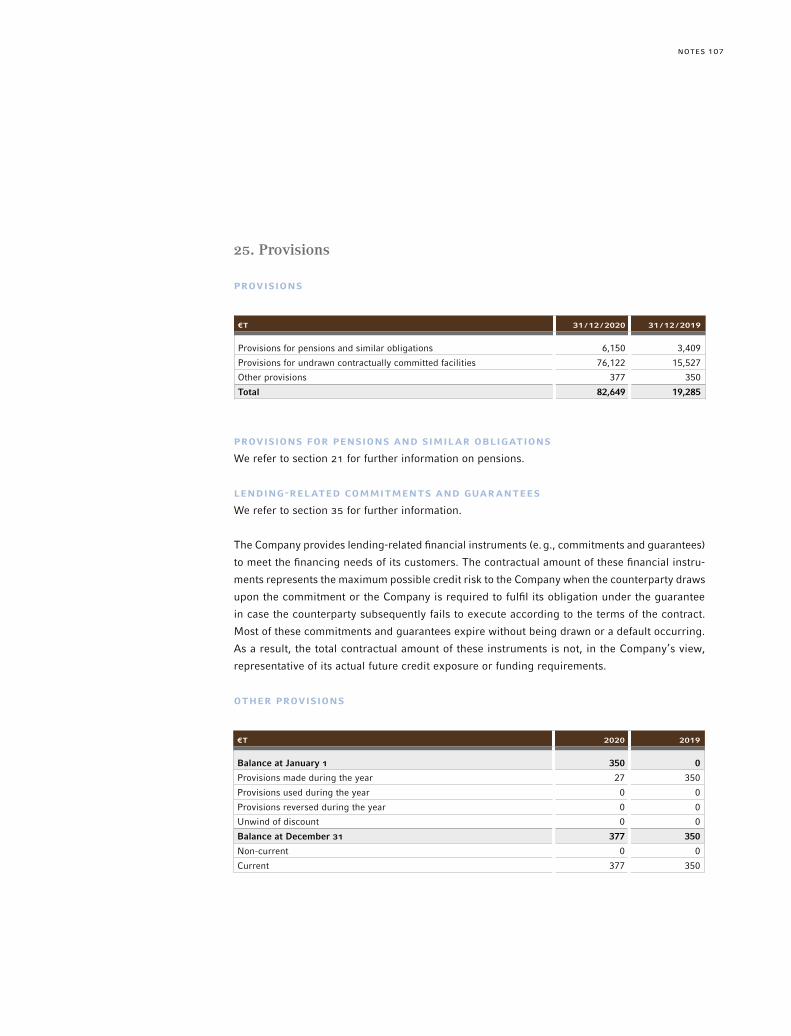
107NOTES
25. Provisions
PROVISIONS
€T 31 /12 /2020 31 /12 /2019
Provisions for pensions and similar obligations 6,150 3,409
Provisions for undrawn contractually committed facilities 76,122 15,527
Other provisions 377 350
Total 82,649 19,285
PROVISIONS FOR PENSIONS AND SIMILAR OBLIGATIONS
We refer to section 21 for further information on pensions.
LENDING-RELATED COMMITMENTS AND GUARANTEES
We refer to section 35 for further information.
The Company provides lending-related financial instruments (e.g., commitments and guarantees)
to meet the financing needs of its customers. The contractual amount of these financial instru-
ments represents the maximum possible credit risk to the Company when the counterparty draws
upon the commitment or the Company is required to fulfil its obligation under the guarantee
in case the counterparty subsequently fails to execute according to the terms of the contract.
Most of these commitments and guarantees expire without being drawn or a default occurring.
As a result, the total contractual amount of these instruments is not, in the Company’s view,
representative of its actual future credit exposure or funding requirements.
OTHER PROVISIONS
€T 2020 2019
Balance at January 1 350 0
Provisions made during the year 27 350
Provisions used during the year 0 0
Provisions reversed during the year 0 0
Unwind of discount 0 0
Balance at December 31 377 350
Non-current 0 0
Current 377 350

NOTES108
26. Other liabilities
€T 2020 2019
Lease liabilities 22,170 25,032
Trade payables 10,739,406 5,062,712
Amounts owed to JPMorgan Chase undertakings 55,634 129,496
Accruals and deferred income 206,750 37,059
Others 477,271 59,698
Total 11,501,231 5,313,997
Trade payables predominantly consist of unsettled trades and brokerage fees payables.
Others include accounts payable to external parties for goods or services provided.
There are no liabilities, which are to be settled longer than 12 months.
27. Subordinated liabilities
The Tier-2 Capital qualifying position consists of a € 150,000,000 subordinated liability issued on
December 21, 2009, a € 35,790,432 subordinated liability which was transferred to the Company
in the course of the merger with J.P. Morgan Beteiligungs- und Verwaltungsgesellschaft mbH as
well as a € 840,000,000 subordinated notes, which were issued on December 3, 2020.
28. Capital and reserves
28.1. SUBSCRIBED CAPITAL, CAPITAL RESERVE AND RETAINED EARNINGS
The subscribed capital of J.P. Morgan AG is divided into 160 million ordinary no par value
registered shares. The shares can only be transferred with the Company’s approval. The shares
are fully paid up and are held directly by J.P. Morgan International Finance Limited, Newark /
Delaware, USA, and each share has one voting right in the annual general meetings as well as
an equal right to dividends.
The subscribed capital has not changed, since the last increase which occurred in September
2019 when it was increased from € 160,000 thousand by € 1,707,200 thousand to € 1,867,200
thousand by reclassification from capital reserves to subscribed capital, while no new shares have
been issued. As a result of this change, the calculated nominal value per share has increased
from € 1.00 to € 11.67.

109NOTES
The capital reserve amounted to € 3,090,157 thousand as of 1 January 2020 and since then it
has been increased through the following capital injections by J.P. Morgan International Finance
Limited:
– € 932,053 thousand payment in March 2020;
– € 4,240,486 thousand payment in September 2020;
– € 2,552,616 thousand payment in October 2020.
The remaining changes of the capital reserve were related to the transfer of business activities
and employees from other J.P. Morgan Group entities.
As a result, the capital reserve amounted to € 10,748,588 thousand as of December 31, 2020.
Retained earnings consist of net income of prior years as well as the current reporting year that
was not distributed as dividends.
The ability to pay-out dividends or to pay back reserves is pursuant to the German commercial
and share company law and it is also based on the financial statements according to the local
accounting standards applicable in Germany and not on these IFrS financial statements. Under
those standards, subscribed capital and part of the capital reserve as well as a part of retained
earnings are restricted to be paid out as dividends or to be paid back to the shareholder. Free
reserves that could be returned to the shareholder as either dividends or a pay back of capital
amounted to € 10,811.7 million as of December 31, 2020 (31 /12 /2019: € 3,019.0 million).
28.2. ACCUMULATIVE OTHER COMPREHENSIVE INCOME
The position “Other reserves” consists of fair value changes on loans at FVOCI and net actuarial
gains / losses for defined benefits plans. In the prior year it also included debit valuation adjust-
ments for long-term debt (FVO). The long-term debt (FVO) was repaid prior to maturity during
the reporting year and the debit valuation adjustments as of year-end 2019 were realized and
reclassified from Other reserves to Retained earnings.
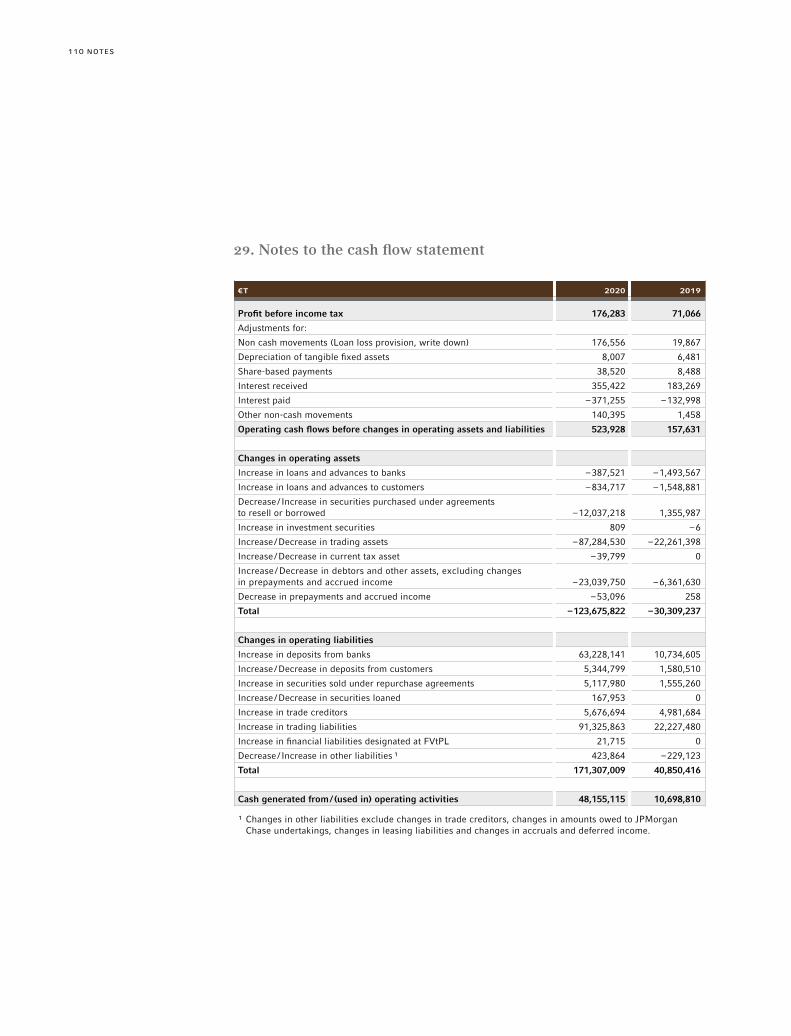
NOTES110
29. Notes to the cash flow statement
€T 2020 2019
Profit before income tax 176,283 71,066
Adjustments for:
Non cash movements (Loan loss provision, write down) 176,556 19,867
Depreciation of tangible fixed assets 8,007 6,481
Share-based payments 38,520 8,488
Interest received 355,422 183,269
Interest paid –371,255 –132,998
Other non-cash movements 140,395 1,458
Operating cash flows before changes in operating assets and liabilities 523,928 157,631
Changes in operating assets
Increase in loans and advances to banks –387,521 –1,493,567
Increase in loans and advances to customers –834,717 –1,548,881
Decrease / Increase in securities purchased under agreements to resell or borrowed –12,037,218 1,355,987
Increase in investment securities 809 –6
Increase /Decrease in trading assets –87,284,530 –22,261,398
Increase /Decrease in current tax asset –39,799 0
Increase /Decrease in debtors and other assets, excluding changes in prepayments and accrued income –23,039,750 –6,361,630
Decrease in prepayments and accrued income –53,096 258
Total –123,675,822 –30,309,237
Changes in operating liabilities
Increase in deposits from banks 63,228,141 10,734,605
Increase /Decrease in deposits from customers 5,344,799 1,580,510
Increase in securities sold under repurchase agreements 5,117,980 1,555,260
Increase /Decrease in securities loaned 167,953 0
Increase in trade creditors 5,676,694 4,981,684
Increase in trading liabilities 91,325,863 22,227,480
Increase in financial liabilities designated at FVtPL 21,715 0
Decrease / Increase in other liabilities ¹ 423,864 –229,123
Total 171,307,009 40,850,416
Cash generated from/ (used in) operating activities 48,155,115 10,698,810
¹ Changes in other liabilities exclude changes in trade creditors, changes in amounts owed to JPMorgan Chase undertakings, changes in leasing liabilities and changes in accruals and deferred income.

111NOTES
30. Assets and liabilities measured at fair value
VALUATION PROCESS
The Bank carries a portion of its assets and liabilities at fair value on a recurring basis.
Fair value is defined as the price that would be received to sell an asset or paid to transfer a
liability in an orderly transaction between market participants at the measurement date. Fair
value is based on quoted market prices or inputs, where available. If listed prices or quotes are
not available, fair value is based on valuation models and other valuation techniques that con-
sider relevant transaction characteristics and use as inputs observable or unobservable market
parameters, including yield curves, interest rates, volatilities, equity prices, foreign exchange
rates, and credit curves.
The level of accuracy in estimating unobservable market inputs or other factors can affect the
amount of gain or loss reported for a particular position. The Bank believes its valuation meth-
ods are appropriate and consistent with those of other market participants. The methods and
assumptions used reflect management judgement and may vary across the Bank’s businesses
and portfolios.
The respective business area is responsible for providing fair value estimates for assets and
liabilities carried on the balance sheet at fair value. The independent Valuation Control Group
(“VCG”) is part of the Bank’s Finance function and is responsible for verifying these estimates and
determining any fair value adjustments that may be required to ensure that the Bank’s positions
are reported at fair value. VCG verifies fair value estimates provided by the business areas by
leveraging independently derived prices, valuation inputs and other market data, where available.
In determining the fair value of a derivative portfolio, valuation adjustments may be appropriate
to reflect the credit quality of the counterparty, the credit quality of the Bank, and the funding
risk inherent to certain derivatives. The credit and funding risks of the derivative portfolio are
generally mitigated by arrangements provided to the Bank by JPMorgan Chase Bank, N.A., and
therefore the Bank takes account of these arrangements in estimating the fair value of its deriv-
ative portfolio.
The Bank manages certain portfolios of financial instruments on the basis of net open risk expo-
sure and has elected to estimate the fair value of such portfolios on the basis of a transfer of
the entire net open risk position in an orderly transaction. Where this is the case, valuation
adjustments may be necessary to reflect the cost of exiting a larger-than-normal market-size net
open risk position. Where applied, such adjustments are based on factors that a relevant market
participant would consider in the transfer of the net open risk position.

NOTES112
VALUATION MODEL REVIEW AND APPROVAL
If prices or quotes are not available for an instrument or a similar instrument, fair value is gener-
ally determined using valuation models. The department responsible for the model monitoring is
independent of the model development department and reviews and approves valuation models
used by the Bank.
FAIR VALUE HIERARCHY
The Bank classifies its assets and liabilities according to a valuation hierarchy that reflects the
observability of significant market inputs. The three levels are defined as follows:
Level 1 – inputs to the valuation methodology are quoted prices (unadjusted) for identical assets
or liabilities in active markets.
Level 2 – inputs to the valuation methodology include quoted prices for similar assets and liabil-
ities in active markets, and inputs that are observable for the asset or liability, either directly or
indirectly, for substantially the full term of the financial instrument.
Level 3 – one or more inputs to the valuation methodology are unobservable and significant to
the fair value measurement.
A financial instrument’s categorization within the valuation hierarchy is based on the lowest level
of input that is significant to the fair value measurement.
VALUATION METHODOLOGIES
The following table describes the valuation methodologies used by the Bank to measure its
more significant products / instruments at fair value, including the general classification of such
instruments pursuant to the valuation hierarchy.
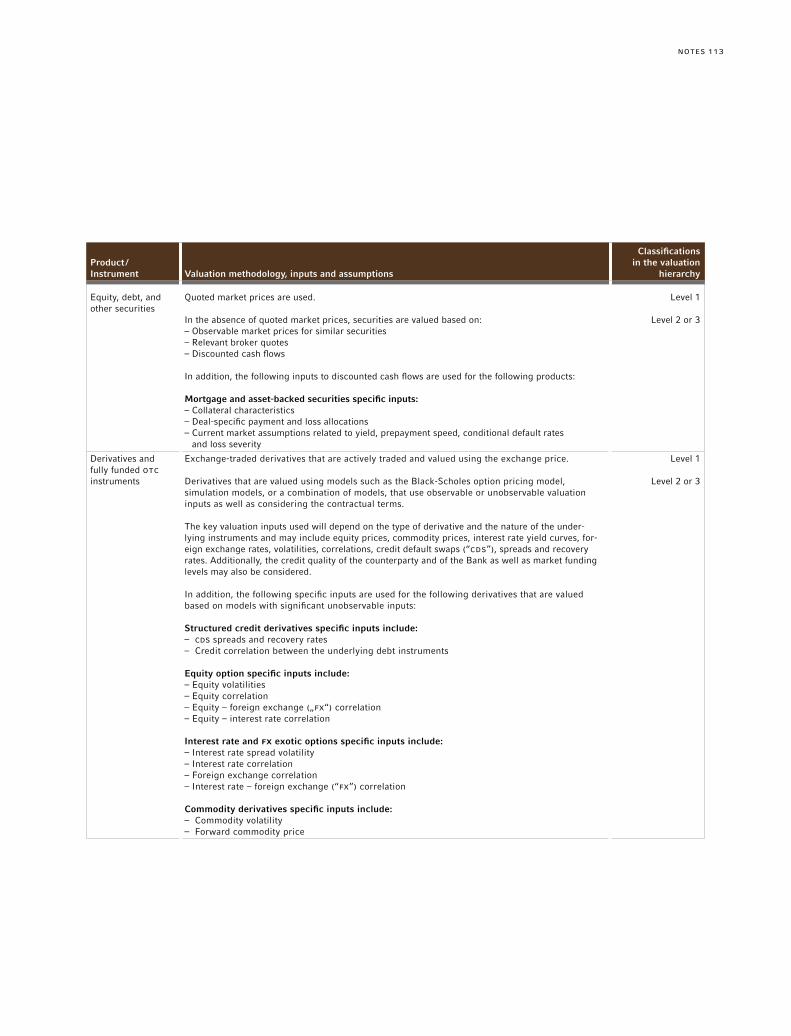
113NOTES
Product / Instrument Valuation methodology, inputs and assumptions
Classifications in the valuation
hierarchy
Equity, debt, and other securities
Quoted market prices are used.
In the absence of quoted market prices, securities are valued based on:– Observable market prices for similar securities– Relevant broker quotes– Discounted cash flows
In addition, the following inputs to discounted cash flows are used for the following products:
Mortgage and asset-backed securities specific inputs:– Collateral characteristics– Deal-specific payment and loss allocations– Current market assumptions related to yield, prepayment speed, conditional default rates
and loss severity
Level 1
Level 2 or 3
Derivatives and fully funded OTC instruments
Exchange-traded derivatives that are actively traded and valued using the exchange price.
Derivatives that are valued using models such as the Black-Scholes option pricing model, simulation models, or a combination of models, that use observable or unobservable valuation inputs as well as considering the contractual terms.
The key valuation inputs used will depend on the type of derivative and the nature of the under- lying instruments and may include equity prices, commodity prices, interest rate yield curves, for-eign exchange rates, volatilities, correlations, credit default swaps (“CDS”), spreads and recovery rates. Additionally, the credit quality of the counterparty and of the Bank as well as market funding levels may also be considered.
In addition, the following specific inputs are used for the following derivatives that are valued based on models with significant unobservable inputs:
Structured credit derivatives specific inputs include:– CDS spreads and recovery rates– Credit correlation between the underlying debt instruments
Equity option specific inputs include:– Equity volatilities– Equity correlation– Equity – foreign exchange („FX“) correlation– Equity – interest rate correlation
Interest rate and Fx exotic options specific inputs include:– Interest rate spread volatility– Interest rate correlation– Foreign exchange correlation– Interest rate – foreign exchange (“FX”) correlation
Commodity derivatives specific inputs include:– Commodity volatility– Forward commodity price
Level 1
Level 2 or 3
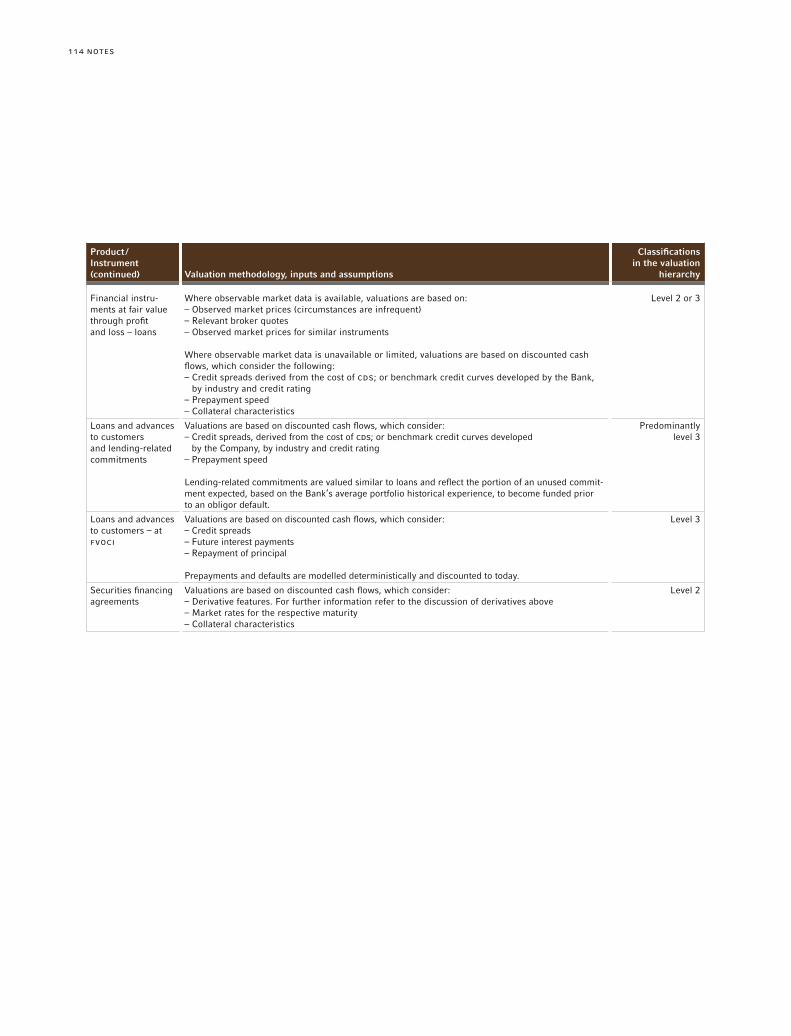
NOTES114
Product / Instrument Valuation methodology, inputs and assumptions
Classifications in the valuation
hierarchy
Financial instru-ments at fair value through profit and loss – loans
Where observable market data is available, valuations are based on:– Observed market prices (circumstances are infrequent)– Relevant broker quotes– Observed market prices for similar instruments
Where observable market data is unavailable or limited, valuations are based on discounted cash flows, which consider the following:– Credit spreads derived from the cost of CDS; or benchmark credit curves developed by the Bank,
by industry and credit rating– Prepayment speed– Collateral characteristics
Level 2 or 3
Loans and advances to customers and lending-related commitments
Valuations are based on discounted cash flows, which consider:– Credit spreads, derived from the cost of CDS; or benchmark credit curves developed
by the Company, by industry and credit rating– Prepayment speed
Lending-related commitments are valued similar to loans and reflect the portion of an unused commit-ment expected, based on the Bank’s average portfolio historical experience, to become funded prior to an obligor default.
Predominantly level 3
Loans and advances to customers – at FVOCI
Valuations are based on discounted cash flows, which consider:– Credit spreads– Future interest payments– Repayment of principal
Prepayments and defaults are modelled deterministically and discounted to today.
Level 3
Securities financing agreements
Valuations are based on discounted cash flows, which consider:– Derivative features. For further information refer to the discussion of derivatives above– Market rates for the respective maturity– Collateral characteristics
Level 2
Product / Instrument (continued)
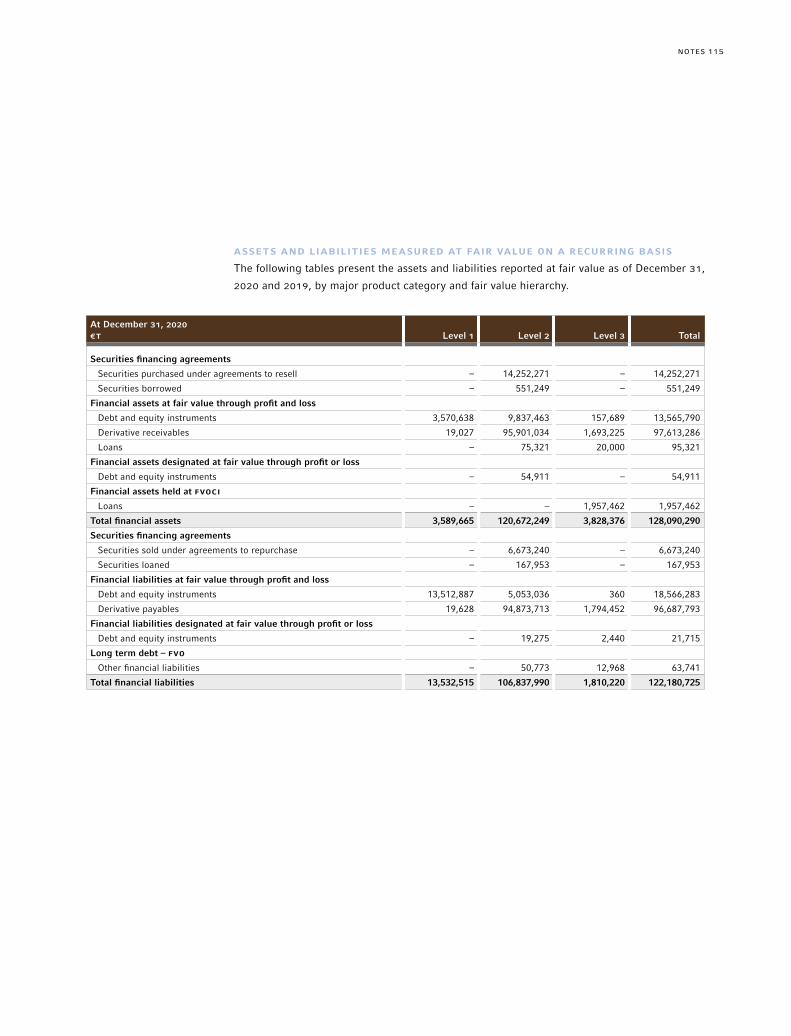
115NOTES
ASSETS AND LIABILITIES MEASURED AT FAIR VALUE ON A RECURRING BASIS
The following tables present the assets and liabilities reported at fair value as of December 31,
2020 and 2019, by major product category and fair value hierarchy.
At December 31, 2020 €T Level 1 Level 2 Level 3 Total
Securities financing agreements
Securities purchased under agreements to resell – 14,252,271 – 14,252,271
Securities borrowed – 551,249 – 551,249
Financial assets at fair value through profit and loss
Debt and equity instruments 3,570,638 9,837,463 157,689 13,565,790
Derivative receivables 19,027 95,901,034 1,693,225 97,613,286
Loans – 75,321 20,000 95,321
Financial assets designated at fair value through profit or loss
Debt and equity instruments – 54,911 – 54,911
Financial assets held at FVOCI
Loans – – 1,957,462 1,957,462
Total financial assets 3,589,665 120,672,249 3,828,376 128,090,290
Securities financing agreements
Securities sold under agreements to repurchase – 6,673,240 – 6,673,240
Securities loaned – 167,953 – 167,953
Financial liabilities at fair value through profit and loss
Debt and equity instruments 13,512,887 5,053,036 360 18,566,283
Derivative payables 19,628 94,873,713 1,794,452 96,687,793
Financial liabilities designated at fair value through profit or loss
Debt and equity instruments – 19,275 2,440 21,715
Long term debt – FVO
Other financial liabilities – 50,773 12,968 63,741
Total financial liabilities 13,532,515 106,837,990 1,810,220 122,180,725
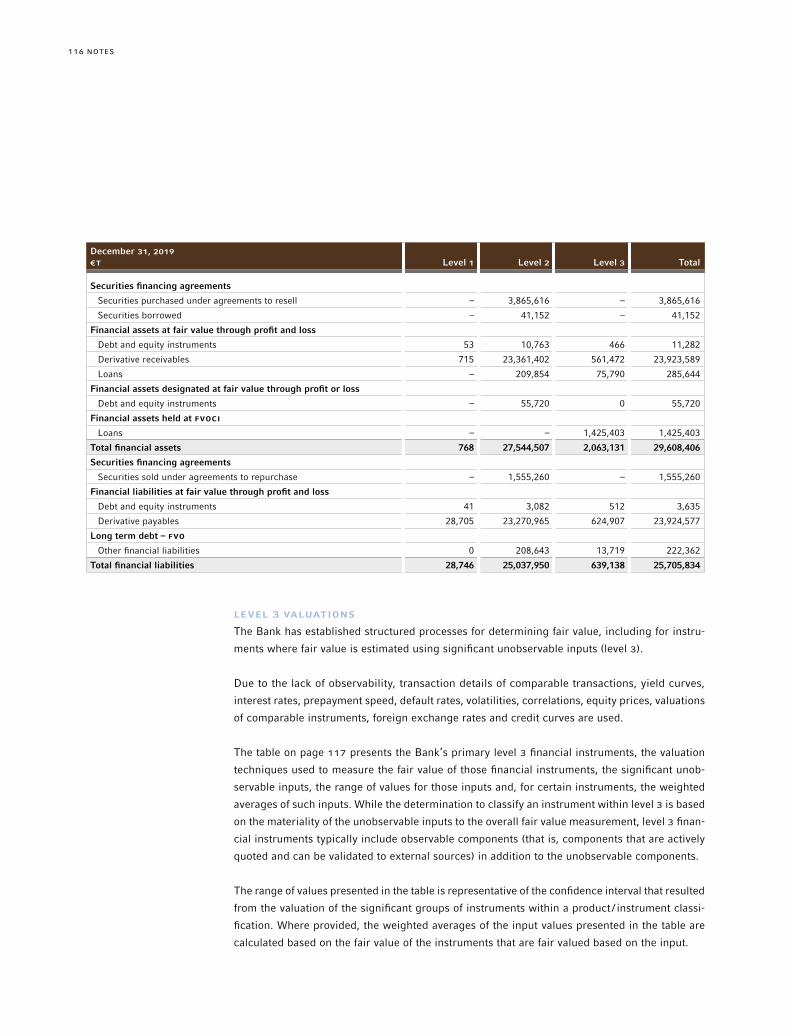
NOTES116
December 31, 2019 €T Level 1 Level 2 Level 3 Total
Securities financing agreements
Securities purchased under agreements to resell – 3,865,616 – 3,865,616
Securities borrowed – 41,152 – 41,152
Financial assets at fair value through profit and loss
Debt and equity instruments 53 10,763 466 11,282
Derivative receivables 715 23,361,402 561,472 23,923,589
Loans – 209,854 75,790 285,644
Financial assets designated at fair value through profit or loss
Debt and equity instruments – 55,720 0 55,720
Financial assets held at FVOCI
Loans – – 1,425,403 1,425,403
Total financial assets 768 27,544,507 2,063,131 29,608,406
Securities financing agreements
Securities sold under agreements to repurchase – 1,555,260 – 1,555,260
Financial liabilities at fair value through profit and loss
Debt and equity instruments 41 3,082 512 3,635
Derivative payables 28,705 23,270,965 624,907 23,924,577
Long term debt – FVO
Other financial liabilities 0 208,643 13,719 222,362
Total financial liabilities 28,746 25,037,950 639,138 25,705,834
LEVEL 3 VALUATIONS
The Bank has established structured processes for determining fair value, including for instru-
ments where fair value is estimated using significant unobservable inputs (level 3).
Due to the lack of observability, transaction details of comparable transactions, yield curves,
interest rates, prepayment speed, default rates, volatilities, correlations, equity prices, valuations
of comparable instruments, foreign exchange rates and credit curves are used.
The table on page 117 presents the Bank’s primary level 3 financial instruments, the valuation
techniques used to measure the fair value of those financial instruments, the significant unob-
servable inputs, the range of values for those inputs and, for certain instruments, the weighted
averages of such inputs. While the determination to classify an instrument within level 3 is based
on the materiality of the unobservable inputs to the overall fair value measurement, level 3 finan-
cial instruments typically include observable components (that is, components that are actively
quoted and can be validated to external sources) in addition to the unobservable components.
The range of values presented in the table is representative of the confidence interval that resulted
from the valuation of the significant groups of instruments within a product / instrument classi-
fication. Where provided, the weighted averages of the input values presented in the table are
calculated based on the fair value of the instruments that are fair valued based on the input.
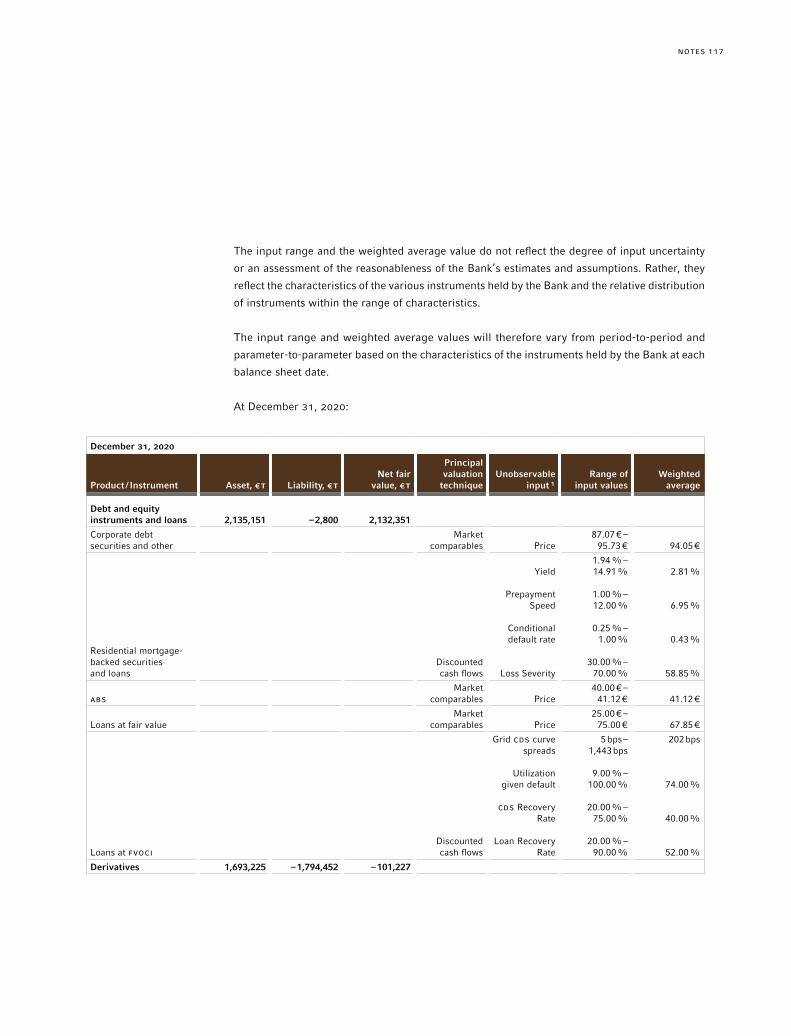
117NOTES
The input range and the weighted average value do not reflect the degree of input uncertainty
or an assessment of the reasonableness of the Bank’s estimates and assumptions. Rather, they
reflect the characteristics of the various instruments held by the Bank and the relative distribution
of instruments within the range of characteristics.
The input range and weighted average values will therefore vary from period-to-period and
parameter-to-parameter based on the characteristics of the instruments held by the Bank at each
balance sheet date.
At December 31, 2020:
December 31, 2020
Product / Instrument Asset, €T Liability, €TNet fair
value, €T
Principal valuation
techniqueUnobservable
input ¹Range of
input valuesWeighted
average
Debt and equity instruments and loans 2,135,151 –2,800 2,132,351
Corporate debt securities and other
Market comparables Price
87.07 € – 95.73 € 94.05 €
Residential mortgage- backed securities and loans
Discounted cash flows
Yield
Prepayment Speed
Conditional default rate
Loss Severity
1.94% – 14.91%
1.00% – 12.00%
0.25% – 1.00%
30.00% – 70.00%
2.81%
6.95%
0.43%
58.85%
ABSMarket
comparables Price40.00 € –
41.12 € 41.12 €
Loans at fair valueMarket
comparables Price25.00 € –
75.00 € 67.85 €
Loans at FVOCIDiscounted cash flows
Grid CDS curve spreads
Utilization given default
CDS Recovery Rate
Loan Recovery Rate
5 bps – 1,443 bps
9.00% – 100.00%
20.00% – 75.00%
20.00% – 90.00%
202 bps
74.00%
40.00%
52.00%
Derivatives 1,693,225 –1,794,452 –101,227
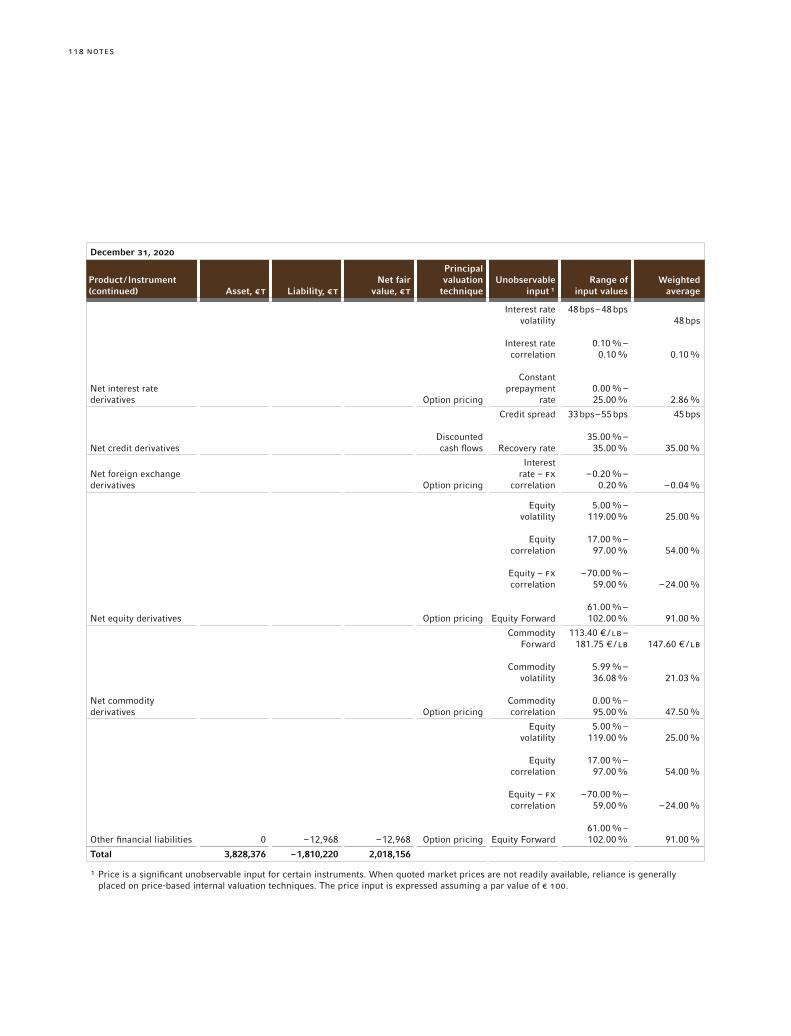
NOTES118
December 31, 2020
Product / Instrument Asset, €T Liability, €TNet fair
value, €T
Principal valuation
techniqueUnobservable
input ¹Range of
input valuesWeighted
average
Net interest rate derivatives Option pricing
Interest rate volatility
Interest rate correlation
Constant prepayment
rate
48 bps – 48 bps
0.10% – 0.10%
0.00% – 25.00%
48 bps
0.10%
2.86%
Net credit derivativesDiscounted cash flows
Credit spread
Recovery rate
33 bps – 55 bps
35.00% – 35.00%
45 bps
35.00%
Net foreign exchange derivatives Option pricing
Interest rate – FX
correlation–0.20% –
0.20% –0.04%
Net equity derivatives Option pricing
Equity volatility
Equity correlation
Equity – FX correlation
Equity Forward
5.00% – 119.00%
17.00% – 97.00%
–70.00% – 59.00%
61.00% – 102.00%
25.00%
54.00%
–24.00%
91.00%
Net commodity derivatives Option pricing
Commodity Forward
Commodity volatility
Commodity correlation
113.40 € /LB – 181.75 € /LB
5.99% – 36.08%
0.00% – 95.00%
147.60 € /LB
21.03%
47.50%
Other financial liabilities 0 –12,968 –12,968 Option pricing
Equity volatility
Equity correlation
Equity – FX correlation
Equity Forward
5.00% – 119.00%
17.00% – 97.00%
–70.00% – 59.00%
61.00% – 102.00%
25.00%
54.00%
–24.00%
91.00%
Total 3,828,376 –1,810,220 2,018,156
¹ Price is a significant unobservable input for certain instruments. When quoted market prices are not readily available, reliance is generally placed on price-based internal valuation techniques. The price input is expressed assuming a par value of € 100.
Product / Instrument (continued)
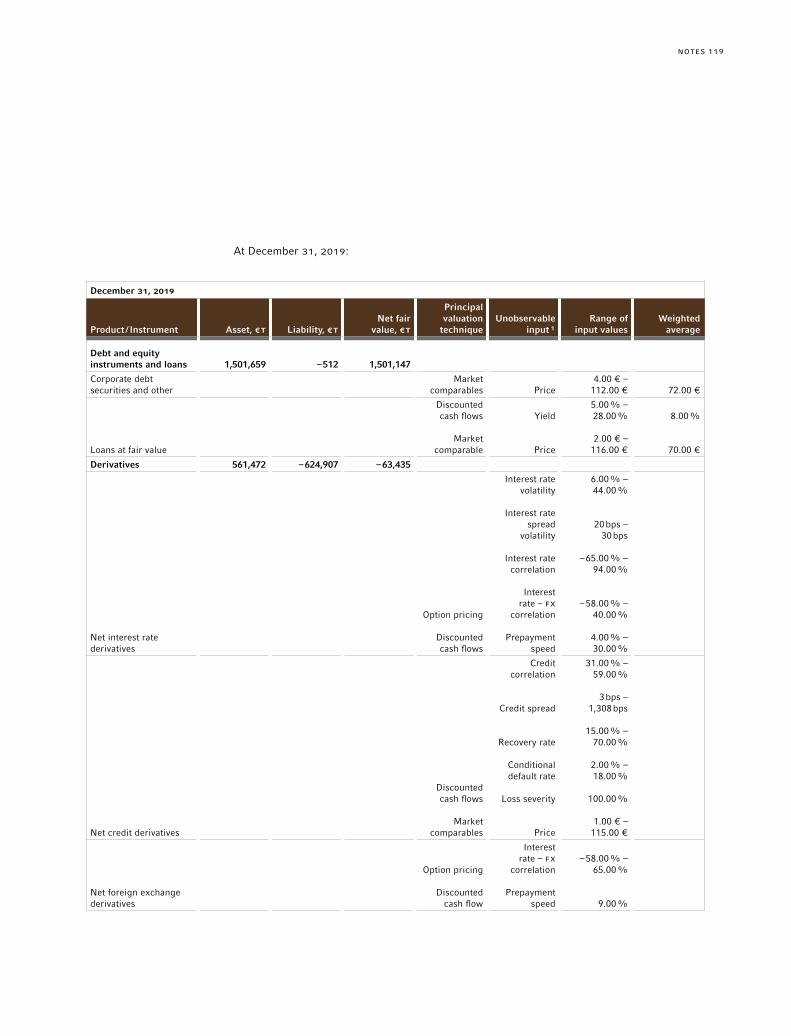
119NOTES
At December 31, 2019:
December 31, 2019
Product / Instrument Asset, €T Liability, €TNet fair
value, €T
Principal valuation
techniqueUnobservable
input ¹Range of
input valuesWeighted
average
Debt and equity instruments and loans 1,501,659 –512 1,501,147
Corporate debt securities and other
Market comparables Price
4.00 € – 112.00 € 72.00 €
Loans at fair value
Discounted cash flows
Market comparable
Yield
Price
5.00% – 28.00%
2.00 € – 116.00 €
8.00%
70.00 €
Derivatives 561,472 –624,907 –63,435
Net interest rate derivatives
Option pricing
Discounted cash flows
Interest rate volatility
Interest rate spread
volatility
Interest rate correlation
Interest rate – FX
correlation
Prepayment speed
6.00% – 44.00%
20 bps –
30 bps
–65.00% – 94.00%
–58.00% – 40.00%
4.00% – 30.00%
Net credit derivatives
Discounted cash flows
Market comparables
Credit correlation
Credit spread
Recovery rate
Conditional default rate
Loss severity
Price
31.00% – 59.00%
3 bps – 1,308 bps
15.00% – 70.00%
2.00% – 18.00%
100.00%
1.00 € – 115.00 €
Net foreign exchange derivatives
Option pricing
Discounted cash flow
Interest rate – FX
correlation
Prepayment speed
–58.00% – 65.00%
9.00%
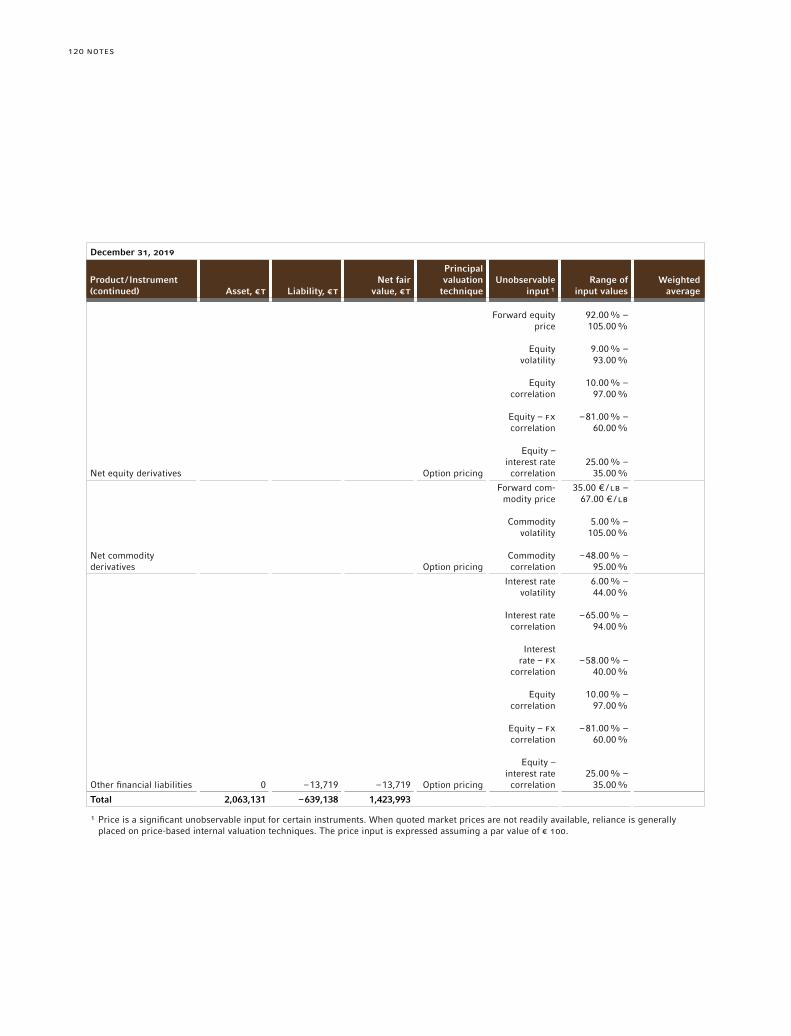
NOTES120
December 31, 2019
Product / Instrument Asset, €T Liability, €TNet fair
value, €T
Principal valuation
techniqueUnobservable
input ¹Range of
input valuesWeighted
average
Net equity derivatives Option pricing
Forward equity price
Equity volatility
Equity correlation
Equity – FX correlation
Equity – interest rate correlation
92.00% – 105.00%
9.00% – 93.00%
10.00% – 97.00%
–81.00% – 60.00%
25.00% – 35.00%
Net commodity derivatives Option pricing
Forward com-modity price
Commodity volatility
Commodity correlation
35.00 € /LB – 67.00 € /LB
5.00% – 105.00%
–48.00% – 95.00%
Other financial liabilities 0 –13,719 –13,719 Option pricing
Interest rate volatility
Interest rate correlation
Interest rate – FX
correlation
Equity correlation
Equity – FX correlation
Equity – interest rate correlation
6.00% – 44.00%
–65.00% – 94.00%
–58.00% – 40.00%
10.00% – 97.00%
–81.00% – 60.00%
25.00% – 35.00%
Total 2,063,131 –639,138 1,423,993
¹ Price is a significant unobservable input for certain instruments. When quoted market prices are not readily available, reliance is generally placed on price-based internal valuation techniques. The price input is expressed assuming a par value of € 100.
Product / Instrument (continued)

121NOTES
The categories presented in the table have been aggregated based upon the product type, which
may differ from their classification on the balance sheet, and fair values are shown net.
CHANGES IN UNOBSERVABLE INPUTS
The following discussion provides a description of the inter-relationship between unobservable
inputs. The impact of changes in inputs may not be independent as a change in one unobserv-
able input may give rise to a change in another unobservable input. Relationships may also exist
between observable and unobservable inputs. Such relationships have not been included in the
discussion below. In addition, for each of the individual relationships described below, the inverse
relationship would also generally apply.
Yield – The yield of an asset is the interest rate used to discount future cash flows in a discounted
cash flow calculation. An increase in the yield, in isolation, would result in a decrease in a fair
value measurement.
Credit spread – The credit spread is the difference between risky and risk-free returns. The
credit spread for an instrument forms part of the discount rate used in a discounted cash flow
calculation. Generally, an increase in the credit spread would result in a decrease of the fair
value measurement.
Prepayment speed – The prepayment speed is a measure of the voluntary unscheduled principal
repayments of a pre-payable obligation in a collateralized pool. Prepayment speeds generally
decline as borrower delinquencies rise. An increase in prepayment cycles, in isolation, would
result in a decrease in the fair value measurement of assets valued at a premium to par and an
increase in the fair value measurement of assets valued at a discount to par.
Conditional default rate – The conditional default rate is a measure of the reduction in the
outstanding collateral balance underlying a collateralized obligation as a result of defaults. An
increase in conditional default rates would generally be accompanied by an increase in loss
severity and an increase in credit spreads. An increase in the conditional default rate, in isolation,
would result in a decrease of the fair value measurement.
Loss severity – The loss severity (the contrary is the recovery rate) is the expected amount of
future realized losses resulting from the ultimate liquidation of a particular loan, expressed as
the net amount of loss relative to the outstanding loan balance. An increase in loss severity is
generally accompanied by an increase in conditional default rates. An increase in the loss severity,
in isolation, would result in a decrease of the fair value measurement.
Utilization given default (“UGD”) – A number between 0% and 100% that is the estimated
fraction of the current undrawn balance on a revolving credit facility that will be drawn at the
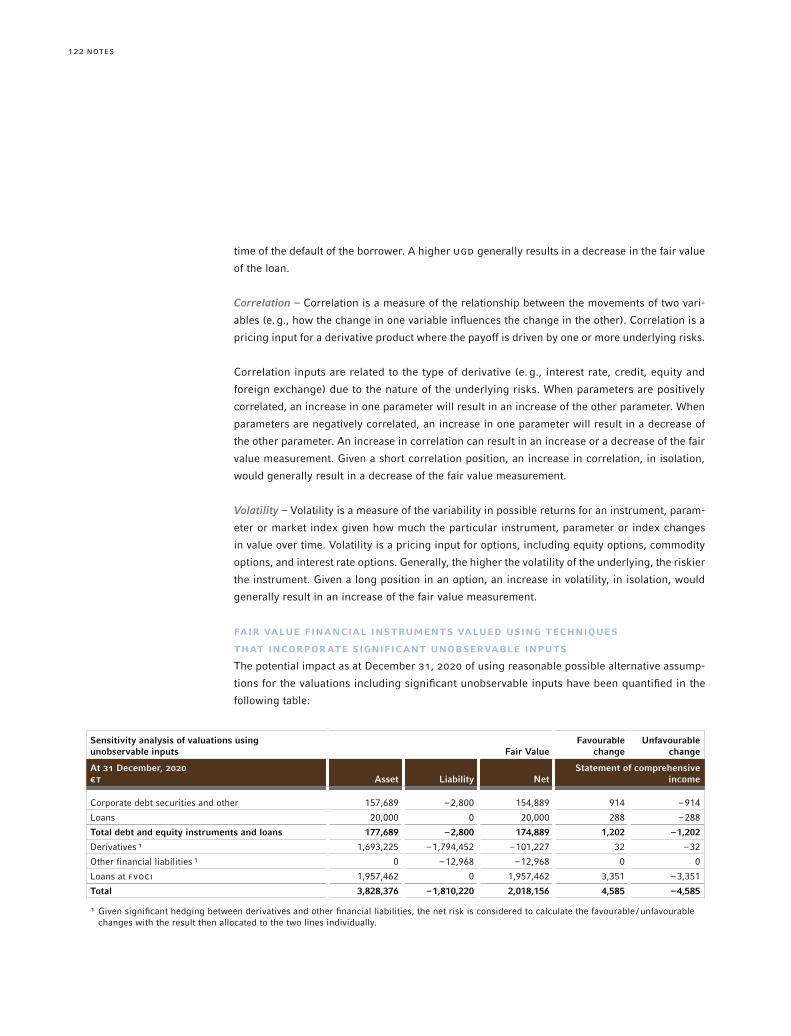
NOTES122
time of the default of the borrower. A higher UGD generally results in a decrease in the fair value
of the loan.
Correlation – Correlation is a measure of the relationship between the movements of two vari-
ables (e.g., how the change in one variable influences the change in the other). Correlation is a
pricing input for a derivative product where the payoff is driven by one or more underlying risks.
Correlation inputs are related to the type of derivative (e.g., interest rate, credit, equity and
foreign exchange) due to the nature of the underlying risks. When parameters are positively
correlated, an increase in one parameter will result in an increase of the other parameter. When
parameters are negatively correlated, an increase in one parameter will result in a decrease of
the other parameter. An increase in correlation can result in an increase or a decrease of the fair
value measurement. Given a short correlation position, an increase in correlation, in isolation,
would generally result in a decrease of the fair value measurement.
Volatility – Volatility is a measure of the variability in possible returns for an instrument, param-
eter or market index given how much the particular instrument, parameter or index changes
in value over time. Volatility is a pricing input for options, including equity options, commodity
options, and interest rate options. Generally, the higher the volatility of the underlying, the riskier
the instrument. Given a long position in an option, an increase in volatility, in isolation, would
generally result in an increase of the fair value measurement.
FAIR VALUE FINANCIAL INSTRUMENTS VALUED USING TECHNIqUES
THAT INCORPORATE SIGNIFICANT UNOBSERVABLE INPUTS
The potential impact as at December 31, 2020 of using reasonable possible alternative assump-
tions for the valuations including significant unobservable inputs have been quantified in the
following table:
Sensitivity analysis of valuations using unobservable inputs Fair Value
Favourable change
Unfavourable change
At 31 December, 2020 €T Asset Liability Net
Statement of comprehensive income
Corporate debt securities and other 157,689 –2,800 154,889 914 –914
Loans 20,000 0 20,000 288 –288
Total debt and equity instruments and loans 177,689 –2,800 174,889 1,202 –1,202
Derivatives ¹ 1,693,225 –1,794,452 –101,227 32 –32
Other financial liabilities ¹ 0 –12,968 –12,968 0 0
Loans at FVOCI 1,957,462 0 1,957,462 3,351 –3,351
Total 3,828,376 –1,810,220 2,018,156 4,585 –4,585
¹ Given significant hedging between derivatives and other financial liabilities, the net risk is considered to calculate the favourable /unfavourable changes with the result then allocated to the two lines individually.
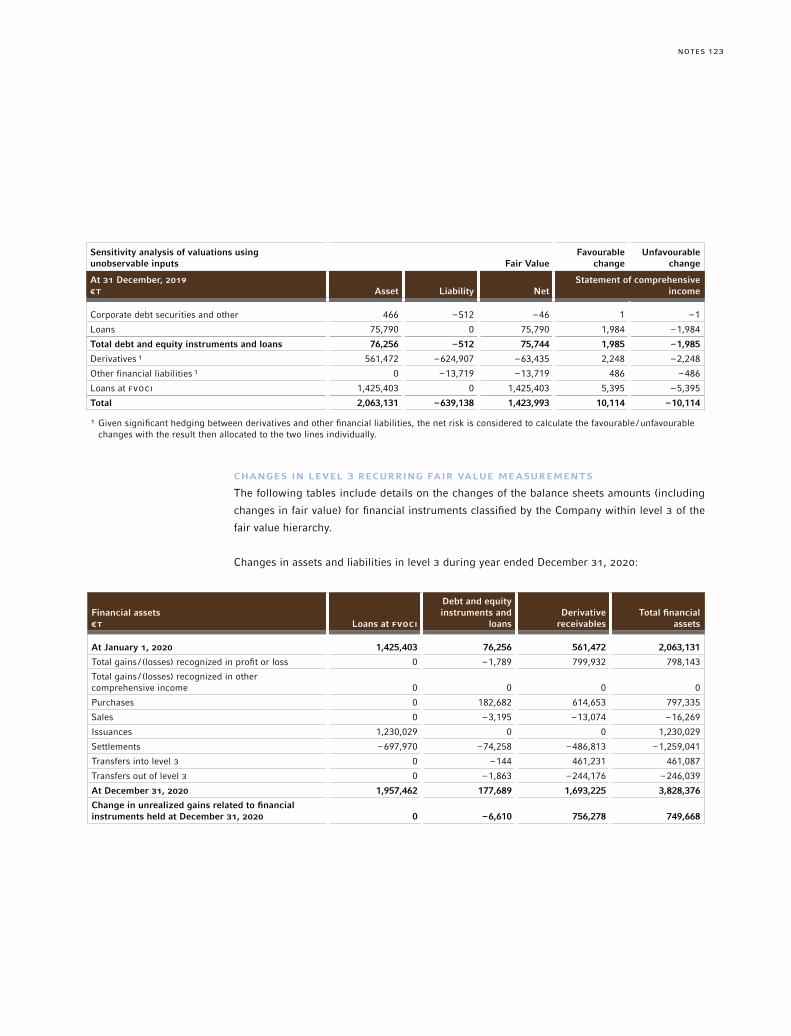
123NOTES
Sensitivity analysis of valuations using unobservable inputs Fair Value
Favourable change
Unfavourable change
At 31 December, 2019 €T Asset Liability Net
Statement of comprehensive income
Corporate debt securities and other 466 –512 –46 1 –1
Loans 75,790 0 75,790 1,984 –1,984
Total debt and equity instruments and loans 76,256 –512 75,744 1,985 –1,985
Derivatives ¹ 561,472 –624,907 –63,435 2,248 –2,248
Other financial liabilities ¹ 0 –13,719 –13,719 486 –486
Loans at FVOCI 1,425,403 0 1,425,403 5,395 –5,395
Total 2,063,131 –639,138 1,423,993 10,114 –10,114
¹ Given significant hedging between derivatives and other financial liabilities, the net risk is considered to calculate the favourable /unfavourable changes with the result then allocated to the two lines individually.
CHANGES IN LEVEL 3 RECURRING FAIR VALUE MEASUREMENTS
The following tables include details on the changes of the balance sheets amounts (including
changes in fair value) for financial instruments classified by the Company within level 3 of the
fair value hierarchy.
Changes in assets and liabilities in level 3 during year ended December 31, 2020:
Financial assets€T Loans at FVOCI
Debt and equity instruments and
loansDerivative
receivablesTotal financial
assets
At January 1, 2020 1,425,403 76,256 561,472 2,063,131
Total gains / (losses) recognized in profit or loss 0 –1,789 799,932 798,143
Total gains / (losses) recognized in other comprehensive income 0 0 0 0
Purchases 0 182,682 614,653 797,335
Sales 0 –3,195 –13,074 –16,269
Issuances 1,230,029 0 0 1,230,029
Settlements –697,970 –74,258 –486,813 –1,259,041
Transfers into level 3 0 –144 461,231 461,087
Transfers out of level 3 0 –1,863 –244,176 –246,039
At December 31, 2020 1,957,462 177,689 1,693,225 3,828,376
Change in unrealized gains related to financial instruments held at December 31, 2020 0 –6,610 756,278 749,668
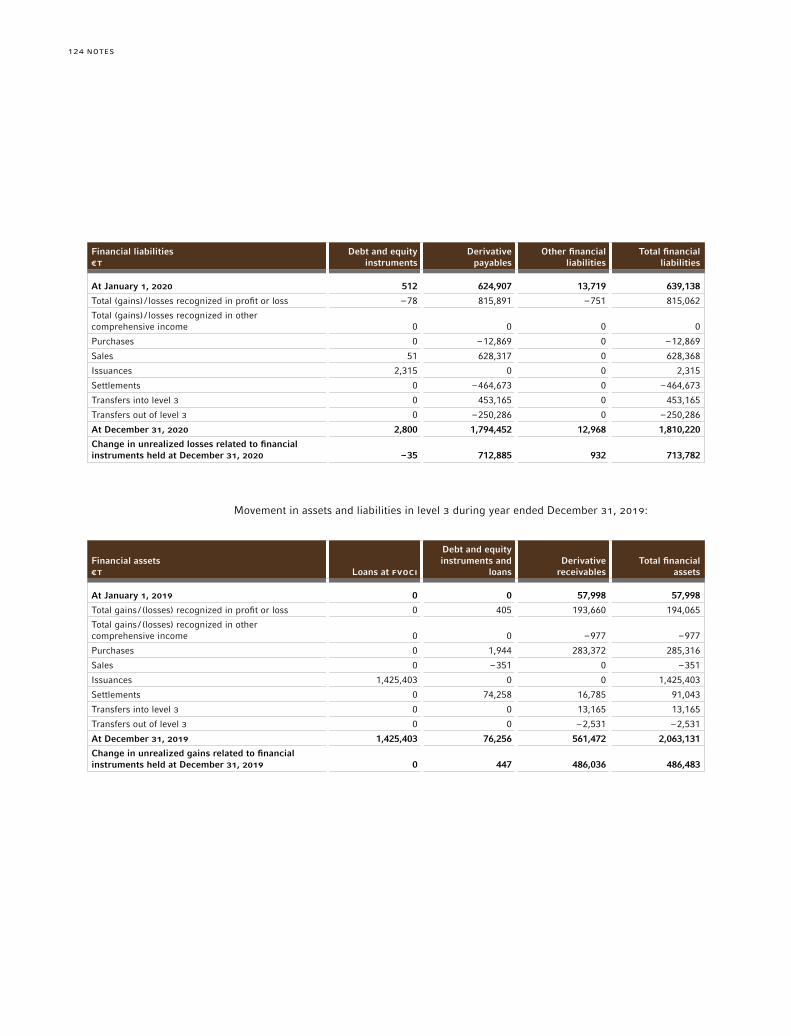
NOTES124
Financial liabilities€T
Debt and equity instruments
Derivative payables
Other financial liabilities
Total financial liabilities
At January 1, 2020 512 624,907 13,719 639,138
Total (gains) / losses recognized in profit or loss –78 815,891 –751 815,062
Total (gains) / losses recognized in other comprehensive income 0 0 0 0
Purchases 0 –12,869 0 –12,869
Sales 51 628,317 0 628,368
Issuances 2,315 0 0 2,315
Settlements 0 –464,673 0 –464,673
Transfers into level 3 0 453,165 0 453,165
Transfers out of level 3 0 –250,286 0 –250,286
At December 31, 2020 2,800 1,794,452 12,968 1,810,220
Change in unrealized losses related to financial instruments held at December 31, 2020 –35 712,885 932 713,782
Movement in assets and liabilities in level 3 during year ended December 31, 2019:
Financial assets€T Loans at FVOCI
Debt and equity instruments and
loansDerivative
receivablesTotal financial
assets
At January 1, 2019 0 0 57,998 57,998
Total gains / (losses) recognized in profit or loss 0 405 193,660 194,065
Total gains / (losses) recognized in other comprehensive income 0 0 –977 –977
Purchases 0 1,944 283,372 285,316
Sales 0 –351 0 –351
Issuances 1,425,403 0 0 1,425,403
Settlements 0 74,258 16,785 91,043
Transfers into level 3 0 0 13,165 13,165
Transfers out of level 3 0 0 –2,531 –2,531
At December 31, 2019 1,425,403 76,256 561,472 2,063,131
Change in unrealized gains related to financial instruments held at December 31, 2019 0 447 486,036 486,483
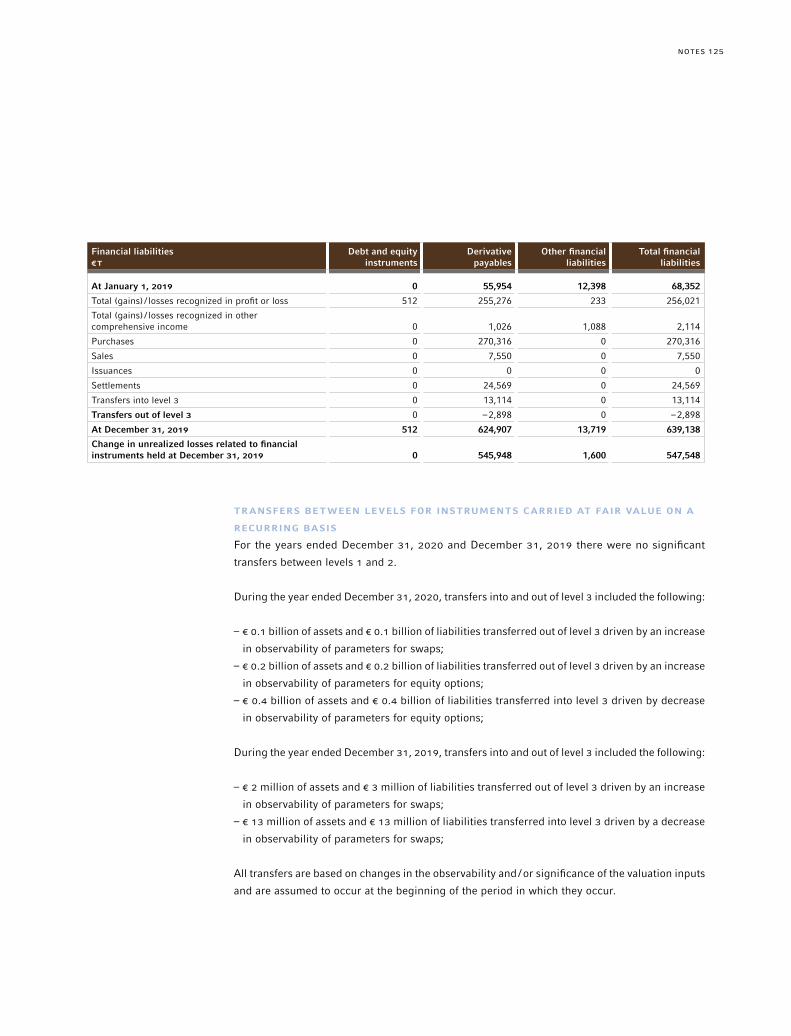
125NOTES
Financial liabilities€T
Debt and equity instruments
Derivative payables
Other financial liabilities
Total financial liabilities
At January 1, 2019 0 55,954 12,398 68,352
Total (gains) / losses recognized in profit or loss 512 255,276 233 256,021
Total (gains) / losses recognized in other comprehensive income 0 1,026 1,088 2,114
Purchases 0 270,316 0 270,316
Sales 0 7,550 0 7,550
Issuances 0 0 0 0
Settlements 0 24,569 0 24,569
Transfers into level 3 0 13,114 0 13,114
Transfers out of level 3 0 –2,898 0 –2,898
At December 31, 2019 512 624,907 13,719 639,138
Change in unrealized losses related to financial instruments held at December 31, 2019 0 545,948 1,600 547,548
TRANSFERS BETWEEN LEVELS FOR INSTRUMENTS CARRIED AT FAIR VALUE ON A
RECURRING BASIS
For the years ended December 31, 2020 and December 31, 2019 there were no significant
transfers between levels 1 and 2.
During the year ended December 31, 2020, transfers into and out of level 3 included the following:
– € 0.1 billion of assets and € 0.1 billion of liabilities transferred out of level 3 driven by an increase
in observability of parameters for swaps;
– € 0.2 billion of assets and € 0.2 billion of liabilities transferred out of level 3 driven by an increase
in observability of parameters for equity options;
– € 0.4 billion of assets and € 0.4 billion of liabilities transferred into level 3 driven by decrease
in observability of parameters for equity options;
During the year ended December 31, 2019, transfers into and out of level 3 included the following:
– € 2 million of assets and € 3 million of liabilities transferred out of level 3 driven by an increase
in observability of parameters for swaps;
– € 13 million of assets and € 13 million of liabilities transferred into level 3 driven by a decrease
in observability of parameters for swaps;
All transfers are based on changes in the observability and /or significance of the valuation inputs
and are assumed to occur at the beginning of the period in which they occur.

NOTES126
FAIR VALUE OF FINANCIAL INSTRUMENTS NOT CARRIED ON BALANCE SHEET AT
FAIR VALUE
Certain financial instruments that are not carried at fair value on the balance sheet are carried
at amounts that came close to fair value, due to their short-term nature and generally negligible
credit risk. These instruments include loans, securities purchased under agreements to resell,
cash and balances at central banks and balances at other credit institutions.
The Bank has € 116.2 billion (2019: € 34.8 billion) of current financial assets and € 109.3 billion
(2019: € 33.5 billion) of current financial liabilities that are not measured at fair value, including
loans and advances to customers of € 0.6 billion (2019: € 0.1 billion).
In estimating the fair value of these loans and advances to customers, typically a discounted
cash flow model is applied with unobservable inputs and therefore would be classified as level 3
instruments.
CREDIT AND FUNDING ADJUSTMENTS
Derivatives are generally valued with models that use observable market parameters. These
market parameters generally do not consider factors such as counterparty non-performance risk,
the Bank’s own credit quality, and funding costs. Therefore, it is generally necessary to make
adjustments to the base estimate of fair value to reflect these factors.
CVA represents the valuation adjustment, relative to the relevant benchmark interest rate, nec-
essary to reflect counterparty non-performance risk. The Bank estimates CVA using a scenario
analysis to estimate the expected positive credit exposure across all of the Bank’s existing posi-
tions with each counterparty, and then estimates losses based on the probability of default and
estimated recovery rate as a result of a counterparty credit event considering contractual factors
designed to mitigate the Bank’s credit exposure, such as collateral and legal rights of offset.
The key inputs to this methodology are (i) the probability of a default event occurring for each
counterparty, as derived from observed or estimated CDS spreads; and (ii) estimated recovery
rates implied by CDS spreads.
FVA represents the valuation adjustment to reflect the impact of funding. The Bank’s FVA frame-
work, applied to uncollateralized (including partially collateralized) over-the-counter (“OTC”)
derivatives incorporates key inputs such as: (i) the expected funding requirements arising from
the Bank’s positions with each counterparty and collateral arrangements; and (ii) the estimated
market funding cost in the principal market which, for derivative liabilities, considers the Bank’s
credit risk (DVA). For collateralized derivatives, the fair value is estimated by discounting expected
future cash flows at the relevant overnight indexed swap rate given the underlying collateral
agreement with the counterparty, and therefore a separate FVA is not necessary.
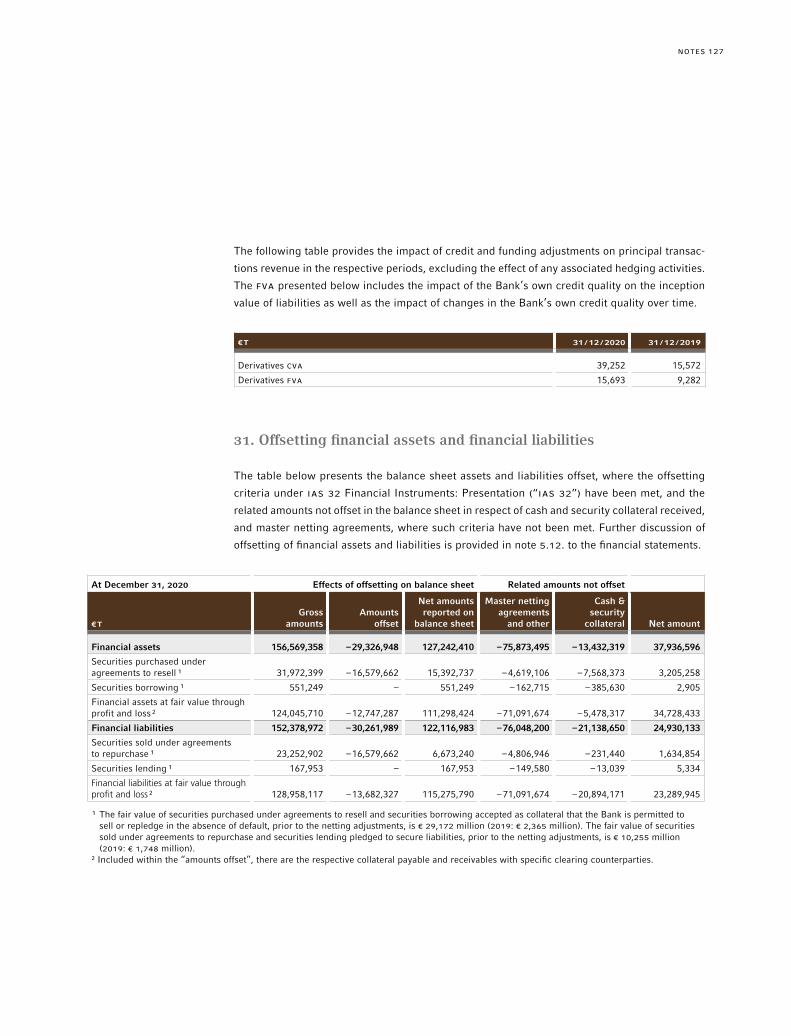
127NOTES
The following table provides the impact of credit and funding adjustments on principal transac-
tions revenue in the respective periods, excluding the effect of any associated hedging activities.
The FVA presented below includes the impact of the Bank’s own credit quality on the inception
value of liabilities as well as the impact of changes in the Bank’s own credit quality over time.
€T 31 /12 /2020 31 /12 /2019
Derivatives CVA 39,252 15,572
Derivatives FVA 15,693 9,282
31. Offsetting financial assets and financial liabilities
The table below presents the balance sheet assets and liabilities offset, where the offsetting
criteria under IAS 32 Financial Instruments: Presentation (“IAS 32”) have been met, and the
related amounts not offset in the balance sheet in respect of cash and security collateral received,
and master netting agreements, where such criteria have not been met. Further discussion of
offsetting of financial assets and liabilities is provided in note 5.12. to the financial statements.
At December 31, 2020 Effects of offsetting on balance sheet Related amounts not offset
€TGross
amountsAmounts
offset
Net amounts reported on
balance sheet
Master netting agreements
and other
Cash & security
collateral Net amount
Financial assets 156,569,358 –29,326,948 127,242,410 –75,873,495 –13,432,319 37,936,596
Securities purchased under agreements to resell ¹ 31,972,399 –16,579,662 15,392,737 –4,619,106 –7,568,373 3,205,258
Securities borrowing ¹ 551,249 – 551,249 –162,715 –385,630 2,905
Financial assets at fair value through profit and loss ² 124,045,710 –12,747,287 111,298,424 –71,091,674 –5,478,317 34,728,433
Financial liabilities 152,378,972 –30,261,989 122,116,983 –76,048,200 –21,138,650 24,930,133
Securities sold under agreements to repurchase ¹ 23,252,902 –16,579,662 6,673,240 –4,806,946 –231,440 1,634,854
Securities lending ¹ 167,953 – 167,953 –149,580 –13,039 5,334
Financial liabilities at fair value through profit and loss ² 128,958,117 –13,682,327 115,275,790 –71,091,674 –20,894,171 23,289,945
¹ The fair value of securities purchased under agreements to resell and securities borrowing accepted as collateral that the Bank is permitted to sell or repledge in the absence of default, prior to the netting adjustments, is € 29,172 million (2019: € 2,365 million). The fair value of securities sold under agreements to repurchase and securities lending pledged to secure liabilities, prior to the netting adjustments, is € 10,255 million (2019: € 1,748 million).
² Included within the “amounts offset”, there are the respective collateral payable and receivables with specific clearing counterparties.
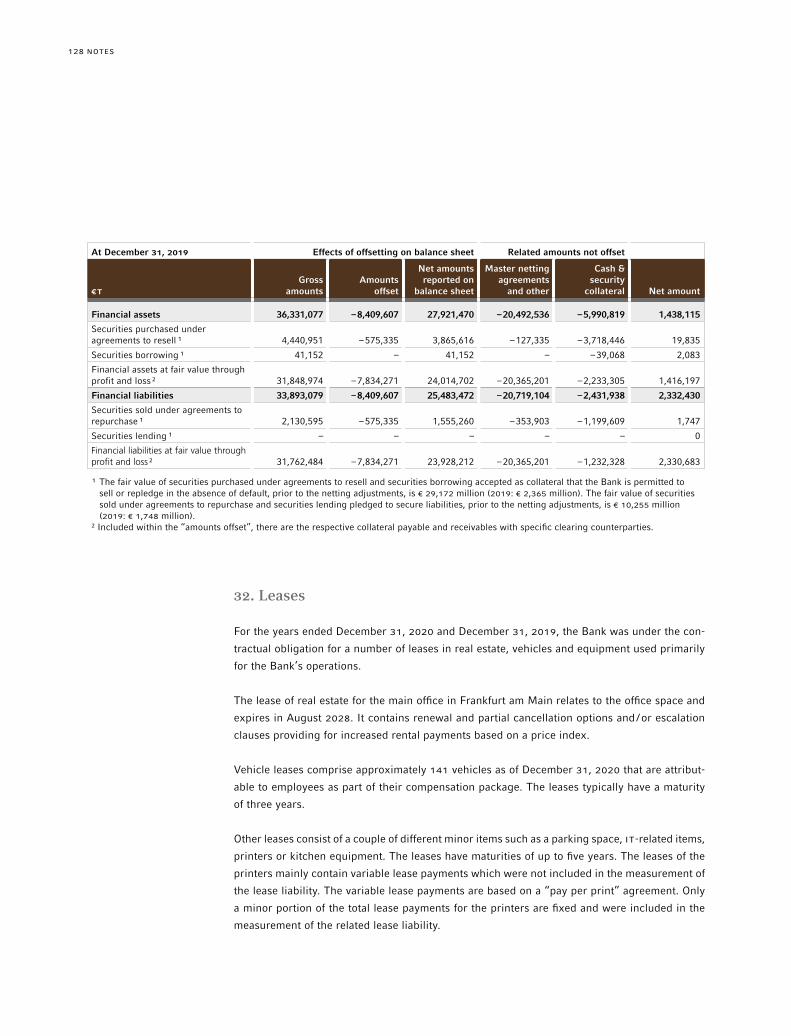
NOTES128
At December 31, 2019 Effects of offsetting on balance sheet Related amounts not offset
€TGross
amountsAmounts
offset
Net amounts reported on
balance sheet
Master netting agreements
and other
Cash & security
collateral Net amount
Financial assets 36,331,077 –8,409,607 27,921,470 –20,492,536 –5,990,819 1,438,115
Securities purchased under agreements to resell ¹ 4,440,951 –575,335 3,865,616 –127,335 –3,718,446 19,835
Securities borrowing ¹ 41,152 – 41,152 – –39,068 2,083
Financial assets at fair value through profit and loss ² 31,848,974 –7,834,271 24,014,702 –20,365,201 –2,233,305 1,416,197
Financial liabilities 33,893,079 –8,409,607 25,483,472 –20,719,104 –2,431,938 2,332,430
Securities sold under agreements to repurchase ¹ 2,130,595 –575,335 1,555,260 –353,903 –1,199,609 1,747
Securities lending ¹ – – – – – 0
Financial liabilities at fair value through profit and loss ² 31,762,484 –7,834,271 23,928,212 –20,365,201 –1,232,328 2,330,683
¹ The fair value of securities purchased under agreements to resell and securities borrowing accepted as collateral that the Bank is permitted to sell or repledge in the absence of default, prior to the netting adjustments, is € 29,172 million (2019: € 2,365 million). The fair value of securities sold under agreements to repurchase and securities lending pledged to secure liabilities, prior to the netting adjustments, is € 10,255 million (2019: € 1,748 million).
² Included within the “amounts offset”, there are the respective collateral payable and receivables with specific clearing counterparties.
32. Leases
For the years ended December 31, 2020 and December 31, 2019, the Bank was under the con-
tractual obligation for a number of leases in real estate, vehicles and equipment used primarily
for the Bank’s operations.
The lease of real estate for the main office in Frankfurt am Main relates to the office space and
expires in August 2028. It contains renewal and partial cancellation options and /or escalation
clauses providing for increased rental payments based on a price index.
Vehicle leases comprise approximately 141 vehicles as of December 31, 2020 that are attribut-
able to employees as part of their compensation package. The leases typically have a maturity
of three years.
Other leases consist of a couple of different minor items such as a parking space, IT-related items,
printers or kitchen equipment. The leases have maturities of up to five years. The leases of the
printers mainly contain variable lease payments which were not included in the measurement of
the lease liability. The variable lease payments are based on a “pay per print” agreement. Only
a minor portion of the total lease payments for the printers are fixed and were included in the
measurement of the related lease liability.
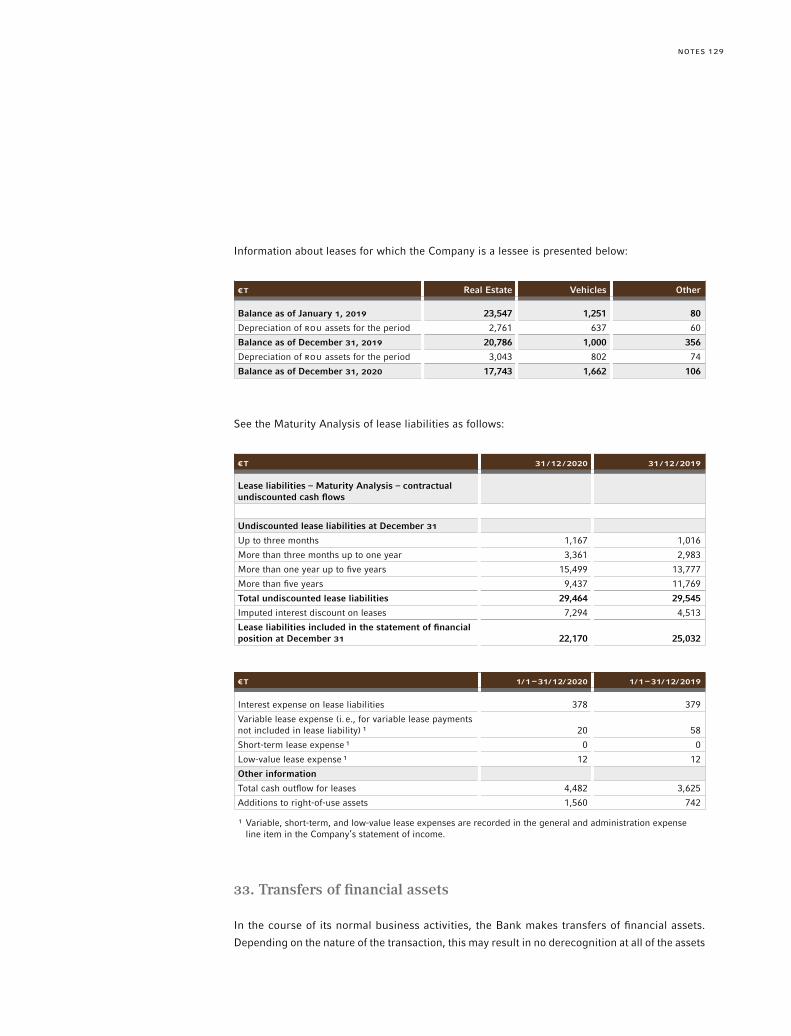
129NOTES
Information about leases for which the Company is a lessee is presented below:
€T Real Estate Vehicles Other
Balance as of January 1, 2019 23,547 1,251 80
Depreciation of rOU assets for the period 2,761 637 60
Balance as of December 31, 2019 20,786 1,000 356
Depreciation of rOU assets for the period 3,043 802 74
Balance as of December 31, 2020 17,743 1,662 106
See the Maturity Analysis of lease liabilities as follows:
€T 31 /12 /2020 31 /12 /2019
Lease liabilities – Maturity Analysis – contractual undiscounted cash flows
Undiscounted lease liabilities at December 31
Up to three months 1,167 1,016
More than three months up to one year 3,361 2,983
More than one year up to five years 15,499 13,777
More than five years 9,437 11,769
Total undiscounted lease liabilities 29,464 29,545
Imputed interest discount on leases 7,294 4,513
Lease liabilities included in the statement of financial position at December 31 22,170 25,032
€T 1/1 – 31/12/2020 1/1 – 31/12/2019
Interest expense on lease liabilities 378 379
Variable lease expense (i. e., for variable lease payments not included in lease liability) ¹ 20 58
Short-term lease expense ¹ 0 0
Low-value lease expense ¹ 12 12
Other information
Total cash outflow for leases 4,482 3,625
Additions to right-of-use assets 1,560 742
¹ Variable, short-term, and low-value lease expenses are recorded in the general and administration expense line item in the Company’s statement of income.
33. Transfers of financial assets
In the course of its normal business activities, the Bank makes transfers of financial assets.
Depending on the nature of the transaction, this may result in no derecognition at all of the assets

NOTES130
subject to the transfer. A summary of the main transactions, and the assets and liabilities and the
financial risks arising from these transactions is set out below.
TRANSFERS OF FINANCIAL ASSETS THAT DO NOT RESULT IN A DERECOGNITION
Assets are transferred under repurchase and securities lending agreements with other banks
and financial institutions. In such transactions, not all the risk and rewards of ownership are
substantially transferred, therefore the assets are not derecognized from the balance sheet. The
recipient is generally able to use, sell or pledge the transferred assets for the duration of the
transaction. The Company remains exposed to interest and credit risk on these instruments which
it is contractually required to repurchase at a later date. The counterparty’s recourse is generally
not limited to the transferred assets. The carrying amount of the securities pledged under repo
transactions is in the amount of € 13,693,733 thousand.
CONTINUING INVOLVEMENT IN FINANCIAL ASSETS THAT HAVE BEEN DERECOGNIZED
Within the reporting period, the Bank has not transferred any financial assets that it has derecog-
nized entirely even though it may have continuing involvement in them.
34. Pledged assets and Collateral received
The Company pledges assets for various purposes, including to collateralize repurchase and other
securities financing agreements, to cover short sales and to collateralize derivative contracts and
deposits. Certain of these pledged assets may be sold or repledged or otherwise used by the
secured parties.
Secured financing transactions expose the Company to credit and liquidity risk. To manage these
risks, the Company monitors the value of the underlying securities (predominantly high-quality
securities collateral, including government-issued debt and mortgage-backed securities) that it
has received from or provided to its counterparties compared to the value of cash proceeds and
exchanged collateral, and either requests additional collateral or returns securities or collateral
when appropriate. Margin levels are initially established based upon the counterparty, the type
of underlying securities, and the permissible collateral, and are monitored on an ongoing basis.
Additionally, the Company typically enters into master netting agreements and other similar
arrangements with its counterparties, which provide for the right to liquidate the underlying
securities and any collateral amounts exchanged in the event of a counterparty default. Further
details on netting arrangements are provided in note 31 to the financial statements.
The following table presents the carrying amount of trading assets pledged and the carrying
amount of securities purchased under agreements to resell at amortized cost.

131NOTES
€T 31 /12 /2020 31 /12 /2019
Trading assets pledged 13,693,733 22,897
Securities purchased under agreements to resell at amortized cost 1,140,466 0
The Company receives collateral primarily in reverse repurchase agreements, securities lending
agreements, derivatives transactions, customer margin loans and other transactions. These trans-
actions are generally conducted under terms that are usual and customary for standard secured
lending activities and the other transactions described. The Company, as the secured party,
has the right to sell or re-pledge such collateral, subject to the Company returning equivalent
securities upon completion of the transaction. This right is used primarily to cover short sales,
securities loaned and securities sold under repurchase agreements.
The following table presents the fair value of collateral accepted.
€T 31 /12 /2020 31 /12 /2019
Collateral permitted to be sold or repledged, delivered, or otherwise used 44,052,068 10,627,470
of which: Collateral sold, repledged, delivered or otherwise used 24,271,190 8,057,654
35. Credit risk management
Credit Risk is the risk associated with the default or change in credit profile of a client or a
counterparty. J.P. Morgan AG is exposed to credit risk through its underwriting, lending, market-
making, capital markets and hedging activities with and for clients and counterparties, as well as
through its operating services activities (such as clearing activities), securities financing activities,
investment securities portfolio, and cash placed with banks.
Credit Risk Management is an independent risk management function that monitors, measures and
manages credit risk in J.P. Morgan AG and defines credit risk policies and procedures. This includes:
– Establishing a credit risk management framework
– Monitoring, measuring and managing credit risk across all portfolio segments, including trans-
action and exposure approval
– Setting portfolio concentration limits
– Assigning and managing credit authorities in connection with the approval of credit exposure
– Managing distressed exposures and delinquent loans
– Estimating credit losses and ensuring appropriate credit risk-based capital management

NOTES132
J.P. Morgan AG’s Credit Risk Management framework supplements the Firmwide risk policy
framework and is approved by J.P. Morgan AG’s Management Board and Risk Oversight Com-
mittee. The J.P. Morgan Credit Risk Framework defines that credit decisions are made on the
basis of the clearly defined separate responsibilities for “Front Office” and “Back Office” as well
as the process of assigning and managing credit authorities in connection with the approval of
all credit exposure.
ExPECTED CREDIT LOSS MEASUREMENT (IFRS 9)
2020 Developments
Impact of COVID-19 pandemic
The COVID-19 pandemic has stressed MEVs to degrees not experienced in recent history, which
created additional challenges in the use of modelled credit loss estimates and increases the reli-
ance on the judgement by the Management Board. The estimated impact of COVID-19 is incor-
porated into ECL through MEVs and forward-looking scenarios, which generally resulted in more
loans exhibiting significant increase in credit risk since initial recognition, and as a result were
classified as Stage 2. As Stage 2 loans have ECL based on a probability of default (PD) over the
lifetime of the loan (as opposed to 12 months in Stage 1), the Company’s overall ECL increased.
These impacts are illustrated and discussed further within the quantitative disclosures below.
Enhancement in modelling methodology
In 2020, the Company enhanced its statistical model methodology used for collective assessment
to better estimate expected credit losses. Key model enhancements included:
– Revision of PD-, LGD- and EAD-model components
– Expansion from using three forward looking scenarios to five forward looking scenarios (cen-
tral, relative upside, extreme upside, relative adverse and extreme adverse) with a standard
weighting of 50%, 20%, 5%, 20% and 5%.
Potential deviations from the standard weighting are considered as part of management adjust-
ments.
– The weighted average facility life logic (WAFL) was replaced by the maturity date, which con-
siders repayment schedules and -rules as well as assumptions for voluntary prepayments.
– Introduction of a new component “large loan uncertainty” (LLU). The consideration of the
LLU-component captures the variance of losses which are due to the non-homogeneous nature
of the portfolio, because actual default rates are statistically made up of “random” defaults. In
contrast to this, actual defaults could be based on significantly different loan volumes or losses
when compared to the average of the loan portfolio. The LLU is estimated on portfolio level
based on PD- and LGD-variance and allocated to individual loans based on a statistical algorithm.
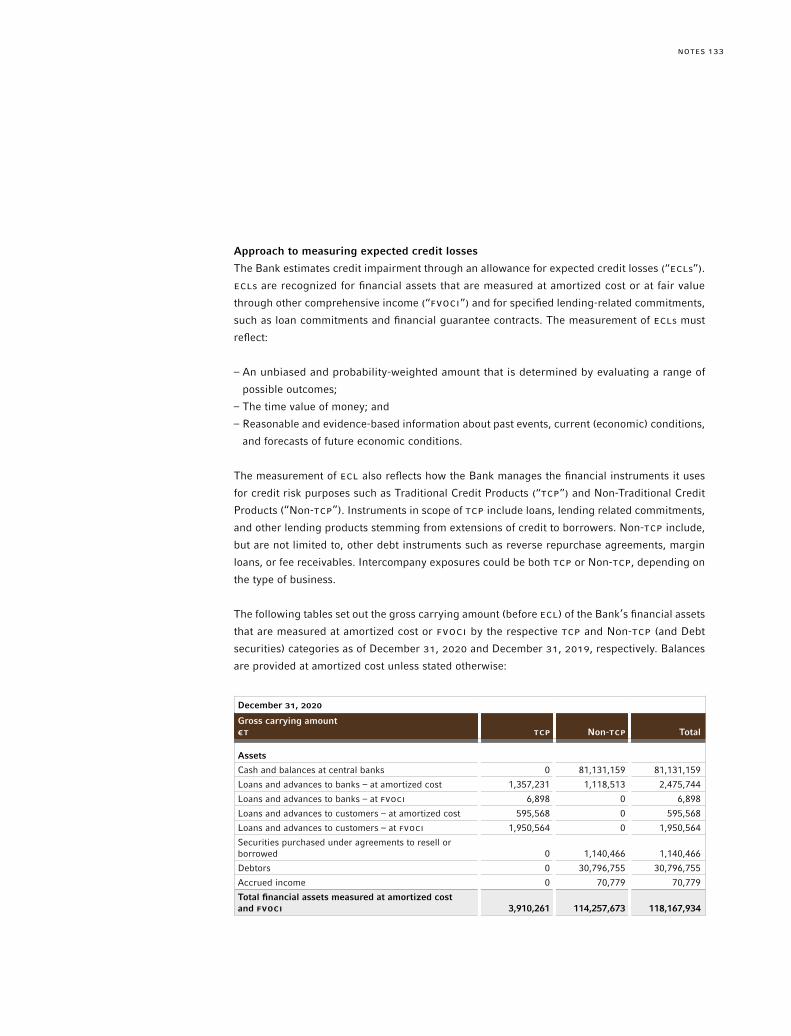
133NOTES
Approach to measuring expected credit losses
The Bank estimates credit impairment through an allowance for expected credit losses (“ECLs”).
ECLs are recognized for financial assets that are measured at amortized cost or at fair value
through other comprehensive income (“FVOCI”) and for specified lending-related commitments,
such as loan commitments and financial guarantee contracts. The measurement of ECLs must
reflect:
– An unbiased and probability-weighted amount that is determined by evaluating a range of
possible outcomes;
– The time value of money; and
– Reasonable and evidence-based information about past events, current (economic) conditions,
and forecasts of future economic conditions.
The measurement of ECL also reflects how the Bank manages the financial instruments it uses
for credit risk purposes such as Traditional Credit Products (“TCP”) and Non-Traditional Credit
Products (“Non-TCP”). Instruments in scope of TCP include loans, lending related commitments,
and other lending products stemming from extensions of credit to borrowers. Non-TCP include,
but are not limited to, other debt instruments such as reverse repurchase agreements, margin
loans, or fee receivables. Intercompany exposures could be both TCP or Non-TCP, depending on
the type of business.
The following tables set out the gross carrying amount (before ECL) of the Bank’s financial assets
that are measured at amortized cost or FVOCI by the respective TCP and Non-TCP (and Debt
securities) categories as of December 31, 2020 and December 31, 2019, respectively. Balances
are provided at amortized cost unless stated otherwise:
December 31, 2020
Gross carrying amount€T TCP Non-TCP Total
Assets
Cash and balances at central banks 0 81,131,159 81,131,159
Loans and advances to banks – at amortized cost 1,357,231 1,118,513 2,475,744
Loans and advances to banks – at FVOCI 6,898 0 6,898
Loans and advances to customers – at amortized cost 595,568 0 595,568
Loans and advances to customers – at FVOCI 1,950,564 0 1,950,564
Securities purchased under agreements to resell or borrowed 0 1,140,466 1,140,466
Debtors 0 30,796,755 30,796,755
Accrued income 0 70,779 70,779
Total financial assets measured at amortized cost and FVOCI 3,910,261 114,257,673 118,167,934
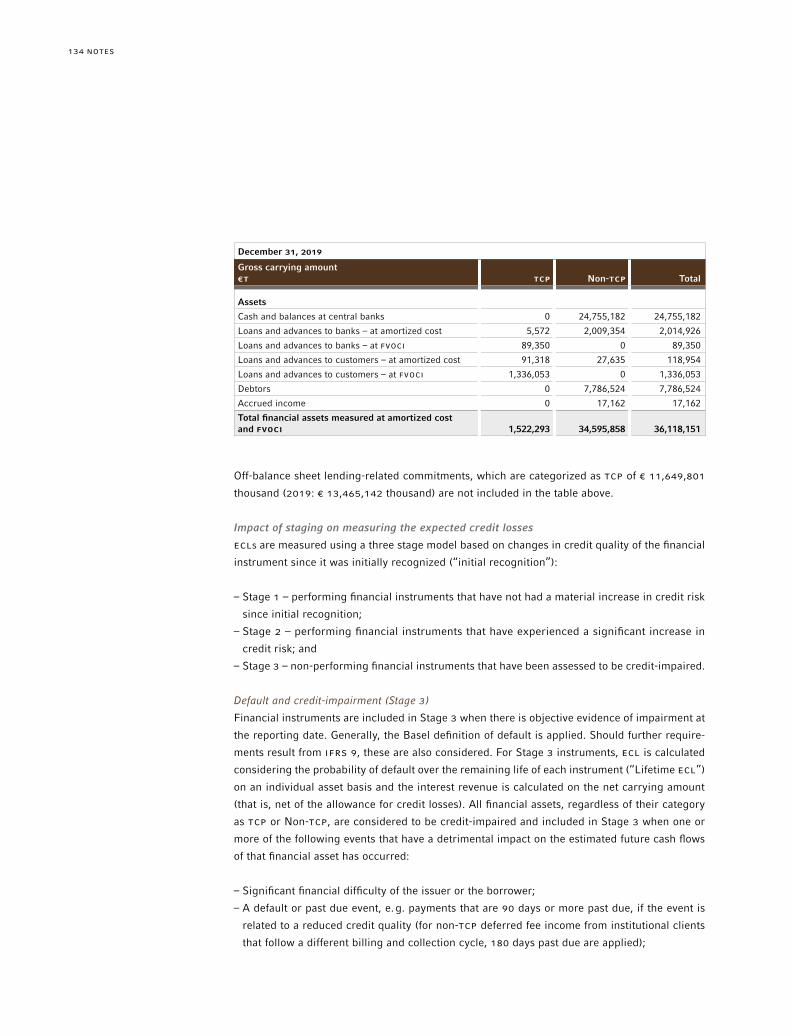
NOTES134
December 31, 2019
Gross carrying amount€T TCP Non-TCP Total
Assets
Cash and balances at central banks 0 24,755,182 24,755,182
Loans and advances to banks – at amortized cost 5,572 2,009,354 2,014,926
Loans and advances to banks – at FVOCI 89,350 0 89,350
Loans and advances to customers – at amortized cost 91,318 27,635 118,954
Loans and advances to customers – at FVOCI 1,336,053 0 1,336,053
Debtors 0 7,786,524 7,786,524
Accrued income 0 17,162 17,162
Total financial assets measured at amortized cost and FVOCI 1,522,293 34,595,858 36,118,151
Off-balance sheet lending-related commitments, which are categorized as TCP of € 11,649,801
thousand (2019: € 13,465,142 thousand) are not included in the table above.
Impact of staging on measuring the expected credit losses
ECLs are measured using a three stage model based on changes in credit quality of the financial
instrument since it was initially recognized (“initial recognition”):
– Stage 1 – performing financial instruments that have not had a material increase in credit risk
since initial recognition;
– Stage 2 – performing financial instruments that have experienced a significant increase in
credit risk; and
– Stage 3 – non-performing financial instruments that have been assessed to be credit-impaired.
Default and credit-impairment (Stage 3)
Financial instruments are included in Stage 3 when there is objective evidence of impairment at
the reporting date. Generally, the Basel definition of default is applied. Should further require-
ments result from IFrS 9, these are also considered. For Stage 3 instruments, ECL is calculated
considering the probability of default over the remaining life of each instrument (“Lifetime ECL”)
on an individual asset basis and the interest revenue is calculated on the net carrying amount
(that is, net of the allowance for credit losses). All financial assets, regardless of their category
as TCP or Non-TCP, are considered to be credit-impaired and included in Stage 3 when one or
more of the following events that have a detrimental impact on the estimated future cash flows
of that financial asset has occurred:
– Significant financial difficulty of the issuer or the borrower;
– A default or past due event, e.g. payments that are 90 days or more past due, if the event is
related to a reduced credit quality (for non-TCP deferred fee income from institutional clients
that follow a different billing and collection cycle, 180 days past due are applied);

135NOTES
– The Bank has granted a concession to the borrower for economic or contractual reasons relating
to the borrower’s financial difficulty;
– It is likely that the borrower will enter bankruptcy or other financial reorganization;
– An active market for that financial asset no longer exists due to the borrower’s financial dif-
ficulties.
Generally, a Stage 3 financial asset is considered to no longer be impaired when the borrower
has made payments for a minimum of six months and there is other objective evidence of credit
improvement. However, for assets that were considered to be Stage 3 as a result of a restructuring
where the borrower experiencing difficulty was granted a financial concession, there is no cure
period and the asset will remain in Stage 3.
Significant increase in credit risk (Stage 2)
Financial instruments that have experienced a significant increase in credit risk (“SICr”) since
initial recognition for which there is no objective evidence of impairment are included in Stage 2. For
Stage 2 instruments, ECL is calculated considering the probability of default over the remaining
life of the instrument on a collective basis and the interest revenue is calculated on the gross
carrying amount of the asset (that is, without deduction for the credit loss allowance).
The Bank assesses for evidence of a SICr by considering whether there has been a change in the
risk of a default occurring since the financial instrument was initially recognized.
For TCP, the Bank considers a financial instrument to have experienced a SICr when any of the
following quantitative or qualitative criteria have been met:
– The Bank determines whether the probability of default (“PD”) has changed between a finan-
cial instruments initial recognition and the reporting date. If the change in PD exceeds certain
relative and absolute thresholds, the instrument has experienced a SICr. The assessment of
the PD takes into account reasonable and evidence-based information, including information
about past events, current and future economic conditions.
– For its credit portfolio that consists of exposures to large international wholesale borrowers,
the Bank has made the experience that short-term days past due of more than 30 days but less
than 90 days is no reliable criterion for a SICr. In fact, the aforementioned decrease in PD is a
much more reliable criterion for the existence of a SICr – long before arrears of payment. As a
result, the Bank applies 90 days past due as an additional criterion instead of 30 days past due.
– The Bank monitors borrowers or financial instruments if they experience a significant increase
in credit risk.
In total, the Bank has experienced that the above-mentioned quantitative and qualitative criteria
are most suitable for the identification of SICr for TCP.

NOTES136
In the following paragraph, the assessment of SICr is described for Non-TCPs:
The method for determining whether there has been a SICr for Non-TCP portfolios depends on
the type of instrument. The Bank assumes as Non-TCP financial assets that are 30 days past due,
have experienced a SICr and are included in Stage 2 except for certain fee receivables (i. e. fee
receivables with institutional clients which follow a different billing and collection cycle) that
are classified in Stage 2 at 90 days past due. Inter-company loans and receivables to material
legal entities covered by the resolution and recovery plans are assumed not to have had a SICr
given the borrower’s level of capitalization and access to liquidity. Finally, the remainder of the
Bank’s Non-TCP are mostly short-term and generally no SICr has arisen prior to the maturity of
that instrument.
Without significant increase in credit risk (Stage 1)
Financial instruments that have not experienced a SICr since initial recognition are included in
Stage 1. For Stage 1 instruments, ECL is individually calculated by considering the probability
of default within 12 months after the reporting date on a collective basis and interest revenue
is calculated on the gross carrying amount of the asset (that is, without deduction for the credit
loss allowance).
Impact of sensitivities on measuring the credit loss
Sensitivity analysis of weighting
The Bank’s allowance for credit losses is subject to numerous factors. Changes in economic
conditions or in the Bank’s assumptions and judgements could affect its estimate of expected
credit losses in the portfolio at the balance sheet date.
The Bank considers a variety of factors and inputs in estimating the allowance for credit losses.
It is difficult to estimate how alternative judgements in specific factors might affect the overall
allowance for credit losses due to the idiosyncratic nature of the factors and inputs involved.
To illustrate the potential magnitude of an alternative judgement, the Bank estimates that adjust-
ing the extreme downside scenario weighting to 100% as of December 31, 2020 could imply an
increase to modelled ECLs of approximately € 50,322 thousand.
The purpose of this sensitivity analysis is to provide an indication of the isolated impact of a
hypothetical alternative judgement on modelled ECLs and is not intended to imply management’s
expectation of future deterioration of the economy nor any specific risk factors.
Sensitivity analysis of ECL due to staging
The following table shows the impact of staging on the Bank’s ECL recognized on balance sheet
as at December 31, 2020 and December 31, 2019, respectively, by comparing the allowance if all
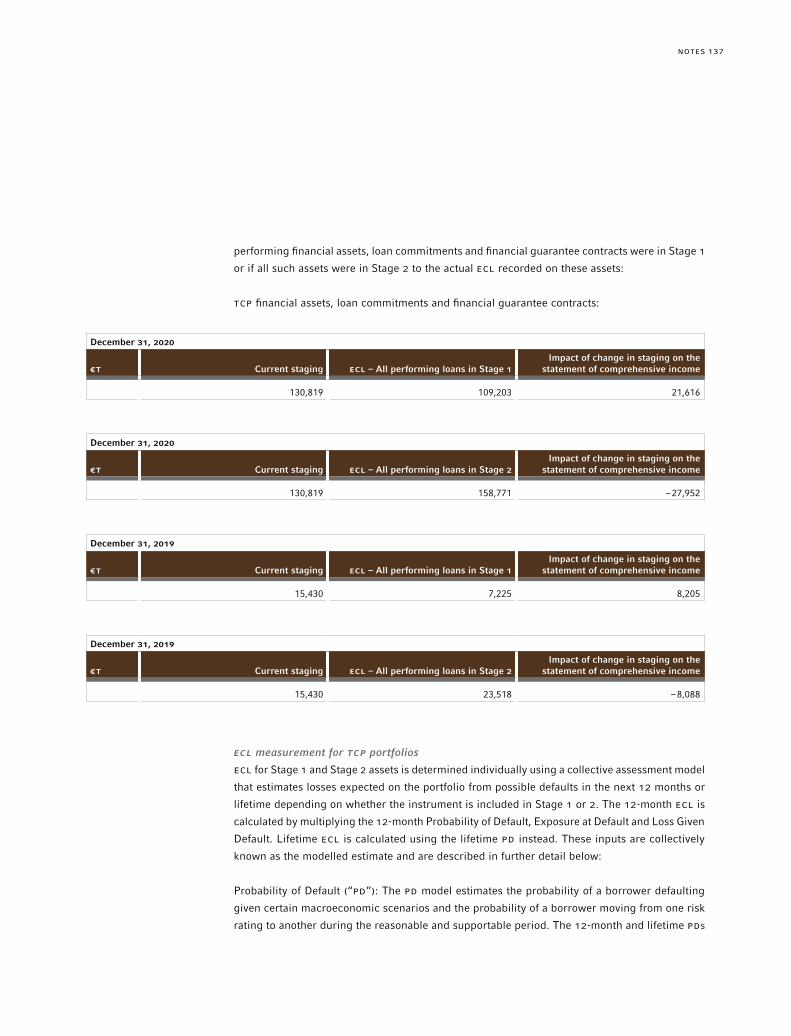
137NOTES
performing financial assets, loan commitments and financial guarantee contracts were in Stage 1
or if all such assets were in Stage 2 to the actual ECL recorded on these assets:
TCP financial assets, loan commitments and financial guarantee contracts:
December 31, 2020
€T Current staging ECL – All performing loans in Stage 1Impact of change in staging on the
statement of comprehensive income
130,819 109,203 21,616
December 31, 2020
€T Current staging ECL – All performing loans in Stage 2Impact of change in staging on the
statement of comprehensive income
130,819 158,771 –27,952
December 31, 2019
€T Current staging ECL – All performing loans in Stage 1Impact of change in staging on the
statement of comprehensive income
15,430 7,225 8,205
December 31, 2019
€T Current staging ECL – All performing loans in Stage 2Impact of change in staging on the
statement of comprehensive income
15,430 23,518 –8,088
ECL measurement for TCP portfolios
ECL for Stage 1 and Stage 2 assets is determined individually using a collective assessment model
that estimates losses expected on the portfolio from possible defaults in the next 12 months or
lifetime depending on whether the instrument is included in Stage 1 or 2. The 12-month ECL is
calculated by multiplying the 12-month Probability of Default, Exposure at Default and Loss Given
Default. Lifetime ECL is calculated using the lifetime PD instead. These inputs are collectively
known as the modelled estimate and are described in further detail below:
Probability of Default (“PD”): The PD model estimates the probability of a borrower defaulting
given certain macroeconomic scenarios and the probability of a borrower moving from one risk
rating to another during the reasonable and supportable period. The 12-month and lifetime PDs

NOTES138
represent the probability of default occurring over the next 12 months and the remaining maturity
of the instrument respectively. The PD is determined at a facility level.
Country-specific information is applied to risk ratings, as appropriate in accordance with internal
risk rating guidelines. Beyond the reasonable and supportable period of 2 years, the probability
of default and likelihood of downgrade are based on long run historical averages with no macro-
economic forecasting element. Internal historical default data are used for all periods, both during
the reasonable and supportable period of 2 years and beyond.
Exposure at Default (“EAD”): Exposure at Default represents the gross exposure of the Firm upon
the Obligor’s default and is characterized as follows:
– Term Loans – EAD is 100% of exposure, net of amortization.
– Revolving commitments – EAD is a model-based estimate that considers the expectation of
future utilization at the facility level in the case of a default under a given macroeconomic
environment. For the reasonable and supportable forecast period, the EAD is determined based
on the facility’s risk characteristics.
– All other unfunded committed facilities – EAD is determined empirically, based on the type of
credit facility, line of business, underlying risk characteristics and utilization.
Loss Given Default (“LGD”): LGD, also known as loss severity, represents the amount of loss,
expressed as a percentage, in the event a facility defaults under a given forecasted macroeco-
nomic environment during the reasonable and supportable period of 2 years. Beyond the rea-
sonable and supportable period, long run historical average LGD is used based on the loan’s risk
characteristics (e.g., secured type, region, line of business). Country-specific considerations are
also applied to the LGD inputs, as appropriate. Similar to PD, internal historical default data are
used for all periods, both during the reasonable and supportable period of 2 years and beyond.
The modelled estimate is subsequently adjusted for Large Loan Uncertainty (LLU) (as described
above in the paragraph “Enhancement in modelling methodology”).
Forward-looking information (IFRS 7, Para. 35g (b))
ECL estimates are derived from the Bank’s historical experience and future forecasted economic
conditions. To incorporate forward-looking information into the ECL calculation, the Company
develops forecasted economic scenarios. As mentioned above in the paragraph “Enhancement
in modelling methodology”, the Company moved from three forward looking scenarios (upside,
base and downside) to five forward looking scenarios (base, relative upside, extreme upside,
relative downside and extreme downside) during the year. Each of these scenarios contain a set
of MEVs that reflect forward-looking economic and financial conditions. MEVs include, but are
not limited to, FX rates, inflation and GDP per country or country block (group of countries that
have similar economic circumstances). MEVs for each scenario are projected over a reasonable

139NOTES
and supportable forecast period of two years. After the 2 year forecast period, it is supposed that
losses revert back to historical averages over a one-year transition period.
On a quarterly basis, the five economic scenarios are updated and the probability-weighting is
reviewed. The Bank uses judgement to develop the scenarios and assign probability-weightings.
The most likely economic scenario in the management’s view is the base case which generally
is assigned a higher weighting than the other four scenarios.
The PD-, LGD- and EAD-models are designed to forecast the credit quality and performance of a
TCP portfolio based on industry, geography, rating and size of the obligors, among other attri-
butes of the portfolio. PD-, LGD- and EAD-models are calibrated based on historical MEVs and use
forecasted macroeconomic scenarios for projecting PD-, LGD- and EAD-values.
ECL calculation
The Bank uses the forward-looking PD-, LGD-, and EAD-values for each of the scenarios to produce
the scenario credit losses (“SCLs”). The modelled ECL estimate is a probability-weighted calcu-
lation of the five SCLs discounted using the original effective interest rate or an approximation
thereof. The weightings are periodically reviewed and approved centrally by a risk governance
committee within the Firm.
As part of the normal review process, the ECL calculation, which is provided by a central group-
wide unit, is subject to further adjustment to take into consideration the requirements of the
Company. As the centrally estimated ECL are not specific to local and regional conditions, the
Company completes a local review, which involves conducting individual client reviews and
reviewing local MEVs and will adjust the centrally estimated ECL to appropriately reflect the
Company’s portfolio. For this adjustment, senior management decides to what extent the ECL
is appropriate for the Company. For this decision economic and political conditions, quality
of underwriting standards, borrower behaviour, deterioration within an industry, product or
portfolio, as well as other relevant internal and external factors affecting the credit quality of
the portfolio are considered. In certain instances, the interrelationships between these factors
create further uncertainties.
Management adjustments
A working group that was newly set up in 2020 and which consists of J.P. Morgan AG Credit
Risk Management, J.P. Morgan AG Credit Risk Controlling and the IFrS 9 Reporting Team is
responsible for the local review and monitoring of the model-based results of the ECL-results.
Additionally, the working group assesses on the appropriateness of the used scenarios including
the forecasted macroeconomic variables that are used for the calculation of the ECL. Management
adjustments are prepared for potential material risks that are not reflected in the model and are
provided to the J.P. Morgan AG CrO and CFO for their approval.

NOTES140
The following management adjustments are included in the ECL as of year-end 2020:
Adjustment of scenario weightings
Given the ongoing macroeconomic uncertainty, it was decided to put more weight on “adverse”
scenarios. The existing uncertainty is based on COVID-19 metrics such as diffusion, vaccination
progress and lock-down measures, which affect both the European and the US-American area.
The following scenario weights were used for the management adjustment (base, relative upward,
extreme upward, relative downward and extreme downward scenarios with the weighting 35%,
5%, 0%, 35%, 25%).
Adjustment of the modelled Leverage Finance LGDs
While exceptions to defined risk standards with regard to Leveraged Finance-transactions are
systematically taken into account in risk management, these were not sufficiently considered in
the above mentioned updated IFrS 9-model that was used for the estimate of credit losses. In
order to nevertheless consider the likelihood of higher losses related to Leveraged Finance-trans-
actions with relaxed covenants, the modelled LGDs for these transactions receive an absolute
LGD surcharge. To calculate the ECL, a minimum value is taken into account for the LGDs in the
adverse scenarios. The calibration of the markups and the minimum floors are both supported
by internal historical data as well as external benchmark data.
Stage 3 portfolio estimation techniques
In estimating ECL for Stage 3 loans using an individual discounted cash flow assessment, broad
economic conditions affecting a borrower are less relevant as they may not have a direct impact
on the specific borrower and his ability to service their debts. Consequently, the Company believes
that borrower-specific scenarios are the most relevant in estimating expected credit losses in an
individual discounted cash flow assessment. When applying the discounted cash flow method-
ology, the Company projects cash flows under three borrower-specific forecast scenarios that
are reviewed, adjusted and ultimately blended into one-probability weighted calculation of ECL.
ECL measurement for Non-TCP portfolios
The Bank’s approach to measure ECLs for Non-TCP portfolios depends on the type of instrument.
a) Cash and balances at central banks
Cash and balances with central banks include interest-bearing deposits, and are held with invest-
ment-grade institutions.
In evaluating the lifetime ECL related to receivables from a bank, the Bank’s determined expected
probability of default was extremely remote, and the magnitude of the lifetime ECL related to
exposures would be negligible as these are regulated investment-grade institutions that have

141NOTES
significant capital, loss absorbing capacity and liquidity. The majority of the deposits held are
short-term in nature and can be withdrawn at short notice (typically overnight).
The Bank includes cash and balances at central banks in Stage 1 as they are short-term and
investment-grade and banking institutions are considered to have high quality credit with low
risk of default and therefore the Bank has concluded there is no material SICr.
b) Other Non-TCP
The Bank has determined that ECLs on other Non-TCP portfolios are immaterial due to the credit
quality of the borrower (e.g. investment-grade) and /or the short-term nature of the instrument.
Similarly, the Bank has determined that these Non-TCP portfolios are without SICr (i. e. Stage 1)
due to the credit quality of the borrower and /or the short-term nature of the instrument. For
non-TCP intercompany transactions, the Company evaluates the counterparty based on the con-
solidated Firm’s resolution and recover plan, tenor of the instrument and any collateral received.
The Company has not experienced any losses on Non-TCP intercompany transactions.
The Bank continues to monitor its Non-TCP portfolios to ensure the described framework is
appropriate and its exposure to credit risk and ECLs on these portfolios are adequately reflected
in the allowance for credit losses.
ECL AND GROSS CARRYING AMOUNT RECONCILIATION
The following tables provide an explanation of the change in the loss allowance during the year
ended December 31, 2020 and December 31, 2019, respectively, by respective product classes
(TCP and Non-TCP). The tables also set out which effects contributed to the changes in the loss
allowance:
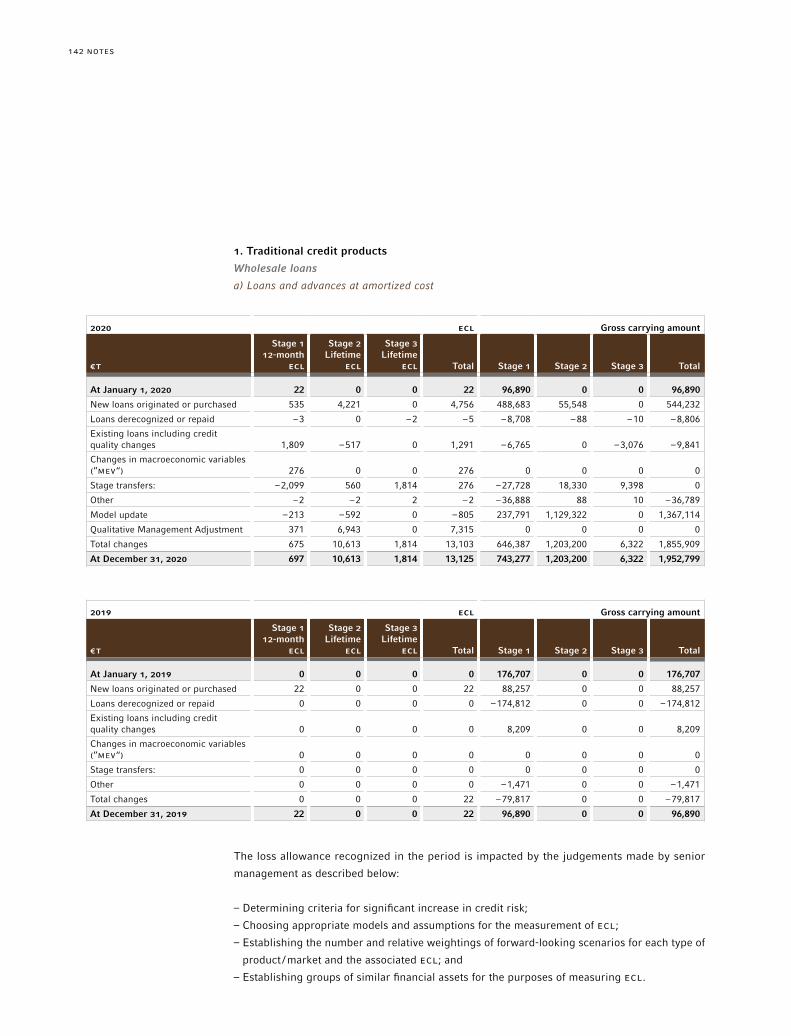
NOTES142
1. Traditional credit products
Wholesale loans
a) Loans and advances at amortized cost
2020 ECL Gross carrying amount
€T
Stage 112-month
ECL
Stage 2Lifetime
ECL
Stage 3Lifetime
ECL Total Stage 1 Stage 2 Stage 3 Total
At January 1, 2020 22 0 0 22 96,890 0 0 96,890
New loans originated or purchased 535 4,221 0 4,756 488,683 55,548 0 544,232
Loans derecognized or repaid –3 0 –2 –5 –8,708 –88 –10 –8,806
Existing loans including credit quality changes 1,809 –517 0 1,291 –6,765 0 –3,076 –9,841
Changes in macroeconomic variables (”MEV“) 276 0 0 276 0 0 0 0
Stage transfers: –2,099 560 1,814 276 –27,728 18,330 9,398 0
Other –2 –2 2 –2 –36,888 88 10 –36,789
Model update –213 –592 0 –805 237,791 1,129,322 0 1,367,114
Qualitative Management Adjustment 371 6,943 0 7,315 0 0 0 0
Total changes 675 10,613 1,814 13,103 646,387 1,203,200 6,322 1,855,909
At December 31, 2020 697 10,613 1,814 13,125 743,277 1,203,200 6,322 1,952,799
2019 ECL Gross carrying amount
€T
Stage 112-month
ECL
Stage 2Lifetime
ECL
Stage 3Lifetime
ECL Total Stage 1 Stage 2 Stage 3 Total
At January 1, 2019 0 0 0 0 176,707 0 0 176,707
New loans originated or purchased 22 0 0 22 88,257 0 0 88,257
Loans derecognized or repaid 0 0 0 0 –174,812 0 0 –174,812
Existing loans including credit quality changes 0 0 0 0 8,209 0 0 8,209
Changes in macroeconomic variables (”MEV“) 0 0 0 0 0 0 0 0
Stage transfers: 0 0 0 0 0 0 0 0
Other 0 0 0 0 –1,471 0 0 –1,471
Total changes 0 0 0 22 –79,817 0 0 –79,817
At December 31, 2019 22 0 0 22 96,890 0 0 96,890
The loss allowance recognized in the period is impacted by the judgements made by senior
management as described below:
– Determining criteria for significant increase in credit risk;
– Choosing appropriate models and assumptions for the measurement of ECL;
– Establishing the number and relative weightings of forward-looking scenarios for each type of
product /market and the associated ECL; and
– Establishing groups of similar financial assets for the purposes of measuring ECL.
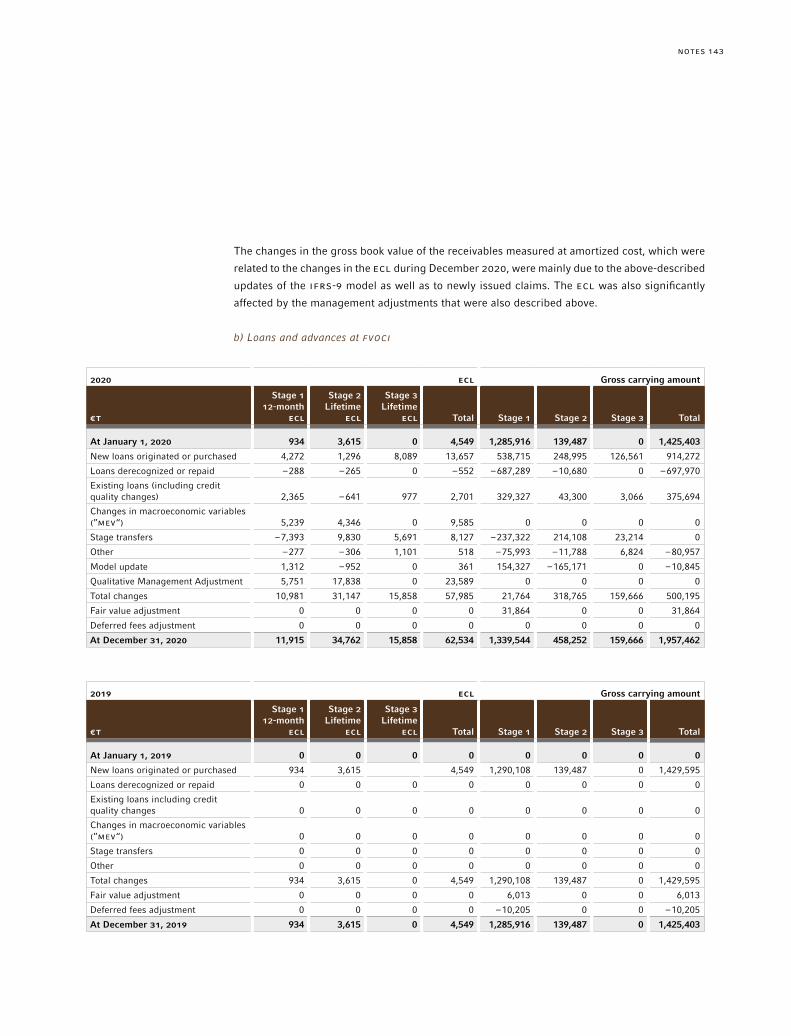
143NOTES
The changes in the gross book value of the receivables measured at amortized cost, which were
related to the changes in the ECL during December 2020, were mainly due to the above-described
updates of the IFrS-9 model as well as to newly issued claims. The ECL was also significantly
affected by the management adjustments that were also described above.
b) Loans and advances at FVOCI
2020 ECL Gross carrying amount
€T
Stage 112-month
ECL
Stage 2Lifetime
ECL
Stage 3Lifetime
ECL Total Stage 1 Stage 2 Stage 3 Total
At January 1, 2020 934 3,615 0 4,549 1,285,916 139,487 0 1,425,403
New loans originated or purchased 4,272 1,296 8,089 13,657 538,715 248,995 126,561 914,272
Loans derecognized or repaid –288 –265 0 –552 –687,289 –10,680 0 –697,970
Existing loans (including credit quality changes) 2,365 –641 977 2,701 329,327 43,300 3,066 375,694
Changes in macroeconomic variables (”MEV“) 5,239 4,346 0 9,585 0 0 0 0
Stage transfers –7,393 9,830 5,691 8,127 –237,322 214,108 23,214 0
Other –277 –306 1,101 518 –75,993 –11,788 6,824 –80,957
Model update 1,312 –952 0 361 154,327 –165,171 0 –10,845
Qualitative Management Adjustment 5,751 17,838 0 23,589 0 0 0 0
Total changes 10,981 31,147 15,858 57,985 21,764 318,765 159,666 500,195
Fair value adjustment 0 0 0 0 31,864 0 0 31,864
Deferred fees adjustment 0 0 0 0 0 0 0 0
At December 31, 2020 11,915 34,762 15,858 62,534 1,339,544 458,252 159,666 1,957,462
2019 ECL Gross carrying amount
€T
Stage 112-month
ECL
Stage 2Lifetime
ECL
Stage 3Lifetime
ECL Total Stage 1 Stage 2 Stage 3 Total
At January 1, 2019 0 0 0 0 0 0 0 0
New loans originated or purchased 934 3,615 4,549 1,290,108 139,487 0 1,429,595
Loans derecognized or repaid 0 0 0 0 0 0 0 0
Existing loans including credit quality changes 0 0 0 0 0 0 0 0
Changes in macroeconomic variables (”MEV“) 0 0 0 0 0 0 0 0
Stage transfers 0 0 0 0 0 0 0 0
Other 0 0 0 0 0 0 0 0
Total changes 934 3,615 0 4,549 1,290,108 139,487 0 1,429,595
Fair value adjustment 0 0 0 0 6,013 0 0 6,013
Deferred fees adjustment 0 0 0 0 –10,205 0 0 –10,205
At December 31, 2019 934 3,615 0 4,549 1,285,916 139,487 0 1,425,403
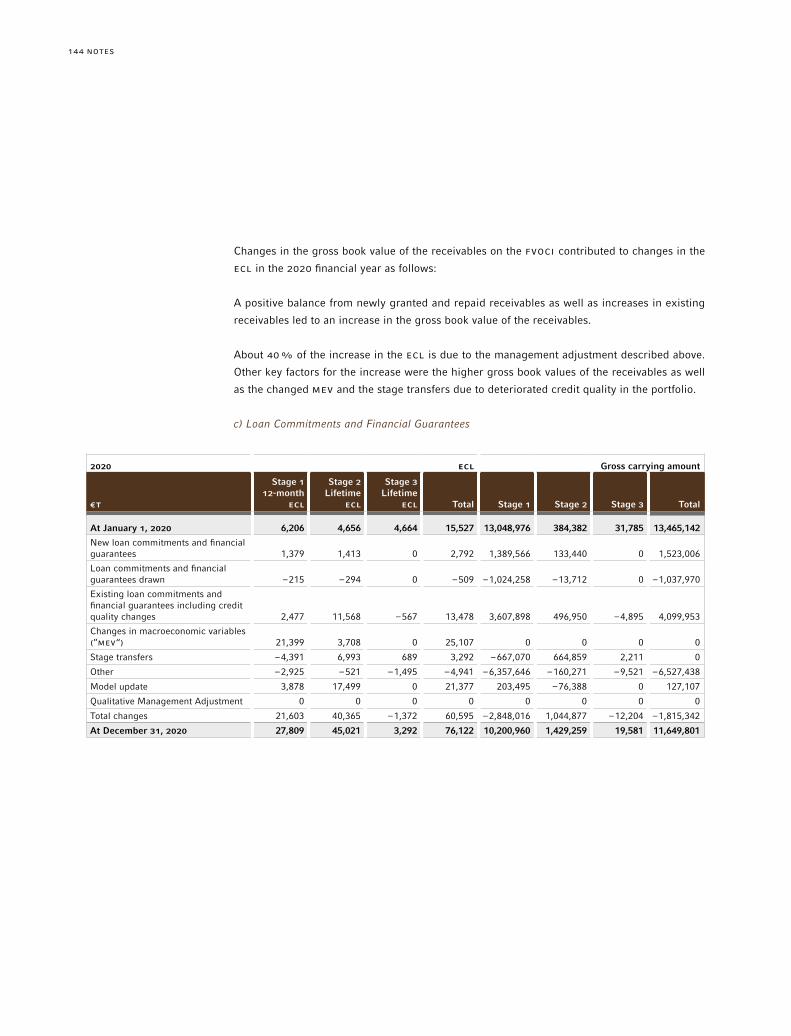
NOTES144
Changes in the gross book value of the receivables on the FVOCI contributed to changes in the
ECL in the 2020 financial year as follows:
A positive balance from newly granted and repaid receivables as well as increases in existing
receivables led to an increase in the gross book value of the receivables.
About 40% of the increase in the ECL is due to the management adjustment described above.
Other key factors for the increase were the higher gross book values of the receivables as well
as the changed MEV and the stage transfers due to deteriorated credit quality in the portfolio.
c) Loan Commitments and Financial Guarantees
2020 ECL Gross carrying amount
€T
Stage 112-month
ECL
Stage 2Lifetime
ECL
Stage 3Lifetime
ECL Total Stage 1 Stage 2 Stage 3 Total
At January 1, 2020 6,206 4,656 4,664 15,527 13,048,976 384,382 31,785 13,465,142
New loan commitments and financial guarantees 1,379 1,413 0 2,792 1,389,566 133,440 0 1,523,006
Loan commitments and financial guarantees drawn –215 –294 0 –509 –1,024,258 –13,712 0 –1,037,970
Existing loan commitments and financial guarantees including credit quality changes 2,477 11,568 –567 13,478 3,607,898 496,950 –4,895 4,099,953
Changes in macroeconomic variables (”MEV“) 21,399 3,708 0 25,107 0 0 0 0
Stage transfers –4,391 6,993 689 3,292 –667,070 664,859 2,211 0
Other –2,925 –521 –1,495 –4,941 –6,357,646 –160,271 –9,521 –6,527,438
Model update 3,878 17,499 0 21,377 203,495 –76,388 0 127,107
Qualitative Management Adjustment 0 0 0 0 0 0 0 0
Total changes 21,603 40,365 –1,372 60,595 –2,848,016 1,044,877 –12,204 –1,815,342
At December 31, 2020 27,809 45,021 3,292 76,122 10,200,960 1,429,259 19,581 11,649,801
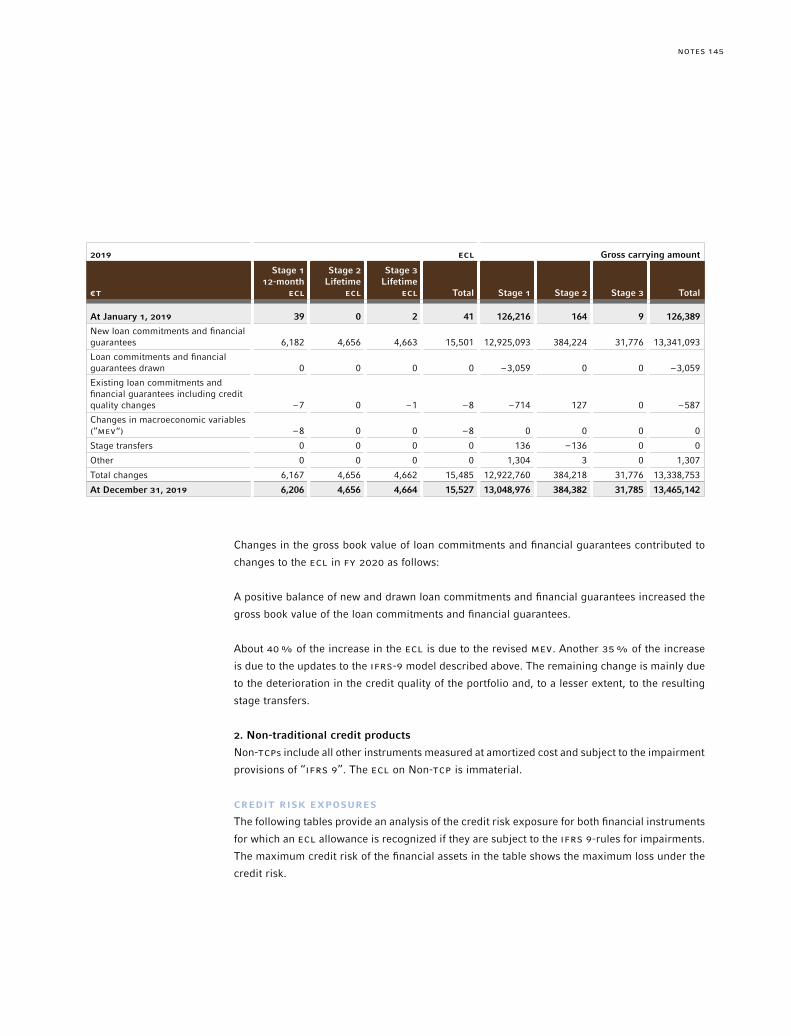
145NOTES
2019 ECL Gross carrying amount
€T
Stage 112-month
ECL
Stage 2Lifetime
ECL
Stage 3Lifetime
ECL Total Stage 1 Stage 2 Stage 3 Total
At January 1, 2019 39 0 2 41 126,216 164 9 126,389
New loan commitments and financial guarantees 6,182 4,656 4,663 15,501 12,925,093 384,224 31,776 13,341,093
Loan commitments and financial guarantees drawn 0 0 0 0 –3,059 0 0 –3,059
Existing loan commitments and financial guarantees including credit quality changes –7 0 –1 –8 –714 127 0 –587
Changes in macroeconomic variables (”MEV“) –8 0 0 –8 0 0 0 0
Stage transfers 0 0 0 0 136 –136 0 0
Other 0 0 0 0 1,304 3 0 1,307
Total changes 6,167 4,656 4,662 15,485 12,922,760 384,218 31,776 13,338,753
At December 31, 2019 6,206 4,656 4,664 15,527 13,048,976 384,382 31,785 13,465,142
Changes in the gross book value of loan commitments and financial guarantees contributed to
changes to the ECL in FY 2020 as follows:
A positive balance of new and drawn loan commitments and financial guarantees increased the
gross book value of the loan commitments and financial guarantees.
About 40% of the increase in the ECL is due to the revised MEV. Another 35% of the increase
is due to the updates to the IFrS-9 model described above. The remaining change is mainly due
to the deterioration in the credit quality of the portfolio and, to a lesser extent, to the resulting
stage transfers.
2. Non-traditional credit products
Non-TCPs include all other instruments measured at amortized cost and subject to the impairment
provisions of “IFrS 9”. The ECL on Non-TCP is immaterial.
CREDIT RISK ExPOSURES
The following tables provide an analysis of the credit risk exposure for both financial instruments
for which an ECL allowance is recognized if they are subject to the IFrS 9-rules for impairments.
The maximum credit risk of the financial assets in the table shows the maximum loss under the
credit risk.
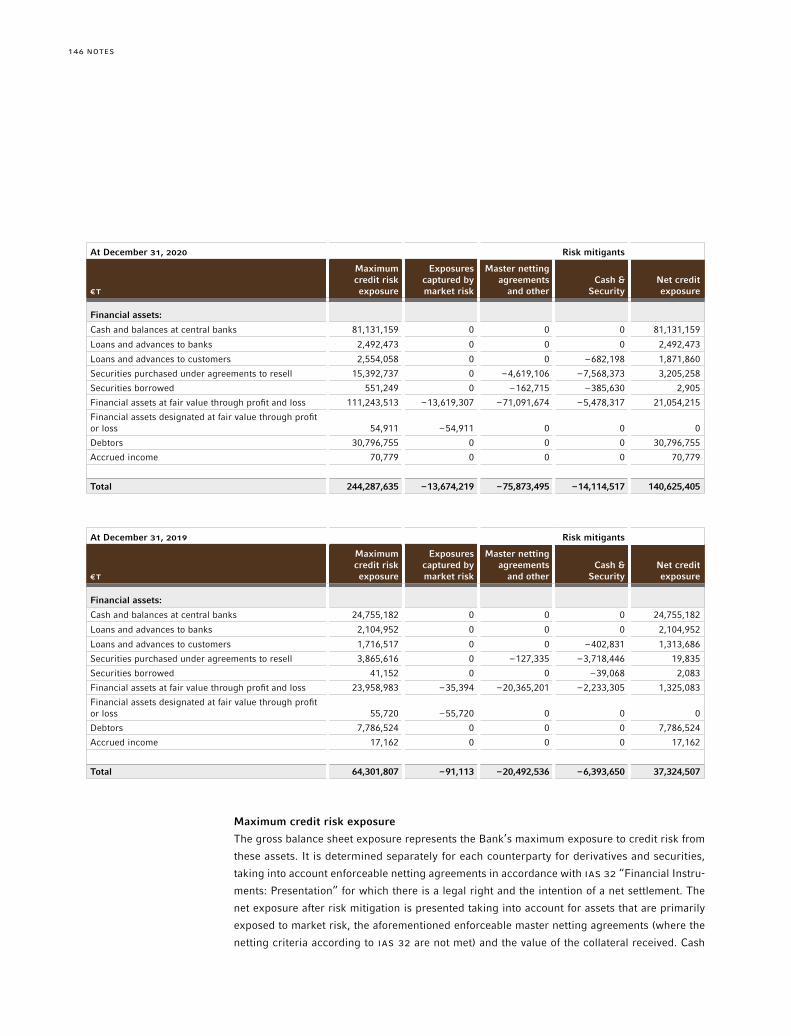
NOTES146
At December 31, 2020 Risk mitigants
€T
Maximum credit risk exposure
Exposures captured by market risk
Master netting agreements
and otherCash &
SecurityNet credit exposure
Financial assets:
Cash and balances at central banks 81,131,159 0 0 0 81,131,159
Loans and advances to banks 2,492,473 0 0 0 2,492,473
Loans and advances to customers 2,554,058 0 0 –682,198 1,871,860
Securities purchased under agreements to resell 15,392,737 0 –4,619,106 –7,568,373 3,205,258
Securities borrowed 551,249 0 –162,715 –385,630 2,905
Financial assets at fair value through profit and loss 111,243,513 –13,619,307 –71,091,674 –5,478,317 21,054,215
Financial assets designated at fair value through profit or loss 54,911 –54,911 0 0 0
Debtors 30,796,755 0 0 0 30,796,755
Accrued income 70,779 0 0 0 70,779
Total 244,287,635 –13,674,219 –75,873,495 –14,114,517 140,625,405
At December 31, 2019 Risk mitigants
€T
Maximum credit risk exposure
Exposures captured by market risk
Master netting agreements
and otherCash &
SecurityNet credit exposure
Financial assets:
Cash and balances at central banks 24,755,182 0 0 0 24,755,182
Loans and advances to banks 2,104,952 0 0 0 2,104,952
Loans and advances to customers 1,716,517 0 0 –402,831 1,313,686
Securities purchased under agreements to resell 3,865,616 0 –127,335 –3,718,446 19,835
Securities borrowed 41,152 0 0 –39,068 2,083
Financial assets at fair value through profit and loss 23,958,983 –35,394 –20,365,201 –2,233,305 1,325,083
Financial assets designated at fair value through profit or loss 55,720 –55,720 0 0 0
Debtors 7,786,524 0 0 0 7,786,524
Accrued income 17,162 0 0 0 17,162
Total 64,301,807 –91,113 –20,492,536 –6,393,650 37,324,507
Maximum credit risk exposure
The gross balance sheet exposure represents the Bank’s maximum exposure to credit risk from
these assets. It is determined separately for each counterparty for derivatives and securities,
taking into account enforceable netting agreements in accordance with IAS 32 “Financial Instru-
ments: Presentation” for which there is a legal right and the intention of a net settlement. The
net exposure after risk mitigation is presented taking into account for assets that are primarily
exposed to market risk, the aforementioned enforceable master netting agreements (where the
netting criteria according to IAS 32 are not met) and the value of the collateral received. Cash

147NOTES
and securities collateral is taken into account at their respective fair values, while other collateral
received, such as guarantees and sureties, is generally not taken into account.
The collateral is taken into account under conditions that are customary for the relevant secu-
rities and financing transactions. J.P. Morgan AG receives securities as collateral for securities
repurchase agreements or cash-backed securities lending transactions. These can generally be
resold or repledged by J.P. Morgan AG. For the resale or repledging of the collateral provided,
the customary contractual terms apply. The quality of the collateral is assured by its ability to be
liquidated, used and third party usability, as well as by regular evaluation.
For the loan portfolio, there is, to a lesser extent, physical collateral such as assignment by way
of security of inventory or guarantees. The bank essentially relies on the enterprise values of the
financed company. These are assessed using DCF models, in order to determine the expected
future cash flows from a possible realization. This also takes into account the extent to which
other creditors have preferred collateral. The calculation of the enterprise value is based on three
various scenarios, from the weighting of which the expected sales proceeds are determined. In
the next step, this flows into the determination of the ECL to be taken into account.
The Bank’s credit risks are described in more detail below. As the loan loss provision is only
considered for receivables recorded at amortized cost and FVOCI, additional anaysis of the expo-
sures is provided.
Loans and advances to customers
The table below shows the Bank’s credit exposure and contractual maturity profile for gross
loans and advances to customers before any provision for impairment. The credit quality and
credit concentration of loans and advances to customers is managed within the Bank’s Credit
Risk Management function. The ratings scale is based on J.P. Morgan AG’s internal risk ratings,
which generally correspond to the ratings as defined by S&P and Moody’s Investors Service.
Maturity profile of TCP financial assets (IFRS 7, Para. 35m)
Maturity€T 2020 2019
5 years or more 107,785 37,721
5 years or less but over 1 year 2,071,244 1,155,319
1 year or less but over 3 months 1,425,443 186,727
3 months or less 305,789 142,526
Total 3,910,261 1,522,293
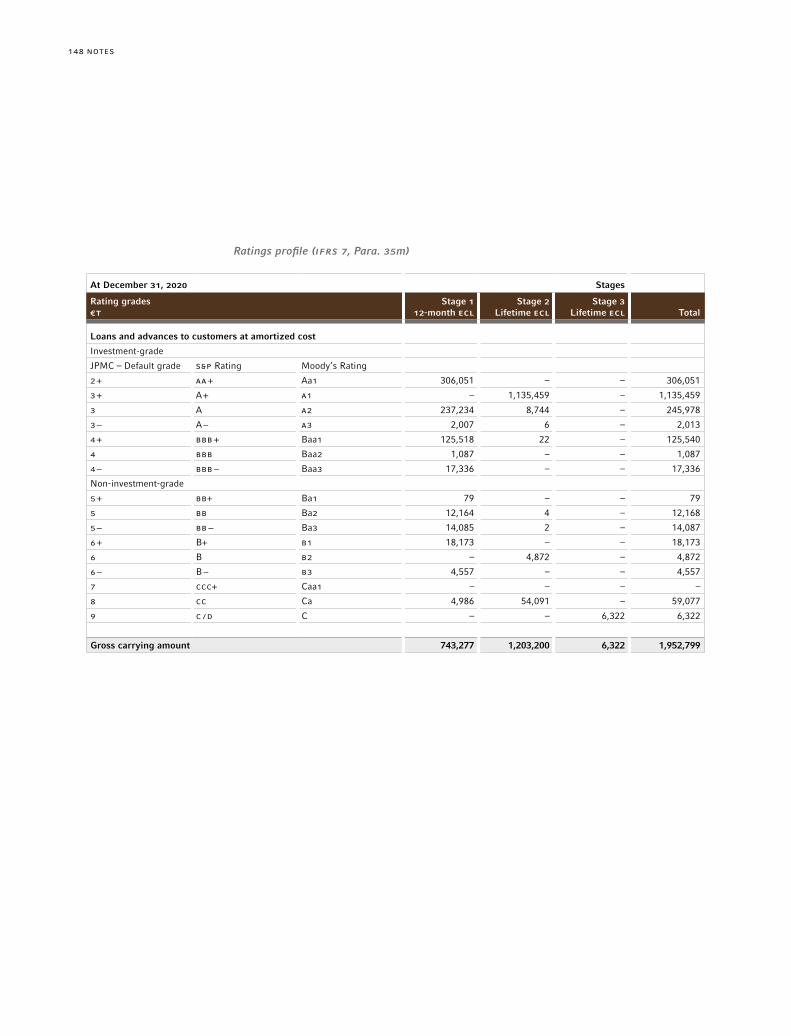
NOTES148
Ratings profile (IFRS 7, Para. 35m)
At December 31, 2020 Stages
Rating grades (continued) €T
Stage 112-month ECL
Stage 2Lifetime ECL
Stage 3Lifetime ECL Total
Loans and advances to customers at amortized cost
Investment-grade
JPMC – Default grade S&P Rating Moody‘s Rating
2 + AA + Aa1 306,051 – – 306,051
3 + A + A1 – 1,135,459 – 1,135,459
3 A A2 237,234 8,744 – 245,978
3 − A − A3 2,007 6 – 2,013
4 + BBB + Baa1 125,518 22 – 125,540
4 BBB Baa2 1,087 – – 1,087
4 − BBB − Baa3 17,336 – – 17,336
Non-investment-grade
5 + BB+ Ba1 79 – – 79
5 BB Ba2 12,164 4 – 12,168
5 − BB − Ba3 14,085 2 – 14,087
6 + B+ B1 18,173 – – 18,173
6 B B2 – 4,872 – 4,872
6 − B − B3 4,557 – – 4,557
7 CCC+ Caa1 – – – –
8 CC Ca 4,986 54,091 – 59,077
9 C /D C – – 6,322 6,322
Gross carrying amount 743,277 1,203,200 6,322 1,952,799
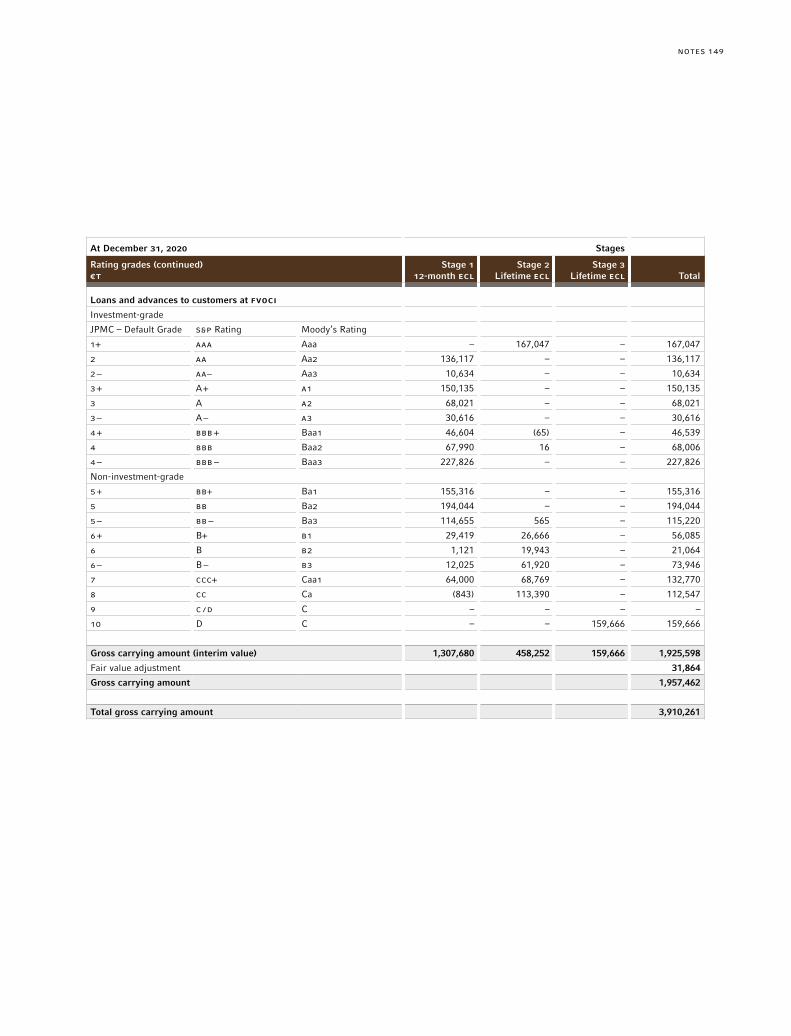
149NOTES
At December 31, 2020 Stages
Rating grades (continued) €T
Stage 112-month ECL
Stage 2Lifetime ECL
Stage 3Lifetime ECL Total
Loans and advances to customers at FVOCI
Investment-grade
JPMC – Default Grade S&P Rating Moody‘s Rating
1+ AAA Aaa – 167,047 – 167,047
2 AA Aa2 136,117 – – 136,117
2 − AA− Aa3 10,634 – – 10,634
3 + A + A1 150,135 – – 150,135
3 A A2 68,021 – – 68,021
3 − A − A3 30,616 – – 30,616
4 + BBB + Baa1 46,604 (65) – 46,539
4 BBB Baa2 67,990 16 – 68,006
4 − BBB − Baa3 227,826 – – 227,826
Non-investment-grade
5 + BB+ Ba1 155,316 – – 155,316
5 BB Ba2 194,044 – – 194,044
5 − BB − Ba3 114,655 565 – 115,220
6 + B+ B1 29,419 26,666 – 56,085
6 B B2 1,121 19,943 – 21,064
6 − B − B3 12,025 61,920 – 73,946
7 CCC+ Caa1 64,000 68,769 – 132,770
8 CC Ca (843) 113,390 – 112,547
9 C /D C – – – –
10 D C – – 159,666 159,666
Gross carrying amount (interim value) 1,307,680 458,252 159,666 1,925,598
Fair value adjustment 31,864
Gross carrying amount 1,957,462
Total gross carrying amount 3,910,261
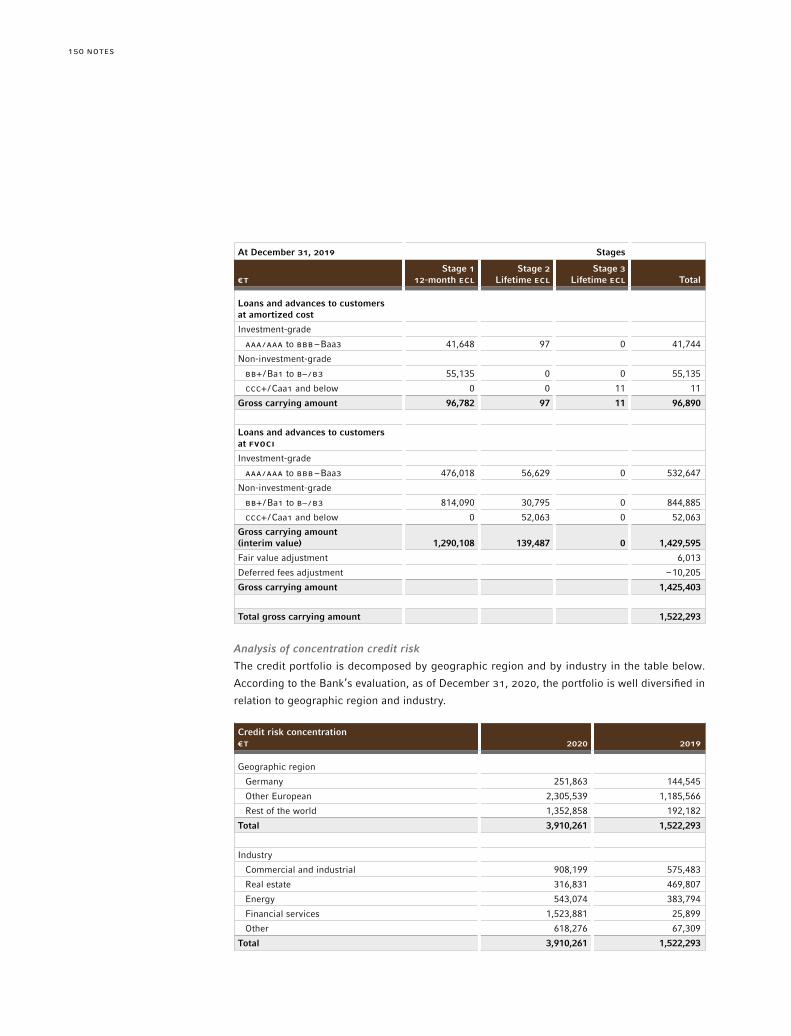
NOTES150
At December 31, 2019 Stages
€TStage 1
12-month ECLStage 2
Lifetime ECL Stage 3
Lifetime ECL Total
Loans and advances to customers at amortized cost
Investment-grade
AAA /AAA to BBB – Baa3 41,648 97 0 41,744
Non-investment-grade
BB+ /Ba1 to B– /B3 55,135 0 0 55,135
CCC+ /Caa1 and below 0 0 11 11
Gross carrying amount 96,782 97 11 96,890
Loans and advances to customers at FVOCI
Investment-grade
AAA /AAA to BBB – Baa3 476,018 56,629 0 532,647
Non-investment-grade
BB+ /Ba1 to B– /B3 814,090 30,795 0 844,885
CCC+ /Caa1 and below 0 52,063 0 52,063
Gross carrying amount (interim value) 1,290,108 139,487 0 1,429,595
Fair value adjustment 6,013
Deferred fees adjustment –10,205
Gross carrying amount 1,425,403
Total gross carrying amount 1,522,293
Analysis of concentration credit risk
The credit portfolio is decomposed by geographic region and by industry in the table below.
According to the Bank’s evaluation, as of December 31, 2020, the portfolio is well diversified in
relation to geographic region and industry.
Credit risk concentration€T 2020 2019
Geographic region
Germany 251,863 144,545
Other European 2,305,539 1,185,566
Rest of the world 1,352,858 192,182
Total 3,910,261 1,522,293
Industry
Commercial and industrial 908,199 575,483
Real estate 316,831 469,807
Energy 543,074 383,794
Financial services 1,523,881 25,899
Other 618,276 67,309
Total 3,910,261 1,522,293
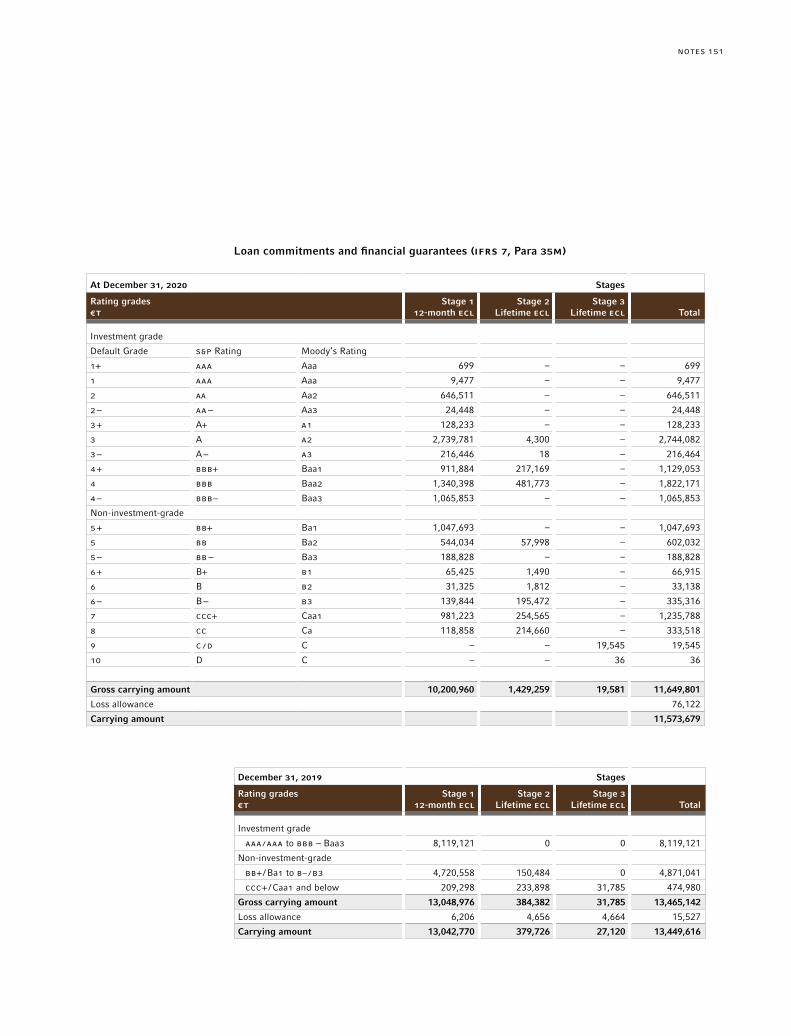
151NOTES
Loan commitments and financial guarantees (IFRS 7, Para 35M)
At December 31, 2020 Stages
Rating grades€T
Stage 112-month ECL
Stage 2Lifetime ECL
Stage 3Lifetime ECL Total
Investment grade
Default Grade S&P Rating Moody‘s Rating
1+ AAA Aaa 699 – – 699
1 AAA Aaa 9,477 – – 9,477
2 aa Aa2 646,511 – – 646,511
2 − AA − Aa3 24,448 – – 24,448
3 + A+ A1 128,233 – – 128,233
3 A A2 2,739,781 4,300 – 2,744,082
3 − A − A3 216,446 18 – 216,464
4 + BBB+ Baa1 911,884 217,169 – 1,129,053
4 BBB Baa2 1,340,398 481,773 – 1,822,171
4 − BBB− Baa3 1,065,853 – – 1,065,853
Non-investment-grade
5 + BB+ Ba1 1,047,693 – – 1,047,693
5 BB Ba2 544,034 57,998 – 602,032
5 − BB − Ba3 188,828 – – 188,828
6 + B+ B1 65,425 1,490 – 66,915
6 B B2 31,325 1,812 – 33,138
6 − B − B3 139,844 195,472 – 335,316
7 CCC+ Caa1 981,223 254,565 – 1,235,788
8 CC Ca 118,858 214,660 – 333,518
9 C /D C – – 19,545 19,545
10 D C – – 36 36
Gross carrying amount 10,200,960 1,429,259 19,581 11,649,801
Loss allowance 76,122
Carrying amount 11,573,679
December 31, 2019 Stages
Rating grades€T
Stage 112-month ECL
Stage 2Lifetime ECL
Stage 3Lifetime ECL Total
Investment grade
AAA /AAA to BBB – Baa3 8,119,121 0 0 8,119,121
Non-investment-grade
BB+ /Ba1 to B– /B3 4,720,558 150,484 0 4,871,041
CCC+ /Caa1 and below 209,298 233,898 31,785 474,980
Gross carrying amount 13,048,976 384,382 31,785 13,465,142
Loss allowance 6,206 4,656 4,664 15,527
Carrying amount 13,042,770 379,726 27,120 13,449,616
NOTES152
Market risk, liquidity risk and operational risk disclosures are incorporated in the risk report as
part of the management report.
36. Related party transactions
Parties are considered to be related if one party has the ability to directly or indirectly control the
other party or exercise significant influence over the other party in making financial or operational
decisions. J.P. Morgan AG’s related parties include:
– key management personnel, close family members of key management personnel and entities
which are controlled, significantly influenced by, or for which significant voting power is held
by key management personnel or their close family members;
– J.P. Morgan group entities; and
– post-employment benefit plans for the benefit of J.P. Morgan AG employees.
Relationship to parent
The sole shareholder of J.P. Morgan AG is J.P. Morgan International Finance Limited, Newark /
Delaware, USA. It has informed us in writing on January 13, 2021 that a direct holding exists
totalling 100%. In addition, J.P. Morgan Chase & Co. and J.P. Morgan Chase Bank, National
Association, have informed us in writing on the same day that an indirect equity interest exists,
totalling 100%.
The group financial statements for the smallest and the largest scope of included companies are
prepared by JPMorgan Chase & Co., New York, whose shares are quoted on the New York Stock
Exchange as well as on certain European and Asian stock markets. The financial statements can
be obtained on request from J.P. Morgan AG, Frankfurt am Main.
Key management personnel
Key management personnel are those persons having authority and responsibility for planning,
directing and controlling the activities of J.P. Morgan AG, directly or indirectly. The Company
considers the members of both of its Management and Supervisory Boards to constitute key
management personnel for the purposes of IAS 24.
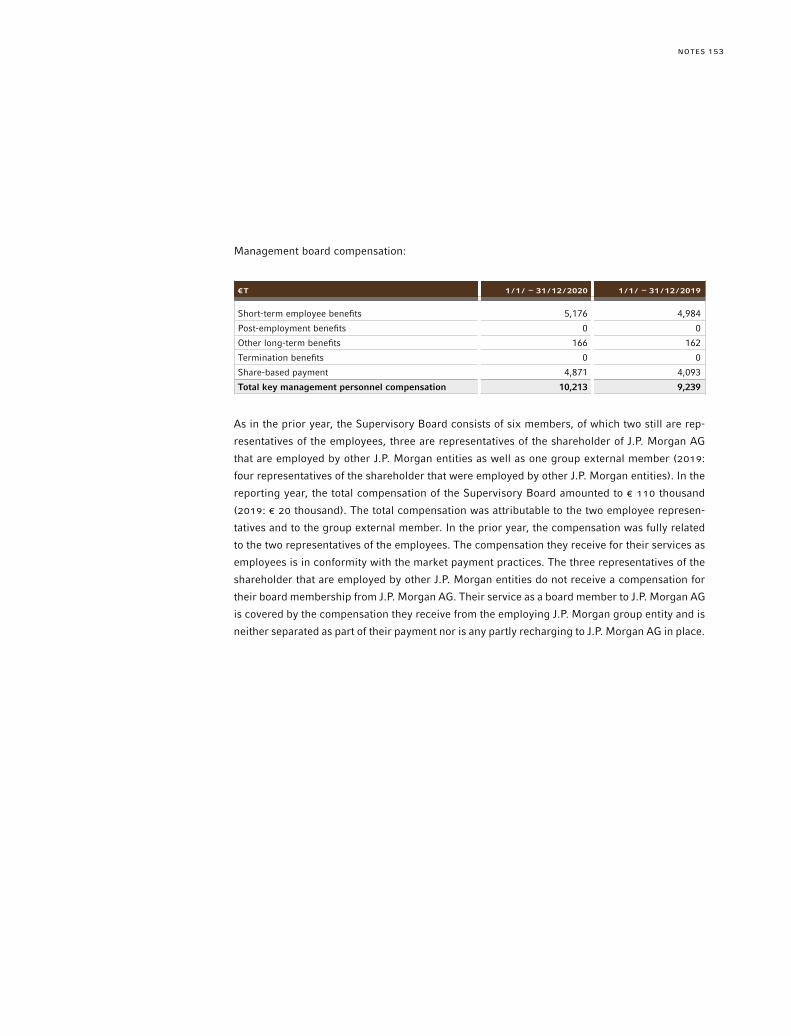
153NOTES
Management board compensation:
€T 1 /1 / – 31 /12 /2020 1 /1 / – 31 /12 /2019
Short-term employee benefits 5,176 4,984
Post-employment benefits 0 0
Other long-term benefits 166 162
Termination benefits 0 0
Share-based payment 4,871 4,093
Total key management personnel compensation 10,213 9,239
As in the prior year, the Supervisory Board consists of six members, of which two still are rep-
resentatives of the employees, three are representatives of the shareholder of J.P. Morgan AG
that are employed by other J.P. Morgan entities as well as one group external member (2019:
four representatives of the shareholder that were employed by other J.P. Morgan entities). In the
reporting year, the total compensation of the Supervisory Board amounted to € 110 thousand
(2019: € 20 thousand). The total compensation was attributable to the two employee represen-
tatives and to the group external member. In the prior year, the compensation was fully related
to the two representatives of the employees. The compensation they receive for their services as
employees is in conformity with the market payment practices. The three representatives of the
shareholder that are employed by other J.P. Morgan entities do not receive a compensation for
their board membership from J.P. Morgan AG. Their service as a board member to J.P. Morgan AG
is covered by the compensation they receive from the employing J.P. Morgan group entity and is
neither separated as part of their payment nor is any partly recharging to J.P. Morgan AG in place.
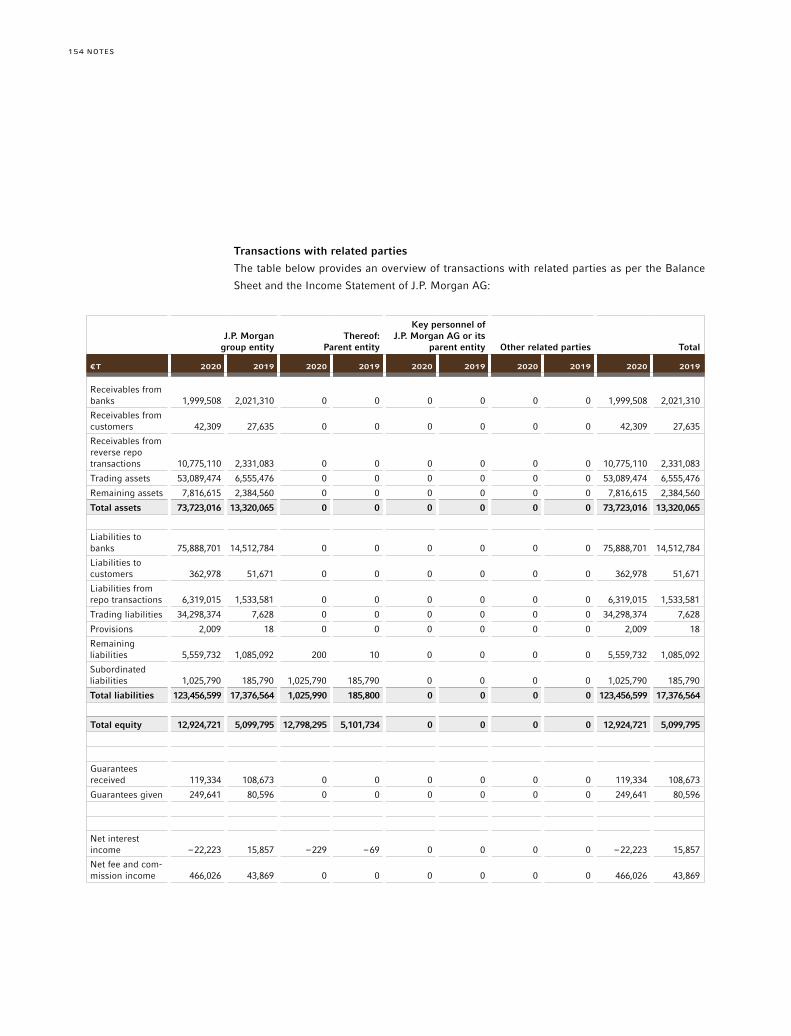
NOTES154
Transactions with related parties
The table below provides an overview of transactions with related parties as per the Balance
Sheet and the Income Statement of J.P. Morgan AG:
J.P. Morgan group entity
Thereof: Parent entity
Key personnel of J.P. Morgan AG or its
parent entity Other related parties Total
€T 2020 2019 2020 2019 2020 2019 2020 2019 2020 2019
Receivables from banks 1,999,508 2,021,310 0 0 0 0 0 0 1,999,508 2,021,310
Receivables from customers 42,309 27,635 0 0 0 0 0 0 42,309 27,635
Receivables from reverse repo transactions 10,775,110 2,331,083 0 0 0 0 0 0 10,775,110 2,331,083
Trading assets 53,089,474 6,555,476 0 0 0 0 0 0 53,089,474 6,555,476
Remaining assets 7,816,615 2,384,560 0 0 0 0 0 0 7,816,615 2,384,560
Total assets 73,723,016 13,320,065 0 0 0 0 0 0 73,723,016 13,320,065
Liabilities to banks 75,888,701 14,512,784 0 0 0 0 0 0 75,888,701 14,512,784
Liabilities to customers 362,978 51,671 0 0 0 0 0 0 362,978 51,671
Liabilities from repo transactions 6,319,015 1,533,581 0 0 0 0 0 0 6,319,015 1,533,581
Trading liabilities 34,298,374 7,628 0 0 0 0 0 0 34,298,374 7,628
Provisions 2,009 18 0 0 0 0 0 0 2,009 18
Remaining liabilities 5,559,732 1,085,092 200 10 0 0 0 0 5,559,732 1,085,092
Subordinated liabilities 1,025,790 185,790 1,025,790 185,790 0 0 0 0 1,025,790 185,790
Total liabilities 123,456,599 17,376,564 1,025,990 185,800 0 0 0 0 123,456,599 17,376,564
Total equity 12,924,721 5,099,795 12,798,295 5,101,734 0 0 0 0 12,924,721 5,099,795
Guarantees received 119,334 108,673 0 0 0 0 0 0 119,334 108,673
Guarantees given 249,641 80,596 0 0 0 0 0 0 249,641 80,596
Net interest income –22,223 15,857 –229 –69 0 0 0 0 –22,223 15,857
Net fee and com-mission income 466,026 43,869 0 0 0 0 0 0 466,026 43,869
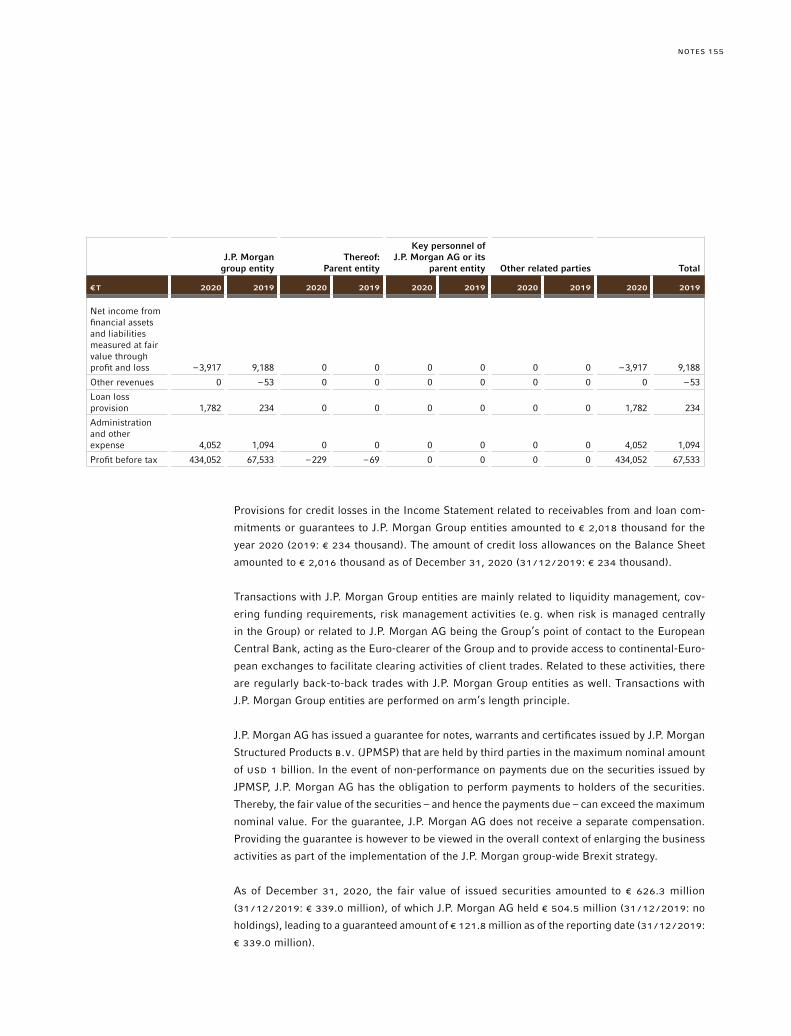
155NOTES
J.P. Morgan group entity
Thereof: Parent entity
Key personnel of J.P. Morgan AG or its
parent entity Other related parties Total
€T 2020 2019 2020 2019 2020 2019 2020 2019 2020 2019
Net income from financial assets and liabilities measured at fair value through profit and loss –3,917 9,188 0 0 0 0 0 0 –3,917 9,188
Other revenues 0 –53 0 0 0 0 0 0 0 –53
Loan loss provision 1,782 234 0 0 0 0 0 0 1,782 234
Administration and other expense 4,052 1,094 0 0 0 0 0 0 4,052 1,094
Profit before tax 434,052 67,533 –229 –69 0 0 0 0 434,052 67,533
Provisions for credit losses in the Income Statement related to receivables from and loan com-
mitments or guarantees to J.P. Morgan Group entities amounted to € 2,018 thousand for the
year 2020 (2019: € 234 thousand). The amount of credit loss allowances on the Balance Sheet
amounted to € 2,016 thousand as of December 31, 2020 (31 /12 /2019: € 234 thousand).
Transactions with J.P. Morgan Group entities are mainly related to liquidity management, cov-
ering funding requirements, risk management activities (e.g. when risk is managed centrally
in the Group) or related to J.P. Morgan AG being the Group’s point of contact to the European
Central Bank, acting as the Euro-clearer of the Group and to provide access to continental-Euro-
pean exchanges to facilitate clearing activities of client trades. Related to these activities, there
are regularly back-to-back trades with J.P. Morgan Group entities as well. Transactions with
J.P. Morgan Group entities are performed on arm’s length principle.
J.P. Morgan AG has issued a guarantee for notes, warrants and certificates issued by J.P. Morgan
Structured Products B.V. (JPMSP) that are held by third parties in the maximum nominal amount
of USD 1 billion. In the event of non-performance on payments due on the securities issued by
JPMSP, J.P. Morgan AG has the obligation to perform payments to holders of the securities.
Thereby, the fair value of the securities – and hence the payments due – can exceed the maximum
nominal value. For the guarantee, J.P. Morgan AG does not receive a separate compensation.
Providing the guarantee is however to be viewed in the overall context of enlarging the business
activities as part of the implementation of the J.P. Morgan group-wide Brexit strategy.
As of December 31, 2020, the fair value of issued securities amounted to € 626.3 million
(31 /12 /2019: € 339.0 million), of which J.P. Morgan AG held € 504.5 million (31 /12 /2019: no
holdings), leading to a guaranteed amount of € 121.8 million as of the reporting date (31 /12 /2019:
€ 339.0 million).
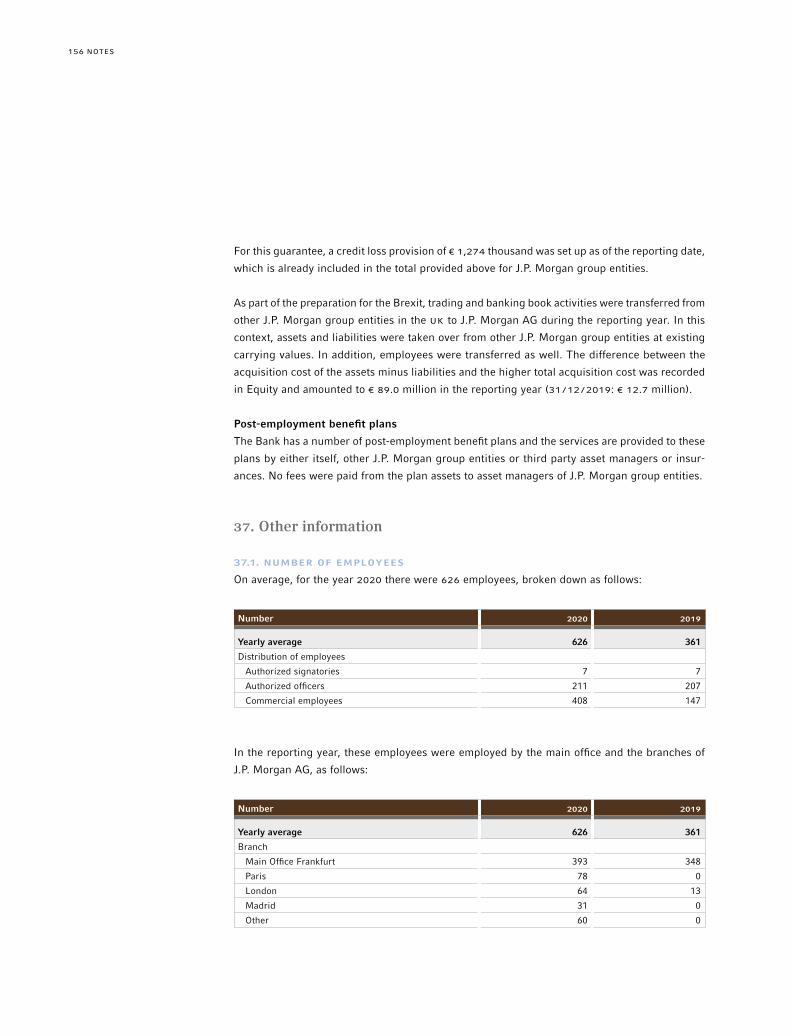
NOTES156
For this guarantee, a credit loss provision of € 1,274 thousand was set up as of the reporting date,
which is already included in the total provided above for J.P. Morgan group entities.
As part of the preparation for the Brexit, trading and banking book activities were transferred from
other J.P. Morgan group entities in the UK to J.P. Morgan AG during the reporting year. In this
context, assets and liabilities were taken over from other J.P. Morgan group entities at existing
carrying values. In addition, employees were transferred as well. The difference between the
acquisition cost of the assets minus liabilities and the higher total acquisition cost was recorded
in Equity and amounted to € 89.0 million in the reporting year (31 /12 /2019: € 12.7 million).
Post-employment benefit plans
The Bank has a number of post-employment benefit plans and the services are provided to these
plans by either itself, other J.P. Morgan group entities or third party asset managers or insur-
ances. No fees were paid from the plan assets to asset managers of J.P. Morgan group entities.
37. Other information
37.1. NUMBER OF EMPLOYEES
On average, for the year 2020 there were 626 employees, broken down as follows:
Number 2020 2019
Yearly average 626 361
Distribution of employees
Authorized signatories 7 7
Authorized officers 211 207
Commercial employees 408 147
In the reporting year, these employees were employed by the main office and the branches of
J.P. Morgan AG, as follows:
Number 2020 2019
Yearly average 626 361
Branch
Main Office Frankfurt 393 348
Paris 78 0
London 64 13
Madrid 31 0
Other 60 0
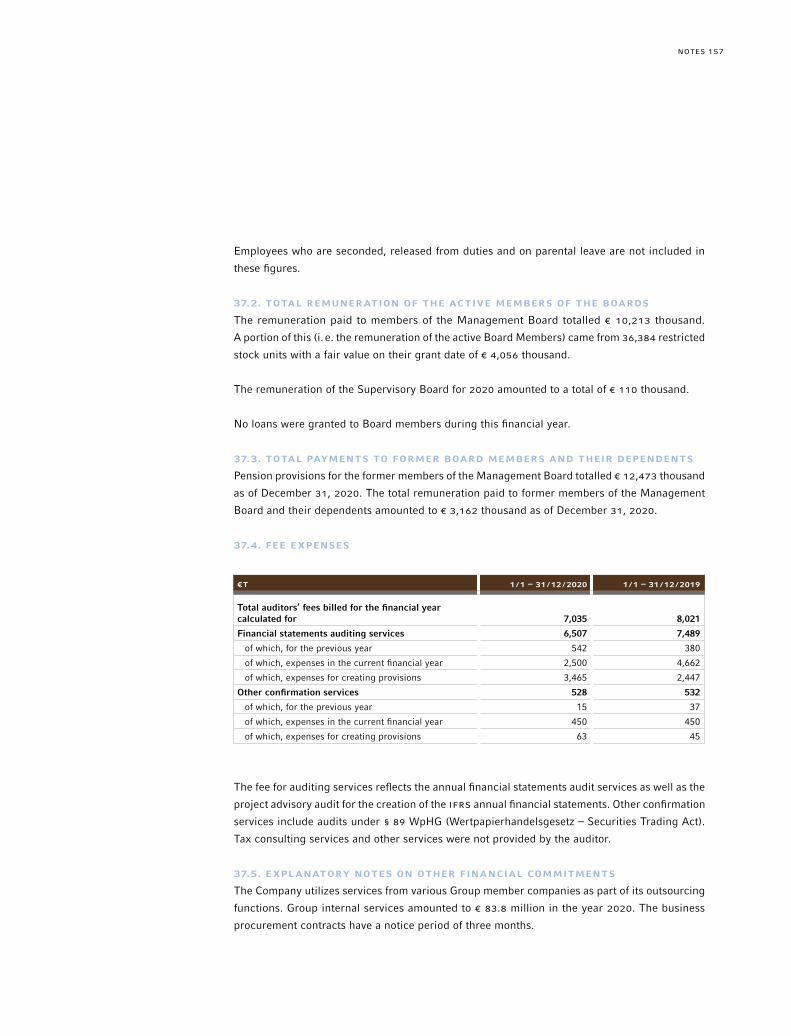
157NOTES
Employees who are seconded, released from duties and on parental leave are not included in
these figures.
37.2. TOTAL REMUNERATION OF THE ACTIVE MEMBERS OF THE BOARDS
The remuneration paid to members of the Management Board totalled € 10,213 thousand.
A portion of this (i. e. the remuneration of the active Board Members) came from 36,384 restricted
stock units with a fair value on their grant date of € 4,056 thousand.
The remuneration of the Supervisory Board for 2020 amounted to a total of € 110 thousand.
No loans were granted to Board members during this financial year.
37.3. TOTAL PAYMENTS TO FORMER BOARD MEMBERS AND THEIR DEPENDENTS
Pension provisions for the former members of the Management Board totalled € 12,473 thousand
as of December 31, 2020. The total remuneration paid to former members of the Management
Board and their dependents amounted to € 3,162 thousand as of December 31, 2020.
37.4. FEE ExPENSES
€T 1 /1 – 31 /12 /2020 1 /1 – 31 /12 /2019
Total auditors’ fees billed for the financial year calculated for 7,035 8,021
Financial statements auditing services 6,507 7,489
of which, for the previous year 542 380
of which, expenses in the current financial year 2,500 4,662
of which, expenses for creating provisions 3,465 2,447
Other confirmation services 528 532
of which, for the previous year 15 37
of which, expenses in the current financial year 450 450
of which, expenses for creating provisions 63 45
The fee for auditing services reflects the annual financial statements audit services as well as the
project advisory audit for the creation of the IFrS annual financial statements. Other confirmation
services include audits under § 89 WpHG (Wertpapierhandelsgesetz – Securities Trading Act).
Tax consulting services and other services were not provided by the auditor.
37.5. ExPLANATORY NOTES ON OTHER FINANCIAL COMMITMENTS
The Company utilizes services from various Group member companies as part of its outsourcing
functions. Group internal services amounted to € 83.8 million in the year 2020. The business
procurement contracts have a notice period of three months.

NOTES158
The lease agreement for the business premises has a term until August 1, 2028. The future rent
payments amount to € 27.7 million as at December 31, 2020.
37.6. INFORMATION ON CORPORATE BODIES
Management Board
Stefan BehrChairperson of the Management Board (since November 1, 2020), Managing Director, J.P. Morgan AG
Dorothee Blessing (until October 31, 2020) Chairperson of the Management Board, Managing Director, J.P. Morgan AG
Cindyrella Amistadi (since April 1, 2021)Outsourcing, Operations, Technology Director, Managing Director, J.P. Morgan AG
Nicholas Conron CrO, Managing Director, J.P. Morgan AG
Burkhard Kübel-SorgerCFO, Managing Director, J.P. Morgan AG
Gunnar RegierMarkets Business Area Director, Managing Director, J.P. Morgan AG
Supervisory Board
Mark S. GarvinChairperson, Managing Director, J.P. Morgan Europe Limited
Guy America Deputy Chairperson, Managing Director, J.P. Morgan Securities plc
Wanda EriksenAuditor
Marco Kistner, (since February 1, 2021)Qualified Banker
Elena Korablina (until January 31, 2021)Managing Director, JPMorgan Chase Bank, N.A., London Branch
Christoph FickelInformation Security Manager, J.P. Morgan AG, Employee Representative, J.P. Morgan AG
Thomas FreiseHead of Works Council, J.P. Morgan AG, Employee Representative, J.P. Morgan AG

159NOTES
Directorships or seats on supervisory boards
Management Board
Stefan Behr; no further mandates
Dorothee Blessing (until October 31, 2020)Management body: J.P. Morgan Securities plc Frankfurt Branch; Supervisory body: A.P. Møller Mærsk Group
Cindyrella Amistadi (since April 1, 2021); no further mandates
Nicholas Conron; no further mandates
Burkhard Kübel-Sorger; no further mandates
Gunnar RegierManagement body: J.P. Morgan Securities plc Frankfurt Branch
Supervisory Board
Mark S. GarvinSupervisory body J.P. Morgan Bank Luxembourg S.A. (Chairperson of the Board);J.P. Morgan Europe Limited (until June 23, 2020);Euroclear Holding S.A. (until June 12, 2020)
Guy America; no further mandates
Wanda EriksenSupervisory body: AXA Switzerland; AXA-ArAG Legal Protection Ltd (subsidiary of AXA);Catlin Re Switzerland Ltd (subsidiary of AXA); Aquila AG; Arnold AG (Vice Chair)
Marco Kistner (since February 1, 2021); no further mandates
Elena Korablina (until January 31, 2021); no further mandates
Christoph Fickel; no further mandates
Thomas Freise; no further mandates
38. Proposed allocation of earnings
Management Board and Supervisory Board propose to the annual general meeting to carry for-
ward the balance sheet profit of € 67,529 thousand for the financial year 2020 as based on local
German accounting regulation (HGB) to other revenue reserves.
39. Addendum report
In January 2021, subordinated notes amounting to € 1,630 million were issued. The notes were
acquired by a J.P. Morgan group entity. They fulfil the requirements of article 63 Crr. Also, in
the first quarter 2021, J.P. Morgan AG has taken over further trading positions from J.P. Morgan
Securities plc, London, in implementing the Group’s Brexit strategy.
In addition, no events have occurred after the end of the financial year which have a significant
effect on the asset, financial and earnings situation.

NOTES160
Frankfurt am Main, April 12, 2021
J.P. Morgan AG
Frankfurt am Main
The Management Board
STEFAN BEHr GUNNAr rEGIEr
NICHOLAS CONrON BUrKHArD KÜBEL-SOrGEr
CINDYrELLA AMISTADI

161NOTES
162
To J.P. Morgan AG, Frankfurt am Main
Report on the audit of the separate financial statements and of the management report
AUDIT OPINIONS
We have audited the separate financial statements of J.P. Morgan AG, Frankfurt am Main, which
comprise the statement of financial position as at December 31, 2020 and the statement of profit
and loss and other comprehensive income, the statement of changes in equity and the statement
of cash flows for the financial year from 1 January 1 to December 31, 2020 and the notes to the
financial statements, including a summary of significant accounting policies. In addition, we
have audited the management report of J.P. Morgan AG for the financial year from January 1 to
December 31, 2020. In accordance with the German legal requirements, we have not audited the
content of the statement on corporate governance pursuant to § [Article] 289f Abs. [paragraph]
4 HGB [Handelsgesetzbuch: German Commercial Code] (disclosures on the quota for women on
executive boards).
In our opinion, on the basis of the knowledge obtained in the audit,
• the accompanying separate financial statements comply, in all material respects, with the
IFrSs as adopted by the EU and the additional requirements of German commercial law pur-
suant to § 325 Abs. 2a HGB and, in compliance with these requirements, give a true and fair
view of the assets, liabilities, and financial position of the Company as at December 31, 2020,
and of its financial performance for the financial year from January 1 to December 31, 2020, and
• the accompanying management report as a whole provides an appropriate view of the Com-
pany’s position. In all material respects, this management report is consistent with the separate
financial statements, complies with German legal requirements and appropriately presents the
opportunities and risks of future development. Our audit opinion on the management report
does not cover the content of the statement on corporate governance referred to above.
Pursuant to § 322 Abs. 3 Satz [sentence] 1 HGB, we declare that our audit has not led to any
reservations relating to the legal compliance of the separate financial statements and of the
management report.
BASIS FOR THE AUDIT OPINIONS
We conducted our audit of the separate financial statements and of the management report in
accordance with § 317 HGB and the EU Audit Regulation (No. 537 /2014, referred to subse-
quently as “EU Audit Regulation”) in compliance with German Generally Accepted Standards
for Financial Statement Audits promulgated by the Institut der Wirtschaftsprüfer [Institute of
INDEPENDENT AUDITOr’S rEPOrT¹
INDEPENDENT AUDITOr’S rEPOrT
¹ Translation of the auditor’s report issued in German language on the separate financial statements prepared in German language by the management of J.P. Morgan AG

163
Public Auditors in Germany] (IDW). Our responsibilities under those requirements and principles
are further described in the “Auditor’s Responsibilities for the Audit of the Separate Financial
Statements and of the Management Report” section of our auditor’s report. We are independent
of the Company in accordance with the requirements of European law and German commercial
and professional law, and we have fulfilled our other German professional responsibilities in
accordance with these requirements. In addition, in accordance with Article 10 (2) point (f) of the
EU Audit Regulation, we declare that we have not provided non-audit services prohibited under
Article 5 (1) of the EU Audit Regulation. We believe that the audit evidence we have obtained
is sufficient and appropriate to provide a basis for our audit opinions on the separate financial
statements and on the management report.
KEY AUDIT MATTERS IN THE AUDIT OF THE SEPARATE FINANCIAL STATEMENTS
Key audit matters are those matters that, in our professional judgment, were of most significance
in our audit of the separate financial statements for the financial year from January 1 to Decem-
ber 31, 2020. These matters were addressed in the context of our audit of the separate financial
statements as a whole, and in forming our audit opinion thereon; we do not provide a separate
audit opinion on these matters.
In our view, the matters of most significance in our audit were as follows:
1 Valuation of complex financial instruments of “trading assets” and “trading
liabilities” at fair value
2 Risk provisions in the customer lending business
Our presentation of these key audit matters has been structured in each case as follows:
1 Matter and issue
2 Audit approach and findings
3 Reference to further information
Hereinafter, we present the key audit matters:
1 Valuation of complex financial instruments of “trading assets” and “trading liabilities”
at fair value1 J.P. Morgan AG enters into transactions in derivatives and structured products, which it
reports in the separate financial statements of the Company under the balance sheet items
“trading assets” and “trading liabilities”. The income and expenses from these transactions
are recognized in the item “Net result on financial assets and liabilities at fair value” in the
INDEPENDENT AUDITOr’S rEPOrT
164
statement of profit and loss. For the purposes of valuation, the Company determines the fair
value of these holdings in accordance with IFrS 13. Due to the lack of an active market, the
fair value of certain financial instruments is not determined on the basis of stock exchange
prices or other market prices, but by using valuation models. The valuation of these financial
instruments can therefore have greater estimation uncertainties, especially also considering
increased market volatility due to the COVID-19 pandemic. Within the Company’s total portfo-
lio of financial instruments, these estimation uncertainties relate specifically to the valuation
of certain structured products, as well as the valuation of commodity, interest rate, foreign
exchange and equity derivatives, including those which refer to specific indices across mul-
tiple asset classes. These products are not standardized and often require the fair value to
be determined using market standard and industry standard valuation models, taking into
account parameters specific to the financial instruments and market-related input factors. If
such parameters cannot be observed on an active market, the fair value is determined based
on estimated values and /or internal indicators of the Bank. In the case of model-valued
financial instruments, there is therefore an increased estimation uncertainty and /or a greater
bandwidth of justifiable ranges of fair values. This applies in particular to complex financial
instruments and when using non-observable parameters. In the light of the potential effects
of these estimation uncertainties on the separate financial statements, the valuation of these
products was of particular significance during our audit.
2 As part of our audit, we analyzed the model-valued holdings of financial instruments with
increased estimation uncertainties. We evaluated the appropriateness and effectiveness of
the relevant controls within the Company’s internal control system for the valuation of these
financial instruments, in particular in terms of the independency of the price validation from
the trading division, and the model validation. Using our internal specialists in financial
mathematics, we undertook an assessment of the suitability of the valuation models used
and the parameters used for selected securities, derivatives, and structured products. We
examined the consistency of the application of the valuation models. In addition, we carried
out an independent revaluation of selected products on a sample basis as at the balance sheet
date. Based on the audit procedures performed, we were able to satisfy ourselves that the
methods and assumptions used by the executive directors are overall suitable for determining
the model-valued holdings of financial instruments.
3 The information provided by the Company on the valuation of financial instruments at fair value
is included in the notes to the financial statements, in particular in the notes No. 8., No. 12. and
No. 30.
2 Risk provisions in the customer lending business1 One focus of the business activities of J.P. Morgan AG is the lending business, which is
reported in the Company’s separate financial statements under the balance sheet line items
“Loans and advances to customers” and “Loans and advances to banks”. The measurement
INDEPENDENT AUDITOr’S rEPOrT
165
of the risk provision in lending business is affected in particular by the structure and quality
of the loan portfolios, macroeconomic factors and the estimates of the executive directors
on future loan defaults, also with regards to the expected impact of the ongoing Corona
crisis on the lending business. The amount of the individual valuation allowance for loans
and advances corresponds to the difference between the outstanding loan amount and the
recoveries expected from the exposure. The Bank uses a discounted cash flow method to
determine the expected credit loss by forming three scenarios in accordance with IFrS 9.
Existing collateral is taken into account. To determine the general loan loss allowance,
the Bank uses statistical models to estimate the expected credit loss in accordance with
IFrS 9. The Bank has made management adjustments on the risk provision. These com-
prise a stronger weighting of adverse macroeconomic scenarios to take into account the
existing uncertainties resulting from the COVID-19 pandemic in order to determine a best
estimate of the expected losses. In addition, the Bank has made adjustments regarding
the estimation of LGD parameters for the leveraged finance business in order to sufficiently
reflect the expectations of the executive directors regarding the specific risks of leveraged
finance, which have not yet been taken into account in the models. The allowances and
provisions in the credit business are, on the one hand, highly significant for the Bank’s
assets, liabilities and financial performance and, on the other hand, involve considerable
estimations of the executive directors with regard to forecasts of macroeconomic variables
and scenarios as well as the cash flows still expected from a credit exposure. In addition,
the valuation parameters applied, which are also subject to significant uncertainties due
to the effects of the COVID-19 pandemic, have a significant influence on the recognition or
amount of any necessary valuation allowances. Against this background, this matter was
of particular significance in the context of our audit.
2 As part of our audit, we first assessed the adequacy of the IT systems and the design of the
controls in the relevant internal control system of the Company and tested the functionality
of the controls, in particular with regard to the recording of loan data, the risk classification
of borrowers, the determination of the risk provision, and the validation of the valuation
models. In addition, we assessed the valuation of loans, including the appropriate appli-
cation of valuation methods and reasonableness of estimated values, based on samples of
loan engagements. In doing so, we evaluated, among other things, the available documen-
tation of the Company with regard to the economic circumstances and the recoverability
of the corresponding collateral. Furthermore, in order to assess the valuation adjustments
made, we evaluated the valuation methods applied by the Company, the underlying input
data, macroeconomic assumptions and parameters as well as the results of the validation
actions. In evaluating the valuation methods, we involved our internal specialists in financial
mathematics. We assessed the executive directors’ assessment of the impact of the Corona
crisis on the economic circumstances of the borrowers and the appropriateness of the model
parameters and assumptions. We questioned the necessity of the creation of management
adjustments and assessed their quantification. On the basis of the audit procedures we per-
INDEPENDENT AUDITOr’S rEPOrT

166
formed, we were able to satisfy ourselves overall of the reasonableness of the assumptions
made by the executive directors when assessing the recoverability of the credit portfolio, and
of the appropriateness and effectiveness of the controls implemented by the Company.
3 The information provided by the Company on the risk provision in the credit business are
included in the note No. 5.4. and No. 35. of the notes to the financial statements.
OTHER INFORMATION
The executive directors are responsible for the other information. The other information com-
prises the statement on corporate governance pursuant § 289f Abs. 4 HGB (disclosures on the
quota for women on executive boards).
The other information also comprises the annual report – excluding cross-references to external
information – with the exception of the audited separate financial statements, the audited man-
agement report and our auditor’s report.
Our audit opinions on the separate financial statements and on the management report do not
cover the other information, and consequently we do not express an audit opinion or any other
form of assurance conclusion thereon.
In connection with our audit, our responsibility is to read the other information and, in so doing,
to consider whether the other information
• is materially inconsistent with the separate financial statements, with the management report
or our knowledge obtained in the audit, or
• otherwise appears to be materially misstated.
RESPONSIBILITIES OF THE ExECUTIVE DIRECTORS AND THE SUPERVISORY BOARD
FOR THE SEPARATE FINANCIAL STATEMENTS AND THE MANAGEMENT REPORT
The executive directors are responsible for the preparation of the separate financial statements
that comply, in all material respects, with IFrSs as adopted by the EU and the additional require-
ments of German commercial law pursuant to § 325 Abs. 2a HGB and that the separate financial
statements, in compliance with these requirements, give a true and fair view of the assets, lia-
bilities, financial position, and financial performance of the Company. In addition, the executive
directors are responsible for such internal control as they have determined necessary to enable
the preparation of separate financial statements that are free from material misstatement, whether
due to fraud or error.
INDEPENDENT AUDITOr’S rEPOrT

167
In preparing the separate financial statements, the executive directors are responsible for assess-
ing the Company’s ability to continue as a going concern. They also have the responsibility for
disclosing, as applicable, matters related to going concern. In addition, they are responsible for
financial reporting based on the going concern basis of accounting unless there is an intention
to liquidate the Company or to cease operations, or there is no realistic alternative but to do so.
Furthermore, the executive directors are responsible for the preparation of the management
report that, as a whole, provides an appropriate view of the Company’s position and is, in all
material respects, consistent with the separate financial statements, complies with German legal
requirements, and appropriately presents the opportunities and risks of future development. In
addition, the executive directors are responsible for such arrangements and measures (systems)
as they have considered necessary to enable the preparation of a management report that is in
accordance with the applicable German legal requirements, and to be able to provide sufficient
appropriate evidence for the assertions in the management report.
The supervisory board is responsible for overseeing the Company’s financial reporting process
for the preparation of the separate financial statements and of the management report.
AUDITOR’S RESPONSIBILITIES FOR THE AUDIT OF THE SEPARATE FINANCIAL
STATEMENTS AND OF THE MANAGEMENT REPORT
Our objectives are to obtain reasonable assurance about whether the separate financial statements
as a whole are free from material misstatement, whether due to fraud or error, and whether the
management report as a whole provides an appropriate view of the Company’s position and,
in all material respects, is consistent with the separate financial statements and the knowledge
obtained in the audit, complies with the German legal requirements and appropriately presents
the opportunities and risks of future development, as well as to issue an auditor’s report that
includes our audit opinions on the separate financial statements and on the management report.
Reasonable assurance is a high level of assurance, but is not a guarantee that an audit conducted
in accordance with § 317 HGB and the EU Audit Regulation and in compliance with German
Generally Accepted Standards for Financial Statement Audits promulgated by the Institut der
Wirtschaftsprüfer (IDW) will always detect a material misstatement. Misstatements can arise
from fraud or error and are considered material if, individually or in the aggregate, they could
reasonably be expected to influence the economic decisions of users taken on the basis of these
separate financial statements and this management report.
We exercise professional judgment and maintain professional scepticism throughout the audit.
We also:
INDEPENDENT AUDITOr’S rEPOrT

168
• Identify and assess the risks of material misstatement of the separate financial statements and
of the management report, whether due to fraud or error, design and perform audit procedures
responsive to those risks, and obtain audit evidence that is sufficient and appropriate to pro-
vide a basis for our audit opinions. The risk of not detecting a material misstatement resulting
from fraud is higher than for one resulting from error, as fraud may involve collusion, forgery,
intentional omissions, misrepresentations, or the override of internal controls.
• Obtain an understanding of internal control relevant to the audit of the separate financial state-
ments and of arrangements and measures (systems) relevant to the audit of the management
report in order to design audit procedures that are appropriate in the circumstances, but not
for the purpose of expressing an audit opinion on the effectiveness of these systems of the
Company.
• Evaluate the appropriateness of accounting policies used by the executive directors and the
reasonableness of estimates made by the executive directors and related disclosures.
• Conclude on the appropriateness of the executive directors’ use of the going concern basis of
accounting and, based on the audit evidence obtained, whether a material uncertainty exists
related to events or conditions that may cast significant doubt on the Company’s ability to
continue as a going concern. If we conclude that a material uncertainty exists, we are required
to draw attention in the auditor’s report to the related disclosures in the separate financial
statements and in the management report or, if such disclosures are inadequate, to modify our
respective audit opinions. Our conclusions are based on the audit evidence obtained up to the
date of our auditor’s report. However, future events or conditions may cause the Company to
cease to be able to continue as a going concern.
• Evaluate the overall presentation, structure and content of the separate financial statements,
including the disclosures, and whether the separate financial statements present the underly-
ing transactions and events in a manner that the separate financial statements give a true and
fair view of the assets, liabilities, financial position and financial performance of the Company
in compliance with IFrSs as adopted by the EU and the additional requirements of German
commercial law pursuant to § 325 Abs. 2a HGB.
• Evaluate the consistency of the management report with the separate financial statements, its
conformity with German law, and the view of the Company’s position it provides.
• Perform audit procedures on the prospective information presented by the executive directors
in the management report. On the basis of sufficient appropriate audit evidence, we evaluate,
in particular, the significant assumptions used by the executive directors as a basis for the
INDEPENDENT AUDITOr’S rEPOrT

169
prospective information and evaluate the proper derivation of the prospective information from
these assumptions. We do not express a separate audit opinion on the prospective information
and on the assumptions used as a basis. There is a substantial unavoidable risk that future
events will differ materially from the prospective information.
We communicate with those charged with governance regarding, among other matters, the
planned scope and timing of the audit and significant audit findings, including any significant
deficiencies in internal control that we identify during our audit.
We also provide those charged with governance with a statement that we have complied with
the relevant independence requirements, and communicate with them all relationships and other
matters that may reasonably be thought to bear on our independence and where applicable, the
related safeguards.
From the matters communicated with those charged with governance, we determine those mat-
ters that were of most significance in the audit of the separate financial statements of the current
period and are therefore the key audit matters. We describe these matters in our auditor’s report
unless law or regulation precludes public disclosure about the matter.
Other legal and regulatory Requirements
FURTHER INFORMATION PURSUANT TO ARTICLE 10 OF THE EU AUDIT REGULATION
We were elected as auditor by the annual general meeting on the April 30, 2020. We were
engaged by the supervisory board on the May 4, 2020. We have been the auditor of the
J.P. Morgan AG, Frankfurt am Main, without interruption since the financial year 1983.
We declare that the audit opinions expressed in this auditor’s report are consistent with the
additional report to the audit committee pursuant to Article 11 of the EU Audit Regulation (long-
form audit report).
INDEPENDENT AUDITOr’S rEPOrT

170
German Public Auditor Responsible for the Engagement
The German Public Auditor responsible for the engagement is Christoph Lehmann.
Frankfurt am Main, April 14, 2021
PricewaterhouseCoopers GmbH
Wirtschaftsprüfungsgesellschaft
sgd. Christoph Lehmann sgd. ppa. Kerstin Voeller
Wirtschaftsprüfer Wirtschaftsprüfer
(German Public Auditor) (German Public Auditor)
INDEPENDENT AUDITOr’S rEPOrT

171INDEPENDENT AUDITOr’S rEPOrT

172
rEPOrT OF THE SUPErVISOrY BOArD
SUPERVISION AND CONTROL
The Supervisory Board continuously has continuosly monitored the management on the basis of
written and verbal reporting and performed the duties for which it is responsible in accordance
with the applicable statutes. The Supervisory Board was informed of important matters about the
economic situation of the Bank, the business policy, the liquidity and capital as well as the risk
management. This has been done within and outside of the meetings of the Supervisory Board
and its committees by means of written and oral reporting, for example on the development of
the relevant economic performance indicators and on fundamental questions relating to further
business development. In addition, the Supervisory Board was kept informed in detail about risk
management on a quarterly basis.
PERSONNEL CHANGES IN THE MANAGEMENT BOARD
There was a personnel change in the Management Board during the financial year 2020. Dorothee
Blessing left the Management Board on October 31, 2020. In addition, Cindyrella Amistadi has
been appointed to Management Board on April 1, 2021.
PERSONNEL CHANGES IN THE SUPERVISORY BOARD
Wanda Eriksen has been appointed to the Supervisory Board as an external member of the Super-
visory Board on January 1, 2020. In addition, Marko Kistner was chosen for Elena Korablina as
a further external member of the Supervisory Board on February 1, 2021.
AUDIT COMMITTEE
For the financial year 2020, the Audit Committee discussed the annual financial statements and
the audit report on April 20, 2021 and they discussed the audit planning on September 8, 2020.
The Audit Committee is responsible for monitoring the accounting process, the effectiveness of
the internal control system, the risk management system and the internal auditing system as well
as the statutory audit, in particular the independence of the auditor and any additional services
performed by the auditor.
Based on the recommendations of the Audit Committee (see § 124 Para. 3 sentence 2 Companies
act (AktG)) in the annual general meeting held on April 26, 2021 and in accordance with the
statutory requirements, the auditor BDO AG Wirtschaftsprüfungsgesellschaft, Frankfurt am Main,
will be appointed for the audit of the annual financial statements, individual financial statements
in accordance with IFrS and the management report for the financial year 2021.
ANNUAL FINANCIAL STATEMENTS AND INDIVIDUAL IFRS FINANCIAL STATEMENTS
The annual financial statements, the individual financial statements according to IFrS and the
management report of the Management Board for the 2020 financial year, including the book-
keeping, have been audited by the auditing company PricewaterhouseCoopers GmbH, Frankfurt
am Main, selected as the auditor by the Annual General Meeting. The auditor raised no objections
rEPOrT OF THE SUPErVISOrY BOArD

173
and issued an unqualified audit opinion. The Management Board has also prepared a report on
affiliated companies (dependent company report) for the 2020 financial year in accordance with
Section 312 of the German Stock Corporation Act. The audit of the report by the Supervisory
Board did not reveal any objections. The auditor conducted its work on the Management Board’s
report on relationships with affiliated companies and issued the following auditor’s report:
“In accordance with our engagement, we have audited the report of the Management Board
pursuant to Section 312 of the German Stock Corporation Act on relationships with affiliated
companies in accordance with Section 313 of the German Stock Corporation Act for the financial
year 2020. As the final outcome of our audit did not give rise to any objections, we issue the
following auditor’s report in accordance with Section 313 (3) sentence 1 of the German Stock
Corporation Act:
After our dutiful examination and assessment, we confirm that:
1. The factual information in the report is correct,
2. In the legal transactions listed in the report, the performance of the company was not inap-
propriately overstated,
3. In the case of the measures listed in the report, there are no circumstances in favor of a material
assessment other than that by the Management Board.”
The Audit Committee discussed and reviewed the annual financial statements, the individual
financial statements in accordance with IFrS and the management report with the auditors
during the meeting on April 21, 2021. Based on the final result of the investigation carried out
by the Audit Committee, the Supervisory Board did not raise any objections. The annual finan-
cial statements, individual financial statements according to IFrS and the management report
prepared by the Management Board for the period ended December 31, 2020 were approved by
the Supervisory Board today. The annual financial statements, as submitted by the Management
Board, are hereby approved and established.
The Supervisory Board would like to express its sincere gratitude to the Management Board and
all employees of the Bank for their commitment and the work they have done together.
April 26, 2021
The Supervisory Board
MArK S. GArVIN
Chairperson of the Supervisory Board
rEPOrT OF THE SUPErVISOrY BOArD

174
The requirements in Article 89 of EU Directive 2013 /36 /EU (Capital Requirements Directive,
CrD IV) for country-by-country reporting were implemented into German law by the Banking
Act (KWG). The information below is shown before the elimination of transactions between
J.P. Morgan AG and its branches.
Crr institutions have to publish information about branches and subsidiaries broken down by
member states of the EU and third countries.
The following information refers to J.P. Morgan AG and its registered branches in 2020. The
amounts included in the table below are based on local German accounting regulations (HGB).
On December 31, 2020, J.P. Morgan AG had the branch offices listed in the overview.
J.P. Morgan AG and its listed branches have not received any public subsidies during this finan-
cial year.
Company name Location Country
J.P. Morgan AG – Brussels Branch Brussels Belgium
J.P. Morgan AG – Copenhagen Branch Copenhagen Denmark
J.P. Morgan AG – Paris Branch Paris France
J.P. Morgan AG – Milan Branch Milan Italy
J.P. Morgan AG – Amsterdam Branch Amsterdam Netherlands
J.P. Morgan AG – Oslo Branch Oslo Norway
J.P. Morgan AG – Warsaw Branch Warsaw Poland
J.P. Morgan AG – Madrid Branch Madrid Spain
J.P. Morgan AG – Stockholm Branch Stockholm Sweden
J.P. Morgan AG – London Branch London United Kingdom
ANNEX: COUNTrY-BY-COUNTrY rEPOrTING 2020
ANNEX: COUNTrY-BY-COUNTrY rEPOrTING
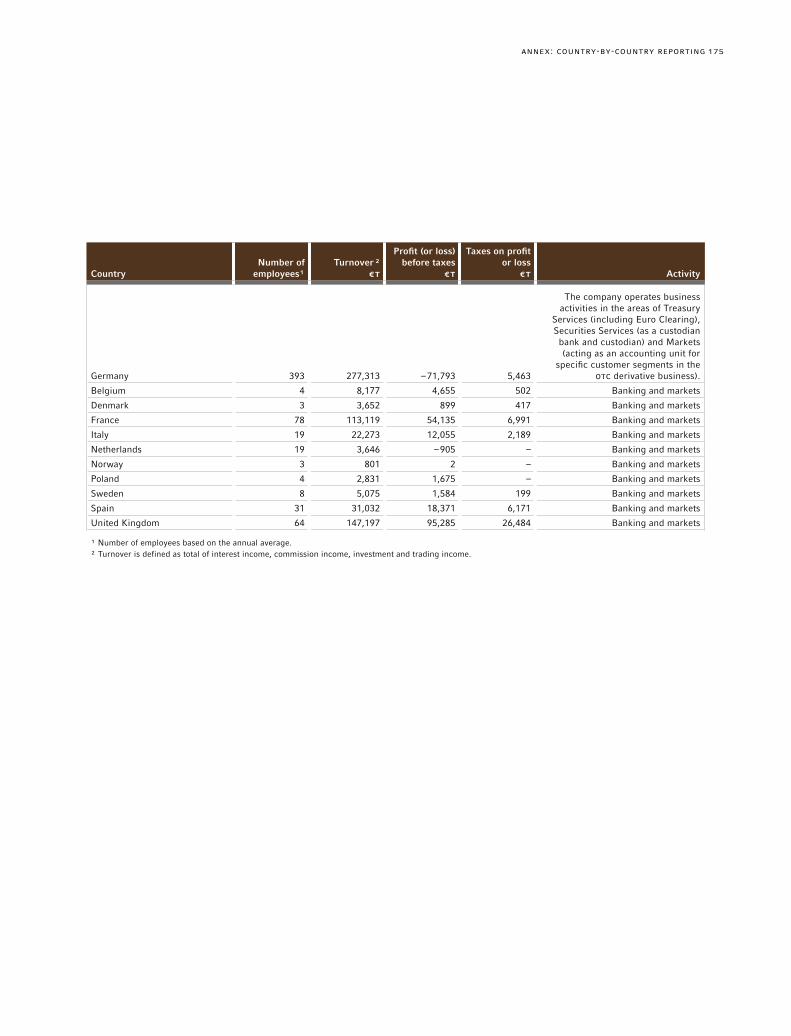
175
CountryNumber of
employees¹Turnover ²
€T
Profit (or loss) before taxes
€T
Taxes on profit or loss
€T Activity
Germany 393 277,313 –71,793 5,463
The company operates business activities in the areas of Treasury
Services (including Euro Clearing), Securities Services (as a custodian
bank and custodian) and Markets (acting as an accounting unit for
specific customer segments in the OTC derivative business).
Belgium 4 8,177 4,655 502 Banking and markets
Denmark 3 3,652 899 417 Banking and markets
France 78 113,119 54,135 6,991 Banking and markets
Italy 19 22,273 12,055 2,189 Banking and markets
Netherlands 19 3,646 –905 – Banking and markets
Norway 3 801 2 – Banking and markets
Poland 4 2,831 1,675 – Banking and markets
Sweden 8 5,075 1,584 199 Banking and markets
Spain 31 31,032 18,371 6,171 Banking and markets
United Kingdom 64 147,197 95,285 26,484 Banking and markets
¹ Number of employees based on the annual average.² Turnover is defined as total of interest income, commission income, investment and trading income.
ANNEX: COUNTrY-BY-COUNTrY rEPOrTING
176
INTRODUCTION:
Pursuant to §§ 21, 22 Entgelttransparenzgesetz, J.P. Morgan AG is required to report every three
years on measures taken to promote equality between women and men, and their effects, and to
establish equal pay for women and men, and to provide this report as an annex to the Manage-
ment Report. This is the first report published by J.P. Morgan AG in relation to such measures
(the number of employees of J.P. Morgan AG reached 500 during 2020 and therefore met the
requirement for providing this report for the first time).
MEASURES TO PROMOTE GENDER EqUALITY
At J.P. Morgan AG, we believe that a diverse workforce and an inclusive work environment are
critical to the success of our business, and that continues to include a commitment to gender
diversity. In 2017, the Supervisory Board has set a target of 30% females for both the Supervisory
Board and the Management Board. J.P. Morgan AG is striving to achieve these targets by June
2022. At the same time, the Management Board has set a 30% female gender target for both
management levels below the Management Board. In addition, globally, at JPMorgan Chase &
Co. (“the Firm”), women represent nearly half of the Operating Committee of and nearly 50%
of its global workforce, and we are committed to supporting the advancement of women at all
stages of their careers.
While we have made progress in increasing women’s representation at all levels, there is still
more work to do. Working with our managers and leaders, we will continue to engage, develop
and empower women, and expand opportunities for growth.
ADVANCING WOMEN IS A KEY PRIORITY
As part of JPMorgan Chase & Co, J.P. Morgan AG is committed to strengthening our diverse and
inclusive culture and providing easily accessible resources to employees at all levels. Throughout
2019 and 2020, the Firm has had programmes at the regional and global level designed to assist
our employees in their professional and personal development and to help attract, develop and
retain top talent:
Women on the Move Interactive Network (WOTM): One of the many Business Resources Groups
(BrGs) within the Firm, WOTM collaborates with lines of business, locations and human resources
to provide members with access to tools that enable the successful retention, development and
advancement of women at all levels at the Firm. Key achievements in the last year within J.P.
Morgan AG have included the promotion of the “Men as Allies” initiative, Wellness events, Men-
toring Circles and country-specific initiatives such as mentoring programmes.
Journey to Inclusive Teams: J.P. Morgan AG is helping managers and employees mitigate bias
and make better decisions every day through new digital learning experiences, interactive virtual
webinars and in-person sessions focused on driving inclusion. The course content is based on
neuroscience and is developed in partnership with industry experts.
ANNEX: EQUAL PAY rEPOrTING 2020 (UNAUDITED)
ANNEX: EQUAL PAY rEPOrTING 2020 (UNAUDITED)

177
parents@jpmc: A web page that promotes parental programs and provides practical support and
tools to help working parents. Resources provided include information about benefits, time away
from work policies, feeding support, adoption assistance, child care options, mentor programs
and education.
Board Readiness: We have partnered with an external organization to deliver bespoke board
readiness workshops. The sessions are designed for women considering their first board role
or seeking to add a new non-executive director or trustee role to their portfolio. This is open to
Vice Presidents and above across the region.
Skills Building Workshops: We work with external organizations to host skills-building workshops
to help our women prepare for a range of difficult conversations in the modern work environment.
These workshops are currently offered across the region and focus on topics such as impact,
influence, brand, emotional intelligence, leadership, presenting.
Leadership Edge: Leadership Edge is our firmwide set of in-class programmes and resources to
develop great managers and leaders, and build one strong leadership culture. Aspiring managers
can take the self-guided learning program, EXPLOrE, and all employees have access to the leader-
ship center, iLead, a curated selection of leadership and management insights, tools and activities.
30–5–1 Campaign: The 30–5–1 global campaign is a framework designed to support women’s
career advancement. The message is simple: a senior leader should spend 30 minutes a week
having coffee with a talented woman; spend 5 minutes a week congratulating a female colleague
on a win or success; and spend 1 minute a week celebrating their successes with other colleagues.
As a major employer across Europe, J.P. Morgan AG is committed to diversity in its workforce and
we are taking a disciplined and regionally tailored approach to help us make further progress.
MEASURES TO CREATE EqUAL PAY FOR WOMEN AND MEN
Our commitment to diversity and inclusion at all levels of the firm extends to our governance
mechanisms, systems and controls which are designed to pay employees fairly for the work they
do, regardless of who they are. We believe our compensation philosophy promotes an equitable
and well governed approach to compensation including pay-for-performance practices that attract
and retain top talent, are responsive to and aligned with shareholders, and encourage a shared
success culture in support of our business principles and strategic framework.
The Firm’s most recent internal review concluded that, globally, women are paid 99% of what
men are paid, taking into account several factors that potentially impact pay. The Firm has made
a commitment to annually disclose this measure. These measures are designed to provide insight
into the Firm’s efforts to provide fair compensation and opportunity.
ANNEX: EQUAL PAY rEPOrTING 2020 (UNAUDITED)

178
These measures reflect that pay decisions are based on many non-discriminatory factors, such
as an employee’s role, tenure, seniority and geography. If we identify individuals with compen-
sation that is less than expected, we conduct further review and, where appropriate, proactively
address it. The Firm recognizes that analyses such as pay equity reviews are only a starting point.
We believe that a more impactful way to further our commitment to fair compensation and
opportunity is to continue to focus on expanding advancement opportunities at more senior levels
across J.P. Morgan AG for diverse employees, building diversity into performance development,
and cultivating a diverse and inclusive environment at all stages of the employee life cycle.
STATISTICAL DATA
J.P. Morgan AG employed an average of 256 female and 348 male employees in 2020. Of these,
an average of 189 women and 338 men worked full-time and 67 women and 10 men worked
part-time.
ANNEX: EQUAL PAY rEPOrTING 2020 (UNAUDITED)

179ANNEX: EQUAL PAY rEPOrTING 2020 (UNAUDITED)

180
PUBLISHER
J.P. Morgan AG, Frankfurt am Main
Taunustor 1
60310 Frankfurt am Main
LAYOUT / DESIGN
HEISTErS & PArTNEr, Corporate & Brand Communication,
Mainz, Germany
IMPrINT


J.P. Morgan AG, Frankfurt am Main
Taunustor 1
60310 Frankfurt am Main