Embed Size (px)
Citation preview
ANNUAL REPORT 2020Y E A R E N D E D 3 0 S E P T E M B E R 2 0 2 0
P L AT F O R M E D F O R
OUR ORCHARDS BLOSSOM LATE JULY TO EARLY SEPTEMBER
2 Select Harvests Annual Report 2020
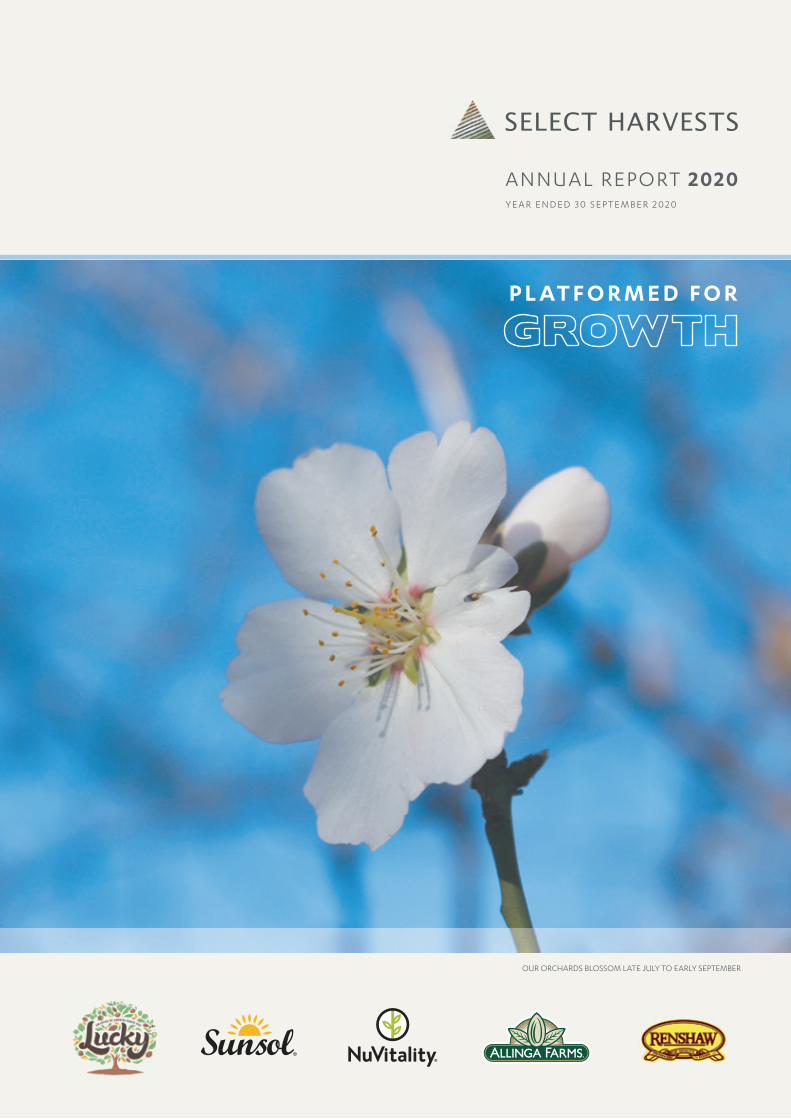
GEOGRAPHIC DIVERSITY
Adelaide
Melbourne
NORTHERNREGION
SOUTHERNREGION
CENTRALREGION
Sydney
EUSTON
LAKECULLULLERAINE
PARINGA
HILLSTON
GRIFFITH
ROBINVALE
THOMASTOWN
LOXTON
WAIKERIE
SELECT HARVESTS ORCHARDS
PROCESSING CENTRES
7,696HA(19,016 ACRES)
TOTAL PLANTED AREA
2,670HA(6,597 ACRES)
SOUTHERN REGIONPLANTED AREA
3,078HA(7,605 ACRES)
CENTRAL REGIONPLANTED AREA
1,948HA(4,814 ACRES)
NORTHERN REGIONPLANTED AREA
The strategy to have geographic diversity between our orchards limits our exposure to the weather, the spread of disease and insect infestation.
Geographic diversity also enhances the availability of labour.
AUSTRALIA
PIANGIL ALMOND ORCHARD
1,566 hectares planted almond trees(NOT INCLUDED IN ACREAGE FIGURES BELOW)
Sale and Implementation Deed entered in October 2020
3Select Harvests Annual Report 2020
CompanyProfile
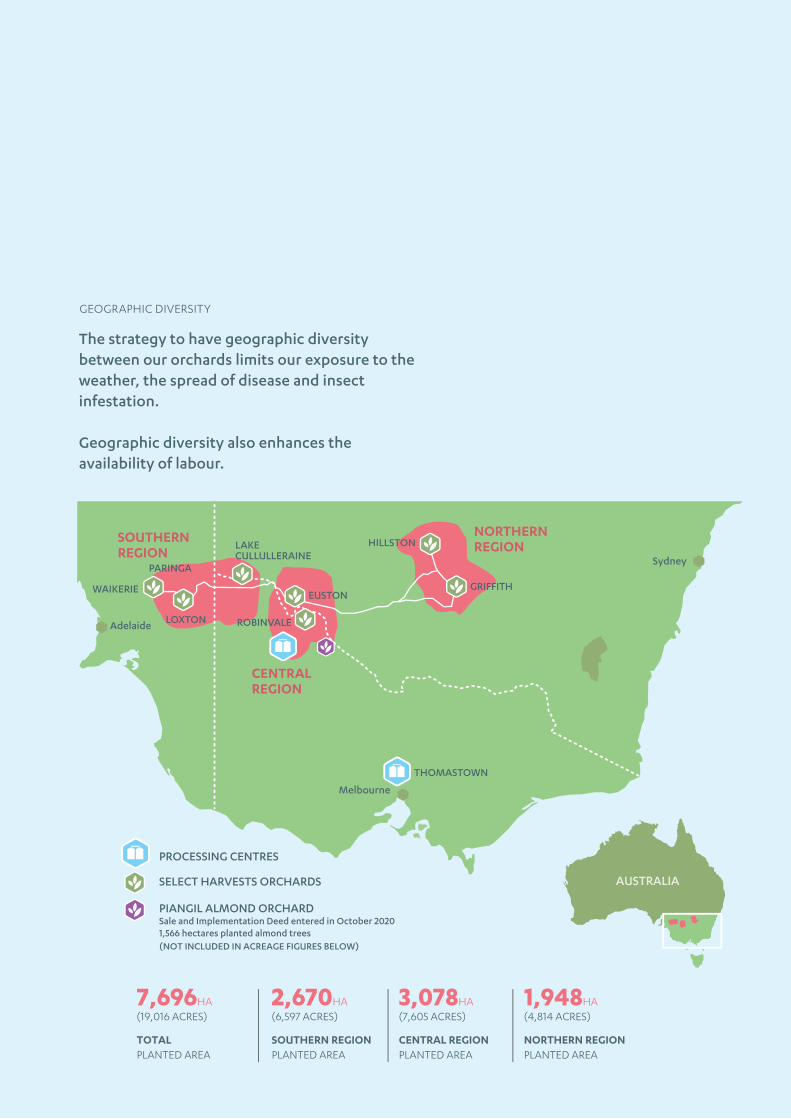
Select Harvests is one of Australia’s largest almond growers and a leading manufacturer, processor and marketer of nut products, health snacks and muesli. We supply the Australian retail and industrial markets plus export almonds globally.
We are Australia’s second largest almond producer and marketer with core capabilities across: Horticulture, Orchard Management, Nut Processing, Sales and Marketing. These capabilities enable us to add value throughout
Our Operations
Export
Our Brands
Our Vision
Our geographically diverse almond orchards are at or near maturity. Located in Victoria, South Australia and New South Wales our portfolio includes more than 7,689 Ha (19,000 acres) of company owned and leased almond orchards and land suitable for planting. These orchards, plus other independent orchards, supply our state-of-the-art processing facility at Carina West near Robinvale, Victoria and our value-added processing facility at Thomastown in the Northern Suburbs of Melbourne. Our Carina West processing facility has the capacity to process 25,000 MT of almonds in the peak season and is capable of meeting the ever increasing demand for in-shell, kernel and value-added product. Our processing plant in Thomastown processes over 10,000 MT of product per annum.
Select Harvests is one of Australia’s largest almond exporters and continues to build strong relationships in the fast growing markets of India and China, as well as maintaining established routes to markets in Asia, Europe and the Middle East.
The Select Harvests Food Division provides a capability and route to market domestically and around the world for processed almonds and other natural products. It supplies both branded and private label products to the key retailers, distributors and industrial users. Our market leading brands are: Lucky, NuVitality, Sunsol, Allinga Farms and Soland in retail; Renshaw and Allinga Farms in wholesale and industrial markets. In addition to almonds, we market a broad range of snacking and cooking nuts, health mixes and muesli.
For Select Harvests to be recognised as one of Australia’s most respected agrifood businesses.
METRIC TONNES
19,000
18,000
17,000
16,000
15,000
14,000
13,000
12,000
11,000
10.000
2014 2015 2016 2017 2018
5,389HA
5,597HA
7,135HA
7,677HA
TONNAGE TOTALSWEIGHT OF KERNELS PER ANNUM
6,687HA
CONTINUED BRAND INVESTMENT
TM
Select Harvests Annual Report November 2019 3
Company Profile
Select Harvests is one of Australia’s largest almond growers and a leading manufacturer, processor and marketer of nut products, health snacks and muesli. We supply the Australian retail and industrial markets plus export almonds globally.
We are Australia’s second largest almond producer and marketer with core capabilities across: Horticulture, Orchard Management, Nut Processing, Sales and Marketing. These capabilities enable us to add value throughout the value chain.
Our Operations
Our geographically diverse almond orchards are located in Victoria, South Australia and New South Wales with a portfolio that includes more than 7,696 Ha (19,016 acres) of company owned and leased almond orchards and land suitable for planting. These orchards, plus other independent orchards, supply our state-of-the-art processing facility at Carina West near Robinvale, Victoria and our value-added processing facility at Thomastown in the Northern Suburbs of Melbourne.
Our Carina West processing facility has the capacity to process above 30,000Mt of almonds in the peak season and is capable of meeting the ever increasing demand for in-shell, kernel and value-added product. Our processing plant in Thomastown processes over 10,000Mt of product per annum.
Export
Select Harvests is one of Australia’s largest almond exporters and continues to build strong relationships in the fast growing markets of India and China, as well as maintaining established routes to markets in Asia, Europe and the Middle East.
Our Brands
The Select Harvests Food Division provides a capability and route to market domestically and around the world for processed almonds and other natural products. It supplies both branded and private label products to the key retailers, distributors and industrial users. Our market leading brands are: Lucky, NuVitality and Sunsol in retail; Renshaw and Allinga Farms in wholesale and industrial markets.
In addition to almonds, we market a broad range of snacking and cooking nuts, health mixes and muesli.
Our Vision
To be a leader in the supply of better for you plant-based foods.
METRIC TONNES
19,000
20,000
21,000
22,000
23,000
18,000
17,000
16,000
15,000
14,000
13,000
12,000
11,000
10,000
9,000
8,000
7,000
6,000
2014 2015 2016 2017 2018 2019 2020
10,500MT
14,100MT
15,700MT
TONNAGE TOTALSWEIGHT OF KERNELS PER ANNUM
14,200MT
CONTINUED STRATEGIC INVESTMENT IN OUR BRANDS
TM
14,500MT
22,690MT
23,250MT
4 Select Harvests Annual Report 2020
Contents
3 Company Profile
4 Contents
5 Performance Summary
6 Chair & Managing Director’s Report
12 Almond Division
13 Food Division
14 People & Diversity
14 Communities
14 OH&S
14 Sustainability & Environment
16 Executive Team
17 Board of Directors
18 Historical Summary
19 Financial Report
20 Directors' Report
28 Remuneration Report
40 Auditor’s Independence Declaration
41 Annual Financial Report
43 Statement of Comprehensive Income
44 Balance Sheet
45 Statement of Changes in Equity
46 Statement of Cash Flows
47 Notes to the Financial Statements
77 Directors' Declaration
78 Independent Auditor’s Report
85 ASX Additional Information
87 Corporate Information
4
Contents
1 Company Profile
2 Contents
3 Performance Summary
4 Chairman & Managing Director’s Report
8 Strategy
10 Almond Division
11 Food Division
12 People & Diversity
12 Communities
12 OH&S
12 Sustainability & Environment
14 Executive Team
15 Board of Directors
16 Historical Summary
17 Financial Report
18 Directors’ Report
24 Remuneration Report
37 Auditor’s Independence Declaration
38 Statement of Comprehensive Income
39 Balance Sheet
40 Statement of Changes in Equity
41 Statement of Cash Flows
42 Notes to the Financial Statements
71 Directors’ Declaration
72 Independent Auditor’s Report
79 ASX Additional Information
81 Corporate Information
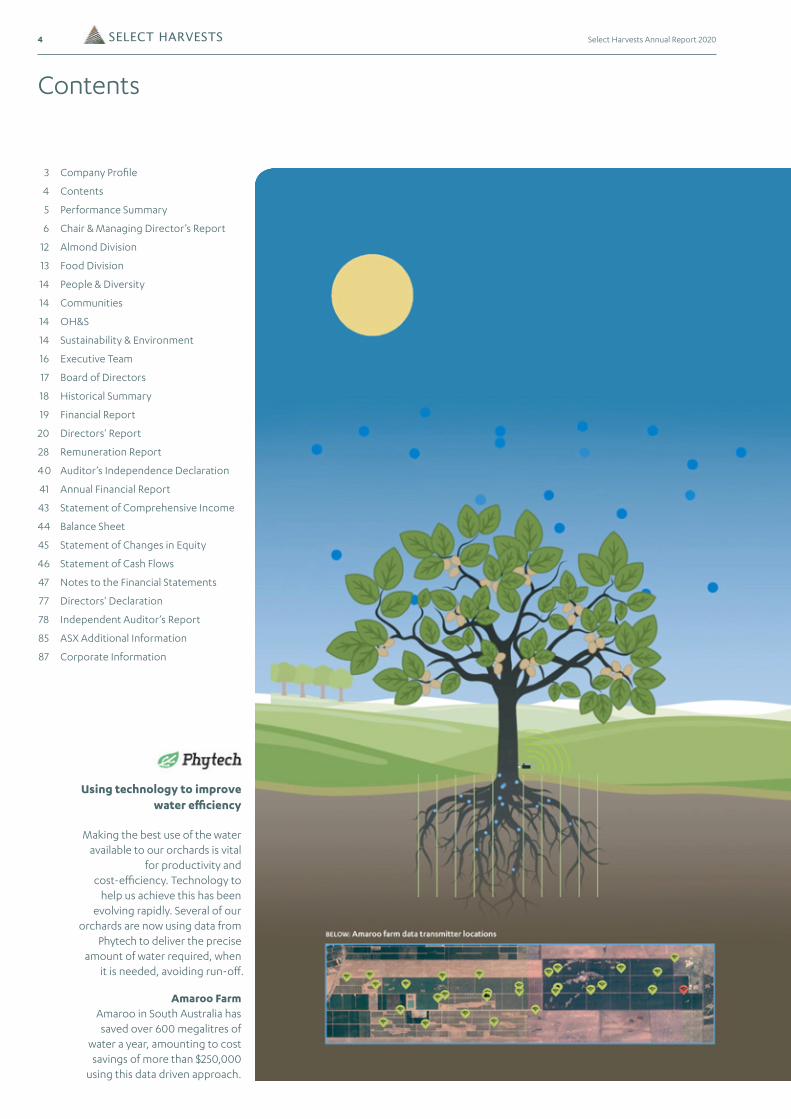
BELOW: Amaroo farm data transmitter locations
Using technology to improve water efficiency
Making the best use of the water available to our orchards is vital
for productivity and cost-efficiency. Technology to
help us achieve this has been evolving rapidly. Several of our
orchards are now using data from Phytech to deliver the precise
amount of water required, when it is needed, avoiding run-off.
Amaroo FarmAmaroo in South Australia has saved over 600 megalitres of
water a year, amounting to cost savings of more than $250,000
using this data driven approach.
5Select Harvests Annual Report 2020
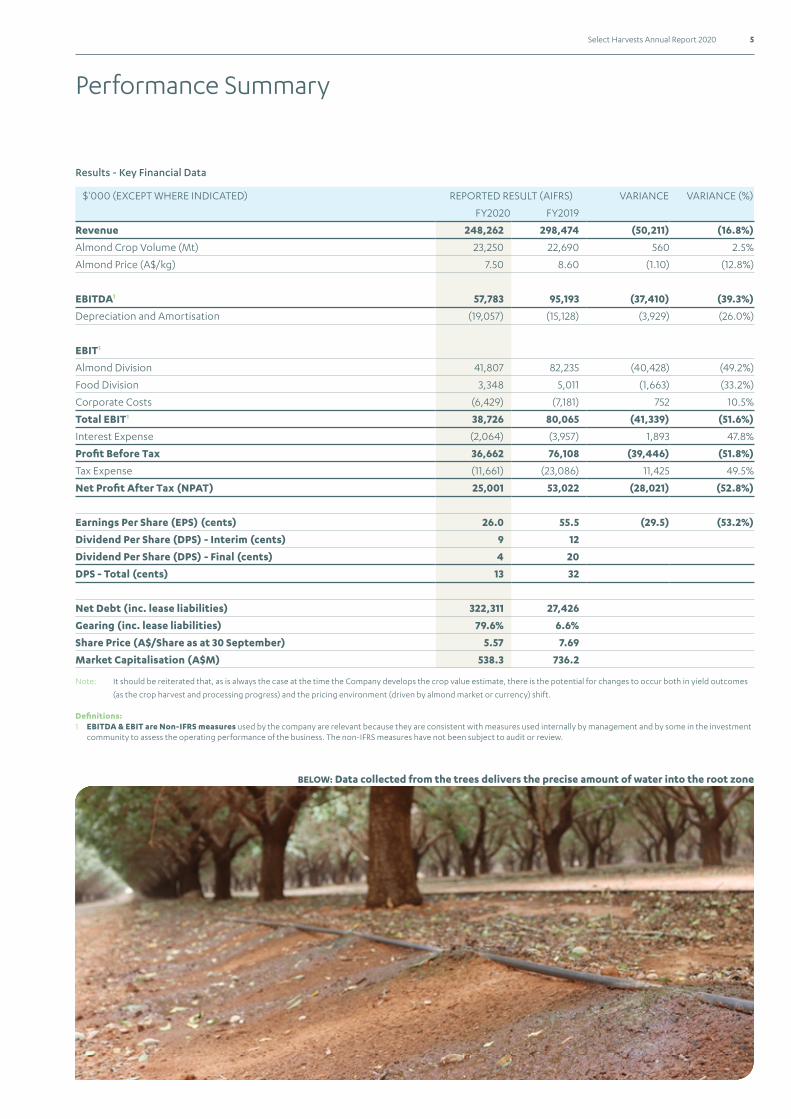
Performance Summary
Results - Key Financial Data
$'000 (EXCEPT WHERE INDICATED) REPORTED RESULT (AIFRS) VARIANCE VARIANCE (%)
FY2020 FY2019
Revenue 248,262 298,474 (50,211) (16.8%)
Almond Crop Volume (Mt) 23,250 22,690 560 2.5%
Almond Price (A$/kg) 7.50 8.60 (1.10) (12.8%)
EBITDA1 57,783 95,193 (37,410) (39.3%)
Depreciation and Amortisation (19,057) (15,128) (3,929) (26.0%)
EBIT1
Almond Division 41,807 82,235 (40,428) (49.2%)
Food Division 3,348 5,011 (1,663) (33.2%)
Corporate Costs (6,429) (7,181) 752 10.5%
Total EBIT1 38,726 80,065 (41,339) (51.6%)
Interest Expense (2,064) (3,957) 1,893 47.8%
Profit Before Tax 36,662 76,108 (39,446) (51.8%)
Tax Expense (11,661) (23,086) 11,425 49.5%
Net Profit After Tax (NPAT) 25,001 53,022 (28,021) (52.8%)
Earnings Per Share (EPS) (cents) 26.0 55.5 (29.5) (53.2%)
Dividend Per Share (DPS) - Interim (cents) 9 12
Dividend Per Share (DPS) - Final (cents) 4 20
DPS - Total (cents) 13 32
Net Debt (inc. lease liabilities) 322,311 27,426
Gearing (inc. lease liabilities) 79.6% 6.6%
Share Price (A$/Share as at 30 September) 5.57 7.69
Market Capitalisation (A$M) 538.3 736.2
Note: It should be reiterated that, as is always the case at the time the Company develops the crop value estimate, there is the potential for changes to occur both in yield outcomes
(as the crop harvest and processing progress) and the pricing environment (driven by almond market or currency) shift. Definitions: 1 EBITDA & EBIT are Non-IFRS measures used by the company are relevant because they are consistent with measures used internally by management and by some in the investment community to assess the operating performance of the business. The non-IFRS measures have not been subject to audit or review.
BELOW: Data collected from the trees delivers the precise amount of water into the root zone
6 Select Harvests Annual Report 2020
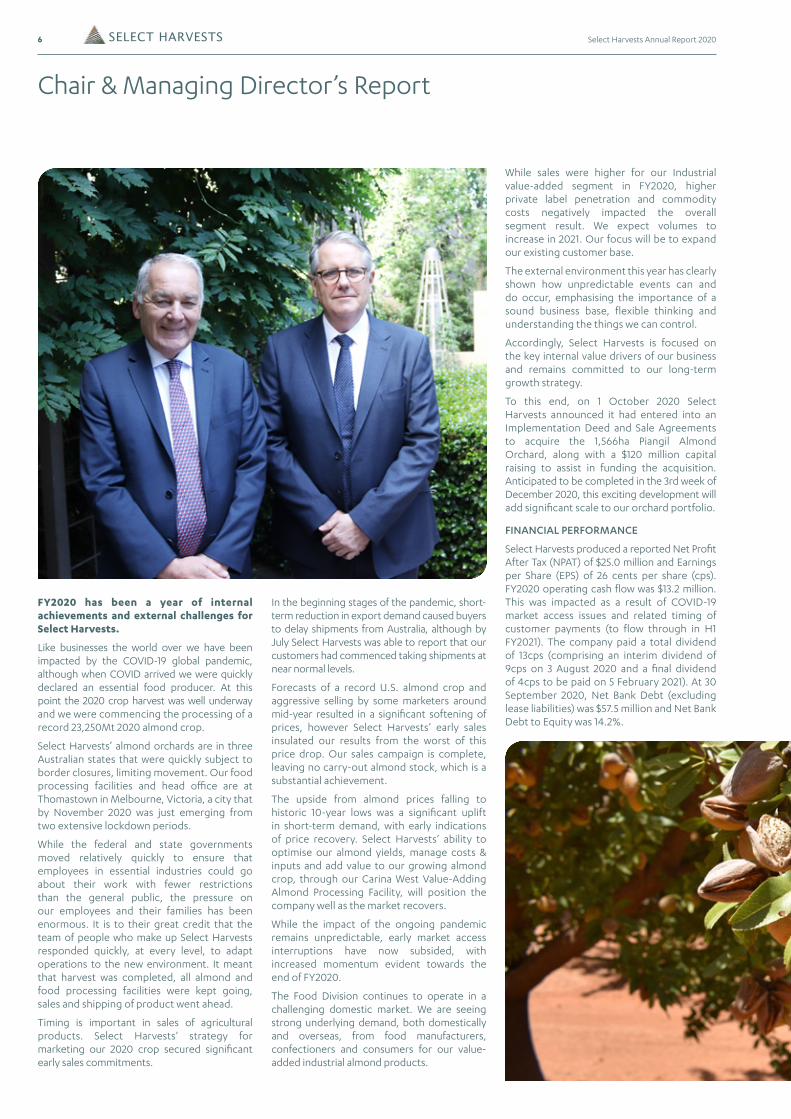
Chair & Managing Director’s Report
In the beginning stages of the pandemic, short-term reduction in export demand caused buyers to delay shipments from Australia, although by July Select Harvests was able to report that our customers had commenced taking shipments at near normal levels.
Forecasts of a record U.S. almond crop and aggressive selling by some marketers around mid-year resulted in a significant softening of prices, however Select Harvests’ early sales insulated our results from the worst of this price drop. Our sales campaign is complete, leaving no carry-out almond stock, which is a substantial achievement.
The upside from almond prices falling to historic 10-year lows was a significant uplift in short-term demand, with early indications of price recovery. Select Harvests’ ability to optimise our almond yields, manage costs & inputs and add value to our growing almond crop, through our Carina West Value-Adding Almond Processing Facility, will position the company well as the market recovers.
While the impact of the ongoing pandemic remains unpredictable, early market access interruptions have now subsided, with increased momentum evident towards the end of FY2020.
The Food Division continues to operate in a challenging domestic market. We are seeing strong underlying demand, both domestically and overseas, from food manufacturers, confectioners and consumers for our value-added industrial almond products.
While sales were higher for our Industrial value-added segment in FY2020, higher private label penetration and commodity costs negatively impacted the overall segment result. We expect volumes to increase in 2021. Our focus will be to expand our existing customer base.
The external environment this year has clearly shown how unpredictable events can and do occur, emphasising the importance of a sound business base, flexible thinking and understanding the things we can control.
Accordingly, Select Harvests is focused on the key internal value drivers of our business and remains committed to our long-term growth strategy.
To this end, on 1 October 2020 Select Harvests announced it had entered into an Implementation Deed and Sale Agreements to acquire the 1,566ha Piangil Almond Orchard, along with a $120 million capital raising to assist in funding the acquisition. Anticipated to be completed in the 3rd week of December 2020, this exciting development will add significant scale to our orchard portfolio.
FINANCIAL PERFORMANCE
Select Harvests produced a reported Net Profit After Tax (NPAT) of $25.0 million and Earnings per Share (EPS) of 26 cents per share (cps). FY2020 operating cash flow was $13.2 million. This was impacted as a result of COVID-19 market access issues and related timing of customer payments (to flow through in H1 FY2021). The company paid a total dividend of 13cps (comprising an interim dividend of 9cps on 3 August 2020 and a final dividend of 4cps to be paid on 5 February 2021). At 30 September 2020, Net Bank Debt (excluding lease liabilities) was $57.5 million and Net Bank Debt to Equity was 14.2%.
FY2020 has been a year of internal achievements and external challenges for Select Harvests.
Like businesses the world over we have been impacted by the COVID-19 global pandemic, although when COVID arrived we were quickly declared an essential food producer. At this point the 2020 crop harvest was well underway and we were commencing the processing of a record 23,250Mt 2020 almond crop.
Select Harvests’ almond orchards are in three Australian states that were quickly subject to border closures, limiting movement. Our food processing facilities and head office are at Thomastown in Melbourne, Victoria, a city that by November 2020 was just emerging from two extensive lockdown periods.
While the federal and state governments moved relatively quickly to ensure that employees in essential industries could go about their work with fewer restrictions than the general public, the pressure on our employees and their families has been enormous. It is to their great credit that the team of people who make up Select Harvests responded quickly, at every level, to adapt operations to the new environment. It meant that harvest was completed, all almond and food processing facilities were kept going, sales and shipping of product went ahead.
Timing is important in sales of agricultural products. Select Harvests’ strategy for marketing our 2020 crop secured significant early sales commitments.
7Select Harvests Annual Report 2020
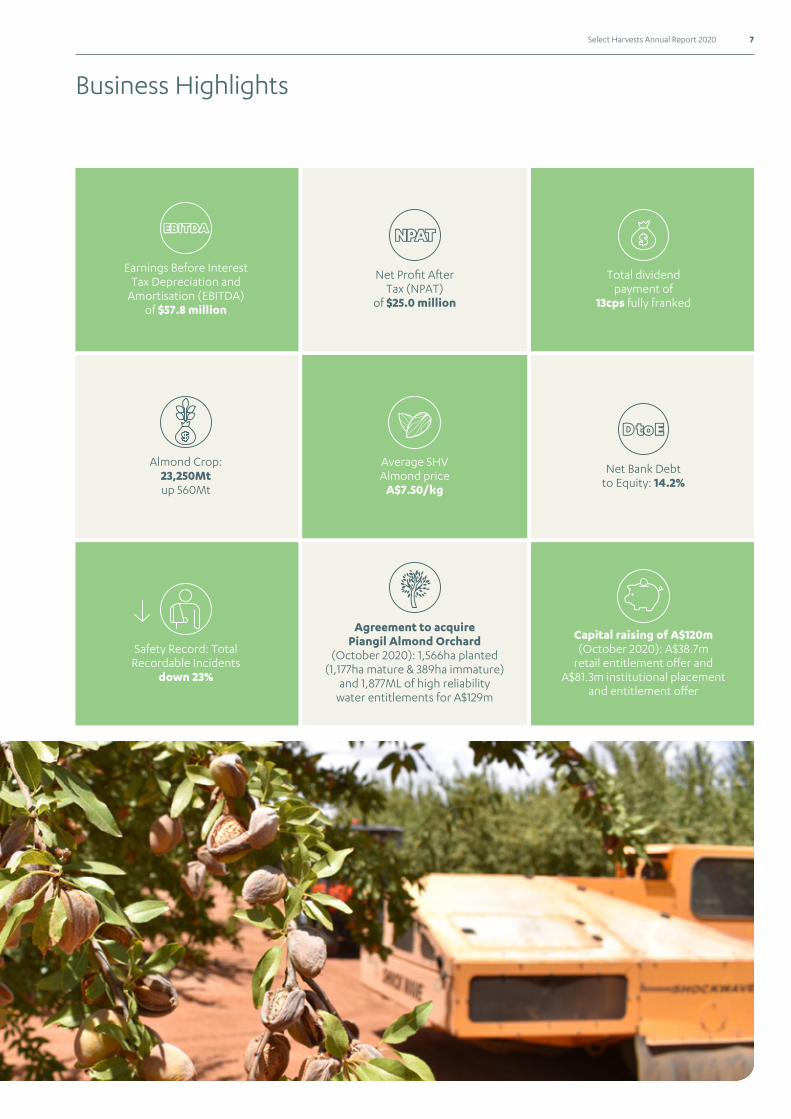
Earnings Before InterestTax Depreciation and
Amortisation (EBITDA)of $57.8 million
Net Profit AfterTax (NPAT)
of $25.0 million
Total dividendpayment of
13cps fully franked
Safety Record: TotalRecordable Incidents
down 23%
Agreement to acquirePiangil Almond Orchard
(October 2020): 1,566ha planted(1,177ha mature & 389ha immature)
and 1,877ML of high reliabilitywater entitlements for A$129m
Capital raising of A$120m(October 2020): A$38.7m
retail entitlement offer andA$81.3m institutional placement
and entitlement offer
Almond Crop:23,250Mtup 560Mt
Average SHVAlmond price
A$7.50/kg
Net Bank Debtto Equity: 14.2%
Business Highlights
8 Select Harvests Annual Report 2020
Chair & Managing Director’s ReportContinued
FOOD DIVISION
The Food Division produced an EBIT of $3.3 million in FY2020. While sales were higher for our value-added Industrial segment in FY2020, higher consumer private label penetration and commodity costs negatively impacted the overall result.
In FY2020 there was further investment in the Sunsol and Lucky brands, with new national ranging of products achieved. Sunsol domestic sales growth was strong, with very positive early responses from major customers to our new product development.
Consumer demand for healthier food products is growing in Asian markets. These markets remain a focus for Select Harvests. However, our in-country export market development was held back in FY2020 due to COVID-19 related travel restrictions.
The Thomastown processing facility, warehouse and corporate office lease expires on 30 June 2022 and as advised previously, Management is currently undertaking a comprehensive review of the Food Division. This review covers both strategic growth options and supply chain solutions to support the various options under consideration. The review is expected to be concluded by the end of 2020.
SAFETY, SUSTAINABILITY & WELLBEING
Select Harvests’ number one objective is to ensure the safety of our people, by preventing injuries before they occur. The aim of the Select Harvests Zero Harm Safety and Wellbeing strategy is to improve our safety performance by 15% per annum until we operate in a zero-harm environment. Overall, total recordable incidents reduced by 23% in FY2020.
Due to the COVID-19 global pandemic, Select Harvests was designated by government as a ‘permitted business’, with no restrictions other than the requirement to operate under a ‘COVID-19 Safe Plan’. We have been able to operate throughout the pandemic period and during the Stage 4 Victorian lockdown.
Appropriate protocols and procedures have been put in place to protect our employees and manage the health and wellbeing risks associated with COVID-19.
MARKET OUTLOOK
The estimated record 2020 U.S. almond crop of 3.0 billion pounds (1.4 million tonnes) and challenges relating to market access due to COVID-19 resulted in a significant softening of the almond price in mid-2020.
Amidst this, global demand for healthy plant-based foods, like almonds, continues to grow.
Recent monthly U.S. almond shipment data shows that demand responded strongly to historic 10-year low almond prices, with record monthly shipments to key world markets, India in particular. This represents significant growth in consumptive demand and should avoid any large, long-term surplus remaining in the market.
Select Harvests’ next crop will begin harvest in February 2021, with early deliveries reaching the market in April. By this time, a more definitive market and pricing environment is likely to have appeared, supporting our next marketing campaign.
STRATEGY
The underlying fundamentals of our business remain strong. Demand for almonds, including raw almonds and value-added almond products, is increasing globally.
Achieving consistent high yielding performance from our mature almond orchards and efforts to increase immature yields underpins the multi-year growth strategy for Select Harvests.
Our strategic priority to ‘Optimise the Almond Base’ has been further strengthened with the October 2020 agreement to acquire the Piangil Almond Orchard.*
Select Harvests’ average orchard age, with the inclusion of Piangil, is 12.3 years, with 95% of current planted hectares cash generative. Almond orchards remain economically viable for +25 years, providing Select Harvests with a solid foundation for long term growth.
Demand for value-added industrial almond products has been increasing in recent years. Not only are these products sold at a premium to other almonds, but demand is more stable and less price sensitive, as value-added almond products are often a key ingredient in consumer plant-based food and beverages, like almond milk.
Select Harvests’ strategic investment in our Carina West Almond Value-Adding Facility is targeted at meeting these trends. We will look to make further strategic capital investments in our Carina West Facility, as the demand for innovative and value-added almond products is increasing.
Optimising our almond based business through increased productivity and achieving sustainably high yields remains our key strategic objective. We continue to assess options to increase our almond production base through acquisitions if suitable orchards become available. We also continue to assess opportunities to diversify into other tree nuts, where we can utilise our expertise around multi-site orchard management, processing, and strategic marketing.
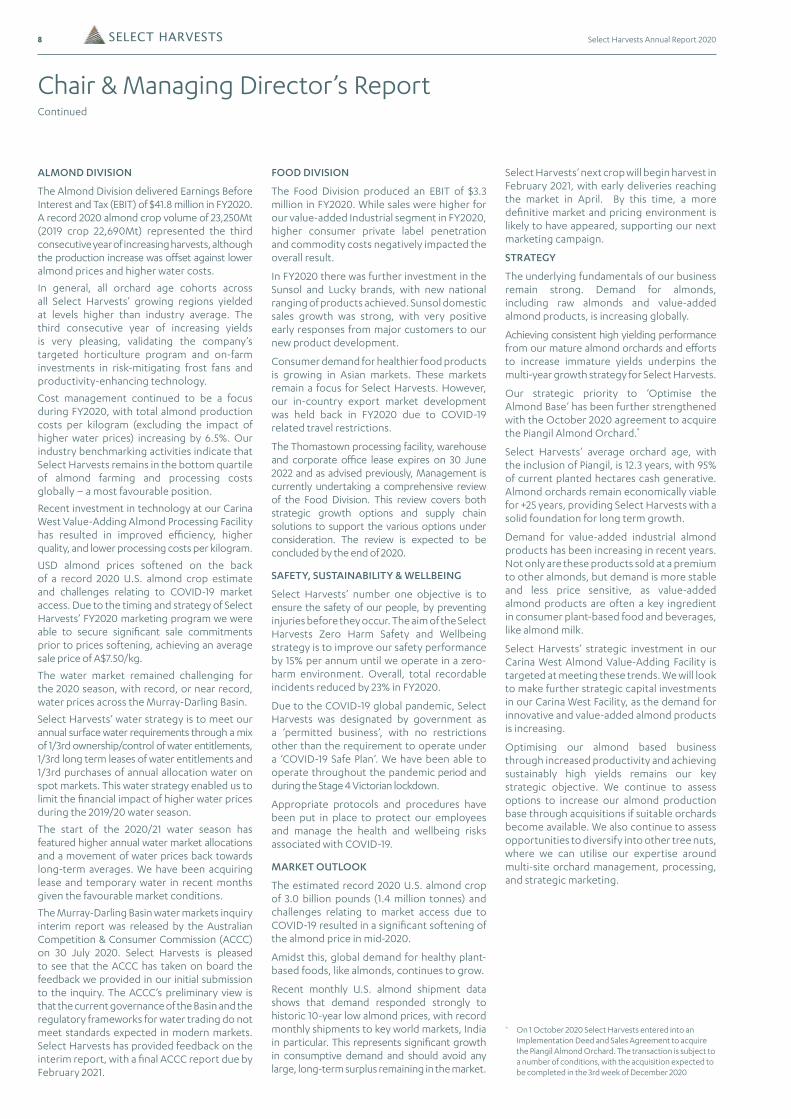
ALMOND DIVISION
The Almond Division delivered Earnings Before Interest and Tax (EBIT) of $41.8 million in FY2020. A record 2020 almond crop volume of 23,250Mt (2019 crop 22,690Mt) represented the third consecutive year of increasing harvests, although the production increase was offset against lower almond prices and higher water costs.
In general, all orchard age cohorts across all Select Harvests’ growing regions yielded at levels higher than industry average. The third consecutive year of increasing yields is very pleasing, validating the company’s targeted horticulture program and on-farm investments in risk-mitigating frost fans and productivity-enhancing technology.
Cost management continued to be a focus during FY2020, with total almond production costs per kilogram (excluding the impact of higher water prices) increasing by 6.5%. Our industry benchmarking activities indicate that Select Harvests remains in the bottom quartile of almond farming and processing costs globally – a most favourable position.
Recent investment in technology at our Carina West Value-Adding Almond Processing Facility has resulted in improved efficiency, higher quality, and lower processing costs per kilogram.
USD almond prices softened on the back of a record 2020 U.S. almond crop estimate and challenges relating to COVID-19 market access. Due to the timing and strategy of Select Harvests’ FY2020 marketing program we were able to secure significant sale commitments prior to prices softening, achieving an average sale price of A$7.50/kg.
The water market remained challenging for the 2020 season, with record, or near record, water prices across the Murray-Darling Basin.
Select Harvests’ water strategy is to meet our annual surface water requirements through a mix of 1/3rd ownership/control of water entitlements, 1/3rd long term leases of water entitlements and 1/3rd purchases of annual allocation water on spot markets. This water strategy enabled us to limit the financial impact of higher water prices during the 2019/20 water season.
The start of the 2020/21 water season has featured higher annual water market allocations and a movement of water prices back towards long-term averages. We have been acquiring lease and temporary water in recent months given the favourable market conditions.
The Murray-Darling Basin water markets inquiry interim report was released by the Australian Competition & Consumer Commission (ACCC) on 30 July 2020. Select Harvests is pleased to see that the ACCC has taken on board the feedback we provided in our initial submission to the inquiry. The ACCC’s preliminary view is that the current governance of the Basin and the regulatory frameworks for water trading do not meet standards expected in modern markets. Select Harvests has provided feedback on the interim report, with a final ACCC report due by February 2021.
* On 1 October 2020 Select Harvests entered into an Implementation Deed and Sales Agreement to acquire the Piangil Almond Orchard. The transaction is subject to a number of conditions, with the acquisition expected to be completed in the 3rd week of December 2020
9Select Harvests Annual Report 2020
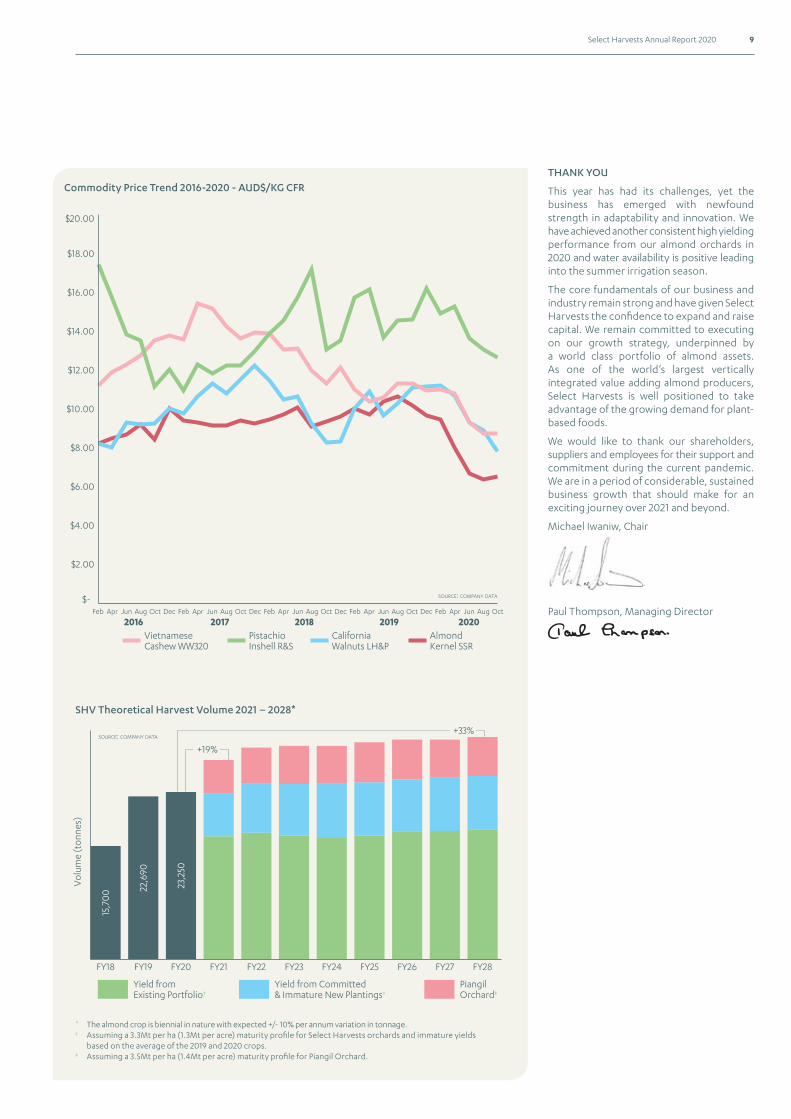
Commodity Price Trend 2016-2020 - AUD$/KG CFR
SHV Theoretical Harvest Volume 2021 – 2028*
Aug OctFeb DecApr Jun Aug OctFeb DecApr Jun Aug OctFeb DecApr Jun Aug OctFeb DecApr Jun Aug OctFeb Apr Jun
$-
$2.00
$4.00
$6.00
$8.00
$10.00
$12.00
$14.00
$16.00
$18.00
$20.00
PistachioInshell R&S
CaliforniaWalnuts LH&P
AlmondKernel SSR
VietnameseCashew WW320
2016 2017 2018 2019 2020
SOURCE: COMPANY DATA
FY18 FY19 FY20 FY22 FY23 FY24 FY25 FY26 FY27 FY28FY21
Vol
ume
(ton
nes)
+19%
Yield fromExisting Portfolio†
Yield from Committed& Immature New Plantings†
PiangilOrchard‡
15,7
00 22
,690
23,2
50
SOURCE: COMPANY DATA+33%
THANK YOU
This year has had its challenges, yet the business has emerged with newfound strength in adaptability and innovation. We have achieved another consistent high yielding performance from our almond orchards in 2020 and water availability is positive leading into the summer irrigation season.
The core fundamentals of our business and industry remain strong and have given Select Harvests the confidence to expand and raise capital. We remain committed to executing on our growth strategy, underpinned by a world class portfolio of almond assets. As one of the world’s largest vertically integrated value adding almond producers, Select Harvests is well positioned to take advantage of the growing demand for plant-based foods.
We would like to thank our shareholders, suppliers and employees for their support and commitment during the current pandemic. We are in a period of considerable, sustained business growth that should make for an exciting journey over 2021 and beyond.
Michael Iwaniw, Chair
Paul Thompson, Managing Director
* The almond crop is biennial in nature with expected +/- 10% per annum variation in tonnage.† Assuming a 3.3Mt per ha (1.3Mt per acre) maturity profile for Select Harvests orchards and immature yields based on the average of the 2019 and 2020 crops.‡ Assuming a 3.5Mt per ha (1.4Mt per acre) maturity profile for Piangil Orchard.
10 Select Harvests Annual Report 2020
In control of our destiny
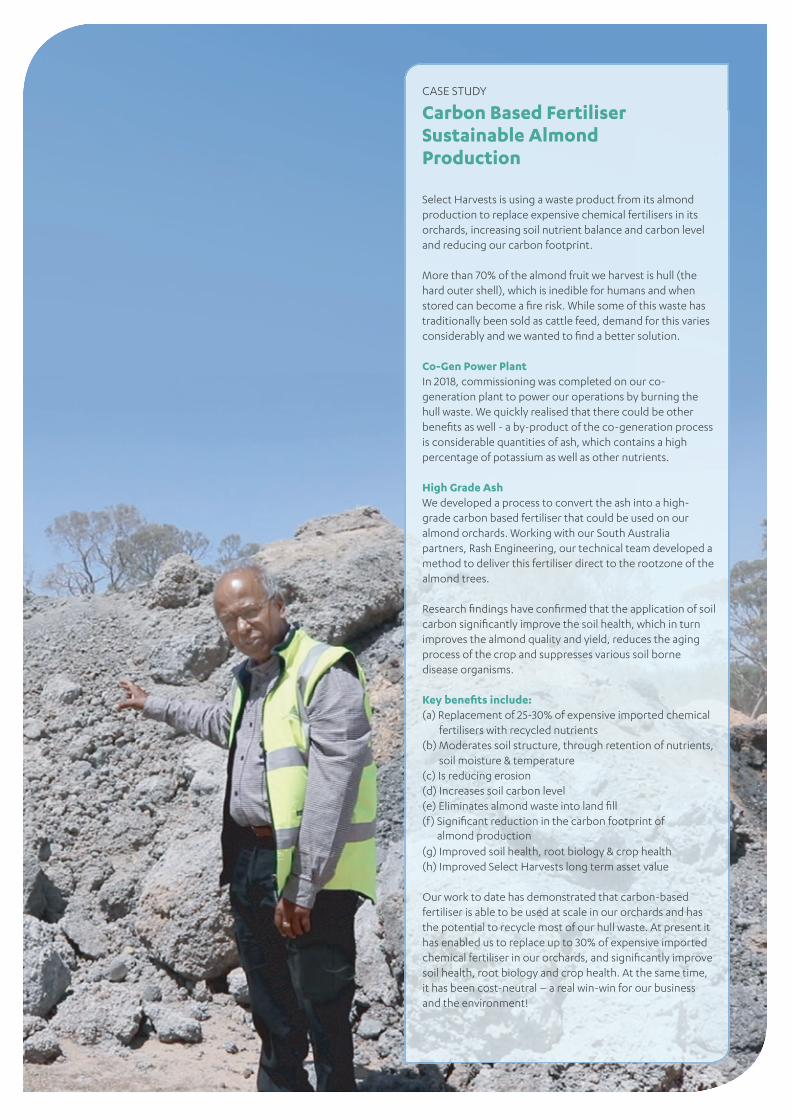
RIGHT: Upul Gunawardena TECHNICAL OFFICER,
CARINA WEST
“We have created a closed loop by using the waste hull ash from the
CoGen power plant, which is high in potassium, as an important
ingredient to our fertiliser program.
All natural, recycled and low cost, our fertiliser program is the only project of it's kind in the almond
industry, world wide.”
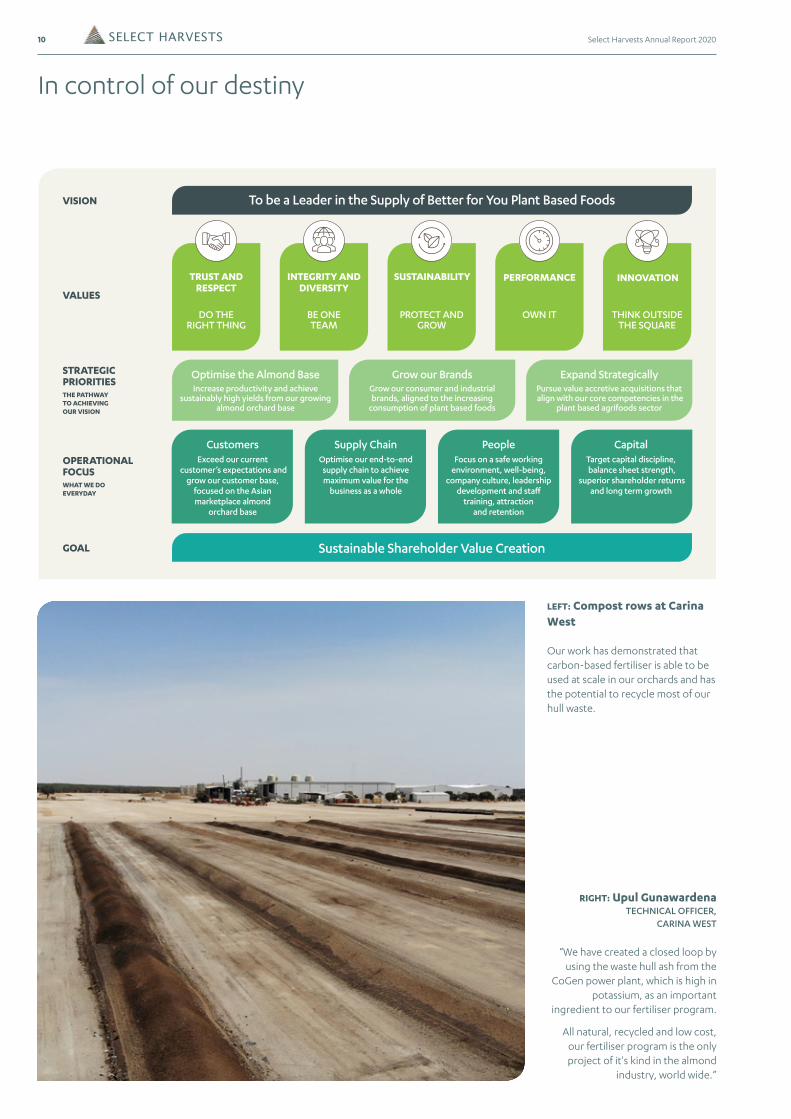
LEFT: Compost rows at Carina West
Our work has demonstrated that carbon-based fertiliser is able to be used at scale in our orchards and has the potential to recycle most of our hull waste.
In control of our destiny CASE STUDY
Carbon Based Fertiliser Sustainable Almond Production
Select Harvests is using a waste product from its almond production to replace expensive chemical fertilisers in its orchards, increasing soil nutrient balance and carbon level and reducing our carbon footprint.
More than 70% of the almond fruit we harvest is hull (the hard outer shell), which is inedible for humans and when stored can become a fire risk. While some of this waste has traditionally been sold as cattle feed, demand for this varies considerably and we wanted to find a better solution.
Co-Gen Power PlantIn 2018, commissioning was completed on our co-generation plant to power our operations by burning the hull waste. We quickly realised that there could be other benefits as well - a by-product of the co-generation process is considerable quantities of ash, which contains a high percentage of potassium as well as other nutrients.
High Grade AshWe developed a process to convert the ash into a high-grade carbon based fertiliser that could be used on our almond orchards. Working with our South Australia partners, Rash Engineering, our technical team developed a method to deliver this fertiliser direct to the rootzone of the almond trees.
Research findings have confirmed that the application of soil carbon significantly improve the soil health, which in turn improves the almond quality and yield, reduces the aging process of the crop and suppresses various soil borne disease organisms.
Key benefits include:(a) Replacement of 25-30% of expensive imported chemical
fertilisers with recycled nutrients(b) Moderates soil structure, through retention of nutrients,
soil moisture & temperature(c) Is reducing erosion(d) Increases soil carbon level(e) Eliminates almond waste into land fill(f) Significant reduction in the carbon footprint of
almond production(g) Improved soil health, root biology & crop health(h) Improved Select Harvests long term asset value
Our work to date has demonstrated that carbon-based fertiliser is able to be used at scale in our orchards and has the potential to recycle most of our hull waste. At present it has enabled us to replace up to 30% of expensive imported chemical fertiliser in our orchards, and significantly improve soil health, root biology and crop health. At the same time, it has been cost-neutral – a real win-win for our business and the environment!
THINK OUTSIDE THE SQUARE
INNOVATION
OWN IT
PERFORMANCE
PROTECT AND GROW
SUSTAINABILITY
BE ONE TEAM
INTEGRITY AND DIVERSITY
DO THE RIGHT THING
TRUST AND RESPECT
To be a Leader in the Supply of Better for You Plant Based FoodsVISION
VALUES
Optimise the Almond BaseIncrease productivity and achieve
sustainably high yields from our growing almond orchard base
Grow our BrandsGrow our consumer and industrial brands, aligned to the increasing
consumption of plant based foods
Expand StrategicallyPursue value accretive acquisitions that align with our core competencies in the
plant based agrifoods sector
STRATEGIC PRIORITIESTHE PATHWAY TO ACHIEVING OUR VISION
Sustainable Shareholder Value CreationGOAL
CustomersExceed our current
customer’s expectations and grow our customer base,
focused on the Asian marketplace almond
orchard base
OPERATIONAL FOCUS WHAT WE DO EVERYDAY
Supply ChainOptimise our end-to-end
supply chain to achieve maximum value for the
business as a whole
PeopleFocus on a safe working
environment, well-being, company culture, leadership
development and staff training, attraction
and retention
CapitalTarget capital discipline, balance sheet strength,
superior shareholder returns and long term growth
Select Harvests – In control of Our Destiny
In control of our destiny
RIGHT: Upul Gunawardena TECHNICAL OFFICER,
CARINA WEST
“We have created a closed loop by using the waste hull ash from the
CoGen power plant, which is high in potassium, as an important
ingredient to our fertiliser program.
All natural, recycled and low cost, our fertiliser program is the only project of it's kind in the almond
industry, world wide.”
LEFT: Compost rows at Carina West
Our work has demonstrated that carbon-based fertiliser is able to be used at scale in our orchards and has the potential to recycle most of our hull waste.
11Select Harvests Annual Report 2020
CASE STUDY
Carbon Based Fertiliser Sustainable Almond Production
Select Harvests is using a waste product from its almond production to replace expensive chemical fertilisers in its orchards, increasing soil nutrient balance and carbon level and reducing our carbon footprint.
More than 70% of the almond fruit we harvest is hull (the hard outer shell), which is inedible for humans and when stored can become a fire risk. While some of this waste has traditionally been sold as cattle feed, demand for this varies considerably and we wanted to find a better solution.
Co-Gen Power PlantIn 2018, commissioning was completed on our co-generation plant to power our operations by burning the hull waste. We quickly realised that there could be other benefits as well - a by-product of the co-generation process is considerable quantities of ash, which contains a high percentage of potassium as well as other nutrients.
High Grade AshWe developed a process to convert the ash into a high-grade carbon based fertiliser that could be used on our almond orchards. Working with our South Australia partners, Rash Engineering, our technical team developed a method to deliver this fertiliser direct to the rootzone of the almond trees.
Research findings have confirmed that the application of soil carbon significantly improve the soil health, which in turn improves the almond quality and yield, reduces the aging process of the crop and suppresses various soil borne disease organisms.
Key benefits include:(a) Replacement of 25-30% of expensive imported chemical
fertilisers with recycled nutrients(b) Moderates soil structure, through retention of nutrients,
soil moisture & temperature(c) Is reducing erosion(d) Increases soil carbon level(e) Eliminates almond waste into land fill(f) Significant reduction in the carbon footprint of
almond production(g) Improved soil health, root biology & crop health(h) Improved Select Harvests long term asset value
Our work to date has demonstrated that carbon-based fertiliser is able to be used at scale in our orchards and has the potential to recycle most of our hull waste. At present it has enabled us to replace up to 30% of expensive imported chemical fertiliser in our orchards, and significantly improve soil health, root biology and crop health. At the same time, it has been cost-neutral – a real win-win for our business and the environment!
12 Select Harvests Annual Report 2020
Almond Division
2020 Crop EBIT Movement vs 2019 Crop EBIT ($M)
2020 Yield Performance
2020 Crop - Cost Per KG (A$/KG)
Orchard HarvestWater Rental Processing Depn/Other TotalProduction
Costs
4.735.36
2019 Crop 2020 CropSOURCE: COMPANY DATA
+13.3%
+63.4%
0.570.93
2019 CropEBIT
AlmondVolume
AlmondPrice
OrchardCost
ProcessingCosts
Rents/Depn/Other
2020 CropEBIT
WaterCost
0
10
20
30
40
50
60
75
80
90
100SOURCE: COMPANY DATA
Central Northern OverallSouthern0
200
400
600
800
1000
1200
kg/a
cre
MATURE IMMATURE
1400
1600 1600
Industry Standard Yield
4th Leaf 5th Leaf 6th Leaf3rd Leaf0
200
400
600
800
1000
1200
1400
SOURCE: COMPANY DATA
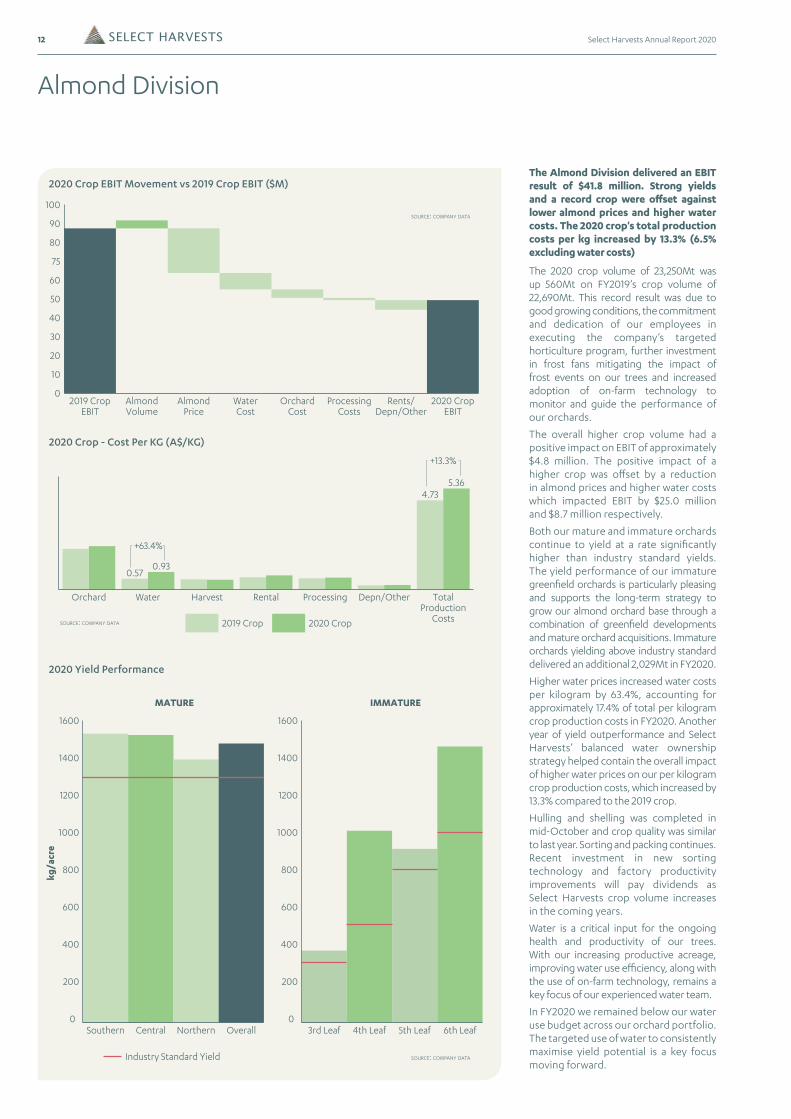
The Almond Division delivered an EBIT result of $41.8 million. Strong yields and a record crop were offset against lower almond prices and higher water costs. The 2020 crop's total production costs per kg increased by 13.3% (6.5% excluding water costs)
The 2020 crop volume of 23,250Mt was up 560Mt on FY2019’s crop volume of 22,690Mt. This record result was due to good growing conditions, the commitment and dedication of our employees in executing the company’s targeted horticulture program, further investment in frost fans mitigating the impact of frost events on our trees and increased adoption of on-farm technology to monitor and guide the performance of our orchards.
The overall higher crop volume had a positive impact on EBIT of approximately $4.8 million. The positive impact of a higher crop was offset by a reduction in almond prices and higher water costs which impacted EBIT by $25.0 million and $8.7 million respectively.
Both our mature and immature orchards continue to yield at a rate significantly higher than industry standard yields. The yield performance of our immature greenfield orchards is particularly pleasing and supports the long-term strategy to grow our almond orchard base through a combination of greenfield developments and mature orchard acquisitions. Immature orchards yielding above industry standard delivered an additional 2,029Mt in FY2020.
Higher water prices increased water costs per kilogram by 63.4%, accounting for approximately 17.4% of total per kilogram crop production costs in FY2020. Another year of yield outperformance and Select Harvests’ balanced water ownership strategy helped contain the overall impact of higher water prices on our per kilogram crop production costs, which increased by 13.3% compared to the 2019 crop.
Hulling and shelling was completed in mid-October and crop quality was similar to last year. Sorting and packing continues. Recent investment in new sorting technology and factory productivity improvements will pay dividends as Select Harvests crop volume increases in the coming years.
Water is a critical input for the ongoing health and productivity of our trees. With our increasing productive acreage, improving water use efficiency, along with the use of on-farm technology, remains a key focus of our experienced water team.
In FY2020 we remained below our water use budget across our orchard portfolio. The targeted use of water to consistently maximise yield potential is a key focus moving forward.
13Select Harvests Annual Report 2020
Food Division
The company has sold or committed for sale 82% of the FY2020 crop with most of the balance held to cover internal value-add processing requirements. An average price of A$7.50/kg will be achieved, 12.8% lower than the FY2019 almond price of A$8.60/kg.
The recent change in financial year, to better align the company’s reporting cycle with the almond crop cycle, has resulted in no prior year crop adjustments being required in FY2020.
No new almond orchard planting, or replanting, was conducted in FY2020. Subject to the completion of the October 2020 acquisition of the Piangil Almond Orchard, Select Harvests’ almond orchard portfolio will increase from 7,696ha (19,016 acres) to 9,262ha (22,886 acres).
The tree health and outlook for Select Harvests’ FY2021 crop remain positive, following good pollination and growing conditions to date. There has only been one significant frost event, which was mitigated by our frost fans. Good seasonal rainfall has led to higher allocations and lower temporary water costs. Given Select Harvests’ high levels of 2019 carry-over water and higher lease costs the benefit of this lower pricing will flow through in FY2021 and the majority in FY2022.
Market pricing will remain somewhat uncertain until a clearer picture of Californian almond shipments emerges at the end of 2020. A record 2020 U.S. crop of 3 billion pounds, significant 2019 U.S. crop carryover, a strengthening AUD and the ongoing market access impacts of COVID-19 are all factors that will impact the 2021 global almond price.
Global demand for almonds has responded well to the lower almond price environment. Raw almond shipments to key consumer markets like India and China are significantly higher than prior periods. The inclusion of value-added almonds as a key ingredient in consumer products is growing as consumers become more conscious of their food choices, and demand healthier options.
Select Harvests is one of the world’s largest almond producers, with a world class portfolio of high performing almond orchards and industry leading value-added processing capabilities. We provide millions of consumers around the world with high quality, healthy, nutritious Australian grown and processed almonds, both in their raw form and increasingly as value-added inputs to a wide range of healthy plant-based food products.
Sunsol sales growth was particularly strong, with sales increasing by 45% in FY2020. Further development of our PRO-biotic range was well received by our major retail customers, with national ranging achieved. An extensive marketing campaign, including Sunsol’s first ever TV advertising, delivered strong consumer engagement.
International opportunities are being pursued across both our industrial and consumer Food segments. In country export market development was held back in the second half of FY2020 due to COVID-19 related travel restrictions.
Select Harvests’ lease on the Thomastown processing facility is due to expire on 30 June 2022. The facility primarily processes our Lucky and Sunsol consumer product ranges and private label consumer products, as well as housing Select Harvests Melbourne based corporate staff and a warehouse. A comprehensive review of strategic growth options and supply chain solutions for the Food Division was commenced in FY2020 and is expected to be concluded by the end of 2020.
The Food Division delivered an EBIT result of $3.3 million.
The Food Division result was below expectations. Strong demand for Industrial value-added almond products was not enough to offset the margin impacts of higher overall imported non-almond commodity input costs and ongoing domestic private label penetration in branded nuts.
The Industrial business sales increased in FY2020, accounting for over 25% of Select Harvest’s 2020 almond crop. Value-added industrial almonds are a key ingredient in an increasing number of consumer products. These value-added almonds both sell at a premium, and are less price elastic, than raw almonds.
Recent investments in the Carina West Value-Adding Facility will enhance our capacity to produce industrial almond products thereby increasing the value of the lower grade portion of our crop.
The core Lucky cooking range is performing well in Woolworths with 6 additional products being ranged in the last quarter and has been supported by an increased interest in consumers home baking activity due to COVID-19 related lockdowns. Lucky snacking nut product deletions in Coles and ongoing private label penetration resulted in a reduction in branded snacking sales in FY2020.
82% OF THE FY2020 CROP SOLD OR COMMITTED FOR SALE
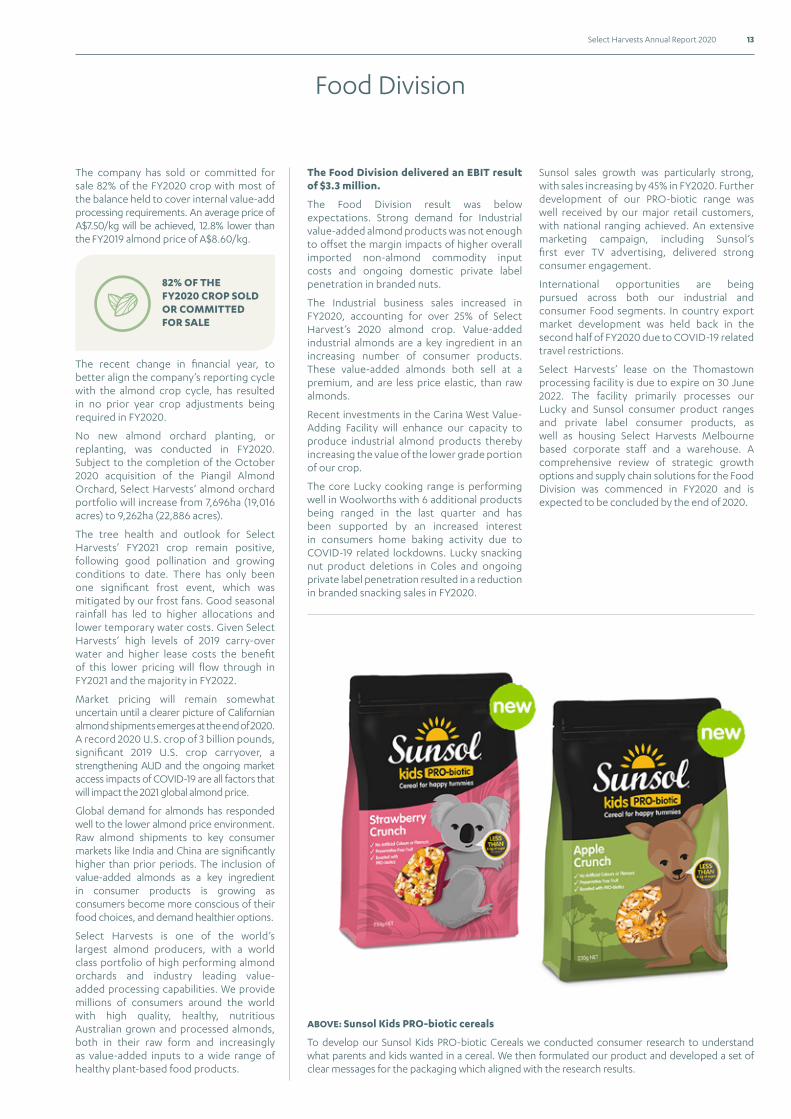
ABOVE: Sunsol Kids PRO-biotic cereals
To develop our Sunsol Kids PRO-biotic Cereals we conducted consumer research to understand what parents and kids wanted in a cereal. We then formulated our product and developed a set of clear messages for the packaging which aligned with the research results.
14 Select Harvests Annual Report 2020
The key strategic priorities for the year were:
1. COVID-19 Management & Response Plan
2. Process improvement and System Implementation
3. Building on Safety Culture and Safety Leadership
4. Targeted Employee health and wellbeing programs
The key activities implemented included:
• Activating and continually updating the COVID-19 Management and Response Plan
• Implementing technology to support compliance management and real time incident and hazard reporting.
• Actioning process improvements in incident investigation reporting and risk assessment.
• Reinforcing the strong safety culture, through the revised Company Values and Behaviours, visible safety leadership, including safety walks and frequent toolbox training sessions and discussions.
• Supporting employee wellbeing through a holistic wellness program (Global Challenge), mental health first aid training for leaders, increased counselling support through our Employee Assistance Program (EAP) and pulse check surveys for employees working from home.
SUSTAINABILITY & ENVIRONMENT
This year, Select Harvests has reviewed its sustainability strategy and as part of that process, aligned reporting with the Global Reporting Initiative Standards as well as the United Nations Sustainable Development Goals (SDGs). Both provide a global framework that helps guide our goals and objectives as a business.
There is a shortage of healthy food globally and as a grower and marketer of nutrient dense food products, we are well positioned to help meet this growing demand.
To capitalise on this demand, we need to set our goals and targets with a long-term lens as we operate in an industry that requires commitment and up to 25 years of foresight when expanding almond operations.
A sustainable, growing business
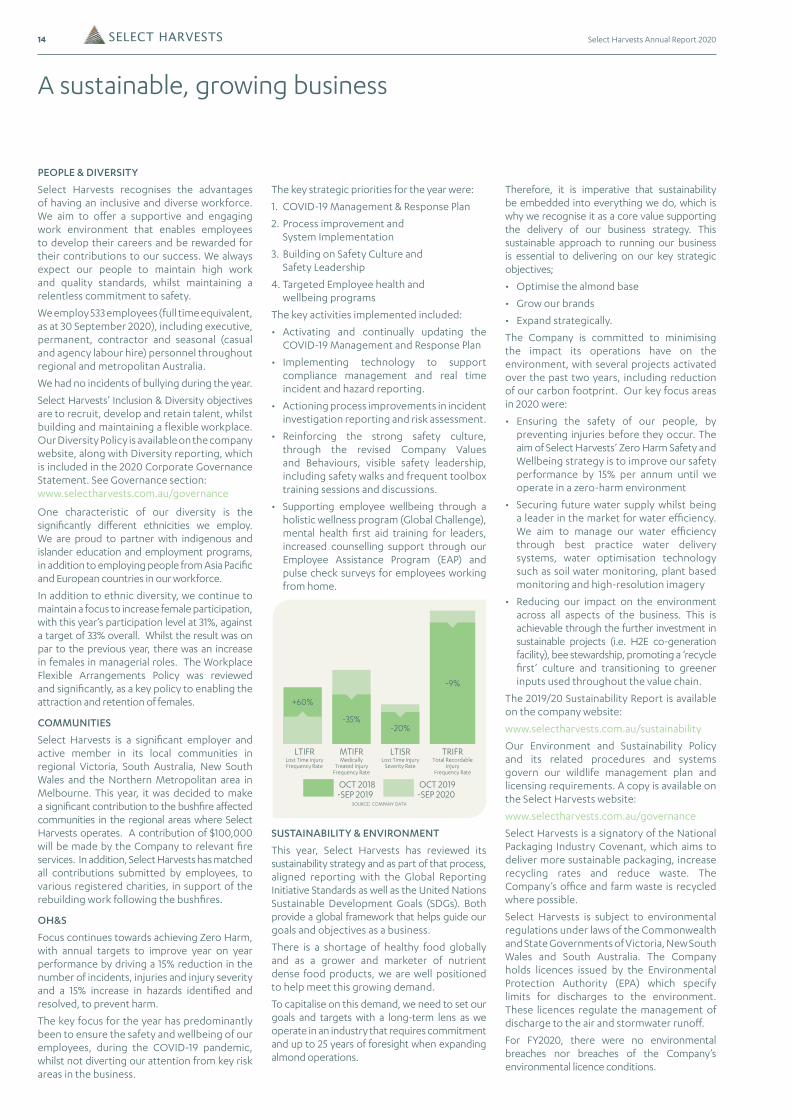
OCT 2018-SEP 2019
OCT 2019-SEP 2020
LTIFRLost Time InjuryFrequency Rate
MedicallyTreated Injury
Frequency Rate
Lost Time InjurySeverity Rate
Total RecordableInjury
Frequency Rate
MTIFR LTISR TRIFR
+60%
-35%-20%
-9%
SOURCE: COMPANY DATA
Therefore, it is imperative that sustainability be embedded into everything we do, which is why we recognise it as a core value supporting the delivery of our business strategy. This sustainable approach to running our business is essential to delivering on our key strategic objectives;
• Optimise the almond base
• Grow our brands
• Expand strategically.
The Company is committed to minimising the impact its operations have on the environment, with several projects activated over the past two years, including reduction of our carbon footprint. Our key focus areas in 2020 were:
• Ensuring the safety of our people, by preventing injuries before they occur. The aim of Select Harvests’ Zero Harm Safety and Wellbeing strategy is to improve our safety performance by 15% per annum until we operate in a zero-harm environment
• Securing future water supply whilst being a leader in the market for water efficiency. We aim to manage our water efficiency through best practice water delivery systems, water optimisation technology such as soil water monitoring, plant based monitoring and high-resolution imagery
• Reducing our impact on the environment across all aspects of the business. This is achievable through the further investment in sustainable projects (i.e. H2E co-generation facility), bee stewardship, promoting a ‘recycle first’ culture and transitioning to greener inputs used throughout the value chain.
The 2019/20 Sustainability Report is available on the company website:
www.selectharvests.com.au/sustainability
Our Environment and Sustainability Policy and its related procedures and systems govern our wildlife management plan and licensing requirements. A copy is available on the Select Harvests website:
www.selectharvests.com.au/governance
Select Harvests is a signatory of the National Packaging Industry Covenant, which aims to deliver more sustainable packaging, increase recycling rates and reduce waste. The Company’s office and farm waste is recycled where possible.
Select Harvests is subject to environmental regulations under laws of the Commonwealth and State Governments of Victoria, New South Wales and South Australia. The Company holds licences issued by the Environmental Protection Authority (EPA) which specify limits for discharges to the environment. These licences regulate the management of discharge to the air and stormwater runoff.
For FY2020, there were no environmental breaches nor breaches of the Company’s environmental licence conditions.
PEOPLE & DIVERSITY
Select Harvests recognises the advantages of having an inclusive and diverse workforce. We aim to offer a supportive and engaging work environment that enables employees to develop their careers and be rewarded for their contributions to our success. We always expect our people to maintain high work and quality standards, whilst maintaining a relentless commitment to safety.
We employ 533 employees (full time equivalent, as at 30 September 2020), including executive, permanent, contractor and seasonal (casual and agency labour hire) personnel throughout regional and metropolitan Australia.
We had no incidents of bullying during the year.
Select Harvests’ Inclusion & Diversity objectives are to recruit, develop and retain talent, whilst building and maintaining a flexible workplace. Our Diversity Policy is available on the company website, along with Diversity reporting, which is included in the 2020 Corporate Governance Statement. See Governance section:www.selectharvests.com.au/governance
One characteristic of our diversity is the significantly different ethnicities we employ. We are proud to partner with indigenous and islander education and employment programs, in addition to employing people from Asia Pacific and European countries in our workforce.
In addition to ethnic diversity, we continue to maintain a focus to increase female participation, with this year’s participation level at 31%, against a target of 33% overall. Whilst the result was on par to the previous year, there was an increase in females in managerial roles. The Workplace Flexible Arrangements Policy was reviewed and significantly, as a key policy to enabling the attraction and retention of females.
COMMUNITIES
Select Harvests is a significant employer and active member in its local communities in regional Victoria, South Australia, New South Wales and the Northern Metropolitan area in Melbourne. This year, it was decided to make a significant contribution to the bushfire affected communities in the regional areas where Select Harvests operates. A contribution of $100,000 will be made by the Company to relevant fire services. In addition, Select Harvests has matched all contributions submitted by employees, to various registered charities, in support of the rebuilding work following the bushfires.
OH&S
Focus continues towards achieving Zero Harm, with annual targets to improve year on year performance by driving a 15% reduction in the number of incidents, injuries and injury severity and a 15% increase in hazards identified and resolved, to prevent harm.
The key focus for the year has predominantly been to ensure the safety and wellbeing of our employees, during the COVID-19 pandemic, whilst not diverting our attention from key risk areas in the business.
15Select Harvests Annual Report 2020

16 Select Harvests Annual Report 2020
Executive Team
BRAD CRUMPChief Financial Officer and Company Secretary Brad joined Select Harvests as Chief Financial Officer on 20 November 2017 and was appointed Company Secretary on 7 August 2018. He is a Certified Practising Accountant and has over 15 years experience in senior financial management. Most recently he has been the CFO of Redflex Limited and previously gained extensive experience in agribusiness as CFO of Landmark (Australia’s largest rural services provider) and senior roles within AWB Limited. He brings extensive agribusiness, agri services and related capital management experience to the role.
BEN BROWNGeneral Manager HorticultureBen joined Select Harvests in 2014. Ben held the position of Project and Technical Manager of the Horticultural Division, before being appointed General Manager Horticulture in April 2018. Ben is an Applied Science graduate with Honours in Soil Science and has 20 years experience across perennial irrigated horticulture with expertise in: orchard development; production horticulture; development of detailed RD&E strategies; and extension and technology transfer of best practice. Prior to joining Select Harvests, Ben was the Industry Development Manager at the Almond Board of Australia and an irrigation and soil agronomist.
PETER ROSSGeneral Manager Almond OperationsPeter joined Select Harvests in 1999. He has held the positions of Plant Manager, Project Manager and General Manager for the Processing area of the Almond Division, General Manager Horticulture and was appointed General Manager Almond Operations in August 2017. Prior to joining Select Harvests, Peter ran his own maintenance and fabrication business servicing agriculture, mining and heavy industry.
LAURENCE VAN DRIELGeneral Manager Trading and Industrial Laurence joined Select Harvests in 2000. Laurence has over 30 years experience in trading edible nuts and dried fruits. He has a comprehensive knowledge of international trade and deep insights into the trading cultures of the various countries in which these commodities are sold. He has held senior purchasing and sales management positions with internationally recognised companies.
URANIA DI CECCOGeneral Manager People, Safety & Sustainability Urania joined Select Harvests in July 2019. Urania is a highly experienced and commercial HR Leader, with a passion for helping businesses transform to achieve success and sustainable growth through a capable, diverse and engaged workforce. She has proven her adaptability to different industries, having worked in manufacturing, professional services and service and distribution. Prior to joining Select Harvests, Urania was the Director of Human Resources for Cummins South Pacific. She also held the position of Group General Manager, Human Resources at Crowe Horwarth and various senior HR roles at Amcor Australasia.
SUZANNE DOUGLASGeneral Manager Consumer Suzanne joined Select Harvests in April 2019. Suzanne is a highly experienced, successful and senior manager who has extensive experience in both the Australian and international Fast-Moving Consumer Goods Industry. Before joining Select Harvests, Suzanne has led HJ Heinz Australia, and held senior management roles at Devondale Murray Goulburn and McPherson’s Consumer Products.

17Select Harvests Annual Report 2020
Board of Directors
MICHAEL IWANIWChair Appointed to the board on 27 June 2011 and appointed Chair 3 November 2011. He began his career as a chemist with the Australian Barley Board (ABB), became managing director in 1989 and retired 20 years later. During these years he accumulated extensive experience in all facets of the company’s operations, including leading the transition from a statutory authority and growing the business from a small base to an ASX 100 listed company. Michael was instrumental in the successful merger of ABB Grain, AusBulk Ltd and United Grower Holdings Limited to form one of Australia’s largest agri-businesses. He has a Bachelor of Science, a graduate diploma in business administration and is a member of the Australian Institute of Company Directors. Michael is the immediate past Chair of Australian Grain Technologies and has extensive non-executive director experience with several listed and private companies. He is a member of the Remuneration and Nomination Committee.
PAUL THOMPSONManaging Director and Chief Executive Officer Appointed as the Managing Director and Chief Executive Officer (MD) of Select Harvests Limited on 9 July 2012. Paul has over 30 years of management experience. Formerly President of SCA Australasia, part of the SCA Group, one of the world’s largest personal care and tissue products manufacturers. He is a member of the Australian Institute of Company Directors and has formerly held positions as a Director of the Food and Grocery Council and councillor in the Australian Industry Group.
MICHAEL CARROLLNon-Executive DirectorJoined the board on 31 March 2009. He brings to the Board diverse experience from executive and non-executive roles in food and agribusiness. Current non-executive board roles include Rural Funds Management (RE for ASX: RFF; director since April 2010), Paraway Pastoral Company, Australian Rural Leadership Foundation and Viridis Ag Pty Ltd. Previous board roles include Queensland Sugar Limited, Elders Limited (ASX: ELD, 2018-2020), Tassal (ASX: TGR, 2014-2018), Warrnambool Cheese & Butter, Rural Finance Corporation, Sunny Queen Farms and Meat and Livestock Australia. During his executive career Mike established and led the NAB’s agribusiness division with earlier senior executive roles including marketing and investment and advisory services. He is Chair of the Remuneration and Nomination Committee.
FRED GRIMWADENon-Executive Director Appointed to the board on 27 July 2010. Fred is a Principal and Director of Fawkner Capital, a specialist corporate advisory and investment firm. He is Chair of CPT Global Ltd (ASX: CGO; director since October 2002) and XRF Scientific Ltd (ASX: XRF; director since May 2012) as well as being a director of Australian United Investment Company Ltd (ASX: AUI; director since March 2014) and AgCap Pty Ltd. He was formerly Chair of Troy Resources Ltd (2013-2017), a non-executive director of AWB Ltd., and has held general management positions with Colonial Agricultural Company, Colonial Mutual Group, Colonial First State Investments Group, Western Mining Corporation and Goldman, Sachs and Co. He is a member of the Audit and Risk Committee.
NICKI ANDERSONNon-Executive Director Appointed to the board on 21 January 2016. Nicki Anderson is an accomplished leader and director with broad experience in strategy, sales, marketing, licensing and innovation within branded food, beverage and consumer goods businesses both in Australia and Internationally (including Coca Cola Amatil, Cadbury Schweppes, McCain, Nestle and Kraft). Nicki has held senior positions in marketing and innovation within world class FMCG companies and was most recently Managing Director of the Blueprint Group concentrating on sales, marketing and merchandising within the retail and pharmacy sales channels. Nicki is currently a Director of Mrs Mac’s, Australia Made Campaign Limited, Prostate Cancer Foundation and ASX listed Funtastic (ASX: FUN; director since October 2018). She is Chair of the Remuneration & Nomination Committee for both Mrs Mac’s Limited and Funtastic Limited. Nicki is a Member and Former Chair of the Monash University Advisory Board for the marketing faculty. She is a member of the Remuneration and Nomination Committee.
FIONA BENNETTNon-Executive Director Appointed to the board on 6 July 2017. Ms Fiona Bennett is a Chartered Accountant and an experienced non-executive director with an extensive background in business management, corporate governance, audit and risk. She is currently on the boards of BWX Limited (ASX: BWX; director since December 2018) and Hills Limited (ASX: HIL; director since May 2010) and is also Chair of the Victorian Legal Services Board. Ms Bennett has previously served on the board of Beach Energy Limited (2012-2017). She has held senior executive roles at BHP Limited and Coles Limited and has been Chief Financial Officer at several organisations in the health sector. She is Chair of the Audit and Risk Committee.
GUY KINGWILLNon-Executive Director Appointed to the board on 25 November 2019. Guy joins the Board with an extensive background in horticulture, international soft commodity marketing and water investment and trading. He is currently on the Boards of Tasmanian Irrigation and ACMII Australia 1 Group and serves as the Chair of the Audit Committee at Tasmanian Irrigation. Guy has previously served as Managing Director of Tandou Limited, and as a non-executive director of Lower Murray Water Urban and Rural Water Corporation. He is a member of the Audit and Risk Committee.
18 Select Harvests Annual Report 2020
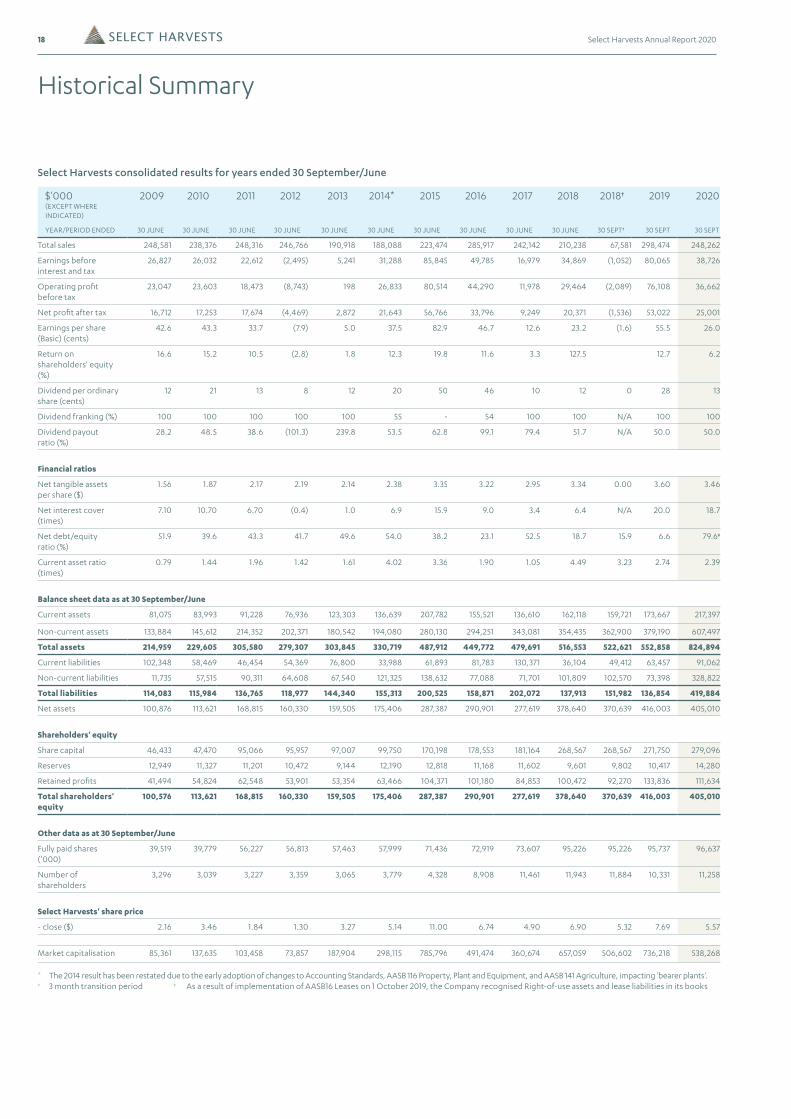
Historical Summary
Select Harvests consolidated results for years ended 30 September/June
$'000 (EXCEPT WHERE INDICATED)
2009 2010 2011 2012 2013 2014* 2015 2016 2017 2018 2018† 2019 2020
YEAR/PERIOD ENDED 30 JUNE 30 JUNE 30 JUNE 30 JUNE 30 JUNE 30 JUNE 30 JUNE 30 JUNE 30 JUNE 30 JUNE 30 SEPT† 30 SEPT 30 SEPT
Total sales 248,581 238,376 248,316 246,766 190,918 188,088 223,474 285,917 242,142 210,238 67,581 298,474 248,262
Earnings before interest and tax
26,827 26,032 22,612 (2,495) 5,241 31,288 85,845 49,785 16,979 34,869 (1,052) 80,065 38,726
Operating profit before tax
23,047 23,603 18,473 (8,743) 198 26,833 80,514 44,290 11,978 29,464 (2,089) 76,108 36,662
Net profit after tax 16,712 17,253 17,674 (4,469) 2,872 21,643 56,766 33,796 9,249 20,371 (1,536) 53,022 25,001
Earnings per share (Basic) (cents)
42.6 43.3 33.7 (7.9) 5.0 37.5 82.9 46.7 12.6 23.2 (1.6) 55.5 26.0
Return on shareholders' equity (%)
16.6 15.2 10.5 (2.8) 1.8 12.3 19.8 11.6 3.3 127.5 12.7 6.2
Dividend per ordinary share (cents)
12 21 13 8 12 20 50 46 10 12 0 28 13
Dividend franking (%) 100 100 100 100 100 55 - 54 100 100 N/A 100 100
Dividend payout ratio (%)
28.2 48.5 38.6 (101.3) 239.8 53.5 62.8 99.1 79.4 51.7 N/A 50.0 50.0
Financial ratios
Net tangible assets per share ($)
1.56 1.87 2.17 2.19 2.14 2.38 3.35 3.22 2.95 3.34 0.00 3.60 3.46
Net interest cover (times)
7.10 10.70 6.70 (0.4) 1.0 6.9 15.9 9.0 3.4 6.4 N/A 20.0 18.7
Net debt/equity ratio (%)
51.9 39.6 43.3 41.7 49.6 54.0 38.2 23.1 52.5 18.7 15.9 6.6 79.6‡
Current asset ratio (times)
0.79 1.44 1.96 1.42 1.61 4.02 3.36 1.90 1.05 4.49 3.23 2.74 2.39
Balance sheet data as at 30 September/June
Current assets 81,075 83,993 91,228 76,936 123,303 136,639 207,782 155,521 136,610 162,118 159,721 173,667 217,397
Non-current assets 133,884 145,612 214,352 202,371 180,542 194,080 280,130 294,251 343,081 354,435 362,900 379,190 607,497
Total assets 214,959 229,605 305,580 279,307 303,845 330,719 487,912 449,772 479,691 516,553 522,621 552,858 824,894
Current liabilities 102,348 58,469 46,454 54,369 76,800 33,988 61,893 81,783 130,371 36,104 49,412 63,457 91,062
Non-current liabilities 11,735 57,515 90,311 64,608 67,540 121,325 138,632 77,088 71,701 101,809 102,570 73,398 328,822
Total liabilities 114,083 115,984 136,765 118,977 144,340 155,313 200,525 158,871 202,072 137,913 151,982 136,854 419,884
Net assets 100,876 113,621 168,815 160,330 159,505 175,406 287,387 290,901 277,619 378,640 370,639 416,003 405,010
Shareholders' equity
Share capital 46,433 47,470 95,066 95,957 97,007 99,750 170,198 178,553 181,164 268,567 268,567 271,750 279,096
Reserves 12,949 11,327 11,201 10,472 9,144 12,190 12,818 11,168 11,602 9,601 9,802 10,417 14,280
Retained profits 41,494 54,824 62,548 53,901 53,354 63,466 104,371 101,180 84,853 100,472 92,270 133,836 111,634
Total shareholders' equity
100,576 113,621 168,815 160,330 159,505 175,406 287,387 290,901 277,619 378,640 370,639 416,003 405,010
Other data as at 30 September/June
Fully paid shares ('000)
39,519 39,779 56,227 56,813 57,463 57,999 71,436 72,919 73,607 95,226 95,226 95,737 96,637
Number of shareholders
3,296 3,039 3,227 3,359 3,065 3,779 4,328 8,908 11,461 11,943 11,884 10,331 11,258
Select Harvests' share price
- close ($) 2.16 3.46 1.84 1.30 3.27 5.14 11.00 6.74 4.90 6.90 5.32 7.69 5.57
Market capitalisation 85,361 137,635 103,458 73,857 187,904 298,115 785,796 491,474 360,674 657,059 506,602 736,218 538,268
* The 2014 result has been restated due to the early adoption of changes to Accounting Standards, AASB 116 Property, Plant and Equipment, and AASB 141 Agriculture, impacting 'bearer plants'.† 3 month transition period ‡ As a result of implementation of AASB16 Leases on 1 October 2019, the Company recognised Right-of-use assets and lease liabilities in its books
19Select Harvests Annual Report 2020
Financial Report
20 Directors' Report
28 Remuneration Report
40 Auditor’s Independence Declaration
41 Annual Financial Report
43 Statement of Comprehensive Income
44 Balance Sheet
45 Statement of Changes in Equity
46 Statement of Cash Flows
47 Notes to the Financial Statements
77 Directors' Declaration
78 Independent Auditor’s Report
85 ASX Additional Information
87 Corporate Information
RIGHT: The Murray River at Euston Lock
20 Select Harvests Annual Report 2020
Directors’ Report
The directors present their report together with the financial report of Select Harvests Limited and controlled entities (referred to hereafter as the “Company”, “the Group” or “the consolidated entity”) for the year ended 30 September 2020.
DIRECTORS
The qualifications, experience and special responsibilities of each person who has been a director of Select Harvests Limited at any time during or since the end of the financial year is provided below, together with details of the company secretary. Directors were in office for this entire period unless otherwise stated.
NAMES, QUALIFICATIONS, EXPERIENCE AND SPECIAL RESPONSIBILITIES
M Iwaniw, B Sc, Graduate Diploma in Business Management, MAICD (Chair)
Appointed to the board on 27 June 2011 and appointed Chair 3 November 2011. He began his career as a chemist with the Australian Barley Board (ABB), became managing director in 1989 and retired 20 years later. During these years he accumulated extensive experience in all facets of the company’s operations, including leading the transition from a statutory authority and growing the business from a small base to an ASX 100 listed company. Instrumental in the successful merger of ABB Grain, AusBulk Ltd and United Grower Holdings Limited to form one of Australia’s largest agri-businesses. He has a Bachelor of Science, a graduate diploma in business administration and is a member of the Australian Institute of Company Directors. Michael is the immediate past Chair of Australian Grain Technologies and has extensive non-executive director experience with several listed and private companies. He is a member of the Remuneration and Nomination Committee.
Interest in shares: 220,545 fully paid shares.
P Thompson, B Bus and MAICD (Managing Director and Chief Executive Officer)
Appointed as the Managing Director and Chief Executive Officer (MD) of Select Harvests Limited on 9 July 2012. Paul has over 30 years of management experience. Formerly President of SCA Australasia, part of the SCA Group, one of the world’s largest personal care and tissue products manufacturers. He is a member of the Australian Institute of Company Directors and has formerly held positions as a Director of the Food and Grocery Council and councillor in the Australian Industry Group.
Interest in Shares: 559,451 fully paid shares.
M Carroll, B Ag Sc, MBA and FAICD (Non-Executive Director)
Joined the board on 31 March 2009. He brings to the Board diverse experience from executive and non-executive roles in food and agribusiness. Current non-executive board roles include Rural Funds Management (RE for ASX: RFF; director since April 2010), Paraway Pastoral Company, Australian Rural Leadership Foundation and Viridis Ag Pty Ltd. Previous board roles include Queensland Sugar Limited, Elders Limited (ASX: ELD, 2018-2020), Tassal (ASX: TGR, 2014-2018), Warrnambool Cheese & Butter, Rural Finance Corporation, Sunny Queen Farms and Meat and Livestock Australia. During his executive career Mike established and led the NAB’s agribusiness division with earlier senior executive roles including marketing and investment and advisory services. He is Chair of the Remuneration and Nomination Committee.
Interest in Shares: 26,023 fully paid shares.
F S Grimwade, B Com, LLB (Hons), MBA, FAICD, SF Fin and FCIS (Non-Executive Director)
Appointed to the board on 27 July 2010. Fred is a Principal and Director of Fawkner Capital, a specialist corporate advisory and investment firm. He is Chair of CPT Global Ltd (ASX: CGO; director since October 2002) and XRF Scientific Ltd (ASX: XRF; director since May 2012) as well as being a director of Australian United Investment Company Ltd (ASX: AUI; director since March 2014) and AgCap Pty Ltd. He was formerly Chair of Troy Resources Ltd (2013-2017), a non-executive director of AWB Ltd., and has held general management positions with Colonial Agricultural Company, Colonial Mutual Group, Colonial First State Investments Group, Western Mining Corporation and Goldman, Sachs and Co. He is a member of the Audit and Risk Committee.
Interest in shares: 92,699 fully paid shares.
N Anderson, B Bus, EMBA, GAICD (Non-Executive Director)
Appointed to the board on 21 January 2016. Nicki Anderson is an accomplished leader and director with broad experience in strategy, sales, marketing, licensing and innovation within branded food, beverage and consumer goods businesses both in Australia and Internationally (including Coca Cola Amatil, Cadbury Schweppes, McCain, Nestle and Kraft). Nicki has held senior positions in marketing and innovation within world class FMCG companies and was most recently Managing Director of the Blueprint Group concentrating on sales, marketing and merchandising within the retail and pharmacy sales channels. Nicki is currently a Director of Mrs Mac’s, Australia Made Campaign Limited, Prostate Cancer Foundation and ASX listed Funtastic (ASX: FUN; director since October 2018). She is Chair of the Remuneration & Nomination Committee for both Mrs Mac’s Limited and Funtastic Limited. Nicki is a Member and Former Chair of the Monash University Advisory Board for the marketing faculty. She is a member of the Remuneration and Nomination Committee.
Interest in shares: 8,653 fully paid shares.
21Select Harvests Annual Report 2020
NAMES, QUALIFICATIONS, EXPERIENCE AND SPECIAL RESPONSIBILITIES
F Bennett, BA (Hons), FCA, FAICD and FIML (Non-Executive Director)
Appointed to the board on 6 July 2017. Ms Fiona Bennett is a Chartered Accountant and an experienced non-executive director with an extensive background in business management, corporate governance, audit and risk. She is currently on the boards of BWX Limited (ASX: BWX; director since December 2018) and Hills Limited (ASX: HIL; director since May 2010) and is also Chair of the Victorian Legal Services Board. Ms Bennett has previously served on the board of Beach Energy Limited (2012-2017). She has held senior executive roles at BHP Limited and Coles Limited and has been Chief Financial Officer at several organisations in the health sector. She is Chair of the Audit and Risk Committee.
Interest in shares: 9,175 fully paid shares.
G Kingwill (Non-Executive Director)
Appointed to the board on 25 November 2019. Guy joins the Board with an extensive background in horticulture, international soft commodity marketing and water investment and trading. He is currently on the Boards of Tasmanian Irrigation and ACMII Australia 1 Group and serves as the Chair of the Audit Committee at Tasmanian Irrigation. Guy has previously served as Managing Director of Tandou Limited, and as a non-executive director of Lower Murray Water Urban and Rural Water Corporation. He is a member of the Audit and Risk Committee.
Interest in shares: 6,212 fully paid shares.
B Crump (Chief Financial Officer and Company Secretary)
Joined Select Harvests as Chief Financial Officer on 20 November 2017 and appointed Company Secretary on 7 August 2018. He is a Certified Practising Accountant and has over 15 years experience in senior financial management. Most recently he has been the CFO of Redflex Limited and previously gained extensive experience in agribusiness as CFO of Landmark (Australia’s largest rural services provider) and senior roles within AWB Limited. He brings extensive agribusiness, agri services and related capital management experience to the role.
Interest in shares: 4,000 fully paid shares.
Improved recent seasonal conditions have meant catchment levels have increased, leading to improved allocations and a significant drop in the temporary water licence market.
The Food Division continued to be impacted by increasing private label competition in the consumer domestic cooking nuts category, however significant growth was again achieved with the Sunsol Brand. The lower global almond price has a material impact on margins in the B2B Industrial segment.
COVID-19 and its impact on global market access has extended the length of Select Harvests’ shipping schedule. This has led to delays in the delivery of the 2020 crop and related cash receipts. As growing and processing costs for the 2020 crop have already occurred this shipment delay has led to lower operational cashflows. As a result, Select Harvests’ net bank debt position at the end of FY2020 is $57.5 million (FY2019: net cash position $7.9 million). There has been no major project expenditure or greenfield development during the year.
The options for greenfield expansion, mature orchard acquisition, and non-almond related opportunities continue to be assessed for future growth.
This performance was offset by a 12.8% reduction in the achieved almond price as a record 2020 U.S. crop and the impact of COVID-19 on global market access negatively impacted prices for almond kernel and processed product. Additionally, increasingly dry conditions led to the cost of temporary water licences increasing substantially leading to an overall increase in cost of production per kilogram by 13.3%.
Despite the adverse movement in the global almond price and cost of water, Select Harvests delivered a solid profit result for FY2020. This performance reflects the prior years’ investment in greenfield developments continuing to increase their production as they mature. Additionally, consistent improved yields achieved through the ongoing investment in technology, supported by a targeted horticultural management approach, has led to an increase in the forecasted production volume. This reflects the current strategic focus on consolidating the almond asset base to maximise returns.
The water market was challenging in FY2020. Ongoing drought conditions, increased horticultural developments and a greater presence of large non-irrigator financial traders in the water markets have all put increased pressure on water (cost and supply).
CORPORATE INFORMATION
Nature of operations and principal activities
The principal activities during the year of entities within the Company were:
• The growing, processing and sale of almonds to the food industry from company owned and leased almond orchards; and
• Processing, packaging, marketing and distribution of edible nuts, dried fruits, seeds, muesli and a range of natural health foods.
EMPLOYEES
The Company employed 533 full time equivalent employees as at 30 September 2020 (30 September 2019: 570 full time equivalent employees).
Full time equivalent employees include: executive, permanent, contractor and seasonal (casual and labour agency hire) employment types.
OPERATING AND FINANCIAL REVIEW
Highlights and Key developments during the year
Another strong yielding performance from Select Harvests almond asset base delivered a record crop in FY2020.
22 Select Harvests Annual Report 2020
Directors’ ReportContinued
Balance Sheet
$’000 FY2020 FY2019
Trade and other receivables 69,154 50,223
Inventories 100,549 77,687
Biological asset 42,432 34,144
Trade and other payables (42,517) (32,345)
Net working capital 169,618 129,709
Results Summary and Reconciliation
($‘000) REPORTED RESULT (AIFRS)
FY2020 FY2019
Almond Division 41,807 82,235
Food Division 3,348 5,011
Corporate Costs (6,429) (7,181)
Operating EBIT 38,726 80,065
Interest Expense (2,064) (3,957)
Net Profit Before Tax 36,662 76,108
Tax (Expense) (11,661) (23,086)
Net Profit After Tax 25,001 53,022
Earnings Per Share (cents) 26.0 55.5
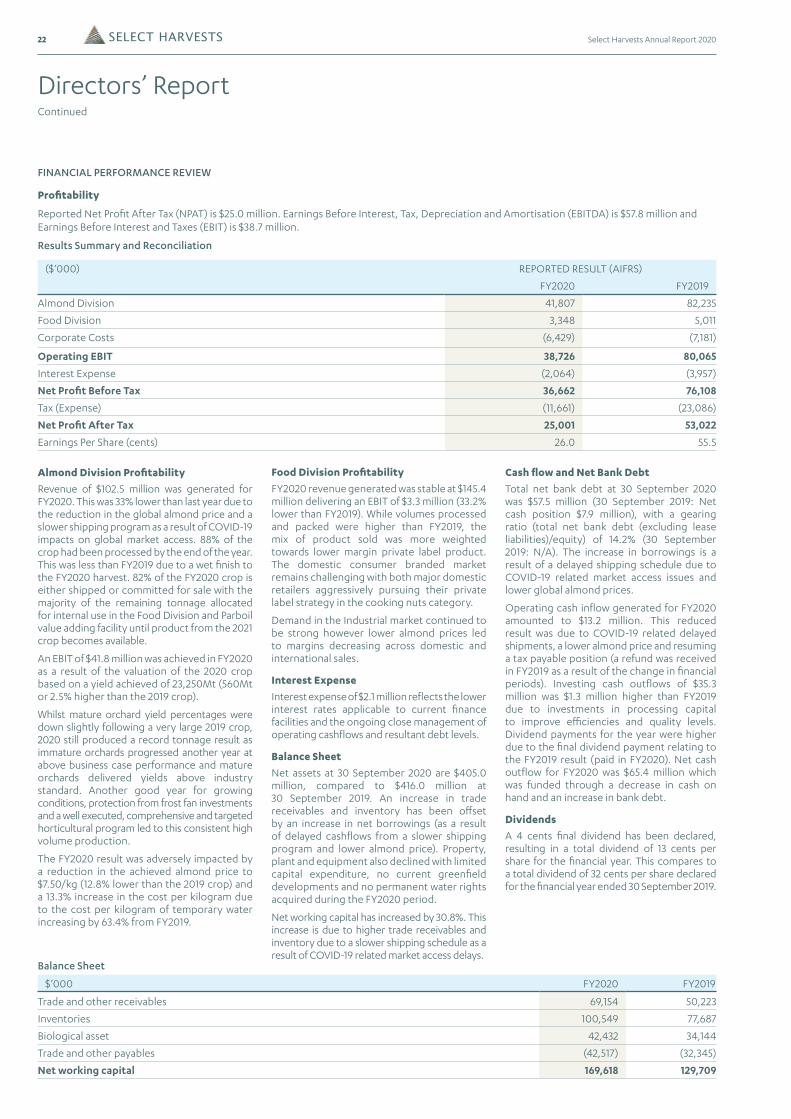
FINANCIAL PERFORMANCE REVIEW
Profitability
Reported Net Profit After Tax (NPAT) is $25.0 million. Earnings Before Interest, Tax, Depreciation and Amortisation (EBITDA) is $57.8 million and Earnings Before Interest and Taxes (EBIT) is $38.7 million.
Food Division Profitability
FY2020 revenue generated was stable at $145.4 million delivering an EBIT of $3.3 million (33.2% lower than FY2019). While volumes processed and packed were higher than FY2019, the mix of product sold was more weighted towards lower margin private label product. The domestic consumer branded market remains challenging with both major domestic retailers aggressively pursuing their private label strategy in the cooking nuts category.
Demand in the Industrial market continued to be strong however lower almond prices led to margins decreasing across domestic and international sales.
Interest Expense
Interest expense of $2.1 million reflects the lower interest rates applicable to current finance facilities and the ongoing close management of operating cashflows and resultant debt levels.
Balance Sheet
Net assets at 30 September 2020 are $405.0 million, compared to $416.0 million at 30 September 2019. An increase in trade receivables and inventory has been offset by an increase in net borrowings (as a result of delayed cashflows from a slower shipping program and lower almond price). Property, plant and equipment also declined with limited capital expenditure, no current greenfield developments and no permanent water rights acquired during the FY2020 period.
Net working capital has increased by 30.8%. This increase is due to higher trade receivables and inventory due to a slower shipping schedule as a result of COVID-19 related market access delays.
Cash flow and Net Bank Debt
Total net bank debt at 30 September 2020 was $57.5 million (30 September 2019: Net cash position $7.9 million), with a gearing ratio (total net bank debt (excluding lease liabilities)/equity) of 14.2% (30 September 2019: N/A). The increase in borrowings is a result of a delayed shipping schedule due to COVID-19 related market access issues and lower global almond prices.
Operating cash inflow generated for FY2020 amounted to $13.2 million. This reduced result was due to COVID-19 related delayed shipments, a lower almond price and resuming a tax payable position (a refund was received in FY2019 as a result of the change in financial periods). Investing cash outflows of $35.3 million was $1.3 million higher than FY2019 due to investments in processing capital to improve efficiencies and quality levels. Dividend payments for the year were higher due to the final dividend payment relating to the FY2019 result (paid in FY2020). Net cash outflow for FY2020 was $65.4 million which was funded through a decrease in cash on hand and an increase in bank debt.
Dividends
A 4 cents final dividend has been declared, resulting in a total dividend of 13 cents per share for the financial year. This compares to a total dividend of 32 cents per share declared for the financial year ended 30 September 2019.
Almond Division Profitability
Revenue of $102.5 million was generated for FY2020. This was 33% lower than last year due to the reduction in the global almond price and a slower shipping program as a result of COVID-19 impacts on global market access. 88% of the crop had been processed by the end of the year. This was less than FY2019 due to a wet finish to the FY2020 harvest. 82% of the FY2020 crop is either shipped or committed for sale with the majority of the remaining tonnage allocated for internal use in the Food Division and Parboil value adding facility until product from the 2021 crop becomes available.
An EBIT of $41.8 million was achieved in FY2020 as a result of the valuation of the 2020 crop based on a yield achieved of 23,250Mt (560Mt or 2.5% higher than the 2019 crop).
Whilst mature orchard yield percentages were down slightly following a very large 2019 crop, 2020 still produced a record tonnage result as immature orchards progressed another year at above business case performance and mature orchards delivered yields above industry standard. Another good year for growing conditions, protection from frost fan investments and a well executed, comprehensive and targeted horticultural program led to this consistent high volume production.
The FY2020 result was adversely impacted by a reduction in the achieved almond price to $7.50/kg (12.8% lower than the 2019 crop) and a 13.3% increase in the cost per kilogram due to the cost per kilogram of temporary water increasing by 63.4% from FY2019.
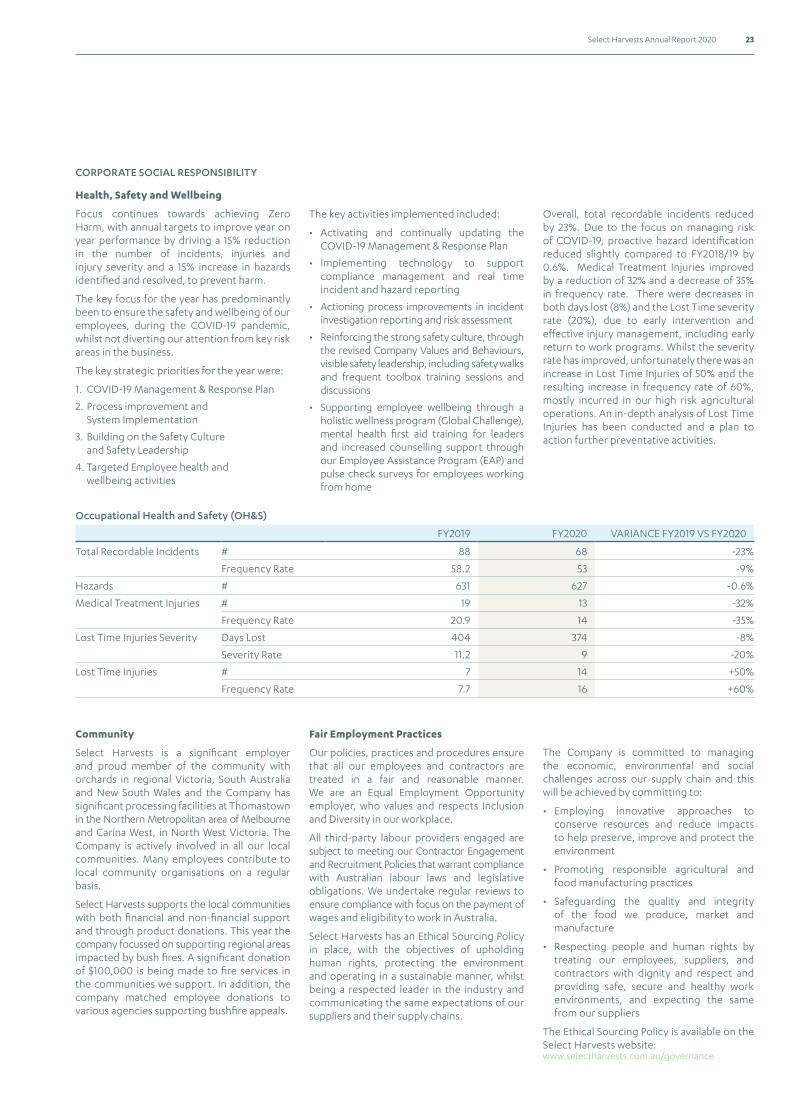
23Select Harvests Annual Report 2020
Occupational Health and Safety (OH&S)
FY2019 FY2020 VARIANCE FY2019 VS FY2020
Total Recordable Incidents # 88 68 -23%
Frequency Rate 58.2 53 -9%
Hazards # 631 627 -0.6%
Medical Treatment Injuries # 19 13 -32%
Frequency Rate 20.9 14 -35%
Lost Time Injuries Severity Days Lost 404 374 -8%
Severity Rate 11.2 9 -20%
Lost Time Injuries # 7 14 +50%
Frequency Rate 7.7 16 +60%
The key activities implemented included:
• Activating and continually updating the COVID-19 Management & Response Plan
• Implementing technology to support compliance management and real time incident and hazard reporting
• Actioning process improvements in incident investigation reporting and risk assessment
• Reinforcing the strong safety culture, through the revised Company Values and Behaviours, visible safety leadership, including safety walks and frequent toolbox training sessions and discussions
• Supporting employee wellbeing through a holistic wellness program (Global Challenge), mental health first aid training for leaders and increased counselling support through our Employee Assistance Program (EAP) and pulse check surveys for employees working from home
Overall, total recordable incidents reduced by 23%. Due to the focus on managing risk of COVID-19, proactive hazard identification reduced slightly compared to FY2018/19 by 0.6%. Medical Treatment Injuries improved by a reduction of 32% and a decrease of 35% in frequency rate. There were decreases in both days lost (8%) and the Lost Time severity rate (20%), due to early intervention and effective injury management, including early return to work programs. Whilst the severity rate has improved, unfortunately there was an increase in Lost Time Injuries of 50% and the resulting increase in frequency rate of 60%, mostly incurred in our high risk agricultural operations. An in-depth analysis of Lost Time Injuries has been conducted and a plan to action further preventative activities.
CORPORATE SOCIAL RESPONSIBILITY
Health, Safety and Wellbeing
Focus continues towards achieving Zero Harm, with annual targets to improve year on year performance by driving a 15% reduction in the number of incidents, injuries and injury severity and a 15% increase in hazards identified and resolved, to prevent harm.
The key focus for the year has predominantly been to ensure the safety and wellbeing of our employees, during the COVID-19 pandemic, whilst not diverting our attention from key risk areas in the business.
The key strategic priorities for the year were:
1. COVID-19 Management & Response Plan
2. Process improvement and System Implementation
3. Building on the Safety Culture and Safety Leadership
4. Targeted Employee health and wellbeing activities
Community
Select Harvests is a significant employer and proud member of the community with orchards in regional Victoria, South Australia and New South Wales and the Company has significant processing facilities at Thomastown in the Northern Metropolitan area of Melbourne and Carina West, in North West Victoria. The Company is actively involved in all our local communities. Many employees contribute to local community organisations on a regular basis.
Select Harvests supports the local communities with both financial and non-financial support and through product donations. This year the company focussed on supporting regional areas impacted by bush fires. A significant donation of $100,000 is being made to fire services in the communities we support. In addition, the company matched employee donations to various agencies supporting bushfire appeals.
Fair Employment Practices
Our policies, practices and procedures ensure that all our employees and contractors are treated in a fair and reasonable manner. We are an Equal Employment Opportunity employer, who values and respects Inclusion and Diversity in our workplace.
All third-party labour providers engaged are subject to meeting our Contractor Engagement and Recruitment Policies that warrant compliance with Australian labour laws and legislative obligations. We undertake regular reviews to ensure compliance with focus on the payment of wages and eligibility to work in Australia.
Select Harvests has an Ethical Sourcing Policy in place, with the objectives of upholding human rights, protecting the environment and operating in a sustainable manner, whilst being a respected leader in the industry and communicating the same expectations of our suppliers and their supply chains.
The Company is committed to managing the economic, environmental and social challenges across our supply chain and this will be achieved by committing to:
• Employing innovative approaches to conserve resources and reduce impacts to help preserve, improve and protect the environment
• Promoting responsible agricultural and food manufacturing practices
• Safeguarding the quality and integrity of the food we produce, market and manufacture
• Respecting people and human rights by treating our employees, suppliers, and contractors with dignity and respect and providing safe, secure and healthy work environments, and expecting the same from our suppliers
The Ethical Sourcing Policy is available on the Select Harvests website:www.selectharvests.com.au/governance
24 Select Harvests Annual Report 2020
To mitigate the risk of inadequate supply of water at an economic price, Select Harvests has developed a strategy that addresses our exposure to immediate and future weather patterns, market trends and projected prices. The company operates in several irrigation regions, has a mix of owned permanent water entitlements, medium term water leases and allocation water purchased in the spot market, and uses a mix of ground and river water. The strategy is reviewed by the Board annually and monitored through monthly reports.
EnergyOur H2E co-generation facility was commissioned in June 2018 and it uses biomass such as hulls, shells and orchard prunings to generate electricity. Enough electricity can be generated to power the Carina West Processing Facility (CWPF) and nearby orchard pumps and supply renewable electricity into the local grid. Project H2E is delivering approximately 27% reduction in the carbon footprint of the facility or the equivalent of taking 8,210 cars off the road. Further work to optimise the facility was completed at the end of 2019, with further increases in energy generation from the installation of the bag filter.
Increased purchases through the Virtual Generation Agreements (VGA) have occurred over the last 12 months, resulting in increase from last year from 39% to 51% of net electricity consumption from renewables (excluding grid mix renewables) through self-generation and targeted Wind Power Purchase Agreements (PPA). A breakdown is provided in the following table:
This highlights the company’s commitment to sourcing sustainable energy and Select Harvests continues to be on track for increasing use of renewable power. We continue to pursue projects to reduce our energy footprint and efficiency. Projects include site energy efficient consumption reviews and portfolio reviews to understand potential contracting options moving forward.
RecyclingThe composting of the cogeneration facility’s ash with organic matter, soil ameliorants and essential plant nutrients resulted in approximately 30,000 tonnes of compost being produced and applied to the orchards in readiness for the 2020/21 season.
The composting process takes all the waste skins from the Carina West value adding facility, which used to be directed to landfill. More recently the waste almond skins from the Thomastown facility have also been diverted to composting, averting them being sent to landfill. The compost will increase soil carbon levels, provide a valuable slow release biological nutrient source, increase water and fertiliser efficiency, and ultimately improve soil health. The compost will reach peak production over the next 12 months with approximately 30,000 tonnes being produced annually, enough to treat approximately 85% of our orchards.
Office waste, containers and packaging are recycled or reused wherever possible. All food waste is sold into the stockfeed industry.
Directors’ ReportContinued
(MWH)
Total Power Consumed 55,523.46
Total Grid Power Consumed 40,587.78
Total Power Generated 20,882.88
Total Power Exported 5,947.20
Power Purchased through VGA 3,201.42
We seek to mitigate the risks and capitalise on the opportunities that occur across the business through sensible and responsible management. To achieve this, we are exploring the following:
• Further steps to address our climate change related risks and opportunities
• Participating and supporting the Murray Darling Basin Plan to bring the Basin back to a healthier and sustainable level.
• In January 2019, Australia’s Modern Slavery Act came into effect. We look forward to releasing our first report in FY2021, which will outline how we plan to address this important global issue.
The 2019/20 Sustainability Report is available on the company website :www.selectharvests.com.au/sustainability
Our Environment and Sustainability Policy and its related procedures and systems govern our wildlife management plan and licensing requirements. A copy is available on the Select Harvests website:www.selectharvests.com.au/governance
Select Harvests is a signatory of the National Packaging Industry Covenant, which aims to deliver more sustainable packaging, increase recycling rates and reduce waste. The Company’s office and farm waste is recycled where possible.
Environmental Regulation & Performance
Select Harvests is subject to environmental regulations under laws of the Commonwealth and State Governments of Victoria, New South Wales and South Australia. The Company holds licences issued by the Environmental Protection Authority (EPA) which specify limits for discharges to the environment. These licences regulate the management of discharge to the air and stormwater runoff.
For FY2020, there were no environmental breaches nor breaches of the Company’s environmental licence conditions.
Water
Water is a limited resource and a key input to Select Harvests’ almond orchards. A significant amount of capital and management time is invested in improving the efficiency of water utilisation. Initiatives include installing state of the art irrigation technology and systems to deliver water efficiently, dedicated resources on each farm to optimise water use which includes reviewing and agreeing the irrigation and fertigation application on a weekly basis. Several innovative technology solutions have also been deployed to improve orchard management, including soil moisture monitoring probes, plant-based water stress monitoring sensors and vegetative index imagery collected by drones that identifies differing tree health. These sources of real time information are connected by telemetry enabling us to build a database that over time will lead to more informed decisions.
In some orchards we are recycling water from the drainage system, resulting in cost savings and minimising the impact on the water table. In addition, trials are being run on higher yielding almond varieties that use less water per tonne of almonds produced.Almond orchards are a long-term investment that require a secure supply of water.
Sustainability This year, Select Harvests has reviewed its sustainability strategy and as part of that process aligned reporting with the Global Reporting Initiative Standards as well as the United Nations Sustainable Development Goals (SDGs). Both provide a global framework that helps guide our goals and objectives as a business.
There is a shortage of healthy food globally and as a grower and marketer of nutrient dense food products, we are well positioned to help meet this growing demand. To capitalise on this demand, we need to set our goals and targets with a long-term lens as we operate in an industry that requires commitment and up to 25 years of foresight when expanding almond operations. Therefore, it is imperative that sustainability be embedded into everything we do, which is why we recognise it as a core value supporting the delivery of our business strategy. This sustainable approach to running our business is essential to delivering on our key strategic objectives;
• Optimise the almond base
• Grow our brands
• Expand strategically.
We are motivated to meet increasing expectations by doing our fair share to address complex global social and environmental challenges, such as managing our resources efficiently, creating a safe working environment that ensures inclusiveness and diversity and compliance to laws within our operations and supply chain, whilst reducing our impact on the environment. To achieve this, we need to execute on the business fundamentals, along with receiving the social and environmental mandate from the communities within which we operate.
The Company is committed to minimising the impact its operations have on the environment, with several projects activated over the past two years, including reduction of our carbon footprint. Our key focus areas in 2020 were:
• Ensuring the safety of our people, by preventing injuries before they occur. The aim of Select Harvests’ Zero Harm Safety and Wellbeing strategy is to improve our safety performance by 15% per annum until we operate in a zero-harm environment
• Securing future water supply whilst being a leader in the market for water efficiency. We aim to manage our water efficiency through best practice water delivery systems, water optimisation technology such as soil water monitoring, plant based monitoring and high-resolution imagery
• Reducing our impact on the environment across all aspects of the business. This is achievable through the further investment in sustainable projects (i.e. H2E co-generation facility), bee stewardship, promoting a ‘recycle first’ culture and transitioning to greener inputs used throughout the value chain.
In looking ahead, we will continue to improve the monitoring and reporting systems we have in place as a business, to ensure that we are pinpointing the right sustainability measures that address the key focus areas of our stakeholders. We are cognisant of the potential impact we have on our environment and the impact that climate change has on our business.
25Select Harvests Annual Report 2020
On 1 October 2020 Select Harvests announced it had entered into an Implementation Deed and Sale Agreements to acquire the 1,566ha Piangil Almond Orchard, along with a $120m capital raising to assist in funding the acquisition. Anticipated to complete by the 3rd week of December 2020, this exciting development will add significant scale to our orchard portfolio.
The Food Division is undergoing a detailed strategic review to determine the best option for the division to deliver maximum returns. Options being considered are:
• Development of a new highly efficient processing facility to build on the current Thomastown plant’s (lease expires in June 2022) capabilities through a targeted growth program
• Optimise the use of the capability of the Carina West processing facility
• Grow the consumer retail branded presence through marketing support and targeted new product development
• Develop strong strategic partnerships with key domestic customers delivering a variety of products and services
• Access new sales channels in the China and South East Asian markets for both the Sunsol and Lucky brands
• Further progress value added almond sales in the business to business Industrial market, particularly China. As our production levels naturally grow there will continue to be a volume uplift in this area. Improvements in our Parboil value adding facility will deliver additional opportunities in domestic and export markets.
• Divest activities that generate below hurdle rate returns.
Additionally, the company continues to carefully assess (through internally set hurdle rates and strategic benefits) its growth opportunities. These comprise:
• Continued expansion in almond orchards, both greenfield and mature
• Diversification into other nuts
• Continue to grow our Food Division both organically (through new product development, brand strengthening and improved operational efficiencies) and inorganically
The macro for the almond industry and ‘better for you’ plant-based foods remains very strong both domestically and internationally. Select Harvests has high quality assets, a sustained increasingly efficient and consistent production profile supported by world class technology. We remain well placed to deliver on the opportunities that will arise from continued demand growth globally for plant based foods.
This ongoing demand continues to be driven by increasing middleclass wealth and a higher number of consumers adopting and consuming healthier diets, including the increased consumption of plant-based products, particularly almonds. Select Harvests continues to successfully deliver in both the Almond and Food Divisions to leverage this macro increase in global demand.
The horticultural program for the 2021 crop is well underway. Conditions to date have been favourable with the trees receiving sufficient chill hours through the dormancy period and the pollination process has completed without issue. There have been a limited number of frost events and the previous investment in frost fans implemented in key areas has mitigated any negative impact.
Based on industry standard yields and the age profile of the orchards, and assuming normal growing conditions for the season, the Select Harvests 2021 theoretical crop would be approximately 23,500Mt (excluding Piangil Orchard).
Increased rainfall to date this season has led to a significant drop in the price of temporary water. Select Harvests will not see the full cost benefit of this flow through into FY2021 due to the level of acquired FY2020 water carried over. Our policy of owning water entitlements, long and medium term leasing entitlements and acquiring annual allocations on the spot market means we are not fully exposed to annual fluctuations in water prices.
USD almond pricing decreased to 10 year lows in mid-2020 due to the confirmation of an estimated 3.0 Billion pound 2020 U.S. crop, the high levels of carry-over stock from the U.S. 2019 crop and the increasing spread and impacts of COVID-19. While levels of demand have increased in response to the price drop, current pricing levels remain subdued and are not expected to materially rise for the next twelve months. After a slow start, 2020 almond exports (kernel and processed product) have increased and are expected to remain strong, particularly into the India and China market.
The Almond Division continues to pursue opportunities to further maximise returns from its core almond asset base. This occurs through increased production (yields), improved quality and greater efficiency. This is achieved through the following:
• Increasing the use of technology to provide a more targeted horticultural management approach delivering improvements to yield, quality and lower water usage
• Further investment in advanced equipment in our Carina West processing facility to deliver additional scale, quality and productivity improvements
• Additional capabilities and operating efficiency from our Parboil value adding facility through targeted investment and new product manufacturing processes
• Consistent maximum power generation from our H2E bio-mass facility using hull and horticultural waste and producing high quality pot ash to be composted and applied to current orchard assets
In addition to the above, domestic greenfield developments and mature orchard acquisitions continue to be assessed.
Pollination Management
Select Harvests’ almond orchards are dependent on bee pollination. The key challenges and risks in bee stewardship centre on optimum bee health, pollination activity and almond yield. The Company sources pollination services through several brokers and direct relationships with apiarists. This generates productive relationships and an optimum pollination outcome.
Recognising the importance of bees, Select Harvests actively engages and supports the bee and pollination industries. This includes the sponsorship and support for apiary associations, participation and presentation at conferences, and collaboration in all-of-horticulture and almond specific R&D projects and steering committees.
We continue to investigate innovative solutions to generate improved colony health and pollination outcomes. These include trialling self-pollinating varieties, improved bee husbandry practices, colony imagery and artificial pollen application.
Our on-farm bee stewardship practices include fostering alternative forage sources for bees, provision of water at pollination sites to aid bee hydration, avoiding the use of products bees are sensitive to when colonies are present. If a spray is required we work with the apiarist and conduct it at night outside of foraging periods. Audited spray diaries are available and ongoing inspections monitor for colony strength and health.
Other critical components to ensuring maximum yield include successful cross-pollination through varietal selection.
Risk Management
Select Harvests has a risk management process in place to identify, analyse, assess, manage and monitor risks throughout all parts of the business.
The Company maintains and refreshes its detailed risk register annually. The register provides a framework and benchmark against which risks are reported on at different levels in the business, with a biannual report presented to the Board.
Each month major risks are reviewed by Senior Management and the Board. They include
• Safety Risks (including employee safety, fire prevention and plant operation);
• Horticultural Risks (including climatic, disease, water management, pollination and quality)
• Food Safety Risks (including product quality, utilities supply, major equipment failure); and
• Financial Risks (including currency, customer concentration, market pricing)
The Audit and Risk Committee Charter is available on the Select Harvests website:
www.selectharvests.com.au/governance
Outlook
The global macro for almonds continues to remain positive moving forward. While COVID-19 has no doubt logistically impacted the global supply of almonds the export shipping data in recent months from the U.S. has shown record breaking levels of shipments.
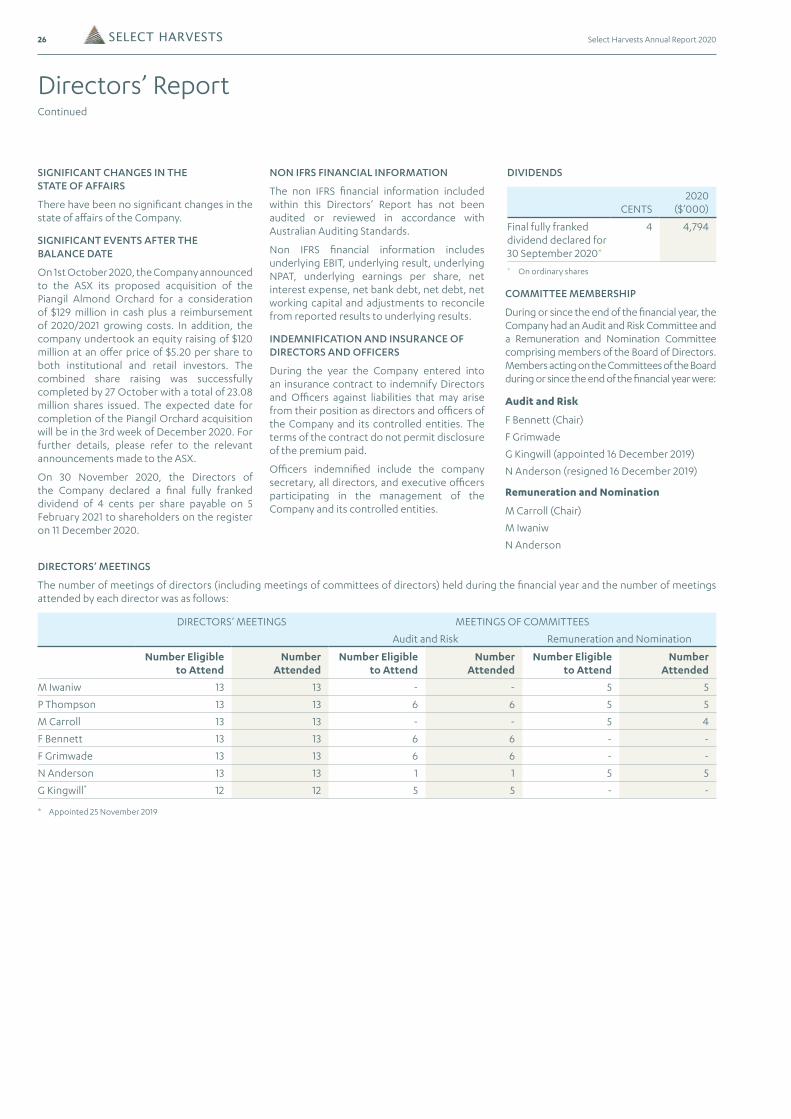
26 Select Harvests Annual Report 2020
COMMITTEE MEMBERSHIP
During or since the end of the financial year, the Company had an Audit and Risk Committee and a Remuneration and Nomination Committee comprising members of the Board of Directors. Members acting on the Committees of the Board during or since the end of the financial year were:
Audit and Risk
F Bennett (Chair)
F Grimwade
G Kingwill (appointed 16 December 2019)
N Anderson (resigned 16 December 2019)
Remuneration and Nomination
M Carroll (Chair)
M Iwaniw
N Anderson
NON IFRS FINANCIAL INFORMATION
The non IFRS financial information included within this Directors’ Report has not been audited or reviewed in accordance with Australian Auditing Standards.
Non IFRS financial information includes underlying EBIT, underlying result, underlying NPAT, underlying earnings per share, net interest expense, net bank debt, net debt, net working capital and adjustments to reconcile from reported results to underlying results.
INDEMNIFICATION AND INSURANCE OF DIRECTORS AND OFFICERS
During the year the Company entered into an insurance contract to indemnify Directors and Officers against liabilities that may arise from their position as directors and officers of the Company and its controlled entities. The terms of the contract do not permit disclosure of the premium paid.
Officers indemnified include the company secretary, all directors, and executive officers participating in the management of the Company and its controlled entities.
SIGNIFICANT CHANGES IN THE STATE OF AFFAIRS
There have been no significant changes in the state of affairs of the Company.
SIGNIFICANT EVENTS AFTER THE BALANCE DATE
On 1st October 2020, the Company announced to the ASX its proposed acquisition of the Piangil Almond Orchard for a consideration of $129 million in cash plus a reimbursement of 2020/2021 growing costs. In addition, the company undertook an equity raising of $120 million at an offer price of $5.20 per share to both institutional and retail investors. The combined share raising was successfully completed by 27 October with a total of 23.08 million shares issued. The expected date for completion of the Piangil Orchard acquisition will be in the 3rd week of December 2020. For further details, please refer to the relevant announcements made to the ASX.
On 30 November 2020, the Directors of the Company declared a final fully franked dividend of 4 cents per share payable on 5 February 2021 to shareholders on the register on 11 December 2020.
DIRECTORS’ MEETINGS
The number of meetings of directors (including meetings of committees of directors) held during the financial year and the number of meetings attended by each director was as follows:
DIRECTORS’ MEETINGS MEETINGS OF COMMITTEES
Audit and Risk Remuneration and Nomination
Number Eligible to Attend
Number Attended
Number Eligible to Attend
Number Attended
Number Eligible to Attend
Number Attended
M Iwaniw 13 13 - - 5 5
P Thompson 13 13 6 6 5 5
M Carroll 13 13 - - 5 4
F Bennett 13 13 6 6 - -
F Grimwade 13 13 6 6 - -
N Anderson 13 13 1 1 5 5
G Kingwill* 12 12 5 5 - -
* Appointed 25 November 2019
DIVIDENDS
CENTS2020
($’000)
Final fully franked dividend declared for 30 September 2020*
4 4,794
* On ordinary shares
Directors’ ReportContinued
27Select Harvests Annual Report 2020
DIRECTORS’ INTERESTS IN CONTRACTS
Directors’ interests in contracts are disclosed in Note 27(e) to the financial statements.
AUDITOR’S INDEPENDENCE DECLARATION
A copy of the auditor’s independence declaration as required under section 307C of the Corporations Act 2001 is set out on page 40.
NON-AUDIT SERVICES
Non-audit services provided by the external auditor are approved by resolution of the Audit and Risk Committee and approval is provided in writing to the board of directors. The directors are satisfied that no non-audit services were provided during the period, as detailed in Note 26.
ROUNDING
The amounts contained in this report and in the financial report have been rounded to the nearest $1,000 (where rounding is applicable) under the option available to the Company under ASIC Corporations (Rounding in Financial/ Directors’ Reports) Instrument 2016/191. The Company is an entity to which the Class Order applies.
PROCEEDINGS ON BEHALF OF THE COMPANY
There are no material legal proceedings in place on behalf of the Company as at the date of this report.
CORPORATE GOVERNANCE
In recognising the need for the highest standards of corporate behaviour and accountability, the directors of Select Harvests Limited support and have adhered to the ASX principles of corporate governance. The Company has previously adopted Listing Rule 4.10.3 which allows companies to publish their corporate governance statement on their website rather than in their annual report. A copy of the statement along with any related disclosures is available at:
www.selectharvests.com.au/governance
This report is made in accordance with a resolution of the Directors.
M Iwaniw
Chair
Melbourne, 30 November 2020
28 Select Harvests Annual Report 2020
TSR over the three year performance period was 24.5% which came out at the 61.5th percentile of the peer group and resulted in 73% vesting. EPS growth was 25%, admittedly off a low base three years prior and therefore fully vested. No adjustments were made to the reported statutory EPS in determining this outcome. The Company was not a recipient of the government JobKeeper scheme. Overall LTI vesting was at 86.5%.
The remuneration outcomes resulting from the FY2020 performance are set out in this Remuneration Report.
Mike Carroll
Chair – Remuneration & Nomination Committee
The report has been prepared and audited against the disclosure requirements of the Corporations Act 2001 (Cth).
Directors’ ReportContinued
1. KEY QUESTIONS
What are our remuneration objectives and guiding principles?
OBJECTIVE PRINCIPLES
To deliver sustainable returns as a leader in “better for you” plant based foods.
Align management and shareholder interests.
Reflect our values of:
• Trust & Respect
• Integrity & Diversity
• Sustainability
• Performance & Innovation
Deliver competitive advantage in attracting, motivating and retaining talent.
Encourage a diverse workforce.
Simple, easily understood, rewarding performance and creating a culture that delivers shareholder value.
In addition to KPIs for their business unit and areas of direct responsibility all Key Management Personnel (KMP) share a company NPAT KPI to encourage a strong executive team dynamic and cross business unit collaboration.
Setting KPIs for a business such as ours has the challenge of a number of factors such as climatic conditions, commodity prices and exchange rates having a significant effect on results. While management can to some degree mitigate these “agricultural risks” and should be encouraged to do so, they are largely out of our control. The Board retains some discretion in evaluating overall performance and taking into account operating conditions. KMP STI vesting levels ranged from 27% to 39% of the maximum opportunity. The higher vesting levels were primarily driven by strong orchard yields, innovation, improved culture and strong cost control in the orchards, processing, manufacturing and head office.
The long term incentive plan is based on 3 year compound annual growth in earnings per share and relative total shareholder return against ASX listed industry peers and absolute Earnings Per Share (EPS) growth. The EPS band is broad with vesting starting at 5% and full vesting occurring at 20%. The choice of a broad band reflects our desire for the start point to have a reasonable probability of occurring and for full vesting to only occur when there is a strong outcome for shareholders.
REMUNERATION REPORT
Introduction from the Chair of the Remuneration and Nomination Committee
Dear Shareholder,
On behalf of the Board, I'm pleased to present our 30 September 2020 remuneration report.
The objective of Select Harvests remuneration strategy is to attract, retain and motivate the people we require to sustainably manage and grow the business. Executive remuneration packages include a balance of fixed remuneration, short term cash incentives and long term equity incentives. The framework endeavours to align executive reward with market conditions and shareholders’ interests.
Fixed remuneration is aligned to the market mid-point for similar roles in comparable companies.
The health and well-being of our people remains the paramount priority for the business, with the short term incentive payments conditional on the foundations being in place for a safe work environment, demonstration of a strong safety culture and our values. The board assessed the safety environment to be sound.
The short term incentive program is based on annual performance and assessed against key financial and operational performance indicators (KPIs). The performance targets are based on the annual business plan and set at a level that results in a 50% payout on achievement of a stretching but realistically achievable level of performance. Maximum payout only occurs where there is a clearly outstanding level of performance across all KPIs.
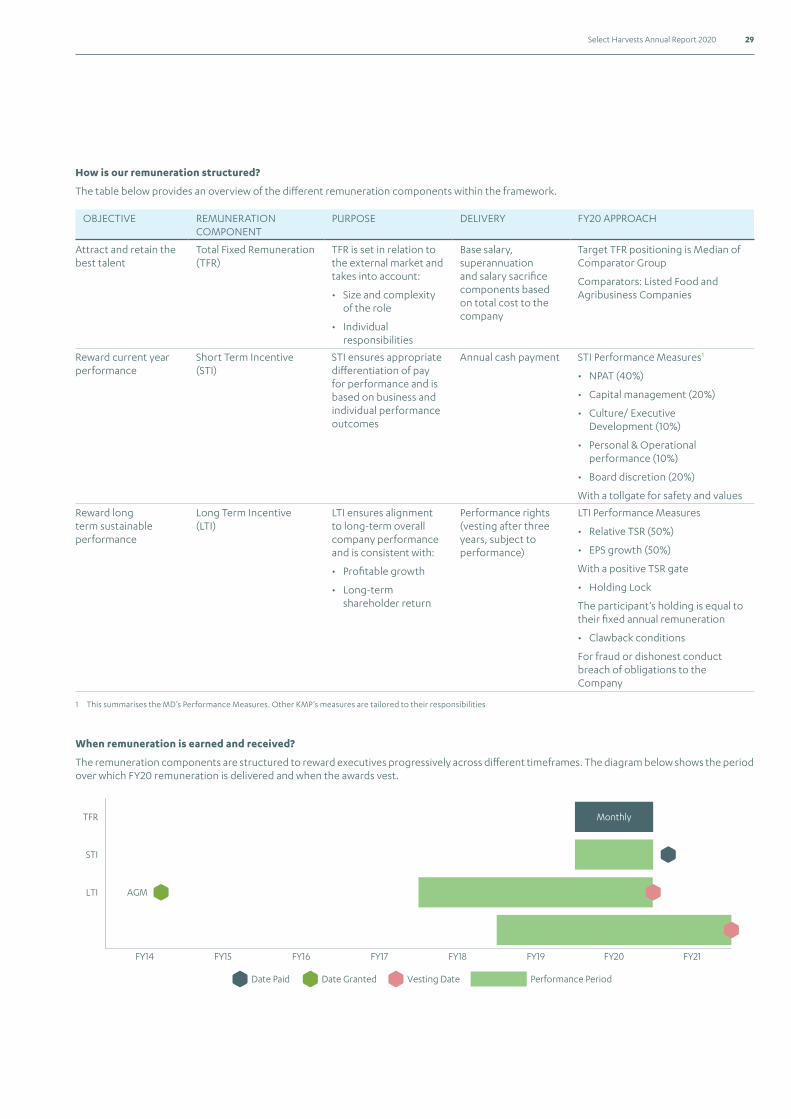
29Select Harvests Annual Report 2020
How is our remuneration structured?
The table below provides an overview of the different remuneration components within the framework.
OBJECTIVE REMUNERATION COMPONENT
PURPOSE DELIVERY FY20 APPROACH
Attract and retain the best talent
Total Fixed Remuneration (TFR)
TFR is set in relation to the external market and takes into account:
• Size and complexity of the role
• Individual responsibilities
Base salary, superannuation and salary sacrifice components based on total cost to the company
Target TFR positioning is Median of Comparator Group
Comparators: Listed Food and Agribusiness Companies
Reward current year performance
Short Term Incentive (STI)
STI ensures appropriate differentiation of pay for performance and is based on business and individual performance outcomes
Annual cash payment STI Performance Measures1
• NPAT (40%)
• Capital management (20%)
• Culture/ Executive Development (10%)
• Personal & Operational performance (10%)
• Board discretion (20%)
With a tollgate for safety and values
Reward long term sustainable performance
Long Term Incentive (LTI)
LTI ensures alignment to long-term overall company performance and is consistent with:
• Profitable growth
• Long-term shareholder return
Performance rights (vesting after three years, subject to performance)
LTI Performance Measures
• Relative TSR (50%)
• EPS growth (50%)
With a positive TSR gate
• Holding Lock
The participant’s holding is equal to their fixed annual remuneration
• Clawback conditions
For fraud or dishonest conduct breach of obligations to the Company
1 This summarises the MD’s Performance Measures. Other KMP’s measures are tailored to their responsibilities
TFR
FY14 FY15 FY16 FY18 FY19FY17 FY21FY20
STI
LTI
Performance PeriodDate Paid Date Granted Vesting Date
AGM
Monthly
When remuneration is earned and received?
The remuneration components are structured to reward executives progressively across different timeframes. The diagram below shows the period over which FY20 remuneration is delivered and when the awards vest.
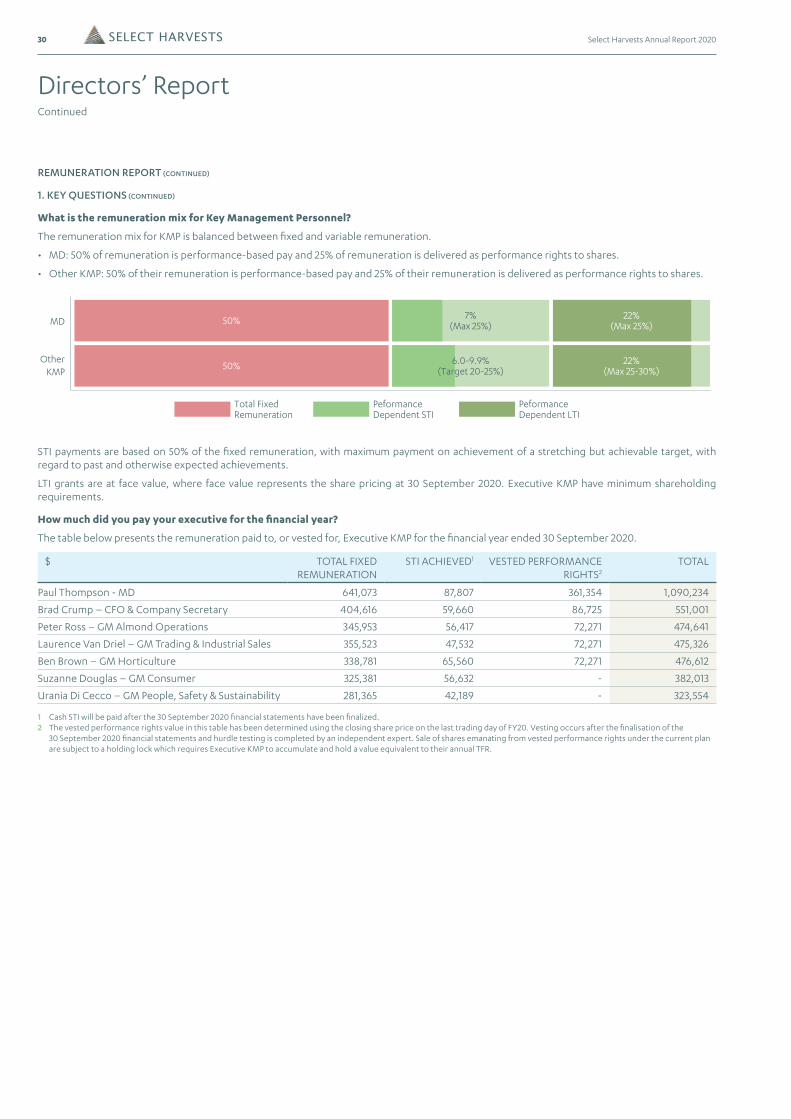
30 Select Harvests Annual Report 2020
Directors’ ReportContinued
REMUNERATION REPORT (CONTINUED)
1. KEY QUESTIONS (CONTINUED)
What is the remuneration mix for Key Management Personnel?
The remuneration mix for KMP is balanced between fixed and variable remuneration.
• MD: 50% of remuneration is performance-based pay and 25% of remuneration is delivered as performance rights to shares.
• Other KMP: 50% of their remuneration is performance-based pay and 25% of their remuneration is delivered as performance rights to shares.
22%(Max 25%)
22%(Max 25-30%)
Total FixedRemuneration
PeformanceDependent STI
PeformanceDependent LTI
MD
OtherKMP
50%
50%
7%(Max 25%)
6.0-9.9%(Target 20-25%)
STI payments are based on 50% of the fixed remuneration, with maximum payment on achievement of a stretching but achievable target, with regard to past and otherwise expected achievements.
LTI grants are at face value, where face value represents the share pricing at 30 September 2020. Executive KMP have minimum shareholding requirements.
How much did you pay your executive for the financial year?
The table below presents the remuneration paid to, or vested for, Executive KMP for the financial year ended 30 September 2020.
$ TOTAL FIXED REMUNERATION
STI ACHIEVED1 VESTED PERFORMANCE RIGHTS2
TOTAL
Paul Thompson - MD 641,073 87,807 361,354 1,090,234
Brad Crump – CFO & Company Secretary 404,616 59,660 86,725 551,001
Peter Ross – GM Almond Operations 345,953 56,417 72,271 474,641
Laurence Van Driel – GM Trading & Industrial Sales 355,523 47,532 72,271 475,326
Ben Brown – GM Horticulture 338,781 65,560 72,271 476,612
Suzanne Douglas – GM Consumer 325,381 56,632 - 382,013
Urania Di Cecco – GM People, Safety & Sustainability 281,365 42,189 - 323,554
1 Cash STI will be paid after the 30 September 2020 financial statements have been finalized.2 The vested performance rights value in this table has been determined using the closing share price on the last trading day of FY20. Vesting occurs after the finalisation of the 30 September 2020 financial statements and hurdle testing is completed by an independent expert. Sale of shares emanating from vested performance rights under the current plan are subject to a holding lock which requires Executive KMP to accumulate and hold a value equivalent to their annual TFR.
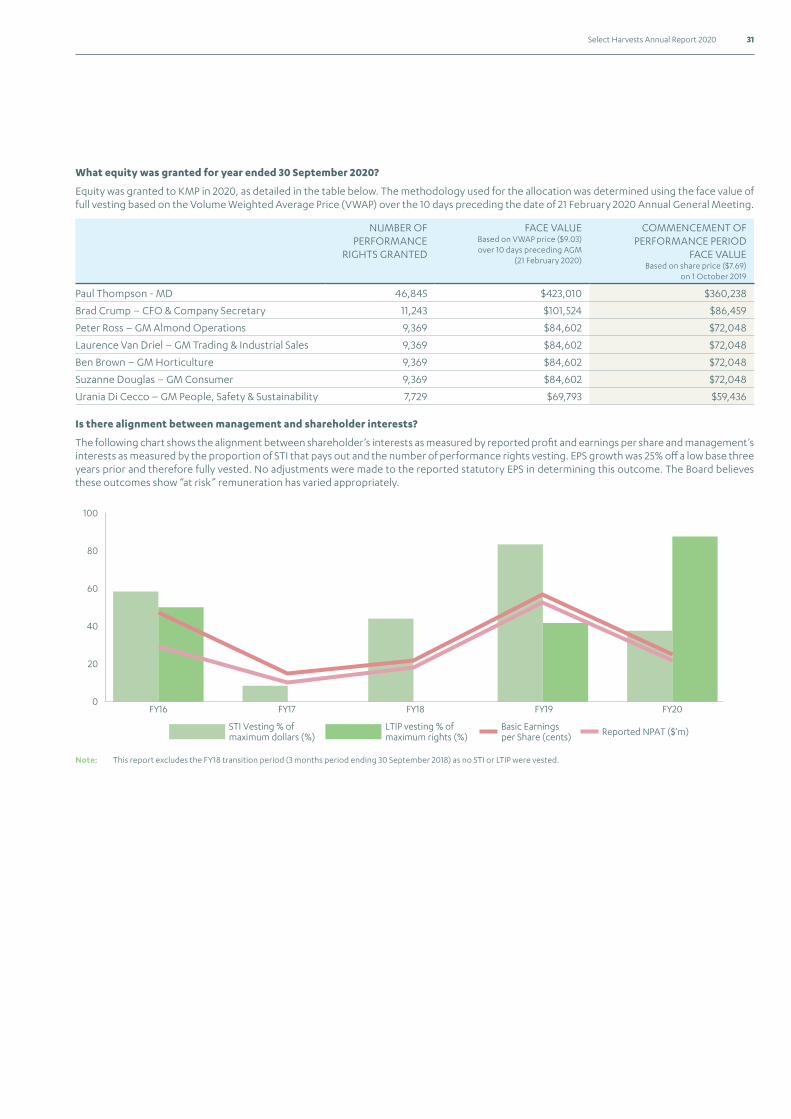
31Select Harvests Annual Report 2020
What equity was granted for year ended 30 September 2020?
Equity was granted to KMP in 2020, as detailed in the table below. The methodology used for the allocation was determined using the face value of full vesting based on the Volume Weighted Average Price (VWAP) over the 10 days preceding the date of 21 February 2020 Annual General Meeting.
NUMBER OF PERFORMANCE
RIGHTS GRANTED
FACE VALUE Based on VWAP price ($9.03) over 10 days preceding AGM
(21 February 2020)
COMMENCEMENT OF PERFORMANCE PERIOD
FACE VALUE Based on share price ($7.69)
on 1 October 2019
Paul Thompson - MD 46,845 $423,010 $360,238
Brad Crump – CFO & Company Secretary 11,243 $101,524 $86,459
Peter Ross – GM Almond Operations 9,369 $84,602 $72,048
Laurence Van Driel – GM Trading & Industrial Sales 9,369 $84,602 $72,048
Ben Brown – GM Horticulture 9,369 $84,602 $72,048
Suzanne Douglas – GM Consumer 9,369 $84,602 $72,048
Urania Di Cecco – GM People, Safety & Sustainability 7,729 $69,793 $59,436
Is there alignment between management and shareholder interests?
The following chart shows the alignment between shareholder’s interests as measured by reported profit and earnings per share and management’s interests as measured by the proportion of STI that pays out and the number of performance rights vesting. EPS growth was 25% off a low base three years prior and therefore fully vested. No adjustments were made to the reported statutory EPS in determining this outcome. The Board believes these outcomes show “at risk” remuneration has varied appropriately.
FY16 FY17 FY19 FY20FY180
20
40
60
80
100
STI Vesting % ofmaximum dollars (%) Reported NPAT ($’m)LTIP vesting % of
maximum rights (%)Basic Earningsper Share (cents)
Note: This report excludes the FY18 transition period (3 months period ending 30 September 2018) as no STI or LTIP were vested.
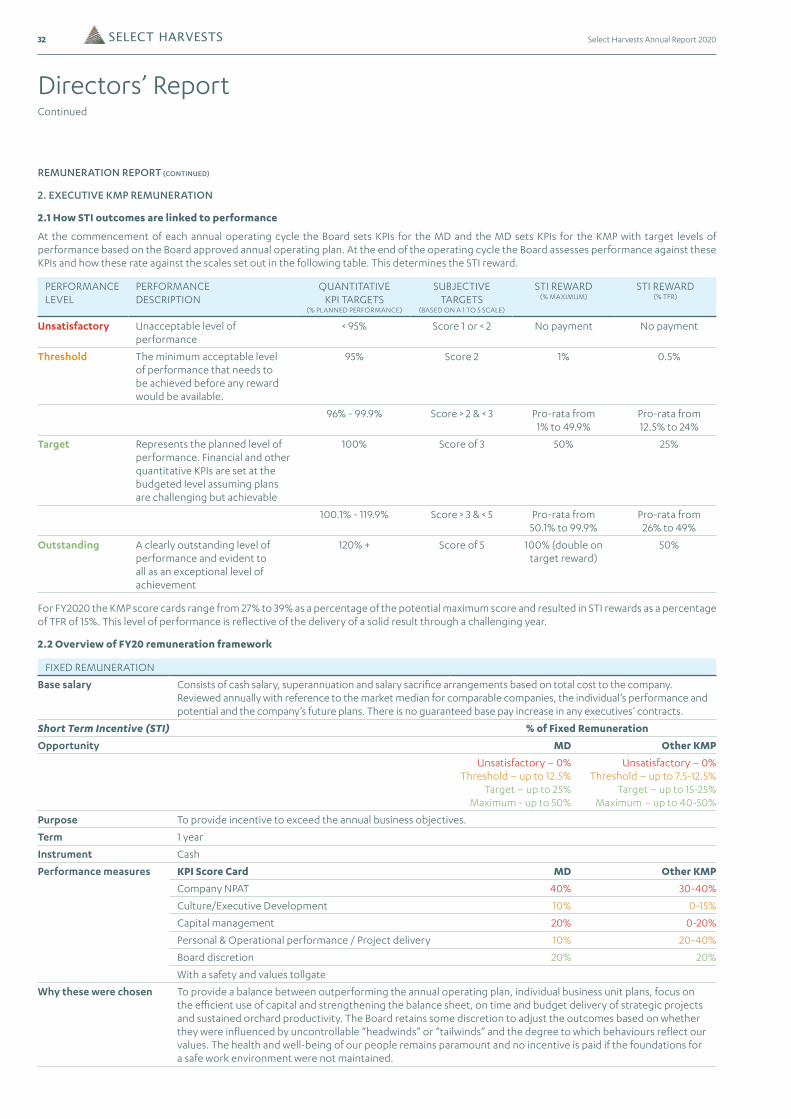
32 Select Harvests Annual Report 2020
Directors’ ReportContinued
REMUNERATION REPORT (CONTINUED)
2. EXECUTIVE KMP REMUNERATION
2.1 How STI outcomes are linked to performance
At the commencement of each annual operating cycle the Board sets KPIs for the MD and the MD sets KPIs for the KMP with target levels of performance based on the Board approved annual operating plan. At the end of the operating cycle the Board assesses performance against these KPIs and how these rate against the scales set out in the following table. This determines the STI reward.
PERFORMANCE LEVEL
PERFORMANCE DESCRIPTION
QUANTITATIVE KPI TARGETS
(% PLANNED PERFORMANCE)
SUBJECTIVE TARGETS
(BASED ON A 1 TO 5 SCALE)
STI REWARD (% MAXIMUM)
STI REWARD (% TFR)
Unsatisfactory Unacceptable level of performance
< 95% Score 1 or < 2 No payment No payment
Threshold The minimum acceptable level of performance that needs to be achieved before any reward would be available.
95% Score 2 1% 0.5%
96% - 99.9% Score > 2 & < 3 Pro-rata from 1% to 49.9%
Pro-rata from 12.5% to 24%
Target Represents the planned level of performance. Financial and other quantitative KPIs are set at the budgeted level assuming plans are challenging but achievable
100% Score of 3 50% 25%
100.1% - 119.9% Score > 3 & < 5 Pro-rata from 50.1% to 99.9%
Pro-rata from 26% to 49%
Outstanding A clearly outstanding level of performance and evident to all as an exceptional level of achievement
120% + Score of 5 100% (double on target reward)
50%
For FY2020 the KMP score cards range from 27% to 39% as a percentage of the potential maximum score and resulted in STI rewards as a percentage of TFR of 15%. This level of performance is reflective of the delivery of a solid result through a challenging year.
2.2 Overview of FY20 remuneration framework
FIXED REMUNERATION
Base salary Consists of cash salary, superannuation and salary sacrifice arrangements based on total cost to the company. Reviewed annually with reference to the market median for comparable companies, the individual’s performance and potential and the company’s future plans. There is no guaranteed base pay increase in any executives’ contracts.
Short Term Incentive (STI) % of Fixed Remuneration
Opportunity MD Other KMP
Unsatisfactory – 0% Threshold – up to 12.5%
Target – up to 25% Maximum - up to 50%
Unsatisfactory – 0% Threshold – up to 7.5-12.5%
Target – up to 15-25% Maximum – up to 40-50%
Purpose To provide incentive to exceed the annual business objectives.
Term 1 year
Instrument Cash
Performance measures KPI Score Card MD Other KMP
Company NPAT 40% 30-40%
Culture/Executive Development 10% 0-15%
Capital management 20% 0-20%
Personal & Operational performance / Project delivery 10% 20-40%
Board discretion 20% 20%
With a safety and values tollgate
Why these were chosen To provide a balance between outperforming the annual operating plan, individual business unit plans, focus on the efficient use of capital and strengthening the balance sheet, on time and budget delivery of strategic projects and sustained orchard productivity. The Board retains some discretion to adjust the outcomes based on whether they were influenced by uncontrollable “headwinds” or “tailwinds” and the degree to which behaviours reflect our values. The health and well-being of our people remains paramount and no incentive is paid if the foundations for a safe work environment were not maintained.
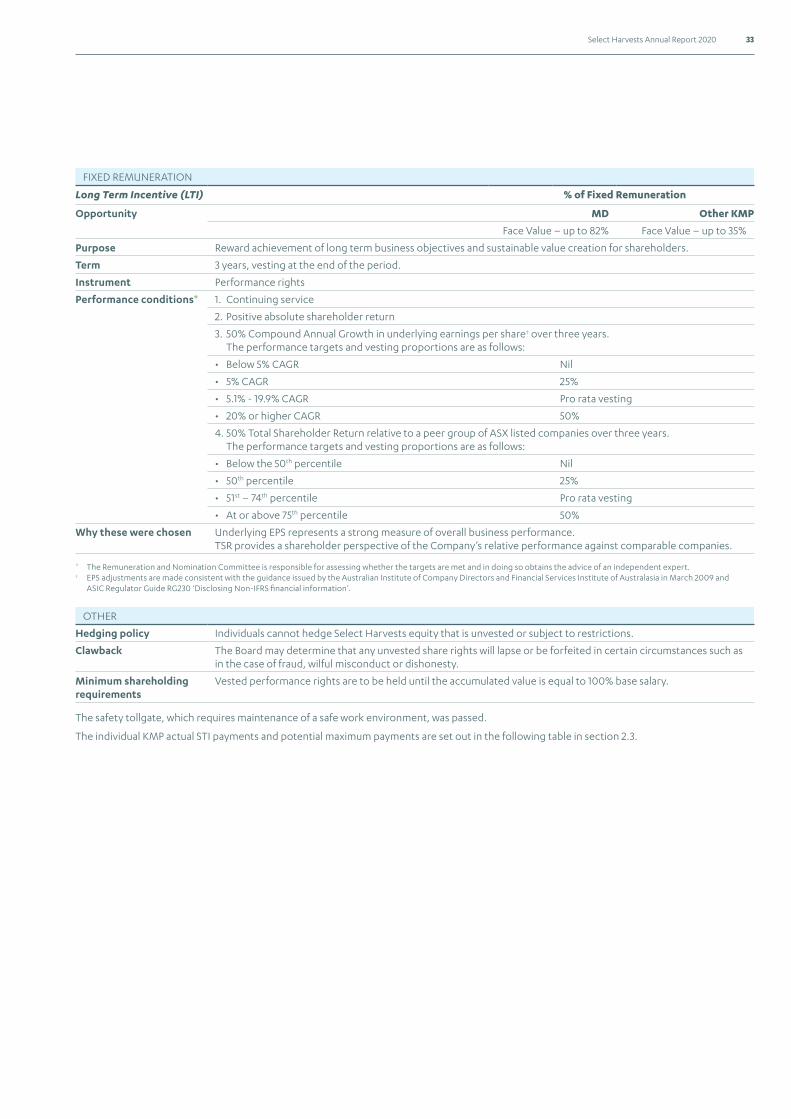
33Select Harvests Annual Report 2020
FIXED REMUNERATION
Long Term Incentive (LTI) % of Fixed Remuneration
Opportunity MD Other KMP
Face Value – up to 82% Face Value – up to 35%
Purpose Reward achievement of long term business objectives and sustainable value creation for shareholders.
Term 3 years, vesting at the end of the period.
Instrument Performance rights
Performance conditions* 1. Continuing service
2. Positive absolute shareholder return
3. 50% Compound Annual Growth in underlying earnings per share† over three years. The performance targets and vesting proportions are as follows:
• Below 5% CAGR Nil
• 5% CAGR 25%
• 5.1% - 19.9% CAGR Pro rata vesting
• 20% or higher CAGR 50%
4. 50% Total Shareholder Return relative to a peer group of ASX listed companies over three years. The performance targets and vesting proportions are as follows:
• Below the 50th percentile Nil
• 50th percentile 25%
• 51st – 74th percentile Pro rata vesting
• At or above 75th percentile 50%
Why these were chosen Underlying EPS represents a strong measure of overall business performance. TSR provides a shareholder perspective of the Company’s relative performance against comparable companies.
* The Remuneration and Nomination Committee is responsible for assessing whether the targets are met and in doing so obtains the advice of an independent expert.† EPS adjustments are made consistent with the guidance issued by the Australian Institute of Company Directors and Financial Services Institute of Australasia in March 2009 and ASIC Regulator Guide RG230 ‘Disclosing Non-IFRS financial information’.
OTHER
Hedging policy Individuals cannot hedge Select Harvests equity that is unvested or subject to restrictions.
Clawback The Board may determine that any unvested share rights will lapse or be forfeited in certain circumstances such as in the case of fraud, wilful misconduct or dishonesty.
Minimum shareholding requirements
Vested performance rights are to be held until the accumulated value is equal to 100% base salary.
The safety tollgate, which requires maintenance of a safe work environment, was passed.
The individual KMP actual STI payments and potential maximum payments are set out in the following table in section 2.3.
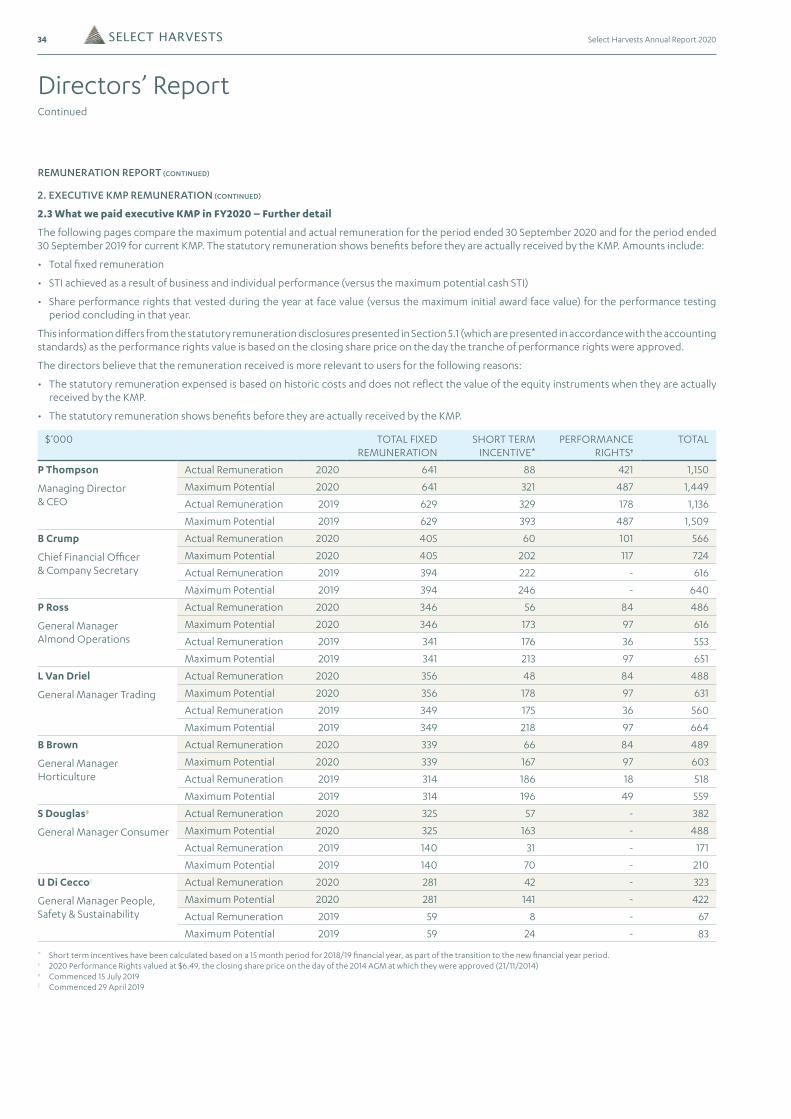
34 Select Harvests Annual Report 2020
Directors’ ReportContinued
REMUNERATION REPORT (CONTINUED)
2. EXECUTIVE KMP REMUNERATION (CONTINUED)
2.3 What we paid executive KMP in FY2020 – Further detail
The following pages compare the maximum potential and actual remuneration for the period ended 30 September 2020 and for the period ended 30 September 2019 for current KMP. The statutory remuneration shows benefits before they are actually received by the KMP. Amounts include:
• Total fixed remuneration
• STI achieved as a result of business and individual performance (versus the maximum potential cash STI)
• Share performance rights that vested during the year at face value (versus the maximum initial award face value) for the performance testing period concluding in that year.
This information differs from the statutory remuneration disclosures presented in Section 5.1 (which are presented in accordance with the accounting standards) as the performance rights value is based on the closing share price on the day the tranche of performance rights were approved.
The directors believe that the remuneration received is more relevant to users for the following reasons:
• The statutory remuneration expensed is based on historic costs and does not reflect the value of the equity instruments when they are actually received by the KMP.
• The statutory remuneration shows benefits before they are actually received by the KMP.
$’000 TOTAL FIXED REMUNERATION
SHORT TERM INCENTIVE*
PERFORMANCE RIGHTS†
TOTAL
P Thompson
Managing Director & CEO
Actual Remuneration 2020 641 88 421 1,150
Maximum Potential 2020 641 321 487 1,449
Actual Remuneration 2019 629 329 178 1,136
Maximum Potential 2019 629 393 487 1,509
B Crump
Chief Financial Officer & Company Secretary
Actual Remuneration 2020 405 60 101 566
Maximum Potential 2020 405 202 117 724
Actual Remuneration 2019 394 222 - 616
Maximum Potential 2019 394 246 - 640
P Ross
General Manager Almond Operations
Actual Remuneration 2020 346 56 84 486
Maximum Potential 2020 346 173 97 616
Actual Remuneration 2019 341 176 36 553
Maximum Potential 2019 341 213 97 651
L Van Driel
General Manager Trading
Actual Remuneration 2020 356 48 84 488
Maximum Potential 2020 356 178 97 631
Actual Remuneration 2019 349 175 36 560
Maximum Potential 2019 349 218 97 664
B Brown
General Manager Horticulture
Actual Remuneration 2020 339 66 84 489
Maximum Potential 2020 339 167 97 603
Actual Remuneration 2019 314 186 18 518
Maximum Potential 2019 314 196 49 559
S Douglas‡
General Manager Consumer
Actual Remuneration 2020 325 57 - 382
Maximum Potential 2020 325 163 - 488
Actual Remuneration 2019 140 31 - 171
Maximum Potential 2019 140 70 - 210
U Di Cecco�
General Manager People, Safety & Sustainability
Actual Remuneration 2020 281 42 - 323
Maximum Potential 2020 281 141 - 422
Actual Remuneration 2019 59 8 - 67
Maximum Potential 2019 59 24 - 83
* Short term incentives have been calculated based on a 15 month period for 2018/19 financial year, as part of the transition to the new financial year period.† 2020 Performance Rights valued at $6.49, the closing share price on the day of the 2014 AGM at which they were approved (21/11/2014)‡ Commenced 15 July 2019� Commenced 29 April 2019
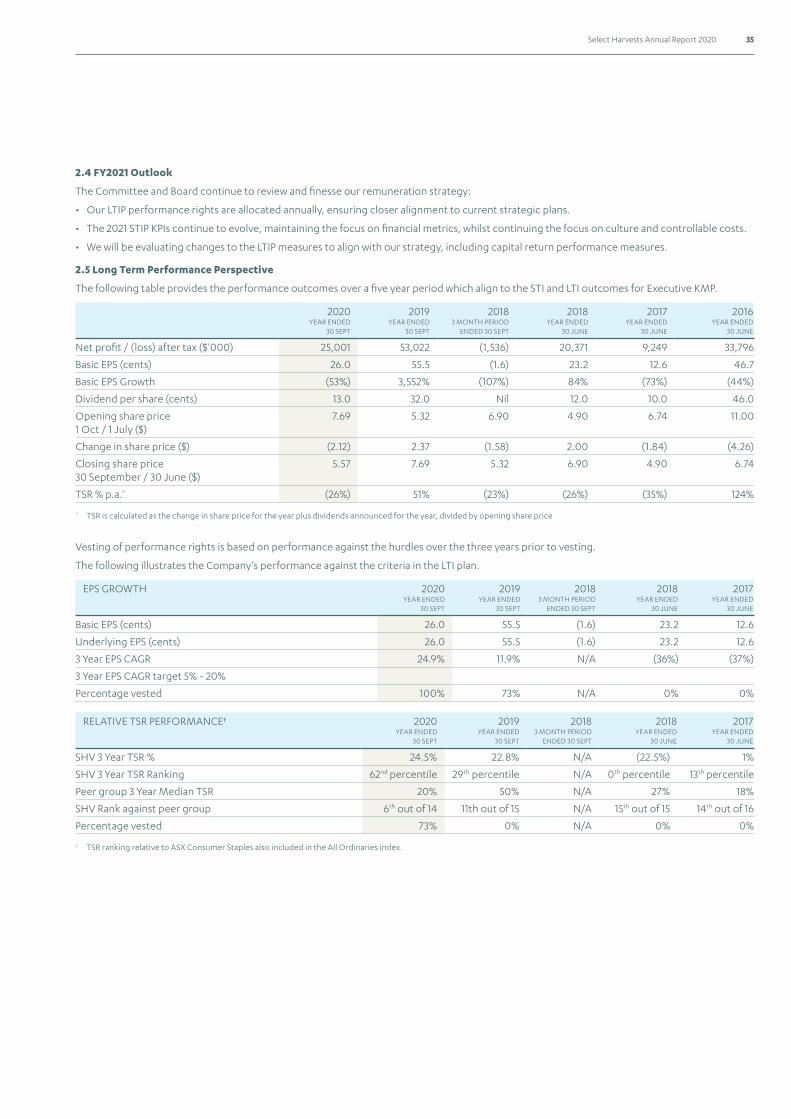
35Select Harvests Annual Report 2020
2.4 FY2021 Outlook
The Committee and Board continue to review and finesse our remuneration strategy:
• Our LTIP performance rights are allocated annually, ensuring closer alignment to current strategic plans.
• The 2021 STIP KPIs continue to evolve, maintaining the focus on financial metrics, whilst continuing the focus on culture and controllable costs.
• We will be evaluating changes to the LTIP measures to align with our strategy, including capital return performance measures.
2.5 Long Term Performance Perspective
The following table provides the performance outcomes over a five year period which align to the STI and LTI outcomes for Executive KMP.
2020 YEAR ENDED
30 SEPT
2019 YEAR ENDED
30 SEPT
2018 3 MONTH PERIOD
ENDED 30 SEPT
2018 YEAR ENDED
30 JUNE
2017 YEAR ENDED
30 JUNE
2016 YEAR ENDED
30 JUNE
Net profit / (loss) after tax ($'000) 25,001 53,022 (1,536) 20,371 9,249 33,796
Basic EPS (cents) 26.0 55.5 (1.6) 23.2 12.6 46.7
Basic EPS Growth (53%) 3,552% (107%) 84% (73%) (44%)
Dividend per share (cents) 13.0 32.0 Nil 12.0 10.0 46.0
Opening share price 1 Oct / 1 July ($)
7.69 5.32 6.90 4.90 6.74 11.00
Change in share price ($) (2.12) 2.37 (1.58) 2.00 (1.84) (4.26)
Closing share price 30 September / 30 June ($)
5.57 7.69 5.32 6.90 4.90 6.74
TSR % p.a.* (26%) 51% (23%) (26%) (35%) 124%
* TSR is calculated as the change in share price for the year plus dividends announced for the year, divided by opening share price
Vesting of performance rights is based on performance against the hurdles over the three years prior to vesting.
The following illustrates the Company’s performance against the criteria in the LTI plan.
EPS GROWTH 2020 YEAR ENDED
30 SEPT
2019 YEAR ENDED
30 SEPT
2018 3 MONTH PERIOD
ENDED 30 SEPT
2018 YEAR ENDED
30 JUNE
2017 YEAR ENDED
30 JUNE
Basic EPS (cents) 26.0 55.5 (1.6) 23.2 12.6
Underlying EPS (cents) 26.0 55.5 (1.6) 23.2 12.6
3 Year EPS CAGR 24.9% 11.9% N/A (36%) (37%)
3 Year EPS CAGR target 5% - 20%
Percentage vested 100% 73% N/A 0% 0%
RELATIVE TSR PERFORMANCE† 2020 YEAR ENDED
30 SEPT
2019 YEAR ENDED
30 SEPT
2018 3 MONTH PERIOD
ENDED 30 SEPT
2018 YEAR ENDED
30 JUNE
2017 YEAR ENDED
30 JUNE
SHV 3 Year TSR % 24.5% 22.8% N/A (22.5%) 1%
SHV 3 Year TSR Ranking 62nd percentile 29th percentile N/A 0th percentile 13th percentile
Peer group 3 Year Median TSR 20% 50% N/A 27% 18%
SHV Rank against peer group 6th out of 14 11th out of 15 N/A 15th out of 15 14th out of 16
Percentage vested 73% 0% N/A 0% 0%
† TSR ranking relative to ASX Consumer Staples also included in the All Ordinaries index.
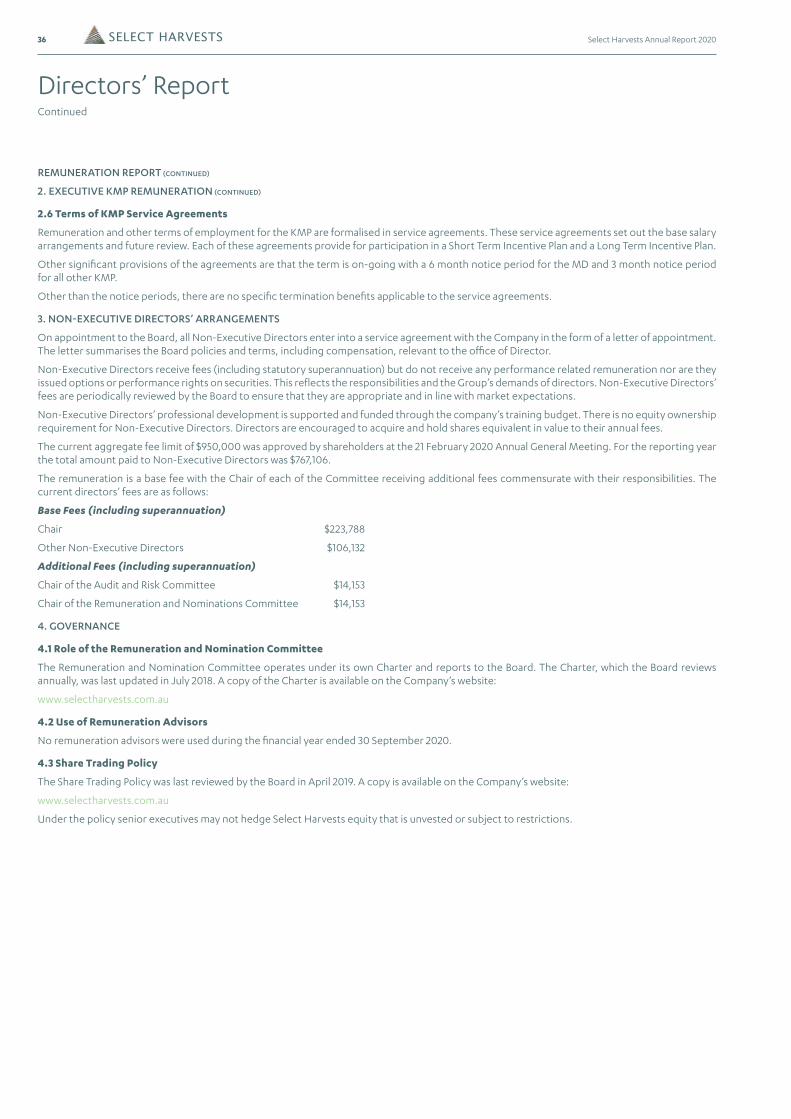
36 Select Harvests Annual Report 2020
Directors’ ReportContinued
REMUNERATION REPORT (CONTINUED)
2. EXECUTIVE KMP REMUNERATION (CONTINUED)
2.6 Terms of KMP Service Agreements
Remuneration and other terms of employment for the KMP are formalised in service agreements. These service agreements set out the base salary arrangements and future review. Each of these agreements provide for participation in a Short Term Incentive Plan and a Long Term Incentive Plan.
Other significant provisions of the agreements are that the term is on-going with a 6 month notice period for the MD and 3 month notice period for all other KMP.
Other than the notice periods, there are no specific termination benefits applicable to the service agreements.
3. NON-EXECUTIVE DIRECTORS’ ARRANGEMENTS
On appointment to the Board, all Non-Executive Directors enter into a service agreement with the Company in the form of a letter of appointment. The letter summarises the Board policies and terms, including compensation, relevant to the office of Director.
Non-Executive Directors receive fees (including statutory superannuation) but do not receive any performance related remuneration nor are they issued options or performance rights on securities. This reflects the responsibilities and the Group’s demands of directors. Non-Executive Directors’ fees are periodically reviewed by the Board to ensure that they are appropriate and in line with market expectations.
Non-Executive Directors’ professional development is supported and funded through the company’s training budget. There is no equity ownership requirement for Non-Executive Directors. Directors are encouraged to acquire and hold shares equivalent in value to their annual fees.
The current aggregate fee limit of $950,000 was approved by shareholders at the 21 February 2020 Annual General Meeting. For the reporting year the total amount paid to Non-Executive Directors was $767,106.
The remuneration is a base fee with the Chair of each of the Committee receiving additional fees commensurate with their responsibilities. The current directors’ fees are as follows:
Base Fees (including superannuation)
Chair $223,788
Other Non-Executive Directors $106,132
Additional Fees (including superannuation)
Chair of the Audit and Risk Committee $14,153
Chair of the Remuneration and Nominations Committee $14,153
4. GOVERNANCE
4.1 Role of the Remuneration and Nomination Committee
The Remuneration and Nomination Committee operates under its own Charter and reports to the Board. The Charter, which the Board reviews annually, was last updated in July 2018. A copy of the Charter is available on the Company’s website:
www.selectharvests.com.au
4.2 Use of Remuneration Advisors
No remuneration advisors were used during the financial year ended 30 September 2020.
4.3 Share Trading Policy
The Share Trading Policy was last reviewed by the Board in April 2019. A copy is available on the Company’s website:
www.selectharvests.com.au
Under the policy senior executives may not hedge Select Harvests equity that is unvested or subject to restrictions.
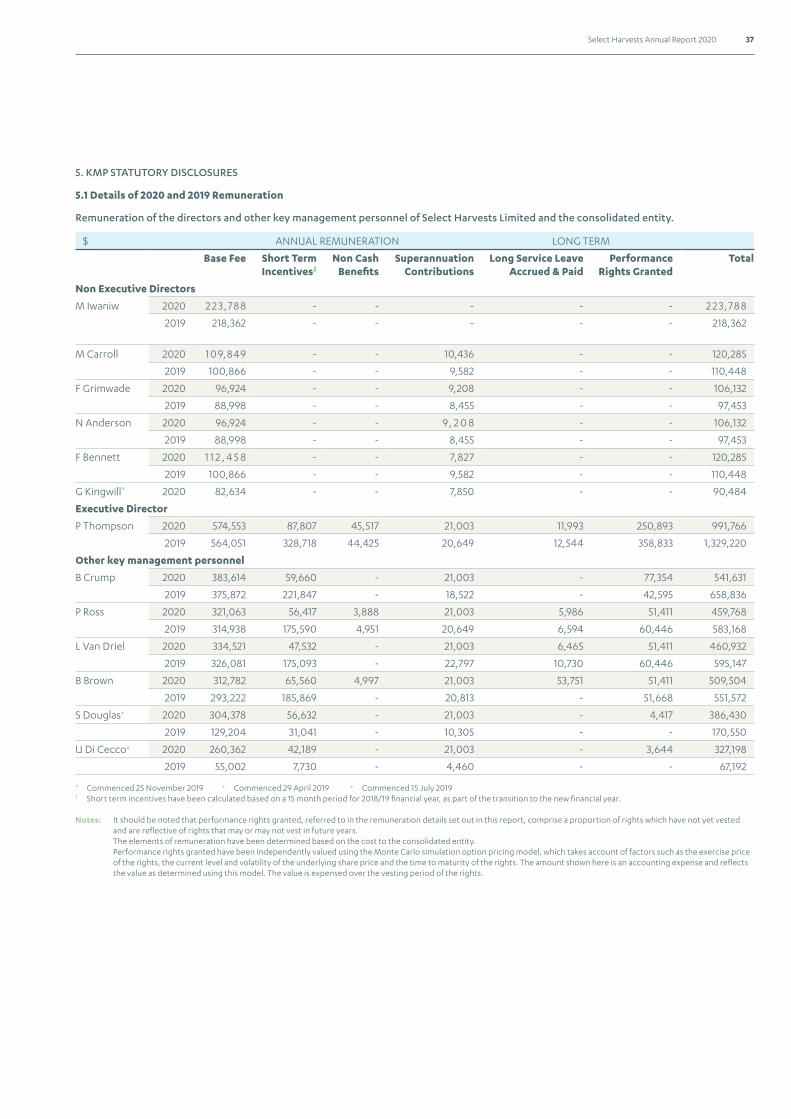
37Select Harvests Annual Report 2020
5. KMP STATUTORY DISCLOSURES
5.1 Details of 2020 and 2019 Remuneration
Remuneration of the directors and other key management personnel of Select Harvests Limited and the consolidated entity.
$ ANNUAL REMUNERATION LONG TERM
Base Fee Short Term Incentives�
Non Cash Benefits
Superannuation Contributions
Long Service Leave Accrued & Paid
Performance Rights Granted
Total
Non Executive Directors
M Iwaniw 2020 2 2 3,788 - - - - - 2 2 3,788
2019 218,362 - - - - - 218,362
M Carroll 2020 109,849 - - 10,436 - - 120,285
2019 100,866 - - 9,582 - - 110,448
F Grimwade 2020 96,924 - - 9,208 - - 106,132
2019 88,998 - - 8,455 - - 97,453
N Anderson 2020 96,924 - - 9, 2 0 8 - - 106,132
2019 88,998 - - 8,455 - - 97,453
F Bennett 2020 1 1 2 , 4 5 8 - - 7,827 - - 120,285
2019 100,866 - - 9,582 - - 110,448
G Kingwill* 2020 82,634 - - 7,850 - - 90,484
Executive Director
P Thompson 2020 574,553 87,807 45,517 21,003 11,993 250,893 991,766
2019 564,051 328,718 44,425 20,649 12,544 358,833 1,329,220
Other key management personnel
B Crump 2020 383,614 59,660 - 21,003 - 77,354 541,631
2019 375,872 221,847 - 18,522 - 42,595 658,836
P Ross 2020 321,063 56,417 3,888 21,003 5,986 51,411 459,768
2019 314,938 175,590 4,951 20,649 6,594 60,446 583,168
L Van Driel 2020 334,521 47,532 - 21,003 6,465 51,411 460,932
2019 326,081 175,093 - 22,797 10,730 60,446 595,147
B Brown 2020 312,782 65,560 4,997 21,003 53,751 51,411 509,504
2019 293,222 185,869 - 20,813 - 51,668 551,572
S Douglas† 2020 304,378 56,632 - 21,003 - 4,417 386,430
2019 129,204 31,041 - 10,305 - - 170,550
U Di Cecco‡ 2020 260,362 42,189 - 21,003 - 3,644 327,198
2019 55,002 7,730 - 4,460 - - 67,192
* Commenced 25 November 2019 † Commenced 29 April 2019 ‡ Commenced 15 July 2019� Short term incentives have been calculated based on a 15 month period for 2018/19 financial year, as part of the transition to the new financial year.
Notes: It should be noted that performance rights granted, referred to in the remuneration details set out in this report, comprise a proportion of rights which have not yet vested and are reflective of rights that may or may not vest in future years. The elements of remuneration have been determined based on the cost to the consolidated entity. Performance rights granted have been independently valued using the Monte Carlo simulation option pricing model, which takes account of factors such as the exercise price of the rights, the current level and volatility of the underlying share price and the time to maturity of the rights. The amount shown here is an accounting expense and reflects the value as determined using this model. The value is expensed over the vesting period of the rights.
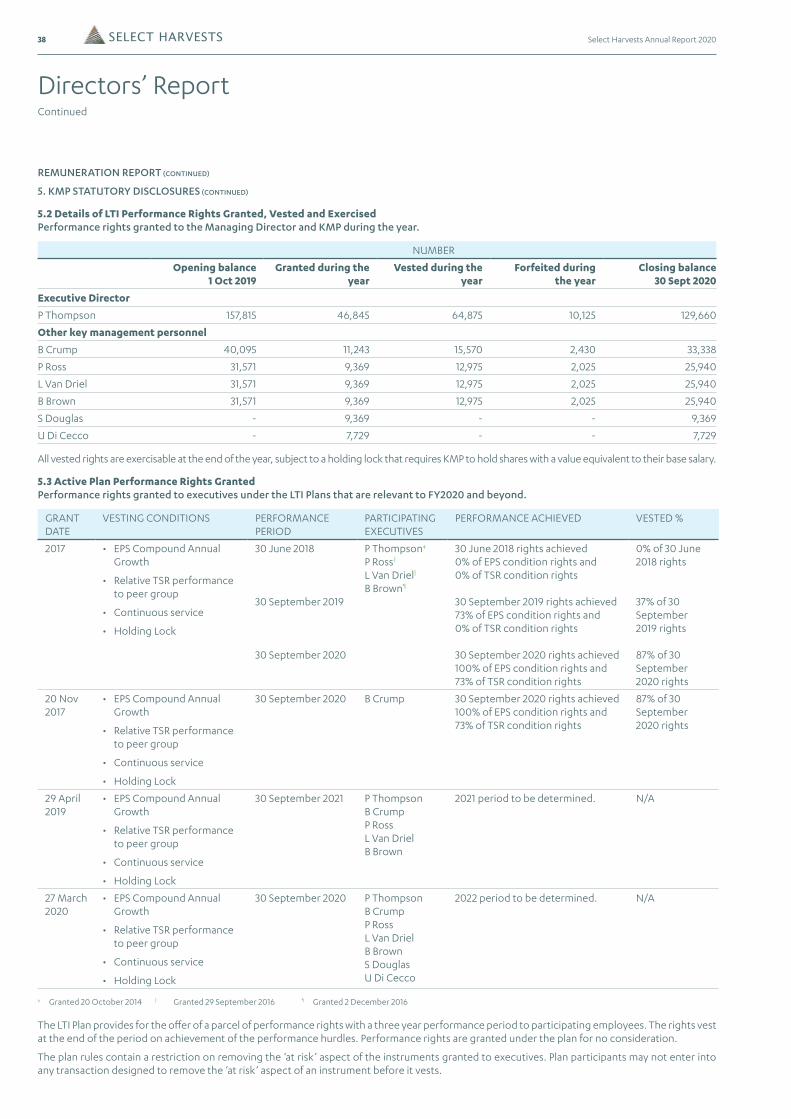
38 Select Harvests Annual Report 2020
Directors’ ReportContinued
REMUNERATION REPORT (CONTINUED)
5. KMP STATUTORY DISCLOSURES (CONTINUED)
5.2 Details of LTI Performance Rights Granted, Vested and ExercisedPerformance rights granted to the Managing Director and KMP during the year.
NUMBER
Opening balance 1 Oct 2019
Granted during the year
Vested during the year
Forfeited during the year
Closing balance 30 Sept 2020
Executive Director
P Thompson 157,815 46,845 64,875 10,125 129,660
Other key management personnel
B Crump 40,095 11,243 15,570 2,430 33,338
P Ross 31,571 9,369 12,975 2,025 25,940
L Van Driel 31,571 9,369 12,975 2,025 25,940
B Brown 31,571 9,369 12,975 2,025 25,940
S Douglas - 9,369 - - 9,369
U Di Cecco - 7,729 - - 7,729
All vested rights are exercisable at the end of the year, subject to a holding lock that requires KMP to hold shares with a value equivalent to their base salary.
5.3 Active Plan Performance Rights Granted Performance rights granted to executives under the LTI Plans that are relevant to FY2020 and beyond.
GRANT DATE
VESTING CONDITIONS PERFORMANCE PERIOD
PARTICIPATING EXECUTIVES
PERFORMANCE ACHIEVED VESTED %
2017 • EPS Compound Annual Growth
• Relative TSR performance to peer group
• Continuous service
• Holding Lock
30 June 2018 30 September 2019 30 September 2020
P Thompson‡ P Ross� L Van Driel� B Brown¶
30 June 2018 rights achieved 0% of EPS condition rights and 0% of TSR condition rights 30 September 2019 rights achieved 73% of EPS condition rights and 0% of TSR condition rights 30 September 2020 rights achieved 100% of EPS condition rights and 73% of TSR condition rights
0% of 30 June 2018 rights 37% of 30 September 2019 rights 87% of 30 September 2020 rights
20 Nov 2017
• EPS Compound Annual Growth
• Relative TSR performance to peer group
• Continuous service
• Holding Lock
30 September 2020 B Crump 30 September 2020 rights achieved 100% of EPS condition rights and 73% of TSR condition rights
87% of 30 September 2020 rights
29 April 2019
• EPS Compound Annual Growth
• Relative TSR performance to peer group
• Continuous service
• Holding Lock
30 September 2021 P Thompson B Crump P Ross L Van Driel B Brown
2021 period to be determined. N/A
27 March 2020
• EPS Compound Annual Growth
• Relative TSR performance to peer group
• Continuous service
• Holding Lock
30 September 2020 P Thompson B Crump P Ross L Van Driel B Brown S Douglas U Di Cecco
2022 period to be determined. N/A
‡ Granted 20 October 2014 � Granted 29 September 2016 ¶ Granted 2 December 2016
The LTI Plan provides for the offer of a parcel of performance rights with a three year performance period to participating employees. The rights vest at the end of the period on achievement of the performance hurdles. Performance rights are granted under the plan for no consideration.
The plan rules contain a restriction on removing the ‘at risk’ aspect of the instruments granted to executives. Plan participants may not enter into any transaction designed to remove the ‘at risk’ aspect of an instrument before it vests.
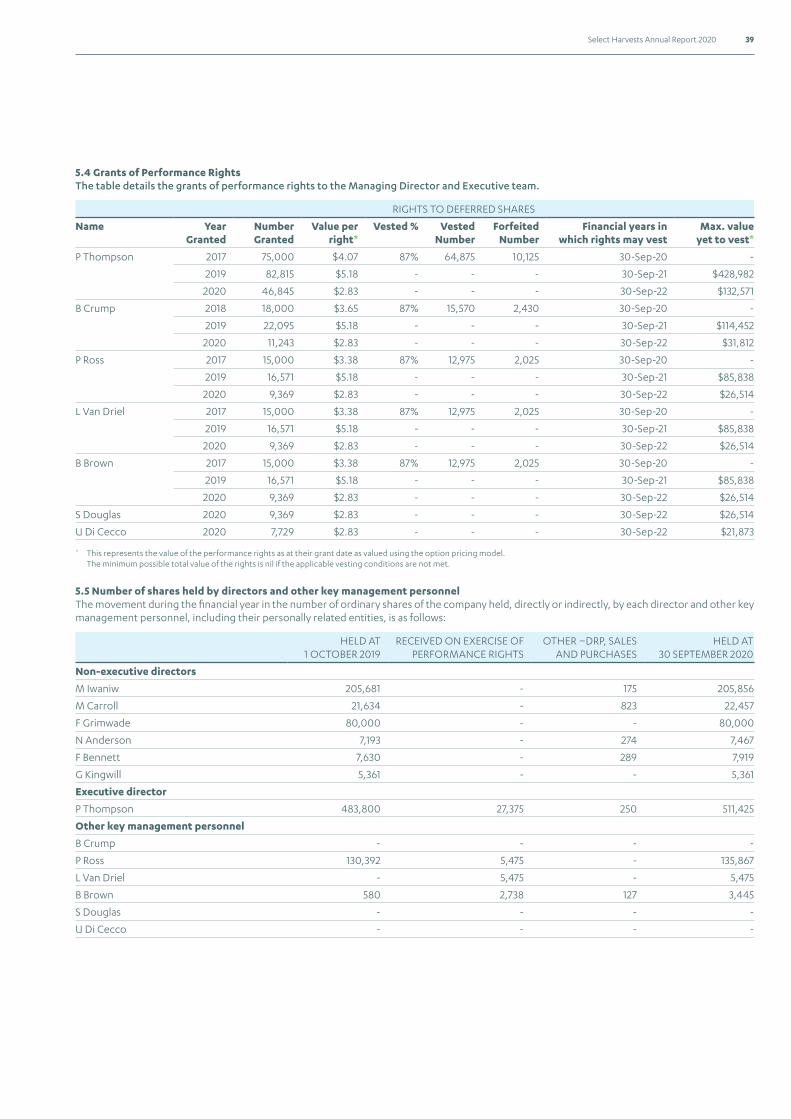
39Select Harvests Annual Report 2020
5.4 Grants of Performance Rights The table details the grants of performance rights to the Managing Director and Executive team.
RIGHTS TO DEFERRED SHARES
Name Year Granted
Number Granted
Value per right*
Vested % Vested Number
Forfeited Number
Financial years in which rights may vest
Max. value yet to vest*
P Thompson 2017 75,000 $4.07 87% 64,875 10,125 30-Sep-20 -
2019 82,815 $5.18 - - - 30-Sep-21 $428,982
2020 46,845 $2.83 - - - 30-Sep-22 $132,571
B Crump 2018 18,000 $3.65 87% 15,570 2,430 30-Sep-20 -
2019 22,095 $5.18 - - - 30-Sep-21 $114,452
2020 11,243 $2.83 - - - 30-Sep-22 $31,812
P Ross 2017 15,000 $3.38 87% 12,975 2,025 30-Sep-20 -
2019 16,571 $5.18 - - - 30-Sep-21 $85,838
2020 9,369 $2.83 - - - 30-Sep-22 $26,514
L Van Driel 2017 15,000 $3.38 87% 12,975 2,025 30-Sep-20 -
2019 16,571 $5.18 - - - 30-Sep-21 $85,838
2020 9,369 $2.83 - - - 30-Sep-22 $26,514
B Brown 2017 15,000 $3.38 87% 12,975 2,025 30-Sep-20 -
2019 16,571 $5.18 - - - 30-Sep-21 $85,838
2020 9,369 $2.83 - - - 30-Sep-22 $26,514
S Douglas 2020 9,369 $2.83 - - - 30-Sep-22 $26,514
U Di Cecco 2020 7,729 $2.83 - - - 30-Sep-22 $21,873
* This represents the value of the performance rights as at their grant date as valued using the option pricing model. The minimum possible total value of the rights is nil if the applicable vesting conditions are not met.
5.5 Number of shares held by directors and other key management personnelThe movement during the financial year in the number of ordinary shares of the company held, directly or indirectly, by each director and other key management personnel, including their personally related entities, is as follows:
HELD AT 1 OCTOBER 2019
RECEIVED ON EXERCISE OF PERFORMANCE RIGHTS
OTHER –DRP, SALES AND PURCHASES
HELD AT 30 SEPTEMBER 2020
Non-executive directors
M Iwaniw 205,681 - 175 205,856
M Carroll 21,634 - 823 22,457
F Grimwade 80,000 - - 80,000
N Anderson 7,193 - 274 7,467
F Bennett 7,630 - 289 7,919
G Kingwill 5,361 - - 5,361
Executive director
P Thompson 483,800 27,375 250 511,425
Other key management personnel
B Crump - - - -
P Ross 130,392 5,475 - 135,867
L Van Driel - 5,475 - 5,475
B Brown 580 2,738 127 3,445
S Douglas - - - -
U Di Cecco - - - -
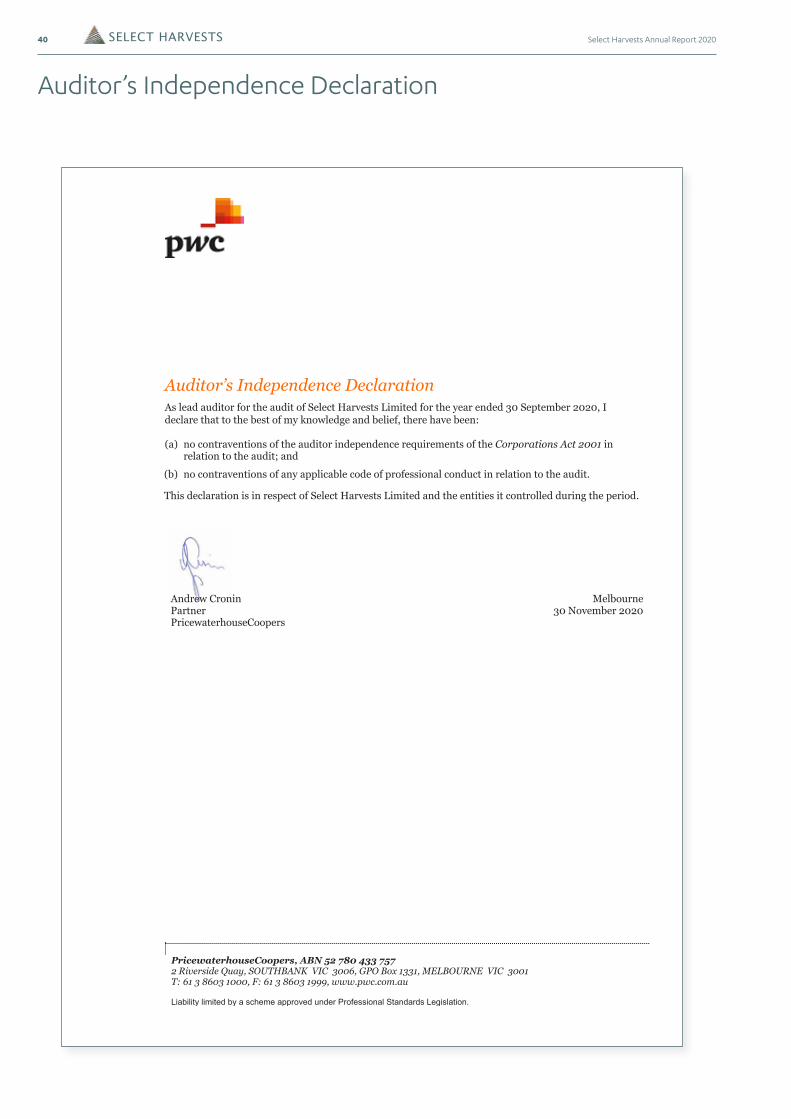
40 Select Harvests Annual Report 2020
Auditor’s Independence Declaration
PricewaterhouseCoopers, ABN 52 780 433 757 2 Riverside Quay, SOUTHBANK VIC 3006, GPO Box 1331, MELBOURNE VIC 3001 T: 61 3 8603 1000, F: 61 3 8603 1999, www.pwc.com.au
Liability limited by a scheme approved under Professional Standards Legislation.
Auditor’s Independence Declaration As lead auditor for the audit of Select Harvests Limited for the year ended 30 September 2020, I declare that to the best of my knowledge and belief, there have been:
(a) no contraventions of the auditor independence requirements of the Corporations Act 2001 in relation to the audit; and
(b) no contraventions of any applicable code of professional conduct in relation to the audit.
Andrew Cronin Melbourne Partner PricewaterhouseCoopers
30 November 2020
This declaration is in respect of Select Harvests Limited and the entities it controlled during the period.
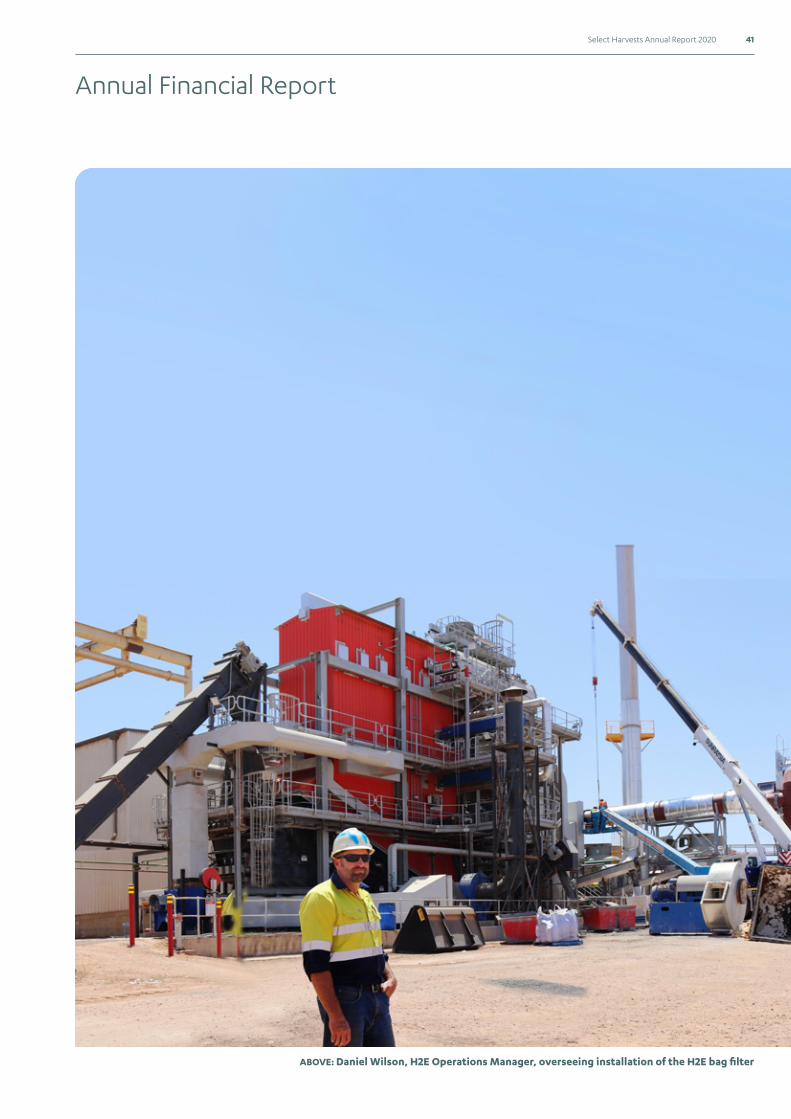
41Select Harvests Annual Report 2020
Annual Financial Report
ABOVE: Daniel Wilson, H2E Operations Manager, overseeing installation of the H2E bag filter
42 Select Harvests Annual Report 2020
Annual Financial Report
This financial report covers the Group consisting of Select Harvests Limited and its subsidiaries. The financial report is presented in Australian currency.
Select Harvests Limited is a company limited by shares, incorporated and domiciled in Australia. Its registered office and principal place of business is:
Select Harvests Limited 360 Settlement Road Thomastown VIC 3074
A description of the nature of the Company’s operations and its principal activities is included in the review of operations and activities and in the directors’ report, both of which are not part of this financial report.
The financial report was authorised for issue by the directors on 30 November 2020. The Company has the power to amend and reissue the financial report.
Through the use of the internet, we have ensured that our corporate reporting is timely, complete, and available globally at minimum cost to the Company. All financial reports and other information are available on our website: www.selectharvests.com.au
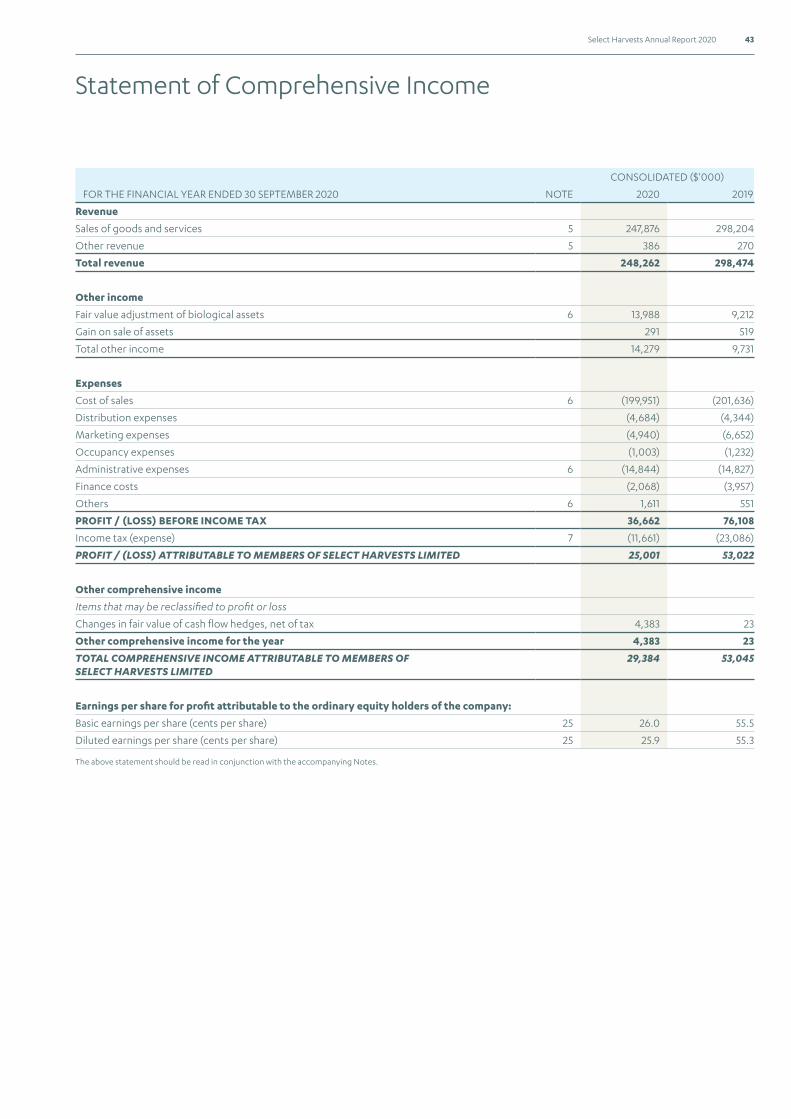
43Select Harvests Annual Report 2020
Statement of Comprehensive Income
CONSOLIDATED ($'000)
FOR THE FINANCIAL YEAR ENDED 30 SEPTEMBER 2020 NOTE 2020 2019
Revenue
Sales of goods and services 5 247,876 298,204
Other revenue 5 386 270
Total revenue 248,262 298,474
Other income
Fair value adjustment of biological assets 6 13,988 9,212
Gain on sale of assets 291 519
Total other income 14,279 9,731
Expenses
Cost of sales 6 (199,951) (201,636)
Distribution expenses (4,684) (4,344)
Marketing expenses (4,940) (6,652)
Occupancy expenses (1,003) (1,232)
Administrative expenses 6 (14,844) (14,827)
Finance costs (2,068) (3,957)
Others 6 1,611 551
PROFIT / (LOSS) BEFORE INCOME TAX 36,662 76,108
Income tax (expense) 7 (11,661) (23,086)
PROFIT / (LOSS) ATTRIBUTABLE TO MEMBERS OF SELECT HARVESTS LIMITED 25,001 53,022
Other comprehensive income
Items that may be reclassified to profit or loss
Changes in fair value of cash flow hedges, net of tax 4,383 23
Other comprehensive income for the year 4,383 23
TOTAL COMPREHENSIVE INCOME ATTRIBUTABLE TO MEMBERS OF SELECT HARVESTS LIMITED
29,384 53,045
Earnings per share for profit attributable to the ordinary equity holders of the company:
Basic earnings per share (cents per share) 25 26.0 55.5
Diluted earnings per share (cents per share) 25 25.9 55.3
The above statement should be read in conjunction with the accompanying Notes.
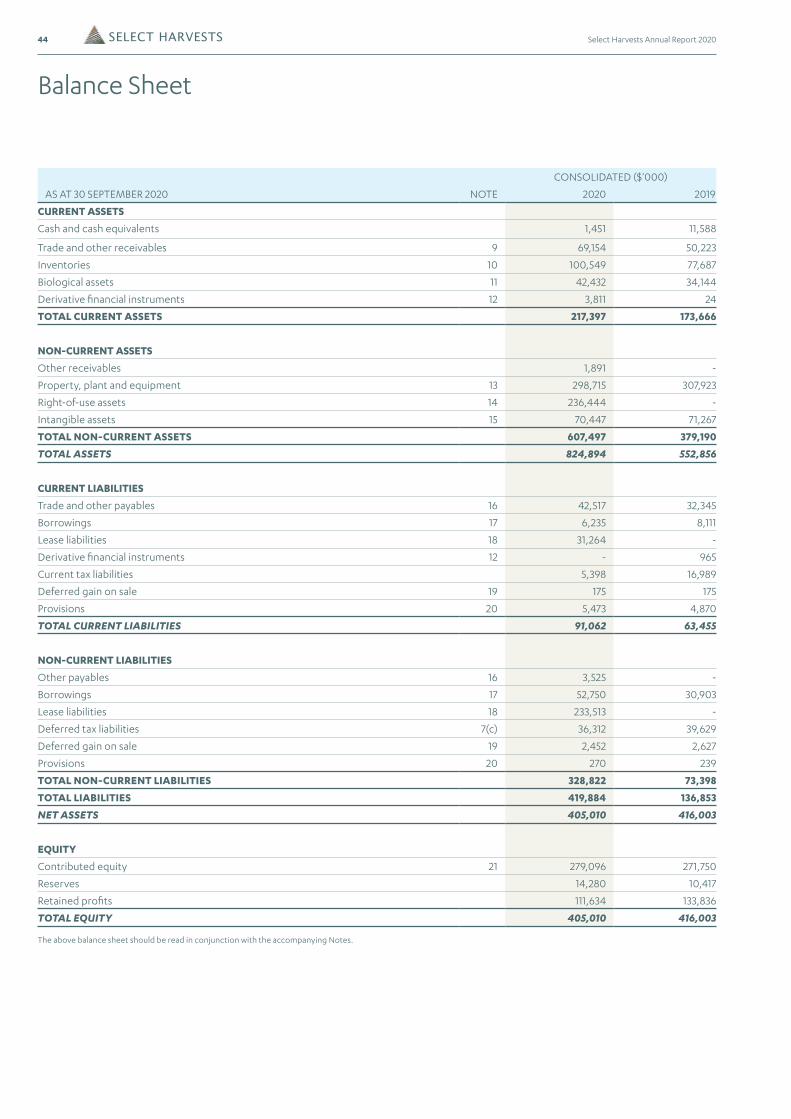
44 Select Harvests Annual Report 2020
Balance Sheet
CONSOLIDATED ($'000)
AS AT 30 SEPTEMBER 2020 NOTE 2020 2019
CURRENT ASSETS
Cash and cash equivalents 1,451 11,588
Trade and other receivables 9 69,154 50,223
Inventories 10 100,549 77,687
Biological assets 11 42,432 34,144
Derivative financial instruments 12 3,811 24
TOTAL CURRENT ASSETS 217,397 173,666
NON-CURRENT ASSETS
Other receivables 1,891 -
Property, plant and equipment 13 298,715 307,923
Right-of-use assets 14 236,444 -
Intangible assets 15 70,447 71,267
TOTAL NON-CURRENT ASSETS 607,497 379,190
TOTAL ASSETS 824,894 552,856
CURRENT LIABILITIES
Trade and other payables 16 42,517 32,345
Borrowings 17 6,235 8,111
Lease liabilities 18 31,264 -
Derivative financial instruments 12 - 965
Current tax liabilities 5,398 16,989
Deferred gain on sale 19 175 175
Provisions 20 5,473 4,870
TOTAL CURRENT LIABILITIES 91,062 63,455
NON-CURRENT LIABILITIES
Other payables 16 3,525 -
Borrowings 17 52,750 30,903
Lease liabilities 18 233,513 -
Deferred tax liabilities 7(c) 36,312 39,629
Deferred gain on sale 19 2,452 2,627
Provisions 20 270 239
TOTAL NON-CURRENT LIABILITIES 328,822 73,398
TOTAL LIABILITIES 419,884 136,853
NET ASSETS 405,010 416,003
EQUITY
Contributed equity 21 279,096 271,750
Reserves 14,280 10,417
Retained profits 111,634 133,836
TOTAL EQUITY 405,010 416,003
The above balance sheet should be read in conjunction with the accompanying Notes.
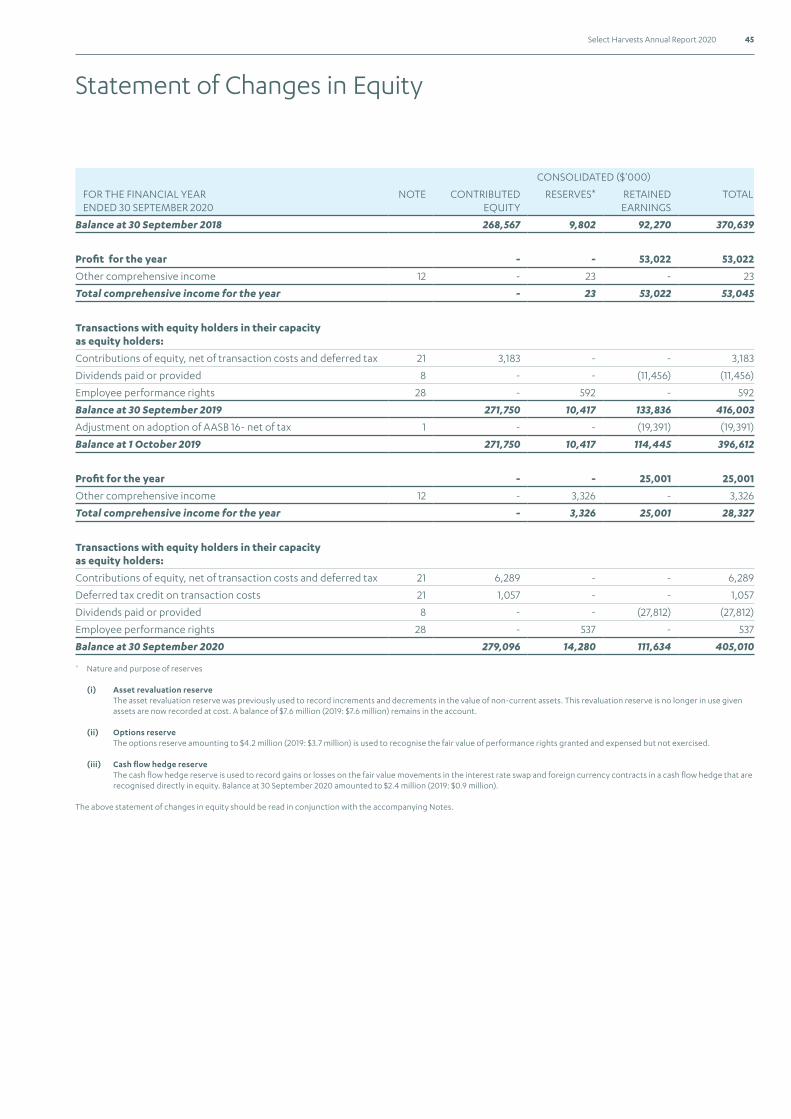
45Select Harvests Annual Report 2020
Statement of Changes in Equity
CONSOLIDATED ($'000)
FOR THE FINANCIAL YEAR ENDED 30 SEPTEMBER 2020
NOTE CONTRIBUTED EQUITY
RESERVES* RETAINED EARNINGS
TOTAL
Balance at 30 September 2018 268,567 9,802 92,270 370,639
Profit for the year - - 53,022 53,022
Other comprehensive income 12 - 23 - 23
Total comprehensive income for the year - 23 53,022 53,045
Transactions with equity holders in their capacity as equity holders:
Contributions of equity, net of transaction costs and deferred tax 21 3,183 - - 3,183
Dividends paid or provided 8 - - (11,456) (11,456)
Employee performance rights 28 - 592 - 592
Balance at 30 September 2019 271,750 10,417 133,836 416,003
Adjustment on adoption of AASB 16- net of tax 1 - - (19,391) (19,391)
Balance at 1 October 2019 271,750 10,417 114,445 396,612
Profit for the year - - 25,001 25,001
Other comprehensive income 12 - 3,326 - 3,326
Total comprehensive income for the year - 3,326 25,001 28,327
Transactions with equity holders in their capacity as equity holders:
Contributions of equity, net of transaction costs and deferred tax 21 6,289 - - 6,289
Deferred tax credit on transaction costs 21 1,057 - - 1,057
Dividends paid or provided 8 - - (27,812) (27,812)
Employee performance rights 28 - 537 - 537
Balance at 30 September 2020 279,096 14,280 111,634 405,010
* Nature and purpose of reserves
(i) Asset revaluation reserve The asset revaluation reserve was previously used to record increments and decrements in the value of non-current assets. This revaluation reserve is no longer in use given assets are now recorded at cost. A balance of $7.6 million (2019: $7.6 million) remains in the account.
(ii) Options reserve The options reserve amounting to $4.2 million (2019: $3.7 million) is used to recognise the fair value of performance rights granted and expensed but not exercised.
(iii) Cash flow hedge reserve The cash flow hedge reserve is used to record gains or losses on the fair value movements in the interest rate swap and foreign currency contracts in a cash flow hedge that are recognised directly in equity. Balance at 30 September 2020 amounted to $2.4 million (2019: $0.9 million).
The above statement of changes in equity should be read in conjunction with the accompanying Notes.
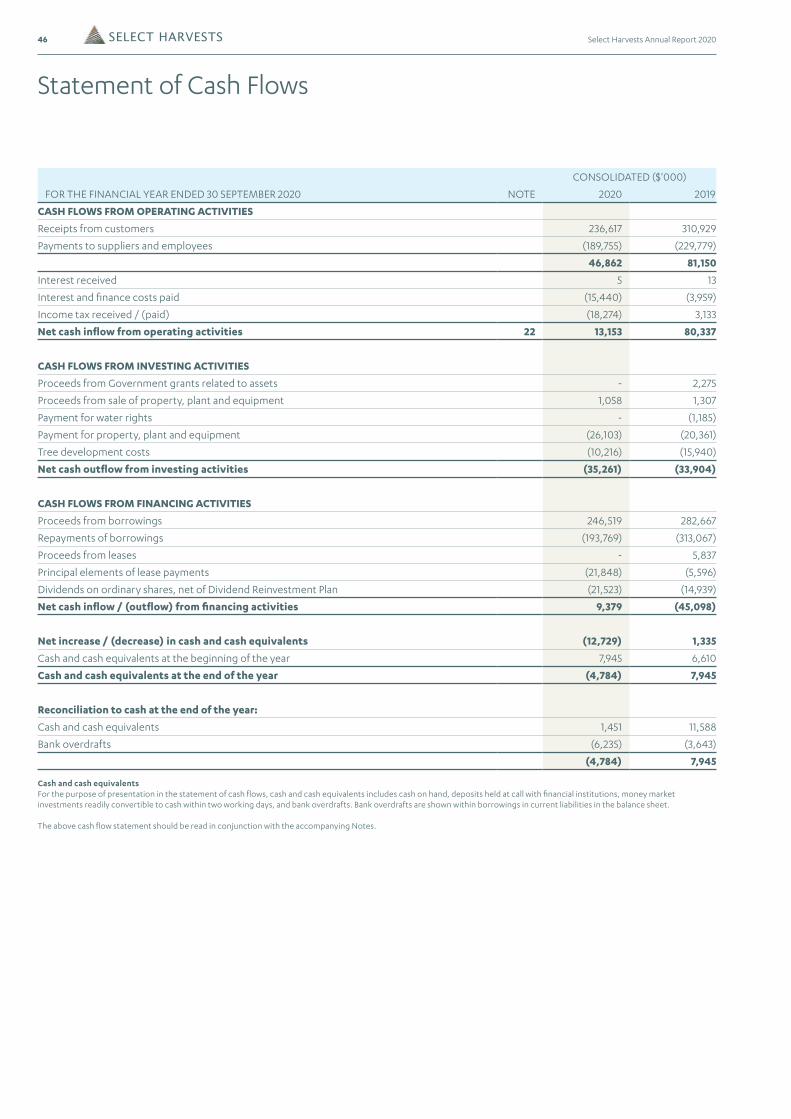
46 Select Harvests Annual Report 2020
Statement of Cash Flows
CONSOLIDATED ($'000)
FOR THE FINANCIAL YEAR ENDED 30 SEPTEMBER 2020 NOTE 2020 2019
CASH FLOWS FROM OPERATING ACTIVITIES
Receipts from customers 236,617 310,929
Payments to suppliers and employees (189,755) (229,779)
46,862 81,150
Interest received 5 13
Interest and finance costs paid (15,440) (3,959)
Income tax received / (paid) (18,274) 3,133
Net cash inflow from operating activities 22 13,153 80,337
CASH FLOWS FROM INVESTING ACTIVITIES
Proceeds from Government grants related to assets - 2,275
Proceeds from sale of property, plant and equipment 1,058 1,307
Payment for water rights - (1,185)
Payment for property, plant and equipment (26,103) (20,361)
Tree development costs (10,216) (15,940)
Net cash outflow from investing activities (35,261) (33,904)
CASH FLOWS FROM FINANCING ACTIVITIES
Proceeds from borrowings 246,519 282,667
Repayments of borrowings (193,769) (313,067)
Proceeds from leases - 5,837
Principal elements of lease payments (21,848) (5,596)
Dividends on ordinary shares, net of Dividend Reinvestment Plan (21,523) (14,939)
Net cash inflow / (outflow) from financing activities 9,379 (45,098)
Net increase / (decrease) in cash and cash equivalents (12,729) 1,335
Cash and cash equivalents at the beginning of the year 7,945 6,610
Cash and cash equivalents at the end of the year (4,784) 7,945
Reconciliation to cash at the end of the year:
Cash and cash equivalents 1,451 11,588
Bank overdrafts (6,235) (3,643)
(4,784) 7,945
Cash and cash equivalentsFor the purpose of presentation in the statement of cash flows, cash and cash equivalents includes cash on hand, deposits held at call with financial institutions, money market investments readily convertible to cash within two working days, and bank overdrafts. Bank overdrafts are shown within borrowings in current liabilities in the balance sheet.
The above cash flow statement should be read in conjunction with the accompanying Notes.
47Select Harvests Annual Report 2020
Notes to the Financial Statements
1. SUMMARY OF SIGNIFICANT ACCOUNTING POLICIES
The principal accounting policies adopted in the preparation of these consolidated financial statements are set out below. These policies have been consistently applied to all the years presented, unless otherwise stated. The financial statements are for the Company consisting of Select Harvests Limited and its subsidiaries. Where appropriate, comparatives have been reclassified to enhance comparability with current year disclosures.
(a) Basis of preparation
This general purpose financial report has been prepared in accordance with Australian Accounting Standards, other authoritative pronouncements of the Australian Accounting Standards Board and the Corporations Act 2001. Select Harvests Limited is a for profit entity for the purpose of preparing the financial statements.
Compliance with IFRS
The consolidated financial statements of the Select Harvests Limited group comply with International Financial Reporting Standards (IFRS) as issued by the International Accounting Standards Board (IASB).
Historical cost convention
These financial statements have been prepared under the historical cost convention, as modified by the revaluation of available-for-sale financial assets, financial assets and liabilities (including derivative instruments) at fair value through the income statement and biological assets.
Critical accounting estimates
The preparation of financial statements in conformity with AIFRS requires the use of certain critical accounting estimates. It also requires management to exercise its judgement in the process of applying the Company’s accounting policies. The areas involving a higher level of judgement or complexity, or areas where assumptions and estimates are significant to the financial statements are disclosed in Note 2.
New standards adopted during the financial year
The Group has adopted all of the new or amended Accounting Standards and Interpretations issued by the Australian Accounting Standards Board (‘AASB’) that are mandatory for the current reporting year as follows:
• AASB 16 Leases
• AASB 2018-1 Amendments to Australian Accounting Standards – Annual Improvements 2015 – 2017 (effective 1 January 2019)
• AASB 2018-2 Amendments to Australian Accounting Standards – Plan Amendment, Curtailment or Settlement (effective 1 January 2019)
• IFRIC 23 Uncertainty over Income Tax Treatments (effective 1 January 2019)
The following Accounting Standard, AASB 16 Leases is most relevant to the consolidated entity.
AASB 16 Leases
The Group has adopted AASB 16 from 1 October 2019 using the modified retrospective approach, under which the cumulative effect of initial application is recognised in retained earnings on that date. Accordingly, the group has not restated comparatives for the 2019 reporting period, as permitted under the specific transition provisions in the standard. The standard replaces AASB 117 ‘Leases’.
Lessee accounting
AASB 16 determines whether a contract contains a lease on the basis of whether the customer has the right to control the use of an identified asset for a period of time in exchange for a consideration. This is in contrast to the concept of ‘risks and rewards’ in AASB 117.
On adoption of AASB 16, the group recognised lease liabilities in relation to leases which had previously been classified as ‘operating leases’ under the principles of AASB 117 Leases. These liabilities were measured at the present value of the remaining lease payments, discounted using the lessee’s incremental borrowing rate as of 1 October 2019. The Group recognised right-of-use assets to represent its right to use the underlying assets which will be depreciated over the estimated lease term.
Where the Group acts as lessee, judgement has been applied to determine the lease term for some lease contracts that include renewal options. The assessment of whether the Group is reasonably certain to exercise such options impacts the lease term, which significantly affects the amount of lease liabilities and right of use assets recognised.
Short term leases (lease term of 12 months or less) and leases of low-value items are recognised as lease expense on a straight-line basis as permitted by the standard.
For leases previously classified as finance leases applying AASB 117, the Group recognised the carrying amount of the lease asset and lease liability immediately before transition as the carrying amount of the right of use asset and the lease liability at the date of initial application. The measurement principles of AASB 16 are only applied after that date.
Lessor accounting
The Group did not need to make any adjustments to the accounting for assets held as lessor under operating leases as a result of the adoption of AASB 16.
48 Select Harvests Annual Report 2020
1. SUMMARY OF SIGNIFICANT ACCOUNTING POLICIES (CONTINUED)
(a) Basis of preparation (continued)
New standards adopted during the financial year (continued)
Impact on transition
On transition to AASB 16, the Group recognised right-of-use assets and lease liabilities. The impact upon transition is summarised below.
1 OCTOBER 2019 ($'000)
Recognition of right of use asset 210,081
Recognition of lease liabilities 237,77
Decrease to retained earnings (pre-tax) 19, 391
Increase to deferred tax asset 8,300
When measuring lease liabilities for leases that were classified as operating leases, the Group discounted the present value of the remaining lease payments using the Group’s incremental borrowing rate at 1 October 2019. The incremental borrowing rate applied depended on the type of lease and remaining lease term. The weighted average lessee’s incremental borrowing rate applied to the lease liabilities on 1 October 2019 was 4.99%.
In applying AASB 16 for the first time, the Group has used the following practical expedients permitted by the standard:
• The use of a single discount rate to a portfolio of leases with reasonably similar characteristics;
• The exclusion of initial direct costs for the measurement of the right-to-use asset at the date of initial application;
• Relying on previous assessments as to whether a lease is onerous;
• The use of hindsight in determining the lease term where the contract contains renewal options;
• Not separating the non-lease components from lease components thereby treating the lease as a single lease component.
Reconciliation of operating lease commitments to lease liability
1 OCTOBER 2019 ($'000)
Operating lease commitments disclosed as at 30 September 2019 339,551
Less: Leases of intangible assets out of AASB 16* scope (7,989)
Discounted using the group’s incremental borrowing rate (93,790)
Lease liability impact on transition 237,772
Add: Finance lease liabilities recognised as at 30 September 2019 35,371
Lease liability recognised as at 1 October 2019 273,143
Of which are:
Current lease liabilities 31,460
Non-current lease liabilities 241,683
273,143
* This relates to leases on water rights. Water rights are classified as intangibles and therefore excluded from AASB 16 scope.
Impact for the financial year on segment disclosures and earnings per share
EBITDA, segment assets and segment liabilities for 30 September 2020 all increased as a result of the change in accounting policy. The following segments were affected by the change in policy:
($'000) ADJUSTED EBITDA SEGMENT ASSETS SEGMENT LIABILITIES
Almond division 1,223 234,440 (261,527)
Food division 1,678 1,985 (3,230)
Corporate 23 19 (20)
2,924 236,444 (264,777)
As a result of the adoption of AASB 16, net profit after tax increased by $0.33 million while earnings per share increased by 0.03 cents per share for the financial year ended 30 September 2020.
Please refer to note 14 and 18 for further information.
Notes to the Financial StatementsContinued
49Select Harvests Annual Report 2020
New standards and interpretations not yet adopted
Certain new accounting standards and interpretations have been published that are not mandatory for the 30 September 2020 reporting periods and have not been early adopted by the Company. The group’s assessment of these new standards and interpretations concluded that it will not have a material impact on the financial statements of the Group in future periods. The new standards and interpretations are as follows:
• AASB 2018-6 Amendments to Australian Accounting Standards definition of a business- AASB 3 Business Combinations (effective 1 January 2020)
• AASB 2018-7 Amendments to Australian Accounting Standards definition of material- AASB 101and AASB 108 (effective 1 January 2020)
• AASB 2019-1 Revised conceptual framework for financial reporting (effective date 1 January 2020)
• AASB 2019-3 Interest rate benchmark reform on hedge accounting- AASB 7, AASB 9 and AASB 139 (effective 1 January 2020)
• AASB 2019-5 Disclosure of the effect of new IFRS standards not yet issued in Australia (effective 1 January 2020)
(b) Principles of consolidation
(i) Subsidiaries
Subsidiaries are all entities (including structured entities) over which the group has control. The group controls an entity when the group is exposed to, or has rights to, variable returns from its involvement with the entity and has the ability to affect those returns through its power to direct the activities of the entity. Subsidiaries are fully consolidated from the date on which control is transferred to the group. They are deconsolidated from the date that control ceases.
Intercompany transactions, balances and unrealised gains on transactions between group companies are eliminated. Unrealised losses are also eliminated unless the transaction provides evidence of an impairment of the transferred asset. Accounting policies of subsidiaries have been changed where necessary to ensure consistency with the policies adopted by the group.
(c) Foreign currency translation
(i) Functional and presentation currency
Items included in the financial statements of each entity comprising the Company are measured using the currency of the primary economic environment in which the entity operates (“the functional currency”). The consolidated financial statements are presented in Australian dollars, which is the functional and presentation currency of Select Harvests Limited.
(ii) Transactions and balances
Foreign currency transactions are translated into the functional currency using the exchange rates prevailing at the dates of the transactions. Foreign exchange gains and losses resulting from the settlement of such transactions and from the translation at year end exchange rates of monetary assets and liabilities denominated in foreign currencies are recognised in the income statement, except when deferred in equity as qualifying cash flow hedges.
(d) Comparatives
Where necessary, comparatives have been reclassified and repositioned for consistency with current year disclosures.
(e) Rounding
The amounts contained in this report and in the financial report have been rounded to the nearest $1,000 (where rounding is applicable) under the option available to the Company under ASIC Corporations (Rounding in Financial/ Directors’ Reports) Instrument 2016/191. The Company is an entity to which the Class Order applies.
(f) Parent entity financial information
The financial information for the parent entity, Select Harvests Limited, disclosed in Note 30 has been prepared on the same basis as the consolidated financial statements, except as set out below.
(i) Investments in subsidiaries and associates
Investments in subsidiaries and associates are accounted for at cost in the financial statements of Select Harvests Limited.
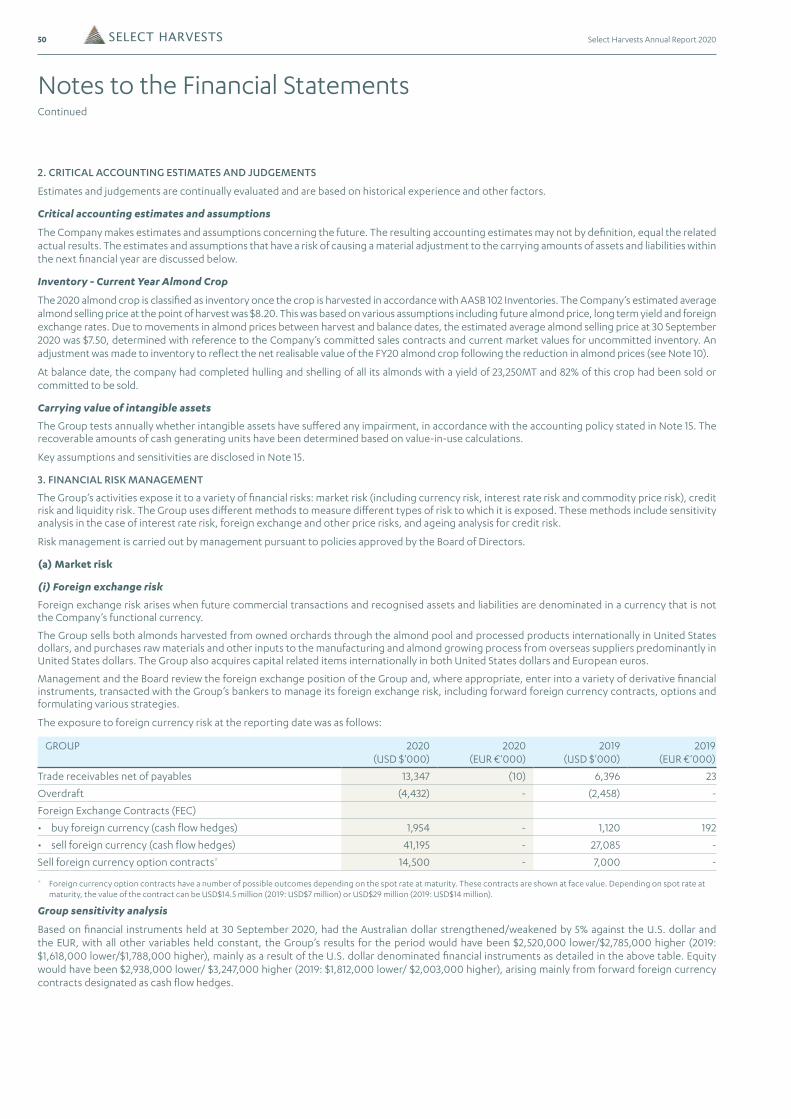
50 Select Harvests Annual Report 2020
2. CRITICAL ACCOUNTING ESTIMATES AND JUDGEMENTS
Estimates and judgements are continually evaluated and are based on historical experience and other factors.
Critical accounting estimates and assumptions
The Company makes estimates and assumptions concerning the future. The resulting accounting estimates may not by definition, equal the related actual results. The estimates and assumptions that have a risk of causing a material adjustment to the carrying amounts of assets and liabilities within the next financial year are discussed below.
Inventory - Current Year Almond Crop
The 2020 almond crop is classified as inventory once the crop is harvested in accordance with AASB 102 Inventories. The Company’s estimated average almond selling price at the point of harvest was $8.20. This was based on various assumptions including future almond price, long term yield and foreign exchange rates. Due to movements in almond prices between harvest and balance dates, the estimated average almond selling price at 30 September 2020 was $7.50, determined with reference to the Company’s committed sales contracts and current market values for uncommitted inventory. An adjustment was made to inventory to reflect the net realisable value of the FY20 almond crop following the reduction in almond prices (see Note 10).
At balance date, the company had completed hulling and shelling of all its almonds with a yield of 23,250MT and 82% of this crop had been sold or committed to be sold.
Carrying value of intangible assets
The Group tests annually whether intangible assets have suffered any impairment, in accordance with the accounting policy stated in Note 15. The recoverable amounts of cash generating units have been determined based on value-in-use calculations.
Key assumptions and sensitivities are disclosed in Note 15.
3. FINANCIAL RISK MANAGEMENT
The Group’s activities expose it to a variety of financial risks: market risk (including currency risk, interest rate risk and commodity price risk), credit risk and liquidity risk. The Group uses different methods to measure different types of risk to which it is exposed. These methods include sensitivity analysis in the case of interest rate risk, foreign exchange and other price risks, and ageing analysis for credit risk.
Risk management is carried out by management pursuant to policies approved by the Board of Directors.
(a) Market risk
(i) Foreign exchange risk
Foreign exchange risk arises when future commercial transactions and recognised assets and liabilities are denominated in a currency that is not the Company’s functional currency.
The Group sells both almonds harvested from owned orchards through the almond pool and processed products internationally in United States dollars, and purchases raw materials and other inputs to the manufacturing and almond growing process from overseas suppliers predominantly in United States dollars. The Group also acquires capital related items internationally in both United States dollars and European euros.
Management and the Board review the foreign exchange position of the Group and, where appropriate, enter into a variety of derivative financial instruments, transacted with the Group’s bankers to manage its foreign exchange risk, including forward foreign currency contracts, options and formulating various strategies.
The exposure to foreign currency risk at the reporting date was as follows:
GROUP 2020 (USD $'000)
2020 (EUR €'000)
2019 (USD $'000)
2019 (EUR €'000)
Trade receivables net of payables 13,347 (10) 6,396 23
Overdraft (4,432) - (2,458) -
Foreign Exchange Contracts (FEC)
• buy foreign currency (cash flow hedges) 1,954 - 1,120 192
• sell foreign currency (cash flow hedges) 41,195 - 27,085 -
Sell foreign currency option contracts* 14,500 - 7,000 -
* Foreign currency option contracts have a number of possible outcomes depending on the spot rate at maturity. These contracts are shown at face value. Depending on spot rate at maturity, the value of the contract can be USD$14.5 million (2019: USD$7 million) or USD$29 million (2019: USD$14 million).
Group sensitivity analysis
Based on financial instruments held at 30 September 2020, had the Australian dollar strengthened/weakened by 5% against the U.S. dollar and the EUR, with all other variables held constant, the Group’s results for the period would have been $2,520,000 lower/$2,785,000 higher (2019: $1,618,000 lower/$1,788,000 higher), mainly as a result of the U.S. dollar denominated financial instruments as detailed in the above table. Equity would have been $2,938,000 lower/ $3,247,000 higher (2019: $1,812,000 lower/ $2,003,000 higher), arising mainly from forward foreign currency contracts designated as cash flow hedges.
Notes to the Financial StatementsContinued
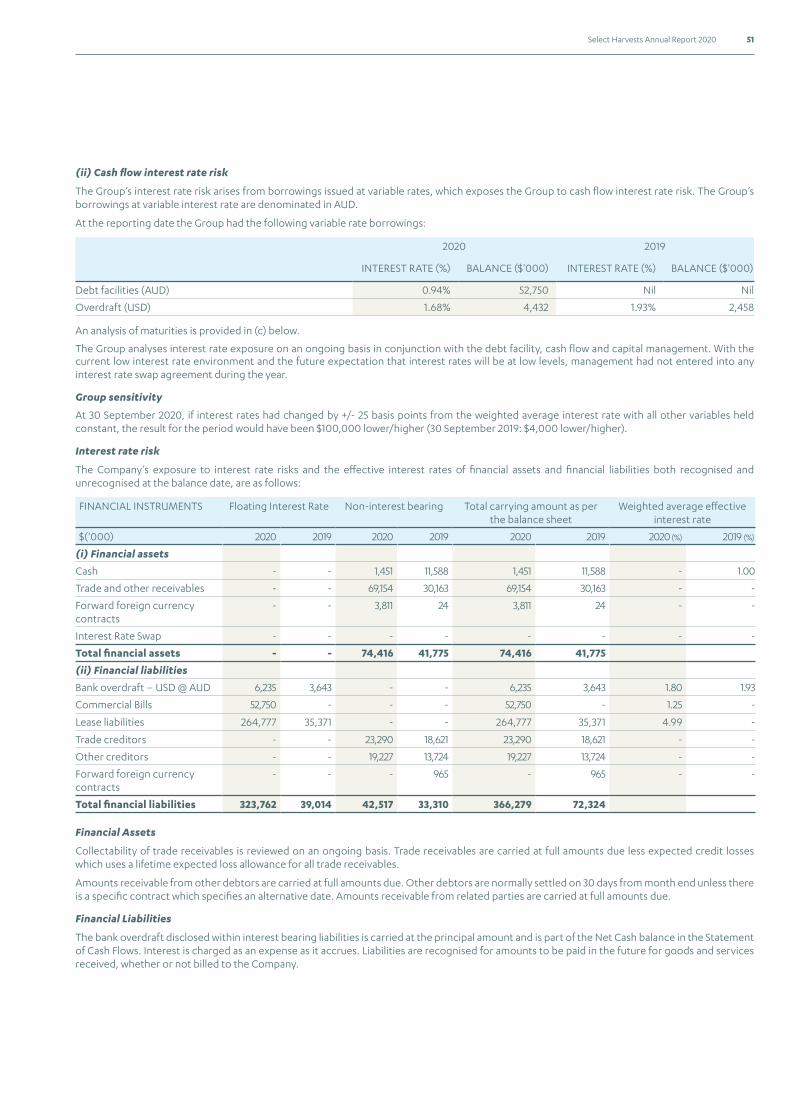
51Select Harvests Annual Report 2020
(ii) Cash flow interest rate risk
The Group’s interest rate risk arises from borrowings issued at variable rates, which exposes the Group to cash flow interest rate risk. The Group’s borrowings at variable interest rate are denominated in AUD.
At the reporting date the Group had the following variable rate borrowings:
2020 2019
INTEREST RATE (%) BALANCE ($'000) INTEREST RATE (%) BALANCE ($'000)
Debt facilities (AUD) 0.94% 52,750 Nil Nil
Overdraft (USD) 1.68% 4,432 1.93% 2,458
An analysis of maturities is provided in (c) below.
The Group analyses interest rate exposure on an ongoing basis in conjunction with the debt facility, cash flow and capital management. With the current low interest rate environment and the future expectation that interest rates will be at low levels, management had not entered into any interest rate swap agreement during the year.
Group sensitivity
At 30 September 2020, if interest rates had changed by +/- 25 basis points from the weighted average interest rate with all other variables held constant, the result for the period would have been $100,000 lower/higher (30 September 2019: $4,000 lower/higher).
Interest rate risk
The Company’s exposure to interest rate risks and the effective interest rates of financial assets and financial liabilities both recognised and unrecognised at the balance date, are as follows:
FINANCIAL INSTRUMENTS Floating Interest Rate Non-interest bearing Total carrying amount as per the balance sheet
Weighted average effective interest rate
$('000) 2020 2019 2020 2019 2020 2019 2020 (%) 2019 (%)
(i) Financial assets
Cash - - 1,451 11,588 1,451 11,588 - 1.00
Trade and other receivables - - 69,154 30,163 69,154 30,163 - -
Forward foreign currency contracts
- - 3,811 24 3,811 24 - -
Interest Rate Swap - - - - - - - -
Total financial assets - - 74,416 41,775 74,416 41,775
(ii) Financial liabilities
Bank overdraft – USD @ AUD 6,235 3,643 - - 6,235 3,643 1.80 1.93
Commercial Bills 52,750 - - - 52,750 - 1.25 -
Lease liabilities 264,777 35,371 - - 264,777 35,371 4.99 -
Trade creditors - - 23,290 18,621 23,290 18,621 - -
Other creditors - - 19,227 13,724 19,227 13,724 - -
Forward foreign currency contracts
- - - 965 - 965 - -
Total financial liabilities 323,762 39,014 42,517 33,310 366,279 72,324
Financial Assets
Collectability of trade receivables is reviewed on an ongoing basis. Trade receivables are carried at full amounts due less expected credit losses which uses a lifetime expected loss allowance for all trade receivables.
Amounts receivable from other debtors are carried at full amounts due. Other debtors are normally settled on 30 days from month end unless there is a specific contract which specifies an alternative date. Amounts receivable from related parties are carried at full amounts due.
Financial Liabilities
The bank overdraft disclosed within interest bearing liabilities is carried at the principal amount and is part of the Net Cash balance in the Statement of Cash Flows. Interest is charged as an expense as it accrues. Liabilities are recognised for amounts to be paid in the future for goods and services received, whether or not billed to the Company.
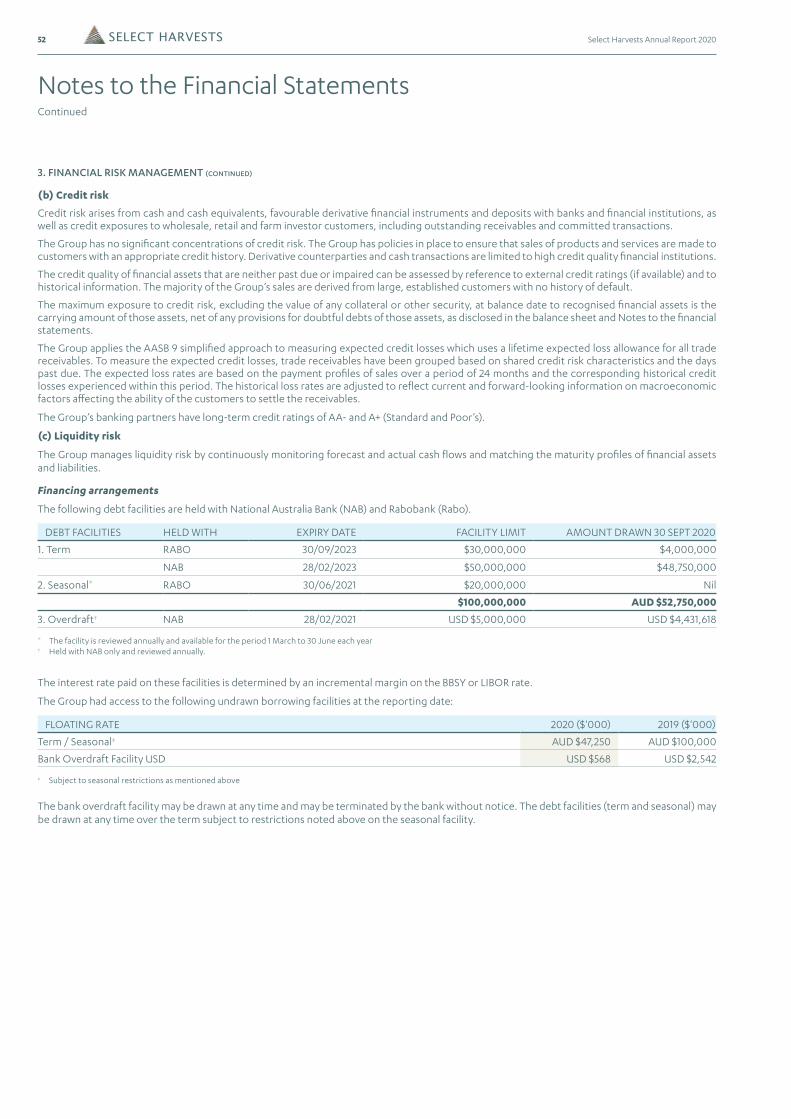
52 Select Harvests Annual Report 2020
3. FINANCIAL RISK MANAGEMENT (CONTINUED)
(b) Credit risk
Credit risk arises from cash and cash equivalents, favourable derivative financial instruments and deposits with banks and financial institutions, as well as credit exposures to wholesale, retail and farm investor customers, including outstanding receivables and committed transactions.
The Group has no significant concentrations of credit risk. The Group has policies in place to ensure that sales of products and services are made to customers with an appropriate credit history. Derivative counterparties and cash transactions are limited to high credit quality financial institutions.
The credit quality of financial assets that are neither past due or impaired can be assessed by reference to external credit ratings (if available) and to historical information. The majority of the Group’s sales are derived from large, established customers with no history of default.
The maximum exposure to credit risk, excluding the value of any collateral or other security, at balance date to recognised financial assets is the carrying amount of those assets, net of any provisions for doubtful debts of those assets, as disclosed in the balance sheet and Notes to the financial statements.
The Group applies the AASB 9 simplified approach to measuring expected credit losses which uses a lifetime expected loss allowance for all trade receivables. To measure the expected credit losses, trade receivables have been grouped based on shared credit risk characteristics and the days past due. The expected loss rates are based on the payment profiles of sales over a period of 24 months and the corresponding historical credit losses experienced within this period. The historical loss rates are adjusted to reflect current and forward-looking information on macroeconomic factors affecting the ability of the customers to settle the receivables.
The Group’s banking partners have long-term credit ratings of AA- and A+ (Standard and Poor’s).
(c) Liquidity risk
The Group manages liquidity risk by continuously monitoring forecast and actual cash flows and matching the maturity profiles of financial assets and liabilities.
Financing arrangements
The following debt facilities are held with National Australia Bank (NAB) and Rabobank (Rabo).
DEBT FACILITIES HELD WITH EXPIRY DATE FACILITY LIMIT AMOUNT DRAWN 30 SEPT 2020
1. Term RABO 30/09/2023 $30,000,000 $4,000,000
NAB 28/02/2023 $50,000,000 $48,750,000
2. Seasonal* RABO 30/06/2021 $20,000,000 Nil
$100,000,000 AUD $52,750,000
3. Overdraft† NAB 28/02/2021 USD $5,000,000 USD $4,431,618
* The facility is reviewed annually and available for the period 1 March to 30 June each year† Held with NAB only and reviewed annually.
The interest rate paid on these facilities is determined by an incremental margin on the BBSY or LIBOR rate.
The Group had access to the following undrawn borrowing facilities at the reporting date:
FLOATING RATE 2020 ($'000) 2019 ($'000)
Term / Seasonal‡ AUD $47,250 AUD $100,000
Bank Overdraft Facility USD USD $568 USD $2,542
‡ Subject to seasonal restrictions as mentioned above
The bank overdraft facility may be drawn at any time and may be terminated by the bank without notice. The debt facilities (term and seasonal) may be drawn at any time over the term subject to restrictions noted above on the seasonal facility.
Notes to the Financial StatementsContinued
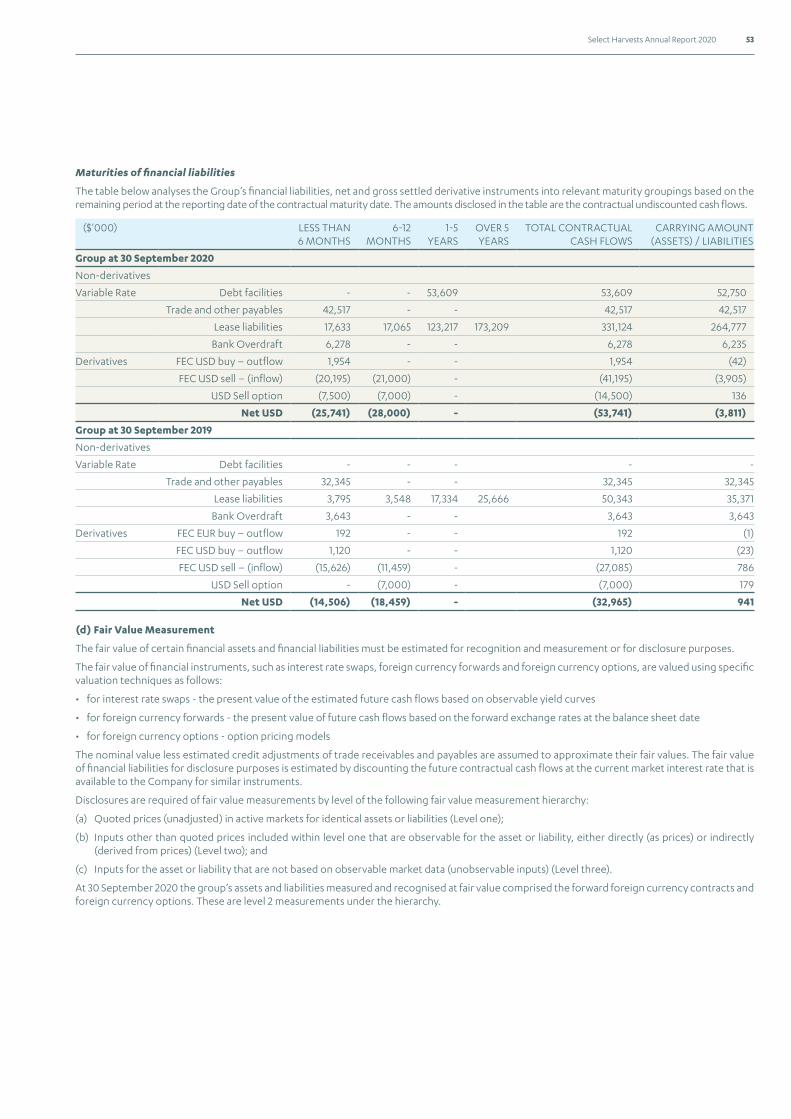
53Select Harvests Annual Report 2020
Maturities of financial liabilities
The table below analyses the Group’s financial liabilities, net and gross settled derivative instruments into relevant maturity groupings based on the remaining period at the reporting date of the contractual maturity date. The amounts disclosed in the table are the contractual undiscounted cash flows.
($'000) LESS THAN 6 MONTHS
6-12 MONTHS
1-5 YEARS
OVER 5 YEARS
TOTAL CONTRACTUAL CASH FLOWS
CARRYING AMOUNT (ASSETS) / LIABILITIES
Group at 30 September 2020
Non-derivatives
Variable Rate Debt facilities - - 53,609 53,609 52,750
Trade and other payables 42,517 - - 42,517 42,517
Lease liabilities 17,633 17,065 123,217 173,209 331,124 264,777
Bank Overdraft 6,278 - - 6,278 6,235
Derivatives FEC USD buy – outflow 1,954 - - 1,954 (42)
FEC USD sell – (inflow) (20,195) (21,000) - (41,195) (3,905)
USD Sell option (7,500) (7,000) - (14,500) 136
Net USD (25,741) (28,000) - (53,741) (3,811)
Group at 30 September 2019
Non-derivatives
Variable Rate Debt facilities - - - - -
Trade and other payables 32,345 - - 32,345 32,345
Lease liabilities 3,795 3,548 17,334 25,666 50,343 35,371
Bank Overdraft 3,643 - - 3,643 3,643
Derivatives FEC EUR buy – outflow 192 - - 192 (1)
FEC USD buy – outflow 1,120 - - 1,120 (23)
FEC USD sell – (inflow) (15,626) (11,459) - (27,085) 786
USD Sell option - (7,000) - (7,000) 179
Net USD (14,506) (18,459) - (32,965) 941
(d) Fair Value Measurement
The fair value of certain financial assets and financial liabilities must be estimated for recognition and measurement or for disclosure purposes.
The fair value of financial instruments, such as interest rate swaps, foreign currency forwards and foreign currency options, are valued using specific valuation techniques as follows:
• for interest rate swaps - the present value of the estimated future cash flows based on observable yield curves
• for foreign currency forwards - the present value of future cash flows based on the forward exchange rates at the balance sheet date
• for foreign currency options - option pricing models
The nominal value less estimated credit adjustments of trade receivables and payables are assumed to approximate their fair values. The fair value of financial liabilities for disclosure purposes is estimated by discounting the future contractual cash flows at the current market interest rate that is available to the Company for similar instruments.
Disclosures are required of fair value measurements by level of the following fair value measurement hierarchy:
(a) Quoted prices (unadjusted) in active markets for identical assets or liabilities (Level one);
(b) Inputs other than quoted prices included within level one that are observable for the asset or liability, either directly (as prices) or indirectly (derived from prices) (Level two); and
(c) Inputs for the asset or liability that are not based on observable market data (unobservable inputs) (Level three).
At 30 September 2020 the group’s assets and liabilities measured and recognised at fair value comprised the forward foreign currency contracts and foreign currency options. These are level 2 measurements under the hierarchy.
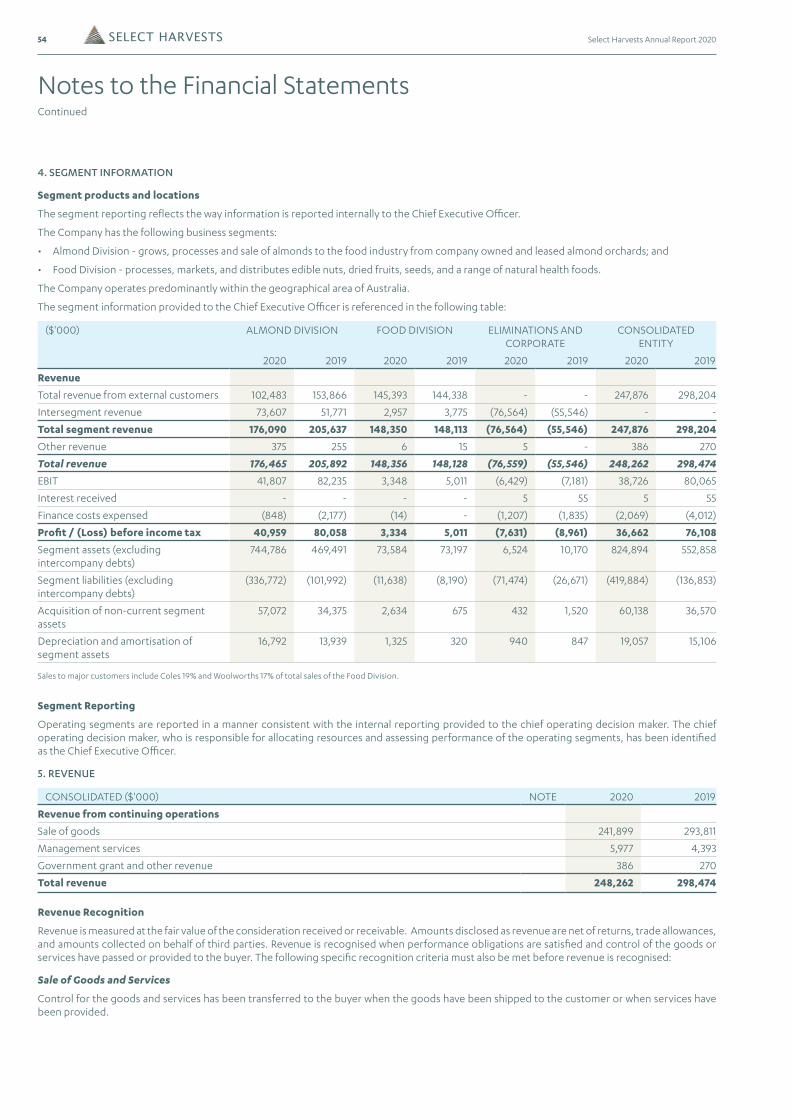
54 Select Harvests Annual Report 2020
4. SEGMENT INFORMATION
Segment products and locations
The segment reporting reflects the way information is reported internally to the Chief Executive Officer.
The Company has the following business segments:
• Almond Division - grows, processes and sale of almonds to the food industry from company owned and leased almond orchards; and
• Food Division - processes, markets, and distributes edible nuts, dried fruits, seeds, and a range of natural health foods.
The Company operates predominantly within the geographical area of Australia.
The segment information provided to the Chief Executive Officer is referenced in the following table:
($'000) ALMOND DIVISION FOOD DIVISION ELIMINATIONS AND CORPORATE
CONSOLIDATED ENTITY
2020 2019 2020 2019 2020 2019 2020 2019
Revenue
Total revenue from external customers 102,483 153,866 145,393 144,338 - - 247,876 298,204
Intersegment revenue 73,607 51,771 2,957 3,775 (76,564) (55,546) - -
Total segment revenue 176,090 205,637 148,350 148,113 (76,564) (55,546) 247,876 298,204
Other revenue 375 255 6 15 5 - 386 270
Total revenue 176,465 205,892 148,356 148,128 (76,559) (55,546) 248,262 298,474
EBIT 41,807 82,235 3,348 5,011 (6,429) (7,181) 38,726 80,065
Interest received - - - - 5 55 5 55
Finance costs expensed (848) (2,177) (14) - (1,207) (1,835) (2,069) (4,012)
Profit / (Loss) before income tax 40,959 80,058 3,334 5,011 (7,631) (8,961) 36,662 76,108
Segment assets (excluding intercompany debts)
744,786 469,491 73,584 73,197 6,524 10,170 824,894 552,858
Segment liabilities (excluding intercompany debts)
(336,772) (101,992) (11,638) (8,190) (71,474) (26,671) (419,884) (136,853)
Acquisition of non-current segment assets
57,072 34,375 2,634 675 432 1,520 60,138 36,570
Depreciation and amortisation of segment assets
16,792 13,939 1,325 320 940 847 19,057 15,106
Sales to major customers include Coles 19% and Woolworths 17% of total sales of the Food Division.
Segment Reporting
Operating segments are reported in a manner consistent with the internal reporting provided to the chief operating decision maker. The chief operating decision maker, who is responsible for allocating resources and assessing performance of the operating segments, has been identified as the Chief Executive Officer.
5. REVENUE
CONSOLIDATED ($'000) NOTE 2020 2019
Revenue from continuing operations
Sale of goods 241,899 293,811
Management services 5,977 4,393
Government grant and other revenue 386 270
Total revenue 248,262 298,474
Revenue Recognition
Revenue is measured at the fair value of the consideration received or receivable. Amounts disclosed as revenue are net of returns, trade allowances, and amounts collected on behalf of third parties. Revenue is recognised when performance obligations are satisfied and control of the goods or services have passed or provided to the buyer. The following specific recognition criteria must also be met before revenue is recognised:
Sale of Goods and Services
Control for the goods and services has been transferred to the buyer when the goods have been shipped to the customer or when services have been provided.
Notes to the Financial StatementsContinued
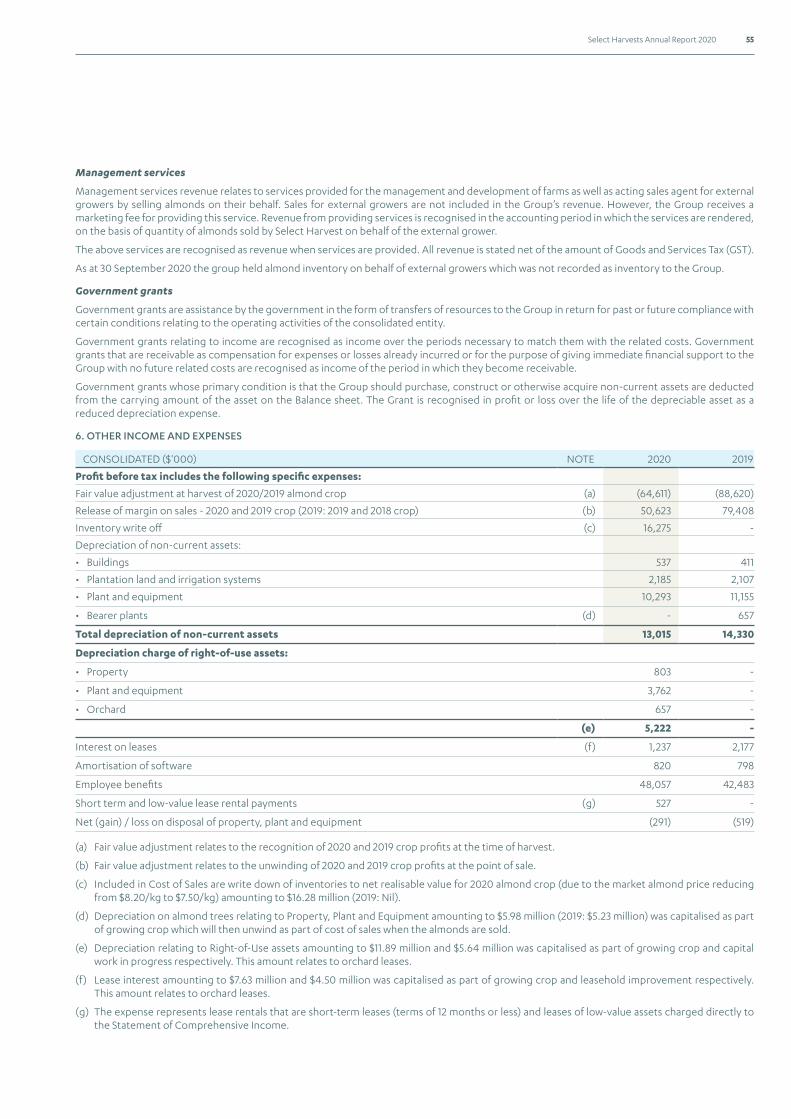
55Select Harvests Annual Report 2020
Management services
Management services revenue relates to services provided for the management and development of farms as well as acting sales agent for external growers by selling almonds on their behalf. Sales for external growers are not included in the Group’s revenue. However, the Group receives a marketing fee for providing this service. Revenue from providing services is recognised in the accounting period in which the services are rendered, on the basis of quantity of almonds sold by Select Harvest on behalf of the external grower.
The above services are recognised as revenue when services are provided. All revenue is stated net of the amount of Goods and Services Tax (GST).
As at 30 September 2020 the group held almond inventory on behalf of external growers which was not recorded as inventory to the Group.
Government grants
Government grants are assistance by the government in the form of transfers of resources to the Group in return for past or future compliance with certain conditions relating to the operating activities of the consolidated entity.
Government grants relating to income are recognised as income over the periods necessary to match them with the related costs. Government grants that are receivable as compensation for expenses or losses already incurred or for the purpose of giving immediate financial support to the Group with no future related costs are recognised as income of the period in which they become receivable.
Government grants whose primary condition is that the Group should purchase, construct or otherwise acquire non-current assets are deducted from the carrying amount of the asset on the Balance sheet. The Grant is recognised in profit or loss over the life of the depreciable asset as a reduced depreciation expense.
6. OTHER INCOME AND EXPENSES
CONSOLIDATED ($'000) NOTE 2020 2019
Profit before tax includes the following specific expenses:
Fair value adjustment at harvest of 2020/2019 almond crop (a) (64,611) (88,620)
Release of margin on sales - 2020 and 2019 crop (2019: 2019 and 2018 crop) (b) 50,623 79,408
Inventory write off (c) 16,275 -
Depreciation of non-current assets:
• Buildings 537 411
• Plantation land and irrigation systems 2,185 2,107
• Plant and equipment 10,293 11,155
• Bearer plants (d) - 657
Total depreciation of non-current assets 13,015 14,330
Depreciation charge of right-of-use assets:
• Property 803 -
• Plant and equipment 3,762 -
• Orchard 657 -
(e) 5,222 -
Interest on leases (f) 1,237 2,177
Amortisation of software 820 798
Employee benefits 48,057 42,483
Short term and low-value lease rental payments (g) 527 -
Net (gain) / loss on disposal of property, plant and equipment (291) (519)
(a) Fair value adjustment relates to the recognition of 2020 and 2019 crop profits at the time of harvest.
(b) Fair value adjustment relates to the unwinding of 2020 and 2019 crop profits at the point of sale.
(c) Included in Cost of Sales are write down of inventories to net realisable value for 2020 almond crop (due to the market almond price reducing from $8.20/kg to $7.50/kg) amounting to $16.28 million (2019: Nil).
(d) Depreciation on almond trees relating to Property, Plant and Equipment amounting to $5.98 million (2019: $5.23 million) was capitalised as part of growing crop which will then unwind as part of cost of sales when the almonds are sold.
(e) Depreciation relating to Right-of-Use assets amounting to $11.89 million and $5.64 million was capitalised as part of growing crop and capital work in progress respectively. This amount relates to orchard leases.
(f) Lease interest amounting to $7.63 million and $4.50 million was capitalised as part of growing crop and leasehold improvement respectively. This amount relates to orchard leases.
(g) The expense represents lease rentals that are short-term leases (terms of 12 months or less) and leases of low-value assets charged directly to the Statement of Comprehensive Income.
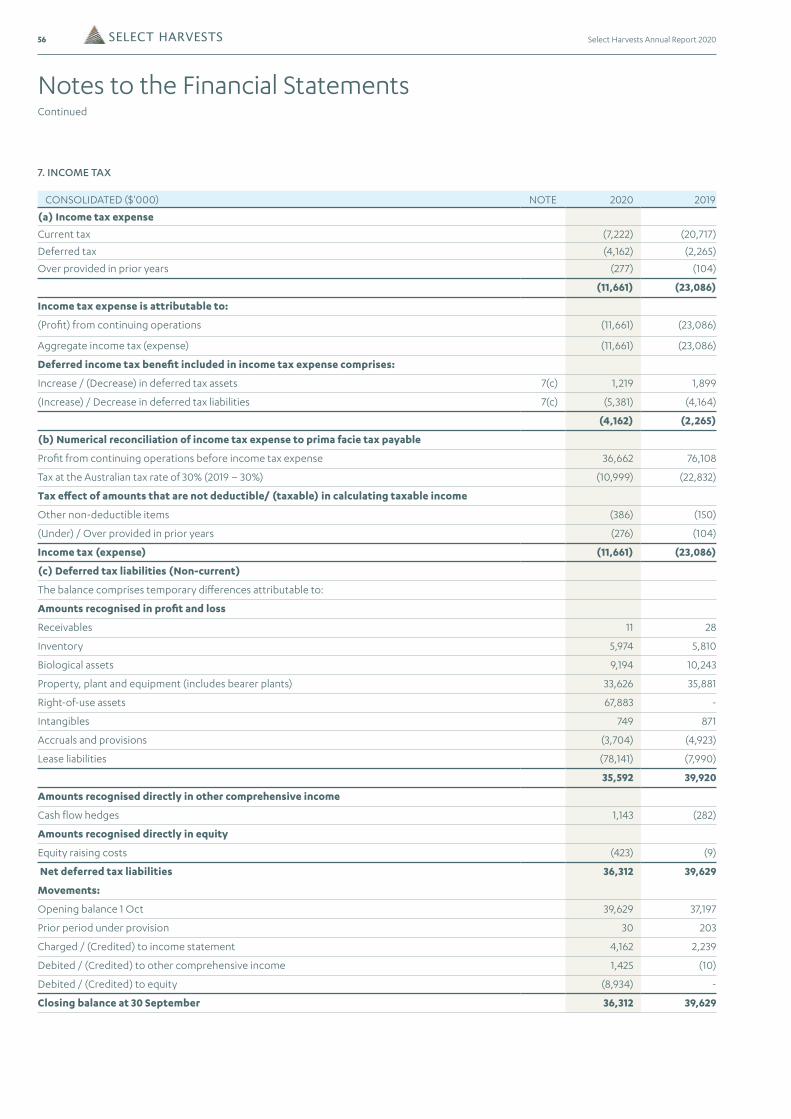
56 Select Harvests Annual Report 2020
7. INCOME TAX
CONSOLIDATED ($'000) NOTE 2020 2019
(a) Income tax expense
Current tax (7,222) (20,717)
Deferred tax (4,162) (2,265)
Over provided in prior years (277) (104)
(11,661) (23,086)
Income tax expense is attributable to:
(Profit) from continuing operations (11,661) (23,086)
Aggregate income tax (expense) (11,661) (23,086)
Deferred income tax benefit included in income tax expense comprises:
Increase / (Decrease) in deferred tax assets 7(c) 1,219 1,899
(Increase) / Decrease in deferred tax liabilities 7(c) (5,381) (4,164)
(4,162) (2,265)
(b) Numerical reconciliation of income tax expense to prima facie tax payable
Profit from continuing operations before income tax expense 36,662 76,108
Tax at the Australian tax rate of 30% (2019 – 30%) (10,999) (22,832)
Tax effect of amounts that are not deductible/ (taxable) in calculating taxable income
Other non-deductible items (386) (150)
(Under) / Over provided in prior years (276) (104)
Income tax (expense) (11,661) (23,086)
(c) Deferred tax liabilities (Non-current)
The balance comprises temporary differences attributable to:
Amounts recognised in profit and loss
Receivables 11 28
Inventory 5,974 5,810
Biological assets 9,194 10,243
Property, plant and equipment (includes bearer plants) 33,626 35,881
Right-of-use assets 67,883 -
Intangibles 749 871
Accruals and provisions (3,704) (4,923)
Lease liabilities (78,141) (7,990)
35,592 39,920
Amounts recognised directly in other comprehensive income
Cash flow hedges 1,143 (282)
Amounts recognised directly in equity
Equity raising costs (423) (9)
Net deferred tax liabilities 36,312 39,629
Movements:
Opening balance 1 Oct 39,629 37,197
Prior period under provision 30 203
Charged / (Credited) to income statement 4,162 2,239
Debited / (Credited) to other comprehensive income 1,425 (10)
Debited / (Credited) to equity (8,934) -
Closing balance at 30 September 36,312 39,629
Notes to the Financial StatementsContinued
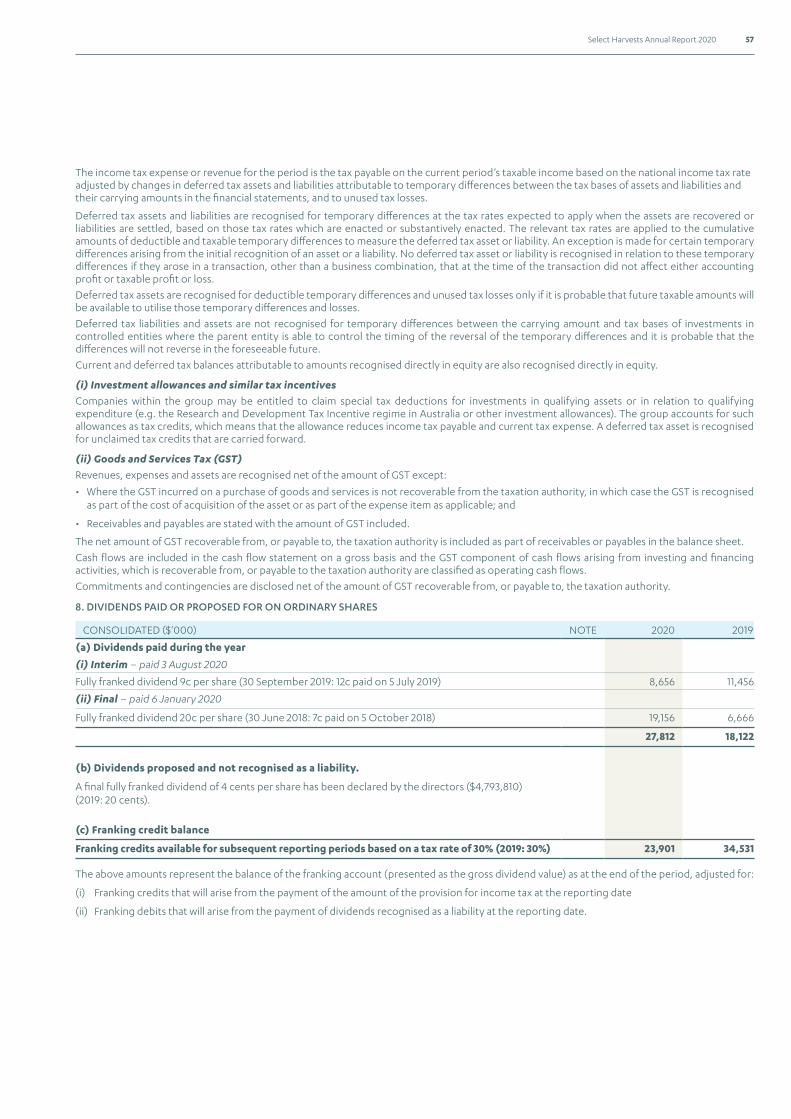
57Select Harvests Annual Report 2020
The income tax expense or revenue for the period is the tax payable on the current period’s taxable income based on the national income tax rate adjusted by changes in deferred tax assets and liabilities attributable to temporary differences between the tax bases of assets and liabilities and their carrying amounts in the financial statements, and to unused tax losses.
Deferred tax assets and liabilities are recognised for temporary differences at the tax rates expected to apply when the assets are recovered or liabilities are settled, based on those tax rates which are enacted or substantively enacted. The relevant tax rates are applied to the cumulative amounts of deductible and taxable temporary differences to measure the deferred tax asset or liability. An exception is made for certain temporary differences arising from the initial recognition of an asset or a liability. No deferred tax asset or liability is recognised in relation to these temporary differences if they arose in a transaction, other than a business combination, that at the time of the transaction did not affect either accounting profit or taxable profit or loss.
Deferred tax assets are recognised for deductible temporary differences and unused tax losses only if it is probable that future taxable amounts will be available to utilise those temporary differences and losses.
Deferred tax liabilities and assets are not recognised for temporary differences between the carrying amount and tax bases of investments in controlled entities where the parent entity is able to control the timing of the reversal of the temporary differences and it is probable that the differences will not reverse in the foreseeable future.
Current and deferred tax balances attributable to amounts recognised directly in equity are also recognised directly in equity.
(i) Investment allowances and similar tax incentives
Companies within the group may be entitled to claim special tax deductions for investments in qualifying assets or in relation to qualifying expenditure (e.g. the Research and Development Tax Incentive regime in Australia or other investment allowances). The group accounts for such allowances as tax credits, which means that the allowance reduces income tax payable and current tax expense. A deferred tax asset is recognised for unclaimed tax credits that are carried forward.
(ii) Goods and Services Tax (GST)
Revenues, expenses and assets are recognised net of the amount of GST except:
• Where the GST incurred on a purchase of goods and services is not recoverable from the taxation authority, in which case the GST is recognised as part of the cost of acquisition of the asset or as part of the expense item as applicable; and
• Receivables and payables are stated with the amount of GST included.
The net amount of GST recoverable from, or payable to, the taxation authority is included as part of receivables or payables in the balance sheet.
Cash flows are included in the cash flow statement on a gross basis and the GST component of cash flows arising from investing and financing activities, which is recoverable from, or payable to the taxation authority are classified as operating cash flows.
Commitments and contingencies are disclosed net of the amount of GST recoverable from, or payable to, the taxation authority.
8. DIVIDENDS PAID OR PROPOSED FOR ON ORDINARY SHARES
CONSOLIDATED ($'000) NOTE 2020 2019
(a) Dividends paid during the year
(i) Interim – paid 3 August 2020
Fully franked dividend 9c per share (30 September 2019: 12c paid on 5 July 2019) 8,656 11,456
(ii) Final – paid 6 January 2020
Fully franked dividend 20c per share (30 June 2018: 7c paid on 5 October 2018) 19,156 6,666
27,812 18,122
(b) Dividends proposed and not recognised as a liability.
A final fully franked dividend of 4 cents per share has been declared by the directors ($4,793,810) (2019: 20 cents).
(c) Franking credit balance
Franking credits available for subsequent reporting periods based on a tax rate of 30% (2019: 30%) 23,901 34,531
The above amounts represent the balance of the franking account (presented as the gross dividend value) as at the end of the period, adjusted for:
(i) Franking credits that will arise from the payment of the amount of the provision for income tax at the reporting date
(ii) Franking debits that will arise from the payment of dividends recognised as a liability at the reporting date.
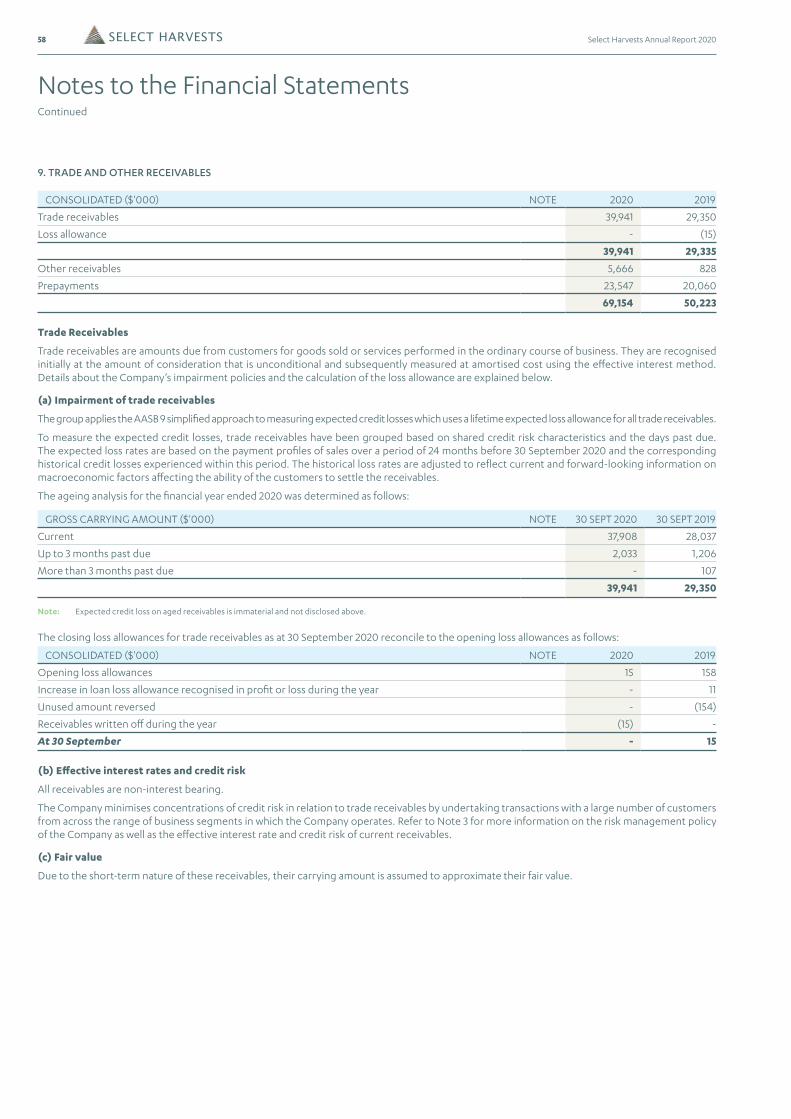
58 Select Harvests Annual Report 2020
9. TRADE AND OTHER RECEIVABLES
CONSOLIDATED ($'000) NOTE 2020 2019
Trade receivables 39,941 29,350
Loss allowance - (15)
39,941 29,335
Other receivables 5,666 828
Prepayments 23,547 20,060
69,154 50,223
Trade Receivables
Trade receivables are amounts due from customers for goods sold or services performed in the ordinary course of business. They are recognised initially at the amount of consideration that is unconditional and subsequently measured at amortised cost using the effective interest method. Details about the Company’s impairment policies and the calculation of the loss allowance are explained below.
(a) Impairment of trade receivables
The group applies the AASB 9 simplified approach to measuring expected credit losses which uses a lifetime expected loss allowance for all trade receivables.
To measure the expected credit losses, trade receivables have been grouped based on shared credit risk characteristics and the days past due. The expected loss rates are based on the payment profiles of sales over a period of 24 months before 30 September 2020 and the corresponding historical credit losses experienced within this period. The historical loss rates are adjusted to reflect current and forward-looking information on macroeconomic factors affecting the ability of the customers to settle the receivables.
The ageing analysis for the financial year ended 2020 was determined as follows:
GROSS CARRYING AMOUNT ($'000) NOTE 30 SEPT 2020 30 SEPT 2019
Current 37,908 28,037
Up to 3 months past due 2,033 1,206
More than 3 months past due - 107
39,941 29,350
Note: Expected credit loss on aged receivables is immaterial and not disclosed above.
The closing loss allowances for trade receivables as at 30 September 2020 reconcile to the opening loss allowances as follows:
CONSOLIDATED ($'000) NOTE 2020 2019
Opening loss allowances 15 158
Increase in loan loss allowance recognised in profit or loss during the year - 11
Unused amount reversed - (154)
Receivables written off during the year (15) -
At 30 September - 15
(b) Effective interest rates and credit risk
All receivables are non-interest bearing.
The Company minimises concentrations of credit risk in relation to trade receivables by undertaking transactions with a large number of customers from across the range of business segments in which the Company operates. Refer to Note 3 for more information on the risk management policy of the Company as well as the effective interest rate and credit risk of current receivables.
(c) Fair value
Due to the short-term nature of these receivables, their carrying amount is assumed to approximate their fair value.
Notes to the Financial StatementsContinued
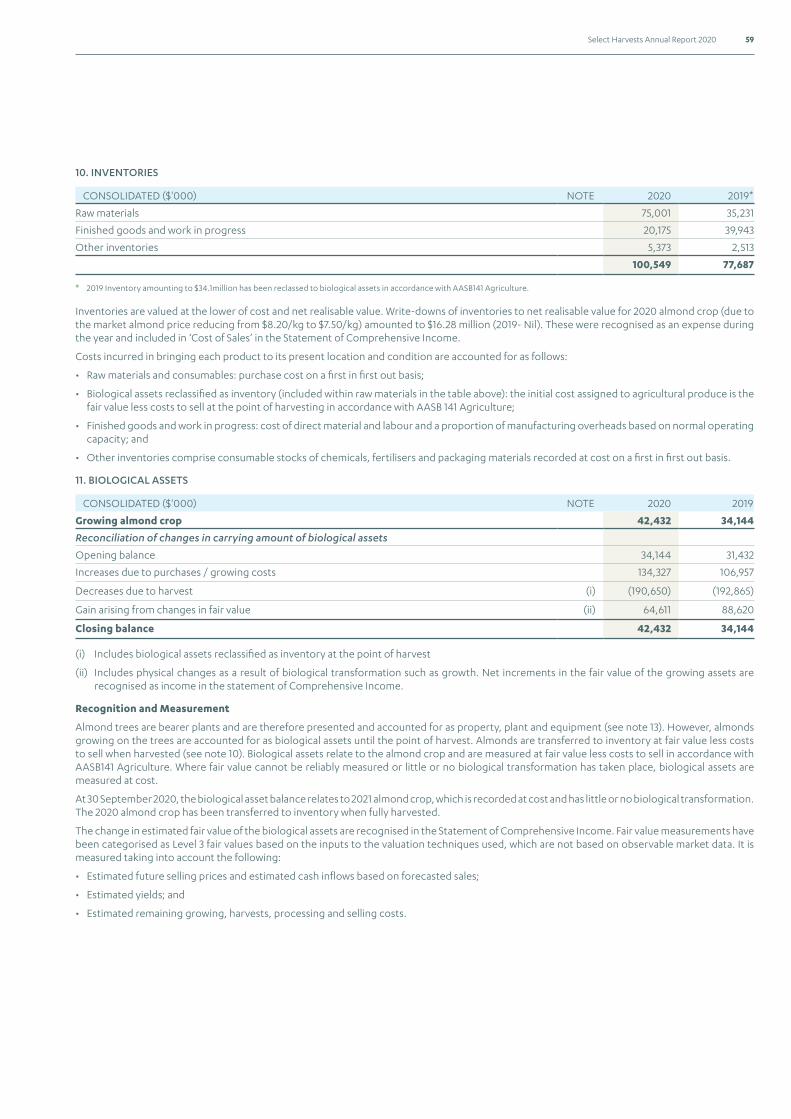
59Select Harvests Annual Report 2020
10. INVENTORIES
CONSOLIDATED ($'000) NOTE 2020 2019*
Raw materials 75,001 35,231
Finished goods and work in progress 20,175 39,943
Other inventories 5,373 2,513
100,549 77,687
* 2019 Inventory amounting to $34.1million has been reclassed to biological assets in accordance with AASB141 Agriculture.
Inventories are valued at the lower of cost and net realisable value. Write-downs of inventories to net realisable value for 2020 almond crop (due to the market almond price reducing from $8.20/kg to $7.50/kg) amounted to $16.28 million (2019- Nil). These were recognised as an expense during the year and included in ‘Cost of Sales’ in the Statement of Comprehensive Income.
Costs incurred in bringing each product to its present location and condition are accounted for as follows:
• Raw materials and consumables: purchase cost on a first in first out basis;
• Biological assets reclassified as inventory (included within raw materials in the table above): the initial cost assigned to agricultural produce is the fair value less costs to sell at the point of harvesting in accordance with AASB 141 Agriculture;
• Finished goods and work in progress: cost of direct material and labour and a proportion of manufacturing overheads based on normal operating capacity; and
• Other inventories comprise consumable stocks of chemicals, fertilisers and packaging materials recorded at cost on a first in first out basis.
11. BIOLOGICAL ASSETS
CONSOLIDATED ($'000) NOTE 2020 2019
Growing almond crop 42,432 34,144
Reconciliation of changes in carrying amount of biological assets
Opening balance 34,144 31,432
Increases due to purchases / growing costs 134,327 106,957
Decreases due to harvest (i) (190,650) (192,865)
Gain arising from changes in fair value (ii) 64,611 88,620
Closing balance 42,432 34,144
(i) Includes biological assets reclassified as inventory at the point of harvest
(ii) Includes physical changes as a result of biological transformation such as growth. Net increments in the fair value of the growing assets are recognised as income in the statement of Comprehensive Income.
Recognition and Measurement
Almond trees are bearer plants and are therefore presented and accounted for as property, plant and equipment (see note 13). However, almonds growing on the trees are accounted for as biological assets until the point of harvest. Almonds are transferred to inventory at fair value less costs to sell when harvested (see note 10). Biological assets relate to the almond crop and are measured at fair value less costs to sell in accordance with AASB141 Agriculture. Where fair value cannot be reliably measured or little or no biological transformation has taken place, biological assets are measured at cost.
At 30 September 2020, the biological asset balance relates to 2021 almond crop, which is recorded at cost and has little or no biological transformation. The 2020 almond crop has been transferred to inventory when fully harvested.
The change in estimated fair value of the biological assets are recognised in the Statement of Comprehensive Income. Fair value measurements have been categorised as Level 3 fair values based on the inputs to the valuation techniques used, which are not based on observable market data. It is measured taking into account the following:
• Estimated future selling prices and estimated cash inflows based on forecasted sales;
• Estimated yields; and
• Estimated remaining growing, harvests, processing and selling costs.
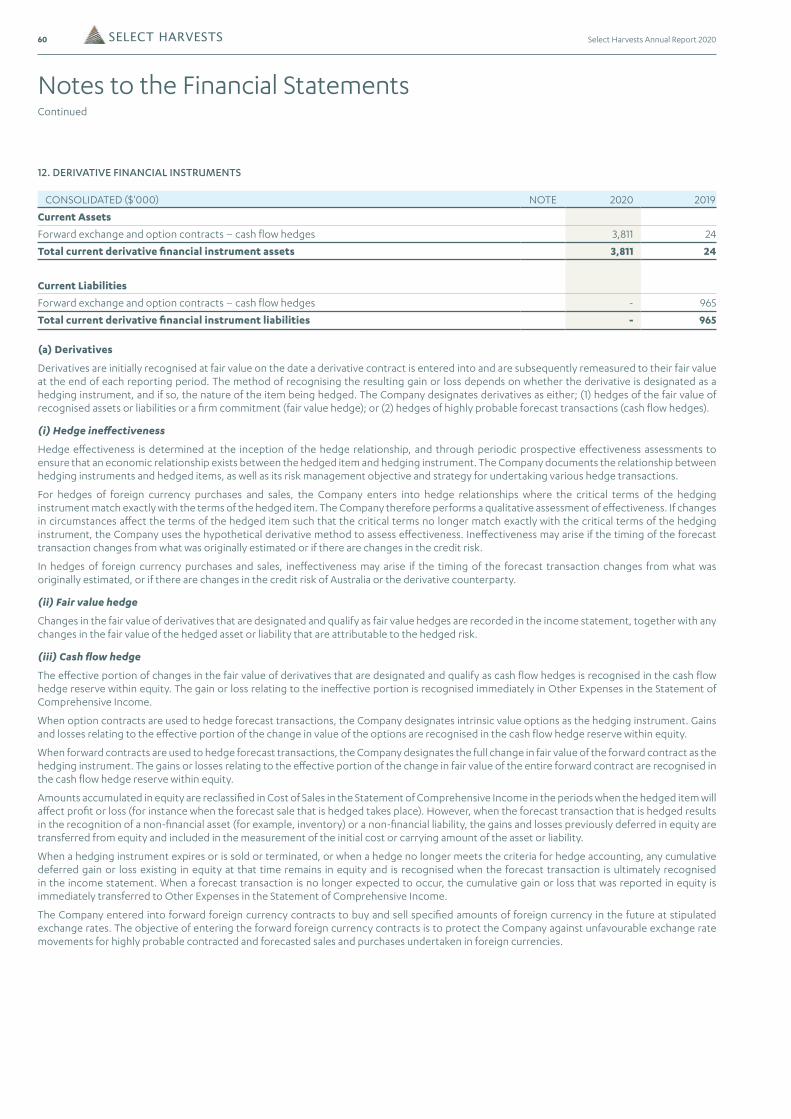
60 Select Harvests Annual Report 2020
12. DERIVATIVE FINANCIAL INSTRUMENTS
CONSOLIDATED ($'000) NOTE 2020 2019
Current Assets
Forward exchange and option contracts – cash flow hedges 3,811 24
Total current derivative financial instrument assets 3,811 24
Current Liabilities
Forward exchange and option contracts – cash flow hedges - 965
Total current derivative financial instrument liabilities - 965
(a) Derivatives
Derivatives are initially recognised at fair value on the date a derivative contract is entered into and are subsequently remeasured to their fair value at the end of each reporting period. The method of recognising the resulting gain or loss depends on whether the derivative is designated as a hedging instrument, and if so, the nature of the item being hedged. The Company designates derivatives as either; (1) hedges of the fair value of recognised assets or liabilities or a firm commitment (fair value hedge); or (2) hedges of highly probable forecast transactions (cash flow hedges).
(i) Hedge ineffectiveness
Hedge effectiveness is determined at the inception of the hedge relationship, and through periodic prospective effectiveness assessments to ensure that an economic relationship exists between the hedged item and hedging instrument. The Company documents the relationship between hedging instruments and hedged items, as well as its risk management objective and strategy for undertaking various hedge transactions.
For hedges of foreign currency purchases and sales, the Company enters into hedge relationships where the critical terms of the hedging instrument match exactly with the terms of the hedged item. The Company therefore performs a qualitative assessment of effectiveness. If changes in circumstances affect the terms of the hedged item such that the critical terms no longer match exactly with the critical terms of the hedging instrument, the Company uses the hypothetical derivative method to assess effectiveness. Ineffectiveness may arise if the timing of the forecast transaction changes from what was originally estimated or if there are changes in the credit risk.
In hedges of foreign currency purchases and sales, ineffectiveness may arise if the timing of the forecast transaction changes from what was originally estimated, or if there are changes in the credit risk of Australia or the derivative counterparty.
(ii) Fair value hedge
Changes in the fair value of derivatives that are designated and qualify as fair value hedges are recorded in the income statement, together with any changes in the fair value of the hedged asset or liability that are attributable to the hedged risk.
(iii) Cash flow hedge
The effective portion of changes in the fair value of derivatives that are designated and qualify as cash flow hedges is recognised in the cash flow hedge reserve within equity. The gain or loss relating to the ineffective portion is recognised immediately in Other Expenses in the Statement of Comprehensive Income.
When option contracts are used to hedge forecast transactions, the Company designates intrinsic value options as the hedging instrument. Gains and losses relating to the effective portion of the change in value of the options are recognised in the cash flow hedge reserve within equity.
When forward contracts are used to hedge forecast transactions, the Company designates the full change in fair value of the forward contract as the hedging instrument. The gains or losses relating to the effective portion of the change in fair value of the entire forward contract are recognised in the cash flow hedge reserve within equity.
Amounts accumulated in equity are reclassified in Cost of Sales in the Statement of Comprehensive Income in the periods when the hedged item will affect profit or loss (for instance when the forecast sale that is hedged takes place). However, when the forecast transaction that is hedged results in the recognition of a non-financial asset (for example, inventory) or a non-financial liability, the gains and losses previously deferred in equity are transferred from equity and included in the measurement of the initial cost or carrying amount of the asset or liability.
When a hedging instrument expires or is sold or terminated, or when a hedge no longer meets the criteria for hedge accounting, any cumulative deferred gain or loss existing in equity at that time remains in equity and is recognised when the forecast transaction is ultimately recognised in the income statement. When a forecast transaction is no longer expected to occur, the cumulative gain or loss that was reported in equity is immediately transferred to Other Expenses in the Statement of Comprehensive Income.
The Company entered into forward foreign currency contracts to buy and sell specified amounts of foreign currency in the future at stipulated exchange rates. The objective of entering the forward foreign currency contracts is to protect the Company against unfavourable exchange rate movements for highly probable contracted and forecasted sales and purchases undertaken in foreign currencies.
Notes to the Financial StatementsContinued
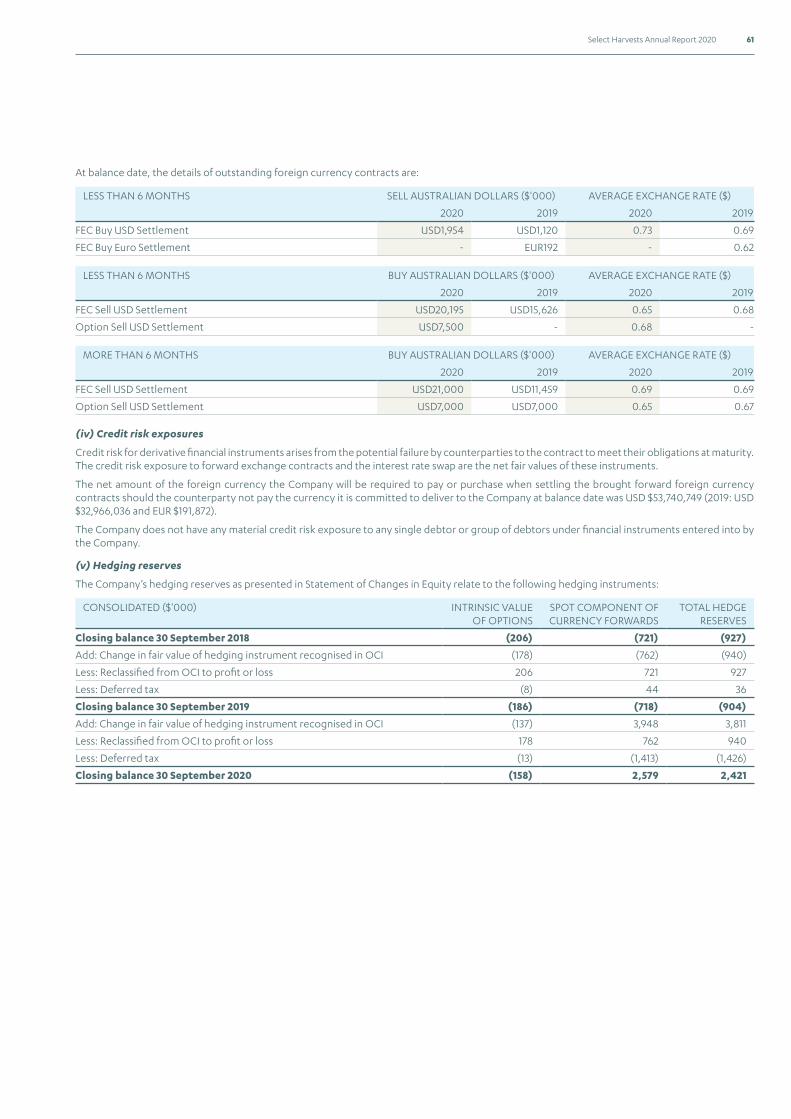
61Select Harvests Annual Report 2020
At balance date, the details of outstanding foreign currency contracts are:
LESS THAN 6 MONTHS SELL AUSTRALIAN DOLLARS ($'000) AVERAGE EXCHANGE RATE ($)
2020 2019 2020 2019
FEC Buy USD Settlement USD1,954 USD1,120 0.73 0.69
FEC Buy Euro Settlement - EUR192 - 0.62
LESS THAN 6 MONTHS BUY AUSTRALIAN DOLLARS ($'000) AVERAGE EXCHANGE RATE ($)
2020 2019 2020 2019
FEC Sell USD Settlement USD20,195 USD15,626 0.65 0.68
Option Sell USD Settlement USD7,500 - 0.68 -
MORE THAN 6 MONTHS BUY AUSTRALIAN DOLLARS ($'000) AVERAGE EXCHANGE RATE ($)
2020 2019 2020 2019
FEC Sell USD Settlement USD21,000 USD11,459 0.69 0.69
Option Sell USD Settlement USD7,000 USD7,000 0.65 0.67
(iv) Credit risk exposures
Credit risk for derivative financial instruments arises from the potential failure by counterparties to the contract to meet their obligations at maturity. The credit risk exposure to forward exchange contracts and the interest rate swap are the net fair values of these instruments.
The net amount of the foreign currency the Company will be required to pay or purchase when settling the brought forward foreign currency contracts should the counterparty not pay the currency it is committed to deliver to the Company at balance date was USD $53,740,749 (2019: USD $32,966,036 and EUR $191,872).
The Company does not have any material credit risk exposure to any single debtor or group of debtors under financial instruments entered into by the Company.
(v) Hedging reserves
The Company’s hedging reserves as presented in Statement of Changes in Equity relate to the following hedging instruments:
CONSOLIDATED ($'000) INTRINSIC VALUE OF OPTIONS
SPOT COMPONENT OF CURRENCY FORWARDS
TOTAL HEDGE RESERVES
Closing balance 30 September 2018 (206) (721) (927)
Add: Change in fair value of hedging instrument recognised in OCI (178) (762) (940)
Less: Reclassified from OCI to profit or loss 206 721 927
Less: Deferred tax (8) 44 36
Closing balance 30 September 2019 (186) (718) (904)
Add: Change in fair value of hedging instrument recognised in OCI (137) 3,948 3,811
Less: Reclassified from OCI to profit or loss 178 762 940
Less: Deferred tax (13) (1,413) (1,426)
Closing balance 30 September 2020 (158) 2,579 2,421
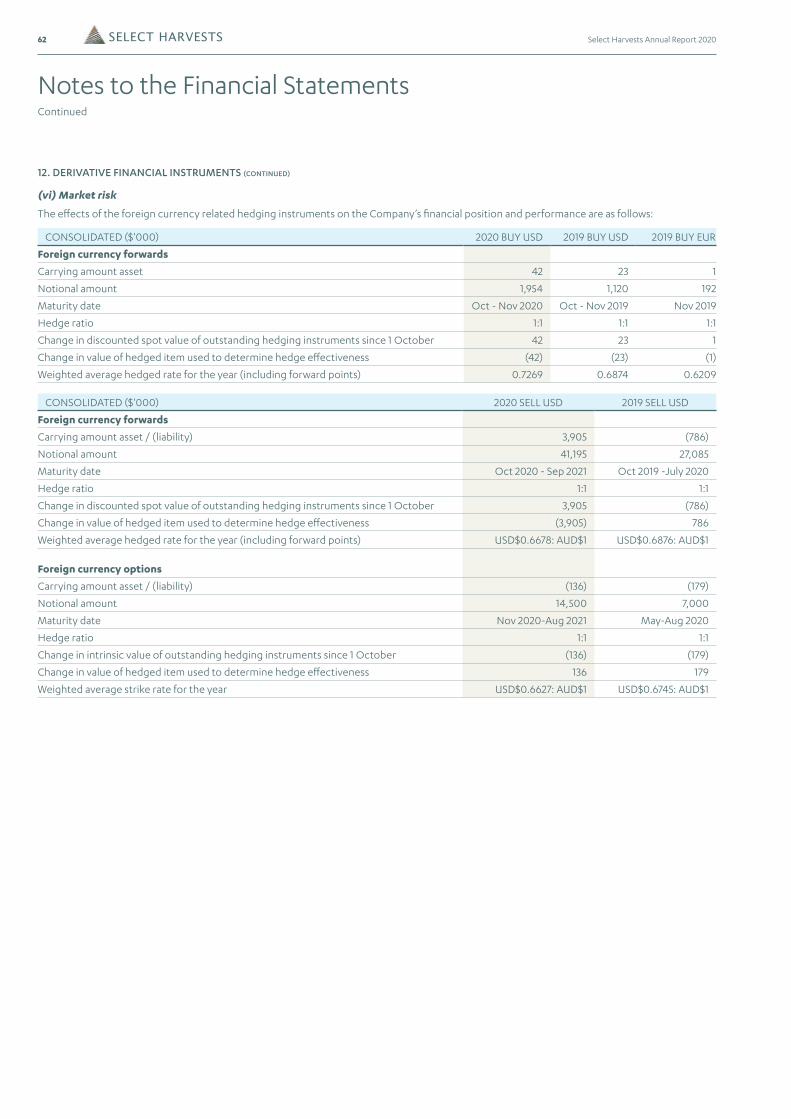
62 Select Harvests Annual Report 2020
12. DERIVATIVE FINANCIAL INSTRUMENTS (CONTINUED)
(vi) Market risk
The effects of the foreign currency related hedging instruments on the Company’s financial position and performance are as follows:
CONSOLIDATED ($'000) 2020 BUY USD 2019 BUY USD 2019 BUY EUR
Foreign currency forwards
Carrying amount asset 42 23 1
Notional amount 1,954 1,120 192
Maturity date Oct - Nov 2020 Oct - Nov 2019 Nov 2019
Hedge ratio 1:1 1:1 1:1
Change in discounted spot value of outstanding hedging instruments since 1 October 42 23 1
Change in value of hedged item used to determine hedge effectiveness (42) (23) (1)
Weighted average hedged rate for the year (including forward points) 0.7269 0.6874 0.6209
CONSOLIDATED ($'000) 2020 SELL USD 2019 SELL USD
Foreign currency forwards
Carrying amount asset / (liability) 3,905 (786)
Notional amount 41,195 27,085
Maturity date Oct 2020 - Sep 2021 Oct 2019 -July 2020
Hedge ratio 1:1 1:1
Change in discounted spot value of outstanding hedging instruments since 1 October 3,905 (786)
Change in value of hedged item used to determine hedge effectiveness (3,905) 786
Weighted average hedged rate for the year (including forward points) USD$0.6678: AUD$1 USD$0.6876: AUD$1
Foreign currency options
Carrying amount asset / (liability) (136) (179)
Notional amount 14,500 7,000
Maturity date Nov 2020-Aug 2021 May-Aug 2020
Hedge ratio 1:1 1:1
Change in intrinsic value of outstanding hedging instruments since 1 October (136) (179)
Change in value of hedged item used to determine hedge effectiveness 136 179
Weighted average strike rate for the year USD$0.6627: AUD$1 USD$0.6745: AUD$1
Notes to the Financial StatementsContinued
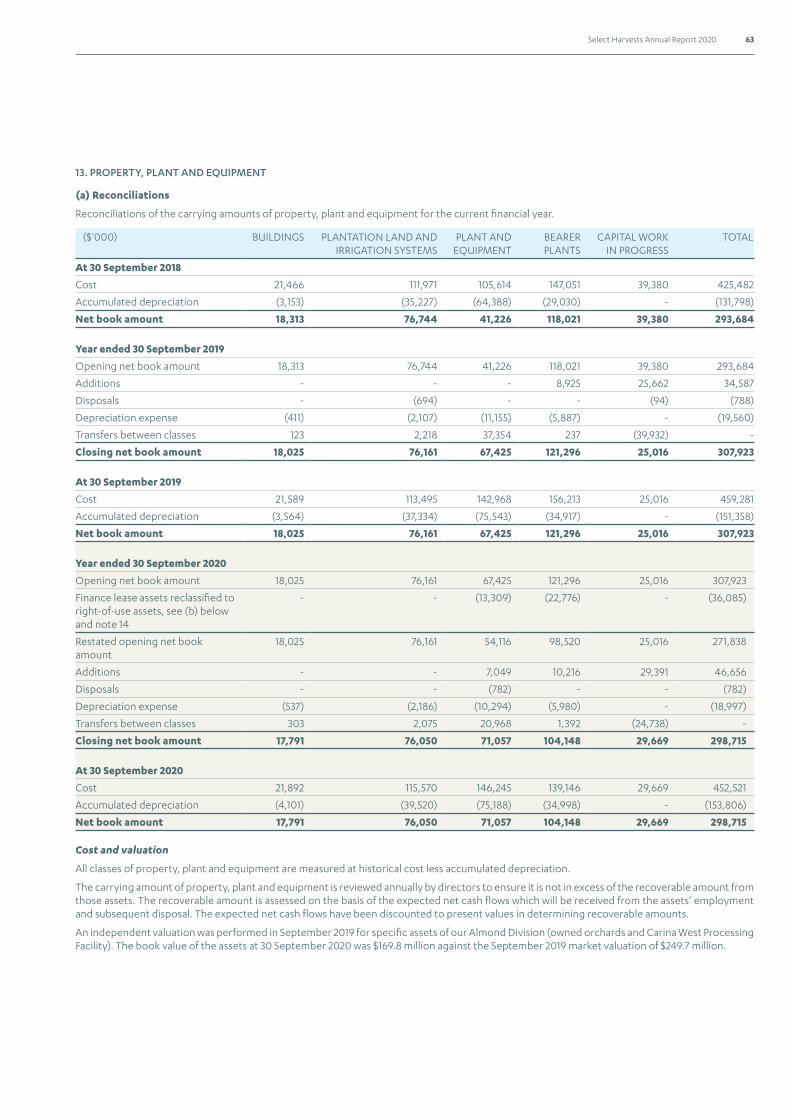
63Select Harvests Annual Report 2020
13. PROPERTY, PLANT AND EQUIPMENT
(a) Reconciliations
Reconciliations of the carrying amounts of property, plant and equipment for the current financial year.
($'000) BUILDINGS PLANTATION LAND AND IRRIGATION SYSTEMS
PLANT AND EQUIPMENT
BEARER PLANTS
CAPITAL WORK IN PROGRESS
TOTAL
At 30 September 2018
Cost 21,466 111,971 105,614 147,051 39,380 425,482
Accumulated depreciation (3,153) (35,227) (64,388) (29,030) - (131,798)
Net book amount 18,313 76,744 41,226 118,021 39,380 293,684
Year ended 30 September 2019
Opening net book amount 18,313 76,744 41,226 118,021 39,380 293,684
Additions - - - 8,925 25,662 34,587
Disposals - (694) - - (94) (788)
Depreciation expense (411) (2,107) (11,155) (5,887) - (19,560)
Transfers between classes 123 2,218 37,354 237 (39,932) -
Closing net book amount 18,025 76,161 67,425 121,296 25,016 307,923
At 30 September 2019
Cost 21,589 113,495 142,968 156,213 25,016 459,281
Accumulated depreciation (3,564) (37,334) (75,543) (34,917) - (151,358)
Net book amount 18,025 76,161 67,425 121,296 25,016 307,923
Year ended 30 September 2020
Opening net book amount 18,025 76,161 67,425 121,296 25,016 307,923
Finance lease assets reclassified to right-of-use assets, see (b) below and note 14
- - (13,309) (22,776) - (36,085)
Restated opening net book amount
18,025 76,161 54,116 98,520 25,016 271,838
Additions - - 7,049 10,216 29,391 46,656
Disposals - - (782) - - (782)
Depreciation expense (537) (2,186) (10,294) (5,980) - (18,997)
Transfers between classes 303 2,075 20,968 1,392 (24,738) -
Closing net book amount 17,791 76,050 71,057 104,148 29,669 298,715
At 30 September 2020
Cost 21,892 115,570 146,245 139,146 29,669 452,521
Accumulated depreciation (4,101) (39,520) (75,188) (34,998) - (153,806)
Net book amount 17,791 76,050 71,057 104,148 29,669 298,715
Cost and valuation
All classes of property, plant and equipment are measured at historical cost less accumulated depreciation.
The carrying amount of property, plant and equipment is reviewed annually by directors to ensure it is not in excess of the recoverable amount from those assets. The recoverable amount is assessed on the basis of the expected net cash flows which will be received from the assets’ employment and subsequent disposal. The expected net cash flows have been discounted to present values in determining recoverable amounts.
An independent valuation was performed in September 2019 for specific assets of our Almond Division (owned orchards and Carina West Processing Facility). The book value of the assets at 30 September 2020 was $169.8 million against the September 2019 market valuation of $249.7 million.
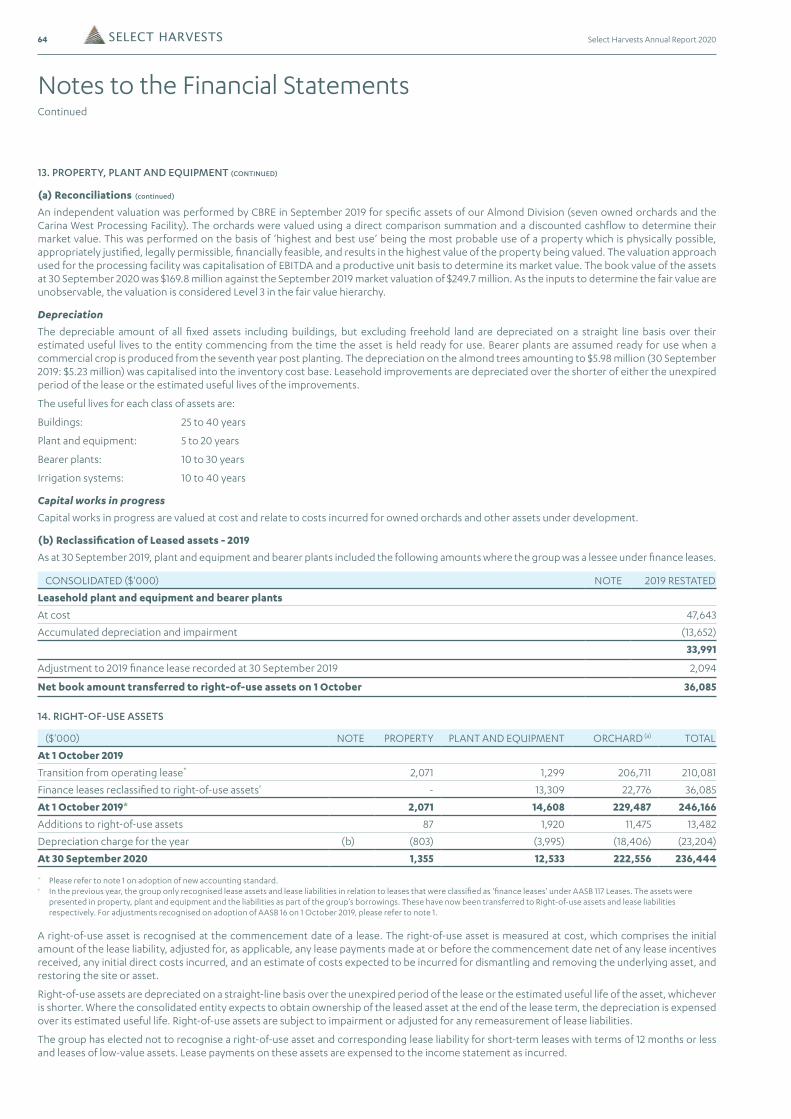
64 Select Harvests Annual Report 2020
13. PROPERTY, PLANT AND EQUIPMENT (CONTINUED)
(a) Reconciliations (continued)
An independent valuation was performed by CBRE in September 2019 for specific assets of our Almond Division (seven owned orchards and the Carina West Processing Facility). The orchards were valued using a direct comparison summation and a discounted cashflow to determine their market value. This was performed on the basis of ‘highest and best use’ being the most probable use of a property which is physically possible, appropriately justified, legally permissible, financially feasible, and results in the highest value of the property being valued. The valuation approach used for the processing facility was capitalisation of EBITDA and a productive unit basis to determine its market value. The book value of the assets at 30 September 2020 was $169.8 million against the September 2019 market valuation of $249.7 million. As the inputs to determine the fair value are unobservable, the valuation is considered Level 3 in the fair value hierarchy.
Depreciation
The depreciable amount of all fixed assets including buildings, but excluding freehold land are depreciated on a straight line basis over their estimated useful lives to the entity commencing from the time the asset is held ready for use. Bearer plants are assumed ready for use when a commercial crop is produced from the seventh year post planting. The depreciation on the almond trees amounting to $5.98 million (30 September 2019: $5.23 million) was capitalised into the inventory cost base. Leasehold improvements are depreciated over the shorter of either the unexpired period of the lease or the estimated useful lives of the improvements.
The useful lives for each class of assets are:
Buildings: 25 to 40 years
Plant and equipment: 5 to 20 years
Bearer plants: 10 to 30 years
Irrigation systems: 10 to 40 years
Capital works in progress
Capital works in progress are valued at cost and relate to costs incurred for owned orchards and other assets under development.
(b) Reclassification of Leased assets - 2019
As at 30 September 2019, plant and equipment and bearer plants included the following amounts where the group was a lessee under finance leases.
CONSOLIDATED ($'000) NOTE 2019 RESTATED
Leasehold plant and equipment and bearer plants
At cost 47,643
Accumulated depreciation and impairment (13,652)
33,991
Adjustment to 2019 finance lease recorded at 30 September 2019 2,094
Net book amount transferred to right-of-use assets on 1 October 36,085
14. RIGHT-OF-USE ASSETS
($'000) NOTE PROPERTY PLANT AND EQUIPMENT ORCHARD (a) TOTAL
At 1 October 2019
Transition from operating lease* 2,071 1,299 206,711 210,081
Finance leases reclassified to right-of-use assets† - 13,309 22,776 36,085
At 1 October 2019* 2,071 14,608 229,487 246,166
Additions to right-of-use assets 87 1,920 11,475 13,482
Depreciation charge for the year (b) (803) (3,995) (18,406) (23,204)
At 30 September 2020 1,355 12,533 222,556 236,444
* Please refer to note 1 on adoption of new accounting standard.† In the previous year, the group only recognised lease assets and lease liabilities in relation to leases that were classified as ‘finance leases’ under AASB 117 Leases. The assets were presented in property, plant and equipment and the liabilities as part of the group’s borrowings. These have now been transferred to Right-of-use assets and lease liabilities respectively. For adjustments recognised on adoption of AASB 16 on 1 October 2019, please refer to note 1.
A right-of-use asset is recognised at the commencement date of a lease. The right-of-use asset is measured at cost, which comprises the initial amount of the lease liability, adjusted for, as applicable, any lease payments made at or before the commencement date net of any lease incentives received, any initial direct costs incurred, and an estimate of costs expected to be incurred for dismantling and removing the underlying asset, and restoring the site or asset.
Right-of-use assets are depreciated on a straight-line basis over the unexpired period of the lease or the estimated useful life of the asset, whichever is shorter. Where the consolidated entity expects to obtain ownership of the leased asset at the end of the lease term, the depreciation is expensed over its estimated useful life. Right-of-use assets are subject to impairment or adjusted for any remeasurement of lease liabilities.
The group has elected not to recognise a right-of-use asset and corresponding lease liability for short-term leases with terms of 12 months or less and leases of low-value assets. Lease payments on these assets are expensed to the income statement as incurred.
Notes to the Financial StatementsContinued
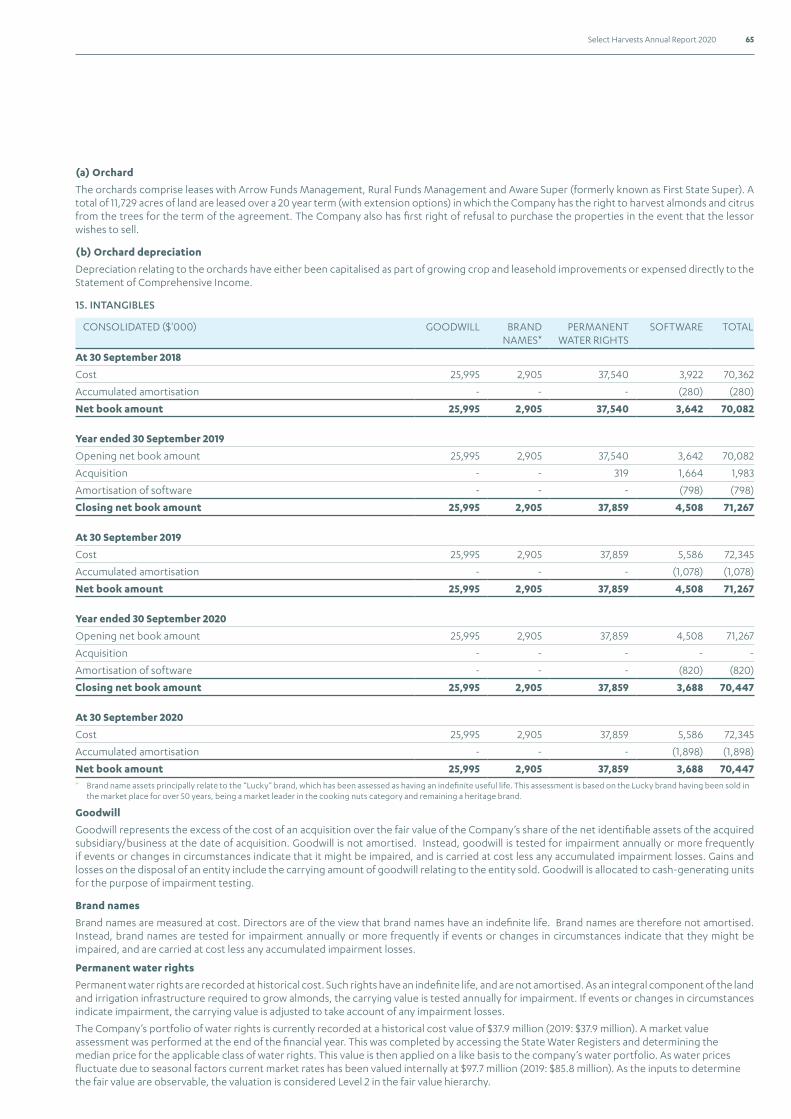
65Select Harvests Annual Report 2020
(a) Orchard
The orchards comprise leases with Arrow Funds Management, Rural Funds Management and Aware Super (formerly known as First State Super). A total of 11,729 acres of land are leased over a 20 year term (with extension options) in which the Company has the right to harvest almonds and citrus from the trees for the term of the agreement. The Company also has first right of refusal to purchase the properties in the event that the lessor wishes to sell.
(b) Orchard depreciation
Depreciation relating to the orchards have either been capitalised as part of growing crop and leasehold improvements or expensed directly to the Statement of Comprehensive Income.
15. INTANGIBLES
CONSOLIDATED ($'000) GOODWILL BRAND NAMES*
PERMANENT WATER RIGHTS
SOFTWARE TOTAL
At 30 September 2018
Cost 25,995 2,905 37,540 3,922 70,362
Accumulated amortisation - - - (280) (280)
Net book amount 25,995 2,905 37,540 3,642 70,082
Year ended 30 September 2019
Opening net book amount 25,995 2,905 37,540 3,642 70,082
Acquisition - - 319 1,664 1,983
Amortisation of software - - - (798) (798)
Closing net book amount 25,995 2,905 37,859 4,508 71,267
At 30 September 2019
Cost 25,995 2,905 37,859 5,586 72,345
Accumulated amortisation - - - (1,078) (1,078)
Net book amount 25,995 2,905 37,859 4,508 71,267
Year ended 30 September 2020
Opening net book amount 25,995 2,905 37,859 4,508 71,267
Acquisition - - - - -
Amortisation of software - - - (820) (820)
Closing net book amount 25,995 2,905 37,859 3,688 70,447
At 30 September 2020
Cost 25,995 2,905 37,859 5,586 72,345
Accumulated amortisation - - - (1,898) (1,898)
Net book amount 25,995 2,905 37,859 3,688 70,447* Brand name assets principally relate to the “Lucky” brand, which has been assessed as having an indefinite useful life. This assessment is based on the Lucky brand having been sold in the market place for over 50 years, being a market leader in the cooking nuts category and remaining a heritage brand.
Goodwill
Goodwill represents the excess of the cost of an acquisition over the fair value of the Company’s share of the net identifiable assets of the acquired subsidiary/business at the date of acquisition. Goodwill is not amortised. Instead, goodwill is tested for impairment annually or more frequently if events or changes in circumstances indicate that it might be impaired, and is carried at cost less any accumulated impairment losses. Gains and losses on the disposal of an entity include the carrying amount of goodwill relating to the entity sold. Goodwill is allocated to cash-generating units for the purpose of impairment testing.
Brand names
Brand names are measured at cost. Directors are of the view that brand names have an indefinite life. Brand names are therefore not amortised. Instead, brand names are tested for impairment annually or more frequently if events or changes in circumstances indicate that they might be impaired, and are carried at cost less any accumulated impairment losses.
Permanent water rights
Permanent water rights are recorded at historical cost. Such rights have an indefinite life, and are not amortised. As an integral component of the land and irrigation infrastructure required to grow almonds, the carrying value is tested annually for impairment. If events or changes in circumstances indicate impairment, the carrying value is adjusted to take account of any impairment losses.
The Company’s portfolio of water rights is currently recorded at a historical cost value of $37.9 million (2019: $37.9 million). A market value assessment was performed at the end of the financial year. This was completed by accessing the State Water Registers and determining the median price for the applicable class of water rights. This value is then applied on a like basis to the company’s water portfolio. As water prices fluctuate due to seasonal factors current market rates has been valued internally at $97.7 million (2019: $85.8 million). As the inputs to determine the fair value are observable, the valuation is considered Level 2 in the fair value hierarchy.
66 Select Harvests Annual Report 2020
15. INTANGIBLES (CONTINUED)
Software
Costs associated with maintaining software programmes are recognised as an expense when incurred. Development costs that are directly attributable to the design and testing of identifiable software products controlled by the group are recognised as intangible assets when the following criteria are met:
• It is technically feasible to complete the software so that it will be available for use
• Management intends to complete the software to use it
• There is an ability to use the software
• It can be demonstrated how the software will generate probable future economic benefits
• Adequate technical, financial and other resources to complete the development of the software
• The expenditure attributable to the software during its development can be reliably measured
Directly attributable costs that are capitalised as part of the software include employee costs, consultant costs and an appropriate portion of relevant overheads. Capitalised development costs are recorded as intangible assets and amortised from the point at which the asset is ready for use.
Software costs are amortised on a straight line basis over the period of their expected benefit, being 7 years.
Impairment of assets
Goodwill, brand names and permanent water rights that have an indefinite useful life are not subject to amortisation and are tested annually for impairment. Assets that are subject to amortisation are reviewed for impairment whenever events or changes in circumstances indicate that the carrying amount may not be recoverable. An impairment loss is recognised for the amount by which the asset’s carrying amount exceeds its recoverable amount. The recoverable amount is the higher of an asset’s fair value less costs to sell and value in use. For the purposes of assessing impairment, assets are grouped at the lowest levels for which there are separately identifiable cash flows (cash generating units).
(a) Impairment tests for goodwill and brand names
Goodwill is allocated to the Company’s cash-generating units (CGU) identified according to operating segment. The total value of goodwill and brand names relates to the Food Division CGU. The recoverable amount of a CGU is determined based on value-in-use calculations which require the use of assumptions. These calculations use cash flow forecasts based on financial projections by management covering a five-year period based on growth rates taking into account past performance and its expectations for the future.
Assumptions made include current domestic and export contracts for branded products are maintained at current rates with a 2% volume growth rate applied from FY22-FY25 (FY21 growth rate used was 27%). Industrial grade sales and crop marketing fees grow in line with the company’s forecasted almond production growth rate and operating costs remain flat. Working capital movements are considered to fluctuate in line with sales forecasts. Cash flow projections beyond the five-year period are not extrapolated, but a terminal value with a nil growth rate is included in the calculations. A real pre-tax weighted average cost of capital of 10.0% (2019: 11.1%) was used to discount the cash flow projections. No material changes in key assumptions arose during the period.
(b) Impact of possible changes to key assumptions
The recoverable amount of the goodwill and brand names in the Food Division Cash Generating Unit (CGU) exceeds its carrying amount based on impairment testing performed at 30 September 2020. A decrease of 10% in the projected annual cash flows, or an increase of 1% in the pre-tax discount rate of 10% does not result in an impairment of the goodwill and brand names. These changes would be considered reasonably possible changes to the key assumptions.
(c) Permanent water rights
The value of permanent water rights relates to the Almond Division CGU and is an integral part of land and irrigation infrastructures required to grow almond orchards. The fair value of permanent water rights is supported by the tradeable market value, which at current market prices is in excess of book value.
16. TRADE AND OTHER PAYABLES
CONSOLIDATED ($'000) NOTE 2020 2019
Current
Trade creditors 22,997 18,621
Other creditors and accruals 19,520 13,724
42,517 32,345
Non-Current
Other creditors and accruals 3,525 -
These amounts represent liabilities for goods and services provided to the Group prior to the end of the year which are unpaid. These amounts are unsecured and are usually paid within 30 days of recognition.
Notes to the Financial StatementsContinued

67Select Harvests Annual Report 2020
17. BORROWINGS
CONSOLIDATED ($'000) NOTE 2020 2019
Current - Secured
Bank overdraft 6,235 3,643
Finance lease* - 4,468
6,235 8,111
Non-current - Secured
Debt facilities 52,750 -
Finance lease* - 30,903
52,750 30,903
* Finance lease liabilities were included in borrowings until 30 September 2019, but were reclassified to lease liabilities on 1 October 2019 in the process of adopting the new leasing standard. Please refer to note 18 Leases for more information.
Borrowings
Borrowings are initially recognised at fair value, net of transaction costs incurred. Borrowings are subsequently measured at amortised cost. Any difference between the proceeds (net of transaction costs) and the redemption amount is recognised in the income statement over the period of the borrowings using the effective interest method. Fees paid on the establishment of loan facilities are recognised as transaction costs of the loan to the extent that it is probable that some or all of the facility will be drawn down. In this case, the fee is deferred until the draw down occurs. To the extent there is no evidence that it is probable that some or all of the facility will be drawn down, the fee is capitalised as a prepayment for liquidity services and amortised over the period of the facility to which it relates.
Borrowings are classified as current liabilities unless the group has an unconditional right to defer settlement of the liability for at least 12 months after the reporting period.
Borrowing costs
Borrowing costs incurred for the construction of any qualifying asset are capitalised during the period of time that is required to complete and prepare the asset for its intended use. All other borrowing costs, inclusive of all facility fees, bank charges, and interest, are expensed as incurred.
(a) Interest rate risk exposures
Details of the Company’s exposure to interest rate changes on borrowings are set out in Note 3.
(b) Assets pledged as security
The bank overdraft and debt facilities of the parent entity and subsidiaries are secured by the following:
(i) A registered mortgage debenture is held as security over all the assets and undertakings of Select Harvests Limited and the entities of the wholly owned group.
(ii) A deed of cross guarantee exists between the entities of the wholly owned group.
The carrying amounts of assets pledged as security for current and non-current borrowings are:
CONSOLIDATED ($'000) NOTE 2020 2019
Current
Floating charge
Cash and cash equivalents 1,451 11,588
Receivables 69,154 50,223
Inventories 100,549 77,687
Biological assets 42,432 34,144
Derivative financial instruments 3,811 24
Total current assets pledged as security 217,397 173,666
Non-current
Floating charge
Other receivables 1,891 -
Property, plant and equipment 298,715 273,932
Permanent water rights 37,859 37,859
Total non-current assets pledged as security 338,465 311,791
Total assets pledged as security 555,862 485,457
68 Select Harvests Annual Report 2020
17. BORROWINGS (CONTINUED)
Financing arrangements
The Company has a debt facility available to the extent of $100,000,000 as at 30 September 2020 (30 September 2019: $100,000,000). The Company has bank overdraft facilities available to the extent of USD$5,000,000 (2019: USD$5,000,000). The current interest rates at balance date are 1.44% (2019: 2.30%) on the debt facility, and 1.675% (2019: 1.925%) on the United States dollar bank overdraft facility.
As part of the planned acquisition announced to the ASX on 1st October 2020, the company had received Commitment Letters from NAB and Rabobank, subject to certain terms and conditions. This will increase the current facilities from $100 million to $160 million over a 3 year term plus a short term facility of $53 million for working capital purposes of the new farm.
18. LEASE LIABILITIES
CONSOLIDATED ($'000) NOTE 2020
Current 31,264
Non-current 233,513
264,777
The following table sets out the maturity analysis of lease payments, showing the undiscounted lease payments after the reporting date.
CONSOLIDATED ($'000) NOTE 2020
Within one year 34,698
Later than one year but not later than 5 years 123,217
Later than 5 years 173,209
331,124
A lease liability is recognised at the commencement date of a lease. The lease liability is initially recognised at the present value of the lease payments to be made over the term of the lease, discounted using the interest rate implicit in the lease or, if that rate cannot be readily determined, the consolidated entity’s incremental borrowing rate. Lease payments comprise of fixed payments less any lease incentives receivable, variable lease payments that depend on an index or a rate, amounts expected to be paid under residual value guarantees, exercise price of a purchase option when the exercise of the option is reasonably certain to occur, and any anticipated termination penalties. The variable lease payments that do not depend on an index or a rate are expensed in the period in which they are incurred.
Lease liabilities are measured at amortised cost using the effective interest method. The carrying amounts are remeasured if there is a change in the following: future lease payments arising from a change in an index or a rate used; residual guarantee; lease term; certainty of a purchase option and termination penalties. When a lease liability is remeasured, an adjustment is made to the corresponding right-of-use asset, or to profit or loss if the carrying amount of the right-of-use asset is fully written down.
Leases are secured with the orchards, property and plant and equipment.
19. DEFERRED GAIN ON SALE
CONSOLIDATED ($'000) NOTE 2020 2019
Current
Sale and leaseback 175 175
Non-Current
Sale and leaseback 2,452 2,627
The deferred gain on sale relates to the sale and leaseback of bearer plants for three orchards that were sold to First State Super on 22 September 2015 and 1 January 2016. The lease is for a 20 year term.
20. PROVISIONS
CONSOLIDATED ($'000) NOTE 2020 2019
Current
Employee benefits 5,218 4,670
Others 255 200
5,473 4,870
Non-Current
Employee benefits 270 239
Provisions
Provisions are recognised when the Company has a present legal or constructive obligation as a result of past events, it is probable that an outflow of resources will be required to settle the obligation, and the amount has been reliably estimated.
Notes to the Financial StatementsContinued
69Select Harvests Annual Report 2020
Employee benefits
This covers the leave obligations for long service leave and annual leave which are classified as either short-term benefits or other long-term benefits explained below. The current portion of this liability includes all of the accrued annual leave, the unconditional entitlements to long service leave where employees have completed the required period of service and also for those employees who are entitled to pro-rata payments in certain circumstances. The entire amount of the provision is presented as current, since the group does not have an unconditional right to defer settlement for any of these obligations.
Contributions are made by the Company to an employee superannuation fund and are charged as expenses when incurred.
(i) Short-term obligations
Liabilities for wages and salaries, including non-monetary benefits and annual leave expected to be settled wholly within 12 months after the end of the period in which the employees render the related service are recognised in respect of employees' services up to the end of the reporting period and are measured at the amounts expected to be paid when the liabilities are settled.
The liability for annual leave is recognised in the provision for employee benefits. All other short-term employee benefit obligations are presented as payables.
(ii) Other long-term benefit obligations
The liability for long service leave and annual leave which is not expected to be settled wholly within 12 months after the end of the period in which the employees render the related service is recognised in the provision for employee benefits and measured as the present value of expected future payments to be made in respect of services provided by employees up to the end of the reporting period using the projected unit credit method. Consideration is given to expected future wage and salary levels, experience of employee departures and periods of service. Expected future payments are discounted using market yields at the end of the reporting period on national government bonds with terms to maturity and currency that match, as closely as possible, the estimated future cash outflows.
21. CONTRIBUTED EQUITY
CONSOLIDATED ($'000) NOTE 2020 2019
(a) Issued and paid up capital
Ordinary shares fully paid 279,096 271,750
Contributed equity
Ordinary shares are classified as equity. The value of new shares or options issued is shown in equity.
(b) Movements in shares on issue
2020 2019
NUMBER OF SHARES $'000 NUMBER OF SHARES $'000
Beginning of the year 95,736,628 271,750 95,226,349 268,567
Issued during the year
• Dividend reinvestment plan 856,584 6,289 510,279 3,183
• Long term incentive plan – tranche vested 43,801 - - -
• Deferred tax credit on transaction costs - 1,057 - -
End of the year 96,637,013 279,096 95,736,628 271,750
(c) Performance Rights
Long Term Incentive Plan
The Company offers employee participation in long term incentive schemes as part of the remuneration packages for the employees. In determining the quantum of rights offered the board considers a number of factors including: the corporate strategy; the appropriate mix of fixed and at risk remuneration; the fair value and face value of the rights; and the market relativity of employees with equivalent responsibilities.
The long term scheme involves the issue of performance rights to the employee, under the Long Term Incentive Plan. The market value of ordinary Select Harvests Limited shares closed at $5.57 on 30 September 2020 ($7.69 on 30 September 2019).
(d) Ordinary shares
Ordinary shares entitle the holder to participate in dividends and the proceeds on winding up of the company in proportion to the number of and amounts paid on the shares held.
On a show of hands every holder of ordinary shares present at a meeting in person or by proxy, is entitled to one vote, and upon a poll each share is entitled to one vote.
(e) Capital risk management
The group’s objectives when managing capital are to safeguard its ability to continue as a going concern, so that it can continue to provide returns for shareholders and benefits for other stakeholders and to maintain an optimal capital structure to reduce the cost of capital.
In order to maintain or adjust the capital structure, the group may adjust the amount of dividends paid to shareholders, return capital to shareholders, issue new shares or sell assets to reduce debt.
70 Select Harvests Annual Report 2020
22. RECONCILIATON OF THE NET PROFIT AFTER INCOME TAX TO THE NET CASH FLOWS FROM OPERATING ACTIVITIES
CONSOLIDATED ($'000) NOTE 2020 2019
Net profit / (loss) after tax 25,001 53,022
Non-cash items
Depreciation and amortisation 19,817 20,358
Depreciation right-of-use assets 23,026 -
Inventory fair value adjustment (13,988) (9,212)
Net (gain) / loss on sale of assets (291) (519)
Options expense 537 592
Deferred gain on sale (175) (175)
Lease interest 4,500 -
Changes in assets and liabilities
(Increase) / Decrease in trade and other receivables (20,822) (4,067)
(Increase) / Decrease in inventory (6,587) 4,732
(Increase) / Decrease in biological assets (8,288) (2,711)
Increase / (Decrease) in trade payables 13,697 (7,840)
(Decrease) / Increase in income tax payable (11,591) 23,393
(Decrease) / Increase in deferred tax liability (3,317) 2,432
Increase in employee entitlements 634 332
Net cash flow from operating activities 13,153 80,337
Non cash financing activities
During the current financial year ended 30 September 2020, the company issued 856,584 of new equity (30 September 2019: 510,279) as part of the Dividend Reinvestment Plan.
(a) Net debt reconciliation
Net debt movement during the year/period as follows:
CONSOLIDATED ($'000) NOTE 2020 2019
Cash and cash equivalents (b) (4,784) 7,945
Borrowings- repayable after one year (52,750) -
Lease liabilities- repayable within one year (31,264) (4,468)
Lease liabilities- repayable after one year (233,513) (30,903)
Net debt (322,311) (27,426)
($'000) CASH/ BANK OVERDRAFT
LIABILITIES FROM FINANCING ACTIVITIES TOTAL
LEASES DUE WITHIN 1 YEAR
LEASES DUE AFTER 1 YEAR
BORROWINGS DUE WITHIN 1 YEAR
BORROWINGS DUE AFTER 1 YEAR
Net debt as at 30 September 2018 6,610 (4,572) (30,558) - (30,400) (58,920)
Cash flows - Principle 4,605 7,845 - - 30,400 42,850
Cash flows - Interest - (2,249) - - - (2,249)
Acquisitions finance leases - (5,837) - - - (5,837)
Foreign exchange adjustments (3,270) - - - - (3,270)
Other non-cash movements - 345 (345) - - -
Net debt as at 30 September 2019 7,945 (4,468) (30,903) - - (27,426)
Adjustment on adoption of AASB16 - (26,992) (210,780) - - (237,772)
Cash flows - Principle (15,820) 35,215 - - (52,750) (33,355)
Cash flows - Interest - (13,367) - - - (13,367)
Additions to leases - (13,482) - - - (13,482)
Foreign exchange adjustments 3,091 - - - - 3,091
Other non-cash movements - (8,170) 8,170 - - -
Net debt as at 30 September 2020 (4,784) (31,264) (233,513) - (52,750) (322,311)
Notes to the Financial StatementsContinued
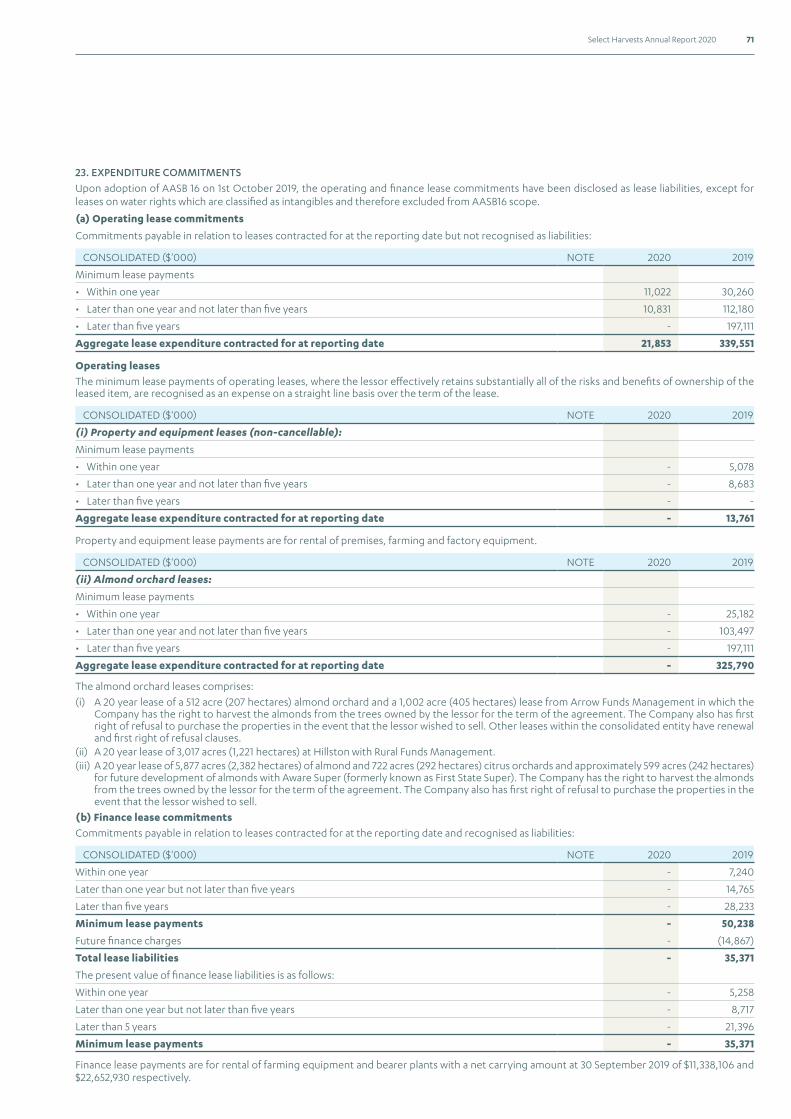
71Select Harvests Annual Report 2020
23. EXPENDITURE COMMITMENTSUpon adoption of AASB 16 on 1st October 2019, the operating and finance lease commitments have been disclosed as lease liabilities, except for leases on water rights which are classified as intangibles and therefore excluded from AASB16 scope.
(a) Operating lease commitments
Commitments payable in relation to leases contracted for at the reporting date but not recognised as liabilities:
CONSOLIDATED ($'000) NOTE 2020 2019
Minimum lease payments
• Within one year 11,022 30,260
• Later than one year and not later than five years 10,831 112,180
• Later than five years - 197,111
Aggregate lease expenditure contracted for at reporting date 21,853 339,551
Operating leasesThe minimum lease payments of operating leases, where the lessor effectively retains substantially all of the risks and benefits of ownership of the leased item, are recognised as an expense on a straight line basis over the term of the lease.
CONSOLIDATED ($'000) NOTE 2020 2019
(i) Property and equipment leases (non-cancellable):
Minimum lease payments
• Within one year - 5,078
• Later than one year and not later than five years - 8,683
• Later than five years - -
Aggregate lease expenditure contracted for at reporting date - 13,761
Property and equipment lease payments are for rental of premises, farming and factory equipment.
CONSOLIDATED ($'000) NOTE 2020 2019
(ii) Almond orchard leases:
Minimum lease payments
• Within one year - 25,182
• Later than one year and not later than five years - 103,497
• Later than five years - 197,111
Aggregate lease expenditure contracted for at reporting date - 325,790
The almond orchard leases comprises:
(i) A 20 year lease of a 512 acre (207 hectares) almond orchard and a 1,002 acre (405 hectares) lease from Arrow Funds Management in which the Company has the right to harvest the almonds from the trees owned by the lessor for the term of the agreement. The Company also has first right of refusal to purchase the properties in the event that the lessor wished to sell. Other leases within the consolidated entity have renewal and first right of refusal clauses.
(ii) A 20 year lease of 3,017 acres (1,221 hectares) at Hillston with Rural Funds Management.(iii) A 20 year lease of 5,877 acres (2,382 hectares) of almond and 722 acres (292 hectares) citrus orchards and approximately 599 acres (242 hectares)
for future development of almonds with Aware Super (formerly known as First State Super). The Company has the right to harvest the almonds from the trees owned by the lessor for the term of the agreement. The Company also has first right of refusal to purchase the properties in the event that the lessor wished to sell.
(b) Finance lease commitments Commitments payable in relation to leases contracted for at the reporting date and recognised as liabilities:
CONSOLIDATED ($'000) NOTE 2020 2019
Within one year - 7,240
Later than one year but not later than five years - 14,765
Later than five years - 28,233
Minimum lease payments - 50,238
Future finance charges - (14,867)
Total lease liabilities - 35,371
The present value of finance lease liabilities is as follows:
Within one year - 5,258
Later than one year but not later than five years - 8,717
Later than 5 years - 21,396
Minimum lease payments - 35,371
Finance lease payments are for rental of farming equipment and bearer plants with a net carrying amount at 30 September 2019 of $11,338,106 and $22,652,930 respectively.
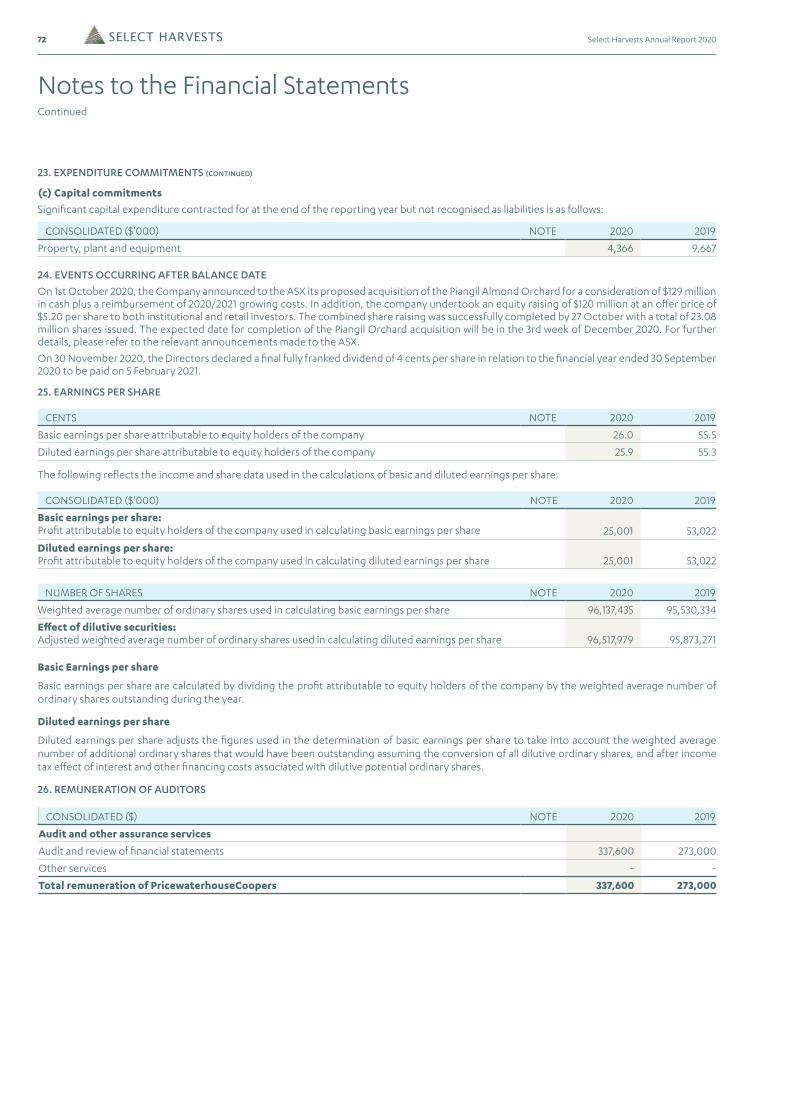
72 Select Harvests Annual Report 2020
23. EXPENDITURE COMMITMENTS (CONTINUED)
(c) Capital commitments
Significant capital expenditure contracted for at the end of the reporting year but not recognised as liabilities is as follows:
CONSOLIDATED ($'000) NOTE 2020 2019
Property, plant and equipment 4,366 9,667
24. EVENTS OCCURRING AFTER BALANCE DATE
On 1st October 2020, the Company announced to the ASX its proposed acquisition of the Piangil Almond Orchard for a consideration of $129 million in cash plus a reimbursement of 2020/2021 growing costs. In addition, the company undertook an equity raising of $120 million at an offer price of $5.20 per share to both institutional and retail investors. The combined share raising was successfully completed by 27 October with a total of 23.08 million shares issued. The expected date for completion of the Piangil Orchard acquisition will be in the 3rd week of December 2020. For further details, please refer to the relevant announcements made to the ASX.
On 30 November 2020, the Directors declared a final fully franked dividend of 4 cents per share in relation to the financial year ended 30 September 2020 to be paid on 5 February 2021.
25. EARNINGS PER SHARE
CENTS NOTE 2020 2019
Basic earnings per share attributable to equity holders of the company 26.0 55.5
Diluted earnings per share attributable to equity holders of the company 25.9 55.3
The following reflects the income and share data used in the calculations of basic and diluted earnings per share:
CONSOLIDATED ($'000) NOTE 2020 2019
Basic earnings per share: Profit attributable to equity holders of the company used in calculating basic earnings per share 25,001 53,022
Diluted earnings per share: Profit attributable to equity holders of the company used in calculating diluted earnings per share 25,001 53,022
NUMBER OF SHARES NOTE 2020 2019
Weighted average number of ordinary shares used in calculating basic earnings per share 96,137,435 95,530,334
Effect of dilutive securities: Adjusted weighted average number of ordinary shares used in calculating diluted earnings per share 96,517,979 95,873,271
Basic Earnings per share
Basic earnings per share are calculated by dividing the profit attributable to equity holders of the company by the weighted average number of ordinary shares outstanding during the year.
Diluted earnings per share
Diluted earnings per share adjusts the figures used in the determination of basic earnings per share to take into account the weighted average number of additional ordinary shares that would have been outstanding assuming the conversion of all dilutive ordinary shares, and after income tax effect of interest and other financing costs associated with dilutive potential ordinary shares.
26. REMUNERATION OF AUDITORS
CONSOLIDATED ($) NOTE 2020 2019
Audit and other assurance services
Audit and review of financial statements 337,600 273,000
Other services - -
Total remuneration of PricewaterhouseCoopers 337,600 273,000
Notes to the Financial StatementsContinued
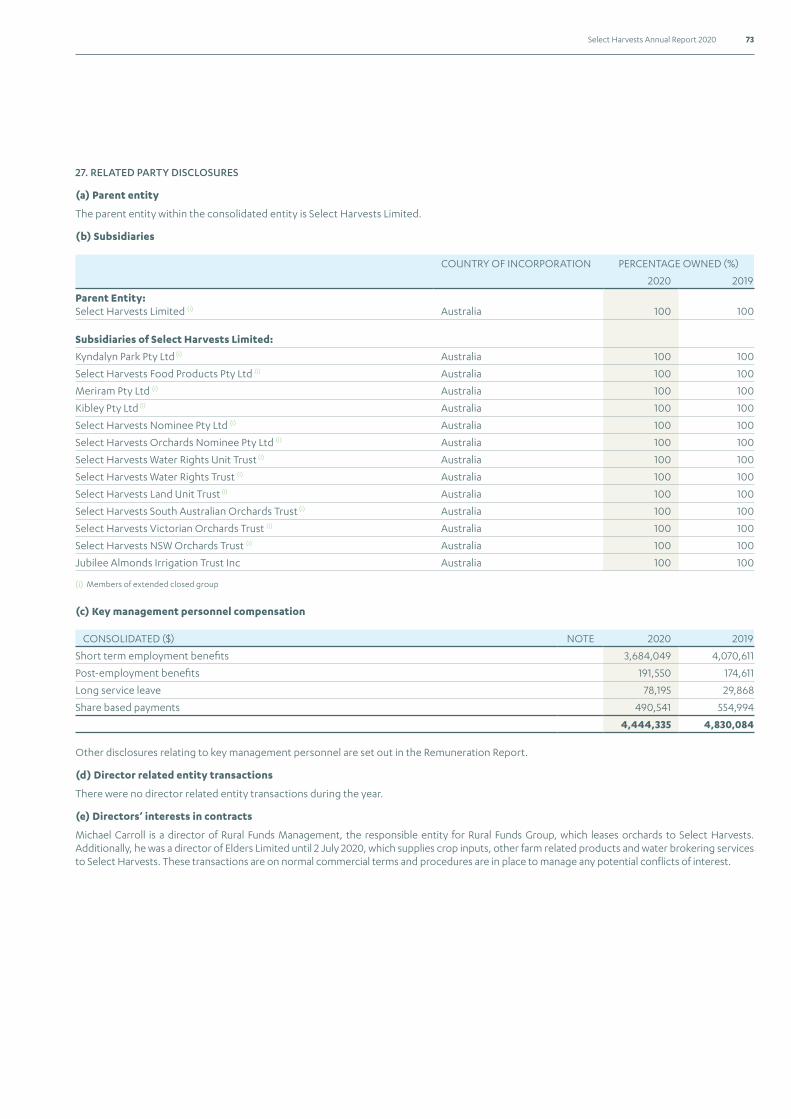
73Select Harvests Annual Report 2020
27. RELATED PARTY DISCLOSURES
(a) Parent entity
The parent entity within the consolidated entity is Select Harvests Limited.
(b) Subsidiaries
COUNTRY OF INCORPORATION PERCENTAGE OWNED (%)
2020 2019
Parent Entity: Select Harvests Limited (i) Australia 100 100
Subsidiaries of Select Harvests Limited:
Kyndalyn Park Pty Ltd (i) Australia 100 100
Select Harvests Food Products Pty Ltd (i) Australia 100 100
Meriram Pty Ltd (i) Australia 100 100
Kibley Pty Ltd (i) Australia 100 100
Select Harvests Nominee Pty Ltd (i) Australia 100 100
Select Harvests Orchards Nominee Pty Ltd (i) Australia 100 100
Select Harvests Water Rights Unit Trust (i) Australia 100 100
Select Harvests Water Rights Trust (i) Australia 100 100
Select Harvests Land Unit Trust (i) Australia 100 100
Select Harvests South Australian Orchards Trust (i) Australia 100 100
Select Harvests Victorian Orchards Trust (i) Australia 100 100
Select Harvests NSW Orchards Trust (i) Australia 100 100
Jubilee Almonds Irrigation Trust Inc Australia 100 100
(i) Members of extended closed group
(c) Key management personnel compensation
CONSOLIDATED ($) NOTE 2020 2019
Short term employment benefits 3,684,049 4,070,611
Post-employment benefits 191,550 174,611
Long service leave 78,195 29,868
Share based payments 490,541 554,994
4,444,335 4,830,084
Other disclosures relating to key management personnel are set out in the Remuneration Report.
(d) Director related entity transactions
There were no director related entity transactions during the year.
(e) Directors’ interests in contracts
Michael Carroll is a director of Rural Funds Management, the responsible entity for Rural Funds Group, which leases orchards to Select Harvests. Additionally, he was a director of Elders Limited until 2 July 2020, which supplies crop inputs, other farm related products and water brokering services to Select Harvests. These transactions are on normal commercial terms and procedures are in place to manage any potential conflicts of interest.
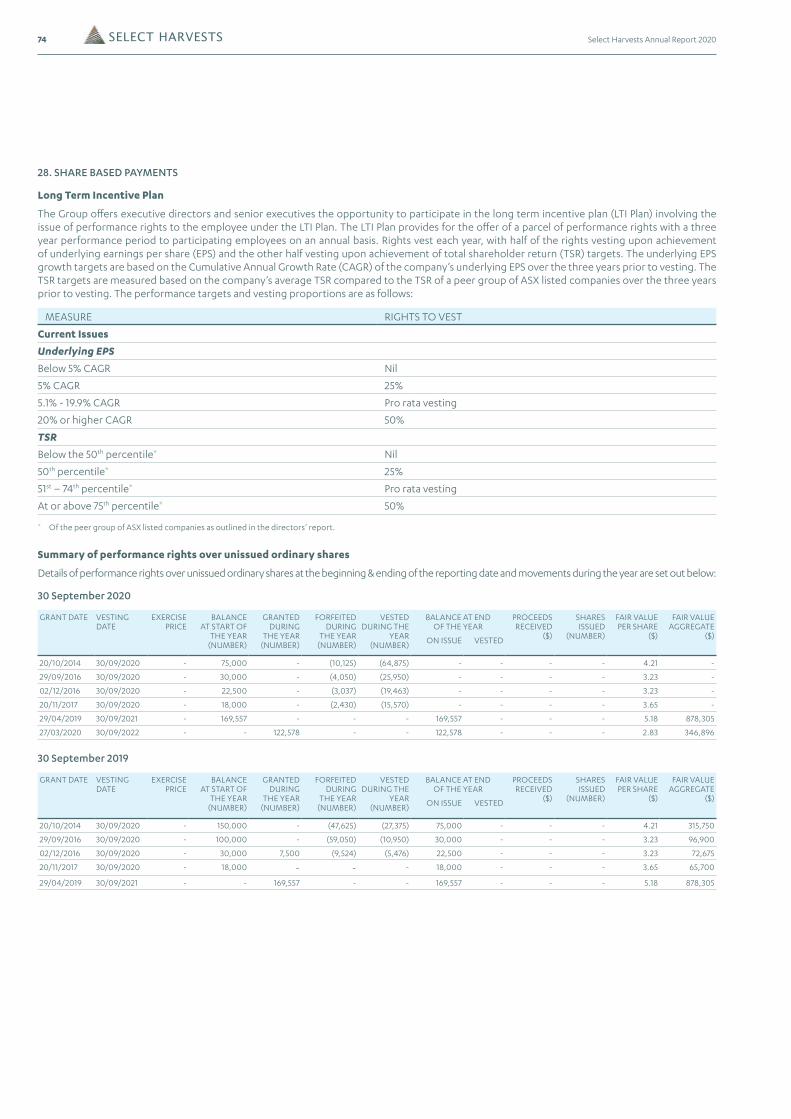
74 Select Harvests Annual Report 2020
28. SHARE BASED PAYMENTS
Long Term Incentive Plan
The Group offers executive directors and senior executives the opportunity to participate in the long term incentive plan (LTI Plan) involving the issue of performance rights to the employee under the LTI Plan. The LTI Plan provides for the offer of a parcel of performance rights with a three year performance period to participating employees on an annual basis. Rights vest each year, with half of the rights vesting upon achievement of underlying earnings per share (EPS) and the other half vesting upon achievement of total shareholder return (TSR) targets. The underlying EPS growth targets are based on the Cumulative Annual Growth Rate (CAGR) of the company’s underlying EPS over the three years prior to vesting. The TSR targets are measured based on the company’s average TSR compared to the TSR of a peer group of ASX listed companies over the three years prior to vesting. The performance targets and vesting proportions are as follows:
MEASURE RIGHTS TO VEST
Current Issues
Underlying EPS
Below 5% CAGR Nil
5% CAGR 25%
5.1% - 19.9% CAGR Pro rata vesting
20% or higher CAGR 50%
TSR
Below the 50th percentile* Nil
50th percentile* 25%
51st – 74th percentile* Pro rata vesting
At or above 75th percentile* 50%
* Of the peer group of ASX listed companies as outlined in the directors’ report.
Summary of performance rights over unissued ordinary shares
Details of performance rights over unissued ordinary shares at the beginning & ending of the reporting date and movements during the year are set out below:
30 September 2020
GRANT DATE VESTING DATE
EXERCISE PRICE
BALANCE AT START OF
THE YEAR (NUMBER)
GRANTED DURING
THE YEAR (NUMBER)
FORFEITED DURING
THE YEAR (NUMBER)
VESTED DURING THE
YEAR (NUMBER)
BALANCE AT END OF THE YEAR
PROCEEDS RECEIVED
($)
SHARES ISSUED
(NUMBER)
FAIR VALUE PER SHARE
($)
FAIR VALUE AGGREGATE
($)ON ISSUE VESTED
20/10/2014 30/09/2020 - 75,000 - (10,125) (64,875) - - - - 4.21 -
29/09/2016 30/09/2020 - 30,000 - (4,050) (25,950) - - - - 3.23 -
02/12/2016 30/09/2020 - 22,500 - (3,037) (19,463) - - - - 3.23 -
20/11/2017 30/09/2020 - 18,000 - (2,430) (15,570) - - - - 3.65 -
29/04/2019 30/09/2021 - 169,557 - - - 169,557 - - - 5.18 878,305
27/03/2020 30/09/2022 - - 122,578 - - 122,578 - - - 2.83 346,896
30 September 2019
GRANT DATE VESTING DATE
EXERCISE PRICE
BALANCE AT START OF
THE YEAR (NUMBER)
GRANTED DURING
THE YEAR (NUMBER)
FORFEITED DURING
THE YEAR (NUMBER)
VESTED DURING THE
YEAR (NUMBER)
BALANCE AT END OF THE YEAR
PROCEEDS RECEIVED
($)
SHARES ISSUED
(NUMBER)
FAIR VALUE PER SHARE
($)
FAIR VALUE AGGREGATE
($)ON ISSUE VESTED
20/10/2014 30/09/2020 - 150,000 - (47,625) (27,375) 75,000 - - - 4.21 315,750
29/09/2016 30/09/2020 - 100,000 - (59,050) (10,950) 30,000 - - - 3.23 96,900
02/12/2016 30/09/2020 - 30,000 7,500 (9,524) (5,476) 22,500 - - - 3.23 72,675
20/11/2017 30/09/2020 - 18,000 - - - 18,000 - - - 3.65 65,700
29/04/2019 30/09/2021 - - 169,557 - - 169,557 - - - 5.18 878,305
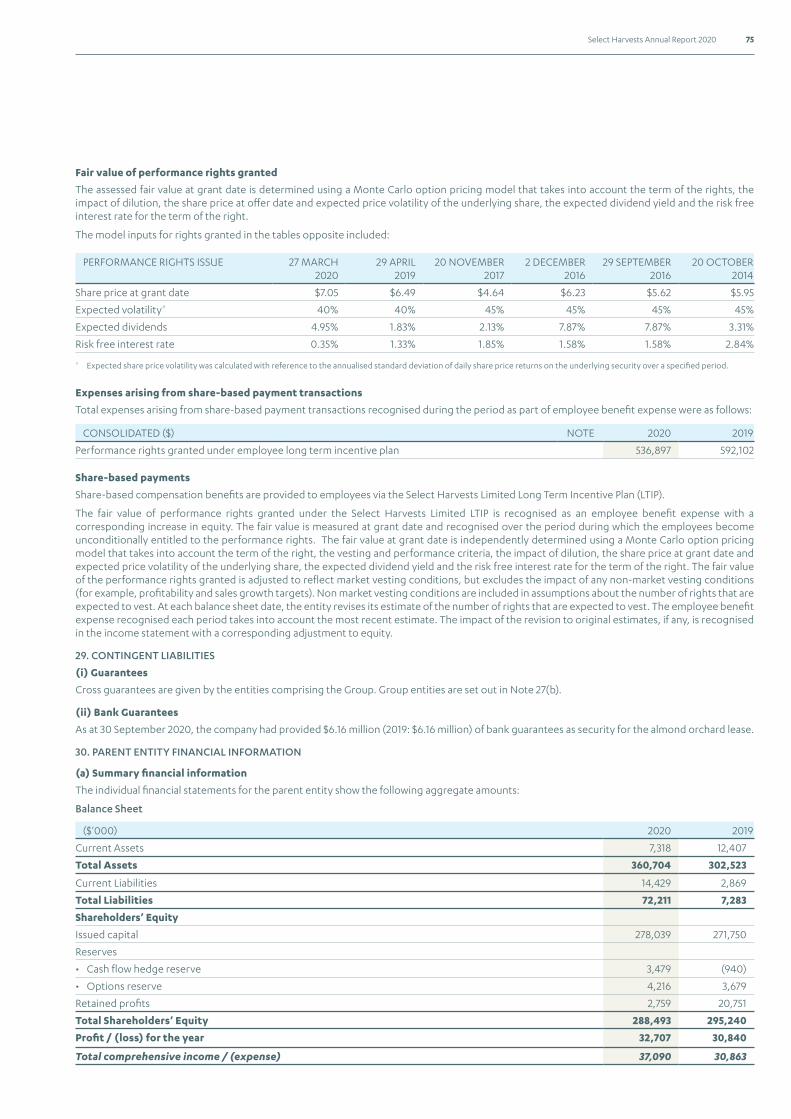
75Select Harvests Annual Report 2020
Fair value of performance rights granted
The assessed fair value at grant date is determined using a Monte Carlo option pricing model that takes into account the term of the rights, the impact of dilution, the share price at offer date and expected price volatility of the underlying share, the expected dividend yield and the risk free interest rate for the term of the right.
The model inputs for rights granted in the tables opposite included:
PERFORMANCE RIGHTS ISSUE 27 MARCH 2020
29 APRIL 2019
20 NOVEMBER 2017
2 DECEMBER 2016
29 SEPTEMBER 2016
20 OCTOBER 2014
Share price at grant date $7.05 $6.49 $4.64 $6.23 $5.62 $5.95
Expected volatility* 40% 40% 45% 45% 45% 45%
Expected dividends 4.95% 1.83% 2.13% 7.87% 7.87% 3.31%
Risk free interest rate 0.35% 1.33% 1.85% 1.58% 1.58% 2.84%
* Expected share price volatility was calculated with reference to the annualised standard deviation of daily share price returns on the underlying security over a specified period.
Expenses arising from share-based payment transactions
Total expenses arising from share-based payment transactions recognised during the period as part of employee benefit expense were as follows:
CONSOLIDATED ($) NOTE 2020 2019
Performance rights granted under employee long term incentive plan 536,897 592,102
Share-based payments
Share-based compensation benefits are provided to employees via the Select Harvests Limited Long Term Incentive Plan (LTIP).
The fair value of performance rights granted under the Select Harvests Limited LTIP is recognised as an employee benefit expense with a corresponding increase in equity. The fair value is measured at grant date and recognised over the period during which the employees become unconditionally entitled to the performance rights. The fair value at grant date is independently determined using a Monte Carlo option pricing model that takes into account the term of the right, the vesting and performance criteria, the impact of dilution, the share price at grant date and expected price volatility of the underlying share, the expected dividend yield and the risk free interest rate for the term of the right. The fair value of the performance rights granted is adjusted to reflect market vesting conditions, but excludes the impact of any non-market vesting conditions (for example, profitability and sales growth targets). Non market vesting conditions are included in assumptions about the number of rights that are expected to vest. At each balance sheet date, the entity revises its estimate of the number of rights that are expected to vest. The employee benefit expense recognised each period takes into account the most recent estimate. The impact of the revision to original estimates, if any, is recognised in the income statement with a corresponding adjustment to equity.
29. CONTINGENT LIABILITIES
(i) Guarantees
Cross guarantees are given by the entities comprising the Group. Group entities are set out in Note 27(b).
(ii) Bank Guarantees
As at 30 September 2020, the company had provided $6.16 million (2019: $6.16 million) of bank guarantees as security for the almond orchard lease.
30. PARENT ENTITY FINANCIAL INFORMATION
(a) Summary financial information
The individual financial statements for the parent entity show the following aggregate amounts:
Balance Sheet
($'000) 2020 2019
Current Assets 7,318 12,407
Total Assets 360,704 302,523
Current Liabilities 14,429 2,869
Total Liabilities 72,211 7,283
Shareholders’ Equity
Issued capital 278,039 271,750
Reserves
• Cash flow hedge reserve 3,479 (940)
• Options reserve 4,216 3,679
Retained profits 2,759 20,751
Total Shareholders’ Equity 288,493 295,240
Profit / (loss) for the year 32,707 30,840
Total comprehensive income / (expense) 37,090 30,863
76 Select Harvests Annual Report 2020
30. PARENT ENTITY FINANCIAL INFORMATION (CONTINUED)
(b) Tax consolidation legislation
Select Harvests Limited and its wholly-owned Australian controlled entities have implemented the tax consolidation legislation as of 1 July 2003. The head entity, Select Harvests Limited, and the controlled entities in the tax consolidated group account for their own current and deferred tax amounts. These tax amounts are measured as if each entity in the tax consolidated group continues to be a standalone taxpayer in its own right. In addition to its own current and deferred tax amounts, Select Harvests Limited also recognises the current tax liabilities (or assets) and the deferred tax assets arising from unused tax losses and unused tax credits assumed from controlled entities in the tax consolidated group.
The entities have also entered into a tax funding agreement under which the wholly-owned entities fully compensate Select Harvests Limited for any current tax payable assumed and are compensated by Select Harvests Limited for any current tax receivable and deferred tax assets relating to unused tax losses or unused tax credits that are transferred to Select Harvests Limited under the tax consolidation legislation. The funding amounts are determined by reference to the amounts recognised in the wholly-owned entities' financial statements.
The amounts receivable/payable under the tax funding agreement is due upon receipt of the funding advice from the head entity, which is issued as soon as practicable after the end of each financial year.
The head entity may also require payment of interim funding amounts to assist with its obligations to pay tax instalments. The funding amounts are recognised as current intercompany receivables or payables.
Assets or liabilities arising under tax funding agreements with the tax consolidated entities are recognised as current amounts receivable from or payable to other entities in the group.
Any difference between the amounts assumed and amounts receivable or payable under the tax funding agreement are recognised as a contribution to (or distribution from) wholly-owned tax consolidated entities
(c) Guarantees entered into by parent entity
Each entity within the consolidated group has entered into a cross deed of financial guarantee in respect of bank overdrafts and loans of the group.
Loans are made by Select Harvests Limited to controlled entities under normal terms and conditions.
77Select Harvests Annual Report 2020
In the directors’ opinion:
(a) the financial statements and Notes set out on pages 41 to 76 are in accordance with the Corporations Act 2001, including:
(i) complying with Accounting Standards, the Corporations Regulations 2001 and other mandatory professional reporting requirements; and
(ii) giving a true and fair view of the consolidated entity’s financial position as at 30 September 2020 and of its performance for the financial year ended on that date; and
(b) there are reasonable grounds to believe that the Company will be able to pay its debts as and when they become due and payable; and
(c) at the date of this declaration, there are reasonable grounds to believe that the members of the extended closed group identified in Note 27 will be able to meet any obligations or liabilities to which they are, or may become, subject by virtue of the deed of cross guarantee described in Note 30.
Note 1(a) confirms that the financial statements also comply with International Financial Reporting Standards as issued by the International Accounting Standards Board.
The directors have been given the declarations by the Managing Director and Chief Financial Officer required under section 295A of the Corporations Act 2001.
This declaration is made in accordance with a resolution of the directors.
M Iwaniw Chair
Melbourne, 30 November 2020
Directors' Declaration
78 Select Harvests Annual Report 2020
PricewaterhouseCoopers, ABN 52 780 433 757 2 Riverside Quay, SOUTHBANK VIC 3006, GPO Box 1331, MELBOURNE VIC 3001 T: 61 3 8603 1000, F: 61 3 8603 1999, www.pwc.com.au
Liability limited by a scheme approved under Professional Standards Legislation.
Independent auditor’s report To the members of Select Harvests Limited
Report on the audit of the financial report
Our opinion In our opinion:
The accompanying financial report of Select Harvests Limited (the Company) and its controlled entities (together the Group) is in accordance with the Corporations Act 2001, including:
(a) giving a true and fair view of the Group's financial position as at 30 September 2020 and of itsfinancial performance for the year then ended
(b) complying with Australian Accounting Standards and the Corporations Regulations 2001.
What we have audited The Group financial report comprises:
● the balance sheet as at 30 September 2020● the statement of comprehensive income for the year then ended● the statement of changes in equity for the year then ended● the statement of cash flows for the year then ended● the notes to the financial statements, which include a summary of significant accounting policies● the directors’ declaration.
Basis for opinion We conducted our audit in accordance with Australian Auditing Standards. Our responsibilities under those standards are further described in the Auditor’s responsibilities for the audit of the financial report section of our report.
We believe that the audit evidence we have obtained is sufficient and appropriate to provide a basis for our opinion.
Independence We are independent of the Group in accordance with the auditor independence requirements of the Corporations Act 2001 and the ethical requirements of the Accounting Professional & Ethical Standards Board’s APES 110 Code of Ethics for Professional Accountants (including Independence Standards) (the Code) that are relevant to our audit of the financial report in Australia. We have also fulfilled our other ethical responsibilities in accordance with the Code.
Our audit approach An audit is designed to provide reasonable assurance about whether the financial report is free from material misstatement. Misstatements may arise due to fraud or error. They are considered material if
Independent Auditor’s Report
79Select Harvests Annual Report 2020
individually or in aggregate, they could reasonably be expected to influence the economic decisions of users taken on the basis of the financial report.
We tailored the scope of our audit to ensure that we performed enough work to be able to give an opinion on the financial report as a whole, taking into account the geographic and management structure of the Group, its accounting processes and controls and the industry in which it operates.
Materiality
● For the purpose of our audit we used overall Group materiality of $2.30 million. This representsapproximately 5% of the Group’s three year average of profit before tax, excluding the three month transitionperiod ended 30 September 2018.
● We applied this threshold, together with qualitative considerations, to determine the scope of our audit andthe nature, timing and extent of our audit procedures and to evaluate the effect of misstatements on thefinancial report as a whole.
● We chose Group profit before tax because, in our view, it is the benchmark against which the performance ofthe Group is most commonly measured. We chose a three year average to address volatility in the profitbefore tax calculation caused by fluctuations in the almond price and yield between years.
● We utilised a 5% threshold based on our professional judgement, noting it is within the range of commonlyacceptable thresholds.
Audit Scope
● Our audit focused on where the Group made subjective judgements; for example, significant accounting estimates involving assumptions and inherently uncertain future events.
80 Select Harvests Annual Report 2020
Key audit matters Key audit matters are those matters that, in our professional judgement, were of most significance in our audit of the financial report for the current period. The key audit matters were addressed in the context of our audit of the financial report as a whole, and in forming our opinion thereon, and we do not provide a separate opinion on these matters. Further, any commentary on the outcomes of a particular audit procedure is made in that context. We communicated the key audit matters to the Audit and Risk Committee.
Key audit matter How our audit addressed the key audit matter
Inventory valuation – current year almond crop (Refer to notes 2, 10 and 11)
The FY20 almond crop is classified by the Group as inventory, given it has been fully harvested at the year end. Australian Accounting Standards require agriculture produce (such as almonds) from an entity’s biological assets to be measured at fair value less costs to sell at the point of harvest.
To measure the fair value at the point of harvest of this agriculture produce, the Group applies various assumptions including estimated yield, estimated future selling price and estimated remaining growing, harvest, processing and selling costs.
As outlined in Notes 2 and 11, the assumptions applied include the estimated average almond selling price at the point of harvest of $8.20 per kg, the crop estimate for the Group’s orchards of 23,250MT based on estimated harvest yield, and the estimated remaining processing and selling costs.
Australian Accounting Standards require inventory to be recognised at the lower of cost and net realisable value. As outlined in Note 10, an adjustment of $16.3m has been recognised in the period to write down inventory to net realisable value.
We consider this to be a key audit matter because of the financial significance of the almond crop to the Group’s assets and profit for the year ended 30 September 2020 and the judgement involved in the assumptions.
Our audit procedures included, amongst others:
• Developing an understanding of the Group’sprocesses and controls over determining thefield weights of almonds produced and testingthe operating effectiveness of a sample ofrelated controls.
• Comparing the actual yield for each orchard inthe current year to prior year levels, forecastyields and discussing significant varianceswith management.
• Attending the Group’s stocktakes inSeptember 2020, where we observed theGroup’s count procedures and tested a sampleof inventory on hand to verify its existence.
• Obtaining external confirmations for a sampleof third party inventory storage locations andagreeing quantities per the confirmations tothe Group’s inventory listing.
• Reconciling opening inventory to closinginventory and testing a sample of inflows ofalmonds from harvest, almonds processedand sales outflows during the year.
• Evaluating the Group’s ability to makeestimates of the fair value of the almond cropand its net realisable value by comparing priorestimates to actual selling prices achievedsince harvest, agreeing a sample of committedsales to contracts and considering externalspot price information and the quality andageing of inventory on hand.
• Assessing sources of estimation uncertainty inuncommitted sales relating to global almondprice movements by comparing to externalindustry information and market data.
Independent Auditor’s ReportContinued
81Select Harvests Annual Report 2020
• Agreeing a sample of costs of harvesting andprocessing the almond crop during the periodto supporting documentation and agreeing theallocation of these costs to inventory at 30September 2020.
• Testing the mathematical accuracy of theGroup’s almond crop valuation.
• Evaluating the adequacy of the disclosuresmade in note 2, 10 and 11 in light of therequirements of Australian AccountingStandards.
Carrying value of goodwill and brand names in the Food Division CGU (Refer to notes 2 and 15)
Under Australian Accounting Standards, the Group is required to assess goodwill and indefinite life intangibles for impairment at least annually. An impairment is recognised where the estimated recoverable amount for each division is less than the carrying amount of the division’s intangible assets.
The Food Division has goodwill and brand names of $28.9m at 30 September 2020. The Group performed an impairment assessment for the Food Division cash generating unit (CGU), calculating the value-in-use using a discounted cash flow model (the model). The model is based on the FY21 Board approved budget. Assumptions applicable to the model are described in note 15.
We consider this to be a key audit matter due to the financial significance of the goodwill and brand names in the Food Division and the significant judgements and assumptions applied in estimating future cash flows and the discount rate.
Our audit procedures included, amongst others:
• Assessing whether the Group’s determinationof CGUs was consistent with our knowledge ofthe Group’s operations and its internalreporting, as required by AustralianAccounting Standards.
• Testing the mathematical accuracy of thecalculations in the model.
• Evaluating the Group’s cash flow forecasts forthe Food Division in the model and theprocess by which they were developed withreference to current year results, externalindustry information and market data.
• Assessing that the forecast earnings wereconsistent with the Board approved budget,and that forecast growth rates are reasonablewith reference to our understanding of the keydrivers, including forecast harvest volumesand the almond price.
• Comparing the previous three years’ forecastto actual results to assess the accuracy andreliability of the Group’s forecasting.
• With the assistance of PwC valuation experts,assessing whether the discount rate applied inthe model is reasonable by comparing it tomarket data and comparable companies.
• Considering the sensitivity of the model byvarying key assumptions such as volumegrowth rates and discount rates and assessingunder which assumptions an impairment
82 Select Harvests Annual Report 2020
would occur and whether this was reasonably possible.
• Evaluating the adequacy of the disclosures innotes 2 and 15 in light of the requirements ofAustralian Accounting Standards.
Financing arrangements (Refer to note 17)
At 30 September 2020, the Group has borrowings of $59.0m outstanding.
During the year, the Group entered into an Implementation Deed and Sale Agreement to acquire the Piangil orchard, which will be partially funded by new debt facilities and for which the lenders have provided conditional commitments to extend existing facilities.
We consider this to be a key audit matter given the financial significance of the Group’s borrowings, commitments received from its lenders for new facilities to partly fund the Piangil orchard acquisition, and the importance of the capital structure for the Group’s growth.
Our audit procedures included, amongst others:
• Obtaining confirmations from the Group’slenders to confirm borrowings outstanding atthe balance date.
• Reading the signed agreements and othercorrespondence between the Group and itslenders to develop an understanding of theterms associated with its facilities, theamounts available for drawdown, and theterms of the conditional commitments offeredin connection with the Piangil acquisition.
• Where debt was classified as non-current,evaluating the Group’s assessment that it hadan unconditional right to defer payment suchthat there were no repayments requiredwithin 12 months from the balance date.
• Evaluating the debt maturity profile andfunding plan in light of our understanding ofthe debt agreements in place.
• Evaluating the adequacy of disclosures madein note 17 in light of the requirements ofAustralian Accounting Standards.
Accounting for bearer plants (Refer to note 13)
The Group accounts for its almond trees as property, plant and equipment recorded at cost less accumulated depreciation.
Under Australian Accounting Standards, the Group capitalises growing and leasing costs proportionate to maturity up to 7 years, when trees are deemed to reach a mature commercial state. Depreciation of the tree begins at this point on a units of production method, reflecting the commencement of revenue generation by the trees. Depreciation is charged over 10 to 30 years depending on the maturity of the bearer plant.
Our audit procedures included, amongst others:
• Testing the amount and nature of a sample ofgrowing costs capitalised during the period tosupporting documentation for trees with amaturity of up to 7 years old.
• Evaluating the Group’s useful life assessment,maturity of trees and yield profileassumptions applied in the units ofproduction method for depreciation againsthistorical experience.
Independent Auditor’s ReportContinued
83Select Harvests Annual Report 2020
At 30 September 2020 the Group had bearer plants with a carrying value of $104.1m, against which depreciation of $6.0m was charged during the year.
This was a key audit matter due to the significance of:
• the net book value of bearer plants to theGroup’s balance sheet.
• estimates and judgements regardingcapitalisation of growing costs and the usefullife and depreciation profile of trees.
• Evaluating the adequacy of disclosures madein note 13 in light of the requirements ofAustralian Accounting Standards.
Other information The directors are responsible for the other information. The other information comprises the information included in the annual report for the year ended 30 September 2020, but does not include the financial report and our auditor’s report thereon.
Our opinion on the financial report does not cover the other information and accordingly we do not express any form of assurance conclusion thereon.
In connection with our audit of the financial report, our responsibility is to read the other information and, in doing so, consider whether the other information is materially inconsistent with the financial report or our knowledge obtained in the audit, or otherwise appears to be materially misstated.
If, based on the work we have performed on the other information that we obtained prior to the date of this auditor’s report, we conclude that there is a material misstatement of this other information, we are required to report that fact. We have nothing to report in this regard.
Responsibilities of the directors for the financial report The directors of the Company are responsible for the preparation of the financial report that gives a true and fair view in accordance with Australian Accounting Standards and the Corporations Act 2001 and for such internal control as the directors determine is necessary to enable the preparation of the financial report that gives a true and fair view and is free from material misstatement, whether due to fraud or error.
In preparing the financial report, the directors are responsible for assessing the ability of the Group to continue as a going concern, disclosing, as applicable, matters related to going concern and using the going concern basis of accounting unless the directors either intend to liquidate the Group or to cease operations, or have no realistic alternative but to do so.
Auditor’s responsibilities for the audit of the financial report Our objectives are to obtain reasonable assurance about whether the financial report as a whole is free from material misstatement, whether due to fraud or error, and to issue an auditor’s report that
84 Select Harvests Annual Report 2020
includes our opinion. Reasonable assurance is a high level of assurance, but is not a guarantee that an audit conducted in accordance with the Australian Auditing Standards will always detect a material misstatement when it exists. Misstatements can arise from fraud or error and are considered material if, individually or in the aggregate, they could reasonably be expected to influence the economic decisions of users taken on the basis of the financial report.
A further description of our responsibilities for the audit of the financial report is located at the Auditing and Assurance Standards Board website at: https://www.auasb.gov.au/admin/file/content102/c3/ar1_2020.pdf. This description forms part of our auditor's report.
Report on the remuneration report
Our opinion on the remuneration report We have audited the remuneration report included in pages 28 to 39 of the directors’ report for the year ended 30 September 2020.
In our opinion, the remuneration report of Select Harvests Limited for the year ended 30 September 2020 complies with section 300A of the Corporations Act 2001.
Responsibilities The directors of the Company are responsible for the preparation and presentation of the remuneration report in accordance with section 300A of the Corporations Act 2001. Our responsibility is to express an opinion on the remuneration report, based on our audit conducted in accordance with Australian Auditing Standards.
PricewaterhouseCoopers
Andrew Cronin Melbourne Partner 30 November 2020
Independent Auditor’s ReportContinued
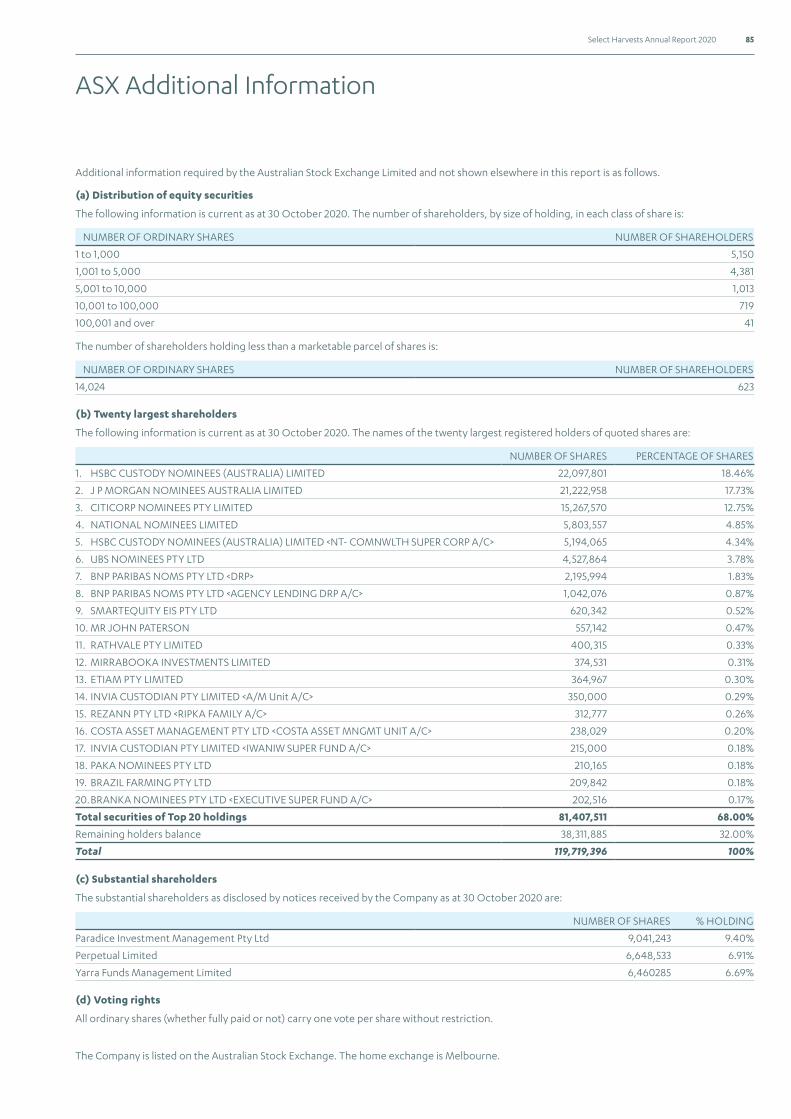
85Select Harvests Annual Report 2020
ASX Additional Information
Additional information required by the Australian Stock Exchange Limited and not shown elsewhere in this report is as follows.
(a) Distribution of equity securities
The following information is current as at 30 October 2020. The number of shareholders, by size of holding, in each class of share is:
NUMBER OF ORDINARY SHARES NUMBER OF SHAREHOLDERS
1 to 1,000 5,150
1,001 to 5,000 4,381
5,001 to 10,000 1,013
10,001 to 100,000 719
100,001 and over 41
The number of shareholders holding less than a marketable parcel of shares is:
NUMBER OF ORDINARY SHARES NUMBER OF SHAREHOLDERS
14,024 623
(b) Twenty largest shareholders
The following information is current as at 30 October 2020. The names of the twenty largest registered holders of quoted shares are:
NUMBER OF SHARES PERCENTAGE OF SHARES
1. HSBC CUSTODY NOMINEES (AUSTRALIA) LIMITED 22,097,801 18.46%
2. J P MORGAN NOMINEES AUSTRALIA LIMITED 21,222,958 17.73%
3. CITICORP NOMINEES PTY LIMITED 15,267,570 12.75%
4. NATIONAL NOMINEES LIMITED 5,803,557 4.85%
5. HSBC CUSTODY NOMINEES (AUSTRALIA) LIMITED <NT- COMNWLTH SUPER CORP A/C> 5,194,065 4.34%
6. UBS NOMINEES PTY LTD 4,527,864 3.78%
7. BNP PARIBAS NOMS PTY LTD <DRP> 2,195,994 1.83%
8. BNP PARIBAS NOMS PTY LTD <AGENCY LENDING DRP A/C> 1,042,076 0.87%
9. SMARTEQUITY EIS PTY LTD 620,342 0.52%
10. MR JOHN PATERSON 557,142 0.47%
11. RATHVALE PTY LIMITED 400,315 0.33%
12. MIRRABOOKA INVESTMENTS LIMITED 374,531 0.31%
13. ETIAM PTY LIMITED 364,967 0.30%
14. INVIA CUSTODIAN PTY LIMITED <A/M Unit A/C> 350,000 0.29%
15. REZANN PTY LTD <RIPKA FAMILY A/C> 312,777 0.26%
16. COSTA ASSET MANAGEMENT PTY LTD <COSTA ASSET MNGMT UNIT A/C> 238,029 0.20%
17. INVIA CUSTODIAN PTY LIMITED <IWANIW SUPER FUND A/C> 215,000 0.18%
18. PAKA NOMINEES PTY LTD 210,165 0.18%
19. BRAZIL FARMING PTY LTD 209,842 0.18%
20. BRANKA NOMINEES PTY LTD <EXECUTIVE SUPER FUND A/C> 202,516 0.17%
Total securities of Top 20 holdings 81,407,511 68.00%
Remaining holders balance 38,311,885 32.00%
Total 119,719,396 100%
(c) Substantial shareholders
The substantial shareholders as disclosed by notices received by the Company as at 30 October 2020 are:
NUMBER OF SHARES % HOLDING
Paradice Investment Management Pty Ltd 9,041,243 9.40%
Perpetual Limited 6,648,533 6.91%
Yarra Funds Management Limited 6,460285 6.69%
(d) Voting rights
All ordinary shares (whether fully paid or not) carry one vote per share without restriction.
The Company is listed on the Australian Stock Exchange. The home exchange is Melbourne.

86 Select Harvests Annual Report 2020
NOTES
Corporate InformationABN 87 000 721 380
DIRECTORS
M Iwaniw (Chair) P Thompson (Managing Director) M Carroll (Non-Executive Director) F S Grimwade (Non-Executive Director) N Anderson (Non-Executive Director) F Bennett (Non-Executive Director) G Kingwill (Non-Executive Director)
COMPANY SECRETARY
B Crump
REGISTERED OFFICE - SELECT HARVESTS LIMITED
360 Settlement Road Thomastown VIC 3074
Postal address PO Box 5 Thomastown VIC 3074 Telephone (03) 9474 3544
Email [email protected]
SOLICITORS
Minter Ellison Lawyers
BANKERS
National Australia Bank Limited Rabobank Australia
AUDITOR
PricewaterhouseCoopers
SHARE REGISTER
Computershare Investor Services Pty Limited Yarra Falls 452 Johnston Street Abbotsford VIC 3067
Telephone (03) 9415 4000
WEBSITE
www.selectharvests.com.au
Select Harvests LimitedABN 87 000 721 380
PO Box 5Thomastown VIC 3074360 Settlement RoadThomastown VIC 3074
T (03) 9474 3544F (03) 9474 3588E [email protected]
ASX ticker code: SHV www.selectharvests.com.au
Company Websites
www.luckynuts.com.auwww.sunsol.com.auwww.nuvitality.com.au
Company Instagram Sites
www.instagram.com/select_harvests/ Select Harvests Limitedwww.instagram.com/lucky.nuts/ www.instagram.com/sunsol_muesli/www.instagram.com/nuvitalityau/
TM
Market leader in the cooking nut category
Cooking Nut product rangealmonds, walnuts, cashews, brazil nuts, pine nuts, pistachios, macadamias, hazelnuts,peanuts, sunflowerseeds and pepitas
Snacking product rangeportion control packsand Lucky Smart Snax
Distribution major supermarkets and export markets including the Middle
China
East, Indonesia, Papua New Guinea and
Product rangemuesli, cereal and oats
Distributionmajor supermarkets (muesli) and export markets including Hong Kong, Singapore, Malaysia, Indonesia and the Pacific Rim
Product rangemuesli, dried fruit, wholefoods, nuts and snacks
DistributionHealth aisle of major supermarkets and export markets including Hong Kong, Singapore, Malaysia, Indonesia and the Pacific Rim
Product rangealmonds and other nuts, dried fruit, seeds, nut pastes, pralines and muesli
Bulk and convenient packs
Products sold to local and overseas food manufacturers, wholesalers, distributors and re-packers
Supplies bulk product to major bakeries, manufacturers and wholesalers who depend on quality and service.