Embed Size (px)
Citation preview

2
0
1
3ANNUAL REPORT

66 942
2013
63 075
2013
508 058
2013
65 094
2012
85 564
2012
472 642
2012
60 811
2012
64 088
2011
104 273
2011
425 261
2011
84 681
2011
62 604
2010
77 704
2010
368 549
2010
70 631
2010
62 377
2009
64 400
2009
296 918
2009
54 644
2009
46 625
2013
1Planted area(in hectares)
2 Share of the groupin the result,before IAS41
3Cash flow fromoperating activitiesafter taxes
4Shareholders’equity

Activity2013 2012 2011 2010 2009
Total own production of
consolidated companies
(in tonnes)
palm oil 206 476 214 521 206 476 192 156 196 368
rubber 9 773 9 757 8 464 9 608 8 633
tea 2 850 2 869 2 626 3 097 3 121
bananas 22 325 23 916 19 297 20 639 20 575
Average market price (USD/tonne)
palm oil 857 999 1 125 901 683
rubber 2 795 3 377 4 823 3 654 1 921
tea (1) 2 399 2 881 2 724 2 719 2 725
bananas 1 022 1 100 1 125 1 002 1 145
Results (in KUSD)
Turnover 291 678 332 522 367 661 279 400 237 829
Gross profit - before IAS41 94 421 112 255 136 808 117 682 89 695
Operating result - before IAS41 66 292 83 635 114 090 95 625 73 908
Share of the group in the result 55 627 68 392 95 088 84 843 60 174
Cash flow from operating activities after taxes 63 075 85 564 104 273 77 704 64 400
Free cash flow - 27 658 - 9 296 37 168 33 922 34 593
Balance sheet (in KUSD)
Operating fixed assets (2) 535 984 467 628 385 363 321 512 278 118
Shareholders' equity 508 058 472 642 425 261 368 549 296 918
Net financial assets (+)/obligations (-) - 31 918 18 193 47 519 56 484 36 108
Investments in intangible and operating fixed assets (2) 91 644 99 323 68 031 37 842 30 847
Data per share (in USD)
Number of shares 8 951 740 8 951 740 8 951 740 8 951 740 8 951 740
Own shares 62 000 59 676 59 676 0 0
Equity 57.15 53.15 47.82 41.17 33.17
Basic earnings per share 6.26 7.69 10.63 9.48 6.72
Cash flow from operating activities after taxes (3) 7.09 9.62 11.65 8.68 7.19
Free cash flow (3) -3.11 -1.05 4.15 3.79 3.86
Gross dividend (in EUR) 1.25 1.70 1.70 1.50 1.10
Stock exchange share price (in EUR)
Maximum 65.30 71.89 75.78 71.93 36.80
Minimum 49.52 54.51 49.01 36.80 18.00
Closing 31/12 57.70 58.50 58.00 71.00 34.78
Stock Exchange capitalization at 31/12 (in KEUR) 516 515 523 677 519 201 635 574 311 342
(1) Mombasa auction
(2) Operating fixed assets = biological assets, property, plant & equipment and investment property
(3) Denominator 2013 = weighted average number of shares issued (8 891 870 shares).
Key figures


SIPEF | ANNUAL REPORT 2013 1
Naamloze Vennootschap
FINANCIAL YEAR2013
Report of the board of directors and of the statutory auditor to be submitted at the 95th ordinary general meeting to be held on 11 June 2014

‘THE CONNECTION TO THE WORLD OF SUSTAINABLE TROPICAL AGRICULTURE’
Financial calendar
The periodical and occasional information relating to
the company and to the group will be published before
opening hours of the stock exchange as follows:
- the interim report for the first 3 months on 24th April
2014;
- the half-year results on 21st August 2014;
- the interim report for the first 9 months on 23rd Octo-
ber 2014;
- the results of the financial year in February 2015 ac-
companied with comments on the activities of the
group;
- in accordance with the legal regulations all important
data that could influence in one way or another the re-
sults of the company and of the group will be subject
to a separate press release.
The next annual meeting of shareholders will be held on
10th June 2015 at 15 hrs at Kasteel Calesberg, Calesberg-
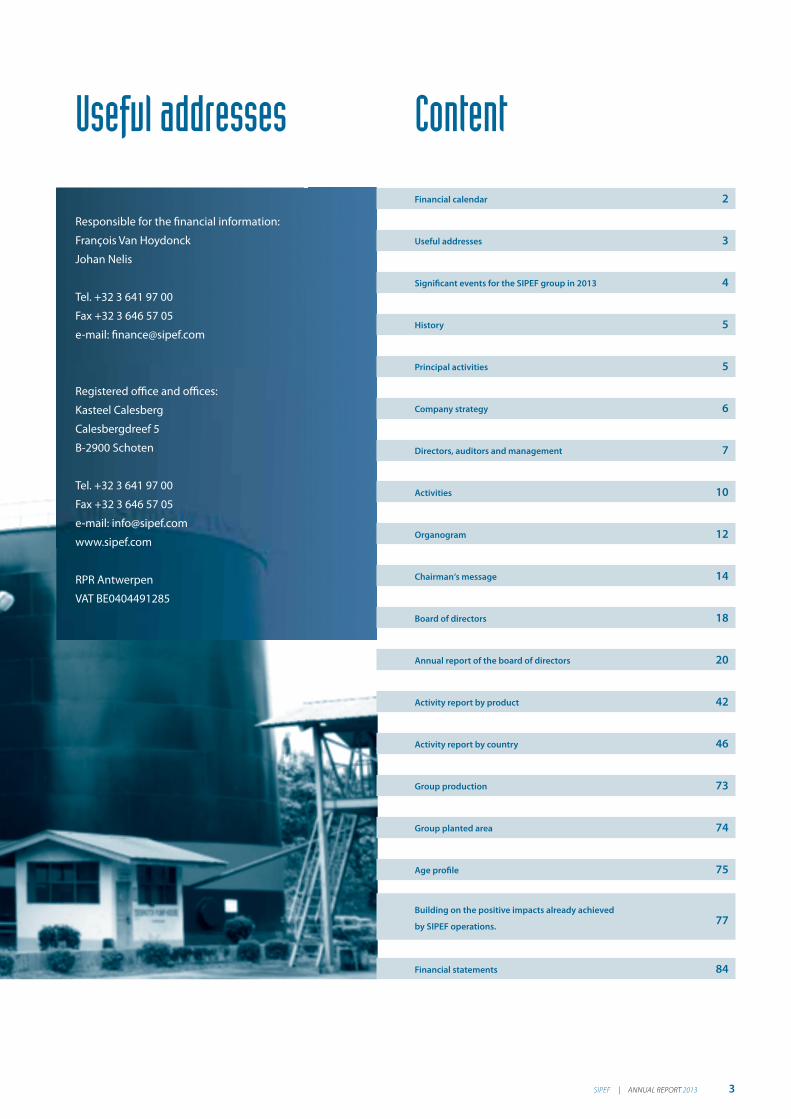
dreef 5 – 2900 Schoten.A view of the tank farm of PT AgroMuko, where the sustainable crudepalm oil is stored before dispatchto the port of Padang, from wheremost of our oil is shipped.
SIPEF | ANNUAL REPORT 2013 3
Useful addressesVerantwoordelijken voor de financiële berichtgeving:
Content
Responsible for the financial information:
François Van Hoydonck
Johan Nelis
Tel. +32 3 641 97 00
Fax +32 3 646 57 05
e-mail: [email protected]
Registered office and offices:
Kasteel Calesberg
Calesbergdreef 5
B-2900 Schoten
Tel. +32 3 641 97 00
Fax +32 3 646 57 05
e-mail: [email protected]
www.sipef.com
RPR Antwerpen
VAT BE0404491285
Financial calendar 2
Useful addresses 3
Significant events for the SIPEF group in 2013 4
History 5
Principal activities 5
Company strategy 6
Directors, auditors and management 7
Activities 10
Organogram 12
Chairman‘s message 14
Board of directors 18
Annual report of the board of directors 20
Activity report by product 42
Activity report by country 46
Group production 73
Group planted area 74
Age profile 75
Building on the positive impacts already achieved
by SIPEF operations.77
Financial statements 84

‘THE CONNECTION TO THE WORLD OF SUSTAINABLE TROPICAL AGRICULTURE’
March 2013
In South Sumatra, a license was obtained
for the additional development of
4 811 hectares in the name of the
PT Agro Muara Rupit company.
July 2013
Distribution of a gross divi-
dend of EUR 1.70 per share.
October 2013
The signing of a joint-venture agreement
in order to develop high yielding oil palm
trees. « F1 Hybrid ».
Significant events for the SIPEF group in 2013
May 2013
Start-up of the bio-gas installation in the
Mukomuko palm oil factory (Indonesia).
September 2013
Acquisition of a fourth licence for 7 498 ha,
which dovetails perfectly with the third project,
PT Agro Muara Rupit.
December 2013
Less favourable agronomic conditions resulted
in a slightly lower group production.
Selling prices for the four products, palm oil, rubber,
tea and bananas, were not as strong as in 2012.
Production costs remained stable, benefiting from the
devaluation of local currencies against the USD.
The result before the IAS41 share of the group, amounted
to KUSD 46 625, the net IFRS result being KUSD 55 627.
Operational investment in Indonesia and Papua New Guinea
exceeds cash flow from operating activities after tax.
Based on the volumes already sold and the production and
price outlook we remain confident that the SIPEF group
will achieve a satisfactory result once more in 2014.
Proposed payment of a gross dividend of EUR 1.25
per share, in line with last year’s payout ratio.

SIPEF | ANNUAL REPORT 2013 5
Société Internationale de Plantations et de Finance was incorpo-
rated in 1919 with the principal aims of promoting and manag-
ing plantation companies in both tropical and sub-tropical areas.
At that time the company had two “agencies”, one operating in
Kuala Lumpur, Malaysia, the other in Medan, Indonesia.
Over the years, the company has developed into an agro-indus-
trial group with production and export facilities in Asia, Oceania,
Africa and South America, where it manages important planta-
tions of traditional crops, such as rubber, palm oil and tea.
Starting in 1970, other crops, such as bananas, pineapples, or-
namental plants, guava and pepper, were also introduced. The
group invested in the real estate sector in Belgium and in the
United States, but these activities were later phased out com-
pletely.
Our traditional activities in commodities and their shipping led
us to also get involved in the insurance sector where we now
offer a wide range of services.
In the last decade, SIPEF has concentrated its efforts in the agro-
industrial sector solely on the production of palm oil, rubber, tea
and bananas in Indonesia, Papua New Guinea and Ivory Coast.
The group sells its own products throughout the world. SIPEF also
provides management and marketing services to third parties.
By the end of 2013 the plantations extend over a planted surface
area of 66 942 hectares.
SIPEF is a Belgian agro-industrial company quoted on NYSE
Euronext Brussels.
The company mainly holds majority stakes in tropical plantation
businesses that it manages and operates.
The group is geographically diversified and produces various
commodities, principally palm oil.
It invests mainly in recently industrialised countries.
History Principal activities

‘THE CONNECTION TO THE WORLD OF SUSTAINABLE TROPICAL AGRICULTURE’
Management
SIPEF plays a decisive role in the management of companies in
which it holds a majority stake or that it controls together with
other partners. This role includes active participation in the
boards of directors of these subsidiaries as well as monitoring
of the management and operation of these companies. SIPEF
strives to transmit its agronomic experience and management
techniques to the local management.
Customers
Every effort is made to meet the needs of our customers and to
provide them with high-quality goods and services in a timely
manner.
Employees
In order to optimise the management of the plantations, we
attach great importance to the training of our local employees,
both in agricultural and management techniques.
The group’s policy concerning agricultural, technical, environ-
mental and general aspects is detailed in manuals containing
practical guidelines to achieve these goals. Training sessions sup-
port proper implementation of these policies. We see to it that all
employees are able to work in a healthy and safe environment.
Environment
The group recognises that, in addition to its statutory and com-
mercial obligations, it bears responsibility towards the communi-
ties and environment in which it operates.
In order to preserve the environment, the group applies ecolog-
ically-responsible agricultural policies that comply with the prin-
ciples and criteria of the “Roundtable on Sustainable Palm Oil”
(RSPO). This covers a broad series of environmental and social
topics such as transparency, compliance with legal standards,
good agricultural policy, sustainable development of the land
and continued efforts to achieve perfection.
A separate chapter in the annual report is devoted to sustainable
agriculture and our efforts to implement those policies.
Company strategy

SIPEF | ANNUAL REPORT 2013 7
Board of directors
Baron BRACHT
François VAN HOYDONCK
Baron BERTRAND
Priscilla BRACHT
Jacques DELEN
Antoine FRILING
Regnier HAEGELSTEEN
Sophie LAMMERANT-VELGE
Richard ROBINOW
Statutory auditor
DELOITTE
Bedrijfsrevisoren BV o.v.v.e. CVBA
represented by
Dirk CLEYMANS
Management
François VAN HOYDONCK
Didier CRUYSMANS (till October 2013)
Charles DE WULF (as from October 2013)
Thomas HILDENBRAND
Robbert KESSELS
Johan NELIS
Consultant
Matthew T. ADAMS
chairman
managing director
director
director
director
director
director
director
director
auditors
managing director
manager estates department
manager estates department
manager marketing bananas and horticulture
manager marketing commodities
chief financial officer
external visiting agent
Directors, auditors and management

‘THE CONNECTION TO THE WORLD OF SUSTAINABLE TROPICAL AGRICULTURE’
The Fresh Fruit Bunches and the collected loosefruits are transported by truck and dumpedonto the loading ramp of the mill.

SIPEF | ANNUAL REPORT 2013 9

‘THE CONNECTION TO THE WORLD OF SUSTAINABLE TROPICAL AGRICULTURE’
Ivory Coast
Belgium / Luxembourg
SipefBDM
ASCO
Jabelmalux
Plantations J. EglinSipef - CI
RÉGION DU BAS-SASSANDRA
RÉGION DE L’AGNÉBY
RÉGION DE LAGUNES
ActivitiesPalm oil RubberInsurance
SIPEF | ANNUAL REPORT 2013 11
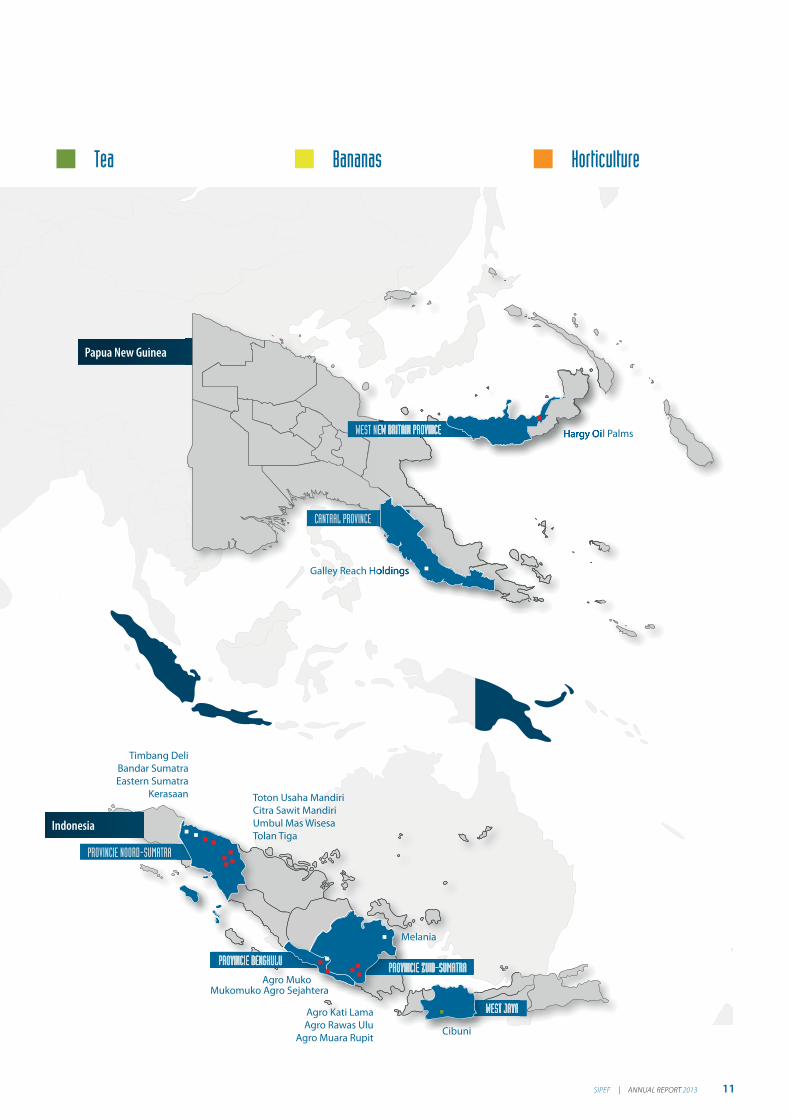
WEST JAVA
PROVINCIE ZUID-SUMATRA
PROVINCIE NOORD-SUMATRA
PROVINCIE BENGKULU
Indonesia
Papua New Guinea
Toton Usaha MandiriCitra Sawit MandiriUmbul Mas WisesaTolan Tiga
Timbang DeliBandar SumatraEastern Sumatra
Kerasaan
Galley Reach Holdings
Hargy Oil Palms
Melania
Cibuni
Agro MukoMukomuko Agro Sejahtera
Agro Kati LamaAgro Rawas Ulu
Agro Muara Rupit
CANTRAL PROVINCE
WEST NEW BRITAIN PROVINCE
HorticultureBananasTea

‘THE CONNECTION TO THE WORLD OF SUSTAINABLE TROPICAL AGRICULTURE’
percentage of control percentage of controlpercentage of interest percentage of interest
PACIFIC OCEAN 100% 100%Hargy Oil Palms Ltd
100% 100%Galley Reach Holdings Ltd
Organogram
INDONESIA 95% 95%PT Tolan Tiga Indonesia
95% 90%PT Eastern Sumatra Indonesia
57% 54%PT Kerasaan Indonesia
95% 90%PT Timbang Deli Indonesia
95% 90%PT Bandar Sumatra Indonesia
95% 90%PT Melania Indonesia
95% 95%PT Umbul Mas Wisesa

SIPEF | ANNUAL REPORT 2013 13
percentage of control percentage of controlpercentage of interest percentage of interest
95% 95%PT Toton Usaha Mandiri
95% 95%PT Citra Sawit Mandiri
47% 45%PT Agro Muko
95% 86%PT Mukomuko Agro Sejahtera
95% 95%PT Agro Kati Lama
95% 95%PT Agro Rawas Ulu
95% 95%PT Agro Muara Rupit
INSURANCE
AFRICA
EUROPE
100% 100%Plantations J. Eglin SA
100% 100%Sograci SA
32% 32%Sipef-Ci SA
50% 50%Sograkin SA
99,60% 99,60%Jabelmalux SA
50% 50%ASCO NV
50% 50%BDM NV
Bunches are loaded in cageswhile waiting for sterilization.

‘THE CONNECTION TO THE WORLD OF SUSTAINABLE TROPICAL AGRICULTURE’
Dear ladies and gentlemen,
It is a pleasure for me to present you with our annual report and
the consolidated accounts for the group and the public limited
company. They will be submitted to the 95th ordinary general
shareholders’ meeting on 11th June 2014.
2013 may be characterised as a weak agricultural production year.
Unfavourable weather conditions at our plantations, but also in
Southeast Asia in general, means volumes are down for our four
products: palm oil, rubber, tea and bananas. We have been faced
with higher than average precipitation. On the mature palm
oil plantations, which enjoyed exceptionally high yields in the
second half of 2012, we have observed a “tree-rest” in 2013.
In the run-up to the presidential elections of July 2014, Indonesia
has seen its currency weakening due to lower growth, a decline in
commodity prices, increased borrowing and higher interest rates.
The resulting negative balance of payments has put pressure on
the country’s economic development. Indonesia is now branded
as one of the “Fragile Five” - countries in urgent need of measures
to prevent further financial weakening. Thus expectations are
high for the elections, which, at the end of the current president’s
second term, will bring on a new administration. Its task will be to
provide the country with transparent regulations, increased legal
certainty, improved infrastructure, especially in the area of roads
and ports, renewed strong growth and balanced budgets.
Despite good long-term prospects for Papua New Guinea, based
on commodity exports and significant gas reserves, which can be
exploited from 2015 onward, the country is faced with temporary
financial deficits and a weakened currency with respect to the US
dollar. The current government is trying to remedy this situation
in the short term, but recently surprised foreign investors with
a number of decisions that came very close to the nationalisa-
tion of interests. In the search for additional revenue, the labour-
intensive agricultural sector has been spared for the time being.
We have seen a stable political climate in Ivory Coast, which
is, however, suffering economically from the lower commod-
ity prices. Nevertheless we see the country gradually resum-
ing its previous prominent position in West Africa. Our banana
and flower activities suffered from the generally unpredictable
weather conditions, with a slight decrease in their contribution
as a consequence. This pattern also characterises the local palm
oil project in which we merely participate.
The positive long-term forecasts for palm oil remain valid. We
observe on a daily basis that palm oil is playing an increasingly
important role in feeding the world’s growing population. The
short-term price fluctuations are mainly determined by the
quantities of vegetable oils (soy, rapeseed and palm oil) available
on the markets at any time. In the first quarter of 2013, the high
stockpiles resulting from good yields in 2012 still weighed on
the price. In the subsequent period we did observe the positive
effect on the price of declining palm oil production and increas-
ing demand for biodiesel, but this was neutralised by the pros-
pects of large soybean harvests in the United States.
Baron Bracht
chairman
Chairman‘s message

SIPEF | ANNUAL REPORT 2013 15
The announcement of an additional Indonesian biodiesel man-
date for transport and energy did result in higher prices by the
end of the year. This positive trend persisted into the first quar-
ter of 2014, where we saw palm oil prices reaching USD 1 000
per tonne (CIF Rotterdam) for the first time in almost two years,
a level at which we wish to place greater volumes on the market.
For the rest of the year, the price will mainly be driven by the
effect of weather forecasts on palm oil volumes in Southeast Asia
and on soybean production (in the first half of the year in South
America, in the second half in the United States). In addition, evo-
lution in the demand for biodiesel will continue to support the
price.
In 2013, the SIPEF group experienced a slight decrease in palm oil
production due to the negative effects of the weather. This was in
sharp contrast to the results of our recent efforts to expand and
rejuvenate the palm oil areas in Papua New Guinea (on locations
where we are already active) and in Indonesia. In the latter coun-
try, our expansion in North Sumatra is complete and we can look
forward to the growing maturity of the palms in the three pro-
jects PT Umbul Mas Wisesa (UMW)/ PT Toton Usaha Mandiri (TUM)
and PT Citra Sawit Mandiri (CSM,) which together cover almost
10 000 hectares.
Expansion in Papua New Guinea continued with the planting
of an additional 1 003 hectares of oil palms, so that now 3 357
hectares are immature. This additional planting will allow opti-
mal use of the third palm oil extraction plant in the coming years.
Weather conditions in this country continue to present a chal-
lenge for our management teams, but on the agricultural level,
Papua New Guinea continues to offer the best yields for oil palms.
The focus of our expansion has in the past two years shifted to
the province of South Sumatra, where we acquired three conces-
sions close to the city of Lubuk Linggau for a maximum of 31 809
hectares of oil palm and rubber plantations. Since the start-up,
during which as always the sustainability studies required by
the RSPO were conducted first and local approvals had to be
obtained, compensation for 4 000 hectares has already been
handed over to local users. These compensations will continue at
least for the next three years in order to develop a new business
unit in the region, which does not yet have many industrial agri-
cultural projects. Almost half of the vegetation in these hectares
has been removed. The first few hundred hectares have already
been planted with oil palms, a process that we hope to accelerate
during the present year.
Natural rubber is a cyclical product and its profitability is under ex-
treme pressure. Not only did we note a slight decrease in volumes
for the group (due to weather conditions), but the substantially
lower selling prices also resulted in decreased profits. Due to the
worldwide planting of additional rubber plantations since 2008-
2009, driven by higher selling prices, a greater supply of rubber
has gradually entered the world market. However, natural rubber
is mainly a raw material for the production of tyres for cars and
heavy industrial vehicles. Falling demand in the automotive and
mining industries has had a direct effect on pricing. The increase
in stockpiles in China and most other consuming countries in the
last six months has driven prices below USD 2 000 per tonne. In
the short term, moreover, no price rises are expected. Only an
improvement in economic prospects for the second half of 2014
can bring relief here.
The tea activities in Cibuni, on the island of Java, continue to make
a valued contribution to the group’s results. Since the second half
of 2013, a greater supply of tea from Kenya has been putting
pressure on the current prices of our hand-picked quality tea,
which is mainly sold in the established market of the Middle East.
We manage to remain competitive thanks to energy-efficient
production methods, but tea is the group’s most labour-intensive
crop. We are following with interest the evolution of salaries in
Indonesia, where the provincial governors themselves set the
salary increases.
In Ivory Coast, the main impact of the political crisis of 2011
appears to be behind us. Banana and flower exports to Europe
from Plantations J. Eglin SA too have fully recovered, even though
in the past year this sector has been marked by lower production
levels. Thanks to the advance setting of selling prices and freight
rates, the business risk remains limited to producing the high-
est quality and the required volumes. The lowering of European
import duties for dollar zone bananas has not had an immediate
effect on the prices of African bananas, which have found their
own market in southern Europe and the United Kingdom. Due
to the absence of the dry Harmattan winds, we have started the
new financial year with an increased production of good quality,
which allows us to look forward to another year of positive con-
tribution to group results in 2014.

‘THE CONNECTION TO THE WORLD OF SUSTAINABLE TROPICAL AGRICULTURE’
The lion’s share of the restructuring process of the insurance ac-
tivities we share with Ackermans & van Haaren has been com-
pleted. The focus is fully on maritime and general risk insurance,
but due to the volume of the undertaking, managing the volatil-
ity in the technical results remains a difficult task. Thanks to an
additional reorganisation of specific risks and a stricter under-
writing policy, we expect more stability in the results for 2014.
The above cited plantation expansions have taken place primar-
ily in remote areas where agriculture is the main employer. These
expansions have been accompanied by important infrastructure
work and the construction of new housing and facilities to bind
the workers to the group in the long term. The increased volumes
of produced fruit also require expansion for their processing into
oil. In 2013, the bulk of our investments went into the construc-
tion of two new extraction plants that were added to the existing
contingent of six plants. Such acquisitions weigh heavily on the
available resources, but it remains our strategy to further develop
the group without building up a structural debt position, while
still providing a fair annual dividend for our shareholders.
With respect to the integration of the activities of the SIPEF group,
I wish to announce that as of 1st January 2014, our Indonesian
branches have switched to a fully integrated accounting and re-
porting system. In the second stage, this system will also be taken
up by the branches in Papua New Guinea and subsequently by
the group’s holding company. This will allow us to analyse both
basic agronomic data and the profitability of the branches much
more quickly and accurately.
SIPEF also continues to play a conscious pioneering role with re-
spect to sustainable tropical agriculture. As a company quoted
on the stock exchange and active in continental Europe, where
sustainability is a basic requirement for the future of the palm oil
sector, we wish to have all the activities of the SIPEF group acquire
the required certifications to allow us to grow our products in an
ecologically and socially responsible way. In this context, we are
also continuing work on the sale of CSM, a young palm oil planta-
tion that will not meet the certification standards.
Seeing as the good reputation enjoyed by palm oil has recently
come under significant pressure in the European media, we view
it as our task as a producer to highlight all aspects of palm oil
while avoiding campaigns with a one-sided focus. We are invest-
ing in the sustainable development of palm oil on a daily basis
and observe that more and more food producers are gradu-
ally switching to the use of identifiably sustainable palm oil and
palm kernel oil. They are prepared to pay a premium over normal
market prices for this oil.
We also are continuing to invest in reducing biogas emissions.
After constructing an additional capture system in Agro Muko
in the province of Bengkulu in 2013, we will also be equipping
our two new plants with systems for capturing methane. We are
also studying the possibility of reusing biogases in the Perlabian
plant in North Sumatra. Consequently, in 2014 five out of the
group’s eight plants are already eligible for certification for the
use of our palm oil for green energy purposes in Europe. SIPEF
always takes care to combine sustainability and certification with
achieving sufficient profitability for all the company’s activities,
which is a basic requirement for an industrial group quoted on
the exchange.
After a patient multi-year campaign, we finally acquired a license
via our own Indonesian foundation in 2013 for the active protec-
tion of approximately 12 000 hectares of forest that is a buffer
zone next to a national park in the province of Bengkulu. After
the required registrations and the legally obligatory investiga-
tions, we expect to be able to engage “rangers” to combat de-
forestation this year, and also involve local residents. In the
meantime, of course, we are also continuing our additional pro-
ject for protecting endangered sea turtle species via a breeding
programme from eggs collected at two beaches on the south
coast of Sumatra.
In addition, we are pleased to announce the signing of a coopera-
tion agreement with NBPOL (a plantation company in Papua New
Guinea quoted on the exchange with a renowned palm seed pro-
duction research centre) and Biosing (an organisation of scien-
tists). We will be co-operating on developing high-yield palms to
greatly improve the extraction of palm oil and in the future take
the industry to a higher level.
Chairman’s message

SIPEF | ANNUAL REPORT 2013 17
Due to slightly decreased production volumes and lower market
prices for all the group’s products, we were unable to match the
results of 2012. SIPEF closed its financial year with a consolidated
group profit of KUSD 46 625. This represents a decrease of 23.3%
compared to last year’s result. Taking into consideration the
changes to the biological fixed assets at fair value, group profit
according to IFRS standards is KUSD 55 627 compared to KUSD
68 392 last year.
I would like to thank all employees of the SIPEF group who con-
tributed, each in their own way, to achieving these results. In
these times of lower prices, it is important to preserve our profit-
ability via good cost management and a focus on the efficiency
of our plantations and factories. The salary increases imposed on
us by the authorities in recent years have certainly not made it
easier for plantation companies to control production costs.
Due to decreased earnings and an expanded investment budget,
the positive cash position of 2012 has now become a slightly
negative debt position. However, the situation cannot be called
structural. This also will allow us to distribute a dividend in line
with the results and the payout ratio of the previous financial
year. We are therefore pleased to confirm that our board of
directors will propose a dividend of EUR 1.25 gross, to be distrib-
uted on 2nd July 2014.
Thanks to good prospects with respect to volume and already
concluded sales of our principal basic products, we are confident
that we will be able to return satisfactory results for the current fi-
nancial year. The actual profit will depend to an important degree
on the evolution of prices on the commodity markets during the
second half of 2014. These may be impacted by the production
volumes and stockpiles of soybean and soy oil in the vegetable
oil markets. The economic recovery in the United States and the
European Union will additionally play a role in the evolution of
the price of natural rubber.
Despite the short-term volatility of the palm oil and rubber
prices, we continue to believe in the long-term perspectives of
both products, with demand in the Far East growing (borne by
a rising middle class with greater purchasing power) and with a
volatile supply side, subject to weather conditions and the limita-
tions inherent in agriculture.
18th February 2014
Baron Bracht
chairman.

‘THE CONNECTION TO THE WORLD OF SUSTAINABLE TROPICAL AGRICULTURE’
Board of directors

SIPEF | ANNUAL REPORT 2013 19
1 2 3 4 5 6 7 8 9
1. Baron Bracht2. Richard Robinow
3. Jacques Delen4. Baron Bertrand
5. Regnier Haegelsteen6. Antoine Friling
7. Sophie Lammerant - Velge8. Priscilla Bracht
9. François Van Hoydonck

‘THE CONNECTION TO THE WORLD OF SUSTAINABLE TROPICAL AGRICULTURE’
To the ordinary general annual meeting of 11th June 2014.
Dear shareholders,
We are honoured to bring you a report about the operating
activities of our company during the past financial year, with the
individual and consolidated annual financial statements, bal-
anced on 31st December 2013, for approval.
In accordance with the Royal Decree of 14th November 2007
(regarding the obligations of issuers of financial instruments that
are permitted to trade in the Belgian regulated market), SIPEF
must make its annual financial report available to the public.
This report includes the combined statutory and consolidated
annual report from the board of directors, drawn up in accord-
ance with article 119, last paragraph, of the Belgian Corporate
Governance Code.
The report also includes an abbreviated version of the statutory
annual financial statements (page 135), drawn up in accordance
with article 105 of the Belgian Corporate Governance Code,
and the integral version of the consolidated annual financial
statements (page 86). The complete individual annual financial
statements are deposited at the National Bank of Belgium, in ac-
cordance with articles 98 and 100 of the Belgian Corporate Gov-
ernance Code, along with the annual report from the board of
directors and the report from the auditor.
With respect to the statutory and consolidated annual financial
statements, the auditor has provided a declaration of approval
without reservations.
The annual report, the integral versions of the statutory and the
consolidated annual financial statements and the reports from
the auditor regarding the afore-mentioned annual financial
statements, are available on the website (www.sipef.com) but
can also be obtained by request, free of charge, at the following
address: Calesbergdreef 5 – 2900 Schoten, Belgium, or by email:
1. Individual annual financial statements
1.1. Capital and ownership of sharesDuring the past financial year, there were no changes in the com-
pany’s capital. The endorsed capital is EUR 34 767 740.80, and is
represented by 8 951 740 shares, without designation of nominal
value and with payment in full.
The company’s updated Articles of Association, including infor-
mation about the legal form, the statutory goal, the capital struc-
ture, the authorised capital and the type of shares, are available
on the website (www.sipef.com).
With respect to the share option plan, 20 000 new options were
assigned in 2013. The options that were assigned as of 31st
December 2013 and options not yet exercised collectively pro-
vide the right to the acquisition of 62 000 SIPEF shares (0.69%).
1.2. ActivitiesFor an overview of the main activities of the SIPEF group during
the financial year 2013, we refer to the ‘Message from the chair-
man’ (page 14).
1.3. Explanatory notes to the statutoryannual financial statements
1.3.1. Financial position as at 31st December 2013
SIPEF’s statutory financial statements have been drawn up in
accordance with the Belgian accounting legislation.
The company’s balance total as at 31st December 2013 is KEUR
235 829 compared to KEUR 212 874 the previous year.
The receivables of a maximum of 1 year increased from KEUR
143 546 to KEUR 169 349 due to an increase in the receivables on
Jabelmalux SA and the receivables on Hargy Oil Palm Ltd (disposal
of funds for the further completion of two oil extraction mills).
SIPEF‘s private capital before profit distribution is KEUR 157 815,
which corresponds with EUR 17.63 per share.
Annual report of the board of directors

SIPEF | ANNUAL REPORT 2013 21
The statutory results of SIPEF are determined to a significant
degree by dividends and increases/reductions in values. Since
SIPEF does not directly hold all of the interests of the group, the
consolidated result of the group is a more accurate reflection
of the underlying economic development. The statutory results
of the financial year 2013 are KEUR 612 compared to a profit of
KEUR 108 407 in the previous financial year.
1.3.2. Allocations of the results
The board of directors proposes to allocate the results as follows
(in KEUR):
- Profit carried over from the previous financial year 98 794
- Profit from the financial year 612
- Total to be allocated 99 406
- Transfers to other reserves 128
- Payment to the shareholders 11 190
- Profit to be carried over 88 088
The board of directors proposes to pay a dividend of EUR 1.25
gross per share. After deduction of the withholding tax, the net
dividend is EUR 0.9375 per share.
If the ordinary general meeting approves this proposal, the divi-
dend will be payable from 2nd July 2014.
1.4. ProspectsThe results of the current financial year will, as in the past, depend
to a significant degree on the dividends that will be paid out from
the subsidiary companies.
1.5. Notices1.5.1. Important events after the close of the financial year
Since the close of the financial year 2013, no significant events
have occurred that could noticeably affect the development of
the company.
1.5.2. Additional compensation to the auditor
In accordance with article 134, § 2 and 4, of the Belgian Corpo-
rate Governance Code, we also inform you that no additional
payment was made to the auditor aside from the normal pay-
ment (as approved by the general meeting). We paid KEUR 33 to
related companies of the auditor for legal, accounting and fiscal
consultations.
1.5.3. Research and development
The company has not engaged in any activities related to
research and development.
1.5.4. Acquisition and transfer of own shares
On 29th May 2009 the extraordinary general meeting authorized
the board of directors of SIPEF to acquire own shares within a
well-defined price range during a period of five years.
In the course of the 2013 financial year SIPEF acquired 2 324 ad-
ditional own shares. These shares were acquired to cover the
company’s obligations under the stock option plan and as a tem-
porary investment of the liquidity excesses.
- The situation as per 31st December 2013 is as follows:
- Number of treasury shares 62 000 (0,69%)
- Average price per share (EUR) 56,35
- Total investment value (KEUR) 3 494
1.5.5. Changes in the Articles of Association
No changes to the Articles of Association were made during 2013.
1.5.6. Announcement based on the Legislation of
1st April 2007 relating to public take-over bids.
Ackermans & van Haaren NV (AvH), acting in consultation with
CABRA NV, GEDEI NV and Baron Bracht and children, have an-
nounced by letter dated 30th August 2013, that together they
own 39.555% of the total voting rights of SIPEF.
1.5.7. Protection measures
The extraordinary general meeting assigned authorization to
the board of directors on 13th June 2012, to acquire or transfer
the company’s shares for a period of three years, if this were to
become necessary in order to prevent the company from suffer-
ing a serious and threatening loss.

‘THE CONNECTION TO THE WORLD OF SUSTAINABLE TROPICAL AGRICULTURE’

SIPEF | ANNUAL REPORT 2013 23
The palm fruit bunches, loaded in cages, aresterilized by steam induction in cylinders.

‘THE CONNECTION TO THE WORLD OF SUSTAINABLE TROPICAL AGRICULTURE’
Annual report of the board of directors
2. Consolidated annual financial statements
2.1. Risks and uncertaintiesThe text below shows the commercial risks as evaluated by the
management and the board of directors. Each of these risks
could have a significantly negative impact on our financial situ-
ation, operating results or liquidity, and could result in special
impairment losses affecting assets.
There could be risks that the SIPEF group currently assumes to be
limited, but which ultimately could have a significantly negative
effect. There could also be additional risks that the group is not
aware of.
The main non-covered commercial risks are identified as follows:
- Fluctuations in the market prices for the basic products of
palm oil, rubber, tea and bananas;
- climatological conditions;
- geo-political developments;
- expansion risks.
The realized turnover and margin are largely dependent on fluc-
tuations in the market prices of mainly palm oil and palm kernel
oil. A change in the palm oil price of USD 10 CIF per tonne has an
impact of about USD 1.2 million per year on the results after tax.
The volumes produced and thus the turnover and margins are
to a certain degree affected by climatological conditions, such as
precipitation, sunshine, temperature and humidity.
In view of the fact that the majority of the investments of the
SIPEF group is located in developing countries (Indonesia, Papua
New Guinea and Ivory Coast), the geo-political developments in
these regions are an extra point of interest to the management.
The recent past has shown that the possible unrest in these coun-
tries has had a limited effect on the group’s net results, subject to
the impact of macro-economic measures.
Whether the SIPEF group will succeed in realizing the intended
additional expansion will depend on the acquisition of new con-
cession agreements for agronomically suitable land, which fits
into the group’s policy on sustainability in economically responsi-
ble terms. If the group does not succeed in this, it could put pres-
sure on its growth plans.
Aside from these most significant risks, the group also has other,
more general risks, to consider, such as:
- currency, interest, credit and liquidity risks, as discussed in the
financial section of this annual report;
- risks associated with social campaigns;
- risks associated with information technology systems;
- risks associated with regulations;
- risks associated with legal matters;
- risks associated with internal audit;
- risks associated with fiscal inspection;
- risks associated with environmental liability;
- ...
2.2. Explanatory notes to the consolidatedannual financial statements
The consolidated annual financial statements for the financial
year 2013 are drawn up in accordance with the “International
Financial Reporting Standards “(IFRS).
The consolidated balance sheet total as at 31st December 2013
is KUSD 710 095, an increase of 12.38% compared to the balance
total of KUSD 631 842 at the end of 2012.
The continued expansion of the plantations in Indonesia and
Papua New Guinea, and the increase in the fair value of existing
areas of oil palms in the same countries, resulted in a further in-
crease in the biological assets that now amount to KUSD 334 712.
In addition to the standard replacement capital expenditure, the
increase in other fixed assets was due to additional compensa-
tion payments made for expansion in North and South Sumatra
and investment in the further optimization of production sites in
Hargy Oil Palms Ltd in Papua New Guinea and the UMW group in
North Sumatra.
The “net assets held for sale” were the net assets of PT Timbang
Deli that, as a result of the execution of the previously announced
joint venture agreement of October 2013 between SIPEF, NBPOL
and BioSing, will be transferred to this new activity.
The net current assets, net cash, rose mainly due to significant tax
prepayments.

SIPEF | ANNUAL REPORT 2013 25
The net financial position decreased by KUSD 50 111 as a result of
the negative free cash flow of KUSD 27 658 and a dividend distri-
bution of KUSD 21 302.
The consolidated equity capital of the SIPEF group, group share
prior to allocation of profit, has increased to KUSD 508 058. This
corresponds to USD 57.15 per share (excluding own shares).
Turnover fell by 12.3% due to the drop in volumes and lower
selling prices for palm oil, rubber, tea and bananas.
In our Indonesia activities the USD cost price per tonne remained
almost stable for the second consecutive year, thanks to a de-
valuation of the rupiah by 12.2% as compared with 2012. This
compensated for the effect of local wage inflation and lower pro-
duction. In Papua New Guinea our USD cost price per tonne fell
by approximately 9.5% in 2013, mainly due to the devaluation of
the kina by 13.1%, so that cost prices of prior to the start of the
LNG project in 2011 could become once more a reality.
Gross profit fell by an average of 15.9%, whereas for rubber and
tea this was as much as about 30% due to the considerably lower
selling prices.
Taking account of the above factors, operating results before
IAS41 decreased by 20.7%.
The other operating income/charges included additional provi-
sions for a VAT dispute in Indonesia (KUSD 3 159 before tax).
The limited net financial charges reflect the group’s strategy to
fund expansion with auto-financing. Exchange rate differences
had a limited effect, a direct result of a consistently implemented
policy of currency hedging.
The effective tax charge before IAS41 was 22.16%. There was
a positive effect on the average tax rate, that was theoretically
27.4%, by a combination of permanent and temporary differences
between the USD consolidation and the local accounts.
Participation in the insurance industry focuses on the core activi-
ties of marine and general risk insurance. Temporarily lower tech-
nical results in specific marine activities meant that the positive
trend of the last few years was not continued.
Profit for the period, without taking account of the results linked
to the IAS41 application, was KUSD 49 255, which was 23.8%
lower than the result in 2012.
The IAS adjustment consists of substituting the depreciation
charge in the cost of sales with the variation in the ‘fair value’
of the biological assets between the end of 2012 and the end
of 2013, reduced by the planting costs and associated deferred
tax charges. The gross variation in biological assets amounted to
KUSD 36 461 and resulted mainly from an increase in the mar-
gins used and the expansion and increasing maturity of the
newly planted areas of our UMW oil palm plantation in Indone-
sia and Hargy Oil Palms Ltd in Papua New Guinea. Planting costs
of KUSD 28 717 reduced the net impact before taxes to KUSD
12 674, which was the basis for the average deferred tax calcula-
tion of 24.2%. The net positive IAS41 impact, share of the group,
amounted to KUSD 9 002 and was 18.7% higher than the KUSD
7 581 for the previous year.
The net IFRS result, share of the group, including IAS41 adjust-
ments, amounts to KUSD 55 627 and was 18.7% lower than the
previous year.
2.3. Significant events after theclose of the financial year
In execution of the joint-venture agreement of October 2013
between SIPEF and NBOL (concerning the start of a project for
developing high yielding palm trees), PT Timbang Deli Indonesia
will be contributed by SIPEF in the company Verdant Bioscience
Singapore (VBS). This transaction will have a material impact on
the consolidated result of 2014. Considering SIPEF will only own
38% of VBS, PT Timbang Deli Indonesia will as of 2014 no longer
be an integral part of the consolidation scope of the SIPEF group
(we also refer to note 21 – assets/liabilities held for sale).
2.4. Research and developmentSIPEF and its consolidated companies did not undertake any
activities with respect to research and development activities
during 2013.
2.5. Financial instrumentsWithin the SIPEF group, we make limited use of financial tools
for risk management. These are financial instruments that sup-
posedly ameliorate the effect of the increase in interest rates and
exchange rates.

‘THE CONNECTION TO THE WORLD OF SUSTAINABLE TROPICAL AGRICULTURE’
Annual report of the board of directors
The providers of these financial tools are exclusively reputable
Belgian banks that SIPEF has built up long-term relationships
with.
2.6. Prospects for 2014The expected volumes for the group are generally favourable at
the start of the year.
Indonesian palm oil production is satisfactory in the mature
plantations in North Sumatra and in PT Agro Muko in Bengkulu
province, and also the increasing volumes from the young plan-
tations in the UMW/TUM projects will likely meet expectations.
The plantations of Hargy Oil Palms Ltd in Papua New Guinea are
recovering from a very wet January, in which rainfall was again
more than 1 000 mm; this caused problems in the estates, but
did not result in any permanent damage. Production volumes are
currently 16% below expectations, although still 5.28% above
January last year. The outlook for the harvest for the next few
months is favourable, if weather conditions will allow it.
Rubber volumes are increasing once more in all the Indonesian
plantations, with the exception of the Bandar Pinang plantation,
where we are still experiencing the effect of the wind damage
last year. Production in January is already 15.74% above last year.
In Papua New Guinea we are trying to increase the raw rubber
quantity from our own plantations and from the smallholders to
reduce our production costs.
So far tea volumes suffered again due to the lack of sunshine.
Banana production for the first quarter is expected to reach 14%
higher than the first quarter of last year, due to the absence of the
usual drought in Ivory Coast at the start of the year.
Lower palm oil stocks compared to last year will be the upbeat for
a positive price scenario. The additional demand from the Indo-
nesian bio-energy mandates will consume almost all additional
supply in 2014, which effectively implies there will be no addi-
tional oil available for export. The record soybean crop in South
America can bring relief, although dry and hot weather condi-
tions could impact the crop negatively. Therefore it is expected
that the traditional discount of palm oil versus soybean oil will be
minimal, and could even lead temporarily to a premium for palm
oil. The global demand for food and bio-energy is still growing by
3 to 4% per annum. Therefore we are looking positively at palm
oil price development throughout 2014.
The rubber market is suffering from the relatively poor Chinese
economic data, its biggest consuming country. The high stock
will keep a lid on prices and 2014 will remain a challenging year
for the rubber producers. In the first six weeks of the year the
rubber market dropped almost 15%. However, the better eco-
nomic global outlook could spark the car and heavy equipment
industries to consume more rubber, particularly at these lower
prices.
Kenya, India and Sri Lanka all had a record tea production in
2013. This will still have an impact on prices during the first quar-
ter considering the stocks carried forward. Weather in Kenya in
coming months will decide the medium term direction of the
market, although it is expected that the crop will retract from
2013’s record harvest.
Due to the unfavourable weather conditions in the main produc-
ing countries the world supply of bananas for the first quarter
will not meet demand, which will lead to a price increase in this
period of the year. Because of the weak currency of the dollar,
producers are more inclined to export to Europe, which may
destabilize the market in this part of the world.
For palm oil in particular we have already covered a significant
part of our expected income for 2014. 36% of our expected
volume has already been sold at an average of USD 1 001 per
tonne CIF Rotterdam. In addition, 12% of the rubber volume was
sold at an average of USD 2 357 per tonne FOB and about one
third of the tea volumes was sold at the current lower market
prices. In 2014 we will continue our marketing strategy for
bananas, with fixed prices for the whole year, via sales in England
and France.
Due to the uncertainty on the outlook on palm oil prices over the
next few months, we remain hopeful that the SIPEF group will
achieve a satisfactory result once more in 2014. The final result
will mainly depend on the volumes produced, the strength of
market prices in the second half of the year, the export tax on
palm oil in Indonesia and the development of cost prices; the
latter will be affected, among other things, by the variance of
local currencies against the reporting currency (USD).
SIPEF | ANNUAL REPORT 2013 27
Once the two new palm oil mills are operational at the end of the
first trimester, most of our capital investment will be concentrat-
ed on the expansion of new plantations in Indonesia and Papua
New Guinea. In Hargy Oil Palms Ltd 600 hectares have already
been prepared for planting as soon as the rainy season allows
and the emphasis is on bringing the more than 3 000 hectares
that have already been planted in the past three years into pro-
duction, next to the replanting of more than 700 hectares of old
oil palms with new high-yielding varieties.
In Musi Rawas in South Sumatra the compensation of local land-
owners is continuing on three concessions at the same time; new
plantations can be planted as quickly as possible in these zones.
In 2014 we hope to expand the earlier planted 223 hectares to
half of the 4 000 hectares already compensated. Both the com-
pensation and the new plantations continue to consume a lot
of time due to the complex social conditions in this region. It is
therefore not yet possible to determine the ultimate size of this
new region in SIPEF activities, but over the next three years we
will continue to work towards the expansion of a sustainable and
profitable project in this high-quality agricultural area.
Our expansion programs remain, however, dependent on the
cash flows generated by the group, without building a structural
debt position.
2.7. Explanation of the responsibilitiesThe undersigned declare that, to their knowledge:
- the consolidated financial statements for the financial year
ended on 31st December 2013 were drawn up in accordance
with IFRS (International Financial Reporting Standards) and
provide an accurate picture of the consolidated financial posi-
tion and the consolidated results of the SIPEF group and its
subsidiary companies that are included in the consolidation;
- the financial report provides an accurate overview of the main
events and transactions with affiliated parties, which occurred
during the financial year 2013 and their effects on the finan-
cial position, as well as a description of the main risks and un-
certainties for the SIPEF group.
On behalf of the board of directors, 20th February 2014.
François Van Hoydonck Baron Bracht
managing director chairman

‘THE CONNECTION TO THE WORLD OF SUSTAINABLE TROPICAL AGRICULTURE’

SIPEF | ANNUAL REPORT 2013 29
View of the construction of the newly installeddigesters and screw presses in the nearlyfinished palm oil extraction mill at PT UMW inNorth Sumatra.

‘THE CONNECTION TO THE WORLD OF SUSTAINABLE TROPICAL AGRICULTURE’
Annual report of the board of directors
3. Corporate Governance
SIPEF’s Corporate Governance Charter can be found under the
heading ‘Investor Relations’ on the website www.sipef.com.
3.1. GeneralThe board of directors of SIPEF approved the first corporate gov-
ernance charter (“Charter”) on 23 November 2005. The Charter
was prepared in accordance with the provisions of the Belgian
Corporate Governance Code (“Code”) that was announced by
the “Corporate Governance Committee” on 9th December 2004.
This version of the Charter already coincided with various Royal
Decrees implementing European rules on market abuse.
SIPEF currently uses the Belgian Corporate Governance Code
2009 as a reference and the corporate governance charter
approved by the board of directors of SIPEF is in compliance with
the Code.
As specified in the Code, SIPEF must devote specific attention
in a chapter of its annual report (the “Corporate Governance
Chapter”) to factual information concerning corporate govern-
ance, any amendments to the corporate governance policy and
relevant events in connection with corporate governance that
have occurred during the previous year. The “Corporate Gov-
ernance Chapter” also provides a more detailed explanation of
the deviations from the Code recommendations, in terms of the
“comply or explain” principle, during the past financial year.
3.2. Board of directors3.2.1. Membership
The board of directors consists of nine members.
End of term of appointment
Baron Bracht, chairman 2014
François Van Hoydonck, managing director 2015
Baron Bertrand, director 2016
Priscilla Bracht, director 2014
Jacques Delen, director 2016
Antoine Friling, director 2015
Regnier Haegelsteen, director 2015
Sophie Lammerant-Velge, director 2015
Richard Robinow, director 2015
The board of directors will submit a proposal to the ordinary gen-
eral meeting of 11th June 2014 to renew the appointments of
Baron Bracht and Madam Priscilla Bracht, both as non-executive
directors, for a period of 2 and 4 years respectively, which will
expire at the general meetings of 2016 and 2018.
3.2.2. Non-executive and executive directors
François Van Hoydonck has been managing director since
1st September 2007.
The remaining eight directors are non-executive directors. Ack-
ermans & van Haaren on the one hand, and Baron Bracht, his
children and their affiliated companies CABRA NV and GEDEI
NV on the other hand, have declared that they possess together
39.555% of the shares in SIPEF.
The directors who hold directorships in other listed companies
outside the group are:
Baron Bertrand:
Ackermans & van Haaren, Atenor Group, Leasinvest Real Estate,
Groupe Flo (FR) en Schroders (UK);
Jacques Delen:
Ackermans & van Haaren;
Regnier Haegelsteen:
Atenor Group;
Richard Robinow:
MP Evans Group plc (UK), R.E.A. Holdings plc (UK) en REA Vipingo
Plantations Ltd (Kenya).
3.2.3. Independent directors
Antoine Friling
Sophie Lammerant-Velge
Both directors fulfil all of the independence criteria set out in ar-
ticle 526ter of the Code.
3.2.4. Activity report
The board of directors of SIPEF met five times in the course of
2013. The average attendance rate was 91%. Individual attend-
ance records were as follows:

SIPEF | ANNUAL REPORT 2013 31
Baron Bracht, chairman 5/5
François Van Hoydonck, managing director 5/5
Baron Bertrand 5/5
Priscilla Bracht 4/5
Jacques Delen 3/5
Antoine Friling 5/5
Regnier Haegelsteen 5/5
Sophie Lammerant-Velge 5/5
Richard Robinow 4/5
During 2013, the board of directors followed the group results
and the development of the activities of the various subsidiaries
by means of reports prepared by the management committee.
The board of directors also took major investment and disposal
decisions during the past financial year.
At its meeting on 19th February 2013, the board of directors
discussed the relationship between itself and the management
committee, in accordance with article 2.7 of the Charter and in
the absence of the executive director. The directors concerned
expressed their satisfaction with the transparency and the excel-
lent collaboration between the two bodies. In this context, they
passed a few suggestions to the executive director.
The directors also assessed the size, composition and operation
of the board of directors and of the committees, paying particu-
lar attention to their current composition, which was assessed in
comparison with the desired composition. It was also established
that there was a proportionate balance of specific skills – such
as the interpretation of financial reporting, familiarity with the
sector, experience in management of a company and opera-
tion of financial markets – within the current composition of the
board of directors.
The board of directors held a special meeting on 19th September
2013 concerning the group’s strategic development, based on a
business plan covering ten years.
3.2.5. Rules of conduct concerning conflicts of interest
The board of directors also announced in the Charter (2.9 and
4.7) its policy in relation to transactions that might give rise to
conflicts of interest (whether or not coinciding with the defini-
tion in the Code). There was no need to apply this policy during
the financial year.
3.2.6. Rules of conduct concerning financial transactions
The board of directors announced its policy concerning the pre-
vention of market abuse in chapter 5 of the charter.
3.3. Audit committee3.3.1. Membership
Regnier Haegelsteen
- chairman and non-executive director;
Antoine Friling
- independent and non-executive director;
Sophie Lammerant-Velge
- independent and non-executive director.
It was confirmed, in accordance with article 526bis of the Code,
that Regnier Haegelsteen, chairman of the committee, possesses
the requisite skills within the disciplines of accountancy and au-
diting. Regnier Haegelsteen no longer fulfils the independence
criteria specified in article 526ter of the Code.
3.3.2. Activity report
The audit committee met on four occasions in 2013. The attend-
ance rate (or representation by proxy) was 100%. In February and
August, the committee focused primarily on analysing the annual
and six-monthly financial reports, in the presence of the auditor.
It also considered the figures for the proposed press release, as
well as the “one-to-one rule” for the waiver of the auditor’s inde-
pendence. There was also an explanation and discussion on the
procedures for valuing the biological assets, in the context of
IAS41. Finally, the audit committee also held a private session on
each occasion with the auditor, but in the absence of members of
the executive board.
In November, in addition to considering internal audit commit-
tee reports from Indonesia, Hargy Oil Palms Ltd and the insurance
activities, the committee also re-examined and supplemented a
risk analysis for the group.
These committees were also attended by the chairman of the
board of directors, the managing director, the CFO and a repre-
sentative of Ackermans & van Haaren.
The audit committee systematically reported on the perfor-
mance of its duties to the board of directors.

‘THE CONNECTION TO THE WORLD OF SUSTAINABLE TROPICAL AGRICULTURE’
Annual report of the board of directors
3.4. Remuneration committee3.4.1. Membership
Regnier Haegelsteen
- chairman and non-executive director;
Antoine Friling
- independent and non-executive director;
Sophie Lammerant-Velge
- independent and non-executive director.
The remuneration committee meetings were consistently at-
tended by representatives of the Bracht family and Ackermans
& van Haaren.
3.4.2. Activity report
The remuneration committee met twice in 2013, on 19th
February and on 19th November. The average attendance rate (or
representation by proxy) was 100%. The remuneration commit-
tee made recommendations to the board of directors in connec-
tion with fixed remuneration for the directors and the chairman,
as well as recommendations for the remuneration of the man-
agement committee, the amount and payment formats for the
variable remuneration and individual payments for the man-
agement committee, as well as salaries and variable remunera-
tion for board members of subsidiaries residing abroad. At the
meeting of 19th November, the remuneration committee made
recommendations to the board of directors in connection with
the offer of share options to the management committee and the
group’s foreign management teams, and regarding the organiza-
tion of the management committee.
3.5. Management committee3.5.1. Membership
François Van Hoydonck
- managing director
Didier Cruysmans (till October 2013)
- director estates department
Charles De Wulf (as from October 2013)
- director estates department
Thomas Hildenbrand
- director marketing bananas and horticulture
Robbert Kessels
- director marketing commodities
Johan Nelis
- chief financial officer
Matthew T. Adams
- external visiting agent
Baron Bracht (chairman of the board of directors) and Priscilla
Bracht (non-executive director) periodically attended the meet-
ings of the management committee as observers.
3.5.2. Activity report
Except in unforeseen circumstances, the management com-
mittee meets once each week. The management committee’s
responsibilities include the day-to-day management of the
group and it also prepares the decisions that have to be taken by
the board of directors.
3.6. Remuneration report3.6.1. Procedure to develop a remuneration policy
and to adopt remuneration levels
The remuneration of the non-executive directors consists ex-
clusively of a fixed payment. This fixed payment consists of a
basic payment and, in appropriate cases, an additional payment
depending on whether the director concerned is a member of a
specific committee.
The remuneration committee periodically assesses the payment
of non-executive directors. The remuneration committee submits
any proposed adjustments to the board of directors for approval.
The members of the management committee receive a fixed re-
muneration and a variable payment depending on the consoli-
dated recurrent results of the SIPEF group (see also under “Policy
regarding variable payments”). They also have use of a company
car and membership of a group insurance plan (pension accrual,
death benefit cover, invalidity cover), meal tokens, a legal assis-
tance insurance policy offering worldwide coverage and hospitali-
sation cover. The group insurance is of a “fixed contribution” type.
Share options were offered to the members of the management
committee and some of the executive directors of the foreign
affiliated companies during 2011, 2012 and 2013. The share op-
tions, which were offered under the SIPEF share option plan, have
the following features:
- Offer: end of November;
- Exercise price: price established on the basis of the average
closing price for the share over 30 days prior to the offer;
SIPEF | ANNUAL REPORT 2013 33
- Exercise period: the options may be exercised from the end
of the third calendar year after the year in which the offer is
made, until the end of the 10th year, counting from the date
of the offer.
These elements are assessed each year by the remuneration
committee, and tested for market conformity. This is generally
done at a meeting in November or December. The test is under-
taken on the basis of public information (for instance, the remu-
neration data included in the annual reports of other comparable
listed companies) and salary studies. Any amendments proposed
by the remuneration committee are submitted to the board of
directors for approval.
3.6.2. Policy regarding variable remuneration
The variable remuneration that is awarded to members of the
management committee depends upon predetermined and ob-
jectively verifiable performance criteria, measured over a period
of one financial year (as mentioned in the bylaws) and depends in
particular upon the consolidated recurrent results, before IAS41,
of the SIPEF group. In other words, there is no long-term cash
incentive plan. The variable remuneration is paid in July of the
ensuing financial year, the same month when dividends are dis-
tributed to the shareholders.
There is a provision for the company to have a right to reclaim the
net variable remuneration that is awarded to the executive direc-
tors and members of the management committee on the basis of
incorrect financial data.
3.6.3. Remuneration of executive and non-executive directors
The remuneration for the directors, for the financial year 2013,
was set at a fixed annual amount of KEUR 20 for the chairman
and KEUR 20 for each director. The members of the audit commit-
tee receive a fixed annual payment of KEUR 4 and the members
of the remuneration committee receive a fixed annual payment
of KEUR 2. These figures are therefore not related to the amount
of the results and can be regarded as fixed, non-performance re-
lated payments awarded during the financial year.
Directors who retire or are appointed during the financial year
are paid pro rata, depending on the length of their mandate in
the financial year.
The individual remuneration figures for the directors, as actually
received in 2013 in the form of payments for 2013, were:
In KEUR
Baron Bracht, chairman 20
François Van Hoydonck, managing director 20
Baron Bertrand 20
Priscilla Bracht 20
Jacques Delen 20
Antoine Friling 26
Regnier Haegelsteen 26
Sophie Lammerant-Velge 26
Richard Robinow 20
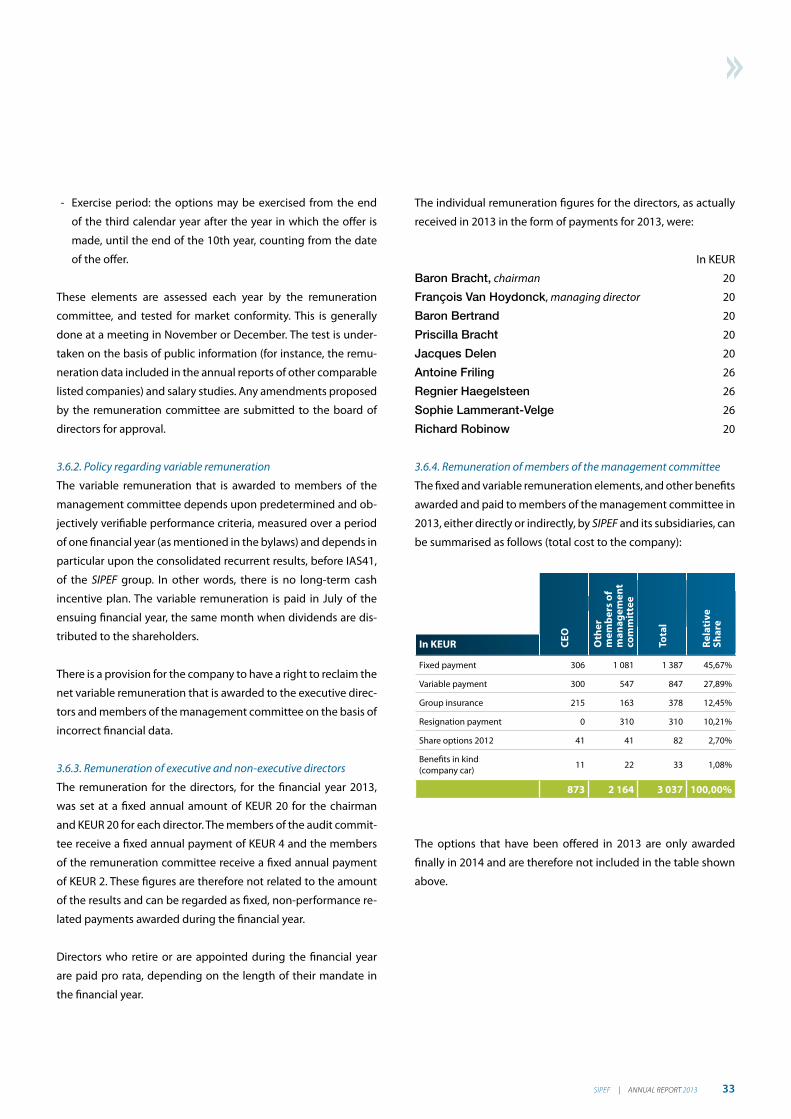
3.6.4. Remuneration of members of the management committee
The fixed and variable remuneration elements, and other benefits
awarded and paid to members of the management committee in
2013, either directly or indirectly, by SIPEF and its subsidiaries, can
be summarised as follows (total cost to the company):
CE
O
Oth
er
me
mb
ers
of
ma
na
ge
me
nt
com
mit
tee
To
tal
Re
lati
ve
Sh
are
In KEUR
Fixed payment 306 1 081 1 387 45,67%
Variable payment 300 547 847 27,89%
Group insurance 215 163 378 12,45%
Resignation payment 0 310 310 10,21%
Share options 2012 41 41 82 2,70%
Benefits in kind(company car)
11 22 33 1,08%
873 2 164 3 037 100,00%
The options that have been offered in 2013 are only awarded
finally in 2014 and are therefore not included in the table shown
above.

‘THE CONNECTION TO THE WORLD OF SUSTAINABLE TROPICAL AGRICULTURE’
12
3 45
Annual report of the board of directors
1. Thomas Hildenbrand2. Charles De Wulf3. Johan Nelis4. Robbert Kessels5. François Van Hoydonck

SIPEF | ANNUAL REPORT 2013 35

‘THE CONNECTION TO THE WORLD OF SUSTAINABLE TROPICAL AGRICULTURE’

SIPEF | ANNUAL REPORT 2013 37
3.6.5. Options awarded to members of the
management committee in 2013
Due Date 31st december 2023
Exercise price EUR 55.50
François Van Hoydonck 6 000
Matthew T. Adams 2 000
Thomas Hildenbrand 2 000
Robbert Kessels 2 000
Johan Nelis 2 000
Total 14 000
In total, 6 000 options were awarded to some of the managing
directors of the foreign subsidiaries.
3.6.6. Most significant contract terms
The managing director is subject to the Statute for the Self-
employed and has a permanent contract. The contract can be
terminated unilaterally by the managing director, subject to a
notice period of 6 months, while the company must observe a
notice period of between 18 and 24 months depending on the
timing of termination of the contract. The notice period will be
extended by 12 months in the event of termination of the agree-
ment as a result of changes in the company’s control in terms of
which more than half of the directors are replaced, and in the
event of serious restrictions in the essential powers introduced
unilaterally by the company. This final provision was approved by
the extraordinary general meeting of 27th December 2007, in the
context of article 556 of the Code.
The position of “external visiting agent” (EVA) was created on 1st
November 2010. The EVA has an exclusivity contract with SIPEF.
This contract can be terminated by either party, subject to a
notice period of one year. The payment awarded to the EVA is
commensurate with the payments awarded to the members of
the management committee. As of 1st January 2014, the exclu-
sive fulltime cooperation was changed into a non-exclusive part-
time agreement.
The contracts with the other members of the management
committee are subject to the statute on employees and contain
the normal provisions regarding remuneration (fixed and vari-
able payments) and insurances. The contracts are permanent in
nature. Any member of the management committee is entitled
to terminate his contract unilaterally, subject to a notice period
of six months. The company can terminate the contract with each
member of the management committee unilaterally, provided
that it gives appropriate notice, determined in accordance with
the rules and customs associated with the Statute on Employees.
One of the newly installed boilers thatgenerates steam as a primary energy sourcefor the oil extraction process in the nearlyfinished Barema Mill in Papua New Guinea.

‘THE CONNECTION TO THE WORLD OF SUSTAINABLE TROPICAL AGRICULTURE’
Annual report of the board of directors
3.6.7. Changes to the remuneration policy
No significant changes were made to the remuneration policy in
2013.
3.6.8. Remuneration policy for the next two
financial years (2014 - 2015)
The board of directors does not expect to make any fundamen-
tal changes to the remuneration policy in the current and next
financial years.
3.7. Internal and external auditThe company’s auditor is Deloitte Bedrijfsrevisoren BV o.v.v.e.
CVBA, represented by Dirk Cleymans.
The auditor arranges for the external audit of the consolidated
and summarised figures for the SIPEF group and reports twice
each year to the audit committee and the board of directors.
The auditor was appointed at the ordinary general meeting of
8th June 2011 and his mandate expires in June 2014.
The board of directors will propose to the ordinary general meet-
ing to renew the mandate of Deloitte Bedrijfsrevisoren BV o.v.v.e.
CVBA, represented by Dirk Cleymans, for a period of three years.
The annual payment to the auditor for the audit of the sum-
marised and consolidated annual financial statements of SIPEF
amounts to KEUR 81. An additional sum of KEUR 33 is also paid to
the company to which the auditor is affiliated, for legal, account-
ancy and fiscal work. These payments are approved by the audit
committee, which received a summary of these honoraria at each
meeting.
The total cost for the external audit of the SIPEF group was KEUR
338 and the amount paid to the same auditor and his affiliated
businesses for advice was KEUR 88.
The internal audit for Indonesia and Hargy Oil Palms Ltd in Papua
New Guinea is structured within an audit department, with a
committee meeting four times each year to consider the inter-
nal audit reports. The internal audit for our insurance business is
subcontracted. The audit committee at SIPEF receives a summary
of their work, with an explanation and estimate of the potential
impact of the findings, which allows it to assess the work of the
local audit department. For the other subsidiaries, the internal
audit is organised by the financial controller. Bearing in mind the
more limited size of these companies, the audit committee has
decided that there is no need, for the time being, to set up any
separate audit department.
3.8. Shareholder structureAs stated in note 16 in the explanatory notes to the consolidated
financial statements, three shareholders have announced a hold-
ing in excess of 5% in our company. The company has no knowl-
edge of any agreements among these shareholders, nor of the
existence of committees of shareholders or directors, with the ex-
ception of the common declaration of 12th February 2007, which
is also included in explanatory note 16.
On that date, Ackermans & van Haaren (AvH) NV and acting in
consultation with Baron Bracht and children, CABRA NV and
GEDEI NV, notified the company of the conclusion of a sharehold-
er agreement with a view to the creation of a stable shareholding
in SIPEF. This was done to promote the balanced development
and profitable growth of SIPEF and its subsidiary companies. The
shareholder agreement, which was concluded for a period of 15
years, includes voting arrangements in connection with the ap-
pointment of directors and arrangements in connection with the
transfer of shares.
The relevant information concerning this transparency report
can be found on the company’s website (www.sipef.com).
3.9. Coincidence with the Belgian CorporateGovernance Code – comply or explain
The Charter at SIPEF deviates from the recommendations of the
Code on a limited number of points.
3.9.1. Membership of the nomination committee
In accordance with recommendation 5.3.1 of Appendix D to the
Code, the nomination committee must have a majority of inde-
pendent non-executive directors.The nomination committee of
SIPEF consists of every member of the board of directors. Since
only 22% of the membership of the board of directors is made
up of independent non-executive directors, the Charter deviates
from the Code on this point.
The board of directors considers, however, that this deviation is
well-founded, bearing in mind the fact that its relatively limited
size (with nine members) does not hinder efficient deliberation
and decision-making processes. Furthermore, the board of direc-

SIPEF | ANNUAL REPORT 2013 39
tors as a whole is in a better position to consider its own size,
membership and succession plans.
3.9.2. Gender diversity
In accordance with paragraph 2.1 of the Code, the board of di-
rectors must be composed in a manner compliant with the
principles of gender diversity as well as of diversity in general.
After the recent nominations, the board of directors of SIPEF is
composed of seven men and two women with varying yet com-
plementary knowledge bases and fields of experience.
The board of directors has taken note of the recent legislative ini-
tiatives with regard to representation of women on the boards of
directors of listed companies and will make every effort to con-
form its composition to the actual legislation before 1st January
2017.
3.10. Report on internal controls andrisk management systems
The board of directors of SIPEF is responsible for assessing the
company’s inherent risks and the effectiveness of its internal con-
trols.
SIPEF’s internal control system was set up in accordance with the
accepted principles relating to internal controls (relevant statu-
tory regulations, Code 2009 and COSO).
The basis of the internal controls and risk management system is
established by means of a risk assessment that has been carried
out at a group level. Particular attention is paid to the reliability of
financial reporting and the communications process.
3.10.1. Control environment
SIPEF implements a Corporate Governance Charter, which aims
to promote the observance of accepted ethical standards by
directors, management and staff in carrying out their duties.
The board of directors at SIPEF supports the application of clear
rules on sustainability, which are applied in terms of the policy
governing our day-to-day operations and which are also more
stringent than the statutory requirements in the countries in
which we operate.
Our operations are assessed in accordance with commonly ap-
plied standards, such as ISO9001, ISO14001, the “Roundtable on
Sustainable Palm Oil” (RSPO), “Indonesian Sustainable Palm Oil “
(ISPO), the “International Sustainability and Carbon Certification”
(ISCC), the “Clean Development Mechanism’”(CDM) of the United
Nations, the “Ethical Tea Partnership” (ETP), “Rainforest Alliance’”
and “GlobalGAP”.
In general terms, the company structure, company philosophy
and management style may be described as being clear, which is
supported by the limited number of decision-making processes
within its hierarchy. This limited number of decision-making pro-
cesses, together with the limited degree of staff rotation, also en-
hances the social controls within the company.
The group is subdivided into a number of departments as set out
in an organisational chart. Each department and each person
within the relevant department has his/her own job description.
The required qualifications and/or level of experience are speci-
fied for each position and job. There is a clearly defined policy of
delegated powers.
3.10.2. Risk assessment and controlling activities
Strategic, operational, financial, tax-related and legal objectives
are defined in a strategic plan, which is approved annually by
the board of directors. The risks that may jeopardise the ability
to meet these objectives have been identified and designated
according to their potential importance, the probability with
which the risk might occur and the measures that have been
taken to deal with the risk according to its importance. Risk man-
agement is divided into various categories (reduction, transfer,
prevention or acceptance).
The necessary instructions and/or procedures have been issued
to ensure that the identified risks are managed appropriately.
3.10.3. Information and communication
A complete set of operational and (internal and external) finan-
cial reports has been set up to provide the necessary information
periodically (daily, weekly, monthly, six-monthly or annually) and
at the appropriate levels in order to ensure that assigned respon-
sibilities are performed properly.

‘THE CONNECTION TO THE WORLD OF SUSTAINABLE TROPICAL AGRICULTURE’
Annual report of the board of directors
3.10.4. Control
It is the responsibility of each employee to report any potential
shortcomings in the internal controls in relation to their respec-
tive responsibilities.
In addition, the internal audit departments (in Indonesia and in
Papua New Guinea at Hargy Oil Palms Ltd) and the subcontracted
internal audit (for our insurance business) are responsible for
continuous supervision of the effectiveness and observance of
the existing internal controls for their respective activities. They
propose any necessary adjustments based upon their findings.
The reports from these internal audit departments are discussed
on a quarterly basis in a local audit committee. A summary of the
most important findings is submitted annually to the group’s
audit committee.
For small subsidiaries, for which no separate internal audit po-
sition has been created, supervision of the internal inspec-
tion is fulfilled by the responsible member of the management
together with the managing director and chief financial officer
of the group.
In addition, each subsidiary of the group is (as a minimum
requirement) subjected annually to scrutiny of its financial state-
ments by an external auditor. Any comments relating to this
external audit are passed on to the management in the form of
a “management letter”. No significant shortcomings in internal
controls have been found in the past.
3.10.5. Internal controls and risk management system
associated with financial reporting
The process for drawing up financial reports is organised as fol-
lows:
- The process is directed by the“corporate finance”department,
which falls under the direct supervision of the group’s chief
financial officer;
- Depending on the (internal and external) deadlines to be met,
a retrospective schedule is drawn up, which is submitted to
each reporting entity and to the external auditor at the start
of the year. The external deadlines are also published on the
company website;
- The following reporting entities can be identified:
a. the entire group of companies in Indonesia
b. Hargy Oil Palms Ltd in Papua New Guinea
c. Galley Reach Holdings Ltd in Papua New Guinea
d. Plantations J. Eglin SA in Ivory Coast
e. Jabelmalux SA in Luxembourg
f. SIPEF in Belgium
g. BDM NV / ASCO NV in Belgium
- There is a certified accountant at the head of the financial de-
partment of each entity;
- The start of the annual reporting cycle consists of drawing
up a budget for the following year. This is completed during
the months of September to November and is submitted for
approval to the board of directors by the end of November /
the start of December. The strategic options that are included
in this budget also fit into the long-term strategic plan that
is updated and approved annually by the board of directors;
- The necessary sensitivity analyses are drawn up for both the
strategic plan and the annual budget, to be able to assess the
correct risk profile for the decisions that need to be taken;
- During the first week of each new month the production
figures and net financial position of the previous month are
received and consolidated by the corporate finance depart-
ment and are submitted to the managing director, chairman
of the board of directors and group management;
- During this first week the intergroup transactions are also
reconciled before proceeding to close the accounts;
- The monthly financial reporting consists of an analysis of the
volumes (starting stock, production, sales and finishing stock),
the operating result, a summary of the other items in the
profit-and-loss account (financial result and taxes), a balance
sheet and cash-flow analysis;
- The accounting standards that are applied for monthly
reporting are exactly the same as those that are used for the
statutory consolidation under the IFRS standards (with the
exception of the IAS41 valuations that are only included for
external reporting);

SIPEF | ANNUAL REPORT 2013 41
- The monthly figures are compared with the budget and with
the same period for the previous year for each reporting entity
in which any significant variations are investigated;
- These (summary) operating and financial figures are converted
on a monthly basis by the“corporate finance”department into
the operating currency (usually USD), consolidated into the
reporting currency (USD) and then once again compared in
terms of their consistency with the budget or the previous
period;
- The consolidated monthly report is submitted to the manag-
ing director, the chairman of the board of directors and the
group management;
- The board of directors receives this report periodically
(months 4, 6, 9 and 12) in preparation for the board of direc-
tors meetings. This report involves a memorandum contain-
ing a detailed description of the operational and financial
trends over the past quarter;
- The board of directors is also notified in the intervening period
in case of any exceptional events;
- In June and December an update is drawn up of the calcula-
tion of the actual value of the biological assets (IAS41 valua-
tion);
- The individual financial statements (only in December for
smaller entities), the IAS41 valuations, as well as the techni-
cal consolidation for June and December undergo an external
audit before the consolidated IFRS figures are submitted to
the audit committee;
- Based upon the advice of the audit committee, the board of
directors states its opinion in relation to approving the con-
solidated figures before publishing the financial statements in
the market;
- Twice a year, after the first quarter and after the third quarter,
an interim report is published on the evolution of the pro-
duced volumes, the world market prices and possible changes
in the prospects;
- It is the “corporate finance” department that is responsible for
monitoring any changes in (IFRS) reporting standards and for
implementing these changes within the group;
- The monthly management report and the statutory consoli-
dation are maintained in an integrated system. Appropriate
care is taken to provide antivirus security software, periodic
backups and measures to ensure continuity of service.

‘THE CONNECTION TO THE WORLD OF SUSTAINABLE TROPICAL AGRICULTURE’
Palm oil
The year 2013 started off in a weak palm oil environment, stocks
were at record levels of over 2.6 million tonnes in Malaysia (the
only country that launches official data), “spot oil” was heavily
discounted because tanks were filled to the brim, and the dis-
count of palm oil versus soybean oil was over USD 300 per
tonnes. The energy market has benefited from these low prices,
with Brent prices hovering around USD 105/115, and there was a
lot of demand for palm oil. Not only did the mandated blending
of biodiesel lead to further uptake in the first half of 2013, but it
also made economic sense to blend biodiesel into regular diesel
beyond the mandated levels.
From February onwards the production went into a prolonged
downward cycle whereby we saw less fruit and lower oil extrac-
tion rates. This is a phenomenon which we call “tree-stress”. 2013
is probably the first year that we have seen hardly any growth
in palm oil production, implying that yields from mature estates
have been lower year by year and that gap has been filled by the
increased production of the young trees.
The stronger biofuel demand, the attractiveness of palm versus
other vegetable oils, and the lower production drove stocks
much lower, around 1.65 million tonnes by mid-summer, a level
that is considered to be very tight. Due to great growing condi-
tions in the US and an expectation of a bumper soybean crop,
these lower palm oil stocks were not reflected in higher markets.
In fact, just prior to harvesting the soybean crop we saw the
lowest price of the year, USD 750 CIF Rotterdam.
2013 has been a year where the market traded within a very
narrow trading range. It ended the year close to its highs since
production has been disappointing throughout the year and
demand for biofuel in particular has been good. The announce-
ment that Indonesia will have a mandated 10% blending of bio-
diesel for 2014 has supported the market. This demand could
consume the entire foreseen growth of production. Given that
the stocks in Malaysia will be lower by almost three quarters of a
million at the end of 2013, we are looking forward to a positive
price scenario for palm oil in 2014.
The average price for CPO CIF Rotterdam was USD 857 against an
average of USD 999 in 2012, a decrease of 14.2%.
We have experienced greater demand for fully “segregated” sus-
tainable palm oil, fuelled by the new EU labelling regulation com-
mencing in the fourth quarter of 2014. SIPEF is in a good position
to serve its customers and we have increased our fully “segrega-
ted” sustainable palm oil and palm kernel oil commitments for
2014. Pressure throughout the food supply chain will continue
this drive to use more and more “segregated” palm oil products.
Palm kernel oil
The price of palm kernel oil was trading below palm oil for the
first half of 2013, a result of high stocks of palm kernel oil and co-
conut oil in the second half of 2012, and a lagging demand that
was caused by markets finding alternatives after the skyrocketing
prices in 2010 and 2011. Such a discount situation never lasts for
a long time. This premium oil was the cheapest vegetable oil in
the world! The price did its job and demand returned. On top of
that, there was the destructive Typhoon Hayan that hit the Philip-
pines in November 2013. More than 20% of the trees that pro-
duce coconut oil were destroyed, meaning that production is not
likely to ever return because the trees just snapped. It boosted
the lauric oil prices and palm kernel oil was back to a premium of
USD 250 over palm oil.
The average price of PKO CIF Rotterdam was USD 897 against an
average in 2012 of USD 1 110, a decline of 19.2%.
Rubber
The rubber market continued its decline in 2013 from USD 3 500
per tonne RSS3 to USD 2 500 per tonne, on the back of a slight
oversupply, high stocks particularly in China, and still a very
much hand-to-mouth buying behavior of the final customers.
The European car industry in particular was still suffering in 2013.
The second half of 2013 showed some signs of bottoming out
as prices reached production costs in the less cost efficient pro-
ducing countries. However, before we can experience a positive
price trend we need to see stocks declining.
Activity report by product

SIPEF | ANNUAL REPORT 2013 43
The average price for natural rubber RSS3 was USD 2 795 per
tonne against USD 3 375 in 2012, a decrease of 17.2%.
The global demand for natural rubber grew in 2013 by only
2.5%, which was below expectations, whereas the International
Rubber Study Group (IRSG) forecasts a growth of 5.3% for 2014
and 2015. The demand in China and the EU in particular disap-
pointed. The IRSG has established the supply growth at 3.1%
for 2013, and its forecast for 2014 and 2015 is respectively 3.9%
and 4.7%. There has been a small oversupply in the last 2 years
when predominantly China had built stocks. Next year it is likely
that we will absorb the majority of these stocks. China holds the
trump card.
Tea
Ideal weather conditions at the end of 2012 and first quarter of
2013 in Kenya, the world’s biggest exporter of black CTC (Crush,
Tear and Curl) tea, boosted a record production. The close to 20%
production increase could not be absorbed by the market, resul-
ting in stockpiling in Kenya and the destination countries. The
political turmoil in several Arab countries in the last two years
certainly played a role in the reduced demand for high quality
CTC tea; however, as of late we see demand improving.
Despite the fact that production in the second half of 2013 was
in line with 2012, the stockpiles built earlier weighed heavily on
prices, reaching the lowest prices since 2008. However, that only
accounts for CTC teas, orthodox produced tea remained stable to
slightly higher. The Cibuni tea estate produces CTC tea.
During the last quarter of 2013 the prices bottomed out. Since
then, prices have increased more than 30% and are not expec-
ted to drop below current levels in the first half of 2014. Weather
conditions, especially in Kenya, will be the main driver of the
market for the remainder of the year.
Bananas
In 2013, volumes of fruit marketed in the European Union fell by
13% as compared with 2012, and by 29% in the regional zone of
West Africa, with a total volume marketed of 22 325 tonnes.
In the European Union, the fall in volume arose from a fall in the
production of our own plantation as well as from a fall in the tra-
ding of a third party producer in the Ivory Coast. The fall in sales
in the sub-region of West Africa is explained by defective logistics
between the ports of Abidjan and Dakar, mainly during the first
half of the year.
England and France continue to be the main destination coun-
tries for the fruits we sell. We called a halt to sales to Spain in the
second half of the year. Our packaged “a la carte” programmes
continue, with ripener clients supplying the big supermarket
chains where we obtain added value, enabling us to continue
our presence in a period of crisis where margins can be low, or
even disappear.
In 2013, global supply to the European Union increased by 4%,
with provenance largely from the dollar zone, with Ecuador,
Colombia and Costa Rica increasing supply by 6%. The ACP
(Africa, Caribbean and Pacific) countries, with the main producers
being the Dominican Republic, Cameroon and Ivory Coast, also
registering an increase in volumes placed on the market amoun-
ting to 7%. On the other hand, production from the EU zone -
dominated by the Canaries, Martinique and Guadeloupe - fell by
7%. These trends will certainly continue in coming years.
We would point out that analysis over several years shows that
banana markets - in green price terms - are stabilising, thanks to
a sharp fall in spot offers on the free market.
The“Bananas Accompanying Measures”(MAB) programmes sup-
porting ACP producers have begun. Ivory Coast will benefit from
an overall budget of EUR 44.75 million, which should make it pos-
sible to limit the impact of the fall in customs duties for dollar
bananas imported into the EU region. As a reminder, on January
1st 2014, import customs duties for the Latin American coun-
tries currently stand at EUR 132 per tonne but will fall gradually
to EUR 114 per tonne on 1st January 2019. Some countries, such

‘THE CONNECTION TO THE WORLD OF SUSTAINABLE TROPICAL AGRICULTURE’
The cyclone dries the shells of the fruit nuts,which are used as an energy source for theboilers.

SIPEF | ANNUAL REPORT 2013 45
as Colombia and Peru, have already ratified parallel agreements
with the EU which guarantee access to the market by means of a
progressive change to EUR 75 per tonne by 2020. These countries
will pay, from the beginning of this year, EUR 117 per tonne in
customs duties, in other words, EUR 15 per tonne less than the
biggest producer and exporter country, Ecuador.
The ACP countries - and Ivory Coast - will have to improve com-
petitiveness and maintain their current qualitative level if they
are to keep their market share. Currently, our Ivory Coast produc-
tion remains on the market and is competitive!
Horticulture
Marketing of pineapple bromelias followed the same pattern as
in previous years even though the traditionally most busy month
of the year - December - was characterised by two trends: the first
fortnight extremely busy, the second quiet...
Our production is sold largely in Northern Europe. Dispatch
flights from Abidjan have been profitable since the end of the
crisis. Productivity increased from the second half of the financial
year, enabling us to lower costs and to increase sale prices.
Trading in ornamental leaves continued to improve and we
believe that we will soon reach optimal volumes of approxima-
tely 1.3 million units of Dracaena Compacta and Cordylines. New
varieties are being intensively developed in order to increase the
range on offer to our customer base.
Sales of lotus flowers remain stable with approximately 260 000
units sold.

‘THE CONNECTION TO THE WORLD OF SUSTAINABLE TROPICAL AGRICULTURE’
Indonesia
North Sumatra
BengkuluSouth Sumatra
Cibuni – Java
In generalDespite a very strong first term, the second period of office
for President Susilo Bambang Yudhoyono, which started in
2009, has seen few fundamental changes in the Indonesian
government’s policies. The focus remains on reducing pov-
erty, improving the public sector, supporting democracy and
increasing legal certainty. Particularly in the last years of his
current period of office, the emphasis appeared to be on ad-
hering to the measures taken in the first term. The country is
now once more facing a major election period, with voting
for the regional and national parliaments on 9th April and the
presidential elections on 9th July 2014. Since, after two terms,
the current president cannot run for office anymore, the iden-
tities of the final party representatives and their plans for tack-
ling the necessary reforms are being awaited with interest.
2013 was a difficult year for Indonesia, both politically and eco-
nomically. For the first time since 2009, the country failed to
reach a 6% annual growth rate. A weak fourth quarter showed
an economy hampered by a weak currency, high interest rates
and a negative balance of payments. The final growth of the
Gross Domestic Product (GDP) was 5.78% compared to 6.1%
in 2012. Reductions in fuel subsidies were the main reason for
rising inflation rates, which amounted to 8.4% by year-end
2013 compared to just 4.3% the year before.
The weak currency was the result of the rising interest rates
imposed by Bank Indonesia, which had an impact on invest-
ments from the private sector. A decline in imports of raw
materials and machinery also played a role. Last year, Bank
Indonesia raised interest rates five times in order to curb the
deficit. In 2013, the Indonesian Rupiah (IDR) fell by 26%.
Indonesia, which has long sought to join the “BRICS” group of
growing economies, is now listed as one of the “Fragile Five”
countries, together with Brazil, India, South Africa and Turkey.
These countries are experiencing problems with their balance
of payments and have become too dependent on foreign in-
vestment to finance growth. Yet the financial markets certainly
do not wish to penalise Indonesia. In fact, they express their
admiration for the way the country tackled its now reduced
deficit. Furthermore, its foreign exchange reserves are grow-
ing once more.
Indonesia is facing a challenging period on a social level too.
The average GDP per capita is now around USD 4 800 and is
considered a lower middle-class income. In order to become a
higher income country, the GDP has to grow to a minimum of
USD 11 750 per capita, which is still far off. The average income
appears to be stagnating rather than growing. High prices for
commodities have boosted the economy in recent years, but
the growth and wealth that these prices brought with them
has had more impact on the world economy than on the coun-
try itself. The middle class is being encouraged to consume at
this time but since the income level does not allow this, we
see consumer loans rising, especially through the import of
goods. This is one of the main causes of the payment deficit
and the weakening currency.
By the end of the year, we again saw major discussions and
political movements arguing for a rise in the minimum wages.
The elections for governor in early 2013 led to a substantial
increase in the minimum wage in most provinces, with peaks
of 44% in Jakarta and even over 50% in Kalimantan. The pro-
posed rises for 2014 are more limited in most provinces but
still amount to between 10% and 20% compared to last year.
Naturally, such recurring annual increases impact heavily on
labour-intensive sectors, including tropical agriculture. Dif-
ferences between the provinces are also growing and this
is not beneficial to overall economic development, which is
reflected in the provision of infrastructure, health and educa-
Activity report by country

SIPEF | ANNUAL REPORT 2013 47
tion. A national approach would certainly bring a solution in
the future.
The Indonesian government remains committed to the regu-
lations on the export taxes on palm oil. Following its introduc-
tion in 2008, the system was further amended in November
2011. It has remained unchanged since then. The tax is levied
on a progressive scale based on world market prices for palm
oil. Furthermore, agricultural holdings are taxed more heav-
ily than the manufacturers of more finished products. For this
reason, since 2011 a lot has been invested in vertically inte-
grated groups that ensure that palm oil is processed into a re-
fined product within the country or even into biodiesel that
is exported to Europe at competitive prices. Subsidisation of
this industry has also caused reactions from other producing
countries, such as Malaysia and India. Moreover, this has led
to Europe taking protective measures against the import of
Indonesian biodiesel. As a producer of crude palm oil, SIPEF
is subject to high tax rates, which amounted to an average
taxation of USD 75 per tonne in 2013 compared to USD 149
in 2012. The group’s gross income was thus reduced by USD
11.6 million, which was however lower compared to USD 23.8
million the year before.
There is still uncertainty for the plantation companies about
the permitted scale of planted hectares. The Minister of Ag-
riculture has set the limit, under certain conditions by law, at
100 000 hectares per group of companies, but the department
that issues the licenses for the acquired land rights continues
to rely on older laws, which set the limit at 20 000 hectares
per province and per company. These situations illustrate the
increasing legal uncertainties facing foreign investors in Indo-
nesia today.
North SumatraWith the exception of the new projects, palm oil production
was generally lower than in 2012. This applies to both the
mature plantations in North Sumatra and those in the prov-
ince of Bengkulu, reducing total palm oil production in Indo-
nesia by 3.3% compared to 2012.
The maturity of some additional young plantings pushed up
the number of hectares of oil palms in production from 33 766
hectares in 2012 to 35 656 hectares by the end of December
2013. Yields per hectare decreased from 18.91 tonnes to 17.94
tonnes per hectare in North Sumatra and from 22 tonnes to
21.57 tonnes per hectare in Bengkulu province. This reduction
was particularly pronounced in the mature plantations. This
was due in part to a seasonal low production trend after the
exceptionally good production year of 2012, and in part to a
rise in the percentage of young trees that cannot yet guaran-
tee a full harvest.
Precipitation was higher than last year in most of the North
Sumatra plantations and also higher than the annual average.
This had a negative impact on the harvest, the quality of the
fruit and the transport from field to mill. There were particular
problems with flooding in the fourth quarter for the lowland
plantations in the Labuhan Batu region. Driving conditions on
the road network were also difficult.
The Perlabian and Tolan plantations form part of PT Tolan
Tiga Indonesia, which has exploited oil palms for decades and
represents 8 214 planted hectares, of which 7 107 are mature
and 1 107 are being replanted. After an exceptional output
in the second half of 2012, it was mainly the Tolan plantation
that appeared to require a recovery period. This resulted in a
10.3% lower volume of harvested fruit in 2013. The average
yield amounted to 22.8 tonnes per hectare in the somewhat
older plantations in Perlabian, but 24.9 tonnes per hectare in
the younger Tolan plantation.
Through early planting of humus-rich ground cover, the use of
nets to protect the young palm crowns and a limited use of se-
lective chemical spraying, the Oryctes beetle (which lays eggs
in the palm and whose larvae devour the soft crown) plague
was controlled far better than has been the case in the past.
The highly effective treatment prevented any delay in growth
to maturity. The immature period of the most recent palm vari-
eties is actually getting shorter and we can reap the first fruits
a mere 24 months after planting.
The Bukit Maradja and Kerasaan plantations (5 416 planted
hectares, of which 4 588 hectares are mature and 828 hec-
tares are replanted) have fully recovered from the attack of
leaf-eating insects that affected production in 2011 and part of
2012. Through constant monitoring and the appropriate treat-
ment, whereby natural balance is maintained by increasing
natural enemies instead of using chemical sprays, any sudden
recurrences could be brought under control fairly quickly. Full
restoration of the ground cover meant that the yield was once

‘THE CONNECTION TO THE WORLD OF SUSTAINABLE TROPICAL AGRICULTURE’
more in line with previous years, with an average yield of 22.6
tonnes of fruit per hectare.
The fight against the Ganoderma fungus required a great
deal of attention from our agronomists, particularly in the
older plantations, where we have third generation palms. This
fungus mainly affects the roots of the tree and in so doing an-
nually reduces the number of palms per hectare. Extensive
cooperation between the various plantation groups in North
Sumatra allowed us to test different treatment methods in
different locations. Besides measures taken in the areas that
needed replanting, Ganoderma-tolerant seeds, recently on
the market, were used for the first time. We also conducted
tests using soil improvement products that were designed to
boost the health and immune system of the palms. For exist-
ing hectares, we are providing extra protection at the base of
the palms so that they survive longer. However, in the years
to come we will have to accelerate plans to replant existing
areas where no protective measures were taken at the time of
replanting. The impact of this earlier replanting will not sig-
nificantly affect total production for the SIPEF group since re-
planting with the latest seed varieties will guarantee a higher
yield per hectare.
The replanting of 437 hectares of the existing plantations
in North Sumatra to prevent the spread of the Ganoderma
fungus went according to plan. In Perlabian, 119 hectares were
replanted, whereas no further replanting will be necessary at
the Tolan plantation in the next few years. In Bukit Maradja,
163 hectares were replanted and in Kerasaan 155 hectares.
These latter replantings fit in with the early replacement plan
for affected areas, where since 2009 the greatest care has been
devoted to purification of the soil before the new palms are
planted.
The most recent expansion in North Sumatra is to be found in
the PT Umbul Mas Wisesa (PT UMW) and PT Toton Usaha Man-
diri (PT TUM) projects, that comprise 8 215 planted hectares,
of which 7 094 hectares are mature and 1 121 hectares not
yet mature. Despite the difficulties at the start of the project,
which resulted in uneven growth in the early stages, we saw
encouraging progress in 2013. The construction of new hous-
ing has now ensured a sufficient workforce. The establishment
of a foundation that operates local shops to provide all the
daily necessities at lower prices is a great success and will be
expanded next year. Besides harvesting the fruit, the workers
now ensure the application of improved agronomic practices
and guarantee that the palms receive sufficient fertiliser. Basic
fertilisers have been replaced by composite products that
slowly release the nutrients and improve soil composition.
Management of water levels in this lowland project was im-
proved using a system of channels and water locks. Further-
more, we invested heavily in the road infrastructure so that we
can now state that the fruit can be harvested and transported
at regular intervals. In 2013, the fruit was still being brought
to the Perlabian mill but from April 2014, our own mill will be
operating and will process the fruit into oil.
The output of fruit rose by 90.1% in 2013 compared with the
previous year, partly due to the maturity of an additional 2 441
hectares but mainly due to the natural growth of the young
areas to their most productive stage. For these young planta-
tions, the average yield per hectare rose from six to just over
nine tonnes. This makes us hopeful that the progress that was
achieved will be repeated in all the mature hectares in the
coming years.
In the fourth quarter particularly, production was disrupted by
exceptionally heavy rainfall, which flooded the lower sections
of the plantations. The access road to this project was cut off
for truck transport for over a month. Delivery of fruit had to
be done partly by boat and transfer to the boats was an addi-
tional cost factor. We investigated various options to facilitate
access to this project during the rainy season. Transport on the
nearby river seemed by far the best solution. We have already
purchased a piece of land on the banks of the Barumun River
in order to build a jetty, and hope that in the course of 2015 we
will have an efficient water transport system in place that will
enable the shipping of oil and the supply of fertilisers. Mean-
while, the volume of oil produced is not so great that it cannot
be transported the relatively small roads.
PT UMW and PT TUM also had to contend with attacks of leaf-
eating insects in 2013. With the experience gained in other
plantations in North Sumatra, we were able to deal with that
fairly quickly. Lower photosynthesis meant that we had to
factor in a slight decline in production for the first months of
2014. Termite attacks had resulted in young palms needing to
be replaced.
Having previously received a definitive operating permit (Hak
Guna Usaha) for PT TUM, which remains valid until 2046, in
Activity report by country

SIPEF | ANNUAL REPORT 2013 49
June 2013 a licence was also issued for an initial phase of 6
468 hectares, which remains valid for 35 years (until 2048).
This permit was issued by two regencies since our lands
extend across the border. Permission for a second section of 1
296 hectares is pending. The local authorities have now visited
the location in order to make the necessary checks regarding
any outstanding disputes. They have confirmed that there is
no reason to postpone this permit any longer. A foundation
was also created to enable the local elementary school to be
extended.
The fertilisation programmes for the established plantations in
North Sumatra were fully implemented. A mechanical spread-
er was used wherever possible. Where manual fertilisation is
necessary, all fertilisers are now packaged in advance to give
an exact amount per palm tree so that fertilisation is always
uniform. Organic fertilisers are also applied systematically. In
addition, the empty palm bunches are spread by tractors and
the wastewater from the plants’ effluent ponds provides irri-
gation for the surrounding areas. Furthermore, deficiencies of
certain micro nutrients are replenished using scientific meth-
ods. In 2013, this primarily concerned magnesium and boron,
of which deficiencies were observed in young plant material
from certain established seed producers as well as in the older
palms of the mature plantations. At the express request of
consultants specialising in fertilisation programmes, an ap-
plication of compound fertilisers with high potassium levels
was formulated at PT UMW and PT TUM, with favourable yield
results. Successful fertilisation of the areas is largely depend-
ent on the available workers, but also on the timely delivery
of the amounts needed in the on-site warehouses and on the
accessibility of the palms.
Prices for fertilisers were to a great extent influenced by
demand. Lower palm oil prices meant that there was an obvi-
ous decrease in use by the local Indonesian farmers. We noted
a lower overall price for phosphates (-10%), for potassium
(-9%) and finally, in the second half of the year for nitrates
(-6%). This downward trend was reinforced at the end of the
year when the largest producers of fertilisers ended their price
fixing. We can thus face 2014 with confidence regarding the
price level of compound fertilisers.
The two palm oil extraction plants in Perlabian and Bukit
Maradja performed as expected and processed 5.8% more fruit
than in the previous year, mainly due to the greater volume
of fruit from the PT UMW and PT TUM projects. The Perlabian
mill has a processing capacity of 60 tonnes per hour and in
2013 had an average utilisation rate of 52.2 tonnes per hour.
The Bukit Maradja mill is smaller, with a processing capacity of
30 tonnes per hour. In spite of replanting in the neighbouring
plantations, it achieved an effective utilisation rate of 30.30
tonnes per hour. The average oil extraction rate of the Perla-
bian mill was limited to 21.5% due to the supply of young fruit
with lower oil content from PT UMW and PT TUM. This is nearly
0.60% lower than in the previous year. Oil extraction at Bukit
Maradja was 23.2%, compared with 23.6% the previous year.
This can also be explained by the generally heavier rainfall in
North Sumatra in 2013. Controlled standards for the maturity
of the delivered fruit meant that high quality oil and kernels
could be produced throughout the year without acidity prob-
lems.
Both plants are ISO, RSPO and ISCC certified. The latter allows
us to export oil to Europe to be used as biodiesel and as a
basis for the generation of green energy. We can only achieve
these certification standards if the plants are equipped with a
system to capture methane gases produced.
These certifications offer us the opportunity to offer our sus-
tainable palm oil to refineries. They can then, according to
demand, use it for nutritional or energy purposes. In either
case, the provision of sustainable oil comes with the right to a
premium on top of the normal price of palm oil. All the output
of these two plants generated an additional premium in 2013.
We are also studying the reuse of biogas as an additional
energy source for the processing of palm fruit into oil. This
means that there will be more organic material available to
fertilise the plantations and that eventually systems to gener-
ate energy could be installed. We have already held talks on
this subject but the Indonesian public grid is not yet adapted
to be able to reimburse such a supply. For the time being, the
system installed in 2008, based on a membrane placed above
the effluent ponds, is still in use. It is also recognised by the
UNFCCC and is entitled to certification.
Since the premiums are mainly paid on deliveries outside of
Indonesia, the share of sales in the export market rose from
70% to 85% of the output. This also means that transport from
the plantations to the port of Belawan markedly increased. We
also hired additional tank storage. Belawan has meanwhile

‘THE CONNECTION TO THE WORLD OF SUSTAINABLE TROPICAL AGRICULTURE’
reached saturation point, whereby the ships experience long
waiting times before they can load palm oil for export, mainly
to Europe. So we are also examining the potential for shipping
from other ports located along the north coast of Sumatra.
The construction of the third palm oil extraction mill in North
Sumatra, which will process the fruit from PT UMW and PT TUM,
continued in 2013. There were delays caused by the very wet
weather conditions in this region in November and Decem-
ber. Flooding of access roads prevented the supply of cement
and steel, which meant we had to postpone the construction
work on the concrete loading platforms and on the cisterns
for methane capture. By the end of December, 70% of the in-
stallation was completed. The mill, completed by the end of
March 2014, will immediately process all of the project’s har-
vest. This mill is built to process 45 tonnes of fruit per hour
with the potential to expand to 60 tonnes per hour at a later
stage. It includes a fully integrated plant for the recycling of
wastewater and the capture of methane gas. The latter is used
as an energy source for generating steam. The plant will also
be responsible for providing drinking water and electricity for
our workers’ residential units.
In spite of lower production volumes, the average unit pro-
duction cost (denominated in USD) of our palm oil in North
Sumatra has not risen. The upward pressure of the significant
rise in the minimum wage in most regions of Indonesia was
offset by the weakening of the local currency against the USD.
In North Sumatra, the increase in the wages paid to our work-
ers, which far exceed the minimum wage, remained compara-
tively low at 19% while in other provinces, 2013 frequently saw
increases of up to 50%. Other major costs, such as petroleum
and fertilisers, which are linked to the USD, were spared from
increases. Regarding fertilisers, we even noted a downward
trend in the second half of the year.
Volumes from the North Sumatra rubber business also re-
mained slightly below expectations. In PT Timbang Deli (where
866 hectares are planted, of which 807 are in production), pro-
duction suffered from the higher precipitation, especially in
the mornings. This led to more lost tapping days. The volume
therefore decreased by 7.3% compared to the previous year.
The yield was 1.57 tonnes per hectare as compared to 1.69
tonnes in 2012. In PT Bandar Sumatra (where 1 164 hectares
are planted, of which 1 010 hectares are tapped), in August
there was the additional impact of wind damage. 4 700 trees
were destroyed by a tornado and 23 600 trees required ad-
ditional pruning. This mainly affected latex production in the
fourth quarter. The average annual yield per hectare dropped
from 1.66 tonnes to 1.61 tonnes in 2013. Replanting of the
mature plantations followed the original pattern, whereby 57
hectares were restored in PT Bandar Sumatra. In PT Timbang
Deli, replanting was postponed by the launch of the research
project.
Following a complete renovation of the PT Bandar Sumatra
plant in 2012, we have seen a strong improvement in the
quality of (Ribbed Smoked Sheet) RSS3 rubber production.
This was also reflected in an optimisation of processing costs.
In the rubber industry too, rising local costs, due to wage in-
creases, interim application of fertilisers and increased super-
vision of the tapping activities, were offset by the weakening
of the local currency against the USD.
South SumatraRubber activities at the Melania plantation in South Sumatra
remain highly satisfactory. In this SIPEF’s largest in size rubber
plantation in Indonesia (with 2 735 planted hectares, of which
2 242 hectares are tapped and thus 18% of which is immature)
production rose by 12.9% compared with last year. Improved
weather conditions, with 56% higher precipitation and, most
importantly, more even distribution across the year, more hec-
tares in production and improved security of the areas, result-
ed in an increase in the average annual yield from 1.52 tonnes
to 1.58 tonnes per hectare. This is comparable to the rubber
zones in North Sumatra.
The installation of our own laboratory, which can measure Dry
Rubber Content (DRC) in latex on-site, significantly improved
the tappers’ perception of their remuneration. This encour-
aged them to increase production. Collection of latex by tank
truck instead of tractors makes transport of the latex to the
factory faster and more efficient. In 2013, we continued with
the heightened ‘zero thief ’ security scheme by bringing in ex-
ternal security officers. This has made production losses neg-
ligible, and workers and supervisors can be more focused on
their work.
The conversion programme to turn the remaining oil palm
plantations into rubber plantations is almost completed: 127
hectares were replanted with young rubber trees in 2013. The
intention is to convert the Melania plantation into a fully-
Activity report by country
SIPEF | ANNUAL REPORT 2013 51
fledged monoculture rubber plantation. Furthermore, low-
land zones that were previously planted with oil palms have
now been transformed into platforms with rubber trees.
Our agronomists continue to closely monitor the progress of
White Root Disease. This disease attacks tree stocks and spreads
through root contact in zones that were not sufficiently puri-
fied during replanting. It requires individual treatment of each
tree, with an 80% success rate.
The production of RSS3 rubber in the factory did not demon-
strate any quality issues. Containers were shipped to South
East Asia, North America and Europe. A change of local freight
handler meant that we could improve export and reduce costs.
The province of South Sumatra was confronted with an in-
crease in the minimum wage of 30% compared to 2012. That
was reflected in increased costs for tapping, maintenance of
roads, supervision of the workers and security costs for pro-
tecting the borders of our plantations. Due to higher produc-
tion volumes and a weaker local currency, costs denominated
in USD rose only 1.1% compared to the previous year.
BengkuluFollowing several years of continuous growth in the PT Agro
Muko oil palm plantations in the province of Bengkulu, a slight
decline in production was noted for 2013. The production of
fruit decreased by 5.8% compared to 2012.
These lower volumes are mainly due to high precipitation,
particularly in the fourth quarter when there was an average
of 1 400 mm of rain spread over 51 days. As a result, harvesting
of the fruit was delayed, the quality was lower and transport
was hampered by damage to roads and bridges. The overall
annual average rainfall was 3 809 mm in 160 days, which is
significantly higher than the long term average. We can there-
fore state that PT Agro Muko had to operate under difficult
weather conditions in 2013. This slightly reduced the average
yield from 21.97 tonnes per hectare in 2012 to 21.57 tonnes
per hectare in the past financial year.
PT Agro Muko is now entering a second production cycle in
which, in the next few years, there will be a gradual replace-
ment of the palms with new, higher-yield varieties. In 2013,
we took 990 hectares out of production. An early start with re-
planting meant that we could complete replanting the entire
area within the year. Of the 17 796 hectares planted with oil
palms, today there are still 1 763 hectares (9.9%) that are im-
mature and 16 033 hectares that are harvested, with an aver-
age age of 14 years.
The comparatively good production results are attributable
to greater availability and stability of the workforce, who stay
in employment longer due to improved housing and utilities,
and to the expansion of the paved road network, enabling
transport of fruit.
The programme to pave all main roads where fruit has to be
collected using gravel progressed to some extent in 2013, with
an additional 50 km of paved roads. Spread over several years,
two thirds of all arterial roads have been paved, but priority
that was given to this project in the past has now dropped
somewhat. In future years, we will certainly continue to add
more gravel as we replant and reconstruct roads. The trucks
are able to collect the fruit in time and within deadlines, even
in very wet weather and without compromising the quality of
the fruit.
Over the past few years, there have been considerable efforts
at PT Agro Muko to make the workers feel attached to the com-
pany. This has been done through the provision of better and
newer homes with more mod-cons, integrating women as
workers for lighter work and by offering permanent contracts
that give entitlement to a pension scheme, healthcare and
access to the company’s facilities.
The fertilisation programmes were completed to the set
standards. We are gradually switching from single to com-
pound fertilisers. A limited proportion of the areas can be fer-
tilised using a mechanical spreader but this is less appropriate
for the hillier landscape farther from the coast. To promote
tree growth through soil improvement and to enhance the
uptake of fertiliser, organic fertilisers were spread across 1 282
hectares. This took the form of Empty Fruit Bunches (EFB), the
remnants of the palm bunches after processing at the mill.
Besides the fruit from our own plantations, we also process
fruit from neighbouring villages. Small plantations are estab-
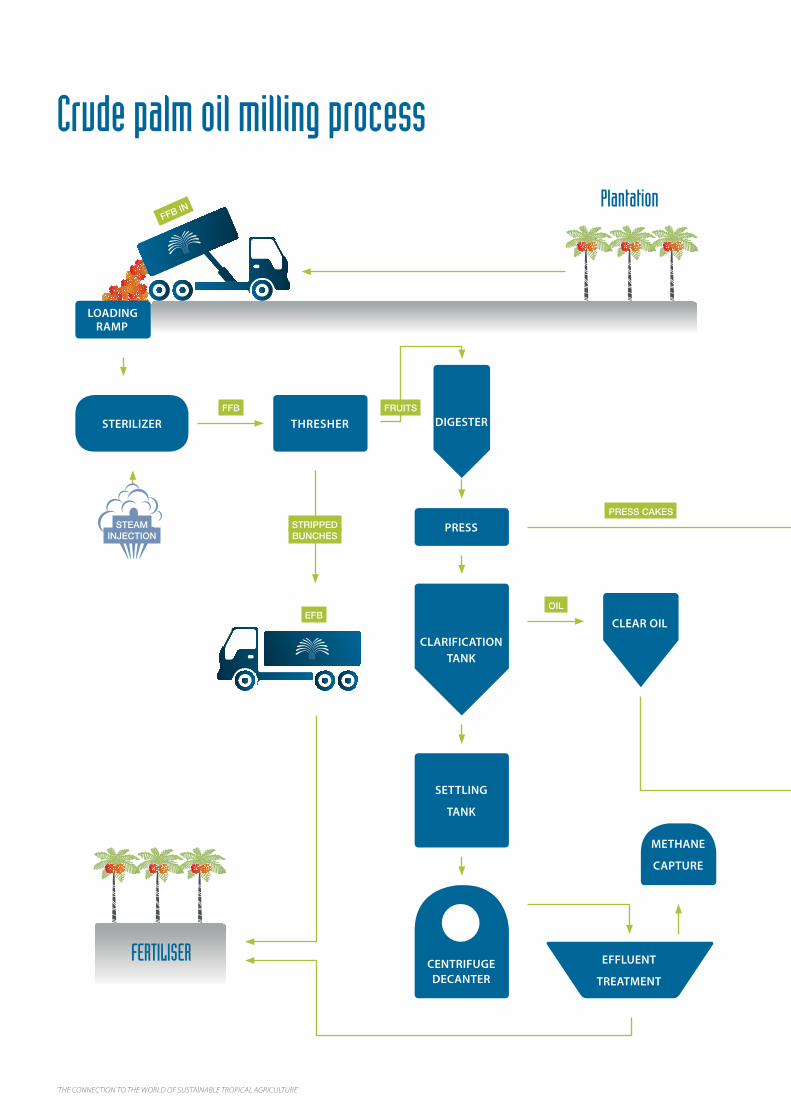
‘THE CONNECTION TO THE WORLD OF SUSTAINABLE TROPICAL AGRICULTURE’
STERILIZER THRESHER
EFFLUENT
TREATMENT
PRESS
CLARIFICATION
TANK
SETTLING
TANK
CLEAR OIL
DIGESTER
Plantation
FFB
OIL
PRESS CAKES
LOADING
RAMP
CENTRIFUGE
DECANTER
METHANE
CAPTURE
FERTILISER
STRIPPEDBUNCHES
EFB
FFBIN
STEAMINJECTION
FRUITS
Crude palm oil milling process

SIPEF | ANNUAL REPORT 2013 53
POWER
GENERATION
CRUDE
PALM OIL
STORAGE
CRUDE
PALM OIL
STORAGE
KERNEL DRYER
RIPPLING
MILL
PURIFIER
TANK
Fertiliser
Mill power and steam
Employees domestic power
CPO
Animal Feed
PALM KERNEL
CRUSHING PLANT
REFINERY
PALMKERNEL
SHELLS
FIBRE
PALM KERNEL OUT
CPO OUT
NUTS
PKEXPELLERNUTS & FIBER
SEPARATOR
CPKO

‘THE CONNECTION TO THE WORLD OF SUSTAINABLE TROPICAL AGRICULTURE’
lished in the region as social projects for the benefit of the
communities. The company is responsible for the planting and
management of these plantations. These projects are highly
appreciated by the neighbouring villages and will increase in
number in the future. There are currently 620 hectares plant-
ed. If there is sufficient land made available, we anticipate an
additional 240 hectares in 2014.
Higher rainfall and 5.8% lower production of palm fruit has
meant that the mills were also less efficient than the previous
year. The average extraction rate of the two palm oil extrac-
tion mills was 22.48% compared to 23.17% in 2012. The quality
of the oil produced met the acidity criteria set by our clients
throughout the entire year. Considering the intensity of rain-
fall in the fourth quarter, this was quite a feat.
The Mukomuko factory has a theoretical processing capacity
of 60 tonnes of fruit per hour. In the past year, an average of
56.3 tonnes per hour was processed. The Bunga Tanjung fac-
tory, with an average throughput of 32.9 tonnes per hour,
remains underutilised. This is reflected in the factory’s oper-
ational costs, since at the Bunga Tanjung factory our use of
energy and labour cannot be as efficient. This factory was built
with the proviso that we also process the fruit of neighbouring
farms. Since then, a number of mills have appeared in the area
that only process purchased fruit, without developing their
own plantations. This means that highly competitive prices are
paid in the region. As a result, we decided to focus on our own
production, with the intention to expand this where possible.
SIPEF decided a few years ago to develop its own plantations
in the area to supply fruit to this mill. PT Muko Muko Agro
Sejahtera (PT MMAS) was founded in 2011, after obtaining
licenses from the local authorities, on two locations to com-
pensate the development of its own plantations by providing
the neighbouring farmers with land (the “plasma” scheme). We
began the process after this expansion was checked against
RSPO standards so that it could be developed sustainably.
However, we have observed that there is less and less inter-
est from the local population in this region in relinquishing
land, as people prefer to develop it themselves for small oil
palm plantations. By the end of the financial year, therefore,
1 910 hectares were compensated, of which 908 hectares were
planted for our own use and 298 hectares for the plasma com-
munity. We continue with the land compensation in order to
achieve contiguous areas in both locations, but expect a limit
of around 1 500 hectares of planted oil palms. Given the small
size of these plantations, the senior leadership of PT Agro Muko
will, for a fee, perform the daily monitoring of them. This will
act to increase the project’s efficiency.
PT Agro Muko’s own plantations and also those of the
neighbouring farmers who supply the mills, are all RSPO certi-
fied for the fruits that are delivered to each of the factories.
Despite the ISO and RSPO certifications of these mills, there
appeared to be little interest in the past in shipping this sus-
tainable oil from the port of Padang. The usual shipping routes
for sustainable oil tended to be from the northern ports of Su-
matra, which offer a more convenient connection to Europe.
This made us decide to build a tank plant for the Mukomu-
ko factory to capture methane gases. This system allows the
biogas to be recycled and used as fuel for steam generation
in the boilers. Furthermore, this means that the factory would
be eligible for ISCC certification, through which sustainable oil
can also be used for energy purposes in Europe.
For this project, a joint venture was entered into with the pro-
ducer of this technology. The plant has been operational since
August 2013 and the ISCC certification has been obtained. In
the months that followed, we had our first buyers. They now
have a choice of two oils: RSPO sustainable oil for food or ISCC
oil for energy. We now expect to get premiums for all the oil
that leaves this factory for shipping from Padang.
In terms of unit production costs, we noted the same dynam-
ic in 2013 at PT Agro Muko as in North Sumatra: a worrying
increase in workers’ wages and slightly declining volumes,
which were mainly offset by the weakening of the rupiah
against the USD. As a result, we registered a net increase of
1.4% compared to 2012. Due to its location, topography and
yields per hectare, the cost price for palm oil from PT Agro
Muko remains approximately one third higher than in North
Sumatra, where the group’s most efficient plantations are
located. This ongoing cost difference is mainly explained by
the hilly terrain. Higher development costs are involved in the
construction of terraces, upon which fewer palms per hectare
can be grown, the need for more roads and more paved roads
to be constructed and limited mechanisation.
There were positive results for PT Agro Muko’s rubber activities,
even though they were confronted with lower sales prices.
After a restructuring period for the areas, with the rubber
Activity report by country
SIPEF | ANNUAL REPORT 2013 55
plantations being centralised in the land most agronomically
suited for rubber development, we are now entering a phase
of rising yields and volumes. There are now 1 653 hectares
planted with rubber trees. Of these, 707 hectares are not yet
mature (42.8%). We are tapping 946 hectares of mainly young
trees. Production grew by 4.9% compared with last year, ex-
plained by the increasing yield per hectare (from 1.47 tonnes
to 1.52 tonnes) and by the “slaughter tapping” in zones to be
replanted. This technique allows very intensive tapping, just
before the tree will be replaced.
The switchover programme and the over 700 hectares of im-
mature trees mean that the capacity of the factory is underu-
tilised. However, in the next few years we will be able to enjoy
greater volumes and lower production costs since the biogas
plant will contribute to the drying of the processed rubber.
We are thus replacing petroleum driers with biogas driers. Fur-
thermore, we are transporting the second quality raw materi-
als that were previously sold to third parties, from the Melania
rubber factory to PT Agro Muko, in order to optimise volumes
here.
After several years of rising unit costs we note that in PT Agro
Muko, like in the other rubber activities, the cost prices re-
mained constant in 2013. Given the lower overall selling prices
for rubber, this is certainly a pleasant realisation.
Cibuni – JavaRegarding the tea activities of our Cibuni plantation near
Bandung on the island of Java, 2013 was agronomically un-
exceptional. We have experienced a lack of sunshine in recent
years compared with the past, and leaf development is re-
duced by constant cloud cover. This year was characterised by
significantly higher precipitation, with the total annual rainfall
of 4 136 mm exceeding the long term average by 33%. The
combination of both effects depressed temperatures in the
tea fields. We produced 2 850 tonnes of black tea, which again
is 0.7% lower than in 2012. The number of hectares of plant-
ed tea remains more or less constant at 1 787, of which only
49 hectares are immature. The yield remained stable at 1.64
tonnes per hectare, the same as last year. Twenty-two hectares
were replanted.
For Cibuni it is essential to produce quality tea on a consistent
basis in order to safeguard the reputation we have built with
our clients in the Middle East. It is this tea that achieves high
sales prices, a tea comparable in quality with that produced
in Kenya. It also allows us to maintain profit margins. When
it comes to Indonesian tea production, quality prevails over
volume.
The tea plantation is our most labour-intensive activity. This
makes the wage level highly significant, of course. The in-
creases imposed by the governors in the past few years are,
therefore, an important factor in the evolution of the unit pro-
duction cost of our black tea. Although protective measures
have been enacted for the minimum wage in the agricultural
sector in Java, any increase remains an additional strain for the
tea plantations that produce hand-picked tea. We note that
even the state-owned enterprises are switching to mechanical
harvesting to maintain profitability. This means that, in con-
trast to previous years, there are sufficient experienced work-
ers offering their services to our plantations. We can say with
confidence that enough pickers are available to harvest the
young shoots in time.
Energy remains the second vital factor for production costs of
the black tea Cut Tear Curl (CTC). In 2012, we expanded the
capacity of the hydroelectric power plants with a new reser-
voir and a new canal from the local river, giving us the capacity
to handle even the driest periods of the year. This also means
that we only needed an extremely limited amount of petro-
leum for energy at the factory. To dry the leaves, we have for
several years employed a coal plant that generates steam. A
sharp decline in coal prices in Indonesia has resulted in lower
than expected energy costs.
A sudden drop in tea prices in the second half of the year left
clients reluctant to ship the tea. This led to exceptionally high
stocks of finished tea at year-end. This did not have a signifi-
cant impact on 2013 results due to forward selling. The cost
price, denominated in USD, fell by 3.9% compared to the pre-
vious year.
ManagementFor over two years, the group of Indonesian companies has
been under the leadership of Mr Adam James, who previously
had been heading the plantations department. The search for
an appropriate replacement to lead this department has taken
some time. In February 2013, we appointed Mr Michael Hoare,
the son of the former president director Dereck Hoare. The
current leadership of the group is in the hands of a team of

‘THE CONNECTION TO THE WORLD OF SUSTAINABLE TROPICAL AGRICULTURE’
Indonesian, Malaysian and European managers who manage
the company together. We need to account for the influences
of all the different cultures and ideologies. We organise di-
verse events, such as manager meetings and family days, in
order to strengthen the bonds between them.
The effective day-to-day management of the plantations was
reorganised in September 2012. We now have three inde-
pendent business units: North Sumatra, South Sumatra and
Bengkulu. This decentralised approach means that each unit
is managed from the plantations and reports to the director
of estates at the headquarters in Medan. There is a general
manager at the head of each unit who is aided by three assis-
tants: a senior field manager, a senior manager operations and
a senior manager administration. With this unit structure, we
aim for an equal treatment of all regions. This strict segrega-
tion of functions promotes proper delegation of tasks to the
lower management and executive levels.
Since 2011, monthly meetings of the executive committee,
that is all department managers in the company, have been
scheduled. They can draw up policies and exchange views on
all aspects of corporate policy.
To assess and improve individual performance and
productivity, we link the training of young managers with an
evaluation system. This includes qualitative and quantitative
indicators and personal goals.
We also encourage managers to develop their creativity and
innovation instincts in the daily practice of their duties on the
plantations and in the factories. We award an annual prize
for the most innovative development or most cost-effective
measure to contribute to our company’s performance.
To ensure a flow of young graduates, we set up an intensive
two-year training programme of theoretical and practical
courses that will train them to be field assistants who each
manage a section of a plantation. Furthermore, their leader-
ship skills in the field or factory are stimulated with courses
in communications, character-building and job motivation.
Since the programme began in 2011, nine new field assistants
have been appointed. From a group of 23 people who began
in 2012, 20 successful graduates remain. The 2013 group of
21 people is now pared down to 15 potential assistants. This
training will continue in 2014.
The success of tropical agriculture in South East Asia has made
it increasingly difficult to attract, and particularly keep, quali-
fied personnel. There is clearly a higher rotation of employ-
ees than in the past. Young executives are more likely to be
tempted by proposals from newcomers in the sector. Through
our extensive contacts with other established plantation com-
panies we are able to compare wage scales and pay for tempo-
rary workers and adapt our payment scales accordingly.
In 2011, we began a conversion programme from contract
type workers to permanent workers to improve loyalty to the
company in our plantation and factory workers. With this, our
permanent workers will exclusively carry out all routine activi-
ties, such as the harvesting, spreading of fertilisers, spraying of
pesticides and stimulation of rubber trees. We hope that this
will increase efficiency and reduce absenteeism. In the past,
this work was done by occasional labourers who were not
motivated to perform the tasks properly. Permanent workers
are entitled to social benefits and pension plans, are usually
housed on the plantation with their families and, therefore,
enjoy the benefits of medical care, education and utilities pro-
vided free of charge by the company. The company also has a
policy of taking on married couples as permanent employees.
The programme is a success: by year-end, 96% of the employ-
ees who carried out the routine activities were on the perma-
nent payroll.
The evolution towards more permanent workers makes con-
tacts with unions more intense. The latest collective bargain-
ing agreement (CBA) was successful after negotiations that
took longer than usual. The subsidy system for additional
remuneration of workers is equalised and formalised for all
plantations.
During the financial year, we were faced with the sudden
deaths of two valued employees: Mr Arden Hasibuan man-
aged plantations in North Sumatra for many years, while Mr
Dewadas was part of the human resources team in the Medan
Office.
In a labour-intensive environment, medical supervision of our
employees, who usually live on the plantations with their fam-
ilies, is of vital importance. The medical management team is
part of the executive committee and supervises 22 polyclinics
with 48 medical assistants, almost equally divided into nurses
and midwives. Training programmes and courses are organ-
Activity report by country
SIPEF | ANNUAL REPORT 2013 57
ised. Along with the usual consultations, the team has con-
ducted over 1 000 check-ups on new employees and people
at risk.
We have noticed that theft is frequently the underlying reason
for lower results, so we redoubled efforts in the past financial
year to improve security services. We did this with the assis-
tance of a specialist consultant who will continuously train
and reorganise our own people to ensure that our assets are
better protected.
The internal audit department now includes seven auditors, a
manager and an administrator. Three auditors are employed
in Medan and conduct site visits in North and South Suma-
tra. The remaining four are located in PT Agro Muko. Given the
growing size of the company, we are working on expanding to
12 people, including 10 auditors. They will focus on the typi-
cal risk areas in the management of decentralised companies.
These two groups rotate between the two locations on an
annual basis in order to avoid habituation. Two auditors are
retained to ensure continuity in information provision. The
manager reports directly to the president director, but the
annual programme is prepared and approved by the audit
committee. This committee meets three to four times a year to
evaluate the results of the regulated audits and to make rec-
ommendations for the departments concerned. Furthermore,
they treat reports of potential fraud cases. The results from
these meetings are also communicated to the head office in
Belgium, and they are discussed at the SIPEF audit committee
meetings.
During the previous financial year, the new “Information Tech-
nology” (IT) department launched three major projects that
will have a significant impact on daily information sharing and
policy making. These projects will lead to the technological in-
tegration of the SIPEF group. Over a period of three years, this
should lead to a policy instrument that will allow integrated
access to all the agricultural, financial and technical informa-
tion of the group. Input will be done only once on the level of
the operating units. Procedures for ordering, monitoring and
paying for materials will be integrated so there can be no ar-
bitrary deviations.
After conducting a comparative market study in 2012, we
decided to purchase a license for the Malaysian integrated
software “Lintramax Plantation”, which has already been used
by Indonesian plantation companies. We prepared for imple-
mentation of this system last year and began using it on 2nd
January 2014.
Following the successful integration of all Indonesian opera-
tions, in 2015 we will gradually incorporate the SIPEF group’s
activities for all the other countries in which it operates (Papua
New Guinea, Ivory Coast and Belgium) into the databank.
We have built a system of hardware communication towers to
support this project and to enable data to be processed from
the operating units. We can, therefore, dismantle the current
system. Moreover, the SIPEF group’s network communication
structure has been adapted and standardised.
With regard to our Indonesian operations, we also report a
dispute pending between the companies in our group and
the Indonesian tax authorities in connection with the repay-
ment of deductible VAT on plantation activities. This tax was
deductible until 2010 and was always refunded. A new inter-
pretation of these taxes has meant that the plantation sector
for the growing of products was suddenly no longer consid-
ered as a VAT taxable operation. Only the industrial processes
were subject to VAT status. This interpretation of the law was
challenged before the tax courts by all plantation companies,
and we are still waiting for a decision regarding the VAT to be
recovered from 2010 to 2013. Recently, the government pub-
lished the confirmation that from 1st January 2014, plantation
operations are once again transactions subject to VAT. This
announcement, however, was not accompanied by a decisive
response concerning the period between 2010 and 2013. We
are, therefore, continuing our lawsuits in order to obtain a
full refund. The amount of VAT that we are reclaiming is KUSD
9 960.
ExpansionIn 2011, three new companies were founded to represent
the potential expansion occuring in the Musi Rawas region in
South Sumatra.
In July 2011, PT Agro Kati Lama (PT AKL) received a permit
for the development of 10 500 hectares of oil palms and/or
rubber, including the development of at least 20% for the local
population under the plasma scheme. This licence provides
four years of exclusivity for the development of these areas.
After following all local and RSPO “New Planting Procedures”

‘THE CONNECTION TO THE WORLD OF SUSTAINABLE TROPICAL AGRICULTURE’
(NPP), we were able to start compensating the current users of
the land. PT AKL’s land is situated in the vicinity of the town of
Lubuk Linggau, where our office is provisionally located.
The exact same procedures were followed for a second permit
for 9 000 hectares of oil palms and rubber trees, which was
obtained in December 2011 by PT Agro Rawas Ulu (PT ARU) for
the same period of four years. Again, this licence came with
the obligation to develop at least 20% for the local population
under the plasma scheme. This land is farther from the town
and the developed area around it, but is the subject of more
frequent social unrest between residents and the authorities.
In March 2013, a third licence was obtained in the name of
PT Agro Muara Rupit (PT AMR), for 4 811 hectares of oil palms
and rubber trees. In September, this was extended with a
second section of 7 498 hectares that is connected to the
previously acquired section and that has the same condi-
tions attached as the first two licences. The latter concession
is the most isolated from any rural development and, as such,
should deliver a proportionally better result for the compen-
sation process.
All the projects, with a total potential area of 32 309 hectares,
are now completely in line with local regulations and the RSPO
NPP. Our teams can thus focus entirely on compensating the
users. We have to negotiate with many smallholders, who each
use several hectares but usually cannot produce property
deeds. As a result, we had to work with witnesses, which is a
long and laborious process that complicates the compensa-
tion procedures.
By the end of December, we had paid compensation for a total
of 3 916 hectares, of which 3 690 hectares are for our own
development and 226 hectares for plasma development. Ap-
proximately half of this land has been cleared of undergrowth.
By the end of the financial year, there were 223 hectares plant-
ed with oil palms. The first nursery was laid out in the MAS
Melania rubber plantation, while we also rent a piece of land
near PT AKL. There, we bring the seeds to maturity for replant-
ing in the years to come.
Although all these projects enjoy the full support of the local
authorities, it is the responsibility of the company to enter into
talks with the many thousands of land users. If this industrial
project is to succeed, we have to convince them to relinquish
the land to us in exchange for compensation. These discus-
sions are confidential, held directly with the smallholders and,
for the time being, remain within our set limits for compensa-
tion amounts. Within the zones, there are always groups who
support our project but there are also those who oppose it.
The region is known for its law and order issues, which our
teams and the contractors who work for us experience on a
daily basis.
It is impossible to give a reliable estimate today for the even-
tual scale, but our teams in the field are enthusiastic about the
future of these agronomically valuable projects.
Since 2006, we have also held a license for the development
of PT Citra Sawit Mandiri (PT CSM) as a palm oil project in North
Sumatra. Following the acquisition, we determined that this
land would probably not comply with the rules and criteria
of the RSPO New Planting Procedures (NPP), because it is too
fragile. The SIPEF board of directors therefore decided to pre-
pare the concession for sale, considering that in the long term
it did not fit in with the sustainability profile of the group. The
process to find a suitable buyer has begun, but this could take
some time considering the relatively small size of the conces-
sion (1 314 hectares planted). There is also a dispute with an
adjacent oil palm plantation that planted palms on 212 hec-
tares of the land granted to us. The companies are now em-
broiled in a lawsuit with a view to reacquiring the land, subject
to compensation for the palm trees. The verdict was provi-
sionally in our favour. With a view to securing the asset, we
therefore decided in the meantime to continue to complete
the project by constructing roads and ensuring that the imma-
ture palms can continue growing. We will then put it back on
the market. The application for a final exploitation licence was
filed for 1 472 hectares. The authorities have already marked
out the boundaries with the adjacent land using concrete pil-
lars.
In 2013, we initiated talks with New Britain Palm Oil (NBPOL)
and Biosing. NBPOL is a palm oil producer, listed on the
London Stock Exchange, that has run a research centre for
the development of oil palm (DAMI) in Papua New Guinea for
many years. Biosing is an organisation of scientists specialis-
ing in research into developing improved yield from oil palm.
The talks have led to the signing of a joint venture agreement
between the three companies in October. SIPEF will contribute
land in the form of the PT Timbang Deli plantation, as well as
Activity report by country
SIPEF | ANNUAL REPORT 2013 59
a cash amount of USD 5 million upon receipt of 38% of the
shares in Verdant BioScience Pty Ltd, based in Singapore and
the headquarters of the new company. NBPOL will keep 52% of
the shares in exchange for its technology. Biosing will receive
10% of shares for the transfer of technical knowledge (Intel-
lectual Property), and to collaborate on developing a research
facility on the grounds of PT Timbang Deli. In the period until
the end of December 2013, we worked on the agreements for
the transfer of company assets in consideration for stock, and
obtaining of an operating licence and a licence to allow the
transfer of PT Timbang Deli under Indonesian law. These activi-
ties were not completed in 2013, meaning that the transfer of
assets had not occurred by year-end and that the transaction
will be recorded in the SIPEF books in 2014.
‘THE CONNECTION TO THE WORLD OF SUSTAINABLE TROPICAL AGRICULTURE’

SIPEF | ANNUAL REPORT 2013 61
Close-up of a recently harvested Fresh FruitBunch, showing the orange colored mesocarp,which contains the palm oil, and the nuts, withthe black shell and the white kernel, containingthe kernel oil.

‘THE CONNECTION TO THE WORLD OF SUSTAINABLE TROPICAL AGRICULTURE’
Papua New Guinea
Hargy Oil Palms Ltd
Galley Reach Holdings Ltd
Papua New Guinea remains a challenging country with over 600
islands spread over 463 000 square kilometres and a popula-
tion of approximately 6.7 million, which means that the internal
market is relatively limited. Approximately 85% of the population
is scattered across the country and is dependent on agriculture.
Annual population growth amounts to 2.8%.
Lower prices for the main export commodities of gold, copper
and oil, plus lower agricultural commodity prices, have resulted in
a slower growth of the Gross Domestic Product (GDP) from 8.1%
in 2012 to 5.4% in 2013. Rising public spending on infrastruc-
ture, education, health and safety has led to a negative balance
of payments and a rise in inflation from 2.2% to 5.3%. We have
also noted rising interest rates and a gradual weakening of the
local currency against the USD, which brings about an additional
local revenue stream from the export-oriented economy. In the
labour-intensive agricultural sector, where labour costs are paid
in local currency but the export of products boosts revenue, we
are looking forward to a weakening of the Papua New Guinean
Kina (PGK).
In 2013, the government had already fully anticipated this
growth, driven by the Liquid Natural Gas (LNG) projects, which
are at their peak and will start to produce in 2015. This will shift
the engine of economic growth from foreign investments and re-
lated infrastructure to the commodity export sector. However, in
2014 many measures will need to be taken to balance the budget
and prevent state debt increasing from its current figure of 63.5%
of GDP.
Hargy Oil Palms LtdExceptional weather events and lower sales prices for palm oil
and palm kernel oil have resulted in less profitable palm oil activi-
ties for Hargy Oil Palms Ltd than in previous years.
The plantations are located on the island of New Britain and
comprise 12 387 hectares planted with oil palms with an average
age of 8.59 years, of which 3 357 hectares (27.1%) are immature.
Furthermore, the company is responsible for the processing of
the fruit of approximately 3 600 local farmers, who harvest 3 849
blocks of oil palms. In 2013, the processing of fruit into palm oil
and palm kernel oil is still done by two extraction plants, each
with a maximum processing capacity of 45 tonnes of fruit per
hour. The monthly shipments to Europe depart from our jetty
near the Hargy factory, which offers direct access to sea-going
vessels.
Despite expansion through new plantings, which are gradu-
ally reaching maturity and improved transport facilities, difficult
weather conditions have meant that annual production from
our plantations and produce purchased from neighbouring
farmers have both decreased, especially in the first quarter, by
respectively 4.10% and 8.53% compared to the previous year.
Once again, the rainy season at the beginning of the year was a
great challenge for our people, with an extremely wet January
and March and a somewhat drier February, which allowed us to
repair the damage to some extent. Total precipitation in the first
quarter reached 2 900 mm in the mature plantations. While this
amount of rain is not exceptional for the time of year, there were
a few very intense storms with a rainfall of over 200 mm per day,
which caused significant damage to road infrastructure. Some of
the bridges over rivers disappeared with the floods and it took
months before new bridges were built by the local authorities.
In the meantime, our company managed to create a passageway
using gravel.
The precipitation meant that the plantations lost an average of
eight harvest days in the first three months.
Certain zones of neighbouring farmers were also inaccessible and
any fruit that was picked did not reach the mill in time. This led
Activity report by country

SIPEF | ANNUAL REPORT 2013 63
to the necessity to refuse 630 tonnes of overripe fruit delivered
by the farmers.
In addition, the oil shipment scheduled for December was de-
layed and the loading of the ship could only begin on 15th
January. Our company’s existing storage capacity could not cope
with such a delay, caused by the shipping line, and we were
forced to transport the oil to be stored at one of our neighbours’
plants, New Britain Palm Oil Ltd, which offered temporary storage
capacity. At the same time, harvesting on our own plantations
was stopped for four days, thereby disrupting the order of the
areas to be harvested and, due to the combination of circum-
stances, it took several months before ‘normal’ harvesting could
resume. In the meantime, the delayed harvesting and the addi-
tional transport caused an increase in the acidity of the available
oil and for three months we shipped oil with a higher acidity level
than the required 5%. Delivery of oil with excessive acid content
meant additional costs for the refineries and we had to accept
the lowering of our contract prices according to an agreed scale.
At the end of the first quarter, production was also 4.5% lower
than in the same period of 2012, with an almost identical decline
in our own production as for that of neighbouring farms.
Hargy Oil Palms Ltd’s entire transport system was dramatically
improved by the gradual introduction of a new system using
open containers loaded in the field and then transported to the
mill, and by investment in very reliable Volvo trucks to replace
the older trucks produced in China. An additional storage buffer
was thus created for fruit that cannot be processed immediately
in the mill. We introduced the open container system at the end
of 2011 at the Hargy plantation and also step by step in Navo in
the second half of 2012. For the sake of efficiency, open trucks
are being used provisionally in the younger Barema plantation,
where even smaller fruit are harvested. On the neighbouring
farms nets are used to retrieve fruit, which is loaded into trucks
using cranes that automatically register the weight. Two modern
service centres were built for the maintenance of the fleet. These
centres allow rolling stock to be serviced in safe conditions, and
the team was expanded with experienced mechanics.
After the necessary budget was earmarked for the repair of our
roads, the production deficit was quickly erased through the ef-
ficient transport of fruit. We also saw production rise by 11.11%
in the second quarter compared with the same period in 2012,
and at the end of June we already quoted a volume of 3.56%
above total production in the first half of last year. These addi-
tional volumes were achieved as much from the neighbouring
farmers as from our own production, with the exception of the
Barema plantation, where the heavy rainfall was followed by a
persistent failure in pollination due to a lack of male flowers. As a
result, some 600 000 fruits were underdeveloped and had to be
removed, which corresponds to a loss of 1 350 tonnes of oil.
Additionally, the normally lower production months of the third
quarter were exceptionally weak this year. There is generally a
stage of formation of male flowers, whereby production in certain
parts of the plantation is less than half of the expected amount,
which cancels out the previously established growth rates. This
masculine stage is completely physiological and cannot be pre-
vented by management. We noted a reduction of 17.03% for our
own plantations and 24,08% for the neighbouring farmers.
Although a recovery was observed in the fourth quarter, the
total annual production remained 6.17% below production in
the previous year, while we had expected an increase of over
5% from additional areas and maturity of the trees. The neigh-
bouring farmers were especially behind at year-end (-8.53%) and
appeared poorly motivated to harvest their blocks at regular in-
tervals.
The Hargy plantation, which formed the basis of the first settle-
ment, covers 2 598 hectares of which only 139 hectares (5.35%)
are immature. The average age is now 13.78 years and, therefore,
fully mature, with an annual production rate of 26.67 tonnes per
hectare. We expect the first limited replanting of 139 hectares
in 2015. The harvest is done using the open-container transport
system only and the programme for paving all the main roads
will be completed in 2014. Hargy’s road network suffered badly
during the rainy season and there was a hiatus in the proper
monitoring of the harvest rounds and maintenance of the palms,
as a result of the replacement of agronomists in spring. For two
quarters, Hargy was not able to make up the deficit and only in
September, when a new expatriate manager was available, was
a significant improvement achieved in the harvest quality of the
fruit delivered to the mill.
The largest plantation is the more northerly located Navo with
5 275 planted hectares, 1 273 of which are presently replanted,
and of which 933 have not yet matured. Also in 2014, another
727 hectares of the first generation of palms that were planted
in 1984/1986 will be replanted. Because of its large size, the plan-
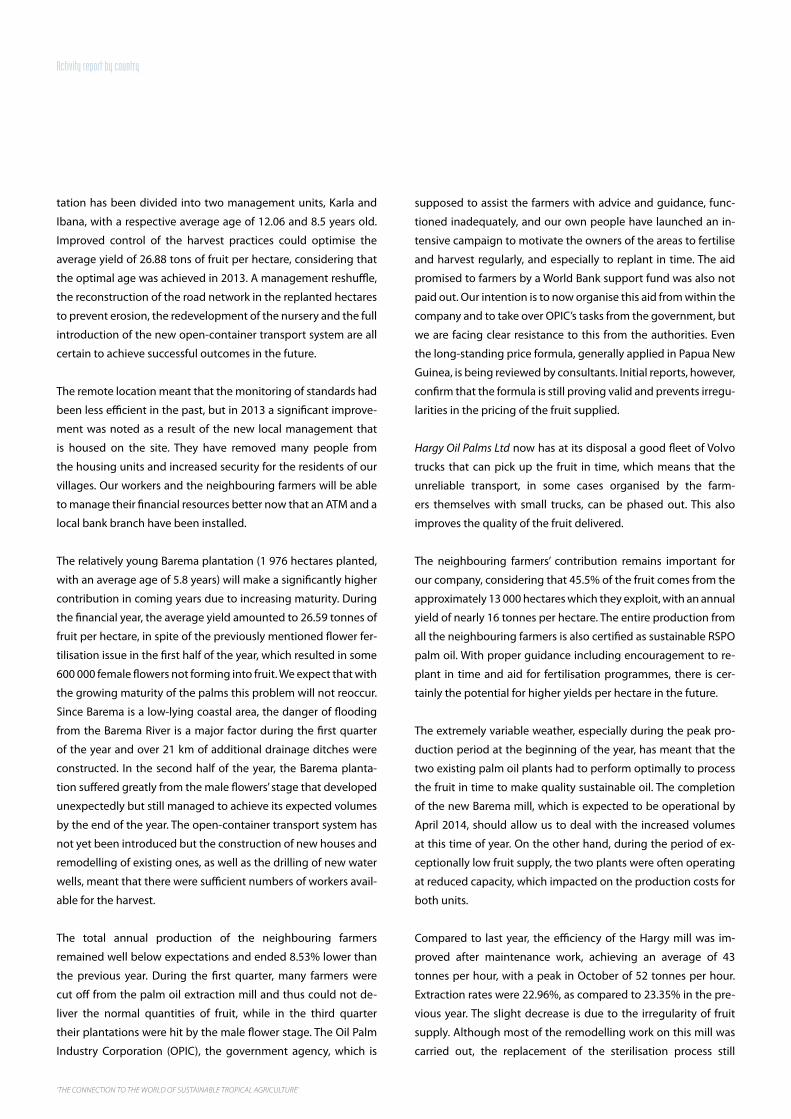
‘THE CONNECTION TO THE WORLD OF SUSTAINABLE TROPICAL AGRICULTURE’
tation has been divided into two management units, Karla and
Ibana, with a respective average age of 12.06 and 8.5 years old.
Improved control of the harvest practices could optimise the
average yield of 26.88 tons of fruit per hectare, considering that
the optimal age was achieved in 2013. A management reshuffle,
the reconstruction of the road network in the replanted hectares
to prevent erosion, the redevelopment of the nursery and the full
introduction of the new open-container transport system are all
certain to achieve successful outcomes in the future.
The remote location meant that the monitoring of standards had
been less efficient in the past, but in 2013 a significant improve-
ment was noted as a result of the new local management that
is housed on the site. They have removed many people from
the housing units and increased security for the residents of our
villages. Our workers and the neighbouring farmers will be able
to manage their financial resources better now that an ATM and a
local bank branch have been installed.
The relatively young Barema plantation (1 976 hectares planted,
with an average age of 5.8 years) will make a significantly higher
contribution in coming years due to increasing maturity. During
the financial year, the average yield amounted to 26.59 tonnes of
fruit per hectare, in spite of the previously mentioned flower fer-
tilisation issue in the first half of the year, which resulted in some
600 000 female flowers not forming into fruit. We expect that with
the growing maturity of the palms this problem will not reoccur.
Since Barema is a low-lying coastal area, the danger of flooding
from the Barema River is a major factor during the first quarter
of the year and over 21 km of additional drainage ditches were
constructed. In the second half of the year, the Barema planta-
tion suffered greatly from the male flowers’ stage that developed
unexpectedly but still managed to achieve its expected volumes
by the end of the year. The open-container transport system has
not yet been introduced but the construction of new houses and
remodelling of existing ones, as well as the drilling of new water
wells, meant that there were sufficient numbers of workers avail-
able for the harvest.
The total annual production of the neighbouring farmers
remained well below expectations and ended 8.53% lower than
the previous year. During the first quarter, many farmers were
cut off from the palm oil extraction mill and thus could not de-
liver the normal quantities of fruit, while in the third quarter
their plantations were hit by the male flower stage. The Oil Palm
Industry Corporation (OPIC), the government agency, which is
supposed to assist the farmers with advice and guidance, func-
tioned inadequately, and our own people have launched an in-
tensive campaign to motivate the owners of the areas to fertilise
and harvest regularly, and especially to replant in time. The aid
promised to farmers by a World Bank support fund was also not
paid out. Our intention is to now organise this aid from within the
company and to take over OPIC’s tasks from the government, but
we are facing clear resistance to this from the authorities. Even
the long-standing price formula, generally applied in Papua New
Guinea, is being reviewed by consultants. Initial reports, however,
confirm that the formula is still proving valid and prevents irregu-
larities in the pricing of the fruit supplied.
Hargy Oil Palms Ltd now has at its disposal a good fleet of Volvo
trucks that can pick up the fruit in time, which means that the
unreliable transport, in some cases organised by the farm-
ers themselves with small trucks, can be phased out. This also
improves the quality of the fruit delivered.
The neighbouring farmers’ contribution remains important for
our company, considering that 45.5% of the fruit comes from the
approximately 13 000 hectares which they exploit, with an annual
yield of nearly 16 tonnes per hectare. The entire production from
all the neighbouring farmers is also certified as sustainable RSPO
palm oil. With proper guidance including encouragement to re-
plant in time and aid for fertilisation programmes, there is cer-
tainly the potential for higher yields per hectare in the future.
The extremely variable weather, especially during the peak pro-
duction period at the beginning of the year, has meant that the
two existing palm oil plants had to perform optimally to process
the fruit in time to make quality sustainable oil. The completion
of the new Barema mill, which is expected to be operational by
April 2014, should allow us to deal with the increased volumes
at this time of year. On the other hand, during the period of ex-
ceptionally low fruit supply, the two plants were often operating
at reduced capacity, which impacted on the production costs for
both units.
Compared to last year, the efficiency of the Hargy mill was im-
proved after maintenance work, achieving an average of 43
tonnes per hour, with a peak in October of 52 tonnes per hour.
Extraction rates were 22.96%, as compared to 23.35% in the pre-
vious year. The slight decrease is due to the irregularity of fruit
supply. Although most of the remodelling work on this mill was
carried out, the replacement of the sterilisation process still
Activity report by country

SIPEF | ANNUAL REPORT 2013 65
needs to be achieved, and will only be done after the Barema
mill opens. In the meantime, the wastewater effluent ponds have
been restored.
At the more recent Navo mill, efficiency also increased again to
41.4 tonnes per hour, despite problems with the system of trans-
porting the fruit to the sterilisers and then on to the presses. The
rail system will be improved in the second half of 2014, as soon
as the Barema mill can take on a part of the production, and the
boilers also require a major overhaul. The oil extraction ratio re-
mained limited at 22.66%. Composting of empty palm bunches
was significantly reduced and they were returned to the field as
organic fertiliser for the younger trees. The wastewater, which is
rich in organic matter, is distributed to the palm fields using a
canal system.
Weather conditions have played a part in delaying progress
in the construction of the new Barema mill, but work was also
slowed down by a succession of different contractors. The new
mill has an efficiency rate of 45 tonnes per hour, as well as a new
palm kernel oil department that will process the palm kernels
from the Navo mill, and a wastewater tank installation, which will
use the released methane gas as an energy resource for steam
production. The mill is ready but still awaits completion of the
wastewater system with biogas recovery, for which large tanks
are being built. This work was impeded by delays obtaining work
permits for the Indian workers in charge of the installation, and
now again by the rainy season of the first quarter of 2014. We
expect the definitive start-up of operations in April 2014.
The pressure to process all the fruit into oil in the two existing
plants requires a lot of steam and does not allow the drying of the
palm kernels to a humidity below 5%, which means that the palm
kernel cannot be efficiently extracted. Yet we achieved an extrac-
tion percentage of 1.80% in the Hargy mill and 1.68% in the Navo
unit, a slight improvement over the previous year.
In spite of a significant improvement in the quality and availabil-
ity of transport for the fruit and the introduction of open con-
tainers, which allow the delivery of all fruit within 24 hours, it
wasn’t possible to collect fruit from the plantations that enable
the production of oil with a low acidity level. Irregular harvests
in our own plantations coupled with the absence of well-organ-
ised plantation management during the second and third quar-
ters and inadequate supervision of the neighbouring farmers
by OPIC, meant that the quality of the delivered fruit remained
substandard. Only three of the twelve deliveries resulted in oil
being produced with an acidity level below 4% at departure, this
quality entitles to premiums at delivery.
The production cost of palm oil, denominated in USD, decreased
significantly (-9.37%) in comparison with the previous financial
year. This is mainly due to the weakening of the local currency
against the US dollar, which after an increase of over 35% in two
years has gradually decreased by 13.1% in value. This decrease
more than offset the increase in costs, which occurred due to the
floods in the first quarter and the additional maintenance that
was necessary in the second half of the year to restore the areas
to a normal agronomic state. The salary expenses also rose by 3%,
based on inflation, since minimum wages were maintained at the
2012 level and will probably be discussed again in 2014 by an
advisory board that must hear all stakeholders. The cost of fuel in
terms of USD experienced a slight decrease and that was certain-
ly also the case for fertilisers imported in containers from China.
Staff retention at Hargy Oil Palms Ltd is essential to ensure proper
operations. Since activities take place in such a remote location,
good housing is vital in order to attract young, high quality
people for the long term. We have put in considerable efforts
building new houses for workers and managers over the past
five years. The budgets that were allocated in 2012 to provide a
new home to over 200 families were still being used in 2013 and
from 2014 we will focus primarily on the new development areas,
which still need a complete housing programme to be imple-
mented as soon as the planted palms reach maturity.
While we have restored stability to the employment of the com-
pany’s management, there is once again a lot of turnover among
the agronomic personnel, both regarding expatriate manage-
ment and local managers, which mainly impacted on exploi-
tation of the plantations in mid-year. The lengthy process of
gaining a work permit makes it impossible to provide an instant
replacement for a departing expatriate manager. Local people
often can’t achieve the required standards and then choose to
depart the company unannounced. We fill these positions by re-
cruiting younger employees who appreciate being trained.
In the framework of implementing the business plan to expand
Hargy Oil Palms Ltd into a company with at least 20 000 hectares
of oil palms, in 2013 as well everything possible was done to re-
alise this expansion quickly. Following rather disappointing ex-
pansion volumes in 2012, the new year has begun with sufficient

‘THE CONNECTION TO THE WORLD OF SUSTAINABLE TROPICAL AGRICULTURE’
heavy equipment and contractors who rapidly cleared the areas
of undergrowth. We had therefore already achieved the planned
1 000 hectares of new planting by September and, in order to
keep the machinery at work in the region, have already started
preparation of the zones that will be planted in 2014, as well as
the replanting zone at the Navo plantation. The need to hire con-
tractors for the accelerated clearance of the land and the laying
of roads was not adequately budgeted for and monitored in
2013, resulting in the planned costs being exceeded, a situation
that was regularised in October.
An additional 1 003 hectares were planted in 2013, which brings
the total of the new zone, after correction by a GPS measure-
ment, to 2 539 hectares, spread over several locations that are
all situated around the base of the Ulawun volcano, but grouped
into two management units, Yanaswali and Bakada. In the mean-
time, the first fruits were harvested from the 262 hectares that
were planted in 2010 and construction of the buildings and utili-
ties to house the workers was completed. It is also important that
the management are living in the zone. Much attention was also
paid to the construction and paving of roads necessary to col-
lect the fruit. We have also expanded the team responsible for
the expansion, with specialised maintenance staff for the heavy
equipment, such as bulldozers and cranes, as well as an expatri-
ate agronomist who will take care of the immature hectares and
will organise the first harvest.
All the lands that qualify for this expansion have been surveyed
and approved in line with RSPO regulations. Agreements have
been signed with the owners of sufficient land to plant an ad-
ditional 600 hectares in 2014 too. In 2014, we deliberately scaled
back the number of hectares a little in order to make sure that
we could bring the previously planted hectares to maturity and
recruit the workers to guarantee the upkeep and harvest. We
have cultivated the necessary palm nurseries with water supplies
but, given the extremely isolated location, the rate of further
expansion will depend on weather conditions and the availabil-
ity of workers. We have received all the required approvals from
the local authorities.
Considering the need for the Internal Audit Department to keep
a growing company in line with the established procedures, the
audit department was expanded by four members last year, but
the fourth auditor could only be recruited in December. The more
experienced Indonesian auditors will continue to support the re-
cently recruited auditors.
In anticipation of the implementation of Lintramax, the integrated
ERP software, in 2015, the communication networks between the
plantations and the satellite link abroad have been further im-
proved. A training room was opened where courses were given
in the advanced use of information technology for over 400 man-
days. The goal for 2014 is to extend this to 1 200 man-days so that
even more people become familiar with the new applications. A
steering committee was also set up to support implementation,
while the integration with the financial department was rein-
forced through the training of young accountants. Additionally,
a new software application was installed for personnel manage-
ment, with derivative applications, such as housing manage-
ment, management of work clothes and tools, and dissemination
of efficient reporting. This software will be linked to the yet to be
developed Lintramax salary package.
We note with satisfaction that the primary school education,
which we organise for 90 of our employees’ children through the
Bialla International Primary School (BIPS) is highly appreciated
by the parents, while the excellent cooperation with the middle
school in Kimbe means the children can also move up.
Construction of the new homes in the expansion zone was en-
trusted to local contractors under the supervision of our own
building department, but the building planned for 2012 was
only completed in August 2013. However, a reorganisation of
the teams has put us back on schedule for 2014. The purchasing
department management team has also been reinforced, and
the monitoring of orders and the diesel supply contract have
been converted into a fixed contract for 10 years, as a result of
the construction of in-house infrastructure that allows diesel to
be delivered at reduced prices by sea transport.
After another re-audit this year for the RSPO certification,
which we received in 2009, the ISO 14001 certification was also
extended. Both certificates apply to the entire production of
our own plantations and that of the neighbouring farmers. This
means that all the oil we ship can be considered “segregated”
sustainable palm oil (not mixed with other oils). This position-
ing is very important to our customers in Europe, as there is a
shortage of “segregated” sustainable oil, which also generates
subsidies that we share with our neighbouring farmers each year.
To properly monitor the changes to criteria, we have increased
integration with the sustainability teams from our Indonesian
operations.
Activity report by country

SIPEF | ANNUAL REPORT 2013 67
The company maintains significant sections of the public road
network itself in order to enable the collection of fruit from the
neighbouring farmers. In 2013, over PGK 1.3 million was spent,
of which to date only PGK 0.3 million PGK has been reimbursed
by the government. There are projects sponsored by Australian
Aid to eventually asphalt all main roads through the area and the
Asian Development Bank will be financing the replacement of 12
bridges starting in 2014. We were able to maintain the roads suf-
ficiently to ensure the regular transport of fruit using the govern-
ment’s tax credits system.
Galley Reach Holdings LtdGalley Reach Holdings Ltd concentrates its plantation activities
in the south of the main island of Papua New Guinea, approxi-
mately 70 km from the capital city of Port Moresby. The land was
acquired in the 1980s, but at that time it was already extensive-
ly planted. There are 3 100 mature hectares still being tapped,
of which the average age exceeds 25 years: for this reason, the
annual yield is limited to 610 kg of dry rubber per hectare. Be-
sides its own production of raw rubber, the mill also processes
raw rubber purchased from smallholders in the neighbouring
provinces.
2013 was a difficult year for operations in its own plantations,
and many tapping days were lost during the exceptionally wet
rainy season, whereby, if it rains in the morning, rubber can’t be
tapped. Great efforts were been made to keep all the areas tapped
through the recruitment and training of new tappers, who were
brought over from other provinces of Papua New Guinea, but it
has proven difficult to keep the workers motivated. Raw rubber
production from the company’s own plantations rose by 9.3%
compared with last year.
Precipitation also had an impact on the tapping activities of
the smallholders, who were moreover already discouraged by
the much lower rubber prices and preferred to save their bark
for more profitable times. As a result, the annual production of
rubber purchased from third parties was 7.3% lower than in 2012.
The purchasing from third parties, which represents 24.9% of the
total production of processed rubber for the entire year, allows
factory capacity to be maximised and is important to the com-
pany’s performance.
The rubber factory also had to contend with technical issues in
order to process the supplied rubber in time. The poor quality
of the rubber delivered caused many machinery failures, and the
availability of spare parts cannot be relied upon in this country.
Total production amounted to 2 535 tonnes compared to 3 127
tonnes last year, a decrease of 18.9%.
The profitability of Galley Reach Holdings Ltd was under consider-
able pressure in 2013. Firstly, there were, of course, the significant-
ly lower sales prices due to the general decline in the demand for
natural rubber in China, Europe and America, resulting in a 21.1%
decrease in the net selling price per tonne. The labour-intensive
nature of the operation meant that the change to the local mini-
mum wage was a cost-raising factor and the declining volumes
impacted on the unit cost price. Weakening of the local currency
against the USD did bring some relief here, allowing the unit cost
price denominated in USD to decrease by 9.7% compared to
2012. However, it was the first year that the net contribution to
the group’s results was negative. There are once more discussions
about raising the minimum wage for all business sectors in Papua
New Guinea. This raises major concerns for the labour-intensive
agricultural sector regarding future economic performance and
thus for employment in rural areas.
Since approximately two thirds of the planted areas are older
than 25 years, there has been a scheme in existence since 2004
to gradually replant, which will allow the company to increase
yields per hectare and remain profitable. At the end of the finan-
cial year, 1 006 hectares had been replanted, of which 426 hec-
tares are immature. We adapt the replanting to the available cash
flow as well as to the available workers in the area, without com-
promising the operation of existing plantations. Low sales and
reduced cash flow restricted investment budgets to maintenance
of the immature areas, housing and the lorry park.

‘THE CONNECTION TO THE WORLD OF SUSTAINABLE TROPICAL AGRICULTURE’
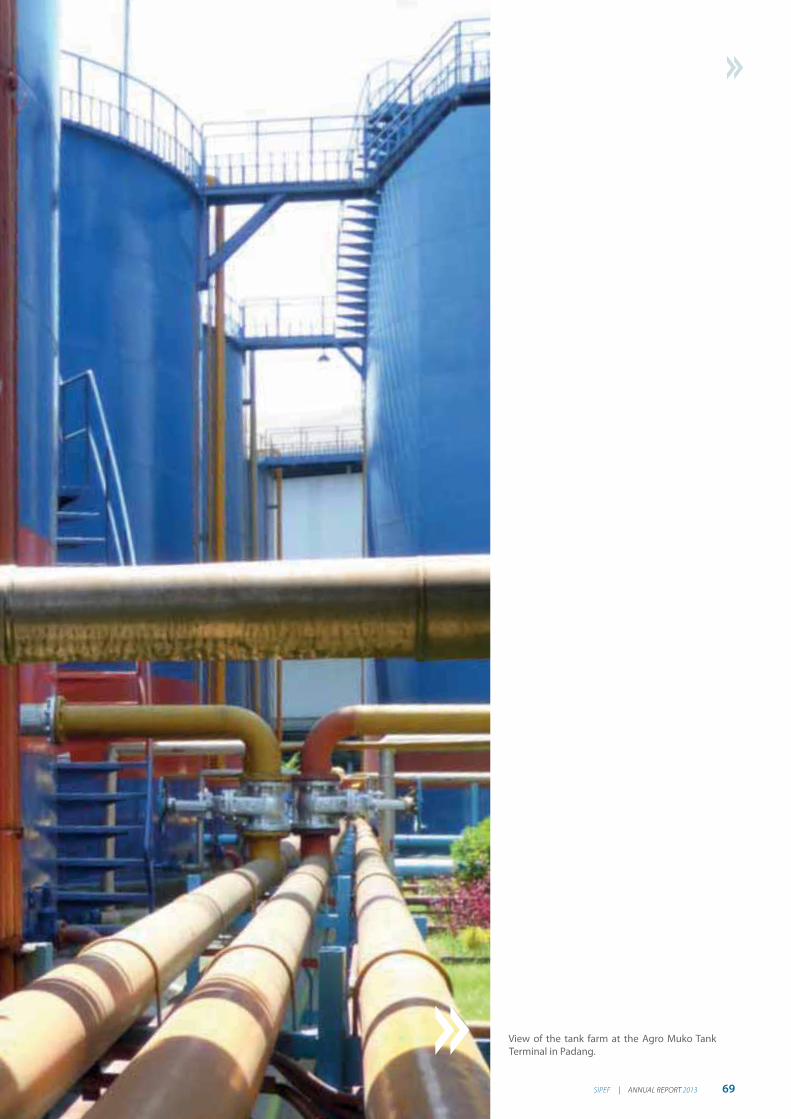
SIPEF | ANNUAL REPORT 2013 69
View of the tank farm at the Agro Muko TankTerminal in Padang.
‘THE CONNECTION TO THE WORLD OF SUSTAINABLE TROPICAL AGRICULTURE’
Ivory Coast
SIPEF-CI SAPlantations J.Eglin SA
After a decade of political crisis that ended in bloody clashes fol-
lowing the elections of October 2010 until April 2011, Alassane
Ouattara came to power and the Ivory Coast has launched a
major diplomatic offensive to break its isolation, improve secu-
rity, bring about reconciliation and relaunch the economy. Today
we can say that Ivory Coast has returned to political stability and
that the country is gradually reassuming the influential position
it once held in West Africa.
SIPEF-CI SAAfter a long agronomic recovery period due to the political
irregularities at the beginning of 2011, 2013 was the first year for
which we can again speak of normal production levels for SIPEF-
CI SA. However, its ambitious production target of 60 000 tonnes
of crude palm oil could not be fully achieved.
With 4 633 hectares of immature and 8 966 hectares of mature
palm trees, at the end of the year SIPEF-CI SA had 13 599 hectares
of industrial plantations with an average age of 8.02 years. The re-
planting of all acres is complete; no rejuvenation will be needed
before 2018.
The surrounding farmers’plantations cover approximately 20 000
hectares and employ 6 000 planters who work independently or
are united in cooperatives. In 2013, they provided 59.9% of the
fruit that was processed in the two plants. An active policy of
guidance and support is pursued in order to protect the sector
from the increasingly clearer preference for rubber trees at the
expense of replanting oil palms.
The two factories are continuing their intensive renewal plan.
Together they have produced 58 008 tonnes of palm oil and 9 190
tonnes of palm kernels. The average extraction level reached
23.9%, which due to weather conditions remained below the
24.11% for 2012. At the end of the year, the company employed
1 570 workers as well as many day labourers.
We marketed 45% of the palm oil locally, all via our most impor-
tant partner UOC, and exported the remainder. The total produc-
tion of palm kernels was transported via trucks to Abidjan and
processed in Vridi at the plant of Oil-Tech SARL, part of the Adam-
Afrique group.
Plantations J. Eglin SAThe outlook for 2013 was good, but by the end of the year our
results, although satisfactory, came in below estimates.
At the beginning of the year, we lost a large proportion of our
banana production on our two large production sites at Agboville
and Motobé, as a result of climatic and technical conditions. Vol-
umes lost were to some extent recuperated in the second half of
the year, but nevertheless our export volumes were lower than
projections and lower than for the previous financial year. We
exported 22 325 tonnes in 2013 compared with 23 917 tonnes
in 2012, with an almost identical area planted. Export logistics
for delivering to the sub-region were also insufficient at the be-
ginning of the year, with a large number of deliveries cancelled,
causing us considerable difficulties in placing our production on
the market in Mauritania.
It should be pointed out that consumption of bananas and local
fruits continues to increase in Africa, mainly in urban areas where
purchasing power is improving, enabling us to obtain net sale
prices fairly close to those obtained on the European continent.
With improving logistics and optimizing South-South trade, mar-
keting is sure to develop positively in the countries bordering on
Ivory Coast. Setting aside Senegal and Mauritania, which we have
been supplying for many years, some Sahelian countries, such as
Mali or Niger, have future potential to be developed.
The average Free On Board (FOB) price for sales to Europe closed
with an average of EUR 442 per tonne, 7% lower than in the
Activity report by country

SIPEF | ANNUAL REPORT 2013 71
previous year, which had registered excellent performances.
Qualitative problems linked to post harvest usage changes led to
a lack of revenue during the rainy season.
Horticultural activities are improving performance with an in-
crease in productivity of bromelias. If trade continues at profitable
levels, the horticultural sector will make a positive contribution
to Plantations J. Eglin SA general business.
Europe
ASCO BDM Sipef
Jabelmalux SA
Jabelmalux SAJabelmalux SA is the Luxembourg parent company of PT Umbul
Mas Wisesa (PT UMW), PT Toton Usaha Mandiri (PT TUM) en PT Citra
Sawit Mandiri (PT CSM), the latest oil palm expansions in North
Sumatra, as well as of PT Agro Muara Rupit (PT AMR), the most
recently acquired concession in Musi Rawas in South Sumatra.
After the successful public purchase bid that was issued in 2011,
the company disappeared from the Luxembourg stock exchange.
The initial offer was then continued, and at the end of 2013 the
SIPEF group controlled 27 172 or 99,6% of the 27 280 issued
shares. SIPEF aims in the future to also acquire the remaining 108
shares that are still in public hands.
InsuranceThe insurance group BDM NV - ASCO NV focuses primarily on
maritime and industrial insurance through brokers. BDM NV is
an insurance agency that acts on behalf of the insurer ASCO NV
and a number of major international insurers to offer risk cover-
age in niche markets. The intense collaboration between BDM NV
as agency and ASCO NV as insurer within the same group offers
substantial advantages: it ensures that BDM NV has a major un-
derwriting capacity and simultaneously offers a powerful com-
mercial outlet for ASCO NV.
BDM NV mIn 2013, BDM NV was able to take full advantage of the previ-
ous year’s investments in information systems and additional
expertise. Targeted actions greatly enhanced the technical qual-
ity of the insurance contracts portfolio. From this reconstruc-
tion schemes resulted a small portfolio decrease : the volume of
premiums dropped from KEUR 67 373 in 2012 to KEUR 65 421 in
2013.
With regard to target groups, in the Property & Casualty segment
BDM NV focused on Small and Medium sized Enterprises (SMEs),
Real Estate, Public Buildings and High Net Worth.
Despite a rigorous selection of risks in Fire and Car, the overall
Property & Casualty portfolio increased by 3%.
In the Marine segment, our Protection & Indemnity and Cruise
portfolios once again showed slight growth. For Cargo and Hull,
the existing portfolios were thoroughly reorganised in order to
protect the technical results for our principals. We are continuing
these reconstruction schemes in 2014. Nevertheless, we can al-

‘THE CONNECTION TO THE WORLD OF SUSTAINABLE TROPICAL AGRICULTURE’
ready see a clear improvement in the technical results of these
segments.
Operating costs are also slightly lower than last year, causing the
final operational result to fall by 6%. The net result of KEUR 729
remains at the same level as in the previous year.
In 2014, BDM NV is focused on developing the Property & Casualty
portfolio and reorienting the Marine business.
ASCO NVASCO NV underwrote gross premiums for KEUR 29 505, 3% more
than the previous year. Thanks to rigorous monitoring and reor-
ganisation by BDM NV, the technical results of this portfolio saw
a dramatic improvement with a gross technical profit of KEUR
4 212, which corresponds to 16 % of the premium collected. How-
ever, this profit was more than halved due to the loss of a French
agency. This agency’s mandate was terminated on 31/12/2013.
From 2014, ASCO NV will have 99% of the business under its own
control.
Given that reinsurance costs increased slightly compared to the
previous year, in 2013 ASCO NV achieved a net result of KEUR -568
as opposed to KEUR -91 in 2012.
In the course of 2013, ASCO NV continued to prepare for the intro-
duction of the Solvency II directive, including a further expansion
of the Own Risk and Solvency Assessment (ORSA) process and
the calculation of the capital requirement under Solvency II.
Activity report by country

SIPEF | ANNUAL REPORT 2013 73
Product Own Outgrowers 2013 Own Outgrowers 2012
Palm Oil 206 476 47 436 253 912 214 521 51 257 265 778
Indonesia 152 430 2 205 154 635 158 162 1 808 159 970
Tolan Tiga group 63 494 513 64 007 67 056 41 67 097
Umbul Mas Wisesa group 10 954 10 954 5 762 5 762
Agro Muko group 77 982 1 692 79 674 85 344 1 767 87 111
Papua New Guinea 54 046 45 231 99 277 56 359 49 449 105 808
Palm kernels 36 301 480 36 781 37 651 357 38 008
Indonesia 36 301 480 36 781 37 651 357 38 008
Tolan Tiga group 15 335 136 15 471 18 284 11 18 295
Umbul Mas Wisesa group 2 900 2 900 0
Agro Muko group 18 066 344 18 410 19 367 346 19 713
Palm kernel oil 4 126 3 471 7 597 4 217 3 728 7 945
Papua New Guinea 4 126 3 471 7 597 4 217 3 728 7 945
Rubber 9 773 630 10 403 9 757 884 10 641
Indonesia 7 868 7 868 7 508 6 7 514
Tolan Tiga group 6 432 6 432 6 138 6 138
Agro Muko group 1 436 1 436 1 370 6 1 376
Papua New Guinea 1 905 630 2 535 2 249 878 3 127
Tea 2 850 0 2 850 2 869 54 2 923
Indonesia 2 850 2 850 2 869 54 2 923
Pineapple flowers ('000 units) 569 0 569 638 0 638
Ivory Coast 569 569 638 638
Bananas 22 325 0 22 325 23 917 0 23 917
Ivory Coast 22 325 22 325 23 917 23 917
Group production (in tonnes)Total prodcution of consolidated companies (≠ share of the group)

‘THE CONNECTION TO THE WORLD OF SUSTAINABLE TROPICAL AGRICULTURE’
Product2013 2012
Mature Immature Planted Mature Immature Planted
Oil palms 44 684 9 857 54 541 42 200 11 076 53 276
Indonesia 35 654 6 500 42 154 33 797 7 895 41 692
Tolan Tiga group 11 763 2 843 14 606 11 658 2 717 14 375
Umbul Mas Wisesa group 7 858 1 671 9 529 5 417 4 113 9 530
Agro Muko group 16 033 1 763 17 796 16 722 1 065 17 787
Musi Rawas group 223 223 0
Papua New Guinea 9 030 3 357 12 387 8 403 3 181 11 584
Rubber 8 105 1 840 9 945 7 306 2 060 9 366
Indonesia 5 005 1 414 6 419 4 786 1 297 6 083
Tolan Tiga group 4 059 707 4 766 3 854 758 4 612
Agro Muko group 946 707 1 653 932 539 1 471
Papua New Guinea 3 100 426 3 526 2 520 763 3 283
Tea 1 738 49 1 787 1 748 39 1 787
Indonesia 1 738 49 1 787 1 748 39 1 787
Pineapple flowers 23 19 42 18 20 38
Ivory Coast 23 19 42 18 20 38
Bananas 570 0 570 569 0 569
Ivory Coast 570 570 569 569
Others 0 58 58 0 58 58
Papua New Guinea 58 58 58 58
Total 55 120 11 823 66 943 51 841 13 253 65 094
* actual planted hectares
Group planted area (in hectares) *Total planted area of consolidated companies (≠ share of the group).

SIPEF | ANNUAL REPORT 2013 75
Planting
year
Oil palms Rubber
Tolan Tiga
group
Umbul
MasWisesa
group
Agro Muko
group
Musi Rawas
group
Hargy Oil
PalmsTotal
Tolan Tiga
group
Agro Muko
group
Galley Reach
HoldingsTotal
2013 670 25 1 018 223 1 039 2 975 184 205 389
2012 1 420 218 719 1 643 4 000 197 195 60 452
2011 754 796 26 675 2 251 168 142 310
2010 546 1 333 304 627 2 810 141 108 182 431
2009 221 1 753 499 391 2 864 52 57 87 196
2008 375 2 006 216 154 2 751 96 117 97 310
2007 301 2 086 350 1 695 4 432 258 173 200 631
2006 619 349 926 879 2 773 205 187 201 593
2005 667 963 434 173 2 237 294 122 416
2004 133 688 160 981 226 58 284
2003 1 165 102 148 1 415 262 262
2002 570 56 331 957 200 200
2001 688 526 903 2 117 96 69 165
2000 802 1 017 392 2 211 419 78 41 538
1999 646 1 680 666 2 992 180 83 139 402
1998 466 2 334 625 3 425 266 157 33 456
1997 827 927 361 2 115 215 151 73 439
1996 991 509 326 1 826 197 197
1995 312 207 333 852 206 37 243
1994 482 712 139 1 333 131 131
1993 346 209 555 191 191
1992 774 106 880 0
1991 269 269 0
1990 31 2 668 2 699 91 91
1989 42 878 920 153 153
Before 1989 758 416 727 1 901 338 2 127 2 465
Total 14 606 9 529 17 796 223 12 387 54 541 4 766 1 653 3 526 9 945
Average age 11,12 4,78 13,97 0,00 8,59 10,32 12,19 6,60 25,89 16,11
Age profile (in hectares)
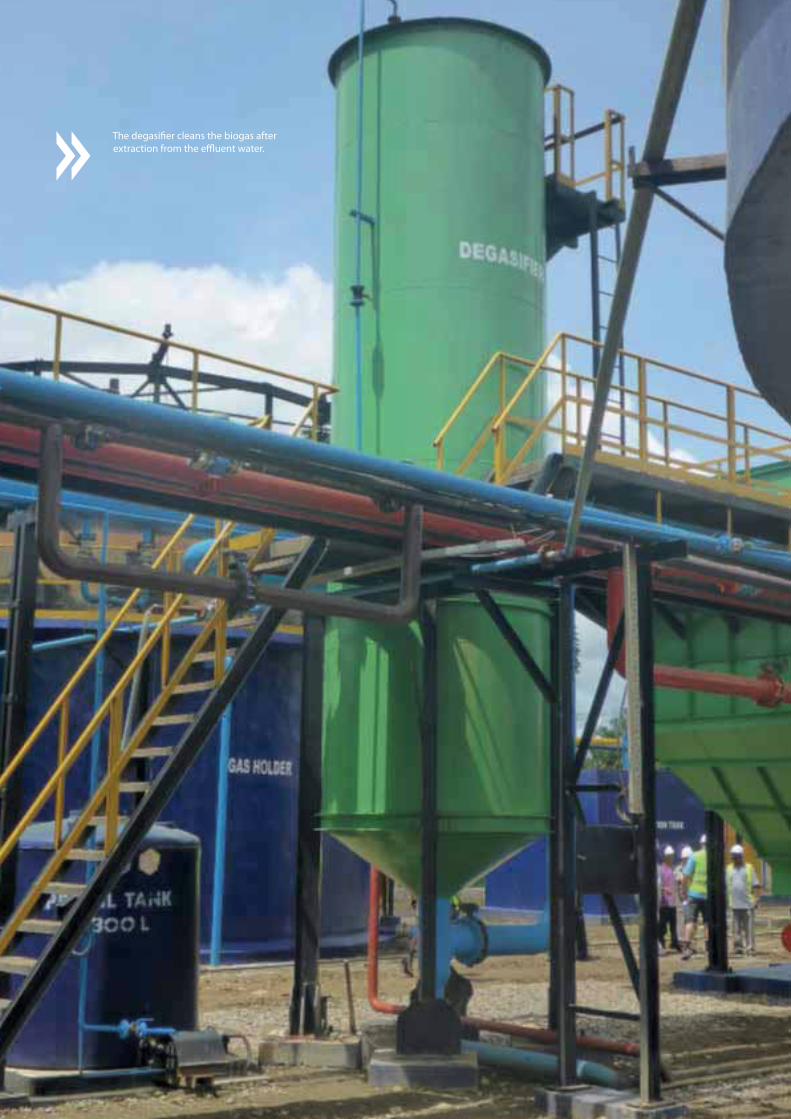
“THE CONNECTION TO THE WORLD OF SUSTAINABLE TROPICAL AGRICULTURE”
The degasifier cleans the biogas afterextraction from the effluent water.

SIPEF | ANNUAL REPORT 2013 77
As environmental legislation and certification standards change
and consumers demand more assurance in terms of traceability
and responsibility on the part of producers, SIPEF is proving its
continued commitment to integrate its operations seamlessly
into the environment, both in terms of duration and transpar-
ency.
This commitment is sustained by continuous efforts to improve
on the technical front, validated by external certification of glob-
ally recognised standards.
Above all, in a market where many questions arise over the prov-
enance of products, SIPEF can guarantee traceability of its sales.
SIPEF only trades produce from its own plantations and from
small partners with which it has close links.
This is a major advantage in assuring SIPEF clients that its social
and environmental commitments are and will be followed on the
ground, both now and in the future.
For many years, SIPEF has been committed to a policy of “sus-
tainable development” certification. This approach enables us to
validate our practise, to improve it, identify risks and weaknesses
and remedy them. Annual audits assess progress and sometimes
difficulties facing our operations. Preparation for each audit in-
volves detailed analysis of technical stages, procedures, and their
application. Being “certified” involves sustained efforts in training
employees at every level, continuous improvement in their work-
ing conditions and lives, and finally commitments to communi-
ties and their representatives.
The standards applied in our operations are well known: ISO 9001
and ISO 14001, “Roundtable for Sustainable Palm Oil” (RSPO), “In-
ternational Sustainability and Carbon Certification” (ISCC), “Eu-
repGAP/GlobalGAP”and “Clean Development Mechanism”(CDM,
United Nations).
SIPEF is active within the RSPO, as in previous years, on commit-
tees such as “Trade and Traceability” and “Biodiversity and High
Conservation Values”, as well as in the RSPO forum in Papua New
Guinea. In 2013, SIPEF was invited to join the RSPO Complaints
Panel which looks at complaints lodged against RSPO members
and which recommends responses. SIPEF remains convinced that
the RSPO, because it includes all actors concerned in the sector,
is the ideal and sole forum for making production and worldwide
consumption of palm oil sustainable.
SIPEF continues to support the Belgian Association for Sustain-
able Palm Oil and is a member of KAURI, the multi-actor Belgian
network for business ethics and nongovernmental organisation
responsibility.
If oil palm cultivation is clearly “certified”, other types of cultiva-
tion are following parallel paths. So, for example, rubber cultiva-
tion will soon see the appearance of an international certification
standard. This standard has been developed by the International
Rubber Study Group (IRSG) which covers producer countries and
the natural rubber industry.
The majority of our industrial sites are ISO 14001 or ISO 9001 cer-
tified. The ISO system is an excellent framework for preparing for
more specific certifications, such as the RSPO or the ISCC.
Whilst SIPEF is finalising construction of two new oil mills (one in
Indonesia and one in Papua New Guinea), the six other units in
operation were RSPO re-certified in 2013. The two new oil mills
will be ready for certification as soon as they begin production in
2014. SIPEF will continue to be 100% RSPO certified for oil mills
in operation.
SIPEF respects RSPO principles and criteria, submitting every new
oil palm plantation project to the “New Planting Procedure”. This
extremely strict protocol ensures that every new development
has been planned respecting the environment - by searching for
high conservation value areas (HCV) - by respecting the rights
and aspirations of local communities - by imposing on every new
project a requirement for patient consultation with affected com-
munities (the acronym is FPIC: Free, Prior and Informed Consent),
and by demonstrating that the area is agronomically compatible
with cultivation of the oil palm. The preparatory documentation
for the project is verified by an external certifying body.
The “New Planting Procedure” includes a period of thirty days
during which the important elements of the project are available
on the RSPO website. Comments by the public are carefully
examined by the RSPO.
Building on the positive impacts already achieved bySIPEF operations.
“THE CONNECTION TO THE WORLD OF SUSTAINABLE TROPICAL AGRICULTURE”
Building on the positive impacts already achieved by SIPEF operations.
In 2013, SIPEF obtained ISCC certification for a third oil mill in
Indonesia. Following Bukit Maradja and Perlabian in North-
ern Sumatra, the Mukomuko plant in the province of Bengkulu
passed its audit successfully.
The ISCC standard certifies that the emissions generated by the
production of palm oil from these three oil mills are lower than or
equal to the limit laid down by the European directive on emis-
sion reduction (RED). ISCC certification enables access to the
European biomass fuel market. It publishes figures for the equiv-
alent CO2 value of each tonne of palm oil, which is an interesting
indicator of environmental performance.
The ISCC certification for these three oil mills has only been possi-
ble thanks to installing methane capture devices, methane being
emitted by the liquid effluents resulting from milling.
In the Bukit Maradja and Perlabian mills, the capture equipment
was installed in 2008. The Mukomuko oil mill has a new genera-
tion system, which is more efficient and even safer than previ-
ous systems. The same system will be used for equipping the two
new company oil mills (Barema in Papua and Umbul Mas Wisesa
in Indonesia) as soon as they are commissioned.
This equipment complies with the United Nations “Clean Devel-
opment Mechanism” standard.
The policy of “sustainable certification” isbuilt on a foundation of good agronomic,industrial and social practises.Good agronomic practise seeks to obtain an optimal yield for a
minimal footprint. A good soil diagnosis is of the first importance,
both for new plots and old, and takes into account climate, soil,
topography and ecological context.
Agronomists work with environmental teams to determine which
areas will be planted and which areas protected. The interactions
between the two types of area are carefully considered in order
to avoid involuntary damage but also to help the plantations to
reach their best performance.
Potential impacts on water resources are examined and cultiva-
tion practises are modified as required for preserving water avail-
ability and quality for communities downstream from operations.
Ecological corridors for protected animal species are put in place
if observations on the ground have shown them to be necessary.
The natural areas surrounding our plantations are regularly pa-
trolled to prevent any intrusions but also to evaluate biodiver-
sity. The results are sometimes surprising and demonstrate the
importance of planning plantations in the light of their position
in the ecosystem, so that they can continue to carry out useful
functions for flora and fauna.
For perennial cultivation, plantations must remain productive
without any time limit. Some of our plots have been producing
for a century. In Indonesia, SIPEF has been growing the oil palm
since 1930, on the Perlabian plantation, which is still one of the
most productive.
It is critically important to maintain and increase the fertility of the
soil. Each stage of cultivation therefore takes this into account,
ranging from preparing plots without slash and burn, establish-
ing growth of leguminous plants for cover as quickly as possible,
adding carefully calculated doses of fertilizer, carefully return-
ing all organic matter (palm trimmings and stalks), to spreading
liquid effluents recycled from the mill. Erosion is also controlled
by cover plants and by constructing terraces on slopes.
The fight against weeds and pests and diseases is also an impor-
tant agronomic aspect. Rapid planting of cover limits the growth
of weeds. For pests and diseases, each plantation develops its
own integrated campaign, with the same order of priority: pre-
vention, then destruction. Preventing attacks by pests depends
upon natural predators for keeping the pest population and the
damage they cause within acceptable limits. Natural predators
are “invited” on our plantations: installation of nests for owls,
against mice, and planting of host plants for insect predators,
against the numerous parasites affecting our cultivation. Special-
ist technicians collect information on a regular basis for monitor-
ing pest populations, thus enabling rapid action if populations
increase by too much. Depending on the gravity of the situation,
use of chemicals can be resorted to as the most effective way of
preventing the spread of infestation.
Every year, the agronomists are provided with a list of authorized
products for use on SIPEF plantations. These products are stored

SIPEF | ANNUAL REPORT 2013 79
The biogas holder, part of the effluent treatmentplant, contains the extracted methane biogas readyfor re-injection as a fuel source for the boiler.

“THE CONNECTION TO THE WORLD OF SUSTAINABLE TROPICAL AGRICULTURE”
Building on the positive impacts already achieved by SIPEF operations.
in secure warehouses and are used by specifically trained and
equipped technicians. Handling and application equipment and
the products themselves are checked and stored carefully. Each
employee who comes into contact with chemical products (on
the plantation or in the plant) must have a quarterly health check
and a complete medical test every year.
The potential environmental impacts of industrial units are pre-
dicted and controlled. Care taken to limit environmental impact
goes together with constant research into technical excellence. A
well-managed plant is efficient and leaves a low environmental
footprint.
Adopting methane capture in our oil mills is an important step
towards a neutral environmental impact from processing our
products.
In our oil mills particular attention is paid to product traceability
in both directions - incoming and outgoing. Each of our plants
is a key stage in the process. The plants check the origin of each
batch of latex, bananas or tea leaves, and can then guarantee this
provenance to our clients.
Good social practises complete good agronomic and industrial
practises. They recognise the first importance of the men and
women who work for SIPEF and also the importance of the link
between our operations and surrounding communities.
Continuous training for our employees has two aims: increasing
their technical skills and improving safety at work. Training re-
quirements are regularly assessed on the basis of requests from
plant or plantation managers and safety at work committees.
These committees play an active role in preventing pollution and
accident risks. Regular inspections and monitoring help to antici-
pate risks and to focus everyone’s attention on maintenance.
Our operations mainly take place in isolated areas. SIPEF builds
and maintains housing for all permanent workers. Water and
electricity are also provided by the company. On most of our
A truck weighing and loading the FreshFruit Bunches and loose fruits harvested byone of the more than 3 000 neighbouringsmallholders, who represent close to 45%of the production of Hargy Oil Palms Ltd.

SIPEF | ANNUAL REPORT 2013 81
plantations, the terms of maintenance of housing units are dis-
cussed every month by residents and the plantation manager.
Dispensaries (and ambulances for serious cases) are arranged
and financed by SIPEF. Regular consultations by doctors are or-
ganised so that all employees and their families can have access
to quality care and treatment.
Education is a major concern for our employees. For the very
young, kindergartens are available on the plantations. In
Indonesia, school transport is arranged. Where necessary, SIPEF
contributes to building public schools, by donating land and
helping with the building of the schools. In Indonesia, on the
Umbul Mas Wisesa plantation, the success of the small school
built by SIPEF has been such that the number of classrooms and
teachers will be doubled in 2014.
In Papua New Guinea, the government has developed a system
of tax credits, which enables Hargy Oil Palms Ltd (HOPL) to con-
tribute directly to local development. A share of HOPL taxes goes
towards maintaining a primary school, the provincial road, sev-
eral bridges, a police station and an airstrip.
Dialogue and cooperation with local people is another key to the
long term success of our operations.
In Papua New Guinea, HOPL has been negotiating every new
acquisition of land rights for several years. The time taken to
explain, but above all to listen, builds a long term relationship of
confidence with village communities.
In Indonesia, since 2000, PT Agro Muko has continued to be highly
successful with its programme for community oil palm plots.
The plots, known as Kebun Masyarakat Desa (KMD), are wholly
managed by PT Agro Muko in the same fashion as the Agromuko
plantations. PT Agro Muko provides early stage finance for de-
velopment and maintenance costs, purchasing production at
the market price. As a guarantee of transparency, all payments
received by each KMD are published in the local newspaper.
Almost half of the villages in the Mukomuko region are now
taking part in the KMD programme.
The new SIPEF projects in the South of Sumatra, in the area of
Musi Rawas, are being developed with a village plantation com-
ponent. In the long run, these village plantations will form 20% of
the area developed by SIPEF in Musi Rawas. Patient preparation
has led to a model of association between village cooperatives
and plantations, which augurs, well for a long term relationship
of benefit to all parties.
Sipef Foundation: 2013, a good year ratified.The activities of the SIPEF foundation during 2013 were concen-
trated on two projects initiated in previous years, and whose po-
tential has been ratified and confirmed.
2013 was a good year for the sea turtle protection project in
Mukomuko (province of Bengkulu, Indonesia). Following the
agreement signed in 2012 with the National Agency for the
Protection of Natural Resources (BKSDA, under the authority of
the Forestry Ministry of the Indonesian Republic), which added
a second village to the project, and thanks to the interest shown
by the villagers in these activities, 5 974 eggs were collected and
4 508 baby turtles were released.
Three species were released during the project, mainly Ridley
turtles (Lepidochelys olivacea), but also some green sea tur-
tles (Chelonia mydas) and a small number of hawksbill turtles,
(Eretmochelys imbricata, classified as “critically endangered” by
the International Union for Conservation of Nature (IUCN).
Sea turtles lay their eggs all along the west coast of Sumatra. The
laying areas are subject to strong pressure from collection by
humans, in spite of the legal protection covering all species of
sea turtles. There are very few projects for the protection of sea
turtles in Indonesia, in spite of the country’s long coastline and
an environment, which is particularly hospitable to these species.
The SIPEF Foundation’s project protects a large proportion of the
laying areas in the project zone, both from commercial collec-
tion and from natural risks to which the nests are exposed. The
hatching rate achieved by the project (75%) can be improved,
but is higher than the natural rate (40%).

“THE CONNECTION TO THE WORLD OF SUSTAINABLE TROPICAL AGRICULTURE”
The chairman, Baron Bracht, surroundedby students at the opening of the newclassrooms of one of the primary schoolsbuilt by Hargy Oil Palms Ltd in Papua NewGuinea.

SIPEF | ANNUAL REPORT 2013 83
The second SIPEF Foundation project “SIPEF Biodiversity
Indonesia” (SBI) is a novel but ambitious project for a plantation
company in Indonesia.
After a lengthy procedure, towards the end of 2013 the Minister
for Forests in the Republic of Indonesia granted a forest man-
agement license (entitled IUPHHK-RE) to SBI for a period of sixty
years. This license is of a new type, covering forest protection,
reforestation and sustainable management. For the time being,
only a handful of such projects have been approved.
SBI is beginning its activities in an area of 12 672 hectares in the
foothills of the Kerinci Seblat National Park (TNKS) on the island of
Sumatra. This area, under legal protection, is being damaged by
local populations but also by migrants. It is a very important area
for protection by the TNKS by virtue of its populations of muntjac
deer, tapir, bears, tigers and protected vegetable species.
With the aim of keeping the forest intact, a major effort is planned
for helping village communities on the perimeter of the project.
In areas already damaged, SBI will carry out replanting both for
creating sustainable growth and sustainable use. The aim is to
create a barrier to deforestation with the participation of local
communities. The project can only succeed with a vote of con-
fidence from these communities in our long term commitment.
Linkswww.rspo.org
www.iscc-system.org
www.zsl.org
www.iucnredlist.org
http://seaturtlestatus.org/learn/meet-the-turtles

‘THE CONNECTION TO THE WORLD OF SUSTAINABLE TROPICAL AGRICULTURE’
Consolidated financial statements 84
Consolidated statement of financial position 86
Consolidated income statement 88
Consolidated statement of comprehensive income 89
Consolidated cash flow statement 90
Consolidated statement of changes in equity 91
Notes to the consolidated financial statements 92
1. Identification 92
2. Statement of compliance 92
3. Accounting policies 93
4. Use of estimates 97
5. Group companies / consolidation scope 98
6. Exchange rates 99
7. Segment reporting 99
8. Goodwill and other intangible assets 103
9. Biological assets 104
10. Property, plant and equipment 107
11. Investment property 108
12. Investments in associates 108
13. Other financial assets 109
14. Inventories 109
15. Other current receivables and other current payables 110
16. Shareholders’ equity 110
17. Non-controlling interests 112
18. Provisions 112
19. Pension liabilities 113
20. Net financial assets/(debts) 115
Financial statements

SIPEF | ANNUAL REPORT 2013 85
21. Assets/liabilities held for sale 115
22. Non-recurring result 116
23. Financial result 117
24. Share based payment 117
25. Income taxes 118
26. Share of results of associated companies 120
27. Change in net working capital 120
28. Financial instruments 121
29. Joint ventures 127
30. Operating leases 127
31. Finance leases 128
32. Rights and commitments not reflected in the balance sheet 128
33. Related party transactions 129
34. Earnings per share (basic and diluted) 130
35. Events after balance sheet date 131
36. Recent developments 131
37. Services provided by the auditor and related fees 132
Statutory Auditor’s report 133
Parent company summarized statutory accounts 135
Although palm oil mills are energy-self-sufficient oncerunning at capacity, the start-up requires the use ofdiesel, stored in bunded tanks.
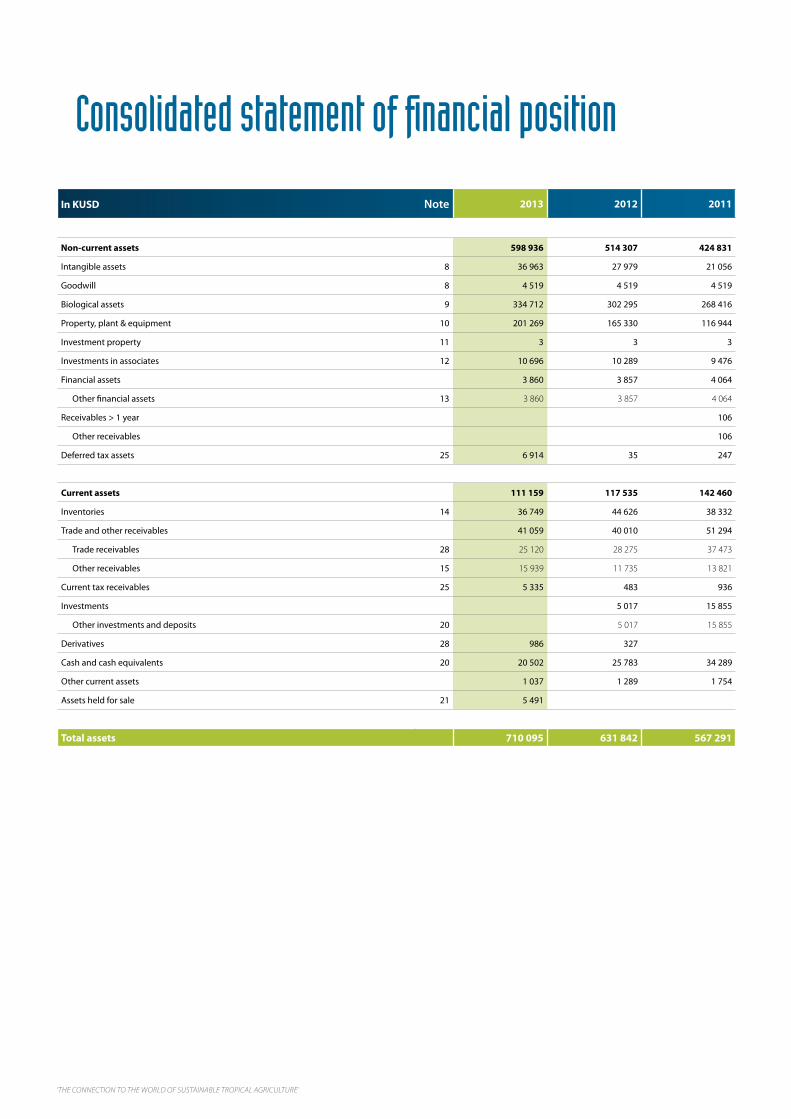
‘THE CONNECTION TO THE WORLD OF SUSTAINABLE TROPICAL AGRICULTURE’
In KUSD Note 2013 2012 2011
Non-current assets 598 936 514 307 424 831
Intangible assets 8 36 963 27 979 21 056
Goodwill 8 4 519 4 519 4 519
Biological assets 9 334 712 302 295 268 416
Property, plant & equipment 10 201 269 165 330 116 944
Investment property 11 3 3 3
Investments in associates 12 10 696 10 289 9 476
Financial assets 3 860 3 857 4 064
Other financial assets 13 3 860 3 857 4 064
Receivables > 1 year 106
Other receivables 106
Deferred tax assets 25 6 914 35 247
Current assets 111 159 117 535 142 460
Inventories 14 36 749 44 626 38 332
Trade and other receivables 41 059 40 010 51 294
Trade receivables 28 25 120 28 275 37 473
Other receivables 15 15 939 11 735 13 821
Current tax receivables 25 5 335 483 936
Investments 5 017 15 855
Other investments and deposits 20 5 017 15 855
Derivatives 28 986 327
Cash and cash equivalents 20 20 502 25 783 34 289
Other current assets 1 037 1 289 1 754
Assets held for sale 21 5 491
Total assets 710 095 631 842 567 291
Consolidated statement of financial position
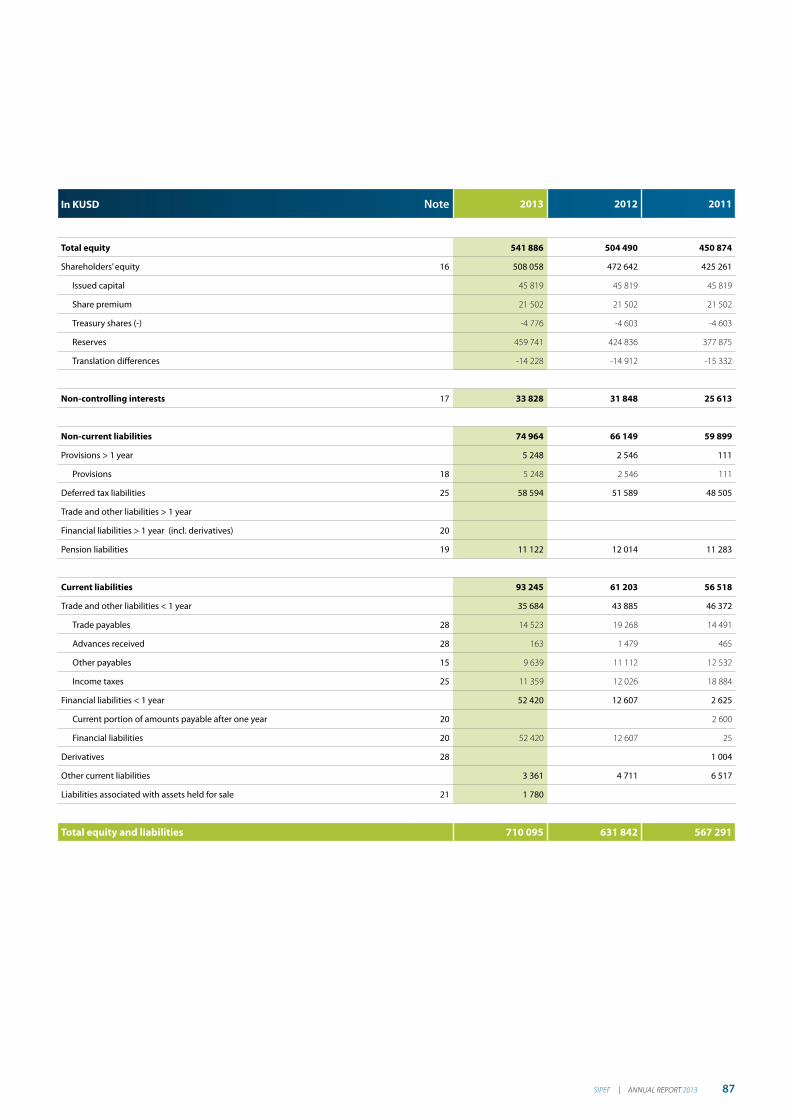
SIPEF | ANNUAL REPORT 2013 87
In KUSD Note 2013 2012 2011
Total equity 541 886 504 490 450 874
Shareholders’ equity 16 508 058 472 642 425 261
Issued capital 45 819 45 819 45 819
Share premium 21 502 21 502 21 502
Treasury shares (-) -4 776 -4 603 -4 603
Reserves 459 741 424 836 377 875
Translation differences -14 228 -14 912 -15 332
Non-controlling interests 17 33 828 31 848 25 613
Non-current liabilities 74 964 66 149 59 899
Provisions > 1 year 5 248 2 546 111
Provisions 18 5 248 2 546 111
Deferred tax liabilities 25 58 594 51 589 48 505
Trade and other liabilities > 1 year
Financial liabilities > 1 year (incl. derivatives) 20
Pension liabilities 19 11 122 12 014 11 283
Current liabilities 93 245 61 203 56 518
Trade and other liabilities < 1 year 35 684 43 885 46 372
Trade payables 28 14 523 19 268 14 491
Advances received 28 163 1 479 465
Other payables 15 9 639 11 112 12 532
Income taxes 25 11 359 12 026 18 884
Financial liabilities < 1 year 52 420 12 607 2 625
Current portion of amounts payable after one year 20 2 600
Financial liabilities 20 52 420 12 607 25
Derivatives 28 1 004
Other current liabilities 3 361 4 711 6 517
Liabilities associated with assets held for sale 21 1 780
Total equity and liabilities 710 095 631 842 567 291

‘THE CONNECTION TO THE WORLD OF SUSTAINABLE TROPICAL AGRICULTURE’
In KUSD Note
2013 2012 2011
Before
IAS 41IAS 41 IFRS
Before
IAS 41IAS 41 IFRS
Before
IAS 41IAS 41 IFRS
Revenue 7 291 678 291 678 332 522 332 522 367 661 367 661
Cost of sales 7, 9 -197 257 4 930 -192 327 -220 267 3 679 -216 588 -230 853 4 132 -226 721
Gross profit 7 94 421 4 930 99 351 112 255 3 679 115 934 136 808 4 132 140 940
Variation biological assets 9 36 461 36 461 33 836 33 836 28 611 28 611
Planting cost (net) 9 -28 717 -28 717 -26 962 -26 962 -17 505 -17 505
Selling, general and administrative expenses -25 336 -25 336 -25 425 -25 425 -24 936 -24 936
Other operating income/(charges) 22 -2 793 -2 793 -3 195 -3 195 2 218 2 218
Operating result 66 292 12 674 78 966 83 635 10 553 94 188 114 090 15 238 129 328
Financial income 155 155 880 880 653 653
Financial charges - 838 - 838 - 488 - 488 - 677 - 677
Exchange differences -2 629 -2 629 2 897 2 897 2 583 2 583
Financial result 23 -3 312 0 -3 312 3 289 0 3 289 2 559 0 2 559
Profit before tax 62 980 12 674 75 654 86 924 10 553 97 477 116 649 15 238 131 887
Tax expense 25, 9 -13 956 -3 062 -17 018 -22 917 -1 710 -24 627 -26 573 -3 951 -30 524
Profit after tax 49 024 9 612 58 636 64 007 8 843 72 850 90 076 11 287 101 363
Share of results of associated companies 26 231 0 231 623 0 623 210 0 210
- Insurance 231 231 623 623 210 210
Result from continuing operations 49 255 9 612 58 867 64 630 8 843 73 473 90 286 11 287 101 573
Result from discontinued operations 0 0 0 0 0 0 0 0 0
Profit for the period 49 255 9 612 58 867 64 630 8 843 73 473 90 286 11 287 101 573
Attributable to:
- Non-controlling interests 17 2 630 610 3 240 3 819 1 262 5 081 5 605 880 6 485
- Equity holders of the parent 46 625 9 002 55 627 60 811 7 581 68 392 84 681 10 407 95 088
Earnings per share ( in USD)
From continuing operations
Basic earnings per share 34 6.26 7.69 10.63
Diluted earnings per share 34 6.26 7.69 10.63
From continuing operations
Basic earnings per share 34 6.26 7.69 10.63
Diluted earnings per share 34 6.26 7.69 10.63
Consolidated income statement

SIPEF | ANNUAL REPORT 2013 89
In KUSD Note
2013 2012 2011
Before
IAS 41IAS 41 IFRS
Before
IAS 41IAS 41 IFRS
Before
IAS 41IAS 41 IFRS
Profit for the period 49 255 9 612 58 867 64 630 8 843 73 473 90 286 11 287 101 573
Other comprehensive income:
Items that may be reclassified to profit and loss insubsequent periods
- Exchange differences on translatingforeign operations
16 684 684 287 287 - 427 - 427
Items that will not be reclasified to profit and loss insubsequent periods
- Defined Benefit Plans - IAS 19R 19 -1 306 -1 306 0 0
- Income tax relating to components of othercomprehensive income
324 324 0 0
Total other comprehensive income for the year,
net of tax:- 298 0 - 298 287 0 287 - 427 0 - 427
Other comprehensive income attributable to:
- Non-controlling interests - 87 - 87
- Equity holders of the parent - 211 - 211 287 287 - 427 - 427
Total comprehensive income for the year 48 957 9 612 58 569 64 917 8 843 73 760 89 859 11 287 101 146
Total comprehensive income attributable to:
- Non-controlling interests 2 543 610 3 153 3 819 1 262 5 081 5 605 880 6 485
- Equity holders of the parent 46 414 9 002 55 416 61 098 7 581 68 679 84 254 10 407 94 661
Consolidated statement of comprehensive income

‘THE CONNECTION TO THE WORLD OF SUSTAINABLE TROPICAL AGRICULTURE’
In KUSD Note 2013 2012 2011
Operating activities
Profit before tax 75 654 97 477 131 887
Adjusted for:
Depreciation 7 15 642 16 006 11 962
Movement in provisions 18 977 3 166 876
Stock options 307 175
Changes in fair value of biological assets 9 -7 744 -6 874 -11 106
Other non-cash results -1 353 5 897 836
Financial income and charges 24 -1 723 24
Result on disposal of property, plant and equipment 1 061 174 - 254
Result on disposal of financial assets -3 346
Cash flow from operating activities before change in net working capital 84 568 110 952 134 225
Change in net working capital 27 - 74 -3 744 -8 167
Cash flow from operating activities after change in net working capital 84 494 107 208 126 058
Income taxes paid 25 -21 419 -21 645 -21 785
Cash flow from operating activities 63 075 85 563 104 273
Investing activities
Acquisition intangible assets 7 -9 503 -6 128 -5 765
Acquisition biological assets 7 -27 610 -26 247 -17 657
Acquisition property, plant & equipment 7 -54 531 -66 948 -44 609
Dividends received from associated companies 266
Proceeds from sale of property, plant & equipment 645 952 926
Proceeds from sale of financial assets 33 3 512
Cash flow from investing activities -90 733 -94 859 -67 105
Free cash flow -27 658 -9 296 37 168
Financing activities
Equity transactions with non-controlling parties * - 5 53 -19 531
Decrease/(increase) of treasury shares 16 - 173 -4 603
Repayment in long-term financial borrowings 20 -2 600 -5 200
Increase/(decrease) short-term financial borrowings 20 39 814 12 582 - 298
Last year's dividend paid during this bookyear -20 122 -18 944 -19 657
Dividends paid by subsidiaries to minorities 17 -1 180 -1 426 -2 271
Financial income and charges - 596 286 - 61
Cash flow from financing activities 17 738 -10 049 -51 621
Net increase in investments, cash and cash equivalents 20 -9 920 -19 345 -14 453
Investments and cash and cash equivalents (opening balance) 20 30 800 50 144 64 607
Effect of exchange rate fluctuations on cash and cash equivalents 20 4 1 - 10
Investments and cash and cash equivalents (closing balance) 20 20 884 30 800 50 144
Consolidated cash flow statement

SIPEF | ANNUAL REPORT 2013 91
In KUSDIssued
capital
SIPEF
Share
premium
SIPEF
Treasury
shares
Defined
benefit
plans
IAS 19R
ReservesTranslation
differences
Share-
holders’
equity
Non-
controlling
interests
Total
equity
January 1, 2013 45 819 21 502 -4 603 0 424 836 -14 912 472 642 31 848 504 490
Result for the period 55 627 55 627 3 240 58 867
Other comprehensive income - 895 684 - 211 - 87 - 298
Total comprehensive income 0 0 0 - 895 55 627 684 55 416 3 153 58 569
Last year's dividend paid -20 122 -20 122 -20 122
Equity transactions with non-controllingparties *
- 12 - 12 7 - 5
Other (note 16,17) - 173 307 134 -1 180 -1 046
December 31, 2013 45 819 21 502 -4 776 - 895 460 636 -14 228 508 058 33 828 541 886
January 1, 2012 45 819 21 502 -4 603 377 875 -15 332 425 261 25 612 450 873
Result for the period 68 392 68 392 5 081 73 473
Other comprehensive income 287 287 287
Total comprehensive income 0 0 0 0 68 392 287 68 679 5 081 73 760
Last year's dividend paid -18 944 -18 944 -18 944
Equity transactions with non-controllingparties **
- 43 - 43 96 53
Transfers without loss of control *** -2 618 133 -2 485 2 485 0
Other (note 17) 174 174 -1 426 -1 252
December 31, 2012 45 819 21 502 -4 603 0 424 836 -14 912 472 642 31 848 504 490
* The equity transactions with non-controlling parties comprise the acquisition of 5 additional shares of Jabelmalux SA, so that the group now owns
99.6% of the shares This transaction was recorded directly in het group’s reserves (KUSD -12) and in the non-controlling interests (KUSD 7).
** During exercise 2012, PT Toton Usaha Mandiri was acknowledged as being a foreign company in Indonesia, whereby the
shareholding of this company has to be formalized. Accordingly, 5% of the shares were sold to a local minority shareholder. This
transaction was recorded directly in het group’s reserves (KUSD -43) and in the non-controlling interests (KUSD 96).
*** In the context of the further centralization of SIPEF’s Indonesian activities, the sharehodings in PT Kerasaan Indonesia, PT Bandar Sumatra Indonesia,
PT Timbang Deli Indonesia, PT Mukomuko Agro Sejahtera and PT Melania Indonesia were transferred within the group on June 25, 2012 from SIPEF/
Jabelmalux SA to PT Tolan Tiga Indonesia, which acts as Indonesian holding company. Therefore the percentage of interest in the concerning subsidiaries
changed resulting in a transfer between reserves and exchange differences on the one hand and non-controlling interests on the other hand.
Consolidated statement of changes in equity
‘THE CONNECTION TO THE WORLD OF SUSTAINABLE TROPICAL AGRICULTURE’
1. Identification
SIPEF (the ‘company’) is a limited liability company (‘naamloze
vennootschap’/ ’société anonyme’) incorporated in Belgium and
registered at 2900 Schoten, Calesbergdreef 5.
The consolidated financial statements for the year ended 31 De-
cember 2013 comprise SIPEF and its subsidiaries (together re-
ferred to as ‘SIPEF group’ or ‘the group’). Comparative figures are
for the financial years 2012 and 2011.
The consolidated financial statements were authorized for issue
by the directors at the board meeting of 18 February 2014 and
shall be approved by the shareholders at the annual general
meeting of 11 June 2014. A list of the directors and the statu-
tory auditor, as well as a description of the principal activities of
the group, are included in the non-financial section of this annual
report.
2. Statement of compliance
The consolidated financial statements have been prepared in ac-
cordance with the International Financial Reporting Standards
(IFRS) which have been adopted by the European Union as per
31 December 2013.
The following standards or interpretations are applicable for the
accounting year commencing on the 1st of January 2013:
- IFRS 13 Fair Value Measurement (applicable for annual periods
beginning on or after 1 January 2013)
- IAS 19 (revised 2011) Employee Benefits (applicable for annual
periods beginning on or after 1 January 2013)
- Improvements to IFRS (2009-2011) (normally applicable for
annual periods beginning on or after 1 January 2013)
- Amendments to IFRS 1 First Time Adoption of International
Financial Reporting Standards – Severe Hyperinflation and
Removal of Fixed Dates for First-time Adopters (applicable for
annual periods beginning on or after 1 January 2013)
- Amendments to IFRS 1 First Time Adoption of International Fi-
nancial Reporting Standards – Government Loans (applicable
for annual periods beginning on or after 1 January 2013)
- Amendments to IFRS 7 Financial Instruments: Disclosures –
Offsetting Financial Assets and Financial Liabilities (applicable
for annual periods beginning on or after 1 January 2013)
- Amendments to IAS 1 Presentation of Financial Statements
- Presentation of Items of Other Comprehensive Income (ap-
plicable for annual periods beginning on or after 1 July 2012)
- Amendments to IAS 12 Income Taxes – Deferred Tax: Recovery
of Underlying Assets (applicable for annual periods beginning
on or after 1 January 2013)
- IFRIC 20 Stripping Costs in the Production Phase of a Surface
Mine (applicable for annual periods beginning on or after
1 January 2013)
These amendments have no significant impact on SIPEF group’s
financial statements. As of January 1, 2013 onwards, IAS 19 Re-
vised Employee Benefits is applicable. IAS19 Revised has to be
applied retrospectively. The impact of this revised accounting
standard for the group consists mainly of the immediate recogni-
tion of unrecognized actuarial gains/losses through other com-
prehensive income. The group has calculated the impact of the
change in this accounting standard on previous periods and have
evaluated this to be immaterial and has therefore decided not to
account for IAS19 Revised retrospectively.
The group did not elect for early application of the following new
standards and interpretations which were issued at the date of
approval of these financial statements but were not yet effective
on the balance sheet date:
- IFRS 9 Financial Instruments and subsequent amendments
(not yet endorsed in EU)
- IFRS 10 Consolidated Financial Statements (applicable for
annual periods beginning on or after 1 January 2014)
- IFRS 11 Joint Arrangements (applicable for annual periods be-
ginning on or after 1 January 2014)
- IFRS 12 Disclosures of Interests in Other Entities (applicable for
annual periods beginning on or after 1 January 2014)
- IFRS 14 Regulatory Deferral Accounts (applicable for annual
periods beginning on or after 1 January 2016)
- IAS 27 Separate Financial Statements (applicable for annual
periods beginning on or after 1 January 2014)
- IAS 28 Investments in Associates and Joint Ventures (applica-
ble for annual periods beginning on or after 1 January 2014)
- Improvements to IFRS (2010-2012) (normally applicable for
annual periods beginning on or after 1 January 2014, but not
yet endorsed in EU)
Notes to the consolidatedfinancial statements

SIPEF | ANNUAL REPORT 2013 93
- Improvements to IFRS (2011-2013) (normally applicable for
annual periods beginning on or after 1 January 2014, but not
yet endorsed in EU)
- Amendments to IFRS 10, IFRS 12 and IAS 27 – Consolidated
Financial Statements and Disclosure of Interests in Other Enti-
ties: Investment Entities (applicable for annual periods begin-
ning on or after 1 January 2014)
- Amendments to IAS 19 Employee Benefits – Employee Contri-
butions (applicable for annual periods beginning on or after
1 July 2014, but not yet endorsed in EU)
- Amendments to IAS 32 Financial Instruments: Presentation –
Offsetting Financial Assets and Financial Liabilities (applicable
for annual periods beginning on or after 1 January 2014)
- Amendments to IAS 36 – Impairment of Assets – Recoverable
Amount Disclosures for Non-Financial Asset (applicable for
annual periods beginning on or after 1 January 2014)
- Amendments to IAS 39 – Financial Instruments – Novation of
Derivatives and Continuation of Hedge Accounting (applica-
ble for annual periods beginning on or after 1 January 2014)
- IFRIC 21 – Levies (applicable for annual periods beginning on
or after 1 January 2014, but not yet endorsed in EU)
At this stage the group does not expect first adoption of these
standards and interpretations to have any material impact on the
net results of the group. The application of IFRS 10, IFRS 11 and
IAS 28 will have an important impact on the presentation of the
consolidated balance sheet and income statement due to the
joint venture “PT Agro Muko”, which is currently accounted for ac-
cording to the proportional consolidation method. As of financial
year 2014, PT Agro Muko will be accounted for using the equity
method. We also refer to note 29 for additional information con-
cerning the joint ventures.
The application of IFRS 12 will have an influence on the notes to
the consolidated financial statements.
3. Accounting policies
Basis of preparationStarting in 2007 the consolidated financial statements are pre-
sented in US dollar (until 2006 this was done in euro), rounded
off to the nearest thousand (KUSD). This modification is the result
of the changed policy with regard to the liquidity and debt man-
agement since the end of 2006, whereby the functional currency
of the majority of the subsidiaries has been changed from the
local currency to the US dollar.
The consolidated financial statements are prepared on the his-
torical cost basis except that the following assets and liabilities
are stated at their fair value: investments classified as available-
for-sale, financial derivative instruments and biological assets.
The accounting policies have been consistently applied through-
out the group and are consistent with those used in the previous
year.
Business combinationsBusiness combinations are accounted for using the purchase
method. The cost of an acquisition is measured as the fair value
of the assets given, equity instruments issued and liabilities in-
curred or assumed at the date of acquisition. Any costs directly
attributable to the acquisition are recognized in profit or loss. The
purchase consideration to acquire a business, including contin-
gent payments, is recorded at fair value at the acquisition date,
while subsequent adjustments to the contingent payments re-
sulting from events after the acquisition date are recognized in
profit or loss. The ‘full goodwill’ option, which can be elected on
a case by case basis, allows SIPEF to measure the non-controlling
interest either at fair value or at its proportionate share of the ac-
quiree’s net assets. All acquisition-related costs, such as consult-
ing fees, are expensed.
Step acquisitionsChanges in the group’s interests in subsidiaries that do not result
in a loss of control are accounted for as equity transactions. The
carrying amounts of the group’s interest and the non-controlling
interests are adjusted to reflect the changes in their relative in-
terests in the subsidiaries. Any difference between the amount
by which the non-controlling interests are adjusted and the fair
value of the consideration paid or received is recognized directly
in equity and attributed to owners of the company.
Where a business combination is achieved in stages, the group’s
previously held interests in the acquired entity are remeasured
to fair value at the acquisition date (i.e. the date the group at-
tains control) and the resulting gain or loss, if any, is recognized
in profit or loss. Amounts arising from interests in the acquiree
prior to the acquisition date that have previously been recog-
nized in other comprehensive income are reclassified to profit or

‘THE CONNECTION TO THE WORLD OF SUSTAINABLE TROPICAL AGRICULTURE’
Notes to the consolidated financial statements
loss, where such treatment would be appropriate if that interest
were disposed of.
Consolidation principlesSubsidiaries
Subsidiaries are those enterprises controlled by the company.
Control exists when the company has the power, directly or in-
directly, to govern the financial and operating policies of an en-
terprise so as to obtain benefits from its activities. The financial
statements of subsidiaries are included in the consolidated finan-
cial statements from the date that control effectively commences
until the date that control effectively ceases (or a date nearby).
Associates
Associates are those enterprises in which the group has signifi-
cant influence, but not control, over the financial and operat-
ing policies. The consolidated financial statements include the
group’s share of the total recognized gains and losses of associ-
ates on an equity accounting basis, from the date that significant
influence effectively commences until the date that significant
influence effectively ceases (or a date nearby). When the group’s
share of losses exceeds the carrying amount of the associate,
the carrying amount is reduced to nil and recognition of further
losses is discontinued except to the extent that the group has in-
curred obligations in respect of the associate.
Joint ventures
Joint ventures are those enterprises over whose activities the
group has joint control, established by contractual agreement.
The consolidated financial statements include the group’s pro-
portionate share of the enterprise’s assets, liabilities, revenue and
expenses, from the date that joint control commences (or a date
nearby) until the date that joint control ceases.
When the ownership interest in a joint venture is increased with-
out losing joint control, the company recognizes a goodwill as
the difference between the consideration paid for the additional
interest and the book value of the net assets of the joint venture.
Transactions eliminated on consolidation
All intra-group balances and transactions, and any unrealized
gains arising on intra-group transactions, are eliminated in pre-
paring the consolidated financial statements. Unrealized gains
arising from transactions with associates are eliminated to the
extent of the group’s interest in the enterprise against the in-
vestment in the associate. Unrealized losses are eliminated in
the same way as unrealized gains except that they are only
eliminated to the extent that there is no evidence of impairment.
Foreign currencyForeign currency transactions
In the individual group companies, transactions in foreign cur-
rencies are translated at the exchange rate ruling at the date of
the transaction. Monetary assets and liabilities denominated in
foreign currencies are translated at the exchange rate ruling at
the balance sheet date. Foreign exchange differences arising on
translation are recognized in the income statement. Non-mone-
tary assets and liabilities denominated in foreign currencies are
translated at the foreign exchange rate ruling at the date of the
transaction.
Financial statements of foreign operations
Functional currency: items included in financial statements of
each entity in the group are measured using the currency that
best reflects the economic substance of the underlying events
and circumstances relevant to that entity (the functional curren-
cy). Starting from 2007 the consolidated financial statements are
presented in USD, this is the functional currency of the majority
of the group companies.
To consolidate the group and each of its subsidiaries, the finan-
cial statements of the individual entities are translated as follows:
- Assets and liabilities at the closing rate;
- Income statements at the average exchange rate for the year;
- The components of shareholders’ equity at the historical ex-
change rate.
Exchange differences arising from the translation of the net in-
vestment in foreign subsidiaries, joint ventures and associated
entities at the year-end exchange rate are recorded as part of the
shareholders’ equity under ‘translation differences’. When a for-
eign entity is sold, such exchange differences are recognized in
the income statement as part of the gain or loss on sale.
Goodwill and fair value adjustments arising on the acquisition of
a foreign entity are treated as local currency assets and liabilities
of the foreign entity and are translated at the closing rate.
Biological assetsAccording to IFRS, biological activities are measured at fair value
(IAS41).

SIPEF | ANNUAL REPORT 2013 95
As from 2006 SIPEF group records its biological assets at the value
according to internal valuation models (formerly on the basis of
external models). These models are mainly based on the Dis-
counted Cash Flow method (DCF).
The main variables in these models concern:
Variable Comment
Currency valuation USD
Production volumes Estimate based on historical data regarding
the yield/ha of the concerning or compara-
ble areas.
Selling price Estimate based on the past 20-year average
world market price:
Palm oil: 622 USD/tonne CIF Rotterdam
Rubber: 1 800 USD/tonne FOB Singapore
Cost price Estimate based on actual cost prices (‘ad-
justed current year cost price’).
Planting costs Estimated costs for the further development
of immature areas are deducted.
Replacement investments Estimated costs for required replacement
investments (vehicles, houses, infrastruc-
ture...) are also deducted.
Disount rate Future cash flows are, depending on the lo-
cation of the underlying assets, discounted
at following discount rates:
Oil palm: 15%
Rubber: 15% - 16%
Tea: 16%
SIPEF group only recognizes a biological asset or agricultural
product when it controls the asset as a result of past events, when
it is probable that future economic benefits associated with the
asset will flow to SIPEF group and when the fair value or cost of
the asset can be measured reliably.
A gain or loss arising on initial recognition of a biological asset at
fair value less estimated point of sale costs and from the change
in fair value less estimated point of sale costs of a biological asset
is included in net profit or loss in the period in which it arises.
GoodwillGoodwill represents the excess of the cost of the business com-
bination over the group’s interest in the net fair value of the iden-
tifiable assets, liabilities and contingent liabilities acquired in a
business combination. Goodwill is not amortized but reviewed
for impairment at least annually. For the purpose of testing good-
will for impairment, goodwill is allocated to operating companies
which is the lowest level at which the goodwill is monitored for
internal management purposes (i.e. cashflow generating unit).
Any impairment is immediately recognized in the income state-
ment and is not subsequently reversed.
Negative goodwill represents the excess of the group’s interest
in the fair value of the net identifiable assets acquired over the
cost of acquisition. Negative goodwill is immediately recognized
in the income statement.
Intangible assetsIntangible assets include computer software, various licenses
and concessions. Intangible assets are capitalized and amortized
using the straight-line method over their useful life. For conces-
sions the useful life is determined by their duration.
Property, plant and equipmentProperty, plant and equipment , including investment property,
are stated at cost less accumulated depreciation and any accu-
mulated impairment losses. Borrowing costs attributable to the
construction or production of qualifying assets are capitalized.
Expenses for the repair of property, plant and equipment are usu-
ally charged against income when incurred.
Property held for sale, if any, is stated at the lower of amortized
cost and fair value less selling charges.

‘THE CONNECTION TO THE WORLD OF SUSTAINABLE TROPICAL AGRICULTURE’
Notes to the consolidated financial statements
Depreciation is calculated using the straight-line method based
on the estimated useful lives of the related assets:
Buildings 5 to 30 years
Infrastructure 5 to 25 years
Installations and machinery 5 to 30 years
Vehicles 3 to 20 years
Office equipment and furniture 5 to 10 years
Other property, plant and
equipment 2 to 20 years
Land is not depreciated.
Impairment of assetsProperty, plant and equipment, financial assets and other non-
current assets are reviewed for impairment losses whenever
events or changes in circumstances indicate that the carrying
amount may be higher than the recoverable amount. An im-
pairment loss is recognized for the amount by which the carry-
ing amount of the asset exceeds its recoverable amount, which
is the higher of an asset’s net selling price and its value in use.
For the purpose of assessing impairment, assets are grouped at
the lowest levels for which there are separately identifiable cash
flows. If impairment is no longer justified in future periods due
to a recovery in assets’ fair value or value in use, the impairment
reserve is reversed.
Financial instruments1. Derivatives
The group uses financial derivative instruments primarily to
manage its exposure to interest rate and foreign currency risks
arising from operational, financing and investment activities. The
group does not apply special hedge accounting under IAS 39 –
‘Financial Instruments: Recognition and Measurement’. Derivatives
are stated at fair value. Any gains or losses arising from changes in
fair value are charged directly to net profit or loss for the period.
2. Receivables and payables
Amounts receivable and payable are measured at amortised cost
price.
Amounts receivable and payable are measured at their nomi-
nal value, less a provision for any doubtful amounts receivable.
Amounts receivable and payable in a currency other than the
currency of the subsidiary are translated at the prevailing group
exchange rates on the balance sheet date.
3. Cash and cash equivalents
Cash and cash equivalents are measured at their nominal value
and include cash and deposits with an original maturity of three
months or less. Negative cash balances are recorded as liabilities.
4. Interest-bearing borrowings
Interest-bearing borrowings are measured at amortised cost
price.
Borrowings are initially recognized as proceeds received, net of
transaction costs. Any difference between cost and redemption
value is recognized in the income statement using the effective
interest method.
5. Financial assets available for sale
Financial assets available for sale are measured at fair value. Fair
value gains and losses are recognized in other comprehensive
income. If the fair value of a financial asset cannot be measured
reliably, the financial asset will be measured at amortized cost.
When a decrease in fair value of a financial asset available for sale
is recognized in other comprehensive income and an objective
evidence of impairment exists, the cumulated losses previously
recognized in equity will be taken into profit or loss.
InventoriesInventories are valued at the lower of cost or net realizable value.
The stock finished products including biological assets are valued
by adding production cost to the fair value of the biological asset
concerned.
Inventories are written down on a case-by-case basis if the esti-
mated net realizable value declines below the carrying amount
of the inventories. Net realizable value is the estimated selling
price less the estimated costs necessary to make the sale. When
the reason for a write-down of the inventories has ceased to exist,
the write-down is reversed.
Shareholders’ equityDividends of the parent company payable on ordinary shares are
only recognized as a liability in the period in which they are de-
clared.
Costs incurred with respect to the issuance of equity instruments
are recorded as a deduction in equity.

SIPEF | ANNUAL REPORT 2013 97
Non-controlling interestNon-controlling interests include a proportion of the fair value of
identifiable assets and liabilities recognized upon acquisition of
a subsidiary, together with the appropriate proportion of subse-
quent profits and losses.
In the income statement the minority share in the company’s
profit or loss is separated from the consolidated result of the
group.
ProvisionsProvisions are recognized when the group has a present legal or
constructive obligation as a result of past events, when it is prob-
able that an outflow of resources will be required to settle the
obligation and when a reliable estimate of the amount can be
made.
Pensions and other post employment benefitsGroup companies have various pension schemes in accordance
with the local conditions and practices in the countries they op-
erate in. The defined benefit plans are generally unfunded but
fully provisioned for using the ‘projected unit credit’- method.
This provision represents the present value of the defined benefit
obligation. The actuarial gains and losses are recognized in the
other comprehensive income.
The group pays contributions to publicly or privately adminis-
tered insurance plans. The payments are recognized as expenses
as they fall due, and as such are included in operating charges.
Revenue recognitionRevenue is measured at the fair value of the amount received for
the sale of goods and services net of value-added tax, rebates and
discounts, and after eliminating sales within the group. Revenue
from the sale of goods is recognized when significant risks and
rewards of ownership of the goods are transferred to the buyer.
Revenue from rendering services is based on the stage of com-
pletion determined by reference to services performed to date as
a percentage of total services to be performed. Interest income
is recognized using the effective interest rate method. Dividends
are recognized when the right to receive payment is established.
Cost of salesCost of sales includes all costs associated with harvest, transfor-
mation and transport. Purchases are recognized net of cash dis-
counts and other supplier discounts and allowances.
Selling, general and administrative expensesSelling, general and administrative expenses include expenses
of the marketing and financial department and general manage-
ment expenses.
Income taxesIncome tax on the profit or loss for the year comprises current
and deferred tax. Income tax is recognized in the income state-
ment except to the extent that it relates to items recognized di-
rectly to equity, in which case it is recognized in equity.
Current tax is the expected tax payable on the taxable income for
the year, using tax rates enacted or substantially enacted at the
balance sheet date, and any adjustment to tax payable in respect
of previous years.
Deferred tax liabilities and assets are recognized for temporary
differences between the carrying amount in the balance sheet
and the tax bases of assets and liabilities and are subsequently
adjusted to reflect changes in tax rates expected to be in effect
when the temporary differences reverse. Deferred tax assets are
included in the consolidated accounts only to the extent that
their realization is probable in the foreseeable future.
4. Use of estimates
The preparation of the consolidated financial statements in con-
formity with IFRS requires the group to use estimates and make
assumptions that may affect the reported amounts of assets and
liabilities at the date of the balance sheets and reported amounts
of revenue and expense during the reporting periods. Actual re-
sults could differ from those estimates.
The main areas in which estimates are used are:
- Post-employment benefits (note 19)
- Deferred tax assets (note 25)
- Provisions
- Fair value biological assets (note 9)
- Impairment of assets

‘THE CONNECTION TO THE WORLD OF SUSTAINABLE TROPICAL AGRICULTURE’
Notes to the consolidated financial statements
5. Group companies / consolidation scope
The ultimate parent of the group, SIPEF, Schoten/Belgium, is the parent company of the following significant subsidiaries:
Location % of control % of interest
Consolidated companies (full consolidation)
PT Tolan Tiga Indonesia Medan / Indonesia 95.00 95.00
PT Eastern Sumatra Indonesia Medan / Indonesia 95.00 90.25
PT Kerasaan Indonesia Medan / Indonesia 57.00 54.15
PT Bandar Sumatra Indonesia Medan / Indonesia 95.00 90.25
PT Timbang Deli Indonesia Medan / Indonesia 95.00 90.25
PT Melania Indonesia Jakarta/ Indonesia 95.00 90.25
PT Mukomuko Agro Sejahtera Medan / Indonesia 95.00 85.74
PT Umbul Mas Wisesa Medan / Indonesia 95.00 94.62
PT Citra Sawit Mandiri Medan / Indonesia 95.00 94.62
PT Toton Usaha Mandiri Medan / Indonesia 95.00 94.62
PT Agro Rawas Ulu Medan / Indonesia 95.00 95.00
PT Agro Kati Lama Medan / Indonesia 95.00 95.00
PT Agro Muara Rupit Medan / Indonesia 95.00 94.62
Hargy Oil Palms Ltd Bialla / Papua-N-G 100.00 100.00
Galley Reach Holdings Ltd Port Moresby / Papua-N-G 100.00 100.00
Plantations J. Eglin SA Azaguié / Ivory Coast 100.00 100.00
Sograci SA Abidjan / Ivory Coast 100.00 100.00
Jabelmalux SA Luxembourg / G.D. Luxemburg 99.60 99.60
Joint ventures (proportionate consolidation)
PT Agro Muko Jakarta / Indonesia 47.29 44.93
Associates (equity method)
B.D.M. NV Antwerpen / Belgium 50.00 50.00
Asco NV Antwerpen / Belgium 50.00 50.00
Companies not included
SIPEF-CI SA San Pedro / Ivory Coast 32.01 32.01
Horikiki Development Cy Ltd Honiara / Solomon Islands 90.80 90.80
Sograkin SA Kinshasa / Congo 50.00 50.00
The scope was expanded with the newly established 100% subsidiary Sograci SA, that shall encompass possible new rubber investments
in Ivory Coast.
As the shareholding and the management of SIPEF-CI SA changed in June 2008, and trustworthy financial information could no longer be
received, it was decided that equity method accounting was not appropriate from the second half of 2008 onwards.
Inspite of the possession of the majority of voting rights, the group has no control over the non consolidated companies because they are
established in inaccessible regions (Horikiki Development Cy Ltd and Sograkin SA).
The non consolidated companies are seen as financial assets available for sale.

SIPEF | ANNUAL REPORT 2013 99
6. Exchange rates
As a result of a revised liquidity- and debt management as from the end of 2006 the functional currency in the majority of the subsidiaries
has been changed to US dollar as from January 1, 2007.
Following subsidaries have however another functional currency:
Plantations J. Eglin SA EUR
B.D.M. NV EUR
Asco NV EUR
The exchange rates below have been used to convert the balance sheets and the results of these entities into US dollar (this is the currency
in which the group presents its results).
Closing rate Average rate
2013 2012 2011 2013 2012 2011
EUR 0.7254 0.7574 0.7715 0.7515 0.7738 0.7145
7. Segment information
Segment reporting is based on two segment reporting formats. The primary reporting format represents business segments – palm
products, rubber, tea, bananas and plants and insurance – which represent the management structure of the group.
The secondary reporting format represents the geographical locations where the group is active. Gross profit per geographical market
shows revenue minus cost of sales based on the location where the enterprise’s products are produced.
Segment result is revenue minus expense that is directly attributable to the segment and the relevant portion of income and expense that
can be allocated on a reasonable basis to the segment.
The result of the companies consolidated using the equity method is immediately detailed (insurance / Europe) in the income statement.
Gross profit by product
Revenue Cost of salesGross profit
before IAS 41IAS 41 Gross profit IFRS % of total
2013 - KUSD
Palm 234 053 -157 064 76 989 4 702 81 691 82.22
Rubber 30 963 -21 360 9 603 461 10 064 10.13
Tea 7 340 -5 725 1 615 25 1 640 1.65
Bananas and plants 16 518 -12 973 3 545 -258 3 287 3.31
Corporate 2 649 2 649 2 649 2.67
Others 155 -135 20 20 0.02
Total 291 678 -197 257 94 421 4 930 99 351 100.00

‘THE CONNECTION TO THE WORLD OF SUSTAINABLE TROPICAL AGRICULTURE’
Notes to the consolidated financial statements
Revenue Cost of salesGross profit
before IAS 41IAS 41 Gross profit IFRS % of total
2012 - KUSD
Palm 257 402 -168 654 88 748 2 995 91 743 79.13
Rubber 41 145 -27 505 13 640 819 14 459 12.47
Tea 9 517 -7 190 2 327 27 2 354 2.03
Bananas and plants 20 859 -16 908 3 951 -162 3 789 3.27
Corporate 3 491 3 491 3 491 3.01
Others 108 -10 98 98 0.09
Total 332 522 -220 267 112 255 3 679 115 934 100.00
The segment ‘corporate’ comprises the management fees received from non group entities.
Under IFRS (IAS41) depreciation on biological assets is not allowed.
Gross profit by geographical segment
Revenue Cost of salesOther
income
Gross profit
before IAS 41IAS 41
Gross profit
IFRS% of total
2013 - KUSD
Indonesia 155 974 -95 513 526 60 987 2 171 63 158 63.57
Papua New Guinea 116 430 -88 636 27 794 3 018 30 812 31.01
Ivory Coast 15 962 -12 448 3 514 -259 3 255 3.28
Europe 2 075 2 075 2 075 2.09
Others 711 -660 51 51 0.05
Total 289 077 -197 257 2 601 94 421 4 930 99 351 100.00
2012 - KUSD
Indonesia 184 162 -112 113 544 72 593 1 874 74 467 64.23
Papua New Guinea 123 935 -91 237 32 699 1 967 34 666 29.90
Ivory Coast 20 853 -16 904 3 949 -162 3 787 3.27
Europe 2 913 2 913 2 913 2.51
Others 115 -13 101 101 0.09
Total 329 065 -220 267 3 457 112 255 3 679 115 934 100.00
Revenue by location of the debtors
In KUSD 2013 2012
Switserland 76 879 70 904
United Kingdom 57 287 57 171
Singapore 56 704 79 950
The Netherlands 42 298 36 415
Indonesia 31 820 47 875
United States 5 733 9 794
Pakistan 4 896 5 942
Belgium 4 363 6 938
Others 3 353 6 603
Germany 3 214 3 098

SIPEF | ANNUAL REPORT 2013 101
In KUSD 2013 2012
Ivory Coast 2 550 2 749
France 2 275 3 821
Spain 306 1 262
Total 291 678 332 522
Segment information by product
Fair value of biological assets per product and the variation per product is detailed further in the note concerning biological assets.
Assets and liabilities of a segment are the assets and liabilities that are directly attributable to the segment or can be allocated to the
segment on a reasonable basis. Segment liabilities that can be attributed are immaterial and therefore these liabilities are not attributed
(liabilities mainly concern the parent company). The section ‘unallocated’ mainly contains cash deposits and other receivables.
In KUSD
2013
Palm Rubber TeaBananas
& PlantsInsurance Unallocated Total
Intangible assets 36 702 75 7 57 122 36 963
Goodwill 4 258 261 4 519
Biological assets 313 368 14 218 4 298 2 828 334 712
Property, plant & equipment 184 163 8 158 1 824 4 456 2 668 201 269
Investment property 3 3
Investments in associates 10 696 10 696
Inventories 30 394 4 033 1 025 1 279 18 36 749
Trade receivables 20 868 1 536 513 1 896 307 25 120
Assets held for sale 5 491 5 491
Unallocated 54 573 54 573
Total assets 589 753 33 772 7 667 10 516 10 696 57 691 710 095
% of total assets 83.05% 4.76% 1.08% 1.48% 1.51% 8.12% 100.00%
Total liabilities 710 095
Segment capital expenditures:
Intangible assets 9 460 41 2 9 503
Biological assets 25 260 2 148 71 131 27 610
Property, plant & equipment 49 863 1 818 210 1 105 1 535 54 531
Total investments 84 583 4 007 281 1 238 0 1 535 91 644
Segment depreciation:
Intangible assets 394 4 1 119 518
Property, plant & equipment 12 975 842 349 812 146 15 124
Total depreciation 13 369 846 350 812 0 265 15 642
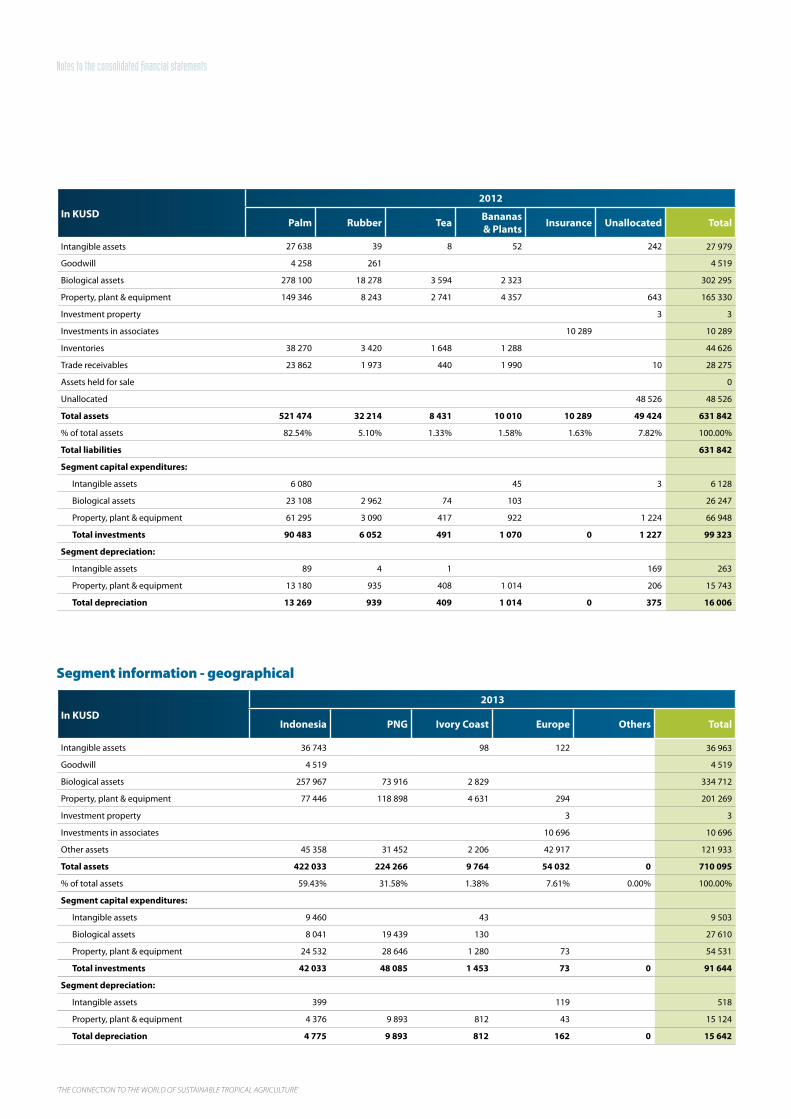
‘THE CONNECTION TO THE WORLD OF SUSTAINABLE TROPICAL AGRICULTURE’
Notes to the consolidated financial statements
In KUSD
2012
Palm Rubber TeaBananas
& PlantsInsurance Unallocated Total
Intangible assets 27 638 39 8 52 242 27 979
Goodwill 4 258 261 4 519
Biological assets 278 100 18 278 3 594 2 323 302 295
Property, plant & equipment 149 346 8 243 2 741 4 357 643 165 330
Investment property 3 3
Investments in associates 10 289 10 289
Inventories 38 270 3 420 1 648 1 288 44 626
Trade receivables 23 862 1 973 440 1 990 10 28 275
Assets held for sale 0
Unallocated 48 526 48 526
Total assets 521 474 32 214 8 431 10 010 10 289 49 424 631 842
% of total assets 82.54% 5.10% 1.33% 1.58% 1.63% 7.82% 100.00%
Total liabilities 631 842
Segment capital expenditures:
Intangible assets 6 080 45 3 6 128
Biological assets 23 108 2 962 74 103 26 247
Property, plant & equipment 61 295 3 090 417 922 1 224 66 948
Total investments 90 483 6 052 491 1 070 0 1 227 99 323
Segment depreciation:
Intangible assets 89 4 1 169 263
Property, plant & equipment 13 180 935 408 1 014 206 15 743
Total depreciation 13 269 939 409 1 014 0 375 16 006
Segment information - geographical
In KUSD
2013
Indonesia PNG Ivory Coast Europe Others Total
Intangible assets 36 743 98 122 36 963
Goodwill 4 519 4 519
Biological assets 257 967 73 916 2 829 334 712
Property, plant & equipment 77 446 118 898 4 631 294 201 269
Investment property 3 3
Investments in associates 10 696 10 696
Other assets 45 358 31 452 2 206 42 917 121 933
Total assets 422 033 224 266 9 764 54 032 0 710 095
% of total assets 59.43% 31.58% 1.38% 7.61% 0.00% 100.00%
Segment capital expenditures:
Intangible assets 9 460 43 9 503
Biological assets 8 041 19 439 130 27 610
Property, plant & equipment 24 532 28 646 1 280 73 54 531
Total investments 42 033 48 085 1 453 73 0 91 644
Segment depreciation:
Intangible assets 399 119 518
Property, plant & equipment 4 376 9 893 812 43 15 124
Total depreciation 4 775 9 893 812 162 0 15 642

SIPEF | ANNUAL REPORT 2013 103
In KUSD
2012
Indonesia PNG Ivory Coast Europe Others Total
Intangible assets 27 685 52 242 27 979
Goodwill 4 519 4 519
Biological assets 240 353 59 618 2 324 302 295
Property, plant & equipment 60 522 100 155 4 357 296 165 330
Investment property 3 3
Investments in associates 10 289 10 289
Other assets 46 149 36 195 1 674 37 409 121 427
Total assets 379 228 195 968 8 407 48 239 0 631 842
% of total assets 60.02% 31.02% 1.33% 7.63% 0.00% 100.00%
Segment capital expenditures:
Intangible assets 6 080 45 3 6 128
Biological assets 10 755 15 389 103 26 247
Property, plant & equipment 26 149 39 784 922 93 66 948
Total investments 42 984 55 173 1 070 96 0 99 323
Segment depreciation:
Intangible assets 94 169 263
Property, plant & equipment 4 606 10 052 1 014 71 15 743
Total depreciation 4 700 10 052 1 014 240 0 16 006
8. Goodwill and other intangible assets
In KUSD
2013 2012
GoodwillIntangible
assetsGoodwill
Intangible
assets
Gross carrying amount at January 1 4 519 29 748 4 519 22 562
Acquisitions 9 502 6 127
Sales and disposals -15
Transfers 1 057
Other -9
Translation differences 4 2
Gross carrying amount at December 31 4 519 39 230 4 519 29 748
Accumulated amortization and impairment losses at Januari 1 -1 769 -1 506
Depreciations -517 -263
Sales and disposals 15
Other 6
Translation differences -2
Accumulated amortization and impairment losses at December 31 -2 267 -1 769
Net carrying amount at January 1 4 519 27 979 4 519 21 056
Net carrying amount at December 31 4 519 36 963 4 519 27 979

‘THE CONNECTION TO THE WORLD OF SUSTAINABLE TROPICAL AGRICULTURE’
Notes to the consolidated financial statements
The acquisitions of intangible assets refer mainly to the additionnal payments made for obtaining the landtitles of PT Umbul Mas Wisesa, PT
Citra Sawit Mandiri, PT Agro Rawas Ulu, PT Agro Kati Lama, PT Agro Muara Rupit, PT Mukomuko Agro Sejahtera and Sograci SA.
In accordance with the accounting policies the goodwill was reviewed for impairment. This had no impact in 2013. The assumptions that
were used for these tests are in accordance with the assumptions for the IAS 41 valuation.
9. Biological assets
According to IFRS biological activities are measured at fair value (IAS 41). In accordance with IFRS 13 biological assets are brought under
level 3. This relates to fair value determination based on inputs that are not based on observable market data. We also refer to note 3 relat-
ing to the accounting policies in which we further disclose the method of valuation and the assumptions used for the calculation. The
valuations, as presented in the internal valuation models based on net present values, take into account the long term exploitation of the
plantations. The board of directors retains their view that commodity markets are inherently cyclical and that long term price projections
are highly unpredictable.
The board of directors is of the opinion that the sensitivity analysis regarding selling price and discount rate variations as included in this
note allows every investor to reasonably challenge the financial impact of the assumptions used in the IAS 41 valuations as included in the
consolidated accounts against his own assumptions. It does concern the directors that no estimate of fair value can ever be completely
accurate (particularly in a business in which selling prices and costs are subject to very material fluctuations). Moreover, in the case of the
group’s biological assets, small differences in valuation assumptions can have a quite disproportionate effect on results.
Another concern is that, as shown from an international benchmark, there is currently no uniform approach within the plantation sector
when it comes to defining the major variables, such as selling price and/or discount rates, in the DCF models resulting in the IAS 41 values.
Because of the inherent uncertainty associated with the valuation at fair value of the biological assets due to the volatility of the prices of
the agricultural produce and the absence of a liquid market, their carrying value may differ from their realisable value. The biological assets
of the SIPEF group are mainly on land for which a long term concession has been obtained. When measuring the fair value of the biological
assets we assume that these concessions can and will be renewed at normal cost. Future production included in the calculation of the fair
value takes into account the age of the asset and not the expiration date of the concessions.
Below is a table with the proprietary rights on which the plantations of the SIPEF group are established:
Hectares Type Maturity Crop
PT Tolan Tiga Indonesia 6 042 Concession 2023 Oil palm
PT Tolan Tiga Indonesia 2 437 Concession 2024 Oil palm
PT Eastern Sumatra Indonesia 3 178 Concession 2023 Oil palm
PT Kerasaan Indonesia 2 362 Concession 2023 Oil palm
PT Bandar Sumatra Indonesia 1 412 Concession 2024 Rubber and oil palm
PT Timbang Deli Indonesia 972 Concession 2023 Rubber
PT Melania Indonesia 5 140 Concession 2023 Rubber, tea and oil palm
PT Toton Usaha Mandiri 1 199 Concession 2046 Oil palm
PT Agro Muko 2 270 Concession 2019 Rubber and oil palm
PT Agro Muko 2 500 Concession 2020 Rubber and oil palm
PT Agro Muko 315 Concession 2031 Rubber and oil palm

SIPEF | ANNUAL REPORT 2013 105
Hectares Type Maturity Crop
PT Agro Muko 1 410 Concession 2028 Rubber and oil palm
PT Agro Muko 2 903 Concession 2022 Rubber and oil palm
PT Agro Muko 7 730 Concession 2019 Rubber and oil palm
PT Agro Muko 2 171 Concession 2022 Rubber and oil palm
PT Agro Muko 1 515 Concession 2020 Rubber and oil palm
PT Agro Muko 2 100 Concession 2022 Rubber and oil palm
PT Umbul Mas Wisea 6 468 Concession 2048 Oil palm
Hargy Oil Palms Ltd 2 967 Concession 2076 Oil palm
Hargy Oil Palms Ltd 128 Concession 2074 Oil palm
Hargy Oil Palms Ltd 322 Concession 2106 Oil palm
Hargy Oil Palms Ltd 364 Concession 2106 Oil palm
Hargy Oil Palms Ltd 6 460 Concession 2082 Oil palm
Hargy Oil Palms Ltd 2 900 Concession 2101 Oil palm
Galley Reach Holdings Ltd 16 429 Concession 2080 Rubber
Plantations J. Eglin SA 1 442 Freehold na Bananas and pineapple flowers
Plantations J. Eglin SA 322 Provisional concession na Bananas and pineapple flowers
83 458
PT Umbul Mas Wisesa 1 296 In negotiation - Oil palm
PT Citra Sawit Mandiri 3 947 In negotiation - Oil palm
PT Agro Rawas Ulu 9 000 In negotiation - Oil palm
PT Agro Kati Lama 10 500 In negotiation - Oil palm
PT Agro Muara Rupit 12 309 In negotiation - Oil palm
PT Mukomuko Agro Sejahtera 2 932 In negotiation - Oil palm
Movement schedule biological assetsThe balance sheet movements in biological assets can be summarized as follows:
In KUSD Oil palm Rubber Tea Others Total
Ending balance at December 31, 2012 278 101 18 278 3 594 2 322 302 295
Variation biological assets 35 267 101 704 389 36 461
Reclassification 0 -4 161 -4 161
313 368 14 218 4 298 2 711 334 595
Translation differences 117 117
Ending balance at December 31, 2013 313 368 14 218 4 298 2 828 334 712
The gross variation of biological assets amounted to KUSD 36 461 and arises mainly from an increase in margins applied and the expansion
and the increase in maturity of the new planted oil palm areas of our PT Umbul Mas Wisesa estate in Indonesia and at Hargy Oil Palms Ltd
in Papua New Guinea.
The reclassification concerns the biological assets of PT Timbang Deli that have been transferred to assets held fo sale (see also note 21).

‘THE CONNECTION TO THE WORLD OF SUSTAINABLE TROPICAL AGRICULTURE’
Notes to the consolidated financial statements
The gross variation of the biological assets is the result of changes in following variables:
In KUSD Palm Oil Rubber Tea Other Total 2013 Total 2012
Variables relating to gross margin 17 875 2 420 484 20 779 25 838
Volumes 12 138 -452 -22 389 12 053 11 733
Extraction rates 2 184 2 184 91
Discount rate 0
Investments 3 070 -1 867 242 1 445 -3 826
Variation of Biological Assets 35 267 101 704 389 36 461 33 836
Sensitivity variation sales priceValues as appearing in the balance sheet are very sensitive to price changes with regard to the average sales prices applied. Simulations
made for oil palm, rubber and tea show that a rise or decrease by 10% of the estimated future selling price has the following effect on the
net present value of biological assets:
In KUSD +10% 2013 -10%
Oil palm 405 129 313 368 221 678
Rubber 19 410 14 218 9 025
Tea 8 728 4 298 -137
Total 433 267 331 884 230 566
Others 2 828
334 712
The sales price for palm oil, in the models approved by the board of directors, is the average world market price of palm oil of the last
20 years (622 USD / tonne CIF Rotterdam). The average price of palmoil for the last 10 years was 767 USD / tonne. The average price for
palmoil for 2013 was 857 USD / tonne. According to the Board of Directors, current sales prices are not relevant for establishing the ex-
pected future margins and are therefore not used in the IAS 41 valuation models.
Sensitivity variation discount rateValues as appearing in the balance sheet are very sensitive to price changes with regard to the discount rate applied. Simulations made for
oil palm, rubber and tea show that a rise or decrease by 1% of the estimated future selling price has the following effect on the net present
value of biological assets:
In KUSD +1% 2013 -1%
Oil palm 296 753 313 368 331 557
Rubber 13 664 14 218 14 817
Tea 4 041 4 298 4 518
Total 314 458 331 884 350 892
Others 2 828
334 712
Impact of IAS 41 on the income statementAccording to IFRS, biological assets are measured at fair value instead of at ‘depreciated cost’ (IAS 41). This means that the amounts paid
for the replanting of existing areas or for the planting of new land are immediately charged to the income statement in the year they arise,
even if these investments have an economic lifetime of at least 20 years. In addition these biological assets are not depreciated but are
adjusted to fair value. Management is of the opinion that capitalising these investments and depreciating them over their economic useful

SIPEF | ANNUAL REPORT 2013 107
life presents the recurring result of the group in a better manner. Therefore the IAS 41 impact is presented in a separate column on the face
of the income statement.
In KUSD Oil palm Rubber Tea Others Total 2013 Total 2012
Depreciation 4 702 461 25 -258 4 930 3 679
Variation biological assets 35 267 101 704 389 36 461 33 836
Planting cost -25 260 -2 148 -71 -131 -27 610 -26 247
Transfers -781 -540 -28 -1 349 -928
Disposals 232 10 242 213
Operating result 14 160 -2 116 630 0 12 674 10 553
Tax impact -3 062 -1 710
Net impact 9 612 8 843
Impact of IAS 41 on the cash flow statement
In KUSD 2013 2012
Variation biological assets -36 461 -33 836
Planting cost (included in investing activities) 27 610 26 247
Transfers 1 349 928
Sales and disposals (included in sale of assets) -242 -213
-7 744 -6 874
10. Property, plant & equipment
In KUSD
2013 2012
Land,
buildings
and infra-
structure
Installa-
tions and
machinery
Vehicles
Office
equipment,
furniture
and others
In progress Total Total
Gross carrying amount at January 1 90 339 71 257 47 693 7 840 40 941 258 070 199 229
Acquisitions 10 963 2 165 3 097 844 37 462 54 531 66 948
Sales and disposals -318 -504 -1 926 -113 -463 -3 324 -6 203
Transfers 308 60 456 60 -2 318 -1 434 -2 230
Other -793 -37 -106 -25 -115 -1 076
Translation differences 487 144 114 43 24 812 326
Gross carrying amount at December 31 100 986 73 085 49 328 8 649 75 531 307 579 258 070
Accumulated depreciation and impairment
losses at January 1-22 897 -42 412 -22 562 -4 869 -92 740 -82 285
Depreciation -3 453 -4 183 -6 828 -662 -15 126 -15 743
Sales and disposals 79 376 1 389 18 1 862 5 285
Transfers 250
Other 206 24 75 12 317
Translation differences -396 -128 -76 -23 -623 -247
Accumulated depreciation and impairment
losses at December 31-26 461 -46 323 -28 002 -5 524 -106 310 -92 740
Net carrying amount at January 1 67 442 28 845 25 131 2 971 40 941 165 330 116 944
Net carrying amount at December 31 74 525 26 762 21 326 3 125 75 531 201 269 165 330
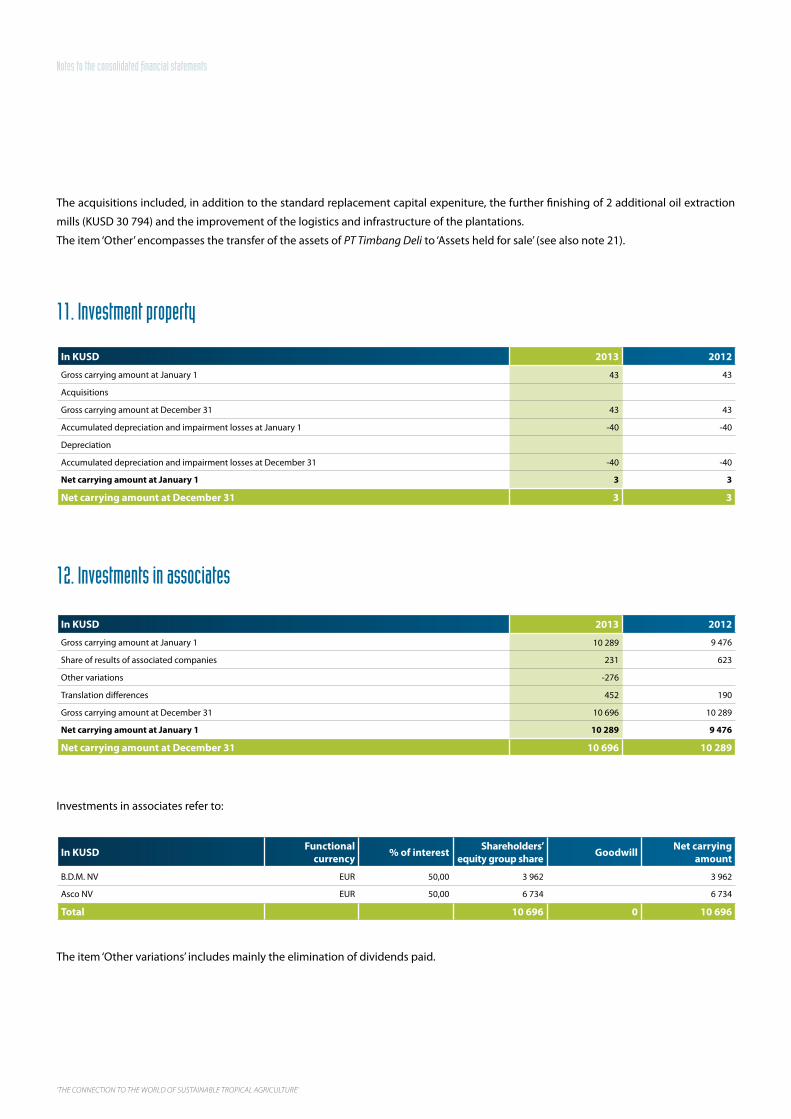
‘THE CONNECTION TO THE WORLD OF SUSTAINABLE TROPICAL AGRICULTURE’
Notes to the consolidated financial statements
The acquisitions included, in addition to the standard replacement capital expeniture, the further finishing of 2 additional oil extraction
mills (KUSD 30 794) and the improvement of the logistics and infrastructure of the plantations.
The item ‘Other’ encompasses the transfer of the assets of PT Timbang Deli to ‘Assets held for sale’ (see also note 21).
11. Investment property
In KUSD 2013 2012
Gross carrying amount at January 1 43 43
Acquisitions
Gross carrying amount at December 31 43 43
Accumulated depreciation and impairment losses at January 1 -40 -40
Depreciation
Accumulated depreciation and impairment losses at December 31 -40 -40
Net carrying amount at January 1 3 3
Net carrying amount at December 31 3 3
12. Investments in associates
In KUSD 2013 2012
Gross carrying amount at January 1 10 289 9 476
Share of results of associated companies 231 623
Other variations -276
Translation differences 452 190
Gross carrying amount at December 31 10 696 10 289
Net carrying amount at January 1 10 289 9 476
Net carrying amount at December 31 10 696 10 289
Investments in associates refer to:
In KUSDFunctional
currency% of interest
Shareholders’
equity group shareGoodwill
Net carrying
amount
B.D.M. NV EUR 50,00 3 962 3 962
Asco NV EUR 50,00 6 734 6 734
Total 10 696 0 10 696
The item ‘Other variations’ includes mainly the elimination of dividends paid.

SIPEF | ANNUAL REPORT 2013 109
13. Other financial assets
In KUSD
2013 2012
Other companiesOther receivables Total Total
Participations Receivables
Gross carrying amount at January 1 5 513 3 050 4 8 567 8 817
Other increase (decrease) 2 2 -207
Translation differences 1 134 135 -43
Gross carrying amount at December 31 5 514 3 184 6 8 704 8 567
Accumulated impairment losses at January 1 -1 660 -3 050 -4 710 -4 753
Translation differences -134 -134 43
Accumulated impairment losses at December 31 -1 660 -3 184 -4 844 -4 710
Net carrying amount at January 1 3 853 4 3 857 4 064
Net carrying amount at December 31 3 854 0 6 3 860 3 857
Investments in other enterprises include a 32% stake in SIPEF-CI SA in Ivory Coast (net book value of KUSD 3 801) and KUSD 53 other par-
ticipations.
The net book value of SIPEF-CI SA is valued at cost minus eventual impairments. The fair value is not applied as no reliable financial informa-
tion is available on time.
On 31 December 2013 an impairment test was effected on the participations based on the latest available information. This test did not
lead to an adjustment of the book values.
14. Inventories
Analysis of inventories
In KUSD 2013 2012
Raw materials and supplies 13 703 20 284
Finished goods 22 950 24 342
Other Inventories 96
Total 36 749 44 626
The reduction in inventories of finished products is due to a slight decrease in the total tonnage of unshipped palm oil at year end com-
pared to 2012.
The reduction of stocks of raw materials and supplies can be atrributed to a general reduction in inventory levels, both in Indonesia and
Papua New Guinea.

‘THE CONNECTION TO THE WORLD OF SUSTAINABLE TROPICAL AGRICULTURE’
Notes to the consolidated financial statements
15. Other current receivables and other current payables
The ‘other payables’ (KUSD 9 639) mainly concern social obligations (salaries to be paid, provisions for holiday pay and bonus) and invoices
to be received.
The ‘other receivables’ (KUSD 15 939) mainly include VAT receivables in the various affiliates, but also contain an impairment for a VAT dis-
pute in Indonesia for an amount of KUSD 4 544.
The net current assets, net of cash, rose mainly due to significant tax prepayments, a direct result of the existing regulation in Indonesia.
16. Shareholders’ equity
Capital stock and share premiumThe issued capital of the company as at December 31, 2013 amounts to KEUR 34 768 (KUSD 45 819), represented by 8 951 740 fully paid
ordinary shares without nominal value.
2013 2012
Number of shares 8 951 740 8 951 740
2013 KEUR 2012 KEUR 2013 KUSD 2012 KUSD
Capital 34 768 34 768 45 819 45 819
Share premium 16 285 16 285 21 502 21 502
51 053 51 053 67 321 67 321
2013 KEUR 2012 KEUR 2013 KUSD 2012 KUSD
Treasury shares - opening balance 3 366 3 366 4 603 4 603
Acquisition treasury shares 128 173
Treasury shares - ending balance 3 494 3 366 4 776 4 603
On November 20, 2013 SIPEF has purchased 2 324 own shares.
Since the start of the share buy-back program on 22 September 2011, SIPEF has bought back 62 000 shares for a total amount of KEUR
3 494, corresponding to 0.6926% of the total shares outstanding, as cover for a share option plan for the management.
Authorized capitalThe extraordinary general meeting of shareholders on June 8, 2011 reauthorized the board of directors to increase the capital in one or
more operations by an amount of KEUR 34 768 over a period of 5 years after the publication of the renewal.

SIPEF | ANNUAL REPORT 2013 111
Shareholder structureThe company has received following shareholders declarations:
In mutual consent Number of shares Date of notifying Denominator %
Ackermans & van Haaren NV 2 395 312 10/09/2013 8 951 740 26.758
Gedei NV 652 379 10/09/2013 8 951 740 7.288
Cabra NV 493 117 10/09/2013 8 951 740 5.509
Baron Bracht 0 10/09/2013 8 951 740 0.000
Total Baron Bracht and children 1 145 496 12.797
Total votes acting in concert 3 540 808 39.555
Fortis Investment Management NV 491 740 1/09/2008 8 951 740 5.493
Alcatel Pensioenfonds VZW 469 600 1/09/2008 8 951 740 5.246
Translation differencesTranslation differences comprise all foreign exchange differences arising from the translation of the financial statements of foreign opera-
tions that are not integral to the operations of the company. The deviation from last year is mainly due to the movement of the USD versus
the EUR (KUSD +684).
In KUSD 2013
Opening balance at January 1, 2013 -14 912
Movement, full consolidation 232
Movement, equity method 452
Ending balance at December 31, 2013 -14 228
DividendsOn February 18, 2014 a dividend of KEUR 11 190 (EUR 1.25 gross per ordinary share) has been recommended by the board of directors but
has not yet been approved by the general meeting of shareholders of SIPEF and is therefore not provided for in the financial statements
as at December 31, 2013.
Capital managementThe capital structure of the group is based on the financial strategy as defined by the board of directors. Summarized, this strategy consists
of an expansion policy while respecting a very limited debt ratio. The management puts forward yearly the plan for approval by the board
of directors.

‘THE CONNECTION TO THE WORLD OF SUSTAINABLE TROPICAL AGRICULTURE’
Notes to the consolidated financial statements
17. Non-controlling interests
These consist mainly of non-controlling interests in the equity and net income of:
% 2013 2012
PT Tolan Tiga Indonesia 5.00 5.00
PT Eastern Sumatra Indonesia 9.75 9.75
PT Kerasaan Indonesia 45.85 45.85
PT Bandar Sumatra Indonesia 9.75 9.75
PT Timbang Deli Indonesia 9.75 9.75
PT Melania Indonesia 9.75 9.75
PT Mukomuko Agro Sejahtera 14.26 14.26
PT Umbul Mas Wisesa 5.38 5.39
PT Citra Sawit Mandiri 5.38 5.39
PT Toton Usaha Mandiri 5.38 5.39
PT Agro Rawas Ulu 5.00 5.00
PT Agro Kati Lama 5.00 5.00
PT Agro Muara Rupit 5.38 5.39
PT Agro Muko 2.36 2.36
Jabelmalux SA 0.40 0.41
The movements of the year can be summarized as follows:
In KUSD 2013 2012
At the end of the preceding period 31 848 25 613
- Profit for the period attributable to non-controlling interests 3 240 5 081
- Defined Benefit Plans - IAS 19R -87
- Distributed dividends -1 180 -1 426
- Equity transactions with non-controlling parties 7 2 580
At the end of the period 33 828 31 848
The equity transactions with non-controlling parties comprise the acquisition of 5 additional shares of Jabelmalux SA.
18. Provisions
The provisions entirely relate to a VAT dispute in Indonesia (KUSD 5 248). It is difficult to make an estimate of the settlement time of the
dispute.

SIPEF | ANNUAL REPORT 2013 113
19. Pension liabilities
Defined benefit plansPension liabilities mainly represent defined benefit plans in Indonesia. These pension plans, set up in order to pay a lump sum amount at
the time of retirement, are not financed with a third party. The total number of employees affected by the pension plan amounts to 9 203.
The pension plan is payable to an employee at the age of 55 or after 30 years of seniority, whichever comes first.
Since the pension plan is adjusted by future salary increases and discount rates, the pension plan is exposed to Indonesia’s future salary
expectations, as well as Indonesia’s inflation and interest rate risk. Furthermore the pension plan is payable in Indonesian Rupiah, exposing
it to a currency risk. We refer to note 28 for further details concerning the currency risk of the group. As the pension plan is unfunded, there
is no risk relating to a return on plan assets.
The following reconciliation summarizes the variation of total pension liabilities between 2012 and 2013:
In KUSD 2012Pension
costPayment Exchange
Translation
difference
Change
consolida-
tion scope
Other 2013
Indonesia 11 264 2 942 -1 082 -2 578 -318 10 228
Ivory Coast 454 69 22 545
Others 296 72 -19 349
12 014 3 083 -1 101 -2 578 22 0 -318 11 122
The item ‘Other’ encompasses the transfer of the obligations of PT Timbang Deli to the post ‘Liabilities associated with assets held for sale’
(see also note 21).
Following assumptions are used in the pension calculation of Indonesia:
In KUSD 2013 2012
Discount rate 9.00% 6.50%
Salary increase 6.50% 4.00%
Past service age 55 years or 30 years of seniority
Pension liabilities in Indonesia have changed as follows:
In KUSD 2013 2012
Opening 11 264 10 694
Service cost 915 856
Interest cost 731 838
Benefits paid -1 082 -1 467
Actuarial gains and losses 1 296 1 043
Exchange differences -2 578 -700
Other -318
Closing 10 228 11 264

‘THE CONNECTION TO THE WORLD OF SUSTAINABLE TROPICAL AGRICULTURE’
Notes to the consolidated financial statements
Actuarial gains and losses consist of:
In KUSD 2013 2012
Experience adjustments 1 397 1 002
Changes in assumptions used -101 41
Total actuarial gains and losses 1 296 1 043
The amounts recognised in the balance sheet are as follows:
In KUSD 2013 2012
Pension liabilities 10 228 11 264
The amounts relating to the pension cost of Indonesia are as follows:
In KUSD 2013 2012
Service cost 915 856
Interest cost 731 838
Actuarial gains and losses recorded in the profit and loss accounts 1 043
Pension cost 1 646 2 737
Actuarial gains and losses recorded in Other Comprehensive Income 1 296
Total Pension cost 2 942 2 737
These costs are included under the headings cost of sales and selling, general and administrative expenses of the income statement.
The experience adjustments on plan liabilities are presented as follows:
In KUSD 2013 2012 2011
Pension liabilities 10 228 11 264 10 694
Experience adjustments 1 397 1 002 365
13.66% 8.90% 3.41%
Estimated benefit payments in 2014 are KUSD 598.
Defined contribution plansContributions paid regarding the defined contribution plans amount to KUSD 551 (KUSD 887 in 2012). Contributions paid within the scope
of the Belgian pension schemes are provided through insurance companies and meet the minimum return requirement and are therefore
treated as defined contribution plans. As per 31 December 2013, an immaterial deficit relating to the defined contribution plans exist,
which has been recorded as a provision in the 2013 financial statements

SIPEF | ANNUAL REPORT 2013 115
20. Net financial assets / (liabilities)
Net financial assets/(liabilities) can be analysed as follows:
In KUSD 2013 2012
Obligations initially payable after more than one year
Short-term obligations - credit institutions -52 420 -12 607
Investments and deposits 5 017
Cash and cash equivalents 20 502 25 783
Net financial assets / (liabilities) -31 918 18 193
Analysis of net financial assets/(liabilities) 2013 per currency
In KUSD EUR USD Others Total
Obligations initially payable after more than one year 0
Short-term financial obligations -17 920 -34 500 -52 420
Investments and deposits 0
Cash and cash equivalents 2 786 14 188 3 528 20 502
Total 2013 -15 134 -20 312 3 528 -31 918
Total 2012 7 814 8 661 1 718 18 193
Obligations initially payable after more than one year expired in 2012.
Reconciliation net financial assets / (liabilities) and cash flow:
In KUSD 2013 2012
Net financial position at the beginning of the period 18 193 47 519
Repayment of long-term borrowings 2 600
(Increase)/decrease in short-term financial obligations -39 814 -12 582
Net movement in cash and cash equivalents -9 920 -19 345
Effect of exchange rate fluctuations on cash and cash equivalents 4 1
Cash and cash equivalents included in assets held for sale - 381
Net financial assets/(liabilities) at the end of the period -31 918 18 193
21. Assets / liabilities held for sale
The ‘net assets held for sale’ were the net assets of PT Timbang Deli that, as a result of the execution of the joint venture agreement of
October 2013 between SIPEF, NBPOL and BioSing, will be transferred to this new activity in the course of 2014.

‘THE CONNECTION TO THE WORLD OF SUSTAINABLE TROPICAL AGRICULTURE’
Notes to the consolidated financial statements
The most important assets and liabilities that these companies contains are described hereafter:
In KUSD 2013 2012
Intangible assets 4
Biological assets 4 162
Property, plant and equipment 844
Current assets 481
Assets held for sale 5 491 0
Non-current liabilities -1 114
Trade payables -522
Other payables -143
Liabilities associated with assets held for sale -1 780 0
Net assets held for sale 3 711 0
22. Non-recurring result
The non-recurring result is included under the heading ‘Other operating income / (charges)’, and can be detailed as follows:
In KUSD
2013 2012
Equity
holders of
the parent
Non-
controlling
interests
Total
Equity
holders of
the parent
Non-
controlling
interests
Total
Sale of GEDEI NV shares 0 3 346 3 346
VAT claim Indonesia 2010 / 2011 0 -5 050 -5 050
Total non-recurring 0 0 0 -1 704 0 -1 704
Tax effect on non-recurring result 0 1 263 1 263
Non-recurring result after taxes 0 0 0 - 441 0 - 441
Adjusted net recurring result group share
In KUSD 2013 2012
Net result - part of the group 55 627 68 392
Adjustment non-recurring result 441
Adjustment IAS41 -9 002 -7 581
Adjusted net recurring result 46 625 61 252

SIPEF | ANNUAL REPORT 2013 117
23. Financial result
The financial income concerns the interests received on current accounts with non-consolidated companies and on temporary excess
cash. The financial charges concern the interests on short term borrowings as well as bank charges and other financial costs.
In KUSD 2013 2012
Financial income 155 844
Financial charges - 838 - 488
Exchange result -3 288 1 602
Financial result derivatives 659 1 331
Financial result -3 312 3 289
24. Share based payment
Grant date 2013 2012 2011
Number options granted 20 000 20 000 22 000
Balance 20 000 20 000 22 000
Exercise price 55.50 59.14 56.99
Exercise period 1/1/2017 - 31/12/2023 1/1/2016 - 31/12/2022 1/1/2015 - 31/12/2021
SIPEF’s stock option plan, which was approved in November 2011, is intended to provide long term motivation for the members of the
management committee and general directors of the foreign subsidiaries whose activities are essential to the succes of the group. The
options give them the right to acquire a corresponding number of SIPEF shares.
The remuneration committee is responsible for monitoring this plan and selecting the beneficiaries. The options are provided free of
charge and their exercise period is 10 years.
IFRS 2 has been applied to the stocks. The fair value as of 31 December 2013 of the outstanding options amounts to KUSD 1 273 and is
calculated according to the Black & Scholes model, of which the main components are:
Year 2013 2012 2011
Share price (In EUR) 57.70 58.50 58.00
Dividend yield 2.50% 2.50% 2.50%
Estimated expected lifetime 5.00 5.00 5.00
Volatility 29.69 37.55 38.29
Interest rate 1.36% 0.90% 3.59%
Black & Scholes value (In EUR) 12.72 15.07 18.37
In 2013, 20 000 new stock options were granted with an exercise price of 55.50 euros per share. The fair value when granted was fixed at
KUSD 351 and is recorded in the profit and loss accounts over the vesting period of 3 years (2014-2016).
To cover the outstanding option obligation, SIPEF has a total of 62 000 treasury shares in portfolio.

‘THE CONNECTION TO THE WORLD OF SUSTAINABLE TROPICAL AGRICULTURE’
Notes to the consolidated financial statements
25. Income taxes
The reconciliation between the tax expenses and tax at local applicable tax rates is as follows:
In KUSD 2013 2012
Profit before tax 75 654 97 477
Tax at the applicable local rates -20 744 -24 723
Average applicable tax rate 27.42% 25.36%
Permanent differences 10 731 1 643
Deferred tax on non current assets resulting from exchange rate fluctuations -7 005 -1 547
Tax expense -17 018 -24 627
Average effective tax rate 22.49% 25.26%
The group prepares consolidated accounts in USD. However, subsidiaries are obliged to pay taxes that are calculated and denominated in
local currency. Accordingly, the tax bases of assets and liabilities are in local currency and changes in exchange rates give rise to temporary
differences. The resulting deferred tax is charged or credited to profit or loss in accordance with IAS 12.41. This has a significant impact on
the effective tax rate.
We received from the Indonesian tax authorities the formal approval, that starting from the financial year 2014 our Indonesian affiliates are
allowed to lodge their tax declaration in USD. Deferred tax liabilities and assets are offset per taxable entity which leads to the following
split between deferred tax assets and deferred tax liabilities:
In KUSD 2013 2012
Deferred tax assets 6 914 35
Deferred tax liabilities -58 594 -51 589
Net deferred taxes -51 680 -51 554
The movements in net deferred taxes (assets - liabilities) are:
In KUSD 2013 2012
Opening balance -51 554 -48 258
Variation (- expense) / (+ income) through income statement -1 077 -3 296
Tax impact of IAS 19R through comprehensive income 324
Reclassification to liabilities associated with assets available for sale 627
Closing balance -51 680 -51 554
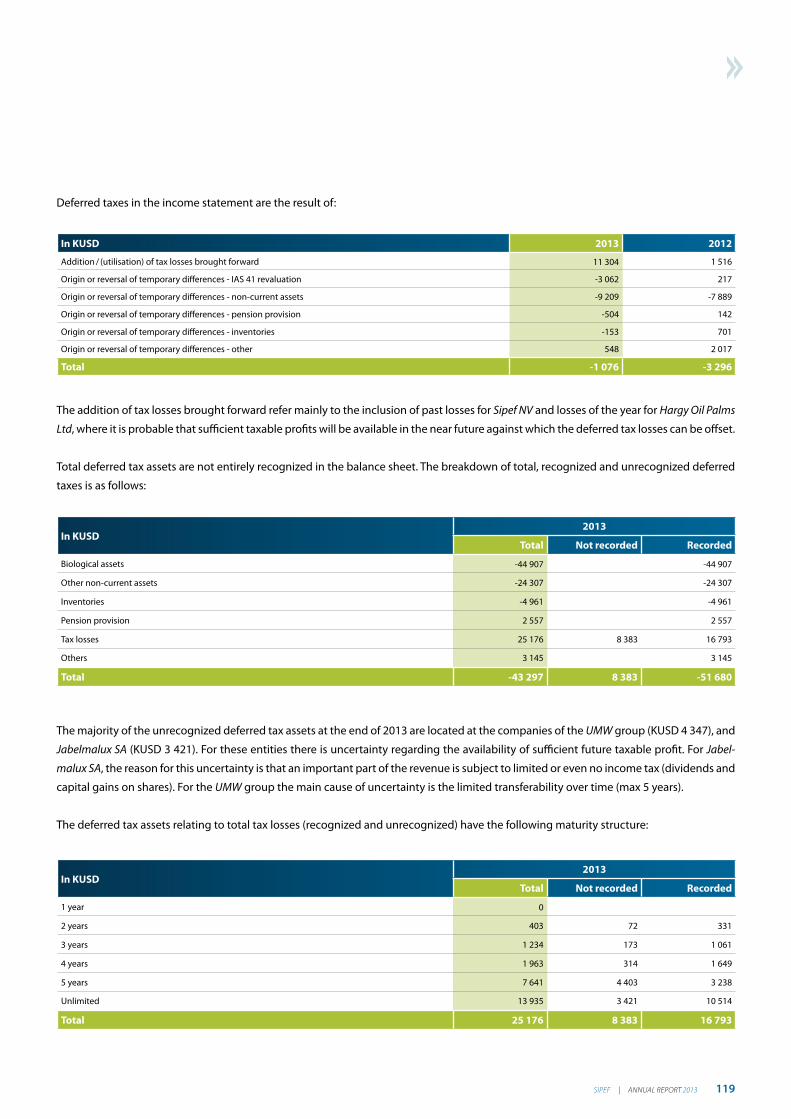
SIPEF | ANNUAL REPORT 2013 119
Deferred taxes in the income statement are the result of:
In KUSD 2013 2012
Addition / (utilisation) of tax losses brought forward 11 304 1 516
Origin or reversal of temporary differences - IAS 41 revaluation -3 062 217
Origin or reversal of temporary differences - non-current assets -9 209 -7 889
Origin or reversal of temporary differences - pension provision -504 142
Origin or reversal of temporary differences - inventories -153 701
Origin or reversal of temporary differences - other 548 2 017
Total -1 076 -3 296
The addition of tax losses brought forward refer mainly to the inclusion of past losses for Sipef NV and losses of the year for Hargy Oil Palms
Ltd, where it is probable that sufficient taxable profits will be available in the near future against which the deferred tax losses can be offset.
Total deferred tax assets are not entirely recognized in the balance sheet. The breakdown of total, recognized and unrecognized deferred
taxes is as follows:
In KUSD2013
Total Not recorded Recorded
Biological assets -44 907 -44 907
Other non-current assets -24 307 -24 307
Inventories -4 961 -4 961
Pension provision 2 557 2 557
Tax losses 25 176 8 383 16 793
Others 3 145 3 145
Total -43 297 8 383 -51 680
The majority of the unrecognized deferred tax assets at the end of 2013 are located at the companies of the UMW group (KUSD 4 347), and
Jabelmalux SA (KUSD 3 421). For these entities there is uncertainty regarding the availability of sufficient future taxable profit. For Jabel-
malux SA, the reason for this uncertainty is that an important part of the revenue is subject to limited or even no income tax (dividends and
capital gains on shares). For the UMW group the main cause of uncertainty is the limited transferability over time (max 5 years).
The deferred tax assets relating to total tax losses (recognized and unrecognized) have the following maturity structure:
In KUSD2013
Total Not recorded Recorded
1 year 0
2 years 403 72 331
3 years 1 234 173 1 061
4 years 1 963 314 1 649
5 years 7 641 4 403 3 238
Unlimited 13 935 3 421 10 514
Total 25 176 8 383 16 793

‘THE CONNECTION TO THE WORLD OF SUSTAINABLE TROPICAL AGRICULTURE’
Notes to the consolidated financial statements
The net taxes to be paid relate mainly to the taxes to be paid in Indonesia and Papua New Guinea.
In KUSD 2013 2012
Taxes to receive 5 336 483
Taxes to pay -11 359 -12 026
Net taxes to pay -6 023 -11 543
In KUSD 2013 2012
Net taxes to pay at the beginning of the period -11 543 -17 948
Transfer 6 091
Reclassification to liabilities associated with assets available for sale 43
Taxes to pay -15 942 -21 331
Paid taxes 21 419 21 645
-6 023 -11 543
Taxes paid as presented in the consolidated cash flow statement are detailed as follows:
In KUSD 2013 2012
Tax expense -17 018 -24 627
Deferred tax 1 076 3 296
Current taxes -15 942 -21 331
Variation prepaid taxes -4 852 453
Variation payable taxes - 625 - 767
Paid taxes -21 419 -21 645
26. Share of results of associated companies
Participation in the insurance industry focuses on the core activities of marine and general risk insurance. Temporarily lower technical
results in specific marine activities meant that the positive trend of the last few years was not continued. (2013: KUSD 231; 2012: KUSD 623)
27. Change in net working capital
As a result of the lower operating results before IAS 41, cash flow from operating activities was reduced by KUSD 26 384 to KUSD 84 568
(2012: KUSD 110 952).

SIPEF | ANNUAL REPORT 2013 121
28. Financial instruments
Exposure to fluctuations in the market price of core products, currencies, interest rates and credit risk arises in the normal course of the
group’s business. Financial derivative instruments are used to a limited extend to reduce the exposure to fluctuations in foreign exchange
rates and interest rates.
Fluctuations in the market price of core productsStructural risk
SIPEF Group is exposed to structural price risks of their core products. The risk is primarily related to palm oil and palm kernel oil and to a
lesser extent to rubber. A change of the palm oil price of USD 10 CIF per ton has an impact of about KUSD 1 250 (without taking into ac-
count the impact of the current export tax in Indonesia) on result after tax. This risk is assumed to be a business risk.
Transactional risk
The group faces transactional price risks on products sold. The transactional risk is the risk that the price of products purchased from third
parties fluctuates between the time the price is fixed with a customer and the time the transaction is settled. This risk is assumed to be a
business risk.
Currency riskMost of the subsidiaries are using the US dollar as functional currency. The group’s currency risk can be split into three distinct categories:
structural, transactional and translational:
Structural risk
A portion of the group’s revenues are denominated in USD, while all of the operations are located outside the USD zone (particularly in
Indonesia, Papua New Guinea, Ivory Coast and Europe). Any change in the USD against the local currency will therefore have a consider-
able impact on the operating result of the company. Most of these risks are considered to be a business risk.
Transactional risk
The group is also subject to transactional risks in respect of currencies, i.e. the risk of currency exchange rates fluctuating between the time
the price is fixed with a customer, supplier or financial institution and the time the transaction is settled. This risk, with the exception of
naturally covered positions, is not covered since most receivables and payables have a short settlement term.
The pension liabilities in Indonesia are important long term liabilities that are fully payable in IDR. A devaluation or revaluation of 10% of
the IDR versus the USD has the following effect on the income statement:
In KUSD IDR Dev 10% Book value IDR Rev 10%
Pension liabilities in Indonesia 9 587 10 546 11 717
Gross impact income statement 959 -1 171
On February 18th, 2014 the board of directors has also proposed the payment of KEUR 11 190 (EUR 1.25 gross per ordinary share). In the
light of our liquidity and currency policy the exchange risk on the payment of this dividend was covered in five forward exchange contracts
for the sale of KUSD 14 883 for KEUR 11 190 (average exchange rate of 0.7519).
- KUSD 13 034 (KEUR 9 847) before the end of the year
- KUSD 1 849 (KEUR 1 343) after year end

‘THE CONNECTION TO THE WORLD OF SUSTAINABLE TROPICAL AGRICULTURE’
Notes to the consolidated financial statements
Sensitivity analysis:
With regard to the cover of the dividend for the end of the year a devaluation or revaluation of 10% of the EUR versus the USD has the fol-
lowing effect on the profit and loss account:
In KUSD EUR Dev 10% Dividend EUR Rev 10%
Dividend 12 218 13 575 14 932
Gross Impact income statement -1 357 1 357
Translational risk
SIPEF group is an international company and has operations which do not use the USD as their reporting currency. When such results are
consolidated into the group’s accounts the translated amount is exposed to variations in the value of such local currencies against the USD.
SIPEF group does not hedge against such risk (see accounting policies). As from 1st of January 2007 onwards the functional currency of
most of our activities is the same as the presentation currency, this risk has been largely restricted.
Interest rate riskThe group’s exposure to changes in interest rates relates to the group’s financial debt obligations. At the end of December 2013, the
group’s net financial assets/(liabilities) amounted to KUSD - 31 918 (2012: KUSD 18 193), of which KUSD 52 420 short term financial liabili-
ties (2012: KUSD 12 607) and KUSD 20 502 net short term cash and cash equivalents (2012: KUSD 30 800).
At the end of December 2013, there are no borrowings with an initial term of more than one year. Since all of the debt is of a current nature
with variable interest rates, we believe a 0.5% change in interest rate will not have a material impact. Available funds are invested in short
term deposits.
Credit riskCredit risk is the risk that one party will fail to discharge an obligation and cause the other party to incur a loss. This credit risk can be split
into a commercial and a financial credit risk. With regard to the commercial credit risk management has established a credit policy and the
exposure to this credit risk is monitored on a continous basis. In practice a difference is made between:
In KUSD 2013 2012
Receivables from the sale of palm oil/rubber/tea 23 224 26 286
Receivables from the sale of bananas and plants 1 896 1 990
25 120 28 276
The credit risk for the first category is rather limited as these sales are for the most part immediately paid against presentation of docu-
ments. Moreover it concerns a relatively small number of first class buyers (per product about 90% of the turnover is realized with maxi-
mum 10 clients of which none is over 30%). Contrary to the first category the credit risk for the receivables from the sales of bananas and
plants are more important.
For both categories there is a weekly monitoring of the open balances due and a proactive system of reminders. Depreciations are applied
as soon as total or partial payments are seen as unlikely. The elements that are taken into account for these appraisals are the lengths of
the delay in payment and the creditworthiness of the client.

SIPEF | ANNUAL REPORT 2013 123
The receivables from the sales of bananas and plants have the following due date schedule:
In KUSD 2013 2012
Not yet due 1 805 1 759
Due < 30 days 10 156
Due between 30 and 60 days 81 62
Due between 60 and 90 days 13
1 896 1 990
In 2012 and 2013 there were no material depreciations on receivables.
Liquidity riskA material and structural shortage in our cash flow would damage both our creditworthiness as well as the trust of investors and would
restrict the capacity of the group to attract fresh capital. The operational cash flow provides the means to finance the financial obligations
and to increase shareholder value. The group manages the liquidity risk by evaluating the short term and long term cash flows. The SIPEF-
group maintains an access to the capital market through short and long term debt programs.
The following table gives the contractually determined (not-discounted) cash flows resulting from liabilities at balance sheet date.
2013 -In KUSDCarrying
amount
Contractual
cash flows
Less than
1 year1-2 years 2-3 years 3-4 years
More than
5 years
Trade & other liabilities < 1 year
Trade payables 14 523 -14 523 -14 523
Advances received 163 -163 -163
Financial liabilities < 1 year
Current portion of amounts payable after one year
Financial liabilities 52 420 -52 426 -52 426
Derivatives
Other current liabilities
Current liabilities 67 106 -67 112 -67 112 0 0 0 0
2012 -In KUSDCarrying
amount
Contractual
cash flows
Less than
1 year1-2 years 2-3 years 3-4 years
More than
5 years
Trade & other liabilities < 1 year
Trade payables 19 268 -19 268 -19 268
Advances received 1 479 -1 479 -1 479
Financial liabilities < 1 year
Current portion of amounts payable after one year
Financial liabilities 12 607 -12 635 -12 635
Derivatives
Other current liabilities
Current liabilities 33 354 -33 382 -33 382 0 0 0 0

‘THE CONNECTION TO THE WORLD OF SUSTAINABLE TROPICAL AGRICULTURE’
Notes to the consolidated financial statements
In order to limit the financial credit risk SIPEF has spread its more important activities over a small number of banking groups with a first
class rating for creditworthiness. In 2013, same as in previous years, there were no infringements on the conditions stated in the credit
agreements no were there any shortcomings in repayments.
Financial instruments measured at fair value in the statement of financial positionFair values of derivatives are:
In KUSD 2013 2012
Forward exchange transactions 986 327
Fair value (+ = asset; - = liability) 986 327
In accordance with IFRS 7 financial derivates are brought under in 3 levels:
- Level 1 relates to fair value determination based on quoted prices in active markets for identical assets or liabilities
- Level 2 relates to fair value determination based on inputs other than quoted prices included within Level 1 that are observable for the
asset or liability
- Level 3 relates to fair value determination based on inputs for the asset or liability that are not based on observable market data
The fair value of the forward exchange contracts calculated at the closing value on the 31st of December 2013 were also incorporated in
level 2. The notional amount from the forward exchange contracts amounts to KUSD 30 445.
Financial instruments per categoryThe next table gives the financial instruments per category as per end 2013 and end 2012. The carrying amount of the financial assets and
liabilities approximates the fair value because of the current nature of the financial instruments, except for the available for sale financial
assets, which are valued at cost due to the fact that reliable information is not available. The financial instruments are measured at level 2.
2013 In KUSDAssets available
for sale
Loans and
receivablesDerivatives (1)
Total carrying
amount
Financial assets
Other investments 0
Other financial assets 3 854 6 3 860
Receivables > 1 year
Other receivables 0
Total non-current financial assets 3 854 6 0 3 860
Trade and other receivables
Trade receivables 25 120 25 120
Investments
Other investments and deposits 0
Cash and cash equivalents 20 502 20 502
Derivatives 986 986
Total current financial assets 0 45 622 986 46 608
Total financial assets 3 854 45 628 986 50 468

SIPEF | ANNUAL REPORT 2013 125
2013 - In KUSD DerivativesOther liabili-
ties (2)
Total carrying
amount
Trade & other obligations < 1 year
Trade payables 14 523 14 523
Advances received 163 163
Financial obligations < 1 year
Current portion of amounts payable after one year 0
Financial obligations 52 420 52 420
Derivatives 0
Total current financial liabilities 0 67 106 67 106
Total financial liabilities 0 67 106 67 106
(1) is technically considered as held for trading under IAS 39
(2) at amortized cost
2012 - In KUSDAssets available
for sale
Loans and
receivablesDerivatives (1)
Total carrying
amount
Financial assets
Other financial assets 0
Other investments 3 853 4 3 857
Receivables > 1 year
Other receivables 0
Total non-current financial assets 3 853 4 0 3 857
Trade and other receivables
Trade receivables 28 275 28 275
Investments
Other investments and deposits 5 017 5 017
Cash and cash equivalents 25 783 25 783
Derivatives 327 327
Total current financial assets 0 59 075 327 59 402
Total financial assets 3 853 59 079 327 63 259

‘THE CONNECTION TO THE WORLD OF SUSTAINABLE TROPICAL AGRICULTURE’
Notes to the consolidated financial statements
2012 - In KUSD DerivativesOther liabili-
ties (2)
Total carrying
amount
Trade & other obligations < 1 year
Trade payables 19 268 19 268
Advances received 1 479 1 479
Financial obligations < 1 year
Current portion of amounts payable after one year 0
Financial obligations 12 607 12 607
Derivatives 0
Total current financial liabilities 0 33 354 33 354
Total financial liabilities 0 33 354 33 354
(1) is technically considered as held for trading under IAS 39
(2) at amortized cost
The contribution to the net result of the financial insturments per category is presented as follows:
2013 - In KUSD
Assets
available
for sale
Loans and
receivablesCash Derivatives
Amortized
costTotal
Revenue 0
Selling, general and administrative expenses 0
Other operating income / (charges) 0
0 0 0 0 0 0
Financial income 3 152 155
Financial charges -520 -318 -838
Derivatives held for trade purposes 659 659
0 -517 -166 659 0 -24
2012 - In KUSD
Assets
available
for sale
Loans and
receivablesCash Derivatives
Amortized
costTotal
Revenue 0
Selling, general and administrative expenses 0
Other operating income / (charges) 0
0 0 0 0 0 0
Financial income 3 877 880
Financial charges -408 -15 -65 -488
Other operating income / (charges) 1 331 1 331
0 -405 862 1 331 -65 1 723

SIPEF | ANNUAL REPORT 2013 127
29. Joint ventures
PT Agro Muko in Indonesia is managed according to the principles of a joint venture (joint control) and is accounted for according to the
proportional consolidation method. The share of the group is 47.2919%.
Key figures related to the joint venture (at the group’s share) are:
Statement of financial position in KUSD 2013 2012
Non-current assets 50 263 48 594
Current assets 12 783 13 915
Non-current liabilities -8 946 -7 478
Current liabilities -843 -4 136
Total equity 53 257 50 895
Income statement in KUSD 2013 2012
Operating result 12 530 20 616
Financial result 252 50
Tax expense -3 327 -5 548
Result from continuing operations 9 455 15 118
30. Operational leases
The group leases office space, office equipment and vehicles under a number of operating lease agreements.
Future lease payments under these non-cancelable operating leases are due as follows:
In KUSD 2013 2012
1 year 350 324
2 years 126 101
3 years 102 96
4 years 41 72
5 years 33
619 626
During the year an amount of KUSD 370 (against KUSD 351 in 2012) has been charged in the income statement.

‘THE CONNECTION TO THE WORLD OF SUSTAINABLE TROPICAL AGRICULTURE’
Notes to the consolidated financial statements
31. Finance leases
In 2010 in the light of further restructuring of the groups’ financing the current financial leasing contracts have been terminated.
32. Rights and commitments not reflected in the balance sheet
Guarantees:No guarantees has been issued by third parties as security for the Company’s account and for KUSD 315 for the account of subsidiaries.
An amount of KUSD 114 has been guaranteed by SIPEF for the account of Hargy Oil Palms Ltd.
The various rights and commitments are comprised of call-options (KUSD -103) and put-options (KUSD 80) on the assets of the insurance
sector.
Significant litigation:Nihil
Forward salesThe commitments for the delivery of goods (palm products, rubber, tea and bananas and plants) after the year end fall within the normal
delivery period of about 3 months from date of sale. Those sales are not considered as forward sales.
As of 31 December 2013 the group has made some forward sales for palm oil with the goal of securing the cash flow necessary to finance
the expansion plans.
These concern the following deliveries:
Tonne Price (USD/tonne CIF)
2014 27 000 1 095
2015 6 000 1 095
Total 33 000

SIPEF | ANNUAL REPORT 2013 129
33. Related party transactions
Transactions with directors and members of the management committeeKey management personnel are defined as the directors and the group’s management committee.
The table below shows an overview of total remuneration received:
in KUSD 2013 2012
Directors’ fees
fixed fees 263 269
Short-term employee benefits 2 946 3 470
Resignation payment 1 146
Share based payments 109 103
Group Insurance 503 508
Benefits in kind (Company car + cell phone) 45 47
Total 5 012 4 397
The amounts are paid in EUR. The amount paid in 2013 is KEUR 3 216 (KEUR 3 402 in 2012). The decrease is mainly the result of the lower-
variable remunerations. Starting from the financial year 2007 fixed fees shall be paid to the members of the board of directors, the audit
committee and the remuneration committee.
Related party transactions are considered immaterial, except for the rental agreement since 1985 between Cabra NV and SIPEF covering
the offices and ancillary parking space at Castle Calesberg in Schoten. The annual rent, adjusted for inflation, amounts to KUSD 211 (KEUR
158) and KUSD 85 (KEUR 64) is invoiced for SIPEF’s share of maintenance of the buildings, parking space and park area.
SIPEF’s relations with board members and management committee members are covered in detail in the ‘Corporate Governance state-
ment’ section.
Other related party transactionsTransactions with related companies are mainly trade transactions and are priced at arms’ length. The revenue and expenses related to
these transactions are immaterial to the consolidated financial statements as a whole.
Transactions with group companiesBalances and transactions between the group and its subsidiaries which are related parties of the group have been eliminated in the
consolidation and are not disclosed in this note. Details of transactions between the group and other related parties (mainly Pt Agro Muko)
are disclosed below.
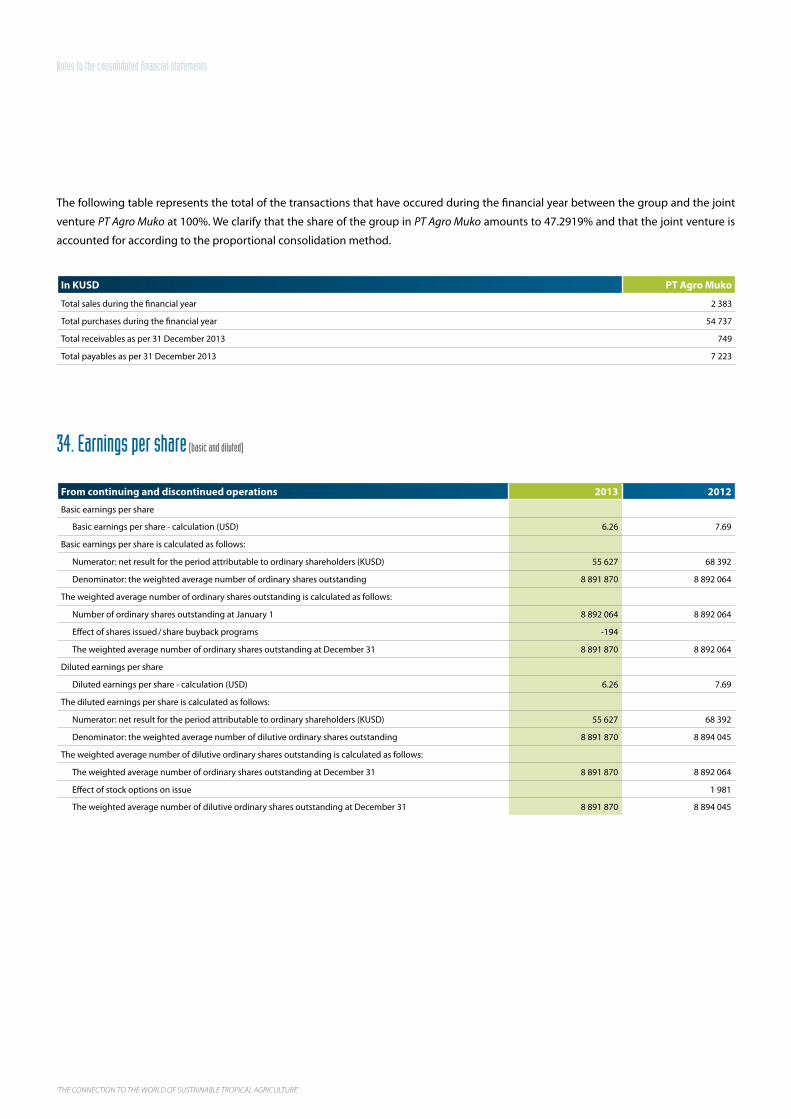
‘THE CONNECTION TO THE WORLD OF SUSTAINABLE TROPICAL AGRICULTURE’
Notes to the consolidated financial statements
The following table represents the total of the transactions that have occured during the financial year between the group and the joint
venture PT Agro Muko at 100%. We clarify that the share of the group in PT Agro Muko amounts to 47.2919% and that the joint venture is
accounted for according to the proportional consolidation method.
In KUSD PT Agro Muko
Total sales during the financial year 2 383
Total purchases during the financial year 54 737
Total receivables as per 31 December 2013 749
Total payables as per 31 December 2013 7 223
34. Earnings per share (basic and diluted)
From continuing and discontinued operations 2013 2012
Basic earnings per share
Basic earnings per share - calculation (USD) 6.26 7.69
Basic earnings per share is calculated as follows:
Numerator: net result for the period attributable to ordinary shareholders (KUSD) 55 627 68 392
Denominator: the weighted average number of ordinary shares outstanding 8 891 870 8 892 064
The weighted average number of ordinary shares outstanding is calculated as follows:
Number of ordinary shares outstanding at January 1 8 892 064 8 892 064
Effect of shares issued / share buyback programs -194
The weighted average number of ordinary shares outstanding at December 31 8 891 870 8 892 064
Diluted earnings per share
Diluted earnings per share - calculation (USD) 6.26 7.69
The diluted earnings per share is calculated as follows:
Numerator: net result for the period attributable to ordinary shareholders (KUSD) 55 627 68 392
Denominator: the weighted average number of dilutive ordinary shares outstanding 8 891 870 8 894 045
The weighted average number of dilutive ordinary shares outstanding is calculated as follows:
The weighted average number of ordinary shares outstanding at December 31 8 891 870 8 892 064
Effect of stock options on issue 1 981
The weighted average number of dilutive ordinary shares outstanding at December 31 8 891 870 8 894 045

SIPEF | ANNUAL REPORT 2013 131
From continuing operations 2013 2012
Basic earnings per share
Basic earnings per share - calculation (USD) 6.26 7.69
Basic earnings per share is calculated as follows:
Numerator: net result for the period attributable to ordinary shareholders (KUSD) 55 627 68 392
Denominator: the weighted average number of ordinary shares outstanding 8 891 870 8 892 064
The weighted average number of ordinary shares outstanding is calculated as follows:
Number of ordinary shares outstanding at January 1 8 892 064 8 892 064
Effect of shares issued / share buyback programs - 194
The weighted average number of ordinary shares outstanding at December 31 8 891 870 8 892 064
Diluted earnings per share
Diluted earnings per share - calculation (USD) 6.26 7.69
The diluted earnings per share is calculated as follows:
Numerator: net result for the period attributable to ordinary shareholders (KUSD) 55 627 68 392
Denominator: the weighted average number of dilutive ordinary shares outstanding 8 891 870 8 894 045
The weighted average number of dilutive ordinary shares outstanding is calculated as follows:
The weighted average number of ordinary shares outstanding at December 31 8 891 870 8 892 064
Effect of stock options on issue 1 981
The weighted average number of dilutive ordinary shares outstanding at December 31 8 891 870 8 894 045
35. Events after the balance sheet date
In execution of the joint-venture agreement of October 2013 between SIPEF and NBOL (concerning the start of a project for developing
high yielding palm trees), PT Timbang Deli Indonesia was contributed by SIPEF in the company Verdant Bioscience Singapore (VBS). This
transaction will have a material impact on the consolidated result of 2014. Considering Sipef will only own 38% of VBS, PT Timbang Deli
Indonesia will as of 2014 no longer be an integral part of the consolidation scope of the SIPEF group (we also refer to note 21 – assets/
liabilities held for sale).
36. Recent developments
To the best of our actual knowledge, there are no circumstances or developments, which would have a major impact on the further devel-
opment of the Group The board of directors proposes a gross dividend of EUR 1.25 per share payable on July 2, 2014. This corresponds to
a payout of 31.94% on the profit, share of the group, before IAS 41, and is identical to last year’s pay-out ratio.

‘THE CONNECTION TO THE WORLD OF SUSTAINABLE TROPICAL AGRICULTURE’
Notes to the consolidated financial statements
37. Services provided by the auditor and related fees
The statutory auditor of the SIPEF group is Deloitte Bedrijfsrevisoren BV o.v.v.e. CVBA represented by Dirk Cleymans. The fees for the annual
report of SIPEF were approved by the general meeting after review and approval of the audit committée and by the board of directors.
These fees correspond to an amount of KUSD 108 (against KUSD 101 last year).
For the group, Deloitte has provided services for KUSD 565 in 2013 (against KUSD 506 the year before), of which KUSD 117 (2012: KUSD
72) are for non audit services.

SIPEF | ANNUAL REPORT 2013 133

‘THE CONNECTION TO THE WORLD OF SUSTAINABLE TROPICAL AGRICULTURE’
Notes to the consolidated financial statements

SIPEF | ANNUAL REPORT 2013 135
The annual accounts of SIPEF are given below in summarized form. In accordance with the Belgian Code on Companies, the annual
accounts of SIPEF, together with the management report and the auditor’s report will be deposited with the National Bank of Belgium.
These documents may also be obtained on request from:
SIPEF, Calesbergdreef 5, B-2900 Schoten
Only the consolidated annual financial statements as set forth in the preceding pages present a true and fair view of the financial position
and performance of the SIPEF group.
The statutory auditor’s report is unqualified and certifies that the non-consolidated financial statements of SIPEF for the year ended
December 31, 2013 give a true and fair view of the financial position and results of the company in accordance with all legal and regulatory
requirements.
Parent company summarized statutory accounts

‘THE CONNECTION TO THE WORLD OF SUSTAINABLE TROPICAL AGRICULTURE’
In KEUR 2013 2012 2011
Assets
Fixed assets 56 637 56 269 61 732
Formation expenses 0 0 0
Intangible assets 78 167 296
Tangible assets 221 223 206
Financial assets 56 338 55 879 61 230
Current assets 179 192 156 605 93 397
Amounts receivable after more than one year 0 0 0
Stocks and contracts in progress 395 365 342
Amounts receivable within one year 169 349 143 546 72 408
Investments 3 494 7 166 15 598
Cash at bank and in hand 5 918 5 425 5 021
Other current assets 36 103 28
Total assets 235 829 212 874 155 129
Liabilities
Equity 146 625 157 203 64 015
Capital 34 768 34 768 34 768
Share premium account 16 285 16 285 16 285
Reserves 7 484 7 356 7 356
Profit / (loss) carried forward 88 088 98 794 5 606
Provisions and deferred taxation 99 149 165
Provisions for liabilities and charges 99 149 165
Creditors 89 105 55 522 90 949
Amounts payable after more than one year 0 0 0
Amounts payable within one year 88 640 54 866 89 581
Accrued charges and deferred income 465 656 1 368
Total liabilities 235 829 212 874 155 129
Condensed balance sheet (after appropriation)

SIPEF | ANNUAL REPORT 2013 137
In KEUR 2013 2012 2011
Operating income 205 225 224 066 238 723
Operating charges -200 688 -219 848 -235 241
Operating result 4 537 4 218 3 482
Financial income 1 014 45 804 4 012
Financial charges -4 943 -4 265 -3 597
Financial result -3 929 41 539 415
Result on ordinary activities 607 45 757 3 897
Extraordinary income 2 62 652 115
Extraordinary charges 0 0 0
Extraordinary result 2 62 652 115
Result for the period before taxes 609 108 409 4 012
Income taxes 2 -2 0
Result for the period 612 108 407 4 012
Condensed income statement

‘THE CONNECTION TO THE WORLD OF SUSTAINABLE TROPICAL AGRICULTURE’
In KEUR 2013 2012 2011
Profit / (loss) to be appropriated 99 406 114 013 24 189
Profit / (loss) for the period available for appropriation 612 108 407 4 012
Profit / (loss) brought forward 98 794 5 606 20 177
Appropriation account 99 406 114 013 24 189
Transfers to legal reserve 0 0 0
Transfers to other reserves 128 0 3 365
Result to be carried forward 88 088 98 795 5 606
Dividends 11 190 15 218 15 218
Remuneration to directors 0 0 0
Appropriation account

SIPEF | ANNUAL REPORT 2013 139

‘THE CONNECTION TO THE WORLD OF SUSTAINABLE TROPICAL AGRICULTURE’
Registered office and offices:
kasteel Calesberg
Calesbergdreef 5
B-2900 Schoten
General contact:
T +32 3 641 97 00
F +32 3 646 57 05
www.sipef.com
Design and printing:
Lannoo
www.lannooprint.be
140084

WWW.SIPEF.COM