Embed Size (px)
Citation preview
Annual Report & Accounts
2011

Annual report & accounts 2011
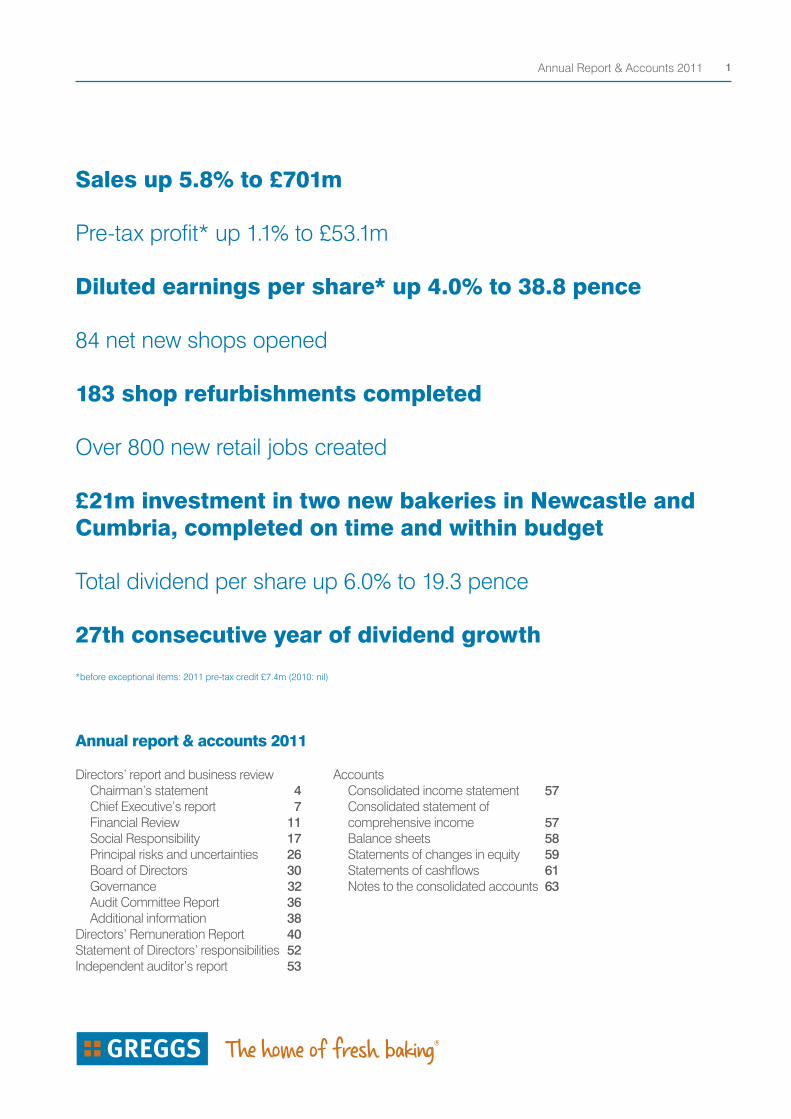
Directors’ report and business review Chairman’s statement 4 Chief Executive’s report 7 Financial Review 11 Social Responsibility 17 Principal risks and uncertainties 26 Board of Directors 30 Governance 32 Audit Committee Report 36 Additional information 38Directors’ Remuneration Report 40Statement of Directors’ responsibilities 52Independent auditor’s report 53
Accounts Consolidated income statement 57 Consolidated statement of comprehensive income 57 Balance sheets 58 Statements of changes in equity 59 Statements of cashflows 61 Notes to the consolidated accounts 63
Sales up 5.8% to £701m
Pre-tax profit* up 1.1% to £53.1m
Diluted earnings per share* up 4.0% to 38.8 pence
84 net new shops opened
183 shop refurbishments completed
Over 800 new retail jobs created
£21m investment in two new bakeries in Newcastle and Cumbria, completed on time and within budget
Total dividend per share up 6.0% to 19.3 pence
27th consecutive year of dividend growth
*before exceptional items: 2011 pre-tax credit £7.4m (2010: nil)
Annual Report & Accounts 2011 1
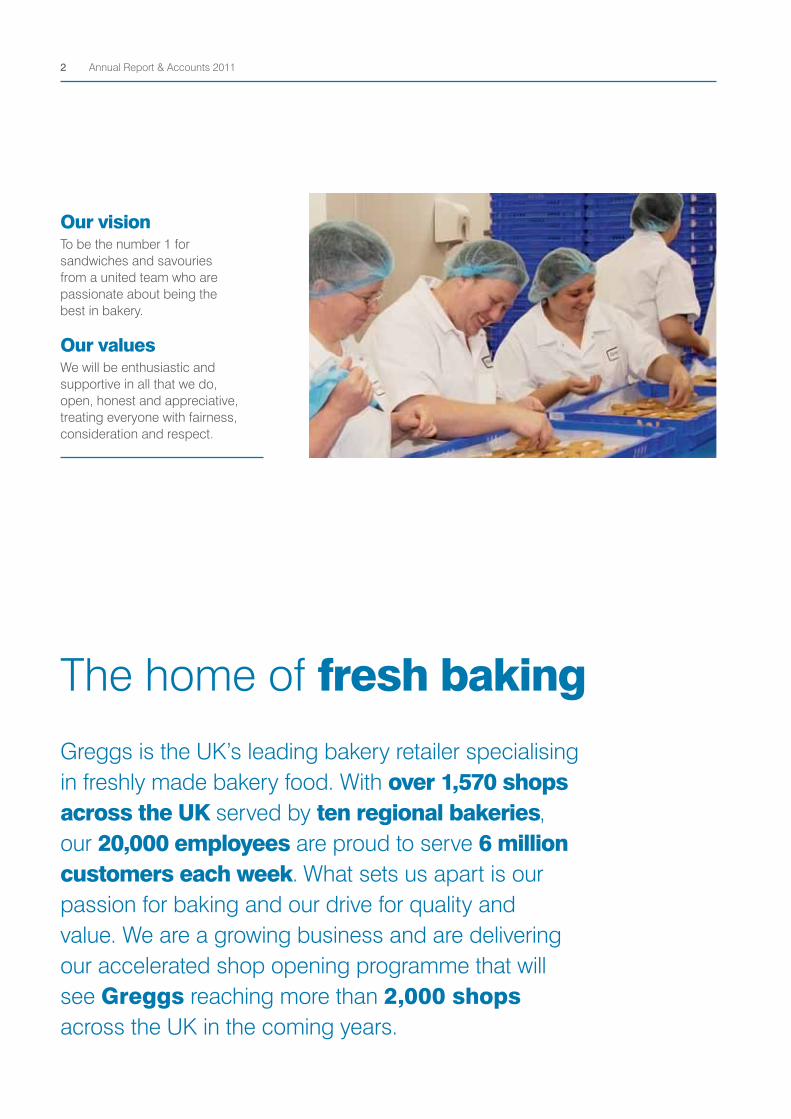
Greggs is the UK’s leading bakery retailer specialising in freshly made bakery food. With over 1,570 shops across the UK served by ten regional bakeries, our 20,000 employees are proud to serve 6 million customers each week. What sets us apart is our passion for baking and our drive for quality and value. We are a growing business and are delivering our accelerated shop opening programme that will see Greggs reaching more than 2,000 shops across the UK in the coming years.
The home of fresh baking
Our visionTo be the number 1 for sandwiches and savouries from a united team who are passionate about being the best in bakery.
Our valuesWe will be enthusiastic and supportive in all that we do, open, honest and appreciative, treating everyone with fairness, consideration and respect.
Annual Report & Accounts 20112

We made hot sandwiches available in over 700 shops;we sold over 2 million in 2011.
Directors’ report and business review The directors have pleasure in presenting their annual report and the audited accounts for the 52 weeks ended 31 December 2011. The comparative period is the 52 weeks ended 1 January 2011.
The directors’ report and business review is set out on pages 4 to 39.
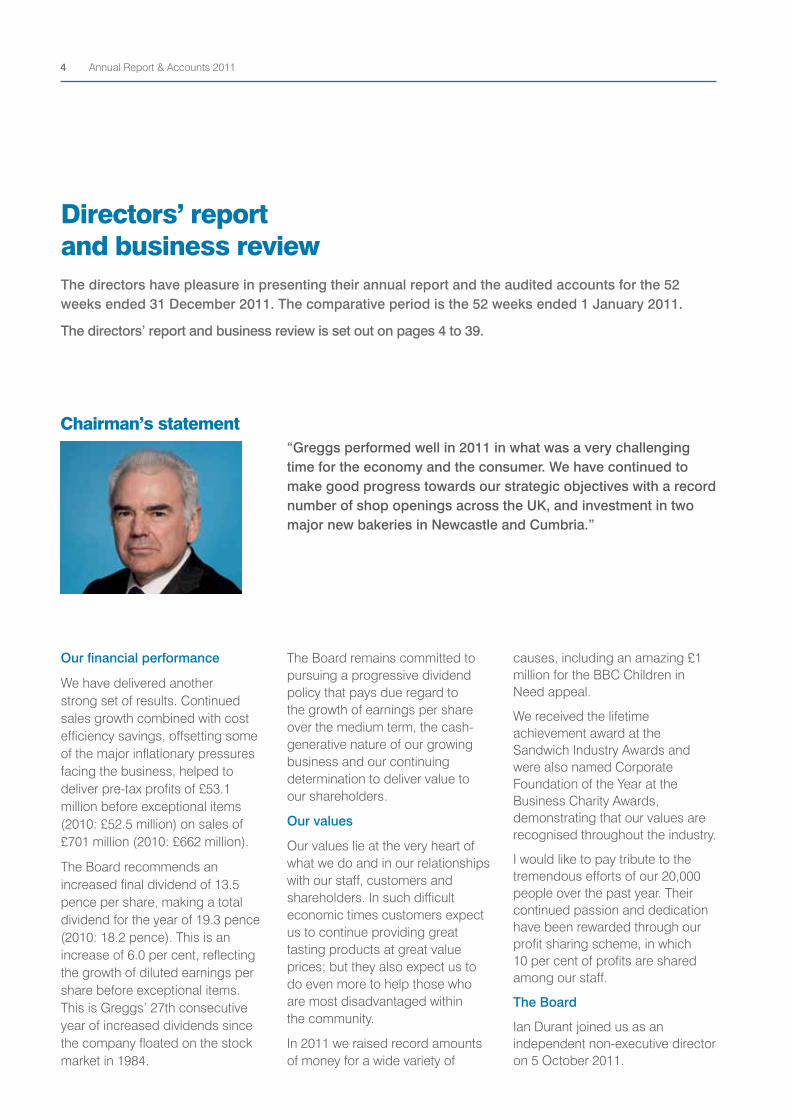
“Greggs performed well in 2011 in what was a very challenging time for the economy and the consumer. We have continued to make good progress towards our strategic objectives with a record number of shop openings across the UK, and investment in two major new bakeries in Newcastle and Cumbria.”
Our financial performance
We have delivered another strong set of results. Continued sales growth combined with cost efficiency savings, offsetting some of the major inflationary pressures facing the business, helped to deliver pre-tax profits of £53.1 million before exceptional items (2010: £52.5 million) on sales of £701 million (2010: £662 million).
The Board recommends an increased final dividend of 13.5 pence per share, making a total dividend for the year of 19.3 pence (2010: 18.2 pence). This is an increase of 6.0 per cent, reflecting the growth of diluted earnings per share before exceptional items. This is Greggs’ 27th consecutive year of increased dividends since the company floated on the stock market in 1984.
The Board remains committed to pursuing a progressive dividend policy that pays due regard to the growth of earnings per share over the medium term, the cash-generative nature of our growing business and our continuing determination to deliver value to our shareholders.
Our values
Our values lie at the very heart of what we do and in our relationships with our staff, customers and shareholders. In such difficult economic times customers expect us to continue providing great tasting products at great value prices; but they also expect us to do even more to help those who are most disadvantaged within the community.
In 2011 we raised record amounts of money for a wide variety of
causes, including an amazing £1 million for the BBC Children in Need appeal.
We received the lifetime achievement award at the Sandwich Industry Awards and were also named Corporate Foundation of the Year at the Business Charity Awards, demonstrating that our values are recognised throughout the industry.
I would like to pay tribute to the tremendous efforts of our 20,000 people over the past year. Their continued passion and dedication have been rewarded through our profit sharing scheme, in which 10 per cent of profits are shared among our staff.
The Board
Ian Durant joined us as an independent non-executive director on 5 October 2011.
Chairman’s statement
Annual Report & Accounts 20114
“ We have delivered another strong set of results.”
Ian is Chairman of Capital and Counties Properties PLC and a non-executive director of Greene King plc and Home Retail Group plc. Ian brings extensive financial and commercial experience, particularly in the property field.
Bob Bennett, a non-executive director since 2003, will retire from the Board at our AGM in May. Bob was, until recently, Chairman of the Audit Committee and our Senior Independent Director. We are indebted to him for his service to Greggs and wish him a very long and happy retirement.
In view of Bob’s impending retirement we made a number of changes to Board responsibilities at the beginning of 2012, with Julie Baddeley succeeding Bob as Senior Independent Director, Ian Durant taking his place as Chairman of the Audit Committee
and Iain Ferguson becoming Chairman of the Remuneration Committee in place of Julie Baddeley.
Prospects
While we expect 2012 to be another year of significant challenge for UK consumers we believe that we are well placed to deliver further progress. In the current year we will continue our accelerated expansion with the opening of around 90 net new shops and further development of new channels to market. This, and our determination to deliver further cost savings, reinforces our belief that the business continues to offer substantial opportunities for long term, profitable growth. Derek Netherton Chairman 14 March 2012
Annual Report & Accounts 2011 5
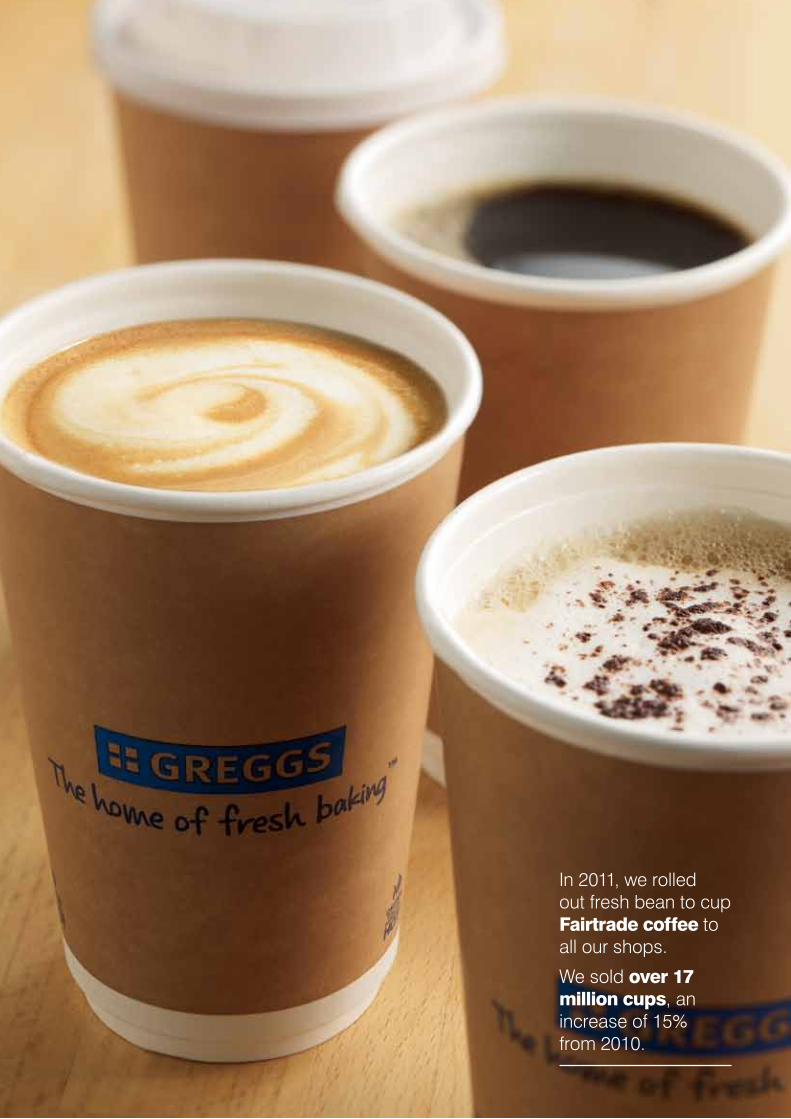
In 2011, we rolled out fresh bean to cup Fairtrade coffee to all our shops.
We sold over 17 million cups, an increase of 15% from 2010.
“ We have grown sales and made Greggs even more accessible to new customers.”
“I am pleased to report a year of progress against the background of continuing pressure on consumers’ disposable incomes and substantial increases in energy and ingredient costs. We have grown sales and made Greggs even more accessible to new customers by opening a record number of new shops across the UK. Increased investment in promotional activity has reinforced our long-established reputation for great value, while our drive to improve efficiency throughout the business has contributed to the delivery of another year of profitable growth.”
Market background: consumers under pressure
Consumers’ disposable income remained under significant pressure throughout 2011, as they were hit by the impact of rising costs for fuel, domestic energy and food. The number of people out of work also continued to grow, with total unemployment reaching its highest level since 1994, and youth unemployment rising to a record of more than one million. Greggs naturally experienced the effects of reduced footfall on high streets resulting from these tough times for the economy as a whole. Some brighter spots included a short-term boost in sentiment around the royal wedding in April, and very strong demand over the Christmas period. This benefited from softer
comparatives with the period of heavy snow in 2010, as well as the more favourable trading pattern of Christmas and New Year’s Day falling on Sundays.
Financial performance: in line with expectations
In this challenging trading environment, we achieved record sales of £701 million, a rise of 5.8 per cent. Like-for-like sales increased by 1.4 per cent, slightly ahead of our expectations of marginally positive like-for-like growth over the year as a whole. Operating profit before exceptional items was up 1.2 per cent at £53.0 million and pre-tax profit before exceptional items rose 1.1 per cent to £53.1 million. Our Finance Director, Richard Hutton, comments on our financial performance in
more detail in the Financial Review on pages 11 and 12.
Our products: listening to our customers
Throughout 2011 we recognised that customers were seeking out even greater value and we responded to this with substantial increases in our promotional investment, particularly our popular Meal Deals. A very strong performance in our savouries category during the year further underlined consumers’ focus on outstanding value, with these products offering a lower average selling price compared to sandwiches.
The breakfast market continued to grow and we performed strongly in this area, aided by our breakfast Meal Deal. Hot drinks also performed very well, following
Chief Executive’s report
Annual Report & Accounts 2011 7
completion of the roll-out to all our shops of coffee machines serving freshly ground Fairtrade coffee; we sold a record 17.3 million cups of coffee during the year, an increase of 15 per cent.
Consumers welcome innovation and we launched 180 new products during the year, an increase of 25 per cent. Notable successes included our range of Superstar Doughnuts, introduced in October, of which we sold more than 4.8 million by the year end. Hot sandwiches also showed good growth as we continued our roll-out of the range, which is now available in over 700 shops.
The quality of our products was recognised by our success in a number of awards during the year. This included the British Sandwich Association’s prestigious “British Sandwich Industry Award”.
Our shops: accelerated expansion and new formats
We set new records for both shop openings and shop refurbishments in 2011. In total we opened 98 new shops, a net addition of 84 shops after 14 closures, and we have been very pleased with the performance of these new outlets. Our new shop in the Westfield Stratford City development in London broke all our records for a first day of trading, and is already our second highest turnover shop in the country.
We have continued to move into a wider range of locations where our customers are at work, on the move, or at leisure, with one in three of our new shops opening away from traditional high street locations. This included nine openings in retail parks and six in industrial parks, together with two new shops at petrol filling stations and a kiosk on the concourse of Newcastle railway station. In October we announced
our move into the motorway services market through a trial with Moto Hospitality Limited. The first franchised Greggs shop opened at Lymm services in Cheshire in January 2012 and is performing well. We will be exploring further opportunities to open shops in partnership with Moto in the year ahead.
We completed 183 shop refurbishments during the year, making the Greggs shopping experience even more enjoyable for our customers by increasing space for browsing, making more products available for self-selection and providing seating wherever possible. As part of our continuing drive to improve customer service we completed the installation of card payment facilities in all our shops during the first half and introduced contactless payment facilities in the second half.
We believe that there are potentially three types of shop format appropriate for Greggs: ’Food on the go’, ’Local bakery’ and ’Coffee shop’. The ’Food on the go’ and ’Local bakery’ formats already exist within Greggs but we believe that there is the potential for a new coffee shop format. Therefore, in September we opened a new coffee shop concept, “Greggs moment”, in Newcastle upon Tyne. “Greggs moment” offers a range of specially developed bakery food to complement our freshly ground coffees and broad selection of teas, served in an attractive contemporary environment with seating on two floors. It has been well received by our customers and we will be opening three more “Greggs moment” outlets this year as we continue to pursue the opportunity presented by the growing coffee shop market.
We passed a significant milestone
with the opening of our 1,500th shop in York in March 2011, and had a total of 1,571 shops at the year end. We plan to continue our investment in shop expansion and refurbishments in the current year, adding around 90 new shops, net of closures, by the end of 2012, and refitting a further 100 - 120 shops.
New channels to market
During the year we diversified into wholesaling as part of our strategy to access new markets. We believe that Greggs has the potential to expand significantly into the ’take home’ food market. The successful trial of Greggs branded four-pack frozen sausage rolls was extended to all 750 Iceland stores nationwide in October, with strong results, and we are now working closely with Iceland to add more Greggs products to their range. Importantly, we have seen no cannibalisation of sales from existing Greggs shops and have received very positive comments from Greggs customers.
Our supply chain: investing for future growth
At Greggs we are both a baker and a retailer. This gives us a distinct point of difference from most of our competitors and a deep passion for our products and the quality of their ingredients. The use of our own unique recipes, and our bakery expertise, enables us to make great tasting food that our customers love, all at great value prices.
During 2011 we completed two major investments in our supply chain, with the commissioning in September of new bakeries in Newcastle upon Tyne and Penrith. Our £16.5 million Gosforth Park bakery in Newcastle replaces an older bakery in the city. Our £4.5 million Penrith bakery is a specialist confectionery facility supplying
Chief Executive’s report - continued
Annual Report & Accounts 20118
shops throughout the country. Following the opening of these new facilities we closed our older bakery in Penrith as part of the strategic repositioning of our supply chain capability.
Both new bakeries were completed on time and within budget, and without any interruption in the supply chain to our customers: a major achievement that is a testament to the expertise of our bakery teams. Operationally, both bakeries are performing very well and delivering the expected improvements in efficiency as well as providing us with increased capacity to support our continued shop expansion.
Across our supply chain as a whole, our investment in more efficient processes has delivered significant savings and we now expect to achieve our targeted £10 million of annual savings two years ahead of schedule in 2012.
In 2012 we will not be making the same level of investments in our supply chain that have been a feature of the last two years. We will complete a £2.5 million upgrade of our savoury manufacturing plant in Newcastle, which will increase its capacity by 10 per cent. In addition we will also invest in a “micro” bakery in Norwich to support our expansion in East Anglia, an area outside the reach of our main bakeries.
Social responsibility: doing the right thing
At Greggs we have always prided ourselves on “doing the right thing”, whether for our people, our customers, local communities or the environment.
One great example of this has been the fantastic work done by so many to support children in some of the most disadvantaged
communities. By the end of the year Greggs Breakfast Clubs were operating in 180 schools across the UK, providing 8,000 children with a free, healthy breakfast every day. Fourteen clubs are now operating through partner organisations and I am delighted that more companies are becoming involved in supporting Breakfast Clubs. We are enormously grateful to these organisations for having the vision and compassion to tackle child poverty right here in the UK. We were particularly pleased to be able to open five new clubs during the second half in areas of London, Birmingham, Manchester and Liverpool affected by the summer riots. I would also like to pay tribute to the head teachers, their staff and the volunteers who make these clubs work so brilliantly.
Our people: our greatest strength
We remain indebted to our people for their incredible energy, enthusiasm and commitment to delivering products and service that will delight our customers. I am particularly pleased that we were able to create more than 800 new retail jobs through our shop opening programme during the year, lifting the total number of Greggs employees above 20,000 for the first time. We continue to share 10 per cent of our profits with our people and I am delighted that a record £5.9 million will be shared among our staff in respect of our performance in 2011.
Outlook for 2012
This will undoubtedly be another challenging year for UK consumers, with disposable incomes expected to continue contracting well into the second half. However, the severe inflationary pressure on fuel, domestic energy and food costs that the consumer suffered
in 2011 is not expected to continue at the same level, and sentiment should benefit from major national events including the Diamond Jubilee celebrations, the London Olympics and the Euro 2012 football championship. We are planning to make the most of these opportunities while focusing throughout the year on maximising our customer appeal through continued product innovation and promotional activity.
As we expected, there has been a slow start to 2012. The pattern of Christmas and New Year holiday trading that contributed to the strength of our sales at the close of 2011 reversed in the first week of January, and two weeks of severe weather, with snow and ice in many parts of the country, also had an adverse impact on sales. Total sales for the first ten weeks of the current financial year to 10 March 2012 are up 3.3 per cent, with like-for-like sales down by 1.8 per cent. It is too early to tell if this slower start is a sign of a more prolonged trend in sales, however we have managed costs well through this period and our profit performance remains on target.
Total sales this year will benefit from the opening of around 90 net new shops, creating a further 700 - 800 new retail jobs and making Greggs even more accessible to customers across the UK. We will also continue to drive our programmes of efficiency improvements throughout the business. Our strategy for long term growth is well on track, and I believe that 2012 will be a year of further progress for Greggs.
Kennedy McMeikan Chief Executive 14 March 2012
Annual Report & Accounts 2011 9

We sold over 800,000 porridge pots in 2011, as part of our new, wider breakfast range.
“ The business has remained cash generative and financially strong.”
“In 2011 we invested to create the capacity for future growth whilst accelerating the number of shop openings and refurbishments as we continue to expand and modernise our estate. Higher increases than we had planned for energy and ingredient costs were mitigated by the accelerated delivery of cost savings, and the business has remained cash generative and financially strong.”
Sales
Total Group sales for the 52 weeks ended 31 December were £701 million (2010: £662 million), an increase of 5.8 per cent. Like-for-like sales grew by 1.4 per cent over the year as a whole, comprising an increase of 0.4 per cent in the first half, 0.8 per cent in the third quarter and 3.8 per cent in the final quarter. The improvement in performance towards the end of the year reflected the benefit of more favourable weather in late November and December, compared with a period severely disrupted by snow in 2010, and an advantageous pattern of Christmas and New Year trading.
Profit before exceptional items
Operating profit before exceptional items was £53.0 million (2010: £52.4 million), an increase of 1.2 per cent. The negative impact on profit caused by the additional
public holiday in 2011 for the royal wedding was in the order of £1 million, reflecting our reduced trading hours and additional costs of operation on the day.
After net finance income of £0.1 million (2010: £0.2 million) pre-tax profit before exceptional items was £53.1 million (2010: £52.5 million), an increase of 1.1 per cent.
Operating margin
Operating margin before exceptional items was 7.6 per cent (2010: 7.9 per cent). Approximately half of this reduction is directly attributable to the costs of the additional public holiday in 2011, with the balance principally reflecting a 50 per cent increase in our investment in promotional activity as we responded to the demands of a significantly more value-driven market place and extended our national Meal Deals.
We bore substantial cost increases in commodity prices during the year, which affected most of our key ingredients as well as our energy-related production, distribution and retailing costs. This pressure was partly mitigated by our continuing drive to identify and unlock cost savings of almost £5 million throughout the business. These were generated by further improvements in the effectiveness of our purchasing, and continued overhead savings following the centralisation of our business. Our supply chain cost reduction programme is ahead of plan, and is now delivering annual savings of £6.8 million compared with the position two years ago. We now expect to achieve our original target of £10 million of annual savings in 2012, two years ahead of schedule, and to increase the total annual saving to £15 million by 2014.
Financial review
Annual Report & Accounts 2011 11
Our diversification into wholesaling, begun in 2011, creates a new growth opportunity for the future. Our initial success with Iceland has demonstrated the potential to sell Greggs products into the take-home market and foodservice sector with no obvious cannibalisation of our own shops’ sales.
Exceptional items
There was a net exceptional credit in 2011 of £7.4 million (2010: nil). As already disclosed in the interim report, this principally comprised an exceptional pension credit of £9.6 million arising from the decision that the revaluation and indexation of occupational pensions should in future be based on the Consumer Price Index rather than the Retail Price Index. This was partly offset by a provision of £2.2 million for property and restructuring costs arising from the closure of our old Newcastle and Penrith bakeries as we relocated to new sites.
Pre-tax profit including exceptional items was £60.5 million (2010: £52.5 million), an increase of 15.2 per cent.
Taxation
The Group’s effective tax rate for the year was 26.4 per cent (2010: 27.8 per cent), a reduction of 1.4 percentage points, primarily reflecting the lowering of the headline rate of corporation tax from 28 per cent to 26 per cent from April 2011.
Earnings per share
Diluted earnings per share before exceptional items were 38.8 pence (2010: 37.3 pence), an increase of 4.0 per cent, with the increase at the pre-tax level boosted by the lower tax charge and a lower average number of shares in issue
following our buyback programme in 2010. Basic earnings per share before exceptional items were 39.5 pence (2010: 37.8 pence). Earnings per share including exceptional items were 44.3 pence diluted (2010: 37.3 pence) and 45.0 pence basic (2010: 37.8 pence).
Dividends
The Board recommends an increased final dividend of 13.5 pence per share (2010: 12.7 pence). Together with the interim dividend of 5.8 pence (2010: 5.5 pence), paid in October 2011, this makes a total for the year of 19.3 pence (2010: 18.2 pence). This is an increase of 6.0 per cent, maintaining cover by diluted earnings per share before exceptional items of 2.0 times.
Subject to the approval of shareholders at the Annual General Meeting, the final dividend will be paid on 25 May 2012 to shareholders on the register on 27 April 2012.
Capital expenditure
We invested £59.1 million (2010: £45.6 million) in the business during 2011. This reflected the completion of the £21 million investment in the Newcastle and Penrith bakeries, as well as the accelerated rate of new shop openings and refits. We also invested £6 million in equipment across the business as we completed the installation of fresh ground coffee machines in all our shops and continued the roll-out of our hot sandwich offer. Depreciation in the year was £30.7 million (2010: £29.0 million).
We plan capital expenditure of circa £45 million in 2012, the focus being on new shop openings and continued refurbishments. As in 2011, our investment in the future
of the business will be funded from our own strong cash flow.
Return on capital
We manage our return on capital through our Investment Board, where all capital expenditure is subject to rigorous appraisal both before and after it is made. For new shops, we target a return on capital of over 20 per cent by the third year of operation, in recognition of the fact that we need to cover our longer term investment in the supply chain. Our new shop returns in 2011 were well on track to achieve returns in line with our targets.
We also targeted greater efficiencies in the costs of refurbishing our shops in 2011 and were successful in achieving a reduction of 15 per cent per square metre in the cost of our shopfitting during the year.
Excluding this year’s exceptional credit, we delivered an overall return on capital employed for 2011 of 24.4 per cent (2010: 25.9 per cent). The year-on-year reduction reflects the relatively modest profit progress during a year in which significant capital expenditure was committed.
Cash flows and balance sheet
The Group remains highly cash generative, with total cash generated from operations in 2011 of £88.1 million (2010: £77.8 million). At the end of the year the Group had no debt and net cash and cash equivalents of £19.5 million (2010: £20.8 million). This puts us in a strong position to fulfil the growth potential of the business while continuing to deliver good returns for shareholders.
Richard Hutton Finance Director 14 March 2012
Financial review - continued
Annual Report & Accounts 201112

We have sold 4.8 million Superstar Doughnuts since their launch in October 2011.
6.4%
7.1%
3.3%
2.1%
5.8%
Key financial performance indicators
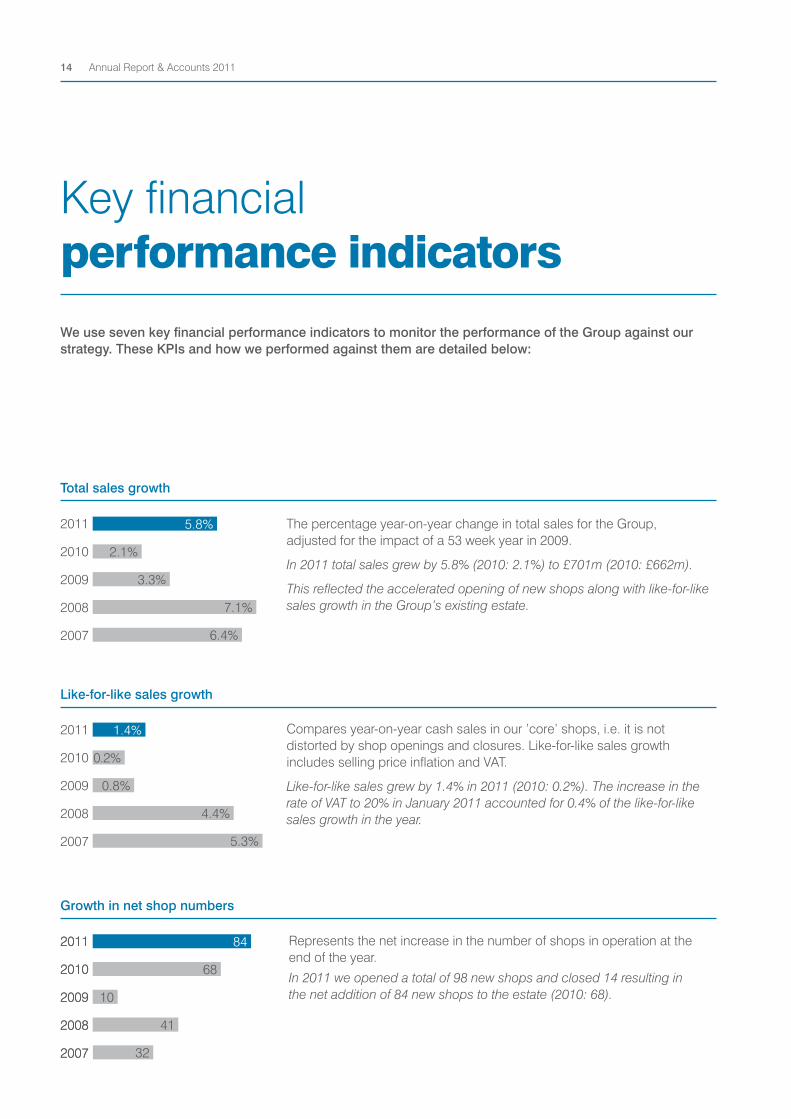
We use seven key financial performance indicators to monitor the performance of the Group against our strategy. These KPIs and how we performed against them are detailed below:
The percentage year-on-year change in total sales for the Group, adjusted for the impact of a 53 week year in 2009.
In 2011 total sales grew by 5.8% (2010: 2.1%) to £701m (2010: £662m).
This reflected the accelerated opening of new shops along with like-for-like sales growth in the Group’s existing estate.
Compares year-on-year cash sales in our ’core’ shops, i.e. it is not distorted by shop openings and closures. Like-for-like sales growth includes selling price inflation and VAT.
Like-for-like sales grew by 1.4% in 2011 (2010: 0.2%). The increase in the rate of VAT to 20% in January 2011 accounted for 0.4% of the like-for-like sales growth in the year.
Represents the net increase in the number of shops in operation at the end of the year.
In 2011 we opened a total of 98 new shops and closed 14 resulting in the net addition of 84 new shops to the estate (2010: 68).
2011
2010
2009
2008
2007
Total sales growth
Growth in net shop numbers
41
68
2011
2010
2009
2008
2007 32
10
2011
2010
2009
2008
2007
84
5.3%
4.4%
0.8%
0.2%
1.4%2011
2010
2009
2008
2007
Like-for-like sales growth
Annual Report & Accounts 201114
53.0
47.7
44.3
48.4
52.4
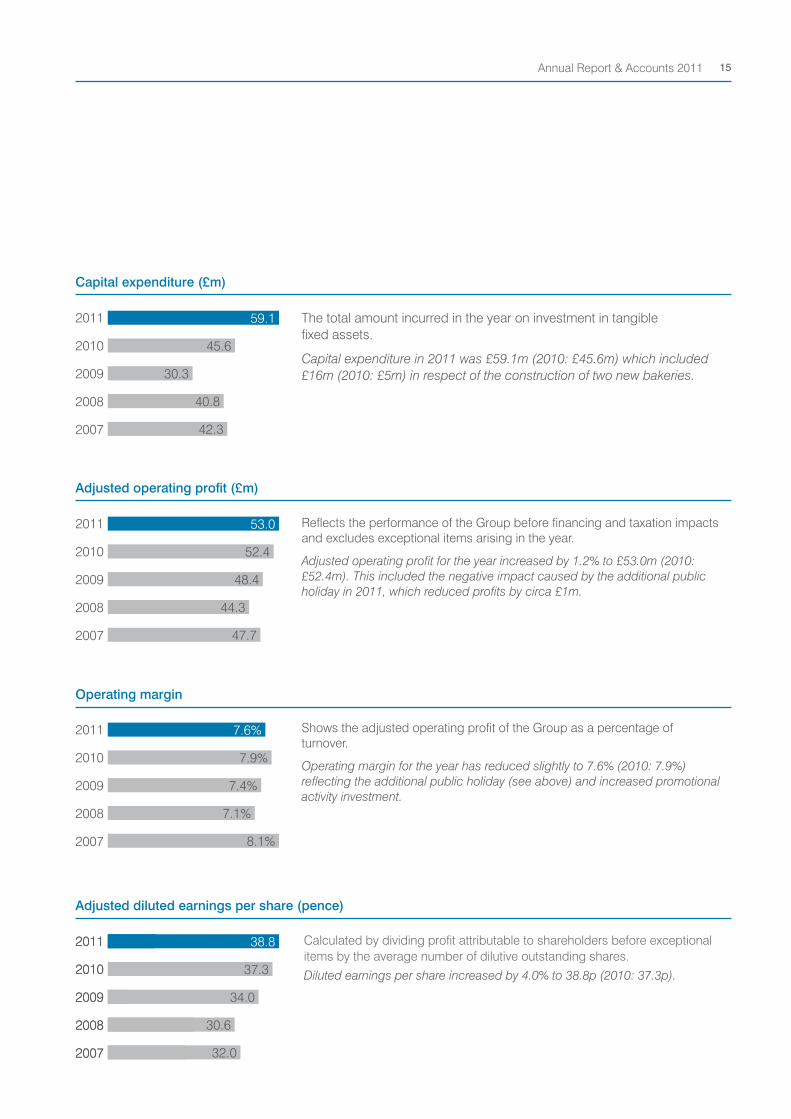
Reflects the performance of the Group before financing and taxation impacts and excludes exceptional items arising in the year.
Adjusted operating profit for the year increased by 1.2% to £53.0m (2010: £52.4m). This included the negative impact caused by the additional public holiday in 2011, which reduced profits by circa £1m.
Shows the adjusted operating profit of the Group as a percentage of turnover.
Operating margin for the year has reduced slightly to 7.6% (2010: 7.9%) reflecting the additional public holiday (see above) and increased promotional activity investment.
Calculated by dividing profit attributable to shareholders before exceptional items by the average number of dilutive outstanding shares.
Diluted earnings per share increased by 4.0% to 38.8p (2010: 37.3p).
2011
2010
2009
2008
2007
Adjusted operating profit (£m)
Adjusted diluted earnings per share (pence)
32
41
10
37.3
2011
2010
2009
2008
2007 32.0
30.6
34.0
2011
2010
2009
2008
2007
38.8
2011
2010
2009
2008
2007
42.3
40.8
30.3
45.6
59.1 The total amount incurred in the year on investment in tangible fixed assets.
Capital expenditure in 2011 was £59.1m (2010: £45.6m) which included £16m (2010: £5m) in respect of the construction of two new bakeries.
2011
2010
2009
2008
2007
Capital expenditure (£m)
Operating margin
8.1%
7.1%
7.4%
7.9%
7.6%
Annual Report & Accounts 2011 15

We serve fresh sandwiches, handmade using bread we baked ourselves.
Social Responsibility
Our approach to Social Responsibility
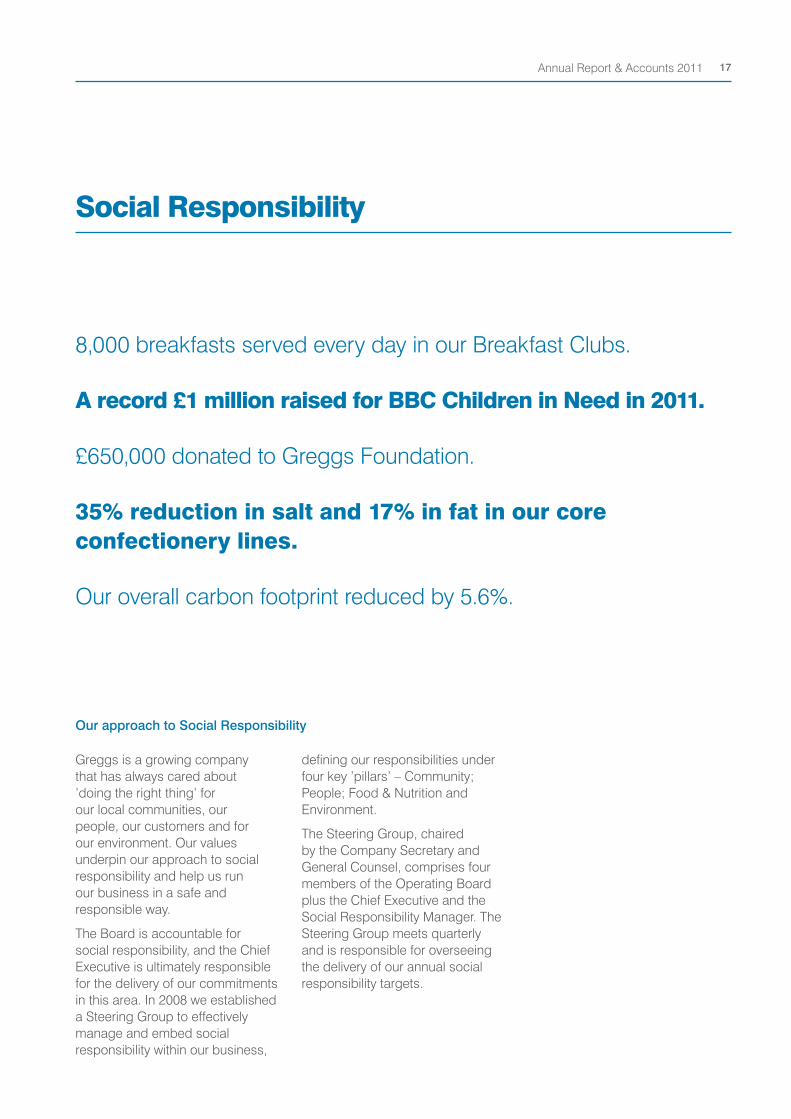
8,000 breakfasts served every day in our Breakfast Clubs.
A record £1 million raised for BBC Children in Need in 2011.
£650,000 donated to Greggs Foundation.
35% reduction in salt and 17% in fat in our core confectionery lines.
Our overall carbon footprint reduced by 5.6%.
Greggs is a growing company that has always cared about ’doing the right thing’ for our local communities, our people, our customers and for our environment. Our values underpin our approach to social responsibility and help us run our business in a safe and responsible way.
The Board is accountable for social responsibility, and the Chief Executive is ultimately responsible for the delivery of our commitments in this area. In 2008 we established a Steering Group to effectively manage and embed social responsibility within our business,
defining our responsibilities under four key ’pillars’ – Community; People; Food & Nutrition and Environment.
The Steering Group, chaired by the Company Secretary and General Counsel, comprises four members of the Operating Board plus the Chief Executive and the Social Responsibility Manager. The Steering Group meets quarterly and is responsible for overseeing the delivery of our annual social responsibility targets.
Annual Report & Accounts 2011 17

✓
✓
✓
✓
Progress against our 2011 targetsExtend the Greggs Breakfast Club scheme to 180 supported clubs.
By the end of the year a total of 180 Breakfast Clubs were open, with 14 of these now operating under our partnership model with other organisations. In total 8,000 children benefit each day from the clubs – that is over 1.4 million healthy breakfasts each year – and over 500 parent volunteers help run clubs. We made a specific mid-year commitment to support the areas of London, Birmingham, Manchester and Liverpool affected by the recent riots, and five of our new clubs were opened in these areas.
Donate at least one per cent of profits to the grant-making and Breakfast Club programmes of Greggs Foundation. Hold a
conference for our Regional Charity Committees in 2011 to encourage our people to do even more for our local communities.
In 2011 we donated a total of £650,000 to the grant-making and Breakfast Club programmes of our Foundation, representing 1.2 per cent of pre-tax profits. We held our Foundation Conference at the beginning of February 2012 after deciding this was the most appropriate date. We were overwhelmed by the enthusiasm of our people to do even more to support our local communities in the year ahead.
Hold our second national fundraising week for Greggs Foundation in 2011 with the aim of raising over £70,000.
We ran a very successful campaign, raising £83,400. All of this money went to support smaller, locally-based organisations in the communities served by our shops,
with our people and customers encouraged to nominate local causes to receive support. We were delighted to have raised such a significant amount of money for the Foundation.
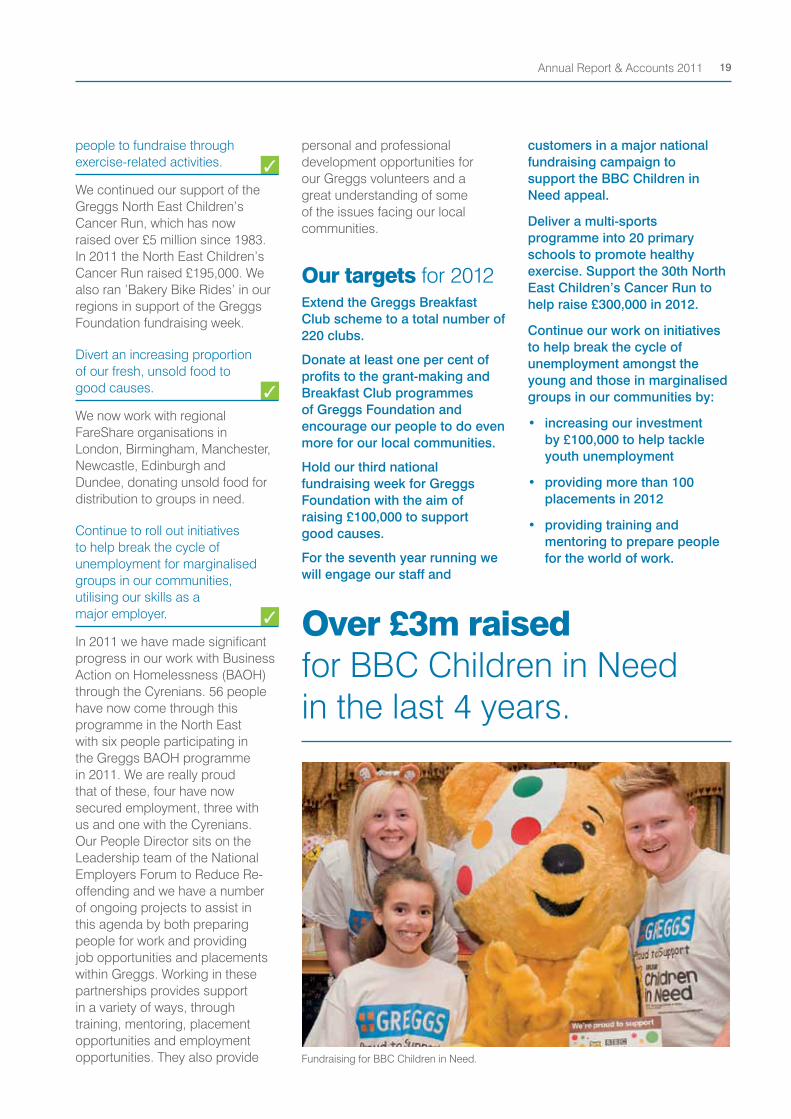
For the sixth year running we will engage our staff and customers in a major national fundraising campaign to support the BBC Children in Need appeal.
2011 was another record year of fundraising by Greggs. We raised an amazing £1,001,052 for BBC Children in Need. This takes our total raised to over £3 million in the last four years and we are the second largest corporate fundraiser. The immense sense of pride and achievement at raising such a phenomenal amount of money for BBC Children in Need was simply fantastic.
Support Greggs-sponsored fun runs and another Great Bakery Bike Ride to help more of our
Greggs Chief Executive, Kennedy McMeikan visiting a Greggs Breakfast Club.
Making a difference to our local communities.
Annual Report & Accounts 201118
✓
✓
✓
people to fundraise through exercise-related activities.
We continued our support of the Greggs North East Children’s Cancer Run, which has now raised over £5 million since 1983. In 2011 the North East Children’s Cancer Run raised £195,000. We also ran ’Bakery Bike Rides’ in our regions in support of the Greggs Foundation fundraising week.
Divert an increasing proportion of our fresh, unsold food to good causes.
We now work with regional FareShare organisations in London, Birmingham, Manchester, Newcastle, Edinburgh and Dundee, donating unsold food for distribution to groups in need.
Continue to roll out initiatives to help break the cycle of unemployment for marginalised groups in our communities, utilising our skills as a major employer.
In 2011 we have made significant progress in our work with Business Action on Homelessness (BAOH) through the Cyrenians. 56 people have now come through this programme in the North East with six people participating in the Greggs BAOH programme in 2011. We are really proud that of these, four have now secured employment, three with us and one with the Cyrenians. Our People Director sits on the Leadership team of the National Employers Forum to Reduce Re-offending and we have a number of ongoing projects to assist in this agenda by both preparing people for work and providing job opportunities and placements within Greggs. Working in these partnerships provides support in a variety of ways, through training, mentoring, placement opportunities and employment opportunities. They also provide
personal and professional development opportunities for our Greggs volunteers and a great understanding of some of the issues facing our local communities.
Our targets for 2012Extend the Greggs Breakfast Club scheme to a total number of 220 clubs.
Donate at least one per cent of profits to the grant-making and Breakfast Club programmes of Greggs Foundation and encourage our people to do even more for our local communities.
Hold our third national fundraising week for Greggs Foundation with the aim of raising £100,000 to support good causes.
For the seventh year running we will engage our staff and
customers in a major national fundraising campaign to support the BBC Children in Need appeal.
Deliver a multi-sports programme into 20 primary schools to promote healthy exercise. Support the 30th North East Children’s Cancer Run to help raise £300,000 in 2012.
Continue our work on initiatives to help break the cycle of unemployment amongst the young and those in marginalised groups in our communities by:
• increasing our investment by £100,000 to help tackle youth unemployment
• providing more than 100 placements in 2012
• providing training and mentoring to prepare people for the world of work.
Over £3m raised for BBC Children in Need in the last 4 years.
Fundraising for BBC Children in Need.
Annual Report & Accounts 2011 19
7
✓
✓
✓
Progress against our 2011 targets
We will continue to share 10 per cent of our profits with our people.
We are proud that we have been able to continue our long-standing commitment to share 10 per cent of our profits with our people and a record £5.9 million will be shared amongst eligible employees in respect of 2011.
In our EOS survey our engagement score will improve to at least 73 per cent.
In our Employee Opinion Survey (EOS) our engagement score improved to 77 per cent, up from 72 per cent in 2010. We are extremely pleased with this result and we thank the 89 per cent of our people who took the time to complete our EOS.
We will focus on communication for our people and our targets will be:
• More than 65 per cent of our people feel they have the opportunity to contribute their views on issues that affect them.
• More than 65 per cent of our supply teams feel that their line manager/supervisor shares important knowledge and information with them.
Our EOS results show that 64 per cent of our workforce feel they have the opportunity to contribute their views. Our retail teams achieved 66 per cent and our Head Office teams 70 per cent. We achieved 53 per cent in our supply chain and this will be our main area of focus in 2012. While missing our overall target, this is a significant improvement on the 58 per cent score in 2010. In 2012 we will focus on increasing the opportunities our people have to contribute their views.
In 2011, 56 per cent of our supply teams felt that important knowledge and information about the business is shared with them.
This misses our target of 65 per cent, but is an improvement on the 51 per cent scored in 2010. Our retail teams scored 81 per cent and our Head Office teams scored 80 per cent. In 2012 we will increase our focus on improving communication within our supply teams.
We will create over 700 new retail jobs through our new shop opening programme.
In 2011 we opened a net 84 new shops around the UK, creating over 800 new retail jobs for people in our local communities.
We will reduce our accidents by 5 per cent from our Accident Incident Rate of 2010.
By delivering a simpler, more easily understood approach to safety, involving all levels within the business, we are pleased that reportable accidents have been reduced by 27 per cent. This was an excellent achievement and a credit to our Health and Safety teams’ efforts in 2011.
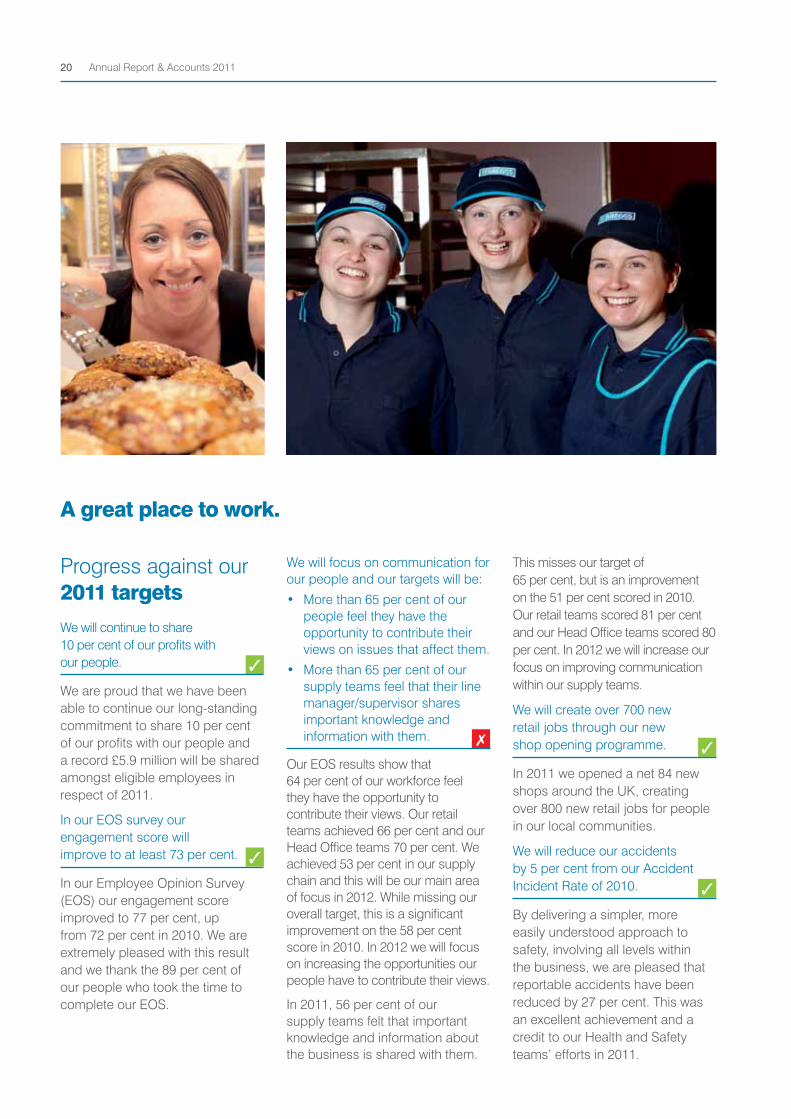
A great place to work.
✓
Annual Report & Accounts 201120
✓
✘
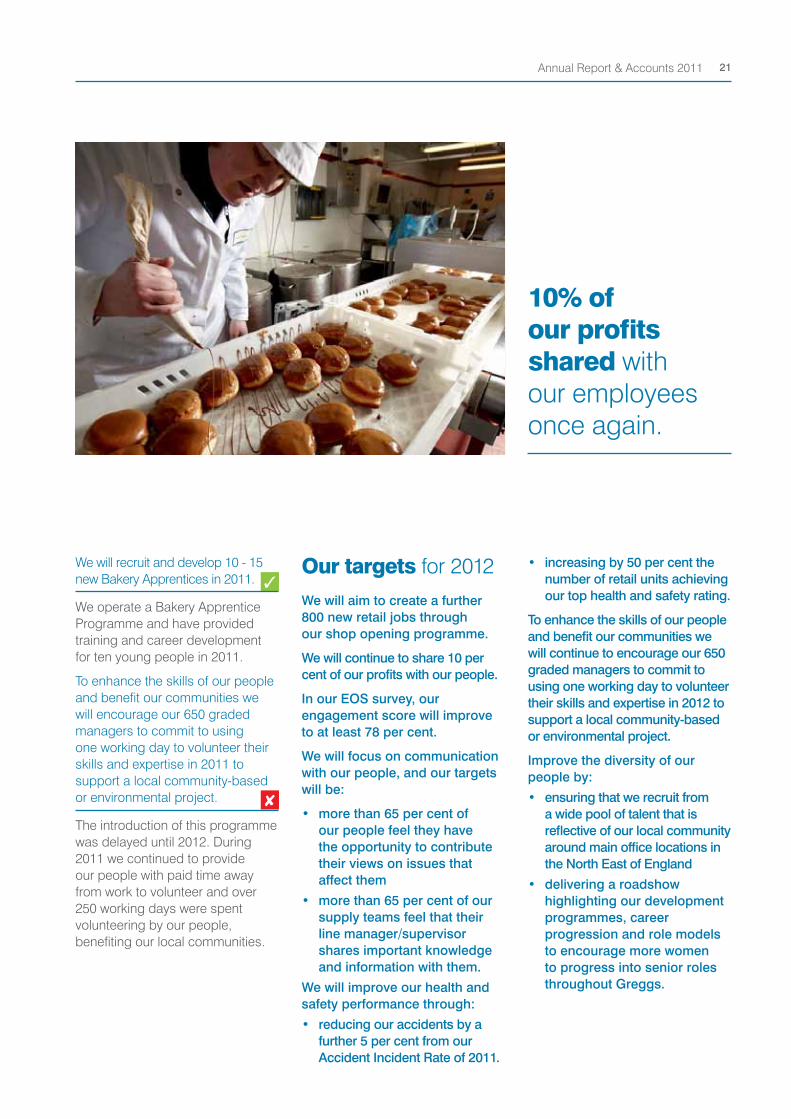
We will recruit and develop 10 - 15 new Bakery Apprentices in 2011.
We operate a Bakery Apprentice Programme and have provided training and career development for ten young people in 2011.
To enhance the skills of our people and benefit our communities we will encourage our 650 graded managers to commit to using one working day to volunteer their skills and expertise in 2011 to support a local community-based or environmental project.
The introduction of this programme was delayed until 2012. During 2011 we continued to provide our people with paid time away from work to volunteer and over 250 working days were spent volunteering by our people, benefiting our local communities.
Our targets for 2012We will aim to create a further 800 new retail jobs through our shop opening programme.
We will continue to share 10 per cent of our profits with our people.
In our EOS survey, our engagement score will improve to at least 78 per cent.
We will focus on communication with our people, and our targets will be:
• more than 65 per cent of our people feel they have the opportunity to contribute their views on issues that affect them
• more than 65 per cent of our supply teams feel that their line manager/supervisor shares important knowledge and information with them.
We will improve our health and safety performance through:
• reducing our accidents by a further 5 per cent from our Accident Incident Rate of 2011.
• increasing by 50 per cent the number of retail units achieving our top health and safety rating.
To enhance the skills of our people and benefit our communities we will continue to encourage our 650 graded managers to commit to using one working day to volunteer their skills and expertise in 2012 to support a local community-based or environmental project.
Improve the diversity of our people by:
• ensuring that we recruit from a wide pool of talent that is reflective of our local community around main office locations in the North East of England
• delivering a roadshow highlighting our development programmes, career progression and role models to encourage more women to progress into senior roles throughout Greggs.
10% of our profits shared with our employees once again.
Annual Report & Accounts 2011 21

✓
✓
✓
✘
✓
Fresh quality bakery food our customers can trust.
Progress against our 2011 targets
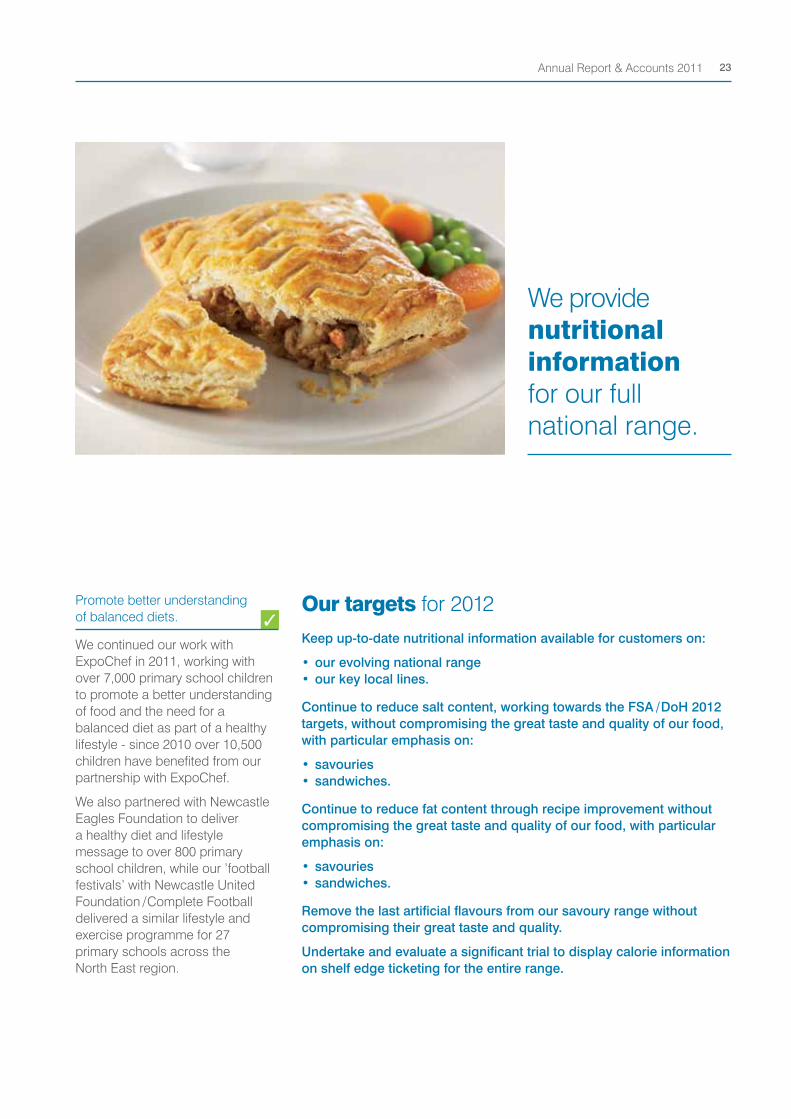
Provide nutritional information for our full national range.
We have published detailed nutritional information on our national range of products using in-store leaflets and our website. Customers can also telephone our customer contact team to request nutritional information on any of our products including regional and local products.
Continue to reduce salt content, working towards the Food Standards Agency and Department of Health 2012 targets, without compromising the great taste and quality of our food.
Our work continues in this area and we are pleased that, for our core bread products, we have reduced the salt content by 19 per cent,
already meeting the FSA’s 2012 target for salt in bread. We have also reduced the salt content of our core confectionery lines by 35 per cent. This work has been done without adversely affecting the taste or quality of our products and our work in 2012 will continue to focus on our sandwich and savoury lines.
Continue to reduce fat content without compromising the great taste and quality of our food.
In addition to the salt reduction work on our core confectionery lines, we have also successfully reduced the fat content in these products by 17 per cent. Again this work has been done without adversely affecting the taste and quality of the products and our work in 2012 will continue to focus on our sandwich and savoury lines.
Continue to remove the last artificial flavours from the range of products we make ourselves.
Work has continued to remove the artificial flavours from the few remaining products containing them. While the work was not completed in 2011, we fully expect this to be completed in 2012, again ensuring that we do not adversely affect the taste and quality our customers expect from Greggs.
Collate our approach to ethical sourcing into a formal, defined policy.
In 2011 we defined our stance on ethical sourcing in a formal policy covering the specific areas of ’Relationships with Suppliers’, ’Local Sourcing’, ’Quality’, ’Animal Welfare’, ’Ethics’, ’Environment’ and ’People’.
Annual Report & Accounts 201122
✓
We provide nutritional information for our full national range.
Promote better understanding of balanced diets.
We continued our work with ExpoChef in 2011, working with over 7,000 primary school children to promote a better understanding of food and the need for a balanced diet as part of a healthy lifestyle - since 2010 over 10,500 children have benefited from our partnership with ExpoChef.
We also partnered with Newcastle Eagles Foundation to deliver a healthy diet and lifestyle message to over 800 primary school children, while our ’football festivals’ with Newcastle United Foundation / Complete Football delivered a similar lifestyle and exercise programme for 27 primary schools across the North East region.
Our targets for 2012Keep up-to-date nutritional information available for customers on:
• our evolving national range • our key local lines.
Continue to reduce salt content, working towards the FSA / DoH 2012 targets, without compromising the great taste and quality of our food, with particular emphasis on:
• savouries • sandwiches.
Continue to reduce fat content through recipe improvement without compromising the great taste and quality of our food, with particular emphasis on:
• savouries • sandwiches.
Remove the last artificial flavours from our savoury range without compromising their great taste and quality.
Undertake and evaluate a significant trial to display calorie information on shelf edge ticketing for the entire range.
Annual Report & Accounts 2011 23
✓
✓
✓
✓
✓
✓
✓
Progress against our 2011 targetsAchieve a 5 per cent reduction on our 2010 carbon footprint (measured in tonnes of CO2e per shop), as part of our target of 25 per cent reduction per shop by the end of 2015.
A range of efficiency work across our shops, bakeries and distribution fleet has successfully reduced our overall footprint (tonnes of carbon per shop) by 5.6 per cent this year.
Achieve a 3 per cent reduction in total energy usage in our shops and bakeries (measured in tonnes of CO2e per shop).
We are pleased to report that our energy efficiency work across retail and supply has delivered a 3.8 per cent reduction in carbon per shop, against a target of 3 per cent.
Achieve a 2.5 per cent reduction over the next three years in carbon generated by our distribution activity (measured in tonnes of CO2e per KM per shop).
Trials of the latest vehicle telematics system and a dedicated fuel efficiency training programme, coupled with ongoing fleet efficiency work, has enabled us to meet our 3-year reduction target on distribution fleet carbon in a single year. Against a 2.5 per cent reduction target, we reduced our carbon (tonnes per KM per shop) by 6.2 per cent.
We will divert an additional 10 per cent of waste from landfill in 2011.
We have worked hard over the last two years to significantly reduce
the proportion of our waste going to landfill and we are pleased to report that in 2011 we successfully diverted an additional 29 per cent of waste from landfill. We now divert 75 per cent of our waste away from landfill, a significant achievement compared to 2009 (16 per cent) and 2010 (49 per cent).
Reduce our bakery waste by 5 per cent (on a per shop basis).
In terms of reducing production waste, we are pleased with our progress in 2011, and while there is room for further improvement, we have successfully reduced bakery waste (on a per shop basis) by 17 per cent.
We will trial an electric car for six months to get a better understanding of how this could help reduce our future carbon footprint.
During 2011 we trialled a Nissan LEAF electric car and feedback was positive although concerns remain over the range of the vehicle. The findings will help us to further revise and shape our car policy when electric vehicles go into mass production in the future.
We will explore involvement with the Rivers Trust to investigate ways in which we can support improvements in the environment.
We have investigated ways in which we can work with the individual Rivers Trusts, and plans are now in place to offer volunteering opportunities as part of our volunteering programme in 2012.
Our targets for 2012We will continue to target a 25 per cent reduction in our carbon footprint by 2015 (measured in tonnes of CO2e per shop) by building on our 5.6 per cent reduction in 2011.
Achieve a reduction in total energy usage (measured in tonnes of CO2e per shop) of:
• 3 per cent in bakeries • 1.5 per cent in shops.
We will divert an additional 5 per cent of waste from landfill in 2012, building on the 75 per cent of waste currently diverted in 2011.
Achieve an additional 1.5 per cent reduction in carbon generated by our distribution activity (measured in tonnes of CO2e per KM per shop) as part of a three-year 6 per cent reduction target.
We will support the Rivers Trusts in Wales through the donation of the revenues raised from the Welsh carrier bag charge.
Reducing our impact on the world around us.
Annual Report & Accounts 201124
The Greggs Foundation received recognition as Corporate Foundation of the Year at the 2011 Business Charity Awards, praised for its localness, the engagement of staff and the fabulous neighbourhood charitable activity.
Greggs Finance Director Richard Hutton was presented with the Sustainable Business Award at the FDs’ Excellence Awards 2011.
Greggs is a contributor to the Carbon Disclosure Project.
Greggs is a member of the FTSE4Good sustainability index.
Greggs took part in the Business in the Community Corporate Responsibility Index for the first time in 2010. We continued our involvement in 2011 and achieved a bronze award.
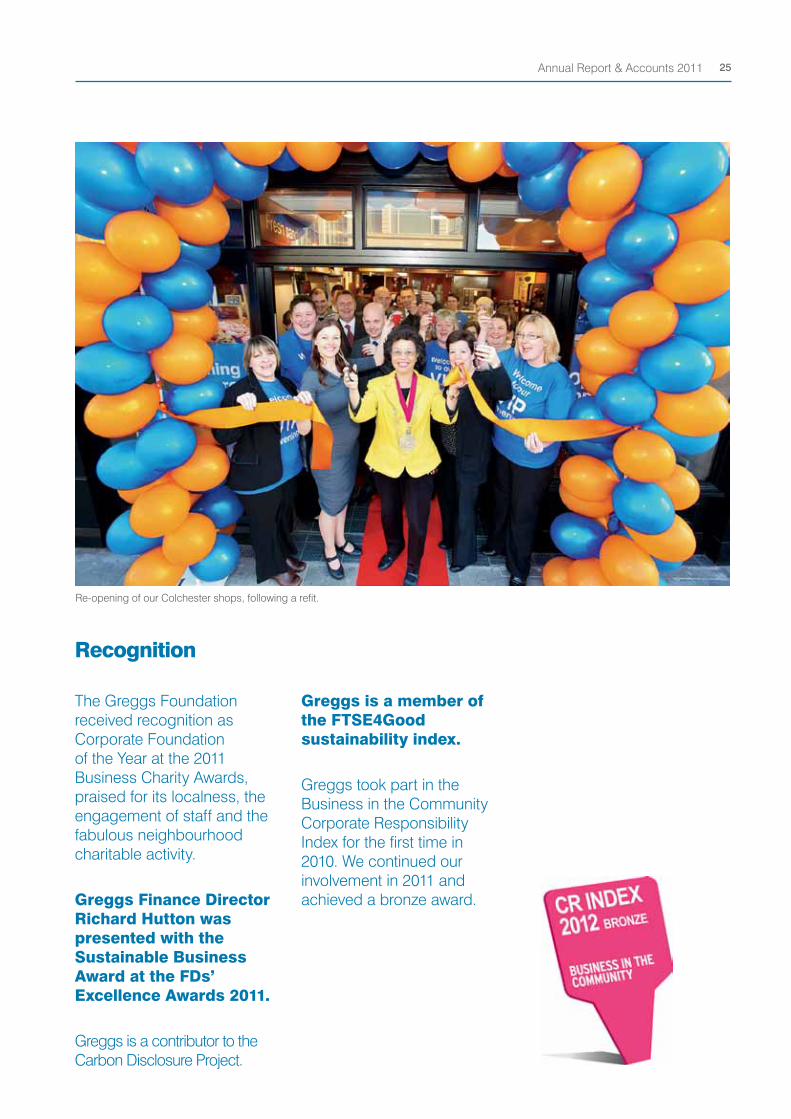
Re-opening of our Colchester shops, following a refit.
Recognition
Annual Report & Accounts 2011 25
Principal risks and uncertainties
The Board is ultimately responsible for the Company’s system of internal control, which covers all aspects of the business, and for reviewing its effectiveness. However, any such system can only be designed to manage, rather than eliminate, the risk of failure to achieve the Company’s objectives and, therefore, is only able to provide reasonable, and not absolute, assurance against material misstatement or loss.
Our principal risks and uncertainties relating to the business at present are as follows:
Market and economic risks
Risks and their impact
Economic uncertainty
The continued economic uncertainty in the UK and beyond affects consumer confidence and reduces the footfall on the high street. This could have a detrimental effect on the Company’s revenues.
Consumers’ tastes and trends
Customer tastes are constantly changing, as are trends in eating, driven by government-backed campaigns linked to the health of the nation and obesity. The Company could lose market share if its products do not keep up with these tastes and trends.
Mitigating actions and controls
The Company is committed to maintaining the value of its offer and works to find the most effective ways to communicate this to customers. The Company continues to diversify its estate such that it is not entirely reliant on high street footfall.
The Company conducts regular research into consumer tastes, and works constantly on product development to ensure its range has broad appeal and reflects changing trends. It also monitors changes in and performance of its competitors. The Company recognises the link between a balanced diet and a healthy lifestyle and therefore provides nutritional information on its website to allow customers to make an informed choice.
Annual Report & Accounts 201126
Operational risks
Risks and their impact
Product quality and safety
The Company produces and sells a wide range of products. If products are not of a high and consistent standard, or out-of-date ingredients and products are used and sold, the Company could be exposed to significant food safety issues. This could have a detrimental impact on consumer confidence and revenue.
Disruption to production
A major incident leads to the loss of a key production facility. This could lead to a significant loss of capacity and supply disruption to our shops with a resultant impact on revenue.
Food scare
A major food scare beyond the control of the Company could lead to a disruption in ingredient supply or a general consumer boycott of some products.
Disruption to external supply chain
Dependencies on key suppliers could lead to a situation where we are unable to maintain production.
Reputation risk
If we don’t meet high production, safety, social, environmental and ethical standards in all of our operations there is a risk that our brand reputation could be damaged.
Mitigating actions and controls
The Company has in place detailed procedures regarding product quality and safety and these are subject to regular audits.
The Company has detailed disaster recovery and business continuity plans which include potential alternative sources of supply.
We constantly monitor national and worldwide situations. We also work closely with Government and other UK agencies.
We aim to ensure we have several sources of supply but where this is not achieved we have an actionable alternative supply strategy.
Our Operating Board, Risk Committee and Social Responsibility Steering Group regularly review and monitor our operations, identifying potentially brand-damaging risks and developing mitigation plans. All of our products are subjected to rigorous quality checks and audit. We also have in place a Crisis Management process for dealing with incidents in an appropriate and timely manner, and we retain public relations consultants to advise and assist with any issues which are being debated in public.
Annual Report & Accounts 2011 27
Principal risks and uncertainties - continued
Regulatory risks
Risks and their impact
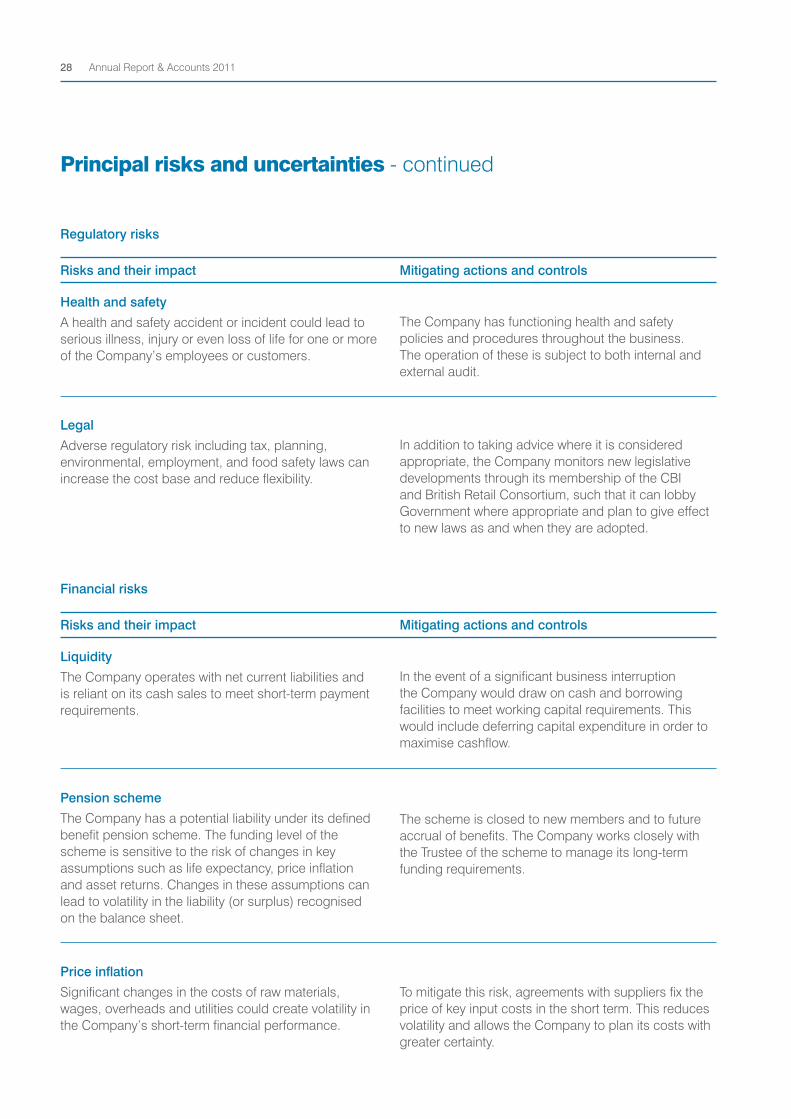
Health and safety
A health and safety accident or incident could lead to serious illness, injury or even loss of life for one or more of the Company’s employees or customers.
Legal
Adverse regulatory risk including tax, planning, environmental, employment, and food safety laws can increase the cost base and reduce flexibility.
Mitigating actions and controls
The Company has functioning health and safety policies and procedures throughout the business. The operation of these is subject to both internal and external audit.
In addition to taking advice where it is considered appropriate, the Company monitors new legislative developments through its membership of the CBI and British Retail Consortium, such that it can lobby Government where appropriate and plan to give effect to new laws as and when they are adopted.
Financial risks
Risks and their impact
Liquidity
The Company operates with net current liabilities and is reliant on its cash sales to meet short-term payment requirements.
Pension scheme
The Company has a potential liability under its defined benefit pension scheme. The funding level of the scheme is sensitive to the risk of changes in key assumptions such as life expectancy, price inflation and asset returns. Changes in these assumptions can lead to volatility in the liability (or surplus) recognised on the balance sheet.
Price inflation
Significant changes in the costs of raw materials, wages, overheads and utilities could create volatility in the Company’s short-term financial performance.
Mitigating actions and controls
In the event of a significant business interruption the Company would draw on cash and borrowing facilities to meet working capital requirements. This would include deferring capital expenditure in order to maximise cashflow.
The scheme is closed to new members and to future accrual of benefits. The Company works closely with the Trustee of the scheme to manage its long-term funding requirements.
To mitigate this risk, agreements with suppliers fix the price of key input costs in the short term. This reduces volatility and allows the Company to plan its costs with greater certainty.
Annual Report & Accounts 201128
Risk management
The directors regularly review the risks to which the Company is exposed, as well as the operation and effectiveness of the system of internal controls. This is an ongoing process which involves the identification, evaluation and management of the significant risks faced by the Company. Key elements of the internal control system, which have been in place during the whole of the year under review and up to the date of approval of this annual report and accounts, are:
Board of Directors
The Board takes a proactive approach to the management of all forms of risk, and views risk management as a vital constituent of its role. At each Board meeting, the effectiveness of the controls relating to the most significant risks (i.e. those which may restrict the Company’s ability to meet its objectives) are monitored and reviewed and consideration is given as to whether any new material risks have emerged. The Audit Committee, on behalf of the Board, conducts a formal review of risk management procedures and reports its findings to the Board. Remedial action is determined where appropriate. For some key risks, where it is felt necessary, specialist advice is sought from external agencies and professional advisers. The Board also reviews, at least annually, the major risks facing the business and the level and scope of insurance cover maintained within the business. The Board receives reports from management on significant changes in the business and external environment which might affect the risk profile. It has also set in place a system of regular hierarchical reporting which provides for relevant details and assurances on the assessment and control of risks to be given to it.
Operating Board
The Operating Board, answerable directly to the Chief Executive, is responsible for implementing decisions of the Board and providing protection against the major risks by various techniques, including strategic planning, monitoring, supervision and training.
The Operating Board is made up of the following functional directors: Finance, Retail, Trading and Marketing, Supply Chain, People, and Corporate Affairs. It meets monthly to review financial and other business performance, as well as to develop, monitor and implement the strategies as set by the Board. Although the Operating Board is not a formal committee of the Board, it does have its own terms of reference which are reviewed by the Board from time to time.
Risk Committee
The Risk Committee is a management committee chaired by the Company Secretary and General Counsel. The Risk Committee consists of the Chief Executive, all members of the Operating Board, and appropriate heads of certain management functions within the business. It has responsibility for analysing, assessing, measuring and understanding the Company’s risk environment, as well as devising a sound risk management strategy for review and approval by the Board. The Risk Committee reports its findings and important changes to the Board through personal presentation, narrative reports and key performance indicators (internal and external to the organisation) and through the Audit Committee. The risks are assessed on a regular basis across all functional areas but, in particular, the areas of food safety, health and safety, the competitive environment, information flow,
asset protection and regulatory requirements.
Whistle blowing
The Company has “whistle blowing” procedures in place, which enable employees to bring matters to the attention of the senior management and for the confidential, proportionate and independent consideration and follow-up of any matter so raised. The “whistle blowing” procedures are reviewed regularly by the Audit Committee, and the Chairman of the Audit Committee is the first line recipient of any matters that are raised through this policy. There were no matters reported through the policy during the year. Following the implementation of the Bribery Act in July 2011, a new Anti-Bribery and Corruption Policy was introduced. Subsequently a Business Conduct Policy with an associated updated Gifts, Tips and Hospitality Policy has been issued and the final stage will include a review of the Whistle Blowing Policy.
Internal audit
The function continues to review the performance of shops, bakeries and central functions across a range of financial and non-financial requirements, reporting findings to senior management and direct to the Audit Committee. The Internal Audit Manager reports to the Company Secretary and General Counsel, to improve functional independence, and has a standing invitation to attend all Audit Committee meetings, not only that part relating to the presentation of relevant audit reports. The Internal Audit team has authority to access all areas of the business, senior management, and the Chairman of the Audit Committee as is seen fit. In 2012 the Internal Audit team will be provided with further resource to increase its effectiveness.
Annual Report & Accounts 2011 29
The Board
The Board currently comprises the Chairman, three executive and five non-executive directors. On 5 October 2011, Ian Durant joined the Board as an independent non-executive director. There were no other changes to the Board during the period.
Derek Netherton (Chairman), 67
Spent his career in investment banking and retired in 1996 from his position as joint head of corporate finance at J Henry Schroder & Co Limited. He was appointed to the
Board on 1 March 2002 and was appointed Chairman in August of the same year. Derek is Chairman of Opera North, and a non-executive director of three companies in the Canada Life UK group. There have been no significant changes to the Chairman’s other commitments during 2011. Derek is Chairman of the Nominations Committee.
Kennedy McMeikan (Chief Executive), 46
Joined the Board on 1 June 2008 and became Chief Executive of the Company on 1 August 2008. Kennedy was Retail Director of J Sainsbury plc from 2005-2008. Prior to this, he had spent 14 years at Tesco. Appointed
Chief Executive of Tesco in Japan in 2004 he had previously been Chief Executive of Europa Foods convenience store business following its acquisition by Tesco in 2002. He began his retail career at Sears UK in 1986, after five years’ service in the Royal Navy.
Richard Hutton FCA (Finance Director), 43
Was appointed to the Board on 13 March 2006. He qualified as a Chartered Accountant with KPMG and gained career experience with Procter & Gamble before joining Greggs in 1998. He was appointed Finance Director on 10 May 2006.
Board of Directors
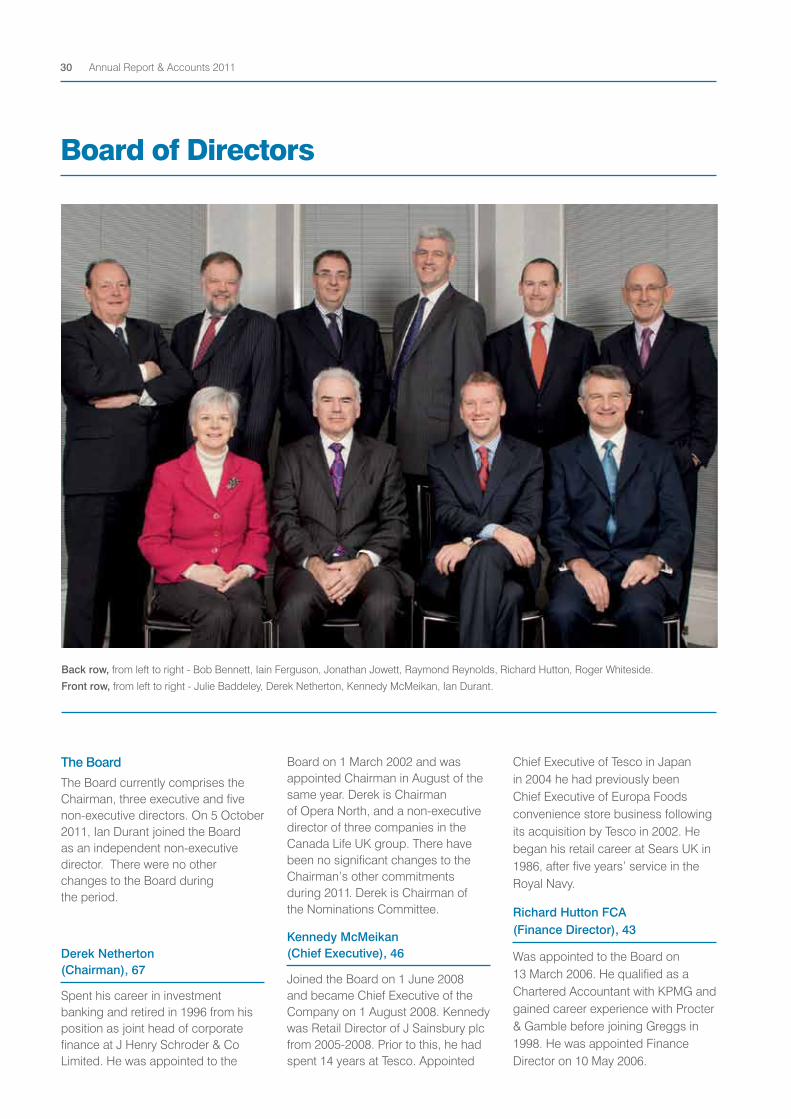
Back row, from left to right - Bob Bennett, Iain Ferguson, Jonathan Jowett, Raymond Reynolds, Richard Hutton, Roger Whiteside.
Front row, from left to right - Julie Baddeley, Derek Netherton, Kennedy McMeikan, Ian Durant.
Annual Report & Accounts 201130
Raymond Reynolds (Retail Director), 52
Was appointed to the Board as Retail Director on 18 December 2006. He joined Greggs in retail management in 1986, and has recently celebrated 25 years’ service with the Company. During the late 1990s, as General Manager, he built a significant new business for Greggs in the Edinburgh region, and in 2002 he was appointed Managing Director of Greggs of Scotland.
Bob Bennett, 64
Was appointed to the Board in December 2003. He trained as a Chartered Accountant with Spicer & Pegler and was Group Finance Director of Northern Rock plc from 1993 until his retirement at the end of January 2007. He is a member of the Audit, Nominations and Remuneration Committees, and was Chairman of the Audit Committee from 2004 and Senior Independent Director (from 2008), until 31 December 2011. Bob will retire as a director at the end of the AGM to be held on 16 May 2012.
Julie Baddeley, 60
Was appointed to the Board in March 2005. She has held senior executive roles in Woolwich plc, (where she was responsible for Information Technology and Human Resources), Accenture and Sema Consulting. Julie is a non-executive director of Chrysalis VCT plc, and Harvey Nash plc, and is Chairwoman of Sustain Limited, the environmental consulting group. Julie is a member of the Remuneration, Nominations and Audit Committees and was Chair of the Remuneration Committee until 31 December 2011. Julie was appointed as the Senior Independent Director on 1 January 2012.
Roger Whiteside, 53
Joined the Board on 17 March 2008. Roger is Chief Executive of Punch Taverns plc. He was Chief Executive of the Thresher Group off-licence chain from 2004 to 2007. Prior to this, he was one of the founding team of Ocado, the innovative online grocer operating in partnership with Waitrose, and served as Joint
Managing Director from 2000 to 2004. He began his career at Marks & Spencer, where he spent 20 years, ultimately becoming head of its food business. Roger is a member of the Nominations, Remuneration and Audit Committees.
Iain Ferguson, CBE, 55
Joined the Board on 31 March 2009. Iain was Chief Executive of Tate & Lyle PLC until October 2009. Previously, he worked for Unilever where he held a number of senior executive positions. He is currently a non-executive director of Balfour Beatty plc, Chairman Elect of Berendson plc, Honorary Vice President of the British Nutrition Foundation and lead non-executive director of the DEFRA Management Committee. Iain became Chairman of the Remuneration Committee on 1 January 2012, and is also a member of the Nominations and Audit Committees.
Ian Durant, 53
Joined the Board on 5 October 2011. He is a Chartered Accountant with a background in international financial and commercial management, and experience of the retail, property, hotel and transport sectors. Ian’s career includes leadership roles with the retail division of Hanson and Jardine Matheson, Hongkong Land, Dairy Farm International, Thistle Hotels, SeaContainers and as Finance Director at Liberty International. Ian is currently Chairman of Capital and Counties Properties PLC, a non-executive director of Greene King plc and Home Retail Group plc, and an Advisory Board member of Eurosite Power Inc. Ian was appointed Chairman of the Audit Committee on 1 January 2012 and he also sits on the Nominations and Remuneration Committees.
Jonathan Jowett (Company Secretary), 49
Joined the Company in April 2010 and was appointed as Company Secretary on 12 May 2010. He is a solicitor by profession, and has held the position of Company Secretary in a number of FTSE 250 and FTSE
Smallcap companies. His previous employers include Avon Cosmetics Limited, SSL International plc, Wagon plc and Bakkavor Group. Jonathan is Secretary to the Board and each of its committees.
Directors and their interests
The names of the directors in office during the year, together with their relevant interests in the share capital of the Company at 1 January 2011 and 31 December 2011 (or at date of appointment if later) are set out in note 25 to the accounts. Details of directors’ share options are set out in the Directors’ Remuneration report on pages 40 to 51.
In accordance with provision B.7.1 of the Governance Code, all directors will retire from the Board at the AGM and offer themselves for election by shareholders.
The Nominations Committee has considered the appropriateness and suitability of each director standing for election and has recommended to the Board that each individual should be put forward for election.
Directors’ indemnities and conflicts
As at the date of this report, indemnities are in force under which the Company has agreed to indemnify the directors, to the extent permitted by law, in respect of losses arising out of or in connection with the execution of their duties, powers or responsibilities as directors of the Company. The indemnities do not apply in situations where the relevant director has been guilty of fraud or wilful misconduct.
Under the authority granted to them in the Company’s Articles of Association, the Board has considered carefully any situation declared by any director pursuant to which they have or might have a conflict of interest and, where it considers it appropriate to do so, has authorised the continuation of that situation. In exercising its authority, the directors have had regard to their statutory and other duties to the Company.
Annual Report & Accounts 2011 31
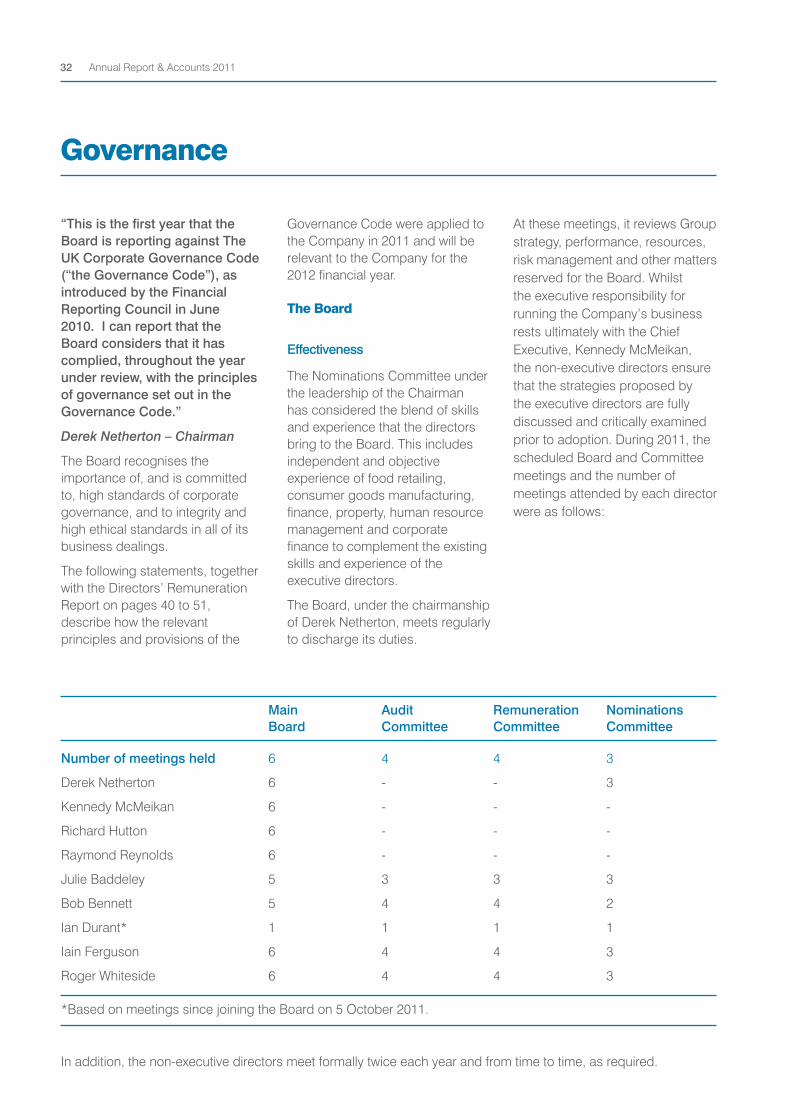
Main Audit Remuneration Nominations Board Committee Committee Committee
Number of meetings held 6 4 4 3
Derek Netherton 6 - - 3
Kennedy McMeikan 6 - - -
Richard Hutton 6 - - -
Raymond Reynolds 6 - - -
Julie Baddeley 5 3 3 3
Bob Bennett 5 4 4 2
Ian Durant* 1 1 1 1
Iain Ferguson 6 4 4 3
Roger Whiteside 6 4 4 3
“This is the first year that the Board is reporting against The UK Corporate Governance Code (“the Governance Code”), as introduced by the Financial Reporting Council in June 2010. I can report that the Board considers that it has complied, throughout the year under review, with the principles of governance set out in the Governance Code.”
Derek Netherton – Chairman
The Board recognises the importance of, and is committed to, high standards of corporate governance, and to integrity and high ethical standards in all of its business dealings.
The following statements, together with the Directors’ Remuneration Report on pages 40 to 51, describe how the relevant principles and provisions of the
Governance Code were applied to the Company in 2011 and will be relevant to the Company for the 2012 financial year. The Board
Effectiveness
The Nominations Committee under the leadership of the Chairman has considered the blend of skills and experience that the directors bring to the Board. This includes independent and objective experience of food retailing, consumer goods manufacturing, finance, property, human resource management and corporate finance to complement the existing skills and experience of the executive directors.
The Board, under the chairmanship of Derek Netherton, meets regularly to discharge its duties.
At these meetings, it reviews Group strategy, performance, resources, risk management and other matters reserved for the Board. Whilst the executive responsibility for running the Company’s business rests ultimately with the Chief Executive, Kennedy McMeikan, the non-executive directors ensure that the strategies proposed by the executive directors are fully discussed and critically examined prior to adoption. During 2011, the scheduled Board and Committee meetings and the number of meetings attended by each director were as follows:
*Based on meetings since joining the Board on 5 October 2011.
In addition, the non-executive directors meet formally twice each year and from time to time, as required.
Governance
Annual Report & Accounts 201132
The Board has a policy on the separation of the roles of the Chairman and the Chief Executive. The Chairman sets the agenda for Board meetings in accordance with a specific Schedule of Matters Reserved, and ensures that the Board is supplied, in a timely manner, with information in a form and of a quality appropriate to enable it to discharge its duties. The Board considers that it effectively leads and controls the Company. All directors take decisions objectively and in the interests of the Company. The non-executive directors scrutinise the performance of management in meeting agreed goals and objectives and monitor the reporting of performance. All directors receive induction training on joining the Board and regularly update and refresh their knowledge through reading, attendance on relevant courses and/or activities outside the Company. As part of the process of maintaining an awareness of the Company’s activities and assessing the ability of the management team, members of the senior management team are invited to attend Board meetings and/or to present papers to the Board. This process also affords senior managers the opportunity to bring matters to the attention of the Board.
The Board is proud of its reputation for bringing the Company’s best talent through the organisation and encouraging people to succeed regardless of gender, race or any other characteristic. As a result three out of seven of the most senior retail managers are women, as are three out of ten bakery managers. The Board believes it is in the best interests of the Company to continue to bring women through to the very top levels within the business and is supportive of Lord Davies’ call to action.
At Board level, the Company has benefited from having a stable Board and would only look to replace the existing directors as and when it is appropriate for them to retire. At the moment the Board has nine directors (of whom one is female) and would hope to have recruited two new female directors by 2015. This of course depends on finding suitable candidates, and the Board will continue to actively encourage its recruiters to seek out qualified women as potential directors.
The Board is firmly of the view that it is in the interests of the Company and the communities in which it operates that it recruits and develops the very best people from the widest possible pool of talent.
The Board is satisfied that a process is in place for orderly succession to the Board and to positions of senior management, so as to maintain an appropriate balance of skills and experience within the Company and on the Board.
After carefully reviewing the guidance in the Governance Code, all of the non-executive directors are considered by the Board to be independent in character and judgement and to be free from any business or other relationship or circumstance which is likely to affect or to interfere with the exercise of their independent judgement.
Election and re-election of directors
The Company’s articles of association require that all directors must retire and seek election at the first AGM following appointment. Accordingly, Ian Durant will resign as a director and offer himself for election at the AGM to be held on 16 May 2012. Furthermore, the Board has resolved that, in line with Governance Code provision B.7.1, all of the directors will be subject to annual re-election by shareholders.
All directors are able to receive training and to take independent professional advice at the expense of the Company. They also have direct access to the Company Secretary, who is responsible for advising the Board, through the Chairman, on all governance matters.
The Chairman meets with the non-executive directors at least annually without the executive directors present. The Senior Independent Director meets the non-executive directors annually without the Chairman present to appraise the Chairman’s performance.
Evaluation
The performance of the Board, its Committees and of all directors is evaluated annually by a formal and rigorous process. For the review relating to 2011, each director completed a written questionnaire and participated in a ’one to one’ interview with the Company Secretary. In addition to covering the effectiveness of the Board, its committees and each individual director, the process also included a review of the performance of the Board against the objectives it set for itself at the start of the year and whether the Board had operated in accordance with the Company’s values at all times. The results are fed back to the Chairman and then to the Board for evaluation and discussion. These discussions are used to identify actions to improve effectiveness, to identify individual and collective training needs and to set objectives for the Board for the next year.
The Board has not yet conducted an external evaluation, and will give consideration to this in autumn 2012 when the subject is next due for review.
Annual Report & Accounts 2011 33
Board Committees
The Board delegates some of its activities to the following committees, each of which has written terms of reference, which are available on the Company’s website. The Company Secretary acts as secretary to each of these committees, and each of the committees is provided with sufficient resources to undertake its duties.
The Audit Committee
currently consists of five independent non-executive directors: Ian Durant (who assumed the Chair on 1 January 2012), Bob Bennett (Chairman until 31 December 2011), Julie Baddeley, Roger Whiteside and Iain Ferguson. The Committee met four times in the year, and a fuller report on its activities is set out on pages 36 and 37.
The Remuneration Committee
currently consists entirely of independent non-executive directors: Iain Ferguson (who assumed the chair from 1 January 2012) Julie Baddeley (who was Chair until 31 December 2011), Bob Bennett, Roger Whiteside and Ian Durant. The Committee’s main duties (which it discharged during the year) are to determine the base salary, benefits in kind, terms and conditions of employment, performance-related bonuses, share options and pension benefits of the executive directors and the Chairman on behalf of the Board. The Committee is also responsible for the operation of the Company’s share option schemes and for monitoring the framework for, broad policy in respect of, and levels of remuneration of the Company’s senior management. A separate executive director committee sets, after discussion with the Chairman, the fees for the non-executive directors so as to ensure that no director is involved in setting his or her own remuneration. The Directors’ Remuneration Report is set out on pages 40 to 51 of this annual report.
The Nominations Committee
currently comprises Derek Netherton - Chairman, and all of the non-executive directors. The Committee’s main functions (which it discharged during the year) are to review the balance and constitution of the Board; to advise the Board as to whether directors should be nominated for re-election by the members; and to approve and manage the process for setting the specification for all Board appointments, identifying candidates who meet that specification and making recommendations to the Board on the basis of merit and compliance with objective criteria in respect of all new Board appointments.
In recruiting additional directors the Nominations Committee defines the role and uses external consultants to assist in identifying suitable candidates from which the Committee selects a shortlist and conducts interviews. The final candidate is then subject to formal recommendation by the Committee and approval by the Board.
During the year the Committee oversaw the appointment of Ian Durant as an independent non-executive director. This process commenced with the appointment of Inzito LLP to assist with the search for a non-executive director. Inzito followed a brief approved by the Nominations Committee and produced a shortlist of candidates who were interviewed by members of the Committee and the executive directors. The Committee then recommended to the Board the appointment of Ian Durant, which was duly confirmed.
Following appointment, new directors are subject to an in-depth tailored induction process. In the case of non-executive directors, this includes meeting with members of the Operating Board, visiting bakeries, shops, and offices, and being provided with an extensive
Board Handbook which contains key information and policies that are relevant to the position. In the induction process tailored for Ian Durant, this included meeting with the external auditor, as well as other senior members of KPMG Audit Plc who are not otherwise engaged on the audit work for the Company. For new executive directors where the appointment is their first such office, the induction includes details of the legal duties and obligations of being a director.
Risk management
Details of the Company’s principal risks and the management of these are given in the Business Review section, Principal risks and uncertainties on pages 26 to 29.
The Board confirms that it has reviewed the effectiveness of the system of internal control (covering all material controls, including financial, operational, compliance and risk management systems) during the year under review and up to the date of approval of the annual report and accounts.
Relations with shareholders
The Chairman ensures that there is effective communication with individual and institutional shareholders through the announcement of regular trading updates, as well as general presentations after announcement of the interim and preliminary results and the posting of results on the Company’s website. The Board receives reports on any comments received from shareholders following these presentations.
The Chief Executive and the Finance Director carry out extensive engagement with institutional shareholders and market analysts, either meeting them as part of company presentations and briefings,
Governance - continued
Annual Report & Accounts 201134
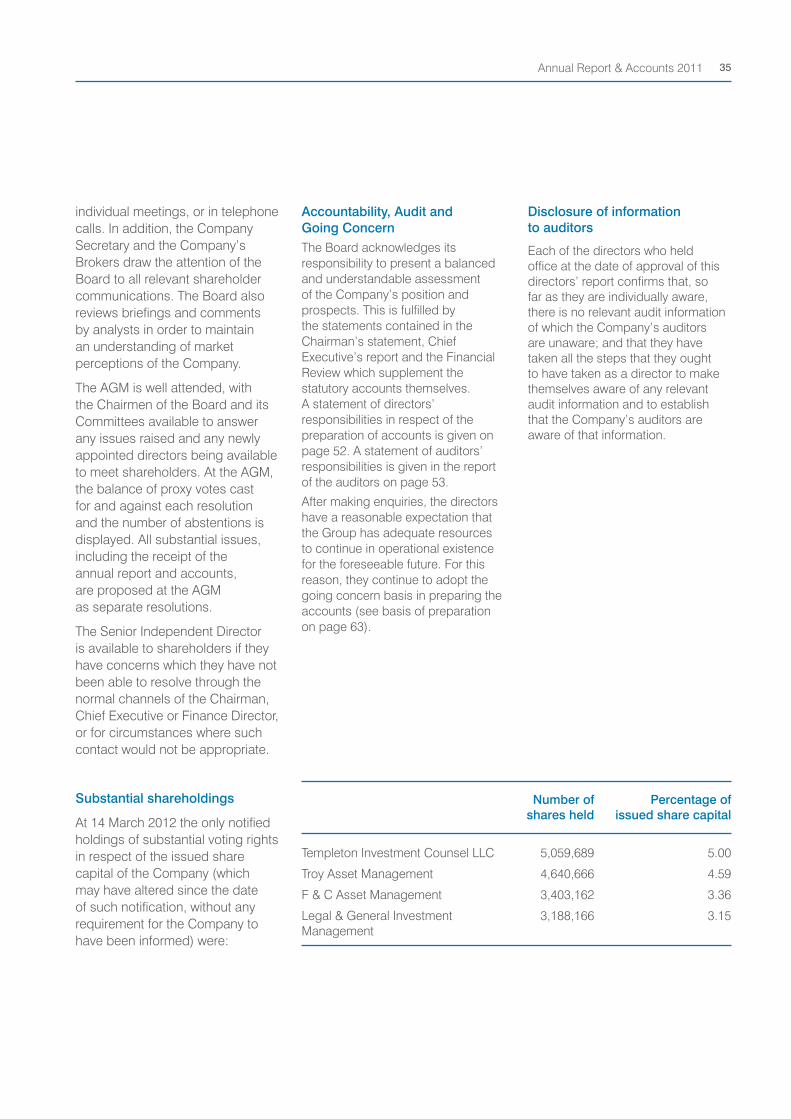
individual meetings, or in telephone calls. In addition, the Company Secretary and the Company’s Brokers draw the attention of the Board to all relevant shareholder communications. The Board also reviews briefings and comments by analysts in order to maintain an understanding of market perceptions of the Company.
The AGM is well attended, with the Chairmen of the Board and its Committees available to answer any issues raised and any newly appointed directors being available to meet shareholders. At the AGM, the balance of proxy votes cast for and against each resolution and the number of abstentions is displayed. All substantial issues, including the receipt of the annual report and accounts, are proposed at the AGM as separate resolutions.
The Senior Independent Director is available to shareholders if they have concerns which they have not been able to resolve through the normal channels of the Chairman, Chief Executive or Finance Director, or for circumstances where such contact would not be appropriate.
Substantial shareholdings
At 14 March 2012 the only notified holdings of substantial voting rights in respect of the issued share capital of the Company (which may have altered since the date of such notification, without any requirement for the Company to have been informed) were:
Number of Percentage of shares held issued share capital
Templeton Investment Counsel LLC 5,059,689 5.00
Troy Asset Management 4,640,666 4.59
F & C Asset Management 3,403,162 3.36
Legal & General Investment 3,188,166 3.15 Management
Accountability, Audit and Going Concern The Board acknowledges its responsibility to present a balanced and understandable assessment of the Company’s position and prospects. This is fulfilled by the statements contained in the Chairman’s statement, Chief Executive’s report and the Financial Review which supplement the statutory accounts themselves. A statement of directors’ responsibilities in respect of the preparation of accounts is given on page 52. A statement of auditors’ responsibilities is given in the report of the auditors on page 53.
After making enquiries, the directors have a reasonable expectation that the Group has adequate resources to continue in operational existence for the foreseeable future. For this reason, they continue to adopt the going concern basis in preparing the accounts (see basis of preparation on page 63).
Disclosure of information to auditors
Each of the directors who held office at the date of approval of this directors’ report confirms that, so far as they are individually aware, there is no relevant audit information of which the Company’s auditors are unaware; and that they have taken all the steps that they ought to have taken as a director to make themselves aware of any relevant audit information and to establish that the Company’s auditors are aware of that information.
Annual Report & Accounts 2011 35
Committee activity
The Audit Committee is one of the key committees of the Board. The main functions discharged by the Committee during the year were:
(i) to ensure that the accounting and financial policies of the Company are proper and effective;
(ii) to assist the Board in fulfilling its oversight responsibilities by monitoring the integrity of the accounts and information published by the Company;
(iii) to review the internal financial controls and the Group’s approach to risk management;
(iv) to monitor compliance with the Listing Rules and the recommendations of the Governance Code; and
(v) to maintain an appropriate relationship with the Company’s external and internal auditors and review the effectiveness and objectivity of the audit process.
During the year, the Committee, in performing these functions,
reviewed the annual and interim accounts issued to shareholders; monitored compliance with financial reporting standards; considered the accounting for items requiring the exercise of material judgements, estimates and assumptions and any unusual items; considered the Company’s taxation policy and accounting; and considered the size and remit of the internal audit function.
The Committee reviewed the Company’s internal control environment to satisfy itself that procedures are in place to ensure that assets are well protected, authority levels for expenditure are clear, segregation of duties exists and performance is regularly monitored. Processes are in place to ensure that key controls are being operated and compliance with these processes is the subject of inspection by the internal audit team and review by the Audit Committee.
The Committee also considered and made recommendations to the Board in relation to the independence and objectivity of the external auditors (including the impact of any non-audit work
undertaken by them) and their suitability for re-appointment. The Audit Committee reviewed the scope of the external audit in discussion with the external auditors and agreed their fees in respect of the audit.
Following the introduction of the Bribery Act in July 2011, the Committee considered and approved a new Anti-Bribery and Corruption Policy, along with a new Business Conduct Policy and a revised Gifts, Tips and Hospitality Policy.
The Committee normally invites the Chairman, the executive directors, the Internal Audit Manager, and the external auditors to attend its meetings, although time is set aside bi-annually for discussion between the Committee and the external auditors and with the Internal Audit Manager, in each case in the absence of all executive directors. The Committee has the power to engage outside advisers if it sees fit. The Committee also monitors and reviews the effectiveness of internal audit activity and the risk management process.
“I am pleased to present the Company’s first separate report to shareholders on the work of the Audit Committee.”
Ian Durant, Chairman of the Audit Committee
Audit Committee Report
Annual Report & Accounts 201136
The Governance Code requires the Board to be satisfied that at least one member of the Audit Committee has recent and relevant financial experience – the Board is satisfied in this respect and is confident that the collective experience of the members enables them to act effectively as an Audit Committee. The Committee also has access to the Company’s financial team and to its auditors and can seek further professional advice, at the Company’s cost, if required.
External auditors
There are strict policies and procedures in place to control the use of external auditors in the provision of non-audit services. The Audit Committee keeps under review all non-audit services provided by the external auditors in order to seek to ensure that their independence and objectivity cannot be compromised. The Committee recognises that there are situations where it is in the Company’s best interests to use the services of its external auditors for non-audit work but manages such appointments and will not allow any non-audit work that might, in the Committee’s opinion impair the auditors’ objectivity or independence. In addition, the Audit Committee ensures that the external auditors have their own policies and are subject to professional standards designed to safeguard their independence as auditors. The Audit Committee has adopted a policy under which all use of the external auditors for non-audit work must be reported
to and approved by the Committee and the aggregate of such fees will normally be less than 100% of the audit fee. In circumstances where the Committee believes that it is right to authorise non-audit fees in excess of this limit the Committee will approve such expenditure in advance of it being committed and provide an explanation to shareholders in the next directors’ report.
The Audit Committee has reviewed whether, and is satisfied that, the Company’s auditors, KPMG Audit Plc, continue to be objective and independent of the Company. KPMG Audit Plc does perform non-audit services for the Group but the Audit Committee is satisfied that its objectivity is not impaired by such work. In 2011, non-audit fees paid to KPMG Audit Plc and related KPMG operations amounted to £83,000 (which is 52 per cent of the audit fee for the year) and related to taxation compliance services and pension scheme audits.
Reappointment of auditors
In accordance with Section 489 of the Companies Act 2006, a resolution for the reappointment of KPMG Audit Plc as auditors of the Company will be proposed at the forthcoming Annual General Meeting.
Ian DurantChairman of the Audit Committee14 March 2012
Annual Report & Accounts 2011 37
Fixed assets
In the opinion of the directors, the aggregate market value of the Group’s properties is not significantly different from their historical net book amount.
Authority to purchase shares
At the AGM (Annual General Meeting) on 11 May 2011, the shareholders passed a resolution authorising the purchase by the Company of its own shares to a maximum of 10,350,000 ordinary shares of 2p each.
That authority had not been used as at 31 December 2011.
The authority remains in force until the conclusion of the AGM in 2012 or 16 August 2012, whichever is the earlier. It is the Board’s intention to seek approval at the 2012 AGM for the renewal of this authority.
Takeover Directive information
Following the implementation of the European Directive on Takeover Bids by certain provisions of the Companies Act 2006, the Company is required to disclose certain additional information in the directors’ report. This information is set out below.
• The Company has one class of share in issue being ordinary shares of 2p each. As at 14 March 2012, there were 101,155,901 such ordinary shares in issue. There are no shares in the Company that grant the holder special rights with regard to control of the Company.
• At general meetings of the Company, on a show of hands every shareholder present in person or by proxy has one vote only and, in the
case of a poll, every shareholder present in person or by proxy has one vote for every share in the capital of the Company held by him.
• The Company’s articles of association set out the circumstances in which shares may become disenfranchised. No shareholder is entitled, unless the directors otherwise determine, in respect of any share held by him to be present or vote at a general meeting either personally or by proxy (or to exercise any other right in relation to meetings of the Company) in respect of that share in certain circumstances if any call or other sum is payable and remains unpaid, if the shareholder is in default in complying with a duly served notice under Section 793(1) of the Companies Act 2006 (CA 2006) or if the shareholder has failed to reply to a duly served notice requiring him to provide a written statement stating he is the beneficial owner of shares.
• A notice convening a general meeting can contain a statement that a shareholder is not entitled to attend and vote at a general meeting unless his name is entered on the register of members of the Company at a specific time (not more than 48 hours before the meeting) and if a shareholder’s name is not so entered he is not entitled to attend and vote.
• Under the Company’s articles of association the directors may, in their absolute discretion, refuse to register the transfer of a share in certified form in certain circumstances where the Company has a lien on the share (provided that the directors do not exercise
their discretion so as to prevent dealings in partly paid shares from taking place on an open and proper basis), where a shareholder has failed to reply to a duly served notice under Section 793(1) CA 2006 or if a transfer of a share is in favour of more than four persons jointly. In addition, the directors may decline to recognise any instrument of transfer unless it is in respect of only one class of share and is deposited at the address at which the register of members of the Company is held (or at such other place as the directors may determine) accompanied by the relevant share certificate(s) and such other evidence as the directors may reasonably require to show the right of the transferor to make the transfer. In respect of shares held in uncertificated form the directors may only refuse to register transfers in accordance with the Uncertificated Securities Regulations 2001 (as amended from time to time).
• Under the Company’s Code on dealings in securities in the Company, persons discharging managerial responsibilities and some other senior executives may in certain circumstances be restricted as to when they can transfer shares in the Company.
• There are no agreements between shareholders known to the Company which may result in restrictions on the transfer of shares or on voting rights.
• Details of the significant holders of the Company’s shares are set out on page 35.
• Where, under an employee share plan operated by the Company,
Additional information
Annual Report & Accounts 201138
participants are the beneficial owners of shares but not the registered owner, the voting rights are normally exercised by the registered owner at the direction of the participant.
• The Company’s articles of association may only be amended by special resolution at a general meeting of the shareholders.
• The Company’s articles of association set out how directors are appointed and replaced. Directors can be appointed by the Board or by the shareholders in a general meeting. At each AGM, any director appointed by the Board since the last AGM must retire from office but is eligible for re-election by the shareholders. Furthermore, the Board has resolved that, in line with Governance Code provision B.7.1, all of the directors will be subject to annual re-election by shareholders. Under the CA 2006 and the Company’s articles of association, a director can be removed from office by the shareholders in a general meeting.
• The Company’s articles of association set out the powers of the directors. The business of the Company is to be managed by the directors, who may exercise all the powers of the Company and do, on behalf of the Company, all such acts as may be exercised and done by the Company and are not, by any relevant statutes or by the Company’s articles of association, required to be exercised or done by the Company in general meeting, subject to the provisions of any relevant statutes and the Company’s articles of association and to such regulations as may be prescribed by
the Company by special resolution.
• Under the CA 2006 and the Company’s articles of association, the directors’ powers include the power to allot and buy back shares in the Company. At each AGM, resolutions are proposed granting and setting out the limits on these powers.
• The Company is not party to any significant agreements which take effect, alter or terminate upon a change of control of the Company, following a takeover bid.
• There are no agreements between the Company and its directors or employees providing for compensation for loss of office or employment (whether through resignation, purported redundancy or otherwise) that occurs because of a takeover bid. Details of the directors’ service agreements and terms of appointment are set out in the Directors’ Remuneration Report on pages 40 to 51. However, provisions in the employee share plans operated by the Company may allow options to be exercised on a takeover.
Payments to suppliers
Good relationships with our suppliers are an important factor in the success of the Group. Payments to suppliers are made in accordance with the Group’s normal terms and conditions of business except where varied terms and conditions are agreed with individual suppliers, in which case these prevail. Where disputes arise, attempts are made to resolve them promptly and amicably to ensure delays in payment are kept to a minimum.
The average creditor payment period for the Company and the Group at 31 December 2011 was 41 days (2010: 41 days).
Disabled employees
Applications for employment of disabled persons are always fully considered, bearing in mind the aptitudes of the applicant concerned. In the event of members of staff becoming disabled every effort is made to ensure that their employment within the Company continues and that appropriate training is arranged. It is the policy of the Company that the training, career development and promotion of disabled persons should, as far as possible, be identical to that of other employees.
Significant relationships
The Group does not have any contractual or other relationships with any single party which are essential to the business of the Group and, therefore, no such relationships have been disclosed.
By order of the Board
Jonathan D Jowett Company Secretary Greggs plc (CRN 502851) Fernwood House Clayton Road Jesmond Newcastle upon Tyne NE2 1TL 14 March 2012
Annual Report & Accounts 2011 39
The aim of Greggs’ remuneration policy is to align executive remuneration with shareholders’ interests and the long term growth of the Company. The Remuneration Committee will continue to review the remuneration arrangements on an ongoing basis to ensure that the structure remains appropriate.
Introduction
This report has been prepared in accordance with the Directors’ Remuneration Report Regulations 2002 (the “Regulations”). This report also meets the relevant requirements of the Listing Rules of the Financial Services Authority and the relevant provisions of the Companies Act 2006 and describes how the Board has applied the UK Corporate Governance code relating to directors’ remuneration.
The Regulations require the auditors to report to the Company’s members on the “auditable part”
of the Directors’ Remuneration Report and to state whether, in their opinion, that part of the report has been properly prepared. This report has, therefore, been divided into separate sections for unaudited and audited information.
Unaudited information
The Remuneration Committee of the Board (the "Committee") sets the remuneration and terms of appointment of the executive directors and the Chairman on behalf of the Board.
The Committee was chaired by Julie Baddeley until 31 December 2011, after which Iain Ferguson was appointed to that role.
During the course of meetings held in the year, items considered by the Committee included:
• the targets in place for the Performance Share Plan;
• setting of objectives for the executive directors ensuring risk forms a key part of these; and
• review of measures and targets to ensure that executive directors were not incentivised to take inappropriate levels of risk.
In addition, each year the Committee considers Greggs’ total remuneration policy in the context of market and best practice.
Jonathan Jowett (Company Secretary and General Counsel) and Roisin Currie (Group People Director) have supported the Committee in their deliberations, along with external consultants, PWC.
General policy on directors’ remuneration
The Committee’s policy is to provide competitive remuneration packages that will attract, retain and motivate individuals with appropriate skills and experience with the incentive to add sustainable long-term growth and value that will best serve the interests of the Company, its shareholders, its employees and customers. Base salaries
Directors’ Remuneration Report
“I am pleased to introduce the Directors’ Remuneration Report of Greggs plc.”
Iain Ferguson, Chairman of the Remuneration Committee
Annual Report & Accounts 201140
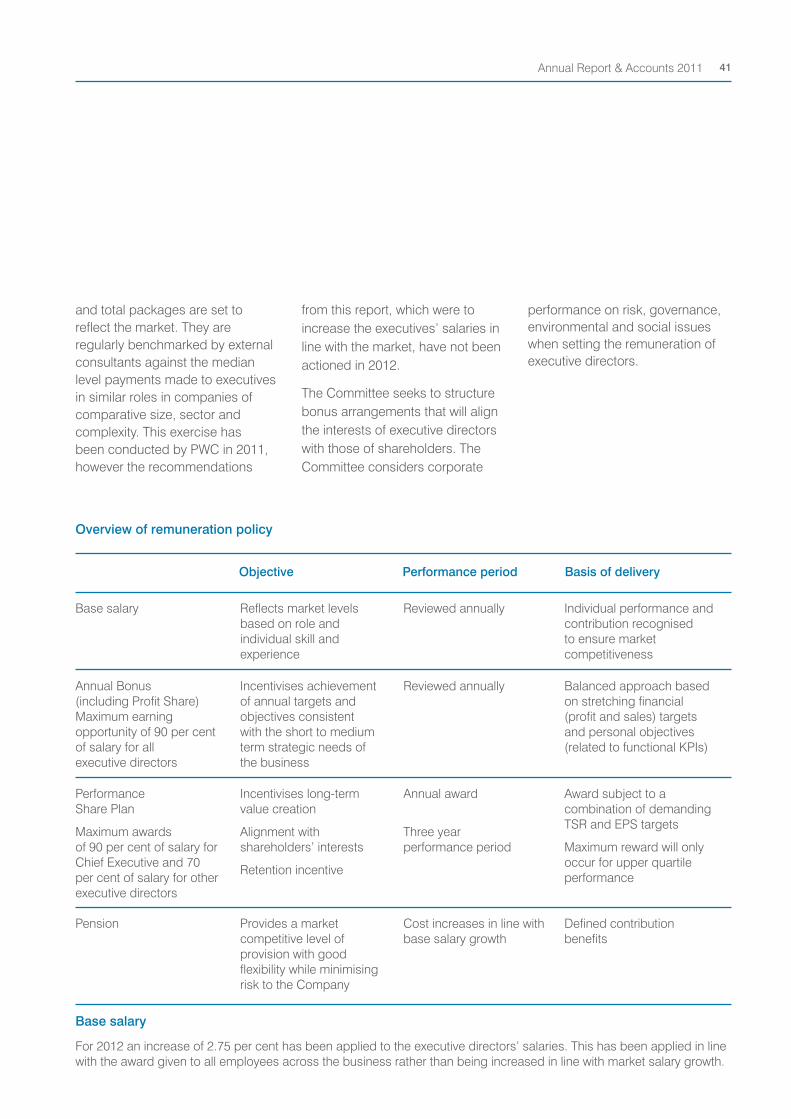
and total packages are set to reflect the market. They are regularly benchmarked by external consultants against the median level payments made to executives in similar roles in companies of comparative size, sector and complexity. This exercise has been conducted by PWC in 2011, however the recommendations
from this report, which were to increase the executives’ salaries in line with the market, have not been actioned in 2012.
The Committee seeks to structure bonus arrangements that will align the interests of executive directors with those of shareholders. The Committee considers corporate
performance on risk, governance, environmental and social issues when setting the remuneration of executive directors.
Base salary
For 2012 an increase of 2.75 per cent has been applied to the executive directors’ salaries. This has been applied in line with the award given to all employees across the business rather than being increased in line with market salary growth.
Overview of remuneration policy
Objective Performance period Basis of delivery
Base salary Reflects market levels based on role and individual skill and experience
Reviewed annually Individual performance and contribution recognised to ensure market competitiveness
Annual Bonus (including Profit Share) Maximum earning opportunity of 90 per cent of salary for all executive directors
Incentivises achievement of annual targets and objectives consistent with the short to medium term strategic needs of the business
Reviewed annually Balanced approach based on stretching financial (profit and sales) targets and personal objectives (related to functional KPIs)
Performance Share Plan
Maximum awards of 90 per cent of salary for Chief Executive and 70 per cent of salary for other executive directors
Incentivises long-term value creation
Alignment with shareholders’ interests
Retention incentive
Annual award
Three year performance period
Award subject to a combination of demanding TSR and EPS targets
Maximum reward will only occur for upper quartile performance
Pension Provides a market competitive level of provision with good flexibility while minimising risk to the Company
Cost increases in line with base salary growth
Defined contribution benefits
Annual Report & Accounts 2011 41
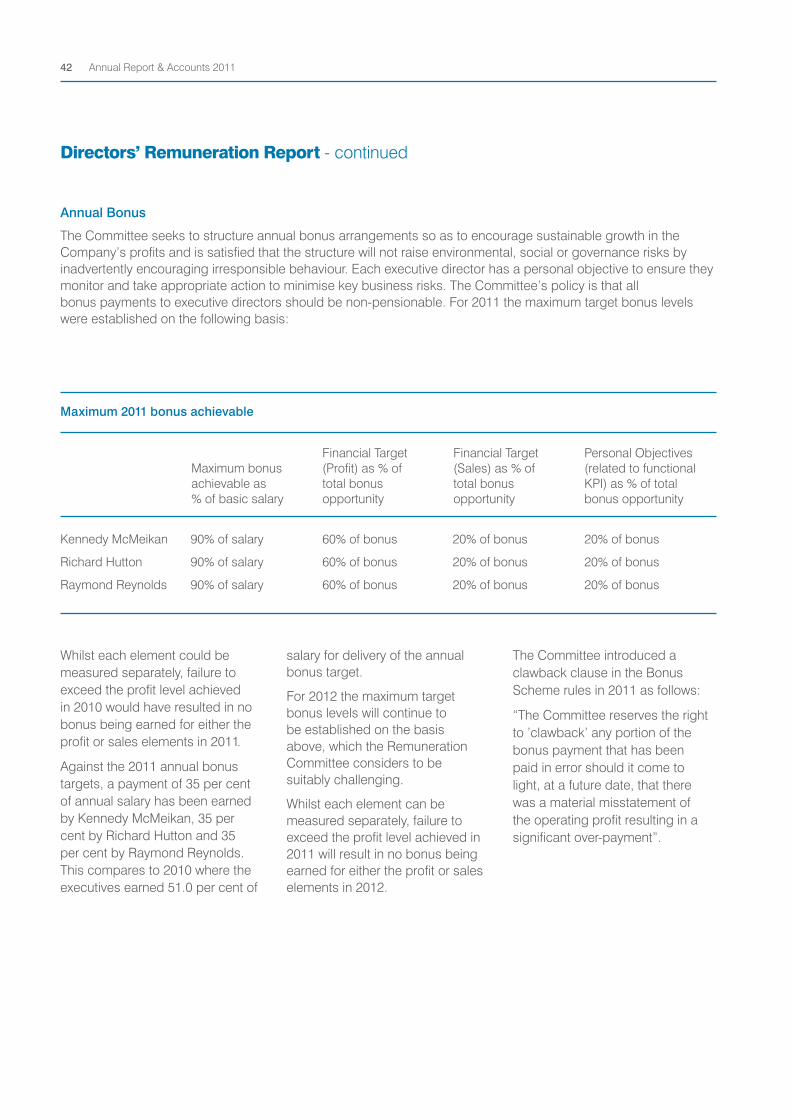
Whilst each element could be measured separately, failure to exceed the profit level achieved in 2010 would have resulted in no bonus being earned for either the profit or sales elements in 2011.
Against the 2011 annual bonus targets, a payment of 35 per cent of annual salary has been earned by Kennedy McMeikan, 35 per cent by Richard Hutton and 35 per cent by Raymond Reynolds. This compares to 2010 where the executives earned 51.0 per cent of
salary for delivery of the annual bonus target.
For 2012 the maximum target bonus levels will continue to be established on the basis above, which the Remuneration Committee considers to be suitably challenging.
Whilst each element can be measured separately, failure to exceed the profit level achieved in 2011 will result in no bonus being earned for either the profit or sales elements in 2012.
The Committee introduced a clawback clause in the Bonus Scheme rules in 2011 as follows:
“The Committee reserves the right to ’clawback’ any portion of the bonus payment that has been paid in error should it come to light, at a future date, that there was a material misstatement of the operating profit resulting in a significant over-payment”.
Annual Bonus
Maximum 2011 bonus achievable
Maximum bonus achievable as % of basic salary
Financial Target (Profit) as % of total bonus opportunity
Financial Target (Sales) as % of total bonus opportunity
Personal Objectives (related to functional KPI) as % of total bonus opportunity
Kennedy McMeikan 90% of salary 60% of bonus 20% of bonus 20% of bonus
Richard Hutton 90% of salary 60% of bonus 20% of bonus 20% of bonus
Raymond Reynolds 90% of salary 60% of bonus 20% of bonus 20% of bonus
The Committee seeks to structure annual bonus arrangements so as to encourage sustainable growth in the Company’s profits and is satisfied that the structure will not raise environmental, social or governance risks by inadvertently encouraging irresponsible behaviour. Each executive director has a personal objective to ensure they monitor and take appropriate action to minimise key business risks. The Committee’s policy is that all bonus payments to executive directors should be non-pensionable. For 2011 the maximum target bonus levels were established on the following basis:
Directors’ Remuneration Report - continued
Annual Report & Accounts 201142
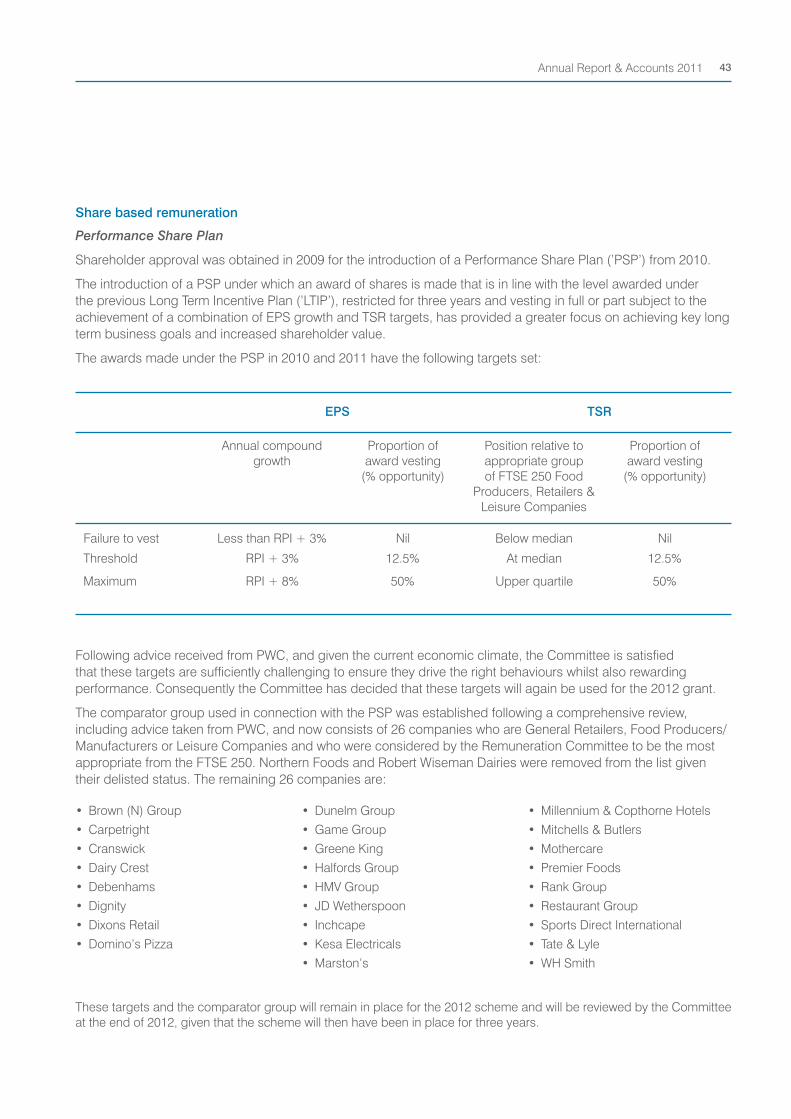
Share based remuneration
Performance Share Plan
Shareholder approval was obtained in 2009 for the introduction of a Performance Share Plan (’PSP’) from 2010.
The introduction of a PSP under which an award of shares is made that is in line with the level awarded under the previous Long Term Incentive Plan (’LTIP’), restricted for three years and vesting in full or part subject to the achievement of a combination of EPS growth and TSR targets, has provided a greater focus on achieving key long term business goals and increased shareholder value.
The awards made under the PSP in 2010 and 2011 have the following targets set:
EPS
Annual compound growth
Proportion of award vesting
(% opportunity)
Position relative to appropriate group of FTSE 250 Food
Producers, Retailers & Leisure Companies
Proportion of award vesting
(% opportunity)
TSR
Threshold RPI + 3% 12.5% At median 12.5%
Maximum RPI + 8% 50% Upper quartile 50%
Less than RPI + 3%Failure to vest Nil Below median Nil
Following advice received from PWC, and given the current economic climate, the Committee is satisfied that these targets are sufficiently challenging to ensure they drive the right behaviours whilst also rewarding performance. Consequently the Committee has decided that these targets will again be used for the 2012 grant.
The comparator group used in connection with the PSP was established following a comprehensive review, including advice taken from PWC, and now consists of 26 companies who are General Retailers, Food Producers/Manufacturers or Leisure Companies and who were considered by the Remuneration Committee to be the most appropriate from the FTSE 250. Northern Foods and Robert Wiseman Dairies were removed from the list given their delisted status. The remaining 26 companies are:
• Brown (N) Group
• Carpetright
• Cranswick
• Dairy Crest
• Debenhams
• Dignity
• Dixons Retail
• Domino’s Pizza
• Dunelm Group
• Game Group
• Greene King
• Halfords Group
• HMV Group
• JD Wetherspoon
• Inchcape
• Kesa Electricals
• Marston’s
• Millennium & Copthorne Hotels
• Mitchells & Butlers
• Mothercare
• Premier Foods
• Rank Group
• Restaurant Group
• Sports Direct International
• Tate & Lyle
• WH Smith
These targets and the comparator group will remain in place for the 2012 scheme and will be reviewed by the Committee at the end of 2012, given that the scheme will then have been in place for three years.
Annual Report & Accounts 2011 43
Other share based incentive schemes
LTIP
As previously outlined, from 2010 a PSP has replaced the previous LTIP, and therefore the Committee will offer no further participation in the LTIP. In 2011, the LTIP award of over 180,210 shares made to Kennedy McMeikan when he joined the Company in 2008, came to maturity. The performance criterion set at the time of the award was not met, and therefore none of the options awarded have vested. Consequently, all options granted under the LTIP have either been exercised or lapsed.
Executive share option scheme
There have also been occasional grants to the executive directors of options over shares in the Company, pursuant to one or more of the share option schemes operated through the Committee. These include both Inland Revenue-approved and unapproved long term share incentive schemes, designed to encourage the executive directors and other employees to hold shares in the Company and to enhance share values.
No such awards were granted to executive directors in 2011.
Details of awards previously made to executive directors under this scheme are given in the audited section of this report on page 49.
In accordance with institutional investor guidelines, the total number of new shares and shares held in treasury over which the Company may grant options is limited and the Company has chosen to allocate a significant proportion of the shares available to the Company’s Savings-
related Share Option Scheme, open to all employees, including executive directors. Any future grants of executive share options to executive directors will be based upon the need to secure individuals of appropriate calibre, having regard to prevailing market conditions at the date of appointment or to help to align the interests of executive directors with those of shareholders, especially if the PSP is not available to a particular individual, or where the Committee considers it appropriate.
The above policies enable the executive directors to receive potentially significant benefits in addition to their base salaries, but only if value has been created for shareholders. The Committee considers that, although the non-performance-related elements of the executive directors’ remuneration packages are substantial, the performance-related elements are significant in terms of providing motivation to the executive directors to improve shareholder value.
Policy on performance conditions
The performance conditions attaching to share options granted to the executive directors under the Company’s Senior Executive Share Option Schemes have varied according to the date of grant. Such conditions are set by the Committee to establish challenging performance objectives linked to shareholder return. Executive directors are not eligible to have executive share options granted in the same year as participation in the PSP. The Committee intends that if any executive share options are granted in the future, performance conditions
will continue to be settled on this basis. Details of the performance conditions for options currently outstanding are set out in the section headed ’Share options’ on page 49.
Whether or not performance conditions attached to share options have been met is tested by the Committee, which compares the actual performance of the Company with relevant published statistics and, if necessary, obtains advice from external consultants in order to reach its conclusion.
No performance conditions have been attached to options granted pursuant to the Company’s Savings-Related Share Option Scheme, which is available to all employees. The principal purpose of this scheme is to encourage employees at all levels within the Company to participate in, and to understand better, the growth in value of the Company and the rules of that scheme require that all options granted must be on the same terms.
Performance criteria in relation to the performance-based annual cash bonuses payable to the executive directors are set by the Committee each year in accordance with the general remuneration policy set out above.
Policy on pensions
Until the scheme was closed to further accrual from 1 April 2008, executive directors earned pension benefits under the Greggs 1978 Retirement & Death Benefit Scheme, the Company’s defined benefit scheme. This scheme, which required a contribution of 6.6 per cent of pensionable salaries from members, provided for up to two-thirds of final pensionable salary, dependent on length of
Directors’ Remuneration Report - continued
Annual Report & Accounts 201144
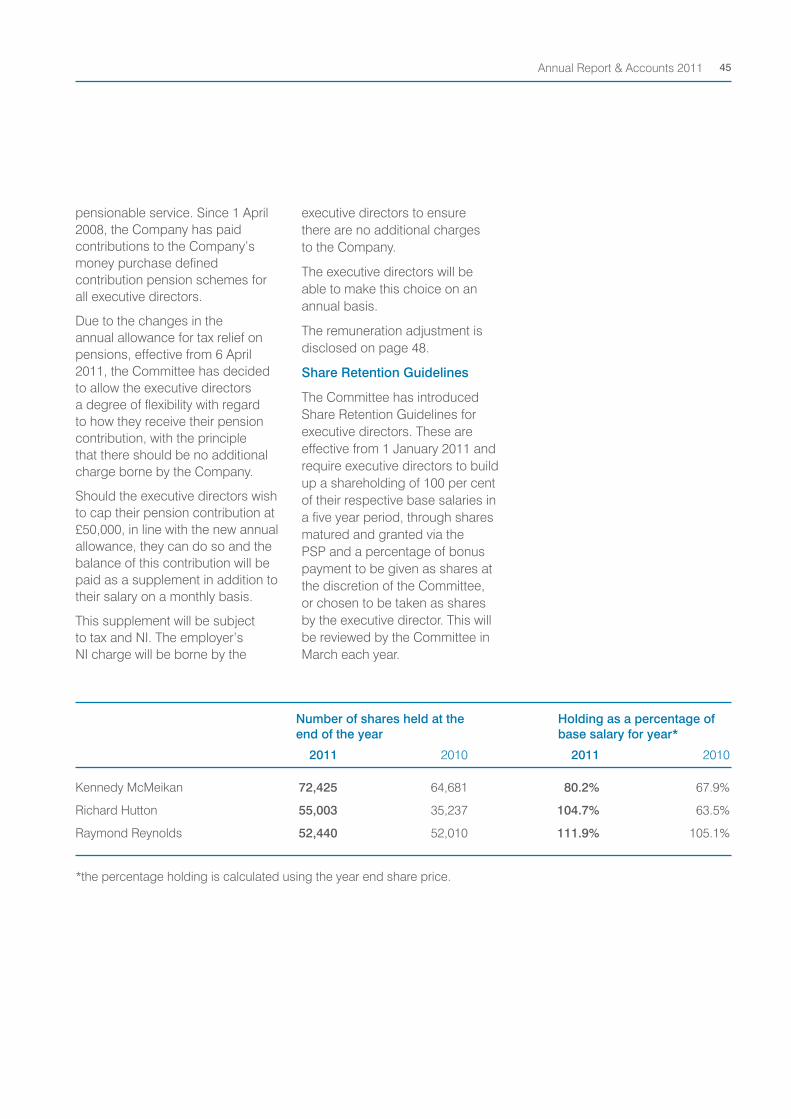
pensionable service. Since 1 April 2008, the Company has paid contributions to the Company’s money purchase defined contribution pension schemes for all executive directors.
Due to the changes in the annual allowance for tax relief on pensions, effective from 6 April 2011, the Committee has decided to allow the executive directors a degree of flexibility with regard to how they receive their pension contribution, with the principle that there should be no additional charge borne by the Company.
Should the executive directors wish to cap their pension contribution at £50,000, in line with the new annual allowance, they can do so and the balance of this contribution will be paid as a supplement in addition to their salary on a monthly basis.
This supplement will be subject to tax and NI. The employer’s NI charge will be borne by the
executive directors to ensure there are no additional charges to the Company.
The executive directors will be able to make this choice on an annual basis.
The remuneration adjustment is disclosed on page 48.
Share Retention Guidelines
The Committee has introduced Share Retention Guidelines for executive directors. These are effective from 1 January 2011 and require executive directors to build up a shareholding of 100 per cent of their respective base salaries in a five year period, through shares matured and granted via the PSP and a percentage of bonus payment to be given as shares at the discretion of the Committee, or chosen to be taken as shares by the executive director. This will be reviewed by the Committee in March each year.
Number of shares held at the end of the year
Holding as a percentage of base salary for year*
Kennedy McMeikan 72,425 64,681 80.2% 67.9%
Richard Hutton 55,003 35,237 104.7% 63.5%
Raymond Reynolds 52,440 52,010 111.9% 105.1%
2011 2010 2011 2010
*the percentage holding is calculated using the year end share price.
Annual Report & Accounts 2011 45
Policy on Service Contract Notice Periods and Payments on Early Termination
The Company’s policy on the duration of executive directors’ contracts is that:
• the Chief Executive’s service contract is terminable on one year’s notice served by either the Company or the director;
• other executive directors’ service contracts are terminable on one year’s notice served by the Company or by six months’ notice served by the director;
• it has been agreed that future executive directors’ service contracts will be terminable on one year’s notice served by either party;
• non-executive directors are appointed subject to the Company’s articles of association, which require them to retire and to seek election at the first AGM after appointment. Thereafter, and following the introduction of the UK Corporate Governance Code in June 2010, the Board has resolved that every director will be subject to annual re-election by shareholders. The Nominations Committee advises the Board as to whether directors should be nominated for re-election; and
• it seeks mitigation of entitlements on termination. The Company does not normally make payments beyond its contractual obligations, including any payment in respect of notice to which a director is entitled.
Non-executive directors are not entitled to compensation for early termination of their appointments prior to the date on which they would next be due to offer themselves for election or re-election, or if not re-appointed at such time.
Directors’ service contracts
Details of the directors’ service contracts or letters of appointment are as follows:
Executive Directors
Kennedy McMeikan has a service contract with the Company dated 8 April 2008. His continuous period of service with the Company commenced on 1 June 2008.
Richard Hutton has a service contract with the Company dated 7 April 2006. His continuous period of service with the Company commenced on 1 January 1998.
Raymond Reynolds has a service contract with the Company dated 18 December 2006. His continuous period of service with the Company commenced on 1 December 1986.
In addition to their base salaries, each is entitled to participate in the Company’s profit sharing scheme available to all employees. The value of this is then deducted from their annual bonus. They are also entitled to additional benefits including membership of the Company pension scheme, the use of a motor car, private medical insurance, life assurance and permanent health insurance.
Non-Executive Directors
In order to ensure that no director is involved in deciding their own remuneration, the fees payable to non-executive directors (other than the Chairman) are set, after consultation with the Chairman, by a committee of the Board consisting only of the executive directors (Kennedy McMeikan, Richard Hutton and Raymond Reynolds) who periodically seek advice from external consultants as to the appropriate market rates applicable. Such advice was obtained in 2011 from PWC.
An increase in fees of 2.75 per cent was awarded to the Chairman and the non-executive directors, effective from 1 January 2012. This was applied in line with the award given to all employees across the business and did not match the average growth in fees across the market.
The basic non-executive fees for 2012 are £38,853 per annum, including membership of committee(s) and an additional £5,775 for Chairmanship of the Audit or Remuneration Committee(s) and for the Senior Independent Director.
The non-executive directors do not have service contracts with the Company. However, each of them does have a letter of appointment. These are dated 25 February 2002 for Derek Netherton, 1 December 2003 for Bob Bennett, 1 March 2005 for Julie Baddeley, 21 February 2008 for Roger Whiteside, 31 March 2009 for Iain Ferguson and 6 December 2011 for Ian Durant. The terms of appointment of each non-executive director require that they seek re-election on a regular basis in accordance with the articles of association of the Company. The fees payable to the non-executive directors cover all normal duties. In exceptional circumstances, where significant additional time commitment is required, the Board (or a duly authorised committee) may award additional fees. No right of compensation exists where the office is terminated, for whatever reason.
Directors’ Remuneration Report - continued
Annual Report & Accounts 201146
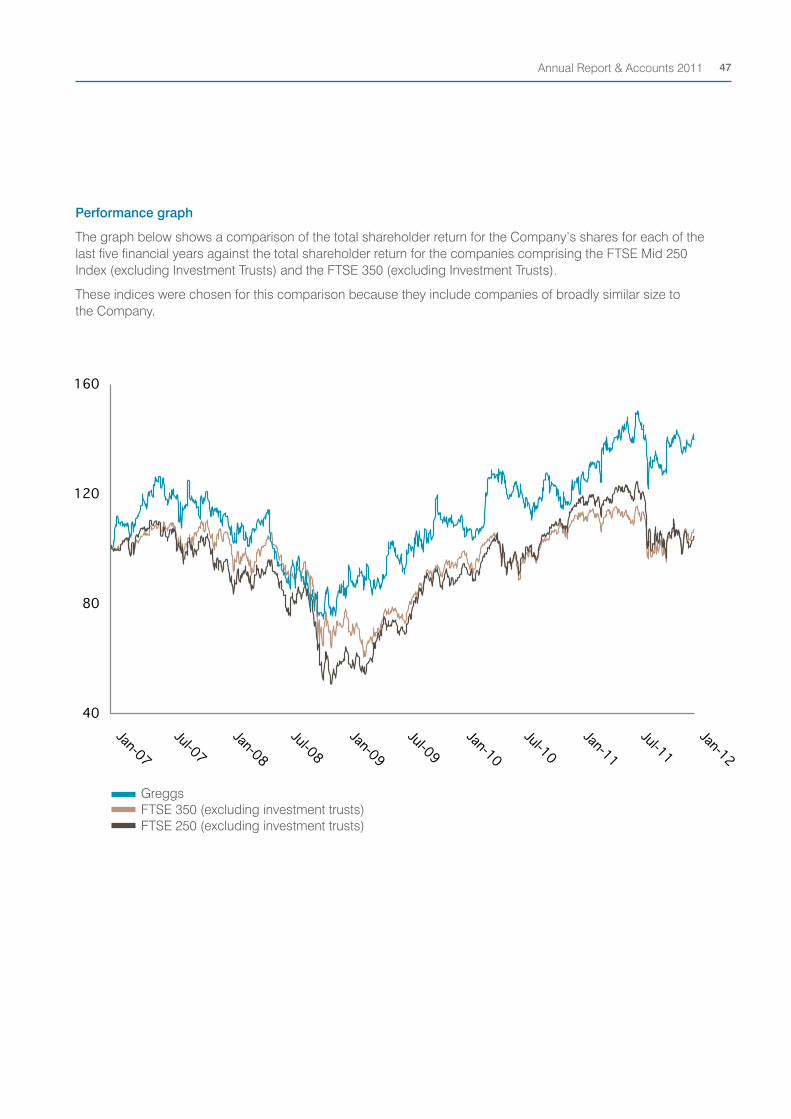
Performance graph
The graph below shows a comparison of the total shareholder return for the Company’s shares for each of the last five financial years against the total shareholder return for the companies comprising the FTSE Mid 250 Index (excluding Investment Trusts) and the FTSE 350 (excluding Investment Trusts).
These indices were chosen for this comparison because they include companies of broadly similar size to the Company.
Greggs FTSE 350 (excluding investment trusts) FTSE 250 (excluding investment trusts)
Annual Report & Accounts 2011 47
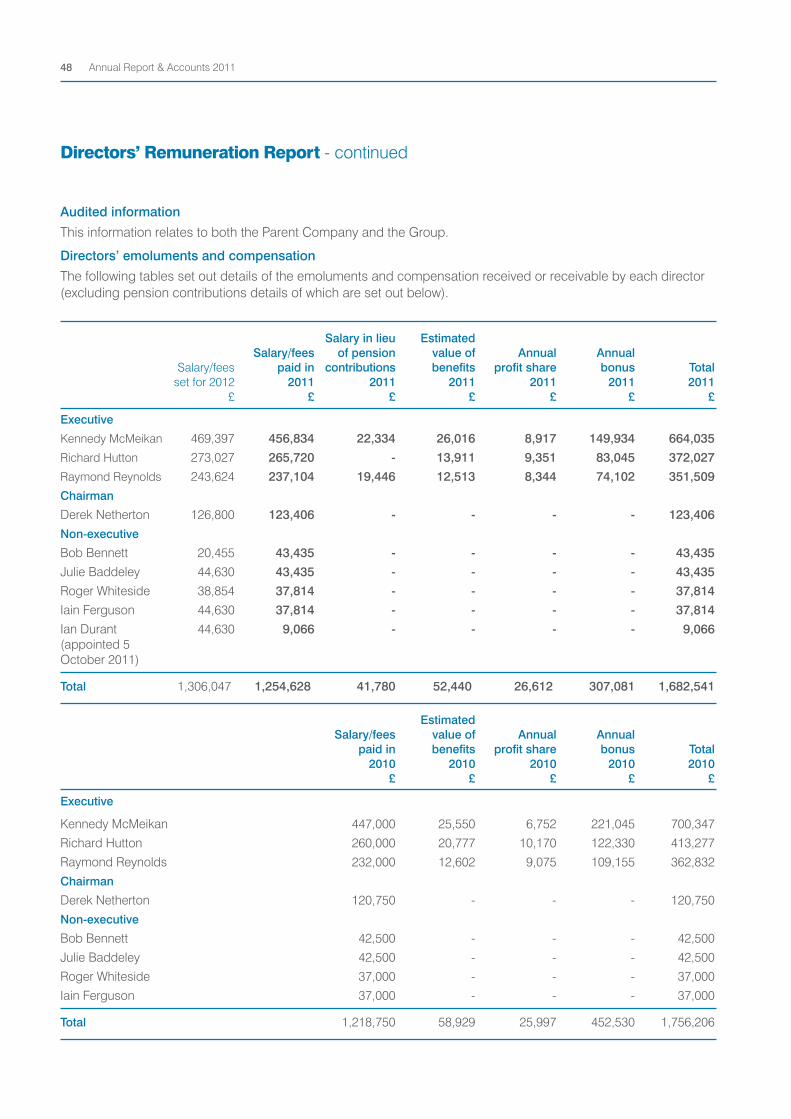
Audited information
This information relates to both the Parent Company and the Group.
Directors’ emoluments and compensation
The following tables set out details of the emoluments and compensation received or receivable by each director (excluding pension contributions details of which are set out below).
Salary in lieu Estimated Salary/fees of pension value of Annual Annual Salary/fees paid in contributions benefits profit share bonus Total set for 2012 2011 2011 2011 2011 2011 2011 £ £ £ £ £ £ £
Executive
Kennedy McMeikan 469,397 456,834 22,334 26,016 8,917 149,934 664,035
Richard Hutton 273,027 265,720 - 13,911 9,351 83,045 372,027
Raymond Reynolds 243,624 237,104 19,446 12,513 8,344 74,102 351,509
Chairman
Derek Netherton 126,800 123,406 - - - - 123,406
Non-executive
Bob Bennett 20,455 43,435 - - - - 43,435
Julie Baddeley 44,630 43,435 - - - - 43,435
Roger Whiteside 38,854 37,814 - - - - 37,814
Iain Ferguson 44,630 37,814 - - - - 37,814
Ian Durant 44,630 9,066 - - - - 9,066 (appointed 5 October 2011)
Total 1,306,047 1,254,628 41,780 52,440 26,612 307,081 1,682,541
Estimated Salary/fees value of Annual Annual paid in benefits profit share bonus Total 2010 2010 2010 2010 2010 £ £ £ £ £
Executive
Kennedy McMeikan 447,000 25,550 6,752 221,045 700,347
Richard Hutton 260,000 20,777 10,170 122,330 413,277
Raymond Reynolds 232,000 12,602 9,075 109,155 362,832
Chairman
Derek Netherton 120,750 - - - 120,750
Non-executive
Bob Bennett 42,500 - - - 42,500
Julie Baddeley 42,500 - - - 42,500
Roger Whiteside 37,000 - - - 37,000
Iain Ferguson 37,000 - - - 37,000
Total 1,218,750 58,929 25,997 452,530 1,756,206
Directors’ Remuneration Report - continued
Annual Report & Accounts 201148
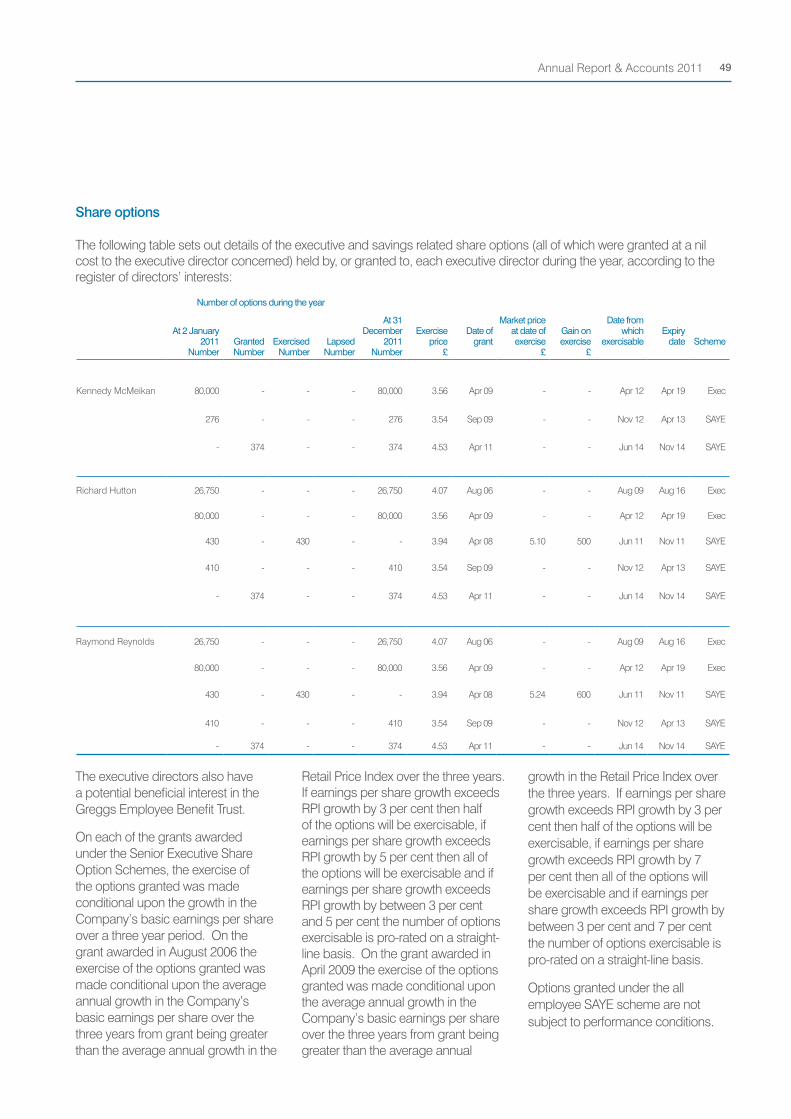
Share options
The following table sets out details of the executive and savings related share options (all of which were granted at a nil cost to the executive director concerned) held by, or granted to, each executive director during the year, according to the register of directors’ interests:
The executive directors also have a potential beneficial interest in the Greggs Employee Benefit Trust.
On each of the grants awarded under the Senior Executive Share Option Schemes, the exercise of the options granted was made conditional upon the growth in the Company’s basic earnings per share over a three year period. On the grant awarded in August 2006 the exercise of the options granted was made conditional upon the average annual growth in the Company’s basic earnings per share over the three years from grant being greater than the average annual growth in the
Retail Price Index over the three years. If earnings per share growth exceeds RPI growth by 3 per cent then half of the options will be exercisable, if earnings per share growth exceeds RPI growth by 5 per cent then all of the options will be exercisable and if earnings per share growth exceeds RPI growth by between 3 per cent and 5 per cent the number of options exercisable is pro-rated on a straight-line basis. On the grant awarded in April 2009 the exercise of the options granted was made conditional upon the average annual growth in the Company’s basic earnings per share over the three years from grant being greater than the average annual
growth in the Retail Price Index over the three years. If earnings per share growth exceeds RPI growth by 3 per cent then half of the options will be exercisable, if earnings per share growth exceeds RPI growth by 7 per cent then all of the options will be exercisable and if earnings per share growth exceeds RPI growth by between 3 per cent and 7 per cent the number of options exercisable is pro-rated on a straight-line basis.
Options granted under the all employee SAYE scheme are not subject to performance conditions.
Number of options during the year
At 2 January 2011
NumberGrantedNumber
Exercised Number
Lapsed Number
At 31 December
2011Number
Exercise price
£
Date of grant
Market price at date of exercise
£
Gain on exercise
£
Date from which
exercisableExpiry
date Scheme
Kennedy McMeikan 80,000 - - - 80,000 3.56 Apr 09 - - Apr 12 Apr 19 Exec
276 - - - 276 3.54 Sep 09 - - Nov 12 Apr 13 SAYE
- 374 - - 374 4.53 Apr 11 - - Jun 14 Nov 14 SAYE
Richard Hutton 26,750 - - - 26,750 4.07 Aug 06 - - Aug 09 Aug 16 Exec
80,000 - - - 80,000 3.56 Apr 09 - - Apr 12 Apr 19 Exec
430 - 430 - - 3.94 Apr 08 5.10 500 Jun 11 Nov 11 SAYE
410 - - - 410 3.54 Sep 09 - - Nov 12 Apr 13 SAYE
- 374 - - 374 4.53 Apr 11 - - Jun 14 Nov 14 SAYE
Raymond Reynolds 26,750 - - - 26,750 4.07 Aug 06 - - Aug 09 Aug 16 Exec
80,000 - - - 80,000 3.56 Apr 09 - - Apr 12 Apr 19 Exec
430 - 430 - - 3.94 Apr 08 5.24 600 Jun 11 Nov 11 SAYE
410 - - - 410 3.54 Sep 09 - - Nov 12 Apr 13 SAYE
- 374 - - 374 4.53 Apr 11 - - Jun 14 Nov 14 SAYE
Annual Report & Accounts 2011 49
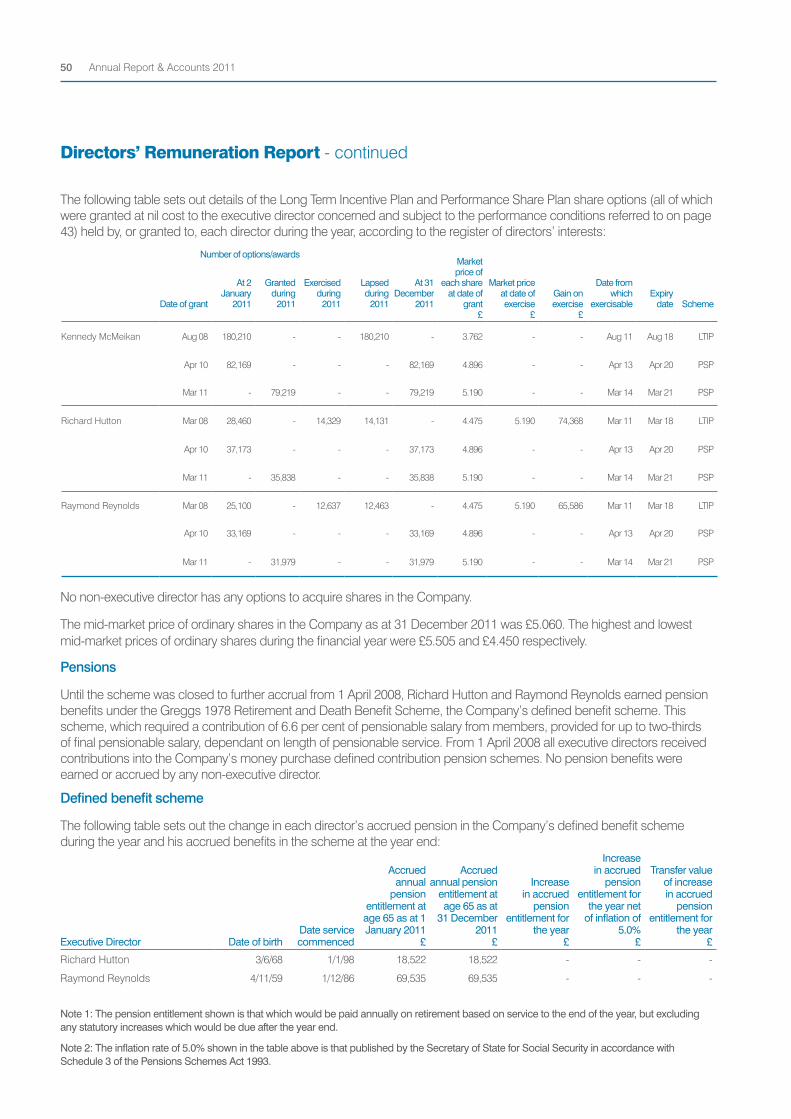
The following table sets out details of the Long Term Incentive Plan and Performance Share Plan share options (all of which were granted at nil cost to the executive director concerned and subject to the performance conditions referred to on page 43) held by, or granted to, each director during the year, according to the register of directors’ interests:
Pensions
Until the scheme was closed to further accrual from 1 April 2008, Richard Hutton and Raymond Reynolds earned pension benefits under the Greggs 1978 Retirement and Death Benefit Scheme, the Company’s defined benefit scheme. This scheme, which required a contribution of 6.6 per cent of pensionable salary from members, provided for up to two-thirds of final pensionable salary, dependant on length of pensionable service. From 1 April 2008 all executive directors received contributions into the Company’s money purchase defined contribution pension schemes. No pension benefits were earned or accrued by any non-executive director.
Defined benefit scheme
The following table sets out the change in each director’s accrued pension in the Company’s defined benefit scheme during the year and his accrued benefits in the scheme at the year end:
No non-executive director has any options to acquire shares in the Company.
The mid-market price of ordinary shares in the Company as at 31 December 2011 was £5.060. The highest and lowest mid-market prices of ordinary shares during the financial year were £5.505 and £4.450 respectively.
Number of options/awards
Date of grant
At 2 January
2011
Granted during
2011
Exercised during
2011
Lapsed during
2011
At 31 December
2011
Market price of
each share at date of
grant £
Market price at date of exercise
£
Gain on exercise
£
Date from which
exercisableExpiry
date Scheme
Kennedy McMeikan Aug 08 180,210 - - 180,210 - 3.762 - - Aug 11 Aug 18 LTIP
Apr 10 82,169 - - - 82,169 4.896 - - Apr 13 Apr 20 PSP
Mar 11 - 79,219 - - 79,219 5.190 - - Mar 14 Mar 21 PSP
Richard Hutton Mar 08 28,460 - 14,329 14,131 - 4.475 5.190 74,368 Mar 11 Mar 18 LTIP
Apr 10 37,173 - - - 37,173 4.896 - - Apr 13 Apr 20 PSP
Mar 11 - 35,838 - - 35,838 5.190 - - Mar 14 Mar 21 PSP
Raymond Reynolds Mar 08 25,100 - 12,637 12,463 - 4.475 5.190 65,586 Mar 11 Mar 18 LTIP
Apr 10 33,169 - - - 33,169 4.896 - - Apr 13 Apr 20 PSP
Mar 11 - 31,979 - - 31,979 5.190 - - Mar 14 Mar 21 PSP
Note 1: The pension entitlement shown is that which would be paid annually on retirement based on service to the end of the year, but excluding any statutory increases which would be due after the year end.
Note 2: The inflation rate of 5.0% shown in the table above is that published by the Secretary of State for Social Security in accordance with Schedule 3 of the Pensions Schemes Act 1993.
Executive Director Date of birthDate service commenced
Accrued annual
pension entitlement at age 65 as at 1 January 2011
£
Accrued annual pension
entitlement at age 65 as at
31 December 2011
£
Increase in accrued
pension entitlement for
the year £
Increase in accrued
pension entitlement for
the year net of inflation of
5.0% £
Transfer value of increase in accrued
pension entitlement for
the year £
Richard Hutton 3/6/68 1/1/98 18,522 18,522 - - -
Raymond Reynolds 4/11/59 1/12/86 69,535 69,535 - - -
Directors’ Remuneration Report - continued
Annual Report & Accounts 201150
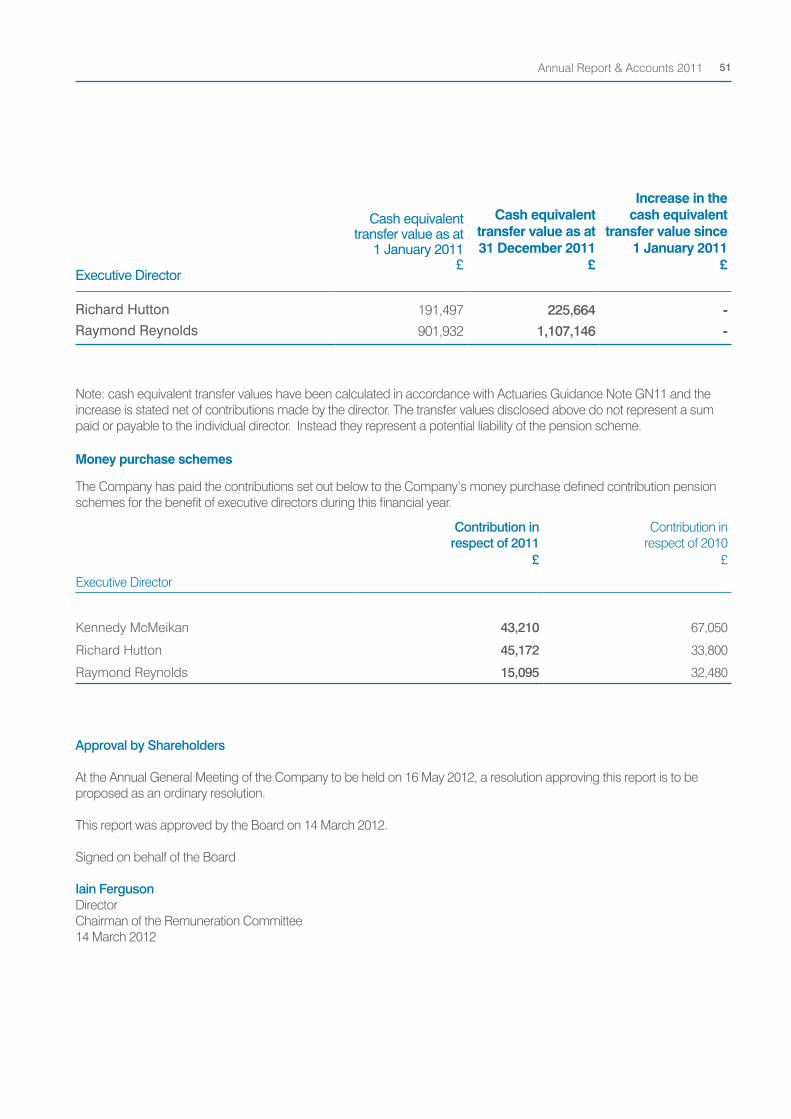
Note: cash equivalent transfer values have been calculated in accordance with Actuaries Guidance Note GN11 and the increase is stated net of contributions made by the director. The transfer values disclosed above do not represent a sum paid or payable to the individual director. Instead they represent a potential liability of the pension scheme.
Cash equivalent transfer value as at
1 January 2011£
Cash equivalent transfer value as at 31 December 2011
£
Increase in the cash equivalent
transfer value since 1 January 2011
£Executive Director
Richard Hutton 191,497 225,664 - Raymond Reynolds 901,932 1,107,146 -
Approval by Shareholders
At the Annual General Meeting of the Company to be held on 16 May 2012, a resolution approving this report is to be proposed as an ordinary resolution.
This report was approved by the Board on 14 March 2012.
Signed on behalf of the Board
Iain FergusonDirectorChairman of the Remuneration Committee14 March 2012
Money purchase schemes
The Company has paid the contributions set out below to the Company’s money purchase defined contribution pension schemes for the benefit of executive directors during this financial year.
Contribution in respect of 2011
Contribution in respect of 2010
£ £
Executive Director
Kennedy McMeikan 43,210 67,050
Richard Hutton 45,172 33,800
Raymond Reynolds 15,095 32,480
Annual Report & Accounts 2011 51
The directors are responsible for preparing the annual report and the Group and Parent Company accounts in accordance with applicable law and regulations.
Company law requires the directors to prepare Group and Parent Company accounts for each financial year. Under that law they are required to prepare the Group accounts in accordance with IFRSs as adopted by the EU and applicable law and have elected to prepare the Parent Company accounts on the same basis.
Under company law the directors must not approve the accounts unless they are satisfied that they give a true and fair view of the state of affairs of the Group and Parent Company and of their profit or loss for that period. In preparing each of the Group and Parent Company accounts, the directors are required to:
• select suitable accounting policies and then apply them consistently; • make judgements and estimates that are reasonable and prudent; • state whether they have been prepared in accordance with IFRSs as adopted by the EU; and • prepare the accounts on the going concern basis unless it is inappropriate to presume that the Group and the Parent Company will continue in business.
The directors are responsible for keeping adequate accounting records that are sufficient to show and explain the Parent Company’s transactions and disclose with reasonable accuracy at any time the financial position of the Parent Company and enable them to ensure that its accounts comply with the Companies Act 2006. They have general responsibility for taking such steps as are reasonably open to them to safeguard the assets of the Group and to prevent and detect fraud and other irregularities.
Under applicable law and regulations, the directors are also responsible for preparing a Directors’ Report, Directors’ Remuneration Report and Corporate Governance Statement that comply with that law and those regulations.
The directors are responsible for the maintenance and integrity of the corporate and financial information included on the Company’s website. Legislation in the UK governing the preparation and dissemination of accounts may differ from legislation in other jurisdictions.
The directors confirm that to the best of their knowledge:
• the accounts, prepared in accordance with the applicable set of accounting standards, give a true and fair view of the assets, liabilities, financial position and profit of the Company and the undertakings included in the consolidation taken as a whole; and
• the directors’ report, which incorporates the Chairman’s statement, the Chief Executive’s report, the Financial Review and the Social Responsibility statement include a fair review of the development and performance of the business and the position of the Company and the undertakings included in the consolidation taken as a whole, together with a description of the principal risks and uncertainties that they face.
Kennedy McMeikan Richard Hutton
14 March 2012
Statement of Directors’ responsibilities in respect of the Annual Report and Accounts
Annual Report & Accounts 201152
We have audited the accounts of Greggs plc for the year ended 31 December 2011 set out on pages 57 to 94.
The financial reporting framework that has been applied in their preparation is applicable law and International Financial Reporting Standards (IFRSs) as adopted by the EU and, as regards the Parent Company accounts, as applied in accordance with the provisions of the Companies Act 2006.
This report is made solely to the Company’s members, as a body, in accordance with Chapter 3 of Part 16 of the Companies Act 2006. Our audit work has been undertaken so that we might state to the Company’s members those matters we are required to state to them in an auditor’s report and for no other purpose. To the fullest extent permitted by law, we do not accept or assume responsibility to anyone other than the Company and the Company’s members, as a body, for our audit work, for this report, or for the opinions we have formed.
Respective responsibilities of directors and auditor
As explained more fully in the Directors’ Responsibilities Statement set out on page 52, the directors are responsible for the preparation of the accounts and for being satisfied that they give a true and fair view. Our responsibility is to audit, and express an opinion on, the accounts in accordance with applicable law and International Standards on Auditing (UK and Ireland). Those standards require us to comply with the Auditing Practices Board’s (APB’s) Ethical Standards for Auditors.
Scope of the audit of the accounts
A description of the scope of an audit of accounts is provided on the APB’s website at www.frc.org.uk/apb/scope/private.cfm
Opinion on accounts
In our opinion:
• the accounts give a true and fair view of the state of the Group’s and of the Parent Company’s affairs as at 31 December 2011 and of the Group’s profit for the year then ended;
• the Group accounts have been properly prepared in accordance with IFRSs as adopted by the EU;
• the Parent Company accounts have been properly prepared in accordance with IFRSs as adopted by the EU and as applied in accordance with the provisions of the Companies Act 2006; and
• the accounts have been prepared in accordance with the requirements of the Companies Act 2006 and, as regards the Group accounts, Article 4 of the IAS Regulation.
Opinion on other matters prescribed by the Companies Act 2006
In our opinion:
• the part of the Directors’ Remuneration Report to be audited has been properly prepared in accordance with the Companies Act 2006;
• the information given in the Directors’ Report for the financial year for which the accounts are prepared is consistent with the accounts.
Independent auditor’s report to the members of Greggs plc
Annual Report & Accounts 2011 53
Matters on which we are required to report by exception
We have nothing to report in respect of the following:
Under the Companies Act 2006 we are required to report to you if, in our opinion:
• adequate accounting records have not been kept by the Parent Company, or returns adequate for our audit have not been received from branches not visited by us; or • the Parent Company accounts and the part of the Directors’ Remuneration Report to be audited are not in agreement with the accounting records and returns; or • certain disclosures of directors’ remuneration specified by law are not made; or • we have not received all the information and explanations we require for our audit; or • a Corporate Governance Statement has not been prepared by the Parent Company.
Under the Listing Rules we are required to review:
• the Directors’ Statement, set out on page 52 in relation to going concern; • the part of the Corporate Governance Statement on page 32 relating to the Company’s compliance with the nine provisions of the UK Corporate Governance Code specified for our review; and • certain elements of the report to shareholders by the Board on Directors’ remuneration.
Nick Plumb (Senior Statutory Auditor) for and on behalf of KPMG Audit Plc, Statutory Auditor Chartered AccountantsQuayside House 110 Quayside Newcastle upon Tyne NE1 3DX
14 March 2012
Annual Report & Accounts 201154
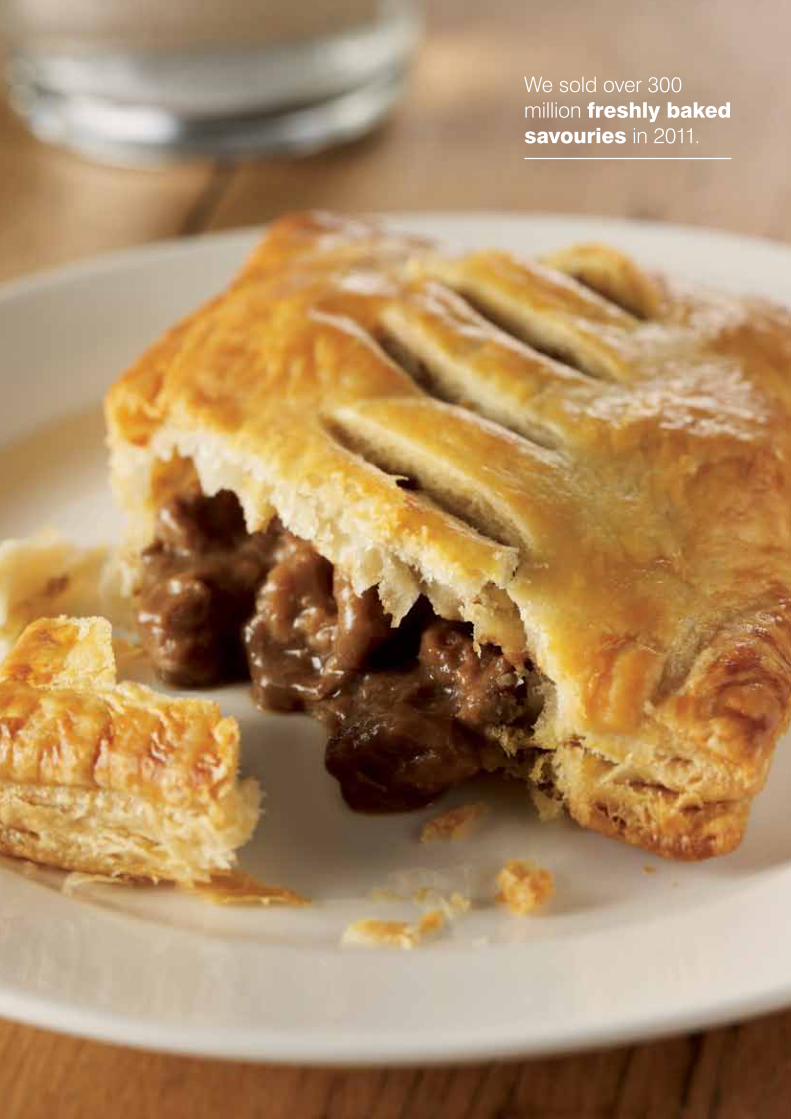
We sold over 300 million freshly baked savouries in 2011.

All our confectionery is hand finished.In 2011 we sold 5.5 million of our Belgian buns.
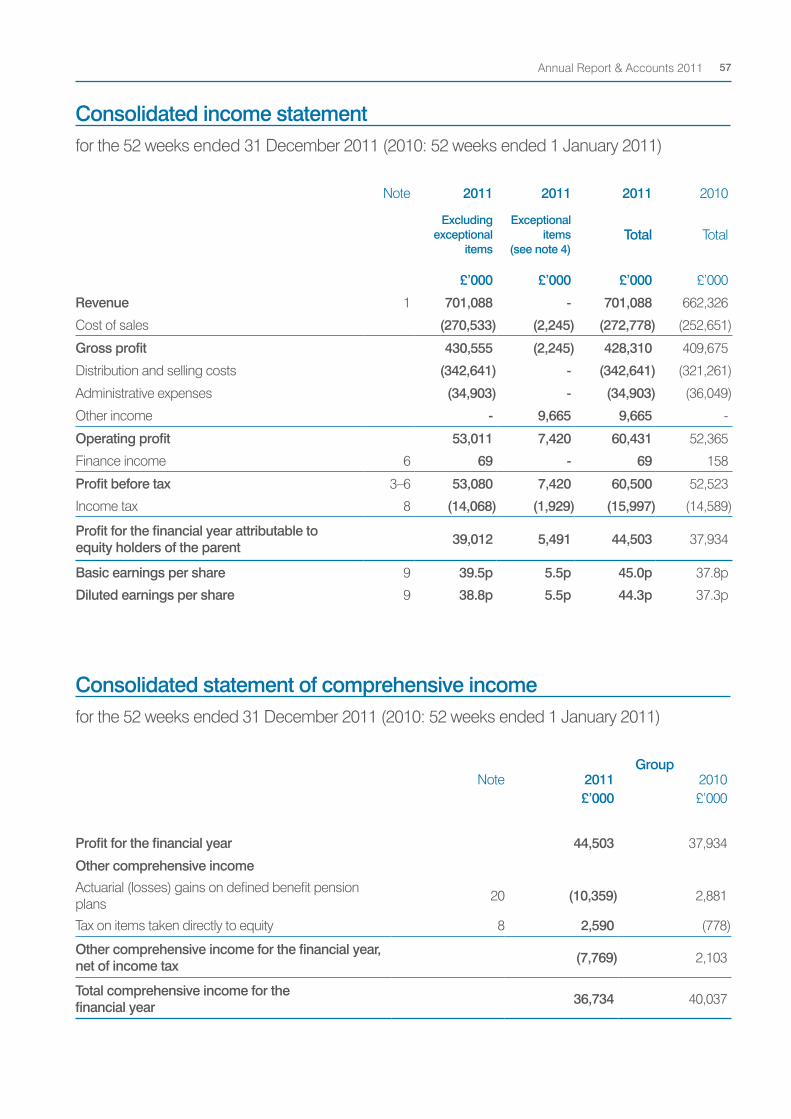
Consolidated income statementfor the 52 weeks ended 31 December 2011 (2010: 52 weeks ended 1 January 2011)
Note 2011 2011 2011 2010
Excluding exceptional
items
Exceptional items
(see note 4)Total Total
£’000 £’000 £’000 £’000
Revenue 1 701,088 - 701,088 662,326
Cost of sales (270,533) (2,245) (272,778) (252,651)
Gross profit 430,555 (2,245) 428,310 409,675
Distribution and selling costs (342,641) - (342,641) (321,261)
Administrative expenses (34,903) - (34,903) (36,049)
Other income - 9,665 9,665 -
Operating profit 53,011 7,420 60,431 52,365
Finance income 6 69 - 69 158
Profit before tax 3–6 53,080 7,420 60,500 52,523
Income tax 8 (14,068) (1,929) (15,997) (14,589)
Profit for the financial year attributable to equity holders of the parent 39,012 5,491 44,503 37,934
Basic earnings per share 9 39.5p 5.5p 45.0p 37.8p
Diluted earnings per share 9 38.8p 5.5p 44.3p 37.3p
Consolidated statement of comprehensive incomefor the 52 weeks ended 31 December 2011 (2010: 52 weeks ended 1 January 2011)
GroupNote 2011 2010
£’000 £’000
Profit for the financial year 44,503 37,934
Other comprehensive income
Actuarial (losses) gains on defined benefit pension plans 20 (10,359) 2,881
Tax on items taken directly to equity 8 2,590 (778)
Other comprehensive income for the financial year, net of income tax (7,769) 2,103
Total comprehensive income for the financial year 36,734 40,037
Annual Report & Accounts 2011 57
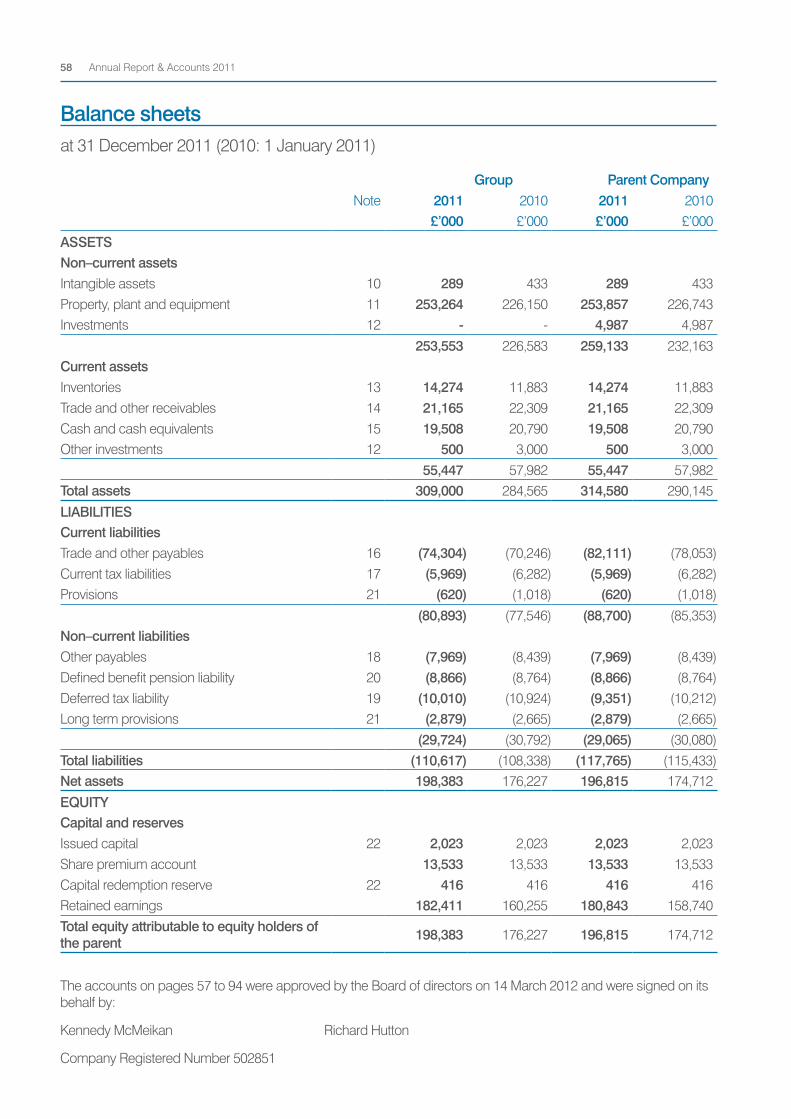
Balance sheetsat 31 December 2011 (2010: 1 January 2011)
Group Parent Company Note 2011 2010 2011 2010
£’000 £’000 £’000 £’000
ASSETSNon–current assetsIntangible assets 10 289 433 289 433 Property, plant and equipment 11 253,264 226,150 253,857 226,743 Investments 12 - - 4,987 4,987
253,553 226,583 259,133 232,163 Current assetsInventories 13 14,274 11,883 14,274 11,883 Trade and other receivables 14 21,165 22,309 21,165 22,309 Cash and cash equivalents 15 19,508 20,790 19,508 20,790 Other investments 12 500 3,000 500 3,000
55,447 57,982 55,447 57,982 Total assets 309,000 284,565 314,580 290,145
LIABILITIESCurrent liabilitiesTrade and other payables 16 (74,304) (70,246) (82,111) (78,053)Current tax liabilities 17 (5,969) (6,282) (5,969) (6,282)Provisions 21 (620) (1,018) (620) (1,018)
(80,893) (77,546) (88,700) (85,353)Non–current liabilitiesOther payables 18 (7,969) (8,439) (7,969) (8,439)Defined benefit pension liability 20 (8,866) (8,764) (8,866) (8,764)Deferred tax liability 19 (10,010) (10,924) (9,351) (10,212)Long term provisions 21 (2,879) (2,665) (2,879) (2,665)
(29,724) (30,792) (29,065) (30,080)Total liabilities (110,617) (108,338) (117,765) (115,433)Net assets 198,383 176,227 196,815 174,712
EQUITYCapital and reservesIssued capital 22 2,023 2,023 2,023 2,023 Share premium account 13,533 13,533 13,533 13,533 Capital redemption reserve 22 416 416 416 416 Retained earnings 182,411 160,255 180,843 158,740 Total equity attributable to equity holders of the parent 198,383 176,227 196,815 174,712
The accounts on pages 57 to 94 were approved by the Board of directors on 14 March 2012 and were signed on its behalf by:
Kennedy McMeikan Richard Hutton
Company Registered Number 502851
Annual Report & Accounts 201158
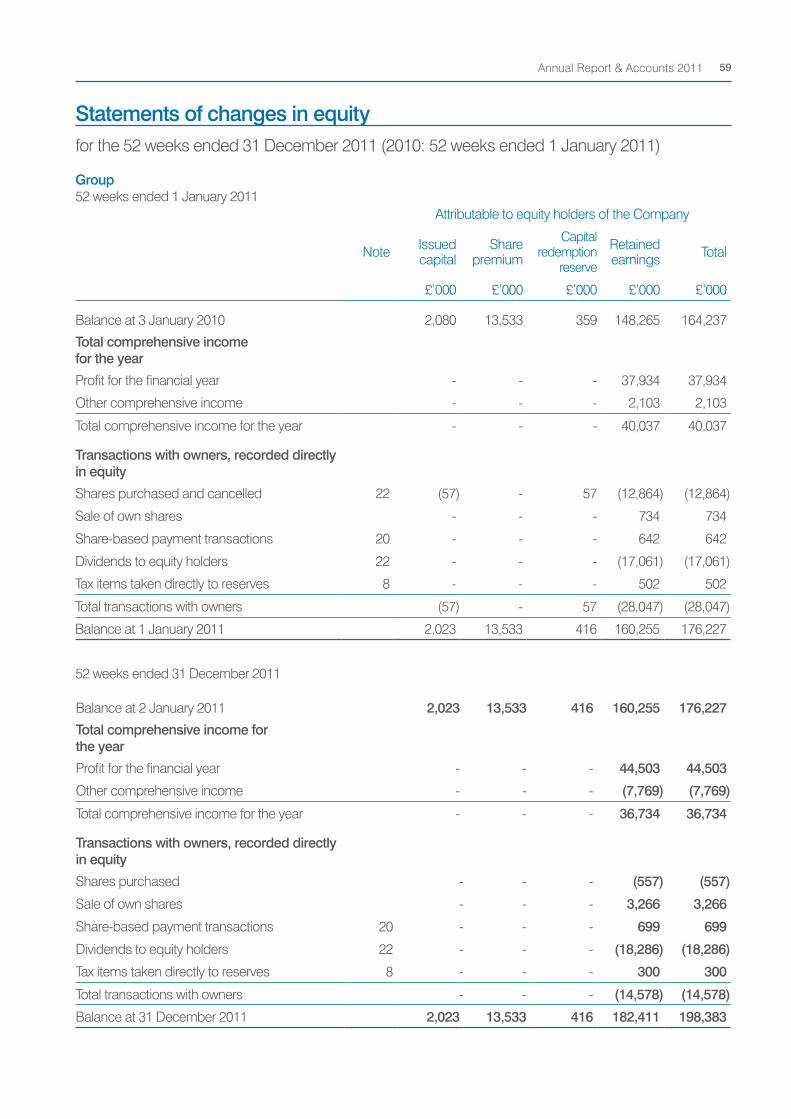
Statements of changes in equityfor the 52 weeks ended 31 December 2011 (2010: 52 weeks ended 1 January 2011)
Group52 weeks ended 1 January 2011
52 weeks ended 31 December 2011
Attributable to equity holders of the Company
Note Issued capital
Share premium
Capital redemption
reserve
Retained earnings Total
£’000 £’000 £’000 £’000 £’000
Balance at 3 January 2010 2,080 13,533 359 148,265 164,237
Total comprehensive income for the year
Profit for the financial year - - - 37,934 37,934
Other comprehensive income - - - 2,103 2,103
Total comprehensive income for the year - - - 40,037 40,037
Transactions with owners, recorded directly in equity
Shares purchased and cancelled 22 (57) - 57 (12,864) (12,864)
Sale of own shares - - - 734 734
Share-based payment transactions 20 - - - 642 642
Dividends to equity holders 22 - - - (17,061) (17,061)
Tax items taken directly to reserves 8 - - - 502 502
Total transactions with owners (57) - 57 (28,047) (28,047)
Balance at 1 January 2011 2,023 13,533 416 160,255 176,227
Balance at 2 January 2011 2,023 13,533 416 160,255 176,227
Total comprehensive income for the year
Profit for the financial year - - - 44,503 44,503
Other comprehensive income - - - (7,769) (7,769)
Total comprehensive income for the year - - - 36,734 36,734
Transactions with owners, recorded directly in equity
Shares purchased - - - (557) (557)
Sale of own shares - - - 3,266 3,266
Share-based payment transactions 20 - - - 699 699
Dividends to equity holders 22 - - - (18,286) (18,286)
Tax items taken directly to reserves 8 - - - 300 300
Total transactions with owners - - - (14,578) (14,578)
Balance at 31 December 2011 2,023 13,533 416 182,411 198,383
Annual Report & Accounts 2011 59
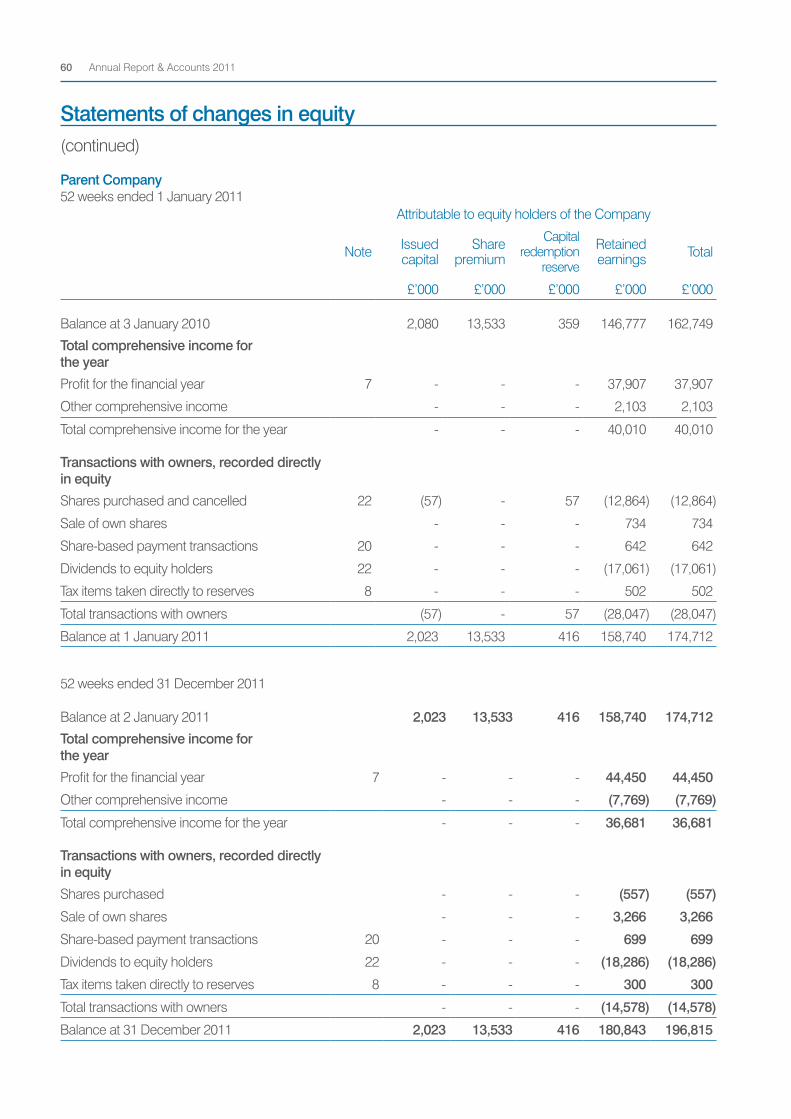
Statements of changes in equity(continued)
Parent Company52 weeks ended 1 January 2011
52 weeks ended 31 December 2011
Attributable to equity holders of the Company
Note Issued capital
Share premium
Capital redemption
reserve
Retained earnings Total
£’000 £’000 £’000 £’000 £’000
Balance at 3 January 2010 2,080 13,533 359 146,777 162,749
Total comprehensive income for the year
Profit for the financial year 7 - - - 37,907 37,907
Other comprehensive income - - - 2,103 2,103
Total comprehensive income for the year - - - 40,010 40,010
Transactions with owners, recorded directly in equity
Shares purchased and cancelled 22 (57) - 57 (12,864) (12,864)
Sale of own shares - - - 734 734
Share-based payment transactions 20 - - - 642 642
Dividends to equity holders 22 - - - (17,061) (17,061)
Tax items taken directly to reserves 8 - - - 502 502
Total transactions with owners (57) - 57 (28,047) (28,047)
Balance at 1 January 2011 2,023 13,533 416 158,740 174,712
Balance at 2 January 2011 2,023 13,533 416 158,740 174,712
Total comprehensive income for the year
Profit for the financial year 7 - - - 44,450 44,450
Other comprehensive income - - - (7,769) (7,769)
Total comprehensive income for the year - - - 36,681 36,681
Transactions with owners, recorded directly in equity
Shares purchased - - - (557) (557)
Sale of own shares - - - 3,266 3,266
Share-based payment transactions 20 - - - 699 699
Dividends to equity holders 22 - - - (18,286) (18,286)
Tax items taken directly to reserves 8 - - - 300 300
Total transactions with owners - - - (14,578) (14,578)
Balance at 31 December 2011 2,023 13,533 416 180,843 196,815
Annual Report & Accounts 201160
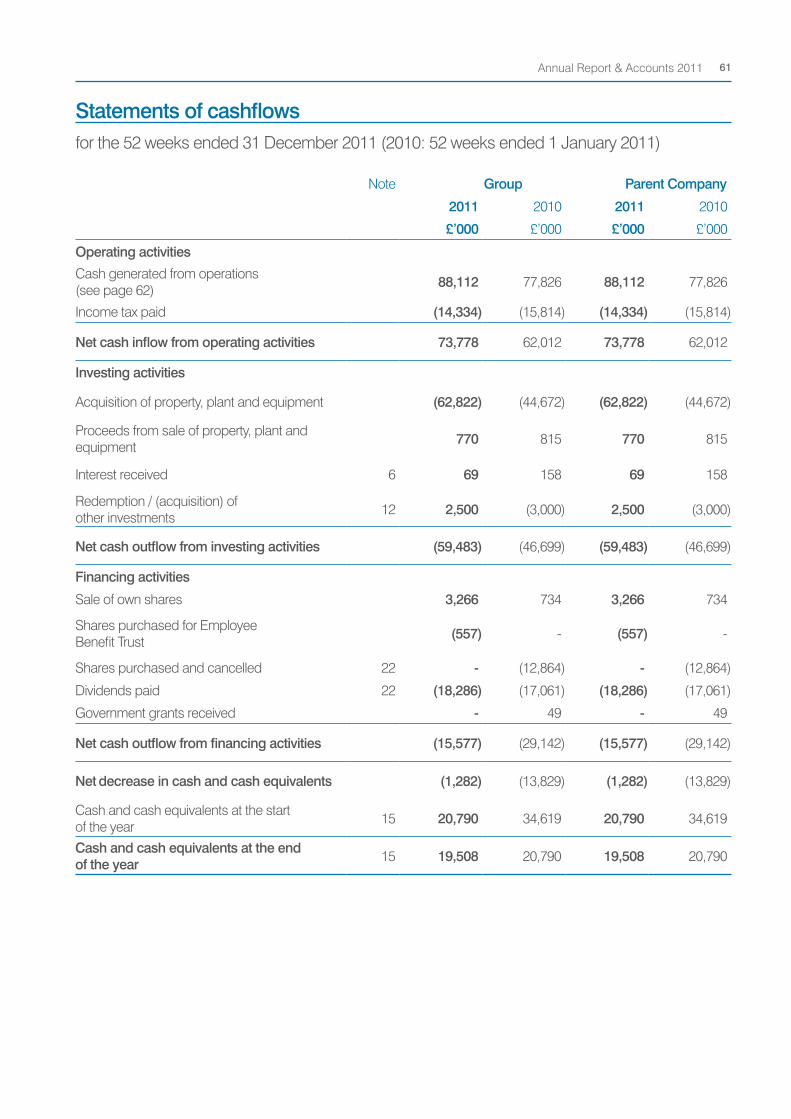
Note Group Parent Company
2011 2010 2011 2010
£’000 £’000 £’000 £’000
Operating activities
Cash generated from operations (see page 62) 88,112 77,826 88,112 77,826
Income tax paid (14,334) (15,814) (14,334) (15,814)
Net cash inflow from operating activities 73,778 62,012 73,778 62,012
Investing activities
Acquisition of property, plant and equipment (62,822) (44,672) (62,822) (44,672)
Proceeds from sale of property, plant and equipment 770 815 770 815
Interest received 6 69 158 69 158
Redemption / (acquisition) of other investments 12 2,500 (3,000) 2,500 (3,000)
Net cash outflow from investing activities (59,483) (46,699) (59,483) (46,699)
Financing activities
Sale of own shares 3,266 734 3,266 734
Shares purchased for Employee Benefit Trust (557) - (557) -
Shares purchased and cancelled 22 - (12,864) - (12,864)
Dividends paid 22 (18,286) (17,061) (18,286) (17,061)
Government grants received - 49 - 49
Net cash outflow from financing activities (15,577) (29,142) (15,577) (29,142)
Net decrease in cash and cash equivalents (1,282) (13,829) (1,282) (13,829)
Cash and cash equivalents at the start of the year 15 20,790 34,619 20,790 34,619
Cash and cash equivalents at the end of the year 15 19,508 20,790 19,508 20,790
Statements of cashflowsfor the 52 weeks ended 31 December 2011 (2010: 52 weeks ended 1 January 2011)
Annual Report & Accounts 2011 61
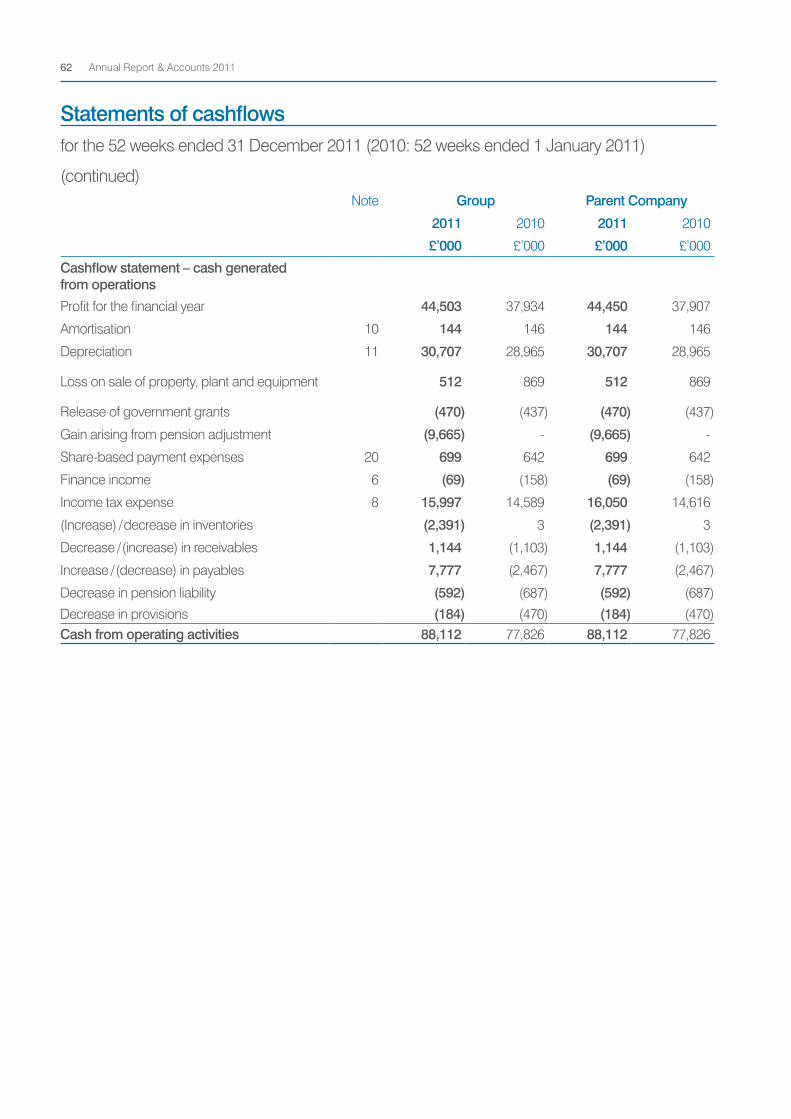
Note Group Parent Company
2011 2010 2011 2010
£’000 £’000 £’000 £’000
Cashflow statement – cash generated from operations
Profit for the financial year 44,503 37,934 44,450 37,907
Amortisation 10 144 146 144 146
Depreciation 11 30,707 28,965 30,707 28,965
Loss on sale of property, plant and equipment 512 869 512 869
Release of government grants (470) (437) (470) (437)
Gain arising from pension adjustment (9,665) - (9,665) -
Share-based payment expenses 20 699 642 699 642
Finance income 6 (69) (158) (69) (158)
Income tax expense 8 15,997 14,589 16,050 14,616
(Increase) / decrease in inventories (2,391) 3 (2,391) 3
Decrease / (increase) in receivables 1,144 (1,103) 1,144 (1,103)
Increase / (decrease) in payables 7,777 (2,467) 7,777 (2,467)
Decrease in pension liability (592) (687) (592) (687)
Decrease in provisions (184) (470) (184) (470)Cash from operating activities 88,112 77,826 88,112 77,826
Statements of cashflowsfor the 52 weeks ended 31 December 2011 (2010: 52 weeks ended 1 January 2011)
(continued)
Annual Report & Accounts 201162
Notes to the consolidated accounts
Significant accounting policies
Greggs plc (‘the Company’) is a company incorporated and domiciled in the UK. The Group accounts consolidate those of the Company and its subsidiaries (together referred to as the ‘Group’). The Parent Company accounts present information about the Company as a separate entity and not about its Group.
The accounts were authorised for issue by the directors on 14 March 2012.
(a) Statement of compliance
Both the Parent Company accounts and the Group accounts have been prepared and approved by the directors in accordance with International Financial Reporting Standards as adopted by the EU (‘adopted IFRSs’), IFRIC interpretations and the Companies Act 2006 applicable to companies reporting under IFRS. On publishing the Parent Company accounts here together with the Group accounts, the Company is taking advantage of the exemption in s408 of the Companies Act 2006 not to present its individual income statement and related notes that form a part of these approved accounts.
(b) Basis of preparation
The accounts are presented in pounds sterling, rounded to the nearest thousand, and are prepared on the historical cost basis except the defined benefit pension liability, which is recognised as plan assets less the present value of the defined benefit obligation.
The Group’s business activities, together with the factors likely to affect its future development, performance and position are set out in the directors’ report and business review on pages 4 to 39. The financial position of the Group, its cashflows and liquidity are described in the Financial Review on pages 11 and 12. In addition note 2 to the accounts includes the Group’s objectives, policies and processes for managing its capital; its financial risk management objectives; details of its financial instruments and hedging activities; and its exposures to credit risk and liquidity risk.
The Group has considerable financial resources and the business continues to be strongly cash generative. As a consequence, the directors believe that the Group is well placed to manage its business risk successfully despite the current uncertain economic outlook.
After making enquiries, the directors have a reasonable expectation that the Company and the Group have adequate resources to continue in operational existence for the foreseeable future. Accordingly, they continue to adopt the going concern basis in preparing the annual report and accounts.
The Group chose not to restate business combinations prior to the IFRS transition date (1 January 2004), as no significant acquisitions had taken place during the previous ten years. The Group’s policy up to and including 1997 was to eliminate goodwill arising upon acquisitions against reserves. Under IFRS 1 and IFRS 3, such goodwill remains eliminated against reserves.
The accounting policies set out below have been applied consistently throughout the Group and to all years presented in these consolidated accounts and are unchanged from previous years. From 2 January 2011 the following standards, amendments and interpretations became effective and were adopted by the Group:
• Revised IAS 24 Related Party Disclosure • Improvements to IFRSs • IFRIC 19 Extinguishing Financial Liabilities with Equity Instruments • Amendments to IFRIC 14 Prepayments of a Minimum Funding Requirement • Amendment to IAS 32 Financial Instruments: Presentation: Classification of Rights Issues • Amendment to IAS 39 Reclassification of Financial Assets: Effective Date and Transition • Amendments to IFRS 2 Group Cash-settled Share-based Payment Transactions
The adoption of the above has not had a significant impact on the Group’s profit for the year or equity.
Annual Report & Accounts 2011 63
Significant accounting policies (continued)
(b) Basis of preparation (continued)
The preparation of financial information in conformity with adopted IFRSs requires management to make judgements, estimates and assumptions that affect the application of policies and reported amounts of assets and liabilities, income and expenses. The estimates and underlying assumptions are reviewed on an ongoing basis. Revisions to accounting estimates are recognised in the year in which the estimate is revised if the revision affects only that year, or in the year of revision and future years if the revision affects both current and future years.
The key estimates and judgements that have the most significant impact on the accounts are as follows:
Lease classification
Judgement has to be applied as to whether the Group’s shop leases are operating leases or finance leases – see note 23 for how this is determined.
Post-retirement benefits
The determination of the defined benefit obligation of the Group’s defined benefit pension scheme depends on the selection of certain assumptions including the discount rate, inflation rate, mortality rates and expected return on scheme assets. Differences arising from actual experience or future changes in assumptions will be reflected in future years. The key assumptions made for 2011 are given in note 20.
Impairment of property, plant and equipment
Property, plant and equipment are reviewed for impairment if events or changes in circumstances indicate that the carrying value may not be recoverable. For example, bakery equipment may be impaired if it is no longer in use and/or shop fittings may be impaired if sales in that shop fall. When a review for impairment is conducted, the recoverable amount is determined based on value in use calculations which include management’s estimates of future cashflows generated by the assets and an appropriate discount rate.
Depreciation of property, plant and equipment
Depreciation is provided so as to write down the assets to the residual values over their estimated useful lives, both of which require management’s judgement (see accounting policy (g)).
Provisions
Provision is required in respect of vacated properties and properties which the Group has committed to vacate and for which the Group has ongoing lease commitments. Management exercise judgement as to whether the property will be sublet to a third party taking into account current market conditions and, if so, for how long and at what rent, in order to estimate the future net holding cost to the Group until the lease can be exited. This estimate is then discounted (where the impact would be material) at a rate that reflects the current time value of money and the risks specific to the liability. In respect of our exit from the Belgian operation in 2008 a provision remains for the potential recourse of leases taken over by the new owner.
(c) Basis of consolidation
The consolidated accounts include the results of Greggs plc and its subsidiary undertakings for the 52 weeks ended 31 December 2011. The comparative period is the 52 weeks ended 1 January 2011.
(i) Subsidiaries
Subsidiaries are entities controlled by the Company. Control exists where the Company has the power, directly or indirectly, to govern the financial and operating policies of an entity so as to obtain benefits from its activities. The accounts of subsidiaries are included in the consolidated accounts from the date control commences until the date that control ceases.
Notes to the consolidated accounts(continued)
Annual Report & Accounts 201164
Significant accounting policies (continued)
(ii) Transactions eliminated on consolidation
Intragroup balances, and any unrealised gains and losses or income and expenses arising from intragroup transactions, are eliminated in preparing the consolidated accounts.
(d) Exceptional items
Exceptional items are defined as items of income and expenditure which are material and unusual in nature and which are considered to be of such significance that they require separate disclosure on the face of the income statement in accordance with IAS 1.
(e) Foreign currency
Transactions in foreign currencies are translated at the foreign exchange rate ruling at the date of the transaction. Monetary assets and liabilities denominated in foreign currencies at the balance sheet date are translated at the foreign exchange rate ruling at that date. Non-monetary assets and liabilities that are measured in terms of historical cost in a foreign currency are translated using the exchange rate at the date of the transaction. Foreign exchange differences arising on translation are recognised in the income statement.
(f) Intangible assets
The Group’s only intangible asset is accounting software which is measured at cost less accumulated amortisation and accumulated impairment losses.
Subsequent expenditure is capitalised only when it increases the future economic benefits embodied in the specific asset to which it relates. All other expenditure is recognised in the income statement as incurred.
Amortisation is recognised in the income statement on a straight line basis over the estimated useful lives of intangible assets from the date that they are available for use. The estimated useful lives for the current and comparative periods are five years.
(g) Property, plant and equipment
(i) Owned assets
Items of property, plant and equipment are stated at cost or deemed cost less accumulated depreciation (see below) and impairment losses (see accounting policy (k)). The cost of self-constructed assets includes the cost of materials, direct labour and an appropriate proportion of production overheads.
(ii) Subsequent costs
The cost of replacing a component of an item of property, plant and equipment is recognised in the carrying amount of the item if it is probable that the future economic benefits embodied within the component will flow to the Group, and its costs can be measured reliably. The carrying value of the replaced component is derecognised. The costs of the day-to-day servicing of property, plant and equipment are recognised in the income statement as incurred.
Annual Report & Accounts 2011 65
Significant accounting policies (continued)
(g) Property, plant and equipment (continued)
(iii) Depreciation
Depreciation is provided so as to write off the cost (less residual value) of each item of property, plant and equipment during its expected useful life using the straight line method over the following periods:
Freehold and long leasehold buildings 40 years Short leasehold properties 10 years or length of lease if shorter Plant, machinery, equipment, vehicles, fixtures and fittings 3 to 10 years
Freehold land is not depreciated.
Depreciation methods, useful lives and residual values (if not insignificant) are reassessed annually.
(iv) Assets in the course of construction
Depreciation on these assets commences when the assets are available for use.
(h) Investments
Non-current investments comprise investments in subsidiaries which are carried at cost less impairment.
Current investments comprise fixed-term, fixed-rate bank deposits where the term is greater than three months.
(i) Inventories
Inventories are stated at the lower of cost and net realisable value. Net realisable value is the estimated selling price in the ordinary course of business, less the estimated costs of completion and selling expenses. The cost of inventories includes expenditure incurred in acquiring the inventories and direct production labour costs.
(j) Cash and cash equivalents
‘Cash and cash equivalents’ comprises cash balances and call deposits with an original maturity of three months or less. Bank overdrafts that are repayable on demand and form an integral part of the Group’s cash management are included as a component of cash and cash equivalents for the purpose of the statement of cashflows.
Notes to the consolidated accounts(continued)
Annual Report & Accounts 201166
Significant accounting policies (continued)
(k) Impairment
The carrying amounts of the Group and Company’s assets, other than inventories and deferred tax assets, are reviewed at each balance sheet date to determine whether there is any indication of impairment. If any such indication exists, the asset’s recoverable amount is estimated. Impairment reviews are carried out on an individual shop basis unless there are a number of shops in the same location, in which case the impairment review is based on the location.
An impairment loss is recognised whenever the carrying amount of an asset exceeds its recoverable amount. Impairment losses are recognised in the income statement. Impairment losses recognised in prior years are assessed at each reporting date and reversed if there has been a change in the estimates used to determine the recoverable amount. An impairment loss is reversed only to the extent that the asset’s carrying amount does not exceed the carrying amount that would have been determined, net of depreciation, if no impairment loss had been recognised.
(l) Non-current assets held for sale
Non-current assets that are expected to be recovered primarily through sale rather than through continuing use are classified as held for sale. Immediately before classification as held for sale, the assets are remeasured in accordance with the Group and Company’s accounting policies. Thereafter generally the assets are measured at the lower of their carrying amount and fair value less cost to sell.
(m) Share capital
(i) Repurchase of share capital
When share capital recognised as equity is repurchased, the amount of the consideration paid, including directly attributable costs, is recognised as a deduction from equity. Repurchased shares that are held in the Employee Share Ownership Plan are classified as treasury shares and are presented as a deduction from total equity.
(ii) Dividends
Dividends are recognised as a liability in the year in which they are approved by the shareholders.
(n) Employee share ownership plan
The Group and Parent Company accounts include the assets and related liabilities of the Greggs Employee Benefit Trust (‘EBT’). In both the Group and Parent Company accounts the shares held by the EBT are stated at cost and deducted from total equity.
(o) Employee benefits
(i) Defined contribution plans
Obligations for contributions to defined contribution pension plans are recognised as an expense in the income statement when they are due.
(ii) Defined benefit plans
The Group and Company’s obligation in respect of defined benefit post-employment plans, including pension plans, is calculated by estimating the amount of the future benefit that employees have earned in return for their service in the current and prior years. That benefit is discounted to determine its present value and any unrecognised past service costs, and the fair value of any plan assets is deducted. The discount rate is the yield at the balance sheet date on AA credit rated bonds that have maturity dates approximating to the terms of the Group’s obligations. The calculation is performed by a qualified actuary using the projected unit credit method.
Annual Report & Accounts 2011 67
Significant accounting policies (continued)
(o) Employee benefits (continued)
When the benefits of a plan are improved, the portion of the increased benefit relating to past service by employees is recognised as an expense in the income statement on a straight-line basis over the average period until the benefits become vested. To the extent that the benefits vest immediately, the expense is recognised immediately in the income statement.
The Group and Company recognise actuarial gains and losses in full, in the year in which they occur, in the statement of changes in equity.
(iii) Share–based payment transactions
The share option programme allows Group employees to acquire shares of the Company. The fair value of share options granted is recognised as an employee expense with a corresponding increase in equity. The fair value is measured at grant date, using an appropriate model, taking into account the terms and conditions upon which the share options were granted, and is spread over the period during which the employees become unconditionally entitled to the options. The amount recognised as an expense is adjusted to reflect the actual number of share options that vest except where forfeiture is only due to share prices not achieving the threshold for vesting.
For options granted before 7 November 2002 the recognition and measurement principles of IFRS 2 have not been applied in accordance with the transitional provisions in IFRS 1. In addition deferred taxation has not been recognised on these options but is accounted for as current tax when it arises.
(p) Provisions
A provision is recognised if, as a result of a past event, the Group has a present legal or constructive obligation that can be estimated reliably, and it is probable that an outflow of economic benefits will be required to settle the obligation. Provisions are determined by discounting the expected future cashflows at a pre-tax rate that reflects current market assessments of the time value of money and the risks specific to the liability.
(i) Restructuring
A provision for restructuring is recognised when the Group has approved a detailed and formal restructuring plan, and the restructuring either has commenced or has been announced publicly. Future operating costs are not provided for.
(ii) Vacant properties
Provision is made for vacant and partly sublet properties for the shorter of the remaining period of the lease and the period until, in the directors’ opinion, they will be able to exit the lease commitment. Significant assumptions are applied in making these calculations and such provisions are assessed by reference to the best available information at the balance sheet date.
(q) Revenue
(i) Goods sold
Revenue from the sale of goods is recognised as income on receipt of cash and is stated after deduction of discounts, promotions and value-added taxation.
(r) Government grants
Government grants are recognised in the balance sheet initially as deferred income when there is a reasonable assurance that they will be received and that the Group will comply with the conditions attaching to them. Grants that compensate the Group for expenses incurred are recognised in the income statement on a systematic basis in the same periods in which the expenses are incurred. Grants that compensate the Group for the cost of an asset are recognised in the income statement over the useful life of the asset.
Notes to the consolidated accounts(continued)
Annual Report & Accounts 201168
Significant accounting policies (continued)
(s) Expenses
(i) Operating lease payments
Payments under operating leases are recognised in the income statement on a straight-line basis over the term of the lease. Lease incentives received are recognised in the income statement as an integral part of the total lease expense over the term of the lease.
(t) Finance income and expenses
(i) Finance income
Finance income comprises interest receivable on cash balances and foreign exchange movements relating to overseas bank accounts. Interest income is recognised in the income statement as it accrues using the effective interest method.
(ii) Finance expenses
Finance expenses comprise interest payable on borrowings and related foreign exchange movements on any Euro bank borrowings.
(u) Income tax
Income tax comprises current and deferred tax. Income tax is recognised in the income statement except to the extent that it relates to items recognised directly in equity, in which case it is recognised in equity.
Current tax is the expected tax payable on the taxable income for the year, using tax rates enacted or substantively enacted at the balance sheet date, and any adjustment to tax payable in respect of previous years.
Deferred tax is recognised using the balance sheet liability method, providing for temporary differences between the carrying amounts of assets and liabilities for financial reporting purposes and the amounts used for taxation purposes. The amount of deferred tax recognised is based on the expected manner of realisation or settlement of the carrying amounts of assets and liabilities, using tax rates that are expected to apply when the temporary differences reverse, based on rates enacted or substantively enacted at the balance sheet date.
Deferred tax is not recognised for the following temporary differences: the initial recognition of assets or liabilities in a transaction that is not a business combination and that affects neither accounting nor taxable profit, and differences relating to investments in subsidiaries to the extent that it is probable that they will not reverse in the foreseeable future.
A deferred tax asset is recognised only to the extent that it is probable that future taxable profits will be available against which the asset can be utilised. Deferred tax assets are reviewed at each reporting date and are reduced to the extent that it is no longer probable that the related deferred tax benefit will be realised.
(v) Research and development
The Company continuously strives to improve its products and processes through technical and other innovation. Such expenditure is typically expensed to the income statement as the related intellectual property is not capable of being formalised and does not always have distinguishable research and development phases.
Annual Report & Accounts 2011 69
Significant accounting policies (continued)
(w) IFRSs available for early adoption not yet applied
The following standards and amendments to standards which will be relevant to the Group, were available for early adoption but have not been applied in these accounts:
• Amendments to IFRS 7 ‘Disclosures – Transfers of Financial Assets’ mandatory for accounting periods commencing on or after 1 July 2011.
• Amendments to IAS 12 ‘Deferred Tax: Recovery of Underlying Assets’ mandatory for accounting periods commencing on or after 1 January 2012.
• Amendments to IAS 1 ‘Presentation of Items of Other Comprehensive Income’ mandatory for accounting periods commencing on or after 1 July 2012.
• IFRS 10 ‘Consolidated Financial Statements’ and IAS 27 (2011) ‘Separate Financial Statements’ mandatory for accounting periods commencing on or after 1 January 2013.
• IFRS 11 ‘Joint Arrangements’ and Amendments to IAS 28 (2008) ‘Investments in Associates and Joint Ventures’ mandatory for accounting periods commencing on or after 1 January 2013.
• IFRS 12 ‘Disclosure of Interests in Other Entities’ mandatory for accounting periods commencing on or after 1 January 2013.
• IFRS 13 ‘Fair Value Measurement’ mandatory for accounting periods commencing on or after 1 January 2013.
• Amendments to IAS 19 ‘Defined Benefit Plans’ mandatory for accounting periods commencing on or after 1 January 2013.
• Amendments to IFRS 7 ‘Disclosures – Offsetting Financial Assets and Financial Liabilities’ mandatory for accounting periods commencing on or after 1 January 2013.
• Amendments to IAS 32 ‘Offsetting Financial Assets and Financial Liabilities’ mandatory for accounting periods commencing on or after 1 January 2014.
• IFRS 9 ‘Financial Instruments’ mandatory for accounting periods commencing on or after 1 January 2015.
None of these standards and amendments are expected to have a significant impact on the accounts when they are adopted except for amendments to IAS 19 ‘Defined Benefit Plans’. The amendments to IAS 19 are expected to reduce profit before tax and increase actuarial gains in other comprehensive income by the same amount. There would be no impact on total equity. The Group does not intend to adopt this standard early and the extent of the impact has not been determined.
1. Segmental analysis
The Board is considered to be the ‘chief operating decision maker’ of the Group in the context of the IFRS 8 definition. The information which is reviewed by the Board for the purposes of assessing financial performance and allocating resources comprises the profit and loss account for the Company as a whole.
The Group is a centrally-managed business with an integrated supply chain. There are seven retail regions, each reporting to the Group Retail Director. The business performance is assessed after allocation of supply chain costs to the retail regions. These retail regions have similar economic characteristics, products, customers and production and distribution methods and have therefore been aggregated into a single reportable segment. The segment results, as reported to the chief operating decision maker, are calculated under the principles of IFRS.
Products and services - the Group sells a consistent range of fresh bakery goods, sandwiches and drinks in its shops.
Major customers - the majority of sales are made to the general public on a cash basis. A small proportion of sales are made on credit to certain organisations, including wholesale customers, but these are immaterial in a Group context.
Geographical areas - all results arise in the UK.
Notes to the consolidated accounts(continued)
Annual Report & Accounts 201170
1. Segmental analysis (continued)
The Board has carefully considered the requirements of IFRS 8 and concluded that, as there is only one reportable segment whose revenue, profits, assets and liabilities are measured and reported on a consistent basis with the Group financial statements no additional numerical disclosures are necessary.
2. Financial risk management
Credit risk
Credit risk is the risk of financial loss to the Group if a customer or counterparty to a financial instrument fails to meet its contractual obligations.
Trade and other receivables
The Group’s exposure to credit risk is considered not to be significant as the majority of sales of goods are for cash. Other receivables are primarily prepaid rent and rates as well as amounts owed from HM Revenue & Customs in respect of VAT. The credit risk on remaining other receivables and trade receivables is therefore not considered significant.
Counterparty risk is also considered low. All of the Group’s surplus cash is held with highly rated banks, in line with Group policy.
Liquidity risk
Liquidity risk is the risk that the Group will not be able to meet its financial obligations as they fall due.
The Group operates with net current liabilities because the majority of sales are for cash and limited stocks are held given their perishable nature. It is therefore reliant on the continued strong performance of the retail portfolio to meet its short term liabilities. This is a well established and proven business model. Any increase in short-term liquidity risk can be mitigated by reducing the capital expenditure budget. The Group has cash resources at the year end, and if necessary, would be able to obtain substantial debt funding.
The Group has overdraft facilities of £5,000,000 of which £5,000,000 was undrawn at 31 December 2011 (2010: £5,000,000).
Market risk
Market risk is the risk that changes in market prices, such as foreign exchange rates, interest rates and equity prices will affect the Group’s income or the value of its holdings of financial instruments.
Given that, as explained above, market risk is not significant, sensitivity analysis would not be meaningful.
Currency risk
The Group has no regular transactions in foreign currency although there are occasional purchases, mainly of capital items, denominated in foreign currency. Whilst certain costs such as electricity and wheat can be influenced by movements in the US dollar, actual contracts are priced in sterling. In respect of those key costs which are volatile, such as electricity and flour, the price may be fixed for a period of time in line with Group policy. All such contracts are for the Group’s own expected usage.
Interest rate
The Group has low exposure to interest rate risk. Interest only arises on its bank deposits and overdrafts. Net financial income in the year was £69,000 (2010: £158,000).
Equity prices
The Group has no equity investments other than its subsidiaries.
Annual Report & Accounts 2011 71
2. Financial risk management (continued)
Capital management
The Board defines capital as the equity of the Group. The Group remains net cash positive with funding requirements met by cash generated from retail operations. The Board’s policy is to maintain a strong capital base so as to maintain investor, creditor and market confidence and to enable successful future development of the business. The Board’s policy on dividend levels is to pursue a progressive dividend policy that pays due regard to the growth of earnings per share over the medium term, the cash generative nature of our growing business and our continuing determination to deliver value to our shareholders.
The Board will continue to consider purchasing its own shares in the market dependent on market prices and surplus cash levels. The trustees of the Greggs Employee Benefit Trust also purchase shares for future satisfaction of employee share options.
Financial instruments
Group and Parent Company
All of the Group’s surplus cash is invested as cash placed on deposit or fixed-term deposits.
The Group’s treasury policy has as its principal objective the achievement of the maximum rate of return on cash balances whilst maintaining an acceptable level of risk. Other than mentioned below there are no financial instruments, derivatives or commodity contracts used.
Financial assets and liabilities
The Group’s main financial assets comprise cash and cash equivalents and fixed-term deposits. Other financial assets include trade receivables arising from the Group’s activities.
Other than trade and other payables, the Group had no financial liabilities within the scope of IAS 39 as at 31 December 2011 (2010: £nil).
Fair values
The fair value of the Group’s financial assets and liabilities is not materially different from their carrying values. Financial assets and liabilities comprise principally of trade receivables and trade payables and the only interest bearing balances are the bank deposits and borrowings which attract interest at variable rate.
Interest rate, credit and foreign currency risk
The Group has not entered into any hedging transactions during the year and considers interest rate, credit and foreign currency risks not to be significant.
Notes to the consolidated accounts(continued)
Annual Report & Accounts 201172
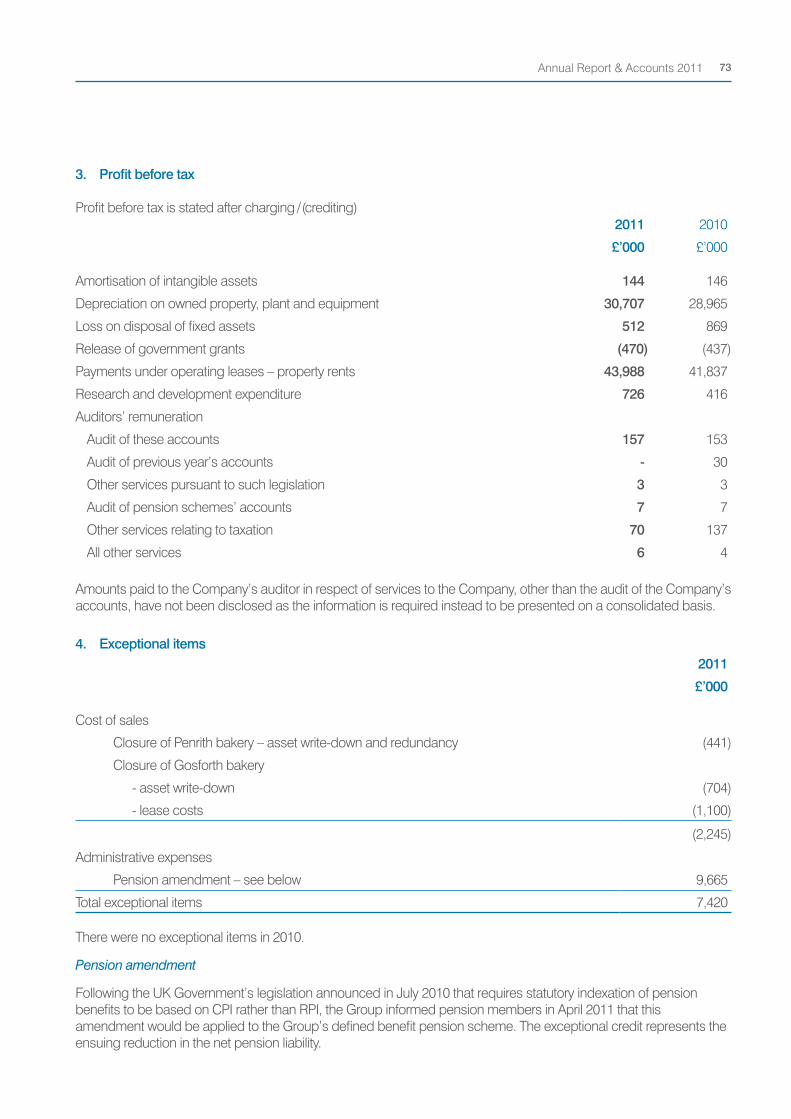
3. Profit before tax
Profit before tax is stated after charging / (crediting)
4. Exceptional items
There were no exceptional items in 2010.
Pension amendment
Following the UK Government’s legislation announced in July 2010 that requires statutory indexation of pension benefits to be based on CPI rather than RPI, the Group informed pension members in April 2011 that this amendment would be applied to the Group’s defined benefit pension scheme. The exceptional credit represents the ensuing reduction in the net pension liability.
2011 2010
£’000 £’000
Amortisation of intangible assets 144 146
Depreciation on owned property, plant and equipment 30,707 28,965
Loss on disposal of fixed assets 512 869
Release of government grants (470) (437)
Payments under operating leases – property rents 43,988 41,837
Research and development expenditure 726 416
Auditors’ remuneration
Audit of these accounts 157 153
Audit of previous year’s accounts - 30
Other services pursuant to such legislation 3 3
Audit of pension schemes’ accounts 7 7
Other services relating to taxation 70 137
All other services 6 4
2011
£’000
Cost of sales
Closure of Penrith bakery – asset write-down and redundancy (441)
Closure of Gosforth bakery
- asset write-down (704)
- lease costs (1,100)
(2,245)
Administrative expenses
Pension amendment – see below 9,665
Total exceptional items 7,420
Amounts paid to the Company’s auditor in respect of services to the Company, other than the audit of the Company’s accounts, have not been disclosed as the information is required instead to be presented on a consolidated basis.
Annual Report & Accounts 2011 73
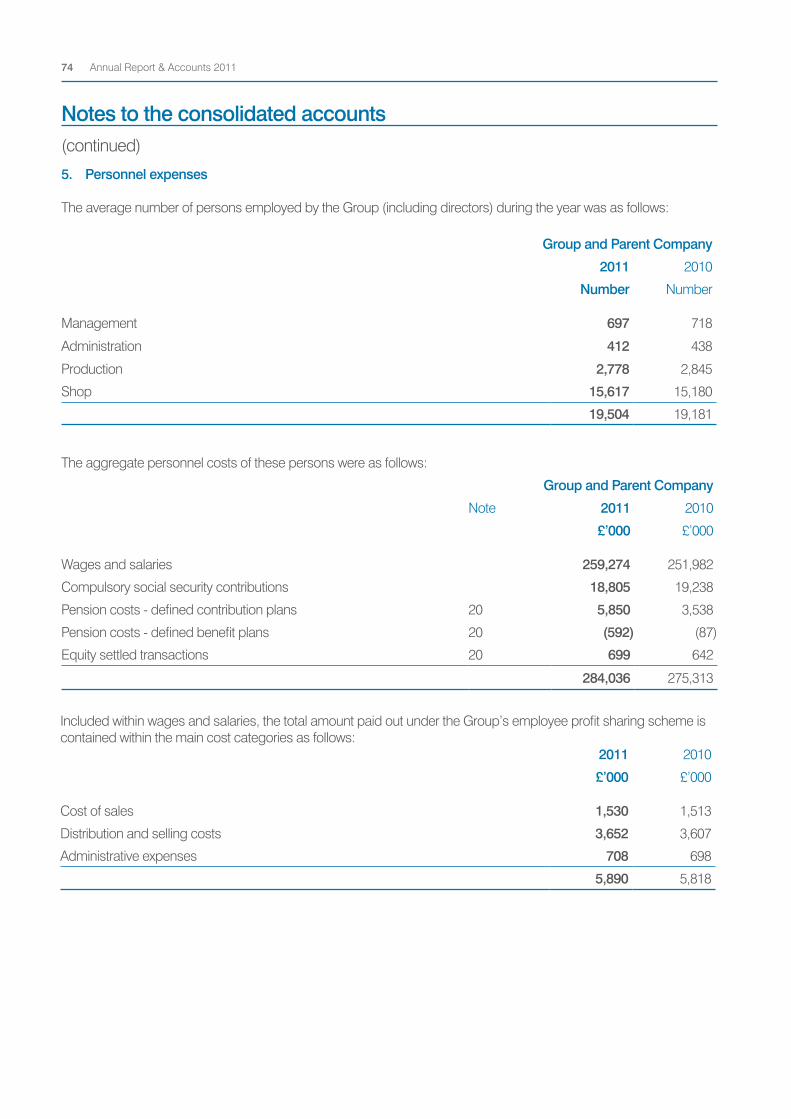
Group and Parent Company
2011 2010
Number Number
Management 697 718
Administration 412 438
Production 2,778 2,845
Shop 15,617 15,180
19,504 19,181
The aggregate personnel costs of these persons were as follows:
Group and Parent Company
Note 2011 2010
£’000 £’000
Wages and salaries 259,274 251,982
Compulsory social security contributions 18,805 19,238
Pension costs - defined contribution plans 20 5,850 3,538
Pension costs - defined benefit plans 20 (592) (87)
Equity settled transactions 20 699 642
284,036 275,313
5. Personnel expenses
The average number of persons employed by the Group (including directors) during the year was as follows:
Notes to the consolidated accounts(continued)
Included within wages and salaries, the total amount paid out under the Group’s employee profit sharing scheme is contained within the main cost categories as follows:
2011 2010
£’000 £’000
Cost of sales 1,530 1,513
Distribution and selling costs 3,652 3,607
Administrative expenses 708 698
5,890 5,818
Annual Report & Accounts 201174
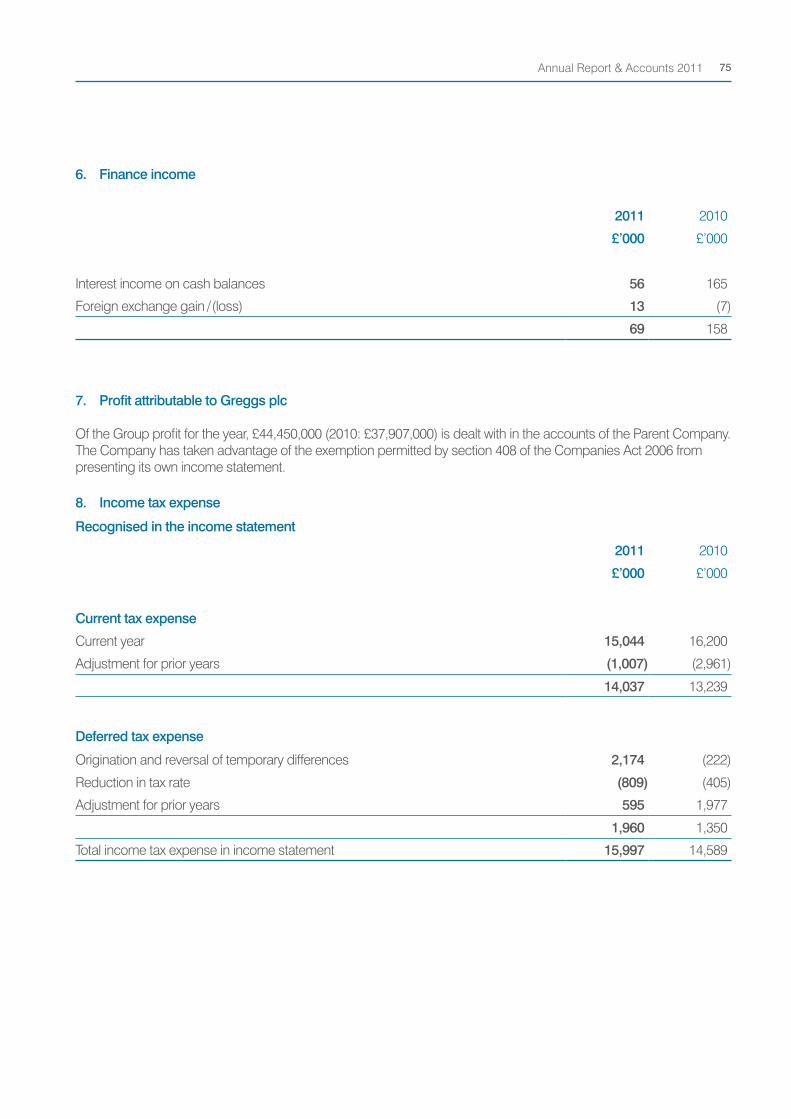
2011 2010
£’000 £’000
Interest income on cash balances 56 165
Foreign exchange gain / (loss) 13 (7)
69 158
6. Finance income
7. Profit attributable to Greggs plc
Of the Group profit for the year, £44,450,000 (2010: £37,907,000) is dealt with in the accounts of the Parent Company. The Company has taken advantage of the exemption permitted by section 408 of the Companies Act 2006 from presenting its own income statement.
8. Income tax expense
Recognised in the income statement
2011 2010
£’000 £’000
Current tax expense
Current year 15,044 16,200
Adjustment for prior years (1,007) (2,961)
14,037 13,239
Deferred tax expense
Origination and reversal of temporary differences 2,174 (222)
Reduction in tax rate (809) (405)
Adjustment for prior years 595 1,977
1,960 1,350
Total income tax expense in income statement 15,997 14,589
Annual Report & Accounts 2011 75
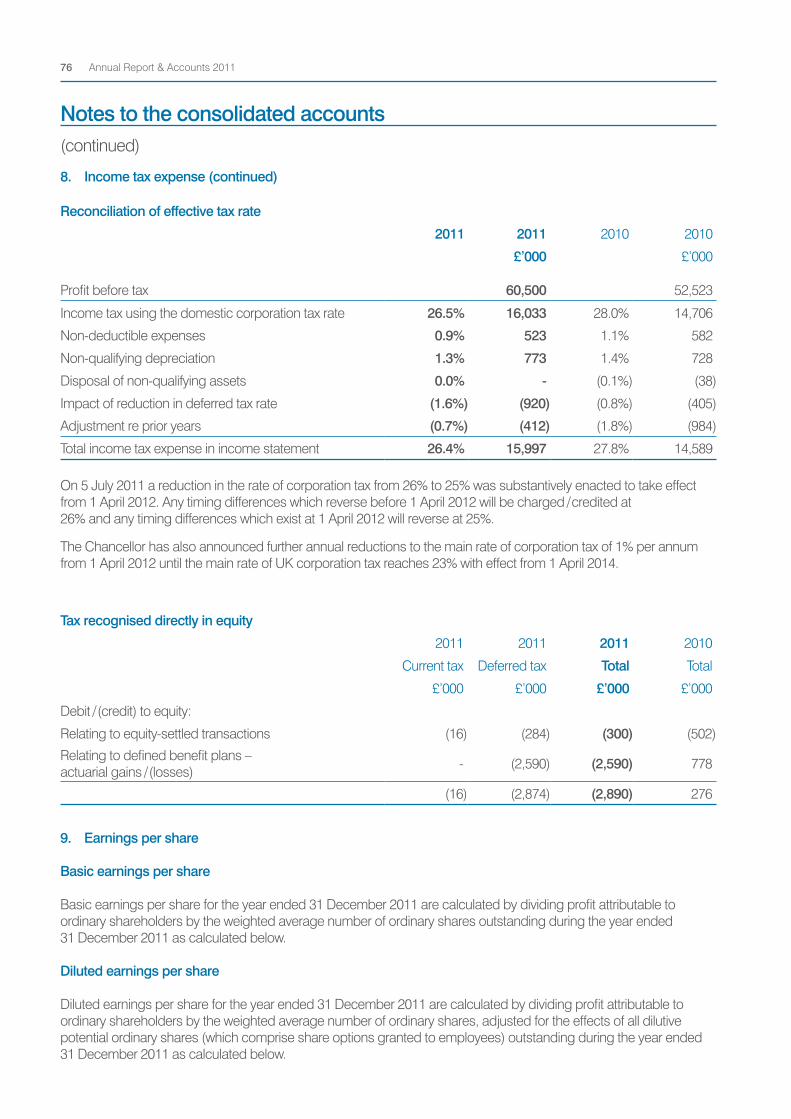
Reconciliation of effective tax rate
2011 2011 2010 2010
£’000 £’000
Profit before tax 60,500 52,523
Income tax using the domestic corporation tax rate 26.5% 16,033 28.0% 14,706
Non-deductible expenses 0.9% 523 1.1% 582
Non-qualifying depreciation 1.3% 773 1.4% 728
Disposal of non-qualifying assets 0.0% - (0.1%) (38)
Impact of reduction in deferred tax rate (1.6%) (920) (0.8%) (405)
Adjustment re prior years (0.7%) (412) (1.8%) (984)
Total income tax expense in income statement 26.4% 15,997 27.8% 14,589
8. Income tax expense (continued)
On 5 July 2011 a reduction in the rate of corporation tax from 26% to 25% was substantively enacted to take effect from 1 April 2012. Any timing differences which reverse before 1 April 2012 will be charged / credited at 26% and any timing differences which exist at 1 April 2012 will reverse at 25%.
The Chancellor has also announced further annual reductions to the main rate of corporation tax of 1% per annum from 1 April 2012 until the main rate of UK corporation tax reaches 23% with effect from 1 April 2014.
Tax recognised directly in equity
2011 2011 2011 2010
Current tax Deferred tax Total Total
£’000 £’000 £’000 £’000
Debit / (credit) to equity:
Relating to equity-settled transactions (16) (284) (300) (502)
Relating to defined benefit plans – actuarial gains / (losses) - (2,590) (2,590) 778
(16) (2,874) (2,890) 276
9. Earnings per share
Basic earnings per share
Basic earnings per share for the year ended 31 December 2011 are calculated by dividing profit attributable to ordinary shareholders by the weighted average number of ordinary shares outstanding during the year ended 31 December 2011 as calculated below.
Diluted earnings per share
Diluted earnings per share for the year ended 31 December 2011 are calculated by dividing profit attributable to ordinary shareholders by the weighted average number of ordinary shares, adjusted for the effects of all dilutive potential ordinary shares (which comprise share options granted to employees) outstanding during the year ended 31 December 2011 as calculated below.
Notes to the consolidated accounts(continued)
Annual Report & Accounts 201176
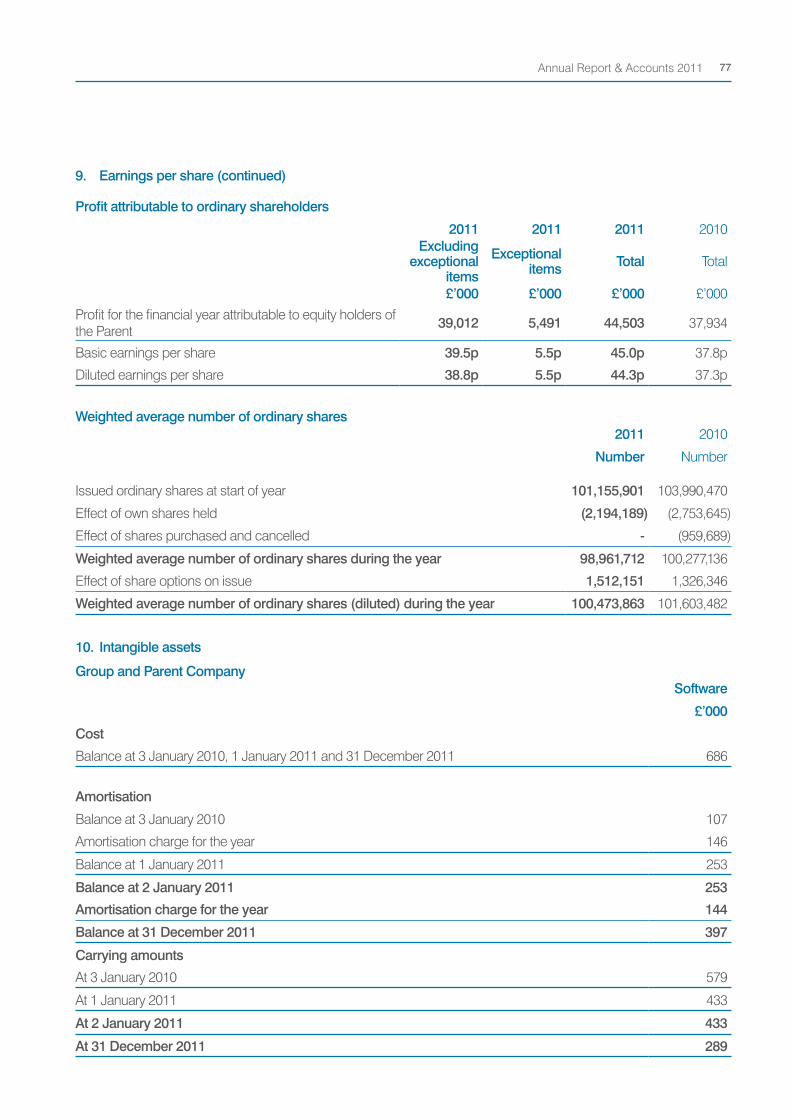
Profit attributable to ordinary shareholders
2011 2011 2011 2010 Excluding
exceptional items
Exceptional items Total Total
£’000 £’000 £’000 £’000
Profit for the financial year attributable to equity holders of the Parent 39,012 5,491 44,503 37,934
Basic earnings per share 39.5p 5.5p 45.0p 37.8p
Diluted earnings per share 38.8p 5.5p 44.3p 37.3p
9. Earnings per share (continued)
Weighted average number of ordinary shares2011 2010
Number Number
Issued ordinary shares at start of year 101,155,901 103,990,470
Effect of own shares held (2,194,189) (2,753,645)
Effect of shares purchased and cancelled - (959,689)
Weighted average number of ordinary shares during the year 98,961,712 100,277,136
Effect of share options on issue 1,512,151 1,326,346
Weighted average number of ordinary shares (diluted) during the year 100,473,863 101,603,482
10. Intangible assets
Group and Parent CompanySoftware
£’000
Cost
Balance at 3 January 2010, 1 January 2011 and 31 December 2011 686
Amortisation
Balance at 3 January 2010 107
Amortisation charge for the year 146
Balance at 1 January 2011 253
Balance at 2 January 2011 253
Amortisation charge for the year 144
Balance at 31 December 2011 397
Carrying amounts
At 3 January 2010 579
At 1 January 2011 433
At 2 January 2011 433
At 31 December 2011 289
Annual Report & Accounts 2011 77
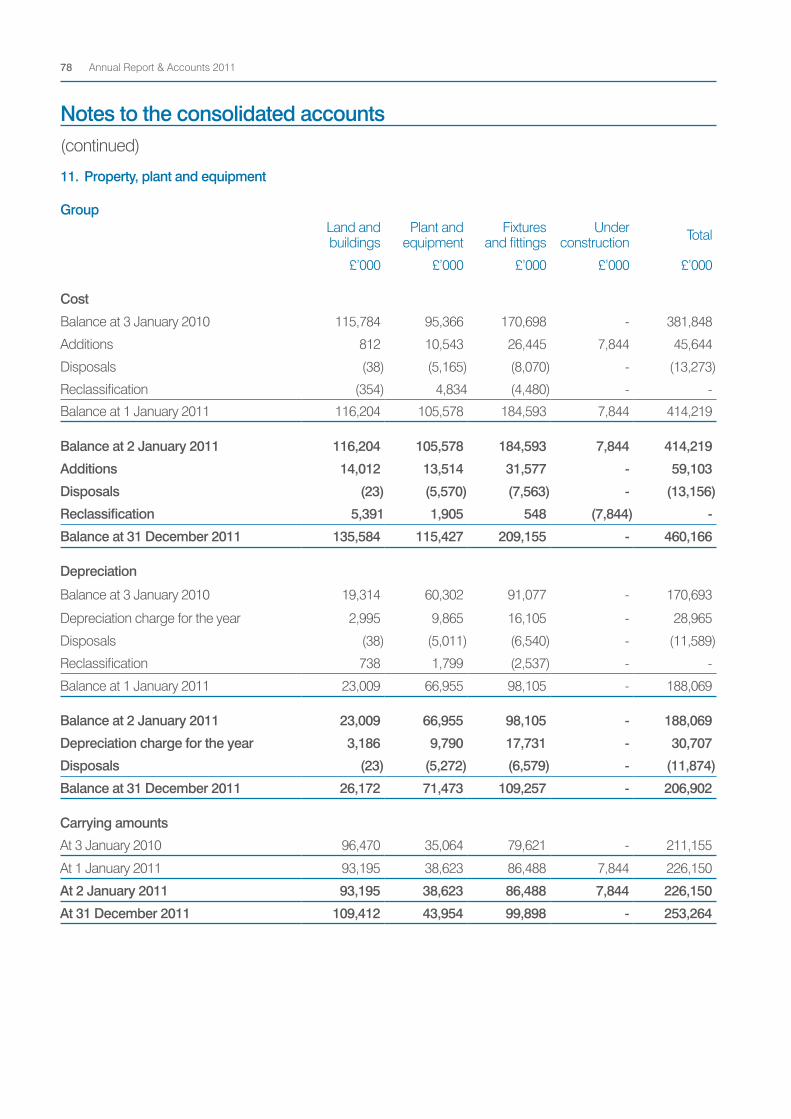
11. Property, plant and equipment
GroupLand and buildings
Plant and equipment
Fixtures and fittings
Under construction Total
£’000 £’000 £’000 £’000 £’000
Cost
Balance at 3 January 2010 115,784 95,366 170,698 - 381,848
Additions 812 10,543 26,445 7,844 45,644
Disposals (38) (5,165) (8,070) - (13,273)
Reclassification (354) 4,834 (4,480) - -
Balance at 1 January 2011 116,204 105,578 184,593 7,844 414,219
Balance at 2 January 2011 116,204 105,578 184,593 7,844 414,219
Additions 14,012 13,514 31,577 - 59,103
Disposals (23) (5,570) (7,563) - (13,156)
Reclassification 5,391 1,905 548 (7,844) -
Balance at 31 December 2011 135,584 115,427 209,155 - 460,166
Depreciation
Balance at 3 January 2010 19,314 60,302 91,077 - 170,693
Depreciation charge for the year 2,995 9,865 16,105 - 28,965
Disposals (38) (5,011) (6,540) - (11,589)
Reclassification 738 1,799 (2,537) - -
Balance at 1 January 2011 23,009 66,955 98,105 - 188,069 Balance at 2 January 2011 23,009 66,955 98,105 - 188,069
Depreciation charge for the year 3,186 9,790 17,731 - 30,707
Disposals (23) (5,272) (6,579) - (11,874)
Balance at 31 December 2011 26,172 71,473 109,257 - 206,902
Carrying amounts
At 3 January 2010 96,470 35,064 79,621 - 211,155
At 1 January 2011 93,195 38,623 86,488 7,844 226,150
At 2 January 2011 93,195 38,623 86,488 7,844 226,150
At 31 December 2011 109,412 43,954 99,898 - 253,264
Notes to the consolidated accounts(continued)
Annual Report & Accounts 201178
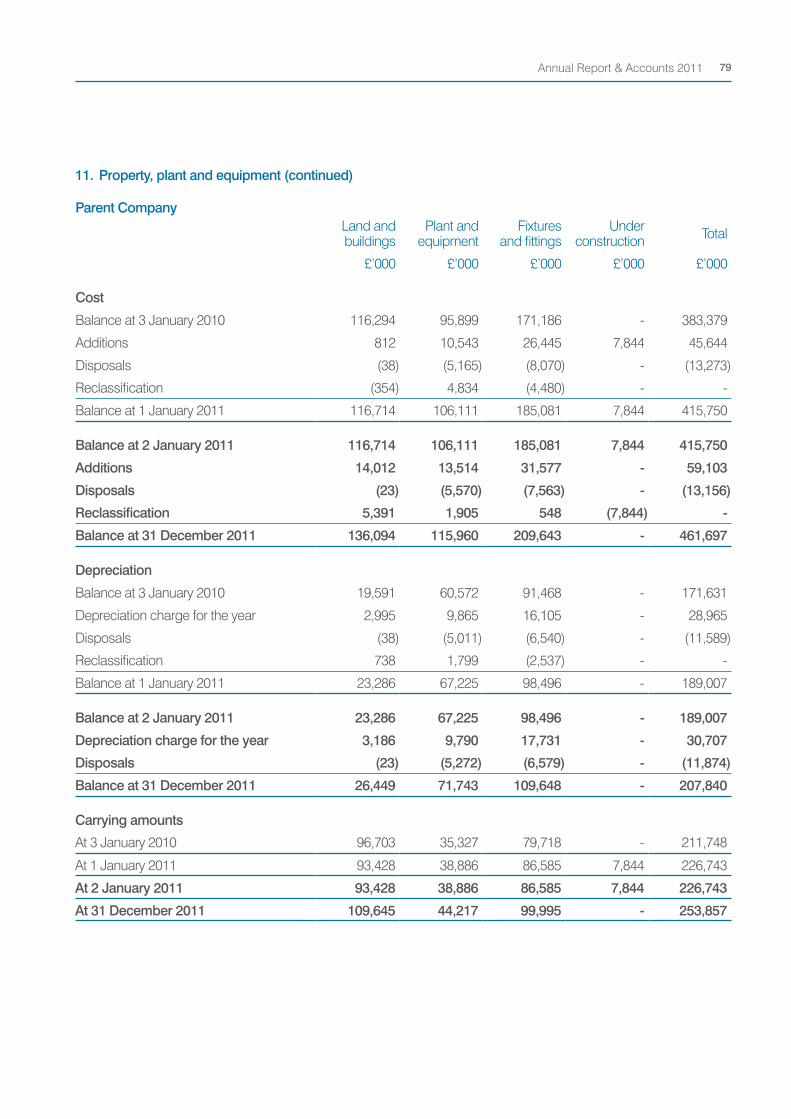
Parent CompanyLand and buildings
Plant and equipment
Fixtures and fittings
Under construction Total
£’000 £’000 £’000 £’000 £’000
Cost
Balance at 3 January 2010 116,294 95,899 171,186 - 383,379
Additions 812 10,543 26,445 7,844 45,644
Disposals (38) (5,165) (8,070) - (13,273)
Reclassification (354) 4,834 (4,480) - -
Balance at 1 January 2011 116,714 106,111 185,081 7,844 415,750
Balance at 2 January 2011 116,714 106,111 185,081 7,844 415,750
Additions 14,012 13,514 31,577 - 59,103
Disposals (23) (5,570) (7,563) - (13,156)
Reclassification 5,391 1,905 548 (7,844) -
Balance at 31 December 2011 136,094 115,960 209,643 - 461,697
Depreciation
Balance at 3 January 2010 19,591 60,572 91,468 - 171,631
Depreciation charge for the year 2,995 9,865 16,105 - 28,965
Disposals (38) (5,011) (6,540) - (11,589)
Reclassification 738 1,799 (2,537) - -
Balance at 1 January 2011 23,286 67,225 98,496 - 189,007
Balance at 2 January 2011 23,286 67,225 98,496 - 189,007
Depreciation charge for the year 3,186 9,790 17,731 - 30,707
Disposals (23) (5,272) (6,579) - (11,874)
Balance at 31 December 2011 26,449 71,743 109,648 - 207,840
Carrying amounts
At 3 January 2010 96,703 35,327 79,718 - 211,748
At 1 January 2011 93,428 38,886 86,585 7,844 226,743
At 2 January 2011 93,428 38,886 86,585 7,844 226,743
At 31 December 2011 109,645 44,217 99,995 - 253,857
11. Property, plant and equipment (continued)
Annual Report & Accounts 2011 79
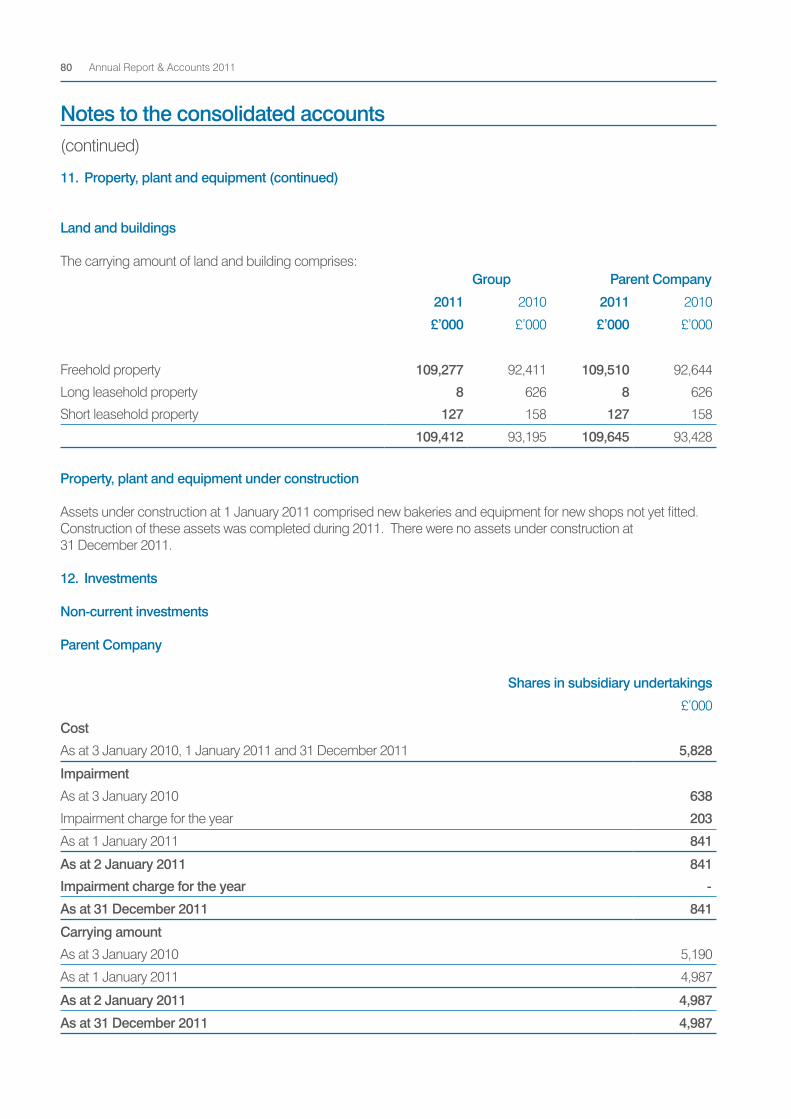
11. Property, plant and equipment (continued)
Land and buildings
The carrying amount of land and building comprises: Group Parent Company
2011 2010 2011 2010
£’000 £’000 £’000 £’000
Freehold property 109,277 92,411 109,510 92,644
Long leasehold property 8 626 8 626
Short leasehold property 127 158 127 158
109,412 93,195 109,645 93,428
Property, plant and equipment under construction
Assets under construction at 1 January 2011 comprised new bakeries and equipment for new shops not yet fitted. Construction of these assets was completed during 2011. There were no assets under construction at 31 December 2011.
12. Investments
Non-current investments
Parent Company
Shares in subsidiary undertakings
£’000
Cost
As at 3 January 2010, 1 January 2011 and 31 December 2011 5,828
Impairment
As at 3 January 2010 638
Impairment charge for the year 203
As at 1 January 2011 841
As at 2 January 2011 841
Impairment charge for the year -
As at 31 December 2011 841
Carrying amount
As at 3 January 2010 5,190
As at 1 January 2011 4,987
As at 2 January 2011 4,987
As at 31 December 2011 4,987
Notes to the consolidated accounts(continued)
Annual Report & Accounts 201180
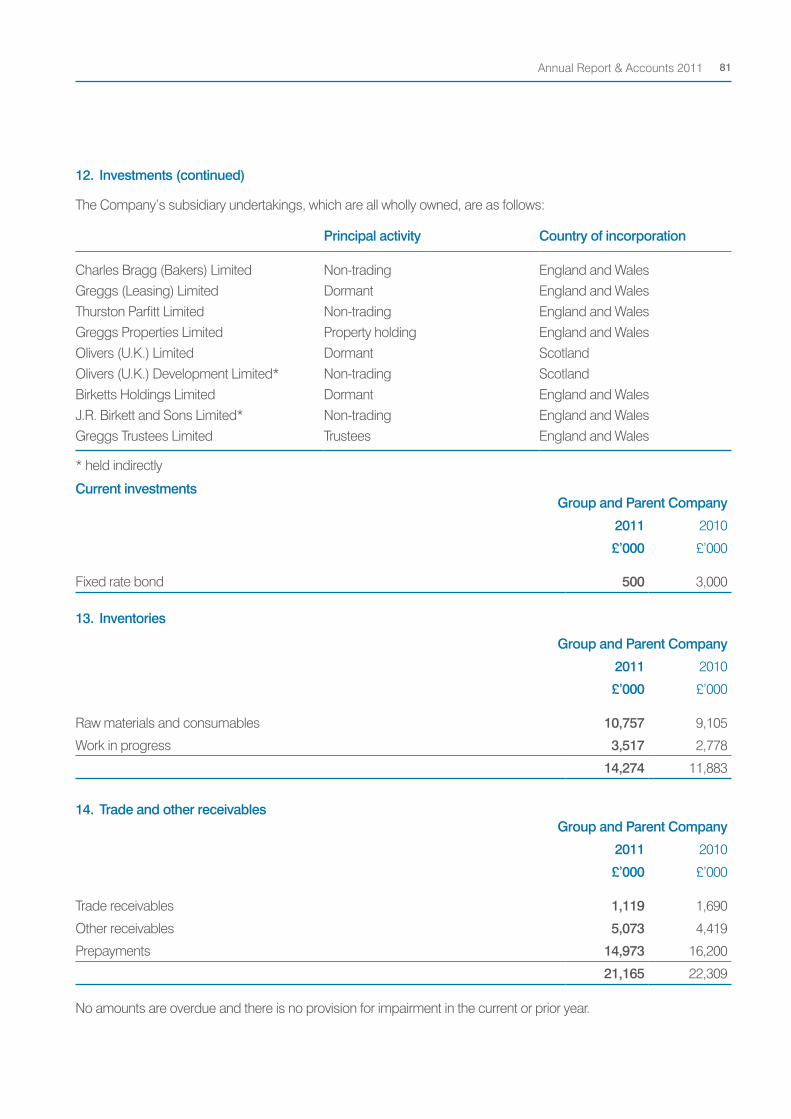
The Company’s subsidiary undertakings, which are all wholly owned, are as follows:
Principal activity Country of incorporation
Charles Bragg (Bakers) Limited Non-trading England and WalesGreggs (Leasing) Limited Dormant England and WalesThurston Parfitt Limited Non-trading England and WalesGreggs Properties Limited Property holding England and WalesOlivers (U.K.) Limited Dormant ScotlandOlivers (U.K.) Development Limited* Non-trading ScotlandBirketts Holdings Limited Dormant England and WalesJ.R. Birkett and Sons Limited* Non-trading England and WalesGreggs Trustees Limited Trustees England and Wales
* held indirectly
12. Investments (continued)
Current investmentsGroup and Parent Company
2011 2010
£’000 £’000
Fixed rate bond 500 3,000
13. Inventories
Group and Parent Company
2011 2010
£’000 £’000
Trade receivables 1,119 1,690
Other receivables 5,073 4,419
Prepayments 14,973 16,200
21,165 22,309
No amounts are overdue and there is no provision for impairment in the current or prior year.
Group and Parent Company
2011 2010
£’000 £’000
Raw materials and consumables 10,757 9,105
Work in progress 3,517 2,778
14,274 11,883
14. Trade and other receivables
Annual Report & Accounts 2011 81
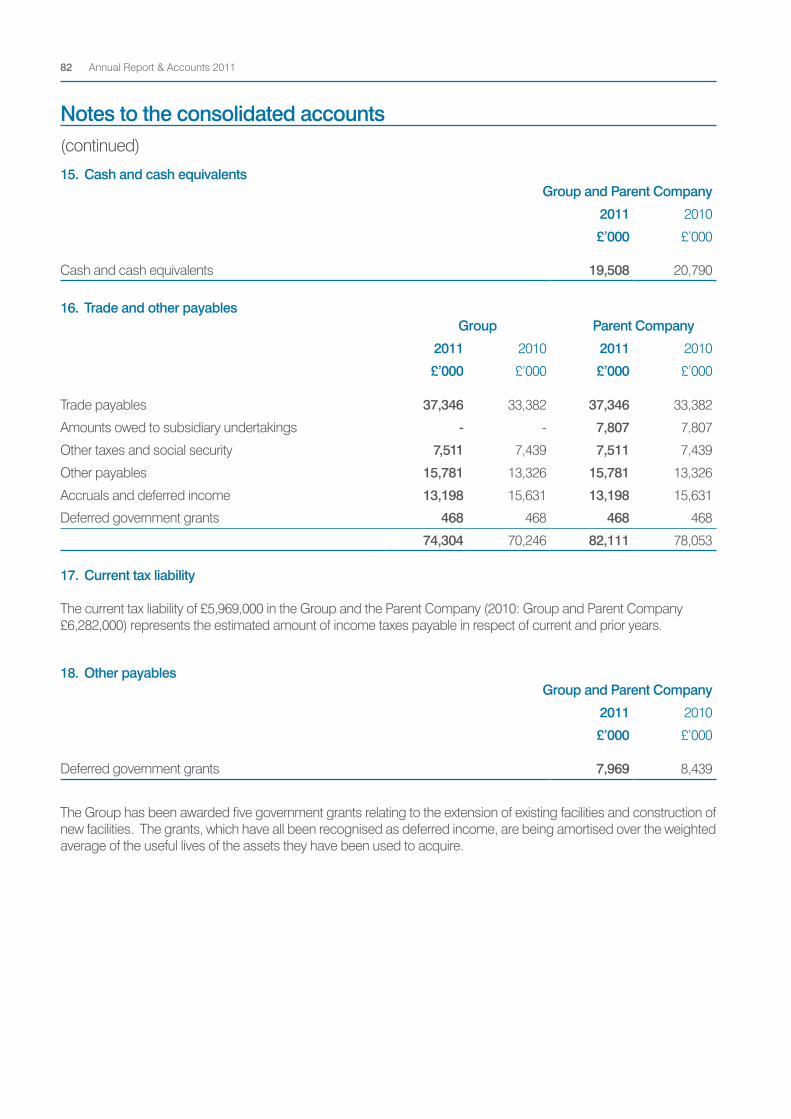
15. Cash and cash equivalents
16. Trade and other payables
17. Current tax liability
The current tax liability of £5,969,000 in the Group and the Parent Company (2010: Group and Parent Company £6,282,000) represents the estimated amount of income taxes payable in respect of current and prior years.
Group and Parent Company
2011 2010
£’000 £’000
Cash and cash equivalents 19,508 20,790
Group Parent Company
2011 2010 2011 2010
£’000 £’000 £’000 £’000
Trade payables 37,346 33,382 37,346 33,382
Amounts owed to subsidiary undertakings - - 7,807 7,807
Other taxes and social security 7,511 7,439 7,511 7,439
Other payables 15,781 13,326 15,781 13,326
Accruals and deferred income 13,198 15,631 13,198 15,631
Deferred government grants 468 468 468 468
74,304 70,246 82,111 78,053
18. Other payables
The Group has been awarded five government grants relating to the extension of existing facilities and construction of new facilities. The grants, which have all been recognised as deferred income, are being amortised over the weighted average of the useful lives of the assets they have been used to acquire.
Group and Parent Company
2011 2010
£’000 £’000
Deferred government grants 7,969 8,439
Notes to the consolidated accounts(continued)
Annual Report & Accounts 201182
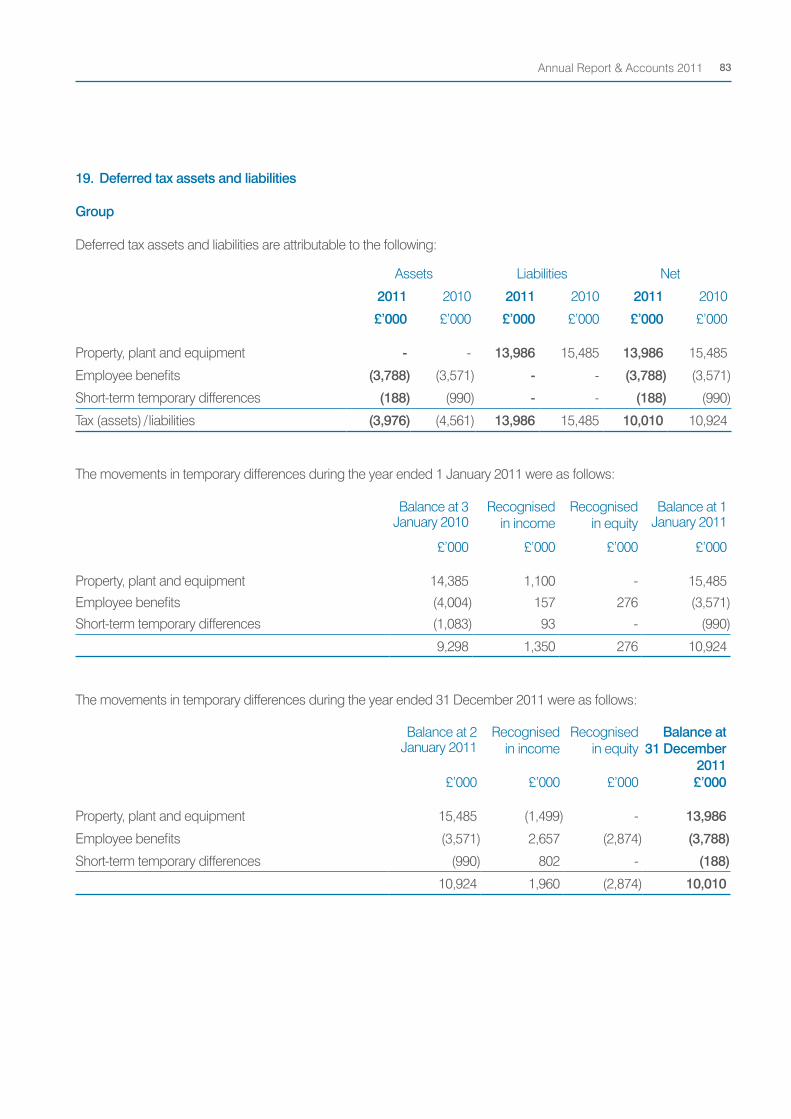
19. Deferred tax assets and liabilities
Group
Deferred tax assets and liabilities are attributable to the following:
The movements in temporary differences during the year ended 31 December 2011 were as follows:
Assets Liabilities Net
2011 2010 2011 2010 2011 2010
£’000 £’000 £’000 £’000 £’000 £’000
Property, plant and equipment - - 13,986 15,485 13,986 15,485
Employee benefits (3,788) (3,571) - - (3,788) (3,571)
Short-term temporary differences (188) (990) - - (188) (990)
Tax (assets) / liabilities (3,976) (4,561) 13,986 15,485 10,010 10,924
Balance at 3 January 2010
Recognised in income
Recognised in equity
Balance at 1 January 2011
£’000 £’000 £’000 £’000
Property, plant and equipment 14,385 1,100 - 15,485
Employee benefits (4,004) 157 276 (3,571)
Short-term temporary differences (1,083) 93 - (990)
9,298 1,350 276 10,924
Balance at 2 January 2011
Recognised in income
Recognised in equity
Balance at 31 December
2011 £’000 £’000 £’000 £’000
Property, plant and equipment 15,485 (1,499) - 13,986
Employee benefits (3,571) 2,657 (2,874) (3,788)
Short-term temporary differences (990) 802 - (188)
10,924 1,960 (2,874) 10,010
The movements in temporary differences during the year ended 1 January 2011 were as follows:
Annual Report & Accounts 2011 83
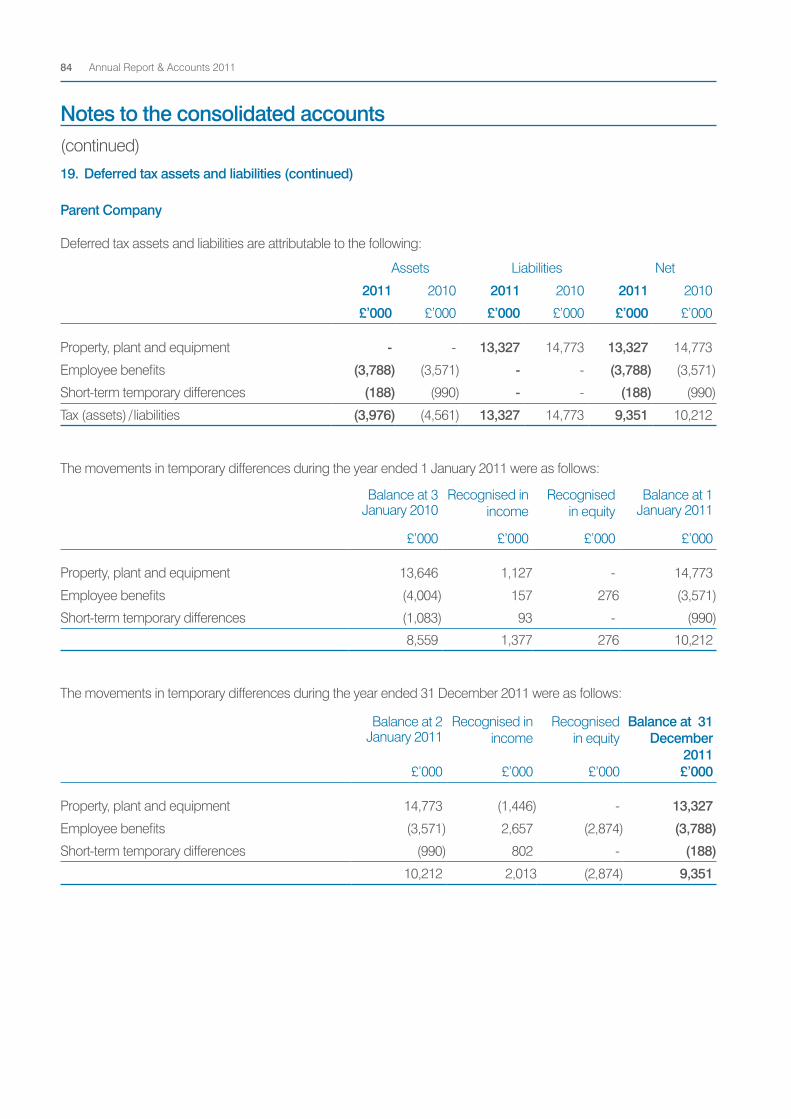
Parent Company
Deferred tax assets and liabilities are attributable to the following:
Assets Liabilities Net
2011 2010 2011 2010 2011 2010
£’000 £’000 £’000 £’000 £’000 £’000
Property, plant and equipment - - 13,327 14,773 13,327 14,773
Employee benefits (3,788) (3,571) - - (3,788) (3,571)
Short-term temporary differences (188) (990) - - (188) (990)
Tax (assets) / liabilities (3,976) (4,561) 13,327 14,773 9,351 10,212
19. Deferred tax assets and liabilities (continued)
The movements in temporary differences during the year ended 1 January 2011 were as follows:
The movements in temporary differences during the year ended 31 December 2011 were as follows:
Balance at 3 January 2010
Recognised in income
Recognised in equity
Balance at 1 January 2011
£’000 £’000 £’000 £’000
Property, plant and equipment 13,646 1,127 - 14,773
Employee benefits (4,004) 157 276 (3,571)
Short-term temporary differences (1,083) 93 - (990)
8,559 1,377 276 10,212
Balance at 2 January 2011
Recognised in income
Recognised in equity
Balance at 31 December
2011 £’000 £’000 £’000 £’000
Property, plant and equipment 14,773 (1,446) - 13,327
Employee benefits (3,571) 2,657 (2,874) (3,788)
Short-term temporary differences (990) 802 - (188)
10,212 2,013 (2,874) 9,351
Notes to the consolidated accounts(continued)
Annual Report & Accounts 201184
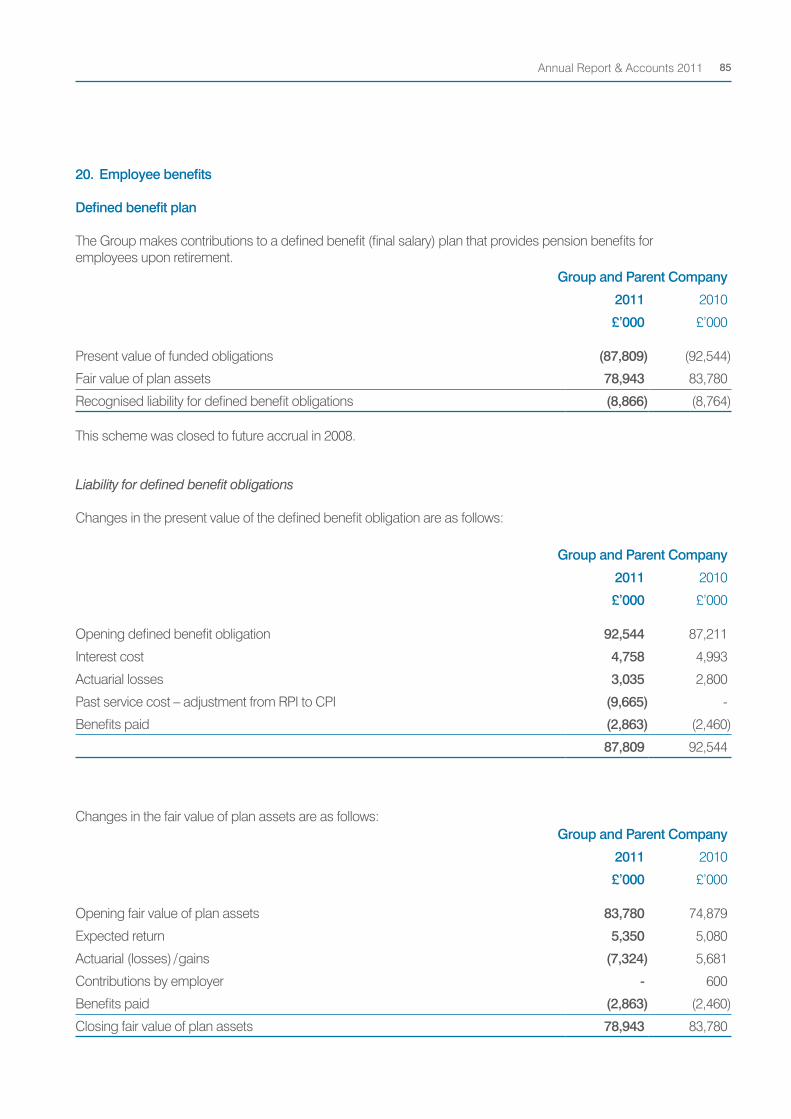
Liability for defined benefit obligations
Changes in the present value of the defined benefit obligation are as follows:
Group and Parent Company
2011 2010
£’000 £’000
Present value of funded obligations (87,809) (92,544)
Fair value of plan assets 78,943 83,780
Recognised liability for defined benefit obligations (8,866) (8,764)
This scheme was closed to future accrual in 2008.
20. Employee benefits
Defined benefit plan
The Group makes contributions to a defined benefit (final salary) plan that provides pension benefits for employees upon retirement.
Changes in the fair value of plan assets are as follows:Group and Parent Company
2011 2010
£’000 £’000
Opening fair value of plan assets 83,780 74,879
Expected return 5,350 5,080
Actuarial (losses) / gains (7,324) 5,681
Contributions by employer - 600
Benefits paid (2,863) (2,460)
Closing fair value of plan assets 78,943 83,780
Group and Parent Company
2011 2010
£’000 £’000
Opening defined benefit obligation 92,544 87,211
Interest cost 4,758 4,993
Actuarial losses 3,035 2,800
Past service cost – adjustment from RPI to CPI (9,665) -
Benefits paid (2,863) (2,460)
87,809 92,544
Annual Report & Accounts 2011 85
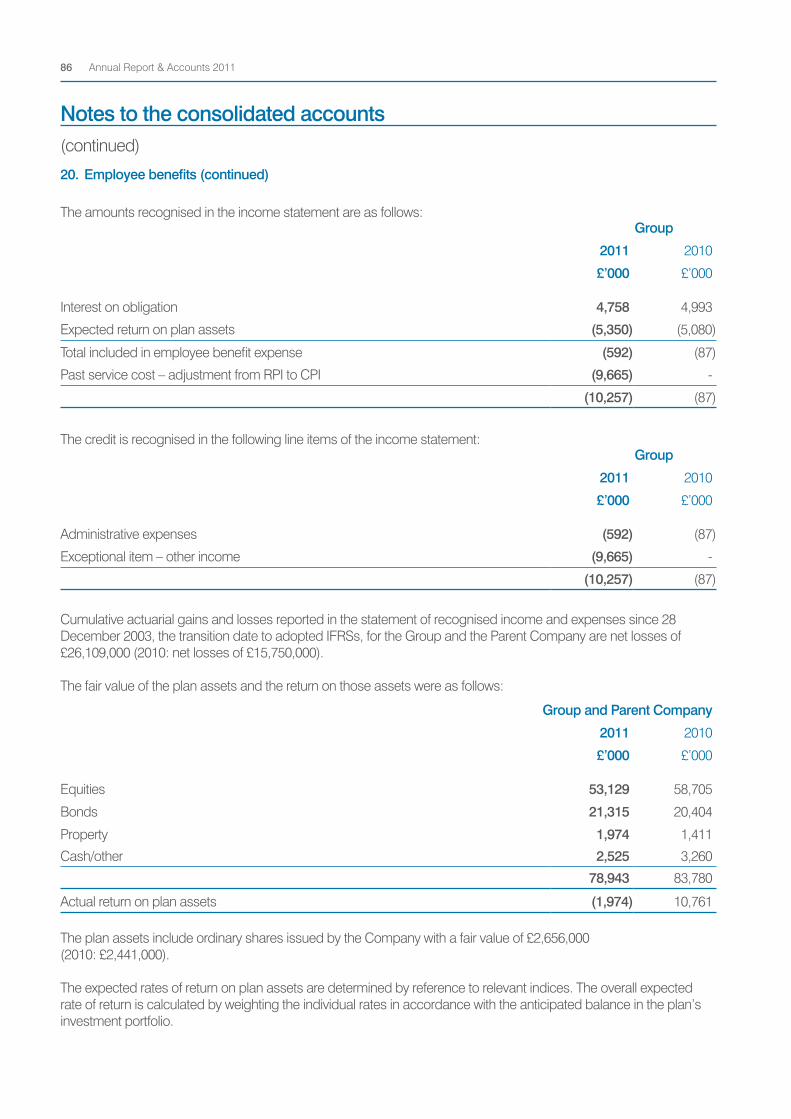
The amounts recognised in the income statement are as follows:
The credit is recognised in the following line items of the income statement:
Group
2011 2010
£’000 £’000
Interest on obligation 4,758 4,993
Expected return on plan assets (5,350) (5,080)
Total included in employee benefit expense (592) (87)
Past service cost – adjustment from RPI to CPI (9,665) -
(10,257) (87)
Group
2011 2010
£’000 £’000
Administrative expenses (592) (87)
Exceptional item – other income (9,665) -
(10,257) (87)
Cumulative actuarial gains and losses reported in the statement of recognised income and expenses since 28 December 2003, the transition date to adopted IFRSs, for the Group and the Parent Company are net losses of £26,109,000 (2010: net losses of £15,750,000).
The fair value of the plan assets and the return on those assets were as follows:
Group and Parent Company
2011 2010
£’000 £’000
Equities 53,129 58,705
Bonds 21,315 20,404
Property 1,974 1,411
Cash/other 2,525 3,260
78,943 83,780
Actual return on plan assets (1,974) 10,761
The plan assets include ordinary shares issued by the Company with a fair value of £2,656,000 (2010: £2,441,000).
The expected rates of return on plan assets are determined by reference to relevant indices. The overall expected rate of return is calculated by weighting the individual rates in accordance with the anticipated balance in the plan’s investment portfolio.
20. Employee benefits (continued)
Notes to the consolidated accounts(continued)
Annual Report & Accounts 201186
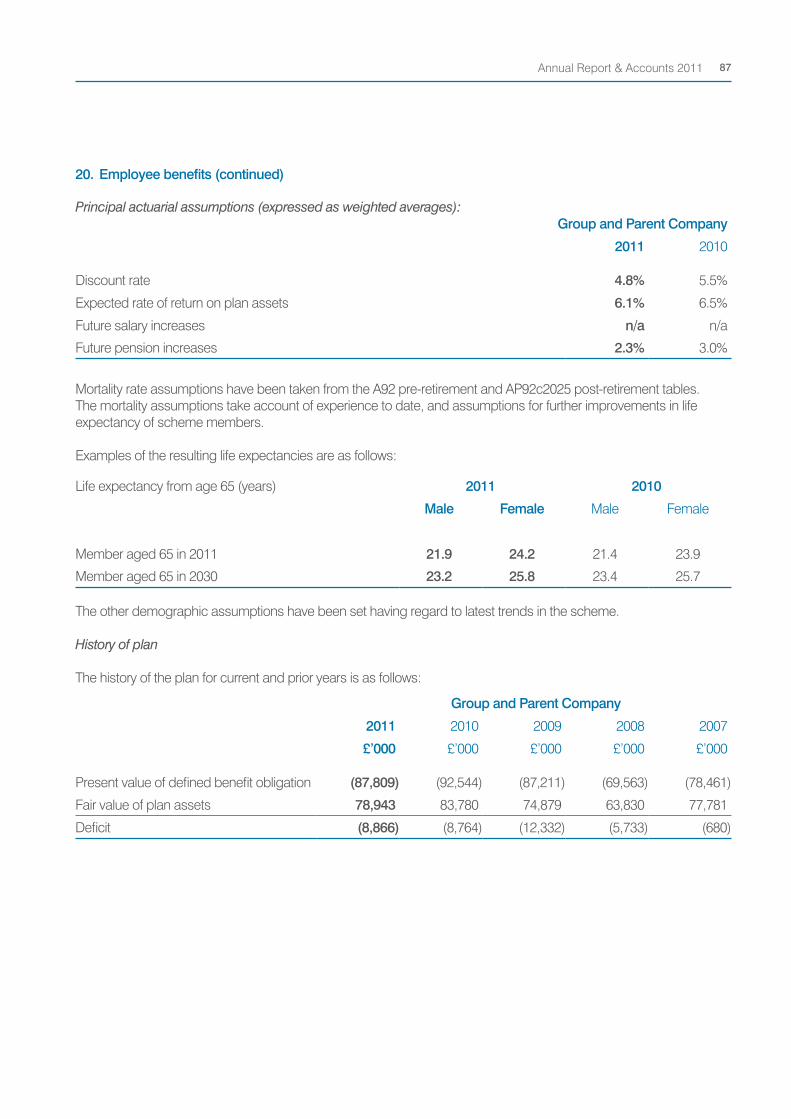
Principal actuarial assumptions (expressed as weighted averages):
Mortality rate assumptions have been taken from the A92 pre-retirement and AP92c2025 post-retirement tables. The mortality assumptions take account of experience to date, and assumptions for further improvements in life expectancy of scheme members.
Examples of the resulting life expectancies are as follows:
Group and Parent Company
2011 2010
Discount rate 4.8% 5.5%
Expected rate of return on plan assets 6.1% 6.5%
Future salary increases n/a n/a
Future pension increases 2.3% 3.0%
Life expectancy from age 65 (years) 2011 2010
Male Female Male Female
Member aged 65 in 2011 21.9 24.2 21.4 23.9
Member aged 65 in 2030 23.2 25.8 23.4 25.7
The other demographic assumptions have been set having regard to latest trends in the scheme.
History of plan
The history of the plan for current and prior years is as follows:
Group and Parent Company
2011 2010 2009 2008 2007
£’000 £’000 £’000 £’000 £’000
Present value of defined benefit obligation (87,809) (92,544) (87,211) (69,563) (78,461)
Fair value of plan assets 78,943 83,780 74,879 63,830 77,781
Deficit (8,866) (8,764) (12,332) (5,733) (680)
20. Employee benefits (continued)
Annual Report & Accounts 2011 87
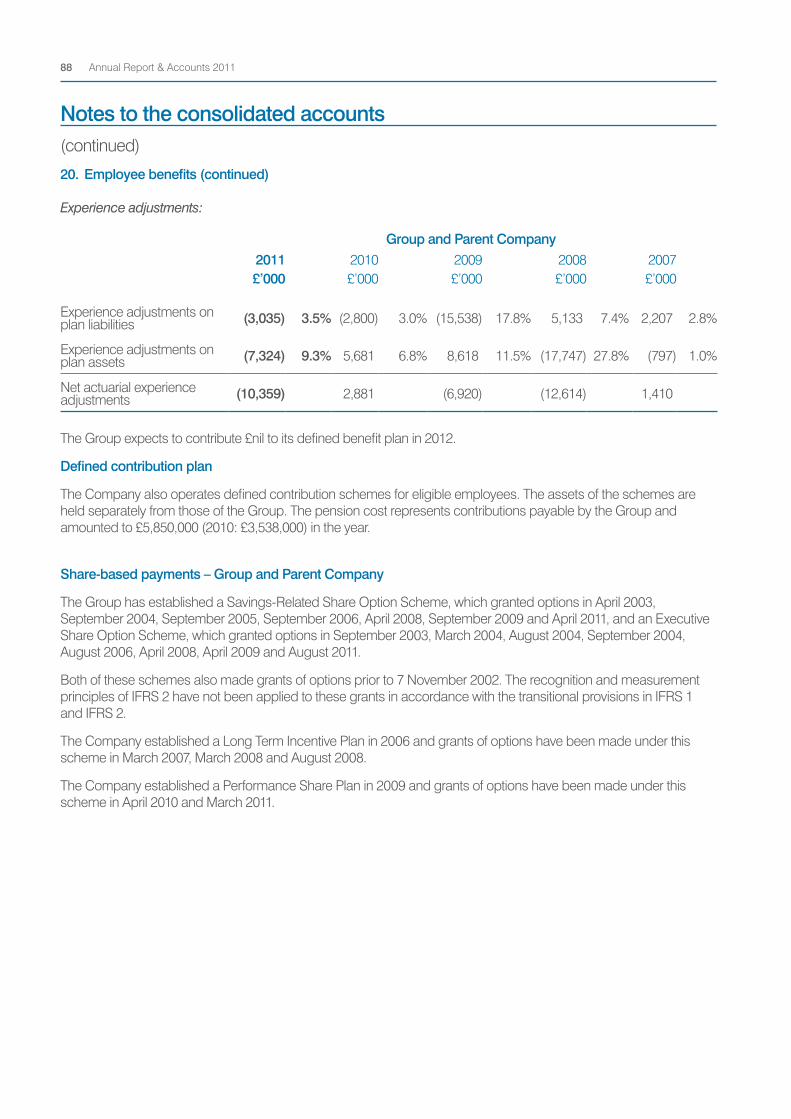
The Group expects to contribute £nil to its defined benefit plan in 2012.
Defined contribution plan
The Company also operates defined contribution schemes for eligible employees. The assets of the schemes are held separately from those of the Group. The pension cost represents contributions payable by the Group and amounted to £5,850,000 (2010: £3,538,000) in the year.
Share-based payments – Group and Parent Company
The Group has established a Savings-Related Share Option Scheme, which granted options in April 2003, September 2004, September 2005, September 2006, April 2008, September 2009 and April 2011, and an Executive Share Option Scheme, which granted options in September 2003, March 2004, August 2004, September 2004, August 2006, April 2008, April 2009 and August 2011.
Both of these schemes also made grants of options prior to 7 November 2002. The recognition and measurement principles of IFRS 2 have not been applied to these grants in accordance with the transitional provisions in IFRS 1 and IFRS 2.
The Company established a Long Term Incentive Plan in 2006 and grants of options have been made under this scheme in March 2007, March 2008 and August 2008.
The Company established a Performance Share Plan in 2009 and grants of options have been made under this scheme in April 2010 and March 2011.
20. Employee benefits (continued)
Experience adjustments:
Group and Parent Company2011 2010 2009 2008 2007£’000 £’000 £’000 £’000 £’000
Experience adjustments on plan liabilities (3,035) 3.5% (2,800) 3.0% (15,538) 17.8% 5,133 7.4% 2,207 2.8%
Experience adjustments on plan assets (7,324) 9.3% 5,681 6.8% 8,618 11.5% (17,747) 27.8% (797) 1.0%
Net actuarial experience adjustments (10,359) 2,881 (6,920) (12,614) 1,410
Notes to the consolidated accounts(continued)
Annual Report & Accounts 201188
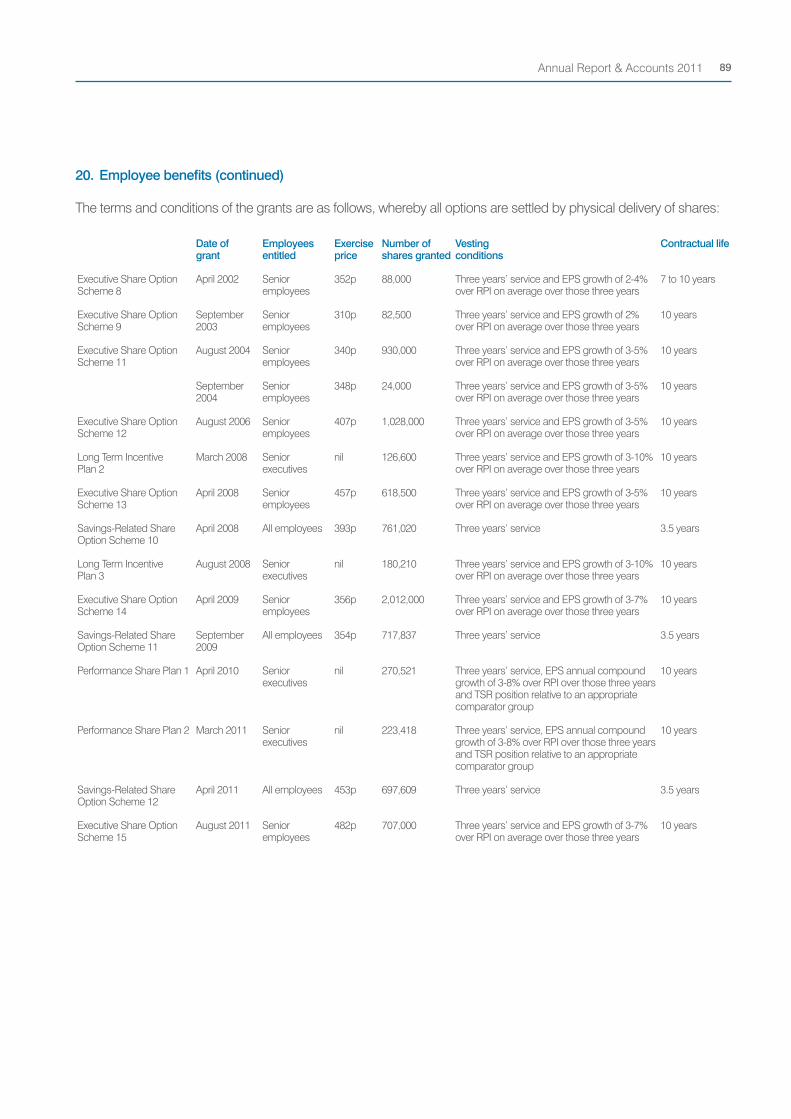
The terms and conditions of the grants are as follows, whereby all options are settled by physical delivery of shares:
Date of grant
Employees entitled
Exercise price
Number of shares granted
Vesting conditions
Contractual life
Executive Share Option Scheme 8
April 2002 Senior employees
352p 88,000 Three years’ service and EPS growth of 2-4% over RPI on average over those three years
7 to 10 years
Executive Share Option Scheme 9
September 2003
Senior employees
310p 82,500 Three years’ service and EPS growth of 2% over RPI on average over those three years
10 years
Executive Share Option Scheme 11
August 2004 Senior employees
340p 930,000 Three years’ service and EPS growth of 3-5% over RPI on average over those three years
10 years
September 2004
Senior employees
348p 24,000 Three years’ service and EPS growth of 3-5% over RPI on average over those three years
10 years
Executive Share Option Scheme 12
August 2006 Senior employees
407p 1,028,000 Three years’ service and EPS growth of 3-5% over RPI on average over those three years
10 years
Long Term Incentive Plan 2
March 2008 Senior executives
nil 126,600 Three years’ service and EPS growth of 3-10% over RPI on average over those three years
10 years
Executive Share Option Scheme 13
April 2008 Senior employees
457p 618,500 Three years’ service and EPS growth of 3-5% over RPI on average over those three years
10 years
Savings-Related Share Option Scheme 10
April 2008 All employees 393p 761,020 Three years’ service 3.5 years
Long Term Incentive Plan 3
August 2008 Senior executives
nil 180,210 Three years’ service and EPS growth of 3-10% over RPI on average over those three years
10 years
Executive Share Option Scheme 14
April 2009 Senior employees
356p 2,012,000 Three years’ service and EPS growth of 3-7% over RPI on average over those three years
10 years
Savings-Related Share Option Scheme 11
September 2009
All employees 354p 717,837 Three years’ service 3.5 years
Performance Share Plan 1 April 2010 Senior executives
nil 270,521 Three years’ service, EPS annual compound growth of 3-8% over RPI over those three years and TSR position relative to an appropriate comparator group
10 years
Performance Share Plan 2 March 2011 Senior executives
nil 223,418 Three years’ service, EPS annual compound growth of 3-8% over RPI over those three years and TSR position relative to an appropriate comparator group
10 years
Savings-Related Share Option Scheme 12
April 2011 All employees 453p 697,609 Three years’ service 3.5 years
Executive Share Option Scheme 15
August 2011 Senior employees
482p 707,000 Three years’ service and EPS growth of 3-7% over RPI on average over those three years
10 years
20. Employee benefits (continued)
Annual Report & Accounts 2011 89
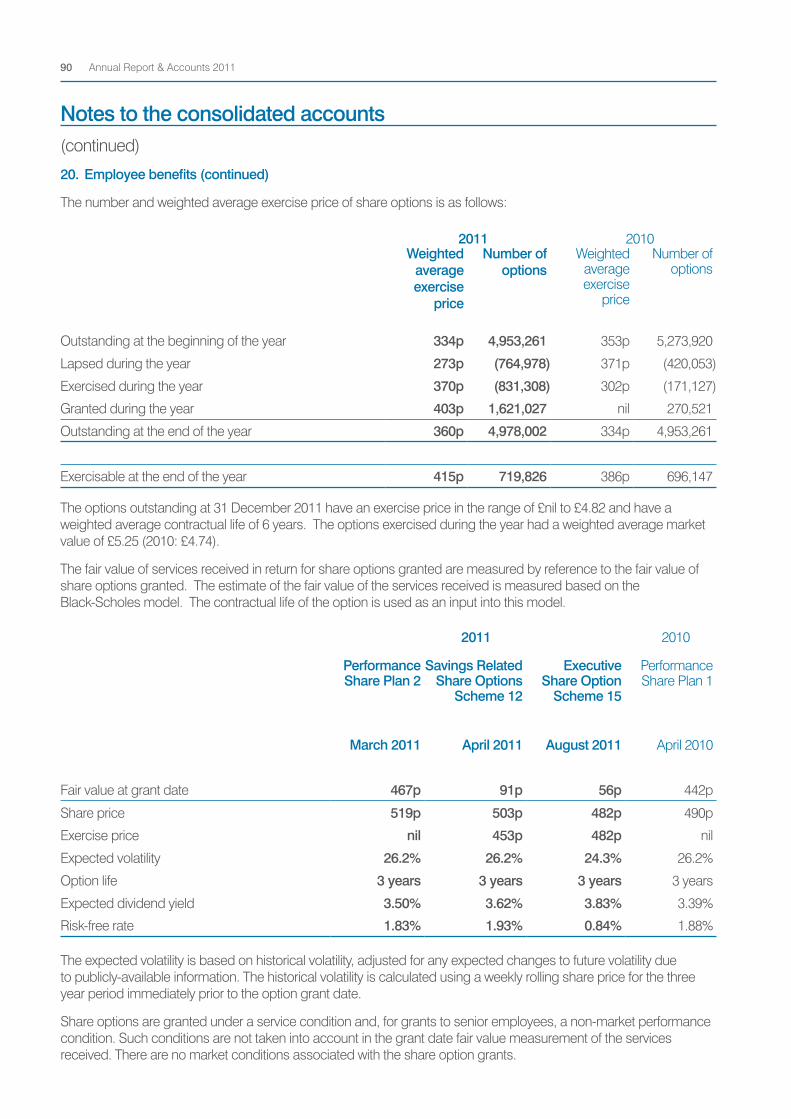
2011 2010Weighted
average exercise
price
Number of options
Weighted average exercise
price
Number of options
Outstanding at the beginning of the year 334p 4,953,261 353p 5,273,920
Lapsed during the year 273p (764,978) 371p (420,053)
Exercised during the year 370p (831,308) 302p (171,127)
Granted during the year 403p 1,621,027 nil 270,521
Outstanding at the end of the year 360p 4,978,002 334p 4,953,261
Exercisable at the end of the year 415p 719,826 386p 696,147
The options outstanding at 31 December 2011 have an exercise price in the range of £nil to £4.82 and have a weighted average contractual life of 6 years. The options exercised during the year had a weighted average market value of £5.25 (2010: £4.74).
The fair value of services received in return for share options granted are measured by reference to the fair value of share options granted. The estimate of the fair value of the services received is measured based on the Black-Scholes model. The contractual life of the option is used as an input into this model.
2011 2010
Performance Share Plan 2
Savings Related Share Options
Scheme 12
Executive Share Option
Scheme 15
Performance Share Plan 1
March 2011 April 2011 August 2011 April 2010
Fair value at grant date 467p 91p 56p 442p
Share price 519p 503p 482p 490p
Exercise price nil 453p 482p nil
Expected volatility 26.2% 26.2% 24.3% 26.2%
Option life 3 years 3 years 3 years 3 years
Expected dividend yield 3.50% 3.62% 3.83% 3.39%
Risk-free rate 1.83% 1.93% 0.84% 1.88%
The number and weighted average exercise price of share options is as follows:
The expected volatility is based on historical volatility, adjusted for any expected changes to future volatility due to publicly-available information. The historical volatility is calculated using a weekly rolling share price for the three year period immediately prior to the option grant date.
Share options are granted under a service condition and, for grants to senior employees, a non-market performance condition. Such conditions are not taken into account in the grant date fair value measurement of the services received. There are no market conditions associated with the share option grants.
20. Employee benefits (continued)
Notes to the consolidated accounts(continued)
Annual Report & Accounts 201190
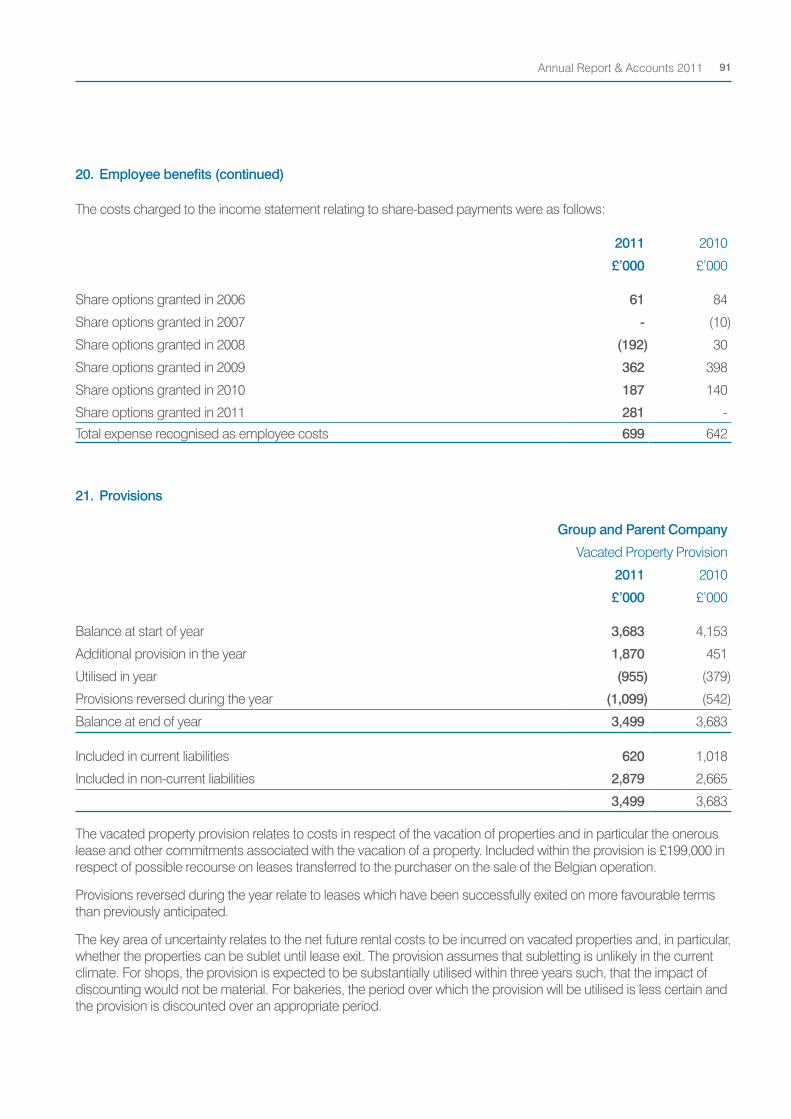
The costs charged to the income statement relating to share-based payments were as follows:
2011 2010
£’000 £’000
Share options granted in 2006 61 84
Share options granted in 2007 - (10)
Share options granted in 2008 (192) 30
Share options granted in 2009 362 398
Share options granted in 2010 187 140
Share options granted in 2011 281 -
Total expense recognised as employee costs 699 642
21. Provisions
Group and Parent Company
Vacated Property Provision
2011 2010
£’000 £’000
Balance at start of year 3,683 4,153
Additional provision in the year 1,870 451
Utilised in year (955) (379)
Provisions reversed during the year (1,099) (542)
Balance at end of year 3,499 3,683
Included in current liabilities 620 1,018
Included in non-current liabilities 2,879 2,665
3,499 3,683
The vacated property provision relates to costs in respect of the vacation of properties and in particular the onerous lease and other commitments associated with the vacation of a property. Included within the provision is £199,000 in respect of possible recourse on leases transferred to the purchaser on the sale of the Belgian operation.
Provisions reversed during the year relate to leases which have been successfully exited on more favourable terms than previously anticipated.
The key area of uncertainty relates to the net future rental costs to be incurred on vacated properties and, in particular, whether the properties can be sublet until lease exit. The provision assumes that subletting is unlikely in the current climate. For shops, the provision is expected to be substantially utilised within three years such, that the impact of discounting would not be material. For bakeries, the period over which the provision will be utilised is less certain and the provision is discounted over an appropriate period.
20. Employee benefits (continued)
Annual Report & Accounts 2011 91
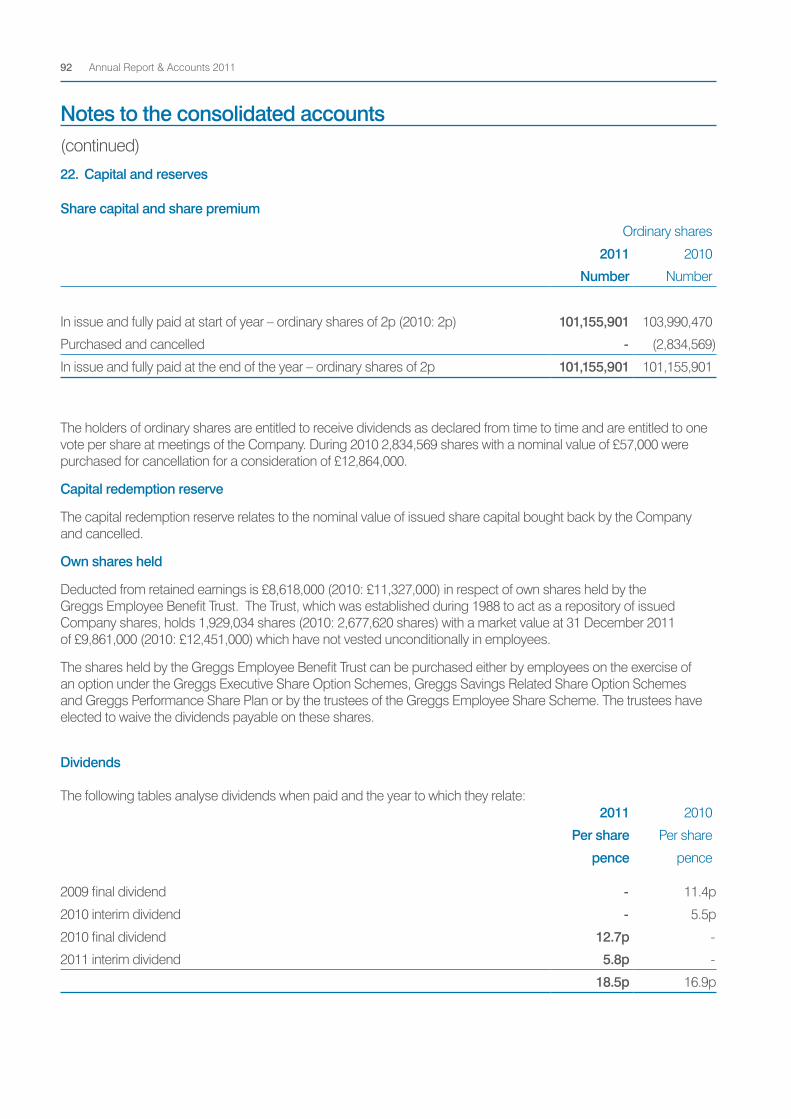
Dividends
The following tables analyse dividends when paid and the year to which they relate:2011 2010
Per share Per share
pence pence
2009 final dividend - 11.4p
2010 interim dividend - 5.5p
2010 final dividend 12.7p -
2011 interim dividend 5.8p -
18.5p 16.9p
Share capital and share premium
Ordinary shares
2011 2010
Number Number
In issue and fully paid at start of year – ordinary shares of 2p (2010: 2p) 101,155,901 103,990,470
Purchased and cancelled - (2,834,569)
In issue and fully paid at the end of the year – ordinary shares of 2p 101,155,901 101,155,901
The holders of ordinary shares are entitled to receive dividends as declared from time to time and are entitled to one vote per share at meetings of the Company. During 2010 2,834,569 shares with a nominal value of £57,000 were purchased for cancellation for a consideration of £12,864,000.
Capital redemption reserve
The capital redemption reserve relates to the nominal value of issued share capital bought back by the Company and cancelled.
Own shares held
Deducted from retained earnings is £8,618,000 (2010: £11,327,000) in respect of own shares held by the Greggs Employee Benefit Trust. The Trust, which was established during 1988 to act as a repository of issued Company shares, holds 1,929,034 shares (2010: 2,677,620 shares) with a market value at 31 December 2011 of £9,861,000 (2010: £12,451,000) which have not vested unconditionally in employees.
The shares held by the Greggs Employee Benefit Trust can be purchased either by employees on the exercise of an option under the Greggs Executive Share Option Schemes, Greggs Savings Related Share Option Schemes and Greggs Performance Share Plan or by the trustees of the Greggs Employee Share Scheme. The trustees have elected to waive the dividends payable on these shares.
22. Capital and reserves
Notes to the consolidated accounts(continued)
Annual Report & Accounts 201192
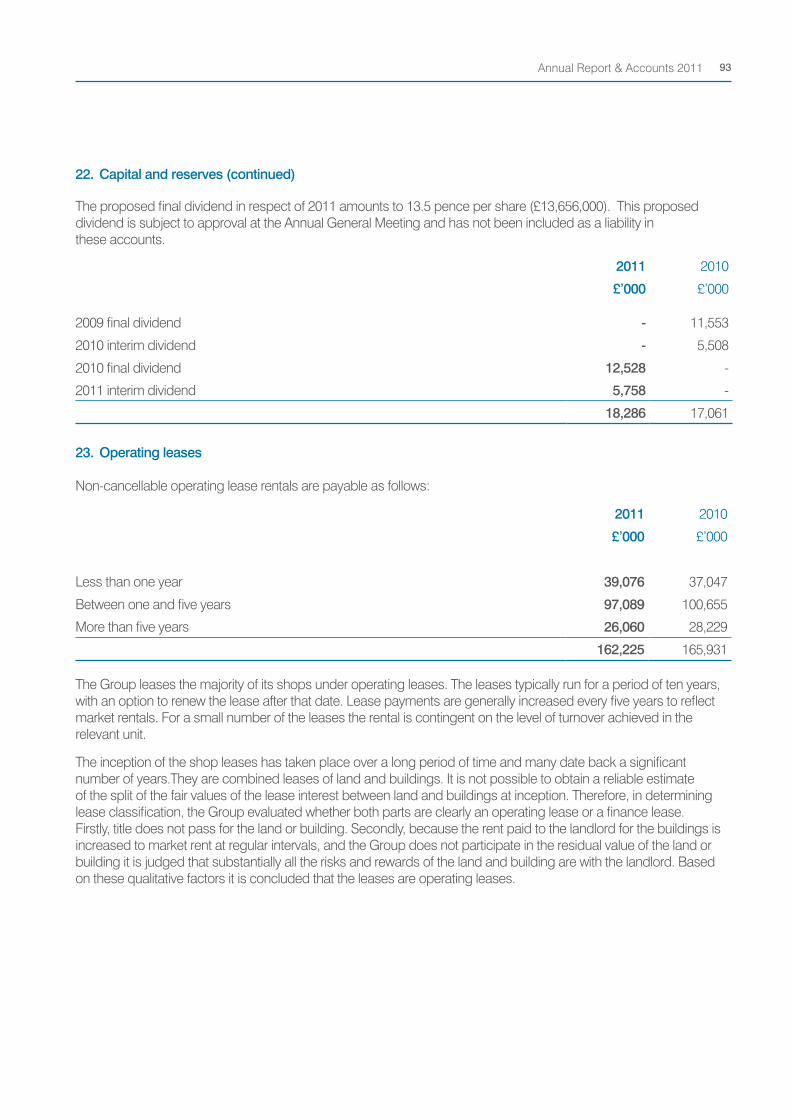
The proposed final dividend in respect of 2011 amounts to 13.5 pence per share (£13,656,000). This proposed dividend is subject to approval at the Annual General Meeting and has not been included as a liability in these accounts.
2011 2010
£’000 £’000
2009 final dividend - 11,553
2010 interim dividend - 5,508
2010 final dividend 12,528 -
2011 interim dividend 5,758 -
18,286 17,061
23. Operating leases
Non-cancellable operating lease rentals are payable as follows:
2011 2010
£’000 £’000
Less than one year 39,076 37,047
Between one and five years 97,089 100,655
More than five years 26,060 28,229
162,225 165,931
The Group leases the majority of its shops under operating leases. The leases typically run for a period of ten years, with an option to renew the lease after that date. Lease payments are generally increased every five years to reflect market rentals. For a small number of the leases the rental is contingent on the level of turnover achieved in the relevant unit.
The inception of the shop leases has taken place over a long period of time and many date back a significant number of years.They are combined leases of land and buildings. It is not possible to obtain a reliable estimate of the split of the fair values of the lease interest between land and buildings at inception. Therefore, in determining lease classification, the Group evaluated whether both parts are clearly an operating lease or a finance lease. Firstly, title does not pass for the land or building. Secondly, because the rent paid to the landlord for the buildings is increased to market rent at regular intervals, and the Group does not participate in the residual value of the land or building it is judged that substantially all the risks and rewards of the land and building are with the landlord. Based on these qualitative factors it is concluded that the leases are operating leases.
22. Capital and reserves (continued)
Annual Report & Accounts 2011 93
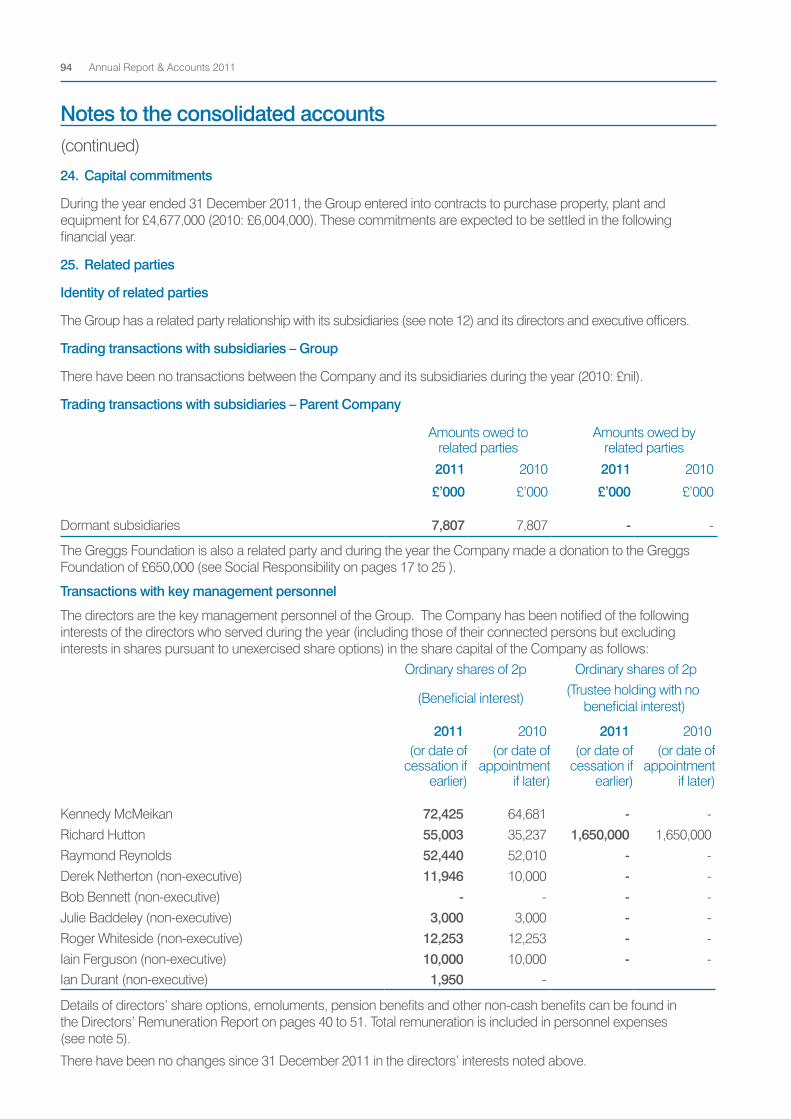
The Greggs Foundation is also a related party and during the year the Company made a donation to the Greggs Foundation of £650,000 (see Social Responsibility on pages 17 to 25 ).
Details of directors’ share options, emoluments, pension benefits and other non-cash benefits can be found in the Directors’ Remuneration Report on pages 40 to 51. Total remuneration is included in personnel expenses (see note 5).
There have been no changes since 31 December 2011 in the directors’ interests noted above.
24. Capital commitments
During the year ended 31 December 2011, the Group entered into contracts to purchase property, plant and equipment for £4,677,000 (2010: £6,004,000). These commitments are expected to be settled in the following financial year.
25. Related parties
Identity of related parties
The Group has a related party relationship with its subsidiaries (see note 12) and its directors and executive officers.
Trading transactions with subsidiaries – Group
There have been no transactions between the Company and its subsidiaries during the year (2010: £nil).
Trading transactions with subsidiaries – Parent Company
Amounts owed to related parties
Amounts owed by related parties
2011 2010 2011 2010
£’000 £’000 £’000 £’000
Dormant subsidiaries 7,807 7,807 - -
Transactions with key management personnel
The directors are the key management personnel of the Group. The Company has been notified of the following interests of the directors who served during the year (including those of their connected persons but excluding interests in shares pursuant to unexercised share options) in the share capital of the Company as follows:
Ordinary shares of 2p Ordinary shares of 2p
(Beneficial interest) (Trustee holding with no beneficial interest)
2011 2010 2011 2010(or date of
cessation if earlier)
(or date of appointment
if later)
(or date of cessation if
earlier)
(or date of appointment
if later)
Kennedy McMeikan 72,425 64,681 - - Richard Hutton 55,003 35,237 1,650,000 1,650,000 Raymond Reynolds 52,440 52,010 - - Derek Netherton (non-executive) 11,946 10,000 - - Bob Bennett (non-executive) - - - - Julie Baddeley (non-executive) 3,000 3,000 - - Roger Whiteside (non-executive) 12,253 12,253 - - Iain Ferguson (non-executive) 10,000 10,000 - - Ian Durant (non-executive) 1,950 -
Notes to the consolidated accounts(continued)
Annual Report & Accounts 201194
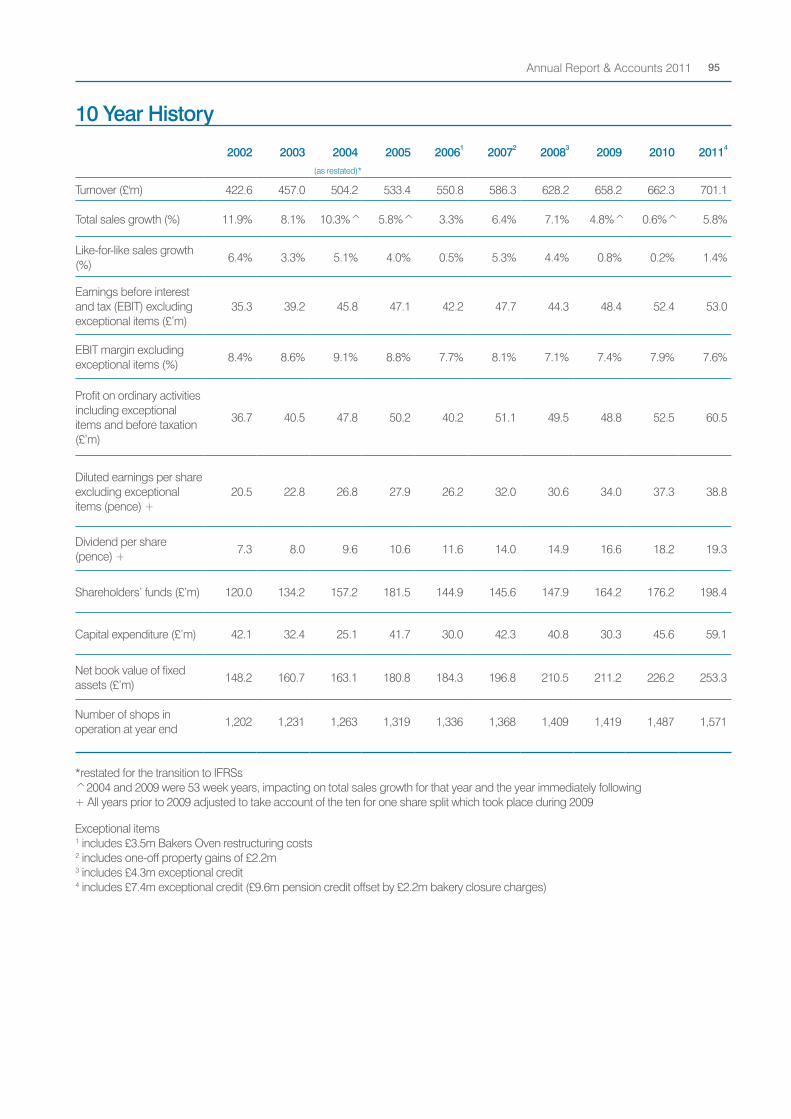
2002 2003 2004 2005 20061 20072 20083 2009 2010 20114
(as restated)*
Turnover (£'m) 422.6 457.0 504.2 533.4 550.8 586.3 628.2 658.2 662.3 701.1
Total sales growth (%) 11.9% 8.1% 10.3%^ 5.8%^ 3.3% 6.4% 7.1% 4.8%^ 0.6%^ 5.8%
Like-for-like sales growth (%)
6.4% 3.3% 5.1% 4.0% 0.5% 5.3% 4.4% 0.8% 0.2% 1.4%
Earnings before interest and tax (EBIT) excluding exceptional items (£’m)
35.3 39.2 45.8 47.1 42.2 47.7 44.3 48.4 52.4 53.0
EBIT margin excluding exceptional items (%)
8.4% 8.6% 9.1% 8.8% 7.7% 8.1% 7.1% 7.4% 7.9% 7.6%
Profit on ordinary activities including exceptional items and before taxation (£’m)
36.7 40.5 47.8 50.2 40.2 51.1 49.5 48.8 52.5 60.5
Diluted earnings per share excluding exceptional items (pence) +
20.5 22.8 26.8 27.9 26.2 32.0 30.6 34.0 37.3 38.8
Dividend per share (pence) +
7.3 8.0 9.6 10.6 11.6 14.0 14.9 16.6 18.2 19.3
Shareholders’ funds (£’m) 120.0 134.2 157.2 181.5 144.9 145.6 147.9 164.2 176.2 198.4
Capital expenditure (£’m) 42.1 32.4 25.1 41.7 30.0 42.3 40.8 30.3 45.6 59.1
Net book value of fixed assets (£’m)
148.2 160.7 163.1 180.8 184.3 196.8 210.5 211.2 226.2 253.3
Number of shops in operation at year end
1,202 1,231 1,263 1,319 1,336 1,368 1,409 1,419 1,487 1,571
*restated for the transition to IFRSs ^2004 and 2009 were 53 week years, impacting on total sales growth for that year and the year immediately following + All years prior to 2009 adjusted to take account of the ten for one share split which took place during 2009
Exceptional items 1 includes £3.5m Bakers Oven restructuring costs2 includes one-off property gains of £2.2m3 includes £4.3m exceptional credit4 includes £7.4m exceptional credit (£9.6m pension credit offset by £2.2m bakery closure charges)
10 Year History
Annual Report & Accounts 2011 95
SecretaryJonathan D Jowett, LL.M. Solicitor
Registered OfficeFernwood HouseClayton RoadJesmondNewcastle upon TyneNE2 1TL
Registered number502851 BankersNational Westminster Bank Plc149 High StreetGosforthNewcastle upon TyneNE3 1HA
AuditorsKPMG Audit PlcQuayside House110 QuaysideNewcastle upon TyneNE1 3DX
StockbrokersUBS1 Finsbury AvenueLondonEC2M 2PA
Nplus1 Brewin LLPTime Central Gallowgate Newcastle upon TyneNE1 4SR
SolicitorsMuckle LLPTime Central32 GallowgateNewcastle upon TyneNE1 4BF
RegistrarsCapita RegistrarsBourne House34 Beckenham RoadBeckenhamKentBR3 4TU
Secretary and advisers
Announcement of results and dividendsHalf year Early AugustFull year March
DividendsInterim Mid OctoberFinal 25 May 2012
Annual report posted to shareholders Early AprilAnnual General Meeting 16 May 2012
Financial calendar
Annual Report & Accounts 201196
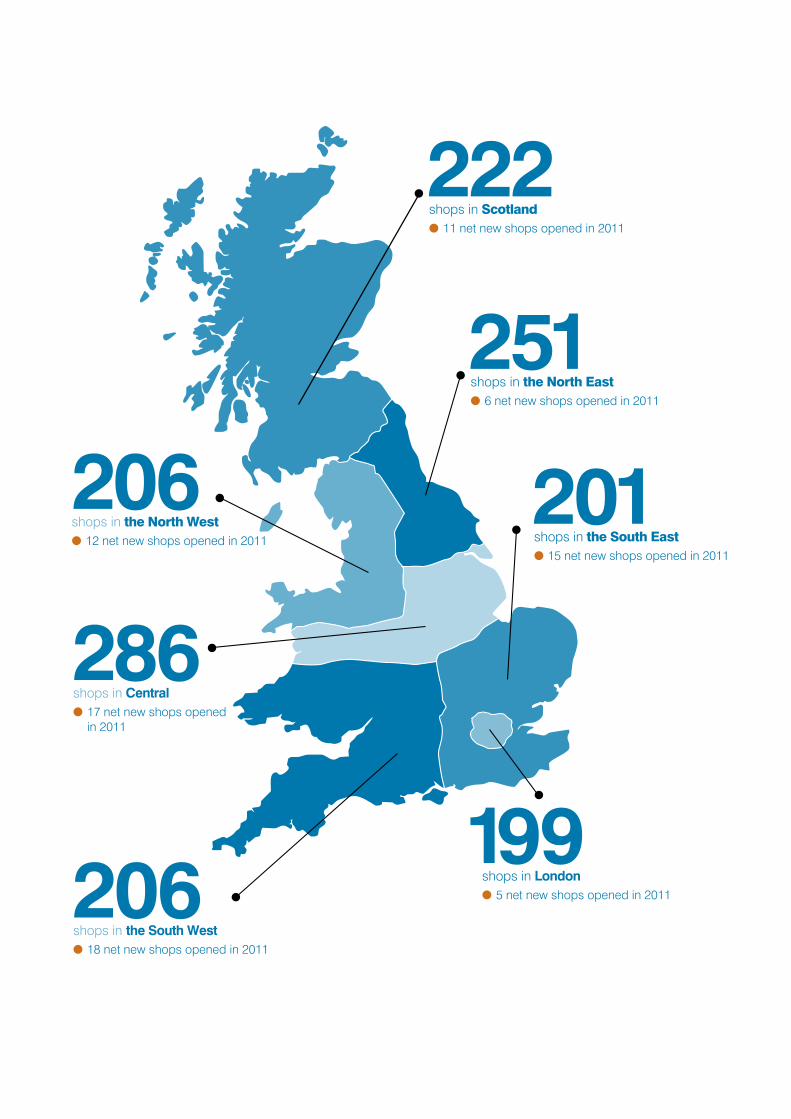
222shops in Scotland● 11 net new shops opened in 2011
201shops in the South East● 15 net new shops opened in 2011
251shops in the North East● 6 net new shops opened in 2011
206shops in the North West● 12 net new shops opened in 2011
286shops in Central● 17 net new shops opened in 2011
206shops in the South West● 18 net new shops opened in 2011
199shops in London● 5 net new shops opened in 2011
Greggs plc Fernwood House Clayton Road Jesmond Newcastle upon Tyne NE2 1TL
Company Registered Number 502851
greggs.co.uk
P R E M I U M
L I S T E D
Design and project management – Gratterpalm.
Material – This report has been printed on elemental chlorine–free paper which is made from trees from sustainable forests.