Embed Size (px)
Citation preview
A N N U A LR E P O R T
2 0 1 8


A N N U A LR E P O R T
2 0 1 8


CONTENTS
OPERATING COMPANIES
Catz International 10
King Nuts & Raaphorst 12
Tovano 28
Delinuts 30
Red River Commodities 38
Red River Global Ingredients 40
Red River-Van Eck 48
Sigco Warenhandelsgesellschaft 50
Van Rees Group 62
Snick EuroIngredients 64
HISTORY 6
KEY DATA 8
CONSOLIDATED FIGURES 9
LETTER FROM THE BOARD 15
THE ACOMO GROUP 16- The Group 16- Value creation 17- Business model 19- Risks and risk management 20- Tax 21- Sustainability 21- Catz Charity Foundation 27
RISK MANAGEMENT 32
BUSINESS PERFORMANCE 42- Group 42- Operating segments 45
GOVERNANCE 54- Corporate governance 54- Statement by the Group Managing Director 56- Report of the Non-Executive Directors 56- Remuneration report 58- Declaration by the Board of Directors 59
THE BOARD OF DIRECTORS 60
THE ACOMO SHARE 61
FINANCIAL STATEMENTS 67- Consolidated financial statements 67- Company financial statements 105
OTHER INFORMATION 112- Appropriation of profit 112- Independent auditor’s report 113
LIST OF ACRONYMS AND ABBREVIATIONS 122
EXPLANATION OF SOME CONCEPTS AND RATIOS 123
INFORMATION TAKEOVER DIRECTIVE DECREE 124
CONTACT DETAILS 125
ANNUAL REPORT 2018 AMSTERDAM COMMODITIES N.V. 3


In Acomo’s Tea segment, Van Rees Group has reached a remarkable milestone: 200 years of uninterrupted existence in the tea industry.
From its humble beginnings in the eastern part of the Netherlands in 1819, the business has evolved into one of the largest suppliers
of tea in the world. Van Rees Group now connects all tea-producing and tea-consuming countries. Every day, product specialists taste,
test, blend and process tea to meet the demands of customers.
V A N R E E SG R O U P
2 0 0 Y E A R S

Snick
EuroIngredients
joins the Group
Tefco EuroIngredients
joins the Group
New name: Acomo,
short for Amsterdam
Commodities N.V.
Tovano
joins the
Group
RCMA is subject to
a reverse take-over
by Catz International
Acomo’s predecessor,
N.V. Rubber Cultuur
Maatschappij Amsterdam
(RCMA), listed on the
Amsterdam stock exchange
RCMA operates
mainly in rubber and
palm oil plantations
in Indonesia
19821908 ‘50-’60 20062000 2009
HISTORYTea and the Geldermalsen treasure
In 1986, an auction at Christie’s Amsterdam fetched a record 40 million guilders for Chinese porcelain recovered from the VOC vessel the Geldermalsen, lost at sea in 1752. The ship had set sail from the Chinese city of Canton with a precious cargo of tea, porcelain, silk, lacquered artefacts, wood and a small chest of gold. It would never reach its home port in the Dutch Republic, however: it sank and lay hidden at the bottom of the sea for over two centuries. Amazingly, over all that time a large part of the porcelain remained in perfectly pristine condition.
The real value of the cargo – at least in the days of the Geldermalsen – lay in neither porcelain nor gold. Tea was the actual treasure. In the mid-18th century, tea was a luxury indulgence in Europe’s more affluent homes. China’s fine porcelain was certainly appreciated for its beauty, but on VOC vessels it also provided extra weight to the cargo without spoiling the fragrance of the tea leaves.
The story of the recovery of the Geldermalsen began in the National Archives in The Hague, the Netherlands,
in 1983, when two students of maritime history, Harry de Bles and Peter Diebels, explored the archives of the VOC (Dutch East India Company). They were looking for clues regarding lost vessels and one of their discoveries was the Geldermalsen. The archives held detailed information
Porcelain from the wreck
of the Geldermalsen, circa 1750
View of the European lodges in Canton, anonymous, post 1750
ANNUAL REPORT 20186 AMSTERDAM COMMODITIES N.V.

Delinuts joins
the Group
Catz International celebrates
160 years of trading business 1856
Container Tea & Commodities joins
the Group as a subsidiary of Van Rees Group
Snick and Tefco EuroIngredients integrated
into a single EuroIngredients proposition
Van Rees Group
celebrates 200 years
SIGCO Warenhandels-
gesellschaft joins the
Group
Acomo shares
included in
the AScX index
Red River Commodities, Red River-
Van Eck, Van Rees Group and
King Nuts & Raaphorst join the Group
Snick
EuroIngredients
joins the Group
20172015201420112010 2016 2019
1819
about the ship, its crew, its cargo and even its likely location on the bottom of the sea. In 1984, professional marine salvor Michael Hatcher recovered what remained of the Geldermalsen’s cargo. Much was still there that holds value today, including a large part of the porcelain. The secret behind the cargo’s preservation? It was the tea. When the ship sank into the seawater the tea was lost for consumption, but became a protective padding for the porcelain.
Salvaged porcelain on view before auction, 1986
From the resolutions of the VOC’s board, the ‘Heren XVII’:
specifications regarding tea for the return shipment from Canton
ANNUAL REPORT 2018 AMSTERDAM COMMODITIES N.V. 7
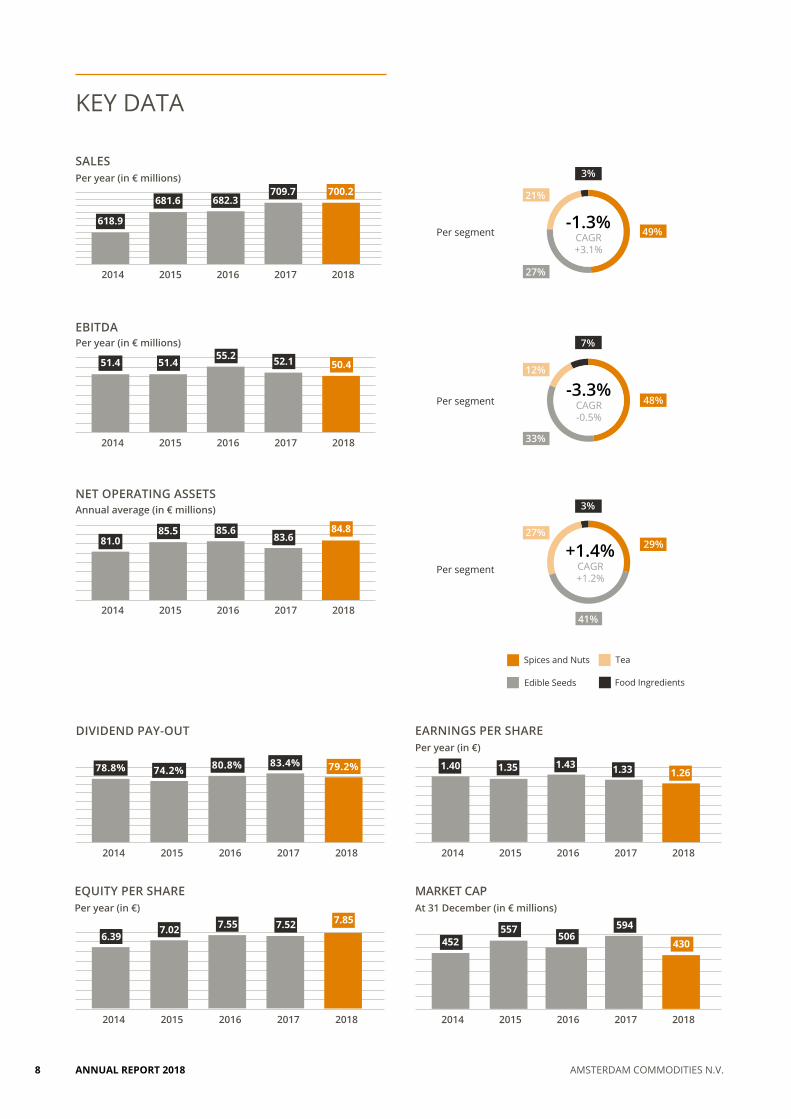
KEY DATA
2014
Per year (in € millions)
2015 2016 2017 2018
Per year (in € millions)
2014 2015 2016 2017 2018
Annual average (in € millions)
2014 2015 2016 2017 2018
SALES
EBITDA
NET OPERATING ASSETS
618.9
681.6 682.3709.7 700.2
51.4 51.455.2 52.1 50.4
81.085.5 85.6
83.684.8
DIVIDEND PAY-OUTPer year (in €)EARNINGS PER SHARE
At 31 December (in € millions)MARKET CAP
Per year (in €)EQUITY PER SHARE
78.8% 74.2% 80.8% 83.4% 79.2%
2014 2015 2016 2017 2018
6.397.02 7.55 7.52 7.85
2014 2015 2016 2017 2018
1.40 1.35 1.43 1.33 1.26
2014 2015 2016 2017 2018
452557
506594
430
2014 2015 2016 2017 2018
Spices and Nuts
Per segment
Per segment
Per segment
Edible Seeds
Tea
Food Ingredients
49%
3%
21%
27%
7%
3%
27%
41%
48%
29%
12%
33%
-1.3%CAGR+3.1%
-3.3%CAGR-0.5%
+1.4%CAGR+1.2%
ANNUAL REPORT 20188 AMSTERDAM COMMODITIES N.V.
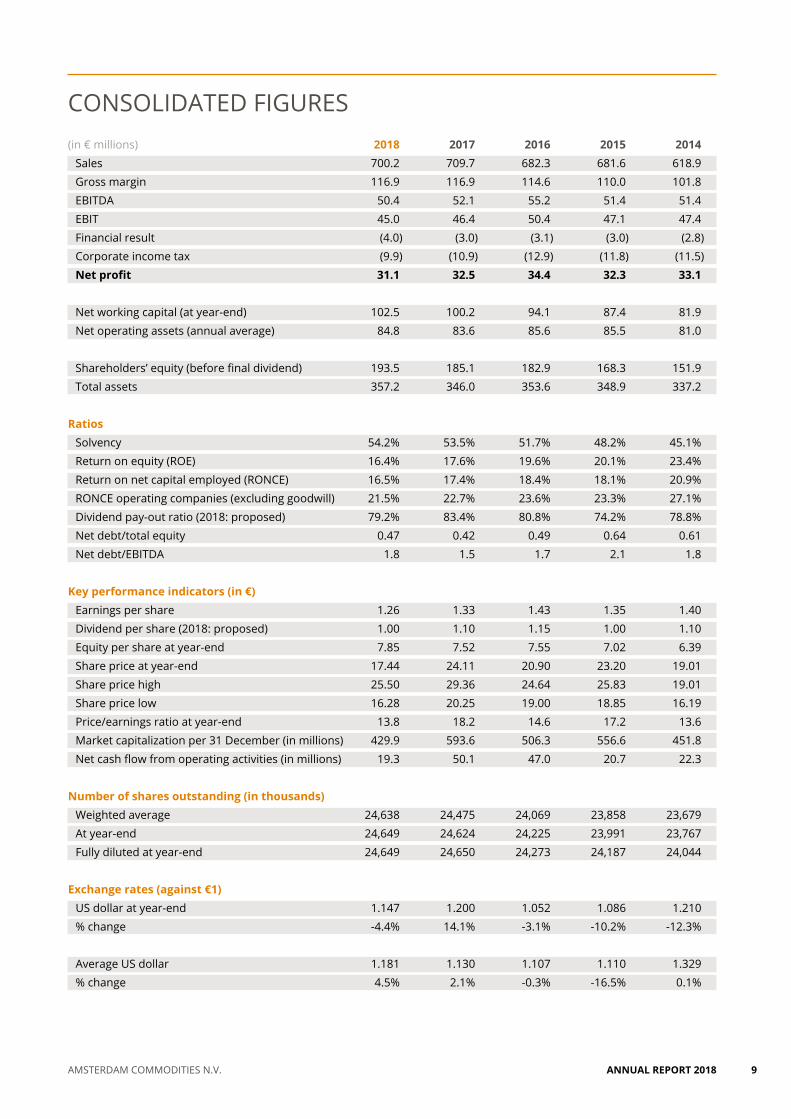
CONSOLIDATED FIGURES(in € millions) 2018 2017 2016 2015 2014
Sales 700.2 709.7 682.3 681.6 618.9 Gross margin 116.9 116.9 114.6 110.0 101.8 EBITDA 50.4 52.1 55.2 51.4 51.4 EBIT 45.0 46.4 50.4 47.1 47.4 Financial result (4.0) (3.0) (3.1) (3.0) (2.8)Corporate income tax (9.9) (10.9) (12.9) (11.8) (11.5)Net profit 31.1 32.5 34.4 32.3 33.1
Net working capital (at year-end) 102.5 100.2 94.1 87.4 81.9 Net operating assets (annual average) 84.8 83.6 85.6 85.5 81.0
Shareholders’ equity (before final dividend) 193.5 185.1 182.9 168.3 151.9 Total assets 357.2 346.0 353.6 348.9 337.2
Ratios Solvency 54.2% 53.5% 51.7% 48.2% 45.1%Return on equity (ROE) 16.4% 17.6% 19.6% 20.1% 23.4%Return on net capital employed (RONCE) 16.5% 17.4% 18.4% 18.1% 20.9%RONCE operating companies (excluding goodwill) 21.5% 22.7% 23.6% 23.3% 27.1%Dividend pay-out ratio (2018: proposed) 79.2% 83.4% 80.8% 74.2% 78.8%Net debt/total equity 0.47 0.42 0.49 0.64 0.61 Net debt/EBITDA 1.8 1.5 1.7 2.1 1.8
Key performance indicators (in €) Earnings per share 1.26 1.33 1.43 1.35 1.40Dividend per share (2018: proposed) 1.00 1.10 1.15 1.00 1.10Equity per share at year-end 7.85 7.52 7.55 7.02 6.39Share price at year-end 17.44 24.11 20.90 23.20 19.01Share price high 25.50 29.36 24.64 25.83 19.01Share price low 16.28 20.25 19.00 18.85 16.19Price/earnings ratio at year-end 13.8 18.2 14.6 17.2 13.6Market capitalization per 31 December (in millions) 429.9 593.6 506.3 556.6 451.8Net cash flow from operating activities (in millions) 19.3 50.1 47.0 20.7 22.3
Number of shares outstanding (in thousands) Weighted average 24,638 24,475 24,069 23,858 23,679At year-end 24,649 24,624 24,225 23,991 23,767Fully diluted at year-end 24,649 24,650 24,273 24,187 24,044
Exchange rates (against €1) US dollar at year-end 1.147 1.200 1.052 1.086 1.210% change -4.4% 14.1% -3.1% -10.2% -12.3%
Average US dollar 1.181 1.130 1.107 1.110 1.329% change 4.5% 2.1% -0.3% -16.5% 0.1%
ANNUAL REPORT 2018 AMSTERDAM COMMODITIES N.V. 9

ANNUAL REPORT 201810 AMSTERDAM COMMODITIES N.V.

CATZ INTERNATIONAL
Catz International started in 1856,
when the Catz brothers opened
a grocery store in the Dutch city
of Groningen. In 1917, the business
moved to Rotterdam, where Catz
started trading spices from Indonesia.
By strategically expanding its
product portfolio and geographical
sourcing base, Catz International
became the global player it is today.
Customers can count on timely
delivery of the correct quality food
ingredients at the agreed price.
Strategic supplyWith local contacts in the origin
countries and collaboration with
growers and collectors, Catz is always
up to date on current and future
market developments. Carefully
selected suppliers can rely on
guaranteed sales at agreed prices.
Climate-controlled storage along
with a top-shelf logistics network
ensure continuous and tailor-made
delivery, which allows customers
in the processing industry to work
efficiently and meet their customers’
requirements.
Geared to all demandsSpotting and seizing opportunities
is second nature to Catz International.
With a portfolio that already comprises
80 different products, it still sees a
market for further diversification
as well as for natural ingredients
without artificial additives. Catz
is equally geared to responding to
projected and unexpected demand.
Catz International takes its
responsibility for overseeing the
chain and fully complies with
evolving global food safety
requirements. Integrated quality
control, certification and full
traceability guarantee a high level
of quality. The company also
invests in sustainability and socially
responsible projects, including
through the Catz Charity Foundation.
A focus on service and quality
makes Catz a reliable partner that
minimizes risks for all partners in
the supply chain, and provides
them peace of mind.
WWW.CATZ.NL
Part of the Acomo Group since 1982
PRODUCTS
• Spices
• Coconut products
• Edible nuts
• Dried fruits
• Dehydrated vegetables
and herbs
Thanks to its broad portfolio, extensive knowledge and impressive worldwide
network, Catz International has grown into a global connector of supply and
demand in tropical niche products.
RELIABLE PARTNER IN TROPICAL PRODUCTS THROUGH HIGH LEVEL OF SERVICE AND FULL CONTRACT SECURITY
ANNUAL REPORT 2018 AMSTERDAM COMMODITIES N.V. 11

ANNUAL REPORT 201812 AMSTERDAM COMMODITIES N.V.

PRODUCTS
• Nuts
• Dried tropical fruits
• Rice crackers
Family culture is a pillar of customer confidence in King Nuts & Raaphorst.
QUALITY, TAILOR-MADE SERVICES AND FLEXIBILITY IN PRODUCT SUPPLY
Raaphorst goes the extra mile to
deliver as promised. Many years of
experience have taught the company
to spot partners that can help it
maintain quality from source to
delivery. A stringent control system
ensures product quality and
compliance with all European food
safety standards is guaranteed.
Long-term customer relationships Nuts and dried fruits have rapidly
gained in popularity in recent years
and King Nuts & Raaphorst has the
flexibility to meet these changes.
The no-nonsense family culture,
high level of service and reliability
in the delivery of quality products
helps customers grow their business
and their profitability – the perfect
starting point for long-term
relationships.
WWW.KINGNUTS-RAAPHORST.COM
The founders of King Nuts &
Raaphorst started out as open
market traders, who entered the
nut trade in the 1970s. King Nuts
started in 1973 as part of the Klijn
company and Raaphorst was
established in 1977. The two merged
in 1997 to become the largest
wholesaler in the Netherlands and
soon also one of the country’s main
importers and exporters of nuts,
dried tropical fruits and rice crackers.
The founding families are still
involved in the company even today.
Fast deliveryKing Nuts & Raaphorst’s distinctive
portfolio comprises products from
all continents at competitive prices.
Many partners are also family
businesses, which adds to supply
and product security. Products are
stored in warehouses with a capacity
of 5,000 pallets in Bodegraven,
the Netherlands, from where they are
packaged and distributed to retailers
and wholesalers across Europe.
Shipments may vary from a single
box to a mixed pallet or a lorry load.
Consistent qualityCustomers across Europe can count
on certainty of delivery, cost savings
and flexibility as King Nuts &
KING NUTS & RAAPHORSTPart of the Acomo Group since 2010
ANNUAL REPORT 2018 AMSTERDAM COMMODITIES N.V. 13
ANNUAL REPORT 201814 AMSTERDAM COMMODITIES N.V.

LETTER FROM THE BOARD
Dear shareholders,
We are pleased to present to you, on behalf of the Board of Acomo, this report on our financial year 2018, our second report that makes use of the principles of the integrated reporting framework and the GRI Standards on sustainability reporting.
2018 has been a year in which the teams in all Acomo’s product segments proved the resilience of our organization in unusual market circumstances. Firstly, while consumer demand for their products was excellent, large crops resulted in consistently decreasing price levels in several major product groups, which reduced the earnings potential. Secondly, the material decline in prices, along with uncertainties about the outcome of trade talks, impacted the horizon used by the demand side. Many of our customers have over the course of the year chosen to focus on the short term and take smaller positions.
We have been pleased to see our teams prove their quality by facing these challenges and achieving results that are slightly below previous years. Profits did not falter significantly, and dividends can be maintained at the usual high pay-out level. The financial position of Acomo and its group companies remains strong in the various supply chains.
In response to trends in consumer demand, several of our companies are broadening their product range and/or adapting processing methods. In tea we are working with customers to extend the range of specialty teas such as blends with fruits, herbs and spices. In nuts, we are able to cater to various health trends, such as low-salt products. These are just a few examples of how we are working with our partners in the chain to create opportunities for sustained profitability and value. At the same time we are increasing the value we can add for our customers through investments in facilities.
In the US, for instance, after the expansion of our roasting capacity, we have initiated the installation of equipment that will further enhance our value-adding capabilities. In Europe, the relocation of our seeds operation in the Netherlands to a new state-of-the-art facility was started in 2018 and will be completed in 2019. These allow us to integrate additional aspects of the value chain to further unburden our customers.
Looking ahead to 2019, we are confident that consumer demand for our products will remain strong, offering our customers as well as our Group opportunities for growth. We will continue to invest in our organization in order to maintain our ability to respond to the requirements of our customers and to comply with ever more complex regulations. The skills and expertise of our teams remain the basis of our strength.
On behalf of the Board of Directors we would like to thank everyone on our teams for their achievements in 2018’s unusual circumstances. We would also like to thank our shareholders, our customers, our suppliers and our partners for their continued trust.
Finally, we would like to mention that 2019 is the year in which Van Rees Group celebrates its 200th anniversary. Starting from humble beginnings, Van Rees has grown into a leading global supplier of tea. We congratulate the team with this milestone.
Together with our fellow Board members we look forward to meeting you, our shareholders, at the annual general meeting in Rotterdam on 25 April 2019.
Rotterdam, 7 March 2019
Bernard Stuivinga Allard GoldschmedingChairman Group Managing Director
‘THE ACHIEVEMENTS OF OUR TEAMS UNDER UNUSUAL MARKET CIRCUMSTANCES PROVE THE RESILIENCE OF THE ACOMO GROUP’
ANNUAL REPORT 2018 AMSTERDAM COMMODITIES N.V. 15

Bodegraven
Toronto
Fargo,ND
Colby,KS
Lubbock, TX
London
Hamburg
Varna
Cairo
Mombasa
Blantyre
Dubai
Moscow
Coonoor
Colombo
Hanoi
Ho Chi Minh City
Jakarta
OFFICES/FACILITIES WORLDWIDE
27
OFFICES/FACILITIES8
RotterdamMaasdijkEtten-LeurDongenEde
Winkler
>350 North America
GLOBAL WORKFORCE (FTE)+650>200 Europe>70 Asia>30 Africa
IN THE NETHERLANDS
Ruddervoorde
THE ACOMO GROUPThe Group
Group overviewAmsterdam Commodities N.V. (‘Acomo’ or ‘the Company’) is the holding company of an international group of companies active in the worldwide sourcing, trading, processing, packaging and distribution of natural food products and ingredients for the food and beverage industry (together ‘Acomo Group’ or ‘the Group’). The Group operates in more than 90 countries and employs more than 650 people. The product range comprises more than 500 main products including spices, nuts, dried fruits, tea, seeds (especially sunflower seeds) and natural food ingredients. Since most of our products are high-quality versions we refer to them with the general term ‘soft commodity’. Contrary to commodities such as oil, corn, wheat or coffee, our commodities are not traded on commodity exchanges or spot markets. Our companies contract and purchase the products at the source for physical delivery and value-added services.
Acomo is committed to supplying peace of mind to all its partners. Entrepreneurship, humility, long-term growth, reliability and passion for our products are
important values within the companies of the Acomo Group and in their relationships with shareholders, customers, suppliers and other partners. These values are the cornerstone of the way we conduct our business.
Acomo’s keys to success are its worldwide sourcing capabilities, absolute reliability of contracts, effective risk management, operational excellence and socially responsible entrepreneurship. Together with our partners we are continuously exploring new opportunities for improvement and growth.
Group DNA Acomo is a diverse group of companies defined by its purpose, philosophy and structure. Our purpose is to bridge the needs of our stakeholders within the value chains in which we operate. We support our trading activities with specific value-added services. Our philosophy defines the way we do business: always as a reliable and trustworthy partner, with a constant focus on niche products of which we have an in-depth knowledge. By structure, we are a public limited liability company listed on the Amsterdam stock exchange (AEX: ACOMO). The activities of the Group are carried out by
ANNUAL REPORT 201816 AMSTERDAM COMMODITIES N.V.

MISSION RISKS
GOVERNANCESTRATEGY
VALUE OUTCOMECAPITAL INPUT
Acomo’s subsidiaries in four segments. The subsidiaries are the operating companies of the Group. They are highly autonomous entities that perform trading and processing activities in their own name and for their own account. Within our companies we maintain straightforward incentives to reward entrepreneurship.
Value creation MissionAcomo’s mission is to achieve long-term sustainable growth of shareholders’ value, allowing for continued high dividend pay-outs representing above-market dividend returns through fulfilling the purpose of the Company.
Strategy Acomo pursues growth by maximizing opportunities in the international sourcing, trading, processing, packaging and distribution of niche food commodities, ingredients and semi-finished products for the food and beverage industry.
Acomo actively pursues a three-tier policy to achieve long-term sustainable growth: • Autonomous value creation within and through our
subsidiaries by diversification of the product assortment, geographies and channels. Here, security of supply and food safety requirements motivate the active quest for expansion in the value chain;
• Bolt-on acquisitions of companies active in one of our
existing segments whereby we can strengthen our market position and/or geographical presence;
• Acquisitions of leading companies in agri-commodities or ingredients for the food and beverage industry which will add new, growing segments to our segment portfolio, preferably in non-listed products.
Acomo’s operational and financial selection criteria are strict as we do not want to compromise our existing activities and other achievements and values of the Group.
Financial objectives Among the financial objectives of the Company and its subsidiaries are: • Maintaining the Group’s traditionally strong dividend
policy. This policy means that we pay out a substantial share of the annual net profit to our shareholders in cash every year. The pay-out ratio is subject to the free cash flow and solvency position and also depends on investment opportunities of the Group;
• Achieving an annual net profit of more than 15% of shareholders’ equity in the long term;
• Safeguarding and strengthening our capability to generate future profits by maintaining a strong balance sheet and healthy financial ratios. We aim to maintain a consolidated solvency of around 40%, with a minimum of 30%;
• Maintaining adequate credit lines to ensure the financing of our subsidiaries’ (trading) activities at all times, regardless of price volatility in the international commodities markets.
ANNUAL REPORT 2018 AMSTERDAM COMMODITIES N.V. 17

ANNUAL REPORT 201818 AMSTERDAM COMMODITIES N.V.

SECONDARY FOCUS
- Acquisitions in current segments
PRIMARY FOCUS
- Add new markets- Invest in supply chain- Add products
TERTIARY FOCUS
- Transformational acquisitions- Agricultural products for food application
ORGANIC GROWTH
BOLT-ON ACQUISITIONS
ADDINGSEGMENTS
MULTIPLEEXPANSION
Business model
Value chainAcomo’s group companies source, trade, process, package and distribute natural food products and ingredients. In these activities the companies strive to add value in each part of their respective value chain.
We supply peace of mind by bridging the specific needs of multiple stakeholders and allow them to fully focus on their core activities. We support our trading activities with specific value-added services such as storage, blending, cleaning, processing, packaging and distribution. In order to optimize our sourcing we have regular contacts with growers and farmers and collect various types of information relevant to crops. This enables us to maintain high quality standards and also to keep buyers fully informed of market developments and product availability. In collaboration with our suppliers, we make use of innovative techniques to develop new products. We give growers peace of mind by contracting to buy harvested products that meet our quality standards. We also bridge the entry to the market for small producers by opening our sales and marketing network for them. We help our customers reduce volatility in their end products by providing future and longer-term pricing, thereby bridging the need for price certainty.
At multiple destinations we store our customers’ products and provide vendor-managed inventory solutions. This allows us to ensure the quality of our products, to secure the proper and timely execution of contracts under all circumstances, to reduce price volatility and to reduce the working capital needs of our customers. In collaboration with our customers we also develop new products and customized solutions that are tailor-made according to their specifications. To ensure the high quality and safety of our products we not only maintain extensive communication with farmers and other suppliers, but we also apply quality control programmes, work with certified partners and continuously invest in our facilities and highly qualified staff. By bridging the distance between origin and destination of our products we always supply high-quality products, on time and according to specifications.
The value creation model of Acomo, based on the International Integrated Reporting Council framework, gives an overview of how Acomo creates long-term value for its shareholders and other stakeholders.
Acomo’s organizational and operating model consists of the operating companies that are focussed on the primary business functions (sourcing, trading, processing, packaging and distribution) and the holding company that provides global support.
ANNUAL REPORT 2018 AMSTERDAM COMMODITIES N.V. 19

Governance structure The parent company, Amsterdam Commodities N.V., is the holding company of the Group. It holds the shares in and has legal control over the Group’s subsidiaries. The subsidiaries operate to a great extent autonomously under the responsibility and financial control of their own management. Specific trading and financial guidelines and risk limits are in place per operating company, per product and per activity. The large subsidiaries are supervised by their own supervisory boards, which may include members of the Board of Directors.
The holding company is intentionally kept small, flexible and cost-efficient (7 FTE). The holding manages the investments of the Group and assists the Group’s subsidiaries in the areas of finance, treasury, legal, tax, business development, mergers and acquisitions, CSR, HR and other matters. Furthermore, the holding company provides and arranges the Group financing. Large investment decisions require holding authorization. All obligations and legal responsibilities that apply to a listed company, including the preparation of annual and semi-annual reports, maintaining contacts with shareholders, potential investors, AFM, Euronext and other stakeholders, are part of the tasks of the holding company.
More information on corporate governance can be found in the chapter Governance on page 54 and following.
Risks and risk management
Risk management is one of the key responsibilities of the Board. The Group’s principal risks and uncertainties – whether under our control or not – are highly dynamic and Acomo’s assessment of and responses to them are critical to the Group’s future business and prospects. Acomo’s approach towards risk management is framed by the ongoing challenge of understanding the risks that the Company is exposed to, the way these risks change over time and the nature of the Company’s risk appetite. The Board assesses and approves Acomo’s overall risk appetite, monitors the Group’s risk exposure and sets Group-wide limits, which are reviewed on an ongoing basis. More information on risks and risk management can be found on page 32 and following.
DeliverWe deliver high-quality and safe products to our customers in the food and beverage industries around the world. We help our customers by delivering on time and according to specifications regardless of price volatility.
SourceWe source natural agricultural products from all over the world. Through our worldwide networks we are able to always source the right quality and quantities. We help our growers and suppliers to sell their production by providing access to the world market.
ACOMO’S ROLE IN THE VALUE CHAIN
SUPPLIER GROWING CUSTOMERS CONSUMERSPROCESSINGTRADING DISTRIBUTION
TradeIn support of our trading activities and to create more options for our partners and ourselves, we provide services such as storage, blending, cleaning, processing and vendor-managed inventory solutions.
ANNUAL REPORT 201820 AMSTERDAM COMMODITIES N.V.

MISSION RISKS
GOVERNANCESTRATEGY
INTELLECTUAL CAPITAL
FINANCIAL CAPITAL
MANUFACTUREDCAPITAL
SOCIAL/RELATIONSHIP
CAPITAL
HUMAN CAPITAL
NATURALRESOURCES
CAPITAL
Our in-depth market knowledge, worldwide sourcing capabilities and global network
help us bridge the needs of our
customers.
Human- 656 employees, 20 nationalities- 72% male, 28% female
Intellectual- 200+ years of trading experience- On-the-job young trainee programmes- 1.3 training programmes per FTE
Financial- Net debt €91.6 million- Equity €193.5 million- Market capitalization €429.9 million
Manufactured- 11 production sites- Total assets €357.2 million- Capital expenditures €5.6 million- Food safety systems based on GFSI and HACCP
Natural- More than 500 agricultural commodities- Energy used 64,295 GJ
Social- Stakeholder engagement- Catz Charity Foundation
Human- Sales per employee €1.1 million- Employee benefit expenses €43.2 million
Intellectual- Skilled employees- Exceptional trading knowledge
Financial- EBITDA as % of sales 7.2%- Net operating assets €84.8 million- Dividend pay-out €27.1 million- Corporate taxes paid €9.9 million
Manufactured- Sales of €700.2 million- Volumes 231,288 MT
Natural- Plant-based products 98%- Certified tea (RA, UTZ or FT) 42%
Social- Long-term relationships with stakeholders- Partnership with National Archives
Our shareholders and banks supply funds
that Acomo uses to create long-term
value and drive growth.
We maintain sites for food processing,
blending and packaging and also work with external
parties.
We build valuable long-term relationships
with our main stakeholders: employees,
shareholders, customers, suppliers,
banks and NGOs.
We employ talented, skilled and dedicated
people with exceptional trading
knowledge.
We aim for business innovation and more
sustainable value chains.
BUSINESSMODEL
Tax
Acomo is subject to taxation in the many countries in which it operates. The tax the Company pays in different parts of the world contributes to its wider economic and social impact. Acomo acts in accordance with all applicable laws and always aims to comply with the spirit as well as the letter of the law.
Acomo believes public trust in tax systems for companies is essential and does not use contrived or abnormal tax structures that are intended for tax avoidance. The Company pays an appropriate amount of tax according to where value is created within the normal course of commercial activity. Any transfer pricing is always calculated using the ‘arm’s-length principle’. Acomo does not use so-called tax havens for tax avoidance.
Sustainability
Our road to sustainable growthTrading has the capacity to accelerate economic and social development. As traders we play a connecting role in the supply chain, which enables us to build bridges between customers and suppliers by providing value-added solutions. We understand that a balance between people, planet and profit is the only way to achieve sustainable development and long-term growth. Together with our partners we aim for business innovation and more sustainable value chains.
Our stakeholder dialogueWe recognize the limitations of a single company in the face of social and environmental challenges and opportunities and seek collaboration with our stakeholders towards practical solutions. As an international group of companies in various supply chains we have many different stakeholders who have an impact on or are impacted by our business.
ANNUAL REPORT 2018 AMSTERDAM COMMODITIES N.V. 21

Rele
vanc
e to
sta
keho
lder
s of
Aco
mo
Low
Hig
h
Low High
Sustainable supply chains
Food safety
Sustainable agricultureHuman rights
EnergyHealth and nutrition
Employment
Materials
SocietyTransport
Cultural heritage
Local economic impactCO2 emissions and climate change
Customer satisfaction
Relevance to Acomo
Shareholder value
Access to capital
MATERIALITY MATRIX
Being a good employer
DiversityTalent
Reducing our environmental footprint
Climate change Circular economy
OUR FOUNDATION
OUR IMPACT AREAS
Responsiblesourcing
Capacity building Food safety Health and nutrition
Creating sustainable supply chains Delivering safe and healthy products
CSR FRAMEWORK ACOMO
We liaise with them regularly to engage them in key areas, which we defined with the help of a survey among our main stakeholders: employees, shareholders, suppliers, customers, banking companies and NGOs. Their prioritizations together with those of the Acomo Board and subsidiary management teams have resulted in a materiality matrix.
Our CSR frameworkAcomo’s CSR framework is based on the materiality matrix. It distinguishes between our foundation themes, which are related to our own operations and therefore within our sphere of control, and to our impact areas: themes over which we have no direct control, but which are vital to sustainable value chains.
Reporting as per GRIAcomo reports its impacts and performances based on the internationally recognized GRI (Global Reporting Initiative) Standards. Acomo complies with the ‘In accordance with’ - Core option. The GRI Content Index is
available on our website, in the section ‘Responsibility’. Acomo started with the new reporting structure in 2017. Over the coming years it will be further developed, among other things through an assessment of the effectiveness of the Code of Conduct. Being a good employerTalent: People and their talents determine our business success. Therefore we seek to attract, develop, reward and retain highly competent and motivated individuals. We give employees the opportunity and freedom to develop and grow.
Diversity: We promote a culture of mutual respect without discrimination and harassment. The organization and its people share a responsibility for a work environment that is healthy, safe, challenging and inspiring. Diversity in the workforce is crucial in such an environment.
Reducing our environmental footprintClimate change: While the direct environmental footprint of Acomo companies is relatively small, we still try to reduce it. We measure the energy consumption in our own processing facilities and have created baselines to understand our impact on the environment, to identify saving opportunities and to improve communication about improvements.
Circular economy: Resource scarcity and environmental pollution drive us to improve material efficiency. We aim to reduce spillage at the source, often in partnerships within the supply chain. We continuously seek to reduce
ANNUAL REPORT 201822 AMSTERDAM COMMODITIES N.V.

ANNUAL REPORT 2018 AMSTERDAM COMMODITIES N.V. 23

the total volume of waste and simultaneously improve the separation of waste in order to enhance recyclability. We explore opportunities to make the packaging of our products more sustainable.
Creating sustainable supply chainsResponsible sourcing: We source our products from all over the world, with different challenges and opportunities regarding social and environmental issues in different areas. It is our responsibility to consider ethics, labour, and social and environmental aspects when purchasing products and services. The Acomo Code of Conduct outlines our shared ethical standards for conducting business. In several of our segments we work with certification programmes.
Capacity building: As a bridge between suppliers and customers we have a unique position that enables us to recognize and understand sustainability challenges and opportunities. We work together with suppliers, customers, NGOs, governments and other partners towards value-added solutions and sustainable supply chains. Technology is at the top of our agenda, as we firmly believe it will play a transformative role in agriculture.
Delivering safe and healthy productsFood safety: With strict control policies in all our facilities we minimize food safety risks for our customers. However, food safety begins at the farms that grow the products we trade and distribute. We work closely with our suppliers to ensure that the products we buy are safe and compliant with relevant regulations. We add value for our customers by investing in equipment to improve the food safety level of micro-bacterially high-risk products.
Health and nutrition: Food products have an undeniable impact on society, both positively and negatively (e.g. obesity and diet-related diseases). Providing healthy and nutritious food is a social responsibility but also a business consideration, as consumers worldwide are increasingly demanding healthier foods. As we trade natural raw agricultural materials, many of our products are innately healthy. We aim to increase transparency regarding the nutritional values of our products. Together with suppliers and customers we develop product innovations that lead to healthier alternatives and products that are safe for people with allergies.
KPIs – Being a good employerIndicator 2018 2017TalentOccupational health and safety1
% of lost time injuries per FTE
0.1% 0.7%Employee training2 # of training programmes 89 127# of training programmes per FTE 1.3 1.8Performance and career development reviews% of employees 73% 59%DiversityMale to female ratio % male 72% 74%% female 28% 26%Age structure of employees % < 30 year 20% 20%% 30 < 40 year 28% 26%% 40 < 50 year 28% 29%% 50+ year 24% 25%Nationalities of employees # of nationalities 20 18
1 Only production facilities covered2 Both external and internal trainings, most trainings have multiple attendees
ANNUAL REPORT 201824 AMSTERDAM COMMODITIES N.V.

KPIs – Reducing our environmental footprintIndicator 2018 2017Climate change Energy consumption GJ 74,125 81,103% of which renewable energy 2.6% 1.3%Energy intensity MJ/kg product 0.32 0.35Greenhouse gas (GHG) emissions (scope 1 + scope 2) MT CO2 9,820 10,190Greenhouse gas (GHG) emissions intensity Kg CO2/MT product 42.46 44.54 Circular economy Total waste MT 2,298 2,230Waste intensity Kg/MT product 9.94 9.75Waste separation % of separation 19% 19%
KPIs – Creating sustainable supply chainsIndicator 2018 2017Responsible sourcing Compliance suppliers with Code of Conduct % of suppliers 44% 20%Sourcing of sustainable products % of tea certified (RA, UTZ or FT)4 42% 35%% of palm oil certified (RSPO)5 96% 91%% of fish certified (MSC)5 47% 19%
KPIs – Delivering safe and healthy productsIndicator 2018 2017Food safety Food safety own operations % of operations GFSI certified 82% 81%Food safety third party operations % of operations GFSI certified 69% 69%Health and nutrition Plant-based products % of total volume 98% 96%
4 Raw material level5 Ingredient level
3
3
3 Corrected figures due to changed methodology
ANNUAL REPORT 2018 AMSTERDAM COMMODITIES N.V. 25
suppliers to use codes of conduct and introduced a Global Supplier Code in 2016, in which we stated our expectations regarding business integrity, labour practices, associate health and safety, and environmental management. In 2018 the supplier code was made an integral part of the supplier approval procedure of group companies.
Partner capacity: Beyond certification according to mainstream industry standards in some of our product groups, we aim to build partners’ capacity to cultivate and produce sustainably. In Vietnam, Van Rees further grew its project to produce pesticide-compliant tea (compliant with EU MRL standards). In the US and Bulgaria, Red River Commodities and Red River-Van Eck continued the promotion of more efficient farming methods (higher yields and better quality at lower input).
Food safety, health and nutrition performanceQuality management: Almost all own processing activities within the Acomo Group are GFSI certified. One of our trading companies became partly BRC certified in 2018 and is in the process of becoming fully certified in 2019. The remaining two locations are ISO 22000 certified. In addition to our own operation, we strive to increase the number of third-party production facilities certified according to food safety standards (GFSI or HACCP based). As quality and food safety are at the top of our agenda, we decided to organize the first Acomo Quality & Food Safety Day in 2018. This event, which was attended by the food safety managers of the group companies, was meant to share best practices within the Group.
Nutritional value: Acomo sources, trades and distributes over 500 agricultural commodities to and from more than 90 countries. Regardless of their ultimate application these raw materials have many positive health and nutritional benefits, as is demonstrated in global recommendations to eat nuts and seeds as part of a healthy diet. Furthermore, research by renowned institutions that became public last year highlighted the importance of nuts and seeds in sustainable diets to mitigate climate change.
Allergen-free alternative: Acomo’s US market brand SunButter® offers consumers a tasty product that is not only a healthy alternative to peanut butter through its nutritional composition, but also free of the top eight allergens.
Talent and diversity performanceTraining and development: Over the reporting year, employees of our subsidiaries have followed a range of programmes on technical topics such as food safety, occupational health and safety and good manufacturing practices; educational programmes such as language courses; compliancy programmes such as trainings on finance, tax and legislation; and IT related programmes such as user trainings for new software systems.Besides formal training, both Van Rees Group and Catz International deploy a young trainee programme through which young traders hone their skills through learning by doing. The professional quality of the Group’s finance community is supported through a Group-wide, targeted management development programme.
Diversity and inclusiveness: Acomo’s principles for a responsible work environment are laid down in the Acomo Code of Conduct. Misconducts can be reported through the Acomo whistleblower procedure.
Climate change and circularity performanceContinuation of energy-saving initiatives: LED lighting in combination with downlighting was installed at Delinuts in Ede, the Netherlands. Due to other construction activities, installation in the factory of Van Rees Dongen, the Netherlands, has been postponed to 2019. With the move of Red River-Van Eck from Zevenbergen to Etten-Leur, the Netherlands, all Acomo facilities will have LED lighting by 2019. Several of our companies purchase guaranteed renewable energy. In addition, 616 solar panels, which have the capacity to produce 175kWp a year, were installed at Snick EuroIngredients in Ruddervoorde, Belgium, in 2018. The subsidy request of last year has resulted in the SDE+ subsidy award for two locations. We are currently investigating the financial and technical feasibility of the installation of these solar panels.
Waste reduction and circularity: Waste figures deteriorated slightly. Next year we will increase our efforts to decrease waste volumes and improve waste separation. Apart from this we will focus on introducing more sustainable and recyclable packaging to reduce the material usage as well as improve the waste separation in the next stage of the value chain.
Responsible sourcing and capacity building performanceSupplier codes of conduct: Acomo encourages its
ANNUAL REPORT 201826 AMSTERDAM COMMODITIES N.V.

The Catz Charity Foundation (CCF) was founded after the deadly tsunami in 2004 with the objective to channel individual
initiatives of Catz International employees and other partners. The foundation focuses on small-scale projects with reliable
partners and minimal overhead costs to ensure that as much as possible of what is donated reaches those who need it.
The Catz Charity Foundation supports several local organizations with financial and material donations. The foundation
aims to help vulnerable people in their most basic living conditions, like shelter, food and education.
CATZ CHARITY FOUNDATION
Blessed Generation, a foundation
which helps nearly 800 children and
young adults in Kenya by providing
food, medicine and education.
Two Wilde Ganzen projects: a new
classroom for practical training in
Madurai, India, and renovations of
a school for handicapped children
in Patuk, Indonesia.
A drainage reconstruction near
group company Van Rees’s office in
Colombo, Sri Lanka, to prevent safety
hazards from mosquito breeding in
stagnant water.
Foundation HoPe, for physio and
occupational therapy, and for a patient
monitor at the burns department of
the regional hospital of Cusco, Peru.
The Art of Charity foundation’s
project Food for life, in which
farmers are trained in a modern
method to grow maize that gives
a much larger yield.
The AMECA Foundation for an
upgrade of the High Dependency Unit
at St Joseph’s Mission Hospital in
Laguna Beach, Malawi.
The Victoria Friendly Montessori foundation for the improvement of
the sanitary situation at three schools
in Rusinga, Kenya.
A Dutch national fundraiser through
Giro 555 for emergency aid to
survivors of the 2018 earthquake and
tsunami on the island of Sulawesi,
Indonesia.
The international microfinancing
charity Deki, which enables
entrepreneurs to work out of poverty
through life-changing loans and
company training.
In 2018 the Catz Charity Foundation was able to support the following:
For more information: www.catzcharityfoundation.nl. For donations please transfer your funds to: IBAN NL79ABNA0439501385.
ANNUAL REPORT 2018 AMSTERDAM COMMODITIES N.V. 27

ANNUAL REPORT 201828 AMSTERDAM COMMODITIES N.V.
Tovano’s reputation for quality,
service and speed is built on a
thorough understanding of the
supply chain and long-standing
relationships. The company was
established in 1950 by the Van
Noort family, who started their
business selling nuts to greengrocers
and market traders. By the time
the second generation of the
founding family retired in 2017,
the company had become a major
wholesaler in the Netherlands and
in European export markets from
Scandinavia to Spain.
Rapid and reliable The compact team of 13 staff keeps
Tovano flexible and practical, so it
can always keeps its word and stay
alert. That means growing with
existing customers and spotting
opportunities to supply new ones.
Tovano guarantees rapid and
reliable delivery by maintaining
adequate stock levels at all times.
Stability in a changing worldIn a highly competitive market
Tovano distinguishes itself through
the quality and diversity of its
product range, particularly for shelled
and unshelled walnuts, almonds,
dates, figs and apricots. As part of a
comprehensive rebranding in 2017
Tovano developed an innovative
packaging range that ensures food
safety and quality while meeting
customers’ demands for distinctive
and attractive products. Given the
continuing societal debate on the
environmental impact of plastics,
Tovano is constantly alert to the
need for responsible packaging that
guarantees product safety while
reducing environmental impact.
Tovano pays continuing attention
to product and food safety and
responsible production. It makes
a point of knowing its suppliers
personally and maintains long-
standing relationships that ensure
stability and reliability. Factors such
as these are increasingly important
in a rapidly changing world.
WWW.TOVANO.NL
Part of the Acomo Group since 2000
PRODUCTS
• Nuts and peanuts
• Dried and tropical fruits
• Kernels and seeds
• Chocolate-coated products
• Snack products
Solid growth based on the motto: Always keep your word and stay alert
to new opportunities.
FLEXIBLE QUALITY SERVICE SUPPLIER THAT MOVES WITH THE TIMES
TOVANO
ANNUAL REPORT 2018 AMSTERDAM COMMODITIES N.V. 29

ANNUAL REPORT 201830 AMSTERDAM COMMODITIES N.V.

Delinuts started life in 1994 selling
nuts and tropical fruits direct from
a lorry. In 2019, Delinuts celebrates
its 25th anniversary. The company
serves its customers from its state-
of-the-art facilities in Ede, the
Netherlands. With 10,000m2 of
climate-controlled warehousing,
direct contacts with suppliers
and a highly developed antenna
for new trends, Delinuts is
well-equipped for future growth.
Customer focusThroughout its 25-year history,
Delinuts has seen many changes.
Products are now sourced directly
rather than through intermediaries,
which gives the company more
control over quality and continuity.
The seasonal peaks of the nut
and dried fruit market have been
replaced by year-round demand
from the food industry and food
service sector in the Netherlands
and other European countries.
Understanding customer needs
and developing the right concepts
are critical components to provide
value-added solutions.
Anticipating future trends Delinuts is a responsible business
partner now and in the future. With
certifications including ISO 22000,
BRC, IFS and Skal, Delinuts is ready
to meet changing consumer demand
for more organically produced
and healthier foods. Trends such
as these are key drivers behind the
company’s product development.
Responsible sourcing and supply
chain management are supported
by automated systems that allow
for rapid delivery and provide
insight, continuity and control. The
company is making its operations
more sustainable with energy-
saving initiatives such as LED
lighting. A solar panel roof is
scheduled for 2019.
WWW.DELINUTS.NL
PRODUCTS
• Nuts
• Tropical fruits
• Rice crackers
• Processed nuts
• Chocolate-coated products
Delinuts combines drive and customer focus to facilitate growth and
anticipate market trends.
CUSTOMER LOYALTY THROUGH HIGH-QUALITY ASSORTMENT
DELINUTSPart of the Acomo Group since 2017
ANNUAL REPORT 2018 AMSTERDAM COMMODITIES N.V. 31

RISK MANAGEMENT Introduction
Risk management within the Group is carried out on the basis of procedures that have been approved by the Board. The Group’s overall risk management focuses primarily on the unpredictability of commodity and financial markets and is aimed at minimizing the potential impact of negative market developments on Acomo’s financial position and results. Identifying, evaluating and hedging risks are primarily the responsibility of the operating companies. The Board and the operating companies’ management apply procedures that cover specific risk areas including exchange rate risks related to foreign currency, interest rate and credit risk exposure, liquidity management, and the use of financial instruments such as derivatives.
The most important risks arising from the Group’s trading activities and the Group’s risk management and control systems are described in this annual report. However, this description is not exhaustive and risk management and control systems do not offer an absolute guarantee against future losses or mistakes. The current assessment of Acomo’s risks, according to exposure and mitigating factors, is detailed on the following pages.
To the extent that any of these risks materialize they may affect, among other matters, the Group’s current and future business and prospects, financial position,
liquidity, asset values, growth potential, reputation and sustainable development (including the impact on food safety, the environment and aspects of social responsibility). The diversification of Acomo’s soft commodity portfolio, geographies, currencies, assets and liabilities is a source of mitigation for many of the risks the Company faces. In addition, through Acomo’s governance processes and its proactive management approach, the Company seeks to mitigate where possible the impact of certain risks should they materialize. In particular: • The Group’s finance policy requires Acomo to maintain
sufficient cash and cash equivalents and other sources of committed funding available to meet anticipated and unanticipated funding needs.
• Acomo makes use of credit enhancement products, such as letters of credit, insurance policies and bank guarantees, and imposes limits on open accounts extended.
Risk appetite Acomo’s willingness to assume risks and uncertainties (the risk appetite) is different for each risk category. The level of the Company’s risk appetite gives guidance as to whether Acomo should take measures to control such uncertainties. The risk overview table shows the risk appetite and the expected impact on the Group’s achievement of its strategic, financial and operational objectives if one or more of the main risks and uncertainties were to materialize.
Risk category Category description Risk appetiteStrategic risk Risk relating to prospective earnings and capital arising from strategic Moderate changes in the business environment and from adverse strategic business decisionsOperational risk Risk relating to current operational and financial performance and Low to moderate capital arising from inadequate or failed internal processes, people and systems or external eventsFinancial risk Risk relating to financial loss due to the financial structure, cash flows Low and financial instruments of the business, which may impair its ability to provide an adequate returnCompliance risk Risk of noncompliance with relevant laws and regulations (including Low food safety), internal policies and procedures
ANNUAL REPORT 201832 AMSTERDAM COMMODITIES N.V.

Group risk profile Below is an overview of the risks that Acomo believes are most relevant to the achievement of its strategy. The sequence of risks does not reflect an order of importance, vulnerability or materiality. This overview is not exhaustive and should be considered in connection with forward looking statements. There may be risks not yet known to the Group or which are currently not
deemed to be material. Nor can it be guaranteed that the activities will not be (materially) affected by one or more of the risk factors described on the following pages.
The risks as defined in 2018 relate largely to the same topics as those identified in previous year. New risks added to our overview versus 2017 are: climate change and cyber risks.
Risk description Mitigating factors Strategic risks Sustainability of our strategy Risk movement in 2018: stableStrong shifts in the success and credibility of our products in the niche segments we operate in, and Acomo’s ability to respond to these adequately. In case there are externalor internal developments negatively affecting the credibility of our products and/or segments, Acomo’s strategy and reputation could be adversely affected, leading to a poorer overall financial position.
• Diversification of the product range and of the industries which are being supplied• Periodic assessment of our strategy by the Board with the management of our operating companies• Investigating market developments in order to identify opportunities for acquisitions and diversification
Increased competition and vertical integration Risk movement in 2018: increaseCompetition and vertical integration of Acomo’s customers may put pressure on market share, volumes and prices, which could have an adverse effect. Operating in attractivemarkets may attract new entrants. On the one hand thismeans more attention for the area we work in, on theother hand it could result in increased pressure on marketshare, and potentially affect revenue and profitability.
• Selective acquisitions• Offering of value-added services such as storage, blending, cleaning, processing, vendor-managed inventory solutions and (heat) treatment of products
Human rights
Seve
reM
ajor
IMPA
CT
Mod
erat
eM
inor
Unlikely Possible Likely Almost certain
PROBABILITY
STRATEGIC RISKS
Minor
1 Sustainability of our strategy
Moderate
2 Increased competition and vertical integration
Major
OPERATIONAL RISKS
Severe
3 Agricultural developments4 Climate change5 Fluctuations in commodity prices6 Fluctuations in the supply of, or demand for,
the commodities in which we operate7
Fluctuations in currency exchange rates8
Geopolitical risks
Sourcing, freight, storage, infrastructure and logistics10Food safety and recall risks11Cyber risks12Fraud, corruption and bribery risks
FINANCIAL RISKS
1314 Inability to attract, develop and retain trading staff
COMPLIANCE RISKS
15 Liquidity risks
16 Government – laws and regulations
Indicates change in 2018
RISK IMPACT
9
2018 OVERVIEW OF RISKS AND UNCERTAINTIES
1
2
3
4
56
9
7
10
11
12
13
14
16
8
15
ANNUAL REPORT 2018 AMSTERDAM COMMODITIES N.V. 33

Risk description Mitigating factors Operational risks Agricultural developments Risk movement in 2018: stableAgricultural developments, including weather conditions, harvests, long-term planting cycles and so on, may affect the availability, quantity and quality of the products.
• Up-to-date and complete market information• Diversification of the purchases across many countries of origin and reliable suppliers• Diversification of the product range
Climate change Risk movement in 2018: newChanges in temperature and rainfall patterns, with more droughts, are affecting yields, product quality and prices of natural food commodities. Commodities as spices, nuts and tea are highly sensitive to changes in growing conditions. These commodities can only be produced in narrowly defined agro-ecological conditions and, hence,in a limited number of countries.
• Diversification of purchases of food commodities across many countries of origin in different parts of the world and reliable suppliers
Fluctuations in commodity prices Risk movement in 2018: stablePrice volatility, both long-term and short-term, of the various food products, depending on supply and demand. Long-term or short-term price volatility, in terms of both scale and speed, has a direct impact on the value of the subsidiaries’ product positions (long or short).
• Diversification of the purchases across many countries of origin and reliable suppliers• Diversification of the product range• Diversification of the industries which are being supplied
Counterparty risk and price fluctuations also affect the behaviour of contract counterparties, particularly withregard to the correct execution of signed, but not yet delivered contracts.
• Research of the solvency and/or the credit risk of customers• Credit limit management
Fluctuations in the supply of, or demand for, the commodities in which we operate
Risk movement in 2018: stable
We are dependent on the expected volumes of supply or demand for commodities in which we are active, which may vary for many reasons, such as competitor supply policies, changes in resource availability, government policies and regulation, costs of production, global and regional economic conditions and natural events.
• Long-term relations with suppliers and customers
Geopolitical risks Risk movement in 2018: increaseWe operate in a number of geographic regions and countries, some of which are categorized as developing, complex or having unstable political or social climates. As a result, we are exposed to a wide range of political, economic,regulatory and tax environments. Also, some countries with more stable political environments may nevertheless change policies and laws, which can affect both the availability of products and the reliability of supply. We have no control over changes in policies, laws and taxes.
• Maintaining a dialogue with authorities• Group-wide Code of Conduct• Keeping informed of new regulations and legal requirements, and proactively anticipating changes
Human rights Risk movement in 2018: stableIt’s our responsibility as a company to respect human rights. We have to prevent and address any negative impacts we may have on the rights of those whom we employ, do business with or interact with along our supply chain. Labour rights – including child labour, excessive hours with low wages, and human trafficking – are often the leading human rights concerns for agriculture companies.
• Acomo has developed a Global Supplier Code of Conduct to clarify our global expectations in the areas of business integrity, labour practices, associate health and safety, and environmental management. Acomo’s Supplier Code is intended to complement Acomo’s Global Code of Conduct
ANNUAL REPORT 201834 AMSTERDAM COMMODITIES N.V.

Risk description Mitigating factors Operational risks Fluctuations in currency exchange rates Risk movement in 2018: stableParticularly fluctuations of the US dollar, in which most of the world’s commodities are traded. The vast majority of our purchase transactions are denominated in US dollars, while operating costs are mainly in euro, the currency of which fluctuates against the US dollar.
• Hedging contracts, such as currency exchange contracts
Sourcing, freight, storage, infrastructure and logistics Risk movement in 2018: stableLogistical factors relating to the availability and cost of transport and storage capacity. Increases in the costs of freight, storage, infrastructure and logistics support, or limitations or interruptions in the supply chain (including any disruptions, refusals or inabilities to supply), may adversely affect our business.
• Long-term contracts with suppliers, customers and logistic service providers• Supplier Code
Food safety and recall risks Risk movement in 2018: stable Food safety aspects and recall risks with regard to imported and delivered products. Our operations are subject to food safety and environmental laws along with compliance with our corporate sustainability framework. Food safety laws may result in increased costs or, in the event of noncompliance or incidents, in significant losses, including arising from (1) litigation and imposition of penalties and sanctions and (2) having licenses and permits withdrawn or suspended.
• Following strict food and product safety procedures• Insurance contracts to manage potential financial consequences• Traceability of the products and extensive, state-of-the-art laboratory testing (internal and external) in order to ensure food safety (all our subsidiaries are HACCP or GFSI certified, and also have various other certifications related to their specific activities) • Supplier Code
Cyber risks Risk movement in 2018: newA cyber security breach, incident or failure of Acomo’s IT systems could disrupt our business, result in the disclosureof confidential information, damage our reputation and create significant financial and legal exposures.
• Autonomous group companies with own IT systems• Awareness training• Business continuity plan• Penetration testing
Fraud, corruption and bribery risks Risk movement in 2018: stableFraud is a deception that is deliberately practiced to secure unfair or unlawful gain and include deceit, concealment, skimming, forgery or alteration of (electronic) documents. Acomo maintains a zero tolerance approach for its companies, employees and business partners with regard to fraud. Bribery is illegal, and it can cripple Acomo’s long-standing reputation of conducting business with integrity.
• The Acomo Code of Conduct outlines our shared ethical standards for conducting business throughout the world. Prevention of fraud, corruption and bribery are integral part of the Code. The standards and principles apply to all employees of the Acomo Group worldwide • Regular visits and interviews with key personnel to assess risks and behaviour• Four-eyes principle in key processes
Inability to attract, develop and retain trading staff Risk movement in 2018: stableAvailability of experienced and professional traders and other staff. If we are unable to attract, develop and retain the right people, our ability to operate our business successfully may be significantly impaired.
• Human resources and remuneration policies aimed at rewarding talent, responsibility and success• Trading guidelines for each company and daily internal control on these, aimed at limiting risks with regard to position taking (overall and per product) and with regard to countries, suppliers and customers
ANNUAL REPORT 2018 AMSTERDAM COMMODITIES N.V. 35

Risk description Mitigating factors Financial risks Liquidity risks Risk movement in 2018: stableAvailability of financing and interest rate developments. Failure to access funds (liquidity) would severely limit our ability to engage in desired activities. Liquidity risk is the risk that we are unable to meet our payment obligations when due, or are unable, on an ongoing basis, to borrow funds in the market on an unsecured or secured basis at an acceptable price to fund actual or proposed commitments. While we adjust our minimum internal liquidity threshold from time to time in response to changes in market conditions, this minimum internal liquidity target may be breached due to circumstances we are unable to control, such as general market disruptions, sharp movements in commodity prices or an operational problem that affects our suppliers, customers or ourselves.
• Maintaining headroom under revolving credit facilities• As at 31 December 2018, the Group had available undrawn credit facilities and cash amounting to €144 million (31 December 2017: €164 million)
Compliance risks Government – laws and regulations Risk movement in 2018: increaseNew government measures, including increased regulations on food safety, may have a major impact on our business and financial position, and can present a threat to activities within a relatively short time frame.
• Monitoring and adapting to relevant (changes in) rules and regulations • Maintaining a dialogue with authorities• Supplier Code
ANNUAL REPORT 201836 AMSTERDAM COMMODITIES N.V.

ANNUAL REPORT 2018 AMSTERDAM COMMODITIES N.V. 37
ANNUAL REPORT 201838 AMSTERDAM COMMODITIES N.V.

The strategy is to find the niche
markets that are difficult for other
companies to manage in food
ingredients, especially when it
comes to allergens, adulteration
and traceability. The company’s
market leadership in sunflower
and specialty seeds processing has
been a logical evolution in response
to changing and interconnected
market needs. Starting with
sunflower procurement through
to wild bird foods, moving to
roasting and salting in a peanut-
and tree nut-free environment
and progressing to the launch
of SunButter® as a healthy and
allergen-free alternative to peanut
butter.
Spotting opportunitiesSunButter® originated from a
research experiment in response
to the growth of nut allergies
in North America. Sunbutter’s
success increasingly marks
Red River Commodities as a solution-
driven consumer packaging group
that spots opportunities in unique
markets. It is a highly sophisticated
player in its own product areas
with the right recipe to stay ahead
on food safety and traceability.
Red River Commodities is a company
with a singular reputation for quality
and reliability. Measures to manage
supply chain risk include producing
at six specialty crop manufacturing
facilities in the US, and secure
sourcing from the rest of the world
through trading partner Red River
Global Ingredients. As a result,
customers know they can rely on the
Red River companies to say what
they do and do what they say.
State-of-the-art technologyRed River Commodities is introducing
a state-of-the-art ERP system to
optimize interconnectivity between
growers, traders, processors and
retailers in the chain. The new
technology will provide further
effectiveness and efficiency within
the organization.
WWW.REDRIV.COMWWW.SUNBUTTER.COM
Part of the Acomo Group since 2010
PRODUCTS
• Sunflower products for
snacks and baking
• SunButter®
• Wildlife foods
• Roasted and flavoured
seeds in consumer packaging
Since 1973 Red River Commodities has carved out a unique category in
the niche market of specialty seeds and grains.
CARVING OUT A UNIQUE POSITION IN SUNFLOWER AND SPECIALTY SEEDS PROCESSING
RED RIVER COMMODITIES
ANNUAL REPORT 2018 AMSTERDAM COMMODITIES N.V. 39

ANNUAL REPORT 201840 AMSTERDAM COMMODITIES N.V.

RED RIVER GLOBAL INGREDIENTS
Since Acomo set up Red River
Global Ingredients in 2016 the
company has grown sharply in 2017,
and doubled its turnover in 2018.
Based in Manitoba, Canada, the
company knows the industry inside
out as it draws on experience from
the same North American market
in which Red River Commodities
operates. Now Red River Commodities
is a partner within the Acomo Group
and adds value to around 25% of
the products that Red River Global
Ingredients imports.
Reliability in the supply chain Increasingly stringent food safety
laws require players in the food
value chain to be ever more
transparent. Through long-term
relationships with first-class
suppliers of sunflower seed and
specialty crops Red River Global
Ingredients can buffer customers
from the food safety risks of
importing. As a trading company, it is
highly alert to opportunities and
developments around the world. It
shares this market intelligence with
the processors it works for, helping
them respond to new generations of
consumers who want the full story
of their food.
Specialized focus adds valueThat story may involve non-GMO
and organic requirements.
Sunflower and flax production in
North America are non-GMO, and
Red River Global Ingredients is
well-placed to respond to increasing
demand for organics. It is also
looking to broaden its trading
portfolio further. It is this expertise
and the personal touch in
combination with flexibility and
focus that makes Red River Global
Ingredients a highly valued partner.
WWW.REDRIVGLOBAL.COM
Part of the Acomo Group since 2016
PRODUCTS
• Bakery ingredients, birdfood
ingredients and special
crops in the grain, seed and
pulse industries
By sharing market intelligence, Red River Global Ingredients enables its
customers to tell consumers the full story of their food.
A SOLID BASE OF EXPERIENCE IN THE CHANGING WORLD OF TRADING
ANNUAL REPORT 2018 AMSTERDAM COMMODITIES N.V. 41

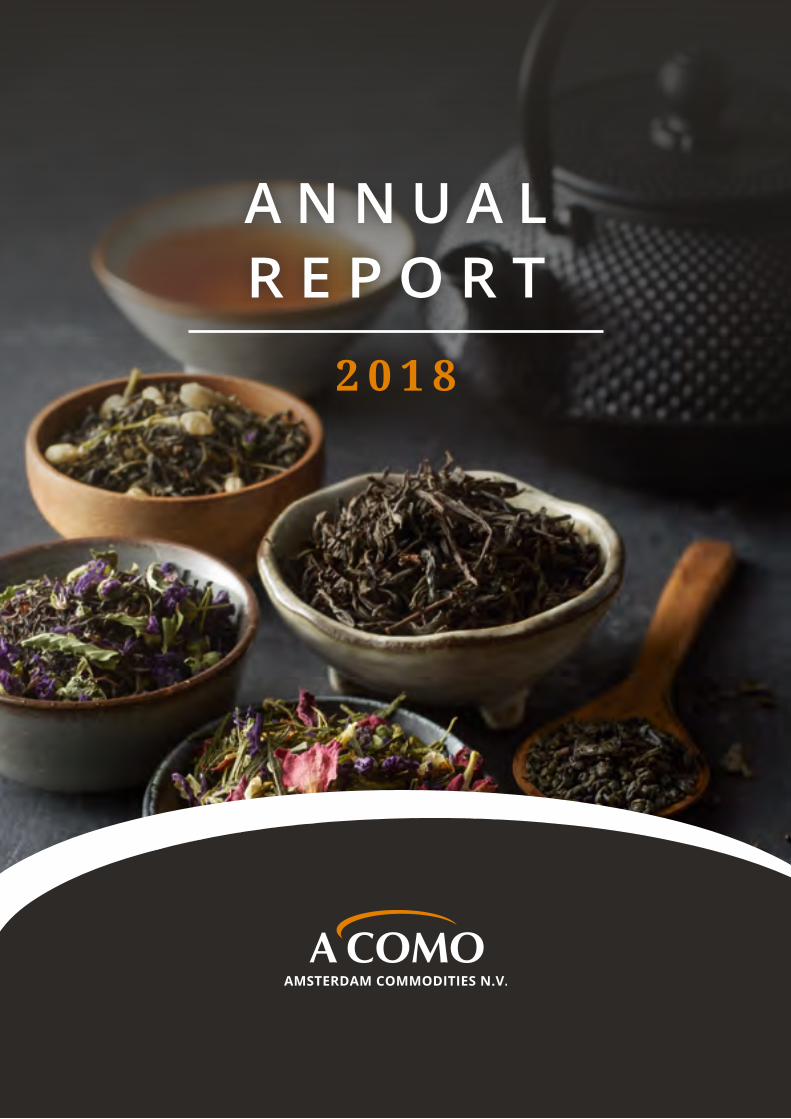
Pepper (black) Vietnam (USD/kg)
3.00
4.00
5.00
6.00
7.00
8.00
9.00
10.00
01-012014
01-012015
01-012016
01-012017
01-012018
31-122018
2.70
Brazils - Bolivian medium (USD/kg)
8.00
10.00
12.00
01-012014
01-012015
01-012016
01-012017
01-012018
31-122018
14.00
16.00
18.00
7.39
Cashew kernels Vietnam (USD/kg)
8.00
8.50
9.50
10.50
9.00
10.00
01-012014
01-012015
01-012016
01-012017
01-012018
31-122018
11.00
11.50
9.04
Tea - Mombasa BP1 (USD/kg)
2.00
2.50
3.00
01-012014
01-012015
01-012016
01-012017
01-012018
31-122018
3.50
4.00
4.50
3.00
BUSINESS PERFORMANCEGroup
General economic environmentGlobal economic activity in 2018 was impacted by geopolitical developments, flattening growth and an upward trend in interest rates. Renegotiations of trade agreements, increased sanctions and growing trade tensions between some countries had their impact on markets and behaviours. While overall global real GDP growth remained in line with the previous year, a number of countries experienced weakening growth towards the end of the year. Interest rates, especially the LIBOR, increased substantially, leading to higher financing costs. Commodity markets were affected by these macroeconomic developments in 2018, and in addition faced a stronger US dollar.
For most of the year, food commodity prices in major product groups continued the downward trend that started in the second half of 2017. A number of spices
reported market prices at the lowest level of the last nine years. Desiccated coconut saw a sharp decline in prices as well. Major nut categories declined in price during 2018, with some stabilization towards the end of the year. Edible seeds, however, showed improved prices in the second half of the year, especially for poppy seeds. Tea prices showed different trends across the origins. Kenya had unusually low prices due to a record crop, while at the same time Sri Lanka reported high prices due to instability in the Middle East.
The graphs below illustrate the volatility of the prices of some of our major products in 2018.
Financial performanceIn 2018, Acomo achieved consolidated sales of €700.2 million, a decrease of 1.3% compared to 2017 (€709.7 million). The decrease in sales was mainly attributable to difficult market circumstances in the Spices and Nuts segment. Gross margin remained
ANNUAL REPORT 201842 AMSTERDAM COMMODITIES N.V.

in line with 2017 at €116.9 million. Total costs increased, mainly due to increased production activity, further investments in the organization and inflation. Unrealized FX hedge results (due to not applying hedge accounting) had a positive effect on gross margin of €2.1 million (2017: -€1.4 million). The impact of unrealized FX hedge results on net profit was €1.6 million (2017: -€1.1 million).
Net profit for 2018 decreased by €1.4 million to €31.1 million versus €32.5 million in 2017 (-4.2%).
The 2018 results were not impacted by non-recurring items. In 2017 net results were positively impacted by non-recurring items of in total +€0.7 million.
EBITDA decreased by 3.3% to €50.4 million, mainly by a lower contribution of Spices and Nuts and Edible Seeds, partly offset by higher contributions of Tea and Food Ingredients.
Balance sheet analysisIn 2018, total capital amounted to €284.0 million, consisting of €100.1 million of fixed capital (intangible assets, property, plant and equipment and other non-current receivables, less provisions), €182.9 million of working capital and other working capital related assets and liabilities, and €1.0 million cash and cash equivalents.
Fixed capital increased by €3.6 million compared to 2017, mainly due to the stronger year-end US dollar that affected the fixed capital denominated in US dollar (mainly in the Edible Seeds and Tea segments).
Working capital and other working capital related assets and liabilities increased by €19.2 million compared to 2017, mainly due to an increase in working capital in the Tea segment and a stronger year-end dollar rate affecting working capital denominated in US dollar.
2014
48
50
52
54
56
2015 2016 2017 2018
EBITDA (in € millions)
51.4 51.4
55.2
52.150.4
244.8
284.0
1.6 1.4 1.8 2.6
163.1184.6
174.5 163.7
80.1
88.5 95.4 96.5
50
0
100
150
200
250
300
2014 2015 2016 2017 2018
USE OF FUNDS (in € millions)
151.9168.3
182.9 185.1
82.5
98.3 82.366.1
10.4
7.9 6.511.6
9.1
50
0
100
150
200
250
300
2014 2015 2016 2017 2018
SOURCE OF FUNDS (in € millions)
Fixed capital Working capital1 Cash
1 Including other assets and liabilities 1 Excluding short-term portion long-term debt
Long-term debt1 Short-term debt Equity and reserves
193.5
81.4
182.9
100.1
1.0
284.0262.8271.7274.5
244.8262.8271.7274.5
€ millions 2018 2017 % changeSales 700.2 709.7 -1.3%Gross margin 116.9 116.9 0.0%EBITDA 50.4 52.1 -3.3%Depreciation and amortization 5.4 5.7 -5.3%Operating income (EBIT) 45.0 46.4 -3.0%Net finance costs (4.0) (3.0) 33.3%Corporate income tax (9.9) (10.9) -9.2%Net profit 31.1 32.5 -4.2%
244.8
284.0
1.6 1.4 1.8 2.6
163.1184.6
174.5 163.7
80.1
88.5 95.4 96.5
50
0
100
150
200
250
300
2014 2015 2016 2017 2018
USE OF FUNDS (in € millions)
151.9168.3
182.9 185.1
82.5
98.3 82.366.1
10.4
7.9 6.511.6
9.1
50
0
100
150
200
250
300
2014 2015 2016 2017 2018
SOURCE OF FUNDS (in € millions)
Fixed capital Working capital1 Cash
1 Including other assets and liabilities 1 Excluding short-term portion long-term debt
Long-term debt1 Short-term debt Equity and reserves
193.5
81.4
182.9
100.1
1.0
284.0262.8271.7274.5
244.8262.8271.7274.5
ANNUAL REPORT 2018 AMSTERDAM COMMODITIES N.V. 43

Shareholders’ equity increased by €8.4 million to €193.5 million on 31 December 2018 (year-end 2017: €185.1 million). The main movements were: 2018 net profit of €31.1 million, €0.3 million of issued new shares relating to the Acomo share option plan, and a positive currency translation effect of €3.8 million, partly offset by dividend payments to shareholders of €27.1 million.
Total debt outstanding at the end of 2018 amounted to €90.5 million (2017: €79.8 million). Long-term debt of €9.1 million (2017: €11.6 million) is repayable in three years on average. The short-term part of the long-term borrowings of €2.1 million, repayable in 2019, is included in other working capital related assets and liabilities. Total short-term debt consists of the short-term bank overdrafts of €81.4 million (2017: €66.1 million).
Solvency as per 31 December 2018 was 54.2% (year-end 2017: 53.5%), which significantly exceeded the minimum solvency levels required by Acomo’s financial policy.
Foreign exchange positionAll operating companies are required to hedge foreign exchange risks related to transactions against their functional currency. The consolidated accounts of Acomo are prepared in euros. The Group comprises several operating companies (Red River Commodities, Red River Global Ingredients and Van Rees Group) that use the US dollar as their functional currency. The results of these subsidiaries are consolidated in the Group’s 2018 results against the average euro/US dollar rate of the year. The euro/US dollar exchange rate was stable during the first four months of the year. In the remainder of the year the US dollar strengthened. The average annual euro/US dollar exchange rate in 2018 was 1.181 (2017: 1.130). The FX rates contributed negatively to sales (-€12.5 million) and net profit (-€0.5 million).
The future development of the euro/US dollar rate can have a positive or negative impact on the consolidated results reported in euro. The assets and liabilities of Red River Commodities, Red River Global Ingredients and Van Rees Group are translated in euro at year-end rate for consolidation purposes. The 2018 year-end exchange rate of 1.147 reflects the stronger US dollar against the euro when compared to the 2017 year-end rate of 1.200. As per 31 December 2018, this resulted in an increase in total assets (+€6.1 million).
1.15
1.12
1.14
1.16
1.18
1.20
1.22
1.24
DEC2017
FEB APR JUN AUG OCT DEC2018
EURO/US DOLLAR RATE 2018
Variations in the year-end rates on the net investment values of US dollar subsidiaries, after taking into account related long-term borrowings in US dollar, are accounted for directly in equity through the currency translation reserve and will impact total consolidated assets and net shareholders’ equity.
Cash flow summaryNet cash generated from operations decreased by €30.8 million, due to a higher working capital (total net cash effect of €22.9 million), mainly caused by higher trade receivables at year-end, €5.5 million lower operating cash flow, and higher interest and tax payments of €2.3 million.
Capital expenditures of €5.6 million were slightly below 2017. The capital expenditures mainly comprised of investments in upgrades of plant equipment and IT-related investments (ERP) in the US operations of Edible Seeds, and investments in tea-blending machinery, building and leasehold improvements in the Tea segment.
The changes in financial liabilities of €19.8 million were mainly due to a higher amount of cash drawn from our working capital bank facilities as a result of the increase in working capital (€10.6 million), higher payments of interest and tax (€2.3 million), and repayments of long-term bank borrowings (€2.4 million).
Dividends paid to the shareholders amounted to €27.1 million (2017: €28.0 million), which included the final 2017 dividend of €0.70 per share and the 2018 interim dividend of €0.40 per share.
Treasury positionOn 24 January 2017 Acomo’s working capital facilities were extended with a three-year term with an option
ANNUAL REPORT 201844 AMSTERDAM COMMODITIES N.V.

for an additional two years. Acomo has a further option to increase this facility with 30%. The Group’s working capital credit facilities including cash positions amounted to in total €228.3 million (2017: €230.3 million). Short-term financing available to the Company on 31 December 2018 amounted to €144.8 million compared to €164.2 million one year earlier.
Working capital credit facilities are managed by treasury at Group level and/or at subsidiary level. These facilities are mostly borrowing based and are secured by either positive or negative pledges on stocks and trade receivables. Financial covenants are linked to a minimum solvency of the Group (30% or 25% minimum on various semi-annual reporting dates) and an interest coverage ratio of 4 to 1. At 31 December 2018 the Company and its subsidiaries were in full compliance with all bank covenants. Acomo pools cash from subsidiaries to the extent that is legally and economically feasible. Cash not pooled remains available for local operational needs.
Operating segments
Spices and NutsOur Spices and Nuts segment faced difficult market circumstances with market price declines of major products between 20% and 40%. Pepper prices continued the decline of 40% during 2017 with another 40% and reached the lowest price levels in nine years, due to large crops in Vietnam, India and Brazil. Most other spices reported lower price levels as well, with only a few exceptions, such as mace, cardamom and turmeric. After a tight market in 2016 and 2017 due to low crops as a consequence of droughts, desiccated coconut saw good crops and price levels declining on average by 15%.
Dehydrated vegetables were faced with a slow market and limited price volatility. Dried fruits reported somewhat lower results due to low price levels. Nuts saw declining prices for most of the year for cashews, walnuts, pecans and Brazil nuts. Towards the end of the year, market conditions for a number of major nuts improved. Despite the low price levels and difficult market circumstances the group companies managed to maintain healthy gross margin percentages, yet at somewhat lower volumes.
EBITDA decreased by €1.4 million (-5.8%) compared to 2017. Invested capital decreased by €1.1 million compared to 2017, mainly due to a decrease in working capital of €5.0 million as a result of lower inventories and accounts receivable positions, partly offset by an increase in fixed capital.
66.1
0
50
100
150
200
250
2014 2015 2016 2017 2018
FINANCING POSITION (€ millions)
Total financing capacity Overdrafts used
228.3230.3233.5229.1223.2
83.598.3
82.5 82.3
€ millions 2018 2017 % changeOperating cash flow (before tax) 49.0 54.5 -10.1%Net changes in working capital (10.6) 12.3 -187.0%Payments of interest and tax (19.1) (16.7) 13.8%Net cash generated by operating activities 19.3 50.1 -61.5%
Capex (5.6) (5.7) 1.8%Acquisitions / investments - (8.0) -Other investing activities (0.2) 0.1 -300.0%Cash used in investing activities (5.8) (13.6) 57.4%
Capital increases 0.3 0.5 -40.0%Changes in financial liabilities 11.6 (8.2) -240.2%Dividends (27.1) (28.0) -3.6%Cash used in financing activities (15.2) (35.7) -57.4%
ANNUAL REPORT 2018 AMSTERDAM COMMODITIES N.V. 45

Edible SeedsOur Edible Seeds segment showed a mixed performance. Sunflower grower prices remained stable during the year. The wildlife division had a slow start of the year due to low market demand. A major success was achieved by the SunGold division as it won the Spitz® production contract. Production of Spitz® was transferred into SunGold during the summer months within an extremely short time frame. Additional production lines where installed to produce these additional volumes. Export opportunities were limited due to the changed market circumstances. The import trading operation in Canada, however, reported a substantial sales growth and proved the trend of growing market opportunities for imported products. The unique product and positioning of SunButter® continued to provide substantial opportunities.
Additional marketing spend was made to continue to benefit from the momentum in the spread category. An ever increasing range of consumers is won over by the healthy attributes of SunButter®. The poppy seed market saw increased prices in the second half of the year. Following the soft market of 2017, with a delay in demand for poppy seed, 2018 saw volumes increasing. These developments resulted in a strong performance due to improved market circumstances.
EBITDA decreased by €0.4 million (-2.1%). The decrease was mainly due to higher production costs in the US, partly offset by the strong performance in poppy seed in Europe.
0
10
20
30
2014 2015 2016 2017 2018
EBITDA (€ millions)
49.5 58.0 61.8 59.2
45.2
56.562.2
53.4
20
0
40
60
80
100
120
2014 2015 2016 2017 2018
INVESTED CAPITAL (€ millions)
54.2
51.3
16.918.920.0
0
50
100
150
200
2014 2015 2016 2017 2018
SALES (€ millions)
188.7182.0158.7 174.4189.1
105.5
124.0
94.7
112.6114.5
17.315.0
Fixed capitalWorking capital
0
10
20
30
2014 2015 2016 2017 2018
EBITDA (€ millions)
16.0 15.9 15.9 19.5
80.4
94.8 96.986.0
20
0
40
60
80
100
120
2014 2015 2016 2017 2018
INVESTED CAPITAL (€ millions)
23.4
81.0
24.428.3
23.3
0
100
200
300
400
2014 2015 2016 2017 2018
SALES (€ millions)
341.1345.8307.4
369.9347.5
104.4112.8
96.4105.5110.7
25.826.2
Fixed capitalWorking capital
ANNUAL REPORT 201846 AMSTERDAM COMMODITIES N.V.
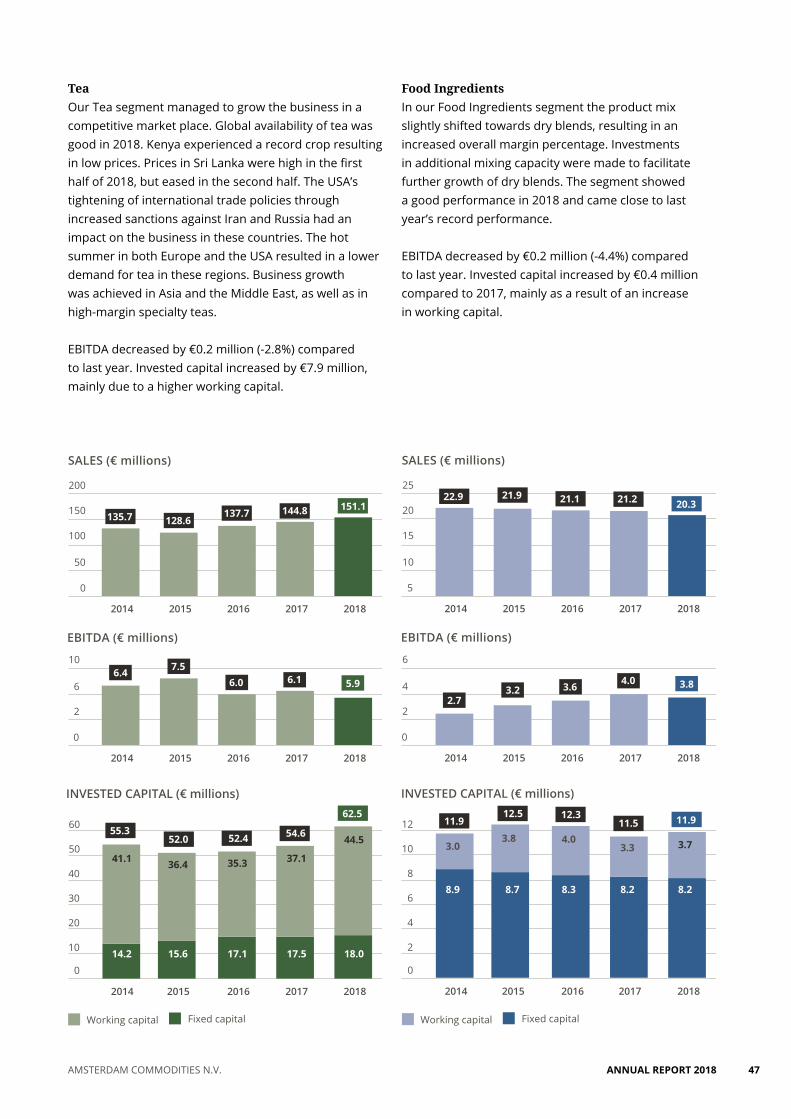
TeaOur Tea segment managed to grow the business in a competitive market place. Global availability of tea was good in 2018. Kenya experienced a record crop resulting in low prices. Prices in Sri Lanka were high in the first half of 2018, but eased in the second half. The USA’s tightening of international trade policies through increased sanctions against Iran and Russia had an impact on the business in these countries. The hot summer in both Europe and the USA resulted in a lower demand for tea in these regions. Business growth was achieved in Asia and the Middle East, as well as in high-margin specialty teas.
EBITDA decreased by €0.2 million (-2.8%) compared to last year. Invested capital increased by €7.9 million, mainly due to a higher working capital.
0
2
6
10
2014 2015 2016 2017 2018
EBITDA (€ millions)
14.2 15.6 17.1 17.5
41.1 36.4 35.3 37.1
10
0
20
30
40
50
60
2014 2015 2016 2017 2018
INVESTED CAPITAL (€ millions)
18.0
44.5
5.96.06.4
0
50
100
150
200
2014 2015 2016 2017 2018
SALES (€ millions)
151.1137.7135.7 144.8
128.6
62.5
52.455.3 54.652.0
6.17.5
Fixed capitalWorking capital
0
2
4
6
2014 2015 2016 2017 2018
EBITDA (€ millions)
8.9 8.7 8.3 8.2
3.03.8 4.0
3.3
2
0
4
6
8
10
12
2014 2015 2016 2017 2018
INVESTED CAPITAL (€ millions)
8.2
3.7
3.83.62.7
5
10
15
20
25
2014 2015 2016 2017 2018
SALES (€ millions)
20.321.122.9 21.221.9
11.912.311.9 11.512.5
4.03.2
Fixed capitalWorking capital
Food IngredientsIn our Food Ingredients segment the product mix slightly shifted towards dry blends, resulting in an increased overall margin percentage. Investments in additional mixing capacity were made to facilitate further growth of dry blends. The segment showed a good performance in 2018 and came close to last year’s record performance.
EBITDA decreased by €0.2 million (-4.4%) compared to last year. Invested capital increased by €0.4 million compared to 2017, mainly as a result of an increase in working capital.
ANNUAL REPORT 2018 AMSTERDAM COMMODITIES N.V. 47

ANNUAL REPORT 201848 AMSTERDAM COMMODITIES N.V.

RED RIVER-VAN ECK
Red River-Van Eck is one of the
top players in a highly specialized
global market. The company
sources, imports, processes and
distributes edible seeds (mainly
poppy, sunflower and caraway)
to the confectionary, spice and
bakery industry. Originally a family
business, the company shifted from
general to specialist trading in 1993,
more than 100 years after it started
out. The specialist seeds company
joined the Acomo Group in 2010.
Reliable long-term partner The strategy is to buy close to
the source and sell close to the
retailer, namely to the packers and
seed mixers who deliver to the
confectionary and bakery industries.
Red River-Van Eck serves a global
customer base. Specially selected
seeds go to customers that use these
as a main ingredient for pastry like
poppy cake. Other types of seed are
used for decoration on bread loaves
and rolls. With decades of experience
Red River-Van Eck knows the value
of networks and loyalty. Through
strategic agreements at the source it
is a reliable long-term partner for
producers. In turn that makes Red
River-Van Eck a reliable supplier to
its customers as it always provides
sufficient supplies when they want
them and how they want them.
The company offers stability and
continuity to all parties in the chain,
including timely advice on market
trends.
Frontrunner in product safetyRising levels of regulation on food
safety and allergen-free facilities pose
both challenges and opportunities.
Anticipating developments,
Red River-Van Eck will move to a
new facility in 2019 to become even
more of a frontrunner on product
safety. More extensive automation
will offer higher capacity with higher
quality for existing customers and
will open the door to new markets
for the future.
WWW.RR-VE.COM
Part of the Acomo Group since 2010
PRODUCTS
• Processing and distribution
of (mainly poppy) seeds
to the confectionary, spice
and bakery industry
Strategic collaboration makes Red River-Van Eck a reliable long-term partner
to both producers and customers.
ONE OF THE WORLD’S TOP PLAYERS IN A HIGHLY SPECIALIZED MARKET
ANNUAL REPORT 2018 AMSTERDAM COMMODITIES N.V. 49

ANNUAL REPORT 201850 AMSTERDAM COMMODITIES N.V.

SIGCO WARENHANDELSGESELLSCHAFT
SIGCO Warenhandel is a full-range
bakery seed supplier and the leading
importer and distributor in Germany.
The company’s development has
always been driven by customer
demand. After acquiring Küchler in
the late 1970s, the business focused
on meeting demand for US sunflower
kernels. In the early 2000s, as
customers requested products like
sesame and pumpkin seeds, SIGCO
sourced high-quality and reliable
suppliers in Asia and Africa.
Customers know they can count on
SICGO for thorough knowledge of
suppliers at origin and for absolute
reliability in the supply chain.
Always fulfil the contractWith at least 90% of its business in
Germany, SIGCO imports mainly
through the Port of Hamburg. A safe
and stable flow of goods is essential
for the company to keep its promise
to always fulfill the contract. As part
of the Acomo Group, SIGCO can
maintain adequate buffer stocks
at all times in its five warehousing
facilities. The company is among
the most experienced sesame seed
traders in the world.
The combination of product know-
how and close relationships with
logistics and warehousing partners
guarantees a safe flow of materials
for just-in-time supply and delivery
tailored to customer needs.
Logistics is key Future developments will partly be
determined by evolving EU food
regulations and the consumer shift to
organic products and ‘superfoods’.
Rising demand for chia seed boosted
SIGCO’s growth in the past year and
the company is well placed to source
organic product. Logistics will again
play a key role in keeping product
flows safe and separate. Through
dedicated facilities and secure sources
of supply SIGCO will continue to meet
customer needs at all times.
WWW.SIGCO.DE
Part of the Acomo Group since 2014
PRODUCTS
• Seeds: sunflower, sesame,
pumpkin, caraway, blue
poppy, flax, millet, chia,
quinoa
Through efficiencies of scale and top-class logistics, SIGCO provides
customized solutions for the bakery industry.
SIGCO DELIVERS ABSOLUTE RELIABILITY IN THE SUPPLY CHAIN
ANNUAL REPORT 2018 AMSTERDAM COMMODITIES N.V. 51


GOVERNANCECorporate governance
IntroductionAcomo is incorporated and based in the Netherlands. Consequently, its governance structure is based on the requirements of Dutch legislation and the Company’s Articles of Association, complemented by internal policies and procedures. Given the worldwide exposure of Acomo’s businesses, the international context is of vital importance, and international developments are closely monitored. Acomo has always sought to enhance its governance in line with the Dutch Corporate Governance Code (‘the Code’, see www.mccg.nl) and international best practices. Any substantial changes in Acomo’s corporate governance structure will be submitted for approval to the Annual General Meeting of Shareholders (‘the AGM’).
On 8 December 2016 the Corporate Governance Monitoring Committee published an update to the Code, replacing the previous version (2008). Acomo supports the new Code while maintaining some of its departures from the Code (see page 55).
Board of Directors The task of the Board is to manage the Company, which includes the responsibility for the performance of the Group, the implementation of the Company’s role, objectives and long-term strategy within the risk profile relating to the strategy, and taking into account corporate social responsibility aspects that are relevant to the Company. The Board is a one-tier board and the responsibility of the directors is collective, taking into account their respective roles as executive directors and non-executive directors. The majority of directors are non-executive directors, who essentially have a supervisory role. The non-executive director profile can be found on the Acomo website. The Company currently has one executive director, the Group Managing Director.
A list of the current directors, with their dates of appointment and their other major appointments, is set out in the chapter The Board of Directors on page 60.
The current Non-Executive Directors of the Board have delegated the operational running of the Group to the
Group Managing Director with the exception of the following matters, which are joint Board responsibilities: structural and constitutional matters, corporate governance, approval of dividends, approval of overall strategy for the Company, approval of significant transactions or arrangements in relation to mergers, acquisitions, joint ventures and disposals, capital expenditure, contracts, litigation, financing and pensions. The Group Managing Director reports to the Board and is able to delegate any of his powers and discretions.
Executive director appointments are for a maximum period of four years with the possibility of re-appointment for consecutive four-year terms.
The role of non-executive directors is to supervise the Group activities of executive directors and the general course of affairs of Acomo. Non-executive directors support executive directors with solicited and unsolicited advice. In the fulfilment of their task, non-executive directors look in the first place to the interests of the Group, taking into consideration the fair interests of all parties concerned.
The supervision of non-executive directors includes the following aspects: • The realization of the Company’s objectives and
strategy – with attention for the risks related to the Company’s activities, strategy and consideration for its corporate social responsibility;
• The process of financial reporting; • The observance of laws and regulations; • A sound corporate governance; • The relations with shareholders.
The rules regarding meetings, decision-making and working procedures of the Board of Directors can be found in the Articles of Association and the Board’s Rules of Procedure. Both documents are published on the Company’s website: www.acomo.nl/corporate-governance.
According to the Dutch Act on Management and Supervision (‘Wet bestuur en toezicht’), a proper composition of the Board means that at least 30% of the seats are held by women and at least 30% by men. Currently one out of five directors of the Board is
ANNUAL REPORT 201854 AMSTERDAM COMMODITIES N.V.

female (20%). With regard to the same act, no non-executive director of the Board can hold more than five supervisory positions at Dutch ‘large companies’. Acomo pays close attention to diversity including gender diversity in the profiles of new directors of the Board in accordance with section 2:166, subsection 2 of the Dutch Civil Code. It currently does not strictly follow the recommendation for an explicit target on gender diversity and has not formulated concrete targets in this respect. Since Acomo is a small company, with four non-executive directors, it is not feasible to set concrete gender targets, also taking into account the other criteria described in the non-executive director profile.
Non-executive directors are appointed for a term of six years with the possibility of re-appointment for consecutive six-year, or shorter, terms.
The Board is the authorized body to adopt resolutions to issue common shares and/or grant rights to acquire common shares up to a maximum 10% of the issued share capital. The Board is the authorized body to adopt resolutions to restrict or exclude pre-emptive rights in relation to the issue of common shares and/or the granting of rights to acquire common shares.
Information following the takeover directive decree is included on page 124.
Annual General Meeting of Shareholders Acomo’s shareholders meet at least once a year in a general meeting, which generally takes place in Rotterdam, the Netherlands. Important matters that require the approval of the General Meeting of Shareholders are: • Adoption of the annual accounts;• Adoption of profit appropriation and additions
to reserves; • Adoption of the proposed dividends; • Remuneration policy of the executive directors
of the Board on a proposal by the non-executive directors of the Board;
• Remuneration of the non-executive directors of the Board;
• Discharge from liability of the executive directors of the Board for their management;
• Discharge from liability of the non-executive directors of the Board for their supervision;
• Appointment of the external auditor;
• Appointment, suspension or dismissal of the members of the Board;
• Adoption of amendments to the Articles of Association on a proposal by the Board.
Voting rights Each of Acomo’s ordinary shares is entitled to one vote. There are no voting restrictions and there is no certification of shares. Shareholders may vote by proxy. The voting rights attached to any company shares held by the Company are suspended as long as they are held in treasury. Resolutions of the General Meeting are adopted by an absolute majority of votes cast, except where Dutch law or Acomo’s Articles of Association provide for a special majority.
Departures from the Code Principle 2.2.2 Appointment and reappointment periods – non-executive directors: Considering the requirement for experience and in-depth expertise in the sourcing, trading, processing, packaging and distribution of food commodities, non-executive directors of the Board are appointed for a term of six years or less and no maximum number of terms has been determined. A non-executive director can be reappointed at the end of each term after careful consideration of his past performance and the adequacy of his profile with the desired profile of the Board.
Principle 3.1.2 Remuneration policy: According to the Code, the remuneration policy should include objectives for the strategy towards long-term value creation. The remuneration structure of Acomo is fairly common in international commodity trading firms and has been consistently applied by Acomo over the past years. The absence of explicit long-term remuneration criteria is explained by the fast and very short-term cycle of the trading activities. Although long-term objectives are not specifically determined in the remuneration policy (see page 58), in practice they play an important role given the long-term relations and the high degree of loyalty of both management and employees towards the Group.
ANNUAL REPORT 2018 AMSTERDAM COMMODITIES N.V. 55

Statement by the Group Managing Director
In accordance with best practice 1.4.3 of the Code of December 2016 the Group Managing Director confirms that: • This report provides sufficient insights into any failings
in the effectiveness of the internal risk management and control systems;
• The aforementioned systems provide reasonable assurance that the financial reporting does not contain any material inaccuracies;
• Based on the current state of affairs, it is justified that the financial reporting is prepared on a going concern basis;
• This report states those material risks and uncertainties that are relevant to the expectation of the Company’s continuity for the period of twelve months after the preparation of the report.
Report of the Non-Executive Directors
This report provides further information on the way the Non-Executive Directors performed their duties in 2018. Board meetings Meetings of the Board are scheduled one year in advance. At least once a year the Group strategy is reviewed by the Board. Besides the regular agenda, the Board receives briefings and updates from key executives and senior management on developments and issues concerning the Group’s business or which have an impact on the business of the Group. Further recurring agenda items for Board meetings are updates on business, financials and treasury topics.
In its meetings, the Board additionally discusses the further development of the Group’s business activities through acquisitions and investment projects in line with Acomo’s long-term strategy.
In addition to the scheduled meetings each year, the Board meets as and when warranted by particular circumstances and engages in informal discussions.
To ensure that the Board has an in-depth understanding of the Group’s business and activities, members of the Board visit the group companies regularly.
Personal informationPersonal information about each Non-Executive Director, as required in principle 2.1.2 of the Code, can be found in chapter The Board of Directors on page 60.
Independence The Board currently considers all Non-Executive Directors to be independent of Acomo as defined in the Code, except for Mr Niessen, since he indirectly owns more than 10% of Acomo shares. However, the Board has ascertained that Mr Niessen in fact acts critically and independently. Trading experience and expertise of the members of the Board are crucial for the effective functioning of the Board. The Company believes that maintaining continuity in its Board is fundamental for delivering long-term shareholder value. Evaluation accountability Every year, the Board evaluates its functioning as a whole as well as that of its individual members and the functioning of the auditor. This review is held outside the presence of executive directors and is held through collective and individual discussions between the Chairman and non-executive directors. In the opinion of the Board, the functioning of the Board as a whole and of its individual members as well as the functioning of the auditor were satisfactory in the light of the current structure, size and strategy of the Company. Following the evaluation, the Board proposes to the Annual Meeting of Shareholders to reappoint the auditor and one of the Non-Executive Directors.
Committees Considering the size of the Group no separate Board Committees are installed. Hence, the tasks of an audit committee, as prescribed in the Dutch Securities Supervision Act (‘Wet toezicht effectenverkeer’) are currently performed by the Non-Executive Directors of the Board.
AttendanceAll Non-Executive Directors and the Executive Director were present at the 13 formal meetings held in 2018 (100%). The Board also convened in the absence of the Executive Director, which happened either before or after each meeting.
Absence internal audit department Considering the size of the Group and based on a cost benefit analysis, Acomo has not established an internal audit department. The Company has taken the following
ANNUAL REPORT 201856 AMSTERDAM COMMODITIES N.V.

ANNUAL REPORT 2018 AMSTERDAM COMMODITIES N.V. 57
alternative measures to mitigate the absence of an internal audit department: • For the international subsidiaries in the Tea segment,
site visits by the Managing Director ad interim/Finance Director of the Van Rees Group are carried out. In 2018 site visits were organized at the Van Rees offices in Indonesia, Sri Lanka, Vietnam and Kenya. The site visit to Sri Lanka was also attended by the independent external Group auditor.
• In addition to these site visits, local audit firms are hired to perform audit procedures with a broader scope on top of their statutory and Group audit procedures.
• All subsidiaries are regularly visited by the Group Managing Director and by members of the Group Finance department. Topics that are addressed during those visits are financial and business performance, Group reporting and IFRS accounting, compliance to laws and regulations and internal control matters.
The Board has assessed the alternative measures performed together with any resulting findings and recommendations and concluded that the findings did not result in any material deficiencies to Acomo’s internal control system. Hence the Board considers the alternative measures performed sufficient for not establishing an internal audit department.
Remuneration report
The information relative to the remuneration of executive and non-executive directors of the Board is disclosed in Note 1.7 of the Company financial statements.
Non-executive directors of the Board are responsible for appointing the Company’s statutory directors (subject to the General Meeting’s approval) and setting their remuneration. The Company currently has one executive director and therefore the Company has not had the need to develop a general remuneration policy. Also, the Board’s annual remuneration report is relatively brief in the absence of material changes year on year.
Remuneration policy The level and structure of remunerations within the Group are such that people with the required expertise and qualifications can be recruited and retained. In determining the individual remunerations, the effect on
the remuneration levels within the Group is taken into account. The total remuneration consists generally of a fixed element and a variable element linked to the annual profit before taxes of the respective entity. Fixed salaries are in line with market salaries. Managers, traders and other personnel of the subsidiaries can earn, in general, an annual profit-sharing compensation based on a fixed percentage of 10% to 15% of the profit before taxes of the (trading) company in which they are employed. This remuneration structure is fairly common in international commodity trading firms. The absence of explicit long-term remuneration criteria is explained by the fast and very short-term cycle of the trading activities. This clear and simple remuneration structure has significantly contributed to the success of the Group because it strongly focuses on profitability and the management of the risks and costs related to the activities. All employees are therefore highly committed to the success of the Group. In practice, the absence of any form of subjective profit-sharing calculation has proved to contribute to maintaining the familial culture of Acomo.
Over the past 20 years Acomo has had very low personnel rotation. In return, the Group expects 100% loyalty, honesty, dedication and a high degree of professionalism from all its employees. The management has always been very loyal and the Group’s track record in terms of retaining key employees is excellent.
Adjustments to the remuneration policy for executive directors There were no adjustments to Acomo’s remuneration policy in 2018.
Remuneration of the Executive Director The remuneration of the Executive Director consists of a fixed and a variable element based on objective targets, which are evaluated each year by the non-executive directors of the Board. Evaluation criteria include the performance of the Group and the achievement of the Group strategy. Scenario analyses The Code requires that the non-executive directors of the Board shall analyse possible outcomes of the variable income components on executive directors’ remuneration. A high-level scenario analysis is included in the annual determination of the variable element of executive directors’ remuneration by the non-executive directors of the Board.
ANNUAL REPORT 201858 AMSTERDAM COMMODITIES N.V.

Declaration by the Board of Directors
In accordance with the Dutch Financial Supervision Act, section 5.25c, the Board of Directors declares that, to the best of its knowledge: • The financial statements for 2018 provide, in
accordance with IFRS as endorsed by the EU, a true and fair view of the consolidated assets, liabilities and financial position as at 31 December 2018, and of the 2018 consolidated statement of income of Amsterdam Commodities N.V.;
• The annual report provides a true and fair view of the situation as at 31 December 2018 and the state of affairs during the financial year 2018, together with a description of the principal risks faced by the Group.
Rotterdam, 7 March 2019
The Board of Directors,
A.W. Goldschmeding, Executive Director B.H. Stuivinga, Chairman M.E. Groothuis, Non-Executive Director Y. Gottesman, Non-Executive Director J.G.H.M. Niessen, Non-Executive Director
ANNUAL REPORT 2018 AMSTERDAM COMMODITIES N.V. 59

THE BOARD OF DIRECTORS
Machtelt Groothuis (1970, f) Non-Executive Director
Non-Executive Director since April 2017. Prior to this she served as member of the Supervisory Board from 2013. End of current term: 2019. Nationality: Dutch.
Entrepreneurial (impact) investor, currently at Social Impact Ventures in Amsterdam, and boardroom advisor.
Allard Goldschmeding (1964, m)Group Managing
Director and
Chief Financial Officer
Executive Director since appointment at the AGM of 26 April 2016. End of current term: 2020. Nationality: Dutch.
Supervisory directorships and other positions held: none.
Bernard Stuivinga (1956, m) Non-Executive Chairman
Non-Executive Chairman since April 2017. Prior to this he served as Chairman of the Supervisory Board from 2002. End of current term: 2022. Nationality: Dutch.
Attorney-at-law and tax advisor with Roorda Advocaten in Amsterdam.
Yoav Gottesman (1952, m)Non-Executive Director
Non-Executive Director since April 2017. Prior to this he served as member of the Supervisory Board from 2002. End of current term: 2022. Nationality: British.
Former director of various companies predominantly in the commodity and food industry. Private investor in technology and private equity ventures.
Jan Niessen (1963, m)Non-Executive Director
Non-Executive Director since April 2017. Prior to this he served as member of the Supervisory Board from 2011. End of current term: 2023. Nationality: Dutch.
Managing director of Mont Cervin Sarl in Luxembourg and member of the Supervisory Board of Ordina N.V.
ANNUAL REPORT 201860 AMSTERDAM COMMODITIES N.V.

THE ACOMO SHAREShares and listings Shares in Amsterdam Commodities N.V. are listed on Euronext stock exchange in Amsterdam (ISIN code NL0000313286). The shares were included in the Amsterdam Small Cap Index (AScX) on 21 March 2011.
The average number of shares outstanding in 2018 was 24,638,238. On 31 December 2018 Acomo had 24,649,060 shares outstanding.
Distribution of shares Under the Dutch Financial Markets Supervision Act, shareholdings of 3% or more in any Dutch company must be disclosed to the Dutch Authority for the Financial Markets (AFM). According to the register kept by the AFM the following shareholders had disclosed that they have a direct or indirect (potential) interest
in Acomo’s total share capital on 31 December 2018: • Mont Cervin Sarl (14.9%) • Mawer Investment Management Ltd. (11.6%) • Red Wood Trust (8.1%) • Teslin Participaties Coöp UA (5.3%)• Kempen Capital Management N.V. (5.0%) • Fidelity Management & Research (Japan) Ltd. (5.0%).
Dividend Acomo aims to maintain the Group’s traditionally strongdividend policy. This policy implies that a substantial share of the annual net profit is paid out to the shareholders in cash every year. The pay-out ratio is subject to the realized free available cash flow and solvency and also depends on investment opportunities of the Group.
Key Acomo share data 2018 2017 2016 2015 2014Year-end price € 17.44 24.11 20.90 23.20 19.01Year high € 25.50 29.36 24.64 25.83 19.01Year low € 16.28 20.25 19.00 18.85 16.19
Number of shares 31 December (thousands) 24,649 24,624 24,225 23,991 23,767Market capitalization 31 December (€ millions) 429.9 593.6 506.3 556.6 451.8Earnings per share € 1.26 1.33 1.43 1.35 1.40Dividend per share € 1.00 1.10 1.15 1.00 1.10Equity per share € 7.85 7.52 7.55 7.02 6.39Price/earnings ratio (P/E ratio) € 13.8 18.2 14.6 17.2 13.6
Share performance 2018
10
15
20
25
30
DEC’17 JAN’18 FEB MAR APR MAY JUN JUL AUG SEP OCT NOV DEC’18
Source: Euronext
ANNUAL REPORT 2018 AMSTERDAM COMMODITIES N.V. 61

ANNUAL REPORT 201862 AMSTERDAM COMMODITIES N.V.

VAN REES GROUP
In 1819, a young Dutchman named
Jan van Rees started a tea company
in the Netherlands. Since those
humble beginnings the business has
developed into Van Rees Group, a
full-service provider and one of the
largest suppliers of tea in the world,
with a unique network of 12 offices
in every major tea-producing origin
and all important tea-consuming
markets, along with state-of-the-art,
fully certified warehouses and
blending facilities. Van Rees Group
believes in sustainable partnerships
with customers and suppliers and
adding value throughout the chain,
such as with customer-specific
blends, strict quality control, vendor-
managed inventory, just-in-time
delivery, long-term contracts, supply
chain financing, and market advice.
Network and reliabilityVan Rees Group’s world-class tea
expertise is founded on 200 years
of experience. Its traders constantly
monitor and analyse market
developments and weekly share
insights with customers. Every day,
specialists taste, test, blend and
process tea to ensure the reliable
supply of healthy, safe and
responsibly sourced products.
Quality and food safety are
guaranteed through strict quality
control, 100% traceability in a
global ERP system and all major
relevant certificates.
Product diversificationVan Rees Group carefully selects its
warehousing partners and local
suppliers and builds long-term
relationships with them. It supports
MRL-compliant production methods
and investments in machines for
new product/market combinations.
The company also firmly believes
in long-term relationships with its
customers and adding value through
innovative, tailor-made solutions
throughout the chain. Just-in-time
delivery from multiple origins
assures its customers a predictable
performance. In the coming years
Van Rees Group aims to further
diversify its product portfolio in
response to trends in the market.
WWW.VANREES.COM
Part of the Acomo Group since 2010
PRODUCTS
• Tea and related products
• Blending
• Tailor-made solutions for
customers and suppliers,
including vendor-managed
inventory and just-in-time
delivery
Van Rees Group bridges the demand and supply of tea with an extensive
international network with 50 tea professionals, deep market intelligence,
top-quality supply and tailor-made solutions.
200 YEARS OF PASSION FOR TEA AND MEETING CUSTOMER REQUIREMENTS WITH TOP-LEVEL PROCESSING AND SUPPLY
ANNUAL REPORT 2018 AMSTERDAM COMMODITIES N.V. 63

ANNUAL REPORT 201864 AMSTERDAM COMMODITIES N.V.

SNICK EUROINGREDIENTS
The unique and innovative solutions
that help customers meet the
demands of their markets are all
developed in Snick’s professional
kitchen and pilot plant in
Ruddervoorde, Belgium, where they
are thoroughly tasted and tested.
For 25 years already, this strategy
has enabled the company to achieve
consistent and profitable growth.
Focus and disciplineAs the food industry is going
through a period of consolidation
(on both the supply and demand
side) Snick EuroIngredients
maintains its position in the
chain through unwavering
commitment to excellence. This
requires focus and discipline:
focus on the right products, the
right partners and the right
customers, and discipline to
continuously deliver the highest
possible level of quality. Services
include product development,
manufacturing, packaging, distribution
and inventory management. Strict
control of quality ensures the safety
of its products.
Distinction through expertiseSnick’s future success depends on its
ability to stay in sync with the market
and have a timely response to trends
such as the growing demand for
vegetarian food. The company’s
strategic focus is on exclusive
partnerships with specialized
suppliers, which allow it to always
have the latest in raw ingredients,
equipment and technology. A recent
expansion of the team of food
technologists has further deepened
Snick’s expertise and stepped up
its ability to meet the requirements
of a wide customer base.
Further strengthening of the positionEach day, Snick EuroIngredients
adds value to the ingredients
delivered by its suppliers and
passes on value to the products of
its customers. This guarantees the
relevance towards stakeholders
and allows Snick to expand its
position in the Benelux countries.
WWW.SNICK.BE
Part of the Acomo Group since 2009
PRODUCTS
• Savoury, sweet and
functional ingredients
• Unique and innovative
tailor-made solutions
(concepts and blends)
Since 1993, the main drive of Snick EuroIngredients has been to add
value through extensive knowledge of the market, its customers and
the possibilities of its ingredients.
ADDING VALUE TO INGREDIENTS TO PASS ON VALUE TO CUSTOMERS’ PRODUCTS
ANNUAL REPORT 2018 AMSTERDAM COMMODITIES N.V. 65

F I N A N C I A LS T A T E M E N T S
C O N S O L I D A T E D
BALANCE SHEET AS AT 31 DECEMBER
STATEMENT OF INCOME
STATEMENT OF COMPREHENSIVE INCOME
STATEMENT OF CASH FLOWS
STATEMENT OF CHANGES IN EQUITY
NOTES TO THE CONSOLIDATED FINANCIAL STATEMENTS
All amounts are in thousands of euros, unless otherwise stated.

CONSOLIDATED BALANCE SHEET AS AT 31 DECEMBER(in € thousands, before profit appropriation)
Assets 31 December 31 December
Non-current assets Note 2018 2017Intangible assets 6 68,098 66,242Property, plant and equipment 7 38,057 36,574Other non-current receivables 8 1,261 1,257Deferred tax assets 19 1,484 1,846Total non-current assets 108,900 105,919
Current assets
Inventories 10 142,512 149,570Trade receivables 11 95,235 83,493Other receivables 12 7,601 4,131Derivative financial instruments 13 1,954 261Cash and cash equivalents 14 957 2,590Total current assets 248,259 240,045
Total assets 357,159 345,964
Equity and liabilities Shareholders’ equity
Share capital 15 11,092 11,081Share premium reserve 15 61,994 61,658Other reserves 16 7,915 3,801Retained earnings 81,414 76,039Net profit for the year 31,107 32,472Total shareholders’ equity 193,522 185,051
Non-current liabilities and provisions
Bank borrowings 18 9,068 11,571Deferred tax liabilities 19 6,339 6,895Retirement benefit obligations 20 2,150 2,453Other provisions 21 315 100Total non-current liabilities 17,872 21,019
Current liabilities
Bank borrowings 18 83,513 68,214Trade creditors 40,679 45,593Tax liabilities 3,233 6,135Derivative financial instruments 13 165 1,271Other current liabilities and accrued expenses 18,175 18,681Total current liabilities 145,765 139,894
Total liabilities 163,637 160,913
Total equity and liabilities 357,159 345,964
The notes on pages 73 to 103 are an integral part of these consolidated financial statements.
ANNUAL REPORT 201868 AMSTERDAM COMMODITIES N.V.

CONSOLIDATED STATEMENT OF INCOME(in € thousands)
Note 2018 2017Sales 5 700,170 709,679Cost of goods sold (583,317) (592,758)Gross margin 116,853 116,921
Personnel costs 22 (43,203) (42,303)General costs 23 (23,275) (22,533)Depreciation and amortization (5,333) (5,643)Total costs (71,811) (70,479)
Operating income 45,042 46,442
Interest income 24 42 68Interest expense 24 (4,218) (3,114)Other financial income and expenses 24 143 (60)Profit before income tax 41,009 43,336Corporate income tax 25 (9,902) (10,864)
Net profit 31,107 32,472
Profit attributable to shareholders of the Company 31,107 32,472
Earnings per share Basic 26 1.263 1.327Diluted 26 1.263 1.325
The notes on pages 73 to 103 are an integral part of these consolidated financial statements.
ANNUAL REPORT 2018 AMSTERDAM COMMODITIES N.V. 69

CONSOLIDATED STATEMENT OF COMPREHENSIVE INCOME(in € thousands)
2018 2017Net profit 31,107 32,472
Other comprehensive income (OCI) OCI to be reclassified to profit or loss in subsequent periods
Movement currency translation reserves 3,751 (11,178)Movement on cash flow hedges 201 (148)OCI to be reclassified to profit or loss in subsequent periods 3,952 (11,326)
OCI not to be reclassified to profit or loss in subsequent periods
Remeasurement gains/(losses) on defined benefit plans 60 (418)Release pension provision 73 -OCI not to be reclassified to profit or loss in subsequent periods 133 (418)
Total other comprehensive income 4,085 (11,744)
Total comprehensive income 35,192 20,728
Total comprehensive income attributable to shareholders of the parent 35,192 20,728
The notes on pages 73 to 103 are an integral part of these consolidated financial statements.
Items in the statement above are disclosed net of income tax. The income tax relating to each component of other comprehensive income is disclosed in Note 25.
ANNUAL REPORT 201870 AMSTERDAM COMMODITIES N.V.

The notes on pages 73 to 103 are an integral part of these consolidated financial statements.
CONSOLIDATED STATEMENT OF CASH FLOWS(in € thousands)
Cash flow from operating activities Note 2018 2017Profit before income tax 41,009 43,336Adjustments for: • Depreciation and amortization 6, 7 5,333 5,643• Net increase/(decrease) in provisions (1,116) 2,082• Interest income 24 (42) (68)• Interest expense 24 4,053 3,114• Cost share option plan and other (252) 413Cash flow from operating activities excluding working capital 48,985 54,520
Changes in working capital
• Inventories 10,877 9,297• Trade and other receivables (9,560) 6,024• Derivatives (4,088) 2,878• Trade and other payables (7,828) (5,871)Total (increase)/decrease in working capital, net (10,599) 12,328
Cash generated from operations 38,386 66,848
Interest paid (3,943) (3,180)Income tax paid (15,098) (13,545)Net cash generated from operating activities 19,345 50,123
Cash flow from investing activities
Investments in property, plant and equipment and intangible assets 6, 7 (5,559) (5,736)Acquisitions - (7,980)Other investing activitities (274) 57Net cash used for investing activities (5,833) (13,659)
Cash flow from financing activities
Proceeds from new shares issued 15 348 450Proceeds from new long-term borrowings 18 - 8,039Repayments of long-term borrowings 18 (2,359) (3,457)Net changes in short-term borrowings 18 13,942 (12,713)Dividends paid to shareholders (27,088) (28,013)Net cash used for financing activities (15,157) (35,694)
Net increase/(decrease) in cash and cash equivalents (1,645) 770
Cash and cash equivalents at the beginning of the year 2,590 1,805Exchange gains/(losses) on cash and cash equivalents 12 15
Cash and cash equivalents at the end of the year 957 2,590
ANNUAL REPORT 2018 AMSTERDAM COMMODITIES N.V. 71

CONSOLIDATED STATEMENT OF CHANGES IN EQUITY(in € thousands) Attributable to owners of the Company
Share Net Share premium Other Retained profit for Total Note capital reserve reserves earnings the year equity
Balance at 1 January 2017 10,901 52,447 15,499 69,684 34,377 182,908
Net profit 2017 - - - - 32,472 32,472Other comprehensive income 2017 - - (11,744) - - (11,744)Total comprehensive income 2017 - - (11,744) - 32,472 20,728
Appropriation of net profit - - - 34,377 (34,377) -New shares issued 15 180 9,211 - - - 9,391Employee share option scheme: • Value of employee services 16 - - 60 - - 60• Tax credit share option scheme 16 - - (14) - - (14)Dividends relating to 2016, final - - - (18,180) - (18,180)Dividends relating to 2017, interim - - - (9,842) - (9,842)Transactions with shareholders 180 9,211 46 6,355 (34,377) (18,585)
Balance at 31 December 2017 11,081 61,658 3,801 76,039 32,472 185,051
Net profit 2018 - - - - 31,107 31,107Other comprehensive income 2018 - - 4,085 - - 4,085Total comprehensive income 2018 - - 4,085 - 31,107 35,192
Appropriation of net profit - - - 32,472 (32,472) -New shares issued 15 11 336 - - - 347Employee share option scheme: • Value of employee services 16 - - 39 - - 39• Tax credit share option scheme 16 - - (10) - - (10)Dividends relating to 2017, final - - - (17,237) - (17,237)Dividends relating to 2018, interim - - - (9,860) - (9,860)Transactions with shareholders 11 336 29 5,375 (32,472) (26,721)
Balance at 31 December 2018 11,092 61,994 7,915 81,414 31,107 193,522
The notes on pages 73 to 103 are an integral part of these consolidated financial statements.
ANNUAL REPORT 201872 AMSTERDAM COMMODITIES N.V.
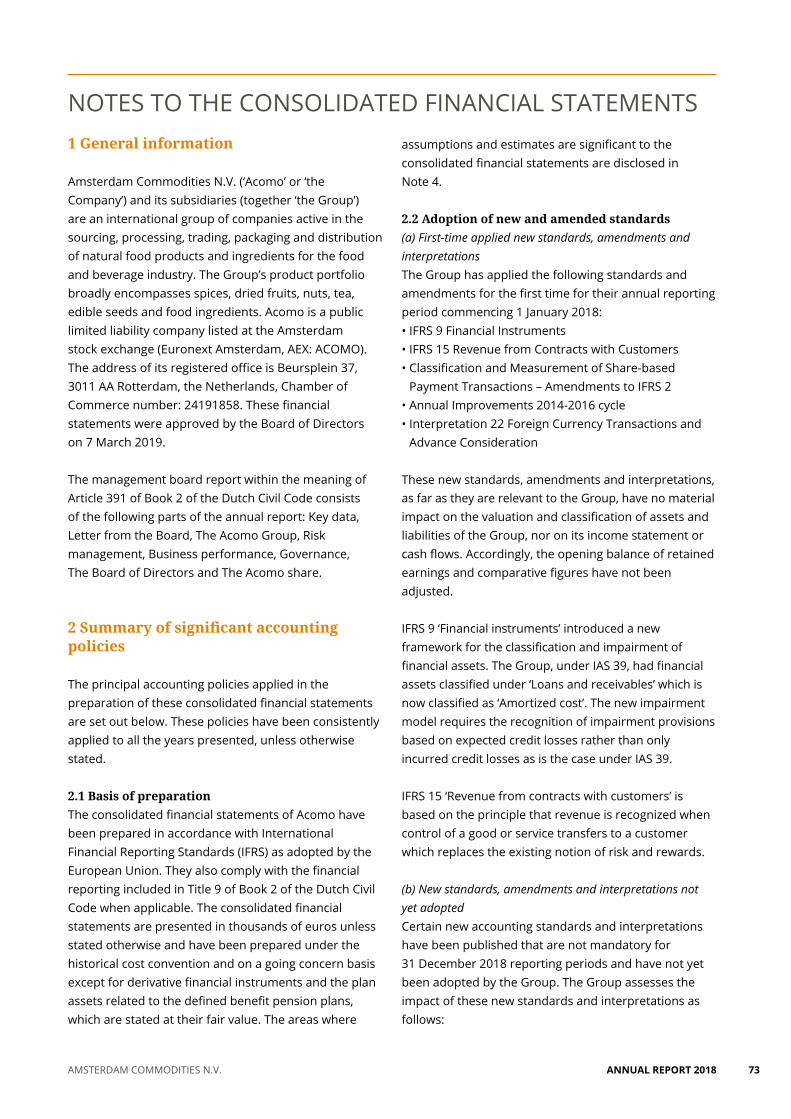
NOTES TO THE CONSOLIDATED FINANCIAL STATEMENTS1 General information
Amsterdam Commodities N.V. (‘Acomo’ or ‘the Company’) and its subsidiaries (together ‘the Group’) are an international group of companies active in the sourcing, processing, trading, packaging and distribution of natural food products and ingredients for the food and beverage industry. The Group’s product portfolio broadly encompasses spices, dried fruits, nuts, tea, edible seeds and food ingredients. Acomo is a public limited liability company listed at the Amsterdam stock exchange (Euronext Amsterdam, AEX: ACOMO). The address of its registered office is Beursplein 37, 3011 AA Rotterdam, the Netherlands, Chamber of Commerce number: 24191858. These financial statements were approved by the Board of Directors on 7 March 2019.
The management board report within the meaning of Article 391 of Book 2 of the Dutch Civil Code consists of the following parts of the annual report: Key data, Letter from the Board, The Acomo Group, Risk management, Business performance, Governance, The Board of Directors and The Acomo share.
2 Summary of significant accounting policies
The principal accounting policies applied in the preparation of these consolidated financial statements are set out below. These policies have been consistently applied to all the years presented, unless otherwise stated.
2.1 Basis of preparation The consolidated financial statements of Acomo have been prepared in accordance with International Financial Reporting Standards (IFRS) as adopted by the European Union. They also comply with the financial reporting included in Title 9 of Book 2 of the Dutch Civil Code when applicable. The consolidated financial statements are presented in thousands of euros unless stated otherwise and have been prepared under the historical cost convention and on a going concern basis except for derivative financial instruments and the plan assets related to the defined benefit pension plans, which are stated at their fair value. The areas where
assumptions and estimates are significant to the consolidated financial statements are disclosed in Note 4.
2.2 Adoption of new and amended standards(a) First-time applied new standards, amendments and interpretations The Group has applied the following standards and amendments for the first time for their annual reporting period commencing 1 January 2018: • IFRS 9 Financial Instruments • IFRS 15 Revenue from Contracts with Customers • Classification and Measurement of Share-based
Payment Transactions – Amendments to IFRS 2 • Annual Improvements 2014-2016 cycle • Interpretation 22 Foreign Currency Transactions and
Advance Consideration
These new standards, amendments and interpretations, as far as they are relevant to the Group, have no material impact on the valuation and classification of assets and liabilities of the Group, nor on its income statement or cash flows. Accordingly, the opening balance of retained earnings and comparative figures have not been adjusted.
IFRS 9 ‘Financial instruments’ introduced a new framework for the classification and impairment of financial assets. The Group, under IAS 39, had financial assets classified under ‘Loans and receivables’ which is now classified as ‘Amortized cost’. The new impairment model requires the recognition of impairment provisions based on expected credit losses rather than only incurred credit losses as is the case under IAS 39.
IFRS 15 ‘Revenue from contracts with customers’ is based on the principle that revenue is recognized when control of a good or service transfers to a customer which replaces the existing notion of risk and rewards.
(b) New standards, amendments and interpretations not yet adoptedCertain new accounting standards and interpretations have been published that are not mandatory for 31 December 2018 reporting periods and have not yet been adopted by the Group. The Group assesses the impact of these new standards and interpretations as follows:
ANNUAL REPORT 2018 AMSTERDAM COMMODITIES N.V. 73

The new standard IFRS 16 ‘Leases’, replacing ‘IAS 17 Leases’ and taking effect on 1 January 2019 will result in the recognition of almost all leases on the balance sheet, as the distinction between operating and finance leases is removed. The new standard recognizes assets (the right to use the leased item) and the financial liability to pay rentals. The only exceptions are short-term and low-value leases.
As at the reporting date, the Group has non-cancellable operating lease commitments of €10.1 million (see Note 27). Of these commitments, approximately €323 relate to short-term leases and low-value leases which will both be recognized on a straight-line basis as expenses in profit or loss. For the remaining lease commitments the Group expects to recognize right- of-use assets of approximately €9.1 million on 1 January 2019 and lease liabilities of €9.1 million (after adjustments for prepayments and accrued lease payments recognized as at 31 December 2018).
The Group expects that net profit after tax will decrease by approximately €178 for 2019 as a result of adopting the new rules. EBITDA used to measure segment results is expected to increase by approximately €2.2 million as the operating lease payments were included in EBITDA, but the amortization of the right-of-use assets and interest on the lease liability are excluded from this measure.
Operating cash flows will increase and financing cash flows decrease by approximately €2.0 million as repayment of the principal portion of the lease liabilities which will be classified as cash flows from financing activities.
The Group will apply the standard from its mandatory adoption date of 1 January 2019. The Group intends to apply the simplified transition approach and will not restate comparative amounts for the year prior to first adoption. All right-of-use assets will be measured at the amount of the lease liability on adoption (adjusted for any prepaid or accrued lease expenses).
There are no other standards that are not yet effective and that would be expected to have a material impact on the entity in the current or future reporting periods or on foreseeable future transactions.
2.3 Consolidation(a) SubsidiariesSubsidiaries are all those entities over which the Company has control. The Company controls an entity when the Company is exposed to, or has rights to, variable returns from its involvement with the entity and has the ability to affect those returns through its power over the entity. Subsidiaries are fully consolidated from the date that control is transferred to the Company until the date that control ceases.
The Group uses the acquisition method of accounting to account for business combinations. The consideration transferred for the acquisition of a subsidiary is the fair values of the assets transferred, the liabilities incurred and the equity interests issued by the Group. The consideration transferred includes the fair value of any asset or liability resulting from a contingent consideration arrangement. Identifiable assets acquired and liabilities and contingent liabilities assumed in a business combination are measured initially at their fair values at the acquisition date. Acquisition-related costs are expensed as incurred.
Intercompany transactions, balances and unrealized gains on transactions between group companies are eliminated. Unrealized losses are also eliminated. Accounting policies of subsidiaries have been changed where necessary to ensure consistency with the policies adopted by the Group.
(b) AssociatesAssociates are all entities over which the Group has significant influence but not control, generally accompanying a shareholding of between 20% and 50% of the voting rights. Currently the Group has no associates.
ANNUAL REPORT 201874 AMSTERDAM COMMODITIES N.V.

2.4 Segment reportingOperating segments are reported in a manner consistent with the internal reporting provided to the Acomo Board of Directors (‘The Board’). The Board is responsible for the allocation of the available resources, the assessment of the operational results and strategic decisions. The Board assesses the performance of the reporting segments based on a measure of adjusted profit before tax. This measurement basis excludes the effects of non-recurring expenditures from the operating segments such as restructuring costs, legal expenses and goodwill impairments when the impairment is the result of an isolated, non-recurring event. The Company has determined that Spices and Nuts, Edible Seeds,
Tea and Food Ingredients represent the reportable segments for the Group. These reportable segments have been determined by aggregation of a number of operating segments, that meet the aggregation criteria as described in IFRS 8, into reportable segments. The segment information is disclosed in Note 5.
2.5 Foreign currency translation(a) Functional and presentation currencyItems included in the financial statements of each of the Group’s entities are measured using the currency of the primary economic environment in which the entity operates (‘the functional currency’). The consolidated financial statements are presented in euros, the Company’s functional and presentation currency.
Percentage of ownershipSubsidiaries Country of incorporation 2018 2017
Catz International B.V. The Netherlands 100% 100%Catz International Dried Fruit B.V. The Netherlands 100% 100%Tovano B.V. The Netherlands 100% 100%Snick EuroIngredients N.V. Belgium 100% 100%Red River Commodities Inc. USA 100% 100%Red River Commodities International Inc. USA 100% 100%SunGold Foods Inc. USA 100% 100%SunButter LLC USA 100% 100%Red River Global Ingredients Ltd. Canada 100% 100%Red River-van Eck B.V. The Netherlands 100% 100%Red River Bulgaria EOOD Bulgaria 100% 100%Van Rees Group B.V. The Netherlands 100% 100%Van Rees B.V. The Netherlands 100% 100%Van Rees India B.V. The Netherlands 100% 100%Van Rees North America Inc. Canada 100% 100%Van Rees UK Ltd. United Kingdom 100% 100%Van Rees Kenya Ltd. Kenya 100% 100%Van Rees Middle East Ltd. United Arab Emirates 100% 100%Van Rees Ceylon B.V. The Netherlands 100% 100%Van Rees Ceylon Ltd. Sri Lanka 100% 100%P.T. Van Rees Indonesia Indonesia 100% 100%Van Rees LLC Russia 100% 100%Container Tea Van Rees Trading Private Ltd. India 100% 100%King Nuts B.V. The Netherlands 100% 100%Delinuts B.V. The Netherlands 100% 100%SIGCO Warenhandelsgesellschaft mbH Germany 100% 100%Acomo Investments B.V. The Netherlands 100% 100%Acomo North American Commodities B.V. The Netherlands 100% 100%Acomo European Nuts Holding B.V. The Netherlands 100% 100%Acomo Food Ingredients Holding B.V. The Netherlands 100% 100%Acomo Seeds Holding B.V. The Netherlands 100% 100%
In the 2018 consolidated financial statements, the Company and the following subsidiaries are included:
ANNUAL REPORT 2018 AMSTERDAM COMMODITIES N.V. 75

All financial information presented in euros has been rounded to the nearest thousand unless stated otherwise.
(b) Transactions and balancesForeign currency transactions are translated into the functional currency using the exchange rates prevailing at the dates of the transactions. Foreign exchange gains and losses resulting from the settlement of such transactions and from the translation at year-end exchange rates of monetary assets and liabilities denominated in foreign currencies are recognized in the statement of income. Translation differences on non-monetary financial assets are included in Other comprehensive income (OCI). Foreign exchange gains and losses that relate to borrowings are presented in the statement of income, within finance costs. All other foreign exchange gains and losses are presented in the statement of income on a net basis within other income or other expenses.
(c) Group companiesThe results and financial position of all the Group’s entities (none of which has the currency of a hyper-inflationary economy) that have a functional currency different from the presentation currency are translated into the presentation currency as follows:• Assets and liabilities for each balance sheet presented
are translated at the closing rate at the date of that balance sheet;
• Income and expenses for each income statement are translated at average exchange rates unless this average is not a reasonable approximation of the cumulative effect of the rates prevailing on the transaction dates, in which case income and expenses are translated at the rate on the dates of the transactions; and
• All resulting exchange differences are recognized in OCI.
On consolidation, exchange differences arising from the translation of the net investment in foreign operations, and of borrowings designated as hedges of such investments, are taken to OCI. When a foreign operation is partially disposed of or sold, exchange differences that were recorded in equity are recognized in the income statement as part of the gain or loss on sale.
Goodwill and fair value adjustments arising on the acquisition of a foreign entity are treated as assets and liabilities of the foreign entity and translated at the closing rate. The resulting changes are recognized in OCI.
2.6 Intangible assetsGoodwillGoodwill represents the excess of the consideration transferred of an acquisition over the fair value of the Group’s share of the net identifiable assets of the acquired business at the date of acquisition. For the purpose of impairment testing, goodwill is allocated to cash-generating units (CGUs), being the parts of the operating segments benefiting from the business combination in which the goodwill arose. Each unit or group of units to which the goodwill is allocated represents the lowest level within the entity at which the goodwill is monitored for internal management purposes. Goodwill is monitored at the operating segment level.
Goodwill is not amortized, but goodwill impairment reviews are undertaken annually or more frequently if events or changes in circumstance indicate a potential impairment. The carrying value of the CGU containing the goodwill is compared to the recoverable amount, which is the higher of value in use and fair value less costs of disposal. Any impairment is recognized immediately as an expense and is not subsequently reversed.
SoftwareCosts related to the development and installation of software are capitalized at historical cost and amortized, using the straight-line method over the estimated useful life (3-5 years).
Other intangible assetsOther intangible assets include acquired trading contracts. Intangible assets that are acquired through business acquisitions are initially valued at fair value. This fair value is subsequently treated as deemed cost. These identifiable intangibles are then amortized using the straight-line method over the estimated useful life (1-2 years). 2.7 Property, plant and equipmentProperty, plant and equipment are valued at historical cost using a component approach less depreciation and impairment losses. In addition to the costs of acquisition, the Company also includes costs of bringing the asset to its working condition, handling and installation costs and the non-refundable purchase taxes. Under the component approach, each component of an item of property, plant and equipment with a cost that is significant in relation to the total cost of the item is depreciated separately.
ANNUAL REPORT 201876 AMSTERDAM COMMODITIES N.V.

Depreciation is calculated using the straight-line method based on the estimated useful life, taking into account any residual value. The asset’s residual value and useful life are reviewed and adjusted, if appropriate, at each balance sheet date. Subsequent costs are included in the asset’s carrying amount or recognized as a separate asset as appropriate, only if and when it is probable that future economic benefits associated with the item will flow to the Company and the cost of the item can be measured reliably. Land is not depreciated.
The useful lives of the following categories are used for depreciation purposes:
Buildings 20-30 yearsBuilding improvements 5-10 yearsMachinery and equipment 5-15 yearsVehicles 3-5 yearsFurniture, fittings and equipment 3-8 years
An asset’s carrying amount is written down immediately to its recoverable amount if the asset’s carrying amount exceeds its estimated recoverable amount (Note 2.8). Gains and losses on disposals are determined by comparing the proceeds with the carrying amount and are recognized in the income statement.
2.8 Impairment of non-financial assetsAn impairment loss is recognized for the amount by which the asset’s carrying amount exceeds its recoverable amount. The recoverable amount is the higher of an asset’s fair value less costs to sell and value in use. For the purposes of assessing impairment, assets are grouped at the lowest levels for which there are separately identifiable cash flows (CGUs). An impairment loss will be reversed if there is a change in the estimates used to determine the recoverable amount of the assets since the last impairment loss was recognized. The net book amount of the asset will be increased to its recoverable amount. Goodwill is never subject to reversion of impairment losses recognized.
2.9 Derivative financial instruments including hedging accountingThe Group uses derivative financial instruments such as forward currency contracts to hedge its risks associated with foreign currency risk. Such derivative financial instruments are initially recognized at fair value on the date on which a derivative contract is entered into and are subsequently remeasured at fair value. Derivatives are carried as assets when the fair value is positive and as liabilities when the fair value is negative.
Any gains or losses arising from changes in the fair value of derivatives are taken directly to profit or loss, except for the effective portion of cash flow hedges, which is recognized in OCI and later reclassified to profit or loss when the hedged item affects profit or loss.
All operating companies are required to hedge their foreign exchange exposure related to transactions against their functional currency. Based on a cost/benefit analysis the Group decided to discontinue applying hedge accounting for all operating segments except for the Tea segment as of 2016. The impact on the 2018 net profit is €1.6 million (2017: -€1.1 million).
For the purpose of hedge accounting, IFRS 9 has been applied. Hedges are classified as cash flow hedges when hedging the exposure to variability in cash flows that is either attributable to a particular risk associated with a recognized asset or liability or a highly probable forecast transaction or the foreign currency risk in an unrecognized firm commitment transaction (cash flow hedge).
At the inception of a hedge relationship, the Group formally designates and documents the hedge relationship to which the Group wishes to apply hedge accounting and the risk management objective and strategy for undertaking the hedge. Hedges that are expected to be highly effective in achieving offsetting changes in cash flows are assessed on an ongoing basis to determine if they actually have been highly effective throughout the financial reporting periods for which they were designated.
Hedges which meet the strict criteria for hedge accounting are accounted for as follows:• The effective portion of the gain or loss on the hedging
instrument is recognized in OCI in the cash flow hedge reserve, while any ineffective portion is recognized immediately in the statement of income within Cost of goods sold.
• Amounts recognized as OCI are transferred to profit or loss when the hedged transaction affects profit or loss, such as when a forecast sale occurs.
• When a hedging instrument expires or is sold, or when a hedge no longer meets the criteria for hedge accounting, any cumulative gain or loss previously recognized in OCI remains separately in equity until the forecast transaction occurs. When a forecast transaction is no longer expected to occur, the cumulative gain or loss that was reported in equity is immediately transferred to the income statement.
ANNUAL REPORT 2018 AMSTERDAM COMMODITIES N.V. 77

2.10 InventoriesInventories are stated at the lower of cost and net realizable value. Cost is determined using the first-in, first-out (FIFO) method. The cost of finished goods and semi-finished products comprises raw materials, direct labour, other direct costs and related production overheads (based on normal operating capacity), but excludes borrowing costs. Net realizable value is the estimated selling price in the ordinary course of business, less applicable variable selling expenses.
2.11 Trade and other receivables and trade and other payablesTrade receivables are amounts due from customers for goods sold in the ordinary course of business. Trade receivables and other receivables are recognized initially at fair value and subsequently measured at amortized cost using the effective interest method, less provision for impairment, taking into account expected credit losses. If collection is expected in one year or less, they are classified as current assets. If not, they are presented as non-current assets. The Group applies the IFRS 9 simplified approach to measuring expected credit losses which uses a lifetime expected loss allowance for all trade receivables.
Trade payables are obligations to pay for goods or services that have been acquired in the ordinary course of business from suppliers. Trade payables and other short-term monetary liabilities are initially recognized at fair value and subsequently carried at amortized cost using the effective interest method. If payment is due within one year or less, they are classified as current liabilities. If not, they are presented as non-current liabilities.
2.12 Cash and cash equivalentsCash and cash equivalents include cash at banks and on hand and short-term highly liquid investments with an original maturity of three months or less. Bank overdrafts are shown within Borrowings in current liabilities in the consolidated balance sheet.
2.13 Share capitalOrdinary issued shares are classified as equity. Incremental costs directly attributable to the issue of new ordinary shares or options are charged to the share premium reserve as a deduction, net of tax, from the proceeds.
2.14 BorrowingsBorrowings are recognized initially at fair value, net of
transaction costs incurred. Borrowings are subsequently carried at amortized cost; any difference between the proceeds (net of transaction costs) and the redemption value is recognized in the income statement over the period of the borrowings using the effective interest method. Fees paid in connection to new loan facilities are recognized as transaction costs of the loan. Borrowings are classified as current liabilities unless the Group has an unconditional right to defer settlement of the liability for at least 12 months after the end of the reporting period.
2.15 Current and deferred corporate income taxIncome tax comprises current and deferred tax. Income tax is recognized in the statement of income except to the extent that it relates to items recognized directly within equity or in OCI. In this case, the tax is also recognized in other comprehensive income or directly in equity, respectively. Current tax is the expected tax payable on the taxable income for the year, using tax rates enacted or substantially enacted at the balance sheet date in the countries where the Company and its subsidiaries operate and generate taxable income, and any adjustment to tax payable in respect of previous years.
Management periodically evaluates positions taken in tax returns with respect to situations in which applicable tax regulation is subject to interpretation. It establishes provisions where appropriate on the basis of amounts expected to be paid to the tax authorities.
Deferred income tax is recognized, using the liability method, on temporary differences arising between the tax bases of assets and liabilities and their carrying amounts in the consolidated financial statements. However, deferred tax liabilities are not recognized if they arise from the initial recognition of goodwill; deferred income tax is not accounted for if it arises from initial recognition of an asset or liability in a transaction other than a business combination that at the time of the transaction affects neither accounting nor taxable profit or loss. Deferred income tax is determined using tax rates (and laws) that have been enacted or substantially enacted at the balance sheet date and are expected to apply when the related deferred income tax asset is realized or the deferred income tax liability is settled.
Deferred income tax assets and liabilities are offset when there is a legally enforceable right to offset current tax assets against current tax liabilities and
ANNUAL REPORT 201878 AMSTERDAM COMMODITIES N.V.

when the deferred income tax assets and liabilities relate to income taxes levied by the same taxation authority on either the same taxable entity or different taxable entities where there is an intention to settle the balances on a net basis.
Deferred income tax assets are recognized only to the extent that it is probable that future taxable profit will be available against which the temporary differences can be utilized.
Deferred income tax is provided on temporary differences arising on investments in subsidiaries and associates, except for deferred income tax liability where the timing of the reversal of the temporary difference is controlled by the Group and it is probable that the temporary difference will not reverse in the foreseeable future.
Deferred tax liabilities for withholding taxes are recognized for subsidiaries in situations where the income is to be paid out as dividend in the foreseeable future to the extent that these withholding taxes are not expected to be refundable or deductible. Changes in tax rates are reflected in the period when the change has been enacted or substantially enacted by the reporting date.
2.16 Employee benefitsGroup companies operate various pension schemes. The schemes are generally funded through payments to insurance companies or trustee-administered funds, determined by periodic actuarial calculations. The Group has one defined benefit plan and various defined contribution plans.
A defined contribution plan is a pension plan under which the Group pays fixed contributions into a separate entity. The Group has no legal or constructive obligations to pay further contributions if the fund does not hold sufficient assets to pay all employees the benefits relating to employee service in the current and prior periods. The contributions are recognized as personnel expenses when they are due. Prepaid contributions are recognized as an asset to the extent that a cash refund or a reduction in the future payments is available.
A defined benefit plan typically defines an amount of pension benefit that an employee will receive on retirement, usually dependent on one or more factors such as age, years of service and compensation. The
defined benefit obligation is calculated annually by independent actuaries using the projected unit credit method.
Remeasurements, comprising of actuarial gains and losses, the effect of the asset ceiling, excluding net interest (not applicable to the Group) and the return on plan assets (excluding net interest), are recognized immediately in the statement of financial position with a corresponding debit or credit to retained earnings through OCI in the period in which they occur. Remeasurements are not reclassified to profit or loss in subsequent periods.
Past service costs are recognized in income on the earlier of the date of the plan amendment or curtailment, and the date that the Group recognizes restructuring-related costs. Net interest is calculated by applying the discount rate to the net defined benefit liability or asset.
Short-term employee benefit obligations are measured on an undiscounted basis and are expensed as the related service is provided. The Group recognizes a liability and an expense for bonuses and profit sharing, based on a percentage (generally 10% - 15%) of the profit before tax of the respective subsidiary. The Group recognizes a provision where contractually obliged or where there is a past practice that has created a constructive obligation.
2.17 Share-based paymentsOn 1 September 2010, the Group introduced an equity-settled share-based compensation plan, under which the entity receives services from employees as consideration for equity instruments (options) of the Company.
The fair value of the employee services received in exchange for the grant of the options is recognized as an expense in the income statement, with a corresponding adjustment to equity. The total amount to be expensed is determined by reference to the fair value of the options granted as measured at the date of grant.
Non-market vesting conditions are included in assumptions about the number of options that are expected to vest. The total expense is recognized over the vesting period, which is the period over which all of the specified vesting conditions are to be satisfied. At the end of each reporting period, the entity revises its estimates of the number of options that are expected
ANNUAL REPORT 2018 AMSTERDAM COMMODITIES N.V. 79

to vest based on the non-market vesting conditions. It recognizes the impact of the revision to original estimates, if any, in the income statement, with a corresponding adjustment to equity.
When the options are exercised, the Company issues new shares. The proceeds received net of any directly attributable transaction costs are credited to share capital (nominal value) and share premium when the options are exercised.
2.18 ProvisionsProvisions are recognized when the Group has a legal or constructive obligation as result of a past event, when it is probable that an outflow of economic benefits will be required to settle the obligation and when a reliable estimate can be made of the amount of the obligation. Provisions are measured at the present value of the expenditures expected to be required to settle the obligation using a pre-tax rate that reflects current market assessments of the time value of money and the risks specific to the obligation. The increase in the provision due to passage of time is recognized as interest expense (when the time value of money is material).
An onerous contract is considered to exist where the Group has a contract under which the unavoidable costs of meeting the obligations under the contract exceed the economic benefits expected to be received from the contract. Present obligations arising under onerous contracts are recognized and measured as provisions.
2.19 Revenue recognitionRevenue is measured at the fair value of the consideration received or receivable for the sale of goods and services in the ordinary course of the Group’s activities. Revenue is shown net of value-added tax, returns, rebates and discounts and after eliminating sales within the Group. The Group recognizes revenue when the amount of revenue can be reliably measured, when it is probable that future economic benefits will flow to the entity and when specific criteria have been met for each of the Group’s activities as described below.
(a) Sales of goods Sales of goods are recognized when a Group entity satisfies a performance obligation by transferring promised products to the customer, the customer has full discretion over the channel and price to sell the products, and there is no unfulfilled obligation that could affect the customer’s acceptance of the products.
Delivery normally does not occur until the products have been shipped to the specified location, the risks of obsolescence and loss have been transferred to the customer, and either the customer has accepted the products in accordance with the sales contract, the acceptance provisions have lapsed or the Group has objective evidence that all criteria for acceptance have been satisfied. Sales are recorded based on the prices specified in the sales contracts.
(b) Interest incomeInterest income is recognized using the effective interest method. When a loan or receivable is impaired, the Group reduces the carrying amount to its recoverable amount, being the estimated future cash flow discounted at the original effective interest rate of the instrument, and continues unwinding the discount as interest income. Interest income on impaired loans and receivables is recognized using the original effective interest rate.
(c) Dividend incomeDividend income is recognized when the right to receive payment has been established, which is generally when shareholders approve the dividend.
2.20 Cost of goods soldCost of goods sold is recorded in the same period in which the sales are recognized and includes the cost of the products sold, changes in the provision for obsolete inventories and direct purchase expenses. It excludes production costs.
2.21 Gross marginGross margin represents the difference between sales and cost of goods sold excluding production costs.
2.22 General costsGeneral costs represent the indirect sales costs, other production costs which are not directly linked to sales and transactions, and other general costs. General costs are allocated to the periods to which they relate.
2.23 Operational leasesLeases in which a significant portion of the risks and rewards of ownership are retained by the lessor are classified as operating leases. Payments made under operating leases (net of any incentives received from the lessor) are charged to the statement of income on a straight-line basis over the period of the lease.
ANNUAL REPORT 201880 AMSTERDAM COMMODITIES N.V.

2.24 Dividend distributionDividend distribution to the Company’s shareholders is recognized as a liability in the Company’s financial statements in the period in which the dividends are approved by the Company’s shareholders.
2.25 Cash flow statementThe statement of cash flows is prepared using the indirect method. Cash flows in foreign currencies are translated into euros using the weighted average rates of exchange for the periods involved.
3 Risk management
3.1 Risk factors The Group operates in international commodity trading and is exposed to a variety of market and financial risks (including foreign exchange risk, interest rate risk and price risk), credit risks and liquidity risks. The Group’s overall risk management focuses on the unpredictability of commodity and financial markets and seeks to minimize potential adverse effects on the Group’s financial performance. The Group uses derivative financial instruments to hedge certain foreign currency risk exposures. Risk management is carried out under policies approved by the Board of Directors. Risks are identified, evaluated and hedged in close cooperation with the Group’s operating units. The Board and the operating companies’ management apply policies covering specific areas, such as foreign exchange risk, interest rate risk, credit risk, use of derivative financial instruments and investment of excess liquidity. The commodities in which the Group trades are not traded on commodity exchanges or spot markets. The group companies contract and purchase the products in general at the source for physical delivery. For further explanation on risk management see page 32.
3.1.1 Market risksForeign exchange risk The Group operates internationally and is exposed to foreign exchange risk arising from various currency exposures, primarily with respect to the US dollar. Foreign exchange risk arises from current and future commercial transactions, current and future costs, recognized assets and liabilities and net investments in foreign operations. The Board has set up a policy to require group companies to manage their foreign exchange risk against their functional currency. The group companies are required to hedge their
foreign exchange risk exposure arising from sales and purchase transactions within the respective company in accordance with Group policies. To manage their foreign exchange risk arising from future commercial transactions and recognized assets and liabilities, entities in the Group use forward contracts, transacted with external banks and net borrowings in foreign currencies. Foreign exchange risk arises when future commercial transactions or recognized assets or liabilities are denominated in a currency that is not the entity’s functional currency.
The Group has certain investments in foreign operations whose net assets are exposed to foreign currency translation risk. Currency exposure arising from the net assets of the Group’s foreign operations is managed primarily through borrowings denominated in the relevant foreign currencies. For the year 2018, if the average US dollar currency applied had weakened/strengthened by 5% against the euro with all other variables held constant, net profit for the year would have been approximately €0.5 million higher/lower (2017: €0.6 million), mainly as a result of foreign exchange results on translation of US-dollar-denominated income from the Van Rees Group tea business and Red River Commodities seeds business. On 31 December 2018, the total impact on shareholders’ equity of a 5% US dollar increase/decrease relating to equity of subsidiaries with a US dollar functional currency would have been approximately €2.7 million (2017: €2.5 million). Similarly, total assets would have increased/decreased by approximately €8.1 million (2017: €6.5 million) in case of the euro/US dollar rate being 5% higher/lower than the rate at 31 December 2018 that has been used. The Group’s exposure to foreign currency changes for all other currencies is not material.
Price risk The Company’s results are sensitive to commodity market price movements. In order to manage the effects of price movements of commodities, the group companies apply trading guidelines internally determined and maximum positions per product group and overall positions. From a financing point of view, headroom available within bank facilities is closely monitored in order to be able to finance increased working capital requirements when commodity prices increase.
Interest rate riskThe Group’s interest rate risk arises from long-term borrowings and working capital financing. Borrowings
ANNUAL REPORT 2018 AMSTERDAM COMMODITIES N.V. 81

and working capital financing contracted at variable interest rates expose the Group to cash flow interest rate risk which is partially offset by cash held at variable interest rates. Borrowings issued at fixed interest rates expose the Group to fair value interest rate risk. During 2018 and 2017, the Group’s borrowings at variable interest rates were denominated in euro and US dollar. The Group analyzes its interest rate exposure on a dynamic basis. Scenarios are simulated taking into consideration refinancing, renewal of existing positions, alternative financing and hedging. Based on these scenarios, the Group calculates the impact on profit and loss of a defined interest rate shift. For each simulation, the same interest rate shift is used for all currencies. The scenarios are run only for liabilities that represent the major interest-bearing positions.
A sensitivity analysis has been made based on the exposure to interest rates for the bank borrowings and current financial bank liabilities at the balance sheet date. If interest rates had been 0.5% (50 basis points) higher/lower and all other variables were held constant, the Group’s result before tax for the year ended 31 December 2018 would have been approximately €0.5 million (2017: €0.5 million) lower/higher respectively.
3.1.2 Credit risk Credit risk is managed at the subsidiary level. Each local subsidiary is responsible for managing and analyzing the credit risk for each of their customers before standard payment and delivery terms and conditions are offered. Credit risk arises from derivative financial instruments and deposits with banks and financial institutions, as well as credit exposures to customers, including outstanding receivables and committed transactions. As part of risk control the credit quality of the customer, taking into account its financial position, past experience and other factors, are assessed. Individual risk limits are set based on internal or external ratings in accordance with limits set by management of the operating companies. The utilization of credit limits is regularly monitored. See Note 11 for further disclosure on credit risk. Management does not expect any undisclosed material losses from non-performance by these counterparties.
3.1.3 Liquidity risk Cash flow forecasting is performed in the operating entities of the Group and aggregated by Group treasury. Group treasury monitors rolling forecasts of the Group’s liquidity requirements and calculates ratios to ensure it
has sufficient funds to meet operational needs while maintaining sufficient headroom on its undrawn committed borrowing facilities at all times, so that the Group does not breach borrowing limits or covenants (where applicable) on any of its borrowing facilities (Note 18). Such forecasting takes into consideration the Group’s debt financing plans, planned capital expenditures, covenant compliance, compliance with internal balance sheet ratio targets and, if applicable, external regulatory or legal requirements – for example, currency restrictions. Surplus cash held by the operating entities over and above balances required for working capital purposes are transferred to Group treasury. Group treasury invests surplus cash in interest bearing current accounts at first class banks.
3.2 Capital risk managementThe Group’s objectives when managing capital are to safeguard the Group’s ability to continue as a going concern in order to ensure the continued financing of the trading activities, to provide adequate long-term returns for shareholders and benefits for other stakeholders and to maintain an optimal capital structure to reduce the cost of capital. In order to maintain or adjust the capital structure, the Company may adjust the dividends paid to shareholders, return capital to shareholders, issue new shares or sell assets to reduce debt.
The Company monitors capital on the basis of the solvency ratio. This ratio is calculated as total equity plus subordinated debt divided by total assets. During 2018, the Company’s objective, which was unchanged from the previous year, was to maintain the solvency ratio at a minimum of 30% and preferably around 40%. The solvency ratios at 31 December 2018 and 2017 were as follows: 31 December 31 DecemberSolvency 2018 2017
Total shareholders’ equity 193,522 185,051Total assets 357,159 345,964Solvency ratio 54.2% 53.5%
The solvency ratio as at 31 December 2018 indicates that the Group is able to continue as a going concern.
4 Critical accounting estimates and judgments
The Group makes estimates and assumptions. The resulting accounting estimates will, by definition,
ANNUAL REPORT 201882 AMSTERDAM COMMODITIES N.V.

seldom equal the related actual results. Estimates and judgments are continually evaluated and are based on historical experience and other factors, including expectations of future events that are believed to be reasonable under the circumstances. The estimates and assumptions that have a significant risk of causing a material adjustment to the carrying amounts of assets and liabilities within the next financial year are addressed below.
(a) Impairment of goodwillThe Group tests annually whether goodwill has suffered any impairment, in accordance with the accounting policy stated in Note 2.8. The recoverable amounts of CGUs have been determined based on value-in-use calculations. These calculations require the use of estimates (Note 6).
(b) Income taxesThe Group is subject to income taxes in numerous jurisdictions. Significant judgment is required in determining the worldwide provision for income taxes. There are many transactions and calculations for which the ultimate tax determination is inherently uncertain. The Group recognizes liabilities for anticipated tax audit issues based on estimates of whether additional taxes will be due. Where the final tax outcome of these matters is different from the amounts that were initially recorded, such differences will impact the current and deferred income tax assets and liabilities in the period in which such determination is made. Additional information is disclosed in Note 19 and Note 25.
(c) Pension benefitsThe present value of the pension obligations depends on a number of factors that are determined on an actuarial basis using a number of assumptions. The assumptions used in determining the net cost (income) for pensions include the discount rate, future salary increases, mortality rates and future pension increases. The mortality rate is based on publicly available mortality tables for the specific countries. Due to the complexities involved in the valuation and its long-term nature, a defined benefit obligation is highly sensitive to changes in these assumptions. All assumptions are reviewed at each reporting date.
The Group determines the appropriate discount rate at the end of each year. This is the interest rate that should be used to determine the present value of estimated
future cash outflows expected to be required to settle the pension obligations. In determining the appropriate discount rate, the Group considers the interest rates of high-quality corporate bonds that are denominated in the currency in which the benefits will be paid and that have terms to maturity approximating the terms of the related pension obligation. Additional information is disclosed in Note 20.
(d) InventoriesProvisions are made for write-down of inventories to net realizable value based on management’s estimates using available market information. Where management has determined that the net realizable value is lower than the initial value, inventories are written down. Additional information is disclosed in Note 10.
(e) Trade receivablesProvisions are made for doubtful debts based on management’s estimates of the prospects of recovering the debt. Where management has determined that recovering is doubtful, the amount is provided for, based on the expected credit loss, also taking into account that historical write-offs have been limited.Additional information is disclosed in Note 11.
(f) Litigation and claimsThe Group is party to various legal proceedings, generally incidental, to its business. In connection with these proceedings and claims, management evaluated, based on the relevant facts and legal principles, the likelihood of an unfavourable outcome and whether the amount of the loss could be reasonably estimated. Subjective judgments were required in these evaluations, including judgments regarding the validity of asserted claims and the likely outcome of legal and administrative proceedings. The outcome of these proceedings, however, is subject to a number of factors beyond the Group’s control, most notably the uncertainty associated with predicting decisions by courts and administrative agencies.
5 Segment information
The Board of Directors, consisting of the Non-Executive Directors and the Executive Director, examines the Group’s performance both from a product and geographic perspective and has identified four reportable segments of its business: Spices and Nuts, Edible Seeds, Tea and Food Ingredients.
ANNUAL REPORT 2018 AMSTERDAM COMMODITIES N.V. 83
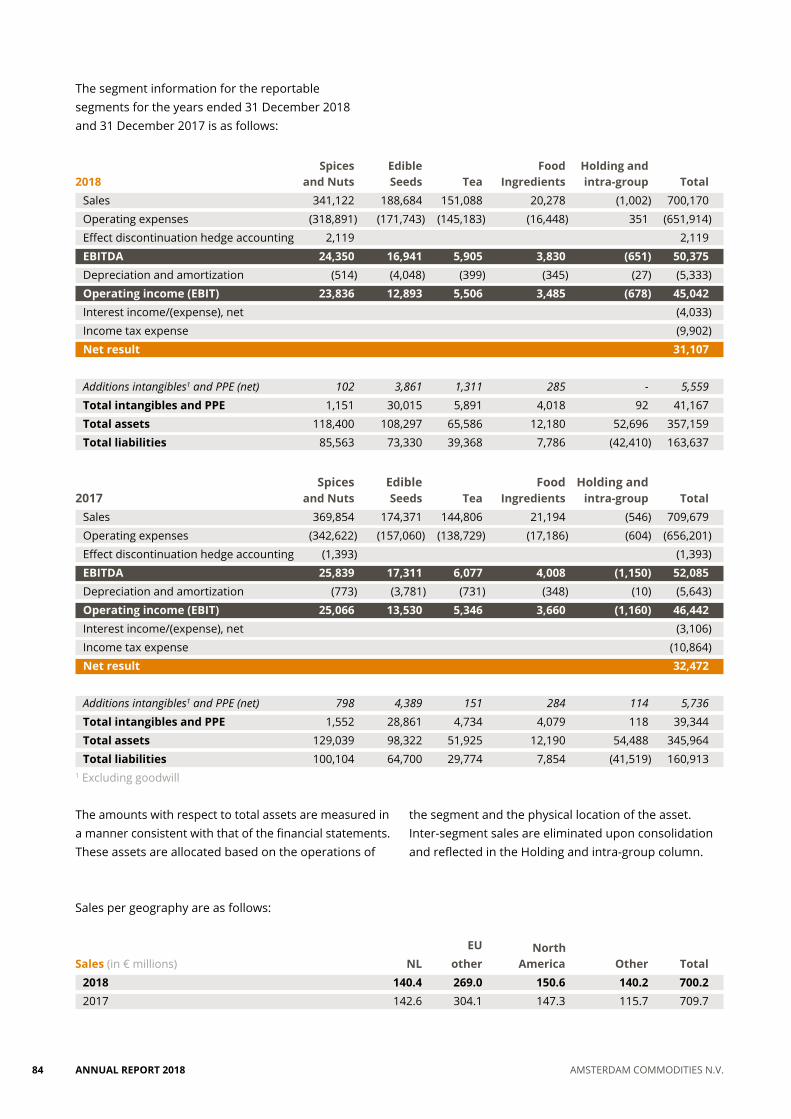
Spices Edible Food Holding and 2018 and Nuts Seeds Tea Ingredients intra-group Total
Sales 341,122 188,684 151,088 20,278 (1,002) 700,170Operating expenses (318,891) (171,743) (145,183) (16,448) 351 (651,914)Effect discontinuation hedge accounting 2,119 2,119EBITDA 24,350 16,941 5,905 3,830 (651) 50,375Depreciation and amortization (514) (4,048) (399) (345) (27) (5,333)Operating income (EBIT) 23,836 12,893 5,506 3,485 (678) 45,042Interest income/(expense), net (4,033)Income tax expense (9,902)Net result 31,107
Additions intangibles1 and PPE (net) 102 3,861 1,311 285 - 5,559
Total intangibles and PPE 1,151 30,015 5,891 4,018 92 41,167Total assets 118,400 108,297 65,586 12,180 52,696 357,159Total liabilities 85,563 73,330 39,368 7,786 (42,410) 163,637
Spices Edible Food Holding and 2017 and Nuts Seeds Tea Ingredients intra-group Total
Sales 369,854 174,371 144,806 21,194 (546) 709,679Operating expenses (342,622) (157,060) (138,729) (17,186) (604) (656,201)Effect discontinuation hedge accounting (1,393) (1,393)EBITDA 25,839 17,311 6,077 4,008 (1,150) 52,085Depreciation and amortization (773) (3,781) (731) (348) (10) (5,643)Operating income (EBIT) 25,066 13,530 5,346 3,660 (1,160) 46,442Interest income/(expense), net (3,106)Income tax expense (10,864)Net result 32,472
Additions intangibles1 and PPE (net) 798 4,389 151 284 114 5,736
Total intangibles and PPE 1,552 28,861 4,734 4,079 118 39,344Total assets 129,039 98,322 51,925 12,190 54,488 345,964Total liabilities 100,104 64,700 29,774 7,854 (41,519) 160,913
1 Excluding goodwill
Sales per geography are as follows:
EU NorthSales (in € millions) NL other America Other Total
2018 140.4 269.0 150.6 140.2 700.22017 142.6 304.1 147.3 115.7 709.7
The amounts with respect to total assets are measured in a manner consistent with that of the financial statements. These assets are allocated based on the operations of
the segment and the physical location of the asset. Inter-segment sales are eliminated upon consolidation and reflected in the Holding and intra-group column.
The segment information for the reportable segments for the years ended 31 December 2018 and 31 December 2017 is as follows:
ANNUAL REPORT 201884 AMSTERDAM COMMODITIES N.V.

6 Intangible assets
At 1 January 2017 Goodwill Software Other TotalCost or valuation 61,843 2,182 - 64,025Accumulated amortization - (1,106) - (1,106)Net book amount 61,843 1,076 - 62,919
2017
Opening net book amount 61,843 1,076 - 62,919Acquisition of subsidiaries - 157 300 457Additions 6,168 1,940 - 8,108Amortization - (208) (279) (487)Exchange differences (4,539) (216) - (4,755)Closing net book amount 63,472 2,749 21 66,242
At 31 December 2017
Cost or valuation 63,472 3,985 300 67,757Accumulated amortization - (1,236) (279) (1,515)Net book amount 63,472 2,749 21 66,242
2018
Opening net book amount 63,472 2,749 21 66,242Additions - 743 - 743Amortization - (503) (21) (524)Exchange differences 1,516 121 - 1,637Closing net book amount 64,988 3,110 - 68,098
At 31 December 2018
Cost or valuation 64,988 4,890 - 69,878Accumulated amortization - (1,780) - (1,780)Net book amount 64,988 3,110 - 68,098
Goodwill An operating segment-level summary of the goodwill allocation is presented below. 31 December 31 DecemberGoodwill 2018 2017
Spices and Nuts 21,474 21,474Edible Seeds 28,094 27,086Tea 11,315 10,807Food Ingredients 4,105 4,105Total goodwill 64,988 63,472
ANNUAL REPORT 2018 AMSTERDAM COMMODITIES N.V. 85

Impairment tests for goodwillFor the purpose of the annual impairment testing, goodwill is allocated to cash-generating units (‘CGUs’) or groups of CGUs, identified at the level of operating segments. The goodwill impairment test is based on the management judgment that the possible net realizable value of an operating segment will not be less than the sum of the goodwill amount plus the net assets of the operating segment. Given the nature of Acomo being a group of trading companies, the recoverable amounts of all CGUs have been determined as follows, based on the discounted cash flow (DCF) method: • The DCF method uses cash flow projections based on
financial budgets approved by management for 2019. The weighted average cost of capital (WACC) is based on the capital asset pricing model using a levered beta of 0.95. Based on the local tax rates, the applied WACC pre-tax for the different CGUs varies between 8.8% and 10.1%.
• A five-year forecast period is used (including approved 2019 budgets when applicable) followed by a terminal value based on perpetual 1.5% to 2.0% growth of
revenues. Cash flows beyond 2019 are extrapolated using estimated growth rates. Cash flows beyond the five-year period are extrapolated taking into account a long-term average growth rate. The discount rates used are pre-tax and reflect specific risks relating to the relevant parts of the business.
After conducting impairment tests on all CGUs within the Group, no impairment was deemed necessary since the discounted future cash flows from the CGUs exceeded the carrying value (including goodwill) for each CGU.
It is inherent in the method of computation used that a change in the assumptions may lead to a different conclusion on the impairment required. If the discount rate is assumed to be one percentage point higher than assumed in the individual impairment tests, no impairment would have been required. The impairment tests performed separately would also not indicate any impairment if the future cash flows were set 10% lower than assumed.
The key assumptions used for value-in-use calculations in 2018 and 2017 are as follows:
Spices Edible FoodAssumptions 2018 and Nuts Seeds Tea Ingredients
Average future growth rates 2019 - 2023 2.3% 2.5% 2.3% 2.0%Long-term average growth rate (after 5 years) 2.0% 2.0% 1.5% 1.5%Discount rate, pre-tax, average 8.9% 8.8% 9.1% 10.1%
Assumptions 2017
Average future growth rates 2018 - 2022 2.3% 2.5% 2.3% 2.0%Long-term average growth rate (after 5 years) 2.0% 2.0% 1.5% 1.5%Discount rate, pre-tax, average 9.6% 10.2% 10.4% 10.3%
ANNUAL REPORT 201886 AMSTERDAM COMMODITIES N.V.

7 Property, plant and equipment
The movements in property, plant and equipment are as follows:
Furniture, Land and Vehicles and fittings and Assets underAt 1 January 2017 buildings machinery equipment construction Total
Cost or valuation 31,776 34,707 2,147 682 69,312Accumulated depreciation (8,622) (17,456) (1,096) - (27,174)Net book amount 23,154 17,251 1,051 682 42,138
2017
Opening net book amount 23,154 17,251 1,051 682 42,138Acquisition of subsidiaries - 188 276 - 464Investments 101 3,428 141 126 3,796Disposals - (580) (20) - (600)Depreciation charge (1,361) (3,454) (341) - (5,156)Assets taken into operation - 635 - (635) -Exchange differences (2,376) (1,579) (66) (47) (4,068)Closing net book amount 19,518 15,889 1,041 126 36,574
At 31 December 2017
Cost or valuation 27,490 32,706 2,333 126 62,655Accumulated depreciation (7,972) (16,817) (1,292) - (26,081)Net book amount 19,518 15,889 1,041 126 36,574
2018
Opening net book amount 19,518 15,889 1,041 126 36,574Investments 605 3,146 166 1,066 4,983Disposals (1) (162) (4) - (167)Depreciation charge (1,038) (3,463) (308) - (4,809)Exchange differences 759 691 17 9 1,476Closing net book amount 19,843 16,101 912 1,201 38,057
At 31 December 2018
Cost or valuation 29,564 37,809 2,559 1,201 71,133Accumulated depreciation (9,721) (21,708) (1,647) - (33,076)Net book amount 19,843 16,101 912 1,201 38,057
The 2018 depreciation charge of €4.8 million (2017: €5.2 million) has been included in depreciation and amortization.
ANNUAL REPORT 2018 AMSTERDAM COMMODITIES N.V. 87

8 Other non-current receivables
31 December 31 December 2018 2017
Issued loan 1,200 1,200Other 61 57Total 1,261 1,257
The issued loan is ultimately due on 31 July 2026 and bears an interest percentage of three-month
Euribor +250 basis points. The loan is secured by a mortgage on commercial real estate.
9 Financial instruments by category
Assets Fair value through31 December 2018 Amortized cost profit and loss Total
Other non-current receivables 1,261 - 1,261Derivative financial instruments - 1,954 1,954Trade and other receivables excluding prepayments 100,312 - 100,312Cash and cash equivalents 957 - 957Total 102,530 1,954 104,484
Liabilities Fair value through 31 December 2018 Amortized cost profit and loss Total
Bank borrowings non-current 9,068 - 9,068Bank borrowings current 83,513 - 83,513Derivative financial instruments - 165 165Trade and other payables 62,087 - 62,087Total 154,668 165 154,833
Assets Loans and 31 December 2017 receivables Derivatives Total
Other non-current receivables 1,257 - 1,257Derivative financial instruments - 261 261Trade and other receivables excluding prepayments 86,081 - 86,081Cash and cash equivalents 2,590 - 2,590Total 89,928 261 90,189
Liabilities Other financial liabilities 31 December 2017 at amortized cost Derivatives Total
Bank borrowings non-current 11,571 - 11,571Bank borrowings current 68,214 - 68,214Derivative financial instruments - 1,271 1,271Trade and other payables 69,796 - 69,796Total 149,581 1,271 150,852
ANNUAL REPORT 201888 AMSTERDAM COMMODITIES N.V.

The fair values of the financial assets and liabilities do not materially differ from the book value due to either the short-term nature of the instruments
used, the absence of long-term fixed interest rates or the accounting policies used.
10 Inventories 31 December 31 December 2018 2017
Raw materials 18,287 28,633Semi-finished products 1,846 1,211Finished goods 122,379 119,726Total inventories 142,512 149,570
The cost of inventories recognized as expense and included in cost of goods sold amounted to €600.8 million (2017: €560.8 million). As at 31 December 2018, the provision for write-down of inventories to net realizable value amounts to €4.1 million (2017: €5.7 million).
As at 31 December 2018, inventories with a book value of €107.5 million have been pledged as a security for certain bank overdrafts (2017: €115.6 million).
11 Trade receivables 31 December 31 December 2018 2017
Trade receivables 95,967 84,328Less: provision for impairment (732) (835)Total trade receivables, net 95,235 83,493
As at 31 December 2018, trade receivables were impaired for a total amount of €0.7 million (2017: €0.8 million). The individually (partly or fully) impaired receivables mainly relate to customers in the ordinary line of business which are in unexpectedly difficult economic or financial situations.
As at 31 December 2018, trade receivables of approximately €7.1 million were past due but not impaired. These relate to a number of independent customers for whom there is no recent history of default.
The ageing analysis of these trade receivables is as follows: 31 December 31 DecemberAgeing receivables 2018 2017
Up to 1 month 88,073 80,5171-2 months 3,881 1,8112-3 months 1,098 714Over 3 months 2,915 1,286Total trade receivables, gross 95,967 84,328
ANNUAL REPORT 2018 AMSTERDAM COMMODITIES N.V. 89
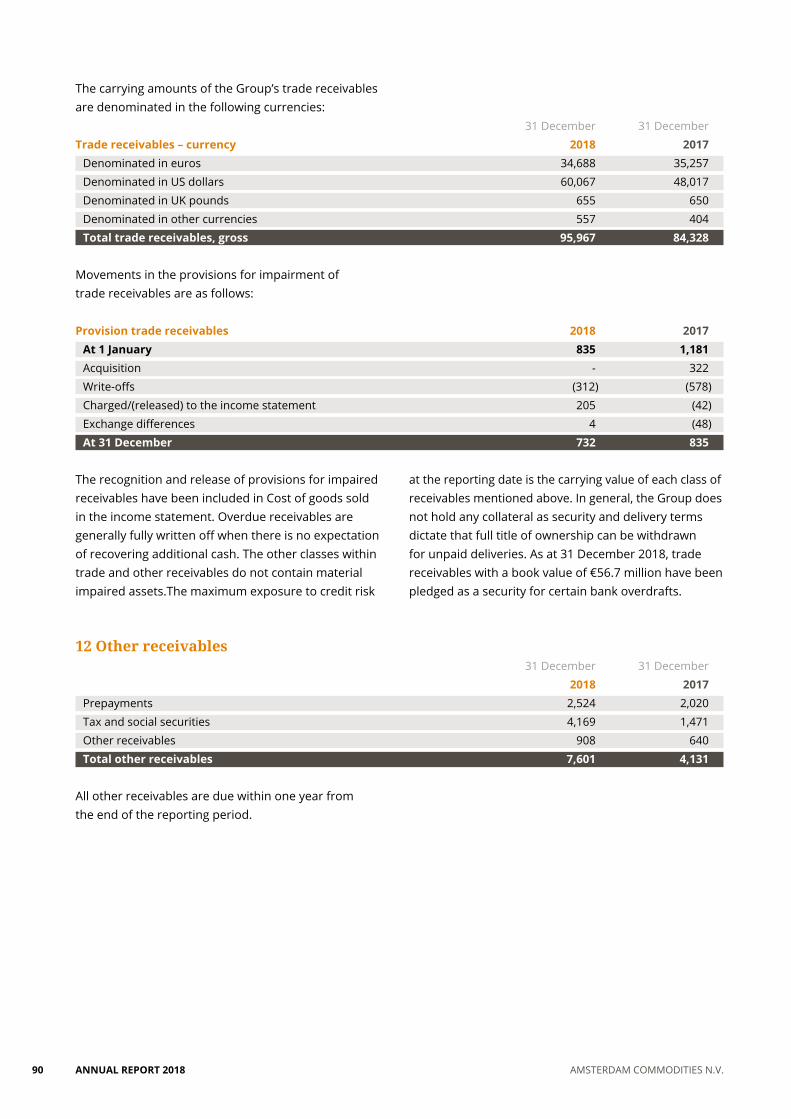
The carrying amounts of the Group’s trade receivables are denominated in the following currencies: 31 December 31 DecemberTrade receivables – currency 2018 2017
Denominated in euros 34,688 35,257Denominated in US dollars 60,067 48,017Denominated in UK pounds 655 650Denominated in other currencies 557 404Total trade receivables, gross 95,967 84,328
Movements in the provisions for impairment of trade receivables are as follows:
Provision trade receivables 2018 2017At 1 January 835 1,181Acquisition - 322Write-offs (312) (578)Charged/(released) to the income statement 205 (42)Exchange differences 4 (48)At 31 December 732 835
The recognition and release of provisions for impaired receivables have been included in Cost of goods sold in the income statement. Overdue receivables are generally fully written off when there is no expectation of recovering additional cash. The other classes within trade and other receivables do not contain material impaired assets.The maximum exposure to credit risk
at the reporting date is the carrying value of each class of receivables mentioned above. In general, the Group does not hold any collateral as security and delivery terms dictate that full title of ownership can be withdrawn for unpaid deliveries. As at 31 December 2018, trade receivables with a book value of €56.7 million have been pledged as a security for certain bank overdrafts.
12 Other receivables 31 December 31 December 2018 2017
Prepayments 2,524 2,020Tax and social securities 4,169 1,471Other receivables 908 640Total other receivables 7,601 4,131
All other receivables are due within one year from the end of the reporting period.
ANNUAL REPORT 201890 AMSTERDAM COMMODITIES N.V.

Foreign exchange contracts relate for more than 95% to forward US dollar sales and purchases with a term of less than 12 months and relate to hedged items with a maturity of less than 12 months. Consequently, the net value of these derivatives is classified as a current asset or liability. The forex contracts are so-called Level-2 derivatives with banks which values are derived directly from foreign exchange rates and interest rate levels. The maximum exposure to credit risk at the reporting date is the fair value of the derivative assets in the consolidated balance sheet. The Group has no commodity-based derivatives (under the definition of IFRS 9).
Forward foreign exchange contractsThe total notional principal amounts of the outstanding forward foreign exchange contracts on 31 December 2018 were $64.5 million bought and $55.2 million sold resulting in a total net amount of $9.3 million (2017: $7.1 million). Gains and losses recognized in the hedge reserve in equity (Note 16) on forward foreign exchange contracts as at 31 December 2018 are recognized in the income statement in the period or periods during which
the hedged forecast transaction affects the income statement.
14 Cash and cash equivalents
Cash and cash equivalents consist almost entirely of cash held at bank accounts.
15 Share capital and share premium reserve
The total authorized number of ordinary shares is 66.7 million shares (2017: 66.7 million shares) with a par value of €0.45 per share (2017: €0.45 per share). All 24.6 million issued shares (31 December 2017: 24.6 million) are fully paid.
During the year, the issued share capital increased by €11 due to issuance of 25,000 new ordinary shares of €0.45 each, as part of the exercise of share options (Note 17). New shares issued have the same rights as existing shares issued.
The movements during 2018 and 2017 were as follows:
Number of Share Share premiumShare capital and share premium reserve shares capital reserve Total
At 1 January 2017 24,225,326 10,901 52,447 63,348New shares issued 398,734 180 9,211 9,391At 31 December 2017 24,624,060 11,081 61,658 72,739New shares issued 25,000 11 336 347At 31 December 2018 24,649,060 11,092 61,994 73,086
13 Derivative financial instruments
Derivatives31 December 2018 Assets Liabilities
Cash flow hedges – foreign exchange contracts 1,954 165Total derivatives 1,954 165
Derivatives31 December 2017 Assets Liabilities
Cash flow hedges – foreign exchange contracts 261 1,271Total derivatives 261 1,271
ANNUAL REPORT 2018 AMSTERDAM COMMODITIES N.V. 91

The currency translation reserve comprises all translation differences arising from the translation of the net investment in group companies, including goodwill, in currencies other than the euro. The share option plan reserve comprises the value of vested rights in respect of the share option plan (Note 17) as far as stock options have not been exercised.The hedge reserve comprises the unrealized gains related to cash flow hedges.
Pursuant to Dutch law, limitations exist relating to the distribution of shareholders’ equity of €19.1 million (2017: €15.4 million). Such limitations relate to share capital as well as to legal reserves required by Dutch law included under Other reserves.
17 Share-based payment
Share options are granted to management and to selected employees. The establishment of Acomo’s share option plan was approved by shareholders at the annual general meeting of 27 May 2010. The share option plan is aimed at retaining key managers and
employees of the Company and its subsidiaries, including executive directors of the Board. Under the plan, participants are granted options which only vest and can be exercised on the continued employment of the participant in the Group. Participation in the plan is at the Board of Directors’ discretion.
The options have a contractual option term of seven years. All options vest in a six-year period with the first vesting three years after granting of the options. Options are granted under the plan for no consideration and carry no dividend or voting rights. When exercisable, each option is convertible into one ordinary share. The Group has no legal or constructive obligation to repurchase or settle the options in cash.
Total 2018 share-based payment expenses charged to the consolidated statement of income amounted to €39 (2017: €58).
The table below shows the movement of share options outstanding at the end of the year with their respective vesting dates, expiry dates and exercise prices.
16 Other reserves Currency translation Share Hedge Other reserve option plan reserve reserves TotalAt 1 January 2017 15,460 626 (92) (495) 15,499
Cash flow hedges - - (148) - (148)Employee share option scheme: • Transfer to other reserves - (589) - 589 -• Value of employee services - 60 - - 60• Tax credit, 25% - (14) - - (14)Currency translation adjustments (CTA) (11,178) - - - (11,178)Remeasurement gains/(losses) on defined benefit plans - - - (418) (418)At 31 December 2017 4,282 83 (240) (324) 3,801
Cash flow hedges - - 201 - 201Employee share option scheme: • Transfer to other reserves - (9) - 9 -• Value of employee services - 39 - - 39• Tax credit, 25% - (10) - - (10)Currency translation adjustments (CTA) 3,751 - - - 3,751Remeasurement gains/(losses) on defined benefit plans - - - 133 133At 31 December 2018 8,033 103 (39) (182) 7,915
ANNUAL REPORT 201892 AMSTERDAM COMMODITIES N.V.

Movement of share options
Year Outstanding Outstanding Exerciseof Vesting Expiry 1 January Granted Exercised Cancelled 31 December price pergrant date date 2018 2018 2018 2018 2018 option (€)
2013 8 March 2018 8 March 2020 25,000 (25,000) - - 13.90 8 March 2019 8 March 2020 2,500 - - 2,500 13.90 2014 1 December 2017 1 December 2021 12,000 - - 12,000 17.00 1 December 2018 1 December 2021 6,000 - - 6,000 17.00 1 December 2019 1 December 2021 10,000 - - 10,000 17.00 1 December 2020 1 December 2021 12,000 - (12,000) - 17.00 2015 1 September 2018 1 December 2022 15,000 - - 15,000 22.46 1 September 2019 1 December 2022 7,500 - - 7,500 22.46 1 September 2020 1 December 2022 12,500 - - 12,500 22.46 1 September 2021 1 December 2022 15,000 - - 15,000 22.46 2018 1 April 2021 1 April 2025 - 10,500 - - 10,500 21.30 1 April 2022 1 April 2025 - 5,250 - - 5,250 21.30 1 April 2023 1 April 2025 - 8,750 - - 8,750 21.30 1 April 2024 1 April 2025 - 10,500 - - 10,500 21.30Total 117,500 35,000 (25,000) (12,000) 115,500
The fair value at grant date is independently determined using the Black-Scholes model that takes into account the exercise price, the term of the option, the share price at grant date and expected price volatility of the Acomo share, the expected dividend yield and the
risk-free interest rate for the term of the option. The volatility measured at the standard deviation of continuously compound share returns is based on statistical analysis of the Acomo share, measured over a historic period equal to the expected life.
The model inputs are set out below:
Fair value per option at grant Share price at Dividend AnnualYear of grant date (€) grant date (€) Volatility yield risk-free rate
2013 2.31 16.34 18.0% 4.40% 1.90%2014 1.96 18.64 22.5% 5.00% 0.30%2015 1.87 22.46 22.5% 5.10% -0.10%2018 1.25 21.30 17.5% 4.60% 0.19%
ANNUAL REPORT 2018 AMSTERDAM COMMODITIES N.V. 93

18 Bank borrowings
31 December 31 DecemberNon-current 2018 2017
Bank borrowings 9,264 11,932Capitalized arrangement fees (196) (361)Total non-current 9,068 11,571
Current
Bank overdrafts 81,400 66,101Bank borrowings short-term part 2,113 2,113Total current 83,513 68,214
Total bank borrowings 92,581 79,785
The carrying amounts of bank borrowings approximate their fair value due to the interest rates being variable. The working capital financing lines are secured through
a mix of positive pledges and negative pledges on inventories and trade receivables.
The movements in bank borrowings were as follows: Non-current Current
At 1 January 2018 11,932 66,101 Repayments (2,359) -Net changes in short-term borrowings - 13,942Other movements (361) -Translation and currency differences 52 1,357At 31 December 2018 9,264 81,400
Bank borrowingsOn 31 December 2018, the Group had three long-term bank borrowings:• A €5 million and a €8 million drawing under the
€50 million acquisition facility, repayable in five years with repayments of 15% per year with a final payment of the remaining borrowing on 31 January 2020;
• A €3 million term loan, repayable in 19 years started at 1 January 2014.
Non-current bank borrowings are secured by pledges on fixed assets of the relating group companies up to €3.0 million.
The carrying amounts of the Group’s bank borrowings are denominated in the following currencies: 31 December 31 DecemberNon-current bank borrowings 2018 2017
Denominated in euros 8,178 10,652Denominated in US dollars 1,086 1,280Total non-current bank borrowings 9,264 11,932
ANNUAL REPORT 201894 AMSTERDAM COMMODITIES N.V.

The maturity of bank borrowings is as follows: 31 December 31 DecemberContractual repayments 2018 2017
2018 - 2,1132019 2,113 9,4552020 6,225 1632021 163 163After 2021 2,876 1,790Total contractual repayments 11,377 13,684
Total interest liabilities based on current interest rates, contractual terms and average 2018 working capital financial levels are approximately €3.6 million for 2019 and approximately €14.5 million in total for the years 2020-2023.
Bank overdraftsOn 31 December 2018, the Group had the following bank overdrafts:• A €200 million revolving credit facility (RCF) with a
borrowing base character; this facility has been extended on 24 January 2017 with a three-year term with options to be extended for an additional two years. Interest is variable.
• Local lines in operating companies, secured by corporate guarantees of the Acomo parent or intermediate group companies within the Group, in total amounting to €2.6 million and $28.4 million; these lines mature on an annual basis and are rolled over annually. Interest is variable.
For these bank overdrafts, financial covenants were agreed being an interest cover ratio that must exceed 4.0 and a minimum solvency that must exceed 25% or 30% at various measurement dates in the periods up until 31 December 2018. The interest cover ratio 2018 exceeded 12 and total solvency as calculated in line with the bank agreement exceeded 54%.
The used and undrawn part of bank overdrafts at 31 December 2018 is as follows:
In local currencies Working capital overdraft facilities Total lines Outstanding Undrawn Available in €
€200,000,000 RCF 200,000 68,903 131,097 131,097Local US dollar lines $28,379 $15,484 $12,895 11,246Local euro lines 2,552 1,106 1,446 1,446
Total in euro equivalent Total 227,302 83,513 143,789 143,789
19 Deferred tax liabilities and assets
31 December 31 DecemberDeferred income tax position 2018 2017
Deferred tax assets 1,484 1,846Deferred tax liabilities (6,339) (6,895)Deferred tax liabilities, net (4,855) (5,049)
ANNUAL REPORT 2018 AMSTERDAM COMMODITIES N.V. 95

The movement in the total deferred income tax position is as follows:
The movement in deferred income tax assets and liabilities during the year, without taking into consideration the offsetting of balances within the same tax jurisdiction, is as follows:
1 Currency 31 January Recognized Recognized translation Other DecemberMovements 2018 2018 in OCI in income effects movements 2018
Intangible assets 360 (26) (90) - - 244Property, plant and equipment (4,841) 23 (243) (222) - (5,283)Inventories (842) - 680 14 - (148)Current assets and liabilities, net 447 (29) 137 9 - 564Pension provisions 675 (18) (230) 27 - 454Other provisions (758) 12 (8) (13) 130 (637)Long-term debt (90) - 41 - - (49)Total (5,049) (38) 287 (185) 130 (4,855)
1 Currency 31 January Recognized Recognized translation Other DecemberMovements 2017 2017 in OCI in income effects movements 2017
Intangible assets 337 37 51 10 (75) 360Property, plant and equipment (7,036) 7 1,465 723 - (4,841)Inventories (1,850) 8 1,059 (59) - (842)Current assets and liabilities, net 659 21 (163) (70) - 447Pension provisions 696 (75) 145 (91) - 675Other provisions (1,456) - 609 54 35 (758)Long-term debt (71) - 2 - (21) (90)Total (8,721) (2) 3,168 567 (61) (5,049)
An amount of €0.9 million (2017: €1.1 million) is expected to be recovered within 12 months.
Total deferred income tax position 2018 2017At 1 January (5,049) (8,721)Recognized in OCI (38) (2)Recognized in income 287 3,168Currency translation effects (185) 642Acquisition subsidiaries - (75)Other movements 130 (61)At 31 December (4,855) (5,049)
ANNUAL REPORT 201896 AMSTERDAM COMMODITIES N.V.

Deferred tax assets and liabilities relate to the balance sheet captions at 31 December 2018 and 31 December 2017 as follows:
2018 Assets Liabilities NetIntangible assets 289 (45) 244Property, plant and equipment - (5,283) (5,283)Inventories 297 (445) (148)Current assets and liabilities, net 564 - 564Pension provisions 454 - 454Other provisions 10 (647) (637)Long-term debt - (49) (49)Total 1,614 (6,469) (4,855)Set-off (130) 130 -Net position 1,484 (6,339) (4,855)
2017 Assets Liabilities Net
Intangible assets 416 (56) 360Property, plant and equipment - (4,841) (4,841)Inventories 217 (1,059) (842)Current assets and liabilities, net 467 (20) 447Pension provisions 675 - 675Other provisions 12 (770) (758)Long-term debt - (90) (90)Total 1,787 (6,836) (5,049)Set-off 59 (59) -Net position 1,846 (6,895) (5,049)
As at 31 December 2018 deferred income tax liabilities of €1.3 million (2017: €1.1 million) have not been recognized for withholding tax and other taxes that would be payable on the unremitted earnings of certain subsidiaries.
Such amounts are permanently reinvested. Unremitted earnings totalled €14.8 million at 31 December 2018 (2017: €12.4 million).
20 Retirement benefit obligations
The retirement benefit obligations are as follows:
Note 31 December 31 DecemberBalance sheet obligations 2018 2017
Pension benefits – defined benefit plans 2,053 2,355Pension benefits – defined contribution plans 97 98Liability in the balance sheet 2,150 2,453
31 December 31 DecemberIncome statement charges 2018 2017
Pension costs – defined benefit plans 22 (2) 109Pension costs – defined contribution plans 22 1,653 1,629Pension costs in the income statement 1,651 1,738
ANNUAL REPORT 2018 AMSTERDAM COMMODITIES N.V. 97

The amounts recognized in the balance sheet are determined as follows: 31 December 31 DecemberNet pension liability 2018 2017
Present value of funded obligations 5,061 5,857Fair value of plan assets (3,008) (3,502)Deficit of funded plans 2,053 2,355Other pension liabilities 97 98Total net pension liability 2,150 2,453
The movement in the defined benefit obligations over the year is as follows:
Actuarial pension obligations 2018 2017At 1 January 5,857 5,501Acquired in business combinations - 627Current service cost 5 33Interest cost 177 217Benefit payments (265) (639)Contribution plan participants - 8Remeasurements (286) 814Effect change to defined contribution scheme (660) -Exchange differences 233 (704)At 31 December 5,061 5,857
Actuarial results mainly consist of changes in financial assumptions.
Pension benefits - defined benefit plansSince the acquisition of Van Rees Group, Red River Commodities Group and Delinuts, the Group has operated defined benefit pension plans in the Netherlands and the US, based on employee pensionable remuneration and length of service. The Van Rees Group plan was changed in 2014 into a defined contribution plan. The pension plan in the US was closed in 2008, both for changes in salaries and for new entrants, and therefore serves as a pension fund for existing and former employees of Red River Commodities Group that were eligible up to mid-2008.
The remaining defined benefit plan in the US is externally funded. The Delinuts pension plan was changed in 2018 into a defined contribution plan. Plan assets are held in trusts and at insurance companies, governed by local regulations and practice in each country. In addition, some relatively limited selected pension agreements have been arranged within the Group.
The Group also operates defined contribution plans which receive fixed contributions from group companies. The Group’s legal or constructive obligation for these plans is limited to the contributions.
ANNUAL REPORT 201898 AMSTERDAM COMMODITIES N.V.

The principal actuarial assumptions were as follows:
31 December 31 DecemberActuarial assumptions 2018 2017
Discount rate US plan 4.2% 3.6% NL plan - 2.1%
Assumptions regarding future mortality experience are set based on actuarial advice in accordance with published statistics and experience in each territory. Average remaining life expectancy applicable for the US pension plan is 35 years. Actuarial calculations
indicate that a 0.5% decrease in the discount rate used would affect the total liability by approximately 5.3%.
Total employer contributions expected to be paid during 2019 are estimated at €107.
31 December 31 December 31 December 31 DecemberHistorical data 2018 2017 2016 2015
Defined benefit obligations 5,061 5,857 5,501 4,938Fair values of plan assets (3,008) (3,502) (3,527) (3,102)Deficit of funded plans 2,053 2,355 1,974 1,836
Other pension liabilities mainly refer to provisions for retirement benefits by law (gratuity) in various countries including Kenya and Sri Lanka.
The movement in the fair value of plan assets of the year is as follows:
Value plan assets 2018 2017At 1 January 3,502 3,527Acquired in business combinations - 490Expected return on plan assets 105 141Remeasurements (209) 244Employer contributions 221 163Contribution plan participants - 8Benefit payments (265) (639)Effect change to defined contribution scheme (484) -Exchange differences 138 (432)At 31 December 3,008 3,502
The amounts recognized in the income statement are as follows:
Pension costs Note 2018 2017Current service cost 5 33Interest cost 177 217Return on plan assets (105) (141)Release provision (79) -Total pension costs, included in personnel costs 22 (2) 109
ANNUAL REPORT 2018 AMSTERDAM COMMODITIES N.V. 99

22 Personnel costs
Note 2018 2017Wages and salaries including profit sharing 36,817 35,338Social security costs 3,960 3,674Pension costs – defined contribution plans 20 1,653 1,629Pension costs – defined benefit plans 20 (2) 109Share options – charge for the year 17 39 60Other 736 1,493Total personnel costs 43,203 42,303
On a full-time equivalent basis the total number of employees was:
Number of employees 2018 2017Average number 650 612Number at 31 December 656 615
The breakdown per function at 31 December is as follows: 2018 2017
Production 276 224General 380 391Total 656 615
21 Other provisions
Legal Other Total At 1 January 2018 285 193 478Charged/(released) to the income statement (69) 59 (10)Exchange differences 5 1 6At 31 December 2018 221 253 474
Analysis of total other provisions
Non-current 172 143 315Current1 49 110 159Total other provisions 221 253 474
1 Included in current liabilities
Legal claimsThe amounts represent a provision for certain claims brought against the Group by third parties, the outcome of which is uncertain. The provision charge is recognized in profit or loss within General cost. In management’s opinion, taken into account all known facts and circumstances on 31 December 2018 and after taking appropriate legal advice, the outcome of these legal claims will not give
rise to any significant loss beyond the amounts provided at 31 December 2018.
OtherOther provisions mainly relate to short positions outstanding at year-end of which contract prices of goods to be delivered were lower than the market price of the goods at year-end and to other onerous trading contracts.
ANNUAL REPORT 2018100 AMSTERDAM COMMODITIES N.V.

25 Corporate income tax
Note 2018 2017Current income tax on profits for the year 10,485 14,131Provisions (releases, net) (165) (380)Adjustments in respect of prior years (131) 281Total current income tax expense 10,189 14,032Deferred income tax expense/(income) 19 (287) (3,168)Total corporate income tax expense 9,902 10,864
The effective tax rate on the Group’s profit differs from the theoretical amount that would arise using the weighted average tax rate applicable to profits of the consolidated entities as follows:
23 General costs
2018 2017Indirect sales costs 3,253 3,051Other production costs 7,378 6,290Other general costs 12,644 13,192Total general costs 23,275 22,533
Indirect sales costs and other production costs are costs which are not directly linked to sales transactions.
24 Net finance costs
2018 2017Interest income on short-term bank deposits 42 68Interest expense on bank borrowings (4,053) (2,938)Amortization arrangement fees (165) (176)Net interest expense (4,176) (3,046)Other financial income and expense 143 (60)Total net finance costs (4,033) (3,106)
Corporate income tax expense 2018 2017Tax calculated at domestic tax rates applicable to profits in the respective countries 10,334 12,121Tax effect of: • Non-taxable amounts and tax allowances (483) (430)• Non-deductible expenses 351 405• Adjustments previous years (131) 281• Provisions (releases, net) (165) (380)• Effect of changes in tax rates (120) (919)• Other items 116 (214)Total corporate income tax expense 9,902 10,864Average effective tax rate 24.1% 25.1%
ANNUAL REPORT 2018 AMSTERDAM COMMODITIES N.V. 101

Earnings used to calculate (diluted) earnings per share 2018 2017Net profit 31,107 32,472Share option plan cost, net 29 46Basis for diluted profit 31,136 32,518
Number of shares, weighted and dilutive Weighted average number of ordinary shares issued 2018 2017
Issued at 1 January 24,624,060 24,225,326New shares issued, weighted part 14,178 250,143Total number of shares issued, weighted at 31 December 24,638,238 24,475,469New shares issued, unweighted part 10,822 148,591Total number of shares issued at 31 December 24,649,060 24,624,060Share options deferred dilution effect 307 26,396Total number of shares, dilutive at 31 December 24,649,367 24,650,456
26 Earnings and dividends per share
Basic earnings per share are calculated by dividing the profit for the year attributable to equity holders of the Company by the weighted average number of ordinary shares outstanding during the year.
Diluted earnings per share are calculated by adjusting the weighted average number of ordinary shares outstanding to assume conversion of all dilutive potential ordinary
shares. For the share options, a calculation is made to determine the number of shares that could have been issued at fair value (determined as the average annual market share price of the Company’s shares) based on the monetary value of the subscription rights attached to outstanding share options. The number of shares calculated as above is compared with the number of shares that will be issued assuming the exercise of all issued share options. The excess number of shares is used for calculating diluted earnings per share.
The average effective tax rate decreased from 25.1% to 24.1% mainly due to a different country mix in combination with lower tax rates. The weighted
average applicable theoretical corporate income tax rate was 25.2% (2017: 28.0%).
The tax (charge)/credit relating to components of OCI is as follows:
Tax components OCI 2018 Before tax Tax After taxCash flow hedges 268 (67) 201Currency translation adjustments (CTA) 3,751 - 3,751Remeasurement gains/(losses) on defined benefit plans 77 (17) 60Release provision 97 (24) 73Total 4,193 (108) 4,085
Tax components OCI 2017 Before tax Tax After taxCash flow hedges (197) 49 (148)Currency translation adjustments (CTA) (11,178) - (11,178)Remeasurement gains/(losses) ondefined benefit plans (570) 152 (418)Release provision - - -Total (11,945) 201 (11,744)
ANNUAL REPORT 2018102 AMSTERDAM COMMODITIES N.V.

It is proposed to distribute a final dividend of €0.60 per share. Together with the 2018 interim dividend of €0.40 per share paid in August 2018, this brings the total 2018 dividend to €1.00 per share. The total number of issued shares is 24,649,060. The 2018 interim dividend amounted to €9,860, implying that the proposed dividend would lead to a total dividend 2018 of €24,649 (total 2017: €27,079). These financial statements do not reflect a liability for this final dividend payable of €14,789.
27 Contingencies and commitments
The Group has contingent liabilities in respect of legal claims arising in the ordinary course of business. Beside the contingent liabilities provided for (Note 21), the Company is from time to time involved in liability disputes. Under certain circumstances, Acomo or our customers may be required to recall or withdraw products. This could result in significant losses. The Group maintains product recall and general liability insurance levels that it believes to be adequate.
However, Acomo cannot assure that no liability claims are incurred which are not covered by insurance policies. These claims could potentially have a material adverse effect on the financial position of the Company. Beside the legal provision (Note 21), the Company cannot reasonably predict potential financial losses to the Company arising from other disputes and/or claims.
Capital commitmentsCapital expenditures contracted for at the end of the reporting period were not material.
Operating lease commitments – group company as lesseeThe Group leases various offices and warehouses under non-cancellable operating lease agreements. The lease terms generally are between five and ten years, and the majority of lease agreements are renewable at the end of the lease period at market rate. The Group is required to give a six-month notice for the termination of these agreements. Operational lease expenses included in the 2018 consolidated income statement amounted to €3.2 million (2017: €2.9 million).
The future aggregate minimum lease payments under non-cancellable operating leases are as follows: 31 December 31 DecemberLease payment commitments 2018 2017
Within 1 year 2,511 2,777Later than 1 year and no later than 5 years 5,859 5,762Later than 5 years 1,745 1,929Total 10,115 10,468
28 Related party transactions
Key management personnel disclosures are included in Note 1.7 of the Company financial statements.
29 Subsequent events
The Group has no subsequent events that require disclosure in the financial statements.
ANNUAL REPORT 2018 AMSTERDAM COMMODITIES N.V. 103


F I N A N C I A LS T A T E M E N T S
C O M P A N Y
BALANCE SHEET AS AT 31 DECEMBER
INCOME STATEMENT
NOTES TO THE COMPANY FINANCIAL STATEMENTS
All amounts are in thousands of euros, unless otherwise stated.
Chamber of Commerce No. 24.191.858

COMPANY BALANCE SHEET AS AT 31 DECEMBER(in € thousands, before profit appropriation) Assets 31 December 31 DecemberNon-current assets Note 2018 2017
Other intangibles 87 109Property, plant and equipment 5 10Investment in subsidiaries and affiliates 1.1 194,334 174,110Total non-current assets 194,426 174,229
Current assets
Other receivables and prepayments 1.2 13,481 19,558Total current assets 13,481 19,558
Total assets 207,907 193,787 Equity and liabilities Shareholders’ equity
Share capital 11,092 11,081Share premium reserve 61,994 61,658Legal reserves 8,136 4,365Other reserves 81,193 75,475Net profit for the year 31,107 32,472Total shareholders’ equity 1.3 193,522 185,051
Provisions Provisions for deferred income tax liabilities 1.2 855 1,674Total provisions 855 1,674
Current liabilities Bank borrowings 285 357Amounts owed to Group subsidiaries 11,719 5,047Other liabilities and accrued expenses 1,526 1,658Total current liabilities 13,530 7,062
Total equity and liabilities 207,907 193,787
The notes on pages 108 to 111 are an integral part of these company financial statements.
ANNUAL REPORT 2018106 AMSTERDAM COMMODITIES N.V.

COMPANY INCOME STATEMENT(in € thousands) Note 2018 2017
Other revenue 2,312 2,437Total revenue 2,312 2,437
Personnel expenses (1,333) (1,907) Depreciation (27) (10)General and administrative expenses (1,514) (1,634)Total costs (2,874) (3,551)
Operating income (562) (1,114)
Interest expenses (319) (326)Result before income tax (881) (1,440)Corporate income tax Acomo 377 589Result subsidiaries and affiliates 1.1 31,611 33,323
Net profit 31,107 32,472
The notes on pages 108 to 111 are an integral part of these company financial statements.
ANNUAL REPORT 2018 AMSTERDAM COMMODITIES N.V. 107

NOTES TO THE COMPANY FINANCIAL STATEMENTSBasis of preparation
The Company financial statements of Amsterdam Commodities N.V. (‘Acomo’) are prepared in accordance with generally accepted accounting principles in the Netherlands (Dutch GAAP) and compliant with the requirements included in Part 9 of Book 2 of the Dutch Civil Code.
The Company prepares its consolidated financial statements according to International Financial Reporting Standards (IFRS) as adopted by the European Union. The Company has made use of the possibility based on Article 362, paragraph 8, Part 9, Book 2 of the Dutch Civil Code to prepare the Company financial statements based on the accounting policies used for the consolidated financial statements. The accounting policies as described in the notes to the consolidated financial statements also apply to the Company financial statements unless indicated otherwise.
Significant accounting policiesInvestments in subsidiaries In accordance with section 2:362, subsection 8 of the Dutch Civil Code, all subsidiaries are presented using the equity method as identified by the Dutch Accounting Standards Board in accordance with the accounting principles applied in the consolidated accounts. The goodwill as identified in the consolidated financial statements is subsumed in the carrying value of the investments in subsidiaries.
1.1 Financial fixed assetsAcomo and its Dutch subsidiaries form a fiscal unity for corporate income tax purposes. In accordance with standard conditions, the Company, along with the respective subsidiaries that are part of the fiscal unity, are wholly and severally liable for the tax liabilities of the fiscal unity. Corporate income tax expense on results of subsidiaries is reported as part of Results subsidiaries and affiliates.
1.2 Other receivables and prepayments – Deferred tax liabilities Other receivables and prepayments consist of a receivable on a group company and prepaid income taxes 2018, which will be charged to the related subsidiaries in 2019. The deferred tax liabilities are
primarily related to temporary differences of assets in Dutch subsidiaries that are part of the fiscal unity of which the Company is the head.
The income taxes are settled through the inter-company current accounts.
Investments in subsidiaries and affiliates 2018 2017At 1 January 174,110 184,664Net profit for the year 31,611 33,323Dividends paid out (15,481) (32,137)Currency translation differences 3,751 (11,178)Pension movements through OCI 133 (418)Other equity movements 210 (144)At 31 December 194,334 174,110
For an overview of the subsidiaries of the Company, see Note 2.3 of the consolidated financial statements.
ANNUAL REPORT 2018108 AMSTERDAM COMMODITIES N.V.

1.3 Shareholders’ equity Attributable to owners of the parent
Share Net Share premium Legal Other profit for Total capital reserve reserves reserves the year equity
Balance at 1 January 2017 10,901 52,447 16,086 69,097 34,377 182,908Net profit 2017 - - - - 32,472 32,472Dividends relating to 2016, final - - - (18,180) - (18,180)Dividends relating to 2017, interim - - - (9,842) - (9,842)Currency translation adjustments (CTA) - - (11,178) - - (11,178)Appropriation of net profit - - - 34,377 (34,377) -Transfer to other reserves - - (589) 589 - -New shares issued 180 9,211 - - - 9,391Employee share option scheme effects - - 46 - - 46Change in cash flow hedges - - - (148) - (148)Remeasurement gains/(losses) - - - (418) - (418)on defined benefit plans Balance at 31 December 2017 11,081 61,658 4,365 75,475 32,472 185,051
Net profit 2018 - - - - 31,107 31,107Dividends relating to 2017, final - - - (17,237) - (17,237)Dividends relating to 2018, interim - - - (9,860) - (9,860)Currency translation adjustments (CTA) - - 3,751 - - 3,751Appropriation of net profit - - - 32,472 (32,472) -Transfer to other reserves - - (9) 9 - -New shares issued 11 336 - - - 347Employee share option scheme effects - - 29 - - 29Change in cash flow hedges - - - 201 - 201Remeasurement gains/(losses) - - - 133 - 133on defined benefit plans Balance at 31 December 2018 11,092 61,994 8,136 81,193 31,107 193,522
The total authorized number of ordinary shares is 66.7 million shares with a par value of €0.45 per share. As at 31 December 2018, 24.6 million (2017: 24.6 million) shares were issued and fully paid. The issued share capital increased in 2018 by 25,000 shares (2017: 398,734) as a result of new shares relating to employees exercising their vested options under the employee share option scheme.
Included in the legal reserves are the currency translation reserve, which comprises all translation differences arising from the translation of the net investment in group companies, including goodwill, in currencies other than the euro, and the share option
plan reserve, which comprises the value of the vested rights in respect of the share option plan as far as stock options have not been exercised.
1.4 Employee informationDuring 2018, the average number of employees employed by the Company was seven full-time equivalents (2017: eight), at year-end nine (2017: seven). All employees are based in the Netherlands. 1.5 Audit feesThe following amounts were paid to the Group auditor PwC as audit fees and included in other operating expenses:
ANNUAL REPORT 2018 AMSTERDAM COMMODITIES N.V. 109

Network In the outside the Fees PwC 2018 Netherlands Netherlands Total
Audit 281 176 457Audit-related1 9 - 9Tax2 - 4 4Total fees PwC 290 180 470
1 Agreed-upon procedures regarding compliance bank covenants and other financial information2 Relates to tax filing in Kenya
Network In the outside the Fees PwC 2017 Netherlands Netherlands Total
Audit 290 173 463Audit-related 4 - 4Tax - 4 4Total fees PwC 294 177 471
The fees are included in the general costs of the consolidated accounts and relate to the procedures applied to the Company and its consolidated group entities by accounting firms and external auditors as referred to in Article 1 (1) of the Audit Firms Supervision Act (Dutch acronym: Wta) as well as by Dutch and foreign based accounting firms, including their tax services and advisory groups. The audit fees relate to the audit of the 2018 financial statements, regardless of whether the work was performed during the financial year.
1.6 Contingent liabilitiesContingent liabilities are not expected to give rise to any material loss and include guarantees given for group companies. The Company has issued joint and several liability undertakings, some as defined in Article 403, Book 2 of the Dutch Civil Code, for almost all Dutch
group companies in the Netherlands. These written undertakings have been filed with the Trade Register of the Chamber of Commerce in the respective seat the group company concerned has its registered office. The Company is the head of a fiscal unity that includes the Dutch wholly-owned group companies. The Company is therefore jointly and severally liable for the tax liabilities of the fiscal unity as a whole.
1.7 Remuneration of the Board of DirectorsThe remuneration of the Executive and Non-Executive Directors of the Board is determined in accordance with the remuneration policy as disclosed in the chapter Governance on page 54 and following. Key management includes the Executive Director, Mr Goldschmeding, who is the statutory director of the Company, and the Non-Executive Directors, Mr Stuivinga, Mrs Groothuis, Mr Gottesman and Mr Niessen.
The 2018 and 2017 remuneration to Executive Directors is shown below:
Short-term Remuneration Executive Directors Post Share- Profit employment based2018 Salary share Bonus benefits expenses
Goldschmeding 275 - 390 25 20Total Executive Director 275 - 390 25 20
2017Goldschmeding 275 - 430 25 24Total current Executive Director 275 - 430 25 24Rietkerk (resigned on 17 May 2017) 118 171 - 22 18Total former Director 118 171 - 22 18
ANNUAL REPORT 2018110 AMSTERDAM COMMODITIES N.V.

Year of Outstanding Exercised Outstanding Exercise ExpiryExecutive Director grant 1 Jan 2018 2018 31 Dec 2018 price (€) date
Goldschmeding 2015 50,000 - 50,000 22.46 01-12-22
Remuneration Non-Executive Directors 2018 2017Stuivinga1 106 89Groothuis 85 68 Gottesman1 95 78 Niessen 85 68 Total 371 303
1 Including €10 remuneration for being a member of the Supervisory Board of Catz International
On 31 December 2018, the following Board members directly or indirectly owned Acomo shares: Mr Stuivinga (40,595) and Mr Niessen (3,665,008). No loans, advances or guarantees were granted to the Board. No share options were granted to the Non-Executive Directors of the Board.
1.8 Profit appropriationIn accordance with the resolution of the Annual General Meeting held on 26 April 2018, the profit for 2017 has been appropriated in conformity with the proposed appropriation of profit stated in the 2017 financial statements.
Mr Goldschmeding can earn a bonus when achieving specific targets in his role as Group Managing Director.
The bonus shown is related to the performance in 2018 and will be paid out in 2019.
The net profit for 2018 attributable to the shareholders amounting to €31,107 shall be available in accordance with Article 24 of the Company’s Articles of Association.
The Board of Directors proposes to distribute a final dividend of €0.60 per share. Together with the 2018 interim dividend of €0.40 per share paid in August 2018, this brings the total 2018 dividend to €1.00 per share.
The residual profit is proposed to be added to reserves.
Rotterdam, 7 March 2019 The Board of Directors,
A.W. Goldschmeding, Executive Director B.H. Stuivinga, ChairmanM.E. Groothuis, Non-Executive DirectorY. Gottesman, Non-Executive DirectorJ.G.H.M. Niessen, Non-Executive Director
ANNUAL REPORT 2018 AMSTERDAM COMMODITIES N.V. 111
OTHER INFORMATION Appropriation of profit according to the Articles of Association
Article 24 paragraph 1 of the Articles of Association stipulates:
From the net profit as disclosed in the adopted income statement, such amounts are transferred to reserves as may be determined by the General Meeting of Shareholders and proposed by the Board of Directors. The remaining amount is at the disposal of the General Meeting of Shareholders.
ANNUAL REPORT 2018112 AMSTERDAM COMMODITIES N.V.

Independent Auditor’s Report
To: the general meeting and the board of directors of Amsterdam Commodities N.V.
Report on the financial statements 2018
Our opinionIn our opinion: • Amsterdam Commodities N.V.’s consolidated financial
statements give a true and fair view of the financial position of the Group as at 31 December 2018 and of its result and cash flows for the year then ended in accordance with International Financial Reporting Standards as adopted by the European Union (EU-IFRS) and with Part 9 of Book 2 of the Dutch Civil Code;
• Amsterdam Commodities N.V.’s company financial statements give a true and fair view of the financial position of the Company as at 31 December 2018 and of its result for the year then ended in accordance with Part 9 of Book 2 of the Dutch Civil Code.
What we have auditedWe have audited the accompanying financial statements 2018 of Amsterdam Commodities N.V., Rotterdam (‘the Company’). The financial statements include the consolidated financial statements of Amsterdam Commodities N.V. together with its subsidiaries (‘the Group’) and the company financial statements.
The consolidated financial statements comprise: • the consolidated balance sheet as at 31 December
2018;• the following statements for 2018: the consolidated
statement of income, the consolidated statements of comprehensive income, cash flows and changes in equity; and
• the notes, comprising significant accounting policies and other explanatory information.
The company financial statements comprise: • the company balance sheet as at 31 December 2018;• the company income statement for the year then
ended;• the notes, comprising the accounting policies
applied and other explanatory information.
The financial reporting framework applied in the preparation of the financial statements is EU-IFRS and the relevant provisions of Part 9 of Book 2 of the Dutch Civil Code for the consolidated financial statements and Part 9 of Book 2 of the Dutch Civil Code for the company financial statements.
The basis for our opinionWe conducted our audit in accordance with Dutch law, including the Dutch Standards on Auditing. We have further described our responsibilities under those standards in the section ‘Our responsibilities for the audit of the financial statements’ of our report. We believe that the audit evidence we have obtained is sufficient and appropriate to provide a basis for our opinion.
IndependenceWe are independent of Amsterdam Commodities N.V. in accordance with the European Regulation on specific requirements regarding statutory audit of public-interest entities, the ‘Wet toezicht accountantsorganisaties’ (Wta, Audit firms supervision act), the ‘Verordening inzake de onafhankelijkheid van accountants bij assuranceopdrachten’ (ViO – Code of Ethics for Professional Accountants, a regulation with respect to independence) and other relevant independence requirements in the Netherlands. Furthermore, we have complied with the ‘Verordening gedrags- en beroepsregels accountants’ (VGBA – Code of Ethics for Professional Accountants, a regulation with respect to rules of professional conduct).
Our audit approach
Overview and contextAmsterdam Commodities N.V. is active in the sourcing, processing, trading, packaging and distribution of (non-quoted) natural food products and ingredients for the food and beverage industry. The Group is comprised of several components and therefore we considered our group audit scope and approach as set out in the section ‘The scope of our group audit’. We paid specific attention to the areas of focus driven by the operations of the Group, as set out below.
ANNUAL REPORT 2018 AMSTERDAM COMMODITIES N.V. 113

As part of designing our audit, we determined materiality and assessed the risks of material misstatement in the financial statements. In particular, we considered where the board of directors made important judgments, for example, in respect of significant accounting estimates that involved making assumptions and considering future events that are inherently uncertain. In note 4 of the financial statements the company describes the areas of judgment in applying accounting policies and the key sources of estimation uncertainty. Given the volatility in (non-quoted) commodity prices and exchange rates we considered valuation of the inventories and commodity trading positions and foreign exchange contracts to be a key audit matter. The uncertainty in the timing of the delivery of the products and the credit risk of the debtors resulted
in the collectability of trade receivables and recognition of revenue to be a key audit matter as well.
Other areas of focus that were not considered as key audit matters were, the assessment of the impact of the two new reporting standards, IFRS 9 ‘Financial Instruments’ and IFRS 15 ‘Revenue from Contracts with Customers’, fraud, uncertain tax positions and goodwill impairment testing.
We ensured that the audit teams at both group and component level included the appropriate skills and competences, which are needed for the audit of a commodity trading company. We included specialists in the areas of IT, financial instruments and valuations in our team.
Materiality• Overall materiality: € 2 million. Audit scope• We have audited the financial information of five components. For four other
components we performed specified audit procedures.• Site visits were conducted by the Group audit team to ten locations in all reporting
segments. • Audit coverage: 92% of consolidated profit before income tax, 90% of consolidated
revenue and 90% of consolidated total assets. Key audit matters• Valuation of inventories, commodity trading positions and foreign exchange contracts. • Collectability of trade receivables and timing of recognition of revenue.
MaterialityThe scope of our audit is influenced by the application of materiality, which is further explained in the section ‘Our responsibilities for the audit of the financial statements’.
Based on our professional judgment, we determined certain quantitative thresholds for materiality, including
the overall materiality for the financial statements as a whole as set out in the table below. These, together with qualitative considerations, helped us to determine the nature, timing and extent of our audit procedures on the individual financial statement line items and disclosures and to evaluate the effect of identified misstatements, both individually and in aggregate, on the financial statements as a whole and on our opinion.
Materiality
Key auditmatters
Audit scope
The outline of our audit approach was as follows:
ANNUAL REPORT 2018114 AMSTERDAM COMMODITIES N.V.

Overall group materiality €2 million (2017: €2.1 million). Basis for determining materiality We used our professional judgment to determine overall materiality. As a basis for our judgment we used 5% of profit before income tax.Rationale for benchmark applied We used profit before income tax as the primary benchmark, a generally accepted auditing practice, based on our analysis of the common information needs of users of the financial statements. On this basis we believe that profit before income tax is an important metric for the financial performance of the company.Component materiality To each component in our audit scope, we, based on our judgment, allocate materiality that is less than our overall group materiality. The range of materiality allocated across components was between €0.7 million and €1.9 million.
We also take misstatements and/or possible misstatements into account that, in our judgment, are material for qualitative reasons.
We agreed with the board of directors that we would report to them misstatements identified during our audit above €100,000 (2017: €120,000) as well as misstatements below that amount that, in our view, warranted reporting for qualitative reasons.
The scope of our group auditAmsterdam Commodities N.V. is the parent company of a group of entities. The financial information of this group is included in the consolidated financial statements of Amsterdam Commodities N.V.
We tailored the scope of our audit to ensure that we performed sufficient work to be able to give an opinion on the financial statements as a whole, taking into account the management structure of the Group, the nature of operations of its components, the accounting processes and controls, and the markets in which the components of the Group operate. In establishing the overall group audit strategy and plan, we determined the type of work required to be performed at component level by the Group engagement team and by each component auditor.
Our group audit primarily focussed on the significant components. In determining our scoping we considered both financial and the following qualitative factors as well as Acomo’s decentralized structure to be relevant:
• Amsterdam Commodities N.V. is the holding company which role includes monitoring financial performance, financing, assessing and monitoring effective risk management, compliance and control systems with regard to the subsidiaries’ activities (as described on page 20 of the annual report) and we therefore determined this to be a significant component.
• The Group consists of a number of subsidiaries active in trading, international sourcing, processing and selling of niche food commodities and ingredients in the food industry. The subsidiaries operate to a great extent autonomously under the responsibility of their own management and financial control. We therefore included a relatively large number of components in our audit scope.
• Acomo’s subsidiary Van Rees Group B.V. manages eleven subsidiaries located across the globe with an oversight role by the Van Rees Group B.V. head office. For four components (Van Rees Group B.V., van Rees B.V., Van Rees Kenya Ltd. and Van Rees Ceylon Ltd.) we performed an audit of the financial information; for one component we performed specified audit procedures (Van Rees North America Inc.).
Our group audit scoping and the components visited by the group audit team where we performed an audit of the financial information (full scope audit) or specified audit procedures, is included in the below table.
Specified audit procedures have been performed for four components to achieve the appropriate coverage on financial line items in the consolidated financial statements.
ANNUAL REPORT 2018 AMSTERDAM COMMODITIES N.V. 115

Significant Visited by group Component component audit team Scoping
Amsterdam Commodities N.V. V V Full scope auditCatz International B.V. V V Full scope auditRed River Commodities Inc. V V Full scope auditVan Rees Group B.V. (consolidated) V V Full scope auditSnick EuroIngredients N.V. V Full scope auditDelinuts B.V. V Specified audit proceduresKing Nuts B.V. V Specified audit proceduresTovano B.V. V Specified audit proceduresRed River-van Eck B.V. V Specified audit procedures
In total, in performing these procedures, we achieved the following coverage on the financial line items:
Revenue 90%Total assets 90%Profit before tax 92%
None of the remaining components for which no audit of financial information or specified audit procedures have been performed represented more than 3% of total Group profit before tax, total Group revenue or total Group assets. For those remaining components we performed, amongst others, analytical procedures to corroborate our assessment that there were no significant risks of material misstatements within those components.
In the Netherlands, the audits of all components are performed by the Group audit team and we have visited all significant and certain smaller components in 2018, as set out in this scoping paragraph above. For the audits of all components outside the Netherlands, we used component auditors who are familiar with the local laws and regulations in each of the locations to perform this audit work.
Where component auditors performed the work, we determined the level of involvement we needed to have in their audit work to be able to conclude whether we had obtained sufficient appropriate audit evidence as a basis for our opinion on the consolidated financial statements as a whole.
We issued instructions to the component auditors in our audit scope. These instructions included amongst others our risk analysis and scope of the work. During the year, we had regular calls with all component auditors in which we discussed, amongst others, recent developments at the respective component, the scope
of our audit, the reports of the component auditor, the findings following their procedures, the need for any support or information from Group level and other matters which could be of relevance for the consolidated financial statements. Furthermore, we attended all the closing meetings of the component audits (partly through calls) and reviewed selected working papers for the significant component audits.
The Group audit team performed the audit work on the group consolidation, financial statement disclosures and a number of complex items at the head office. These items include, but are not limited to the implementation of IFRS 9 and IFRS 15, goodwill impairment testing, valuation of derivative financial instruments, tax accounting, segmentation and share based payments.
By performing the procedures above at the components, combined with additional procedures at Group level, we have been able to obtain sufficient and appropriate audit evidence on the Group’s financial information, as a whole, to provide a basis for our opinion on the financial statements.
Our focus on fraud
Our objectives We assess and respond to the risk of fraud in the context of our audit of the financial statements. In this context and with reference to the sections on responsibilities in this report, our objectives in relation to fraud are:• to identify and assess the risks of material
misstatement of the financial statements due to fraud;• to obtain sufficient appropriate audit evidence
regarding the assessed risks of material misstatement due to fraud, through designing and implementing appropriate audit responses; and
ANNUAL REPORT 2018116 AMSTERDAM COMMODITIES N.V.

• to respond appropriately to fraud or suspected fraud identified during the audit.
However, because of the characteristics of fraud, particularly those involving sophisticated and carefully organised schemes to conceal it, such as forgery, deliberate failure to record transactions and collusion, our audit might not detect instances of material fraud.
Our risk assessment We obtained an understanding of the entity and its environment, including the entity’s internal control. We made inquiries with the board of directors and local management. In addition, we considered other external and internal information. As part of our process of identifying fraud risks, we evaluated fraud risk factors both at central and component level with respect to financial reporting fraud, misappropriation of assets and bribery and corruption. Fraud risk factors are events or conditions, which indicate an incentive or pressure, an opportunity, or an attitude or rationalisation to commit fraud. We evaluated the fraud risk factors to consider whether those factors indicated risks of material misstatement due to fraud.
As in all of our audits, we addressed the risk of management override of internal controls, including evaluating whether there was evidence of bias by the board of directors that may represent a risk of material misstatement due to fraud. Given the territories the Group operates in, we considered the risk of bribery and corruption taking into account the corruption perception index of the countries of operation and updated our understanding of the internal controls that the Group has in place to address and manage this risk when doing business in higher risk countries.
Our response to the risk of fraud We evaluated the design and the implementation and, where considered appropriate, tested the operating effectiveness of internal controls that mitigate fraud risks. In addition, we performed procedures, which include journal entry testing and evaluating accounting estimates for bias.
In particular, our procedures consisted of inquiries with the board of directors and local management for actual or suspected fraud incidents noted within the Group through the whistleblower process or otherwise. We performed data analysis of unusual or high-risk journal entries and evaluation of key estimates and judgments
made by management including retrospective evaluation of prior year estimates. Where we identified instances of unusual transactions, unusual or unexpected journal entries or other risks through our data analytics, we performed additional audit procedures to address each identified risk. These procedures also included testing of transactions back to source documentation. We considered the possibility of fraudulent or corrupt payments made across various countries of operation determined by a risk based process and included contracts with commission or rebates in our testing. We also reviewed payments made and received through cash transactions. We also incorporated an element of unpredictability in our audit.
We considered the outcome of our other audit procedures and evaluated whether any findings or misstatements were indicative of fraud. If so, we re-evaluate our assessment of fraud risk and its resulting impact on our audit procedures.
We refer to the key audit matters below, that are examples of our approach related to areas of higher risk due to accounting estimates where management makes significant judgments.
Key audit matters Key audit matters are those matters that, in our professional judgment, were of most significance in the audit of the financial statements. We have communicated the key audit matters to the board of directors. The key audit matters are not a comprehensive reflection of all matters identified by our audit and that we discussed. In this section, we described the key audit matters and included a summary of the audit procedures we performed on those matters.
We addressed the key audit matters in the context of our audit of the financial statements as a whole, and in forming our opinion thereon. We do not provide separate opinions on these matters or on specific elements of the financial statements. Any comments or observations we made on the results of our procedures should be read in this context. The key audit matter on the correct application of the purchase price allocation is not applicable this year as the group did not make an acquisition this year. The two other key audit matters are similar to prior year as they are directly linked to Acomo’s long term nature business activities.
ANNUAL REPORT 2018 AMSTERDAM COMMODITIES N.V. 117

Key audit matter
Valuation of inventories, (non-quoted) commodity trading
positions and foreign exchange contracts
(note 2.9 — 2.11, note 10 and 13)
It is the core business of Acomo to accept managed risks, by taking positions in different types of (non-quoted) commodities and contracts in different currencies. This is to a great extent done autonomously under the responsibility of local management with separate financial and operational systems. The Group has issued specific trading and financial guidelines and risk limits per operating company, per product and per category, which are monitored by the Acomo board of directors to mitigate the risk of management override of controls, error and volatility from product positions (for example monthly review of trading positions and segregation of duties).
Certain operating companies use derivative financial instruments to hedge risks associated with foreign currency risk (mainly Euro/US Dollar exposures). In the Tea segment, hedge accounting is applied. Acomo’s approach in relation to foreign exchange risk is disclosed in note 3.1.1 to the financial statements.
The price and foreign currency volatilities of the (non-quoted) commodity markets have a direct impact on the value of the subsidiaries’ (non-quoted) commodity trading positions and could therefore result in significant inventory write-downs to net realisable value and/or losses on onerous contracts. This assessment requires judgment based on historic trades, as there are no direct observable market prices available.
The activities and processes as set out above are complex and require judgment, we therefore considered the valuation of inventories, (non-quoted) commodity trading positions and foreign exchange contracts a key audit matter.
How our audit addressed the matter
In our audit we performed procedures which allowed us to rely, to the extent possible, on internal controls at subsidiary and Group level for the purpose of our audit. We performed, amongst others, procedures designed to identify risks around segregation of duties for the trading activities between the front office and back office, authorization of trading transactions and accounting of these transactions in the financial and operational systems. As part of our audits of the operating companies, we have assessed that specific trading and financial guidelines and risk limits per operating company as set out by the group, were applied.
We assessed the company’s hedging policies for their foreign exchange risk exposure. We tested the recognition at fair value of derivative financial instruments based on market data together with our financial instruments specialists and we investigated, for the Tea segment, whether the hedge accounting has been applied correctly. Based on these audit procedures performed, we noted no material exceptions.
We tested inventory for their existence by obtaining third party warehouse confirmations, attending inventory counts on all significant locations and by testing the inventory pricing through reconciliation with purchase contracts. For the effects of price movements we assessed the company’s trading guidelines, positions per product group and overall positions. We tested and challenged management’s analysis of the valuation of inventories and the economic trading positions with contracts and market prices. Furthermore, we tested the calculation and authorisation of onerous contract provisions and the net realisable value of inventories below cost through comparison with recent transactions and transactions subsequent to the year-end.
Based on the aforementioned audit procedures performed, we found management’s judgment around the valuation of the inventories and trading positions reasonable and we noted no material exceptions.
ANNUAL REPORT 2018118 AMSTERDAM COMMODITIES N.V.

Key audit matter
Collectability of trade receivables and timing of recognition
of revenue
(note 2.11 / 2.19)
Trade receivable balances are significant to Acomo as they represent 28% of the consolidated balance sheet (refer to note 11 to the financial statements). The collectability of trade receivables is a risk as Acomo is trading with customers worldwide and judgment is involved in the assessment of the collectability of trade receivables. The collectability of trade receivables is a key element of Acomo’s working capital management, which is managed on an ongoing basis by local management. The Acomo board of directors supports operating companies in setting credit limits for customers and approve such limits above certain thresholds where applicable.
Given the nature of the businesses with delivery world-wide, frequent changes in planned delivery dates and requirements of customers, various shipping terms are in place which impact the timing of revenue recognition.
Given the magnitude and judgment involved in the collectability assessment of trade receivables and variety of shipping terms that impact the timing of revenue recognition, this is considered a key audit matter.
How our audit addressed the matter
We have challenged the assumptions used to calculate the trade receivables impairment amount based on the expected credit loss model, notably through assessing specific local risks, detailed analyses of ageing of receivables and assessment of individual significant overdue trade receivables, combined with legal documentation, where applicable and testing of receipts after the year-end. We found management’s judgment around the collectability of trade receivables reasonable.
We performed audit procedures on the recognition of revenue, which included but were not limited to control testing on sales transactions for the purpose of our audit and substantive audit procedures, such as tracing transactions back to shipping documents, contracts and performing subsequent receipt testing. We have tested management’s timing of revenue recognition in accordance with EU-IFRS 15 based on the shipping terms agreed with customers. Furthermore, we have tested management’s cut-off testing procedures to assess that revenue was recognized in the correct period and have independently selected samples to test cut-off of revenue through verification of shipping documents, contracts and invoices.
Based on the aforementioned audit procedures performed, we noted no material exceptions.
Report on the other information included in the annual report
In addition to the financial statements and our auditor’s report thereon, the annual report contains other information that consists of:• the management board report, as defined in note 1
of the financial statements;• the other information pursuant to Part 9 of Book 2
of the Dutch Civil Code; and• other parts of the annual report: History, Key data,
Letter from the board, The Acomo group, Risk management, Business performance, Governance, The Board of directors, The Acomo share, List of acronyms and abbreviations, Explanation of some concepts and rations, Information takeover directive degree and Contact details.
Based on the procedures performed as set out below, we conclude that the other information:• is consistent with the financial statements and does
not contain material misstatements;• contains the information that is required by Part 9
of Book 2 of the Dutch Civil Code.
We have read the other information. Based on our knowledge and understanding obtained in our audit of the financial statements or otherwise, we have considered whether the other information contains material misstatements.
By performing our procedures, we comply with the requirements of Part 9 of Book 2 of the Dutch Civil Code and the Dutch Standard 720. The scope of such procedures was substantially less than the scope of those performed in our audit of the financial statements.
ANNUAL REPORT 2018 AMSTERDAM COMMODITIES N.V. 119

The board of directors is responsible for the preparation of the other information, including the management board report and the other information in accordance with Part 9 of Book 2 of the Dutch Civil Code.
Report on other legal and regulatory requirements
Our appointment We were appointed as auditors of Amsterdam Commodities N.V. following the passing of a resolution by the shareholders at the annual meeting held on 30 April 2014. Our appointment has been renewed annually by shareholders representing a total period of uninterrupted engagement appointment of 5 years.
No prohibited non-audit services To the best of our knowledge and belief, we have not provided prohibited non-audit services as referred to in Article 5(1) of the European Regulation on specific requirements regarding statutory audit of public-interest entities.
Services rendered The services, in addition to the audit, that we have provided to the Company and its controlled entities, for the period to which our statutory audit relates, are disclosed in note 1.5 to the company financial statements.
Responsibilities for the financial statements and the audit
Responsibilities of the board of directors The board of directors is responsible for:• the preparation and fair presentation of the financial
statements in accordance with EU-IFRS and with Part 9 of Book 2 of the Dutch Civil Code; and for
• such internal control as the board of directors determines is necessary to enable the preparation of the financial statements that are free from material misstatement, whether due to fraud or error.
As part of the preparation of the financial statements, the board of directors is responsible for assessing the Company’s ability to continue as a going concern. Based on the financial reporting frameworks mentioned, the board of directors should prepare the financial statements using the going-concern basis of
accounting unless the board of directors either intends to liquidate the company or to cease operations, or has no realistic alternative but to do so. The board of directors should disclose events and circumstances that may cast significant doubt on the Company’s ability to continue as a going concern in the financial statements.
Our responsibilities for the audit of the financial statements Our responsibility is to plan and perform an audit engagement in a manner that allows us to obtain sufficient and appropriate audit evidence to provide a basis for our opinion. Our audit opinion aims to provide reasonable assurance about whether the financial statements are free from material misstatement. Reasonable assurance is a high but not absolute level of assurance, which makes it possible that we may not detect all misstatements. Misstatements may arise due to fraud or error. They are considered to be material if, individually or in the aggregate, they could reasonably be expected to influence the economic decisions of users taken on the basis of the financial statements.
Materiality affects the nature, timing and extent of our audit procedures and the evaluation of the effect of identified misstatements on our opinion.
A more detailed description of our responsibilities is set out in the appendix to our report.
Amsterdam, 7 March 2019
PricewaterhouseCoopers Accountants N.V.
J. van Meijel RA
ANNUAL REPORT 2018120 AMSTERDAM COMMODITIES N.V.
Appendix to our auditor’s report on the financial statements 2018 of Amsterdam Commodities N.V.
In addition to what is included in our auditor’s report, we have further set out in this appendix our responsibilities for the audit of the financial statements and explained what an audit involves.
The auditor’s responsibilities for the audit of the financial statements We have exercised professional judgment and have maintained professional scepticism throughout the audit in accordance with Dutch Standards on Auditing, ethical requirements and independence requirements. Our objectives are to obtain reasonable assurance about whether the financial statements as a whole are free from material misstatement, whether due to fraud or error. Our audit consisted, among other things of the following:• Identifying and assessing the risks of material
misstatement of the financial statements, whether due to fraud or error, designing and performing audit procedures responsive to those risks, and obtaining audit evidence that is sufficient and appropriate to provide a basis for our opinion. The risk of not detecting a material misstatement resulting from fraud is higher than for one resulting from error, as fraud may involve collusion, forgery, intentional omissions, misrepresentations, or the intentional override of internal control.
• Obtaining an understanding of internal control relevant to the audit in order to design audit procedures that are appropriate in the circumstances, but not for the purpose of expressing an opinion on the effectiveness of the Company’s internal control.
• Evaluating the appropriateness of accounting policies used and the reasonableness of accounting estimates and related disclosures made by the board of directors.
• Concluding on the appropriateness of the board of directors’ use of the going-concern basis of accounting, and based on the audit evidence obtained, concluding whether a material uncertainty exists related to events and/or conditions that may cast significant doubt on the Company’s ability to continue as a going concern. If we conclude that a material uncertainty exists, we are required to draw attention in our auditor’s report to the related disclosures in the financial statements or, if such disclosures are inadequate, to modify our opinion. Our conclusions are based on the audit evidence obtained up to the date of our auditor’s report and are made in the context of our opinion on
the financial statements as a whole. However, future events or conditions may cause the company to cease to continue as a going concern.
• Evaluating the overall presentation, structure and content of the financial statements, including the disclosures, and evaluating whether the financial statements represent the underlying transactions and events in a manner that achieves fair presentation.
Considering our ultimate responsibility for the opinion on the consolidated financial statements, we are responsible for the direction, supervision and performance of the group audit. In this context, we have determined the nature and extent of the audit procedures for components of the Group to ensure that we performed enough work to be able to give an opinion on the financial statements as a whole. Determining factors are the geographic structure of the Group, the significance and/or risk profile of group entities or activities, the accounting processes and controls, and the industry in which the Group operates. On this basis, we selected group entities for which an audit or review of financial information or specific balances was considered necessary.
We communicate with the board of directors regarding, among other matters, the planned scope and timing of the audit and significant audit findings, including any significant deficiencies in internal control that we identify during our audit. In this respect, we also issue an additional report to the audit committee in accordance with Article 11 of the EU Regulation on specific requirements regarding statutory audit of public-interest entities. The information included in this additional report is consistent with our audit opinion in this auditor’s report.
We provide the board of directors with a statement that we have complied with relevant ethical requirements regarding independence, and to communicate with them all relationships and other matters that may reasonably be thought to bear on our independence, and where applicable, related safeguards.
From the matters communicated with the board of directors, we determine those matters that were of most significance in the audit of the financial statements of the current period and are therefore the key audit matters. We describe these matters in our auditor’s report unless law or regulation precludes public disclosure about the matter or when, in extremely rare circumstances, not communicating the matter is in the public interest.
ANNUAL REPORT 2018 AMSTERDAM COMMODITIES N.V. 121

LIST OF ACRONYMS AND ABBREVIATIONSAFM Dutch Authority for the Financial MarketsAGM Annual general meetingAScX Amsterdam Small Cap IndexBRC British Retail Consortium Global Standard for Food SafetyCAGR Compound annual growth rateCCF Catz Charity FoundationCGU Cash-generating unitCSR Corporate social responsibilityCTA Currency translation adjustmentsDCF Discounted cash flowEBIT Earnings before interest and taxes (operating income)EBITDA Earnings before interest, taxes, depreciation and amortizationERP Enterprise resource planningFIFO First in, first outFT Fair TradeFTE Full-time equivalentFX rate Foreign exchange rateGAAP Generally accepted accounting principlesGFSI Global Food Safety InitiativeGRI Global Reporting InitiativeHACCP Hazard analysis and critical control pointsIAS International accounting standardICR Interest cover ratioIFRIC International Financial Reporting Interpretations CommitteeIFRS International Financial Reporting StandardsIFS International Food StandardISIN International securities identification numberISO International Organization for StandardizationMRL Maximum residue limitsMSC Marine Stewardship CouncilNGO Non-governmental organizationOCI Other comprehensive incomePPE Property, plant and equipmentPwC PricewaterhouseCoopers Accountants N.V.RA Rainforest AllianceRCF Revolving credit facilityROE Return on equityRONCE Return on net capital employedRSPO Roundtable on Sustainable Palm OilSDE Sustainable energy production subsidy scheme Skal Dutch control authority for organic productionThe Code Dutch Corporate Governance CodeTSR Total shareholders’ returnUTZ UTZ certifiedWACC Weighted average cost of capitalWta Audit Firms Supervision Act
ANNUAL REPORT 2018122 AMSTERDAM COMMODITIES N.V.

EXPLANATION OF SOME CONCEPTS AND RATIOSCompound annual growth rate (CAGR)This rate is calculated as the value at the end of the period divided by the value at the beginning of the period, compounded to the respective period.
Dividend pay-out ratioThe dividend pay-out ratio is calculated as the sum of the interim and (proposed) final dividend for the year as a percentage of the net profit for the year.
Earnings per shareThe earnings per share are calculated as the total net profit for the period divided by the (weighted) average number of ordinary shares outstanding.
Equity per shareThe equity per share reflects the Company’s equity allocated to each outstanding share of common stock and is calculated by dividing the total shareholders’ equity by the total number of ordinary shares outstanding at year-end.
Interest cover ratioThe interest cover ratio is calculated by dividing the normalized EBITDA by the total of the interest expenses minus interest income.
Market capitalizationMarket capitalization reflects the total market value of all the Company’s outstanding shares and is calculated by multiplying the total shares issued by the share price at period-end.
Net capital employedNet capital employed consists of the total assets minus cash and banks, provisions, trade creditors and other liabilities.
Net debt/total equityThis ratio is calculated by dividing the net debt by the total shareholders’ equity.
Net operating assetsNet operating assets comprise the average total net assets adjusted for goodwill.
One-off itemsItems with a specific non-recurring character are presented as one-off items.
Price/earnings ratioThe price/earnings ratio is calculated by dividing the share price at year-end by the earnings per share.
Return on equityReturn on equity is the amount of net profit returned as a percentage of the (weighted) average shareholders’ equity.
Return on net capital employedReturn on net capital employed measures a company’s profitability and the efficiency with which its capital is employed. This indicator reflects the EBIT as a percentage of the average net capital employed.
SolvencySolvency reflects the total shareholders’ equity as a percentage of the total assets.
Total shareholders’ returnThe total shareholders’ return shows the performance of the Company’s shares over time using the change in share price at year-end and the total dividend paid during the year, divided by the year-end share price of prior year.
ANNUAL REPORT 2018 AMSTERDAM COMMODITIES N.V. 123

INFORMATION TAKEOVER DIRECTIVE DECREEInformation following Article 10, Takeover Directive Decree, and section 391, subsection 5, Book 2 of the Dutch Civil Code
a. Capital structure and attached rights and duties
The information on the capital structure of the Company can be found in chapter The Acomo share, and information on the attached rights and duties (voting rights) can be found in chapter Governance.
b. Statutory or contractual restrictions on share transfer
Not applicable.
c. Major shareholders See chapter The Acomo share.
d. Special rights of control Not applicable.
e. Control mechanisms relating to options plans, share plans, and share purchase plans
The Company has only one share-based payment arrangement in effect: a share option plan for key managers and employees of the Company and its subsidiaries, including executive directors. The relevant characteristics of the plan can be found in the notes to share-based payment.
f. Voting limitations Not applicable.
g. Agreements with shareholders that can limit the transfer of shares or voting rights
Not applicable.
h. Regulations concerning the appointment and dismissal of Board members and changes to the Articles of Association
Members of the Board of Directors are appointed by, and may at any time be suspended or dismissed by, the Annual General Meeting of Shareholders. Resolutions with respect to appointment and dismissal are passed by an absolute majority of votes cast. If an amendment to the Articles of Association is proposed to the Annual General Meeting of Shareholders, this is always stated in the convening notice for that meeting.
i. Authority of the Board, especially to issue and repurchase shares in the Company
This information is disclosed in chapter Governance.
j. Change of control arrangements Change of control provisions have been included
in the Company’s arrangements with the financial institutions that provide the credit facilities to the Company.
k. Agreements with Executive Board members or employees
The severance payment for the Executive Director has been set at a maximum of one time his annual pay.
ANNUAL REPORT 2018124 AMSTERDAM COMMODITIES N.V.
CONTACT DETAILSAmsterdam Commodities N.V. WTC, Beursplein 37P.O. Box 30156, 3001 DD RotterdamThe NetherlandsT +31 10 405 11 95
Amsterdam Commodities N.V.Chamber of Commerce No. 24.191.858
Operating companies
Catz InternationalBlaak 22P.O. Box 180, 3000 AD RotterdamThe NetherlandsT +31 10 411 34 40E [email protected]
King Nuts & Raaphorst Spanjeweg 4 P.O. Box 1044, 2410 CA BodegravenThe Netherlands T +31 172 63 22 22E [email protected]
Red River Commodities501, 42nd Street NWP.O. Box 3022, Fargo, North Dakota 58102, USAT +1 701 28 22 600E [email protected]
Red River-Van Eck From 1 April 2019:Nijverheidsweg 148, 4879 AZ Etten-LeurThe NetherlandsT +31 168 32 35 55E [email protected]
Van Rees GroupBlaak 16P.O. Box 914, 3000 AX RotterdamThe NetherlandsT +31 10 402 17 50E [email protected]
TovanoTransportweg 472676 LM MaasdijkThe NetherlandsT +31 174 52 83 33E [email protected]
DelinutsRadonstraat 12P.O. Box 8100, 6710 AC EdeThe NetherlandsT +31 318 555 000E [email protected]
Red River Global Ingredients880 L-15th Street, Unit #4Winkler, Manitoba R6W OH5CanadaT +1 204 325 5105 E [email protected]
SIGCO Warenhandelsgesellschaft Dammtorstraße 21b20354 HamburgGermanyT +49 40 351 03 90E [email protected]
Snick EuroIngredients De Leiteweg 138020 RuddervoordeBelgiumT +32 50 36 16 85E [email protected]
ANNUAL REPORT 2018 AMSTERDAM COMMODITIES N.V. 125

IMAGESCoverIn Acomo’s Tea segment, Van Rees Group has reached a remarkable milestone: 200 years of uninterrupted existence in the tea industry.
History, page 6View of the European lodges in Canton, anonymous, post 1750Source: collection Maritime Museum Rotterdam
After China had decided to allow Europeans to enter supervised trade through Canton, the VOC began sending ships to deliver silver or opium and bring back tea and porcelain to the Netherlands. The flags pictured here indicate the lodges of European countries trading through Canton. The lodges were located outside the city walls.
History, page 6From the resolutions of the VOC’s board, the ‘Heren XVII’: specifications regarding tea for the return shipment from CantonSource: National Archives, VOC archives, 1.04.02, No. 170
History, page 6Porcelain from the wreck of the Geldermalsen, circa 1750Source: private collection Peter Diebels
History, page 6Salvaged porcelain on view before auction, 1986Source: National Archives, Fotocollectie Anefo
Auction house Christie’s organized the Amsterdam sale of the salvaged cargo from the Geldermalsen in 1986. The 160,000 porcelain items, gold and other objects were in great demand.
Page 14 Preparing tea samples for a tasting session at the Van Rees office in Rotterdam, the Netherlands
Page 18 Positioning of a dry blend unit above the filling line at Snick EuroIngredients in Ruddervoorde, Belgium
Page 23 Organoleptic testing of Brazil nut samples at Catz International in Rotterdam, the Netherlands
Page 37 Stocking of high-quality products in the warehouse of Delinuts
Page 57 Preparing products for transport at Delinuts in Ede, the Netherlands
The history of the National Archives dates back to 1802. As the national memory institution of the Netherlands, the National Archives are the custodian of the archives of the national government as well as those of numerous social organizations and individuals of national importance. In addition to documents, the National Archives have a large collection of photographs and historical maps.
Captains of History programmeThe Captains of History are a group of leading Dutch companies that, in addition to their corporate interests, have a keen eye for the historical role that their company has played in Dutch history. Acomo supports the National Archives in their mission to be the Netherlands’ national memory and make history accessible to a broad and diverse audience.
ANNUAL REPORT 2018126 AMSTERDAM COMMODITIES N.V.

Production Acomo Copy editing Scribo’nea & talig. Graphic design Elan, Rijswijk.Print Quantes, Rijswijk. Photography Raymond Rutting. Paper Sulfate cardboard 260 gsm, cover. OLIN regular high white 100 gsm, inside pages. OLIN offers the highest printing quality and is FSC-certified.


Bridging your needs
The Acomo Group sources, processes, trades, packages and distributes natural food products and ingredients for the food and beverage industry in more than 90 countries across the world. In these activities the Group strives to add value in each part of the food value chain.
The activities of our operating companies are bundled in four product segments: Spices and Nuts, Edible Seeds, Tea and Food Ingredients. Each segment has its own role in its own specific value chain, thereby bridging the specific needs of suppliers and customers.
Our global presence and long-standing history put us in a position to recognize the needs of our stakeholders and to find solutions to bridge those needs. All companies within the Acomo Group strive to add value and to realize sustainable profits that give all our stakeholders peace of mind.

WTC, Beursplein 37 | 3011 AA Rotterdam | T + 31 (0)10 405 11 95 | E [email protected] | www.acomo.nl