Embed Size (px)
Citation preview

Intertek Group plcHead Office25 Savile RowLondonW1S 2ESUnited KingdomT: +44 20 7396 3400F: +44 20 7396 3480E: [email protected]
www.intertek.com
Annual report and accounts: 2004
Intertek G
rou
p p
lcA
nn
ual rep
ort an
d acco
un
ts:2004
We are committed to driving our businessforward, capitalising on our strengths:> Our extensive global network> Our strong local presence> Our unique range of accreditations,
certifications and approvals> Our teams of highly-skilled individuals> Our cutting-edge solutions> Our passion to exceed our customers’
expectations
Intertek is an international leader in testing,inspection and certification of products andcommodities and the certification of systems.
We deliver our services with skill and integritywhich enables our customers to meet quality,performance, regulatory and safety standardsin respect of the products they sell and theservices they perform.
01 2004 Highlights02 Description of business09 Operating and financial review13 Directors’ report15 Remuneration report22 Corporate governance27 Group profit and loss account28 Balance sheets29 Statement of group cash flow29 Reconciliation of net cash flow30 Statement of total group recognised gains
and losses30 Reconciliation of movements in shareholders’
(deficit)/funds55 Independent auditors’ report to the members
of Intertek Group plc56 Corporate and shareholder information
. . . . . . . . . . . . . . . . . . . . . . . . . . . . . . . . . . . . . . . . . . . . . . . . . . . . . . . . . . . . . . . . . . . . . . . . . . . . . . . . . . . . . . . . .
www.intertek.com
Contact us for information on the office or laboratory that can best serve your business needs.Information and e-mail available at www.intertek.com
Regional Head Offices
Intertek Group plc Worldwidewww.intertek.com T: +44 20 7396 3400E: [email protected] F: +44 20 7396 3480
RegistrarsLloyds TSB RegistrarsThe Causeway, WorthingWest Sussex BN99 6DAT: 0870 600 3983 (UK only)T: +44 121 415 7059
AuditorsKPMG Audit PlcPO Box 486, 8 Salisbury SquareLondon EC4Y 8BBT: +44 20 7311 1000
Registered OfficeIntertek Group plc25 Savile RowLondon W1S 2EST: +44 20 7396 3400F: +44 20 7396 3480
Company SecretaryFiona Evans
Registered number: 4267576ISIN: GB0031638363
Symbol: ITRK
BrokersCazenove & Co Ltd20 MoorgateLondon EC2R 6DAT: +44 20 7588 2828
Goldman Sachs InternationalPeterborough Court, 133 Fleet StreetLondon EC4A 2BBT: +44 20 7774 1000
Labtest Americas Europe Asiawww.intertek-labtest.com T: +1 973 346 5500 T: +33 2 3209 3636 T: +852 2173 8888E: [email protected] F: +1 973 379 5232 F: +33 2 3209 3637 F: +852 2786 1903
Caleb Brett Americas Europe Asiawww.intertek-cb.com T: +1 713 407 3500 T: +44 1708 680200 T: +65 6222 3889E: [email protected] F: +1 713 407 3529 F: +44 1708 680262 F: +65 6222 2383
ETL SEMKO Americas Europe Asiawww.intertek-etlsemko.com T: +1 800 967 5352 T: +46 8 750 0000 T: +86 21 6495 6565E: [email protected] F: +1 978 264 9403 F: +46 8 750 6030 F: +86 21 6495 6263
Foreign Trade Standards Americas Europe Asiawww.intertek-fts.com T: +1 305 513 3000 T: +44 1277 223400 T: +65 6285 7557E: [email protected] F: +1 305 513 3001 F: +44 1277 220950 F: +65 6382 8662
RAM Consulting Americas Europe Asiawww.intertek-ram.com T: +1 630 623 6060 T: +44 207 665 6678 T: +852 2926 3920E: [email protected] F: +1 630 623 6074 F: +44 207 665 6839 F: +852 2926 3933
01
www.intertek.com
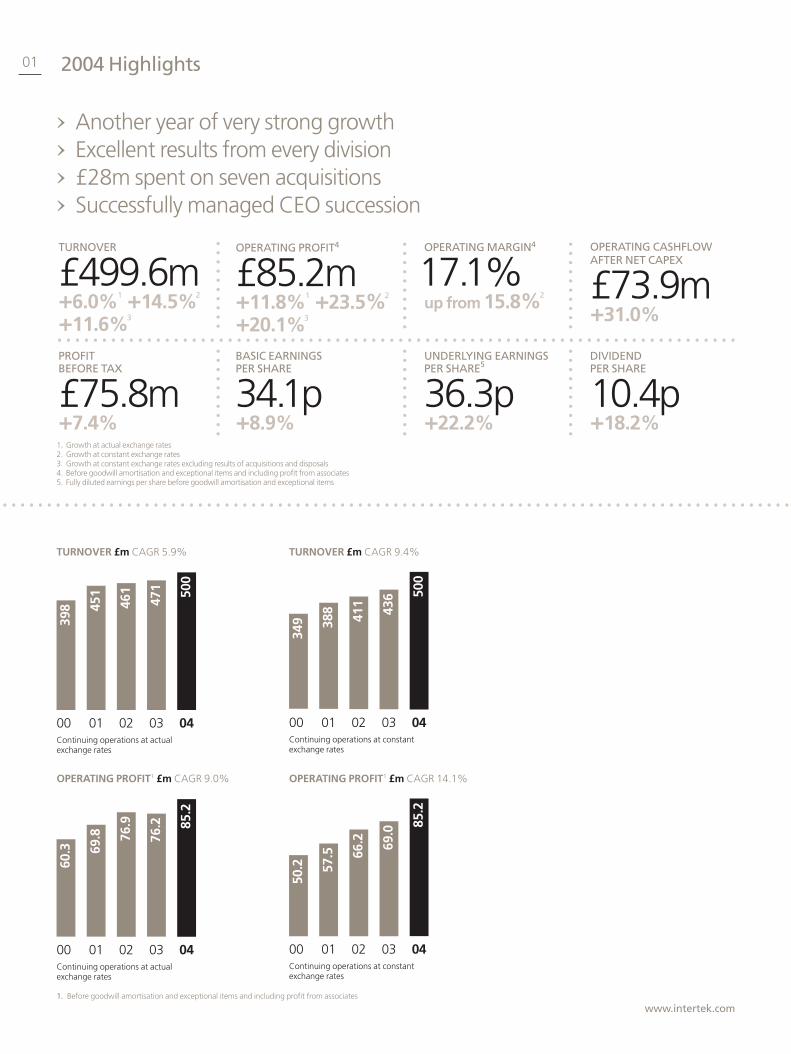
> Another year of very strong growth> Excellent results from every division> £28m spent on seven acquisitions > Successfully managed CEO succession
1. Before goodwill amortisation and exceptional items and including profit from associates
TURNOVER
£499.6m+6.0%1 +14.5%2
+11.6%3
OPERATING PROFIT4
£85.2m+11.8%1 +23.5%2
+20.1%3
OPERATING MARGIN4
17.1%up from 15.8%2
OPERATING CASHFLOW AFTER NET CAPEX
£73.9m+31.0%
PROFITBEFORE TAX
£75.8m+7.4%
BASIC EARNINGSPER SHARE
34.1p+8.9%
UNDERLYING EARNINGSPER SHARE5
36.3p+22.2%
DIVIDENDPER SHARE
10.4p+18.2%
. . . . . . . . . . . . . . . . . . . . . . . . . . . . . . . . . . . . . . . . . . . . . . . . . . . . . . . . . . . . . . . . . . . . . . . . . . . .
....................
....................
....................
1. Growth at actual exchange rates2. Growth at constant exchange rates3. Growth at constant exchange rates excluding results of acquisitions and disposals4. Before goodwill amortisation and exceptional items and including profit from associates5. Fully diluted earnings per share before goodwill amortisation and exceptional items
2004 Highlights
. . . . . . . . . . . . . . . . . . . . . . . . . . . . . . . . . . . . . . . . . . . . . . . . . . . . . . . . . . . . . . . . . . . . . . . . . . . . . . . . . . . . . . . . .
TURNOVER £m CAGR 9.4%
Continuing operations at constantexchange rates
00 01 02 03 04
500
436
411
388
349
TURNOVER £m CAGR 5.9%
Continuing operations at actualexchange rates
00 01 02 03 04
500
471
461
451
398
Continuing operations at actualexchange rates
00 01 02 03 04
85.2
76.2
76.9
69.8
60.3
OPERATING PROFIT1 £m CAGR 9.0%
Continuing operations at constantexchange rates
00 01 02 03 04
85.2
69.0
66.2
57.5
50.2
OPERATING PROFIT1 £m CAGR 14.1%

Description of business
Intertek Group plc Annual report and accounts
GENERALIntertek is an international leader in testing, inspection andcertification of products and commodities and the certification ofsystems. Customers include retailers, distributors, manufacturers,traders, industrial bodies, oil and chemical companies andgovernment bodies.
The products and commodities tested, inspected and certifiedinclude textiles, toys and other consumer goods, electrical andelectronic goods, building and heating, ventilation and airconditioning products, automotive components, crude oil,petroleum products, chemicals, food and agricultural produce.
Products are tested against safety standards decreed bygovernmental or regulatory bodies or recognised standardsauthorities and also against quality and performance standardsthat are established by recognised standards bodies or customersthemselves.
Testing, inspection and certification services are performed around the world, generally near the points of manufacture,design or other forms of sourcing. Intertek has a broad range ofaccreditations, approvals and certifications to assist customers inqualifying their products and commodities for sale in the principalmarkets of the world.
Intertek also reviews and certifies the systems of customers in conformity with their requirements and the requirements of regulators.
Intertek operates in a large number of different market segmentsand the business is organised into four main operating divisions,each involved in the testing, inspection and certification ofparticular goods or commodities.
GROUP STRATEGYIntertek’s businesses operate across a broad spectrum of consumerand industrial markets, and across a wide geographic spread. Itsstrategy is to be an industry leader in creating value for itscustomers and shareholders in its chosen markets.
GEOGRAPHIC FOCUSIntertek operates a decentralised management structure with asmall corporate head office in London. Operations are conductedthrough subsidiary companies located in 102 countries throughoutthe world. It is Intertek’s policy to recruit local managementwhenever possible. An analysis of turnover, operating profit andnet operating assets by geographic area is given in note 2 to theFinancial Statements.
OPERATIONSIntertek’s four main operating divisions are as follows:
LABTESTBusiness overview and growth prospectsLabtest is a leading international provider of testing and inspectionservices for a range of consumer goods including textiles, footwear,toys and hardlines (such as ceramics, bicycles, cosmetic products,sporting goods, juvenile products and furniture). Labtest alsoprovides services to certify customers’ own operating standards,assess the security of customers’ supply chains and undertake
corporate social responsibility audits of suppliers. The Labtest brandname has been established since 1973.
The Labtest division tests and inspects products against applicablesafety, regulatory, quality and performance standards which areeither set by regulatory bodies such as standards bodies or arespecified by retailers or importers.
Labtest provides a wide range of testing services near the points of product manufacture and design, and buying offices. Labtesthas a broad range of accreditations from standards bodies whichmean that it is able to test products to the safety and performancerequirements of different markets around the world. This, togetherwith quick turnaround times and Labtest’s reputation for serviceexcellence, ensures that the performance and quality needs ofretailers and other customers worldwide are met.
Demand for testing and inspection is driven by a number offactors. European and North American retailers and importers areincreasingly sourcing products from China and other parts of Asia.This increases the need for testing and inspection in order toensure that products are compliant with standards in the retailer’shome market and also meet the retailer’s own internal standards.There is also a growing demand for testing and inspection ascustomers become more quality conscious and retailers andmanufacturers wish to improve or protect their reputations and reduce returns of sub-standard products to manufacturers.Shorter product life cycles, new fabrics, a greater number ofdesigns and more “own brand” merchandise also increase theneed for Labtest’s services.
The demand for testing and inspection is also driven by new safetystandards and regulations. For example, two new EU directives,The Waste Electrical and Electronic Equipment (WEEE) directive andthe Restriction of the Use of Certain Hazardous Substances inElectrical and Electronic Equipment (RoHS) directive, will requiremanufacturers, retailers, importers, exporters and consumers ofelectrical and electronic equipment (E&E) to play their part in theenvironmentally sound management of E&E waste. Labtest has theauditing knowledge and experience to advise customers whetherthey are in compliance with these directives.
Labtest divides its activities into the following sub-divisions formanagement purposes – Textile testing, Toys and Hardline testing,Inspection of consumer products, Systems Certification, RAMConsulting and Social Compliance Audit.
Textile testing is carried out to provide retailers and importerswith confidence that they are buying merchandise that meets theirrequirements with respect to fibre composition, colourfastness,shrinkage, flammability and other performance, quality and legallyrequired safety standards, and it also helps manufacturers to meetthese standards. Labtest has the largest and most comprehensivenetwork of textile testing laboratories in the industry.
Toy testing is carried out during both the design andmanufacturing processes to evaluate toys against the mandatorysafety standards of the countries in which they will be sold. Testscarried out include testing for sharp edges, choking hazards,toxicity of paint, flammability and electrical safety. Labtest’sextensive network of laboratories has the certifications and
02
03

www.intertek.com
approvals needed for testing toys to meet relevant safety standardsin all the major markets in the world.
Hardline testing is carried out on various products, such asceramics, bicycles, cosmetic products, sporting goods, juvenileproducts, furniture, fireworks and other products against retailers’performance standards and, where applicable, mandatory safety standards.
Inspection of consumer products involves the inspection ofgoods, at manufacturers’ plants in order to verify that they meetbuyers’ specifications during manufacturing and when they areshipped. The goods are statistically inspected to check such factorsas sizing, quantities, colours, packing and labelling. Labtest has anetwork of inspectors in China and other Asian and developingcountries, around the Mediterranean rim and in Latin America whoare located close to the manufacturers and who have the skillsnecessary to carry out this inspection work. Labtest, in partnershipwith Sandler & Travis Trade Advisory Services, provides securityvalidation programmes for customers to assess whether theirglobal supply chains comply with the C-TPAT security guidelines. C-TPAT (Customs Trade Partnership Against Terrorism) is aninitiative between US businesses and the US government toprotect global commerce from terrorism.
Systems Certification involves the certification of a customer’sprocesses and systems to external standards such as ISO 9000 and ISO 14000 or to customers’ own standards. Certificationinvolves Labtest checking that a company has properly defined and documented its business processes and standards of service.Companies receiving certifications are subject to regular audits as a condition of continuing certification.
RAM Consulting works with customers to assess and reduce the hazards associated with products before the products areproduced. RAM has built injury databases containing details ofmore than four million injuries, including information on productcharacteristics, which it uses to develop safety processes that areincorporated into the customer’s business process. RAM’s majorcustomer is McDonalds and its suppliers of promotional items suchas toys. However, as safety standards become more rigorous,RAM’s client base is growing and the range of products it evaluatesis widening to include such items as children’s clothes. RAMservices include safety training, supply chain management andtotal quality assurance within the manufacturing process.
Social Compliance Audit is the audit of the social and safetyconditions of workers. It includes factory inspections, documentreview and employee interviews. Retailers and distributors mainlycommission the audits and Labtest works closely with bothmanufacturers and retailers to review problems that have beenidentified. The main focus of these audits is to detect the use ofchild labour, involuntary labour, coercion and harassment, healthand safety breaches, excessive working hours, compensation and environmental protection abuses. The development of thebusiness has resulted from consumers and pressure groups being increasingly concerned about the social conditions andsafety of workers in factories.
Labtest’s other services include Validation and Monitoring workwhich is undertaken in France and China for customers operating
under ultra-clean or sterile manufacturing conditions in thepharmaceutical, biotech, cosmetic and electronics industries.
Divisional strategy Labtest aims to capitalise on the continuing strong growth in itsmarket by organic growth and by acquisitions, whilst maintainingits operating margins. Labtest intends to continue to build itsnetwork of laboratories, grow its inspection network to expand its international coverage and adapt its service range to meetcustomer needs.
Labtest also aims to continue strengthening its relationship withretailers, especially in North America and Europe, building trust andconfidence in the excellence of its services. The relationships withmanufacturers and retailers’ local buying offices are importantboth for the direct testing and inspection work they create and for the influence they exert over manufacturers and retailers forLabtest to be appointed. Labtest is well positioned to sell to these manufacturers and buying offices as it has strong localmanagement in Asia and other developing countries which iscontinually being strengthened and expanded.
Labtest expects Systems Certification to be an area of growth,particularly in Asia and believes that Intertek’s strong position and extensive customer base in product testing will assist it topenetrate this market.
OperationsLabtest’s principal testing facilities are located near the point of manufacture and design of a product or the buying offices ofretailers. They range from the Hong Kong laboratory, the largesttextile testing laboratory in the world, and major laboratories inShanghai and Guangzhou in China, India and Turkey to smalloperations in territories such as Morocco and South Africa. Labtestemploys highly skilled technicians, managers and consultants in anumber of specialist fields such as textile analysis and toy testing.
Geographic coverageLabtest operates in 32 countries and has 35 laboratories and 79 offices worldwide. The head office is located in Hong Kong.
CustomersLabtest’s customers are mainly retailers based in North Americaand Europe but who have remote buying offices, often in Asia, and manufacturers, mostly based in Asia. Labtest’s top 10 globalcustomers represented approximately 21% of its turnover in 2004and the largest customer accounted for 5.2% of its turnover in thesame period.
Market and competitionLabtest has approximately 45% of the textile testing market and is the market leader. It has about 28% of the toys and hardlinetesting market and about 25% of the inspection of consumergoods market. SGS and the Bureau Veritas group compete withLabtest in textile, toys and hardline testing, inspection, socialcompliance audit and systems certification.
EmployeesAt 31 December 2004, Labtest had a total of 4,095 employees,with 3,234 in Asia, 570 in Europe, and 291 in the Americas.
Description of business continued
Intertek Group plc Annual report and accounts
CALEB BRETTBusiness overview and growth prospectsCaleb Brett was founded in 1885 and is a leading internationalservice provider of laboratory testing and commercial inspectionservices, mainly for petroleum, refined products, chemicals,consumer and agricultural products. Caleb Brett performs a rapidlygrowing number of large laboratory outsourcing projects, offeringanalytical testing for oil, chemical and other companies on a globalbasis.
Caleb Brett has earned a reputation for reliability andconfidentiality, offering professional services to global standards.
Caleb Brett divides its activities into the following sub-divisions formanagement purposes – Laboratory services, including laboratoryoutsourcing, and Inspection services.
Laboratory services and outsourcing involves the provision of testing and laboratory analytical services to supplement orreplace the in-house testing activities carried out by customers. The division provides a wide range of analytical testing work fora diverse and growing range of industries and companies.
Testing activities include the analysis of crude oil and refinedproducts, chemicals, consumer products, pharmaceuticals, metals,polymers and other products. Growing research capabilities in the Caleb Brett laboratory network have created new testingmarkets in nanotechnology, microelectronics and biotechnology.Laboratory outsourcing provides customers access to an extensiveand growing global network of scientific expertise and technologyavailable from Caleb Brett laboratories. Laboratory outsourcingoffers the client a value-added service with enhanced quality at alower total cost.
Inspection services help to safeguard the commercial interests ofcustomers during the transfer of high value petroleum, chemicaland agricultural cargoes. This involves the physical sampling,testing, quantification, inspection and certification of commoditiessuch as petroleum, petrochemicals, grain, vegetable oils and otherproducts for the companies, organisations and governmentagencies trading in them.
Caleb Brett provides field inspection and laboratory testing in orderto assess the quantity and quality of bulk commodity shipments.These services are performed in major markets across the world,with offices and laboratories located in key locations to determinethe quantities of cargoes, to sample them, and then analyse the samples. Caleb Brett certifies the quantity and quality ofshipments, and both buyers and sellers rely on these certificates tocomplete transactions. Customers also use Caleb Brett reports toassess the composition of cargoes, as well as their quality andcompliance with commercial and regulatory standards.
Divisional strategy The main opportunity for growth continues to be the outsourcingof testing activities to Caleb Brett on a global scale. Several newcontracts were gained in 2004, including business from Avecia,ChevronTexaco, ExxonMobil, BP and Shell.
Significant opportunities exist in the petroleum, chemical, lifesciences, materials sciences, food and pharmaceutical sectors.
Caleb Brett has experienced project teams who work withcustomers on a global basis to implement laboratory outsourcingand create optimal service solutions.
The strategic acquisition of attractive independent laboratoriesserving key market and geographical niches is another avenue forgrowth. The acquisition of Kelley Completion Services in 2004,enhanced Caleb Brett’s service offerings and outsourcingcapabilities for the upstream petroleum exploration andproduction market in the Gulf of Mexico.
The market for cargo inspection and inspection related testing ingeographic sectors such as Europe and the United States is matureand not expected to grow significantly. Caleb Brett intends tomaintain and expand its share of the global inspection business by continually improving its service to customers and furtherextending its network of inspection offices and laboratories intoareas where there are long-term strategic growth opportunities,including China, Eastern Europe and the Former Soviet Union.
Caleb Brett’s share of the global agricultural commodity inspectionand testing market is small and its strategy is to expand in nichesegments both organically and through acquisitions. A centralisedAgri centre in Geneva was established in 2004 in order to build the resources needed to drive expansion in the agriculturalcommodity inspection market. The recent expansion of the USfood laboratory and the outsourcing of an agricultural inspectionfacility in Canada have extended the division’s service offerings inthis market.
OperationsCaleb Brett employs experienced chemists in its laboratories, manyof whom hold PhD, MSc and BSc level qualifications. Professionallytrained field and coordination personnel perform inspection,sampling and other operations seven days a week aroundthe world.
Computerised laboratory information systems allow for enhancedreporting accuracy, reduced operating costs and faster turnaroundtimes. Caleb Brett’s testing facilities are ISO 9000 certified and a growing number are ISO 17025 accredited. Through itsoutsourcing agreement with Avecia, Caleb Brett has gained asignificant laboratory research centre in the UK which is compliantwith the Good Laboratory Practice (GLP) and the current GoodManufacturing Practice (cGMP) directives.
Geographic coverageCaleb Brett offers its services to 118 countries through its network of 353 offices and 209 laboratories. The division has its headquarters in Houston, Texas and is organised into threegeographic regions with headquarters located in the UnitedKingdom for Europe, the Middle East and Africa, in Singapore for Asia and in Houston, Texas for the Americas.
CustomersCaleb Brett has well established, long-term relationships withcustomers including companies in the petroleum, chemical,agricultural, consumer, pharmaceutical and other industry sectors.Caleb Brett’s top ten customers represented approximately 32% ofturnover in 2004 and its largest customer accounted for 9.5% ofturnover in the same period.
04
05

www.intertek.com
Market and competitionAt this relatively early phase in terms of market penetration, CalebBrett has a growing track record of laboratory outsource projectsuccesses, and can be considered a world leader in providing thistype of specialised service solution to industry. Caleb Brett is one ofthe first companies to have started a major strategic industry shiftin how such laboratory services are provided.
The global market for traditional oil and chemical inspection and testing is estimated to be about £500m. Caleb Brett hasapproximately 25% of this market. Competition is expected to berelatively stable due to the high start up and fixed costs involved inmaintaining a global network of facilities and the importance of awell-recognised brand name. Caleb Brett’s in-house expertise,brand name recognition and solid reputation are competitivestrengths in the marketplace.
EmployeesAt 31 December 2004, Caleb Brett had a total of 5,870 employeesworldwide with 1,990 in Europe, the Middle East and Africa, 2,260in the Americas and 1,620 in Asia.
ETL SEMKOBusiness overview and growth prospects ETL SEMKO tests, certifies and inspects a wide range of electricaland electronic products, including telecommunications, medical,consumer and industrial, heating, ventilation and air conditioning(HVAC) equipment, building products and other products, against safety and performance standards. Through the acquisitionof Entela Inc. in May of 2004, ETL Entela tests automotivematerials, components and systems. Additionally, IntertekAutomotive Systems Certification provides automotive qualitysystems certification.
The ETL brand name is long established in the United States and Canada and can trace its origins back to 1896 from ThomasEdison’s Electrical Testing Laboratories. The SEMKO brand name is widely respected in the industry for safety and is the name of the former state owned certification body in Sweden that wasacquired in 1994.
Manufacturing has increasingly migrated from Europe and North America to developing countries in Asia. ETL SEMKO is wellpositioned to take advantage of this migration due to its extensiveAsian network of testing and inspection capabilities, especially in China. In addition, manufacturers are increasingly becomingglobal, exporting products to many more markets, forcing them tocomply with a wide range of varied regulations and having to testproducts to different country standards. Further, the demand fortesting and certification is increasing in developed countries as theybecome more focused on safety and performance.
Retailers and manufacturers require performance testing ofelectrical and electronic products so that they can compare the products of different suppliers, especially when they aresourcing own-brand domestic appliances from Asia. Third partyperformance testing is also used to confirm suppliers’ own claimsand verify the claims of competitors. Retailers also want productsthey buy to be inspected during and after manufacture to ensure that the merchandise being shipped to them meets their specifications. The ETL mark is now confirmed by the major
retailers as an acceptable mark for products sold in their stores withthe same status as the UL mark.
European legislation requires all products placed on the EU markethave a CE mark affixed. Suppliers to the marketplace are requiredto either make a self-declaration that the product complies with allrelevant European standards and directives or have a mandatorythird party assessment if the product group has this restriction, an example being Medical equipment. Where self declaration of products is acceptable there is an increasing demand frommanufacturers and suppliers to gain third party verification of theirproducts’ compliance with the necessary directives prior to makingthat declaration. This verification affords a level of confidence that all safety requirements have been covered to minimise their risk profile.
ETL SEMKO divides its activities into the following sub-divisions formanagement purposes – Safety testing and certification of electricaland electronic products, Performance testing of electrical andelectronic products, Testing and certification of building productsand materials, Risk assessment and regulatory compliance testingand certification of semiconductor manufacturing equipment andInspection of electrical and electronic goods, Automotive testingand engineering and Automotive System’s Certification.
Safety testing and certification of electrical and electronicproducts involves the testing of products in ETL SEMKOlaboratories against internationally recognised safety, electro-magnetic compatibility (EMC), or telecom-specific standards. The laboratories are, in most cases, accredited or recognised bynational government bodies, for example, UKAS (UK AccreditationService) in the United Kingdom and OSHA (Occupational Safetyand Health Administration) in the United States. The test resultsdemonstrate conformity with the standards or requirements andcan be used as part of the technical file for verifying conformitywith regulations or as the basis for a certificate to be issued to themanufacturer, which in turn means that the manufacturer mayapply a “mark” to the product to demonstrate that the productmeets the appropriate safety standards. In some cases, certificatesor marks are owned by and are unique to ETL SEMKO, forexample, the “ETL” mark in the United States and the “S” mark inEurope. In other cases, ETL SEMKO may be one of a number oforganisations authorised to act as an agent in issuing the certificateor mark on behalf of another body such as the “GS” mark onbehalf of the German government. ETL SEMKO works closely withother third party certification bodies, who will issue a certificate onthe basis of the ETL SEMKO test results, such as BEAB (BritishElectro-technical Approvals Board) in the United Kingdom. Inaddition, ETL SEMKO is a major participator in the Global CB andRegional CCA and ENEC product certification schemes.
Performance testing of electrical and electronic productsincludes performance testing and verification of energy, capacity,acoustics, reliability, power, durability, usability and comparisonevaluation on a wide range of products. Testing is carried outagainst international, national, industry association’s or customer’sspecifications. These services are available to all clients in all regionsand cover all industry sectors. Major third party testing programmesare operated for the Air Conditioning and Refrigeration Institute (ARI),Association of Home Appliance Manufacturers (AHAM), GasAppliance Manufacturers Association (GAMA), Pool Heat Pump

Description of business continued
Intertek Group plc Annual report and accounts
Manufacturers Association (PHPMA), Safety Equipment Institute (SEI),US Department of Transportation (DOT) and the US Federal AviationAdministration (FAA).
Testing and certification of building products and materialsincludes testing for fire resistance, structural, mechanical, physical,and accelerated ageing of materials as well as electrical and gastesting. ETL SEMKO is the market leader in the testing of fire doorsand it also tests other building products such as hardware, hearthproducts, glazing, plumbing, roofing, manufactured wood,fenestration, gypsum board and insulation materials. ETL SEMKOowns the “Warnock Hersey” certification mark in North Americawhich denotes product compliance to standards referenced inbuilding codes.
Risk assessment and regulatory compliance testing andcertification of semiconductor manufacturing equipmentis carried out under the brand Global Semiconductor SafetyServices (GS3) and involves the inspection of manufacturers’facilities to provide comprehensive evaluations of manufacturingequipment to semiconductor industry standards as well as product safety testing in order to comply with regulatoryrequirements in the United States and Europe. These activities are conducted worldwide.
Inspection of electrical and electronic goods is carried out at manufacturers’ plants or at selected points in the supply chain in order to confirm that goods meet buyers’ specifications. The goods are inspected to confirm a variety of requirementsincluding quantities, electrical specifications, packing and labelling.ETL SEMKO has a global network of qualified inspectors, includinga strong presence in China and other Asian and developingcountries located close to the manufacturers.
Automotive testing and engineering was established throughthe acquisition of Entela Inc., a testing and engineering, productcertification and systems certification firm, with over 80% of its business in the automotive industry. As automotive sectorproduct development continues to expand in North America and Europe and manufacturing migrates to China and EasternEurope, there are significant growth opportunities. The Entelaacquisition provides a platform for the global growth of theGroup’s automotive business through a combination of organicgrowth, acquisitions and outsourcing.
Automotive System‘s Certification provides quality systemscertification to the automotive supply base. Standards include ISO9000, ISO 14000, QS 9000 and the mandated global automotivequality standard ISO/TS 16949.
Divisional strategy ETL SEMKO’s objective is to provide an excellent service to itsclients, increase its market share and provide a good return oninvestment to its shareholders. It aims to achieve this by continuingto promote and provide manufacturers with local testing and givethem global market access by testing and certifying their productsto the standards of different countries. ETL SEMKO aims to helpcustomers reduce the time it takes to bring their products tomarket by working with them through the design stage andachieving fast turnarounds. In particular, ETL SEMKO intends to continue to expand its presence in Asia, especially in China.
ETL SEMKO’s growth strategy includes increasing the level ofbusiness undertaken for retailers. This includes inspection workand developing the performance testing business for retailers inETL SEMKO. The wider acceptance of the ETL safety mark byretailers in the United States will lead to an increased market share of the North American domestic appliance, consumer andhome electronics safety markets for ETL SEMKO.
In addition to the above initiatives, ETL SEMKO will broaden its geographic spread by making strategic bolt-on acquisitions, or opening laboratories in regions where there are growthopportunities. ETL SEMKO can add value to these developments by making available its safety labels and other accreditations andapprovals for markets around the world and by transferring itstesting and certification skills.
As more countries become focused on safety standards, there areopportunities to enter into co-operative arrangements with theirstandards bodies with a view to testing and certifying products to their standards and having them issue safety compliancecertificates. ETL SEMKO has entered into more than 20 sucharrangements in countries as diverse as Belarus, Brazil, Argentina,Singapore and Japan. These arrangements position Intertekstrongly with respect to manufacturers wanting to gain access to these emerging markets.
OperationsETL SEMKO has experienced engineers and extensive equipmentand facilities to test and certify a wide range of products against alarge number of performance and safety standards.
Geographic coverageETL SEMKO operates in 16 countries and has 53 offices and 50 laboratories worldwide. The division has its headquarters in the United Kingdom and there are regional head offices in the UK for Europe, in Shanghai, China for Asia, and Chicago, Illinoisfor the Americas.
CustomersETL SEMKO’s customers include retailers, manufacturers, industryorganisations and government departments. ETL SEMKO’s top tencustomers represented about 14% of its turnover in 2004 and thelargest customer accounted for 3.8% of such turnover in the sameperiod. ETL SEMKO also has long-standing relationships withvarious industry organisations including the Air Conditioning andRefrigeration Institute (ARI) in the United States, which has been acustomer since 1956.
Market and competitionMarket information is difficult to obtain due to the non-publicreporting of ETL SEMKO’s main competitors. Based however, on internally generated information, ETL SEMKO has about 11% market share in the United States (excluding automotivecomponents), with a wide range of market share for individualsegments. Market share in Europe varies from country to countrybut is estimated to be about 6% in total. In Asia, market share isestimated to be about 16%. ETL SEMKO has about 4% of theautomotive component testing market in the United States.
ETL SEMKO has few direct competitors with a similar marketprofile. Underwriters Laboratories, which is primarily engaged in safety testing and certification, has the major share of the
06
07

www.intertek.com
market in the United States, especially in domestic appliances and consumer electronic products. In Europe there are many
competitors, the largest being the German TechnischeÜberwachungsvereine (TÜVs) who have the major marketshare in Germany and Asia.
EmployeesAt 31 December 2004, ETL SEMKO had a total of 2,486employees, with 451 in Europe, the Middle East and Africa, 1,067 in Asia and 968 in the Americas.
FOREIGN TRADE STANDARDS (FTS)Business overview and growth prospectsThe Foreign Trade Standards division works for the standardsbodies of different countries helping to ensure that imports comply with national safety and other requirements; for FinanceMinistries and Customs Departments providing services thatensure import duties are properly declared and paid; and for bothTransport and Finance Ministries to implement cargo scanningsolutions to protect trade security. FTS also uses its inspectionresources to provide services to major industrial and commercialclients to ensure that equipment and goods they buy meet all their specifications.
FTS divides its activities into the following sub-divisions for management purposes – Standards programmes, Pre-shipment Inspection (PSI) programmes, Cargo Scanning, and Technical inspection.
Standards programmes are contracted by the governments and standards bodies of client countries such as the Ministry ofCommerce in Saudi Arabia, and the government of Kuwait. FTS is appointed to ensure that imports are assessed for compliancewith the safety and other standards of the importing country. Thetesting and inspection takes place in the country of export, andapplies to a specified range of imported goods. Following asuccessful assessment, FTS issues a certificate which enables thegoods to be cleared through customs.
Standards bodies appoint FTS to help ensure the safety of imports,and to support the implementation of security and ethical importpolicies and legislation. FTS also provides client standards bodieswith support in the development of standards, training, and safetyrelated information.
To deliver standards programmes, FTS makes extensive use of thelaboratory facilities of other Intertek divisions.
Pre-shipment inspection (PSI) programmes are provided by FTSto client governments to maximise import duty revenues. FTSinspects shipments destined for the client country, in the country ofexport. The service helps ensure that import duties are properlycalculated and paid, and that goods being imported meet the legalrequirements of the client country.
FTS inspections are used to confirm the quantity and quality of goods to be shipped. FTS assigns the correct tariff code for the goods, verifies the declared value and certifies the importduties payable. The FTS certificate is needed in order to clear the shipment through customs in the client country.
By developing new products and services, the division hasexpanded the range of value added services provided to customsdepartments. These include training and consultancy, and softwareproducts for risk management and valuation. FTS can also provideclient governments with local Customs Support Teams, to provideimmediate valuation advice and on-the-job training support.
Exporters of goods to client countries may use FTS certificates aspart of the documentation needed to draw down on letters ofcredit. The FTS certificate also provides importers with a degree ofprotection against exporters delivering goods which do not meetthe importer’s specifications or are of low quality.
Cargo scanning services help client governments to implementand operate cargo scanning equipment to ensure better security of the supply chain, and to comply with the growing securityrequirements of the US and elsewhere. Cargo scanning equipmentuses X-ray technology to inspect the contents of a shippingcontainer without the need to open it. The results of the X-ray canthen be compared with shipping documents and any deviationscan then be subject to further investigation.
Technical inspection services are provided to a wide range ofindustrial clients. The range of inspection, expediting andoutsourced project management activities is usually focused onlarger engineering plants and projects. The service covers thereview of specifications sent to suppliers and, technical inspectionactivities including the witnessing of tests on finished products andmaterials.
Divisional strategy FTS focuses on increasing its market share while maintaining both a satisfactory operating margin and a rigorous complianceprogramme. The division has developed new products and servicesthat can support client customs departments. These services meanthat FTS can provide a more comprehensive customs supportpackage to client governments. The division will also work toincrease its turnover in standards programmes, building on thesuccess of the Saudi Arabian and Kuwaiti programmes. Thedivision is also investing in its cargo scanning business, both togenerate new revenues and to protect existing revenues.
OperationsInspection requirements typically involve verification of shipmentquantity, quality, product specification and value. As well as its own full time inspectors, FTS uses the services of sub-contractorsaround the world who operate on a pay-per-job basis, minimisingthe fixed cost of FTS’ worldwide inspection capability.
Geographic coverageFTS has 45 offices worldwide and its head office is located in theUnited Kingdom.

Description of business continued
Intertek Group plc Annual report and accounts
CustomersFTS customers include the governments of Bangladesh, Ecuador,Iran, Kuwait, Malawi, Mexico, Mozambique, Nigeria, Saudi Arabia, Sierra Leone, Venezuela and Uzbekistan. These customersrepresented about 93% of the division’s turnover in 2004.
In any given year, approximately 50% of FTS’ contracts (by number)are scheduled for renewal. FTS manages the renewal of contractsthrough its relationship managers for each major contract. In2004, the government of Rwanda cancelled its contract with FTS.
Market and competitionFour companies dominate the PSI and Standards market. The high cost of entry caused by the requirement to have an extensiveworldwide inspection and pricing network creates a barrier tonewcomers. Based on the number of programmes in existence andFTS’ knowledge of the main competitors, FTS has approximately20% of the PSI and Standards Programme market with over 70%held by three competitors.
EmployeesAt 31 December 2004, FTS had 1,018 employees andapproximately 1,200 sub-contractors.
CENTRAL FUNCTIONSIntertek operates a decentralised structure where the majority of support functions are provided at the level of the individualdivisions and are co-ordinated and monitored by the Group’s headoffice. The operating divisions have financial, human resources,information technology and compliance personnel who report to their respective divisional directors. In addition to providingcentral support to these specialist areas, the Group’s head office is responsible for centralised functions such as group finance,treasury, tax, group information technology, compliance, companysecretarial services and acquisition strategy.
The Company’s head office is in London, United Kingdom andconsists of 38 people. In addition, there are four head officeemployees based in the United States.
08
09

Operating and financial review
www.intertek.com
REVIEW OF RESULTS FOR 2004OverviewIn 2004, each of the divisions achieved excellent growth in turnoverand operating profit at both constant and actual exchange rates.Group turnover was £499.6m, up 6% on the previous year atactual exchange rates and up 14.5% at constant exchange rates.
Total operating profit before goodwill amortisation and operatingexceptional items, was £85.2m, up 11.8% on the previous year at actual exchange rates and up 23.5% at constant exchangerates. Labtest and Foreign Trade Standards continued to grow welland produce excellent results. Following the restructuring andmanagement changes in 2003, ETL SEMKO and Caleb Brettmarkedly improved their results over last year, showing excellentgrowth in turnover and operating profit.
About 80% of the Group’s results are denominated in US dollars orcurrencies linked to the US dollar. The strength of sterling againstthe US dollar and related currencies during 2004 had a negative
impact on the results of the Group on translation into sterling. In order to compare the Group’s results for 2004 with 2003, atconstant exchange rates, the reported results for 2003 have beenretranslated into sterling using the 2004 average exchange rates.
In 2004, the Group made seven acquisitions and two disposals for a net consideration of £27.6m. Excluding the results of theacquisitions and disposals made in 2003 and 2004, at constantexchange rates, turnover increased by 11.6% over the previousyear and operating profit increased by 20.1%.
The Group’s operating margin after central overheads improvedfrom 15.8% to 17.1% with increases in every division.
The growth in each division is shown below at both constant andactual exchange rates. The figures at constant exchange rates areused in the explanation below of the performance of each division.
Financial performance by division
Turnover Total operating profit2
Growth Growthat Growth at Growth
constant at actual constant at actual2004 2003 rates rates 2004 2003 rate rates
£m £m % % £m £m % %
Labtest 132.3 119.0 11.2 1.1 45.0 38.5 16.9 5.1Caleb Brett 177.3 157.9 12.3 4.5 15.5 11.9 30.3 17.4ETL SEMKO 122.4 102.5 19.4 9.7 17.5 13.0 34.6 23.2Foreign Trade Standards 67.6 56.8 19.0 14.4 14.0 11.4 22.8 17.6Central overheads – – – – (6.8) (5.8) 17.2 15.3
Continuing operations at constant exchange rates1 499.6 436.2 14.5 – 85.2 69.0 23.5 –Exchange rate adjustment – 34.9 – – – 7.2 – –
As reported at actual average exchange rates 499.6 471.1 – 6.0 85.2 76.2 – 11.8
1. 2004 and 2003 figures are stated at average annual exchange rates for 2004.2. Total operating profit is stated before goodwill amortisation and exceptional items – see note 2 to the Financial Statements.

Operating and financial review continued
Intertek Group plc Annual report and accounts
REVIEW OF 2004 DIVISIONAL PERFORMANCEOperating profit referred to in the discussion below is totaloperating profit before goodwill amortisation and operatingexceptional items. Growth rates are calculated using constantexchange rates.
LabtestLabtest continued to perform very strongly and maintained itsmarket leader position. Labtest’s turnover increased by 11.2% to £132.3m and operating profit increased by 16.9% to £45.0m.Excluding the results of the acquisitions and disposals made in2003 and 2004, turnover increased by 13.5% and operating profitincreased by 16.6%. About 90% of the operating profits of thedivision are generated in Asia where the main drivers of the Labtestbusiness continued to be strong: retailers increasing their sourcingof products from China and other parts of Asia, their need forreliable testing of quality and safety certification, shorter productlife cycles and widening ranges of products, and manufacturerswanting technical support on quality. Textiles, toys and hardlinestesting all performed well and there was growth in socialcompliance auditing. Inspection work declined slightly due to increased competition and pricing pressure. Our businesses in China and India grew particularly well, accounting for about16% and 4%, respectively, of the division’s total turnover in 2004.The division’s operating margin increased from 32.4% in 2003 to 34.0% in 2004.
In September, the Group completed a transaction with Atlas LLCwhereby two Labtest subsidiaries in the laboratory equipment sales business were sold to Allium LLC, a newly formed company,in return for a 40% interest in it. Atlas simultaneously sold itsbusiness to Allium in return for a 60% interest. This businessgenerated turnover of £4.7m and an operating loss of £0.2m in2004, up to the date of disposal. In March 2004, Labtest acquireda small business in Mauritius.
Caleb BrettCaleb Brett reported strong growth in 2004. Turnover increased by12.3% to £177.3m and operating profit increased by 30.3% to£15.5m. The cargo inspection market accounted for 70% of theturnover in 2004 (2003: 75%). Whilst market conditions improvedcompared to last year due to higher volumes of shipments, themain source of growth continued to be outsourced testing. Thisbusiness grew by 34%, increasing its contribution to divisionalturnover from 25% to 30%. Several new contracts were gainedduring the year, including business from Avecia, ChevronTexaco,ExxonMobil, BP and Shell. Caleb Brett’s operating margin increasedfrom 7.5% in 2003 to 8.7% in 2004, partly due to the reducedcost base which resulted from the restructuring in the first half of 2003 and partly due to the growth in outsourcing which has a higher margin than cargo inspection and testing. In April, Caleb Brett acquired the assets of Vestfold Telemark Metering, a consultancy company offering metering services in Norway, for £1.0m and in December it bought the assets of KelleyCompletion Services, an offshore oil and gas measurementbusiness operating in the Gulf of Mexico for £5.3m.
ETL SEMKOFollowing the restructuring and management changes made in2003, ETL SEMKO returned to a strong growth position. Turnoverincreased by 19.4% to £122.4m and operating profit increased by34.6% to £17.5m. In May 2004, ETL SEMKO bought Entela Inc., a
US automotive component testing business for £16.2m. Thebusiness has performed well and accounted for about half the turnover growth in the division. ETL SEMKO also made twoother small acquisitions in the year. Excluding the results of thesethree acquisitions, turnover increased by 8.0% and operatingincome increased by 23.8%. Asia continued to perform strongly,particularly in the safety testing of household appliancesmanufactured in China for export to the West. The sales team in the United States has been successful in gaining acceptance for the ETL safety label from the major retailers. ETL SEMKO hastraditionally had a very small share of the market in the UnitedStates for the safety testing and labelling of electrical products soldby retailers, but it is now starting to compete aggressively in thismarket although the main competitor still has a stronglyentrenched position. The division’s operating margin increasedfrom 12.7% to 14.3%, due to the reduced cost base following therestructuring in the second half of 2003 and the growth in Asia,where the profit margin is higher than in the West.
Foreign Trade StandardsTurnover increased by 19.0% to £67.6m and operating profitincreased by 22.8% to £14.0m. The operating margin increasedfrom 20.1% to 20.7%. The growth was principally due to the pre-shipment inspection contract in Venezuela which started in the second half of 2003 and due to the other main contractsperforming well.
Central overheadsCentral overheads increased by 17.2% to £6.8m in the year,principally due to the strengthening of central IT resources andadditional expenses on internal audit and compliance.
INTERESTThe Group’s net interest charge before exceptional items forthe year was £5.4m compared to £7.9m in 2003. The decreasewas primarily due to the reduced level of net borrowings duringthe year.
In December 2004, the Group arranged a new £300m creditfacility with its banks. Fees of £0.6m were incurred in connectionwith this arrangement. The new facility replaced the credit facilitiesput in place at the time of the Group’s flotation in 2002. The feesassociated with the previous credit arrangement were beingamortised over five years but the balance of £2.1m was fullyamortised in 2004. The total fee amortisation of £2.7m wasreported as an exceptional finance charge in 2004.
PROFIT BEFORE TAXProfit before tax was £75.8m compared to £70.6m in 2003, mainlydue to the good trading performance in the year.
TAXATIONTax on profit before exceptional items was £20.8m, £2.1m higherthan last year but the effective tax rate before exceptional itemsreduced from 27.8% to 26.5%. The effective tax rate is expectedto be sustainable at close to the current year level in the short tomedium-term.
NET PROFITNet profit after tax and exceptional items but before minorityinterests was £55.5m compared to £51.8m last year.
10
11

www.intertek.com
MINORITY INTERESTSProfit attributable to minority shareholders reduced from £3.7m in 2003 to £2.8m in 2004, mainly due to the reduction in minorityshareholdings in certain of the Group’s subsidiaries in China.
EARNINGS PER SHAREAs set out in note 10 to the Financial Statements, basic earningsper share in the year were 34.1p (2003: 31.3p), an increase of8.9%. An adjusted earnings per share calculation is also shownwhich removes the impact of exceptional items and goodwillamortisation to give underlying basic earnings per share of 36.5p(2003: 29.8p).
DIVIDEND An interim dividend of 3.4p per share (2003: 2.9p) was paid on16 November 2004. A final dividend of 7.0p per share (2003: 5.9p)has been proposed, which subject to shareholder approval, will bepaid on 17 June 2005, to shareholders on the Register at 3 June2005. This makes a full year dividend of 10.4p per share, up18.2% over last year.
SHAREHOLDERS’ DEFICITThe net profit after minority interests for 2004 of £52.7m (2003:£48.1m) was reduced by dividends of £16.1m (2003: £13.6m).Shareholders’ deficit reduced by £39.5m in the year, mainly due to retained profits of £36.6m (2003: £34.5m) and favourableforeign exchange movements taken through reserves of £7.1m(2003: £10.2m), reduced by an actuarial loss on the pension fundsof £6.6m (2003: £1.6m gain). At the end of 2004, shareholders’funds were in deficit by £3.6m compared to a deficit of £43.1m at31 December 2003. The deficit arises principally from the write-offof goodwill in 1996 when the Group was purchased from its formerowners. This amounted to £229.9m at 31 December 2004.
CASH AND LIQUIDITYThe Group’s net debt at 31 December 2004, was £112.4mcompared to £132.2m at the previous year end. The principalinflow arose from operating activities which generated £101.9m(2003: £80.0m). The principal outflows were £36.3m (2003:£6.8m) for net repayment of borrowings, £28.2m (2003: £24.4m) in respect of the purchase of fixed assets, £26.3m (2003: £7.8m)related to the cost of acquisitions, £18.5m (2003: £15.3m) relatedto dividends, £16.0m (2003: £13.7m) tax paid and £5.3m (2003:£7.3m) net interest paid.
Throughout the year there has continued to be a strong focus on cash management with an emphasis on working capital management.
ACQUISITIONS AND DISPOSALSDuring 2004, the Group made seven acquisitions and twodisposals for a net consideration of £27.6m (see note 25 to theFinancial Statements). In April, Caleb Brett acquired the assets of Vestfold Telemark Metering, a consultancy company offeringmetering services in Norway, for £1.0m. In May, Avecia outsourced its Analytical Sciences Group to Caleb Brett in the UK,which involved the acquisition of assets for £4.4m. Also in May,ETL SEMKO bought Entela Inc., a US automotive componenttesting business for £16.2m. In September, the Group completed
a transaction with Atlas LLC whereby two Labtest subsidiaries inthe laboratory equipment sales business were sold to Allium LLC, a newly formed company in return for a 40% interest in it. Atlassimultaneously sold its business to Allium in return for a 60%interest. In December, Caleb Brett bought the assets of KelleyCompletion Services, an offshore oil and gas measurementbusiness operating in the Gulf of Mexico, for £5.3m. During the year, Labtest also bought a small business in Mauritius and ETL SEMKO bought a small business in the US.
ACCOUNTING POLICIESDuring the year, the Group adopted UITF 38: Accounting for ESOPTrusts. As shown in note 1 to the Financial Statements the impactof this change was immaterial. Apart from this, the accountingpolicies of the Group remain unchanged from last year.
INTERNATIONAL ACCOUNTING STANDARDSAll European Union listed companies are required to adoptInternational Financial Reporting Standards (IFRS) for their financialstatements from 2005, which will include comparative informationfor 2004. The Group is continuing its preparatory work to enable itto report under IFRS for the first time when the Group announcesits interim results for 2005. The key areas of impact are as follows:
IFRS 2: Share Based Payments – for all employee share schemes, afair value calculated using an option pricing model is required to be expensed.
IFRS 3: Business Combinations – the amortisation of goodwill is not permitted, and instead impairment tests are required at eachbalance sheet date.
IAS 19: Employment Benefits – the net position on the Group’sdefined benefit pension schemes based on market values will beincluded on the balance sheet. This is expected to be broadly in line with the FRS 17 amounts currently included in the Group’sFinancial Statements.
IAS 32 and IAS 39: Financial Instruments – currency and interestrate risk is managed by entering into forward foreign exchangerate contracts and interest rate swaps. Currently gains and losseson these derivatives are taken to the profit and loss account in thesame period as the underlying transaction. IAS 39 requires all suchinstruments to be revalued to market values at the balance sheetdate. For hedge accounting under IAS 39, the hedges need to bestrictly designated against specific income or costs and the hedgeeffectiveness tested on a periodic basis. Hedge accounting permitsthe changes in the market value of the instruments to go toreserves. If hedge accounting is not designated or achieved, thenthe change in the market value of these instruments is takendirectly to the profit and loss account. Therefore, the hedges not designated or those that do not qualify under the hedgeaccounting criteria of IAS 39, will increase the volatility in the profit and loss relating to the charges or credits resulting from the changes in the market value of the derivatives. In assessing the adoption of IAS 39, the Group has no plans to amend theunderlying policy for the economic hedging of its exposures. In accordance with the options on transition to IFRS, provided byIFRS 1 (first time adoption of IFRS), the Group will apply IAS 32 and

Operating and financial review continued
Intertek Group plc Annual report and accounts
IAS 39 prospectively from 1 January 2005. Thus for the 2004 IFRScomparatives, financial instruments will be recorded on the existingUK GAAP basis.
TREASURY CONTROLSPolicyThe Group’s treasury and funding activities are undertaken by acentralised treasury function. Its primary activities are to managethe Group’s liquidity, funding and financial risk, principally arisingfrom movements in interest rates and foreign currency exchangerates. The Group’s policy is to ensure that adequate liquidity andfinancial resource is available to support the Group’s growth anddevelopment while managing these risks. The Group’s policy is notto engage in speculative transactions. Group Treasury operates as aservice centre within clearly defined objectives and controls and issubject to periodic review by internal audit.
Foreign currency exposureTranslation exposure: the results of the Group’s overseas activitiesare translated into sterling using the cumulative average exchangerates for the period concerned. The balance sheets of overseassubsidiaries are translated at closing exchange rates.
The Group’s borrowings are principally denominated in US dollarsand HK dollars.
Transaction exposure: the Group’s policy requires overseassubsidiaries to hedge all significant transaction exposures withGroup Treasury where they are managed centrally. Subsidiaries’transaction exposures include committed foreign currency salesand purchases together with the anticipated transactionsreasonably expected to occur during future periods. The Group’spolicy is also to hedge transaction exposures arising from theremittance of overseas dividends and interest as soon as they arecommitted. Committed transaction exposures are hedged forwardusing forward currency contracts.
Interest rate risk and exposureThe Group’s policy is to maintain an appropriate balance of fixedand variable rate debt to minimise interest expenses while managinginterest rate exposure. This balance will be periodically adjusted onthe basis of prevailing and anticipated market conditions and theGroup’s gearing and interest cover, which are monitored by GroupTreasury. Approximately 40% of the Group’s principal borrowingshave been fixed for up to five years through interest rate swaps.
Liquidity riskGroup policy is to ensure that projected financing needs aresupported by adequate committed facilities. In December 2004,the Group refinanced its existing £300m Secured FacilityAgreement with a new £300m non-secured Facility Agreement.This new facility expires on 15 December 2009 with an option toextend for a further two years. At 31 December 2004, there was£164.9m of debt outstanding (2003: £216.5m), the reductionfrom last year being due to repayments and foreign exchangeadjustments. Apart from £5.0m (2003: £3.7m) which was utilisedto support letters of credit and guarantees, the £135.1m (2003:£50m) Revolving Credit Facility remained undrawn at 31 December2004. These facilities are adequate to support the Group’s mediumterm funding requirements. Surplus cash is placed on deposit withshort term maturities providing liquidity when required.
Counterparty credit riskThe Group monitors the distribution of cash deposits, borrowingsand hedging instruments which are assigned to each of theGroup’s counterparties and which are subject to periodic review.
LITIGATIONFrom time to time, the Group is involved in claims and lawsuitsincidental to the ordinary course of the business, including claimsfor damages, negligence and commercial disputes regardinginspection and testing and disputes with former employees. TheGroup is not currently party to any legal proceedings which, basedon currently available information, are likely to have a materialadverse effect on the financial position of the Group. The followingprocedures are adopted to minimise both the potential and actualcost to the Group:
• Rigorous compliance policies and procedures;• A zero tolerance policy;• Thorough investigation of all incidents which could potentially
result in a claim.
12
13
Directors’ report
www.intertek.com
The Directors of Intertek Group plc have pleasure in presentingtheir Annual Report and the audited Financial Statements for theyear ended 31 December 2004.
PRINCIPAL ACTIVITIES AND REVIEW OF BUSINESSThe Group’s principal activities are the testing, inspection andcertification of products and commodities against a wide range of safety, regulatory, quality and performance standards. A reviewof the Company and its subsidiaries’ businesses and likely futuredevelopments is given in the Annual Review, Description ofBusiness and the Operating and Financial Review.
DIVIDENDSAn interim dividend of 3.4p (2003: 2.9p) per ordinary share was paid on 16 November 2004. A final dividend of 7.0p (2003: 5.9p) per ordinary share has been proposed which, subject to shareholder approval, will be paid on 17 June 2005, to shareholders on the Register at 3 June 2005.
SHARE CAPITALThe authorised and issued share capital of the Company, together with details of the movements in the Company’s issued share capital during the year, are shown in note 19 to the Financial Statements.
PURCHASE OF OWN SHARESThe Company is, until the date of the forthcoming Annual GeneralMeeting, generally and unconditionally authorised to buy back aproportion of its own ordinary shares. Although no such purchaseshave been made to date, pursuant to this authority, the Directorswill seek to renew this authority for up to 10% of the Company’sissued share capital at the Annual General Meeting to be held on6 May 2005.
DIRECTORSThe Directors of the Company who served during the year are setout below. Short biographies are set out in the Annual Review.
VE Treves ChairmanRC Nelson Chief Executive OfficerW Spencer Chief Financial OfficerDP Allvey Non-Executive DirectorW Hauser Non-Executive DirectorRE Sayers Non-Executive DirectorR Kong Executive President China and Asia
RC Nelson and VE Treves retire by rotation and being eligible, offerthemselves for re-election at the forthcoming Annual GeneralMeeting. R Kong was appointed during the year and offers himselffor election.
On 1 March 2005, W Hauser was appointed joint Chief ExecutiveOfficer. On 31 March 2005, RC Nelson will cease to be ChiefExecutive Officer and will be an Executive Director until 8 April2005, when he becomes Non-Executive Deputy Chairman.
Other than employment contracts, none of the Directors of theCompany had a material interest in any contract with theCompany or its subsidiary undertakings, other than W Hauser, whountil 1 March 2005, had a consultancy agreement with the Groupto provide support to assist the Group in its expansion. The termsof the Directors’ service contracts and the Directors’ interests in theshares and options of the Company are disclosed in theRemuneration Report on pages 15 to 21.
EMPLOYMENT POLICYThe Group’s employment policy is to ensure that all employees areassessed solely in terms of their ability irrespective of their race,religion, colour, age, disability, gender or sexual orientation.
In accordance with the Group’s equal opportunities policy, peoplewith disabilities are given the same consideration as others whenthey apply for jobs. Depending on their skills and abilities, theyenjoy the same career prospects as other employees. Whereemployees become disabled, every effort will be made to retainthem in their current role or to explore possibilities for retraining orredeployment within the Group. Where necessary, the Group aimsto provide such employees with facilities, equipment and trainingto assist them in doing their jobs.
The Company is committed to offering its key employees theopportunity to align themselves more closely with the interests of shareholders and the Company’s performance, through theownership of the Company’s shares. The Company operates twoshare option schemes for key employees and details are containedin the Remuneration Report.
The health and safety of the Group’s employees is a matter ofprimary concern. Accordingly, it is the Group’s policy to manageits activities so as to avoid any unnecessary or unacceptable risksand to have in place procedures that conform to best practice inthis area.
A small number of the Group’s employees are members of tradeunions and work councils, mostly in continental Europe. The Groupcommunicates regularly with the union representatives and aims tomaintain good labour relations with all its employees.
POLICY AND PRACTICE ON PAYMENT OF SUPPLIERS The Group does not follow any code or standard on paymentpractice but has a variety of payment terms with its suppliers.Payment terms are agreed at the commencement of business witheach supplier and it is the policy of the Group that payment ismade accordingly, subject to the terms and conditions being met.The Company has no trade creditors.

Directors’ report continued
Intertek Group plc Annual report and accounts
SUBSTANTIAL SHAREHOLDINGSAs at 1 March 2005, the Company has been notified in accordancewith sections 198 to 210 of the Companies Act 1985, that thefollowing were interested in 3% or more of the Company’sordinary share capital:
Number Percentageof shares notified
FMR Corp/Fidelity International Ltd 20,012,625 12.93%Lazard Asset Management 6,881,140 4.48%Prudential plc 6,142,025 3.96%Axa S.A. 5,973,574 3.86%Legal & General Investments 5,401,647 3.50%HBOS 4,661,649 3.02%
Save for the above, no other person has reported an interest,which is notifiable under the Companies Act 1985, being aninterest of 3% or more in the Company’s issued ordinary share capital.
CORPORATE GOVERNANCEThe Group’s statement of corporate governance is set out onpages 22 to 27 of this Annual Report and Accounts.
CHARITABLE AND POLITICAL DONATIONSThe Group made no political or charitable donations in 2004(2003: £nil). In January 2005, the Group made a donation of USD250,000 to the Tsunami Disaster Appeal fund.
AUDITORSThe auditors, KPMG Audit Plc, have indicated their willingness tocontinue in office and a resolution that they be reappointed will beproposed at the forthcoming Annual General Meeting.
STATEMENT OF DIRECTORS’ RESPONSIBILITIESCompany law requires the Directors to prepare financialstatements for each financial year which give a true and fair view of the state of affairs of the Company and the Group and of the profit or loss for that period. In preparing those financial statements, the Directors are required to:
• Select suitable accounting policies and then apply themconsistently;
• Make judgements and estimates that are reasonable andprudent;
• State whether applicable accounting standards have beenfollowed, subject to any material departures disclosed andexplained in the financial statements; and
• Prepare the financial statements on a going concern basis unless it is inappropriate to presume that the Group will continue in business.
The Directors are responsible for keeping proper accountingrecords which disclose with reasonable accuracy at any time thefinancial position of the Company and to enable them to ensurethat the financial statements comply with the Companies Act1985. They have general responsibility for taking such steps as arereasonably open to them to safeguard the assets of the Group andto prevent and detect fraud and other irregularities.
ANNUAL GENERAL MEETINGThe Notice of the Annual General Meeting to be held on Friday6 May 2005, is enclosed with this Annual Report and Accounts.The Notice details the business to be conducted at the meeting.
By order of the Board
F EvansGroup Company Secretary
7 March 2005Registered Office25 Savile RowLondonW1S 2ES
Registered Number: 4267576
14
15

Remuneration report
www.intertek.com
This report sets out the Group’s policy and disclosures in relation to Directors’ remuneration for the year ended 31 December 2004and, as required by schedule 7A to the Companies Act 1985 – The Directors’ Remuneration Report Regulations 2002 (theRegulations) – will be subject to an advisory shareholder vote at the forthcoming Annual General Meeting (AGM). The report fullycomplies with the requirements of the Regulations and TheCombined Code annexed to the Listing Rules (the CombinedCode) and has been audited by KPMG Audit Plc to the extentrequired by the Regulations.
The Group has applied the Principles of Good CorporateGovernance relating to the remuneration of its Directors and thisreport outlines how the Group has complied with the provisions ofthe Combined Code as well as some of the guidelines issued byinstitutional bodies.
REMUNERATION COMMITTEE (the Committee)The Committee determines, on behalf of the Board, the Company’spolicy on the remuneration of Executive Directors and seniormanagement. The Committee determines their total remunerationpackages, including any compensation on termination of office. TheCommittee also provides advice and consults with the Chief ExecutiveOfficer on major policy issues affecting the remuneration of seniorexecutives. To ensure that the Group’s remuneration practices aremarket competitive, the Committee takes advice from variousindependent sources. The Committee met nine times during 2004.
The Remuneration Committee is comprised of the followingNon-Executive Directors of the Company.
DP Allvey (Chairman)RE SayersVE Treves
The Committee members have no personal financial interest, otherthan as shareholders, in the matters to be decided. No Directorplays a part in any discussion about his or her own remuneration.They give due regard to the interests of shareholders and therequirements of the Listing Rules and associated guidance. To helpachieve its objectives, the Committee has appointed and takenindependent advice from New Bridge Street Consultants LLP (NewBridge Street) and the Hay Group Management Ltd (Hay Group)remuneration consultants, in relation to remuneration matters andon share incentive arrangements. None of these consultants haveany other connection with the Company.
The Board, with the support of external professional advice,determines the remuneration of the Non-Executive Directors.
REMUNERATION POLICYThe Committee’s policy is to attract, retain, motivate and rewardhigh calibre individuals to ensure the future success of the businessand to deliver shareholder value. It sets the terms of servicecontracts and any changes to the terms of employment of theExecutive Directors. The Committee therefore has regard to thefollowing objective:
The maintenance of a competitive package of pay and benefits,commensurate with comparable packages of pay and benefitsprovided by other companies of comparable size and complexityin the FTSE 250 index.
The base salary is targeted at the market median whilst for superiorperformance the total package of salary and bonus is aimed at thetop quartile.
The Company anticipates that its policy for 2005 and for theforeseeable future will remain the same.
EXECUTIVE DIRECTORSBase salaryThe base salary for each Executive Director is set by theRemuneration Committee taking into account both the performance and experience of the individual and information from external advisors with respect to comparators. Consideration is given to remuneration levels in the Group when determining Executive Directors’ pay.
Performance bonusesThe Executive Directors and senior executives are eligible for annualincentive payments for the achievement of annual financial andstrategic goals of the Group and its businesses. The financialtargets are derived from the strategic planning process for theGroup and its businesses which is the cornerstone of the Group’sresults culture. During 2004, bonus targets focused on profitgrowth, the delivery of cash, increasing shareholder return and theachievement of individual strategic objectives. For the ExecutiveDirectors these were based on the measure of achievement foroperating profit, operating cash flow to operating profit andGroup Earnings per Share (EPS). RC Nelson is entitled to receive abonus payment of up to 70% of base salary, whilst W Spencer andR Kong are each entitled to receive bonus payments of up to 50%of base salary. These amounts include a discretionary elementpayable in appropriate circumstances. Typical measures used forthe Executive Directors are as follows:
Measure/percentage RC W Rof salary Notes Nelson Spencer Kong*
EPS 1 25% 25% –Operating profit 2 23% 12% 25%Operating cash flow/ 12% 6% 5%
operating profitOperating profit margin – – 5%Working capital/turnover – – 5%Return on operating assets 3 – – 5%Discretionary 10% 7% 5%
Total 70% 50% 50%
*All measures for R Kong are based on Labtest
1. Basic earnings per share excluding exceptional items.2. Operating profit excluding goodwill amortisation and exceptional items, translated
at constant exchange rates.3. Return on Labtest’s operating assets excluding goodwill.
Remuneration report continued
Intertek Group plc Annual report and accounts
For RC Nelson and W Spencer, the main target is growth in theGroup’s earnings per share compared to the previous year, with themaximum bonus opportunity for this target being 25% of salaryfor each person. The other major target is growth in Groupoperating profit compared to the previous year, with the bonusopportunity being 23% and 12% of salary respectively.
In addition, RC Nelson and W Spencer may earn a further 12%and 6% of salary, respectively, based on operating cash flow as apercentage of operating profit. In 2004, full bonus was payable onthis element when the ratio of operating cash flow to operatingprofit for the Group (excluding FTS) exceeded 85%, and whenthe ratio of operating cash flow to operating profit in FTSexceeded 75%. In appropriate circumstances, the Committeemay also award a discretionary bonus of up to 10% and 7% ofsalary, respectively.
For R Kong, the main target is operating profit growth in theLabtest division, compared to the previous year, with the maximumbonus opportunity for this target being 25% of salary. A further5% of salary may also be earned based on each of the following:operating cash flow as a percentage of operating profit; operatingprofit margin; working capital to turnover and return on operatingassets for the Labtest division. In 2004, full bonus was payablewhen the ratio of operating cash flow to operating profit for theLabtest division exceeded 90%. In appropriate circumstances, theRemuneration Committee may also award a discretionary bonus ofup to 5% of salary.
All targets are established and approved by the RemunerationCommittee and bonus is paid dependent on the achievement ofappropriate thresholds for each relevant measure. Based on eachof these, the total bonus accrued in 2004 for RC Nelson,W Spencer and R Kong equated to 70%, 50% and 45.6%of base salary respectively. Bonuses are not pensionable.
In conjunction with the introduction of the Intertek Deferred BonusPlan (the Plan), described below, and with effect from the 2005financial year, the maximum annual cash bonus potential of theExecutive Directors and the two other most senior executives in theCompany (being the members of the Company’s ManagementBoard) will decrease from 70% of salary in the case of the ChiefExecutive and 50% of salary in the case of the other membersof the Management Board, to 50% and 40% respectively. Theannual cash bonuses will continue to operate using a combinationof the measures described above. The Plan is described in moredetail in the accompanying Notice of AGM.
PensionsRC Nelson has a private pension scheme and contributions madeto this scheme by the Group are governed by Inland Revenuecontribution limits. W Spencer participates in the Company’s UKfinal salary pension scheme on the same basis as other eligibleemployees. R Kong participates in the “Intertek Hong KongRetirement Scheme” on the same basis as other eligible local executive employees in Hong Kong. See page 20 for more information.
NON-EXECUTIVE DIRECTORSThe Board determines the remuneration of the Non-ExecutiveDirectors of the Company. Their fees have not increased this yearand are disclosed in the notes to the Directors’ remuneration
summary on page 18. Such remuneration is neither pensionablenor eligible for annual incentive payments. The Non-ExecutiveDirectors are not allowed to participate in the Company‘s shareincentive plans. Other than VE Treves, who has the benefit of acompany car, no other benefits in kind are provided.
SERVICE CONTRACTSDetails of the service contracts currently in place for Directors whohave served during the year are as follows:
Executive DirectorsThe service contracts of RC Nelson and W Spencer are dated24 May 2002, whilst the service contract of R Kong is dated14 May 2002. All are 12-month rolling contracts terminable byeither party on 12 month’s notice and contain provisions by way of compensation for loss of office, limited to payment of salaryover a 12-month period, pro-rated bonus, and benefits in lieu ofnotice. None of the Directors’ service contracts contain provisionsregarding a change of control.
Non-Executive DirectorsThe Non-Executive Directors do not have service contracts withthe Company. The letter of engagement for each Non-ExecutiveDirector states that they are appointed for an initial period ofthree years. At the end of the initial period the contract may berenewed for a further period if the Company and the Directoragree. W Hauser had a consultancy agreement with the Company until 1 March 2005, the details of which are disclosed in note 31 to the Financial Statements.
W Hauser is appointed Chief Executive Officer with effect from 1 March 2005. RC Nelson will remain in a non-executive role asDeputy Chairman, effective 8 April 2005. These new roles will carryterms and conditions broadly similar to the other executive andnon-executive roles outlined above.
POLICY ON EXTERNAL APPOINTMENTSThe Company recognises that, during their employment with the Company, Executive Directors may be invited to become Non-Executive Directors of other companies and that such duties can broaden their experience and knowledge. ExecutiveDirectors may, with written consent of the Company, accept onesuch directorship outside the Company. No such appointmentshave been made during this year.
SHARE INCENTIVES – current arrangementsThe Company believes that share ownership by employees is anintegral part of its programme to incentivise, reward and retainemployees as it strengthens the link between the employee’spersonal interest and that of the shareholders and enables them to benefit from the growth of the Company. In order to encourageshare ownership, the Company established a share option scheme for senior management in March 1997. This scheme wasdiscontinued and replaced by the Intertek Group plc 2002 ShareOption Plan (the 2002 Plan) and the Intertek Group plc 2002Approved Share Option Plan (the Approved Plan) on 9 May 2002,under which options may be granted by either the Board or theEmployee Share Ownership Trust on the recommendation of theRemuneration Committee. All awards are discretionary.
16
17

www.intertek.com
The 2002 PlanOnly Executive Directors or employees of the Group are eligible toparticipate in the 2002 Plan. The exercise price is determined bythe average of the closing middle market quotations of an ordinaryshare in the Company on the five dealing days immediately prior to the date of grant and the options are exercisable between threeand 10 years after the date of grant, provided the performancecondition has been satisfied. The Remuneration Committee willdecide whether the performance condition has been met at theappropriate time.
Options are granted annually and each tranche is based onapproximately 1% of the Company’s issued share capital. Noindividual can be granted options with a value of more than their annual base salary in each year. The options are subject toperformance criteria unless there are regulatory or legal difficultiesin jurisdictions where the employee is based. The performancecondition requires that the growth in the Company’s EPSoutperforms the growth in the UK Retail Price Index (RPI) by aminimum of 5% per annum over a three year period. If thecondition is met, 25% of the options become exercisable. If thegrowth rate is 8% then 66.6% of options become exercisable.100% of the options would only become exercisable if theCompany’s growth in EPS outperformed the growth in the UK RPIby 11% per annum over a three year period. For growth ratesbetween 5% and 8%, and 8% and 11%, the percentage ofoptions exercisable is calculated on a sliding scale. In respect ofoptions granted prior to 2005, if the performance targets are notmet in full for the initial performance period of three years, theperformance period may be extended by one further period of 12 months, to ascertain whether the balance of the unvestedoptions can be exercised. The final grant of options in 2005 will not have a re-testing provision. The above performance criteria wereselected to closely link improvement in performance with increasein shareholder value and targets are reviewed regularly to ensurethat they remain stretching.
Other than in the case of hardship, senior executives are required to retain 25% of their shares acquired upon the exercise of their options (ignoring shares sold to meet any taxliability and the financing cost on exercise), for a period of up to two years following exercise, in order to demonstrate theircommitment to the Group.
The Approved PlanThe key features of the Approved Plan (which has been approvedby the Inland Revenue) are broadly the same as for the 2002 Planexcept that options are granted subject to the requirement that theaggregate exercise price of all the subsisting options granted to anemployee under the Approved Plan must not exceed £30,000.
Subject to the approval of the new incentive arrangementsdescribed below, the Committee has decided that, after 2005,no further awards will be made under the 2002 Plan or theApproved Plan.
SHARE INCENTIVES – changes 2005/2006During the year, the Committee has undertaken a comprehensivereview of the Company’s long-term incentive arrangements, inconjunction with New Bridge Street. This review concluded thatthe Company should adopt a new long-term incentive plan, linked
to the existing cash bonus arrangement, to be called “the IntertekDeferred Bonus Plan” (the Plan). The Plan will operate from 2006onwards, based on bonuses payable in respect of the financial yearending 31 December 2005. The Company is therefore seekingshareholder approval for adoption of this Plan at the AGM in May2005 and the rationale for introducing the Plan, together withdetails of how it will operate, are described in more detail in theaccompanying Notice of AGM.
The Committee also proposes to introduce a shareholdingretention requirement for the Management Board and other seniorexecutives. Under these arrangements, the Management Boardwill be required, within five years, to build up a shareholding in theCompany worth at least 100% of base salary and it is expectedthat, after allowing for tax and similar liabilities, 100% of theshares subject to each vested award under the Plan will be retainedby the executive until the ownership target is attained.
The Company does not operate any long-term incentive plansother than those described above. Other than as stated above, nosignificant amendments are proposed to be made to the terms andconditions of any entitlement of a Director to share incentives.
PERFORMANCE GRAPH Total Shareholder Return (TSR), comprising the changes in value ofa share and dividends distributed can be represented by the valueof a notional £100 invested at the beginning of a period and itschange over that period.
The graph below shows TSR in respect of the Company sinceflotation on 24 May 2002. The TSR for the Company is comparedwith the TSR for the FTSE Mid 250 index. The FTSE Mid 250 indexwas selected, as it is a broad market index of which the Group is amember. In addition, the Group uses that group of companies,amongst others, for comparison of pay and benefit levels.
Jun
02
Sep
02
Sep
04
Dec
02
Mar
03
Jun
03
Sep
03
Dec
03
Mar
04
Jun
04
Dec
04
Intertek (rebased) FTSE Mid 250 (rebased)
60
80
100
140
180
160
120
Total Shareholder Return

Remuneration report continued
Intertek Group plc Annual report and accounts
The auditors are required to report on the information contained in this section of the Remuneration Report.
The table below summarises Directors’ emoluments and pension contributions for 2004 and the prior year for comparison. No paymentsfor loss of office were made during the year and no other awards were made to any Director.
DIRECTORS’ REMUNERATION SUMMARY
2004 2003
Base Total Pension Total Pensionsalary Benefits emolu- contri- emolu- contri-
and fees Bonuses in kind ments butions Total ments tions TotalNotes £000 £000 £000 £000 £000 £000 £000 £000 £000
Executive DirectorsRC Nelson 1 372.5 266.0 87.5 726.0 173.7 899.7 609.7 162.0 771.7W Spencer 195.0 100.0 14.6 309.6 12.2 321.8 266.0 11.3 277.3R Kong 2 162.0 73.9 29.7 265.6 18.5 284.1 n/a n/a n/a
Non-Executive DirectorsVE Treves 80.0 – 12.5 92.5 – 92.5 86.9 – 86.9DP Allvey 30.0 – – 30.0 – 30.0 27.5 – 27.5RE Sayers 27.5 – – 27.5 – 27.5 25.6 – 25.6W Hauser 3 25.0 – – 25.0 – 25.0 25.0 – 25.0
Total 892.0 439.9 144.3 1,476.2 204.4 1,680.6 1,040.7 173.3 1,214.0
1. Benefits in kind for RC Nelson included £50,880 (2003: £50,800) in respect of life assurance premium for the £1,000,000 policy described below. 2. Appointed on 14 May 2004, therefore remuneration reported pro rata from date of appointment. R Kong is paid in Hong Kong dollars and the figures shown above are
translated into sterling using the average exchange rate 2004.3. In addition to his Director’s fees, W Hauser received £36,700 (2003: £77,000) under a consultancy agreement with the Group.
BENEFITS IN KINDThe principal benefits in kind for Executive Directors are a company car, private medical and permanent health insurance, life assuranceand personal accident insurance. In addition, for the purposes of business entertaining, RC Nelson is provided with club membership andan air ticket for his spouse to accompany him on one long distance business trip each year. R Kong is provided with a housing allowance,club membership and an air ticket between London and Hong Kong for himself and his spouse every two years. VE Treves is provided with acompany car.
PENSIONSThe details of the Executive Directors’ pension arrangements are shown below. The Group is keeping under review current changesin UK pensions legislation; however, as the majority of the Group’s employees are non-UK, these changes should only impact a smallnumber of individuals.
RC NelsonRC Nelson is not a member of a Group company pension scheme. The Group pays contributions directly into his private pensionarrangement. The Group contributes to this private pension plan at the greater of:
• Inland Revenue contribution limits allowed under retirement annuity contracts, currently 27.5% of relevant earnings (base salary plusbonus); or
• Inland Revenue contribution limits allowed under personal pension schemes (currently 40% of relevant earnings ) on the maximumearnings on which contributions attract relief, currently £102,000 for 2004/2005 plus 40% of the excess to base salary.
During 2004, the Company made contributions of £173,737 (2003: £162,000) to his pension scheme.
RC Nelson is entitled to a death in service benefit comprising a lump sum payment equivalent to four times his base annual salary. There isalso another life assurance policy for £1,000,000 to be maintained for the whole of his life and payable to his beneficiaries on his death.
18
19

www.intertek.com
W SpencerW Spencer is a member of the defined benefit section of the Intertek UK Company Pension Scheme. This is a defined benefit and definedcontribution occupational pension scheme approved by the Inland Revenue. The main features of the defined benefit section of thescheme are:
Normal retirement age 65
Annual pension at normal retirement age 1/60 of final pensionable salary (highest base salary in any 12 month period precedingretirement date) for each year of service. Member may exchange part of their pensionfor a tax-free cash sum. This will reduce their pension but not that of their spouse.
Spouse’s or dependant’s pension payableon death of member Half of member’s pension.
Early retirement From age 50 onwards with the consent of the Company and the Trustees, based onaccrued entitlement reduced by 4% for each year of retirement prior to age 65.
Pension increases in payment or deferment Increases in deferment – revaluation is in two parts:i) The part that represents the Guaranteed Minimum Pension (GMP) will be
increased at the rate of 4.5% for each complete tax year between date ofleaving and State Pension Age.
ii) The balance of the pension will increase at the rate of 5% per annum or in linewith the Retail Price Index if lower for each completed year between the date ofleaving and the Normal Retirement Date.
Increases in retirement (or payment): i) Pre 1997 excess pension benefits will increase at the rate of 3%
per annum.ii) Post 1997 excess pension benefits will increase at the rate of the lower of 5% pa
or the increases in Retail Price Index.iii) Pre 1988 GMP 0% increase.iv) Post 1988 GMP 3% or increase in the Retail Price Index, if lower.
Employee contributions As determined by the Company and the Trustees: currently 8% of base salary(excluding incentive payments) up to the earnings cap.
Employer contributions As determined by the Company and the Trustees: currently 12% of base salary(excluding incentive payments) up to the earnings cap.
Ill health or incapacity In the case of ill health, the pension is calculated as for early retirement but withoutthe 4% reduction. In the case of incapacity the pension is calculated as ifpensionable service had continued to normal retirement date.
Death in service Lump sum of four times pensionable salary.
Details of the accrued pension to which W Spencer is entitled on leaving service, and the changes during the year are shown in thetable below:
IncreaseContribitions in accrued Increase in
Age at made entitlement Accrued Transfer Transfer transfer31 December during the during the entitlement1 value2 value2 value
2004 year year1 2004 2003 2004 in yearName £ £ £ £ £ £
W Spencer 45 12,150 2,317 22,667 128,469 137,191 8,722
1. The accrued pension entitlement is the amount that would be paid each year on retirement at 65 based on service to 31 December 2004, excluding the effect of inflation.Including inflation, the increase was £2,376 during the year. Transfer values have been calculated in a manner consistent with “Retirement Benefit Schemes – Transfer Values(GN11)” published by the Institute of Actuaries and the Faculty of Actuaries dated 6 April 2001.
2. The transfer value disclosed above does not represent a sum paid or payable to the individual Director, instead it represents a potential liability of the Pension Scheme.

Remuneration report continued
Intertek Group plc Annual report and accounts
R KongR Kong is a member of the Intertek Hong Kong Retirement Scheme (the ORSO Scheme). This is a hybrid scheme (combination of definedbenefit and defined contribution benefit structure) registered under the Occupational Retirement Schemes Ordinance (ORSO) in HongKong. The main features are:
Normal retirement age 60
Early retirement From age 55 onwards, having completed 25 years of employment and withCompany consent.
Retirement benefit (at either normal retirement A lump sum benefit equal to a sum as calculated in accordance with thedate or early retirement date) retirement scheme.
Employee contributions Not required to contribute.
Employer contributions 10%* of Monthly Base Salary (excluding allowances, bonus and other fluctuatingincome).
*Actual contribution rate is to be determined by the Company and the Trustees: 11.4% of monthly base salary (excluding allowances and incentive payments) from 1 March 2004 and 15.9% prior to that in 2004.
Leaving Service Benefit (prior to retirement date) V%* x Company Balance (total value of regular contributions made for theemployee by the company plus interest theron) plus Transfer Balance (if any).
* V% varies according to length of service and is equal to 100% for completing 10 years of schemeservice.
Total Permanent Incapacity Benefit The greatest of:(i) 48 x Last Scheme Salary (basic monthly salary excluding bonus, allowances
and overtime immediately prior to incapacity)(ii) Company Balance plus Transfer Balance (if any); or(iii) HK$500,000
Death in service The greatest of:(i) 48 x Last Scheme Salary (ii) Company Balance plus Transfer Balance (if any); or (iii) HK$500,000
Prior Scheme Guarantee Members transferred from other schemes may have guaranteed benefits.
Details of the accrued pension to which R Kong is entitled on leaving service, and the changes during the year are shown in thetable below:
IncreaseContribitions in accrued Increase in
Age at made since entitlement Accrued Transfer Transfer transfer value 31 December date of since date of entitlement2 value3 value since date of
2004 appointment appointment1 2004 2003 2004 appointment1
Name £ £ £ £ £ £
R Kong 57 18,500 85,775 1,051,911 876,832 960,465 102,833
1. Based on pro rata of full year increases of £128,663 (accrued entitlement) and £154,250 (transfer value).2. The accrued entitlement refers to the lump sum payable to R Kong if he retired at age 60, based on his service to 31 December 2004. Since R Kong is covered by a retirement
scheme in Hong Kong, the above calculation has taken into account the economic conditions in Hong Kong. 3. The transfer value disclosed above is calculated in a manner consistent with ‘Retirement Benefit Schemes – Transfer Values (GN11)’ published by the Institute of Actuaries and
the Faculty of Actuaries dated 6 April 2001. To be consistent with the GN11, the transfer value has been determined to be the past service liability based on the ORSO fundingmethod and assumptions.
TRANSACTIONS WITH DIRECTORS These are disclosed in note 31 to the Financial Statements.
20
21

www.intertek.com
DIRECTORS’ INTERESTS IN SHARE OPTIONSNon-Executive Directors are not allowed to participate in the Company‘s share incentive plans. No options were granted to the ExecutiveDirectors under the 1997 Plan. Options granted to the Executive Directors under the Approved Plan and the 2002 Plan are shown below:
Options31 granted 31
December during December Date2003
12004 2004 option Date
Number of Number of Price Number becomes optionshares shares £ of shares exercisable expires
RC NelsonApproved Plan 6,864 – 4.37 6,864 May 2005 May 20122002 Plan 55,379 – 4.37 55,379 May 2005 May 20122002 Plan 57,939 – 3.59 57,939 April 2006 April 20132002 Plan – 53,486 5.235 53,486 April 2007 April 2014
Total 120,182 53,486 173,668
W SpencerApproved Plan 6,864 – 4.37 6,864 May 2005 May 20122002 Plan 15,466 – 4.37 15,466 May 2005 May 20122002 Plan 21,357 – 3.59 21,357 April 2006 April 20132002 Plan – 24,069 5.235 24,069 April 2007 April 2014
Total 43,687 24,069 67,756
R Kong 2002 Plan 42,526 – 4.37 42,526 May 2005 May 20122002 Plan 37,266 – 3.59 37,266 April 2006 April 20132002 Plan – 40,600 5.235 40,600 April 2007 April 2014
Total 79,792 40,600 120,392
1. At his date of appointment R Kong also held the 40,600 options granted during 2004.
Grants of options have been phased, so far as possible, over the 10 year life of each of the plans. No Director was eligible to exercise anyshare options during 2004 and therefore no aggregate gain was made (2003: £nil).
On 31 December 2004, the closing market price of Intertek ordinary shares was 705p. The highest and lowest prices of the shares duringthe year were 723p and 460.25p respectively.
DIRECTORS’ INTERESTS IN ORDINARY SHARESThe interests of the Directors in the shares of the Company are set out below:
31 31December December
Number of ordinary shares of 1p 20031 Acquired Sold 2004
VE Treves 100,000 – 50,000 50,000DP Allvey 100,000 270 95,000 5,270R Kong 500,000 – 300,000 200,000RC Nelson 1,732,514 – 1,232,514 500,000RE Sayers 1,500 – – 1,500W Spencer 512,000 – 133,000 379,000
1. Or as at date of appointment.
Save as stated above, during the course of the year, no Director, nor any member of his immediate family, had any other interest in theordinary share capital of the Company or any of its subsidiaries. No changes in the above Directors’ interests have taken place between31 December 2004, and the date of this Report.
Approved by the Board on 7 March 2005.
DP AllveyChairman, Remuneration Committee

Corporate governance
Intertek Group plc Annual report and accounts
The Group is committed to high standards of corporate governanceand this report outlines where the Company has complied with the provisions of the revised Combined Code on CorporateGovernance issued by the Financial Reporting Council in July 2003,which applies to listed companies with a financial year ending on or after 1 November 2003 (the Code). During 2004, the Companyhas not complied with some of the provisions of the Code and the areas of non-compliance are described in this report. The Board is accountable to the Company’s shareholders for good corporategovernance and this statement describes how the relevantprinciples of governance have been applied to the Company.
THE BOARDAn effective Board is in place, which provides entrepreneurialleadership and controls the Group. The Board’s main roles are tocreate value to shareholders, to provide entrepreneurial leadershipof the Group, to approve the Group’s strategic objectives and toensure that the necessary financial and other resources are madeavailable to enable them to meet those objectives. The Board isresponsible to shareholders for the proper management of theGroup. A statement of the Directors’ responsibilities in respect of the Annual Report and Accounts is set out on page 14. AllDirectors have a wide range of experience, bringing independentjudgement to bear in the interests of the Company on issues ofstrategy, performance, resources and standards of conduct, andthe Board has the appropriate wide range of skills, which is vital to the success of the Group.
There were eight scheduled Board meetings held in 2004 and,outside of these, there was frequent contact between the Directorsto discuss the Company’s affairs and develop its business. During2004, all Directors were present at every Board meeting. Alsoduring the year, the Chairman held meetings with the Non-Executive Directors without the Executive Directors being present.
The Group has identified a number of key areas that are subjectto regular reporting to the Board and this enables the performanceof management to be reviewed and monitored by the Board.A Board matrix is in place which formally outlines the mattersspecifically requiring the consent of the full Board and includes,inter alia, the approval of Group strategy and operating plans, the annual budget, the Annual Report and Accounts, the InterimReport and related announcements, major divestments and capital expenditure, large acquisitions and disposals, therecommendation of dividends and the approval of treasury and risk management policies.
The Board matrix also identifies areas where executivemanagement can give approval subject to certain financial limits.Where any of the activities involve amounts greater than thelimits laid down for management approval they are referredto the full Board. The authorities in the Board matrix are reviewedregularly and any changes are approved by the Board. The Boardmatrix is communicated to all senior management to ensurethat throughout the Group it is known when Board approvalis required.
The Board consists of the Chairman VE Treves, the Chief ExecutiveOfficer RC Nelson, two Executive Directors, two independent Non-Executive Directors and one other Non-Executive Director. The Senior Independent Director is DP Allvey. The Directors’biographies appear in the Annual Review on pages 16 and 17.
Each Director will ensure that if he has any concerns which cannotbe resolved about the Company or a proposed action, that hisconcern is recorded in the Board minutes. Appropriate insurancecover is in place in respect of legal action against the Directors.
There is a clear division of responsibilities between the Chairmanand the Chief Executive Officer and they have been set out inwriting and approved by the Board. The Chairman met theindependence criteria set out in the Code on appointment to the Board in May 2002.
The Chairman leads the Board in the determination of its strategyand in the achievement of its objectives. The Chairman isresponsible for organising the business of the Board, ensuring its effectiveness and setting its agenda. The Chairman has noinvolvement in the day-to-day business of the Group. TheChairman facilitates the effective contribution of the Non-Executive Directors, and constructive relations between Executiveand Non-Executive Directors ensures Directors receive accurate,timely and clear information and effective communication withshareholders. The Chief Executive Officer has direct charge of theGroup on a day-to-day basis and is accountable to the Board forthe financial and operational performance of the Group.
The Board comprises a balance of Executive and Non-ExecutiveDirectors who bring a wide range of skills and experience to thedeliberations of the board. The Non-Executive Directors fulfil a vitalrole in corporate accountability.
The Non-Executive Directors have a particular responsibility toensure that the strategies proposed by the Executive Directors arefully discussed and critically examined, not only in the best long-term interests of shareholders, but also to ensure that they takeproper account of the interests of employees, customers andsuppliers. The Non-Executive Directors are all experienced andinfluential individuals and through their mix of skills and businessexperience they contribute significantly to the effective functioningof the Board and its committees, ensuring that matters are fullydebated and that no one individual or group dominates thedecision making process.
The Board considers DP Allvey and RE Sayers to be independentNon-Executive Directors. W Hauser is not considered to beindependent under the provisions of the Code as he has aconsultancy agreement with the Company. However, the Boardbelieves that during the year ended 31 December 2004, W Hauserbrought valuable expertise to the Board and exercised independentjudgement in all decisions. With effect from 1 March 2005,Wolfhart Hauser is appointed Chief Executive Officer.
22
23

www.intertek.com
The Board, excluding the Chairman, does not comprise at least halfindependent Non-Executive Directors, as set out in the Code, butbelieves that during 2004, its composition, taking into account thebalance of skills, knowledge and experience, resulted in an efficientand effective board operation and that the balance betweenExecutive and Non-Executive Directors remained satisfactory. It wasfelt to be inappropriate to recruit a new Non-Executive Directorwhilst the search for a new Chief Executive Officer was also beingundertaken, though a further review of the Board’s compositionand balance will be undertaken during 2005.
To enable all the Directors to discharge their duties, they have fulland timely access to all relevant information. The Board papers arecirculated in plenty of time before the Board meetings to ensurethat Directors have the necessary time to read and review thepapers. The Non-Executive Directors receive monthly managementaccounts and regular management reports and information whichenable them to scrutinise the Group’s and management’sperformance against agreed objectives.
A formal induction programme has been established for newDirectors and this is tailored to suit the individual to ensure that it is appropriate for their level of previous experience.
All Directors have access to the advice and services of theCompany Secretary who will assist in arranging any additionaltraining as required. The appointment and removal of theCompany Secretary is a matter for the Board as a whole.
Each year a conference is held, attended by the Board and seniormanagement from each division and geographic area, in order todiscuss strategy and policy. In 2004, the Board also visited the USAto tour some of the Group’s facilities and meet local management.These meetings help to ensure that the Directors continue todevelop their knowledge of the business of the Group and get toknow the senior management in the Group.
All Directors are entitled to obtain independent professionaladvice, at the Company’s expense, in the performance of theirduties as Directors. No such advice was sought during the year.
A new annual performance evaluation process led by theChairman, has been established for each Director, Committee andthe Board as a whole. A series of questionnaires has been designedand these forms provide a framework for the evaluation process,and provide the Chairman with a means of making year-on-yearcomparisons. There are five questionnaires in total, one foreach of the following: the Board; each individual Director; theRemuneration Committee; the Nomination Committee; andthe Audit Committee.
The first evaluation took place in 2004, when the performance of each individual Director and the functioning and constitution of the Board and each Committee was assessed. The Chairmanassessed the individual performance of each Director, inconsultation with the other Directors. The Senior IndependentDirector, taking into account the views of the Executive Directors,had discussions with the other Non-Executive Directors without the Chairman being present in order to appraise the Chairman’sperformance during the year. The results of the assessmentsconcluded that the performance of the Board, each Committeeand each Director is effective and that all Directors demonstrate full commitment in their respective roles to the Company.
It is the Board’s intention to continue to review annually itsperformance and that of its Committees and individual Directors.
BOARD COMMITTEESThe Board has established several Committees, each with clearlydefined terms of reference, procedures and powers. All theseCommittees operate in accordance with the relevant terms ofreference as approved by the Board. Copies of the terms ofreference for each of these Committees are available on requestfrom the Secretariat Department at the registered office or can bedownloaded from www.intertek.com. The number of full Boardmeetings and Committee meetings attended by each Directorduring the year was as follows:
Scheduled Audit Nomination RemunerationBoard Committee Committee Committee
Name Position meetings meetings meetings meetings
VE Treves Chairman 8 (8) 4 (4) 3 (3) 7 (9)
RC Nelson Chief Executive Officer 8 (8) N/A N/A N/A
W Spencer Chief Financial Officer 8 (8) N/A N/A N/A
R Kong Executive Director 3 (3) N/A N/A N/A
DP Allvey Senior Independent Director 8 (8) 4 (4) 3 (3) 8 (9)
W Hauser Non-Executive Director 8 (8) N/A N/A N/A
RE Sayers Independent Non-Executive Director 8 (8) 4 (4) 3 (3) 9 (9)
Figures in brackets indicate the maximum number of meetings in the period during which the relevant individual was a Director orCommittee member.

Corporate governance continued
Intertek Group plc Annual Report and Accounts
Membership of the three relevant Board Committees is setout below.
THE REMUNERATION COMMITTEEThis Committee comprises three Non-Executive Directors,DP Allvey (Chairman), RE Sayers and VE Treves. Under the Code, asChairman of the Company, VE Treves is not viewed as independent.Therefore the Company is not in full compliance with the Code,which requires the Remuneration Committee to have at least threeindependent Non-Executive Directors. However, during 2004, the Remuneration Committee was evaluated and the Boardagreed that the current membership of the Committee wasappropriate and effective and deemed that VE Treves exercisedindependent judgement on all remuneration matters referred tothat Committee.
The Committee has responsibility for making recommendations to the Board on the Group’s policy for the remuneration of the Executive Directors and senior executives and for thedetermination, within agreed terms of reference, of additionalbenefits for each of the Executive Directors, including pensionrights and any compensation for loss of office. The Committee is also responsible for the implementation and operation ofemployee share incentive arrangements. During 2004, theRemuneration Committee met nine times.
THE NOMINATION COMMITTEEThis Committee comprises three Non-Executive Directors,VE Treves (Chairman), DP Allvey and RE Sayers. This Committee,which met three times during the year, nominates candidatesto fill board vacancies, reviews succession planning and makesrecommendations to the Board on the balance and compositionof the Board in order to ensure that the Board is effective indischarging its responsibilities.
Bearing in mind the balance of skills, knowledge and experienceon the Board, a job description is prepared for any new Boardposition and when a Non–Executive Director is appointed, theCommittee will ensure that he or she has confirmed that they havesufficient time to fulfil the commitments of the role. The terms andconditions of appointment of Non-Executive Directors are availablefor inspection by any person at the Company’s registered officeduring normal business hours and at the Annual General Meeting(for 15 minutes prior to the meeting and during the meeting). Allnew Directors are subject to election by shareholders at the firstAnnual General Meeting after their appointment and then aresubject to re-election by shareholders once every three years.
During the year the Committee appointed Whitehead Mann, anexternal search firm, to ensure a formal, rigorous and transparentprocess in the appointment of the new Chief Executive Officer.
The policy on Directors’ service contracts is set out in theRemuneration Report.
THE AUDIT COMMITTEEThis Committee comprises three Non-Executive Directors,DP Allvey (Chairman), RE Sayers and VE Treves. Under theCode, VE Treves is not viewed as independent as he is Chairman of the Company. Therefore the Company is not in full compliancewith the Code, which requires an Audit Committee to have at least three independent Non-Executive Directors. However, during2004, the Audit Committee was evaluated and the Board agreedthat the current membership of the Committee was appropriateand effective and also deemed that VE Treves exercisedindependent judgement on all issues presented to that Committee.DP Allvey has recent and relevant financial experience as detailed inhis biography on page 16 of the Annual Review.
The Audit Committee monitors the integrity of the Group’sFinancial Statements and any formal announcements relating to the Group’s performance. The Committee is responsible formonitoring the effectiveness of the external audit process andmaking recommendations to the Board in relation to theappointment, re-appointment and remuneration of the externalauditor. It is responsible for ensuring that an appropriaterelationship between the Group and the external auditors ismaintained. It also reviews annually the Group’s systems of internalcontrol and the processes for monitoring and evaluating the risksfacing the Group. The Committee reviews the effectiveness of theinternal audit function and is responsible for approving, upon therecommendation of the Chief Executive, the appointment andtermination of the head of that function. The Committee meetswith the Vice President Compliance at least once a year withoutmanagement present.
The Group’s auditors, Chief Executive Officer, Chief FinancialOfficer, Vice President Financial Control, Vice President Complianceand the Head of Internal Audit, usually attend Committeemeetings. The Group’s auditors meet with the members of theAudit Committee alone at least once a year.
The Audit Committee seeks to ensure the continued independenceand objectivity of the Group’s auditors and in this regard, monitorsthe level of non-audit work undertaken for the Group. During 2004,a policy on the provision of non-audit work by the external auditor was approved by the Board to ensure that auditor objectivity andindependence is safeguarded. The policy highlights those areas where the external auditor cannot provide services to the Group and they include inter alia, the provision of Group managementfunctions, internal audit outsourcing, provision of legal advice and recruitment and remuneration advice. A breakdown of theaudit and non-audit fees paid to the Group’s auditors during theyear is set out in note 3 to the Financial Statements.
The ultimate responsibility for reviewing and approving the AnnualReport and Accounts and the Interim Report remains with theBoard. During 2004, the Audit Committee met four times. TheChairman and other Committee members when available, alsoattend meetings held twice a year with the external auditor andmanagement to discuss any accounting issues associated with thefull-year audit and half-year review.
24
25

www.intertek.com
INTERNAL CONTROLThe Directors are ultimately responsible for establishing andmaintaining the Group’s system of internal control and forreviewing its effectiveness. However, such a system is designed tomanage rather than eliminate the risk of failure to achieve businessobjectives and can only provide reasonable assurance againstmaterial mis-statement or loss.
The Board can confirm that there is an ongoing process foridentifying, evaluating and managing the significant risks to theGroup’s short and long-term value, including those arising fromsocial, environmental and ethical matters. This process has been inplace for the year under review and up to the date of approval ofthe Annual Report and Accounts, and is regularly reviewed by theBoard, and accords with the Turnbull Guidance. During 2004, anindependent third party review of internal controls was undertakenand any suggested improvements have been implemented. Nomaterial breaches of any internal controls were identified duringthe year. In carrying out the risk review the Board is satisfied that itreceived adequate information from the operations around theworld. Training is provided to Directors on these matters wherenecessary.
The Audit Committee has reviewed the effectiveness of the systemof financial and non-financial internal control. In particular, it has reviewed and continues to seek to improve the process foridentifying and evaluating the significant risks affecting thebusiness and the policies and procedures by which these risks aremanaged. This has been reinforced by the adoption of a Code ofEthical Business Conduct, approved by the Board, which providespractical guidance and instruction for staff. A copy of this Code is available on www.intertek.com.
The Group operates a zero tolerance policy in regard to breaches ofethics and employees are required to sign a certificate confirmingtheir understanding that any breaches of the Group’s code ofethics will result in disciplinary action that may include dismissal of the employee concerned. To support Group policies and raiseconcerns about possible improprieties in matters of financialreporting and other matters there is an independent e-mail andtelephone hotline so that staff may report anonymously anyinaccurate or unethical working practices. The telephone hotline is managed by an independent third party.
In carrying out its review, the Audit Committee endeavours toensure that the Group has in place the most appropriate andeffective controls, checks, systems and risk managementtechniques so as to be in line with best practice on such matters.
Each operating division is responsible for the identification andevaluation of significant risks applicable to that area of businesstogether with the design and operation of suitable internalcontrols. These risks are assessed on a continual basis and may beassociated with a variety of internal or external sources includingcontrol breakdowns, disruption of information systems,competition, natural catastrophe and regulatory requirements.
A process of control using self-assessment and hierarchicalreporting has been established which provides a documented trail
of accountability. These procedures are applied across Groupoperations and provide for continuing assurances to be given atincreasingly higher levels of management and finally, to the Board.This process is facilitated by Internal Audit which also providesassurance as to the operation and validity of the system of internalcontrol. Planned corrective actions are independently monitoredfor timely completion.
Each division reports annually to the Audit Committee via the Vice President Compliance on its review of risks and how they are managed. Each year senior managers throughout the Group confirm the adequacy of their systems of internal controls,compliance with Group policies, local laws and regulations andreport any control weaknesses identified in the past year. The AuditCommittee’s main role is to review, on behalf of the Board, the keyrisks inherent in the business and the system of controls necessaryto ensure such risks are properly managed.
The Vice President Compliance heads a central compliance team,which co-ordinates the quality assurance function, internal auditand claims management. Quality assurance audits are carried out by the divisions and the findings reported to divisionalmanagement and to centrally controlled compliance officers whoreport to the Vice President Compliance. Each division has at leastone dedicated compliance officer who undertakes investigations of issues that arise either from quality assurance audits or by othermeans such as the employee hotline. Reports of significant findingsare presented to the Audit Committee. Each geographic region hasan internal auditor who is independent of the divisions. The mainreporting sites are reviewed annually. The other sites are reviewedregularly on a schedule based on materiality and risk. Reports ofsignificant findings are presented to the Audit Committee and itmonitors and reviews the effectiveness of the internal auditfunction. The international internal audit department has beenawarded ISO 9001: 2000 accreditation, one of the few internalaudit teams in the UK to have achieved this standard.
The Group has implemented internal audit systems to facilitatecompliance with applicable requirements of the US ForeignCorrupt Practices Act, the Office of Foreign Assets Control, theOrganisation for Economic Co-operation and Development andsimilar laws and regulations affecting the conduct of its business.
The Audit Committee reviews the assurance procedures, ensuringthat an appropriate mix of techniques is used to attain the level ofassurance required by the Board.
The Chief Executive Officer also reports to the Board on significantchanges in the business and the external environment, whichcould impact on risk. The Chief Financial Officer provides the Boardwith monthly financial information, which includes the comparisonof key performance figures against budget and forecasts, riskindicators and compliance with covenants. Where areas forimprovement in the system are identified, the Board considers the recommendations made by management and the AuditCommittee. The Board approves the treasury policy and thatdepartment’s activities are also subject to internal audit.

Corporate governance continued
Intertek Group plc Annual report and accounts
RELATIONS WITH SHAREHOLDERSCommunications with shareholders are given a high priority.The Company produces an Annual Review which is sent toshareholders together with the Annual Report and Accounts.At the half year, an Interim Report is published. The Company alsohas a website (www.intertek.com) which contains up-to-dateinformation on the Group’s activities and published financialresults. Shareholders can subscribe via the Investor Relationssection of www.intertek.com to receive e-mail alerts of importantannouncements made by the Company.
There is regular dialogue with institutional shareholders includingpresentations after the Company’s Preliminary Announcement ofthe year end results and at the half year. The Chairman ensuresthat any feedback from the institutional shareholders iscommunicated directly to the Board and all the analysts’ andbrokers’ reports on the Group are e-mailed directly to eachDirector. The Chairman, Senior Independent Director and otherNon-Executive Directors have also attended meetings withinstitutional shareholders during the year.
The Board views the Annual General Meeting as a valuableopportunity to communicate with private and institutionalinvestors and welcomes their participation. All Board membersattend the Annual General Meeting and in particular, theChairmen of the Audit, Nomination and RemunerationCommittees are available to answer questions. At GeneralMeetings, a schedule of the proxy votes cast is made availableto all shareholders. The Company proposes a resolution on each substantially separate issue and does not bundle together resolutions inappropriately.
GOING CONCERNAfter making enquiries, the Directors have a reasonableexpectation that the Group has adequate resources to continuein operation for the foreseeable future. Accordingly, theycontinue to adopt the going concern basis in preparing theGroup’s Financial Statements.
CORPORATE SOCIAL RESPONSIBILITY The Board recognises that the Group has a responsibility to actethically in relation to the physical and social environment in whichit operates and that failure to do so could adversely impact on theGroup’s long and short-term value, as a result of financial penaltyand loss of customer support. It takes such responsibilities seriouslypaying due regard to international and local laws in all its dealings.The Group provides equal opportunity for its entire staffirrespective of their ethnic or religious background, sex, sexualorientation or disability as disclosed in the Directors’ Reporton page 13.
Appropriate health and safety measures have been established and are operated throughout the Group. Local compliance officerskeep the operation of such measures under regular review. Anyincidents are investigated by a central team of specialists, whichmakes recommendations to avoid a repetition.
The Group actively seeks to provide good employmentopportunities and conditions for all staff and it is part of thecorporate culture to hire, train and develop employees andmanagers from local communities.
No use is made of live animals in any of the tests carried out bythe Group.
ENVIRONMENTAL MATTERSThe Group is committed to preventing any adverse impact on theenvironment as a result of its operations. The Group’s worldwiderisk management team is tasked with identifying all potential risks and introducing procedures to prevent such an occurrence.The policy on the audit of environmental risks has recently beenrevised. In future, the Vice President Compliance will choose 10 to 15 sites per annum for review to determine whetherprocedures are being properly implemented, and to advise onfurther precautionary measures. The internal audit team will checkthe process for the disposal of samples. A policy of zero tolerancefor non-compliance with such procedures is enforced and regularchecks are carried out to ensure compliance.
In certain cases, the Group occupies facilities where pollutionoccurred prior to the Group’s use of the site. In each case theGroup has implemented remedial works, on the advice of thirdparty specialists, to minimise further damage to the environment.Environmental due diligence is carried out before the acquisition ofany new sites.
26
27

Group profit and loss accountfor the year ended 31 December 2004
www.intertek.com
Pre- Pre-exceptional Exceptional exceptional Exceptional
items items Total items items Total2004 2004 2004 2003 2003 2003
Notes £m £m £m £m £m £m
Turnover – continuing operations 2 499.6 – 499.6 471.1 – 471.1Cost of sales (385.0) – (385.0) (364.2) – (364.2)
Gross profit 114.6 – 114.6 106.9 – 106.9
Administrative expenses (30.6) – (30.6) (31.9) (1.1) (33.0)Goodwill amortisation (1.5) – (1.5) (1.0) – (1.0)
Total administrative expenses (32.1) – (32.1) (32.9) (1.1) (34.0)
Group operating profit 82.5 – 82.5 74.0 (1.1) 72.9Share of operating profit of associates 1.2 – 1.2 1.2 – 1.2
Total operating profit 2 83.7 – 83.7 75.2 (1.1) 74.1
Continuing operations 83.7 – 83.7 75.2 (3.7) 71.5Discontinued operations – – – – 2.6 2.6
Non-operating exceptional itemsNet profit on disposal of businesses – continuing 5 – – – – 4.5 4.5
Profit on ordinary activities before interest 83.7 – 83.7 75.2 3.4 78.6Net interest and similar charges 7a (5.4) (2.7) (8.1) (7.9) – (7.9)Other net finance income/(expense) 7b 0.2 – 0.2 (0.1) – (0.1)
Profit on ordinary activities before taxation 3 78.5 (2.7) 75.8 67.2 3.4 70.6Taxation on profit on ordinary activities 8 (20.8) 0.5 (20.3) (18.7) (0.1) (18.8)
Profit on ordinary activities after taxation 57.7 (2.2) 55.5 48.5 3.3 51.8Attributable to minorities – equity interests (2.8) – (2.8) (3.7) – (3.7)
Profit for the financial year 54.9 (2.2) 52.7 44.8 3.3 48.1Dividends 9 (16.1) – (16.1) (13.6) – (13.6)
Retained profit for the year 38.8 (2.2) 36.6 31.2 3.3 34.5
Earnings per share 10Basic 35.6p (1.5)p 34.1p 29.1p 2.2p 31.3p
Diluted 35.3p (1.4)p 33.9p 29.0p 2.1p 31.1p

Balance sheetsat 31 December 2004
Intertek Group plc Annual report and accounts
Group Group Company Company2004 2003 2004 2003
Notes £m £m £m £m
Fixed assetsIntangible assets – goodwill 11 36.9 17.8 – –Tangible assets 12 88.5 77.8 – –Investments:
Subsidiaries 13 – – 271.2 263.2Associates 13 1.8 1.2 – –
127.2 96.8 271.2 263.2
Current assetsStocks 14 1.5 1.4 – –Debtors 15 109.8 105.3 0.9 3.7Cash at bank and in hand 52.5 81.5 1.2 23.8
163.8 188.2 2.1 27.5Creditors due within one yearBorrowings 16 (14.0) (17.5) – –Other creditors 16 (106.2) (92.1) (11.9) (10.1)
(120.2) (109.6) (11.9) (10.1)
Net current assets 43.6 78.6 (9.8) 17.4
Total assets less current liabilities 170.8 175.4 261.4 280.6
Creditors due after more than one yearBorrowings 17 (150.9) (196.2) – –Other creditors 17 (0.5) (1.4) (7.7) (23.9)
(151.4) (197.6) (7.7) (23.9)Provisions for liabilities and charges 18 (6.0) (8.6) – –
Net assets/(liabilities) excluding pension liabilities 13.4 (30.8) 253.7 256.7Pension liabilities 23 (11.3) (5.1) – –
Net assets/(liabilities) 2.1 (35.9) 253.7 256.7
Capital and reservesCalled up share capital 19 1.5 1.5 1.5 1.5Share premium 20 234.5 232.1 234.5 232.1Merger reserve 20 3.6 3.6 – –Other reserves 20 2.8 2.8 – –Profit and loss account 20 (246.0) (283.1) 17.7 23.1
Shareholders’ (deficit)/funds (3.6) (43.1) 253.7 256.7Minority shareholders’ equity interest 21 5.7 7.2 – –
Capital employed – equity 2.1 (35.9) 253.7 256.7
The Financial Statements on pages 27 to 54 were approved by the Board on 7 March 2005 and were signed on its behalf by:
RC NelsonDirector
W SpencerDirector
28
29

Statement of group cash flowfor the year ended 31 December 2004
Reconciliation of net cash flow to movement in net debtfor the year ended 31 December 2004
www.intertek.com
2004 2003Notes £m £m
Net cash inflow from operating activities 24 101.9 80.0Dividends received from associated undertakings 0.8 0.7Returns on investments and servicing of finance 25 (9.4) (10.1)Taxation (16.0) (13.7)Capital expenditure and financial investment 25 (28.0) (23.6)Acquisitions and disposals:
Cash outflow from acquisitions 25 (26.3) (7.8)Cash inflow from disposal 25 – 6.6
Equity dividends paid (14.4) (12.5)
Cash inflow before financing 8.6 19.6Financing: 25
Net issue of shares 1.1 (0.1)Decrease in debt (36.3) (6.8)
(Decrease)/increase in cash in the year (26.6) 12.7
2004 2003Notes £m £m
(Decrease)/increase in cash in the year 26 (26.6) 12.7Decrease in debt 26 36.3 6.8
Decrease in net debt resulting from cash flows 26 9.7 19.5Acquisitions and disposals 26 (0.3) 0.5Other non-cash movements 26 (2.8) (1.0)Exchange adjustments 26 13.2 15.7
Decrease in net debt in the year 19.8 34.7Net debt at the start of the year (132.2) (166.9)
Net debt at the end of the year 26 (112.4) (132.2)

Statement of total group recognised gains and lossesfor the year ended 31 December 2004
Intertek Group plc Annual report and accounts
2004 2003£m £m
Net profit from group companies 52.0 47.3Net profit from associates 0.7 0.8
Profit for the financial year 52.7 48.1Actuarial pension (loss)/gain* (6.6) 1.6Exchange adjustments 7.1 10.2
Total recognised gains and losses relating to the year 53.2 59.9
* Actuarial pension (loss)/gain is stated net of deferred tax.
Reconciliation of movements in shareholders’ (deficit)/funds
Group Group Company Company2004 2003 2004 2003
£m £m £m £m
Opening shareholders’ (deficit)/funds (43.0) (90.5) 256.7 262.1Restatement (see note below)* (0.1) (0.1) – –
Restated at 1 January 2004 (43.1) (90.6) 256.7 262.1Issue of ordinary shares 2.4 0.5 2.4 0.5Profit for the financial year 52.7 48.1 10.7 7.7Dividends (16.1) (13.6) (16.1) (13.6)Goodwill on disposals – 0.7 – –Actuarial pension (loss)/gain ** (6.6) 1.6 – –Exchange adjustments 7.1 10.2 – –
Closing shareholders’ (deficit)/funds (3.6) (43.1) 253.7 256.7
** In accordance with UITF 38, own shares of £0.1m held by the ESOT have been reclassified from investments.** Actuarial pension (loss)/gain is stated net of deferred tax.
Historical cost profits and losses
A note of consolidation historical cost profits and losses is not presented as there is no material difference in either year between the profitsof the Group as shown in these accounts and those shown on a historical cost basis.
30
31

Notes to the financial statementsfor the year ended 31 December 2004
www.intertek.com
1. Accounting policiesBasis of preparationThe financial statements have been prepared in accordance with applicable United Kingdom accounting standards and under the historicalcost accounting rules. The following principal accounting policies have been applied consistently, except for the presentation of ESOP sharesreferred to below, throughout the year and the preceding year in dealing with items which are considered material in relation to the Group’sFinancial Statements.
The Group was created by a group reconstruction whereby, on 24 May 2002, the shareholders in Intertek Testing Services Holdings Limited(ITSHL), formerly Intertek Testing Services Limited, exchanged the whole of their shareholdings in ITSHL in return for shares in a newlyformed holding company, Intertek Testing Services, plc (now Intertek Group plc). The acquisition of ITSHL by Intertek Testing Services plc wasaccounted for in accordance with the principles of merger accounting as set out in FRS 6: Acquisitions and Mergers and Schedule 4A to theCompanies Act 1985. By adopting this accounting treatment the consolidated financial information included in these accounts has beenshown as though the parent company had always been the parent company of the Group.
During the year, the Group adopted the requirement of UITF 38: Accounting for ESOP Trusts, and therefore, the Group’s investment in itsown shares of £0.1m, which is held in an Employee Share Ownership Trust (ESOT), is reported as a deduction from shareholders’ funds.Previously this was reported as an investment. The balance sheet at 31 December 2003 has been restated to reflect this change inpresentation. The impact of this change is not material.
Parent companyUnder section 230(4) of the Companies Act 1985 the Company is exempt from the requirement to present its own profit and loss account.
Basis of consolidation The consolidated financial statements include the financial statements of the Company and its subsidiaries together with the Group’s share of net assets and results of associates, made up to 31 December 2004. New subsidiaries are included from their respective dates ofacquisition during the period except where they have been merger accounted. The results of subsidiaries disposed of during the period are included up to the date of disposal.
An associate is a company in which the Group has a long term interest, usually from 20% to 50% of the equity voting rights, and overwhich it actually exercises significant influence. The Group’s share of the profits less losses of associates is included in the consolidated profitand loss account on the equity accounting basis and the holding value of associates in the Group balance sheet is calculated by reference tothe Group’s equity in the net assets of such undertakings.
In the Company’s Financial Statements, investments in subsidiaries are stated at cost less provisions for impairment.
Foreign currencies Transactions in foreign currencies are recorded using the rate of exchange ruling at the date of the transaction or, if hedged forward, at therate of exchange under the related forward currency contract. Monetary assets and liabilities of group companies which are denominated inforeign currencies are translated using the contracted rate or the rate of exchange ruling at the balance sheet date and the gains or losseson translation are included in the profit and loss account.
The assets and liabilities of overseas subsidiary undertakings and associated undertakings are translated at the closing exchange rates. Profitand loss accounts of such undertakings are consolidated at the average rates of exchange during the year. Gains and losses arising on thesetranslations are taken to reserves, net of exchange differences arising on related foreign currency borrowings.
Tangible fixed assets and depreciationTangible fixed assets are stated at cost less depreciation, which is provided, except for freehold land, on a straight line basis over theestimated useful lives of the assets down to their expected residual value, mainly at the following annual rates:
Freehold buildings and long leasehold land and buildings 2%
Short leasehold land and buildings term of lease
Plant and machinery 10% – 33.3%

Notes to the financial statements continuedfor the year ended 31 December 2004
Intertek Group plc Annual report and accounts
1. Accounting policies continuedLeasesAssets held under finance leases are treated as if they had been purchased at the present value of the minimum lease payments.This cost is included in tangible fixed assets and depreciation is provided over the shorter of the lease term or the estimated useful life. The corresponding obligations under these leases are included within borrowings. The finance charge element of rentals payable is chargedto the profit and loss account to produce a constant rate of interest. Operating lease rentals are charged to the profit and loss account on astraight line basis over the period of the lease.
StocksStocks and work in progress are stated at the lower of cost and net realisable value. Cost comprises expenditure incurred in the normalcourse of business in bringing stocks and work in progress to their present condition and location.
TurnoverTurnover represents the total amount receivable for services provided and goods sold, excluding sales related taxes and intra grouptransactions. Turnover is recognised when the relevant service is completed or goods delivered.
Deferred taxDeferred taxation is recognised, without discounting, in respect of all timing differences between the treatment of certain items for taxationand accounting purposes which have arisen but not reversed by the balance sheet date except as otherwise required by FRS 19: Deferredtax. Deferred tax assets are only recognised to the extent that it is more likely than not that there will be suitable taxable profits to offset thefuture reversal of these timing differences.
Pension benefitsContributions payable under defined contribution schemes are charged to the profit and loss account as they fall due.
The Group has a number of defined benefit pension schemes. Following the implementation in 2001 of FRS 17: Retirement Benefits, thedefined benefit schemes’ assets are valued at market value and the schemes’ liabilities are discounted to present values using high qualitycorporate bond rates. The resultant pension scheme surpluses, to the extent that they are considered recoverable, or deficits, are recognisedin full on the face of the balance sheet, net of deferred taxation. The increase in the present value of the liabilities expected to arise from theemployees’ services in the accounting period is charged to profits. The expected return on the schemes’ assets less the interest on thepresent value of the schemes’ liabilities during the accounting period is shown as ‘Other finance income’. Actuarial gains and losses, net ofdeferred tax, are recognised in the Statement of Total Group Recognised Gains and Losses.
GoodwillPurchased goodwill, being the difference between the fair value of consideration payable and the fair value of separable net assetsacquired, in respect of acquisitions since 1 January 1998, is capitalised in accordance with the requirements of FRS 10: Goodwill andIntangible Assets, and is amortised on a straight line basis over the Directors’ estimate of useful life, which is up to 20 years.
Purchased goodwill in respect of acquisitions before 1 January 1998, was written off to reserves in the year of acquisition, in accordancewith the accounting standard then in force. When a subsequent disposal occurs any goodwill previously written off to reserves is writtenback through the profit and loss account. In respect of acquisitions since 1 January 1998, the profit or loss on disposal is calculated aftercharging the unamortised amount of any related goodwill. Impairment of goodwill is recorded when it becomes clear that the carryingvalue of goodwill in relation to a specific business may not be recoverable.
Fair value accounting adjustments are made in respect of acquisitions and these may be made on provisional estimates. Amendments maybe made to these adjustments in the subsequent accounting period with corresponding adjustment to goodwill.
Financial instrumentsThese instruments are used to manage the Group’s exposure to fluctuations in interest rates and foreign currency exchange rates.Instruments accounted for as hedges are designated as a hedge at the inception of contracts. Interest differentials on derivative instrumentsand amounts receivable and payable on interest rate instruments are recognised as adjustments to interest expense over the period of the contracts. Gains and losses on foreign currency hedges are recognised on maturity of the underlying transaction. Gains and lossesarising on hedging instruments which are cancelled due to the termination of the underlying exposure are taken to the profit and lossaccount immediately.
32
33

www.intertek.com
2. Segmental informationThe Group comprises four operating divisions which are organised as follows: Labtest, which tests and inspects textiles, toys and otherconsumer products; Caleb Brett, which tests and inspects oil, chemicals and agricultural produce; ETL SEMKO, which tests and certifieselectrical and electronic products, telecommunication equipment, automotive components, building products and heating, ventilationand air conditioning equipment and Foreign Trade Standards, which provides standards programmes and pre-shipment inspectionprogrammes to standards bodies and governments. Central overheads comprise the costs of the corporate head office and non-operatingholding companies.
2004 2003
Profit Profitbefore Net before Net
interest operating interest operatingTurnover and tax assets* Turnover and tax assets*
Business analysis Notes £m £m £m £m £m £m
By activityLabtest 132.3 45.0 23.7 130.8 42.8 23.4Caleb Brett 177.3 15.5 53.7 169.6 13.2 48.7ETL SEMKO 122.4 17.5 32.3 111.6 14.2 32.6Foreign Trade Standards 67.6 14.0 8.5 59.1 11.9 13.7Central overheads – (6.8) 1.2 – (5.9) (3.5)
Total continuing operations 499.6 85.2 119.4 471.1 76.2 114.9Goodwill amortisation – (1.5) – – (1.0) –
Total before operating exceptional items 499.6 83.7 119.4 471.1 75.2 114.9Operating exceptional items – continuing 4 – – – – (3.7)
Continuing operations 499.6 83.7 119.4 471.1 71.5 114.9Operating exceptional items – discontinued 4 – – – – 2.6 –Non-operating exceptional items 5 – – – – 4.5 –
Total 499.6 83.7 119.4 471.1 78.6 114.9
* See analysis below
Turnover and profit before interest and tax for 2004, includes £18.3m and £3.0m respectively, from acquisitions made during the year and£4.6m and £(0.1)m respectively, from businesses that were sold during the year.
A reconciliation of net assets as reported on the Group balance sheet to the net operating assets shown above, is set out on page 35.

Notes to the financial statements continuedfor the year ended 31 December 2004
Intertek Group plc Annual report and accounts
2. Segmental information continuedThe following table shows turnover, operating profit, and net operating assets by significant countries.
2004 2003
Net NetOperating operating Operating operating
Turnover profit* assets Turnover profit* assetsBy significant country £m £m £m £m £m £m
United States 132.1 11.8 38.5 124.0 6.7 37.5United Kingdom 77.2 3.0 20.4 63.5 0.8 19.2Hong Kong 64.6 25.1 5.4 70.4 25.5 6.8China 33.0 14.3 7.1 25.9 11.0 6.5Other (each under 10% of total) 192.7 31.0 48.0 187.3 32.2 44.9
Continuing operations 499.6 85.2 119.4 471.1 76.2 114.9
* Operating profit is stated before goodwill amortisation and operating exceptional items.
2004 2003
Net NetOperating operating Operating operating
Turnover profit* assets Turnover profit* assetsBy geographic origin £m £m £m £m £m £m
Americas 169.0 17.6 47.9 157.3 12.0 47.0Europe, Middle East and Africa 166.3 14.4 41.6 149.6 11.0 38.3Asia 164.3 53.2 29.9 164.2 53.2 29.6
Continuing operations 499.6 85.2 119.4 471.1 76.2 114.9
* Operating profit is stated before goodwill amortisation and operating exceptional items.
The above table shows the turnover analysed by geographic origin. The turnover of continuing operations by geographic destination wasAmericas £181.3m (2003: £161.1m), Europe, Middle East and Africa £149.0m (2003: £142.1m) and Asia £169.3m (2003: £167.9m).
In order to facilitate comparison of the underlying performance, profit on continuing operations by activity shown above, is stated beforeexceptional operating items and before allocating goodwill amortisation to the divisions. After allocating these costs, the divisionalprofitability was: Labtest £44.9m (2003: £42.7m), Caleb Brett £14.8m (2003: £9.6m), ETL SEMKO £16.8m (2003: £12.3m), FTS £14.0m(2003: £12.8m) and Central overheads £(6.8)m (2003: £(5.9)m) and geographically was: Americas £17.0m (2003: £10.2m), Europe,Middle East and Africa £13.6m (2003: £8.6m) and Asia £53.1m (2003: £52.7m).
34
35

www.intertek.com
2. Segmental information continued2004 2003
Net operating assets reconciliation £m £m
Net assets/(liabilities) as reported on the balance sheet 2.1 (35.9)Goodwill (36.9) (17.8)Investments and associates (1.8) (1.2)Provisions for liabilities and charges 6.0 8.6Tax payable 19.5 16.6Net debt 112.4 132.2Non-operating assets, liabilities and provisions (4.0) (1.8)Net deficit on pension funds 11.3 5.1Proposed final dividend 10.8 9.1
Net operating assets 119.4 114.9
Analysed as:Fixed assets 88.5 77.8Stocks 1.5 1.4Operating debtors 108.6 103.8Operating creditors and provisions (79.2) (68.1)
Net operating assets 119.4 114.9
3. Profit on ordinary activities before taxation2004 2003
£m £m
Profit on ordinary activities before taxation is stated after charging:Auditors’ remuneration:
Group – audit 0.9 0.9Group – non audit work 0.3 0.3Company – audit 0.1 0.1
Depreciation 18.4 18.6Amortisation of goodwill 1.5 1.0Property rentals 17.3 17.1Lease and hire charges – plant and machinery 4.4 4.4
The fees of £0.3m (2003: £0.3m) for non-audit work were primarily for tax advice, tax compliance work and the review of theInterim Report.
4. Operating exceptional items2004 2003
£m £m
Caleb Brett – (3.0)ETL SEMKO – (1.7)FTS – (1.8)FTS – government contracts – 2.8
Total continuing operations – (3.7)Discontinued operations – recoveries – 2.6
Total operating exceptional items – (1.1)
By geographic region:Americas – 0.8Europe, Middle East and Africa – (1.5)Asia – (0.4)
Total – (1.1)
The charge of £3.7m for continuing operations in 2003, comprised £6.5m in respect of restructuring and a credit of £2.8m in respect of a release of a debt provision relating to Nigeria. The credit of £2.6m for discontinued operations in 2003, was in respect of insurancerefunds relating to the discontinued Environmental Testing division.

Notes to the financial statements continuedfor the year ended 31 December 2004
Intertek Group plc Annual report and accounts
5. Non-operating exceptional items2004 2003
£m £m
Labtest (Asia) – 5.5Caleb Brett (Americas) – (1.0)
Total continuing operations – 4.5
The profit of £5.5m in 2003 related to the disposal of the 50% interest in a company operating in China. The loss of £1.0m was in respectof the disposal of a trade investment.
6. Employees2004 2003
Staff costs £m £m
Wages and salaries 182.0 176.7Social security costs 18.4 17.6Pension costs 9.0 8.3
Total 209.4 202.6
Details of the remuneration of the Directors are set out in the Remuneration Report on page 18.
Average number of employees by activity 2004 2003
Labtest 4,004 3,670 Caleb Brett 5,551 5,181ETL SEMKO 2,146 1,773Foreign Trade Standards 974 878Central 42 38
Total 12,717 11,540
7a) Net interest and similar charges2004 2003
Pre-exceptional £m £m
Interest payable:Senior Term Loans 5.9 8.2Other 0.4 0.4Amortisation of debt issuance costs 0.7 1.0
7.0 9.6Interest receivable:
On bank balances (1.6) (1.7)
Net interest payable 5.4 7.9
2004 2003Exceptional £m £m
Unamortised costs in connection with:Repaid Senior Term Loans 2.1 –Refinancing 0.6 –
Exceptional amortisation of debt issuance costs 2.7 –
Total net interest and similar charges 8.1 7.9
7b) Other net finance income/(expense)Expected return on pension assets 2.5 2.2Pension interest cost (2.3) (2.3)
Net finance income/(expense) 0.2 (0.1)
36
37

www.intertek.com
8. Taxation2004 2003
£m £m
UK corporation tax at 30% (2003: 30%) 1.2 1.8Double taxation relief (1.2) (1.1)
– 0.7Overseas taxation 19.5 18.4Share of associated undertakings’ tax 0.5 0.4
Current tax 20.0 19.5Deferred tax – origination and reversal of timing differences 0.3 (0.7)
Total 20.3 18.8
The tax charge of £20.3m includes tax relief of £0.5m relating to exceptional items (2003: charge of £0.1m).
Reconciliation of the notional tax charge at UK standard rate to the actual current tax charge:
2004 2003£m £m
Profit before taxation 75.8 70.6
Notional tax charge at UK standard rate 30% (2003: 30%) 22.7 21.2Differences in overseas tax rates (4.8) (5.9)Tax on dividends 1.2 0.9Permanent differences – disallowables 4.6 4.6Permanent differences – untaxed income (0.4) (2.3)Losses (utilised)/not recognised (1.2) 0.8Accelerated capital allowances and other provisions (2.5) 0.1Other 0.4 0.1
Total current tax 20.0 19.5
The effective tax rate before exceptional items was 26.5% (2003: 27.8%). The main reason for the reduction in the effective tax rate wasimproved utilisation of losses and other previously unrecognised timing differences due to improved trading performance in particularjurisdictions. The effective tax rate is expected to be close to current year levels for the short to medium-term.

Notes to the financial statements continuedfor the year ended 31 December 2004
Intertek Group plc Annual report and accounts
9. Dividends2004 2003
£m £m
Interim paid 16 November 2004 3.4p per share (2003: 2.9p) 5.3 4.5Final proposed 7.0p per share (2003: 5.9p) 10.8 9.1
Total dividends 16.1 13.6
10. Earnings per shareThe calculation of earnings per ordinary share is based on earnings after tax and minority interests and the weighted average number ofordinary shares in issue during the year. In addition to the earnings per share required by FRS 14: Earnings per share, an underlying earningsper share has also been calculated and is based on earnings excluding the effect of the exceptional items and goodwill amortisation. It hasbeen calculated to allow shareholders to gain a clearer understanding of the trading performance of the Group. Details of the underlyingearnings per share are set out below:
2004 2003Based on the profit for the year: £m £m
Underlying profit before tax 80.0 68.2Taxation on underlying profit (20.8) (18.7)Minority interest in underlying profit (2.8) (3.7)
Underlying earnings 56.4 45.8Goodwill amortisation (1.5) (1.0)Exceptional operating items – (1.1)Exceptional non-operating items – 4.5Exceptional finance charges (2.7) –Taxation on exceptional items 0.5 (0.1)
Basic earnings 52.7 48.1
Number of shares (millions):Basic weighted average number of shares 154.4 153.7Potentially dilutive share options 1.1 0.7
Diluted weighted average number of shares 155.5 154.4
Basic underlying earnings per share 36.5p 29.8pOptions (0.2)p (0.1)p
Diluted underlying earnings per share 36.3p 29.7p
Basic earnings per share 34.1p 31.3pOptions (0.2)p (0.2)p
Diluted earnings per share 33.9p 31.1p
The weighted average number of shares used in the calculation of the diluted earnings per share for the year to 31 December 2004,excludes 56,280 potential shares (2003: 1,220,962) as these were not dilutive in accordance with FRS 14: Earnings per share.
38
39
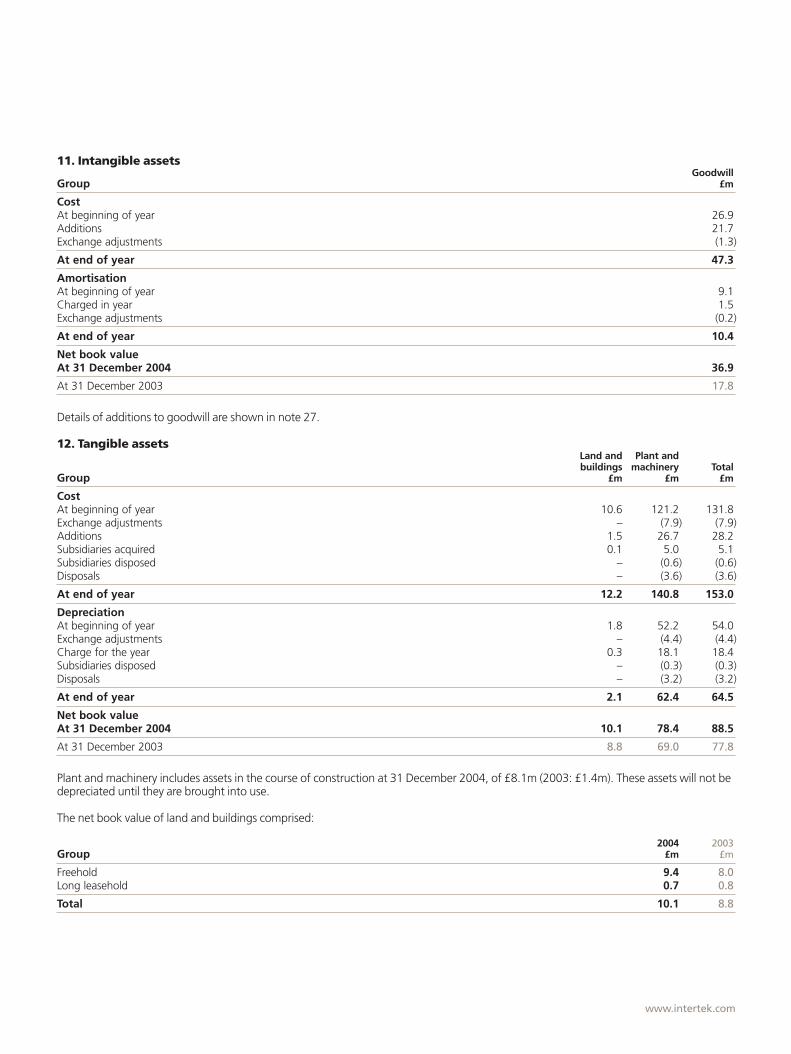
www.intertek.com
11. Intangible assetsGoodwill
Group £m
CostAt beginning of year 26.9Additions 21.7Exchange adjustments (1.3)
At end of year 47.3
AmortisationAt beginning of year 9.1Charged in year 1.5Exchange adjustments (0.2)
At end of year 10.4
Net book valueAt 31 December 2004 36.9
At 31 December 2003 17.8
Details of additions to goodwill are shown in note 27.
12. Tangible assetsLand and Plant andbuildings machinery Total
Group £m £m £m
CostAt beginning of year 10.6 121.2 131.8Exchange adjustments – (7.9) (7.9)Additions 1.5 26.7 28.2Subsidiaries acquired 0.1 5.0 5.1Subsidiaries disposed – (0.6) (0.6)Disposals – (3.6) (3.6)
At end of year 12.2 140.8 153.0
DepreciationAt beginning of year 1.8 52.2 54.0Exchange adjustments – (4.4) (4.4)Charge for the year 0.3 18.1 18.4Subsidiaries disposed – (0.3) (0.3)Disposals – (3.2) (3.2)
At end of year 2.1 62.4 64.5
Net book valueAt 31 December 2004 10.1 78.4 88.5
At 31 December 2003 8.8 69.0 77.8
Plant and machinery includes assets in the course of construction at 31 December 2004, of £8.1m (2003: £1.4m). These assets will not bedepreciated until they are brought into use.
The net book value of land and buildings comprised:
2004 2003Group £m £m
Freehold 9.4 8.0Long leasehold 0.7 0.8
Total 10.1 8.8

Notes to the financial statements continuedfor the year ended 31 December 2004
Intertek Group plc Annual report and accounts
13. InvestmentsGroup Group Company
associates other subsidiariesNotes £m £m £m
CostAt beginning of year 0.8 0.1 263.2Restatement for own shares a – (0.1) –
Restated at beginning of year 0.8 – 263.2Additions b 0.7 – 8.0
At end of year 1.5 – 271.2
Share of post acquisition reservesAt beginning of year 0.4 – –Share of net profit for the year 0.7 – –Dividends received (0.8) – –
At end of year 0.3 – –
Net book valueAt 31 December 2004 1.8 – 271.2
At 31 December 2003 (restated) 1.2 – 263.2
a) In accordance with UITF 38, investment in own shares of £0.1m held in an ESOT has now been reclassified and deducted from retainedearnings (see note 20).
b) During the year the Group acquired a 40% interest in Allium LLC, a company incorporated in the USA, and the Company subscribed£8.0m into the share capital of a subsidiary.
c) Details of principal operating subsidiaries and associated companies are set out in note 32.
14. Stocks2004 2003
Group £m £m
Raw materials and consumables 0.6 0.3Work in progress 0.7 0.5Finished goods 0.2 0.6
Total 1.5 1.4
40
41

www.intertek.com
15. DebtorsGroup Group Company Company
2004 2003 2004 2003£m £m £m £m
Trade debtors 87.0 87.3 – –Amounts owed by group undertakings – – – 3.6Other debtors 9.8 7.6 0.7 –Prepayments and accrued income 13.0 10.4 0.2 0.1
Total 109.8 105.3 0.9 3.7
For the Group, other debtors included £2.0m (2003: £1.6m) due after more than one year.
16. Creditors due within one yearGroup Group Company Company
2004 2003 2004 2003£m £m £m £m
Borrowings:Senior Term Loans 14.0 18.4 – –Debt issuance costs – (0.9) – –
Total net borrowings 14.0 17.5 – –Trade creditors 23.8 22.0 – –Corporation tax 19.5 16.6 – –Other taxation and social security 6.4 5.9 – –Other creditors 1.1 2.4 – 0.1Accruals and deferred income 44.6 36.1 0.1 0.2Dividends payable 10.8 9.1 10.8 9.1Amounts owed to group undertakings – – 1.0 0.7
Total 120.2 109.6 11.9 10.1
17. Creditors due after more than one yearGroup Group Company Company
2004 2003 2004 2003£m £m £m £m
Borrowings:Senior Term Loans 150.9 198.1 – –Debt issuance costs – (1.9) – –
Total net borrowings 150.9 196.2 – –Other creditors 0.5 1.4 – –Amounts owed to group undertakings – – 7.7 23.9
Total 151.4 197.6 7.7 23.9

Notes to the financial statements continuedfor the year ended 31 December 2004
Intertek Group plc Annual report and accounts
17. Creditors due after more than one year continued2004 2003
Other Total Other Totalfinancial financial financial financial
Borrowings liabilities* liabilities Borrowings liabilities* liabilities£m £m £m £m £m £m
Debt falling due:In one year or less 14.0 – 14.0 18.4 – 18.4Between one and two years 93.2 0.5 93.7 27.6 1.4 29.0Between two and five years 57.7 – 57.7 170.5 – 170.5
Total gross borrowings 164.9 0.5 165.4 216.5 1.4 217.9Debt issuance costs – – – (2.8) – (2.8)
Total net borrowings 164.9 0.5 165.4 213.7 1.4 215.1
* Other financial liabilities exclude amounts payable within one year (as permitted by FRS 13) and pension deficits, full details of which are given in note 23.
Description of borrowingsIn December 2004, the Group refinanced its existing £300m secured facility with a £300m non-secured facility. The previous facility wasdue to expire on 15 June 2007. The new facility is for five years expiring on 15 December 2009, with the option to extend this for a furthertwo years.
The facility comprises three tranches. Facility A is a £70m multi-currency term loan with equal bi-annual amortisations over five years. Facility B is a £150m multicurrency revolving credit, available up to 15 December 2009. Facility C is a 364 day, £80m multi-currencyrevolving credit facility, with the option to convert this into a one year loan by the end of the 364 day period.
Advances under Facilities A and B initially bear interest at a rate equal to LIBOR (as adjusted) plus a margin of 0.5%. The margin over LIBORis in the range from 0.6% to 0.4% in accordance with a leverage grid. As at 31 December 2004, the margin was 0.5%. Advances underFacility C initially bear interest at a rate equal to LIBOR (as adjusted) plus a margin of 0.4%. The margin over LIBOR is in the range from0.5% to 0.3% in accordance with a leveraged grid. As at 31 December 2004, the margin was 0.4%.
The undrawn committed borrowing facilities, which mature in 2009, amounted to £135.1m (2003: £50m) of which £5.0m (2003: £3.7m)has been utilised for letters of credit and guarantees.
18. Provisions for liabilities and chargesDeferred
tax Restructuring Claims TotalGroup £m £m £m £m
At beginning of year 0.3 3.0 5.3 8.6Exchange adjustments – – (0.2) (0.2)Provided in the year 0.3 – 2.9 3.2Released during the year – – (0.3) (0.3)Utilised during the year – (2.4) (2.9) (5.3)
At end of year 0.6 0.6 4.8 6.0
The provision for claims includes claims from customers, former employees, other plaintiffs and environmental agencies includingassociated legal costs. The restructuring provision is expected to be utilised in 2005. The provision for claims and associated legal costsis expected to be utilised in one to two years. Details of contingent liabilities in respect of claims are set out in note 30.
42
43

www.intertek.com
18. Provisions for liabilities and charges continuedThe amounts provided and amounts not recognised for deferred taxation at 31 December 2004, are set out below:
2004 2004 2003 2003Not Not
Provided recognised Provided recognisedGroup £m £m £m £m
Accelerated depreciation/(capital allowances) 0.3 (0.1) (0.1) (0.4)Losses carried forward – (20.9) – (23.6)Other timing differences 0.3 (17.8) 0.4 (22.9)
Deferred tax liability/(asset) 0.6 (38.8) 0.3 (46.9)
A potential deferred tax asset arises in certain territories which is not recognised in the accounts because the directors believe thatsuitable taxable profits from which the future reversal of timing differences can be deducted, cannot be predicted with a reasonabledegree of certainty.
At 31 December 2004, the Company had an unprovided deferred tax asset of £3.6m (2003: £3.6m) arising on losses and othertiming differences.
19. Called up share capital2004 2004 2003
Group and Company Notes Number £m £m
AuthorisedOrdinary shares of 1p each 200,000,000 2.0 2.0Non equityZero coupon redeemable preference shares of £1 each – 105.5 105.5
200,000,000 107.5 107.5
Allotted, called up and fully paidOrdinary shares of 1p each at start of year 153,960,122 1.5 1.5Issued in connection with the acquisition of Entela Inc. 27 256,622 – –Employee share option schemes – options exercised 28 551,390 – –
Ordinary shares of 1p each at end of year 154,768,134 1.5 1.5
None of the zero coupon redeemable preference shares were allotted at 31 December 2004 or at 31 December 2003.
20. Shareholders’ (deficit)/funds Share Share Merger Other Profit
capital premium reserve reserve and loss TotalGroup £m £m £m £m £m £m
At beginning of year 1.5 232.1 3.6 2.8 (283.0) (43.0)Restatement (note below)* – – – – (0.1) (0.1)
Restated at 1 January 2004 1.5 232.1 3.6 2.8 (283.1) (43.1)Retained profit for the year – – – – 36.6 36.6Exchange adjustments – – – – 7.1 7.1Actuarial pension loss – – – – (6.6) (6.6)Shares issued – 2.4 – – – 2.4
At end of year 1.5 234.5 3.6 **2.8 ***(246.0) (3.6)
* In accordance with UITF 38, own shares of £0.1m held by the ESOT have been reclassified from investments.** The ‘other’ reserve arose on the conversion of share warrants into share capital.*** After charging £229.9m (2003: £244.1m) for goodwill written off to reserves in relation to subsidiaries acquired prior to 31 December 1997.
Own shares of £0.1m (2003: £0.1m) are held in an Employee Share Ownership Trust (ESOT), which is managed and controlled by anindependent offshore trustee. The assets, liabilities, income and costs of the ESOT have been incorporated into the Group’s financialstatements. At 31 December 2004, the ESOT held 87,000 (2003: 87,000) ordinary shares purchased at 140p. The market value of theshares at 31 December 2004, was 705p (2003: 461p). The ESOT has waived the right to receive dividends on its shareholding. The ESOT isused to acquire shares which will, at a later date, be allocated to employees following exercises through the 2002 Share Option Plan. Thetotal ESOT costs charged to the Group profits for 2004 were £15,000 (2003: £16,000) of which £6,000 (2003: £6,000) was interestexpense.

Notes to the financial statements continuedfor the year ended 31 December 2004
Intertek Group plc Annual report and accounts
20. Shareholders’ (deficit)/funds continuedThe profit and loss reserve of the Group is analysed as follows:
2004 2003£m £m
Profit and loss reserve deficit excluding pension liabilities (234.7) (277.9)Pension liabilities (11.3) (5.1)
Profit and loss reserve deficit including net pension liability (246.0) (283.0)
Share Share Profitcapital premium and loss Total
Company £m £m £m £m
At beginning of year 1.5 232.1 23.1 256.7Retained loss for the year – – (5.4) (5.4)Shares issued – 2.4 – 2.4
At end of year 1.5 234.5 17.7 253.7
Details of share options are set out in note 28.
A profit and loss account for Intertek Group plc has not been presented as permitted by Section 230(4) of the Companies Act 1985.The profit for the financial year, before dividends payable of £16.1m, was £10.7m, which was mainly in respect of dividends receivedfrom subsidiaries.
21. Minority interests
2004 2003Group £m £m
At beginning of year 7.2 7.1Share of profit for the year 2.8 3.7Additions 0.5 –Disposals (0.6) (0.4)Dividends (4.1) (2.8)Exchange adjustments (0.1) (0.4)
At end of year 5.7 7.2
22. CommitmentsAt 31 December, the Group had annual unprovided commitments under non-cancellable operating leases which expire as follows:
2004 2003
Land and Land andbuildings Other Total buildings Other Total
Group £m £m £m £m £m £m
Within one year 2.1 0.9 3.0 2.0 0.8 2.8In the second to fifth years inclusive 7.6 2.4 10.0 7.0 2.3 9.3Over five years 4.3 – 4.3 4.4 – 4.4
Total 14.0 3.3 17.3 13.4 3.1 16.5
Contracts for capital expenditure which are not provided in these accounts amounted to £1.7m (2003: £0.9m).
44
45

www.intertek.com
23. Pension schemesThe Group operates a number of pension plans throughout the world. In most locations, these are defined contribution arrangements.However, there are significant defined benefit plans in the United Kingdom, United States, Hong Kong and Taiwan. These are all fundedplans, with assets held in separate trustee administered funds. Other defined benefit plans in certain countries are not considered to be material and are therefore accounted for as if they were defined contribution plans. The schemes in Hong Kong and in the UnitedKingdom were closed to new entrants with effect from 1 December 2001 and 1 April 2002, respectively.
In 2005, around 45 former Avecia employees will have the option to transfer past service pension benefits to the UK Plan followingan acquisition which took place on 13 May 2004. Approximate assets and liabilities in respect of this bulk transfer are included in theFRS 17 figures by assuming that all eligible employees elect to transfer.
a) The total pension cost for the Group was:
2004 2003£m £m
Defined contribution schemes 7.0 6.2Defined benefit schemes – current service cost 2.0 2.1
Pension cost included in operating profit 9.0 8.3
Included in other net finance (income)/expense:2004 2003
£m £m
Defined benefit schemes – interest cost 2.3 2.3Defined benefit schemes – expected return on assets (2.5) (2.2)
Other net finance (income)/expense (0.2) 0.1
The pension cost for the defined contribution plans is the contributions payable by the Group during the year. At 31 December 2004, therewere outstanding contributions of £2.7m (2003: £2.5m).
There were no past service costs during the year in respect of the defined benefit plans. For closed schemes, under the projected unitmethod (as required by FRS 17), the current service cost as a percentage of relevant defined benefit pensionable payroll will increase as the members of the scheme approach retirement.
b) The pension cost for the defined benefit plans was assessed in accordance with the advice of qualified actuaries. The last full triennialactuarial valuation of the UK pension scheme was carried out as at 31 March 2004. The last full valuation of the Hong Kong plan was carriedout with an effective date of 31 December 2004, for local accounting purposes.
The major assumptions used in each country as at 31 December, were:
United Kingdom Hong Kong Taiwan
2004 2003 2004 2003 2004 2003
Discount rate 5.3% 5.4% 4.0% 5.0% 3.5% 3.5%Expected return on assets 6.9% 7.1% 5.8% 7.1% 3.5% 3.5%Rate of increase in pensionable salaries 3.0% 3.0% 4.0% 4.0% 3.0% 3.0%Rate of increase in pensions in payment 2.7% 2.6% n/a n/a n/a n/aInflation assumption 2.7% 2.6% 2.5% 2.6% 2.6% 2.6%
In the plan in the United States, the benefits are frozen. The discount rate applied for that plan was 5.75%. The Hong Kong and Taiwanplans provide for a lump sum upon retirement based on a multiple of final salary.

Notes to the financial statements continuedfor the year ended 31 December 2004
Intertek Group plc Annual report and accounts
23. Pension schemes continued
Weighted average assumptions used at year end: 2004 2003 2002
Discount rate 5.0% 5.3% 5.6%Expected return on assets 6.5% 6.9% 6.9%Compensation increase 3.1% 3.2% 3.3%
c) The net pension liability included in the Group’s balance sheet is made up as follows:
2004 2003 2002£m £m £m
Pension assets, being fair value of schemes’ assets 46.7 36.4 30.6Pension liabilities being the discounted present values (62.8) (43.9) (40.6)Deferred tax asset 4.8 2.4 2.6
Pension liability net of deferred tax (11.3) (5.1) (7.4)
Shown on the balance sheet as follows:Schemes with liabilities (11.3) (5.1) (7.4)
d) The net pension liabilities of each scheme at 31 December 2004, are as follows:
United United HongKingdom States Kong Taiwan Total
£m £m £m £m £m
Pension assets, being fair value of schemes’ assets 33.0 1.0 11.2 1.5 46.7Pension liabilities, being the discounted present values (48.7) (1.1) (11.4) (1.6) (62.8)
Pension deficit (15.7) (0.1) (0.2) (0.1) (16.1)Deferred tax asset 4.7 – 0.1 – 4.8
Pension liability net of deferred tax (11.0) (0.1) (0.1) (0.1) (11.3)
Deferred tax movements are netted against the actuarial gains and losses shown in the statement of recognised gains and losses.
e) The assets in the main schemes and the expected rates of return were:
United Kingdom Hong Kong
Long- Long-term rate Value term rate Value
At 31 December 2004 of return £m of return £m
Equities 7.5% 24.7 7.0% 6.9Bonds 5.3% 6.3 4.0% 3.9Cash and other 4.8% 2.0 3.5% 0.4
Total fair value of assets 33.0 11.2Present value of scheme liabilities (48.7) (11.4)
Deficit in the scheme (15.7) (0.2)
46
47

www.intertek.com
23. Pension schemes continuedUnited Kingdom Hong Kong
Long- Long-term rate Value term rate Value
At 31 December 2003 of return £m of return £m
Equities 7.5% 18.8 8.0% 7.0Bonds 5.5% 4.2 5.0% 3.1Cash and other 5.0% 0.6 4.5% –
Total fair value of assets 23.6 10.1Present value of scheme liabilities (30.7) (10.3)
Deficit in the scheme (7.1) (0.2)
United Kingdom Hong Kong
Long- Long-term rate Value term rate Value
At 31 December 2002 of return £m of return £m
Equities 7.5% 13.5 8.5% 4.8Bonds 5.5% 3.4 6.5% 3.2Cash and other 5.0% 2.2 5.5% 0.6
Total fair value of assets 19.1 8.6Present value of scheme liabilities (26.3) (11.3)
Deficit in the scheme (7.2) (2.7)
f) Movement in deficit during the year:
2004 2003£m £m
Deficit at the beginning of the year (7.5) (10.0)Deferred tax thereon 2.4 2.6
Deficit at the beginning of the year, net of deferred tax (5.1) (7.4)Movement in the year:
Current service cost (2.0) (2.1)Contributions 2.2 2.9Other finance income/(charge) 0.2 (0.1)Actuarial (losses)/ gains (9.0) 1.8Deferred tax 2.4 (0.2)
Deficit at end of the year, net of deferred tax (11.3) (5.1)
g) The employer has paid contributions at the following rates expressed as a percentage of pensionable payroll:
United Kingdom 12.0%United States Not applicable as the scheme is closed and members’ benefits are frozen.Hong Kong Average of 9.8% across all sections.Taiwan Caleb Brett: 12.1% combining retirement benefit and leaving service benefit;
Labtest: 7.4% combining retirement benefit and leaving service benefit.
h) History of experience of gains and losses:
2004 2003 2002 2001 2000£m £m £m £m £m
Actual return less expected return on scheme assets 0.4 2.7 (7.6) (5.0) 1.7Percentage of scheme assets 0.9% 7.4% 24.8% 14.7% 4.9%Gains and losses on scheme liabilities (1.6) (0.9) 0.7 – (0.7)Percentage of present value of scheme liabilities 2.5% 1.8% 1.7% – 2.1%Amount recognised in STRGL (6.6) 1.6 (6.5) (3.3) 3.4Percentage of present value of scheme liabilities 10.5% 3.6% 16.0% 9.2% 10.2%

Notes to the financial statements continuedfor the year ended 31 December 2004
Intertek Group plc Annual report and accounts
23. Pension schemes continuedi) Analysis of amount recognised in the Statement of Total Recognised Gains and Losses (STRGL):
2004 2003 2002 2001 2000£m £m £m £m £m
Actual return less expected return on scheme assets 0.4 2.7 (7.6) (5.0) 1.7Experience (losses)/gains arising on scheme liabilities (1.6) (0.9) 0.7 – (0.7)Losses on acquisitions (0.2) – – – –Changes in assumptions (7.6) – (1.8) 1.5 2.4Deferred tax 2.4 (0.2) 2.2 0.2 –
Actuarial (loss)/gain recognised in STRGL (6.6) 1.6 (6.5) (3.3) 3.4
24. Reconciliation of operating profit to operating cash flows2004 2003
£m £m
Group operating profit after exceptional items 82.5 72.9Depreciation charge 18.4 18.6Goodwill amortisation 1.5 1.0Loss on disposal of fixed assets 0.2 0.5(Increase)/decrease in stocks (0.8) 0.1Increase in debtors (8.9) (10.5)Increase/(decrease) in creditors 11.9 (3.3)(Decrease)/increase in provisions (2.9) 0.7
Total operating cash inflow 101.9 80.0
25. Analysis of cash flows2004 2003
£m £m
Returns on investments and servicing of financeNet interest, refinancing and redemption fees paid (5.3) (7.3)Dividends paid to minorities (4.1) (2.8)
(9.4) (10.1)
Capital expenditure and financial investmentPurchase of tangible fixed assets (28.2) (24.4)Sale of plant and machinery 0.2 0.8
(28.0) (23.6)
Acquisitions and disposalsPurchase of subsidiaries and businesses (26.3) (7.5)Net deferred consideration paid on past acquisitions – (0.3)Sale of subsidiary undertakings – 6.6
(26.3) (1.2)
FinancingIssue of ordinary shares, net of issue expenses 1.1 (0.1)Issue of new debt 165.7 –Repayment of old debt (202.0) (6.5)Repayment of other loans – (0.3)
(35.2) (6.9)
Net cash outflow on purchase of businesses and subsidiaries2004 2003
£m £m
Fair value of consideration 27.6 7.6Amount satisfied by issue of shares (1.3) (0.1)
Consideration paid in cash 26.3 7.5Net deferred consideration paid on past acquisitions – 0.3
Net cash outflow in respect of acquisitions 26.3 7.8
48
49

www.intertek.com
26. Analysis of net debtAt Other
beginning non-cash Acquisitions Exchange At endof year Cash flow changes and disposals adjustments of year
£m £m £m £m £m £m
Cash 81.5 (26.6) – (0.3) (2.1) 52.5Borrowings (213.7) 36.3 (2.8) – 15.3 (164.9)
Total net debt (132.2) 9.7 (2.8) (0.3) 13.2 (112.4)
The movement of £0.3m relates to cash relinquished on disposals.The non-cash change of £2.8m relates to the amortisation of debt issuance costs.
27. Purchase of subsidiaries and businessesa) On 10 May 2004, the Group acquired 100% of the share capital of Entela Inc. The analysis of net assets acquired and the fair value to theGroup is set out below. The fair value accounting adjustments have been made on a provisional basis, pending the quantification of certainenvironmental liabilities at the acquisition date. The goodwill of £12.8m has been capitalised and is being amortised over 20 years, being itsestimated useful life. This acquisition has been accounted for using the acquisition method.
Fair Book value Fair value to
prior to value Group onacquisition adjustments acquisition
£m £m £m
Property, plant and equipment 2.5 – 2.5Stocks 0.2 (0.1) 0.1Debtors 2.3 – 2.3Creditors (0.9) (0.6) (1.5)
Net assets acquired 4.1 (0.7) 3.4
The fair value adjustments relate to provision against the carrying value of stocks and additional accruals in respect of liabilities.
Fair value of consideration £m
Cash consideration (including fees) 14.8Net borrowings acquired 0.1Shares issued (note 19) 1.3
Fair value of the consideration 16.2Less fair value of assets acquired (3.4)
Goodwill arising on acquisition 12.8
b) The table below sets out the fair value of net assets and consideration in respect of all other subsidiaries and businesses acquired.These included Analytical Sciences Group (UK), VTM AS (Norway) and Kelley Completion Services LLC (USA).
Fair Book value Fair value to
prior to value Group onacquisition adjustments acquisition
£m £m £m
Property, plant and equipment 3.4 (0.8) 2.6
Cash consideration (including fees) 11.5
Goodwill arising on acquisition 8.9
The goodwill has been capitalised and is being amortised over 20 years.

Notes to the financial statements continuedfor the year ended 31 December 2004
Intertek Group plc Annual report and accounts
28. Share option schemesThe Company established a share option scheme for senior management in March 1997. The maximum number of options that can begranted under the scheme have been allocated and that scheme has been discontinued. In May 2002, the Intertek Group plc 2002 ShareOption Plan (2002 Plan) and the Intertek Group plc 2002 Approved Share Option Plan (Approved Plan) were established for employees tobe granted at the discretion of the Remuneration Committee.
a) Summary of movements in number of share options:
1997 Plan 2002 Approved(discontinued) Plan Plan Total
At beginning of year 659,044 2,175,292 356,187 3,190,523Granted – 1,376,816 121,911 1,498,727Exercised (516,469) (22,429) (12,492) (551,390)Forfeited (11,806) (195,487) (47,417) (254,710)
At end of year 130,769 3,334,192 418,189 3,883,150
b) The outstanding options at 31 December 2004, are exercisable as follows:
Number Subscriptionof options price
Option Scheme outstanding per share Exercisable between
1997 Plan 5,903 10p 1-Jun-01 1-Jun-0518,612 10p 1-Jun-02 1-Jun-0647,224 140p 31-Dec-03 31-Dec-0741,321 140p 1-Dec-04 1-Dec-0817,709 400p 28-Mar-05 28-Mar-09
130,769
2002 Plan 867,137 437p 30-May-05 30-May-1223,352 380p 17-Jul-05 17-Jul-124,000 421p 31-Oct-05 31-Oct-12
1,061,281 359p 7-Apr-06 7-Apr-1355,293 462p 12-Sep-06 12-Sep-13
1,274,271 523.5p 7-Apr-07 7-Apr-1448,858 607p 14-Sep-07 14-Sep-14
3,334,192
Approved Plan 183,272 437p 30-May-05 30-May-127,894 380p 17-Jul-05 17-Jul-12
104,241 359p 7-Apr-06 7-Apr-136,082 462p 12-Sep-06 12-Sep-13
109,278 523.5p 7-Apr-07 7-Apr-147,422 607p 14-Sep-07 14-Sep-14
418,189
Total 3,883,150
Details of the share option schemes are shown in the Remuneration Report on pages 16 and 17.
50
51

www.intertek.com
29. Financial instrumentsDetails of the Group’s Treasury controls are set out in the Operating and Financial Review on page 12.
a) Derivative financial instrumentsThe Group uses derivative financial instruments to manage interest rate and foreign currency risks. Whilst these hedging instruments aresubject to fluctuations in value, such fluctuations are offset by the value of the underlying exposures being hedged. The Group is not a partyto any leverage derivatives and does not hold derivative financial instruments for trading purposes.
The notional amount of derivatives summarised in this note does not represent amounts exchanged by parties and, thus, is not a measureof the exposure of the Group through its use of derivatives. The amounts exchanged are calculated on the basis of the notional amount andthe other terms of the derivatives, which relate to interest rates or exchange rates.
Counterparties to financial instruments expose the Group to credit related losses in the event of non-performance, but the Group does notexpect any counterparties to fail to meet their obligations given their high credit ratings. The Group does not demand collateral whenentering into derivative financial instruments. The credit exposure of interest rate and foreign currency contracts is represented by the fairvalue of contracts with a positive fair value at the end of each period.
The following numerical disclosures relate to the Group’s financial assets and financial liabilities as defined in FRS 13: Derivatives and otherfinancial instruments. For all the numerical disclosures, short term debtors and creditors have been excluded as permitted under FRS 13.
b) Foreign exchange risk managementA substantial portion of the Group’s turnover is derived from customers located outside the United Kingdom. In addition, the net assets of foreign subsidiaries represent a significant portion of the Company’s shareholders’ funds. The Group’s administrative operations areconducted in several countries outside of the United Kingdom and operating costs are incurred in currencies other than sterling. Because of the high proportion of international activity, the Group’s income is exposed to exchange rate fluctuations. Two types of risk arise as aresult: “transaction risk”, that is, the risk that currency fluctuations will have a negative effect on the value of the Group’s commercial cashflows in various currencies, and “translation risk”, that is, the risk of adverse currency fluctuations in the translation of foreign currencyoperations and foreign assets and liabilities into sterling.
The Group enters into forward exchange contracts to hedge certain firm commitments denominated in foreign currencies. Some of the contracts involve the exchange of two foreign currencies, according to local needs in foreign subsidiaries. The term of the currencyderivatives do not exceed one year.
The table below summarises by major currency the contractual amounts of the Group’s forward exchange contracts in sterling. The “buy”amounts represent the sterling equivalent of commitments to purchase foreign currency, and the “sell” amounts represent the sterlingequivalent of commitment to sell foreign currencies.
2004 2003
Buy Sell Buy Sell£m £m £m £m
US dollar – 17.2 – 10.5Euro 1.6 – 1.7 –
The following table presents information regarding the forward exchange contract amounts in sterling equivalent and the estimated fair value (net cost of closing the contracts) of the Group’s forward contracts with a positive fair value (assets) and a negative fair value (liabilities):
2004 2003
Contract Contractamount Fair value amount Fair value
£m £m £m £m
Assets 1.6 0.1 1.7 –Liabilities (17.2) (0.1) (10.5) –
Net liabilities (15.6) – (8.8) –

Notes to the financial statements continuedfor the year ended 31 December 2004
Intertek Group plc Annual report and accounts
29. Financial instruments continuedc) The currency composition of net assets before borrowings is shown below:
2004 2003£m £m
Sterling (1.9) 43.7US dollar 92.2 71.9Euro 12.9 10.8Chinese renminbi 11.8 9.4Swedish kroner 6.5 6.4Hong Kong dollar 5.0 6.1Others 34.8 22.4
Total 161.3 170.7
In accordance with FRS 13, borrowings are excluded from the above table as they are used to finance foreign currency investments.
d) Currency exposure of the Group’s net monetary assets/(liabilities)These exposures comprise the monetary assets and liabilities of the Group that are not denominated in the operating (or “functional”)currency of the operating units involved. In view of the hedges taken out by the Group, the currency exposure i.e. those transactionalexposures that give rise to the net currency gains and losses recognised in the profit and loss account, of the Group’s net monetaryassets/(liabilities) are not material.
e) Interest rate risk managementThe Group has a significant amount of borrowings bearing interest at variable rates. To reduce its exposure to interest rate fluctuations, theGroup enters into interest rate swap agreements.
The interest rate swap agreements convert certain long term borrowing at floating rates (based on inter-bank borrowing rates in variouscountries) to fixed rates that are lower than those available to the Group if the fixed rate borrowing were made directly.
Under the interest rate swap agreements, the Group agrees with other parties to exchange, at specified intervals, the difference betweenfixed rate and floating rate interest amounts calculated by reference to an agreed notional principal amount. The interest rate profile of theGroup’s financial assets and financial liabilities at 31 December 2004, is set out below:
At floating Totalinterest Interest carryingrates* free value
Financial assets £m £m £m
Short term deposits and cash:Sterling 8.0 – 8.0US dollar 8.4 2.6 11.0Chinese renminbi 8.8 – 8.8Hong Kong dollar 2.6 – 2.6Euros 0.3 3.1 3.4Other currencies 16.6 2.1 18.7
44.7 7.8 52.5
Investments and debtors due after one year:US dollar – 0.6 0.6Other currencies – 3.2 3.2
– 3.8 3.8
Total financial assets 44.7 11.6 56.3
*Short term deposits are overnight deposits bearing interest at rates fixed daily in advance.
The fair value of total financial assets approximates its carrying value.
52
53

www.intertek.com
29. Financial instruments continuedFinancial liabilitiesThe fair values, maturity, interest rate and exchange rate profiles of borrowings is shown in the table under the exchange rate sensitivitysection below.
The maturity profile of other financial liabilities of £0.5m is shown in note 17. The fair value approximates its carrying value of £0.5m.
f) Fair value of financial instrumentsThe Group’s on-balance sheet financial instruments, with the exception of borrowings, are generally short term in nature. Accordingly,the fair value of such instruments approximates their carrying value. The fair value of variable rate borrowings approximates carrying valuebecause such loans re-price at market rate periodically. The fair value and carrying value of long term borrowings, including the currentportion, was £164.9m (2003: £216.5m) and £164.9m (2003: £216.5m) respectively.
The fair value of off-balance sheet financial instruments are as follows:
2004 2003£m £m
Forward exchange contracts – –Interest rate swaps (1.0) (1.4)
g) Exchange rate sensitivityThe table below provides information about the maturity and interest rate profile of the Group’s borrowings.
Carryingand fair
2005 2006 2007 2008 2009 valueLiabilities 2004 £m £m £m £m £m £m
Floating rate (USD) – 64.4 – – 15.6 80.0Average interest rate – 3.8% – – 4.4% –Floating rate (HKD) 11.7 26.5 11.7 11.7 11.7 73.3Average interest rate 1.4% 1.9% 2.6% 3.1% 3.5% –Floating rate (SEK) 2.3 2.3 2.3 2.3 2.4 11.6Average interest rate 2.7% 3.1% 3.4% 3.7% 4.0% –
14.0 93.2 14.0 14.0 29.6 164.9
h) Counterparty riskAll the foreign exchange contracts and interest rate swaps are governed by ISDA (International Swap Dealers Association Inc.) agreementswith the counterparties. Accordingly, the counterparty risk is reduced from the nominal to the fair value of the derivatives. Therefore, theGroup’s counterparty exposure under foreign exchange contracts was £nil (2003: £nil) and interest rate swaps was £nil (2003: £nil).
i) Unrecognised gains and lossesThere are no material unrecognised gains or losses arising from the use of financial assets and financial liabilities as hedges.
30. Contingent liabilities2004 2003
Group £m £m
Guarantees, letters of credit and performance bonds 5.0 3.7
From time-to-time, the Group is involved in various claims and lawsuits incidental to the ordinary course of its business, including claims for damages, negligence and commercial disputes regarding inspection and testing and disputes with former employees. The Group is not currently party to any legal proceedings other than ordinary litigation incidental to the conduct of business. On the basis of currently available information, the Directors consider that the cost to the Group of an unfavourable outcome, arising from any such ordinary litigation, is unlikely to have a material adverse effect on the financial position of the Group in the foreseeable future.
The Group holds a professional indemnity insurance policy that provides coverage for certain claims from customers. The Directors consider this policy adequate for normal commercial purposes.
From time-to-time, in the normal course of business, the Company may give guarantees in respect of certain liabilities of subsidiary companies.

Notes to the financial statements continuedfor the year ended 31 December 2004
Intertek Group plc Annual report and accounts
31. Related party transactionsUntil 1 March 2005, W Hauser, a Non-Executive Director of the Company, had a consultancy agreement to assist the Group in its expansion,for which he received a fee of £1,000 per working day plus an annual bonus of up to 25% of the consultancy fees payable on thesatisfactory completion of the tasks assigned to him. In 2004, the amount paid under this consultancy agreement including bonus was£36,700 (2003: £77,000).
Apart from the above, neither the Company nor the Group has entered into any material transactions with related parties during the year asdefined by FRS 8: Related Party Disclosures.
32. Principal operating subsidiaries and associated companiesThe Group comprises 157 subsidiary companies and three associated companies. As permitted by Section 231 (5) of the Companies Act1985, only the holding companies and the principal subsidiaries whose results or financial position, in the opinion of the Directors,principally affect the figures of the Group in 2004 and 2003 have been shown below. A full list of subsidiaries will be attached to theCompany’s Annual Return filed with the Registrar of Companies. All the subsidiaries were consolidated at 31 December 2004.
Percentage of ordinary
Country of Principal activity shares heldCompany name incorporation by division Group Company
Intertek Holdings Limited England and Wales Holding company 100 100Intertek Testing Services UK Limited England and Wales Holding company 100 –Intertek Finance plc England and Wales Finance 100 –Interek Testing Services Holdings Limited England and Wales Holding company 100 –Intertek Testing Management Limited England and Wales Management company 100 –Intertek International Limited England and Wales FTS 100 –ITS Testing Services (UK) Limited England and Wales Caleb Brett 100 –ITS Testing Holdings Canada Limited Canada Holding company 100 –Testing Holdings France EURL France Holding company 100 –Testing Holdings Germany GmbH Germany Holding company 100 –ITS Hong Kong Limited Hong Kong Labtest & ETL SEMKO 100 –Yickson Enterprises Limited Hong Kong Holding company 100 –Intertek Testing Services Limited Shanghai China Labtest & ETL SEMKO 85 –Intertek Testing Services Taiwan Limited Taiwan Labtest & ETL SEMKO 100 –Intertek Testing Services Shenzhen Limited China Labtest & ETL SEMKO 85 –Kite Overseas Holdings BV Netherlands Holding company 100 –Testing Holdings Sweden AB Sweden Holding company 100 –SEMKO AB Sweden ETL SEMKO 100 –ITS NA Inc USA ETL SEMKO 100 –Entela Inc USA ETL SEMKO 100 –Caleb Brett USA Inc USA Caleb Brett 100 –Testing Holdings USA Inc USA Holding company 100 –
Percentage of ordinary
Country of Principal activity shares heldAssociates incorporation by division Group Company
DEKRA ITS Certification Services GmbH Germany Labtest 49 –SEMKO-DEKRA Certification AB Sweden Labtest 49 –Allium LLC United States Labtest 40 –
54
55
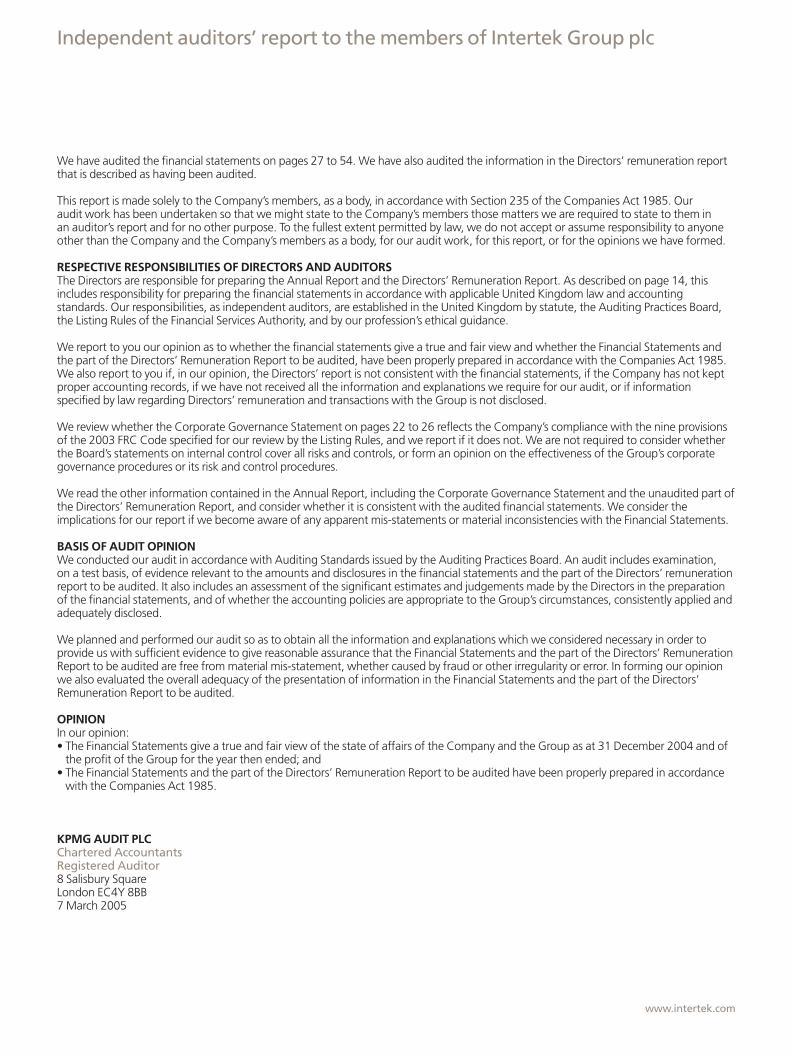
Independent auditors’ report to the members of Intertek Group plc
www.intertek.com
We have audited the financial statements on pages 27 to 54. We have also audited the information in the Directors’ remuneration reportthat is described as having been audited.
This report is made solely to the Company’s members, as a body, in accordance with Section 235 of the Companies Act 1985. Our audit work has been undertaken so that we might state to the Company’s members those matters we are required to state to them inan auditor’s report and for no other purpose. To the fullest extent permitted by law, we do not accept or assume responsibility to anyoneother than the Company and the Company’s members as a body, for our audit work, for this report, or for the opinions we have formed.
RESPECTIVE RESPONSIBILITIES OF DIRECTORS AND AUDITORSThe Directors are responsible for preparing the Annual Report and the Directors’ Remuneration Report. As described on page 14, thisincludes responsibility for preparing the financial statements in accordance with applicable United Kingdom law and accountingstandards. Our responsibilities, as independent auditors, are established in the United Kingdom by statute, the Auditing Practices Board,the Listing Rules of the Financial Services Authority, and by our profession’s ethical guidance.
We report to you our opinion as to whether the financial statements give a true and fair view and whether the Financial Statements andthe part of the Directors’ Remuneration Report to be audited, have been properly prepared in accordance with the Companies Act 1985.We also report to you if, in our opinion, the Directors’ report is not consistent with the financial statements, if the Company has not keptproper accounting records, if we have not received all the information and explanations we require for our audit, or if informationspecified by law regarding Directors’ remuneration and transactions with the Group is not disclosed.
We review whether the Corporate Governance Statement on pages 22 to 26 reflects the Company’s compliance with the nine provisionsof the 2003 FRC Code specified for our review by the Listing Rules, and we report if it does not. We are not required to consider whetherthe Board’s statements on internal control cover all risks and controls, or form an opinion on the effectiveness of the Group’s corporategovernance procedures or its risk and control procedures.
We read the other information contained in the Annual Report, including the Corporate Governance Statement and the unaudited part ofthe Directors’ Remuneration Report, and consider whether it is consistent with the audited financial statements. We consider theimplications for our report if we become aware of any apparent mis-statements or material inconsistencies with the Financial Statements.
BASIS OF AUDIT OPINIONWe conducted our audit in accordance with Auditing Standards issued by the Auditing Practices Board. An audit includes examination,on a test basis, of evidence relevant to the amounts and disclosures in the financial statements and the part of the Directors’ remunerationreport to be audited. It also includes an assessment of the significant estimates and judgements made by the Directors in the preparationof the financial statements, and of whether the accounting policies are appropriate to the Group’s circumstances, consistently applied andadequately disclosed.
We planned and performed our audit so as to obtain all the information and explanations which we considered necessary in order toprovide us with sufficient evidence to give reasonable assurance that the Financial Statements and the part of the Directors’ RemunerationReport to be audited are free from material mis-statement, whether caused by fraud or other irregularity or error. In forming our opinionwe also evaluated the overall adequacy of the presentation of information in the Financial Statements and the part of the Directors’Remuneration Report to be audited.
OPINIONIn our opinion:• The Financial Statements give a true and fair view of the state of affairs of the Company and the Group as at 31 December 2004 and of
the profit of the Group for the year then ended; and • The Financial Statements and the part of the Directors’ Remuneration Report to be audited have been properly prepared in accordance
with the Companies Act 1985.
KPMG AUDIT PLCChartered AccountantsRegistered Auditor8 Salisbury SquareLondon EC4Y 8BB7 March 2005

Corporate and shareholder information
Intertek Group plc Annual report and accounts
56
Financial year end 31 December 2004
Results announced 7 March 2005
Annual General Meeting 6 May 2005
Ex-dividend date for final dividend 1 June 2005
Record date for final dividend 3 June 2005
Final dividend payable 17 June 2005
Interim results announced September 2005
Interim dividend payable November 2005
Shareholder Enquiries andElectronic Communications –www.shareview.co.ukAny shareholders with enquiries relating totheir shareholding should, in the firstinstance, contact Lloyds TSB Registrars.
Shareholders who would prefer to viewdocumentation electronically can elect toreceive automatic notification by e-maileach time the Company distributesdocuments, instead of receiving a paperversion of such documents, by registeringa request at the Lloyds TSB Registrarswebsite, www.shareview.co.uk.
There is no fee for using this service andyou will automatically receive confirmationthat a request has been registered. Shouldyou wish to change your mind or request a paper version of any document in thefuture, you may do so by contacting theRegistrar by e-mail or by post.
To access www.shareview.co.uk, you willneed to have your shareholder referenceavailable when you first log in, which maybe found on your dividend voucher, sharecertificate or form of proxy.
The facility also allows shareholders to viewtheir holding details, find out how toregister a change of name or what to do if a share certificate is lost, as well asdownload forms in respect of changes of address, dividend mandates and share transfers.
Share dealing serviceA share dealing service for the purchase or sale of shares in Intertek is availablethrough Cazenove & Co, whose details are as follows:
Cazenove & Co (postal service)20 Moorgate, London EC2R 6DATelephone +44 20 7155 5155
ShareGiftThe Orr Mackintosh Foundation operatesa charity share donation scheme forshareholders with small parcels of shareswhose value makes it uneconomic tosell them. Details of the scheme areavailable from:
ShareGift at www.sharegift.org Telephone +44 20 7337 0501.
Share price informationInformation on the Company’s share priceis available from the Investor Relationspages of www.intertek.com, and fromthe UK via the FT Cityline ServiceTelephone 0906 003 2361 (calls are charged at 60p per minute at all times).

We are committed to driving our businessforward, capitalising on our strengths:> Our extensive global network> Our strong local presence> Our unique range of accreditations,
certifications and approvals> Our teams of highly-skilled individuals> Our cutting-edge solutions> Our passion to exceed our customers’
expectations
Intertek is an international leader in testing,inspection and certification of products andcommodities and the certification of systems.
We deliver our services with skill and integritywhich enables our customers to meet quality,performance, regulatory and safety standardsin respect of the products they sell and theservices they perform.
01 2004 Highlights02 Description of business09 Operating and financial review13 Directors’ report15 Remuneration report22 Corporate governance27 Group profit and loss account28 Balance sheets29 Statement of group cash flow29 Reconciliation of net cash flow30 Statement of total group recognised gains
and losses30 Reconciliation of movements in shareholders’
(deficit)/funds55 Independent auditors’ report to the members
of Intertek Group plc56 Corporate and shareholder information
. . . . . . . . . . . . . . . . . . . . . . . . . . . . . . . . . . . . . . . . . . . . . . . . . . . . . . . . . . . . . . . . . . . . . . . . . . . . . . . . . . . . . . . . .
www.intertek.com
Contact us for information on the office or laboratory that can best serve your business needs.Information and e-mail available at www.intertek.com
Regional Head Offices
Intertek Group plc Worldwidewww.intertek.com T: +44 20 7396 3400E: [email protected] F: +44 20 7396 3480
RegistrarsLloyds TSB RegistrarsThe Causeway, WorthingWest Sussex BN99 6DAT: 0870 600 3983 (UK only)T: +44 121 415 7059
AuditorsKPMG Audit PlcPO Box 486, 8 Salisbury SquareLondon EC4Y 8BBT: +44 20 7311 1000
Registered OfficeIntertek Group plc25 Savile RowLondon W1S 2EST: +44 20 7396 3400F: +44 20 7396 3480
Company SecretaryFiona Evans
Registered number: 4267576ISIN: GB0031638363
Symbol: ITRK
BrokersCazenove & Co Ltd20 MoorgateLondon EC2R 6DAT: +44 20 7588 2828
Goldman Sachs InternationalPeterborough Court, 133 Fleet StreetLondon EC4A 2BBT: +44 20 7774 1000
Labtest Americas Europe Asiawww.intertek-labtest.com T: +1 973 346 5500 T: +33 2 3209 3636 T: +852 2173 8888E: [email protected] F: +1 973 379 5232 F: +33 2 3209 3637 F: +852 2786 1903
Caleb Brett Americas Europe Asiawww.intertek-cb.com T: +1 713 407 3500 T: +44 1708 680200 T: +65 6222 3889E: [email protected] F: +1 713 407 3529 F: +44 1708 680262 F: +65 6222 2383
ETL SEMKO Americas Europe Asiawww.intertek-etlsemko.com T: +1 800 967 5352 T: +46 8 750 0000 T: +86 21 6495 6565E: [email protected] F: +1 978 264 9403 F: +46 8 750 6030 F: +86 21 6495 6263
Foreign Trade Standards Americas Europe Asiawww.intertek-fts.com T: +1 305 513 3000 T: +44 1277 223400 T: +65 6285 7557E: [email protected] F: +1 305 513 3001 F: +44 1277 220950 F: +65 6382 8662
RAM Consulting Americas Europe Asiawww.intertek-ram.com T: +1 630 623 6060 T: +44 207 665 6678 T: +852 2926 3920E: [email protected] F: +1 630 623 6074 F: +44 207 665 6839 F: +852 2926 3933

Intertek Group plcHead Office25 Savile RowLondonW1S 2ESUnited KingdomT: +44 20 7396 3400F: +44 20 7396 3480E: [email protected]
www.intertek.com
Annual report and accounts: 2004
Intertek G
rou
p p
lcA
nn
ual rep
ort an
d acco
un
ts:2004