Embed Size (px)
Citation preview
Nationw
ide Building Society
Annual Reportand Accounts 2016
Annual Report and Accounts 2016

2016 Annual Report and Accounts
Because we’re owned by our members, not shareholders.
Because we’re a building society and our mutual values ensure we put our members first.
Because delivering value for our members is the reason why we exist.
Delivering value for our members
2
Strategic Report Business and Risk Report
GovernanceFinancial Statem
entsO
ther Information
Contents
Strategic Report 2016 Society highlights 5Chairman’s statement 7Chief Executive’s review 11Strategic review 17Financial review 27Risk overview 37Our people 39Citizenship report 43The Nationwide Foundation 53
GovernanceBoard of directors 57 Group directors 61Directors’ report 63Report of the directors on corporate governance 69Report of the directors on remuneration 93
Business and Risk Report Introduction 107Principal risks 108Top and emerging risks 109 Lending risk 111Financial risk 151Operational risk 183Conduct and compliance risk 186Strategic risk 188Managing risk 189
Financial StatementsIndependent auditors’ report 195Accounts 202Notes to the accounts 208
Other InformationAnnual business statement 289Forward looking statements 293Glossary 294Index 304

2016 Annual Report and Accounts
Strategic Report2016 Society highlights 5
Chairman’s statement 7
Chief Executive’s review 11
Strategic review 17
Financial review 27
Risk overview 37
Our people 39
Citizenship report 43
The Nationwide Foundation 53
The Strategic Report on pages 3 to 54 has been approved
by the board of directors and signed on its behalf by:
Joe Garner
Chief Executive
23 May 2016
3
Back to Contents

Strategic Report
Strategic Report
4
Back to Contents
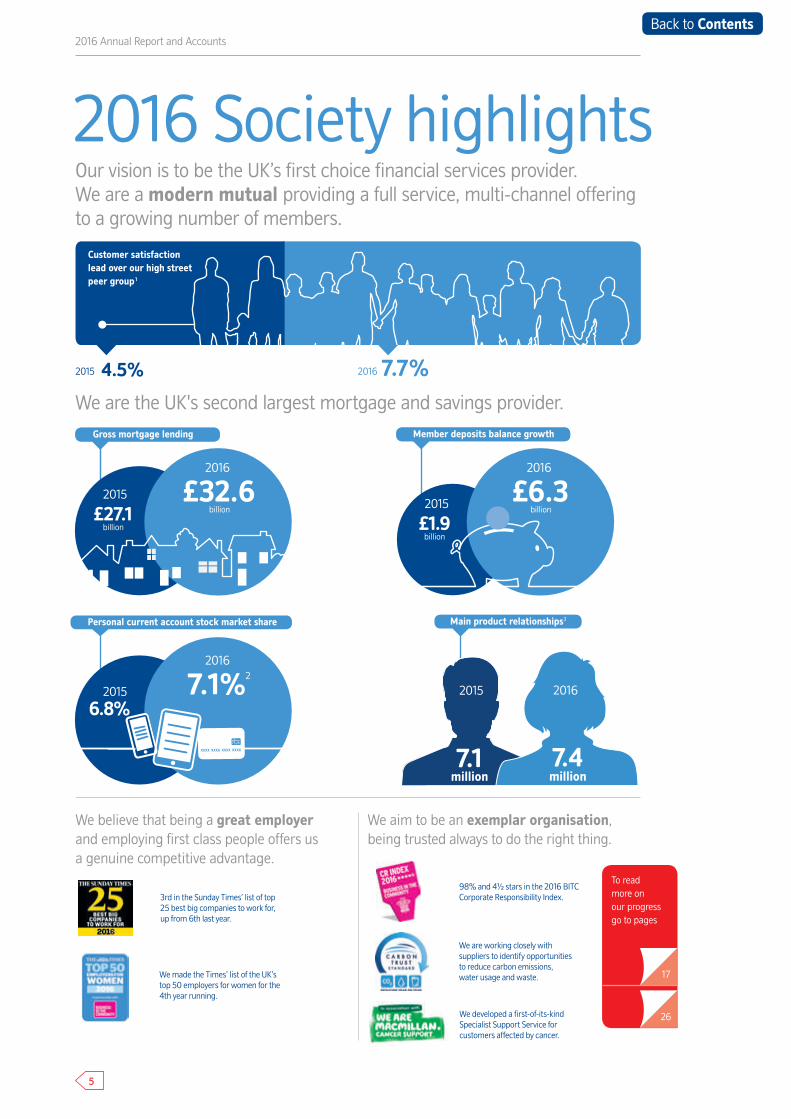
7.1%2
2016
6.8%2015
2016 Annual Report and Accounts
Our vision is to be the UK’s first choice financial services provider. We are a modern mutual providing a full service, multi-channel offering to a growing number of members.
Savings market stock shareMortgage market stock share
Main product relationships3
4.5%2015
Customer satisfaction lead over our high street peer group¹
7.7%2016
2015 2016
7.1 million
7.4 million
Personal current account stock market share
2016 Society highlights
Member deposits balance growthGross mortgage lending
£6.32016
£32.62016
£1.9£27.12015
2015
billionbillion
billion billion
To read more on our progress go to pages
26
17We made the Times’ list of the UK’s top 50 employers for women for the 4th year running.
98% and 4½ stars in the 2016 BITC Corporate Responsibility Index.3rd in the Sunday Times’ list of top
25 best big companies to work for, up from 6th last year.
We developed a first-of-its-kind Specialist Support Service for customers affected by cancer.
We are working closely with suppliers to identify opportunities to reduce carbon emissions, water usage and waste.
We believe that being a great employer and employing first class people offers us a genuine competitive advantage.
We aim to be an exemplar organisation, being trusted always to do the right thing.
We are the UK's second largest mortgage and savings provider.
5
Back to Contents
Strategic Report
1 © GfK 2016, Financial Research Survey (FRS), 3 months ending 31 March 2016 vs 31 March 2015, proportion of extremely/very satisfied customers minus proportion of extremely/very/fairly dissatisfied customers summed across current account, mortgage and savings, high street peer group defined as providers with main current account market share >6% (Barclays, Halifax, HSBC, Lloyds Bank (inc C&G), NatWest and Santander). Prior to April 2015, Lloyds Bank and TSB combined as Lloyds TSB Group (including Lloyds Bank, TSB and C&G).2 As at February 2016.3 Main personal current account (PCA) customers and mortgage/savings customers with balances greater than £5,000.4 Comparatives have been restated as described in note 1 to the financial statements.
2012 2013 2014 2015 2016
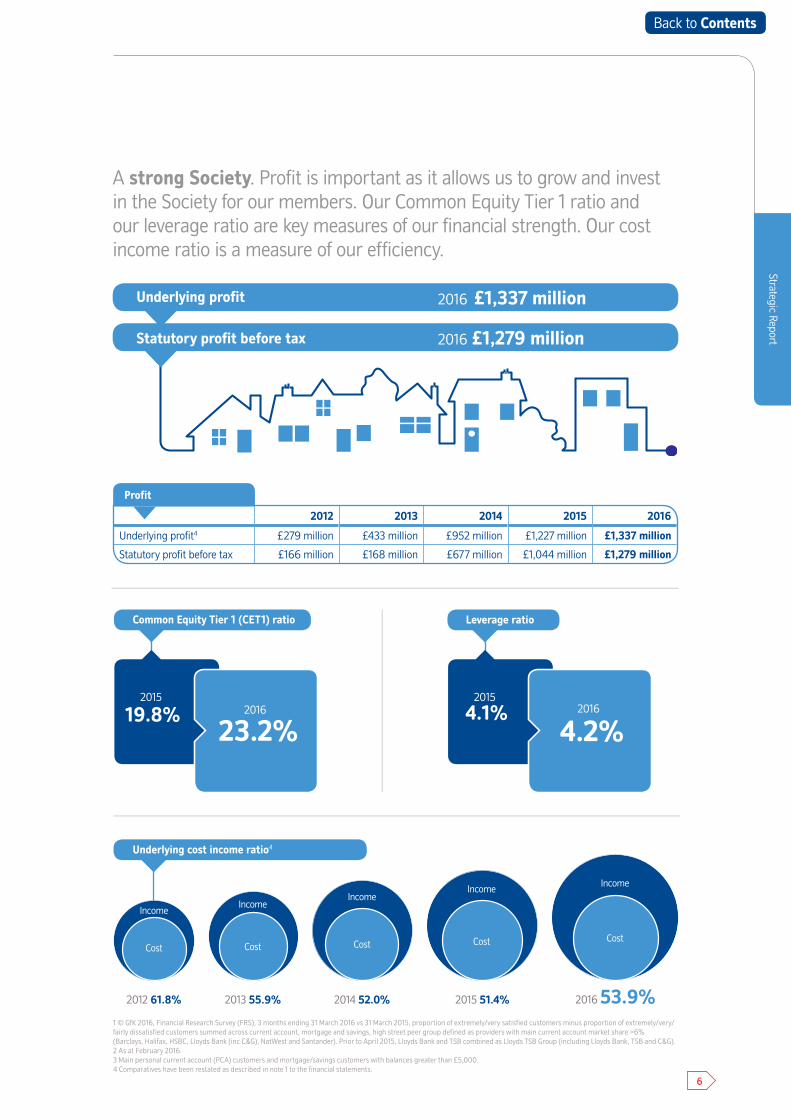
Underlying profit4 £279 million £433 million £952 million £1,227 million £1,337 million
Statutory profit before tax £166 million £168 million £677 million £1,044 million £1,279 million
A strong Society. Profit is important as it allows us to grow and invest in the Society for our members. Our Common Equity Tier 1 ratio and our leverage ratio are key measures of our financial strength. Our cost income ratio is a measure of our efficiency.
Common Equity Tier 1 (CET1) ratio
Underlying cost income ratio4
2012 61.8% 2013 55.9% 2014 52.0% 2015 51.4% 2016 53.9%
Profit
Leverage ratio
23.2%201619.8%
2015
4.2%20164.1%
2015
Underlying profit 2016 £1,337 million
Statutory profit before tax 2016 £1,279 million
Income
Cost
Income
Cost
Income
Cost
Income
Cost
Income
Cost
6
Back to Contents

My first year This is my first annual statement as your Chairman. It has been a privilege and a pleasure to have led the Board during what has, once again, been a highly successful year.
2016Chairman’s statement
2016 Annual Report and Accounts
The ‘magic ingredient’ that sets your Society apart from
all other competitors in retail financial services is the
commitment of our people to always do the right thing
for our members. I am convinced this culture is a direct
consequence of our history and heritage, and the resultant
mutual business model.
From our earliest ancestry in Ramsbury, Wiltshire in 1846,
when we were formed to offer ordinary people a safe place
to save and the prospect of borrowing to buy a home,
Nationwide (and its constituent societies) has always stood
for doing what’s right and delivering the very best service,
and this continues to the present day. Indeed, every day I
experience first-hand the overwhelming commitment within
the Board, the management team and all colleagues across
the Society to do the right thing for you, our members, and
on your behalf I extend my deepest thanks to them all for
their outstanding professionalism, dedication and care.
I joined Nationwide in 2014 after a 30 year career in retail
and commercial banking, working both in the UK and around
the world. Based on that experience, I would like to take the
opportunity to offer some reflections about your Society and
why I believe we are able to make a genuine difference in the
provision of retail financial services in the United Kingdom:
• we were born out of a social, rather than a commercial,
purpose so our sole focus is to help improve the quality
of life for our members,
• we are a building society, which makes us tangibly
different to the established UK banks,
• we are therefore legally required to hold at least 75% of
our assets as loans secured on UK residential property
and we have to be primarily financed through retail
savings deposits, enabling us to prioritise the financial
security of our business and our members’ money,
• we are owned by our members, so do not have
to consider the potentially conflicting demands of
shareholders and customers typical in the ‘plc’ style
models I have witnessed elsewhere,
• therefore all profits are re-invested in the Society to
deliver excellent service and value to our members
over the long term.
Founded 1846
7
Back to Contents
Strategic Report
We run the Society to deliver outstanding service to all
customers and members, and we seek to optimise, rather
than maximise, profits. I am often asked why the Society
makes a profit when it is run for the benefit of our members.
Put simply, profits are the ‘oxygen’ that allows the Society to
support future growth, to sustain a strong balance sheet and
capital ratios in order to keep the Society safe and secure,
and crucially to be able to invest to provide the consistent top
quality service our members rightfully demand.
Nationwide is a business that our members and employees
say ‘feels different’. Our mutual heritage drives a shared
sense of purpose to offer good, long term value products and
exceptional service, recognising the complementarity of our
members foremost as customers and secondly as owners.
Your Board is constantly seeking to balance the needs of all
members, particularly between savers and borrowers, and
between delivering value in both the short term and over the
longer term.
Our performance in the past year is reflective of this approach.
In the last twelve months, Nationwide has successfully
grown its membership through strong mortgage lending, an
increase in savings balances and a continued expansion of
our current account market share, all reflecting our strategic
focus on being a modern mutual. I am pleased to report we
have delivered a set of results which are the product of this
consistent strategy, achieving underlying profits in excess of
£1.3 billion and continuing to demonstrate strong levels of
capital. We are, and will remain, a safe and trusted home for
our members’ money at all times, and we have the ‘financial
firepower’ to continue to support our members and invest in
our future service.
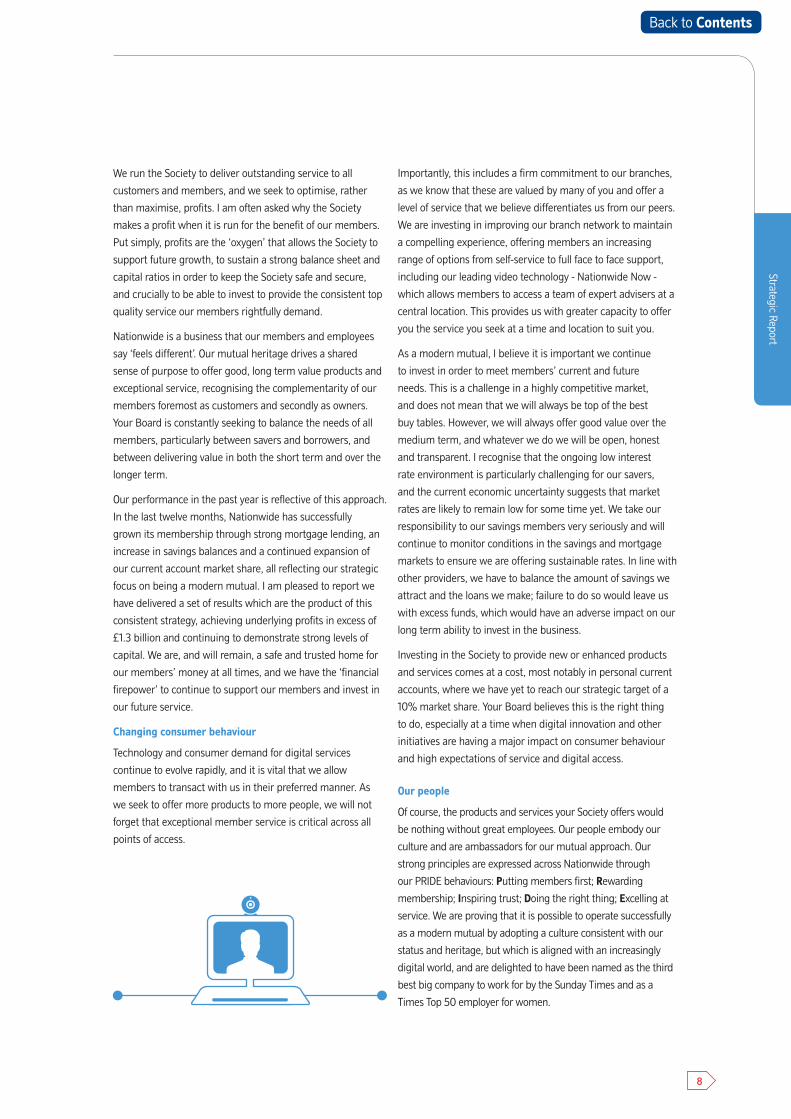
Changing consumer behaviour
Technology and consumer demand for digital services
continue to evolve rapidly, and it is vital that we allow
members to transact with us in their preferred manner. As
we seek to offer more products to more people, we will not
forget that exceptional member service is critical across all
points of access.
Importantly, this includes a firm commitment to our branches,
as we know that these are valued by many of you and offer a
level of service that we believe differentiates us from our peers.
We are investing in improving our branch network to maintain
a compelling experience, offering members an increasing
range of options from self-service to full face to face support,
including our leading video technology - Nationwide Now -
which allows members to access a team of expert advisers at a
central location. This provides us with greater capacity to offer
you the service you seek at a time and location to suit you.
As a modern mutual, I believe it is important we continue
to invest in order to meet members’ current and future
needs. This is a challenge in a highly competitive market,
and does not mean that we will always be top of the best
buy tables. However, we will always offer good value over the
medium term, and whatever we do we will be open, honest
and transparent. I recognise that the ongoing low interest
rate environment is particularly challenging for our savers,
and the current economic uncertainty suggests that market
rates are likely to remain low for some time yet. We take our
responsibility to our savings members very seriously and will
continue to monitor conditions in the savings and mortgage
markets to ensure we are offering sustainable rates. In line with
other providers, we have to balance the amount of savings we
attract and the loans we make; failure to do so would leave us
with excess funds, which would have an adverse impact on our
long term ability to invest in the business.
Investing in the Society to provide new or enhanced products
and services comes at a cost, most notably in personal current
accounts, where we have yet to reach our strategic target of a
10% market share. Your Board believes this is the right thing
to do, especially at a time when digital innovation and other
initiatives are having a major impact on consumer behaviour
and high expectations of service and digital access.
Our people
Of course, the products and services your Society offers would
be nothing without great employees. Our people embody our
culture and are ambassadors for our mutual approach. Our
strong principles are expressed across Nationwide through
our PRIDE behaviours: Putting members first; Rewarding
membership; Inspiring trust; Doing the right thing; Excelling at
service. We are proving that it is possible to operate successfully
as a modern mutual by adopting a culture consistent with our
status and heritage, but which is aligned with an increasingly
digital world, and are delighted to have been named as the third
best big company to work for by the Sunday Times and as a
Times Top 50 employer for women.
8
Back to Contents
Listening to member views
As the Chairman of your Society, it is very important that
I am able to gain direct feedback on how Nationwide is
performing, what members think could improve and how we
might help them more effectively in the future.
We are constantly looking for ways to make it easier for
members to talk to us through a range of media, and to listen
and respond to suggestions and comments. We run a wide
range of events and activities over the course of the year, full
details of which can be found in the Report of the directors on
corporate governance, but amongst the highlights are:
• the Annual General Meeting, at which members can
have their say on the way the Society is run and hear
first-hand from the directors
• Member TalkBacks, which provide an opportunity
for members and directors to discuss the Society’s
activities face to face. We have held a further seven
TalkBack sessions during the year, taking our total to
over 150
• Online TalkBacks, which provide an opportunity for
members unable to attend a face to face session to
interact with our directors, ask questions and make
suggestions about our products and services
• our online Member Suggestion Scheme, through
which we received nearly 1,000 ideas during the year
• social media and e-newsletters, which reflect the
growing trend towards the use of digital channels and
media to obtain and share stories
• Nationwide Connect, our online research panel of
around 6,000 members, which provides feedback on
a variety of topics.
All directors are engaged in listening directly to the views of
members through attendance at Member TalkBack events
and similar activities, and your Board receives regular reports
on the views and inputs of members. We place real value
on the feedback we receive and a number of enhancements
to our products and services can be traced directly to ideas
generated by our members.
Regulation
Effective and proportionate regulation is critical to ensuring
the long term sustainability of the financial services sector,
and as an exemplar organisation we are committed to
operating to both the letter and spirit of regulation and
legislation.
Nationwide has been a long term provider of finance to the
buy to let market, and we have noted with interest recent
actions and proposals of both regulators and government
which are designed to control growth in the sector and
ensure that it does not pose a threat to market stability. The
precise impacts of the measures on the broader market will
become apparent over time, and we will adjust our approach
accordingly.
We were pleased to work with the Banking Standards Board
as it carried out its initial assessment of the culture and
standards of behaviour and competence in leading firms
across the retail banking industry. Exercises such as this
force organisations to take a long, hard look at how they are
operating and challenge themselves as to whether they are
acting in the best interests of their customers. Whilst there
will always be room for improvement, we were very pleased
that the final report noted Nationwide’s strong and stable
culture and the consistency and stability of our stated values.
Supporting the broader society
In addition to providing financial services to members, we
have a role to play in positively impacting the communities
in which we operate, full details of which can be found in
our Citizenship report. We aim to be recognised as one of
the UK’s leading corporate citizens and over the past year
we have continued to engage in a range of initiatives to add
value both at a local and national level.
2016 Annual Report and Accounts
To read more about our citizenship strategy go to pages
52
43
9
Back to Contents
This encompasses a wide range of activities, including
our longstanding commitment to employee volunteering,
whereby all employees are provided with two paid
volunteering days per annum, and the start of our plan to
plant a series of woodlands to provide local amenities that
can be enjoyed by the public for generations to come.
Your board of directors
The retail financial services marketplace is changing rapidly,
and it is my responsibility to ensure the composition of the
Board has the correct mix of skills, experiences and diverse
thinking to steer the Society through the challenges ahead.
We are delighted to welcome three new independent
non executive directors to the Board. Mai Fyfield and
Tim Tookey joined us in June 2015. Kevin Parry was appointed
to the Board on 23 May 2016 and will become Chairman of
the Audit Committee upon the retirement of Roger Perkin
at the conclusion of this year’s AGM. Roger has provided his
fellow directors with much wise counsel and Nationwide
owes him a debt of gratitude for his significant contribution
over the last six years.
This year also saw the retirement of our longstanding Chief
Executive, Graham Beale. Graham worked for Nationwide for
over 30 years and was appointed CEO in 2007, just before the
financial crisis hit. He played a critical role in ensuring that
your Society not only survived the financial crisis unscathed,
but also took the courageous decision to invest for the future
at a time when the easier decision would have been simply
to hunker down and wait for the storm to abate. He has left
the business in great shape, prospering as a modern mutual,
ready to take on new opportunities as the market for financial
services evolves. On behalf of all at Nationwide, I would like
to thank him for his immense contribution to the Society, and
wish him well for the future.
Your Board spent considerable time identifying a suitable
successor to Graham. We set out first and foremost to find
someone who embodied Nationwide’s values and who
was deeply committed to the mutual business model. In
addition, we were looking for someone who had the skills
and experience to lead the Society in the years to come as
the market evolves and as the widespread adoption of digital
technology changes the way members and customers wish to
interact with the Society. I am delighted Joe Garner has been
appointed as our new Chief Executive. Joe brings a breadth
of experience gained from his wide-ranging career working
for a number of large organisations, most particularly from
his time as Head of HSBC UK. Your Board is convinced he
is the right person to take Nationwide forward into new
opportunities and looks forward to working closely with him.
Further details on Joe and his background can be found in the
Governance section of this report.
We are committed to ensuring that our Board, management
and broader workforce reflects the communities in which we
operate, and we value diversity across the Society. With our
recent appointments, women make up 27% of our Board and
33% of our Executive Committee. But we recognise that there
is still much to do, and have a strategy to focus activity on
equality, diversity and inclusion, setting ourselves challenging
aims in our priority areas of ethnicity, gender and disability
across the whole Society.
We are in a new era in UK financial services, an era
which is increasingly defined by a move to digital
technology but one in which the personal touch will
continue to be of critical importance. I am delighted
to be your Chairman at this exciting time, and am
confident that Nationwide is ideally placed to take
advantage of the opportunities on offer to provide
ever-better services and products to you, our members.
Strategic Report
10
Back to Contents
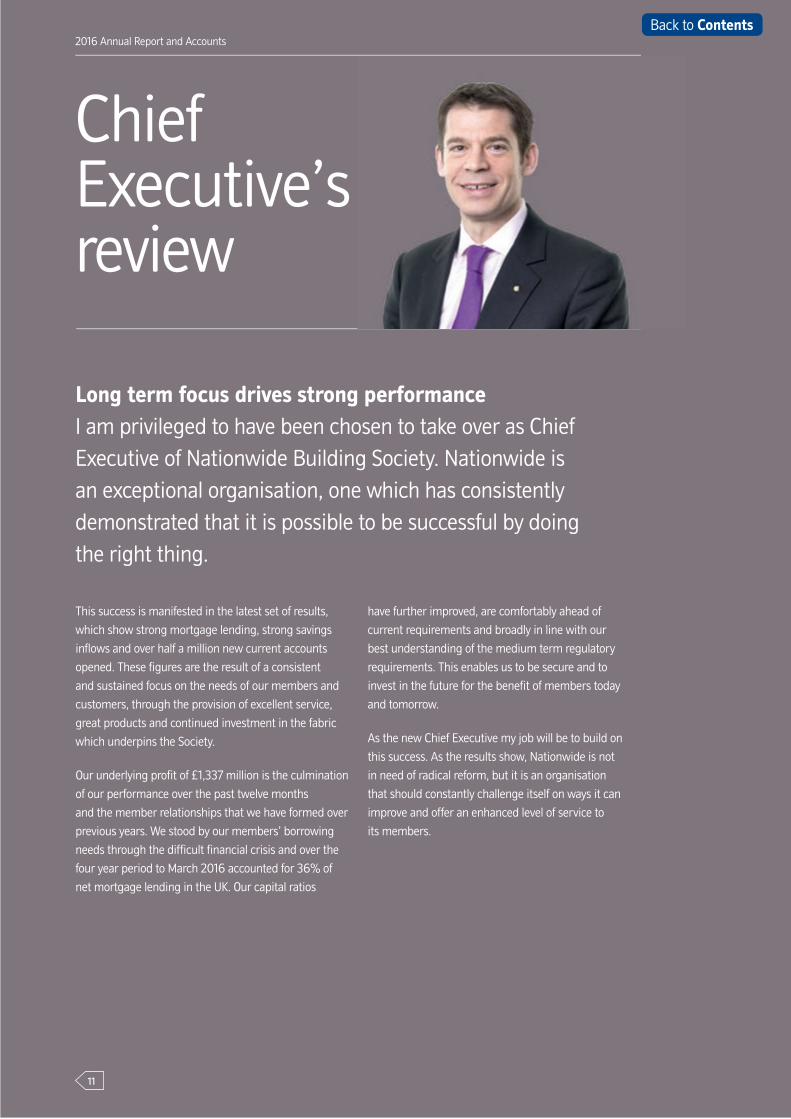
Long term focus drives strong performance I am privileged to have been chosen to take over as Chief Executive of Nationwide Building Society. Nationwide is an exceptional organisation, one which has consistently demonstrated that it is possible to be successful by doing the right thing.
This success is manifested in the latest set of results,
which show strong mortgage lending, strong savings
inflows and over half a million new current accounts
opened. These figures are the result of a consistent
and sustained focus on the needs of our members and
customers, through the provision of excellent service,
great products and continued investment in the fabric
which underpins the Society.
Our underlying profit of £1,337 million is the culmination
of our performance over the past twelve months
and the member relationships that we have formed over
previous years. We stood by our members’ borrowing
needs through the difficult financial crisis and over the
four year period to March 2016 accounted for 36% of
net mortgage lending in the UK. Our capital ratios
have further improved, are comfortably ahead of
current requirements and broadly in line with our
best understanding of the medium term regulatory
requirements. This enables us to be secure and to
invest in the future for the benefit of members today
and tomorrow.
As the new Chief Executive my job will be to build on
this success. As the results show, Nationwide is not
in need of radical reform, but it is an organisation
that should constantly challenge itself on ways it can
improve and offer an enhanced level of service to
its members.
Chief Executive’s review
2016 Annual Report and Accounts
11
Back to Contents
Strategic Report
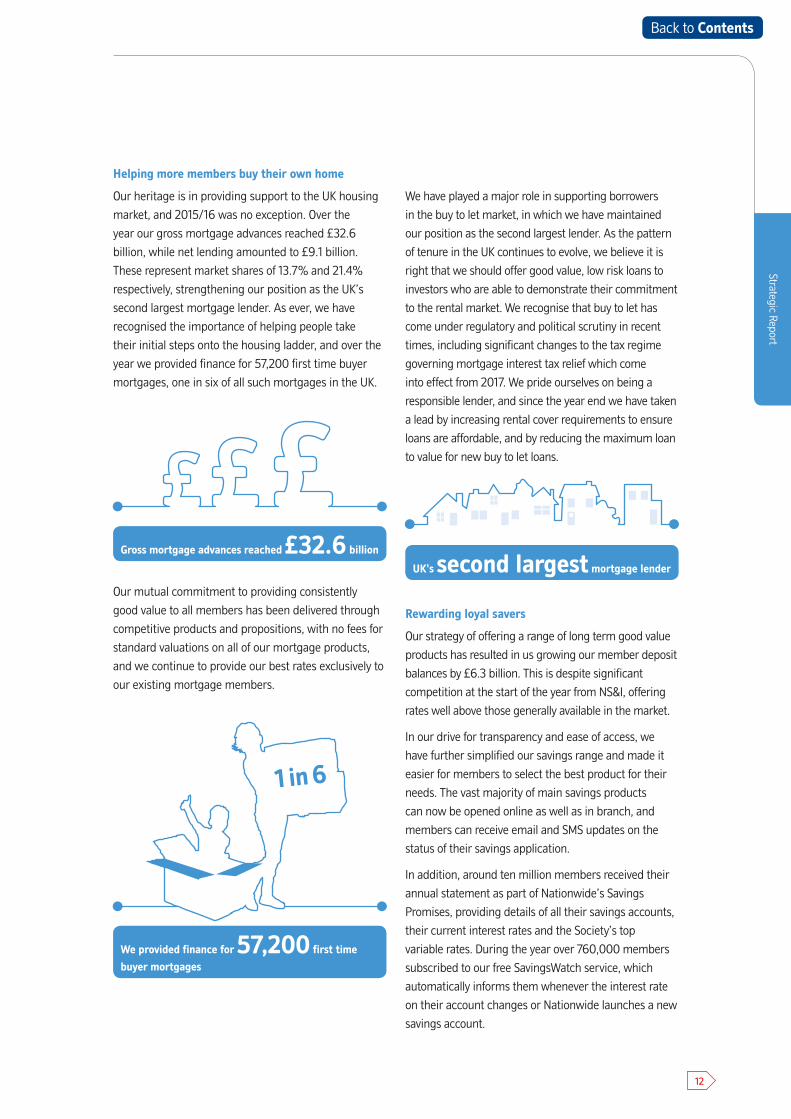
Helping more members buy their own home
Our heritage is in providing support to the UK housing
market, and 2015/16 was no exception. Over the
year our gross mortgage advances reached £32.6
billion, while net lending amounted to £9.1 billion.
These represent market shares of 13.7% and 21.4%
respectively, strengthening our position as the UK’s
second largest mortgage lender. As ever, we have
recognised the importance of helping people take
their initial steps onto the housing ladder, and over the
year we provided finance for 57,200 first time buyer
mortgages, one in six of all such mortgages in the UK.
Our mutual commitment to providing consistently
good value to all members has been delivered through
competitive products and propositions, with no fees for
standard valuations on all of our mortgage products,
and we continue to provide our best rates exclusively to
our existing mortgage members.
We have played a major role in supporting borrowers
in the buy to let market, in which we have maintained
our position as the second largest lender. As the pattern
of tenure in the UK continues to evolve, we believe it is
right that we should offer good value, low risk loans to
investors who are able to demonstrate their commitment
to the rental market. We recognise that buy to let has
come under regulatory and political scrutiny in recent
times, including significant changes to the tax regime
governing mortgage interest tax relief which come
into effect from 2017. We pride ourselves on being a
responsible lender, and since the year end we have taken
a lead by increasing rental cover requirements to ensure
loans are affordable, and by reducing the maximum loan
to value for new buy to let loans.
Rewarding loyal savers
Our strategy of offering a range of long term good value
products has resulted in us growing our member deposit
balances by £6.3 billion. This is despite significant
competition at the start of the year from NS&I, offering
rates well above those generally available in the market.
In our drive for transparency and ease of access, we
have further simplified our savings range and made it
easier for members to select the best product for their
needs. The vast majority of main savings products
can now be opened online as well as in branch, and
members can receive email and SMS updates on the
status of their savings application.
In addition, around ten million members received their
annual statement as part of Nationwide’s Savings
Promises, providing details of all their savings accounts,
their current interest rates and the Society’s top
variable rates. During the year over 760,000 members
subscribed to our free SavingsWatch service, which
automatically informs them whenever the interest rate
on their account changes or Nationwide launches a new
savings account.
Gross mortgage advances reached £32.6 billion
We provided finance for 57,200 first time
buyer mortgages
1 in 6
UK's second largest mortgage lender
12
Back to Contents
2016 Annual Report and Accounts
We understand that low market interest rates continue
to pose challenges for savers and, in response, have
offered a number of products aimed at rewarding our
loyal and committed members:
• Loyalty Bond, which offered our highest two-year
fixed rate exclusively for existing members.
Over 96,000 accounts were opened, with
members depositing £2.7 billion during the four
months the bond was available.
• Loyalty Saver, which pays higher rates of
interest according to length of membership.
Over 100,000 accounts were opened during the
year, with over 1.2 million members now holding
these accounts.
• Flexclusive Regular Saver, which offers our
current account holders a rate of 5% for a year on
monthly deposits of up to £500. In the first four
months of the offer being available, over 185,000
members opened an account.
More people choosing Nationwide for their current account
I am very pleased that we have opened 525,000 new
current accounts in the last twelve months, up 12% on
the previous year. This has taken our market share of
main standard and packaged current accounts as at
February to 7.1%; our strategic aim is to expand this to
10% to provide an effective balance with our established
positions in the mortgage and savings markets.
As testament to the quality of our current account
range we have been a net beneficiary of customers
seeking to switch their account in each and every month
since the introduction of the Current Account Switch
Service in September 2013. During the past year over
129,000 customers have switched their accounts to us
through this service, up 38% on the previous year and
representing a market share of switchers of 12.5%.
Our current accounts are complemented by our
high quality, good value credit card and personal
loan propositions. We issued 186,000 new cards
(2015: 196,000), with the attraction of new customers
being impacted by the long term balance transfer
products which are dominating the market. We continue
to reward our main current account customers with the
Select Credit Card cashback, which benefited customers
to a total of over £15 million in cash reward payments,
and also provides them with fee-free overseas
transactions. Our strategy is to meet the unsecured
borrowing needs of our existing members, and over
the year we have lent £1.2 billion (2015: £0.9 billion)
of personal loans.
Over 129,000 customers have
switched their accounts to us
£ ££
££
Growing our member deposit balances by £6.3 billion
We have opened 525,000 new current
accounts in the last twelve months
13
Back to Contents

Strategic Report
Leading service satisfaction
I am delighted that we continue to be ranked number
one for customer satisfaction amongst our high street
peer group and our lead over our nearest competitor
has increased to 7.7% for the quarter ending March
2016 (2015: 4.5%)1. Over a longer twelve month period
we remain ranked number one with a 6.6% lead2.
Our service satisfaction lead is a measure of our
performance over the last three months compared to
the performance of our next nearest competitor, in
our high street peer group. As a result, our lead can
be volatile as it is dependent on the performance of
our competitors.
Despite our size, we account for only 2% of total
industry complaints, and we make every attempt to
resolve these to members’ satisfaction. When cases do
get referred to the Financial Ombudsman Service, 82%
of our decisions are upheld, compared with the industry
average of 47%.
1 © GfK 2016, Financial Research Survey (FRS), 3 months ending 31 March 2016 vs 31 March 2015, proportion of extremely/very satisfied customers minus proportion of extremely/very/fairly dissatisfied customers summed across current account, mortgage and savings, high street peer group defined as providers with main current account market share >6% (Barclays, Halifax, HSBC, Lloyds Bank (inc C&G), NatWest and Santander). Prior to April 2015, Lloyds Bank and TSB combined as Lloyds TSB Group (including Lloyds Bank, TSB and C&G).
2 © GfK 2016, Financial Research Survey (FRS), 12 months ending 31 March 2016, proportion of extremely/very satisfied customers minus proportion of extremely/very/fairly dissatisfied customers summed across current account, mortgage and savings, high street peer group defined as providers with main current account market share >6% (Barclays, Halifax, HSBC, Lloyds Bank (inc C&G), NatWest and Santander).
14
Back to Contents
2016 Annual Report and Accounts
Building a financially strong Society
As a mutual we aim to optimise, rather than maximise,
profit, retaining sufficient earnings to support future
growth, sustain strong capital ratios and to allow us to
invest in the business to provide the services that our
members demand. This will help us to deliver a long
term, sustainable business that operates in the interests
of our members.
Buoyant volumes and an improved net interest margin
have contributed to a 5% increase in total underlying
income to £3,333 million (2015:£3,163 million). Our
underlying profit for the year was £1,337 million
(2015: £1,227 million), an increase of 9%, and statutory
profit before tax was £1,279 million (2015: £1,044 million),
an increase of 23%. Underlying costs have increased by
£170 million to £1,796 million, reflecting the growth of
our business, our focus on risk and control and continued
investment in new and enhanced products and services.
This has resulted in our underlying cost income ratio
deteriorating slightly to 53.9% (2015: 51.4%).
Our strong financial performance has resulted in our
CET1 ratio increasing to 23.2% (2015: 19.8%). The
primary driver of the amount of capital we hold is our
leverage ratio, which over the year has improved to
4.2% (2015: 4.1%).
Guidance issued by the regulators during the financial
year has given us greater certainty of the expected
maximum capital requirements for the Society. This has
allowed us to develop a financial framework to assess
future performance and maintain our financial strength.
The framework is based on the fundamental principle
of maintaining our capital in excess of regulatory
leverage ratio requirements. Based on our current
assumptions, a level of underlying Group profit of
approximately £1 billion to £1.5 billion per annum over
the medium term would optimise our ability to invest
to support members’ needs while maintaining our
financial strength.
Leading employer
Our delivery of great service, great products and great
results flows from employing talented and dedicated
people and allowing them to make the most of their
diverse range of talents. Being a great employer
provides a genuine competitive advantage. We pay
particular attention to providing a supportive and
encouraging working environment, and our success
is reflected in our annual employee survey, which
continues to show exceptionally high levels of employee
engagement and enablement.
Supporting the communities we serve
We have continued to support the communities in
which we operate through a broad range of initiatives.
The most notable development during the year has
been our investment to extend our existing Specialist
Support Service for customers affected by cancer; going
forward, this will be available for customers facing other
life-limiting or long term physical conditions, such as
heart disease, stroke and multiple sclerosis. We will
phase the roll-out to allow us to gather feedback and
refine the service as it is deployed to meet a range of
different circumstances. To read more about our objectives and how we measure success see pages
26
23
15
Back to Contents

Strategic Report
Outlook
Our financial performance in the period ahead is likely
to be influenced by a number of themes in line with the
guidance we provided at our half year results:
• clear evidence of more sustained competition
within the mortgage market, resulting in further
margin pressure during 2016/17
• as a modern mutual we will continue to invest
in order to meet our members’ current and
future needs by providing good, long term value
products, services and security
• these two factors combine such that we anticipate
profits are likely to moderate in the period ahead.
The continual evolution of technology, changing
customer preferences and regulatory change will affect
the whole industry, and we will continue to invest to
ensure we are able to deliver value to our members and
maintain excellent relationships with regulators. The
threat of cyber-attacks has increased, and will require
ongoing focus and investment as we seek constantly to
maintain the resilience of our systems and protect the
interests of our members.
Uncertainty surrounding the EU referendum and the
global economic outlook are likely to have some impact
on UK economic activity in the near term. Our central
expectation is that if this uncertainty lifts and the
global economy gradually strengthens, UK economic
growth will move back towards its long term trend rate
of 2% to 2.5% per annum. The household sector is
expected to remain a main driving force, underpinned
by continued healthy gains in employment and rising
real earnings. We expect the housing market to remain
resilient, with any dampening of activity from modest
increases in interest rates offset by a strengthening
labour market and an under-supply of housing.
Nationwide is a unique organisation with a proud history
and an optimistic future. We have the potential to build
an even stronger Society serving the needs of today’s
and tomorrow’s members, by championing the right
thing to do and continuing to deliver tangible service
excellence and long term value. We are committed to
serving members and the wider society.
16
Back to Contents
2016 Annual Report and Accounts
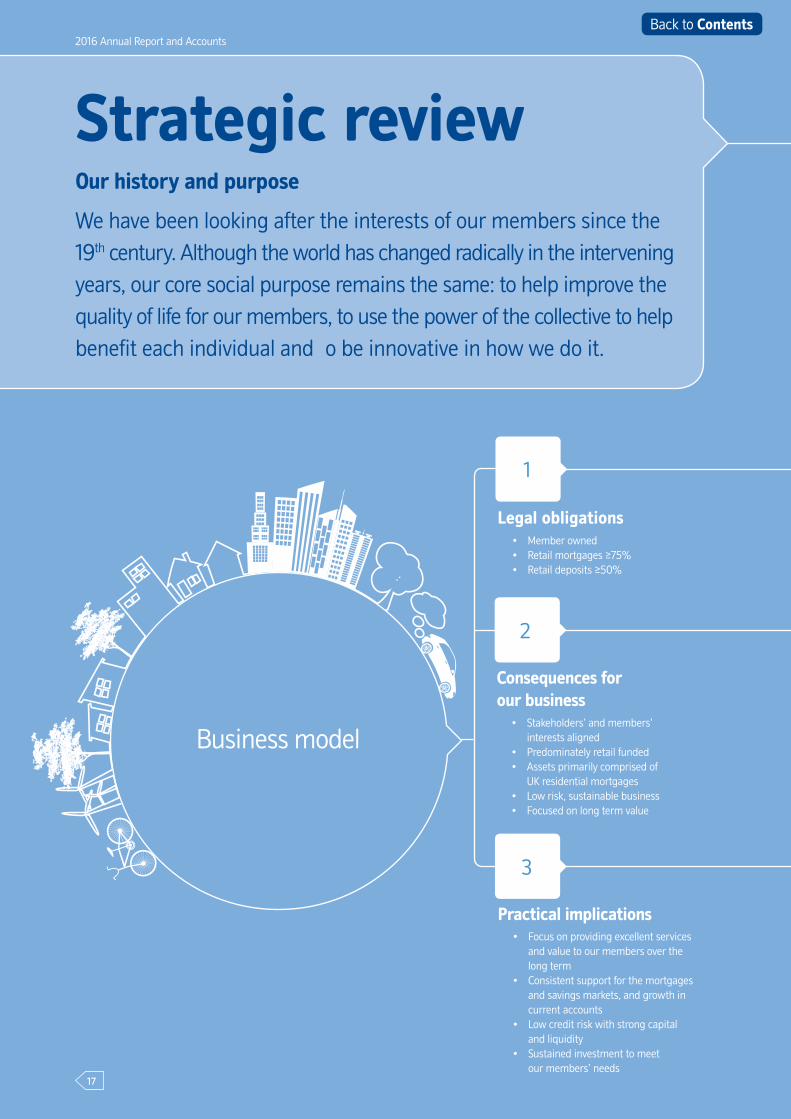
Strategic reviewOur history and purpose
We have been looking after the interests of our members since the 19th century. Although the world has changed radically in the intervening years, our core social purpose remains the same: to help improve the quality of life for our members, to use the power of the collective to help benefit each individual and o be innovative in how we do it.
Business model
1
2
3
Legal obligations
Practical implications
• Member owned• Retail mortgages ≥75%• Retail deposits ≥50%
Consequences for our business
• Stakeholders’ and members’ interests aligned
• Predominately retail funded• Assets primarily comprised of
UK residential mortgages• Low risk, sustainable business• Focused on long term value
• Focus on providing excellent services and value to our members over the long term
• Consistent support for the mortgages and savings markets, and growth in current accounts
• Low credit risk with strong capital and liquidity
• Sustained investment to meet our members’ needs
17
Back to Contents

Strategic review
Strategic Report
Nationwide was originally founded around a simple idea, the power of the
collective: by giving members a secure place to grow their savings, we were
able to offer mortgages to allow people to buy their own homes.
We are now the world’s largest building society, with relationships with one
in four households in the UK, and we are still owned by our members,
not shareholders.
Our aim is to help our members, at every stage of their lives. We can provide
a secure home for members’ savings, offer them a range of current accounts,
help them to buy their first home and work with them o plan for their retirement.
Our low risk business model is focused mainly on the provision of retail
financial se vices, almost exclusively in the UK and as a building society we
are barred from any speculative trading. Reflecting our heritage and the
legislation that governs our business, our balance sheet comprises primarily
residential mortgages funded through retail deposits and, to a lesser extent,
wholesale funding.
In our traditional products, mortgages and savings, we are the second largest
provider in the UK, with over 12% of total residential mortgage balances and
over 10% of total retail deposit balances.
We have recognised that as a modern mutual we need to diversify our business
model by offering a range of current accounts to new and existing members,
thereby enabling us to build deeper, long term member relationships. We began
offering current accounts in 1987; our market share now stands at over 7% and
our strategic aim is to expand this to 10%.
We also offer competitive personal loans, credit cards, general insurance,
protection products and financial planning se vices. We undertake a limited
range of other activities, including property based commercial lending and
deposit-taking for small and medium sized enterprises (SMEs).
We retain only sufficient earnings o ensure the financial afety and security
of our business. The remainder is reinvested into the Society to maintain our
capital ratios, provide consistently good value products and deliver industry
leading service for our members. For this reason we invest heavily in our culture
and our people, who are committed to ensuring we deliver the best possible
customer outcomes.
18
Back to Contents
2016 Annual Report and Accounts
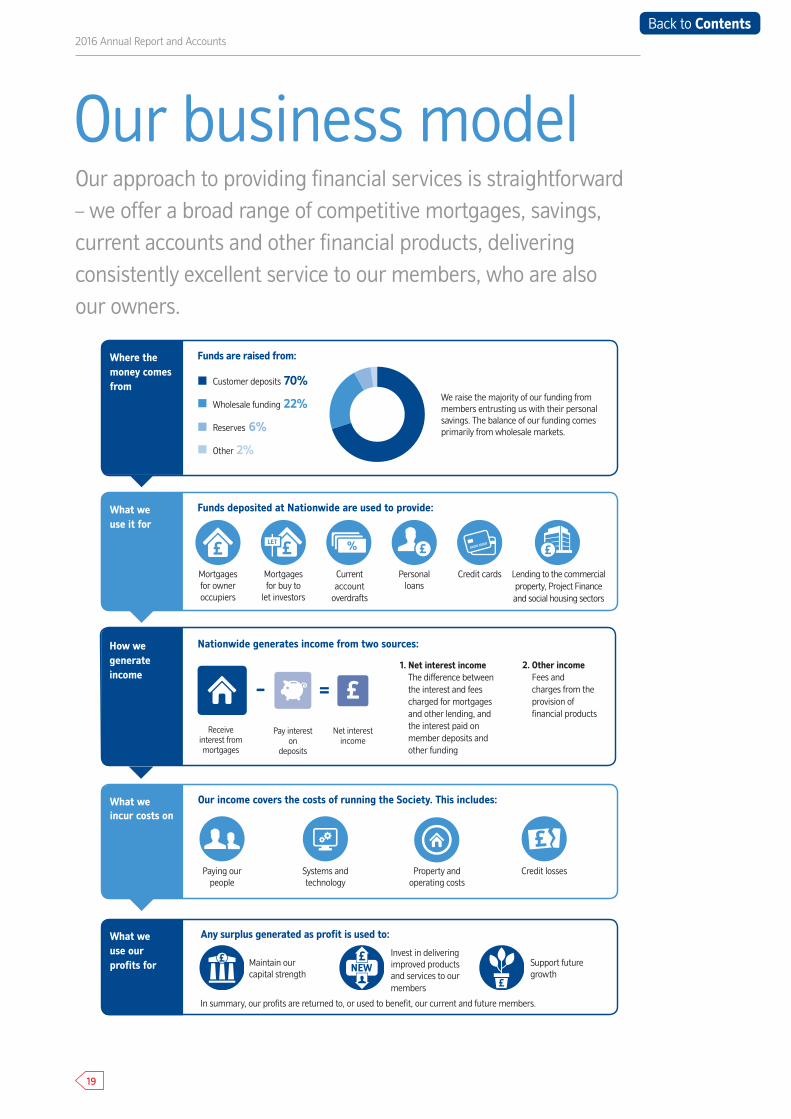
Our approach to providing financial services is straightforward – we offer a broad range of competitive mortgages, savings,current accounts and other financial products, deliveringconsistently excellent service to our members, who are alsoour owners.
Our business model
Where the money comes from
We raise the majority of our funding from members entrusting us with their personal savings. The balance of our funding comes primarily from wholesale markets.
Customer deposits 70%
Wholesale funding 22%
Reserves 6%
Other 2%
What we use it for
Funds deposited at Nationwide are used to provide:
Funds are raised from:
Mortgages for owner occupiers
Mortgages for buy to
let investors
Currentaccount
overdrafts
Personal loans
Credit cards
What weincur costs on
Our income covers the costs of running the Society. This includes:
In summary, our profits are returned to, or used to benefit, our current and future members.
What we use our profits for
Any surplus generated as profit is used to:
£
£
Invest in delivering improved products and services to ourmembers
Support future growth
Maintain our capital strength
2. Other incomeFees andcharges from theprovision offinancial products
1. Net interest incomeThe difference between the interest and feescharged for mortgagesand other lending, andthe interest paid onmember deposits andother funding
How we generate income
Nationwide generates income from two sources:
Receive interest from mortgages
Pay interest on
deposits
=– £Net interest
income
Lending to the commercialproperty, Project Financeand social housing sectors
Paying our people
Credit lossesProperty and operating costs
Systems and technology
19
Back to Contents

As a mutual we aim to optimise, rather than maximise, profit, retaining sufficient earnings to support future growth, sustain a strong capital position and allow us to invest in the business to provide the products and services that our members demand. This helps us to deliver a long term, sustainable business that operates in the interests of our members.
Recent guidance from regulators has given us greater certainty of the expected maximum capital requirement for the Group. This has allowed us to develop a framework based on the fundamental principle of maintaining our capital at a prudent level in excess of regulatory leverage ratio requirements. The framework provides parameters which will allow us to calibrate future performance and help ensure we achieve the right balance between distributing value to members, investing in the business and maintaining our financial strength.
Based on current assumptions, we believe that a level of underlying Group profit of approximately £1 billion to £1.5 billion per annum over the medium term, would optimise our ability to invest and support members’ needs while maintaining financial strength.
We may see our profitability move outside the range in any one individual year, either through external factors, a conscious decision to return value or to make investment into the business. One of the benefits of being a strong, safe and secure modern mutual is that we are able to take long term decisions which are in the best interests of current and future members. Should performance move outside the range, management will consider what future actions, if any, to take in order to bring financial performance back within the range.
Strategic Report
Our financial performance framework
20
Back to Contents
We have followed a consistent strategy for many years. As a result, we have been able to focus our business on one central aim: to deliver outstanding service and long term value to our current and future members. We expect this continued focus to result in the achievement of our vision of being the UK’s first choice financial services provider. Our strategic priorities remain in line with those set out in last year’s Annual Report and Accounts.
Our strategy
2016 Annual Report and Accounts
Modern mutual Great employer
Exemplar organisation Strong Society
21
Back to Contents

The Group’s strategic priorities are set out under four themes:
Our strategic priorities
Strategic Report
Great employer• Create a flexible and multi-skilled workforce• Identify and grow the competencies our
people need to create a modern mutual• Ensure our people are engaged and enabled,
and that they continue to operate at the levelexpected of a high performing organisation
Modern mutual• Offer a full multi-channel service to a growing
number of members
• Deliver ‘next generation banking’ throughautomation, simplified processes andself-service, with a branch network focusedon help, guidance and advice
• Extend our personal current account range
• Build an iconic brand
• Create relationships with members digitally,providing them with choice in how they caninteract with us
Strong Society• Generate optimal levels of profit to support
the delivery of enhanced member value
• Embed a financial performance frameworkto ensure that we preserve a strong, robustand efficient Society
• Maintain our capital strength
• Maintain our strong governance and riskframework
Exemplar organisation• Be recognised as ‘what good looks like’
by all stakeholders• Champion our customers’ interests• Have a culture focused on good conduct
and fair customer outcomes• Provide support for vulnerable customers• Maintain strong relationships with
our regulators
22
Back to Contents

2016 Annual Report and Accounts
Modern mutual
What we measure and why Performance Strategic target Commentary
1 © GfK 2016, Financial Research Survey (FRS), 3 months ending 31 March 2016 vs 31 March 2015, proportion of extremely/very satisfied customers minus proportion of extremely/very/fairly dissatisfied customers summed across current account, mortgage and savings, high street peer group defined as providers with main current account market share >6% (Barclays, Halifax, HSBC, Lloyds Bank (inc C&G), NatWest and Santander). Prior to April 2015, Lloyds Bank and TSB combined as Lloyds TSB Group (including Lloyds Bank, TSB and C&G).
Delivering leading levels of customer satisfaction is a key point of differentiation to our peers. We measure this through GfK FRS Customer Service Satisfaction scores relative to our high street peer group.
2015
2014
2013
2012
2016
1.8%
2.3%
4.2%
4.5%
7.7%
1st + 6%
We ended the year with our lead over our nearest high street peer group competitor standing at 7.7%, compared with 4.5% at the same time last year¹.
Market leading satisfaction
Growing our base of members with whom we have a main product relationship2 allows us to spread the benefits of mutuality to a wider proportion of the UK population.2 Defined as main personal current account customers and mortgages/savings customers with a balance greater than £5,000
2015
2014
2013
2012
2016
6.7m
6.7m
6.9m
7.1m
7.4m
9 million main product relationships by 2021
Main product relationships grew by 300,000 during the year to 7.4 million, largely driven by growth in current account customers.
Grow the membership
Our success measures
We aim to maintain our top two position in our heritage markets of mortgages and savings. We are aiming to grow our personal current account market share to 10%.
2015
2014
2013
2012
2016
11.0%
10.5%
10.6%
10.2%
10.2%
2015
2014
2013
2012
2016
10.6%
11.1%
11.7%
12.1%
12.6%
Mortgage balances market share
Savings balances market share
2015
2014
2013
2012
2016
5.1%
5.7%
6.2%
6.8%
7.1%
Personal current accounts market stock share
We ended the year as the second largest provider of mortgages and savings in the UK, with market shares of 12.6% and 10.2% respectively.
Our personal current account market share was 7.1% in February 2016. Whilst our personal current account market share has continued to grow, we recognise that intense market competition may result in us taking longer than originally anticipated to achieve our target market share of 10%.
Grow our market shares
Mortgages: 13.1% market share
Savings: 10.2% market share
Personal current accounts: 10% market share (main adult standard
and packaged accounts)
23
Back to Contents
Strategic Report
Modern mutual continued
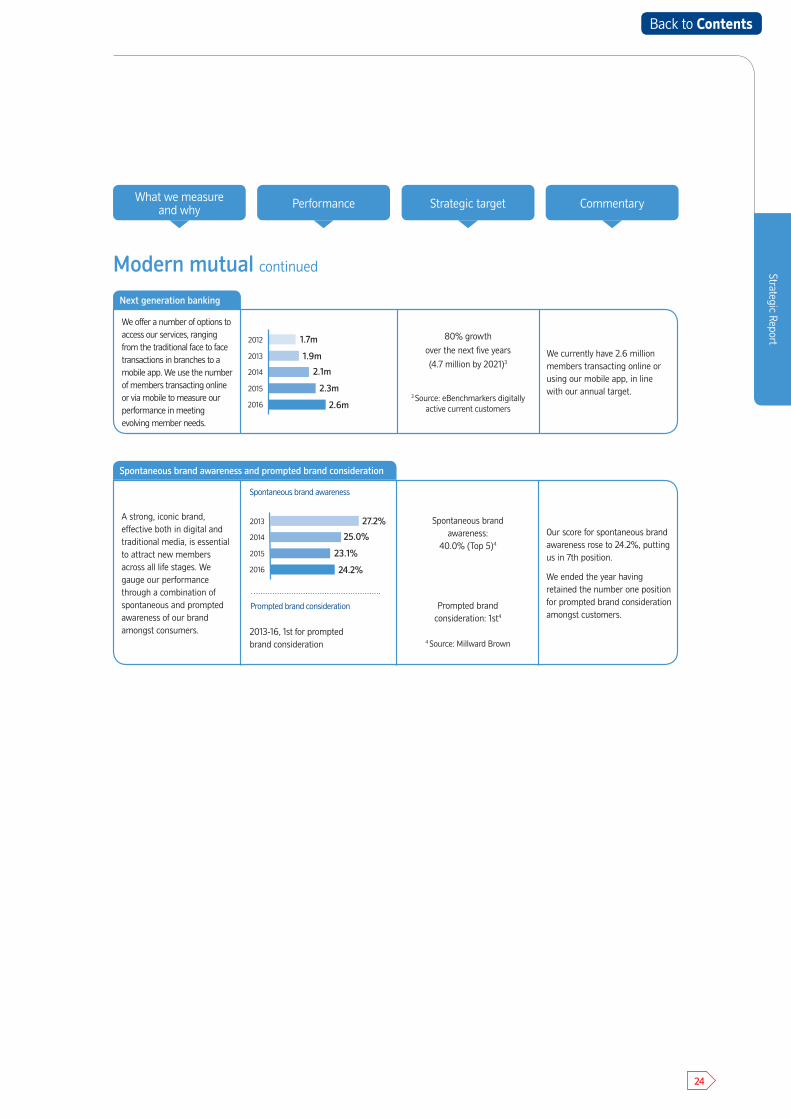
We offer a number of options to access our services, ranging from the traditional face to face transactions in branches to a mobile app. We use the number of members transacting online or via mobile to measure our performance in meeting evolving member needs.
2015
2014
2013
2012
2016
1.7m
1.9m
2.1m
2.3m
2.6m
80% growth
over the next five years
(4.7 million by 2021)3
3 Source: eBenchmarkers digitally active current customers
We currently have 2.6 million members transacting online or using our mobile app, in line with our annual target.
Next generation banking
Performance Strategic target CommentaryWhat we measure and why
Spontaneous brand awareness and prompted brand consideration
A strong, iconic brand, effective both in digital and traditional media, is essential to attract new members across all life stages. We gauge our performance through a combination of spontaneous and prompted awareness of our brand amongst consumers.
Spontaneous brand awareness
2015
2014
2013
2016
25.0%
27.2%
23.1%
24.2%
Prompted brand consideration
2013-16, 1st for prompted brand consideration
Spontaneous brand awareness:
40.0% (Top 5)4
Prompted brand consideration: 1st4
4 Source: Millward Brown
Our score for spontaneous brand awareness rose to 24.2%, putting us in 7th position.
We ended the year having retained the number one position for prompted brand consideration amongst customers.
24
Back to Contents
2016 Annual Report and Accounts
Our success measures continued
What we measure and why Performance Strategic target Commentary
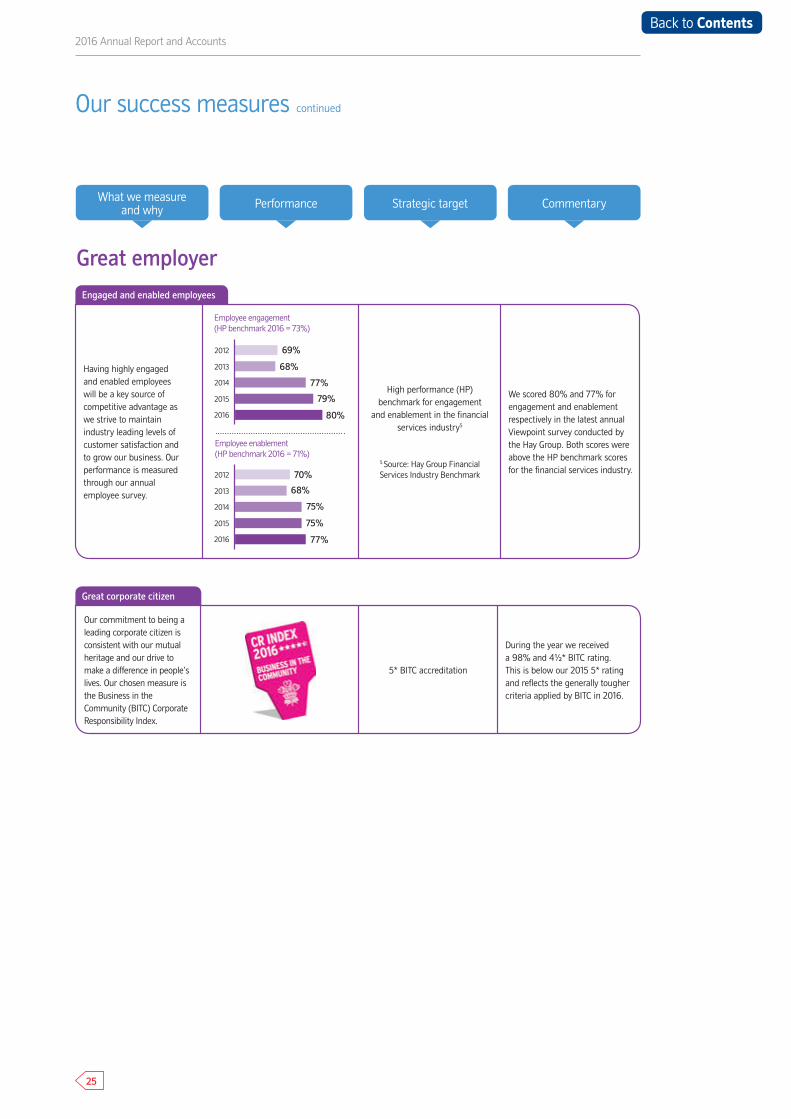
Our commitment to being a leading corporate citizen is consistent with our mutual heritage and our drive to make a difference in people’s lives. Our chosen measure is the Business in the Community (BITC) Corporate Responsibility Index.
5* BITC accreditation
During the year we received a 98% and 4½* BITC rating. This is below our 2015 5* rating and reflects the generally tougher criteria applied by BITC in 2016.
Great corporate citizen
Great employer
Having highly engaged and enabled employees will be a key source of competitive advantage as we strive to maintain industry leading levels of customer satisfaction and to grow our business. Our performance is measured through our annual employee survey.
Employee engagement (HP benchmark 2016 = 73%)
Employee enablement (HP benchmark 2016 = 71%)
2015
2014
2013
2012
2016
69%
68%
77%
79%
80%
2015
2014
2013
2012
2016
70%
68%
75%
75%
77%
High performance (HP) benchmark for engagement
and enablement in the financial services industry5
5 Source: Hay Group Financial Services Industry Benchmark
We scored 80% and 77% for engagement and enablement respectively in the latest annual Viewpoint survey conducted by the Hay Group. Both scores were above the HP benchmark scores for the financial services industry.
Engaged and enabled employees
25
Back to Contents
What we measure and why Performance Strategic target* Commentary
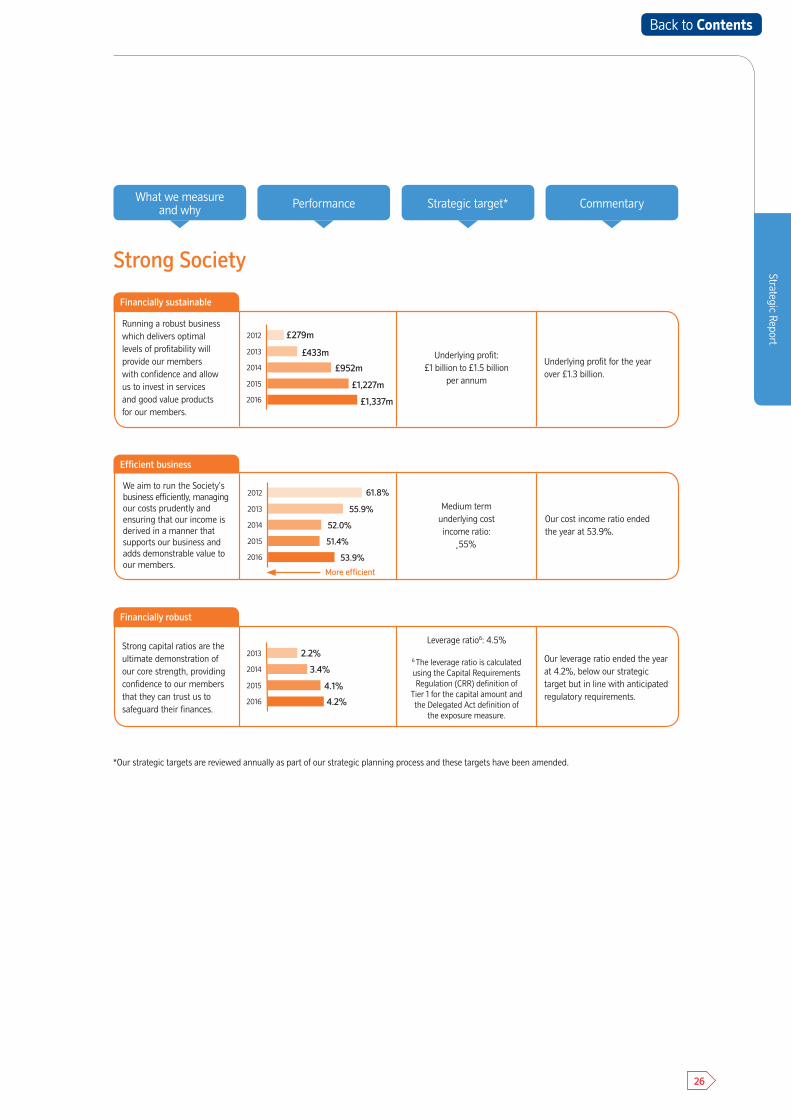
*Our strategic targets are reviewed annually as part of our strategic planning process and these targets have been amended.
Strong capital ratios are the ultimate demonstration of our core strength, providing confidence to our members that they can trust us to safeguard their finances.
2015
2014
2013
2016
2.2%
3.4%
4.1%
4.2%
Leverage ratio6: 4.5%
6 The leverage ratio is calculated using the Capital Requirements Regulation (CRR) definition of
Tier 1 for the capital amount and the Delegated Act definition of
the exposure measure.
Our leverage ratio ended the year at 4.2%, below our strategic target but in line with anticipated regulatory requirements.
Financially robust
Strong Society
Running a robust business which delivers optimal levels of profitability will provide our members with confidence and allow us to invest in services and good value products for our members.
2015
2014
2013
2012
2016
£279m
Underlying profit: £1 billion to £1.5 billion
per annum
Underlying profit for the year over £1.3 billion.
Financially sustainable
£433m
£1,227m
£952m
£1,337m
We aim to run the Society’s business efficiently, managing our costs prudently and ensuring that our income is derived in a manner that supports our business and adds demonstrable value to our members.
2015
2014
2013
2012
2016
61.8%
Medium term underlying cost income ratio:
˛55%
Our cost income ratio ended the year at 53.9%.
Efficient business
52.0%
55.9%
More efficient
51.4%
53.9%
Strategic Report
26
Back to Contents
2016 Annual Report and Accounts
2016Financial reviewFinancial
Our 2015/16 financial performance has been strong with statutory profit before tax up 23% year on year, reflecting a 7% increase in net interest income, underpinned by our strong operating performance, and an improvement in asset quality with impairments falling 71%.
The underlying cost income ratio has deteriorated to 53.9%
(2015: 51.4%) reflecting our investment in new products and
services such as Nationwide Now and Apple Pay functionality,
our ongoing investment in improving and strengthening our
IT infrastructure, increasing sales and service capacity and
our response to new regulation.
Total assets have grown by £13 billion to £209 billion
at 4 April 2016. This increase is largely attributable to
£9.3 billion growth in residential mortgage lending,
reinforcing our position as second largest mortgage lender
in the UK. The remaining growth is driven by an increase in
high quality liquid assets, with the Liquidity Coverage Ratio
(LCR) increasing to 142.6% (2015: 119.3%).
Our capital strength has improved during the year through
retained earnings and a continued improvement in asset
quality. As a result our CET1 and leverage ratios have
reached 23.2% and 4.2% respectively (2015: 19.8% and
4.1% respectively), well in excess of current regulatory
requirements. We also believe we are well placed to meet
foreseeable regulatory capital requirements.
We anticipate that profits are likely to moderate in the
period ahead as competition maintains pressure on margins
and we focus on delivering value to members, including
investment in service enhancements, whilst maintaining our
capital strength.
Our Financial Statements can be found on pages
286
193
27
Back to Contents
Strategic Report
Year to 4 April 2016
Year to 4 April 2015*
£m £m
Net interest income 3,086 2,872
Net other income 247 291
Total underlying income 3,333 3,163
Underlying administrative expenses (1,796) (1,626)
Impairment losses (73) (251)
Underlying provisions for liabilities and charges (127) (59)
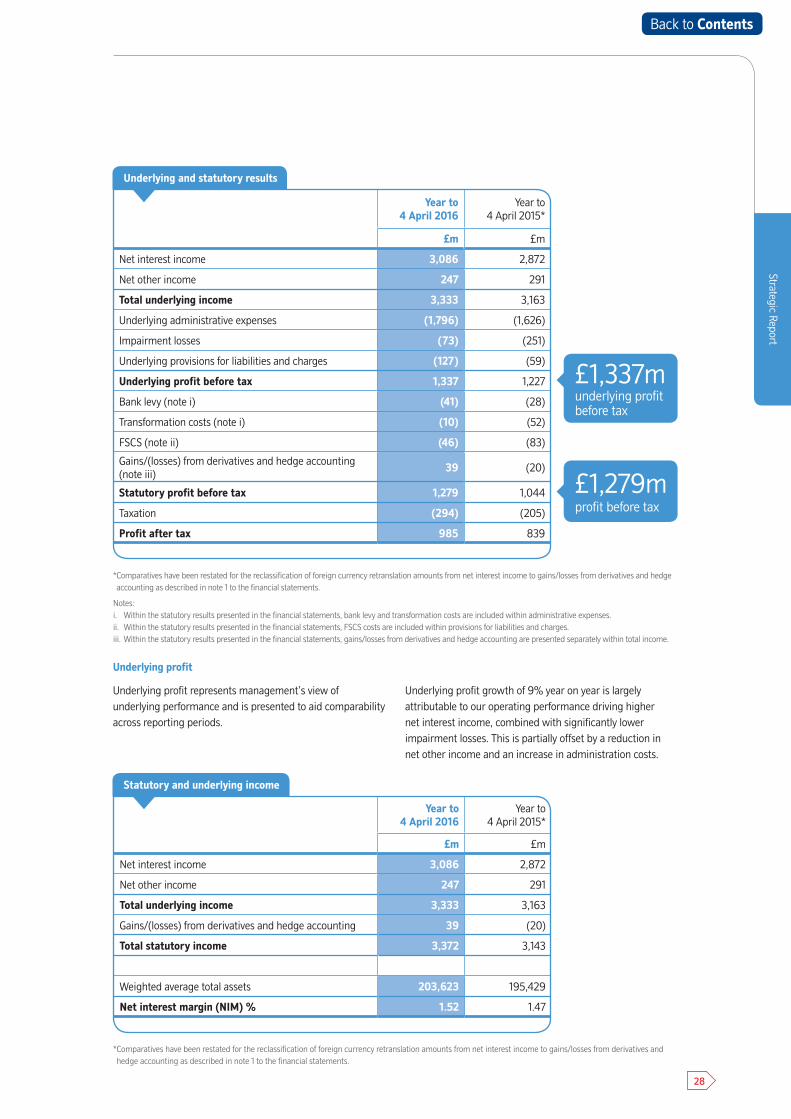
Underlying profit before tax 1,337 1,227
Bank levy (note i) (41) (28)
Transformation costs (note i) (10) (52)
FSCS (note ii) (46) (83)
Gains/(losses) from derivatives and hedge accounting (note iii)
39 (20)
Statutory profit before tax 1,279 1,044
Taxation (294) (205)
Profit after tax 985 839
Underlying and statutory results
£1,337munderlying profit before tax
£1,279mprofit before tax
Underlying profit
Underlying profit represents management’s view of underlying performance and is presented to aid comparability across reporting periods.
Underlying profit growth of 9% year on year is largely attributable to our operating performance driving higher net interest income, combined with significantly lower impairment losses. This is partially offset by a reduction in net other income and an increase in administration costs.
* Comparatives have been restated for the reclassification of foreign currency retranslation amounts from net interest income to gains/losses from derivatives and hedgeaccounting as described in note 1 to the financial statements.
Notes:i. Within the statutory results presented in the financial statements, bank levy and transformation costs are included within administrative expenses.ii. Within the statutory results presented in the financial statements, FSCS costs are included within provisions for liabilities and charges.iii. Within the statutory results presented in the financial statements, gains/losses from derivatives and hedge accounting are presented separately within total income.
Year to 4 April 2016
Year to 4 April 2015*
£m £m
Net interest income 3,086 2,872
Net other income 247 291
Total underlying income 3,333 3,163
Gains/(losses) from derivatives and hedge accounting 39 (20)
Total statutory income 3,372 3,143
Weighted average total assets 203,623 195,429
Net interest margin (NIM) % 1.52 1.47
Statutory and underlying income
* Comparatives have been restated for the reclassification of foreign currency retranslation amounts from net interest income to gains/losses from derivatives and hedge accounting as described in note 1 to the financial statements.
28
Back to Contents
Net interest income and margin
Net interest income has increased 7% to £3,086 million (2015: £2,872 million) due to a 4% growth in average assets, reflecting a 21.4% market share of net residential mortgage lending in the year, and a 5 bps improvement in NIM to 152 bps.
Interest income during the year reflects our consistent support for the housing market over recent years, providing mortgages to customers over a period when a number of our competitors constrained their lending. In the four years to 4 April 2016, the Group accounted for over one third of net lending in the market.
Savings rates have continued to fall across the industry and this reduction in retail funding costs has underpinned our margin performance. We estimate that our average margin on savings balances measured against relevant market indices (swaps or Bank base rate) was circa 50 bps over the year in comparison to circa 70 bps during the year to 4 April 2015. Notwithstanding this, our savings range has been very competitively positioned throughout the year with savings rates often better than, and sometimes significantly so, equivalent products offered by our high street peer group.
The benefit to NIM of lower retail funding costs has been partly offset by a decrease in mortgage margins. Over the last year there has been increased competition in both the prime and buy to let mortgage markets, resulting in new business gross margins falling by an average of 24 bps during 2015/16. In addition, our Base Mortgage Rate (BMR) balances continue to run off, reducing by £8 billion to £35 billion at 4 April 2016. This attrition reflects the highly competitive new business rates available across the market which have increased switching and redemption behaviours of customers, a trend which is likely to continue into 2016/17.
Whilst our average NIM has increased year on year by 5 bps, the quarterly picture for the 2015/16 financial year shows a downward trend, caused by the repricing of assets described above. Our spot margin at the end of the financial year was 10 bps lower than the rate of 152 bps reported for the year as a whole. Whilst we expect the impact to moderate, we nevertheless anticipate further margin compression throughout 2016/17 as competition is sustained and we focus on delivering long term value to members.
The macroeconomic environment could pose further risks to NIM, in particular sustained low interest rates and deterioration in the global economy, which could lead to a downturn in the UK economy, and could have an impact on the cost of wholesale funding.
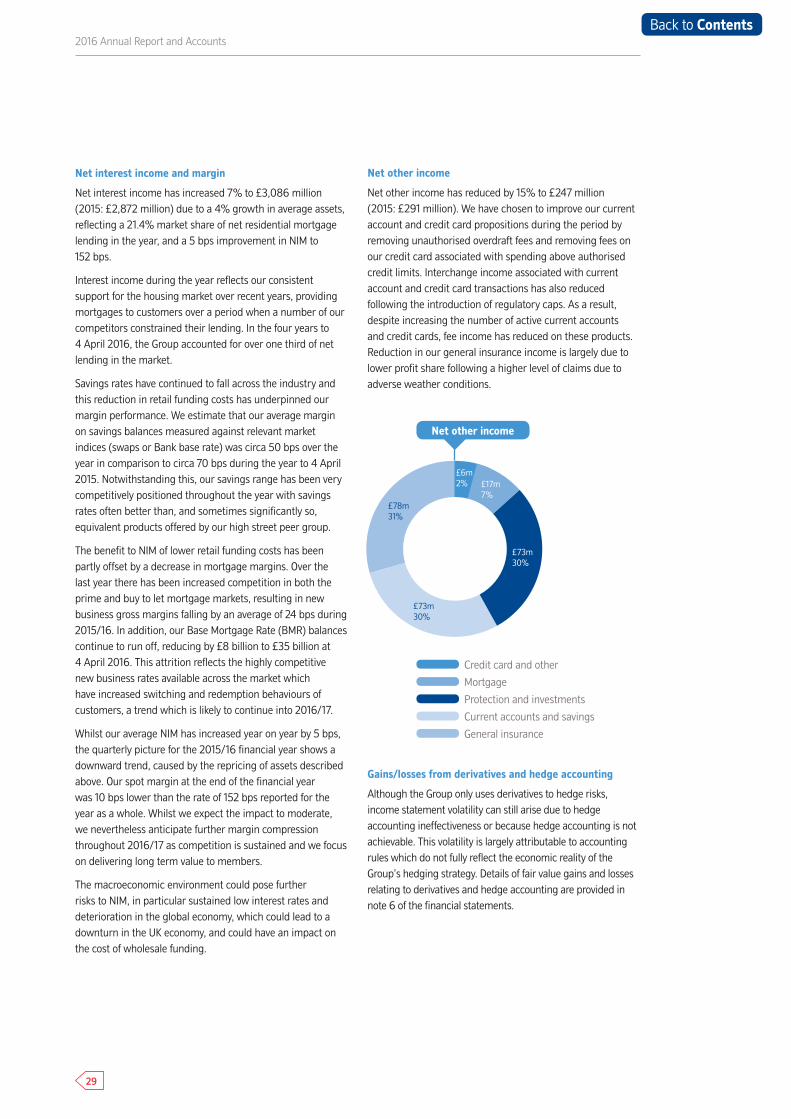
Net other income
Net other income has reduced by 15% to £247 million (2015: £291 million). We have chosen to improve our current account and credit card propositions during the period by removing unauthorised overdraft fees and removing fees on our credit card associated with spending above authorised credit limits. Interchange income associated with current account and credit card transactions has also reduced following the introduction of regulatory caps. As a result, despite increasing the number of active current accounts and credit cards, fee income has reduced on these products. Reduction in our general insurance income is largely due to lower profit share following a higher level of claims due to adverse weather conditions.
Gains/losses from derivatives and hedge accounting
Although the Group only uses derivatives to hedge risks, income statement volatility can still arise due to hedge accounting ineffectiveness or because hedge accounting is not achievable. This volatility is largely attributable to accounting rules which do not fully reflect the economic reality of the Group’s hedging strategy. Details of fair value gains and losses relating to derivatives and hedge accounting are provided in note 6 of the financial statements.
2016 Annual Report and Accounts
Credit card and other
Mortgage
Protection and investments
Current accounts and savings
General insurance
Net other income
£6m 2% £17m
7%
£73m 30%
£73m 30%
£78m 31%
29
Back to Contents
Strategic Report
Year to 4 April 2016
Year to 4 April 2015*
£m £m
Employee costs 736 671
Other administrative expenses 735 661
Depreciation and amortisation 325 294
Total underlying administrative expenses 1,796 1,626
Bank levy 41 28
Transformation costs 10 52
Total statutory administrative expenses 1,847 1,706
% %
Cost income ratio – underlying basis* 53.9 51.4
Cost income ratio – statutory basis 54.8 54.3
Administrative expenses
53.9%underlying cost income ratio
Total underlying administrative expenses have increased by £170 million to £1,796 million, driven by continued investment in the business. At a statutory level administrative expenses have increased by £141 million to £1,847 million.
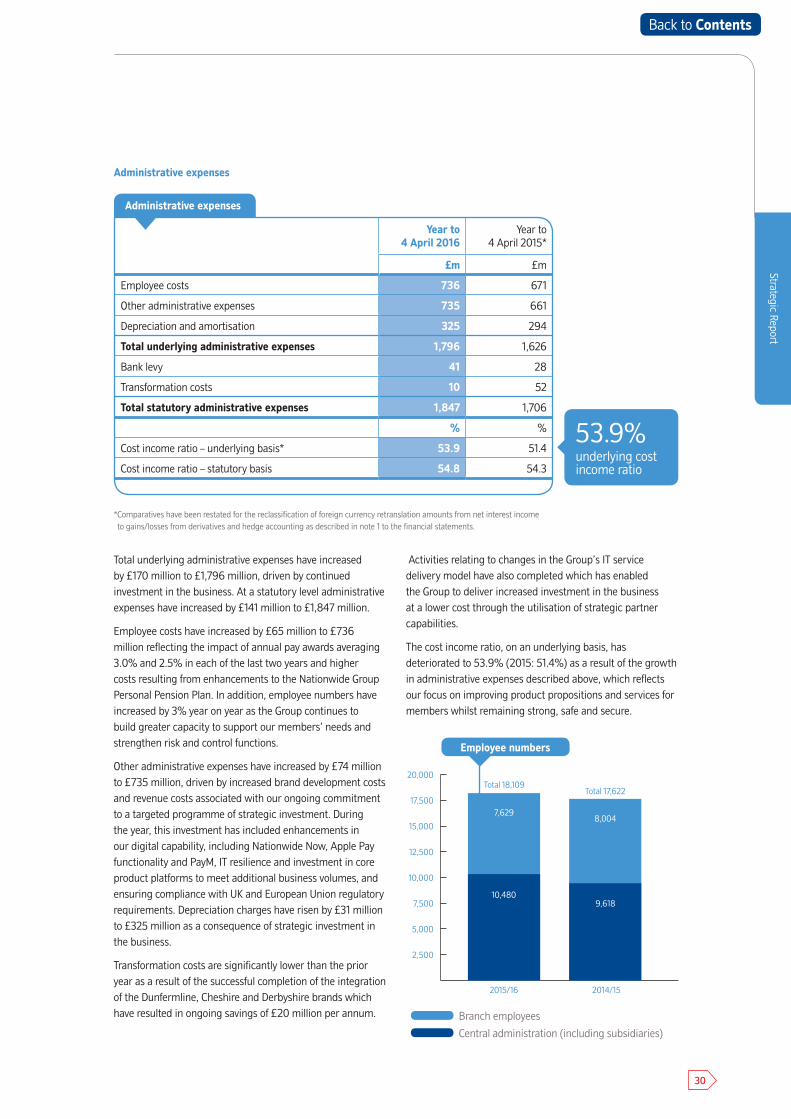
Employee costs have increased by £65 million to £736 million reflecting the impact of annual pay awards averaging 3.0% and 2.5% in each of the last two years and higher costs resulting from enhancements to the Nationwide Group Personal Pension Plan. In addition, employee numbers have increased by 3% year on year as the Group continues to build greater capacity to support our members’ needs and strengthen risk and control functions.
Other administrative expenses have increased by £74 million to £735 million, driven by increased brand development costs and revenue costs associated with our ongoing commitment to a targeted programme of strategic investment. During the year, this investment has included enhancements in our digital capability, including Nationwide Now, Apple Pay functionality and PayM, IT resilience and investment in core product platforms to meet additional business volumes, and ensuring compliance with UK and European Union regulatory requirements. Depreciation charges have risen by £31 million to £325 million as a consequence of strategic investment in the business.
Transformation costs are significantly lower than the prior year as a result of the successful completion of the integration of the Dunfermline, Cheshire and Derbyshire brands which have resulted in ongoing savings of £20 million per annum.
Activities relating to changes in the Group’s IT service delivery model have also completed which has enabled the Group to deliver increased investment in the business at a lower cost through the utilisation of strategic partner capabilities.
The cost income ratio, on an underlying basis, has deteriorated to 53.9% (2015: 51.4%) as a result of the growth in administrative expenses described above, which reflects our focus on improving product propositions and services for members whilst remaining strong, safe and secure.
* Comparatives have been restated for the reclassification of foreign currency retranslation amounts from net interest income to gains/losses from derivatives and hedge accounting as described in note 1 to the financial statements.
Administrative expenses
Branch employees
Central administration (including subsidiaries)
2015/16 2014/15
7,6298,004
9,61810,480
20,000
17,500
15,000
12,500
10,000
7,500
5,000
2,500
Employee numbers
Total 18,109Total 17,622
30
Back to Contents
2016 Annual Report and Accounts
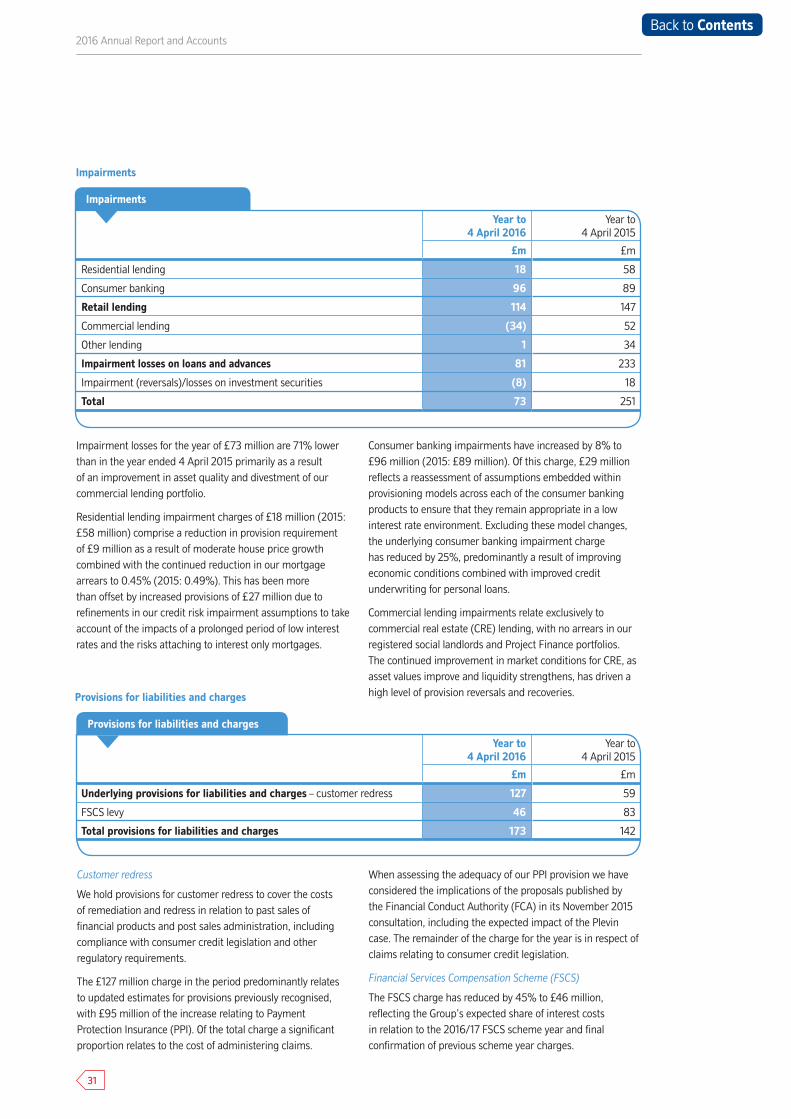
Year to 4 April 2016
Year to 4 April 2015
£m £m
Residential lending 18 58
Consumer banking 96 89
Retail lending 114 147
Commercial lending (34) 52
Other lending 1 34
Impairment losses on loans and advances 81 233
Impairment (reversals)/losses on investment securities (8) 18
Total 73 251
Impairment losses for the year of £73 million are 71% lower than in the year ended 4 April 2015 primarily as a result of an improvement in asset quality and divestment of our commercial lending portfolio.
Residential lending impairment charges of £18 million (2015: £58 million) comprise a reduction in provision requirement of £9 million as a result of moderate house price growth combined with the continued reduction in our mortgage arrears to 0.45% (2015: 0.49%). This has been more than offset by increased provisions of £27 million due to refinements in our credit risk impairment assumptions to take account of the impacts of a prolonged period of low interest rates and the risks attaching to interest only mortgages.
Consumer banking impairments have increased by 8% to £96 million (2015: £89 million). Of this charge, £29 million reflects a reassessment of assumptions embedded within provisioning models across each of the consumer banking products to ensure that they remain appropriate in a low interest rate environment. Excluding these model changes, the underlying consumer banking impairment charge has reduced by 25%, predominantly a result of improving economic conditions combined with improved credit underwriting for personal loans.
Commercial lending impairments relate exclusively to commercial real estate (CRE) lending, with no arrears in our registered social landlords and Project Finance portfolios. The continued improvement in market conditions for CRE, as asset values improve and liquidity strengthens, has driven a high level of provision reversals and recoveries.
Impairments
Customer redress
We hold provisions for customer redress to cover the costs of remediation and redress in relation to past sales of financial products and post sales administration, including compliance with consumer credit legislation and other regulatory requirements.
The £127 million charge in the period predominantly relates to updated estimates for provisions previously recognised, with £95 million of the increase relating to Payment Protection Insurance (PPI). Of the total charge a significant proportion relates to the cost of administering claims.
When assessing the adequacy of our PPI provision we have considered the implications of the proposals published by the Financial Conduct Authority (FCA) in its November 2015 consultation, including the expected impact of the Plevin case. The remainder of the charge for the year is in respect of claims relating to consumer credit legislation.
Financial Services Compensation Scheme (FSCS)
The FSCS charge has reduced by 45% to £46 million, reflecting the Group’s expected share of interest costs in relation to the 2016/17 FSCS scheme year and final confirmation of previous scheme year charges.
Year to 4 April 2016
Year to 4 April 2015
£m £m
Underlying provisions for liabilities and charges – customer redress 127 59
FSCS levy 46 83
Total provisions for liabilities and charges 173 142
Provisions for liabilities and charges
Impairments
Provisions for liabilities and charges
31
Back to Contents
Strategic Report
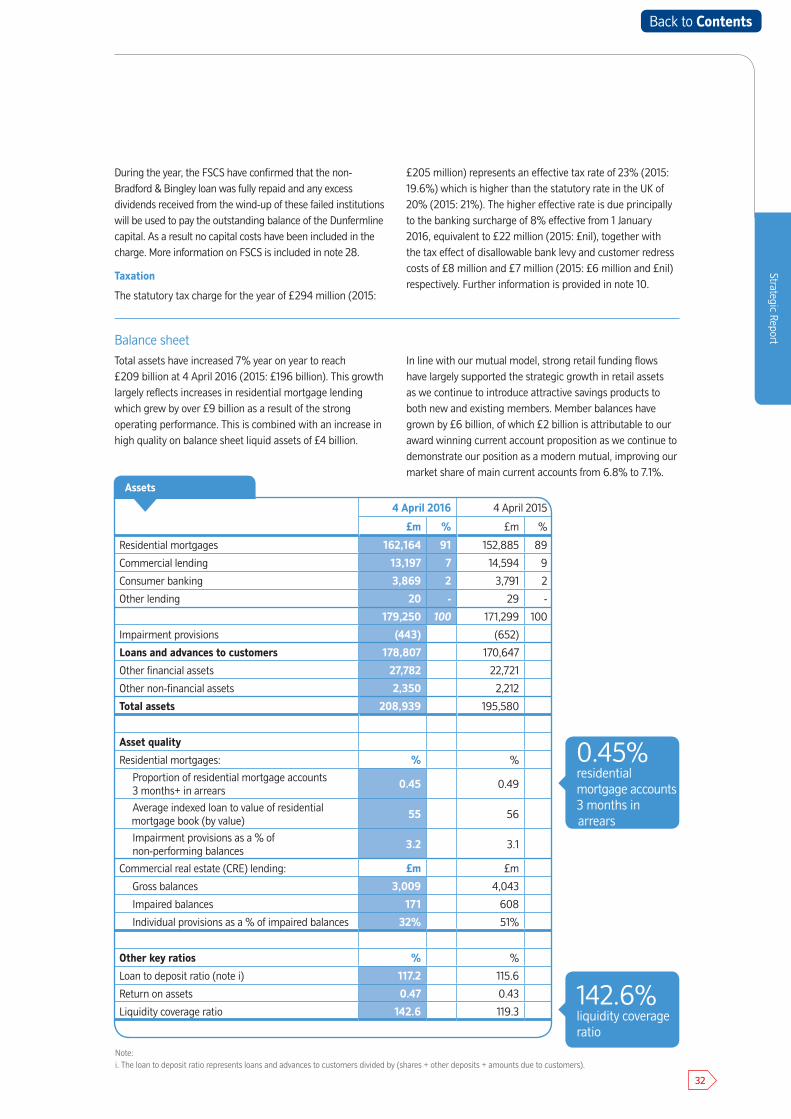
4 April 2016 4 April 2015
£m % £m %
Residential mortgages 162,164 91 152,885 89
Commercial lending 13,197 7 14,594 9
Consumer banking 3,869 2 3,791 2
Other lending 20 - 29 -
179,250 100 171,299 100
Impairment provisions (443) (652)
Loans and advances to customers 178,807 170,647
Other financial assets 27,782 22,721
Other non-financial assets 2,350 2,212
Total assets 208,939 195,580
Asset quality
Residential mortgages: % %
Proportion of residential mortgage accounts 3 months+ in arrears
0.45 0.49
Average indexed loan to value of residential mortgage book (by value)
55 56
Impairment provisions as a % of non-performing balances
3.2 3.1
Commercial real estate (CRE) lending: £m £m
Gross balances 3,009 4,043
Impaired balances 171 608
Individual provisions as a % of impaired balances 32% 51%
Other key ratios % %
Loan to deposit ratio (note i) 117.2 115.6
Return on assets 0.47 0.43
Liquidity coverage ratio 142.6 119.3
Assets
142.6%liquidity coverage ratio
0.45%residential mortgage accounts 3 months in arrears
During the year, the FSCS have confirmed that the non-Bradford & Bingley loan was fully repaid and any excess dividends received from the wind-up of these failed institutions will be used to pay the outstanding balance of the Dunfermline capital. As a result no capital costs have been included in the charge. More information on FSCS is included in note 28.
Taxation
The statutory tax charge for the year of £294 million (2015:
£205 million) represents an effective tax rate of 23% (2015: 19.6%) which is higher than the statutory rate in the UK of 20% (2015: 21%). The higher effective rate is due principally to the banking surcharge of 8% effective from 1 January 2016, equivalent to £22 million (2015: £nil), together with the tax effect of disallowable bank levy and customer redress costs of £8 million and £7 million (2015: £6 million and £nil) respectively. Further information is provided in note 10.
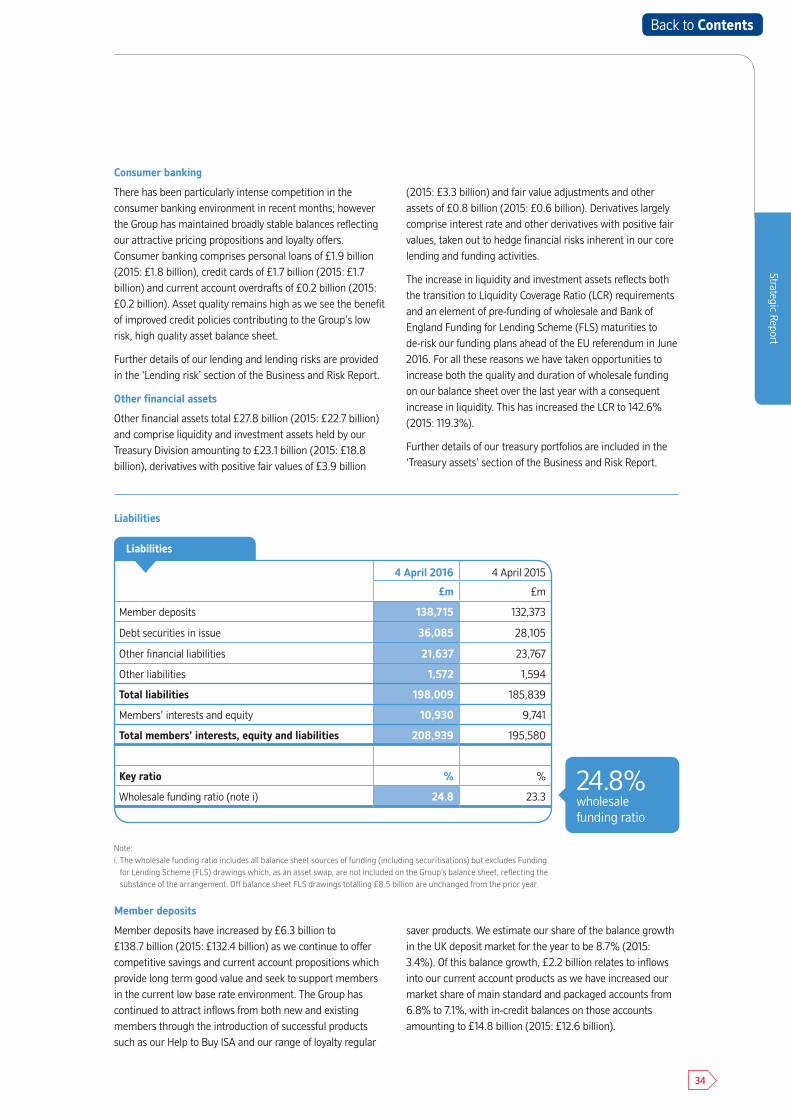
Balance sheetTotal assets have increased 7% year on year to reach £209 billion at 4 April 2016 (2015: £196 billion). This growth largely reflects increases in residential mortgage lending which grew by over £9 billion as a result of the strong operating performance. This is combined with an increase in high quality on balance sheet liquid assets of £4 billion.
In line with our mutual model, strong retail funding flows have largely supported the strategic growth in retail assets as we continue to introduce attractive savings products to both new and existing members. Member balances have grown by £6 billion, of which £2 billion is attributable to our award winning current account proposition as we continue to demonstrate our position as a modern mutual, improving our market share of main current accounts from 6.8% to 7.1%.
Note:i. The loan to deposit ratio represents loans and advances to customers divided by (shares + other deposits + amounts due to customers).
32
Back to Contents
Residential mortgages
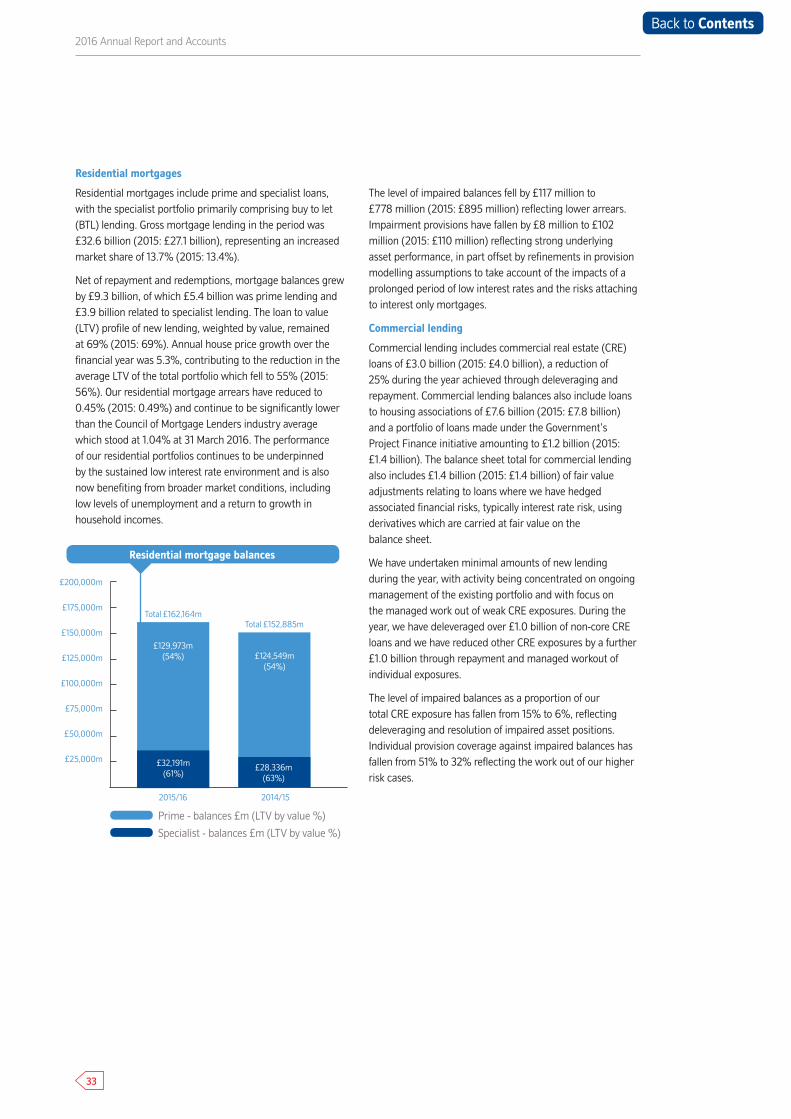
Residential mortgages include prime and specialist loans, with the specialist portfolio primarily comprising buy to let (BTL) lending. Gross mortgage lending in the period was £32.6 billion (2015: £27.1 billion), representing an increased market share of 13.7% (2015: 13.4%).
Net of repayment and redemptions, mortgage balances grew by £9.3 billion, of which £5.4 billion was prime lending and £3.9 billion related to specialist lending. The loan to value (LTV) profile of new lending, weighted by value, remained at 69% (2015: 69%). Annual house price growth over the financial year was 5.3%, contributing to the reduction in the average LTV of the total portfolio which fell to 55% (2015: 56%). Our residential mortgage arrears have reduced to 0.45% (2015: 0.49%) and continue to be significantly lower than the Council of Mortgage Lenders industry average which stood at 1.04% at 31 March 2016. The performance of our residential portfolios continues to be underpinned by the sustained low interest rate environment and is also now benefiting from broader market conditions, including low levels of unemployment and a return to growth in household incomes.
The level of impaired balances fell by £117 million to £778 million (2015: £895 million) reflecting lower arrears. Impairment provisions have fallen by £8 million to £102 million (2015: £110 million) reflecting strong underlying asset performance, in part offset by refinements in provision modelling assumptions to take account of the impacts of a prolonged period of low interest rates and the risks attaching to interest only mortgages.
Commercial lending
Commercial lending includes commercial real estate (CRE) loans of £3.0 billion (2015: £4.0 billion), a reduction of 25% during the year achieved through deleveraging and repayment. Commercial lending balances also include loans to housing associations of £7.6 billion (2015: £7.8 billion) and a portfolio of loans made under the Government’s Project Finance initiative amounting to £1.2 billion (2015: £1.4 billion). The balance sheet total for commercial lending also includes £1.4 billion (2015: £1.4 billion) of fair value adjustments relating to loans where we have hedged associated financial risks, typically interest rate risk, using derivatives which are carried at fair value on the balance sheet.
We have undertaken minimal amounts of new lending during the year, with activity being concentrated on ongoing management of the existing portfolio and with focus on the managed work out of weak CRE exposures. During the year, we have deleveraged over £1.0 billion of non-core CRE loans and we have reduced other CRE exposures by a further £1.0 billion through repayment and managed workout of individual exposures.
The level of impaired balances as a proportion of our total CRE exposure has fallen from 15% to 6%, reflecting deleveraging and resolution of impaired asset positions. Individual provision coverage against impaired balances has fallen from 51% to 32% reflecting the work out of our higher risk cases.
2016 Annual Report and Accounts
Prime - balances £m (LTV by value %)
Specialist - balances £m (LTV by value %)
2015/16 2014/15
£129,973m(54%) £124,549m
(54%)
£28,336m(63%)
£32,191m(61%)
£200,000m
£175,000m
£150,000m
£125,000m
£100,000m
£75,000m
£50,000m
£25,000m
Residential mortgage balances
Total £162,164mTotal £152,885m
33
Back to Contents
Strategic Report
Consumer banking
There has been particularly intense competition in the consumer banking environment in recent months; however the Group has maintained broadly stable balances reflecting our attractive pricing propositions and loyalty offers. Consumer banking comprises personal loans of £1.9 billion (2015: £1.8 billion), credit cards of £1.7 billion (2015: £1.7 billion) and current account overdrafts of £0.2 billion (2015: £0.2 billion). Asset quality remains high as we see the benefit of improved credit policies contributing to the Group’s low risk, high quality asset balance sheet.
Further details of our lending and lending risks are provided in the ‘Lending risk’ section of the Business and Risk Report.
Other financial assets
Other financial assets total £27.8 billion (2015: £22.7 billion) and comprise liquidity and investment assets held by our Treasury Division amounting to £23.1 billion (2015: £18.8 billion), derivatives with positive fair values of £3.9 billion
(2015: £3.3 billion) and fair value adjustments and other assets of £0.8 billion (2015: £0.6 billion). Derivatives largely comprise interest rate and other derivatives with positive fair values, taken out to hedge financial risks inherent in our core lending and funding activities.
The increase in liquidity and investment assets reflects both the transition to Liquidity Coverage Ratio (LCR) requirements and an element of pre-funding of wholesale and Bank of England Funding for Lending Scheme (FLS) maturities to de-risk our funding plans ahead of the EU referendum in June 2016. For all these reasons we have taken opportunities to increase both the quality and duration of wholesale funding on our balance sheet over the last year with a consequent increase in liquidity. This has increased the LCR to 142.6% (2015: 119.3%).
Further details of our treasury portfolios are included in the ‘Treasury assets’ section of the Business and Risk Report.
Liabilities
4 April 2016 4 April 2015
£m £m
Member deposits 138,715 132,373
Debt securities in issue 36,085 28,105
Other financial liabilities 21,637 23,767
Other liabilities 1,572 1,594
Total liabilities 198,009 185,839
Members’ interests and equity 10,930 9,741
Total members’ interests, equity and liabilities 208,939 195,580
Key ratio % %
Wholesale funding ratio (note i) 24.8 23.3
Liabilities
24.8%wholesale funding ratio
Member deposits
Member deposits have increased by £6.3 billion to £138.7 billion (2015: £132.4 billion) as we continue to offer competitive savings and current account propositions which provide long term good value and seek to support members in the current low base rate environment. The Group has continued to attract inflows from both new and existing members through the introduction of successful products such as our Help to Buy ISA and our range of loyalty regular
saver products. We estimate our share of the balance growth in the UK deposit market for the year to be 8.7% (2015: 3.4%). Of this balance growth, £2.2 billion relates to inflows into our current account products as we have increased our market share of main standard and packaged accounts from 6.8% to 7.1%, with in-credit balances on those accounts amounting to £14.8 billion (2015: £12.6 billion).
Note:i. The wholesale funding ratio includes all balance sheet sources of funding (including securitisations) but excludes Funding
for Lending Scheme (FLS) drawings which, as an asset swap, are not included on the Group’s balance sheet, reflecting the substance of the arrangement. Off balance sheet FLS drawings totalling £8.5 billion are unchanged from the prior year.
34
Back to Contents

Debt securities in issue
Debt securities in issue of £36.1 billion (2015: £28.1 billion) are used to raise funding in wholesale markets in order to finance core activities. The increase in outstanding amounts reflects increased issuance activity in the wholesale markets during the year to support increased liquidity.
The wholesale funding ratio has increased to 24.8% (2015: 23.3%), as a result of the wholesale issuance activity.
Further details on the Group’s wholesale funding mix and liquidity holdings are included in the ‘Liquidity and funding risk’ section of the Business and Risk Report.
Other financial liabilities
Other financial liabilities include customer and bank deposits of £15.9 billion (2015: £17.2 billion), permanent interest bearing shares (PIBS) of £0.4 billion (2015: £0.4 billion), subordinated debt of £1.8 billion (2015: £2.1 billion) and derivatives and fair value adjustments of £3.5 billion (2015: £4.0 billion). Derivatives and fair value adjustments largely comprise interest rate and other derivatives with negative fair values, taken out to hedge financial risks inherent in our core lending and funding activities.
2016 Annual Report and Accounts
CET1 capital resources have increased over the period by approximately £0.7 billion mainly as a result of a strong operating performance with £985 million of profit after tax for the period.
Risk weighted assets (RWAs) reduced over the period by approximately £2.3 billion due to reduced commercial RWAs, lower retail unsecured RWAs (resulting from model development) and lower residential lending RWAs as a result of house price inflation, which more than offset portfolio growth.
The movements described above have resulted in an increase in the CET1 ratio to 23.2% (2015: 19.8%). The leverage ratio has increased to 4.2% (2015: 4.1%) as growth in Tier 1 capital has outstripped the balance sheet growth, which has been driven by increases in residential mortgage and liquidity balances.
The Group continues to monitor regulatory developments that could lead to an increased level of capital requirements. Whilst there are a number of areas where potential requirements
are yet to be finalised, regulatory announcements during the financial year mean that we have better visibility of expectations for future capital requirements. The Group will remain engaged in the development of the regulatory approach to ensure we are prepared for any change.
We expect to have a steady state leverage ratio requirement of 3.75% from 2019, which comprises a minimum requirement of 3%, a supplementary leverage ratio buffer of 0.35% and countercyclical leverage ratio buffer of 0.4%. The Financial Policy Committee could set a countercyclical leverage buffer up to 0.9%, but has so far set the buffer at 0.2%, which is expected to apply from March 2017. The Group’s strategic leverage ratio target of 4.5% reflects its desire to maintain strong levels of capital relative to maximum regulatory expectations (4.25%).
Further details of the capital position are included in the ‘Solvency risk’ section of the Business and Risk Report.
4 April 2016 4 April 2015
£m £m
Capital resources (note i)
Common Equity Tier 1 (CET1) capital 8,013 7,279
Total Tier 1 capital 9,005 8,271
Total regulatory capital 10,654 9,950
Risk weighted assets (RWAs) 34,475 36,804
Leverage exposure 213,181 200,665
CRD IV capital ratios % %
CET1 ratio 23.2 19.8
Leverage ratio (note ii) 4.2 4.1
Capital structure
23.2%CET1 ratio
4.2%leverage ratio
Notes:i. Data in the table is reported under CRD IV on an end point basis.ii. The leverage ratio is calculated using the Capital Requirements Regulation definition of Tier 1 for the capital amount and
the Delegated Act definition of the exposure measure.
Capital structure
35
Back to Contents
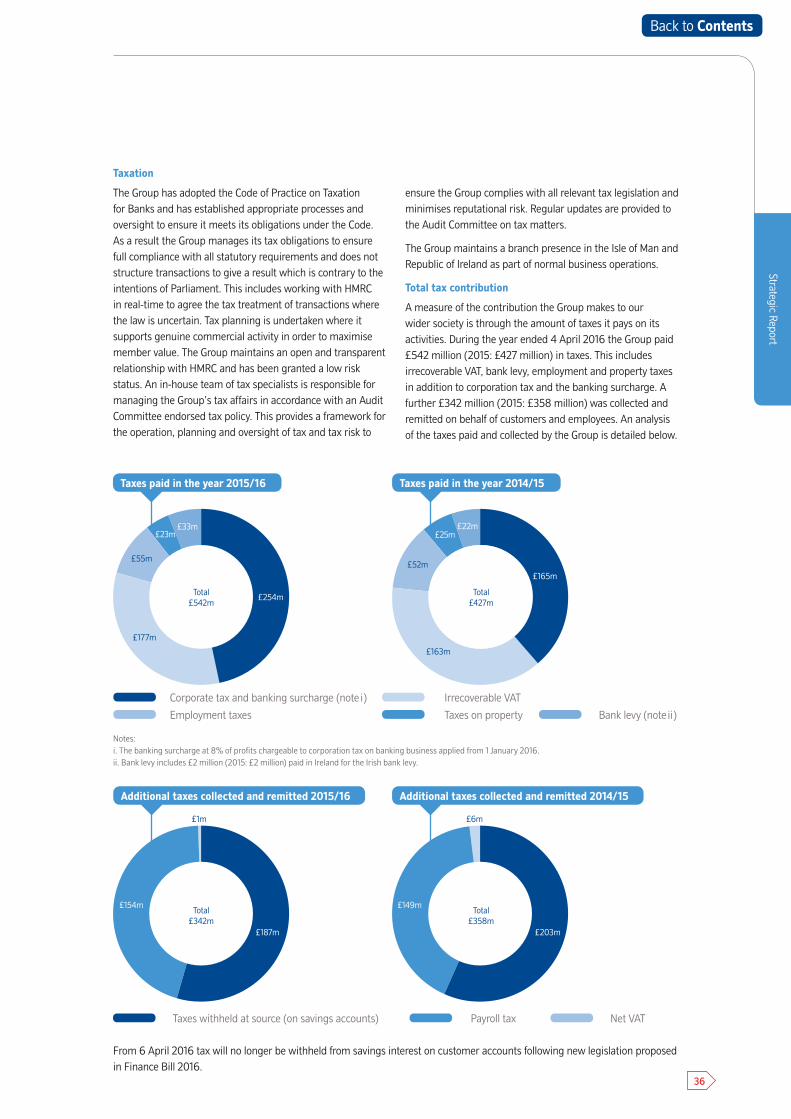
Strategic Report
Taxation
The Group has adopted the Code of Practice on Taxation for Banks and has established appropriate processes and oversight to ensure it meets its obligations under the Code. As a result the Group manages its tax obligations to ensure full compliance with all statutory requirements and does not structure transactions to give a result which is contrary to the intentions of Parliament. This includes working with HMRC in real-time to agree the tax treatment of transactions where the law is uncertain. Tax planning is undertaken where it supports genuine commercial activity in order to maximise member value. The Group maintains an open and transparent relationship with HMRC and has been granted a low risk status. An in-house team of tax specialists is responsible for managing the Group’s tax affairs in accordance with an Audit Committee endorsed tax policy. This provides a framework for the operation, planning and oversight of tax and tax risk to
ensure the Group complies with all relevant tax legislation and minimises reputational risk. Regular updates are provided to the Audit Committee on tax matters.
The Group maintains a branch presence in the Isle of Man and Republic of Ireland as part of normal business operations.
Total tax contribution
A measure of the contribution the Group makes to our wider society is through the amount of taxes it pays on its activities. During the year ended 4 April 2016 the Group paid £542 million (2015: £427 million) in taxes. This includes irrecoverable VAT, bank levy, employment and property taxes in addition to corporation tax and the banking surcharge. A further £342 million (2015: £358 million) was collected and remitted on behalf of customers and employees. An analysis of the taxes paid and collected by the Group is detailed below.
Taxes withheld at source (on savings accounts) Payroll tax Net VAT
Additional taxes collected and remitted 2015/16 Additional taxes collected and remitted 2014/15
£203m£187m
£149m£154m
£6m£1m
Total £342m
Total £358m
Notes:i. The banking surcharge at 8% of profits chargeable to corporation tax on banking business applied from 1 January 2016.ii. Bank levy includes £2 million (2015: £2 million) paid in Ireland for the Irish bank levy.
Corporate tax and banking surcharge (note i) Irrecoverable VAT
Employment taxes Taxes on property Bank levy (note ii)
Taxes paid in the year 2015/16
£23m £25m£33m £22m
£254m
£165m
£177m
£163m
£55m£52m
Total £542m
Total £427m
Taxes paid in the year 2014/15
From 6 April 2016 tax will no longer be withheld from savings interest on customer accounts following new legislation proposed in Finance Bill 2016.
36
Back to Contents

2016 Annual Report and Accounts
To manage Policies and practices are in place to ensure that
Lendingrisk
• the Group lends responsibly, only taking risks that are well understood• the Group builds prudent loan portfolios, primarily focused on residential mortgages, without creating
undue risk concentrations and controls exposure to higher risk portfolios• the Group only participates in non-member business where it has existing capabilities and earns a
premium return on capital or provides valuable services to members.
Financial risk
• the Group maintains a strong balance sheet with prudent levels of liquidity and diverse sources of funding• the Group maintains a strong capital base above regulatory requirements• the Group can withstand a severe stress event without any significant disruption to products and services.
Operational risk
• the Group operates its business to ensure a minimum level of serious disruption to customers, brand andreputation with systems and services designed to achieve defined levels of availability and performance.
Conduct and compliance risk
• the Group never knowingly creates unfair outcomes for customers• the Group’s products, services and distribution channels are designed, monitored and managed to provide
value over time, accessibility, and meet the needs and experience expectations of our customers• the Group has a strong, focused conduct culture, where conduct risk is embedded in governance
frameworks, to ensure adequate consideration, identification, management and mitigation of conduct risks• the Group puts customers at the heart of everything it does, and this is reflected in its conduct outcomes.
Strategic risk
• the Group is committed to a mutual business model, and ensures this model remains sustainable withinlegal and regulatory requirements
• the Group focuses strategic decisions on achieving the best long term outcome for its members.
Risk overview Effective risk management is at the heart of the business, supporting the delivery of the Group’s strategy by ensuring the business continues to be safe and sustainable and ultimately by protecting members’ interests.
The Group adopts an enterprise-wide risk management framework to ensure that it manages risks effectively. This is underpinned by the three lines of defence model which ensures independent oversight and audit of risk management carried out by the business. More detail on the risk management framework and three lines of defence model is given in the Business and Risk Report.
The principal risks facing the Group are set out below. Fuller definitions are provided in the Business and Risk Report.
• Lending risk: The risk that a borrower or counterparty fails to pay interest or repay the principal on a loan.
• Financial risk: The risk of inadequate earnings, cash flow or capital.
• Operational risk: The risk of loss from inadequate or failed internal operations or external events.
• Conduct and compliance risk: The risk that customers experience unfair outcomes or that the Group fails to comply with regulatory requirements.
• Strategic risk: The risk of significant loss from longer term business decisions or from an inability to adapt toexternal developments.
For each of these principal risks, a formal statement of Board appetite for risk defines how much risk the Board is prepared to take in pursuit of the Group’s goals, and establishes a framework for decision making. Performance is reviewed regularly against this statement to ensure that the business operates within risk appetite.
In addition, the Group manages each of these principal risks
through adopting policies and practices as set out below:
37
Back to Contents

Risk overview
Strategic Report
Our Business and Risk Report can be found on pages
105
192
Top and emerging risksWhilst the Group accepts that all of its business activities involve risk, it seeks to protect its members by managing risks that arise from its activities appropriately. Against this background, during the last year the Group’s financial strength has continued to grow and lending performance has further improved, with low arrears reflecting high quality underwriting and the current economic environment. Risk management activity has focused on strengthening business resilience and managing conduct and regulatory challenges. As a result the Group’s top and emerging risks remain largely unchanged and fall within four themes: macroeconomic, cyber attack and business resilience, the changing face of financial services, and conduct and compliance risk challenges. More details of these are given in the Business and Risk Report and are summarised below.
Macroeconomic
The Group’s financial position remains strong, with increasing profitability and robust capital and liquidity positions. However, uncertainty both globally and in the UK presents two main areas that could affect the Group. If UK bank base rates remain at their current low levels for a protracted period this could constrain the Group’s margin. In addition, although not expected, a move to zero or negative rates may result in changing customer attitudes to savings which could challenge the Group’s business model. Global factors or the referendum on UK membership of the EU could temporarily affect access to and pricing of wholesale funding or reduce confidence and activity in property markets.
Cyber attack and business resilience
Cyber security threats are increasing and this, coupled with the pace of technological development, creates risk across the financial services industry. Recent high profile cyber attacks serve to illustrate the increasing sophistication in this area and also prompt greater member and regulator concerns about security. In addition, customer tolerance for service disruption continues to reduce within the financial services industry. The potential for cyber attacks across the industry increases as the business becomes increasingly digital, and greater reliance is placed on integrated industry-wide systems.
Changing face of financial services
The Group will continue to develop new and existing technology to deliver a market-leading proposition. However, there are a number of challenges from new and changing competition, in particular: ring-fencing of retail operations may lead traditional banking competitors to refocus their activity in the Group’s core markets, whilst challenger banks and FinTech firms may impact product pricing and customer propositions. New technology and new models, such as peer-to-peer lending or robo-advice, may mean that customer behaviours and attitudes deviate significantly from expectations.
Conduct and compliance challenges
The Group’s culture places conduct and compliance as central to its values and behaviours. The Group’s risk governance and control framework drives a strong customer-focused conduct culture at each stage of a customer’s interaction from product design, through sales and post-sales servicing. However, the scale and quantity of changing regulation affecting the industry continues apace, with the consequential risk that industry developments proceed ahead of regulatory change. In addition, customers increasingly expect to be able to access products and services at a time, and through a medium, of their choosing. It is critical that the Group’s products and services remain resilient to meet customer expectations and are designed to meet the changing needs of an ageing population.
Further details on risk management and top and emerging risks can be found in the Business and Risk Report, together with full principal risk definitions.
38
Back to Contents

2016 Annual Report and Accounts
Our peopleOur people are central to providing exceptional service to our members. We believe that being a great employer and employing first class people offers us a genuine competitive advantage. We are proud to have been ranked as the third best big company to work for by the Sunday Times and a top 50 employer for women by The Times.
39
Back to Contents
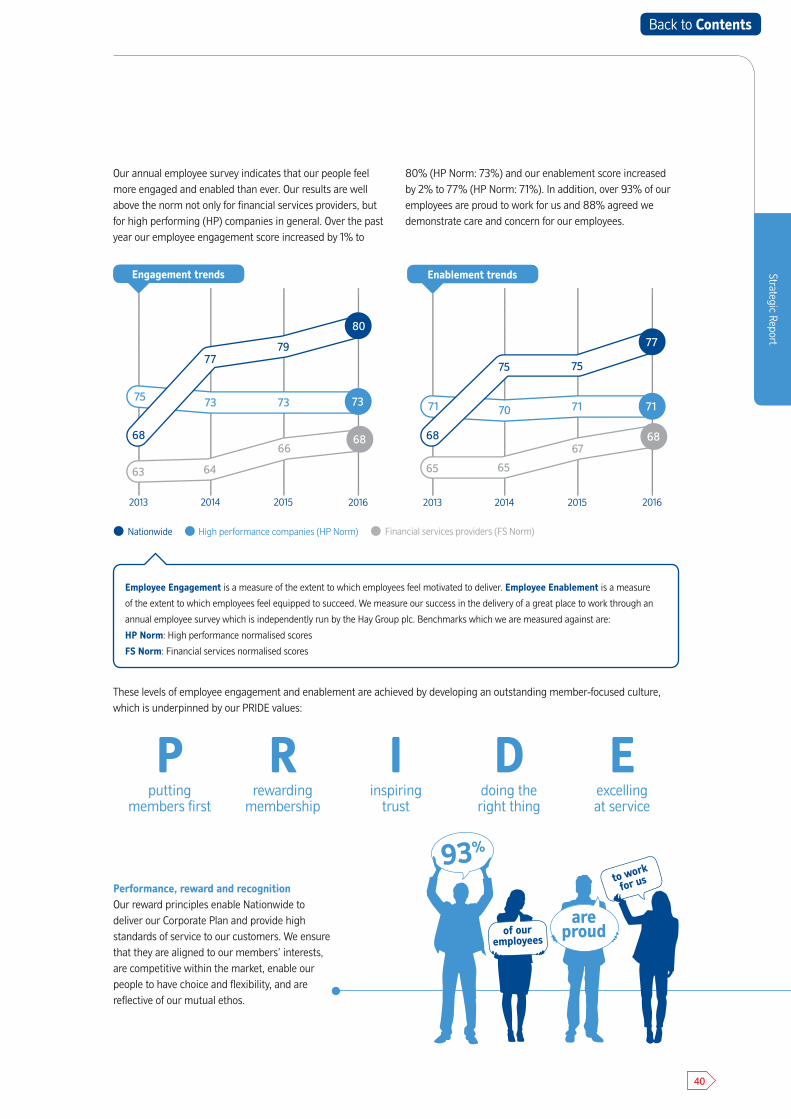
Our annual employee survey indicates that our people feel more engaged and enabled than ever. Our results are well above the norm not only for financial services providers, but for high performing (HP) companies in general. Over the past year our employee engagement score increased by 1% to
80% (HP Norm: 73%) and our enablement score increased by 2% to 77% (HP Norm: 71%). In addition, over 93% of our employees are proud to work for us and 88% agreed we demonstrate care and concern for our employees.
These levels of employee engagement and enablement are achieved by developing an outstanding member-focused culture, which is underpinned by our PRIDE values:
Pputting
members first
Rrewarding
membership
Iinspiring
trust
Ddoing the right thing
Eexcelling at service
Performance, reward and recognitionOur reward principles enable Nationwide to deliver our Corporate Plan and provide high standards of service to our customers. We ensure that they are aligned to our members’ interests, are competitive within the market, enable our people to have choice and flexibility, and are reflective of our mutual ethos.
Employee Engagement is a measure of the extent to which employees feel motivated to deliver. Employee Enablement is a measure
of the extent to which employees feel equipped to succeed. We measure our success in the delivery of a great place to work through an
annual employee survey which is independently run by the Hay Group plc. Benchmarks which we are measured against are:
HP Norm: High performance normalised scores
FS Norm: Financial services normalised scores
Nationwide High performance companies (HP Norm) Financial services providers (FS Norm)
Strategic Report
93%
are proudof our
employees
to work
for us
2014 20142013 20132015 20152016 2016
7775
68 68
79
75
8077
73 7173 717370
7571
68 68
63 6564 65
66 67
Engagement trends Enablement trends
40
Back to Contents
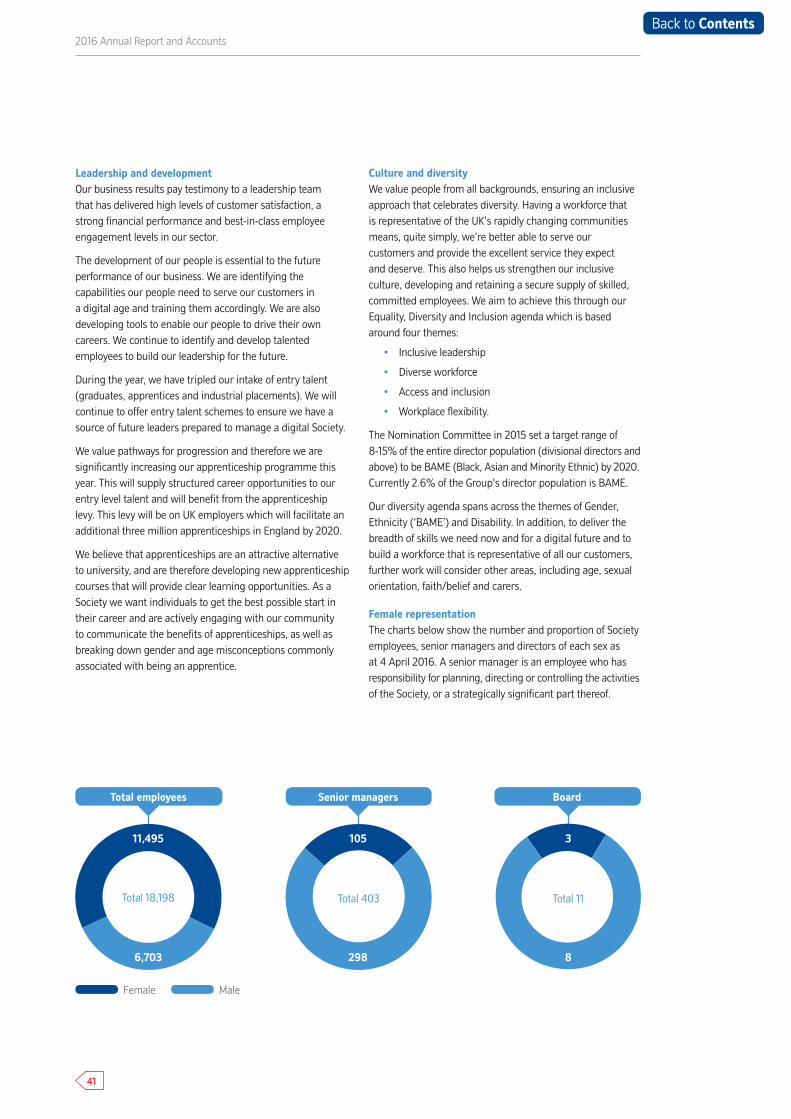
Leadership and developmentOur business results pay testimony to a leadership team that has delivered high levels of customer satisfaction, a strong financial performance and best-in-class employee engagement levels in our sector.
The development of our people is essential to the future performance of our business. We are identifying the capabilities our people need to serve our customers in a digital age and training them accordingly. We are also developing tools to enable our people to drive their own careers. We continue to identify and develop talented employees to build our leadership for the future.
During the year, we have tripled our intake of entry talent (graduates, apprentices and industrial placements). We will continue to offer entry talent schemes to ensure we have a source of future leaders prepared to manage a digital Society.
We value pathways for progression and therefore we are significantly increasing our apprenticeship programme this year. This will supply structured career opportunities to our entry level talent and will benefit from the apprenticeship levy. This levy will be on UK employers which will facilitate an additional three million apprenticeships in England by 2020.
We believe that apprenticeships are an attractive alternative to university, and are therefore developing new apprenticeship courses that will provide clear learning opportunities. As a Society we want individuals to get the best possible start in their career and are actively engaging with our community to communicate the benefits of apprenticeships, as well as breaking down gender and age misconceptions commonly associated with being an apprentice.
Culture and diversityWe value people from all backgrounds, ensuring an inclusive approach that celebrates diversity. Having a workforce that is representative of the UK’s rapidly changing communities means, quite simply, we’re better able to serve our customers and provide the excellent service they expect and deserve. This also helps us strengthen our inclusive culture, developing and retaining a secure supply of skilled, committed employees. We aim to achieve this through our Equality, Diversity and Inclusion agenda which is based around four themes:
• Inclusive leadership
• Diverse workforce
• Access and inclusion
• Workplace flexibility.
The Nomination Committee in 2015 set a target range of 8-15% of the entire director population (divisional directors andabove) to be BAME (Black, Asian and Minority Ethnic) by 2020. Currently 2.6% of the Group's director population is BAME.
Our diversity agenda spans across the themes of Gender, Ethnicity (‘BAME’) and Disability. In addition, to deliver the breadth of skills we need now and for a digital future and to build a workforce that is representative of all our customers, further work will consider other areas, including age, sexual orientation, faith/belief and carers.
Female representationThe charts below show the number and proportion of Society employees, senior managers and directors of each sex as at 4 April 2016. A senior manager is an employee who has responsibility for planning, directing or controlling the activities of the Society, or a strategically significant part thereof.
2016 Annual Report and Accounts
Female Male
Total employees Senior managers Board
Total 18,198
11,495
6,703
Total 403
105
298
Total 11
3
8
41
Back to Contents

Future focus
As we move into an increasingly digital world the requirements of our leaders will change. To ensure that we continue to meet our members’ needs we will continue to develop our future leadership capability.
We will focus on our diversity agenda to ensure our people continue to feel confident in working and developing in a diverse workforce, and can respond appropriately to an increasingly diverse customer base.
Strategic Report
Further detail on our talent development, diversity and gender balance initiatives and targets may be found in the Nomination and Governance Committee report within the Report of the directors on corporate governance.
For the Nomination and Governance Committee report see pages
89
92
42
Back to Contents
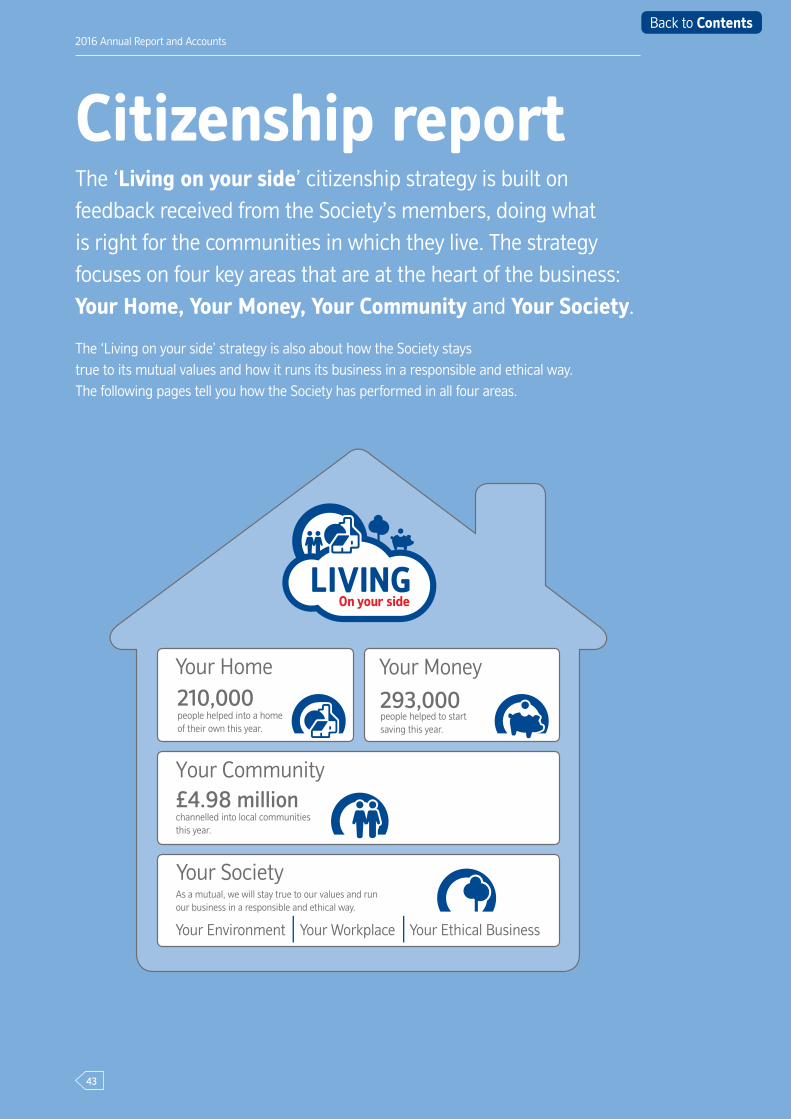
Citizenship reportThe ‘Living on your side’ citizenship strategy is built on feedback received from the Society’s members, doing what is right for the communities in which they live. The strategy focuses on four key areas that are at the heart of the business: Your Home, Your Money, Your Community and Your Society.
The ‘Living on your side’ strategy is also about how the Society stays true to its mutual values and how it runs its business in a responsible and ethical way. The following pages tell you how the Society has performed in all four areas.
2016 Annual Report and Accounts
210,000 293,000
Your Community£4.98 million
people helped into a home of their own this year.
people helped to start saving this year.
channelled into local communities this year.
As a mutual, we will stay true to our values and run our business in a responsible and ethical way.
Your Environment Your Workplace Your Ethical Business
Your Home Your Money
Your Society
43
Back to Contents

This year, ‘Living on your side’ has made strong progress against the targets which were set in 2012. Members and employees have worked side by side to make a real difference to local communities, including:
• taking the sector lead in supporting vulnerable customers, military families and young people
• working with Shelter to exceed a target of helping 16,000 people into a home of their own
• in conjunction with Macmillan Cancer Support, launching the Specialist Support Service for customers living with cancer
• partnering with the Woodland Trust as part of the Society’s woodland creation programme
• employees volunteering almost 90,000 hours of their time
• raising more than £150,000 for Macmillan Cancer Support and breaking the record for the world’s largest cream tea party.
Independent recognitionThe citizenship agenda is a core part of how the Society operates as a business, staying true to its mutual values and helping it remain truly ‘on your side’. This was recognised when the Society scored 98% in the BITC Corporate Responsibility Index and received re-accreditation of BITC’s CommunityMark.
GovernanceWhile ‘Living on your side’ is the collective citizenship strategy of the Society, overall accountability for it rests with the senior management team and the board of directors.
Help shape the next citizenship strategyAs the Society enters the fifth and final year of its
‘Living on your side’ strategy, it is ready to start
creating a new five year plan for how it will continue
to make a difference as a leading responsible
business. Input from members will be crucial in this
process – the Society wants members’ views on
what it should be doing to support local communities
and what can be achieved by investing up to 1% of
profits to support good causes. For more information,
visit your.nationwide.co.uk/your-society/
Graham Beale Chief Executive*• Occupational health and safety • Human Rights
Alison Robb Group Director• Employee engagement • Citizenship
Chris Rhodes Executive Director, Group Retail• Members/customers
Tony Prestedge Chief Operating Officer• Supply chain • Environment
* Graham Beale led this until his intention to retire in April 2016.
A replacement will be appointed shortly.
Strategic Report
44
Back to Contents
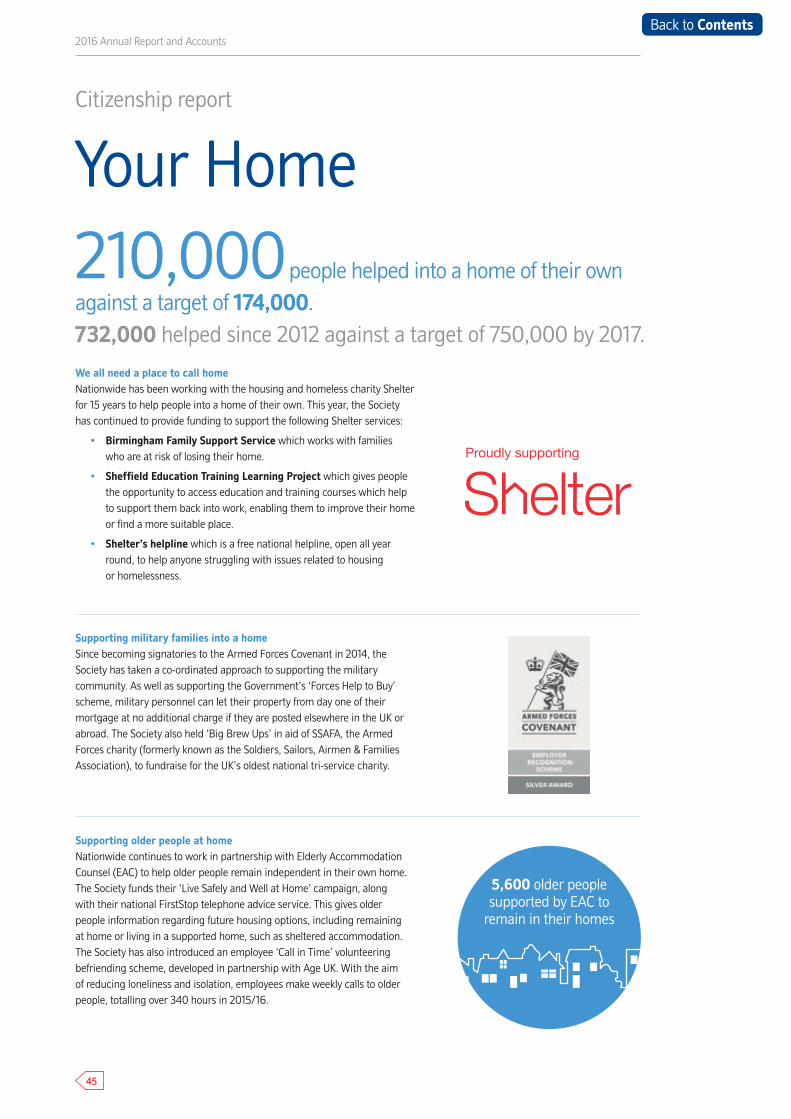
2016 Annual Report and Accounts
Citizenship report
Your Home210,000 people helped into a home of their ownagainst a target of 174,000. 732,000 helped since 2012 against a target of 750,000 by 2017.
We all need a place to call home Nationwide has been working with the housing and homeless charity Shelter for 15 years to help people into a home of their own. This year, the Society has continued to provide funding to support the following Shelter services:
• Birmingham Family Support Service which works with families who are at risk of losing their home.
• Sheffield Education Training Learning Project which gives people the opportunity to access education and training courses which help to support them back into work, enabling them to improve their home or find a more suitable place.
• Shelter’s helpline which is a free national helpline, open all year round, to help anyone struggling with issues related to housing or homelessness.
Supporting military families into a homeSince becoming signatories to the Armed Forces Covenant in 2014, the Society has taken a co-ordinated approach to supporting the military community. As well as supporting the Government’s ‘Forces Help to Buy’ scheme, military personnel can let their property from day one of their mortgage at no additional charge if they are posted elsewhere in the UK or abroad. The Society also held ‘Big Brew Ups’ in aid of SSAFA, the Armed Forces charity (formerly known as the Soldiers, Sailors, Airmen & Families Association), to fundraise for the UK’s oldest national tri-service charity.
Supporting older people at homeNationwide continues to work in partnership with Elderly Accommodation Counsel (EAC) to help older people remain independent in their own home. The Society funds their ‘Live Safely and Well at Home’ campaign, along with their national FirstStop telephone advice service. This gives older people information regarding future housing options, including remaining at home or living in a supported home, such as sheltered accommodation. The Society has also introduced an employee ‘Call in Time’ volunteering befriending scheme, developed in partnership with Age UK. With the aim of reducing loneliness and isolation, employees make weekly calls to older people, totalling over 340 hours in 2015/16.
5,600 older people supported by EAC to
remain in their homes
45
Back to Contents
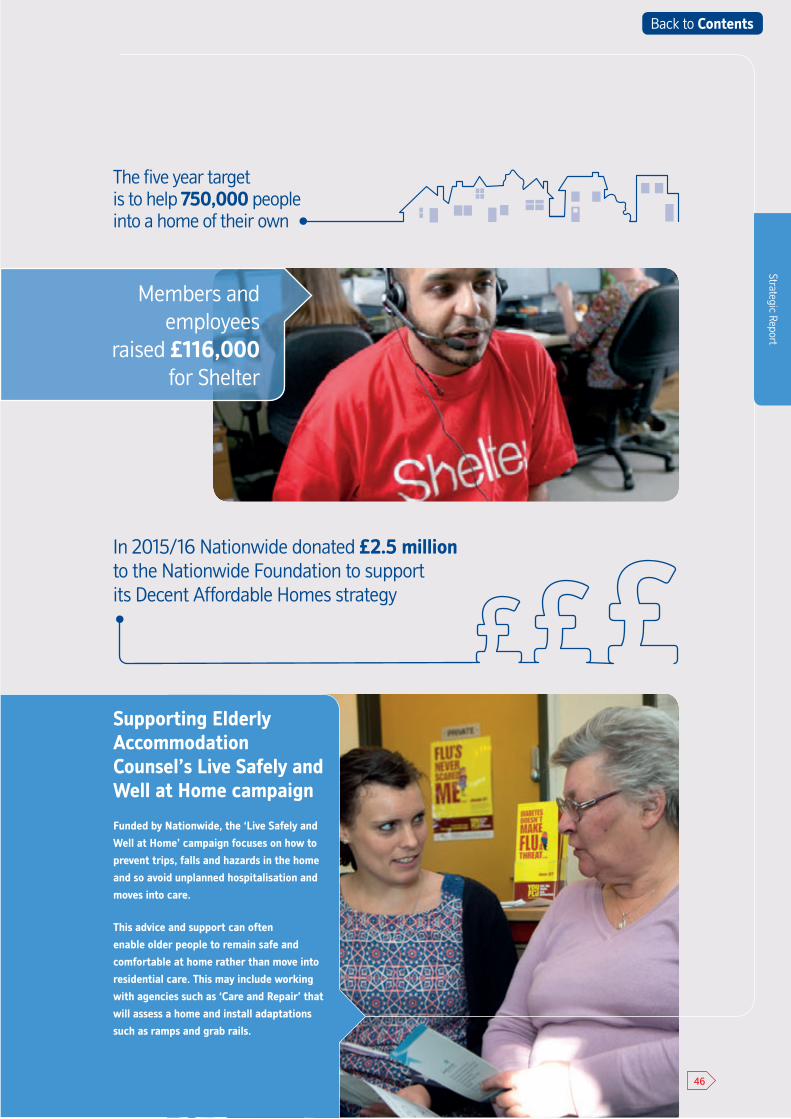
Citizenship report
In 2015/16 Nationwide donated £2.5 million to the Nationwide Foundation to support its Decent Affordable Homes strategy
Supporting Elderly Accommodation Counsel’s Live Safely and Well at Home campaign
Funded by Nationwide, the ‘Live Safely and
Well at Home’ campaign focuses on how to
prevent trips, falls and hazards in the home
and so avoid unplanned hospitalisation and
moves into care.
This advice and support can often
enable older people to remain safe and
comfortable at home rather than move into
residential care. This may include working
with agencies such as ‘Care and Repair’ that
will assess a home and install adaptations
such as ramps and grab rails.
Strategic Report
The five year target is to help 750,000 people into a home of their own
Members and employees
raised £116,000 for Shelter
46
Back to Contents

2016 Annual Report and Accounts
Encouraging people to saveNationwide is committed to encouraging people to save. Initiatives this year included:
• Regular Saver and Regular Saver ISA accounts have been introduced and designed specifically to encourage new saving.
• In December 2015, Help to Buy ISA was launched to support people saving for their first home. This provides up to £3,000 Government cash back.
• The new FlexBasic current account was created for people that do not have a credit score or who may have faced financial difficulties in the past. This was further supported by the launch of the Your Money website, a no-nonsense guide to money, budgeting and credit ratings.
Nationwide Education NationwideEducation.co.uk is a website providing free, independent online resources for children, parents and teachers covering numeracy and financial capability as well as careers, sustainability and road and home safety. This year, three new supermarket games have been added for Key Stages 1 and 2. For Key Stages 3 and 4, the ‘Saving the Day’ game has been launched where six characters face every day financial conundrums.
Talking NumbersTalking Numbers is Nationwide’s education programme to improve the everyday number skills of more than 200,000 young people by 2017. The Society works closely with teachers and partner organisations to improve numeracy skills. This year’s highlights included:
• funding ten secondary school maths teachers through Teach First
• working with the Personal Finance Education Group (known as pfeg) to develop a bespoke programme, Money-Matics, which trains primary school teachers to teach financial literacy
• the delivery of Rock Club with the Transformation Trust, which is all about makingmaths fun by running workshops across the country whereby young people use their maths skills to plan a rock concert
• development of a Nationwide branch in RADAR (Northern Ireland’s first fullyinteractive safety and life skills centre) and running a series of financial skills modules (MoneyLIVE) for students to participate in at similar centres that Nationwide supports.
Your Money293,000 people helped to start saving this yearagainst a target of 248,000. 925,000 helped since 2012 against a target of 1 million by 2017.
Citizenship report
47
Back to Contents

Strategic Report
Number Crunchers
helped 12 schools and 300 school childrenNumber Crunchers is Nationwide’s volunteering programme that supports children in primary schools to help them improve
number skills. It involves visiting a local school for short sessions to help those children who need a little extra support.
Jeremy Beach, a Nationwide employee, comments: “I love volunteering as a Number Cruncher as I’m helping the children
directly and, of course, supporting the local community.”
18,700young people
benefited from MoneyLIVE workshops
29,300parents, teachers and young people regularly visited NationwideEducation.co.uk over the past year.
helped 925,000 to start saving since 2012
48
Back to Contents

2016 Annual Report and Accounts
£4.98 million channelled into localcommunities this year against a target of £5 million. £16 million since 2012 against a target of £15 million by 2017.
Working side by side with membersTogether with members, the Society supports causes that are close to people’s hearts. This has been achieved through:
• The Nationwide Big Local where once a month customers vote online for one of three shortlisted charities to win £5,000.
• Community Match which asks customers quarterly to vote for one of three local causes in branch to win a £500 donation.
• Side by Side volunteering where members and employees volunteerfor a number of projects such as CPR training and tree planting.
Macmillan – a record breaking yearThe Society’s 23 year relationship with Macmillan Cancer Support was taken to a new level this year. Both organisations have worked together to develop and launch a ground-breaking Specialist Support Service for Nationwide customers affected by cancer. Members and employees also celebrated Macmillan’s World’s Biggest Coffee Morning, raising more than £150,000 for the charity. A highlight of the year was breaking the record for holding the world’s largest cream tea party in Swindon, with the support of one of the Society’s suppliers, Baxter Storey.
Skills volunteeringNationwide employees are passionate about supporting the communities in which they live and work, with 76% getting involved in fundraising, volunteering or payroll giving. More and more employees are choosing to share their business and professional skills with charities that benefit from expertise they may otherwise not be able to access or afford. The Great Western Air Ambulance Charity, for example, has a target to recruit 60 new volunteers. A team of employee volunteers spent time with the charity to develop a new volunteer recruitment strategy. The relationship has continued as the employees are now fundraising for the charity and continuing to support them with other activities.
Your CommunityCitizenship report
49
Back to Contents

Strategic Report
Are you affected by
cancer?
0800 917 2393You’ve got other things on your mind. So let us help you with your finances.
nationwide.co.uk/specialistsupport
90364 Macmillan Support A1 Poster (i) AW NjB.indd 1 27/04/2015 12:42
Nationwide employees involved in citizenship
The value of employees volunteering their time was £1.5 million (all employees are given up to 14 hours to volunteer during company time each year)
1,900 hours volunteeredthrough Side by Side1.2 million votes received for
Big Local and Community Match
76%
Specialist Support Service
With the mutual goal to help customers manage their finances
and reduce the stress of money worries, the Society has worked
with Macmillan Cancer Support to develop a first-of-its-kind
Specialist Support Service for customers affected by cancer. In its
2013 report, ‘Cancer’s Hidden Price Tag’, Macmillan found that
as a direct result of being diagnosed with cancer, four out of five
people are on average £570 worse off each month, comparable
to a monthly mortgage payment. Its 2014 report ‘Counting on
Your Support’ also showed that 98% of people chose not to
contact their bank or building society for fear of not getting any
help or worse, that their diagnosis will have a negative impact
on their financial situation. 800 Nationwide customers have
been supported since the Service was set up and it is now being
extended to other life limiting and life threatening conditions.
£1.7 millionraised for charity by members
and employees
50
Back to Contents

2016 Annual Report and Accounts
Your Environment Despite growing as a Society and creating the need for new buildings and more data management facilities, the Society continues to reduce its energy consumption and carbon emissions. The Society does, however, face new challenges as
it continues to grow, for example water usage has increased slightly across the organisation. Over the last 12 months, the Society has reduced energy use by 1% and its carbon footprint by 3%.
Your WorkplaceA new ‘Equality, Diversity and Inclusion’ strategy was introduced this year covering four themes: inclusive leadership, diverse workforce, access and inclusion and workplace flexibility. It sets clear goals for the next five years, including specific workforce targets for women and Black, Asian and Minority Ethnic (BAME) employees at executive and senior manager levels and for disabled employees across the Society.
More than 50 apprentices, on a mixture of intermediate, advanced and higher schemes, are now working for the
Society and are a critical element of its people strategy. All apprentices are paid the Living Wage and have permanent contracts. The advanced and higher apprentices are also able to study to A-Level and degree level.
The Society continues to monitor its performance through a variety of equality, diversity and inclusion benchmarks. This year, it was ranked within the top 20% of participating organisations in the BITC Age and Wellbeing benchmarks, which reflects the Society’s more holistic approach to the diversity agenda.
Your Ethical PoliciesAfter becoming the first high street financial services provider to become a Principal Partner of the Living Wage Foundation, from 1 April 2016 everyone employed by Nationwide, including all contractors, will be paid a Living Wage. To encourage other organisations to take the Society’s lead, Alison Robb, Group Director, has joined the Living Wage Commission.
Your SocietyCitizenship report
New targets have been created for 2020:
Reduce water consumption
by 5%
Reduce waste by 100 tonnes
and increase recycled waste to 80%
Carbon footprint not to exceed the 2014/15 level
of 52,000 tonnes C02
51
Back to Contents

Creating Nationwide woodlandsAs part of the Society’s programme to reduce its
environmental impact, it pledged to plant a tree
for every current and future employee and a tree
for members who opted to go paperless at the
2015 AGM; this equates to a total of 60,000 trees.
By planting trees, the Society will offset its impact
on the environment and provide long lasting
community benefit for generations to come.
In March 2016, a third tree planting event took
place at a woodlands site, Ravens Retreat,
in Wiltshire with the Wiltshire Wildlife Trust.
Employees, their families and local members came
together to work side by side to plant more of the
trees the Society has committed to planting in
UK woodlands.
Strategic Report
8,500 trees havebeen planted so far out of
60,000 pledged
Our carbon footprint has
reduced by 3%
To help Nationwide create woodlands in other
parts of the UK, the Society has partnered with the
Woodland Trust. One aspect of the partnership is to
help local communities manage their own woodlands
by offering start up grants and training. By providing
resources and funding this can help people who are
passionate about their local woods take an active role
in the care and management of them.
52
Back to Contents
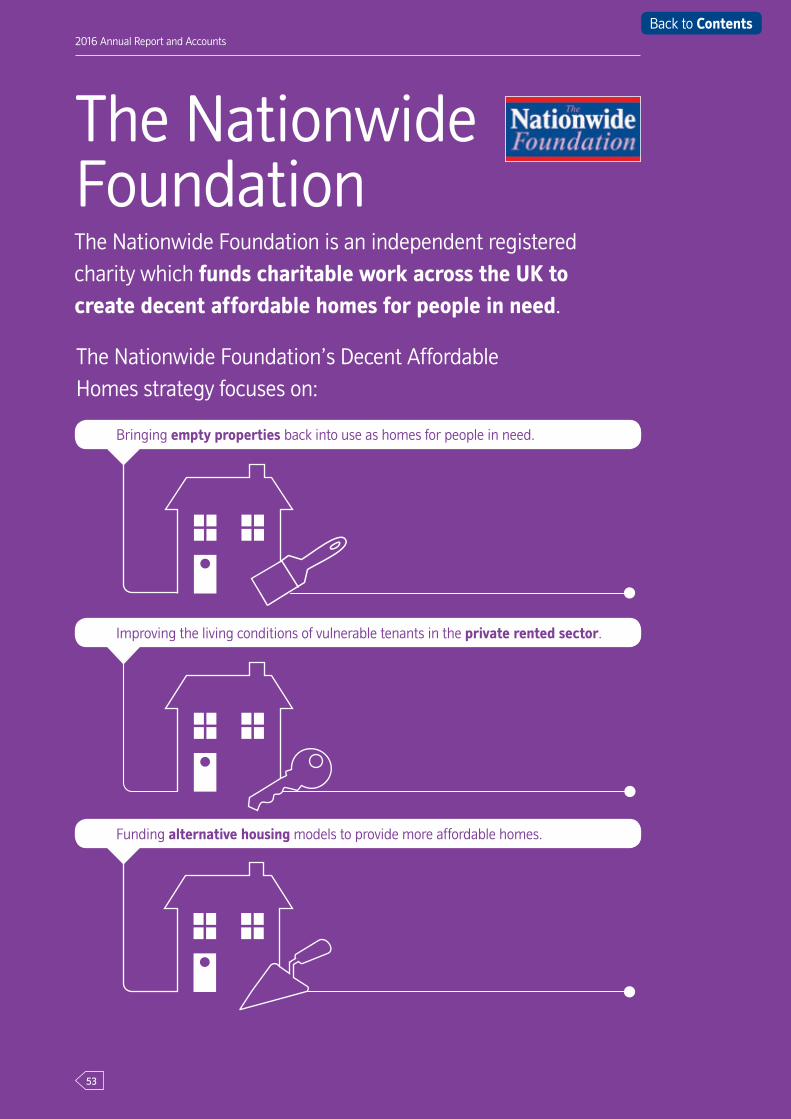
The NationwideFoundationThe Nationwide Foundation is an independent registered charity which funds charitable work across the UK to create decent affordable homes for people in need.
The Nationwide Foundation’s Decent Affordable Homes strategy focuses on:
Bringing empty properties back into use as homes for people in need.
Improving the living conditions of vulnerable tenants in the private rented sector.
Funding alternative housing models to provide more affordable homes.
2016 Annual Report and Accounts
53
Back to Contents

giving communities more power over local housing developments can help to get more homes built
• the launch of an online toolkit intended to help local councils take forward initiatives to boost the number of affordable self and custom-build homes.
Living Wage Friendly FunderThe Nationwide Foundation has joined the Living Wage Foundation’s scheme for charity funders ensuring that where its grants are supporting employment that these workers are paid fairly with a UK Living Wage. The UK Living Wage reflects the real cost of living and is a simple way of tackling poverty and disadvantage.
Find out more at www.nationwidefoundation.org.uk
Alternative housing modelsThe Nationwide Foundation is committed to developing alternative models for the creation of genuinely affordable housing. It is a firm supporter of community-led housing, putting communities at the heart of housing development. Community-led housing includes community land trusts, cooperative housing, self and custom-build and cohousing. To grow these housing models, the Nationwide Foundation provided grants to a range of projects in 2015/16 including:
• the launch of an alliance to represent organisations witha passion for community-led housing, supporting the delivery of more homes
• support for early-stage community-led housing projectslocated in deprived urban areas in the UK facing homelessness and affordability issues
• research projects exploring what needs to change to enable local communities to provide more of the homesthey need using alternative housing models and how
The Nationwide Foundation is a registered charity (no.1065552) and a company limited by guarantee registered in England and Wales (no.3451979).
Empty properties become homes for people in needIn 2015/16 the Nationwide Foundation’s funding helped bring empty properties back into use to create safe and secure homes for people in housing need.
People in needThe former empty properties are now homes for people who had been homeless, were at risk of homelessness or were living in poor housing. Those helped include vulnerable young people and low income families who were trapped in over-crowded damp homes. Without the help of the organisations funded by the Nationwide Foundation, none of these people could have accessed decent, affordable housing.
Support towards employmentThe community-led organisations that the Nationwide Foundation funds deliver greater benefits than simply creating a home. These organisations support local people to develop work skills; giving them opportunities to gain work experience, training or apprenticeships, as well as helping them to find paid employment.
New empty properties funding programmeIn autumn 2015, the Nationwide Foundation continued its commitment to creating affordable homes from empty properties by launching a £1 million grants programme to bring more properties back into use, aiming to provide homes for 80 people in housing need.
Nationwide makes an annual donation to the Nationwide Foundation, which for 2015/16 was £2.5 million
Strategic Report
Helped to create decent, affordable homes for
1,000 people since 2012
54
Back to Contents

55
2016 Annual Report and Accounts2016 Annual Report and Accounts
GovernanceBoard of directors 57
Group directors 61
Directors’ report 63
Report of the directors on corporate governance 69
• Corporate governance report 69
• Audit Committee report 83
• Board Risk Committee report 87
• Nomination and Governance Committee report 89
Report of the directors on remuneration 93
55
Back to Contents

56
GovernanceGovernance
Governance
56
Back to Contents

57
2016 Annual Report and Accounts
As at 4 April 2016
Meet your Board of directors who were in office at 4 April 2016, including Mai Fyfield and Tim Tookey who are seeking election as non executive directors. Details of Joe Garner, who joined as Chief Executive on 5 April 2016, are also included below.
Board of directors
Graham Beale CBE, BSc, FCA (57)
Term of Office:Executive Director since April 2003, Chief Executive since April 2007 and stepped down from the Board on 4 April 2016.
Skills and experience (including directorships):Graham joined the Society in 1985 and gained extensive experience and understanding of both retail financial services and the mutual building society sector. This has been established over a period of over 30 years and during this time the Society has grown and expanded to become one of the leading financial service providers in the UK as well as being the largest mutual financial institution and building society. In his role as Chief Executive, Graham was responsible for managing the Society in accordance with the strategy which remains firmly rooted in the Society’s mutual heritage. Prior to joining Nationwide, Graham trained and qualified as a chartered accountant.
Graham was a member of the FCA Practitioner Panel and was Chairman of the Panel for two years to April 2015. He sat on the Council of the Building Societies Association, having been its Chairman during 2009 and 2010 and chaired its Remuneration and Nomination Committee from 2011 to 2014. He was a director of the British Bankers’ Association. Previously, he has been a director of Visa Europe, 2007 to 2011.
Rita Clifton CBE, MA (Cantab), FRSA (58)
Term of Office:Non Executive Director since July 2012.
Independent: Yes
Skills and experience (including directorships):Rita holds a number of non executive roles including at BUPA, ASOS and Populus and is a former non executive director of Dixons Retail plc (now Dixons Carphone plc). She is also a fellow of WWF-UK, and sits on the Assurance and Advisory Board for BP’s carbon off-setting programme. Rita has over 20 years’ senior management experience in a range of roles, with an expertise in demonstrating how brand is an integral part of long-term business strategy and in analysing and understanding consumer perceptions and behaviour. Her executive career has been in advertising, strategic marketing and market research; she was previously Chairman and Chief Executive at Interbrand UK Ltd, and prior to that Vice Chairman at Saatchi & Saatchi. During her career Rita has advised, at the most senior level, some of the UK’s best known organisations, including British Airways, Barclays, BT, Citigroup, Visa and the British Army.
Back to Contents

58
Governance
Mai Fyfield MA, BA (Hons) (46)
Term of Office:Non Executive Director since June 2015.
Independent: Yes
Skills and experience (including directorships):Mai is currently Sky’s Chief Strategy and Commercial Officer responsible for leading strategy across the Sky Group. She is also responsible for business development, negotiating agreements with third party channels included as part of Sky’s retail offering and for the distribution of Sky’s channels to other platforms. Prior to joining Sky in 1999, Mai spent eight years working as an economic advisor to blue-chip companies in a number of different industries, both in the UK and the USA.
Lynne Peacock BA (Hons) (62)
Term of Office:Non Executive Director since July 2011.
Independent: Yes
Skills and experience (including directorships):Lynne, a former Chief Executive of National Australia Bank’s (NAB) UK business and Chief Executive of Woolwich plc, has over 25 years’ senior management experience in a range of roles comprising brand development, mergers and acquisitions, change management and business transformation, including almost 20 years at board level. During her time at NAB, Lynne was responsible for its businesses in the UK consisting of Clydesdale and Yorkshire banks. She became Chief Executive of Woolwich plc in October 2000 following its takeover by the Barclays Bank Group, having previously held a number of senior management and board positions at the Woolwich Building Society, both before and after its conversion to a public listed company in 1997. Lynne is a non executive director of Scottish Water and Standard Life plc and a trustee of the Westminster Society for People with Learning Difficulties.
Mitchel Lenson MBA, BA (Hons), ACIB, FSI (61)
Term of Office:Non Executive Director since July 2011.
Independent: Yes
Skills and experience (including directorships):Mitchel has spent over 30 years in the financial services industry and is a former Group Chief Information Officer at Deutsche Bank with responsibility for IT and Operations for all operating divisions of the bank, including its retail banking operations. Mitchel was a member of the Executive Committee for both the Corporate and Investment Bank and the Private Client and Asset Management Division. He has also previously served as Managing Director, Global Head of Operations & Operations IT at UBS Warburg and as Director, Group Operations at Credit Suisse First Boston. Mitchel was a partner of Olivant & Co, an investment company providing strategic and operational expertise alongside investment capital to financial services businesses in Europe, the Middle East and Asia-Pacific and was a non executive director of NYFIX, a NASDAQ listed company and BCS, an AIM listed company. Mitchel is currently a non executive director of Currency Cloud.
Roger Perkin MA (Cantab), FCA (67)
Term of Office:Non Executive Director since April 2010 and Senior Independent Director since July 2012. Roger will step down from the Board at the AGM and is therefore not seeking re-election.
Independent: Yes
Skills and experience (including directorships):Roger is a former partner at Ernst & Young LLP and spent 40 years in the accounting profession. During his time at Ernst & Young he worked with many blue chip clients and advised boards across the spectrum of financial services, including banking, insurance, fund management and private equity. He is also a non executive director at Electra Private Equity plc and Tullett Prebon plc, chairing the Audit Committee of both companies. Additionally, he is a trustee of two charities, Chiddingstone Castle and Change, Grow, Live.
Back to Contents

59
2016 Annual Report and Accounts
Mark Rennison BA, FCA (55)
Term of Office:Executive Director since February 2007.
Skills and experience (including directorships):Mark, a chartered accountant, is the Group Finance Director with responsibility for Finance, Treasury and Corporate Development. He is also a director of various Society subsidiaries, a member of the PRA Practitioner Panel and Chair of the BBA Financial Risk and Policy Committee.
Prior to his appointment, Mark was a partner at PricewaterhouseCoopers LLP where he worked in the financial services practice with a specific focus on retail and corporate banking; whilst in professional practice, Mark also worked extensively with group treasury operations, leasing and asset finance businesses.
David Roberts BSc (Hons), MBA, PhD (Honorary), CFifs (53)
Term of Office:Non Executive Director and Chairman Elect from September 2014. Chairman since July 2015.
Independent: Yes (upon appointment as Chairman)
Skills and experience (including directorships):David joined Nationwide on 1 September 2014 and took over as Chairman in July 2015. From 2010 to 2014 he was on the Board of Lloyds Banking Group, where he was Group Deputy Chairman and Chairman of the Board Risk Committee. David has many years of experience at board and executive level in retail and commercial banking in the UK and internationally. He joined Barclays in 1983 and held various senior management positions culminating in Executive Director, member of the Group Executive Committee and Chief Executive, International Retail and Commercial Banking, a position he held until December 2006. He is a former Non Executive Director of BAA plc and Absa Group SA, and was Chairman and Chief Executive of Bawag PSK AG, Austria’s second largest retail bank. David is Vice Chairman of NHS England, a fellow of the Chartered Institute of Financial Services and holds an MBA and Honorary Doctorate in Business Administration from Henley Business School.
Tony Prestedge (46)
Term of Office:Executive Director since August 2007.
Skills and experience (including directorships):Tony is Nationwide’s Group Chief Operating Officer and was previously Executive Director, Group Development. He previously held a number of senior executive roles at Barclays plc, including Managing Director Home Finance and Retail Support and Operations Director. He was a member of both Woolwich plc and Barclays Retail Banking Executive Committees. Tony is accountable for the Group’s operational strategy, performance and transformation and his divisional reports include Customer Services and Product Operations, Telephone Channels, Digital Development, Transformation Delivery, Technology, Payments, Group Security and Property Services. Tony is a board member of Opportunity Now.
Chris Rhodes BSc (Hons), ACA (53)
Term of Office:Executive Director since April 2009.
Skills and experience (including directorships):Chris joined Nationwide in April 2009 from Abbey Santander, where he was Director of Retail Distribution for Alliance and Leicester (A&L). Chris is the Group Retail Director and his responsibilities include Nationwide’s retail product range, distribution and marketing. Chris has spent 28 years working in the financial services sector and his previous positions include Deputy Managing Director of Girobank and Retail Operations Director of A&L. In 2003 he was appointed as Managing Director Retail Banking for the entire A&L Group. In 2007 Chris moved to become Group Finance Director, a role he held until the merger with Santander in 2008. Chris is a board member of National Numeracy.
Back to Contents

Board Committees Membership Board Committees Membership
Audit Committee Roger Perkin (Chairman) Rita Clifton Lynne Peacock Tim Tookey
Executive Committee Graham Beale Chief Executive (Chairman) (to 4 April 2016)
Joe Garner Chief Executive (Chairman) (from 5 April 2016)
Mark Rennison Group Finance Director
Tony Prestedge Chief Operating Officer
Chris Rhodes Executive Director Group Retail
Sara Bennison Chief Marketing Officer (from 1 March 2016)
Julia Dunn Chief Compliance Officer
Graeme Hughes Group Director Distribution
Iain Laing Chief Risk Officer
Alison Robb Group Director People, Customer and Commercial
Board Risk Committee Tim Tookey (Chairman) Mitchel Lenson Lynne Peacock Roger Perkin
Remuneration Committee Lynne Peacock (Chairman) Rita Clifton David Roberts
Nomination and Governance Committee
David Roberts (Chairman)Lynne Peacock Roger Perkin Tim Tookey
IT Strategy and Resilience Committee
Mitchel Lenson (Chairman) David Roberts Tim Tookey
Results Approval Committee
David Roberts (Chairman) Graham Beale (to 4 April 2016) Joe Garner (from 5 April 2016) Roger PerkinMark Rennison
60
Governance
Tim Tookey BSc (Hons), FCA (53)
Term of Office:Non Executive Director since June 2015.
Independent: Yes
Skills and experience (including directorships):Tim is a chartered accountant with substantial experience of major retail financial services organisations. He has significant board experience and became Chairman of the Society’s Board Risk Committee in July 2015. Tim is a former Chief Financial Officer at Friends Life Group Ltd, a position he held from 2012 until the sale of the business to Aviva in April 2015. Prior to joining Friends Life, he was Group Finance Director of Lloyds Banking Group between 2008 and 2012, having been appointed as Deputy Group Finance Director upon joining the bank in 2006. From 2002 to 2006, he was Finance Director of Prudential PLC’s UK business and from 1996 to 2002 he held the role of Group Finance Director at Heath Lambert Group.
Board Committees and their director memberships at 4 April 2016
Joe Garner (46)
Term of Office:Chief Executive since 5 April 2016. As Joe took up his role following the end of the 2015/16 financial year, in accordance with the Society’s Memorandum and Rules, he will stand for election at the AGM 2017.
Skills and experience (including directorships):Joe joined Nationwide from BT Group where he was Chief Executive of Openreach, a position he held from early 2014. Prior to that he was Deputy Chief Executive of HSBC Bank PLC and Head of HSBC in the UK, roles which included responsibility for all of HSBC’s retail and commercial banking business, including Marks and Spencer Bank, First Direct and The John Lewis Partnership Card. He has also held senior positions at Dixons Stores Group (now Dixons Carphone plc) and spent the early part of his career at Procter and Gamble. Joe was the Chair of the FSA (now FCA) Practitioner Panel from 2011 to 2013 and a non executive director of the Financial Ombudsman Service from 2007 to 2010. He is currently Chairman of the British Triathlon Foundation Trust.
Chief Executive appointed on 5 April 2016
Back to Contents

61
2016 Annual Report and Accounts
As at 4 April 2016
Biographies of the Executive Committee who are not members of the Board are provided below.
Group directors
Julia Dunn BA (Hons), ACA (50)Chief Compliance Officer
Julia joined Nationwide in September 2013 as the Chief Compliance Officer with responsibility for the Compliance, Legal, Secretariat and Financial Crime functions. Julia trained as an accountant with Price Waterhouse and before joining Nationwide she spent 13 years with the Financial Services Authority and latterly the Financial Conduct Authority in both supervision and enforcement as FCA Director of Retail Banking Supervision.
Julia has over 25 years’ experience of managing complex conduct and compliance issues in financial services as well as strong working relationships with the regulatory authorities, HM Treasury and Law Enforcement Agencies. She leads the Disability Network at Nationwide and currently serves on the BITC Education Committee.
Sara Bennison MA (Oxon) (48)Chief Marketing Officer
Sara joined Nationwide in March 2016. She previously spent 7 years at Barclays in a number of marketing roles, finally as Chief Marketing Officer for the Personal and Corporate Bank globally. Before Barclays, Sara worked at BT but the majority of her career has been spent in advertising agencies in the UK and Asia, working across a variety of sectors and geographies.
As Chief Marketing Officer, Sara is responsible for developing and executing brand strategy, marketing, citizenship and communication across all audiences and channels.
Sara serves on a number of industry bodies, including the General Media Panel for the ASA, ISBA and Facebook’s UK Advisory Council.
Back to Contents

62
Governance
Iain Laing BEng (45)Chief Risk Officer
Iain is Nationwide’s Chief Risk Officer, having joined the Society in 2011 when the role was first created. He is responsible for credit risk management, and for independent oversight of the Group’s prudential risks. He joined Nationwide with experience of senior risk management roles at Capital One, HBoS and Santander UK and he was the Chief Credit Officer of Santander UK Retail throughout the financial crisis.
Prior to these financial services roles, Iain began his career in manufacturing engineering and strategic consulting.
Graeme Hughes MBA, DMS, ACIB (51)Group Director, Distribution
Graeme’s career has been spent almost exclusively with Nationwide since joining the Society in 1984 as a management trainee. He has held a variety of roles within the Branch Network from Branch Manager to his present position of Group Distribution Director, having previously been a Director of Group HR , Customer Experience and Corporate Affairs.
Graeme is on the Board of the Society’s Charitable Foundation and a member of the Executive Committee, as well as the Board of Race for Opportunity.
Alison Robb BSc (Hons), FCA (47) Group Director, People, Customer & Commercial
Alison has been the Group Director for People, Customer & Commercial since December 2012.
Alison has been at Nationwide for almost 20 years and prior to her current role worked in many roles in the Group Finance function. She led Corporate Development during the financial crisis when Nationwide merged with a number of smaller societies. She trained as a chartered accountant with KPMG and also worked at WH Smith before she joined Nationwide.
In 2015 Alison was appointed as a non executive director of the Banking Standards Board, a new body supporting the development of trust in the banking sector and she is also a Commissioner of the Living Wage Commission.
Back to Contents
63
2016 Annual Report and Accounts
The Annual Report and Accounts has been prepared in accordance with International Financial Reporting Standards (IFRSs) as adopted by the EU. All financial information given in this Directors’ report is taken solely from the statutory results prepared on this basis. More information is included in Note 1 to the Accounts. Unaudited, underlying results which allow comparison between 2016 and 2015 are given in the Strategic Report and the Business and Risk Report.
Business objectives, future developments and key performance indicators
The Group’s objectives and future plans are set out in the Strategic Report, together with the Group’s principal key performance indicators.
Profits and capital
Profit before tax for the year ended 4 April 2016 was £1,279 million (2015: £1,044 million). The profit after tax transferred to the general reserve was £985 million (2015: £839 million).
Total Group reserves at 4 April 2016 were £9,407 million (2015: £8,218 million). Further details on the movements of reserves are given in the Group statement of movements in members’ interests and equity.
Gross capital at 4 April 2016 was £13,160 million (2015: £12,277 million) including £531 million (2015: £531 million) of core capital deferred shares (CCDS), £992 million (2015: £992 million) of other equity instruments, £1,817 million (2015: £2,121 million) of subordinated debt and £413 million (2015: £415 million) of subscribed capital. The ratio of gross capital as a percentage of shares and borrowings at 4 April 2016 was 6.9% (2015: 6.9%) and the free capital ratio was 6.0% (2015: 6.0%). The Annual business statement includes an explanation of these ratios.
Mortgage arrears
The Group mortgage portfolios at 4 April 2016 included 1,454 mortgage accounts (2015: 1,760), including those in possession, where payments were more than 12 months in arrears. The total amount of principal loans outstanding in these cases was £182 million (2015: £235 million). The total amount of arrears in these cases was £18 million (2015: £20 million) or 0.01% (2015: 0.01%) of total mortgage balances. The mortgage arrears methodology is based on the Council of Mortgage Lenders’ definition, which calculates months in arrears by dividing the balance outstanding by the latest contractual payment.
Charitable and political donations
Results for the year include charitable donations of £3,963,262 (2015: £2,212,619), including £2,523,333 (2015: £1,500,000) to the Nationwide Foundation; further details on the Foundation are provided in the Strategic Report. In addition, the Society has contributed employee time for volunteering programmes at a cost of £1,547,726 (2015: £1,219,929), resulting in a total commitment to the community of £5,510,988 (2015: £3,432,548). No contributions were made for political purposes. Time allowed to employees to carry out civic duties can amount to a donation. The Group supports a very small number of employees in this way.
Participation in the unclaimed assets scheme
The Society has participated in the Government-backed unclaimed assets scheme, whereby savings accounts that have been inactive for 15 years are eligible to be transferred into a central reclaim fund. The central reclaim fund has the responsibility for retaining sufficient monies to meet the costs of future reclaims for any previously transferred dormant account balances, and to transfer any surplus to the Big Lottery Fund for the benefit of good causes which have a social or environmental purpose. The Society transferred £1,185,455 on 5 April 2016 to the Reclaim Fund Limited, the administrators of the unclaimed assets scheme. The Group’s total contributions from inception to that date are £52,502,672.
Creditor payment policy
The Group’s policy is to agree the terms of payment with suppliers at the start of trading, ensure that suppliers are aware of the terms of payment, and pay in accordance with its contractual and other legal obligations. The Group’s policy is to settle the supplier’s invoice for the complete provision of goods and services (unless there is an express provision for stage payments), when in full conformity with the terms and conditions of the purchase, within the agreed payment terms. The Society’s creditor days were 13 days at 4 April 2016 (2015: 10 days).
For the year ended 4 April 2016
Directors’ reportThe directors have pleasure in presenting their Annual Report and Accounts for the year ended 4 April 2016.
Back to Contents
64
Governance
Risk management
The Group seeks to manage all the risks that arise from its activities. There is a formal structure for monitoring and managing risk across the Group comprising a risk appetite agreed by the Board, detailed risk management frameworks, and independent governance and risk oversight. The risk management objectives and risk framework of the Group are included in the Business and Risk Report.
The Group has established a number of committees, frameworks and policies to manage these risks. These are set out in the Business and Risk Report and in the Report of the directors on corporate governance.
The Business and Risk Report also details those risks which are considered the Group’s top and emerging risks that could affect the delivery of the Corporate Plan.
Disclosure requirements under CRD IV country-by-country reporting
In compliance with the Regulations of Article 89 of the Capital Requirements Directive IV (CRD IV) Country-by-Country Reporting Regulations 2013, effective 1 January 2014, the Group will publish additional information, in respect of the year ended 4 April 2016, by 31 December 2016. This information will be available by that date on Nationwide’s website: nationwide.co.uk272
Employees
Nationwide has a culture focused on delivering an exceptional customer experience at all times. This culture is referred to as ‘PRIDE’.
PRIDE is understood by our employees, supports the delivery of our member promise of being ‘On your side’ and is the combination of principles, values and behaviours which form the basis of our employment proposition and our ability to achieve fair customer outcomes.
As a key element of our corporate strategy, we aim to achieve industry leading levels of employee engagement and enablement, maintaining our unique culture as the leading mutual financial services organisation and have achieved levels above industry benchmarks. We focus on an inclusive culture in which employees can perform to their full potential in order to deliver our strategic aims. As a national organisation with local representation, the Society aims to contribute to each of its communities, for example our Corporate Citizenship strategy enables employees to engage locally through our volunteering programme.
We have continued to invest in the development of leaders and have launched an executive leadership programme in partnership with an accredited business school. In addition, we recognise that we must also deliver a steady flow of new talent to our business, and actively recruit from external sources. This includes award winning graduate programmes and apprenticeship schemes, which were significantly expanded in 2015 to bring in three times the number of people of the previous year. We will continue to expand our apprenticeship offering in response to the apprenticeship levy in 2016 and beyond.
To help ensure we build a workforce that represents our customer base and provides us with diverse decision making, a five year Equality, Diversity and Inclusion (ED&I) Strategy has been approved by the ED&I Steering Committee. This is chaired by the Chief Operating Officer and membership includes our staff union and other executive sponsors. The strategy maps out four Society wide themes, which together address our priority areas:
• Inclusive leadership
• Diverse workforce
• Access and inclusion
• Workplace flexibility.
We are focusing on three distinct diversity strands in each of these areas: ethnicity, gender and disability.
It is the Society’s policy to afford access to training, career development and promotion opportunities equally to all employees regardless of their ethnicity, faith and belief, gender, marital status, age or physical or mental disability. Should employees become disabled, it is the Society’s policy to continue their employment where possible with appropriate training and redeployment. We are proud to note that over 80% of women return to Nationwide following maternity leave, often on more flexible working arrangements.
The Society continues to consult actively with the Nationwide Group Staff Union. The Employee Involvement Committee, chaired by the Chief Operating Officer, acts as a forum where representatives from the business and the Union consult and share information on a range of business and employment issues to the benefit of our employees and our business.
For further details on the Society’s people strategy please see the ‘Our people’ section of the Strategic Report.
Back to Contents

65
2016 Annual Report and Accounts
Year to 4 April 2016
Year to 4 April 2015
Baseline year4 April 2011
Carbon dioxide (CO2e)1 in tonnes2
Scope 1 emissions
Energy 3,138 3,498 4,890
Travel 2,239 2,243 2,448
Scope 2 emissions
Electricity 44,934 46,245 50,802
Total Scope 1 and 2 emissions3 50,311 51,986 58,140
Total carbon dioxide in tonnes per FTE 2.81 2.90 3.46
Water use (cubic metres) 198,450 191,242 259,718
Water use (cubic metres) per FTE 11.06 10.85 15.45
Environment
Our vision is to be among the best performers for environmental sustainability in the UK Financial Services sector.
Our business is growing which in turn is creating a need for new buildings, increased use of digital technology and data management facilities. Despite these challenges we have continued to reduce our energy consumption and our carbon emissions. We also continue to divert our waste from landfill. We do, however, face new challenges – increased numbers of people working in our administration centres means water use and the amount of waste we produce has slightly increased. Therefore, we have set new targets to achieve by 2020:
• carbon emissions will not exceed our 2015 levels
• we will reduce water use by 5% by 2020
• we will reduce our waste by 100 tonnes and increase the amount we recycle to at least 80% by 2020.
The challenge we face now is how to continue to grow our business successfully and to reduce our environmental impacts. From July 2016, at least 50% of our electricity will be generated for us on a solar farm – this means we will be able
to meet the business demand for energy, whilst reducing our carbon emissions.
We are also committed to identifying, targeting and addressing inefficiencies in our supply chain and in 2015 were the first high street financial services provider to achieve level one of the new Carbon Trust Supply Chain Standard. Moving forward we will work with our key suppliers to identify innovative solutions which will continue to reduce our environmental impacts.
We have recently announced a new partnership with the Woodland Trust, which will help us meet our pledge to plant a tree for every employee and our pledge to plant a tree for every three members who opted to receive an electronic AGM pack last year. Over the next five years, the Trust will work with us to plant 60,000 trees in woodlands across the UK and these will provide lasting benefit for generations to come.
Further details of our activities can be found in our Citizenship report and on our website at nationwide.co.uk (Citizenship section).
A summary of our greenhouse gas emissions performance is as follows:
Directors’ responsibilities in respect of the preparation of the Annual Report and Accounts
This statement, which should be read in conjunction with the Independent auditors’ report, is made by the directors to explain their responsibilities in relation to the preparation of the Annual Report and Accounts, the directors’
emoluments disclosures within the Report of the directors on remuneration, the Annual business statement and the Directors’ report.
Directors’ report continued
Notes:1. CO
2e is an abbreviation of ‘carbon dioxide equivalent’ and is the internationally recognised measure of greenhouse gas emissions.
2. When calculating our carbon emissions we have used the new DEFRA 2015 conversion factors.3. Scope 1 covers direct combustion of fuels and company owned vehicles and Scope 2 covers emissions from electricity.
Back to Contents
66
Governance
As required by the Building Societies Act 1986 (the Act), the directors have prepared an Annual Report and Accounts which gives a true and fair view of the income and expenditure of the Society and the Group for the financial year and of the state of the affairs of the Society and the Group as at the end of the financial year, and which provides details of directors’ emoluments in accordance with Part VIII of the Act and regulations made under it. The Act states that the requirements under international accounting standards achieve a fair presentation. In preparing the Annual Report and Accounts, the directors have:
• selected appropriate accounting policies and applied them consistently
• made judgements and estimates that are reasonable and prudent
• stated whether applicable accounting standards have been followed, subject to any material departures disclosed and explained in the financial statements
• prepared the financial statements on the going concern basis.
As required by the Disclosure and Transparency Rules of the Financial Conduct Authority, the directors have included a management report containing a fair review of the business and a description of the principal risks and uncertainties facing the Group. This information is contained in the Strategic Report and the Business and Risk Report. In addition to the Annual Report and Accounts, as required by the Act the directors have prepared an Annual business statement and a Directors’ report, each containing prescribed information relating to the business of the Society and its connected undertakings.
The British Bankers’ Association Code for Financial Reporting Disclosure (the BBA Code), published in September 2010, sets out five disclosure principles together with supporting guidance. The principles are that UK financial institutions will:
• provide high quality, meaningful and decision-useful disclosures
• review and enhance their financial instrument disclosures for key areas of interest
• assess the applicability and relevance of good practice recommendations to their disclosures acknowledging the importance of such guidance
• seek to enhance the comparability of financial statement disclosures across the UK banking sector
• clearly differentiate in their annual reports between information that is audited and information that is unaudited.
The Group and other major UK banks have continued to adopt the BBA Code in their 2015/16 financial statements and the Group’s financial statements have therefore been prepared in compliance with the BBA Code’s principles.
The Group aims to continually enhance its disclosures and their usefulness to the readers of the financial statements in the light of developing market practice and areas of focus.
A copy of the Annual Report and Accounts can be found on Nationwide Building Society’s website at nationwide.co.uk (Results and accounts section). The directors are responsible for the maintenance and integrity of statutory and audited information on the website. Information published on the internet is accessible in many countries with different legal requirements. Legislation in the United Kingdom governing the preparation and dissemination of financial statements may differ from legislation in other jurisdictions.
Directors’ statement pursuant to the Disclosure and Transparency Rules
The directors confirm that, to the best of each director’s knowledge and belief:
• the financial statements, prepared in accordance with IFRSs as adopted by the EU, give a true and fair view of the assets, liabilities, financial position and profit of the Group and Society
• the management report contained in the Strategic Report and the Business and Risk Report includes a fair review of the development and performance of the business and the position of the Group and Society, together with a description of the principal risks and uncertainties that they face.
Directors’ responsibilities in respect of accounting records and internal control
The directors are responsible for ensuring that the Society and its connected undertakings:
• keep accounting records which disclose with reasonable accuracy the financial position of the Society and the Group and which enable them to ensure that the Annual Report and Accounts comply with the Building Societies Act
• establish and maintain systems for control of its business, records, inspection and reports.
The directors have general responsibility for safeguarding the assets of the Group and for taking reasonable steps for the prevention and detection of fraud and other irregularities.
The directors who held office at the date of approval of this Directors’ report confirm that, so far as they are each aware, there is no relevant audit information of which the Group’s auditors are unaware, and each director has taken all the steps that they ought to have taken as directors to make themselves aware of any relevant audit information and to establish that the Group’s auditors are aware of that information.
Back to Contents

67
2016 Annual Report and Accounts
Going concern and business viability
The directors’ responsibilities in respect of going concern are set out below. In addition, the directors now have an obligation under the UK Corporate Governance Code to state in a Business Viability Statement whether there is a reasonable expectation the Society and the Group will be able to continue in operation and meet their liabilities as they fall due. The period assessed under the Business Viability Statement is required to be significantly longer than the minimum period of 12 months over which going concern is assessed.
Directors’ responsibilities in respect of going concern
In preparing the financial statements the directors have satisfied themselves that it is reasonable for them to conclude that it is appropriate to adopt the going concern basis in accordance with the Financial Reporting Council’s guidance ‘Going Concern and Liquidity Risk: Guidance for Directors of UK Companies 2009’ and IAS 1 Presentation of Financial Statements.
The Group meets its day to day liquidity requirements through the management of both its retail and wholesale funding sources and is required to maintain a sufficient buffer over regulatory capital requirements in order to continue to be authorised to carry on its business.
The Group’s business activities, along with its financial position, capital structure, risk management approach and factors likely to affect its future performance are described in the Strategic Report and the Business and Risk Report.
The Group’s forecasts and projections, taking account of possible changes in trading performance and funding retention, and including stress testing and scenario analysis, show that the Group will be able to operate at adequate levels of both liquidity and capital for the next 12 months. Furthermore the Group’s capital ratios and its total capital resources are comfortably in excess of PRA requirements.
After making enquiries the directors are satisfied that the Group has adequate resources to continue in business for the foreseeable future and that, therefore, it is appropriate to adopt the going concern basis in preparing the financial statements.
Business Viability Statement
In addition to the going concern statement above, and in accordance with provision C.2.2 of the UK Corporate Governance Code, the directors confirm that they have a reasonable expectation that both the Society and the Group will be able to continue in operation and meet their liabilities as they fall due over the next three years. In making this confirmation the Board has specifically sought input from the Audit Committee and the Board Risk Committee.
The assessment covers a period of three years as this is within the period covered by the Group’s medium-term plan (the Plan) and regulatory and internal stress testing. The time period chosen reflects the consideration that the level of uncertainty relating to the assessment increases the longer the period chosen. The pace of change of the economic, market and regulatory environments in which the Group operates may undermine the reliability of longer forecasts.
The directors have based this statement on a robust assessment of those risks that could threaten the business model, future profitability, solvency, liquidity or capital adequacy of the Group. In making the assessment, the directors considered a range of information concerning each of these risks across a range of scenarios, including but not limited to the Group’s Plan and the programme of regulatory and internal stress testing it undertakes, further details of which are as follows:
• The Plan is reviewed by the directors in detail at least annually. The Plan makes certain assumptions about the performance of the Group and the economic, market and regulatory environments in which it operates.
• The Plan includes consideration of how the Group’s financial performance would be affected in an ‘Alternative Economic Scenario’ based on the continuation of the current low interest rate environment throughout the assessment period.
• Alternative forecasts are also constructed against a number of stress scenarios, including a robust downside scenario as part of the Board’s review of the Group’s Internal Capital Adequacy Assessment Process (ICAAP). This is a severe stress of the UK economy, with large increases in unemployment and interest rates negatively impacting consumers and households, resulting in a steep fall in house prices.
• Liquidity stress tests are conducted as part of the Group’s Internal Liquidity Adequacy Assessment Process (ILAAP). The ILAAP demonstrates that the Group holds sufficient liquid assets to meet cash outflows during a severe-but-plausible scenario where there is a combined, market-wide and Nationwide-specific, stress, resulting, inter alia, in a multi-notch credit rating downgrade. In addition to a high-quality liquidity buffer, Nationwide maintains diverse funding sources and has contingency funding arrangements available for use in a stress.
Directors’ report continued
Back to Contents
68
Governance
The review considered all aspects of emerging regulation where there is sufficient clarity over future standards to inform the analysis. For example, our assessment of the Group’s capital position reflects our latest understanding of capital buffer and leverage requirements likely to be imposed on the Group, together with the consequences of the PRA’s proposed minimum requirements for own funds and eligible liabilities (MREL).
Information relevant to these assessments can be found in the following sections of the Annual Report and Accounts:
• the Group’s principal activities, business and operating models, and strategic direction are described in the Strategic Report (pages 3 to 54)
• a financial summary, including a review of the latest income statement and balance sheet, is provided in the ‘Financial review’ section (pages 27 to 36)
• a review of the Group’s capital position is included in the ‘Solvency risk’ section (pages 167 to 172)
• the Group’s liquidity position is described in the ‘Liquidity and funding risk’ section (pages 152 to 166), and
• the Group’s top and emerging risks and policies and processes for managing credit, liquidity and market risk, together with its approach to capital management, are described in the Business and Risk Report (pages105 to 192).
Fair, balanced and understandable
The directors are satisfied that the Annual Report and Accounts, taken as a whole, are fair, balanced and understandable, and provide the information necessary for members and other stakeholders to assess the Group’s performance, strategy and business model.
Details of the governance procedures which have been embedded to support this can be found in the Audit Committee report.
Directors
The directors of the Society who were in office during the year and up to the date of signing the financial statements were:
Geoffrey Howe (Chairman) (retired on 23 July 2015)
David Roberts (Chairman) (from 23 July 2015)
Graham Beale (Chief Executive) (to 4 April 2016)
Joe Garner (Chief Executive) (from 5 April 2016)
Tony Prestedge (Chief Operating Officer)
Mark Rennison (Group Finance Director)
Chris Rhodes (Group Retail Director)
Rita Clifton
Mai Fyfield (appointed 2 June 2015)
Michael Jary (retired on 23 July 2015)
Mitchel Lenson
Kevin Parry (appointed 23 May 2016)
Lynne Peacock
Roger Perkin
Tim Tookey (appointed 2 June 2015)
The Board has agreed that in accordance with the UK Corporate Governance Code (see the Report of the directors on corporate governance) that all the directors will stand for election or re-election on an annual basis. In accordance with these requirements all of the directors will stand for re-election at the 2016 AGM with the exception of Roger Perkin who will retire at the AGM and Mai Fyfield and Tim Tookey who are standing for election.
None of the directors has any beneficial interest in equity shares in, or debentures of, any connected undertaking of the Society. 50% of awards to directors from the 2015/16 Directors’ Performance Award and the legacy 2013-16 Medium Term Performance Pay Plan will be linked to the value of the Society’s core capital deferred shares, details of which have been provided in the Report of the directors on remuneration. 50% of outstanding awards under the 2014/15 Directors’ Performance Pay Plan and the legacy 2012-15 Medium Term Performance Pay Plan are also linked to the value of the Society’s core capital deferred shares.
The auditors
A resolution to re-appoint PricewaterhouseCoopers LLP as auditors will be proposed at the Annual General Meeting.
David Roberts
Chairman, 23 May 2016
Back to Contents
69
2016 Annual Report and Accounts
Report of the directors on
Dear Member, I am pleased to present my first Corporate Governance Report as Chairman since succeeding Geoffrey Howe in July 2015.Nationwide aims to be an exemplar organisation in all aspects of its business. The Board’s commitment to good governance has served it well to date and it continues to aspire to the highest standards in order to safeguard members’ interests.
As Chairman, I am responsible for ensuring that the Board
operates effectively within a sound governance framework,
based on best practice principles suitable for Nationwide’s
status as a mutual. As with all areas of our business, we keep
our governance arrangements under review to ensure they
remain fit for purpose. It is particularly important that, as our
business adapts and grows to changing member and societal
demands, we adapt our governance arrangements to address
the risks and challenges we face as a modern mutual. For
instance, as we enhance our digital capability and customer
experience, our decision making will continue to focus first
and foremost on the safety and security of the Society as well
as balancing the interests of all our members. The move to a
more modern, dynamic delivery of services does not signify
a change in our strategic commitment, which remains to be
unequivocally ‘member-focused’.
Reflecting the need to keep pace with regulatory and best
practice standards as well as developments in our own
business, I am keen to ensure that there is appropriate
oversight of governance arrangements at Board level. In
March 2016, the remit of the Nomination Committee was
expanded to expressly include oversight of the Group’s
governance arrangements. Through the Nomination
and Governance Committee, the Board will ensure that
there is a renewed and ongoing focus on governance as
we adapt to new ways of doing business and the new
regulatory landscape.
Since taking over as Chairman in July 2015, my core priority
has been to ensure that the Board has the requisite skills
and experience to support continuing success in what we
foresee as a more dynamic, competitive and fast moving retail
financial services marketplace. During the year, a number of
additions have been made to further strengthen the Board.
Full details are set out in the report of the Nomination and
Governance Committee and are summarised below:
For the year ended 4 April 2016
corporate governance
Back to Contents
70
Governance
• Strengthening our leadership
Effective leadership is a prerequisite for good governance. Nationwide has enjoyed the considerable benefits of strong leadership under the stewardship of the previous Chairman, Geoffrey Howe and Chief Executive, Graham Beale. Ensuring the right successor to Graham as Chief Executive has therefore been of paramount importance to the Board.
After a thorough and rigorous search, the Board is delighted that Joe Garner joined Nationwide as Chief Executive with effect from 5 April 2016. The process leading to Joe’s appointment is explained in the Chief Executive Succession section of the Nomination and Governance Report. Joe stood out as an exceptional candidate both as a motivational leader and customer champion. The Board believes that his character and expertise in financial services, marketing, customer services and digital delivery make him the right person to lead the Society through the next stage of its strategic development.
• Enhancing the Board’s effectiveness
Having the right people with the right skills on the Board is critical to effective leadership. As Chairman, I am responsible for ensuring the Board collectively has the right mix of skills, diversity and independence to provide appropriate oversight of the whole business. Working with the Nomination and Governance Committee, we keep the composition of the Board under review to ensure that we bring in the necessary skills, experience and perspectives required to help steer the Society through the changing retail financial services marketplace. The need for new thinking always has to be balanced against the need for continuity and a deep understanding of Nationwide’s business, including its culture and values. Continuity is particularly important when, as now, there are a number of new directors on the Board.
The appointments of Tim Tookey, Mai Fyfield and Kevin Parry have enhanced the Board’s skills and experience across a range of areas. Tim has further strengthened the Board’s retail financial services experience, while Mai brings broader commercial experience, including specialist digital strategy skills. Kevin’s experience as the Chief Financial Officer of one of the FTSE’s leading asset managers and as Chair of several audit committees makes him another excellent addition to the Board. Roger Perkin will retire by rotation as Senior Independent Director and Chairman of the Audit Committee. Nationwide owes him a deep debt of gratitude for his distinguished service and considerable wisdom over the last 6 years.
The report of the Nomination and Governance Committee explains the progress we are making with Board diversity, including our performance against internal targets. I am pleased with the progress being made with gender diversity but there is some way to go with other aspects, particularly ethnic diversity. To address this, we have, for the first time, set a Black, Asian and Minority Ethnic (BAME) target for the Board and Executive.
The Board has completed its annual review of its effectiveness and that of its Committees. As our last two reviews have been conducted internally, in keeping with best practice, this year’s review was conducted by Independent Audit Limited, an external facilitator. A summary of findings is set out in the Nomination and Governance Committee report and the recommendations contained in their report will be addressed during 2016/2017.
• Clarifying accountabilities
The implementation in March 2016 of the Financial Services Senior Managers Regime provided an opportunity to review our governance arrangements to make certain that individual accountabilities continue to be allocated appropriately and are fully understood by all entrusted with the stewardship of the Society. One output of that review was the consolidation of the Society’s governance arrangements into a comprehensive new ‘Nationwide Governance Manual’ (NGM) which describes the entirety of our governance arrangements, including clear delegation of authorities to management, to ensure the continued prudent management of the Society.
Further details of the above matters, as well as the wider work of the Board, are described in the report that follows.
In conclusion, whilst it has been another successful year for the Society, it is important that the Board continues to set the correct tone and provide strong leadership. I am confident the Board has the capacity and capabilities to fulfil this responsibility for the benefit of members.
David Roberts
Chairman
Back to Contents
71
2016 Annual Report and Accounts
Governance at NationwideAs the world’s largest building society, Nationwide is owned by, and run for, its members. We are proud of, and committed to, our mutual status, which sets us apart from other types of business. We compete with banks in areas such as current accounts, savings, mortgages and personal loans. However, as a mutual, Nationwide is different; other than a small amount of core capital deferred shares (CCDS), we are not funded by shareholders, which means that we are able to reinvest all our profits into supporting lending to our members as well as improving products and customer service, and rewarding loyalty.
Whilst we balance the interests of a number of stakeholders including employees, customers, suppliers, regulators and communities, doing the right thing for our members is at the heart of everything we do. Our governance structures are designed to ensure that decisions are underpinned by our PRIDE values, in particular putting members first and doing the right thing.
Leadership and effectivenessThe role of the Board
As a major player in the UK financial services sector, it is imperative that we have in place robust risk management and control frameworks, including in relation to governance. Corporate governance is the set of internal standards and principles established by the Board to ensure sound and prudent control over the business. The Board sets the tone from the top and is responsible for promoting ethical leadership, culture, values, governance, controls and risk management. The Board relies on management, via the Chief Executive, to cascade the agreed standards to the business. The Society’s governance arrangements are communicated to the business via the NGM which was introduced in March 2016 and will gradually replace the High Level Business Controls Manual. The NGM describes the Society’s constitutional and governance arrangements including the cascade of delegations and authorities from the Board to the Chief Executive.
The Board is collectively responsible for ensuring the sustainability of the business model in order to deliver long term success for members of the Society. The Board operates under formal terms of reference which include a schedule of matters reserved to the Board for decision with the day to day running of the business delegated to the Chief Executive. Matters reserved to the Board include: determining the strategy; setting policies and guidelines within which the business is managed; reviewing business performance and determining the nature and extent of key risks to the business. The Board is also responsible for ensuring that the business is conducted in accordance with applicable laws and regulations including the Society’s own Rules.
The Board sets the strategy and high level remuneration policy which the Remuneration Committee ensures is implemented. Strategic objectives are documented in the Corporate Plan (the Plan) which is reviewed and approved by the Board annually in March and monitored on an ongoing basis. The Plan is developed on the basis of current and prospective market conditions and incorporates a range of economic assumptions such as the Bank of England base rate, inflationary expectations, forecasts of the size of the mortgage and savings market and the regulatory environment in which Nationwide operates. The Board monitors performance against the Plan using key financial and non-financial indicators including the principal risks which are explained in the Business and Risk Report.
In reviewing management’s performance, the Board is concerned to ensure that management has the necessary skills and resources to deliver the Plan within a framework of sound systems and controls. The Board sets prudent but stretching targets for achieving the strategy whilst ensuring that key risks are adequately assessed and managed. Whilst adhering to the Plan is important, it is essential that the Society can respond in a timely and considered manner to innovation or changes in market practices. The digital agenda is a good example of an area where the Plan has evolved to reflect changes in customer behaviours.
UK Corporate Governance Code principles
Consistent with Nationwide’s strategic priority of being an exemplar organisation, the Board adheres to best practice governance principles, in particular, the UK Corporate Governance Code (the Code). Although the Code sets the standards for public listed companies, the Prudential Regulation Authority (PRA) expects building societies to follow the Code where practical to do so. Where possible and appropriate, the Society aims to comply with the Code’s principles and provisions to ensure alignment with good practice, transparency and openness. As the Code is not written with mutuals in mind, the Board has regard to the Guidance for Building Societies (October 2014 version) issued by the Building Societies Association (BSA) to assist building societies in applying the Code.
The Board considers that the Society has, throughout the period, complied with the principles and relevant provisions of the Code to the extent applicable to building societies; this report explains how it has done so. The format of this report follows the Code’s key themes of leadership, effectiveness, accountability and member engagement.
This report covers the period commencing 5 April 2015 until the date of the report.
Report of the directors on corporate governance continued
Back to Contents
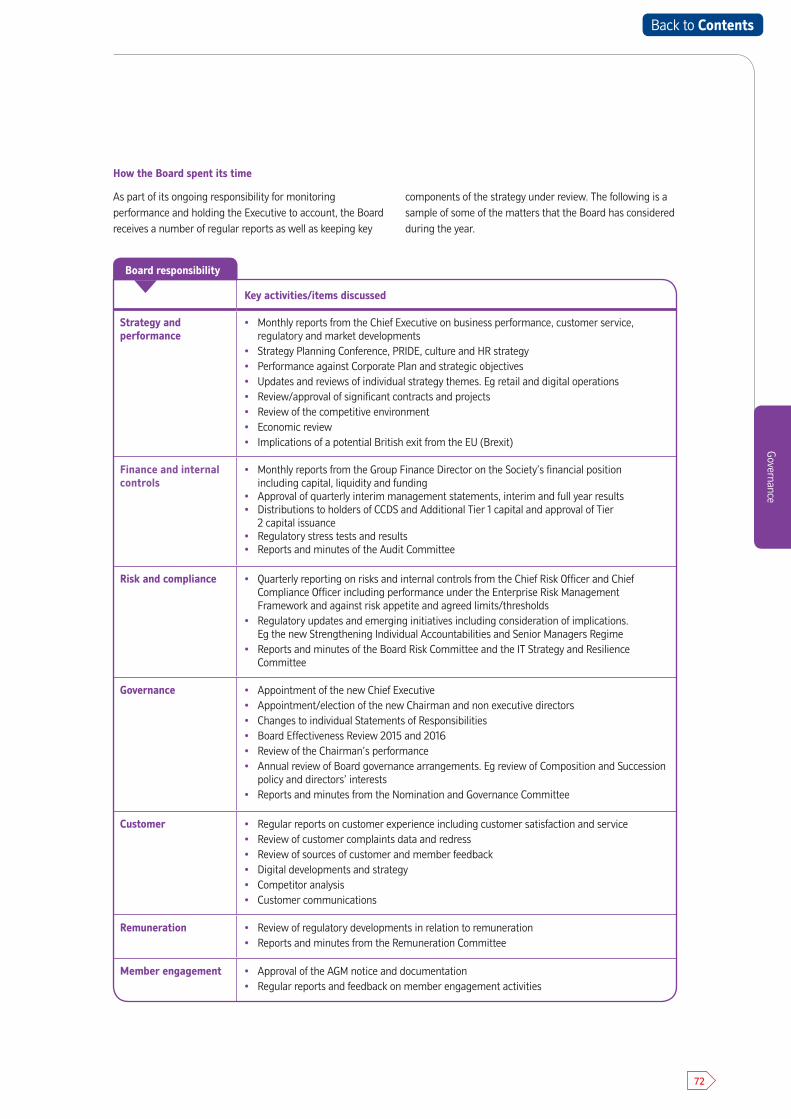
72
Governance
How the Board spent its time
As part of its ongoing responsibility for monitoring performance and holding the Executive to account, the Board receives a number of regular reports as well as keeping key
components of the strategy under review. The following is a sample of some of the matters that the Board has considered during the year.
Key activities/items discussed
Strategy and performance
• Monthly reports from the Chief Executive on business performance, customer service, regulatory and market developments
• Strategy Planning Conference, PRIDE, culture and HR strategy• Performance against Corporate Plan and strategic objectives• Updates and reviews of individual strategy themes. Eg retail and digital operations• Review/approval of significant contracts and projects• Review of the competitive environment• Economic review• Implications of a potential British exit from the EU (Brexit)
Finance and internal controls
• Monthly reports from the Group Finance Director on the Society’s financial position including capital, liquidity and funding
• Approval of quarterly interim management statements, interim and full year results• Distributions to holders of CCDS and Additional Tier 1 capital and approval of Tier
2 capital issuance• Regulatory stress tests and results• Reports and minutes of the Audit Committee
Risk and compliance • Quarterly reporting on risks and internal controls from the Chief Risk Officer and Chief Compliance Officer including performance under the Enterprise Risk Management Framework and against risk appetite and agreed limits/thresholds
• Regulatory updates and emerging initiatives including consideration of implications. Eg the new Strengthening Individual Accountabilities and Senior Managers Regime
• Reports and minutes of the Board Risk Committee and the IT Strategy and Resilience Committee
Governance • Appointment of the new Chief Executive• Appointment/election of the new Chairman and non executive directors• Changes to individual Statements of Responsibilities• Board Effectiveness Review 2015 and 2016• Review of the Chairman’s performance• Annual review of Board governance arrangements. Eg review of Composition and Succession
policy and directors’ interests• Reports and minutes from the Nomination and Governance Committee
Customer • Regular reports on customer experience including customer satisfaction and service• Review of customer complaints data and redress• Review of sources of customer and member feedback• Digital developments and strategy• Competitor analysis• Customer communications
Remuneration • Review of regulatory developments in relation to remuneration• Reports and minutes from the Remuneration Committee
Member engagement • Approval of the AGM notice and documentation• Regular reports and feedback on member engagement activities
Board responsibility
Back to Contents
73
2016 Annual Report and Accounts
Report of the directors on corporate governance continued
To ensure that adequate time is devoted to Board business,
the Board operates through formally constituted
committees, membership of which comprises non executive
directors only. The terms of reference of the Board and its
committees are reviewed at least annually and can be found
on the Society’s website: nationwide.co.uk
The key activities of the Board and its committees are
planned on an annual basis but also allow sufficient time for
urgent or ad-hoc matters to be considered on a timely basis.
The Board has access to all committee minutes and receives
regular reports from the relevant committee chairs on the
business transacted at each committee meeting.
The Board committees are:
• Audit Committee – The Audit Committee is chaired by
Roger Perkin, independent non executive director. Having
previously been an audit partner in global accounting and
professional services firm, Ernst & Young LLP, Roger
Perkin meets the Code requirement for recent and
relevant financial experience. Kevin Parry will replace
Roger as Chairman of the Committee upon his retirement
at the AGM. Kevin has considerable financial experience
gained in his previous roles of Chief Financial Officer at
Schroders Plc from 2009 to 2013, and as a managing
partner of KPMG. The work of the Committee is explained
in the Audit Committee Report.
• Remuneration Committee – The Remuneration
Committee is chaired by Lynne Peacock, independent non
executive director. The Board has delegated to the
Remuneration Committee, authority to determine the
framework for the remuneration of the Chairman, the
executive directors and the other senior executives of the
Society. A comprehensive review of its activities during
the year is contained in the Directors’ Remuneration
Report.
• Nomination and Governance Committee – The
Nomination and Governance Committee is chaired by the
Chairman of the Board. The work of the Committee is
explained in the Nomination and Governance Committee
Report. The purpose of the Nomination and Governance
Committee is to assist the Chairman in keeping the
composition of the Board under review and leading the
appointments process for nominations to the Board. The
Committee also keeps the Board’s governance
arrangements under review and makes recommendations
to the Board to ensure that the arrangements are
consistent with the Society’s strategic objective of being
an exemplar organisation and the Society’s mutual status.
• Board Risk Committee – The Board Risk Committee is
chaired by Tim Tookey, independent non executive
director. The work of the Committee is explained in the
Board Risk Committee Report. The purpose of the Board
Risk Committee is to provide oversight and advice to the
Board in relation to current and potential future risk
exposures of the Group, and future risk strategy, including
determination of risk appetite.
• Results Approval Committee – The Committee is
chaired by the Chairman of the Board. The Committee
reviews and executes the decisions made by the Board in
relation to the Annual Report and Accounts and the
Interim Results of the Group.
The Society has also established the IT Strategy and
Resilience Committee which supports the Board.
• IT Strategy and Resilience Committee – The
Committee is chaired by Mitchel Lenson, independent
non executive director. David Roberts and Tim Tookey are
members. The Committee oversees and advises the
Board on IT strategy and governance controls, resilience
and related risks. The Committee also oversees the
strategic investment portfolio. The work of the
Committee is described in the Board Risk Committee
report.
Back to Contents
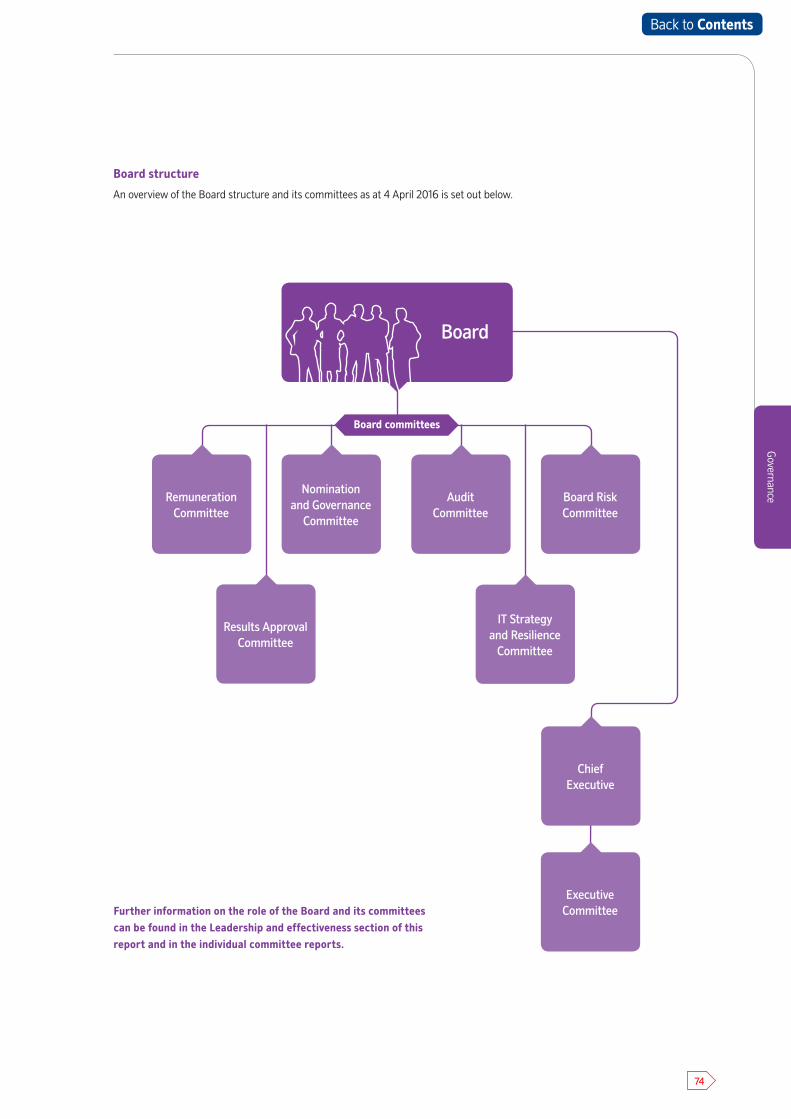
74
Governance
Board structure
An overview of the Board structure and its committees as at 4 April 2016 is set out below.
Further information on the role of the Board and its committees can be found in the Leadership and effectiveness section of this report and in the individual committee reports.
Remuneration Committee
Nomination and Governance
Committee
Audit Committee
Board Risk Committee
Chief Executive
Results Approval Committee
Executive Committee
IT Strategy and Resilience
Committee
Board
Board committees
Back to Contents
75
2016 Annual Report and Accounts
Report of the directors on corporate governance continued
Roles and responsibilitiesThe roles and responsibilities of Board members are agreed by the Board and set out in writing in Statements of Responsibilities and in individual terms of service. These were reviewed and approved by the Board in January 2016 to reflect the introduction of the Senior Managers Regime in March 2016. Given the influence they exercise over the Society’s conduct, the Chairman, Chairs of the Audit, Board Risk, Remuneration and Nomination and Governance Committees, and Senior Independent Director are subject to all aspects of the Senior Managers Regime including the Approved Persons Regime. Whilst all directors must satisfy requirements relating to their fitness and propriety, the appointment of non executive directors who fall outside the Senior Managers Regime are no longer subject to pre-approval by the regulator.
Terms of appointment for non executive directors and their Statements of Responsibility are available on the Society’s website or can be obtained from the Group Secretary on request.
Typically, non executive directors are appointed for an initial period of three years and may be invited to serve a second, or on occasion, a third term, subject to the overall Board composition and succession needs. All directors are required to stand for annual election by members. No current non executive director has served more than six years.
The collective and individual responsibilities of Board members are also set out in the NGM.
There is a clear division of responsibilities between the Chairman, as leader of the Board, and the Chief Executive who is responsible for the day to day running of the business.
Key responsibilities of the Chairman, Chairman Elect (which was an interim position), Senior Independent Director (SID), non executive directors, Chief Executive and executive directors are summarised in the following table.
Back to Contents
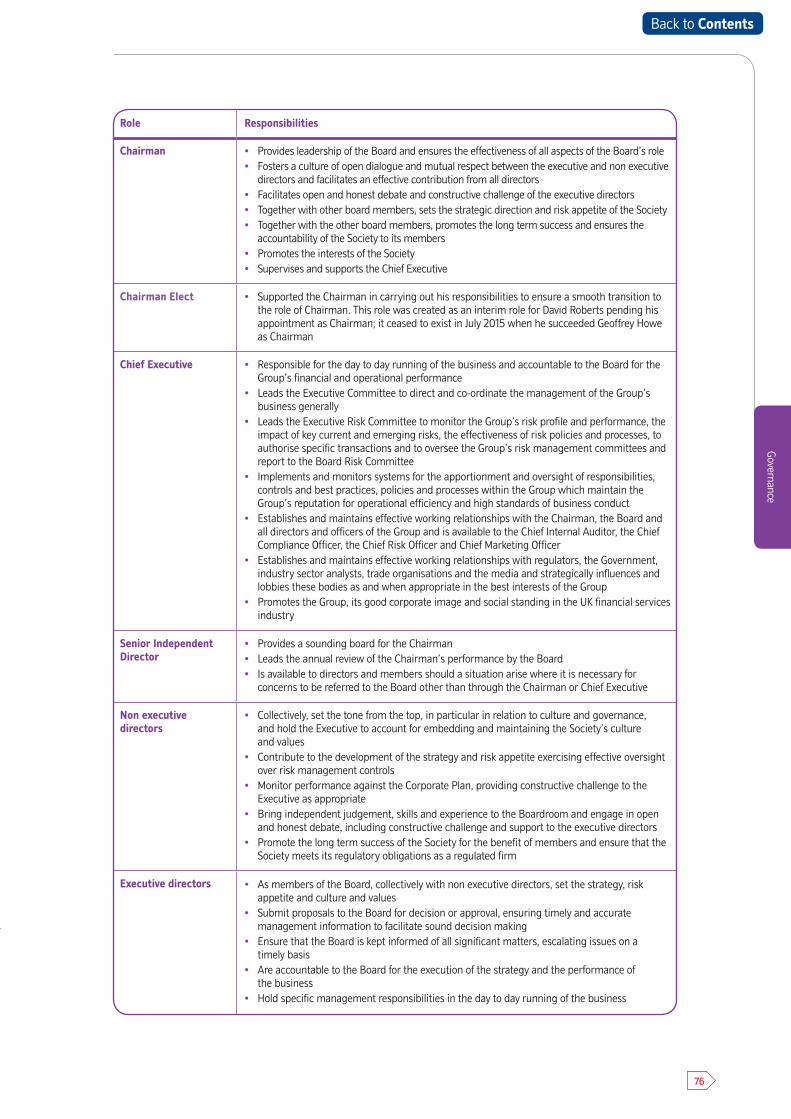
76
Governance
Role Responsibilities
Chairman • Provides leadership of the Board and ensures the effectiveness of all aspects of the Board’s role• Fosters a culture of open dialogue and mutual respect between the executive and non executive
directors and facilitates an effective contribution from all directors • Facilitates open and honest debate and constructive challenge of the executive directors• Together with other board members, sets the strategic direction and risk appetite of the Society• Together with the other board members, promotes the long term success and ensures the
accountability of the Society to its members • Promotes the interests of the Society• Supervises and supports the Chief Executive
Chairman Elect • Supported the Chairman in carrying out his responsibilities to ensure a smooth transition to the role of Chairman. This role was created as an interim role for David Roberts pending his appointment as Chairman; it ceased to exist in July 2015 when he succeeded Geoffrey Howe as Chairman
Chief Executive • Responsible for the day to day running of the business and accountable to the Board for the Group’s financial and operational performance
• Leads the Executive Committee to direct and co-ordinate the management of the Group’s business generally
• Leads the Executive Risk Committee to monitor the Group’s risk profile and performance, the impact of key current and emerging risks, the effectiveness of risk policies and processes, to authorise specific transactions and to oversee the Group’s risk management committees and report to the Board Risk Committee
• Implements and monitors systems for the apportionment and oversight of responsibilities, controls and best practices, policies and processes within the Group which maintain the Group’s reputation for operational efficiency and high standards of business conduct
• Establishes and maintains effective working relationships with the Chairman, the Board and all directors and officers of the Group and is available to the Chief Internal Auditor, the Chief Compliance Officer, the Chief Risk Officer and Chief Marketing Officer
• Establishes and maintains effective working relationships with regulators, the Government, industry sector analysts, trade organisations and the media and strategically influences and lobbies these bodies as and when appropriate in the best interests of the Group
• Promotes the Group, its good corporate image and social standing in the UK financial services industry
Senior Independent Director
• Provides a sounding board for the Chairman• Leads the annual review of the Chairman’s performance by the Board• Is available to directors and members should a situation arise where it is necessary for
concerns to be referred to the Board other than through the Chairman or Chief Executive
Non executivedirectors
• Collectively, set the tone from the top, in particular in relation to culture and governance, and hold the Executive to account for embedding and maintaining the Society’s culture and values
• Contribute to the development of the strategy and risk appetite exercising effective oversight over risk management controls
• Monitor performance against the Corporate Plan, providing constructive challenge to the Executive as appropriate
• Bring independent judgement, skills and experience to the Boardroom and engage in open and honest debate, including constructive challenge and support to the executive directors
• Promote the long term success of the Society for the benefit of members and ensure that the Society meets its regulatory obligations as a regulated firm
Executive directors • As members of the Board, collectively with non executive directors, set the strategy, risk appetite and culture and values
• Submit proposals to the Board for decision or approval, ensuring timely and accurate management information to facilitate sound decision making
• Ensure that the Board is kept informed of all significant matters, escalating issues on a timely basis
• Are accountable to the Board for the execution of the strategy and the performance of the business
• Hold specific management responsibilities in the day to day running of the business
Back to Contents
77
2016 Annual Report and Accounts
Report of the directors on corporate governance continued
Board composition
Biographies for all directors in place as at the date of this report are set out in the Board of directors section.
The Board is made up of a majority of independent non executive directors. As at the date of this report, the Board comprised the Chairman, seven independent non executive directors and four executive directors who collectively possess an appropriate balance of expertise suitable for Nationwide’s business. Each non executive director not only brings a broad range of business knowledge and experience but also provides specific skills in key areas such as retail banking, information technology, strategy, brand, finance and risk.
The Society continues to comply with the Code provision which recommends that all directors stand for re-election on an annual basis.
Diversity
Improving diversity and inclusion at Nationwide has been an important focus for the Board in recent years. The Board met the 2011 Davies Review target of 25% of women on the Board by July 2015 and has increased this target to 33% for female representation at Board and director level by 2020. This target includes representation at Group and divisional director level (non Board roles) with the objective of building a strong pipeline of senior women. Reflecting the need to do more to enhance other aspects of diversity, the Board has also set a target for Black, Asian and Minority Ethnic (BAME) of 8%-15% by 2020. Further information on diversity initiatives is set out in the report of the Nomination and Governance Committee.
Independence
All non executive directors have been assessed by the Nomination and Governance Committee to be independent as to character and judgement and to be free of relationships and other circumstances that might impact their independence.
At the time of his appointment as a non executive director and Chairman Elect in September 2014, the Board assessed David Roberts to be independent. The Chairman commits a substantial proportion of his time to his role and represents Nationwide in a number of capacities. Consequently, he is not expected to remain independent following his appointment.
During the year, the Chairman and the non executive directors held two meetings without the executive directors present.
Board changes
In the course of the year, there have been a number of Board changes:
• Geoffrey Howe chaired the Board until his retirement at the conclusion of the Annual General Meeting (AGM) in July 2015, having served as Chairman for eight years and as a non executive director for ten years. He was succeeded by David Roberts who joined the Board as a non executive director and Chairman Elect on 1 September 2014. The process leading to the appointment of David Roberts as Chairman was explained in the Annual Report and Accounts 2015.
• Michael Jary, an independent non executive director, also retired at the 2015 AGM having served on the Board for six years.
• Tim Tookey and Mai Fyfield both joined the Boardon 2 June 2015. Kevin Parry was appointed on23 May 2016.
• As explained below, Graham Beale stepped down from the Board on 4 April 2016.
Appointments to the Board are generally led by the Nomination and Governance Committee. Further information on the process and individual appointments can be found in the Committee’s report.
CEO succession
Throughout the period, the role of Chief Executive was held by Graham Beale. In May 2015, Graham Beale announced his intention to retire at or around the time of the AGM in 2016. A search for his successor was started immediately, led by a special committee made up of each of the non executive directors and chaired by David Roberts, Chairman of the Society. The process is explained in the report of the Nomination and Governance Committee.
In November 2015, the Board announced that Joe Garner would succeed Graham Beale as Chief Executive. Graham Beale stepped down from the Board on 4 April 2016 and was succeeded by Joe Garner on 5 April 2016.
Member nominations
Members of Nationwide have the right to nominate candidates for election to the Board, subject to the Society’s own rules and compliance with PRA and FCA requirements. No such nominations had been received by 4 April 2016 being the deadline for election to the Board at the 2016 AGM.
Back to Contents
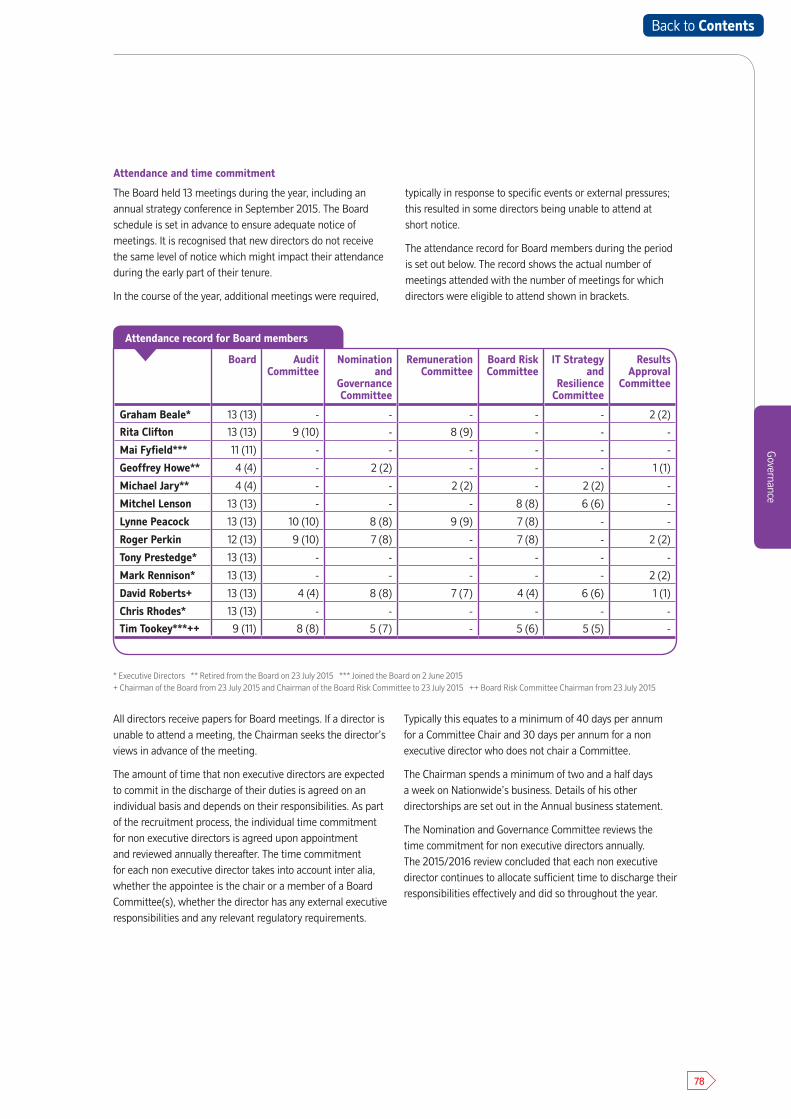
78
Governance
Attendance and time commitment
The Board held 13 meetings during the year, including an annual strategy conference in September 2015. The Board schedule is set in advance to ensure adequate notice of meetings. It is recognised that new directors do not receive the same level of notice which might impact their attendance during the early part of their tenure.
In the course of the year, additional meetings were required,
typically in response to specific events or external pressures; this resulted in some directors being unable to attend at short notice.
The attendance record for Board members during the period is set out below. The record shows the actual number of meetings attended with the number of meetings for which directors were eligible to attend shown in brackets.
Board Audit Committee
Nomination and
Governance Committee
Remuneration Committee
Board Risk Committee
IT Strategy and
Resilience Committee
Results Approval
Committee
Graham Beale* 13 (13) - - - - - 2 (2)
Rita Clifton 13 (13) 9 (10) - 8 (9) - - -
Mai Fyfield*** 11 (11) - - - - - -
Geoffrey Howe** 4 (4) - 2 (2) - - - 1 (1)
Michael Jary** 4 (4) - - 2 (2) - 2 (2) -
Mitchel Lenson 13 (13) - - - 8 (8) 6 (6) -
Lynne Peacock 13 (13) 10 (10) 8 (8) 9 (9) 7 (8) - -
Roger Perkin 12 (13) 9 (10) 7 (8) - 7 (8) - 2 (2)
Tony Prestedge* 13 (13) - - - - - -
Mark Rennison* 13 (13) - - - - - 2 (2)
David Roberts+ 13 (13) 4 (4) 8 (8) 7 (7) 4 (4) 6 (6) 1 (1)
Chris Rhodes* 13 (13) - - - - - -
Tim Tookey***++ 9 (11) 8 (8) 5 (7) - 5 (6) 5 (5) -
Attendance record for Board members
All directors receive papers for Board meetings. If a director is unable to attend a meeting, the Chairman seeks the director’s views in advance of the meeting.
The amount of time that non executive directors are expected to commit in the discharge of their duties is agreed on an individual basis and depends on their responsibilities. As part of the recruitment process, the individual time commitment for non executive directors is agreed upon appointment and reviewed annually thereafter. The time commitment for each non executive director takes into account inter alia, whether the appointee is the chair or a member of a Board Committee(s), whether the director has any external executive responsibilities and any relevant regulatory requirements.
Typically this equates to a minimum of 40 days per annum for a Committee Chair and 30 days per annum for a non executive director who does not chair a Committee.
The Chairman spends a minimum of two and a half days a week on Nationwide’s business. Details of his other directorships are set out in the Annual business statement.
The Nomination and Governance Committee reviews the time commitment for non executive directors annually. The 2015/2016 review concluded that each non executive director continues to allocate sufficient time to discharge their responsibilities effectively and did so throughout the year.
* Executive Directors ** Retired from the Board on 23 July 2015 *** Joined the Board on 2 June 2015+ Chairman of the Board from 23 July 2015 and Chairman of the Board Risk Committee to 23 July 2015 ++ Board Risk Committee Chairman from 23 July 2015
Back to Contents
79
2016 Annual Report and Accounts
Report of the directors on corporate governance continued
Conflicts of interest
Directors have a legal duty to avoid conflicts of interests. Prior to appointment, potential conflicts of interest are disclosed and assessed to ensure that there are no matters which would prevent that person from taking on the appointment. The Board has considered the current external appointments of all directors which may give rise to a situational conflict and has authorised potential conflicts where appropriate.
If any potential conflict arises, the Rules permit the Board to authorise the conflict, subject to such conditions or limitations as the Board may determine. In situations where a potential conflict arises, the Director will excuse him/herself from any meeting or discussion, and all material in relation to that matter will be restricted, including Board papers and minutes.
Board effectiveness
The Board keeps its performance under review and formally evaluates its effectiveness on an annual basis. Having conducted internal effectiveness reviews in 2014 and 2015, the Board commissioned an externally facilitated review in 2016 by Independent Audit Limited. The process was overseen by the Nomination and Governance Committee. Further information can be found in that Committee’s report.
AccountabilityThe Board is accountable to the members of the Society and seeks to balance their interests with the broader range of stakeholders, including suppliers, customers, regulators, the community and employees.
The Board is responsible for ensuring that the Group maintains a sound system of internal control to support its strategy and objectives. The Board approves the Group’s risk appetite and metrics, and Stress Testing results including the Concurrent Stress Test, the Internal Capital Adequacy Assessment Process and the Individual Liquidity Adequacy Assessment Process. It receives regular reports and assessments of the Group’s risk and control processes, and recommendations from the Board Risk Committee on matters spanning all major risk categories and risk appetite.
The Board is responsible for robustly assessing the principal risks facing the Group, including those that could potentially threaten its business model, future performance, solvency or liquidity. These risks are set out in the Business and Risk Report which explains how they are being managed. To manage these risks effectively, the Board monitors the Group’s risk management and internal control systems and carries out an annual review of their effectiveness. The Board delegates detailed review of these to the Board Risk Committee and Audit Committee as set out below.
The Board approves the Group’s risk appetite and has delegated responsibility for monitoring performance against appetite to the Board Risk Committee. The Board has also delegated responsibility to the Board Risk Committee for approval of the Enterprise Risk Management Framework (ERMF) and principal risk management strategies. The ERMF is an enterprise-wide risk framework which defines how risk management should operate across the business. Further information about the Group’s ERMF is set out in the Business and Risk Report.
The Board has delegated responsibility for reviewing the adequacy and effectiveness of the Group’s internal controls to the Audit Committee.
The Audit Committee and the Board Risk Committee receive regular reports throughout the year, which include information about reviews conducted by Group Risk Oversight, Compliance Oversight and Group Internal Audit. The Audit Committee receives reports from the Group’s auditor, PricewaterhouseCoopers LLP, and has a discussion with the auditor at least once a year without management present, to ensure that there are no unresolved issues of concern. The chairs of the Board Risk Committee and the Audit Committee are accountable to the Board, to which both submit regular reports covering the Committees’ activities, providing an opportunity to highlight any potential areas of concern.
Back to Contents
80
Governance
Between them the Audit Committee and the Board Risk Committee have reviewed all components of the ERMF. The Group will continue to enhance the ERMF to ensure it remains appropriate for the size and complexity of the organisation and responsive to its increased sophistication, emerging developments and regulatory change.
The Board has also delegated to the Audit Committee oversight of the management of the relationship with the Group’s auditors, details of which are set out in the Audit Committee report. Group Internal Audit provides the Audit Committee with a report of their audit work carried out during the year. This is accompanied by reports from the Compliance and Group Risk Oversight teams which outline the programme of reviews performed during the year.
Individual accountability at Board and senior manager level has been strengthened during the year following the introduction by the Group’s regulators of the Senior Managers Regime in March 2016. This established a revised framework under which senior managers are individually and personally accountable for specific areas of the Group’s business. It also introduced a certification regime requiring the Group to assess the fitness and propriety of staff in positions where the decisions they make could pose significant harm to the business or its customers. In support of this, all directors have access to the services and advice of the Group Secretary, and the Group General Counsel, and are able to obtain independent, professional advice on matters relating to their responsibilities.
The Society maintains appropriate directors’ and officers’ insurance cover in respect of legal and regulatory claims against its directors and officers in relation to the Society’s business.
Under the Society’s Memorandum and Rules, and to the extent permitted by law, directors have been granted an indemnity by the Group in respect of any third party liabilities which they incur as a result of holding office. This policy was in force during the financial year and at the date of approval of this report.
Further information on risk management and the performance of internal controls is set out in the Audit Committee Report, the Board Risk Committee Report and the Business and Risk Report.
Members at the heart of our businessAs a mutual organisation, our members are also the owners of Nationwide and, as such, they need to be able to share their views on the overall direction of the business. We seek to ensure they can do this in a number of ways. Our aims are:
• to make it as easy as possible for members to talk to us in whichever way they prefer
• to listen and respond to their suggestions and comments with products and services built around their needs
• to include members in some of our citizenship activities.
Back to Contents
81
2016 Annual Report and Accounts
Report of the directors on corporate governance continued
Contributing to the AGM
The AGM is the key event at which members can have their say on the way the Society is run and hear first-hand from their directors. It is the main opportunity to hold the Board to account as members can vote for or against those standing for election and on a number of other key issues.
Member involvement is an important principle for us as a mutual. We work hard to make it as easy as possible for members to have their say and constantly work to improve our communication. Last year, with input from our online customer research panel, we redesigned our AGM mail pack to make it more engaging and as a result saw a 12% increase in young adults voting. Members’ views have also informed what we will be doing with this year’s pack. We are enabling more members than ever to receive the information, and vote, online, which also enables us to use more engaging ways such as films to provide some of the information. We also tell our members how they can get more involved with the Society, and provide a report on the Society’s year and our financial results. Members are, of course, very welcome to attend the AGM itself, which, this year, will be held in Gateshead on Thursday 21 July 2016.
The AGM may be the single most important event in our calendar, but we work throughout the year to communicate with our members as owners of the business, and to encourage feedback on the way we operate.
Face to face
November 2015 saw us host our 150th Member TalkBack. These events provide an invaluable opportunity for Nationwide’s members and decision-makers to get together to discuss the Group’s activities face to face. Our members can listen to and question our directors, and our directors can hear our members talk about their needs and priorities. Overall, during the financial year, we held seven TalkBack sessions in Newbury, Sheffield, Belfast, Worcester, Manchester, Norwich and London and over 600 members attended. 90% of attendees rated the events as very good or excellent (up from 83% in 2015). In addition, we ran over 100 First Time Buyer and Investment seminars with more than 7,500 people attending.
Our branch employees are obviously the greatest source of face to face contact with our members. That sometimes goes beyond helping with queries or providing financial advice and information. Last year our branches in Nottingham, Swindon, London and Poole involved some of their members in our latest ‘Side by Side’ initiatives, which bring our employees and members together to offer practical support and help to local charities. On 25 September 2015, we celebrated our partnership with Macmillan by hosting the ‘world’s largest cream tea party’, our version of their ‘world’s biggest coffee morning’ campaign. Our record-breaking event saw members and employees come together to increase cancer awareness and raise vital funds. This coming year we plan to involve members in shaping some aspects of the way their branches look when we update or redesign them. A member suggestions leaflet available in branches is another way in which members can make their voice heard. The Society looks at every suggestion made.
Back to Contents
82
Governance
Online
Our online TalkBacks also provide an opportunity for members to interact with our directors, ask questions and make suggestions about our products and services. In addition, members can use our online Member Suggestion Scheme. We received nearly 1,000 ideas via this scheme during the year. Here are just a few of the member suggestions we have received over the past 12 months that we are working on:
• a student current account
• a mobile app for Windows phones
• an online chat facility.
Members can endorse other people’s suggestions and see feedback on past suggestions. To see past examples of how members have shaped our products and services, visit your.nationwide.co.uk
You can find our latest performance figures for customer service and complaints there too.
Social media and e-newsletter
The number of followers on our main social media channels has doubled over the last 12 months with our citizenship initiatives like Macmillan’s coffee morning and Children in Need activity attracting most interest. Our monthly members’ e-newsletter containing news on our latest products, services and competitions now reaches over 2 million members each month.
The research we carry out
We commission research to find out how our members rate our service; we also have around 6,000 members signed up to our online customer research panel ‘Nationwide Connect’, which helps us by providing feedback on a variety of topics. Each week we ask them to take part in a survey. This year the panel gave us their views on topics like lending in retirement, our savings promises and cashless innovations. They can provide feedback on whatever is concerning them. We also ask them to take part in regular online discussions and polls. It’s a two-way channel: every quarter we send out a newsletter recognising their contribution and telling them how their feedback has shaped our thinking.
Board reporting
We have recently amended the Board reporting pack to include a new section entitled ‘member voice’. This has been designed to ensure that Nationwide Board members are kept abreast of member events, feedback and any issues arising across the Group.
Chairman
on behalf of the Board
Back to Contents
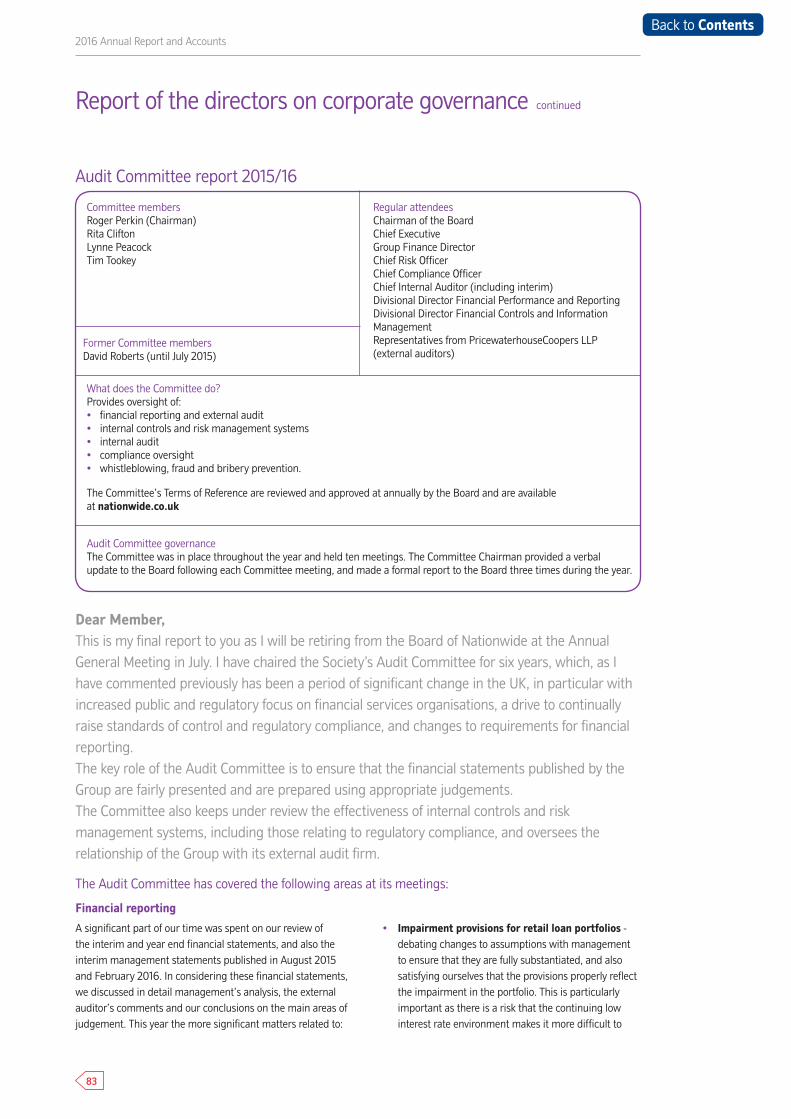
83
2016 Annual Report and Accounts
Audit Committee report 2015/16
The Audit Committee has covered the following areas at its meetings:
Financial reporting
A significant part of our time was spent on our review of the interim and year end financial statements, and also the interim management statements published in August 2015 and February 2016. In considering these financial statements, we discussed in detail management’s analysis, the external auditor’s comments and our conclusions on the main areas of judgement. This year the more significant matters related to:
• Impairment provisions for retail loan portfolios - debating changes to assumptions with management to ensure that they are fully substantiated, and also satisfying ourselves that the provisions properly reflect the impairment in the portfolio. This is particularly important as there is a risk that the continuing low interest rate environment makes it more difficult to
Dear Member, This is my final report to you as I will be retiring from the Board of Nationwide at the Annual General Meeting in July. I have chaired the Society’s Audit Committee for six years, which, as I have commented previously has been a period of significant change in the UK, in particular with increased public and regulatory focus on financial services organisations, a drive to continually raise standards of control and regulatory compliance, and changes to requirements for financial reporting. The key role of the Audit Committee is to ensure that the financial statements published by the Group are fairly presented and are prepared using appropriate judgements. The Committee also keeps under review the effectiveness of internal controls and risk management systems, including those relating to regulatory compliance, and oversees the relationship of the Group with its external audit firm.
Committee membersRoger Perkin (Chairman) Rita Clifton Lynne Peacock Tim Tookey
Regular attendeesChairman of the Board Chief Executive Group Finance Director Chief Risk Officer Chief Compliance Officer Chief Internal Auditor (including interim) Divisional Director Financial Performance and Reporting Divisional Director Financial Controls and Information Management Representatives from PricewaterhouseCoopers LLP (external auditors)
Former Committee membersDavid Roberts (until July 2015)
What does the Committee do?Provides oversight of: • financial reporting and external audit • internal controls and risk management systems • internal audit • compliance oversight • whistleblowing, fraud and bribery prevention.
The Committee’s Terms of Reference are reviewed and approved at annually by the Board and are available at nationwide.co.uk
Audit Committee governanceThe Committee was in place throughout the year and held ten meetings. The Committee Chairman provided a verbal update to the Board following each Committee meeting, and made a formal report to the Board three times during the year.
Report of the directors on corporate governance continued
Back to Contents

84
Governance
identify events leading to impairment. We continued to review provisions against commercial lending and treasury assets, although these are less material than in recent years.
• Customer redress - ensuring that provisions are based on the most up to date information available and legal and regulatory developments are fully considered.
• Calculation of effective interest rate balances - ensuring expected behavioural profiles used for the recognition of interest are appropriate and ensuring that the accounting treatment correctly reflects any changes to products.
• Defined benefit pension liabilities - focusing on the important market assumptions used to calculate the pension deficit amounts recognised in the accounts and the position of these assumptions relative to market benchmarks.
• Capitalisation of costs of information technologydevelopment - reviewing the outcomes and conclusions of work carried out by management to ensure the costs are accounted for in accordance with relevant accounting standards in view of the significant investment needed to deliver next generation banking.
• Hedge accounting - reviewing the impacts of hedge accounting on the financial statements, in particular focusing on the implementation of cash flow hedge accounting and the effect on income statement volatility.
In addition, we considered a number of matters relating to the overall presentation of the financial statements including:
• Whether the Annual Report and Accounts 2016 are fair, balanced and understandable. This means considering whether we are satisfied that the overall portrayal of Nationwide represents fairly the performance of the business against its strategy, and also whether the important messages about the results are clearly explained and can be understood by the reader. In considering this, we were provided with a report by management setting out the review processes used to assess the overall presentation of the financial statements. This included an independent management review which concluded that the Annual Report and Accounts are clear, consistent, balanced, open and appropriately focused on the more material items. After consideration of management’s report and our own review of the financial statements, we concluded that we could recommend to the Board that the Annual Report and Accounts are fair, balanced and understandable.
• Consideration of the business viability statement and whether it is appropriate to assume in preparation of the accounts that Nationwide will continue as a going concern. We considered factors including profitability, levels of capital, the availability of funding and liquidity and the risk and implications were there to be a rating agency downgrade. Our conclusions were that the profitability, balance sheet and capital position are robust and that it was appropriate to prepare the accounts on a going concern basis, that the viability statement could be provided and that three years was a suitable period for review.
• Reviewing the effectiveness of risk management and internal controls at Nationwide in order to recommend to the Board that the relevant Corporate Governance Code disclosures can be made within the Annual Report and Accounts 2016.
In concluding on these matters we also considered the views of PricewaterhouseCoopers LLP (PwC), the external auditors. There were no disagreements between management and the audit firm. The external auditor’s report sets out the key areas of focus considered by them in relation to their statutory audit; these matters were considered by the Committee in its assessment of areas of judgement in the financial statements as set out above.
Monitoring the effectiveness of Internal Controls
To inform our consideration of internal controls, we received and discussed reports from a number of business areas, senior management teams and external sources during the year:
Group Internal Audit reports
The Audit Committee approved the Group Internal Audit plan for the year, and discussed detailed quarterly reports from Group Internal Audit as well as an annual report which gave an overall assessment of the effectiveness of internal control. The reports included the key matters raised from their work, including common issues and themes, as well as management’s effectiveness in taking prompt action to address issues reported.
External Audit reports
Following the audit of the prior year Annual Report and Accounts, the external auditors provided the Committee with an Internal Controls Report setting out control weaknesses identified during the audit process and actions agreed with management.
Back to Contents
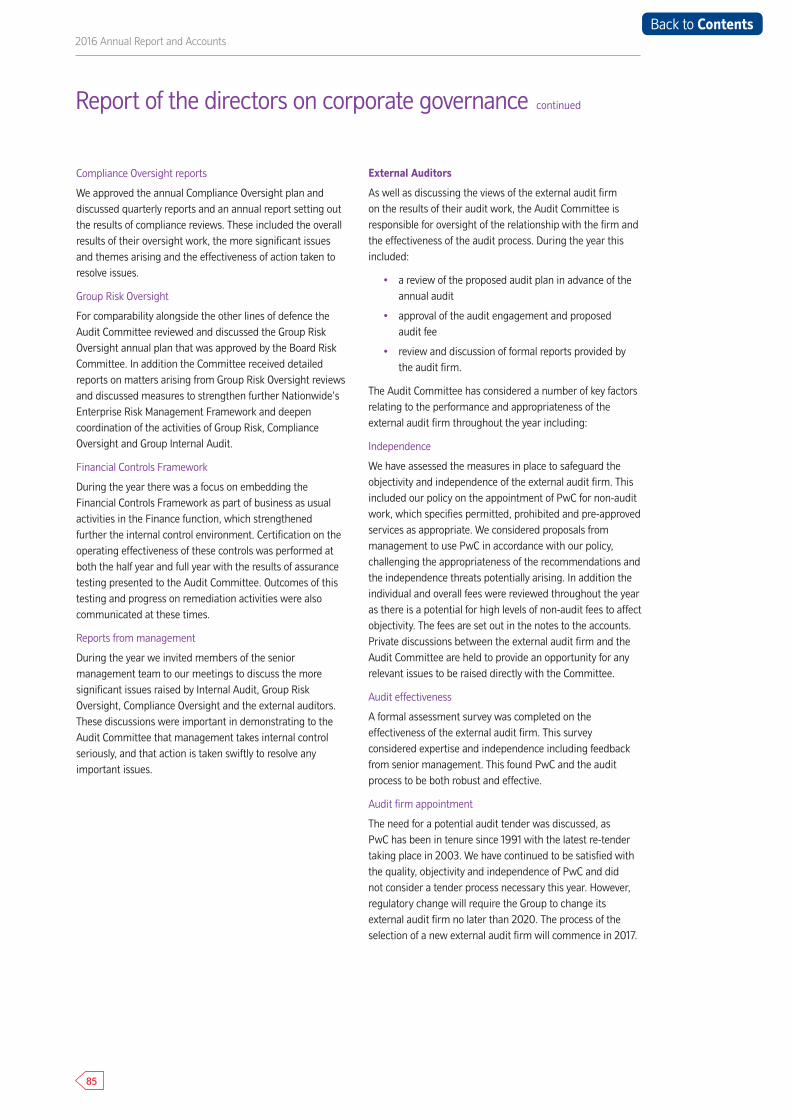
85
2016 Annual Report and Accounts
Compliance Oversight reports
We approved the annual Compliance Oversight plan and discussed quarterly reports and an annual report setting out the results of compliance reviews. These included the overall results of their oversight work, the more significant issues and themes arising and the effectiveness of action taken to resolve issues.
Group Risk Oversight
For comparability alongside the other lines of defence the Audit Committee reviewed and discussed the Group Risk Oversight annual plan that was approved by the Board Risk Committee. In addition the Committee received detailed reports on matters arising from Group Risk Oversight reviews and discussed measures to strengthen further Nationwide’s Enterprise Risk Management Framework and deepen coordination of the activities of Group Risk, Compliance Oversight and Group Internal Audit.
Financial Controls Framework
During the year there was a focus on embedding the Financial Controls Framework as part of business as usual activities in the Finance function, which strengthened further the internal control environment. Certification on the operating effectiveness of these controls was performed at both the half year and full year with the results of assurance testing presented to the Audit Committee. Outcomes of this testing and progress on remediation activities were also communicated at these times.
Reports from management
During the year we invited members of the senior management team to our meetings to discuss the more significant issues raised by Internal Audit, Group Risk Oversight, Compliance Oversight and the external auditors. These discussions were important in demonstrating to the Audit Committee that management takes internal control seriously, and that action is taken swiftly to resolve any important issues.
External Auditors
As well as discussing the views of the external audit firm on the results of their audit work, the Audit Committee is responsible for oversight of the relationship with the firm and the effectiveness of the audit process. During the year this included:
• a review of the proposed audit plan in advance of the annual audit
• approval of the audit engagement and proposed audit fee
• review and discussion of formal reports provided by the audit firm.
The Audit Committee has considered a number of key factors relating to the performance and appropriateness of the external audit firm throughout the year including:
Independence
We have assessed the measures in place to safeguard the objectivity and independence of the external audit firm. This included our policy on the appointment of PwC for non-audit work, which specifies permitted, prohibited and pre-approved services as appropriate. We considered proposals from management to use PwC in accordance with our policy, challenging the appropriateness of the recommendations and the independence threats potentially arising. In addition the individual and overall fees were reviewed throughout the year as there is a potential for high levels of non-audit fees to affect objectivity. The fees are set out in the notes to the accounts. Private discussions between the external audit firm and the Audit Committee are held to provide an opportunity for any relevant issues to be raised directly with the Committee.
Audit effectiveness
A formal assessment survey was completed on the effectiveness of the external audit firm. This survey considered expertise and independence including feedback from senior management. This found PwC and the audit process to be both robust and effective.
Audit firm appointment
The need for a potential audit tender was discussed, as PwC has been in tenure since 1991 with the latest re-tender taking place in 2003. We have continued to be satisfied with the quality, objectivity and independence of PwC and did not consider a tender process necessary this year. However, regulatory change will require the Group to change its external audit firm no later than 2020. The process of the selection of a new external audit firm will commence in 2017.
Report of the directors on corporate governance continued
Back to Contents

86
Governance
Group Internal Audit
Group Internal Audit plays a key role in providing independent assessment and challenge of governance, risk and control at Nationwide. As well as approving the Internal Audit plan and considering the results of its work, the Audit Committee is responsible for the oversight of Group Internal Audit. During the year we therefore:
• Approved the Internal Audit Charter which sets out the role and expectations of Internal Audit.
• Monitored the adequacy of Group Internal Audit resources, including the financial budget and the availability of external specialists to bring additional expertise when appropriate. We were satisfied that Group Internal Audit had adequate resources available this year.
• Monitored the delivery of Internal Audit’s action plan to develop the function further, considering the findings of the prior year external quality assurance review.
I met monthly with the Chief Internal Auditor, and spent some time with the Internal Audit team discussing the priorities for their work and, as a Committee, we held a private discussion with the Chief Internal Auditor. We also held a number of workshops with Internal Audit senior management during the year, discussing audit planning and priorities as well as continued progress in developing the Internal Audit function.
Compliance Oversight
Compliance Oversight also plays an important role in monitoring Nationwide’s compliance with regulatory requirements and, critically, ensuring that we continue to deliver fair customer outcomes. The Audit Committee approved the Compliance Oversight plan for the year, and discussed with the Chief Compliance Officer the resources available to complete the planned programme of work. Regular reports from Compliance Oversight also gave updates on progress in delivering the Compliance Oversight plan, and we held private discussions with the Chief Compliance Officer as necessary.
Group Risk Oversight
The Group Risk Oversight function is operationally independent of management and personnel responsible for owning and managing risk. The teams are responsible for setting and embedding the methodologies and standards needed to enable business areas to assess and manage risk. The Audit Committee discussed the Group Risk Oversight plan for the year alongside the Group Internal Audit and Compliance Oversight plans to ensure sufficiency of coverage. The Audit Committee received reports on the oversight reviews and held private meetings with the Chief Risk Officer and Group Risk Director to discuss any issues arising.
Other activities
During the year we carried out a range of other activities including:
• Completing the annual review of the effectiveness of the Audit Committee, which included a detailed review of our work against published guidance and best practice, and feedback from Committee members and attendees. We concluded that the Committee continued to operate effectively.
• Reviewing the progress of and key technical decisions made by the Society’s project to address the revised requirements of IFRS 9 Financial Instruments that will be adopted for the 2018/19 financial year.
• Carrying out our annual review of whistleblowing arrangements in place to enable employees to raise concerns in confidence. A paper prepared by management set out details of the types of concerns raised by employees, with thematic analysis; no new significant matters were noted in the year, and the number of reports made was similar to the prior year.
• Discussing briefings from management on a number of issues, some of which were discussed in Committee meetings and others in workshops together with other board members. These included the Senior Managers Regime, remuneration, anti-money laundering and anti-bribery and corruption.
Reporting to the Board
Immediately following each Audit Committee meeting I provided a verbal update to the board of directors on matters discussed by the Audit Committee. I also presented a formal written paper to the Board three times during the year, giving details of the Committee’s discussions and conclusions.
This is my final report as Audit Committee Chairman before I hand over to Kevin Parry. It has been both a privilege and hugely enjoyable to serve as both a Board member and Chair of this Committee. I wish Nationwide all the best for the future and will follow its progress with great interest, not least as a continuing member.
Roger Perkin
Chairman – Audit Committee
Back to Contents
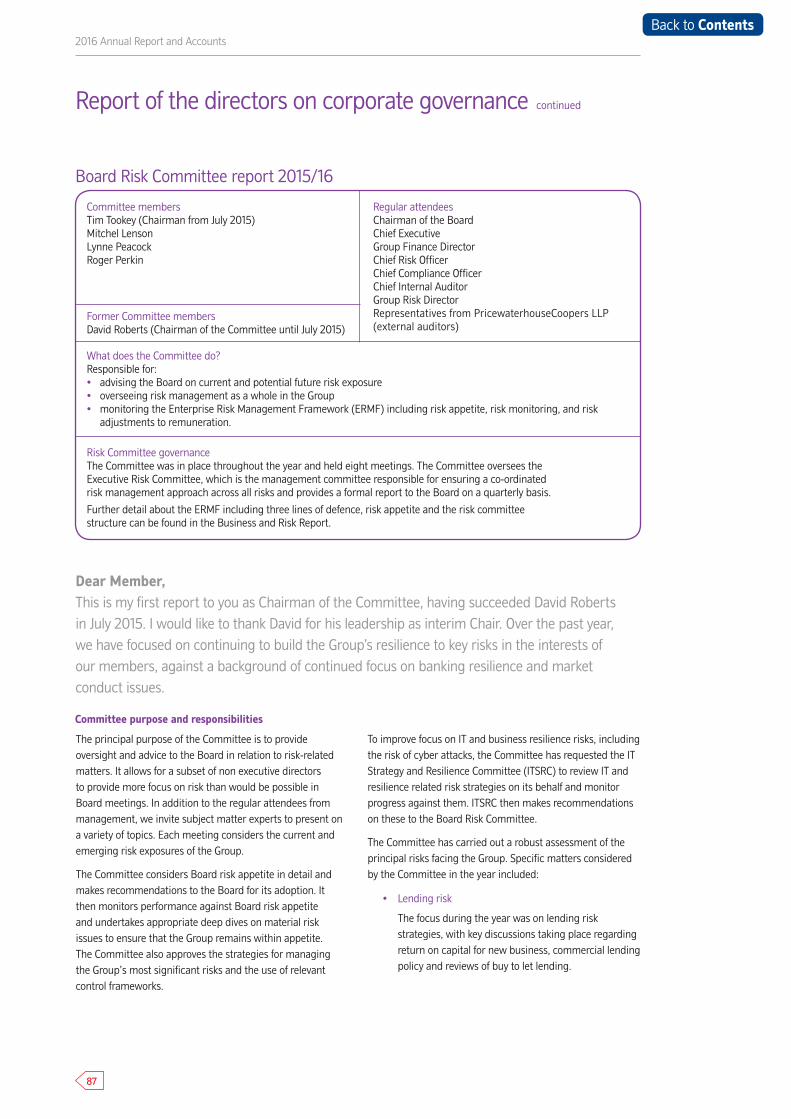
87
2016 Annual Report and Accounts
Committee membersTim Tookey (Chairman from July 2015) Mitchel Lenson Lynne Peacock Roger Perkin
Regular attendeesChairman of the Board Chief Executive Group Finance Director Chief Risk Officer Chief Compliance Officer Chief Internal Auditor Group Risk Director Representatives from PricewaterhouseCoopers LLP (external auditors)
Former Committee membersDavid Roberts (Chairman of the Committee until July 2015)
What does the Committee do?Responsible for:• advising the Board on current and potential future risk exposure• overseeing risk management as a whole in the Group• monitoring the Enterprise Risk Management Framework (ERMF) including risk appetite, risk monitoring, and risk
adjustments to remuneration.
Risk Committee governanceThe Committee was in place throughout the year and held eight meetings. The Committee oversees the Executive Risk Committee, which is the management committee responsible for ensuring a co-ordinated risk management approach across all risks and provides a formal report to the Board on a quarterly basis.
Further detail about the ERMF including three lines of defence, risk appetite and the risk committee structure can be found in the Business and Risk Report.
Dear Member, This is my first report to you as Chairman of the Committee, having succeeded David Roberts in July 2015. I would like to thank David for his leadership as interim Chair. Over the past year, we have focused on continuing to build the Group’s resilience to key risks in the interests of our members, against a background of continued focus on banking resilience and market conduct issues.
The principal purpose of the Committee is to provide oversight and advice to the Board in relation to risk-related matters. It allows for a subset of non executive directors to provide more focus on risk than would be possible in Board meetings. In addition to the regular attendees from management, we invite subject matter experts to present on a variety of topics. Each meeting considers the current and emerging risk exposures of the Group.
The Committee considers Board risk appetite in detail and makes recommendations to the Board for its adoption. It then monitors performance against Board risk appetite and undertakes appropriate deep dives on material risk issues to ensure that the Group remains within appetite. The Committee also approves the strategies for managing the Group’s most significant risks and the use of relevant control frameworks.
To improve focus on IT and business resilience risks, including the risk of cyber attacks, the Committee has requested the IT Strategy and Resilience Committee (ITSRC) to review IT and resilience related risk strategies on its behalf and monitor progress against them. ITSRC then makes recommendations on these to the Board Risk Committee.
The Committee has carried out a robust assessment of the principal risks facing the Group. Specific matters considered by the Committee in the year included:
• Lending risk
The focus during the year was on lending risk strategies, with key discussions taking place regarding return on capital for new business, commercial lending policy and reviews of buy to let lending.
Committee purpose and responsibilities
Report of the directors on corporate governance continued
Board Risk Committee report 2015/16
Back to Contents

88
Governance
• Financial risk
Core responsibilities included reviewing capital and liquidity adequacy, stress testing and the Pillar 3 disclosures. In addition, the Committee reviewed the investment strategy of the defined benefit pension fundfocusing on the inherent market risks, the long-term objectives and risk appetite.
• Operational risk
Risk strategy reviews were completed for people risk, fraud risk and information and financial management risk and recommendations were received from ITSRC on IT and resilience related risks.
• Conduct and compliance risk
Risk strategy reviews included product and service design and review, sales, after sales, financial crime and firm and culture. There were also reviews ofanti-money laundering, vulnerable customers, and conduct risks relating to interest only mortgages.
• Strategic risk
Matters covered included discussion of potential emerging risks, developments in model risk governance, and a review of the economic and political landscape, including consideration of alternative economic scenarios.
• ERMF
Core responsibilities included the annual review and approval of changes to the ERMF, a review of conflicts of interest in the three lines of defence, risk adjustments to remuneration, and governance updates, including ensuring that Risk Committee Terms of Reference reflectthe Senior Managers Regime (SMR).
• Risk Culture
A review of the Group’s risk culture was carried out to assess whether the Group places sufficient value on risk management and that risk issues are proactively identified and addressed.
• Corporate Governance Code
A detailed review of the responsibilities relating to the Corporate Governance Code requirements for risk management was carried out to enable the Committee to confirm how it will review the effectiveness of risk management and internal control systems. The outcome of this review is recorded in the Accountability section of the Report of the directors on
corporate governance.
Risk reporting
Risk reporting is comprehensive across all risk categories (see Business and Risk Report for details). The Committee monitors the Group’s risk profile against Board risk appetite.
More granular risk appetite metrics are escalated when a trigger or limit has been breached. In addition, we also consider longer-term risks to delivering the Corporate Plan and emerging issues that could present risks in the future. These ‘Top and Emerging’ risks are presented within the Business and Risk Report. Following each Committee meeting, I update the Board verbally. In addition, a formal quarterly report to the Board summarises the Committee activities undertaken, discussions held and anticipated activities for the coming quarter. This is accompanied by reports from both the Chief Risk Officer and Chief Compliance Officer.
Other activities
Other than the change in respect of the ITSRC as noted above, the operation of the Committee has remained similar to the previous year. The annual effectiveness review resulted in some minor revisions to our Terms of Reference to align to the SMR regime, and we have continued to focus the agenda on the most material risk items.
The last 12 months have seen continued progress in risk management at Nationwide. In particular, we continue to mature our risk management frameworks and improve our capital position and have focused on ensuring our stress testing capability remains in line with the expectations of the regulator. The results of the 2015 concurrent stress testing exercise demonstrated that we are resilient to a severe stress.
Over the next 12 months the Committee will further mature discussions on risk appetite, considering each principal risk category (see Business and Risk Report for detail). We will continue to focus on oversight of macroeconomic and market uncertainty, including the forthcoming referendum on EU membership, material lending portfolios and conduct challenges. We are also engaged in the next iteration of concurrent stress testing due for submission in June 2016. It is clear that regulatory and industry expectations of improvements in risk management continue to rise. In addition, perhaps more fundamentally, the expectations of members and the general public of the safety, security, resilience and ethics of large financial institutions are rightfully very high. The Committee engages fully with management in order to oversee the strengthening in the Group’s business operations, to meet these rising standards to safeguard members’ interests, and to continue to serve our members to the best of our ability.
Tim Tookey
Chairman – Board Risk Committee
members to the best of our ability.
Chairman – Board Risk Committee
Back to Contents
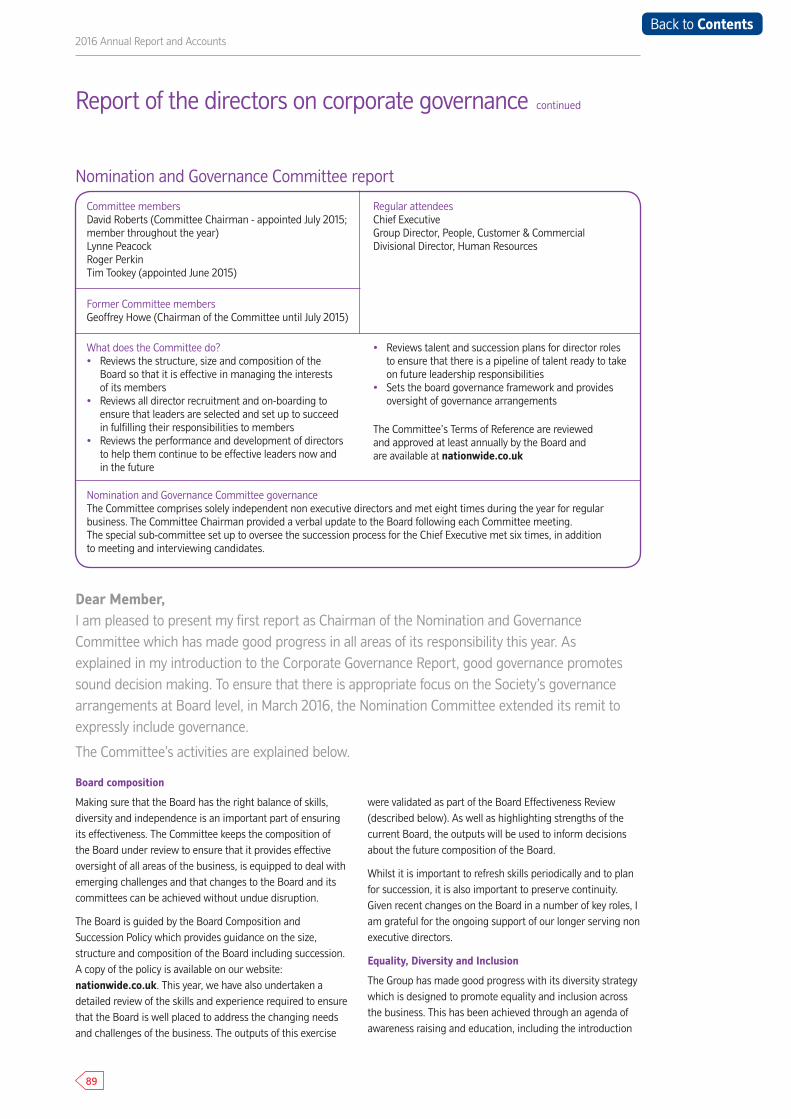
89
2016 Annual Report and Accounts
Board composition
Making sure that the Board has the right balance of skills, diversity and independence is an important part of ensuring its effectiveness. The Committee keeps the composition of the Board under review to ensure that it provides effective oversight of all areas of the business, is equipped to deal with emerging challenges and that changes to the Board and its committees can be achieved without undue disruption.
The Board is guided by the Board Composition and Succession Policy which provides guidance on the size, structure and composition of the Board including succession. A copy of the policy is available on our website: nationwide.co.uk. This year, we have also undertaken a detailed review of the skills and experience required to ensure that the Board is well placed to address the changing needs and challenges of the business. The outputs of this exercise
were validated as part of the Board Effectiveness Review (described below). As well as highlighting strengths of the current Board, the outputs will be used to inform decisions about the future composition of the Board.
Whilst it is important to refresh skills periodically and to plan for succession, it is also important to preserve continuity. Given recent changes on the Board in a number of key roles, I am grateful for the ongoing support of our longer serving non executive directors.
Equality, Diversity and Inclusion
The Group has made good progress with its diversity strategy which is designed to promote equality and inclusion across the business. This has been achieved through an agenda of awareness raising and education, including the introduction
Dear Member, I am pleased to present my first report as Chairman of the Nomination and Governance Committee which has made good progress in all areas of its responsibility this year. As explained in my introduction to the Corporate Governance Report, good governance promotes sound decision making. To ensure that there is appropriate focus on the Society’s governance arrangements at Board level, in March 2016, the Nomination Committee extended its remit to expressly include governance.
The Committee’s activities are explained below.
Report of the directors on corporate governance continued
Nomination and Governance Committee report
Committee membersDavid Roberts (Committee Chairman - appointed July 2015; member throughout the year)Lynne Peacock Roger Perkin Tim Tookey (appointed June 2015)
Regular attendeesChief Executive Group Director, People, Customer & CommercialDivisional Director, Human Resources
Former Committee membersGeoffrey Howe (Chairman of the Committee until July 2015)
What does the Committee do?• Reviews the structure, size and composition of the
Board so that it is effective in managing the interests of its members
• Reviews all director recruitment and on-boarding to ensure that leaders are selected and set up to succeed in fulfilling their responsibilities to members
• Reviews the performance and development of directors to help them continue to be effective leaders now and in the future
• Reviews talent and succession plans for director roles to ensure that there is a pipeline of talent ready to take on future leadership responsibilities
• Sets the board governance framework and provides oversight of governance arrangements
The Committee’s Terms of Reference are reviewed and approved at least annually by the Board and are available at nationwide.co.uk
Nomination and Governance Committee governanceThe Committee comprises solely independent non executive directors and met eight times during the year for regular business. The Committee Chairman provided a verbal update to the Board following each Committee meeting. The special sub-committee set up to oversee the succession process for the Chief Executive met six times, in addition to meeting and interviewing candidates.
Back to Contents
90
Governance
of mandatory equality, diversity and inclusion online training and promoting Diversity Week 2015 with external keynote speakers and panel events open to all employees. Other activity has included enhanced governance, a new focus on diversity targets and a campaign to increase diversity declaration rates that resulted in a rise from 27% to over 90% in six months.
Nationwide demonstrates its commitment to equality, diversity and inclusion by endorsing and leveraging the power of employee network groups. These are groups of employees who share similar characteristics or life experiences and want to use those similarities to create cross-functional workplace connections, provide professional development and mentoring opportunities, and advance business initiatives. They were started in 2012 and now include employees all across the UK. Senior leaders actively demonstrate visible commitment to equality, diversity and inclusion by serving as key sponsors of our groups and provide support, guidance and resources.
In June 2015, we met our target of 25% female representation on the Board. In our last annual report, we committed to increasing female representation to 33% by 2020 across the Group’s director population (divisional directors and above, including the Board). As a result of our focus on strengthening the talent pipeline at executive level, I am pleased to report that we have achieved 31.6% female representation in this director population.
Whilst there has been a strong focus on improving female representation at senior level, our strategy is broader than gender and includes initiatives aimed at increasing representation in other areas including ethnicity. The impact of positive action to promote ethnic diversity is yet to be felt. To ensure appropriate focus we have set a target of 8% - 15% for Black, Asian and Minority Ethnic (BAME) representation across our director population by 2020. Representation currently stands at 2.6%. We recognise that further attention will be needed in order to achieve our BAME target.
Board recruitment
The recruitment process for non executive directors is designed to ensure that the Board collectively possesses a range of skills and expertise to oversee the full range of business activities and brings appropriate objectivity and independent judgement.
The Committee has presided over a number of changes to the Board and its Committees including the following as independent non executive directors:
• Tim Tookey, appointed in June 2015, who also serves as Chairman of the Board Risk Committee. Tim Tookey brings extensive executive experience as a Finance Director in the banking and insurance sector as well as in risk management and retail financial services.
• Mai Fyfield was appointed in June 2015 and brings experience in technology and digital strategy in a range of retail and commercial environments.
• Kevin Parry joined the Board on 23 May 2016 and will take over as Chairman of the Audit Committee in July 2016. Kevin has experience as the Chief Financial Officer of one of the FTSE’s leading asset managers and as Chair of several Audit Committees. Roger will step down in July 2016 after six years on the Board and as Chairman of the Audit Committee.
As well as ensuring the right balance of non executive directors, the Chief Executive succession process has been a particular priority for the Board this year. All non executive directors participated in the search and selection process, which is described below.
Chief Executive succession
In May 2015, Graham Beale announced his intention to retire at, or around, the time of the 2016 AGM. A search and selection process for a new Chief Executive was immediately commenced. The process was led by me as Chairman and supported by a specially constituted CEO Appointment Committee comprising all the independent non executive directors.
The Committee met six times prior to recommending Joe Garner to the Board as the preferred candidate as Chief Executive. Committee members also met and interviewed the candidates. The process was supported by independent search firm, JCA Group, who worked with the CEO Appointment Committee on a detailed role profile. In appointing a new Chief Executive we were keen to attract an exceptional individual with retail banking experience, a strong consumer and brand bias and ideally someone with significant experience of digital propositions. We were also looking for a visionary and strategic thinker with an engaging leadership style and, most importantly, a strong alignment with the Society’s values and mutual principles.
JCA Group worked with the CEO Appointment Committee to develop a short list. Candidates (both internal and external) underwent a series of interviews supported by an external assessment.
Joe Garner stood out as an exceptional candidate; as a motivational leader, a customer champion with a strong focus on operational excellence in customer service, a role model of the Society’s values, and as being committed to the principles of mutuality. The Board believes that he is the right person to lead the Society through the next stage of its strategic development and is delighted to have attracted someone of Joe’s calibre.
Back to Contents
91
2016 Annual Report and Accounts
Recruitment process
Non executive directors are subject to a rigorous search and selection process which is overseen by the Committee. The Committee, supported by an independent search firm, prepares a detailed role description and person specification. The search firm conducts an extensive search of the market, usually agreeing a long list with the Committee before narrowing down to a short list for interview.
The Committee conducts the interviews to assess the suitability of the candidates for the role. Ensuring that the candidate is the right fit for Nationwide’s culture as a mutual is a key part of the assessment stage. Preferred candidates may also meet other members of the Board and the Executive.
The process involves detailed referencing and other checks to establish the candidate’s credentials including fitness and propriety. Certain roles also require regulatory pre-approval.
Once all checks have been completed and the Committee is satisfied that the candidate is right for the role, a recommendation is made to the Board. All members of the Board meet new non executive directors before they are appointed.
In 2015, the Committee worked with Spencer Stuart in relation to the appointment of Tim Tookey and Mai Fyfield. The Committee was also supported by JCA Group in relation to the appointment of Kevin Parry, who will succeed Roger Perkin as Chairman of the Audit Committee. Both firms are independent of Nationwide.
As part of our ongoing review of board composition, we continue to look for non executive directors with specialist skills to address succession needs. Consistent with our stated objectives, future appointments will seek to secure and further progress the diversity of our Board.
Induction and development
All new directors undergo a comprehensive induction and development programme which is designed to help new directors make an early contribution to the Board. The induction programme is tailored to the individual needs of directors identified during the selection process and is completed over a six-month period to ensure that directors gain an understanding of the business within an appropriately short period of time. The induction covers key themes, priorities and challenges faced by the Group and involves visits and meetings to various branches and office locations.
Typical Non Executive Director On-Boarding Themes
• The Society, its Business Strategy and Model• Risk, Compliance and Audit • Personal, Legal and Regulatory Responsibilities • People, Customer, Communication and Commercial• Capital Management, Financial Performance
and Controls• Brand, Product, Markets and Customers• Group Operations and Transformation
Board directors also receive ongoing training sessions on a quarterly basis, or more frequently as required, to address a range of Society-specific and market or regulatory matters. During 2015/16, topics included buy to let lending, cyber security, anti-money laundering requirements, changes to UK Corporate Governance Code requirements in relation to risk management and control reporting, emerging risks and changes to the Senior Managers Regime.
Performance and development
Ensuring a strong pipeline of future leaders is a key consideration for the Committee. Whilst four external divisional director appointments were made this year, a further ten internal director moves and role changes took place. Over 60% of all senior executive appointments were internal, confirming our commitment to “grow our own” talent.
Preparing for the future has also been a key driver for research undertaken to understand the capabilities required by our executive leaders in order to take the organisation forward in a rapidly changing world. Based on this research, the Committee has approved Nationwide’s participation in an initiative run jointly with Imperial College Business School to provide development for all executive, Group and divisional directors, helping to develop the capabilities of our leaders and equipping them to deal with future challenges.
Board effectiveness
A key responsibility of the Committee is to ensure that the Board operates effectively. Whilst having the right people on the Board is central to overall effectiveness, how the Board operates and interacts at and outside meetings is equally important. In keeping with best practice, the Board conducts a review of its effectiveness annually. Having conducted internal reviews in 2014 and 2015, the 2016 review of the Board and its principal committees was carried out by Independent Audit Limited, an external facilitator which has no other connection with Nationwide.
Report of the directors on corporate governance continued
Back to Contents
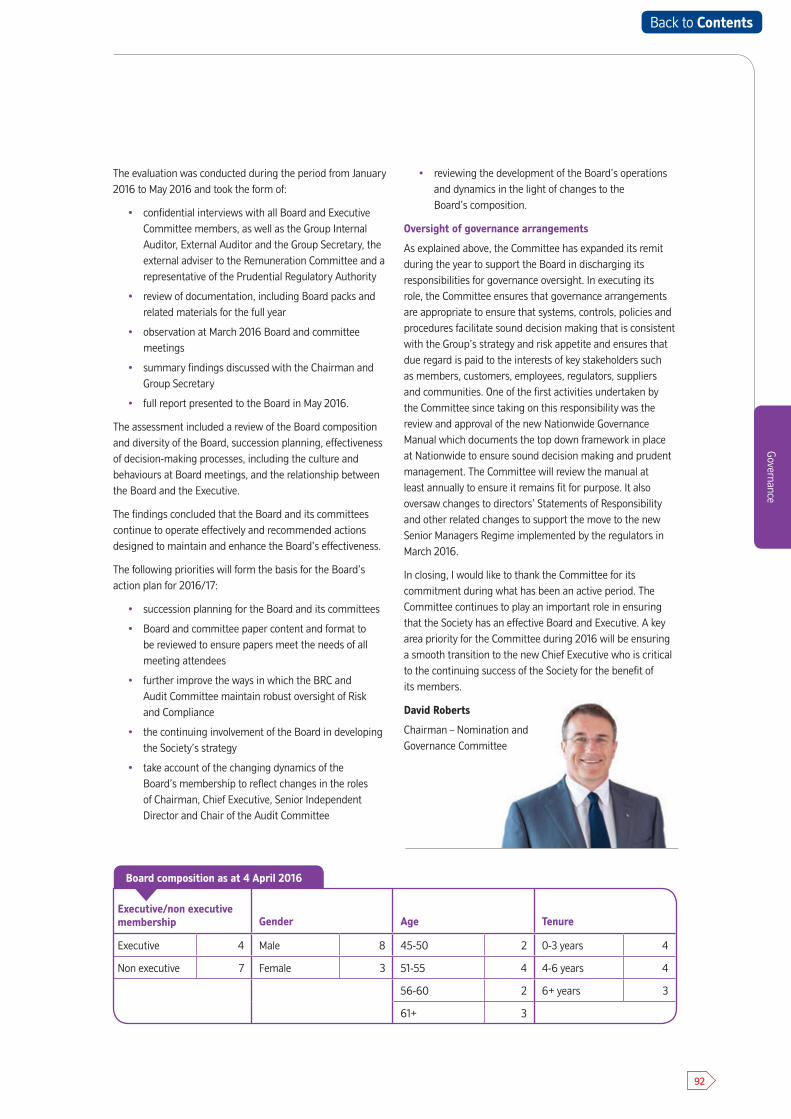
92
Governance
The evaluation was conducted during the period from January 2016 to May 2016 and took the form of:
• confidential interviews with all Board and Executive Committee members, as well as the Group Internal Auditor, External Auditor and the Group Secretary, the external adviser to the Remuneration Committee and a representative of the Prudential Regulatory Authority
• review of documentation, including Board packs and related materials for the full year
• observation at March 2016 Board and committee meetings
• summary findings discussed with the Chairman and Group Secretary
• full report presented to the Board in May 2016.
The assessment included a review of the Board composition and diversity of the Board, succession planning, effectiveness of decision-making processes, including the culture and behaviours at Board meetings, and the relationship between the Board and the Executive.
The findings concluded that the Board and its committees continue to operate effectively and recommended actions designed to maintain and enhance the Board’s effectiveness.
The following priorities will form the basis for the Board’s action plan for 2016/17:
• succession planning for the Board and its committees
• Board and committee paper content and format to be reviewed to ensure papers meet the needs of all meeting attendees
• further improve the ways in which the BRC and Audit Committee maintain robust oversight of Risk and Compliance
• the continuing involvement of the Board in developing the Society’s strategy
• take account of the changing dynamics of the Board’s membership to reflect changes in the roles of Chairman, Chief Executive, Senior Independent Director and Chair of the Audit Committee
• reviewing the development of the Board’s operations and dynamics in the light of changes to the Board’s composition.
Oversight of governance arrangements
As explained above, the Committee has expanded its remit during the year to support the Board in discharging its responsibilities for governance oversight. In executing its role, the Committee ensures that governance arrangements are appropriate to ensure that systems, controls, policies and procedures facilitate sound decision making that is consistent with the Group’s strategy and risk appetite and ensures that due regard is paid to the interests of key stakeholders such as members, customers, employees, regulators, suppliers and communities. One of the first activities undertaken by the Committee since taking on this responsibility was the review and approval of the new Nationwide Governance Manual which documents the top down framework in place at Nationwide to ensure sound decision making and prudent management. The Committee will review the manual at least annually to ensure it remains fit for purpose. It also oversaw changes to directors’ Statements of Responsibility and other related changes to support the move to the new Senior Managers Regime implemented by the regulators in March 2016.
In closing, I would like to thank the Committee for its commitment during what has been an active period. The Committee continues to play an important role in ensuring that the Society has an effective Board and Executive. A key area priority for the Committee during 2016 will be ensuring a smooth transition to the new Chief Executive who is critical to the continuing success of the Society for the benefit of its members.
David Roberts
Chairman – Nomination and Governance Committee
Executive/non executive membership Gender Age Tenure
Executive 4 Male 8 45-50 2 0-3 years 4
Non executive 7 Female 3 51-55 4 4-6 years 4
56-60 2 6+ years 3
61+ 3
Board composition as at 4 April 2016
Back to Contents
93
2016 Annual Report and Accounts
Dear Member, I am pleased to present the Remuneration Committee’s report, including details of the directors’ pay for the year to 4 April 2016.
Change in Chief Executive
Last year our long serving Chief Executive Graham Beale announced his intention to step down from his role leading our Society. We are grateful for Graham’s successful leadership over the last nine years, the early part of which was characterised by some particularly challenging and turbulent times. He leaves our Society in great shape and in the careful stewardship of our incoming Chief Executive Joe Garner, who joined us on 5 April 2016. Details of Graham Beale’s leaving arrangements and the remuneration package for Joe Garner are described within this report.
Our policy
Our remuneration policy was approved by our members in 2014, and continues to set the framework for our directors’ remuneration. For this year, the Directors’ Performance Pay Plan (DPPP) has been renamed the Directors’ Performance Award (DPA), although the plan design remains the same. For the 2016/17 performance year we have revised the deferral schedules in the DPA in response to new regulatory requirements, which have lengthened the period over which directors’ pay will be deferred. Further details of this change are set out within the report.
How the directors have performed
The leadership team has again delivered a strong performance this year, driven by our consistent focus on putting the needs of our members first. We continue to be ranked number one for customer satisfaction amongst our high street peer group1, underlying income and profits
have both increased and we strengthened our capital position. Underlying costs have increased, reflecting the growth of our business and continued investment in new products and services which means our underlying cost income ratio has increased slightly. We have successfully grown our membership, as well as continuing to invest in new products and technologies.
The impact on directors’ performance pay
Our excellent results have led to payments being awarded under the DPA. Awards have also been made in relation to the final cycle of the Medium Term Performance Pay Plan (now discontinued), which was based on a three year performance period ending in March 2016. Details of how both sets of payments have been calculated are set out in this report.
In delivering the stretching targets which they were set, the Committee considers that our directors have delivered real benefits for the Society and all of our members.
Going forward, the total levels of variable pay opportunity available will fall, reflecting the reduction in the overall performance pay opportunity for directors under the DPA compared to our legacy plans.
On behalf of the Remuneration Committee, I recommend that you endorse the report.
Lynne Peacock
Chair – Remuneration Committee
1 © GfK 2016, Financial Research Survey (FRS), 3 months ending 31 March 2016 vs 31 March 2015, proportion of extremely/very satisfied customers minus proportion of extremely/very/fairly dissatisfied customers summed across current account, mortgage and savings, high street peer group defined as providers with main current account market share >6% (Barclays, Halifax, HSBC, Lloyds Bank (inc C&G), NatWest and Santander). Prior to April 2015, Lloyds Bank and TSB combined as Lloyds TSB Group (including Lloyds Bank, TSB and C&G).
Report of the directors on
For the year ended 4 April 2016
remuneration
Introduction
Back to Contents
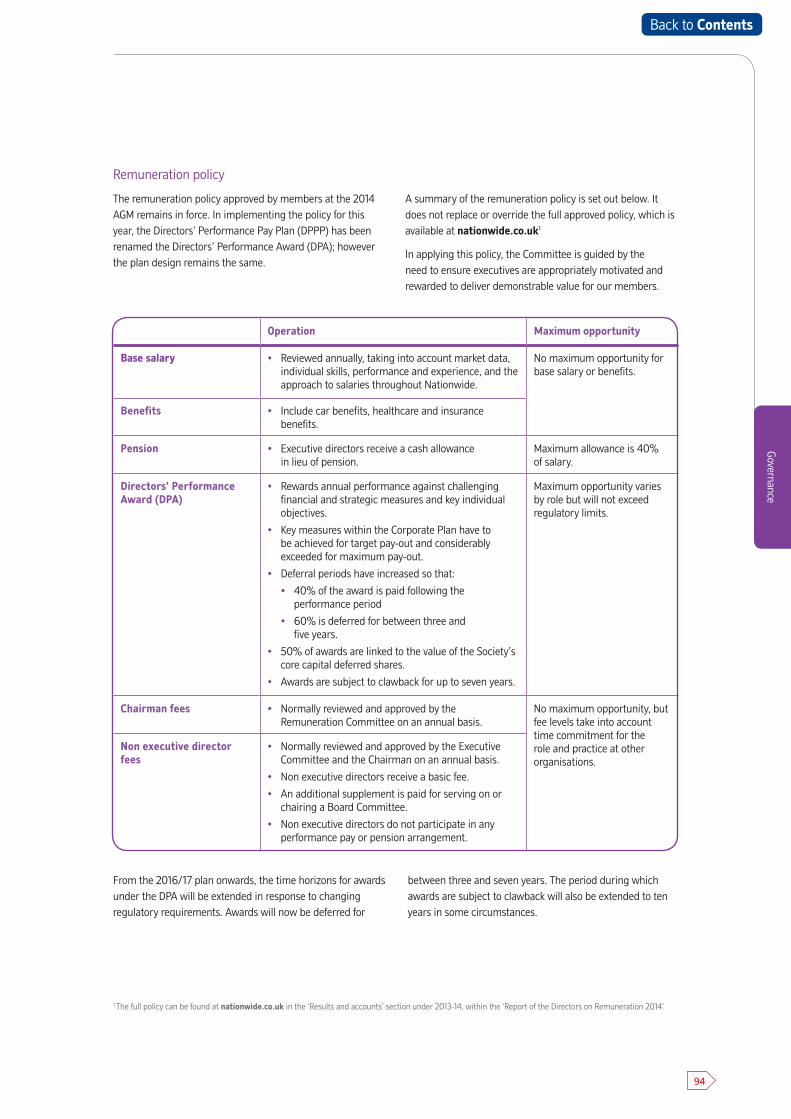
94
Governance
From the 2016/17 plan onwards, the time horizons for awards under the DPA will be extended in response to changing regulatory requirements. Awards will now be deferred for
between three and seven years. The period during which awards are subject to clawback will also be extended to ten years in some circumstances.
Operation Maximum opportunity
Base salary • Reviewed annually, taking into account market data, individual skills, performance and experience, and the approach to salaries throughout Nationwide.
No maximum opportunity for base salary or benefits.
Benefits • Include car benefits, healthcare and insurance benefits.
Pension • Executive directors receive a cash allowance in lieu of pension.
Maximum allowance is 40% of salary.
Directors’ Performance Award (DPA)
• Rewards annual performance against challenging financial and strategic measures and key individual objectives.
• Key measures within the Corporate Plan have to be achieved for target pay-out and considerably exceeded for maximum pay-out.
• Deferral periods have increased so that:
• 40% of the award is paid following the performance period
• 60% is deferred for between three andfive years.
• 50% of awards are linked to the value of the Society’s core capital deferred shares.
• Awards are subject to clawback for up to seven years.
Maximum opportunity varies by role but will not exceed regulatory limits.
Chairman fees • Normally reviewed and approved by the Remuneration Committee on an annual basis.
No maximum opportunity, but fee levels take into account time commitment for the role and practice at other organisations.
Non executive director fees
• Normally reviewed and approved by the Executive Committee and the Chairman on an annual basis.
• Non executive directors receive a basic fee.
• An additional supplement is paid for serving on or chairing a Board Committee.
• Non executive directors do not participate in any performance pay or pension arrangement.
Remuneration policy
The remuneration policy approved by members at the 2014 AGM remains in force. In implementing the policy for this year, the Directors’ Performance Pay Plan (DPPP) has been renamed the Directors’ Performance Award (DPA); however the plan design remains the same.
A summary of the remuneration policy is set out below. It does not replace or override the full approved policy, which is available at nationwide.co.uk1
In applying this policy, the Committee is guided by the need to ensure executives are appropriately motivated and rewarded to deliver demonstrable value for our members.
1 The full policy can be found at nationwide.co.uk in the ‘Results and accounts’ section under 2013-14, within the ‘Report of the Directors on Remuneration 2014’.
Back to Contents
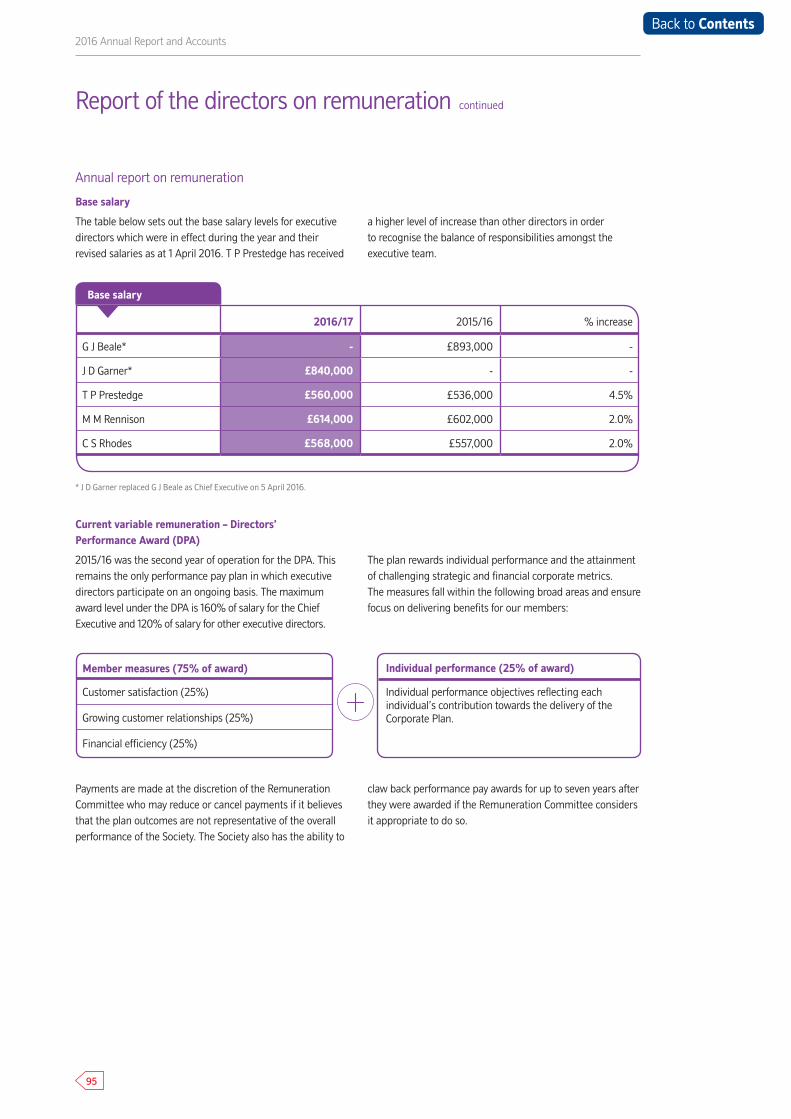
95
2016 Annual Report and Accounts
Member measures (75% of award)
Customer satisfaction (25%)
Growing customer relationships (25%)
Financial efficiency (25%)
Individual performance (25% of award)
Individual performance objectives reflecting each individual’s contribution towards the delivery of the Corporate Plan.
Annual report on remuneration
Base salary
The table below sets out the base salary levels for executive directors which were in effect during the year and their revised salaries as at 1 April 2016. T P Prestedge has received
a higher level of increase than other directors in order to recognise the balance of responsibilities amongst the executive team.
* J Garner replaced G J Beale as CEO on 5 April 2016.
* J D Garner replaced G J Beale as Chief Executive on 5 April 2016.
Current variable remuneration – Directors’ Performance Award (DPA)
2015/16 was the second year of operation for the DPA. This remains the only performance pay plan in which executive directors participate on an ongoing basis. The maximum award level under the DPA is 160% of salary for the Chief Executive and 120% of salary for other executive directors.
The plan rewards individual performance and the attainment of challenging strategic and financial corporate metrics. The measures fall within the following broad areas and ensure focus on delivering benefits for our members:
Payments are made at the discretion of the Remuneration Committee who may reduce or cancel payments if it believes that the plan outcomes are not representative of the overall performance of the Society. The Society also has the ability to
claw back performance pay awards for up to seven years after they were awarded if the Remuneration Committee considers it appropriate to do so.
Report of the directors on remuneration continued
2016/17 2015/16 % increase
G J Beale* - £893,000 -
J D Garner* £840,000 - -
T P Prestedge £560,000 £536,000 4.5%
M M Rennison £614,000 £602,000 2.0%
C S Rhodes £568,000 £557,000 2.0%
Base salary
Back to Contents
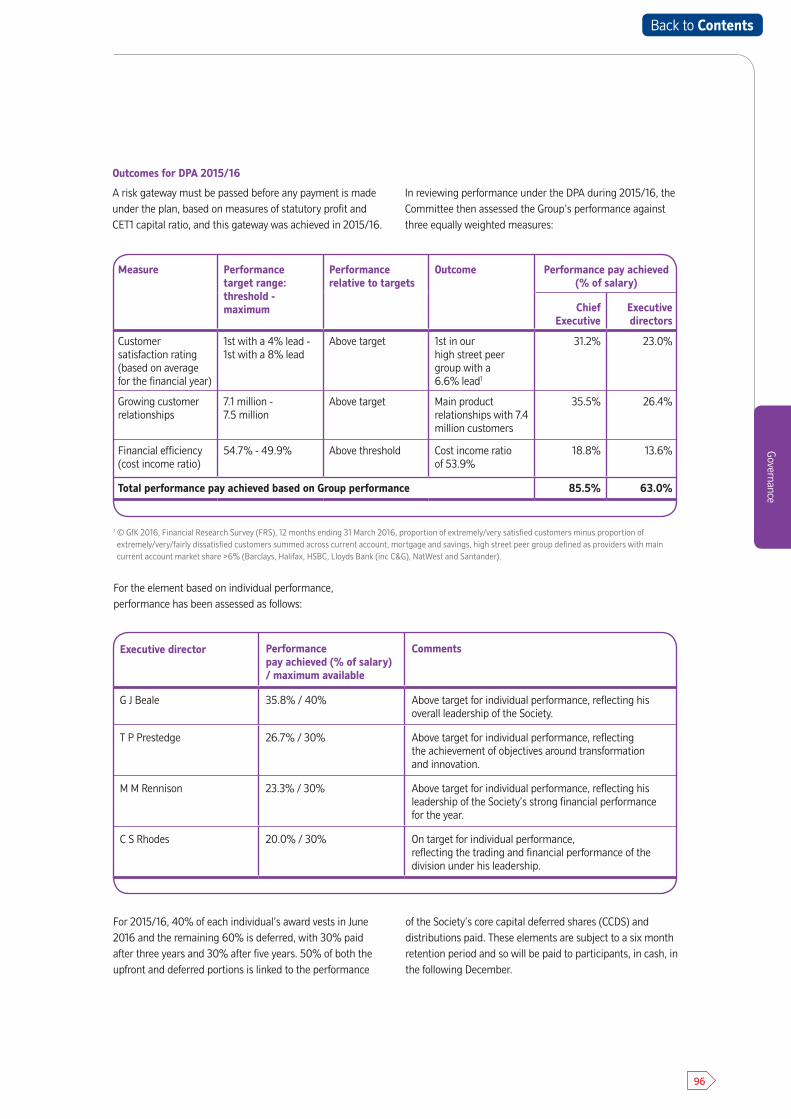
96
Governance
Outcomes for DPA 2015/16
A risk gateway must be passed before any payment is made under the plan, based on measures of statutory profit and CET1 capital ratio, and this gateway was achieved in 2015/16.
In reviewing performance under the DPA during 2015/16, the Committee then assessed the Group’s performance against three equally weighted measures:
For 2015/16, 40% of each individual’s award vests in June 2016 and the remaining 60% is deferred, with 30% paid after three years and 30% after five years. 50% of both the upfront and deferred portions is linked to the performance
of the Society’s core capital deferred shares (CCDS) and distributions paid. These elements are subject to a six month retention period and so will be paid to participants, in cash, in the following December.
For the element based on individual performance, performance has been assessed as follows:
Measure Performance target range: threshold - maximum
Performance relative to targets
Outcome Performance pay achieved (% of salary)
Chief Executive
Executive directors
Customer satisfaction rating (based on average for the financial year)
1st with a 4% lead - 1st with a 8% lead
Above target 1st in our high street peer group with a 6.6% lead1
31.2% 23.0%
Growing customer relationships
7.1 million - 7.5 million
Above target Main product relationships with 7.4 million customers
35.5% 26.4%
Financial efficiency(cost income ratio)
54.7% - 49.9% Above threshold Cost income ratio of 53.9%
18.8% 13.6%
Total performance pay achieved based on Group performance 85.5% 63.0%
Executive director Performance pay achieved (% of salary) / maximum available
Comments
G J Beale 35.8% / 40% Above target for individual performance, reflecting his overall leadership of the Society.
T P Prestedge 26.7% / 30% Above target for individual performance, reflecting the achievement of objectives around transformation and innovation.
M M Rennison 23.3% / 30% Above target for individual performance, reflecting his leadership of the Society’s strong financial performance for the year.
C S Rhodes 20.0% / 30% On target for individual performance, reflecting the trading and financial performance of the division under his leadership.
1 © GfK 2016, Financial Research Survey (FRS), 12 months ending 31 March 2016, proportion of extremely/very satisfied customers minus proportion of extremely/very/fairly dissatisfied customers summed across current account, mortgage and savings, high street peer group defined as providers with main current account market share >6% (Barclays, Halifax, HSBC, Lloyds Bank (inc C&G), NatWest and Santander).
Back to Contents
97
2016 Annual Report and Accounts
Legacy variable remuneration – Medium Term Performance Pay Plan (MTPPP)
The MTPPP was replaced by the single annual scheme from 2014/15, although historic awards under the 2013-16 award cycle remained due for payment. This is the final cycle of this legacy scheme.
The MTPPP rewards sustained performance and the achievement of challenging financial targets over a three year performance cycle. For the 2013-16 award cycle the measures were:
The maximum award level under the plan was 120% of salary for the Chief Executive and 81% of salary for other executive directors.
Risk criteria
All outstanding medium term performance pay awards will be cancelled if the Group’s Core Tier 1 capital ratio falls below a minimum level set by the Board.
Achievement of this measure ensures that the Group maintains a strong capital base that is consistent with our risk criteria and regulatory standards for the business.
Performance measures (100% of the award)
The plan measures the Society’s performance over a three year period against the following equally weighted factors:• Customer satisfaction rating achieved at the
end of the three year period• Cumulative underlying profit over the three
year period• Stock of main and packaged current accounts.
Outcomes for MTPPP 2013-16
In reviewing performance under the 2013-16 MTPPP, the Committee assessed the Group’s performance against the following measures. These targets were set at the start
of the plan in 2013, with performance assessed over a three year period.
In addition, the Committee confirmed that the risk criteria for the MTPPP had been met.
Two thirds of each individual’s award vests in June 2016 and the remaining one third is deferred for an additional year until June 2017. For each portion vesting, 50% will be paid in
cash in the respective June. The remaining 50% of each portion is linked to the performance of the Society’s CCDS. These elements are subject to a six month retention period and so will be paid to participants, in cash, in the following December.
Report of the directors on remuneration continued
Measure Performance target range: threshold - maximum
Performance relative to targets
Outcome Performance pay achieved (% of salary)
Chief Executive
Executive directors
Customer satisfaction rating (based on six month rolling average)
1st with a 2% lead - 1st with a 6% lead
Maximum 1st in our high street peer group with a 6.5% lead1
40.0% 27.0%
Cumulative underlying profit
£2,173 million - £3,531 million
Above target Cumulative underlying profit of £3,524 million achieved over period
39.9% 26.9%
Stock of main and packaged current accounts (‘000s)
2,992 - 3,512 Above threshold 3,090 main and packaged current accounts held
17.1% 12.3%
Total performance pay achieved 97.0% 66.2%
1 © GfK 2016, Financial Research Survey (FRS), 6 months ending 31 March 2016, proportion of extremely/very satisfied customers minus proportion of extremely/very/fairly dissatisfied customers summed across current account, mortgage and savings, high street peer group defined as providers with main current account market share >6% (Barclays, Halifax, HSBC, Lloyds Bank (inc C&G), NatWest and Santander).
Back to Contents
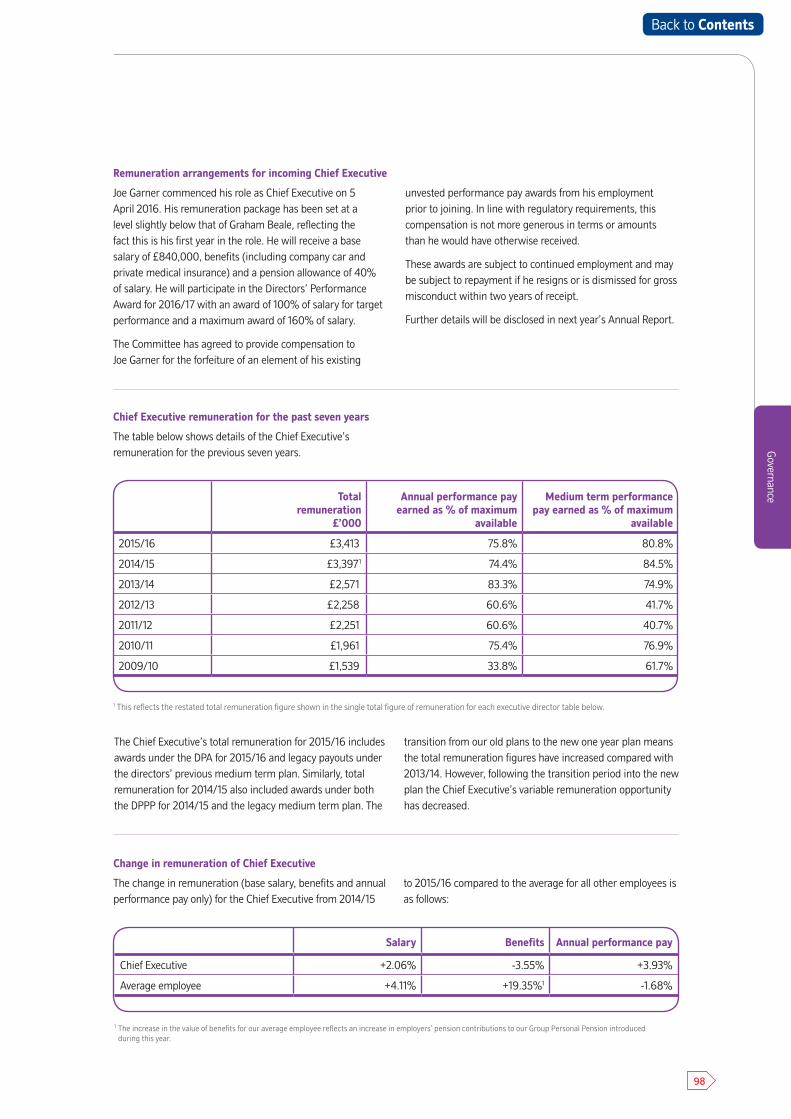
98
GovernanceTotal remuneration
£’000
Annual performance pay earned as % of maximum
available
Medium term performance pay earned as % of maximum
available
2015/16 £3,413 75.8% 80.8%
2014/15 £3,3971 74.4% 84.5%
2013/14 £2,571 83.3% 74.9%
2012/13 £2,258 60.6% 41.7%
2011/12 £2,251 60.6% 40.7%
2010/11 £1,961 75.4% 76.9%
2009/10 £1,539 33.8% 61.7%
Salary Benefits Annual performance pay
Chief Executive +2.06% -3.55% +3.93%
Average employee +4.11% +19.35%1 -1.68%
Chief Executive remuneration for the past seven years
The table below shows details of the Chief Executive’s remuneration for the previous seven years.
The Chief Executive’s total remuneration for 2015/16 includes awards under the DPA for 2015/16 and legacy payouts under the directors’ previous medium term plan. Similarly, total remuneration for 2014/15 also included awards under both the DPPP for 2014/15 and the legacy medium term plan. The
transition from our old plans to the new one year plan means the total remuneration figures have increased compared with 2013/14. However, following the transition period into the new plan the Chief Executive’s variable remuneration opportunity has decreased.
Change in remuneration of Chief Executive
The change in remuneration (base salary, benefits and annual performance pay only) for the Chief Executive from 2014/15
to 2015/16 compared to the average for all other employees is as follows:
Remuneration arrangements for incoming Chief Executive
Joe Garner commenced his role as Chief Executive on 5 April 2016. His remuneration package has been set at a level slightly below that of Graham Beale, reflecting the fact this is his first year in the role. He will receive a base salary of £840,000, benefits (including company car and private medical insurance) and a pension allowance of 40% of salary. He will participate in the Directors’ Performance Award for 2016/17 with an award of 100% of salary for target performance and a maximum award of 160% of salary.
The Committee has agreed to provide compensation to Joe Garner for the forfeiture of an element of his existing
unvested performance pay awards from his employment prior to joining. In line with regulatory requirements, this compensation is not more generous in terms or amounts than he would have otherwise received.
These awards are subject to continued employment and may be subject to repayment if he resigns or is dismissed for gross misconduct within two years of receipt.
Further details will be disclosed in next year’s Annual Report.
1 This reflects the restated total remuneration figure shown in the single total figure of remuneration for each executive director table below.
1 The increase in the value of benefits for our average employee reflects an increase in employers’ pension contributions to our Group Personal Pension introduced during this year.
Back to Contents
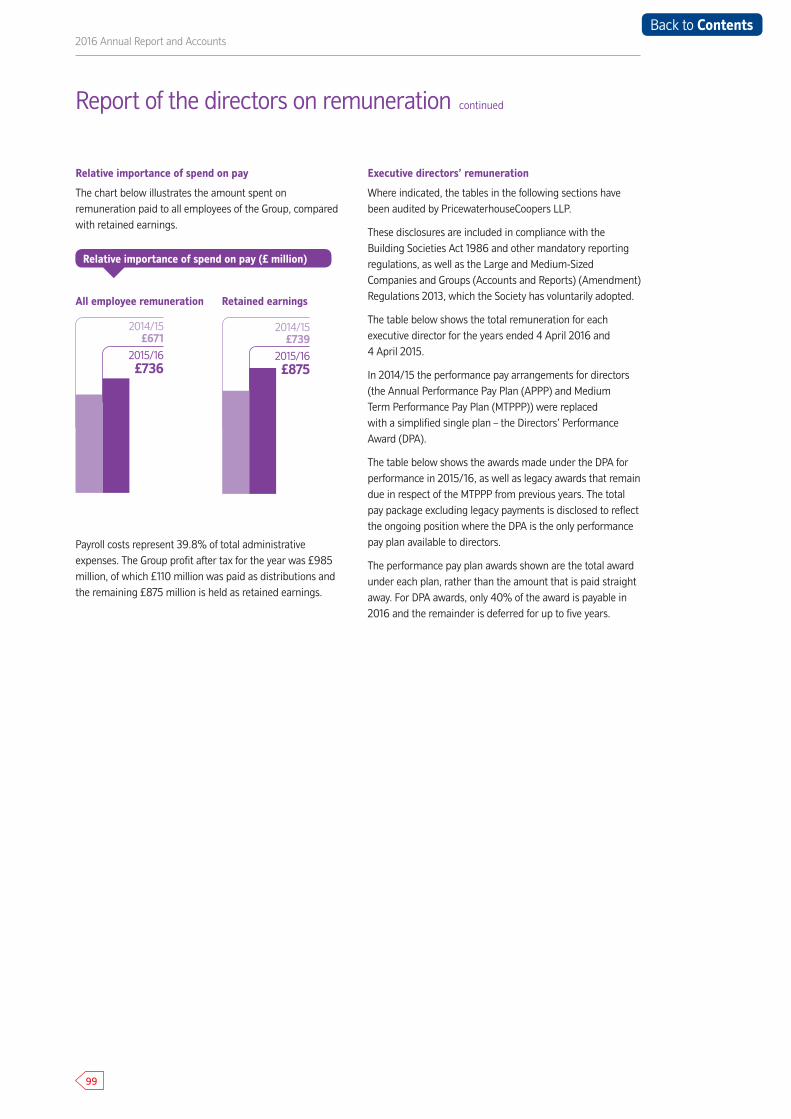
Relative importance of spend on pay (£ million)
99
2016 Annual Report and Accounts
Relative importance of spend on pay
The chart below illustrates the amount spent on remuneration paid to all employees of the Group, compared with retained earnings.
Payroll costs represent 39.8% of total administrative expenses. The Group profit after tax for the year was £985 million, of which £110 million was paid as distributions and the remaining £875 million is held as retained earnings.
Executive directors’ remuneration
Where indicated, the tables in the following sections have been audited by PricewaterhouseCoopers LLP.
These disclosures are included in compliance with the Building Societies Act 1986 and other mandatory reporting regulations, as well as the Large and Medium-Sized Companies and Groups (Accounts and Reports) (Amendment) Regulations 2013, which the Society has voluntarily adopted.
The table below shows the total remuneration for each executive director for the years ended 4 April 2016 and 4 April 2015.
In 2014/15 the performance pay arrangements for directors (the Annual Performance Pay Plan (APPP) and Medium Term Performance Pay Plan (MTPPP)) were replaced with a simplified single plan – the Directors’ Performance Award (DPA).
The table below shows the awards made under the DPA for performance in 2015/16, as well as legacy awards that remain due in respect of the MTPPP from previous years. The total pay package excluding legacy payments is disclosed to reflect the ongoing position where the DPA is the only performance pay plan available to directors.
The performance pay plan awards shown are the total award under each plan, rather than the amount that is paid straight away. For DPA awards, only 40% of the award is payable in 2016 and the remainder is deferred for up to five years.
All employee remuneration Retained earnings
2015/16£875
2014/15£739
2015/16£736
2014/15£671
Report of the directors on remuneration continued
Back to Contents
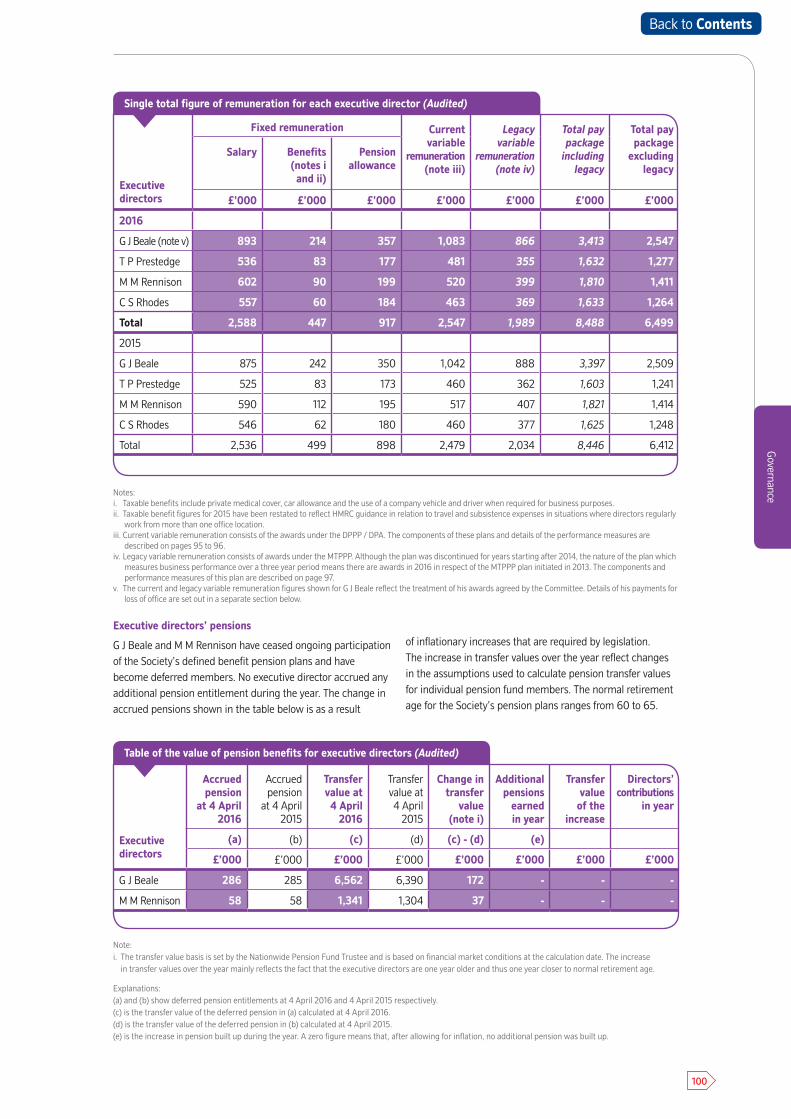
100
Governance
Executivedirectors
Fixed remuneration Currentvariable
remuneration(note iii)
Legacy variable
remuneration(note iv)
Total paypackage
including legacy
Total paypackage
excluding legacy
Salary Benefits(notes i and ii)
Pensionallowance
£’000 £’000 £’000 £’000 £’000 £’000 £’000
2016
G J Beale (note v) 893 214 357 1,083 866 3,413 2,547
T P Prestedge 536 83 177 481 355 1,632 1,277
M M Rennison 602 90 199 520 399 1,810 1,411
C S Rhodes 557 60 184 463 369 1,633 1,264
Total 2,588 447 917 2,547 1,989 8,488 6,499
2015
G J Beale 875 242 350 1,042 888 3,397 2,509
T P Prestedge 525 83 173 460 362 1,603 1,241
M M Rennison 590 112 195 517 407 1,821 1,414
C S Rhodes 546 62 180 460 377 1,625 1,248
Total 2,536 499 898 2,479 2,034 8,446 6,412
Executive directors’ pensions
G J Beale and M M Rennison have ceased ongoing participation of the Society’s defined benefit pension plans and have become deferred members. No executive director accrued any additional pension entitlement during the year. The change in accrued pensions shown in the table below is as a result
of inflationary increases that are required by legislation. The increase in transfer values over the year reflect changes in the assumptions used to calculate pension transfer values for individual pension fund members. The normal retirement age for the Society’s pension plans ranges from 60 to 65.
Executivedirectors
Accruedpension
at 4 April 2016
Accruedpension
at 4 April 2015
Transfervalue at4 April
2016
Transfervalue at4 April
2015
Change in transfer
value (note i)
Additionalpensions
earned in year
Transfervalue
of theincrease
Directors’contributions
in year
(a) (b) (c) (d) (c) - (d) (e)
£’000 £’000 £’000 £’000 £’000 £’000 £’000 £’000
G J Beale 286 285 6,562 6,390 172 - - -
M M Rennison 58 58 1,341 1,304 37 - - -
Table of the value of pension benefits for executive directors (Audited)
Notes:i. Taxable benefits include private medical cover, car allowance and the use of a company vehicle and driver when required for business purposes.ii. Taxable benefit figures for 2015 have been restated to reflect HMRC guidance in relation to travel and subsistence expenses in situations where directors regularly
work from more than one office location.iii. Current variable remuneration consists of the awards under the DPPP / DPA. The components of these plans and details of the performance measures are
described on pages 95 to 96.iv. Legacy variable remuneration consists of awards under the MTPPP. Although the plan was discontinued for years starting after 2014, the nature of the plan which
measures business performance over a three year period means there are awards in 2016 in respect of the MTPPP plan initiated in 2013. The components and performance measures of this plan are described on page 97.
v. The current and legacy variable remuneration figures shown for G J Beale reflect the treatment of his awards agreed by the Committee. Details of his payments forloss of office are set out in a separate section below.
Note:i. The transfer value basis is set by the Nationwide Pension Fund Trustee and is based on financial market conditions at the calculation date. The increase
in transfer values over the year mainly reflects the fact that the executive directors are one year older and thus one year closer to normal retirement age.
Explanations:(a) and (b) show deferred pension entitlements at 4 April 2016 and 4 April 2015 respectively.(c) is the transfer value of the deferred pension in (a) calculated at 4 April 2016. (d) is the transfer value of the deferred pension in (b) calculated at 4 April 2015.(e) is the increase in pension built up during the year. A zero figure means that, after allowing for inflation, no additional pension was built up.
Single total figure of remuneration for each executive director (Audited)
Back to Contents
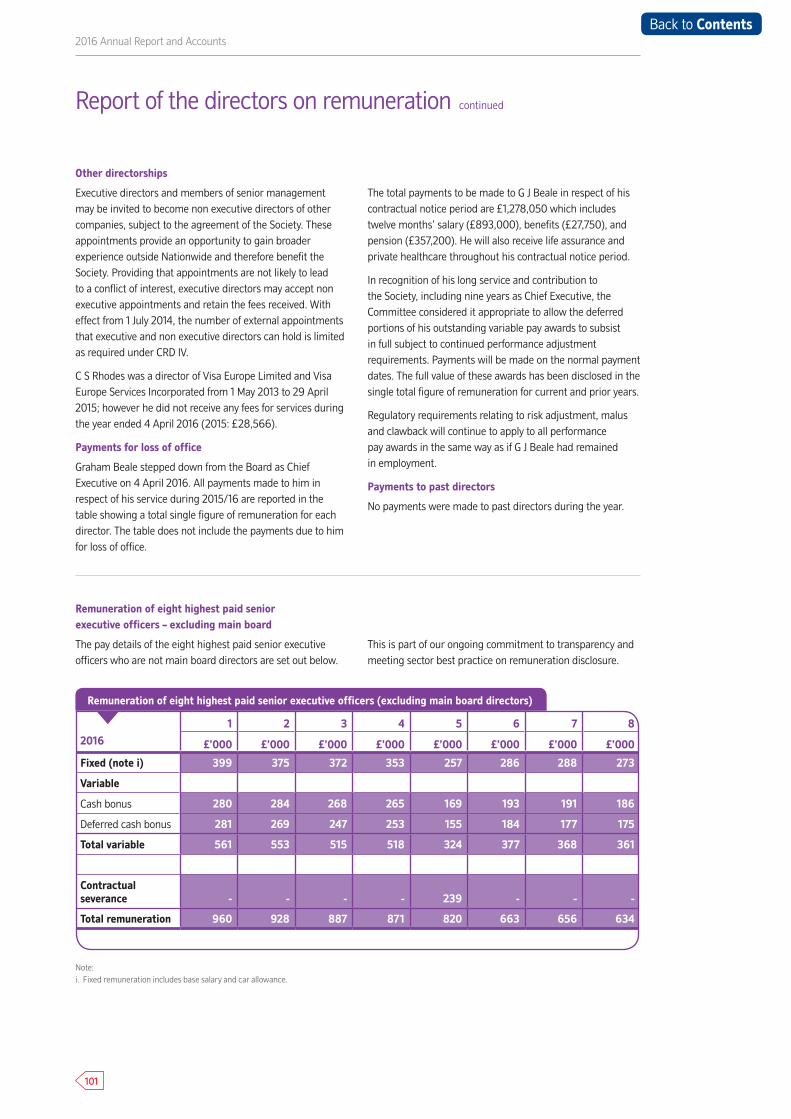
101
2016 Annual Report and Accounts
Remuneration of eight highest paid senior executive officers – excluding main board
The pay details of the eight highest paid senior executive officers who are not main board directors are set out below.
This is part of our ongoing commitment to transparency and meeting sector best practice on remuneration disclosure.
Other directorships
Executive directors and members of senior management may be invited to become non executive directors of other companies, subject to the agreement of the Society. These appointments provide an opportunity to gain broader experience outside Nationwide and therefore benefit the Society. Providing that appointments are not likely to lead to a conflict of interest, executive directors may accept non executive appointments and retain the fees received. With effect from 1 July 2014, the number of external appointments that executive and non executive directors can hold is limited as required under CRD IV.
C S Rhodes was a director of Visa Europe Limited and Visa Europe Services Incorporated from 1 May 2013 to 29 April 2015; however he did not receive any fees for services during the year ended 4 April 2016 (2015: £28,566).
Payments for loss of office
Graham Beale stepped down from the Board as Chief Executive on 4 April 2016. All payments made to him in respect of his service during 2015/16 are reported in the table showing a total single figure of remuneration for each director. The table does not include the payments due to him for loss of office.
The total payments to be made to G J Beale in respect of his contractual notice period are £1,278,050 which includes twelve months’ salary (£893,000), benefits (£27,750), and pension (£357,200). He will also receive life assurance and private healthcare throughout his contractual notice period.
In recognition of his long service and contribution to the Society, including nine years as Chief Executive, the Committee considered it appropriate to allow the deferred portions of his outstanding variable pay awards to subsist in full subject to continued performance adjustment requirements. Payments will be made on the normal payment dates. The full value of these awards has been disclosed in the single total figure of remuneration for current and prior years.
Regulatory requirements relating to risk adjustment, malus and clawback will continue to apply to all performance pay awards in the same way as if G J Beale had remained in employment.
Payments to past directors
No payments were made to past directors during the year.
Report of the directors on remuneration continued
2016
1 2 3 4 5 6 7 8
£’000 £’000 £’000 £’000 £’000 £’000 £’000 £’000
Fixed (note i) 399 375 372 353 257 286 288 273
Variable
Cash bonus 280 284 268 265 169 193 191 186
Deferred cash bonus 281 269 247 253 155 184 177 175
Total variable 561 553 515 518 324 377 368 361
Contractual severance - - - - 239 - - -
Total remuneration 960 928 887 871 820 663 656 634
Remuneration of eight highest paid senior executive officers (excluding main board directors)
Note:i. Fixed remuneration includes base salary and car allowance.
Back to Contents
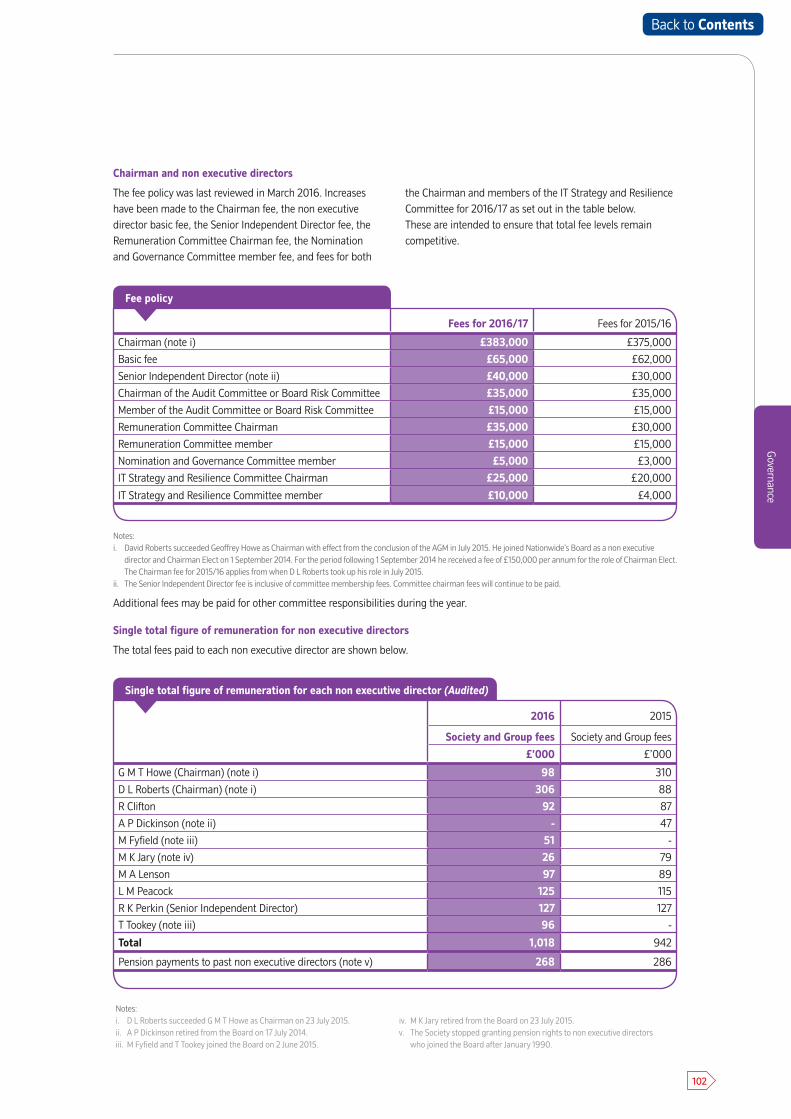
102
Governance
Fees for 2016/17 Fees for 2015/16
Chairman (note i) £383,000 £375,000
Basic fee £65,000 £62,000
Senior Independent Director (note ii) £40,000 £30,000
Chairman of the Audit Committee or Board Risk Committee £35,000 £35,000
Member of the Audit Committee or Board Risk Committee £15,000 £15,000
Remuneration Committee Chairman £35,000 £30,000
Remuneration Committee member £15,000 £15,000
Nomination and Governance Committee member £5,000 £3,000
IT Strategy and Resilience Committee Chairman £25,000 £20,000
IT Strategy and Resilience Committee member £10,000 £4,000
Fee policy
Chairman and non executive directors
The fee policy was last reviewed in March 2016. Increases have been made to the Chairman fee, the non executive director basic fee, the Senior Independent Director fee, the Remuneration Committee Chairman fee, the Nomination and Governance Committee member fee, and fees for both
the Chairman and members of the IT Strategy and Resilience Committee for 2016/17 as set out in the table below. These are intended to ensure that total fee levels remain competitive.
Single total figure of remuneration for non executive directors
The total fees paid to each non executive director are shown below.
Additional fees may be paid for other committee responsibilities during the year.
2016 2015
Society and Group fees Society and Group fees
£’000 £’000
G M T Howe (Chairman) (note i) 98 310
D L Roberts (Chairman) (note i) 306 88
R Clifton 92 87
A P Dickinson (note ii) - 47
M Fyfield (note iii) 51 -
M K Jary (note iv) 26 79
M A Lenson 97 89
L M Peacock 125 115
R K Perkin (Senior Independent Director) 127 127
T Tookey (note iii) 96 -
Total 1,018 942
Pension payments to past non executive directors (note v) 268 286
Single total figure of remuneration for each non executive director (Audited)
Notes:i. David Roberts succeeded Geoffrey Howe as Chairman with effect from the conclusion of the AGM in July 2015. He joined Nationwide’s Board as a non executive
director and Chairman Elect on 1 September 2014. For the period following 1 September 2014 he received a fee of £150,000 per annum for the role of Chairman Elect. The Chairman fee for 2015/16 applies from when D L Roberts took up his role in July 2015.
ii. The Senior Independent Director fee is inclusive of committee membership fees. Committee chairman fees will continue to be paid.
Notes:i. D L Roberts succeeded G M T Howe as Chairman on 23 July 2015.ii. A P Dickinson retired from the Board on 17 July 2014.iii. M Fyfield and T Tookey joined the Board on 2 June 2015.
iv. M K Jary retired from the Board on 23 July 2015.v. The Society stopped granting pension rights to non executive directors
who joined the Board after January 1990.
Back to Contents

103
2016 Annual Report and Accounts
Remuneration Committee Terms of Reference
The Remuneration Committee is responsible for determining remuneration strategy and policy for the remuneration of the Chairman, the executive directors and group and divisional directors of the Society as well as any other employees who are deemed to fall within scope of the PRA Remuneration Code and, within the terms of the agreed policy, the specific remuneration packages for these roles. This includes approving the design of, and determining the performance targets for, any discretionary performance pay plans operated by the Society for the benefit of employees within the Committee’s remit, and approving the total annual payments under such plans.
The Committee also oversees the remuneration policy throughout the Society, with a specific focus on the risks posed by remuneration policies and practices.
The Committee’s terms of reference were last reviewed and updated in May 2015. The full terms of reference are available on the Society’s website.
The members of the Remuneration Committee are all independent non executive directors of the Society and include a member of the Board Risk Committee. During the year the Committee members were: Lynne Peacock (Chairman of the Committee), David Roberts and Rita Clifton.
The Committee met nine times during the year. Activities during the year included:
• a strategic review of our approach to benchmarking remuneration
• agreeing the performance targets for awards to be made under the DPA, taking into account the Corporate Plan
• reviewing the outcome of the performance pay plan awards which were paid in respect of the year
• ongoing work in relation to the PRA Remuneration Code and how it applies to Nationwide as a mutual
• agreeing the approach for executive director base salary increases for 2016/17
• agreeing the remuneration package for the new Chief Executive.
The Committee is supported by the Group Director, People, Customer & Commercial, the Divisional Director, Human Resources and where appropriate the Chief Executive, who is invited to attend Committee meetings to provide further background information and context to assist the Committee in its duties. The Remuneration Committee is also supported by the Board Risk Committee on risk related matters including performance pay plan design, the assessment of specific performance measures, and wider issues relating to risk and business protection. In no case is any person present when their own remuneration is discussed.
In performing its duties, the Remuneration Committee draws on the advice of independent external consultants. During the year the Committee received advice on market rates of pay, best practice and remuneration trends from Deloitte LLP, who were appointed by the Committee following a tender process.
Deloitte is a member of the Remuneration Consultants Group and as such, voluntarily operates under the code of conduct in relation to executive remuneration consulting in the UK.
As well as advising the Remuneration Committee, Deloitte also provided tax, corporate finance, risk, internal audit and consulting services to the Society during the year. The Committee is satisfied that the advice received is objective and independent, and reviews annually all other services provided by Deloitte to ensure this continues to be the case. Deloitte’s fees are charged on a time and expenses basis. Their fees for advice provided to the Committee during 2015/16 were £216,700.
Report of the directors on remuneration continued
Back to Contents

104
Governance
Report of the directors on remuneration Remuneration Policy
Votes in favour 697,234 (93.66%) 738,438 (91.4%)
Votes against 47,180 (6.34%) 69,518 (8.6%)
Votes withheld 11,531 13,341
Lynne Peacock
Chair of the Remuneration Committee 23 May 2016
Voting at AGM
A resolution to approve the 2014/15 ‘Report of the directors on remuneration’ was passed at the 2015 AGM.
The Remuneration Policy was approved by members at the 2014 AGM. In each case votes were cast as follows:
Back to Contents
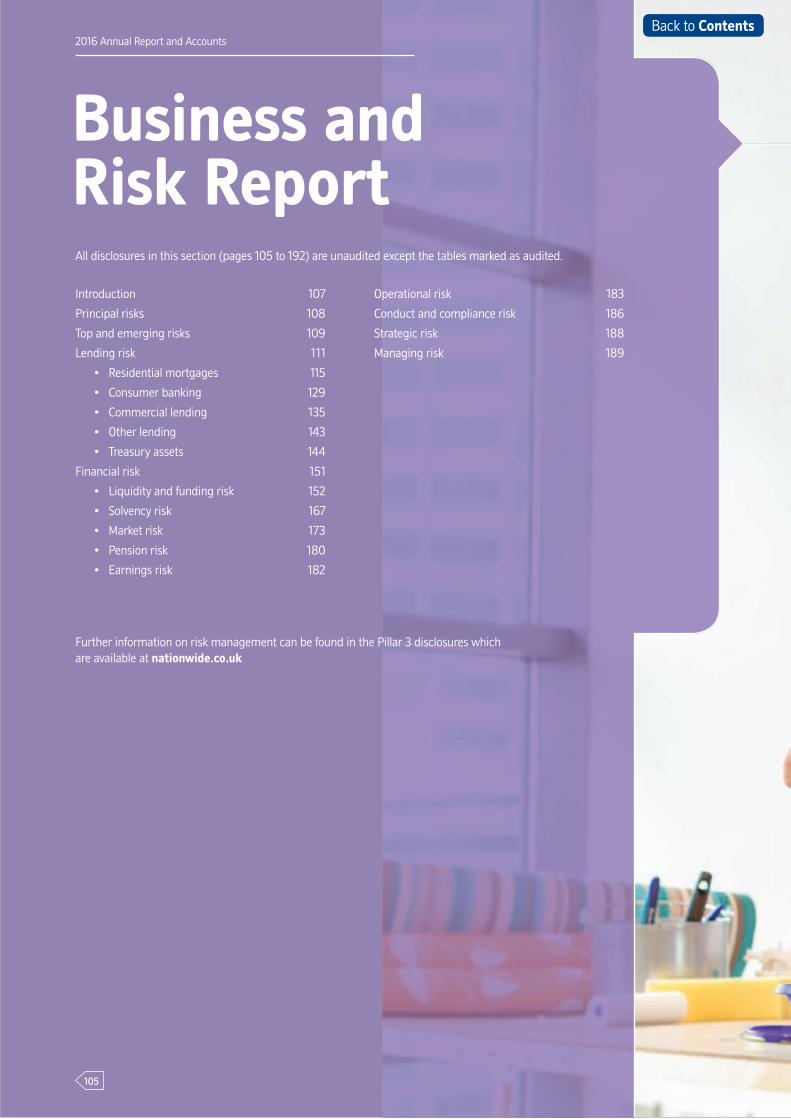
105
2016 Annual Report and Accounts2016 Annual Report and Accounts
Business and Risk Report All disclosures in this section (pages 105 to 192) are unaudited except the tables marked as audited.
Introduction 107
Principal risks 108
Top and emerging risks 109
Lending risk 111
• Residential mortgages 115
• Consumer banking 129
• Commercial lending 135
• Other lending 143
• Treasury assets 144
Financial risk 151
• Liquidity and funding risk 152
• Solvency risk 167
• Market risk 173
• Pension risk 180
• Earnings risk 182
Further information on risk management can be found in the Pillar 3 disclosures which are available at nationwide.co.uk
Operational risk 183
Conduct and compliance risk 186
Strategic risk 188
Managing risk 189
105
Back to Contents

106
Business and Risk ReportBusiness and Risk Report
Back to Contents
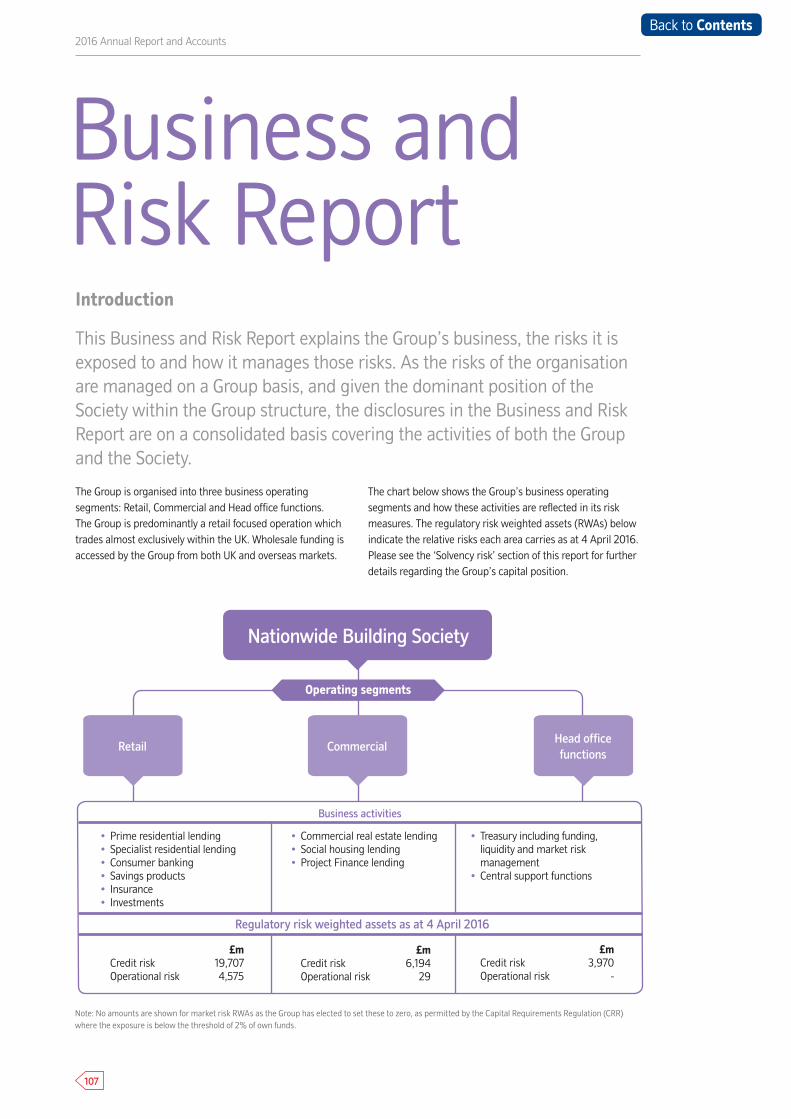
107
2016 Annual Report and Accounts
Business and Risk Report
Note: No amounts are shown for market risk RWAs as the Group has elected to set these to zero, as permitted by the Capital Requirements Regulation (CRR) where the exposure is below the threshold of 2% of own funds.
Introduction
This Business and Risk Report explains the Group’s business, the risks it is exposed to and how it manages those risks. As the risks of the organisation are managed on a Group basis, and given the dominant position of the Society within the Group structure, the disclosures in the Business and Risk Report are on a consolidated basis covering the activities of both the Group and the Society.
The Group is organised into three business operating segments: Retail, Commercial and Head office functions. The Group is predominantly a retail focused operation which trades almost exclusively within the UK. Wholesale funding is accessed by the Group from both UK and overseas markets.
The chart below shows the Group’s business operating segments and how these activities are reflected in its risk measures. The regulatory risk weighted assets (RWAs) below indicate the relative risks each area carries as at 4 April 2016. Please see the ‘Solvency risk’ section of this report for further details regarding the Group’s capital position.
Retail CommercialHead office functions
Nationwide Building Society
Operating segments
• Prime residential lending• Specialist residential lending• Consumer banking• Savings products• Insurance • Investments
£mCredit risk 19,707Operational risk 4,575
Business activities
Regulatory risk weighted assets as at 4 April 2016
• Commercial real estate lending• Social housing lending• Project Finance lending
£mCredit risk 6,194Operational risk 29
• Treasury including funding,liquidity and market riskmanagement
• Central support functions
£mCredit risk 3,970Operational risk -
Back to Contents
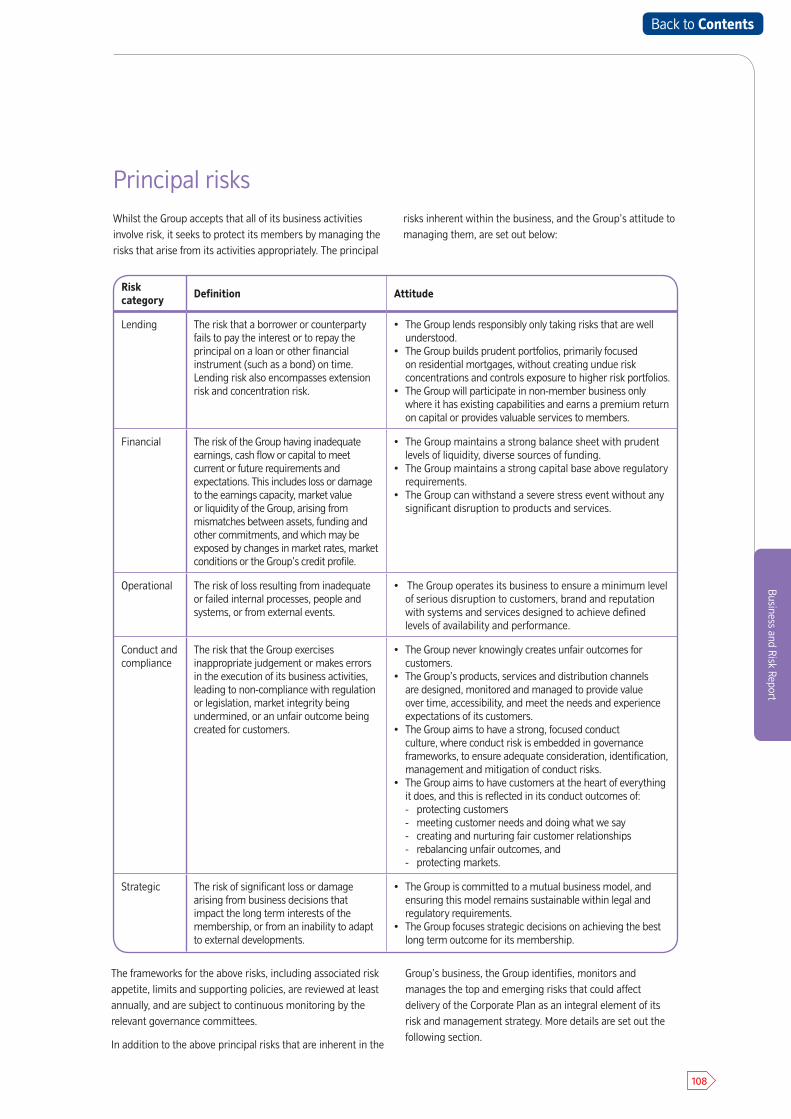
108
Business and Risk Report
Risk category Definition Attitude
Lending The risk that a borrower or counterparty fails to pay the interest or to repay the principal on a loan or other financial instrument (such as a bond) on time. Lending risk also encompasses extension risk and concentration risk.
• The Group lends responsibly only taking risks that are wellunderstood.
• The Group builds prudent portfolios, primarily focused on residential mortgages, without creating undue risk concentrations and controls exposure to higher risk portfolios.
• The Group will participate in non-member business only where it has existing capabilities and earns a premium returnon capital or provides valuable services to members.
Financial The risk of the Group having inadequate earnings, cash flow or capital to meet current or future requirements and expectations. This includes loss or damage to the earnings capacity, market value or liquidity of the Group, arising from mismatches between assets, funding and other commitments, and which may be exposed by changes in market rates, market conditions or the Group’s credit profile.
• The Group maintains a strong balance sheet with prudent levels of liquidity, diverse sources of funding.
• The Group maintains a strong capital base above regulatory requirements.
• The Group can withstand a severe stress event without any significant disruption to products and services.
Operational The risk of loss resulting from inadequate or failed internal processes, people and systems, or from external events.
• The Group operates its business to ensure a minimum level of serious disruption to customers, brand and reputation with systems and services designed to achieve defined levels of availability and performance.
Conduct and compliance
The risk that the Group exercises inappropriate judgement or makes errors in the execution of its business activities, leading to non-compliance with regulation or legislation, market integrity being undermined, or an unfair outcome being created for customers.
• The Group never knowingly creates unfair outcomes forcustomers.
• The Group’s products, services and distribution channels are designed, monitored and managed to provide value over time, accessibility, and meet the needs and experienceexpectations of its customers.
• The Group aims to have a strong, focused conduct culture, where conduct risk is embedded in governance frameworks, to ensure adequate consideration, identification,management and mitigation of conduct risks.
• The Group aims to have customers at the heart of everythingit does, and this is reflected in its conduct outcomes of:- protecting customers- meeting customer needs and doing what we say- creating and nurturing fair customer relationships- rebalancing unfair outcomes, and- protecting markets.
Strategic The risk of significant loss or damage arising from business decisions that impact the long term interests of the membership, or from an inability to adapt to external developments.
• The Group is committed to a mutual business model, andensuring this model remains sustainable within legal and regulatory requirements.
• The Group focuses strategic decisions on achieving the bestlong term outcome for its membership.
Principal risksWhilst the Group accepts that all of its business activities involve risk, it seeks to protect its members by managing the risks that arise from its activities appropriately. The principal
risks inherent within the business, and the Group’s attitude to managing them, are set out below:
The frameworks for the above risks, including associated risk appetite, limits and supporting policies, are reviewed at least annually, and are subject to continuous monitoring by the relevant governance committees.
In addition to the above principal risks that are inherent in the
Group’s business, the Group identifies, monitors and manages the top and emerging risks that could affect delivery of the Corporate Plan as an integral element of its risk and management strategy. More details are set out the following section.
Back to Contents
109
2016 Annual Report and Accounts
Business and Risk Report continued
Top and emerging risks
The Group’s top and emerging risks are identified through the process outlined in the ‘Managing risk’ section, and are closely tracked throughout the governance structure. The Group continues to keep these risks under close observation through risk reporting.
Whilst the Group accepts that all of its business activities involve risk, it seeks to protect its members by managing risks that arise from its activities appropriately. Against this background, during the last year the Group’s financial strength has continued to grow and lending performance has further improved with low arrears, reflecting high quality underwriting and management. Risk management activity has focused on strengthening business resilience and managing regulatory and conduct challenges. As a result the Group’s top and emerging risks remain largely unchanged and fall within four themes: macroeconomic, cyber attack and business resilience, the changing face of financial services, and conduct and compliance challenges. These themes are outlined further below.
MacroeconomicThe Group’s financial position remains strong, with increasing profitability and robust capital and liquidity positions. However, uncertainty both globally and in the UK present two main areas that could affect the Group:
• Sustained low interest rates could impact the GroupIf rates stay at the current low rate for longer, this could constrain margins and, although not expected, a move to zero or negative rates may result in changing customer attitudes to savings, potentially impacting the Group’s business model.
• A deterioration in the global economy could lead to a
downturn in the UK economy
A number of global factors could impact the UK economy, for example, a divergence in monetary policy between Europe and the US, a slow-down in China as well as the referendum on UK membership of the EU. Any slowdown could temporarily affect access to and pricing of wholesale funding or reduce confidence and activity in property markets. A deterioration in the housing market or unwinding of property hotspots, such as London, could affect new business volumes and credit losses in the Group’s mortgage portfolios. The Group’s exposure in central London, although within appetite, remains an area that is closely monitored.
Cyber attack and business resilienceThe Group’s strategy is to use new and existing technology to deliver a market leading proposition. At the same time cyber security threats are increasing and this, coupled with the pace of technological development, creates risk across the financial services industry. In particular the Group sees two key areas which pose risks to achieving its goals:
• The increased frequency and sophistication of cyber
attacks increases perceived and real exposureRecent high-profile cyber attacks serve to illustrate the increasing sophistication in this area and also prompt greater regulator and member concerns about security. The interconnectivity of banking and payments infrastructures and links between wider business providers and banking data mean that a successful attack anywhere in the supply chain could impact members and damage confidence in the sector as a whole. This requires the Group to ensure that it can defend against attacks and also detect and respond to any threats.
• Rising customer expectations could exceed the Group’s
ability to provide a highly reliable and widely available
service in an increasingly digital environment
Customer and regulator tolerance for service disruption continues to reduce within the financial services industry and, as the business becomes increasingly digital, the reliance on industry-wide systems is greater. Together these issues increase the risks that:- planned and unplanned IT outages fail to meet
availability expectations, causing financial and reputational damage to the Group
- the failure of an external system could have a detrimental impact on the Group’s operations and the service level that customers expect
- maintaining IT systems and infrastructure becomes increasingly time-consuming and expensive.
Back to Contents
110
Business and Risk Report
Top and emerging risks continued
Changing face of financial servicesThe Group has delivered significant digital change over the past year, including updates to mobile and internet banking and new payment technology. The branch experience has also evolved with the introduction of digital technology such as Nationwide Now, whilst still offering more traditional products and services that are so important to many of the Group’s members. The Group will continue to develop new and existing technology to deliver a market-leading proposition. However, there are a number of challenges from
new and changing competition and technology, in particular:
• The Group faces a range of direct and indirect challengers
as the financial services industry evolves
For example: - traditional banking competitors may pose an
increasing challenge to the Group’s core markets as the requirement to ring-fence their retail operations leads them to refocus their activities
- collectively, challenger banks may impact product pricing, and accelerate changes in customer expectations
- FinTech firms may also impact product pricing and customer propositions.
• New technology and new models, such as peer-to-
peer lending or robo-advice, may mean that customer
interactions deviate significantly from expectations
This could potentially mean that:- the cost of keeping up with widespread technology
changes may prove unsustainable and require investment choices that do not match member expectations
- the economics of branch distribution could be undermined
- retail deposit balances may become more volatile due to a combination of digital savings propositions and responses to adverse social media coverage, impacting the business model and placing a strain on short term liquidity.
Conduct and compliance challengesThe Group’s culture places conduct and compliance as central to its values and behaviours. The Group’s risk governance and control framework drives a strong customer-focused conduct culture at each stage of a customer’s interaction from product design, through sales and to post-sales servicing.
The member-focused nature of the Group’s business model places it in a good position to meet current and future conduct requirements. However, the following are seen as key conduct and compliance risks for the Group:
• The regulatory landscape is changing
The scale and quantity of changing regulation affecting the industry continues apace. This change needs to reflect innovation in the industry that is designed to meet changing customer demands and behaviours. There is a risk that industry developments proceed ahead of regulatory change resulting in uncertainty and potential delays in the development and launch of products designed to meet customers’ needs.
• The Group’s digital strategy may not meet the changing
behaviours of customersCustomers expect to be able to access products and services at a time, and through a medium, of their choosing. It is critical that these services remain resilient to meet demands and prevent customer detriment. As new channels are developed to meet evolving demands it is essential that fair customer outcomes continue to be delivered.
• The Group’s business model may not address the
developing needs of its customersThere is a risk that the Group’s business model fails to develop to meet the changing needs of customers across their life stages. In particular the Group should ensure that it is able to quickly identify customers who may, at any time during their relationship with the Group, be in vulnerable circumstances.
Back to Contents
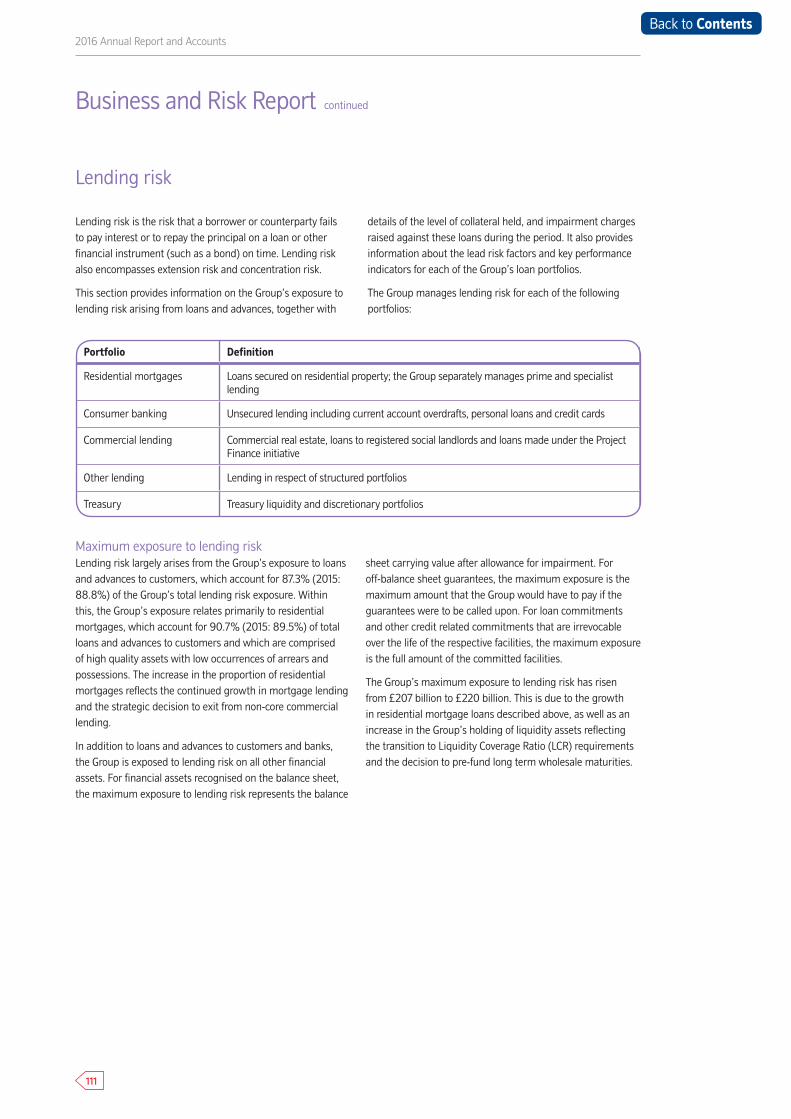
111
2016 Annual Report and Accounts
Lending risk is the risk that a borrower or counterparty fails to pay interest or to repay the principal on a loan or other financial instrument (such as a bond) on time. Lending risk also encompasses extension risk and concentration risk.
This section provides information on the Group’s exposure to lending risk arising from loans and advances, together with
details of the level of collateral held, and impairment charges raised against these loans during the period. It also provides information about the lead risk factors and key performance indicators for each of the Group’s loan portfolios.
The Group manages lending risk for each of the following portfolios:
Portfolio Definition
Residential mortgages Loans secured on residential property; the Group separately manages prime and specialist lending
Consumer banking Unsecured lending including current account overdrafts, personal loans and credit cards
Commercial lending Commercial real estate, loans to registered social landlords and loans made under the Project Finance initiative
Other lending Lending in respect of structured portfolios
Treasury Treasury liquidity and discretionary portfolios
Maximum exposure to lending risk Lending risk largely arises from the Group’s exposure to loans and advances to customers, which account for 87.3% (2015: 88.8%) of the Group’s total lending risk exposure. Within this, the Group’s exposure relates primarily to residential mortgages, which account for 90.7% (2015: 89.5%) of total loans and advances to customers and which are comprised of high quality assets with low occurrences of arrears and possessions. The increase in the proportion of residential mortgages reflects the continued growth in mortgage lending and the strategic decision to exit from non-core commercial lending.
In addition to loans and advances to customers and banks, the Group is exposed to lending risk on all other financial assets. For financial assets recognised on the balance sheet, the maximum exposure to lending risk represents the balance
sheet carrying value after allowance for impairment. For off-balance sheet guarantees, the maximum exposure is the maximum amount that the Group would have to pay if the guarantees were to be called upon. For loan commitments and other credit related commitments that are irrevocable over the life of the respective facilities, the maximum exposure is the full amount of the committed facilities.
The Group’s maximum exposure to lending risk has risen from £207 billion to £220 billion. This is due to the growth in residential mortgage loans described above, as well as an increase in the Group’s holding of liquidity assets reflecting the transition to Liquidity Coverage Ratio (LCR) requirements and the decision to pre-fund long term wholesale maturities.
Business and Risk Report continued
Lending risk
Back to Contents
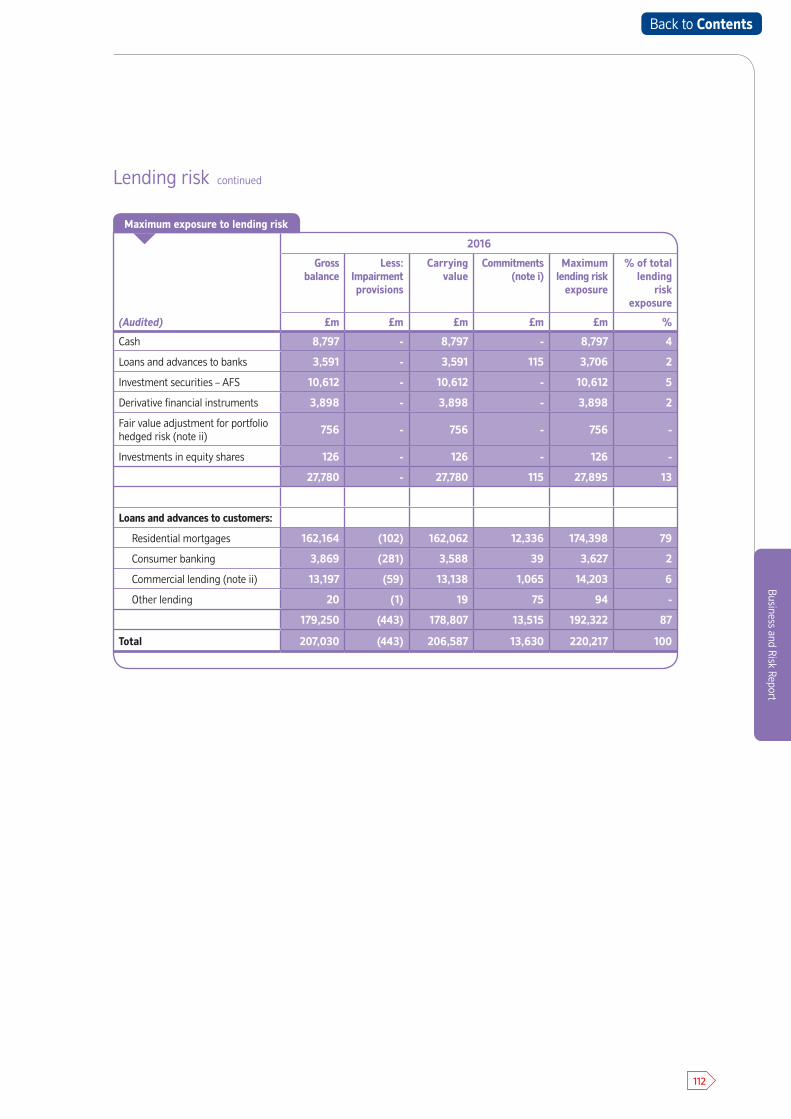
112
Business and Risk Report
2016
Gross balance
Less: Impairment provisions
Carrying value
Commitments(note i)
Maximum lending risk
exposure
% of total lending
risk exposure
(Audited) £m £m £m £m £m %
Cash 8,797 - 8,797 - 8,797 4
Loans and advances to banks 3,591 - 3,591 115 3,706 2
Investment securities – AFS 10,612 - 10,612 - 10,612 5
Derivative financial instruments 3,898 - 3,898 - 3,898 2
Fair value adjustment for portfolio hedged risk (note ii)
756 - 756 - 756 -
Investments in equity shares 126 - 126 - 126 -
27,780 - 27,780 115 27,895 13
Loans and advances to customers:
Residential mortgages 162,164 (102) 162,062 12,336 174,398 79
Consumer banking 3,869 (281) 3,588 39 3,627 2
Commercial lending (note ii) 13,197 (59) 13,138 1,065 14,203 6
Other lending 20 (1) 19 75 94 -
179,250 (443) 178,807 13,515 192,322 87
Total 207,030 (443) 206,587 13,630 220,217 100
Lending risk continued
Maximum exposure to lending risk
Back to Contents
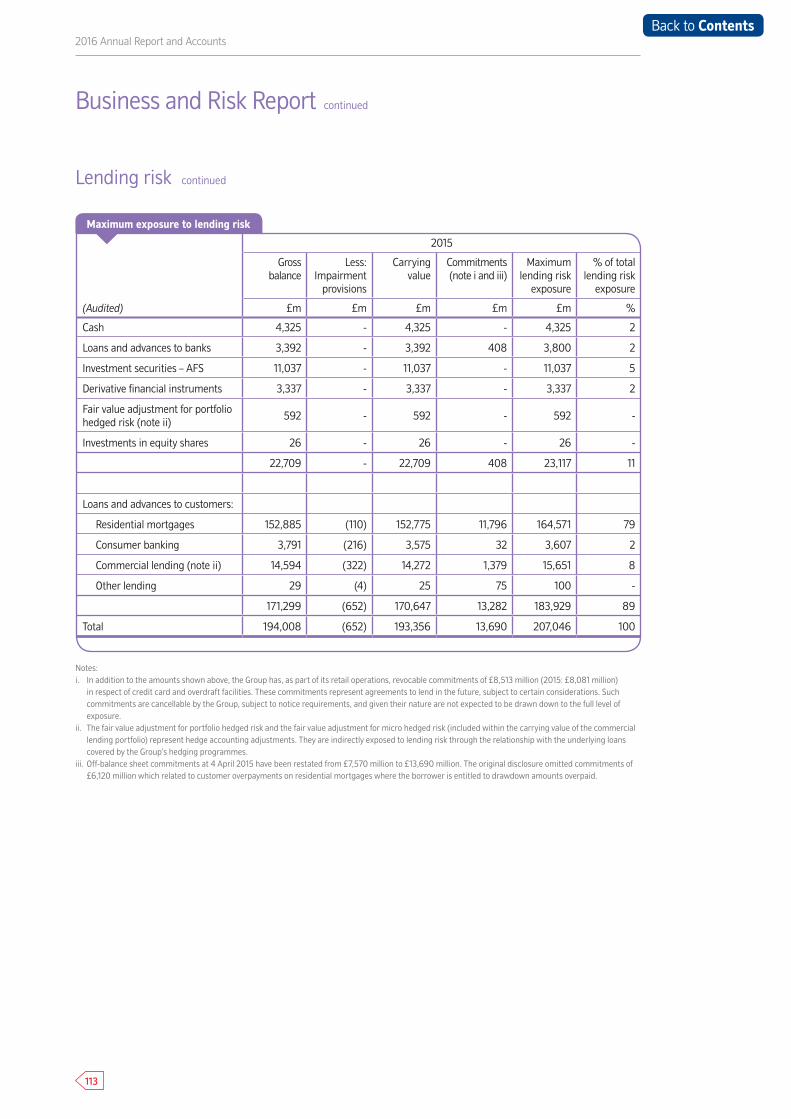
113
2016 Annual Report and Accounts
2015
Gross balance
Less: Impairment
provisions
Carrying value
Commitments(note i and iii)
Maximum lending risk
exposure
% of total lending risk
exposure
(Audited) £m £m £m £m £m %
Cash 4,325 - 4,325 - 4,325 2
Loans and advances to banks 3,392 - 3,392 408 3,800 2
Investment securities – AFS 11,037 - 11,037 - 11,037 5
Derivative financial instruments 3,337 - 3,337 - 3,337 2
Fair value adjustment for portfolio hedged risk (note ii)
592 - 592 - 592 -
Investments in equity shares 26 - 26 - 26 -
22,709 - 22,709 408 23,117 11
Loans and advances to customers:
Residential mortgages 152,885 (110) 152,775 11,796 164,571 79
Consumer banking 3,791 (216) 3,575 32 3,607 2
Commercial lending (note ii) 14,594 (322) 14,272 1,379 15,651 8
Other lending 29 (4) 25 75 100 -
171,299 (652) 170,647 13,282 183,929 89
Total 194,008 (652) 193,356 13,690 207,046 100
Maximum exposure to lending risk
Business and Risk Report continued
Notes:i. In addition to the amounts shown above, the Group has, as part of its retail operations, revocable commitments of £8,513 million (2015: £8,081 million)
in respect of credit card and overdraft facilities. These commitments represent agreements to lend in the future, subject to certain considerations. Such commitments are cancellable by the Group, subject to notice requirements, and given their nature are not expected to be drawn down to the full level of exposure.
ii. The fair value adjustment for portfolio hedged risk and the fair value adjustment for micro hedged risk (included within the carrying value of the commercial lending portfolio) represent hedge accounting adjustments. They are indirectly exposed to lending risk through the relationship with the underlying loans covered by the Group’s hedging programmes.
iii. Off-balance sheet commitments at 4 April 2015 have been restated from £7,570 million to £13,690 million. The original disclosure omitted commitments of £6,120 million which related to customer overpayments on residential mortgages where the borrower is entitled to drawdown amounts overpaid.
Lending risk continued
Back to Contents
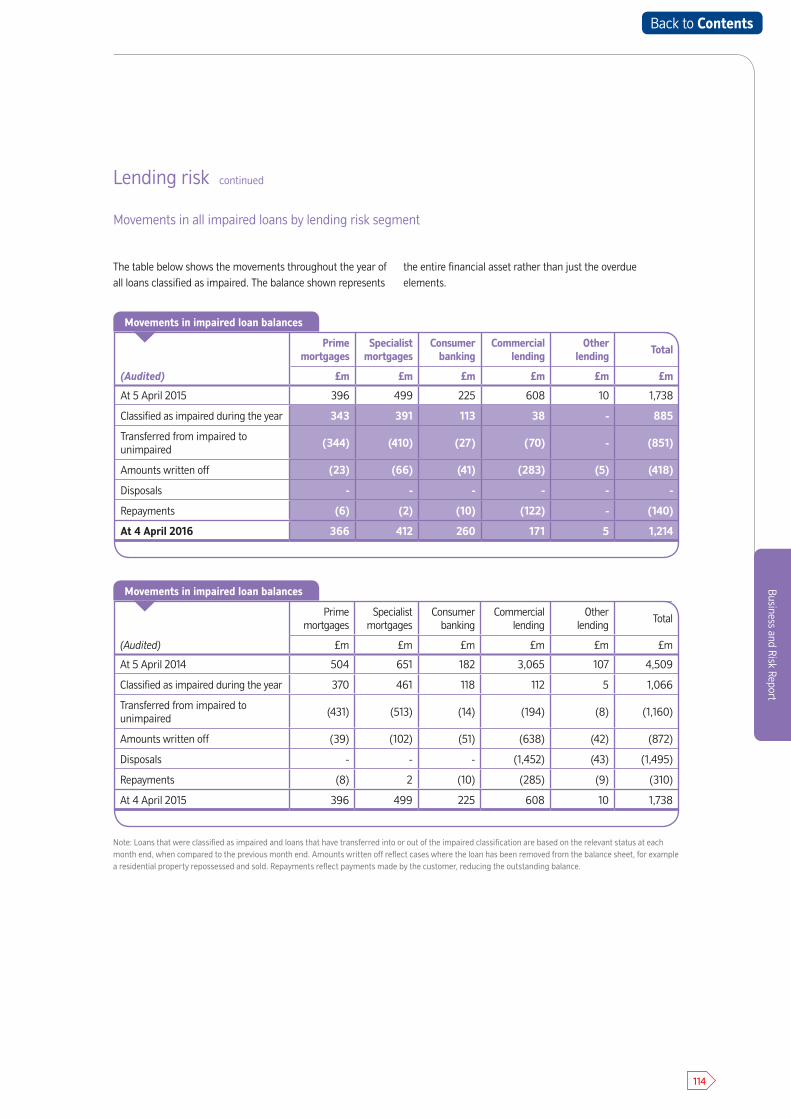
114
Business and Risk Report
Prime mortgages
Specialist mortgages
Consumer banking
Commercial lending
Other lending Total
(Audited) £m £m £m £m £m £m
At 5 April 2015 396 499 225 608 10 1,738
Classified as impaired during the year 343 391 113 38 - 885
Transferred from impaired to unimpaired
(344) (410) (27) (70) - (851)
Amounts written off (23) (66) (41) (283) (5) (418)
Disposals - - - - - -
Repayments (6) (2) (10) (122) - (140)
At 4 April 2016 366 412 260 171 5 1,214
Prime mortgages
Specialist mortgages
Consumer banking
Commercial lending
Other lending
Total
(Audited) £m £m £m £m £m £m
At 5 April 2014 504 651 182 3,065 107 4,509
Classified as impaired during the year 370 461 118 112 5 1,066
Transferred from impaired to unimpaired
(431) (513) (14) (194) (8) (1,160)
Amounts written off (39) (102) (51) (638) (42) (872)
Disposals - - - (1,452) (43) (1,495)
Repayments (8) 2 (10) (285) (9) (310)
At 4 April 2015 396 499 225 608 10 1,738
Movements in impaired loan balances
Movements in impaired loan balances
The table below shows the movements throughout the year of all loans classified as impaired. The balance shown represents
the entire financial asset rather than just the overdue elements.
Note: Loans that were classified as impaired and loans that have transferred into or out of the impaired classification are based on the relevant status at each month end, when compared to the previous month end. Amounts written off reflect cases where the loan has been removed from the balance sheet, for example a residential property repossessed and sold. Repayments reflect payments made by the customer, reducing the outstanding balance.
Movements in all impaired loans by lending risk segment
Lending risk continued
Back to Contents
115
2016 Annual Report and Accounts
Residential mortgages
SummaryThe Group’s residential mortgages comprise prime and specialist loans. Prime residential mortgages are mainly Nationwide branded advances made through the Group’s branch network and intermediary channels; all new specialist lending is limited to buy to let mortgages originated under The Mortgage Works (UK) plc (TMW) brand.
Strong levels of new lending across prime and buy to let have seen the residential mortgage portfolio continue to grow, from £153 billion to £162 billion over the year. The geographical distribution across the UK is unchanged and the average loan to value (LTV), weighted by value, is marginally lower at 55% (2015: 56%), attributable to the increase in house prices over the year.
Buy to let lending has accounted for 22% of total new business, up from 18% in 2015, primarily due to the growing importance of the private rental sector for UK housing needs as a whole, reflecting long term economic and social trends. New lending performance was boosted in the final quarter as many investors sought to complete purchases ahead of the imposition of the additional 3% stamp duty for buy to let properties at the end of March.
Within prime lending, first time buyers accounted for an increased share of overall lending, up to 28% compared to 26% in 2015. The Group has widened its offering of mortgages at 90 to 95% LTV, and revised its existing Save to Buy proposition to align to the government’s Help to Buy ISA to give first time buyers a further contribution to a deposit. As a consequence the average LTV of new business, the proportion of lending at higher LTVs and the loan to income metric have increased and are likely to continue to do so as the Group maintains its support for first time buyers, whilst remaining within its risk appetite.
Arrears have continued to fall across both prime and specialist lending over the period reflecting the continuing favourable economic conditions and low interest rate environment, supported by a robust credit assessment and affordability controls at the point of lending. The proportion of loans that are more than three months in arrears fell from 0.49% to 0.45%; the proportion of non-performing loans and overall levels of impairment loss also fell. The Group has taken action during the year to increase the provision for losses which have been incurred but not specifically reported at the balance sheet date; this limited the fall in provisions which ended the year at £102 million (2015: £110 million).
In March of this year the PRA issued a consultation paper aimed at strengthening buy to let underwriting standards across the industry. It would require lenders to ensure their approach to affordability includes a provision for the usual costs associated with a buy to let property together with suitable allowances for tax liabilities. This follows changes to income tax relief on buy to let properties announced by the Chancellor in 2015 which are due to be phased in from April 2017 to March 2021. These changes will impact existing landlords and may also impact investor demand as net rental yields are reduced. As tax will be charged on rental income without deducting mortgage interest payments, it is likely to cause a number of investors to move from a basic rate to high rate tax band, and some borrowers may find that the tax charge exceeds the current net profit they make from rent after interest payments.
The Group’s buy to let lending continues to benefit from a number of enhanced controls implemented since the financial crisis, including the use of a stressed interest rate when applying interest cover ratio criteria. However the Group recognises that the changes to tax relief will materially affect the cash flow and affordability of many investors, and has taken steps to ensure that buy to let borrowing remains sustainable and affordable for landlords as the tax changes are phased in. The Group has increased its minimum interest coverage ratio (ICR) from 125% to 145% with effect from 11 May 2016, and also lowered its maximum LTV for buy to let borrowing from 80% to 75%. The Group will continue to review its approach to underwriting as the PRA consultation concludes to ensure that asset quality is maintained and new regulations are met.
House prices in London have been outstripping the wider UK market in recent years. The gap between the price of a typical London house and the UK equivalent is at, or close to, record levels, with London houses worth twice as much on average as houses in the UK as a whole. The house price to earnings ratio for London has increased above 11, above its previous pre-crisis peak of 8.3, and rental yields have dropped below 3.5%. Demand in London has in part been driven by the growth in buy to let activity (which is more heavily concentrated in London) and there is a risk that the stretched affordability and yield metrics, combined with a change in economic conditions or reduced investor demand, could cause a correction to house prices.
Business and Risk Report continued
Back to Contents
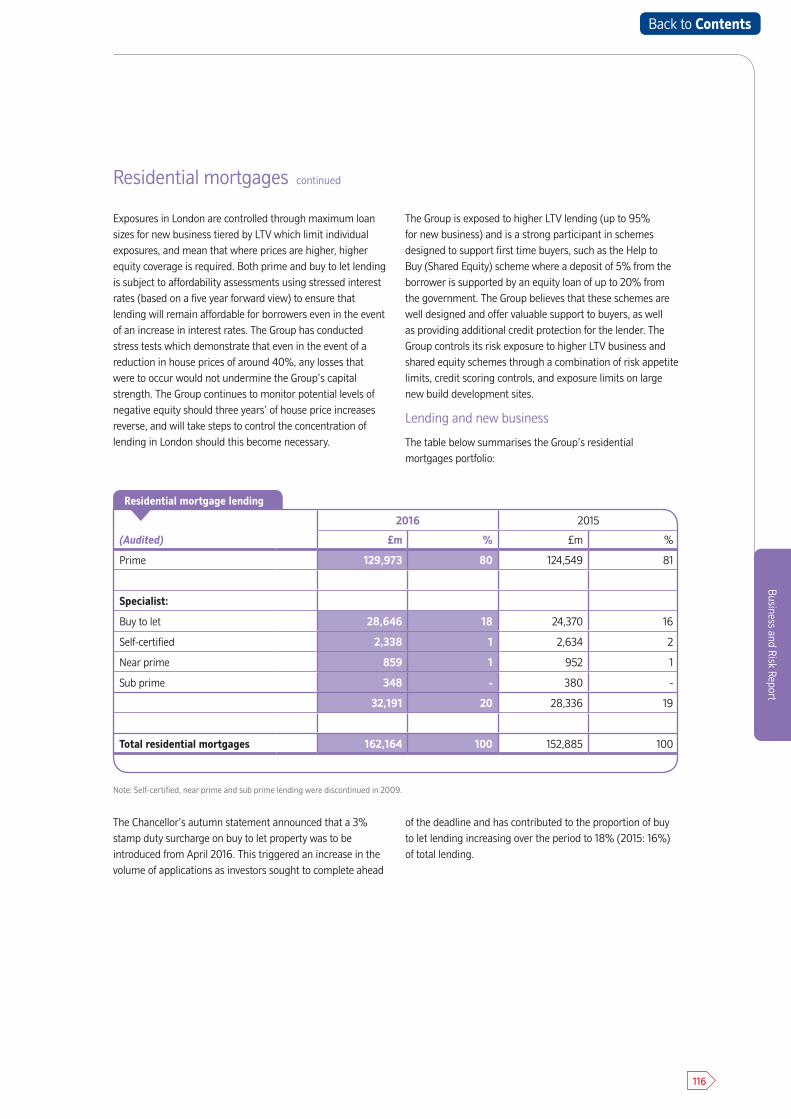
116
Business and Risk Report
Residential mortgages continued
Exposures in London are controlled through maximum loan sizes for new business tiered by LTV which limit individual exposures, and mean that where prices are higher, higher equity coverage is required. Both prime and buy to let lending is subject to affordability assessments using stressed interest rates (based on a five year forward view) to ensure that lending will remain affordable for borrowers even in the event of an increase in interest rates. The Group has conducted stress tests which demonstrate that even in the event of a reduction in house prices of around 40%, any losses that were to occur would not undermine the Group’s capital strength. The Group continues to monitor potential levels of negative equity should three years’ of house price increases reverse, and will take steps to control the concentration of lending in London should this become necessary.
The Group is exposed to higher LTV lending (up to 95% for new business) and is a strong participant in schemes designed to support first time buyers, such as the Help to Buy (Shared Equity) scheme where a deposit of 5% from the borrower is supported by an equity loan of up to 20% from the government. The Group believes that these schemes are well designed and offer valuable support to buyers, as well as providing additional credit protection for the lender. The Group controls its risk exposure to higher LTV business and shared equity schemes through a combination of risk appetite limits, credit scoring controls, and exposure limits on large new build development sites.
Lending and new business
The table below summarises the Group’s residential mortgages portfolio:
Note: Self-certified, near prime and sub prime lending were discontinued in 2009.
The Chancellor’s autumn statement announced that a 3% stamp duty surcharge on buy to let property was to be introduced from April 2016. This triggered an increase in the volume of applications as investors sought to complete ahead
of the deadline and has contributed to the proportion of buy to let lending increasing over the period to 18% (2015: 16%) of total lending.
(Audited)
2016 2015
£m % £m %
Prime 129,973 80 124,549 81
Specialist:
Buy to let 28,646 18 24,370 16
Self-certified 2,338 1 2,634 2
Near prime 859 1 952 1
Sub prime 348 - 380 -
32,191 20 28,336 19
Total residential mortgages 162,164 100 152,885 100
Residential mortgage lending
Back to Contents
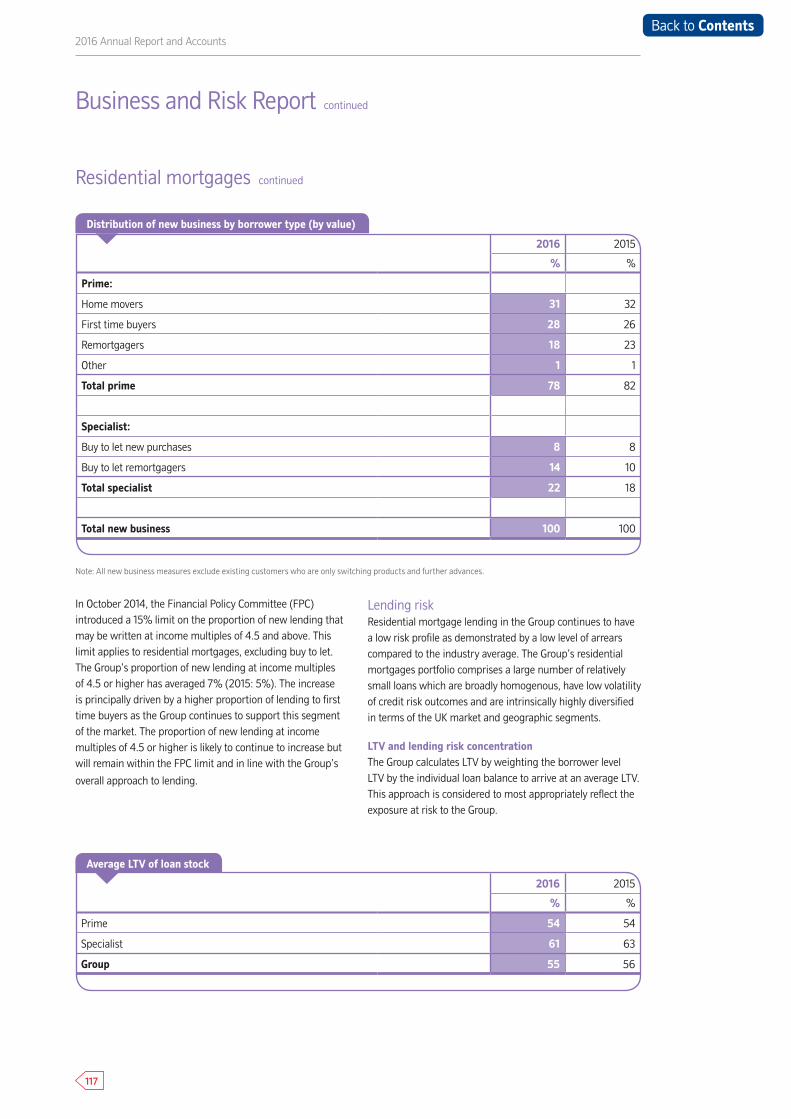
117
2016 Annual Report and Accounts
Residential mortgages continued
In October 2014, the Financial Policy Committee (FPC) introduced a 15% limit on the proportion of new lending that may be written at income multiples of 4.5 and above. This limit applies to residential mortgages, excluding buy to let. The Group’s proportion of new lending at income multiples of 4.5 or higher has averaged 7% (2015: 5%). The increase is principally driven by a higher proportion of lending to first time buyers as the Group continues to support this segment of the market. The proportion of new lending at income multiples of 4.5 or higher is likely to continue to increase but will remain within the FPC limit and in line with the Group’s
overall approach to lending.
Lending riskResidential mortgage lending in the Group continues to have a low risk profile as demonstrated by a low level of arrears compared to the industry average. The Group’s residential mortgages portfolio comprises a large number of relatively small loans which are broadly homogenous, have low volatility of credit risk outcomes and are intrinsically highly diversified in terms of the UK market and geographic segments.
LTV and lending risk concentrationThe Group calculates LTV by weighting the borrower level LTV by the individual loan balance to arrive at an average LTV. This approach is considered to most appropriately reflect the exposure at risk to the Group.
Business and Risk Report continued
2016 2015
% %
Prime:
Home movers 31 32
First time buyers 28 26
Remortgagers 18 23
Other 1 1
Total prime 78 82
Specialist:
Buy to let new purchases 8 8
Buy to let remortgagers 14 10
Total specialist 22 18
Total new business 100 100
Distribution of new business by borrower type (by value)
Note: All new business measures exclude existing customers who are only switching products and further advances.
2016 2015
% %
Prime 54 54
Specialist 61 63
Group 55 56
Average LTV of loan stock
Back to Contents
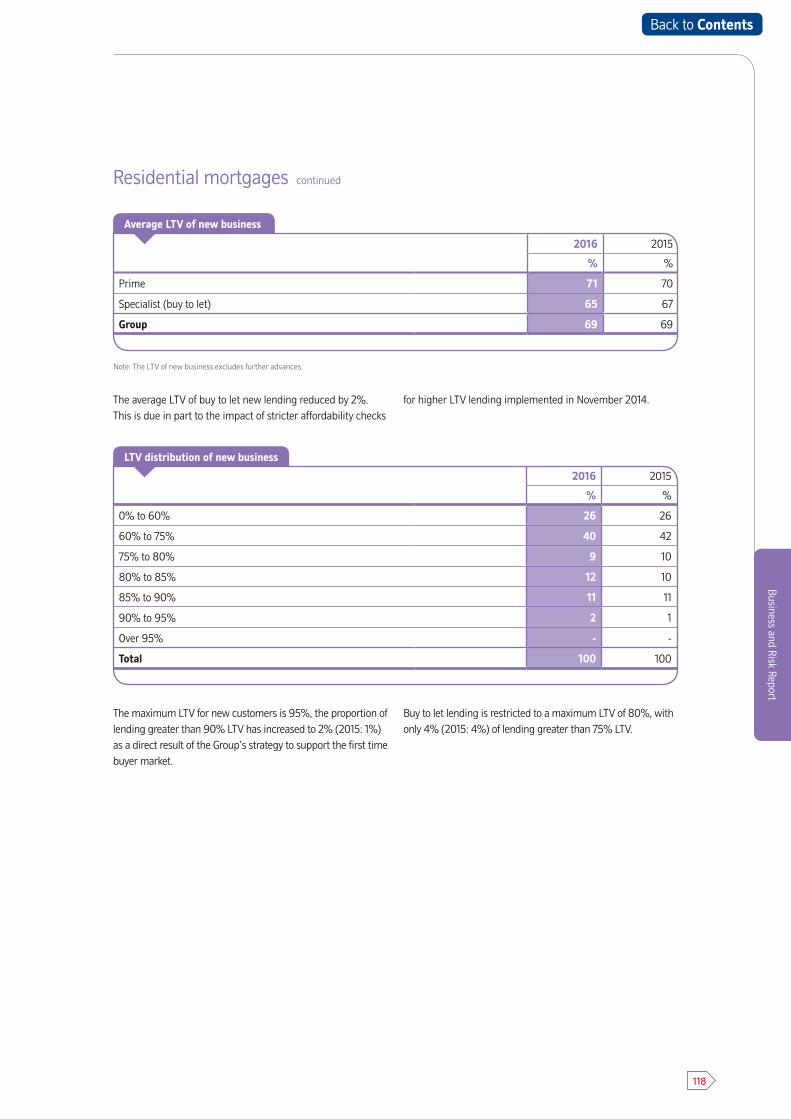
118
Business and Risk Report
Residential mortgages continued
The average LTV of buy to let new lending reduced by 2%. This is due in part to the impact of stricter affordability checks
for higher LTV lending implemented in November 2014.
The maximum LTV for new customers is 95%, the proportion of lending greater than 90% LTV has increased to 2% (2015: 1%) as a direct result of the Group’s strategy to support the first time buyer market.
Buy to let lending is restricted to a maximum LTV of 80%, with only 4% (2015: 4%) of lending greater than 75% LTV.
2016 2015
% %
0% to 60% 26 26
60% to 75% 40 42
75% to 80% 9 10
80% to 85% 12 10
85% to 90% 11 11
90% to 95% 2 1
Over 95% - -
Total 100 100
LTV distribution of new business
2016 2015
% %
Prime 71 70
Specialist (buy to let) 65 67
Group 69 69
Average LTV of new business
Note: The LTV of new business excludes further advances.
Back to Contents
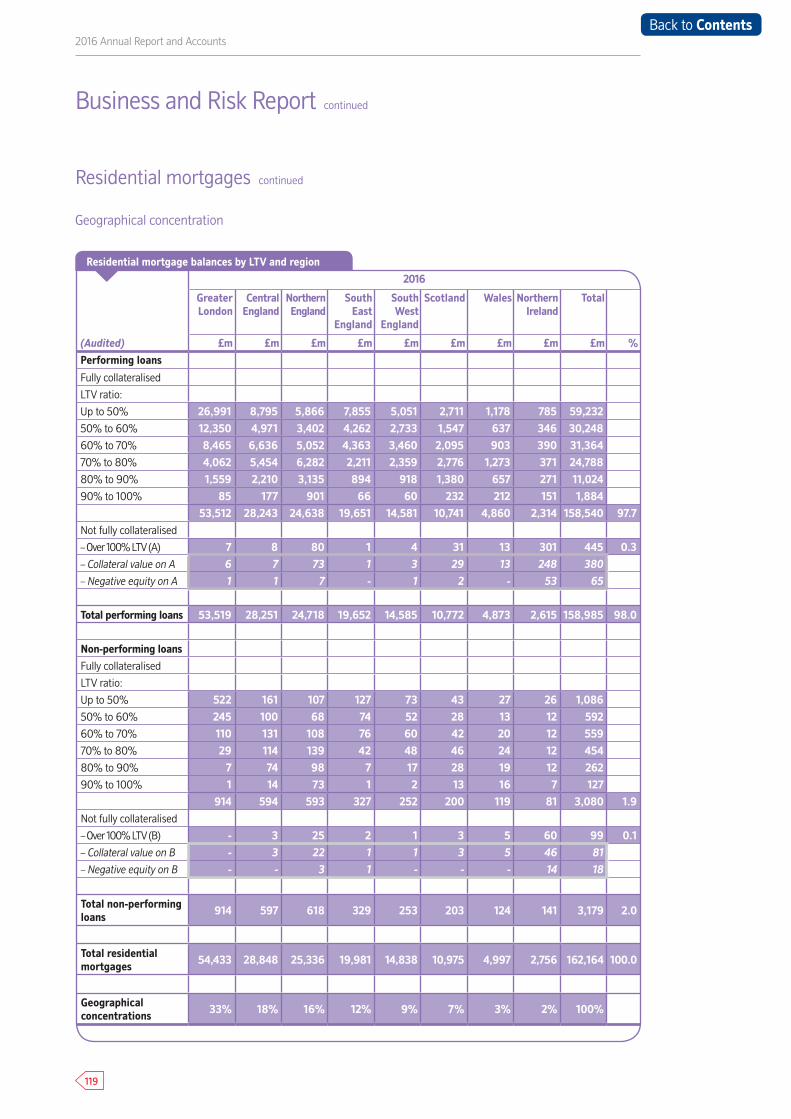
119
2016 Annual Report and Accounts
Geographical concentration
Residential mortgages continued
2016
Greater London
Central England
Northern England
South East
England
South West
England
Scotland Wales Northern Ireland
Total
(Audited) £m £m £m £m £m £m £m £m £m %Performing loans
Fully collateralised
LTV ratio:
Up to 50% 26,991 8,795 5,866 7,855 5,051 2,711 1,178 785 59,232
50% to 60% 12,350 4,971 3,402 4,262 2,733 1,547 637 346 30,248
60% to 70% 8,465 6,636 5,052 4,363 3,460 2,095 903 390 31,364
70% to 80% 4,062 5,454 6,282 2,211 2,359 2,776 1,273 371 24,788
80% to 90% 1,559 2,210 3,135 894 918 1,380 657 271 11,024
90% to 100% 85 177 901 66 60 232 212 151 1,88453,512 28,243 24,638 19,651 14,581 10,741 4,860 2,314 158,540 97.7
Not fully collateralised
– Over 100% LTV (A) 7 8 80 1 4 31 13 301 445 0.3
– Collateral value on A 6 7 73 1 3 29 13 248 380
– Negative equity on A 1 1 7 - 1 2 - 53 65
Total performing loans 53,519 28,251 24,718 19,652 14,585 10,772 4,873 2,615 158,985 98.0
Non-performing loans
Fully collateralised
LTV ratio:
Up to 50% 522 161 107 127 73 43 27 26 1,086
50% to 60% 245 100 68 74 52 28 13 12 592
60% to 70% 110 131 108 76 60 42 20 12 559
70% to 80% 29 114 139 42 48 46 24 12 454
80% to 90% 7 74 98 7 17 28 19 12 262
90% to 100% 1 14 73 1 2 13 16 7 127914 594 593 327 252 200 119 81 3,080 1.9
Not fully collateralised
– Over 100% LTV (B) - 3 25 2 1 3 5 60 99 0.1
– Collateral value on B - 3 22 1 1 3 5 46 81
– Negative equity on B - - 3 1 - - - 14 18
Total non-performing loans 914 597 618 329 253 203 124 141 3,179 2.0
Total residential mortgages 54,433 28,848 25,336 19,981 14,838 10,975 4,997 2,756 162,164 100.0
Geographical concentrations 33% 18% 16% 12% 9% 7% 3% 2% 100%
Business and Risk Report continued
Residential mortgage balances by LTV and region
Back to Contents
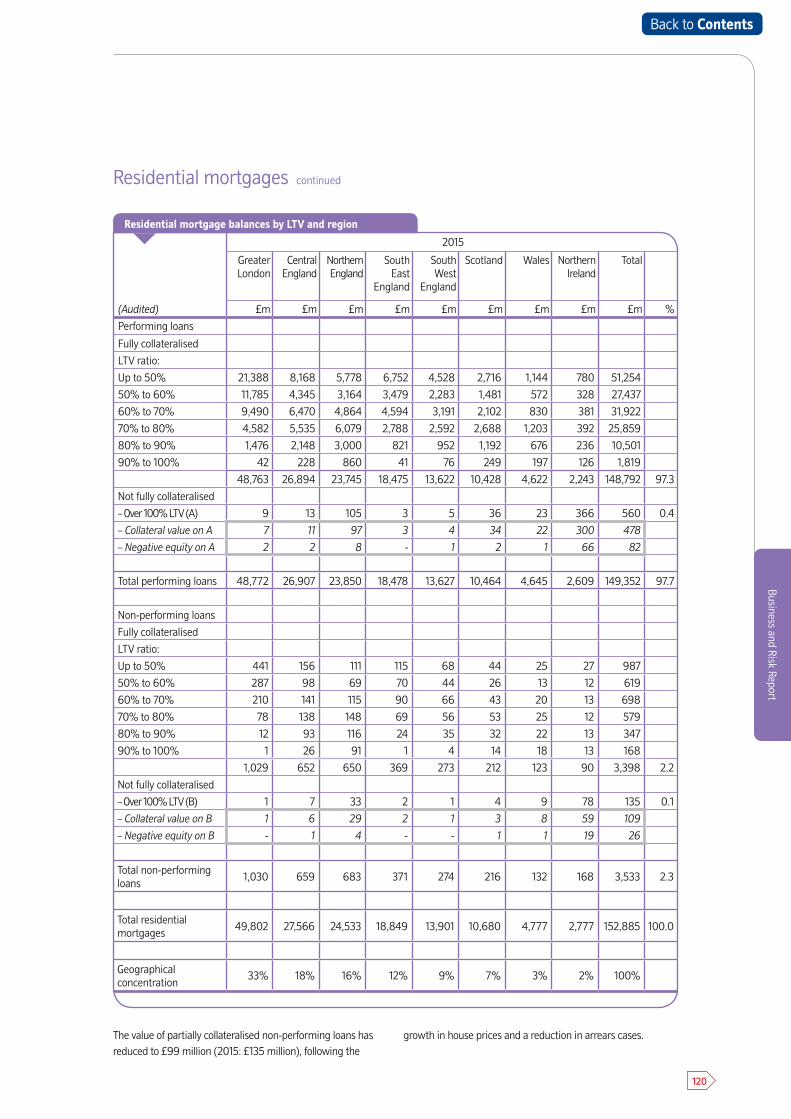
120
Business and Risk Report
Residential mortgages continued
2015
Greater London
Central England
Northern England
South East
England
South West
England
Scotland Wales Northern Ireland
Total
(Audited) £m £m £m £m £m £m £m £m £m %
Performing loans
Fully collateralised
LTV ratio:
Up to 50% 21,388 8,168 5,778 6,752 4,528 2,716 1,144 780 51,254
50% to 60% 11,785 4,345 3,164 3,479 2,283 1,481 572 328 27,437
60% to 70% 9,490 6,470 4,864 4,594 3,191 2,102 830 381 31,922
70% to 80% 4,582 5,535 6,079 2,788 2,592 2,688 1,203 392 25,859
80% to 90% 1,476 2,148 3,000 821 952 1,192 676 236 10,501
90% to 100% 42 228 860 41 76 249 197 126 1,819
48,763 26,894 23,745 18,475 13,622 10,428 4,622 2,243 148,792 97.3
Not fully collateralised
– Over 100% LTV (A) 9 13 105 3 5 36 23 366 560 0.4
– Collateral value on A 7 11 97 3 4 34 22 300 478
– Negative equity on A 2 2 8 - 1 2 1 66 82
Total performing loans 48,772 26,907 23,850 18,478 13,627 10,464 4,645 2,609 149,352 97.7
Non-performing loans
Fully collateralised
LTV ratio:
Up to 50% 441 156 111 115 68 44 25 27 987
50% to 60% 287 98 69 70 44 26 13 12 619
60% to 70% 210 141 115 90 66 43 20 13 698
70% to 80% 78 138 148 69 56 53 25 12 579
80% to 90% 12 93 116 24 35 32 22 13 347
90% to 100% 1 26 91 1 4 14 18 13 168
1,029 652 650 369 273 212 123 90 3,398 2.2
Not fully collateralised
– Over 100% LTV (B) 1 7 33 2 1 4 9 78 135 0.1
– Collateral value on B 1 6 29 2 1 3 8 59 109
– Negative equity on B - 1 4 - - 1 1 19 26
Total non-performing loans
1,030 659 683 371 274 216 132 168 3,533 2.3
Total residential mortgages
49,802 27,566 24,533 18,849 13,901 10,680 4,777 2,777 152,885 100.0
Geographical concentration
33% 18% 16% 12% 9% 7% 3% 2% 100%
Residential mortgage balances by LTV and region
The value of partially collateralised non-performing loans has reduced to £99 million (2015: £135 million), following the
growth in house prices and a reduction in arrears cases.
Back to Contents
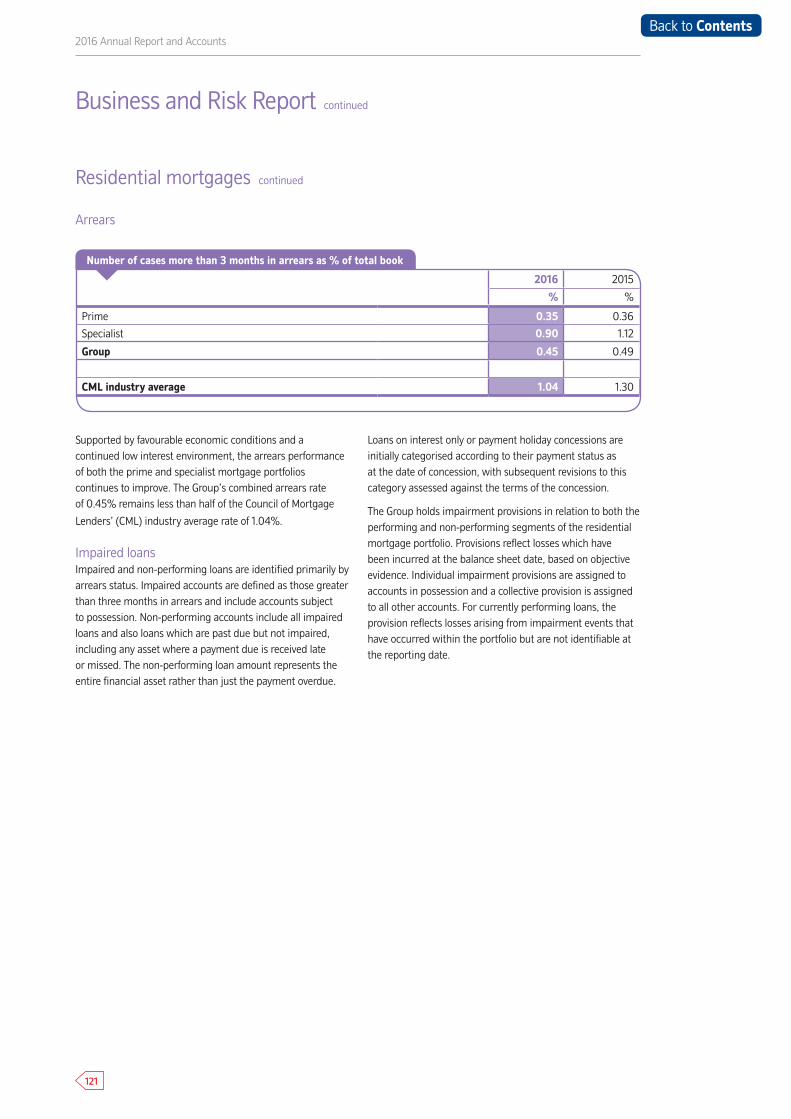
121
2016 Annual Report and Accounts
Arrears
2016 2015
% %
Prime 0.35 0.36
Specialist 0.90 1.12
Group 0.45 0.49
CML industry average 1.04 1.30
Supported by favourable economic conditions and a continued low interest environment, the arrears performance of both the prime and specialist mortgage portfolios continues to improve. The Group’s combined arrears rate of 0.45% remains less than half of the Council of Mortgage
Lenders’ (CML) industry average rate of 1.04%.
Impaired loansImpaired and non-performing loans are identified primarily by arrears status. Impaired accounts are defined as those greater than three months in arrears and include accounts subject to possession. Non-performing accounts include all impaired loans and also loans which are past due but not impaired, including any asset where a payment due is received late or missed. The non-performing loan amount represents the entire financial asset rather than just the payment overdue.
Loans on interest only or payment holiday concessions are initially categorised according to their payment status as at the date of concession, with subsequent revisions to this category assessed against the terms of the concession.
The Group holds impairment provisions in relation to both the performing and non-performing segments of the residential mortgage portfolio. Provisions reflect losses which have been incurred at the balance sheet date, based on objective evidence. Individual impairment provisions are assigned to accounts in possession and a collective provision is assigned to all other accounts. For currently performing loans, the provision reflects losses arising from impairment events that have occurred within the portfolio but are not identifiable at the reporting date.
Business and Risk Report continued
Residential mortgages continued
Number of cases more than 3 months in arrears as % of total book
Back to Contents
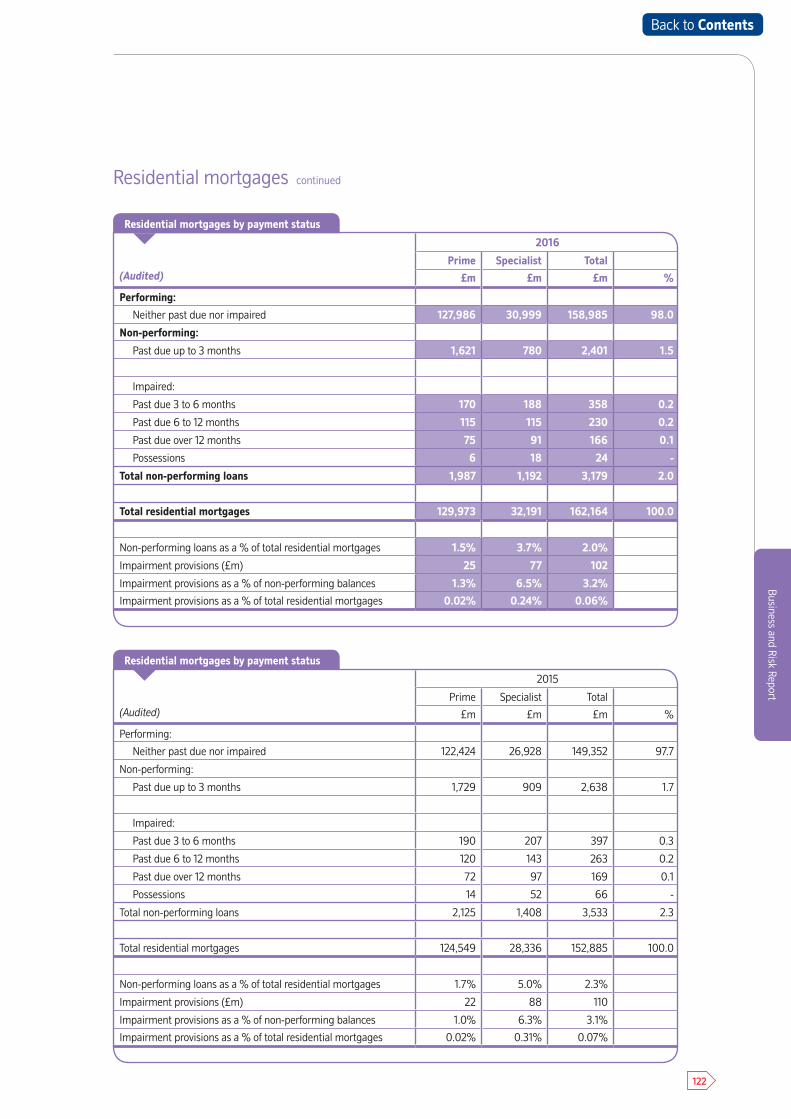
122
Business and Risk Report
(Audited)
2016
Prime Specialist Total
£m £m £m %
Performing:
Neither past due nor impaired 127,986 30,999 158,985 98.0
Non-performing:
Past due up to 3 months 1,621 780 2,401 1.5
Impaired:
Past due 3 to 6 months 170 188 358 0.2
Past due 6 to 12 months 115 115 230 0.2
Past due over 12 months 75 91 166 0.1
Possessions 6 18 24 -
Total non-performing loans 1,987 1,192 3,179 2.0
Total residential mortgages 129,973 32,191 162,164 100.0
Non-performing loans as a % of total residential mortgages 1.5% 3.7% 2.0%
Impairment provisions (£m) 25 77 102
Impairment provisions as a % of non-performing balances 1.3% 6.5% 3.2%
Impairment provisions as a % of total residential mortgages 0.02% 0.24% 0.06%
(Audited)
2015
Prime Specialist Total
£m £m £m %
Performing:
Neither past due nor impaired 122,424 26,928 149,352 97.7
Non-performing:
Past due up to 3 months 1,729 909 2,638 1.7
Impaired:
Past due 3 to 6 months 190 207 397 0.3
Past due 6 to 12 months 120 143 263 0.2
Past due over 12 months 72 97 169 0.1
Possessions 14 52 66 -
Total non-performing loans 2,125 1,408 3,533 2.3
Total residential mortgages 124,549 28,336 152,885 100.0
Non-performing loans as a % of total residential mortgages 1.7% 5.0% 2.3%
Impairment provisions (£m) 22 88 110
Impairment provisions as a % of non-performing balances 1.0% 6.3% 3.1%
Impairment provisions as a % of total residential mortgages 0.02% 0.31% 0.07%
Residential mortgages continued
Residential mortgages by payment status
Residential mortgages by payment status
Back to Contents
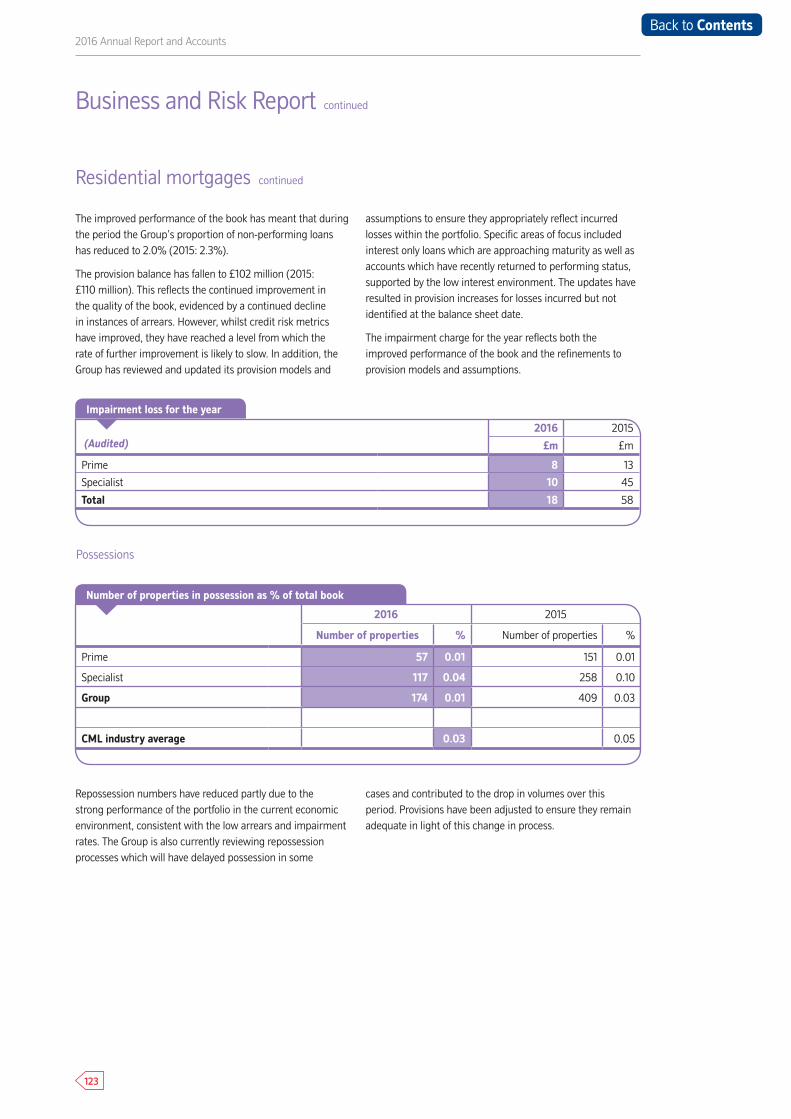
123
2016 Annual Report and Accounts
The improved performance of the book has meant that during the period the Group’s proportion of non-performing loans has reduced to 2.0% (2015: 2.3%).
The provision balance has fallen to £102 million (2015: £110 million). This reflects the continued improvement in the quality of the book, evidenced by a continued decline in instances of arrears. However, whilst credit risk metrics have improved, they have reached a level from which the rate of further improvement is likely to slow. In addition, the Group has reviewed and updated its provision models and
assumptions to ensure they appropriately reflect incurred losses within the portfolio. Specific areas of focus included interest only loans which are approaching maturity as well as accounts which have recently returned to performing status, supported by the low interest environment. The updates have resulted in provision increases for losses incurred but not identified at the balance sheet date.
The impairment charge for the year reflects both the improved performance of the book and the refinements to provision models and assumptions.
Repossession numbers have reduced partly due to the strong performance of the portfolio in the current economic environment, consistent with the low arrears and impairment rates. The Group is also currently reviewing repossession processes which will have delayed possession in some
cases and contributed to the drop in volumes over this period. Provisions have been adjusted to ensure they remain adequate in light of this change in process.
Business and Risk Report continued
Residential mortgages continued
(Audited)2016 2015
£m £m
Prime 8 13
Specialist 10 45
Total 18 58
Impairment loss for the year
Possessions
2016 2015
Number of properties % Number of properties %
Prime 57 0.01 151 0.01
Specialist 117 0.04 258 0.10
Group 174 0.01 409 0.03
CML industry average 0.03 0.05
Number of properties in possession as % of total book
Back to Contents
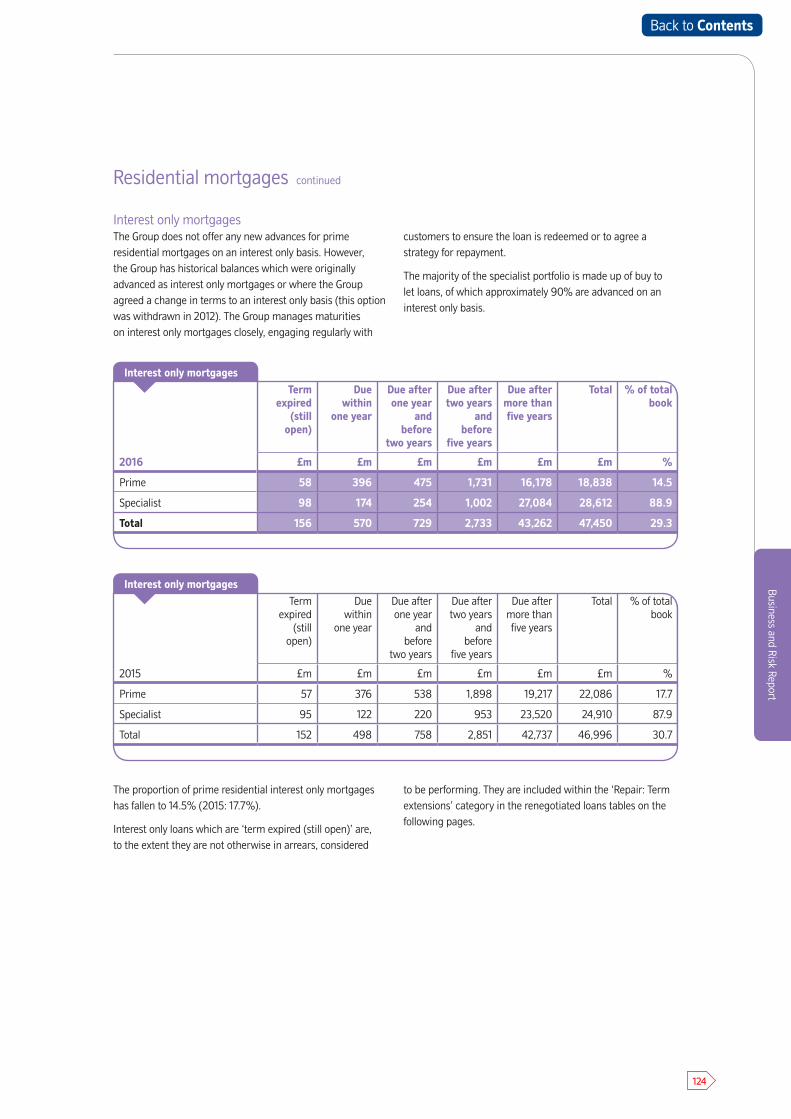
124
Business and Risk Report
Interest only mortgagesThe Group does not offer any new advances for prime residential mortgages on an interest only basis. However, the Group has historical balances which were originally advanced as interest only mortgages or where the Group agreed a change in terms to an interest only basis (this option was withdrawn in 2012). The Group manages maturities on interest only mortgages closely, engaging regularly with
customers to ensure the loan is redeemed or to agree a strategy for repayment.
The majority of the specialist portfolio is made up of buy to let loans, of which approximately 90% are advanced on an interest only basis.
The proportion of prime residential interest only mortgages has fallen to 14.5% (2015: 17.7%).
Interest only loans which are ‘term expired (still open)’ are, to the extent they are not otherwise in arrears, considered
to be performing. They are included within the ‘Repair: Term extensions’ category in the renegotiated loans tables on the following pages.
Residential mortgages continued
2016
Term expired
(still open)
Due within
one year
Due after one year
and before
two years
Due after two years
and before
five years
Due after more than five years
Total % of total book
£m £m £m £m £m £m %
Prime 58 396 475 1,731 16,178 18,838 14.5
Specialist 98 174 254 1,002 27,084 28,612 88.9
Total 156 570 729 2,733 43,262 47,450 29.3
2015
Term expired
(still open)
Due within
one year
Due after one year
and before
two years
Due after two years
and before
five years
Due after more than five years
Total % of total book
£m £m £m £m £m £m %
Prime 57 376 538 1,898 19,217 22,086 17.7
Specialist 95 122 220 953 23,520 24,910 87.9
Total 152 498 758 2,851 42,737 46,996 30.7
Interest only mortgages
Interest only mortgages
Back to Contents
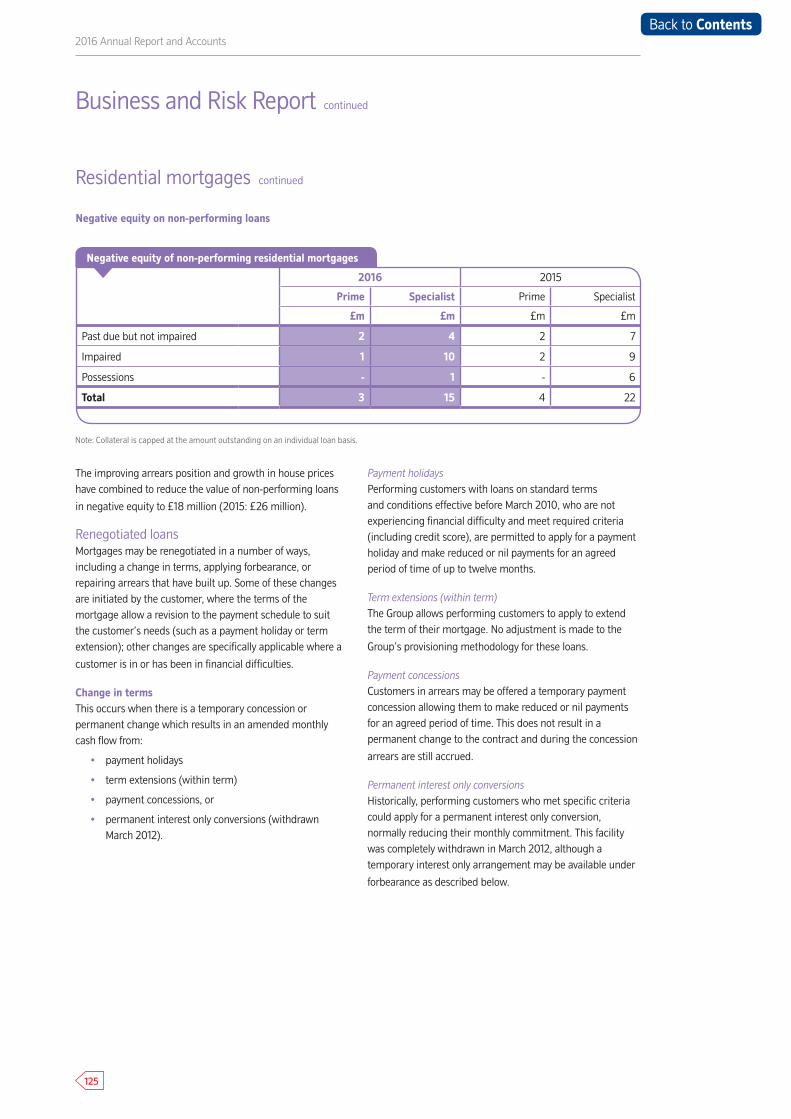
125
2016 Annual Report and Accounts
The improving arrears position and growth in house prices have combined to reduce the value of non-performing loans
in negative equity to £18 million (2015: £26 million).
Renegotiated loansMortgages may be renegotiated in a number of ways, including a change in terms, applying forbearance, or repairing arrears that have built up. Some of these changes are initiated by the customer, where the terms of the mortgage allow a revision to the payment schedule to suit the customer’s needs (such as a payment holiday or term extension); other changes are specifically applicable where a
customer is in or has been in financial difficulties.
Change in termsThis occurs when there is a temporary concession or permanent change which results in an amended monthly cash flow from:
• payment holidays
• term extensions (within term)
• payment concessions, or
• permanent interest only conversions (withdrawn March 2012).
Payment holidaysPerforming customers with loans on standard terms and conditions effective before March 2010, who are not experiencing financial difficulty and meet required criteria (including credit score), are permitted to apply for a payment holiday and make reduced or nil payments for an agreed period of time of up to twelve months.
Term extensions (within term)The Group allows performing customers to apply to extend the term of their mortgage. No adjustment is made to the
Group’s provisioning methodology for these loans.
Payment concessionsCustomers in arrears may be offered a temporary payment concession allowing them to make reduced or nil payments for an agreed period of time. This does not result in a permanent change to the contract and during the concession
arrears are still accrued.
Permanent interest only conversionsHistorically, performing customers who met specific criteria could apply for a permanent interest only conversion, normally reducing their monthly commitment. This facility was completely withdrawn in March 2012, although a temporary interest only arrangement may be available under
forbearance as described below.
Negative equity on non-performing loans
Business and Risk Report continued
Residential mortgages continued
2016 2015
Prime Specialist Prime Specialist
£m £m £m £m
Past due but not impaired 2 4 2 7
Impaired 1 10 2 9
Possessions - 1 - 6
Total 3 15 4 22
Negative equity of non-performing residential mortgages
Note: Collateral is capped at the amount outstanding on an individual loan basis.
Back to Contents
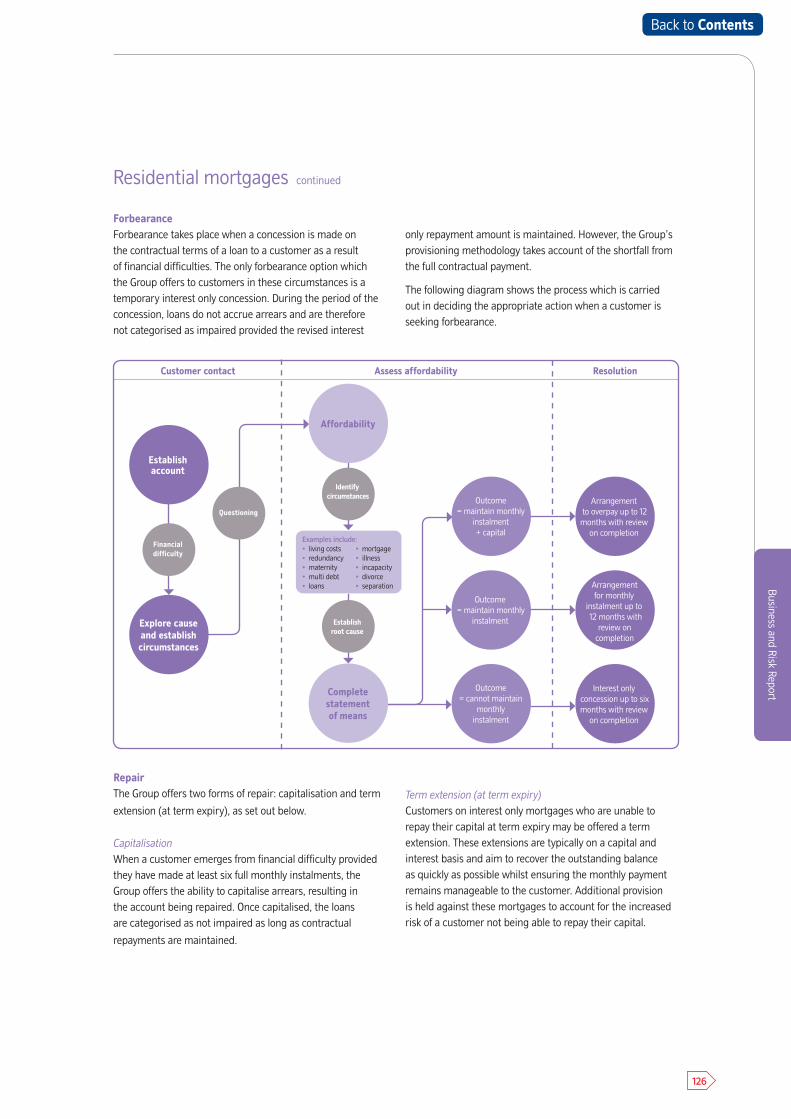
126
Business and Risk Report
ForbearanceForbearance takes place when a concession is made on the contractual terms of a loan to a customer as a result of financial difficulties. The only forbearance option which the Group offers to customers in these circumstances is a temporary interest only concession. During the period of the concession, loans do not accrue arrears and are therefore not categorised as impaired provided the revised interest
only repayment amount is maintained. However, the Group’s provisioning methodology takes account of the shortfall from the full contractual payment.
The following diagram shows the process which is carried out in deciding the appropriate action when a customer is seeking forbearance.
RepairThe Group offers two forms of repair: capitalisation and term
extension (at term expiry), as set out below.
CapitalisationWhen a customer emerges from financial difficulty provided they have made at least six full monthly instalments, the Group offers the ability to capitalise arrears, resulting in the account being repaired. Once capitalised, the loans are categorised as not impaired as long as contractual
repayments are maintained.
Term extension (at term expiry)Customers on interest only mortgages who are unable to repay their capital at term expiry may be offered a term extension. These extensions are typically on a capital and interest basis and aim to recover the outstanding balance as quickly as possible whilst ensuring the monthly payment remains manageable to the customer. Additional provision is held against these mortgages to account for the increased risk of a customer not being able to repay their capital.
Establish account
Explore cause and establish circumstances
Assess affordabilityCustomer contact Resolution
Financial difficulty
Questioning
Outcome = maintain monthly
instalment + capital
Outcome = maintain monthly
instalment
Outcome = cannot maintain
monthly instalment
Arrangement to overpay up to 12
months with review on completion
Arrangement for monthly
instalment up to 12 months with
review on completion
Interest only concession up to six months with review
on completion
Identify circumstances
Establish root cause
Affordability
Complete statement of means
Examples include:• living costs• redundancy• maternity• multi debt• loans
• mortgage• illness• incapacity• divorce• separation
Residential mortgages continued
Back to Contents
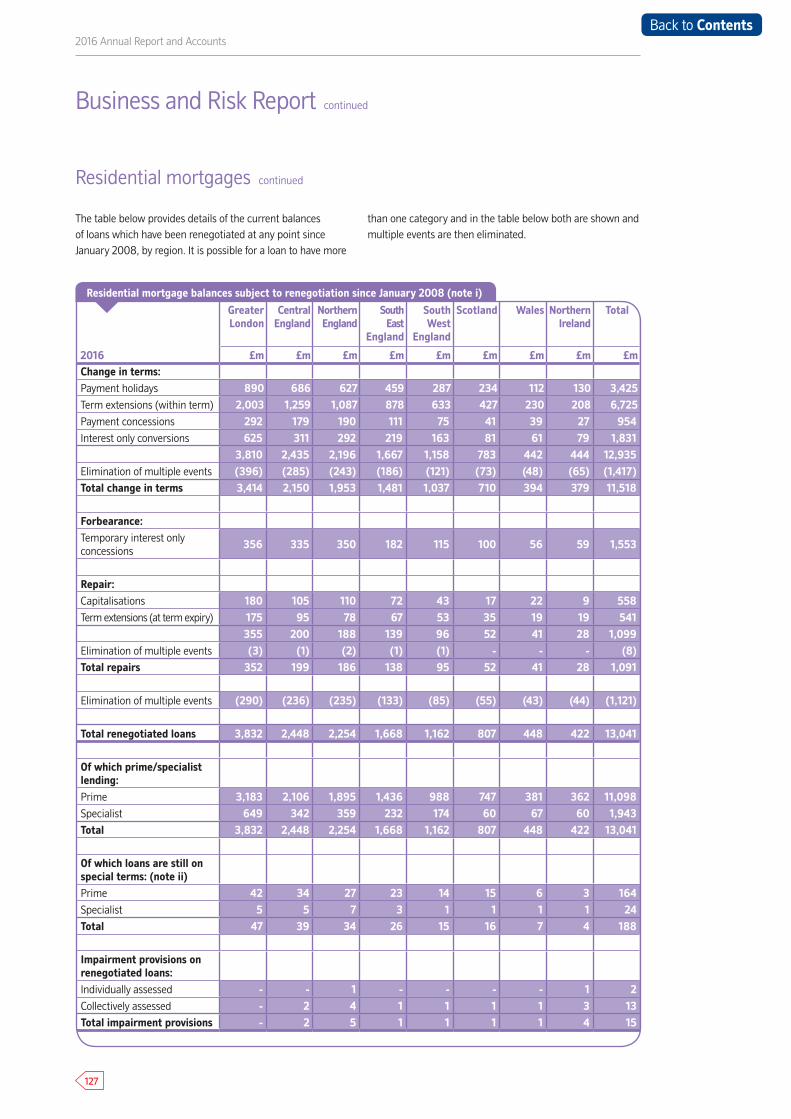
127
2016 Annual Report and Accounts
The table below provides details of the current balances of loans which have been renegotiated at any point since January 2008, by region. It is possible for a loan to have more
than one category and in the table below both are shown and multiple events are then eliminated.
Business and Risk Report continued
Residential mortgages continued
2016
Greater London
Central England
Northern England
South East
England
South West
England
Scotland Wales Northern Ireland
Total
£m £m £m £m £m £m £m £m £mChange in terms:Payment holidays 890 686 627 459 287 234 112 130 3,425Term extensions (within term) 2,003 1,259 1,087 878 633 427 230 208 6,725Payment concessions 292 179 190 111 75 41 39 27 954Interest only conversions 625 311 292 219 163 81 61 79 1,831
3,810 2,435 2,196 1,667 1,158 783 442 444 12,935Elimination of multiple events (396) (285) (243) (186) (121) (73) (48) (65) (1,417)Total change in terms 3,414 2,150 1,953 1,481 1,037 710 394 379 11,518
Forbearance:Temporary interest only concessions
356 335 350 182 115 100 56 59 1,553
Repair:Capitalisations 180 105 110 72 43 17 22 9 558Term extensions (at term expiry) 175 95 78 67 53 35 19 19 541
355 200 188 139 96 52 41 28 1,099Elimination of multiple events (3) (1) (2) (1) (1) - - - (8)Total repairs 352 199 186 138 95 52 41 28 1,091
Elimination of multiple events (290) (236) (235) (133) (85) (55) (43) (44) (1,121)
Total renegotiated loans 3,832 2,448 2,254 1,668 1,162 807 448 422 13,041
Of which prime/specialist lending:Prime 3,183 2,106 1,895 1,436 988 747 381 362 11,098Specialist 649 342 359 232 174 60 67 60 1,943Total 3,832 2,448 2,254 1,668 1,162 807 448 422 13,041
Of which loans are still on special terms: (note ii)Prime 42 34 27 23 14 15 6 3 164Specialist 5 5 7 3 1 1 1 1 24Total 47 39 34 26 15 16 7 4 188
Impairment provisions on renegotiated loans:Individually assessed - - 1 - - - - 1 2Collectively assessed - 2 4 1 1 1 1 3 13Total impairment provisions - 2 5 1 1 1 1 4 15
Residential mortgage balances subject to renegotiation since January 2008 (note i)
Back to Contents
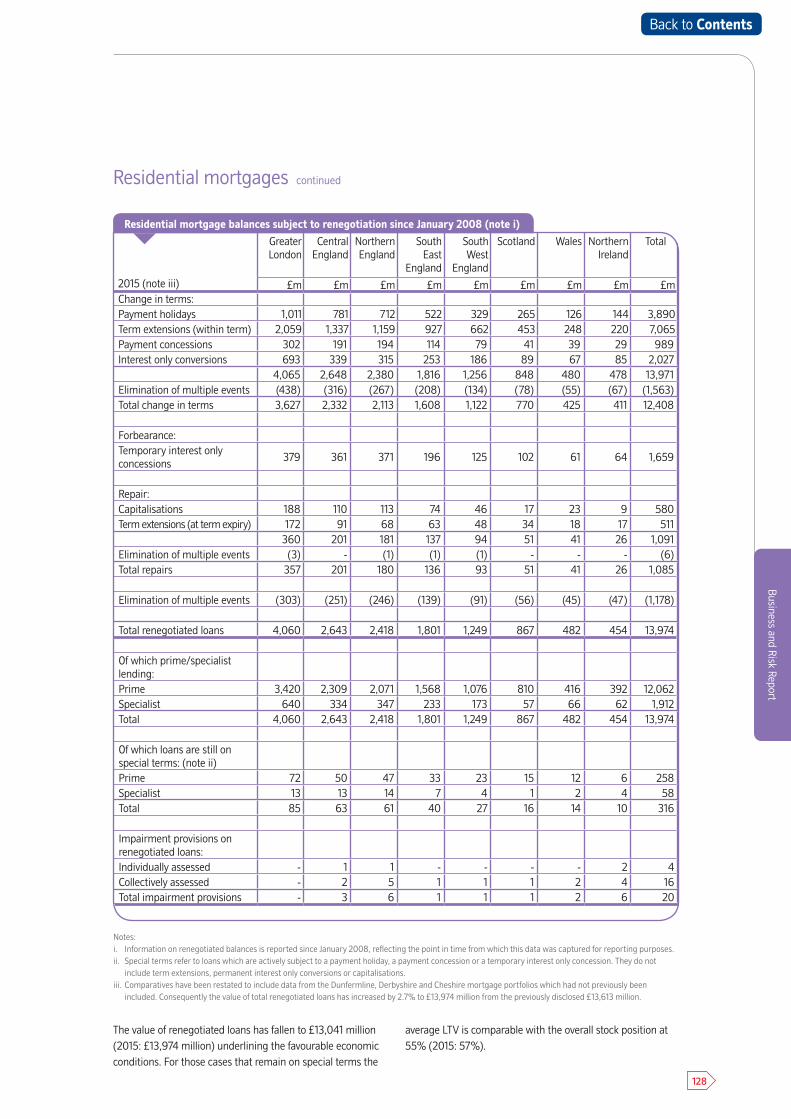
128
Business and Risk Report
The value of renegotiated loans has fallen to £13,041 million (2015: £13,974 million) underlining the favourable economic conditions. For those cases that remain on special terms the
average LTV is comparable with the overall stock position at 55% (2015: 57%).
Residential mortgages continued
2015 (note iii)
Greater London
Central England
Northern England
South East
England
South West
England
Scotland Wales Northern Ireland
Total
£m £m £m £m £m £m £m £m £mChange in terms:Payment holidays 1,011 781 712 522 329 265 126 144 3,890Term extensions (within term) 2,059 1,337 1,159 927 662 453 248 220 7,065Payment concessions 302 191 194 114 79 41 39 29 989Interest only conversions 693 339 315 253 186 89 67 85 2,027
4,065 2,648 2,380 1,816 1,256 848 480 478 13,971Elimination of multiple events (438) (316) (267) (208) (134) (78) (55) (67) (1,563)Total change in terms 3,627 2,332 2,113 1,608 1,122 770 425 411 12,408
Forbearance:Temporary interest only concessions
379 361 371 196 125 102 61 64 1,659
Repair:Capitalisations 188 110 113 74 46 17 23 9 580Term extensions (at term expiry) 172 91 68 63 48 34 18 17 511
360 201 181 137 94 51 41 26 1,091Elimination of multiple events (3) - (1) (1) (1) - - - (6)Total repairs 357 201 180 136 93 51 41 26 1,085
Elimination of multiple events (303) (251) (246) (139) (91) (56) (45) (47) (1,178)
Total renegotiated loans 4,060 2,643 2,418 1,801 1,249 867 482 454 13,974
Of which prime/specialist lending:Prime 3,420 2,309 2,071 1,568 1,076 810 416 392 12,062Specialist 640 334 347 233 173 57 66 62 1,912Total 4,060 2,643 2,418 1,801 1,249 867 482 454 13,974
Of which loans are still on special terms: (note ii)Prime 72 50 47 33 23 15 12 6 258Specialist 13 13 14 7 4 1 2 4 58Total 85 63 61 40 27 16 14 10 316
Impairment provisions on renegotiated loans:Individually assessed - 1 1 - - - - 2 4Collectively assessed - 2 5 1 1 1 2 4 16Total impairment provisions - 3 6 1 1 1 2 6 20
Residential mortgage balances subject to renegotiation since January 2008 (note i)
Notes:i. Information on renegotiated balances is reported since January 2008, reflecting the point in time from which this data was captured for reporting purposes.ii. Special terms refer to loans which are actively subject to a payment holiday, a payment concession or a temporary interest only concession. They do not
include term extensions, permanent interest only conversions or capitalisations.iii. Comparatives have been restated to include data from the Dunfermline, Derbyshire and Cheshire mortgage portfolios which had not previously been
included. Consequently the value of total renegotiated loans has increased by 2.7% to £13,974 million from the previously disclosed £13,613 million.
Back to Contents

129
2016 Annual Report and Accounts
SummaryThe Group’s consumer banking portfolio includes balances relating to the unsecured portfolios for overdrawn current accounts, personal loans and credit cards. Total balances across these portfolios have grown by 2.1% during the period to £3,869 million (2015: £3,791 million), despite the continued intense competition across all lenders in the unsecured market. This is evident in the increasing duration of introductory offers for credit cards, switching incentives for current accounts and lower rates for personal loans.
Portfolio performance and risk profile has continued to improve as a result of previous policy and pricing changes, alongside the favourable economic environment. This has led to a 13.5% reduction in non-performing balances (excluding charged off accounts), from £171 million to £148 million, and forbearance levels have remained stable over this period.
The Group actively monitors and manages emerging risks in the UK and the potential impacts on its exposure to lending risk, including the potential effect of interest rate rises and a reversal in current trends, such as unemployment.
Due to the prolonged low interest environment and the associated improvement in portfolio performance, the Group has conducted a comprehensive review of its credit risk impairment assumptions to ensure they remain appropriate. This has led to an increase in provisions of £29 million in relation to the up to date book and total provisions have increased to £281 million (2015: £216 million).
The regulatory environment for unsecured lending continues to evolve with the Competition & Markets Authority assessment of competitive practices, fees charged and assistance for vulnerable customers, alongside the FCA market review due for publication later this year. The Group considers that its focus on responsible lending and its commitment to ensuring good outcomes for customers will be consistent with the direction of any regulatory changes.
The table below summarises the Group’s consumer banking portfolio:
Lending riskImpaired loansThe Group monitors and reports lending risk on consumer banking portfolios primarily on delinquency status, since no security is held against the loans. Impaired accounts are defined as those greater than three months in arrears. Non-performing accounts include all impaired loans and also loans which are past due but not impaired, including any asset where a payment due is received late or missed. The non-performing loan amount represents the entire financial asset rather than just the payment overdue.
The performance of the portfolios is closely monitored, with corrective action taken when appropriate to ensure adherence with risk appetite.
The Group holds impairment provisions for both the performing and non-performing segments of the consumer banking portfolio. Provisions reflect losses which have been incurred at the balance sheet date, based on objective evidence. For currently performing loans, the provision reflects the Group’s assessment of losses arising from impairment events that have occurred but which have not been specifically identified at the reporting date.
2016 2015
(Audited) £m % £m %
Overdrawn current accounts 247 6 248 7
Personal loans 1,901 49 1,799 47
Credit cards 1,721 45 1,744 46
Total consumer banking 3,869 100 3,791 100
Business and Risk Report continued
Consumer banking
Consumer banking balances
Back to Contents
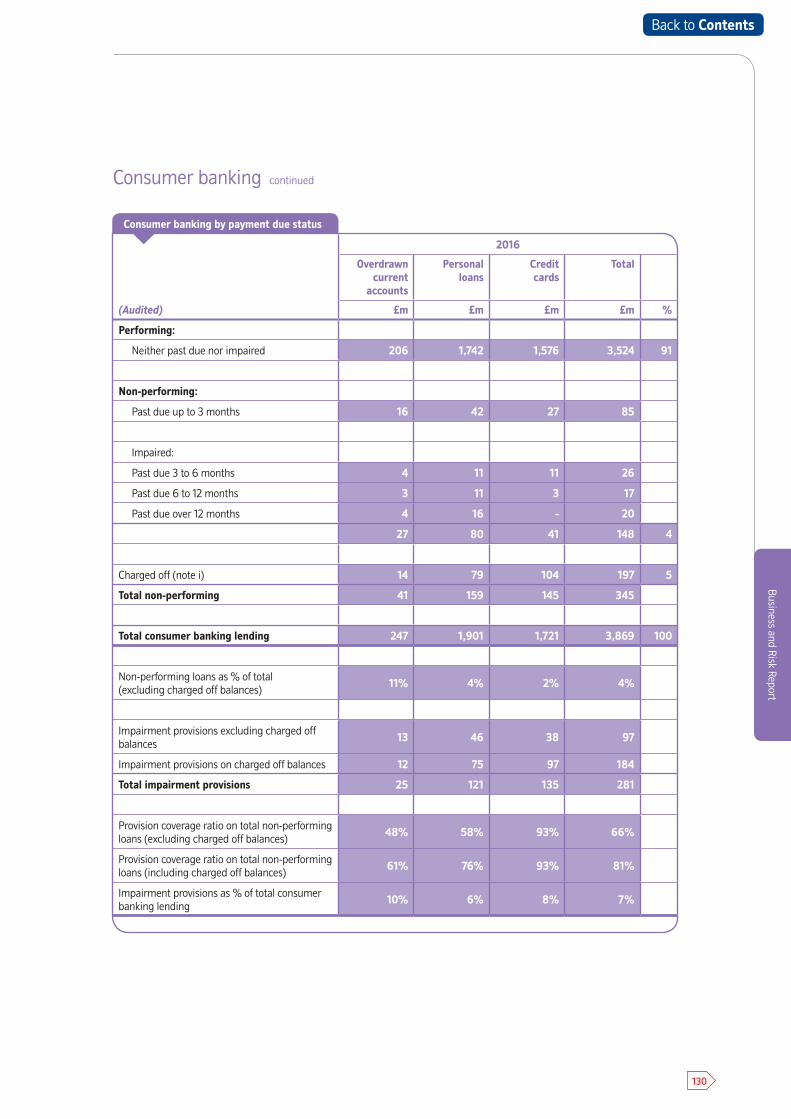
130
Business and Risk Report
Consumer banking continued
2016
(Audited)
Overdrawn current
accounts
Personal loans
Credit cards
Total
£m £m £m £m %
Performing:
Neither past due nor impaired 206 1,742 1,576 3,524 91
Non-performing:
Past due up to 3 months 16 42 27 85
Impaired:
Past due 3 to 6 months 4 11 11 26
Past due 6 to 12 months 3 11 3 17
Past due over 12 months 4 16 - 20
27 80 41 148 4
Charged off (note i) 14 79 104 197 5
Total non-performing 41 159 145 345
Total consumer banking lending 247 1,901 1,721 3,869 100
Non-performing loans as % of total (excluding charged off balances)
11% 4% 2% 4%
Impairment provisions excluding charged off balances
13 46 38 97
Impairment provisions on charged off balances 12 75 97 184
Total impairment provisions 25 121 135 281
Provision coverage ratio on total non-performing loans (excluding charged off balances)
48% 58% 93% 66%
Provision coverage ratio on total non-performing loans (including charged off balances)
61% 76% 93% 81%
Impairment provisions as % of total consumer banking lending
10% 6% 8% 7%
Consumer banking by payment due status
Back to Contents
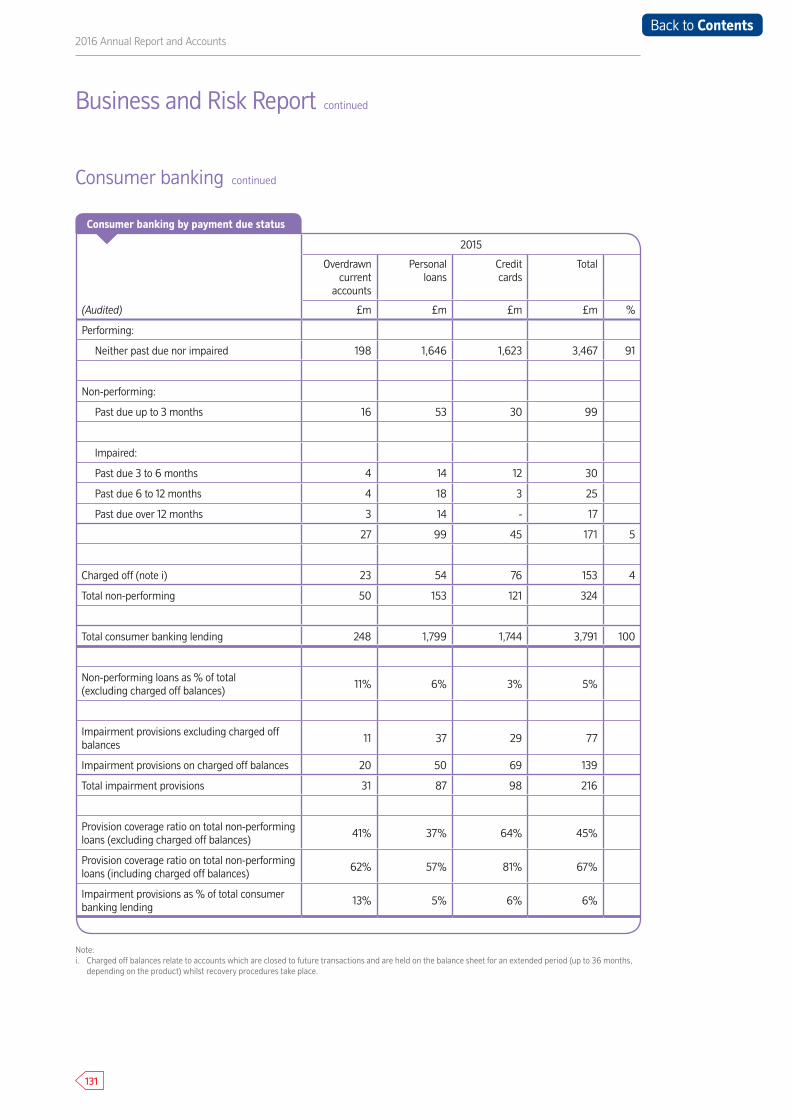
131
2016 Annual Report and Accounts
Consumer banking continued
Business and Risk Report continued
2015
(Audited)
Overdrawn current
accounts
Personal loans
Credit cards
Total
£m £m £m £m %
Performing:
Neither past due nor impaired 198 1,646 1,623 3,467 91
Non-performing:
Past due up to 3 months 16 53 30 99
Impaired:
Past due 3 to 6 months 4 14 12 30
Past due 6 to 12 months 4 18 3 25
Past due over 12 months 3 14 - 17
27 99 45 171 5
Charged off (note i) 23 54 76 153 4
Total non-performing 50 153 121 324
Total consumer banking lending 248 1,799 1,744 3,791 100
Non-performing loans as % of total (excluding charged off balances)
11% 6% 3% 5%
Impairment provisions excluding charged off balances
11 37 29 77
Impairment provisions on charged off balances 20 50 69 139
Total impairment provisions 31 87 98 216
Provision coverage ratio on total non-performing loans (excluding charged off balances)
41% 37% 64% 45%
Provision coverage ratio on total non-performing loans (including charged off balances)
62% 57% 81% 67%
Impairment provisions as % of total consumer banking lending
13% 5% 6% 6%
Consumer banking by payment due status
Note:i. Charged off balances relate to accounts which are closed to future transactions and are held on the balance sheet for an extended period (up to 36 months,
depending on the product) whilst recovery procedures take place.
Back to Contents
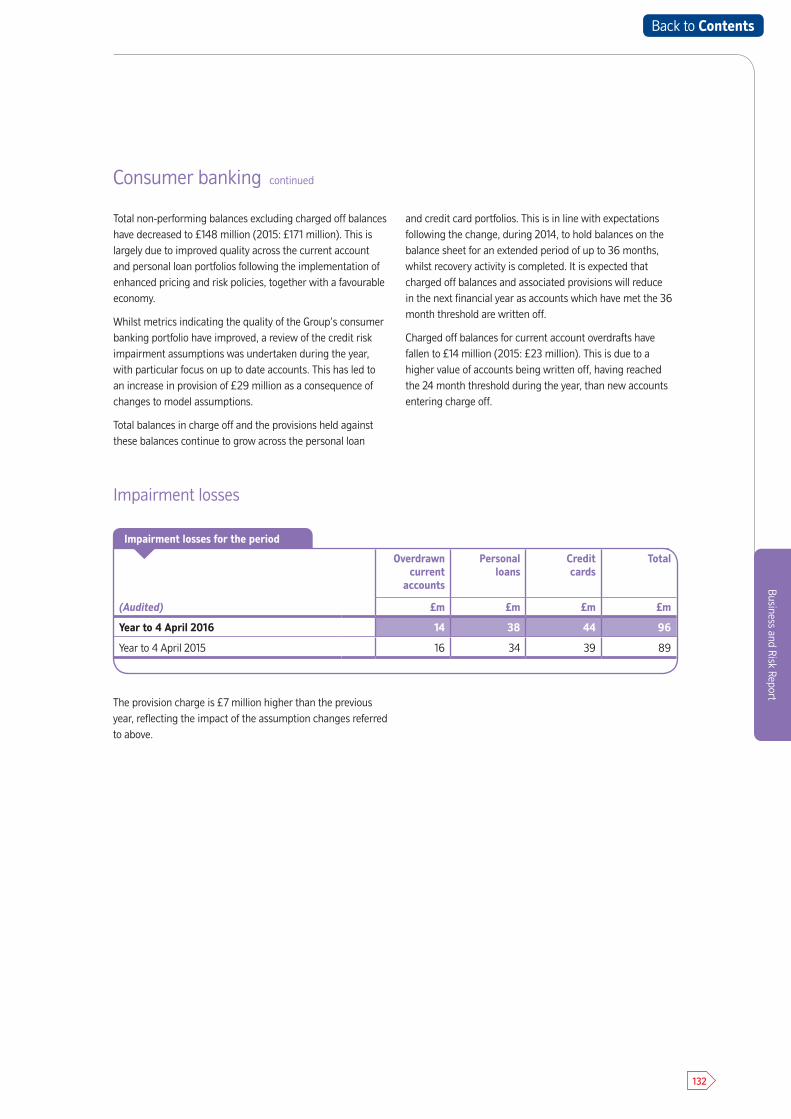
132
Business and Risk Report
Consumer banking continued
Total non-performing balances excluding charged off balances have decreased to £148 million (2015: £171 million). This is largely due to improved quality across the current account and personal loan portfolios following the implementation of enhanced pricing and risk policies, together with a favourable economy.
Whilst metrics indicating the quality of the Group’s consumer banking portfolio have improved, a review of the credit risk impairment assumptions was undertaken during the year, with particular focus on up to date accounts. This has led to an increase in provision of £29 million as a consequence of changes to model assumptions.
Total balances in charge off and the provisions held against these balances continue to grow across the personal loan
and credit card portfolios. This is in line with expectations following the change, during 2014, to hold balances on the balance sheet for an extended period of up to 36 months, whilst recovery activity is completed. It is expected that charged off balances and associated provisions will reduce in the next financial year as accounts which have met the 36 month threshold are written off.
Charged off balances for current account overdrafts have fallen to £14 million (2015: £23 million). This is due to a higher value of accounts being written off, having reached the 24 month threshold during the year, than new accounts entering charge off.
Impairment losses
(Audited)
Overdrawn current
accounts
Personal loans
Credit cards
Total
£m £m £m £m
Year to 4 April 2016 14 38 44 96
Year to 4 April 2015 16 34 39 89
Impairment losses for the period
The provision charge is £7 million higher than the previous year, reflecting the impact of the assumption changes referred to above.
Back to Contents
133
2016 Annual Report and Accounts
Renegotiated loansThe Group’s approach is to reduce lending risk through good lending decisions. Where it is considered likely that a customer may face financial difficulty the Group seeks to find a solution to support the customer and to mitigate losses, including proactive management of exposure, forbearance or
arrears management.
Proactive management of exposureAccount performance is monitored on an ongoing basis using a range of factors including credit scores and information held by the credit reference agencies. For credit card and current account customers, this may result in the proactive reduction of credit limits or other changes in terms. In addition to this, unsecured customers may be contacted by a specialist team to discuss their financial commitments and consider available options to improve their financial position in a sustainable
manner.
Arrears managementWhen a customer has, or expects to have, difficulty in meeting contractual payments, the Group will work with them to try to find a manageable solution. This will involve a full review of the customer’s individual circumstances, including establishing the root cause behind the arrears, likely duration of this situation and monthly income and expenditure, before an outcome is agreed. The range of potential renegotiation outcomes includes change in terms, forbearance or repair. All these options, described more fully below, aim to alleviate payment difficulty and bring the account back into a sustainable position.
In certain circumstances, the loan agreement is terminated or charged off to avoid ongoing member detriment such as unsustainable fees and charges. Customers who enter charge
off are managed through the Group’s recoveries process.
Change in termsThis occurs when there is a temporary concession or permanent change which results in an amended monthly cash flow. The Group may agree a repayment plan to bring the account to a performing position over a set time period, or a plan which is typically less than the minimum contractual payment for an agreed time period. Changes in terms are not offered as a means of forbearance to assist customers already in financial difficulty and interest is not suppressed during this period.
Forbearance This takes place when a concession on the contractual terms of a loan is made to a customer as a result of financial difficulties. The only forbearance option offered on the unsecured portfolios is an interest-suppressed payment concession, where the Group agrees a repayment plan which is typically less than the minimum contractual payment for an agreed time period, without interest being charged.
RepairAny action that brings a loan back to a performing position is classified as repair. This is only offered to customers who have shown that they are no longer in financial difficulty. The conditions and treatments vary by product, and can include capitalisation of arrears on loans and credit cards, and a reducing overdraft limit on current accounts.
The balances at the balance sheet date which have been subject to a change in terms, forbearance or repair at any point since March 2010 are summarised in the table below. It is possible for borrowers to have more than one type of renegotiation and in this instance they are shown in both
categories and multiple events are eliminated.
Business and Risk Report continued
Consumer banking continued
Back to Contents
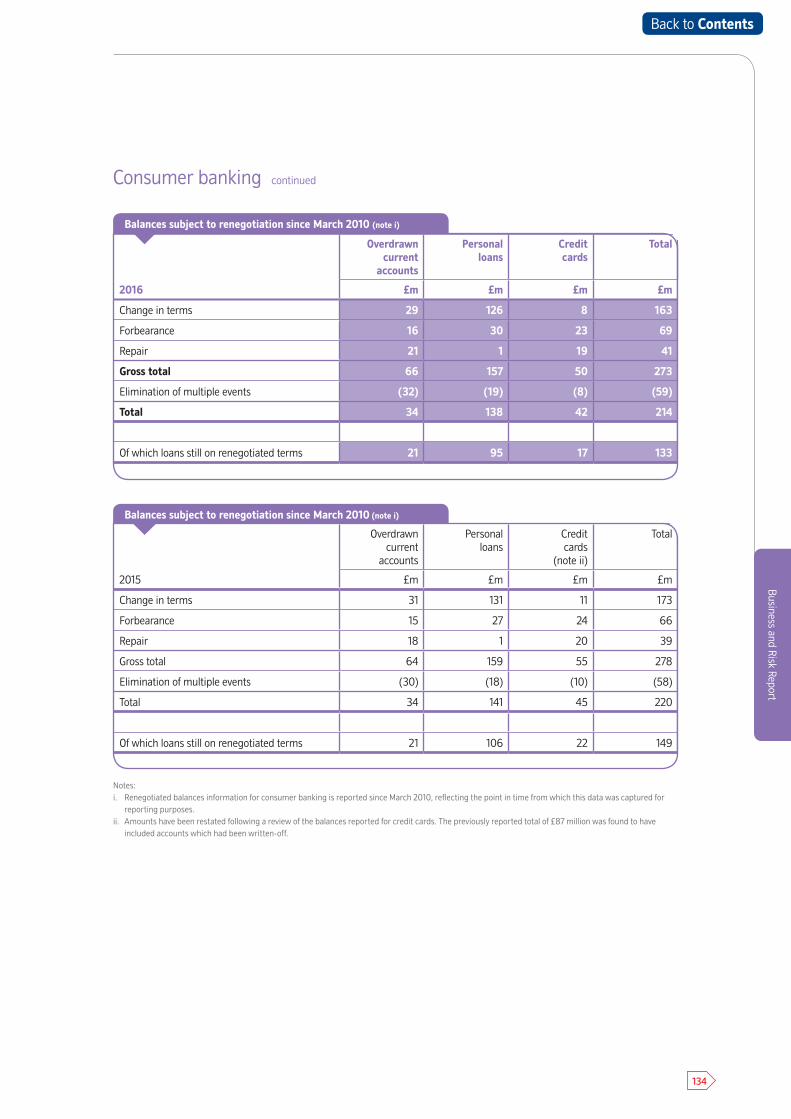
134
Business and Risk Report
Overdrawn current
accounts
Personal loans
Creditcards
(note ii)
Total
2015 £m £m £m £m
Change in terms 31 131 11 173
Forbearance 15 27 24 66
Repair 18 1 20 39
Gross total 64 159 55 278
Elimination of multiple events (30) (18) (10) (58)
Total 34 141 45 220
Of which loans still on renegotiated terms 21 106 22 149
Notes:i. Renegotiated balances information for consumer banking is reported since March 2010, reflecting the point in time from which this data was captured for
reporting purposes.ii. Amounts have been restated following a review of the balances reported for credit cards. The previously reported total of £87 million was found to have
included accounts which had been written-off.
Consumer banking continued
Overdrawn current
accounts
Personal loans
Credit cards
Total
2016 £m £m £m £m
Change in terms 29 126 8 163
Forbearance 16 30 23 69
Repair 21 1 19 41
Gross total 66 157 50 273
Elimination of multiple events (32) (19) (8) (59)
Total 34 138 42 214
Of which loans still on renegotiated terms 21 95 17 133
Balances subject to renegotiation since March 2010 (note i)
Balances subject to renegotiation since March 2010 (note i)
Back to Contents
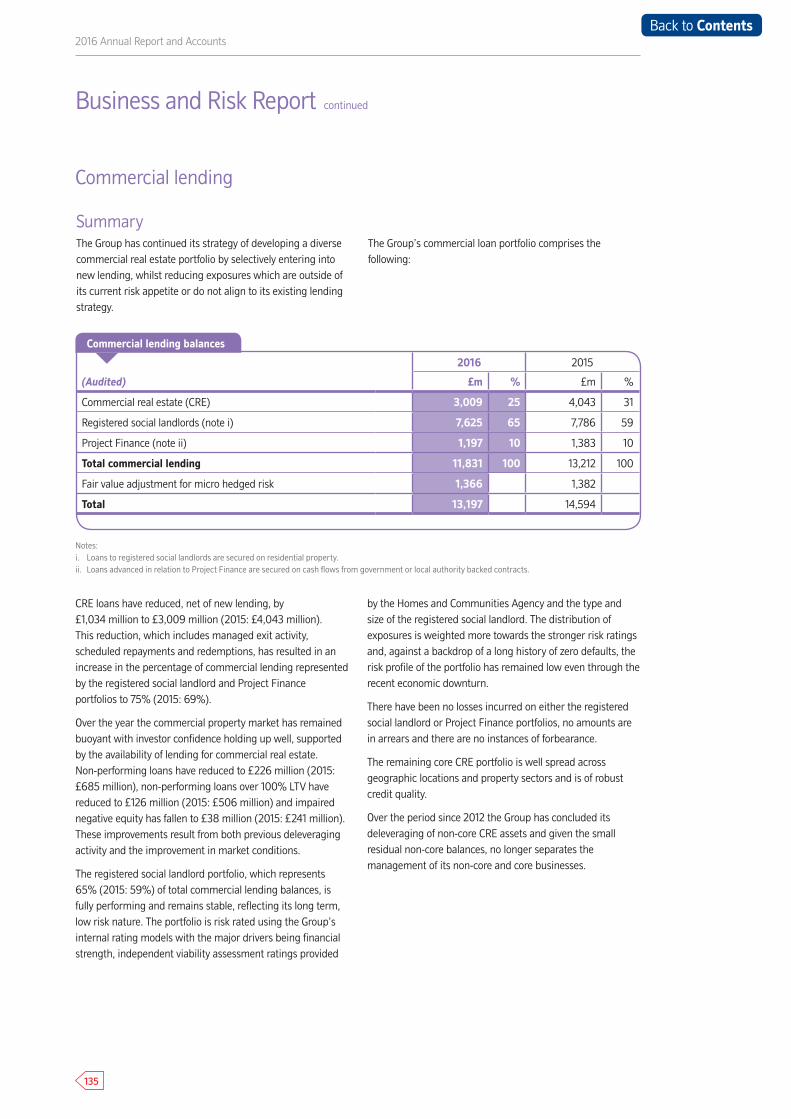
135
2016 Annual Report and Accounts
SummaryThe Group has continued its strategy of developing a diverse commercial real estate portfolio by selectively entering into new lending, whilst reducing exposures which are outside of its current risk appetite or do not align to its existing lending strategy.
The Group’s commercial loan portfolio comprises the following:
CRE loans have reduced, net of new lending, by £1,034 million to £3,009 million (2015: £4,043 million). This reduction, which includes managed exit activity, scheduled repayments and redemptions, has resulted in an increase in the percentage of commercial lending represented by the registered social landlord and Project Finance portfolios to 75% (2015: 69%).
Over the year the commercial property market has remained buoyant with investor confidence holding up well, supported by the availability of lending for commercial real estate. Non-performing loans have reduced to £226 million (2015: £685 million), non-performing loans over 100% LTV have reduced to £126 million (2015: £506 million) and impaired negative equity has fallen to £38 million (2015: £241 million). These improvements result from both previous deleveraging activity and the improvement in market conditions.
The registered social landlord portfolio, which represents 65% (2015: 59%) of total commercial lending balances, is fully performing and remains stable, reflecting its long term, low risk nature. The portfolio is risk rated using the Group’s internal rating models with the major drivers being financial strength, independent viability assessment ratings provided
by the Homes and Communities Agency and the type and size of the registered social landlord. The distribution of exposures is weighted more towards the stronger risk ratings and, against a backdrop of a long history of zero defaults, the risk profile of the portfolio has remained low even through the recent economic downturn.
There have been no losses incurred on either the registered social landlord or Project Finance portfolios, no amounts are in arrears and there are no instances of forbearance.
The remaining core CRE portfolio is well spread across geographic locations and property sectors and is of robust credit quality.
Over the period since 2012 the Group has concluded its deleveraging of non-core CRE assets and given the small residual non-core balances, no longer separates the management of its non-core and core businesses.
Notes:i. Loans to registered social landlords are secured on residential property.ii. Loans advanced in relation to Project Finance are secured on cash flows from government or local authority backed contracts.
2016 2015
(Audited) £m % £m %
Commercial real estate (CRE) 3,009 25 4,043 31
Registered social landlords (note i) 7,625 65 7,786 59
Project Finance (note ii) 1,197 10 1,383 10
Total commercial lending 11,831 100 13,212 100
Fair value adjustment for micro hedged risk 1,366 1,382
Total 13,197 14,594
Business and Risk Report continued
Commercial lending
Commercial lending balances
Back to Contents
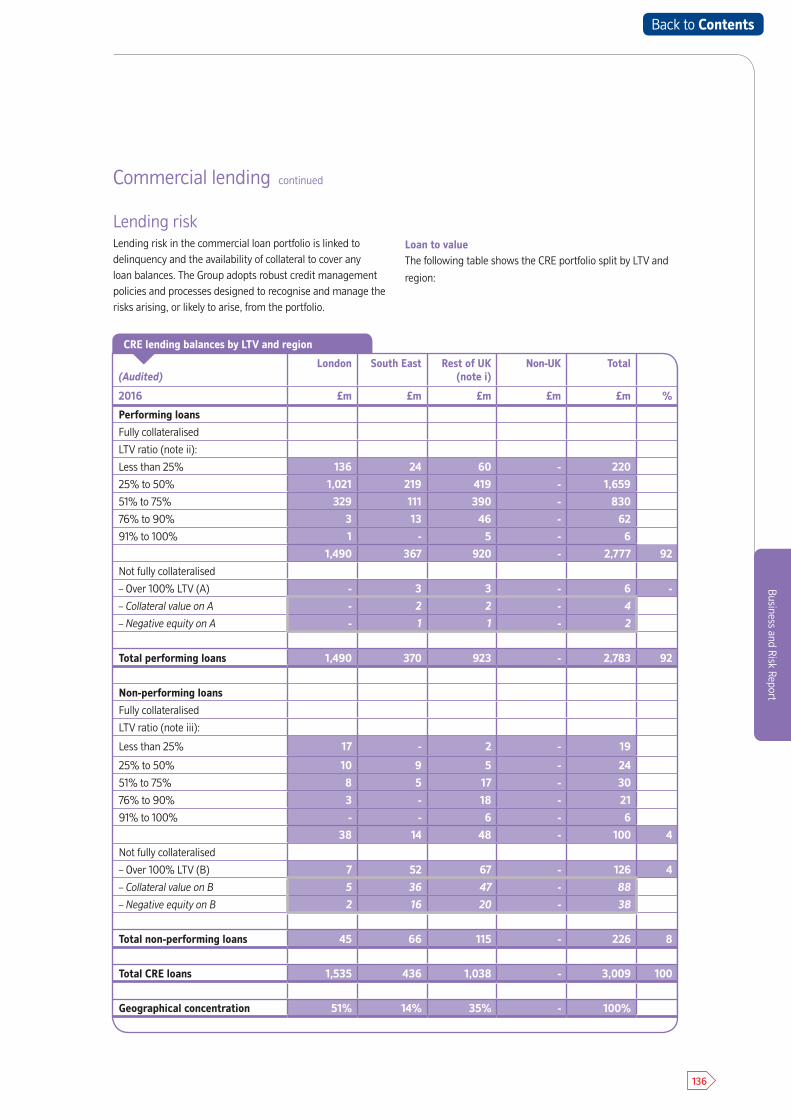
136
Business and Risk Report
Commercial lending continued
Lending risk Lending risk in the commercial loan portfolio is linked to delinquency and the availability of collateral to cover any loan balances. The Group adopts robust credit management policies and processes designed to recognise and manage the risks arising, or likely to arise, from the portfolio.
Loan to valueThe following table shows the CRE portfolio split by LTV and
region:
(Audited)London South East Rest of UK
(note i)Non-UK Total
2016 £m £m £m £m £m %
Performing loans
Fully collateralised
LTV ratio (note ii):
Less than 25% 136 24 60 - 220
25% to 50% 1,021 219 419 - 1,659
51% to 75% 329 111 390 - 830
76% to 90% 3 13 46 - 62
91% to 100% 1 - 5 - 6
1,490 367 920 - 2,777 92
Not fully collateralised
– Over 100% LTV (A) - 3 3 - 6 -
– Collateral value on A - 2 2 - 4
– Negative equity on A - 1 1 - 2
Total performing loans 1,490 370 923 - 2,783 92
Non-performing loans
Fully collateralised
LTV ratio (note iii):
Less than 25% 17 - 2 - 19
25% to 50% 10 9 5 - 24
51% to 75% 8 5 17 - 30
76% to 90% 3 - 18 - 21
91% to 100% - - 6 - 6
38 14 48 - 100 4
Not fully collateralised
– Over 100% LTV (B) 7 52 67 - 126 4
– Collateral value on B 5 36 47 - 88
– Negative equity on B 2 16 20 - 38
Total non-performing loans 45 66 115 - 226 8
Total CRE loans 1,535 436 1,038 - 3,009 100
Geographical concentration 51% 14% 35% - 100%
CRE lending balances by LTV and region
Back to Contents
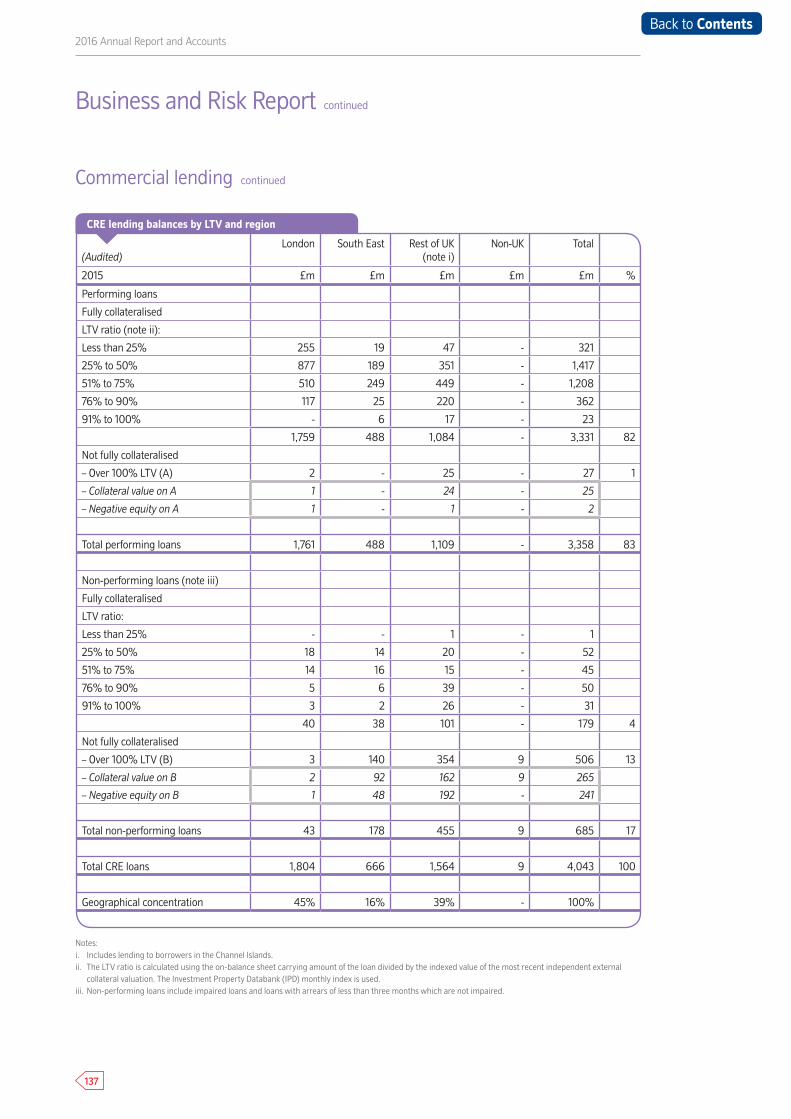
137
2016 Annual Report and Accounts
Commercial lending continued
(Audited)London South East Rest of UK
(note i)Non-UK Total
2015 £m £m £m £m £m %
Performing loans
Fully collateralised
LTV ratio (note ii):
Less than 25% 255 19 47 - 321
25% to 50% 877 189 351 - 1,417
51% to 75% 510 249 449 - 1,208
76% to 90% 117 25 220 - 362
91% to 100% - 6 17 - 23
1,759 488 1,084 - 3,331 82
Not fully collateralised
– Over 100% LTV (A) 2 - 25 - 27 1
– Collateral value on A 1 - 24 - 25
– Negative equity on A 1 - 1 - 2
Total performing loans 1,761 488 1,109 - 3,358 83
Non-performing loans (note iii)
Fully collateralised
LTV ratio:
Less than 25% - - 1 - 1
25% to 50% 18 14 20 - 52
51% to 75% 14 16 15 - 45
76% to 90% 5 6 39 - 50
91% to 100% 3 2 26 - 31
40 38 101 - 179 4
Not fully collateralised
– Over 100% LTV (B) 3 140 354 9 506 13
– Collateral value on B 2 92 162 9 265
– Negative equity on B 1 48 192 - 241
Total non-performing loans 43 178 455 9 685 17
Total CRE loans 1,804 666 1,564 9 4,043 100
Geographical concentration 45% 16% 39% - 100%
Business and Risk Report continued
CRE lending balances by LTV and region
Notes:i. Includes lending to borrowers in the Channel Islands. ii. The LTV ratio is calculated using the on-balance sheet carrying amount of the loan divided by the indexed value of the most recent independent external
collateral valuation. The Investment Property Databank (IPD) monthly index is used.iii. Non-performing loans include impaired loans and loans with arrears of less than three months which are not impaired.
Back to Contents
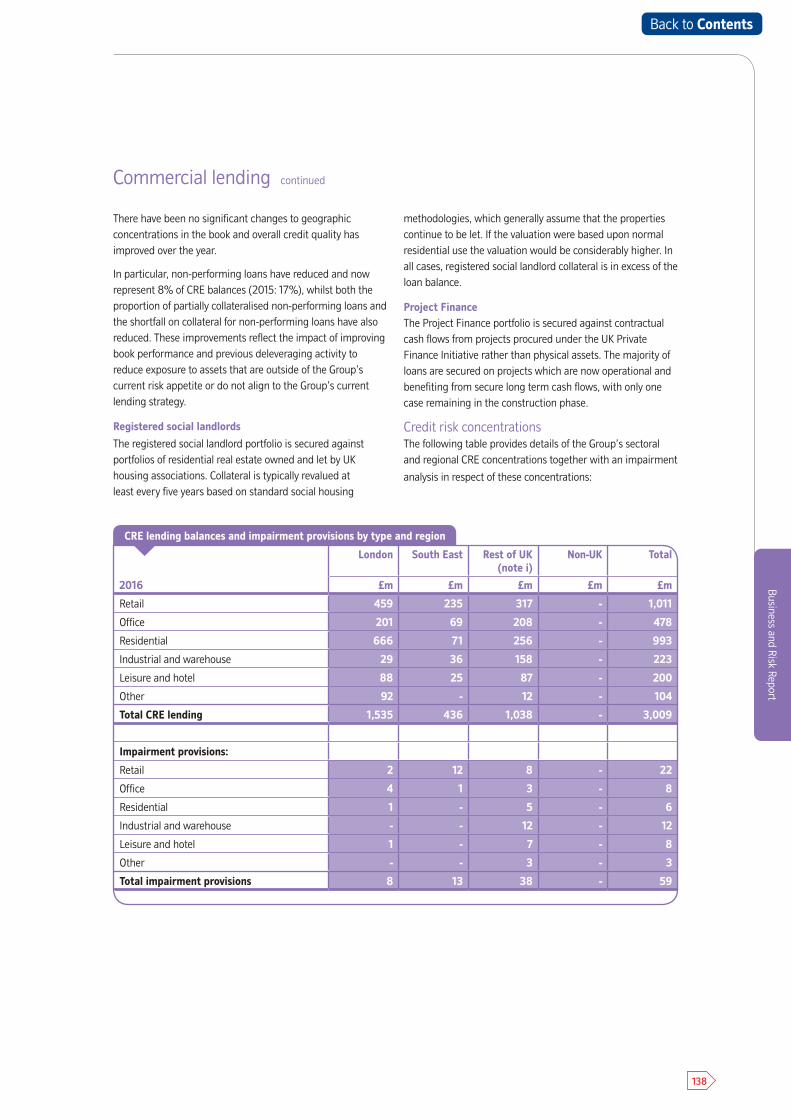
138
Business and Risk Report
Commercial lending continued
There have been no significant changes to geographic concentrations in the book and overall credit quality has improved over the year.
In particular, non-performing loans have reduced and now represent 8% of CRE balances (2015: 17%), whilst both the proportion of partially collateralised non-performing loans and the shortfall on collateral for non-performing loans have also reduced. These improvements reflect the impact of improving book performance and previous deleveraging activity to reduce exposure to assets that are outside of the Group’s current risk appetite or do not align to the Group’s current lending strategy.
Registered social landlords
The registered social landlord portfolio is secured against portfolios of residential real estate owned and let by UK housing associations. Collateral is typically revalued at least every five years based on standard social housing
methodologies, which generally assume that the properties continue to be let. If the valuation were based upon normal residential use the valuation would be considerably higher. In all cases, registered social landlord collateral is in excess of the loan balance.
Project FinanceThe Project Finance portfolio is secured against contractual cash flows from projects procured under the UK Private Finance Initiative rather than physical assets. The majority of loans are secured on projects which are now operational and benefiting from secure long term cash flows, with only one case remaining in the construction phase.
Credit risk concentrationsThe following table provides details of the Group’s sectoral and regional CRE concentrations together with an impairment
analysis in respect of these concentrations:
London South East Rest of UK (note i)
Non-UK Total
2016 £m £m £m £m £m
Retail 459 235 317 - 1,011
Office 201 69 208 - 478
Residential 666 71 256 - 993
Industrial and warehouse 29 36 158 - 223
Leisure and hotel 88 25 87 - 200
Other 92 - 12 - 104
Total CRE lending 1,535 436 1,038 - 3,009
Impairment provisions:
Retail 2 12 8 - 22
Office 4 1 3 - 8
Residential 1 - 5 - 6
Industrial and warehouse - - 12 - 12
Leisure and hotel 1 - 7 - 8
Other - - 3 - 3
Total impairment provisions 8 13 38 - 59
CRE lending balances and impairment provisions by type and region
Back to Contents
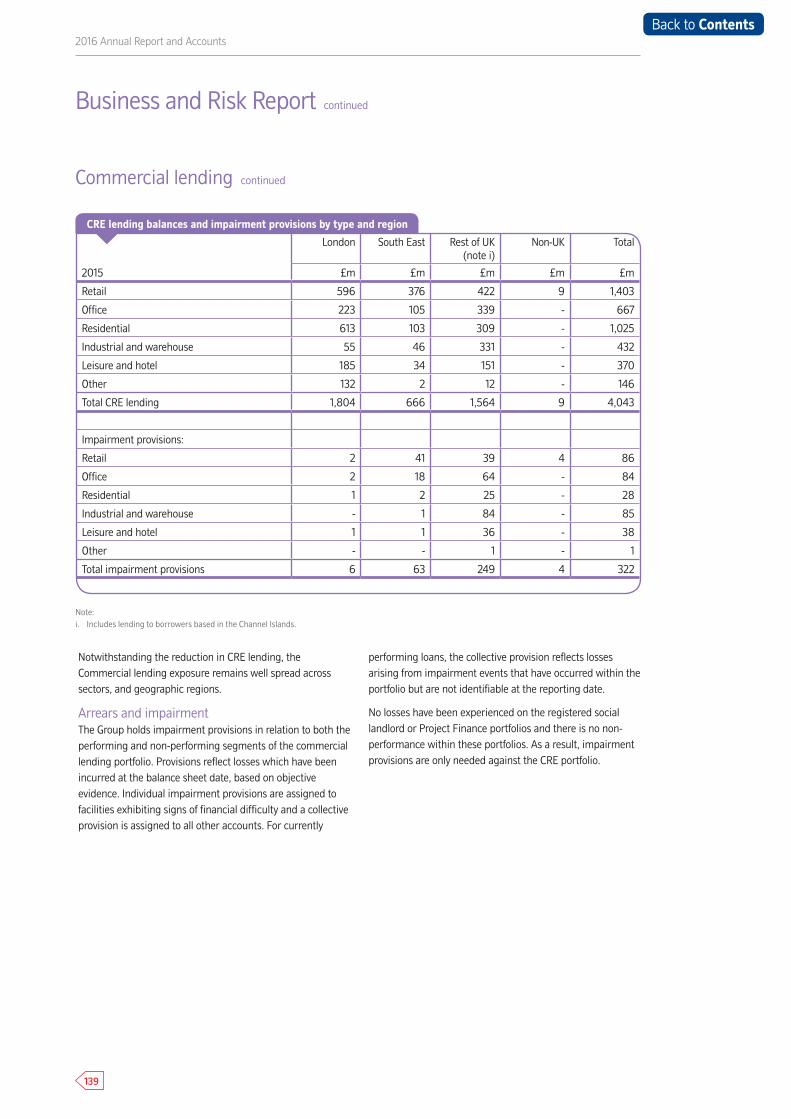
139
2016 Annual Report and Accounts
London South East Rest of UK (note i)
Non-UK Total
2015 £m £m £m £m £m
Retail 596 376 422 9 1,403
Office 223 105 339 - 667
Residential 613 103 309 - 1,025
Industrial and warehouse 55 46 331 - 432
Leisure and hotel 185 34 151 - 370
Other 132 2 12 - 146
Total CRE lending 1,804 666 1,564 9 4,043
Impairment provisions:
Retail 2 41 39 4 86
Office 2 18 64 - 84
Residential 1 2 25 - 28
Industrial and warehouse - 1 84 - 85
Leisure and hotel 1 1 36 - 38
Other - - 1 - 1
Total impairment provisions 6 63 249 4 322
Notwithstanding the reduction in CRE lending, the Commercial lending exposure remains well spread across sectors, and geographic regions.
Arrears and impairmentThe Group holds impairment provisions in relation to both the performing and non-performing segments of the commercial lending portfolio. Provisions reflect losses which have been incurred at the balance sheet date, based on objective evidence. Individual impairment provisions are assigned to facilities exhibiting signs of financial difficulty and a collective provision is assigned to all other accounts. For currently
performing loans, the collective provision reflects losses arising from impairment events that have occurred within the portfolio but are not identifiable at the reporting date.
No losses have been experienced on the registered social landlord or Project Finance portfolios and there is no non-performance within these portfolios. As a result, impairment provisions are only needed against the CRE portfolio.
Business and Risk Report continued
Commercial lending continued
CRE lending balances and impairment provisions by type and region
Note:i. Includes lending to borrowers based in the Channel Islands.
Back to Contents
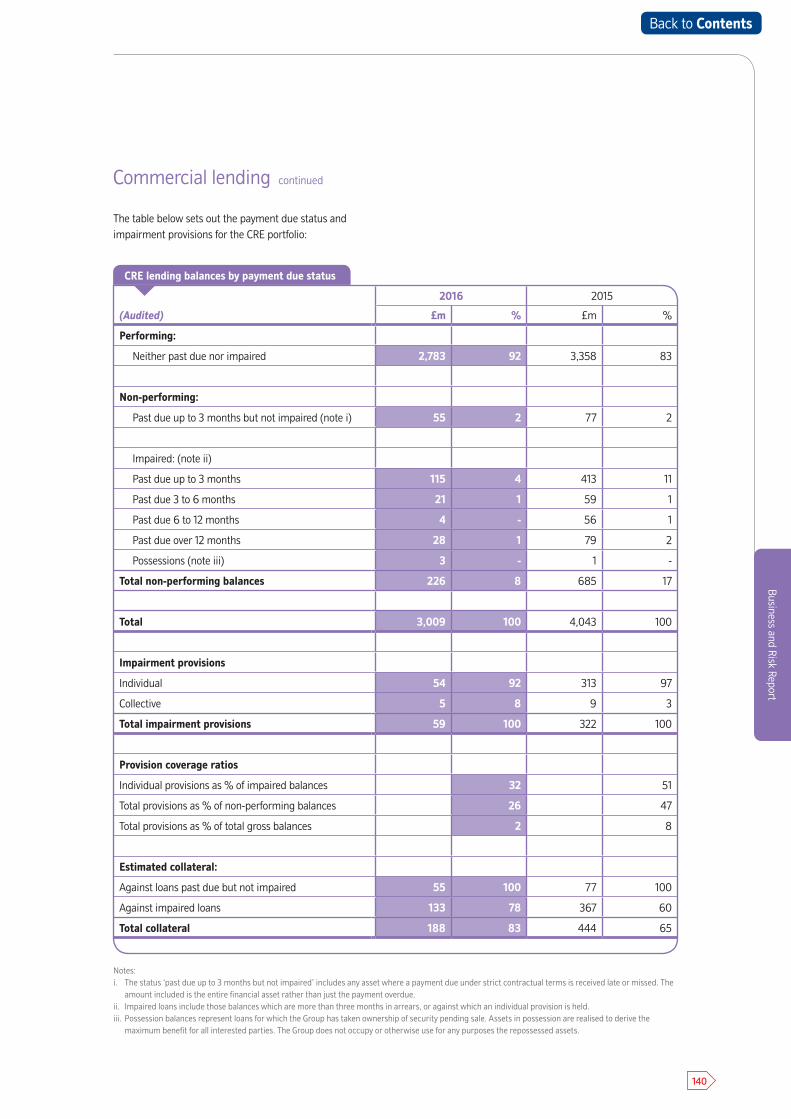
140
Business and Risk Report
The table below sets out the payment due status and impairment provisions for the CRE portfolio:
Commercial lending continued
Notes:i. The status ‘past due up to 3 months but not impaired’ includes any asset where a payment due under strict contractual terms is received late or missed. The
amount included is the entire financial asset rather than just the payment overdue.ii. Impaired loans include those balances which are more than three months in arrears, or against which an individual provision is held.iii. Possession balances represent loans for which the Group has taken ownership of security pending sale. Assets in possession are realised to derive the
maximum benefit for all interested parties. The Group does not occupy or otherwise use for any purposes the repossessed assets.
2016 2015
(Audited) £m % £m %
Performing:
Neither past due nor impaired 2,783 92 3,358 83
Non-performing:
Past due up to 3 months but not impaired (note i) 55 2 77 2
Impaired: (note ii)
Past due up to 3 months 115 4 413 11
Past due 3 to 6 months 21 1 59 1
Past due 6 to 12 months 4 - 56 1
Past due over 12 months 28 1 79 2
Possessions (note iii) 3 - 1 -
Total non-performing balances 226 8 685 17
Total 3,009 100 4,043 100
Impairment provisions
Individual 54 92 313 97
Collective 5 8 9 3
Total impairment provisions 59 100 322 100
Provision coverage ratios
Individual provisions as % of impaired balances 32 51
Total provisions as % of non-performing balances 26 47
Total provisions as % of total gross balances 2 8
Estimated collateral:
Against loans past due but not impaired 55 100 77 100
Against impaired loans 133 78 367 60
Total collateral 188 83 444 65
CRE lending balances by payment due status
Back to Contents
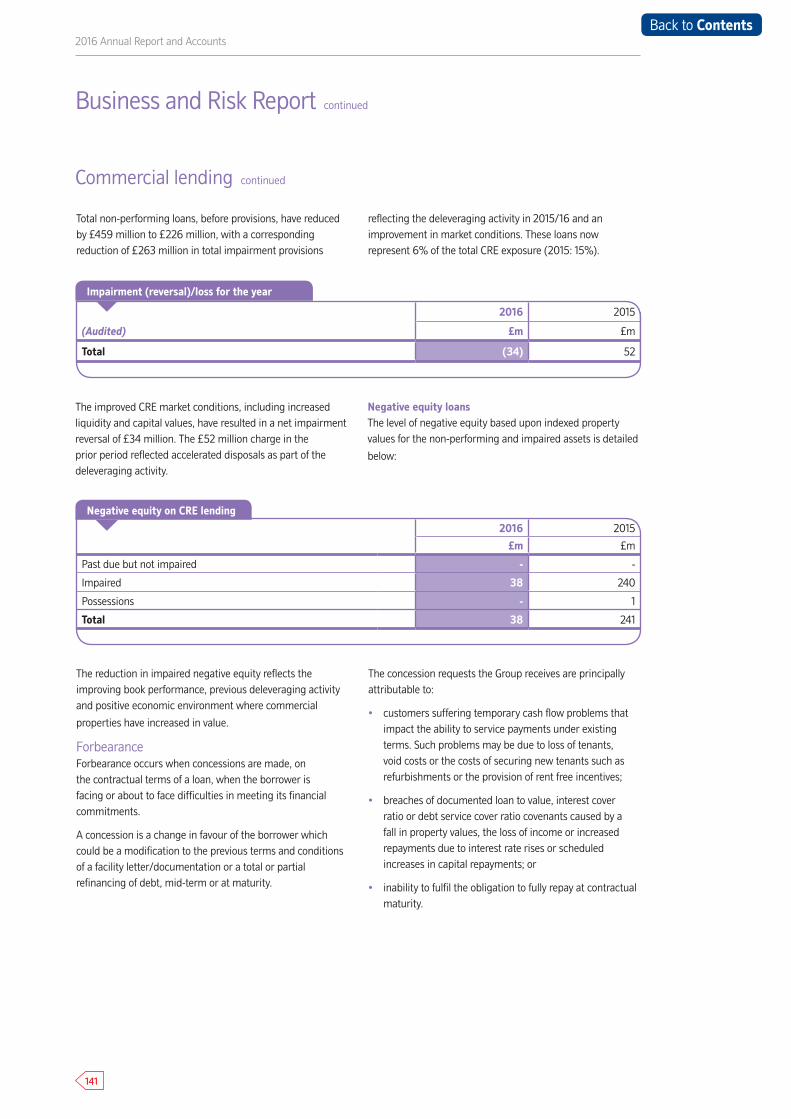
141
2016 Annual Report and Accounts
Total non-performing loans, before provisions, have reduced by £459 million to £226 million, with a corresponding reduction of £263 million in total impairment provisions
reflecting the deleveraging activity in 2015/16 and an improvement in market conditions. These loans now represent 6% of the total CRE exposure (2015: 15%).
2016 2015
(Audited) £m £m
Total (34) 52
The improved CRE market conditions, including increased liquidity and capital values, have resulted in a net impairment reversal of £34 million. The £52 million charge in the prior period reflected accelerated disposals as part of the deleveraging activity.
Negative equity loansThe level of negative equity based upon indexed property values for the non-performing and impaired assets is detailed
below:
The reduction in impaired negative equity reflects the improving book performance, previous deleveraging activity and positive economic environment where commercial
properties have increased in value.
ForbearanceForbearance occurs when concessions are made, on the contractual terms of a loan, when the borrower is facing or about to face difficulties in meeting its financial commitments.
A concession is a change in favour of the borrower which could be a modification to the previous terms and conditions of a facility letter/documentation or a total or partial refinancing of debt, mid-term or at maturity.
The concession requests the Group receives are principally attributable to:
• customers suffering temporary cash flow problems that impact the ability to service payments under existing terms. Such problems may be due to loss of tenants, void costs or the costs of securing new tenants such as refurbishments or the provision of rent free incentives;
• breaches of documented loan to value, interest cover ratio or debt service cover ratio covenants caused by a fall in property values, the loss of income or increased repayments due to interest rate rises or scheduled increases in capital repayments; or
• inability to fulfil the obligation to fully repay at contractual maturity.
Business and Risk Report continued
Commercial lending continued
Impairment (reversal)/loss for the year
2016 2015
£m £m
Past due but not impaired - -
Impaired 38 240
Possessions - 1
Total 38 241
Negative equity on CRE lending
Back to Contents
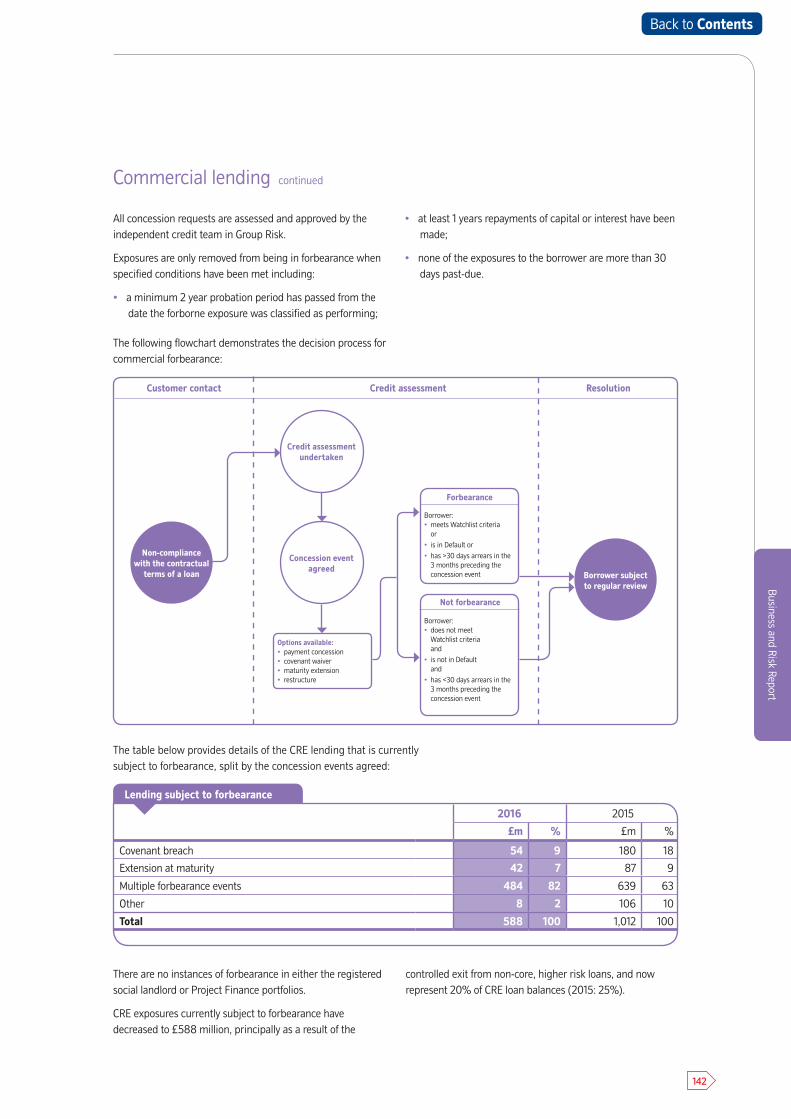
142
Business and Risk Report
All concession requests are assessed and approved by the independent credit team in Group Risk.
Exposures are only removed from being in forbearance when specified conditions have been met including:
• a minimum 2 year probation period has passed from the date the forborne exposure was classified as performing;
• at least 1 years repayments of capital or interest have been made;
• none of the exposures to the borrower are more than 30 days past-due.
Commercial lending continued
Credit assessment undertaken
Concession event agreed
Borrower subject to regular review
Credit assessment Customer contact Resolution
Options available:• payment concession• covenant waiver• maturity extension• restructure
Borrower:• meets Watchlist criteria
or• is in Default or• has >30 days arrears in the
3 months preceding the concession event
Forbearance
Not forbearance
Borrower:• does not meet
Watchlist criteria and
• is not in Default and
• has <30 days arrears in the 3 months preceding the concession event
Non-compliance with the contractual
terms of a loan
The following flowchart demonstrates the decision process for commercial forbearance:
The table below provides details of the CRE lending that is currently subject to forbearance, split by the concession events agreed:
There are no instances of forbearance in either the registered social landlord or Project Finance portfolios.
CRE exposures currently subject to forbearance have decreased to £588 million, principally as a result of the
controlled exit from non-core, higher risk loans, and now represent 20% of CRE loan balances (2015: 25%).
2016 2015
£m % £m %
Covenant breach 54 9 180 18
Extension at maturity 42 7 87 9
Multiple forbearance events 484 82 639 63
Other 8 2 106 10
Total 588 100 1,012 100
Lending subject to forbearance
Back to Contents
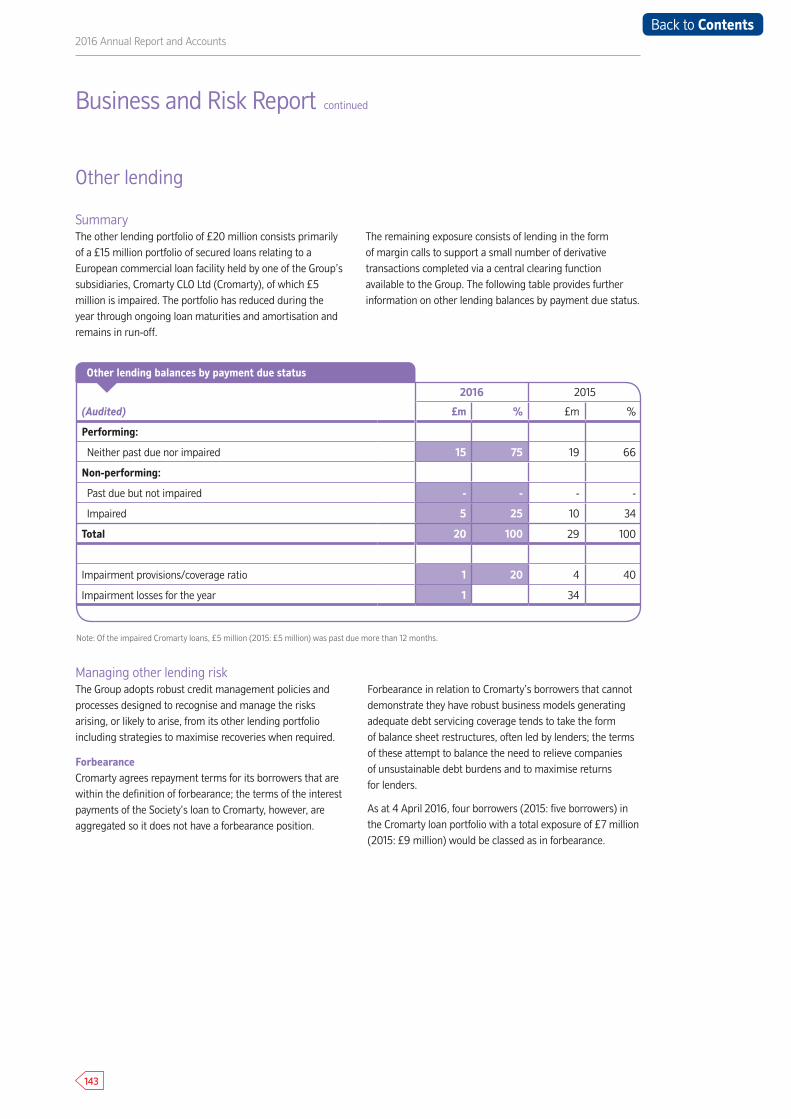
143
2016 Annual Report and Accounts
Managing other lending riskThe Group adopts robust credit management policies and processes designed to recognise and manage the risks arising, or likely to arise, from its other lending portfolio including strategies to maximise recoveries when required.
ForbearanceCromarty agrees repayment terms for its borrowers that are within the definition of forbearance; the terms of the interest payments of the Society’s loan to Cromarty, however, are aggregated so it does not have a forbearance position.
Forbearance in relation to Cromarty’s borrowers that cannot demonstrate they have robust business models generating adequate debt servicing coverage tends to take the form of balance sheet restructures, often led by lenders; the terms of these attempt to balance the need to relieve companies of unsustainable debt burdens and to maximise returns for lenders.
As at 4 April 2016, four borrowers (2015: five borrowers) in the Cromarty loan portfolio with a total exposure of £7 million (2015: £9 million) would be classed as in forbearance.
Business and Risk Report continued
SummaryThe other lending portfolio of £20 million consists primarily of a £15 million portfolio of secured loans relating to a European commercial loan facility held by one of the Group’s subsidiaries, Cromarty CLO Ltd (Cromarty), of which £5 million is impaired. The portfolio has reduced during the year through ongoing loan maturities and amortisation and remains in run-off.
The remaining exposure consists of lending in the form of margin calls to support a small number of derivative transactions completed via a central clearing function available to the Group. The following table provides further information on other lending balances by payment due status.
Other lending
(Audited)
2016 2015
£m % £m %
Performing:
Neither past due nor impaired 15 75 19 66
Non-performing:
Past due but not impaired - - - -
Impaired 5 25 10 34
Total 20 100 29 100
Impairment provisions/coverage ratio 1 20 4 40
Impairment losses for the year 1 34
Other lending balances by payment due status
Note: Of the impaired Cromarty loans, £5 million (2015: £5 million) was past due more than 12 months.
Back to Contents
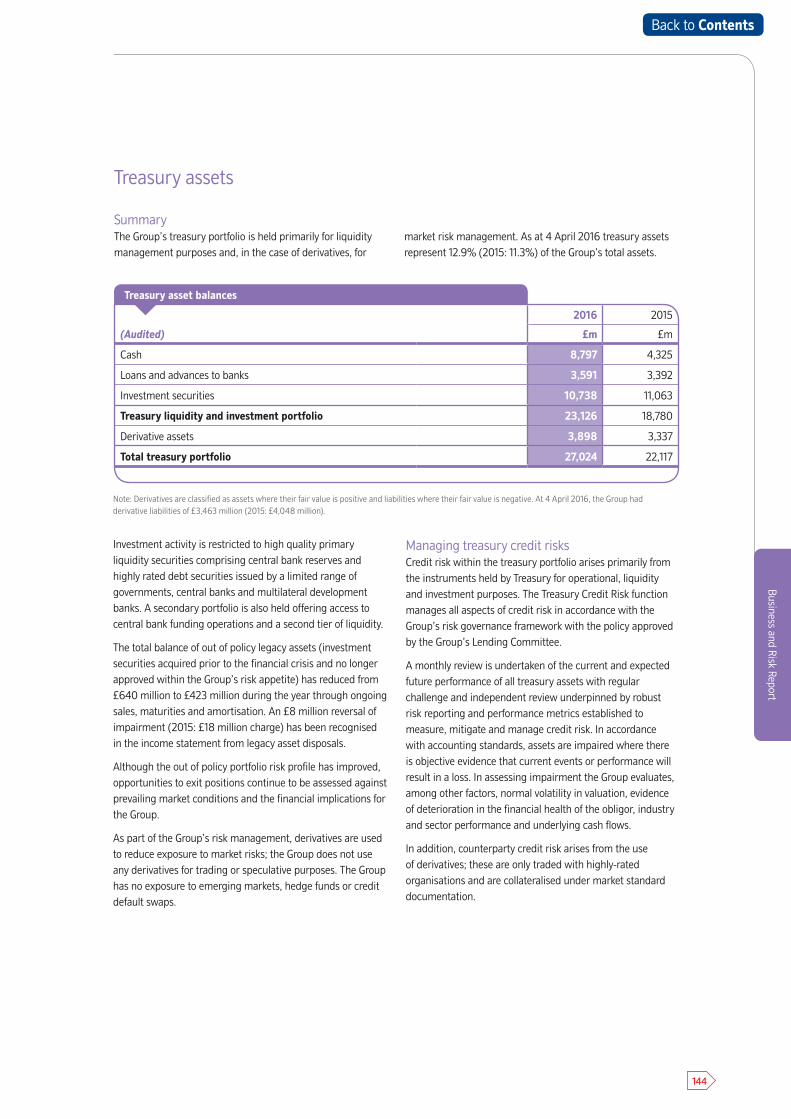
144
Business and Risk Report
Treasury assets
SummaryThe Group’s treasury portfolio is held primarily for liquidity management purposes and, in the case of derivatives, for
market risk management. As at 4 April 2016 treasury assets represent 12.9% (2015: 11.3%) of the Group’s total assets.
Investment activity is restricted to high quality primary liquidity securities comprising central bank reserves and highly rated debt securities issued by a limited range of governments, central banks and multilateral development banks. A secondary portfolio is also held offering access to central bank funding operations and a second tier of liquidity.
The total balance of out of policy legacy assets (investment securities acquired prior to the financial crisis and no longer approved within the Group’s risk appetite) has reduced from £640 million to £423 million during the year through ongoing sales, maturities and amortisation. An £8 million reversal of impairment (2015: £18 million charge) has been recognised in the income statement from legacy asset disposals.
Although the out of policy portfolio risk profile has improved, opportunities to exit positions continue to be assessed against prevailing market conditions and the financial implications for the Group.
As part of the Group’s risk management, derivatives are used to reduce exposure to market risks; the Group does not use any derivatives for trading or speculative purposes. The Group has no exposure to emerging markets, hedge funds or credit default swaps.
Managing treasury credit risksCredit risk within the treasury portfolio arises primarily from the instruments held by Treasury for operational, liquidity and investment purposes. The Treasury Credit Risk function manages all aspects of credit risk in accordance with the Group’s risk governance framework with the policy approved by the Group’s Lending Committee.
A monthly review is undertaken of the current and expected future performance of all treasury assets with regular challenge and independent review underpinned by robust risk reporting and performance metrics established to measure, mitigate and manage credit risk. In accordance with accounting standards, assets are impaired where there is objective evidence that current events or performance will result in a loss. In assessing impairment the Group evaluates, among other factors, normal volatility in valuation, evidence of deterioration in the financial health of the obligor, industry and sector performance and underlying cash flows.
In addition, counterparty credit risk arises from the use of derivatives; these are only traded with highly-rated organisations and are collateralised under market standard documentation.
2016 2015
(Audited) £m £m
Cash 8,797 4,325
Loans and advances to banks 3,591 3,392
Investment securities 10,738 11,063
Treasury liquidity and investment portfolio 23,126 18,780
Derivative assets 3,898 3,337
Total treasury portfolio 27,024 22,117
Treasury asset balances
Note: Derivatives are classified as assets where their fair value is positive and liabilities where their fair value is negative. At 4 April 2016, the Group had derivative liabilities of £3,463 million (2015: £4,048 million).
Back to Contents
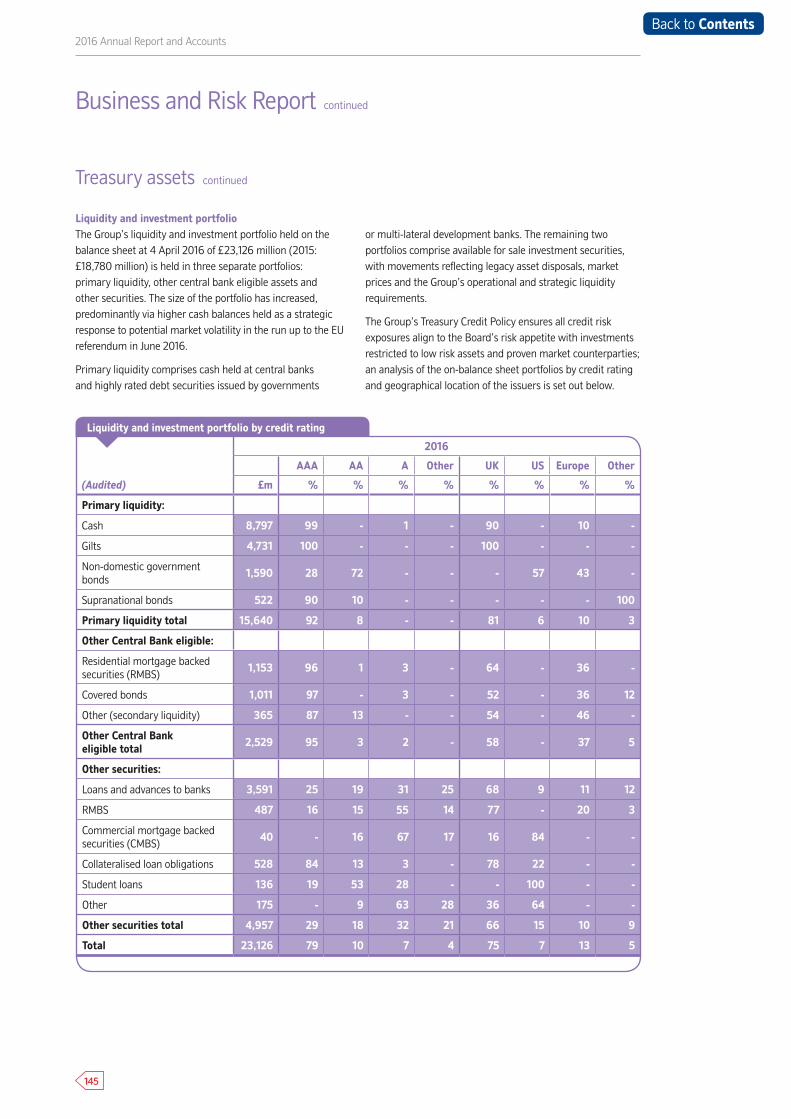
145
2016 Annual Report and Accounts
Business and Risk Report continued
Treasury assets continued
Liquidity and investment portfolioThe Group’s liquidity and investment portfolio held on the balance sheet at 4 April 2016 of £23,126 million (2015: £18,780 million) is held in three separate portfolios: primary liquidity, other central bank eligible assets and other securities. The size of the portfolio has increased, predominantly via higher cash balances held as a strategic response to potential market volatility in the run up to the EU referendum in June 2016.
Primary liquidity comprises cash held at central banks and highly rated debt securities issued by governments
or multi-lateral development banks. The remaining two portfolios comprise available for sale investment securities, with movements reflecting legacy asset disposals, market prices and the Group’s operational and strategic liquidity requirements.
The Group’s Treasury Credit Policy ensures all credit risk exposures align to the Board’s risk appetite with investments restricted to low risk assets and proven market counterparties; an analysis of the on-balance sheet portfolios by credit rating and geographical location of the issuers is set out below.
2016
AAA AA A Other UK US Europe Other
(Audited) £m % % % % % % % %
Primary liquidity:
Cash 8,797 99 - 1 - 90 - 10 -
Gilts 4,731 100 - - - 100 - - -
Non-domestic government bonds
1,590 28 72 - - - 57 43 -
Supranational bonds 522 90 10 - - - - - 100
Primary liquidity total 15,640 92 8 - - 81 6 10 3
Other Central Bank eligible:
Residential mortgage backed securities (RMBS)
1,153 96 1 3 - 64 - 36 -
Covered bonds 1,011 97 - 3 - 52 - 36 12
Other (secondary liquidity) 365 87 13 - - 54 - 46 -
Other Central Bank eligible total 2,529 95 3 2 - 58 - 37 5
Other securities:
Loans and advances to banks 3,591 25 19 31 25 68 9 11 12
RMBS 487 16 15 55 14 77 - 20 3
Commercial mortgage backed securities (CMBS)
40 - 16 67 17 16 84 - -
Collateralised loan obligations 528 84 13 3 - 78 22 - -
Student loans 136 19 53 28 - - 100 - -
Other 175 - 9 63 28 36 64 - -
Other securities total 4,957 29 18 32 21 66 15 10 9
Total 23,126 79 10 7 4 75 7 13 5
Liquidity and investment portfolio by credit rating
Back to Contents
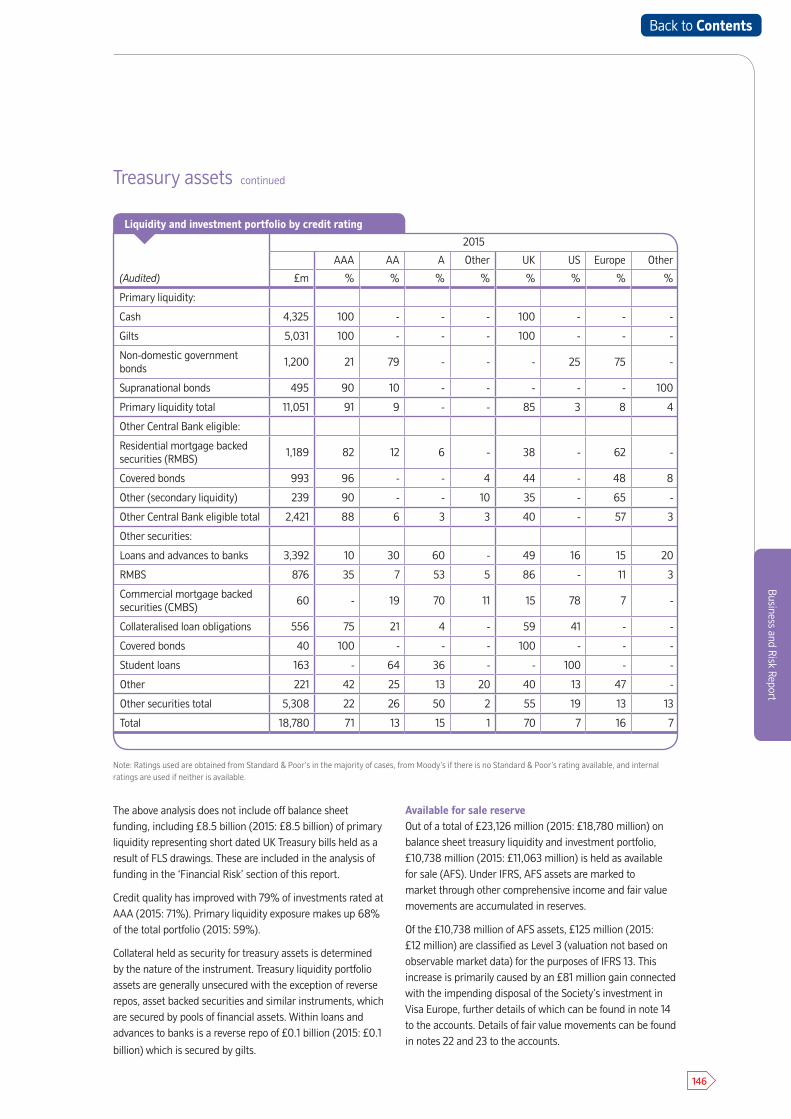
146
Business and Risk Report
2015
AAA AA A Other UK US Europe Other
(Audited) £m % % % % % % % %
Primary liquidity:
Cash 4,325 100 - - - 100 - - -
Gilts 5,031 100 - - - 100 - - -
Non-domestic government bonds
1,200 21 79 - - - 25 75 -
Supranational bonds 495 90 10 - - - - - 100
Primary liquidity total 11,051 91 9 - - 85 3 8 4
Other Central Bank eligible:
Residential mortgage backed securities (RMBS)
1,189 82 12 6 - 38 - 62 -
Covered bonds 993 96 - - 4 44 - 48 8
Other (secondary liquidity) 239 90 - - 10 35 - 65 -
Other Central Bank eligible total 2,421 88 6 3 3 40 - 57 3
Other securities:
Loans and advances to banks 3,392 10 30 60 - 49 16 15 20
RMBS 876 35 7 53 5 86 - 11 3
Commercial mortgage backed securities (CMBS)
60 - 19 70 11 15 78 7 -
Collateralised loan obligations 556 75 21 4 - 59 41 - -
Covered bonds 40 100 - - - 100 - - -
Student loans 163 - 64 36 - - 100 - -
Other 221 42 25 13 20 40 13 47 -
Other securities total 5,308 22 26 50 2 55 19 13 13
Total 18,780 71 13 15 1 70 7 16 7
The above analysis does not include off balance sheet funding, including £8.5 billion (2015: £8.5 billion) of primary liquidity representing short dated UK Treasury bills held as a result of FLS drawings. These are included in the analysis of funding in the ‘Financial Risk’ section of this report.
Credit quality has improved with 79% of investments rated at AAA (2015: 71%). Primary liquidity exposure makes up 68% of the total portfolio (2015: 59%).
Collateral held as security for treasury assets is determined by the nature of the instrument. Treasury liquidity portfolio assets are generally unsecured with the exception of reverse repos, asset backed securities and similar instruments, which are secured by pools of financial assets. Within loans and advances to banks is a reverse repo of £0.1 billion (2015: £0.1
billion) which is secured by gilts.
Available for sale reserveOut of a total of £23,126 million (2015: £18,780 million) on balance sheet treasury liquidity and investment portfolio, £10,738 million (2015: £11,063 million) is held as available for sale (AFS). Under IFRS, AFS assets are marked to market through other comprehensive income and fair value movements are accumulated in reserves.
Of the £10,738 million of AFS assets, £125 million (2015: £12 million) are classified as Level 3 (valuation not based on observable market data) for the purposes of IFRS 13. This increase is primarily caused by an £81 million gain connected with the impending disposal of the Society’s investment in Visa Europe, further details of which can be found in note 14 to the accounts. Details of fair value movements can be found in notes 22 and 23 to the accounts.
Liquidity and investment portfolio by credit rating
Note: Ratings used are obtained from Standard & Poor’s in the majority of cases, from Moody’s if there is no Standard & Poor’s rating available, and internal ratings are used if neither is available.
Treasury assets continued
Back to Contents
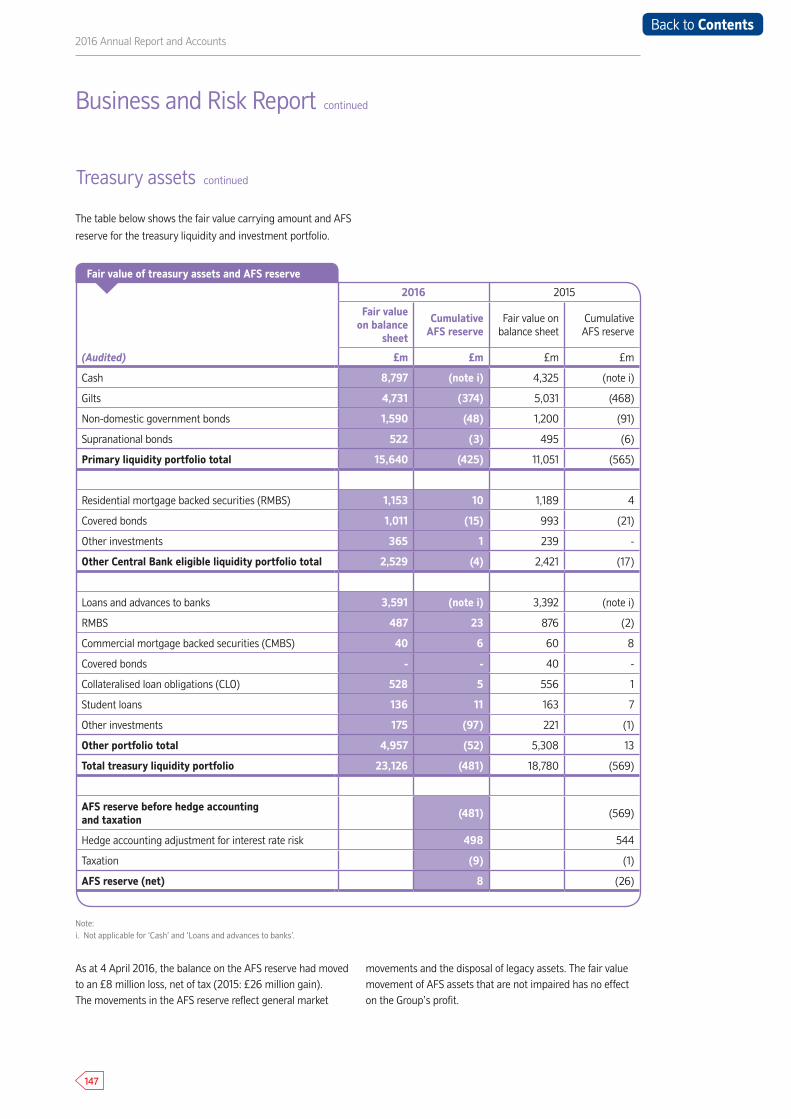
147
2016 Annual Report and Accounts
Treasury assets continued
The table below shows the fair value carrying amount and AFS
reserve for the treasury liquidity and investment portfolio.
2016 2015
Fair value on balance
sheet
Cumulative AFS reserve
Fair value on balance sheet
Cumulative AFS reserve
(Audited) £m £m £m £m
Cash 8,797 (note i) 4,325 (note i)
Gilts 4,731 (374) 5,031 (468)
Non-domestic government bonds 1,590 (48) 1,200 (91)
Supranational bonds 522 (3) 495 (6)
Primary liquidity portfolio total 15,640 (425) 11,051 (565)
Residential mortgage backed securities (RMBS) 1,153 10 1,189 4
Covered bonds 1,011 (15) 993 (21)
Other investments 365 1 239 -
Other Central Bank eligible liquidity portfolio total 2,529 (4) 2,421 (17)
Loans and advances to banks 3,591 (note i) 3,392 (note i)
RMBS 487 23 876 (2)
Commercial mortgage backed securities (CMBS) 40 6 60 8
Covered bonds - - 40 -
Collateralised loan obligations (CLO) 528 5 556 1
Student loans 136 11 163 7
Other investments 175 (97) 221 (1)
Other portfolio total 4,957 (52) 5,308 13
Total treasury liquidity portfolio 23,126 (481) 18,780 (569)
AFS reserve before hedge accounting and taxation (481) (569)
Hedge accounting adjustment for interest rate risk 498 544
Taxation (9) (1)
AFS reserve (net) 8 (26)
As at 4 April 2016, the balance on the AFS reserve had moved to an £8 million loss, net of tax (2015: £26 million gain). The movements in the AFS reserve reflect general market
movements and the disposal of legacy assets. The fair value movement of AFS assets that are not impaired has no effect on the Group’s profit.
Business and Risk Report continued
Fair value of treasury assets and AFS reserve
Note: i. Not applicable for ‘Cash’ and ‘Loans and advances to banks’.
Back to Contents
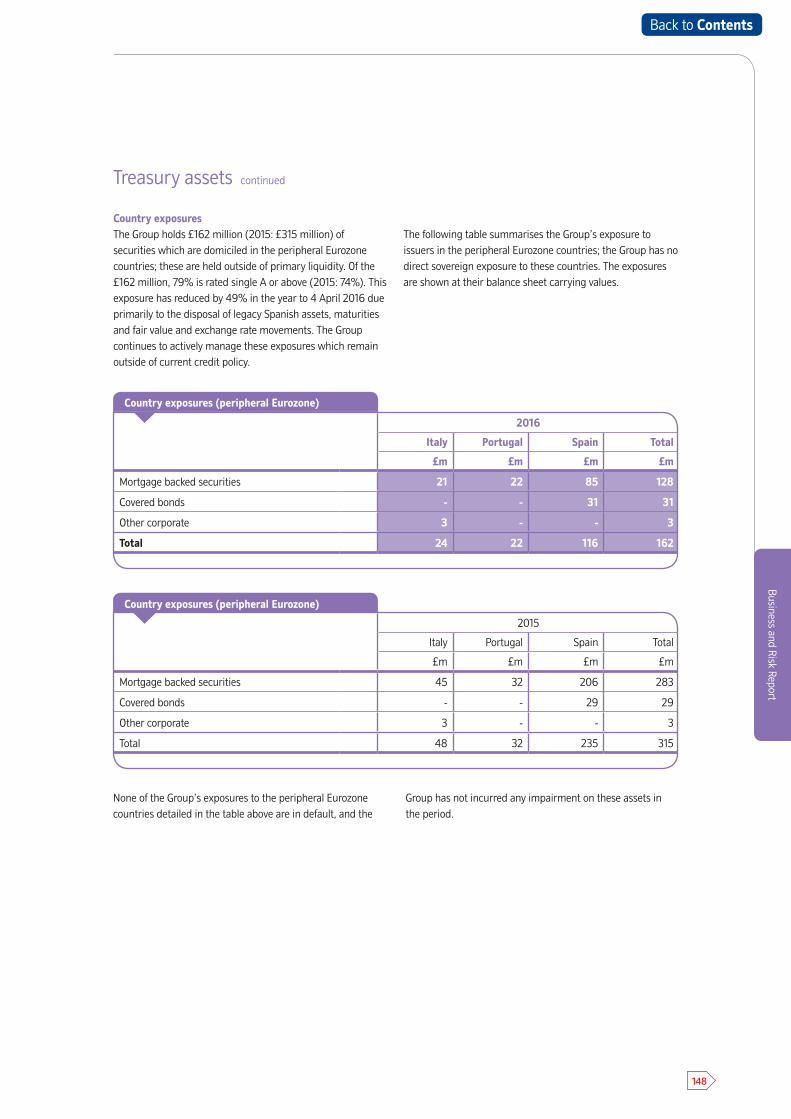
148
Business and Risk Report
Treasury assets continued
Country exposuresThe Group holds £162 million (2015: £315 million) of securities which are domiciled in the peripheral Eurozone countries; these are held outside of primary liquidity. Of the £162 million, 79% is rated single A or above (2015: 74%). This exposure has reduced by 49% in the year to 4 April 2016 due primarily to the disposal of legacy Spanish assets, maturities and fair value and exchange rate movements. The Group continues to actively manage these exposures which remain outside of current credit policy.
The following table summarises the Group’s exposure to issuers in the peripheral Eurozone countries; the Group has no direct sovereign exposure to these countries. The exposures are shown at their balance sheet carrying values.
2016
Italy Portugal Spain Total
£m £m £m £m
Mortgage backed securities 21 22 85 128
Covered bonds - - 31 31
Other corporate 3 - - 3
Total 24 22 116 162
2015
Italy Portugal Spain Total
£m £m £m £m
Mortgage backed securities 45 32 206 283
Covered bonds - - 29 29
Other corporate 3 - - 3
Total 48 32 235 315
None of the Group’s exposures to the peripheral Eurozone countries detailed in the table above are in default, and the
Group has not incurred any impairment on these assets in the period.
Country exposures (peripheral Eurozone)
Country exposures (peripheral Eurozone)
Back to Contents
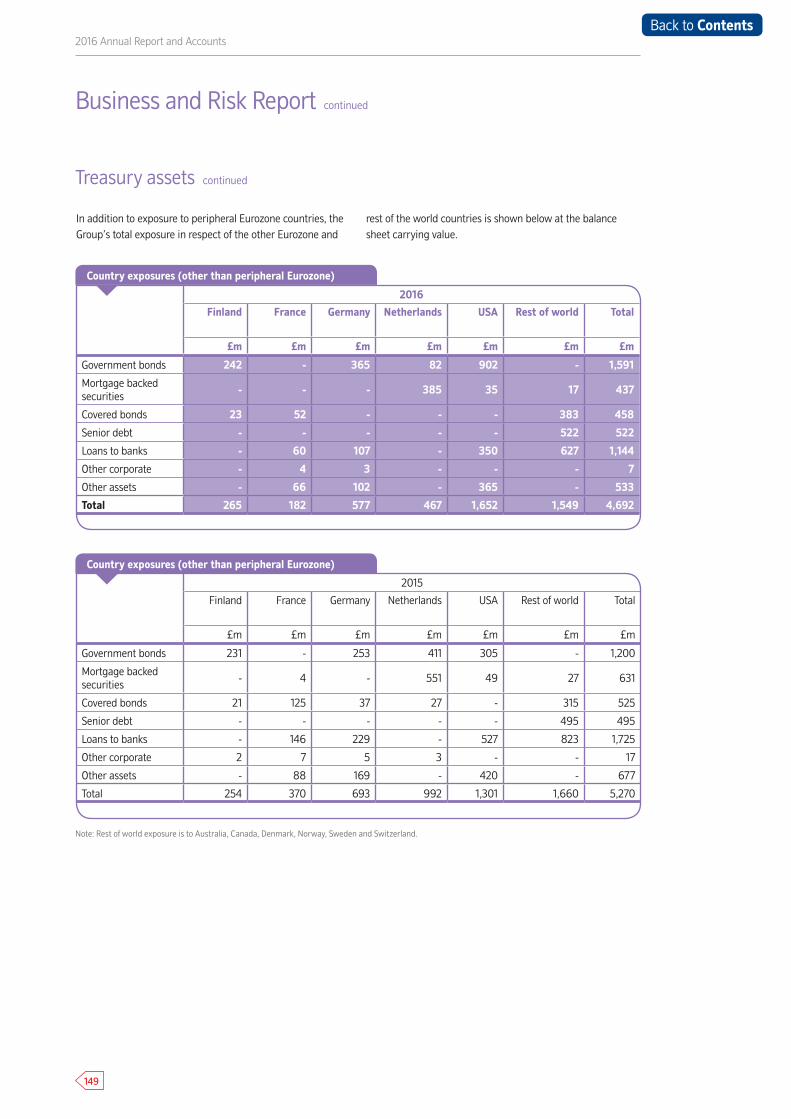
149
2016 Annual Report and Accounts
Treasury assets continued
In addition to exposure to peripheral Eurozone countries, the Group’s total exposure in respect of the other Eurozone and
rest of the world countries is shown below at the balance sheet carrying value.
Business and Risk Report continued
2016
Finland France Germany Netherlands USA Rest of world Total
£m £m £m £m £m £m £m
Government bonds 242 - 365 82 902 - 1,591
Mortgage backed securities
- - - 385 35 17 437
Covered bonds 23 52 - - - 383 458
Senior debt - - - - - 522 522
Loans to banks - 60 107 - 350 627 1,144
Other corporate - 4 3 - - - 7
Other assets - 66 102 - 365 - 533
Total 265 182 577 467 1,652 1,549 4,692
Country exposures (other than peripheral Eurozone)
2015
Finland France Germany Netherlands USA Rest of world Total
£m £m £m £m £m £m £m
Government bonds 231 - 253 411 305 - 1,200
Mortgage backed securities
- 4 - 551 49 27 631
Covered bonds 21 125 37 27 - 315 525
Senior debt - - - - - 495 495
Loans to banks - 146 229 - 527 823 1,725
Other corporate 2 7 5 3 - - 17
Other assets - 88 169 - 420 - 677
Total 254 370 693 992 1,301 1,660 5,270
Country exposures (other than peripheral Eurozone)
Note: Rest of world exposure is to Australia, Canada, Denmark, Norway, Sweden and Switzerland.
Back to Contents

150
Business and Risk Report
Treasury assets continued
Derivative financial instruments The Group uses derivatives to reduce exposure to market risks, although the application of accounting rules can create volatility in the income statement in a particular financial year. The fair value of derivative assets at 4 April 2016 was £3.9 billion (2015: £3.3 billion) and the fair value of derivative liabilities was £3.5 billion (2015: £4.0 billion).
The International Swaps and Derivatives Association (ISDA) Master Agreement is the Group’s preferred agreement for documenting derivative transactions. A Credit Support Annex (CSA) is always executed in conjunction with the ISDA Master Agreement. Under a CSA, collateral is passed between parties to mitigate the market contingent counterparty risk inherent in the outstanding positions. The Group’s CSAs are two-way agreements where both parties post collateral dependent on the exposure of the derivative. Collateral is paid or received on a regular basis (typically daily) to mitigate the mark to market exposures on derivatives.
The Group’s CSA legal documentation for derivative transactions grants legal rights of set off for transactions with the same overall counterparty. Accordingly, the credit risk associated with such positions is reduced to the extent that negative mark to market values offset positive mark to market values in the calculation of credit risk within each netting agreement.
As a result of CSA netting arrangements, outstanding transactions with the same counterparty can be offset and settled net following a default or other predetermined event. Under CSA arrangements netting benefits of £2.0 billion (2015: £1.9 billion) are available and £1.8 billion of collateral is held (2015: £1.3 billion) is available; cash is the only collateral held.
The following table shows the exposure to counterparty credit risk for derivative contracts after netting benefits and collateral:
Counterparty credit quality
(Audited)
2016 2015
AA A Total AA A Total
£bn £bn £bn £bn £bn £bn
Gross positive fair value of contracts 1.1 2.8 3.9 0.4 2.9 3.3
Netting benefits (0.5) (1.5) (2.0) (0.3) (1.6) (1.9)
Net current credit exposure 0.6 1.3 1.9 0.1 1.3 1.4
Collateral held (0.6) (1.2) (1.8) (0.1) (1.2) (1.3)
Net derivative credit exposure - 0.1 0.1 - 0.1 0.1
Derivative credit exposure
Back to Contents
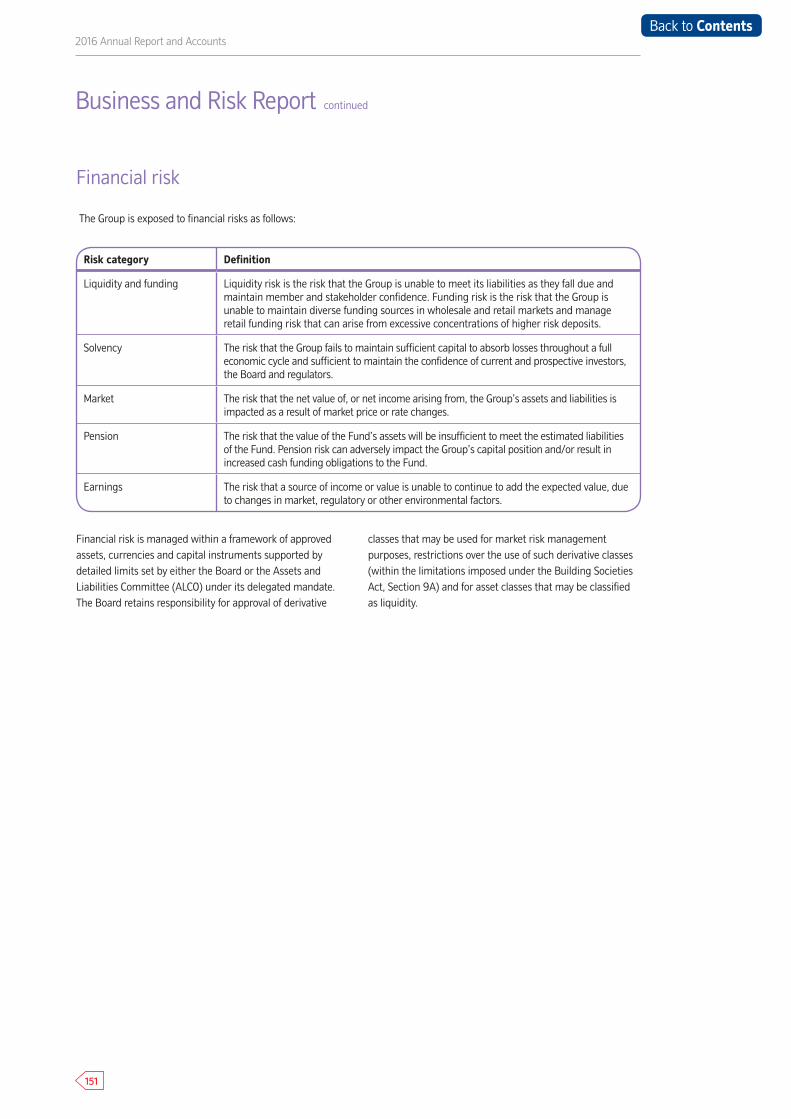
151
2016 Annual Report and Accounts
Financial risk
The Group is exposed to financial risks as follows:
Financial risk is managed within a framework of approved assets, currencies and capital instruments supported by detailed limits set by either the Board or the Assets and Liabilities Committee (ALCO) under its delegated mandate. The Board retains responsibility for approval of derivative
classes that may be used for market risk management purposes, restrictions over the use of such derivative classes (within the limitations imposed under the Building Societies Act, Section 9A) and for asset classes that may be classified as liquidity.
Risk category Definition
Liquidity and funding Liquidity risk is the risk that the Group is unable to meet its liabilities as they fall due and maintain member and stakeholder confidence. Funding risk is the risk that the Group is unable to maintain diverse funding sources in wholesale and retail markets and manage retail funding risk that can arise from excessive concentrations of higher risk deposits.
Solvency The risk that the Group fails to maintain sufficient capital to absorb losses throughout a full economic cycle and sufficient to maintain the confidence of current and prospective investors, the Board and regulators.
Market The risk that the net value of, or net income arising from, the Group’s assets and liabilities is impacted as a result of market price or rate changes.
Pension The risk that the value of the Fund’s assets will be insufficient to meet the estimated liabilities of the Fund. Pension risk can adversely impact the Group’s capital position and/or result in increased cash funding obligations to the Fund.
Earnings The risk that a source of income or value is unable to continue to add the expected value, due to changes in market, regulatory or other environmental factors.
Business and Risk Report continued
Back to Contents
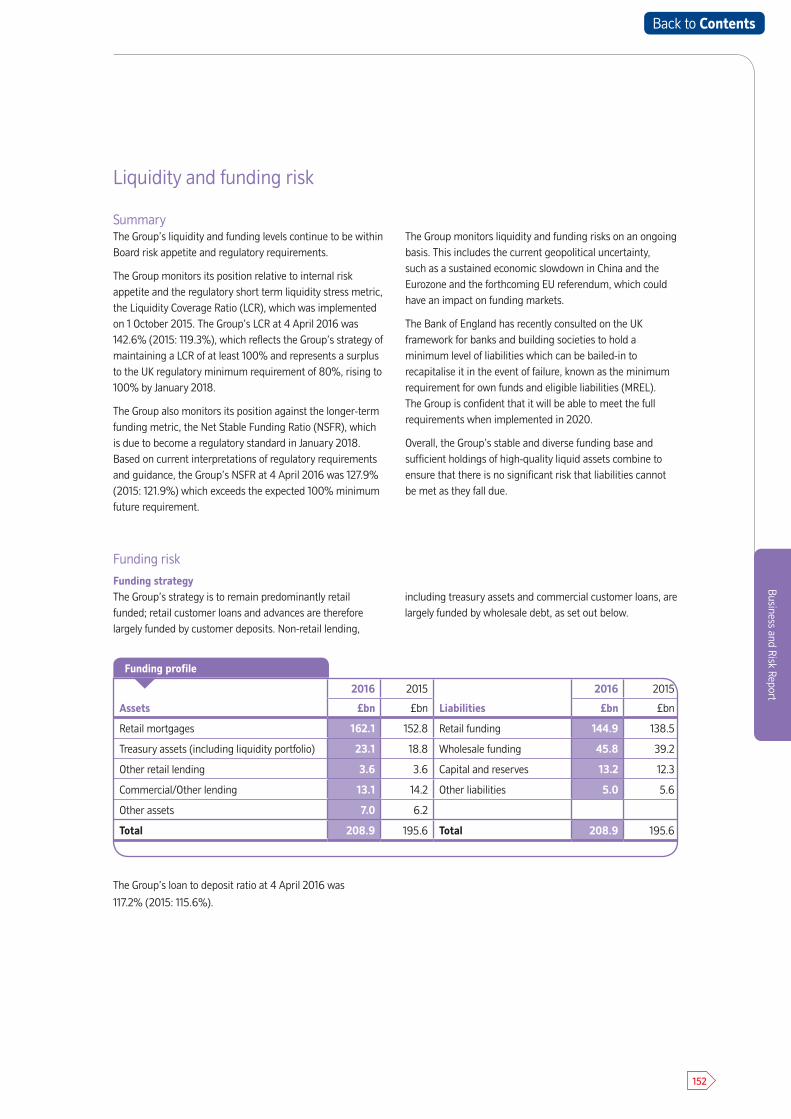
152
Business and Risk Report
Liquidity and funding risk
Funding risk
Funding strategyThe Group’s strategy is to remain predominantly retail funded; retail customer loans and advances are therefore largely funded by customer deposits. Non-retail lending,
including treasury assets and commercial customer loans, are largely funded by wholesale debt, as set out below.
SummaryThe Group’s liquidity and funding levels continue to be within Board risk appetite and regulatory requirements.
The Group monitors its position relative to internal risk appetite and the regulatory short term liquidity stress metric, the Liquidity Coverage Ratio (LCR), which was implemented on 1 October 2015. The Group’s LCR at 4 April 2016 was 142.6% (2015: 119.3%), which reflects the Group’s strategy of maintaining a LCR of at least 100% and represents a surplus to the UK regulatory minimum requirement of 80%, rising to 100% by January 2018.
The Group also monitors its position against the longer-term funding metric, the Net Stable Funding Ratio (NSFR), which is due to become a regulatory standard in January 2018. Based on current interpretations of regulatory requirements and guidance, the Group’s NSFR at 4 April 2016 was 127.9% (2015: 121.9%) which exceeds the expected 100% minimum future requirement.
The Group monitors liquidity and funding risks on an ongoing basis. This includes the current geopolitical uncertainty, such as a sustained economic slowdown in China and the Eurozone and the forthcoming EU referendum, which could have an impact on funding markets.
The Bank of England has recently consulted on the UK framework for banks and building societies to hold a minimum level of liabilities which can be bailed-in to recapitalise it in the event of failure, known as the minimum requirement for own funds and eligible liabilities (MREL). The Group is confident that it will be able to meet the full requirements when implemented in 2020.
Overall, the Group’s stable and diverse funding base and sufficient holdings of high-quality liquid assets combine to ensure that there is no significant risk that liabilities cannot be met as they fall due.
Assets
2016 2015
Liabilities
2016 2015
£bn £bn £bn £bn
Retail mortgages 162.1 152.8 Retail funding 144.9 138.5
Treasury assets (including liquidity portfolio) 23.1 18.8 Wholesale funding 45.8 39.2
Other retail lending 3.6 3.6 Capital and reserves 13.2 12.3
Commercial/Other lending 13.1 14.2 Other liabilities 5.0 5.6
Other assets 7.0 6.2
Total 208.9 195.6 Total 208.9 195.6
The Group’s loan to deposit ratio at 4 April 2016 was
117.2% (2015: 115.6%).
Funding profile
Back to Contents
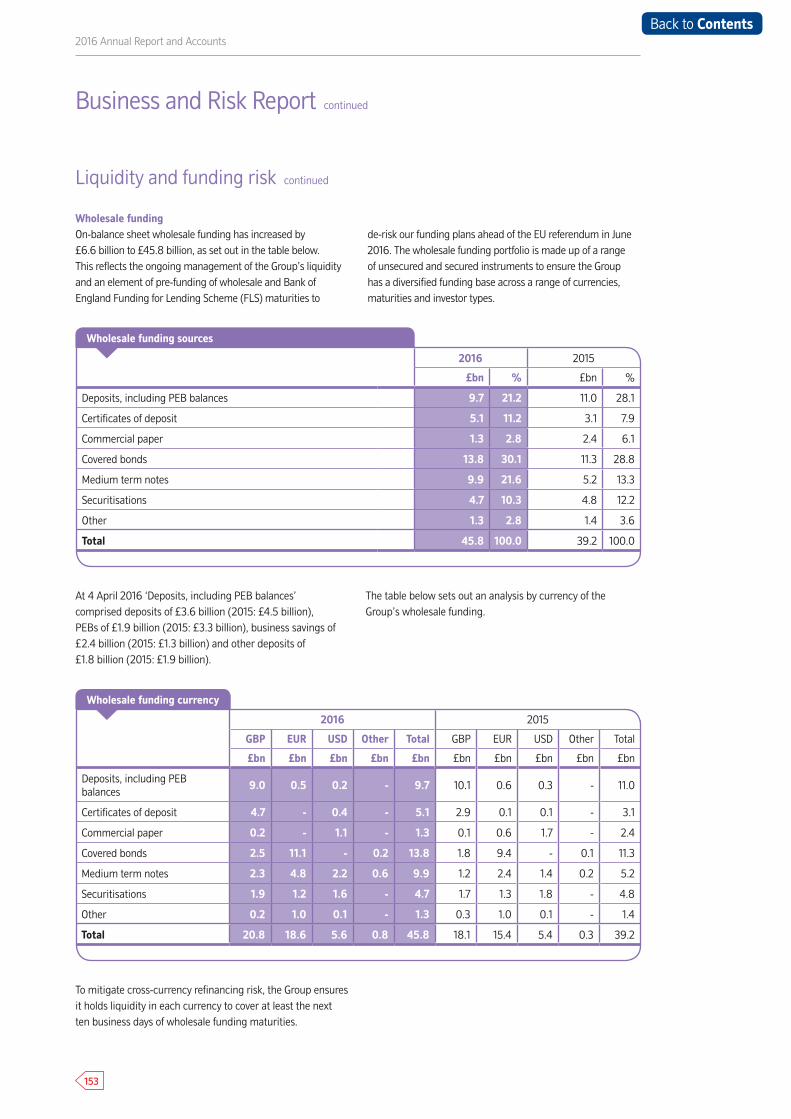
153
2016 Annual Report and Accounts
Liquidity and funding risk continued
Wholesale fundingOn-balance sheet wholesale funding has increased by £6.6 billion to £45.8 billion, as set out in the table below. This reflects the ongoing management of the Group’s liquidity and an element of pre-funding of wholesale and Bank of England Funding for Lending Scheme (FLS) maturities to
de-risk our funding plans ahead of the EU referendum in June 2016. The wholesale funding portfolio is made up of a range of unsecured and secured instruments to ensure the Group has a diversified funding base across a range of currencies, maturities and investor types.
At 4 April 2016 ‘Deposits, including PEB balances’ comprised deposits of £3.6 billion (2015: £4.5 billion), PEBs of £1.9 billion (2015: £3.3 billion), business savings of £2.4 billion (2015: £1.3 billion) and other deposits of £1.8 billion (2015: £1.9 billion).
The table below sets out an analysis by currency of the Group’s wholesale funding.
2016 2015
£bn % £bn %
Deposits, including PEB balances 9.7 21.2 11.0 28.1
Certificates of deposit 5.1 11.2 3.1 7.9
Commercial paper 1.3 2.8 2.4 6.1
Covered bonds 13.8 30.1 11.3 28.8
Medium term notes 9.9 21.6 5.2 13.3
Securitisations 4.7 10.3 4.8 12.2
Other 1.3 2.8 1.4 3.6
Total 45.8 100.0 39.2 100.0
To mitigate cross-currency refinancing risk, the Group ensures it holds liquidity in each currency to cover at least the next ten business days of wholesale funding maturities.
Business and Risk Report continued
Wholesale funding sources
2016 2015
GBP EUR USD Other Total GBP EUR USD Other Total
£bn £bn £bn £bn £bn £bn £bn £bn £bn £bn
Deposits, including PEB balances
9.0 0.5 0.2 - 9.7 10.1 0.6 0.3 - 11.0
Certificates of deposit 4.7 - 0.4 - 5.1 2.9 0.1 0.1 - 3.1
Commercial paper 0.2 - 1.1 - 1.3 0.1 0.6 1.7 - 2.4
Covered bonds 2.5 11.1 - 0.2 13.8 1.8 9.4 - 0.1 11.3
Medium term notes 2.3 4.8 2.2 0.6 9.9 1.2 2.4 1.4 0.2 5.2
Securitisations 1.9 1.2 1.6 - 4.7 1.7 1.3 1.8 - 4.8
Other 0.2 1.0 0.1 - 1.3 0.3 1.0 0.1 - 1.4
Total 20.8 18.6 5.6 0.8 45.8 18.1 15.4 5.4 0.3 39.2
Wholesale funding currency
Back to Contents
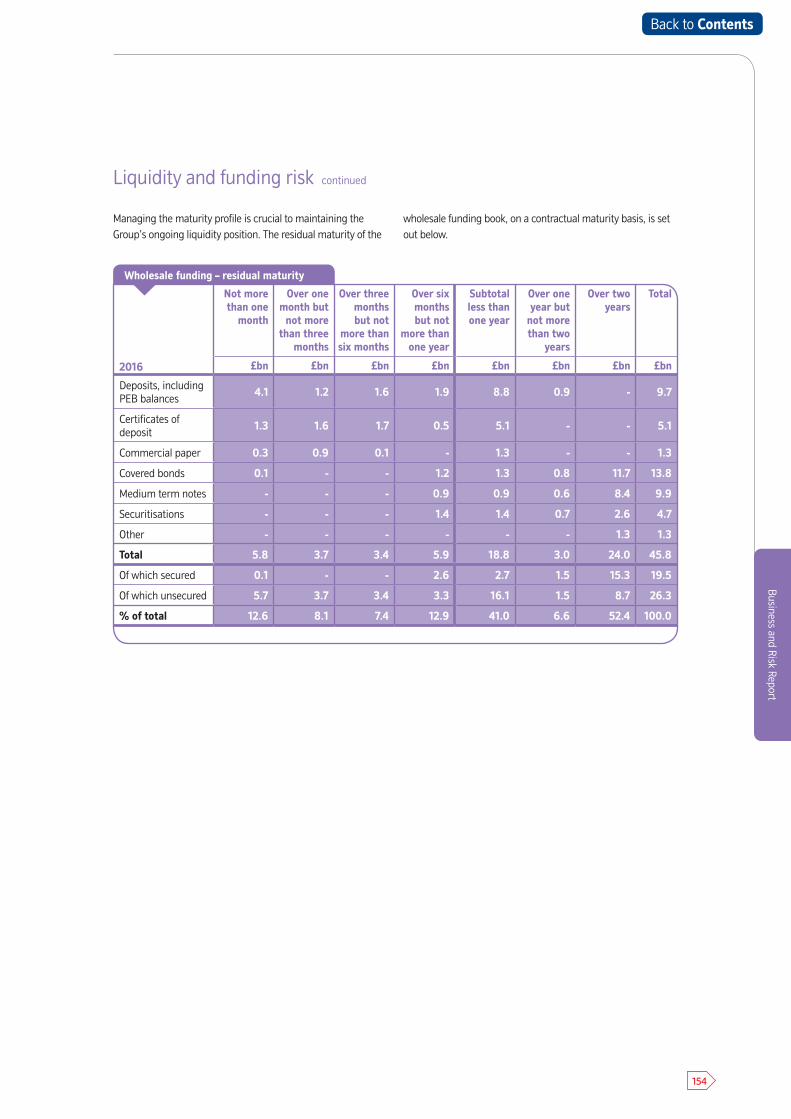
154
Business and Risk Report
Liquidity and funding risk continued
Managing the maturity profile is crucial to maintaining the Group’s ongoing liquidity position. The residual maturity of the
wholesale funding book, on a contractual maturity basis, is set out below.
2016
Not more than one
month
Over one month but
not more than three
months
Over three months but not
more than six months
Over six months but not
more than one year
Subtotal less than one year
Over one year but
not more than two
years
Over two years
Total
£bn £bn £bn £bn £bn £bn £bn £bn
Deposits, including PEB balances
4.1 1.2 1.6 1.9 8.8 0.9 - 9.7
Certificates of deposit
1.3 1.6 1.7 0.5 5.1 - - 5.1
Commercial paper 0.3 0.9 0.1 - 1.3 - - 1.3
Covered bonds 0.1 - - 1.2 1.3 0.8 11.7 13.8
Medium term notes - - - 0.9 0.9 0.6 8.4 9.9
Securitisations - - - 1.4 1.4 0.7 2.6 4.7
Other - - - - - - 1.3 1.3
Total 5.8 3.7 3.4 5.9 18.8 3.0 24.0 45.8
Of which secured 0.1 - - 2.6 2.7 1.5 15.3 19.5
Of which unsecured 5.7 3.7 3.4 3.3 16.1 1.5 8.7 26.3
% of total 12.6 8.1 7.4 12.9 41.0 6.6 52.4 100.0
Wholesale funding – residual maturity
Back to Contents
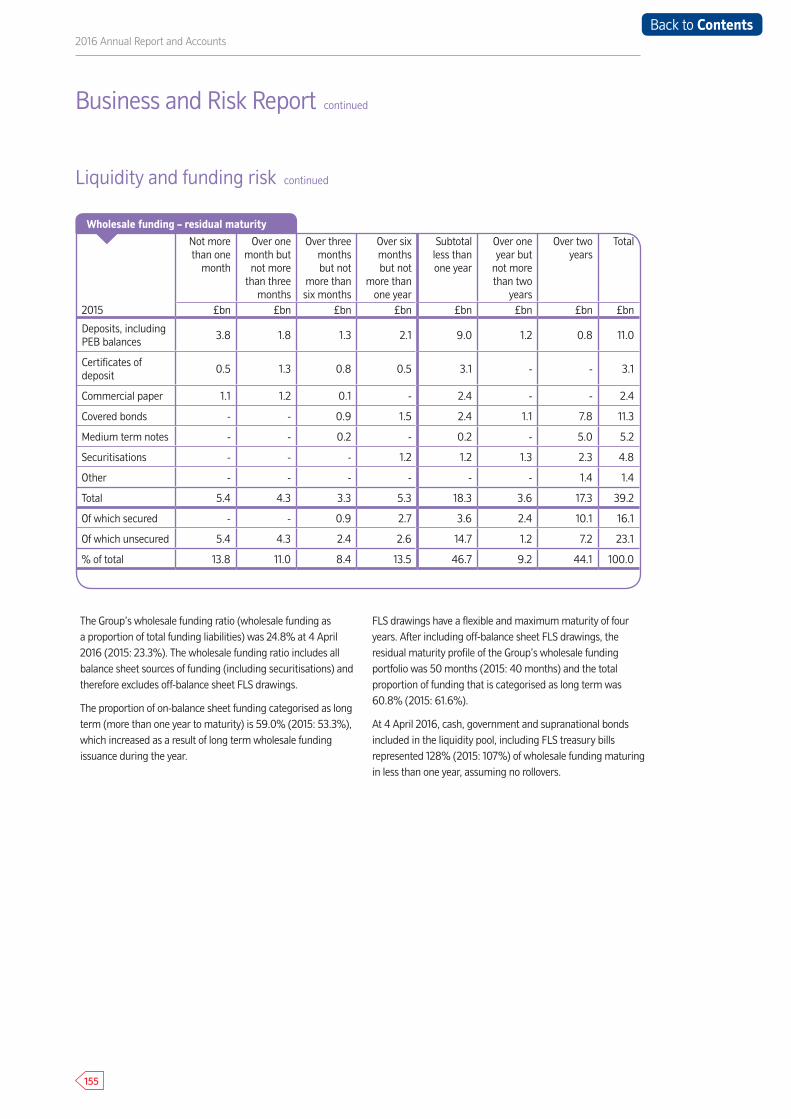
155
2016 Annual Report and Accounts
Liquidity and funding risk continued
Business and Risk Report continued
The Group’s wholesale funding ratio (wholesale funding as a proportion of total funding liabilities) was 24.8% at 4 April 2016 (2015: 23.3%). The wholesale funding ratio includes all balance sheet sources of funding (including securitisations) and therefore excludes off-balance sheet FLS drawings.
The proportion of on-balance sheet funding categorised as long term (more than one year to maturity) is 59.0% (2015: 53.3%), which increased as a result of long term wholesale funding issuance during the year.
FLS drawings have a flexible and maximum maturity of four years. After including off-balance sheet FLS drawings, the residual maturity profile of the Group’s wholesale funding portfolio was 50 months (2015: 40 months) and the total proportion of funding that is categorised as long term was 60.8% (2015: 61.6%).
At 4 April 2016, cash, government and supranational bonds included in the liquidity pool, including FLS treasury bills represented 128% (2015: 107%) of wholesale funding maturing in less than one year, assuming no rollovers.
2015
Not more than one
month
Over one month but
not more than three
months
Over three months but not
more than six months
Over six months but not
more than one year
Subtotal less than one year
Over one year but
not more than two
years
Over two years
Total
£bn £bn £bn £bn £bn £bn £bn £bn
Deposits, including PEB balances
3.8 1.8 1.3 2.1 9.0 1.2 0.8 11.0
Certificates of deposit
0.5 1.3 0.8 0.5 3.1 - - 3.1
Commercial paper 1.1 1.2 0.1 - 2.4 - - 2.4
Covered bonds - - 0.9 1.5 2.4 1.1 7.8 11.3
Medium term notes - - 0.2 - 0.2 - 5.0 5.2
Securitisations - - - 1.2 1.2 1.3 2.3 4.8
Other - - - - - - 1.4 1.4
Total 5.4 4.3 3.3 5.3 18.3 3.6 17.3 39.2
Of which secured - - 0.9 2.7 3.6 2.4 10.1 16.1
Of which unsecured 5.4 4.3 2.4 2.6 14.7 1.2 7.2 23.1
% of total 13.8 11.0 8.4 13.5 46.7 9.2 44.1 100.0
Wholesale funding – residual maturity
Back to Contents
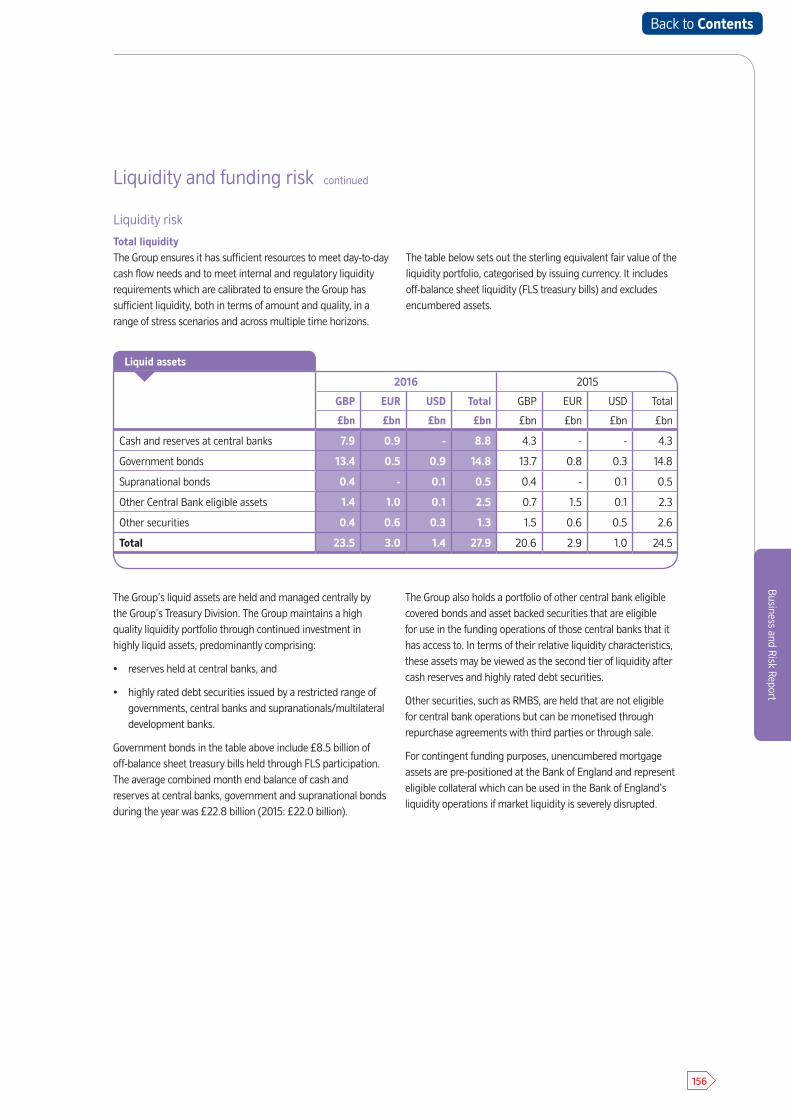
156
Business and Risk Report
Liquidity and funding risk continued
2016 2015
GBP EUR USD Total GBP EUR USD Total
£bn £bn £bn £bn £bn £bn £bn £bn
Cash and reserves at central banks 7.9 0.9 - 8.8 4.3 - - 4.3
Government bonds 13.4 0.5 0.9 14.8 13.7 0.8 0.3 14.8
Supranational bonds 0.4 - 0.1 0.5 0.4 - 0.1 0.5
Other Central Bank eligible assets 1.4 1.0 0.1 2.5 0.7 1.5 0.1 2.3
Other securities 0.4 0.6 0.3 1.3 1.5 0.6 0.5 2.6
Total 23.5 3.0 1.4 27.9 20.6 2.9 1.0 24.5
Liquidity risk
Total liquidityThe Group ensures it has sufficient resources to meet day-to-day cash flow needs and to meet internal and regulatory liquidity requirements which are calibrated to ensure the Group has sufficient liquidity, both in terms of amount and quality, in a range of stress scenarios and across multiple time horizons.
The table below sets out the sterling equivalent fair value of the liquidity portfolio, categorised by issuing currency. It includes off-balance sheet liquidity (FLS treasury bills) and excludes encumbered assets.
Liquid assets
The Group’s liquid assets are held and managed centrally by the Group’s Treasury Division. The Group maintains a high quality liquidity portfolio through continued investment in highly liquid assets, predominantly comprising:
• reserves held at central banks, and
• highly rated debt securities issued by a restricted range of governments, central banks and supranationals/multilateraldevelopment banks.
Government bonds in the table above include £8.5 billion of off-balance sheet treasury bills held through FLS participation. The average combined month end balance of cash and reserves at central banks, government and supranational bonds during the year was £22.8 billion (2015: £22.0 billion).
The Group also holds a portfolio of other central bank eligible covered bonds and asset backed securities that are eligible for use in the funding operations of those central banks that it has access to. In terms of their relative liquidity characteristics, these assets may be viewed as the second tier of liquidity after cash reserves and highly rated debt securities.
Other securities, such as RMBS, are held that are not eligible for central bank operations but can be monetised through repurchase agreements with third parties or through sale.
For contingent funding purposes, unencumbered mortgage assets are pre-positioned at the Bank of England and represent eligible collateral which can be used in the Bank of England’s liquidity operations if market liquidity is severely disrupted.
Back to Contents

157
2016 Annual Report and Accounts
Liquidity and funding risk continued
Business and Risk Report continued
Residual maturity of liquidity assets and liabilitiesThe table below segments the carrying value of financial assets and financial liabilities into relevant maturity groupings based on the final contractual maturity date (residual maturity). In practice, customer behaviours mean that liabilities are often retained for longer than their contractual maturities and assets are repaid faster. This gives rise to funding gaps on the Group’s balance sheet.
The balance sheet structure and risks are managed and monitored by ALCO. For forecasting purposes, the Group uses judgement and past behavioural performance of each asset and liability class to anticipate likely cash flow requirements of the Group.
The analysis below excludes certain non-financial assets (including property, plant and equipment, intangible assets, investment property, other assets, deferred tax assets and accrued income and expenses prepaid) and non-financial liabilities (including provisions for liabilities and charges, accruals and deferred income, current tax liabilities, other liabilities and retirement benefit obligations).
Back to Contents
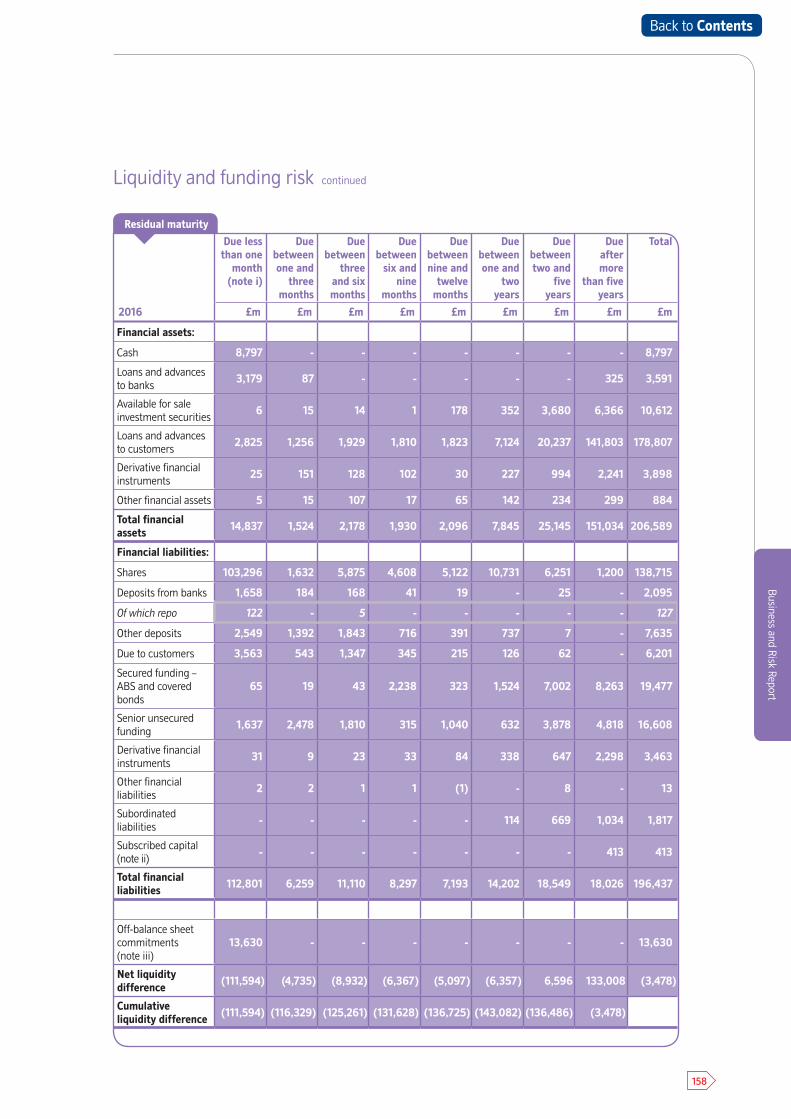
158
Business and Risk Report
Due less than one
month (note i)
Due between one and
three months
Due between
three and six months
Due between
six and nine
months
Due between nine and
twelve months
Due between one and
two years
Due between two and
five years
Due after more
than five years
Total
2016 £m £m £m £m £m £m £m £m £m
Financial assets:
Cash 8,797 - - - - - - - 8,797
Loans and advances to banks
3,179 87 - - - - - 325 3,591
Available for sale investment securities
6 15 14 1 178 352 3,680 6,366 10,612
Loans and advances to customers
2,825 1,256 1,929 1,810 1,823 7,124 20,237 141,803 178,807
Derivative financial instruments
25 151 128 102 30 227 994 2,241 3,898
Other financial assets 5 15 107 17 65 142 234 299 884
Total financial assets 14,837 1,524 2,178 1,930 2,096 7,845 25,145 151,034 206,589
Financial liabilities:
Shares 103,296 1,632 5,875 4,608 5,122 10,731 6,251 1,200 138,715
Deposits from banks 1,658 184 168 41 19 - 25 - 2,095
Of which repo 122 - 5 - - - - - 127
Other deposits 2,549 1,392 1,843 716 391 737 7 - 7,635
Due to customers 3,563 543 1,347 345 215 126 62 - 6,201
Secured funding – ABS and covered bonds
65 19 43 2,238 323 1,524 7,002 8,263 19,477
Senior unsecured funding
1,637 2,478 1,810 315 1,040 632 3,878 4,818 16,608
Derivative financial instruments
31 9 23 33 84 338 647 2,298 3,463
Other financial liabilities
2 2 1 1 (1) - 8 - 13
Subordinated liabilities
- - - - - 114 669 1,034 1,817
Subscribed capital (note ii)
- - - - - - - 413 413
Total financial liabilities 112,801 6,259 11,110 8,297 7,193 14,202 18,549 18,026 196,437
Off-balance sheet commitments (note iii)
13,630 - - - - - - - 13,630
Net liquidity difference (111,594) (4,735) (8,932) (6,367) (5,097) (6,357) 6,596 133,008 (3,478)
Cumulative liquidity difference (111,594) (116,329) (125,261) (131,628) (136,725) (143,082) (136,486) (3,478)
Residual maturity
Liquidity and funding risk continued
Back to Contents
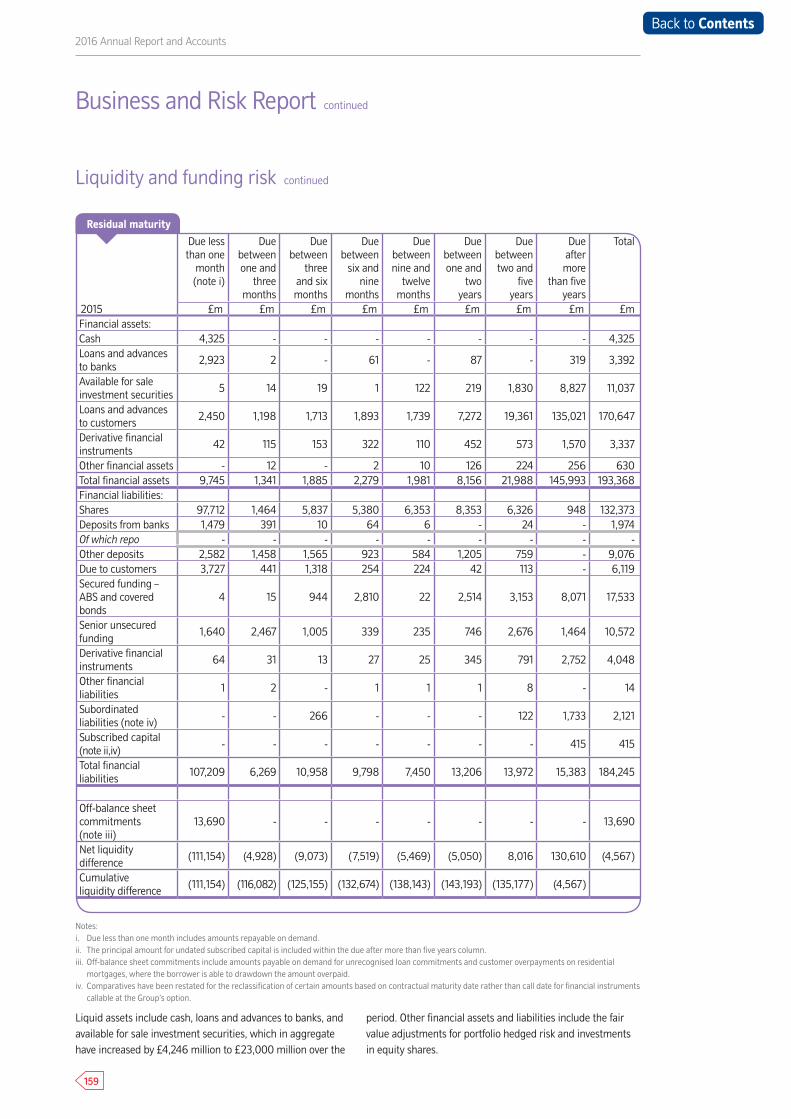
159
2016 Annual Report and Accounts
Liquidity and funding risk continued
Business and Risk Report continued
Due less than one
month (note i)
Due between one and
three months
Due between
three and six months
Due between
six and nine
months
Due between nine and
twelve months
Due between one and
two years
Due between two and
five years
Due after
more than five
years
Total
2015 £m £m £m £m £m £m £m £m £mFinancial assets:Cash 4,325 - - - - - - - 4,325Loans and advances to banks
2,923 2 - 61 - 87 - 319 3,392
Available for sale investment securities
5 14 19 1 122 219 1,830 8,827 11,037
Loans and advances to customers
2,450 1,198 1,713 1,893 1,739 7,272 19,361 135,021 170,647
Derivative financial instruments
42 115 153 322 110 452 573 1,570 3,337
Other financial assets - 12 - 2 10 126 224 256 630Total financial assets 9,745 1,341 1,885 2,279 1,981 8,156 21,988 145,993 193,368Financial liabilities: Shares 97,712 1,464 5,837 5,380 6,353 8,353 6,326 948 132,373Deposits from banks 1,479 391 10 64 6 - 24 - 1,974Of which repo - - - - - - - - -Other deposits 2,582 1,458 1,565 923 584 1,205 759 - 9,076Due to customers 3,727 441 1,318 254 224 42 113 - 6,119Secured funding – ABS and covered bonds
4 15 944 2,810 22 2,514 3,153 8,071 17,533
Senior unsecured funding
1,640 2,467 1,005 339 235 746 2,676 1,464 10,572
Derivative financial instruments
64 31 13 27 25 345 791 2,752 4,048
Other financial liabilities
1 2 - 1 1 1 8 - 14
Subordinated liabilities (note iv)
- - 266 - - - 122 1,733 2,121
Subscribed capital (note ii,iv)
- - - - - - - 415 415
Total financial liabilities
107,209 6,269 10,958 9,798 7,450 13,206 13,972 15,383 184,245
Off-balance sheet commitments (note iii)
13,690 - - - - - - - 13,690
Net liquidity difference
(111,154) (4,928) (9,073) (7,519) (5,469) (5,050) 8,016 130,610 (4,567)
Cumulative liquidity difference
(111,154) (116,082) (125,155) (132,674) (138,143) (143,193) (135,177) (4,567)
Residual maturity
Notes: i. Due less than one month includes amounts repayable on demand.ii. The principal amount for undated subscribed capital is included within the due after more than five years column.iii. Off-balance sheet commitments include amounts payable on demand for unrecognised loan commitments and customer overpayments on residential
mortgages, where the borrower is able to drawdown the amount overpaid.iv. Comparatives have been restated for the reclassification of certain amounts based on contractual maturity date rather than call date for financial instruments
callable at the Group’s option.
Liquid assets include cash, loans and advances to banks, and available for sale investment securities, which in aggregate have increased by £4,246 million to £23,000 million over the
period. Other financial assets and liabilities include the fair value adjustments for portfolio hedged risk and investments in equity shares.
Back to Contents
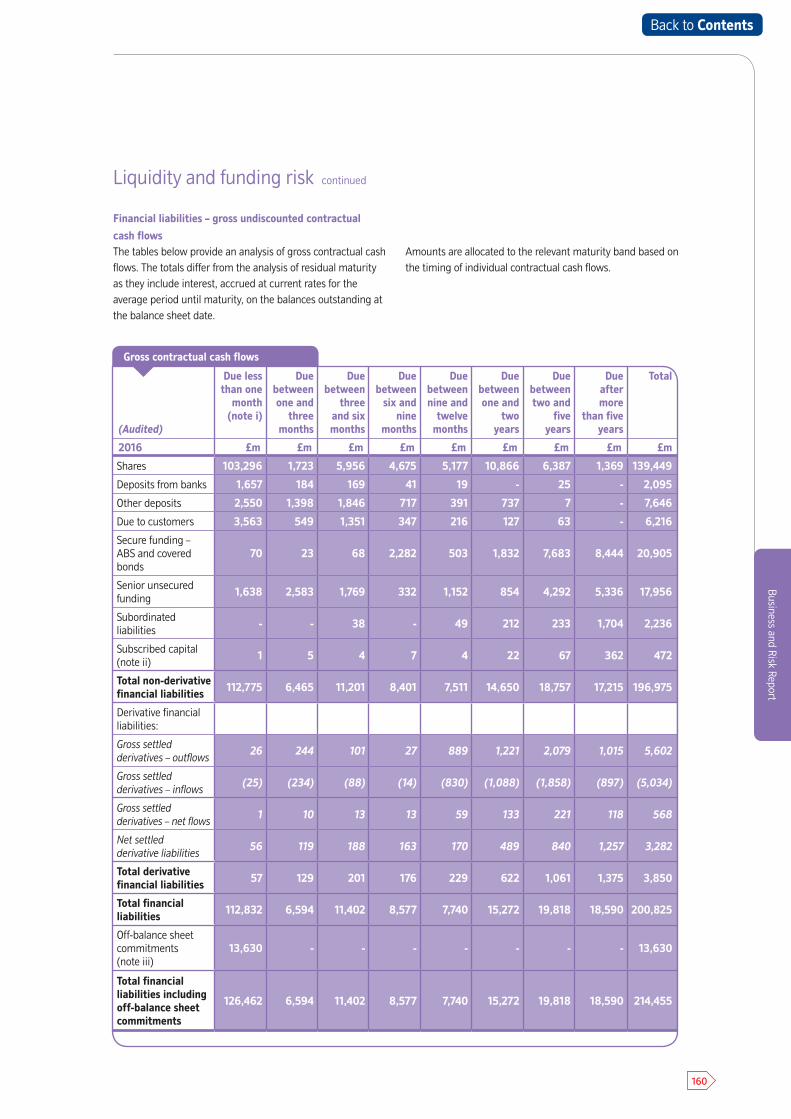
160
Business and Risk Report
Liquidity and funding risk continued
Financial liabilities – gross undiscounted contractual
cash flowsThe tables below provide an analysis of gross contractual cash flows. The totals differ from the analysis of residual maturity as they include interest, accrued at current rates for the average period until maturity, on the balances outstanding at the balance sheet date.
Amounts are allocated to the relevant maturity band based on the timing of individual contractual cash flows.
(Audited)
Due less than one
month (note i)
Due between one and
three months
Due between
three and six months
Due between
six and nine
months
Due between nine and
twelve months
Due between one and
two years
Due between two and
five years
Due after more
than five years
Total
2016 £m £m £m £m £m £m £m £m £m
Shares 103,296 1,723 5,956 4,675 5,177 10,866 6,387 1,369 139,449
Deposits from banks 1,657 184 169 41 19 - 25 - 2,095
Other deposits 2,550 1,398 1,846 717 391 737 7 - 7,646
Due to customers 3,563 549 1,351 347 216 127 63 - 6,216
Secure funding – ABS and covered bonds
70 23 68 2,282 503 1,832 7,683 8,444 20,905
Senior unsecured funding
1,638 2,583 1,769 332 1,152 854 4,292 5,336 17,956
Subordinated liabilities
- - 38 - 49 212 233 1,704 2,236
Subscribed capital (note ii)
1 5 4 7 4 22 67 362 472
Total non-derivative financial liabilities 112,775 6,465 11,201 8,401 7,511 14,650 18,757 17,215 196,975
Derivative financial liabilities:
Gross settled derivatives – outflows
26 244 101 27 889 1,221 2,079 1,015 5,602
Gross settled derivatives – inflows
(25) (234) (88) (14) (830) (1,088) (1,858) (897) (5,034)
Gross settled derivatives – net flows
1 10 13 13 59 133 221 118 568
Net settled derivative liabilities
56 119 188 163 170 489 840 1,257 3,282
Total derivative financial liabilities 57 129 201 176 229 622 1,061 1,375 3,850
Total financial liabilities 112,832 6,594 11,402 8,577 7,740 15,272 19,818 18,590 200,825
Off-balance sheet commitments (note iii)
13,630 - - - - - - - 13,630
Total financial liabilities including off-balance sheet commitments
126,462 6,594 11,402 8,577 7,740 15,272 19,818 18,590 214,455
Gross contractual cash flows
Back to Contents
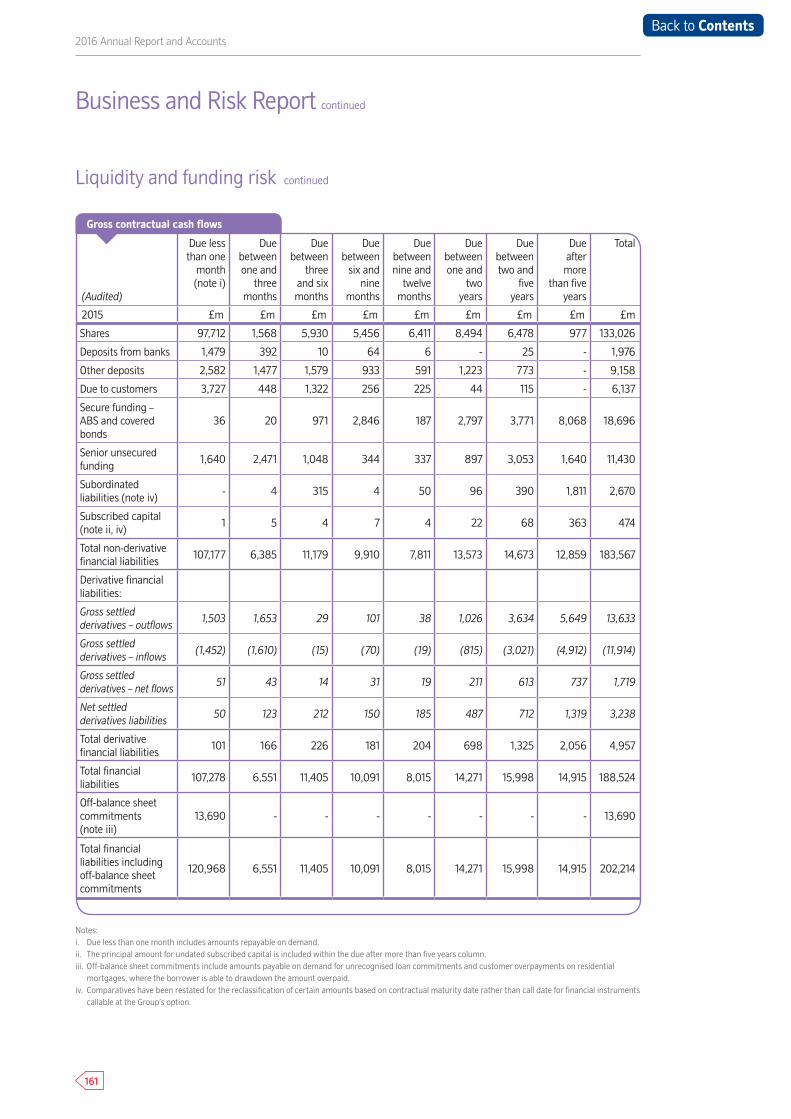
161
2016 Annual Report and Accounts
(Audited)
Due less than one
month (note i)
Due between one and
three months
Due between
three and six months
Due between
six and nine
months
Due between nine and
twelve months
Due between one and
two years
Due between two and
five years
Due after
more than five
years
Total
2015 £m £m £m £m £m £m £m £m £m
Shares 97,712 1,568 5,930 5,456 6,411 8,494 6,478 977 133,026
Deposits from banks 1,479 392 10 64 6 - 25 - 1,976
Other deposits 2,582 1,477 1,579 933 591 1,223 773 - 9,158
Due to customers 3,727 448 1,322 256 225 44 115 - 6,137
Secure funding – ABS and covered bonds
36 20 971 2,846 187 2,797 3,771 8,068 18,696
Senior unsecured funding
1,640 2,471 1,048 344 337 897 3,053 1,640 11,430
Subordinated liabilities (note iv)
- 4 315 4 50 96 390 1,811 2,670
Subscribed capital (note ii, iv)
1 5 4 7 4 22 68 363 474
Total non-derivative financial liabilities
107,177 6,385 11,179 9,910 7,811 13,573 14,673 12,859 183,567
Derivative financial liabilities:
Gross settled derivatives – outflows
1,503 1,653 29 101 38 1,026 3,634 5,649 13,633
Gross settled derivatives – inflows
(1,452) (1,610) (15) (70) (19) (815) (3,021) (4,912) (11,914)
Gross settled derivatives – net flows
51 43 14 31 19 211 613 737 1,719
Net settled derivatives liabilities
50 123 212 150 185 487 712 1,319 3,238
Total derivative financial liabilities
101 166 226 181 204 698 1,325 2,056 4,957
Total financial liabilities
107,278 6,551 11,405 10,091 8,015 14,271 15,998 14,915 188,524
Off-balance sheet commitments (note iii)
13,690 - - - - - - - 13,690
Total financial liabilities including off-balance sheet commitments
120,968 6,551 11,405 10,091 8,015 14,271 15,998 14,915 202,214
Gross contractual cash flows
Liquidity and funding risk continued
Business and Risk Report continued
Notes:i. Due less than one month includes amounts repayable on demand.ii. The principal amount for undated subscribed capital is included within the due after more than five years column.iii. Off-balance sheet commitments include amounts payable on demand for unrecognised loan commitments and customer overpayments on residential
mortgages, where the borrower is able to drawdown the amount overpaid.iv. Comparatives have been restated for the reclassification of certain amounts based on contractual maturity date rather than call date for financial instruments
callable at the Group’s option.
Back to Contents
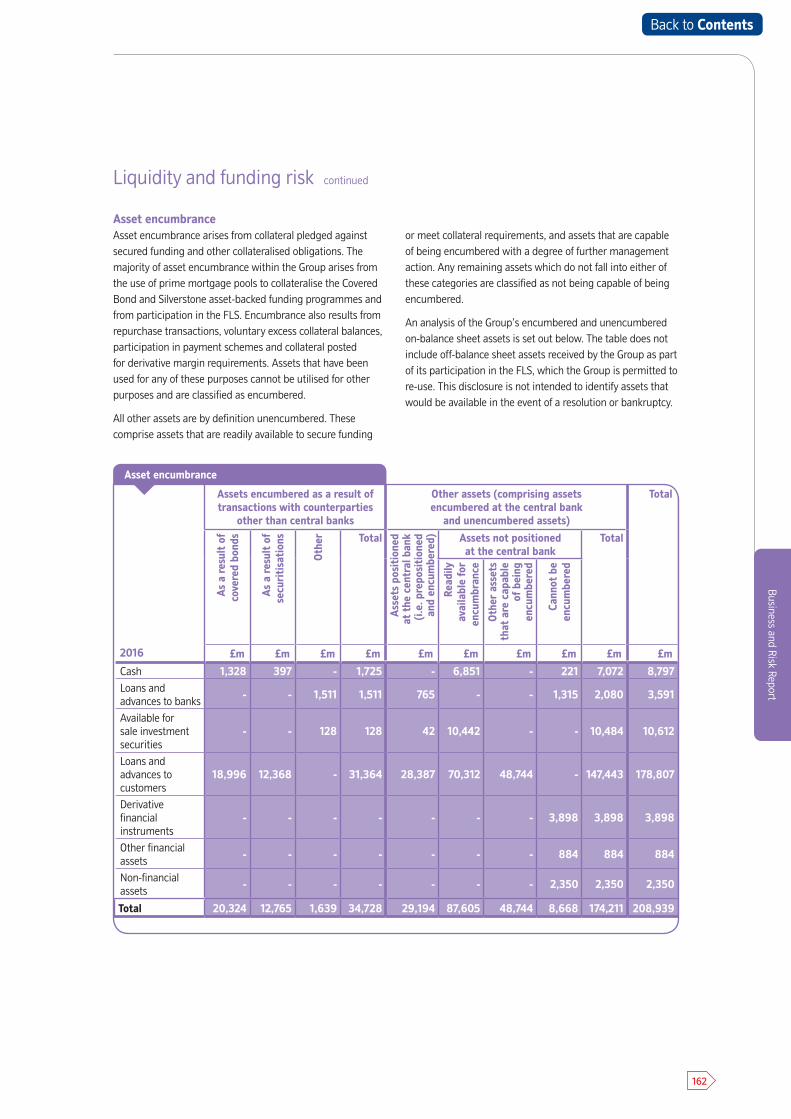
162
Business and Risk Report
Liquidity and funding risk continued
Asset encumbranceAsset encumbrance arises from collateral pledged against secured funding and other collateralised obligations. The majority of asset encumbrance within the Group arises from the use of prime mortgage pools to collateralise the Covered Bond and Silverstone asset-backed funding programmes and from participation in the FLS. Encumbrance also results from repurchase transactions, voluntary excess collateral balances, participation in payment schemes and collateral posted for derivative margin requirements. Assets that have been used for any of these purposes cannot be utilised for other purposes and are classified as encumbered.
All other assets are by definition unencumbered. These comprise assets that are readily available to secure funding
or meet collateral requirements, and assets that are capable of being encumbered with a degree of further management action. Any remaining assets which do not fall into either of these categories are classified as not being capable of being encumbered.
An analysis of the Group’s encumbered and unencumbered on-balance sheet assets is set out below. The table does not include off-balance sheet assets received by the Group as part of its participation in the FLS, which the Group is permitted to re-use. This disclosure is not intended to identify assets that would be available in the event of a resolution or bankruptcy.
2016
Assets encumbered as a result of transactions with counterparties
other than central banks
Other assets (comprising assets encumbered at the central bank
and unencumbered assets)
Total
As
a re
sult
of
cove
red
bond
s
As
a re
sult
of
secu
riti
sati
ons
Oth
er Total
Ass
ets
posi
tion
ed
at t
he c
entr
al b
ank
(i.e.
pre
posi
tion
ed
and
encu
mbe
red) Assets not positioned
at the central bankTotal
Read
ily
avai
labl
e fo
r en
cum
bran
ce
Oth
er a
sset
s th
at a
re c
apab
le
of b
eing
en
cum
bere
d
Cann
ot b
e en
cum
bere
d
£m £m £m £m £m £m £m £m £m £m
Cash 1,328 397 - 1,725 - 6,851 - 221 7,072 8,797Loans and advances to banks
- - 1,511 1,511 765 - - 1,315 2,080 3,591
Available for sale investment securities
- - 128 128 42 10,442 - - 10,484 10,612
Loans and advances to customers
18,996 12,368 - 31,364 28,387 70,312 48,744 - 147,443 178,807
Derivative financial instruments
- - - - - - - 3,898 3,898 3,898
Other financial assets
- - - - - - - 884 884 884
Non-financial assets
- - - - - - - 2,350 2,350 2,350
Total 20,324 12,765 1,639 34,728 29,194 87,605 48,744 8,668 174,211 208,939
Asset encumbrance
Back to Contents
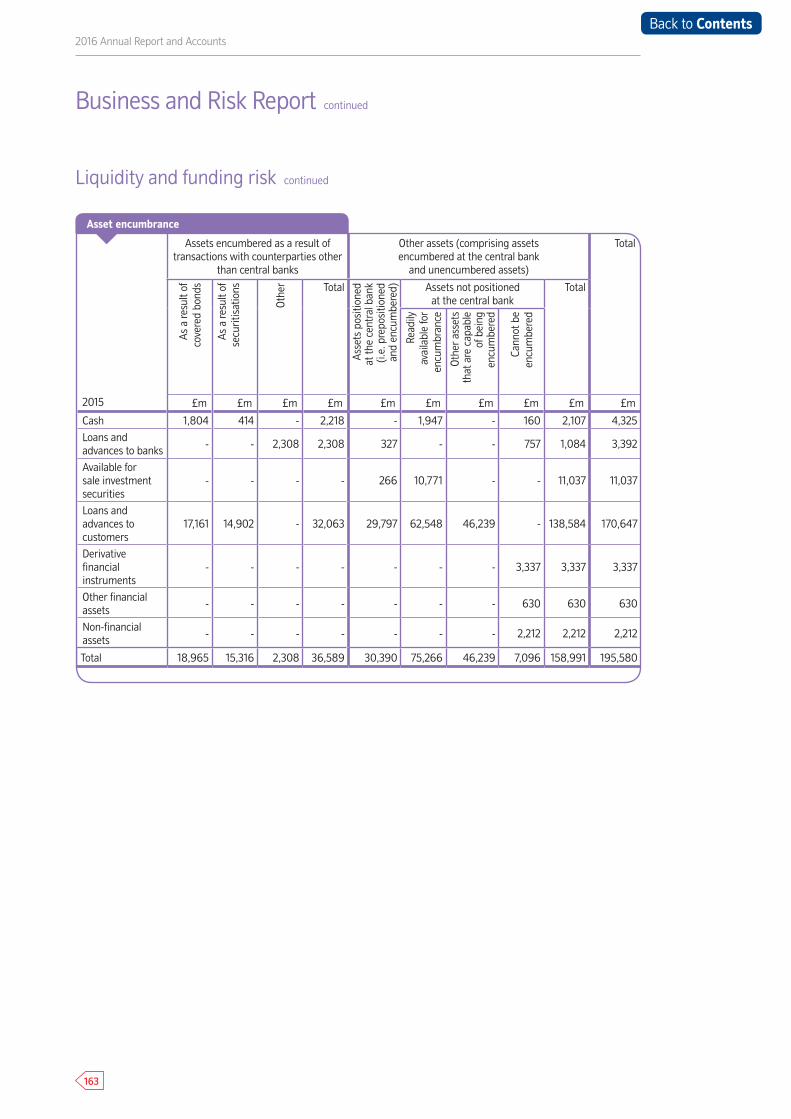
163
2016 Annual Report and Accounts
Liquidity and funding risk continued
Business and Risk Report continued
2015
Assets encumbered as a result of transactions with counterparties other
than central banks
Other assets (comprising assets encumbered at the central bank
and unencumbered assets)
Total
As a
resu
lt of
co
vere
d bo
nds
As a
resu
lt of
se
curit
isat
ions
Oth
er Total
Asse
ts p
ositi
oned
at
the
cent
ral b
ank
(i.e.
pre
posi
tione
d an
d en
cum
bere
d) Assets not positionedat the central bank
Total
Read
ily
avai
labl
e fo
r en
cum
bran
ce
Oth
er a
sset
s th
at a
re c
apab
le
of b
eing
en
cum
bere
d
Cann
ot b
e en
cum
bere
d
£m £m £m £m £m £m £m £m £m £m
Cash 1,804 414 - 2,218 - 1,947 - 160 2,107 4,325
Loans and advances to banks
- - 2,308 2,308 327 - - 757 1,084 3,392
Available for sale investment securities
- - - - 266 10,771 - - 11,037 11,037
Loans and advances to customers
17,161 14,902 - 32,063 29,797 62,548 46,239 - 138,584 170,647
Derivative financial instruments
- - - - - - - 3,337 3,337 3,337
Other financial assets
- - - - - - - 630 630 630
Non-financial assets
- - - - - - - 2,212 2,212 2,212
Total 18,965 15,316 2,308 36,589 30,390 75,266 46,239 7,096 158,991 195,580
Asset encumbrance
Back to Contents
164
Business and Risk Report
Liquidity and funding risk continued
Repurchase agreementsThe Group undertakes securities financing transactions in the form of repurchase agreements (repo) to demonstrate liquidity of the securities held in the Group’s Liquid Asset Buffer (LAB). Cash is borrowed in return for pledging securities as collateral and because settlement is on a simultaneous ‘delivery versus payment’ basis, the main credit risk arises from intra-day changes in the value of the collateral. This is largely mitigated by the Group’s collateral management processes.
From a liquidity perspective, the main risk is that during a period of stress the Group has insufficient repo market capacity to rapidly monetise the LAB. To mitigate this risk, repo market capacity is assessed and tested regularly.
Managing liquidity and funding riskThe Group’s management of liquidity and funding risks aims to ensure that at all times there are sufficient liquid resources, both as to amount and quality, to cover cash flow mismatches and fluctuations in funding, to retain public confidence and to enable it to meet financial obligations as they fall due, even during episodes of stress. This is achieved through management and stress testing of business cash flows, and the setting of appropriate risk limits, to maintain a prudent funding mix, maturity profile and level of high quality liquid assets.
The Board is responsible for setting risk appetite with respect to levels of liquidity and funding risks. The Board’s risk appetite statements are translated into limits which define the minimum level of liquid resources and the funding structure of the balance sheet.
ALCO and the Group’s Balance Sheet Risk Committee are responsible for monitoring liquidity and funding risks and the composition of the Group’s balance sheet through setting more detailed limits within Board limits. These include limits in respect of the composition of the liquidity portfolio, the funding mix, levels of maturity concentration and levels of encumbrance.
Further, the Liquidity and Funding risk framework is reviewed by the Board as part of the annual Internal Liquidity Adequacy Assessment Process (ILAAP).
A consolidated cash flow forecast is also maintained on an ongoing basis and reviewed by the Group’s Weekly Trading Committee which is also responsible for monitoring liquidity metrics.
A Liquidity Contingency Plan (LCP) is maintained and describes metrics which would indicate an emerging market-wide or Nationwide-specific stress. It also details invocation and escalation procedures and a range of available actions that the Group could take in the event of a liquidity or funding stress, thereby allowing adequate liquidity resources to be maintained. The LCP is reviewed every six months and tested at least annually. The Group also has a Recovery Plan which describes potential actions that could be utilised in a more extreme stress.
Liquidity stress testingTo mitigate liquidity and funding risks generated by its business activities, the Group holds a portfolio of liquid assets as detailed in the ‘Total liquidity’ section of this report. A series of liquidity stress tests are performed daily against a number of scenarios, including those prescribed by the regulator. Internal stress tests are run to assess the Group’s minimum liquidity requirement alongside the calculation of the prescribed regulatory Liquidity Coverage Ratio (LCR). Together, they represent the Group’s view of the required levels of liquidity.
The Group aims to maintain liquidity resources of at least 100% of the anticipated outflows seen under each of the internal and regulatory-prescribed stress tests. The internal scenarios include an idiosyncratic stress, a market-wide stress and a combination of the two. The stress scenarios consider a range of risk factors and the consequent impact of stressed behavioural and contractual assumptions on the Group’s cash flows over multiple time horizons. Assumptions used in internal liquidity stress tests are reviewed regularly with changes proposed to ALCO for approval and approved annually by the Board as part of the ILAAP.
Back to Contents
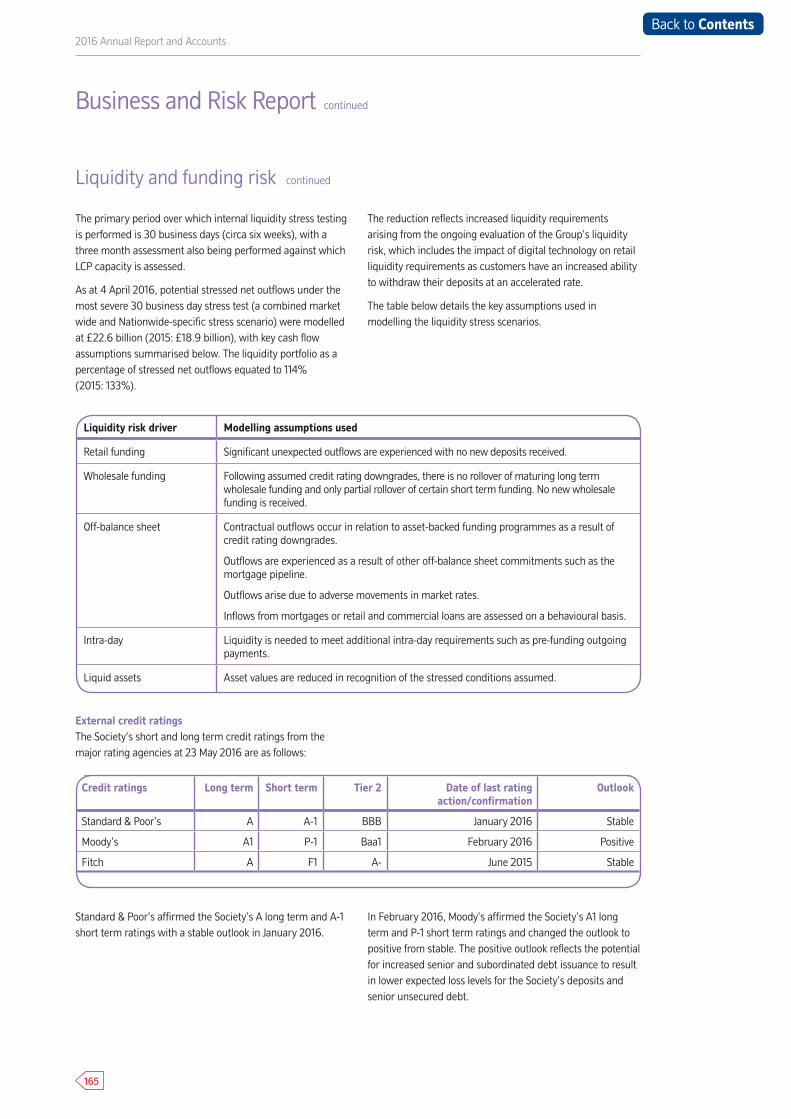
165
2016 Annual Report and Accounts
Business and Risk Report continued
Liquidity and funding risk continued
The primary period over which internal liquidity stress testing is performed is 30 business days (circa six weeks), with a three month assessment also being performed against which LCP capacity is assessed.
As at 4 April 2016, potential stressed net outflows under the most severe 30 business day stress test (a combined market wide and Nationwide-specific stress scenario) were modelled at £22.6 billion (2015: £18.9 billion), with key cash flow assumptions summarised below. The liquidity portfolio as a percentage of stressed net outflows equated to 114% (2015: 133%).
The reduction reflects increased liquidity requirements arising from the ongoing evaluation of the Group’s liquidity risk, which includes the impact of digital technology on retail liquidity requirements as customers have an increased ability to withdraw their deposits at an accelerated rate.
The table below details the key assumptions used in modelling the liquidity stress scenarios.
Liquidity risk driver Modelling assumptions used
Retail funding Significant unexpected outflows are experienced with no new deposits received.
Wholesale funding Following assumed credit rating downgrades, there is no rollover of maturing long term wholesale funding and only partial rollover of certain short term funding. No new wholesale funding is received.
Off-balance sheet Contractual outflows occur in relation to asset-backed funding programmes as a result of credit rating downgrades.
Outflows are experienced as a result of other off-balance sheet commitments such as the mortgage pipeline.
Outflows arise due to adverse movements in market rates.
Inflows from mortgages or retail and commercial loans are assessed on a behavioural basis.
Intra-day Liquidity is needed to meet additional intra-day requirements such as pre-funding outgoing payments.
Liquid assets Asset values are reduced in recognition of the stressed conditions assumed.
Credit ratings Long term Short term Tier 2 Date of last rating action/confirmation
Outlook
Standard & Poor’s A A-1 BBB January 2016 Stable
Moody’s A1 P-1 Baa1 February 2016 Positive
Fitch A F1 A- June 2015 Stable
External credit ratingsThe Society’s short and long term credit ratings from the major rating agencies at 23 May 2016 are as follows:
Standard & Poor’s affirmed the Society’s A long term and A-1 short term ratings with a stable outlook in January 2016.
In February 2016, Moody’s affirmed the Society’s A1 long term and P-1 short term ratings and changed the outlook to positive from stable. The positive outlook reflects the potential for increased senior and subordinated debt issuance to result in lower expected loss levels for the Society’s deposits and senior unsecured debt.
Back to Contents
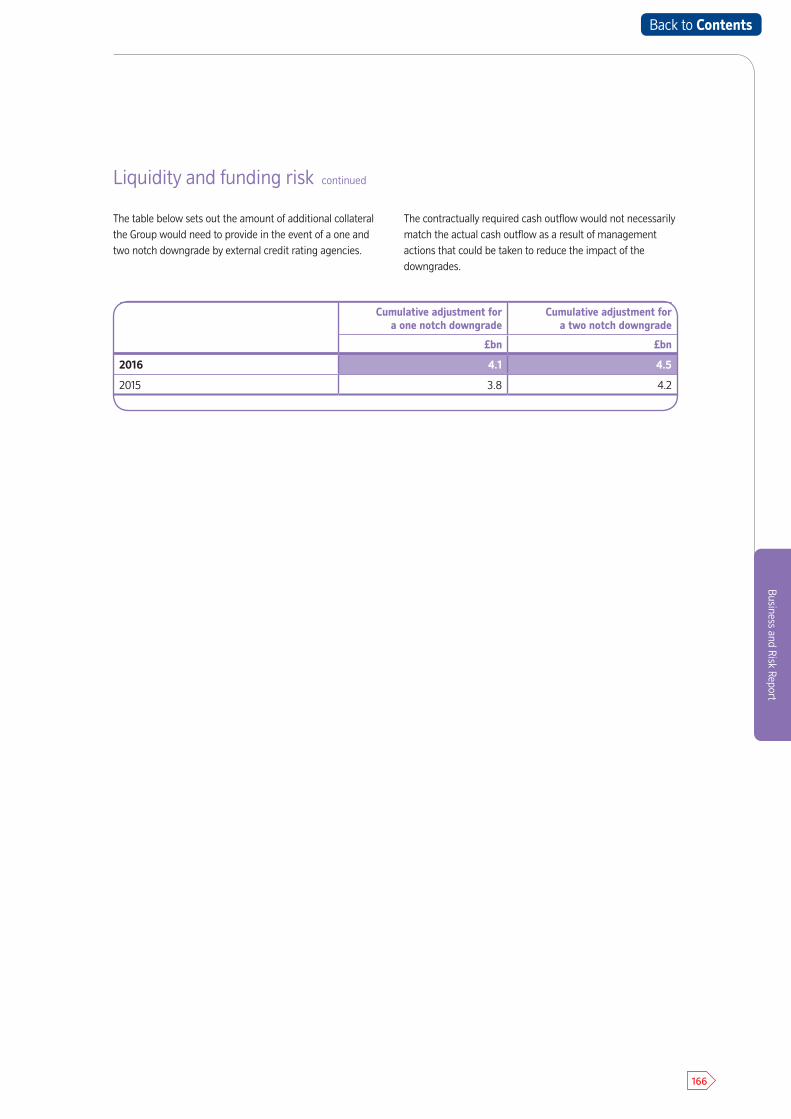
166
Business and Risk Report
Liquidity and funding risk continued
The table below sets out the amount of additional collateral the Group would need to provide in the event of a one and two notch downgrade by external credit rating agencies.
The contractually required cash outflow would not necessarily match the actual cash outflow as a result of management actions that could be taken to reduce the impact of the downgrades.
Cumulative adjustment for a one notch downgrade
Cumulative adjustment for a two notch downgrade
£bn £bn
2016 4.1 4.5
2015 3.8 4.2
Back to Contents
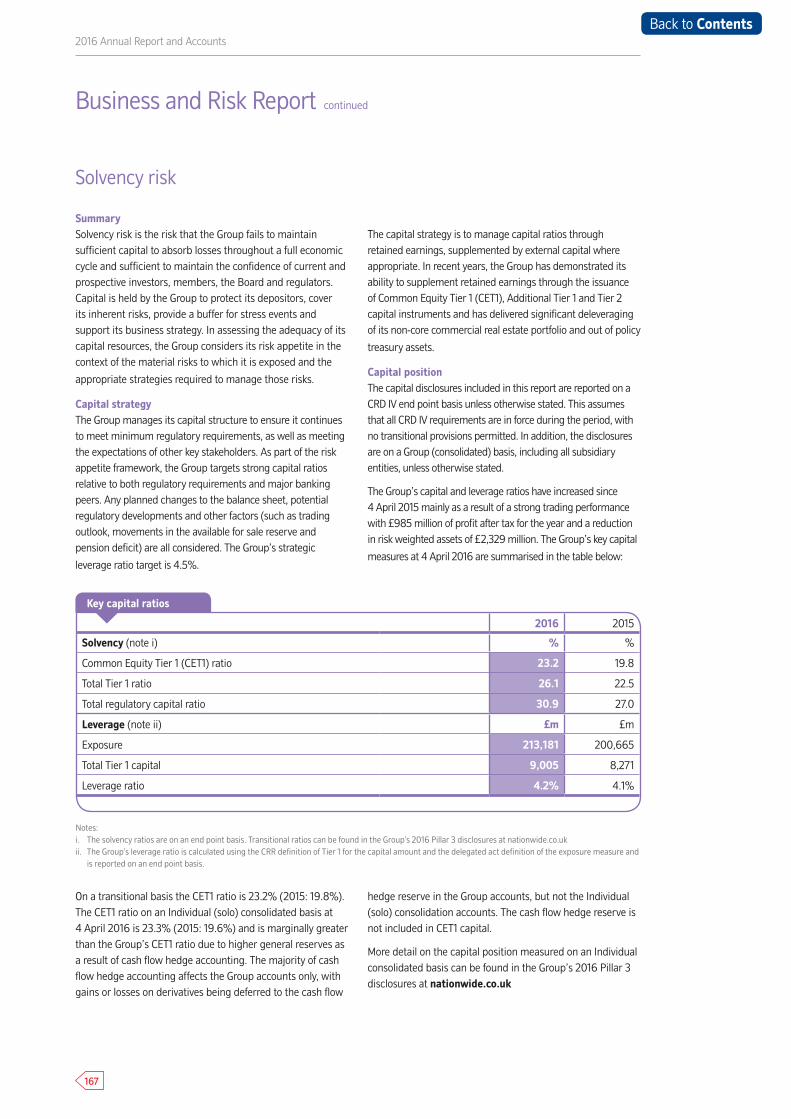
167
2016 Annual Report and Accounts
Solvency risk
SummarySolvency risk is the risk that the Group fails to maintain sufficient capital to absorb losses throughout a full economic cycle and sufficient to maintain the confidence of current and prospective investors, members, the Board and regulators. Capital is held by the Group to protect its depositors, cover its inherent risks, provide a buffer for stress events and support its business strategy. In assessing the adequacy of its capital resources, the Group considers its risk appetite in the context of the material risks to which it is exposed and the
appropriate strategies required to manage those risks.
Capital strategyThe Group manages its capital structure to ensure it continues to meet minimum regulatory requirements, as well as meeting the expectations of other key stakeholders. As part of the risk appetite framework, the Group targets strong capital ratios relative to both regulatory requirements and major banking peers. Any planned changes to the balance sheet, potential regulatory developments and other factors (such as trading outlook, movements in the available for sale reserve and pension deficit) are all considered. The Group’s strategic
leverage ratio target is 4.5%.
The capital strategy is to manage capital ratios through retained earnings, supplemented by external capital where appropriate. In recent years, the Group has demonstrated its ability to supplement retained earnings through the issuance of Common Equity Tier 1 (CET1), Additional Tier 1 and Tier 2 capital instruments and has delivered significant deleveraging of its non-core commercial real estate portfolio and out of policy
treasury assets.
Capital positionThe capital disclosures included in this report are reported on a CRD IV end point basis unless otherwise stated. This assumes that all CRD IV requirements are in force during the period, with no transitional provisions permitted. In addition, the disclosures are on a Group (consolidated) basis, including all subsidiary entities, unless otherwise stated.
The Group’s capital and leverage ratios have increased since 4 April 2015 mainly as a result of a strong trading performance with £985 million of profit after tax for the year and a reduction in risk weighted assets of £2,329 million. The Group’s key capital
measures at 4 April 2016 are summarised in the table below:
2016 2015
Solvency (note i) % %
Common Equity Tier 1 (CET1) ratio 23.2 19.8
Total Tier 1 ratio 26.1 22.5
Total regulatory capital ratio 30.9 27.0
Leverage (note ii) £m £m
Exposure 213,181 200,665
Total Tier 1 capital 9,005 8,271
Leverage ratio 4.2% 4.1%
On a transitional basis the CET1 ratio is 23.2% (2015: 19.8%). The CET1 ratio on an Individual (solo) consolidated basis at 4 April 2016 is 23.3% (2015: 19.6%) and is marginally greater than the Group’s CET1 ratio due to higher general reserves as a result of cash flow hedge accounting. The majority of cash flow hedge accounting affects the Group accounts only, with gains or losses on derivatives being deferred to the cash flow
hedge reserve in the Group accounts, but not the Individual (solo) consolidation accounts. The cash flow hedge reserve is not included in CET1 capital.
More detail on the capital position measured on an Individual consolidated basis can be found in the Group’s 2016 Pillar 3 disclosures at nationwide.co.uk
Business and Risk Report continued
Notes:i. The solvency ratios are on an end point basis. Transitional ratios can be found in the Group’s 2016 Pillar 3 disclosures at nationwide.co.ukii. The Group’s leverage ratio is calculated using the CRR definition of Tier 1 for the capital amount and the delegated act definition of the exposure measure and
is reported on an end point basis.
Key capital ratios
Back to Contents
168
Business and Risk Report
Solvency risk continued
CET1 capital has increased from £7,279 million to £8,013 million over the year primarily due to increased retained earnings, driven by a strong trading performance for the year and a reduction in the pension deficit. This was partly offset by an increase in intangible assets and the prudent valuation adjustment as well as a reduction in the value of the available for sale reserve. The increases in total Tier 1 capital and total regulatory capital include the increase in CET1 resources, offset at a total regulatory capital level by a reduction in Tier 2 capital, due to amortisation of subordinated debt.
Total exposure used to calculate the leverage ratio, which consists of balance sheet assets, off-balance sheet items and other regulatory adjustments, has increased by £12,516 million to £213,181 million. Balance sheet assets have grown by £13,359 million to £208,939 million since 4 April 2015, mainly driven by increases in mortgage balances, together with higher deposits with central banks held for liquidity purposes as a result of the Group’s pre-funding of wholesale maturities ahead of the EU referendum. The leverage ratio has increased to 4.2% (2015: 4.1%) as growth in Tier 1 capital has outstripped the balance sheet growth. The leverage ratio at 4 April 2016 is lower than that reported at 31 December 2015 (4.3%) due to balance sheet growth during the fourth quarter. Further details on leverage can be found in the Group’s 2016 Pillar 3 disclosures at nationwide.co.uk
The Group holds capital to meet Pillar 1 requirements (for credit, operational and market risks). In addition, the PRA requires firms to hold capital to meet Pillar 2A requirements, which are set out in the Individual Capital Guidance (ICG). This is a point in time estimate, set by the PRA on an annual basis, of the amount of capital required to be held to meet risks partly covered by Pillar 1 such as credit concentration and operational risk, and risks not covered by Pillar 1 such as pension and interest rate risk.
The Group’s current ICG equates to £2.2 billion, of which at least £1.2 billion must be met by CET1 capital (previously around £1.9 billion, of which at least approximately £1.1 billion had to be met by CET1 capital). This amount is equivalent to 6.4% of RWAs as at 4 April 2016 (2015: 5.2%), reflecting the Group’s low average risk weight given that approximately 76% (2015: 76%) of the Group’s exposure is in the form of secured residential mortgages, of which 80% (2015: 81%) are prime.
In order to protect against the risk of consuming Pillar 1 or Pillar 2A requirements (thereby breaching ICG), firms are subject to regulatory capital buffers which are set out in CRD IV. In addition, the PRA may set a firm-specific buffer based upon supervisory judgement informed by the impact of stress scenarios on a firm’s capital requirements and resources, and taking into account other factors including leverage, systemic importance and any weaknesses in firms’ risk management and governance procedures.
Back to Contents
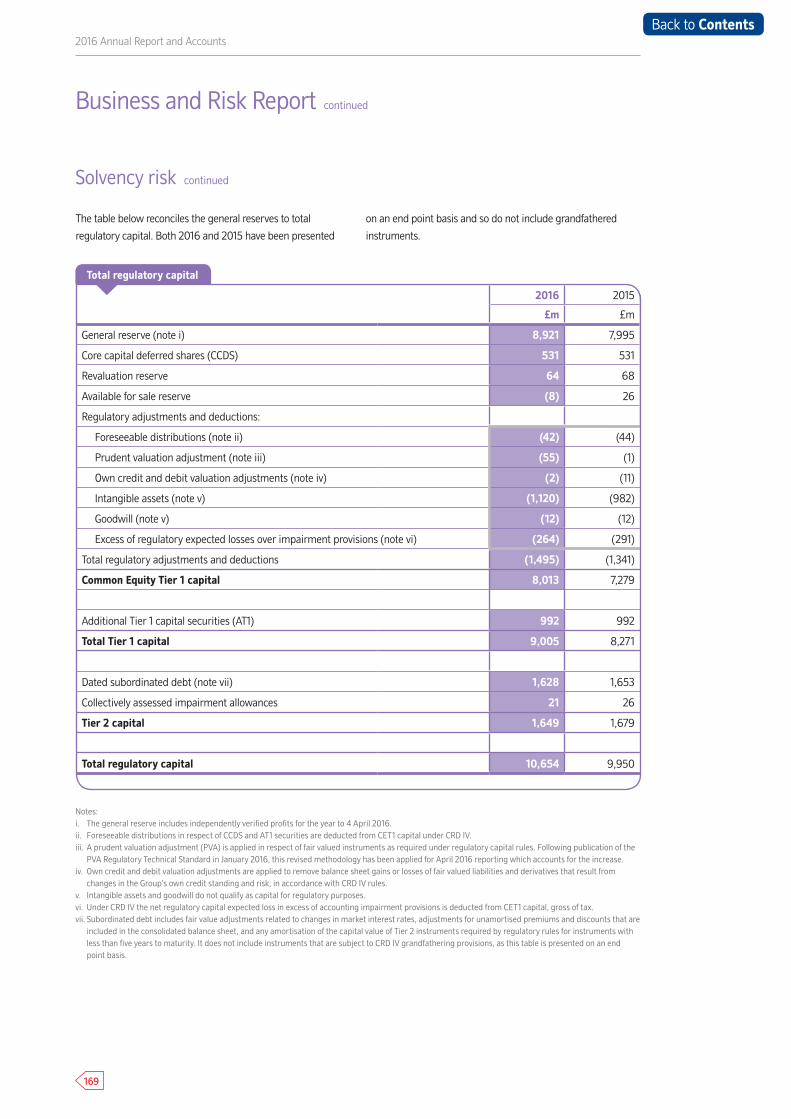
169
2016 Annual Report and Accounts
Solvency risk continued
2016 2015
£m £m
General reserve (note i) 8,921 7,995
Core capital deferred shares (CCDS) 531 531
Revaluation reserve 64 68
Available for sale reserve (8) 26
Regulatory adjustments and deductions:
Foreseeable distributions (note ii) (42) (44)
Prudent valuation adjustment (note iii) (55) (1)
Own credit and debit valuation adjustments (note iv) (2) (11)
Intangible assets (note v) (1,120) (982)
Goodwill (note v) (12) (12)
Excess of regulatory expected losses over impairment provisions (note vi) (264) (291)
Total regulatory adjustments and deductions (1,495) (1,341)
Common Equity Tier 1 capital 8,013 7,279
Additional Tier 1 capital securities (AT1) 992 992
Total Tier 1 capital 9,005 8,271
Dated subordinated debt (note vii) 1,628 1,653
Collectively assessed impairment allowances 21 26
Tier 2 capital 1,649 1,679
Total regulatory capital 10,654 9,950
The table below reconciles the general reserves to total
regulatory capital. Both 2016 and 2015 have been presented
on an end point basis and so do not include grandfathered
instruments.
Business and Risk Report continued
Total regulatory capital
Notes:i. The general reserve includes independently verified profits for the year to 4 April 2016. ii. Foreseeable distributions in respect of CCDS and AT1 securities are deducted from CET1 capital under CRD IV.iii. A prudent valuation adjustment (PVA) is applied in respect of fair valued instruments as required under regulatory capital rules. Following publication of the
PVA Regulatory Technical Standard in January 2016, this revised methodology has been applied for April 2016 reporting which accounts for the increase. iv. Own credit and debit valuation adjustments are applied to remove balance sheet gains or losses of fair valued liabilities and derivatives that result from
changes in the Group’s own credit standing and risk, in accordance with CRD IV rules.v. Intangible assets and goodwill do not qualify as capital for regulatory purposes.vi. Under CRD IV the net regulatory capital expected loss in excess of accounting impairment provisions is deducted from CET1 capital, gross of tax. vii. Subordinated debt includes fair value adjustments related to changes in market interest rates, adjustments for unamortised premiums and discounts that are
included in the consolidated balance sheet, and any amortisation of the capital value of Tier 2 instruments required by regulatory rules for instruments with less than five years to maturity. It does not include instruments that are subject to CRD IV grandfathering provisions, as this table is presented on an endpoint basis.
Back to Contents
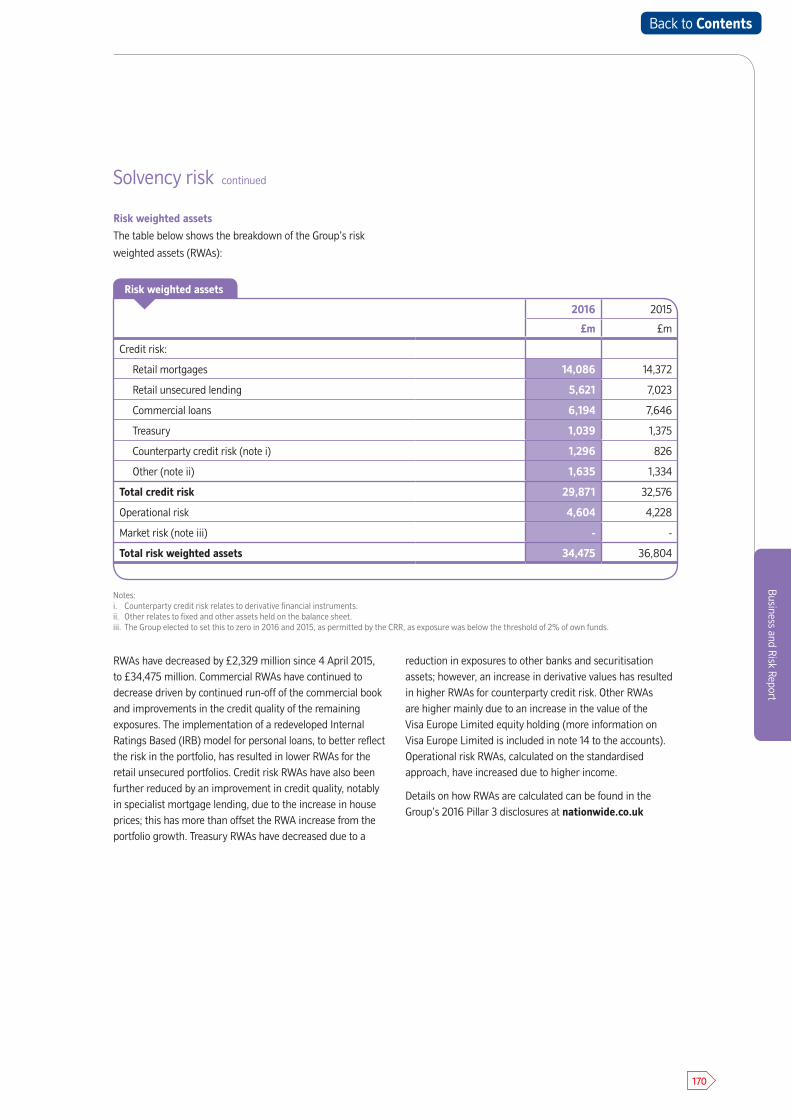
170
Business and Risk Report
Solvency risk continued
Risk weighted assets
The table below shows the breakdown of the Group’s risk
weighted assets (RWAs):
RWAs have decreased by £2,329 million since 4 April 2015, to £34,475 million. Commercial RWAs have continued to decrease driven by continued run-off of the commercial book and improvements in the credit quality of the remaining exposures. The implementation of a redeveloped Internal Ratings Based (IRB) model for personal loans, to better reflect the risk in the portfolio, has resulted in lower RWAs for the retail unsecured portfolios. Credit risk RWAs have also been further reduced by an improvement in credit quality, notably in specialist mortgage lending, due to the increase in house prices; this has more than offset the RWA increase from the portfolio growth. Treasury RWAs have decreased due to a
reduction in exposures to other banks and securitisation assets; however, an increase in derivative values has resulted in higher RWAs for counterparty credit risk. Other RWAs are higher mainly due to an increase in the value of the Visa Europe Limited equity holding (more information on Visa Europe Limited is included in note 14 to the accounts). Operational risk RWAs, calculated on the standardised approach, have increased due to higher income.
Details on how RWAs are calculated can be found in the Group’s 2016 Pillar 3 disclosures at nationwide.co.uk
2016 2015
£m £m
Credit risk:
Retail mortgages 14,086 14,372
Retail unsecured lending 5,621 7,023
Commercial loans 6,194 7,646
Treasury 1,039 1,375
Counterparty credit risk (note i) 1,296 826
Other (note ii) 1,635 1,334
Total credit risk 29,871 32,576
Operational risk 4,604 4,228
Market risk (note iii) - -
Total risk weighted assets 34,475 36,804
Risk weighted assets
Notes:i. Counterparty credit risk relates to derivative financial instruments. ii. Other relates to fixed and other assets held on the balance sheet.iii. The Group elected to set this to zero in 2016 and 2015, as permitted by the CRR, as exposure was below the threshold of 2% of own funds.
Back to Contents
171
2016 Annual Report and Accounts
Solvency risk continued
Managing solvency riskThe Group employs a number of tools to support the management of solvency risks. The Board is responsible for setting risk appetite with respect to solvency risk, which is articulated through its risk appetite statements, and it defines minimum levels of capital, including leverage, that it is willing to operate with. These are translated into specific risk metrics, which are monitored by the Board Risk Committee, Assets and Liabilities Committee (ALCO) and other internal management committees.
With general reserves forming the majority of the Group’s capital resources, profitability is an important factor when considering the ability to meet capital requirements. A return on capital framework is in place, based upon an allocation of overall capital requirements, which monitors targets for individual product segments.
The Group also undertakes a regular Internal Capital Adequacy Assessment Process (ICAAP), which considers the minimum amount of capital to be held in order to cover all risks including credit risks, operational risks, interest rate risks in the banking book and pension risks, and also considers an additional buffer to ensure that the impact of a severe but plausible stress can be absorbed. As a result of this internal assessment, the PRA sets the Group’s Pillar 2 capital requirements.
Stress testingRegular Group-wide stress tests are undertaken to enhance the understanding of potential vulnerabilities and how management actions might be deployed in the event of stressed conditions developing. These stress tests project capital resources and requirements over a five-year period, during severe but plausible scenarios.
The Group aims to be in a position where it would maintain strong capital and leverage ratios in the event of a severe but plausible economic or idiosyncratic stress. Embedded in the risk appetite framework is an expectation to maintain the CET1 and leverage ratios in excess of regulatory minima, including buffers where appropriate.
A set of management actions is maintained, that would be available in the event of a breach of one or more of the risk metrics, to support the capital position. In a more severe stress, the Group would expect to invoke its Recovery Plan, maintained under UK regulatory rules implementing the European Bank Recovery and Resolution Directive (BRRD), which documents a broad range of management actions.
During 2015, the major UK banks and building societies, including Nationwide, took part in the PRA’s annual concurrent stress test, which assessed firms’ resilience to a severe global downturn, albeit with a materially less severe impact on the UK housing market than the 2014 concurrent stress scenario. The impact of the stress differed substantially across banks, and most significantly affected those with exposures to international markets, in particular Asia and emerging markets. The results of this stress test, published by the PRA in December 2015, showed that Nationwide remained in a strong position, above the PRA’s minimum CET1 ratio hurdle rate throughout the period, with a low point CET1 ratio of 19.1% (prior to application of management actions).
Nationwide, along with other major UK banks and building societies, is currently taking part in the 2016 PRA annual concurrent stress test. The scenario (published in March 2016) is the first Annual Cyclical Scenario issued by the PRA as part of the new approach to concurrent stress testing. It is a broad stress describing vulnerabilities that crystallise across financial markets, incorporating a synchronised global and domestic downturn.
Business and Risk Report continued
Back to Contents
172
Business and Risk Report
Solvency risk continued
Regulatory developments The Group continues to monitor regulatory developments that could lead to an increased level of capital requirements. Whilst there are a number of areas where potential requirements are yet to be finalised, regulatory announcements during the financial year mean that we have better visibility on expectations for future capital requirements. However, the Group will remain engaged in the development of the regulatory approach to ensure it is prepared for any change.
We expect to have a steady state leverage ratio requirement of 3.75% from 2019, which comprises a minimum requirement of 3%, a supplementary leverage ratio buffer of 0.35% and countercyclical leverage ratio buffer of 0.4%. Whilst the Financial Policy Committee could set a countercyclical leverage buffer up to 0.9%, in March 2016 it set the buffer at 0.2%, which is expected to apply from March 2017. The Basel Committee on Banking Supervision and the European Banking Authority are currently reviewing the leverage ratio requirement for banks and building societies, but it is expected that the PRA leverage framework will remain the Group’s binding requirement. The Group’s strategic leverage ratio target of 4.5% reflects its desire to maintain strong levels of capital relative to maximum regulatory expectations (4.25%).
As part of the European BRRD, the Bank of England, in its capacity as the UK resolution authority, has consulted on setting the Minimum Requirement for Eligible Liabilities (MREL). This consultation proposed that a firm of Nationwide’s size should, from 2020, have a MREL requirement equal to double minimum capital requirements. The Group is confident it has a strong foundation from which to meet MREL requirements.
The Basel Committee is expected to finalise its revisions to the standardised approach for credit and operational risks in late 2016. We do not believe that these will lead to a material increase in capital requirements for the Group. Whilst the revised standardised approach is due to be used as a basis for a floor for minimum capital requirements, the precise calibration of this has not yet been published. In addition, a Basel Committee consultation proposing constraints on the use of IRB approaches for credit risk was published in March 2016, which could lead to higher risk weights for certain portfolios.
In October 2015, the Bank of England published its medium term approach to concurrent stress testing: ‘The Bank of England’s approach to stress testing the UK banking system’. Two additional hurdle rates have been introduced for this year’s exercise (firms must meet Pillar 2A capital requirements and Global Systemically Important Bank (G-SIB) buffers in addition to CET1 and leverage ratios), and the Bank of England has clarified its approach to scenario setting. Each year the participating firms will be required to model a stress scenario that is linked to the UK’s position in the economic cycle, and on a biannual basis an additional ‘exploratory scenario’ will be published that will explore specific areas of risk or vulnerability in the economy that may not be captured in the annual scenario.
The Group continues to develop its approach to stress testing to ensure it responds to increasing regulatory expectations and it remains a valuable tool for the management of risk within its
business.
Back to Contents
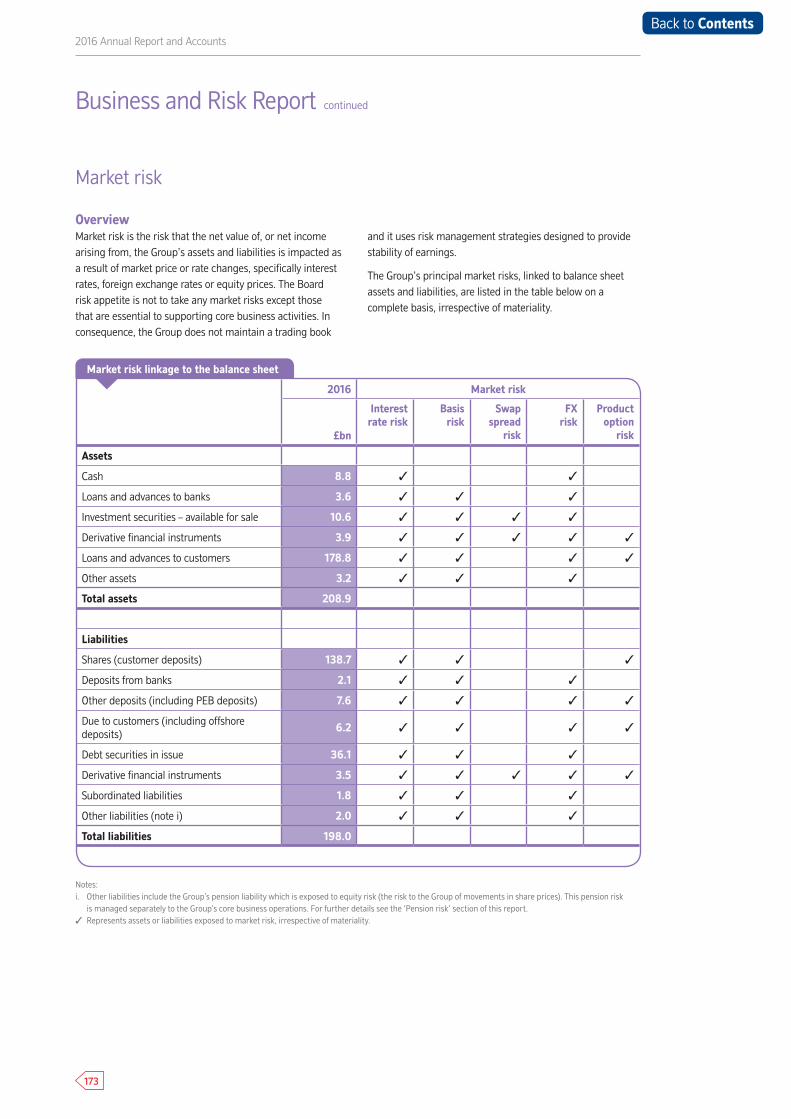
173
2016 Annual Report and Accounts
Market risk
Overview Market risk is the risk that the net value of, or net income arising from, the Group’s assets and liabilities is impacted as a result of market price or rate changes, specifically interest rates, foreign exchange rates or equity prices. The Board risk appetite is not to take any market risks except those that are essential to supporting core business activities. In consequence, the Group does not maintain a trading book
and it uses risk management strategies designed to provide stability of earnings.
The Group’s principal market risks, linked to balance sheet assets and liabilities, are listed in the table below on a complete basis, irrespective of materiality.
2016 Market risk
£bn
Interest rate risk
Basisrisk
Swap spread
risk
FXrisk
Product option
risk
Assets
Cash 8.8 ✓ ✓
Loans and advances to banks 3.6 ✓ ✓ ✓
Investment securities – available for sale 10.6 ✓ ✓ ✓ ✓
Derivative financial instruments 3.9 ✓ ✓ ✓ ✓ ✓
Loans and advances to customers 178.8 ✓ ✓ ✓ ✓
Other assets 3.2 ✓ ✓ ✓
Total assets 208.9
Liabilities
Shares (customer deposits) 138.7 ✓ ✓ ✓
Deposits from banks 2.1 ✓ ✓ ✓
Other deposits (including PEB deposits) 7.6 ✓ ✓ ✓ ✓
Due to customers (including offshore deposits)
6.2 ✓ ✓ ✓ ✓
Debt securities in issue 36.1 ✓ ✓ ✓
Derivative financial instruments 3.5 ✓ ✓ ✓ ✓ ✓
Subordinated liabilities 1.8 ✓ ✓ ✓
Other liabilities (note i) 2.0 ✓ ✓ ✓
Total liabilities 198.0
Business and Risk Report continued
Market risk linkage to the balance sheet
Notes:i. Other liabilities include the Group’s pension liability which is exposed to equity risk (the risk to the Group of movements in share prices). This pension risk
is managed separately to the Group’s core business operations. For further details see the ‘Pension risk’ section of this report. ✓ Represents assets or liabilities exposed to market risk, irrespective of materiality.
Back to Contents
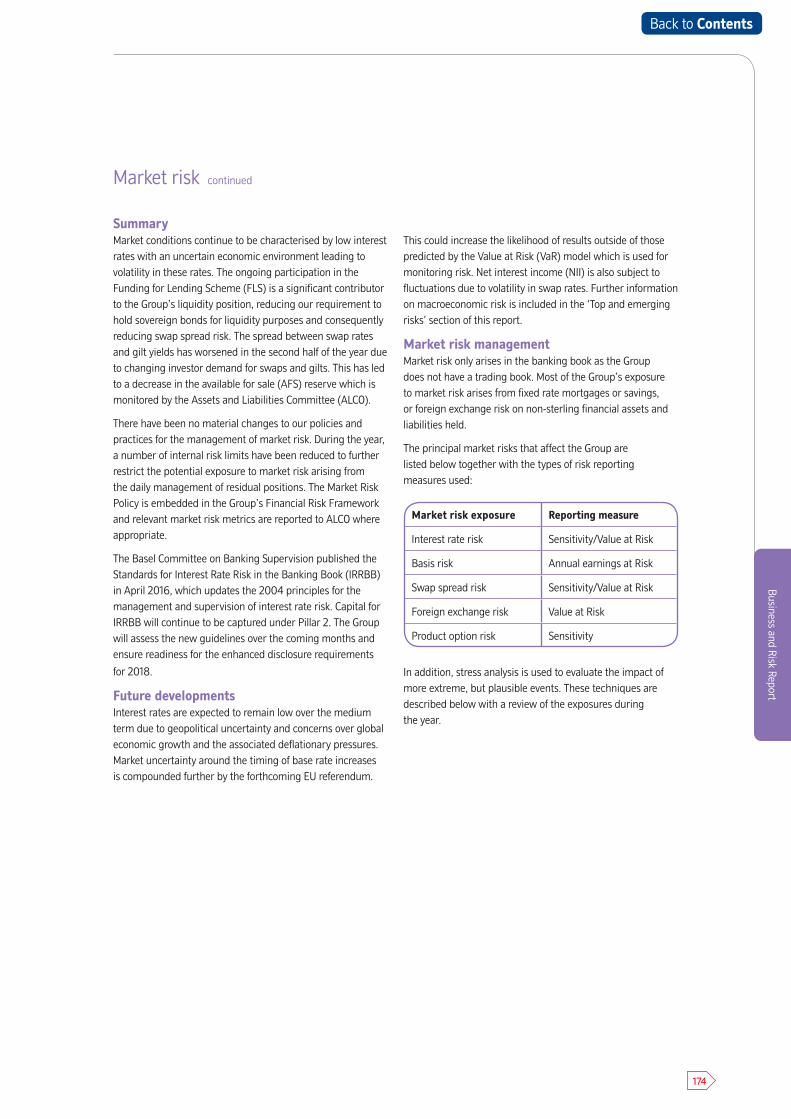
174
Business and Risk Report
Market risk continued
Summary Market conditions continue to be characterised by low interest rates with an uncertain economic environment leading to volatility in these rates. The ongoing participation in the Funding for Lending Scheme (FLS) is a significant contributor to the Group’s liquidity position, reducing our requirement to hold sovereign bonds for liquidity purposes and consequently reducing swap spread risk. The spread between swap rates and gilt yields has worsened in the second half of the year due to changing investor demand for swaps and gilts. This has led to a decrease in the available for sale (AFS) reserve which is monitored by the Assets and Liabilities Committee (ALCO).
There have been no material changes to our policies and practices for the management of market risk. During the year, a number of internal risk limits have been reduced to further restrict the potential exposure to market risk arising from the daily management of residual positions. The Market Risk Policy is embedded in the Group’s Financial Risk Framework and relevant market risk metrics are reported to ALCO where appropriate.
The Basel Committee on Banking Supervision published the Standards for Interest Rate Risk in the Banking Book (IRRBB) in April 2016, which updates the 2004 principles for the management and supervision of interest rate risk. Capital for IRRBB will continue to be captured under Pillar 2. The Group will assess the new guidelines over the coming months and ensure readiness for the enhanced disclosure requirements
for 2018.
Future developmentsInterest rates are expected to remain low over the medium term due to geopolitical uncertainty and concerns over global economic growth and the associated deflationary pressures. Market uncertainty around the timing of base rate increases is compounded further by the forthcoming EU referendum.
This could increase the likelihood of results outside of those predicted by the Value at Risk (VaR) model which is used for monitoring risk. Net interest income (NII) is also subject to fluctuations due to volatility in swap rates. Further information on macroeconomic risk is included in the ‘Top and emerging risks’ section of this report.
Market risk managementMarket risk only arises in the banking book as the Group does not have a trading book. Most of the Group’s exposure to market risk arises from fixed rate mortgages or savings, or foreign exchange risk on non-sterling financial assets and liabilities held.
The principal market risks that affect the Group are listed below together with the types of risk reporting measures used:
Market risk exposure Reporting measure
Interest rate risk Sensitivity/Value at Risk
Basis risk Annual earnings at Risk
Swap spread risk Sensitivity/Value at Risk
Foreign exchange risk Value at Risk
Product option risk Sensitivity
In addition, stress analysis is used to evaluate the impact of more extreme, but plausible events. These techniques are described below with a review of the exposures during the year.
Back to Contents
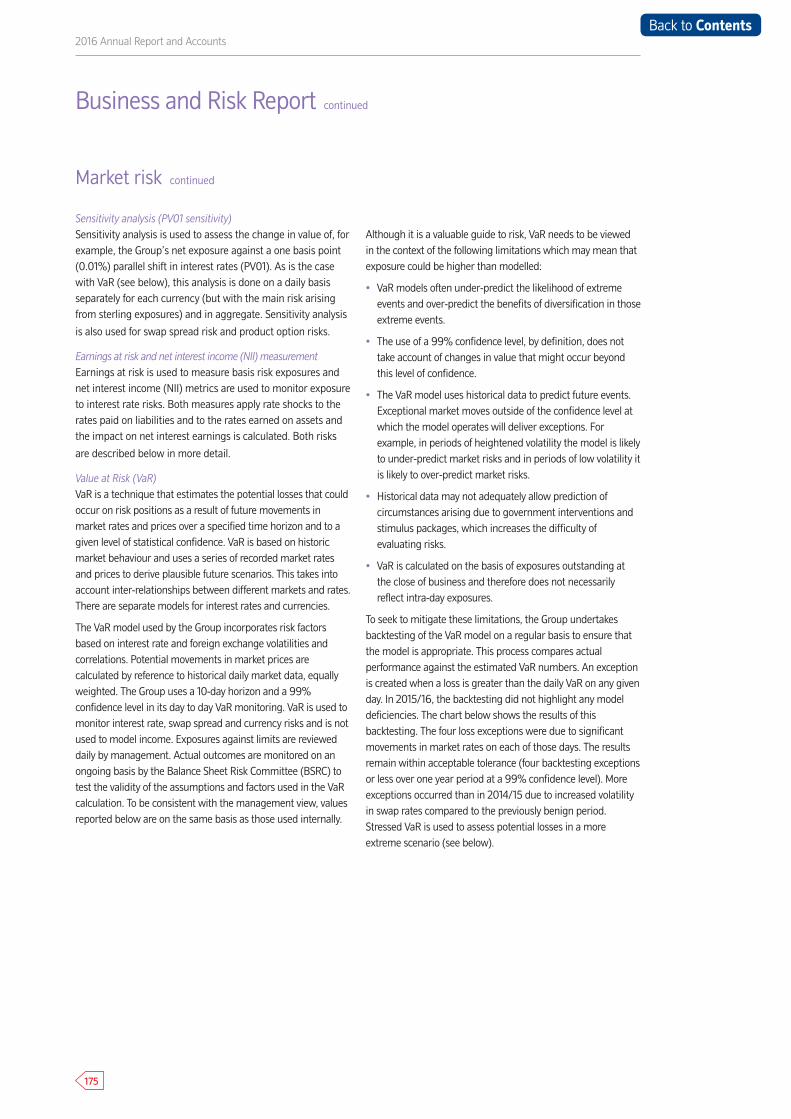
175
2016 Annual Report and Accounts
Market risk continued
Sensitivity analysis (PV01 sensitivity)Sensitivity analysis is used to assess the change in value of, for example, the Group’s net exposure against a one basis point (0.01%) parallel shift in interest rates (PV01). As is the case with VaR (see below), this analysis is done on a daily basis separately for each currency (but with the main risk arising from sterling exposures) and in aggregate. Sensitivity analysis
is also used for swap spread risk and product option risks.
Earnings at risk and net interest income (NII) measurementEarnings at risk is used to measure basis risk exposures and net interest income (NII) metrics are used to monitor exposure to interest rate risks. Both measures apply rate shocks to the rates paid on liabilities and to the rates earned on assets and the impact on net interest earnings is calculated. Both risks
are described below in more detail.
Value at Risk (VaR)VaR is a technique that estimates the potential losses that could occur on risk positions as a result of future movements in market rates and prices over a specified time horizon and to a given level of statistical confidence. VaR is based on historic market behaviour and uses a series of recorded market rates and prices to derive plausible future scenarios. This takes into account inter-relationships between different markets and rates. There are separate models for interest rates and currencies.
The VaR model used by the Group incorporates risk factors based on interest rate and foreign exchange volatilities and correlations. Potential movements in market prices are calculated by reference to historical daily market data, equally weighted. The Group uses a 10-day horizon and a 99% confidence level in its day to day VaR monitoring. VaR is used to monitor interest rate, swap spread and currency risks and is not used to model income. Exposures against limits are reviewed daily by management. Actual outcomes are monitored on an ongoing basis by the Balance Sheet Risk Committee (BSRC) to test the validity of the assumptions and factors used in the VaR calculation. To be consistent with the management view, values reported below are on the same basis as those used internally.
Although it is a valuable guide to risk, VaR needs to be viewed in the context of the following limitations which may mean that exposure could be higher than modelled:
• VaR models often under-predict the likelihood of extreme events and over-predict the benefits of diversification in thoseextreme events.
• The use of a 99% confidence level, by definition, does not take account of changes in value that might occur beyond this level of confidence.
• The VaR model uses historical data to predict future events. Exceptional market moves outside of the confidence level at which the model operates will deliver exceptions. For example, in periods of heightened volatility the model is likely to under-predict market risks and in periods of low volatility itis likely to over-predict market risks.
• Historical data may not adequately allow prediction of circumstances arising due to government interventions andstimulus packages, which increases the difficulty of evaluating risks.
• VaR is calculated on the basis of exposures outstanding atthe close of business and therefore does not necessarily reflect intra-day exposures.
To seek to mitigate these limitations, the Group undertakes backtesting of the VaR model on a regular basis to ensure that the model is appropriate. This process compares actual performance against the estimated VaR numbers. An exception is created when a loss is greater than the daily VaR on any given day. In 2015/16, the backtesting did not highlight any model deficiencies. The chart below shows the results of this backtesting. The four loss exceptions were due to significant movements in market rates on each of those days. The results remain within acceptable tolerance (four backtesting exceptions or less over one year period at a 99% confidence level). More exceptions occurred than in 2014/15 due to increased volatility in swap rates compared to the previously benign period. Stressed VaR is used to assess potential losses in a more extreme scenario (see below).
Business and Risk Report continued
Back to Contents
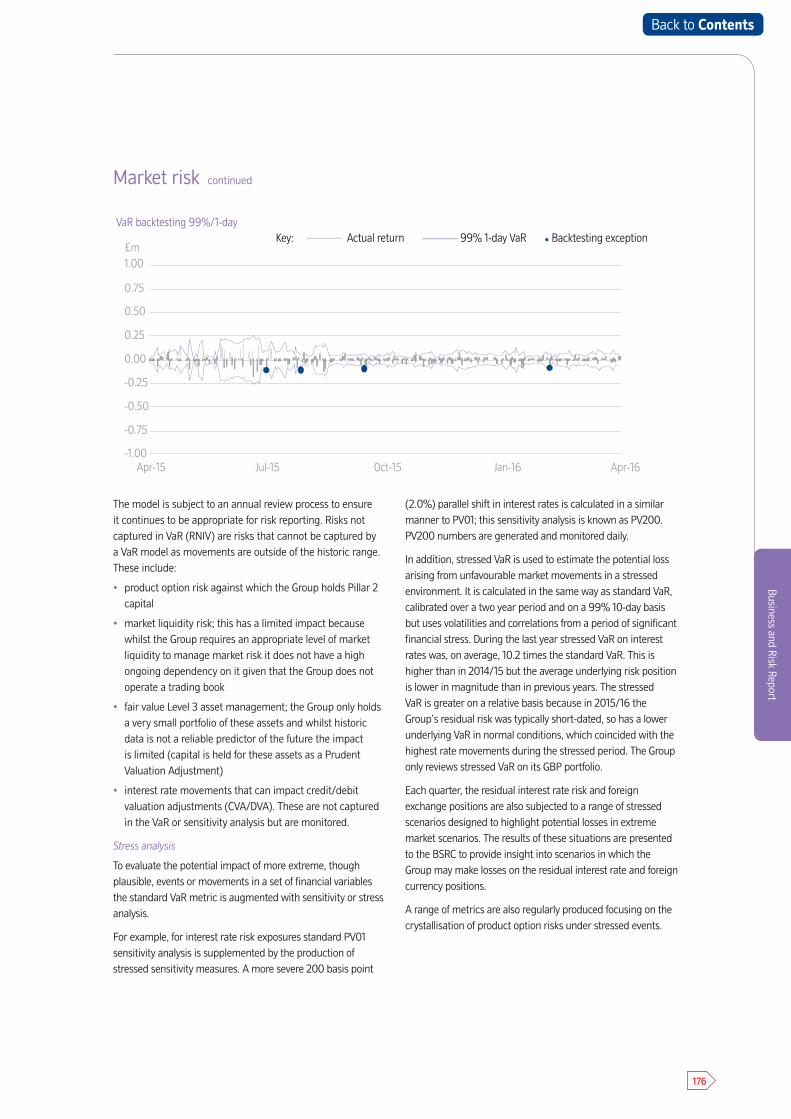
176
Business and Risk Report
Market risk continued
The model is subject to an annual review process to ensure it continues to be appropriate for risk reporting. Risks not captured in VaR (RNIV) are risks that cannot be captured by a VaR model as movements are outside of the historic range. These include:
• product option risk against which the Group holds Pillar 2 capital
• market liquidity risk; this has a limited impact because whilst the Group requires an appropriate level of market liquidity to manage market risk it does not have a high ongoing dependency on it given that the Group does not operate a trading book
• fair value Level 3 asset management; the Group only holds a very small portfolio of these assets and whilst historic data is not a reliable predictor of the future the impact is limited (capital is held for these assets as a Prudent Valuation Adjustment)
• interest rate movements that can impact credit/debit valuation adjustments (CVA/DVA). These are not captured in the VaR or sensitivity analysis but are monitored.
Stress analysis
To evaluate the potential impact of more extreme, though plausible, events or movements in a set of financial variables the standard VaR metric is augmented with sensitivity or stress analysis.
For example, for interest rate risk exposures standard PV01 sensitivity analysis is supplemented by the production of stressed sensitivity measures. A more severe 200 basis point
(2.0%) parallel shift in interest rates is calculated in a similar manner to PV01; this sensitivity analysis is known as PV200. PV200 numbers are generated and monitored daily.
In addition, stressed VaR is used to estimate the potential loss arising from unfavourable market movements in a stressed environment. It is calculated in the same way as standard VaR, calibrated over a two year period and on a 99% 10-day basis but uses volatilities and correlations from a period of significant financial stress. During the last year stressed VaR on interest rates was, on average, 10.2 times the standard VaR. This is higher than in 2014/15 but the average underlying risk position is lower in magnitude than in previous years. The stressed VaR is greater on a relative basis because in 2015/16 the Group’s residual risk was typically short-dated, so has a lower underlying VaR in normal conditions, which coincided with the highest rate movements during the stressed period. The Group only reviews stressed VaR on its GBP portfolio.
Each quarter, the residual interest rate risk and foreign exchange positions are also subjected to a range of stressed scenarios designed to highlight potential losses in extreme market scenarios. The results of these situations are presented to the BSRC to provide insight into scenarios in which the Group may make losses on the residual interest rate and foreign currency positions.
A range of metrics are also regularly produced focusing on the crystallisation of product option risks under stressed events.
1.00
0.75
0.50
0.25
0.00
-0.25
-0.50
-0.75
-1.00Apr-15
Key: ______ Actual return ______ 99% 1-day VaR • Backtesting exceptionVaR backtesting 99%/1-day
Jul-15 Oct-15 Jan-16 Apr-16
£m
Back to Contents
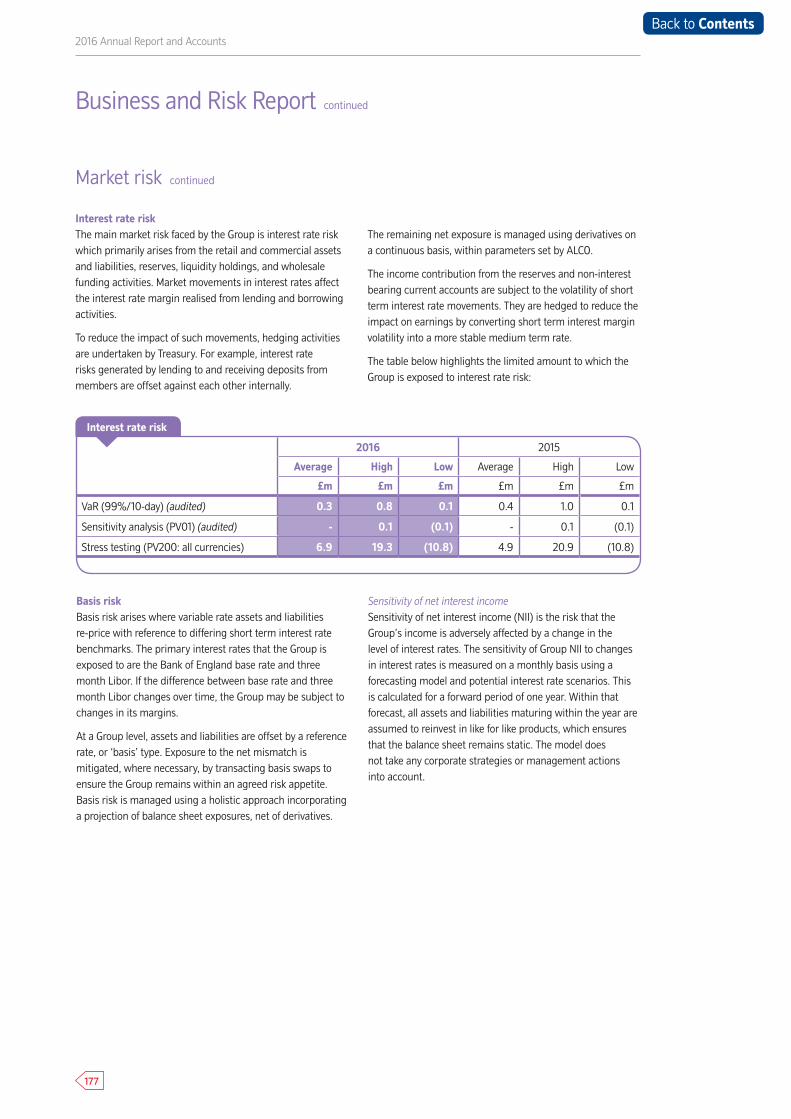
177
2016 Annual Report and Accounts
Interest rate risk The main market risk faced by the Group is interest rate risk which primarily arises from the retail and commercial assets and liabilities, reserves, liquidity holdings, and wholesale funding activities. Market movements in interest rates affect the interest rate margin realised from lending and borrowing activities.
To reduce the impact of such movements, hedging activities are undertaken by Treasury. For example, interest rate risks generated by lending to and receiving deposits from members are offset against each other internally.
The remaining net exposure is managed using derivatives on a continuous basis, within parameters set by ALCO.
The income contribution from the reserves and non-interest bearing current accounts are subject to the volatility of short term interest rate movements. They are hedged to reduce the impact on earnings by converting short term interest margin volatility into a more stable medium term rate.
The table below highlights the limited amount to which the Group is exposed to interest rate risk:
2016 2015
Average High Low Average High Low
£m £m £m £m £m £m
VaR (99%/10-day) (audited) 0.3 0.8 0.1 0.4 1.0 0.1
Sensitivity analysis (PV01) (audited) - 0.1 (0.1) - 0.1 (0.1)
Stress testing (PV200: all currencies) 6.9 19.3 (10.8) 4.9 20.9 (10.8)
Basis risk Basis risk arises where variable rate assets and liabilities re-price with reference to differing short term interest rate benchmarks. The primary interest rates that the Group is exposed to are the Bank of England base rate and three month Libor. If the difference between base rate and three month Libor changes over time, the Group may be subject to changes in its margins.
At a Group level, assets and liabilities are offset by a reference rate, or ‘basis’ type. Exposure to the net mismatch is mitigated, where necessary, by transacting basis swaps to ensure the Group remains within an agreed risk appetite. Basis risk is managed using a holistic approach incorporating a projection of balance sheet exposures, net of derivatives.
Sensitivity of net interest incomeSensitivity of net interest income (NII) is the risk that the Group’s income is adversely affected by a change in the level of interest rates. The sensitivity of Group NII to changes in interest rates is measured on a monthly basis using a forecasting model and potential interest rate scenarios. This is calculated for a forward period of one year. Within that forecast, all assets and liabilities maturing within the year are assumed to reinvest in like for like products, which ensures that the balance sheet remains static. The model does not take any corporate strategies or management actions into account.
Market risk continued
Business and Risk Report continued
Interest rate risk
Back to Contents
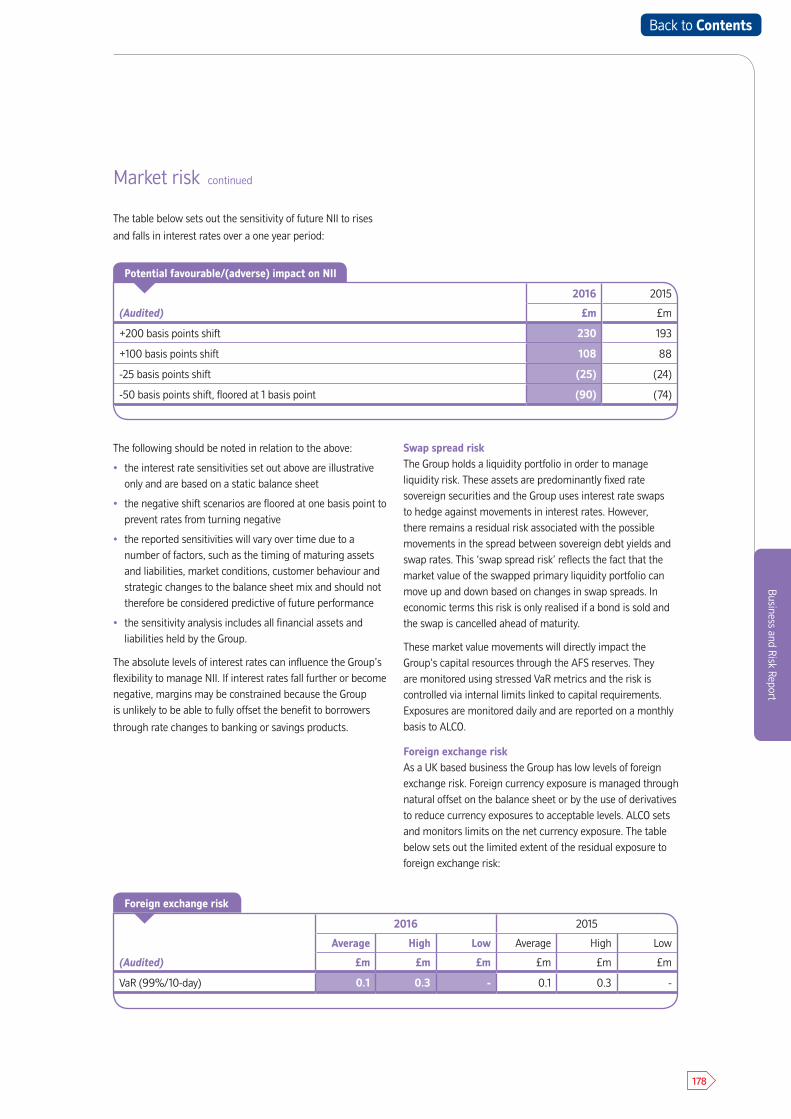
178
Business and Risk Report
Market risk continued
The table below sets out the sensitivity of future NII to rises
and falls in interest rates over a one year period:
The following should be noted in relation to the above:
• the interest rate sensitivities set out above are illustrative only and are based on a static balance sheet
• the negative shift scenarios are floored at one basis point to prevent rates from turning negative
• the reported sensitivities will vary over time due to a number of factors, such as the timing of maturing assets and liabilities, market conditions, customer behaviour and strategic changes to the balance sheet mix and should not therefore be considered predictive of future performance
• the sensitivity analysis includes all financial assets and liabilities held by the Group.
The absolute levels of interest rates can influence the Group’s flexibility to manage NII. If interest rates fall further or become negative, margins may be constrained because the Group is unlikely to be able to fully offset the benefit to borrowers
through rate changes to banking or savings products.
Swap spread riskThe Group holds a liquidity portfolio in order to manage liquidity risk. These assets are predominantly fixed rate sovereign securities and the Group uses interest rate swaps to hedge against movements in interest rates. However, there remains a residual risk associated with the possible movements in the spread between sovereign debt yields and swap rates. This ‘swap spread risk’ reflects the fact that the market value of the swapped primary liquidity portfolio can move up and down based on changes in swap spreads. In economic terms this risk is only realised if a bond is sold and the swap is cancelled ahead of maturity.
These market value movements will directly impact the Group’s capital resources through the AFS reserves. They are monitored using stressed VaR metrics and the risk is controlled via internal limits linked to capital requirements. Exposures are monitored daily and are reported on a monthly basis to ALCO.
Foreign exchange riskAs a UK based business the Group has low levels of foreign exchange risk. Foreign currency exposure is managed through natural offset on the balance sheet or by the use of derivatives to reduce currency exposures to acceptable levels. ALCO sets and monitors limits on the net currency exposure. The table below sets out the limited extent of the residual exposure to foreign exchange risk:
(Audited)
2016 2015
Average High Low Average High Low
£m £m £m £m £m £m
VaR (99%/10-day) 0.1 0.3 - 0.1 0.3 -
2016 2015
(Audited) £m £m
+200 basis points shift 230 193
+100 basis points shift 108 88
-25 basis points shift (25) (24)
-50 basis points shift, floored at 1 basis point (90) (74)
Potential favourable/(adverse) impact on NII
Foreign exchange risk
Back to Contents
179
2016 Annual Report and Accounts
Market risk continued
Product option risk Potential losses from market risks also arise as a result of customers exercising options embedded in fixed rate products which can result in required changes to hedging. The key product risks are prepayment risk (early redemption or overpayment of fixed rate mortgages), access risk (early withdrawal of fixed rate savings), and take-up risk (higher or lower take-up of fixed rate mortgages). These risk exposures are quantified and assessed using a set of bespoke models that predict customer behaviour in response to changes in interest rates. The resulting potential costs are then closely monitored. These stressed risk measures are subject to a set of triggers and are reported to ALCO, along with a set of proposed management actions where necessary to bring the exposures within appetite. Stresses are also used to calculate potential losses to drive internal capital requirements for product option related risks.
Model riskManaging market risk effectively is highly dependent on effective models which are mathematical representations of business systems designed to help describe, predict and optimise decisions and scenarios which are used throughout the Group’s business.
The risk associated with market risk models is controlled and managed through the Model Validation Policy which requires that all significant new models are validated by an independent oversight team prior to use. The validation process identifies model strengths and weaknesses, assesses the potential impact of these and suggests appropriate mitigating actions. The review findings are finally presented to the Model Risk Oversight Committee (MROC) which is responsible for endorsing models for use. In addition, the business performs backtesting and sensitivity analysis on models with a set of performance metrics assessed monthly for each model in terms of accuracy and its associated impact on results. All models are also subject to a more thorough periodic review, at least annually, to ensure they remain fit for purpose.
Calculations to determine the capital requirements for interest rate risk are made using the same models as those used for monitoring day-to-day interest rate risk to ensure consistency with the management view.
Business and Risk Report continued
Back to Contents
180
Business and Risk Report
Pension risk
OverviewThe Group has funding obligations to a number of defined benefit pension schemes, the most significant being the Nationwide Pension Fund (the Fund). Pension risk is defined as the risk that the value of the Fund’s assets will be insufficient to meet the estimated liabilities of the Fund. Pension risk can adversely impact the Group’s capital position and/or result in increased cash funding obligations to the Fund.
The Fund is closed to new employees, although some employees continue to accrue benefits. In accordance with UK legislation, the assets of the Fund are held in a legally separate trust from the Group’s assets and are administered by a board of trustees (the Trustee) who have fiduciary responsibilities to the beneficiaries of the Fund.
Risk factorsVolatility in investment returns from the assets and the value of the liabilities cause volatility in the Fund’s deficit. The key risk factors impacting the deficit are set out below. These factors can have a positive or negative impact on the deficit.
• Long term interest rates and credit spreads
Decreases in long-term interest rates and/or credit spreads will increase the value placed on the Fund’s liabilities. The increase in liabilities will be partially offset by an increase in the value of the Fund’s bonds and credit investments.
• Inflation
The majority of the pension benefits are linked to inflation and higher inflation will lead to higher liabilities (although, for most benefits, caps on the level of inflationary increases protect the Fund against extreme inflation). Where asset values are correlated with inflation (for example,index-linked gilts and inflation swaps), the increase inthe liabilities will be partially offset by asset increases.
• Asset performanceThe liabilities are calculated using a discount rate set with reference to bond yields. If the assets underperform the bond yields, this will cause the net position of the Fund to deteriorate.
The Fund also holds a significant proportion ofreturn-seeking assets such as equities and credit investments. Whilst return-seeking assets are expected to outperform the liabilities in the long term, they create risk and volatility in the short to medium term. The investment in return-seeking assets, such as equities, is monitored by both the Trustee and the Group to ensure it remains appropriate given the Fund’s long term objectives.
• Longevity (life expectancy)
The majority of the pension benefits received by members of the Fund are paid for life. Therefore, the Group is exposed to the risk of Fund members living longer than expected, as this would lead to pension benefits being paid for longer.
• RegulationThe Group is exposed to potential changes in the regulatory environment and pension legislation, which could increase the pension liabilities and/or impact the Group’s capital position.
In addition, a change in the methodology used to derive key actuarial assumptions (for example, the discount rate, or longevity assumption) can result in a step change in the assessment of the liabilities and therefore the deficit. However, the ultimate cost of providing benefits will depend on actual future events, rather than assumptions made.
Back to Contents
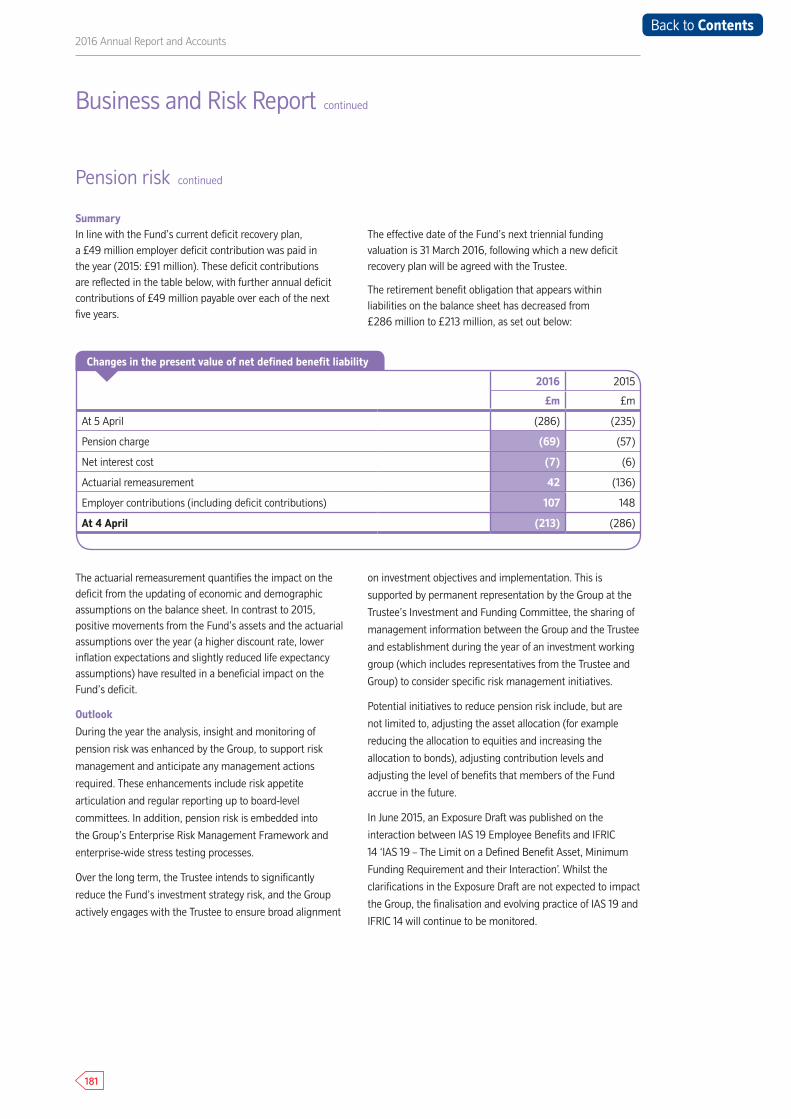
181
2016 Annual Report and Accounts
Pension risk continued
SummaryIn line with the Fund’s current deficit recovery plan, a £49 million employer deficit contribution was paid in the year (2015: £91 million). These deficit contributions are reflected in the table below, with further annual deficit contributions of £49 million payable over each of the next five years.
The effective date of the Fund’s next triennial funding valuation is 31 March 2016, following which a new deficit recovery plan will be agreed with the Trustee.
The retirement benefit obligation that appears within liabilities on the balance sheet has decreased from £286 million to £213 million, as set out below:
2016 2015
£m £m
At 5 April (286) (235)
Pension charge (69) (57)
Net interest cost (7) (6)
Actuarial remeasurement 42 (136)
Employer contributions (including deficit contributions) 107 148
At 4 April (213) (286)
The actuarial remeasurement quantifies the impact on the deficit from the updating of economic and demographic assumptions on the balance sheet. In contrast to 2015, positive movements from the Fund’s assets and the actuarial assumptions over the year (a higher discount rate, lower inflation expectations and slightly reduced life expectancy assumptions) have resulted in a beneficial impact on the Fund’s deficit.
Outlook
During the year the analysis, insight and monitoring of
pension risk was enhanced by the Group, to support risk
management and anticipate any management actions
required. These enhancements include risk appetite
articulation and regular reporting up to board-level
committees. In addition, pension risk is embedded into
the Group’s Enterprise Risk Management Framework and
enterprise-wide stress testing processes.
Over the long term, the Trustee intends to significantly
reduce the Fund’s investment strategy risk, and the Group
actively engages with the Trustee to ensure broad alignment
on investment objectives and implementation. This is
supported by permanent representation by the Group at the
Trustee’s Investment and Funding Committee, the sharing of
management information between the Group and the Trustee
and establishment during the year of an investment working
group (which includes representatives from the Trustee and
Group) to consider specific risk management initiatives.
Potential initiatives to reduce pension risk include, but are
not limited to, adjusting the asset allocation (for example
reducing the allocation to equities and increasing the
allocation to bonds), adjusting contribution levels and
adjusting the level of benefits that members of the Fund
accrue in the future.
In June 2015, an Exposure Draft was published on the
interaction between IAS 19 Employee Benefits and IFRIC
14 ‘IAS 19 – The Limit on a Defined Benefit Asset, Minimum
Funding Requirement and their Interaction’. Whilst the
clarifications in the Exposure Draft are not expected to impact
the Group, the finalisation and evolving practice of IAS 19 and
IFRIC 14 will continue to be monitored.
Business and Risk Report continued
Changes in the present value of net defined benefit liability
Back to Contents
182
Business and Risk Report
Earnings risk
OverviewThe Group ensures that it can generate sustainable profit through focus on recurrent sources of income commensurate with the risks taken. Earnings risk is defined as the risk that the Group’s sources of income are unable to continue to add the expected value, due to changes in market, regulatory or
other environmental factors.
StrategyThe Group’s earnings risk strategy is to ensure that sufficient earnings are maintained to withstand non-trading shocks and deliver retained member value. The strategy identifies and quantifies plausible trading risks within the context of the Corporate Plan and financial forecast. The strategy takes into account economic and market uncertainties, such as the potential earnings impact of lower for longer bank base rates and the impact of regulatory and tax changes in the buy to let market. These risks are then monitored and updated on an
ongoing basis throughout the financial year.
The Group mitigates and manages its earnings risk through
the following measures:
• Corporate planning and financial forecasts
The Group’s planning process forecasts earnings over a five year period. Income forecasts are reviewed and updated monthly through a detailed ‘opportunities and risks’ assessment and reported to the Weekly Trading Committee. In addition the Executive Committee and the Board are provided with a current year earnings and capital forecast.
• Monitoring of financial performance
Earnings risk is monitored against internal forecasts, limits and triggers set by the Board’s earnings risk strategy. This process involves reviewing product pricing scenarios and their impact on net interest margin, provisioning and costs. Investment spend is analysed and approved under a cost benefit methodology by the applicable investment board.
• Stress testing and sensitivity analysis
The Group’s earnings are regularly stress tested as part of both internal management reporting and externally, under the PRA’s scenario based testing. Sensitivity analysis of expected recurrent net interest income and net interest margin is conducted against a range of possible macroeconomic scenarios.
• Reporting governance
The Board reviews recurrent earnings in the Business Performance Pack, which is updated each month for the latest financial forecasts and assumptions on the Group’s underlying performance.
Back to Contents
183
2016 Annual Report and Accounts
Operational risk
Operational risk profileThe Group defines operational risk as the risk of loss resulting from inadequate or failed internal processes, people and systems, or from external events. The Group manages operational risk across a number of sub-categories, the most significant of which cover Cyber, Information Technology (IT) Resilience and Security, Business Continuity, Payments and Fraud.
The Group’s operational risk profile is informed by risk assessments from across the business, and by review and challenge by both management and the oversight functions. The Group’s operational risk oversight function supports the business in managing the risks it faces in its normal day-to-day activities and when implementing change programmes. The Group continues to strengthen and embed the operational risk framework, expanding the use of techniques such as scenario analysis and ‘war-gaming’ to support the understanding of current and future risks and optimise risk-based decision making across the business.
The oversight function also monitors and reports on the operational risk events that have occurred, by number and by value, in order to better understand those exposures that require management attention. For the purposes of reporting, operational risk events include those which have a financial loss or costs arising from an operational risk incident. The Group reports operational risk events against the causal category, as well as by Basel defined categories. This latter approach allows the Group to compare operational risk experience with its peer group and is a regulatory requirement.
Business and Risk Report continued
Back to Contents
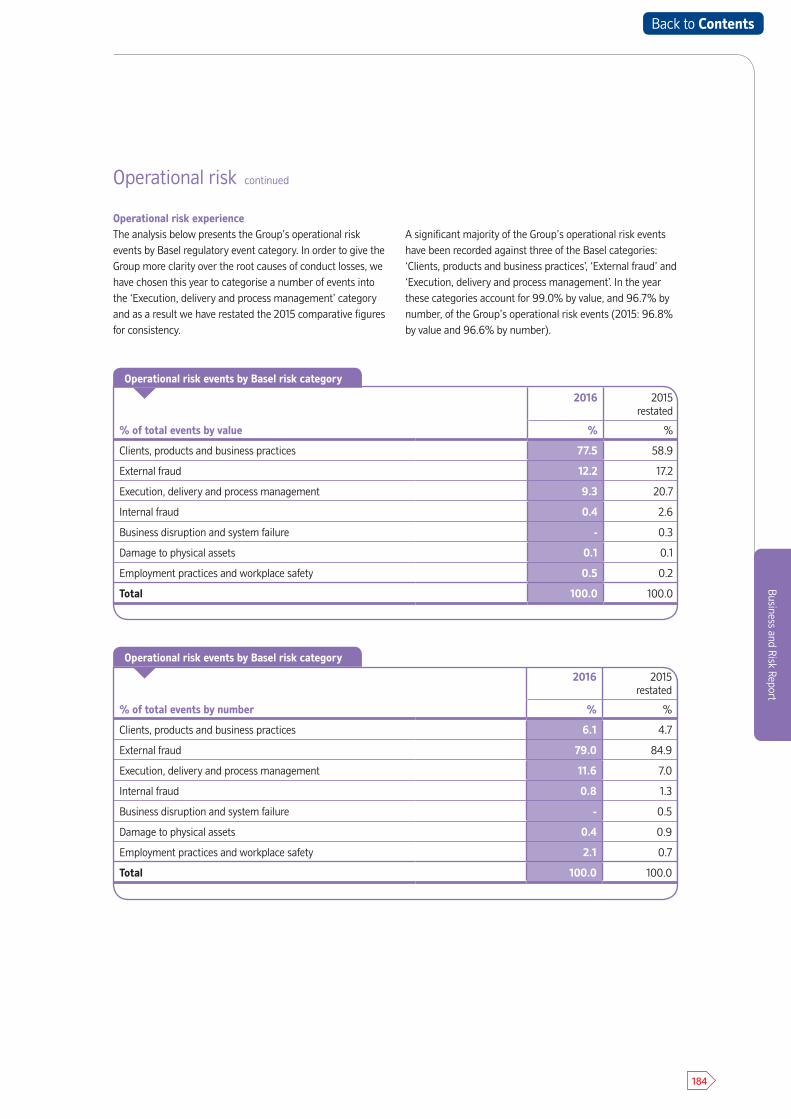
184
Business and Risk Report
Operational risk continued
% of total events by value
2016 2015 restated
% %
Clients, products and business practices 77.5 58.9
External fraud 12.2 17.2
Execution, delivery and process management 9.3 20.7
Internal fraud 0.4 2.6
Business disruption and system failure - 0.3
Damage to physical assets 0.1 0.1
Employment practices and workplace safety 0.5 0.2
Total 100.0 100.0
Operational risk experience The analysis below presents the Group’s operational risk events by Basel regulatory event category. In order to give the Group more clarity over the root causes of conduct losses, we have chosen this year to categorise a number of events into the ‘Execution, delivery and process management’ category and as a result we have restated the 2015 comparative figures for consistency.
A significant majority of the Group’s operational risk events have been recorded against three of the Basel categories: ‘Clients, products and business practices’, ‘External fraud’ and ‘Execution, delivery and process management’. In the year these categories account for 99.0% by value, and 96.7% by number, of the Group’s operational risk events (2015: 96.8% by value and 96.6% by number).
Operational risk events by Basel risk category
% of total events by number
2016 2015 restated
% %
Clients, products and business practices 6.1 4.7
External fraud 79.0 84.9
Execution, delivery and process management 11.6 7.0
Internal fraud 0.8 1.3
Business disruption and system failure - 0.5
Damage to physical assets 0.4 0.9
Employment practices and workplace safety 2.1 0.7
Total 100.0 100.0
Operational risk events by Basel risk category
Back to Contents
185
2016 Annual Report and Accounts
Operational risk continued
Current environmentOver the course of the year, the overall portfolio of operational risks has remained relatively stable. The increased expectations surrounding key inherent risks such as cyber security and IT resilience, particularly when coupled with an increasing pace of change, have been matched by increased control and monitoring in order to ensure service availability and customer data security. These main drivers of operational risk across the Group are detailed below:
• Cyber security
The threat of organised cyber crime continues to increase and has been highlighted by a number of recent attacks in the financial and non-financial sectors. Such attacks have also increased the public awareness of cyber threats. As a result of the increasing threat from cyber crime the Group’s security controls need to keep pace to prevent, detect and respond to any threats or attacks.
The Group continues to focus its efforts on discharging its cyber risk management responsibilities effectively, with ongoing investment in appropriate technology and processes. This ensures the Group safeguards its operations and, more importantly, its customers. The cyber security control framework includes systems, processes, policies and controls to ensure the Group manages cyber risk effectively. This framework is also designed to ensure that the Group haseffective approaches to responding to any attacks, whether aimed directly at the Group or at other parties where there may be an indirect impact on our customers.
• IT and operational resilience
The Group’s implementation of new systems, infrastructuresand processes, alongside the maintenance of legacy systems, introduces a level of operational complexity. In an increasingly digital world, customer expectations for service availability are rising with a significantly lower tolerance of service disruption. Ensuring a highly reliable and widely available service requires resilient IT, business systems and processes. Meanwhile the exponential rise in data used in digital services increases the complexity and cost of managing data securely and effectively. In response, the Group operates a dedicated Operational Resilience Function to ensure it meets customer expectations.
• Pace of change in a digital environment
The Group invests significantly in its digital channels, regularly updating the mobile and internet banking services and enabling new payment technologies such as Apple Pay. The experience for members and staff in branches has also improved with the expansion of the ‘Nationwide Now’ service to over 400 installations (Nationwide Now allows the Group to provide its members with the opportunity to meet with a consultant via a high definition video link in a branch). Whilst the member-focused nature of the Group’s business model puts it in a good position to respond to the varied and evolving needs of members, the scale and pace of change can create delivery challenges. Such challenges can lead to disruption of the Group’s operating environment,with impacts on the service experienced by members. These operational risks are managed through a strong focus on service management, transformation governance and programme management disciplines.
• Use of third parties
The Group needs to ensure that customer outcomes and service experience are maintained regardless of whether services are delivered in house or through third parties. Therelationships with our third parties are managed closely to ensure that the service they offer is in line with acceptable standards and Nationwide’s customer ethos.
OutlookThe operational risk outlook focuses on the environment in which the Group operates and on its strategy. The Group expects that the drivers of operational risk will remain broadly stable, with themes around the scale and pace of change in a digital environment, IT resilience, effective management of increasingly sophisticated cyber security threats and use of third parties.
Business and Risk Report continued
Back to Contents
186
Business and Risk Report
Conduct and compliance risk
Introduction Conduct and compliance risk is defined as the risk that the Group exercises inappropriate judgement or makes errors in the execution of its business activities, leading to non-compliance with regulation or legislation, market integrity being undermined, or an unfair outcome being created for customers.
The Group has a culture in which conduct and compliance is central to its values and behaviours. It will continue to deliver and develop systems and controls that protect its members, with carefully designed products with transparent and fair pricing, delivered by a sales force that is well-trained and monitored, and offering channels that meet the customers’ demands for flexibility of access.
The Group has developed a set of conduct risk statements to more clearly emphasise its focus on proactively creating fair customer outcomes and protecting market integrity. This is supported by a comprehensive suite of policies and controls, designed to ensure the delivery of fair customer outcomes. Performance against these outcomes and of the operation of key controls is reported to the Conduct and Compliance Committee, which is chaired by the Chief Compliance Officer with escalation to the Executive Risk Committee.
Environment In recent years, issues associated with poor customer conduct, unfair customer outcomes, and insufficient market integrity have proven costly for the industry. The ongoing focus on conduct and customer outcomes in this environment will, rightly, remain a key area of priority for the industry. The Financial Conduct Authority (FCA) continues to evolve its regulatory regime around the concept of culture and conduct risk. This supports the FCA’s aim of securing an appropriate degree of protection for consumers, protecting and enhancing the integrity of the UK financial system and promoting effective competition in the interests of consumers, each of which will contribute to the improved trust and confidence in the UK financial services market. The Group is very supportive of these developments.
The growth in digital channels has changed the nature of many interactions with customers and challenges the industry to ensure that it continues to deliver fair customer outcomes as these channels evolve. The development of the ‘Nationwide Now’ proposition in addition to the Group’s existing digital, mobile, telephone and branch services has enabled the Group
to interact with its customers in a manner and at a time of their choosing. This service has been designed with fair customer outcomes in mind.
The Group always seeks to do the right thing for its customers and is developing its policy and practical approach to the support of customers in vulnerable circumstances. It has worked with Macmillan Cancer Care to provide additional support for customers with cancer and is piloting the extension of this support to customers with other life-limiting conditions. The lessons learned will inform the Group’s wider approach to other groups of vulnerable customers.
Given changing regulatory expectations, there is a risk that some parts of the Group’s past business may be considered as not having been conducted fully in accordance with law and regulation or may not, in the regulator’s opinion, be regarded as having resulted in fair or reasonable treatment of customers. This could occur, for example, through products, sale processes or services failing to meet customer expectations. The Group is reviewing its compliance with various regulatory matters, including consumer credit legislation and during the period has recognised a net provision charge of £127 million in respect of potential customer redress to reflect its latest estimate of potential exposure.
The total provision held at 4 April 2016 of £227 million (2015: £140 million) continues to include amounts for the mis-selling of payment protection insurance (PPI). The provision held represents the Group’s best estimate of the amount required to deal with PPI claims, taking into account the consultation issued by the FCA in November 2015. The amount provided at 4 April 2016 reflects the compensation likely to be payable in respect of the claims which the Group now expects to receive and the associated administrative costs of processing claims.
There has been significant strengthening of financial crime controls across the industry in recent years. The Group has introduced tighter controls to protect customers and has an ongoing programme of activity to ensure that these controls address emerging threats and ongoing industry changes.
Back to Contents
187
2016 Annual Report and Accounts
Conduct and compliance risk continued
Significant events
There is a significant volume of change currently affecting the Group. Some of the key developments being addressed by the Group are listed below:
• The introduction of the Mortgage Credit Directive in March 2016 has led to a period of adjustment for the industry as a whole and, specifically, in relation to disclosures to customers.
• The Immigration Bill 2016 introduces new requirements designed to prevent those unlawfully in the UK from having access to financial services; banks and building societies will be required to undertake checks and make notification to the Secretary of State regarding products held by disqualified persons. They may also be asked to freezeand/or close accounts held by disqualified persons.
• The Payment Services Directive II, due to be implemented into UK Law in January 2018, will help to encourage new entrants to the financial services market by opening up access to payment data and will introduce enhanced security and authentication measures.
• The Prudential Regulation Authority’s (PRA) and FCA’s new Senior Managers Regime, Strengthening Individual Accountability, which increases personal accountability across the industry was introduced in March 2016. The Group’s simple business model and its focus on its members has meant that it is well placed to address the challenges from the change. The PRA and the FCA will be introducing further regulation in 2017 to support a change in culture and accountabilities.
OutlookThere is increasing demand from customers to transact business at a time and through a medium of their choosing. The Group will continue to develop its proposition to meet the changing behaviours of customers. Increasing standards for conduct could restrict the Group’s channels, services or proposition whilst developments pushing the boundaries of existing regulation may increase the risk of misinterpretation through greater reliance on subjective assessments. The Group is continuing to develop new service propositions for customers to meet their changing demands and operates policies and controls that are designed to ensure the delivery of fair customer outcomes at the point of product development, selling and post-sales support.
The scale and pace of regulatory change will see the industry continuing to evolve as it responds to these demands. The Group is, however, well placed to meet these challenges.
Business and Risk Report continued
Back to Contents
188
Business and Risk Report
Strategic risk
The Group defines strategic risk as the risk of significant loss or damage arising from business decisions that impact the long term interests of the membership, or from an inability to adapt to external developments.
Strategic risk focuses on large, longer term risks that could become a material issue for the Group, arising from the business model or strategic initiatives that the Group undertakes. Whilst all business areas are responsible for managing their own risks, management of strategic risk is primarily the responsibility of senior management.
The management of strategic risk is intrinsically linked to the corporate planning and stress testing processes, and is further supported by the regular provision of consolidated business performance and risk reporting data to the Board and senior risk committees. In addition, the annual process of setting Board risk appetite ensures that the Group establishes the risks it is willing to take to achieve its strategic goals.
A number of the top and emerging risks have the potential to affect more than one risk category and could have significant impact on the business model if these were to crystallise in the same timeframe. In particular, new business models operated by new market entrants or changes made by existing large competitors could significantly change the UK banking landscape which could, over the longer term, require changes to the Group’s business model.
As the scale and pace of digital change intensifies there is a risk that financial services providers who do not keep pace will be left with unattractive customer propositions with resulting damage to reputation and underlying viability. The pace of change may also result in investments in technology becoming outdated before the end of their expected lives. The cost of keeping pace with change must be carefully monitored, particularly in the face of the intense competition seen across the retail banking market which could compress margins, to ensure that the business model remains financially balanced.
Global economic factors, including the UK referendum on membership of the EU, have the scope to disrupt financial markets and therefore impact on the strategic priorities of the Group.
To manage strategic risk, the Group considers strategic investments in the light of its focus on serving both current and future members while maximising member benefit. Activities are centred on mainstream UK retail personal financial services, with participation in other non-member businesses only where these activities fit with core capabilities, diversify risks, and earn a premium return for members.
Back to Contents
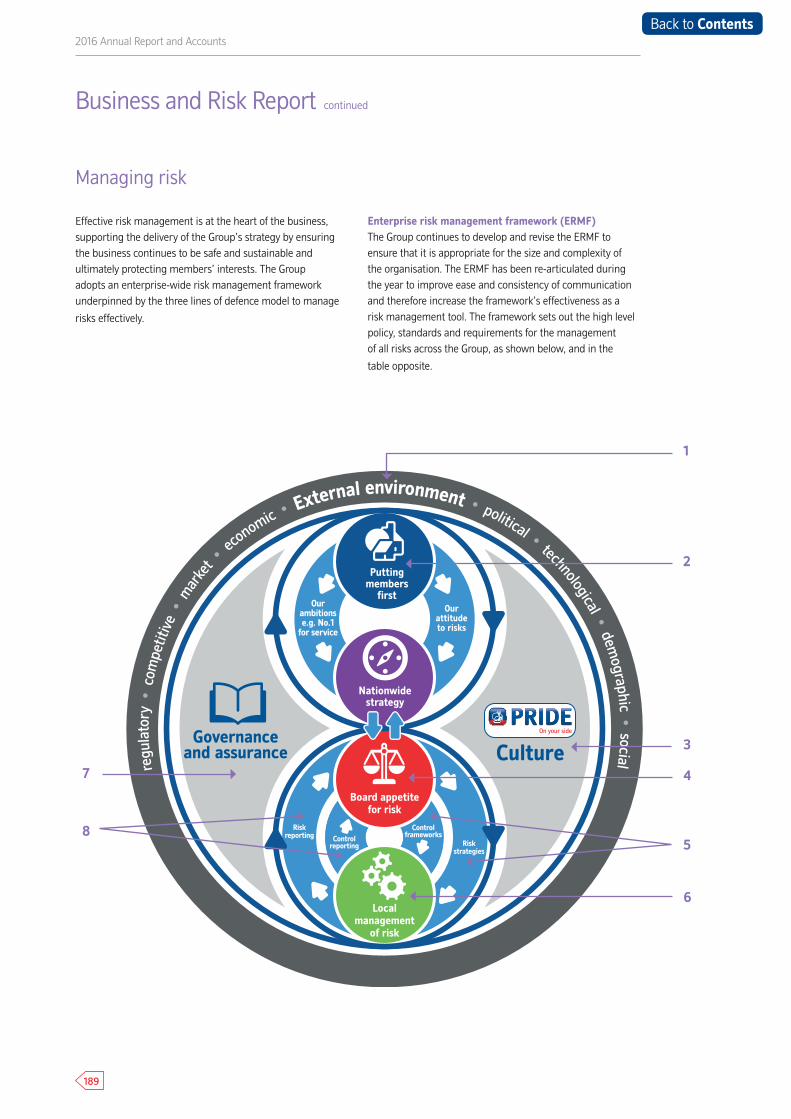
189
2016 Annual Report and Accounts
Managing risk
Effective risk management is at the heart of the business, supporting the delivery of the Group’s strategy by ensuring the business continues to be safe and sustainable and ultimately protecting members’ interests. The Group adopts an enterprise-wide risk management framework underpinned by the three lines of defence model to manage
risks effectively.
Enterprise risk management framework (ERMF)The Group continues to develop and revise the ERMF to ensure that it is appropriate for the size and complexity of the organisation. The ERMF has been re-articulated during the year to improve ease and consistency of communication and therefore increase the framework’s effectiveness as a risk management tool. The framework sets out the high level policy, standards and requirements for the management of all risks across the Group, as shown below, and in the
table opposite.
Business and Risk Report continued
regu
lato
ry •
com
petit
ive •
mar
ket •
economic • External environment • political • technological • dem
ographic • social
Governance and assurance Culture
Risk reporting
Risk strategies
Control frameworksControl
reporting
Our attitude to risks
Our ambitions e.g. No.1
for service
Nationwidestrategy
Putting members
first
Local management
of risk
Board appetite for risk
1
2
3
4
5
6
8
7
Back to Contents
190
Business and Risk Report
Managing risk continued
1 External environment The Group’s risk management agenda is shaped by external environmental factors including but not limited to those listed in the diagram.
2 Putting members first The Group’s core purpose sets its corporate ambitions and informs its strategy and attitude to risks.
3 Culture Having the right culture supports risk management activity across the business. The Group’s ‘On your side’ culture and PRIDE values ensure that customers’ interests, safety and security are put at the heart of its approach to risk management.
4 Board appetite for risk Board appetite for risk defines how much risk the Board is prepared to take in pursuit of the Group’s goals, and establishes a framework for decision making. It is supported by metrics and limits which enable performance against appetite to be effectively reported. Board appetite for risk is informed by and informs the Group’s strategy.
5 Risk strategies and Control frameworks
The Board approves the control frameworks and strategies that management use to ensure that major risks remain within Board appetite for risk.
6 Local management of risk Local management of risk is the process of identifying, assessing, managing, monitoring and reporting risks. Risk management activity is carried out by all of the Group’s staff to ensure that risks which are part of their day-to-day jobs are properly identified and controlled. As part of this, the Group undertakes stress testing and scenario analysis to ensure that it understands and remains resilient to the impact of remote but potentially severe risks. Further details of stress testing can be found in the ‘Liquidity and funding risk’ and the ‘Solvency risk’ sections of the Business and Risk Report.
7 Governance and assurance
Governance and assurance describes the risk committee structures and mandates and ensures that roles and responsibilities are clear and operate within the Group’s ‘three lines of defence’ model. These are described further on the following pages.
8 Risk and control reporting Risk and control reporting enables the Board to ensure that the ERMF and internal control systems are working correctly and that risks are being managed within risk appetite.
Back to Contents
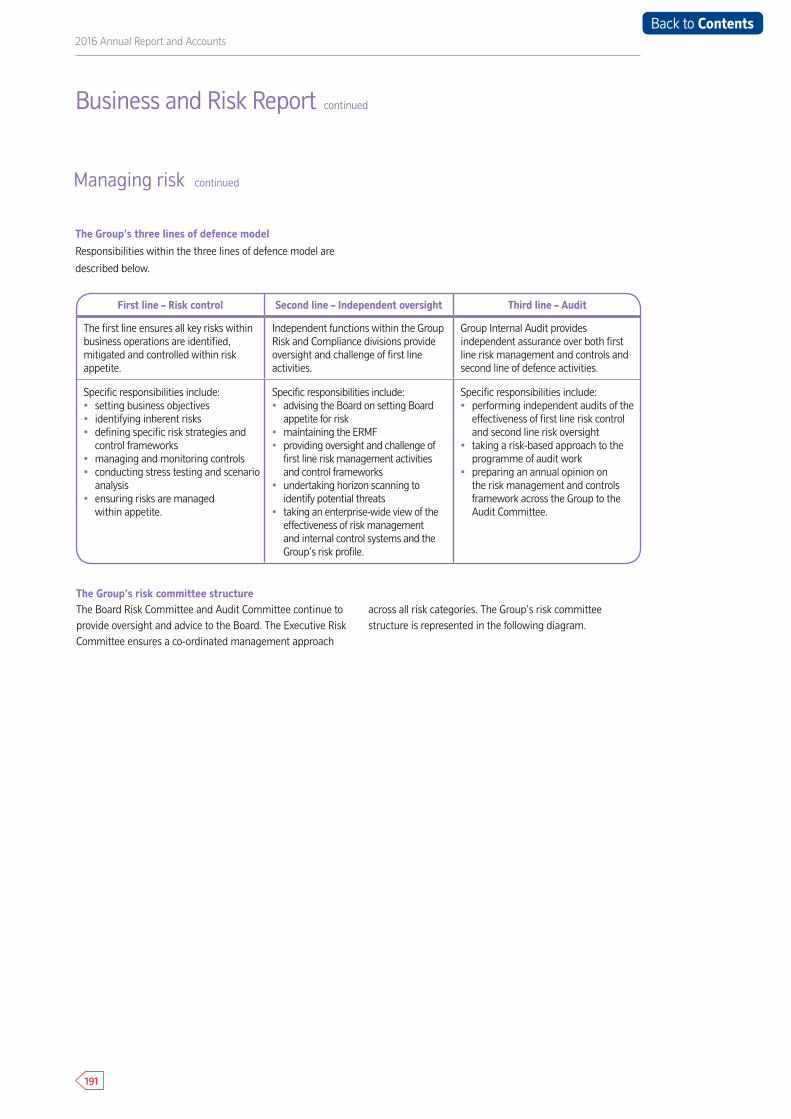
191
2016 Annual Report and Accounts
Managing risk continued
Business and Risk Report continued
The Group’s risk committee structureThe Board Risk Committee and Audit Committee continue to provide oversight and advice to the Board. The Executive Risk Committee ensures a co-ordinated management approach
across all risk categories. The Group’s risk committee structure is represented in the following diagram.
The Group’s three lines of defence model
Responsibilities within the three lines of defence model are
described below.
First line – Risk control Second line – Independent oversight Third line – Audit
The first line ensures all key risks within business operations are identified, mitigated and controlled within risk appetite.
Independent functions within the Group Risk and Compliance divisions provide oversight and challenge of first line activities.
Group Internal Audit provides independent assurance over both first line risk management and controls and second line of defence activities.
Specific responsibilities include:• setting business objectives• identifying inherent risks• defining specific risk strategies and
control frameworks • managing and monitoring controls• conducting stress testing and scenario
analysis• ensuring risks are managed
within appetite.
Specific responsibilities include:• advising the Board on setting Board
appetite for risk• maintaining the ERMF• providing oversight and challenge of
first line risk management activities and control frameworks
• undertaking horizon scanning to identify potential threats
• taking an enterprise-wide view of the effectiveness of risk management and internal control systems and the Group’s risk profile.
Specific responsibilities include:• performing independent audits of the
effectiveness of first line risk control and second line risk oversight
• taking a risk-based approach to theprogramme of audit work
• preparing an annual opinion on the risk management and controls framework across the Group to theAudit Committee.
Back to Contents
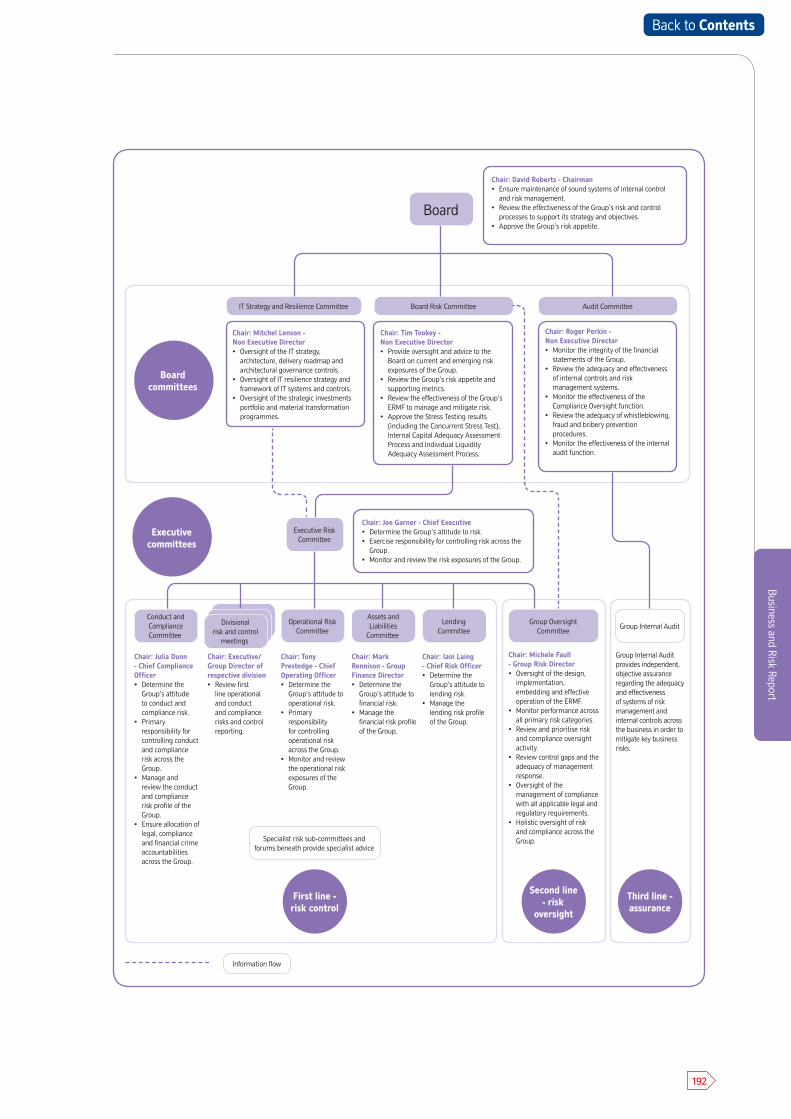
192
Business and Risk Report
Executive committees
Board committees
Group OversightCommittee
Group Internal Audit
Chair: Michele Faull - Group Risk Director• Oversight of the design,
implementation, embedding and effective operation of the ERMF.
• Monitor performance across all primary risk categories.
• Review and prioritise risk and compliance oversight activity.
• Review control gaps and the adequacy of management response.
• Oversight of the management of compliance with all applicable legal and regulatory requirements.
• Holistic oversight of risk and compliance across the Group.
Group Internal Audit provides independent, objective assurance regarding the adequacy and effectiveness of systems of risk management and internal controls across the business in order to mitigate key business risks.
Conduct and Compliance Committee
IT Strategy and Resilience Committee
Chair: Julia Dunn - Chief Compliance Officer• Determine the
Group’s attitude to conduct and compliance risk.
• Primary responsibility for controlling conduct and compliance risk across the Group.
• Manage and review the conduct and compliance risk profile of the Group.
• Ensure allocation of legal, compliance and financial crime accountabilities across the Group.
Chair: Mitchel Lenson - Non Executive Director• Oversight of the IT strategy,
architecture, delivery roadmap and architectural governance controls.
• Oversight of IT resilience strategy and framework of IT systems and controls.
• Oversight of the strategic investments portfolio and material transformation programmes.
Chair: David Roberts - Chairman• Ensure maintenance of sound systems of internal control
and risk management.• Review the effectiveness of the Group’s risk and control
processes to support its strategy and objectives.• Approve the Group’s risk appetite.
Divisional risk and control
meetings
Board Risk Committee Audit Committee
Chair: Executive/Group Director of respective division• Review first
line operational and conduct and compliance risks and control reporting.
Chair: Tim Tookey - Non Executive Director• Provide oversight and advice to the
Board on current and emerging risk exposures of the Group.
• Review the Group’s risk appetite and supporting metrics.
• Review the effectiveness of the Group’s ERMF to manage and mitigate risk.
• Approve the Stress Testing results (including the Concurrent Stress Test), Internal Capital Adequacy Assessment Process and Individual Liquidity Adequacy Assessment Process.
Operational Risk Committee
Chair: Tony Prestedge - Chief Operating Officer• Determine the
Group’s attitude to operational risk.
• Primary responsibility for controlling operational risk across the Group.
• Monitor and review the operational risk exposures of the Group.
Assets and Liabilities
Committee
Chair: Mark Rennison - Group Finance Director• Determine the
Group’s attitude to financial risk.
• Manage the financial risk profile of the Group.
Lending Committee
Chair: Iain Laing - Chief Risk Officer• Determine the
Group’s attitude to lending risk.
• Manage the lending risk profile of the Group.
First line - risk control
Second line - risk
oversight
Third line - assurance
Board
Chair: Roger Perkin - Non Executive Director• Monitor the integrity of the financial
statements of the Group.• Review the adequacy and effectiveness
of internal controls and risk management systems.
• Monitor the effectiveness of the Compliance Oversight function.
• Review the adequacy of whistleblowing, fraud and bribery prevention procedures.
• Monitor the effectiveness of the internal audit function.
Chair: Joe Garner - Chief Executive• Determine the Group’s attitude to risk.• Exercise responsibility for controlling risk across the
Group.• Monitor and review the risk exposures of the Group.
Executive Risk Committee
Information flow
Specialist risk sub-committees and forums beneath provide specialist advice
Back to Contents
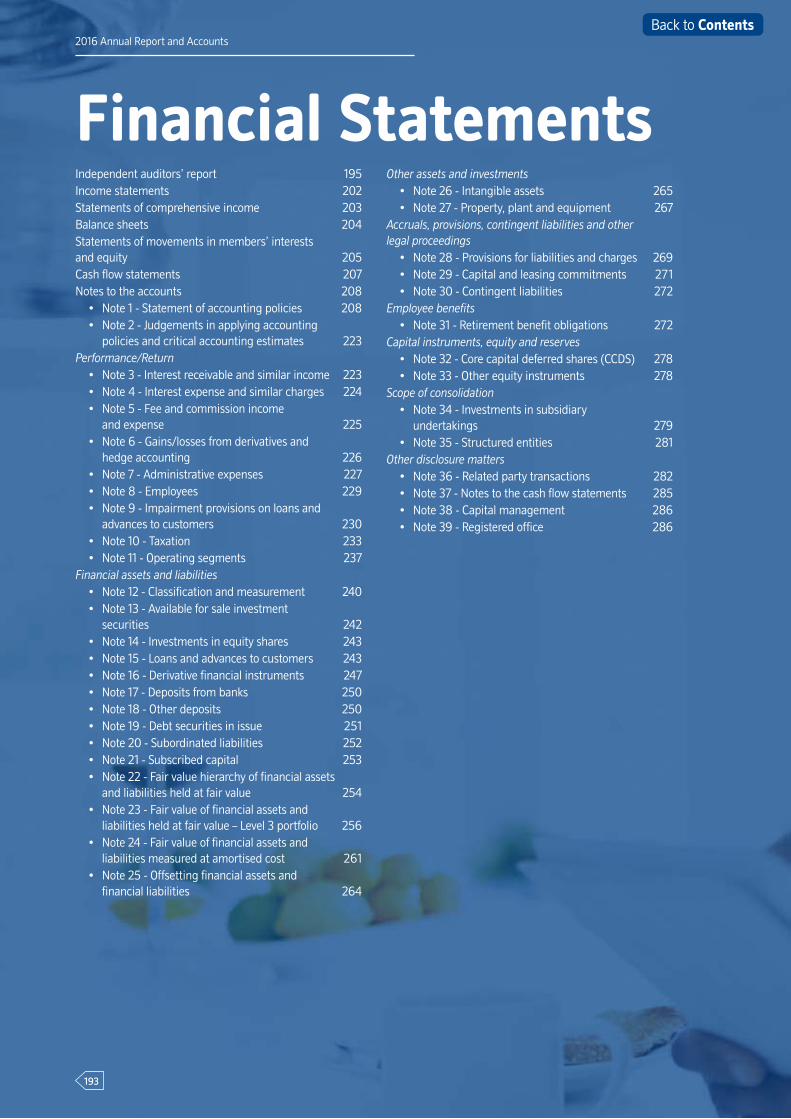
2016 Annual Report and Accounts
193
2016 Annual Report and Accounts
Financial StatementsIndependent auditors’ report 195Income statements 202Statements of comprehensive income 203Balance sheets 204Statements of movements in members’ interests and equity 205Cash flow statements 207Notes to the accounts 208
• Note 1 - Statement of accounting policies 208• Note 2 - Judgements in applying accounting
policies and critical accounting estimates 223Performance/Return
• Note 3 - Interest receivable and similar income 223• Note 4 - Interest expense and similar charges 224• Note 5 - Fee and commission income
and expense 225• Note 6 - Gains/losses from derivatives and
hedge accounting 226• Note 7 - Administrative expenses 227• Note 8 - Employees 229• Note 9 - Impairment provisions on loans and
advances to customers 230• Note 10 - Taxation 233• Note 11 - Operating segments 237
Financial assets and liabilities• Note 12 - Classification and measurement 240• Note 13 - Available for sale investment
securities 242• Note 14 - Investments in equity shares 243• Note 15 - Loans and advances to customers 243• Note 16 - Derivative financial instruments 247• Note 17 - Deposits from banks 250• Note 18 - Other deposits 250• Note 19 - Debt securities in issue 251• Note 20 - Subordinated liabilities 252• Note 21 - Subscribed capital 253• Note 22 - Fair value hierarchy of financial assets
and liabilities held at fair value 254• Note 23 - Fair value of financial assets and
liabilities held at fair value – Level 3 portfolio 256• Note 24 - Fair value of financial assets and
liabilities measured at amortised cost 261• Note 25 - Offsetting financial assets and
financial liabilities 264
Other assets and investments• Note 26 - Intangible assets 265• Note 27 - Property, plant and equipment 267
Accruals, provisions, contingent liabilities and other legal proceedings
• Note 28 - Provisions for liabilities and charges 269• Note 29 - Capital and leasing commitments 271• Note 30 - Contingent liabilities 272
Employee benefits • Note 31 - Retirement benefit obligations 272
Capital instruments, equity and reserves• Note 32 - Core capital deferred shares (CCDS) 278• Note 33 - Other equity instruments 278
Scope of consolidation• Note 34 - Investments in subsidiary
undertakings 279• Note 35 - Structured entities 281
Other disclosure matters• Note 36 - Related party transactions 282• Note 37 - Notes to the cash flow statements 285• Note 38 - Capital management 286• Note 39 - Registered office 286
193
Back to Contents

Financial Statements
194
Financial Statements
Financial Statements
194
Back to Contents
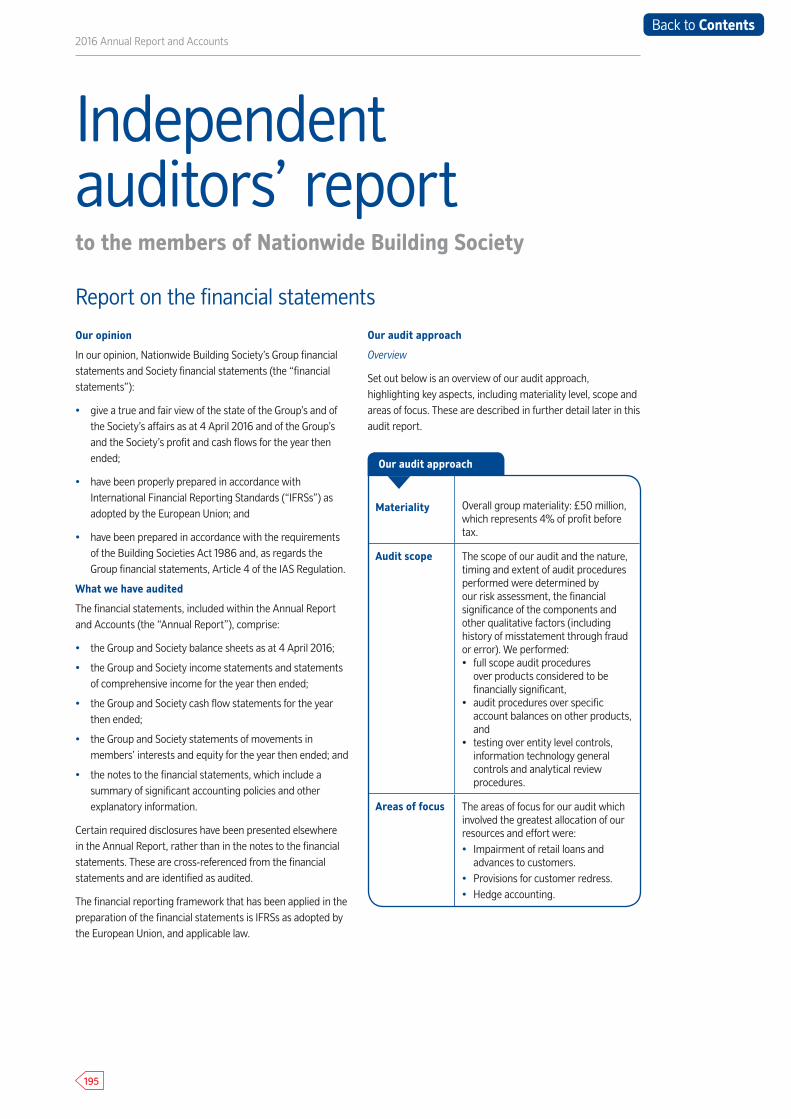
2016 Annual Report and Accounts
195
Our opinion
In our opinion, Nationwide Building Society’s Group financial statements and Society financial statements (the “financial statements”):
• give a true and fair view of the state of the Group’s and ofthe Society’s affairs as at 4 April 2016 and of the Group’s and the Society’s profit and cash flows for the year then ended;
• have been properly prepared in accordance with International Financial Reporting Standards (“IFRSs”) as adopted by the European Union; and
• have been prepared in accordance with the requirements of the Building Societies Act 1986 and, as regards the Group financial statements, Article 4 of the IAS Regulation.
What we have audited
The financial statements, included within the Annual Report and Accounts (the “Annual Report”), comprise:
• the Group and Society balance sheets as at 4 April 2016;
• the Group and Society income statements and statementsof comprehensive income for the year then ended;
• the Group and Society cash flow statements for the yearthen ended;
• the Group and Society statements of movements in members’ interests and equity for the year then ended; and
• the notes to the financial statements, which include asummary of significant accounting policies and other explanatory information.
Certain required disclosures have been presented elsewhere in the Annual Report, rather than in the notes to the financial statements. These are cross-referenced from the financial statements and are identified as audited.
The financial reporting framework that has been applied in the preparation of the financial statements is IFRSs as adopted by the European Union, and applicable law.
Our audit approach
Overview
Set out below is an overview of our audit approach, highlighting key aspects, including materiality level, scope and areas of focus. These are described in further detail later in this audit report.
Independent auditors’ reportto the members of Nationwide Building Society
Report on the financial statements
Materiality Overall group materiality: £50 million, which represents 4% of profit before tax.
Audit scope The scope of our audit and the nature, timing and extent of audit procedures performed were determined by our risk assessment, the financial significance of the components and other qualitative factors (including history of misstatement through fraud or error). We performed: • full scope audit procedures
over products considered to befinancially significant,
• audit procedures over specific account balances on other products,and
• testing over entity level controls,information technology general controls and analytical review procedures.
Areas of focus The areas of focus for our audit which involved the greatest allocation of our resources and effort were:• Impairment of retail loans and
advances to customers.• Provisions for customer redress.• Hedge accounting.
Our audit approach
Back to Contents
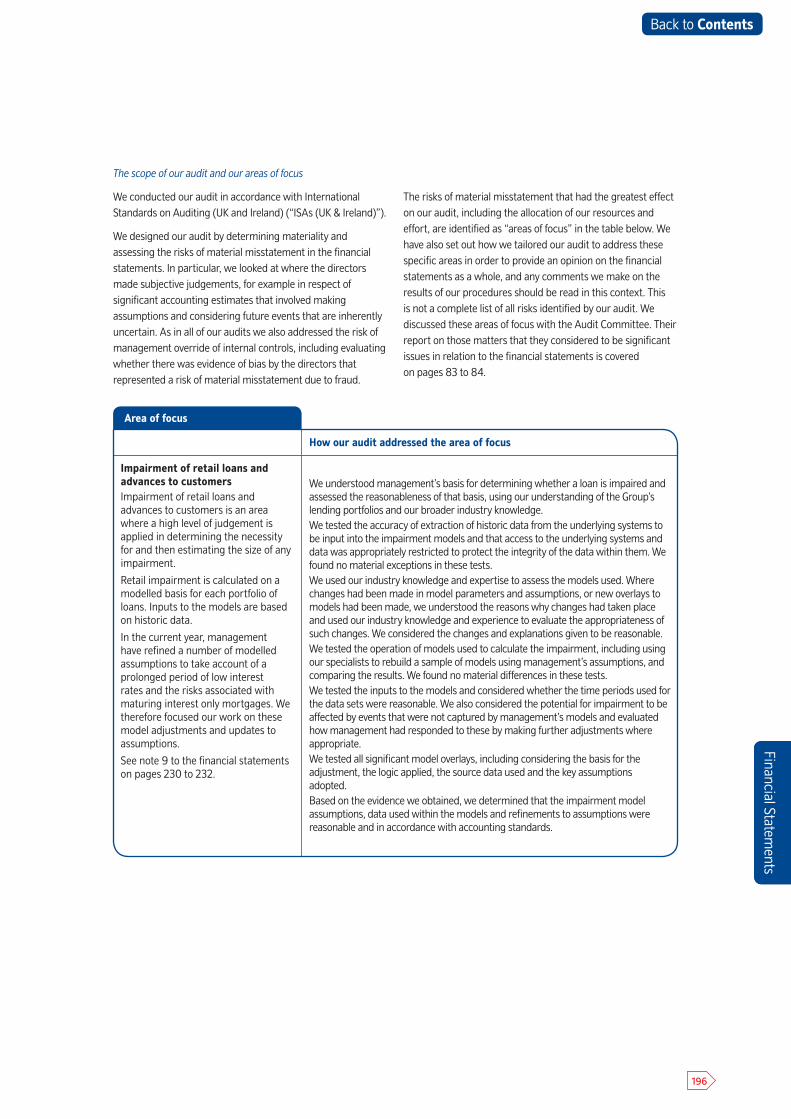
Financial Statements
196
The scope of our audit and our areas of focus
We conducted our audit in accordance with International Standards on Auditing (UK and Ireland) (“ISAs (UK & Ireland)”).
We designed our audit by determining materiality and assessing the risks of material misstatement in the financial statements. In particular, we looked at where the directors made subjective judgements, for example in respect of significant accounting estimates that involved making assumptions and considering future events that are inherently uncertain. As in all of our audits we also addressed the risk of management override of internal controls, including evaluating whether there was evidence of bias by the directors that represented a risk of material misstatement due to fraud.
The risks of material misstatement that had the greatest effect on our audit, including the allocation of our resources and effort, are identified as “areas of focus” in the table below. We have also set out how we tailored our audit to address these specific areas in order to provide an opinion on the financial statements as a whole, and any comments we make on the results of our procedures should be read in this context. This is not a complete list of all risks identified by our audit. We discussed these areas of focus with the Audit Committee. Their report on those matters that they considered to be significant issues in relation to the financial statements is covered on pages 83 to 84.
Financial Statements
Area of focus
How our audit addressed the area of focus
Impairment of retail loans and advances to customersImpairment of retail loans and advances to customers is an area where a high level of judgement is applied in determining the necessity for and then estimating the size of any impairment.
Retail impairment is calculated on a modelled basis for each portfolio of loans. Inputs to the models are based on historic data.
In the current year, management have refined a number of modelled assumptions to take account of a prolonged period of low interest rates and the risks associated with maturing interest only mortgages. We therefore focused our work on these model adjustments and updates to assumptions.
See note 9 to the financial statements on pages 230 to 232.
We understood management’s basis for determining whether a loan is impaired and assessed the reasonableness of that basis, using our understanding of the Group’s lending portfolios and our broader industry knowledge. We tested the accuracy of extraction of historic data from the underlying systems to be input into the impairment models and that access to the underlying systems and data was appropriately restricted to protect the integrity of the data within them. We found no material exceptions in these tests.We used our industry knowledge and expertise to assess the models used. Where changes had been made in model parameters and assumptions, or new overlays to models had been made, we understood the reasons why changes had taken place and used our industry knowledge and experience to evaluate the appropriateness of such changes. We considered the changes and explanations given to be reasonable.We tested the operation of models used to calculate the impairment, including using our specialists to rebuild a sample of models using management’s assumptions, and comparing the results. We found no material differences in these tests.We tested the inputs to the models and considered whether the time periods used for the data sets were reasonable. We also considered the potential for impairment to be affected by events that were not captured by management’s models and evaluated how management had responded to these by making further adjustments where appropriate.We tested all significant model overlays, including considering the basis for the adjustment, the logic applied, the source data used and the key assumptions adopted.Based on the evidence we obtained, we determined that the impairment model assumptions, data used within the models and refinements to assumptions were reasonable and in accordance with accounting standards.
Back to Contents
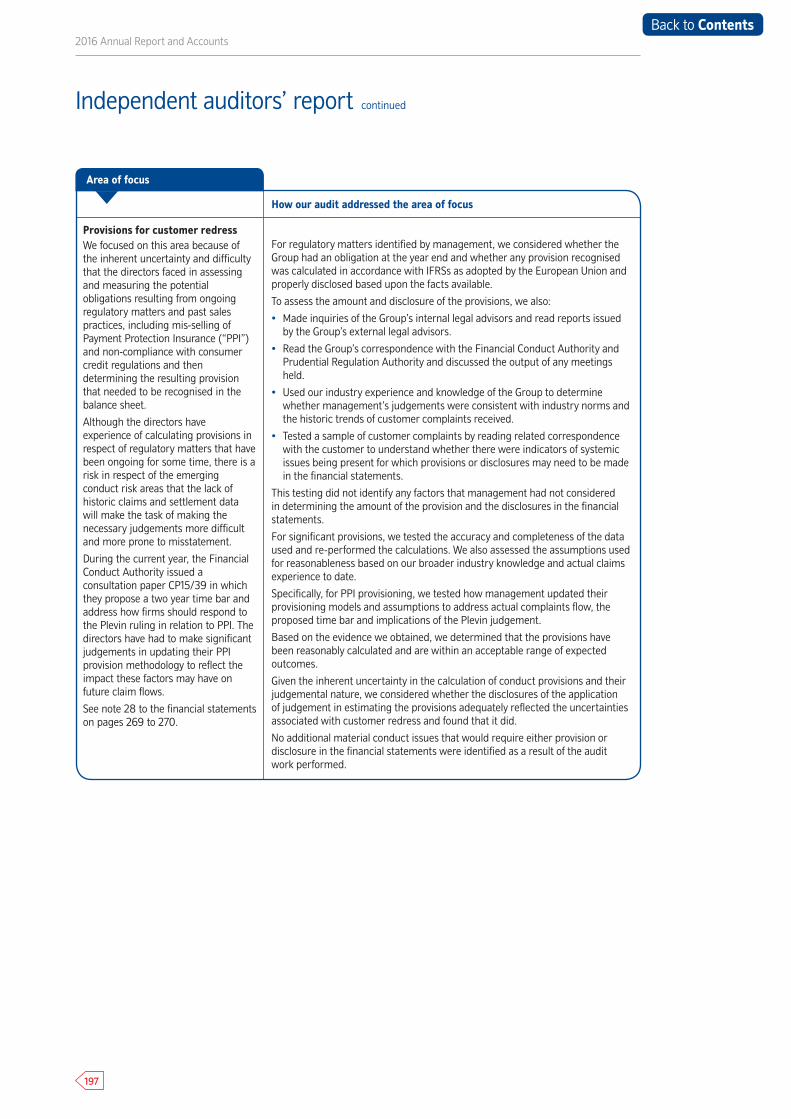
2016 Annual Report and Accounts
197
How our audit addressed the area of focus
Provisions for customer redress We focused on this area because of the inherent uncertainty and difficulty that the directors faced in assessing and measuring the potential obligations resulting from ongoing regulatory matters and past sales practices, including mis-selling of Payment Protection Insurance (“PPI”) and non-compliance with consumer credit regulations and then determining the resulting provision that needed to be recognised in the balance sheet.
Although the directors have experience of calculating provisions in respect of regulatory matters that have been ongoing for some time, there is a risk in respect of the emerging conduct risk areas that the lack of historic claims and settlement data will make the task of making the necessary judgements more difficult and more prone to misstatement.
During the current year, the Financial Conduct Authority issued a consultation paper CP15/39 in which they propose a two year time bar and address how firms should respond to the Plevin ruling in relation to PPI. The directors have had to make significant judgements in updating their PPI provision methodology to reflect the impact these factors may have on future claim flows.
See note 28 to the financial statements on pages 269 to 270.
For regulatory matters identified by management, we considered whether the Group had an obligation at the year end and whether any provision recognised was calculated in accordance with IFRSs as adopted by the European Union and properly disclosed based upon the facts available.
To assess the amount and disclosure of the provisions, we also:
• Made inquiries of the Group’s internal legal advisors and read reports issued by the Group’s external legal advisors.
• Read the Group’s correspondence with the Financial Conduct Authority and Prudential Regulation Authority and discussed the output of any meetings held.
• Used our industry experience and knowledge of the Group to determine whether management’s judgements were consistent with industry norms and the historic trends of customer complaints received.
• Tested a sample of customer complaints by reading related correspondence with the customer to understand whether there were indicators of systemic issues being present for which provisions or disclosures may need to be made in the financial statements.
This testing did not identify any factors that management had not considered in determining the amount of the provision and the disclosures in the financial statements.
For significant provisions, we tested the accuracy and completeness of the data used and re-performed the calculations. We also assessed the assumptions used for reasonableness based on our broader industry knowledge and actual claims experience to date.
Specifically, for PPI provisioning, we tested how management updated their provisioning models and assumptions to address actual complaints flow, the proposed time bar and implications of the Plevin judgement.
Based on the evidence we obtained, we determined that the provisions have been reasonably calculated and are within an acceptable range of expected outcomes.
Given the inherent uncertainty in the calculation of conduct provisions and their judgemental nature, we considered whether the disclosures of the application of judgement in estimating the provisions adequately reflected the uncertainties associated with customer redress and found that it did.
No additional material conduct issues that would require either provision or disclosure in the financial statements were identified as a result of the audit work performed.
Area of focus
Independent auditors’ report continued
Back to Contents
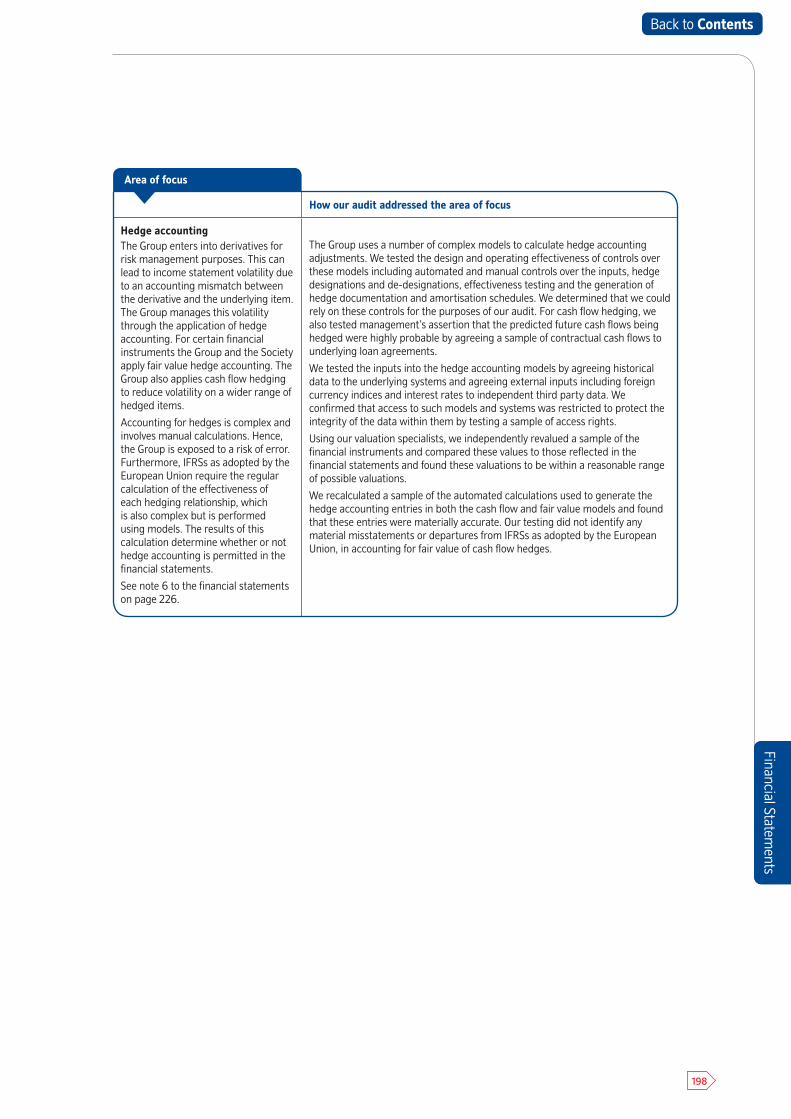
Financial Statements
198
Financial Statements
How our audit addressed the area of focus
Hedge accountingThe Group enters into derivatives for risk management purposes. This can lead to income statement volatility due to an accounting mismatch between the derivative and the underlying item. The Group manages this volatility through the application of hedge accounting. For certain financial instruments the Group and the Society apply fair value hedge accounting. The Group also applies cash flow hedging to reduce volatility on a wider range of hedged items.
Accounting for hedges is complex and involves manual calculations. Hence, the Group is exposed to a risk of error. Furthermore, IFRSs as adopted by the European Union require the regular calculation of the effectiveness of each hedging relationship, which is also complex but is performed using models. The results of this calculation determine whether or not hedge accounting is permitted in the financial statements.
See note 6 to the financial statements on page 226.
The Group uses a number of complex models to calculate hedge accounting adjustments. We tested the design and operating effectiveness of controls over these models including automated and manual controls over the inputs, hedge designations and de-designations, effectiveness testing and the generation of hedge documentation and amortisation schedules. We determined that we could rely on these controls for the purposes of our audit. For cash flow hedging, we also tested management’s assertion that the predicted future cash flows being hedged were highly probable by agreeing a sample of contractual cash flows to underlying loan agreements.
We tested the inputs into the hedge accounting models by agreeing historical data to the underlying systems and agreeing external inputs including foreign currency indices and interest rates to independent third party data. We confirmed that access to such models and systems was restricted to protect the integrity of the data within them by testing a sample of access rights.
Using our valuation specialists, we independently revalued a sample of the financial instruments and compared these values to those reflected in the financial statements and found these valuations to be within a reasonable range of possible valuations.
We recalculated a sample of the automated calculations used to generate the hedge accounting entries in both the cash flow and fair value models and found that these entries were materially accurate. Our testing did not identify any material misstatements or departures from IFRSs as adopted by the European Union, in accounting for fair value of cash flow hedges.
Area of focus
Back to Contents
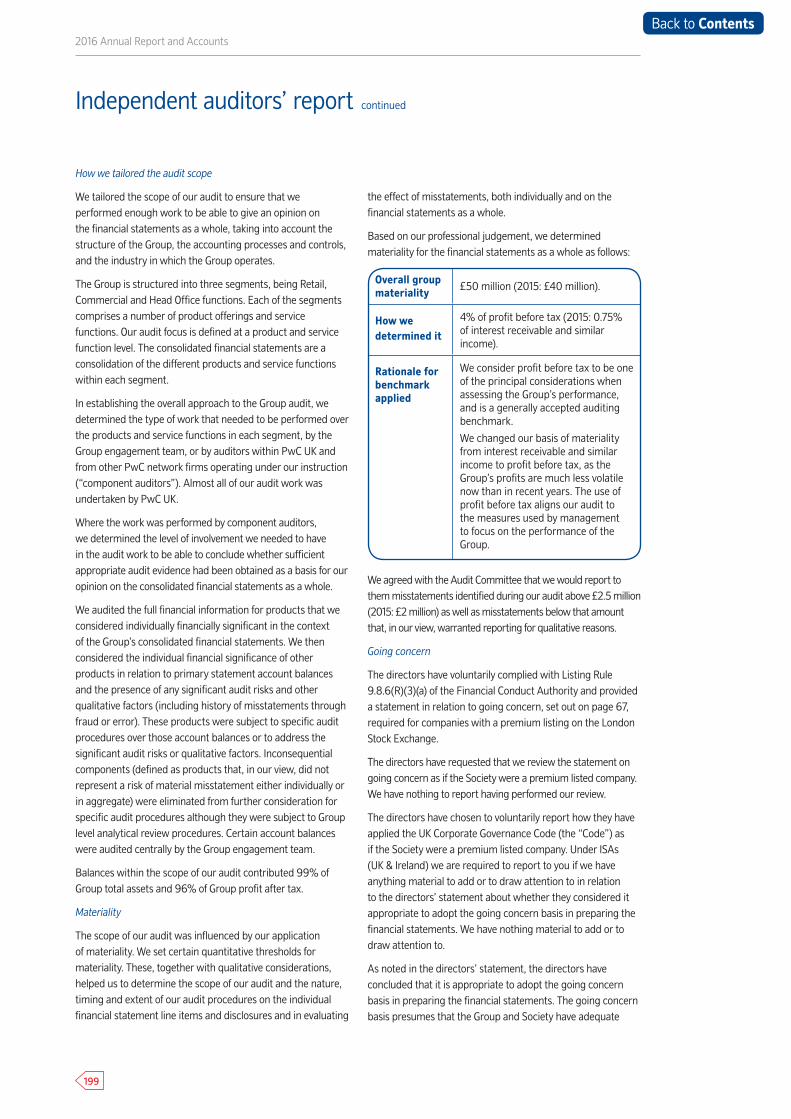
2016 Annual Report and Accounts
199
Independent auditors’ report continued
How we tailored the audit scope
We tailored the scope of our audit to ensure that we performed enough work to be able to give an opinion on the financial statements as a whole, taking into account the structure of the Group, the accounting processes and controls, and the industry in which the Group operates.
The Group is structured into three segments, being Retail, Commercial and Head Office functions. Each of the segments comprises a number of product offerings and service functions. Our audit focus is defined at a product and service function level. The consolidated financial statements are a consolidation of the different products and service functions within each segment.
In establishing the overall approach to the Group audit, we determined the type of work that needed to be performed over the products and service functions in each segment, by the Group engagement team, or by auditors within PwC UK and from other PwC network firms operating under our instruction (“component auditors”). Almost all of our audit work was undertaken by PwC UK.
Where the work was performed by component auditors, we determined the level of involvement we needed to have in the audit work to be able to conclude whether sufficient appropriate audit evidence had been obtained as a basis for our opinion on the consolidated financial statements as a whole.
We audited the full financial information for products that we considered individually financially significant in the context of the Group’s consolidated financial statements. We then considered the individual financial significance of other products in relation to primary statement account balances and the presence of any significant audit risks and other qualitative factors (including history of misstatements through fraud or error). These products were subject to specific audit procedures over those account balances or to address the significant audit risks or qualitative factors. Inconsequential components (defined as products that, in our view, did not represent a risk of material misstatement either individually or in aggregate) were eliminated from further consideration for specific audit procedures although they were subject to Group level analytical review procedures. Certain account balances were audited centrally by the Group engagement team.
Balances within the scope of our audit contributed 99% of Group total assets and 96% of Group profit after tax.
Materiality
The scope of our audit was influenced by our application of materiality. We set certain quantitative thresholds for materiality. These, together with qualitative considerations, helped us to determine the scope of our audit and the nature, timing and extent of our audit procedures on the individual financial statement line items and disclosures and in evaluating
the effect of misstatements, both individually and on the financial statements as a whole.
Based on our professional judgement, we determined materiality for the financial statements as a whole as follows:
Overall group materiality £50 million (2015: £40 million).
How we determined it
4% of profit before tax (2015: 0.75% of interest receivable and similar income).
Rationale for benchmark applied
We consider profit before tax to be one of the principal considerations when assessing the Group’s performance, and is a generally accepted auditing benchmark.
We changed our basis of materiality from interest receivable and similar income to profit before tax, as the Group’s profits are much less volatile now than in recent years. The use of profit before tax aligns our audit to the measures used by management to focus on the performance of the Group.
We agreed with the Audit Committee that we would report to them misstatements identified during our audit above £2.5 million (2015: £2 million) as well as misstatements below that amount that, in our view, warranted reporting for qualitative reasons.
Going concern
The directors have voluntarily complied with Listing Rule 9.8.6(R)(3)(a) of the Financial Conduct Authority and provided a statement in relation to going concern, set out on page 67, required for companies with a premium listing on the London Stock Exchange.
The directors have requested that we review the statement on going concern as if the Society were a premium listed company. We have nothing to report having performed our review.
The directors have chosen to voluntarily report how they have applied the UK Corporate Governance Code (the “Code”) as if the Society were a premium listed company. Under ISAs (UK & Ireland) we are required to report to you if we have anything material to add or to draw attention to in relation to the directors’ statement about whether they considered it appropriate to adopt the going concern basis in preparing the financial statements. We have nothing material to add or to draw attention to.
As noted in the directors’ statement, the directors have concluded that it is appropriate to adopt the going concern basis in preparing the financial statements. The going concern basis presumes that the Group and Society have adequate
Back to Contents
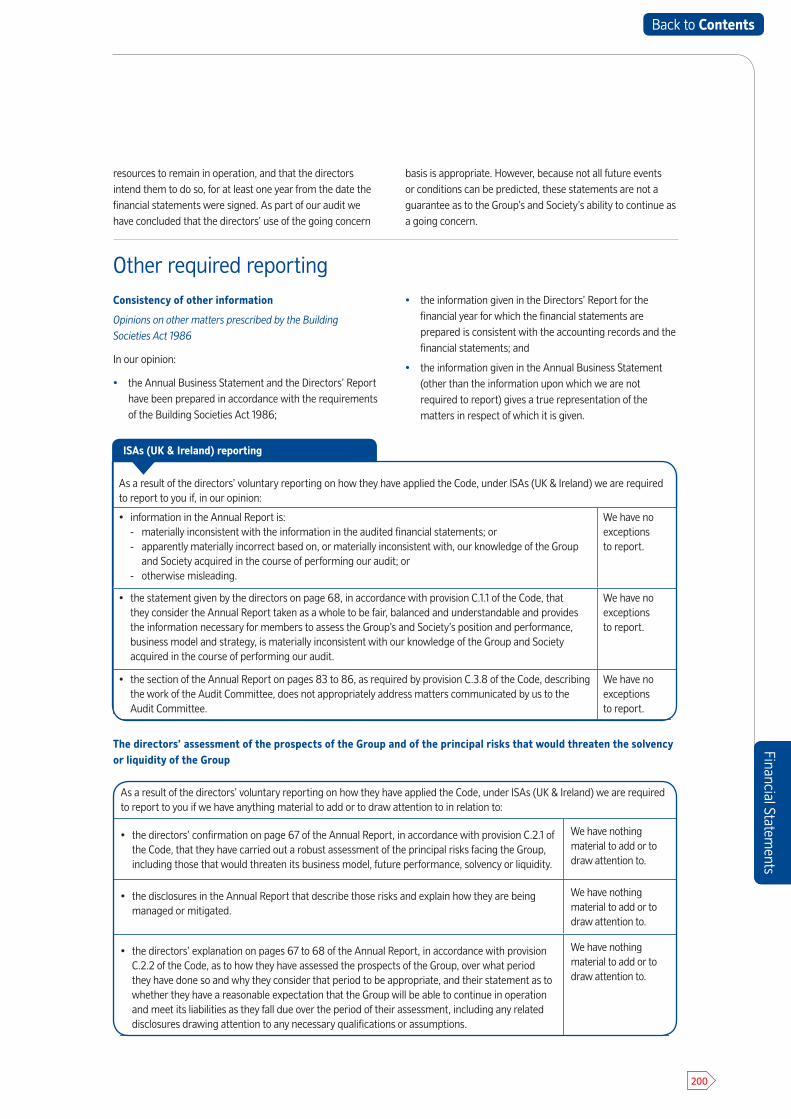
Financial Statements
200
As a result of the directors’ voluntary reporting on how they have applied the Code, under ISAs (UK & Ireland) we are required to report to you if, in our opinion:
• information in the Annual Report is:- materially inconsistent with the information in the audited financial statements; or- apparently materially incorrect based on, or materially inconsistent with, our knowledge of the Group
and Society acquired in the course of performing our audit; or- otherwise misleading.
We have no exceptions to report.
• the statement given by the directors on page 68, in accordance with provision C.1.1 of the Code, that they consider the Annual Report taken as a whole to be fair, balanced and understandable and providesthe information necessary for members to assess the Group’s and Society’s position and performance, business model and strategy, is materially inconsistent with our knowledge of the Group and Society acquired in the course of performing our audit.
We have no exceptions to report.
• the section of the Annual Report on pages 83 to 86, as required by provision C.3.8 of the Code, describingthe work of the Audit Committee, does not appropriately address matters communicated by us to the Audit Committee.
We have no exceptions to report.
Financial Statements
Other required reportingConsistency of other information
Opinions on other matters prescribed by the Building Societies Act 1986
In our opinion:
• the Annual Business Statement and the Directors’ Report have been prepared in accordance with the requirementsof the Building Societies Act 1986;
• the information given in the Directors’ Report for the financial year for which the financial statements are prepared is consistent with the accounting records and thefinancial statements; and
• the information given in the Annual Business Statement(other than the information upon which we are not required to report) gives a true representation of the matters in respect of which it is given.
The directors’ assessment of the prospects of the Group and of the principal risks that would threaten the solvency or liquidity of the Group
ISAs (UK & Ireland) reporting
As a result of the directors’ voluntary reporting on how they have applied the Code, under ISAs (UK & Ireland) we are required to report to you if we have anything material to add or to draw attention to in relation to:
• the directors’ confirmation on page 67 of the Annual Report, in accordance with provision C.2.1 ofthe Code, that they have carried out a robust assessment of the principal risks facing the Group, including those that would threaten its business model, future performance, solvency or liquidity.
We have nothing material to add or to draw attention to.
• the disclosures in the Annual Report that describe those risks and explain how they are beingmanaged or mitigated.
We have nothing material to add or to draw attention to.
• the directors’ explanation on pages 67 to 68 of the Annual Report, in accordance with provisionC.2.2 of the Code, as to how they have assessed the prospects of the Group, over what period they have done so and why they consider that period to be appropriate, and their statement as towhether they have a reasonable expectation that the Group will be able to continue in operation and meet its liabilities as they fall due over the period of their assessment, including any related disclosures drawing attention to any necessary qualifications or assumptions.
We have nothing material to add or to draw attention to.
resources to remain in operation, and that the directors intend them to do so, for at least one year from the date the financial statements were signed. As part of our audit we have concluded that the directors’ use of the going concern
basis is appropriate. However, because not all future events or conditions can be predicted, these statements are not a guarantee as to the Group’s and Society’s ability to continue as a going concern.
Back to Contents
2016 Annual Report and Accounts
201
Independent auditors’ report continued
Adequacy of accounting records and information and explanations received
Under the Building Societies Act 1986 we are required to report to you if, in our opinion:
• proper accounting records have not been kept by theSociety; or
• the Society financial statements are not in agreement withthe accounting records; or
• we have not received all the information and explanationsand access to documents we require for our audit.
We have no exceptions to report arising from this responsibility.
Other voluntary reportingOpinion on additional disclosures
Directors’ Remuneration Report
The Society voluntarily prepares a Directors’ Remuneration Report in accordance with the provisions of the Companies Act 2006. The directors have requested that we audit the part of the Directors’ Remuneration Report specified by the Companies Act 2006 to be audited as if the Society were a quoted company.
In our opinion, the part of the Directors’ Remuneration Report to be audited has been properly prepared in accordance with the Companies Act 2006.
Matters on which we have agreed to report by exception
Corporate Governance Statement
The Society voluntarily prepares a Corporate Governance Statement in accordance with the provisions of the UK Corporate Governance Code. The directors have requested that we review the parts of the Corporate Governance Statement relating to ten further provisions of the UK Corporate Governance Code specified for auditor review by the Listing Rules of the Financial Conduct Authority as if the Society were a premium listed company. We have nothing to report having performed our review.
Responsibilities for the financial statements and the auditOur responsibilities and those of the directors
As explained more fully in the ‘Directors’ responsibilities in respect of the preparation of the Annual Report and Accounts’ set out on pages 65 to 66, the directors are responsible for the preparation of the financial statements and for being satisfied that they give a true and fair view.
Our responsibility is to audit and express an opinion on the financial statements in accordance with applicable law and ISAs (UK & Ireland). Those standards require us to comply with the Auditing Practices Board’s Ethical Standards for Auditors.
This report, including the opinions, has been prepared for and only for the Society’s members as a body in accordance with Section 78 of the Building Societies Act 1986 and for no other purpose. We do not, in giving these opinions, accept or assume responsibility for any other purpose or to any other person to whom this report is shown or into whose hands it may come save where expressly agreed by our prior consent in writing.
What an audit of financial statements involves
An audit involves obtaining evidence about the amounts and disclosures in the financial statements sufficient to give reasonable assurance that the financial statements are free from material misstatement, whether caused by fraud or error. This includes an assessment of:
• whether the accounting policies are appropriate to the Group’s and the Society’s circumstances and have beenconsistently applied and adequately disclosed;
• the reasonableness of significant accounting estimatesmade by the directors; and
• the overall presentation of the financial statements.
We primarily focus our work in these areas by assessing the directors’ judgements against available evidence, forming our own judgements, and evaluating the disclosures in the financial statements.
We test and examine information, using sampling and other auditing techniques, to the extent we consider necessary to provide a reasonable basis for us to draw conclusions. We obtain audit evidence through testing the effectiveness of controls, substantive procedures or a combination of both.
In addition, we read all the financial and non-financial information in the Annual Report to identify material inconsistencies with the audited financial statements and to identify any information that is apparently materially incorrect based on, or materially inconsistent with, the knowledge acquired by us in the course of performing the audit. If we become aware of any apparent material misstatements or inconsistencies we consider the implications for our report.
Hemione Hudson (Senior Statutory Auditor) for and on behalf of PricewaterhouseCoopers LLP Chartered Accountants and Statutory Auditors London 23 May 2016
Back to Contents
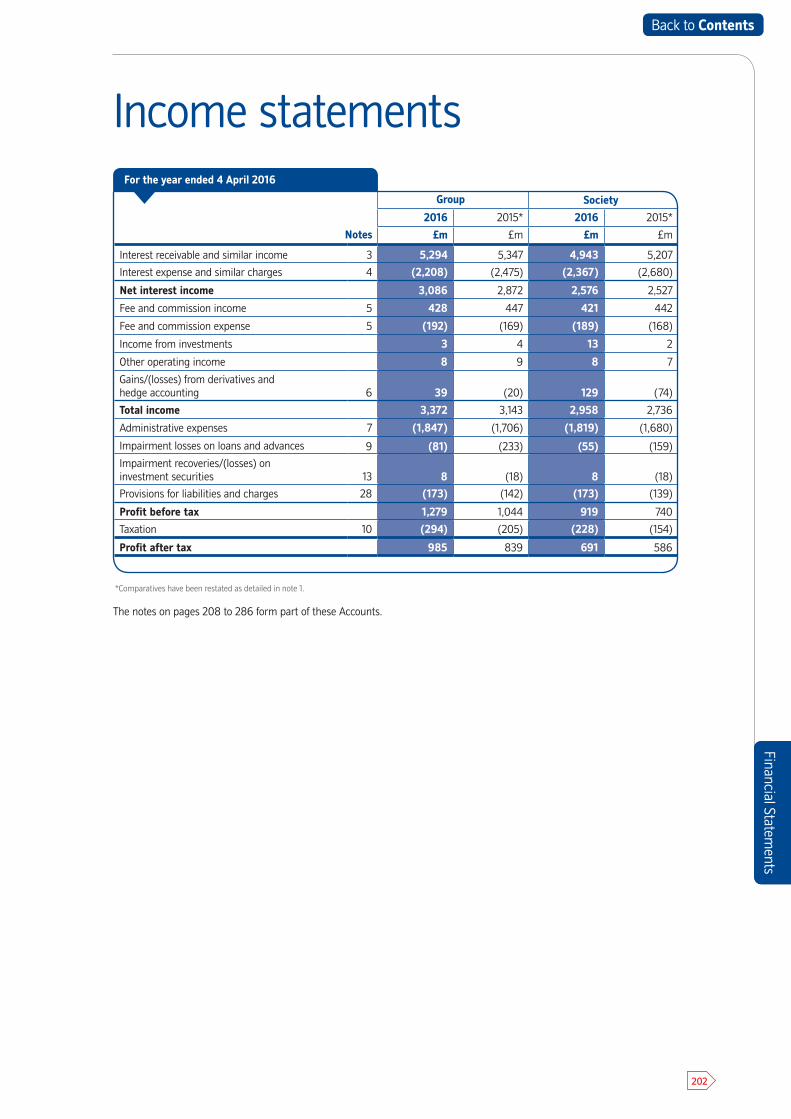
Financial Statements
202
Notes
Group Society
2016 2015* 2016 2015*
£m £m £m £m
Interest receivable and similar income 3 5,294 5,347 4,943 5,207
Interest expense and similar charges 4 (2,208) (2,475) (2,367) (2,680)
Net interest income 3,086 2,872 2,576 2,527
Fee and commission income 5 428 447 421 442
Fee and commission expense 5 (192) (169) (189) (168)
Income from investments 3 4 13 2
Other operating income 8 9 8 7
Gains/(losses) from derivatives and hedge accounting 6 39 (20) 129 (74)
Total income 3,372 3,143 2,958 2,736
Administrative expenses 7 (1,847) (1,706) (1,819) (1,680)
Impairment losses on loans and advances 9 (81) (233) (55) (159)
Impairment recoveries/(losses) on investment securities 13 8 (18) 8 (18)
Provisions for liabilities and charges 28 (173) (142) (173) (139)
Profit before tax 1,279 1,044 919 740
Taxation 10 (294) (205) (228) (154)
Profit after tax 985 839 691 586
*Comparatives have been restated as detailed in note 1.
The notes on pages 208 to 286 form part of these Accounts.
Income statements
Financial Statements
For the year ended 4 April 2016
Back to Contents
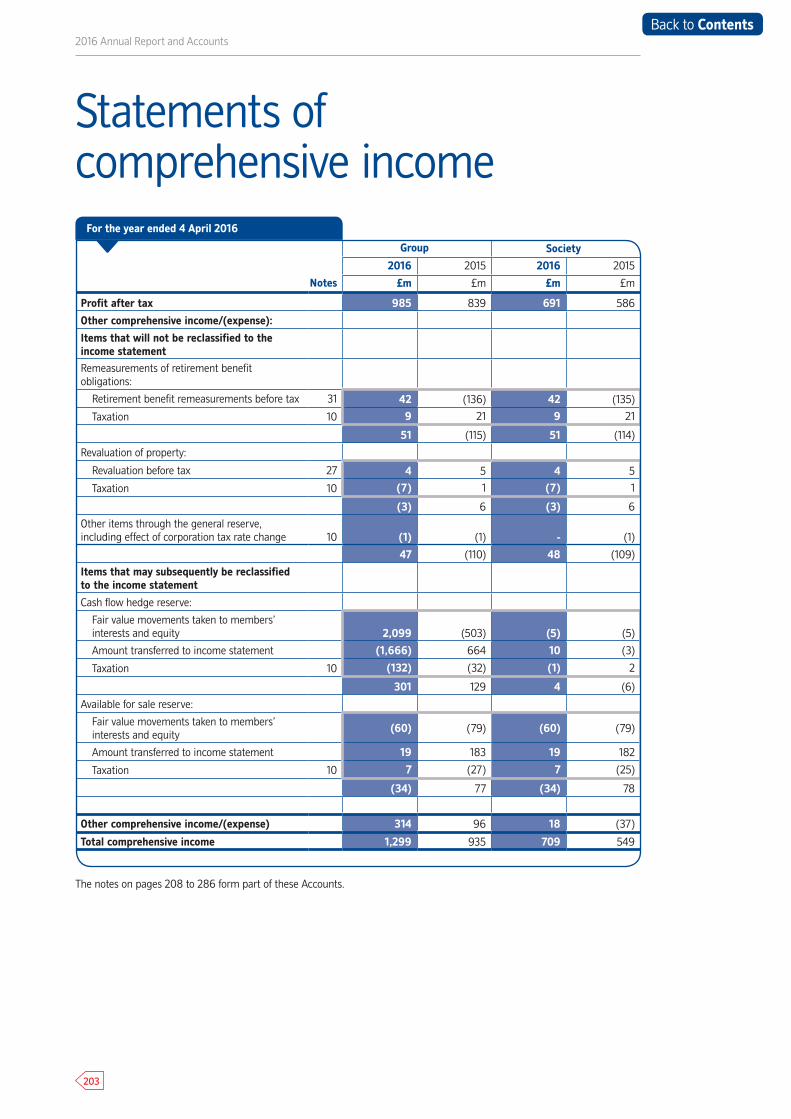
2016 Annual Report and Accounts
203
Group Society
2016 2015 2016 2015
Notes £m £m £m £m
Profit after tax 985 839 691 586
Other comprehensive income/(expense):
Items that will not be reclassified to the income statementRemeasurements of retirement benefit obligations:
Retirement benefit remeasurements before tax 31 42 (136) 42 (135)
Taxation 10 9 21 9 21
51 (115) 51 (114)
Revaluation of property:
Revaluation before tax 27 4 5 4 5
Taxation 10 (7) 1 (7) 1
(3) 6 (3) 6
Other items through the general reserve, including effect of corporation tax rate change 10 (1) (1) - (1)
47 (110) 48 (109)
Items that may subsequently be reclassified to the income statement
Cash flow hedge reserve:
Fair value movements taken to members’ interests and equity 2,099 (503) (5) (5)
Amount transferred to income statement (1,666) 664 10 (3)
Taxation 10 (132) (32) (1) 2
301 129 4 (6)
Available for sale reserve:
Fair value movements taken to members’ interests and equity
(60) (79) (60) (79)
Amount transferred to income statement 19 183 19 182
Taxation 10 7 (27) 7 (25)
(34) 77 (34) 78
Other comprehensive income/(expense) 314 96 18 (37)
Total comprehensive income 1,299 935 709 549
The notes on pages 208 to 286 form part of these Accounts.
Statements of comprehensive income
For the year ended 4 April 2016
Back to Contents

Financial Statements
204
Group Society2016 2015 2016 2015
Notes £m £m £m £m
AssetsCash 8,797 4,325 8,797 4,325
Loans and advances to banks 3,591 3,392 3,542 3,357
Available for sale investment securities 13 10,612 11,037 10,612 11,037
Derivative financial instruments 16 3,898 3,337 3,515 3,664
Fair value adjustment for portfolio hedged risk 756 592 756 592
Loans and advances to customers 15 178,807 170,647 146,289 141,894
Investments in equity shares 14 126 26 126 26
Investments in Group undertakings 34 - - 31,402 27,732
Intangible assets 26 1,191 1,040 1,179 1,028
Property, plant and equipment 27 823 856 821 854
Investment properties 8 8 8 8
Accrued income and expenses prepaid 166 192 421 188
Deferred tax 10 35 38 27 26Other assets 129 90 127 90
Total assets 208,939 195,580 207,622 194,821
LiabilitiesShares 138,715 132,373 138,715 132,373
Deposits from banks 17 2,095 1,974 1,373 1,167
Other deposits 18 7,635 9,076 8,797 10,023
Due to customers 6,201 6,119 6,201 6,119
Fair value adjustment for portfolio hedged risk 13 14 13 14
Debt securities in issue 19 36,085 28,105 30,521 22,143
Derivative financial instruments 16 3,463 4,048 4,910 5,037
Other liabilities 414 475 4,760 5,828
Provisions for liabilities and charges 28 343 295 340 292
Accruals and deferred income 288 369 287 369
Subordinated liabilities 20 1,817 2,121 1,823 2,124
Subscribed capital 21 413 415 413 415
Deferred tax 10 186 53 43 11
Current tax liabilities 128 116 83 90Retirement benefit obligations 31 213 286 211 283
Total liabilities 198,009 185,839 198,490 186,288
Members’ interests and equityCore capital deferred shares 32 531 531 531 531
Other equity instruments 33 992 992 992 992
General reserve 8,921 7,995 7,554 6,921
Revaluation reserve 64 68 64 68
Cash flow hedge reserve 430 129 (2) (6)Available for sale reserve (8) 26 (7) 27
Total members’ interests and equity 10,930 9,741 9,132 8,533
Total members’ interests, equity and liabilities 208,939 195,580 207,622 194,821
Statements ofcomprehensive income
Balance sheets
Financial Statements
The notes on pages 208 to 286 form part of these Accounts.
Approved by the board of directors on 23 May 2016.D L Roberts Chairman, J D Garner Director and Chief Executive, M M Rennison Group Finance Director
At 4 April 2016
Back to Contents
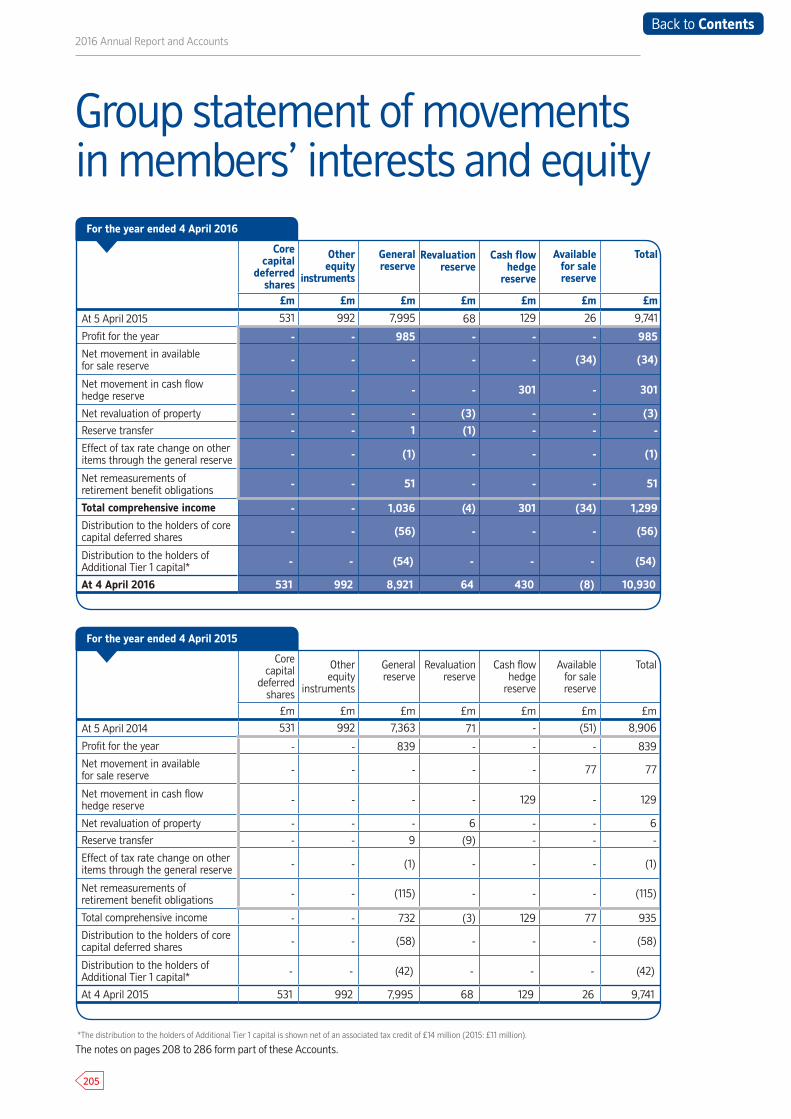
2016 Annual Report and Accounts
205
Core capital
deferred shares
Otherequity
instruments
General reserve
Revaluation reserve
Cash flow hedge
reserve
Available for sale reserve
Total
£m £m £m £m £m £m £m
At 5 April 2015 531 992 7,995 68 129 26 9,741
Profit for the year - - 985 - - - 985
Net movement in available for sale reserve - - - - - (34) (34)
Net movement in cash flow hedge reserve - - - - 301 - 301
Net revaluation of property - - - (3) - - (3)
Reserve transfer - - 1 (1) - - -
Effect of tax rate change on other items through the general reserve - - (1) - - - (1)
Net remeasurements of retirement benefit obligations - - 51 - - - 51
Total comprehensive income - - 1,036 (4) 301 (34) 1,299
Distribution to the holders of core capital deferred shares - - (56) - - - (56)
Distribution to the holders of Additional Tier 1 capital* - - (54) - - - (54)
At 4 April 2016 531 992 8,921 64 430 (8) 10,930
Core capital
deferred shares
Otherequity
instruments
General reserve
Revaluation reserve
Cash flow hedge
reserve
Available for sale reserve
Total
£m £m £m £m £m £m £m
At 5 April 2014 531 992 7,363 71 - (51) 8,906
Profit for the year - - 839 - - - 839
Net movement in available for sale reserve - - - - - 77 77
Net movement in cash flow hedge reserve - - - - 129 - 129
Net revaluation of property - - - 6 - - 6
Reserve transfer - - 9 (9) - - -
Effect of tax rate change on other items through the general reserve - - (1) - - - (1)
Net remeasurements of retirement benefit obligations - - (115) - - - (115)
Total comprehensive income - - 732 (3) 129 77 935
Distribution to the holders of core capital deferred shares - - (58) - - - (58)
Distribution to the holders of Additional Tier 1 capital* - - (42) - - - (42)
At 4 April 2015 531 992 7,995 68 129 26 9,741
Group statement of movements in members’ interests and equity
*The distribution to the holders of Additional Tier 1 capital is shown net of an associated tax credit of £14 million (2015: £11 million).
The notes on pages 208 to 286 form part of these Accounts.
For the year ended 4 April 2016
For the year ended 4 April 2015
Back to Contents
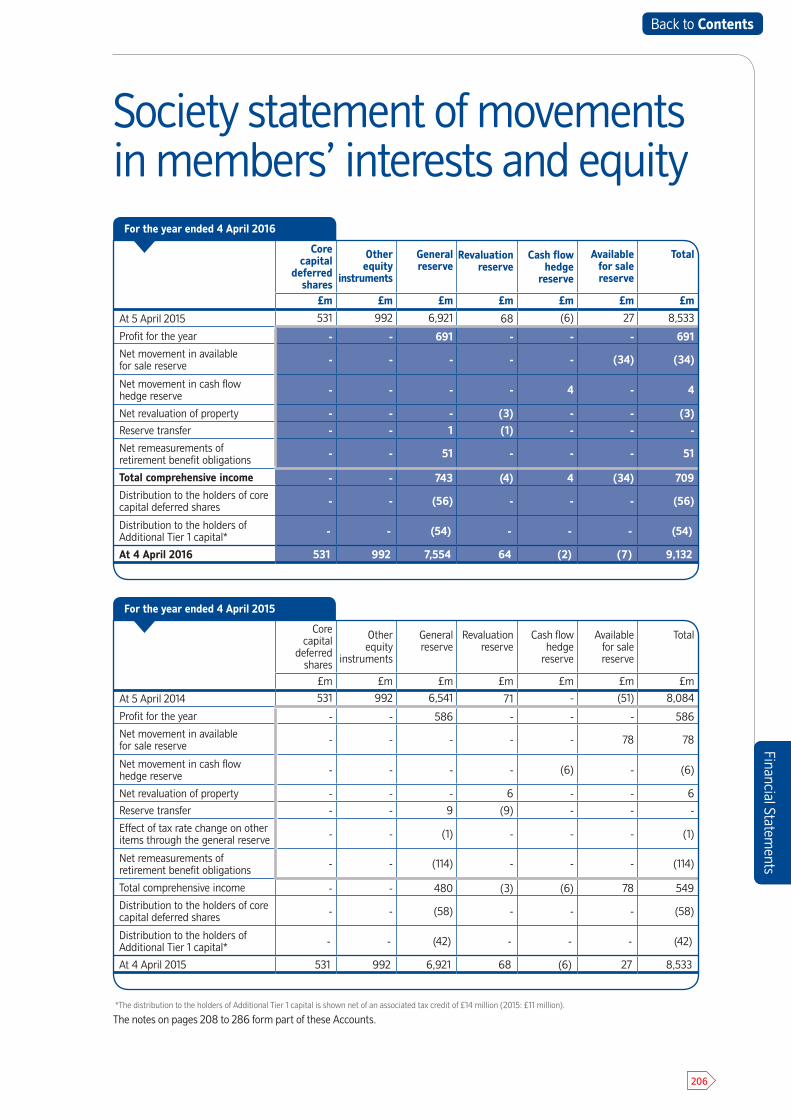
Financial Statements
206
Core capital
deferred shares
Otherequity
instruments
General reserve
Revaluation reserve
Cash flow hedge
reserve
Available for sale reserve
Total
£m £m £m £m £m £m £m
At 5 April 2014 531 992 6,541 71 - (51) 8,084
Profit for the year - - 586 - - - 586
Net movement in available for sale reserve - - - - - 78 78
Net movement in cash flow hedge reserve - - - - (6) - (6)
Net revaluation of property - - - 6 - - 6
Reserve transfer - - 9 (9) - - -
Effect of tax rate change on other items through the general reserve - - (1) - - - (1)
Net remeasurements of retirement benefit obligations - - (114) - - - (114)
Total comprehensive income - - 480 (3) (6) 78 549
Distribution to the holders of core capital deferred shares - - (58) - - - (58)
Distribution to the holders of Additional Tier 1 capital* - - (42) - - - (42)
At 4 April 2015 531 992 6,921 68 (6) 27 8,533
Core capital
deferred shares
Otherequity
instruments
General reserve
Revaluation reserve
Cash flow hedge
reserve
Available for sale reserve
Total
£m £m £m £m £m £m £m
At 5 April 2015 531 992 6,921 68 (6) 27 8,533
Profit for the year - - 691 - - - 691
Net movement in available for sale reserve - - - - - (34) (34)
Net movement in cash flow hedge reserve - - - - 4 - 4
Net revaluation of property - - - (3) - - (3)
Reserve transfer - - 1 (1) - - -
Net remeasurements of retirement benefit obligations - - 51 - - - 51
Total comprehensive income - - 743 (4) 4 (34) 709
Distribution to the holders of core capital deferred shares - - (56) - - - (56)
Distribution to the holders of Additional Tier 1 capital* - - (54) - - - (54)
At 4 April 2016 531 992 7,554 64 (2) (7) 9,132
Society statement of movements in members’ interests and equity
Financial Statements
*The distribution to the holders of Additional Tier 1 capital is shown net of an associated tax credit of £14 million (2015: £11 million).
The notes on pages 208 to 286 form part of these Accounts.
For the year ended 4 April 2016
For the year ended 4 April 2015
Back to Contents
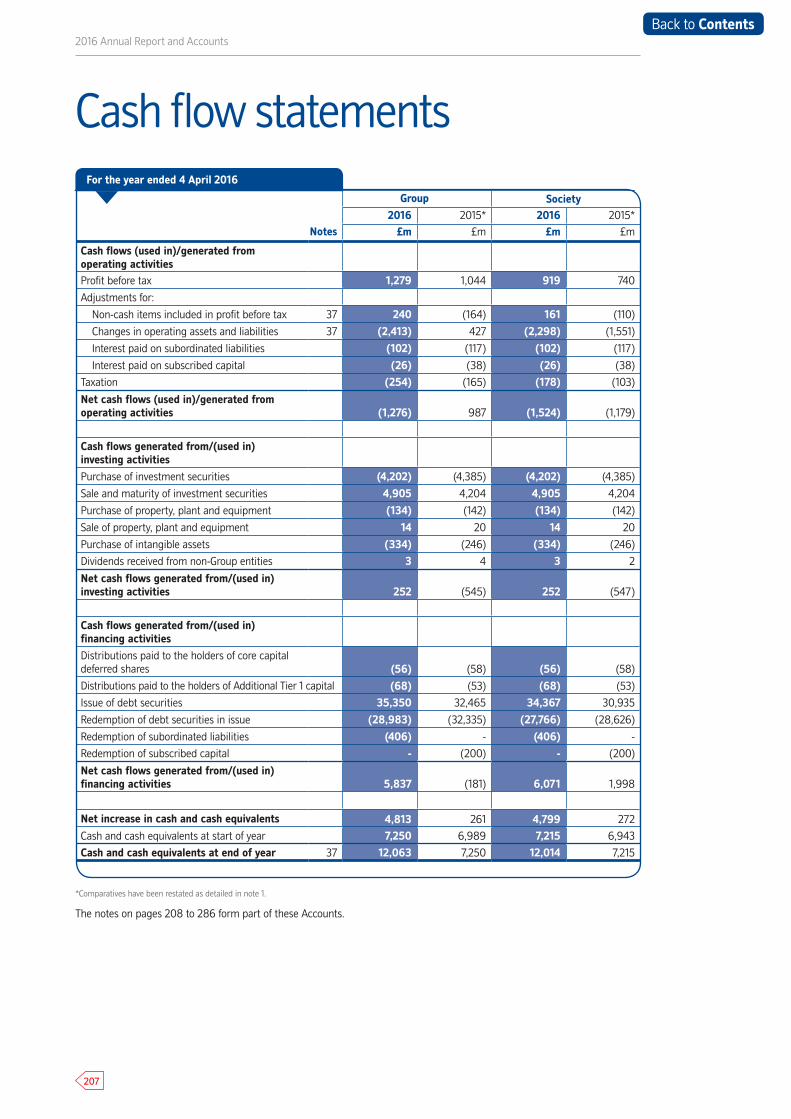
2016 Annual Report and Accounts
207
Cash flow statements
*Comparatives have been restated as detailed in note 1.
The notes on pages 208 to 286 form part of these Accounts.
Group Society2016 2015* 2016 2015*
Notes £m £m £m £m
Cash flows (used in)/generated from operating activitiesProfit before tax 1,279 1,044 919 740
Adjustments for:
Non-cash items included in profit before tax 37 240 (164) 161 (110)
Changes in operating assets and liabilities 37 (2,413) 427 (2,298) (1,551)
Interest paid on subordinated liabilities (102) (117) (102) (117)
Interest paid on subscribed capital (26) (38) (26) (38)
Taxation (254) (165) (178) (103)
Net cash flows (used in)/generated from operating activities (1,276) 987 (1,524) (1,179)
Cash flows generated from/(used in) investing activitiesPurchase of investment securities (4,202) (4,385) (4,202) (4,385)
Sale and maturity of investment securities 4,905 4,204 4,905 4,204
Purchase of property, plant and equipment (134) (142) (134) (142)
Sale of property, plant and equipment 14 20 14 20
Purchase of intangible assets (334) (246) (334) (246)
Dividends received from non-Group entities 3 4 3 2
Net cash flows generated from/(used in) investing activities 252 (545) 252 (547)
Cash flows generated from/(used in) financing activitiesDistributions paid to the holders of core capital deferred shares (56) (58) (56) (58)
Distributions paid to the holders of Additional Tier 1 capital (68) (53) (68) (53)
Issue of debt securities 35,350 32,465 34,367 30,935
Redemption of debt securities in issue (28,983) (32,335) (27,766) (28,626)
Redemption of subordinated liabilities (406) - (406) -
Redemption of subscribed capital - (200) - (200)
Net cash flows generated from/(used in)financing activities 5,837 (181) 6,071 1,998
Net increase in cash and cash equivalents 4,813 261 4,799 272
Cash and cash equivalents at start of year 7,250 6,989 7,215 6,943
Cash and cash equivalents at end of year 37 12,063 7,250 12,014 7,215
For the year ended 4 April 2016
Back to Contents
Financial Statements
208
Basis of preparation
These financial statements have been prepared in accordance with International Financial Reporting Standards (IFRS) and interpretations (IFRICs) issued by the Interpretations Committee, as published by the International Accounting Standards Board (IASB), and adopted by the European Union, and with those parts of the Building Societies (Accounts and Related Provisions) Regulations 1998 (as amended) applicable to organisations reporting under IFRS.
The financial statements have been prepared under the historical cost convention as modified by the revaluation of investment properties, branches and non-specialised buildings, available for sale assets, derivatives, certain mortgage commitments for which a fair value election is made, certain investments in equity shares and certain other deposits. As stated in the Directors’ report, the directors consider that it is appropriate to continue to adopt the going concern basis in preparing the accounts. A summary of the Group’s accounting policies is set out below. The accounting policies have been consistently applied, except for a voluntary change in accounting policy to reclassify gains and losses arising from the retranslation of foreign currency items, as described below.
The preparation of financial statements in conformity with IFRS requires the use of estimates and assumptions that affect the reported amounts of assets and liabilities at the date of the financial statements and the reported amounts of revenues and expenses during the year. Although these estimates are based on management’s best knowledge of the amount, event or actions, actual results ultimately may differ from those estimates. Further details on critical accounting estimates are given in note 2.
Adoption of new and revised IFRSs
The following IFRS pronouncements, relevant to the Group, were adopted with effect from 5 April 2015:
• Amendments to IAS 19 Employee Benefits: The amendments clarify the requirements for attributing employee/third party contributions that are linked to service to the relevant accounting period. Applying the requirements of the amendments to IAS 19 has had noimpact for the Group.
• Annual improvements to IFRSs 2010-2012 and 2011-2013cycles: Several small amendments were adopted with no significant impact for the Group.
1 Statement of accounting policies
Financial Statements
Notes to the accounts
Back to Contents
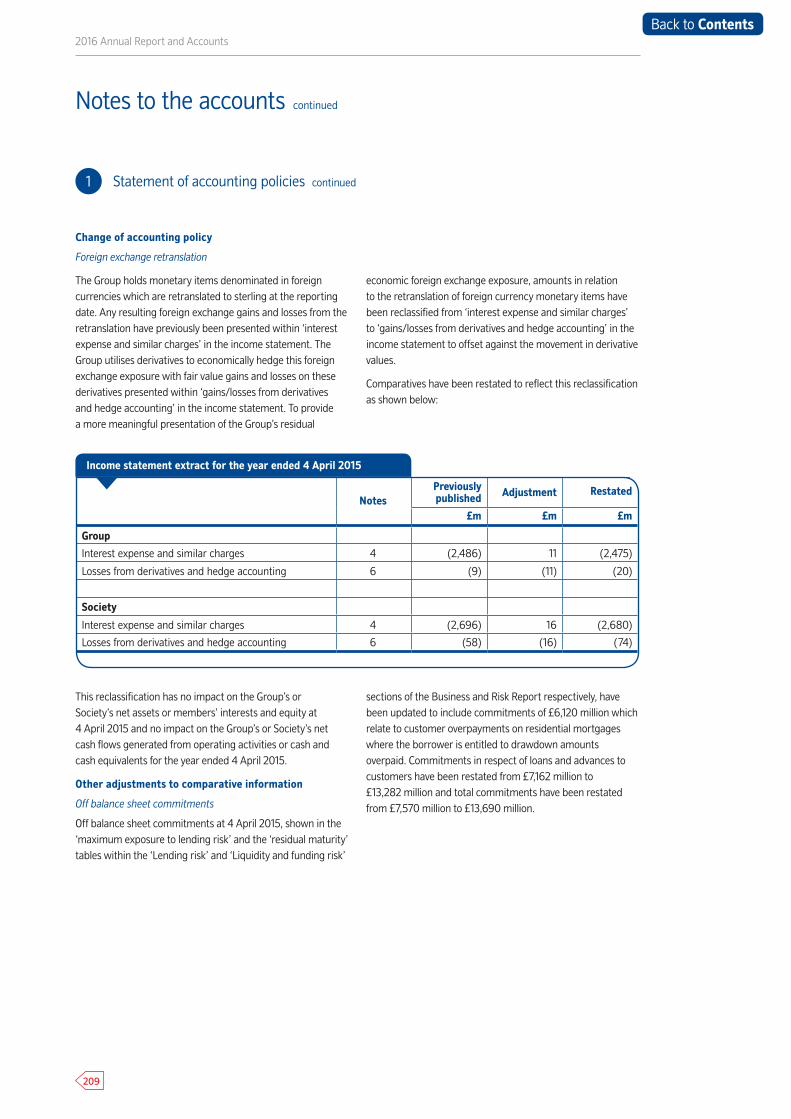
2016 Annual Report and Accounts
209
1 Statement of accounting policies continued
Notes to the accounts continued
Change of accounting policy
Foreign exchange retranslation
The Group holds monetary items denominated in foreign currencies which are retranslated to sterling at the reporting date. Any resulting foreign exchange gains and losses from the retranslation have previously been presented within ‘interest expense and similar charges’ in the income statement. The Group utilises derivatives to economically hedge this foreign exchange exposure with fair value gains and losses on these derivatives presented within ‘gains/losses from derivatives and hedge accounting’ in the income statement. To provide a more meaningful presentation of the Group’s residual
economic foreign exchange exposure, amounts in relation to the retranslation of foreign currency monetary items have been reclassified from ‘interest expense and similar charges’ to ‘gains/losses from derivatives and hedge accounting’ in the income statement to offset against the movement in derivative values.
Comparatives have been restated to reflect this reclassification as shown below:
NotesPreviously published Adjustment Restated
£m £m £m
Group
Interest expense and similar charges 4 (2,486) 11 (2,475)
Losses from derivatives and hedge accounting 6 (9) (11) (20)
Society
Interest expense and similar charges 4 (2,696) 16 (2,680)
Losses from derivatives and hedge accounting 6 (58) (16) (74)
This reclassification has no impact on the Group’s or Society’s net assets or members’ interests and equity at 4 April 2015 and no impact on the Group’s or Society’s net cash flows generated from operating activities or cash and cash equivalents for the year ended 4 April 2015.
Other adjustments to comparative information
Off balance sheet commitments
Off balance sheet commitments at 4 April 2015, shown in the ‘maximum exposure to lending risk’ and the ‘residual maturity’ tables within the ‘Lending risk’ and ‘Liquidity and funding risk’
sections of the Business and Risk Report respectively, have been updated to include commitments of £6,120 million which relate to customer overpayments on residential mortgages where the borrower is entitled to drawdown amounts overpaid. Commitments in respect of loans and advances to customers have been restated from £7,162 million to £13,282 million and total commitments have been restated from £7,570 million to £13,690 million.
Income statement extract for the year ended 4 April 2015
Back to Contents
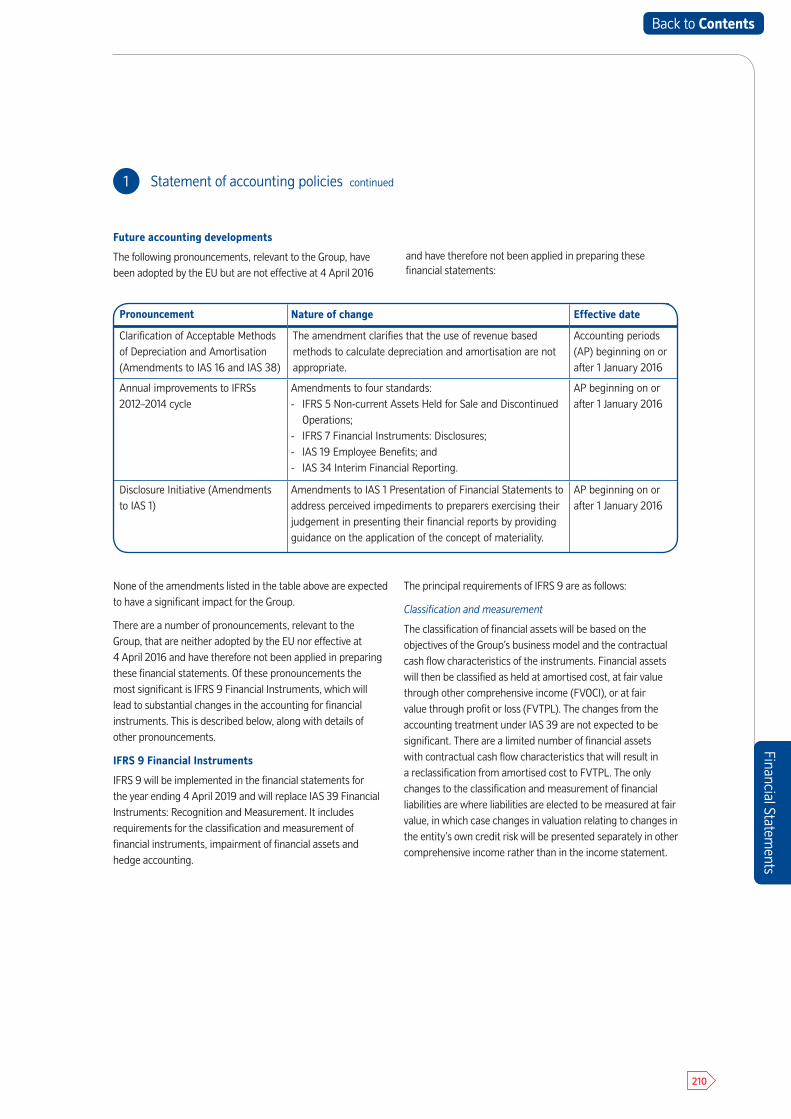
Financial Statements
210
Future accounting developments
The following pronouncements, relevant to the Group, have been adopted by the EU but are not effective at 4 April 2016
and have therefore not been applied in preparing these financial statements:
1 Statement of accounting policies continued
Financial Statements
Pronouncement Nature of change Effective date
Clarification of Acceptable Methods of Depreciation and Amortisation (Amendments to IAS 16 and IAS 38)
The amendment clarifies that the use of revenue based methods to calculate depreciation and amortisation are not appropriate.
Accounting periods (AP) beginning on or after 1 January 2016
Annual improvements to IFRSs 2012–2014 cycle
Amendments to four standards: - IFRS 5 Non-current Assets Held for Sale and Discontinued
Operations; - IFRS 7 Financial Instruments: Disclosures; - IAS 19 Employee Benefits; and - IAS 34 Interim Financial Reporting.
AP beginning on or after 1 January 2016
Disclosure Initiative (Amendments to IAS 1)
Amendments to IAS 1 Presentation of Financial Statements to address perceived impediments to preparers exercising their judgement in presenting their financial reports by providing guidance on the application of the concept of materiality.
AP beginning on or after 1 January 2016
None of the amendments listed in the table above are expected to have a significant impact for the Group.
There are a number of pronouncements, relevant to the Group, that are neither adopted by the EU nor effective at 4 April 2016 and have therefore not been applied in preparing these financial statements. Of these pronouncements the most significant is IFRS 9 Financial Instruments, which will lead to substantial changes in the accounting for financial instruments. This is described below, along with details of other pronouncements.
IFRS 9 Financial Instruments
IFRS 9 will be implemented in the financial statements for the year ending 4 April 2019 and will replace IAS 39 Financial Instruments: Recognition and Measurement. It includes requirements for the classification and measurement of financial instruments, impairment of financial assets and hedge accounting.
The principal requirements of IFRS 9 are as follows:
Classification and measurement
The classification of financial assets will be based on the objectives of the Group’s business model and the contractual cash flow characteristics of the instruments. Financial assets will then be classified as held at amortised cost, at fair value through other comprehensive income (FVOCI), or at fair value through profit or loss (FVTPL). The changes from the accounting treatment under IAS 39 are not expected to be significant. There are a limited number of financial assets with contractual cash flow characteristics that will result in a reclassification from amortised cost to FVTPL. The only changes to the classification and measurement of financial liabilities are where liabilities are elected to be measured at fair value, in which case changes in valuation relating to changes in the entity’s own credit risk will be presented separately in other comprehensive income rather than in the income statement.
Back to Contents

2016 Annual Report and Accounts
211
1 Statement of accounting policies continued
Notes to the accounts continued
Impairment of financial assets
IFRS 9 changes the basis of recognition of impairment on financial assets from an incurred loss to an expected credit loss (ECL) approach for amortised cost and FVOCI financial assets. This introduces a number of new concepts and changes to the approach to provisioning compared with the current methodology under IAS 39:
• Expected credit losses are based on an assessment of the probability of default, loss given default and exposure at default, discounted to give a net present value. The estimation of ECL should be unbiased and probability-weighted, taking into account all reasonable and supportable information, including forward looking economic assumptions and a range of possible outcomes. IFRS 9 has the effect of bringing forward recognition of impairment losses relative to IAS 39 which requires provisions to be recognised only when there is objective evidence of credit impairment.
• On initial recognition, and for financial assets where therehas not been a significant increase in credit risk since the date of advance, IFRS 9 provisions will be made for expected credit default events within the next 12 months.
• A key requirement of IFRS 9 compared with the existing provision approach under IAS 39 relates to assets where there has been a significant increase in credit risk since the date of origination. Provisions will be made for those assets expected to default at any point over their lifetime reflectingthe asset’s full expected loss. This change to lifetime loss provisions for significantly credit deteriorated assets is expected to lead to increases in impairment provisions, and to increased volatility in provisions, although the size of the change will depend on a number of factors, including the composition of asset portfolios and the view of the economic outlook at the date of implementation.
• For assets where there is evidence of credit impairment, provisions will be made under IFRS 9 on the basis of lifetime expected credit losses, taking account of forward looking economic assumptions and a range of possible outcomes. Under IAS 39 provisions are based on the asset’s carrying value and the present value of the estimated futurecash flows. IAS 39 does not explicitly take account of a range of possible economic outcomes including forecasts of any downturn of the economic cycle.
Hedge accounting
The hedge accounting requirements of IFRS 9 are designed to create a stronger link with financial risk management. A separate financial reporting standard will be developed on accounting for dynamic risk management (macro hedge accounting) and IFRS 9 allows the option to continue to apply the existing hedge accounting requirements of IAS 39 until this is implemented. Therefore no changes are currently being implemented to hedge accounting policies and methodologies.
Implementation strategy
The Group’s implementation strategy for IFRS 9 is based on an integrated solution using common systems, tools and data to assess credit risk and account for ECLs. This is consistent with guidance issued by the Basel Committee on Banking Supervision which sets an expectation of a high quality strategic implementation, and will entail changes to the governance, controls, models and business processes relating to credit loss provisioning. An extensive period of internal dual reporting is planned in advance of the implementation date.
Responsibilities and accountabilities
The Group has an established IFRS 9 implementation programme with formal governance reporting to the Group Finance Director and Chief Risk Officer. Progress is reported regularly to the Audit Committee. Extensive work is being carried out to complete technical analysis, including methodologies for ECL models, develop models and design the required changes to systems, data, business processes, reporting and governance of impairment provisions. During the next financial year work will include building and testing of models and validating outputs, development of management information and implementation of business process changes. The financial impact of IFRS 9 will be quantified once models and systems allow the Group to provide reliable estimates, and expected impacts will be disclosed in the financial statements no later than the year ending 4 April 2018.
Back to Contents
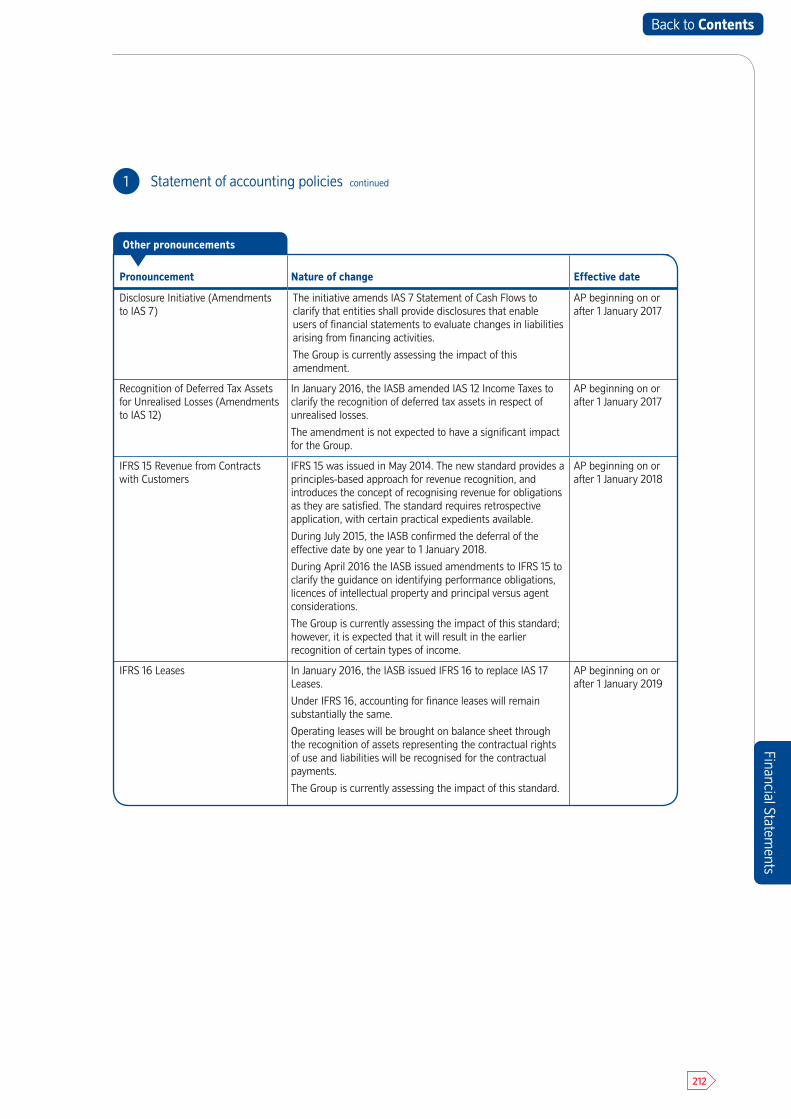
Financial Statements
212
Financial Statements
1 Statement of accounting policies continued
Pronouncement Nature of change Effective date
Disclosure Initiative (Amendments to IAS 7)
The initiative amends IAS 7 Statement of Cash Flows to clarify that entities shall provide disclosures that enable users of financial statements to evaluate changes in liabilities arising from financing activities.
The Group is currently assessing the impact of this amendment.
AP beginning on or after 1 January 2017
Recognition of Deferred Tax Assets for Unrealised Losses (Amendments to IAS 12)
In January 2016, the IASB amended IAS 12 Income Taxes to clarify the recognition of deferred tax assets in respect of unrealised losses.
The amendment is not expected to have a significant impact for the Group.
AP beginning on or after 1 January 2017
IFRS 15 Revenue from Contracts with Customers
IFRS 15 was issued in May 2014. The new standard provides a principles-based approach for revenue recognition, and introduces the concept of recognising revenue for obligations as they are satisfied. The standard requires retrospective application, with certain practical expedients available.
During July 2015, the IASB confirmed the deferral of the effective date by one year to 1 January 2018.
During April 2016 the IASB issued amendments to IFRS 15 to clarify the guidance on identifying performance obligations, licences of intellectual property and principal versus agent considerations.
The Group is currently assessing the impact of this standard; however, it is expected that it will result in the earlier recognition of certain types of income.
AP beginning on or after 1 January 2018
IFRS 16 Leases In January 2016, the IASB issued IFRS 16 to replace IAS 17 Leases.
Under IFRS 16, accounting for finance leases will remain substantially the same.
Operating leases will be brought on balance sheet through the recognition of assets representing the contractual rights of use and liabilities will be recognised for the contractual payments.
The Group is currently assessing the impact of this standard.
AP beginning on or after 1 January 2019
Other pronouncements
Back to Contents
2016 Annual Report and Accounts
213
1 Statement of accounting policies continued
Notes to the accounts continued
Basis of consolidation
The assets, liabilities and results of the Society and its undertakings, which include subsidiaries and structured entities, are included in the financial statements on the basis of accounts made up to the reporting date.
The Group consolidates an entity from the date on which the Group: (i) has power over the entity; (ii) is exposed to, or has rights to variable returns from its involvement with the entity; and (iii) has the ability to affect those returns through the exercise of its power. The assessment of control is based on all facts and circumstances. The Group reassesses whether it controls an investee if facts and circumstances indicate that there are changes to one or more of the three elements of control. The Group deconsolidates subsidiaries from the date that control ceases.
A structured entity is an entity in which voting or similar rights are not the dominant factor in deciding control. Structured entities are consolidated when the substance of the relationship indicates control. The Group considers factors such as the purpose and design of the entity, size and exposure to variability of returns and nature of the relationship.
Upon consolidation, intra-Group transactions, balances and unrealised gains are eliminated.
Investments in subsidiary undertakings are stated in the Society accounts at cost less provisions for any impairment in value. The directors consider it appropriate for administrative and commercial reasons that subsidiary undertakings have financial years ending on 31 March. Certain structured entities have year ends other than 31 March and are therefore consolidated using internal management accounts prepared to that date. Adjustment is made for individually significant transactions arising between 31 March and the Society’s year end.
Securitisation transactions
The Group has securitised certain mortgage loans by the transfer of the loans to structured entities controlled by the Group. The securitisation enables a subsequent issuance of debt, either by the Society or the structured entities, to investors who gain the security of the underlying assets as collateral. Those structured entities are fully consolidated into the Group accounts.
The transfers of the mortgage loans to the structured entities are not treated as sales by the Society. The Society continues to recognise the mortgage loans on its own balance sheet after the transfer because it retains their risks and rewards through the receipt of substantially all of the profits or losses of the structured entities. In the accounts of the Society, the proceeds
received from the transfer are accounted for as a deemed loan repayable to the structured entities.
As explained in note 15, the Group has also entered into self issuances of debt to be used as collateral for repurchase (‘repo’) and similar transactions. Investments in self issued debt and the equivalent deemed loan, together with the related income, expenditure and cash flows, are not recognised in the Society’s or Group’s financial statements. This avoids the ‘grossing-up’ of the financial statements that would otherwise arise.
To manage interest rate risk, the Society enters into derivative transactions with the structured entities, receiving a rate of interest based on the securitised mortgages and paying a rate inherent in the debt issuances. In accordance with IAS 39, these internal derivatives are treated as part of the deemed loan and not separately fair valued because the relevant mortgage loans are not derecognised. All other derivatives relating to securitisations are treated as explained in the derivatives and hedge accounting policy below.
Interest receivable and interest expense
For instruments measured at amortised cost the effective interest rate method is used to measure the carrying value of a financial asset or liability and to allocate associated interest income or expense over the relevant period. The effective interest rate is the rate that exactly discounts estimated future cash payments or receipts through the expected life of the financial instrument or, when appropriate, a shorter period to the net carrying amount of the financial asset or financial liability.
In calculating the effective interest rate, the Group estimates cash flows considering all contractual terms of the financial instrument (for example, early redemption penalty charges) and anticipated customer behaviour but does not consider future credit losses. The calculation includes all fees received and paid and costs borne that are an integral part of the effective interest rate and all other premiums or discounts above or below market rates.
Interest income on available for sale assets, derivatives and other financial assets at fair value through the income statement is included in interest receivable and similar income. Once a financial asset or a group of similar financial assets has been written down as a result of an impairment loss, interest income is recognised using the rate of interest used to discount the future cash flows for the purpose of measuring the impairment loss.
Back to Contents

Financial Statements
214
Fees and commissions
Fees and commissions not directly attributable to generating a financial instrument are recognised on the accruals basis as services are provided, or on the performance of a significant act.
Segmental reporting
Operating segments are reported in a manner consistent with the internal reporting provided to the Executive Committee. The Executive Committee, which is responsible for allocating resources and assessing performance of operating segments, has been identified as the chief operating decision maker. Further information is included in note 11.
No segmental analysis is presented on geographical lines as substantially all of the Group’s activities are in the United Kingdom, with limited deposit taking operations in the Isle of Man and the Republic of Ireland.
Intangible assets
(a) Goodwill Goodwill represents the excess of the consideration transferred for an acquisition over the fair value of the Group’s share of the net identifiable assets (including the fair value of contingent liabilities) of the acquired business at the date of acquisition. Goodwill on acquisitions is held at cost less accumulated impairment and is included as an intangible asset.
Goodwill is tested for impairment at least annually. For the purpose of impairment testing, goodwill is allocated to cash generating units. If the carrying value of the cash generating unit exceeds its recoverable value, goodwill is considered impaired. The estimation of recoverable value is based on value in use calculations incorporating forecasts by management of post tax profits for the subsequent five years, discounted at a risk-adjusted interest rate appropriate to the cash generating unit. While forecasts are compared with actual performance, expected profits reflectmanagement’s view of future performance.
(b) Computer software IAS 38 Intangible Assets requires the capitalisation of certain costs relating to software development. Software development costs are capitalised if it is probable that the asset created will generate future economic benefits and are held at cost less accumulated amortisation and impairment. Costs incurred to establish technological feasibility or to maintain existing levels of performance arerecognised as an expense.
Web development costs are capitalised where the expenditure is incurred on developing an income generating website.
Computer software is reviewed for impairment whenever events or changes in circumstances indicate that the carrying amount may not be recoverable. Where the carrying amount is not recoverable the asset is written down immediately to the estimated recoverable amount, based on value in use calculations.
Where applicable, directly attributable borrowing costs incurred in the construction of qualifying assets are capitalised.
(c) Other intangible assets Other intangible assets, which largely represent core deposit intangibles acquired by the Group, are held at cost less accumulated amortisation and impairment and are amortised using the straight line method over their estimated useful lives of between 5 and 10 years. The amortisation period is reviewed annually.
Other intangible assets are reviewed for impairment whenever events or changes in circumstances indicate thatthe carrying amount may not be recoverable. Where the carrying amount is not recoverable the asset is written down immediately to the estimated recoverable amount, based on value in use calculations.
Leases
The Group has entered into operating leases for land and buildings. Operating leases are leases that do not transfer substantially all the risks and rewards incidental to ownership to the lessee. Operating lease payments and receipts are charged or credited to the income statement on a straight line basis over the life of the lease.
1 Statement of accounting policies continued
Financial Statements
Back to Contents
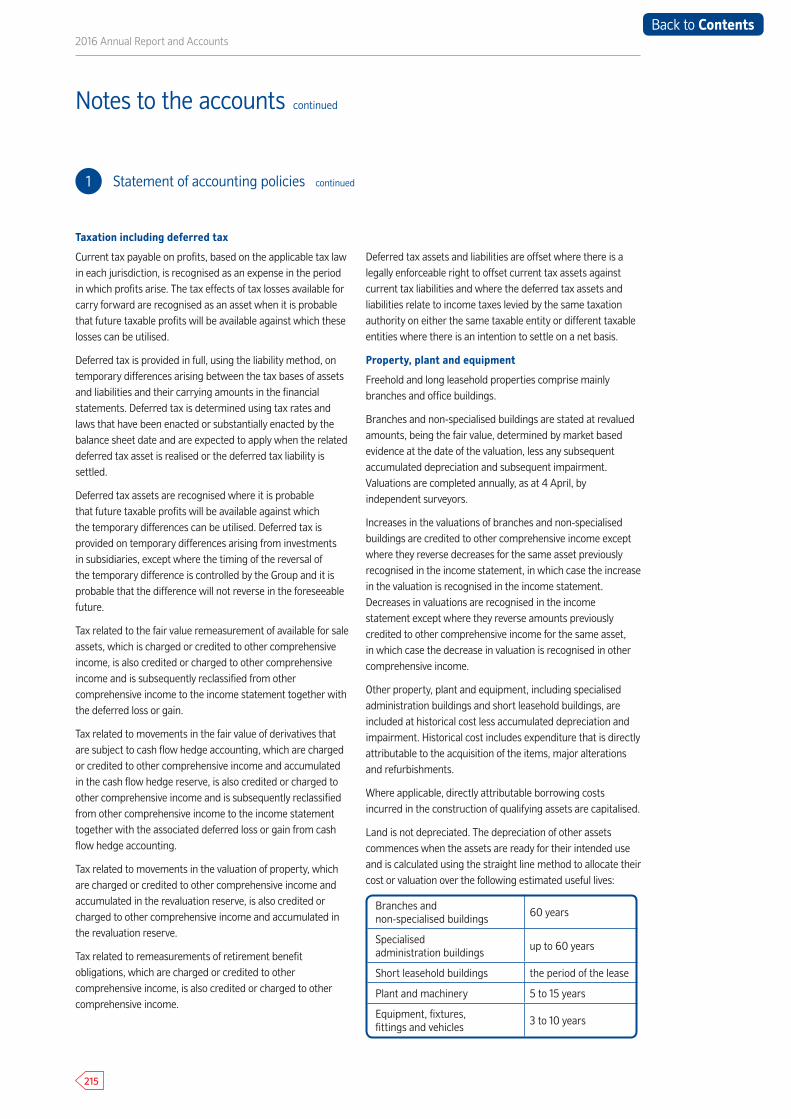
2016 Annual Report and Accounts
215
1 Statement of accounting policies continued
Taxation including deferred tax
Current tax payable on profits, based on the applicable tax law in each jurisdiction, is recognised as an expense in the period in which profits arise. The tax effects of tax losses available for carry forward are recognised as an asset when it is probable that future taxable profits will be available against which these losses can be utilised.
Deferred tax is provided in full, using the liability method, on temporary differences arising between the tax bases of assets and liabilities and their carrying amounts in the financial statements. Deferred tax is determined using tax rates and laws that have been enacted or substantially enacted by the balance sheet date and are expected to apply when the related deferred tax asset is realised or the deferred tax liability is settled.
Deferred tax assets are recognised where it is probable that future taxable profits will be available against which the temporary differences can be utilised. Deferred tax is provided on temporary differences arising from investments in subsidiaries, except where the timing of the reversal of the temporary difference is controlled by the Group and it is probable that the difference will not reverse in the foreseeable future.
Tax related to the fair value remeasurement of available for sale assets, which is charged or credited to other comprehensive income, is also credited or charged to other comprehensive income and is subsequently reclassified from other comprehensive income to the income statement together with the deferred loss or gain.
Tax related to movements in the fair value of derivatives that are subject to cash flow hedge accounting, which are charged or credited to other comprehensive income and accumulated in the cash flow hedge reserve, is also credited or charged to other comprehensive income and is subsequently reclassified from other comprehensive income to the income statement together with the associated deferred loss or gain from cash flow hedge accounting.
Tax related to movements in the valuation of property, which are charged or credited to other comprehensive income and accumulated in the revaluation reserve, is also credited or charged to other comprehensive income and accumulated in the revaluation reserve.
Tax related to remeasurements of retirement benefit obligations, which are charged or credited to other comprehensive income, is also credited or charged to other comprehensive income.
Deferred tax assets and liabilities are offset where there is a legally enforceable right to offset current tax assets against current tax liabilities and where the deferred tax assets and liabilities relate to income taxes levied by the same taxation authority on either the same taxable entity or different taxable entities where there is an intention to settle on a net basis.
Property, plant and equipment
Freehold and long leasehold properties comprise mainly branches and office buildings.
Branches and non-specialised buildings are stated at revalued amounts, being the fair value, determined by market based evidence at the date of the valuation, less any subsequent accumulated depreciation and subsequent impairment. Valuations are completed annually, as at 4 April, by independent surveyors.
Increases in the valuations of branches and non-specialised buildings are credited to other comprehensive income except where they reverse decreases for the same asset previously recognised in the income statement, in which case the increase in the valuation is recognised in the income statement. Decreases in valuations are recognised in the income statement except where they reverse amounts previously credited to other comprehensive income for the same asset, in which case the decrease in valuation is recognised in other comprehensive income.
Other property, plant and equipment, including specialised administration buildings and short leasehold buildings, are included at historical cost less accumulated depreciation and impairment. Historical cost includes expenditure that is directly attributable to the acquisition of the items, major alterations and refurbishments.
Where applicable, directly attributable borrowing costs incurred in the construction of qualifying assets are capitalised.
Land is not depreciated. The depreciation of other assets commences when the assets are ready for their intended use and is calculated using the straight line method to allocate their cost or valuation over the following estimated useful lives:
Branches and non-specialised buildings
60 years
Specialised administration buildings
up to 60 years
Short leasehold buildings the period of the lease
Plant and machinery 5 to 15 years
Equipment, fixtures, fittings and vehicles
3 to 10 years
Notes to the accounts continued
Back to Contents
Financial Statements
216
1 Statement of accounting policies continued
Estimated useful lives and residual values are reviewed annually and adjusted, if appropriate, in the light of technological developments, usage and other relevant factors.
Assets are reviewed for impairment whenever events or changes in circumstances indicate that the carrying amount may not be recoverable. Where the carrying amount is not recoverable the asset is written down immediately to the estimated recoverable amount.
Gains and losses on disposals are included in other operating income in the income statement.
Investment properties
Investment properties, which comprise properties held for rental, are stated at fair value, determined by market based evidence at the date of the valuation. Valuations are completed annually, as at 4 April, by independent surveyors. Changes in fair value are included in the income statement. Depreciation is not charged on investment properties.
Employee benefits
(a) Pensions The Group operates a number of defined benefit and defined contribution pension arrangements. A defined benefit plan is one that defines the benefit an employee will receive on retirement, depending on such factors as age, length of service and salary.
The liability recognised on the balance sheet in respect of the defined benefit pension plans is the present value of the defined benefit obligation at the balance sheet date less the fair value of plan assets. The defined benefit obligation is calculated by independent actuaries using the projected unit credit method and assumptions agreed with the Group.The present value of the defined benefit obligation is determined by discounting the estimated future cash flows using interest rates of high quality corporate bonds that have terms to maturity approximating to the terms of the related pension liability.
Actuarial remeasurements arise from experience adjustments (the effects of differences between previous actuarial assumptions and what has actually occurred) and changes in forward looking actuarial assumptions. Actuarial remeasurements are recognised in full, in the year they occur, in other comprehensive income.
The Group also operates defined contribution arrangements. A defined contribution arrangement is one into which the Group and the employee pay fixed contributions, without any further obligation to pay
additional contributions. Payments to defined contribution schemes are charged to the income statement as they fall due.
Past service costs are recognised immediately in the income statement.
(b) Other post retirement obligations
The Group provides post retirement healthcare to a smallnumber of former employees. The Group recognises this obligation and the actuarial remeasurement in a similar manner to the defined benefit pension plans.
(c) Other long term employee benefits
The cost of bonuses payable 12 months or more after the end of the year in which they are earned is recognised in the year in which the employees render the related serviceand when there is an obligation to pay a bonus under the terms of the scheme.
(d) Short term employee benefits
The cost of short term employee benefits, including wages and salaries, social security costs and healthcare for currentemployees, is recognised in the year of service.
Provisions
A provision is recognised where there is a present obligation as a result of a past event, it is probable that the obligation will be settled and it can be reliably estimated. This includes management’s best estimate of amounts payable for customer redress.
Nationwide has an obligation to contribute to the Financial Services Compensation Scheme (FSCS) to enable the FSCS to meet compensation claims from, in particular, retail depositors of failed banks. A provision is recognised, to the extent that it can be reliably estimated, when Nationwide has an obligation in accordance with IAS 37 and the levy is legally enforceable in line with IFRIC 21. The amount provided is based on information received from the FSCS, forecast future interest rates and the Group’s historic share of industry protected deposits.
Financial Statements
Back to Contents
2016 Annual Report and Accounts
217
1 Statement of accounting policies continued
Financial assets
The Group classifies its financial assets at inception into the following three categories:
(a) Financial assets at fair value through the income statement
This category consists of derivative financial assets used for risk management purposes. The Group does not hold any other financial assets classified as held for trading.
Assets in this category are carried at fair value. The fair values of derivative instruments are calculated by discounted cash flow models using yield curves that are based on observable market data or are based on valuations obtained from counterparties. Gains and losses arising from the changes in the fair values are recognised inthe income statement.
The Group recognises the fair value of certain mortgage commitments on the balance sheet to alleviate an accounting mismatch. The fair value of mortgage commitments is included within other assets or other liabilities. Movements in the fair value are included within gains/losses from derivatives and hedge accounting in the income statement.
(b) Loans and receivables
Loans and receivables are non-derivative financial assets with fixed or determinable payments that are not quoted in an active market. The Group’s residential and commercial mortgage loans, unsecured lending, loans and advances to banks and cash are classified as loans and receivables.
Loans are recognised when the funds are advanced to customers. Loans and receivables are carried at amortised cost using the effective interest rate method less provisions for impairment.
Loans and receivables acquired through a business combination or portfolio acquisition are recognised at fair value at the acquisition date. The fair value at acquisition becomes the new amortised cost for acquired loans and receivables. Fair value adjustments are made to reflect bothcredit and interest rate risk associated with the acquired loan assets.
(c) Available for sale assets
Available for sale assets are non-derivative financial assetsthat are not classified into either of the two categories above. The majority of available for sale assets are measured at fair value using, in the majority of cases, market prices or, where markets have become inactive, prices obtained from market participants. In sourcing valuations, the Group makes use of a consensus pricing
service, in line with standard industry practice. In cases where market prices or prices obtained from market participants are not available, discounted cash flow models are used. Further information is provided in notes 22 and 23. Investments in equities that do not have a quoted market price in an active market and whose value cannotbe reliably measured are recognised at cost.
Interest on available for sale assets is recognised using the effective interest rate method.
Unrealised gains and losses arising from changes in the fair values are recognised in other comprehensive income, except for amounts relating to impairment losses and foreign exchange gains and losses, which are recognised in the income statement. Gains and losses arising on the sale of available for sale assets are recognised in the income statement, including any cumulative gains or losses previously recognised in other comprehensive income, which are reclassified to the income statement.
The Group has not classified any financial assets into the held to maturity category and has not reclassified any financial assets between categories.
Purchases and sales of financial assets are accounted for at trade date. Financial assets are derecognised when the rights to receive cash flows have expired or where the assets have been transferred and substantially all of the risks and rewards of ownership have been transferred.
The impact of hedging on the measurement of financial assets is detailed in the derivatives and hedge accounting policy below.
Impairment of financial assets
(a) Assets carried at amortised cost The Group assesses at each balance sheet date whether, as a result of one or more events that occurred after initial recognition, there is objective evidence that a financial assetor group of financial assets is impaired. Evidence of impairment may include:
i) indications that the borrower or group of borrowers isexperiencing significant financial difficulty
ii) default or delinquency in interest or principal payments
iii) debt being restructured to reduce the burden on theborrower.
The Group first assesses whether objective evidence of impairment exists either individually for assets that are separately significant or individually or collectively for assets that are not separately significant. If there is no objective
Notes to the accounts continued
Back to Contents
Financial Statements
218
1 Statement of accounting policies continued
evidence of impairment for an individually assessed asset it is included in a group of assets with similar credit risk characteristics and collectively assessed for impairment.
If there is objective evidence that an impairment loss has been incurred, the amount of the loss is measured as the difference between the asset’s carrying amount and the present value of estimated future cash flows discounted at the asset’s original effective interest rate. For loans in a hedge relationship, the effective interest rate used for discounting is calculated using the carrying value of the loan including the hedge adjustment. The resultant provisions are deducted from the appropriate asset values on the balance sheet.
The methodology and assumptions used for estimating future cash flows are reviewed regularly by the Group to reduce any differences between loss estimates and actual loss experience.
If, in a subsequent period, the amount of the impairment loss decreases and the decrease can be related objectively to an event occurring after the impairment was recognised, the provision is adjusted and the amount of the reversal is recognised in the income statement.
Loans remain on the balance sheet net of associated provisions until they are deemed no longer recoverable. Where a loan is not recoverable, it is written off against the related provision for loan impairment once all the necessary procedures have been completed and the amount of the loss has been determined. Subsequent recoveries of amounts previously written off decrease the amount of impairment losses recorded in the income statement.
Retail loans For retail loans cash flows are estimated based on past experience combined with the Group’s view of the future considering the following factors:
i) exposure to the customer
ii) based on the number of days in arrears at the balancesheet date, the likelihood that a loan will progress through the various stages of delinquency and ultimately be written off
iii) the amount and timing of expected receipts andrecoveries
iv) the realisable value of any security at the estimated dateof sale
v) the likely deduction of any costs involved in the recoveryof amounts outstanding.
The Group’s provision methodology recognises previous arrears as a driver of future possible default and therefore accounts which have either capitalised arrears or have been
in arrears in the last 12 months typically attract a higher provision level.
Commercial loans In assessing objective evidence of a loss event for commercial loans, the following key indicators are considered:
i) contractually due payments exceeding 30 days inarrears
ii) high loan to value or low interest cover ratio
iii) other covenant breaches
iv) loss of significant tenants or other decreases in tenantquality
v) the probability of the borrower entering bankruptcy
vi) restructuring of the debt relating to the borrower’sfinancial difficulties (‘forbearance’)
vii) local economic conditions (for example, where thisimpacts on the value of underlying collateral).
Where there is objective evidence of impairment, cash flows are assessed on a case by case basis considering the following factors:
i) aggregate exposure to the customer
ii) the viability of the customer’s business model and their capacity to trade successfully out of financial difficulties and generate sufficient cash flows to service debt obligations
iii) the amount and timing of expected receipts andrecoveries of collateral
iv) the likely dividend available on liquidation or bankruptcy
v) the extent of other creditors’ claims ranking ahead ofthe Group’s, and the likelihood of other creditors continuing to support the borrower
vi) the complexity of determining the aggregate amountand ranking of all creditor claims and the extent to which legal and insurance uncertainties are evident
vii) the realisable value of security at the expected date ofsale and likelihood of successful repossession
viii) the likely deduction of any costs involved in recovery ofamounts outstanding
ix) when available, the secondary market price of the debt.
Loans subject to individual impairment assessment, whose terms have been renegotiated, are subject to ongoing review to determine whether they remain impaired or are considered to be past due.
Where a loan is renegotiated on different terms such that it is substantially a different loan, the loan is derecognised and a new loan is recognised at its fair value.
Financial Statements
Back to Contents
2016 Annual Report and Accounts
219
1 Statement of accounting policies continued
For those loans, for which no individual impairment is recognised, a collective impairment assessment is made, taking account of the following factors:
i) size of the loan
ii) arrears status
iii) historical loss experience (adjusted for current marketconditions)
iv) the estimated period between impairment occurringand the loss being identified (‘emergence period’).
(b) Available for sale assets The Group assesses at each balance sheet date whether there is objective evidence that a financial asset or a group of financial assets is impaired. If any such evidence exists for available for sale assets, the cumulative loss, measured as the difference between the current amortised cost and the current fair value, less any impairment loss on that asset previously recognised, is recognised in impairment losses/recoveries on investment securities in the income statement.
A subsequent decline in the fair value of an available for sale asset is recognised in the income statement when there is further objective evidence of impairment as a result of further decreases in the estimated future cash flows of the financial asset. Where there is no further objective evidence of impairment, the decline in the fair value of the financial asset is recognised in other comprehensive income.
If the fair value of an available for sale asset increases in a subsequent period, and the increase can be objectively related to an event occurring after the impairment loss was recognised in the income statement, the impairment loss is reversed through the income statement to the extent it reverses the previously recognised impairment. Any gain in fair value in excess of the original impairment is recognised in other comprehensive income. On disposal, where sales proceeds exceed the carrying amount of an impaired asset, the proportion of the gain which offsets the previously recognised impairment loss is recognised as a credit in impairment losses/recoveries on investment securities in the income statement.
Impairment losses recognised in the income statement on available for sale equity shares are not reversed through the income statement.
Financial liabilities
Borrowings, including shares, deposits, debt securities in issue and subordinated liabilities are recognised initially at fair value, being the issue proceeds net of premiums, discounts and transaction costs incurred.
With the exception of deposits relating to the sale of protected equity bonds (PEBs) all borrowings are subsequently measured at amortised cost using the effective interest rate method. Amortised cost is adjusted for the amortisation of any premiums, discounts and transaction costs. The amortisation is recognised in interest expense and similar charges using the effective interest rate method.
Derivative financial liabilities are classified as fair value through the income statement. The Group does not hold any other financial liabilities classified as held for trading.
Permanent interest bearing shares (subscribed capital) are classified as financial liabilities.
Financial liabilities are derecognised when the obligation is discharged, cancelled or has expired.
Borrowings that are designated as hedged items are subject to measurement under the hedge accounting requirements described in the derivatives and hedge accounting policy below.
The financial liabilities of dormant shares and deposit accounts have been extinguished when balances have been transferred to the Government backed unclaimed asset scheme under the terms of the Dormant Accounts and Building Society Accounts Act 2008 with no impact on the income statement.
Fair value of assets and liabilities
IFRS 13 requires an entity to classify assets and liabilities held at fair value and those not measured at fair value but for which the fair value is disclosed according to a hierarchy that reflects the significance of observable market inputs in calculating those fair values. The three levels of the fair value hierarchy are defined below:
Level 1 – Valuation using quoted market prices Assets and liabilities are classified as Level 1 if their value is observable in an active market. Such instruments are valued by reference to unadjusted quoted prices for identical assets or liabilities in active markets where the quoted price is readily available, and the price reflects actual and regularly occurring market transactions on an arm’s length basis. An active market is one in which transactions occur with sufficient volume and frequency to provide pricing information on an ongoing basis.
Notes to the accounts continued
Back to Contents
Financial Statements
220
1 Statement of accounting policies continued
Level 2 – Valuation technique using observable inputs Assets and liabilities classified as Level 2 have been valued using models whose inputs are observable in an active market. Valuations based on observable inputs include derivative financial instruments such as swaps and forwards which are valued using market standard pricing techniques, and options that are commonly traded in markets where all the inputs to the market standard pricing models are observable. They also include investment securities valued using consensus pricing or other observable market prices.
Level 3 – Valuation technique using significant unobservable inputs Assets and liabilities are classified as Level 3 if their valuation incorporates significant inputs that are not based on observable market data (‘unobservable inputs’). A valuation input is considered observable if it can be directly observed from transactions in an active market, or if there is compelling external evidence demonstrating an executable exit price. An input is deemed significant if it is shown to contribute more than 10% to the valuation of a financial instrument. Unobservable input levels are generally determined based on observable inputs of a similar nature, historical observations or other analytical techniques.
Protected equity bonds (PEBs)
Certain non-derivative financial liabilities relating to the sale of PEBs by the Group on behalf of Legal & General, included within other deposits, have been designated at fair value upon initial recognition. Changes in fair value are recognised through the income statement in gains/losses from derivatives and hedge accounting. The PEBs are economically matched using equity-linked derivatives, which do not meet the requirements for hedge accounting. Recording changes in fair value of both the derivatives and the related liabilities through the income statement most closely reflects the economic reality of the transactions. In so doing, this accounting treatment eliminates a measurement inconsistency that would otherwise arise from valuing the PEBs at amortised cost and the derivatives at fair value.
In measuring fair value, separate debit valuation adjustments are made for own credit risk to the extent not already included in the PEBs valuation.
Income received from Legal & General upon inception of a PEB transaction is deferred and recognised in interest expense and similar charges in the income statement on an effective interest basis over the term of the product where it partially offsets interest incurred on the equity-linked derivatives.
Derivatives and hedge accounting
Derivatives are entered into to reduce exposures to fluctuations in interest rates, exchange rates, market indices and credit risk and are not used for speculative purposes.
(a) Derivative financial instruments Derivatives are carried at fair value with movements in fair values recorded in the income statement. Derivative financial instruments are principally valued by discounted cash flow models using yield curves that are based on observable market data or are based on valuations obtainedfrom counterparties. For collateralised positions the Group uses discount curves based on overnight indexed swap rates, and for non-collateralised positions the Group uses discount curves based on term Libor rates.
In the first instance fair values are calculated using mid prices. With the exception of derivatives hedging liabilities relating to the sale of PEBs, an adjustment is then made to derivative assets and liabilities to value them on a bid and offer basis respectively. The bid-offer adjustment is calculated on a portfolio basis and reflects the costs that would be incurred if substantially all residual net portfolio market risks were closed out using available hedging instruments or by disposing of or unwinding actual positions. The methodology for determining the bid-offer adjustments involves netting between long and short positions and the grouping of risk by type, in accordance with hedging strategy. Bid-offer spreads are derived from market sources such as broker data and are reviewed periodically. The derivatives hedging PEBs are not traded in an active market and are therefore valued at mid price.
In measuring fair value, separate credit valuation and debit valuation adjustments are made for counterparty or own credit risk to the extent not already included in the valuation.
All derivatives are classified as assets where their fair value is positive and liabilities where their fair value is negative. Where there is the legal ability and intention to settle net, then the derivative is classified as a net asset or liability, as appropriate.
Where cash collateral is received, to mitigate the risk inherent in amounts due to the Group, it is included as a liability within deposits from banks. Where cash collateral is given, to mitigate the risk inherent in amounts due from the Group, it is included as an asset in loans and advances to banks. Where securities collateral is received the securities are not recognised in the accounts as the Group does not obtain the risks and rewards of the securities. Where
Financial Statements
Back to Contents
2016 Annual Report and Accounts
221
securities collateral is given, the securities have not been derecognised as the Group has retained substantially all the risks and rewards of ownership.
(b) Embedded derivatives A number of complex contracts contain both a derivative and a non-derivative component, in which case the derivative is termed an embedded derivative. If the economic characteristics and risks of embedded derivativesare not closely related to those of the host contract, and the overall contract itself is not carried at fair value, the embedded derivative is accounted for separately and reported at fair value with gains and losses being recognised in the income statement.
c) Hedge accounting When transactions meet the criteria specified in IAS 39, the Group can apply two types of hedge accounting: either hedges of the changes in fair value of the financial asset or liability or hedges of the variability in cash flows of the financial asset or liability:
Fair value hedge accounting In a micro hedge relationship, the carrying value of the underlying asset or liability (‘the hedged item’) is adjusted to reflect changes in fair value attributable to the risk being hedged. This creates an offset to the fair value movement ofthe derivative (‘the hedging instrument’). In the case of a portfolio hedge, this fair value adjustment is recorded at a portfolio level in the fair value adjustments for portfolio hedged risk category on the balance sheet. Changes in the fair value of hedged items and hedging instruments are recorded in the income statement.
Cash flow hedge accounting In a cash flow hedge accounting relationship, the portion of the derivative’s fair value movement that is deemed to be an effective hedge is deferred to the cash flow hedge reserve, instead of being immediately recognised in the income statement. The ineffective portion of the derivative fair value movement is recognised immediately in the income statement. Amounts deferred to the cash flow hedge reserve are subsequently recycled to the income statement. This recycling occurs when the underlying asset or liability being hedged impacts the income statement, for example when interest payments are recognised.
To qualify for hedge accounting the hedge relationship must be clearly documented at inception and the derivative must be expected to be highly effective in offsetting the hedged risk. Prospective and retrospective effectiveness must be tested throughout the life of the hedge relationship.
The Group discontinues hedge accounting when:
i) it is evident from testing that a derivative is not, or hasceased to be, highly effective as a hedge
ii) the derivative expires, or is sold, terminated or exercised
iii) the underlying item matures or is sold or repaid
iv) the forecast transactions are no longer deemed to behighly probable.
The Group may also decide to cease hedge accounting even though the hedge relationship continues to be highly effective by ceasing to designate the financial instrument as a hedge.
Fair value hedge accounting If the derivative no longer meets the criteria for hedge accounting, the cumulative fair value hedge adjustment is amortised over the period to maturity of the previously designated hedge relationship. If the underlying item is sold or repaid, the unamortised fair value adjustment is immediately recognised in the income statement.
Cash flow hedge accounting
If the derivative no longer meets the criteria for hedge accounting, the cumulative gain or loss from the effective portion of the movement in the fair value of the derivative remains in other comprehensive income until the cash flows from the underlying hedged item are recognised in the income statement. If the underlying item is sold or repaid, the cumulative gain or loss in other comprehensive income is immediately recognised in the income statement.
Offsetting financial instruments
Financial assets and liabilities are offset and the net amount reported on the balance sheet if, and only if, there is a currently enforceable legal right to set off the recognised amounts and there is an intention to settle on a net basis, or to realise an asset and settle the liability simultaneously.
Sale and repurchase agreements (including stock borrowing and lending) and collateralised total return swaps
Investment and other securities may be lent or sold subject to a commitment to repurchase them at a predetermined price (a repo) or a right to continue to receive all future cash flows and changes in capital value on collateral pledged (a total return swap). Such securities are retained on the balance sheet when substantially all the risks and rewards of ownership (typically, the interest rate risk and credit risk on the asset) remain within the Group, and the counterparty liability is included separately on the balance sheet as appropriate.
1 Statement of accounting policies continued
Notes to the accounts continued
Back to Contents
Financial Statements
222
Financial Statements
1 Statement of accounting policies continued
Similarly, where the Group borrows or purchases securities subject to a commitment to resell them (a reverse repo) or settle all future cash flows and changes in capital value to a third party on collateral held (a reverse total return swap) but does not acquire the risks and rewards of ownership, the transactions are treated as collateralised loans, and the securities are not included on the balance sheet.
The difference between sale and repurchase price is accrued over the life of the agreements using the effective interest rate method.
Equity instruments
Issued financial instruments are classified as equity instruments where the contractual arrangement with the holder does not result in the Group having a present obligation to deliver cash, another financial asset or a variable number of equity instruments. Where the Group does have a present obligation, the instrument is classified as a financial liability.
The proceeds of the issuance of equity instruments are included in equity. Costs incurred that are incremental and directly attributable to the issuance are deducted from the proceeds (net of applicable tax).
Distributions to holders of equity instruments are recognised when they become irrevocable and are deducted, net of tax where applicable, from the general reserve.
Foreign currency translation
The consolidated financial statements are presented in sterling, which is the functional currency of the Society. Items included in the financial statements of each of the Group’s entities are measured using their functional currency. Foreign currency transactions are translated into sterling using the exchange rates prevailing at the dates of the transactions.
Monetary items denominated in foreign currencies are retranslated at the rate prevailing at the year end. Foreign exchange gains and losses resulting from the retranslation and settlement of these items are recognised in the income statement as disclosed in note 6.
The Group implemented cash flow hedge accounting in December 2014. This has been applied to a portfolio of derivatives which are economically hedging foreign currency items. For derivatives included in effective cash flow hedges, the change in fair value caused by foreign exchange movements is deferred to the cash flow hedge reserve instead of being immediately reported in the income statement. If cash flow hedges are ineffective, the ineffective portion of the change in fair value is recognised within the income statement. Amounts deferred to the cash flow hedge reserve are recycled to the income statement when the related movements in the underlying hedged item impacts the income statement.
Cash and cash equivalents
For the purposes of the cash flow statement, cash and cash equivalents comprise balances with less than three months maturity from the date of acquisition, included within cash and loans and advances to banks on the balance sheet.
Contingent liabilities
Contingent liabilities are possible obligations whose existence is dependent on the outcome of uncertain future events, or those where the outflow of resources are uncertain or cannot be measured reliably.
During the ordinary course of business the Group is subject to threatened or actual legal proceedings. All such material cases are periodically reassessed, with the assistance of external professional advisers where appropriate, to determine the likelihood of incurring a liability. The Group does not disclose amounts in relation to contingent liabilities associated with such claims where the likelihood of any payment is remote or where such disclosure could be seriously prejudicial to the conduct of the claims.
IFRS disclosures
The audited sections in the Business and Risk Report for Lending risk and Financial risk and the Report of the directors on remuneration form an integral part of these financial statements.
These disclosures (where marked as ‘audited’) are covered by the Independent auditors’ report for this Annual Report and Accounts.
Back to Contents
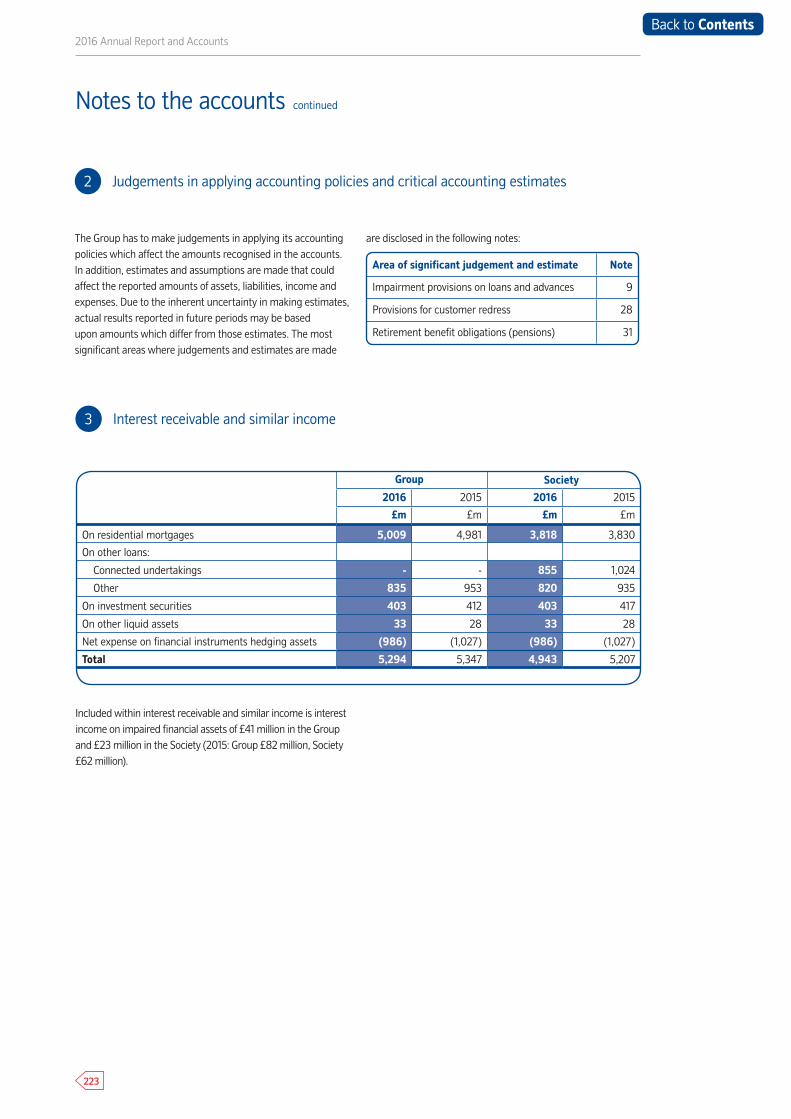
2016 Annual Report and Accounts
223
Notes to the accounts continued
3 Interest receivable and similar income
Included within interest receivable and similar income is interest income on impaired financial assets of £41 million in the Group and £23 million in the Society (2015: Group £82 million, Society £62 million).
2 Judgements in applying accounting policies and critical accounting estimates
The Group has to make judgements in applying its accounting policies which affect the amounts recognised in the accounts. In addition, estimates and assumptions are made that could affect the reported amounts of assets, liabilities, income and expenses. Due to the inherent uncertainty in making estimates, actual results reported in future periods may be based upon amounts which differ from those estimates. The most significant areas where judgements and estimates are made
are disclosed in the following notes:
Area of significant judgement and estimate Note
Impairment provisions on loans and advances 9
Provisions for customer redress 28
Retirement benefit obligations (pensions) 31
Group Society
2016 2015 2016 2015
£m £m £m £m
On residential mortgages 5,009 4,981 3,818 3,830
On other loans:
Connected undertakings - - 855 1,024
Other 835 953 820 935
On investment securities 403 412 403 417
On other liquid assets 33 28 33 28
Net expense on financial instruments hedging assets (986) (1,027) (986) (1,027)
Total 5,294 5,347 4,943 5,207
Back to Contents
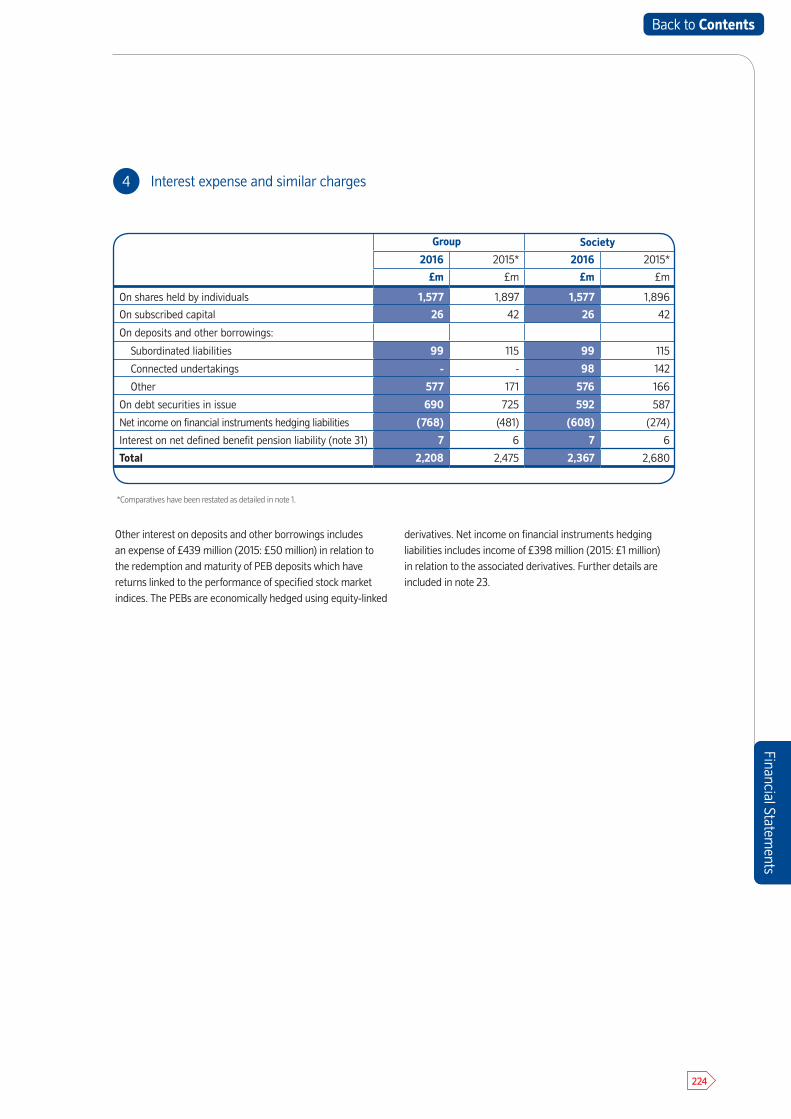
Financial Statements
224
4 Interest expense and similar charges
*Comparatives have been restated as detailed in note 1.
Other interest on deposits and other borrowings includes an expense of £439 million (2015: £50 million) in relation to the redemption and maturity of PEB deposits which have returns linked to the performance of specified stock market indices. The PEBs are economically hedged using equity-linked
derivatives. Net income on financial instruments hedging liabilities includes income of £398 million (2015: £1 million) in relation to the associated derivatives. Further details are included in note 23.
Financial Statements
Group Society
2016 2015* 2016 2015*
£m £m £m £m
On shares held by individuals 1,577 1,897 1,577 1,896
On subscribed capital 26 42 26 42
On deposits and other borrowings:
Subordinated liabilities 99 115 99 115
Connected undertakings - - 98 142
Other 577 171 576 166
On debt securities in issue 690 725 592 587
Net income on financial instruments hedging liabilities (768) (481) (608) (274)
Interest on net defined benefit pension liability (note 31) 7 6 7 6
Total 2,208 2,475 2,367 2,680
Back to Contents
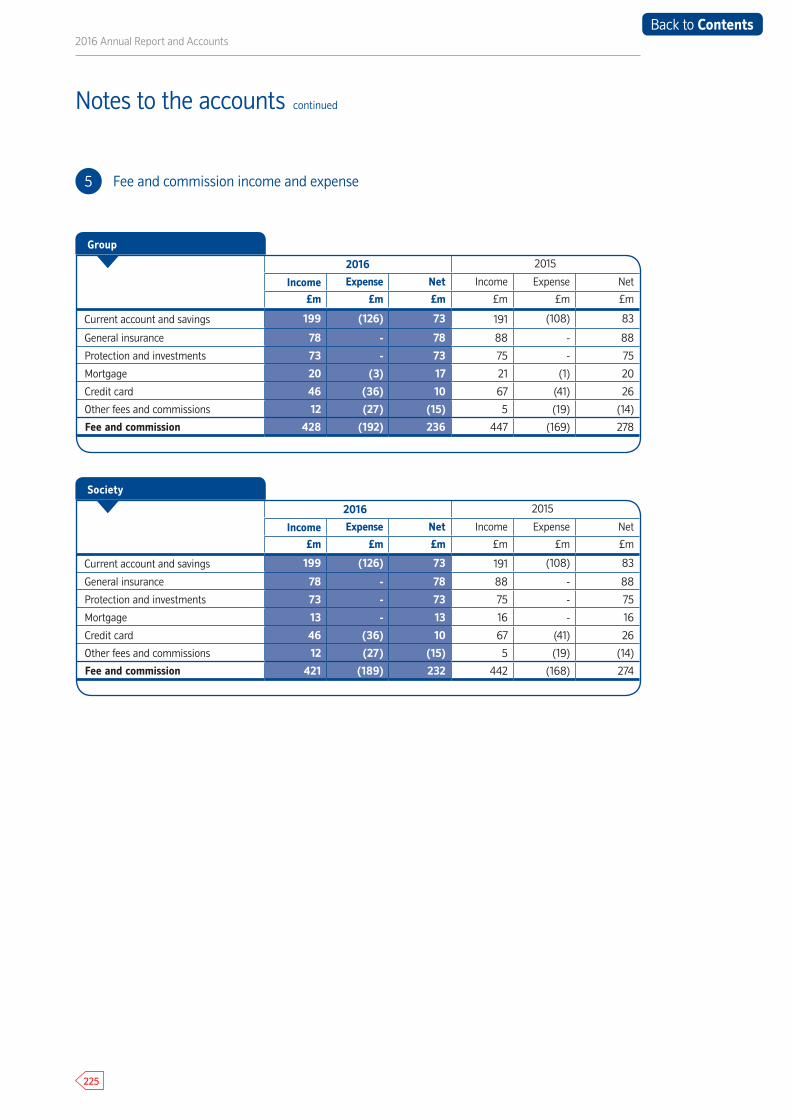
2016 Annual Report and Accounts
225
5 Fee and commission income and expense
2016 2015
Income Expense Net Income Expense Net
£m £m £m £m £m £m
Current account and savings 199 (126) 73 191 (108) 83
General insurance 78 - 78 88 - 88
Protection and investments 73 - 73 75 - 75
Mortgage 20 (3) 17 21 (1) 20
Credit card 46 (36) 10 67 (41) 26
Other fees and commissions 12 (27) (15) 5 (19) (14)
Fee and commission 428 (192) 236 447 (169) 278
Notes to the accounts continued
Group
2016 2015
Income Expense Net Income Expense Net
£m £m £m £m £m £m
Current account and savings 199 (126) 73 191 (108) 83
General insurance 78 - 78 88 - 88
Protection and investments 73 - 73 75 - 75
Mortgage 13 - 13 16 - 16
Credit card 46 (36) 10 67 (41) 26
Other fees and commissions 12 (27) (15) 5 (19) (14)
Fee and commission 421 (189) 232 442 (168) 274
Society
Back to Contents
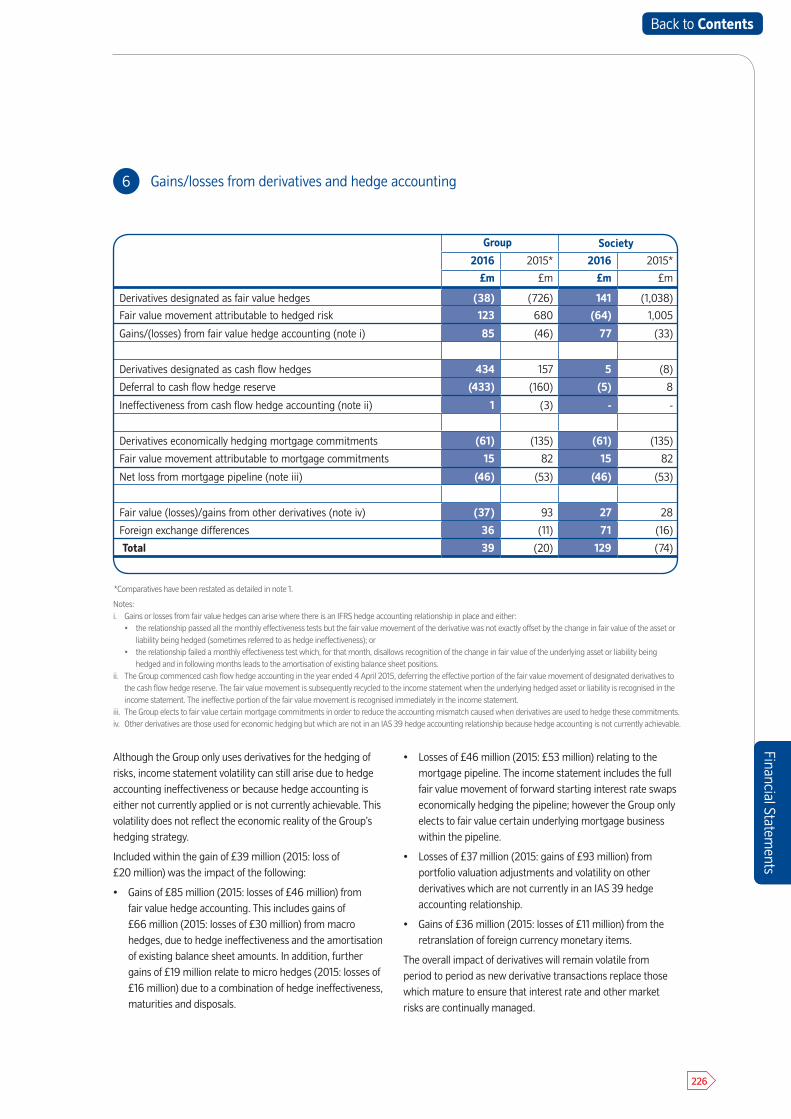
Financial Statements
226
Group Society
2016 2015* 2016 2015*
£m £m £m £m
Derivatives designated as fair value hedges (38) (726) 141 (1,038)
Fair value movement attributable to hedged risk 123 680 (64) 1,005
Gains/(losses) from fair value hedge accounting (note i) 85 (46) 77 (33)
Derivatives designated as cash flow hedges 434 157 5 (8)
Deferral to cash flow hedge reserve (433) (160) (5) 8
Ineffectiveness from cash flow hedge accounting (note ii) 1 (3) - -
Derivatives economically hedging mortgage commitments (61) (135) (61) (135)
Fair value movement attributable to mortgage commitments 15 82 15 82
Net loss from mortgage pipeline (note iii) (46) (53) (46) (53)
82
Fair value (losses)/gains from other derivatives (note iv) (37) 93 27 28
Foreign exchange differences 36 (11) 71 (16)
Total 39 (20) 129 (74)
Although the Group only uses derivatives for the hedging of risks, income statement volatility can still arise due to hedge accounting ineffectiveness or because hedge accounting is either not currently applied or is not currently achievable. This volatility does not reflect the economic reality of the Group’s hedging strategy.
Included within the gain of £39 million (2015: loss of £20 million) was the impact of the following:
• Gains of £85 million (2015: losses of £46 million) from fair value hedge accounting. This includes gains of £66 million (2015: losses of £30 million) from macro hedges, due to hedge ineffectiveness and the amortisation of existing balance sheet amounts. In addition, further gains of £19 million relate to micro hedges (2015: losses of £16 million) due to a combination of hedge ineffectiveness,maturities and disposals.
• Losses of £46 million (2015: £53 million) relating to the mortgage pipeline. The income statement includes the full fair value movement of forward starting interest rate swapseconomically hedging the pipeline; however the Group only elects to fair value certain underlying mortgage business within the pipeline.
• Losses of £37 million (2015: gains of £93 million) from portfolio valuation adjustments and volatility on other derivatives which are not currently in an IAS 39 hedgeaccounting relationship.
• Gains of £36 million (2015: losses of £11 million) from theretranslation of foreign currency monetary items.
The overall impact of derivatives will remain volatile from period to period as new derivative transactions replace those which mature to ensure that interest rate and other market risks are continually managed.
6 Gains/losses from derivatives and hedge accounting
Notes:i. Gains or losses from fair value hedges can arise where there is an IFRS hedge accounting relationship in place and either:
• the relationship passed all the monthly effectiveness tests but the fair value movement of the derivative was not exactly offset by the change in fair value of the asset or liability being hedged (sometimes referred to as hedge ineffectiveness); or
• the relationship failed a monthly effectiveness test which, for that month, disallows recognition of the change in fair value of the underlying asset or liability being hedged and in following months leads to the amortisation of existing balance sheet positions.
ii. The Group commenced cash flow hedge accounting in the year ended 4 April 2015, deferring the effective portion of the fair value movement of designated derivatives to the cash flow hedge reserve. The fair value movement is subsequently recycled to the income statement when the underlying hedged asset or liability is recognised in the income statement. The ineffective portion of the fair value movement is recognised immediately in the income statement.
iii. The Group elects to fair value certain mortgage commitments in order to reduce the accounting mismatch caused when derivatives are used to hedge these commitments.iv. Other derivatives are those used for economic hedging but which are not in an IAS 39 hedge accounting relationship because hedge accounting is not currently achievable.
Financial Statements
*Comparatives have been restated as detailed in note 1.
Back to Contents
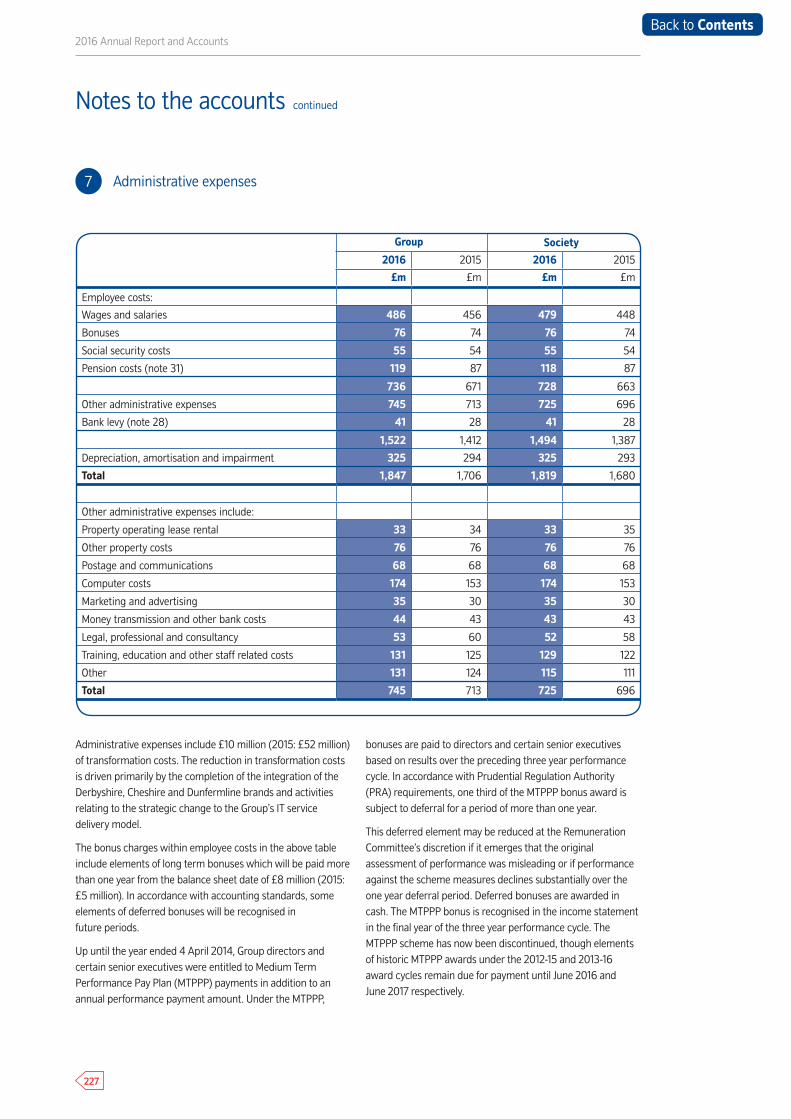
2016 Annual Report and Accounts
227
7 Administrative expenses
Group Society
2016 2015 2016 2015
£m £m £m £m
Employee costs:
Wages and salaries 486 456 479 448
Bonuses 76 74 76 74
Social security costs 55 54 55 54
Pension costs (note 31) 119 87 118 87
736 671 728 663
Other administrative expenses 745 713 725 696
Bank levy (note 28) 41 28 41 28
1,522 1,412 1,494 1,387
Depreciation, amortisation and impairment 325 294 325 293
Total 1,847 1,706 1,819 1,680
Other administrative expenses include:
Property operating lease rental 33 34 33 35
Other property costs 76 76 76 76
Postage and communications 68 68 68 68
Computer costs 174 153 174 153
Marketing and advertising 35 30 35 30
Money transmission and other bank costs 44 43 43 43
Legal, professional and consultancy 53 60 52 58
Training, education and other staff related costs 131 125 129 122
Other 131 124 115 111
Total 745 713 725 696
Notes to the accounts continued
Administrative expenses include £10 million (2015: £52 million) of transformation costs. The reduction in transformation costs is driven primarily by the completion of the integration of the Derbyshire, Cheshire and Dunfermline brands and activities relating to the strategic change to the Group’s IT service delivery model.
The bonus charges within employee costs in the above table include elements of long term bonuses which will be paid more than one year from the balance sheet date of £8 million (2015: £5 million). In accordance with accounting standards, some elements of deferred bonuses will be recognised in future periods.
Up until the year ended 4 April 2014, Group directors and certain senior executives were entitled to Medium Term Performance Pay Plan (MTPPP) payments in addition to an annual performance payment amount. Under the MTPPP,
bonuses are paid to directors and certain senior executives based on results over the preceding three year performance cycle. In accordance with Prudential Regulation Authority (PRA) requirements, one third of the MTPPP bonus award is subject to deferral for a period of more than one year.
This deferred element may be reduced at the Remuneration Committee’s discretion if it emerges that the original assessment of performance was misleading or if performance against the scheme measures declines substantially over the one year deferral period. Deferred bonuses are awarded in cash. The MTPPP bonus is recognised in the income statement in the final year of the three year performance cycle. The MTPPP scheme has now been discontinued, though elements of historic MTPPP awards under the 2012-15 and 2013-16 award cycles remain due for payment until June 2016 and June 2017 respectively.
Back to Contents
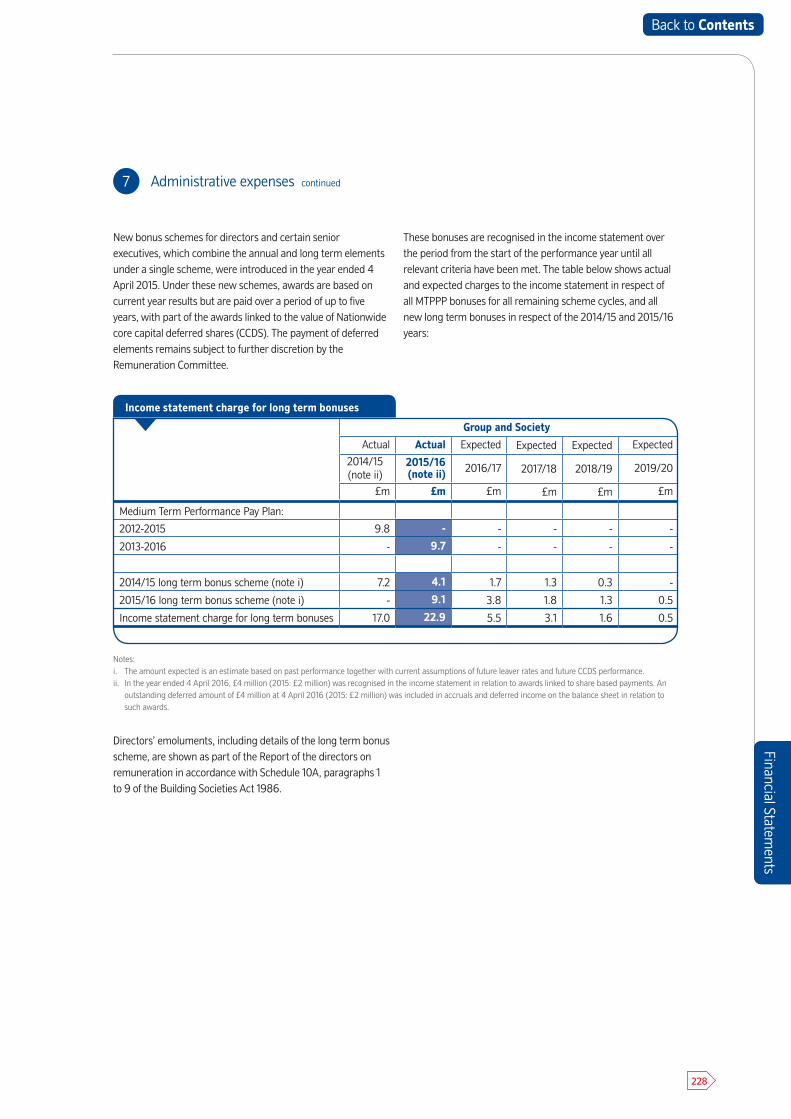
Financial Statements
228
7 Administrative expenses continued
Directors’ emoluments, including details of the long term bonus scheme, are shown as part of the Report of the directors on remuneration in accordance with Schedule 10A, paragraphs 1 to 9 of the Building Societies Act 1986.
New bonus schemes for directors and certain senior executives, which combine the annual and long term elements under a single scheme, were introduced in the year ended 4 April 2015. Under these new schemes, awards are based on current year results but are paid over a period of up to five years, with part of the awards linked to the value of Nationwide core capital deferred shares (CCDS). The payment of deferred elements remains subject to further discretion by the Remuneration Committee.
These bonuses are recognised in the income statement over the period from the start of the performance year until all relevant criteria have been met. The table below shows actual and expected charges to the income statement in respect of all MTPPP bonuses for all remaining scheme cycles, and all new long term bonuses in respect of the 2014/15 and 2015/16 years:
Group and Society
Actual Actual Expected Expected Expected Expected
2014/15(note ii)
2015/16(note ii) 2016/17 2017/18 2018/19 2019/20
£m £m £m £m £m £m
Medium Term Performance Pay Plan:
2012-2015 9.8 - - - - -
2013-2016 - 9.7 - - - -
2014/15 long term bonus scheme (note i) 7.2 4.1 1.7 1.3 0.3 -
2015/16 long term bonus scheme (note i) - 9.1 3.8 1.8 1.3 0.5
Income statement charge for long term bonuses 17.0 22.9 5.5 3.1 1.6 0.5
Notes:i. The amount expected is an estimate based on past performance together with current assumptions of future leaver rates and future CCDS performance.ii. In the year ended 4 April 2016, £4 million (2015: £2 million) was recognised in the income statement in relation to awards linked to share based payments. An
outstanding deferred amount of £4 million at 4 April 2016 (2015: £2 million) was included in accruals and deferred income on the balance sheet in relation to such awards.
Financial Statements
Income statement charge for long term bonuses
Back to Contents
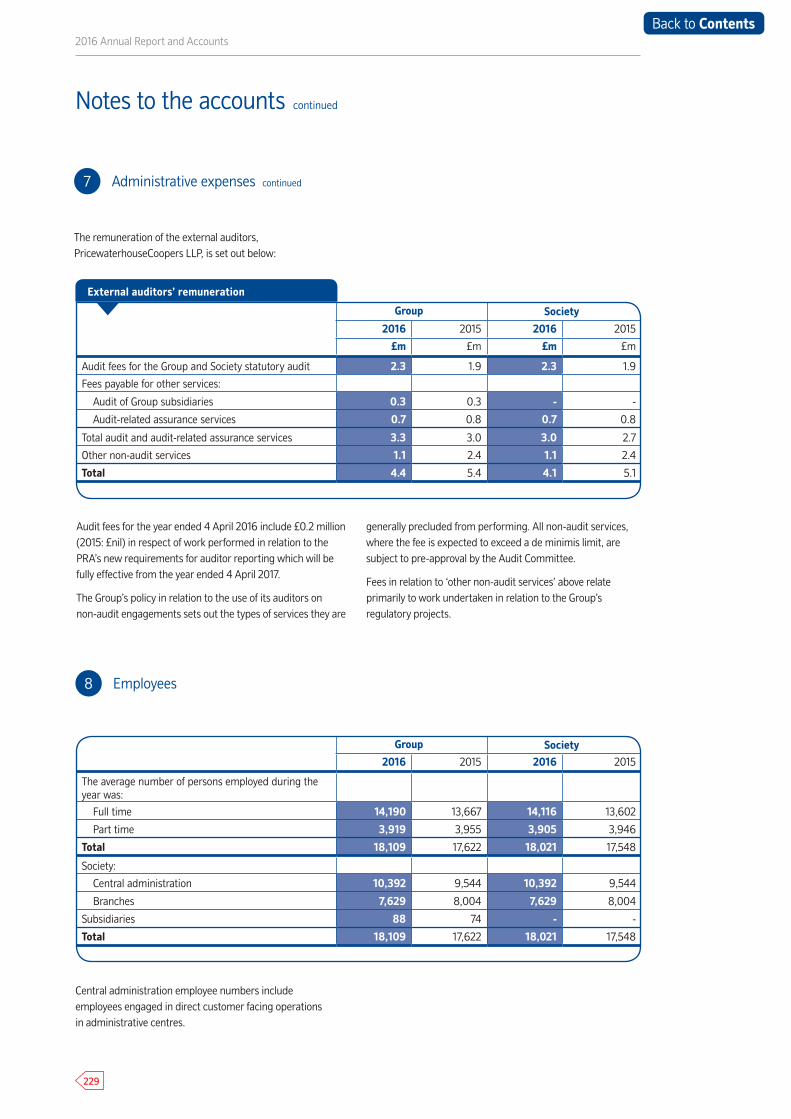
2016 Annual Report and Accounts
229
8 Employees
Group Society2016 2015 2016 2015
The average number of persons employed during the year was:
Full time 14,190 13,667 14,116 13,602
Part time 3,919 3,955 3,905 3,946
Total 18,109 17,622 18,021 17,548
Society:
Central administration 10,392 9,544 10,392 9,544
Branches 7,629 8,004 7,629 8,004
Subsidiaries 88 74 - -
Total 18,109 17,622 18,021 17,548
Notes to the accounts continued
Central administration employee numbers include employees engaged in direct customer facing operations in administrative centres.
Audit fees for the year ended 4 April 2016 include £0.2 million (2015: £nil) in respect of work performed in relation to the PRA’s new requirements for auditor reporting which will be fully effective from the year ended 4 April 2017.
The Group’s policy in relation to the use of its auditors on non-audit engagements sets out the types of services they are
generally precluded from performing. All non-audit services, where the fee is expected to exceed a de minimis limit, are subject to pre-approval by the Audit Committee.
Fees in relation to ‘other non-audit services’ above relate primarily to work undertaken in relation to the Group’s regulatory projects.
7 Administrative expenses continued
The remuneration of the external auditors, PricewaterhouseCoopers LLP, is set out below:
Group Society
2016 2015 2016 2015
£m £m £m £m
Audit fees for the Group and Society statutory audit 2.3 1.9 2.3 1.9
Fees payable for other services:
Audit of Group subsidiaries 0.3 0.3 - -
Audit-related assurance services 0.7 0.8 0.7 0.8
Total audit and audit-related assurance services 3.3 3.0 3.0 2.7
Other non-audit services 1.1 2.4 1.1 2.4
Total 4.4 5.4 4.1 5.1
External auditors’ remuneration
Back to Contents
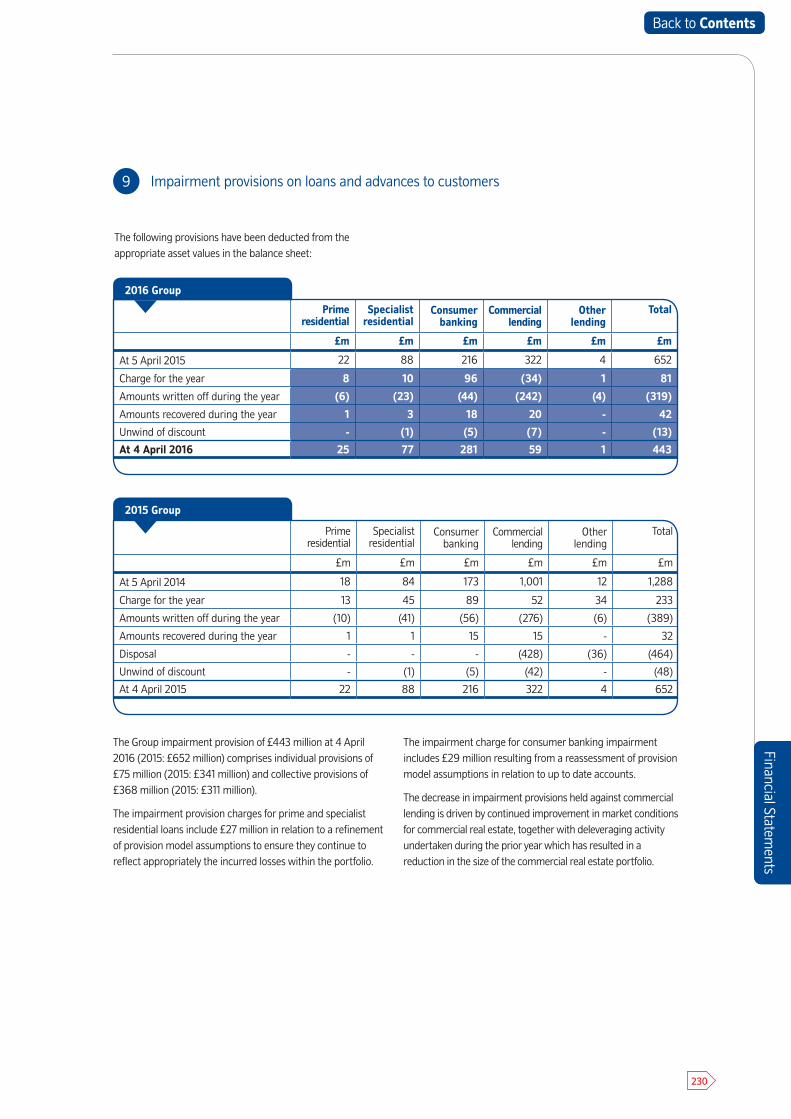
Financial Statements
230
The Group impairment provision of £443 million at 4 April 2016 (2015: £652 million) comprises individual provisions of £75 million (2015: £341 million) and collective provisions of £368 million (2015: £311 million).
The impairment provision charges for prime and specialist residential loans include £27 million in relation to a refinement of provision model assumptions to ensure they continue to reflect appropriately the incurred losses within the portfolio.
The impairment charge for consumer banking impairment includes £29 million resulting from a reassessment of provision model assumptions in relation to up to date accounts.
The decrease in impairment provisions held against commercial lending is driven by continued improvement in market conditions for commercial real estate, together with deleveraging activity undertaken during the prior year which has resulted in a reduction in the size of the commercial real estate portfolio.
The following provisions have been deducted from the appropriate asset values in the balance sheet:
9 Impairment provisions on loans and advances to customers
Financial Statements
Prime residential
Specialist residential
Consumer banking
Commercial lending
Other lending
Total
£m £m £m £m £m £m
At 5 April 2015 22 88 216 322 4 652
Charge for the year 8 10 96 (34) 1 81
Amounts written off during the year (6) (23) (44) (242) (4) (319)
Amounts recovered during the year 1 3 18 20 - 42
Unwind of discount - (1) (5) (7) - (13)
At 4 April 2016 25 77 281 59 1 443
2016 Group
Prime residential
Specialist residential
Consumer banking
Commercial lending
Other lending
Total
£m £m £m £m £m £m
At 5 April 2014 18 84 173 1,001 12 1,288
Charge for the year 13 45 89 52 34 233
Amounts written off during the year (10) (41) (56) (276) (6) (389)
Amounts recovered during the year 1 1 15 15 - 32
Disposal - - - (428) (36) (464)
Unwind of discount - (1) (5) (42) - (48)
At 4 April 2015 22 88 216 322 4 652
2015 Group
Back to Contents
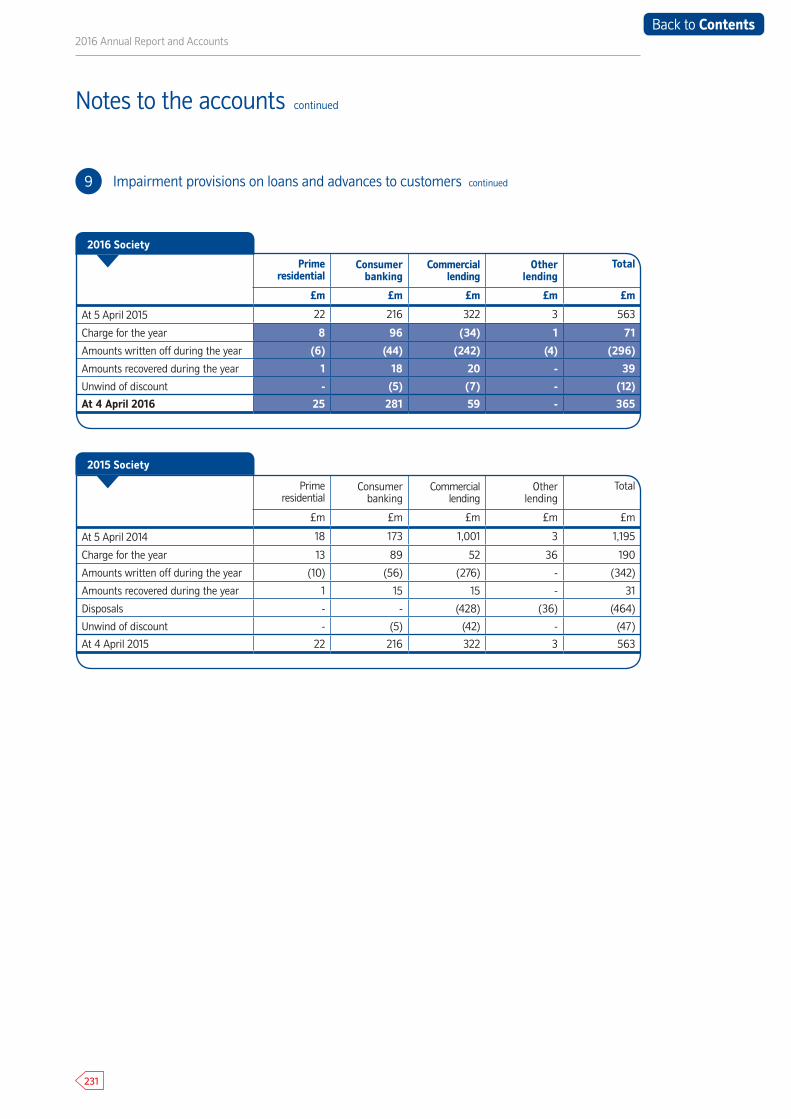
2016 Annual Report and Accounts
231
Notes to the accounts continued
9 Impairment provisions on loans and advances to customers continued
Prime residential
Consumer banking
Commercial lending
Other lending
Total
£m £m £m £m £m
At 5 April 2015 22 216 322 3 563
Charge for the year 8 96 (34) 1 71
Amounts written off during the year (6) (44) (242) (4) (296)
Amounts recovered during the year 1 18 20 - 39
Unwind of discount - (5) (7) - (12)
At 4 April 2016 25 281 59 - 365
2016 Society
Prime residential
Consumer banking
Commercial lending
Other lending
Total
£m £m £m £m £m
At 5 April 2014 18 173 1,001 3 1,195
Charge for the year 13 89 52 36 190
Amounts written off during the year (10) (56) (276) - (342)
Amounts recovered during the year 1 15 15 - 31
Disposals - - (428) (36) (464)
Unwind of discount - (5) (42) - (47)
At 4 April 2015 22 216 322 3 563
2015 Society
Back to Contents
Financial Statements
232
The Society impairment provision of £365 million at 4 April 2016 (2015: £563 million) comprises individual provisions of £58 million (2015: £320 million) and collective provisions of £307 million (2015: £243 million).
The Society’s impairment loss on loans and advances in the income statement of £55 million (2015: £159 million) includes a £16 million release of a provision (2015: £31 million) relating
to the Society’s loan to a subsidiary undertaking. The provision release reflects the subsidiary’s repayment of intra-Group loan amounts as a result of disposals and redemptions of amounts outstanding on corporate loans held within the subsidiary. The Group figures above include the impairment of the underlying corporate loans within other lending.
9 Impairment provisions on loans and advances to customers continued
Critical accounting estimates and judgements
Impairment provisions on loans and advances
Impairment is measured as the difference between an asset’s carrying amount and the present value of management’s estimate of future cash flows.
Key assumptions included in the measurement of impairment include the probability of any account going into default, the probability of defaulted accounts progressing to possession and the eventual loss incurred in the event of forced sale or write off. These assumptions are based on observed historical data and updated as management considers appropriate to reflect current conditions and the Group’s strategy for the book. The accuracy of the impairment provision will therefore be affected by unexpected changes in these assumptions.
To the extent that actual cash flows in relation to the Group’s retail loans and advances differ from those estimated by 10%, the impairment provision would change by an estimated £41 million.
For residential mortgages the estimate of future house price index (HPI) movements is also a key assumption
in estimating the eventual loss. The Group does not take account of projected future HPI increases in establishing provisions. If future HPI increases do materialise then this will reduce the amount of actual loss incurred. If provisions were based on an assumption that future HPI would decrease by 10%, the provision at the balance sheet date would increase by an estimated £9 million.
In calculating the provisions for commercial loans, estimates of discounted cash flows are made on the basis of the planned strategy for each loan. These estimates include assumptions for underlying property values and future expected cash flows for rental income and any maintenance, redevelopment or refurbishment expenditure on the properties. To the extent that actual cash flows differ from those estimated by 10% on impaired loans, the impairment provision would change by an estimated £13 million.
Financial Statements
Back to Contents

2016 Annual Report and Accounts
233
Notes to the accounts continued
10 Taxation
The actual tax charge differs from the theoretical amount that would arise using the standard rate of corporation tax in the UK as follows:
The Finance (No. 2) Act 2015 introduced legislation to impose a surcharge of 8% on the profits of banking companies after 1 January 2016. As a result, a banking surcharge of £22 million is included in the UK corporation tax charge shown above.
Group Society
2016 2015 2016 2015
£m £m £m £m
Current tax:
UK corporation tax 330 215 236 158
Corporation tax – adjustment in respect of prior years (8) (22) (7) (21)
Total current tax 332 193 229 137
Deferred tax:
Current year (credit)/charge (35) 13 (12) 17
Adjustment in respect of prior years 5 6 3 6
Effect of corporation tax rate change - (7) - (6)
Effect of banking surcharge on deferred tax balances 2 - 8 -
Total deferred taxation (28) 12 (1) 17
Tax charge 294 205 228 154
Tax charge in the income statement
Group Society
2016 2015 2016 2015
£m £m £m £m
Profit before tax 1,279 1,044 919 740
Tax calculated at a tax rate of 20% (2015: 21%) 256 219 184 155
Adjustments in respect of prior years (3) (16) (4) (15)
Banking surcharge 22 - 22 -
Expenses not deductible for tax purposes/(income not taxable):
Depreciation on non-qualifying assets 1 2 1 2
Non-taxable dividends received - - (2) (2)
Bank levy 8 6 8 6
Other 8 1 11 14
Effect of corporation tax rate change - (7) - (6)
Effect of banking surcharge on deferred tax balances 2 - 8 -
Tax charge 294 205 228 154
Reconciliation of tax charge
Back to Contents
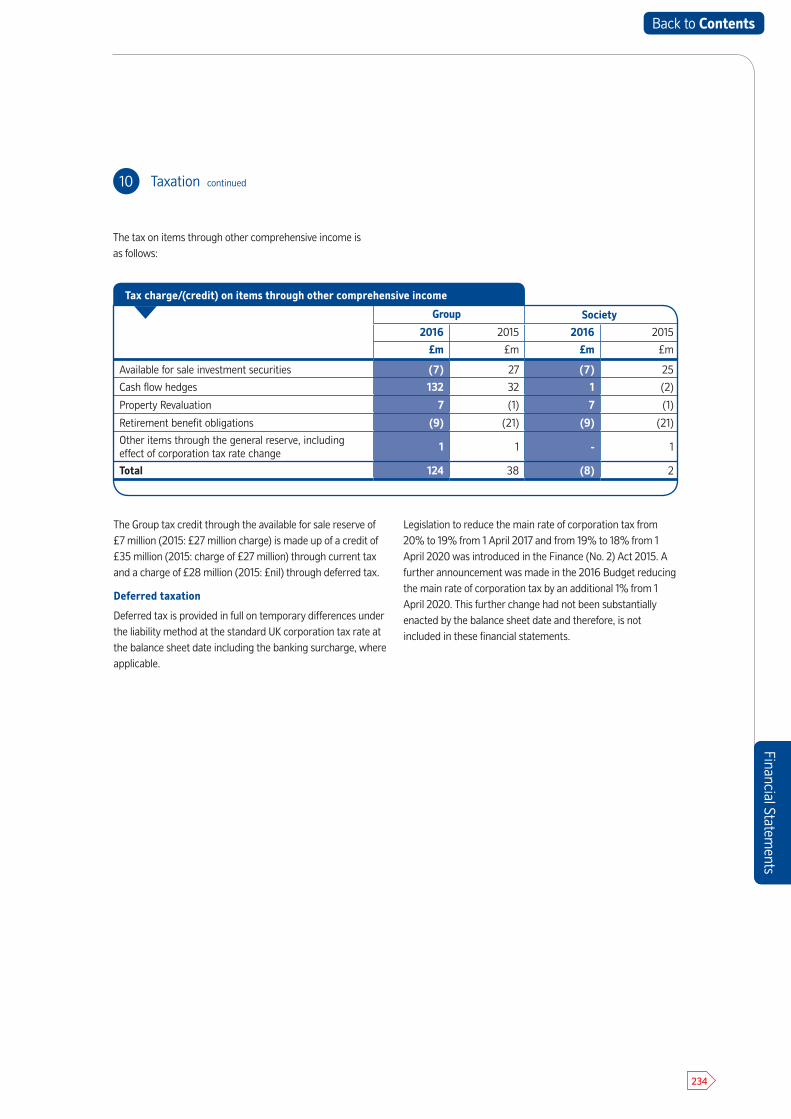
Financial Statements
234
Financial Statements
10 Taxation continued
Group Society
2016 2015 2016 2015
£m £m £m £m
Available for sale investment securities (7) 27 (7) 25
Cash flow hedges 132 32 1 (2)
Property Revaluation 7 (1) 7 (1)
Retirement benefit obligations (9) (21) (9) (21)
Other items through the general reserve, including effect of corporation tax rate change
1 1 - 1
Total 124 38 (8) 2
Tax charge/(credit) on items through other comprehensive income
The tax on items through other comprehensive income is as follows:
The Group tax credit through the available for sale reserve of £7 million (2015: £27 million charge) is made up of a credit of £35 million (2015: charge of £27 million) through current tax and a charge of £28 million (2015: £nil) through deferred tax.
Deferred taxation
Deferred tax is provided in full on temporary differences under the liability method at the standard UK corporation tax rate at the balance sheet date including the banking surcharge, where applicable.
Legislation to reduce the main rate of corporation tax from 20% to 19% from 1 April 2017 and from 19% to 18% from 1 April 2020 was introduced in the Finance (No. 2) Act 2015. A further announcement was made in the 2016 Budget reducing the main rate of corporation tax by an additional 1% from 1 April 2020. This further change had not been substantially enacted by the balance sheet date and therefore, is not included in these financial statements.
Back to Contents

2016 Annual Report and Accounts
235
Notes to the accounts continued
10 Taxation continued
The movements on the deferred tax account are as follows:
Group Society
2016 2015 2016 2015
£m £m £m £m
At 5 April (15) 8 15 8
Income statement credit/(charge) 30 (19) 9 (23)Income statement effect of corporation tax rate change - 7 - 6
Income statement effect of bank surcharge (2) - (8) -
Taxation on items through the income statement 28 (12) 1 (17)
Available for sale investment securities (20) - (20) -Cash flow hedges (86) (34) (1) 2
Property revaluation (1) 1 (1) 1
Retirement benefit obligations (14) 28 (14) 28
Effect of corporation tax rate change in other comprehensive income - (6) - (7)
Effect of banking surcharge in other comprehensive income (43) - 4 -
Taxation on items through other comprehensive income (164) (11) (32) 24
At 4 April (151) (15) (16) 15
Movements in deferred taxation
Deferred tax assets and liabilities are attributable to the following items:
Group Society
2016 2015 2016 2015
£m £m £m £m
Deferred tax assetsAccelerated capital allowances (45) (45) (45) (45)Property revaluation 1 1 - -
Cash flow hedges 1 2 1 2
Retirement benefit obligations 58 56 58 56
Provisions for loan impairment 3 5 2 2
Other provisions 17 19 11 11
35 38 27 26Deferred tax liabilities
Property revaluation (14) (10) (14) (10)Cash flow hedges (166) (34) - -
Other provisions (6) (9) (29) (1)
(186) (53) (43) (11)
Net deferred tax (liability)/asset (151) (15) (16) 15
Deferred tax assets and liabilities
The majority of deferred tax assets are anticipated to be recoverable after one year. The Group considers that there will be sufficient future trading profits in excess of profits arising
from the reversal of existing taxable temporary differences to utilise the deferred tax assets.
Back to Contents
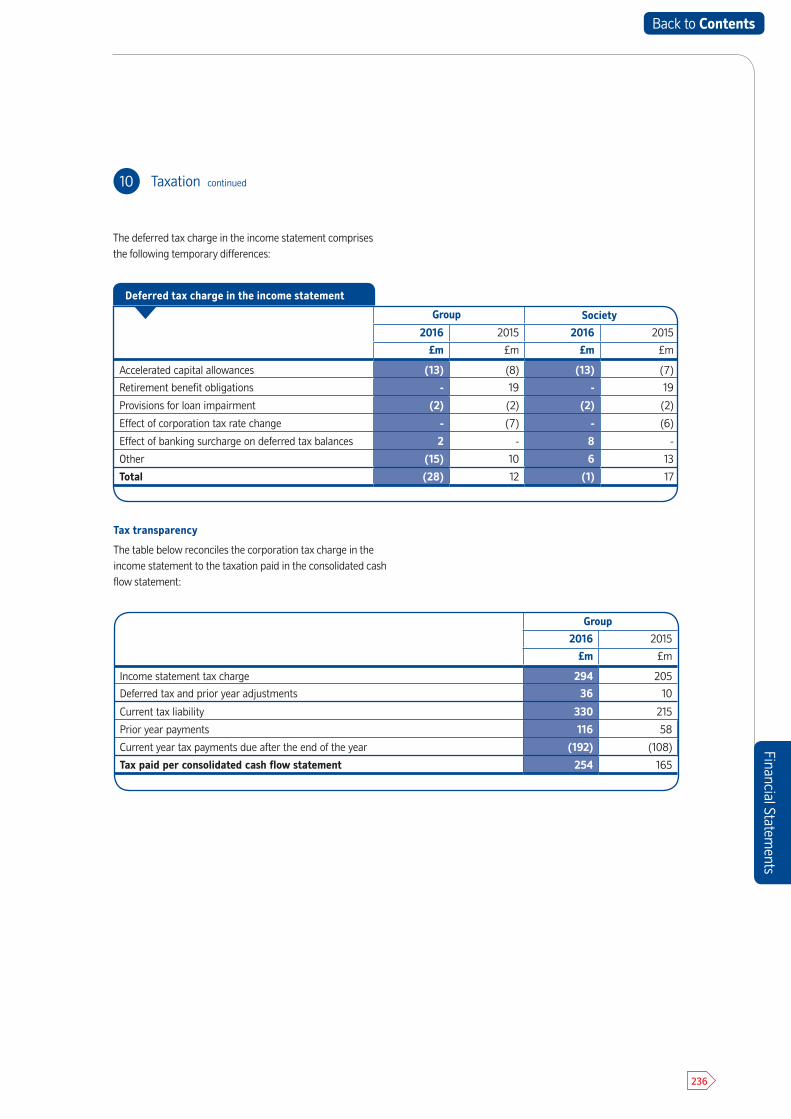
Financial Statements
236
The deferred tax charge in the income statement comprises the following temporary differences:
10 Taxation continued
Group Society
2016 2015 2016 2015
£m £m £m £m
Accelerated capital allowances (13) (8) (13) (7)
Retirement benefit obligations - 19 - 19
Provisions for loan impairment (2) (2) (2) (2)
Effect of corporation tax rate change - (7) - (6)
Effect of banking surcharge on deferred tax balances 2 - 8 -
Other (15) 10 6 13
Total (28) 12 (1) 17
Deferred tax charge in the income statement
Group
2016 2015
£m £m
Income statement tax charge 294 205
Deferred tax and prior year adjustments 36 10
Current tax liability 330 215
Prior year payments 116 58
Current year tax payments due after the end of the year (192) (108)
Tax paid per consolidated cash flow statement 254 165
Tax transparency
The table below reconciles the corporation tax charge in the income statement to the taxation paid in the consolidated cash flow statement:
Back to Contents
2016 Annual Report and Accounts
237
Notes to the accounts continued
11 Operating segments
For management reporting purposes, the Group is organised into the following business streams:
• Retail• Commercial• Head office functions
These business streams reflect how management assesses performance and makes decisions on allocating resources to the business on the basis of product and customers. Revenues from external and internal customers are allocated to the appropriate business segment.
Retail
Retail functions include prime residential lending, specialist residential lending, consumer banking, retail funding (savings products), commercial deposits which are managed by the retail business, insurance and investments. The distribution channels supporting these products are also included in this segment.
Commercial
This segment comprises the commercial lending business, including commercial real estate lending, lending to housing associations and Project Finance lending.
Head office functions
Head office functions include treasury operational and income generation activities, head office and central support functions, commercial deposits received and managed by the Treasury Division and the result arising from the funds transfer pricing methodology relating to the funding of other segments.
Head office and central support functions include executive management, corporate secretariat, legal services, human resources, strategy and planning, finance, risk management, compliance, capital management, corporate affairs, property services and internal audit.
Back to Contents
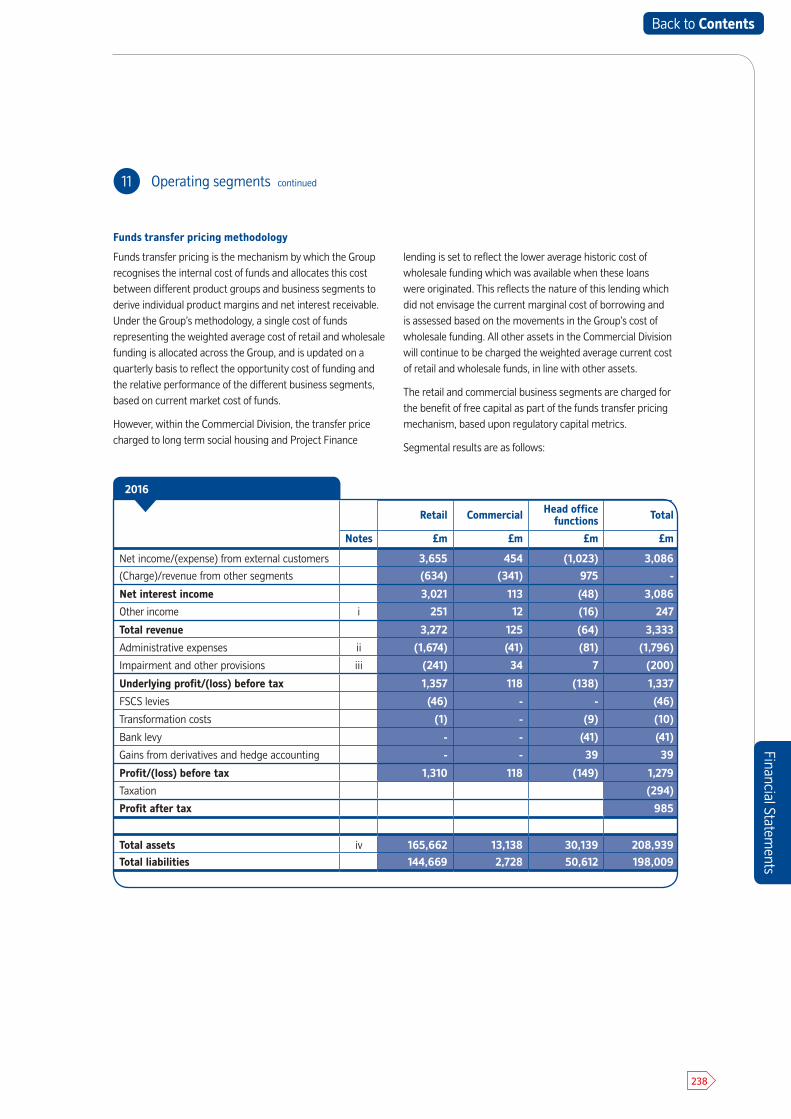
Financial Statements
238
Funds transfer pricing methodology
Funds transfer pricing is the mechanism by which the Group recognises the internal cost of funds and allocates this cost between different product groups and business segments to derive individual product margins and net interest receivable. Under the Group’s methodology, a single cost of funds representing the weighted average cost of retail and wholesale funding is allocated across the Group, and is updated on a quarterly basis to reflect the opportunity cost of funding and the relative performance of the different business segments, based on current market cost of funds.
However, within the Commercial Division, the transfer price charged to long term social housing and Project Finance
lending is set to reflect the lower average historic cost of wholesale funding which was available when these loans were originated. This reflects the nature of this lending which did not envisage the current marginal cost of borrowing and is assessed based on the movements in the Group’s cost of wholesale funding. All other assets in the Commercial Division will continue to be charged the weighted average current cost of retail and wholesale funds, in line with other assets.
The retail and commercial business segments are charged for the benefit of free capital as part of the funds transfer pricing mechanism, based upon regulatory capital metrics.
Segmental results are as follows:
11 Operating segments continued
Retail Commercial Head office functions Total
Notes £m £m £m £m
Net income/(expense) from external customers 3,655 454 (1,023) 3,086
(Charge)/revenue from other segments (634) (341) 975 -
Net interest income 3,021 113 (48) 3,086
Other income i 251 12 (16) 247
Total revenue 3,272 125 (64) 3,333
Administrative expenses ii (1,674) (41) (81) (1,796)
Impairment and other provisions iii (241) 34 7 (200)
Underlying profit/(loss) before tax 1,357 118 (138) 1,337
FSCS levies (46) - - (46)
Transformation costs (1) - (9) (10)
Bank levy - - (41) (41)
Gains from derivatives and hedge accounting - - 39 39
Profit/(loss) before tax 1,310 118 (149) 1,279
Taxation (294)
Profit after tax 985
Total assets iv 165,662 13,138 30,139 208,939Total liabilities 144,669 2,728 50,612 198,009
2016
Back to Contents
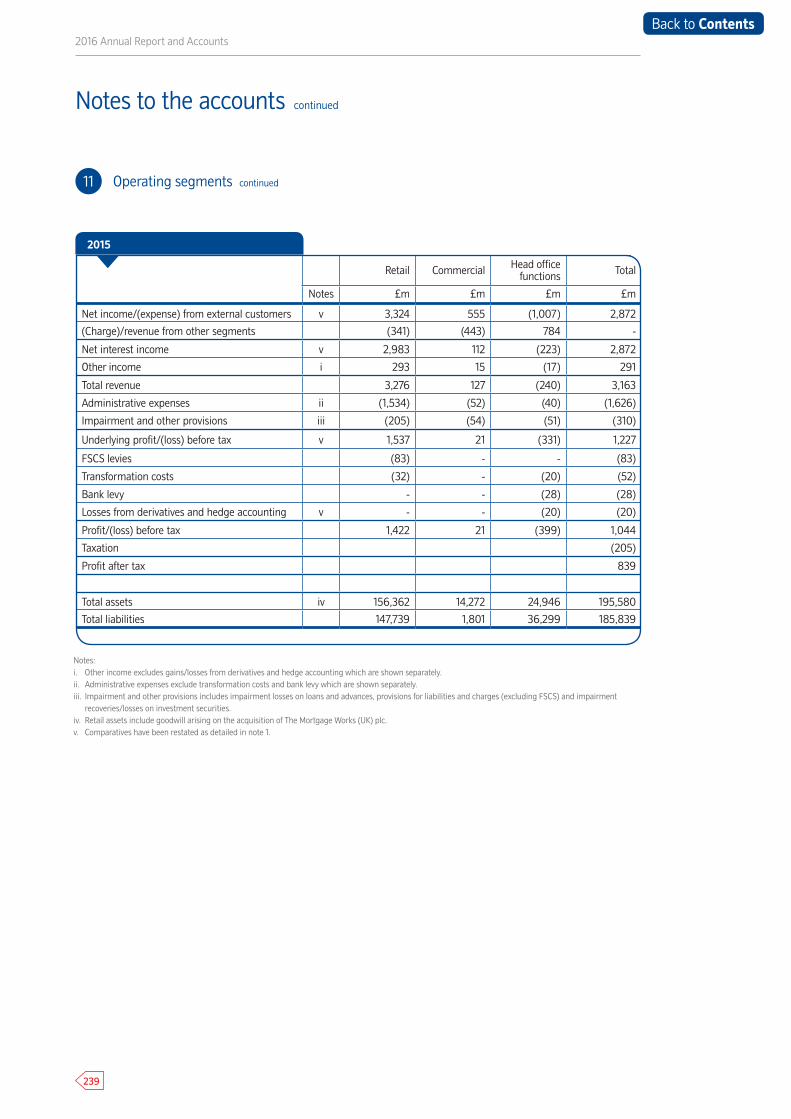
2016 Annual Report and Accounts
239
Notes to the accounts continued
Notes:i. Other income excludes gains/losses from derivatives and hedge accounting which are shown separately.ii. Administrative expenses exclude transformation costs and bank levy which are shown separately.iii. Impairment and other provisions includes impairment losses on loans and advances, provisions for liabilities and charges (excluding FSCS) and impairment
recoveries/losses on investment securities.iv. Retail assets include goodwill arising on the acquisition of The Mortgage Works (UK) plc.v. Comparatives have been restated as detailed in note 1.
11 Operating segments continued
Retail Commercial Head office functions Total
Notes £m £m £m £m
Net income/(expense) from external customers v 3,324 555 (1,007) 2,872
(Charge)/revenue from other segments (341) (443) 784 -
Net interest income v 2,983 112 (223) 2,872
Other income i 293 15 (17) 291
Total revenue 3,276 127 (240) 3,163
Administrative expenses ii (1,534) (52) (40) (1,626)
Impairment and other provisions iii (205) (54) (51) (310)
Underlying profit/(loss) before tax v 1,537 21 (331) 1,227
FSCS levies (83) - - (83)
Transformation costs (32) - (20) (52)
Bank levy - - (28) (28)
Losses from derivatives and hedge accounting v - - (20) (20)
Profit/(loss) before tax 1,422 21 (399) 1,044
Taxation (205)
Profit after tax 839
Total assets iv 156,362 14,272 24,946 195,580
Total liabilities 147,739 1,801 36,299 185,839
2015
Back to Contents
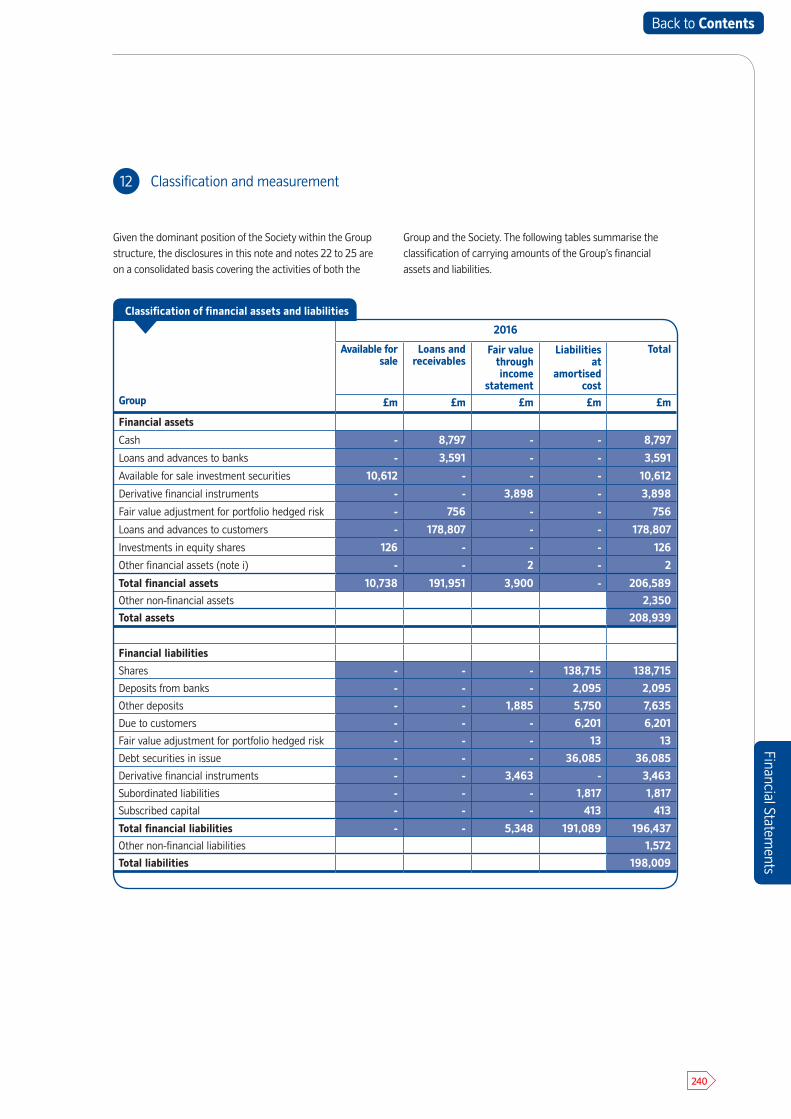
Financial Statements
240
Financial Statements
2016
Group
Available for sale
Loans and receivables
Fair value through income
statement
Liabilities at
amortised cost
Total
£m £m £m £m £m
Financial assets
Cash - 8,797 - - 8,797
Loans and advances to banks - 3,591 - - 3,591
Available for sale investment securities 10,612 - - - 10,612
Derivative financial instruments - - 3,898 - 3,898
Fair value adjustment for portfolio hedged risk - 756 - - 756
Loans and advances to customers - 178,807 - - 178,807
Investments in equity shares 126 - - - 126
Other financial assets (note i) - - 2 - 2
Total financial assets 10,738 191,951 3,900 - 206,589
Other non-financial assets 2,350
Total assets 208,939
Financial liabilities
Shares - - - 138,715 138,715
Deposits from banks - - - 2,095 2,095
Other deposits - - 1,885 5,750 7,635
Due to customers - - - 6,201 6,201
Fair value adjustment for portfolio hedged risk - - - 13 13
Debt securities in issue - - - 36,085 36,085
Derivative financial instruments - - 3,463 - 3,463
Subordinated liabilities - - - 1,817 1,817
Subscribed capital - - - 413 413
Total financial liabilities - - 5,348 191,089 196,437
Other non-financial liabilities 1,572
Total liabilities 198,009
Classification of financial assets and liabilities
12 Classification and measurement
Given the dominant position of the Society within the Group structure, the disclosures in this note and notes 22 to 25 are on a consolidated basis covering the activities of both the
Group and the Society. The following tables summarise the classification of carrying amounts of the Group’s financial assets and liabilities.
Back to Contents
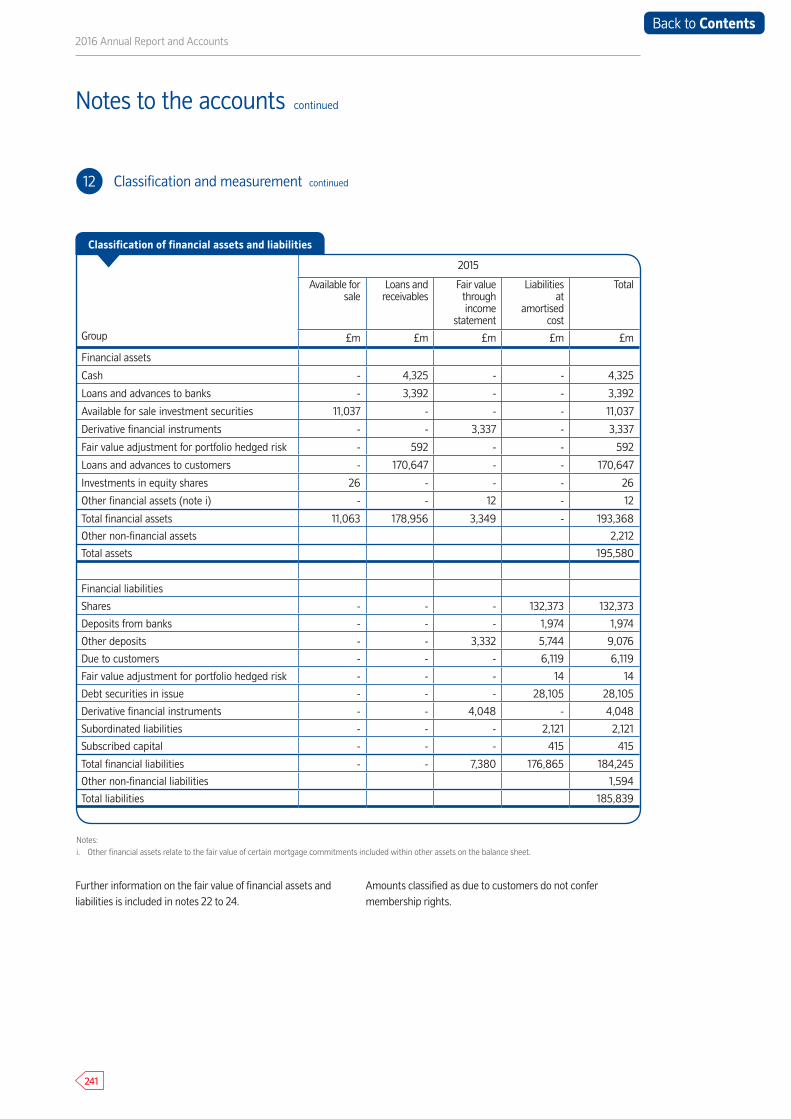
2016 Annual Report and Accounts
241
2015
Group
Available for sale
Loans and receivables
Fair value through income
statement
Liabilities at
amortised cost
Total
£m £m £m £m £m
Financial assets
Cash - 4,325 - - 4,325
Loans and advances to banks - 3,392 - - 3,392
Available for sale investment securities 11,037 - - - 11,037
Derivative financial instruments - - 3,337 - 3,337
Fair value adjustment for portfolio hedged risk - 592 - - 592
Loans and advances to customers - 170,647 - - 170,647
Investments in equity shares 26 - - - 26
Other financial assets (note i) - - 12 - 12
Total financial assets 11,063 178,956 3,349 - 193,368
Other non-financial assets 2,212
Total assets 195,580
Financial liabilities
Shares - - - 132,373 132,373
Deposits from banks - - - 1,974 1,974
Other deposits - - 3,332 5,744 9,076
Due to customers - - - 6,119 6,119
Fair value adjustment for portfolio hedged risk - - - 14 14
Debt securities in issue - - - 28,105 28,105
Derivative financial instruments - - 4,048 - 4,048
Subordinated liabilities - - - 2,121 2,121
Subscribed capital - - - 415 415
Total financial liabilities - - 7,380 176,865 184,245
Other non-financial liabilities 1,594
Total liabilities 185,839
Classification of financial assets and liabilities
12 Classification and measurement continued
Further information on the fair value of financial assets and liabilities is included in notes 22 to 24.
Amounts classified as due to customers do not confer membership rights.
Notes to the accounts continued
Notes:i. Other financial assets relate to the fair value of certain mortgage commitments included within other assets on the balance sheet.
Back to Contents

Financial Statements
242
13 Available for sale investment securities
At 4 April 2016 no investment securities have been pledged as collateral under UK payment schemes (2015: £267 million).
Investment securities include items with a fair value of £128 million (2015: £nil) which have been sold under sale and repurchase agreements. These assets have not been derecognised, as the Group has retained substantially all the risks and rewards of ownership. The Group is unable to use, sell or pledge the transferred assets for the duration of the transaction and remains exposed to any associated interest rate risk or credit risk of the assets. The counterparty is permitted to sell or re-pledge the collateral in the absence of default by the owner. The cash received and accrued interest in relation to the sale and repurchase agreements of £127 million (2015: £nil) are included within deposits from banks (note 17).
At 4 April 2016 the Group holds collateral under reverse sale and repurchase agreements and reverse total return swaps with a fair value of £577 million (2015: £211 million). In line with accounting standards, the collateral is not recognised in
the accounts and therefore is not reflected in the table above. The Group is permitted to sell or re-pledge the collateral in the absence of default by the owner. No amounts have been sold or re-pledged at 4 April 2016 (2015: £nil). The amount of cash outflow and accrued interest of £537 million (2015: £149 million) are included in loans and advances to banks.
£8 million of recoveries on impaired investment securities were recognised in the year ended 4 April 2016 (2015: £18 million losses) in connection with asset disposals.
Further information on available for sale investment securities and treasury credit risk is included in the ‘Treasury assets’ section of the Business and Risk Report.
Group and Society
2016 2015
£m £m
Government and supranational investment securities 6,843 6,726
Other debt investment securities 3,769 4,311
Total 10,612 11,037
Back to Contents
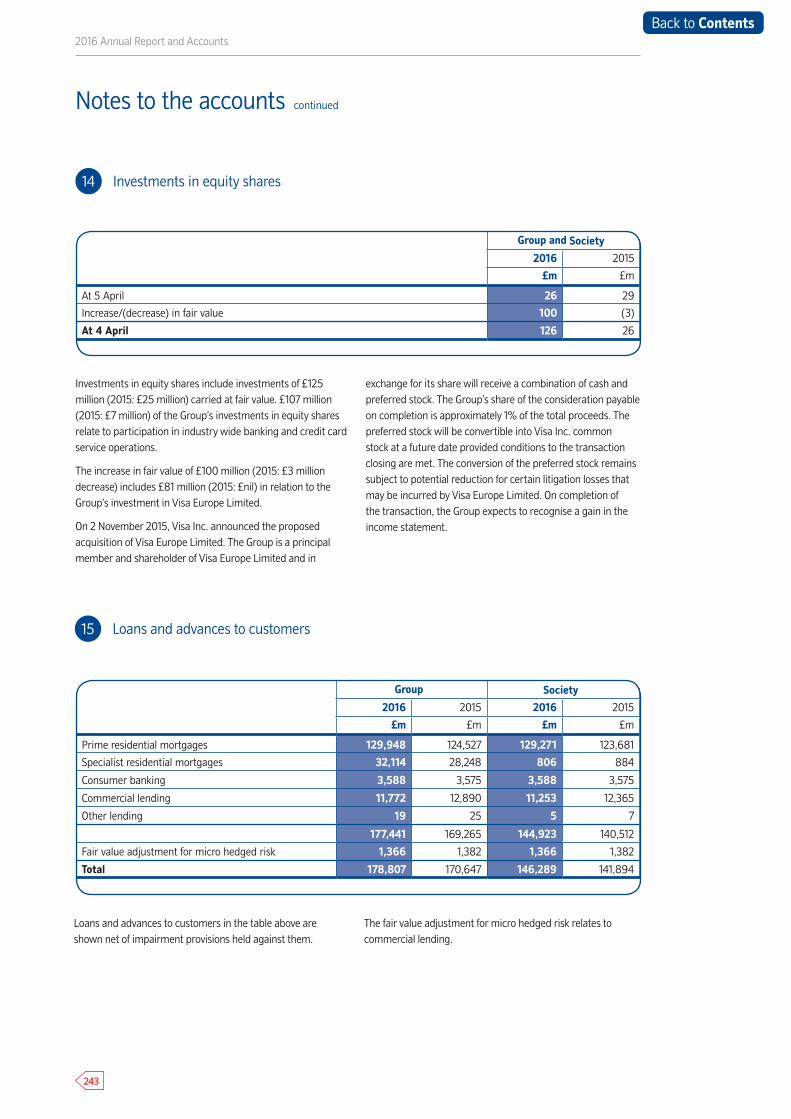
2016 Annual Report and Accounts
243
Notes to the accounts continued
Investments in equity shares include investments of £125 million (2015: £25 million) carried at fair value. £107 million (2015: £7 million) of the Group’s investments in equity shares relate to participation in industry wide banking and credit card service operations.
The increase in fair value of £100 million (2015: £3 million decrease) includes £81 million (2015: £nil) in relation to the Group’s investment in Visa Europe Limited.
On 2 November 2015, Visa Inc. announced the proposed acquisition of Visa Europe Limited. The Group is a principal member and shareholder of Visa Europe Limited and in
exchange for its share will receive a combination of cash and preferred stock. The Group’s share of the consideration payable on completion is approximately 1% of the total proceeds. The preferred stock will be convertible into Visa Inc. common stock at a future date provided conditions to the transaction closing are met. The conversion of the preferred stock remains subject to potential reduction for certain litigation losses that may be incurred by Visa Europe Limited. On completion of the transaction, the Group expects to recognise a gain in the income statement.
14 Investments in equity shares
Group and Society
2016 2015
£m £m
At 5 April 26 29
Increase/(decrease) in fair value 100 (3)
At 4 April 126 26
15 Loans and advances to customers
Group Society
2016 2015 2016 2015
£m £m £m £m
Prime residential mortgages 129,948 124,527 129,271 123,681
Specialist residential mortgages 32,114 28,248 806 884
Consumer banking 3,588 3,575 3,588 3,575
Commercial lending 11,772 12,890 11,253 12,365
Other lending 19 25 5 7
177,441 169,265 144,923 140,512
Fair value adjustment for micro hedged risk 1,366 1,382 1,366 1,382
Total 178,807 170,647 146,289 141,894
Loans and advances to customers in the table above are shown net of impairment provisions held against them.
The fair value adjustment for micro hedged risk relates to commercial lending.
Back to Contents
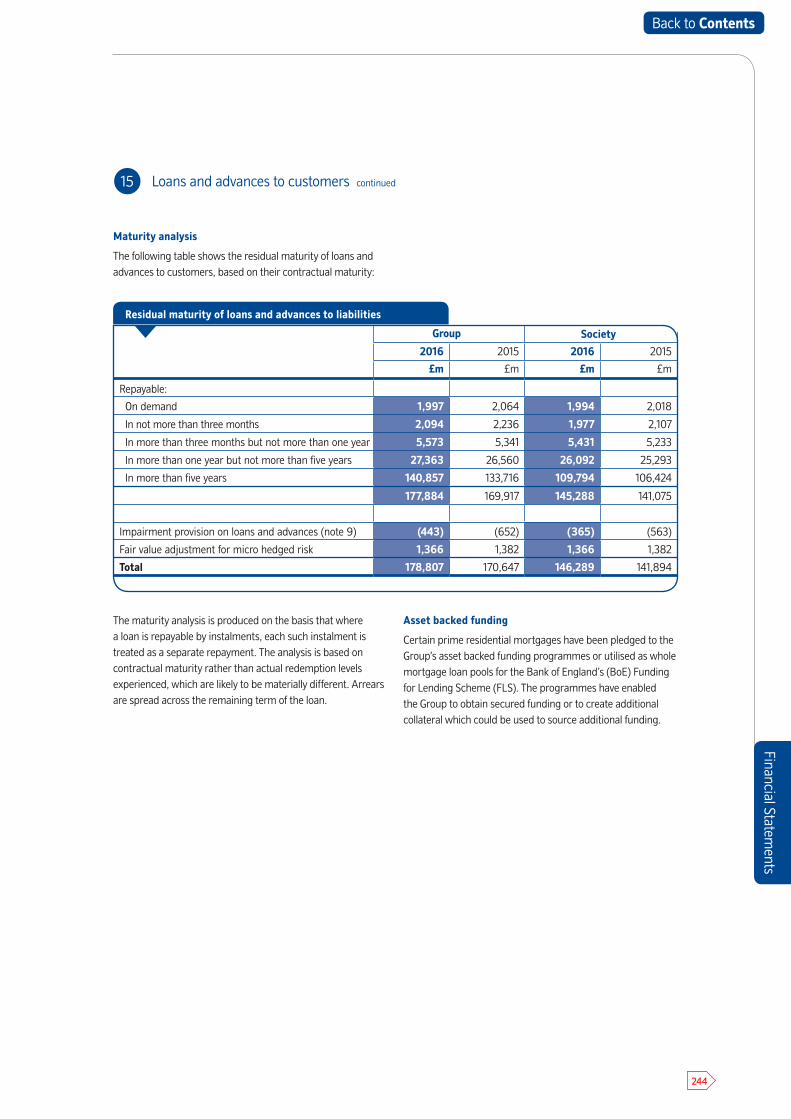
Financial Statements
244
15 Loans and advances to customers continued
Group Society
2016 2015 2016 2015
£m £m £m £m
Repayable:
On demand 1,997 2,064 1,994 2,018
In not more than three months 2,094 2,236 1,977 2,107
In more than three months but not more than one year 5,573 5,341 5,431 5,233
In more than one year but not more than five years 27,363 26,560 26,092 25,293
In more than five years 140,857 133,716 109,794 106,424
177,884 169,917 145,288 141,075
Impairment provision on loans and advances (note 9) (443) (652) (365) (563)
Fair value adjustment for micro hedged risk 1,366 1,382 1,366 1,382
Total 178,807 170,647 146,289 141,894
Residual maturity of loans and advances to liabilities
Maturity analysis
The following table shows the residual maturity of loans and advances to customers, based on their contractual maturity:
The maturity analysis is produced on the basis that where a loan is repayable by instalments, each such instalment is treated as a separate repayment. The analysis is based on contractual maturity rather than actual redemption levels experienced, which are likely to be materially different. Arrears are spread across the remaining term of the loan.
Asset backed funding
Certain prime residential mortgages have been pledged to the Group’s asset backed funding programmes or utilised as whole mortgage loan pools for the Bank of England’s (BoE) Funding for Lending Scheme (FLS). The programmes have enabled the Group to obtain secured funding or to create additional collateral which could be used to source additional funding.
Back to Contents
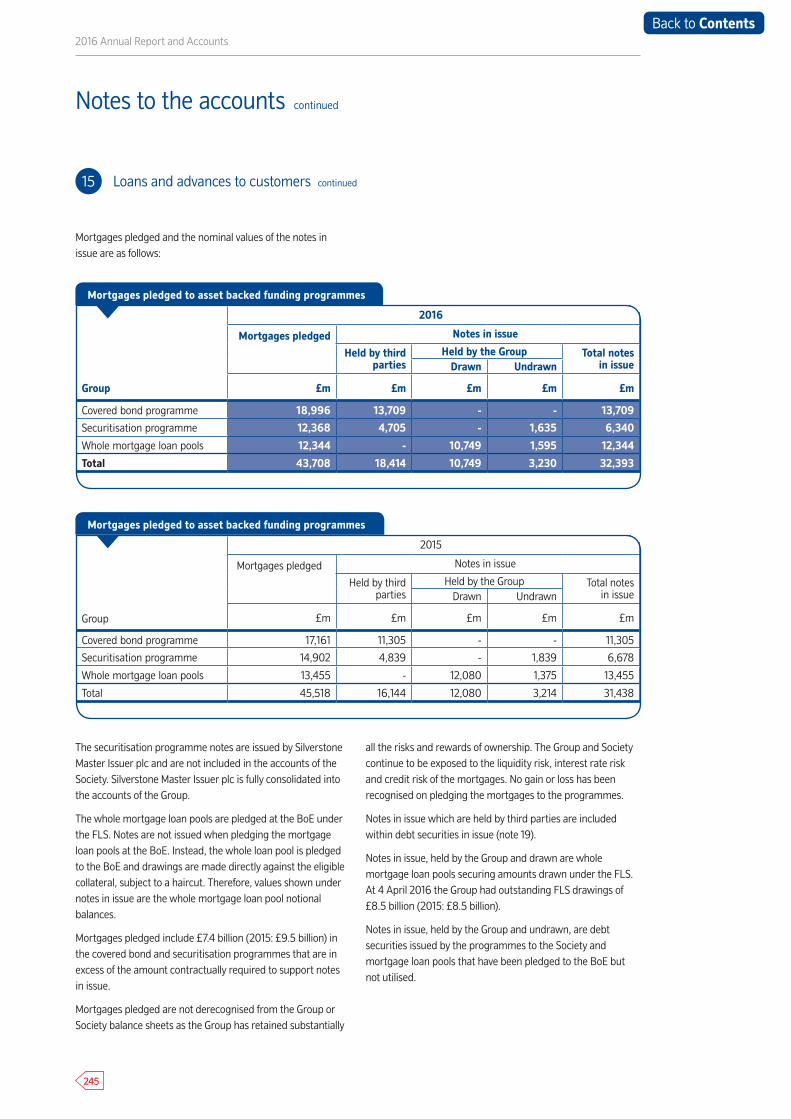
2016 Annual Report and Accounts
245
Notes to the accounts continued
15 Loans and advances to customers continued
2016
Mortgages pledged Notes in issue
Group
Held by third parties
Held by the Group Total notes in issueDrawn Undrawn
£m £m £m £m £m
Covered bond programme 18,996 13,709 - - 13,709
Securitisation programme 12,368 4,705 - 1,635 6,340
Whole mortgage loan pools 12,344 - 10,749 1,595 12,344
Total 43,708 18,414 10,749 3,230 32,393
Mortgages pledged to asset backed funding programmes
Group
2015
Mortgages pledged Notes in issue
Held by third parties
Held by the Group Total notes in issueDrawn Undrawn
£m £m £m £m £m
Covered bond programme 17,161 11,305 - - 11,305
Securitisation programme 14,902 4,839 - 1,839 6,678
Whole mortgage loan pools 13,455 - 12,080 1,375 13,455
Total 45,518 16,144 12,080 3,214 31,438
Mortgages pledged to asset backed funding programmes
The securitisation programme notes are issued by Silverstone Master Issuer plc and are not included in the accounts of the Society. Silverstone Master Issuer plc is fully consolidated into the accounts of the Group.
The whole mortgage loan pools are pledged at the BoE under the FLS. Notes are not issued when pledging the mortgage loan pools at the BoE. Instead, the whole loan pool is pledged to the BoE and drawings are made directly against the eligible collateral, subject to a haircut. Therefore, values shown under notes in issue are the whole mortgage loan pool notional balances.
Mortgages pledged include £7.4 billion (2015: £9.5 billion) in the covered bond and securitisation programmes that are in excess of the amount contractually required to support notes in issue.
Mortgages pledged are not derecognised from the Group or Society balance sheets as the Group has retained substantially
all the risks and rewards of ownership. The Group and Society continue to be exposed to the liquidity risk, interest rate risk and credit risk of the mortgages. No gain or loss has been recognised on pledging the mortgages to the programmes.
Notes in issue which are held by third parties are included within debt securities in issue (note 19).
Notes in issue, held by the Group and drawn are whole mortgage loan pools securing amounts drawn under the FLS. At 4 April 2016 the Group had outstanding FLS drawings of £8.5 billion (2015: £8.5 billion).
Notes in issue, held by the Group and undrawn, are debt securities issued by the programmes to the Society and mortgage loan pools that have been pledged to the BoE but not utilised.
Mortgages pledged and the nominal values of the notes in issue are as follows:
Back to Contents

Financial Statements
246
15 Loans and advances to customers continued
In accordance with accounting standards, notes in issue and held by the Group are not recognised in the Group’s or Society’s balance sheets.
The Society established the Nationwide Covered Bond programme in November 2005. Mortgages pledged provide security for issues of covered bonds made by the Society. During the year ended 4 April 2016 €3.3 billion (£2.4 billion sterling equivalent) of notes matured. During the year ended 4 April 2016 £0.8 billion and €4.3 billion (£3.9 billion sterling equivalent) of notes were issued.
The Society established the Silverstone Master Trust securitisation programme in July 2008. Notes are issued under the programme and the issuance proceeds are used to purchase, for the benefit of note holders, a share of the beneficial interest in the mortgages pledged by the Society. The remaining beneficial interest in the pledged mortgages of £6.3 billion (2015: £8.2 billion) stays with the Society and
includes its required minimum seller share in accordance with the rules of the programme. The Group is under no obligation to support losses incurred by the programme or holders of the notes and does not intend to provide such further support. The entitlement of note holders is restricted to payment of principal and interest to the extent that the resources of the programme are sufficient to support such payment and the holders of the notes have agreed not to seek recourse in any other form. During the year ended 4 April 2016 £0.2 billion, €1.1 billion and $0.6 billion (total £1.4 billion sterling equivalent) of notes matured. During the year ended 4 April 2016 £0.3 billion, €0.7 billion and $0.3 billion (total £1.0 billion sterling equivalent) of notes were issued.
The following table sets out the carrying value and fair value of the transferred assets and liabilities for the Silverstone Master Trust.
Carrying value Fair value
Transferred assets
Associated liabilities Total Transferred
assetsAssociated
liabilities Total
£m £m £m £m £m £m
At 4 April 2016 12,368 (6,402) 5,966 12,031 (6,424) 5,607
At 4 April 2015 14,902 (6,678) 8,224 13,153 (6,793) 6,360
The Society holds cash deposited by the covered bond programme of £1.2 billion (2015: £1.8 billion) and by the Silverstone programme of £0.4 billion (2015: £0.4 billion).
Back to Contents
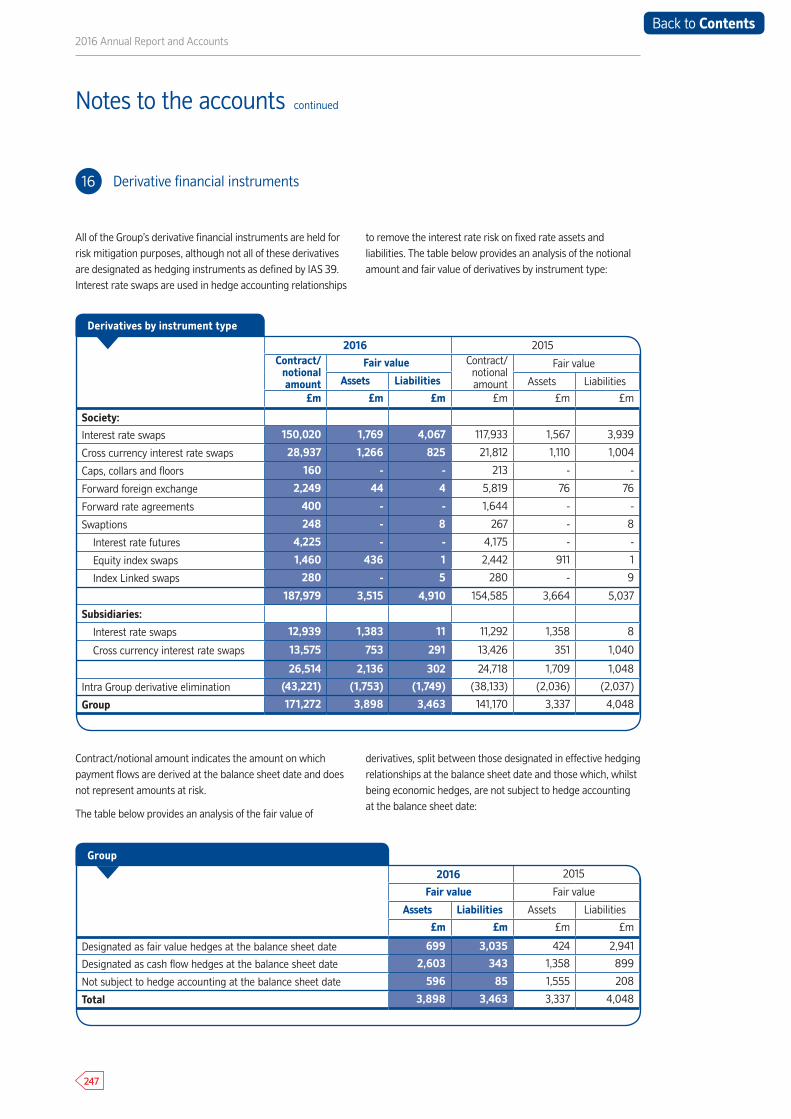
2016 Annual Report and Accounts
247
Notes to the accounts continued
All of the Group’s derivative financial instruments are held for risk mitigation purposes, although not all of these derivatives are designated as hedging instruments as defined by IAS 39. Interest rate swaps are used in hedge accounting relationships
to remove the interest rate risk on fixed rate assets and liabilities. The table below provides an analysis of the notional amount and fair value of derivatives by instrument type:
16 Derivative financial instruments
2016 2015Contract/
notional amount
Fair value Contract/notional amount
Fair value
Assets Liabilities Assets Liabilities
£m £m £m £m £m £m
Society:
Interest rate swaps 150,020 1,769 4,067 117,933 1,567 3,939
Cross currency interest rate swaps 28,937 1,266 825 21,812 1,110 1,004
Caps, collars and floors 160 - - 213 - -
Forward foreign exchange 2,249 44 4 5,819 76 76
Forward rate agreements 400 - - 1,644 - -
Swaptions 248 - 8 267 - 8
Interest rate futures 4,225 - - 4,175 - -
Equity index swaps 1,460 436 1 2,442 911 1
Index Linked swaps 280 - 5 280 - 9
187,979 3,515 4,910 154,585 3,664 5,037
Subsidiaries:
Interest rate swaps 12,939 1,383 11 11,292 1,358 8
Cross currency interest rate swaps 13,575 753 291 13,426 351 1,040
26,514 2,136 302 24,718 1,709 1,048
Intra Group derivative elimination (43,221) (1,753) (1,749) (38,133) (2,036) (2,037)
Group 171,272 3,898 3,463 141,170 3,337 4,048
Derivatives by instrument type
Contract/notional amount indicates the amount on which payment flows are derived at the balance sheet date and does not represent amounts at risk.
The table below provides an analysis of the fair value of
derivatives, split between those designated in effective hedging relationships at the balance sheet date and those which, whilst being economic hedges, are not subject to hedge accounting at the balance sheet date:
2016 2015
Fair value Fair value
Assets Liabilities Assets Liabilities
£m £m £m £m
Designated as fair value hedges at the balance sheet date 699 3,035 424 2,941
Designated as cash flow hedges at the balance sheet date 2,603 343 1,358 899
Not subject to hedge accounting at the balance sheet date 596 85 1,555 208
Total 3,898 3,463 3,337 4,048
Group
Back to Contents
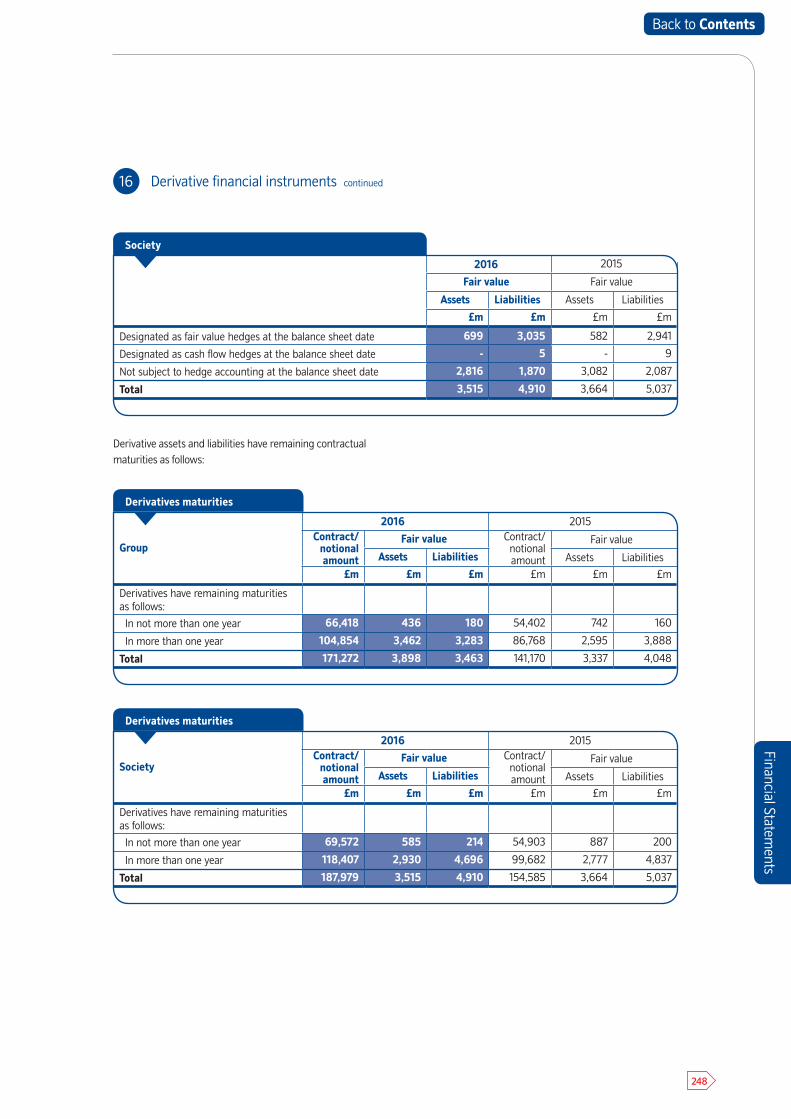
Financial Statements
248
2016 2015
Fair value Fair value
Assets Liabilities Assets Liabilities
£m £m £m £m
Designated as fair value hedges at the balance sheet date 699 3,035 582 2,941
Designated as cash flow hedges at the balance sheet date - 5 - 9
Not subject to hedge accounting at the balance sheet date 2,816 1,870 3,082 2,087
Total 3,515 4,910 3,664 5,037
Society
Group
2016 2015Contract/
notional amount
Fair value Contract/notional amount
Fair value
Assets Liabilities Assets Liabilities
£m £m £m £m £m £m
Derivatives have remaining maturities as follows:
In not more than one year 66,418 436 180 54,402 742 160
In more than one year 104,854 3,462 3,283 86,768 2,595 3,888
Total 171,272 3,898 3,463 141,170 3,337 4,048
Derivatives maturities
Society
2016 2015Contract/
notional amount
Fair value Contract/notional amount
Fair value
Assets Liabilities Assets Liabilities
£m £m £m £m £m £m
Derivatives have remaining maturities as follows:
In not more than one year 69,572 585 214 54,903 887 200
In more than one year 118,407 2,930 4,696 99,682 2,777 4,837
Total 187,979 3,515 4,910 154,585 3,664 5,037
Derivatives maturities
Derivative assets and liabilities have remaining contractual maturities as follows:
16 Derivative financial instruments continued
Back to Contents
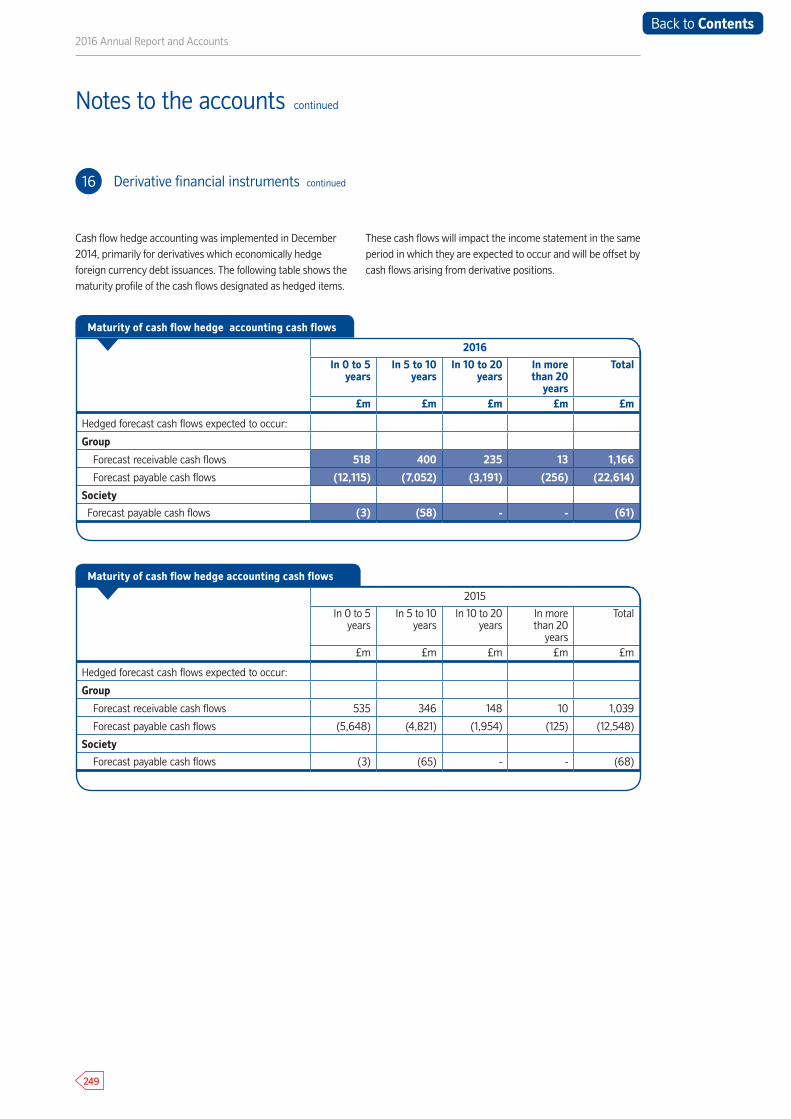
2016 Annual Report and Accounts
249
Notes to the accounts continued
2016
In 0 to 5 years
In 5 to 10 years
In 10 to 20 years
In more than 20
years
Total
£m £m £m £m £m
Hedged forecast cash flows expected to occur:
Group
Forecast receivable cash flows 518 400 235 13 1,166
Forecast payable cash flows (12,115) (7,052) (3,191) (256) (22,614)
Society
Forecast payable cash flows (3) (58) - - (61)
Maturity of cash flow hedge accounting cash flows
2015
In 0 to 5 years
In 5 to 10 years
In 10 to 20 years
In more than 20
years
Total
£m £m £m £m £m
Hedged forecast cash flows expected to occur:
Group
Forecast receivable cash flows 535 346 148 10 1,039
Forecast payable cash flows (5,648) (4,821) (1,954) (125) (12,548)
Society
Forecast payable cash flows (3) (65) - - (68)
Maturity of cash flow hedge accounting cash flows
Cash flow hedge accounting was implemented in December 2014, primarily for derivatives which economically hedge foreign currency debt issuances. The following table shows the maturity profile of the cash flows designated as hedged items.
These cash flows will impact the income statement in the same period in which they are expected to occur and will be offset by cash flows arising from derivative positions.
Back to Contents
16 Derivative financial instruments continued
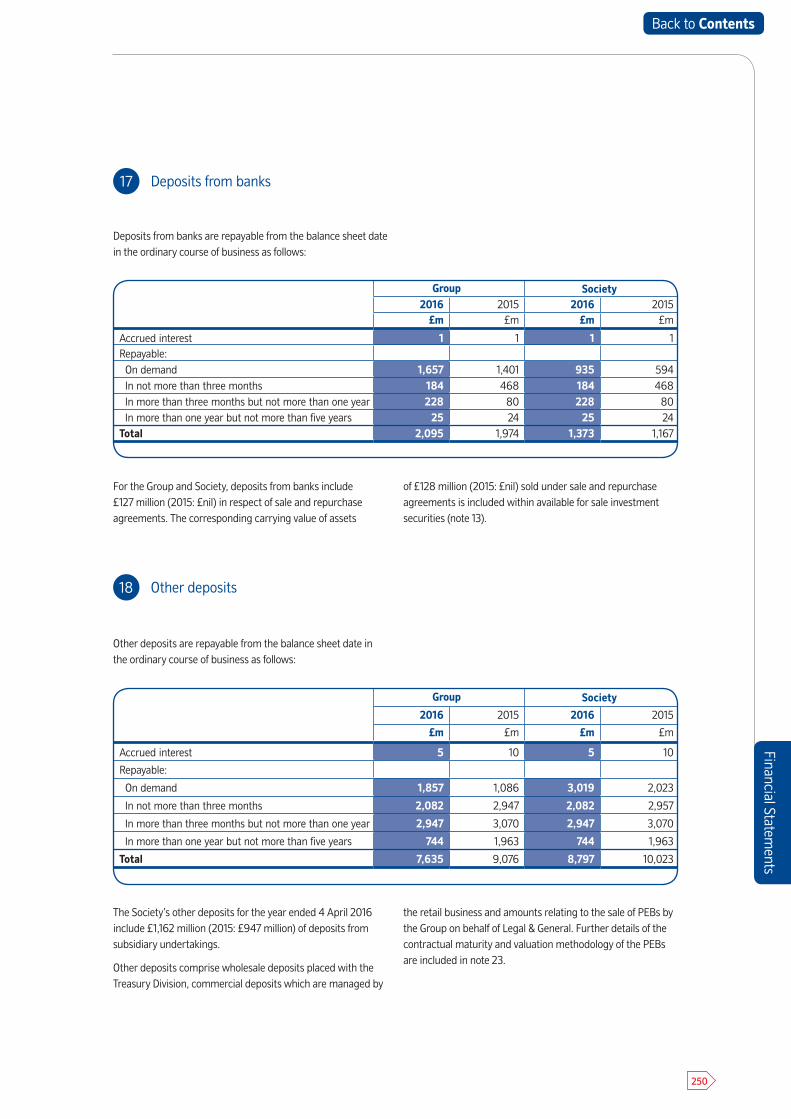
Financial Statements
250
18 Other deposits
Group Society
2016 2015 2016 2015
£m £m £m £m
Accrued interest 5 10 5 10
Repayable:
On demand 1,857 1,086 3,019 2,023
In not more than three months 2,082 2,947 2,082 2,957
In more than three months but not more than one year 2,947 3,070 2,947 3,070
In more than one year but not more than five years 744 1,963 744 1,963
Total 7,635 9,076 8,797 10,023
The Society’s other deposits for the year ended 4 April 2016 include £1,162 million (2015: £947 million) of deposits from subsidiary undertakings.
Other deposits comprise wholesale deposits placed with the Treasury Division, commercial deposits which are managed by
the retail business and amounts relating to the sale of PEBs by the Group on behalf of Legal & General. Further details of the contractual maturity and valuation methodology of the PEBs are included in note 23.
Other deposits are repayable from the balance sheet date in the ordinary course of business as follows:
17 Deposits from banks
Group Society2016 2015 2016 2015
£m £m £m £m
Accrued interest 1 1 1 1Repayable: On demand 1,657 1,401 935 594In not more than three months 184 468 184 468In more than three months but not more than one year 228 80 228 80In more than one year but not more than five years 25 24 25 24
Total 2,095 1,974 1,373 1,167
For the Group and Society, deposits from banks include £127 million (2015: £nil) in respect of sale and repurchase agreements. The corresponding carrying value of assets
of £128 million (2015: £nil) sold under sale and repurchase agreements is included within available for sale investment securities (note 13).
Deposits from banks are repayable from the balance sheet date in the ordinary course of business as follows:
Back to Contents
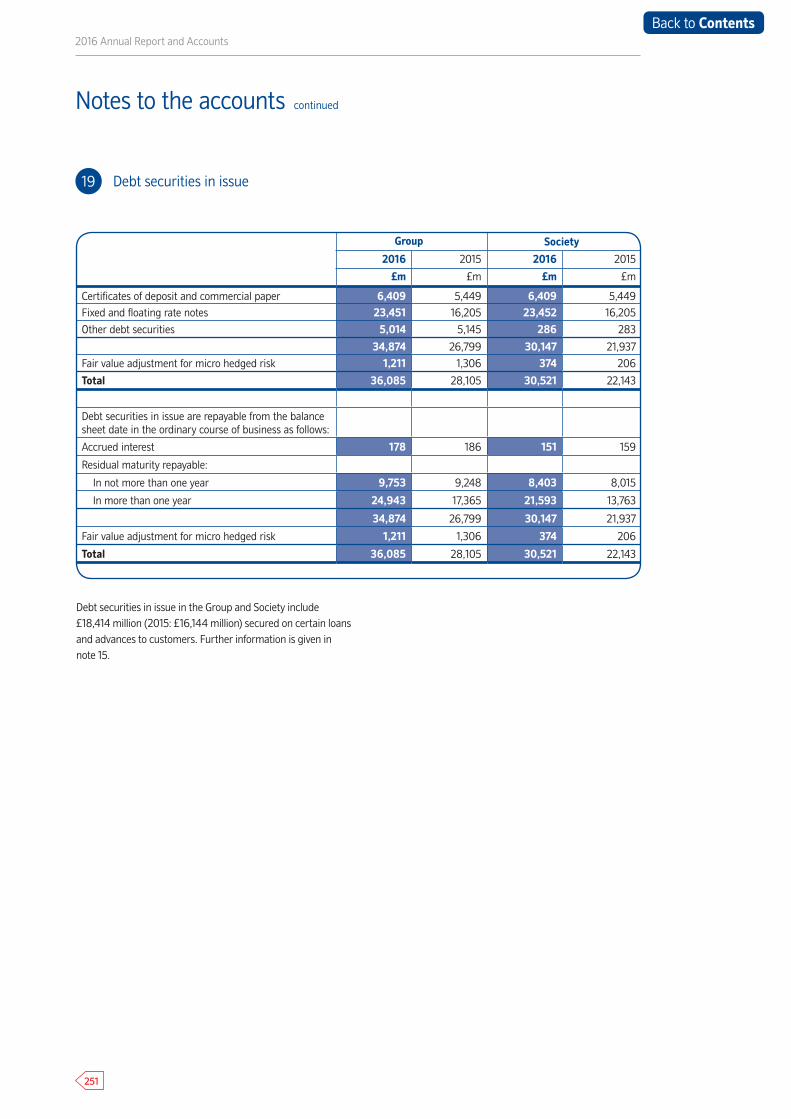
2016 Annual Report and Accounts
251
Notes to the accounts continued
19 Debt securities in issue
Group Society
2016 2015 2016 2015
£m £m £m £m
Certificates of deposit and commercial paper 6,409 5,449 6,409 5,449Fixed and floating rate notes 23,451 16,205 23,452 16,205
Other debt securities 5,014 5,145 286 283
34,874 26,799 30,147 21,937
Fair value adjustment for micro hedged risk 1,211 1,306 374 206
Total 36,085 28,105 30,521 22,143
Debt securities in issue are repayable from the balance sheet date in the ordinary course of business as follows:
Accrued interest 178 186 151 159
Residual maturity repayable:
In not more than one year 9,753 9,248 8,403 8,015
In more than one year 24,943 17,365 21,593 13,763
34,874 26,799 30,147 21,937
Fair value adjustment for micro hedged risk 1,211 1,306 374 206
Total 36,085 28,105 30,521 22,143
Debt securities in issue in the Group and Society include £18,414 million (2015: £16,144 million) secured on certain loans and advances to customers. Further information is given in note 15.
Back to Contents
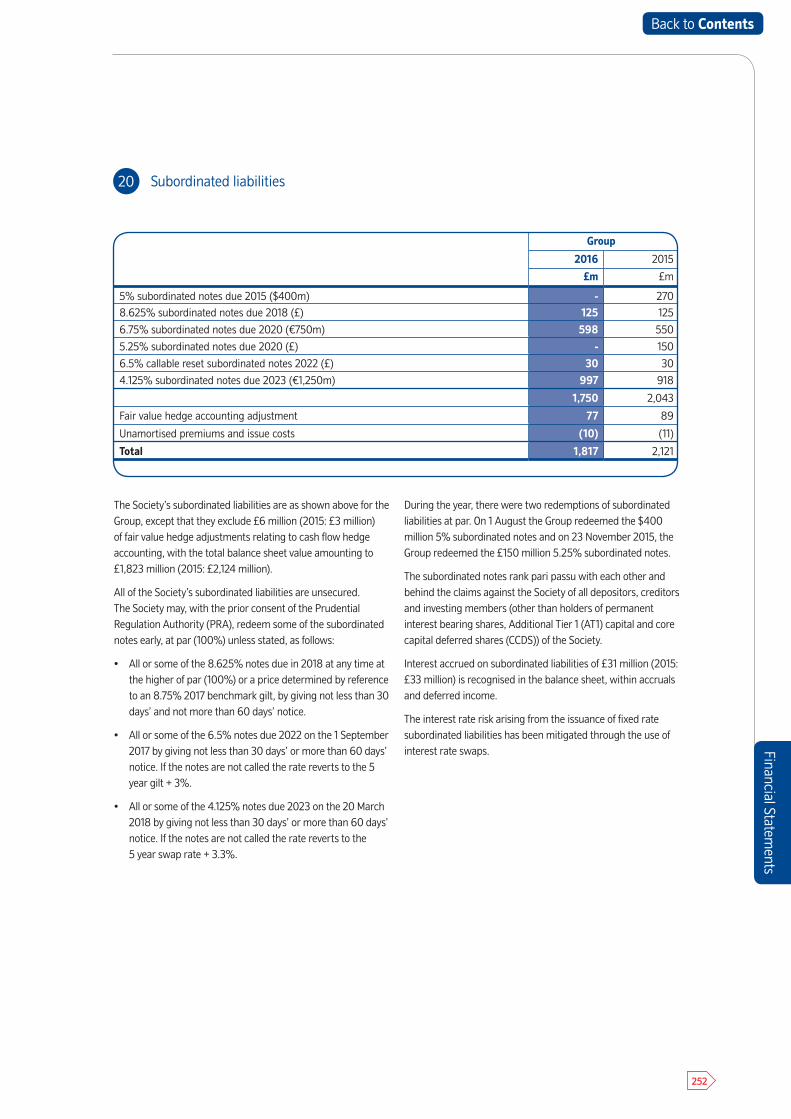
Financial Statements
252
Group
2016 2015
£m £m
5% subordinated notes due 2015 ($400m) - 2708.625% subordinated notes due 2018 (£) 125 125
6.75% subordinated notes due 2020 (€750m) 598 550
5.25% subordinated notes due 2020 (£) - 150
6.5% callable reset subordinated notes 2022 (£) 30 30
4.125% subordinated notes due 2023 (€1,250m) 997 918
1,750 2,043
Fair value hedge accounting adjustment 77 89
Unamortised premiums and issue costs (10) (11)
Total 1,817 2,121
The Society’s subordinated liabilities are as shown above for the Group, except that they exclude £6 million (2015: £3 million) of fair value hedge adjustments relating to cash flow hedge accounting, with the total balance sheet value amounting to £1,823 million (2015: £2,124 million).
All of the Society’s subordinated liabilities are unsecured. The Society may, with the prior consent of the Prudential Regulation Authority (PRA), redeem some of the subordinated notes early, at par (100%) unless stated, as follows:
• All or some of the 8.625% notes due in 2018 at any time at the higher of par (100%) or a price determined by reference to an 8.75% 2017 benchmark gilt, by giving not less than 30days’ and not more than 60 days’ notice.
• All or some of the 6.5% notes due 2022 on the 1 September2017 by giving not less than 30 days’ or more than 60 days’ notice. If the notes are not called the rate reverts to the 5 year gilt + 3%.
• All or some of the 4.125% notes due 2023 on the 20 March 2018 by giving not less than 30 days’ or more than 60 days’notice. If the notes are not called the rate reverts to the 5 year swap rate + 3.3%.
During the year, there were two redemptions of subordinated liabilities at par. On 1 August the Group redeemed the $400 million 5% subordinated notes and on 23 November 2015, the Group redeemed the £150 million 5.25% subordinated notes.
The subordinated notes rank pari passu with each other and behind the claims against the Society of all depositors, creditors and investing members (other than holders of permanent interest bearing shares, Additional Tier 1 (AT1) capital and core capital deferred shares (CCDS)) of the Society.
Interest accrued on subordinated liabilities of £31 million (2015: £33 million) is recognised in the balance sheet, within accruals and deferred income.
The interest rate risk arising from the issuance of fixed rate subordinated liabilities has been mitigated through the use of interest rate swaps.
20 Subordinated liabilities
Back to Contents
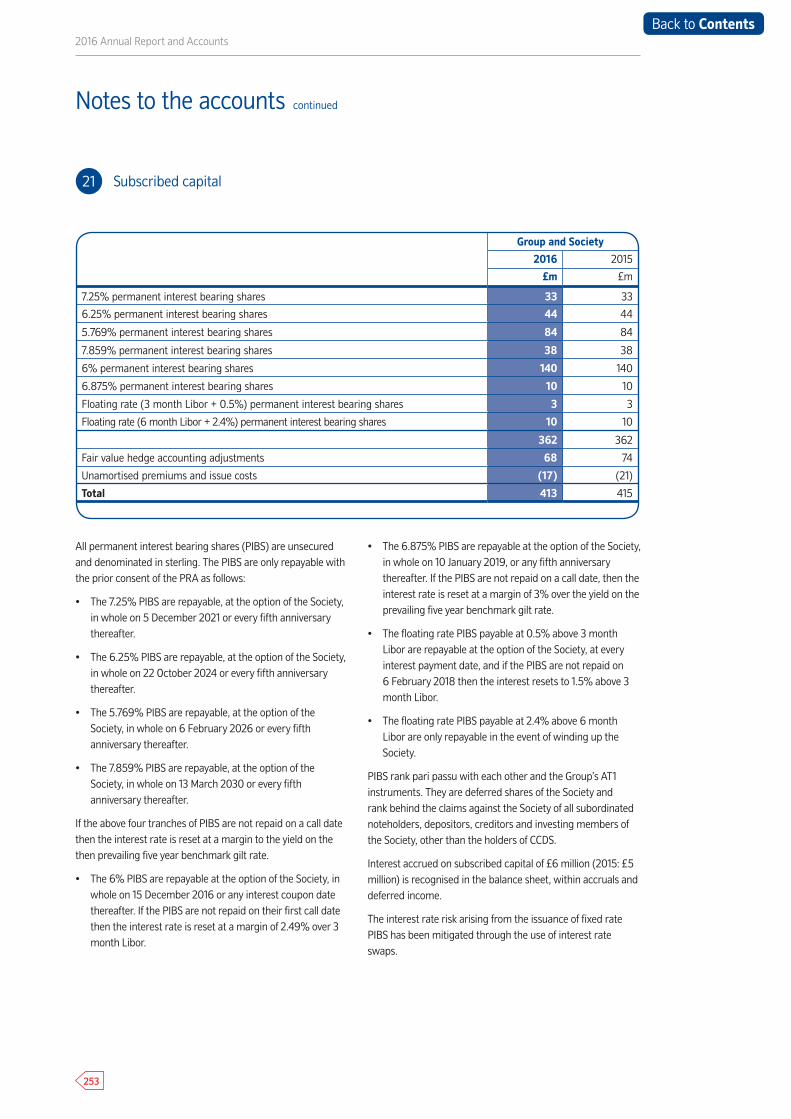
2016 Annual Report and Accounts
253
Notes to the accounts continued
21 Subscribed capital
All permanent interest bearing shares (PIBS) are unsecured and denominated in sterling. The PIBS are only repayable with the prior consent of the PRA as follows:
• The 7.25% PIBS are repayable, at the option of the Society,in whole on 5 December 2021 or every fifth anniversary thereafter.
• The 6.25% PIBS are repayable, at the option of the Society,in whole on 22 October 2024 or every fifth anniversary thereafter.
• The 5.769% PIBS are repayable, at the option of theSociety, in whole on 6 February 2026 or every fifth anniversary thereafter.
• The 7.859% PIBS are repayable, at the option of theSociety, in whole on 13 March 2030 or every fifth anniversary thereafter.
If the above four tranches of PIBS are not repaid on a call date then the interest rate is reset at a margin to the yield on the then prevailing five year benchmark gilt rate.
• The 6% PIBS are repayable at the option of the Society, in whole on 15 December 2016 or any interest coupon date thereafter. If the PIBS are not repaid on their first call datethen the interest rate is reset at a margin of 2.49% over 3 month Libor.
• The 6.875% PIBS are repayable at the option of the Society,in whole on 10 January 2019, or any fifth anniversary thereafter. If the PIBS are not repaid on a call date, then the interest rate is reset at a margin of 3% over the yield on the prevailing five year benchmark gilt rate.
• The floating rate PIBS payable at 0.5% above 3 month Libor are repayable at the option of the Society, at every interest payment date, and if the PIBS are not repaid on 6 February 2018 then the interest resets to 1.5% above 3month Libor.
• The floating rate PIBS payable at 2.4% above 6 month Libor are only repayable in the event of winding up theSociety.
PIBS rank pari passu with each other and the Group’s AT1 instruments. They are deferred shares of the Society and rank behind the claims against the Society of all subordinated noteholders, depositors, creditors and investing members of the Society, other than the holders of CCDS.
Interest accrued on subscribed capital of £6 million (2015: £5 million) is recognised in the balance sheet, within accruals and deferred income.
The interest rate risk arising from the issuance of fixed rate PIBS has been mitigated through the use of interest rate swaps.
Group and Society
2016 2015
£m £m
7.25% permanent interest bearing shares 33 33
6.25% permanent interest bearing shares 44 44
5.769% permanent interest bearing shares 84 84
7.859% permanent interest bearing shares 38 38
6% permanent interest bearing shares 140 140
6.875% permanent interest bearing shares 10 10
Floating rate (3 month Libor + 0.5%) permanent interest bearing shares 3 3
Floating rate (6 month Libor + 2.4%) permanent interest bearing shares 10 10
362 362
Fair value hedge accounting adjustments 68 74
Unamortised premiums and issue costs (17) (21)
Total 413 415
Back to Contents

Financial Statements
254
Financial Statements
22 Fair value hierarchy of financial assets and liabilities held at fair value
Given the dominant position of the Society within the Group structure, the disclosures in notes 22 to 25 are on a consolidated basis covering the activities of both the Group and the Society.
The following tables show the Group’s financial assets and liabilities that are held at fair value by fair value hierarchy, balance sheet classification and product type:
Fair values based on
Level 1 Level 2 Level 3 Total
£m £m £m £m
Financial assets
Government and supranational investments 6,843 - - 6,843
Other debt investment securities 1,011 2,758 - 3,769
Available for sale investment securities 7,854 2,758 - 10,612
Investments in equity shares (note i) - - 125 125
Interest rate swaps - 2,180 - 2,180
Cross currency interest rate swaps - 1,238 - 1,238
Forward foreign exchange - 44 - 44
Equity index swaps - - 436 436
Total derivative financial instruments - 3,462 436 3,898
Other financial assets (note ii) - 2 - 2
Total financial assets 7,854 6,222 561 14,637
Financial liabilities
Interest rate swaps - (3,103) (4) (3,107)
Cross currency interest rate swaps - (338) - (338)
Forward foreign exchange - (4) - (4)
Swaptions - (8) - (8)
Index linked swaps
- - (1) (1)Equity index swaps
- (5) - (5)
Total derivative financial instruments - (3,458) (5) (3,463)
Other deposits - PEBs (note iii) - - (1,885) (1,885)
Total financial liabilities - (3,458) (1,890) (5,348)
2016
Back to Contents
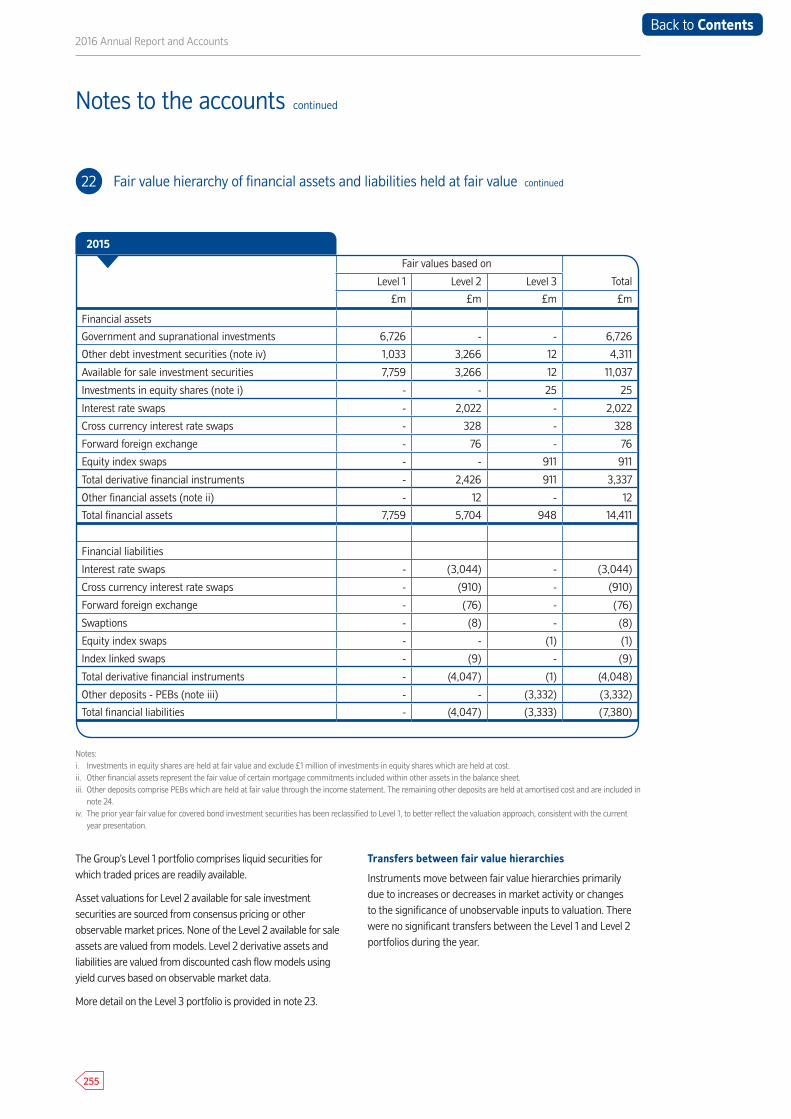
2016 Annual Report and Accounts
255
Notes to the accounts continued
22 Fair value hierarchy of financial assets and liabilities held at fair value continued
Fair values based on
Level 1 Level 2 Level 3 Total
£m £m £m £m
Financial assets
Government and supranational investments 6,726 - - 6,726
Other debt investment securities (note iv) 1,033 3,266 12 4,311
Available for sale investment securities 7,759 3,266 12 11,037
Investments in equity shares (note i) - - 25 25
Interest rate swaps - 2,022 - 2,022
Cross currency interest rate swaps - 328 - 328
Forward foreign exchange - 76 - 76
Equity index swaps - - 911 911
Total derivative financial instruments - 2,426 911 3,337
Other financial assets (note ii) - 12 - 12
Total financial assets 7,759 5,704 948 14,411
Financial liabilities
Interest rate swaps - (3,044) - (3,044)
Cross currency interest rate swaps - (910) - (910)
Forward foreign exchange - (76) - (76)
Swaptions - (8) - (8)
Equity index swaps - - (1) (1)
Index linked swaps - (9) - (9)
Total derivative financial instruments - (4,047) (1) (4,048)
Other deposits - PEBs (note iii) - - (3,332) (3,332)
Total financial liabilities - (4,047) (3,333) (7,380)
Notes:i. Investments in equity shares are held at fair value and exclude £1 million of investments in equity shares which are held at cost.ii. Other financial assets represent the fair value of certain mortgage commitments included within other assets in the balance sheet.iii. Other deposits comprise PEBs which are held at fair value through the income statement. The remaining other deposits are held at amortised cost and are included in
note 24.iv. The prior year fair value for covered bond investment securities has been reclassified to Level 1, to better reflect the valuation approach, consistent with the current
year presentation.
The Group’s Level 1 portfolio comprises liquid securities for which traded prices are readily available.
Asset valuations for Level 2 available for sale investment securities are sourced from consensus pricing or other observable market prices. None of the Level 2 available for sale assets are valued from models. Level 2 derivative assets and liabilities are valued from discounted cash flow models using yield curves based on observable market data.
More detail on the Level 3 portfolio is provided in note 23.
Transfers between fair value hierarchies
Instruments move between fair value hierarchies primarily due to increases or decreases in market activity or changes to the significance of unobservable inputs to valuation. There were no significant transfers between the Level 1 and Level 2 portfolios during the year.
2015
Back to Contents
Financial Statements
256
Financial Statements
23 Fair value of financial assets and liabilities held at fair value – Level 3 portfolio
The main constituents of the Level 3 portfolio are as follows:
Available for sale investment securities
The Group did not hold any Level 3 available for sale investment securities at 4 April 2016. During the period all investments were transferred from Level 3 to Level 2 due to changes in the availability of observable market prices. For the purpose of reporting movements between levels of the fair value hierarchy, transfers are recognised at the beginning of the reporting period in which they occur.
Investments in equity shares
The Level 3 investments in equity shares of £125 million at 4 April 2016 consist primarily of the investment in Visa Europe Limited, further details of which can be found in Note 14, and an interest in a fund which is supported by zero coupon bonds of an A rated bank. External valuations are used to obtain the fair value of this instrument.
Derivative financial instruments
Level 3 assets and liabilities in this category are primarily equity linked derivatives with external counterparties which economically match the investment return payable by the Group to investors in the PEBs product. The derivatives are linked to the performance of specified stock market indices and have been valued by an external third party. Fair value changes are recognised within gains/losses from derivatives and hedge accounting. Upon maturity the gain/loss is transferred to interest expense and similar charges.
Other deposits – PEBs
This category relates to deposit accounts with the potential for stock market correlated growth linked to the performance of specified stock market indices. The PEBs liability of £1,885 million (2015: £3,332 million) is valued at a discount to reflect the time value of money, overlaid by a fair value adjustment representing the expected return payable to the customer. The fair value adjustment has been constructed from the valuation of the associated derivatives as valued by an external third party. Fair value changes are recognised within gains/losses from derivatives and hedge accounting. Upon maturity the gain/loss is transferred to interest expense and similar charges.
The minimum amount on an undiscounted basis that the Group and Society are contractually required to pay at maturity for the PEBs is £1,551 million (2015: £2,585 million). The maximum additional amount which would also be payable at maturity in respect of additional investment returns is £636 million (2015: £1,080 million). The payment of additional investment returns is dependent upon performance of certain specified stock indices during the period of the PEBs. As noted above, the Group has entered into equity-linked derivatives with external counterparties which economically match the investment returns on the PEBs.
Back to Contents

2016 Annual Report and Accounts
257
Notes to the accounts continued
23 Fair value of financial assets and liabilities held at fair value – Level 3 portfolio continued
Available for sale
investment securities
Investmentsin equity
shares
Net derivative
financialinstruments
Otherdeposits -
PEBs
£m £m £m £m
At 5 April 2015 12 25 910 (3,332)
Gains/(losses) recognised in the income statement:
Net interest income/(expense) - - 398 (439)
(Losses)/gains from derivatives and hedge accounting - - (476) 465
Gains/(losses) recognised in other comprehensive income:
Fair value movement taken to members’ interests and equity - 100 - -
Settlements - - (401) 1,421
Transfers out of Level 3 portfolio (12) - - -
At 4 April 2016 - 125 431 (1,885)
Available for sale
investment securities
Investmentsin equity
shares
Net derivative
financialinstruments
Otherdeposits -
PEBs
£m £m £m £m
At 5 April 2014 71 28 669 (3,222)
Gains/(losses) recognised in the income statement:
Net interest income/(expense) - - 1 (50)
Gains/(losses) from derivatives and hedge accounting - - 241 (245)
Net impairment losses on investment securities (5) - - -
Gains/(losses) recognised in other comprehensive income:
Fair value movement taken to members’ interests and equity 1 (3) - -
Settlements (55) - (1) 185
At 4 April 2015 12 25 910 (3,332)
The tables below set out movements in the Level 3 portfolio, including transfers in and out of Level 3.
Movements in Level 3 portfolio
Movements in Level 3 portfolio
Back to Contents
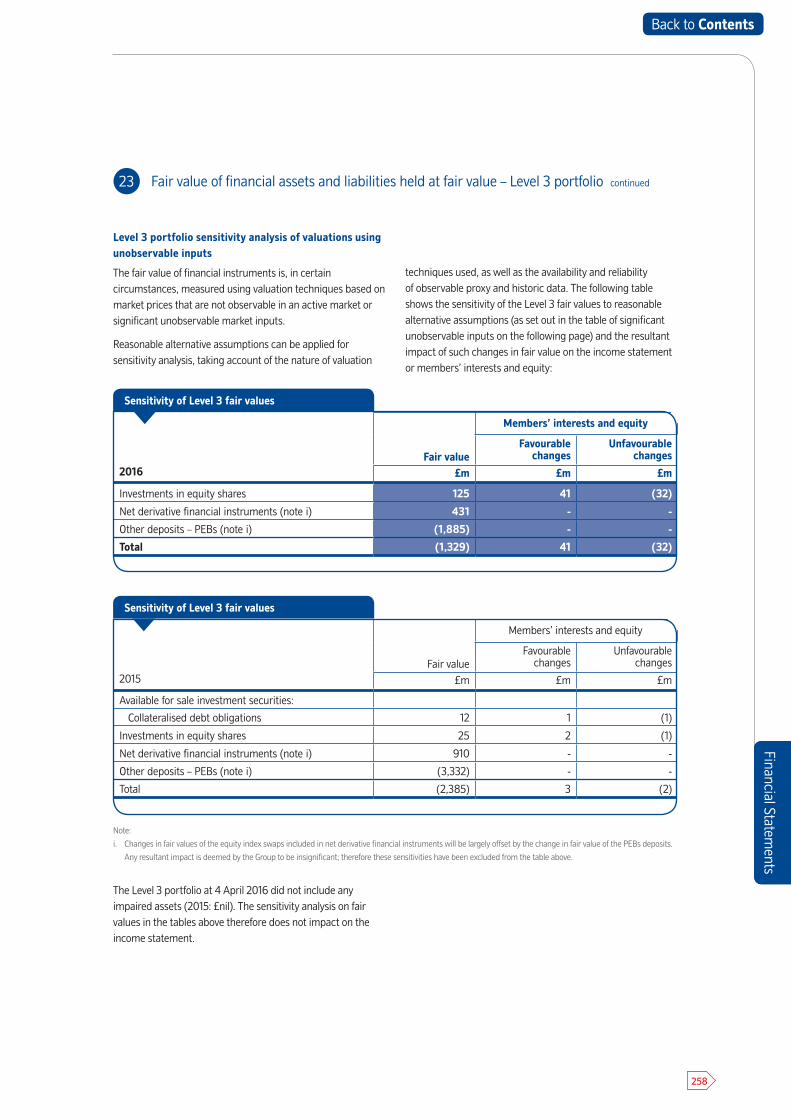
Financial Statements
258
Financial Statements
23 Fair value of financial assets and liabilities held at fair value – Level 3 portfolio continued
Level 3 portfolio sensitivity analysis of valuations using unobservable inputs
The fair value of financial instruments is, in certain circumstances, measured using valuation techniques based on market prices that are not observable in an active market or significant unobservable market inputs.
Reasonable alternative assumptions can be applied for sensitivity analysis, taking account of the nature of valuation
techniques used, as well as the availability and reliability of observable proxy and historic data. The following table shows the sensitivity of the Level 3 fair values to reasonable alternative assumptions (as set out in the table of significant unobservable inputs on the following page) and the resultant impact of such changes in fair value on the income statement or members’ interests and equity:
The Level 3 portfolio at 4 April 2016 did not include any impaired assets (2015: £nil). The sensitivity analysis on fair values in the tables above therefore does not impact on the income statement.
Note:
i. Changes in fair values of the equity index swaps included in net derivative financial instruments will be largely offset by the change in fair value of the PEBs deposits.
Any resultant impact is deemed by the Group to be insignificant; therefore these sensitivities have been excluded from the table above.
2016Fair value
Members’ interests and equity
Favourable changes
Unfavourable changes
£m £m £m
Investments in equity shares 125 41 (32)
Net derivative financial instruments (note i) 431 - -
Other deposits – PEBs (note i) (1,885) - -
Total (1,329) 41 (32)
Sensitivity of Level 3 fair values
2015Fair value
Members’ interests and equity
Favourable changes
Unfavourable changes
£m £m £m
Available for sale investment securities:
Collateralised debt obligations 12 1 (1)
Investments in equity shares 25 2 (1)
Net derivative financial instruments (note i) 910 - -
Other deposits – PEBs (note i) (3,332) - -
Total (2,385) 3 (2)
Sensitivity of Level 3 fair values
Back to Contents
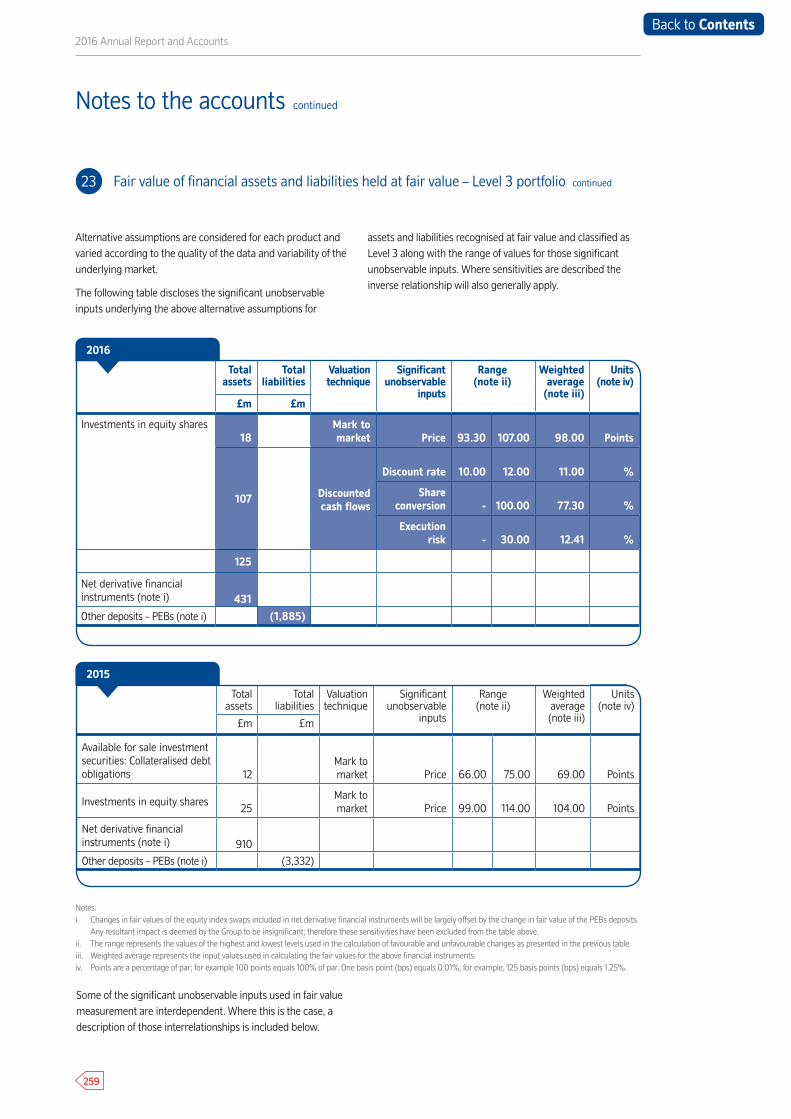
2016 Annual Report and Accounts
259
Notes to the accounts continued
23 Fair value of financial assets and liabilities held at fair value – Level 3 portfolio continued
Alternative assumptions are considered for each product and varied according to the quality of the data and variability of the underlying market.
The following table discloses the significant unobservable inputs underlying the above alternative assumptions for
assets and liabilities recognised at fair value and classified as Level 3 along with the range of values for those significant unobservable inputs. Where sensitivities are described the inverse relationship will also generally apply.
Some of the significant unobservable inputs used in fair value measurement are interdependent. Where this is the case, a description of those interrelationships is included below.
Notes:i. Changes in fair values of the equity index swaps included in net derivative financial instruments will be largely offset by the change in fair value of the PEBs deposits.
Any resultant impact is deemed by the Group to be insignificant; therefore these sensitivities have been excluded from the table above.ii. The range represents the values of the highest and lowest levels used in the calculation of favourable and unfavourable changes as presented in the previous table.iii. Weighted average represents the input values used in calculating the fair values for the above financial instruments.iv. Points are a percentage of par; for example 100 points equals 100% of par. One basis point (bps) equals 0.01%; for example, 125 basis points (bps) equals 1.25%.
Total assets
Totalliabilities
Valuationtechnique
Significantunobservable
inputs
Range(note ii)
Weightedaverage
(note iii)
Units(note iv)
£m £m
Investments in equity shares18
Mark to market Price 93.30 107.00 98.00 Points
107 Discounted cash flows
Discount rate 10.00 12.00 11.00 %
Share conversion - 100.00 77.30 %
Execution risk - 30.00 12.41 %
125
Net derivative financial instruments (note i) 431
Other deposits – PEBs (note i) (1,885)
2016
Total assets
Totalliabilities
Valuationtechnique
Significantunobservable
inputs
Range(note ii)
Weightedaverage(note iii)
Units(note iv)
£m £m
Available for sale investment securities: Collateralised debt obligations 12
Mark to market Price 66.00 75.00 69.00 Points
Investments in equity shares25
Mark to market Price 99.00 114.00 104.00 Points
Net derivative financial instruments (note i) 910
Other deposits – PEBs (note i) (3,332)
2015
Back to Contents
Financial Statements
260
Financial Statements
23 Fair value of financial assets and liabilities held at fair value – Level 3 portfolio continued
Price
Prices for securities that are marked to market, where the market is illiquid, and supporting price information is scarce, are typically subject to significant uncertainty. An increase in the price will directly cause an increase in fair value and vice versa.
Discount rate
The discount rate is used to determine the present value of future cash flows. The level of the discount rate takes into account the time value of money, but also the risk or uncertainty of future cash flows. Typically, the greater the uncertainty, the higher the discount rate. A higher discount rate leads to a lower valuation and vice versa.
Share conversion
Where the conversion of a security into an underlying instrument is subject to underlying security market pricing
and contingent litigation risk, share conversion is factored in to the fair value. The higher the share conversion, the higher the valuation and vice versa.
Execution risk
Where a security’s value is dependent on a future transaction taking place, and the occurrence of this is not certain, execution risk is factored into the security’s valuation. The greater the execution risk, the lower the valuation and vice versa.
Back to Contents
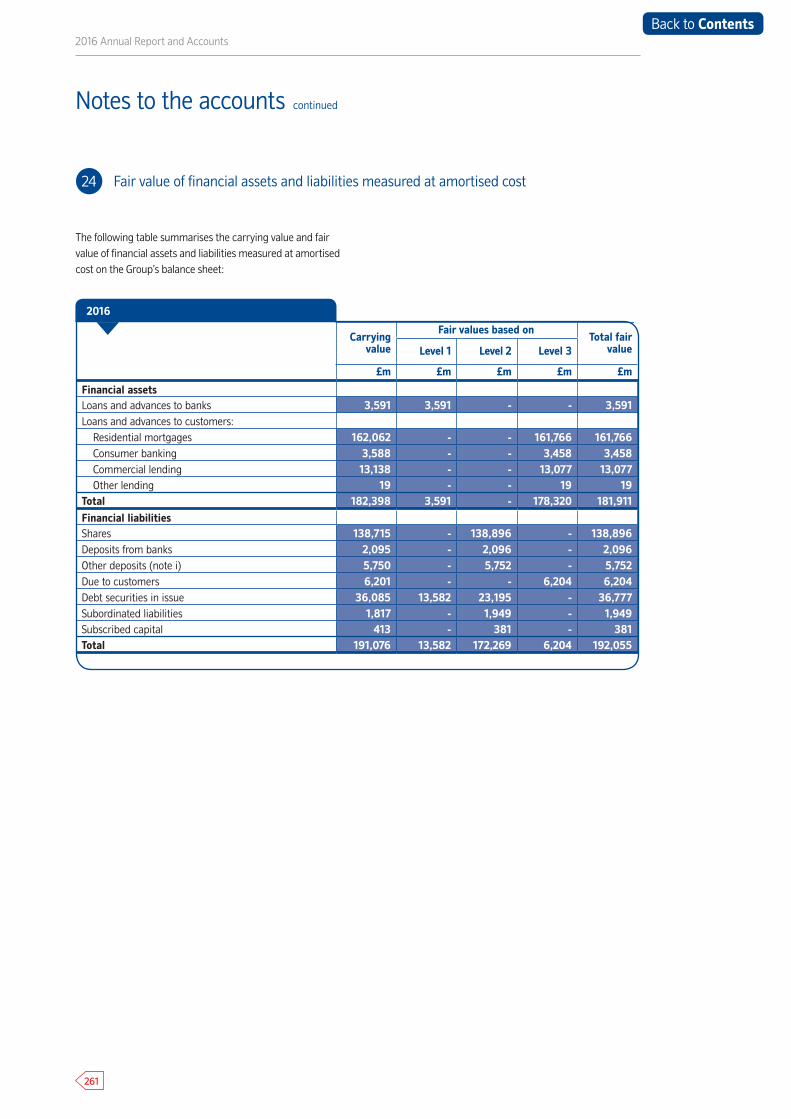
2016 Annual Report and Accounts
261
24 Fair value of financial assets and liabilities measured at amortised cost
The following table summarises the carrying value and fair value of financial assets and liabilities measured at amortised cost on the Group’s balance sheet:
Carrying value
Fair values based onTotal fair
valueLevel 1 Level 2 Level 3
£m £m £m £m £m
Financial assetsLoans and advances to banks 3,591 3,591 - - 3,591Loans and advances to customers:
Residential mortgages 162,062 - - 161,766 161,766Consumer banking 3,588 - - 3,458 3,458Commercial lending 13,138 - - 13,077 13,077Other lending 19 - - 19 19
Total 182,398 3,591 - 178,320 181,911Financial liabilitiesShares 138,715 - 138,896 - 138,896Deposits from banks 2,095 - 2,096 - 2,096Other deposits (note i) 5,750 - 5,752 - 5,752Due to customers 6,201 - - 6,204 6,204Debt securities in issue 36,085 13,582 23,195 - 36,777Subordinated liabilities 1,817 - 1,949 - 1,949Subscribed capital 413 - 381 - 381Total 191,076 13,582 172,269 6,204 192,055
2016
Notes to the accounts continued
Back to Contents
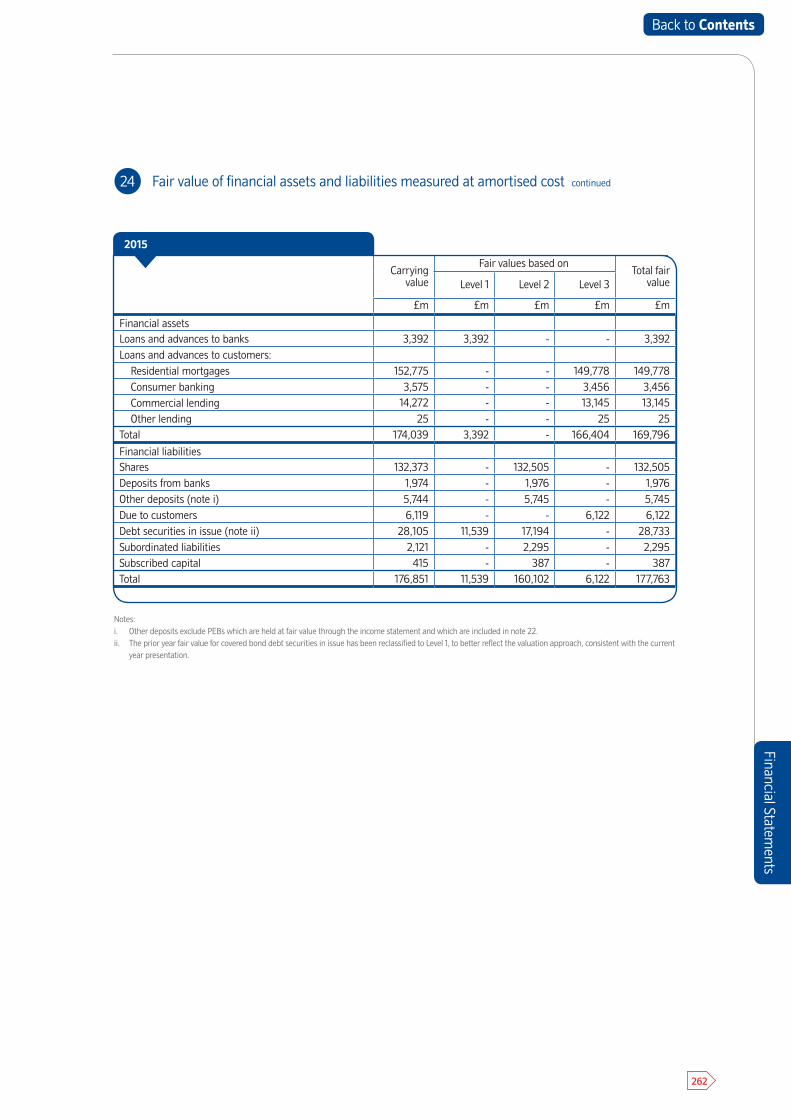
Financial Statements
262
Notes:i. Other deposits exclude PEBs which are held at fair value through the income statement and which are included in note 22.ii. The prior year fair value for covered bond debt securities in issue has been reclassified to Level 1, to better reflect the valuation approach, consistent with the current
year presentation.
24 Fair value of financial assets and liabilities measured at amortised cost continued
Carrying value
Fair values based onTotal fair
valueLevel 1 Level 2 Level 3
£m £m £m £m £m
Financial assetsLoans and advances to banks 3,392 3,392 - - 3,392Loans and advances to customers:
Residential mortgages 152,775 - - 149,778 149,778Consumer banking 3,575 - - 3,456 3,456Commercial lending 14,272 - - 13,145 13,145Other lending 25 - - 25 25
Total 174,039 3,392 - 166,404 169,796
Financial liabilitiesShares 132,373 - 132,505 - 132,505Deposits from banks 1,974 - 1,976 - 1,976Other deposits (note i) 5,744 - 5,745 - 5,745Due to customers 6,119 - - 6,122 6,122Debt securities in issue (note ii) 28,105 11,539 17,194 - 28,733Subordinated liabilities 2,121 - 2,295 - 2,295Subscribed capital 415 - 387 - 387Total 176,851 11,539 160,102 6,122 177,763
2015
Back to Contents
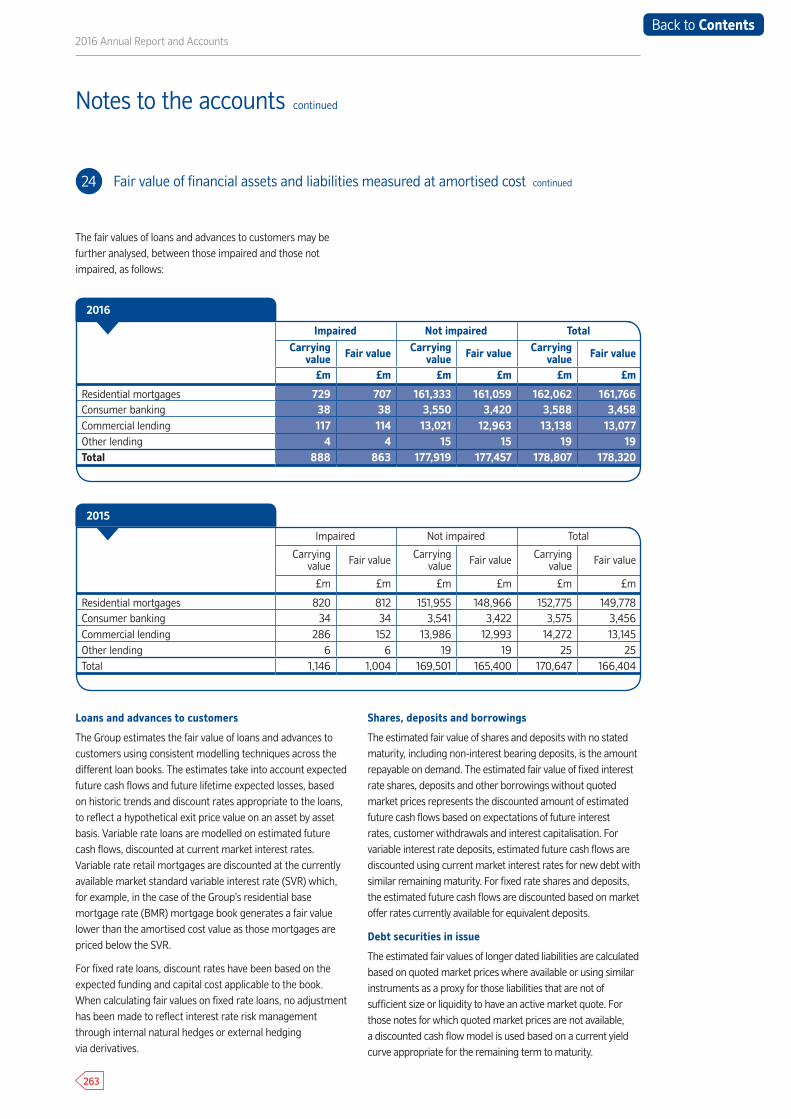
2016 Annual Report and Accounts
263
Notes to the accounts continued
24 Fair value of financial assets and liabilities measured at amortised cost continued
Impaired Not impaired TotalCarrying
value Fair value Carrying value Fair value Carrying
value Fair value
£m £m £m £m £m £m
Residential mortgages 729 707 161,333 161,059 162,062 161,766Consumer banking 38 38 3,550 3,420 3,588 3,458Commercial lending 117 114 13,021 12,963 13,138 13,077Other lending 4 4 15 15 19 19Total 888 863 177,919 177,457 178,807 178,320
Impaired Not impaired Total
Carrying value Fair value Carrying
value Fair value Carrying value Fair value
£m £m £m £m £m £m
Residential mortgages 820 812 151,955 148,966 152,775 149,778Consumer banking 34 34 3,541 3,422 3,575 3,456Commercial lending 286 152 13,986 12,993 14,272 13,145Other lending 6 6 19 19 25 25Total 1,146 1,004 169,501 165,400 170,647 166,404
The fair values of loans and advances to customers may be further analysed, between those impaired and those not impaired, as follows:
Loans and advances to customers
The Group estimates the fair value of loans and advances to customers using consistent modelling techniques across the different loan books. The estimates take into account expected future cash flows and future lifetime expected losses, based on historic trends and discount rates appropriate to the loans, to reflect a hypothetical exit price value on an asset by asset basis. Variable rate loans are modelled on estimated future cash flows, discounted at current market interest rates. Variable rate retail mortgages are discounted at the currently available market standard variable interest rate (SVR) which, for example, in the case of the Group’s residential base mortgage rate (BMR) mortgage book generates a fair value lower than the amortised cost value as those mortgages are priced below the SVR.
For fixed rate loans, discount rates have been based on the expected funding and capital cost applicable to the book. When calculating fair values on fixed rate loans, no adjustment has been made to reflect interest rate risk management through internal natural hedges or external hedging via derivatives.
Shares, deposits and borrowings
The estimated fair value of shares and deposits with no stated maturity, including non-interest bearing deposits, is the amount repayable on demand. The estimated fair value of fixed interest rate shares, deposits and other borrowings without quoted market prices represents the discounted amount of estimated future cash flows based on expectations of future interest rates, customer withdrawals and interest capitalisation. For variable interest rate deposits, estimated future cash flows are discounted using current market interest rates for new debt with similar remaining maturity. For fixed rate shares and deposits, the estimated future cash flows are discounted based on market offer rates currently available for equivalent deposits.
Debt securities in issue
The estimated fair values of longer dated liabilities are calculated based on quoted market prices where available or using similar instruments as a proxy for those liabilities that are not of sufficient size or liquidity to have an active market quote. For those notes for which quoted market prices are not available, a discounted cash flow model is used based on a current yield curve appropriate for the remaining term to maturity.
2016
2015
Back to Contents
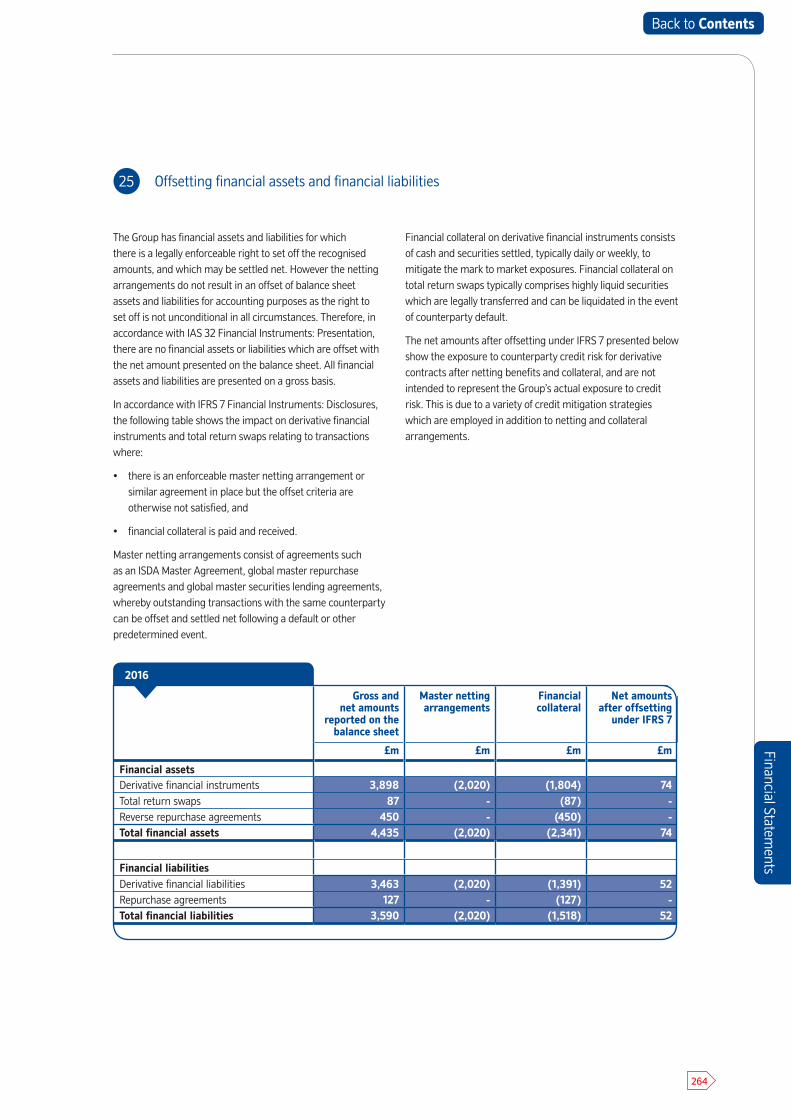
Financial Statements
264
Financial Statements
25 Offsetting financial assets and financial liabilities
Gross and net amounts
reported on the balance sheet
Master netting arrangements
Financial collateral
Net amounts after offsetting
under IFRS 7
£m £m £m £m
Financial assetsDerivative financial instruments 3,898 (2,020) (1,804) 74Total return swaps 87 - (87) -Reverse repurchase agreements 450 - (450) -Total financial assets 4,435 (2,020) (2,341) 74
Financial liabilitiesDerivative financial liabilities 3,463 (2,020) (1,391) 52Repurchase agreements 127 - (127) -Total financial liabilities 3,590 (2,020) (1,518) 52
2016
The Group has financial assets and liabilities for which there is a legally enforceable right to set off the recognised amounts, and which may be settled net. However the netting arrangements do not result in an offset of balance sheet assets and liabilities for accounting purposes as the right to set off is not unconditional in all circumstances. Therefore, in accordance with IAS 32 Financial Instruments: Presentation, there are no financial assets or liabilities which are offset with the net amount presented on the balance sheet. All financial assets and liabilities are presented on a gross basis.
In accordance with IFRS 7 Financial Instruments: Disclosures, the following table shows the impact on derivative financial instruments and total return swaps relating to transactions where:
• there is an enforceable master netting arrangement orsimilar agreement in place but the offset criteria are otherwise not satisfied, and
• financial collateral is paid and received.
Master netting arrangements consist of agreements such as an ISDA Master Agreement, global master repurchase agreements and global master securities lending agreements, whereby outstanding transactions with the same counterparty can be offset and settled net following a default or other predetermined event.
Financial collateral on derivative financial instruments consists of cash and securities settled, typically daily or weekly, to mitigate the mark to market exposures. Financial collateral on total return swaps typically comprises highly liquid securities which are legally transferred and can be liquidated in the event of counterparty default.
The net amounts after offsetting under IFRS 7 presented below show the exposure to counterparty credit risk for derivative contracts after netting benefits and collateral, and are not intended to represent the Group’s actual exposure to credit risk. This is due to a variety of credit mitigation strategies which are employed in addition to netting and collateral arrangements.
Back to Contents
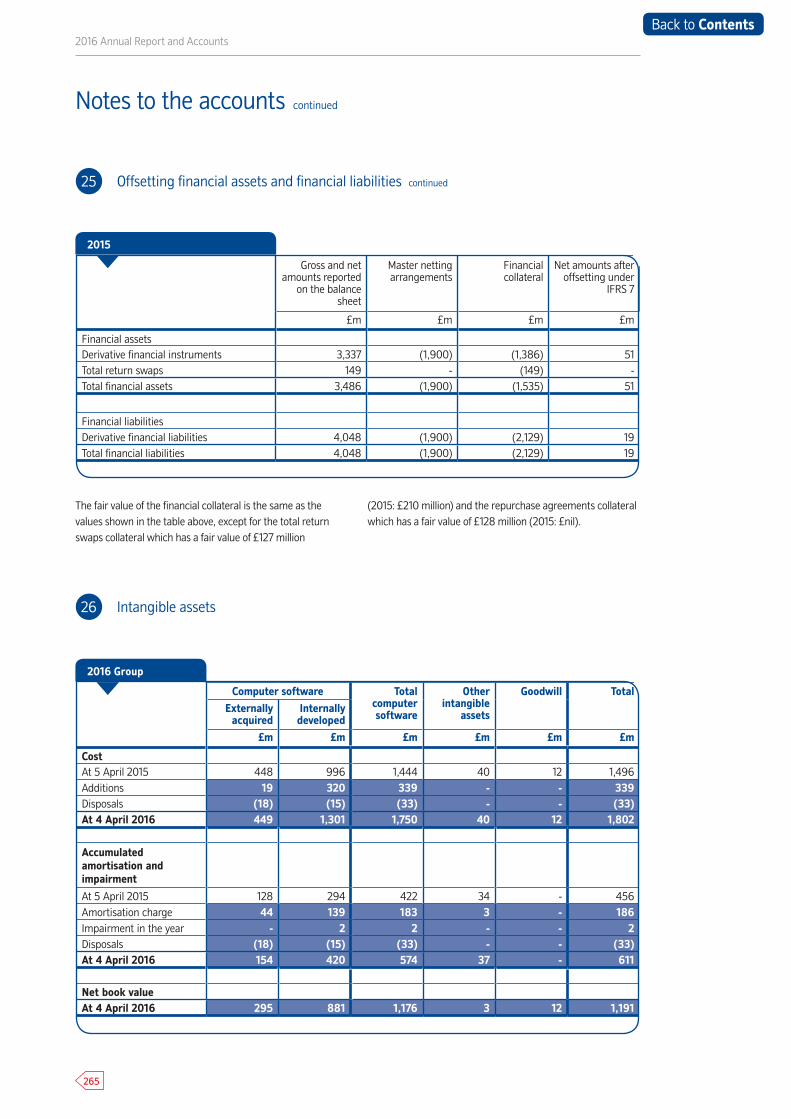
2016 Annual Report and Accounts
265
Notes to the accounts continued
25 Offsetting financial assets and financial liabilities continued
26 Intangible assets
Gross and net amounts reported
on the balance sheet
Master netting arrangements
Financial collateral
Net amounts after offsetting under
IFRS 7
£m £m £m £m
Financial assetsDerivative financial instruments 3,337 (1,900) (1,386) 51Total return swaps 149 - (149) -Total financial assets 3,486 (1,900) (1,535) 51
Financial liabilitiesDerivative financial liabilities 4,048 (1,900) (2,129) 19Total financial liabilities 4,048 (1,900) (2,129) 19
2015
The fair value of the financial collateral is the same as the values shown in the table above, except for the total return swaps collateral which has a fair value of £127 million
(2015: £210 million) and the repurchase agreements collateral which has a fair value of £128 million (2015: £nil).
Computer software Total computer software
Other intangible
assets
Goodwill TotalExternally
acquiredInternally developed
£m £m £m £m £m £m
Cost At 5 April 2015 448 996 1,444 40 12 1,496Additions 19 320 339 - - 339Disposals (18) (15) (33) - - (33)At 4 April 2016 449 1,301 1,750 40 12 1,802
Accumulated amortisation and impairment
At 5 April 2015 128 294 422 34 - 456Amortisation charge 44 139 183 3 - 186Impairment in the year - 2 2 - - 2Disposals (18) (15) (33) - - (33)At 4 April 2016 154 420 574 37 - 611
Net book valueAt 4 April 2016 295 881 1,176 3 12 1,191
2016 Group
Back to Contents
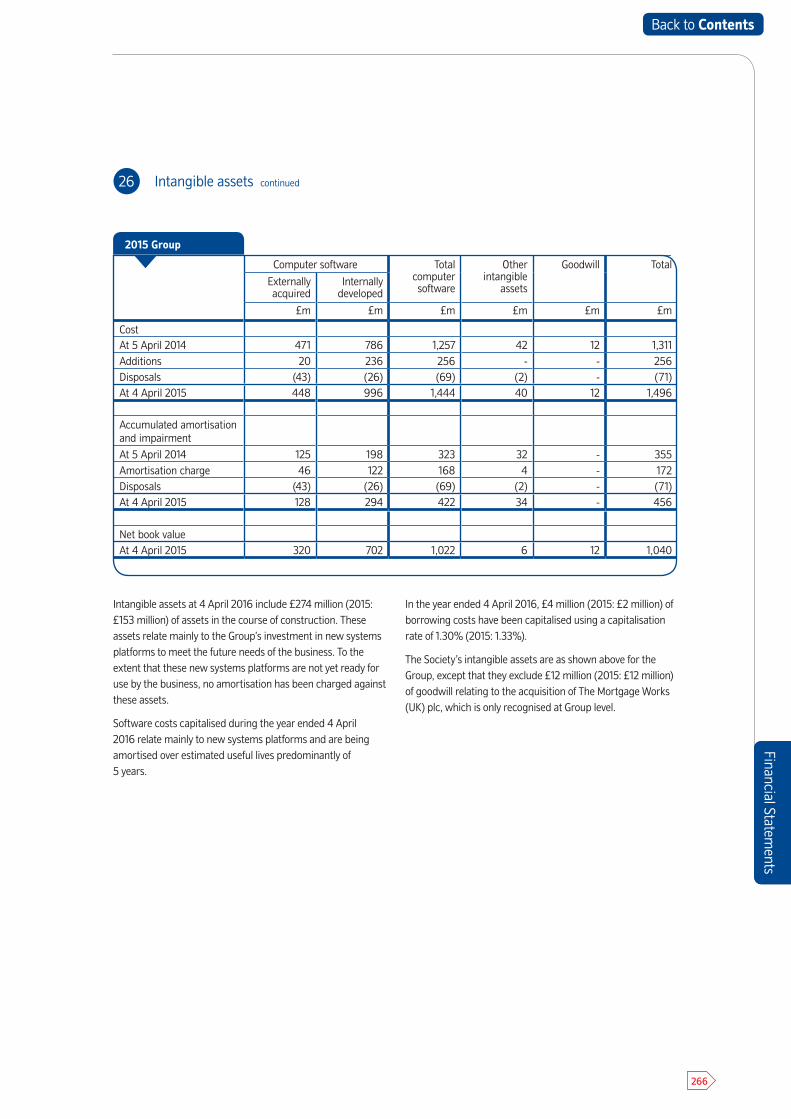
Financial Statements
266
Financial Statements
26 Intangible assets continued
Intangible assets at 4 April 2016 include £274 million (2015: £153 million) of assets in the course of construction. These assets relate mainly to the Group’s investment in new systems platforms to meet the future needs of the business. To the extent that these new systems platforms are not yet ready for use by the business, no amortisation has been charged against these assets.
Software costs capitalised during the year ended 4 April 2016 relate mainly to new systems platforms and are being amortised over estimated useful lives predominantly of 5 years.
In the year ended 4 April 2016, £4 million (2015: £2 million) of borrowing costs have been capitalised using a capitalisation rate of 1.30% (2015: 1.33%).
The Society’s intangible assets are as shown above for the Group, except that they exclude £12 million (2015: £12 million) of goodwill relating to the acquisition of The Mortgage Works (UK) plc, which is only recognised at Group level.
Computer software Total computer software
Other intangible
assets
Goodwill Total
Externally acquired
Internally developed
£m £m £m £m £m £m
Cost At 5 April 2014 471 786 1,257 42 12 1,311Additions 20 236 256 - - 256Disposals (43) (26) (69) (2) - (71)At 4 April 2015 448 996 1,444 40 12 1,496
Accumulated amortisation and impairmentAt 5 April 2014 125 198 323 32 - 355Amortisation charge 46 122 168 4 - 172Disposals (43) (26) (69) (2) - (71)At 4 April 2015 128 294 422 34 - 456
Net book valueAt 4 April 2015 320 702 1,022 6 12 1,040
2015 Group
Back to Contents
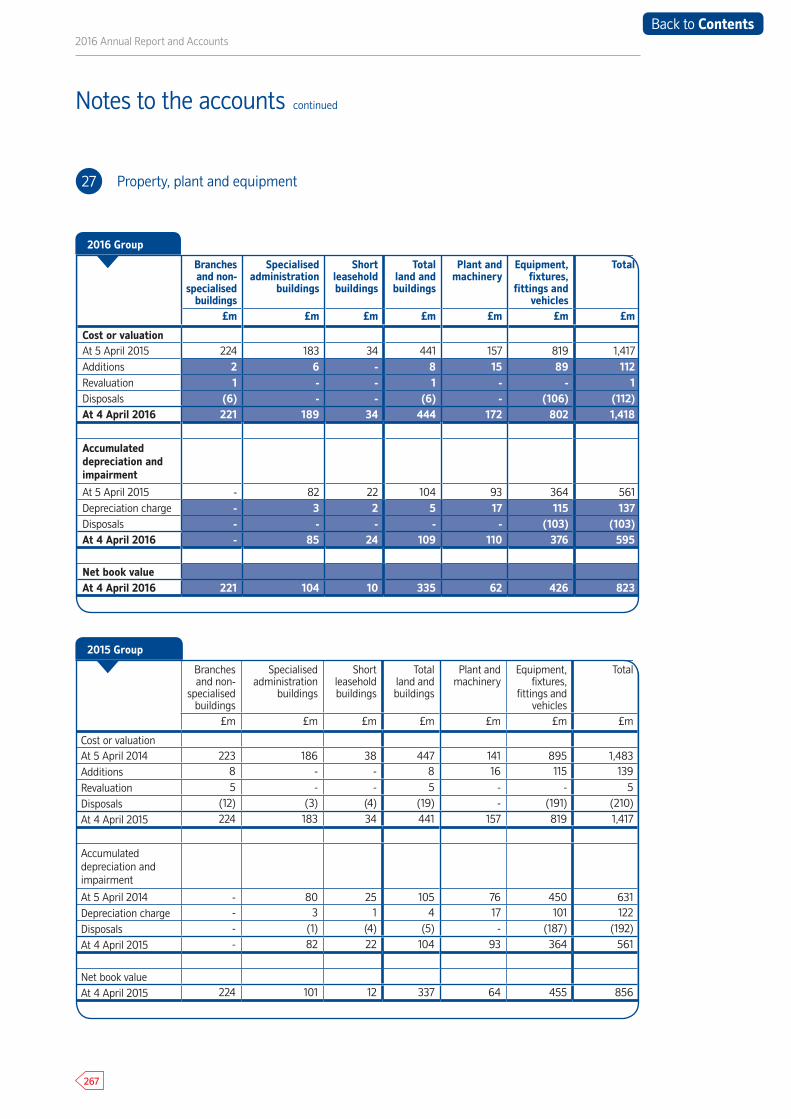
2016 Annual Report and Accounts
267
Notes to the accounts continued
27 Property, plant and equipment
Branches and non-
specialised buildings
Specialised administration
buildings
Short leasehold buildings
Total land andbuildings
Plant and machinery
Equipment,fixtures,
fittings and vehicles
Total
£m £m £m £m £m £m £m
Cost or valuationAt 5 April 2015 224 183 34 441 157 819 1,417Additions 2 6 - 8 15 89 112Revaluation 1 - - 1 - - 1Disposals (6) - - (6) - (106) (112)At 4 April 2016 221 189 34 444 172 802 1,418
Accumulated depreciation and impairment
At 5 April 2015 - 82 22 104 93 364 561Depreciation charge - 3 2 5 17 115 137Disposals - - - - - (103) (103)At 4 April 2016 - 85 24 109 110 376 595
Net book valueAt 4 April 2016 221 104 10 335 62 426 823
Branches and non-
specialised buildings
Specialised administration
buildings
Short leasehold buildings
Total land and buildings
Plant and machinery
Equipment,fixtures,
fittings and vehicles
Total
£m £m £m £m £m £m £m
Cost or valuationAt 5 April 2014 223 186 38 447 141 895 1,483Additions 8 - - 8 16 115 139
Revaluation 5 - - 5 - - 5
Disposals (12) (3) (4) (19) - (191) (210)
At 4 April 2015 224 183 34 441 157 819 1,417
Accumulated depreciation and impairment
At 5 April 2014 - 80 25 105 76 450 631Depreciation charge - 3 1 4 17 101 122
Disposals - (1) (4) (5) - (187) (192)
At 4 April 2015 - 82 22 104 93 364 561
Net book valueAt 4 April 2015 224 101 12 337 64 455 856
2016 Group
2015 Group
Back to Contents
Financial Statements
268
Financial Statements
27 Property, plant and equipment continued
Group property, plant and equipment at 4 April 2016 includes £2 million (2015: £2 million) of land and buildings held by subsidiary undertakings.
Property, plant and equipment includes £13 million (2015: £59 million) of assets in the course of construction.
In the year ended 4 April 2016, £1 million (2015: £nil) of borrowing costs have been capitalised using a capitalisation rate of 1.30% (2015: 1.33%).
Branches and non-specialised buildings are valued annually by external, independent and qualified valuers who have recent experience in the location and categories of the properties.
The current use of all branches and non-specialised buildings equates to highest and best use, and there have been no changes to the valuation technique during the year. Valuations are performed in accordance with the Royal Institution of Chartered Surveyors Appraisal and Valuation Standards and are performed on a vacant possession basis, using a comparative method of valuation with reference to sales prices and observable market rents for similar properties in similar locations.
These valuations are therefore classified within Level 2 of the fair value hierarchy.
Back to Contents
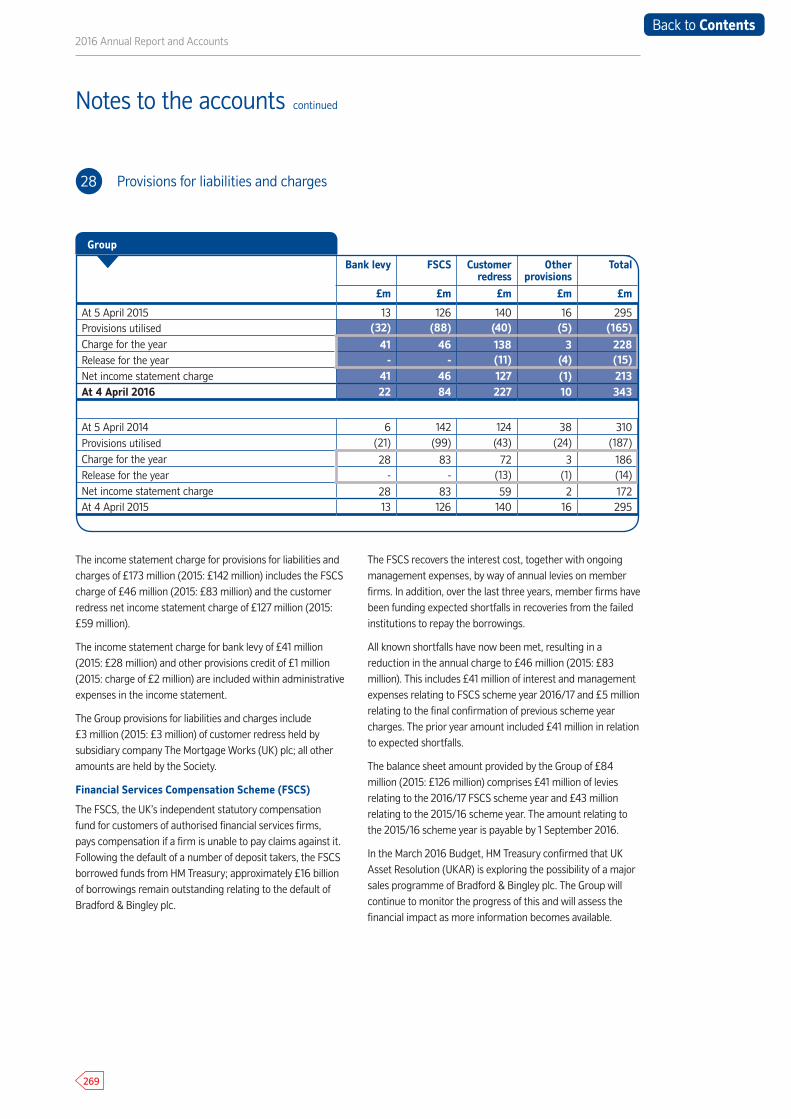
2016 Annual Report and Accounts
269
28 Provisions for liabilities and charges
The income statement charge for provisions for liabilities and charges of £173 million (2015: £142 million) includes the FSCS charge of £46 million (2015: £83 million) and the customer redress net income statement charge of £127 million (2015: £59 million).
The income statement charge for bank levy of £41 million (2015: £28 million) and other provisions credit of £1 million (2015: charge of £2 million) are included within administrative expenses in the income statement.
The Group provisions for liabilities and charges include £3 million (2015: £3 million) of customer redress held by subsidiary company The Mortgage Works (UK) plc; all other amounts are held by the Society.
Financial Services Compensation Scheme (FSCS)
The FSCS, the UK’s independent statutory compensation fund for customers of authorised financial services firms, pays compensation if a firm is unable to pay claims against it. Following the default of a number of deposit takers, the FSCS borrowed funds from HM Treasury; approximately £16 billion of borrowings remain outstanding relating to the default of Bradford & Bingley plc.
The FSCS recovers the interest cost, together with ongoing management expenses, by way of annual levies on member firms. In addition, over the last three years, member firms have been funding expected shortfalls in recoveries from the failed institutions to repay the borrowings.
All known shortfalls have now been met, resulting in a reduction in the annual charge to £46 million (2015: £83 million). This includes £41 million of interest and management expenses relating to FSCS scheme year 2016/17 and £5 million relating to the final confirmation of previous scheme year charges. The prior year amount included £41 million in relation to expected shortfalls.
The balance sheet amount provided by the Group of £84 million (2015: £126 million) comprises £41 million of levies relating to the 2016/17 FSCS scheme year and £43 million relating to the 2015/16 scheme year. The amount relating to the 2015/16 scheme year is payable by 1 September 2016.
In the March 2016 Budget, HM Treasury confirmed that UK Asset Resolution (UKAR) is exploring the possibility of a major sales programme of Bradford & Bingley plc. The Group will continue to monitor the progress of this and will assess the financial impact as more information becomes available.
Bank levy FSCS Customer redress
Other provisions
Total
£m £m £m £m £m
At 5 April 2015 13 126 140 16 295Provisions utilised (32) (88) (40) (5) (165)Charge for the year 41 46 138 3 228Release for the year - - (11) (4) (15)Net income statement charge 41 46 127 (1) 213At 4 April 2016 22 84 227 10 343
At 5 April 2014 6 142 124 38 310Provisions utilised (21) (99) (43) (24) (187)
Charge for the year 28 83 72 3 186Release for the year - - (13) (1) (14)Net income statement charge 28 83 59 2 172At 4 April 2015 13 126 140 16 295
Group
Notes to the accounts continued
Back to Contents
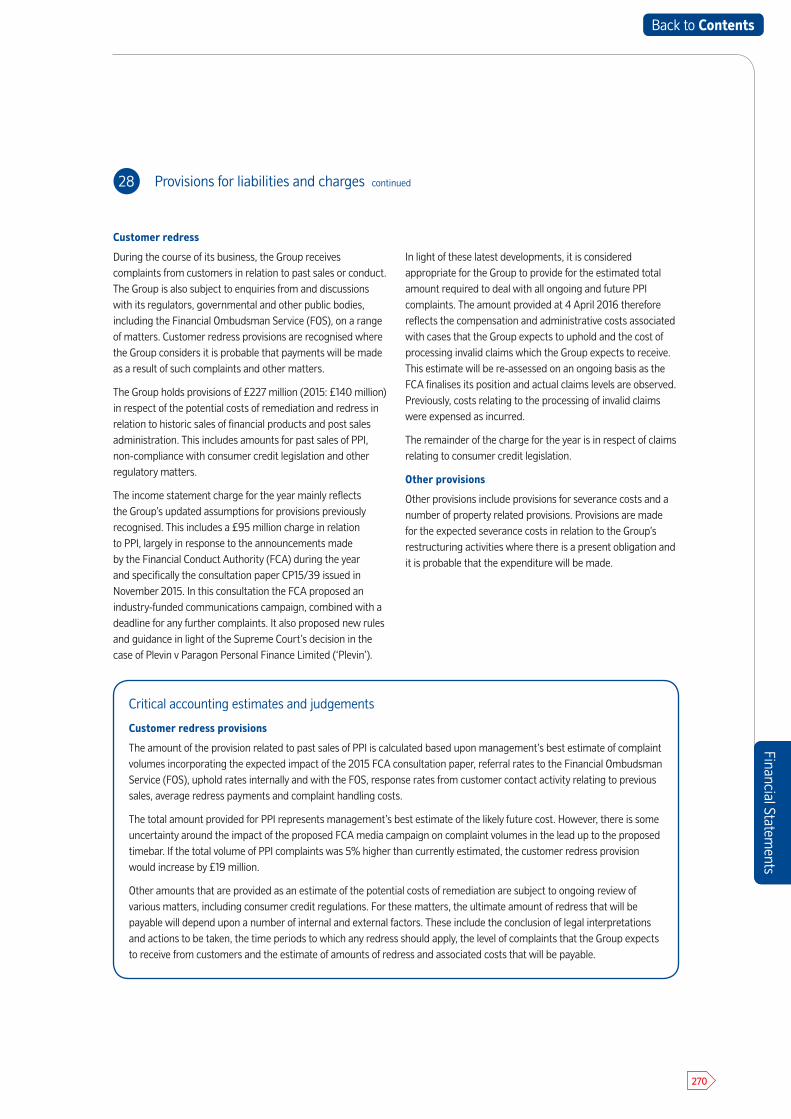
Financial Statements
270
Financial Statements
28 Provisions for liabilities and charges continued
Customer redress
During the course of its business, the Group receives complaints from customers in relation to past sales or conduct. The Group is also subject to enquiries from and discussions with its regulators, governmental and other public bodies, including the Financial Ombudsman Service (FOS), on a range of matters. Customer redress provisions are recognised where the Group considers it is probable that payments will be made as a result of such complaints and other matters.
The Group holds provisions of £227 million (2015: £140 million) in respect of the potential costs of remediation and redress in relation to historic sales of financial products and post sales administration. This includes amounts for past sales of PPI, non-compliance with consumer credit legislation and other regulatory matters.
The income statement charge for the year mainly reflects the Group’s updated assumptions for provisions previously recognised. This includes a £95 million charge in relation to PPI, largely in response to the announcements made by the Financial Conduct Authority (FCA) during the year and specifically the consultation paper CP15/39 issued in November 2015. In this consultation the FCA proposed an industry-funded communications campaign, combined with a deadline for any further complaints. It also proposed new rules and guidance in light of the Supreme Court’s decision in the case of Plevin v Paragon Personal Finance Limited (‘Plevin’).
In light of these latest developments, it is considered appropriate for the Group to provide for the estimated total amount required to deal with all ongoing and future PPI complaints. The amount provided at 4 April 2016 therefore reflects the compensation and administrative costs associated with cases that the Group expects to uphold and the cost of processing invalid claims which the Group expects to receive. This estimate will be re-assessed on an ongoing basis as the FCA finalises its position and actual claims levels are observed. Previously, costs relating to the processing of invalid claims were expensed as incurred.
The remainder of the charge for the year is in respect of claims relating to consumer credit legislation.
Other provisions
Other provisions include provisions for severance costs and a number of property related provisions. Provisions are made for the expected severance costs in relation to the Group’s restructuring activities where there is a present obligation and it is probable that the expenditure will be made.
Critical accounting estimates and judgements
Customer redress provisions
The amount of the provision related to past sales of PPI is calculated based upon management’s best estimate of complaint volumes incorporating the expected impact of the 2015 FCA consultation paper, referral rates to the Financial Ombudsman Service (FOS), uphold rates internally and with the FOS, response rates from customer contact activity relating to previous sales, average redress payments and complaint handling costs.
The total amount provided for PPI represents management’s best estimate of the likely future cost. However, there is some uncertainty around the impact of the proposed FCA media campaign on complaint volumes in the lead up to the proposed timebar. If the total volume of PPI complaints was 5% higher than currently estimated, the customer redress provision would increase by £19 million.
Other amounts that are provided as an estimate of the potential costs of remediation are subject to ongoing review of various matters, including consumer credit regulations. For these matters, the ultimate amount of redress that will be payable will depend upon a number of internal and external factors. These include the conclusion of legal interpretations and actions to be taken, the time periods to which any redress should apply, the level of complaints that the Group expects to receive from customers and the estimate of amounts of redress and associated costs that will be payable.
Back to Contents

2016 Annual Report and Accounts
271
29 Capital and leasing commitments
Notes to the accounts continued
Group and Society
2016 2015
£m £m
Capital expenditure relating to: Intangibles 100 55
Property, plant and equipment 24 22Total 124 77
Group
2016 2015
£m £m
Amounts falling due:Within one year 32 31
Between one and five years 96 99
After five years 174 198Total 302 328
Group and Society
2016 2015
£m £m
Amounts falling due:Within one year 4 5
Between one and five years 11 13
After five years 35 32Total 50 50
At the balance sheet date, future minimum sublease payments receivable under non-cancellable subleases
12 14
Capital commitments at 4 April
Leasing commitments at 4 April
Leasing payments receivable as lessor at 4 April
Capital expenditure contracted for but not accrued is as follows:
£2 million of the leasing commitments arise in a subsidiary of the Group (2015: £2 million).
At the balance sheet date, future minimum lease payments receivable under non-cancellable operating leases were as follows:
The Group leases various offices, branches and other premises under non-cancellable operating lease arrangements. The leases have various terms, escalation, renewal rights and in some cases contingent rent payable.
Future minimum payments under operating leases relating to land and buildings were as follows:
Back to Contents
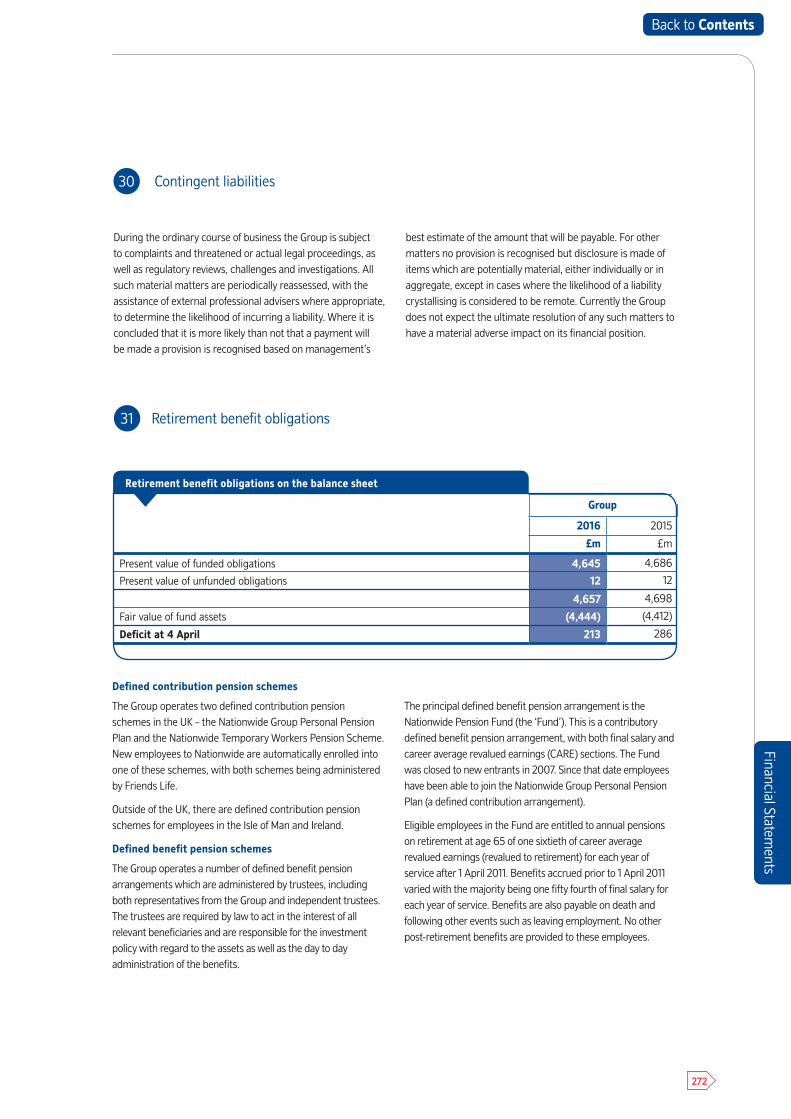
Financial Statements
272
Financial Statements
30 Contingent liabilities
During the ordinary course of business the Group is subject to complaints and threatened or actual legal proceedings, as well as regulatory reviews, challenges and investigations. All such material matters are periodically reassessed, with the assistance of external professional advisers where appropriate, to determine the likelihood of incurring a liability. Where it is concluded that it is more likely than not that a payment will be made a provision is recognised based on management’s
best estimate of the amount that will be payable. For other matters no provision is recognised but disclosure is made of items which are potentially material, either individually or in aggregate, except in cases where the likelihood of a liability crystallising is considered to be remote. Currently the Group does not expect the ultimate resolution of any such matters to have a material adverse impact on its financial position.
31 Retirement benefit obligations
Group
2016 2015
£m £m
Present value of funded obligations 4,645 4,686
Present value of unfunded obligations 12 12
4,657 4,698
Fair value of fund assets (4,444) (4,412)
Deficit at 4 April 213 286
Retirement benefit obligations on the balance sheet
Defined contribution pension schemes
The Group operates two defined contribution pension schemes in the UK – the Nationwide Group Personal Pension Plan and the Nationwide Temporary Workers Pension Scheme. New employees to Nationwide are automatically enrolled into one of these schemes, with both schemes being administered by Friends Life.
Outside of the UK, there are defined contribution pension schemes for employees in the Isle of Man and Ireland.
Defined benefit pension schemes
The Group operates a number of defined benefit pension arrangements which are administered by trustees, including both representatives from the Group and independent trustees. The trustees are required by law to act in the interest of all relevant beneficiaries and are responsible for the investment policy with regard to the assets as well as the day to day administration of the benefits.
The principal defined benefit pension arrangement is the Nationwide Pension Fund (the ‘Fund’). This is a contributory defined benefit pension arrangement, with both final salary and career average revalued earnings (CARE) sections. The Fund was closed to new entrants in 2007. Since that date employees have been able to join the Nationwide Group Personal Pension Plan (a defined contribution arrangement).
Eligible employees in the Fund are entitled to annual pensions on retirement at age 65 of one sixtieth of career average revalued earnings (revalued to retirement) for each year of service after 1 April 2011. Benefits accrued prior to 1 April 2011 varied with the majority being one fifty fourth of final salary for each year of service. Benefits are also payable on death and following other events such as leaving employment. No other post-retirement benefits are provided to these employees.
Back to Contents
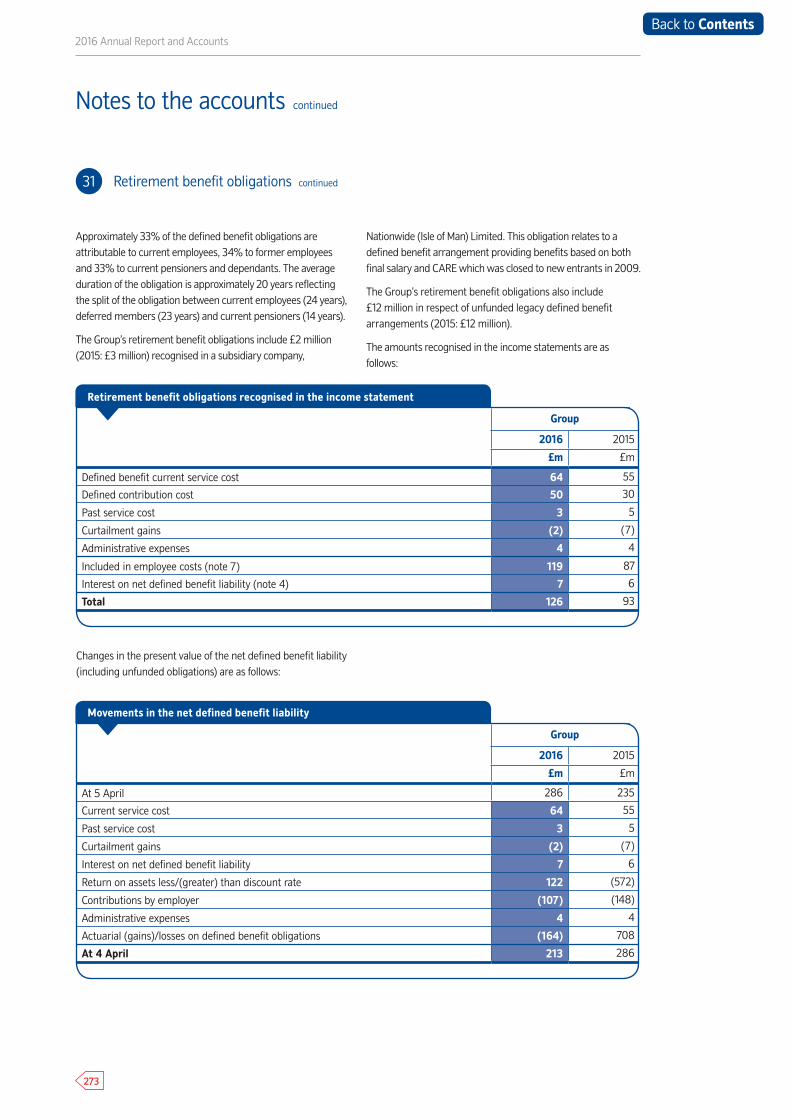
2016 Annual Report and Accounts
273
31 Retirement benefit obligations continued
Group
2016 2015
£m £m
At 5 April 286 235
Current service cost 64 55
Past service cost 3 5
Curtailment gains (2) (7)
Interest on net defined benefit liability 7 6
Return on assets less/(greater) than discount rate 122 (572)
Contributions by employer (107) (148)
Administrative expenses 4 4
Actuarial (gains)/losses on defined benefit obligations (164) 708
At 4 April 213 286
Group
2016 2015
£m £m
Defined benefit current service cost 64 55
Defined contribution cost 50 30
Past service cost 3 5
Curtailment gains (2) (7)
Administrative expenses 4 4
Included in employee costs (note 7) 119 87
Interest on net defined benefit liability (note 4) 7 6
Total 126 93
Movements in the net defined benefit liability
Retirement benefit obligations recognised in the income statement
Changes in the present value of the net defined benefit liability (including unfunded obligations) are as follows:
Notes to the accounts continued
Approximately 33% of the defined benefit obligations are attributable to current employees, 34% to former employees and 33% to current pensioners and dependants. The average duration of the obligation is approximately 20 years reflecting the split of the obligation between current employees (24 years), deferred members (23 years) and current pensioners (14 years).
The Group’s retirement benefit obligations include £2 million (2015: £3 million) recognised in a subsidiary company,
Nationwide (Isle of Man) Limited. This obligation relates to a defined benefit arrangement providing benefits based on both final salary and CARE which was closed to new entrants in 2009.
The Group’s retirement benefit obligations also include £12 million in respect of unfunded legacy defined benefit arrangements (2015: £12 million).
The amounts recognised in the income statements are as follows:
Back to Contents
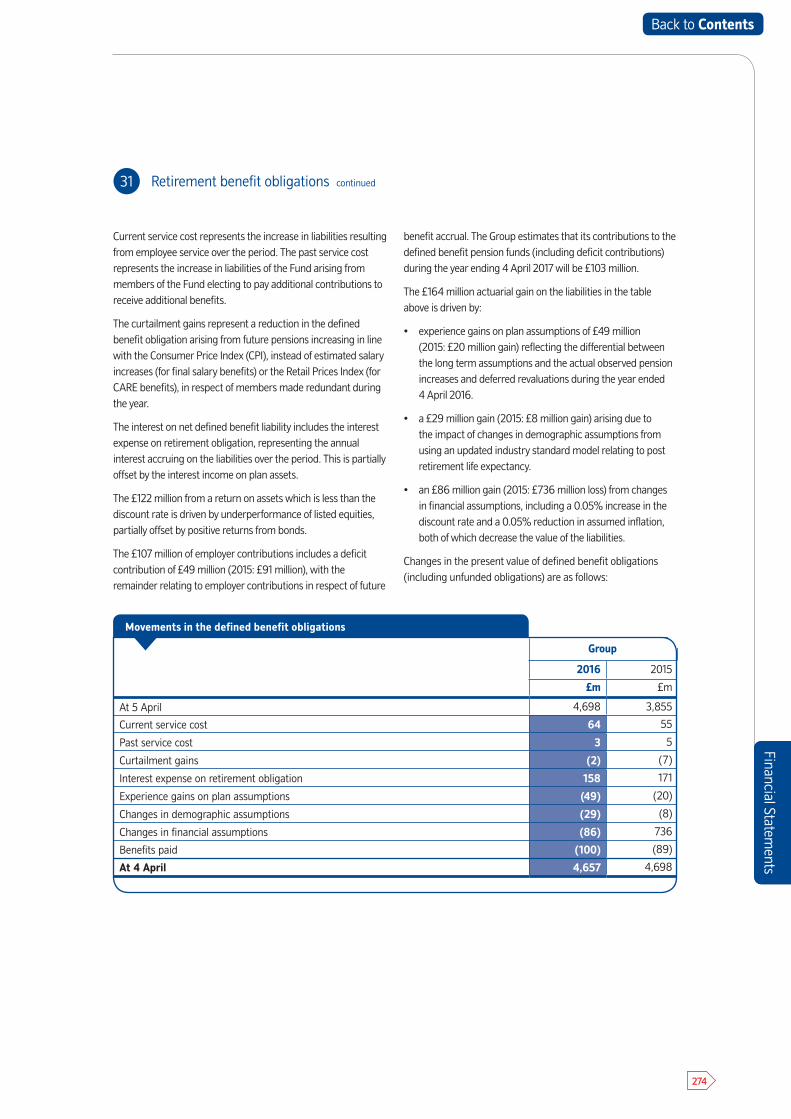
Financial Statements
274
Financial Statements
31 Retirement benefit obligations continued
Group
2016 2015
£m £m
At 5 April 4,698 3,855
Current service cost 64 55
Past service cost 3 5
Curtailment gains (2) (7)
Interest expense on retirement obligation 158 171
Experience gains on plan assumptions (49) (20)
Changes in demographic assumptions (29) (8)
Changes in financial assumptions (86) 736
Benefits paid (100) (89)
At 4 April 4,657 4,698
Movements in the defined benefit obligations
Current service cost represents the increase in liabilities resulting from employee service over the period. The past service cost represents the increase in liabilities of the Fund arising from members of the Fund electing to pay additional contributions to receive additional benefits.
The curtailment gains represent a reduction in the defined benefit obligation arising from future pensions increasing in line with the Consumer Price Index (CPI), instead of estimated salary increases (for final salary benefits) or the Retail Prices Index (for CARE benefits), in respect of members made redundant during the year.
The interest on net defined benefit liability includes the interest expense on retirement obligation, representing the annual interest accruing on the liabilities over the period. This is partially offset by the interest income on plan assets.
The £122 million from a return on assets which is less than the discount rate is driven by underperformance of listed equities, partially offset by positive returns from bonds.
The £107 million of employer contributions includes a deficit contribution of £49 million (2015: £91 million), with the remainder relating to employer contributions in respect of future
benefit accrual. The Group estimates that its contributions to the defined benefit pension funds (including deficit contributions) during the year ending 4 April 2017 will be £103 million.
The £164 million actuarial gain on the liabilities in the table above is driven by:
• experience gains on plan assumptions of £49 million (2015: £20 million gain) reflecting the differential between the long term assumptions and the actual observed pension increases and deferred revaluations during the year ended 4 April 2016.
• a £29 million gain (2015: £8 million gain) arising due to the impact of changes in demographic assumptions from using an updated industry standard model relating to post retirement life expectancy.
• an £86 million gain (2015: £736 million loss) from changes in financial assumptions, including a 0.05% increase in the discount rate and a 0.05% reduction in assumed inflation, both of which decrease the value of the liabilities.
Changes in the present value of defined benefit obligations (including unfunded obligations) are as follows:
Back to Contents
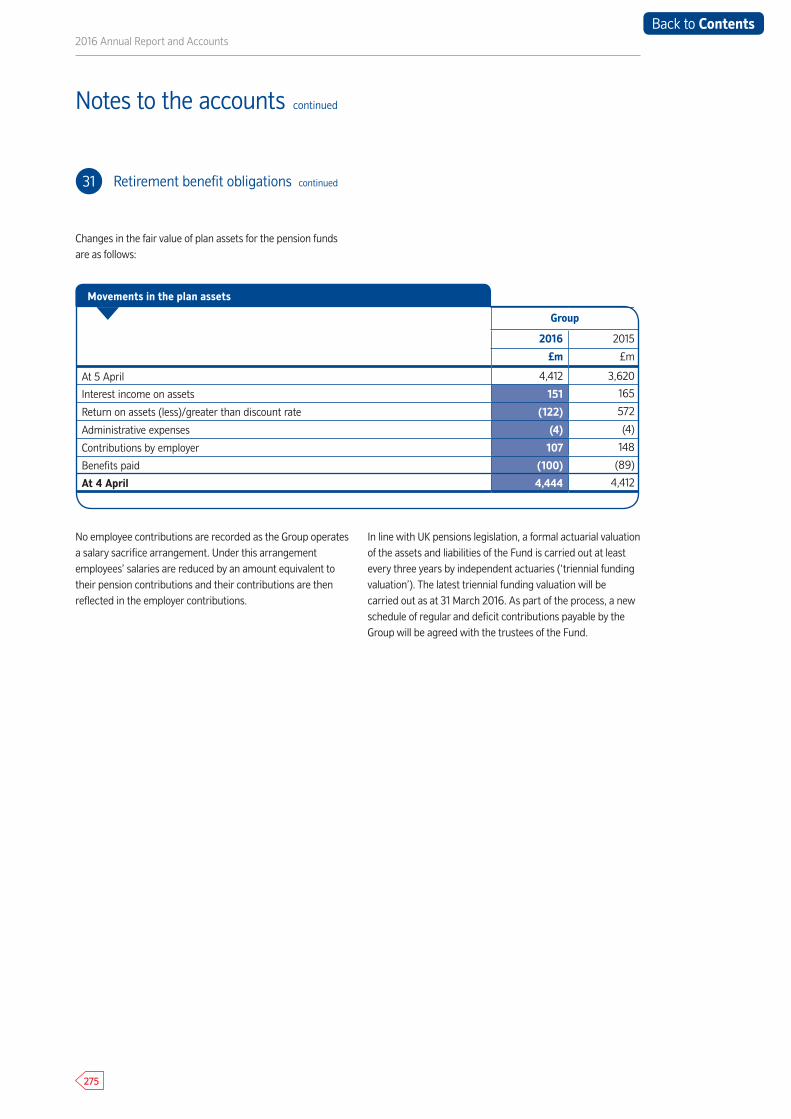
2016 Annual Report and Accounts
275
31 Retirement benefit obligations continued
No employee contributions are recorded as the Group operates a salary sacrifice arrangement. Under this arrangement employees’ salaries are reduced by an amount equivalent to their pension contributions and their contributions are then reflected in the employer contributions.
In line with UK pensions legislation, a formal actuarial valuation of the assets and liabilities of the Fund is carried out at least every three years by independent actuaries (‘triennial funding valuation’). The latest triennial funding valuation will be carried out as at 31 March 2016. As part of the process, a new schedule of regular and deficit contributions payable by the Group will be agreed with the trustees of the Fund.
Changes in the fair value of plan assets for the pension funds are as follows:
Notes to the accounts continued
Group
2016 2015
£m £m
At 5 April 4,412 3,620
Interest income on assets 151 165
Return on assets (less)/greater than discount rate (122) 572
Administrative expenses (4) (4)
Contributions by employer 107 148
Benefits paid (100) (89)
At 4 April 4,444 4,412
Movements in the plan assets
Back to Contents
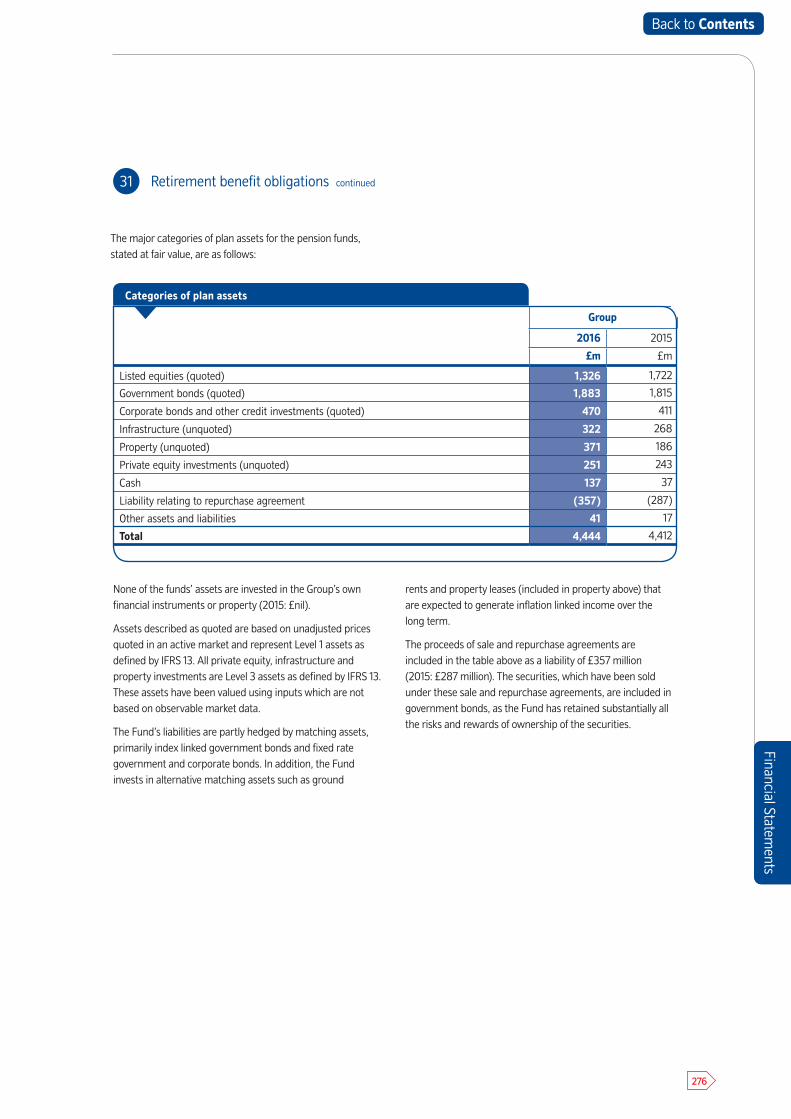
Financial Statements
276
Financial Statements
31 Retirement benefit obligations continued
None of the funds’ assets are invested in the Group’s own financial instruments or property (2015: £nil).
Assets described as quoted are based on unadjusted prices quoted in an active market and represent Level 1 assets as defined by IFRS 13. All private equity, infrastructure and property investments are Level 3 assets as defined by IFRS 13. These assets have been valued using inputs which are not based on observable market data.
The Fund’s liabilities are partly hedged by matching assets, primarily index linked government bonds and fixed rate government and corporate bonds. In addition, the Fund invests in alternative matching assets such as ground
rents and property leases (included in property above) that are expected to generate inflation linked income over the long term.
The proceeds of sale and repurchase agreements are included in the table above as a liability of £357 million (2015: £287 million). The securities, which have been sold under these sale and repurchase agreements, are included in government bonds, as the Fund has retained substantially all the risks and rewards of ownership of the securities.
The major categories of plan assets for the pension funds, stated at fair value, are as follows:
Group
2016 2015
£m £m
Listed equities (quoted) 1,326 1,722
Government bonds (quoted) 1,883 1,815
Corporate bonds and other credit investments (quoted) 470 411
Infrastructure (unquoted) 322 268
Property (unquoted) 371 186
Private equity investments (unquoted) 251 243
Cash 137 37
Liability relating to repurchase agreement (357) (287)
Other assets and liabilities 41 17
Total 4,444 4,412
Categories of plan assets
Back to Contents
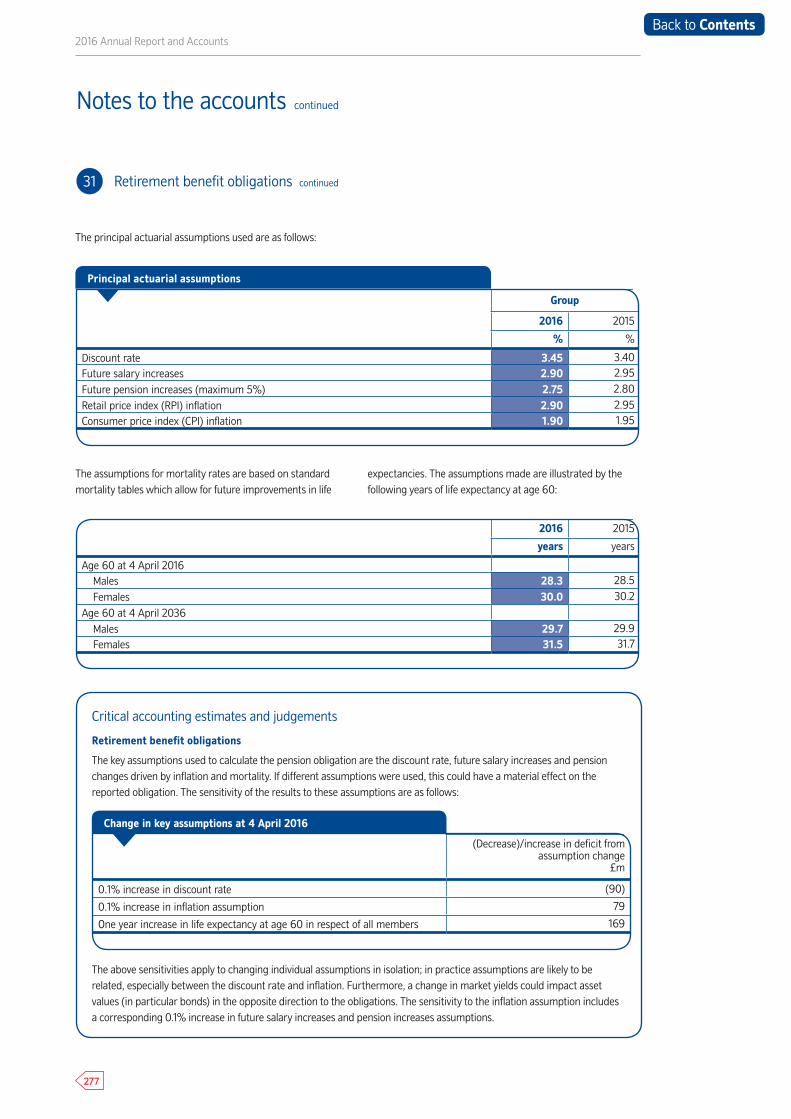
2016 Annual Report and Accounts
277
31 Retirement benefit obligations continued
Notes to the accounts continued
Group
2016 2015
% %
Discount rate 3.45 3.40Future salary increases 2.90 2.95
Future pension increases (maximum 5%) 2.75 2.80
Retail price index (RPI) inflation 2.90 2.95Consumer price index (CPI) inflation 1.90 1.95
2016 2015
years years
Age 60 at 4 April 2016Males 28.3 28.5
Females 30.0 30.2
Age 60 at 4 April 2036Males 29.7 29.9Females 31.5 31.7
Principal actuarial assumptions
The principal actuarial assumptions used are as follows:
The assumptions for mortality rates are based on standard mortality tables which allow for future improvements in life
expectancies. The assumptions made are illustrated by the following years of life expectancy at age 60:
Critical accounting estimates and judgements
Retirement benefit obligations
The key assumptions used to calculate the pension obligation are the discount rate, future salary increases and pension changes driven by inflation and mortality. If different assumptions were used, this could have a material effect on the reported obligation. The sensitivity of the results to these assumptions are as follows:
(Decrease)/increase in deficit from assumption change
£m
0.1% increase in discount rate (90)
0.1% increase in inflation assumption 79
One year increase in life expectancy at age 60 in respect of all members 169
Change in key assumptions at 4 April 2016
The above sensitivities apply to changing individual assumptions in isolation; in practice assumptions are likely to be related, especially between the discount rate and inflation. Furthermore, a change in market yields could impact asset values (in particular bonds) in the opposite direction to the obligations. The sensitivity to the inflation assumption includes a corresponding 0.1% increase in future salary increases and pension increases assumptions.
Back to Contents
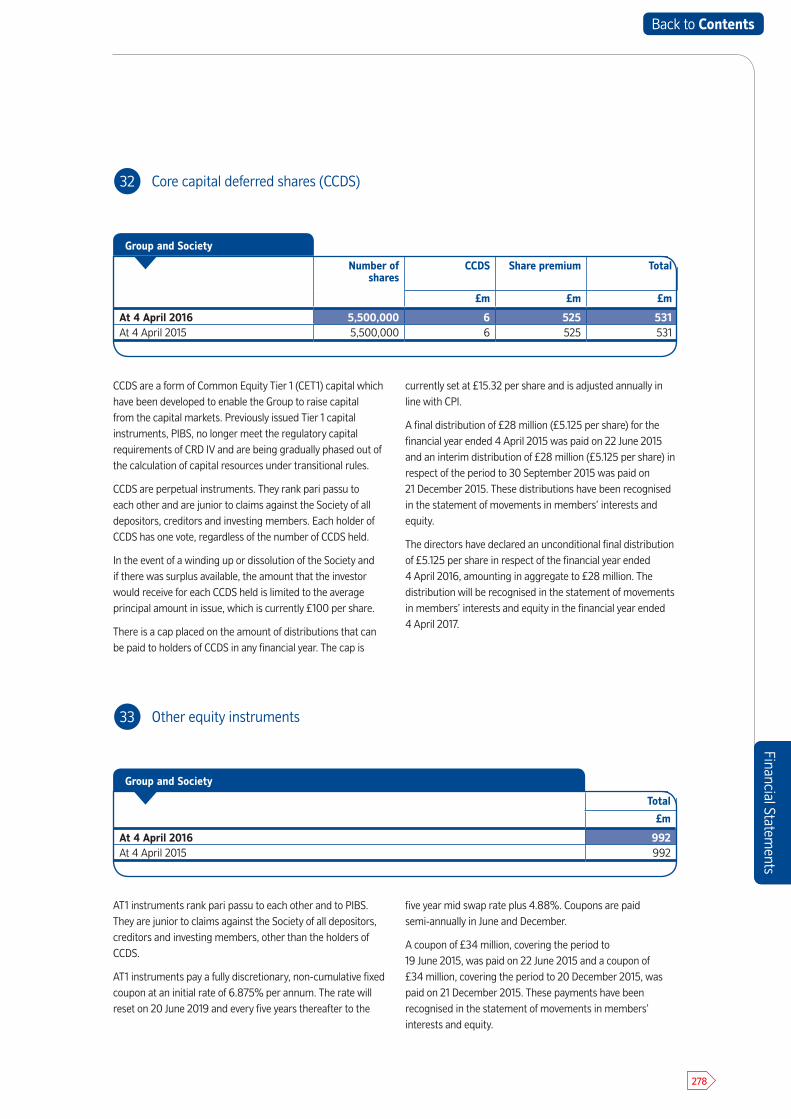
Financial Statements
278
Financial Statements
32 Core capital deferred shares (CCDS)
33 Other equity instruments
CCDS are a form of Common Equity Tier 1 (CET1) capital which have been developed to enable the Group to raise capital from the capital markets. Previously issued Tier 1 capital instruments, PIBS, no longer meet the regulatory capital requirements of CRD IV and are being gradually phased out of the calculation of capital resources under transitional rules.
CCDS are perpetual instruments. They rank pari passu to each other and are junior to claims against the Society of all depositors, creditors and investing members. Each holder of CCDS has one vote, regardless of the number of CCDS held.
In the event of a winding up or dissolution of the Society and if there was surplus available, the amount that the investor would receive for each CCDS held is limited to the average principal amount in issue, which is currently £100 per share.
There is a cap placed on the amount of distributions that can be paid to holders of CCDS in any financial year. The cap is
currently set at £15.32 per share and is adjusted annually in line with CPI.
A final distribution of £28 million (£5.125 per share) for the financial year ended 4 April 2015 was paid on 22 June 2015 and an interim distribution of £28 million (£5.125 per share) in respect of the period to 30 September 2015 was paid on 21 December 2015. These distributions have been recognised in the statement of movements in members’ interests and equity.
The directors have declared an unconditional final distribution of £5.125 per share in respect of the financial year ended 4 April 2016, amounting in aggregate to £28 million. The distribution will be recognised in the statement of movements in members’ interests and equity in the financial year ended 4 April 2017.
AT1 instruments rank pari passu to each other and to PIBS. They are junior to claims against the Society of all depositors, creditors and investing members, other than the holders of CCDS.
AT1 instruments pay a fully discretionary, non-cumulative fixed coupon at an initial rate of 6.875% per annum. The rate will reset on 20 June 2019 and every five years thereafter to the
five year mid swap rate plus 4.88%. Coupons are paid semi-annually in June and December.
A coupon of £34 million, covering the period to 19 June 2015, was paid on 22 June 2015 and a coupon of £34 million, covering the period to 20 December 2015, was paid on 21 December 2015. These payments have been recognised in the statement of movements in members’ interests and equity.
Number of shares
CCDS Share premium Total
£m £m £m
At 4 April 2016 5,500,000 6 525 531At 4 April 2015 5,500,000 6 525 531
Total
£m
At 4 April 2016 992At 4 April 2015 992
Group and Society
Group and Society
Back to Contents
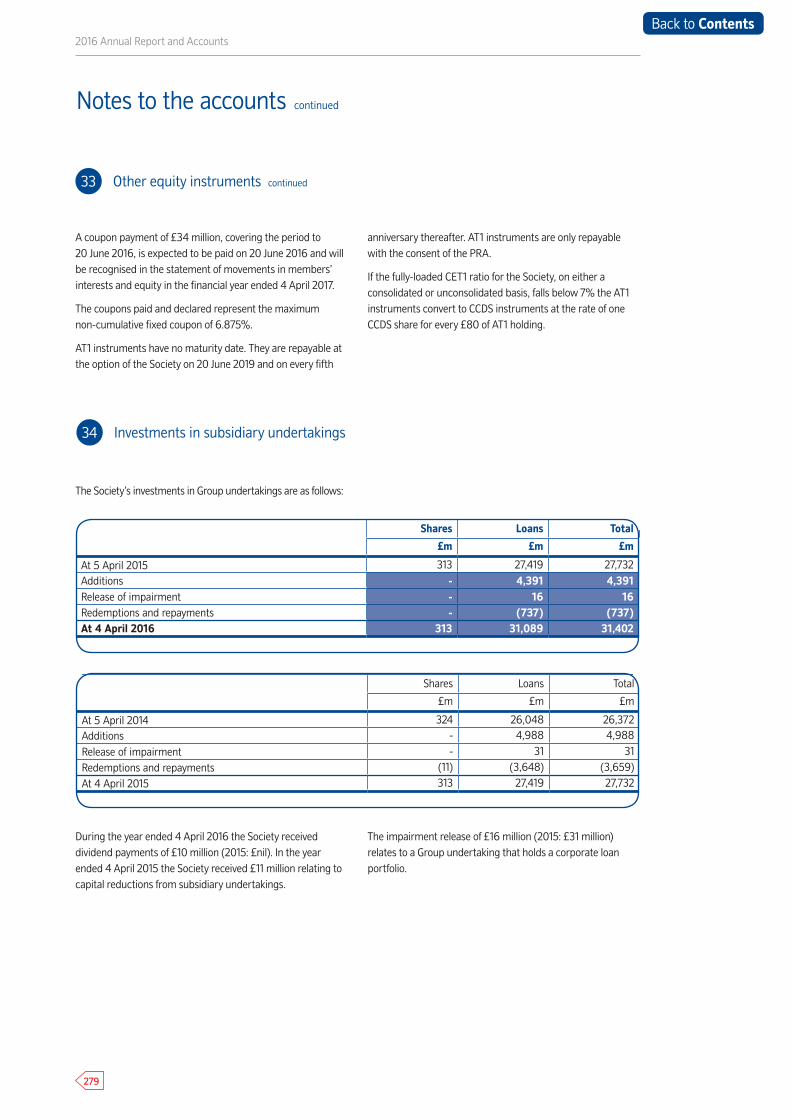
2016 Annual Report and Accounts
279
33 Other equity instruments continued
34 Investments in subsidiary undertakings
Notes to the accounts continued
A coupon payment of £34 million, covering the period to 20 June 2016, is expected to be paid on 20 June 2016 and will be recognised in the statement of movements in members’ interests and equity in the financial year ended 4 April 2017.
The coupons paid and declared represent the maximum non-cumulative fixed coupon of 6.875%.
AT1 instruments have no maturity date. They are repayable at the option of the Society on 20 June 2019 and on every fifth
anniversary thereafter. AT1 instruments are only repayable with the consent of the PRA.
If the fully-loaded CET1 ratio for the Society, on either a consolidated or unconsolidated basis, falls below 7% the AT1 instruments convert to CCDS instruments at the rate of one CCDS share for every £80 of AT1 holding.
During the year ended 4 April 2016 the Society received dividend payments of £10 million (2015: £nil). In the year ended 4 April 2015 the Society received £11 million relating to capital reductions from subsidiary undertakings.
The impairment release of £16 million (2015: £31 million) relates to a Group undertaking that holds a corporate loan portfolio.
The Society’s investments in Group undertakings are as follows:
Shares Loans Total
£m £m £m
At 5 April 2015 313 27,419 27,732Additions - 4,391 4,391Release of impairment - 16 16Redemptions and repayments - (737) (737)At 4 April 2016 313 31,089 31,402
Shares Loans Total
£m £m £m
At 5 April 2014 324 26,048 26,372Additions - 4,988 4,988
Release of impairment - 31 31
Redemptions and repayments (11) (3,648) (3,659)
At 4 April 2015 313 27,419 27,732
Back to Contents
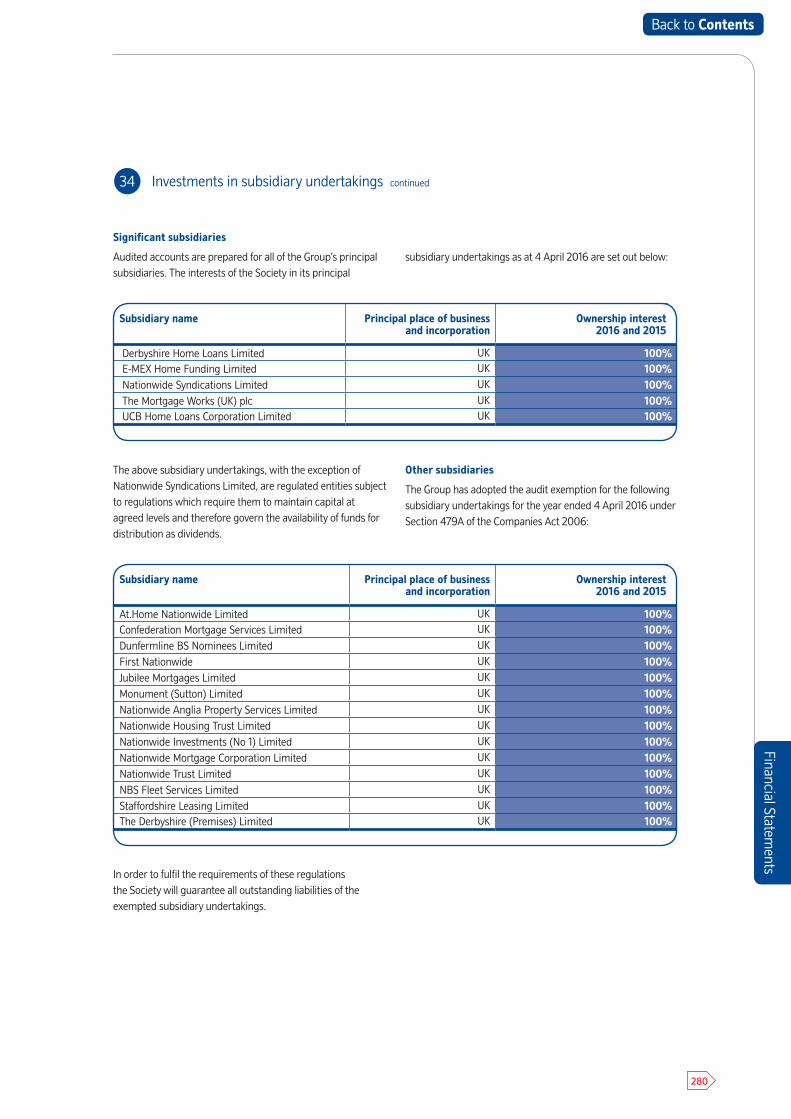
Financial Statements
280
Financial Statements
34 Investments in subsidiary undertakings continued
The above subsidiary undertakings, with the exception of Nationwide Syndications Limited, are regulated entities subject to regulations which require them to maintain capital at agreed levels and therefore govern the availability of funds for distribution as dividends.
Other subsidiaries
The Group has adopted the audit exemption for the following subsidiary undertakings for the year ended 4 April 2016 under Section 479A of the Companies Act 2006:
In order to fulfil the requirements of these regulations the Society will guarantee all outstanding liabilities of the exempted subsidiary undertakings.
Significant subsidiaries
Audited accounts are prepared for all of the Group’s principal subsidiaries. The interests of the Society in its principal
subsidiary undertakings as at 4 April 2016 are set out below:
Subsidiary name Principal place of business and incorporation
Ownership interest 2016 and 2015
Derbyshire Home Loans Limited UK 100%E-MEX Home Funding Limited UK 100%
Nationwide Syndications Limited UK 100% The Mortgage Works (UK) plc UK 100% UCB Home Loans Corporation Limited UK 100%
Subsidiary name Principal place of business and incorporation
Ownership interest 2016 and 2015
At.Home Nationwide Limited UK 100%Confederation Mortgage Services Limited UK 100%Dunfermline BS Nominees Limited UK 100%First Nationwide UK 100%Jubilee Mortgages Limited UK 100%Monument (Sutton) Limited UK 100%Nationwide Anglia Property Services Limited UK 100%Nationwide Housing Trust Limited UK 100%Nationwide Investments (No 1) Limited UK 100%Nationwide Mortgage Corporation Limited UK 100%Nationwide Trust Limited UK 100%NBS Fleet Services Limited UK 100%Staffordshire Leasing Limited UK 100%The Derbyshire (Premises) Limited UK 100%
Back to Contents
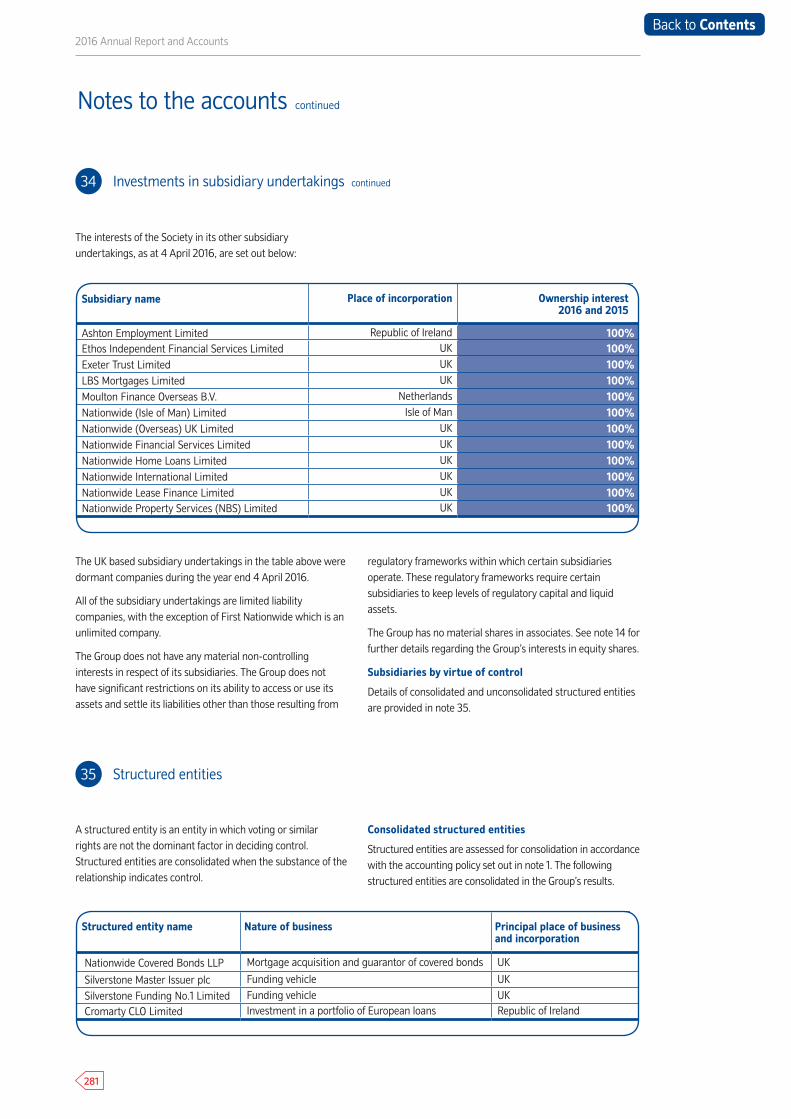
2016 Annual Report and Accounts
281
34 Investments in subsidiary undertakings continued
35 Structured entities
Notes to the accounts continued
The UK based subsidiary undertakings in the table above were dormant companies during the year end 4 April 2016.
All of the subsidiary undertakings are limited liability companies, with the exception of First Nationwide which is an unlimited company.
The Group does not have any material non-controlling interests in respect of its subsidiaries. The Group does not have significant restrictions on its ability to access or use its assets and settle its liabilities other than those resulting from
regulatory frameworks within which certain subsidiaries operate. These regulatory frameworks require certain subsidiaries to keep levels of regulatory capital and liquid assets.
The Group has no material shares in associates. See note 14 for further details regarding the Group’s interests in equity shares.
Subsidiaries by virtue of control
Details of consolidated and unconsolidated structured entities are provided in note 35.
The interests of the Society in its other subsidiary undertakings, as at 4 April 2016, are set out below:
A structured entity is an entity in which voting or similar rights are not the dominant factor in deciding control. Structured entities are consolidated when the substance of the relationship indicates control.
Consolidated structured entities
Structured entities are assessed for consolidation in accordance with the accounting policy set out in note 1. The following structured entities are consolidated in the Group’s results.
Subsidiary name Place of incorporation Ownership interest 2016 and 2015
Ashton Employment Limited Republic of Ireland 100%Ethos Independent Financial Services Limited UK 100%Exeter Trust Limited UK 100%LBS Mortgages Limited UK 100%Moulton Finance Overseas B.V. Netherlands 100%Nationwide (Isle of Man) Limited Isle of Man 100%Nationwide (Overseas) UK Limited UK 100%Nationwide Financial Services Limited UK 100%Nationwide Home Loans Limited UK 100%Nationwide International Limited UK 100%Nationwide Lease Finance Limited UK 100%Nationwide Property Services (NBS) Limited UK 100%
Structured entity name Nature of business Principal place of business and incorporation
Nationwide Covered Bonds LLP Mortgage acquisition and guarantor of covered bonds UK
Silverstone Master Issuer plc Funding vehicle UK
Silverstone Funding No.1 Limited Funding vehicle UK Cromarty CLO Limited Investment in a portfolio of European loans Republic of Ireland
Back to Contents
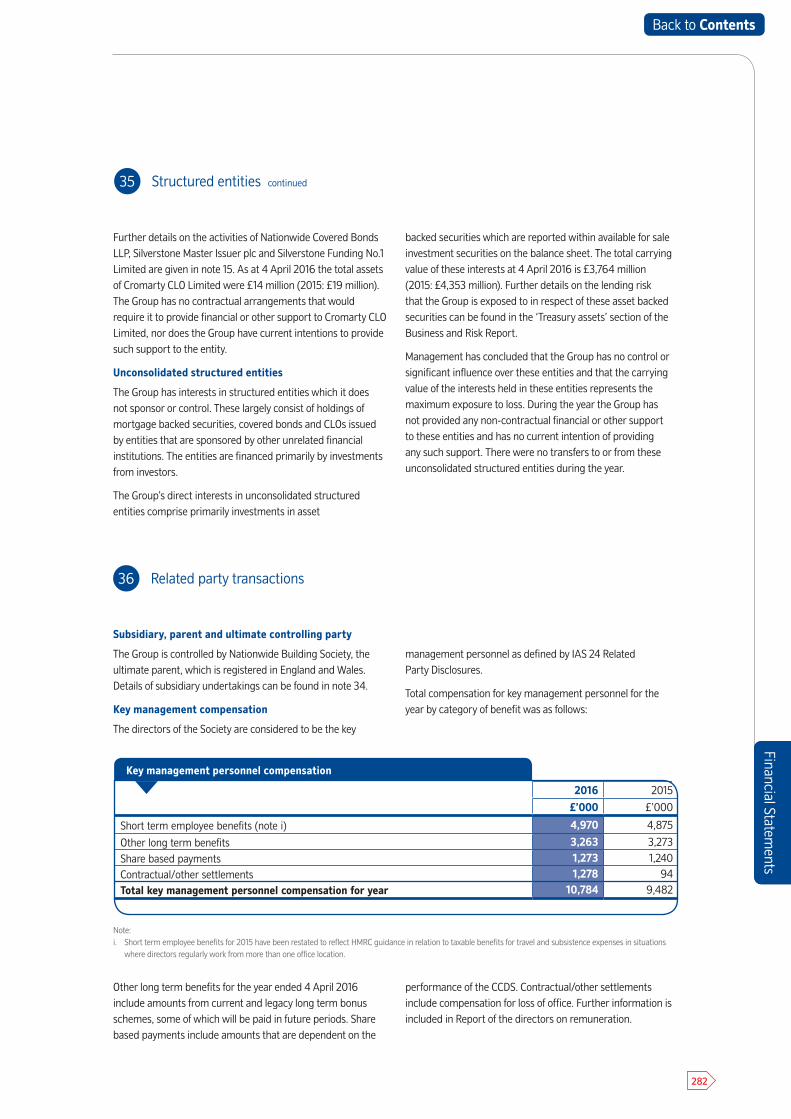
Financial Statements
282
Financial Statements
35 Structured entities continued
36 Related party transactions
Further details on the activities of Nationwide Covered Bonds LLP, Silverstone Master Issuer plc and Silverstone Funding No.1 Limited are given in note 15. As at 4 April 2016 the total assets of Cromarty CLO Limited were £14 million (2015: £19 million). The Group has no contractual arrangements that would require it to provide financial or other support to Cromarty CLO Limited, nor does the Group have current intentions to provide such support to the entity.
Unconsolidated structured entities
The Group has interests in structured entities which it does not sponsor or control. These largely consist of holdings of mortgage backed securities, covered bonds and CLOs issued by entities that are sponsored by other unrelated financial institutions. The entities are financed primarily by investments from investors.
The Group’s direct interests in unconsolidated structured entities comprise primarily investments in asset
backed securities which are reported within available for sale investment securities on the balance sheet. The total carrying value of these interests at 4 April 2016 is £3,764 million (2015: £4,353 million). Further details on the lending risk that the Group is exposed to in respect of these asset backed securities can be found in the ‘Treasury assets’ section of the Business and Risk Report.
Management has concluded that the Group has no control or significant influence over these entities and that the carrying value of the interests held in these entities represents the maximum exposure to loss. During the year the Group has not provided any non-contractual financial or other support to these entities and has no current intention of providing any such support. There were no transfers to or from these unconsolidated structured entities during the year.
Subsidiary, parent and ultimate controlling party
The Group is controlled by Nationwide Building Society, the ultimate parent, which is registered in England and Wales. Details of subsidiary undertakings can be found in note 34.
Key management compensation
The directors of the Society are considered to be the key
management personnel as defined by IAS 24 Related Party Disclosures.
Total compensation for key management personnel for the year by category of benefit was as follows:
Other long term benefits for the year ended 4 April 2016 include amounts from current and legacy long term bonus schemes, some of which will be paid in future periods. Share based payments include amounts that are dependent on the
performance of the CCDS. Contractual/other settlements include compensation for loss of office. Further information is included in Report of the directors on remuneration.
2016 2015
£’000 £’000
Short term employee benefits (note i) 4,970 4,875
Other long term benefits 3,263 3,273
Share based payments 1,273 1,240
Contractual/other settlements 1,278 94Total key management personnel compensation for year 10,784 9,482
Key management personnel compensation
Note:i. Short term employee benefits for 2015 have been restated to reflect HMRC guidance in relation to taxable benefits for travel and subsistence expenses in situations
where directors regularly work from more than one office location.
Back to Contents
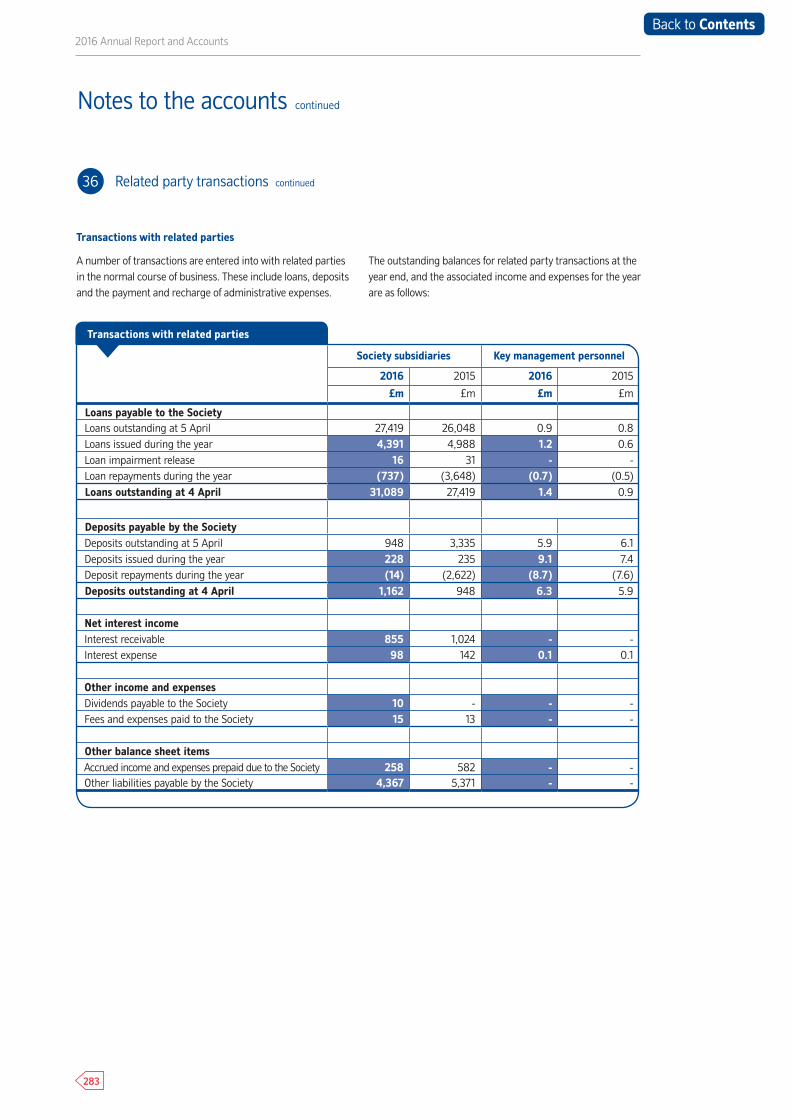
2016 Annual Report and Accounts
283
36 Related party transactions continued
Notes to the accounts continued
Transactions with related parties
A number of transactions are entered into with related parties in the normal course of business. These include loans, deposits and the payment and recharge of administrative expenses.
The outstanding balances for related party transactions at the year end, and the associated income and expenses for the year are as follows:
Society subsidiaries Key management personnel
2016 2015 2016 2015
£m £m £m £m
Loans payable to the Society Loans outstanding at 5 April 27,419 26,048 0.9 0.8 Loans issued during the year 4,391 4,988 1.2 0.6 Loan impairment release 16 31 - - Loan repayments during the year (737) (3,648) (0.7) (0.5) Loans outstanding at 4 April 31,089 27,419 1.4 0.9
Deposits payable by the Society Deposits outstanding at 5 April 948 3,335 5.9 6.1 Deposits issued during the year 228 235 9.1 7.4 Deposit repayments during the year (14) (2,622) (8.7) (7.6) Deposits outstanding at 4 April 1,162 948 6.3 5.9
Net interest income Interest receivable 855 1,024 - - Interest expense 98 142 0.1 0.1
Other income and expenses Dividends payable to the Society 10 - - - Fees and expenses paid to the Society 15 13 - -
Other balance sheet items Accrued income and expenses prepaid due to the Society 258 582 - - Other liabilities payable by the Society 4,367 5,371 - -
Transactions with related parties
Back to Contents

Financial Statements
284
Financial Statements
36 Related party transactions continued
Transactions with key management personnel
Transactions with key management personnel are on the same terms and conditions applicable to other employees within the Group.
In addition to the loans and deposits disclosed in the above table, one non executive director held £106,255 of core capital deferred shares at 4 April 2015 and received dividends of £4,285 during the year.
A register is maintained by the Society containing details of loans, transactions and arrangements made between the Society or its subsidiary undertakings and directors of the Society or persons connected with directors of the Society.
The register will be available for inspection by members at the Annual General Meeting on 21 July 2016 and during normal
office hours at the Society’s principal office (Nationwide House, Pipers Way, Swindon) during the period of 15 days prior to the meeting.
Transactions with Group companies
Transactions with Group companies arise in the normal course of business. Interest on outstanding loans and deposits accrues at a transfer price rate agreed between the Society and its subsidiary undertakings.
The Society does not charge the net defined benefit cost to the subsidiary undertakings that participate in the Nationwide Pension Fund. The pension cost to these subsidiary undertakings equals the contributions payable to the Fund.
Back to Contents
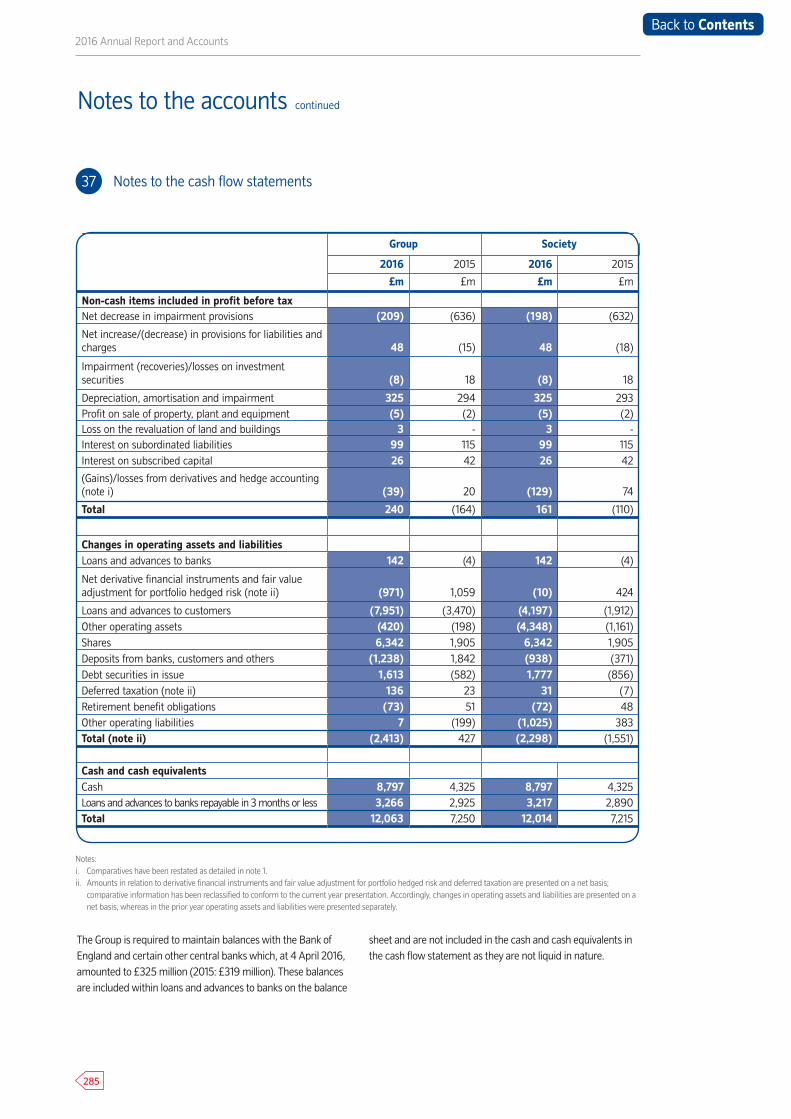
2016 Annual Report and Accounts
285
37 Notes to the cash flow statements
Notes to the accounts continued
Group Society
2016 2015 2016 2015
£m £m £m £m
Non-cash items included in profit before taxNet decrease in impairment provisions (209) (636) (198) (632)
Net increase/(decrease) in provisions for liabilities and charges 48 (15) 48 (18)
Impairment (recoveries)/losses on investment securities (8) 18 (8) 18
Depreciation, amortisation and impairment 325 294 325 293Profit on sale of property, plant and equipment (5) (2) (5) (2)Loss on the revaluation of land and buildings 3 - 3 -Interest on subordinated liabilities 99 115 99 115Interest on subscribed capital 26 42 26 42
(Gains)/losses from derivatives and hedge accounting (note i) (39) 20 (129) 74
Total 240 (164) 161 (110)
Changes in operating assets and liabilitiesLoans and advances to banks 142 (4) 142 (4)
Net derivative financial instruments and fair value adjustment for portfolio hedged risk (note ii) (971) 1,059 (10) 424
Loans and advances to customers (7,951) (3,470) (4,197) (1,912)Other operating assets (420) (198) (4,348) (1,161)Shares 6,342 1,905 6,342 1,905Deposits from banks, customers and others (1,238) 1,842 (938) (371)Debt securities in issue 1,613 (582) 1,777 (856)Deferred taxation (note ii) 136 23 31 (7)Retirement benefit obligations (73) 51 (72) 48Other operating liabilities 7 (199) (1,025) 383Total (note ii) (2,413) 427 (2,298) (1,551)
Cash and cash equivalentsCash 8,797 4,325 8,797 4,325Loans and advances to banks repayable in 3 months or less 3,266 2,925 3,217 2,890Total 12,063 7,250 12,014 7,215
Notes:i. Comparatives have been restated as detailed in note 1.ii. Amounts in relation to derivative financial instruments and fair value adjustment for portfolio hedged risk and deferred taxation are presented on a net basis;
comparative information has been reclassified to conform to the current year presentation. Accordingly, changes in operating assets and liabilities are presented on anet basis, whereas in the prior year operating assets and liabilities were presented separately.
The Group is required to maintain balances with the Bank of England and certain other central banks which, at 4 April 2016, amounted to £325 million (2015: £319 million). These balances are included within loans and advances to banks on the balance
sheet and are not included in the cash and cash equivalents in the cash flow statement as they are not liquid in nature.
Back to Contents
Financial Statements
286
Financial Statements
38 Capital management
39 Registered office
The Group is subject to the capital requirements imposed by its regulator the Prudential Regulation Authority (PRA). Regulatory capital comprises the Group’s general reserve, revaluation reserve, core capital deferred shares, other equity instruments, permanent interest bearing shares (PIBS) and subordinated debt, subject to various adjustments required by the capital rules.
During the year the Group complied with the capital requirements set by the PRA. Further unaudited details about the Group’s capital position can be found in the ‘Solvency risk’ section of the Business and Risk Report.
Nationwide is a building society, incorporated and domiciled in the United Kingdom. The address of its registered office is:
Nationwide Building Society Nationwide House Pipers Way, Swindon SN38 1NW
Back to Contents

287
2016 Annual Report and Accounts2016 Annual Report and Accounts
Other InformationAnnual business statement 289
• Statutory percentages 289
• Other percentages 290
• Information relating to directors 291
• Directors’ service contracts 292
• Directors’ share options 292
Forward looking statements 293
Glossary 294
Index 304
287
Back to Contents

288
Other Inform
ation
Other Information
Other Inform
ation
288
Back to Contents
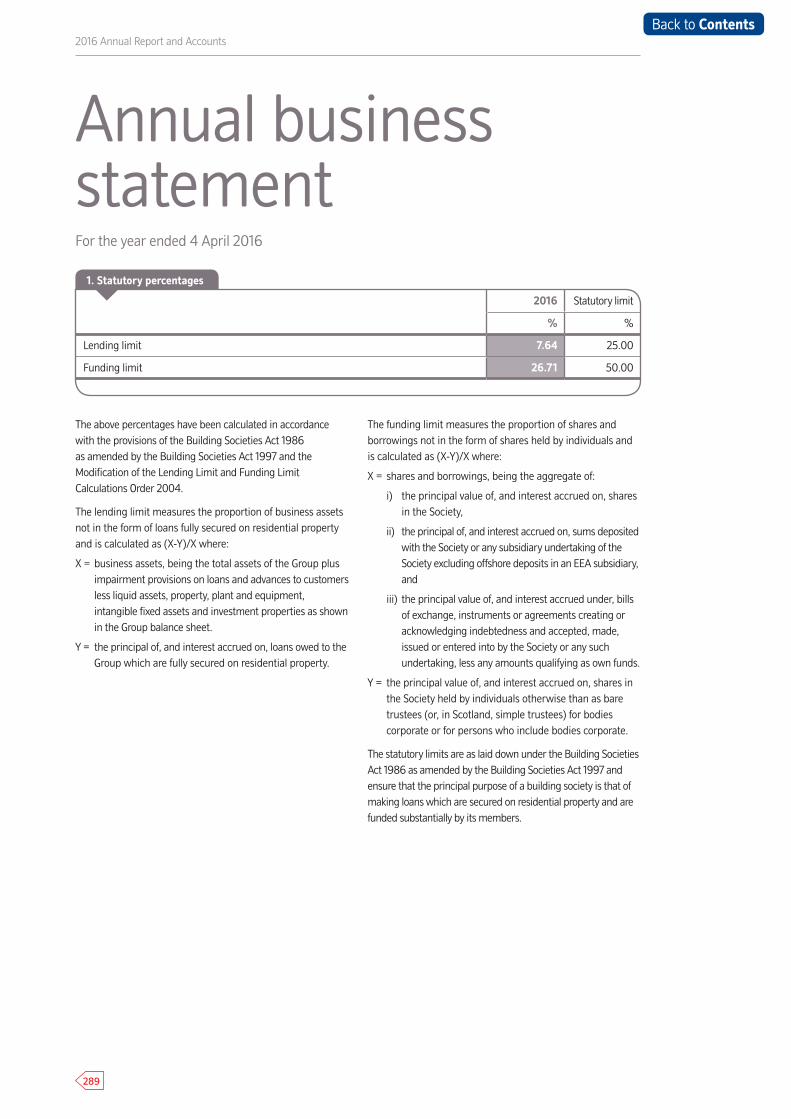
289
2016 Annual Report and Accounts
2016 Statutory limit
% %
Lending limit 7.64 25.00
Funding limit 26.71 50.00
Annual business statement
The above percentages have been calculated in accordance with the provisions of the Building Societies Act 1986 as amended by the Building Societies Act 1997 and the Modification of the Lending Limit and Funding Limit Calculations Order 2004.
The lending limit measures the proportion of business assets not in the form of loans fully secured on residential property and is calculated as (X-Y)/X where:
X = business assets, being the total assets of the Group plus impairment provisions on loans and advances to customers less liquid assets, property, plant and equipment, intangible fixed assets and investment properties as shown in the Group balance sheet.
Y = the principal of, and interest accrued on, loans owed to the Group which are fully secured on residential property.
The funding limit measures the proportion of shares and borrowings not in the form of shares held by individuals and is calculated as (X-Y)/X where:
X = shares and borrowings, being the aggregate of:
i) the principal value of, and interest accrued on, shares in the Society,
ii) the principal of, and interest accrued on, sums deposited with the Society or any subsidiary undertaking of the Society excluding offshore deposits in an EEA subsidiary, and
iii) the principal value of, and interest accrued under, bills of exchange, instruments or agreements creating or acknowledging indebtedness and accepted, made, issued or entered into by the Society or any such undertaking, less any amounts qualifying as own funds.
Y = the principal value of, and interest accrued on, shares in the Society held by individuals otherwise than as bare trustees (or, in Scotland, simple trustees) for bodies corporate or for persons who include bodies corporate.
The statutory limits are as laid down under the Building Societies Act 1986 as amended by the Building Societies Act 1997 and ensure that the principal purpose of a building society is that of making loans which are secured on residential property and are funded substantially by its members.
For the year ended 4 April 2016
1. Statutory percentages
Back to Contents
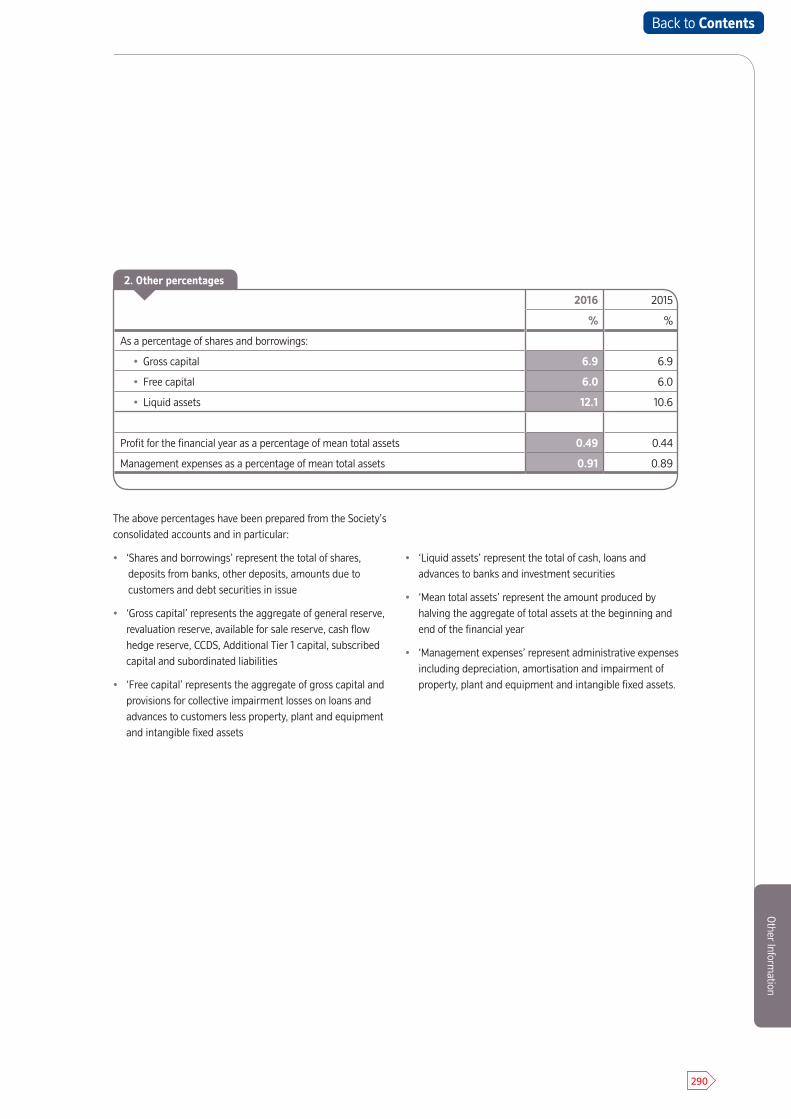
290
Other Inform
ation
2016 2015
% %
As a percentage of shares and borrowings:
• Gross capital 6.9 6.9
• Free capital 6.0 6.0
• Liquid assets 12.1 10.6
Profit for the financial year as a percentage of mean total assets 0.49 0.44
Management expenses as a percentage of mean total assets 0.91 0.89
The above percentages have been prepared from the Society’s consolidated accounts and in particular:
• ‘Shares and borrowings’ represent the total of shares, deposits from banks, other deposits, amounts due to customers and debt securities in issue
• ‘Gross capital’ represents the aggregate of general reserve, revaluation reserve, available for sale reserve, cash flow hedge reserve, CCDS, Additional Tier 1 capital, subscribed capital and subordinated liabilities
• ‘Free capital’ represents the aggregate of gross capital and provisions for collective impairment losses on loans and advances to customers less property, plant and equipment and intangible fixed assets
• ‘Liquid assets’ represent the total of cash, loans and advances to banks and investment securities
• ‘Mean total assets’ represent the amount produced by halving the aggregate of total assets at the beginning and end of the financial year
• ‘Management expenses’ represent administrative expenses including depreciation, amortisation and impairment of property, plant and equipment and intangible fixed assets.
2. Other percentages
Back to Contents
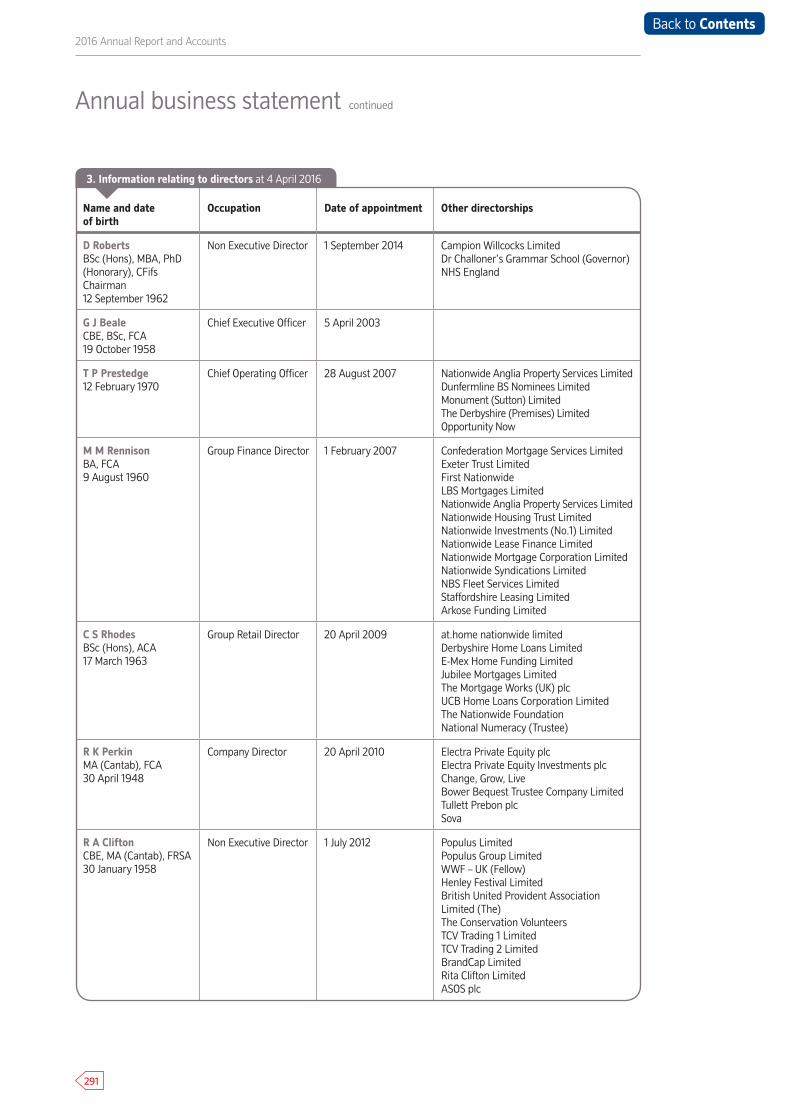
291
2016 Annual Report and Accounts
Name and date of birth
Occupation Date of appointment Other directorships
D RobertsBSc (Hons), MBA, PhD (Honorary), CFifsChairman12 September 1962
Non Executive Director 1 September 2014 Campion Willcocks LimitedDr Challoner’s Grammar School (Governor)NHS England
G J BealeCBE, BSc, FCA19 October 1958
Chief Executive Officer 5 April 2003
T P Prestedge12 February 1970
Chief Operating Officer 28 August 2007 Nationwide Anglia Property Services LimitedDunfermline BS Nominees LimitedMonument (Sutton) LimitedThe Derbyshire (Premises) LimitedOpportunity Now
M M RennisonBA, FCA9 August 1960
Group Finance Director 1 February 2007 Confederation Mortgage Services LimitedExeter Trust LimitedFirst NationwideLBS Mortgages LimitedNationwide Anglia Property Services LimitedNationwide Housing Trust LimitedNationwide Investments (No.1) LimitedNationwide Lease Finance LimitedNationwide Mortgage Corporation Limited Nationwide Syndications LimitedNBS Fleet Services LimitedStaffordshire Leasing LimitedArkose Funding Limited
C S RhodesBSc (Hons), ACA17 March 1963
Group Retail Director 20 April 2009 at.home nationwide limitedDerbyshire Home Loans LimitedE-Mex Home Funding LimitedJubilee Mortgages LimitedThe Mortgage Works (UK) plcUCB Home Loans Corporation LimitedThe Nationwide FoundationNational Numeracy (Trustee)
R K PerkinMA (Cantab), FCA30 April 1948
Company Director 20 April 2010 Electra Private Equity plcElectra Private Equity Investments plcChange, Grow, LiveBower Bequest Trustee Company LimitedTullett Prebon plc Sova
R A CliftonCBE, MA (Cantab), FRSA30 January 1958
Non Executive Director 1 July 2012 Populus LimitedPopulus Group LimitedWWF – UK (Fellow)Henley Festival LimitedBritish United Provident Association Limited (The)The Conservation VolunteersTCV Trading 1 LimitedTCV Trading 2 LimitedBrandCap LimitedRita Clifton LimitedASOS plc
Annual business statement continued
3. Information relating to directors at 4 April 2016
Back to Contents

292
Other Inform
ationO
ther Information
Documents may be served on any of the directors c/o The Group Secretary, Nationwide Building Society, Nationwide House, Pipers Way, Swindon, Wiltshire SN38 1SN.
Directors’ service contractsExecutive directors’ terms and conditions of employment are detailed in their individual contracts which include a notice period of 12 months from the Society to the individual and a notice period of six months from the individual to the Society. The notice period offered to any new recruit would be in line with this approach.
Directors’ share options50% of awards to directors from the 2015/16 Directors’ Performance Award and the legacy 2013-16 Medium Term Performance Pay Plan will be linked to the value of the Society’s core capital deferred shares, details of which have been provided in the Report of the directors on remuneration. 50% of outstanding awards under the 2014/15 Directors’ Performance Pay Plan and the legacy 2012-15 Medium Term Performance Pay Plan are also linked to the value of the Society’s core capital deferred shares.
Name and date of birth
Occupation Date of appointment Other directorships
L M PeacockBA (Hons)26 December 1953
Company Director 18 July 2011 Hawkins Residents LimitedScottish WaterScottish Water Business Stream Holdings LimitedScottish Water Horizons Holdings LimitedStandard Life plcStandard Life Assurance LimitedStandard Life Charitable TrustThe Westminster Society for People with Learning Disabilities
M A LensonMBA, BA (Hons),ACIB, FSI17 September 1954
Company Director 18 July 2011 Eclipse Film Partners No.39 LLP (Designated Member)The Invicta Film Partnership No.37 LLP (Designated Member)Elysian Fuels 1 LLP (Designated Member)Elysian Fuels 2 LLP (Designated Member)MVA Consultant Services LimitedThe Currency Cloud Group Limited
R M FyfieldMA, BA (Hons)3 May 1969
Non Executive Director 2 June 2015 Jupiter Entertainment
T J W TookeyBSc (Hons), FCA17 July 1962
Non Executive Director 2 June 2015 Westmoreland Court Management (Beckenham) LimitedZoological Society of London (Member of Strategy & Development Board)
3. Information relating to directors at 4 April 2016
Back to Contents
293
2016 Annual Report and Accounts
Forward looking statements
Statements in this document are forward looking with respect to plans, goals and expectations relating to the future financial position, business performance and results of Nationwide. Although Nationwide believes that the expectations reflected in these forward looking statements are reasonable, Nationwide can give no assurance that these expectations will prove to be an accurate reflection of actual results. By their nature, all forward looking statements involve risk and uncertainty because they relate to future events and circumstances that are beyond the control of Nationwide including, amongst other things, UK domestic and global economic and business conditions, market related risks such as fluctuation in interest rates and exchange rates, inflation/deflation, the impact of competition, changes in customer preferences, risks concerning borrower credit quality, delays in implementing proposals, the timing, impact and other uncertainties of future acquisitions or other combinations within relevant industries, the policies and actions of regulatory authorities, the impact of tax or other legislation and other regulations in the jurisdictions in which Nationwide operates. As a result, Nationwide’s actual future financial condition, business performance and results may differ materially from the plans, goals and expectations expressed or implied in these forward looking statements. Due to such risks and uncertainties Nationwide cautions readers not to place undue reliance on such forward looking statements.
Nationwide undertakes no obligation to update any forward looking statements whether as a result of new information, future events or otherwise.
This document does not constitute or form part of an offer of securities for sale in the United States. Securities may not be offered or sold in the United States absent registration or an exemption from registration. Any public offering to be made in the United States will be made by means of a prospectus that may be obtained from the Society and will contain detailed information about the Society and management as well as financial statements.
Back to Contents
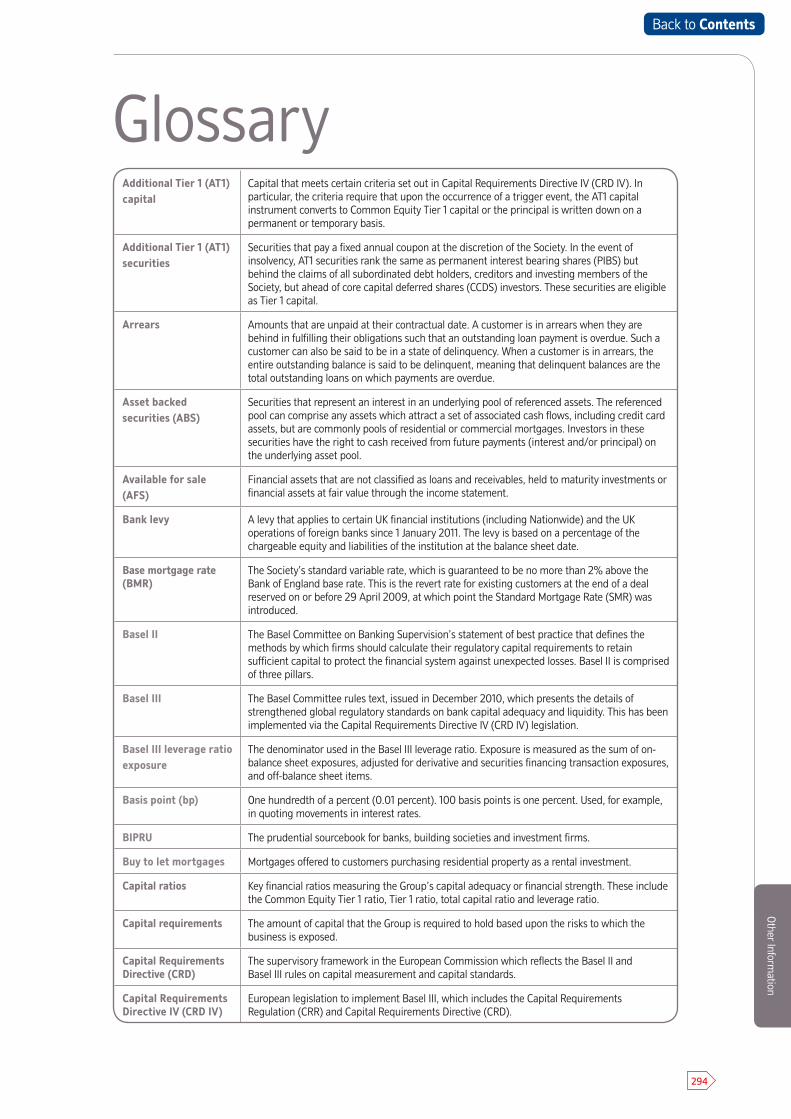
294
Other Inform
ation
Additional Tier 1 (AT1) capital
Capital that meets certain criteria set out in Capital Requirements Directive IV (CRD IV). In particular, the criteria require that upon the occurrence of a trigger event, the AT1 capital instrument converts to Common Equity Tier 1 capital or the principal is written down on a permanent or temporary basis.
Additional Tier 1 (AT1) securities
Securities that pay a fixed annual coupon at the discretion of the Society. In the event of insolvency, AT1 securities rank the same as permanent interest bearing shares (PIBS) but behind the claims of all subordinated debt holders, creditors and investing members of the Society, but ahead of core capital deferred shares (CCDS) investors. These securities are eligible as Tier 1 capital.
Arrears Amounts that are unpaid at their contractual date. A customer is in arrears when they are behind in fulfilling their obligations such that an outstanding loan payment is overdue. Such a customer can also be said to be in a state of delinquency. When a customer is in arrears, the entire outstanding balance is said to be delinquent, meaning that delinquent balances are the total outstanding loans on which payments are overdue.
Asset backed securities (ABS)
Securities that represent an interest in an underlying pool of referenced assets. The referenced pool can comprise any assets which attract a set of associated cash flows, including credit card assets, but are commonly pools of residential or commercial mortgages. Investors in these securities have the right to cash received from future payments (interest and/or principal) on the underlying asset pool.
Available for sale (AFS)
Financial assets that are not classified as loans and receivables, held to maturity investments or financial assets at fair value through the income statement.
Bank levy A levy that applies to certain UK financial institutions (including Nationwide) and the UK operations of foreign banks since 1 January 2011. The levy is based on a percentage of the chargeable equity and liabilities of the institution at the balance sheet date.
Base mortgage rate (BMR)
The Society’s standard variable rate, which is guaranteed to be no more than 2% above the Bank of England base rate. This is the revert rate for existing customers at the end of a deal reserved on or before 29 April 2009, at which point the Standard Mortgage Rate (SMR) was introduced.
Basel II The Basel Committee on Banking Supervision’s statement of best practice that defines the methods by which firms should calculate their regulatory capital requirements to retain sufficient capital to protect the financial system against unexpected losses. Basel II is comprised of three pillars.
Basel III The Basel Committee rules text, issued in December 2010, which presents the details of strengthened global regulatory standards on bank capital adequacy and liquidity. This has been implemented via the Capital Requirements Directive IV (CRD IV) legislation.
Basel III leverage ratio exposure
The denominator used in the Basel III leverage ratio. Exposure is measured as the sum of on-balance sheet exposures, adjusted for derivative and securities financing transaction exposures, and off-balance sheet items.
Basis point (bp) One hundredth of a percent (0.01 percent). 100 basis points is one percent. Used, for example, in quoting movements in interest rates.
BIPRU The prudential sourcebook for banks, building societies and investment firms.
Buy to let mortgages Mortgages offered to customers purchasing residential property as a rental investment.
Capital ratios Key financial ratios measuring the Group’s capital adequacy or financial strength. These include the Common Equity Tier 1 ratio, Tier 1 ratio, total capital ratio and leverage ratio.
Capital requirements The amount of capital that the Group is required to hold based upon the risks to which the business is exposed.
Capital Requirements Directive (CRD)
The supervisory framework in the European Commission which reflects the Basel II and Basel III rules on capital measurement and capital standards.
Capital Requirements Directive IV (CRD IV)
European legislation to implement Basel III, which includes the Capital Requirements Regulation (CRR) and Capital Requirements Directive (CRD).
Glossary
Back to Contents
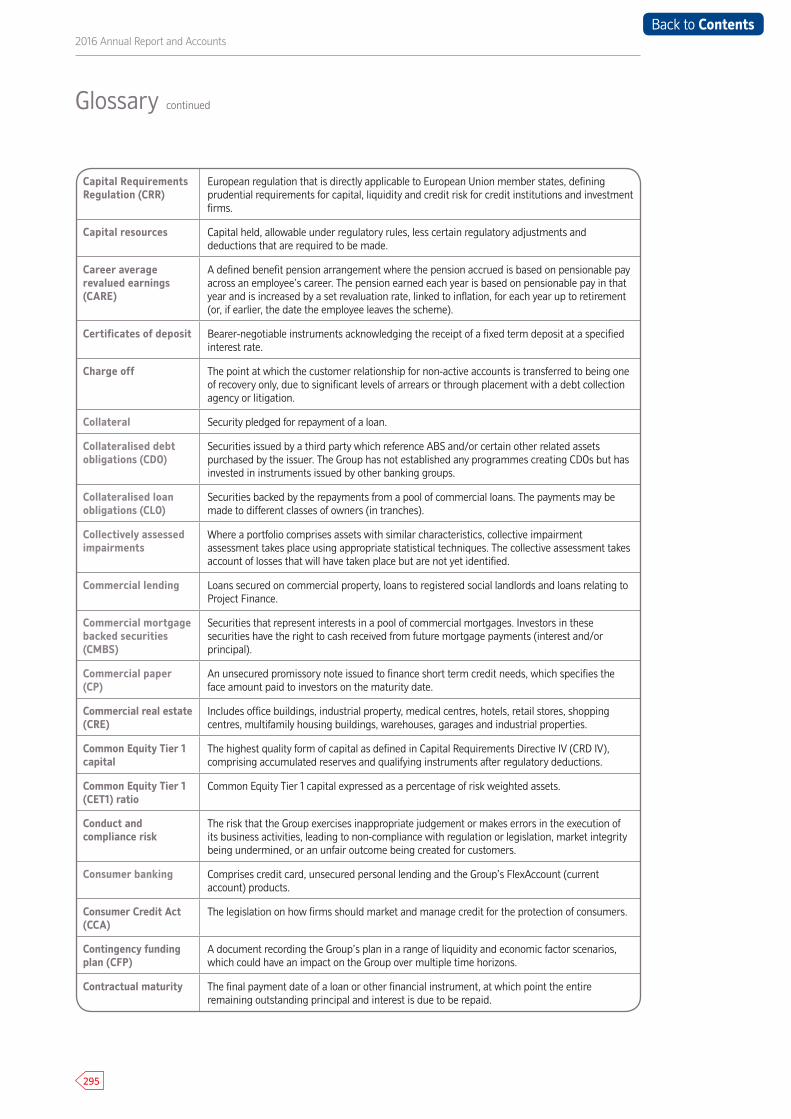
295
2016 Annual Report and Accounts
Capital Requirements Regulation (CRR)
European regulation that is directly applicable to European Union member states, defining prudential requirements for capital, liquidity and credit risk for credit institutions and investment firms.
Capital resources Capital held, allowable under regulatory rules, less certain regulatory adjustments and deductions that are required to be made.
Career average revalued earnings (CARE)
A defined benefit pension arrangement where the pension accrued is based on pensionable pay across an employee’s career. The pension earned each year is based on pensionable pay in that year and is increased by a set revaluation rate, linked to inflation, for each year up to retirement (or, if earlier, the date the employee leaves the scheme).
Certificates of deposit Bearer-negotiable instruments acknowledging the receipt of a fixed term deposit at a specified interest rate.
Charge off The point at which the customer relationship for non-active accounts is transferred to being one of recovery only, due to significant levels of arrears or through placement with a debt collection agency or litigation.
Collateral Security pledged for repayment of a loan.
Collateralised debt obligations (CDO)
Securities issued by a third party which reference ABS and/or certain other related assets purchased by the issuer. The Group has not established any programmes creating CDOs but has invested in instruments issued by other banking groups.
Collateralised loan obligations (CLO)
Securities backed by the repayments from a pool of commercial loans. The payments may be made to different classes of owners (in tranches).
Collectively assessed impairments
Where a portfolio comprises assets with similar characteristics, collective impairment assessment takes place using appropriate statistical techniques. The collective assessment takes account of losses that will have taken place but are not yet identified.
Commercial lending Loans secured on commercial property, loans to registered social landlords and loans relating to Project Finance.
Commercial mortgage backed securities (CMBS)
Securities that represent interests in a pool of commercial mortgages. Investors in these securities have the right to cash received from future mortgage payments (interest and/or principal).
Commercial paper (CP)
An unsecured promissory note issued to finance short term credit needs, which specifies the face amount paid to investors on the maturity date.
Commercial real estate (CRE)
Includes office buildings, industrial property, medical centres, hotels, retail stores, shopping centres, multifamily housing buildings, warehouses, garages and industrial properties.
Common Equity Tier 1 capital
The highest quality form of capital as defined in Capital Requirements Directive IV (CRD IV), comprising accumulated reserves and qualifying instruments after regulatory deductions.
Common Equity Tier 1 (CET1) ratio
Common Equity Tier 1 capital expressed as a percentage of risk weighted assets.
Conduct and compliance risk
The risk that the Group exercises inappropriate judgement or makes errors in the execution of its business activities, leading to non-compliance with regulation or legislation, market integrity being undermined, or an unfair outcome being created for customers.
Consumer banking Comprises credit card, unsecured personal lending and the Group’s FlexAccount (current account) products.
Consumer Credit Act (CCA)
The legislation on how firms should market and manage credit for the protection of consumers.
Contingency funding plan (CFP)
A document recording the Group’s plan in a range of liquidity and economic factor scenarios, which could have an impact on the Group over multiple time horizons.
Contractual maturity The final payment date of a loan or other financial instrument, at which point the entire remaining outstanding principal and interest is due to be repaid.
Glossary continued
Back to Contents
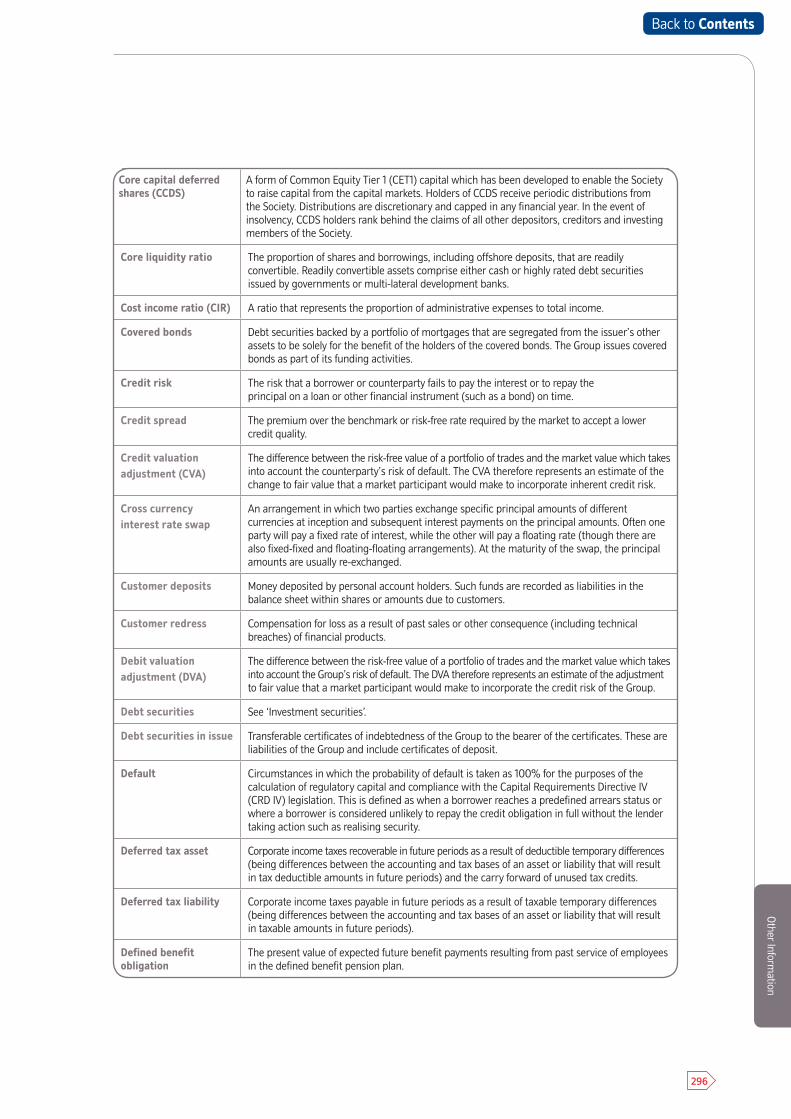
296
Other Inform
ation
Core capital deferred shares (CCDS)
A form of Common Equity Tier 1 (CET1) capital which has been developed to enable the Society to raise capital from the capital markets. Holders of CCDS receive periodic distributions from the Society. Distributions are discretionary and capped in any financial year. In the event of insolvency, CCDS holders rank behind the claims of all other depositors, creditors and investing members of the Society.
Core liquidity ratio The proportion of shares and borrowings, including offshore deposits, that are readily convertible. Readily convertible assets comprise either cash or highly rated debt securities issued by governments or multi-lateral development banks.
Cost income ratio (CIR) A ratio that represents the proportion of administrative expenses to total income.
Covered bonds Debt securities backed by a portfolio of mortgages that are segregated from the issuer’s other assets to be solely for the benefit of the holders of the covered bonds. The Group issues covered bonds as part of its funding activities.
Credit risk The risk that a borrower or counterparty fails to pay the interest or to repay the principal on a loan or other financial instrument (such as a bond) on time.
Credit spread The premium over the benchmark or risk-free rate required by the market to accept a lower credit quality.
Credit valuation adjustment (CVA)
The difference between the risk-free value of a portfolio of trades and the market value which takes into account the counterparty’s risk of default. The CVA therefore represents an estimate of the change to fair value that a market participant would make to incorporate inherent credit risk.
Cross currency interest rate swap
An arrangement in which two parties exchange specific principal amounts of different currencies at inception and subsequent interest payments on the principal amounts. Often one party will pay a fixed rate of interest, while the other will pay a floating rate (though there are also fixed-fixed and floating-floating arrangements). At the maturity of the swap, the principal amounts are usually re-exchanged.
Customer deposits Money deposited by personal account holders. Such funds are recorded as liabilities in the balance sheet within shares or amounts due to customers.
Customer redress Compensation for loss as a result of past sales or other consequence (including technical breaches) of financial products.
Debit valuation adjustment (DVA)
The difference between the risk-free value of a portfolio of trades and the market value which takes into account the Group’s risk of default. The DVA therefore represents an estimate of the adjustment to fair value that a market participant would make to incorporate the credit risk of the Group.
Debt securities See ‘Investment securities’.
Debt securities in issue Transferable certificates of indebtedness of the Group to the bearer of the certificates. These areliabilities of the Group and include certificates of deposit.
Default Circumstances in which the probability of default is taken as 100% for the purposes of the calculation of regulatory capital and compliance with the Capital Requirements Directive IV (CRD IV) legislation. This is defined as when a borrower reaches a predefined arrears status or where a borrower is considered unlikely to repay the credit obligation in full without the lender taking action such as realising security.
Deferred tax asset Corporate income taxes recoverable in future periods as a result of deductible temporary differences (being differences between the accounting and tax bases of an asset or liability that will result in tax deductible amounts in future periods) and the carry forward of unused tax credits.
Deferred tax liability Corporate income taxes payable in future periods as a result of taxable temporary differences (being differences between the accounting and tax bases of an asset or liability that will result in taxable amounts in future periods).
Defined benefit obligation
The present value of expected future benefit payments resulting from past service of employees in the defined benefit pension plan.
Back to Contents

297
2016 Annual Report and Accounts
Defined benefit pension plan
A pension or other post-retirement benefit plan under which the Group has an obligation to provide agreed benefits to current and former employees. The Group bears the risk that its obligation may increase or that the value of the assets in the pension fund may fall.
Defined contribution pension plan
A pension plan under which the Group pays fixed contributions as they fall due into a separate entity (a fund) and has no further legal or constructive obligations.
Delinquency See ‘Arrears’.
Derivative A contract or agreement whose value changes with movements in an underlying index such as interest rates, foreign exchange rates, share prices or indices, and which requires no initial investment or an initial investment that is smaller than would be required for other types of contracts with a similar response to market factors. The principal types of derivatives are swaps, forwards, futures and options.
Earnings risk The risk that a source of income or value is unable to continue to add the expected value, due to changes in market, regulatory or other environmental factors.
Effective interest rate method (EIR)
The method used to measure the carrying value of a financial asset or liability. EIR allocates associated income or expense to produce a level yield, either to maturity or to the next re-pricing to a market rate.
Effective tax rate The tax charge in the income statement as a percentage of profit before tax.
Encumbered assets Assets on the balance sheet which are pledged in order to secure, collateralise or credit-enhance a financial transaction from which they cannot be freely withdrawn.
End point Full implementation of Capital Requirements Directive IV (CRD IV) with no transitional provisions.
Enterprise Risk Management Framework (ERMF)
A framework that seeks to provide the context and guidance for cohesive risk management activity across the Group.
European Banking Authority (EBA)
The independent EU authority which works to ensure effective and consistent prudential regulation and supervision across the European banking sector.
Expected loss (EL) A calculation to estimate the potential losses on current exposures due to potential defaults. It is the product of probability of default (PD), loss given default (LGD) and exposure at default (EAD).
Exposure The maximum loss that a financial institution might suffer if a borrower, counterparty or group fails to meet their obligations or if assets and off-balance sheet positions have to be realised.
Exposure at default (EAD)
An estimation of the amount of exposure that will be outstanding at the time of default.
Final salary pension arrangements
A defined benefit pension arrangement where the pension payable is based on the employee’s final pensionable salary.
Financial Conduct Authority (FCA)
The statutory body responsible for conduct of business regulation and supervision of UK authorised firms from 1 April 2013. The FCA also has responsibility for the prudential regulation of firms that do not fall within the Prudential Regulation Authority’s (PRA’s) scope.
Financial Ombudsman Service (FOS)
An independent service in the UK for settling disputes between businesses providing financial services and their customers.
Financial Policy Committee (FPC)
A committee based at the Bank of England, charged with identifying, monitoring and taking action to reduce or remove systemic risks with a view to protect and enhance the resilience of the UK financial system. It is also responsible for supporting the economic policy of the UK Government.
Financial risk The risk of the Group having inadequate earnings, cash flow or capital to meet current or future requirements and expectations. This includes loss or damage to the earnings capacity, market value or liquidity of the Group, arising from mismatches between assets, funding and other commitments, and which may be exposed by changes in market rates, market conditions or the Group’s credit profile.
Glossary continued
Back to Contents
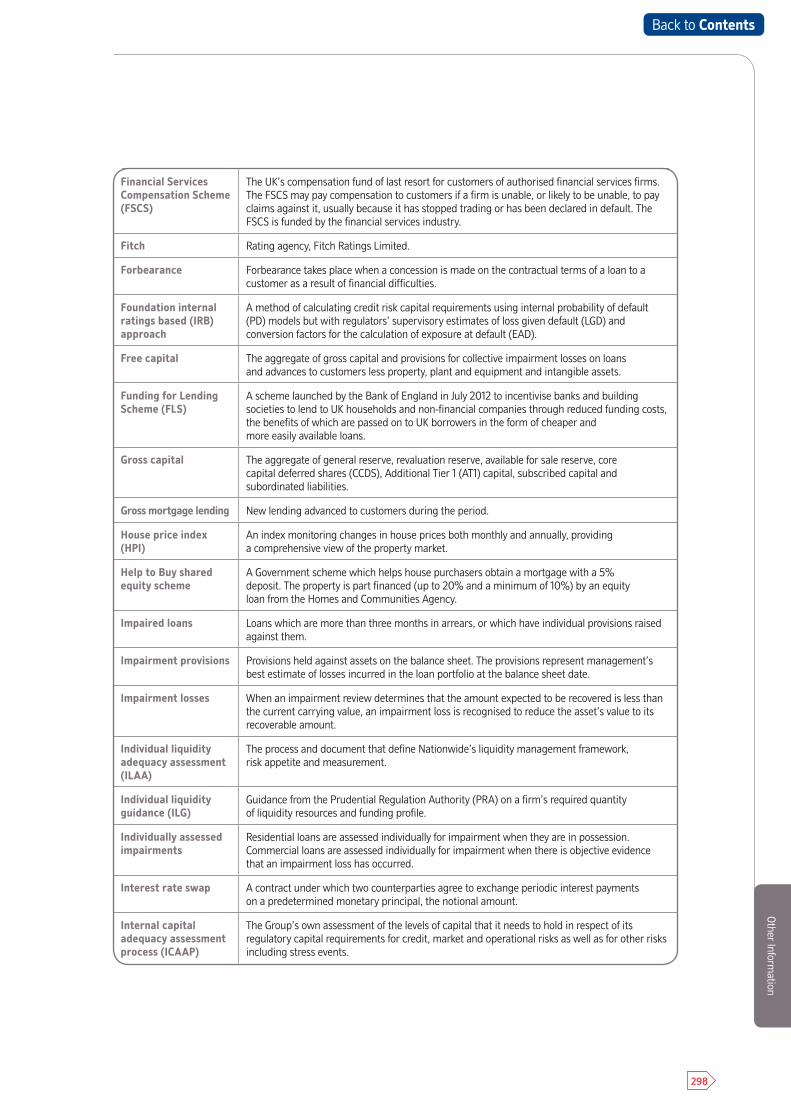
298
Other Inform
ation
Financial Services Compensation Scheme (FSCS)
The UK’s compensation fund of last resort for customers of authorised financial services firms. The FSCS may pay compensation to customers if a firm is unable, or likely to be unable, to pay claims against it, usually because it has stopped trading or has been declared in default. The FSCS is funded by the financial services industry.
Fitch Rating agency, Fitch Ratings Limited.
Forbearance Forbearance takes place when a concession is made on the contractual terms of a loan to a customer as a result of financial difficulties.
Foundation internal ratings based (IRB) approach
A method of calculating credit risk capital requirements using internal probability of default (PD) models but with regulators’ supervisory estimates of loss given default (LGD) and conversion factors for the calculation of exposure at default (EAD).
Free capital The aggregate of gross capital and provisions for collective impairment losses on loans and advances to customers less property, plant and equipment and intangible assets.
Funding for Lending Scheme (FLS)
A scheme launched by the Bank of England in July 2012 to incentivise banks and building societies to lend to UK households and non-financial companies through reduced funding costs, the benefits of which are passed on to UK borrowers in the form of cheaper and more easily available loans.
Gross capital The aggregate of general reserve, revaluation reserve, available for sale reserve, core capital deferred shares (CCDS), Additional Tier 1 (AT1) capital, subscribed capital and subordinated liabilities.
Gross mortgage lending New lending advanced to customers during the period.
House price index (HPI)
An index monitoring changes in house prices both monthly and annually, providing a comprehensive view of the property market.
Help to Buy shared equity scheme
A Government scheme which helps house purchasers obtain a mortgage with a 5% deposit. The property is part financed (up to 20% and a minimum of 10%) by an equity loan from the Homes and Communities Agency.
Impaired loans Loans which are more than three months in arrears, or which have individual provisions raised against them.
Impairment provisions Provisions held against assets on the balance sheet. The provisions represent management’s best estimate of losses incurred in the loan portfolio at the balance sheet date.
Impairment losses When an impairment review determines that the amount expected to be recovered is less than the current carrying value, an impairment loss is recognised to reduce the asset’s value to its recoverable amount.
Individual liquidity adequacy assessment (ILAA)
The process and document that define Nationwide’s liquidity management framework, risk appetite and measurement.
Individual liquidity guidance (ILG)
Guidance from the Prudential Regulation Authority (PRA) on a firm’s required quantity of liquidity resources and funding profile.
Individually assessed impairments
Residential loans are assessed individually for impairment when they are in possession.Commercial loans are assessed individually for impairment when there is objective evidence that an impairment loss has occurred.
Interest rate swap A contract under which two counterparties agree to exchange periodic interest payments on a predetermined monetary principal, the notional amount.
Internal capital adequacy assessment process (ICAAP)
The Group’s own assessment of the levels of capital that it needs to hold in respect of its regulatory capital requirements for credit, market and operational risks as well as for other risks including stress events.
Back to Contents
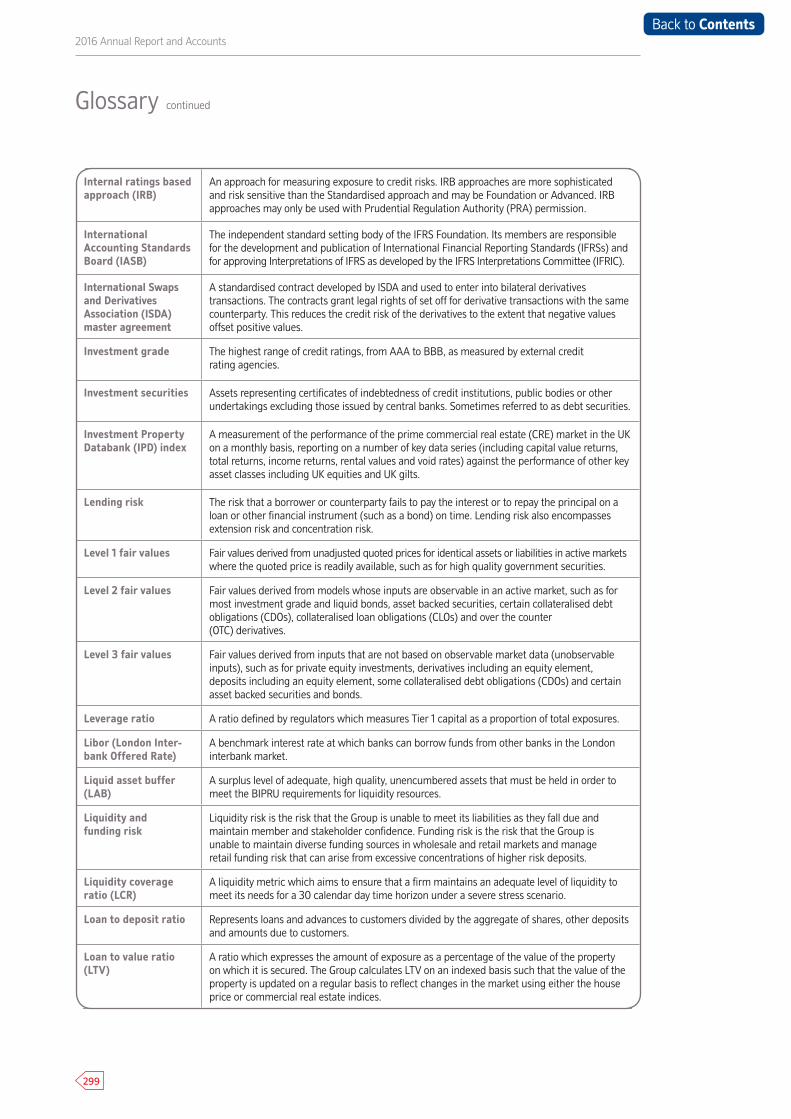
299
2016 Annual Report and Accounts
Internal ratings based approach (IRB)
An approach for measuring exposure to credit risks. IRB approaches are more sophisticated and risk sensitive than the Standardised approach and may be Foundation or Advanced. IRB approaches may only be used with Prudential Regulation Authority (PRA) permission.
International Accounting Standards Board (IASB)
The independent standard setting body of the IFRS Foundation. Its members are responsible for the development and publication of International Financial Reporting Standards (IFRSs) and for approving Interpretations of IFRS as developed by the IFRS Interpretations Committee (IFRIC).
International Swaps and Derivatives Association (ISDA) master agreement
A standardised contract developed by ISDA and used to enter into bilateral derivatives transactions. The contracts grant legal rights of set off for derivative transactions with the same counterparty. This reduces the credit risk of the derivatives to the extent that negative values offset positive values.
Investment grade The highest range of credit ratings, from AAA to BBB, as measured by external credit rating agencies.
Investment securities Assets representing certificates of indebtedness of credit institutions, public bodies or other undertakings excluding those issued by central banks. Sometimes referred to as debt securities.
Investment Property Databank (IPD) index
A measurement of the performance of the prime commercial real estate (CRE) market in the UK on a monthly basis, reporting on a number of key data series (including capital value returns, total returns, income returns, rental values and void rates) against the performance of other key asset classes including UK equities and UK gilts.
Lending risk The risk that a borrower or counterparty fails to pay the interest or to repay the principal on a loan or other financial instrument (such as a bond) on time. Lending risk also encompasses extension risk and concentration risk.
Level 1 fair values Fair values derived from unadjusted quoted prices for identical assets or liabilities in active markets where the quoted price is readily available, such as for high quality government securities.
Level 2 fair values Fair values derived from models whose inputs are observable in an active market, such as for most investment grade and liquid bonds, asset backed securities, certain collateralised debt obligations (CDOs), collateralised loan obligations (CLOs) and over the counter (OTC) derivatives.
Level 3 fair values Fair values derived from inputs that are not based on observable market data (unobservable inputs), such as for private equity investments, derivatives including an equity element, deposits including an equity element, some collateralised debt obligations (CDOs) and certain asset backed securities and bonds.
Leverage ratio A ratio defined by regulators which measures Tier 1 capital as a proportion of total exposures.
Libor (London Inter-bank Offered Rate)
A benchmark interest rate at which banks can borrow funds from other banks in the London interbank market.
Liquid asset buffer (LAB)
A surplus level of adequate, high quality, unencumbered assets that must be held in order to meet the BIPRU requirements for liquidity resources.
Liquidity and funding risk
Liquidity risk is the risk that the Group is unable to meet its liabilities as they fall due andmaintain member and stakeholder confidence. Funding risk is the risk that the Group isunable to maintain diverse funding sources in wholesale and retail markets and manageretail funding risk that can arise from excessive concentrations of higher risk deposits.
Liquidity coverage ratio (LCR)
A liquidity metric which aims to ensure that a firm maintains an adequate level of liquidity to meet its needs for a 30 calendar day time horizon under a severe stress scenario.
Loan to deposit ratio Represents loans and advances to customers divided by the aggregate of shares, other deposits and amounts due to customers.
Loan to value ratio (LTV)
A ratio which expresses the amount of exposure as a percentage of the value of the property on which it is secured. The Group calculates LTV on an indexed basis such that the value of the property is updated on a regular basis to reflect changes in the market using either the house price or commercial real estate indices.
Glossary continued
Back to Contents
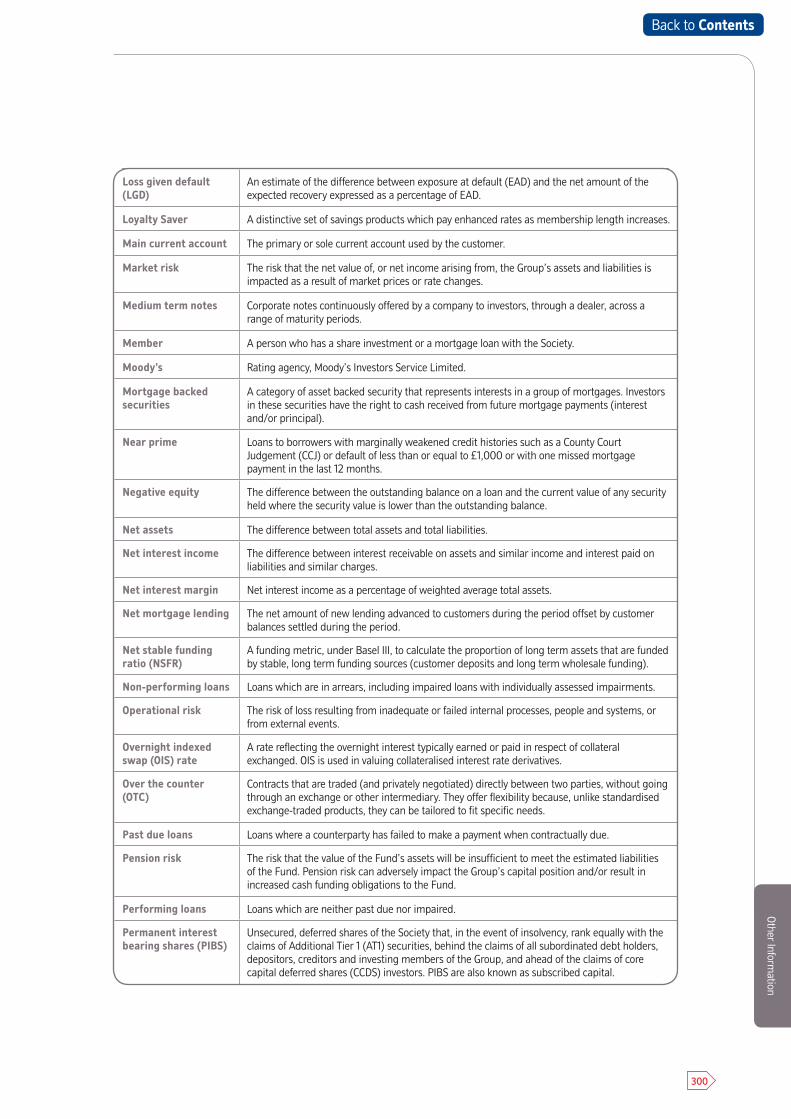
300
Other Inform
ation
Loss given default (LGD)
An estimate of the difference between exposure at default (EAD) and the net amount of the expected recovery expressed as a percentage of EAD.
Loyalty Saver A distinctive set of savings products which pay enhanced rates as membership length increases.
Main current account The primary or sole current account used by the customer.
Market risk The risk that the net value of, or net income arising from, the Group’s assets and liabilities is impacted as a result of market prices or rate changes.
Medium term notes Corporate notes continuously offered by a company to investors, through a dealer, across a range of maturity periods.
Member A person who has a share investment or a mortgage loan with the Society.
Moody’s Rating agency, Moody’s Investors Service Limited.
Mortgage backed securities
A category of asset backed security that represents interests in a group of mortgages. Investors in these securities have the right to cash received from future mortgage payments (interest and/or principal).
Near prime Loans to borrowers with marginally weakened credit histories such as a County Court Judgement (CCJ) or default of less than or equal to £1,000 or with one missed mortgage payment in the last 12 months.
Negative equity The difference between the outstanding balance on a loan and the current value of any security held where the security value is lower than the outstanding balance.
Net assets The difference between total assets and total liabilities.
Net interest income The difference between interest receivable on assets and similar income and interest paid on liabilities and similar charges.
Net interest margin Net interest income as a percentage of weighted average total assets.
Net mortgage lending The net amount of new lending advanced to customers during the period offset by customer balances settled during the period.
Net stable funding ratio (NSFR)
A funding metric, under Basel III, to calculate the proportion of long term assets that are funded by stable, long term funding sources (customer deposits and long term wholesale funding).
Non-performing loans Loans which are in arrears, including impaired loans with individually assessed impairments.
Operational risk The risk of loss resulting from inadequate or failed internal processes, people and systems, or from external events.
Overnight indexed swap (OIS) rate
A rate reflecting the overnight interest typically earned or paid in respect of collateral exchanged. OIS is used in valuing collateralised interest rate derivatives.
Over the counter (OTC)
Contracts that are traded (and privately negotiated) directly between two parties, without going through an exchange or other intermediary. They offer flexibility because, unlike standardised exchange-traded products, they can be tailored to fit specific needs.
Past due loans Loans where a counterparty has failed to make a payment when contractually due.
Pension risk The risk that the value of the Fund’s assets will be insufficient to meet the estimated liabilities of the Fund. Pension risk can adversely impact the Group’s capital position and/or result in increased cash funding obligations to the Fund.
Performing loans Loans which are neither past due nor impaired.
Permanent interest bearing shares (PIBS)
Unsecured, deferred shares of the Society that, in the event of insolvency, rank equally with the claims of Additional Tier 1 (AT1) securities, behind the claims of all subordinated debt holders, depositors, creditors and investing members of the Group, and ahead of the claims of core capital deferred shares (CCDS) investors. PIBS are also known as subscribed capital.
Back to Contents
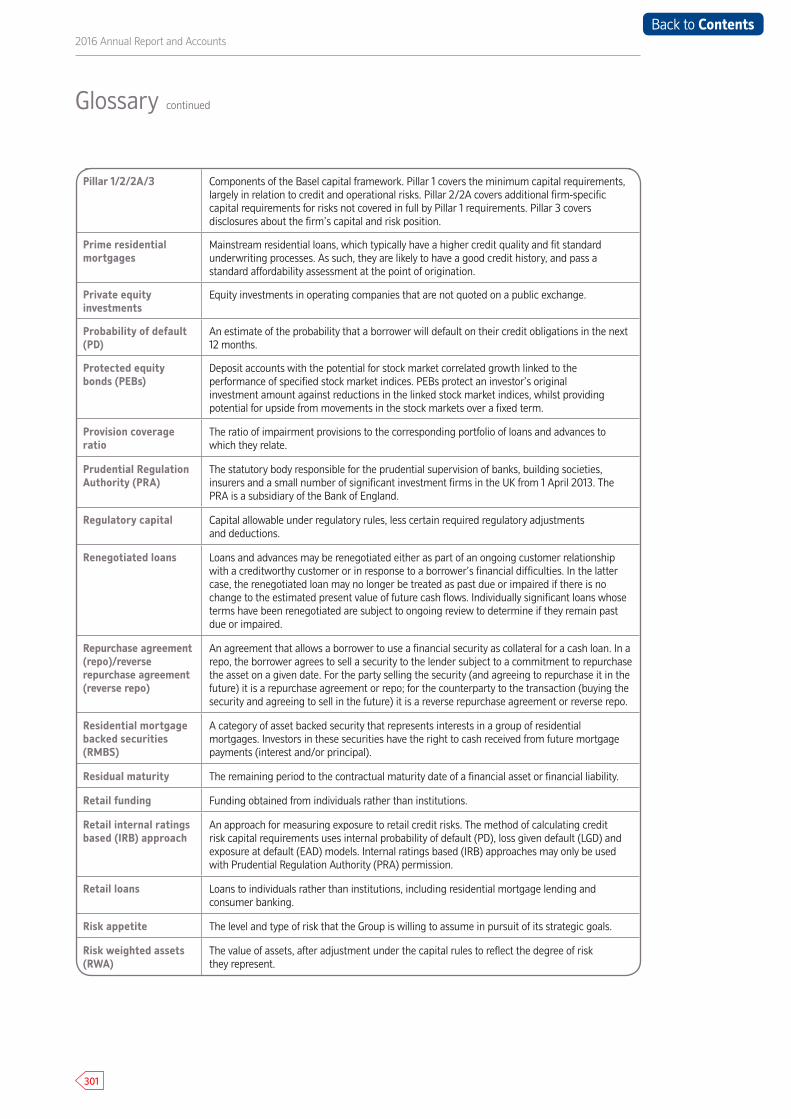
301
2016 Annual Report and Accounts
Pillar 1/2/2A/3 Components of the Basel capital framework. Pillar 1 covers the minimum capital requirements, largely in relation to credit and operational risks. Pillar 2/2A covers additional firm-specific capital requirements for risks not covered in full by Pillar 1 requirements. Pillar 3 covers disclosures about the firm’s capital and risk position.
Prime residential mortgages
Mainstream residential loans, which typically have a higher credit quality and fit standard underwriting processes. As such, they are likely to have a good credit history, and pass a standard affordability assessment at the point of origination.
Private equity investments
Equity investments in operating companies that are not quoted on a public exchange.
Probability of default (PD)
An estimate of the probability that a borrower will default on their credit obligations in the next 12 months.
Protected equity bonds (PEBs)
Deposit accounts with the potential for stock market correlated growth linked to theperformance of specified stock market indices. PEBs protect an investor’s originalinvestment amount against reductions in the linked stock market indices, whilst providingpotential for upside from movements in the stock markets over a fixed term.
Provision coverage ratio
The ratio of impairment provisions to the corresponding portfolio of loans and advances to which they relate.
Prudential Regulation Authority (PRA)
The statutory body responsible for the prudential supervision of banks, building societies, insurers and a small number of significant investment firms in the UK from 1 April 2013. The PRA is a subsidiary of the Bank of England.
Regulatory capital Capital allowable under regulatory rules, less certain required regulatory adjustments and deductions.
Renegotiated loans Loans and advances may be renegotiated either as part of an ongoing customer relationship with a creditworthy customer or in response to a borrower’s financial difficulties. In the latter case, the renegotiated loan may no longer be treated as past due or impaired if there is no change to the estimated present value of future cash flows. Individually significant loans whose terms have been renegotiated are subject to ongoing review to determine if they remain past due or impaired.
Repurchase agreement (repo)/reverse repurchase agreement (reverse repo)
An agreement that allows a borrower to use a financial security as collateral for a cash loan. In a repo, the borrower agrees to sell a security to the lender subject to a commitment to repurchase the asset on a given date. For the party selling the security (and agreeing to repurchase it in the future) it is a repurchase agreement or repo; for the counterparty to the transaction (buying the security and agreeing to sell in the future) it is a reverse repurchase agreement or reverse repo.
Residential mortgage backed securities (RMBS)
A category of asset backed security that represents interests in a group of residential mortgages. Investors in these securities have the right to cash received from future mortgage payments (interest and/or principal).
Residual maturity The remaining period to the contractual maturity date of a financial asset or financial liability.
Retail funding Funding obtained from individuals rather than institutions.
Retail internal ratings based (IRB) approach
An approach for measuring exposure to retail credit risks. The method of calculating credit risk capital requirements uses internal probability of default (PD), loss given default (LGD) and exposure at default (EAD) models. Internal ratings based (IRB) approaches may only be used with Prudential Regulation Authority (PRA) permission.
Retail loans Loans to individuals rather than institutions, including residential mortgage lending and consumer banking.
Risk appetite The level and type of risk that the Group is willing to assume in pursuit of its strategic goals.
Risk weighted assets (RWA)
The value of assets, after adjustment under the capital rules to reflect the degree of risk they represent.
Glossary continued
Back to Contents
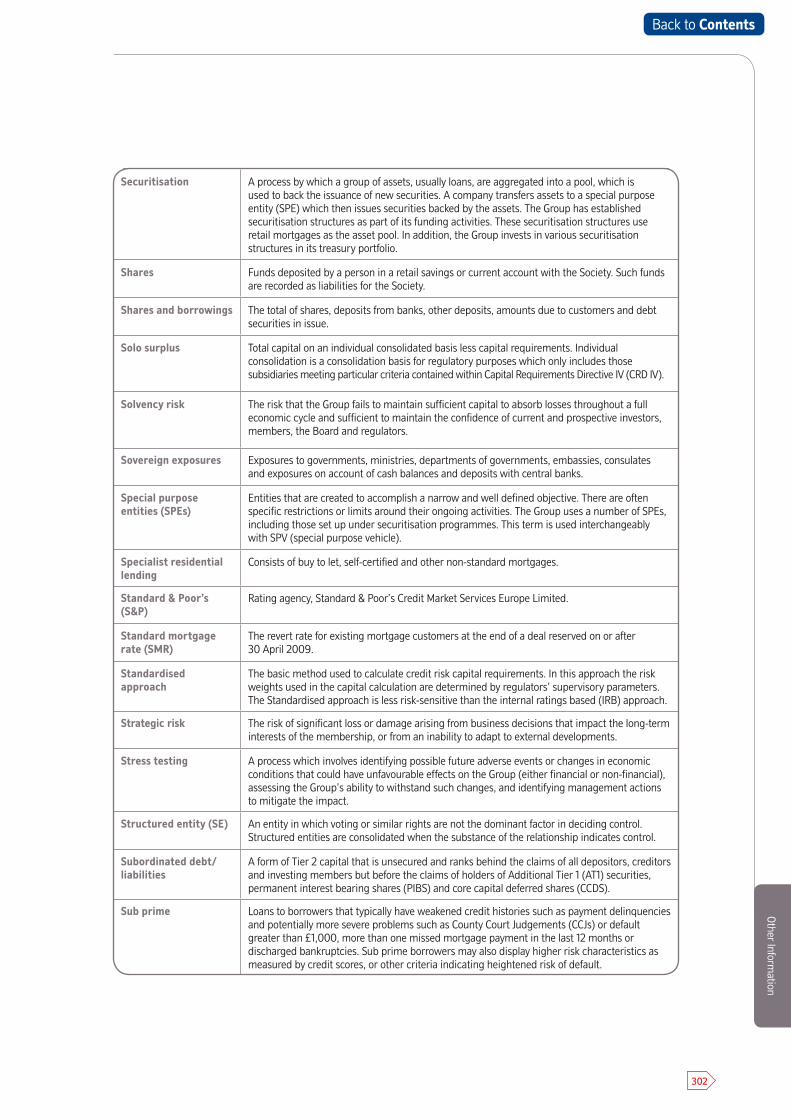
302
Other Inform
ation
Securitisation A process by which a group of assets, usually loans, are aggregated into a pool, which is used to back the issuance of new securities. A company transfers assets to a special purpose entity (SPE) which then issues securities backed by the assets. The Group has established securitisation structures as part of its funding activities. These securitisation structures use retail mortgages as the asset pool. In addition, the Group invests in various securitisation structures in its treasury portfolio.
Shares Funds deposited by a person in a retail savings or current account with the Society. Such funds are recorded as liabilities for the Society.
Shares and borrowings The total of shares, deposits from banks, other deposits, amounts due to customers and debt securities in issue.
Solo surplus Total capital on an individual consolidated basis less capital requirements. Individual consolidation is a consolidation basis for regulatory purposes which only includes those subsidiaries meeting particular criteria contained within Capital Requirements Directive IV (CRD IV).
Solvency risk The risk that the Group fails to maintain sufficient capital to absorb losses throughout a full economic cycle and sufficient to maintain the confidence of current and prospective investors, members, the Board and regulators.
Sovereign exposures Exposures to governments, ministries, departments of governments, embassies, consulates and exposures on account of cash balances and deposits with central banks.
Special purpose entities (SPEs)
Entities that are created to accomplish a narrow and well defined objective. There are often specific restrictions or limits around their ongoing activities. The Group uses a number of SPEs, including those set up under securitisation programmes. This term is used interchangeably with SPV (special purpose vehicle).
Specialist residential lending
Consists of buy to let, self-certified and other non-standard mortgages.
Standard & Poor’s (S&P)
Rating agency, Standard & Poor’s Credit Market Services Europe Limited.
Standard mortgage rate (SMR)
The revert rate for existing mortgage customers at the end of a deal reserved on or after 30 April 2009.
Standardised approach
The basic method used to calculate credit risk capital requirements. In this approach the risk weights used in the capital calculation are determined by regulators’ supervisory parameters. The Standardised approach is less risk-sensitive than the internal ratings based (IRB) approach.
Strategic risk The risk of significant loss or damage arising from business decisions that impact the long-term interests of the membership, or from an inability to adapt to external developments.
Stress testing A process which involves identifying possible future adverse events or changes in economic conditions that could have unfavourable effects on the Group (either financial or non-financial), assessing the Group’s ability to withstand such changes, and identifying management actions to mitigate the impact.
Structured entity (SE) An entity in which voting or similar rights are not the dominant factor in deciding control. Structured entities are consolidated when the substance of the relationship indicates control.
Subordinated debt/liabilities
A form of Tier 2 capital that is unsecured and ranks behind the claims of all depositors, creditors and investing members but before the claims of holders of Additional Tier 1 (AT1) securities, permanent interest bearing shares (PIBS) and core capital deferred shares (CCDS).
Sub prime Loans to borrowers that typically have weakened credit histories such as payment delinquencies and potentially more severe problems such as County Court Judgements (CCJs) or default greater than £1,000, more than one missed mortgage payment in the last 12 months or discharged bankruptcies. Sub prime borrowers may also display higher risk characteristics as measured by credit scores, or other criteria indicating heightened risk of default.
Back to Contents
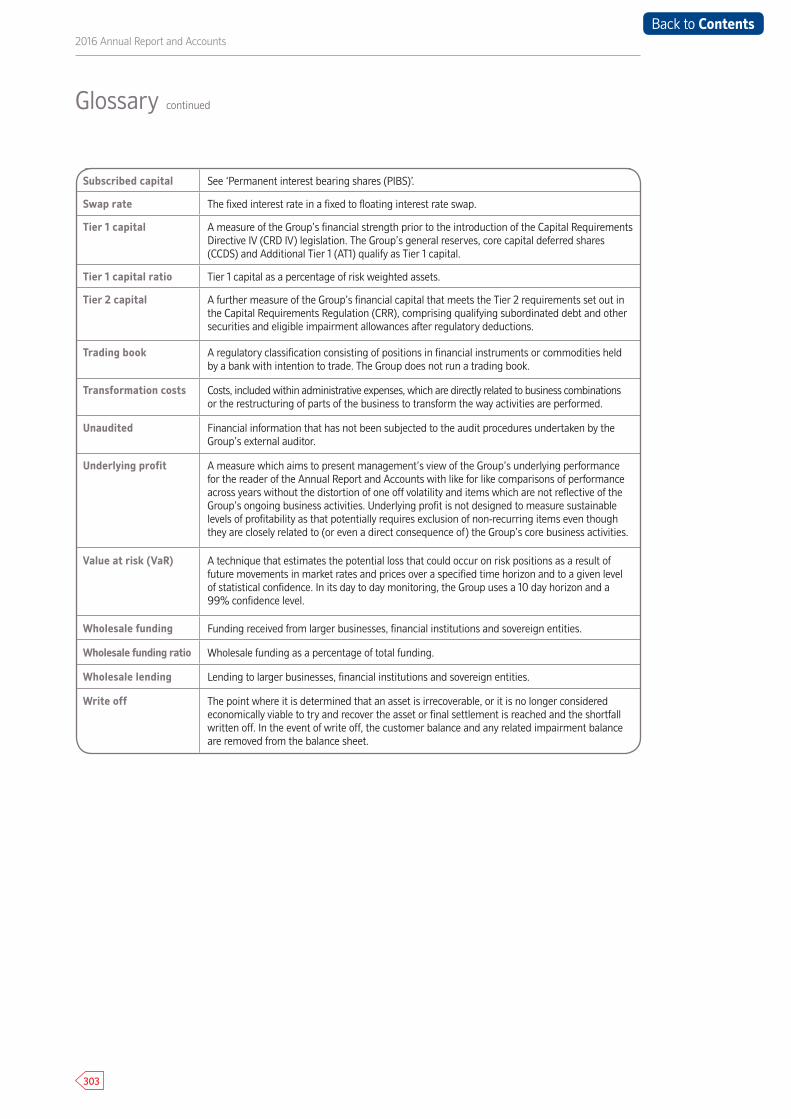
303
2016 Annual Report and Accounts
Subscribed capital See ‘Permanent interest bearing shares (PIBS)’.
Swap rate The fixed interest rate in a fixed to floating interest rate swap.
Tier 1 capital A measure of the Group’s financial strength prior to the introduction of the Capital Requirements Directive IV (CRD IV) legislation. The Group’s general reserves, core capital deferred shares (CCDS) and Additional Tier 1 (AT1) qualify as Tier 1 capital.
Tier 1 capital ratio Tier 1 capital as a percentage of risk weighted assets.
Tier 2 capital A further measure of the Group’s financial capital that meets the Tier 2 requirements set out in the Capital Requirements Regulation (CRR), comprising qualifying subordinated debt and other securities and eligible impairment allowances after regulatory deductions.
Trading book A regulatory classification consisting of positions in financial instruments or commodities held by a bank with intention to trade. The Group does not run a trading book.
Transformation costs Costs, included within administrative expenses, which are directly related to business combinations or the restructuring of parts of the business to transform the way activities are performed.
Unaudited Financial information that has not been subjected to the audit procedures undertaken by the Group’s external auditor.
Underlying profit A measure which aims to present management’s view of the Group’s underlying performance for the reader of the Annual Report and Accounts with like for like comparisons of performance across years without the distortion of one off volatility and items which are not reflective of the Group’s ongoing business activities. Underlying profit is not designed to measure sustainable levels of profitability as that potentially requires exclusion of non-recurring items even though they are closely related to (or even a direct consequence of) the Group’s core business activities.
Value at risk (VaR) A technique that estimates the potential loss that could occur on risk positions as a result of future movements in market rates and prices over a specified time horizon and to a given level of statistical confidence. In its day to day monitoring, the Group uses a 10 day horizon and a 99% confidence level.
Wholesale funding Funding received from larger businesses, financial institutions and sovereign entities.
Wholesale funding ratio Wholesale funding as a percentage of total funding.
Wholesale lending Lending to larger businesses, financial institutions and sovereign entities.
Write off The point where it is determined that an asset is irrecoverable, or it is no longer considered economically viable to try and recover the asset or final settlement is reached and the shortfall written off. In the event of write off, the customer balance and any related impairment balance are removed from the balance sheet.
Glossary continued
Back to Contents
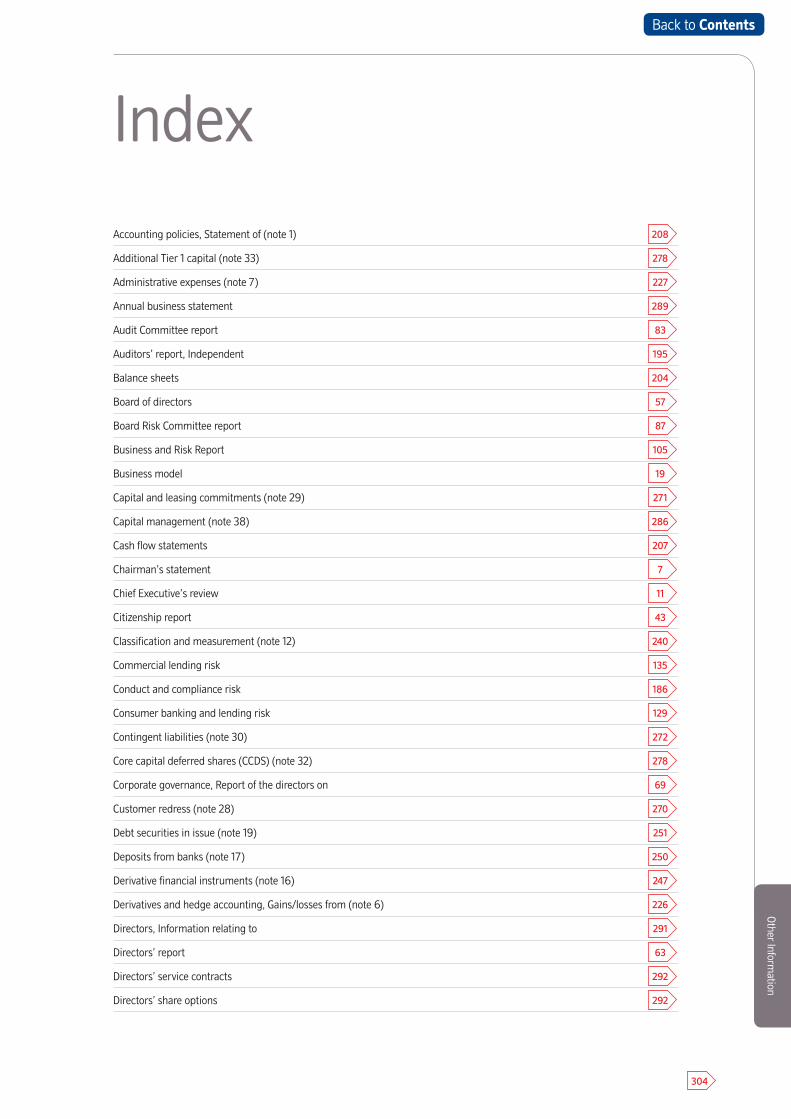
304
Other Inform
ation
Accounting policies, Statement of (note 1) 208
Additional Tier 1 capital (note 33) 278
Administrative expenses (note 7) 227
Annual business statement 289
Audit Committee report 83
Auditors’ report, Independent 195
Balance sheets 204
Board of directors 57
Board Risk Committee report 87
Business and Risk Report 105
Business model 19
Capital and leasing commitments (note 29) 271
Capital management (note 38) 286
Cash flow statements 207
Chairman’s statement 7
Chief Executive’s review 11
Citizenship report 43
Classification and measurement (note 12) 240
Commercial lending risk 135
Conduct and compliance risk 186
Consumer banking and lending risk 129
Contingent liabilities (note 30) 272
Core capital deferred shares (CCDS) (note 32) 278
Corporate governance, Report of the directors on 69
Customer redress (note 28) 270
Debt securities in issue (note 19) 251
Deposits from banks (note 17) 250
Derivative financial instruments (note 16) 247
Derivatives and hedge accounting, Gains/losses from (note 6) 226
Directors, Information relating to 291
Directors’ report 63
Directors’ service contracts 292
Directors’ share options 292
Index
Back to Contents
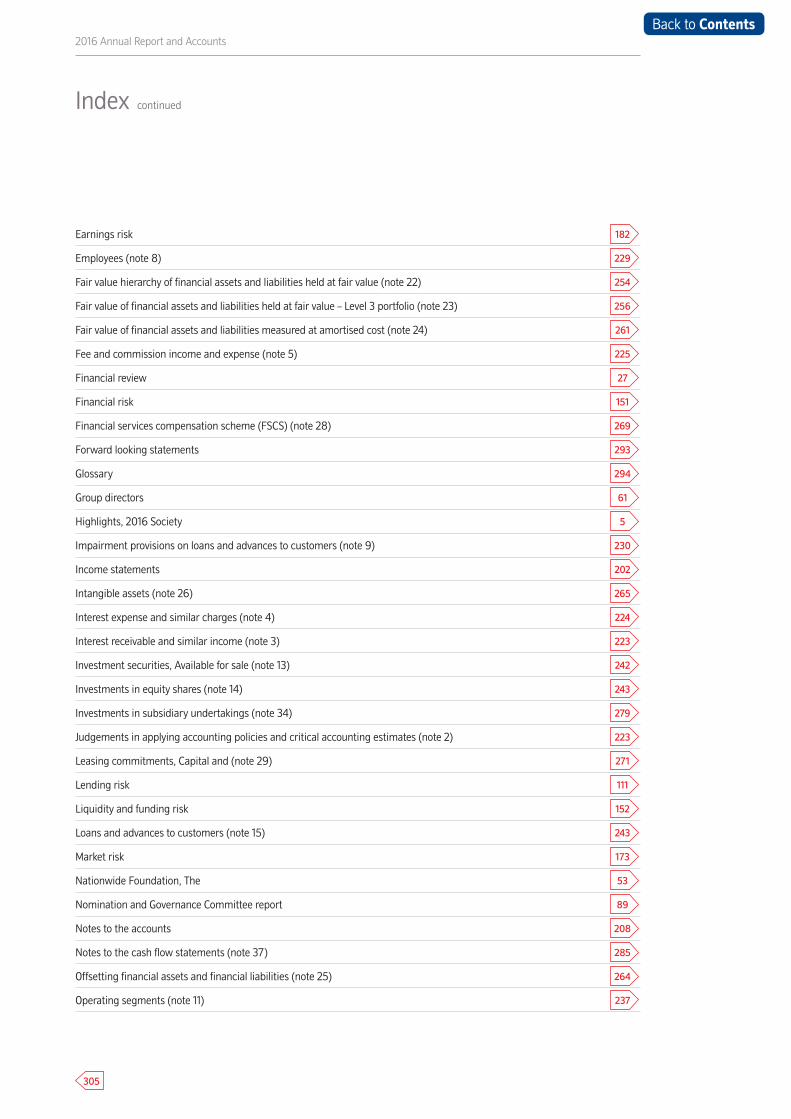
305
2016 Annual Report and Accounts
Earnings risk 182
Employees (note 8) 229
Fair value hierarchy of financial assets and liabilities held at fair value (note 22) 254
Fair value of financial assets and liabilities held at fair value – Level 3 portfolio (note 23) 256
Fair value of financial assets and liabilities measured at amortised cost (note 24) 261
Fee and commission income and expense (note 5) 225
Financial review 27
Financial risk 151
Financial services compensation scheme (FSCS) (note 28) 269
Forward looking statements 293
Glossary 294
Group directors 61
Highlights, 2016 Society 5
Impairment provisions on loans and advances to customers (note 9) 230
Income statements 202
Intangible assets (note 26) 265
Interest expense and similar charges (note 4) 224
Interest receivable and similar income (note 3) 223
Investment securities, Available for sale (note 13) 242
Investments in equity shares (note 14) 243
Investments in subsidiary undertakings (note 34) 279
Judgements in applying accounting policies and critical accounting estimates (note 2) 223
Leasing commitments, Capital and (note 29) 271
Lending risk 111
Liquidity and funding risk 152
Loans and advances to customers (note 15) 243
Market risk 173
Nationwide Foundation, The 53
Nomination and Governance Committee report 89
Notes to the accounts 208
Notes to the cash flow statements (note 37) 285
Offsetting financial assets and financial liabilities (note 25) 264
Operating segments (note 11) 237
Index continued
Back to Contents
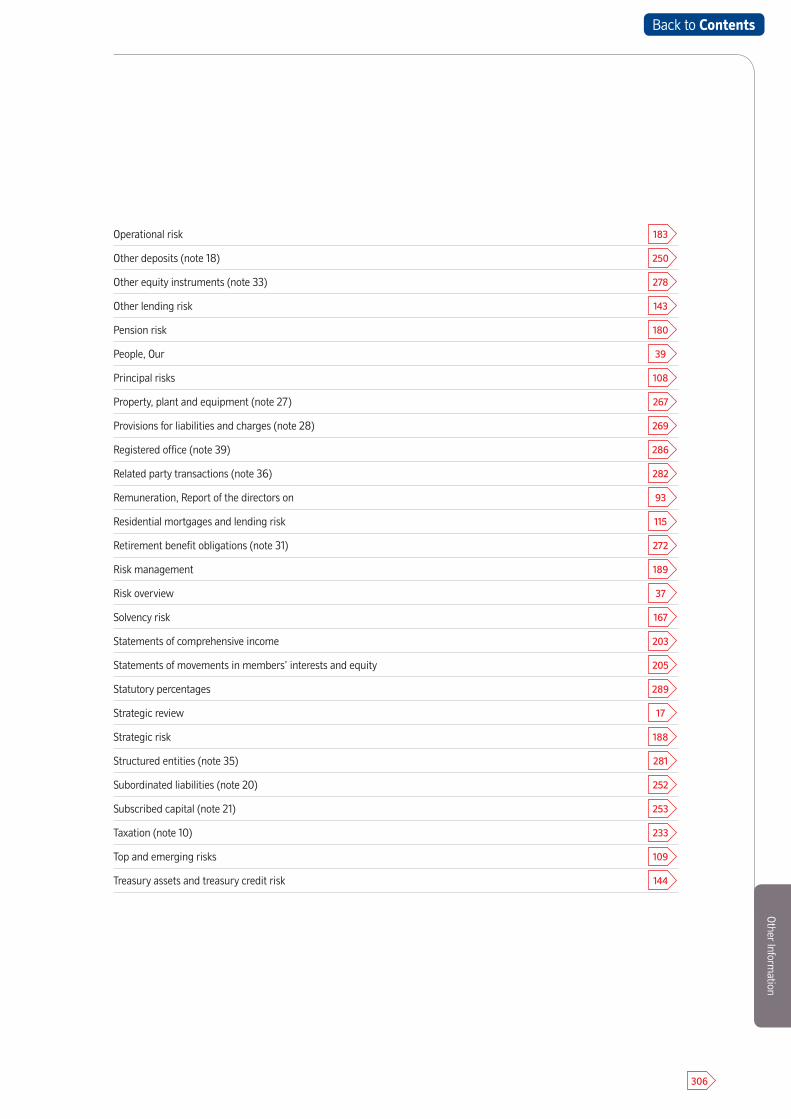
306
Other Inform
ation
Operational risk 183
Other deposits (note 18) 250
Other equity instruments (note 33) 278
Other lending risk 143
Pension risk 180
People, Our 39
Principal risks 108
Property, plant and equipment (note 27) 267
Provisions for liabilities and charges (note 28) 269
Registered office (note 39) 286
Related party transactions (note 36) 282
Remuneration, Report of the directors on 93
Residential mortgages and lending risk 115
Retirement benefit obligations (note 31) 272
Risk management 189
Risk overview 37
Solvency risk 167
Statements of comprehensive income 203
Statements of movements in members’ interests and equity 205
Statutory percentages 289
Strategic review 17
Strategic risk 188
Structured entities (note 35) 281
Subordinated liabilities (note 20) 252
Subscribed capital (note 21) 253
Taxation (note 10) 233
Top and emerging risks 109
Treasury assets and treasury credit risk 144
Back to Contents

Nationw
ide Building Society
If you have hearing or speech difficulties and are a textphone user, you can call us direct in text on 0800 37 80 01.
We also accept calls via BT Text Relay. Just dial 18001 followed by the full telephone number you wish to ring.
Nationwide Building Society Head Office: Nationwide House, Pipers Way, Swindon, SN38 1NWnationwide.co.uk
G101 (A) 2016
Annual Report and Accounts 2016