Embed Size (px)
Citation preview

2
Annual Report andAccounts
2010/2011

2

3
Chairman’s statement 4
Operating and Financial Review 7
Responsibilities of the Board of Governors 19
Statement of Corporate Governance 22
Report of the independent auditors to the Board of Governors of the University of Hertfordshire 26
Consolidated income and expenditure account 27
Statement of Group historical cost surpluses and deficits 28 Statement of Group total recognised gains and losses 29
Balance sheets 30
Consolidated cash flow statement 32
Statement of principal accounting policies 33
Notes to the accounts 37
Board of Governors 66
Members of the executive team 67
List of Major Corporate Donors 70
Contents

4
Chairman’s statement
Despite the difficult external climate in 2010/11 the University enjoyed an outstanding year. The presentation of these accounts shows a strong financial performance with a headline surplus of £10 million, an excellent cash position and a robust balance sheet which only serves to round off well an exceptional performance by both the staff and students of the University Group in 2010/11.

5
Chairman’s statement
Achievements are numerous but I must pick out some which I think characterise the ethos, culture and standing of the University.
In November 2010 at a ceremony in London the University was awarded the accolade of Times Higher Education ‘Entrepreneurial
University of the Year’. This confirmed the University’s pre-eminence as the country’s leading business-facing university.
We started the year well recruiting new home undergraduates within the target permitted by the Funding Council and with a significant increase in entry tariff.
We were delighted to learn of the announcement in the New Year Honours list of a Knighthood for our retiring Vice-Chancellor, Professor Tim Wilson, in recognition of his services to Higher Education and equally of the award of a CBE to our incoming Vice-Chancellor, Professor Quintin McKellar, for his services to science.
With the announcement by the Government of the new fee regime from September 2012 the University submitted its proposed fee arrangement and agreement to OFFA (Office for Fair Access) and upon receiving OFFA agreement announced these. This followed a significant amount of analysis to identify the University’s market position, establish the financial implications and above all establish what would be a fair offer to students. The University submitted its proposals with an average fee of just under £7,500 and we feel it represents an excellent offer especially as many universities chose to set their fee closer to the £9,000 cap set by the Government.
The University completed the construction of a new Law Court building on the de Havilland Campus over the summer. To mark the handover of the building, the University hosted, and won, the national Blackstone’s Criminal Advocacy Competition, in the newly built state-of-the-art Law Court. Improvements to buildings and the reception also at de Havilland enabled the move of the School of Law from the St Albans Campus to Hatfield. The St Albans Campus has been sold to the County Council to improve primary school provision in the City whilst
the University’s Arts provision in St Albans has been moved to the nearby Museum of St Albans.The National Student Survey results have shown a further improvement in students’ satisfaction which demonstrates that the focus on the quality of the student experience is having an impact. Key to improving the student experience is improving the quality of the estate and the Board debated and approved a vision for the Campus in 2020 encompassing both teaching and residential buildings and further improving the quality of public and learning spaces and enhancing the sense of community. New management information systems in finance and HR have been introduced and a new student system is on the point of being implemented commencing with the management of the student application cycle for September 2011. Improved procurement arrangements yielded significant savings throughout the year and further improvement is planned for 2011/12.
Our students have also posted many successes notably:
•One of our international PhD students won a 2010 Chinese government award for outstanding overseas PhD student - the only winner globally in the field of astrophysics.
•We had further success with Formula Student 2011 where we gained 3rd place overall, placing us as the top UK team.
•One of our recent BA Graphic Design and Illustration graduates won the New Designer of the Year 2011 award at New Designers and New Designers Virgin Atlantic Award for Graphic Design.
•Six BA Hons Digital Animation graduates were part of the Oscar-winning team for the blockbuster film “Inception”.
•A Creative Arts student was awarded the Kubrick Prize for fiction by Elstree Studios for a short film, whilst three BA Film and TV graduates screened their three graduate films at BAFTA.
•Our Ladies Football team continues to go from strength to strength and became BUCS Premier League champions for the 3rd year running in April.
•One of our Physiotherapy students was selected for the Great Britain Senior Women’s Bobsleigh Team.
•BA Hons Model & Special Effects students also worked on Ridley Scott’s new “Alien” prequel; Tim Burton’s stop motion film “Frankenweenie”; a remake of the Samurai film “47 Ronin”; “Clash of the Titans 2”; “Jack the Giant Killer”; “X Men” and “Captain America”.

6
All these achievements would not be possible without the commitment and talents of the staff of the University, to whom the Board and I express our gratitude especially amongst the challenges of a changing environment for higher education. My thanks also go to the on-going commitment of the Board of Governors who freely give of their time and experience to ensure the continuing success of the University. They found time to conclude and implement the major review on ‘Size and Shape of the Board’ and a new committee structure and modus operandi for Board business took effect from April 2011 with more Board meetings and fewer committees and meetings of committees.
In saying goodbye to Professor Sir Tim Wilson as Vice-Chancellor in December 2010, the Board acknowledged the enormous debt the University owes to him in raising the profile and standing of the institution – he literally invented the concept of the
‘business-facing university’. The new Vice-Chancellor, Professor Quintin McKellar, joined us in January 2011 and he has completed a comprehensive review leading to the launch of a project to simplify the academic structure of the University. The project, known as ‘Project Agile’, aims to create a more flexible structure which can adapt to an even more demanding era for higher education with the new fee and funding structure, the prospect of greater competition at home and from overseas and challenging economic times.
Mrs Jo Connell ChairmanBoard of Governors
Chairman’s statement

7
Operating and Financial Review
Strategic PlanThe University of Hertfordshire has successfully positioned itself in the sector as the leading business-facing university. We have established a thoroughly ambitious and entrepreneurial university with superb facilities and a close relationship with industry, commerce and the public sector. We strive to put the experience of our students first by our efforts in distinguishing them for being innovative, creative, highly employable and equipped for their future careers.
Our visionWe will shape the next generation of business-facing universities. We will continue to be an exemplar in the sector and we will play a leading role in addressing the economic and social challenges facing the UK in increasingly competitive global markets. Innovation, creativity and an enterprising mindset will be the defining characteristics of our University. We will provide flexible and transformational learning and commit to adding value to our partners and delivering positive and productive engagements with business, industry and the professions. The University will continue to play a central role in the local and regional economy, contributing positively to its social and economic development, and we will build our international profile and global reputation.
Our missionTo be an innovative and enterprising university, challenging individuals and organisations to excel.
Our valuesThe following core values will inform and sustain all of our activities. We aspire to be:
•Student-centred
•Innovative, creative and enterprising
•Committed to supporting and developing our people
•Focused on excellence and its celebration
•Dedicated to enjoyment in learning and work
•A place of integrity where the individual is respected
Our strategic focusWe will deliver our vision through a focus on five key strategic drivers:
•Student experience
•Learning and teaching
•Employability and entrepreneurship
•Research, innovation and enterprise
•International engagement
The delivery of these drivers will be underpinned by our:
•Academic profile
•People and culture
•Financial strength
•Infrastructure and sustainability
•Community engagement
Each of these ten areas is supported by a detailed strategy and action plan. A set of Key Performance Indicators (KPIs) for each area provides the basis for monitoring progress and help to define the future size, shape and profile of the University.
Key Performance Indicators (KPIs)The University has adopted a revised set of KPIs which are used by the Board of Governors to monitor the overall strength of the University. Areas covered include: student recruitment, retention and employability, financial health and achievement of budget, volume and nature of business interactions, general management and organisational development. Key facts and figures relating to student recruitment are set out on pages 8 to 9 and financial data on page 11 to 14.
The KPIs are monitored constantly by the Board of Governors and are updated on an annual basis. During the year the University has performed well and the majority of its key internal targets set for 2010/11 have been met or exceeded. In addition, the University has also created a target profile which it intends to achieve by 2011/12. This sets out the University’s broad aims in the areas of student experience and institutional achievement in the Higher Education context by the end of this period. This profile is also monitored by the Board of Governors.
Risk awareness and mitigationRisk assessment and management is embedded in the institution, and risk registers are prepared at project level, Strategic Business Unit level and institution level. At the strategic level, a number of key risks have been identified which relate to delivery of the University’s Strategic Plan and good

8
performance against the KPIs. The major risks which the University has identified include recruitment and retention of students, and the position of the institution in a difficult future economic climate. Key risks and mitigating actions are monitored by committees across the University and reported to and monitored overall by the Audit Committee. The Board of Governors receives a risk report as part of the normal business of their meetings. The current economic climate and events pose a significant financial risk to all business and universities alike. As stated in our investment policy below, the University manages its investment portfolio and cash reserves in such a way as to mitigate this risk as far as possible.
Student facts and figures
Student profileStudent numbers have increased slightly from a total enrolment of 27,650 in 2009/10 to 27,700 in 2010/11. This includes students based at consortium colleges
and other partner institutions. The student population has stabilised over recent years in accordance with the strategic plan.
Distribution of Higher Education students in 2010/11 compared with 2009/10 was as follows and is illustrated in the tables and charts below.
•56% (2010: 55%) of the University’s students were female
•74% (2010: 74%) were full-time/sandwich of which 73% (2010: 75%) were first degree students
•26% (2010: 26%) were part-time, 41% (2010: 43%) of whom were postgraduate (taught (PGT) and research (PGR))
•The University continues to offer a very wide range of subject mix with business and subjects allied to medicine being the most popular. There has been growth in the areas of education and the creative arts.
•The student ethnic mix also continues to be diverse.
Operating and Financial Review
2010/2011 Full-time / sandwich
2010/2011 Part-time 2009/2010 Part-time
2009/2010 Full-time / sandwich
Gender 2010/2011 Gender 2009/2010
Male 44%
Male 45%Female
56%Female 55%
PGR 1%
PGR 4% PGR 4%
PGR 1%Other UG 7%
Other UG 31% Other UG 31%
Other UG 6%Foundation 5%
Foundation 10% Foundation 9%
Foundation 5%PGT 15%
PGT 37% PGT 39%
PGT 13%
Firstdegree72%
First degree 18% First degree 17%
Firstdegree75%
2010/2011 Mode split 2009/2010 Mode split
Part-time 26%
Part-time 26%Full-time /
sandwich 74%
Full-time /sandwich 74%

9
Operating and Financial Review
Additionally:
•97.1% of young full-time first degree entrants in 2009/10 were from state schools compared to 88.8% for the sector as a whole.
•39.5% of young full-time first degree entrants in 2009/10 were from socio-economic groups 4, 5, 6 or 7, compared to 30.0% for the sector as a whole.
•94.6% of young full-time first degree entrants from low participation neighbourhoods continue or qualify at the University, compared to a sector figure of 88.4%.
•Over 5,600 (2010: 5,200) of the University’s students studying in the UK originate from outside the UK.
Combined
Education
Creative arts and design
Historical and philosophical studies
Languages
Mass communications and documentation
Business and administrative studies
Law
Social studies
Architecture, building and planning
Engineering and technology
Computer science
Mathematical sciences
Physical sciences
Agriculture and related subjects
Veterinary science
Biological sciences
Subjects allied to medicine
Medicine and dentistry
1,000 2,000 3,000 4,000 5,000 6,0000
2009/10
2010/11
0 2,000
2009/10
2010/11
4,000 6,000 8,000 10,000 12,000 14,000
Not known (includes code ‘information refused’)
Other (including mixed)
Other Asian background
Chinese
Asian or Asian British - Bangladeshi
Asian or Asian British - Pakistani
Asian or Asian British - Indian
Other Black background
Black or Black British - African
Black or Black British - Caribbean
White
Total number of students by ethnicity
Total number of students by subject area
10
Operating and Financial Review
Destination of Leavers from Higher Education (2009/10 students surveyed in 2010/11)
The Destination of Leavers from Higher Education (DLHE) is an annual survey reviewing destinations of students six months after they have left higher education. The data below highlights destinations of leavers who completed their studies from January 2009 to July 2010. In this period 4,886 graduates were surveyed with a response rate of 86%. Of the responses received, a population of 2,875 (home, first degree, full-time students in graduate jobs) contributes to determining our Times graduate employment league table position. The University’s overall employment rate was 89.3% (2010: 90.7%).
Destination of University of Hertfordshire students in 2009/10
Other highlights from this survey indicated that:
•Most of our graduates are opting to work in the East, followed by London and the South East. There are 33 graduates working overseas.
•Approximately one third of graduates reported that they had secured employment with companies for which they had previously worked.
•3.8% of our students are self employed (2010: 2.7%).
•The average salary band is similar to last year, between £20,000 and £24,999.
Research and knowledge transfer Despite operating in a challenging economic climate the University’s research and knowledge transfer activities continue to bring meaningful rewards that recognise the expertise of its staff.
When the Higher Education Innovation Fund (HEIF) allocations for 2011/2015 were announced the University of Hertfordshire was delighted to be awarded the maximum allocation of £2.8 million per year for four years, one of only two post-1992 universities in the country to achieve this. The HEIF allocations are calculated based on an institution’s innovation activity in knowledge exchange and business-facing undertakings including contract and collaborative research, consultancy, short courses, economic development projects, intellectual property and Knowledge Transfer Partnerships (KTPs). Non-financial outcomes are also important factors in the calculation. Activities such as enabling graduates to start-up their own businesses, research exploitation, public engagement and social enterprise feature. The income will be used to build on the existing strengths of the University in all these areas.
The outcomes of the Government’s Comprehensive Spending Review (CSR) have impacted this year and will continue to impact in the coming years on the level of publicly-funded research funding available to universities.
For example, in October 2010, the Technology Strategy Board (TSB) announced that it was delaying the approval of new KTPs pending the outcome of the CSR. The subsequent reduction in core funding for the rest of the CSR will result in the reduction in the number of KTPs to be funded nationally by approximately 50% by 2012/13. The TSB also introduced some new criteria for the award of future KTP projects, ‘innovation, impact and challenge’. It is therefore pleasing that the University and its business partners have continued to be awarded KTPs this year, enabling it to maintain its commitment to its local business community.
Another example of the outcome of the CSR is that of UK Research Councils, traditionally key sponsors of research in UK universities. They are seeking efficiency savings and are introducing demand management policies in order to reduce the number of research applications submitted to them, one aim is to reduce their Shared Services Centre costs
Full time work,voluntary and
self employment57.38%
Full time study9.18%
Unemployed6.76%
Part timework
and/orstudy
15.98%
Other (inc. refusals)10.70%

11
Operating and Financial Review
in administering bids and another is to improve the currently low level of conversion rates. The University continually monitors these developments to ensure that it is well-placed to respond to the changing requirements.
The University was successful this year with its first joint bid to the Arts and Humanities Research Council for a Block Grant Partnership under its Capacity Building Scheme to provide funding for 18 postgraduate masters and doctoral studentships between 2011 and 2013 in collaboration with Oxford Brookes University and the University of Surrey.The European Union (EU) has proved a fruitful source of funding for the University’s research activities this year having received awards in excess of €4 million. The subject content of the projects funded range from robotics, engineering, astronomy and health. This funding will feed into research income in future years.
Having robust structures and processes in which research can be conducted is an important priority for the University and gives confidence to its sponsors and collaborators. Accordingly, the University constantly reviews its existing practices. As part of this review the University arranged a visit from the UK Research Integrity Office in June 2011 to discuss current issues in ethics and research integrity.
Investment in its research infrastructure led to the purchase of a new Research Information System that went live in July 2011. This will support the implementation of the University’s Research Strategy, preparation for the Research Excellence Framework (REF) 2014, the systematic management of research information across the University and provide an integrated link to the existing UH Research Archive for external promotion of our research strengths.
Looking to the future, the University is already well into its preparation for the forthcoming 2014 REF for which submissions are to be made at the end of November 2013. It has appointed a REF Manager, started populating the Research Information System and has produced impact case studies that outline how its research has benefitted the economy, society and/or culture.
Financial Review
The financial statementsThe financial statements presented by the Board comprise the consolidated results of the University and its subsidiary companies, associates and joint ventures (the Group). The Group companies undertake activities which, for legal or commercial reasons, are more appropriately channelled through a limited company. These subsidiaries and their activities are listed in note 13. Where possible the wholly owned subsidiary companies pay their taxable profits to the University under the Gift Aid scheme.
Results for the yearThe consolidated results for the Group for the year to 31 July 2011 are summarised in the following table:
2011 2011 2010 2010 £’000 £’000 £’000 £’000 (after (before (after (before FRS 17) FRS 17) FRS 17) FRS 17) Income 254,732 254,732 262,845 262,845 Less: share of income in joint ventures (23,898) (23,898) (28,219) (28,219) ______ ______ ______ ______
Total income 230,834 230,834 234,626 234,626 Expenditure (216,639) (219,127) (232,097) (229,262) _______ _______ _______ _______ Surplus on continuing operations 14,195 11,707 2,529 5,364 Share of operating (loss)/profit in joint ventures (779) (779) 288 288 Surplus on sale of fixed assets 1,974 1,974 35 35 Impairment of fixed assets (5,187) (5,187) - - _____ _____ _____ _____ Surplus before taxation 10,203 7,715 2,852 5,687
Taxation (159) (159) (141) (141) _____ _____ _____ _____ Surplus for the year 10,044 7,556 2,711 5,546 _____ _____ _____ _____

12
The financial results of the Group for the year show a surplus of £10 million, a margin of 4.3%, and cash of £39.6 million and demonstrate a strong position in advance of the uncertainties surrounding student choices in September 2012. With the exception of 2003/04, when the outcome was boosted by asset sales of £15 million, the results are the best in the history of the Group.
Group surplus/deficit 2007/2011
Following the announcement by the Government of substantial reductions in public funding, the Group has embarked on several initiatives to reduce ongoing non-staff costs through enhanced procurement activity, re-specification of its requirements and delivery of several measures to eliminate waste. Investment in financial management has also enhanced the decision-making abilities of senior management.
Changes in income source 2005/2006 compared to 2010/2011
Staff costs as a proportion of income remain some of the lowest in the sector.
Staff costs as a percentage of total income 2007/2011
The University continued to deliver its academic and research portfolio, achieving targets in many of its key non-financial measures. The subsidiary companies also delivered profits throughout, other than Corporate Fit Science Ltd which has now ceased trading, in a demanding economic climate. The activities of the subsidiary companies are detailed on pages 13 to 15.
The deficit in the local government pension scheme, which most non-academic members of staff are members of, has remained broadly level at £24 million, as detailed in note 32.
The University is mindful of its responsibilities to future students and has set its undergraduate fees for UK and EU students starting in September 2012 below the maximum permitted by Government and within the £7,500 average suggested by Government. A tiered approach has been adopted to offer some choice to students in deciding where to study, and the Board believes that this represents very good value for the quality of the experience delivered. A package of support for eligible students will also be offered.
12,000
10,000
8,000
6,000
4,000
2,000
02007 2008 2009 2010 2011
Year
Surplus £’000
2005/2006
Other income25% Funding
council grants38%
Tuition fees33%
Researchgrants
3%
Investment income1%
2010/2011
Other income32%
Fundingcouncil grants
26%
Tuition fees39%
Researchgrants
3%
Investment income0%
Operating and Financial Review
44%
46%
48%
50%
52%
54%
56%
58%
42%2007 2008 2009 2010 2011
Year
Percentage

13
Operating and Financial Review
Capital projectsThe Group invested £18.8 million in capital projects including the new Law Court building on the de Havilland campus, on its HR and Student IT systems, on improvements to the BioPark facility in Welwyn Garden City and on a number of vehicle purchases for its bus company, Uno. A plan for redevelopment of the College Lane campus over the next decade, the “2020 Estates Vision”, has been formulated and the financial position of the Group is now such that external borrowing requirements to fund the project will be limited.
Private Finance InitiativeThe Group has, under the terms of the agreement with Ellenbrook, permanent use of 1,600 student residences at the de Havilland Campus. This development has been provided by the private sector through a Private Finance Initiative for which the Group pays an annual unitary charge for facilities management over the next twenty-two years. At the end of this period (2032/33) ownership of the residences will revert to the University.
Cash flowCash during the year increased by £10 million to £39.6 million as a result of the strong trading performance and due to the sale of the former Law School site in St Albans, which earned £3.5 million. Loans of £1.4 million have been repaid during the year in respect of The Student Forum, residences and buses. The graph below shows the Group’s cash and borrowings position over the last five years.
Last five years borrowing and cash (Group)
Investment policy and performanceThe investment policy of the University provides that deposits are made on the basis of the long-term credit rating assigned by the Fitch global rating agency to the financial institution with which the proposed investment is to be made. Deposit limits with one financial institution range from £1 million to £10 million depending on the rating.
Commercial activityIn pursuance of its business-facing strategy, the University of Hertfordshire has been growing its income from the delivery of a wide range of services to the business community and the general public through its subsidiary companies. In addition the University also holds investments in other companies, for example some small start-up companies.
The income from the subsidiary companies is becoming an ever more important aspect of the University of Hertfordshire Group’s activity amounting to £67 million in 2010/11, and now represents 30% of the total Group income which can be seen from the chart on the next page.
90,000
80,000
70,000
60,000
50,000
40,000
30,000
20,000
10,000
2006/07 2007/08 2008/09 2009/10 2010/11Financial Year
Borrowing Total
Cash Total
£000’s

14
Operating and Financial Review
Source of total Group income 2010/11 (£ million)
The University’s main trading subsidiaries with details of their activities in the year are as follows (see also note 13).
UnoUno is a subsidiary business of the University of Hertfordshire operating through two trading companies, Universitybus Limited and Uno Buses Limited, and employs 200 staff. Established in 1992, Uno was designed as a bus service for the University of Hertfordshire. With the continued success of the company and the ever increasing expansion of the route network, Uno was opened to all members of the public and is now a leading public transport operator for Hertfordshire, transporting on average 18,000 passengers on a daily basis. The network extends from Luton in the North to Victoria in London and overall 100 buses operate 75,000 miles per week. Uno is recognised as a major regional transport operator throughout Hertfordshire and surrounding areas. Uno is a member of the Intalink partnership which brings together Hertfordshire County Council, district councils and the county’s bus operators to promote a high quality passenger transport network for the entire county. Uno is currently tendering for routes into London and surrounding urban environments, which will interlink with existing routes. It remains central to the University in that it ensures that substantial numbers of students and staff can access the University where otherwise they might not.
With fuel being one of the companies’ most significant costs, the Board agreed to the forward hedging of up to 75% of their fuel requirements. This has fixed the
cost within budget at a time of very volatile market fluctuations. The companies have also successfully tendered for a number of Hertfordshire County Council bus route contracts. Two new hybrid buses have been ordered in support of the University’s carbon emission policy.
Polyfield Property Limited - Hertfordshire Sports Village
The Hertfordshire Sports Village provides opportunities for students, staff and the wider community to get fit, get competitive or just do something different. The Sports Village is actively involved in improving the health and wellbeing of students and staff. In the past year,the Sports Village has secured a £350,000 grant from Sport England to run an Active Students project aimed at getting an additional 2,500 students active in 2011/12. Work with staff has included offering over 300 free health MOT’s and working with Uno on a project designed to improve the health of bus drivers. The Sports Village also hosts and works with a variety of community and elite sports organisations including Arsenal Ladies FC (women’s football), Hertfordshire Mavericks (superleague netball), Hatfield Swim Club (swimming), the English Institute of Sport, Saracens Sport Foundation and the Herts Sports Partnership. The Sports Village have also hosted a number of teams from National Olympic Committees as part of their role as a preparation camp for the 2012 games including all canoe slalom teams as part of the official test event for the Olympic White Water Canoe Slalom course in Hertfordshire.
Key achievements in 2010/11 included: membership of the Athletic Union and student gym membership numbers increased: the changes in VAT were absorbed without cost increase to clients or overall loss of income; the number of external events held increased including great exposure for the University by hosting the National Superleague Netball play off and final shown live on TV; and the grant for Active Universities (largest award in England) was won.
ExemplasExemplas has an extensive record of successful national and international project management covering employability, enterprise and skills development. Exemplas works with organisations to fully understand their needs and aspirations in order to develop and implement tailored solutions. As part of the University of Hertfordshire Group, they offer unique value to their customers and their people, including:
Specialinitiatives
6.5
Other fundingcouncilgrants
6.2
Tuition fees -home & EU
53.4
Tuition fees -overseas
26.2
Residences17.7
Research8.3
Health andother
contractincome
19.4
Bus companies11.1
Exemplas17.6
Other10.5 HEFCE
recurrentgrants53.9

15
Operating and Financial Review
•Full range of work-based skills progression from NVQs to in-company degree programmes
• Improving employability
•Facilitated recruitment and progressive apprenticeship programmes
•Leveraging training subsidies
•Accredited leadership and management development
•Advice improving management systems and processes
•Consultancy on organisation effectiveness
Exemplas helps their customers deliver exceptional performance through development of people, processes and strategy to maximise profitable growth.
During the year Exemplas has developed and begun to implement a five year strategic plan. Important elements of this achieved during 2011 have been the successful bid to be included on the Department for Work and Pensions contract framework, the acquisition of a training company that possessed a core government apprenticeships contract, and the reorganisation of its commercial training and consultancy business.
Evalu8 Transport Innovations LimitedEvalu8 Transport Innovations Limited has been established to accelerate the development and uptake of electric vehicles in the East of England. It aims to provide both a contribution to reducing CO2 emissions and the development of the low carbon economy, with benefit to sustainability and economic growth, in particular in small-to-medium sized enterprises.
Evalu8 has won funding from the East of England Development Agency, the Office of Low Emission Vehicles and the European Regional Development Fund to install an operationally effective electric vehicle recharging network, called Evalu8 Plugged in Places, across the East of England. The programme will be used as test bed and innovation platform to build upon the region’s significant innovation capabilities and help catalyse the new global electric vehicle economy.
In addition Evalu8 plans to contribute to education and policy, regionally, nationally and internationally in the area of low emission vehicles. It is a not for profit company wholly owned by the University of Hertfordshire.
UH Ventures LimitedThe Company has been significantly involved in the rationalisation of the University of Hertfordshire’s subsidiary companies with the transfer of the trading activities of UH Hospitality Limited, Unisecure Limited and Cimtech Limited as ConferenceHertfordshire, Unisecure and Cimtech divisions respectively.
Despite exceptionally difficult market conditions, a strong summer conference season, along with tight cost control the ConferenceHertfordshire division came close to achieving its forecast target for the year.
During the year the Joint Academic Commercial Company (JACC) division developed a number of commercial courses offers including online and corporate degrees. Working with a partner in Dubai, UH Ventures has introduced a number of degrees assessed under an APEL (Accreditation of Prior Experiential Learning) model.
Corporate responsibility
People and cultureThe People and Culture enabler underpins the 2010/15 Strategic Plan.
The University has continued to reduce overall staff costs as a percentage of total costs and is significantly below the sector average. Apart from prudent control it demonstrates that the University uses its capacity to generate income from a wide range of sources to the full.
The average score in response to a cross section of staff survey questions related to wellbeing was 3.08 from a maximum of 4. The questions cover meaningful work, opportunity for growth and development, a safe working environment and involvement. During 2010/11 HR and Occupational Health have been working closely together to develop an approach to identifying and managing occupational stress. An approach to risk assessment, a policy and manager guidance have all been produced in order to support managers and staff who may be facing issues related to workplace stress.
Work has been undertaken to extend salary sacrifice opportunities to staff. Under the banner “Choices” staff will be able to sacrifice salary to pay for car park permits and Sports Village membership as well as childcare vouchers and bicycles.

16
Operating and Financial Review
The flagship leadership programme, “Making Sense of Leading” has been re-designed and re-launched. This programme was shortlisted for a Times Higher Education Award in 2010, and has been accredited by the Business School. The University was awarded the European Commission ‘HR Excellence in Research’ badge. In addition, the HR Development Team successfully secured a £10,000 grant from the Leadership Foundation for Higher Education to research the specific development needs of research leaders.
A hugely successful professional staff conference was held in January 2011. Over 100 staff attended a half day conference which involved plenary and workshop sessions.
Organisation design is a critical element to all organisations. The Southern Universities Management Service were commissioned to review academic management structures. The resulting report was instrumental in supporting the development of a future University structure, leading to ‘Project Agile’ which will involve the removal of faculty structures and the full devolution of authority and responsibility to heads of Strategic Business Units.
There continues to be a close working relationship with the recognised trade unions both via formal Joint Negotiating Committees, chaired by a Pro-Vice-Chancellor, and through day-to-day working particularly on casework and change management.
Equality and diversity The University promotes an inclusive ethos of fairness, courtesy and respect which encourages differences to be shared, explored and celebrated. This commitment to promoting equality and valuing diversity, which informs all policies, procedures and activities, is made known to Governors, students and staff, applicants and visitors. The University provides development opportunities on equality for Governors, staff and students.
As part of meeting its positive legal duties to promote race, disability and gender equality, the University reviewed and revised the Race Equality Policy, Disability Equality Scheme and Gender Equality Scheme. The reviews used the outcomes of monitoring, equality impact assessments and consultations to determine equality objectives. The Board of Governors approved these and the revised
policy to promote dignity and respect: preventing and dealing with harassment and bullying.
Through the Higher Education Academy/Equality Challenge Unit’s Summit Program, changes were made at University level, and in the Business School, to address differences in degree attainment between students of different ethnic groups. Although the program has concluded, the search and use of successful interventions continues.
The University continued working with Hertfordshire County Council, Welwyn Hatfield Borough Council, Hertfordshire Equality Council and the Hertfordshire Partnership NHS Foundation Trust, as well as with voluntary groups such as the Welwyn Hatfield Ethnic Minority Group, to promote equality and to encourage good community relations.
Health and safety The University’s staff accident data illustrates five successive years of lower than the sector average for reportable accidents as shown below. Along with various external audits and internal monitoring procedures, it can be reported that the University has good levels of control of its health and safety risks.
Staff accidents compared to UK university average
Highlights for the year on safety training include:
•The introduction of an online Health and Safety package. Primarily for new starters it covers the University’s safety policy and procedures.
• IOSH Managing Safely has been offered to line managers.
•Fire Safety for Managers.
10
8
6
4
2
02005 2006 2007 2008 2009 2010
Year
UK university staff per 1000University of Hertfordshire staff per 1000

17
Operating and Financial Review
The University Health and Safety Consultative Committee (HSCC) met three times over the course of 2010/2011 with an opportunity for consultation with staff representatives and recognised trade unions, to review and discuss the work of the Occupational Health and Safety Office.
Wellbeing activities offered by the Occupational Health and Safety Office for 2010/2011included a seasonal flu vaccination programme, occupational health physiotherapy service, and the annual wellbeing week.
Sustainability and environment The University’s Environment Team, part of the Centre for Sustainable Communities, and the Department of Estates have shared responsibility for making the University as energy efficient and environmentally responsible as possible. These responsibilities are reflected in the KPIs, which relate to the University’s position in the People & Planet Green League and to its carbon emissions. Because of its strong performance in relation to waste management and transport planning, and its well developed sustainability policy, the University has remained in the top ten of the Green League. However, carbon emissions (measured in terms of weight of CO2
produced per year) remain higher than target, but the University has recently approved a Carbon Management Plan that sets out how these emissions will be reduced by 60% by 2020. This position cannot be changed rapidly, but implementation of the initial projects is underway and the 2020 vision for development of the University’s estate will have a major beneficial impact on these carbon emissions. The new Law Court building is an excellent example of how a very low carbon footprint can be achieved, and it sets the standard for future University developments.
The Infrastructure and Sustainability Group oversees and coordinates the activities of Estates, Information Hertfordshire, the Environment Team and Procurement in relation to sustainability.
Community The University’s Community Engagement Strategy was approved by the Governors and Academic Board in 2010/11 and it has been widely disseminated across the University and amongst external partners. The strategy is based on key areas of activity: social enterprise support, schools outreach, local community support, culture and sport, public engagement, and strategic partnerships.
The University’s Social Enterprise Unit provides a highly valued service to third sector organisations, supplying expertise in a range of disciplines including business management, finance and IT, delivered by teams of students supervised by academic staff. The commercial value of this support, were it to be bought in, is substantial, and the benefit to students in terms of giving them experience of real life projects is considerable.
The UK Recruitment and Access team, working in close collaboration with the University’s academic Strategic Business Units and its students, has built a strong reputation amongst schools and colleges in Hertfordshire for their work in helping to inspire pupils to aim for university. The team organises a wide range of activities, some of which have been funded by the Aimhigher initiative. Although Aimhigher funding has now ended, these activities are so highly regarded that schools are prepared to pay for many of them to continue. Other ways in which the University supports Hertfordshire schools include its partnerships with schools and colleges through the Academy Schools and Trust Schools programmes, and through encouraging staff to become school governors and supporting them once in post.
The University’s students and staff provide a large volunteer resource within Hertfordshire, and this has been strengthened during the year by the formation of links between the University of Hertfordshire Students’ Union and the Centre for Voluntary Service. Further strengthening of the University’s volunteering activities is being planned. The Students’ Union continues to be very successful in raising funds for local charities.
The University’s Community Partnerships Office (CPO) has been especially effective in tackling the causes of tensions between students and the local community, especially at the start and end of the academic year, when problems of noise and inconsiderate behaviour can be acute. Working with the Borough Council, the CPO has introduced measures such as extra rubbish collections, late night patrols, and a hotline to pre-empt some of the problems experienced previously. These initiatives have been so successful that they will be continued.
The University’s Sports Village makes a substantial contribution to the wellbeing of its local community, through making facilities available to the public, schools and teams, and through going out into the community to promote and support sports activities.

18
Operating and Financial Review
Preparations for the Olympic Games have been a high priority for University staff and these have ensured that the University will be fully engaged with the Games in 2012 through its sports facilities, sports expertise and residential accommodation. Similarly, UHArts is a major cultural asset for Hertfordshire, with its concerts, exhibitions, theatrical performances and films attended by large numbers of the public each year. In the past year UHArts has worked with St Albans District Council to move the Margaret Harvey Gallery from the old Law School to an excellent venue in the Museum of St Albans, and will continue to play a leading role in curating exhibitions there.
The academic expertise of the University’s staff is made available to the public through a range of public lectures, workshops and conferences, and an audit is being carried out to establish the scope and volume of such activities, with the aim of raising awareness amongst the public of the wealth of such events on offer to them each year.
The University is represented on a variety of local bodies, to ensure that it remains closely engaged in local strategic decision-making. It also has formal partnerships with Hertfordshire County Council, and St Albans District Council. This year a partnership was agreed with Welwyn Hatfield Borough Council, and several priority areas for collaboration were identified. The University’s partnership with the Hertfordshire Further Education Colleges, through
the Hertfordshire Higher Education Consortium, was reviewed during the year and a new agreement has been signed which is more in keeping with the changed national Higher Education environment.
Charitable TrustOn 21 October 2009 the University became the sole trustee of the University of Hertfordshire Charitable Trust whose objects are to support the advancement of teaching and research and students at the University. Major donors of the Charitable Trust are shown on page 70.
AuditorsA resolution to reappoint Grant Thornton UK LLP as auditors of the University for this purpose will be proposed at the meeting of the Audit Committee of the Board of Governors.
P E Waters Secretary
A Moffat Group Finance Director

19
Responsibilities of the Board of Governors
In accordance with the University’s Articles of Government, the Board of Governors is responsible for the administration and management of the University’s affairs, including ensuring an effective system of internal control, and is required to present audited financial statements for each financial year.
The Board of Governors is responsible for keeping adequate accounting records, which disclose with reasonable accuracy at any time the financial position of the Group, and for ensuring that the financial statements are prepared in accordance with the Instrument and Articles of Government, the Statement of Recommended Practice: Accounting for Further and Higher Education and other relevant accounting standards. In addition, within the terms and conditions of a Financial Memorandum agreed between the Higher Education Funding Council for England (HEFCE) and the Board of Governors of the University of Hertfordshire, the Board of Governors, through its designated accountable officer, is required to prepare financial statements for each financial year which give a true and fair view of the state of affairs of the University of Hertfordshire and Group and of the surplus or deficit and cash flows for that year. At the University of Hertfordshire the designated accountable officer has been identified as the Vice-Chancellor. In preparing those financial statements, the Board of Governors is required to:
•select suitable accounting policies and then apply them consistently
•make judgements and estimates that are reasonable and prudent and state whether applicable United Kingdom Accounting Standards have been followed, subject to any material departures disclosed and explained in the financial statements
•prepare the financial statements on the going concern basis unless it is inappropriate to presume that the Group will continue in operation.
The Board of Governors has taken reasonable steps to:
•ensure that funds from HEFCE are used only for the purposes for which they have been given and in accordance with the Financial Memorandum with the Funding Council and any other conditions which the Funding Council may from time to time prescribe
•ensure that there are appropriate financial and management controls in place to safeguard public funds from other sources
•safeguard the assets of the Group and prevent and detect fraud and other irregularities
•secure the economical, efficient and effective management of the University’s resources and expenditure.
In so far as each of the Governors is aware:
•there is no relevant audit information of which the University’s auditors are unaware; and
•the governors have taken all steps that they ought to have taken to make themselves aware of any relevant audit information and to establish that the auditors are aware of that information.
The Board of Governors is satisfied that the University has adequate resources to continue in operation for the foreseeable future; for this reason, the going concern basis continues to be adopted in the preparation of the financial statements.
It acknowledges its responsibility for ensuring that an effective system of internal financial control is maintained and operated by the University of Hertfordshire. The system can provide only reasonable and not absolute assurance that assets are safeguarded, transactions authorised and properly recorded, and that material errors or irregularities are either prevented or would be detected within a timely period. The system of internal financial control is based on a framework of regular management information, administrative procedures including the segregation of duties, and a system of delegation and accountability. In particular, it includes:
•comprehensive budgeting systems with an annual budget which is reviewed and agreed by the Board of Governors
•regular reviews by the Board of Governors of periodic and annual financial reports which indicate financial performance against budgets and forecasts
•setting targets to measure financial and other performance using KPIs as appropriate
•clearly defined capital investment control guidelines•the adoption of formal project management
disciplines where appropriate.

20
Responsibilities of the Board of Governors
The Board of Governors has established the processes to comply with the revised direction from HEFCE for the identification, evaluation and management of risks the University faces. The following is a statement of the University’s internal control and risk management policy:
•As the Board of Governors of the University of Hertfordshire, we have responsibility for maintaining a sound system of internal control that supports the achievement of policies, aims and objectives, while safeguarding the public and other funds and assets for which we are responsible, in accordance with the responsibilities assigned to the governing body in the charter and statutes/instrument and articles and the Financial Memorandum with HEFCE.
•The system of internal control is designed to manage rather than eliminate the risk of failure to achieve policies, aims and objectives; it can therefore only provide reasonable and not absolute assurance of effectiveness.
•The system of internal control is based on an ongoing process designed to identify the principal risks to the achievement of policies, aims and objectives, to evaluate the nature and extent of those risks and to manage them efficiently, effectively and economically. This process has been formally documented during the year to the extent that the University considers that it has embraced the broad principles of British Universities Finance Directors Group (BUFDG) guidance on ‘Corporate Governance for Higher Education’ and has in place comprehensive risk management policies and procedures as at 31 July 2011 and up to the date of approval of the financial statements, and accords with HEFCE guidance.
As the Board of Governors, we have responsibility for reviewing the effectiveness of the system of internal control. The following processes have been established:
•We have met at regular intervals to consider performance reports, operational plans and the strategic direction of the University.
•We receive periodic reports from the Chairman of the Audit Committee concerning internal control, and we require regular reports from managers on the steps they are taking to manage risks in their areas of responsibility, including progress reports on key projects.
•The Audit Committee provides an oversight of risk management.
•The Audit Committee receives regular reports from the internal audit service, which includes the internal audit service’s independent opinion on the adequacy and effectiveness of the institution’s system of internal control, together with recommendations for improvement.
•A programme of risk awareness training has been completed. All new managers will receive training in risk management as part of the New Managers’ programme and Making Sense of Leading. This will be one of the mandatory aspects within our Management Development Strategy.
•A system of key performance and risk indicators has been developed.
•A robust risk prioritisation methodology based on risk ranking and cost-benefit analysis has been established.
•An organisation-wide risk register is maintained.
•Reports are received from budget holders, department heads and project managers on internal control activities.
Our review of the effectiveness of the system of internal control is informed by the work of the internal audit service, which operates to standards defined in the HEFCE Audit Code of Practice and which was last reviewed for effectiveness by the HEFCE Audit Service in March 2005. The HEFCE Audit Service visited again in February 2006 to carry out ‘Evaluation of Risk Management, Control, and Governance Arrangements’. The overall conclusion of the Audit Service report was that the University achieved a ‘high level of assurance’.
Our review of the effectiveness of the system of internal control is also informed by the work of the Office of the Vice-Chancellor within the institution, which has responsibility for the development and maintenance of the internal control framework, and by comments made by the external auditors in their management letter and other reports.
The Audit Committee oversees the work of the internal audit service. The work of the internal audit service is informed by an analysis of the risks to which the University is exposed, and annual internal audit plans are based on this analysis. The Board

21
Responsibilities of the Board of Governors
of Governors endorses the analysis of risks and the internal audit plans on the recommendations of the Audit Committee. The head of internal audit provides the Audit Committee with an annual report on internal audit activity in the University and is required to provide the Board and the Vice- Chancellor with an opinion on the adequacy and effectiveness of the University’s risk management, control and governance processes. A full discussion on the risk management effectiveness takes place within the Audit Committee with questioning by members of the head of internal audit and officers in attendance. Within this context the head of internal audit, based upon the work undertaken for the twelve months ended 31 July 2011, gave the opinion that the University has adequate and effective risk management, governance and control processes to manage the achievement of the organisation’s objectives.
The University has demonstrated that it has proper arrangements in place to promote economy, efficiency and effectiveness, and a value for money programme has been approved.
Returns to HEFCE and HESA (Higher Education Statistics Agency)As part of the annual accountability return to the funding council, from autumn 2009 the Chairman of the Audit Committee was required to complete and sign various documents before submission. Discussion with the Funding Council took place over 2009/10 who confirmed that they sought assurance on the process. The Audit Committee can give full assurance on the processes associated with these returns submitted during 2010/11 and this assurance is also confirmed in the Annual Report of the Audit Committee to the Board of Governors for 2010/11.

22
Statement of Corporate Governance
The following statement is provided to enable readers of the financial statements of the University to obtain a better understanding of the governance and legal structure of the University.
The University endeavours to conduct its business in accordance with the seven Principles identified by the Committee on Standards in Public Life and with the guidance to institutions of higher education provided by the Committee of University Chairmen (CUC). The Board is satisfied that it is in compliance with the revised ‘Guide for Members of Higher Education Governing Bodies in the UK’ published by the CUC in November 2004. The University maintains a Register of Interests of members of the Board of Governors and of members of the Office of the Vice-Chancellor, which may be consulted by arrangement with the Secretary and Registrar. Also at the beginning of each meeting of the Board and its Committees an item headed ‘Declaration’ allows for those attendees to make known any conflicts or associations with the matters under consideration.
The University is an independent corporation, established as a Higher Education Corporation under the provisions of the Education Reform Act 1988 and the Further and Higher Education Act 1992, and is a charity exempt from registration. Its objects, powers and framework of governance are set in the Articles of Government, which were approved in 1989 by the Secretary of State for Education. The current version of the Articles was approved by the Privy Council in 1993. The Articles require the University to constitute a Board of Governors and an Academic Board, each with clearly defined functions and responsibilities, to oversee and manage its activities.
The Board of Governors is the overall governing body, responsible for the finance, property and staffing of the University. It is specifically required to determine the educational character and mission of the University and to set its general strategic direction. The Board has a majority of independent members, chosen in line with strict criteria contained in the legislation. It is customary for the Chairman of the Board to be elected from the independent members. There is also provision for the appointment of co-opted members, some of whom may be members of the staff of the University, and for representatives of the Academic Board and of the student body. No members of the Board, apart from staff members, will receive any reimbursement for the work they do for the Board. The full list of the Board of Governors is shown on page 66.
Subject to the overall responsibility of the Board of Governors, the Academic Board has oversight of the academic affairs of the University and draws its membership entirely from the staff and students of the University. It is particularly concerned with general issues relating to the teaching and research work of the University. The Vice-Chancellor, as Chief Executive, is the head of the University and has a general responsibility to the Board of Governors for the organisation, direction and management of the University. Under the terms of the formal Financial Memorandum between the University and HEFCE, the Vice-Chancellor is the designated accountable officer of the University and in that capacity can be summoned to appear before the Public Accounts Committee of the House of Commons.
The Board of Governors met seven times during the academic year. Average attendance was approximately 83%. Whilst certain matters such as approval of the strategic plan, the annual budget, major investments and the sale and purchase of land, are reserved matters for the Board, much of its detailed work was handled initially by committee, in particular the Finance and Employment Committee (which assumed some of the responsibilities of the Finance and General Purposes Committee and Student, Employment and Quality Committee from 1 April 2011) and the Governance and Nominations Committee (the Vice-Chancellor is a member of these Committees) and the Audit and Remuneration Committees. Other than the Development and Audit Committees, whose compositions include a staff governor nominated by the Board of Governors, these committees are composed of independent and external co-opted members of the Board. The decisions of all of these committees are reported formally to the Board.
The Board of Governors conducts regular effectiveness reviews of itself and its committees. These reviews include an analysis of attendance, the work undertaken and the views of members so that changes can be introduced as appropriate during the next cycle. As Chief Executive, the Vice-Chancellor exercises considerable influence upon the development of University strategy, the identification and planning of new developments and the shaping of the University ethos. Members of the Office of the Vice-Chancellor, currently the Deputy Vice-Chancellor, the Group Finance Director and the Secretary and Registrar, all contribute in various ways to this aspect of the work but the ultimate responsibility to the Board rests with the Vice-Chancellor.

23
Statement of Corporate Governance
In accordance with the Articles of Government of the University, the University Secretary and Registrar has been designated Secretary to the Board and in that capacity provides independent advice on matters of governance to all Board members.
Activities of the Board The Board met on seven occasions during the year (19 October 2010, 23 November 2010, 17 February 2011 (the Board’s annual away day), 22 March 2011, 25 May 2011, 21 June 2011 and 11 July 2011). It again proved a particularly busy year for the Board with a Vice-Chancellor retiring and a new Vice-Chancellor commencing and in discussing the impact of the announcement by Her Majesty’s Government of legislation to change the tuition fee arrangements for home undergraduates and then agreeing the tuition fee, conducting a review of the ‘Size and Shape’ of the Board in addition to its normal programme of activity.
The Board continued to discharge its primary responsibilities set out in the Articles of Government with enthusiasm and due diligence. It determined the educational character and mission of the University whilst ensuring the efficient and effective use of resources, solvency and the safeguarding of assets.
Much of the business of the Board in the year focussed upon the impact of the major changes in Higher Education which had been signalled even before the election of the Coalition Government in May 2010. First with the publication of the Browne Review closely followed by the announcement of the Comprehensive Spending Review the Board considered the possible changes and how they would affect the future of the University. This was followed quickly by legislation to change student fees and the Board at its away day in February looked in depth at the University’s market and financial position and the characteristics of any final fee offer that the University should make. At the March meeting the Board agreed in principle that a fee and access offer should be submitted to the Office for Fair Access (OFFA) based around a number of bands which taken together should establish an average fee of just under £7,500. The Board felt strongly that this was fair to the potential student within its principles of fair access whilst, if achieved, should ensure the University remained in a financially robust position. The Board learned over the summer that OFFA had accepted the University’s proposals.
The year started with the Board hearing that student number control had been effectively applied and whilst the new student cohort would bring a higher entry tariff the University would not exceed the maximum student numbers set by the Funding Council.
Another major theme throughout the year was the focus on the estate. Fundamental to the quality of student experience is the quality of the University environment, its teaching and residential buildings, facilities and public spaces and the sense of community that well-designed space could bring about.
The decision was taken to sell the Law School site in St Albans to the County Council to enable the establishment of a new primary school in an area where there was a severe shortage of primary school spaces. The proposal to seek planning permission to construct, from funds raised by the partner bodies, a new head-quarters for both Groundwork Hertfordshire and the Herts and Middlesex Wildlife Trust at the Bayfordbury site was approved. An agreement was accepted to extend the lease on the Ridgeview hostel at London Colney pending the development of new halls of residence. The University secured a key role in supporting the 2012 London Olympics and the Board agreed to proposals to improve residences at College Lane as an essential part of the booking. This would have the added value of improving the quality of the halls for students in the meantime before the proposed redevelopment of the halls at College Lane took effect as part of the 2020 Estates Vision. Finally over the two summer meetings the Board considered in depth the 2020 Estates Vision which looked at the estates needs of the university post tuition fee changes and recommended a range of new academic and residential facilities particularly at College Lane. The Board commissioned feasibility studies to take certain projects to the next stage. As an essential part of these estates plans the Board also agreed to a Carbon Management Strategy.
Matters relating to the subsidiary companies were discussed. The relationship with the other shareholders in Exemplas Holdings Limited was examined whilst the success of winning a bid to provide the ‘plugged in places’ government programme for the East of England was noted with pleasure. A new subsidiary company Evalu8 Transport Innovations Limited was formed to manage the placement of charging points for electric vehicles over the East of England.

24
Statement of Corporate Governance
In addition to the regular reports of its committees, Finance and General Purposes, Employment, Business Review, Development, Audit, Nominations and Remuneration, reports were made on and consideration given to the Annual Accounts for 2009/10, the Budget for 2011/12,the 5 year forecast for HEFCE, the Key Performance Indicators (KPIs), Honorary Awards, the University Court, risk management, academic quality assurance and enhancement, people and culture, equality policies, health and safety and the Committee of University Chairmen (CUC). The Board learned of the success of the School of Engineering and Technology in obtaining accreditation from the professional engineering bodies for all its BEng programmes an achievement rarely awarded to Engineering Departments. The away day in February besides focussing on the tuition fee issue also looked at the progress on implementing the international strategy. The Board was encouraged to see how links were deepening with key partners and how the increasing focus was beginning to yield results.
Another substantial item was the continuing work on the size and structure of the Board. Following upon the recommendations of the effectiveness review of the Board which reported in Summer 2009, the Board agreed to a full review of its size and structure. To assist them in this, the Board appointed two acknowledged experts in Higher Education governance, Professor Robin Middlehurst of Kingston University and the Leadership Foundation and Mr Allan Schofield also of the Leadership Foundation. They produced a comprehensive report looking at the various options, and accordingly, following a full discussion, the Board agreed to have proposals drawn up by a group of its members for consideration in Autumn 2010. The Group reported in the autumn and the Board agreed the way forward and this led to formal proposals being put to the Board meeting in March and many of the changes taking effect from April 2011. Essentially the Board has simplified its committee structure with the disbandment of the Employment Committee and Business Review Committee and the Finance and General Purposes Committee being restructured into the Finance and Employment Committee with its business being focussed on ‘reserved’ matters. The terms of reference of all committees were refreshed. The Board of Governors would meet more often (possibly up to eight times a year) with less business being
considered by the remaining committees thus allowing all Board members to be fully involved in business and reduce duplication. Also the Board signalled its intention over time to reduce its membership to approximately 15 members and make application to the Privy Council for the approval of minor changes to the Instrument and Articles of Government.
The retiring Vice-Chancellor, Professor Tim Wilson, gave his valedictory remarks to the Board at the November meeting prior to his retirement from the University at the end of 2010. The Board was fulsome on the contribution that he had made and the profile the University now enjoyed was in no small measure due to his personal efforts and leadership. It was a fitting tribute that at a ceremony in the West End just prior to his final Board meeting the University was named the ‘Times Higher Education Entrepreneurial University of the Year 2010’ and he collected the award on the University’s behalf. Professor Quintin McKellar formerly the Principal of the Royal Veterinary College, commenced his duties as Vice-Chancellor of the University in January 2011 and he set about getting to know the institution. This led to him presenting proposals, which were agreed, to the June meeting of the Board on the organisational structure to simplify the present faculty and school arrangements and reduce the number of schools. It was a particular pleasure for the Board to note of the announcement in the New Year’s Honours of a knighthood to Professor Tim Wilson for services to Higher Education and of a CBE to the incoming Vice-Chancellor Professor Quintin McKellar for his services to science.
Membership The Board, through its Nominations Committee and involving the independent members where required by the Instrument and Articles of Government, considered a whole range of membership issues. His Honour Judge Baker, Ms Yasmin Batliwala and Mr Peter Block began terms as independent members following serving as co-opted members and Mrs Jo Connell, Mr Alan Graham, Mr Jim Park and Mr Gordon Morrison were re-appointed as independent members. Mr Robert Gordon and Dr Dwain Neil joined the Board as co-opted members serving in a personal capacity. Professor Michael Elves commenced a further term of one year serving as an independent member. Mr Noel Lawler commenced

25
Statement of Corporate Governance
a term of office until 31 August 2011 as the member elected from the professional staff of the University and Ms Nica de Koenigswarter joined the Board as a student of the University nominated by the Trustees of the Students’ Union. Professor Tim Wilson retired as Vice-Chancellor on 31 December 2010 and stood down from the Board and Professor Quintin McKellar became Vice-Chancellor and a Board member from 1 January 2011.
Proposals from the Nominations Committee for membership from 1 September 2011 were approved. Lady Staughton was appointed as an independent member for further period of office until 31 August 2012. Ms Erika Masefield was welcomed to the Board to serve as the student of the University nominated by the Trustees of the Students’ Union for the period 1 July 2011 to 30 June 2012. The Board also noted the outcome of elections from amongst the staff for terms of office commencing on 1 September 2011 until 30 August 2014. Dr Les Mitchell was elected to serve from amongst the teaching staff and Mrs Sharon Harrison-Barker from amongst the professional staff.
The review of the ‘size and shape of the board’ led to a number of changes to chairmanships. With the disbandment of the Employment Committee and the Business Review Committee Mr Peter Block and Mr Nigel Matthews stood down as chairmen. Mr Colin Gordon became chairman of the Finance and Employment Committee whilst Mr John Heywood and Lady Staughton continued as Chairman of the Audit and the Development Committees respectively. Mr David Goodridge became Chairman of the Charitable Trust Committee which exercised some of the powers of the Board as corporate trustee of the Charitable Trust.
The Board, at its annual dinner in June 2011, paid tribute to its retiring members. Professor Michael Elves stood down after many years membership of the Board. Latterly he had served as chairman of the Scholarships Group of the Development Committee. Dr Adrian Stokes completed his term of six years as a co-opted member. Mr Noel Lawler completed his term as a representative of the non-teaching staff. Ms Nica de Koenigswarter completed her term as the representative of its student body.
Public BenefitThe University performs its responsibilities as set out in legislation to carry out teaching and research and in relation to this the University has had regard to the Charity Commissioner’s Guidance on Public Benefit. The University admits students to its full-time undergraduate programmes on the basis of merit and potential to benefit, and has in place an agreement with the Office for Fair Access (OFFA) to demonstrate that access should not be limited on the grounds of individual financial circumstances. The University engages enthusiastically in a wide range of activities to not only advance education but to the benefit of its wider communities. A statement on charitable status now appears on the governance section of the University website in accordance with HEFCE guidance as regulator on behalf of the Charity Commission.
Going ConcernThe Board consider that the accounts of the Group should be prepared on a going concern basis. The Group has made surpluses in each of the past two years and has cash reserves at a near-record high level. The budget for 2011/12 is also indicating the achievement of a surplus and the medium and long-term cash forecasts demonstrate financial sustainability. The University has set fee levels for 2012 entrants at levels which it believes will continue to attract a high level of applications. In 2010 and 2011, more than six applications were made for each place for UK and EU based undergraduates. It is hoped that the banded fee approach will prove to be attractive for prospective students, giving them a real choice, with the average annual fee for these students being set at less than £7,500.
Investments in fixed assets are carefully reviewed prior to approval. The Executive only undertake such investments with the knowledge that the Group will remain solvent, and will have added value as a result of the investment. Although no new external borrowing is likely to be required in the near-term, the board is confident that funding would be available from its lenders should the need arise.
The commercial subsidiary companies return payments to the University as Gift Aid each year, further sustaining the academic organisation.

26
Report of the independent auditors to the Board of Governors of the University of Hertfordshire
We have audited the financial statements of the University of Hertfordshire for the year ended 31 July 2011which comprise the consolidated income and expenditure account, the statement of total recognised gains and losses, the statement of historical cost surpluses and deficits, the University and consolidated balance sheets, the consolidated cash flow statement, the statement of principle accounting policies, and the related notes. The financial reporting framework that has been applied in their preparation is applicable law and United Kingdom Accounting Standards (United Kingdom Generally Accepted Accounting Practice) and the 2007 Statement of Recommended Practice: Accounting for Further and Higher Education.
This report is made solely to the Governing Body, in accordance with the University’s articles of government, section 124B (3) of the Education and Reform Act 1988. Our audit work has been undertaken so that we might state to the University’s members and trustees those matters we are required to state to them in an auditor’s report and for no other purpose. To the fullest extent permitted by law, we do not accept or assume responsibility to anyone other than the board of governors and its members and trustees as a body, for our audit work, for this report, or for the opinions we have formed.
Respective responsibilities of Governing Body and auditorAs explained more fully in the Governing Body’s Responsibilities Statement on pages 19 to 21, the Governing Body are responsible for the preparation of the financial statements and for being satisfied that they give a true and fair view.
We have been appointed auditor under the Education and Reform Act 1988 and report in accordance with that Act. Our responsibility is to audit and express an opinion on the financial statements in accordance with applicable law and International Standards on Auditing (UK and Ireland). Those standards require us to comply with the Auditing Practices Board’s (APB’s) Ethical Standards for Auditors.
We also report to you whether income from funding councils, grants and income for specific purposes and from other restricted funds administered by the University have been properly applied only for the purposes for which they were received. In addition, we report to you whether, in all material respect, income has been applied in accordance with the statutes and, where appropriate, the financial memorandum with the Higher Education Funding Council for England (‘the Funding Council’), the Training and Development Agency for Schools.
We read the report of the Operating and Financial Review, the Responsibilities of the Board of Governors and the Statement of Corporate Governance and consider the implications for our report if we become aware of any apparent misstatements within them or material inconsistencies with the financial statements. We are not required to consider whether the statement of internal control (included as part of the Statement of Corporate Governance ) covers all risks and controls, or to form an opinion on the effectiveness of the institution’s corporate governance procedures or its risk and control procedures.
Scope of the audit of the financial statementsA description of the scope of an audit of financial statements is provided on the APB’s website at www.frc.org.uk/apb/scope/private.cfm.
Opinion on financial statementsIn our opinion:•the financial statements give a true and fair view of
the state of the Group and of the University’s affairs as at 31 July 2011 and of the Group’s incoming resources and application of resources, including its income and expenditure, for the year then ended; and
•the Group consolidated financial statements have been properly prepared in accordance with United Kingdom Generally Accepted Accounting Practice and the 2007 Statement of Recommended Practice: Accounting for Further and Higher Education.
Opinion on other mattersIn all material respects:• income from the funding council, the Training and
Development Agency for Schools, grants and income for specific purposes and from other restricted funds administered by the University during the year ended 31 July 2011 have been applied for the purposes for which they were received; and
• income during the year ended 31 July 2011 has been applied in accordance with the University’s statutes and, where appropriate, with the financial memorandum with the funding council, the funding agreement with the Training and Development Agency for Schools.
Grant Thornton UK LLPStatutory Auditor, Chartered Accountants202 Silbury BoulevardCentral Milton KeynesMK9 1LW
Date: 22 November 2011

27
2011 2010 Notes £’000 £’000 Income Funding council grants 1 66,595 64,621Tuition fees and education contracts 2 99,035 96,305Research grants and contracts 3 8,323 11,124Other operating income 4 80,481 90,535Endowment and investment income 5 298 260 ______ ______ 254,732 262,845 Less: Share of income from joint ventures (23,898) (28,219) _______ _______ Total income 230,834 234,626 _______ _______
Expenditure Staff costs 6 110,747 112,877 Other operating expenses 8 89,464 100,651 Depreciation 8 18,147 12,447 Interest and other finance costs 10 3,468 6,122 _______ _______
Total expenditure 8 221,826 232,097 Surplus after depreciation of tangible fixed assets at valuation and before taxation 9,008 2,529 Share of operating (loss)/profit in joint ventures (779) 288 _______ _______
Surplus after depreciation of tangible fixed assets at valuation, share of operating (loss)/profit in joint ventures and before taxation 8,229 2,817
Exceptional item: continuing operations Surplus on disposal of fixed assets 1,974 35 _______ ______
Surplus after depreciation of tangible fixed assets at valuation, disposal of fixed assets and before taxation 10,203 2,852 Taxation 9 (159) (141) _______ ______
Surplus after depreciation of tangible fixed assets at valuation, disposal of fixed assets and taxation 10,044 2,711
Surplus/(deficit) for the year transferred to accumulated income in endowment funds 15 (5) _______ ______
Surplus for the year retained within general reserves 10,059 2,706 _______ ______
All results are from continuing operations.
Consolidated income and expenditure account Year ended 31 July 2011

28
Statement of Group historical cost surpluses and deficits
2011 2010 Notes £’000 £’000 Surplus after depreciation of assets at valuation and taxation 10,044 2,711
Difference between historical cost depreciation charge and actual charge on revalued amount of fixed assets 25 786 786
Amount in respect of the impairment of revalued assets 25 2,172 - _______ ______
Historical cost surplus for the year after taxation 13,002 3,497 _______ ______

29
Statement of Group total recognised gains and losses
2011 2010 Notes £’000 £’000
Surplus after depreciation of tangible fixed assets at valuation, 10,044 2,711 disposal of fixed assets and taxation Appreciation of endowment asset investments 24 111 146 New endowments 15 34 75Actuarial (loss)/gain relating to pension scheme 32 (2,558) 42,355 _______ _______ Total recognised gains for the year 7,631 45,287 _______ Prior year adjustment (11,974) _______ Total recognised gains since last report 33,313 _______
Reconciliation of group reserves and endowments 2011 2010 £’000 £’000 Opening reserves and endowments 109,879 64,592
Total recognised gains for the year 7,631 45,287 _______ _______
Closing reserves and endowments 117,510 109,879 _______ _______

30
2011 2011 2010 2010 Group University Group University RESTATED RESTATED Notes £’000 £’000 £’000 £’000 Fixed assets
Goodwill 14 1,475 - 1,566 - Tangible assets 12 265,576 198,154 267,011 198,044 Investments 13 2,226 68,501 1,545 69,119 Investment in joint ventures: Share of gross assets - - 4,302 - Share of gross liabilities - - (3,595) - _______ _______ _______ _______ 269,277 266,655 270,829 267,163 Endowment asset investments 15 2,527 614 2,397 602
Current assets
Stock and work in progress 16 558 127 260 114 Debtors - within one year 17 17,812 19,234 25,531 29,069 - more than one year 17 - 3,004 - 1,311 Short term deposits 14,445 14,445 7,951 7,951 Cash at bank and in hand 25,157 15,271 21,372 11,855 _______ _______ _______ _______
57,972 52,081 55,114 50,300
Creditors: amounts falling due within one year 19 (58,579) (54,238) (60,866) (57,249) _______ _______ _______ _______ Net current liabilities (607) (2,157) (5,752) (6,949) _______ _______ _______ _______
Total assets less current liabilities 271,197 265,112 267,474 260,816 Creditors: amounts falling due after more than one year 20 (82,376) (71,699) (84,598) (72,945)
Provisions for liabilities 22 (2,641) (1,834) (2,619) (1,641)
Pension scheme liability 32 (23,443) (24,263) (23,373) (24,317) _______ _______ _______ _______
Total net assets 162,737 167,316 156,884 161,913 _______ _______ _______ _______
Balance sheets as at 31 July 2011

31
2011 2011 2010 2010 Group University Group University RESTATED RESTATED Notes £’000 £’000 £’000 £’000
Deferred capital grants 23 45,227 45,315 47,005 47,270 _______ _______ _______ _______ Endowment funds - Permanent 24 2,527 614 2,397 602 _______ _______ _______ _______
Reserves Income and expenditure account excluding pension reserve 25 117,849 126,213 107,320 115,963 Pension reserve 25 (23,443) (24,263) (23,373) (24,317) _______ _______ _______ _______
Income and expenditure reserveincluding pension reserve 94,406 101,950 83,947 91,646 _______ _______ _______ _______
Revaluation reserve 25 20,577 19,437 23,535 22,395 _______ _______ _______ _______
Total endowment funds and reserves 117,510 122,001 109,879 114,643 _______ _______ _______ _______
Total funds 162,737 167,316 156,884 161,913 _______ _______ _______ _______
The Financial Statements on pages 27 to 64 were approved by the Board of Governors on 22 November 2011 and signed on their behalf by:
Mrs J L Connell Professor Q A McKellar Mr A MoffatChairman Vice-Chancellor Group Finance Director
Balance sheets as at 31 July 2011

32
2011 2010 Notes £’000 £’000 Net cash inflow from operating activities 26 28,647 28,701
Return on investments and servicing of finance 27 (2,609) (2,061)
Taxation – UK corporation tax (paid)/received (363) 81
Capital expenditure and financial investment 28 (13,480) (13,737) _______ _______
Cash inflow before use of liquid resources and financing 12,195 12,984
Management of liquid resources 29 (6,494) (6,075)
Financing 30 (1,897) 8,518 _______ _______ Increase in cash for the period 3,804 15,427 _______ _______
Reconciliation of net cash flow to movement in net debt 2011 2010 £’000 £’000
Increase in cash for the period 3,804 15,427
Cash used to increase liquid resources 29 6,494 6,075
New loans 1,897 (8,518) _______ _______ Change in net debt 31 12,195 12,984
Opening net debt at 1 August 31 (55,958) (68,942) _______ _______
Closing net debt at 31 July 31 (43,763) (55,958) _______ _______
Consolidated cash flow statement Year ended 31 July 2011

33
Statement of principal accounting policies
Basis of preparationThese financial statements have been prepared in accordance with the Statement of Recommended Practice (SORP): Accounting for Further and Higher Education 2007 and in accordance with applicable Accounting Standards.
The accounting policies are unchanged compared with the prior year and have been applied consistently in dealing with items considered material in the financial statements.
Basis of accountingThe financial statements have been prepared under the historical cost convention, as modified by the revaluation of certain land and buildings.
RestatementsThe restatements of 2010 comparatives arise due to reallocations within various captions within the accounts. There is no overall change to the surplus for the year ended 31 July 2010 nor the net assets at that date. For further details see notes 6, 9, 19 and 22.
Basis of consolidationThe consolidated financial statements incorporate those of the University and its subsidiary undertakings for the year ended 31 July 2011. The University and its wholly owned subsidiaries prepare statutory accounts to 31 July, whereas Exemplas Holdings Limited and its subsidiary companies and joint ventures prepare statutory accounts to 31 March. Management accounts for the year to 31 July 2011 for Exemplas Holdings Limited have been consolidated within the University’s financial statements. The results of subsidiaries acquired or disposed of during the period are included in the consolidated income and expenditure account from the date of acquisition or up to the date of disposal. Intra-group sales and profits are eliminated fully on consolidation.
The Group’s share of the results of associate undertakings is included in the consolidated income and expenditure account from operating surplus onwards.
Investments in joint ventures and associated undertakings are carried in the consolidated balance sheet at the Group’s share of their net assets/liabilities at the date of acquisition and of their post-acquisition retained profits or losses together with any goodwill arising on the acquisition, net of amortisation. The investor’s share of the results is included within the consolidated income and expenditure account.
Under the gross equity method the income and expenditure account also shows the Group’s share of the joint venture’s turnover and the balance sheet shows the gross assets and liabilities in amplification of the net investment in joint ventures. Where gross assets are greater than gross liabilities this is shown in fixed asset investments; where gross liabilities are greater than gross assets the balance is shown in provisions.
In accordance with FRS2, the activities of the Students’ Union have not been consolidated as the University does not have control.
Recognition of incomeRecurrent grants received from the Higher Education Funding Council for England and the Training and Development Agency for Schools are recognised in the period to which they relate.
Fee income is credited to the income and expenditure account over the period in which the students are studying and is shown net of discount. Bursaries and scholarships are accounted for as expenditure in accordance with the SORP.
Income from research grants, contracts and other services rendered is included to the extent of completion of the contract or service concerned. This is generally equivalent to the sum of the relevant expenditure incurred during the year, together with any related contributions towards overhead costs. Any payments received in advance of such performance are recognised on the balance sheet as liabilities. Any future predicted losses on individual long-term contracts are recognised immediately.
Non-recurrent grants from funding councils or other bodies received in respect of the acquisition or construction of fixed assets are treated as deferred capital grants and amortised in line with depreciation over the life of the assets.
Other income is received from a range of activities and for services rendered and is recognised on the exchange of the relevant goods or service.
Charitable donations
a) Unrestricted donationsCharitable donations are recognised in the accounts under other operating income when the charitable donation has been received or if, before receipt, there is sufficient evidence to provide the necessary certainty that the donation will be received and the

34
Statement of principal accounting policies
value of the incoming resources can be measured with sufficient reliability. They are expendable within three years.
b) Endowment fundsWhere the charitable donations are to be retained for the benefit of the institution as specified by the donors, these are accounted for as endowments. There are three main types:
1) Unrestricted permanent endowments – the donor has specified that the fund is to be permanently invested to generate an income stream for the general benefit of the institution.
2) Restricted expendable endowments – the donor has specified a particular objective other than the purchase or construction of tangible fixed assets, and the institution can convert the donated sum into income.
3) Restricted permanent endowments – the donor has specified that the fund is to be permanently invested to generate an income stream to be applied to a particular objective.
For all the above endowment funds the capital is shown as an asset on the balance sheet. The income and expenditure are recognised in the income and expenditure account on a cash basis in the period on the basis of materiality it is not practical to account on an accruals basis.
Maintenance of premisesThe cost of routine corrective maintenance is charged to the income and expenditure account as incurred. Where a commitment has been entered into prior to 31 July and not expended, a provision is made for work started prior to the year end.
Foreign currency transactionsTransactions denominated in foreign currencies are recorded at the rate of exchange ruling at the date of the transaction. Monetary assets and liabilities in foreign currencies are translated into sterling at the year end rates and the resulting surplus or deficit transferred to the income and expenditure account.
Derivative financial instrumentsThe Group uses derivative financial instruments designated as hedging to reduce exposure to changes in fuel prices to acceptable levels. The initial contracts were introduced in March 2010 within its bus operations. No more than 75% of future estimated annual consumption is contracted. The derivatives are recognised at fair value.
Pension schemesThe two principal pension schemes for the University’s staff are the Teachers Pension Scheme (TPS) and the Local Government Pension Scheme (LGPS). Additionally, the University has agreed with the Universities Superannuation Scheme (USS) that designated employees may be eligible to become members of that scheme. These defined benefit schemes are externally funded and contracted out of the State Second Pension.
It is not possible to identify the University’s share of the underlying assets and liabilities in the TPS and USS schemes and hence, using the exemption under FRS 17 (Retirement Benefits), contributions to the schemes are accounted for as if they were defined contribution schemes. The employer contributions payable to the schemes are charged as expenditure in the period in which they relate to.
The University is able to identify its share of the underlying assets and liabilities of the LGPS and thus fully adopts FRS17. The scheme assets are measured at fair values. Scheme liabilities are measured on an actuarial basis using the projected unit method and are discounted at appropriate high quality corporate bond rates. The net surplus or deficit, adjusted for deferred tax, is presented separately from other net assets on the balance sheet. A net surplus is recognised only to the extent that it is recoverable by the Group.
The current service costs and costs from settlements and curtailments are charged against operating profit. Past service costs are spread over the period until the benefit increases vest. Interest on the scheme liabilities and the expected return on scheme assets are included net in other finance costs/income. Actuarial gains and losses are reported in the statement of total recognised gains and losses.
Staff employed by Exemplas Holdings Limited and its subsidiary companies are either members of the LGPS or are members of the group administered personal pension plan, which is a defined contribution scheme. The costs of providing retirement and related benefits for the group administered personal pension plan are charged to the income and expenditure account over the periods during which the members are employed.
The pension scheme liability also takes account of the University’s unfunded pension liability. This liability, which relates to pension enhancements payable to staff who have taken early retirement, was

35
Statement of principal accounting policies
previously included in the accounts as a provision before the full adoption of FRS 17 under which this is now accounted for. See note 32 for details.
Tangible fixed assets
(a) Land and buildingsLand and buildings are stated at cost or at valuation. On adoption of FRS 15, the institution followed the transitional provision to retain the book value of land and buildings, which were revalued in 1996, but not to adopt a policy of revaluations of these properties in the future. These values are retained subject to the requirement to test assets for impairment on an annual basis in accordance with FRS 11. Where there is evidence of impairment, fixed assets are written down to their recoverable amount. Any such write down is charged to the income and expenditure account. The valuation of land and buildings on 31 July 1996 was £80 million and was performed by Fuller Peiser.
Investment properties are stated at market value with an annual revaluation and not depreciated.
Depreciation on buildings is provided on a straight-line basis over the estimated useful lives as follows:
Freehold buildings 30 - 50 years
Refurbishments 10 years
Leasehold land and buildings are amortised over the life of the lease up to a maximum of fifty years. Freehold land is not depreciated. Assets in the course of construction represent those assets which have not yet been brought into use. These assets are transferred to the relevant category of asset and depreciated from the date they are substantially complete at the appropriate rate for that category.
Land and buildings inherited from Hertfordshire County Council are stated in the balance sheet at valuation on the basis of depreciated replacement cost and were revalued on July 1996.
Finance costs are capitalised where they can be directly attributable to the construction of tangible fixed assets and only for the period of construction.
Donated assets are included within the relevant heading within tangible fixed assets with a corresponding amount shown as a deferred capital grant amortised over the useful economic life of the asset to match depreciation.
(b) Equipment Capitalised equipment is stated at cost and depreciated over its useful life on a straight line basis as follows:
Plant and machinery 1 - 15 years
Fixtures, fittings and equipment 3 - 10 years
LeasesLeasing agreements that transfer substantially all the benefits and risks of ownership of an asset are treated as if the asset had been purchased outright. The assets are included in fixed assets and the capital elements of the leasing commitments are shown as obligations under finance leases. The lease rentals are treated as consisting of capital and interest elements. The capital element is applied to reduce the outstanding obligations and the interest element is charged to the income and expenditure account in proportion to the reducing capital element outstanding. Assets held under finance leases are depreciated over the shorter of the lease term and the useful economic lives of equivalent owned assets.
Operating leases are charged against income on a straight-line basis over the lease term. Benefits received as an incentive to sign an operating lease, are spread on a straight-line basis over the shorter of the lease term or the first review date, at which the rent is first expected to be adjusted to the prevailing market rate.
InvestmentsFixed asset investments that are not listed on a recognised stock exchange are carried at historical cost less any provision for impairment of their value.
Endowment asset investments are included in the balance sheet at market value. Gains and losses on revaluations of endowment assets are recognised in the statement of total recognised gains and losses.Current asset investments are included at the lower of cost and net realisable value.
Investments in subsidiary and associated companies are valued at the lower of cost or net realisable value.
Where trade and net assets have been transferred from subsidiaries to the University as the parent, the value of the transferred net assets has been recorded as an investment to reflect the fact that the value of the remaining business has been retained by the University.

36
Statement of principal accounting policies
StocksStocks and work in progress are valued at the lower of cost and net realisable value. Cost includes staff time, direct materials and attributable overheads. Where necessary, provision is made for obsolete, slow moving and defective stocks.
Taxation statusThe University is an exempt charity within the meaning of Schedule 2 of the Charities Act 1993 and as such within the meaning of Para 1 of Schedule 6 to the Finance Act 2010. Accordingly, the University is potentially exempt from taxation in respect of income or capital gains received within categories covered by Sections 478-488 of the Corporation Taxes Act 2010 (formerly enacted in Section 505 of the Income and Corporation Taxes Act 1988), or Section 256 of the Taxation of Chargeable Gains Act 1992 to the extent that such income or gains are applied to exclusively charitable purposes. The University receives no similar exemption in respect of Value Added Tax.
The University’s subsidiary companies are subject to corporation tax and VAT in the same way as any commercial organisation.
Deferred taxDeferred tax is recognised in respect of all timing differences that have originated but not reversed at the balance sheet date where transactions or events that result in an obligation to pay more tax in the future, or a right to pay less tax in the future, have occurred at the balance sheet date.
Timing differences are differences between the taxable profits and the results as stated in the financial statements. Deferred tax is measured at the average tax rates expected to apply in the periods in which the timing differences are expected to reverse based on rates and laws that have been enacted or substantially enacted by the balance sheet date.
Deferred tax is measured on a non-discounted basis.
ProvisionsProvisions are recognised when the institution has a present legal or constructive obligation as a result of a past event, it is probable that a transfer of economic benefit will be required to settle the obligation and a reliable estimate can be made of the amount of the obligation.
Agency arrangementsFunds the institution receives and disburses as paying agent on behalf of a funding body or other body, where the institution is exposed to minimal risk or enjoys minimal economic benefit related to the receipt and subsequent disbursement of the funds, are excluded from the income and expenditure of the institution.
GoodwillGoodwill represents the difference between the cost of an acquired operation and the aggregate of the fair values of that operation’s identifiable assets and liabilities. Positive purchased goodwill is capitalised and classified as an asset on the balance sheet. Where goodwill is regarded as having limited useful economic life, it is amortised over that life up to a maximum of twenty years. Currently goodwill is amortised over a period of twenty years. Impairment tests are carried out at the end of the first year and thereafter subject to normal periodic reviews for indications of impairment.
Cash flows and liquid resourcesCash flows comprise increases or decreases in cash. Cash includes cash in hand, cash at bank, and deposits repayable on demand. Deposits are repayable on demand if they are available within twenty-four hours without penalty. No other investments, however liquid, are included as cash.
Liquid resources comprise assets held as readily disposable store of value. They include term deposits, government securities and loan stock held as part of the institution’s treasury management activities. They exclude any such assets held as endowment asset investments.

37
1. Funding Council grants 2011 2010 Higher Training and Total Total Education Development Funding Funding Funding Agency for Council Council Council for Schools grants grants England Notes £’000 £’000 £’000 £’000 Recurrent grants 53,863 3,246 57,109 56,219 Selective initiatives 5,388 1,114 6,502 6,201
Release of deferred capital grants: Buildings 23 2,335 - 2,335 1,748 Equipment 23 649 - 649 453 ______ ______ ______ ______ 62,235 4,360 66,595 64,621 ______ ______ ______ ______
2. Tuition fees and education contracts 2011 2010 £’000 £’000 UK Higher Education students 51,455 51,384 European Union (EU) (excluding UK) students 1,933 1,013 Non–EU students 26,223 25,841 ______ ______ Total fees paid by or on behalf of individual students 79,611 78,238
Education contracts 19,424 18,067 ______ ______ 99,035 96,305 ______ ______
3. Research grants and contracts 2011 2010 £’000 £’000 Research councils 2,165 2,522 UK based charities 100 368 European Commission 2,235 5,261 Other grants and contracts 3,823 2,973 ______ ______
8,323 11,124 ______ ______
Notes to the accounts

38
4. Other operating income 2011 2010 £’000 £’000
Residences, catering and conferences 17,678 16,697 Other services rendered 56,330 68,025 Release of capital grant 241 240 Other income 6,232 5,573 _______ _______
80,481 90,535 _______ _______
5. Endowment and investment income 2011 2010 £’000 £’000
Income from permanent endowments 60 50 Interest receivable 238 210 _______ _______
298 260 _______ _______
6. Staff costs
The average weekly number of full time equivalent(FTE) employees (including senior post-holders) during the year was made up as follows: 2011 2010 Numbers Numbers
Teaching departments 1,183 1,194 Teaching support services 165 161 Other support services 36 43 Administration and central services 431 393 Premises 86 88 Other 428 429 _______ _______
2,329 2,308 _______ _______
The aggregate payroll costs of these employees were as follows: 2011 2010 RESTATED £’000 £’000
Teaching departments 66,867 67,391 Teaching support services 6,031 6,326 Other support services 1,117 1,605 Administration and central services 20,181 19,071 Premises 2,589 3,030 Other 13,962 15,454 _______ _______
110,747 112,877 _______ _______
The 2010 comparatives have been restated due to a reallocation of costs to ensure consistency with the current year.
Notes to the accounts

39
Notes to the accounts
6. Staff costs (continued) 2011 2010 £’000 £’000Staff costs: Wages and salaries 90,565 93,903Social security costs 7,678 7,354Other pension costs 12,504 11,620 _______ _______
110,747 112,877 _______ _______
2011 2010 £’000 £’000 Employment costs for staff on permanent contracts 97,970 97,976Employment costs for staff on short-term contracts 12,777 14,901 _______ _______
110,747 112,877 _______ _______
Remuneration of higher paid staff other than the Vice-Chancellor, excluding employer’s pension and national insurance contributions but including benefits, fall within the following bands:
2011 2010 Numbers Numbers£100,000 - £110,000 8 8£110,001 - £120,000 2 1£120,001 - £130,000 2 1£130,001 - £140,000 - -£140,001 - £150,000 - -£150,001 - £160,000 1 1£160,001 - £170,000 1 - ______ ______
14 11 ______ ______
7. Emoluments of the Vice-Chancellor
Emoluments of the current Vice-Chancellor, appointed on 1 January 2011, excluding national insurance contributions: 2011 2010 £’000 £’000 Salary 132 -Benefits in kind 1 -Pension contributions 21 - ______ ______
154 - ______ ______

40
7. Emoluments of the Vice-Chancellor (continued)
Emoluments of the previous Vice-Chancellor, who retired on 31 December 2010, excluding national insurance contributions: 2011 2010 £’000 £’000 Salary 96 251Benefits in kind 1 2Pension contributions 3 35 ______ ______
100 288 ______ ______
The University’s pension contributions are paid at the same rate for the Vice-Chancellor as for other staff.
In the year the retiring Vice-Chancellor donated £14,000 (2010: £7,700) to the University of Hertfordshire Charitable Trust.
8. Analysis of expenditure by activity Staff Other Interest 2011 2010 costs operating payable Total Total expenses £’000 £’000 £’000 £’000 £’000 Academic departments 63,012 27,562 - 90,574 95,500Academic services 6,142 5,194 - 11,336 12,121Administration* 16,792 9,991 - 26,783 25,734Premises 2,620 15,221 2,518 20,359 23,604Residences, catering and conferences 2,844 13,955 333 17,132 17,342Research grants and contracts 4,907 1,871 - 6,778 9,834Other expenses 14,430 15,670 617 30,717 35,515 ______ ______ ______ ______ ______
110,747 89,464 3,468 203,679 219,650 ______ ______ ______ Depreciation** 18,147 12,447 _______ _______
221,826 232,097 _______ _______
The depreciation charge has been funded by: 2011 2010 Notes £’000 £’000 Deferred capital grants released 23 3,275 2,491Revaluation reserve released to fund current year depreciation 25 786 786Revaluation reserve released to fund asset impairment 25 2,172 -General income 11,914 9,170 ______ ______
18,147 12,447 ______ ______
* Administration expenses include internal auditors remuneration of £10,200 (2010: £nil) and external auditors remuneration of £103,000 (2010: £102,000). The external auditors remuneration includes £10,000 in respect of non-audit work (2010: £11,810).
** Depreciation includes £5,187,000 (2010:£nil) in respect of fixed asset impairment. Full details are shown in note 12.
Notes to the accounts

41
9. Taxation 2011 2010 £’000 £’000Current tax: UK corporation tax on surplus for the year 159 141 ______ ______
Tax on surplus on ordinary activities 159 141 ______ ______
2011 2010 £’000 £’000Current tax reconciliation: Surplus on ordinary activities before tax 10,203 2,852 ______ ______ Surplus on ordinary activities multiplied by standard rate in the UK (27.33%) (2010: 28%) 2,789 799Effects of: Depreciation for the period in excess of capital allowances 203 105Non taxable income (2,296) (2,591)Expenses not deductible for tax purposes 446 146Tax losses 29 27Other timing differences (363) (145)Tax at marginal rate (1) -Adjustments in respect of prior years 20 (88)Revenue expenditure capitalised (1) (21)Timing differences relating to pension liability (667) 1,909 ______ ______
Current tax charge for the year 159 141 ______ ______
The above taxation charge relates to the profits of Exemplas Holdings Limited and its subsidiary companies.
10. Interest payable and other finance costs 2011 2010 Notes RESTATED £’000 £’000On bank loans, overdrafts and other loans: Repayable within five years 261 283 Repayable wholly or partly in more than five years 1,979 1,636Finance leases 737 753Other interest payable 68 139Net charge on pension scheme 32 423 3,311 ______ ______ 3,468 6,122 ______ ______
The 2010 comparatives have been restated to correct a misclassification of interest payable on bank loans repayable within and over five years. £283,000 has been reallocated for loans repayable in more than 5 years to loans repayable within 5 years.
Notes to the accounts

42
11. Surplus on continuing operations for the period
The University made a surplus on continuing operations for the period after the depreciation of tangible fixed assets, disposal of fixed assets and taxation of £9,555,000 (2010: £1,831,000). This surplus includes a profit arising on the sale of fixed assets of £1,940,000 (2010: £nil) and impairment of fixed assets of £5,187,000 (2010: £nil).
12. Tangible fixed assets
Group Land and buidings Assets in the Fixtures, Plant and Long course of fittings and machinery Freehold leasehold construction equipment Total
£’000 £’000 £’000 £’000 £’000 £’000 Cost or valuation At 1 August 2010 296,602 18,438 9,907 14,648 7,811 347,406 Additions at cost 8,661 432 3,072 6,061 617 18,843Transfers between accounts 3,660 (11) (8,507) 4,858 - -Re-categorisation (4,067) - - - - (4,067)Less disposals in year (1,990) - (856) (104) (57) (3,007) _______ _______ _______ _______ _______ _______
At 31 July 2011 302,866 18,859 3,616 25,463 8,371 359,175 _______ _______ _______ _______ _______ _______ Depreciation At 1 August 2010 65,775 2,940 - 7,831 3,849 80,395
Charge for the year 8,613 133 - 3,708 506 12,960Impairment 5,187 - - - - 5,187Re-categorisation (4,067) - - - - (4,067)Less disposals in year (732) - - (101) (43) (876) _______ _______ _______ _______ _______ _______
At 31 July 2011 74,776 3,073 - 11,438 4,312 93,599 _______ _______ _______ _______ _______ _______ Net book value At 31 July 2011 228,090 15,786 3,616 14,025 4,059 265,576 _______ _______ _______ _______ _______ _______ At 31 July 2010 230,827 15,498 9,907 6,817 3,962 267,011 _______ _______ _______ _______ _______ _______ Inherited 25,090 - - - - 25,090Financed by capital grant 41,467 - - 3,944 - 41,467Other 161,533 15,786 3,616 10,081 4,059 199,019 _______ _______ _______ _______ _______ _______
Net book valueAt 31 July 2011 228,090 15,786 3,616 14,025 4,059 265,576 _______ _______ _______ _______ _______ _______
Notes to the accounts

43
12. Tangible fixed assets (continued)
University Land and Assets in the Fixtures, Plant and buildings course of fittings and machinery Total Freehold construction equipment
£’000 £’000 £’000 £’000 £’000 Cost or valuation At 1 August 2010 236,437 9,666 11,766 - 257,869 Additions at cost 8,543 2,935 6,101 360 17,939Transfers between accounts 3,292 (8,139) 4,847 - -Re-categorisation (4,067) - - - (4,067)Less disposals in the year (1,966) (856) - - (2,822) _______ ______ ______ ______ _______
At 31 July 2011 242,239 3,606 22,714 360 268,919 _______ ______ ______ ______ _______ Depreciation At 1 August 2010 53,059 - 6,766 - 59,825 Charge for the year 7,140 - 3,400 12 10,552Impairment 5,187 - - - 5,187Re-categorisation (4,067) - - - (4,067)Less disposals in the year (732) - - - (732) _______ ______ ______ ______ _______
At 31 July 2011 60,587 - 10,166 12 70,765 _______ ______ ______ ______ _______ Net book value At 31 July 2011 181,652 3,606 12,548 348 198,154 _______ ______ ______ ______ _______ At 31 July 2010 183,378 9,666 5,000 - 198,044 _______ ______ ______ ______ _______ Inherited 25,090 - - - 25,090Financed by capital grant 41,467 - 3,944 - 45,411Other 115,095 3,606 8,604 348 127,653 _______ ______ ______ ______ _______
Net book value At 31 July 2011 181,652 3,606 12,548 348 198,154 _______ ______ ______ ______ _______
Notes to the accounts

44
12. Tangible fixed assets (continued)
The net book value of assets held under finance leases as at 31 July 2011 was:
2011 2011 2010 2010 Group University Group University £’000 £’000 £’000 £’000 Buildings 12,845 - 13,151 -Plant and machinery 1,116 - 1,111 - ______ ______ ______ ______
13,961 - 14,262 - ______ ______ ______ ______
The depreciation charge for the year was: 2011 2011 2010 2010 Group University Group University £’000 £’000 £’000 £’000 Buildings 306 - 398 -Plant and machinery 106 - 72 - ______ ______ ______ ______
412 - 470 - ______ ______ ______ ______
Freehold land and buildings includes an investment property purchased on 14 August 2008 at a cost of £234,000. This asset is not depreciated. The property was revalued at 31 July 2011 by the Director of Estates and the carrying value is considered to be a reasonable estimate of the market value at that date.
Buildings with a net book value of £72.3 million and a cost of £82.8 million have been partly funded from Treasury sources. Should these particular buildings be sold, the University would either have to surrender part of the proceeds to the Treasury or use them in accordance with the Financial Memorandum with the Higher Education Funding Council for England.
The amount of finance costs capitalised in the year amounts to £nil (2010: £381,000). The accumulated amount of capitalised finance costs is £1.8 million which is included in freehold land and buildings. There were no assets constructed during the year financed by loan capital.
During the year ended 31 July 2011 a review was undertaken of the value of the estate belonging to the University and its subsidiary companies. The review considered the value in use of all buildings in light of the information set out in a condition and suitability survey compiled by the Director of Estates and reviewed by the University’s team of external advisers.
The review concluded that a number of the University’s properties had suffered a permanent diminution in value due to their lack of suitability for current activities. In light of the Estates Vision 2020, these buildings have been reduced to a nil net book value, as they require either demolition or immediate and extensive refurbishment to bring them up to a standard suitable for use. This impairment has resulted in a charge of accelerated depreciation to the income and expenditure account of £5.2 million. Certain of these assets are funded by deferred capital grant and the accelerated release of these grants amounting to £565,000 is included within Funding Council Grant income (see note 1). In addition some of the impaired assets had previously been revalued. An amount of £2.1 million has been transferred from the revaluation reserve to the income and expenditure reserve in respect of these assets (see note 25).
During the year it was identified that the University’s fixed assets and accumulated depreciation were overstated within detailed financial records. Overstatement had arisen following the original transfer at value of assets from Hertfordshire County council to the University in the late 1980’s. As the overstatement existed in both asset and depreciation records the decision was taken during the year to recategorise the balances as such. The financial impact on the balance sheet and profit and loss account is nil.
Notes to the accounts
45
12. Tangible fixed assets (continued)
An external valuation of the University’s land and buildings as at 31 July 1996 was carried out by Fuller Peiser, qualified Chartered Surveyors, in accordance with the Practice Statements of the Royal Institute of Chartered Surveyors Appraisal and Valuation manual. The valuation represented the surveyor’s opinion of the values of the freehold and leasehold interests in the land and buildings comprising the various properties on the basis of existing use value, depreciated replacement cost or open market value as appropriate, resulting in a valuation of £80 million. The surplus was transferred to the revaluation reserve.
The major site at Hatfield, east of College Lane, is subject to a deed of gift and conveyance dated 12 December 1946 for the purposes of education to the charity called Hatfield Polytechnic. The charity is part of the assets transferred from Hertfordshire County Council and trusteeship now rests with the Board of Governors of the University. Any proposed change in use or ownership is subject to the agreement of the Charity Commission.
It is a condition of funding, imposed by the Secretary of State and the Treasury, that no transaction involving either the acquisition of land and buildings to be maintained with the aid of funding from the Higher Education Funding Council for England or the disposal of land and buildings purchased with the aid of public funds, shall be entered into without the prior approval of the Council.
During 1999 the University entered into a Private Finance Initiative scheme with a contractor for the construction of residential and sports facilities, and for the facilities management of those premises for a period of thirty years. Construction was completed in September 2003 and under the terms of the scheme the contractor raised the finance for the construction of buildings.
Having reviewed the arrangement on completion, the University’s advisers deemed that the risk and reward associated with the sports facilities rested with Polyfield Property Limited, and that associated with the residences remained with the PFI contractor. As a result the buildings comprising the Sports Village have been subsequently let on a long lease to Polyfield Property Limited. The transactions for the sports facilities have been reflected in the accounts for the University Group and Polyfield Property Limited as a fixed asset under Land and Buildings (Long Leasehold) at a net book value of £12.8 million with a consequential, and matching, finance lease as a long-term creditor. At the end of the lease period ownership of the Sports Village will revert to Polyfield Property Limited.
The buildings comprising the residences on the de Havilland campus do not appear in the Group’s balance sheet. The agreement with the PFI provider sets out an annual rental and facilities management charge in respect of these properties which the University is contracted to pay on a monthly basis for the period of the agreement. These costs are benchmarked periodically and subject to variations to base contract dependent on changes in the University’s requirements. During the current year the total charge paid to the PFI provider in respect of the residences was £6,671,963 (2010: £6,320,105), and this sum increases annually by a predetermined rate which incorporates both RPI as set by the Office of National Statistics and LPI (subject to a 5% increase cap). These costs are accounted for within other operating expenses. At the end of the contract period, ownership of the residential properties will also revert to the University.
Notes to the accounts

46
Notes to the accounts
13. Investments
2011 2011 2010 2010 Group University Group University £’000 £’000 £’000 £’000 Balance at 1 August 1,545 69,119 1,604 69,119Additions 681 83 - -Disposals - - (59) -Write down of investment in subsidiary - (701) - - ______ ______ ______ ______ Balance at 31 July 2,226 68,501 1,545 69,119 ______ ______ ______ ______
Representing: Subsidiary undertakings - 68,380 - 69,081Other 2,226 121 1,545 38 ______ ______ ______ ______ 2,226 68,501 1,545 69,119 ______ ______ ______ ______
The write down of investments in the University is in respect of trading losses made and impairment of investments in companies which have ceased to trade completely. Where the trade and net assets have been transferred within the Group, no impairment has been made to reflect the value of the remaining businesses within the Group.
The University’s subsidiaries (all of which are registered in England and Wales) and its percentage shareholding in each are as follows:
Company Nature of business % Shareholding Number of shares UH Holdings Limited Holding company 100% 13,434,020Student Forum Limited Dormant 100% Limited by guarantee
The University consolidates the results of the University of Hertfordshire Charitable Trust on the basis that it exercises dominant influence.
The University does not consolidate the results of The Building Hub, a company limited by guarantee in which the University has a 50% interest, on the basis of immateriality.
The University does not consolidate the accounts of the Students’ Union as it has no control and all decisions are exercised by the Students’ Union Executive.

47
13. Investments (continued)
The subsidiary companies of UH Holdings Limited (all registered in England and Wales except UH Global Education (Asia Pacific) Sdn Bhd which is registered in Malaysia and Corporte Fit Science Limited which is registered in Scotland) and its percentage shareholding in each is as follows:
Company Nature of business % Shareholding Number of shares Exemplas Holdings Limited Business advice and support 98% 98Polyfield Property Limited Provision of property services 100% 16,099,854Universitybus Limited Transport services 100% 2Uno Buses Limited Transport services 100% 1UH Ventures Limited Training, consultancy and 100% 2 conference services Evalu8 Transport Innovations Limited Development of electric vehicles Limited by guaranteeCorporate FIT Science Limited Provision and development of 100% 60,000 executive development products online UH Global Education (Asia-Pacific) Sdn Bhd Overseas student recruitment 100% 2Cimtech Limited Dormant 100% 2Unisecure Limited Dormant 100% 3UH Hospitality Limited Dormant 100% 3UH Recordings Limited Dormant 100% 2UH Invest Limited Dormant 100% 2The FIT Corporation Limited Dormant 100% 1,000UH Health Limited Dormant 100% 2
Corporate FIT Science Limited ceased to trade with effect from 1 August 2011.
During the year ended 31 July 2010 UH Ventures Limited acquired 100% holding in the FIT Corporation Limited, 34% of the holding was transferred from UH Holdings Limited and the balance from the majority shareholder.
UH Hospitality Limited, Cimtech Limited, UH Health Limited, UH Invest Limited and UH Recordings Limited ceased trading on 31 July 2010. The trading activities of UH Hospitality Limited and Cimtech Limited were transferred to UH Ventures Limited; the trading activities of UH Health Limited, UH Invest Limited and UH Recordings Limited were transferred to the University of Hertfordshire.
Notes to the accounts

48
13. Investments (continued)
The subsidiary companies of Exemplas Holdings Limited (all of which are registered in England and Wales) and its percentage shareholding in each are as follows:
Company Nature of business % Shareholding Number of shares Exemplas Limited Provision of services to business 100% 2Trade Skills Academy Limited Provision of services to business 51% 51BioPark Hertfordshire Limited Letting of property 100% 2Film Link Limited Services to the film industry 100% 2Quest Training Limited Provision of services to business 100% 99Polyfield Services Limited Provision of services to business 100% 14London Brokerage Limited Provision of services to business 100% 2Hertfordshire Local Enterprise Partnership Limited Dormant 100% 2Bedfordshire Local Enterprise Partnership Limited Dormant 100% 2Suffolk Enterprise Partnership Limited Dormant 100% 2Cambridgeshire Local Enterprise Partnership Limited Dormant 100% 2Norfolk Enterprise Partnership Limited Dormant 100% 2Corporate Degrees Limited Dormant 100% 2Hertfordshire Business Centre Limited Dormant 100% 2Hertfordshire Development Organisation Limited Dormant 100% 2Employer Training Services Dormant 100% 2South East IDB Limited Dormant 100% 2Exemplas Training Limited Dormant 100% 2East of England Brokerage Limited Dormant 100% 2Hertfordshire Business Centre Services Limited Dormant 100% 2Herts IDB Limited Dormant 100% 2 All of the above subsidiaries are consolidated in the Group accounts.
Exemplas Holdings Limited also has a 50% interest in East of England IDB Limited and Yorkshire & Humberside IDB Limited, which run the Business Link Contracts for the East of England and Yorkshire & Humberside respectively, and a 51% interest in Sales Skills Academy. These have been accounted for as joint ventures.
During the year Exemplas Holdings Limited acquired 51% of Trade Skills Academy Limited. No further details are given on the basis of materiality.
14. Intangible fixed assets 2011 2011 2010 2010 Group University Group University £’000 £’000 £’000 £’000
Balance at 1 August 1,566 - 1,655 -Amortisation (91) - (89) - ______ ______ ______ ______
Balance at 31 July 1,475 - 1,566 - ______ ______ ______ ______
Notes to the accounts

49
15. Endowment asset investments 2011 2011 2010 2010 Group University Group University £’000 £’000 £’000 £’000 Balance at 1 August 2,397 602 2,171 592New endowments invested 34 - 75 -Deccrease/(increase) in cash balances held for endowment funds (15) 6 5 3Increase in market value of investments 111 6 146 7 ______ ______ ______ ______ Balance at 31 July 2,527 614 2,397 602 ______ ______ ______ ______Represented by: Securities 1,455 59 1,344 53Cash at bank held for endowment funds 1,072 555 1,053 549 ______ ______ ______ ______ Total 2,527 614 2,397 602 ______ ______ ______ ______
16. Stocks and work in progress 2011 2011 2010 2010 Group University Group University £’000 £’000 £’000 £’000 Stock and work in progress 558 127 260 114 ______ ______ ______ ______
17. Debtors 2011 2011 2010 2010 Group University Group University £’000 £’000 £’000 £’000Amounts falling due within one year: Trade debtors 10,788 9,146 15,729 12,652Other debtors 1,740 738 942 448Deferred tax 50 - 45 -Amounts due from subsidiaries - 6,442 - 11,286Prepayments and accrued income 5,234 2,908 8,815 4,683 ______ ______ ______ ______
17,812 19,234 25,531 29,069 Amounts falling due after more than one year: Amounts due from subsidiaries - 3,004 - 1,311 ______ ______ ______ ______ 17,812 22,238 25,531 30,380 ______ ______ ______ ______
18. Deferred tax asset 2011 2011 2010 2010 Group University Group University £’000 £’000 £’000 £’000 Other timing differences 50 - 45 - ______ ______ ______ ______
The above deferred tax asset relates to Exemplas Holdings Limited and its subsidiary companies.
Notes to the accounts

50
19. Creditors: amounts falling due within one year 2011 2011 2010 2010 Group University Group University RESTATED RESTATED Notes £’000 £’000 £’000 £’000 Bank loan and overdraft 21a 1,597 1,158 1,270 834Obligation under finance lease 21b 531 - 502 -Payments received on account 11,297 11,297 9,284 9,937Research and other commercial activity payments received in advance 8,285 8,085 9,685 9,033Trade creditors 6,664 5,853 6,208 5,476Other creditors 2,675 2,221 2,064 1,982Amounts due to subsidiaries - 5,553 - 11,707Corporation tax 82 - 286 -Other taxation and social security 2,667 2,574 2,797 2,302Accruals and deferred income 20,159 12,949 22,393 9,602Deferred revenue grants 4,622 4,548 6,377 6,376 _____ ______ _____ ______ 58,579 54,238 60,866 57,249 _____ ______ _____ ______
The corporation tax creditor relates to Exemplas Holdings Limited and its subsidiary companies.
Accruals in 2010 has been restated as the University element of the VAT capital goods scheme balance at 31 July 2010 amounting to £487,000 has been transferred to provisions (see note 22).
20. Creditors: amounts falling due after more than one year 2011 2011 2010 2010 Group University Group University Notes £’000 £’000 £’000 £’000 Bank loan and overdraft 21a 68,116 66,197 69,838 67,445Other creditors 67 2 36 -Obligation under finance leases 21b 14,193 - 14,724 -Amounts due to subsidiaries - 5,500 - 5,500 ______ ______ ______ ______ 82,376 71,699 84,598 72,945 ______ ______ ______ ______
Notes to the accounts
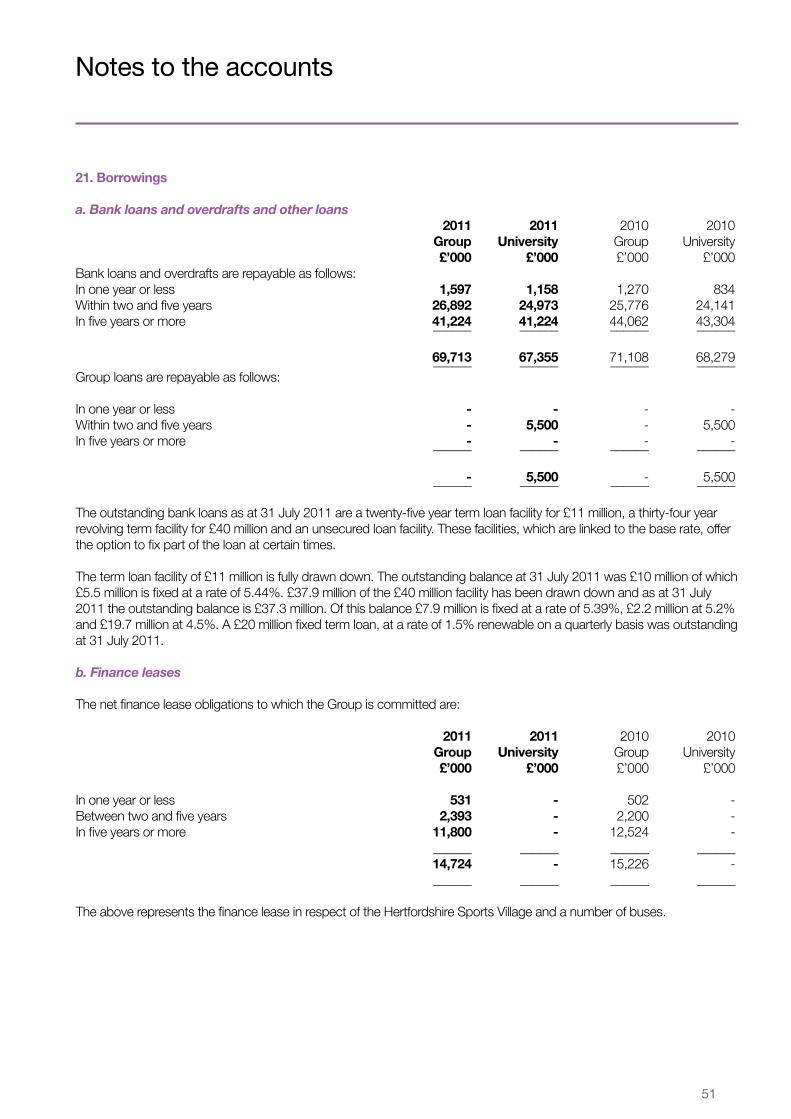
51
21. Borrowings
a. Bank loans and overdrafts and other loans 2011 2011 2010 2010 Group University Group University £’000 £’000 £’000 £’000Bank loans and overdrafts are repayable as follows: In one year or less 1,597 1,158 1,270 834Within two and five years 26,892 24,973 25,776 24,141In five years or more 41,224 41,224 44,062 43,304 ______ ______ ______ ______
69,713 67,355 71,108 68,279 ______ ______ ______ ______Group loans are repayable as follows: In one year or less - - - -Within two and five years - 5,500 - 5,500In five years or more - - - - ______ ______ ______ ______
- 5,500 - 5,500 ______ ______ ______ ______
The outstanding bank loans as at 31 July 2011 are a twenty-five year term loan facility for £11 million, a thirty-four year revolving term facility for £40 million and an unsecured loan facility. These facilities, which are linked to the base rate, offer the option to fix part of the loan at certain times.
The term loan facility of £11 million is fully drawn down. The outstanding balance at 31 July 2011 was £10 million of which £5.5 million is fixed at a rate of 5.44%. £37.9 million of the £40 million facility has been drawn down and as at 31 July 2011 the outstanding balance is £37.3 million. Of this balance £7.9 million is fixed at a rate of 5.39%, £2.2 million at 5.2% and £19.7 million at 4.5%. A £20 million fixed term loan, at a rate of 1.5% renewable on a quarterly basis was outstanding at 31 July 2011.
b. Finance leases
The net finance lease obligations to which the Group is committed are:
2011 2011 2010 2010 Group University Group University £’000 £’000 £’000 £’000 In one year or less 531 - 502 -Between two and five years 2,393 - 2,200 -In five years or more 11,800 - 12,524 - ______ ______ ______ ______ 14,724 - 15,226 - ______ ______ ______ ______
The above represents the finance lease in respect of the Hertfordshire Sports Village and a number of buses.
Notes to the accounts

52
22. Provision for liabilities
Group Long-term VAT capital Provision for maintenance goods investment in scheme joint ventures Total £’000 £’000 £’000 £’000 At 1 August 2010 as previously reported 1,154 978 - 2,132Transfer from accruals - 487 - 487 ______ ______ ______ ______
At 1 August 2010 restated 1,154 1,465 - 2,619 Increase in provision 476 871 - 1,347Provision utilised (1,154) (244) - (1,398) Gross assets - - (4,182) (4,182)Gross liabilities - - 4,255 4,255 ______ ______ ______ ______
At 31 July 2011 476 2,092 73 2,641 ______ ______ ______ ______
University Long-term VAT capital maintenance goods scheme Total £’000 £’000 £’000 At 1 August 2010 as previously reported 1,154 - 1,154Transfer from accruals - 487 487 ______ ______ ______
At 1 August 2010 restated 1,154 487 1,641 Increase in provision 476 871 1,347Provision utilised (1,154) - (1,154) ______ ______ ______
At 31 July 2011 476 1,358 1,834 ______ ______ ______
The long-term maintenance provision is for costs in relation to the committed maintenance programme for premises taking place over the summer vacation. Works are scheduled to be carried out over this period as it is the only practical time when certain types of maintenance can be undertaken.
The VAT capital goods scheme provision is in respect of VAT claw back on costs incurred in the construction and refurbishment of various properties within the Group’s estate. The brought forward balance has been restated to include the University element of the VAT capital goods scheme amounting to £487,000 which was previously included in accruals.
Notes to the accounts

53
23. Deferred capital grants
Group Funding Council grants Other grants Total £’000 £’000 £’000At 1 August 2010 Buildings 36,236 7,611 43,847 Equipment 3,031 127 3,158 ______ ______ ______
39,267 7,738 47,005 ______ ______ ______Cash received Buildings 552 60 612 Equipment 597 111 708 Plant and machinery - 177 177 ______ ______ ______
1,149 348 1,497 ______ ______ ______
Released to income and expenditure Buildings 2,335 214 2,549 Equipment 649 77 726 ______ ______ ______
2,984 291 3,275 ______ ______ ______At 31 July 2011 Buildings 34,453 7,457 41,910 Equipment 2,979 161 3,140 Plant and machinery - 177 177 ______ ______ ______
37,432 7,795 45,227 ______ ______ ______
University Funding Council grants Other grants Total £’000 £’000 £’000At 1 August 2010 Buildings 36,236 7,876 44,112 Equipment 3,031 127 3,158 ______ ______ ______
39,267 8,003 47,270 ______ ______ ______Cash received Buildings 552 60 612 Equipment 597 111 708 ______ ______ ______ 1,149 171 1,320 ______ ______ ______Released to income and expenditure Buildings 2,335 214 2,549 Equipment 649 77 726 ______ ______ ______
2,984 291 3,275 ______ ______ ______At 31 July 2011 Buildings 34,453 7,722 42,175 Equipment 2,979 161 3,140 ______ ______ ______
37,432 7,883 45,315 ______ ______ ______
Notes to the accounts

54
24. Endowment funds
Group Unrestricted Restricted 2011 2010 permanent permanent Total Total £’000 £’000 £’000 £’000Balance at 1 August Capital 886 1,135 2,021 1,801Accumulated income 313 63 376 370 ______ ______ ______ ______
1,199 1,198 2,397 2,171
New endowments - 34 34 75 Investment income 24 36 60 50Expenditure (53) (22) (75) (45)Increase in market value of investments 53 58 111 146 ______ ______ ______ ______ Balance at 31 July 1,223 1,304 2,527 2,397 ______ ______ ______ ______Represented by: Capital 939 1,227 2,166 2,021Accumulated income 284 77 361 376 ______ ______ ______ ______ Total 1,223 1,304 2,527 2,397 ______ ______ ______ ______
University Unrestricted permanent
2011 2010 Total Total £’000 £’000Balance at 1 August Capital 509 502Accumulated income 93 90 ______ ______
602 592New endowments - -Investment income 6 3Expenditure - -Increase in market value of investments 6 7 ______ ______ Balance at 31 July 614 602 ______ ______
Represented by: Capital 515 509Accumulated income 99 93 ______ ______ Total 614 602 ______ ______
Notes to the accounts

55
25. Reserves
Group Income and expenditure reserve Income and including expenditure Pension pension Revaluation reserve reserve reserve reserve Total £’000 £’000 £’000 £’000 £’000 At 1 August 2010 107,320 (23,373) 83,947 23,535 107,482 Transfer to endowments 15 - 15 - 15Transfer to income and expenditure (2,488) 2,488 - - -Transfer to income and expenditure – depreciation 786 - 786 (786) -Transfer to income and expenditure – impairment of revalued assets 2,172 - 2,172 (2,172) -Surplus after depreciation of assets at valuation and tax 10,044 - 10,044 - 10,044Actuarial loss - (2,558) (2,558) - (2,558) _______ _______ _______ _______ _______
At 31 July 2011 117,849 (23,443) 94,406 20,577 114,983 _______ _______ _______ _______ _______
The consolidated income and expenditure reserves include £6.5 million in respect of Exemplas Holdings Limited and its subsidiary companies. According to that company’s Memorandum of Association, these reserves cannot be transferred to the shareholders by way of dividend, bonus or other distribution.
Of this amount £1,000 represents the Exemplas Holdings Limited group share of reserves belonging to Business Link Yorkshire Limited. This is a contract cessation reserve which is intended to cover potential liabilities that may arise over the life of the Business Link contract. It is anticipated that the wind-up liability will principally accrue in relation to personnel costs. A target figure for this reserve represents the company’s share of 100% of the estimated contract cessation costs. By virtue of the company’s main contract, this reserve may only be used for this specific purpose.
University Income and expenditure reserve Income and including expenditure Pension pension Revaluation reserve reserve reserve reserve Total £’000 £’000 £’000 £’000 £’000 At 1 August 2010 115,963 (24,317) 91,646 22,395 114,041 Transfer to endowments (6) - (6) - (6)Transfer to income and expenditure (2,257) 2,257 - - -Transfer to income and expenditure - depreciation 786 - 786 (786) -Transfer to income and expenditure – impairment of revalued assets 2,172 - 2,172 (2,172) -Surplus after depreciation of assets at valuation and tax 9,555 - 9,555 - 9,555Actuarial loss - (2,203) (2,203) - (2,203) _______ _______ _______ _______ _______
At 31 July 2011 126,213 (24,263) 101,950 19,437 121,387 _______ _______ _______ _______ _______
Notes to the accounts

56
26. Reconciliation of net cash flow from operating activities 2011 2010 Notes £’000 £’000 Operating surplus before tax 10,203 2,852Investment income (238) (565)Endowment income (60) (50)Deferred capital grants released to income 23 (3,275) (2,491)Depreciation 12 12,960 12,447Impairment 12 5,187 -Amortisation of goodwill 14 91 89Profit on sale of fixed assets (1,974) (35)Interest payable 3,045 2,811Pension costs (2,488) 2,835Increase in stocks (298) (46)Decrease in debtors 7,719 688(Increase)/decrease in creditors (3,148) 10,069Increase in provisions 923 97 ______ ______ Net cash inflow from operating activities 28,647 28,701 ______ ______
27. Returns on investments and servicing of finance 2011 2010 £’000 £’000 Income from endowments 60 50Other interest received 228 565Interest paid (2,897) (2,676) _______ _______ Net cash outflow from returns on investments and servicing of finance (2,609) (2,061) _______ _______
28. Capital expenditure and financial investment 2011 2010 £’000 £’000 Payments to acquire tangible fixed assets (17,593) (20,545)Investments acquired (671) -Endowment asset investments acquired (34) (75)Receipts from sales of tangible fixed assets 3,321 116Deferred capital grant received 23 1,497 6,767 _______ _______ Net cash outflow from capital expenditure and financial investment (13,480) (13,737) _______ _______
Notes to the accounts

57
29. Management of liquid resources 2011 2010 £’000 £’000
Deposits to short-term investments (6,494) (6,075) ______ ______Net cash outflow from management of liquid resources (6,494) (6,075) ______ ______
30. Financing 2011 2010 £’000 £’000Debt due beyond a year: (Repayment of loans)/new long term loans (1,395) 8,975Capital element of finance lease repayments/principal (502) (457) ______ ______Net cash (outflow)/ inflow from financing (1,897) 8,518 ______ ______
31. Analysis of changes in (net debt)/net funds Other 2010 Cashflows changes 2011 Notes £’000 £’000 £’000 £’000 Cash at bank and in hand 21,372 3,785 - 25,157Endowment bank balance 15 1,053 19 - 1,072 _______ _______ _______ _______ 22,425 3,804 - 26,229 Debt due over more than one year: Long-term loans 20 (69,838) - 1,722 (68,116)Obligations under finance lease 20 (14,724) - 531 (14,193) Debt due under one year: Bank loan (1,270) 1,395 (1,722) (1,597)Obligation under finance lease 19 (502) 502 (531) (531) Short-term deposits 7,951 6,494 - 14,445 _______ _______ _______ _______ (55,958) 12,195 - (43,763) _______ _______ _______ _______
Notes to the accounts
58
32. Pension schemesThe two principal pension schemes for the University’s staff are the Teachers’ Pension Scheme (TPS) and the Local Government Pension Scheme (LGPS). Additionally, the University has agreed with the Universities Superannuation Scheme (USS) that designated employees may be eligible to become members of that scheme. The assets of the schemes are held in separate administered funds.
Teachers’ Pension Scheme (TPS)The Teachers’ Pension Scheme (TPS) is a statutory, contributory, defined benefit scheme. The regulations under which the TPS operates are the Teachers’ Pensions Regulations 2010. These regulations apply to teachers in schools and other educational establishments in England and Wales maintained by local authorities, to teachers in many independent and voluntary-aided schools, and to teachers and lecturers in establishments of further and higher education. Membership is automatic for full-time teachers and lecturers and from 1 January 2007 automatic too for teachers and lecturers in part-time employment following appointment or a change of contract. Teachers and lecturers are able to opt out of the TPS.
Although teachers and lecturers are employed by various bodies, their retirement and other pension benefits, including annual increases payable under the Pensions (Increase) Acts are, as provided for in the Superannuation Act 1972, paid out of monies provided by Parliament. Under the unfunded TPS, teachers’ contributions on a ‘pay-as-you-go’ basis, and employers’ contributions, are credited to the Exchequer under arrangements governed by the above Act.
The Teachers’ Pensions Regulations require an annual account, the Teachers’ Pension Budgeting and Valuation Account, to be kept of receipts and expenditure (including the cost of pensions’ increases). From 1 April 2001, the Account has been credited with a real rate of return (in excess of price increases and currently set at 3.5%), which is equivalent to assuming that the balance in the Account is invested in notional investments that produce that real rate of return. Valuation of the Teachers’ Pension SchemeNot less than every four years the Government Actuary (GA), using normal actuarial principles, conducts a formal actuarial review of the TPS. The aim of the review is to specify the level of future contributions.
The contribution rate paid into the TPS is assessed in two parts. First, a standard contribution rate (SCR) is determined. This is the contribution, expressed as a percentage of the salaries of teachers and lecturers in service or entering service during the period over which the contribution rate applies, which if it were paid over the entire active service of these teachers and lecturers would broadly defray the cost of benefits payable in respect of that service. Secondly, a supplementary contribution is payable if, as a result of the actuarial investigation, it is found that accumulated liabilities of the Account for benefits to past and present teachers, are not fully covered by standard contributions to be paid in future and by the notional fund built up from past contributions. The total contribution rate payable is the sum of the SCR and the supplementary contribution rate.
The last valuation of the TPS related to the period 1 April 2001 - 31 March 2004. The GA’s report of October 2006 revealed that the total liabilities of the scheme (pensions currently in payment and the estimated cost of future benefits) amounted to £166,500 million. The value of the assets (estimated future contributions together with the proceeds from the notional investments held at the valuation date) was £163,240 million. The assumed real rate of return is 3.5% in excess of prices and 2% in excess of earnings. The rate of real earnings growth is assumed to be 1.5%. The assumed gross rate of return is 6.5%.
As from 1 January 2007, and as part of the cost-sharing agreement between employers’ and teachers’ representatives, the SCR has been assessed at 19.75%, and the supplementary contribution rate has been assessed to be 0.75% (to balance assets and liabilities as required by the regulations within fifteen years); a total contribution rate of 20.5%. This translates into an employee contribution rate of 6.4% and employer contribution rate of 14.1% payable. The cost-sharing agreement has also introduced – effective for the first time for the 2008 valuation – a 14% cap on employer contributions payable.
Notes to the accounts

59
Notes to the accounts
32. Pension schemes (continued)
Universities Superannuation Scheme (USS)The USS is a defined benefits scheme which is externally funded and contracted out of the State Second Pension. The assets of the scheme are held in a separate trustee-administered fund. It is not possible to identify the University’s share of the underlying assets and liabilities in the scheme and hence, using the exemption under FRS 17, contributions to the scheme are accounted for as if it were a defined contribution scheme. As a result, the amount charged to the income and expenditure account is equal to the contributions payable to the scheme in respect of the accounting period.
The pensions cost is assessed every three years. The assumptions and other data that have the most significant effect on the determination of the contribution levels are as follows:
Latest actuarial valuation 31 March 2008Actuarial method Projected unit method Past service liabilities Future service liabilitiesInvestment returns per annum 6.4% 6.1%Salary scale increases per annum 4.3% 3.9%Pensions increases per annum 3.3% 2.9%Market value of assets at date of last valuation £28,842 millionValue of schemes technical provisions at date of last valuation £28,135 millionSurplus £707 millionProportion of member’s accrued benefits covered by the actuarial value of the assets 103%
Since 31 March 2008 global investment markets have continued to fluctuate and as at 31 March 2011 the market’s assessment of inflation has increased slightly. The government has also announced a change to the inflation measure used in determining the “Official Pensions Index” from the Retail Prices Index to the Consumer Prices Index. The actuary has taken this all into account in his funding level estimates at 31 March 2011 by reducing the assumption for pension increases from 3.3% pa to 2.9% pa. The actuary has estimated that the funding level as at 31 March 2011 under the scheme specific funding regime had fallen from 103% to 98% (a deficit of circa £700 million). Compared to the previous twelve months, the funding level has improved from 91% (as at 31 March 2010) to 98%.
Surplus or deficits which arise at future valuations may impact on the institution’s future contribution commitment. On advice of the actuary the employer contribution rate was increased to 16% with effect from 1 October 2009.
Local Government Pension Scheme (LGPS)The LGPS is regulated by statute, with separate regulations for (a) England and Wales and (b) Scotland. The benefits of the LGPS are determined nationally by regulation and meet the definition of a defined benefit scheme. It is a funded scheme, with some ninety-nine separate funds administered locally by administering authorities. Each fund has many employing authorities. The Hertfordshire County Council is the administering authority with the District Councils in their County, and other bodies, for example the University, being employing authorities within that scheme. The University’s wholly owned subsidiary company Universitybus Limited, whose employees are members of the LGPS, is an admitted body to the fund. All other wholly owned subsidiary companies contribute to the scheme through the University. Staff employed by Exemplas Holdings Limited and its subsidiary companies are either members of the LGPS or are members of the group administered personal pension plan, which is a defined contribution scheme.
The LGPS is not therefore a national multi-employer scheme, but each separate LGPS fund is a multi-employer scheme.
Changes to the Local Government Pension Scheme permit employees retiring on or after 6 April 2006 to take an increase in their lump sum payment on retirement in exchange for a reduction in their future annual pension. An allowance is included for future retirements to elect to take 50% of the maximum additional tax-free cash up to

60
Notes to the accounts
32. Pension schemes (continued)
HMRC limits for pre- April 2008 service and 75% of the maximum tax-free cash for post-April 2008 service.In calculating the scheme assets and liabilities, the fund’s actuaries had to make a number of assumptions about events and circumstances in the future. These assumptions represent the best estimate of expected outcomes but it is possible that actual outcomes will differ from those included in the accounts. Any differences between expected and actual outcomes are reported through experience gains and losses.
The total contribution made to the LGPS for the year ended 31 July 2011 was as follows: Total Employers Employees £’000 £’000 £’000
University 7,579 5,730 1,849Universitybus 304 229 75Exemplas 100 81 19 ______ ______ ______
Total 7,983 6,040 1,943 ______ ______ ______
Employer contributions are affected by a surplus or deficit in the scheme. All new entrants to the fund are now single status employees and there is no longer any classification of officer and manual employees. The agreed contribution rates for future years are:
Year ending 31 March 2012 2013 2014University 20.7% 22.2% 23.7%Universitybus 21.6% 21.6% 21.6%Exemplas 27.5% 27.5% 27.5%Employees 5.5-7.5% 5.5-7.5%* 5.5-7.5%*
*The employee contribution rates for the year ending 31 March 2013 and subsequent years are currently under review following the publication of the Independent Public Service Pensions Commission Report in March 2011.
The estimated employer contribution payable for the year ending 31 July 2012 is £5,785,000.
The following information is based upon a full actuarial valuation of the fund at 31 March 2010 updated to 31 July 2011 by a qualified independent actuary. 2011 2010 2009Inflation and rate of increase in pension 3.0% 3.0% 3.7%Rate of increase in salaries 3.0% 3.0% 5.2%Expected return on assets 6.2% 6.6% 6.0%Discount rate for liabilities 5.8% 5.8% 6.0%
The salary increase assumption is 1.5% until 31 March 2013 reverting to the long term rate shown above thereafter.
The current mortality assumptions include sufficient allowance for future improvements in mortality rates. The assumed life expectancies on retirement at age 65 are:
University and Exemplas Holdings Limited: Males FemalesCurrent pensioners 22.1 years 25.1 yearsFuture pensioners 23.2 years 26.1 years
Universitybus Limited: Males FemalesCurrent pensioners 17 years 19 yearsFuture pensioners 18 years 20 years

61
Notes to the accounts
32. Pension schemes (continued)
The assets in the scheme (of which the Group’s share is 4.64%) and the expected rates of return were: Long-term Long-term Long-term rate of return rate of return rate of return expected Value expected Value expected Value 2011 2011 2010 2010 2009 2009 £’000 £’000 £’000 Equities 7.0% 1,643,000 7.3% 1,500,000 7.3% 1,213,000Bonds 4.6% 507,000 4.8% 401,000 5.3% 373,000Property 5.1% 121,000 5.3% 85,000 5.3% 75,000Cash 4.0% 145,000 4.4% 127,000 4.3% 205,000 _________ _________ ________
Total market value of assets 2,416,000 2,113,000 1,866,000 _________ _________ ________
Expected rates of return on the fund are estimated based on the actual fund returns as provided by the administering authority (Hertfordshire County Council) and index returns where necessary.
The pension scheme liability detailed below also takes account of the University’s unfunded pension liability. This liability, which relates to pension enhancements payable to staff who have taken early retirement, was previously included in the accounts as a provision before the full adoption of FRS 17 in the year ended 31 July 2006.
2011 2010 2009 2008 2007 £’000 £’000 £’000 £’000 £’000 Group’s estimated asset share 112,017 105,244 87,893 94,234 95,664Present value of scheme liabilities (128,528) (121,896) (142,544) (116,506) (107,434)Present value of unfunded liabilities (6,932) (6,721) (8,242) (9,680) (10,536) ________ ________ ________ ________ ________ Deficit in the scheme (23,443) (23,373) (62,893) (31,952) (22,306) ________ ________ _______ ________ ________
The pension scheme liability for the University was £24,263,000 as at 31 July 2011 (2010: £24,317,000).
Analysis of the amount charged to income and expenditure account 2011 2010 £’000 £’000 Service cost 3,090 5,040Past service cost 39 -Curtailment and settlements - 264 ______ ______
Total operating charge 3,129 5,304 ______ ______
Analysis of net return on pension assets 2011 2010 £’000 £’000
Expected return on pension scheme assets 7,022 5,838Interest on pension liabilities (7,445) (9,149) ______ ______
Net charge on pension scheme (423) (3,311) ______ ______

62
Notes to the accounts
32. Pension schemes (continued)
Amount recognised in the statement of total recognised gains and losses (STRGL) 2011 2010 £’000 £’000 Actual return less expected return on pension scheme assets (2,799) 7,623Experience gains and losses arising on the scheme liabilities 3,889 1,273Changes in financial and demographic assumptions underlying the present value of liabilities (3,648) 25,393Actuarial gain arising on changes to actuarial asumptions - 8,066 ______ ______
Actuarial (loss)/gain recognised in STRGL (2,558) 42,355 ______ ______
The amount of the actuarial loss relating to changes in financial assumptions for the year ended 31 July 2011 is £3,648,000 (2010: gain of £25,393,000). The cumulative actuarial gain recognised in STRGL as at 31 July 2011 is £1,080,000 (2010: gain of £3,638,000).
The actual return on scheme assets in the year was £14,253,000 (2010: £13,463,000).
In the year ended 31 July 2010 an atuarial gain arising on changes to actuarial asumptions of £8,066,000 arose as a result of the Government’s announcement on 22 June 2010 that future pension increases would be linked to CPI rather than RPI. The Group recognised this amount in the STRGL.
Movement in deficit during the year 2011 2010 £’000 £’000 Deficit in scheme at 1 August (23,373) (62,893)Current service cost (3,090) (5,040)Employer contributions 6,040 5,780Actuarial gain arising on changes to actuarial asumptions - 8,066Past service costs (39) -Curtailment and settlements - (264)Net return on assets (423) (3,311)Actuarial (loss)/gain (2,558) 34,289 _______ _______
Deficit in scheme at 31 July (23,443) (23,373) _______ _______
Analysis of movement in the present value of the scheme liabilities 2011 2010 £’000 £’000 At 1 August 128,617 150,787Current service cost 3,090 5,040Contributions by members 1,943 1,902Actuarial gain arising on changes to actuarial asumptions - (8,066)Past service costs 39 -Curtailment and settlements - 264Interest cost 7,445 9,149Actuarial gain (241) (26,667)Estimated unfunded benefits paid (496) (496)Estimated benefits paid (4,937) (3,296) _______ _______
At 31 July 135,460 128,617 _______ _______

63
Notes to the accounts
32. Pension schemes (continued)
Analysis of movement in the fair value of the scheme assets 2011 2010 £’000 £’000 At 1 August 105,244 87,894Contributions by members 1,943 1,902Employer contributions 5,544 5,284Contributions in respect of unfunded benefits 496 496Expected return on assets 7,022 5,838Actuarial (loss)/gain (2,799) 7,623Estimated unfunded benefits paid (496) (496)Estimated benefits paid (4,937) (3,297) _______ _______
At 31 July 112,017 105,244 _______ _______
History of experience gains and losses 2011 2010 2009 2008 2007 £’000 £’000 £’000 £’000 £’000Difference between the expected and actual return on assets (2,799) 7,623 (17,311) (11,770) 4,143Percentage of scheme assets (2.5%) 7.2% (19.7%) (12.5%) 4.3%Experience gains/(losses) on scheme liabilities 3,889 1,273 2,004 (9) (1) Percentage of scheme liabilities (2.9%) (1.2%) (1.8%) 0.0% 0.0%
Employers and employee total contributions 2011 2010 Employers Employees Total Total £’000 £’000 £’000 £’000 Contributions to TPS 5,983 3,081 9,064 8,596Contributions to LGPS 6,040 1,943 7,983 7,682Contributions to USS 37 21 58 52Other Pension Schemes 444 76 520 - ______ ______ ______ ______
Total contributions 12,504 5,121 17,625 16,330 ______ ______ ______ ______
33. Capital commitments 2011 2011 2010 2010 Group University Group University £’000 £’000 £’000 £’000 Contracted at 31 July 2,045 1,836 6,666 6,603Authorised but not contracted at 31 July 896 566 11,733 11,546 ______ ______ ______ ______ 2,941 2,402 18,399 18,149 ______ ______ ______ ______
34. Financial instruments The fuel hedging contracts entered into by Universitybus Limited have a fair value at 31 July 2011 of £835,000 (2010: £nil).

64
Notes to the accounts
35. Access to Learning Fund 2011 2010 £’000 £’000 Balance at 1 August 56 14Funding council grants received 417 433Interest earned 1 1 ______ ______
474 448 Disbursed to students (411) (379)Administration charges (12) (13) ______ ______
Balance at 31 July 51 56 ______ ______
Access to Learning Funds are available solely for students; the University acts only as paying agent. The grants and related disbursements are accounted for as agency arrangements and are therefore excluded from the income and expenditure account.
36. Related party transactions
All transactions detailed below were undertaken at an arms length basis in accordance with the normal agreements between customers and suppliers.
Name of entity Value of Value of Amount services services outstanding at delivered received 31 July 2011
Year ended 31 July 2011 University of Hertfordshire Students’ Union £1,227,000* £335,000 £4,000East of England IDB Limited £2,503,000 - £88,000Yorkshire & Humberside IDB Limited £1,615,000 £13,000 £1,000
Year ended 31 July 2010 University of Hertfordshire Students’ Union £1,202,000* £166,000 £9,000 East of England IDB Limited £2,056,000 - -Yorkshire & Humberside IDB Limited £1,775,000 - -
* This includes the 2010/11 Students’ Union Subvention of £899,000 (2010: £650,000) and £nil (2010:£200,000) in respect of student union facilities.
The Students’ Union occupies University buildings for which it is not charged. The market rent for such occupancy amounts to £180,000 (2010:£180,000).
In the year ended 31 July 2011 the Governors received payments of £4,500 for the reimbursement of travel and subsistence expenses incurred in the course of their duties (2010: £6,200). The University also incurred expenditure of £500 in respect of computer equipment provided to Governors to enable them to carry out their duties (2010: £2,000).
The University has granted a loan of £300,000 to the Vice-Chancellor as part of his relocation package. This loan shall be subject to the interest rate determined by Her Majesty’s Revenue and Customs (“the Official Rate”) being 4% pa for the period to 31 July 2011. Interest paid on the loan in the year to 31 July 2011 amounted to £7,000 and the balance of the loan outstanding at that date was £300,000. The full capital amount of the loan shall be repaid on termination of the employment.

65

66
Board of GovernorsMemberships from 1 August 2010
Board of GovernorsIndependent MembersMrs J L Connell (Chairman)His Honour Judge BakerMs Y BatliwalaMr P L BlockProfessor M Elves (to 31/08/11)Mr D J Goodridge Mr C J GordonMr A P Graham Mr J K HeywoodMr N F MatthewsMr G MorrisonMr J F H ParkLady Staughton
Vice-ChancellorProfessor R J T Wilson (to 31/12/10)Professor Q A McKellar (from 1/01/11)
Member nominated by the Academic BoardMrs L Karstadt
Students’ UnionMs P F de Koenigswarter (to 30/06/11)Ms E Masefield (from 1/07/11)
Co-opted membersProfessor Sir Graeme Davies (from 1/09/11)Mr R I N GordonMr N B Lawler (to 31/08/11)Mrs S D Harrison-Barker (from 1/09/11)Miss J L McCueDr L MitchellDr D A NeilDr A V Stokes (to 31/08/11)
BankersBarclays Bank Plc, St Albans
AuditorsGrant Thornton UK LLPChartered Accountants and Registered AuditorsMilton Keynes
Audit CommitteeMr J K Heywood (Chairman)His Honour Judge Baker (from 1/09/11)Ms Y Batliwala (from 1/09/11)Mr P L Block (from 1/09/11)Mr J F H Park (from 1/09/11)Mr A P Graham Mr N F Matthews (to 31/08/11)Dr L Mitchell Dr A V Stokes (to 31/08/11)
Remuneration CommitteeMrs J L Connell (Chairman)Mr P L Block (to 31/08/11)Mr C J GordonMr J K Heywood (from 1/09/10)Mr N F MatthewsMr J F H Park (from 1/09/11)Lady Staughton (to 31/08/11)
Finance and General Purposes Committee(to 31/03/11)Mr C J Gordon (Chairman) (from 1/09/10)Ms Y Batliwala (from 1/09/10)Mr P L BlockMrs J L ConnellProfessor M ElvesMr D J Goodridge (from 1/09/10)Miss J L McCueProfessor Q A McKellar (from 1/01/11)Mr G MorrisonMr J F H ParkProfessor R J T Wilson (to 31/12/10)
Finance and Employment Committee(from 1/04/11)Mr C J Gordon (Chairman) (from 1/04/11)Mrs J L ConnellProfessor Q A McKellarMs Y Batliwala (1/04/11 – 31/08/11)Mr P L Block (1/04/11 – 31/08/11)Professor M Elves (1/04/11 – 31/08/11)Mr D J GoodridgeMr R I N Gordon (from 1/09/11)Mr N F Matthews (from 1/09/11)Miss J L McCue (1/04/11 – 31/08/11)Mr G Morrison Dr D A Neil (from 1/09/11)Mr J F H Park (1/04/11 – 31/08/11)
The above committees have a direct responsibility for the financial activities of the University.

67
Members of the executive team
Professor Quintin McKellar CBEVice-ChancellorBVMS PhD DVM DipECVPT CBiol FSB FRSA FRAgS MRCVS FRSE
Professor McKellar joined the University on 1 January 2011. As Vice-Chancellor and Chief Executive, his responsibilities include the day-to-day running of the institution, the delivery of strategic and operation plans, performance, its internal structure and organisation and its interface with external bodies and agencies.
Having graduated from Glasgow University Veterinary School in 1981, Professor McKellar went on to gain his PhD in Veterinary Parasitology in 1984 and was appointed to a lectureship at the Veterinary School in the same year. He became Head of the Veterinary Pharmacology Department in 1990 and was awarded a personal professorship by the University of Glasgow in 1996. In August 1997 Professor McKellar took up the post of Scientific Director of Moredun Research Institute and Chief Executive of the Moredun Foundation. He became a Doctor of Veterinary Medicine (DVM) with Honours in 2002 and was elected Fellow of the Institute of Biology in 2001, Fellow of the Royal Agricultural Societies in 2002 and Fellow of the Royal Society of Edinburgh in 2003.
In 2004, Professor McKellar was appointed Principal of The Royal Veterinary College of the University of London, the first and largest institution of its kind in the UK which was identified as the top English veterinary school in the 2008 Research Assessment Exercise. During Professor McKellar’s tenure, The Royal Veterinary College doubled its research income which in 2009/2010 reached £13.1million.
Professor McKellar was made a Commander of the Order of the British Empire (CBE) in 2011 for services to science. He was a distinguished researcher with interests in the pharmacology of anti-infective and anti-inflammatory drugs in domestic animals.
Professor Graham GalbraithDeputy Vice-ChancellorBSc MSc PhD CEng MCIBSE FHEA
Professor Galbraith joined the University of Hertfordshire in September 2008 as Deputy Vice-Chancellor.
He previously held the role Pro-Vice-Chancellor (International) at Glasgow Caledonian University which he joined in 1993 after spending ten years at Strathclyde University.
Professor Galbraith is a prolific researcher, particularly active in applied research. He has a leading reputation in the study of condensation in buildings, and has a strong track record in research income generation. He has interests in Sustainable Living and has sponsored the development of a new Centre for Sustainable Communities at the University of Hertfordshire.
As the sole Deputy Vice-Chancellor he is currently engaged in all strategic and operational decisions which underpin the positioning and success of the University. Most recently he led the development and implementation of the strategic plan for the University which has involved wide engagement across all academic and professional areas of the University.
He has overall responsibility for research strategy; university planning including the development of all academic areas; staff development; international and regional partnerships and developments; recruitment, induction and retention of students; student experience and student outcomes.

68
Members of the executive team
Philip Waters Secretary and RegistrarBSc FRSA
Philip Waters was appointed Secretary and Registrar in 2001. He is responsible for the management and operation of the Board of Governors and the Academic Board; compliance with University policies, regulations and procedures; legal matters of the University and its wholly-owned subsidiaries.
He joined the University in 1989 as Deputy Secretary and Registrar. At national level he is Chairman of Southern Universities Purchasing Consortium (SUPC), a Director of SUMS and is Director and Trustee of Higher Education Careers Services Unit (HECSU). At local and regional level he is a Director and Trustee of Groundwork Hertfordshire, Chairman of Universitybus Ltd (UNO), and serves on several bodies in St Albans.
Alistair MoffatGroup Finance DirectorBA FCMA
Alistair Moffat was appointed Group Finance Director in 2009. He has responsibility for all aspects of financial management within the Group including financial control, statutory reporting, treasury, tax, insurance and commercial financial support for the academic community. His role also incorporates board responsibility for the management of the Estate, he attends several of the board committees, and is a director of UH Holdings Limited which oversees the commercial subsidiaries in the Group.
He joined the University from Monarch Airlines where he was Chief Financial Officer. Previous roles in industry include: Finance Director Scotland at First Group Plc; Finance Director at Alstom Signalling Limited; a number of senior finance positions within British Rail; and Finance Director at Mainline Freight Limited, through the rail privatisation process.
Graduating in Accounting and Finance, he then qualified as an accountant in 1989 and is now a Fellow of the Chartered Institute of Management Accountants.
The above listed members of the executive team have a direct responsibility for the financial activities of the University.

69

70
List of Major Corporate Donors
Chancellors Circle
Jarvis Group Limited
Lafarge Aggregates Limited
Royal Dutch Shell plc
Garfield Weston Foundation
Vice-Chancellors Circle
A&R Woolf Charitable Trust
Beds Bucks and Herts Society of Chartered Accountants
Carlton Travel Goods
Caribbean Women’s Equality and Diversity Forum
Debenhams Ottaway
Geoffrey de Havilland Flying Foundation
HRJ Law
Hertfordshire County Council
Hertfordshire Educational Foundation
Kirby Laing Foundation
Mills & Reeve LLP
Mundy Cruising
NADFAS
PJE Foundation
Premier Foods
Provincial Grand Lodge of Mark Master Masons of Hertfordshire
RMJM
ROKO Cancer Charity
SA Law
Scotia UK plc
St Johns Church, Lemsford
Taylor Walton Solicitors
Tesco plc
The Legacy Partnership
Twin Technology Limited
Willmott Dixon Group
Worshipful Company of Carpenters
There are numerous individuals who have also donated generously to the University.

71

University of HertfordshireHatfieldAL10 9ABUK
Telephone +44 (0)1707 284800Fax +44 (0)1707 284870www.herts.ac.uk SX6157/PD/11_11