Embed Size (px)
Citation preview
ANNUAL REPORT AND ACCOUNTS2012


1
JD Sports Fashion Plc Hollinsbrook Way Pilsworth Bury BL9 8RR
+44 (0)161 767 1000 +44 (0)161 767 1001www.jdplc.com
Trading websiteswww.jdsports.co.uk www.size.co.uk www.scottsonline.co.uk www.bankfashion.co.uk www.chausport.com www.getthelabel.com www.champion.ie www.canterbury.com www.canterburynz.com.au www.canterburynz.net.nz www.kooga-rugby.com www.kukrisports.com www.nicholasdeakins.comwww.thedufferofstgeorge.comwww.cecilgee.com www.peterwerth.co.uk www.blacks.co.ukwww.millets.co.ukwww.varsitykit.com
Non trading websiteswww.sprinter.eswww.footpatrol.co.uk
Contents
Contact
2 Summary of Key Performance Indicators
3 – 4 The Group at a Glance
21 – 26 Chairman's Statement
27 – 30 Financial and Risk Review
31 – 33 Property and Stores Review
34 – 37 Corporate and Social Responsibility
38 The Board
39 – 41 Directors’ Report
42 – 45 Corporate Governance Report
46 – 50 Directors’ Remuneration Report
51 Statement of Directors’ Responsibilities
52 Independent Auditor’s Report
53 Consolidated Income Statement
53 Group and Company Consolidated Statement of Comprehensive Income
54 Group and Company Consolidated Statement of Financial Position
55 Group and Company Consolidated Statement of Changes in Equity
56 Group and Company Consolidated Statement of Cash Flows
57 –101 Notes to the Consolidated Financial Statements
102 Five Year Record
103 Financial Calendar
103 Shareholder Information
Annual Report & Accounts 2012
Summary of Key Performance Indicators
52 weeks to 28 January 2012
£000
52 weeks to 29 January 2011
£000 %
Change
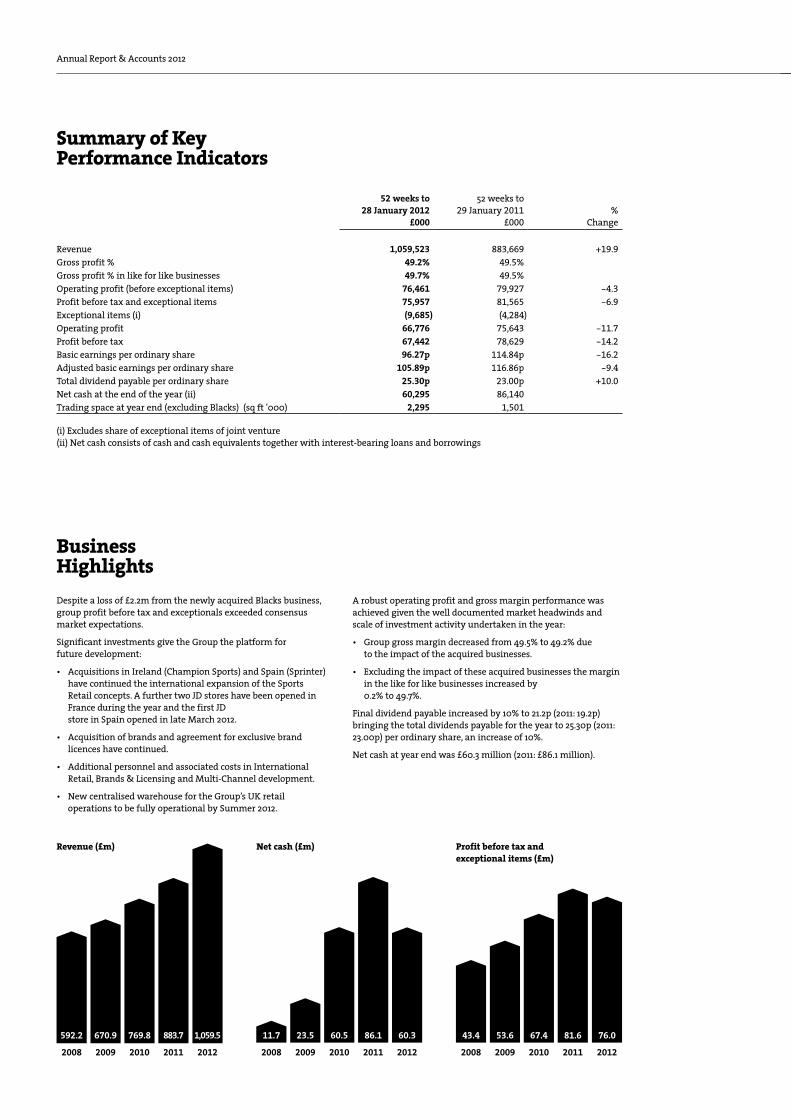
Revenue 1,059,523 883,669 +19.9Gross profit % 49.2% 49.5%Gross profit % in like for like businesses 49.7% 49.5%Operating profit (before exceptional items) 76,461 79,927 -4.3Profit before tax and exceptional items 75,957 81,565 -6.9Exceptional items (i) (9,685) (4,284)Operating profit 66,776 75,643 -11.7Profit before tax 67,442 78,629 -14.2Basic earnings per ordinary share 96.27p 114.84p -16.2Adjusted basic earnings per ordinary share 105.89p 116.86p -9.4Total dividend payable per ordinary share 25.30p 23.00p +10.0Net cash at the end of the year (ii) 60,295 86,140Trading space at year end (excluding Blacks) (sq ft '000) 2,295 1,501
(i) Excludes share of exceptional items of joint venture(ii) Net cash consists of cash and cash equivalents together with interest-bearing loans and borrowings
Business Highlights Despite a loss of £2.2m from the newly acquired Blacks business, group profit before tax and exceptionals exceeded consensus market expectations.
Significant investments give the Group the platform for future de velopment:
• Acquisitions in Ireland (Champion Sports) and Spain (Sprinter) have continued the international expansion of the Sports Retail concepts. A further two JD stores have been opened in France during the year and the first JD store in Spain opened in late March 2012.
• Acquisition of brands and agreement for exclusive brand licences have continued.
• Additional personnel and associated costs in International Retail, Brands & Licensing and Multi-Channel development.
• New centralised warehouse for the Group’s UK retail operations to be fully operational by Summer 2012.
A robust operating profit and gross margin performance was achieved given the well documented market headwinds and scale of investment activity undertaken in the year:
• Group gross margin decreased from 49.5% to 49.2% due to the impact of the acquired businesses.
• Excluding the impact of these acquired businesses the margin in the like for like businesses increased by 0.2% to 49.7%.
Final dividend payable increased by 10% to 21.2p (2011: 19.2p) bringing the total dividends payable for the year to 25.30p (2011: 23.00p) per ordinary share, an increase of 10%.
Net cash at year end was £60.3 million (2011: £86.1 million).
Profit before tax and exceptional items (£m)
Net cash (£m)Revenue (£m)
2008 2009 2010 2011 2012
592.2 670.9 769.8 883.7 1,059.5
2008
43.4
2009
53.6
2010
67.4 81.6 76.0
2011 20122008 2009 2010 2011 2012
11.7 23.5 60.5 86.1 60.3
2/3
The Group at a Glance
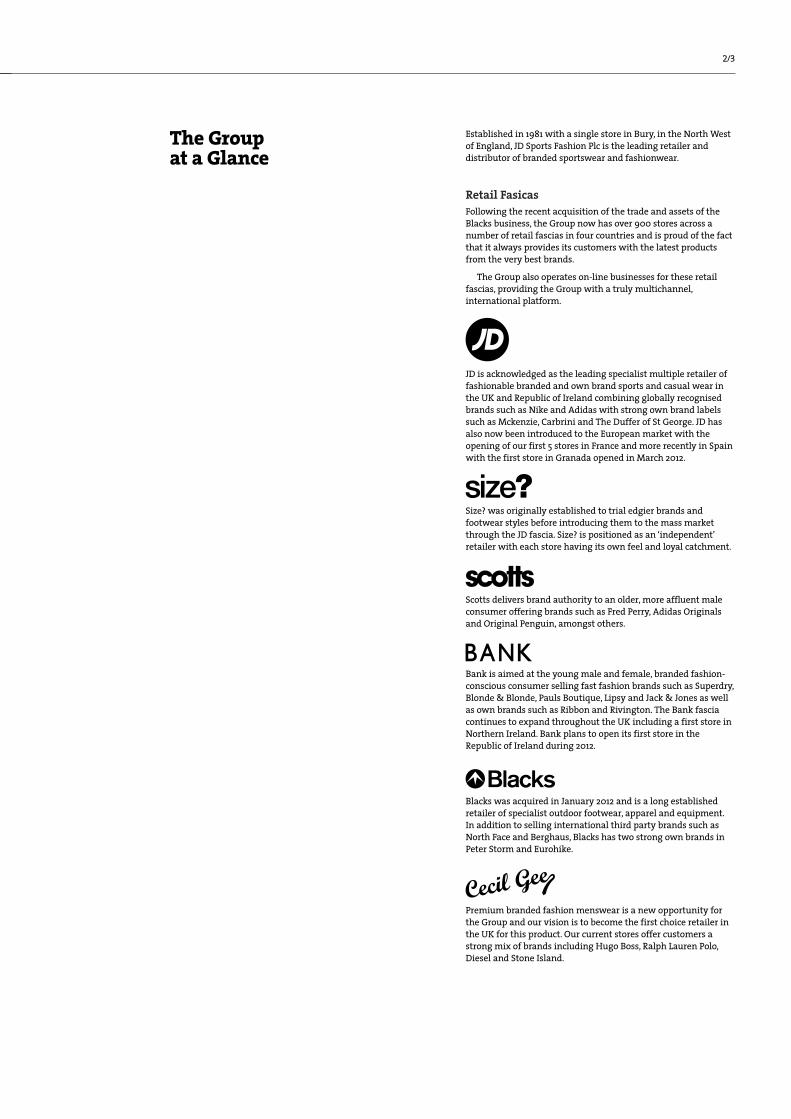
Established in 1981 with a single store in Bury, in the North West of England, JD Sports Fashion Plc is the leading retailer and distributor of branded sportswear and fashionwear.
Retail FasicasFollowing the recent acquisition of the trade and assets of the Blacks business, the Group now has over 900 stores across a number of retail fascias in four countries and is proud of the fact that it always provides its customers with the latest products from the very best brands.
The Group also operates on-line businesses for these retail fascias, providing the Group with a truly multichannel, international platform.
JD is acknowledged as the leading specialist multiple retailer of fashionable branded and own brand sports and casual wear in the UK and Republic of Ireland combining globally recognised brands such as Nike and Adidas with strong own brand labels such as Mckenzie, Carbrini and The Duffer of St George. JD has also now been introduced to the European market with the opening of our first 5 stores in France and more recently in Spain with the first store in Granada opened in March 2012.
Size? was originally established to trial edgier brands and footwear styles before introducing them to the mass market through the JD fascia. Size? is positioned as an ‘independent’ retailer with each store having its own feel and loyal catchment.
Scotts delivers brand authority to an older, more affluent male consumer offering brands such as Fred Perry, Adidas Originals and Original Penguin, amongst others.
Bank is aimed at the young male and female, branded fashion-conscious consumer selling fast fashion brands such as Superdry, Blonde & Blonde, Pauls Boutique, Lipsy and Jack & Jones as well as own brands such as Ribbon and Rivington. The Bank fascia continues to expand throughout the UK including a first store in Northern Ireland. Bank plans to open its first store in the Republic of Ireland during 2012.
Blacks was acquired in January 2012 and is a long established retailer of specialist outdoor footwear, apparel and equipment. In addition to selling international third party brands such as North Face and Berghaus, Blacks has two strong own brands in Peter Storm and Eurohike.
Premium branded fashion menswear is a new opportunity for the Group and our vision is to become the first choice retailer in the UK for this product. Our current stores offer customers a strong mix of brands including Hugo Boss, Ralph Lauren Polo, Diesel and Stone Island.

Annual Report & Accounts 2012
The Group at a Glance (continued)
Retail Fasicas (continued)
Chausport was acquired in May 2009 and sells a strong range of international brands such as Nike, Adidas and Le Coq Sportif together with brands more specific to the French market such as Redskins.
Champion was acquired in April 2011 and is one of the leading retailers of sports apparel and footwear in the Republic of Ireland with 20 stores in premium locations in town centres and shopping centres.
Sprinter was acquired in June 2011 and is one of the leading sports retailers in Spain selling footwear, apparel, accessories and equipment for a wide range of sports as well as lifestyle casual wear and childrenswear. This offer includes both international sports brands and successful own brands.
Distribution BusinessesThe Group also has a number of businesses which design and distribute team wear and fashion product.
Getthelabel.com is an on-line and catalogue business which offers customers significant savings on branded fashion and footwear.
Canterbury was initially established in the New Zealand province of Canterbury in 1904 to manufacture and supply rugby jerseys. Backed by over a century of rigorous on field testing, Canterbury is one of the world’s largest rugby brands and has recently secured the contract to be the official partner to the Rugby Football Union for the next four years including through the 2015 World Cup.
Kooga design, source and wholesale rugby apparel and equipment, with teamwear, replica and leisurewear ranges. Kooga is also sole kit supplier to a number of professional rugby union and rugby league clubs.
Kukri, acquired in February 2011, sources and provides bespoke sports teamwear to schools, universities and sports clubs. Teams design and order their personalised kit on-line, with over 75 different sports catered for. In addition, Kukri provides replica apparel and accessories for the Hong Kong 7's and is sole kit supplier to a number of professional sports teams.
Nicholas Deakins designs and manufactures predominantly men’s footwear and clothing. Since its inception in 1991, the brand has been moulded into several collections with labels including Nicholas Deakins Green Label clothing and footwear, Deakins and Deakins kids. Nicholas Deakins supplies both group and external customers.
Focus are involved in the design, sourcing and distribution of footwear and apparel both for own brand and licensed brands, such as Ecko, Ellesse, Kickers and Le Coq Sportif, for both group and external customers.

THE RETURN OF A LEGEND

STYLE WITHOUT LIMITSTHE BEST OF THE BEST

UNRIVALLEDO N L I N E . I N S T O R E . M O B I L E .SHOP IT 24 / 7

B A N K F A S H I O N . C O . U K


EPIC BRANDS TOTAL STYLE

11 OUT OF 10AWESOME TRENDS
UNMISSABLE THIS SPRING
JDSPORTS.CO.UK


UNRIVALLEDO N L I N E . I N S T O R E . M O B I L E .SHOP IT 24 / 7
JDSPORTS.CO.UK

The World’s Original Rugby Brand

Ed Sheeran, 2012 D
ouble Brit A
ward W
inner wears T
he Duffer of St. G
eorge.


ONLY AT


20/21
Executive Chairman’s Statement
IntroductionFollowing the acquisition of Blacks in January 2012, the Group now comprises four divisions being Sports Fascias, Fashion Fascias, Outdoor and Distribution. Our core business is retail and our other businesses largely support the retail proposition and offer benefits to the Group from a strategic standpoint.
During the period, we have invested significantly in brands, businesses, multi-channel and other infrastructure to strengthen the platform for future development of the Group. Beyond the UK we have also expanded by acquisition in Ireland and Spain and opened further JD stores in France. In addition, the first JD store in Spain was opened in Granada on 30 March 2012. International development will be a key foundation for our future and further investment in our infrastructure overhead will be required to deliver longer term sustained profitability from this activity.
Our new centralised warehouse in Kingsway, Rochdale is a further example of the investment that we have undertaken. This will be fully operational in Summer 2012 and we anticipate that almost all stock for the core UK Sports and Fashion retail fascias will be channelled through one warehouse, improving service to retail and reducing transportation time and costs.
In April 2011, we noted that the increased proportion of gross takings represented by VAT combined with increased commodity costs and low consumer confidence would inhibit potential earnings growth in the year just ended. Therefore, taking into account these factors and the scale of the investment activity in the year, it is pleasing to report that the final group profit before tax (adding back exceptional items) of £76.0 million (2011: £81.6 million) exceeds the market expectations set at that time. Within the Group there have been positive results notably the contribution from our newly acquired Spanish retail business (Sprinter) which has contributed to a further enhancement in the overall performance from the Sports Fascias.
Group operating profit (adding back exceptional items and excluding share of results of joint venture) for the year was £76.5 million (2011: £79.9 million) and comprises a Sports Fascias profit of £74.3 million (2011: £73.3 million), a Fashion Fascias profit of £3.3 million (2011: £6.4 million), an Outdoor loss of £2.2 million (2011: £nil) and a Distribution profit of £1.1 million (2011: £0.2 million).
Net cash at the year end was £60.3 million, a decline of £25.8 million reflecting both the level of acquisition activity and an increase in capital expenditure for the fit out of the Kingsway warehouse facility. However, the Group continues to generate significant amounts of cash at the operating level.
The ongoing strength of the Group’s Balance Sheet, together with confidence that the Group’s operations are fundamentally cash generative, mean that the Board is able to propose another significant rise in the level of the total dividend to shareholders with a final proposed dividend up 10% to 21.2p (2011: 19.2p). This brings the total dividends payable for the year to 25.3p (2011: 23.0p) and means that annual dividends payable have now risen by 198% over the last four years.
Annual Report & Accounts 2012
AcquisitionsWe have been pleased with the early development of our JD business in France. This has given us the confidence to replicate this model in further territories. At the end of June 2011 we invested €12m (net of cash retained in the business) to acquire 50.1% of the Sprinter business in Spain. On acquisition, Sprinter had 47 stores primarily based in Andalucia and Levante. As with Chausport in 2009, we believe that we have acquired a business which can perform well in its own right, whilst also providing us with a management team and infrastructure to expand JD’s fascia into a new territory. We have subsequently opened our first JD store in Granada, Spain on 30 March 2012 and we anticipate further openings in 2012. In the seven months to January 2012 Sprinter contributed turnover of £51.7m and generated an operating profit of £4.7m, although this performance benefitted from not having to include the loss making opening period of the year in the post acquisition result.
In April 2011 we acquired Champion Sports (Holdings) (‘Champion’), for a nominal consideration, although we advanced €17.1 million to the business to allow it to settle all of its bank debt (at a substantial discount to the par value) save for €2.5 million of leasing finance. After closing three smaller loss making stores, Champion now has 20 stores which are all located in the Republic of Ireland giving the Group a significant market position throughout the whole of Ireland. The most significant returns from this acquisition will come when economic conditions improve in the Republic of Ireland. In the meantime, we are reviewing our strategic options with regards to store locations and fascias and are seeking to reduce the current level of certain store rents to a level which is more consistent with the revenues now being generated. We are also working to realise the savings from combining the operations of the two businesses where this is practical.
The acquisition of the trade and assets of Blacks for £20.0 million on 9 January 2012 was on the basis that the core Blacks business has similarities to JD with its premium branded offering complemented by a selection of relevant own brands. We believe that Blacks needs to concentrate on the traditional core strengths of its branded and own brand outdoor offer and re-establish its market-leading authority through a much reduced store base, a strong multi-channel offer and a more appropriate central cost structure.
The acquisition of the trade and assets of eight Cecil Gee stores, from Moss Bros Group Plc, in June 2011 for a consideration of £1.6 million provided the Group with a relatively low cost opportunity to develop a premium fashion fascia which can stock brands previously unavailable to the Group’s existing fascias. Post acquisition these stores delivered revenues of £6.0 million but made an operating loss of £0.6 million. We have subsequently closed two loss making stores and are looking at additional acquisition opportunities with the potential to provide critical mass in premium fashion.
The acquisition of the Fenchurch brand during the year combined with the agreement for exclusive licences for Fila and Diadora, are a further demonstration of our commitment to developing a unique and exclusive product offering for our retail customers.
In the Distribution segment, we have further increased our general teamwear offering through the acquisition of 80% of the global Kukri business which provides bespoke teamwear primarily to schools, colleges and universities. We have also increased our shareholding in the Focus business by 31% to 80% thereby making it a subsidiary.
Sports FasciasThe Sports Fascias are JD, Size?, Chausport, Sprinter and Champion Sports.
The Sports Fascias’ total revenue (after elimination of inter-group sales) increased by 16.3% during the period to £774.6 million (2011: £665.9 million) with gross like for like sales growth of 0.3% (2011: +5.6%) in the core UK and Ireland sports fascia stores although on a net basis, excluding VAT, this represented a decline in these stores of 1.2% (2011: +3.8%).
Gross margin achieved in the Sports Fascias decreased marginally to 50.8% (2011: 51.0%) driven by lower margins in the acquired Champion and Sprinter businesses. The margin in the like for like businesses rose to 51.5% which we consider to be a very robust performance given the increase in VAT and the impact of the rise in the cost of cotton.
Operating profit (before exceptional items) of the Sports Fascias increased by £1.0 million to £74.3 million (2011: £73.3 million) after the absorption of incremental overhead in the year primarily from duplicate operating costs at Kingsway as we started paying rent on 1st March 2011 when we took possession of the facility. There were also incremental costs in the year from investment in resource in International Retail, Brands & Licensing and Multi-Channel development. Inevitably, there is lag between the investment in resource and the generation of results but we are confident that these investments will drive returns in future years.
The contribution from France increased to £1.3 million (2011: £0.5 million). This included an overall growth in like for like sales in the Chausport stores for the year of 2.2% which is a strong result given the prior year growth of 12.5%. We remain encouraged by the performance and potential of Chausport as a fascia in its own right.
The newly acquired Sprinter business contributed an operating profit of £4.7 million for the seven months post acquisition which was ahead of our expectations.
We continue to invest in the store portfolio with 27 store openings and 21 refurbishments or conversions. These include 4 new stores in France (including a new JD in Marseille), 3 new Sprinter stores, the conversion of an existing Chausport store in Amiens to JD and the refurbishment of the Champion store in Blanchardstown. 21 Sports Fascia stores were closed in the period including 3 smaller loss making Champion stores.
Fashion FasciasThe Fashion Fascias are Bank, Scotts and Cecil Gee.
The Fashion Fascias’ total revenue (after elimination of inter-group sales) increased by 13.2% during the period to £151.6 million (2011: £133.9 million) which includes £6.0 million from the Cecil Gee stores (7 months). Gross like for like sales grew by 2.2% (2011: +1.5%) being Bank +3.9% (2011: +1.2%) and Scotts -2.9% (2011: +2.1%). On a net basis, the like for like sales grew by 0.1% (2011: -0.7%) being Bank +1.8% (2011: -0.9%) and Scotts -5.0% (2011: +0.0%). The performance of the Bank fascia was heavily influenced by significant growth in its online channel which, in a very competitive sector, is proving to be an effective method of making targeted promotions to customers.
Gross margin achieved in the Fashion Fascias has reduced from 49.0% to 48.5%. However, this includes a dilutive effect from clearing excess and fragmented stocks which we acquired with the Cecil Gee stores and excluding this acquisition the like for like margin was 48.7%. Given the VAT rate rise this is a robust performance for the segment as a whole.
22/23
Fashion Fascias (continued)The Bank fascia sells largely branded fashion to both males and females, predominantly for the teenage to mid-twenties sector. In the year the store portfolio grew from 74 stores to 80 stores, still based predominantly in the North and the Midlands. The loss of distribution of two key brands had a significant impact on the overall result with operating profit (before exceptional items) reduced by £2.1 million to £3.1 million (2011: £5.2 million). Bank needs to develop a greater level of exclusivity in its brand mix and our acquisition in the year of Fenchurch will help create that differentiated offer. The Board remains confident about the future prospects for the fascia.The Scotts fascia stores offer brand authority to older more affluent males. Two loss making stores were closed in the period with no new openings resulting in 35 stores at the year end, largely in the North and the Midlands. The operating profit (before exceptional items) in the year was £0.8 million (2011: £1.2 million). The premium fashion business (which incorporates Cecil Gee) is in the early stages of brand and fascia redevelopment.
Outdoor The acquisition of Blacks has created a new reporting segment for the Group in Outdoor Retail.
The Blacks business was in a very fractured state on acquisition. We inherited a limited and unbalanced stock position, with a particularly severe lack of stocks in many core high performing lines. The management team is investing a significant amount of time on developing relationships with the key brands and getting stocks flowing again.
In the three weeks from acquisition to year end Blacks generated revenues of £5.9 million, but delivered an operating loss (excluding exceptional items) of £2.2 million for the period, which we attribute to the lack of stock in the business and the inheritance of an excessively large and overrented store portfolio as well as a disproportionate central cost base.
Since acquisition we have closed 81 loss making Blacks stores leaving a current store base of 215 stores. Ultimately, determining the size of the long term store base will depend on store performance when set against newly negotiated rents and associated property costs. We are also evaluating the central overheads and rationalising where appropriate. We do not expect these savings to be wholly realised until Spring 2013 and so, whilst we expect a modest recovery in the second half, we now anticipate that Blacks will be earnings dilutive in the current year.
We have started the process of streamlining the business and included in exceptional items is a charge for £3.5 million for redundancies and other restructuring costs following the initial review of both the store portfolio and overhead cost base. This review process is ongoing and we would anticipate a further charge for restructuring costs in the year to January 2013.
DistributionThe Distribution businesses delivered a small operating profit of £1.1 million (2011: £0.2 million) with good performances from Focus, Kukri, Canterbury and Nicholas Deakins offset by investment at Topgrade Wholesale to build Getthelabel.com and ongoing weak performance in Kooga.
Focus has been an 80% subsidiary of the Group since a controlling interest of the former joint venture was acquired in February 2011. Focus will continue to concentrate on the design, sourcing and distribution of footwear and apparel for own brand and under license brands for both group and external customers. Included within Focus’s stable of brands going forward is Peter Werth, which we acquired in the period for £0.4 million, and Fly 53, which we acquired after the year end for £0.5 million. Focus contributed external revenues of £17.2 million and an operating profit (before exceptional items) of £1.4m in the period after the acquisition of the controlling interest.
Kukri has also been an 80% subsidiary of the Group since February 2011 with its global bespoke teamwear business contributing revenues of £16.1 million and an operating profit of £0.5 million. Kukri’s principal customers are schools, colleges and universities. Kukri also supply replica apparel and accessories for the Hong Kong Sevens rugby tournament, which is one of the biggest events in the Sevens World Series.
Canterbury’s global rugby business had an encouraging year with a strong performance, principally in New Zealand and Australia, from sales associated with the Rugby World Cup. However, after a substantial rise in the losses in the US operation (largely fashionwear) to £1.1 million (2011: £0.3 million) and a smaller rise in the losses of the Canterbury European Fashionwear business to £0.8 million (2011: £0.6 million) the total operating profit for the Canterbury Group reduced to £0.4 million (2011: £1.1 million). We have decided to close the US business and have recognised a total of £1.6m costs associated with the closure within exceptional items. In future, the brand will operate in the US through licensing partners.
The Getthelabel.com online and catalogue business within Topgrade has now been trading for over two years. Sales increased by 58% compared to the prior year which was in line with the initial business plan. However, this required substantial investment in marketing and so consequently the losses with the online business widened by £0.5 million to £1.5 million (2011: £1.0 million). This is not unusual in this phase of the development of a young multi-channel business. However, we anticipate further significant growth this year and would anticipate that the losses in the online business will at least be substantially reduced. The wholesale operation within Topgrade had strong year with operating profits increasing by £0.6 million to £0.8 million (2011: £0.2 million) with good availability of clearance packages from the key brands.

Annual Report & Accounts 2012
Group PerformanceRevenue
Total revenue increased by 19.9% in the year to £1,059.5 million (2011: £883.7 million) of which £139.3 million of sales were generated from businesses acquired in the year, principally from Sprinter (£51.7 million), Champion (£36.9 million), Focus (£17.2 million) and Kukri (£16.1 million).
Gross Margin
Total Gross Margin fell from 49.5% to 49.2%. However, excluding the impact of the acquired businesses the margin in the like for like businesses increased by 0.2% to 49.7%. The margin achieved in the acquired businesses was 45.7%.
Operating profits
Operating profit (before exceptional items) decreased by £3.4 million to £76.5 million (2011: £79.9 million) which represents a Group operating margin (before exceptional items) of 7.2% (2011: 9.0%). Operating costs increased to 42.0% of sales (2011: 40.5%) with operating expenses in the like for like businesses of 41.8% and operating expenses in the acquired businesses of 43.2%. Costs increased in the like for like businesses due to duplicate warehouse costs and investments in resource in International Retail, Brands & Licensing and Multi-Channel development.
Following an increase in the exceptional items to £9.7 million (2011: £4.3 million), Group operating profit decreased from £75.6 million to £66.8 million.
The exceptional items (excluding share of exceptional items in joint venture) comprise:
2012 2011
£m £m
Loss on disposal of fixed assets 1.2 1.5
Impairment of fixed assets in loss making stores 1.5 -
Onerous store lease provision (0.2) 1.8
Total property related exceptional costs 2.5 3.3
Reorganisation of warehouse operations (1) 3.0 -
Closure of Canterbury North America LLC (2) 1.6 -
Blacks restructuring (3) 3.5 -
Total reorganisation and restructuring costs 8.1 -
Impairment of intangible assets (4) 2.7 -
Gain following acquisition of Focus Brands (5) (3.6) -
Impairment of investment property - 1.0
Total other exceptional (credits) / charges (0.9) 1.0
Total exceptional charge 9.7 4.3
(1) Relates to the reorganisation of the current warehouse operations consisting of the provision for onerous property leases and redundancy costs.
(2) Relates to redundancies and other one off costs incurred in the closure of Canterbury North America. The charge includes £0.1m for the impairment of fixed assets.
(3) Relates to redundancy costs in stores, warehouse and central operations.
(4) The impairment of intangible assets relates to Kooga goodwill and brand name (£1.9 million) and Cecil Gee fascia name (£0.8 million).
(5) The gain on the disposal of the Focus joint venture arose from the remeasurement to fair value of the Group’s previously held investment in Focus Brands Limited.
Working capital and financingThe level of acquisition activity through the year together with the capital expenditure incurred on fitting out the Kingsway warehouse means that year end net cash decreased by £25.8 million to £60.3 million (2011: £86.1 million) and the revolving credit facility has been used through most of the year. As a consequence, the Group had a net financing charge of £0.4 million compared to net financing income in the prior year of £0.2 million.
The Group has a £75 million committed syndicated bank facility secured until 12 October 2015. This facility consists of a £60 million revolving credit facility with a margin of 1.25% over LIBOR together with a £15 million working capital facility.
Gross capital expenditure (excluding disposal costs) increased by £12.7 million to £45.7 million (2011: £33.0 million). This increase was a result of spend in the year of £19.4 million (2011: £3.9 million) on fitting out Kingsway. This investment is now largely complete and testing of the sortation equipment has been ongoing for several weeks. We will start taking inbound deliveries into Kingsway from 23 April 2012 and anticipate that the full migration of activity will be complete by late June.
The investment in the retail fascias during the year decreased by £5.3 million to £20.1 million (2011: £25.4 million). This decrease was primarily focused in the core JD fascia where we opened 19 stores (2011: 21 stores) and completed 11 major refurbishments (2011: 14 refurbishments). There was also a reduction in the number of new stores in Bank to 8 stores (2011: 13 stores). Even though we will not be incurring significant expenditure on the Kingsway warehouse, we anticipate that capital expenditure in the year to January 2013 will increase further to approximately £60 million as we look to accelerate the programme of JD store openings and refurbishments in France and Spain. In addition, we will also start a programme to replace the core ERP systems in the retail businesses. This programme of works will take approximately 3 years to complete.
Working capital remains well controlled with suppliers continuing to be paid to agreed terms and settlement discounts taken whenever due.

24/25
Store Portfolio Although slightly lower than the prior year, we have still made a further significant investment in the store portfolio during the year, with expenditure on both new stores and refurbishments of existing space.
During the year, store numbers in the Sports and Fashion fascias moved as follows:
Store Portfolio
(No. Stores) JD & Size JD France Chausport Champion Sprinter Sport
Start of year 351 3 73 - - 427
New stores 19 1 4 - 3 27
Acquisitions - - - 23 47 70
Transfers - 1 (1) - - -
Closures (15) - (2) (3) (1) (21)
Close of year 355 5 74 20 49 503
(000 Sq Ft) JD & Size JD France Chausport Champion Sprinter Sport
Start of year 1,131 5 79 - - 1,215
New stores 66 3 6 - 32 107
Acquisitions - - - 98 598 696
Transfers - 1 (1) - - -
Closures (24) - (2) (6) (27) (59)
Remeasures 10 - - - - 10
Close of year 1,183 9 82 92 603 1,969
Fashion Fascias
(No. Stores) Bank Scotts Cecil Gee Fashion
Start of year 74 37 - 111
New stores 8 - - 8
Acquisitions - - 8 8
Closures (2) (2) (2) (6)
Close of year 80 35 6 121
(000 Sq Ft) Bank Scotts Cecil Gee Fashion
Start of year 210 76 - 286
New stores 32 - - 32
Acquisitions - - 22 22
Closures (4) (4) (6) (14)
Close of year 238 72 16 326

Annual Report & Accounts 2012
Dividends and Earnings per ShareThe Board proposes paying a final dividend of 21.20p (2011: 19.20p) bringing the total dividend payable for the year to 25.30p (2011: 23.00p) per ordinary share. The proposed final dividend will be paid on 30 July 2012 to all shareholders on the register at 4 May 2012. The final dividend has been increased by 10% with total dividends payable for the year increased by 10%. The dividend has therefore increased by 198% in 4 years.
The adjusted earnings per ordinary share before exceptional items were 105.89p (2011: 116.86p).
The basic earnings per ordinary share were 96.27p (2011: 114.84p).
EmployeesIn difficult trading conditions we are more reliant than ever on the skills and energy of our employees around the world to drive performance and the whole Board would like to thank them for their commitment. We remain totally committed to their training and career development and the ongoing development of the Group internationally should enhance their prospects.
Current Trading and OutlookWhilst we expect some improvement in consumer confidence from the forthcoming international sporting events, we remain cautious for well reported reasons. Trading in the early part of the current financial year has been satisfactory in the core UK and Ireland fascias with net like for like sales for the 9 weeks to 31 March 2012 of +1.2% (Sports Fascias +1.0%, Fashion Fascias +2.3%). Margins remain under pressure as consumers continue to be offer driven.
It is clear that the recently acquired Blacks business will be dilutive to earnings this year whilst we resolve the challenges across the business, particularly with regards to stock and property. We envisage that the majority of the earnings dilution will come in the first half of the year.
The Group is exceptionally well positioned with its retail proposition, financial resources and management experience to take advantage of any opportunities both in the UK and internationally. Whilst the Board recognises that current expansion activity is likely to impact returns in the short term, it remains confident that the Group is being positioned to deliver longer term earnings growth and increasing shareholder returns.
A further update will be made in our Interim Management Statement no later than 15 June 2012.
Peter CowgillExecutive Chairman12 April 2012

26/27
Financial and Risk Review
IntroductionDespite a loss of £2.2 million from the newly acquired Blacks business, Group profit before tax (adding back exceptional items) exceeded consensus market expectations at £76.0million (2011: £81.6 million) but nevertheless final group profit before tax after exceptionals decreased by £11.2 million to £67.4 million in the year primarily from an increase of £5.4m in the charge for exceptionals which included: • Recognition of a provision of £3.5m for the future onerous
property costs at the Group’s existing warehouses pending the full utilisation of the new facility at Kingsway in Rochdale during 2012
• Impairment of the goodwill and brand name pertaining to the acquisitions of Kooga Rugby Limited and fascia name of the Cecil Gee business
• Costs for the closure of the loss making Canterbury business in North America
• Redundancy costs of £3.5m in stores, warehouse and central operations for the recently acquired Blacks business
Taxation The effective rate of tax on profit has decreased by 2.1% to 26.8% primarily due to a decrease in the standard rate of corporation tax.
Excluding both exceptional items and prior year adjustments, the effective core tax rate has decreased from 28.9% to 27.7%. This core effective tax rate continues to be above the standard rate due to the depreciation of non-current assets and the professional fees on corporate transactions, both of which do not qualify for any form of tax relief.
Earnings per ShareThe basic earnings per share has decreased by 16% from 114.84p to 96.27p. However, the Directors consider the adjusted earnings per share to be a more appropriate measure of the Group’s earnings performance since it excludes the post-tax effect of exceptional items (other than the loss on disposal of non-current assets). The adjusted earnings per share decreased by 9.4% from 116.86p to 105.89p.
DividendsA final cash dividend of 21.20p per share is proposed, which if approved, would represent an increase of 10% on the final dividend from the prior year. Added to the interim dividend of 4.10p per share, this takes the full year dividend to 25.30p, which is an increase of 10% on the prior year. The full year dividend has therefore grown by 198% in 4 years. The dividend is covered 3.8 times by basic earnings per share and 4.2 times by the adjusted earnings per share.

Annual Report & Accounts 2012
Net Cash and Treasury FacilitiesThe year end net cash position has decreased by £25.8 million to £60.3 million. Gross capital expenditure excluding disposal costs increased in the year by £12.7 million to £45.7 million including £19.4 million on fit out of the Kingsway warehouse. A further £41.4 million was spent on the acquisition of businesses in the year including repayment of legacy indebtedness.
In spite of the heavy level of capital expenditure and cost of acquisitions, the Group generates significant amounts of cash in its operations enabling the delivery of a further substantial enhancement in dividends to shareholders.
The working capital cycle means that the Group does use the £60m revolving credit facility and £15m working capital facility during the year although we continue to look for opportunities to reduce seasonal demand at the traditional quarter days by the negotiation of monthly rents as a standard term on all new leases.
The existing facilities have been used to fund both the increased capital expenditure and investment activity in the year with no requirement for other Group facilities to be put in place. The Board believes that the existing facilities are appropriate to the Group as they can be used to fund investments in the Group’s existing businesses and enable quick decision making on significant future investments whilst providing flexibility over the short term seasonal peaks in the working capital cycle.
Interest rate hedging has not been put in place on the current facility. The Directors continue to be mindful of the potential volatility in base rates, but at present do not consider a long term interest rate hedge to be necessary given the inherent short term nature of both the revolving credit facility and working capital facility. This position is reviewed regularly, along with the level of facility required.
The net cash position has continued to benefit from improved merchandising controls over stocks in the retail fascias. Trade creditors continue to be paid to terms to maximise settlement discounts with the period end creditor days being 39 (2011: 33).
Foreign Exchange ExposuresThe Group’s principal foreign exchange exposure continues to be on the sourcing of own brand merchandise from either the Far East or Indian Sub-Continent which usually has to be paid for in US Dollars. A buying rate is set at the start of the buying season (typically six to nine months before product is delivered to stores). At this point, the Group aims to protect the anticipated US Dollar requirement at rates at, or above, the buying rate through appropriate foreign exchange instruments.
Following the Group’s recent acquisition of the trade and assets of the Blacks business, the Group’s forecast requirement for US Dollars in the period to January 2013 is now $107 million. Cover is in place for 2012 for $103 million meaning that the Group is currently exposed on exchange rate movements for $4 million of the current year’s estimated requirement.
The Group is also exposed to the movement in the rate of the Euro from the sale of its UK sourced stocks to its subsidiaries in Europe. However, the Group has a natural hedge on this exposure as the Euros received for that stock are then reinvested back in those European subsidiaries to fund the development of both new stores and refurbishments.
Risk FactorsAny business undertaking will involve some risk with many risk factors common to any business no matter what segment it operates in. The Directors acknowledge however that certain risks and uncertainties are more specific to the Group and the markets in which its businesses operate. The principal risk factors are assessed below:
Retail SpecificBrands
The retail fascias sell a mixture of third party and own brand product. They are heavily dependent on the products and the brands themselves being desirable to the customer. Therefore, the Group needs all of its third party and own brands, including brands licensed exclusively to it, to maintain their design and marketing prominence to sustain that desirability. Further, the Group is also subject to the distribution policies operated by some third party brands.
Ultimately, the Group seeks to ensure it is not overly reliant on a small number of brands by offering a stable of brands which is constantly evolving. This includes actively seeking additional brands which it can either own or license exclusively.
Retail property factors
The retail landscape has seen significant changes in recent years with a number of new developments opened and a high volume of retail units becoming vacant. The Group can be exposed where it has committed itself to a long lease in a location which, as a result of a more recent retail development, is no longer as attractive to the customer so suffers from reduced footfall. Wherever possible, the Group will seek either to take out new leases for a period not exceeding 10 years or to negotiate lease breaks, thereby limiting this potential exposure and affording the Group increased flexibility to respond to such changes.
When the Group determines that a store performance is unsatisfactory it approaches the landlords to agree a surrender of the lease. Where this is not possible, the Group would seek to assign the lease or sublet it to another retailer. This may necessitate the payment of an incentive to the other retailer. The Group is mindful of current economic factors and the adverse impact on the potential for disposal from the high volume of vacant units already available as a consequence of a number of retailers going out of business in recent years.
However, assigning the lease or finding a sub-tenant is not without risk because if the other retailer fails then the liability to pay the rent usually reverts to the head lessee. The Group monitors the financial condition of the assignees closely for evidence that the possibility of a store returning is more than remote and makes a provision for the return of stores if this risk becomes probable. The Board reviews the list of assigned leases regularly and is comfortable that appropriate provisions have been made where there is a probable risk of the store returning to the Group under privity of contract and that there are no further stores where there is a possible risk of the store returning.

28/29
Retail Specific (continued)Warehouse operations
Following the acquisition of First Sport in 2002, warehousing operations have been split across two main sites. The Group has now taken possession of the new warehouse in Rochdale and whilst the consolidation of activity and increased automation within the picking process will bring significant operational and cost benefits, there is an increased risk from both equipment and system failure, together with the inherent risk of having all the stock in one location. The Group is working with its insurers on a robust Business Continuity Plan which will come into effect once the new warehouse becomes operational in mid 2012.
The Group has also invested a significant amount of time on developing a robust change management plan to reduce the execution risk associated with the transition from the current warehouses to the new facility and thereby ensure that there is no interruption to supply to stores. The warehouse at Peterlee will be handed back to the landlord on 30 June 2012 and the Board are confident that sufficient contingency has been built into the timing of the transition plan to ensure that this deadline will be met.
Seasonality
The Group’s core retail business is highly seasonal. Historically, the Group’s most important trading period in terms of sales, profitability and cash flow has been the Christmas season. Lower than expected performance in this period may have an adverse impact on results for the full year, which may cause excess inventories that are difficult to liquidate.
IT
The Group relies on its IT systems and networks and those of the banks and the credit card companies to service its retail customers all year round.
The principal legacy enterprise system is ideally suited to the operations of the business, but it has always been heavily reliant on a very limited number of key development staff. This risk has been mitigated by improving documentation of the system and increasing the development team. However, the Board are mindful that it is difficult to recruit people with the relevant technical knowledge of the language that the legacy system is written in and so is actively considering a number of third party enterprise systems.
The Board has decided to start a programme to replace the legacy enterprise system. However, whilst a move to a third party system would reduce the risks in the current system there would be significant execution risk during the migration work which will take a number of years to complete. Further, the introduction of a third party system will bring additional costs both in terms of the initial development and ongoing support.
Any long term interruption in the availability of the core enterprise system would have a significant impact on the retail businesses. The Group manages the hardware operations element of this risk by the principal IT servers being housed in a third party location which has a mirror back up available should the primary servers or links fail.
Loss of business caused by terrorism, riots or natural disaster
The Group has insurance policies in place to cover the risk of stock loss, property expenditure and loss of trade in the event of a terrorism, riots or natural disaster. The standard cover for loss on trade is one year but some stores have extended periods of cover where a rebuild would take in excess of one year.
Distribution SpecificCredit risk
The distribution businesses could have a credit risk if credit evaluations were not performed on all customers requiring credit over a certain amount. If the credit report presents an adverse picture the management of the business concerned take a commercial decision as to whether credit should be given. All customers are monitored closely with outstanding amounts chased rigorously and future supplies stopped where necessary. Provisions are made for customer debts where there is a probable risk of non-payment.
All BusinessesEconomic factors
As with other retailers and distributors into retail businesses, the demand for the Group’s products is influenced by a number of economic factors, notably interest rates, the availability of consumer credit, employment levels and ultimately, disposable incomes. This is particularly relevant at the current time, where there are significant cutbacks within national and local government and so many consumers have had to cut back on non-essential spending. The Group seeks to manage this risk by offering a highly desirable and competitively priced product range, which is differentiated to that of the Group’s competitors.
Indirect taxation
The Board are mindful of the fact that Governments across Europe are seeking to raise their tax yields to deal with their nation’s long term deficit. One way that a number of governments have done this is by increasing the rate of Value Added Tax. In regard to the Group’s current locations, there have been rises in the last 18 months in the UK, Republic of Ireland and Spain. The Board is conscious of potential future rises in Value Added Tax.
When Value Added Tax is raised part way through season then the Group’s businesses cannot pass the rise on as the price of the product is already known by the consumers in the relevant retail market. It is not always possible to pass on rises in new season product as to do so could make the product unattractive to the consumer and the Group’s retail businesses are mindful of the potential for ‘ticket shock’ where they are introduced to price points that they have not been used to seeing in a store. Wherever possible the Group’s businesses look to work with their respective suppliers on ensuring that the cost of the product is maintained at a level that makes it possible to achieve an appropriate margin. We are also investing additional time and effort in ensuring that markdown activity is reduced through strong and focused merchandising.
In the Group’s Distribution businesses the Board are mindful of the fact that they are acting as supplier and so face reverse pressure from their Retail customers.

Annual Report & Accounts 2012
Reliance on non-UK manufacturers
The majority of both third party branded product and the Group’s own branded product is sourced outside of the UK. The Group is therefore exposed to the risks associated with international trade and transport as well as different legal systems and operating standards. Whilst the Group can manage the risk in the supply chain on its own and licensed products, it has little control over the supply chain within the third party brands. As such, the Group is exposed to events which may not be under its control.
The Group works with its suppliers to ensure that the products being sourced satisfy increasingly stringent laws and regulations governing issues of health and safety, packaging and labelling and other social and environmental factors.
Costs
During the year the Group faced increased costs in both cotton, fuel and other energy with the cost of fuel in particular increasing further in the current year.
The price of cotton is monitored constantly by the Imports team with orders placed wherever possible at an opportune time and at fixed prices. A number of measures have been introduced in recent years to reduce the impact of fuel cost rises:
• Appropriate software used to manage the distribution of product to stores so that vehicles are fuller and fewer vehicle journeys made
• The Group’s distribution facilities have been designed to accommodate double decker trailers
• Annual fixed price contracts agreed on electricity
Intellectual property
The Group’s trademarks and other intellectual property rights are critical in maintaining the value of the Group’s own brands. Ensuring that the Group’s businesses can use these brands exclusively is critical in providing a point of differentiation to our customers. The Group therefore works with third party organisations to ensure that the Group’s intellectual property is registered in all relevant territories. The Group also actively works to prevent counterfeit product being passed off as legitimate.
Personnel
The success of the Group is partly dependent upon the continued service of its key management personnel and upon its ability to attract, motivate and retain suitably qualified employees. To help achieve this continued service, the Group has competitive reward packages for all of its staff.
More specifically for the retail businesses, the Group also has a long established and substantial training function which seeks to develop training for all levels of retail employees and thereby increase morale and improve staff retention. This then ensures that knowledge of the Group’s differentiated product offering is not lost, thereby enhancing customer service.
Treasury
Whilst the Group does not have any borrowings from its core syndicated facility currently, any borrowings that will be made are at variable rates linked to LIBOR. Further details of the Group’s interest rate risk are provided in note 23 on page 87.
The Group operates internationally and is exposed to foreign exchange risk arising from various currency exposures but primarily with respect to the US dollar. As described earlier, this risk is managed through the use of appropriate foreign currency contracts. Further information is also provided in note 23 on page 87.
Acquisitions in new geographical markets
The Group has expanded its international presence significantly recently. Wherever possible, this expansion is undertaken by way of acquisition of a local business where there is a strong local management team who are familiar with the market and country that they operate in. We look to incentivise the management team through an appropriate reward structure which compensates them at an appropriate level for the achievement of demanding yet realistic performance targets.
Brian Small Group Finance Director 12 April 2012

30/31
Property and Stores Review
UK Our retail property strategy is to have modern, fashionable and attractively presented stores located in prime locations with strong footfall. We maintain our belief that the vibrant presentation of our stores increases the attractiveness and desirability of our product and provides our stores with a real point of difference. Consequently, we continue to invest heavily in the store portfolio both in terms of new stores and major refurbishments of existing space. 27 new stores opened in the period (19 Sports Fascia stores and 8 Fashion Fascia stores) with 12 stores refurbished (11 Sports Fascia stores and 1 Fashion Fascia store). These refurbishments included 7 locations where we upsized by taking a neighbouring unit. We have also converted a former JD store in Leicester to the Size? fascia.
The 19 new Sports Fascia stores included 15 stores in new locations (including 2 Size? stores). Included within the new stores are stores at Birmingham and Liverpool airports. We are pleased with the development of our airports business which we expect to see some benefit from the Olympics. The new stores in the year also included a store in the new Stratford City development which we will use as the focal point for our Olympic product offering. 15 Sports Fascia stores were closed in the period. These closures included a number of secondary towns where there is simply insufficient footfall. We are mindful of retail occupancy levels in other locations and the negative impact this can have on footfall. At the end of the period we had a total of 347 stores which included 21 Size? stores.
The 8 new Fashion Fascias stores were all new Bank stores with 2 of the stores being replacements of existing space. When we acquired Bank in December 2007, the average store size was 2,150 sqft which we always believed was too small to present a full product offer to both a male and female consumer. Consequently, we have looked for a larger retail footprint in new stores with 8 stores opened in the year all having in excess of 2,500 sqft of retail space. The openings in the year included Bank’s first store in Northern Ireland and we are looking to follow this up in the new financial year with the first store in the Republic of Ireland. No new Scotts stores were opened in the year although we did refurbish one store. The results from this have been encouraging to date. 2 Bank stores and 2 Scotts stores closed in the period.
We have approximately 35 stores with lease expiries in the current financial year and any decision to extend an individual lease will need to take into account the prospects for retail occupancy in the town concerned, consumer footfall and the terms on offer.

Annual Report & Accounts 2012
Republic of Ireland Our acquisition of the Champion Sports business provided us with an extra 23 stores in the Republic of Ireland. 3 smaller and loss making stores have subsequently been closed so at the end of the period we had a total of 28 stores (20 Champion, 7 JD and 1 Size). We believe the Group now has a satisfactory footprint in the market to exploit, particularly when economic conditions improve.
FranceWe acquired the Chausport business in France in May 2009 and late last year we opened our first JD stores in France in new locations in Evry and Lyon and by the conversion of the former Chausport store in the centre of Lille. The performance of this conversion has been pleasing with a sales growth in excess of 50%. This positive performance has given us the confidence to trial another conversion. Accordingly, in Autumn 2011 we converted the Chausport store in Amiens to a JD and, to date, this has seen a similar sales uplift. In addition, we have also opened a JD in France’s second city, Marseille, which means that at the end of the period we had a total of 5 JD stores in France.
At this stage, all of the JD stores are learning exercises which help us understand the French market more and assist in planning the future store and product strategy for France. We will continue this learning exercise in the new financial year. We are looking to accelerate our openings of new locations for the JD fascia in France during the new financial year with up to 8 stores targeted to open including a number in malls around Paris. To date we have found it a little difficult finding suitable sites for JD in France as there is not the same availability of retail space as there is in the UK. We have therefore invested time at Board level in enhancing our relationships with the key landlords. We believe this has led to us being offered sites in some of the prime centres which previously we would not have been able to access.
It is still our belief that the JD fascia is best suited to the major metropolitan areas and Chausport is more suited to the smaller regional towns and centres. Therefore, given Chausport’s historical concentration in towns in Northern France, then there is a growth opportunity for Chausport in its own right. We have opened 4 Chausport stores in the period and refurbished a further 7 stores. As with the Bank fascia in the UK, we believe that Chausport need to increase the size of their stores if they are to present a comprehensive product offer to the consumers. The average size of the stores opened in the period was c2,000 sqft compared to the Chausport average of c1,000 sqft. Investment in new stores and refurbishments for Chausport will continue at a similar level in the current year. 2 smaller Chausport stores were closed in the period.
SpainSprinter had 47 stores on acquisition, primarily located in the provinces of Andalucia and Levante with a minimal presence elsewhere in Spain. Sprinter has traditionally been located in out of town retail units either in individual units or as part of a larger retail park. Unlike JD, Sprinter has historically sold an element of technical sport equipment including running machines and bikes. Consequently, these stores need a greater amount of space and, on acquisition, the average size of a Sprinter store was c12,700 sqft.
In many locations, Sprinter has been the exclusive provider of technical sportswear and equipment. Sprinter’s limited presence outside of its heartland gives us confidence that there are many locations in Spain where Sprinter could target store openings. Indeed, of the 3 Sprinter stores that have opened post acquisition, one was in Galicia and one was in Extremadura and the performance of these stores since opening has reinforced our views on the potential of this business.
As with France, we have looked to develop strong relationships with the key landlords and, indeed, in many cases these key landlords have centres across much of Europe. We have therefore identified a number of suitable locations for JD in Spain with the first store having opened in Granada on 30th March 2012.
We anticipate further openings through 2012 and, as with France, we will target these openings in the key metropolitan areas.
OutdoorThe Outdoor portfolio has been reduced since acquisition from 296 stores to 215 stores but all leases are in the process of renegotiation and there will be some further reductions in store numbers where more attractive new terms cannot be achieved. We have sought to avoid having two Outdoor stores in close proximity and to eliminate significant loss makers in the closure programme.

32/33
Store Portfolio The store portfolio for the Group at 28 January 2012 and 29 January 2011 can be analysed as follows:
Sports Fascias
Country Fascia 2012 2011 2012 2011
UK JD 325 324 1,129 1,083
Size 21 18 32 26
Other 1 1 1 1
Total 347 343 1,162 1,110
Republic of Ireland JD 7 7 20 20
Size 1 1 1 1
Champion 20 - 92 -
Total 28 8 113 21
France JD 5 3 9 5
Chausport 74 73 82 79
Total 79 76 91 84
Spain Sprinter 49 - 603 -
Sport Fascias Total 503 427 1,969 1,215
Fashion Fascias
2012 2011 2012 2011
UK Bank 80 74 238 210
Scotts 35 37 72 76
Cecil Gee 6 - 16 -
Fashion Fascias Total 121 111 326 286
Outdoor
2012 2011 2012 2011
UK Blacks* 295 - 763 -
Outdoor Total 295 763 -
Group Total 919 538 3,058 1,501
*A further 80 stores have been closed in the period since 28 January 2012.
No. Stores
No. Stores
No. Stores
‘000 sq ft
‘000 sq ft
‘000 sq ft

Annual Report & Accounts 2012
Corporate and Social Responsibility
The Group recognises that it has a responsibility to ensure its business is carried out in a way that ensures high standards of environmental and human behaviour. With the help and co-operation of all employees, the Group endeavours to comply with all relevant laws in order to meet that duty and responsibility wherever it operates. The major contributions of the Group in this respect are detailed below.
RETAIl BUSINESSES
EmploymentThe Group is a large equal opportunities employer and a large training organisation, with the Group’s retail businesses providing direct employment and career development to thousands of people, both in the UK and wherever we operate. The Group employs large numbers of school leavers and university graduates and participates regularly in work experience schemes with schools and colleges.
Training
The Group recognises that training for all levels of staff is vital to performance and it also provides a mechanism for increasing morale and improving staff retention. This ensures that knowledge of the Group’s differentiated product offering is not lost, thereby enhancing customer service.
Retail staff at all levels in the Group’s core UK and Ireland retail fascias are encouraged to seek development and progression ultimately up to management level, with training provided by the Group’s long established and substantial training function. Training is given in four main areas:
No. of courses in
a yearlength of
course
No. of people on
each course
New Management induction 19 5 days 20Training academy
3 12 weeks 20Junior Management Development 60 4 hours 10Various Management Development 22 1 day 10
Chausport and Sprinter operate their own training programmes. However, the managers and assistant managers of the JD stores in France and Spain have their own bespoke training programme organised by the UK training function which is designed to ensure they operate their stores to standards consistent with JD in the UK and Republic of Ireland.
Equal opportunities
The Group is committed to promoting policies which are designed to ensure that employees and those who seek to work for the Group are treated equally regardless of sex, marital status, creed, colour, race or ethnic origin.
The Group gives full and fair consideration to applications for employment by people who are disabled, to continue whenever possible the development of staff who become disabled and to provide equal opportunities for the career development of disabled employees. It is also Group policy to provide opportunities for the large number of people seeking flexible or part time hours.
Communication
The number and geographic dispersion of the Group’s operating locations make it difficult, but essential, to communicate effectively with employees.
Communication with retail staff is primarily achieved through the management in the regional and area operational structures. In addition, formal communications informing all employees of the financial performance of the Group are issued on a regular basis by the Group’s Human Resources Department in the form of ‘Team Briefs’.

34/35
Health and Safety We are committed to ensuring a safe environment for all of our employees and customers and actively encourage a positive health and safety culture throughout the organisation. The Group recognises its responsibility for health and safety and there is accountability from the Group Board and throughout the various management levels of the business to each employee and this is cascaded down.
Occupation of a new distribution centre has lead to the strengthening of our health and safety team ensuring safe procedures are established and managed from the outset in what is a very large and complex operation.
The team has continued to develop a comprehensive induction and training programme which is regarded as an essential part of our commitment to health and safety. Targeted safety awareness campaigns are run regularly throughout the year and a monthly newsletter ensures that the safety message is communicated effectively throughout the Group.
Our Health and Safety Committee, which is chaired by the Group Finance Director, meets regularly each year allowing every employee the opportunity to raise any safety concerns through their nominated representative.
To ensure that stores are designed and built with safety in mind, our health and safety team has input into all our new and refitted stores from the initial design through to opening. We conduct our own audit programme to ensure the highest safety standards during the construction phase of all our shop-fit projects.
We set targets to enable us to measure our performance. During the current year we have seen positive improvements in the completion of internal health and safety inspections and risk assessments, as a result of countrywide presentations to the retail team, to increase awareness of our responsibilities.
Our health and safety team regularly review the management processes we have in place, with the aim of maintaining our high standards, whilst adapting to business and legislative changes.
EnvironmentalThe Group recognises the importance of protecting our environment for future generations and is committed to carrying out its activities with due consideration for the environmental impact of its operations particularly with regards to:
• Ensuring efficient use of energy and other materials
• Minimising waste by recycling wherever possible
• Ensuring compliance with relevant legislation and codes of best practice
Energy
It is the Group’s aim to give customers an enjoyable retail experience with goods presented in an environment that is both well lit and has a pleasant ambient temperature. However, the Group accepts that all the businesses within it must be responsible in their energy usage and associated carbon emissions. This policy applies to the acquired businesses where we work closely with the local management after acquisition to identify gaps and implement group strategies.
The Group maintains a Carbon Management Programme (‘CMP’) which is sponsored by the Group Finance Director and is reviewed regularly. Our objectives are to:
• Work with our energy suppliers to ensure that bills reflect actual usage
• Understand the drivers and timing of usage by continued investment in energy ‘smart’ meters. This has been achieved in over 350 of the Group’s sites with further rollout planned. Combined with the stores where accurate and timely usage data is already received from mandatory half hourly meters, this means that in excess of 92% of the UK and Republic of Ireland electricity consumption and 81% of gas consumption is automatically measured every 30 minutes. In addition to accurate billing for these sites, analysis of the data has also shown that usage in non-trading periods can be reduced. This is being done through additional training and investment in small scale building management systems where appropriate
• Enhance staff awareness through training at store level, thereby ensuring that our retail staff understand they have a key role in the CMP. This training is expanding across our acquired businesses as part of the Group’s standard training programme
• Pursue a multi-disciplined approach to the CMP to ensure all business activities are aware of their impact on energy consumption
Under the current rules of the statutory Carbon Reduction Commitment Energy Efficiency scheme (‘CRC’), the Group’s submission to the UK Environment Agency is aggregated with that of Pentland Group Plc who are the Group’s ultimate holding company (see note 35). The Group continues to work closely with Pentland Group Plc on ensuring an efficient process with regards to the emissions trading scheme which was introduced in April 2010, as part of the CRC. Pentland Group Plc was placed in the upper half of the first Participant League Table compiled by the UK Environment Agency.
Annual Report & Accounts 2012
Environmental (continued)The Group is committed to using and subsequently reporting
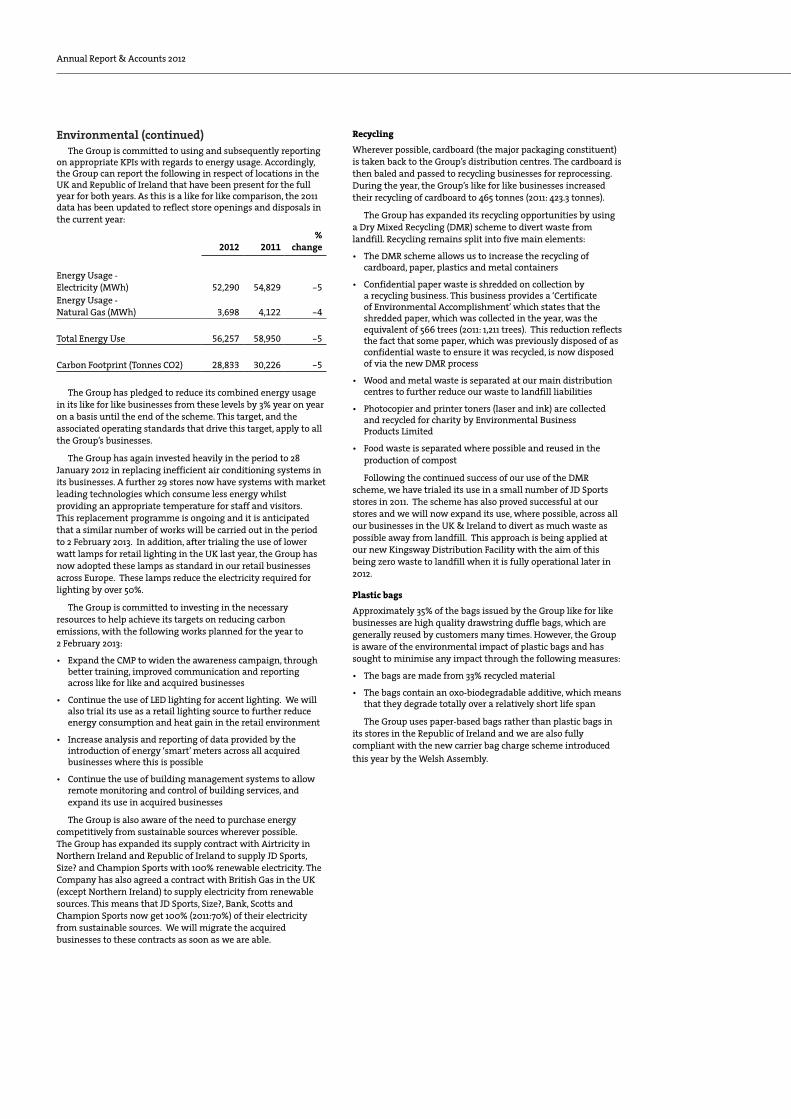
on appropriate KPIs with regards to energy usage. Accordingly, the Group can report the following in respect of locations in the UK and Republic of Ireland that have been present for the full year for both years. As this is a like for like comparison, the 2011 data has been updated to reflect store openings and disposals in the current year:
2012 2011%
change
Energy Usage - Electricity (MWh) 52,290 54,829 -5Energy Usage - Natural Gas (MWh) 3,698 4,122 -4
Total Energy Use 56,257 58,950 -5
Carbon Footprint (Tonnes CO2) 28,833 30,226 -5
The Group has pledged to reduce its combined energy usage in its like for like businesses from these levels by 3% year on year on a basis until the end of the scheme. This target, and the associated operating standards that drive this target, apply to all the Group’s businesses.
The Group has again invested heavily in the period to 28 January 2012 in replacing inefficient air conditioning systems in its businesses. A further 29 stores now have systems with market leading technologies which consume less energy whilst providing an appropriate temperature for staff and visitors. This replacement programme is ongoing and it is anticipated that a similar number of works will be carried out in the period to 2 February 2013. In addition, after trialing the use of lower watt lamps for retail lighting in the UK last year, the Group has now adopted these lamps as standard in our retail businesses across Europe. These lamps reduce the electricity required for lighting by over 50%.
The Group is committed to investing in the necessary resources to help achieve its targets on reducing carbon emissions, with the following works planned for the year to 2 February 2013:
• Expand the CMP to widen the awareness campaign, through better training, improved communication and reporting across like for like and acquired businesses
• Continue the use of LED lighting for accent lighting. We will also trial its use as a retail lighting source to further reduce energy consumption and heat gain in the retail environment
• Increase analysis and reporting of data provided by the introduction of energy ‘smart’ meters across all acquired businesses where this is possible
• Continue the use of building management systems to allow remote monitoring and control of building services, and expand its use in acquired businesses
The Group is also aware of the need to purchase energy competitively from sustainable sources wherever possible. The Group has expanded its supply contract with Airtricity in Northern Ireland and Republic of Ireland to supply JD Sports, Size? and Champion Sports with 100% renewable electricity. The Company has also agreed a contract with British Gas in the UK (except Northern Ireland) to supply electricity from renewable sources. This means that JD Sports, Size?, Bank, Scotts and Champion Sports now get 100% (2011:70%) of their electricity from sustainable sources. We will migrate the acquired businesses to these contracts as soon as we are able.
Recycling
Wherever possible, cardboard (the major packaging constituent) is taken back to the Group’s distribution centres. The cardboard is then baled and passed to recycling businesses for reprocessing. During the year, the Group’s like for like businesses increased their recycling of cardboard to 465 tonnes (2011: 423.3 tonnes).
The Group has expanded its recycling opportunities by using a Dry Mixed Recycling (DMR) scheme to divert waste from landfill. Recycling remains split into five main elements:
• The DMR scheme allows us to increase the recycling of cardboard, paper, plastics and metal containers
• Confidential paper waste is shredded on collection by a recycling business. This business provides a ‘Certificate of Environmental Accomplishment’ which states that the shredded paper, which was collected in the year, was the equivalent of 566 trees (2011: 1,211 trees). This reduction reflects the fact that some paper, which was previously disposed of as confidential waste to ensure it was recycled, is now disposed of via the new DMR process
• Wood and metal waste is separated at our main distribution centres to further reduce our waste to landfill liabilities
• Photocopier and printer toners (laser and ink) are collected and recycled for charity by Environmental Business Products Limited
• Food waste is separated where possible and reused in the production of compost
Following the continued success of our use of the DMR scheme, we have trialed its use in a small number of JD Sports stores in 2011. The scheme has also proved successful at our stores and we will now expand its use, where possible, across all our businesses in the UK & Ireland to divert as much waste as possible away from landfill. This approach is being applied at our new Kingsway Distribution Facility with the aim of this being zero waste to landfill when it is fully operational later in 2012.
Plastic bags
Approximately 35% of the bags issued by the Group like for like businesses are high quality drawstring duffle bags, which are generally reused by customers many times. However, the Group is aware of the environmental impact of plastic bags and has sought to minimise any impact through the following measures:
• The bags are made from 33% recycled material
• The bags contain an oxo-biodegradable additive, which means that they degrade totally over a relatively short life span
The Group uses paper-based bags rather than plastic bags in its stores in the Republic of Ireland and we are also fully compliant with the new carrier bag charge scheme introduced this year by the Welsh Assembly.

36/37
Retail and Distribution BusinessesEthical Sourcing
The Group seeks to provide its customers with high quality and value merchandise from suppliers who can demonstrate compliance with internationally accepted core labour and ethical standards throughout their supply chain.
These standards are based upon the provisions of the Ethical Trading Initiative (‘ETI’) Base Code and specifically cover areas such as wages, working hours, health and safety and the right to freedom of association.
The Group requires all of its suppliers, both existing and new, to formally commit to implementing the provisions of the ETI Base Code throughout their supply chains. Prior to any orders being placed, all new suppliers are required to complete the Group’s risk assessment form to indicate their degree of compliance to the ETI Base Code. All existing suppliers are also required to conduct this assessment on an annual basis. These forms are reviewed by the Group’s Buying team and any areas of concern with regard to potential non-compliance are investigated when visiting the factories concerned.
Also during the period to 28 January 2012 the Group has engaged the services of Sercura to complete an audit and compliance programme of the Group’s current suppliers to the ETI Base Code standard. Sercura is a global quality and compliance solutions provider which performs factory audits. In the period to 2 February 2013, 70% of the supplier base will be visited and audited with the results reported to the Group Sourcing and Supply Chain Manager.
Due to the diverse nature and scope of the supply chain, it is not always possible to visit all of the factories directly. Where instances of non-compliance are identified from the risk assessment forms and the supplier cannot be visited, they are required to confirm what corrective actions are being undertaken to resolve the issue. These actions will be verified directly by the Group’s Buying team as soon as practically possible on a future visit.
All suppliers are contractually obliged to comply with the Group’s Conditions of Supply which includes a specific policy on ‘Employment Standards for Suppliers’.
Community EngagementThe Group seeks to be involved in the community where it can make an appropriate contribution from its resources and skills base. Examples of this include:
• JD Sports Fashion Plc is pleased to report a three year commitment to The Christie Hospital to help raise £500,000 for the teenage cancer unit. The fundraising begins with Team JD running the BUPA Great Manchester Run in May 2012
• JD Sports Fashion Plc is sponsoring 60 children at the Udavum Karangal orphanage in Coimbatore, India. In the year to January 2012 donations of £5,000 were made to the orphanage as well as donations of t shirts, water bottles, footballs and caps
• Donation to the Christchurch Earthquake appeal by Canterbury of New Zealand Limited (NZ) and Canterbury Limited (UK) totalling £18,000.
• Donations by Champion Sports to Temple Street Children’s University Hospital of £14,000 to fund the purchase of medical equipment, fund research and develop new treatment facilities
• Donations by JD Sports Fashion Plc to The Marina Dalglish Appeal of £4,000 to improve cancer treatment facilities in Liverpool
• A charity 'Barn Fest' was held by Kukri GB Limited in September 2011 which raised £1,800 for The Good Life Orphanage, Derian House Hospice, Clatterbridge Cancer Centre and Alder Hey Imagine Appeal
Policy on Acquired BusinessesThe Group has acquired a number of retail and distribution businesses in recent years, and acknowledges that the high standards which the core retail businesses have historically operated to, need to be replicated in the wider global Group.
After making an acquisition, staff from the core retail businesses, with the relevant knowledge and experience, work with the management teams at these acquired businesses. The initial focus is to help the local management analyse their position against these standards with action plans developed as necessary.
Our experience to date is that the businesses which we have acquired generally operate to standards similar to those of existing Group companies and so little action has been necessary to bring them up to the required level.
Standards of the existing Group companies, along with any future acquisitions, will continue to be monitored, with action taken to maintain Group standards as required.

Annual Report & Accounts 2012
The Board Peter CowgillExecutive Chairman and Chairman of the Nomination Committee aged 59
Peter was appointed Executive Chairman in March 2004. He was previously Finance Director of the Group until his resignation in June 2001. Since then he has been a partner in Cowgill Holloway Chartered Accountants. He is a Non-Executive Director of a number of private companies and Non-Executive Chairman of United Carpets Plc and MBL Group Plc.
Barry BownChief Executive Officer aged 50
Barry joined the Board in 2000 and has been with JD Sports Fashion Plc since 1984. He held the positions of Head of Retail, Head of Buying and Merchandising and Chief Operating Officer prior to his appointment as Chief Executive Officer in 2000.
Brian SmallGroup Finance Director aged 55
Brian was appointed Finance Director in January 2004. Immediately prior to his appointment he was Operations Finance Director at Intercare Group Plc and has also been Finance Director of a number of other companies. He qualified as an accountant with Price Waterhouse in 1981.
Colin ArcherNon-Executive Director, Chairman of the Audit and Remuneration Committees and member of the Nomination Committee aged 70
Colin was appointed a Non-Executive Director in November 2001. He has over 40 years experience in the banking and financial arenas, having previously been an Assistant Corporate Director with Barclays Bank Plc. He is also a member of the Chartered Institute of Bankers.
Chris BirdNon-Executive Director, member of the Audit, Remuneration and Nomination Committees aged 49
Chris was appointed to the Board in May 2003. He is a marketing specialist with his own public relations and marketing agency. He is also Chief Executive of Sports Tours International Limited. Chris has over 20 years media experience in newspapers, commercial radio and sport.
Andrew leslieNon-Executive Director aged 65
Andrew was appointed to the Board in May 2010. He has over 40 years of experience in the retail, footwear and apparel sectors. He was an Executive Board Director of Pentland Brands Plc, from which he retired in 2008. During his career, Andrew also held a number of senior positions with British Shoe Corporation, The Burton Group Plc and Timpson Shoes Limited.

38/39
Directors’ Report
The Directors present their annual report and the audited financial statements of JD Sports Fashion Plc (the ‘Company’) and its subsidiaries (together referred to as the ‘Group’) for the 52 week period ended 28 January 2012.
Principal Activities and Business ReviewThe principal activity of the Group is the retail and distribution of sport and athletic inspired fashion, footwear, apparel and accessories.
In accordance with the Companies Act 2006, a review of the business providing a comprehensive analysis of the main trends and factors likely to affect the development, performance and position of the business, including environmental, employee and social and community issues, together with the Group’s Key Performance Indicators and a description of the principal risks and uncertainties facing the business is detailed in the following sections of this Annual Report:
• Summary of Key Performance Indicators (page 2)
• Chairman’s Statement (pages 21 to 26)
• Financial and Risk Review (pages 27 to 30)
• Property and Stores Review (page 31 to 33)
• Corporate and Social Responsibility (pages 34 to 37)
All the information set out in those sections is incorporated by reference into, and is deemed to form part of, this report.
The Corporate Governance Report (pages 42 to 45) and the Directors’ Remuneration Report (pages 46 to 50) are incorporated by reference into, and are deemed to form part of, this report.
Business Strategy and ObjectivesThe Group aims to sustain its position as the UK’s leading retailer of branded sportswear and fashionwear. This will be achieved through a strong differentiated product offering combining branded and own brand product presented in modern, fashionable and attractively presented stores located in prime locations with strong footfall.
The Group also intends to further enhance its UK and international retail presence through organic growth and acquisitions, where suitable opportunities arise, as well as by investing in its current retail portfolio.
Our ultimate objective is to deliver longer term earnings growth and increasing shareholder returns.
In working towards our objectives, we aim to act in a responsible manner in our dealings with our key stakeholders including our employees, customers and suppliers.
Share CapitalAs at 28 January 2012 the Company’s authorised share capital was £3,107,500 divided into 62,150,000 ordinary shares of 5p each. As at 28 January 2012 the Company’s issued share capital was £2,433,083 comprising 48,661,658 ordinary shares of 5p each.
Shareholder and Voting Rights All members who hold ordinary shares are entitled to attend and vote at the Company’s Annual General Meeting. On a show of hands at a general meeting, every member present in person or by proxy shall have one vote and, on a poll, every member present in person or by proxy shall have one vote for every ordinary share they hold. Subject to relevant statutory provisions and the Company’s Articles of Association, holders of ordinary shares are entitled to a dividend where declared or paid out of profits available for such purposes.

Annual Report & Accounts 2012
Restrictions on Transfer of SharesThe restrictions on the transfer of shares in the Company are as follows:
• The Board may, in absolute discretion, refuse to register any transfer of shares which are not fully paid up (but not so as to prevent dealings in listed shares from taking place), or which is in favour of more than four persons jointly or which is in relation to more than one class of share
• Certain restrictions may, from time to time, be imposed by laws and regulations (for example, insider trading laws)
• Restrictions apply pursuant to the Listing Rules of the Financial Services Authority whereby Directors and certain of the Group’s employees require prior approval to deal in the Company’s shares
The Company is not aware of any arrangement between its shareholders that may result in restrictions on the transfer of shares and/or voting rights.
Authority to Purchase Own SharesA resolution was passed at the 2011 Annual General Meeting giving Directors authority to buy back ordinary shares up to a maximum of 10% of the total issued ordinary share capital of the Company. As at the date of this report no shares have been purchased under this authority.
Directors’ InterestsThe interests of the Directors who held office at 28 January 2012 and their connected persons in the Company’s ordinary shares are shown below:
Ordinary shares of 5p each29 January
201130 January
2010
P Cowgill 410,263 410,263B Bown 5,676 5,676B Small 23,950 21,750C Archer 22,621 19,121
462,510 456,810
There has been no change in the interests of the Directors or their connected persons between 28 January 2012 and the date of this report.
Substantial Interests in Share CapitalAs at 28 January 2012 the Company has been advised of the following significant holdings of voting rights in its ordinary share capital pursuant to the Disclosure and Transparency Rules of the Financial Services Authority ('DTRs'):
Number of ordinary
shares/voting rights held
% of ordinary share capital
Pentland Group plc 27,963,722 57.47 Sports World International Ltd 5,775,255 11.87Aberforth Partners LLP* 4,351,898 8.94
*Aberforth Partners LLP have a further non-voting holding of 1,953,900 ordinary shares.
Since 28 January 2012 and the date of this report the Company has been notified that the number of ordinary shares/voting rights held by Aberforth Partners LLP is 4,270,898 (being 8.78% of the Company's ordinary share capital) and that the non-voting holding of Aberforth Partners LLP is 1,974,900.
Save as above, the Company has not been notified of any change in interests pursuant to the DTRs between 28 January 2012 and the date of this report.
DirectorsThe names and roles of the current Directors together with brief biographical details are given on page 38. The Directors are responsible for the management of the business of the Company and, subject to law and the Company’s Articles of Association ('Articles'), the Directors may exercise all of the powers of the Company and may delegate their power and discretion to committees.
The number of directors at any one point in time shall not be less than two.
The Articles give the Directors power to appoint and replace directors. Any director so appointed shall hold office only until the dissolution of the first AGM of the Company following appointment unless they are re-elected during such meeting.
The Articles require that, at each AGM of the Company, any director who was elected or last re-elected at or before the AGM held in the third calendar year before the then current calendar year must retire by rotation and such further Directors must retire by rotation so that in total not less than one third of the Directors retire by rotation each year. A retiring director is eligible for re-election.
However in accordance with the UK Corporate Governance Code the Board has determined that all Directors will stand for re-election at the 2012 AGM.
Amendment of the Company’s Articles of AssociationThe Company’s Articles of Association may only be amended by a special resolution at a general meeting of shareholders.
Change of Control – Significant AgreementsIn the event of a change of control of the Company, the Company and the lenders of the £75 million bank syndicated facility shall enter into an agreement to determine how to continue the facility. If no agreement is reached within 20 business days of the date of change in control, the lenders may, by giving not less than 10 business days notice to the Company, cancel the facility and declare all outstanding loans, together with accrued interest and all other amounts accrued immediately due and payable.
Contractual Arrangements Essential to the Business of the Group The Board considers that continuing supply from Nike and Adidas, being the main suppliers of third party branded sporting products, to the Group’s core sports fashion retail operation is essential to the business of the Group.
40/41
EmployeesThe Group communicates with its employees through team briefs and via the Company’s intranet and notice boards. Views of employees are sought on matters of common concern. Priority is given to ensuring that employees are aware of all significant matters affecting the Group’s performance and of significant organisational changes.
The Group’s employee remuneration strategy is set out in the Remuneration Report on pages 46 to 50.
The Group is committed to promote equal opportunities in employment regardless of employees’ or potential employees’ sex, marital status, creed, colour, race, ethnic origin or disability. Recruitment, promotion and the availability of training are based on the suitability of any applicant for the job and full and fair consideration is always given to disabled persons in such circumstances.
Should an employee become disabled during his or her employment by the Group, every effort is made to continue employment and training within their existing capacity wherever practicable, or failing that, in some alternative suitable capacity.
DonationsDuring the financial year ended 28 January 2012 the Group did not make any political donations (2011: £nil) and made charitable donations of £61,000 (2011: £39,000). See page 37 in the Corporate and Social Responsibility report for the breakdown of which charities these donations were predominantly made to.
Creditors Payment PolicyFor all trade creditors, it is the Group policy to:
• A gree terms of payment at the start of business with the supplier
• Ensure that suppliers are aware of the terms of payment
• Pay in accordance with its contractual and other legal obligations
The average number of days taken to pay trade creditors by the Group at the period end was 39 (2011: 33).
The Group does not follow any code or statement on payment practice.
AuditorKPMG Audit Plc have indicated their willingness to continue in office as auditors of the Company. A resolution proposing their re-appointment will be proposed to shareholders at the forthcoming AGM.
Disclosure of Information to the AuditorEach person who is a Director at the date of approval of this report confirms that:
• So far as he is aware, there is no relevant audit information of which the Company’s auditor is unaware; and
• Each Director has taken all the steps that he ought to have taken as a Director to make himself aware of any relevant audit information and to establish that the Company’s auditor is aware of that information.
Going ConcernAfter making enquiries, the Directors have a reasonable expectation that the Company, and the Group as a whole, has adequate resources to continue in operational existence for the foreseeable future. For this reason, the financial statements have been prepared on a going concern basis
Annual General Meeting (AGM)Notice of the Company’s AGM to be held at 12 noon on 20 June 2012 at Edinburgh House, Hollinsbrook Way, Pilsworth, Bury, Lancashire, BL9 8RR incorporating explanatory notes of the resolutions to be proposed at the meeting is enclosed, together with a form of proxy.
By order of the Board
Jane Brisley Company Secretary 12 April 2012

Annual Report & Accounts 2012
Corporate Governance Report
UK Corporate Governance CodeThe Board is committed to high standards of corporate governance. This report sets out how the Company has applied the main principles set out in the UK Corporate Governance Code published by the Financial Reporting Council in June 2010 (‘the Code’) and the extent to which the Company has complied with the provisions of the Code.
The BoardThe Board consists of six directors: an Executive Chairman, two other Executive Directors and three Non-Executive Directors. The name, position and brief profile of each Director is set out on page 38.
Composition of the Board is kept under review and changes are made when appropriate and in the best interests of the Group. The Board considers that its composition during the year had the necessary balance of Executive and Non-Executive Directors providing the desired blend of skills, experience and judgement appropriate for the needs of the Group’s business and overall effectiveness of the Board. None of the Directors have served for more than three years without having been re-elected by shareholders. Colin Archer is the senior independent Non-Executive Director.
All three Non-Executive Directors are considered to be independent by the Board. Colin Archer has served on the Board for more than ten years, having been appointed on 6 November 2001. Chris Bird was appointed to the Board on 1 May 2003 and so will have served for more than nine years as at the date of the Company’s forthcoming AGM. The Board considers both Mr Archer and Mr Bird to be independent for the purposes of the Code as, in the Board’s view, they continue to be independent in character and judgment notwithstanding their length of service. Andrew Leslie was appointed to the Board in May 2010 and is considered to be independent by the Board for the purposes of the Code. Mr Leslie was formerly an executive director of Pentland, the Company’s largest shareholder. Mr Leslie does not represent the interests of Pentland on the Board and retired from Pentland in 2008. The Board believes that all three Non-Executive Directors have provided ample guidance to the Board and perform an effective role in challenging the Executive Directors when appropriate.
The Board considers that all the Directors are able to devote sufficient time to their duties as Directors of the Company. The brief biographical detail on page 38 includes details of the Chairman’s other directorships of listed companies. The Board is satisfied that these appointments do not conflict with the Chairman’s ability to carry out his role effectively for the Group.
Under the Company’s Articles of Association, all Directors are required to retire and offer themselves for re-election every three years. However, in accordance with the Code, the Board has agreed that all Directors will retire and offer themselves for re-election at the 2012 AGM.

42/43
Board operation
The Board is responsible for the direction, management and performance of the Company. The Board held nine scheduled meetings during the year under review and ad hoc meetings were held between scheduled meetings where required. Directors’ attendance at scheduled Board and Committee meetings is set out in the table beyond. The Board is responsible for providing effective leadership and promoting the success of the Group.
The Board has a formal schedule of matters reserved specifically to it for decisions which include major strategic matters, approval of financial statements, acquisitions and disposals and significant capital projects.
The Board delegates certain powers to a number of committees.
Board papers are circulated to Directors prior to Board meetings which include up-to-date financial information, reports from the Executive Directors and papers on major issues for consideration by the Board. The Board has a formal procedure for Directors to obtain independent professional advice.
All Board members have full access to the Company Secretary who is a fully admitted solicitor and attends all Board and Committee meetings. The Company Secretary is responsible for advising the Board on Corporate Governance matters. The appointment and removal of the Company Secretary is a matter for the Board as a whole to determine.
All newly appointed Directors receive a tailored induction when they join the Board. Relevant training can be arranged as and when deemed appropriate.
The Board has established a formal process for the annual evaluation of the performance of the Board, its Committees and individual Directors. This has been conducted through the completion by each Director of a questionnaire prepared by the Company Secretary which encourages the Directors to give his opinions on Board and Committee procedures, operation and effectiveness as well as any other matter they wish to raise. The feedback from the evaluation process has been presented to the Board by the Executive Chairman. A separate questionnaire was completed by the Directors (other than the Executive Chairman) in relation to the performance of the Executive Chairman with the Senior Independent Director discussing the resulting feedback with the other Non-Executive Directors, taking into account the views of the other Executive Directors (excluding the Executive Chairman). The Board considered an internal evaluation exercise to be appropriate but will consider on an annual basis the value and appropriateness of an externally facilitated evaluation exercise.
The division of responsibilities between the Executive Chairman and Chief Executive Officer is in writing and has been agreed by the Board. The Chairman is responsible for overall Board leadership, corporate strategy and communication with major shareholders. The Chief Executive Officer’s responsibilities are focused on the development of the Group’s core retail operations.
The Company, through its majority shareholder Pentland Group Plc, maintains appropriate Directors and Officers liability insurance.
Attendance at Board and Committee meetingsBoard
MeetingsRemuneration
CommitteeAudit
CommitteeNomination
Committee
Number of meetingsin year 9 3 3 0
P Cowgill 9 1 2 -B Bown 8 - - -B Small 8 1 2 -C Archer 9 3 3 -C Bird 9 3 3 -A Leslie 9 - - -
Peter Cowgill and Brian Small attended the Remuneration Committee meetings and the Audit Committee meetings at the invitation of the members of those committees.
Conflicts of interest
The Company’s Articles of Association permit the Board to consider and, if it sees fit, to authorise situations where a Director has an interest that conflicts, or possibly could conflict, with the interests of the Company. The Board considers that the procedures it has in place for reporting and considering conflicts of interest are effective.
Board CommitteesThere are three principal Board Committees to which the Board has delegated certain of its responsibilities. The terms of reference for all three Committees are available for inspection on request and are available on the Company’s corporate website www.jdplc.com.
Audit Committee
The Audit Committee currently comprises two independent Non-Executive Directors, Colin Archer (Chairman) and Chris Bird. The Committee’s principal duties are to review draft annual and interim financial statements prior to being submitted to the Board, reviewing the effectiveness of the Group’s system of internal control and risk management and to review the performance and cost effectiveness of the external auditor.
The Audit Committee met three times in the year with the external auditor attending each meeting. Details of attendance at Audit Committee meetings are set out above.
In the year the Audit Committee’s activities included:
• Reviewing the Group’s draft financial statements and interim results statement prior to Board approval and reviewing the external auditor’s detailed reports thereon including internal controls
• Reviewing regularly the potential impact on the Group’s financial statements of certain matters such as impairments of fixed asset values and proposed International Accounting Standards
• Reviewing the external auditor’s plan for the audit of the Group’s financial statements, key risks of misstatement in the financial statements, confirmations of auditor independence, audit fee and terms of engagement of the auditor
• Reviewing the independence of the Group’s external auditor.

Annual Report & Accounts 2012
Board Committees (continued)Audit Committee (continued)
The Audit Committee is also responsible for ensuring that appropriate arrangements are in place for employees to be able to raise matters of possible impropriety in confidence. These arrangements were reviewed during the year and deemed by the Committee to be appropriate.
A breakdown of the audit and non-audit related fees is set out in note 3 to the Consolidated Financial Statements on page 65. Non-audit work was comprised mainly of tax and project work in relation to the Company’s acquisitions and was undertaken by the external auditor due to their knowledge and understanding of the Group’s business and in the interests of efficiency. The Company has instructed other firms to provide non-audit services from time to time in prior years and the Audit Committee will keep the level of non-audit work performed by the auditor under review. The Audit Committee is satisfied that the level and scope of non-audit services performed by the external auditor does not impact their independence.
The Audit Committee keeps under review the relationship between the Group and external auditor and, having considered the external auditor’s performance during their period in office, recommends their reappointment.
Remuneration Committee
The Remuneration Committee currently comprises two independent Non-Executive Directors, Colin Archer (Chairman) and Chris Bird.
The Committee’s principal duties are to determine overall Group remuneration policy, remuneration packages for Executive Directors and senior management, the terms of Executive Director service contracts, the terms of any performance-related schemes operated by the Group and awards thereunder.
The Committee met twice during the year. Details of attendance at Remuneration Committee meetings are set out in the table on page 43.
Further details about Directors’ remuneration are set out in the Directors’ Remuneration Report on pages 46 to 50.
Nomination Committee
The Nomination Committee currently comprises the Executive Chairman and two independent Non-Executive Directors.
The Committee’s principal duties are to consider the size, structure and composition of the Board, ensure appropriate succession plans are in place for the Board and senior management and, where necessary, consider new appointments to the Board and senior management. From time to time the full Board performs some of the duties of the Nomination Committee.
The Nomination Committee did not meet during the year. No appointments to the Board were made during the year. The Board as a whole considered recent developments on the issue of diversity on boards in general. The Board confirms that diversity will be considered, including gender diversity, when changes to the Board’s composition are considered. The Board’s overriding aim is to make appointments based on merit gainst objective criteria.
Internal ControlThere is an ongoing process for identifying, evaluating and managing the significant risks faced by the Group. This process has been in place for the year under review and accords with the Turnbull guidance.
The Board, in conjunction with the Audit Committee, has full responsibility for the Group’s system of internal controls and monitoring their effectiveness. However, such a system is designed to manage rather than eliminate the risk of failure to achieve business objectives, and can only provide reasonable and not absolute assurance against material misstatement. The Board has established a well-defined organisation structure with clear operating procedures, lines of responsibility, delegated authority to executive management and a comprehensive financial reporting process.
Key features of the Group’s system of internal control and risk management are:
• Identification and monitoring of the business risks facing the Group, with major risks identified and reported to the Audit Committee and the Board
• Detailed appraisal and authorisation procedures for capital investment
• Prompt preparation of comprehensive monthly management accounts providing relevant, reliable and up-to-date information. These allow for comparison with budget and previous year’s results. Significant variances from approved budgets are investigated as appropriate
• Preparation of comprehensive annual profit and cash flow budgets allowing management to monitor business activities and major risks and the progress towards financial objectives in the short and medium term
• Monitoring of store procedures and the reporting and investigation of suspected fraudulent activities
• Reconciliation and checking of all cash and stock balances and investigation of any material differences
In addition, the Audit Committee receives comprehensive reports from the external auditor in relation to the financial statements and the Group’s system of internal controls.
The Group has a formal whistle blowing policy in place enabling employees to raise concerns in relation to the Group’s activities on a confidential basis.
The Board has reviewed the effectiveness of the Group’s system of internal controls and believes this to be effective. In establishing the system of internal control the Directors have regard to the materiality of relevant risks, the likelihood of a loss being incurred and costs of control. It follows, therefore, that the system of internal control can only provide a reasonable, and not absolute, assurance against the risk of material misstatement or loss.
The integration of the recently acquired businesses into the Group’s system of internal controls is on-going.
During the year under review the Company appointed a suitably qualified and experienced internal auditor who will report to the Audit Committee on a regular basis. In addition, the Company has an experienced Loss Control team whose main focus is on security and minimization of unauthorized losses in the business. The Loss Control Director reports to the Board on a quarterly basis.
The responsibility for internal control procedures within joint ventures rests with the senior management of those operations. The Company monitors its investment in such ventures and exerts influence through Board representation

44/45
Shareholder RelationsThe Executive Directors maintain an active dialogue with the Company’s major shareholders to enhance understanding of their respective objectives. The Executive Chairman provides feedback to the Board on issues raised by major shareholders. This is supplemented by twice yearly formal feedback to the Board on meetings between management, analysts and investors which seeks to convey the financial market’s perception of the Group.
The Senior Independent Non-Executive Director is available to shareholders if they have concerns which have not been resolved through dialogue with the Executive Directors, or for which such contact is inappropriate.
External brokers’ reports on the Group are circulated to the Board for consideration. In addition, the Non-Executive Directors attend results presentations and analyst and institutional investor meetings whenever possible.
The AGM is attended by all Directors, and shareholders are invited to ask questions during the meeting and to meet with Directors after the formal proceedings have ended. At the AGM the level of proxies lodged on each resolution is announced to the meeting after the show of hands for that resolution.
Compliance with the CodeThe Directors consider that during the year under review and to the date of this report, the Company complied with the Code except in relation to the following:
• Code provisions C.3.1 and D.2.1 – during the year under review the Company did not comply with Code provisions C.3.1 and D.2.1, which require there to be three independent non-executive directors on the Audit Committee and Remuneration Committee respectively. Each such Committee was comprised of two independent non-executive directors. The Board will keep Committee composition under review.
This report was approved by the Board and signed on its behalf by:
Jane Brisley Company Secretary 12 April 2012
Annual Report & Accounts 2012
Directors’ Remuneration Report
This Report sets out the remuneration policy operated by the Group in respect of the Executive Directors, together with disclosures on Directors’ remuneration required by The Large and Medium-sized Companies and Groups (Accounts and Reports) Regulations 2008 (‘the Regulations’). It has been prepared in accordance with the Companies Act 2006. The content of the Report under the section headed ‘Audited Information’ has been audited by the Group’s auditor, KPMG Audit Plc.
The Board have reviewed the Group’s compliance with the UK Corporate Governance Code (June 2010) (‘the Code’) on remuneration related matters. It is the opinion of the Board that the Group complied with all remuneration related aspects of the Code during the year except for Code provision D.2.1 relating to composition of the Remuneration Committee. Please refer to the section ‘Compliance with the Code’ on page 45 of thisAnnual Report.
The Report will be subject to an advisory shareholder vote at the Annual General Meeting (‘AGM’) on 20 June 2012.
UNAUDITED INFORMATION
Remuneration CommitteeThe Remuneration Committee (the ‘Committee’) comprises two independent Non-Executive Directors, being Colin Archer and Chris Bird. Colin Archer is Chairman of the Committee.
The Committee assists the Board in determining the Group’s policy on Executive Directors’ remuneration and determines the specific remuneration packages for senior executives, including the Executive Directors, on behalf of the Board. Peter Cowgill, the Executive Chairman, Barry Bown, the Chief Executive Officer, and Brian Small, the Group Finance Director have assisted the Committee when requested with regards to matters concerning key executives below Board level.
The Committee can obtain independent advice at the Company’s expense where they consider it appropriate and in order to perform their duties.
The Committee is formally constituted with written Terms of Reference, which are available on the Company’s corporate website www.jdplc.com. The Committee is willing to engage with any of the major shareholders or other representative groups where appropriate concerning remuneration matters.
The Committee is mindful of the Company’s social, ethical and environmental responsibilities and is satisfied that the current remuneration arrangements and policies do not encourage irresponsible behaviour.
The Committee has met twice during the year under review with each member attending all the meetings. Details of attendance at the Committee meetings are set out on page 43.
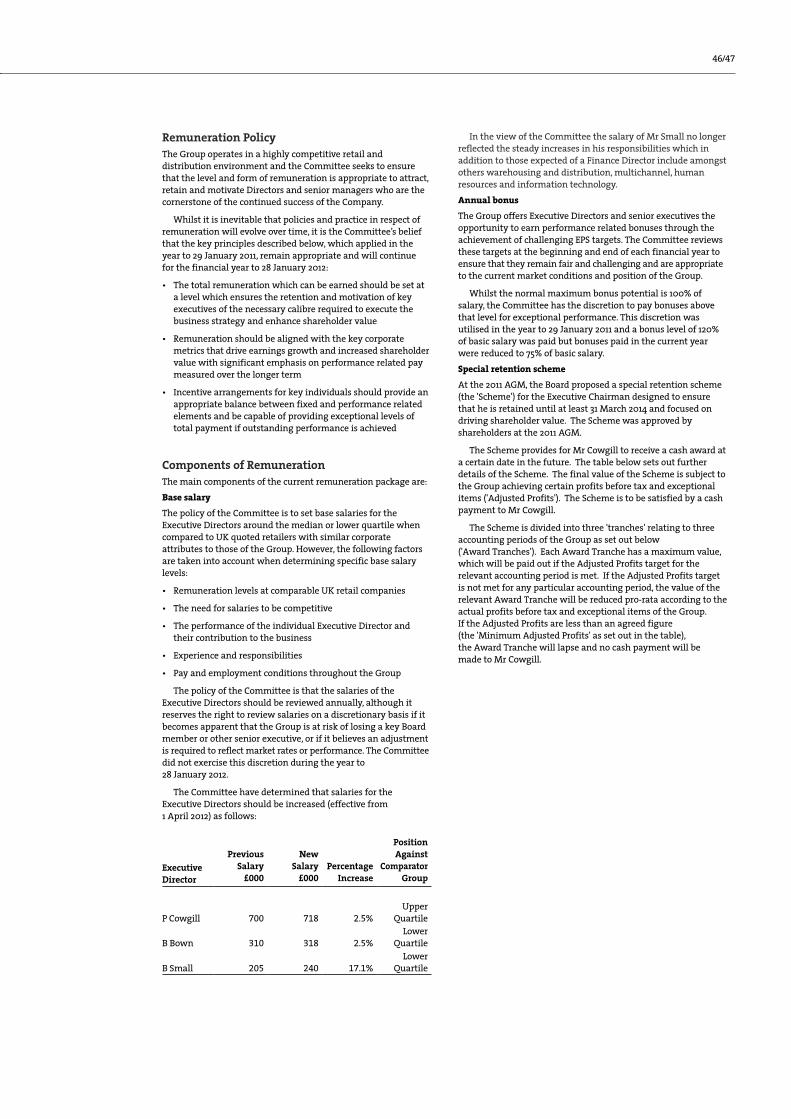
46/47
Remuneration PolicyThe Group operates in a highly competitive retail and distribution environment and the Committee seeks to ensure that the level and form of remuneration is appropriate to attract, retain and motivate Directors and senior managers who are the cornerstone of the continued success of the Company.
Whilst it is inevitable that policies and practice in respect of remuneration will evolve over time, it is the Committee’s belief that the key principles described below, which applied in the year to 29 January 2011, remain appropriate and will continue for the financial year to 28 January 2012:
• The total remuneration which can be earned should be set at a level which ensures the retention and motivation of key executives of the necessary calibre required to execute the business strategy and enhance shareholder value
• Remuneration should be aligned with the key corporate metrics that drive earnings growth and increased shareholder value with significant emphasis on performance related pay measured over the longer term
• Incentive arrangements for key individuals should provide an appropriate balance between fixed and performance related elements and be capable of providing exceptional levels of total payment if outstanding performance is achieved
Components of RemunerationThe main components of the current remuneration package are:
Base salary
The policy of the Committee is to set base salaries for the Executive Directors around the median or lower quartile when compared to UK quoted retailers with similar corporate attributes to those of the Group. However, the following factors are taken into account when determining specific base salary levels:
• Remuneration levels at comparable UK retail companies
• The need for salaries to be competitive
• The performance of the individual Executive Director and their contribution to the business
• Experience and responsibilities
• Pay and employment conditions throughout the Group
The policy of the Committee is that the salaries of the Executive Directors should be reviewed annually, although it reserves the right to review salaries on a discretionary basis if it becomes apparent that the Group is at risk of losing a key Board member or other senior executive, or if it believes an adjustment is required to reflect market rates or performance. The Committee did not exercise this discretion during the year to 28 January 2012.
The Committee have determined that salaries for the Executive Directors should be increased (effective from 1 April 2012) as follows:
Executive Director
Previous Salary
£000
New Salary
£000Percentage
Increase
Position Against
ComparatorGroup
P Cowgill 700 718 2.5%Upper
Quartile
B Bown 310 318 2.5%Lower
Quartile
B Small 205 240 17.1%Lower
Quartile
In the view of the Committee the salary of Mr Small no longer reflected the steady increases in his responsibilities which in addition to those expected of a Finance Director include amongst others warehousing and distribution, multichannel, human resources and information technology.
Annual bonus
The Group offers Executive Directors and senior executives the opportunity to earn performance related bonuses through the achievement of challenging EPS targets. The Committee reviews these targets at the beginning and end of each financial year to ensure that they remain fair and challenging and are appropriate to the current market conditions and position of the Group.
Whilst the normal maximum bonus potential is 100% of salary, the Committee has the discretion to pay bonuses above that level for exceptional performance. This discretion was utilised in the year to 29 January 2011 and a bonus level of 120% of basic salary was paid but bonuses paid in the current year were reduced to 75% of basic salary.
Special retention scheme
At the 2011 AGM, the Board proposed a special retention scheme (the 'Scheme') for the Executive Chairman designed to ensure that he is retained until at least 31 March 2014 and focused on driving shareholder value. The Scheme was approved by shareholders at the 2011 AGM.
The Scheme provides for Mr Cowgill to receive a cash award at a certain date in the future. The table below sets out further details of the Scheme. The final value of the Scheme is subject to the Group achieving certain profits before tax and exceptional items ('Adjusted Profits'). The Scheme is to be satisfied by a cash payment to Mr Cowgill.
The Scheme is divided into three 'tranches' relating to three accounting periods of the Group as set out below ('Award Tranches'). Each Award Tranche has a maximum value, which will be paid out if the Adjusted Profits target for the relevant accounting period is met. If the Adjusted Profits target is not met for any particular accounting period, the value of the relevant Award Tranche will be reduced pro-rata according to the actual profits before tax and exceptional items of the Group. If the Adjusted Profits are less than an agreed figure (the 'Minimum Adjusted Profits' as set out in the table), the Award Tranche will lapse and no cash payment will be made to Mr Cowgill.

Annual Report & Accounts 2012
As an alternative, the Company may choose to determine the amount due under any Award Tranche by reference to the performance of the Company against such comparator group or other performance condition(s) or criteria as the Committee, in its discretion, considers appropriate.
Although the amount of cash to be awarded will be calculated at three different times, the cash payments will not be made to Mr Cowgill until after the Committee has met to confirm the final amount due to Mr Cowgill under the Scheme, which will be after the announcement of the Company's results for the accounting period ending 1 February 2014. If Mr Cowgill leaves his employment with the Company before the start of any accounting period, he will not be entitled to any part of the award for that accounting period or any subsequent accounting period. If Mr Cowgill leaves his employment with the Company after the start of any accounting period in circumstances where he is a 'good leaver', he will be entitled to a pro-rata amount of the Award Tranche for the accounting period in which he leaves and full payment in respect of any accounting period which has finished. The Committee may, at its discretion, decide to allow the Award Tranche to vest in full in respect of the accounting period in which Mr Cowgill leaves his employment with the Company. In either case, the cash payment will only be made to Mr Cowgill on the usual date, unless the Committee decides otherwise. 'Good leaver' grounds include ill-health or retirement and are further defined in the Scheme agreement.
On a takeover or change of control (or similar sale of the Company), Mr Cowgill will be entitled to a pro rata amount of the Award Tranche for the accounting period in which the change of control event occurs and full payment of the Award Tranche in respect of any accounting period which has finished. Again, the Committee may, at its discretion, decide to allow the Award Tranche to vest in full in respect of the accounting period current at the time of such takeover or change of control (or similar sale of the Company). The payment will be made on the usual date unless the Committee decides otherwise.
None of the benefits which may be received under the Scheme will be pensionable.
The Adjusted Profits target for the 52 weeks to 28 January 2012 was met and so the first Award Tranche of £900,000 as set out in the above table has vested and has been recognised in the Consolidated Income Statement for the 52 weeks to 28 January 2012.
Cash based long term incentive planIn 2010, the Committee proposed the introduction of a cash based Long Term Incentive Plan (‘2010 LTIP’) in order to:
• Provide the Committee with the necessary mechanism with which to retain the Executive Directors who are critical to driving shareholder value
• Provide the Executive Directors with the opportunity to earn competitive rewards which was previously severely restricted by the absence of any long term incentive plan
• Align the Executive Directors’ interests more closely with those of the shareholders
• Focus the Executive Directors on sustaining and improving the long-term financial performance of the Company and reward them appropriately for doing so
• Ensure a more appropriate balance in the Executive Directors’ compensation between fixed and performance related elements
The 2010 LTIP was subsequently approved by shareholders at the Annual General Meeting held on 9 June 2010 and consists of one award that will pay out in cash after three years, subject to continued employment and meeting performance targets which would drive the creation of shareholder value. The Committee gave considerable thought as to whether the awards should pay out in cash or shares and decided that given the current shareholder structure and the lack of a large free float, the delivery mechanism should be in cash although all payments would be non-pensionable.
The following table outlines the structure of the 2010 LTIP:
Performance To2 February 2013
£000
Amount Payable:
P Cowgill 500B Bown 437B Small 313Other Key Executives 2,750
4,000
Accounting period Maximum value of Award (£)
Adjusted Profits target to achieve maximum Award
Minimum Adjusted Profits target to achieve 40% of maximum Award
52 weeks to 28 January 2012 900,000 £74 million £70 million
53 weeks to 2 February 2013 900,000 £74 million The targets for the 53 weeks to 2 February 2013 were set subject to adjustment within the Committee's discretion to take account of the impact of the Blacks acquisition.
£70 millionThe targets for the 53 weeks to 2 February 2013 were set subject to adjustment within the Committee's discretion to take account of the impact of the Blacks acquisition.
52 weeks to 1 February 2014 1.7m To be determined by the Company's remuneration committee prior to or on the start of accounting period
To be determined by the Company's remuneration committee prior to or on the start of accounting period

48/49
The 2010 LTIP will be payable in full in 2013 if the following performance conditions are both satisfied:
• Average headline earnings (defined above) of £74 million over the three year performance period from 31 January 2010 to 2 February 2013
• Absolute headline earnings of at least £74 million in the year to 2 February 2013
Lower awards to a minimum of 40% will be paid on a sliding scale if the performance on either of these criteria is in the range of £70 million to £74 million. If the performance under either of these criteria is below £70 million then no award will be payable.
An amount of £1,333,000 has been recognised in the Consolidated Income Statement for the period ended 28 January 2012 (2011: £2,250,000) being one-third of the 2010 LTIP payable (2011: one-third of the 2010 LTIP payable in addition to one-third of the 2nd award of the 2008 Long Term Incentive Plan payable). These amounts are consistent with the vesting profile of the three year performance period.
Other benefitsThe Company makes contributions into individual personal pension schemes for Barry Bown and Brian Small at a defined percentage of salary, excluding bonus and other forms of remuneration.
Other benefits vary from director to director and include entitlement to a fully expensed car, private health care for the Executive Director and immediate family and life assurance to provide cover equal to four times the Executive Director’s salary. Car benefits have been calculated in accordance with HM Revenue and Customs scale charges.
The Executive Chairman does not receive any pension contribution or car allowance.
The Committee actively reviews the levels of benefit received to ensure that they remain competitive in the UK quoted environment.
Service ContractsDetails of the contracts currently in place for Executive Directors are as follows:
Date Of Contract
Notice Period (Months)
Unexpired Term
P Cowgill 16 March 2004
12 Rolling 12 months
B Bown 20 February 2009
12 Rolling 12 months
B Small 10 March 2004
12 Rolling 12 months
Each service contract includes provision for compensation commitments in the event of early termination. For each of the Executive Directors, these commitments do not exceed one year’s salary and benefits. The Committee consider these levels of compensation for loss of office appropriate in light of the levels of basic salary levels and prevailing market conditions.
In the event of gross misconduct, the Company may terminate the service contract of an executive director immediately and with no liability to make further payments other than in respect of amounts accrued at the date of termination.
The service agreements and letters of appointment are available for inspection by shareholders at the forthcoming Annual General Meeting and during normal business hours at the Company’s registered office address.
In accordance with the recommendations of the UK Corporate Governance Code, all Directors will retire and offer themselves for re-election at the 2012 AGM.
Non-Executive DirectorshipsThe Board recognises that Executive Directors may be invited to become Non-Executive Directors of other businesses and that the knowledge and experience which they gain in those appointments could be of benefit to the Company. Prior approval of the Board is required before acceptance of any new appointments.
During the year to 28 January 2012, only Peter Cowgill held Non-Executive positions through his role as Non-Executive Chairman of United Carpets Group Plc and MBL Group Plc. He has retained earnings of £72,500 (2011: £372,000) in respect of these offices.
Non-Executive DirectorshipsThe Non-Executive Directors have entered into letters of appointment with the Company which are terminable by the Non-Executive Director or the Company on not less than three months’ notice.
Non-Executive Director remuneration is determined by the Board taking into account the scope and nature of their duties and market rates. The Non-Executive Directors do not participate in the Company’s incentive arrangements and no pension contributions are made in respect of them. Details of their fees are set out in the audited information on page 50.
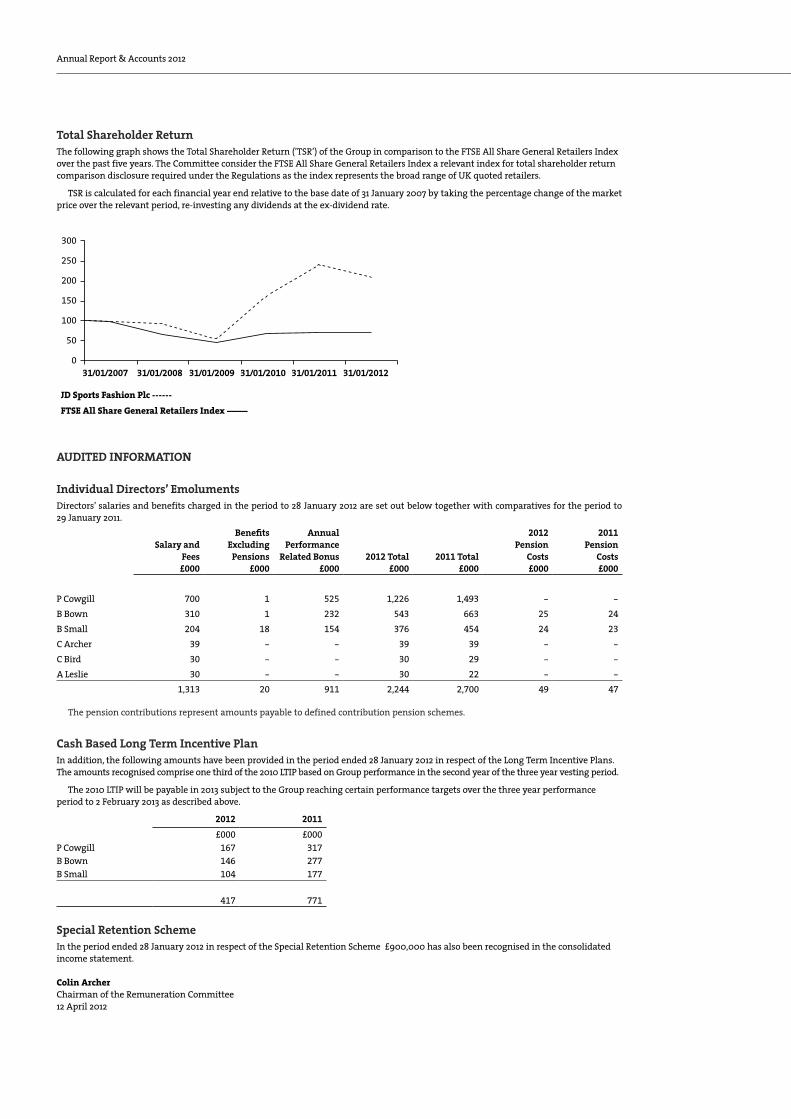
Annual Report & Accounts 2012
Total Shareholder ReturnThe following graph shows the Total Shareholder Return (’TSR’) of the Group in comparison to the FTSE All Share General Retailers Index over the past five years. The Committee consider the FTSE All Share General Retailers Index a relevant index for total shareholder return comparison disclosure required under the Regulations as the index represents the broad range of UK quoted retailers.
TSR is calculated for each financial year end relative to the base date of 31 January 2007 by taking the percentage change of the market price over the relevant period, re-investing any dividends at the ex-dividend rate.
AUDITED INFORMATION
Individual Directors’ EmolumentsDirectors’ salaries and benefits charged in the period to 28 January 2012 are set out below together with comparatives for the period to 29 January 2011.
Salary andFees£000
BenefitsExcluding
Pensions£000
Annual Performance
Related Bonus£000
2012 Total£000
2011 Total£000
2012 Pension
Costs£000
2011 Pension
Costs£000
P Cowgill 700 1 525 1,226 1,493 - -B Bown 310 1 232 543 663 25 24B Small 204 18 154 376 454 24 23C Archer 39 - - 39 39 - -C Bird 30 - - 30 29 - -A Leslie 30 - - 30 22 - -
1,313 20 911 2,244 2,700 49 47
The pension contributions represent amounts payable to defined contribution pension schemes.
Cash Based long Term Incentive PlanIn addition, the following amounts have been provided in the period ended 28 January 2012 in respect of the Long Term Incentive Plans. The amounts recognised comprise one third of the 2010 LTIP based on Group performance in the second year of the three year vesting period.
The 2010 LTIP will be payable in 2013 subject to the Group reaching certain performance targets over the three year performance period to 2 February 2013 as described above.
2012 2011£000 £000
P Cowgill 167 317B Bown 146 277B Small 104 177
417 771
Special Retention SchemeIn the period ended 28 January 2012 in respect of the Special Retention Scheme £900,000 has also been recognised in the consolidated income statement.
Colin ArcherChairman of the Remuneration Committee12 April 2012
JD Sports Fashion Plc ------
FTSE All Share General Retailers Index ----------
300
250
200
150
100
50
031/01/2007 31/01/2008 31/01/2009 31/01/2010 31/01/2011 31/01/2012

50/51
Statement of Directors’ Responsibilities in Respect of the Annual Report and the Financial Statements
Responsibilities of Directors The Directors are responsible for preparing the Annual Report and the Group and Parent Company financial statements in accordance with applicable law and regulations.
Company law requires the Directors to prepare Group and Parent Company financial statements for each financial year. Under that law they are required to prepare the Group financial statements in accordance with IFRSs as adopted by the EU and applicable law and have elected to prepare the Parent Company financial statements on the same basis.
Under company law the Directors must not approve the financial statements unless they are satisfied that they give a true and fair view of the state of affairs of the Group and Parent Company and of their profit or loss for that period. In preparing each of the Group and Parent Company financial statements, the Directors are required to:
• Select suitable accounting policies and then apply them consistently
• Make judgments and estimates that are reasonable and prudent
• State whether they have been prepared in accordance with IFRSs as adopted by the EU
• Prepare the financial statements on the going concern basis unless it is inappropriate to presume that the Group and the Parent Company will continue in business
The Directors are responsible for keeping adequate accounting records that are sufficient to show and explain the Parent Company’s transactions and disclose with reasonable accuracy at any time the financial position of the Parent Company and enable them to ensure that its financial statements comply with the Companies Act 2006. They have general responsibility for taking such steps as are reasonably open to them to safeguard the assets of the Group and to prevent and detect fraud and other irregularities.
Under applicable law and regulations, the Directors are also responsible for preparing a Directors’ Report, Directors’ Remuneration Report and Corporate Governance Report that complies with that law and those regulations.
The Directors are responsible for the maintenance and integrity of the corporate and financial information included on the Group’s websites. Legislation in the UK governing the preparation and dissemination of financial statements may differ from legislation in other jurisdictions.
Responsibility StatementEach of the Directors whose names and positions are set out on page 38 confirms that, to the best of their knowledge:
• The Financial Statements, prepared in accordance with the applicable set of accounting standards, give a true and fair view of the assets, liabilities, financial position and profit or loss of the Company and the undertakings included in the consolidation taken as a whole
• The Directors’ Report includes a fair review of the development and performance of the business and the position of the Company and the undertakings included in the consolidation taken as a whole, together with a description of the principal risks and uncertainties that they face
By order of the Board
Brian SmallGroup Finance Director12 April 2012
Annual Report & Accounts 2012
Independent Auditor’s Report to the Members of JD Sports Fashion PlcWe have audited the financial statements of JD Sports Fashion Plc for the 52 weeks ended 28 January 2012, which comprise the Consolidated Income Statement, Consolidated and Parent Company Statement of Comprehensive Income, Consolidated and Parent Company Statement of Financial Position, Consolidated and Parent Company Statement of Cash Flows, Consolidated and Parent Company Statement of Changes in Equity and the related notes set out on pages 57-105. The financial reporting framework that has been applied in their preparation is applicable law and International Financial Reporting Standards (IFRSs) as adopted by the EU and, as regards the Parent Company financial statements, as applied in accordance with the provisions of the Companies Act 2006.
This report is made solely to the Company's members, as a body, in accordance with Chapter 3 of Part 16 of the Companies Act 2006. Our audit work has been undertaken so that we might state to the Company's members those matters we are required to state to them in an auditor’s report and for no other purpose. To the fullest extent permitted by law, we do not accept or assume responsibility to anyone other than the Company and the Company's members, as a body, for our audit work, for this report, or for the opinions we have formed.
Respective responsibilities of directors and auditorAs explained more fully in the Statement of Directors' Responsibilities set out on page 51, the Directors are responsible for the preparation of the financial statements and for being satisfied that they give a true and fair view. Our responsibility is to audit, and express and opinion on, the financial statements in accordance with applicable law and International Standards on Auditing (UK and Ireland). Those standards require us to comply with the Auditing Practices Board's (APB's) Ethical Standards for Auditors.
Scope of the audit of the financial statementsA description of the scope of an audit of financial statements is provided on the APB's website at www.frc.org.uk/apb/scope/private.cfm.
Opinion on financial statementsIn our opinion:
• The financial statements give a true and fair view of the state of the Group's and of the Parent Company's affairs as at 28 January 2012 and of the Group's and the Parent Company’s profit for the 52 week period then ended
• The Group financial statements have been properly prepared in accordance with IFRSs as adopted by the EU
• The Parent Company financial statements have been properly prepared in accordance with IFRSs as adopted by the EU and as applied in accordance with the provisions of the Companies Act 2006
• The financial statements have been prepared in accordance with the requirements of the Companies Act 2006 and, as regards the Group financial statements, Article 4 of the IAS Regulation
Opinion on other matters prescribed by the Companies Act 2006In our opinion:
• The part of the Directors' Remuneration Report to be audited has been properly prepared in accordance with the Companies Act 2006
• The information given in the Directors' Report for the financial year for which the financial statements are prepared is consistent with the financial statements
• Information given in the Corporate Governance Report with respect to internal control and risk management systems in relation to financial reporting processes and about share capital structures is consistent with the financial statements
Matters on which we are required to report by exceptionWe have nothing to report in respect of the following:Under the Companies Act 2006 we are required to report to you if, in our opinion:
• Adequate accounting records have not been kept by the Parent Company, or returns adequate for our audit have not been received from branches not visited by us or
• The Parent Company financial statements and the part of the Directors' Remuneration Report to be audited are not in agreement with the accounting records and returns or
• Certain disclosures of Directors' remuneration specified by law are not made or
• We have not received all the information and explanations we require for our audit or
• A Corporate Governance Statement has not been prepared by the Group
Under the Listing Rules we are required to review:
• The Directors' statement, set out on page 41, in relation to going concern
• The part of the Corporate Governance Report relating to the Company's compliance with the nine provisions of the UK Corporate Governance Code specified for our review
• Certain elements of the report to shareholders by the Board on Directors’ remuneration
Stuart Burdass (Senior Statutory Auditor)For and on behalf of: KPMG Audit PlcStatutory Auditor Chartered AccountantsSt James’ SquareManchesterM2 6DS12 April 2012

52/53
Consolidated Income StatementFor the 52 weeks ended 28 January 2012
Note
52 weeks to28 January 2012
£000
52 weeks to28 January 2012
£000
52 weeks to29 January 2011
£000
52 weeks to29 January 2011
£000 Revenue 1,059,523 883,669 Cost of sales (538,676) (446,657)
Gross profit 520,847 437,012 Selling and distribution expenses - normal (403,923) (326,296)Selling and distribution expenses - exceptional 4 (10,532) (3,277)Selling and distribution expenses (414,455) (329,573)Administrative expenses - normal (43,193) (32,966)Administrative expenses - exceptional 4 847 (1,007)Administrative expenses (42,346) (33,973)Other operating income 2,730 2,177
Operating profit 66,776 75,643
Before exceptional items 76,461 79,927 Exceptional items 4 (9,685) (4,284)
Operating profit 66,776 75,643
Share of results of joint venture before exceptional items (net of income tax) 17 (102) 1,475 Share of exceptional items (net of income tax) 17 1,170 1,348
Share of results of joint venture 17 1,068 2,823 Financial income 7 646 618 Financial expenses 8 (1,048) (455)
Profit before tax 3 67,442 78,629 Income tax expense 9 (18,093) (22,762)
Profit for the period 49,349 55,867
Attributable to equity holders of the parent 46,847 55,884 Attributable to non-controlling interest 2,502 (17)
Basic earnings per ordinary share 10 96.27p 114.84p
Diluted earnings per ordinary share 10 96.27p 114.84p
Consolidated Statement of Comprehensive IncomeFor the 52 weeks ended 28 January 2012
GROUP COMPANY 52 weeks to
28 January 2012 £000
52 weeks to 29 January 2011
£000
52 weeks to 28 January 2012
£000
52 weeks to 29 January 2011
£000
Profit for the period 49,349 55,867 52,190 47,045 Other comprehensive income:
Exchange differences on translation of foreign operations (2,096) 95 - -
Total other comprehensive income for the period (2,096) 95 - -
Total comprehensive income and expense for the period (net of income tax) 47,253 55,962 52,190 47,045
Attributable to equity holders of the parent 44,751 55,979 52,190 47,045 Attributable to non-controlling interest 2,502 (17) - -

Consolidated Statement of Financial PositionAs at 28 January 2012
GROUP COMPANY
Note
As at28 January 2012
£000
As at 29 January 2011
£000
As at28 January 2012
£000
As at29 January 2011
£000
Assets
Intangible assets 13 99,814 58,315 28,186 28,096 Property, plant and equipment 14 119,518 78,120 71,103 51,539 Investment property 15 - 3,000 2,970 3,000 Other assets 16 16,975 13,047 3,558 3,590 Equity accounted investment in joint venture 17 - 3,458 - - Investments 18 - - 42,475 9,064 Deferred tax assets 26 - 125 307 1,082
Total non-current assets 236,307 156,065 148,599 96,371
Inventories 19 130,355 84,490 52,579 47,472 Trade and other receivables 20 54,147 37,105 123,953 82,535 Cash and cash equivalents 21 67,024 90,131 28,762 81,204
Total current assets 251,526 211,726 205,294 211,211
Total assets 487,833 367,791 353,893 307,582
Liabilities Interest-bearing loans and borrowings 22 (5,547) (2,874) - - Trade and other payables 24 (196,052) (128,445) (95,077) (85,520)Provisions 25 (3,375) (2,591) (2,404) (1,920)Income tax liabilities (8,861) (12,370) (2,877) (11,465)
Total current liabilities (213,835) (146,280) (100,358) (98,905)
Interest-bearing loans and borrowings 22 (1,182) (1,117) - - Other payables 24 (36,149) (28,782) (28,440) (24,370)Provisions 25 (6,407) (6,437) (4,008) (4,072)Deferred tax liabilities 26 (1,012) - - -
Total non-current liabilities (44,750) (36,336) (32,448) (28,442)
Total liabilities (258,585) (182,616) (132,806) (127,347)
Total assets less total liabilities 229,248 185,175 221,087 180,235
Capital and reserves Issued ordinary share capital 27 2,433 2,433 2,433 2,433 Share premium 11,659 11,659 11,659 11,659 Retained earnings 207,503 171,916 206,995 166,143 Other reserves (6,339) (1,918) - -
Total equity attributable to equity holders of the parent 215,256 184,090 221,087 180,235
Non-controlling interest 13,992 1,085 - -
Total equity 229,248 185,175 221,087 180,235
These financial statements were approved by the Board of Directors on 12 April 2012 and were signed on its behalf by:
B Small Director
Registered number: 1888425

54/55
Consolidated Statement of Changes in EquityFor the 52 weeks ended 28 January 2012
GROUP
Ordinary share
capital £000
Share premium
£000
Retained earnings
£000
Other equity
£000
Foreign currency
translation reserve
£000
Total equity attributable
to equity holders of the parent
£000
Non-controlling
interest £000
Total equity £000
Balance at 30 January 2010 2,433 11,659 125,341 - (244) 139,189 1,333 140,522
Profit for the period - - 55,884 - - 55,884 (17) 55,867 Other comprehensive income: Exchange differences on translation of foreign operations - - - - 95 95 - 95
Total other comprehensive income - - - - 95 95 - 95
Total comprehensive income for the period - - 55,884 - 95 55,979 (17) 55,962 Dividends to equity holders - - (9,002) - - (9,002) - (9,002)Put options held by non-controlling interests - - - (1,769) - (1,769) - (1,769)Acquisition of non-controlling interest - - (627) - - (627) (573) (1,200)Disposal of non-controlling interest - - 320 - - 320 342 662
Balance at 29 January 2011 2,433 11,659 171,916 (1,769) (149) 184,090 1,085 185,175
Profit for the period - - 46,847 - - 46,847 2,502 49,349 Other comprehensive income: Exchange differences on translation of foreign operations - - - - (2,096) (2,096) - (2,096)
Total other comprehensive income - - - - (2,096) (2,096) - (2,096)
Total comprehensive income for the period - - 46,847 - (2,096) 44,751 2,502 47,253 Dividends to equity holders - - (11,338) - - (11,338) (140) (11,478)Put options held by non-controlling interests - - - (2,325) - (2,325) - (2,325)Non-controlling interest arising on acquisition - - - - - - 10,622 10,622 Disposal of non-controlling interest - - 78 - - 78 (77) 1
Balance at 28 January 2012 2,433 11,659 207,503 (4,094) (2,245) 215,256 13,992 229,248
Put options are held by the 49% non-controlling interest in Canterbury of New Zealand and 25% non-controlling interest in Canterbury International (Australia) Pty Limited (see note 24).
COMPANY
Ordinary share
capital£000
Share premium
£000
Retained earnings
£000
Total equity
£000
Balance at 30 January 2010 2,433 11,659 128,100 142,192
Profit for the period - - 47,045 47,045
Total comprehensive income for the period - - 47,045 47,045 Dividends to equity holders - - (5,937) (5,937)
Balance at 29 January 2011 2,433 11,659 166,143 180,235
Profit for the period - - 52,190 52,190
Total comprehensive income for the period - - 52,190 52,190 Dividends to equity holders - - (11,338) (11,338)
Balance at 28 January 2012 2,433 11,659 206,995 221,087
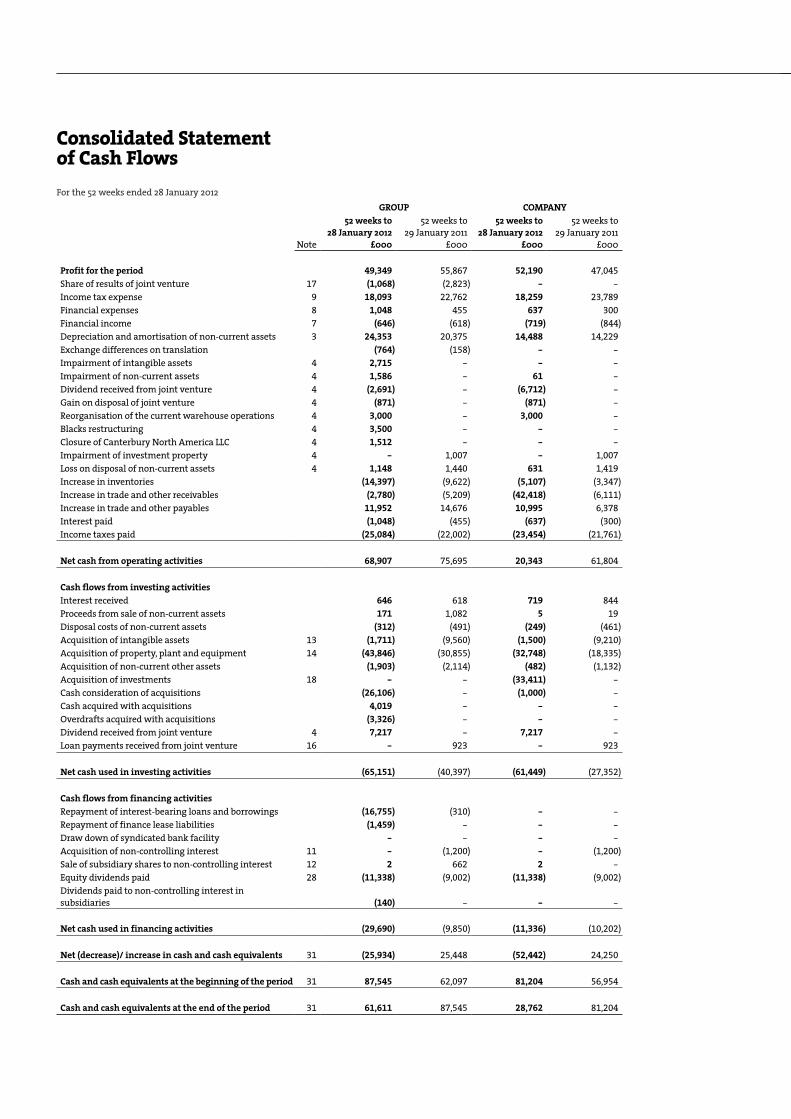
Consolidated Statement of Cash FlowsFor the 52 weeks ended 28 January 2012
GROUP COMPANY
Note
52 weeks to 28 January 2012
£000
52 weeks to 29 January 2011
£000
52 weeks to 28 January 2012
£000
52 weeks to 29 January 2011
£000
Profit for the period 49,349 55,867 52,190 47,045 Share of results of joint venture 17 (1,068) (2,823) - - Income tax expense 9 18,093 22,762 18,259 23,789 Financial expenses 8 1,048 455 637 300 Financial income 7 (646) (618) (719) (844)Depreciation and amortisation of non-current assets 3 24,353 20,375 14,488 14,229 Exchange differences on translation (764) (158) - - Impairment of intangible assets 4 2,715 - - - Impairment of non-current assets 4 1,586 - 61 - Dividend received from joint venture 4 (2,691) - (6,712) - Gain on disposal of joint venture 4 (871) - (871) - Reorganisation of the current warehouse operations 4 3,000 - 3,000 - Blacks restructuring 4 3,500 - - - Closure of Canterbury North America LLC 4 1,512 - - - Impairment of investment property 4 - 1,007 - 1,007 Loss on disposal of non-current assets 4 1,148 1,440 631 1,419 Increase in inventories (14,397) (9,622) (5,107) (3,347)Increase in trade and other receivables (2,780) (5,209) (42,418) (6,111)Increase in trade and other payables 11,952 14,676 10,995 6,378 Interest paid (1,048) (455) (637) (300)Income taxes paid (25,084) (22,002) (23,454) (21,761)
Net cash from operating activities 68,907 75,695 20,343 61,804
Cash flows from investing activities Interest received 646 618 719 844 Proceeds from sale of non-current assets 171 1,082 5 19 Disposal costs of non-current assets (312) (491) (249) (461)Acquisition of intangible assets 13 (1,711) (9,560) (1,500) (9,210)Acquisition of property, plant and equipment 14 (43,846) (30,855) (32,748) (18,335)Acquisition of non-current other assets (1,903) (2,114) (482) (1,132)Acquisition of investments 18 - - (33,411) -Cash consideration of acquisitions (26,106) - (1,000) - Cash acquired with acquisitions 4,019 - - - Overdrafts acquired with acquisitions (3,326) - - - Dividend received from joint venture 4 7,217 - 7,217 - Loan payments received from joint venture 16 - 923 - 923
Net cash used in investing activities (65,151) (40,397) (61,449) (27,352)
Cash flows from financing activities Repayment of interest-bearing loans and borrowings (16,755) (310) - - Repayment of finance lease liabilities (1,459) - - - Draw down of syndicated bank facility - - - - Acquisition of non-controlling interest 11 - (1,200) - (1,200)Sale of subsidiary shares to non-controlling interest 12 2 662 2 - Equity dividends paid 28 (11,338) (9,002) (11,338) (9,002)Dividends paid to non-controlling interest in subsidiaries (140) - - -
Net cash used in financing activities (29,690) (9,850) (11,336) (10,202)
Net (decrease)/ increase in cash and cash equivalents 31 (25,934) 25,448 (52,442) 24,250
Cash and cash equivalents at the beginning of the period 31 87,545 62,097 81,204 56,954
Cash and cash equivalents at the end of the period 31 61,611 87,545 28,762 81,204
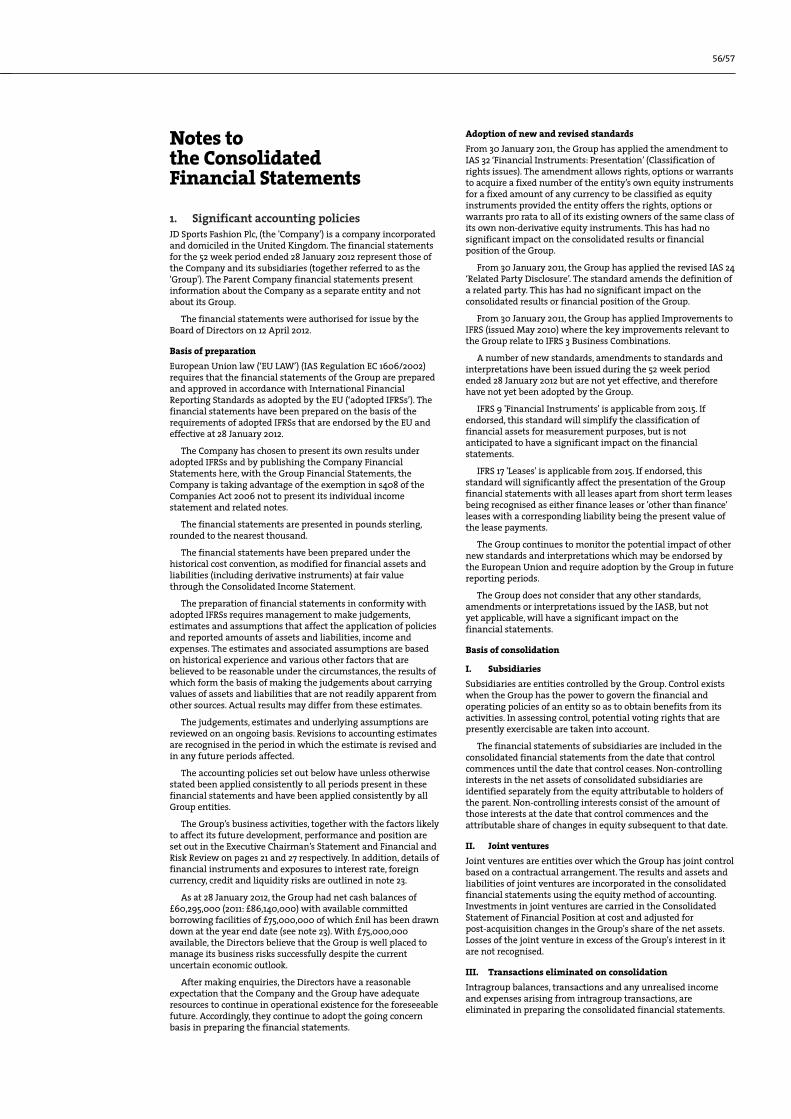
56/57
Notes to the Consolidated Financial Statements
1. Significant accounting policiesJD Sports Fashion Plc, (the 'Company') is a company incorporated and domiciled in the United Kingdom. The financial statements for the 52 week period ended 28 January 2012 represent those of the Company and its subsidiaries (together referred to as the 'Group'). The Parent Company financial statements present information about the Company as a separate entity and not about its Group.
The financial statements were authorised for issue by the Board of Directors on 12 April 2012.
Basis of preparationEuropean Union law (‘EU LAW’) (IAS Regulation EC 1606/2002) requires that the financial statements of the Group are prepared and approved in accordance with International Financial Reporting Standards as adopted by the EU (‘adopted IFRSs’). The financial statements have been prepared on the basis of the requirements of adopted IFRSs that are endorsed by the EU and effective at 28 January 2012.
The Company has chosen to present its own results under adopted IFRSs and by publishing the Company Financial Statements here, with the Group Financial Statements, the Company is taking advantage of the exemption in s408 of the Companies Act 2006 not to present its individual income statement and related notes.
The financial statements are presented in pounds sterling, rounded to the nearest thousand.
The financial statements have been prepared under the historical cost convention, as modified for financial assets and liabilities (including derivative instruments) at fair value through the Consolidated Income Statement.
The preparation of financial statements in conformity with adopted IFRSs requires management to make judgements, estimates and assumptions that affect the application of policies and reported amounts of assets and liabilities, income and expenses. The estimates and associated assumptions are based on historical experience and various other factors that are believed to be reasonable under the circumstances, the results of which form the basis of making the judgements about carrying values of assets and liabilities that are not readily apparent from other sources. Actual results may differ from these estimates.
The judgements, estimates and underlying assumptions are reviewed on an ongoing basis. Revisions to accounting estimates are recognised in the period in which the estimate is revised and in any future periods affected.
The accounting policies set out below have unless otherwise stated been applied consistently to all periods present in these financial statements and have been applied consistently by all Group entities.
The Group’s business activities, together with the factors likely to affect its future development, performance and position are set out in the Executive Chairman’s Statement and Financial and Risk Review on pages 21 and 27 respectively. In addition, details of financial instruments and exposures to interest rate, foreign currency, credit and liquidity risks are outlined in note 23.
As at 28 January 2012, the Group had net cash balances of £60,295,000 (2011: £86,140,000) with available committed borrowing facilities of £75,000,000 of which £nil has been drawn down at the year end date (see note 23). With £75,000,000 available, the Directors believe that the Group is well placed to manage its business risks successfully despite the current uncertain economic outlook.
After making enquiries, the Directors have a reasonable expectation that the Company and the Group have adequate resources to continue in operational existence for the foreseeable future. Accordingly, they continue to adopt the going concern basis in preparing the financial statements.
Adoption of new and revised standardsFrom 30 January 2011, the Group has applied the amendment to IAS 32 ‘Financial Instruments: Presentation’ (Classification of rights issues). The amendment allows rights, options or warrants to acquire a fixed number of the entity’s own equity instruments for a fixed amount of any currency to be classified as equity instruments provided the entity offers the rights, options or warrants pro rata to all of its existing owners of the same class of its own non-derivative equity instruments. This has had no significant impact on the consolidated results or financial position of the Group.
From 30 January 2011, the Group has applied the revised IAS 24 ‘Related Party Disclosure’. The standard amends the definition of a related party. This has had no significant impact on the consolidated results or financial position of the Group.
From 30 January 2011, the Group has applied Improvements to IFRS (issued May 2010) where the key improvements relevant to the Group relate to IFRS 3 Business Combinations.
A number of new standards, amendments to standards and interpretations have been issued during the 52 week period ended 28 January 2012 but are not yet effective, and therefore have not yet been adopted by the Group.
IFRS 9 'Financial Instruments' is applicable from 2015. If endorsed, this standard will simplify the classification of financial assets for measurement purposes, but is not anticipated to have a significant impact on the financial statements.
IFRS 17 'Leases' is applicable from 2015. If endorsed, this standard will significantly affect the presentation of the Group financial statements with all leases apart from short term leases being recognised as either finance leases or 'other than finance' leases with a corresponding liability being the present value of the lease payments.
The Group continues to monitor the potential impact of other new standards and interpretations which may be endorsed by the European Union and require adoption by the Group in future reporting periods.
The Group does not consider that any other standards, amendments or interpretations issued by the IASB, but not yet applicable, will have a significant impact on the financial statements.
Basis of consolidation
I. Subsidiaries Subsidiaries are entities controlled by the Group. Control exists when the Group has the power to govern the financial and operating policies of an entity so as to obtain benefits from its activities. In assessing control, potential voting rights that are presently exercisable are taken into account.
The financial statements of subsidiaries are included in the consolidated financial statements from the date that control commences until the date that control ceases. Non-controlling interests in the net assets of consolidated subsidiaries are identified separately from the equity attributable to holders of the parent. Non-controlling interests consist of the amount of those interests at the date that control commences and the attributable share of changes in equity subsequent to that date.
II. Joint venturesJoint ventures are entities over which the Group has joint control based on a contractual arrangement. The results and assets and liabilities of joint ventures are incorporated in the consolidated financial statements using the equity method of accounting. Investments in joint ventures are carried in the Consolidated Statement of Financial Position at cost and adjusted for post-acquisition changes in the Group's share of the net assets. Losses of the joint venture in excess of the Group's interest in it are not recognised.
III. Transactions eliminated on consolidationIntragroup balances, transactions and any unrealised income and expenses arising from intragroup transactions, are eliminated in preparing the consolidated financial statements.

Notes to the Consolidated Financial Statements (continued)
1. Significant accounting policies (continued)Property, plant and equipment
I. Owned assetsItems of property, plant and equipment are stated at cost less accumulated depreciation and impairment losses. Where parts of an item of property, plant and equipment have different useful economic lives, they are accounted for as separate items. Assets in the course of construction are held at cost less any recognised impairment loss.
II. Leased assetsAssets funded through finance leases and similar hire purchase contracts are capitalised as property, plant and equipment where the Group assumes substantially all of the risks and rewards of ownership. Upon initial recognition, the leased asset is measured at the lower of its fair value and the present value of the minimum lease payments. Future instalments under such leases, net of financing costs, are included within interest-bearing loans and borrowings. Rental payments are apportioned between the finance element, which is included in finance costs, and the capital element which reduces the outstanding obligation for future instalments so as to give a constant charge on the outstanding obligation.
All other leases are accounted for as operating leases and the rental costs are charged to the Consolidated Income Statement on a straight line basis over the life of the lease.
Legal fees and other costs associated with the acquisition of a leasehold interest are capitalised within non-current other assets. These costs are amortised over the life of the lease.
Lease incentives are credited to the Consolidated Income Statement on a straight line basis over the life of the lease.
III. Depreciation Depreciation is charged to the Consolidated Income Statement over the estimated useful life of each part of an item of property, plant and equipment. The estimated useful economic lives are as follows:
• Freehold land not depreciated
• Long leasehold properties
2% per annum on a straight line basis
• Improvements to short leasehold properties
life of lease on a straight line basis
• Computer equipment 3 - 4 years on a straight line basis
• Fixtures and fittings 5 - 7 years, or length of lease if shorter, on a straight line basis
• Motor vehicles 25% per annum on a reducing balance basis
Investment propertyInvestment property, which is property held to earn rentals, is stated at cost less accumulated depreciation and impairment losses. Investment property is depreciated over a period of 50 years on a straight line basis, with the exception of freehold land, which is not depreciated. The Group has elected not to revalue investment property annually but to disclose the fair value in the Consolidated Financial Statements.
The fair value is based on an external valuation prepared by persons having the appropriate professional qualification and experience.
Business combinationsAll business combinations are accounted for by applying the acquisition method.
Business combinations are accounted for using the acquisition method as at the acquisition date, which is the date on which control is transferred to the Group. Control is the power to govern the financial and operating policies of an entity so as to obtain benefits from its activities. In assessing control, the Group takes into consideration potential voting rights that currently are exercisable.
The consideration transferred does not include amounts related to the settlement of pre-existing relationships. Such amounts are generally recognised in the Consolidated Income Statement.
Costs related to the acquisition, other than those associated with the issue of debt or equity securities, that the Group incurs in connection with a business combination are expensed as incurred.
Any contingent consideration payable is recognised at fair value at the acquisition date. If the contingent consideration is classified as equity, it is not remeasured and settlement is accounted for within equity. Otherwise, subsequent changes to the fair value of the contingent consideration are recognised in the Consolidated Income Statement.
Intangible assets
I. GoodwillGoodwill represents amounts arising on acquisition of subsidiaries.
For acquisitions on or after 31 January 2010, the Group measures goodwill at the acquisition date as:
• the fair value of the consideration transferred; plus
• the recognised amount of any non-controlling interests in the acquiree; plus
• if the business combination is achieved in stages, the fair value of the existing equity interest in the acquiree; less
• the net recognised amount of the identifiable assets acquired and liabilities assumed.
When the excess is negative, negative goodwill is recognised immediately in the Consolidated Income Statement.
In respect of business acquisitions that occurred from 1 February 2004 to 30 January 2010, goodwill represents the difference between the cost of the acquisition and the net fair value of the identifiable assets, liabilities and contingent liabilities of the acquiree. When the excess was negative (negative goodwill), it was recognised immediately in the Consolidated Income Statement as an exceptional item. Transaction costs, other than those associated with the issue of debt or equity securities, that the Group incurred in connection with business combinations were capitalised as part of the cost of the acquisition.
In respect of acquisitions prior to 1 February 2004, goodwill is included on the basis of its deemed cost, which represents the amount recorded under previous GAAP. The classification and accounting treatment of business combinations that occurred prior to 1 February 2004 has not been reconsidered in preparing the Group’s opening adopted IFRS balance sheet at 1 February 2004.
Goodwill is stated at cost less any accumulated impairment losses. Goodwill is allocated to cash-generating units ('CGUs') and is tested annually for impairment and whenever there is an indication that the goodwill may be impaired. The CGUs used are the store portfolios and distribution companies acquired. The recoverable amount is compared to the carrying amount of the CGU including goodwill. The recoverable amount of a CGU is determined based on value-in-use calculations.
II. Other intangible assetsOther intangible assets represent brand licences, brand names and purchased fascia names.
Brand licences are stated at cost less accumulated amortisation and impairment losses. Amortisation of brand licences' is charged to the Consolidated Income Statement over the term to the licence expiry on a straight line basis.
Brand names acquired as part of a business combination are stated at fair value as at the acquisition date less accumulated amortisation and impairment losses. Brand names separately acquired are stated at cost less accumulated amortisation and impairment losses. The useful economic life of each purchased brand name is considered to be definite. Amortisation of brand names is charged to the Consolidated Income Statement over their useful life on a straight line basis.

58/59Notes to the Consolidated Financial Statements (continued)
1. Significant accounting policies (continued)Separately identifiable fascia names acquired are stated at fair value as at the acquisition date less accumulated impairment losses. The useful economic life of each purchased fascia name is considered separately. Where the Directors believe that there is no foreseeable limit to the period over which the asset is expected to generate a net cash flow, the specific fascia name is not amortised but is subject to an impairment review on an annual basis or more frequently if there is an indicator that the fascia name is impaired.
Investments in subsidiary undertakings and joint venturesIn the Company’s accounts all investments in subsidiary undertakings and joint ventures are stated at cost less provisions for impairment losses.
Changes in ownership interest without a loss of controlIn accordance with IAS 27 'Consolidated and Separate Financial Statements' (2008), upon a change in ownership interest in a subsidiary without a loss of control, the carrying amounts of the controlling and non-controlling interests are adjusted to reflect the changes in their relative interests in the subsidiary. Any difference between the amount by which the non-controlling interests are adjusted and the fair value of the consideration paid or received is recognised directly in equity and attributed to the owners of the parent. Acquisitions or disposals of non-controlling interests are therefore accounted for as transactions with owners in their capacity as owners and no goodwill is recognised as a result of such transactions. Associated transaction costs are accounted for within equity.
Inventories Inventories are stated at the lower of cost and net realisable value. Cost is based on the weighted average principle. Provisions are made for obsolescence, mark downs and shrinkage.
Financial instruments Financial assets and financial liabilities are recognised in the Group’s Statement of Financial Position when the Group becomes a party to the contractual provisions of the instrument. Financial assets are derecognised when the contractual rights to the cash flows from the financial assets expire or are transferred. Financial liabilities are derecognised when the obligation specified in the contract is discharged, cancelled or expires.
Trade receivablesTrade receivables are recognised at amortised cost less impairment losses. A provision for the impairment of trade receivables is established when there is objective evidence that the Group will not be able to collect all amounts due according to the original terms. Significant financial difficulties of the debtor, probability that the debtor will enter bankruptcy or financial reorganisation and default or delinquency in payments are considered indicators that the trade receivable is impaired. The movement in the provision is recognised in the Consolidated Income Statement.
Non-current other assets
I. Key moneyMonies paid in certain countries to give access to retail locations are capitalised within non-current assets. These assets are not depreciated as past experience has shown that the key money is generally recoverable on disposal of a retail location and as such is deemed to have an indefinite useful economic life but will be impaired if evidence exists that the market value is less than the historic cost. Gains/losses on key money from the subsequent disposal of these retail locations are recognised in the Consolidated Income Statement.
II. DepositsMoney paid in certain countries as deposits to store landlords as protection against non-payment of rent, is capitalised within non-current assets. A provision for the impairment of these deposits is established when there is objective evidence that the landlord will not repay the deposit in full.
III. Legal feesLegal fees and other costs associated with the acquisition of a leasehold interest are capitalised within non-current other assets and amortised over the life of the lease.
Cash and cash equivalentsCash and cash equivalents comprise cash balances and call deposits with an original maturity of three months or less. Bank overdrafts are included as a component of cash and cash equivalents for the purpose of the Consolidated Statement of Cash Flows, as these are used as an integral part of the Group’s cash management.
Net cash/interest-bearing loans and borrowingsNet cash consists of cash and cash equivalents together with other borrowings from bank loans and overdrafts, other loans, loan notes, finance leases and similar hire purchase contracts.
Interest-bearing borrowings are recognised initially at fair value less attributable transaction costs. Following the initial recognition, interest-bearing borrowings are stated at amortised cost with any difference between cost and redemption value being recognised in the Consolidated Income Statement over the period of the borrowings on an effective interest basis.
Trade and other payablesTrade and other payables are non-interest-bearing and are stated at their cost.
Foreign currency translationTransactions denominated in foreign currencies are translated into sterling at the exchange rate prevailing on the date of the transaction. Monetary assets and liabilities denominated in foreign currencies are translated into sterling at the rate of exchange at the reporting date. Exchange differences in monetary items are recognised in the Consolidated Income Statement.
Non-monetary assets and liabilities that are measured in terms of historical cost in a foreign currency are translated using the exchange rate at the date of the transaction.
On consolidation, the assets and liabilities of the Group’s overseas operations are translated into sterling at the rate of exchange at the reporting date. Income and expenses are translated at the average exchange rate for the accounting period. Foreign currency differences are recognised in Other Comprehensive Income and are presented in the foreign currency translation reserve.
Derivative financial instrumentsThe Group uses derivative financial instruments to hedge its exposure to foreign exchange and interest rate risks arising from operational, financing and investment activities. In accordance with its treasury policy, the Group does not hold or issue derivative financial instruments for trading purposes. However, derivatives that do not qualify for hedge accounting are accounted for as trading instruments.
Derivative financial instruments are recognised initially at fair value and remeasured at each period end. The gain or loss on remeasurement to fair value is recognised immediately in the Consolidated Income Statement. However, where derivatives qualify for hedge accounting, recognition of any resultant gain or loss depends on the nature of the item being hedged.
Interest rate swaps are recognised at fair value in the Consolidated Statement of Financial Position with movements in fair value recognised in the Consolidated Income Statement for the period. The fair value of interest rate swaps is the estimated amount that the Group would receive or pay to terminate the swap at the reporting date, taking into account current interest rates and the respective risk profiles of the swap counterparties.
Put options held by non-controlling interestsThe Group recognises put options over non-controlling interests in its subsidiary undertakings as a liability in the Consolidated Statement of Financial Position at the present value of the estimated exercise price of the put option. Upon initial recognition, and for subsequent changes on remeasurement of the liability, a corresponding entry is made to other equity.
Hedging of monetary assets and liabilitiesWhere a derivative financial instrument is used to hedge the foreign exchange exposure of a recognised monetary asset or liability, no hedge accounting is applied and any gain or loss on the hedging instrument is recognised in the Consolidated Income Statement.
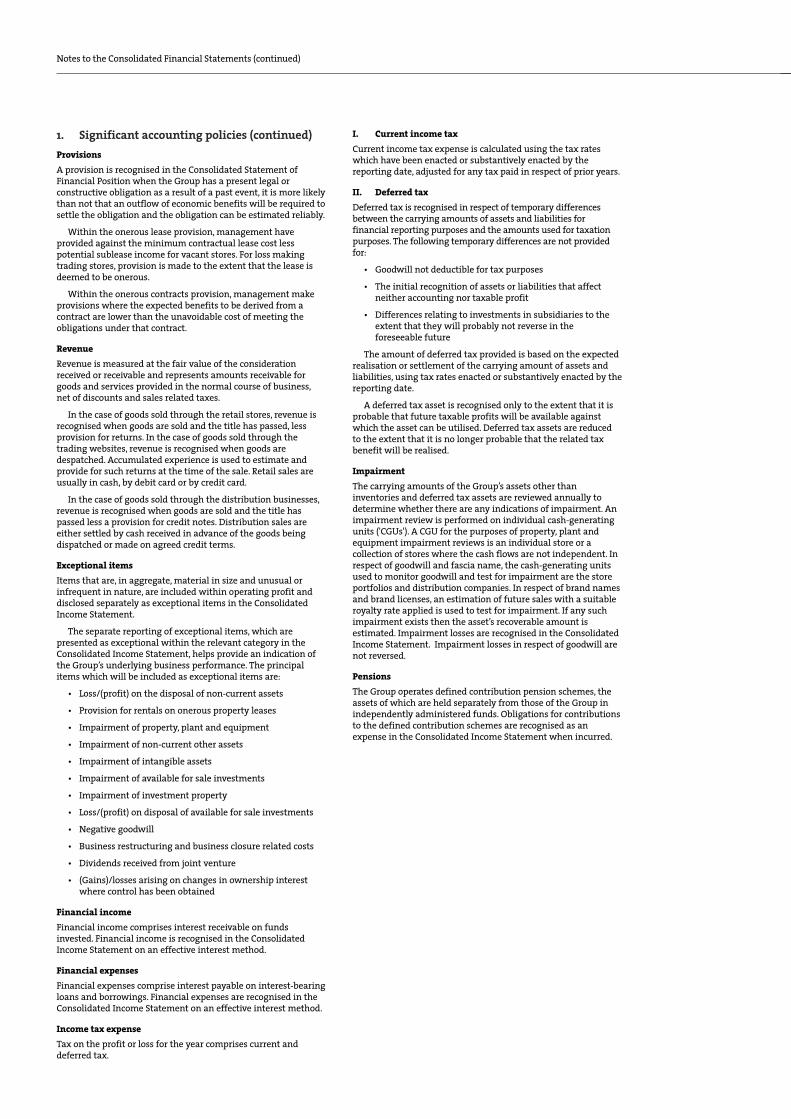
Notes to the Consolidated Financial Statements (continued)
1. Significant accounting policies (continued)ProvisionsA provision is recognised in the Consolidated Statement of Financial Position when the Group has a present legal or constructive obligation as a result of a past event, it is more likely than not that an outflow of economic benefits will be required to settle the obligation and the obligation can be estimated reliably.
Within the onerous lease provision, management have provided against the minimum contractual lease cost less potential sublease income for vacant stores. For loss making trading stores, provision is made to the extent that the lease is deemed to be onerous.
Within the onerous contracts provision, management make provisions where the expected benefits to be derived from a contract are lower than the unavoidable cost of meeting the obligations under that contract.
Revenue Revenue is measured at the fair value of the consideration received or receivable and represents amounts receivable for goods and services provided in the normal course of business, net of discounts and sales related taxes.
In the case of goods sold through the retail stores, revenue is recognised when goods are sold and the title has passed, less provision for returns. In the case of goods sold through the trading websites, revenue is recognised when goods are despatched. Accumulated experience is used to estimate and provide for such returns at the time of the sale. Retail sales are usually in cash, by debit card or by credit card.
In the case of goods sold through the distribution businesses, revenue is recognised when goods are sold and the title has passed less a provision for credit notes. Distribution sales are either settled by cash received in advance of the goods being dispatched or made on agreed credit terms.
Exceptional itemsItems that are, in aggregate, material in size and unusual or infrequent in nature, are included within operating profit and disclosed separately as exceptional items in the Consolidated Income Statement.
The separate reporting of exceptional items, which are presented as exceptional within the relevant category in the Consolidated Income Statement, helps provide an indication of the Group’s underlying business performance. The principal items which will be included as exceptional items are:
• Loss/(profit) on the disposal of non-current assets
• Provision for rentals on onerous property leases
• Impairment of property, plant and equipment
• Impairment of non-current other assets
• Impairment of intangible assets
• Impairment of available for sale investments
• Impairment of investment property
• Loss/(profit) on disposal of available for sale investments
• Negative goodwill
• Business restructuring and business closure related costs
• Dividends received from joint venture
• (Gains)/losses arising on changes in ownership interest where control has been obtained
Financial incomeFinancial income comprises interest receivable on funds invested. Financial income is recognised in the Consolidated Income Statement on an effective interest method.
Financial expensesFinancial expenses comprise interest payable on interest-bearing loans and borrowings. Financial expenses are recognised in the Consolidated Income Statement on an effective interest method.
Income tax expenseTax on the profit or loss for the year comprises current and deferred tax.
I. Current income taxCurrent income tax expense is calculated using the tax rates which have been enacted or substantively enacted by the reporting date, adjusted for any tax paid in respect of prior years.
II. Deferred taxDeferred tax is recognised in respect of temporary differences between the carrying amounts of assets and liabilities for financial reporting purposes and the amounts used for taxation purposes. The following temporary differences are not provided for:
• Goodwill not deductible for tax purposes
• The initial recognition of assets or liabilities that affect neither accounting nor taxable profit
• Differences relating to investments in subsidiaries to the extent that they will probably not reverse in the foreseeable future
The amount of deferred tax provided is based on the expected realisation or settlement of the carrying amount of assets and liabilities, using tax rates enacted or substantively enacted by the reporting date.
A deferred tax asset is recognised only to the extent that it is probable that future taxable profits will be available against which the asset can be utilised. Deferred tax assets are reduced to the extent that it is no longer probable that the related tax benefit will be realised.
ImpairmentThe carrying amounts of the Group’s assets other than inventories and deferred tax assets are reviewed annually to determine whether there are any indications of impairment. An impairment review is performed on individual cash-generating units ('CGUs'). A CGU for the purposes of property, plant and equipment impairment reviews is an individual store or a collection of stores where the cash flows are not independent. In respect of goodwill and fascia name, the cash-generating units used to monitor goodwill and test for impairment are the store portfolios and distribution companies. In respect of brand names and brand licenses, an estimation of future sales with a suitable royalty rate applied is used to test for impairment. If any such impairment exists then the asset’s recoverable amount is estimated. Impairment losses are recognised in the Consolidated Income Statement. Impairment losses in respect of goodwill are not reversed.
PensionsThe Group operates defined contribution pension schemes, the assets of which are held separately from those of the Group in independently administered funds. Obligations for contributions to the defined contribution schemes are recognised as an expense in the Consolidated Income Statement when incurred.

60/61Notes to the Consolidated Financial Statements (continued)
1. Significant accounting policies (continued)Critical accounting estimates and judgementsThe preparation of financial statements in conformity with adopted IFRSs requires management to make judgements, estimates and assumptions that affect the application of policies and reported amounts of assets and liabilities, income and expenses. The estimates and associated assumptions are based on historical experience and various other factors that are believed to be reasonable under the circumstances, the results of which form the basis of making the judgements about carrying values of assets and liabilities that are not readily apparent from other sources. Actual results may differ from these estimates. The judgements, estimates and assumptions which have a significant risk of causing a material adjustment to the carrying amount of assets and liabilities are discussed below:
I. Impairment of goodwillGoodwill arising on acquisition is allocated to the cash-generating units that are expected to benefit from the synergies of the business combination from which goodwill arose. In the case of retail acquisitions, goodwill is allocated to groups of cash-generating units, being portfolios of stores, whereas for acquisition of distribution businesses, goodwill is allocated to the individual distribution company acquired. The cash-generating units used to monitor goodwill and to test it for impairment are therefore the store portfolios and distribution companies. The recoverable amount is the higher of the value in use and the fair value less the costs to sell. The recoverable amounts of these cash-generating units are determined based on value-in-use calculations. The use of this method requires the estimation of future cash flows expected to arise from the continuing operation of the cash-generating unit and the choice of a suitable discount rate in order to calculate the present value. See note 13 for further disclosure on impairment of goodwill and review of the key assumptions used.
II. Impairment of property, plant and equipment and non-current other assets
Property, plant and equipment and non-current other assets are reviewed for impairment if events or changes in circumstances indicate that the carrying amount of an asset or a cash-generating unit is not recoverable. The recoverable amount is the greater of the fair value less costs to sell and value-in-use. Impairment losses recognised in prior periods are assessed at each reporting period date for any indications that the loss has decreased or no longer exists. An impairment loss is reversed if there has been a change in the estimates used to determine the recoverable amount. An impairment loss is reversed only to the extent that the assets carrying amount does not exceed the carrying amount that would be held (net of depreciation) if no impairment had been realised.
III. Impairment of other intangible assets with definite lives
The Group is required to test whether other intangible assets with a definite useful economic life have suffered any impairment. The recoverable amount of brand names is based on an estimation of future sales and the choice of a suitable royalty and discount rate in order to calculate the present value. The recoverable amount of brand licences is based on an estimation of future sales and other specific cash flows, the contracted royalty rate and the choice of a suitable discount rate in order to calculate the present value. Note 13 provides further disclosure on impairment of other intangible assets with definite lives, including review of the key assumptions used.
IV. Impairment of other intangible assets with indefinite lives
The Group is required to test whether other intangible assets which are not authorised have suffered any impairment. The recoverable amount of these assets is determined based on value-in-use calculations. The use of this method requires the estimation of future cash flows expected to arise from the continuing operation of the cash-generating unit and the choice of a suitable discount rate in order to calculate the present value. Note 13 provides further detail of the judgements made by the Board in determining that the lives of acquired fascia names are indefinite and further disclosure on impairment of other intangible assets with indefinite lives, including review of the key assumptions used.
V. Provisions to write inventories down to net realisable value
The Group makes provisions for obsolescence, mark downs and shrinkage based on historical experiences and management estimates of future events.
VI. Onerous property lease provisionsThe Group makes a provision for onerous property leases on specific stores based on the anticipated future cash outflows relating to the contractual lease cost less potential sublease income. The estimation of sublease income is based on historical experience and knowledge of the retail property market in the area around each specific property. Significant assumptions and judgements are used in making these estimates and changes in assumptions and future events could cause the value of these provisions to change. This would include sublet premises becoming vacant, the liquidation of an assignee resulting in a property reverting to the Group or closing an uneconomic store and subletting at below contracted rent.
VII. Onerous contract provisionsThe Group makes a provision for specific onerous contracts where there is a shortfall between the anticipated revenues and costs pertaining to those contracts. Significant assumptions and judgements are used in making these estimates, and changes in assumptions and future events could cause the value of these provisions to change.
VIII. Value of put options held by non-controlling interestsThe Group recognises put options over non-controlling interests in its subsidiary undertakings as a liability in the Consolidated Statement of Financial Position at the present value of the estimated exercise price of the put option. The present value of the non-controlling interests' put options are estimated based on expected earnings in Board-approved forecasts and the choice of a suitable discount rate. Upon initial recognition, and for subsequent changes on remeasurement of the liability, a corresponding entry is made to other equity.
IX. Estimation of useful economic lives of brand namesThe Group amortises brand names over their useful economic life. In determining the useful economic life of each brand name, the Board considers the market position of the brands acquired, the nature of the market that the brands operate in, typical product life cycles of brands and the useful economic lives of similar assets that are used in comparable ways.
X. Determination of fair value of assets and liabilities on acquisition
For each acquisition, the Group reviews the appropriateness of the book values of the assets and liabilities acquired, taking into account the application of Group accounting policies, to determine if fair value adjustments are required. The key judgements involved are the identification and valuation of intangible assets which require the estimation of future cash flows based on the Board's strategic plans for the intangible asset, the useful economic life of the intangible asset and the selection of a suitable discount rate.
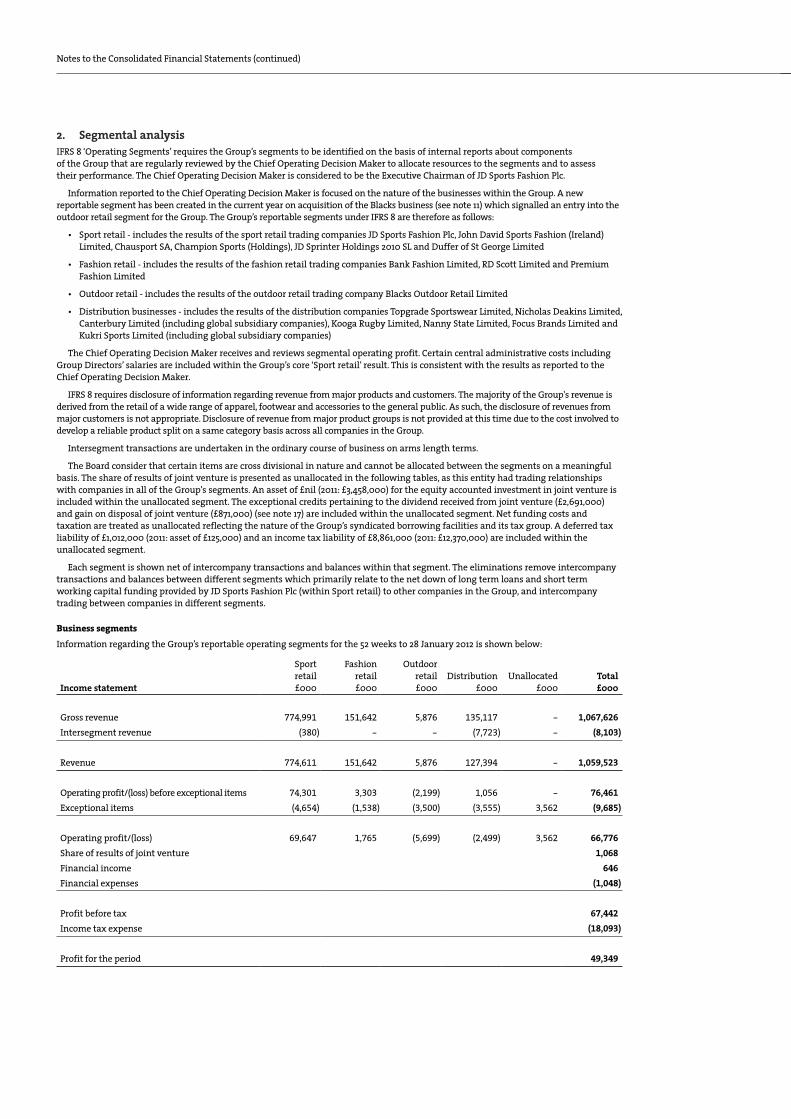
Notes to the Consolidated Financial Statements (continued)
2. Segmental analysisIFRS 8 ‘Operating Segments’ requires the Group’s segments to be identified on the basis of internal reports about components of the Group that are regularly reviewed by the Chief Operating Decision Maker to allocate resources to the segments and to assess their performance. The Chief Operating Decision Maker is considered to be the Executive Chairman of JD Sports Fashion Plc.
Information reported to the Chief Operating Decision Maker is focused on the nature of the businesses within the Group. A new reportable segment has been created in the current year on acquisition of the Blacks business (see note 11) which signalled an entry into the outdoor retail segment for the Group. The Group’s reportable segments under IFRS 8 are therefore as follows:
• Sport retail - includes the results of the sport retail trading companies JD Sports Fashion Plc, John David Sports Fashion (Ireland) Limited, Chausport SA, Champion Sports (Holdings), JD Sprinter Holdings 2010 SL and Duffer of St George Limited
• Fashion retail - includes the results of the fashion retail trading companies Bank Fashion Limited, RD Scott Limited and Premium Fashion Limited
• Outdoor retail - includes the results of the outdoor retail trading company Blacks Outdoor Retail Limited
• Distribution businesses - includes the results of the distribution companies Topgrade Sportswear Limited, Nicholas Deakins Limited, Canterbury Limited (including global subsidiary companies), Kooga Rugby Limited, Nanny State Limited, Focus Brands Limited and Kukri Sports Limited (including global subsidiary companies)
The Chief Operating Decision Maker receives and reviews segmental operating profit. Certain central administrative costs including Group Directors’ salaries are included within the Group’s core ‘Sport retail’ result. This is consistent with the results as reported to the Chief Operating Decision Maker.
IFRS 8 requires disclosure of information regarding revenue from major products and customers. The majority of the Group's revenue is derived from the retail of a wide range of apparel, footwear and accessories to the general public. As such, the disclosure of revenues from major customers is not appropriate. Disclosure of revenue from major product groups is not provided at this time due to the cost involved to develop a reliable product split on a same category basis across all companies in the Group.
Intersegment transactions are undertaken in the ordinary course of business on arms length terms.
The Board consider that certain items are cross divisional in nature and cannot be allocated between the segments on a meaningful basis. The share of results of joint venture is presented as unallocated in the following tables, as this entity had trading relationships with companies in all of the Group's segments. An asset of £nil (2011: £3,458,000) for the equity accounted investment in joint venture is included within the unallocated segment. The exceptional credits pertaining to the dividend received from joint venture (£2,691,000) and gain on disposal of joint venture (£871,000) (see note 17) are included within the unallocated segment. Net funding costs and taxation are treated as unallocated reflecting the nature of the Group’s syndicated borrowing facilities and its tax group. A deferred tax liability of £1,012,000 (2011: asset of £125,000) and an income tax liability of £8,861,000 (2011: £12,370,000) are included within the unallocated segment.
Each segment is shown net of intercompany transactions and balances within that segment. The eliminations remove intercompany transactions and balances between different segments which primarily relate to the net down of long term loans and short term working capital funding provided by JD Sports Fashion Plc (within Sport retail) to other companies in the Group, and intercompany trading between companies in different segments.
Business segments
Information regarding the Group’s reportable operating segments for the 52 weeks to 28 January 2012 is shown below:
Income statement
Sport retail £000
Fashion retail £000
Outdoor retail £000
Distribution £000
Unallocated £000
Total £000
Gross revenue 774,991 151,642 5,876 135,117 - 1,067,626 Intersegment revenue (380) - - (7,723) - (8,103)
Revenue 774,611 151,642 5,876 127,394 - 1,059,523
Operating profit/(loss) before exceptional items 74,301 3,303 (2,199) 1,056 - 76,461 Exceptional items (4,654) (1,538) (3,500) (3,555) 3,562 (9,685)
Operating profit/(loss) 69,647 1,765 (5,699) (2,499) 3,562 66,776 Share of results of joint venture 1,068 Financial income 646 Financial expenses (1,048)
Profit before tax 67,442 Income tax expense (18,093)
Profit for the period 49,349

62/63Notes to the Consolidated Financial Statements (continued)
2. Segmental analysis (continued)
Business segments (continued)
Total assets and liabilities
Sport retail £000
Fashion retail £000
Outdoor retail
£000 Distribution
£000 Unallocated
£000 Eliminations
£000 Total £000
Total assets 408,256 60,587 38,509 68,485 - (88,004) 487,833
Total liabilities (169,320) (53,852) (42,322) (71,222) (9,873) 88,004 (258,585)
Total segment net assets/(liabilities) 238,936 6,735 (3,813) (2,737) (9,873) - 229,248
Other segment information
Sport retail £000
Fashion retail £000
Outdoor retail
£000 Distribution
£000 Total £000
Capital expenditure: Brand names purchased 1,500 - - 211 1,711 Property, plant and equipment 37,656 4,090 - 2,100 43,846 Non-current other assets 1,903 - - - 1,903
Depreciation, amortisation and impairments: Depreciation and amortisation of non-current assets 18,990 3,618 - 1,745 24,353 Impairment of intangible assets - 838 - 1,877 2,715 Impairment of non-current assets 202 1,282 - 102 1,586
The comparative segmental results for the 52 weeks to 29 January 2011 are as follows:
Income statement
Sport retail £000
Fashion retail £000
Distribution £000
Total £000
Gross revenue 667,224 134,110 85,498 886,832 Intersegment revenue (1,290) (162) (1,711) (3,163)
Revenue 665,934 133,948 83,787 883,669
Operating profit before exceptional items 73,340 6,399 188 79,927 Exceptional items (2,687) (1,573) (24) (4,284)
Operating profit 70,653 4,826 164 75,643 Share of results of joint venture 2,823 Financial income 618 Financial expenses (455)
Profit before tax 78,629 Income tax expense (22,762)
Profit for the period 55,867
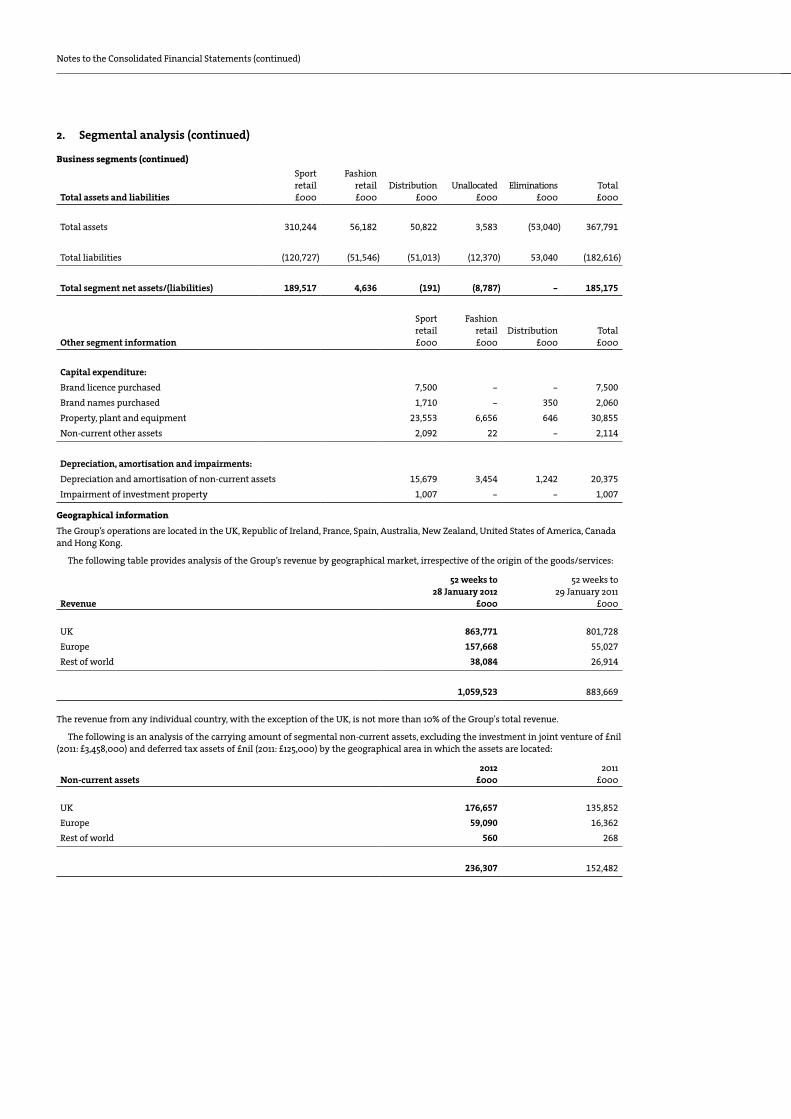
Notes to the Consolidated Financial Statements (continued)
2. Segmental analysis (continued)
Business segments (continued)
Total assets and liabilities
Sport retail £000
Fashion retail £000
Distribution £000
Unallocated £000
Eliminations £000
Total £000
Total assets 310,244 56,182 50,822 3,583 (53,040) 367,791
Total liabilities (120,727) (51,546) (51,013) (12,370) 53,040 (182,616)
Total segment net assets/(liabilities) 189,517 4,636 (191) (8,787) - 185,175
Other segment information
Sport retail£000
Fashion retail£000
Distribution£000
Total£000
Capital expenditure: Brand licence purchased 7,500 - - 7,500 Brand names purchased 1,710 - 350 2,060 Property, plant and equipment 23,553 6,656 646 30,855 Non-current other assets 2,092 22 - 2,114
Depreciation, amortisation and impairments: Depreciation and amortisation of non-current assets 15,679 3,454 1,242 20,375 Impairment of investment property 1,007 - - 1,007
Geographical information
The Group’s operations are located in the UK, Republic of Ireland, France, Spain, Australia, New Zealand, United States of America, Canada and Hong Kong.
The following table provides analysis of the Group’s revenue by geographical market, irrespective of the origin of the goods/services:
Revenue
52 weeks to28 January 2012
£000
52 weeks to29 January 2011
£000
UK 863,771 801,728 Europe 157,668 55,027 Rest of world 38,084 26,914
1,059,523 883,669
The revenue from any individual country, with the exception of the UK, is not more than 10% of the Group's total revenue.
The following is an analysis of the carrying amount of segmental non-current assets, excluding the investment in joint venture of £nil (2011: £3,458,000) and deferred tax assets of £nil (2011: £125,000) by the geographical area in which the assets are located:
Non-current assets 2012
£000 2011
£000
UK 176,657 135,852 Europe 59,090 16,362 Rest of world 560 268
236,307 152,482

64/65Notes to the Consolidated Financial Statements (continued)
3. Profit before tax
52 weeks to 28 January 2012
£000
52 weeks to 29 January 2011
£000
Profit before tax is stated after charging: Auditor’s remuneration: Fees payable to the Company’s auditor for the audit of the Company’s annual accounts 120 117 Fees payable to the Company’s auditor and its associates for other services: The audit of the Company’s subsidiaries pursuant to legislation 393 249 Other services pursuant to legislation 45 38 Tax services 160 94 All other services 55 11 Depreciation and amortisation of non-current assets: Depreciation of property, plant and equipment - owned 21,427 18,338 Depreciation of investment property - owned 3 46 Amortisation of intangible assets 2,451 1,460 Amortisation of non-current other assets - owned 472 531 Impairments of non-current assets: Property, plant and equipment 1,597 - Intangible assets (see note 4) 2,715 - Investment property (see note 4) - 1,007 Other non-current assets (11) - Rentals payable under non-cancellable operating leases for: Land and buildings 92,586 80,632 Other - plant and equipment 2,243 1,716 Provision to write down inventories to net realisable value 81 1,627 Foreign exchange loss recognised - 568
Profit before tax is stated after crediting: Rents receivable and other income from property 578 682 Sundry income 1,952 1,495 Foreign exchange gain recognised 1,438 -
In addition, fees of £35,000 (2011: £30,000) were incurred and paid by Pentland Group Plc (see note 35) in relation to the non-coterminous audit of the Group for the purpose of inclusion in their consolidated financial statements.
Non-current other assets comprise key money, store deposits and legal fees associated with the acquisition of leasehold interests (see note 16).

Notes to the Consolidated Financial Statements (continued)
4. Exceptional items
Note
52 weeks to 28 January 2012
£000
52 weeks to29 January 2011
£000
Loss on disposal of non-current assets (1) 1,148 1,440 Impairment of non-current assets (2) 1,586 - Onerous lease provision (3) 25 (214) 1,837 Reorganisation of the current warehouse operations (4) 3,000 - Closure of Canterbury North America LLC (5) 1,512 - Blacks restructuring (6) 3,500 -
Selling and distribution expenses - exceptional 10,532 3,277
Gain on acquisition (7) 17 (871) - Dividend received from joint venture (8) 17 (2,691) - Impairment of intangible assets (9) 2,715 - Impairment of investment property (10) 15 - 1,007
Administrative expenses - exceptional (847) 1,007
9,685 4,284
(1) Relates to the excess of net book value of property, plant and equipment and non-current other assets disposed over proceeds received
(2) Relates to property, plant and equipment and non-current other assets in cash-generating units which are loss making, where it is considered that this position cannot be recovered. The charge includes £101,000 in relation to the closure of the Canterbury North America LLC operations
(3) Relates to the net movement in the provision for onerous property leases on trading and non-trading stores (see note 25)
(4) Relates to the reorganisation of the current warehouse operations consisting of the provision of onerous property leases and redundancy costs
(5) Relates to the closure of the Canterbury North America LLC operations. Included in the impairment of non-current assets is a further £101,000 which relates to the closure of these operations
(6) Relates to the restructuring of the Blacks business following acquisition
(7) Relates to the remeasurement in fair value of the Group's previously held investment in Focus Brands Limited (see note 17)
(8) The dividend of £7,217,000 was received from Focus Brands Limited on 15 February 2011 prior to the Group's acquisition of a further 31% of the issued share capital of Focus Brands Limited. The dividend received was eliminated against the carrying value of the Group's equity accounted investment with the excess of £2,691,000 recognised in the Consolidated Income Statement as an exceptional credit
(9) Relates to the impairment in the period to 28 January 2012 of the goodwill and brand name arising on the acquisition of Kooga Rugby Limited and the fascia name arising on the acquisition of Premium Fashion Limited (see note 13)
(10) Relates to the impairment in the period to 29 January 2011 of investment property (see note 15)
These selling and distribution expenses and administrative expenses are exceptional items as they are, in aggregate, material in size and unusual or infrequent in nature.
5. Remuneration of Directors 52 weeks to
28 January 2012 £000
52 weeks to 29 January 2011
£000
Directors’ emoluments: As Non-Executive Directors 99 90 As Executive Directors 3,462 3,381 Pension contributions 49 47
3,610 3,518
The remuneration of the Executive Directors includes provision for future special retention scheme payments totalling £900,000 (2011: £nil) and provision for future LTIP payments of £417,000 (2011: £771,000). Further information on Directors’ emoluments is shown in the Directors' Remuneration Report on page 50.

66/67Notes to the Consolidated Financial Statements (continued)
6. Staff numbers and costsGroup
The average number of persons employed by the Group (including Directors) during the period, analysed by category, was as follows:
GROUP 2012 2011
Sales and distribution 16,791 10,906 Administration 591 325
17,382 11,231
Full time equivalents 10,626 6,759
The aggregate payroll costs of these persons were as follows:
GROUP
52 weeks to 28 January 2012
£000
52 weeks to29 January 2011
£000
Wages and salaries 155,369 122,946 Social security costs 14,018 9,711 Other pension costs (see note 30) 1,416 1,201
170,803 133,858
In the opinion of the Board, the key management as defined under revised IAS 24 'Related Party Disclosures' are the six Executive and Non-Executive Directors (2011: six). Full disclosure of the Directors' remuneration is given in the Directors' Remuneration Report on page 50.
Company
The average number of persons employed by the Company (including Directors) during the period, analysed by category, was as follows:
COMPANY 2012 2011
Sales and distribution 8,412 8,185 Administration 258 225
8,670 8,410
Full time equivalents 5,114 4,899
The aggregate payroll costs of these persons were as follows:
COMPANY
52 weeks to 28 January 2012
£000
52 weeks to29 January 2011
£000
Wages and salaries 91,548 85,913 Social security costs 6,289 5,911 Other pension costs 485 484
98,322 92,308
7. Financial income 52 weeks to
28 January 2012 £000
52 weeks to29 January 2011
£000
Bank interest 572 579 Other interest 74 39
646 618
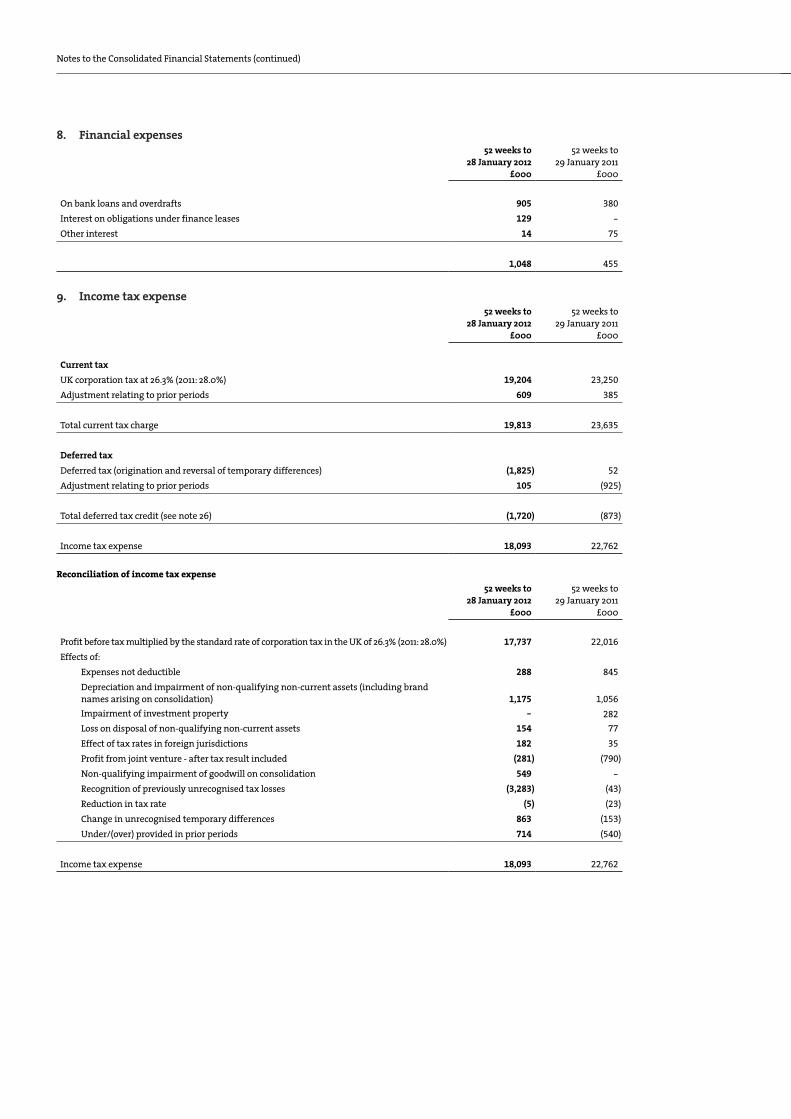
Notes to the Consolidated Financial Statements (continued)
8. Financial expenses 52 weeks to
28 January 2012 £000
52 weeks to 29 January 2011
£000
On bank loans and overdrafts 905 380 Interest on obligations under finance leases 129 - Other interest 14 75
1,048 455
9. Income tax expense 52 weeks to
28 January 2012 £000
52 weeks to 29 January 2011
£000
Current tax UK corporation tax at 26.3% (2011: 28.0%) 19,204 23,250 Adjustment relating to prior periods 609 385
Total current tax charge 19,813 23,635
Deferred tax Deferred tax (origination and reversal of temporary differences) (1,825) 52 Adjustment relating to prior periods 105 (925)
Total deferred tax credit (see note 26) (1,720) (873)
Income tax expense 18,093 22,762
Reconciliation of income tax expense 52 weeks to
28 January 2012 £000
52 weeks to29 January 2011
£000
Profit before tax multiplied by the standard rate of corporation tax in the UK of 26.3% (2011: 28.0%) 17,737 22,016 Effects of: Expenses not deductible 288 845 Depreciation and impairment of non-qualifying non-current assets (including brand
names arising on consolidation) 1,175 1,056 Impairment of investment property - 282 Loss on disposal of non-qualifying non-current assets 154 77 Effect of tax rates in foreign jurisdictions 182 35 Profit from joint venture - after tax result included (281) (790) Non-qualifying impairment of goodwill on consolidation 549 - Recognition of previously unrecognised tax losses (3,283) (43) Reduction in tax rate (5) (23) Change in unrecognised temporary differences 863 (153) Under/(over) provided in prior periods 714 (540)
Income tax expense 18,093 22,762
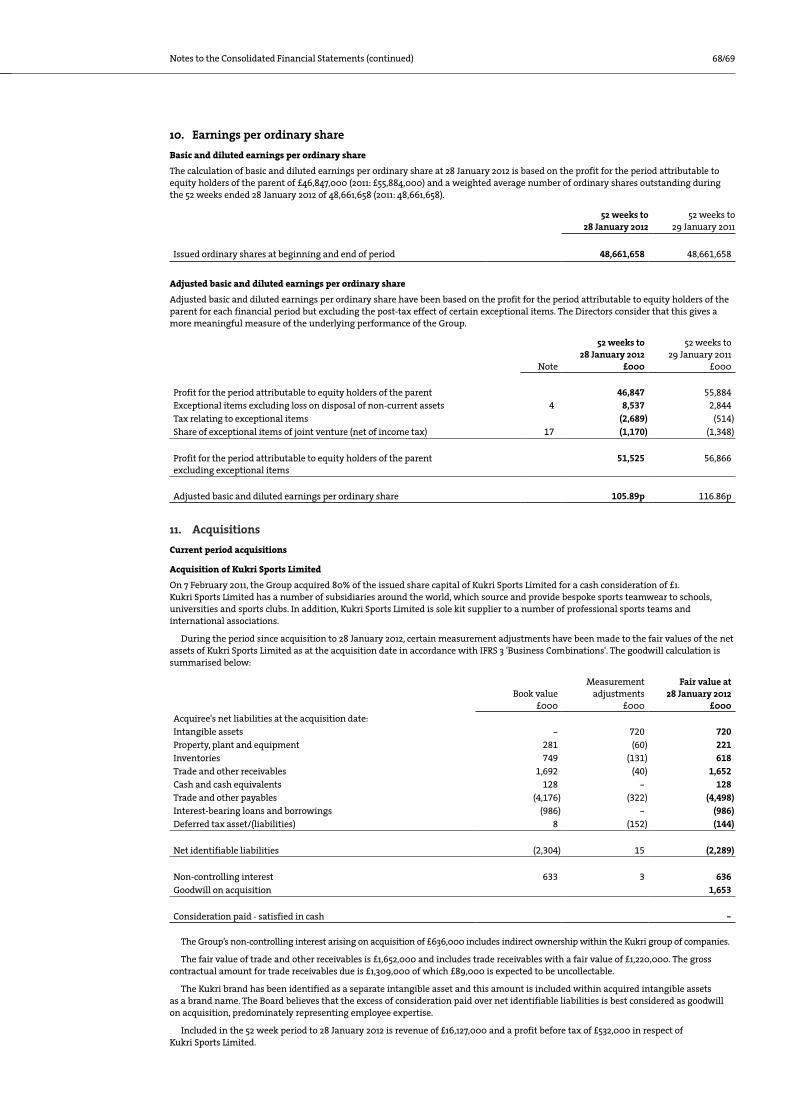
68/69Notes to the Consolidated Financial Statements (continued)
10. Earnings per ordinary share Basic and diluted earnings per ordinary share
The calculation of basic and diluted earnings per ordinary share at 28 January 2012 is based on the profit for the period attributable to equity holders of the parent of £46,847,000 (2011: £55,884,000) and a weighted average number of ordinary shares outstanding during the 52 weeks ended 28 January 2012 of 48,661,658 (2011: 48,661,658).
52 weeks to 28 January 2012
52 weeks to29 January 2011
Issued ordinary shares at beginning and end of period 48,661,658 48,661,658
Adjusted basic and diluted earnings per ordinary share
Adjusted basic and diluted earnings per ordinary share have been based on the profit for the period attributable to equity holders of the parent for each financial period but excluding the post-tax effect of certain exceptional items. The Directors consider that this gives a more meaningful measure of the underlying performance of the Group.
Note
52 weeks to 28 January 2012
£000
52 weeks to 29 January 2011
£000
Profit for the period attributable to equity holders of the parent 46,847 55,884 Exceptional items excluding loss on disposal of non-current assets 4 8,537 2,844 Tax relating to exceptional items (2,689) (514)Share of exceptional items of joint venture (net of income tax) 17 (1,170) (1,348)
Profit for the period attributable to equity holders of the parent excluding exceptional items
51,525 56,866
Adjusted basic and diluted earnings per ordinary share 105.89p 116.86p
11. AcquisitionsCurrent period acquisitions
Acquisition of Kukri Sports Limited
On 7 February 2011, the Group acquired 80% of the issued share capital of Kukri Sports Limited for a cash consideration of £1. Kukri Sports Limited has a number of subsidiaries around the world, which source and provide bespoke sports teamwear to schools, universities and sports clubs. In addition, Kukri Sports Limited is sole kit supplier to a number of professional sports teams and international associations.
During the period since acquisition to 28 January 2012, certain measurement adjustments have been made to the fair values of the net assets of Kukri Sports Limited as at the acquisition date in accordance with IFRS 3 'Business Combinations'. The goodwill calculation is summarised below:
Book value £000
Measurement adjustments
£000
Fair value at 28 January 2012
£000 Acquiree's net liabilities at the acquisition date:Intangible assets - 720 720 Property, plant and equipment 281 (60) 221 Inventories 749 (131) 618 Trade and other receivables 1,692 (40) 1,652 Cash and cash equivalents 128 - 128 Trade and other payables (4,176) (322) (4,498)Interest-bearing loans and borrowings (986) - (986)Deferred tax asset/(liabilities) 8 (152) (144)
Net identifiable liabilities (2,304) 15 (2,289)
Non-controlling interest 633 3 636 Goodwill on acquisition 1,653
Consideration paid - satisfied in cash -
The Group’s non-controlling interest arising on acquisition of £636,000 includes indirect ownership within the Kukri group of companies.
The fair value of trade and other receivables is £1,652,000 and includes trade receivables with a fair value of £1,220,000. The gross contractual amount for trade receivables due is £1,309,000 of which £89,000 is expected to be uncollectable.
The Kukri brand has been identified as a separate intangible asset and this amount is included within acquired intangible assets as a brand name. The Board believes that the excess of consideration paid over net identifiable liabilities is best considered as goodwill on acquisition, predominately representing employee expertise.
Included in the 52 week period to 28 January 2012 is revenue of £16,127,000 and a profit before tax of £532,000 in respect of Kukri Sports Limited.
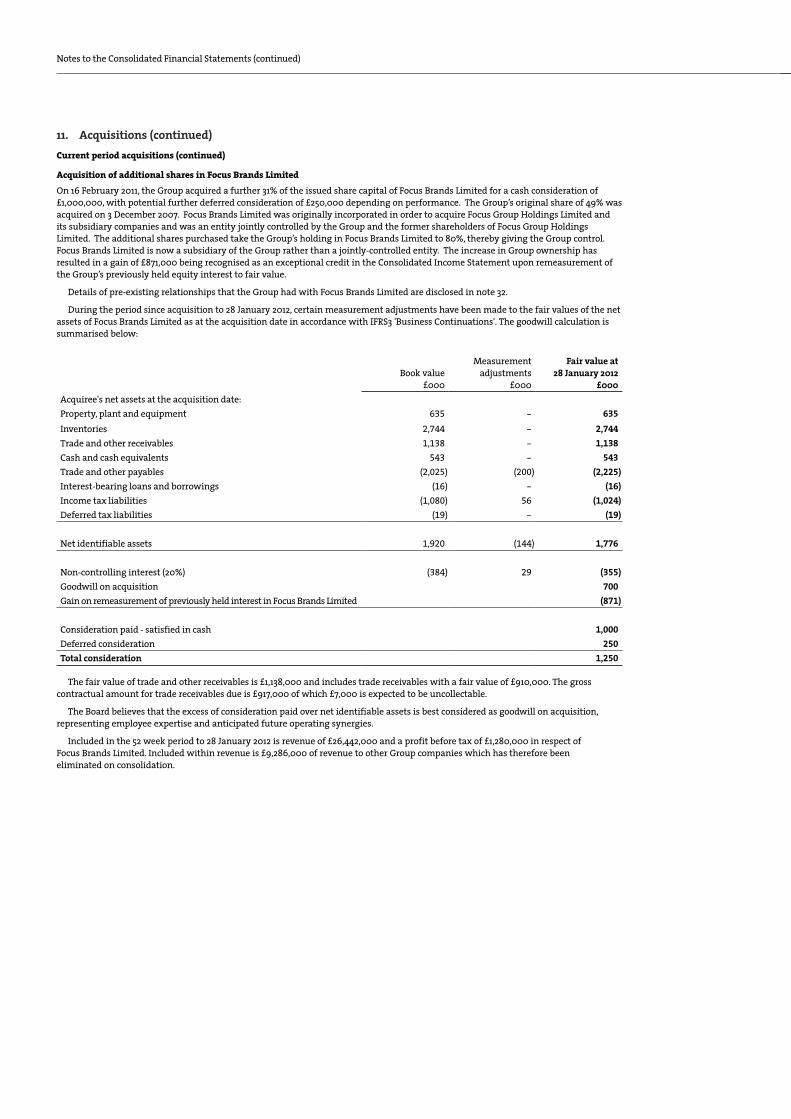
Notes to the Consolidated Financial Statements (continued)
11. Acquisitions (continued)Current period acquisitions (continued)
Acquisition of additional shares in Focus Brands Limited
On 16 February 2011, the Group acquired a further 31% of the issued share capital of Focus Brands Limited for a cash consideration of £1,000,000, with potential further deferred consideration of £250,000 depending on performance. The Group’s original share of 49% was acquired on 3 December 2007. Focus Brands Limited was originally incorporated in order to acquire Focus Group Holdings Limited and its subsidiary companies and was an entity jointly controlled by the Group and the former shareholders of Focus Group Holdings Limited. The additional shares purchased take the Group’s holding in Focus Brands Limited to 80%, thereby giving the Group control. Focus Brands Limited is now a subsidiary of the Group rather than a jointly-controlled entity. The increase in Group ownership has resulted in a gain of £871,000 being recognised as an exceptional credit in the Consolidated Income Statement upon remeasurement of the Group’s previously held equity interest to fair value.
Details of pre-existing relationships that the Group had with Focus Brands Limited are disclosed in note 32.
During the period since acquisition to 28 January 2012, certain measurement adjustments have been made to the fair values of the net assets of Focus Brands Limited as at the acquisition date in accordance with IFRS3 'Business Continuations'. The goodwill calculation is summarised below:
Book value £000
Measurementadjustments
£000
Fair value at 28 January 2012
£000 Acquiree's net assets at the acquisition date:Property, plant and equipment 635 - 635 Inventories 2,744 - 2,744 Trade and other receivables 1,138 - 1,138 Cash and cash equivalents 543 - 543 Trade and other payables (2,025) (200) (2,225)Interest-bearing loans and borrowings (16) - (16)Income tax liabilities (1,080) 56 (1,024)Deferred tax liabilities (19) - (19)
Net identifiable assets 1,920 (144) 1,776
Non-controlling interest (20%) (384) 29 (355)Goodwill on acquisition 700 Gain on remeasurement of previously held interest in Focus Brands Limited (871)
Consideration paid - satisfied in cash 1,000 Deferred consideration 250 Total consideration 1,250
The fair value of trade and other receivables is £1,138,000 and includes trade receivables with a fair value of £910,000. The gross contractual amount for trade receivables due is £917,000 of which £7,000 is expected to be uncollectable.
The Board believes that the excess of consideration paid over net identifiable assets is best considered as goodwill on acquisition, representing employee expertise and anticipated future operating synergies.
Included in the 52 week period to 28 January 2012 is revenue of £26,442,000 and a profit before tax of £1,280,000 in respect of Focus Brands Limited. Included within revenue is £9,286,000 of revenue to other Group companies which has therefore been eliminated on consolidation.

70/71Notes to the Consolidated Financial Statements (continued)
11. Acquisitions (continued)Current period acquisitions (continued)
Acquisition of Champion Sports (Holdings)
On 4 April 2011, the Group (via its subsidiaries The John David Group Limited and JD Sports Limited) acquired 100% of the issued share capital of Champion Sports (Holdings) for a cash consideration of £6 (€7) and have also advanced £15,066,000 (€17,100,000) to allow it to settle all of its indebtedness save for a maximum potential liability of £2,203,000 (€2,500,000) of leasing finance.
Champion was founded in 1992 and is one of the leading retailers of sports apparel and footwear in the Republic of Ireland with 22 stores in premium locations in town centres and shopping centres. On acquisition, Champion has one store In Northern Ireland, which has subsequently closed.
During the period since acquisition to 28 January 2012, certain measurement adjustments have been made to the fair values of the net assets of Champion Sports (Holdings) as at the acquisition date in accordance with IFRS 3 'Business Combinations'.
The goodwill calculation is summarised below:
Book value £000
Measurementadjustments
£000
Fair value at 28 January 2012
£000 Acquiree's net liabilities at the acquisition date:Intangible assets - 2,000 2,000 Property, plant and equipment 6,384 - 6,384 Inventories 4,560 - 4,560 Trade and other receivables 2,645 - 2,645 Cash and cash equivalents 1,456 - 1,456 Interest-bearing loans and borrowings (40,677) 23,695 (16,982)Trade and other payables (9,660) (411) (10,071)Provisions (1,416) - (1,416)Deferred tax liabilities (141) (879) (1,020)
Net identifiable liabilities (36,849) 24,405 (12,444)
Goodwill on acquisition 12,444
Consideration paid - satisfied in cash -
Measurement adjustments include a reduction of £23,695,000 in interest-bearing loans and borrowings following an agreement with the lender.
The fair value of trade and other receivables is £2,645,000 and includes trade receivables with a fair value of £12,000. The gross contractual amount for trade receivables is £12,000 of which £nil is expected to be uncollectable.
The intangible asset acquired represents the fair value of the ‘Champion’ fascia name (see note 13). The Board believes that the excess of consideration paid over net identifiable liabilities is best considered as goodwill on acquisition, representing employee expertise and anticipated future operating synergies.
Subsequent to the acquisition and prior to 28 January 2012 the loan of €17,100,000 has been capitalised as an investment (see note 18).
Included in the 52 week period to 28 January 2012 is revenue of £36,916,000 and a loss before tax of £119,000 in respect of Champion Sports (Holdings).
Premium Fashion Limited
On 18 June 2011, the Group acquired, via its subsidiary Premium Fashion Limited, the trade and assets of eight stores trading as Cecil Gee along with the Cecil Gee name and inventory from Moss Bros Group Plc for a cash consideration of £1,598,000. No measurement adjustments have been made from the date of acquisition to 28 January 2012.
Subsequently 15% of the issued share capital of Premium Fashion Limited has been disposed of (see note 12).
Included in the 52 week period to 28 January 2012 is revenue of £6,030,000 and a loss before tax of £1,420,000 in respect of Premium Fashion Limited.
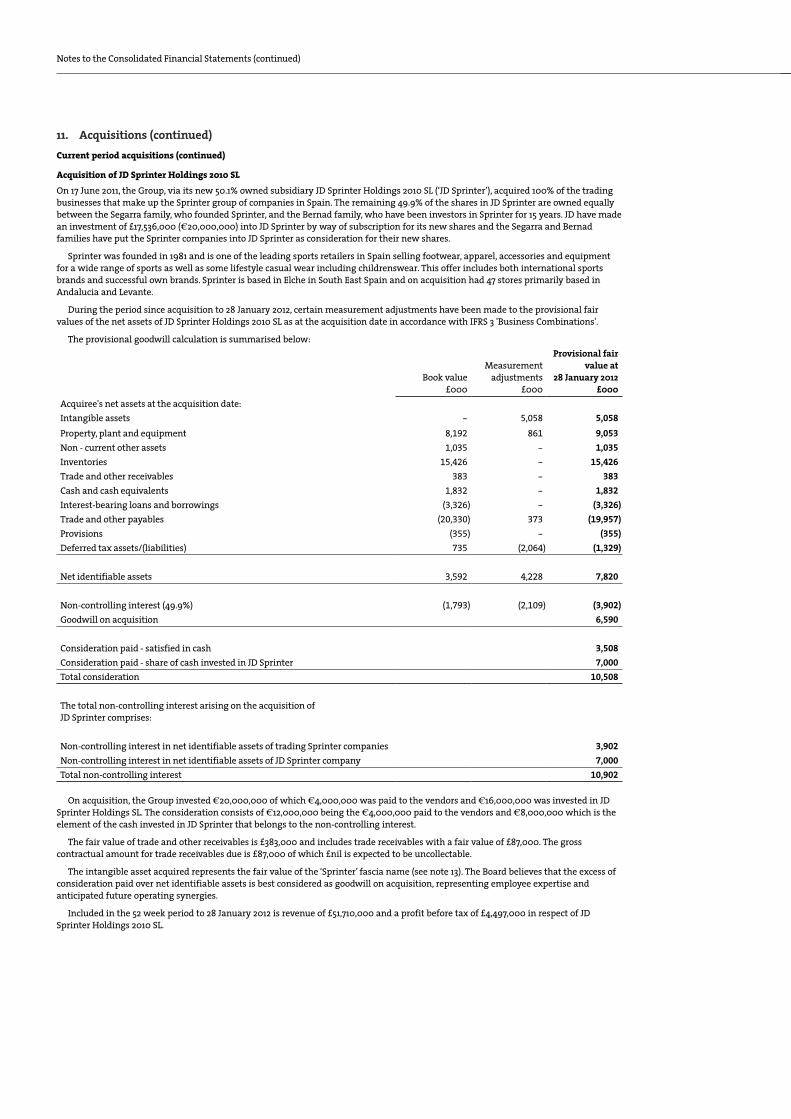
Notes to the Consolidated Financial Statements (continued)
11. Acquisitions (continued)Current period acquisitions (continued)
Acquisition of JD Sprinter Holdings 2010 SL
On 17 June 2011, the Group, via its new 50.1% owned subsidiary JD Sprinter Holdings 2010 SL (‘JD Sprinter’), acquired 100% of the trading businesses that make up the Sprinter group of companies in Spain. The remaining 49.9% of the shares in JD Sprinter are owned equally between the Segarra family, who founded Sprinter, and the Bernad family, who have been investors in Sprinter for 15 years. JD have made an investment of £17,536,000 (€20,000,000) into JD Sprinter by way of subscription for its new shares and the Segarra and Bernad families have put the Sprinter companies into JD Sprinter as consideration for their new shares.
Sprinter was founded in 1981 and is one of the leading sports retailers in Spain selling footwear, apparel, accessories and equipment for a wide range of sports as well as some lifestyle casual wear including childrenswear. This offer includes both international sports brands and successful own brands. Sprinter is based in Elche in South East Spain and on acquisition had 47 stores primarily based in Andalucia and Levante.
During the period since acquisition to 28 January 2012, certain measurement adjustments have been made to the provisional fair values of the net assets of JD Sprinter Holdings 2010 SL as at the acquisition date in accordance with IFRS 3 'Business Combinations'.
The provisional goodwill calculation is summarised below:
Book value £000
Measurement adjustments
£000
Provisional fair value at
28 January 2012 £000
Acquiree's net assets at the acquisition date:Intangible assets - 5,058 5,058 Property, plant and equipment 8,192 861 9,053 Non - current other assets 1,035 - 1,035 Inventories 15,426 - 15,426 Trade and other receivables 383 - 383 Cash and cash equivalents 1,832 - 1,832 Interest-bearing loans and borrowings (3,326) - (3,326)Trade and other payables (20,330) 373 (19,957)Provisions (355) - (355)Deferred tax assets/(liabilities) 735 (2,064) (1,329)
Net identifiable assets 3,592 4,228 7,820
Non-controlling interest (49.9%) (1,793) (2,109) (3,902)Goodwill on acquisition 6,590
Consideration paid - satisfied in cash 3,508 Consideration paid - share of cash invested in JD Sprinter 7,000 Total consideration 10,508
The total non-controlling interest arising on the acquisition of JD Sprinter comprises:
Non-controlling interest in net identifiable assets of trading Sprinter companies 3,902 Non-controlling interest in net identifiable assets of JD Sprinter company 7,000 Total non-controlling interest 10,902
On acquisition, the Group invested €20,000,000 of which €4,000,000 was paid to the vendors and €16,000,000 was invested in JD Sprinter Holdings SL. The consideration consists of €12,000,000 being the €4,000,000 paid to the vendors and €8,000,000 which is the element of the cash invested in JD Sprinter that belongs to the non-controlling interest.
The fair value of trade and other receivables is £383,000 and includes trade receivables with a fair value of £87,000. The gross contractual amount for trade receivables due is £87,000 of which £nil is expected to be uncollectable.
The intangible asset acquired represents the fair value of the ‘Sprinter’ fascia name (see note 13). The Board believes that the excess of consideration paid over net identifiable assets is best considered as goodwill on acquisition, representing employee expertise and anticipated future operating synergies.
Included in the 52 week period to 28 January 2012 is revenue of £51,710,000 and a profit before tax of £4,497,000 in respect of JD Sprinter Holdings 2010 SL.

72/73Notes to the Consolidated Financial Statements (continued)
11. Acquisitions (continued)Current period acquisitions (continued)
Blacks Outdoor Retail Limited
On 9 January 2012, the Group acquired, via its subsidiary Blacks Outdoor Retail Limited, the trade and assets of Blacks Leisure Group Plc and certain of its subsidiaries from its Administrators for a total cash consideration of £20,000,000.
Blacks is a long established retailer of specialist outdoor footwear, apparel and equipment and has two fascias (Blacks and Millets) and was trading from 296 stores at the point of its administration. In addition to selling third party brands such as North Face and Berghaus, Blacks has two strong own brands in Peter Storm and Eurohike.
The provisional goodwill calculation is summarised below:
Book value £000
Measurement adjustments
£000
Provisional fair value at
28 January 2012£000
Acquiree's net assets at acquisition date: Intangible Assets 3,000 8,500 11,500 Other assets - 1,650 1,650 Property, plant and equipment 6,799 (3,799) 3,000 Inventories 6,692 - 6,692 Cash 60 - 60 Trade and other receivables 3,449 1,900 5,349 Trade and other payables - (13,022) (13,022)Deferred tax liabilities - (413) (413)
Net identifiable assets 20,000 (5,184) 14,816
Goodwill on acquisition 5,184
Consideration paid - satisfied in cash 20,000
Measurement adjustments include accruals of £13,022,000 for Retention of Title and other claims arising consequent to the Administration process.
The fair value of trade and other receivables is £5,349,000 and includes trade receivables with a fair value of £nil.
The intangible assets acquired represent the fair value of the Peter Storm and Eurohike brands as well as the ‘Blacks’ and 'Millets' fascia names (see note 13). The Board believes that the excess of consideration paid over net identifiable assets is best considered as goodwill on acquisition, representing employee expertise and anticipated future operating synergies.
Included in the 52 week period to 28 January 2012 is revenue of £5,876,000 and a loss before tax of £5,699,000 in respect of Blacks Outdoor Retail Limited.
Full year impact of acquisitions
Had the acquisitions of Kukri Sports Limited, Focus Brands Limited, Champion Sports (Holdings), JD Sprinter Holdings 2010 SL, Premium Fashion Limited and Blacks Outdoor Retail Limited been effected at 30 January 2011, the revenue and profit before tax of the Group for the 52 week period to 28 January 2012 would have been £1,254,938,000 and £40,710,000 respectively.
Acquisition costs
Acquisition-related costs amounting to £495,000 (Kukri Sports Limited: £40,000; Focus Brands Limited: £40,000; Champion Sports (Holdings): £120,000; JD Sprinter Holdings 2010 SL: £160,000; Premium Fashion Limited: £45,000 and Blacks Outdoor Retail Limited: £90,000) have been excluded from the consideration transferred and have been recognised as an expense in the year, within administrative expenses in the Consolidated Income Statement.
Prior period acquisitions
Acquisition of non-controlling interest in Topgrade Sportswear Limited
On 21 June 2010, the Group acquired a further 29% of the issued share capital of Hallco 1521 Limited (the intermediate holding company of Topgrade Sportswear Limited) for a cash consideration of £1,200,000. This takes the Group’s holding to 80%. The Group’s original share of 51% was acquired on 7 November 2007. Topgrade Sportswear Limited is a distributor and multichannel retailer of sports and fashion clothing and footwear. As the Group already had control of Hallco 1521 Limited, the increase in Group ownership has been accounted for as an equity transaction. No measurement adjustments were made to the fair value in the 52 week period to 28 January 2012.
Nanny State Limited
On 4 August 2010, the Group (via its new subsidiary Nanny State Limited) acquired the global rights to the fashion footwear and apparel brand, 'Nanny State', from D.R.I.P Brands Limited (in administration) and D.R. Shoes Limited (in administration) for a cash consideration of £350,000. Inventory with a value of £141,000 and other debtors with a value of £86,000 were also acquired. The book value of the assets acquired is considered to be the fair value. No measurement adjustments were made to the fair value in the 52 week period to 28 January 2012.

Notes to the Consolidated Financial Statements (continued)
12. DisposalsCurrent year disposals
Disposal of 15% of issued ordinary share capital of Premium Fashion Limited
On 2 December 2011, JD Sports Fashion Plc disposed of 15% of the issued ordinary share capital of Premium Fashion Limited to Benba Investments Limited, Chape Investments Limited and Ginda Investments Limited by issuing 1,500 new shares (500 shares to each new shareholder) in exchange for a cash consideration of £1,500. This reduces the Group’s shareholding to 85%, as simultaneously to this Premium Fashion Limited allotted JD Sports Fashion Plc a further 8,499 shares for a cash consideration of £8,499. As the Group has maintained control of Premium Fashion Limited, the decrease in Group ownership has been accounted for as an equity transaction.
Prior year disposals
Disposal of 25% of issued ordinary share capital of Canterbury International (Australia) Pty Limited
On 28 January 2011, Canterbury Limited disposed of 25% of the issued ordinary share capital of Canterbury International (Australia) Pty Limited to the local management team by issuing new shares in exchange for a cash consideration of AUD $1,100,000. This takes the Group’s shareholding to 75%. As the Group has maintained control of Canterbury International (Australia) Pty Limited, the decrease in Group ownership has been accounted for as an equity transaction.
13. Intangible assets
GROUP Goodwill
£000
Brand licences
£000
Brand names
£000
Fascia name £000
Total £000
Cost or valuation At 30 January 2010 42,341 4,279 9,167 5,481 61,268 Acquisitions - 7,500 2,060 - 9,560
At 29 January 2011 42,341 11,779 11,227 5,481 70,828 Acquisitions 26,571 - 5,431 16,396 48,398 Exchange differences (1,006) - - (727) (1,733)
At 28 January 2012 67,906 11,779 16,658 21,150 117,493
Amortisation and impairment At 30 January 2010 9,869 784 400 - 11,053 Charge for the period - 424 1,036 - 1,460
At 29 January 2011 9,869 1,208 1,436 - 12,513 Charge for the period - 1,111 1,340 - 2,451 Impairments 1,537 - 340 838 2,715
At 28 January 2012 11,406 2,319 3,116 838 17,679
Net book value At 28 January 2012 56,500 9,460 13,542 20,312 99,814
At 29 January 2011 32,472 10,571 9,791 5,481 58,315
At 30 January 2010 32,472 3,495 8,767 5,481 50,215
Impairment
The impairment in the period relates to the goodwill and brand name totalling £1,877,000 on the acquisition of the entire issued share capital of Kooga Rugby Limited in 2009 and the Cecil Gee fascia name of £838,000 arising on the acquisition of the trade and assets of Cecil Gee from Moss Bros in June 2011.
Kooga Rugby Limited performance has not progressed sufficiently to carry on justifying the carrying value of the goodwill and brand name and so, accordingly, the Board believes that the balance of £1,877,000 should be impaired.
The fair value of the ‘Cecil Gee’ fascia name acquired as part of the acquisition on 18 June 2011 of the trade and assets of 8 stores trading as Cecil Gee from Moss Bros Group Plc was £838,000. Management will rebrand these stores in the longer term. Consequently the Board believes that the fascia name should be impaired as at 28 January 2012.

74/75Notes to the Consolidated Financial Statements (continued)
13. Intangible assets (continued)Brand licences
Brand licences comprise the following:
GROUP Terms Segment Cost
£000
Net book value
2012 £000
Net book value
2011 £000
Fila
10 year license for exclusive use of the brand in the UK and Republic
of Ireland Sport 7,500 6,688 7,437
Sergio TacchiniSub-licence to use the brand in the
UK until 2019 Sport 4,279 2,772 3,134
9,460 10,571
Brand licences are being amortised on a straight line basis over the licence period. Amortisation of these intangibles is included within cost of sales in the Consolidated Income Statement.
Brand names
Brand names comprise the following:
GROUP Acquisition
date Segment Cost
£000
Net book value
2012 £000
Net book value
2011 £000
Fenchurch 17 March 2011 Sport 1,100 999 - Peter Werth 26 May 2011 Sport 400 373 - Sonneti 26 April 2010 Sport 1,520 1,292 1,444 Chilli Pepper 18 June 2010 Sport 190 162 181 Duffer of St George 24 November 2009 Sport 2,042 1,558 1,779 Peter Storm 9 January 2012 Outdoor 2,250 2,250 - Eurohike 9 January 2012 Outdoor 750 750 - Kukri 7 February 2011 Distribution 720 648 - Canterbury 4 August 2009 Distribution 6,884 5,212 5,672 Kooga 3 July 2009 Distribution 453 - 382 Nanny State 4 August 2010 Distribution 350 298 333
13,542 9,791
All brand names are being amortised over a period of 10 years and the amortisation charge is included within administrative expenses in the Consolidated Income Statement.
Fascia name
Fascia names comprise the following:
GROUP Segment Cost
£000
Net book value
2012 £000
Net book value
2011 £000
Champion Sport 2,000 2,000 - Sprinter Sport 5,058 4,331 - Blacks Outdoor 8,000 8,000 - Millets Outdoor 500 500 - Bank Fashion 5,481 5,481 5,481 Cecil Gee Fashion 838 - -
20,312 5,481
Fascia names are not being amortised as management consider these assets to have indefinite useful economic life. Factors considered by the Board in determining that the useful life of the fascia names are indefinite for all fascia names, with the exception of 'Cecil Gee' include:
• The strength of the respective fascia names in the relevant sector and geographic region where the fascia is located
• The history of the fascia names and that of similar assets in the UK (in relation to Blacks, Millets and Bank), Republic of Ireland (Champion) and Spain (Sprinter) retail sectors
• The commitment of the Group to continue to operate these stores separately for the foreseeable future, including the ongoing investment in new stores and refurbishments
As described on page 74 the 'Cecil Gee' fascia name has been fully impaired as at 28 January 2012.

Notes to the Consolidated Financial Statements (continued)
13. Intangible assets (continued)
COMPANY Goodwill
£000 Brand licences
£000 Brand names
£000 Total £000
Cost or valuation At 30 January 2010 19,945 4,279 - 24,224 Acquisitions - 7,500 1,710 9,210
At 29 January 2011 19,945 11,779 1,710 33,434 Acquisitions - - 1,500 1,500
At 28 January 2012 19,945 11,779 3,210 34,934
Amortisation and impairment At 30 January 2010 4,045 784 - 4,829 Charge for the period - 424 85 509
At 29 January 2011 4,045 1,208 85 5,338 Charge for the period - 1,111 299 1,410
At 28 January 2012 4,045 2,319 384 6,748
Net book value At 28 January 2012 15,900 9,460 2,826 28,186
At 29 January 2011 15,900 10,571 1,625 28,096
At 30 January 2010 15,900 3,495 - 19,395
Impairment tests for cash-generating units containing goodwill
Goodwill and fascia names are allocated to the Group’s cash-generating units ('CGUs') and tested annually for impairment. The CGUs used are either the store portfolios or distribution businesses. The recoverable amount is compared to the carrying amount of the CGU including goodwill and fascia names.
The recoverable amount of a CGU is determined based on value-in-use calculations. The carrying amount of goodwill and fascia name by CGU is shown below
GROUP COMPANY
Goodwill 2012
£000
Fascia name
2012 £000
2012
£000
Goodwill 2011
£000
Fascia name
2011 £000
2011
£000
Goodwill 2012
£000
Goodwill 2011
£000
Allsports store portfolio 924 - 924 924 - 924 924 924 First Sport store portfolio 14,976 - 14,976 14,976 - 14,976 14,976 14,976 Bank store portfolio 14,154 5,481 19,635 14,154 5,481 19,635 - - Champion store portfolio 11,765 2,000 13,765 - - - - - Sprinter store portfolio 6,263 4,331 10,594 - - - - - Topgrade Sportswear Limited 17 - 17 17 - 17 - - Nicholas Deakins Limited 864 - 864 864 - 864 - - Kooga Rugby Limited - - - 1,537 - 1,537 - - Kukri Sports Limited 1,653 - 1,653 - - - - - Blacks store portfolio 5,184 8,000 13,184 - - - - - Millets store portfolio - 500 500 - - - - - Focus Brands Limited 700 - 700 - - - - -
56,500 20,312 76,812 32,472 5,481 37,953 15,900 15,900

76/77Notes to the Consolidated Financial Statements (continued)
13. Intangible assets (continued)Impairment tests for cash-generating units containing goodwill (continued)Goodwill and fascia names are allocated to the Group’s cash-generating units ('CGUs') and tested annually for impairment. The CGUs used are either the store portfolios or distribution businesses. The recoverable amount is compared to the carrying amount of the CGU including goodwill and fascia names.
The recoverable amount of a CGU is determined based on value-in-use calculations. The carrying amount of goodwill and fascia name by CGU is shown below.
The key assumptions used for value-in-use calculations are set out below:• In relation to the Allsports store portfolio, First Sport store
portfolio and Bank store portfolio, the cash flow projections are based on actual operating results, together with financial forecasts and strategy plans approved by the Board covering a five year period. These forecasts and plans are based on both past performance and expectations for future market development. Revenue is expected to grow by a compound annual growth rate of 1.0% in the first five year period for the First Sport store portfolio and 4.0% in the first five year period for the Bank store portfolio. Gross margins are assumed to be broadly consistent with recent historic levels. Cash flows beyond this five year period are extrapolated using a growth rate of 2.0% (2011: 2.0%) which is an estimate of the growth based on past experience within the Group taking account of economic growth forecasts for the sport and fashion retail industries
• In relation to the Champion store portfolio and the Sprinter store portfolio, which are newly acquired in the period, the cash flow projections are based on actual operating results from the period since acquisition, together with financial forecasts and strategy plans approved by the Board covering a five year period. These forecasts and plans reflect predicted synergies as a result of the business combination and expectations for future market development. For the Champion store portfolio, revenue is expected to grow by a compound annual growth rate of 2.0% in the first five year period, with a steady margin % improvement of 5.0% over this period in total to reflect implementation of enhanced group terms and a more focused strategy regarding stock and merchandising. For the Sprinter store portfolio, revenue is expected to grow by a compound annual growth rate of 3.0% in the first five year period, with a steady margin % improvement of 2.0% over this period in total to reflect a more focused strategy regarding stock and merchandising. Cash flows beyond this five year period are extrapolated using a growth rate of 2.0% which is an estimate of the growth based on past experience of other retail store portfolios in the Group taking account of economic growth forecasts for the sport retail industries
• In relation to the Blacks and Millets store portfolio which was newly acquired in the period, the cash flow projections are based on actual operating results from the period since acquisition, together with financial forecasts and strategy plans approved by the Board covering a five year period. These forecasts and plans reflect predicted synergies as a result of the business combination and expectations for future market development. Revenue is expected to grow by a compound annual growth rate of 5.00% in the first five year period. Cash flows beyond this five year period are extrapolated using a growth rate of 2.0% which is an estimate of the growth based on past experience of other retail store portfolios in the Group taking account of economic growth forecasts for the sport retail industries
• In relation to Nicholas Deakins Limited, the cash flow projections are based on actual divisional operating results together with financial forecasts and strategy plans approved by the Board covering a five year period. These forecasts are based on both past performance and expectations for future development. Cash flows beyond this five year period are extrapolated using a growth rate of up to 2.0% (2011: 2.0%) which is an estimate based on past experience
• In relation to Kukri Sports Limited and Focus Sports Limited, the cash flow projections are based on actual divisional operating results from the period since acquisition, together with financial forecasts and strategy plans approved by the Board covering a five year period. These forecasts are based on predicted synergies as a result of the business combination and expectations for future market development. Cash flows beyond this five year period are extrapolated using a growth rate of up to 2.0% (2011: 2.0%) which is an estimate based on past experience of other similar distribution businesses within the Group
• Kooga Rugby Limited has been fully impaired in the current period (see above)
• A discount rate of 12.2% (2011: 14.9%) has been used for all impairment reviews with the exception of Champion store portfolio and Sprinter store portfolio. This is pre-tax and reflects the current market assessments of the time value of money and any specific risk premiums relevant to the individual CGU's. A pre tax rate of 16.4% has been used for the Sprinter store portfolio to reflect the current market assessments of the time value of money and specific geographical market related premium. A pre tax rate of 16.1% has been used for the Champion store portfolio to reflect the current market assessments of the time value of money and specific geographical market related premium. These discount rates are considered to be equivalent to the rates a market participant would use.
Impairment tests for intangible assets with definite livesIntangible assets with definite lives are tested annually for impairment by comparing the recoverable amount to their carrying value.
Brand namesThe recoverable amount of brand names is determined based on a ‘royalty relief’ method of valuation, which takes projected future sales, applies a royalty rate to them and discounts the projected future post-tax royalties to arrive at a net present value. A value in use calculation is alternatively used where operating cash flows can be reliably allocated to a brand name. The Group has used a pre-tax discount rate of 12.2% (2011: 14.9%) to reflect current market assessments of the time value of money and risks specific to the assets, for which the future cash flow estimates have not been adjusted. This discount rate is considered to be equivalent to the rate a market participant would use. Projected future sales are based on Board approved forecasts up to five years, and subsequent sales projections assume an annual growth up to 2.0% over the remaining life of the brand names.
Brand licencesThe recoverable amount of brand licences is based on an estimation of future sales and other specific cash flows, the contracted royalty rate and the choice of a suitable discount rate in order to calculate the present value. The Group has used a pre-tax discount rate of 12.2% (2011: 14.9%) to reflect current market assessments of the time value of money and risks specific to the assets, for which future cash flow estimates have not been adjusted. This discount rate is considered to be equivalent to the rate a market participant would use. Projected future sales are based on a three year Board approved forecast. Subsequent sales projections assume an annual growth of 5.0% for the following two years and then 2.0% over the remaining licence period for the Sergio Tacchini license and an annual growth of 10.0% for the following two years and then 2.0% over the remaining licence period for the Fila license.
Sensitivity analysisA sensitivity analysis has been performed on the base case assumptions of sales growth and discounts rates used for assessing the goodwill.
For the Champion cash-generating unit, changes in key assumptions could cause the carrying value of the unit to exceed its recoverable amount.
The Board has considered the possibility of the business achieving less revenue and gross profit than budgeted. Whilst the reduction in revenue would be partially offset by a reduction in revenue related costs, the Board would also take actions to mitigate the loss of gross profit by reducing other costs.
Should the business have 0.0% sales growth beyond year five rather than the 2.0% assumed and be unable to reduce selling and distribution and administrative costs, the reduction in value-in-use would lead to an impairment of £1,529,000. All other assumptions remain unchanged.
Should the pre-tax discount rate increase by 2.0%, the reduction in value-in-use would lead to an impairment of £1,116,000. All other assumptions remain unchanged.
With regards to the assessment of value-in-use of all other cash-generating units, the Board believe that there are no reasonably possible changes in any of the key assumptions, which would cause the carrying value of the unit to exceed its recoverable amount.

Notes to the Consolidated Financial Statements (continued)
14. Property, plant and equipment
GROUP
Land and long leasehold
properties £000
Improvements
to short leasehold
properties £000
Computer equipment
£000
Fixtures and
fittings £000
Motor vehicles
£000
Assets in the course of construction
£000 Total £000
Cost At 30 January 2010 - 16,157 11,673 120,011 130 - 147,971 Additions 942 2,492 2,325 24,922 174 - 30,855 Disposals - (1,504) (304) (8,549) (124) - (10,481)Exchange differences - 59 73 (207) 7 - (68)
At 29 January 2011 942 17,204 13,767 136,177 187 - 168,277 Additions - 1,959 4,761 18,180 184 18,762 43,846 Disposals - (720) (3,094) (9,031) (243) - (13,088)Transfer from investment property 2,997 - - - - - 2,997 On acquisition of subsidiaries - - 1,409 17,469 415 - 19,293 Exchange differences - 124 25 (490) 4 - (337)
At 28 January 2012 3,939 18,567 16,868 162,305 547 18,762 220,988
Depreciation and impairment At 30 January 2010 - 8,579 8,742 63,193 23 - 80,537 Charge for period - 1,890 1,870 14,515 63 - 18,338 Disposals - (1,159) (285) (7,109) (94) - (8,647)Exchange differences - 53 69 (196) 3 - (71)
At 29 January 2011 - 9,363 10,396 70,403 (5) - 90,157 Charge for period 27 1,398 2,421 17,418 163 - 21,427 Disposals - (584) (3,040) (8,243) (115) - (11,982)Impairments - 21 106 1,470 - - 1,597 Exchange differences - 62 80 123 6 - 271
At 28 January 2012 27 10,260 9,963 81,171 49 - 101,470
Net book value At 28 January 2012 3,912 8,307 6,905 81,134 498 18,762 119,518
At 29 January 2011 942 7,841 3,371 65,774 192 - 78,120
At 30 January 2010 - 7,578 2,931 56,818 107 - 67,434
The carrying amount of the group's property, plant and equipment includes an amount of £2,165,000 (2011: £nil) in respect of assets held under finance leases, comprising fixtures and fittings of £2,080,000 (2011: £nil) and motor vehicles of £85,000 (2011: £nil). The depreciation charge on those assets for the current period was £567,000 (2011: £nil), comprising fixtures and fittings of £532,000 (2011: £nil) and motor vehicles of £35,000 (2011: £nil).
Impairment charges of £1,597,000 (2011: £nil) relate to all classes of property, plant and equipment in cash-generating units which are loss making and where it is considered that the position cannot be recovered as a result of a continuing deterioration in the performance in the particular store. The cash-generating units represent individual stores, or a collection of stores where the cash flows are not independent, with the loss based on the specific revenue streams and costs attributable to those cash-generating units. Assets in impaired stores are written down to their recoverable amount which is calculated as the greater of the fair value less costs to sell and value-in-use.

78/79Notes to the Consolidated Financial Statements (continued)
14. Property, plant and equipment (continued)
COMPANY Land £000
Improvements
to short leasehold
properties £000
Computer equipment
£000
Fixtures and
fittings £000
Motor vehicles
£000
Assets in the course of construction
£000 Total £000
Cost At 30 January 2010 - 12,790 10,608 93,870 158 - 117,426 Additions - 1,383 1,752 15,042 158 - 18,335 Exchange differences - (1,184) (197) (5,486) (82) - (6,949)
At 29 January 2011 - 12,989 12,163 103,426 234 - 128,812 Additions 942 1,116 3,501 8,427 - 18,762 32,748 Exchange differences - (525) (2,253) (6,307) (21) - (9,106)
At 28 January 2012 942 13,580 13,411 105,546 213 18,762 152,454
Depreciation and impairment At 30 January 2010 - 7,549 8,437 53,909 86 - 69,981 Charge for period - 1,279 1,438 10,477 44 - 13,238 Disposals - (935) (195) (4,763) (53) - (5,946)
At 29 January 2011 7,893 9,680 59,623 77 - 77,273 Charge for period - 950 1,556 10,050 42 - 12,598 Disposals - (435) (2,226) (5,907) (13) - (8,581)Impairments - 7 2 51 1 - 60
At 28 January 2012 - 8,415 9,012 63,817 107 - 81,351
Net book value At 28 January 2012 942 5,165 4,399 41,729 106 18,762 71,103
At 29 January 2011 - 5,096 2,483 43,803 157 - 51,539
At 30 January 2010 - 5,241 2,171 39,961 72 - 47,445

Notes to the Consolidated Financial Statements (continued)
15. Investment property GROUP £000
Cost At 30 January 2010 and 29 January 2011 4,160 Transfer to Property, Plant and Equipment (4,160)
At 28 January 2012 -
Depreciation and impairment At 30 January 2010 107 Charge for period 46 Impairment 1,007
At 29 January 2011 1,160 Charge for period 3 Transfer to Property, Plant and Equipment (1,163)
At 28 January 2012 -
Net book value At 28 January 2012 -
At 29 January 2011 3,000
At 30 January 2010 4,053
The investment property relates to a property leased to Focus Brands Limited. As such the property became owner-occupied from the perspective of the Group at the point when Focus Brands Limited became a subsidiary of the Group on 16 February 2011 (see note 11). The property remains an Investment Property from the Company perspective as at 28 January 2012.
COMPANY £000
Cost At 30 January 2010, 29 January 2011 and 28 January 2012 4,160
Depreciation and impairment At 30 January 2010 107 Charge for period 46 Impairment 1,007
At 29 January 2011 1,160 Charge for period 30
At 28 January 2012 1,190
Net book value At 28 January 2012 2,970
At 29 January 2011 3,000
At 30 January 2010 4,053
Based on an external valuation, the fair value of the investment property as at 28 January 2012 was £2,800,000 (2011: £3,000,000).
Management do not consider the investment property to be impaired as the rental income over the life of the lease until December 2023 supports the carrying value.
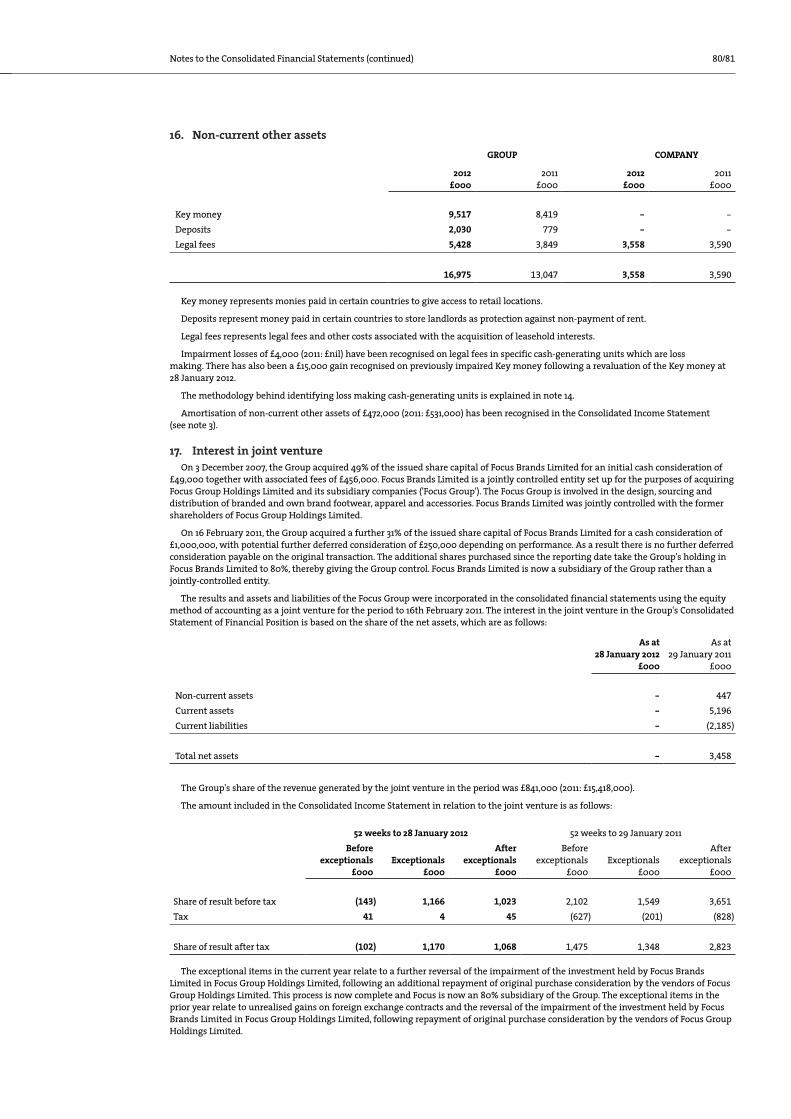
80/81Notes to the Consolidated Financial Statements (continued)
16. Non-current other assets GROUP COMPANY
2012 £000
2011 £000
2012 £000
2011 £000
Key money 9,517 8,419 - - Deposits 2,030 779 - - Legal fees 5,428 3,849 3,558 3,590
16,975 13,047 3,558 3,590
Key money represents monies paid in certain countries to give access to retail locations.
Deposits represent money paid in certain countries to store landlords as protection against non-payment of rent.
Legal fees represents legal fees and other costs associated with the acquisition of leasehold interests.
Impairment losses of £4,000 (2011: £nil) have been recognised on legal fees in specific cash-generating units which are loss making. There has also been a £15,000 gain recognised on previously impaired Key money following a revaluation of the Key money at 28 January 2012.
The methodology behind identifying loss making cash-generating units is explained in note 14.
Amortisation of non-current other assets of £472,000 (2011: £531,000) has been recognised in the Consolidated Income Statement (see note 3).
17. Interest in joint venture On 3 December 2007, the Group acquired 49% of the issued share capital of Focus Brands Limited for an initial cash consideration of
£49,000 together with associated fees of £456,000. Focus Brands Limited is a jointly controlled entity set up for the purposes of acquiring Focus Group Holdings Limited and its subsidiary companies ('Focus Group'). The Focus Group is involved in the design, sourcing and distribution of branded and own brand footwear, apparel and accessories. Focus Brands Limited was jointly controlled with the former shareholders of Focus Group Holdings Limited.
On 16 February 2011, the Group acquired a further 31% of the issued share capital of Focus Brands Limited for a cash consideration of £1,000,000, with potential further deferred consideration of £250,000 depending on performance. As a result there is no further deferred consideration payable on the original transaction. The additional shares purchased since the reporting date take the Group's holding in Focus Brands Limited to 80%, thereby giving the Group control. Focus Brands Limited is now a subsidiary of the Group rather than a jointly-controlled entity.
The results and assets and liabilities of the Focus Group were incorporated in the consolidated financial statements using the equity method of accounting as a joint venture for the period to 16th February 2011. The interest in the joint venture in the Group's Consolidated Statement of Financial Position is based on the share of the net assets, which are as follows:
As at 28 January 2012
£000
As at 29 January 2011
£000
Non-current assets - 447 Current assets - 5,196 Current liabilities - (2,185)
Total net assets - 3,458
The Group's share of the revenue generated by the joint venture in the period was £841,000 (2011: £15,418,000).
The amount included in the Consolidated Income Statement in relation to the joint venture is as follows:
52 weeks to 28 January 2012 52 weeks to 29 January 2011 Before
exceptionals £000
Exceptionals £000
After exceptionals
£000
Before exceptionals
£000 Exceptionals
£000
After exceptionals
£000
Share of result before tax (143) 1,166 1,023 2,102 1,549 3,651 Tax 41 4 45 (627) (201) (828)
Share of result after tax (102) 1,170 1,068 1,475 1,348 2,823
The exceptional items in the current year relate to a further reversal of the impairment of the investment held by Focus Brands Limited in Focus Group Holdings Limited, following an additional repayment of original purchase consideration by the vendors of Focus Group Holdings Limited. This process is now complete and Focus is now an 80% subsidiary of the Group. The exceptional items in the prior year relate to unrealised gains on foreign exchange contracts and the reversal of the impairment of the investment held by Focus Brands Limited in Focus Group Holdings Limited, following repayment of original purchase consideration by the vendors of Focus Group Holdings Limited.

Notes to the Consolidated Financial Statements (continued)
18. Investments COMPANY £000
Cost At 30 January 2010 13,334 Additions 1,200
At 29 January 2011 14,534 Additions 33,411
At 28 January 2012 47,945
Impairment At 30 January 2010 and 29 January 2011 5,470 Impairments -
At 28 January 2012 5,470
Net book value At 28 January 2012 42,475
At 29 January 2011 9,064
At 30 January 2010 7,864
The additions to investments in the current year comprise the following. Unless otherwise stated the investment is 100% owned.
COMPANY2012
£000
Kukri Sports Limited (80% owned) - Focus Brands Limited (80% owned) 1,616 Champion Sports (Holdings) 14,250 Premium Fashion Ltd (85% owned) 9 JD Sprinter Holdings 2010 (50.1% owned) 17,536
Total additions 33,411
The carrying value of the investment in Focus Brands Limited at 28 January 2012 is £2,121,000 comprising the cash consideration of £1,000,000, with potential deferred consideration of £250,000 in relation to the acquisition to an additional 31% of the issued share capital acquired in the year, in addition to the gain on acquisition of £871,000 relating to the remeasurement to fair value of the previously held investment in Focus Brands Limited (see note 17). The previously held investment of £505,000 was disposed of to give the net additional investment of £1,616,000.
The long term loan owed to the Company by Champion Sports (Holdings) of £14,250,000 (€17,100,000) has been capitalised as an investment in the period to 28 January 2012 with £816,000 as a movement in the foreign currency translation reserve since acquisition.
A list of principal subsidiaries is shown in note 36.
19. Inventories GROUP COMPANY
2012 £000
2011 £000
2012 £000
2011 £000
Finished goods and goods for resale 130,355 84,490 52,579 47,472
The cost of inventories recognised as expenses and included in cost of sales for the 52 weeks ended 28 January 2012 was £538,676,000 (2011: £446,657,000).

82/83Notes to the Consolidated Financial Statements (continued)
20. Trade and other receivables GROUP COMPANY
2012 £000
2011 £000
2012 £000
2011 £000
Current assets Trade receivables 17,730 13,626 1,368 902 Other receivables 3,804 1,955 507 601 Prepayments and accrued income 32,613 21,524 15,250 13,566 Amounts owed by other Group companies - - 106,828 67,466
54,147 37,105 123,953 82,535
The ageing of trade receivables is detailed below:2012 2011
GROUP Gross £000
Provision £000
Net £000
Gross £000
Provision £000
Net £000
Not past due 10,062 (40) 10,022 7,474 (56) 7,418 Past due 30-60 days 3,664 (107) 3,557 2,973 (25) 2,948 Past 60 days 5,024 (873) 4,151 4,041 (781) 3,260
18,750 (1,020) 17,730 14,488 (862) 13,626
As at 28 January 2012, trade receivables at nominal value £1,455,000 was provided for, of which £83,000 was not past due, £383,000 was past due 30-60 days and £989,000 was past 60 days.
2012 2011
COMPANYGross £000
Provision £000
Net £000
Gross £000
Provision £000
Net £000
Not past due 264 - 264 111 - 111 Past due 30-60 days 437 - 437 475 (26) 449 Past 60 days 767 (100) 667 538 (196) 342
1,468 (100) 1,368 1,124 (222) 902
As at 28 January 2012, trade receivables at nominal value £623,000 was provided for, of which £52,000 was not past due, £267,000 was past due 30-60 days and £304,000 was past 60 days.
The Board consider that the carrying amount of trade and other receivables approximate their fair value. Concentrations of credit risk with respect to trade receivables are limited due to the majority of the Group’s customer base being wide and unrelated. Therefore, no further credit risk provision is required in excess of the normal provision for impairment losses, which has been calculated following individual assessments of credit quality based on historic default rates and knowledge of debtor insolvency or other credit risk.
Movement on this provision is shown below:
GROUP £000
COMPANY £000
At 30 January 2010 916 108 Created 715 114 Released (45) - Utilised (724) -
At 29 January 2011 862 222 Created 760 100 Released (77) - Utilised (525) (222)
At 28 January 2012 1,020 100
The other classes within trade and other receivables do not contain impaired assets.

Notes to the Consolidated Financial Statements (continued)
21. Cash and cash equivalents GROUP COMPANY
2012 £000
2011 £000
2012 £000
2011 £000
Bank balances and cash floats 67,024 90,131 28,762 81,204
22. Interest-bearing loans and borrowings GROUP COMPANY
2012 £000
2011 £000
2012 £000
2011 £000
Current liabilities Finance lease liabilities 610 - - - Bank loans and overdrafts 4,937 2,874 - -
5,547 2,874 - -
Non-current liabilities Finance lease liabilities 50 - - - Bank loans and overdrafts 765 287 - - Other loans 367 830 - -
1,182 1,117 - -
The following provides information about the contractual terms of the Group and Company’s interest-bearing loans and borrowings. For more information about the Group and Company’s exposure to interest rate risk, see note 23.
Bank facilities
As at 28 January 2012, the Group has a syndicated committed £75,000,000 bank facility which expires on 11 October 2015. Under this facility, a maximum of 10 drawdowns can be outstanding at any time with drawdowns made for a period of one, two, three or six months with interest payable at a rate of LIBOR plus a margin of 1.25%. The arrangement fee is 0.6%. The commitment fee on the undrawn element of the facility is 45% of the applicable margin rate. This facility encompasses cross guarantees between the Company, Bank Fashion Limited, RD Scott Limited, Topgrade Sportswear Limited, Nicholas Deakins Limited, Canterbury Limited, Canterbury of New Zealand Limited and Focus International Limited.
At 28 January 2012, there were no amounts drawn down on this facility (2011: no amounts were drawn down on the previous facility).
Bank loans and overdrafts
The following Group companies have overdraft facilities which are repayable on demand:
• Chausport SA €5,000,000 (2011: €3,000,000)
• Sprinter Megacentros Del Deporte SLU €8,800,000
• Champion Sports Holdings €3,000,000
• Kukri Sports Limited and Kukri GB Limited £170,000
• Canterbury International (Australia) Pty Limited AUD $3,000,000
Further information on guarantees provided by the Company is disclosed in notes 33.
Included within bank loans and overdrafts are term loans of £288,000 (2011: £575,000) within Chausport SA which have been taken out to fund the refurbishment of specific stores. The interest rates range from 5.10% to 6.50% and are secured on the fixtures in those particular stores.

84/85Notes to the Consolidated Financial Statements (continued)
22. Interest-bearing loans and borrowings (continued) The maturity of the bank loans and overdrafts is as follows:
GROUP COMPANY 2012
£000 2011
£000 2012
£000 2011
£000
Within one year 4,937 2,874 - - Between one and five years 765 287 - -
5,702 3,161 - -
Other loans
The Group has a loan payable to Herald Island Limited, the non-controlling interest in Canterbury of New Zealand Limited. The loan attracts interest at 3.0% above the Group’s cost of funds and is repayable on exercise of the put and call option (see note 24).
The maturity of the other loans is as follows:
GROUP COMPANY 2012
£000 2011
£000 2012
£000 2011
£000
Between one and five years 367 830 - -
367 830 - -
Finance leases
As at 28 January 2012, the Group's liabilities under finance leases are analysed as follows:
Minimum lease paymentsPresent value of minimum
lease payments 2012
£000 2011
£000 2012
£000 2011
£000
Amounts payable under finance leases: Within one year 646 - 610 - Later than one year and not later than five years 55 - 50 - After five years - - - -
701 - 660 -
The present value of future payments is analysed as:
2012 £000
2011 £000
Current liabilities 610 - Non- current liabilities 50 -
660 -
Assets held under finance leases consists of store fit outs (included within fixtures and fittings) and motor vehicles. The fair value of the Group's lease obligations approximate to their present value. The Group's obligations under finance leases are secured by the lessors' rights over the leased assets.

Notes to the Consolidated Financial Statements (continued)
23. Financial instruments Financial assets
The Group’s financial assets are all categorised as loans and receivables. Loans and receivables are non-derivative financial assets with fixed or determinable payments that are not quoted in an active market. The Group’s loans and receivables comprise ‘Trade and other receivables’ and ‘Cash and cash equivalents’ in the Consolidated Statement of Financial Position.
Cash and cash equivalents comprise short-term cash deposits with major United Kingdom and European clearing banks earning floating rates of interest based upon bank base rates or rates linked to LIBOR and EURIBOR. The currency profile of cash and cash equivalents is shown below:
GROUP COMPANY 2012
£000 2011
£000 2012
£000 2011
£000
Bank balances and cash floats 67,024 90,131 28,762 81,204
Sterling 31,846 74,031 21,706 69,831 Euros 29,117 7,126 4,701 4,881 US Dollars 3,591 6,984 2,265 6,492 Australian Dollars 1,075 1,040 90 - New Zealand Dollars 1,262 930 - - Other 133 20 - -
67,024 90,131 28,762 81,204
Included in trade and other receivables are the following foreign currency denominated receivables:
GROUP COMPANY 2012
£000 2011
£000 2012
£000 2011
£000
Euros 6,574 1,350 4 240 US Dollars 816 802 - 12 Australian Dollars 2,564 1,845 - - New Zealand Dollars 1,726 1,179 - - Other 966 387 - -
Financial liabilities
The Group’s financial liabilities are all categorised as other financial liabilities. Other financial liabilities are measured at amortised cost. The Group’s other financial liabilities comprise ‘Interest-bearing loans and borrowings’ and ‘Trade and other payables’.
The currency profile of interest-bearing loans and borrowings is shown below:
GROUP COMPANY 2012
£000 2011
£000 2012
£000 2011
£000
Interest-bearing loans and borrowings 6,729 3,991 - -
Sterling 150 603 - - Euros 6,159 2,558 - - New Zealand Dollars 404 830 - - Canadian Dollars 16 - - -
6,729 3,991 - -
Included in trade and other payables are the following foreign currency denominated payables:
GROUP COMPANY 2012
£000 2011
£000 2012
£000 2011
£000
Euros 38,256 7,775 198 41 US Dollars 5,397 1,479 220 469 Australian Dollars 1,880 197 - - New Zealand Dollars 676 850 - - Other 1,121 144 - -

86/87Notes to the Consolidated Financial Statements (continued)
23. Financial instruments (continued)Risk management
The Group’s operations expose it to a variety of financial risks that include the effects of changes in exchange rates, interest rates, credit risk and its liquidity position. The Group manages these risks through the use of derivative instruments, which are reviewed on a regular basis. Derivative instruments are not entered into for speculative purposes. There are no concentrations of risk in the period to 28 January 2012.
Interest rate risk
The Group finances its operations by a mixture of retained profits and bank borrowings. The Group’s borrowings are at floating rates, partially hedged by floating rate interest on deposits, reflecting the seasonality of its cash flow. Interest rate risk therefore arises from bank borrowings. Interest rate hedging has not been put in place on the current facility. The Directors continue to be mindful of the potential volatility in base rates, but at present do not consider a long term interest rate hedge to be necessary given the inherent short term nature of both the revolving credit facility and working capital facility. This position is reviewed regularly, along with the level of facility required.
The Group has potential bank floating rate financial liabilities on the £75,000,000 committed bank facility, together with overdraft facilities in subsidiary companies (see note 22). At 28 January 2012 £nil was drawdown from the committed bank facility (2011: £nil). When drawdowns are made, the Group is exposed to cash flow interest risk with interest paid at a rate of LIBOR plus a margin of 1.25% (2011 (previous facility): 0.75%).
As at 28 January 2012 the Group has liabilities of £660,000 (2011: £nil), in respect of finance lease or similar hire purchase contracts.
A change of 1.0% in the average interest rates during the year, applied to the Group's floating interest rate loans and borrowings as at the reporting date, would change profit before tax by £37,000 (2011: £24,000) and would change equity by £37,000 (2011: £24,000). This assumes that all other variables remain unchanged. Calculations are performed on the same basis as the prior year.
Foreign currency risk
The Group is exposed to foreign currency risk on sales and purchases that are denominated in a currency other than pound sterling. The currencies giving rise to this risk are the Euro and US Dollar with sales made in Euros and purchases made in both Euros and US Dollars (principal exposure). To protect its foreign currency position, the Group sets a buying rate in each country for the purchase of goods in US Dollars at the start of the buying season (typically six to nine months before the product actually starts to appear in the stores) and then enters into a number of local currency/US Dollar contracts whereby the minimum exchange rate on the purchase of dollars is guaranteed.
As at 28 January 2012, options have been entered into to protect approximately 97% of the US Dollar requirement for the period to January 2013. The balance of the US Dollar requirement for the period will be satisfied at spot rates. Hedge accounting is not applied.
As at 28 January 2012, the fair value of these instruments was an asset of £30,000 (2011: liability of £789,000) which has been included within current assets (2011: current liabilities). A gain of £1,018,000 (2011: loss of £1,394,000) has been recognised in the Consolidated Income Statement for the change in fair value of these instruments.
A 10.0% strengthening of sterling relative to the following currencies as at the reporting date would have reduced profit before tax and equity as follows:
Profit before tax Equity2012
£000 2011
£000 2012
£000 2011
£000
Euros 515 179 4,675 179 US Dollars (13) 693 (240) 693 Australian Dollars 13 (2) (177) (2)New Zealand Dollars 4 3 271 3 Other (61) 23 (100) 23
458 896 4,429 896
A 10.0% weakening of sterling relative to the following currencies as at the reporting date would have increased profit before tax and equity as follows:
Profit before tax Equity2012
£000 2011
£000 2012
£000 2011
£000
Euros 630 219 5,714 219 US Dollars (4) 848 (293) 848 Australian Dollars 16 (2) (216) (2)New Zealand Dollars 1 3 332 3 Other (74) 28 (122) 28
569 1,096 5,415 1,096
Calculations are performed on the same basis as the prior year and the method assumes that all other variables remain unchanged.
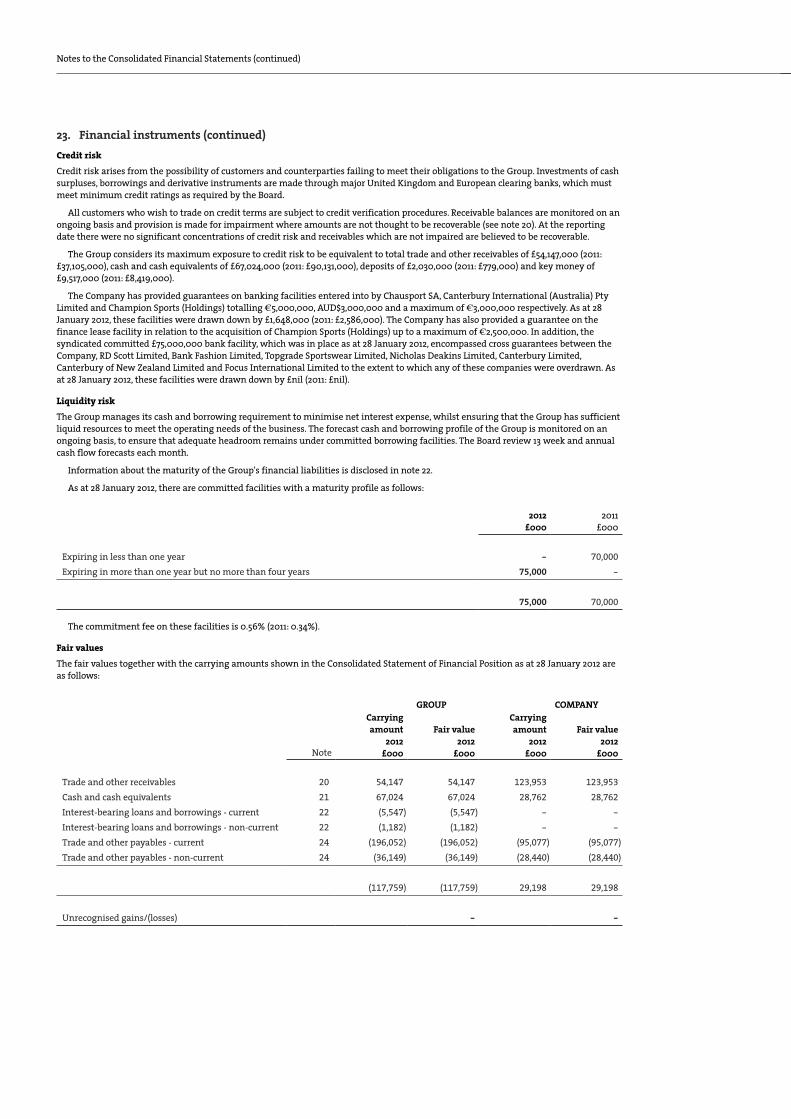
Notes to the Consolidated Financial Statements (continued)
23. Financial instruments (continued)Credit risk
Credit risk arises from the possibility of customers and counterparties failing to meet their obligations to the Group. Investments of cash surpluses, borrowings and derivative instruments are made through major United Kingdom and European clearing banks, which must meet minimum credit ratings as required by the Board.
All customers who wish to trade on credit terms are subject to credit verification procedures. Receivable balances are monitored on an ongoing basis and provision is made for impairment where amounts are not thought to be recoverable (see note 20). At the reporting date there were no significant concentrations of credit risk and receivables which are not impaired are believed to be recoverable.
The Group considers its maximum exposure to credit risk to be equivalent to total trade and other receivables of £54,147,000 (2011: £37,105,000), cash and cash equivalents of £67,024,000 (2011: £90,131,000), deposits of £2,030,000 (2011: £779,000) and key money of £9,517,000 (2011: £8,419,000).
The Company has provided guarantees on banking facilities entered into by Chausport SA, Canterbury International (Australia) Pty Limited and Champion Sports (Holdings) totalling €5,000,000, AUD$3,000,000 and a maximum of €3,000,000 respectively. As at 28 January 2012, these facilities were drawn down by £1,648,000 (2011: £2,586,000). The Company has also provided a guarantee on the finance lease facility in relation to the acquisition of Champion Sports (Holdings) up to a maximum of €2,500,000. In addition, the syndicated committed £75,000,000 bank facility, which was in place as at 28 January 2012, encompassed cross guarantees between the Company, RD Scott Limited, Bank Fashion Limited, Topgrade Sportswear Limited, Nicholas Deakins Limited, Canterbury Limited, Canterbury of New Zealand Limited and Focus International Limited to the extent to which any of these companies were overdrawn. As at 28 January 2012, these facilities were drawn down by £nil (2011: £nil).
Liquidity risk
The Group manages its cash and borrowing requirement to minimise net interest expense, whilst ensuring that the Group has sufficient liquid resources to meet the operating needs of the business. The forecast cash and borrowing profile of the Group is monitored on an ongoing basis, to ensure that adequate headroom remains under committed borrowing facilities. The Board review 13 week and annual cash flow forecasts each month.
Information about the maturity of the Group's financial liabilities is disclosed in note 22.
As at 28 January 2012, there are committed facilities with a maturity profile as follows:
2012 £000
2011 £000
Expiring in less than one year - 70,000 Expiring in more than one year but no more than four years 75,000 -
75,000 70,000
The commitment fee on these facilities is 0.56% (2011: 0.34%).
Fair values
The fair values together with the carrying amounts shown in the Consolidated Statement of Financial Position as at 28 January 2012 are as follows:
GROUP COMPANY
Note
Carrying amount
2012 £000
Fair value 2012
£000
Carrying amount
2012 £000
Fair value 2012
£000
Trade and other receivables 20 54,147 54,147 123,953 123,953 Cash and cash equivalents 21 67,024 67,024 28,762 28,762 Interest-bearing loans and borrowings - current 22 (5,547) (5,547) - - Interest-bearing loans and borrowings - non-current 22 (1,182) (1,182) - - Trade and other payables - current 24 (196,052) (196,052) (95,077) (95,077)Trade and other payables - non-current 24 (36,149) (36,149) (28,440) (28,440)
(117,759) (117,759) 29,198 29,198
Unrecognised gains/(losses) - -
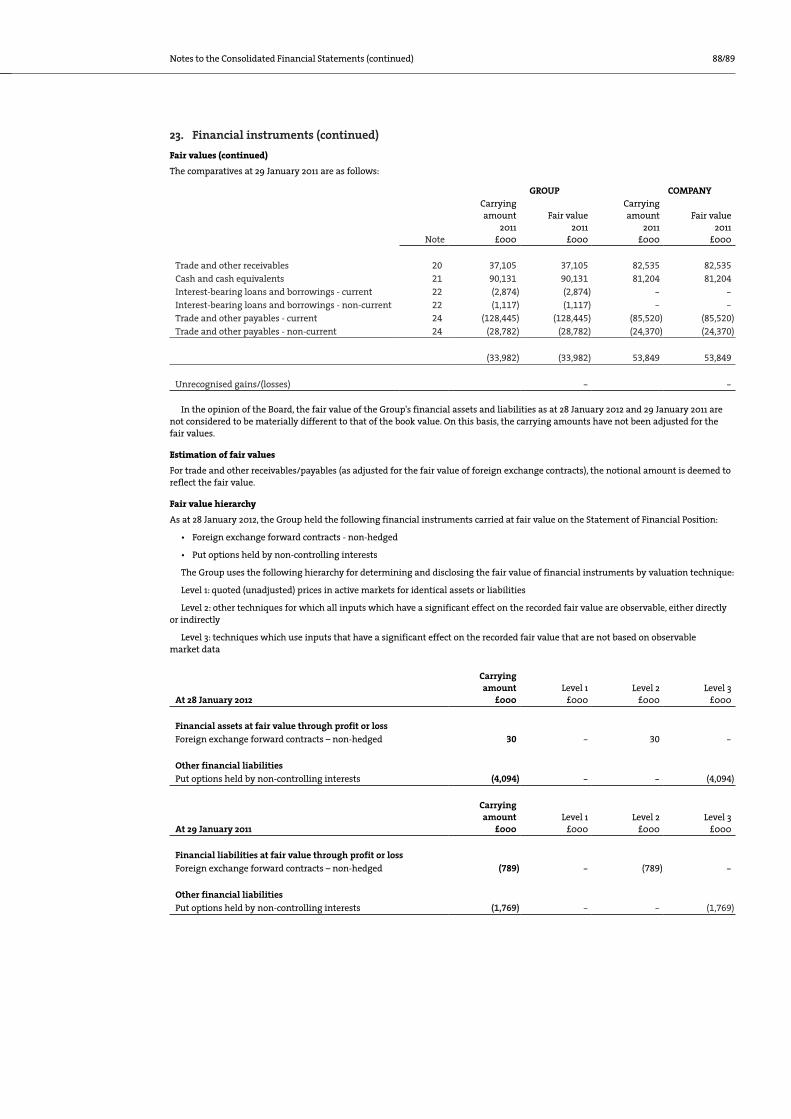
88/89Notes to the Consolidated Financial Statements (continued)
23. Financial instruments (continued) Fair values (continued)
The comparatives at 29 January 2011 are as follows:
GROUP COMPANY
Note
Carrying amount
2011 £000
Fair value 2011
£000
Carrying amount
2011 £000
Fair value 2011
£000
Trade and other receivables 20 37,105 37,105 82,535 82,535 Cash and cash equivalents 21 90,131 90,131 81,204 81,204 Interest-bearing loans and borrowings - current 22 (2,874) (2,874) - - Interest-bearing loans and borrowings - non-current 22 (1,117) (1,117) - - Trade and other payables - current 24 (128,445) (128,445) (85,520) (85,520)Trade and other payables - non-current 24 (28,782) (28,782) (24,370) (24,370)
(33,982) (33,982) 53,849 53,849
Unrecognised gains/(losses) - -
In the opinion of the Board, the fair value of the Group's financial assets and liabilities as at 28 January 2012 and 29 January 2011 are not considered to be materially different to that of the book value. On this basis, the carrying amounts have not been adjusted for the fair values.
Estimation of fair values
For trade and other receivables/payables (as adjusted for the fair value of foreign exchange contracts), the notional amount is deemed to reflect the fair value.
Fair value hierarchy
As at 28 January 2012, the Group held the following financial instruments carried at fair value on the Statement of Financial Position:
• Foreign exchange forward contracts - non-hedged
• Put options held by non-controlling interests
The Group uses the following hierarchy for determining and disclosing the fair value of financial instruments by valuation technique:
Level 1: quoted (unadjusted) prices in active markets for identical assets or liabilities
Level 2: other techniques for which all inputs which have a significant effect on the recorded fair value are observable, either directly or indirectly
Level 3: techniques which use inputs that have a significant effect on the recorded fair value that are not based on observable market data
At 28 January 2012
Carrying amount
£000
Level 1 £000
Level 2 £000
Level 3 £000
Financial assets at fair value through profit or loss Foreign exchange forward contracts – non-hedged 30 - 30 -
Other financial liabilities Put options held by non-controlling interests (4,094) - - (4,094)
At 29 January 2011
Carrying amount
£000
Level 1 £000
Level 2 £000
Level 3 £000
Financial liabilities at fair value through profit or loss Foreign exchange forward contracts – non-hedged (789) - (789) -
Other financial liabilities Put options held by non-controlling interests (1,769) - - (1,769)

Notes to the Consolidated Financial Statements (continued)
24. Trade and other payables
GROUP COMPANY 2012
£000 2011
£000 2012
£000 2011
£000
Current liabilities Trade payables 93,305 56,297 48,109 40,777 Other payables and accrued expenses 79,808 54,103 36,899 34,627 Other tax and social security costs 22,939 18,045 10,069 10,116
196,052 128,445 95,077 85,520
Non-current liabilities Other payables and accrued expenses 36,149 28,782 21,858 17,788 Amounts payable to other Group companies - - 6,582 6,582
36,149 28,782 28,440 24,370
Put and call options
The Group has a number of options to buy the remaining shares in partly-owned subsidiaries from the non-controlling interest. The present value of these options has been estimated as at 28 January 2012 and is included within other payables and accrued expenses.
Canterbury of New Zealand
On 23 December 2009, the Group (via its subsidiary Canterbury Limited) acquired 51% of the issued ordinary share capital of Canterbury of New Zealand Limited. The transaction included the agreement of a put and call option between Canterbury Limited and the vendors of Canterbury of New Zealand, whereby Canterbury Limited may acquire or be required to acquire the remaining 49% of the issued share capital of Canterbury of New Zealand Limited.
This option is exercisable by either party on the third anniversary of the completion of the initial transaction and on each anniversary thereafter. The option price is calculated based on a multiple of average audited profit before tax over the two most recently completed financial years prior to the exercise date. The option price shall not exceed NZ $15,000,000.
At as 28 January 2012, the present value of the non-controlling interest’s put option has been calculated based on expected earnings in Board-approved forecasts and a discount rate of 12.2% (2011: 14.9%), which is pre-tax and reflects the current market assessments of the time value of money and the specific risks applicable to the liability. A liability of £2,961,000 has been recognised (2011: £1,202,000), with a corresponding debit to other equity.
Canterbury European Fashionwear Limited
On 27 July 2010, a new Group company was incorporated, Canterbury European Fashionwear Limited, which is 75% owned by Canterbury Limited, with the remaining 25% owned by a party external to the Group. On incorporation, a put and call option was agreed between Canterbury Limited and the non-controlling interest in Canterbury European Fashionwear Limited, whereby Canterbury Limited may acquire or be required to acquire the remaining 25% of the issued share capital of Canterbury European Fashionwear Limited.
This option is exercisable by either party on the fifth anniversary of incorporation and on each anniversary thereafter until the fifteenth anniversary, unless both parties agree to extend this term. The option price is calculated based on a multiple of average audited profit before interest, tax, depreciation and amortisation over the two most recently completed financial years prior to the exercise date. The option price shall not exceed £15,000,000.
At as 28 January 2012, the present value of the non-controlling interest’s put option has been calculated based on expected earnings in Board-approved forecasts and a discount rate of 12.2% (2011: 14.9%), which is pre-tax and reflects the current market assessments of the time value of money and the specific risks applicable to the liability. The present value of this option has been assessed as £nil as at 28 January 2012 (2011: £nil). Accordingly, no liability has been recognised.
Canterbury International (Australia) Pty Limited
On 23 December 2009, the Group (via its subsidiary Canterbury Limited) acquired 100% of the issued ordinary share capital of Canterbury International (Australia) Pty Limited. Subsequently, on 28 January 2011, Canterbury Limited disposed of 25% of the issued ordinary share capital of Canterbury International (Australia) Pty Limited by issuing new shares to the management team in exchange for a cash consideration of AUD $1,100,000. On completion of this transaction, a put and call option was agreed between Canterbury Limited and the non-controlling interest in Canterbury International (Australia) Pty Limited, whereby Canterbury Limited may re-acquire the remaining 25% issued ordinary share capital from the non-controlling interest.
This option is exercisable by either party on 1 March 2014 and on each anniversary thereafter. The option price is calculated based on a multiple of average earnings before tax. If, either, Canterbury Limited exercises its call option, or, the non-controlling interest exercises its put option and profit before tax has improved over the two most recent financial years, the option price is based on a multiple of average audited earnings before tax over the two most recently completed financial years prior to the exercise date. If the non-controlling interest gives notice to exercise its put option and profit before tax has declined over the two most recent financial years, the put option is deferred until 1 October in the year of the exercise date. The option price is based on a multiple of earnings before tax, however, the time period over which average earnings is calculated varies depending on the performance of the business to 31 July in the year of the exercise date. In all cases the option price shall not exceed AUD $30,000,000.
At as 28 January 2012, the present value of the non-controlling interest’s put option has been calculated based on expected earnings in Board-approved forecasts and a discount rate of 12.2% (2011: 14.9%), which is pre-tax and reflects the current market assessments of the time value of money and the specific risks applicable to the liability. A liability of £1,133,000 (2011: £567,000) has been recognised, with a corresponding debit to other equity.
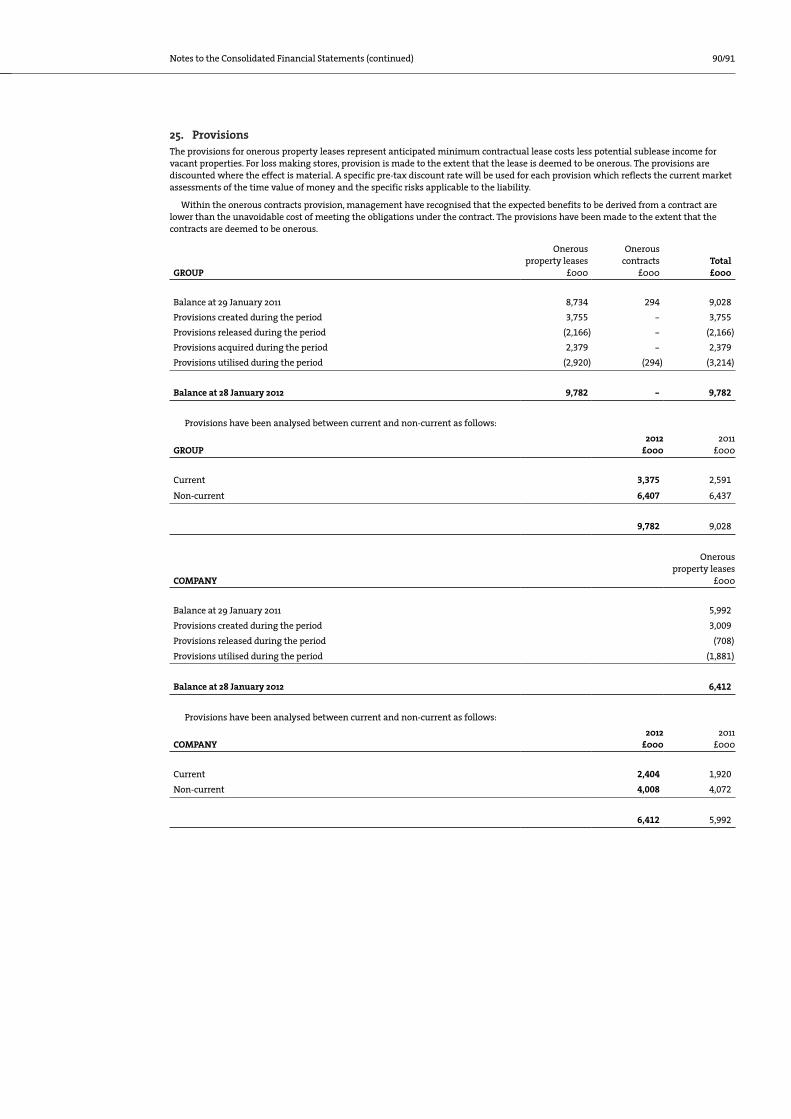
90/91Notes to the Consolidated Financial Statements (continued)
25. ProvisionsThe provisions for onerous property leases represent anticipated minimum contractual lease costs less potential sublease income for vacant properties. For loss making stores, provision is made to the extent that the lease is deemed to be onerous. The provisions are discounted where the effect is material. A specific pre-tax discount rate will be used for each provision which reflects the current market assessments of the time value of money and the specific risks applicable to the liability.
Within the onerous contracts provision, management have recognised that the expected benefits to be derived from a contract are lower than the unavoidable cost of meeting the obligations under the contract. The provisions have been made to the extent that the contracts are deemed to be onerous.
GROUP
Onerousproperty leases
£000
Onerouscontracts
£000 Total
£000
Balance at 29 January 2011 8,734 294 9,028 Provisions created during the period 3,755 - 3,755 Provisions released during the period (2,166) - (2,166)Provisions acquired during the period 2,379 - 2,379 Provisions utilised during the period (2,920) (294) (3,214)
Balance at 28 January 2012 9,782 - 9,782
Provisions have been analysed between current and non-current as follows:
GROUP 2012
£000 2011
£000
Current 3,375 2,591
Non-current 6,407 6,437
9,782 9,028
COMPANY
Onerousproperty leases
£000
Balance at 29 January 2011 5,992 Provisions created during the period 3,009 Provisions released during the period (708)Provisions utilised during the period (1,881)
Balance at 28 January 2012 6,412
Provisions have been analysed between current and non-current as follows:
COMPANY 2012
£000 2011
£000
Current 2,404 1,920 Non-current 4,008 4,072
6,412 5,992

Notes to the Consolidated Financial Statements (continued)
26. Deferred tax assets and liabilities Recognised deferred tax assets and liabilities
Deferred tax assets and liabilities are attributable to the following
GROUP
Assets 2012
£000
Assets 2011
£000
Liabilities 2012
£000
Liabilities 2011
£000
Net 2012
£000
Net 2011
£000
Property, plant and equipment - (626) 836 - 836 (626)Chargeable gains held over/rolled over - - 297 320 297 320 General accruals - - 4,856 890 4,856 890 Tax losses (4,977) (709) - - (4,977) (709)
Tax (assets)/liabilities (4,977) (1,335) 5,989 1,210 1,012 (125)
Deferred tax assets on losses of AUS $nil (2011: AUS $9,276,000) within Canterbury International (Australia) Pty Limited and losses of £4,629,000 (2011: £4,629,000) within Kooga Rugby Limited have not been recognised as there is uncertainty over the utilisation of these losses.
Movement in deferred tax during the period
GROUP
Property, plantand equipment
£000
Chargeable gains held over/
rolled over£000
General accruals
£000Tax losses
£000Total £000
Balance at 30 January 2010 330 332 810 (724) 748 Recognised in income (956) (12) 80 15 (873)
Balance at 29 January 2011 (626) 320 890 (709) (125)Recognised on acquisition 1,227 - 2,372 (742) 2,857 Recognised in income 235 (23) 1,594 (3,526) (1,720)
Balance at 28 January 2012 836 297 4,856 (4,977) 1,012
Recognised deferred tax assets and liabilities
Deferred tax assets and liabilities are attributable to the following:
COMPANY
Assets 2012
£000
Assets 2011
£000
Liabilities 2012
£000
Liabilities 2011
£000
Net 2012
£000
Net 2011
£000
Property, plant and equipment
- (331) 355 - 355 (331)
Chargeable gains held over/rolled over - - 297 320 297 320
General accruals (959) (1,071) - - (959) (1,071)
Tax (assets)/liabilities (959) (1,402) 652 320 (307) (1,082)
Movement in deferred tax during the period
COMPANY
Property, plant and equipment
£000
Chargeable gains held over/
rolled over£000
General accruals
£000Total£000
Balance at 30 January 2010 (95) 332 (847) (610) Recognised in income (236) (12) (224) (472)
Balance at 29 January 2011 (331) 320 (1,071) (1,082) Recognised in income 686 (23) 112 775
Balance at 28 January 2012 355 297 (959) (307)

92/93Notes to the Consolidated Financial Statements (continued)
26. Deferred tax assets and liabilities (continued)At 28 January 2012, the Group has no recognised deferred income tax liability (2011: £nil) in respect of taxes that would be payable on the unremitted earnings of certain subsidiaries. As at 28 January 2012, the unrecognised gross temporary differences in respect of reserves of overseas subsidiaries is £13,950,000 (2011: £3,034,000). No deferred income tax liability has been recognised in respect of this temporary timing difference due to the foreign profits exemption, the availability of double tax relief and the ability to control the remittance of earnings.
There are no income tax consequences attached to the payment of dividends by the Group to its shareholders.
27. CapitalIssued ordinary share capital
GROUP AND COMPANY
Number ofordinary shares
thousands
Ordinaryshare capital
£000
At 29 January 2011 and 28 January 2012 48,662 2,433
The total number of authorised ordinary shares was 62,150,000 (2011: 62,150,000) with a par value of 5p per share (2011: 5p per share). All issued shares are fully paid.
The capital structure of the Group consists of equity attributable to equity holders of the parent, comprising issued share capital, share premium and retained earnings.
It is the Board’s policy to maintain a strong capital base so as to maintain investor, creditor and market confidence and to sustain future development of the business. The processes for managing the Group's capital levels are that the Board regularly monitors the net cash/debt in the business, the working capital requirements and forecasts cash flows. Based on this analysis, the Board determines the appropriate return to equity holders while ensuring sufficient capital is retained in the business to meet its strategic objectives.
The Board consider the capital of the Group as the net cash/debt at the year end (see note 31) and the Board review the gearing position of the Group which as at 28 January 2012 was zero (2011: zero). There were no changes to the Group’s approach to capital management during the period.
Full disclosure on the rights attached to shares is provided in the Directors' Report on page 39.
28. DividendsAfter the reporting date the following dividends were proposed by the Directors. The dividends were not provided for at the reporting date.
52 weeks to28 January 2012
£000
52 weeks to29 January 2011
£000
21.20p per ordinary share (2011: 19.20p) 10,316 9,343
Dividends on issued ordinary share capital 52 weeks to
28 January 2012£000
52 weeks to29 January 2011
£000
Final dividend of 19.20p (2011: 14.70p) per qualifying ordinary share paid in respect of prior period, but not recognised as a liability in that period 9,343 7,153 Interim dividend of 4.10p (2011: 3.80p) per qualifying ordinary share paid in respect of current period 1,995 1,849
11,338 9,002

Notes to the Consolidated Financial Statements (continued)
29. CommitmentsGroup (i) Capital commitments
As at 28 January 2012, the Group had entered into contracts to purchase property, plant and equipment as follows:
GROUP 2012
£000 2011
£000
Contracted 5,672 9,772
Included in the commitments at 28 January 2012 is £700,000 (2011: £6,500,000) for the purchase of property, plant and equipment for the new warehouse which is substantially complete and will be brought into full operation by Summer 2012.
(ii) Operating lease commitments
The Group leases various retail outlets, offices, warehouses, plant and equipment under non-cancellable operating lease agreements. The leases have varying terms, escalation clauses and renewal rights.
Undiscounted total future minimum rentals payable under non-cancellable operating leases are as follows:
GROUP
Land andbuildings
2012£000
Plant andequipment
2012£000
Land andbuildings
2011£000
Plant andequipment
2011£000
Within one year 95,406 1,297 78,644 1,142 Later than one year and not later than five years 293,790 1,134 258,483 935 After five years 281,191 - 238,698 -
670,387 2,431 575,825 2,077
The future minimum rentals payable on land and buildings represent the base rents that are due on each property. Certain properties have rents which are partly dependent on turnover levels in the individual store concerned.
(iii) Sublease receipts
The Group subleases various retail outlets under non-cancellable operating lease agreements. The leases have varying terms, escalation clauses and renewal rights. The total future minimum operating sublease receipts expected to be received at 28 January 2012 are as follows:
GROUP 2012
£000 2011
£000
Within one year 352 507 Later than one year and not later than five years 533 1,154 After five years 320 1,376
1,205 3,037
Company (i) Capital commitments
As at 28 January 2012, the Company had entered into contracts to purchase property, plant and equipment as follows:
COMPANY 2012
£000 2011
£000
Contracted 2,534 8,015
Included in the commitments at 28 January 2012 is £700,000 (2011: £6,500,000) for the purchase of property, plant and equipment for the new warehouse which is substantially complete and will be brought into full operation by Summer 2012.

94/95Notes to the Consolidated Financial Statements (continued)
29. Commitments (continued)Company (continued)
(ii) Operating lease commitments
The Company leases various retail outlets, offices, warehouses, plant and equipment under non-cancellable operating lease agreements. The leases have varying terms, escalation clauses and renewal rights.
Undiscounted total future minimum rentals payable under non-cancellable operating leases are as follows:
COMPANY
Land andbuildings
2012£000
Plant andequipment
2012£000
Land andbuildings
2011£000
Plant andequipment
2011£000
Within one year 59,265 990 59,581 934 Later than one year and not later than five years 186,423 875 193,267 753 After five years 180,895 - 193,930 -
426,583 1,865 446,778 1,687
(iii) Sublease receipts
The Company subleases various retail outlets under non-cancellable operating lease agreements. The leases have varying terms, escalation clauses and renewal rights. The total future minimum operating sublease receipts expected to be received at 28 January 2012 are as follows:
COMPANY 2012
£000 2011
£000
Within one year 534 428
Later than one year and not later than five years 1,429 1,099
After five years 1,661 1,376
3,624 2,903
30. Pension schemesThe Group only operates defined contribution pension schemes. The pension charge for the period represents contributions payable by the Group of £1,367,000 (2011: £1,154,000) in respect of employees, and £49,000 (2011: £47,000) in respect of Directors. The amount owed to the schemes at the period end was £181,000 (2011: £63,000).
31. Analysis of net cash
GROUP At 29 January 2011
£000
On acquisition of subsidiaries
£000 Cash flow
£000 At 28 January 2012
£000
Cash at bank and in hand 90,131 4,019 (27,126) 67,024 Overdrafts (2,586) (3,326) 499 (5,413)
Cash and cash equivalents 87,545 693 (26,627) 61,611
Interest-bearing loans and borrowings: Bank loans (575) (16,006) 16,292 (289) Finance lease liabilities - (2,119) 1,459 (660) Other loans (830) - 463 (367)
86,140 (17,432) (8,413) 60,295
COMPANY At 29 January 2011
£000 Cash flow
£000 At 28 January 2012
£000
Cash at bank and in hand 81,204 (52,442) 28,762
Cash and cash equivalents 81,204 (52,442) 28,762

Notes to the Consolidated Financial Statements (continued)
32. Related party transactions and balancesTransactions and balances with related parties during the period are shown below. Transactions were undertaken in the ordinary course of business on an arms length basis. Outstanding balances are unsecured (unless otherwise stated) and will be settled in cash.
Transactions with related parties who are not members of the Group
During the period, the Group entered into the following transactions with related parties who are not members of the Group:
GROUP
Income from related parties
2012 £000
Expenditure withrelated parties
2012£000
Income from related parties
2011£000
Expenditure withrelated parties
2011£000
Pentland Group PlcSale of inventory 7 - 440 - Purchase of inventory - (13,672) - (13,306)Royalty costs - (282) - (104)Other income 203 - 264 -
GROUP
Income from related parties
30 January to 15 February 2011
£000
Expenditure withrelated parties
30 January to 15 February 2011
£000
Income from related parties
2011£000
Expenditure withrelated parties
2011£000
Focus Brands LimitedPurchase of inventory - (1,489) - (12,201)Interest income 17 - 1 - Rental income - - 308 - Royalty income 49 - 480 -
At the end of the period, the following balances were outstanding with related parties who are not members of the Group:
GROUP
Amounts owed by related parties
2012£000
Amounts owed to related parties
2012 £000
Amounts owed by related parties
2011£000
Amounts owed to related parties
2011£000
Pentland Group PlcTrade receivables/(payables) 58 (1,773) 21 (1,226)
Focus Brands LimitedOther receivables - - 273 - Trade payables - - - (3,154)
During the period, the Company entered into the following transactions with related parties who are not members of the Group:
COMPANY
Income from related parties
2012£000
Expenditure with related parties
2012£000
Income from related parties
2011£000
Expenditure with related parties
2011£000
Pentland Group PlcPurchase of inventory - (8,792) - (10,821)Other income 216 - 236 -
COMPANY
Income from related parties
30 January to 15 February 2011
£000
Expenditure withrelated parties
30 January to 15 February 2011
£000
Income from related parties
2011£000
Expenditure with related parties
2011£000
Focus Brands LimitedPurchase of inventory - (395) - (4,218)Interest income - - 1 - Rental income 17 - 308 - Royalty income - - 480 -
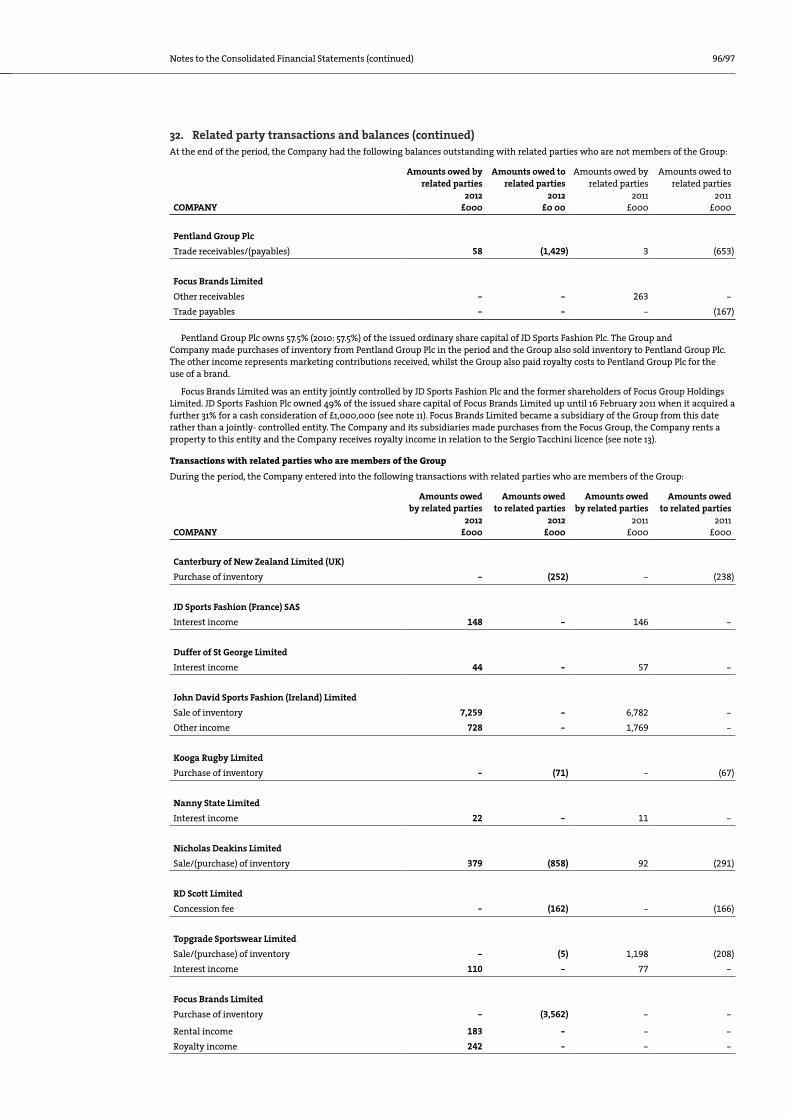
96/97Notes to the Consolidated Financial Statements (continued)
32. Related party transactions and balances (continued)At the end of the period, the Company had the following balances outstanding with related parties who are not members of the Group:
COMPANY
Amounts owed by related parties
2012£000
Amounts owed to related parties
2012£0 00
Amounts owed by related parties
2011£000
Amounts owed to related parties
2011£000
Pentland Group PlcTrade receivables/(payables) 58 (1,429) 3 (653)
Focus Brands LimitedOther receivables - - 263 - Trade payables - - - (167)
Pentland Group Plc owns 57.5% (2010: 57.5%) of the issued ordinary share capital of JD Sports Fashion Plc. The Group and Company made purchases of inventory from Pentland Group Plc in the period and the Group also sold inventory to Pentland Group Plc. The other income represents marketing contributions received, whilst the Group also paid royalty costs to Pentland Group Plc for the use of a brand.
Focus Brands Limited was an entity jointly controlled by JD Sports Fashion Plc and the former shareholders of Focus Group Holdings Limited. JD Sports Fashion Plc owned 49% of the issued share capital of Focus Brands Limited up until 16 February 2011 when it acquired a further 31% for a cash consideration of £1,000,000 (see note 11). Focus Brands Limited became a subsidiary of the Group from this date rather than a jointly- controlled entity. The Company and its subsidiaries made purchases from the Focus Group, the Company rents a property to this entity and the Company receives royalty income in relation to the Sergio Tacchini licence (see note 13).
Transactions with related parties who are members of the Group
During the period, the Company entered into the following transactions with related parties who are members of the Group:
COMPANY
Amounts owed by related parties
2012 £000
Amounts owed to related parties
2012£000
Amounts owed by related parties
2011£000
Amounts owed to related parties
2011£000
Canterbury of New Zealand Limited (UK)Purchase of inventory - (252) - (238)
JD Sports Fashion (France) SASInterest income 148 - 146 -
Duffer of St George LimitedInterest income 44 - 57 -
John David Sports Fashion (Ireland) LimitedSale of inventory 7,259 - 6,782 - Other income 728 - 1,769 -
Kooga Rugby LimitedPurchase of inventory - (71) - (67)
Nanny State LimitedInterest income 22 - 11 -
Nicholas Deakins LimitedSale/(purchase) of inventory 379 (858) 92 (291)
RD Scott LimitedConcession fee - (162) - (166)
Topgrade Sportswear LimitedSale/(purchase) of inventory - (5) 1,198 (208)Interest income 110 - 77 -
Focus Brands LimitedPurchase of inventory - (3,562) - -
Rental income 183 - - - Royalty income 242 - - -

Notes to the Consolidated Financial Statements (continued)
32. Related party transactions and balances (continued)
COMPANY (continued)
Amounts owed by related parties
2012 £000
Amounts owed to relate d parties
2012£000
Amounts owed by related parties
2011£000
Amounts owed to related parties
2012£000
Kukri Sports LimitedPurchase of inventory - (37) - - Interest income 44 - - -
At the end of the period, the Company had the following balances outstanding with related parties who are members of the Group:
COMPANY
Amounts owed by related parties
2012 £000
Amounts owed to related parties
2012£000
Amounts owed by related parties
2011£000
Amounts owed to related parties
2011£000
Athleisure LimitedLong term loan 6,638 - 6,638 -
Bank Stores Holdings LimitedLong term loan 10,681 - 13,046 -
Bank Fashion LimitedOther intercompany balances 57 (2) - -
Canterbury LimitedSecured loan 6,500 - 6,500 - Working capital loan 3,322 - 3,594 - Income tax Group relief - (85) - -
Canterbury of New Zealand Limited (UK)Working capital loan 13,506 - 7,574 - Trade payables - (9) - (12)
Canterbury European Fashionwear LimitedIncome tax Group relief - (202) - (167)
First Sport LimitedLong term loan - (6,582) - (6,582)
JD Sports Fashion (France) SASLong term loan 4,251 - 4,102 -
Chausport SALong term loan 4,167 - - - Other intercompany balances 3,009 - 3,210 -
Duffer of St George Limited
Secured loan 899 - 1,121 - Income tax Group relief - - - (4)
John David Sports Fashion (Ireland) LimitedTrade receivables 457 - 399 - Other intercompany balances 3,660 - 3,492 -
John David Sports LimitedOther intercompany balance - - 942 -
Kooga Rugby LimitedLong term loan (net of provision) 1,499 - 1,499 - Working capital loan 3,101 - 2,185 - Trade payables - (10) - (2)Income tax Group relief - (271) - (44)

98/99Notes to the Consolidated Financial Statements (continued)
32. Related party transactions and balances (continued)
COMPANY (continued)
Amounts owed by related parties
2012 £000
Amounts owed to related parties
2012£000
Amounts owed by by related parties
2011£000
Amounts owed toto related parties
2011£000
Nanny State LimitedSecured loan 494 - 472 - Working capital loan 631 - 620 - Income tax Group relief - (31) - (4)
Nicholas Deakins LimitedTrade receivables/(payables) 95 (30) 57 (11)Other intercompany balances 71 - 106 -
RD Scott LimitedLong term loan 5,047 - 6,833 - Trade receivables/(payables) 64 (60) 6 (57)Income tax Group relief - - - (247)
Topgrade Sportswear LimitedWorking capital loan 8,188 - 6,328 - Trade receivables/(payables) 92 (3) 255 (867)Income tax Group relief - (112) - (98)
Premium Fashion LimitedLong term loan 1,598 - - - Working capital loan 574 - - - Income tax Group relief - (369) - -
Champion Sports (Holdings)Trade receivables 106 - - -
JD Sprinter Holdings 2010 SLTrade receivables 10 - - -
Focus Brands LimitedWorking capital loan 3,302 - - - Other 29 Trade receivables/(payables) 142 (1) - -
Kukri Sports LimitedLong term loan 180 - - - Long term loan (interest bearing) 2,444 - - - Working capital loan 490 - - - Trade receivables 184 - - -
Blacks Outdoor Retail LimitedWorking capital loan 3,820 - - - Long term loan 20,000 - - - Trade receivables 57 - - - Income tax Group relief - (1,474) - -

Notes to the Consolidated Financial Statements (continued)
32. Related party transactions and balances (continued)Long term loans represent historic intercompany balances and initial investment in subsidiary undertakings to enable them to purchase other businesses. These loans do not attract interest, with the exception of the loans to Chausport SA and JD Sports Fashion (France) SAS, where interest is charged at the official French government interest rate. This interest rate is variable and is reviewed quarterly. These loans are repayable on demand.
Working capital loans represent short term financing provided by the Company to its subsidiaries. These loans do not attract interest, with the exception of the loan to Topgrade Sportswear Limited and Kukri Sports Limited which are not wholly owned subsidiaries. The loan to Topgrade Sportswear Limited attracts interest at the UK base rate plus a margin of 1.0%. The loan to Kukri Sports Limited attracts interest at the UK base rate plus a margin of 2.0%. These loans are repayable on demand.
The secured loans from the Company to Canterbury Limited, Duffer of St George Limited and Nanny State Limited are secured upon the intellectual property in these companies. The loan to Canterbury Limited does not attract interest, whereas the loans to Duffer of St George Limited and Nanny State Limited accrue interest at the UK base rate plus a margin of 4.0%. These loans are repayable on demand.
Other intercompany balances relates to recharges.
Trade receivables/payables relate to the sale and purchase of stock between the Company and its subsidiaries on arms length terms.
There have been no transactions in the year (2011: £nil) and there are no balances outstanding (2011: £nil) with the other subsidiary undertakings of the Company, as listed in note 36. Other than the remuneration of Directors as shown in note 5 and in the Directors' Remuneration Report on page 50 there have been no other transactions with Directors in the year (2011: £nil)
33. Contingent liabilitiesThe Company has provided the following guarantees:
• Guarantee capped at £788,000 (2011: £2,500,000) in relation to the acquisition of Canterbury of New Zealand Limited under a kit supply and sponsorship agreement with the Scottish Rugby Union Plc, which was entered into in January 2010
• Guarantee on the working capital facilities in Chausport SA of €5,000,000 (2011: €3,000,000)
• Guarantee on the working capital facilities in Canterbury International (Australia) Pty Limited of AUD$3,000,000 (2011: $nil)
• Guarantee on the finance lease facility in relation to the acquisition of Champion Sports (Holdings) up to a maximum of €2,500,000 (2011: €nil)
• Guarantee on the working capital facilities in Champion Sports (Holdings) up to a maximum of €3,000,000 (2011: €nil)
The Company formerly provided a guarantee on the working capital facilities in both Topgrade Sportswear Limited and Nicholas Deakins Limited of £2,000,000 and £600,000 respectively. As at 28 January 2012, Topgrade Sportswear Limited and Nicholas Deakins Limited are encompassed in the syndicated committed £75,000,000 bank facility. In addition, the Company formerly provided a guarantee on the letter of credit facility in Canterbury (North America) LLC and Focus Brands Limited. The contingent liability varied depending on the value of the letters of credit outstanding at any point in time, but the maximum exposure on this guarantee was $550,000 and £1,000,000 respectively.
34. Subsequent eventsFly53
On 2 February 2012, the Group acquired the trade and assets of the 'Fly53' brand, inventory and rights to 14 House of Fraser concession stores from Fly53 Limited and Sabotage Limited for a total cash consideration of £466,000.
Originals
On 14 March 2012, the Group acquired, via its subsidiary R.D. Scotts Limited, the trade and assets of seven stores trading as Originals and the head office along with the Originals name and inventory from Retailchic Limited for a total cash consideration of £150,000.
35. Ultimate parent companyThe Company is a subsidiary undertaking of Pentland Group Plc which is also the ultimate parent company. Pentland Group Plc is incorporated in England and Wales.
The largest group in which the results of the Company are consolidated is that headed by Pentland Group Plc. The results of Pentland Group Plc may be obtained from Companies House, Crown Way, Cardiff, CF14 3UZ.
The Company has taken advantage of the exemption in s408 of the Companies Act 2006 not to present its individual income statement and related notes. The total recognised income and expense for the parent included in these consolidated financial statements is £52,190,000 (2011: £47,045,000). The Consolidated Financial Statements of JD Sports Fashion Plc are available to the public and may be obtained from The Company Secretary, JD Sports Fashion Plc, Hollinsbrook Way, Pilsworth, Bury, BL9 8RR or online at www.jdplc.com.

100/101Notes to the Consolidated Financial Statements (continued)
36. Principal subsidiary undertakingsThe following companies were the principal subsidiary undertakings of JD Sports Fashion Plc at 28 January 2012.
Place of registration
Nature of business and operation
Ownership interest
Voting rights interest
Name of subsidiary John David Sports Fashion (Ireland) Limited Ireland Retailer of sports inspired footwear and apparel 100% 100%Athleisure Limited UK Intermediate holding company 100% 100%R.D. Scott Limited UK Retailer of fashion clothing and footwear 100% 100%Pink Soda Limited UK Intermediate holding company 100% 100%Varsity Kit Limited* UK Intermediate holding company 100% 100%Bank Fashion Limited* UK Retailer of fashion clothing and footwear 100% 100%Topgrade Sportswear Holdings Limited UK Intermediate holding company 80% 80%Topgrade Sportswear Limited* UK Distributor and multichannel retailer of sports and
fashion clothing and footwear 80% 80%Nicholas Deakins Limited UK Distributor of fashion footwear 100% 100%JD Sports Fashion (France) SAS France Intermediate holding company 100% 100%Chausport SA* France Intermediate holding company 100% 100%Spodis SA* France Retailer of sports footwear and accessories 100% 100%Kooga Rugby Limited UK Distributor of rugby clothing and accessories 100% 100%Canterbury Limited UK Intermediate holding company 100% 100%Canterbury of New Zealand Limited* UK Distributor of leisure wear and rugby apparel 100% 100%Canterbury International (Far East) Limited* Hong Kong Distributor of leisure wear and rugby apparel 100% 100%Canterbury (North America) LLC* America Distributor of leisure wear and rugby apparel 100% 100%Canterbury International (Australia) Pty Limited* Australia Distributor of leisure wear and rugby apparel 75% 75%Canterbury of New Zealand Limited* New Zealand Distributor of leisure wear and rugby apparel 51% 51%Canterbury European Fashionwear Limited* UK Distributor of leisure wear and rugby apparel 75% 75%Duffer of St George Limited UK Licensor of a fashion brand 100% 100%Premium Fashion Limited UK Retailer of fashion clothing and footwear 85% 85%Nanny State Limited UK Distributor of fashion footwear and apparel 100% 100%Focus Brands Limited UK Intermediate holding company 80% 80%Focus International Limited* UK Distributor of sports clothing and footwear 80% 80%Kukri Sports Limited UK Intermediate holding company 80% 80%Kukri GB Limited* UK Distributor and retailer of sports clothing and acces-
sories 80% 80%
Kukri (Asia) Limited* Hong Kong Distributor of sports clothing and accessories 80% 80%Kukri NZ Limited* New Zealand Distributor of sports clothing and accessories 60% 60%Kukri Sports Ireland Limited* Ireland Distributor of sports clothing and accessories 80% 80%Kukri Australia Pty Limited* Australia Distributor of sports clothing and accessories 66% 66%Kukri Sports Canada Inc* Canada Distributor of sports clothing and accessories 60% 60%Kukri USA Inc* USA Distributor of sports clothing and accessories 80% 80%Kukri Sports Spain SL* Spain Distributor of sports clothing and accessories 60% 60%Frank Harrison Limited* UK Distributor and retailer of school clothing 72% 72%Champion Sports (Holdings)* Ireland Intermediate holding company 100% 100%Champion Sports Ireland* Ireland Retailer of sports and leisure goods 100% 100%JD Champion Ireland Limited Ireland Retailer of sports and leisure goods 100% 100%Marathon Sports Limited* UK Retailer of sports and leisure goods 100% 100%JD Sprinter Holdings 2010 SL Spain Intermediate holding company 50.1% 50.1%JD Spain Sport Fashion 2010 SL* Spain Retailer of sports and leisure goods 65.1% 65.1%Sprinter Megacentros Del Deporte SLU* Spain Retailer of sports and leisure goods 50.1% 50.1%Blacks Outdoor Retail Limited UK Retailer of outdoor footwear, apparel and equipment 100% 100%
*Indirect holding of the Company.
A full list of subsidiary undertakings of JD Sports Fashion Plc can be obtained from Companies House.

Five Year Record
Consolidated Income Statement53 weeks to
2 February 2008£000
52 weeks to31 January 2009
£000
52 weeks to30 January 2010
£000
52 weeks to29 January 2011
£000
52 weeks to29 January 2012
£000
Revenue 592,240 670,855 769,785 883,669 1,059,523 Cost of sales (300,813) (340,309) (390,248) (446,657) (538,676)
Gross profit 291,427 330,546 379,537 437,012 520,847 Selling and distribution expenses - normal (225,994) (256,315) (288,462) (326,296) (403,923)Selling and distribution expenses - exceptional (8,404) (8,201) (6,458) (3,277) (10,532)
Selling and distribution expenses (234,398) (264,516) (294,920) (329,573) (414,455)
Administrative expenses - normal (22,500) (20,867) (26,051) (32,966) (43,193)Administrative expenses - exceptional - (8,122) 1,472 (1,007) 847
Administrative expenses (22,500) (28,989) (24,579) (33,973) (42,346)
Other operating income 1,086 1,109 2,270 2,177 2,730
Operating profit 35,615 38,150 62,308 75,643 66,776
Before exceptional items 44,019 54,473 67,294 79,927 76,461 Exceptional items (8,404) (16,323) (4,986) (4,284) (9,685)
Operating profit before financing and share of result of joint venture 35,615 38,150 62,308 75,643 66,776
Share of results of joint venture before exceptional items (net of income tax) (145) (166) 539 1,475 (102)Share of exceptional items (net of income tax) - 914 (1,012) 1,348 1,170
Share of results of joint venture (145) 748 (473) 2,823 1,068 Financial income 297 529 385 618 646 Financial expenses (764) (1,210) (827) (455) (1,048)
Profit before tax 35,003 38,217 61,393 78,629 67,442 Income tax expense (11,416) (13,707) (18,647) (22,762) (18,093)
Profit for the period 23,587 24,510 42,746 55,867 49,349
Attributable to equity holders of the parent 23,549 24,379 42,900 55,884 46,847 Attributable to non-controlling interest 38 131 (154) (17) 2,502
Basic earnings per ordinary share 48.79p 50.49p 88.16p 114.84p 96.27p
Adjusted basic earnings per ordinary share (i) 57.05p 72.33p 93.64p 116.86p 105.89p
Dividends per ordinary share (ii) 8.50p 12.00p 18.00p 23.00p 25.30p
(i) Adjusted basic earnings per ordinary share is based on earnings excluding the post-tax effect of certain exceptional items (see note 10).(ii) Represents dividends declared for the year. Under IFRS dividends are only accrued when approved.

102/103
Financial Calendar
Final Results Announced 12 April 2012
Final Dividend Record Date 4 May 2012
Financial Statements Published May 2012
Annual General Meeting 20 June 2012
Final Dividend Payable 30 July 2012
Interim Results Announced September 2012
Period End (53 Weeks) 02 February 2013
Final Results Announced April 2013
Shareholder InformationRegistered office Financial advisers Principal bankers SolicitorsJD Sports Fashion Plc and stockbrokers Barclays Bank Plc DLA Piper UK LLPHollinsbrook Way Investec 43 High Street Princes ExchangePilsworth 2 Gresham Street Sutton Princes SquareBury BL9 8RR London EC2V 7QP Surrey SM1 1DR Leeds LS1 4BY
Addleshaw Goddard LLP100 Barbirolli SquareManchester M2 3AB
Company number Financial public relations Registrars AuditorRegistered in England MHP Communications Equiniti Limited KPMG Audit Plcand Wales, 60 Great Portland Street Aspect House St James’ SquareNumber 1888425 London W1W 7RT Spencer Road Manchester M2 6DS
LancingWest Sussex BN99 6DA
The Board wishes to express its thanks to the marketing and finance department for the in-house production of this Annual Report and Accounts.