Embed Size (px)
Citation preview

Annual Report and AccountsFor the year ended 31 December 2012


1 Family Investments Annual Report and Accounts 2012
Chairman’s review 2
Chief Executive’s report 4
Investment review 6
Group performance highlights 10
Group summary financial statement 11
Committee of Management 12
Committee of Management’s annual report 14
Remuneration report 23
Independent auditor’s report 26
Income and expenditure account 27
Balance sheet 28
Notes to the accounts 30
Annual Report and Accounts 2012
Contents.
ActuARIesTowers WatsonWatson HouseLondon RoadReigateSurrey RH2 9PQ
AudItoRMazars LLPTower Bridge HouseSt Katharine’s WayLondon E1W 1DD
BAnkeRsNational Westminster Bank PLC135 BishopsgateLondon EC2M 3UR
solIcItoRsAshfords SolicitorsPrincess Court23 Princess StreetPlymouth PL1 2EX
custodIAnsState Street Bank and Trust Company20 Churchill PlaceCanary WharfLondon E14 5HJ
1 Family Investments Annual Report and Accounts 2012

2 Family Investments Annual Report and Accounts 2012
chairman’s review.
Economists tell us that we’ve just experienced the longest double-dip recession in modern history. This, combined with the present Government’s austerity programme means that, for many people, their ability to save and invest for the future has been severely impaired. We all hope that the risk of a return to recession is fading but we are certainly not yet out of the woods. The broad environment remains fragile with the level of sovereign debt in the developed world viewed as unsustainable and European policy makers continuing to grapple with the problem of the Euro.
Despite this unedifying backdrop, Family has enjoyed another satisfactory year against all of our key measures. We now have over 1.8m members and nearly £4.5bn of funds under management, attaining record levels for the Society. Importantly, this increase in scale means that our key measure of efficiency, operating expenses as a percentage of funds under management, has improved again for the fifth successive year.
It is interesting to note how maligned the art of investing has become in some quarters. Yet, inflation is increasing and that acts to diminish the buying power of cash, which is why historically equities have been a better asset class to hold over the longer term. Managing simple and affordable investments is at the heart of our traditional business, and I’m therefore pleased to report that our funds delivered solid returns in 2012. Despite the economic headwinds I have already mentioned, the equity rally in the second half of the year meant that the FTSE 100 Total Return index, (as one simple measure), rose 10.6% over the year as a whole. In turn, our core Sovereign Fund grew by 8% after charges, which means that the policies held by our most long-standing group of members demonstrated returns well in excess of cash and inflation.
chairmanRobert Weir

3 Family Investments Annual Report and Accounts 2012
With equity markets showing such volatility in recent years, it is understandable why so many people view cash as a safe haven. As a business, Family manages more cash than ever before and as part of this broader diversification strategy, I announced last year that we had acquired an online cash administration service called Governor Money. Despite some initial success, this fledgling business has been buffeted by wider forces, such as the Government pumping cheap money into the banking industry through its Funding for Lending scheme. This in turn has reduced the appetite of deposit takers to work with us to attract retail savings, and as a result we have closed Governor to new business.
2012 also marked another significant moment in the history of this Society as John Reeve, our long-standing Chief Executive, retired at the end of October. John had been with Family Investments for 30 years, the last 20 as Chief Executive, taking us from a tiny financial services company to one of significant size and capability. John will always be held here in high regard for having steadily built this business to what it is today. Writing this commentary provides me with a final opportunity to note his achievements and to thank him for his contribution over so long a time.
After an extensive search, the Board is very pleased to have recruited an experienced financial services professional, Simon Markey, to lead our business into the future. We have recruited from outside the mutual sector, not because we want to change our status or ethos, but because Simon’s background in banking and insurance brings that all important external view of the world. We believe he’s the right man to create a new vision for Family and continue to lead us forward.
We’re not the sort of business to chase awards, but I am pleased to report that in 2012 Family Investments won two awards from Moneyfacts, one in innovation and the other for our Junior ISA product. Alongside the feedback we get from our members and the high quality of customer service we have delivered in 2012, it tells me that we are continuing to do the right things for you, our members.
I’d like to conclude by thanking all our members for their support of the Society in 2012. In addition, I’d particularly like to note the efforts of our staff during a year that has contained considerable uncertainties due to the change of Chief Executive.
Robert WeirChairmanMarch 2013

4 Family Investments Annual Report and Accounts 2012
chief executive’s report.
Introduction.Firstly, I’d like to thank my predecessor, John Reeve, who has been such a driving force in the story of Family Investments so far. I’ve often been confronted with new roles where there are major problems to address and so to join a stable, profitable business with a skilled workforce and a good culture is a tribute to John’s leadership.
My background in large corporate concerns and private equity could be considered a world away from that of a friendly society, but in most of my formative years as a banker, I enjoyed running business areas that were providing great products and services to customers. It’s only really in recent years that the banking industry has become somewhat out of touch with its roots, culminating in today’s environment where the general public has lost faith in some of the larger banking institutions. So, it’s incredibly refreshing for me to join a firm like Family Investments where we embrace the mutual ethos of doing things properly and being able to align our business to the needs of the membership, rather than to shareholders.
I firmly believe that because the trust between the public and larger banks has broken down, there should be a bright future for mutual firms. That said, we can’t afford to be complacent in any way. Surely, if it were simply a matter of mutual firms being seen as good and corporate concerns being the bad guys, then customers would be falling over themselves to do business with firms like ours. Life is more complex and whatever type of business you operate in, you have to provide great products that people need with high service levels. There also needs to be some profit at the end of the day, a word we shouldn’t be shy of using. Sustainability, growth and profit are all entwined and ultimately serve our membership.
chief executivesimon Markey

5 Family Investments Annual Report and Accounts 2012
Review of results.2012 was another year of progress for the Society with increases in both operating profits and our reserves. Family’s reserves now stand at over £46m - their strongest level in five years.
The Junior ISA celebrated its first birthday in the month of my arrival. Government figures show that in its first 5 months to April 5th, 72,000 Junior ISAs were created and it is encouraging to think that a cohort of children will reach adulthood and receive a substantial financial asset that might help them through further education or onto the housing ladder. Family has already established an enviable position over the last decade in the long-term children’s savings arena and, based on accounts opened, we believe we are the market leading firm in investment-based Junior ISAs.
Although our business is best known for investment-backed children’s savings, the Society has diversified recently and now 52% of our assets are held in cash. Our most successful current relationship is our distribution agreement with Post Office where we provide them with a range of ISA products. 2012 was another successful year of trading.
outlook.The financial services industry is littered with brands that were once strong but have failed to adapt to the changing needs of the market. Each year brings fresh challenges and in the world of investments, the introduction by the regulator of the Retail Distribution Review is once again altering the fabric of the industry. From January 2013, financial advisors are no longer allowed simply to take commission for their services and are now required to agree their remuneration with clients at outset. This has already led to most of the banks closing down their own advisor networks. Where will customers turn for help when making more complex financial decisions? How many customers will no longer be able to access financial advice, either because they don’t want to pay fees or because they simply don’t have enough investable money to make it worthwhile for an advisor to service them under the new regime? We don’t yet have all the answers to these questions, but it is illustrative of the ever changing environment in which Family Investments operates. Whilst there are some advantages to being a smaller business, taking a long-term view, we have to acknowledge that we remain vulnerable to the winds of change.
It’s with this in mind that I intend to build a more durable business. Clearly, this is not an easy challenge but it is fundamental to ensuring the continued success of the Society. The Committee of Management is currently undertaking a strategic review of our business in order to work out how best to operate in the future and what technologies to employ. I am not in a position to give too much information at this stage as we are still in the early days. Needless to say, it’s a big undertaking and exciting times here as we map out our future path. I look forward to meeting the membership at our forthcoming Annual General Meeting (AGM) in May, where I hope to be in a position to share more information about our future direction.
simon MarkeyChief ExecutiveMarch 2013

6 Family Investments Annual Report and Accounts 2012
Investment review.
Background.The Group has a number of unit trusts and unit-linked funds, together with one with-profits fund which has been closed to new business since 2002 and is ring fenced from the rest of the Society’s funds. The unit trusts and unit-linked funds are collective vehicles into which the majority of the Society’s tax efficient products invest, i.e. Friendly Society Tax Exempt Savings Plans (TESPs), Child Trust Funds (CTFs) and ISAs. As well as these managed funds, which contain either equities or a mix of equities, bonds and other investments, the Society also manages a number of cash funds for ISAs, CTFs and TESPs. As at the end of 2012 the Society’s funds under management totalled £4.5bn of which £2.3bn was in cash, and the balance was invested in managed funds comprising equities, bonds and other asset classes. More details of asset allocations are set out in Tables 2 and 3 on page 9.
A sub-committee of the Society’s Committee of Management, the Investment Sub Committee (ISC), is responsible for the implementation of the Society’s investment strategy and policy and currently delegates the management of the various managed investment funds to State Street Global Advisors Limited, who were appointed as the Society’s principal investment manager with effect from 1st May 2012.
State Street is one of the world’s largest and best resourced index managers and the ISC firmly believes they will do an excellent job of managing the Society’s investments.

7 Family Investments Annual Report and Accounts 2012
This underpinned gains for UK gilts, which also benefited from their perceived safe haven status. 10-year gilt yields tumbled to a record low of 1.41% in July, before an increase in Euro confidence eroded those gains. Corporate bonds enjoyed a better year as investors’ search for higher income and improving risk appetite drove prices higher.
The UK stock market was led higher by bank stocks as cheap funding from the ECB and BOE, a resilient housing market and receding euro break-up fears offset other concerns. Initial investor preference for ‘defensive’ stocks shifted in mid-2012 on hopes that central bank interventions will promote an economic upswing. Some consumer staples stocks held up well, but telecom and pharmaceutical sectors featured among the poorer performers. Slowing Chinese demand for commodities weighed on London-listed mining stocks, although the sector staged a partial recovery late in the year.
The UK commercial property market remains split by geographical lines with properties located in London outperforming all other regions in each of the sectors. Prime properties continued to be the most sought after, but demand also remained for development opportunities.
overview of investment conditions.FTSE performanceEquity investors enjoyed a healthy return in 2012, though the gains were hard-won at times. The FTSE All-Share Index delivered a positive total return of 12.9%, with the FTSE 100 Total Return’s gain of 10.6% more muted by comparison. A strong finish to the year saw advances made in Europe, where German and French markets generated gains of 29.1% and 15.3% respectively. Spain was a notable exception, lagging by a distance with a loss of nearly 5%. Emerging markets experienced a mixed year, with Chinese stocks posting a relatively modest gain of 3.2% while India’s Sensex Index rose 25.7%. The US S&P 500 didn’t close below its end-2011 level during the year en route to a 13.4% return. The FTSE World Index achieved a total return of 11.8% in 2012.
Market environmentThe pivotal moment of 2012 for financial markets arguably came in late July when European Central Bank (ECB) President Mario Draghi stated that the bank would do ‘whatever it takes’ to support the Euro. Backed up by renewed bond purchase plans and commitments by other central banks to provide economic stimulus measures, investor risk appetite recovered from Euro break-up fears that mounted in the second quarter. The advances were achieved even as US and Chinese economic data looked to have taken a turn for the worse and as Europe lurched towards another recession.
Worries about a possible hard landing for China’s economy were eased by year-end as indicators towards the end of 2012 suggested the economy may have passed its low point. Ultimately, it was the expectation that the world’s governments and central banks will do whatever is necessary to avert a return to the depths of the financial crisis that underpinned the improvement in investor sentiment.
UK marketsThe UK macro-economic backdrop provided an uninspiring tone in 2012, but still avoided being excessively weak. Third-quarter growth of 0.9% brought to an end three consecutive quarters of contraction and while unemployment rose consistently through the year, it is better than the broader European experience. The Bank of England (BOE) kept interest rates at 0.5%, a stance made easier by the drop in headline inflation to 2.7% by the end of the year. The bank extended its quantitative easing programme twice in 2012 to take its asset purchase programme total to £375 billion.

8 Family Investments Annual Report and Accounts 2012
Investment review (continued).
Unit prices are as at 10am while the market indices are as at close.
Members wanting further detail on performance of the Society’s funds should contact the Secretary.
* FIBI was launched less than five years ago and therefore does not have a five year performance figure. The figure quoted here is for the Sovereign Fund, which was the predecessor of FIBI and which now invests in FIBI.
table 1 unit price growth. Fund Name
One Year%
Three Year%
Five Year%
Family Balanced International Fund (FIBI) (Share Class A) 8.4 13.7 11.2*
Child Trust Fund 8.9 12.9 5.2
Family Asset Trust 9.4 18.5 (4.2)
Family Charities Ethical Trust 9.8 12.8 (13.5)
Fixed Interest Fund 3.7 24.1 36.2
FTSE 350 index 7.8 11.7 (6.0)
US index 8.2 25.1 18.9
Euro index 12.5 (4.9) (19.9)
Far East index 14.9 17.5 12.9
Japan index 0.9 0.3 (10.1)
Performance.You will note from Table 1 that the unit prices of the Society’s balanced funds grew strongly in 2012 as a result of the largely benign investment markets, whilst the Fixed Interest Fund also performed well with an increase to its unit price of just under 4% in the year, and just over 36% for the last 5 years in total.
The Child Trust Fund, in which the majority of our CTF plans are invested and which invests in UK, US, European and Far East equities, grew by 8.9%. The Family Balanced International Fund (Share Class A), in which many of our Family Bond and Junior Bond policies are invested and which invests in emerging market equities, property and bonds in addition to the global equities referred to above, grew by 8.4%.
outlook for 2013.Europe will remain a drag on global growth prospects in 2013, with the eurozone likely to see another year of economic decline as austerity continues to bite. While ECB efforts to avert a euro break-up have improved confidence, we are likely to see further
chapters in this drama unfold. Whether this has the same impact on market confidence as before remains to be seen. The US and UK must also address deficit concerns in 2013 if they are to retain their credit rating status.
Modest prospects for corporate profit gains and unexciting bond yields in 2013 makes it difficult to project anything more than a moderate pace of advance for either equities or fixed income in the months ahead. For the moment, however, financial markets seem poised to continue riding the bounty of central bank balance sheets.
table 1.Unit price growth
This table shows the growth in the unit price of the Society’s largest funds for the one, three and five year periods ended 31 December 2012, together with major market indices for the same periods. Note though that the unit price movements are not directly comparable to those of the indices as the unit price figures are after deduction of fund management charges whereas no fund deductions apply to the market indices. Please remember that the value of investments can fall as well as rise.

9 Family Investments Annual Report and Accounts 2012
table 2 top 10 holdings. as at 31 December 2012
Security description % of Fund
sovereign Fund
SPDR Sterling Corp Bond ETF 10.65
Aberdeen Emerging Markets 6.08
GAM Absolute Return Fund 5.60
SPDR 1-5 Year Gilt ETF 4.81
IShares FTSE REIT UK Prop Fund 2.56
HSBC HDG 2.21
SPDR UK Gilt ETF 1.61
BP 1.50
Royal Dutch Shell A 1.45
Vodafone Group 1.42
UK Equities30%
Cash 3%UK Gilts & Corporate
Bonds 18%
Property 4%
Far EastEquities
10%
European Equities 15%
US Equities
11%
Absolute ReturnFunds 9%
table 2 – sovereign Fund asset allocation. as at 31/12/2012 (fund size £793m)
Cash1%
Far East Equities 6%
European Equities 21%
US Equities17%
UK Equities55%
table 3 – child trust Fund asset allocation. as at 31/12/2012 (fund size £491m)
table 3 top 10 holdings. as at 31 December 2012
Security description % of Fund
child trust Fund
HSBC HDG 3.49
BP 2.38
Royal Dutch Shell A 2.30
Vodafone Group 2.24
GlaxoSmithKline 1.93
British American Tobacco 1.78
Royal Dutch Shell B 1.69
Diageo 1.32
BHP Billiton 1.32
Rio Tinto 1.29

10 Family Investments Annual Report and Accounts 2012
Group performance highlights.
25,000
20,000
15,000
10,000
5,000
02008 2009 2010 2011 2012
Operating expenses £000.
17,974
16,714
13,074
16,191
19,695
3,309,477
3,452,4691,660,471
4,500,000
4,000,000
3,500,000
3,000,000
2,500,000
2,000,000
1,500,000
1,000,000
500,000
02008 2009 2010 2011 2012
Members’ funds undermanagement – £000.
2,293,696
4,465,783
2,000,000
1,750,000
1,500,000
1,250,000
1,000,000
750,000
500,000
250,000
02008 2009 2010 2011 2012
Membership.
1,720,000
1,781,000
1,036,000
1,589,000
1,807,000
1,142,377
849,239
374,303
1,250,000
1,000,000
750,000
350,000
300,000
250,000
200,000
150,000
100,000
50,000
02008 2009 2010 2011 2012
Customer contributions £000.
370,658
1,200,880
1.0
0.8
0.6
0.4
0.2
02008 2009 2010 2011
Operating efficiency. (Operating expenses as a % of
members’ funds under management)
2012
0.54%
0.48%
0.78%
0.71%
0.44%
40,677
44,167
41,478
70,000
60,000
50,000
40,000
30,000
20,000
10,000
02008 2009 2010 2011 2012
Reserves – £000.
32,247
46,169
Source of fundsunder management 2012.
TESP23%
CTF26%
ISA
46%
Other5%
source of funds under management 2012.

11 Family Investments Annual Report and Accounts 2012
Group summary financial statement.
notes:
1 The contributions paid by members into their policies.
2 The amounts paid out to members on maturity or surrender of their policies.
3 The change in value of, and income earned from, members’ investments.
4 The management fees charged by the Group and paid out of members’ funds.
5 Other charges include charges for life cover and early surrender.
6 Income from activities not paid for by policyholders, including administration income from 3rd party products.
7 The cost of administering members’ policies. This number differs from those in the Technical Account due to different classification of certain expenses. The Summary Financial Statements attempts to provide more clarity whilst the Technical Account is driven by regulatory requirements.
8 The cost of acquiring new business, mainly commission and marketing expenses and the amount spent on developing the business, mainly on new product lines and improving systems capabilities.
9 The change in the value of the assets, less the change in the value of the liabilities, of the Society’s non-linked investment funds.
10 The change in value of, and income earned from, investments that form part of the Group’s reserves.
summary of group financial results. Results for the year ended 31 December 2012 Notes
2012Group£’000
2011Group£’000
Members’ funds under management.
opening balance 3,452,469 3,309,477
Amounts paid in by members 1 1,200,880 849,239
Amounts withdrawn by members 2 (372,718) (692,966)
Investment income, gains and losses 3 211,076 11,108
Management charges paid to the Society (below) 4 (25,924) (24,389)
closing balance 4,465,783 3,452,469
Results for the year.
operating income
Management charges from members’ funds (above) 4 25,924 24,389
Other charges levied on members 5 806 890
Other income 6 8,121 5,982
34,851 31,261
Operating expenses 7 (19,695) (16,714)
operating profit 15,156 14,547
Investment in systems and new business 8 (12,314) (12,098)
Change in non-linked fund reserves 9 (2,199) (3,018)
Investment income, gains and losses net of taxation 10 1,359 4,059
net result for the year 2,002 3,490
Reserves at 1 January 44,167 40,677
Reserves at 31 december 46,169 44,167

12 Family Investments Annual Report and Accounts 2012
committee of Management.
non-executive directors.
chairmanRobert Weir FcAMr Weir, aged 64, has been a member of the Committee since 1997, Vice Chairman and Senior Independent Director from 2007 and was appointed Chairman in 2010. He was previously a director of the Household Mortgage Corporation and has wide experience in financial and general management. Robert is a member of the Investment Sub-Committee, the Remuneration Sub-Committee and the Nominations Sub-Committee.
Peter BoxMr Box, aged 60, was appointed to the Committee in 2009 and was an audit and business advisory partner at PricewaterhouseCoopers, to a broad range of companies from large international businesses to specialist national firms in his 39-year career. In particular, through his focus on the insurance industry, he has developed a deep understanding of the major issues affecting the sector, both in the UK and around the world, and has significant experience of regulatory and governance matters. He also serves as Vice Chairman and non-executive director of Marsh Limited, a non-executive director of Pool Reinsurance Company Limited and Cardif Pinnacle Insurance Holdings plc. Peter chairs the Risk and Audit Sub-Committee and is a member of the Nominations Sub-Committee.
Ian BuckleyMr Buckley, aged 62, joined the Committee in 2009. He is a member of the Group Executive Committee of Rathbone Brothers Plc, having previously served as a director of that company for 11 years. Prior to this, he was Chief Executive of Smith & Williamson from 1985 to 1995. He was subsequently Chief Executive of EFG Private Bank Limited and in February 2000 set up Tenon Group Plc. He is also a non-executive director of Miller Insurance Services LLP. Ian is a member of the Investment Sub-Committee, the Risk and Audit Sub-Committee and the Nominations Sub-Committee.
Veronica FranceMs France, aged 51, was appointed to the Committee in 2006. She has held positions as Marketing Director for a life assurance and unit trust group and a reassurance company. Since 1992 she has been an independent business development consultant working with a wide range of UK financial services organisations. She is a non-executive director of Chesnara plc. She is a past chairman of the Investment and Life Assurance Group (ILAG) and its Non-Executive Directors’ Forum. Veronica chairs the Remuneration Sub-Committee and is a member of the Risk and Audit Sub-Committee and the Nominations Sub-Committee.
Vice chairmannorman RiddellMr Riddell, aged 65, joined the Committee in 2006 and was appointed Vice Chairman in 2010. Having trained and qualified as a commercial banker in Scotland, he moved into investment management and held the position of Chief Executive Officer in three different investment management companies, including the INVESCO Group, over a period of some 20 years. He has served in the capacity of non-executive director in a number of financial companies, including Life Assurance Holding Corporation and is a non-executive director of Invesco UK Limited. Norman chairs the Investment Sub-Committee and is a member of the Remuneration Sub-Committee and the Nominations Sub-Committee.

13 Family Investments Annual Report and Accounts 2012
chief executivesimon MarkeyMr Markey, aged 47, joined the Society on 1st November 2012 as Chief Executive. Mr Markey started his career at Lloyds Bank in 1984 where he remained for over 20 years and held numerous positions including Head of Savings and Director of Customer and Sales. Following Lloyds, Simon became Managing Director of Lifestyle Services Group Ltd and CEO of Consumer at Marsh Ltd, before joining NBNK Investments PLC in 2011.
executive directors.
chief operating officerRob edwardsMr Edwards, aged 57, has been a full-time executive of the Society since 1988. Prior to this he had 10 years experience with a medium sized life and pensions company and another Friendly Society. He was appointed to the Committee in 1997, became General Manager in 2001 and Chief Operating Officer (COO) in 2006. He is responsible for overseeing the Society’s Customer Services, Corporate Projects and IT functions. He is an active member of the Association of Financial Mutuals COO Network.
Finance directorJohn Adams FccAMr Adams, aged 58, is a Certified Accountant and has been a full-time executive of the Society since 1986 when he was appointed Financial Controller. He was promoted to Finance Director and appointed to the Committee in 1993. Mr Adams previously worked for American Express for 7 years in a variety of finance roles, and is a director of Albion in the Community, a charity which supports and assists the disadvantaged youth of Brighton and Hove through sports.
secretary and corporate services directorkeith Meeres McsIMr Meeres, aged 55, joined the Society in 1993 as Compliance Officer having previously worked for a large insurer and a building society. He became Secretary in 1996. He was appointed to the Committee in 1997 and he is responsible for overseeing the Society’s Regulatory Compliance, Risk, Internal Audit, Human Resources and Facilities functions. He is a director of the Investment and Life Assurance Group (ILAG), Chairman of its Regulations Practitioner Group and a member of the Association of Financial Mutuals Regulations Committee.
Business development directorMiles BinghamMr Bingham, aged 46, joined the Society in 2001 as Head of Marketing following 11 years in various marketing and product development roles at both HSBC and Abbey (now Santander).In 2008, he was promoted to Business Development Director with key responsibility for finding new distribution partners alongside managing a number of existing relationships and expanding the overall range of products offered by the Society. He is responsible for overseeing the Society’s Marketing function.

14 Family Investments Annual Report and Accounts 2012
committee of Management’s annual report.
The Annual Report and Accounts have been prepared in accordance with The Friendly Societies (Accounts and Related Provisions) Regulations 1994 (‘the Regulations’). A Committee of Management comprising the Chairman, four other independent non-executive directors and five executive directors governs the Society. The Committee is led by the Chairman whose role, along with that of the Chief Executive, has been set out and approved by the Committee. The Committee delegates management of the business to the executive directors, who meet as a group at least monthly.
The Committee is satisfied that having considered the background and current circumstances of each non-executive director there are no relationships or issues which could affect the independence of their judgement in performing their duties. Directors’ biographies and details of length of service can be found on pages 12 to 13.
committee of Management.During 2012 the members of the Committee were as follows:
non-executives.Robert Weir (Chairman)Norman Riddell (Vice Chairman)Peter BoxIan BuckleyVeronica France
executives.Simon Markey (Chief Executive) Appointed 1st November 2012John Reeve (Chief Executive) Retired 31st October 2012Rob Edwards (Chief Operating Officer)John Adams (Finance Director)Keith Meeres (Secretary and Corporate
Services Director)Miles Bingham (Business Development
Director)
statement of responsibilities of the committee of Management.The Committee is primarily responsible for the strategic direction and governance of the Society. It delegates responsibility for the day-to-day running of the business to executive management. Progress on operational matters, governance and key initiatives is reported through Committee and Sub-Committee meetings. All initiatives involving significant expenditure, strategic change, governance policies, significant perceived risk or material departure from agreed budget or strategy require Committee consideration and approval.
The division of responsibilities between Robert Weir, Chairman and Simon Markey, Chief Executive has been agreed by the Committee and documented. Norman Riddell, Vice Chairman, undertakes the role of Senior Independent Director.
The Friendly Societies Act 1992 (‘the Act’) requires the Committee to prepare accounts for each financial year which give a true and fair view of the state of the affairs of the Society and of the Group as at the end of the financial year and of the income and expenditure of the Society and of the Group for that period. In preparing those accounts, the Committee is required to:
• select suitable accounting policies and then apply them consistently;
• make judgements and estimates that are reasonable and prudent;
• state whether applicable accounting standards have been followed, subject to any material departures disclosed and explained in the accounts; and
• prepare the accounts on a going concern basis unless it is inappropriate to presume that the Society will continue in business.
The Committee confirms that it has complied with the above requirements in preparing the accounts and believes they provide a fair, balanced and understandable view of the Society.
The Committee is responsible for keeping proper accounting records which disclose with reasonable accuracy at any time the financial position of the Society and ensuring that the accounts comply with the Act.
It is also responsible for safeguarding the assets of the Society and hence for taking reasonable steps for the prevention and detection of fraud and other irregularities.
The Committee is responsible for the Society’s systems of control and acknowledges that such systems can provide only reasonable and not absolute assurance against material misstatement or loss.
The Committee conducts, through the Risk and Audit Sub-Committee, an ongoing review of the effectiveness of the Group’s systems of internal controls and risk management and is satisfied that there are no material shortcomings (see the Risk and Audit Sub-Committee report on page 18).

15 Family Investments Annual Report and Accounts 2012
In accordance with the Act, the Committee confirms that all activities carried out during the year by the Society and its subsidiary undertakings are believed to have been carried out within their respective powers.
The Committee considers that the skills, independence and experience of the non-executive directors provide an appropriate balance to ensure that the Society is effectively managed and controlled.
strategic objectives and activities.The Group’s objective is to be a trusted provider of financial solutions for families. We aim to provide good value life assurance and savings products and excellent service. We judge our performance against these objectives through customer research and monitoring the performance of our products. We also believe that our members expect the Society to thrive and grow in order to achieve economies of scale whilst maintaining prudent control over costs, maintaining adequate financial resources and complying with all relevant legislation and regulation.
The Society is currently undertaking a strategic review; more details can be found in the Chairman’s Review and Chief Executive’s Report.
As at 31st December 2012 the Society’s margins of solvency comfortably exceeded the minimum requirements, as prescribed by the Financial Services Authority (FSA) (the Prudential Regulatory Authority and Financial Conduct Authority from 1st April 2013).
number of members.As at 31st December 2012, the Society had 1,806,686 members (2011: 1,780,884).
Financial risk management objectives.The Group is exposed to financial risk through its financial assets, financial liabilities, reinsurance assets and policyholder liabilities. In particular, the key financial risk is that the proceeds from financial assets are not sufficient to fund the obligations from contracts with policyholders.
The most important components of this financial risk are equity price risk and interest rate risk. These risks arise from open positions in equity products and interest rate, all of which are exposed to general and specific market movements.
The Group manages these positions within an asset liability management (ALM) framework that has been developed to achieve long-term investment returns in excess of its obligations under insurance and investment contracts. The principal technique of the Group’s ALM is to match assets to the liabilities arising from insurance contracts by reference to the type of benefits payable to contract holders. For each distinct category of liabilities, a separate portfolio of assets is maintained. For unit-linked contracts, the liabilities to policyholders are matched with assets in the portfolio. The Society therefore is not directly exposed to the equity price, currency, credit or interest rate risk for these contracts.
equity price risk.
The Group is exposed to equity price risk as a result of holdings in equity investments held by both the Society’s unit-linked funds and by the authorised collective investment schemes that it manages.
The Group’s most significant income stream is derived as a fixed percentage of the market value of the unit-linked funds and authorised collective investment schemes. Exposures to individual companies and to equity shares in aggregate are monitored in order to ensure compliance with the relevant regulatory limits for solvency purposes. Investments held are listed and traded on the UK and other recognised stock exchanges (primarily in Europe, North America and the Far East).
The Group has a defined investment policy, which sets limits on the Group’s exposure to equities both in aggregate terms and by geography and counterparty. This is monitored by the Investment Sub- Committee (see page 18).

16 Family Investments Annual Report and Accounts 2012
committee of Management’s annual report (continued).
Interest rate risk.The Group is exposed to interest rate risk due to the sensitivity of the value of its assets and liabilities to changes in current interest rates. The Group monitors interest rate risk by calculating the mean duration of the investment portfolio and the liabilities issued. The mean duration is an indicator of the sensitivity of the assets and liabilities to changes in current interest rates. The mean duration of the liabilities is determined by means of projecting expected cash flows from the contracts using best estimates of mortality and voluntary terminations. No future discretionary supplemental benefits are assumed to accrue. The mean duration of the assets is calculated in a consistent manner.
Any gap between the mean duration of the assets and the mean duration of the liabilities is minimised by means of buying and selling fixed interest securities of different durations.
Reappointment of auditor.A resolution to reappoint Mazars LLP as auditor to the Society will be proposed at the forthcoming AGM on 24th May 2013.
complaints.It is the Society’s policy to investigate and resolve all complaints promptly and fairly but in the event that members are not satisfied with the Society’s response, the Financial Ombudsman Service provides a complaints resolution service. Full details can be obtained from the Secretary or from the Society’s website at www.family.co.uk. In 2012 we resolved 96.8% of complaints within four weeks.
Health and safety report.The Society has developed a health and safety framework to ensure compliance with applicable laws and regulations including a Health and Safety Committee that comprises senior management and employee representatives. We are pleased to report that in 2012 there were no serious accidents or injuries.
corporate governance.The Society is committed to high standards of corporate governance. The UK Corporate Governance Code (as Annotated for Mutual Insurers (the “Code”)) applies to these Report and Accounts. The Society considers the Code to be closely aligned to the standards that it has set itself and
has endeavoured to comply with the main principles for many years. The Committee has set the values and standards for the Society and its employees, taking account of the principles of the Code, and requires senior management to report to the Committee on adherence. The Committee considers that throughout the period under review it has applied and complied with most of the relevant principles and provisions of the Code, other than as follows:
• The Committee comprises five executive directors and five non-executive directors, including the Chairman. The Code requires a majority of non-executive directors however the Society amended its Rules, in 2009, to preserve the voting majority of the non-executives, thus ensuring that the Society complies with the intention of the Code.
• The Committee has reviewed the length of service of the non-executive directors and considers that they all meet the criteria of independence. The Code for Mutual Insurers recommends that all directors should stand for re-election annually. The Committee has not followed this recommendation as it believes that retirement of one third of the Committee each year is appropriate, given that the Society’s Rules provide other means for members to make directors accountable for their actions. The Committee will keep this practice under review. Additionally, the Committee will continue to require any non-executive director who has exceeded nine years service to, if still considered independent by the Committee, seek re-election on an annual basis rather than every three years. One non-executive director, Robert Weir, has served in excess of nine years on the Committee. After careful consideration of his character, judgement, competence and experience the Committee continues to view him as suitably independent and he will therefore stand for re-election in 2013, however his service will continue to be subject to annual review.
None of the directors had any interests in the Society or its subsidiary companies other than those interests in respect of fees or salaries paid to them as directors, those interests in respect of the policies which they hold with the Society and those interests specifically disclosed in note 21 of these Annual Report and Accounts.
17 Family Investments Annual Report and Accounts 2012
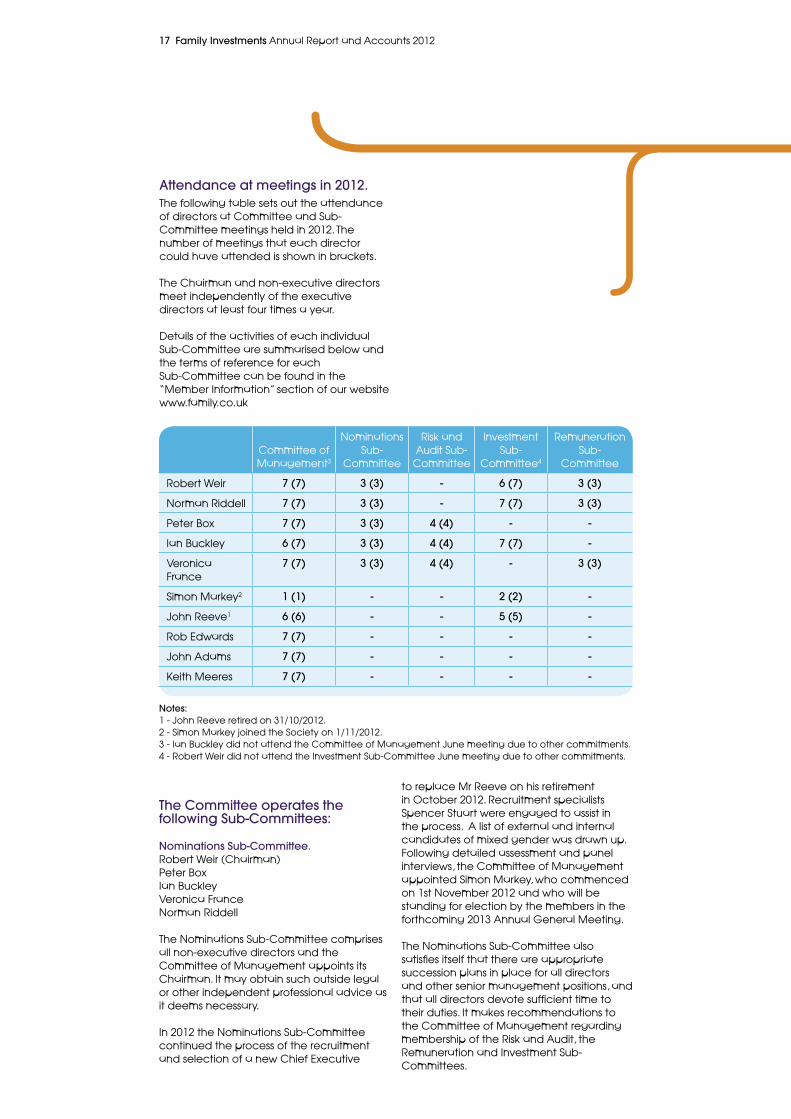
Attendance at meetings in 2012.The following table sets out the attendance of directors at Committee and Sub-Committee meetings held in 2012. The number of meetings that each director could have attended is shown in brackets.
The Chairman and non-executive directors meet independently of the executive directors at least four times a year.
Details of the activities of each individual Sub-Committee are summarised below and the terms of reference for each Sub-Committee can be found in the “Member Information” section of our website www.family.co.uk
the committee operates the following sub-committees:
nominations sub-committee.Robert Weir (Chairman)Peter BoxIan BuckleyVeronica FranceNorman Riddell
The Nominations Sub-Committee comprises all non-executive directors and the Committee of Management appoints its Chairman. It may obtain such outside legal or other independent professional advice as it deems necessary.
In 2012 the Nominations Sub-Committee continued the process of the recruitment and selection of a new Chief Executive
Committee of Management3
Nominations Sub-
Committee
Risk and Audit Sub-
Committee
Investment Sub-
Committee4
Remuneration Sub-
Committee
Robert Weir 7 (7) 3 (3) - 6 (7) 3 (3)
Norman Riddell 7 (7) 3 (3) - 7 (7) 3 (3)
Peter Box 7 (7) 3 (3) 4 (4) - -
Ian Buckley 6 (7) 3 (3) 4 (4) 7 (7) -
Veronica France
7 (7) 3 (3) 4 (4) - 3 (3)
Simon Markey2 1 (1) - - 2 (2) -
John Reeve1 6 (6) - - 5 (5) -
Rob Edwards 7 (7) - - - -
John Adams 7 (7) - - - -
Keith Meeres 7 (7) - - - -
notes:1 - John Reeve retired on 31/10/2012.2 - Simon Markey joined the Society on 1/11/2012.3 - Ian Buckley did not attend the Committee of Management June meeting due to other commitments.4 - Robert Weir did not attend the Investment Sub-Committee June meeting due to other commitments.
to replace Mr Reeve on his retirement in October 2012. Recruitment specialists Spencer Stuart were engaged to assist in the process. A list of external and internal candidates of mixed gender was drawn up. Following detailed assessment and panel interviews, the Committee of Management appointed Simon Markey, who commenced on 1st November 2012 and who will be standing for election by the members in the forthcoming 2013 Annual General Meeting.
The Nominations Sub-Committee also satisfies itself that there are appropriate succession plans in place for all directors and other senior management positions, and that all directors devote sufficient time to their duties. It makes recommendations to the Committee of Management regarding membership of the Risk and Audit, the Remuneration and Investment Sub-Committees.

18 Family Investments Annual Report and Accounts 2012
committee of Management’s annual report (continued).
Investment sub-committee.Norman Riddell (Chairman)Ian BuckleyRobert WeirSimon Markey (appointed 1/11/2012)John Reeve (retired 31/10/2012)Gregor Logan (external adviser)
The Investment Sub-Committee generally meets at least seven times a year and is responsible for monitoring the Group’s investment performance and for assessing the effectiveness of the investment strategy.
In 2012 State Street Global Advisors Ltd became the Society’s fund manager. State Street Global Advisors Ltd manages £1 trillion worldwide, and is ideally placed to deliver the Society’s long term investment strategy for its members. They have responsibility for the discretionary investment management decisions taken on behalf of the Society’s funds.
Remuneration sub-committee.Veronica France (Chairman)Robert WeirNorman Riddell
The Remuneration Sub-Committee meets at least twice each year to review remuneration policy and determines the remuneration packages of the executive directors and senior management. It works with the Group’s Human Resources department, and independent external advisers where appropriate, to assess trends in the competitor and local employment markets.
Details of the directors’ remuneration can be found in the Remuneration Report on pages 23 to 25.
Risk and Audit sub-committee.Peter Box (Chairman)Ian BuckleyVeronica France
The Risk and Audit Sub-Committee meets at least three times a year. It comprises individuals who have recent and relevant experience to enable the Committee of Management to meet its responsibilities in respect of the systems of internal control, management of risk and external financial reporting.
It considers the appointment of, and fees for, the external auditor by reviewing their work and meeting regularly with the Audit Partner and Audit Manager. The criteria against which the external auditor’s performance is assessed include independence, expertise, resource, timeliness and accuracy of
reporting, and fee levels.
It considers the effectiveness of the Internal Audit and Compliance departments by reviewing Internal Audit reports and assessing and agreeing the Internal Audit and Compliance work programmes. The Chief Risk Officer and Head of Internal Audit meet periodically with the Chairman of the Risk and Audit Sub-Committee and both have unrestricted access to the Risk and Audit Sub-Committee and the Committee of Management. It also takes an independent view of the appropriateness of the Group’s accounting policies and practices.
The Risk and Audit Sub-Committee’s activities include a review of the Group’s systems and controls which is undertaken by means of receiving audit, risk and management reports, holding discussions with executive and operational management and reviewing the risk management process and risk framework. Where significant control shortcomings or risks are identified progress is monitored until the issue is satisfactorily resolved.
The Risk and Audit Sub-Committee reviews the outcomes of and sets the parameters for financial stress testing. It also undertakes a periodic sample review of complaints.
The Risk and Audit Sub-Committee also undertakes the role of a “with-profits committee” in order to oversee the Society’s with-profits business in accordance with the rules of the FSA, in particular the Principles and Practices of Financial Management published for the POIS With-Profits Fund. This work includes reviewing the performance of the With-Profits Actuary.
The Risk and Audit Sub-Committee regularly reviews the nature and extent of non-audit work and related fees, and the Committee of Management has developed a policy setting out the terms and conditions for engaging the Society’s external auditor to supply non-audit services that is designed to protect objectivity and independence.
other risk controls.The above sub-committees operate within a risk framework and defined risk appetite that is designed to ensure regular review and stress testing of the changing risks arising both from within the Group and from changes in the external environment and to consider appropriate strategies to mitigate those risks. Key risk areas reviewed include: Operational; Credit; Insurance; Liquidity; Investment.

19 Family Investments Annual Report and Accounts 2012
The risk framework ensures appropriate monitoring of the systems of internal control which are embedded in the operations of the Group to ensure that management is capable of responding quickly to changing risks and that procedures are in place for reporting immediately to appropriate levels of management any major control weaknesses that are identified. The Chief Risk Officer provides regular risk reports to the Committee of Management and the Risk and Audit Sub-Committee.
Financial crime.The Society continuously reviews its exposure to financial crime and takes appropriate measures including anti-fraud and anti-money laundering training of its employees to mitigate these risks. Regular fraud and money laundering risk assessment occurs within the Society with this activity underpinned through the respective corporate anti-fraud, anti- money laundering, anti-bribery and whistle-blowing policies.
The Society is also a member of the Investment Management Association Fraud Alert Scheme whose main objectives are to protect member assets and work with the industry in reducing financial crime.
Performance monitoring and evaluation.Each year the Committee of Management sets key business objectives for the Society for that year and as part of its rolling three year plan based on the objectives outlined in the strategic objectives and activities section on page 15. The Committee monitors performance against these objectives at regular intervals.
In compliance with the UK Corporate Governance Code, the Committee conducts a formal evaluation annually of the performance of the Chairman and each director and of the performance of the sub-committees and Committee as a whole.
In 2012 the evaluation was conducted by questionnaires and interviews by the Chairman, who reported to the Committee of Management. The Committee intends to conduct a detailed review externally facilitated every three years. No material issues arose from the 2012 review other than recognising that succession planning remains important as Committee members retire over the next few years.
In addition the Chairman holds periodic meetings with each executive director and formal meetings with the non-executive directors to evaluate the performance and development needs of the individual directors.
Member relations.The Committee is committed to maintaining good communications with members and is keen to develop its understanding of members’ views and provide members with sufficient relevant information to enable them to understand the performance of the Society and its products. From time to time the Society conducts independent research and surveys with its members who provide valuable feedback to help the Society measure and where necessary improve its services. We hope that members will continue to participate in our surveys. Details of the Society’s Member Relations Strategy are available on our website at www.family.co.uk or from the Society’s Secretary.

20 Family Investments Annual Report and Accounts 2012
committee of Management’s annual report (continued).
employees. The Group employed an average of 415 employees during 2012 at a total cost of £14.7m.
The Committee recognises that the Society’s most valuable resource is its employees and that they are key to its success in implementing its strategy. The Committee believes that the continued learning and development of employees is essential, in order to ensure effective management of the Society and provision of appropriate service to members.
In 2012 the Society both updated and ran familiarisation sessions on certain aspects of employment law with the support of ACAS. The in-house Leadership Development Programme is now in its seventh year and through this the Society aims to continue to develop its managers and leaders to a consistently high standard to be good advocates of its customer ethos and articulate what it means to treat customers fairly.
The Society communicates with its employees on a regular basis to ensure that they are fully aware of the Society’s core values and business strategy and the part which they play in achieving a successful outcome.
equal opportunities and diversity.It is the Society’s policy to treat job applicants and employees equally, regardless of their sex, race, ethnic origin, religion, age, sexual orientation, marital or parental status, or disability. The Society is committed to recruiting, developing, progressing and training employees on the basis of their individual aptitude, competencies and performance.
As at 31st December 2012 the gender mix at management levels is:
corporate social responsibility.our role as an institutional investor.The UK Stewardship Code was first published in July 2010, a revision to the Code came into effect in October 2012. Its aim is to enhance the quality of engagement between institutional investors and the companies in which they invest. The purpose of this is to help improve long term returns to shareholders and effective governance by setting out good practice on engagement with investee companies. The Society provides a range of passive and actively managed funds investing on behalf of its members in companies on a medium to longer term basis. Investment management of our funds has been outsourced to an external Investment Manager, who takes seriously and supports the responsibilities of institutional shareholders outlined within the Stewardship Code, and you can find out more about this in the Members section of our website: www.family.co.uk
Male Female
Committee of Management 90% 10%
Heads of Department 50% 50%
Managers 63% 37%

21 Family Investments Annual Report and Accounts 2012
our environment.The Society recognises that its day-to-day operation will impact on the environment in a number of ways and wishes to minimise the potentially harmful effects of such activity wherever possible.
In particular the Group is committed to:-• Reducing any emissions into the air;
• Reducing any discharge into the water supply;
• Implementing policies through an Environmental Management System;
• Using environmentally safe and sustainable energy sources;
• Seeking to address its impact on the environment through the adoption of an appropriate procurement policy;
• Recognising its responsibilities to recycle materials wherever possible;
• Making suitable and sufficient resources available to manage environmental matters;
• Ensuring that employees are provided with appropriate information and training in environmental matters;
• Minimising the use of energy consumed and waste produced;
• Regularly audit and review the environmental management system with the Committee of Management with a view to improving performance.
The Society will encourage and support employee involvement in environmental matters at all levels, which will be promoted through training and other communications.
our work in the community.At Family our desire to do the right thing for our customers, employees and local community has always been central to our ethos. Our award-winning Community Programme, which has been running for over 20 years, has always taken a different approach to working with the local community by the creation of mutually beneficial relationships and activities, where there is not only benefit for the local community, but also a benefit to Family – mainly in the development and motivation of our employees.
2012 has been an excellent year with 202 (48%) employees giving 1,565 hours in support of the programme, which works out to the equivalent of 223 days. Included in these figures are our core activities, which can be broadly broken down into three categories: education, fundraising and community challenges.
• Education has been a major part of our programme. We support all age groups, from nurseries through to sixth form students. Activities range from Family employees running regular maths clubs at a local primary school, through to running work orientation and interview skills days for a local sixth form college. Family Investments was instrumental in 2012 in setting up a programme which encouraged other large local employers to collaboratively deliver work related learning.
• Employees were very engaged in supporting local causes throughout 2012 and we raised over £33,000 for more than 25 different charities.
• Our community challenges are an opportunity to get employees out into the community to provide hands-on assistance to local charities and other non-profit organisations. This is a great way of providing team and relationship building opportunities for employees whilst helping local causes. In 2012 19 teams took part and made a tangible difference to charities in our local area.
No political donations were made.

22 Family Investments Annual Report and Accounts 2012

23 Family Investments Annual Report and Accounts 2012
Remuneration report.
This report sets out the Society’s policy in relation to the remuneration of directors. The report, which will be submitted to the forthcoming AGM for approval, explains how the Society has applied the Code as regards directors’ remuneration.
Remuneration sub-committee. The role of the Remuneration Sub-Committee is outlined on page 18.
Remuneration policy. The Society’s remuneration policy is designed to attract, motivate and retain key executives, and indeed all employees, with the relevant skills to help achieve the Group’s objectives and to ensure that employees are rewarded for enhancing the level of service that we provide to our members. It is also designed to achieve an effective link between pay and performance whilst not encouraging undue risk.
The Society is undertaking a strategic review following which the bonus and incentive schemes for directors and employees will be reviewed and aligned to the new strategy. This will include a new Long Term Incentive Plan (LTIP) which will be effective from 1st January 2013 and designed with the input of external consultants. Details of the new LTIP have yet to be finalised but it is anticipated that payment will be capped, deferred for three years and subject to achievement of demanding objectives.
The Committee of Management recognises that whilst it is important to incentivise performance, all bonus schemes should be aligned with the long term interests of members and comply with regulation and best practice guidelines.
No director is involved in the determination of, or votes on, any matter relating to their own remuneration.
service contracts. It is the Society’s policy that the notice period of executive directors’ contracts should not exceed one year. None of the non-executive directors has a service contract and any compensation for loss of office should not exceed 12 months’ remuneration.
Fees for non-executive directors are reviewed each year.
Remuneration components comprise:Base salary.Base salaries are determined by individual performance and by reference to market salary levels obtained from independent sources such as Towers Watson. This is the only element of remuneration which is pensionable.
long term incentive scheme and bonuses.The five executive directors, together with twenty five senior managers, are included within an annual bonus scheme targeted at increasing the embedded value of the Society. Payments have been capped at 25% of salary and are awarded, based on individual performance, at the discretion of the Remuneration Sub-Committee.
A proportion of the total bonus due is withheld for a period of three years during which time the accrued amount may rise or fall as determined by the increase or reduction in the Society’s embedded value. Amounts accrued for executive directors at the year end are disclosed on the following page.
Pension.The Society participates in a Stakeholder pension scheme managed by Legal & General. Both the employer and the employee can make payments into this scheme. All of the executive directors participate in the scheme. The Society previously operated a defined benefits pension scheme which was closed to future accrual of benefit from 31st December 2009.
other benefits.The Society provides other benefits to the executive directors including life assurance and private medical insurance.

24 Family Investments Annual Report and Accounts 2012
Remuneration report (continued).
Salary / Fees 1 Bonuses 2 Other benefits 3 Total
2012 2011 2012 2011 2012 2011 2012 2011
£’000 £’000 £’000 £’000 £’000 £’000 £’000 £’000
executives
Simon Markey5 50 - - - 8 - 58 -
John Reeve4 221 257 33 36 35 41 289 334
Rob Edwards 189 183 26 32 29 28 244 243
John Adams 179 174 24 18 28 27 231 219
Keith Meeres 157 152 22 27 24 23 203 202
Miles Bingham 127 124 18 21 19 16 164 161
non-executives
Robert Weir 75 73 - - - - 75 73
Peter Box 33 30 - - - - 33 30
Ian Buckley 33 30 - - - - 33 30
Veronica France 33 30 - - - - 33 30
Norman Riddell 39 36 - - - - 39 36
1136 1089 123 134 143 135 1402 1358
Note 1 – Excluding new appointments, promotions and retirements noted below, year on year the Salaries and Fees paid to the Committee of Management have increased by 4% (2011: 4%).
Note 2 – Bonuses include amounts added to, and movement in, the value of the long term incentive scheme.
Note 3 – The figures include the contributions paid by the Society into the Stakeholder Pension Scheme.
Note 4 – Mr Reeve retired on 31st October 2012. In 2012 £33k was invested into the long term incentive scheme as an alternative to a pension contribution for Mr Reeve. In 2011 Mr Reeve received a cash alternative to a pension contribution of £39k.
Note 5 – Mr Markey was appointed Chief Executive on 1st November 2012.
committee of Management remuneration.
long term incentive scheme.
Value at 1.1.2012
Bonus withdrawn during 2012
Amount added in lieu
of pension contributions
Embedded value
movement during 2012
Bonus added
during 2012Value at
31.12.2012
£’000 £’000 £’000 £’000 £’000 £’000
executives
John Reeve1 54 - 33 4 29 120
Rob Edwards 14 - - 1 11 26
John Adams 8 - - 1 10 19
Keith Meeres 11 - - 1 9 21
Miles Bingham 10 - - 1 7 18
97 - 33 8 66 204
Note 1 – Mr Reeve retired on 31st October 2012. He will withdraw his benefits accrued under the long term incentive scheme in early 2013.
25 Family Investments Annual Report and Accounts 2012
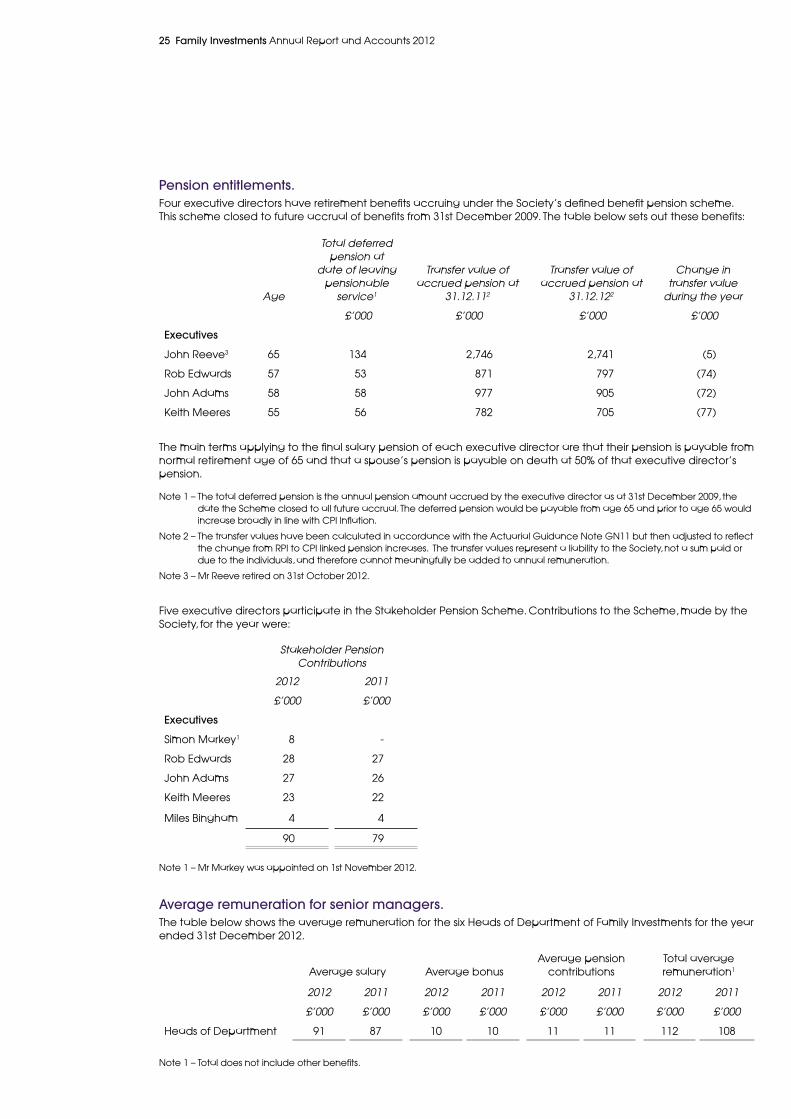
Pension entitlements.Four executive directors have retirement benefits accruing under the Society’s defined benefit pension scheme. This scheme closed to future accrual of benefits from 31st December 2009. The table below sets out these benefits:
Age
Total deferred pension at
date of leaving pensionable
service1
Transfer value of accrued pension at
31.12.112
Transfer value of accrued pension at
31.12.122
Change in transfer value
during the year
£’000 £’000 £’000 £’000
executives
John Reeve3 65 134 2,746 2,741 (5)
Rob Edwards 57 53 871 797 (74)
John Adams 58 58 977 905 (72)
Keith Meeres 55 56 782 705 (77)
The main terms applying to the final salary pension of each executive director are that their pension is payable from normal retirement age of 65 and that a spouse’s pension is payable on death at 50% of that executive director’s pension.
Note 1 – The total deferred pension is the annual pension amount accrued by the executive director as at 31st December 2009, the date the Scheme closed to all future accrual. The deferred pension would be payable from age 65 and prior to age 65 would increase broadly in line with CPI Inflation.
Note 2 – The transfer values have been calculated in accordance with the Actuarial Guidance Note GN11 but then adjusted to reflect the change from RPI to CPI linked pension increases. The transfer values represent a liability to the Society, not a sum paid or due to the individuals, and therefore cannot meaningfully be added to annual remuneration.
Note 3 – Mr Reeve retired on 31st October 2012.
Five executive directors participate in the Stakeholder Pension Scheme. Contributions to the Scheme, made by the Society, for the year were:
Stakeholder Pension Contributions
2012 2011
£’000 £’000
executives
Simon Markey1 8 -
Rob Edwards 28 27
John Adams 27 26
Keith Meeres 23 22
Miles Bingham 4 4
90 79
Average remuneration for senior managers.The table below shows the average remuneration for the six Heads of Department of Family Investments for the year ended 31st December 2012.
Average salary Average bonusAverage pension
contributionsTotal average remuneration1
2012 2011 2012 2011 2012 2011 2012 2011
£’000 £’000 £’000 £’000 £’000 £’000 £’000 £’000
Heads of Department 91 87 10 10 11 11 112 108
Note 1 – Total does not include other benefits.
Note 1 – Mr Markey was appointed on 1st November 2012.

26 Family Investments Annual Report and Accounts 2012
Independent auditor’s report. To the Members of Family Assurance Friendly Society Limited.
We have audited the financial statements of Family Assurance Friendly Society Limited for the year ended 31st December 2012 which comprise the Group and Society Income and Expenditure Account, the Group and Society Balance Sheet and the related notes. The financial reporting framework that has been applied in their preparation is applicable law and United Kingdom Accounting Standards (United Kingdom Generally Accepted Accounting Practice).
Respective responsibilities of the committee of Management and the Auditor.As explained more fully in the statement of responsibilities of the Committee of Management set out on page 14, the Committee of Management is responsible for preparing financial statements which give a true and fair view. Our responsibility is to audit and express an opinion on the financial statements in accordance with applicable law and International Standards on Auditing (UK and Ireland). Those standards require us to comply with the Auditing Practices Board’s (APB’s) Ethical Standards for Auditors. This report is made solely to the Society’s members, as a body, in accordance with Section 73 of the Friendly Societies Act 1992. Our audit work has been undertaken so that we might state to the Society’s members those matters we are required to state to them in an auditor’s report and for no other purpose. To the fullest extent permitted by law, we do not accept or assume responsibility to anyone other than the Society and Society’s members as a body, for our audit work, for this report, or for the opinions we have formed.
scope of the audit of the financial statements.A description of the scope of an audit of financial statements is provided on the Financial Reporting Council’s website atwww.frc.org.uk/auditscopeukprivate
opinion on financial statements. In our opinion the Group and Society’s financial statements:
• give a true and fair view, in accordance with UK Generally Accepted Accounting Practice, of the state of the Group and Society’s affairs as at 31st December 2012 and of its income and expenditure for the year then ended; and
• have been properly prepared in accordance with the Friendly Societies Act 1992.
opinion on other matters prescribed by the Friendly societies Act 1992.In our opinion the Report of the Committee of Management has been prepared in accordance with the Friendly Societies Act 1992 and the regulations made under it, and the information given therein is consistent with the financial statements for the financial year.
Matters on which we are required to report by exception. We have nothing to report in respect of the following matters where the Friendly Societies Act 1992 requires us to report to you if, in our opinion:
• proper accounting records have not been kept; or
• the financial statements are not in agreement with the accounting records; or
• we have not received all the information and explanations and access to documents that we require for our audit.
In accordance with our instructions from the Society we review whether the Corporate Governance Statement reflects the Society’s compliance with the 8 provisions of the Annotated UK Corporate Governance Code specified by the Association of Financial Mutuals. Raymond tidbury (Senior Statutory Auditor) for and on behalf of Mazars LLP, Chartered Accountants and Statutory Auditor
Tower Bridge House, St Katharine’s Way, London E1W 1DD
13th March 2013
27 Family Investments Annual Report and Accounts 2012
notes
Group 2012
£’000
Society 2012
£’000
Group 2011
£’000
Society 2011
£’000
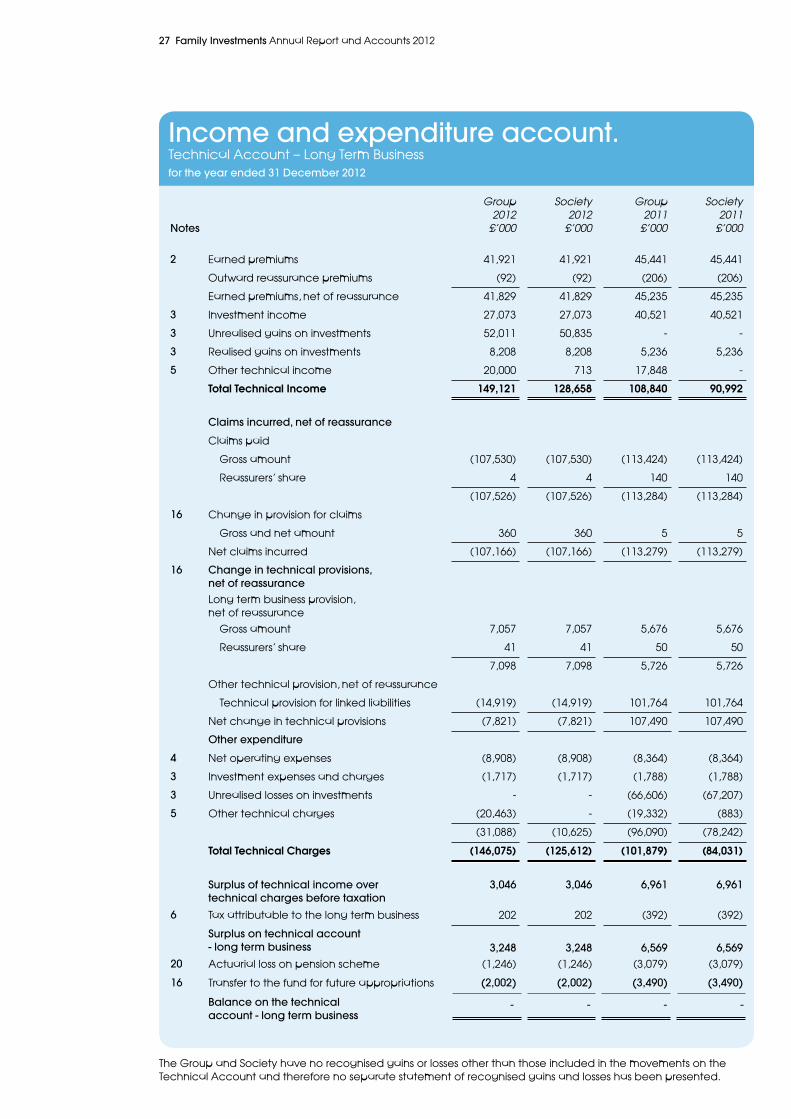
2 Earned premiums 41,921 41,921 45,441 45,441
Outward reassurance premiums (92) (92) (206) (206)
Earned premiums, net of reassurance 41,829 41,829 45,235 45,235
3 Investment income 27,073 27,073 40,521 40,521
3 Unrealised gains on investments 52,011 50,835 - -
3 Realised gains on investments 8,208 8,208 5,236 5,236
5 Other technical income 20,000 713 17,848 -
Total Technical Income 149,121 128,658 108,840 90,992
claims incurred, net of reassurance
Claims paid
Gross amount (107,530) (107,530) (113,424) (113,424)
Reassurers’ share 4 4 140 140
(107,526) (107,526) (113,284) (113,284)
16 Change in provision for claims
Gross and net amount 360 360 5 5
Net claims incurred (107,166) (107,166) (113,279) (113,279)
16 change in technical provisions, net of reassuranceLong term business provision, net of reassurance
Gross amount 7,057 7,057 5,676 5,676
Reassurers’ share 41 41 50 50
7,098 7,098 5,726 5,726
Other technical provision, net of reassurance
Technical provision for linked liabilities (14,919) (14,919) 101,764 101,764
Net change in technical provisions (7,821) (7,821) 107,490 107,490
other expenditure
4 Net operating expenses (8,908) (8,908) (8,364) (8,364)
3 Investment expenses and charges (1,717) (1,717) (1,788) (1,788)
3 Unrealised losses on investments - - (66,606) (67,207)
5 Other technical charges (20,463) - (19,332) (883)
(31,088) (10,625) (96,090) (78,242)
Total Technical Charges (146,075) (125,612) (101,879) (84,031)
surplus of technical income over technical charges before taxation
3,046 3,046 6,961 6,961
6 Tax attributable to the long term business 202 202 (392) (392)
surplus on technical account - long term business 3,248 3,248 6,569 6,569
20 Actuarial loss on pension scheme (1,246) (1,246) (3,079) (3,079)
16 Transfer to the fund for future appropriations (2,002) (2,002) (3,490) (3,490)
Income and expenditure account.Technical Account – Long Term Businessfor the year ended 31 december 2012
The Group and Society have no recognised gains or losses other than those included in the movements on the Technical Account and therefore no separate statement of recognised gains and losses has been presented.
- - - -Balance on the technical account - long term business

28 Family Investments Annual Report and Accounts 2012
notes
Group 2012
£’000
Society 2012
£’000
Group 2011
£’000
Society 2011
£’000
Investments9 Land and buildings 1,770 1,770 2,004 2,004
10 Investments in group undertakings
Investments in subsidiaries - 11,847 - 11,273
11 Other financial investments
Shares, variable yield securities and units in unit trusts
68,870 68,870 2,611 2,611
Debt securities and other fixed income securities
- - 64,847 64,847
Deposits with credit institutions 12,129 7,613 20,266 11,173
82,769 90,100 89,728 91,908
12 Assets held to cover linked liabilities 1,015,032 1,015,032 1,000,113 1,000,113
Reassurers’ share of technical provisions
Long term business provision 602 602 561 561
other assets13 Tangible assets 3 - 548 -14 Other debtors 4,796 2,660 5,115 4,317
Cash at bank and in hand 10,477 4,633 6,573 6,132
Prepayments and accrued incomeAccrued interest and rent 423 92 2,361 699
Other prepayments and accrued income
534 534 487 440
1,114,636 1,113,653 1,105,486 1,104,170
Balance sheet.ASSETSAs at 31 december 2012

Approved by the Committee of Management on 13th March 2013, and signed on its behalf by:
Robert Weir, Chairman
simon Markey, Chief Executive
keith Meeres, Secretary
29 Family Investments Annual Report and Accounts 2012
Balance sheet.LIABILITIESAs at 31 december 2012
notes
Group 2012
£’000
Society 2012
£’000
Group 2011
£’000
Society 2011
£’000
16 ReservesFund for future appropriations 46,169 46,169 44,167 44,167
16 technical provisionsLong term business provision 42,191 42,191 49,248 49,248
Claims outstanding 1,288 1,288 1,648 1,648
16 technical provision for linked liabilities 1,015,032 1,015,032 1,000,113 1,000,113
15 creditorsOther creditors, including taxation and social security
4,767 4,310 4,597 3,700
Accruals and deferred income 3,487 2,961 3,077 2,658
20 Pension liability 1,702 1,702 2,636 2,636
1,114,636 1,113,653 1,105,486 1,104,170

30 Family Investments Annual Report and Accounts 2012
notes to the accounts.1 Principal accounting policies.
Basis of accounting. The Accounts have been prepared in accordance with The Friendly Societies (Accounts and Related Provisions) Regulations 1994 (‘Regulations’) and in accordance with applicable Accounting Standards in the United Kingdom including the guidance provided by the Association of British Insurers in their Statement of Recommended Practice (‘ABI SORP’) dated December 2005 and amended December 2006.
Basis of consolidation.
The Group Accounts comprise the assets, liabilities and income and expenditure account transactions of the Society together with its subsidiary undertakings. The activities of the Society and the Group are accounted for in the Technical Account - Long Term Business. The results of subsidiary undertakings are included from the date of acquisition.
Premiums. Premiums for non-linked business are accounted for on a receivable basis. Premiums for unit-linked business are accounted for when the policy liability is established. Outward reassurance premiums are accounted for in accordance with the contract terms when due, reflecting the period in which risk is transferred. Investment return. Investment return comprises investment income, including realised investment gains and losses and movements in unrealised gains and losses, net of investment expenses and charges. Dividends are included as investment income on the date that the shares become quoted ex-dividend. Interest, rents and expenses are included on an accruals basis. Realised gains and losses on investments are calculated as the difference between net sales proceeds and original cost. Unrealised gains and losses on investments represent the difference between the valuation at the balance sheet date and their purchase price, or if they have been previously valued, their valuation at the last balance sheet date. The movement in unrealised gains and losses recognised in the year also includes the reversal of unrealised gains and losses recognised in earlier accounting periods in respect of investment disposals in the current period. claims. Maturity claims and annuities are charged against revenue when due for payment. Surrenders are accounted for when paid or, if earlier, on the date the policy ceases to be included within the calculation of the long term business provision and/or the technical provision for linked liabilities. Death claims and all other claims are accounted for on notification. Claims payable include all related internal and external claims handling costs. Reassurance recoveries are accounted for in the same period as the related claim.
Pensions costs. The Group operates a defined benefit pension scheme, the Family Assurance Staff Pension Scheme (‘the Scheme’). The Scheme’s funds are administered by trustees and are independent of the Group’s finances. The Scheme is valued every three years by a professionally qualified independent actuary, the rates of contribution payable being determined by the actuary. In intervening years the actuary reviews the continuing appropriateness of the rates. The pension liability recognised in the balance sheet is the value of the Scheme’s assets less the present value of the Scheme’s liabilities.

31 Family Investments Annual Report and Accounts 2012
The pension cost for the Scheme is analysed between current service cost, past service cost (until closed to accrual) and net return on pension scheme assets. Current service cost is the actuarially calculated present value of the benefits earned by the active employees in each period. Past service costs, relating to employee service in prior periods arising in the current period as a result of the introduction of, or improvement to, retirement benefits, are recognised in the Technical Account - Long Term Business on a straight line basis over the period in which the increase in benefits vest. Net expected return on the pension liability comprises the expected return on the pension scheme assets less interest on pension scheme liabilities. The actuarial gains and losses, which arise from a valuation and from updating the latest actuarial valuation to reflect conditions at the balance sheet date, are included as a separate line in the Technical Account - Long Term Business immediately above the line for transfer to or from the fund for future appropriations and are reflected in that transfer. The defined benefit scheme closed to new accruals on 31st December 2009. In its place the Society makes pension contributions to a defined contribution stakeholder pension scheme on behalf of staff when they become eligible for pension benefits. Contributions are reflected in the Technical Account - Long Term Business in the period the contributions become payable. Investments. Investments are stated at market value at the balance sheet date. Any appreciation or impairment in value during the year is accounted for in the Technical Account - Long Term Business. Investments in subsidiary undertakings are stated at net asset value (see note 10). Land and buildings occupied by the Society are valued annually by independent professional advisers at market value. No depreciation is provided on owner-occupied properties as it is considered that their useful economic lives and residual values are such that their depreciation is immaterial, both individually and in aggregate. An impairment review is also performed on owner-occupied properties. Unrealised gains and losses arising on the revaluation of land and buildings are taken to the Technical Account - Long Term Business.
Assets held to cover linked liabilities.
Assets held to cover linked liabilities reflect the terms of the related policies and are valued on a basis consistent with the related liabilities.
Reassurers’ share of technical provisions.
The reassurers’ share of technical provisions is calculated on a basis consistent with that of the corresponding liabilities.
deferred tax.
Deferred tax is calculated on a full provision basis and consists of the estimated taxation, or relief from taxation, which is expected to arise in the foreseeable future from material timing differences using expected future rates of tax where applicable. Credit is taken for relief from trading losses only to the extent that the Committee of Management anticipates that profits will absorb such losses in the foreseeable future.

32 Family Investments Annual Report and Accounts 2012
1 Principal accounting policies (continued).
tangible assets. Tangible assets are valued at cost less depreciation or amortisation. Depreciation or amortisation is provided on tangible assets at rates calculated to write-off the cost of each asset over its expected useful life as follows:
Furniture, fixtures and fittings and office equipment 2 years Computer hardware 4 years Computer software In full in year of purchase
Research and development expenditure. Research and development expenditure represents product and related systems development costs incurred and written off during the year. Foreign currencies. Assets and liabilities denominated in foreign currencies are translated into sterling at rates of exchange ruling at the balance sheet date. Foreign exchange differences, which arise principally on the investment portfolio, are included in investment gains and losses in the Technical Account - Long Term Business.
Fund for future appropriations. The fund for future appropriations incorporates amounts for which allocation has not yet been determined between the different categories of policyholders based on the Rules and Tables of the Society. Transfers to and from this fund reflect the excess or deficiency of income over expenditure arising from the business underwritten by the Society.
This fund includes surpluses arising on the former POIS Assurance Limited closed fund which is ring fenced according to the transfer of engagements agreement. long term business provision. The long term business provision is determined by the Society’s actuary following the annual investigation of the long term business, and is calculated initially on a statutory solvency basis to comply with the reporting requirements of the Interim Prudential Sourcebook for Insurers. The calculation in respect of term assurance and annuities in payment uses the gross premium valuation method, the calculation for all other types of business uses the net premium valuation method and as such, includes explicit provision for vested bonuses (including those vesting following the current valuation). Implicit provision is made for future reversionary bonuses, but not terminal bonuses, by means of a reduction in the valuation rate of interest. The valuation is then adjusted for certain items, including the removal of certain contingency and other reserves. This adjusted basis is referred to as the modified statutory solvency basis.
The long term business provision includes the life cover and expenses associated with the linked liabilities of the Society. segmental reporting. In the opinion of the Committee of Management, the Group operates in one business segment being that of long term insurance and retail investment business in the United Kingdom.

33 Family Investments Annual Report and Accounts 2012
Group and Society
2012 2011a) Gross premiums written: £’000 £’000
life assurance business:Linked 38,474 41,404
Non-linked 1,919 2,477 Pension business:Linked 1,528 1,560total gross premiums written 41,921 45,441
Regular premiums 40,393 43,881
Single premiums 1,528 1,560 total gross premiums written 41,921 45,441
b) Gross new regular life business premiums: 1,819 3,041
In classifying new regular life business premiums the following basis of recognition is adopted:
• Incremental increases under existing policies are classified as new business premiums.• Where regular premiums are received other than annually the regular new business
premiums are on an annualised basis.• Products substituted due to the exercise of standard contract terms are not included in
the new business statistics.
Group Society Group Society
2012 2012 2011 2011c) contributions received for products £’000 £’000 £’000 £’000
administered by subsidiary companies:Regular contributions 96,880 - 86,589 -
Single contributions 1,062,171 - 717,415 -
1,159,051 - 804,004 -
Contributions relate to business conducted by four of the Society’s regulated subsidiaries, Family Equity Plan Limited, Family PEP Managers Limited, Family Investment Management Limited and Governor Finance Limited. The business is defined as retail investment business and accordingly the contributions received are not included in ‘Earned premiums’ as disclosed in the Technical Account - Long Term Business. The income and expenditure from this business is included in ‘Other technical income’ and ‘Other technical charges’ as disclosed in the Technical Account - Long Term Business (see note 5).
2 Premium analysis.
All business is written in the United Kingdom and is direct business relating exclusively to individual policyholders.
Number of policies Number of policies
Group Society Group Societyd) Policies on file: 2012 2012 2011 2011
Average during the year 1,933,493 338,785 1,877,960 368,190
As at 31 December 1,960,029 324,407 1,906,957 353,162

34 Family Investments Annual Report and Accounts 2012
Group Society Group Society
2012 2012 2011 2011
£’000 £’000 £’000 £’000Investment income:Income from listed investments 12,756 12,756 32,647 32,647
Income from other investments 14,137 14,137 7,484 7,484
Net return on pension scheme (see note 20) 180 180 390 390
27,073 27,073 40,521 40,521
unrealised gains / (losses) on investments 52,011 50,835 (66,606) (67,207)
Realised gains on investments 8,208 8,208 5,236 5,236
Investment expenses and charges:Investment management expenses,
including interest (1,717) (1,717) (1,788) (1,788)
net investment return included in thetechnical Account - long term Business 85,575 84,399 (22,637) (23,238)
3 Investment return summary.
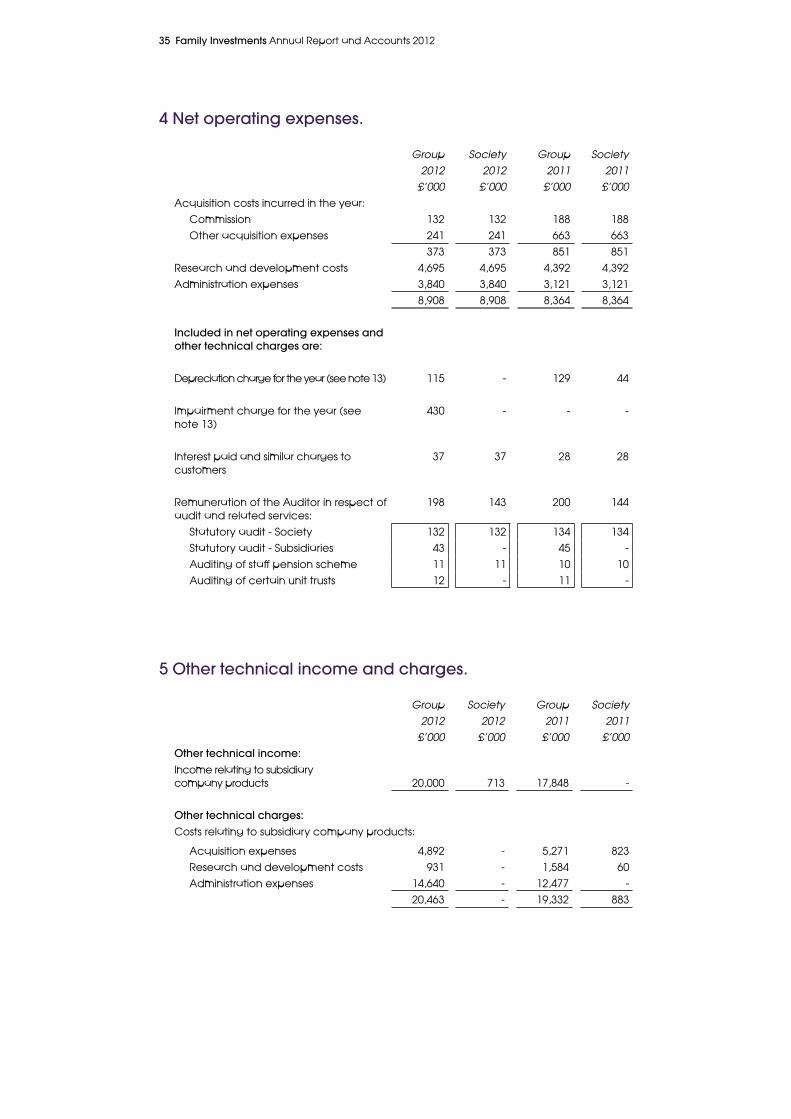
35 Family Investments Annual Report and Accounts 2012
4 net operating expenses.
Group Society Group Society
2012 2012 2011 2011
£’000 £’000 £’000 £’000
Acquisition costs incurred in the year:
Commission 132 132 188 188
Other acquisition expenses 241 241 663 663
373 373 851 851
Research and development costs 4,695 4,695 4,392 4,392
Administration expenses 3,840 3,840 3,121 3,121
8,908 8,908 8,364 8,364
Included in net operating expenses and other technical charges are:
Depreciation charge for the year (see note 13) 115 - 129 44
Impairment charge for the year (see note 13)
430 - - -
Interest paid and similar charges to customers
37 37 28 28
Remuneration of the Auditor in respect of audit and related services:
198 143 200 144
Statutory audit - Society 132 132 134 134
Statutory audit - Subsidiaries 43 - 45 -
Auditing of staff pension scheme 11 11 10 10
Auditing of certain unit trusts 12 - 11 -
5 other technical income and charges.
Group Society Group Society
2012 2012 2011 2011
£’000 £’000 £’000 £’000other technical income:Income relating to subsidiary company products 20,000 713 17,848 -
other technical charges:Costs relating to subsidiary company products:
Acquisition expenses 4,892 - 5,271 823
Research and development costs 931 - 1,584 60
Administration expenses 14,640 - 12,477 -
20,463 - 19,332 883

36 Family Investments Annual Report and Accounts 2012
6 taxation.
Group Society Group Society
2012 2012 2011 2011
£’000 £’000 £’000 £’000uk corporation tax:Current year 200 200 344 344
Tax (repayable) / payable on unrealised gains on unit-linked assets
(22) (22) 41 41
Adjustments in respect of prior periods (380) (380) 7 7
(202) (202) 392 392
The Society’s main product, the Family Bond, represents tax-exempt business under Section 460 of the Income and Corporation Taxes Act 1988. The Society also writes taxable business, principally temporary annuities, together with other life and pensions business.
A taxation liability of £178k (2011: £385k) relating to taxable business has been provided for. Taxes have been charged at 20% (2011: 20%).
Group Society Group Society
2012 2012 2011 2011
£’000 £’000 £’000 £’000deferred tax liability:Actuarial reserves 4 4 8 8 deferred tax liability 4 4 8 8
Deferred acquisition expenses (4) (4) (8) (8)deferred tax balance - - - -
There is a potential deferred tax asset of £811k (2011: £829k), in respect of the mutual business carried on by the Society, of which £4k (2011: £8k) has been set aside to offset recognised deferred tax liabilities of the mutual business. The balance of £807k (2011: £821k) represents the net unrecognised deferred tax asset. This balance comprises, inter-alia, two principal components: unit trust deemed disposal losses and deferred acquisition expenditure which will both unwind in future periods to reduce taxable income and gains (as appropriate) arising from life business.
The Society has taken the view that there is insufficient evidence that the net deferred tax asset will be recoverable, and has therefore decided not to recognise any benefit.
the average numbers of employees (including committee of Management) during the year were:
Group 2012
Number
Society 2012
Number
Group 2011
Number
Society 2011
Number
Marketing 22 22 21 20
Investments 10 10 9 9
Administration 383 383 363 360
415 415 393 389
staff costs for the above employees were:
Group 2012
£’000
Society 2012
£’000
Group 2011
£’000
Society 2011
£’000
Wages and salaries 12,594 12,594 11,421 11,301
Pension costs 809 809 655 655
Social security costs 1,265 1,265 1,151 1,136
14,668 14,668 13,227 13,092
7 employee information.
All employees are employed and remunerated directly by the Society.
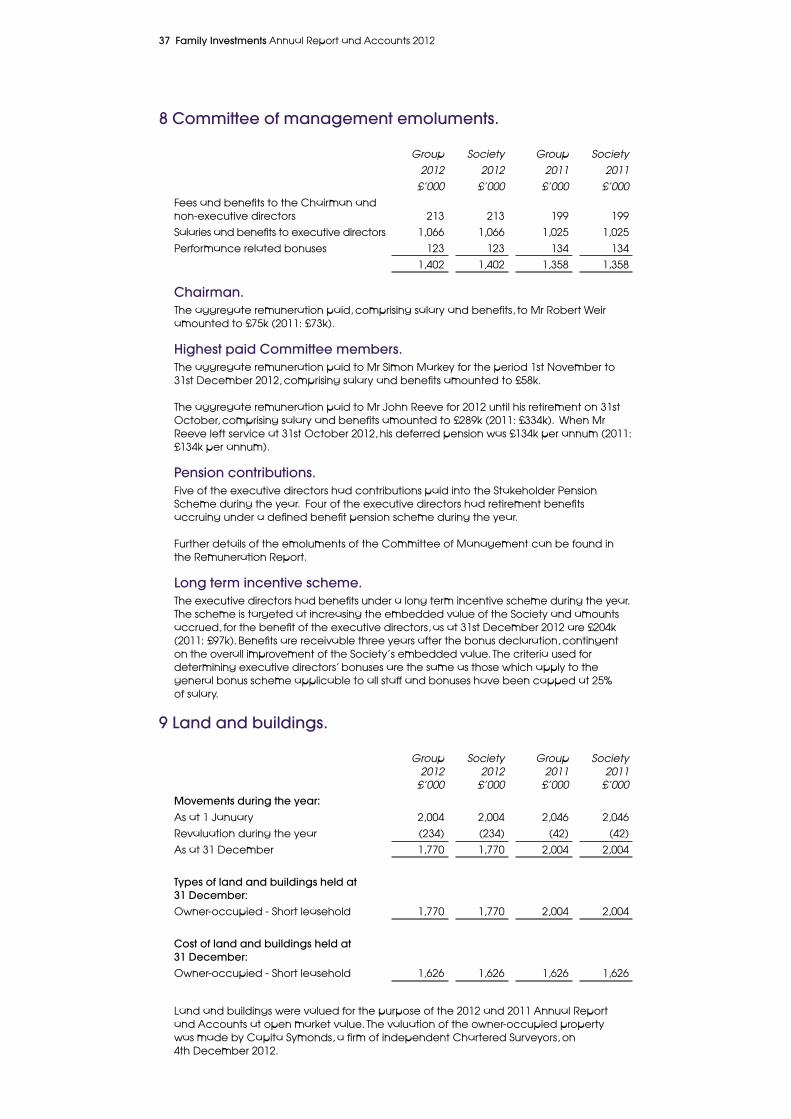
37 Family Investments Annual Report and Accounts 2012
8 committee of management emoluments.
Group Society Group Society
2012 2012 2011 2011
£’000 £’000 £’000 £’000
Fees and benefits to the Chairman and non-executive directors 213 213 199 199
Salaries and benefits to executive directors 1,066 1,066 1,025 1,025
Performance related bonuses 123 123 134 134
1,402 1,402 1,358 1,358
chairman.The aggregate remuneration paid, comprising salary and benefits, to Mr Robert Weir amounted to £75k (2011: £73k).
Highest paid committee members. The aggregate remuneration paid to Mr Simon Markey for the period 1st November to 31st December 2012, comprising salary and benefits amounted to £58k.
The aggregate remuneration paid to Mr John Reeve for 2012 until his retirement on 31st October, comprising salary and benefits amounted to £289k (2011: £334k). When Mr Reeve left service at 31st October 2012, his deferred pension was £134k per annum (2011: £134k per annum). Pension contributions.Five of the executive directors had contributions paid into the Stakeholder Pension Scheme during the year. Four of the executive directors had retirement benefits accruing under a defined benefit pension scheme during the year.
Further details of the emoluments of the Committee of Management can be found in the Remuneration Report. long term incentive scheme. The executive directors had benefits under a long term incentive scheme during the year. The scheme is targeted at increasing the embedded value of the Society and amounts accrued, for the benefit of the executive directors, as at 31st December 2012 are £204k (2011: £97k). Benefits are receivable three years after the bonus declaration, contingent on the overall improvement of the Society’s embedded value. The criteria used for determining executive directors’ bonuses are the same as those which apply to the general bonus scheme applicable to all staff and bonuses have been capped at 25% of salary.
9 land and buildings.
Group 2012
£’000
Society 2012
£’000
Group 2011
£’000
Society 2011
£’000Movements during the year:As at 1 January 2,004 2,004 2,046 2,046
Revaluation during the year (234) (234) (42) (42)
As at 31 December 1,770 1,770 2,004 2,004
types of land and buildings held at 31 december:Owner-occupied - Short leasehold 1,770 1,770 2,004 2,004
cost of land and buildings held at 31 december:Owner-occupied - Short leasehold 1,626 1,626 1,626 1,626
Land and buildings were valued for the purpose of the 2012 and 2011 Annual Report and Accounts at open market value. The valuation of the owner-occupied property was made by Capita Symonds, a firm of independent Chartered Surveyors, on 4th December 2012.

38 Family Investments Annual Report and Accounts 2012
10 Investment in group undertakings.
Society Society
2012 2011subsidiaries £’000 £’000ordinary shares at directors’ valuation:As at 1 January 11,273 10,450
Purchase of new subsidiary1 - 922
Purchase of Share Capital2 1,750 500
Revaluation during the year (1,176) (599)
As at 31 December 11,847 11,273
The subsidiaries are included in the consolidated Group accounts at their net asset value, however the directors are of the opinion that the net realisable value of the subsidiaries is significantly greater than the capital invested therein but have elected to use the net asset value as their valuation due to the uncertainty inherent in precisely quantifying the valuation of the subsidiaries’ future profits.
The Society owns 100% of the ordinary share capital of all its subsidiaries, all of which are registered in England and Wales, are included in the Group accounts and are listed below: names of subsidiaries nature of business Family Investment Management Limited Unit trust manager Family Equity Plan Limited ISA & CTF manager Family PEP Managers Limited ISA manager Governor Finance Limited ISA & Savings manager Family Enterprise Limited Administrative services Family Assurance Staff Pension Scheme Trustees Limited Corporate trustee of the Staff Pension Scheme Governor Finance Nominees Limited Dormant Post Office Insurance Society Trustees Limited Dormant Family.co.uk Limited Dormant Family Nominees Limited Dormant
1The Society acquired the entire share capital of Governor Finance Limited and Governor Finance Nominees Limited on 27th July 2011 for a deferred consideration, determined at the time of purchase, of £922k. The deferred consideration is paid based on the total revenue earned by Governor Finance Limited as per the Share Purchase Agreement.
Governor Finance Nominees Limited is a dormant, wholly owned subsidiary of Governor Finance Limited.
2On 19th December 2011 Governor Finance Limited issued 500,000 £1 shares at par to the Society for cash.
2On 19th March 2012 Governor Finance Limited issued 1,000,000 £1 shares at par to the Society for cash.
2On 20th September 2012 Governor Finance Limited issued 500,000 £1 shares at par to the Society for cash.
2On 11th December 2012 Governor Finance Limited issued 250,000 £1 shares at par to the Society for cash.

39 Family Investments Annual Report and Accounts 2012
11 other financial investments.
Group Society Group Society
2012 2012 2011 2011
£’000 £’000 £’000 £’000At cost:Shares, variable yield securities and units in unit trusts 67,381 67,381 2,152 2,152
Debt securities and other fixed income securities - - 62,916 62,916
Deposits with credit institutions 12,129 7,613 20,266 11,173
79,510 74,994 85,334 76,241
Included in other financial investments are investments, listed on a recognised investment exchange, with market values of:
Shares, variable yield securities and units in unit trusts
68,870 68,870 2,611 2,611
Debt securities and other fixed income securities
- - 64,847 64,847
68,870 68,870 67,458 67,458
12 Assets held to cover linked liabilities.
Group and Society
2012 2011
£’000 £’000
Market value as at 31 december 1,015,032 1,000,113
cost as at 31 december 924,478 962,668
£62m of the shares, variable yield securities and units in unit trusts shown above are held in Exchange Traded Funds, which in turn invest in fixed income securities (2011:nil).

40 Family Investments Annual Report and Accounts 2012
15 other creditors.
Group Society Group Society
2012 2012 2011 2011
£’000 £’000 £’000 £’000
Taxes payable 876 862 600 585
Sundry creditors 3,891 3,448 3,997 3,115
4,767 4,310 4,597 3,700
14 other debtors.
Group Society Group Society
2012 2012 2011 2011
£’000 £’000 £’000 £’000Amounts falling due within one year:Due from subsidiary undertakings - 358 - 235
Amounts owed by linked funds 162 162 422 422
Loans to members 183 183 298 298
Taxation recoverable 1,684 1,684 3,282 3,239
Sundry debtors 2,767 273 1,113 123
4,796 2,660 5,115 4,317
13 tangible assets.
Group Group Group
Group Computer Computer Computer Group
Equipment hardware software platform Total
£’000 £’000 £’000 £’000 £’000At cost:As at 1 January 2012 639 1,485 3,191 633 5,948
Transfer - 8 - (8) -
As at 31 December 2012 639 1,493 3,191 625 5,948
Accumulated depreciation:As at 1 January 2012 639 1,485 3,191 85 5,400
Transfer - 3 - (3) -
Charge for the year - 2 - 113 115
Impairment - - - 430 430
As at 31 December 2012 639 1,490 3,191 625 5,945
net book value as at 31 december 2012
-
3
- - 3
net book value as at 31 december 2011
- -
-
548
548
During November 2012 an impairment review was performed on the cash platform held by Governor Finance Limited. An assessment of the recoverable value of the platform resulted in an impairment to reduce the carrying value of the asset to nil.

41 Family Investments Annual Report and Accounts 2012
16 Policyholder liabilities and reserves in respect of the society and the group.
Long term Technical
business provision Fund for
technical for linked Claims future
provision liabilities outstanding appropriations
£’000 £’000 £’000 £’000
As at 1 January 2012 49,248 1,000,113 1,648 44,167
changes in technical provisions:Gross change in technical provisions, net of reassurance
(7,098) 14,919 (360) 2,002
Reassurers’ share of the change in technical provisions
41 - - -
As at 31 december 2012 42,191 1,015,032 1,288 46,169
Principal assumptions:The valuation of the business has been carried out using a net premium valuation method using the following principal assumptions:
Interest rate % Mortality rate
2012 2011 2012 2011
Taxable with-profits POIS fund 0.25 0.25 100% of AM80/AF80
100% of AM80/ AF80
Non taxable with-profits POIS fund 0.00 0.40 100% of AM80/AF80
100% of AM80/AF80
Taxable non-profit POIS fund1 0.75 0.75 100% of AM80/AF80
100% of AM80/AF80
Non taxable non-profit POIS fund 0.50 0.90 100% of AM80/AF80
100% of AM80/AF80
Taxable business in the Management fund1
1.00 1.00 110% of AMC00/AFC00
110% of AMC00/AFC00
Non taxable business in the Management fund
1.00 1.25 110% of AMC00/AFC00
110% of AMC00/AFC00
1 Mortality table for Golden Cover plan, Over 50s plan and Mortgage Protection Plan is 150% of AF80/AM80.
The level of expenses included in the valuation are based on the current year’s expenses allowing for cost inflation of 3.75%.
The principal changes to valuation assumptions made since the previous year-end were:
• a decrease in the gross valuation rate of interest from 1.25% to 1.00% for business in the Management Fund to reflect falls in gilt yields during 2012, in addition to a decrease in the gross valuation rate of interest for with-profits business in the POIS Fund from 0.40% to 0.00%, and a decrease in the gross valuation rate of interest for non-profits business in the POIS Fund from 0.90% to 0.50%.
• changes in the assumed level of volatility of assets backing policies with guarantees, reflecting current economic experience.
• changes in the expense inflation from 4% to 3.75% and a reduction in the unit price growth rate from 4.5% to 4.25%.
The overall impact of the changes described above has been to increase the long term business provision, net of reassurance, by £0.8 million.
A reduction in interest rates would reduce the impact of discounting on the long term business provision, resulting in an increased provision. If, for example, the valuation interest rate were to be reduced by 0.5%, the long term business provision would increase by approximately £0.4m. This does not include the corresponding effect on the valuation of assets.

42 Family Investments Annual Report and Accounts 2012
18 capital position statement.
former POIS Assurance
Limited
Available capital resourcesUK
non-profitUK
with-profits Total
£’000 £’000 £’000As at 31 december 2012Fund for future appropriations 35,703 10,466 46,169
Allocation of Group capital (3,575) - (3,575)
Other adjustments (157) - (157)
total available capital resources 31,971 10,466 42,437
As at 31 december 2011Fund for future appropriations 32,768 11,399 44,167
Allocation of Group capital (3,365) - (3,365)
Other adjustments (293) - (293)
total available capital resources 29,110 11,399 40,509
former POIS Assurance
Limited
Movement in available capital resources
UK non-profit
UK with-profits Total
£’000 £’000 £’000Available capital resources as at 31 december 2011 29,110 11,399 40,509
Effect of investment variations (1,162) 1,247 85
Effect of experience variations 4,008 (68) 3,940
Effect of change in valuation basis 726 (680) 46
New business strain (1,626) - (1,626)
Research and development (5,626) - (5,626)
Cost of bonuses - (1,432) (1,432)
Operating profit in the subsidiaries 4,647 - 4,647
Other factors 1,894 - 1,894
Available capital resources as at 31 december 2012 31,971 10,466 42,437
17 Bonuses and rebates.
Group and Society
2012 2011
£’000 £’000cost of bonuses declared, as at 31 december:Reversionary bonuses 193 232

43 Family Investments Annual Report and Accounts 2012
former POIS Assurance
Limited
technical provisionsUK non-
profitUK
with-profits Total
£’000 £’000 £’000As at 31 december 2012Unit-linked 1,015,032 - 1,015,032
With-profits liabilities - 36,963 36,963
Non-profit liabilities 4,320 908 5,228
1,019,352 37,871 1,057,223
Claims outstanding 788 500 1,288
Reassurance (38) (564) (602)
technical provisions in the balance sheet 1,020,102 37,807 1,057,909
As at 31 december 2011Unit-linked 1,000,113 - 1,000,113
With-profits liabilities - 43,625 43,625
Non-profit liabilities 4,687 936 5,623
1,004,800 44,561 1,049,361
Claims outstanding 1,227 421 1,648
Reassurance - (561) (561)
technical provisions in the balance sheet 1,006,027 44,421 1,050,448
The were no material options or guarantees included within the Technical provisions at either 31 December 2012 or 31 December 2011.
Management of insurance risk.
capital management The Society maintains sufficient capital, consistent with the Group’s risk profile and the regulatory and market requirements of its business.
The Society is subject to a number of regulatory capital tests and also employs a number of realistic tests to allocate capital and manage risk. Overall the Society meets all of these requirements.
In reporting financial strength, capital and solvency is measured using the regulations prescribed by the FSA. These regulatory capital tests are based upon required levels of solvency capital and a series of prudent assumptions in respect of the type of business written by the Society.
Capital management policies and objectives. The Society’s objectives in managing its capital are: • To match the profile of its assets and liabilities, taking into account the risks inherent in
the business; • To satisfy the requirements of its policyholders, regulators and rating agencies; • To maintain financial strength to support new business growth; • To retain financial flexibility by maintaining strong liquidity and access to a range of
financial markets; • To allocate capital efficiently to support growth; and • To manage exposures to movements in interest and exchange rates.

44 Family Investments Annual Report and Accounts 2012
18 capital position statement (continued).
Restrictions on available capital resources The Society is required to hold sufficient capital to meet the FSA’s capital requirements. The capital requirements for both with-profits and non-profit business are calculated on the statutory basis. Account is also taken of the Individual Capital Assessment which considers certain business risks not reflected in the statutory basis.
The Society’s total available capital resources are £42.4m (2011: £40.5m) of which £10.4m (2011: £11.4m) is held in with-profits funds and £32.0m (2011: £29.1m) is held in the general fund.
The available capital is subject to certain restrictions as to its availability to meet capital requirements. The available surplus held in the with-profit fund can only be applied to meet the requirements of the fund itself or to be distributed to policyholders of that particular fund.
The available surplus held outside of the with-profit fund is generally available to meet any requirements. It remains the intention of management to ensure that there is adequate capital to exceed the Society’s regulatory requirements. At 31 December the Society’s available capital was 1087% of the capital requirement of £3.9m (2011: 961% of £4.2m).
capital resource sensitivities The capital position is sensitive to changes in market conditions, due to both changes in the value of the assets and the effect that changes in investment conditions may have on the value of liabilities. It is also sensitive to assumptions and experience relating to expenses and persistency and, to a lesser extent, mortality.
The most significant sensitivities arise from the following three risks:
• Market risk in relation to the unit-linked business, which would arise if there were adverse changes in the value of unit-linked assets. The Society’s most significant income stream is derived as a fixed percentage of the market value of unit-linked assets. A 30% decrease in the value of the unit-linked investments held by the Group would reduce available capital resources by approximately £18.8m (2011: £13.6m), including the impact of the staff pension scheme.
• Expense risk in relation to the costs of running the business and administering the policies held by the Society, which would arise if there was an increase in expense inflation and / or the cost structure of the Society. An immediate 20% increase in the costs of administration on all policies would reduce available capital resources by approximately £2.2m (2011: £2.6m).
• Persistency risk in relation to unit-linked business, which would arise if there was a significant increase in surrender rates which would deprive the Society of the future income that business provides. An increase in surrender rates of 80% would reduce available capital resources by approximately £1.5m (2011: £0.2m).
The timing of any impact on capital would depend on the interaction of past experience and assumptions about future experience. In general, if experience had deteriorated or was expected to deteriorate and management actions were not expected to reduce the future impact, then assumptions relating to future experience would be changed to reflect it. In this way, liabilities would be increased to anticipate the future impact of the worse experience with immediate impact on the capital position. Examples of possible management action would be to alter the investment allocation in the unit-linked funds to reduce anticipated adverse market movements and to reduce the discretionary expenditure of the Society.

45 Family Investments Annual Report and Accounts 2012
The Actuarial Function Holder of the Society is Mr D Addison of Towers Watson. The Society has requested him to furnish it with the particulars required in Section 77 of the Friendly Societies Act 1992. Mr. Addison has confirmed that neither he nor his family have any financial or pecuniary interests in the Society, with the exception of the fees paid to Towers Watson for professional services, which in 2012 amounted to £525k (2011: £563k).
19 Actuarial function holder.
The Society operates a defined benefit pension scheme, the Family Assurance Staff Pension Scheme (“the Scheme”). The Scheme funds are administered by trustees and are independent of the Society’s finances. Contributions are paid to the Scheme in accordance with the recommendations of an independent actuary.
The defined benefit scheme closed to all further benefit accrual with effect from 31st December 2009. In its place the Society makes pension contributions to a defined contribution stakeholder pension scheme on behalf of new staff when they become eligible for pension benefits. The stakeholder scheme is administered by Legal & General Assurance Society Limited.
Details in respect of the Scheme are provided below in accordance with FRS17.
An actuarial valuation was carried out as at 31st December 2010 and updated to 31st December 2012 by an independent qualified actuary in accordance with FRS17. As required by FRS17, the defined benefit liabilties have been measured using the projected unit credit method.
The expected rate of return on assets for the financial year ending 31st December 2012 was 5.8% pa (2011: 6.9% pa). This rate is derived by taking the weighted average of the long term expected rate of return on each of the asset classes that the Scheme was invested in at 31st December 2011.
The following table sets out the key FRS17 assumptions used for the Scheme. The table also sets out, as at 31st December 2012, 2011 and 2010, the fair value of assets, a breakdown of the assets into the main asset classes, the present value of the FRS17 liabilities and the surplus or deficit of the assets over the FRS17 liabilities (the gross pension asset or liability).
20 staff pension provision.

46 Family Investments Annual Report and Accounts 2012
20 staff pension provision (continued).
Assumptions: 2012 2011 2010
Retail Prices Index Inflation 3.2 % 3.3 % 3.7 %
Consumer Prices Index Inflation 2.5 % 2.3 % 3.0 %
Revaluation in deferment 2.5 % 2.3 % 3.0 %
Pension increases:
pre April 1997 pension 0.0 % 0.0 % 0.0 %
post April 1997 pension 3.1 %/2.5 %* 3.2 %/2.3 %* 3.5 %/3.0 %
post April 2005 pension 2.0 %* 1.9 %* 2.2 %
Salary growth n/a n/a n/a
Discount rate 4.5 % 4.8 % 5.4 %
Investment returns:
Equities 7.0 % 7.0 % 7.7 %
Bonds 3.0 % 3.0 % 4.2 %
Diversified growth/absolute return funds 6.3 % 6.3 % 7.2 %
Cash 0.5 % 0.6 % 1.7 %
Other assets 4.5 % 4.8 % 5.4 %
Life expectancy:
male aged 65 at the balance sheet date 22.7 years 22.3 years 22.4 years
male aged 65 in 2037 (25 years from balance sheet date) 24.9 years 24.0 years 24.8 years
2012 2011 2010
Fair value of assets £’000 £’000 £’000
Equities 19,651 16,197 17,926
Bonds 6,064 5,567 4,783
Diversified growth/absolute return funds 4,257 3,371 3,380
Cash 18 974 330
Other net assets 292 290 290
total fair value of assets 30,282 26,399 26,709
Present value of liabilities (31,984) (29,035) (27,156)
Gross pension liability (1,702) (2,636) (447)
*assumption for members who transferred in to the Scheme from the Family Assurance Society Limited Staff Pension Scheme.
Over the year to 31st December 2012, the Society made contributions amounting to £2m to the Scheme. This is part of a staged programme of additional contributions designed to remove the deficit by 31st October 2014, the Society will pay £2m into the Scheme in 2013 plus the Pension Protection Fund levies due, where these are met from Scheme assets.

47 Family Investments Annual Report and Accounts 2012
the post retirement deficit under FRs17 moved as follows:2012 2011
£’000 £’000
Post retirement deficit as at 1 January (2,636) (447)
contributions (employee and employer) 2,000 500
other net finance income:Past service cost (12) 0
Expected return on pension scheme assets 1,573 1,843
Interest on post retirement liabilities (1,381) (1,453)
Net return credited to finance income 180 390
Actuarial (loss) / profitActual return less expected return on pension scheme assets 834 (2,153)
Experience (loss) / gain arising on pension scheme liabilities (18) (13)
(Loss) / gain due to changes in assumptions underlying the present value of scheme liabilities (2,062) (913)
Actuarial (loss) / gain recognised in the fund for future appropriations (1,246) (3,079)
Post retirement deficit as at 31 december (1,702) (2,636)
2012 2011 2010 2009
History of experience gains and losses £’000 £’000 £’000 £’000
Actual return less expected return on pension scheme assets 834 (2,153) 1,335 1,804
As a percentage of pension scheme liabilities at end of year -3% 8% -5% -8%
Experience gain / (loss) arising on pension scheme liabilities (18) (13) 1,276 82
As a percentage of pension scheme liabilities at end of year 0% 0% -5% 0%
Actuarial (loss) / gain recognised in the fund for future appropriations (1,246) (3,079) 4,469 (3,408)
As a percentage of pension scheme liabilities at end of year 4% 11% -16% 12%
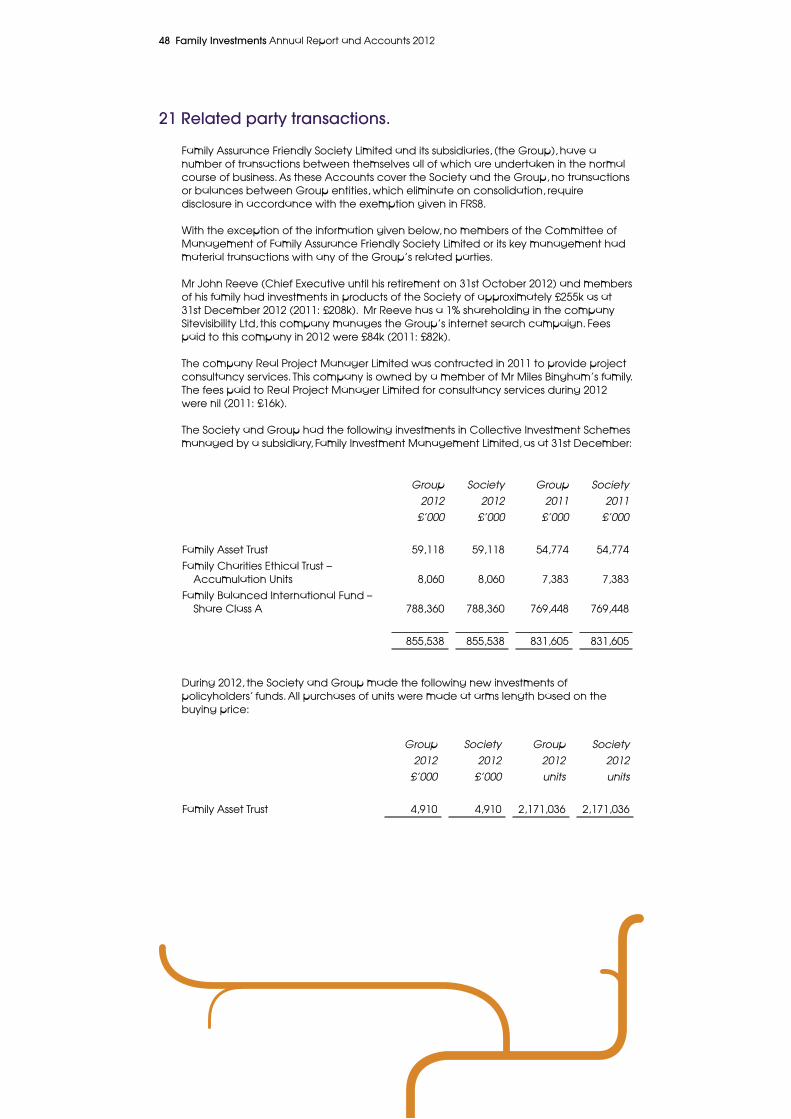
48 Family Investments Annual Report and Accounts 2012
Family Assurance Friendly Society Limited and its subsidiaries, (the Group), have a number of transactions between themselves all of which are undertaken in the normal course of business. As these Accounts cover the Society and the Group, no transactions or balances between Group entities, which eliminate on consolidation, require disclosure in accordance with the exemption given in FRS8.
With the exception of the information given below, no members of the Committee of Management of Family Assurance Friendly Society Limited or its key management had material transactions with any of the Group’s related parties.
Mr John Reeve (Chief Executive until his retirement on 31st October 2012) and members of his family had investments in products of the Society of approximately £255k as at 31st December 2012 (2011: £208k). Mr Reeve has a 1% shareholding in the company Sitevisibility Ltd, this company manages the Group’s internet search campaign. Fees paid to this company in 2012 were £84k (2011: £82k).
The company Real Project Manager Limited was contracted in 2011 to provide project consultancy services. This company is owned by a member of Mr Miles Bingham’s family. The fees paid to Real Project Manager Limited for consultancy services during 2012 were nil (2011: £16k).
The Society and Group had the following investments in Collective Investment Schemes managed by a subsidiary, Family Investment Management Limited, as at 31st December:
21 Related party transactions.
Group Society Group Society
2012 2012 2011 2011
£’000 £’000 £’000 £’000
Family Asset Trust 59,118 59,118 54,774 54,774
Family Charities Ethical Trust – Accumulation Units 8,060 8,060 7,383 7,383
Family Balanced International Fund – Share Class A 788,360 788,360 769,448 769,448
855,538 855,538 831,605 831,605
During 2012, the Society and Group made the following new investments of policyholders’ funds. All purchases of units were made at arms length based on the buying price:
Group Society Group Society
2012 2012 2012 2012
£’000 £’000 units units
Family Asset Trust 4,910 4,910 2,171,036 2,171,036

Designed by Fruit Design
www.fruit-design.co.uk

Headquarters and Registered office17 West Street, Brighton, East Sussex BN1 2RL Telephone: 01273 725272 Facsimile: 01273 736958 www.family.co.uk
Family Investments is the trading name of Family Assurance Friendly Society Limited (incorporated under the Friendly Societies Act 1992 Reg. No. 939F), Family PEP Managers Limited (Co. No. 02934967), Family Investment Management Limited (Co. No. 01915516) andFamily Equity Plan Limited (Co. No. 02208249) which are authorised and regulated by the Financial Services Authority (25 The North Colonnade, Canary Wharf, London E14 5HS). Family Enterprise Limited (Co. No. 02489291) is not authorised or regulated by the Financial Services Authority. Governor is the trading name of Governor Finance Limited (Co. No. 07210404). Governor is a subsidiary of Family Assurance Friendly Society Limited, and is authorised and regulated by the Financial Services Authority.
Registered in England and Wales at 16-17 West Street, Brighton, East Sussex, United Kingdom BN1 2RL.
The Financial Services Authority is replaced with the Prudential Regulatory Authority and Financial Conduct Authority from 1st April 2013.