Embed Size (px)
Citation preview

A P O L LO B A N C O R P, I N C .
A P O L L O B A N C O R P, I N C .
2019ANNUAL REPORT

Sincerely,
Nelson L. PersonPresident and CEO
President’s Message
Dear Stockholders:
Apollo Bancorp, Inc. produced a record year of earnings due to a notable increase in interest and fees on loans as well as significant valuation gains in equity securities. Net income totaled $2,083,000 in 2019, which was a 44.9% increase compared with $1,437,000 reported for 2018. Gains in equity securities, which were a very small balance sheet component, totaled $475,000 due to the historic market performance during 2019. The equity securities portfolio produces some earnings volatility while complementing net interest income, and it is expected to deliver long-term shareholder value.
In 2019, the core driver of profitability, which remains net interest income, increased by $142,000, or 2.4%, due to a $497,000, or 10.0%, increase in loan interest income, which was offset by a $340,000 reduction in securities income. The balance sheet continued transitioning assets to higher yielding loans and fewer investment securities. Interest expense increased only $17,000 as interest rates changed direction mid-year and began to decrease. Noninterest income from deposit service charges and fiduciary activities decreased $45,000, or 3.8%, in 2019.
Loan portfolio growth moderated to $5.4 million, or 4.7%, during 2019, following three years of extremely robust double digit increases. While asset yields increased from loans, prepayments in both the loan and investment securities portfolios accelerated due to the former’s larger balance as well as a decreasing interest rate environment. Nevertheless, the net interest margin remained strong and wholesale funding decreased. Exposure to changes in interest rates is modest regardless of their directional trend based upon emerging economic indicators and resulting monetary policy.
Asset quality remains consistently strong with few watchlist credits and low borrower delinquency. A vast majority of credit exposure is secured by investment and owner occupied real estate. Diligent management reporting systems are in place for credit risk and regulatory compliance using extensive internal procedures, frequent independent testing and thorough oversight from the Board of Directors.
Noninterest expense was well controlled and remained flat for the second consecutive year despite ongoing investment in technology and risk management. Retail deposit balances increased modestly and continued a trend of the past several years. There is continued focus on delivering a personalized approach to all community banking customers.
Earnings per share totaled $4.02 in 2019 compared with $2.77 in 2018. The quarterly dividend was increased from $0.51 to $0.52 per share, or 2.0%, in the fourth quarter. Total cash dividends per share increased from $2.01 in 2018 to $2.05 in 2019. In addition, stockholders’ equity increased 6.9% to $21,139,000, and retained earnings increased $1,021,000 in support of future growth. The Company’s performance compares favorably with its peer group, and its independent local ownership is consistently rewarded.
I am most appreciative of the longtime dedication and extensive contributions of Barbara R. Calizzi who retired as Executive Vice President, Secretary and Chief Operating Officer at year-end. She has left an indelible mark of excellence upon the organization and will be greatly missed by our employees, directors, stockholders and customers.
Thank you for your ongoing support and loyalty.

Lisa R. Ferguson, CTFA, Assistant Vice President, Trust Off and Financial Advisor
Directors and Off
Director Emeritus
John C. Dormire
Dickson K. Forbes
Richard G. Hildebrand
Larry D. Loperfito
Nelson L. Person
Karen A. Stanford
Antonio O. DiFilippo
Board of Directors
Off cersi
icers
icer
icer
icer
icer
Nelson L. Person, President and Chief Executive Off
T. J. Backus, Vice President, Lending Operations
icerBarbara R. Calizzi*, Executive Vice President, Secretary and Chief Operating Off
Stephanie A. Embry, Vice President, Retail Banking
Robert B. Kastan, CPA, Vice President, Treasurer and Chief Financial Off
Robert J. Kopec, Vice President, Residential Lending
Kirk S. Montgomery, Vice President, Operations and Chief Information Off
Carolyn R. Bash, Assistant Secretary/Assistant Treasurer
Sara J. Copeland, Assistant Vice President, Operations
Julia M. Holmes, Assistant Vice President, Risk Management and Secretary
*Retired January 2020

DividendsEPS
ROAROE
2018
Financial Performance Balance Sheet Highlights
(in millions)
$2.05 $4.02
1.28%10.11%
$2.01 $2.77
0.88%7.25%
2019
LoansAssets
Deposits*Capital*Excludes wholesale deposits
2018
$118.4 $161.2
$120.6 $21.1
$113.1 $164.3
$119.5 $19.8
2019
Earnings Per Share (EPS), Dividends Paid Per Share (Dividends), Return on Average Assets (ROA) and Return on Average Equity (ROE) are presented below:
Financial Summary
In Recognition Of
Barbara R. Calizzi
Barbara R. Calizzi joined Apollo Trust Company in July 1999 as Vice President, Operations after a career that started in the thrift industry in 1976 and progressed through a decade spent with a large data processor. Barb later served as Senior Vice President, Secretary-Treasurer and Chief Financial Off icer, and more recently, as Executive Vice President, Secretary and Chief Operating Off icer through 2019. Barb worked closely with three of the bank’s President & CEOs, mentored a number of off icers and employees, and currently works part-time as a Senior Advisor.

Independent Auditor’s Report
Financial Statements
Consolidated Balance Sheet
Consolidated Statement of Income
Consolidated Statement of Comprehensive Income
Consolidated Statement of Changes in Stockholders’ Equity
Consolidated Statement of Cash Flows
Notes to Consolidated Financial Statements
Page Number
1
2
3
4
5
6
7-32
AUDITED CONSOLIDATED FINANCIAL STATEMENTS
DECEMBER 31, 2019

INDEPENDENT AUDITOR’S REPORT
Board of Directors and Stockholders Apollo Bancorp, Inc. Report on the Financial Statements
We have audited the accompanying consolidated financial statements of Apollo Bancorp, Inc. and subsidiary, which comprise the consolidated balance sheet as of December 31, 2019 and 2018; the related consolidated statements of income, comprehensive income, changes in stockholders’ equity, and cash flows for the years then ended; and the related notes to the consolidated financial statements. Management’s Responsibility for the Financial Statements
Management is responsible for the preparation and fair presentation of these consolidated financial statements, in accordance with accounting principles generally accepted in the United States of America; this includes the design, implementation, and maintenance of internal control relevant to the preparation and fair presentation of consolidated financial statements that are free from material misstatement, whether due to fraud or error. Auditor’s Responsibility
Our responsibility is to express an opinion on these consolidated financial statements based on our audits. We conducted our audits in accordance with auditing standards generally accepted in the United States of America. Those standards require that we plan and perform the audit to obtain reasonable assurance about whether the consolidated financial statements are free of material misstatement.
An audit involves performing procedures to obtain audit evidence about the amounts and disclosures in the consolidated financial statements. The procedures selected depend on the auditor’s judgment, including the assessment of the risks of material misstatement of the consolidated financial statements, whether due to fraud or error. In making those risk assessments, the auditor considers internal control relevant to the entity’s preparation and fair presentation of the consolidated financial statements in order to design audit procedures that are appropriate in the circumstances, but not for the purpose of expressing an opinion on the effectiveness of the entity’s internal control. Accordingly, we express no such opinion. An audit also includes evaluating the appropriateness of accounting policies used and the reasonableness of significant accounting estimates made by management, as well as evaluating the overall presentation of the consolidated financial statements.
We believe that the audit evidence we have obtained is sufficient and appropriate to provide a basis for our audit opinion. Opinion In our opinion, the consolidated financial statements referred to above present fairly, in all material respects, the financial position of Apollo Bancorp, Inc. and subsidiary as of December 31, 2019 and 2018, and the results of their operations and their cash flows for the years then ended, in accordance with accounting principles generally accepted in the United States of America. Cranberry Township, Pennsylvania March 6, 2020

See accompanying notes to the consolidated financial statements.
2
2019 2018ASSETS
Cash and due from banks $ 3,833,504 $ 3,657,204 Investment securities available for sale, at fair value 31,381,941 40,407,525 Equity securities, at fair value 2,259,163 1,771,108 Loans 118,424,462 113,068,861 Less allowance for loan losses 1,208,092 1,182,302
Net loans 117,216,370 111,886,559
Premises and equipment, net 2,114,375 1,957,313 Bank owned life insurance 2,196,862 2,137,890 Accrued interest and other assets 2,220,344 2,513,288
TOTAL ASSETS $ 161,222,559 $ 164,330,887
LIABILITIESDeposits:
Noninterest-bearing demand $ 49,052,903 $ 47,709,169 Interest-bearing demand 5,498,653 4,758,434 Money market 2,487,726 2,435,421 Savings 53,109,033 53,118,637 Time 10,436,717 11,520,772 Wholesale 4,000,758 8,005,278 Total deposits 124,585,790 127,547,711
Short-term borrowings 14,250,000 16,000,000 Accrued interest and other liabilities 1,247,917 1,002,956
TOTAL LIABILITIES 140,083,707 144,550,667
STOCKHOLDERS’ EQUITYCommon stock, par value $2; 2,000,000 shares authorized; 600,000 shares issued; 517,946 shares outstanding in 2019 and 2018 1,200,000 1,200,000 Capital surplus 3,615,097 3,615,097 Retained earnings 20,361,127 19,340,263 Accumulated other comprehensive loss (585,308) (923,076) Treasury stock, at cost (82,054 shares) (3,452,064) (3,452,064)
TOTAL STOCKHOLDERS’ EQUITY 21,138,852 19,780,220
TOTAL LIABILITIES AND STOCKHOLDERS’ EQUITY $ 161,222,559 $ 164,330,887
APOLLO BANCORP, INC.CONSOLIDATED BALANCE SHEET
December 31,

See accompanying notes to the consolidated financial statements.
3
2019 2018INTEREST AND DIVIDEND INCOME
Interest and fees on loans $ 5,485,491 $ 4,988,120 Interest on deposits 25,658 23,506 Investment securities: Taxable interest 814,440 951,278 Tax-exempt interest 481,875 634,778 Dividend income 44,851 95,010
Total interest and dividend income 6,852,315 6,692,692
INTEREST EXPENSE Deposits 281,489 244,078 Short-term borrowings 371,987 392,128
Total interest expense 653,476 636,206
NET INTEREST INCOME 6,198,839 6,056,486
Provision for loan losses 42,000 146,650
NET INTEREST INCOME AFTER PROVISION FOR LOAN LOSSES 6,156,839 5,909,836
NONINTEREST INCOMEService charges on deposit accounts 921,296 989,152 Fiduciary income 242,575 220,139 Gains (losses) in fair value of equity securities, net 474,574 (210,023) Gains (losses) investment securities sold, net 2,203 (33,511) Bank owned life insurance 58,972 61,101 Other 67,757 76,325
Total noninterest income 1,767,377 1,103,183
NONINTEREST EXPENSECompensation and employee benefits 3,052,683 3,053,050 Occupancy and equipment 529,677 566,489 Pennsylvania shares tax 136,089 145,170 Professional fees 270,500 297,800 Data processing 474,118 429,047 Federal Deposit Insurance Corporation assessment 72,676 88,305 Advertising 66,425 28,200 Other 792,958 798,050
Total noninterest expense 5,395,126 5,406,111
Income before income tax expense 2,529,090 1,606,907 Income tax expense 446,436 169,417
NET INCOME $ 2,082,654 $ 1,437,490
EARNINGS PER SHARE $ 4.02 $ 2.77
AVERAGE SHARES OUTSTANDING 517,946 518,211
APOLLO BANCORP, INC. CONSOLIDATED STATEMENT OF INCOME
Year Ended December 31,

See accompanying notes to the consolidated financial statements.
4
2019 2018
Net income $ 2,082,654 $ 1,437,490 Other comprehensive income (loss):
Unrealized holding gain (loss) on available for sale securities 353,391 (808,842) Tax effect (74,211) 169,857 Reclassification adjustment for (gains) losses on available for sale securities included in net income (2,203) 13,345 Tax effect 463 (2,803) Change in unrecognized cost for defined benefit pension plan 76,365 (130,334) Tax effect (16,037) 27,370
Total other comprehensive income (loss) 337,768 (731,407)
TOTAL COMPREHENSIVE INCOME $ 2,420,422 $ 706,083
APOLLO BANCORP, INC. CONSOLIDATED STATEMENT OF COMPREHENSIVE INCOME
Year Ended December 31,

See accompanying notes to the consolidated financial statements.
5
AccumulatedOther
Common Capital Retained Comprehensive TreasuryStock Surplus Earnings Loss Stock Total
Balance, December 31, 2017 $ 1,200,000 $ 3,615,097 $ 18,937,763 $ (191,669) $ (2,927,715) $ 20,633,476
Net income 1,437,490 1,437,490 Other comprehensive loss (731,407) (731,407) Cash dividends ($2.01 per share) (1,034,990) (1,034,990) Purchase of treasury stock (22,900 shares) (996,150) (996,150) Sale of treasury stock (10,846 shares) 471,801 471,801
Balance, December 31, 2018 1,200,000 3,615,097 19,340,263 (923,076) (3,452,064) 19,780,220
Net income 2,082,654 2,082,654 Other comprehensive income 337,768 337,768 Cash dividends ($2.05 per share) (1,061,790) (1,061,790)
Balance, December 31, 2019 $ 1,200,000 $ 3,615,097 $ 20,361,127 $ (585,308) $ (3,452,064) $ 21,138,852
APOLLO BANCORP, INC. CONSOLIDATED STATEMENT OF CHANGES IN STOCKHOLDERS’ EQUITY
See accompanying notes to the consolidated financial statements.
6
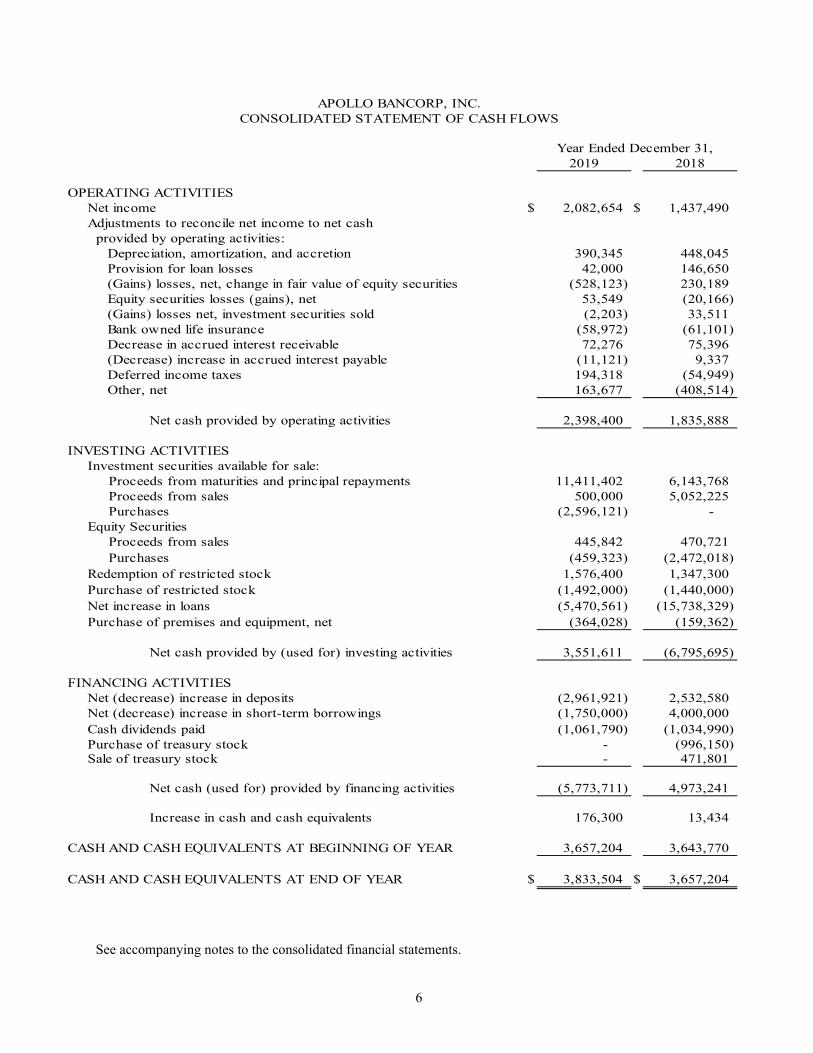
2019 2018
OPERATING ACTIVITIES Net income $ 2,082,654 $ 1,437,490 Adjustments to reconcile net income to net cash provided by operating activities:
Depreciation, amortization, and accretion 390,345 448,045 Provision for loan losses 42,000 146,650 (Gains) losses, net, change in fair value of equity securities (528,123) 230,189 Equity securities losses (gains), net 53,549 (20,166) (Gains) losses net, investment securities sold (2,203) 33,511 Bank owned life insurance (58,972) (61,101) Decrease in accrued interest receivable 72,276 75,396 (Decrease) increase in accrued interest payable (11,121) 9,337 Deferred income taxes 194,318 (54,949) Other, net 163,677 (408,514)
Net cash provided by operating activities 2,398,400 1,835,888
INVESTING ACTIVITIES Investment securities available for sale: Proceeds from maturities and principal repayments 11,411,402 6,143,768 Proceeds from sales 500,000 5,052,225 Purchases (2,596,121) - Equity Securities Proceeds from sales 445,842 470,721 Purchases (459,323) (2,472,018) Redemption of restricted stock 1,576,400 1,347,300 Purchase of restricted stock (1,492,000) (1,440,000) Net increase in loans (5,470,561) (15,738,329) Purchase of premises and equipment, net (364,028) (159,362)
Net cash provided by (used for) investing activities 3,551,611 (6,795,695)
FINANCING ACTIVITIES Net (decrease) increase in deposits (2,961,921) 2,532,580 Net (decrease) increase in short-term borrowings (1,750,000) 4,000,000 Cash dividends paid (1,061,790) (1,034,990) Purchase of treasury stock - (996,150) Sale of treasury stock - 471,801
Net cash (used for) provided by financing activities (5,773,711) 4,973,241
Increase in cash and cash equivalents 176,300 13,434
CASH AND CASH EQUIVALENTS AT BEGINNING OF YEAR 3,657,204 3,643,770
CASH AND CASH EQUIVALENTS AT END OF YEAR $ 3,833,504 $ 3,657,204
Year Ended December 31,
APOLLO BANCORP, INC. CONSOLIDATED STATEMENT OF CASH FLOWS

7
APOLLO BANCORP, INC. NOTES TO CONSOLIDATED FINANCIAL STATEMENTS
1. SUMMARY OF SIGNIFICANT ACCOUNTING POLICIES
A summary of the significant accounting and reporting policies applied in the presentation of the accompanying financial statements follows: Nature of Operations and Basis of Presentation Apollo Bancorp, Inc. (the “Company”) is a Pennsylvania corporation and is registered under the Bank Holding Company Act. The Company was organized to become the holding company of Apollo Trust Company (the “Bank”). Apollo Realty, Inc. is the wholly owned subsidiary of Apollo Trust Company. The Company and its subsidiary derive substantially all their income from banking and bank-related services, which include interest earnings on residential real estate, commercial mortgage, commercial, and consumer loan financing as well as interest-earning investment securities and a variety of deposit and fiduciary services to its customers through seven locations. The Bank is a state-chartered bank located in Pennsylvania. The Board of Governors of the Federal Reserve System supervises the Company, while the Bank is subject to regulation and supervision by the Board of Governors of the Federal Reserve System and the Pennsylvania Department of Banking and Securities. The consolidated financial statements include the accounts of the Company and its wholly owned subsidiary, the Bank, and its wholly owned subsidiary, Apollo Realty, Inc. All significant intercompany transactions have been eliminated in consolidation. The consolidated financial statements have been prepared in conformity with U.S. generally accepted accounting principles. In preparing the financial statements, management is required to make estimates and assumptions that affect the reported amounts of assets and liabilities as of the Consolidated Balance Sheet date and reported amounts of revenues and expenses for the period. Actual results could differ significantly from those estimates. Material estimates that are particularly susceptible to significant change in the near term relate to the determination of the allowance for loan losses, the valuation of deferred tax assets, and the fair value of financial instruments. Investment Securities Investment securities are classified at the time of purchase, based on management’s intention and ability, as securities available for sale or held to maturity. Debt securities classified as available for sale serve principally as a source of liquidity. Unrealized holding gains and losses for available for sale debt securities are reported as a separate component of stockholders’ equity, net of tax, until realized. Realized securities gains and losses are computed using the specific identification method. Interest and dividends on investment securities are recognized as income when earned. Securities are periodically reviewed for other-than-temporary impairment based upon a number of factors, including, but not limited to, the length of time and extent to which the market value has been less than cost, the financial condition of the underlying issuer, the ability of the issuer to meet contractual obligations, the likelihood of the security’s ability to recover any decline in its market value, and the Company’s intent to sell the security or whether the Company would be required to sell the security before its anticipated recovery in market value. A decline in value that is considered to be other than temporary is recorded as a loss within non-interest income in the Consolidated Statement of Income. Equity Securities Equity securities are held at fair value. Unrealized holding gains and losses are recorded in income. Dividends on equity securities are recognized as income when earned.

8
1. SUMMARY OF SIGNIFICANT ACCOUNTING POLICIES (Continued) Restricted Stock Common stock of the Federal Home Loan Bank of Pittsburgh (“FHLB”), Federal Reserve Bank of Cleveland, and Atlantic Community Bankers Bank represents ownership interest in institutions that are wholly owned by other financial institutions. These equity securities are accounted for at cost and are classified with other assets. The Bank is a member of the FHLB, and as such, is required to maintain a minimum investment in stock of the FHLB that varies with the level of advances outstanding. The stock is purchased from and sold to the FHLB based upon its $100 par value. The stock does not have a readily determinable fair value, and as such, is classified as restricted stock, carried at cost, and evaluated for impairment as necessary. The stock’s value is determined by the ultimate recoverability of the par value rather than by recognizing temporary declines. The determination of whether the par value will ultimately be recovered is influenced by criteria such as the following: (a) the significance of the decline in net assets of the FHLB as compared to the capital stock amount and the length of time this situation has persisted; (b) commitments by the FHLB to make payments required by law or regulation and the level of such payments in relation to the operating performance; (c) the impact of legislative and regulatory changes on the customer base of the FHLB; and (d) the liquidity position of the FHLB. Management evaluated the stock and concluded that it was not impaired for the periods presented herein. More consideration was given to the long-term prospects for the FHLB as opposed to the stress caused by the economic conditions the world is facing. Management also considered that the FHLB maintains regulatory capital ratios in excess of all regulatory capital requirements, liquidity appears adequate, new shares of FHLB stock continue to be issued and redeemed at the $100 par value, and the payment of dividends. Loans Loans that management has the intent and ability to hold for the foreseeable future or until maturity or payoff generally are reported at their principal amount net of the allowance for loan losses and deferred origination fees or costs. Interest on loans is recognized as income when earned on the accrual method. Generally, the policy has been to stop accruing interest on loans when it is determined that a reasonable doubt exists as to the collectability of additional interest. Interest previously accrued but deemed uncollectible is deducted from current interest income. Payments received on nonaccrual loans are recorded as income or applied against principal according to management’s judgment as to the collectability of such principal. Nonaccrual loans will generally be put back on accrual status after demonstrating six consecutive months of contractual payments. The allowance for loan losses is established through provisions for loan losses charged against income. Loans deemed to be uncollectible are charged against the allowance for loan losses, and subsequent recoveries, if any, are credited to the allowance. Loan origination fees and certain direct loan origination costs are being deferred and the net amount amortized as an adjustment of the related loan’s yield. Management amortizes these amounts over contractual life of the related loans. Allowance for Loan Losses The allowance for loan losses represents an amount that management estimates is adequate to provide for probable losses inherent in its loan portfolio. The allowance method is used in providing for loan losses. Accordingly, all loan losses are charged to the allowance, and all recoveries are credited to it. The allowance for loan losses is established through a provision for loan losses that is charged to operations. The provision is based on management’s evaluation of adequacy of the allowance for loan losses, which encompasses overall risk characteristics of various portfolio segments, past experience with losses, impact of economic conditions on borrowers, and other relevant factors. Estimates used in determining adequacy of the allowance for loan losses, including amounts and timing of future cash flows expected on impaired loans, are particularly susceptible to significant changes in the near term.

9
1. SUMMARY OF SIGNIFICANT ACCOUNTING POLICIES (Continued) Allowance for Loan Losses (Continued) Impaired loans are commercial and commercial real estate loans for which it is probable the Company will not be able to collect all amounts due according to contractual terms of the loan agreement. The Company individually evaluates such loans for impairment and does not aggregate loans by major risk classifications. The definition of “impaired loans” is not the same as “nonaccrual loans,” although the two categories may overlap. The Company may also choose to place a loan on nonaccrual status due to payment delinquency or uncertain collectability while not classifying the loan as impaired, provided it is not a commercial or commercial real estate classification. Factors considered by management in determining impairment include payment status and collateral value. The amount of impairment for these types of loans is determined by the difference between the present value of expected cash flows related to the loan, using the original interest rate, and its recorded value, or as a practical expedient in the case of collateralized loans, the difference between fair value of the collateral and the recorded amount of such loans. When foreclosure is probable, impairment is measured based on fair value of the collateral. In situations where, for economic or legal reasons related to a borrower's financial difficulties, management may grant a concession for other than an insignificant period of time to the borrower that would not otherwise be considered, the related loan is classified as a troubled debt restructuring (TDR). Management strives to identify borrowers in financial difficulty early and work with them to modify to more affordable terms before their loan reaches nonaccrual status. These modified terms may include rate reductions, principal forgiveness, payment forbearance and other actions intended to minimize the economic loss and to avoid foreclosure or repossession of the collateral. In cases where borrowers are granted new terms that provide for a reduction of either interest or principal, management measures any impairment on the restructuring and charges down the principal balance as determined in the analysis. This process is completed for all types of loans. It is then further analyzed to determine if the loan should be classified as impaired. Mortgage loans secured by one-to-four family residential properties and all consumer loans are large groups of smaller-balance homogeneous loans and are measured for impairment collectively. Loans that experience insignificant payment delays, which are defined as 90 days or less, generally are not classified as impaired. Management determines significance of payment delays on a case-by-case basis, taking into consideration all circumstances concerning the loan, creditworthiness and payment history of the borrower, length of payment delay, and amount of any shortfall in relation to principal and interest owed. In addition to the allowance for loan losses, the Company also estimates probable losses related to unfunded lending commitments, including letters of credit and financial guarantees. Unfunded lending commitments are subject to individual reviews and are analyzed and segregated by risk according to the Company’s internal risk rating scale. These risk classifications, in conjunction with an analysis of historical loss experience, current economic conditions, performance trends within specific portfolio segments, and any other pertinent information, result in an estimation of the reserve for unfunded lending commitments. Provision for credit losses related to the loan portfolio and unfunded lending commitments is reported in the Consolidated Statement of Income. Bank Owned Life Insurance The Company purchased insurance on the lives of certain Bank officers. The policies accumulate value to meet future liabilities, including payment of employee benefits. Increases in the cash surrender value are recorded as noninterest income in the Consolidated Statement of Income. The cash surrender value of bank-owned life insurance is recorded as an asset on the Consolidated Balance Sheet. Premises and Equipment Land is carried at cost. Premises and equipment are stated at cost less accumulated depreciation. Depreciation is computed on both the straight-line over the estimated useful lives of the assets, which range from 5 to 15 years for furniture, fixtures, and equipment, and 7 to 39 years for Company buildings. Expenditures for maintenance and repairs are charged against income as incurred. Costs of major additions and improvements are capitalized.
10
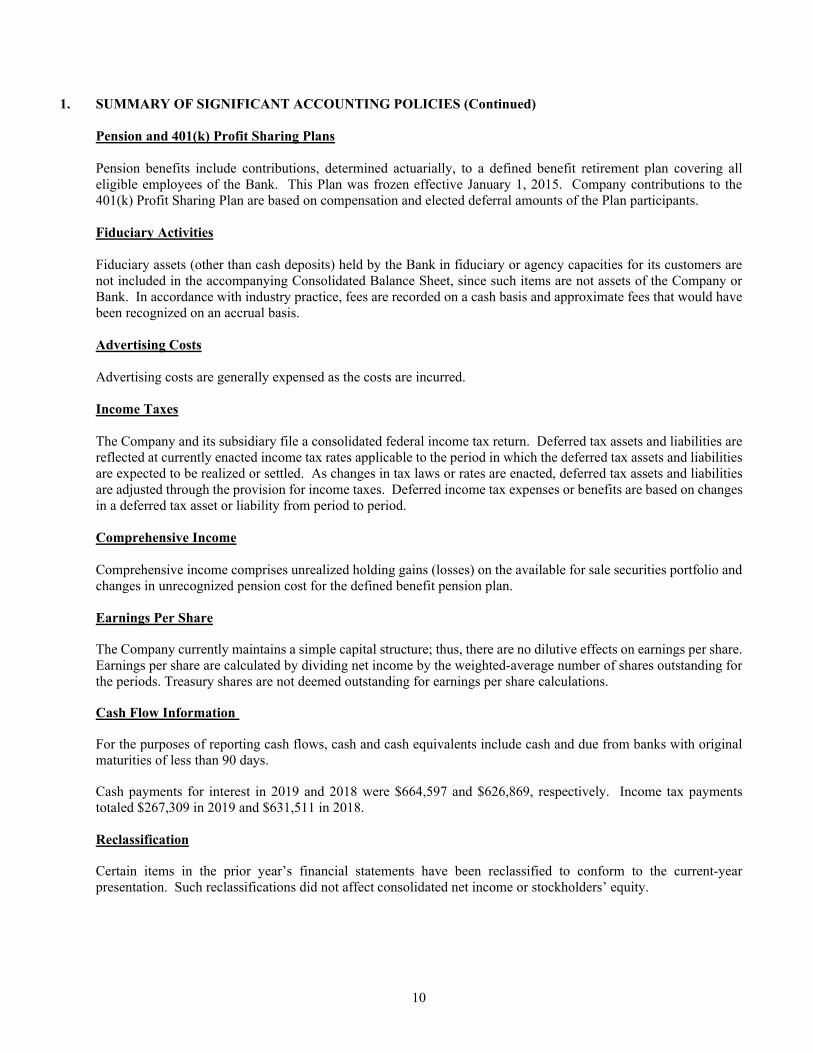
1. SUMMARY OF SIGNIFICANT ACCOUNTING POLICIES (Continued) Pension and 401(k) Profit Sharing Plans Pension benefits include contributions, determined actuarially, to a defined benefit retirement plan covering all eligible employees of the Bank. This Plan was frozen effective January 1, 2015. Company contributions to the 401(k) Profit Sharing Plan are based on compensation and elected deferral amounts of the Plan participants. Fiduciary Activities Fiduciary assets (other than cash deposits) held by the Bank in fiduciary or agency capacities for its customers are not included in the accompanying Consolidated Balance Sheet, since such items are not assets of the Company or Bank. In accordance with industry practice, fees are recorded on a cash basis and approximate fees that would have been recognized on an accrual basis. Advertising Costs Advertising costs are generally expensed as the costs are incurred. Income Taxes The Company and its subsidiary file a consolidated federal income tax return. Deferred tax assets and liabilities are reflected at currently enacted income tax rates applicable to the period in which the deferred tax assets and liabilities are expected to be realized or settled. As changes in tax laws or rates are enacted, deferred tax assets and liabilities are adjusted through the provision for income taxes. Deferred income tax expenses or benefits are based on changes in a deferred tax asset or liability from period to period. Comprehensive Income Comprehensive income comprises unrealized holding gains (losses) on the available for sale securities portfolio and changes in unrecognized pension cost for the defined benefit pension plan. Earnings Per Share The Company currently maintains a simple capital structure; thus, there are no dilutive effects on earnings per share. Earnings per share are calculated by dividing net income by the weighted-average number of shares outstanding for the periods. Treasury shares are not deemed outstanding for earnings per share calculations. Cash Flow Information For the purposes of reporting cash flows, cash and cash equivalents include cash and due from banks with original maturities of less than 90 days. Cash payments for interest in 2019 and 2018 were $664,597 and $626,869, respectively. Income tax payments totaled $267,309 in 2019 and $631,511 in 2018. Reclassification Certain items in the prior year’s financial statements have been reclassified to conform to the current-year presentation. Such reclassifications did not affect consolidated net income or stockholders’ equity.

11
1. SUMMARY OF SIGNIFICANT ACCOUNTING POLICIES (Continued) Revenue Recognition On January 1, 2018, the Company adopted ASU No. 2014-09 Revenue from Contracts with Customers (Topic 606) and all subsequent ASUs that modified Topic 606. Topic 606 does not apply to revenue associated with financial instruments, including revenue from loans and securities. In addition, certain noninterest income streams, such as fees associated with mortgage servicing rights, financial guarantees, derivatives, and certain credit card fees, are also not in scope of the new guidance. Topic 606 is applicable to noninterest revenue streams, such as trust and asset management income, deposit related fees, interchange fees, merchant income, and annuity and insurance commissions. However, the recognition of these revenue streams did not change significantly upon adoption of Topic 606. Substantially, all of the Company’s revenue is generated from contracts with customers. Noninterest revenue streams in-scope of Topic 606 are discussed below. Fiduciary Fees Trust and asset management income is primarily comprised of fees earned from the management and administration of trusts and other customer assets. The Bank’s performance obligation is generally satisfied over time, and the resulting annual fees are based on the average market value of assets held in the account as valued at the end of each month. Payment is generally received within a few days after the end of the month via a debit from the customers’ accounts. The Bank does not earn performance based incentives. Additional services, including, but not limited to, additional accountings and supervision of personal affairs for the elderly may be provided on a case-by-case basis. The Bank’s performance obligation for these transactional-based services is generally satisfied, and related revenue recognized, at a point in time (i.e., as incurred). Payment is received shortly after services are rendered. Service Charges Service charges on deposit accounts consist of overdraft charges, monthly service fees, check orders, and other deposit account related fees. The Bank’s performance obligation for monthly service fees is generally satisfied, and the related revenue recognized, over the period in which the service is provided. Check orders and other deposit account related fees are largely transactional-based, and, therefore, the Bank’s performance obligation is satisfied, and related revenue recognized, at a point in time. Payment for service charges on deposit accounts is primarily received immediately, or in the following month, through a direct charge to customers’ accounts. Debit Card Network Fees The Bank earns interchange fees from debit cardholder transactions conducted primarily through the Mastercard payment network. Interchange fees from cardholder transactions represent a percentage of the underlying transaction value and are recognized daily, net of card network fees, concurrently with the transaction processing services provided to the cardholder. Gain on Sale of Other Real Estate Owned (OREO) The Bank records a gain or loss from the sale of OREO when control of the property transfers to the buyer, which generally occurs at the time of delivery of an executed deed. When the Bank finances the sale of OREO to the buyer, management assesses whether the buyer is committed to perform the buyer’s obligation under the contract and whether collectability of the transaction price is probable. Once these criteria are met, the OREO asset is derecognized and the gain or loss on sale is recorded upon the transfer of control of the property to the buyer. In determining the gain or loss on the sale, the Bank adjusts the transaction price and related gain or loss on sale if a significant financing component is present. The Company had no OREO sales in 2019 or 2018.

12
2. INVESTMENT SECURITIES AVAILABLE FOR SALE The amortized cost and fair values of investment securities available for sale are summarized as follows at December 31:
Gross GrossAmortized Unrealized Unrealized Fair
Cost Gains Losses Value
U.S. government agency securities $ 6,171,607 $ 36,126 $ (130,394) $ 6,077,339 Obligations of states and political subdivisions 20,965,692 546,353 (25,435) 21,486,610 Corporate securities 2,737,995 85,318 (3,501) 2,819,812 Mortgage-backed securities: Government-sponsored entities 973,649 24,531 - 998,180 Total debt securities $ 30,848,943 $ 692,328 $ (159,330) $ 31,381,941
Gross GrossAmortized Unrealized Unrealized Fair
Cost Gains Losses Value
U.S. government agency securities $ 8,273,281 $ 23,326 $ (203,836) $ 8,092,771 Obligations of states and political subdivisions 27,478,813 487,610 (84,805) 27,881,618 Corporate securities 3,232,754 9,177 (38,313) 3,203,618 Mortgage-backed securities: Government-sponsored entities 1,240,868 4,881 (16,231) 1,229,518 Total debt securities $ 40,225,716 $ 524,994 $ (343,185) $ 40,407,525
2018
2019
The following table shows proceeds from sales of available for sale securities and gross realized gains and losses on sales of those securities that have been included in earnings as a result of sales in 2019 and 2018.
2019 2018Proceeds $ 500,000 $ 5,052,225Realized gains 3,953 208Realized losses 1,750 13,553
The following table is the activity of equity investments. 2019 2018
Net gains (losses) recognized during the period on equity securities $ 528,123 $ (230,189)
Less: Net losses recognized during the period on equity securitiessold during the period (53,549) (20,166)
Net gains (losses), change in fair value of equity securities still heldat the reporting date $ 474,574 $ (210,023)

13
2. INVESTMENT SECURITIES AVAILABLE FOR SALE (Continued) The following tables show the Company’s gross unrealized losses and fair value, aggregated by investment category and length of time that individual securities have been in a continuous unrealized loss position at December 31.
Gross Gross GrossFair Unrealized Fair Unrealized Fair Unrealized
Value Losses Value Losses Value LossesU.S. government agency securities $ 622,866 $ (296) $ 3,590,020 $ (130,098) $ 4,212,886 $ (130,394) Obligations of states and political subdivisions - - 1,393,572 (25,435) 1,393,572 (25,435) Corporate securities 496,500 (3,501) - - 496,500 (3,501)
Total $ 1,119,366 $ (3,797) $ 4,983,592 $ (155,533) $ 6,102,958 $ (159,330)
Gross Gross GrossFair Unrealized Fair Unrealized Fair Unrealized
Value Losses Value Losses Value LossesU.S. government agency securities $ 595,728 $ (14,464) $ 6,235,324 $ (189,372) $ 6,831,052 $ (203,836) Obligations of states and political subdivisions 937,254 (1,839) 3,676,392 (82,966) 4,613,646 (84,805) Corporate securities 1,716,832 (36,316) 498,003 (1,997) 2,214,835 (38,313) Mortgage-backed securities: Government-sponsored entities - - 378,313 (16,231) 378,313 (16,231)
Total $ 3,249,814 $ (52,619) $ 10,788,032 $ (290,566) $ 14,037,846 $ (343,185)
2018Less than Twelve Months Twelve Months or Greater Total
2019Less than Twelve Months Twelve Months or Greater Total

14
2. INVESTMENT SECURITIES AVAILABLE FOR SALE (Continued) U.S. government agency securities. The unrealized losses on eleven investments in direct obligations of U.S. government agencies were caused by interest rate increases. The contractual terms of those investments do not permit the issuer to settle the securities at a price less than the amortized cost basis. The Company does not intend to sell the investments, and it is unlikely that it will be required to sell the investments, before recovery of their amortized cost basis. The Company does not consider those investments to be other-than-temporarily impaired at December 31, 2019. Obligations of states and political subdivisions. The Company’s unrealized losses on four municipal bonds relates to an investment within the governmental service sector. The unrealized losses may be caused by interest rate increases or from market responses to forecasts by industry analysts. The contractual terms of those investments do not permit the issuer to settle the securities at a price less than the amortized cost basis. The Company does not intend to sell the investments, and it is unlikely that it will be required to sell the investments, before recovery of their amortized cost basis. The Company does not consider those investments to be other-than-temporarily impaired at December 31, 2019. Corporate securities. The unrealized losses on one investment in corporate securities was caused by interest rate increases or from market responses to forecasts by industry analysts. The contractual terms of those investments do not permit the issuer to settle the securities at a price less than the amortized cost basis. The Company does not intend to sell the investments, and it is unlikely that it will be required to sell the investments, before recovery of their amortized cost basis. The Company does not consider those investments to be other-than-temporarily impaired at December 31, 2019. The amortized cost and estimated market values of debt securities at December 31, 2019, by contractual maturity are shown below. Expected maturities will differ from contractual maturities because issuers may have the right to call or prepay obligations with or without call or prepayment penalties.
Amortized FairCost Value
Due in one year or less $ 1,053,270 $ 1,059,964 Due after one year through five years 7,992,219 8,277,237 Due after five years through ten years 13,814,910 14,106,820 Due after ten years 7,988,542 7,937,920
Total $ 30,848,941 $ 31,381,941
Investment securities with a carrying value of $14,656,813 and $17,485,552 were pledged to secure public deposits and other purposes as required by law at December 31, 2019 and 2018, respectively.

15
3. LOANS Major classifications of loans are summarized as follows at December 31:
2019 2018Commercial and industrial $ 9,820,299 $ 7,845,412 Commercial real estate 58,552,634 59,771,962 Residential real estate 46,900,246 42,965,805 Consumer 3,091,913 2,437,810
118,365,092 113,020,989 Less:
Allowance for loan losses 1,208,092 1,182,302 Net deferred loan costs (59,370) (47,872)
Net loans $ 117,216,370 $ 111,886,559
The Company’s primary business activity is with customers located within its identified trade area. Commercial, residential, and consumer loans are granted. Although the Company had a diversified loan portfolio at December 31, 2019, loans outstanding to individuals and businesses are dependent upon economic conditions in its primary market area. The Company has an industry concentration in loans to lessors of buildings and dwellings, with a balance of $47,455,265 and $47,254,077 at December 31, 2019 and 2018, respectively.
4. ALLOWANCE FOR LOAN LOSSES Management has an established methodology to determine adequacy of the allowance for loan losses that assesses the risks and losses inherent in the loan portfolio. For purposes of determining the allowance for loan losses, the Company has segmented certain loans in the portfolio by product type. Loans are segmented into the following pools: commercial and industrial loans; commercial real estate loans; residential real estate loans; and consumer loans. Historical loss percentages for each risk category are calculated and used as a basis for calculating allowance allocations. These historical loss percentages are calculated over a two-year period for all portfolio segments. Certain qualitative factors are also added to the historical loss percentages to determine the adjusted factor to be applied to loans classified as pass. The following qualitative factors are analyzed to determine allocations for pass loans for each portfolio segment:
Changes in lending policies and procedures Changes in economic and business conditions Changes in nature and volume of the loan portfolio Changes in lending staff experience and ability Changes in past-due loans, nonaccrual loans, and classified loans Changes in the loan review system Changes in underlying value of collateral-dependent loans Levels of credit concentrations Effects of external factors, such as legal and regulatory requirements

16
4. ALLOWANCE FOR LOAN LOSSES (Continued) These qualitative factors are reviewed each quarter and adjusted based upon relevant changes within the Company’s operating environment. The Company offers an overdraft privilege program; the charge-offs, recoveries, and provision amounts are included in the consumer loan category. Commercial and industrial loans, commercial real estate loans, and consumer loans are considered to be riskier than one-to-four family residential mortgage loans. Commercial real estate loans entail significant additional credit risks compared to one-to-four family residential mortgage loans, as they involve large loan balances concentrated with single borrowers or groups of related borrowers. In addition, the payment experience on loans secured by income-producing properties typically depends on successful operation of the related real estate project and/or business operation of the borrower and, therefore, may be subject to a greater extent to adverse conditions in the real estate market and in the general economy. Commercial and industrial loans involve a higher risk of default than residential mortgage loans of like duration since their repayment is generally dependent on successful operation of the borrower’s business and sufficiency of collateral, if any. Although a borrower’s ability to repay for both one-to-four family residential mortgage loans and consumer loans is highly dependent on personal income, as well as the local economy, especially employment levels, consumer loans, as a group, generally present a higher degree of risk because of the nature of collateral, if any. The following tables present, by portfolio segment, changes in the allowance for loan losses and the recorded investment in loans as of and for the years ended December 31, 2019 and 2018:
Commercial Commercial Residential December 31, 2019 and Industrial Real Estate Real Estate Consumer Unallocated TotalAllowance for loan losses:Beginning balance $ 228,616 $ 618,996 $ 293,181 $ 18,693 $ 22,816 $ 1,182,302 Charge-offs - - - (19,601) - (19,601) Recoveries - 599 - 2,792 - 3,391 Provision (119,661) 100,363 61,150 19,672 (19,524) 42,000 Ending balance $ 108,955 $ 719,958 $ 354,331 $ 21,556 $ 3,292 $ 1,208,092
Ending balance individually evaluated for impairment $ 21,542 $ - $ - $ - $ - $ 21,542
Ending balance collectively evaluated for impairment $ 87,413 $ 719,958 $ 354,331 $ 21,556 $ 3,292 $ 1,186,550
Loans:Individually evaluated for impairment $ 107,708 $ - $ - $ - $ 107,708 Collectively evaluated for impairment 9,712,591 58,552,634 46,900,246 3,091,913 118,257,384 Ending balance $ 9,820,299 $ 58,552,634 $ 46,900,246 $ 3,091,913 $ 118,365,092

17
4. ALLOWANCE FOR LOAN LOSSES (Continued)
Commercial Commercial Residential December 31, 2018 and Industrial Real Estate Real Estate Consumer Unallocated TotalAllowance for loan losses:Beginning balance $ 266,377 $ 517,389 $ 235,544 $ 11,811 $ 16,187 $ 1,047,308 Charge-offs - - - (16,963) - (16,963) Recoveries - 807 - 4,500 - 5,307 Provision (37,761) 100,800 57,637 19,345 6,629 146,650 Ending balance $ 228,616 $ 618,996 $ 293,181 $ 18,693 $ 22,816 $ 1,182,302
Ending balance individually evaluated for impairment $ 133,909 $ - $ - $ - $ - $ 133,909
Ending balance collectively evaluated for impairment $ 94,707 $ 618,996 $ 293,181 $ 18,693 $ 22,816 $ 1,048,393
Loans:Individually evaluated for impairment $ 399,904 $ - $ - $ - $ 399,904 Collectively evaluated for impairment 7,445,508 59,771,962 42,965,805 2,437,810 112,621,085 Ending balance $ 7,845,412 $ 59,771,962 $ 42,965,805 $ 2,437,810 $ 113,020,989
Credit Quality Information The following table represents the commercial credit exposures by internally assigned credit risk ratings for the years ended December 31, 2019 and 2018. The grading analysis estimates capability of a borrower to repay contractual obligations under the loan agreements as scheduled or at all. The Company’s internal credit risk rating system is based on experiences with similarly rated loans. The Company’s internally assigned credit risk ratings are as follows:
Pass loans are protected by current net worth and paying capacity of an obligor or by the value of underlying collateral.
Special Mention loans have a potential weakness or risk evident, which could cause a more serious problem if not corrected.
Substandard loans have a well-defined weakness based on objective evidence and are characterized by a distinct possibility that the Company would sustain some loss if the deficiencies are not corrected.
Doubtful loans have all the weaknesses inherent in a substandard asset. In addition, these weaknesses make collection or liquidation in full highly questionable and improbable based on existing circumstances.
Loss loans are considered uncollectible, or of such value that continuance as an asset is not warranted.

18
4. ALLOWANCE FOR LOAN LOSSES (Continued) Credit Quality Information (Continued)
Commercial Commercial Commercial Commercialand Industrial Real Estate and Industrial Real Estate
Pass $ 9,712,591 $ 56,646,305 $ 7,180,583 $ 58,508,686 Special Mention - 688,467 - 998,763 Substandard 107,708 1,217,862 664,829 264,513 Doubtful - - - - Total $ 9,820,299 $ 58,552,634 $ 7,845,412 $ 59,771,962
December 31, 2018December 31, 2019
For residential real estate and consumer loans, the Company evaluates credit quality based on whether the loan is considered performing or nonperforming. Loans are generally considered to be nonperforming when they become 90 days past due unless they are well secured and/or in the process of collection. The following table presents the balances of residential real estate and consumer loans by classes of loan portfolio based on payment performance:
Residential ResidentialReal Estate Consumer Real Estate Consumer
Performing $ 46,900,246 $ 3,091,913 $ 42,926,632 $ 2,437,810 Nonperforming - - 39,173 - Total $ 46,900,246 $ 3,091,913 $ 42,965,805 $ 2,437,810
December 31, 2019 December 31, 2018
Age Analysis of Past-Due Loans by Class The following is a table which shows an aging analysis of past-due loans as of December 31, 2019 and 2018:
Recorded 90 Days or Investment
30-59 Days 60-89 Days Greater Total Total 90 DaysDecember 31, 2019 Past Due Past Due Past Due Past Due Current Loans and Accruing
Commercial and industrial $ 415,015 $ - $ - $ 415,015 $ 9,405,284 $ 9,820,299 $ - Commercial real estate 428,344 - 279,849 708,193 57,844,441 58,552,634 279,849 Residential real estate 25,602 223,174 - 248,776 46,651,470 46,900,246 - Consumer - - - - 3,091,913 3,091,913 - Total $ 868,961 $ 223,174 $ 279,849 $ 1,371,984 $ 116,993,108 $ 118,365,092 $ 279,849
Recorded 90 Days or Investment
30-59 Days 60-89 Days Greater Total Total 90 DaysDecember 31, 2018 Past Due Past Due Past Due Past Due Current Loans and Accruing
Commercial and industrial $ - $ - $ 234,795 $ 234,795 $ 7,610,617 $ 7,845,412 $ - Commercial real estate - - - - 59,771,962 59,771,962 - Residential real estate - - 39,173 39,173 42,926,632 42,965,805 39,173 Consumer 5,681 4,846 - 10,527 2,427,283 2,437,810 - Total $ 5,681 $ 4,846 $ 273,968 $ 284,495 $ 112,736,494 $ 113,020,989 $ 39,173

19
4. ALLOWANCE FOR LOAN LOSSES (Continued) Impaired Loans The following table includes the recorded investment and unpaid principal balances for impaired loans receivable with the associated allowance amount.
Unpaid Average InterestRecorded Principal Related Recorded Income
Investment Balance Allowance Investment Recognized
With an allowance recorded:Commercial $ 107,708 $ 107,708 $ 21,542 $ 132,161 $ 6,684
Unpaid Average InterestRecorded Principal Related Recorded Income
Investment Balance Allowance Investment Recognized
With an allowance recorded: Commercial $ 399,904 $ 399,904 $ 133,909 $ 444,922 $ 9,919
Year Ended December 31, 2018
Year Ended December 31, 2019
Nonaccrual Loans Loans are typically considered nonaccrual upon reaching 90 days of delinquency for commercial and industrial, commercial real estate, and residential real estate loans and 120 days of delinquency for consumer loans unless well secured and in the process of collection, even though the Company may be receiving partial payments of interest and partial repayments of principal on such loans. When a loan is placed on nonaccrual status, previously accrued but unpaid interest is deducted from interest income. As of December 31, 2019 and 2018, two loans and one loan, respectively, were on nonaccrual status. The recorded investment for the loans was $38,177 at December 31, 2019, and $234,795 at December 31, 2018. Troubled Debt Restructurings In situations where, for economic or legal reasons related to a borrower’s financial difficulties, management may grant a concession for other than an insignificant period of time to the borrower that would not otherwise be considered, the related loan is classified as a TDR. Management strives to identify borrowers in financial difficulty early and work with them to modify more affordable terms before their loan reaches nonaccrual status. These modified terms may include rate reductions, principal forgiveness, payment forbearance, and other actions intended to minimize the economic loss and to avoid foreclosure or collateral repossession. Upon identification as a TDR, these loans are classified as impaired. As of December 31, 2019 and 2018, there is one loan identified as a TDR/impaired loan. There were no loans approved as TDRs in the year ended December 31, 2019. The loan identified as a TDR in 2018 is a commercial lease secured by commercial vehicles. The lease was modified in order to reduce the lessee’s annual debt service requirement. Terms of the lease were modified by extending the maturity date, increasing the interest rate, and reducing the number of payments. The lease is adequately collateralized and is performing. The outstanding balance as of December 31, 2019 is $107,708.

20
5. PREMISES AND EQUIPMENT Major classifications of premises and equipment are summarized as follows at December 31:
2019 2018Land $ 823,526 $ 771,090 Bank buildings 4,164,927 4,129,383 Leasehold improvements 50,348 50,348 Furniture, fixtures, and equipment 2,106,020 2,035,071
7,144,821 6,985,892 Less accumulated depreciation 5,030,446 5,028,579
Total $ 2,114,375 $ 1,957,313
Depreciation charged to operations was $206,433 in 2019 and $209,141 in 2018.
6. DEPOSITS Time deposits, including wholesale deposits, at December 31, 2019, mature $7,976,792, $2,862,715, $1,630,330, $1,387,553, $580,085 during 2020, 2021, 2022, 2023 and 2024, respectively. Time deposits include certificates of deposit in denominations of $250,000 or more. Such deposits aggregated $973,025 and $962,649 at December 31, 2019 and 2018, respectively.
7. SHORT-TERM BORROWINGS
Short-term borrowings are from the FHLB. The outstanding balances and related information for short-term borrowings are summarized as follows:
2019 2018Balance, December 31 $ 14,250,000 $ 16,000,000 Maximum month-end balance during the year 21,000,000 26,000,000 Average balance during the year 14,998,725 18,571,150 Average year-end interest rate 1.81% 1.88%Average interest rate during the year 2.48% 2.11% Average balances outstanding during the year represent daily average balances, and average interest rates represent interest expenses divided by average balance.

21
8. OTHER BORROWINGS
The Bank maintains an Open RepoPlus credit arrangement, which is renewable annually, with the FHLB. The line maintains a variable rate of interest that may be reset daily at the FHLB’s discretion. The Bank’s maximum borrowing capacity under the credit arrangement with the FHLB as of December 31, 2019, was approximately $79 million. All borrowings from the FHLB are secured by a blanket lien on qualified collateral, defined principally as investment securities and mortgage loans that are owned by the Bank, free and clear of any liens or encumbrances, and the Bank’s investment in FHLB stock. The Bank may request a Federal Reserve Advance secured by acceptable collateral. The Bank’s maximum borrowing capacity with the Federal Reserve Bank as of December 31, 2019, is approximately $5.5 million. The Bank did not have outstanding advances at December 31, 2019 and 2018. The Bank also maintains a $4.0 million federal funds line of credit with another financial institution. The Bank did not have outstanding borrowings related to this line of credit at December 31, 2019 and 2018. In addition, the Company maintains a line of credit at the Bank, which is eliminated during consolidation. The Company did not have an outstanding balance at December 31, 2019 and 2018.
9. INCOME TAXES The provision (benefit) for income taxes consists of:
2019 2018Federal income tax $ 205,714 $ 247,097 State income tax 46,404 (22,731) Deferred 194,318 (54,949)
Total $ 446,436 $ 169,417 The tax effects of deductible and taxable temporary differences that gave rise to significant portions of the deferred tax assets and deferred tax liabilities, respectively, are as follows at December 31:
2019 2018Deferred tax assets:
Allowance for loan losses $ 205,976 $ 200,559 Accrued pension expense 150,662 105,229 Premises and equipment - 9,711 Net unrealized loss on equity securities - 44,105 Other - employee benefits - 105,229 Total deferred tax assets 356,638 464,833
Deferred tax liabilities:Prepaid pension expense (32,464) (47,473) Deferred loan costs (12,531) (10,053) Net unrealized gain on securities (111,929) (38,180) Net unrealized gain on equity securities (66,801) - Premises and equipment (47,889) - Total deferred tax liabilities (271,614) (95,706) Net deferred tax asset $ 85,024 $ 369,127

22
9. INCOME TAXES (Continued) The reconciliation of the federal statutory rate and the Company’s effective income tax rate is as follows:
2019 2018% of Pretax % of Pretax
Amount Income Amount IncomeProvision at statutory rate $ 531,109 21.0 % $ 337,450 21.0 %State income taxes 36,659 1.4 (17,957) (1.1) Effect of tax-exempt income (112,885) (4.5) (149,007) (9.3) Other, net (8,447) (0.3) (1,069) (0.1) Actual tax expense and effective rate $ 446,436 17.6 % $ 169,417 10.5 %
U.S. generally accepted accounting principles prescribe a recognition threshold and a measurement attribute for the financial statement recognition and measurement of a tax position taken or expected to be taken in a tax return. Benefits from tax positions should be recognized in the financial statements only when it is more likely than not that the tax position will be sustained upon examination by the appropriate taxing authority that would have full knowledge of all relevant information. A tax position that meets the more-likely-than-not recognition threshold is measured at the largest amount of benefit that is greater than 50 percent likely of being realized upon ultimate settlement. Tax positions that previously failed to meet the more-likely-than-not recognition threshold should be recognized in the first subsequent financial reporting period in which that threshold is met. Previously recognized tax positions that no longer meet the more-likely-than-not recognition threshold should be derecognized in the first subsequent financial reporting period in which that threshold is no longer met. U.S. generally accepted accounting principles also provides guidance on the accounting for and disclosure of unrecognized tax benefits, interest, and penalties. There is currently no liability for uncertain tax positions and no known unrecognized tax benefits. The Company recognized, when applicable, interest and penalties related to unrecognized tax benefits in the provision for income taxes in the Consolidated Statement of Income. The Company’s federal and state income tax returns for taxable years through 2015 have been closed for purposes of examination by the Internal Revenue Service and the Pennsylvania Department of Revenue.

23
10. EMPLOYEE BENEFITS The Bank sponsors a trusteed, noncontributory defined benefit pension plan (the “Plan”) covering certain employees and officers. The Plan calls for benefits to be paid to eligible employees at retirement based primarily upon years of service with the Bank and compensation rates. The Bank’s funding policy is to make annual contributions, if needed, based upon the funding formula developed by the Plan’s actuary. Effective January 1, 2015, a Plan amendment was approved that froze all employee participation and benefit accruals under the Plan. Compensation received after the Plan freeze date will not be recognized for any purpose under the Plan. The following table sets forth the change in Plan assets and benefit obligation at December 31:
2019 2018Change in benefit obligation:Benefit obligation at beginning of year $ 2,007,337 $ 2,174,606 Interest cost 89,936 92,136 Actuarial gain (loss) 238,626 (89,157) Benefits paid (27,721) (170,248) Benefit obligation at end of year 2,308,178 2,007,337
Change in Plan assets:Fair value of Plan assets at beginning of year 2,103,374 2,106,497 Actual return on Plan assets 381,571 (132,875) Contributions - 300,000 Benefits paid (27,721) (170,248) Fair value of Plan assets at end of year 2,457,224 2,103,374
Funded status $ 149,046 $ 96,037
Amounts recognized in accumulated other comprehensive income consist of:Net loss $ 1,273,894 $ 1,350,259
The accumulated benefit obligation for the defined benefit pension plan was $2,308,178 and $2,007,337 at December 31, 2019 and 2018, respectively.
Components of Net Periodic Benefit Cost
2019 2018Interest cost $ 89,936 $ 92,136 Expected return on Plan assets (157,124) (162,732) Net amortization and deferral 90,544 76,116 Net periodic benefit cost $ 23,356 $ 5,520

24
10. EMPLOYEE BENEFITS (Continued)
Assumptions The weighted-average assumptions used to determine benefit obligations at December 31:
2019 2018Discount rate 3.75 % 4.50 %Rate of compensation increase N/A N/A
The weighted-average assumptions used to determine net periodic cost for years ended December 31:
2019 2018Discount rate 4.50 % 4.25 %Expected long-term return on Plan assets 7.00 7.00
The long-term rate of return on Plan assets gives consideration to returns currently being earned on Plan assets, as well as future rates expected to be earned. Plan Assets The Bank’s defined benefit pension plan weighted-average asset allocations at December 31 by asset category are as follows:
2019 2018Equities 64.25 % 59.49 %Fixed income 35.10 38.67Cash and cash equivalents 0.65 1.84 Total 100.00 % 100.00 %
The Bank believes that the Plan’s risk and liquidity position are, in large part, a function of the asset class mix. The Bank desires to utilize a portfolio mix that results in a balanced investment strategy. The target allocations are as follows: equities, 65 percent and fixed income, 35 percent.
25
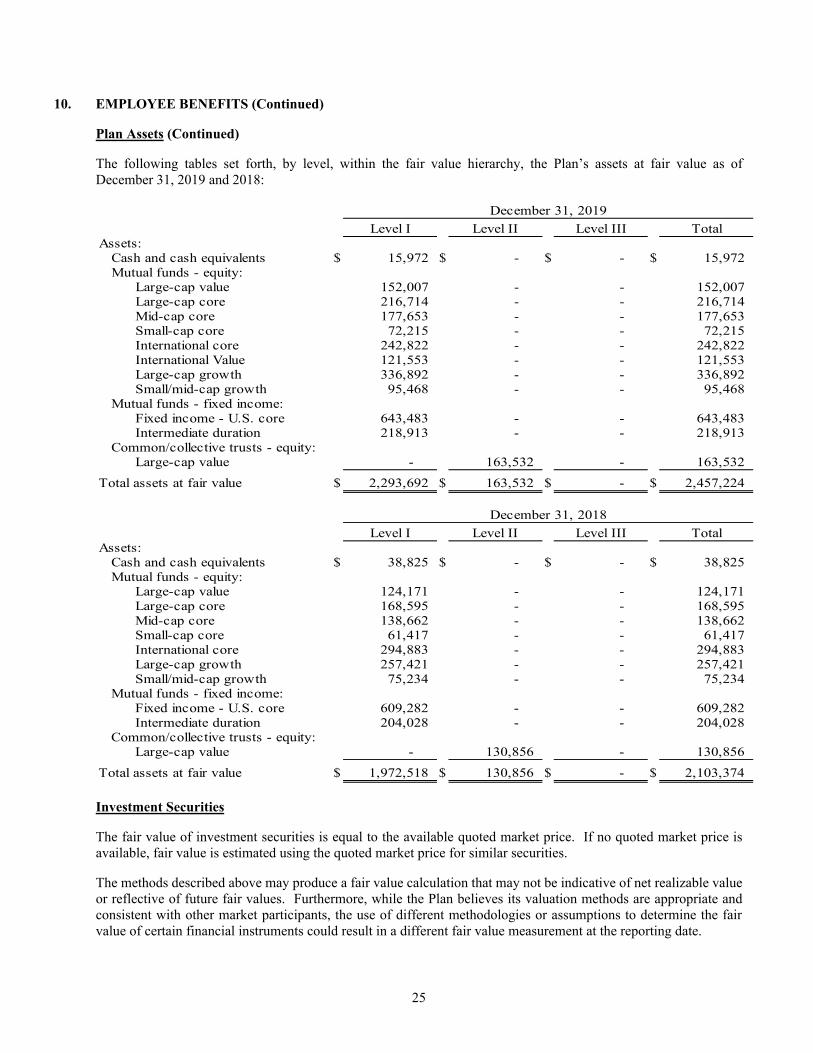
10. EMPLOYEE BENEFITS (Continued) Plan Assets (Continued) The following tables set forth, by level, within the fair value hierarchy, the Plan’s assets at fair value as of December 31, 2019 and 2018:
Level I Level II Level III TotalAssets: Cash and cash equivalents $ 15,972 $ - $ - $ 15,972 Mutual funds - equity:
Large-cap value 152,007 - - 152,007 Large-cap core 216,714 - - 216,714 Mid-cap core 177,653 - - 177,653 Small-cap core 72,215 - - 72,215 International core 242,822 - - 242,822 International Value 121,553 - - 121,553 Large-cap growth 336,892 - - 336,892 Small/mid-cap growth 95,468 - - 95,468
Mutual funds - fixed income: Fixed income - U.S. core 643,483 - - 643,483 Intermediate duration 218,913 - - 218,913
Common/collective trusts - equity: Large-cap value - 163,532 - 163,532
Total assets at fair value $ 2,293,692 $ 163,532 $ - $ 2,457,224
Level I Level II Level III TotalAssets: Cash and cash equivalents $ 38,825 $ - $ - $ 38,825 Mutual funds - equity:
Large-cap value 124,171 - - 124,171 Large-cap core 168,595 - - 168,595 Mid-cap core 138,662 - - 138,662 Small-cap core 61,417 - - 61,417 International core 294,883 - - 294,883 Large-cap growth 257,421 - - 257,421 Small/mid-cap growth 75,234 - - 75,234
Mutual funds - fixed income: Fixed income - U.S. core 609,282 - - 609,282 Intermediate duration 204,028 - - 204,028
Common/collective trusts - equity: Large-cap value - 130,856 - 130,856
Total assets at fair value $ 1,972,518 $ 130,856 $ - $ 2,103,374
December 31, 2018
December 31, 2019
Investment Securities The fair value of investment securities is equal to the available quoted market price. If no quoted market price is available, fair value is estimated using the quoted market price for similar securities.
The methods described above may produce a fair value calculation that may not be indicative of net realizable value or reflective of future fair values. Furthermore, while the Plan believes its valuation methods are appropriate and consistent with other market participants, the use of different methodologies or assumptions to determine the fair value of certain financial instruments could result in a different fair value measurement at the reporting date.

26
10. EMPLOYEE BENEFITS (Continued) Cash Flows The following benefit payments that reflect expected future service, as appropriate, are expected to be paid:
PensionBenefit
2020 24,434$ 2021 41,600 2022 56,318 2023 72,941 2024 84,987 2025 through 2029 641,605
The payment streams are based upon the normal form of payment, which is a monthly annuity benefit.
11. 401(k) PROFIT SHARING PLAN The Bank sponsors a qualified Section 401(k) deferred compensation plan for all eligible employees. An annual profit sharing contribution to the plan is determined each year by the Board of Directors. Bank contributions to the 401(k) Profit Sharing Plan are based on compensation and elected deferral amounts of the plan participants. The contributions amounted to $95,168 and $98,814 for 2019 and 2018, respectively.
12. SUPPLEMENTAL RETIREMENT PLANS The Bank maintains supplemental retirement plans (SRPs). The SRPs require the Bank to make monthly payments to the affected individuals upon retirement. There was no expense recognized in 2019 and 2018. At December 31, 2019 and 2018, $89,604 and $81,545, respectively, has been accrued under the SRPs.
13. COMMITMENTS In the normal course of business there are various outstanding commitments and contingent liabilities that are not reflected in the accompanying consolidated financial statements. Commitments to extend credit are agreements to lend to a customer as long as there is no violation of any condition established in the contract. Standby letters of credit are conditional commitments issued by the Bank to guarantee the performance of a customer to a third party. These commitments comprised the following at December 31:
2019 2018
Commitments to extend credit $ 9,121,625 $ 11,386,113 Standby letters of credit and financial guarantees 41,600 54,100
Total $ 9,163,225 $ 11,440,213
The instruments involve, to varying degrees, elements of credit and interest rate risk in excess of the amount recognized in the Consolidated Balance Sheet. The Bank uses the same credit policies in making commitments and conditional obligations as it does for on-balance sheet instruments. The amount of collateral obtained, as deemed necessary, is based upon management’s credit evaluation in compliance with the lending policy guidelines. Since many of the credit line commitments are expected to expire without being fully drawn upon, the total contractual amounts do not necessarily represent future funding requirements.

27
13. COMMITMENTS (Continued)
Standby letters of credit and financial guarantees represent conditional commitments issued to guarantee performance of a customer to a third party. The coverage period for these instruments is typically a one-year period, with renewal option subject to prior approval by management. For secured letters of credit, the collateral is typically Bank deposit instruments.
14. REGULATORY RESTRICTIONS Loans Federal law prevents the Company from borrowing from the Bank unless the loans are secured by specified collateral. Further, such secured loans are limited in amount to 10 percent of the Bank’s common stock and capital surplus. Dividend Limitation The Bank is subject to dividend restrictions by both the Board of Governors of the Federal Reserve System and the Pennsylvania Department of Banking and Securities. Under the Board of Governors of the Federal Reserve System, the Bank is subject to a dividend restriction that generally limits the amount of dividends that can be paid by a state member bank. Nonobjection of the Board of Governors of the Federal Reserve System is required if the total of all dividends declared by a state member bank in any calendar year exceeds net profits, as defined for the year, combined with its retained net profits for the two preceding calendar years less any required transfers to surplus. The Pennsylvania Banking Code also restricts the availability of capital funds for the payment of dividends by all state-chartered banks to the surplus of the Bank. Accordingly, at December 31, 2019, the balance in the Bank’s capital surplus account totaling $3,400,000 is unavailable for dividends. Cash Requirements The district Federal Reserve Bank requires the Bank to maintain certain average reserve balances. As of December 31, 2019 and 2018, the Bank had required reserves of $1,266,000 and $1,193,000, respectively, composed of vault cash and a depository amount held with the Federal Reserve Bank. Regulatory Capital Requirements Federal regulations require the Company and Bank to maintain minimum amounts of capital. Specifically, the Company and the Bank are required to maintain certain minimum dollar amounts and ratios of total capital, common equity Tier 1 capital, and Tier 1 capital to risk-weighted assets, and Tier 1 capital to average total assets. In addition to the capital requirements, the Federal Deposit Insurance Corporation Improvement Act (FDICIA) established five capital categories ranging from “well capitalized” to “critically undercapitalized.” Should any institution fail to meet the requirements to be considered “adequately capitalized,” it would become subject to a series of increasingly restrictive regulatory actions. As of December 31, 2019 and 2018, the Federal Deposit Insurance Corporation categorized the Company and the Bank as well capitalized under the regulatory framework for prompt corrective action. To be classified as a well-capitalized financial institution, total risk-based, common equity Tier 1, Tier 1 risk-based, and Tier 1 leverage capital ratios must be at least 10 percent, 6.5 percent, 8 percent, and 5 percent, respectively.

28
14. REGULATORY RESTRICTIONS (Continued) Regulatory Capital Requirements (Continued) The following table sets forth the Company’s capital position and minimum requirements as of December 31.
2019 2018Amount Ratio Amount Ratio
Total capital (to risk-weighted assets)Actual $ 22,900,160 24.35 % $ 21,884,675 23.06 %For capital adequacy purposes 7,522,320 8.00 7,592,284 8.00 To be well capitalized 9,402,900 10.00 9,490,355 10.00
Common equity Tier 1 capital (to risk-weighted assets)Actual $ 21,724,160 23.10 % $ 20,703,296 21.82 %For capital adequacy purposes 4,231,305 4.50 4,270,660 4.50 To be well capitalized 6,111,885 6.50 6,168,731 6.50
Tier 1 capital (to risk-weighted assets)Actual $ 21,724,160 23.10 % $ 20,703,296 21.82 %For capital adequacy purposes 5,641,740 6.00 5,694,213 6.00 To be well capitalized 7,522,320 8.00 7,592,284 8.00
Tier 1 capital (to average assets)Actual $ 21,724,160 13.68 % $ 20,703,296 12.58 %For capital adequacy purposes 6,349,880 4.00 6,582,462 4.00 To be well capitalized 7,937,350 5.00 8,228,078 5.00

29
14. REGULATORY RESTRICTIONS (Continued) Regulatory Capital Requirements (Continued) The following table sets forth the Bank’s capital position and minimum requirements as of December 31.
2019 2018
Amount Ratio Amount RatioTotal capital (to risk-weighted assets)Actual $ 18,919,397 20.12 % $ 18,253,791 19.60 %For capital adequacy purposes 7,522,320 8.00 7,449,440 8.00 To be well capitalized 9,402,900 10.00 9,311,800 10.00
Common equity Tier 1 capital (to risk-weighted assets)Actual $ 17,743,397 18.87 % $ 17,072,412 18.33 %For capital adequacy purposes 4,231,305 4.50 4,190,310 4.50 To be well capitalized 6,111,885 6.50 6,052,670 6.50
Tier 1 capital (to risk-weighted assets)Actual $ 17,743,397 18.87 % $ 17,072,412 18.33 %For capital adequacy purposes 5,641,740 6.00 5,587,080 6.00 To be well capitalized 7,522,320 8.00 7,449,440 8.00
Tier 1 capital (to average assets)Actual $ 17,743,397 11.18 % $ 17,072,412 10.49 %For capital adequacy purposes 6,349,880 4.00 6,471,440 4.00 To be well capitalized 7,937,350 5.00 8,089,300 5.00
15. FAIR VALUE MEASUREMENTS
The following disclosures show the hierarchal disclosure framework associated with the level of pricing observations utilized in measuring assets and liabilities at fair value. The three broad levels defined by U.S. generally accepted accounting principles are as follows: Level I: Quoted prices are available in active markets for identical assets or liabilities as of the reported date. Level II: Pricing inputs are other than the quoted prices in active markets, which are either directly or indirectly
observable as of the reported date. The nature of these assets and liabilities includes items for which quoted prices are available but traded less frequently and items that are fair-valued using other financial instruments, the parameters of which can be directly observed.
Level III: Valuations derived from valuation techniques in which one or more significant inputs or significant
value drivers are unobservable. This hierarchy requires the use of observable market data, when available.

30
15. FAIR VALUE MEASUREMENTS (Continued) The following tables present the assets reported on the Consolidated Balance Sheet at their fair value as of December 31, 2019 and 2018, by level within the fair value hierarchy. Financial assets and liabilities are classified in their entirety based on the lowest level of input that is significant to the fair value measurement.
Level I Level II Level III TotalAssets measured on a recurring basis:U.S. government agency securities $ - $ 6,077,339 $ - $ 6,077,339 Obligations of states and political subdivisions - 21,486,610 - 21,486,610 Corporate securities - 2,819,812 - 2,819,812 Mortgage-backed securities - 998,180 - 998,180 Common equity securities 2,259,163 - - 2,259,163
Total $ 2,259,163 $ 31,381,941 $ - $ 33,641,104
Level I Level II Level III TotalAssets measured on a recurring basis:U.S. government agency securities $ - $ 8,092,771 $ - $ 8,092,771 Obligations of states and political subdivisions - 27,881,618 - 27,881,618 Corporate securities - 3,203,618 - 3,203,618 Mortgage-backed securities - 1,229,518 - 1,229,518 Common equity securities 1,771,108 - - 1,771,108
Total $ 1,771,108 $ 40,407,525 $ - $ 42,178,633
December 31, 2018
December 31, 2019
There were no assets measured on a nonrecurring basis at December 31, 2019 and 2018.

31
16. FAIR VALUE DISCLOSURE OF FINANCIAL INSTRUMENTS The fair value of the Company’s financial instruments not recorded at fair value on a recurring basis is as follows:
December 31, 2019Carrying Fair
Value Level I Level II Level III ValueFinancial assets:
Net loans $ 117,216,370 $ - $ - $ 118,356,364 $ 118,356,364
Financial liabilities:Deposits $ 124,585,790 $ 110,024,387 $ - $ 14,404,844 $ 124,429,231
December 31, 2018Carrying Fair
Value Level I Level II Level III ValueFinancial assets:
Net loans $ 111,886,559 $ - $ - $ 111,244,795 $ 111,244,795
Financial liabilities:Deposits $ 127,547,711 $ 102,889,022 $ - $ 19,245,500 $ 122,134,522
For cash and cash equivalents, restricted stock, bank owned life insurance, accrued interest receivable, short-term borrowings and accrued interest payable, the carrying value is a reasonable estimate of fair value.
17. ACCUMULATED OTHER COMPREHENSIVE LOSS The following table presents the changes in accumulated other comprehensive loss by component net of tax for the years ended December 31, 2019 and 2018:
Unrealized Gains onAvailable for Sale Unrecognized
Securities Pension Costs Total
Balance as of December 31, 2017 $ 772,071 $ (963,740) $ (191,669) Other comprehensive income (loss) before reclassification (638,985) (163,096) (802,081) Amount reclassified from accumulated other comprehensive loss 10,542 60,132 70,674 Balance as of December 31, 2018 143,628 (1,066,704) (923,076) Other comprehensive income (loss) before reclassification 279,180 (11,202) 267,978 Amount reclassified from accumulated other comprehensive loss (1,740) 71,530 69,790 Balance as of December 31, 2019 $ 421,068 $ (1,006,376) $ (585,308)

32
17. ACCUMULATED OTHER COMPREHENSIVE LOSS (Continued) The following table presents significant amounts reclassified out of each component of accumulated other comprehensive loss for the years ended December 31, 2019 and 2018:
Amount Reclassifiedfrom Accumulated
Other Comprehensive December 31, 2019 Income (Loss)
Unrealized gain on available for sale securities $ 2,203 Gains (losses) investment securities sold, net463 Income tax expense
$ 1,740 Net of tax
Unrecognized pension costs $ (90,544) Other noninterest expense19,014 Income tax expense
$ (71,530) Net of tax
December 31, 2018Unrealized loss on available for sale securities $ (13,345) Gains (losses) investment securities sold, net
2,803 Income tax expense $ (10,542) Net of tax
Unrecognized pension costs $ (76,116) Other noninterest expense15,984 Income tax expense
$ (60,132) Net of tax
Affected Line Item in the Consolidated Statement of Income
18. SUBSEQUENT EVENTS
The Company assessed events occurring subsequent to December 31, 2019, through March 6, 2020, for potential recognition and disclosure in the consolidated financial statements. No other events have occurred that would require adjustment to or disclosure in the consolidated financial statements which were issued March 6, 2020.

201 North Warren AvenueApollo, PA 15613
Second Street Drive Thru
Main Off
312 North Second StreetApollo, PA 15613
Allegheny Township Off501 Hyde Park RoadLeechburg, PA 15656
North Apollo Off2113 River Road
North Apollo, PA 15673
North Washington Off697 Sportsman Drive
Apollo, PA 15613
Spring Church Off1696 State Route 56
Spring Church, PA 15686
Loan Off1250 Freeport Road
Pittsburgh, PA 15238
Apollo Bancorp, Inc. common stock is tradedOver-the-Counter on OTC Pink under the symbol APLO.
Recent trades and current bid-ask prices may be viewed at:
otcmarkets.com
Apollo Bancorp, Inc. also serves as its own stock transfer agent.
724-478-3151 • apollotrust.com
Locationsice
ice
ice
ice
ice
ice

A P O L LO B A N C O R P, I N C .
A P O L L O B A N C O R P, I N C .
2019ANNUAL REPORT