Embed Size (px)
Citation preview

ANNUAL REPORT 2015/16
Turbinevej 10, 5500 Middelfart, Denmark · Telephone +45 88 61 88 61 · Company reg. no. 12 56 07 96
Annual Report approved on 4 July 2016 Thus adopted on the Annual General Meeting:
Chairman of the meeting: Michael Keldsen, Kromann Reumert
Financial year: 1 May 2015 – 30 April 2016

2
FLEET OF 50 VESSELS AT YEAR-END TOTALLING 451,168 DWT
81 SHOREBASED EMPLOYEES AT YEAR-END
PROFIT OFUSD 12.1 MILLION
REVENUE OFUSD 252 MILLION
SOLVENCY OF 33.5% AT YEAR-END
510 SEAFARERS
UNI-TANKERS A/S
2015/16 in brief

3
Contents
Key figures and financial ratios .......................... 4
Management review ............................................ 6
Highlights in 2015/16 ........................................... 6
Outlook for 2016/17 ............................................ 7
Risk management ................................................ 7
Corporate Social Responsibility ........................... 8
Board of Directors ............................................... 10
Executive management ....................................... 12
Financials ............................................................. 14
Financial review ................................................... 14
Income statement 1 May – 30 April ..................... 17
Balance sheet statement at 30 April .................... 18
Equity statement at 30 April ................................. 21
Cash flow statement 1 May – 30 April .................. 23
Notes to the financial statements ......................... 25
Accounting policies and definitions ...................... 34
Signatures ............................................................ 41
Management’s Statement .................................... 41
Independent Auditor’s Statement ......................... 42
Group chart .......................................................... 45
Company information .......................................... 46
Uni-Tankers is a tanker shipping company trading worldwide in the intermediate and small tanker segment, carrying all kinds of liquid cargo – from refined oil products over fertilisers, vegetable oils and chemicals. The parent company Uni-Tankers A/S was established in 1995 and has since then with pride served the oil majors and other global customers.
Headquarters is domiciled in Middelfart, Denmark, and commercial activities are carried out under the Uni-Chartering brand, having local offices in Aalborg (Denmark), Nice (France), Istanbul (Turkey) and Houston (USA).
Uni-Tankers is controlled by the Middelfart based shipping conglomerate A/S United Shipping & Trading Company.
From the left: Lars Pihl Fly (CMO), Per Ekmann (CCO), Torben Andersen (CEO), Jan Rindebæk (CTO) and Simon Jarl Jacobsen (CFO)

4
Key figures and financial ratios
0
50
100
150
200
250
12/1311/12 15/1614/1513/14
Revenue
USD
m
0
5
10
15
20
25
12/1311/12 15/1614/1513/14
Cash �ow from operating activities
USD
m
Solvency ratio %
Perc
ent
0
10%
20%
30%
40%
12/1311/12 15/1614/1513/14
70.2
252
20.1
5.3
9.27.6
33.5212.8
184
142.8
0.5
5.6
9.3
11.7
23.1
0
10
20
30
40
50
12/1311/12 15/1614/1513/14
Fleet of owned and time chartered vessels
Vess
els
22
27
35
42
50
Shorebased employees Shorebased employeesGender split at year-end 2015/16
0
20
40
60
80
100
12/1311/12 15/1614/1513/14
Empl
oyee
s
31% Female
69% Male
814553
60
70
81
Shorebased employees Shorebased employeesGender split at year-end 2015/16
0
20
40
60
80
100
12/1311/12 15/1614/1513/14
Empl
oyee
s
31% Female
69% Male
814553
60
70
81
Shorebased employees Shorebased employeesGender split at year-end 2015/16
0
20
40
60
80
100
12/1311/12 15/1614/1513/14
Empl
oyee
s
31% Female
69% Male
814553
60
70
81
0
50
100
150
200
250
12/1311/12 15/1614/1513/14
Revenue
USD
m
0
5
10
15
20
25
12/1311/12 15/1614/1513/14
Cash �ow from operating activities
USD
m
Solvency ratio %
Perc
ent
0
10%
20%
30%
40%
12/1311/12 15/1614/1513/14
70.2
252
20.1
5.3
9.27.6
33.5212.8
184
142.8
0.5
5.6
9.3
11.7
23.1
0
50
100
150
200
250
12/1311/12 15/1614/1513/14
Revenue
USD
m
0
5
10
15
20
25
12/1311/12 15/1614/1513/14
Cash �ow from operating activities
USD
m
Solvency ratio %
Perc
ent
0
10%
20%
30%
40%
12/1311/12 15/1614/1513/14
70.2
252
20.1
5.3
9.27.6
33.5212.8
184
142.8
0.5
5.6
9.3
11.7
23.1

5
KEY FIGURES AND FINANCIAL RATIOS
USD ‘000 2015/16 2014/15 2013/14 2012/13 2011/12
Key figuresIncome statementRevenue 251,968 212,770 183,971 142,773 70,162 Profit before financial income and expenses 16,205 1,769 6,331 (38,376) (4,905)Net financials (5,726) (7,387) (5,719) 1,789 (3,411)Profit before tax 10,479 (5,618) 612 (36,587) (8,316)Net profit for the year 12,137 (4,512) 1,534 (37,357) (7,186)
Balance sheetBalance sheet total 276,226 263,668 266,264 258,093 219,902 Equity 92,651 20,074 24,578 13,591 44,122
Cash flowsCash flows from: - operating activities 23,108 11,688 9,329 5,558 542 - investing activities (14,173) (11,116) (19,141) (89,905) (66,741) hereof investment in property, plant and equipment and intangible assets
(14,191) (11,135) (33,072) (89,955) (60,041)
- financing activities 949 (900) 4,978 78,773 79,094 Change in cash and cash equivalents for the year 9,883 (328) (4,834) (5,574) 12,895
Employees 592 567 569 472 210
Financial ratiosGross margin 33.3% 30.0% 37.3% 31.7% 27.6%Profit margin 6.4% 0.8% 3.4% (26.9%) (7.0%)Return on equity 21.5% (20.2%) 8.0% (129.5%) (19.5%)Liquidity ratio 1.88 1.08 1.41 1.70 1.85Solvency ratio 33.5% 7.6% 9.2% 5.3% 20.1%
For definitions, see under accounting policies (page 39)

6
HIGHLIGHTS IN 2015/16
This year has been a year of records for the Group! We have achieved record high revenue of USD 252 million, up by 18 percent from last year, EBITDA of USD 34.4 million and the best ever profit at USD 12.1 million. At the start of the year we forecasted a small profit just above break-even, and thus the achieved results are very satisfactory under the given market conditions.
There remains to be overcapacity of tonnage in our segments, however demand seems to have peaked up slightly during the year, and thus the pressure on freight rates have not been as heavy as in recent years. The rather steep fall in oil prices during the year has outweighed the otherwise negative impact of the fluctuating USD rate against EUR, all together bringing TCE rates at a higher level than the past years. TCE rates peaked during autumn 2015, and have since then been slightly declining, and going forward we expect a slightly lower level than achieved in 2015/16.
Our capacity measured in ship days available have increased by 13.7 percent up to 14,841 ship days in 2015/16, mainly because we have added another 8 time chartered vessels to the fleet, and at year-end the Group’s fleet counts 50 vessels – 17 owned and 33 time chartered vessels – giving us a position among the world’s largest chemical tanker operators in the segment below 20,000 DWT. We have a total of 451,168 DWT at our disposal (last year: 389,119 DWT), and the average age of our fleet is 7.85 years, placing us among the youngest fleets in our area of business.
After having successfully reached the main goals of the strategy initiated in 2012, management has initiated a new strategy process during the year, still focusing on delivering world-class safety for our crew, reliability for our customers, and profitability for our owner. There is no doubt that the Group is in this business for the long run, and we strive to become the preferred carrier for all our customers in the years to come.
Besides planning for the future development of the Group, it is also important to have a continued focus on optimising the current business. In this sense, during the year we have continued our focus on cost-saving programs, streamlining of processes, energy optimisation of our vessels, and optimising of IT systems.
Cost-saving programs with special attention to vessel OPEX have resulted in reduction of the average OPEX per vessel.
Our working DNA follows the principle “work smarter AND harder”, and our focus on streamlining of processes have helped us achieve
• faster turnaround time on vessels’ port calls gene-rating increased profits,
• faster reporting of monthly accounts enabling us to make timely management decisions,
• lowering the number of off-hire days.
Energy optimisation of our vessels is a constant focus area for our dedicated Technical organisation, and though the economic impact has decreased during the
year following the decline in oil prices, attention is still at its highest to decrease fuel costs and the negative impact on the environment. Several new initiatives have been taken during the year, among others application of new generation hull coating, offline main engine lubrication oil filtration, and testing of LED lights in the engine rooms. All of which are initiatives that have proven to have great positive impact on energy consumption on board our vessels. Together with the full-year effect of actions taken in previous years, we have achieved a significant reduction in the average fuel consumption per tonned mile.
Optimal IT systems are crucial to every business’ performance. Over the past years we have worked hard on implementing the best systems available for every critical business area of the Group. We believe it is absolutely necessary to have only “one version of the truth” and in that hence, all business critical IT systems are integrated to the extent possible – from vessel to office and with data floating between systems – also enabling the smoothest and most efficient working routines. In 2015/16 we have among others implemented the Voyage Management System IMOS, which has greatly contributed to efficient chartering and operation of our vessels, and with valuable reporting both for the daily operation and for top management decision-making.
At 11 March 2016 we and our shareholders concluded a new financing agreement with Danske Bank. As consequences of the new agreement A/S United Shipping & Trading Company (USTC) has injected USD 30 million in cash capital, and Danske Bank has converted
Management review
7
USD 30 million of ship loans to equity in Uni-Tankers A/S. Danske Bank has thus become a shareholder, but USTC has an exclusive repurchase option of Danske Bank’s shareholding in Uni-Tankers A/S. As a consequence of the refinancing the ship loans have been reduced substantially. The Group’s fleet financing is now at market terms, and financing is secured until the end of April 2021. Management consider this an important step and feel confident that the capital resources are now in place for further future growth.
The high result is especially driven by our motivated and dedicated staff of employees. We pay great attention to being able to attract and retain the best employees – ashore as well as at sea. Among many other things we proudly participate in the Danish “Great Place to Work” program, and in this relation we have taken many steps to creating world-class working conditions for our 81 shore based employees, and will continuously strive to maintain the position as one of Denmark’s greatest places to work – with same conditions for our foreign offices. We also value our 510 seafarers, and our dedicated Crewing department have put a lot of efforts in to arranging officer’s seminars for both our Senior Officers and Junior Officers. Moreover, we ensure that the vessels’ conditions for seafarers are always high standard with regards to accommodation, food, internet access etc. Together with other Nordic shipowners we take part in running a Crewing Academy in the Philippines, and we also take pride in having our own cadet program for Danish seafarers currently counting 11 cadets, taking our part of the responsibility that Denmark also in the future will be a proud shipping nation.
We strive against top performance when it comes to safety, security and reliability, and we will continue to be top-performing in order to meet up to the strictest demands of our primary customers, the major oil companies. In order to do so every employee as well as management must work hard and be stringent towards our Management System and pay attention to every detail every day. Only by doing so we will be able to maintain the highest vetting standards we have today, making us the preferred carrier for our customers.
Our high vetting standards and flexible world wide trading fleet and network of offices have also made it possible for us to increase our contract coverage substantially during the year. We have thus extended the contracts we had for 2015 to also cover 2016, and have further added a number of contracts with new and existing customers for the new year.
OUTLOOK FOR 2016/17
As a worldwide operator, the Group’s results are highly affected by the general development in the global economy, and the outlook for global economy and world trade remains to be volatile and uncertain. The imbalance between demand and supply due to overcapacity of vessels in the Group’s segments further continue to bring a high degree of uncertainty to the expected forward-looking development. Also the fluctuations of oil price and the EUR/USD currency rates may have high impact on the expected results.
The Group expects to be able to further position itself as a leading operator of intermediate and small tanker vessels in the year to come. Based on the present market conditions and outlook expectations for next year, we expect that the result for 2016/17 will be slightly lower than the result achieved in 2015/16.
RISK MANAGEMENT
Market risksThe Group is exposed to the commercial risks that follow from the general freight market fluctuations. The commercial risk for the Group’s vessels operated in a time charter equivalent sharing (TCE) pool, is considered reduced compared to operating the vessels in the spot market. Focus is on maintaining a healthy balance between spot business and covered business, being by Contracts of Affreightment, time charters etc.
The Group’s fleet of 50 vessels consist of 34 percent own vessels and 66 percent time chartered vessels. As the time charter hire is fixed over the charter period, the Group is exposed to the commercial risk of a falling market, as well as other commercial risks. The Group’s policy is to balance the risk between short, medium and long term charter hire periods.
Foreign exchange risksHaving USD as its presentation currency, the Group is affected by transactions taking place in EUR and DKK. The Group’s policy is to hedge material foreign exchange exposures.
MANAGEMENT REVIEW
“There is no doubt that the Group is in this business for the long run, and we strive to become the preferredt carrier for all our customers in the years to come”
8
Counterparty riskThe Group is not exposed to any material risks relating to individual, large customers or business partners. The Group’s policy for assuming credit risks implies that all customers and business partners are subject to current credit rating.
CORPORATE SOCIAL RESPONSIBILITY
The Company’s policies for corporate social responsibility are disclosed in the Financial Statements of A/S United Shipping & Trading Company for 2015/16.
Targets for the under-represented gender on the Board of DirectorsToday the percentage of female members of the board elected by the shareholders’ committee is 12.5%. Uni-Tankers A/S’ target for female members of the Board of Directors is 10-20%, and as such the current level satisfies the goal.
In an effort to maintain this position, the Company will ensure to have the under-represented gender on the list of candidates, however reserves the right to decide on the most qualified candidate, regardless of gender.
Policy for the under-represented gender at other management levelsThe policy of the Group is that the employees, irrespective of gender, must have equal career and management opportunities, and that the Group will have an open-minded and unprejudiced culture in which the individual employee can make the best possible use of his og her skills irrespective of gender. The Group’s internal management training is open to anyone with the right skills, regardless of gender.
MANAGEMENT REVIEW

9
REVIEW
“We take pride in having our own cadet program for Danish seafarers currently counting 11 cadets, taking our part of the responsibility that Denmark also in the future will be a proud shipping nation”

10
Board of Directors
Torben Østergaard-NielsenChairman
Born in 1954.Board member since 1991 and Chairman since 2014. CEO, founder and owner of the USTC Group (A/S United Shipping & Trading Company).
Special competencesExtensive background and global experience within the shipping industry.
Other directorshipsChairman and member of the boards in several USTC Group companies. Chairman of the board in Middelfart Bycenter A/S. Member of the boards in H.J. Hansen Holding A/S, Fayard A/S, Angel Holding ApS, Gottfred Petersen Holding A/S.
OtherGerman Honorary Consul since 1988, member of Corps Consulaire since 1988. Member of Nykredit Regionsråd and member of Danske Bank Erhvervsråd.
Klaus NyborgVice Chairman
Born in 1963.Board member since 2012 and Vice Chairman since 2014. Professional board member and investor.
Special competencesGlobal experience with management of listed shipping companies incl. CEO of Pacific Basin Shipping, Hong Kong. Strategic and financial expertise as well as in-depth knowledge of risk management.
Other directorshipsChairman of the boards in A/S United Shipping & Trading Company, Norden A/S and Bawat A/S. Vice Chairman of the board in Bunker Holding A/S. Member of the boards in Odfjell SE, Karen og Poul F. Hansens Familiefond and DFDS A/S.
EducationMsc in Business & Law, Copenhagen Business School supplemented with management courses at London Business School and IMD.
Michael KeldsenBoard member
Born in 1950.Board member since 1991. Chairman of the board from 2005-2014. Of Counsel, Kromann Reumert Law firm, former partner.
Special competencesIn-depth knowledge and experience within corporate and foundation/trust law as well as mergers and acquisitions and shipbuilding contracts.
Other directorshipsMember of the boards in A/S United Shipping & Trading Company, Bunker Holding A/S, Shipping Holding A/S, Iron Pump A/S, Nemco Machinery A/S, Autronica Fire & Security A/S, Stanley Nordic Aps, GW Sprinkler A/S and Better CPH A/S.
EducationLL.M. (Master of Law).
Torben JanholtBoard member
Born in 1946.Board member since 2006.Professional board member.
Special competencesExtensive background and global experience within the shipping industry, primarily through his 28 years with J. Lauritzen A/S, the last 14 years as CEO, and as chairman of the Danish Shipowners’ Association from 2005-2009.
Other directorshipsChairman of the board in Otto Suenson A/S. Member of the boards in A/S United Shipping & Trading Company, Bunker Holding A/S, Torm A/S and PostNord.
EducationBachelor of Commerce supplemented with executive management training at IMD and IESE.
11
BOARD OF DIRECTORS
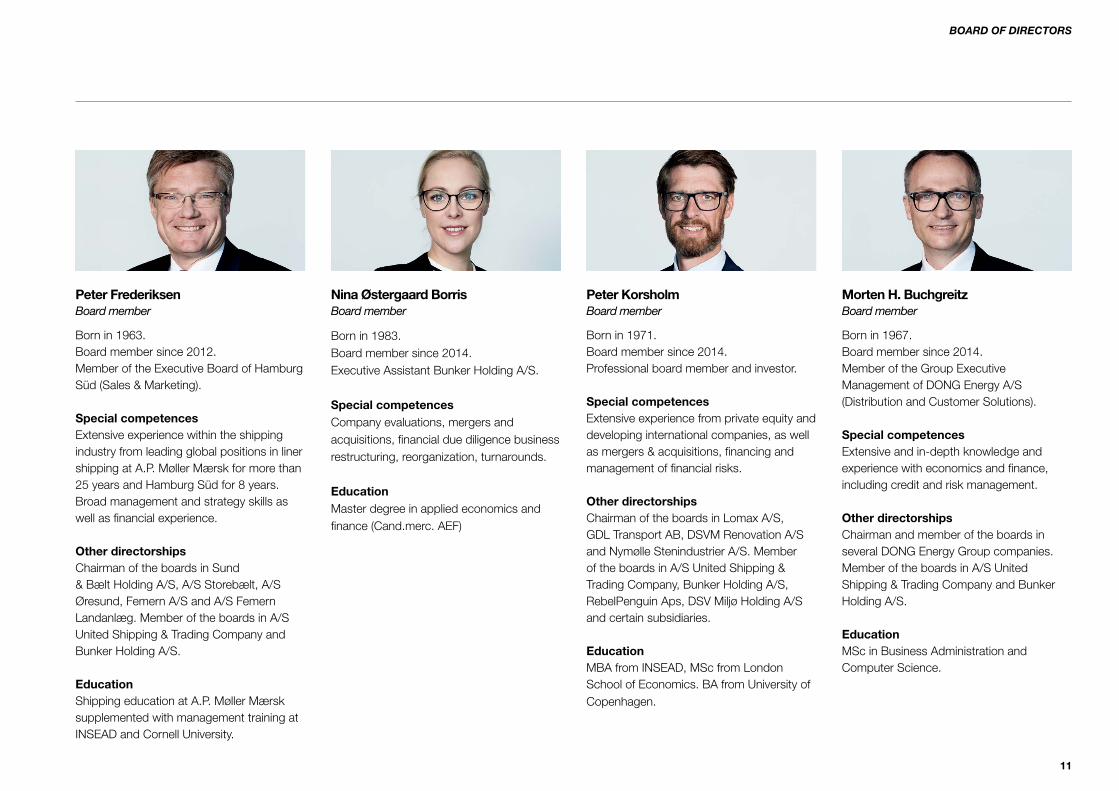
Peter FrederiksenBoard member
Born in 1963.Board member since 2012.Member of the Executive Board of Hamburg Süd (Sales & Marketing).
Special competencesExtensive experience within the shipping industry from leading global positions in liner shipping at A.P. Møller Mærsk for more than 25 years and Hamburg Süd for 8 years. Broad management and strategy skills as well as financial experience.
Other directorshipsChairman of the boards in Sund & Bælt Holding A/S, A/S Storebælt, A/S Øresund, Femern A/S and A/S Femern Landanlæg. Member of the boards in A/S United Shipping & Trading Company and Bunker Holding A/S.
EducationShipping education at A.P. Møller Mærsk supplemented with management training at INSEAD and Cornell University.
Morten H. BuchgreitzBoard member
Born in 1967.Board member since 2014.Member of the Group Executive Management of DONG Energy A/S (Distribution and Customer Solutions).
Special competencesExtensive and in-depth knowledge and experience with economics and finance, including credit and risk management.
Other directorshipsChairman and member of the boards in several DONG Energy Group companies. Member of the boards in A/S United Shipping & Trading Company and Bunker Holding A/S.
EducationMSc in Business Administration and Computer Science.
Peter KorsholmBoard member
Born in 1971.Board member since 2014.Professional board member and investor.
Special competencesExtensive experience from private equity and developing international companies, as well as mergers & acquisitions, financing and management of financial risks.
Other directorshipsChairman of the boards in Lomax A/S, GDL Transport AB, DSVM Renovation A/S and Nymølle Stenindustrier A/S. Member of the boards in A/S United Shipping & Trading Company, Bunker Holding A/S, RebelPenguin Aps, DSV Miljø Holding A/S and certain subsidiaries.
EducationMBA from INSEAD, MSc from London School of Economics. BA from University of Copenhagen.
Nina Østergaard BorrisBoard member
Born in 1983.Board member since 2014.Executive Assistant Bunker Holding A/S.
Special competencesCompany evaluations, mergers and acquisitions, financial due diligence business restructuring, reorganization, turnarounds.
EducationMaster degree in applied economics and finance (Cand.merc. AEF)

12
Executive management
Torben AndersenChief Executive Officer, Uni-Tankers A/S
Simon Jarl JacobsenChief Financial Officer, Uni-Tankers A/S
Per F. EkmannChief Commercial Officer, Uni-Tankers A/S Chief Executive Officer, Uni-Chartering A/S
Lars Pihl FlyChief Marine Officer, Uni-Tankers A/S
Jan RindebækChief Technical Officer, Uni-Tankers A/S


14
FINANCIAL REVIEW
Operating activitiesThe Group recorded revenue of USD 252 million in 2015/16 up by 18.4 percent compared to last year, driven primarily by increase in ship days of 13.7 percent, and subsequently by slightly increased freight rates on several routes and cargos, and stronger contract coverage.
Direct expenses amounted to USD 168.2 million up by 12.9 percent from last year. Direct expenses consist of bunkers, port expenses and other voyage expenses, and hire payments for time chartered vessels. While bunker expenses declined by 21.7 percent down to USD 39.7 million due to the fall in oil prices, the main reason for the increase in direct expenses is increased time charter hire by 35.6 percent up to USD 79 million.
Gross profit for the year increased by USD 20.1 million or 31.5 percent up to USD 83.8 million in 2015/16.
EBITDA totalled USD 34.4 million in 2015/16 compared to USD 18.4 million last year.
Depreciation and amortisation increased by USD 1.6 million up to USD 18.2 million, mainly due to higher depreciation costs on vessels’ dockings.
Net financial expenses amounted to USD 5.7 million down by USD 1.7 million, primarily due to lower exchange rate adjustments.
Net result after tax for 2015/16 was a profit of USD 12.1 million compared to a loss of USD 4.5 million in 2014/15.
Balance sheet and capital positionAt 30 April 2016 total assets amounted to USD 276.2 million up from USD 263.7 million last year.
VesselsBook value of vessels at year-end amounted to USD 217.8 million compared to USD 221.6 million last year. During the
year more than half of the Group’s owned vessels have been dry-docked for repair works and statutory surveys, amounting in total investments of USD 13.4 million, while ordinary depreciation amounted to USD 17.1 million.
Brokers’ vessel valuations have increased slightly during the year, but remain to reflect a lower net selling price of the fleet than book value. In management’s opinion, such valuations do not give a true and fair view in a long-term perspective as the market for trade with vessels such as those owned by the Group remains to be not very active. In accordance with the accounting policies applied, an impairment test has been made as in previous years by comparing the broker valuations with the calculated value in use based on continued operation of the Group’s fleet stated as the net present value of future estimated net freight income.
The value in use of vessels is heavily affected by the development in freight rates, which is still subject to material uncertainty. Deviations in freight rates according to the managements’ estimates will thus affect the value in use in either positive or negative direction.
Management have made their best estimate over development in freight rates etc., and consider the assumptions reasonable.
The impairment test has not resulted in need for write downs on the Group’s fleet.
Investments in subsidiariesInvestments in subsidiaries (Parent Company) amounted
Financials
EBITDA
USD
m
Mar
gin
0
10
20
30
40
0
4%
8%
12%
16%
12/1311/12 15/1614/1513/14
Margin
Growth
0
50
100
150
200
250
20%
40%
60%
80%
100%
12/1311/12 15/1614/1513/14
Revenue and Growth
USD
m
Gro
wth
0
70.2
4.2
7.6
22
18.4
34.4
47.2
103.5
28.9
15.7 18.4
252
212.8
184
142.8
65,3
12
8,6
13,7
EBITDA
USD
m
Mar
gin
0
10
20
30
40
0
4%
8%
12%
16%
12/1311/12 15/1614/1513/14
Margin
Growth
0
50
100
150
200
250
20%
40%
60%
80%
100%
12/1311/12 15/1614/1513/14
Revenue and Growth
USD
m
Gro
wth
0
70.2
4.2
7.6
22
18.4
34.4
47.2
103.5
28.9
15.7 18.4
252
212.8
184
142.8
65,3
12
8,6
13,7

15
to USD 57.7 million at 30 April 2016. The increase of USD 15.1 million is specified in note 8 to the financial statements. During the year management decided to change accounting policy from previously measuring investments in subsidiaries at the lower of historical cost and net realisable value to now recognising and measuring investments in subsidiaries under the equity method. The change has affected the parent company’s result positively by USD 12.7 million (2014/15: negative USD 30k). The parent company’s fixed assets increased by USD 18.8 million (2014/15: USD 5.6 million), and total assets and equity by the same amounts. Cash flows are not affected by the change, and neither are Group results, assets or equity.
EquityAt 30 April 2016, equity was USD 92.7 million compared to USD 20.1 million at 30 April 2015. The increase of USD 72.6 million derived from capital contribution of USD 30 million, debt conversion of USD 30 million, profit for the year of USD 12.1 million and adjustment of hedging instruments of USD 0.5 million. The solvency ratio at 30 April 2016 is 33.5% compared to 7.6% at 30 April 2015.
Debt to credit institutionsTotal debt to credit institutions decreased to USD 162.9 million at 30 April 2016 from USD 221.6 million at 30 April 2015, primarily due to conversion of debt of USD 30 million, and repayments on vessel loans of USD 29.1 million.
Cash flow and financial resourcesThe Group’s cash flow from operating activities totalled USD 23.1 million in 2015/16 up from USD 11.7 million in 2014/15 reflecting the increased EBITDA and a negative effect from increased net working capital due to the increased activity.
Investing activities affected cash flows negatively by USD 14.2 million in 2015/16 compared to USD 11.1 million last year, primarily due to increased docking expenses and other investments in vessels.
Financing activities affected cash flow positively by USD 0.9 million in 2015/16 (negative USD 0.9 million last year), reflecting the net impact of cash capital contribution of USD 30 million and loan repayments of USD 29.1 million.
Cash and cash equivalents increased by USD 9.9 million in 2015/16 up to USD 20.4 million at 30 April 2016.
The new financing agreement with Danske Bank is effective until end of April 2021, and management considers the current capital resources and liquidity adequate for the continued operations and further development of the Group.
Subsequent eventsNo significant events affecting the assessment of the Annual Report have occurred after the balance sheet date.
FINANCIALS
16
FINANCIALS
17
Group Parent Company
USD ‘000 Note 2015/16 2014/15 2015/16 2014/15
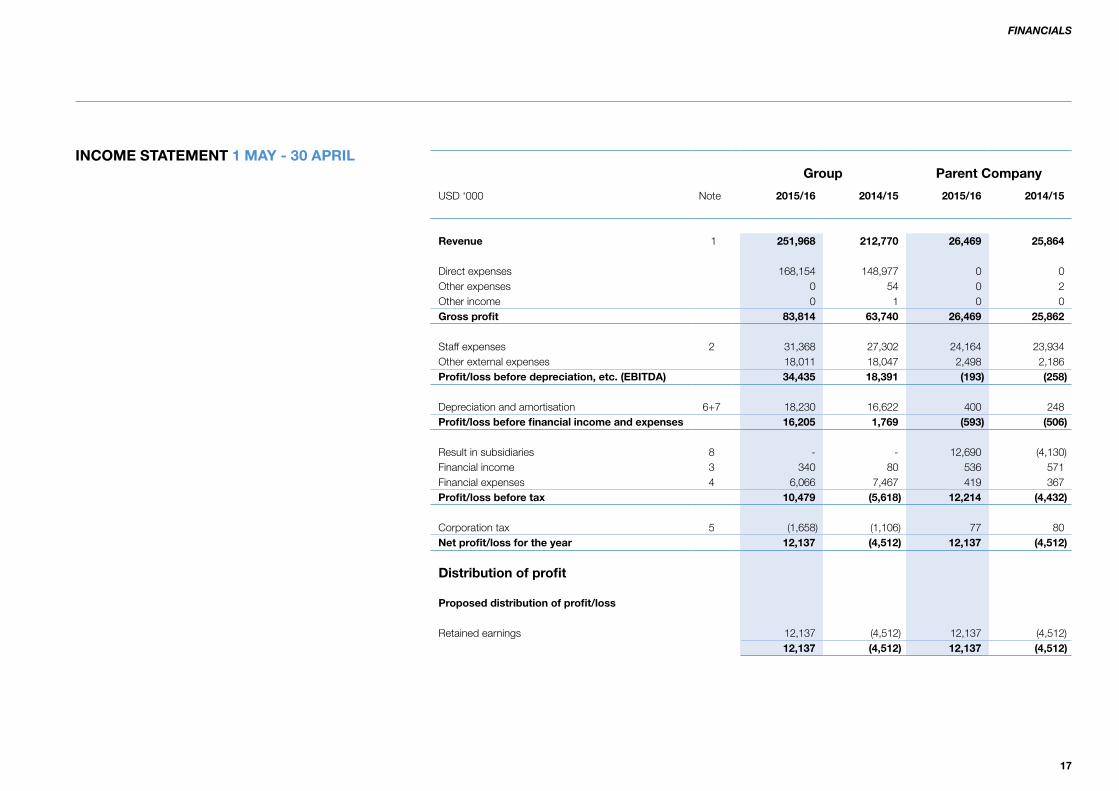
Revenue 1 251,968 212,770 26,469 25,864
Direct expenses 168,154 148,977 0 0Other expenses 0 54 0 2Other income 0 1 0 0Gross profit 83,814 63,740 26,469 25,862
Staff expenses 2 31,368 27,302 24,164 23,934Other external expenses 18,011 18,047 2,498 2,186Profit/loss before depreciation, etc. (EBITDA) 34,435 18,391 (193) (258)
Depreciation and amortisation 6+7 18,230 16,622 400 248Profit/loss before financial income and expenses 16,205 1,769 (593) (506)
Result in subsidiaries 8 - - 12,690 (4,130)Financial income 3 340 80 536 571Financial expenses 4 6,066 7,467 419 367Profit/loss before tax 10,479 (5,618) 12,214 (4,432)
Corporation tax 5 (1,658) (1,106) 77 80Net profit/loss for the year 12,137 (4,512) 12,137 (4,512)
Distribution of profit
Proposed distribution of profit/loss
Retained earnings 12,137 (4,512) 12,137 (4,512)12,137 (4,512) 12,137 (4,512)
FINANCIALS
INCOME STATEMENT 1 MAY - 30 APRIL

18
Group Parent Company
USD ‘000 Note 2016 2015 2016 2015
Goodwill 3,336 3,925 - -Software 1,104 766 1,077 748 Intangible assets 6 4,440 4,691 1,077 748
Vessels and equipment 217,846 221,623 0 0Fixtures and fittings, tools and equipment 428 491 211 316Leasehold improvements 51 37 17 10Prepayments 57 39 57 39Property, plant and equipment 7 218,382 222,190 285 365
Investments in subsidiaries - - 57,656 42,524Fixed asset investments 0 0 57,656 42,524
Fixed assets 222,822 226,881 59,018 43,637
Inventory of fuel and lube oil 2,916 4,110 0 0Inventories 2,916 4,110 0 0
Trade receivables 13,150 10,045 0 1Receivables from group enterprises 101 84 35,957 15,716Other receivables 2,562 2,271 702 221Corporation tax 4,873 0 0 0Deferred tax asset 9 0 3,199 0 0Prepayments 9,366 6,525 117 116Receivables 30,052 22,124 36,776 16,054
Cash and cash equivalents 20,436 10,553 10,143 5,183
Current assets 53,404 36,787 46,919 21,237
Total assets 276,226 263,668 105,937 64,874
BALANCE SHEET AT 30 APRIL
Assets
FINANCIALS

19
Group Parent Company
USD ‘000 Note 2016 2015 2016 2015
Share capital 10,990 5,993 10,990 5,993Retained earnings 81,661 14,081 81,661 14,081Equity 10 92,651 20,074 92,651 20,074
Pension obligations 26 18 0 0Provisions 26 18 0 0
Credit institutions 11 155,165 209,361 0 0Long-term liabilities 155,165 209,361 0 0
Credit institutions 11 7,701 12,212 0 0Trade payables 12,142 10,046 555 383Payables to group enterprises 1,757 7,178 10,737 42,723Corporation tax 3 81 154 73Other payables 5,095 2,739 1,840 1,620Deferred income 1,686 1,959 0 0Short-term liabilities 28,384 34,215 13,286 44,799
Liabilities 183,549 243,576 13,286 44,799
Total equity and liabilities 276,226 263,668 105,937 64,873
Deferred tax 12Security and contractual obligations 13Transactions with related parties 14Fee to auditors appointed at the general meeting 15
BALANCE SHEET AT 30 APRIL
Equity and liabilities
FINANCIALS

20
“As a consequence of the refinancing the ship loans have been reduced
substantially. The Group’s fleet financing is now at market terms, and financing is
secured until the end of April 2021”

21
2015/16 Group Parent Company
USD ‘000Sharecapital
Retainedearnings Total
Sharecapital
Share premiumaccount
Retainedearnings Total
Equity at 1 May 5,993 14,081 20,074 5,993 0 8,435 14,428Change in accounting policies 0 0 0 0 0 5,646 5,646Adjusted equity at 1 May 5,993 14,081 20,074 5,993 0 14,081 20,074Conversion of debt 4,997 25,003 30,000 4,997 25,003 0 30,000Capital increase 0 30,000 30,000 0 30,000 0 30,000Transfer from share premium account 0 0 0 0 (55,003) 55,003 0Exchange rate adjustments 0 (17) (17) 0 0 (17) (17)Fair value adjustment of hedging instruments 0 457 457 0 0 457 457Net profit for the year 0 12,137 12,137 0 0 12,137 12,137Equity at 30 April 10,990 81,661 92,651 10,990 0 81,661 92,651
2014/15 Group Parent Company
USD ‘000Sharecapital
Retainedearnings Total
Sharecapital
Share premiumaccount
Retainedearnings Total
Equity at 1 May 5,993 18,585 24,578 5,993 0 12,917 18,910Exchange rate adjustments 0 8 8 0 0 0 0Change in accounting policies 0 0 0 0 0 5,676 5,676Adjusted equity at 1 May 5,993 18,593 24,586 5,993 0 18,593 24,586Net loss for the year 0 (4,512) (4,512) 0 0 (4,512) (4,512)Equity at 30 April 5,993 14,081 20,074 5,993 0 14,081 20,074
FINANCIALS
STATEMENT OF CHANGES IN EQUITY

22

23
Group
USD ‘000 2015/16 2014/15
Profit/loss for the year before tax 10,479 (5,618)Reversal of depreciation, amortisation, profit from sale of assets, and exchange rate adjustments for the year 18,213 16,636 Amortisation of loan costs 347 350Changes in inventories 1,194 992 Changes in receivables (5,881) (3,661)Changes in trade payables and other debt, etc (1,242) 3,357 Pension obligations 8 (4)Cash flow from ordinary activities 23,118 12,052
Corporation tax paid (10) (364)Cash flow from operating activities 23,108 11,688
Purchase of property, plant and equipment (13,548) (10,781)Sale of property, plant and equipment 18 19 Purchase of intangible assets (643) (354)Cash flow from investing activities (14,173) (11,116)
Capital increase 30,000 0 Repayment/raising of loans from credit institutions (net) (29,051) (900)Cash flow from financing activities 949 (900)
Changes in cash and cash equivalents 9,883 (328)Cash and cash equivalents at 1 May 10,553 10,881 Cash and cash equivalents at 30 April 20,436 10,553
FINANCIALS
CASH FLOW STATEMENT 1 MAY - 30 APRIL
24
FINANCIALS
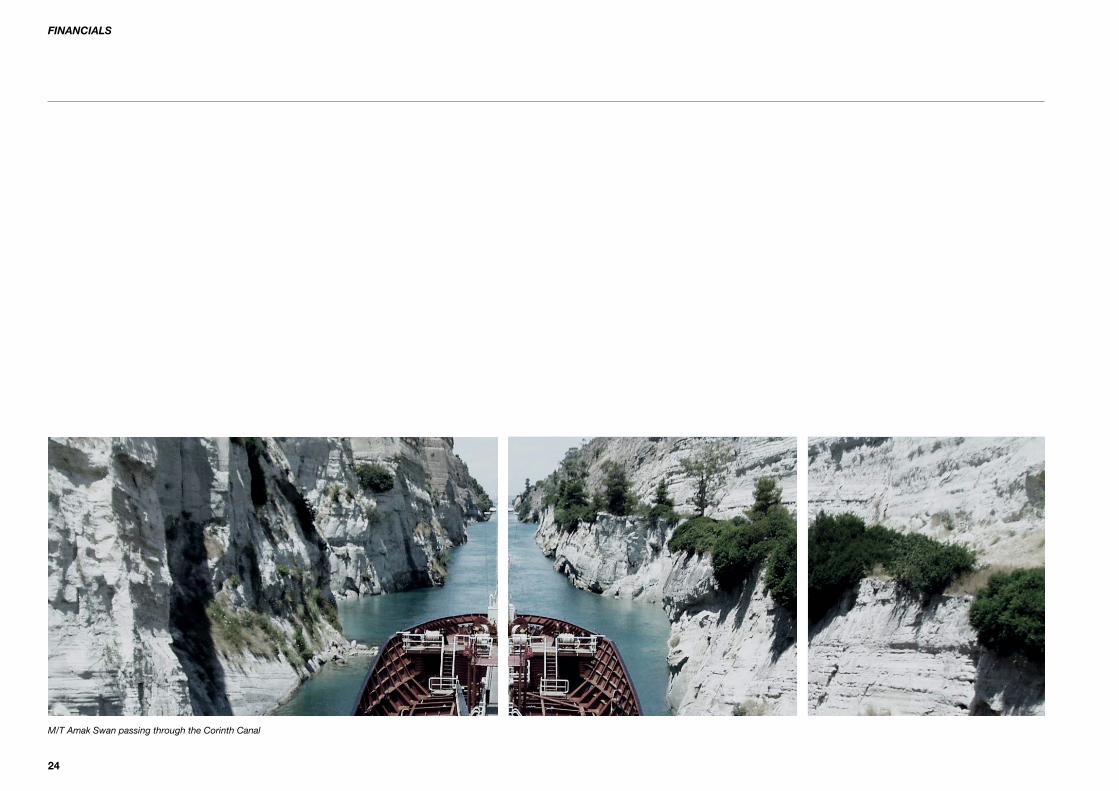
M/T Amak Swan passing through the Corinth Canal

25
1. Segment information
The Group’s activities are considered one segment.
2. Staff expenses Group Parent Company
USD ‘000 2015/16 2014/15 2015/16 2014/15
Rented crew 11,597 10,865 11,597 10,865Wages and salaries 12,399 9,815 5,814 6,437Pensions 460 419 246 228Social security expenses 516 533 243 243Other staff expenses 6,396 5,670 6,264 6,161
31,368 27,302 24,164 23,934Average number of employees. The figures include rented crew on vessels
592 567 554 536
Staff expences include the salaries of crew in the Parent Company’s subsidiaries. These expences are reinvoiced to the ship owning companies and recognised as revenue.
With reference to the Danish Financial Statements Act § 98 B paragraph 3 the remuneration of Directors is not disclosed.
FINANCIALS
NOTES TO THE FINANCIAL STATEMENTS

26
3. Financial income Group Parent Company
USD ‘000 2015/16 2014/15 2015/16 2014/15
Intercompany interest income 0 0 536 508 Exchange rate adjustments 326 68 0 61 Other financial income 14 12 0 2
340 80 536 571
4. Financial expenses Group Parent Company
USD ‘000 2015/16 2014/15 2015/16 2014/15
Intercompany interest expenses 0 0 278 251 Exchange rate adjustments 87 1,528 53 0 Other financial expenses 5,979 5,939 88 116
6,066 7,467 419 367
5. Corporation tax Group Parent Company
USD ‘000 2015/16 2014/15 2015/16 2014/15
Current tax for the year (1,404) (35) 76 81Adjustment of current tax re. previous years (3,441) 11 1 (1)Deferred tax for the year 0 (1,082) 0 0Adjustment of deferred tax re. previous years 3,187 0 0 0
(1,658) (1,106) 77 80
FINANCIALS
NOTES TO THE FINANCIAL STATEMENTS
27
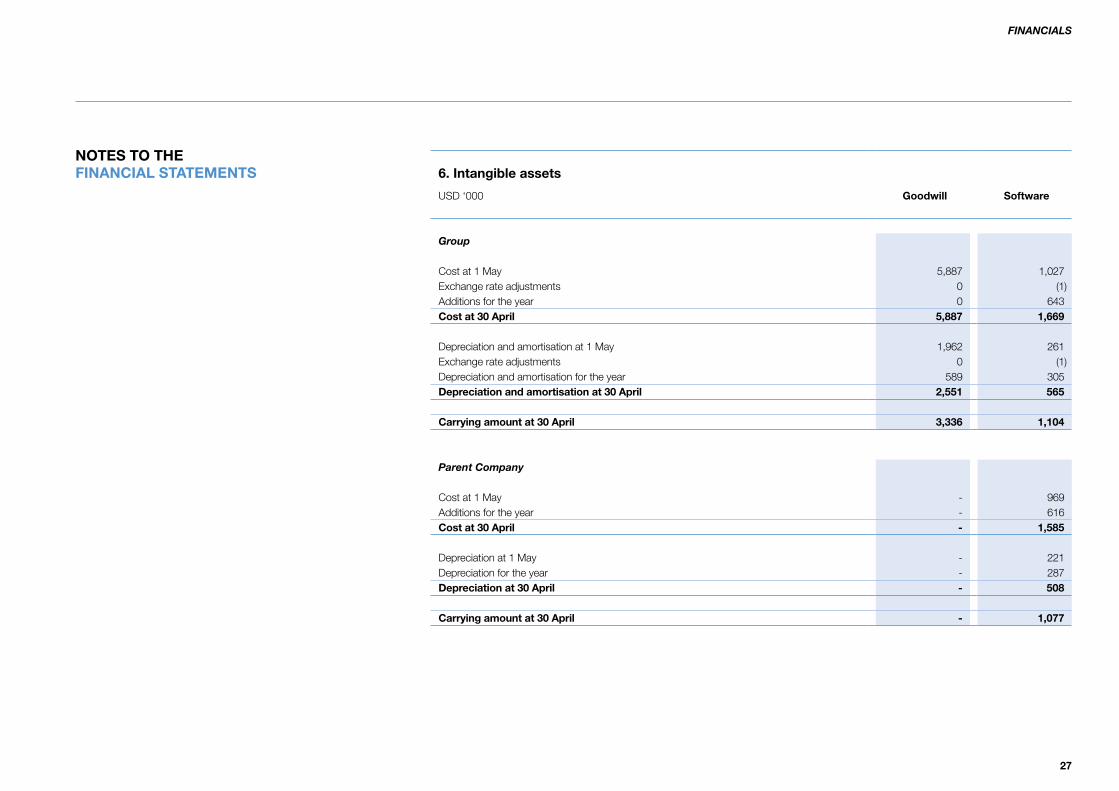
6. Intangible assets
USD ‘000 Goodwill Software
Group
Cost at 1 May 5,887 1,027Exchange rate adjustments 0 (1)Additions for the year 0 643Cost at 30 April 5,887 1,669
Depreciation and amortisation at 1 May 1,962 261Exchange rate adjustments 0 (1)Depreciation and amortisation for the year 589 305Depreciation and amortisation at 30 April 2,551 565
Carrying amount at 30 April 3,336 1,104
Parent Company
Cost at 1 May - 969Additions for the year - 616Cost at 30 April - 1,585
Depreciation at 1 May - 221Depreciation for the year - 287Depreciation at 30 April - 508
Carrying amount at 30 April - 1,077
FINANCIALS
NOTES TO THE FINANCIAL STATEMENTS
28
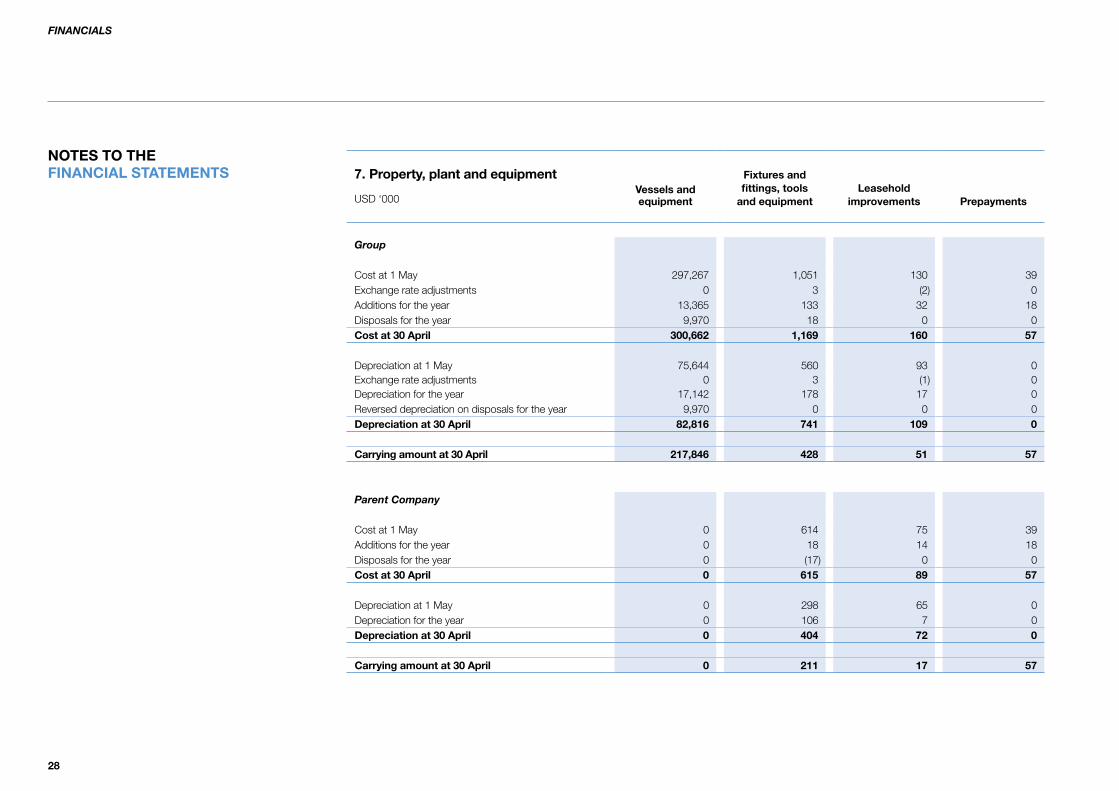
7. Property, plant and equipmentVessels andequipment
Fixtures and fittings, tools
and equipmentLeasehold
improvements PrepaymentsUSD ‘000
Group
Cost at 1 May 297,267 1,051 130 39Exchange rate adjustments 0 3 (2) 0Additions for the year 13,365 133 32 18Disposals for the year 9,970 18 0 0Cost at 30 April 300,662 1,169 160 57
Depreciation at 1 May 75,644 560 93 0Exchange rate adjustments 0 3 (1) 0Depreciation for the year 17,142 178 17 0Reversed depreciation on disposals for the year 9,970 0 0 0Depreciation at 30 April 82,816 741 109 0
Carrying amount at 30 April 217,846 428 51 57
Parent Company
Cost at 1 May 0 614 75 39Additions for the year 0 18 14 18Disposals for the year 0 (17) 0 0Cost at 30 April 0 615 89 57
Depreciation at 1 May 0 298 65 0Depreciation for the year 0 106 7 0Depreciation at 30 April 0 404 72 0
Carrying amount at 30 April 0 211 17 57
FINANCIALS
NOTES TO THE FINANCIAL STATEMENTS

29
8. Fixed asset investmentsInvestments
in subsidiariesUSD ‘000
Parent Company
Cost at 1 May 88,277Additions for the year 2,000Cost at 30 April 90,277
Value adjustments 1 May (45,753)Value adjustments for the year 13,132Value adjustments 30 April (32,621)
Carrying amount at 30 April 57,656
Remaining positive difference included in the above carrying amount 3,336
Investments in subsidiaries are specified as follows:
Name Place of reg. office Ownership share
Uni-Chartering A/S Middelfart 100%Uni-Chartering (Gibraltar) Ltd. Gibraltar 100%Uni-Chartering France EURL Nice, Frankrig 100%Uni-Tankers m/t "Jutlandia Swan" ApS Middelfart 100%Uni-Tankers m/t "Selandia Swan" ApS Middelfart 100%Uni-Tankers m/t "Fionia Swan" ApS Middelfart 100%Uni-Tankers m/t "Erria Swan" ApS Middelfart 100%Uni-Tankers m/t "Mona Swan" ApS Middelfart 100%Uni-Tankers m/t "Tasing Swan" ApS Middelfart 100%Uni-Tankers m/t "Boringia Swan" ApS Middelfart 100%Uni-Tankers m/t "Anhout Swan" ApS Middelfart 100%Uni-Tankers m/t "Lessow Swan" ApS Middelfart 100%Uni-Tankers m/t "Falstria Swan" ApS Middelfart 100%Uni-Tankers m/t "Amak Swan" ApS Middelfart 100%Uni-Tankers m/t "Alsia Swan" ApS Middelfart 100%Uni-Tankers m/t "Samus Swan" ApS Middelfart 100%Uni-Tankers m/t "Feo Swan" ApS Middelfart 100%Uni-Tankers m/t "Lillo Swan" ApS Middelfart 100%Uni-Tankers m/t "Fenno Swan" ApS Middelfart 100%Uni-Tankers m/t "Endelo Swan" ApS Middelfart 100%
FINANCIALS
NOTES TO THE FINANCIAL STATEMENTS

30
9. Deferred tax asset
USD ‘000 2016 2015
Group
Deferred tax at 1 May (3,199) (2,625)Adjustment, beginning of year 3,199 22 Adjustment of tax rate 0 195 Exchange rate adjustment 0 697 Change for the year 0 (1,488)Deferred tax at 30 April 0 (3,199)
FINANCIALS
NOTES TO THE FINANCIAL STATEMENTS
10. Equity
The share capital consists of shares of DKK 100 or multiples hereof. Within the last 5 years following changes have been made to the Company’s share capital:
2015/16 - increased by USD 4,997k2013/14 - increased by USD 2,894k2012/13 - increased by USD 435k2011/12 - increased by USD 870k.
11. Credit institutions
Long-term part of installments falling due within 1 year are recognised as short-term liabilities in the balance sheet.

31
FINANCIALS
NOTES TO THE FINANCIAL STATEMENTS 12. Deferred tax
Tax on transitional balance and equalisation balance relating to vessels amounts to USD 3,104k.
13. Security and contractual obligations
Group
The Group has provided security in vessels and equipment for debt to credit institutions of USD 164,450k. At the balance sheet date, the carrying amount of the assets provided as security was USD 217,846k.
The Group has concluded contracts with the following obligations:• Tenancy contract with external parties with a total obligation of USD 25k• Tenancy contract with group enterprises with a total obligation of USD 1,662k• Operating leases with a total obligation of USD 720k• Time charter contracts with a total obligation of USD 70,988k.
The Danish group enterprises are jointly and severally liable for tax on the consolidated jointly taxed income etc. The total corporation tax payable is shown in the Annual Report of Selfinvest ApS, which is the management company of the joint taxation. The Danish group enterprises are moreover jointly and severally liable for Danish withholding taxes. Any subsequent adjustments of corporation tax and withholding taxes may imply that the Company is liable for a higher amount.
Parent Company
The Company has issued a joint and several guarantee of USD 164,450k in respect of the obligations of group enterprises toward credit institutions. At the balance sheet date, the obligations of group enterprises amounted to USD 164,450k.
Investments in subsidiaries have been provided as security for loans from credit institutions.
The Company has concluded operating leases with a total obligation of USD 304k and tenancy contracts with group enterprises with a total obligation of USD 1,391k.

32
FINANCIALS
NOTES TO THE FINANCIAL STATEMENTS 14. Transactions with related parties
Related parties comprise the Board of Directors, the Executive Management and senior executives in the group enterprises as well as companies in which these persons have significant interests.
There have been no transactions with the Board of Directors, the Executive Management, senior executives, significant shareholders, group enterprises or other related parties, except for intercompany transactions which have been eliminated in the Consolidated Financial Statements and consulting fees settled on an arm’s-length basis.
The Company is included in the Consolidated Financial Statements of the immediate Parent Company, A/S United Shipping & Trading Company.
Controlling interest is exercised through the Company’s immediate Parent Company, A/S United Shipping & Trading Company. The Company’s ultimate Parent Company which prepares Consolidated Financial Statements is Selfinvest ApS, in which Torben Østergaard-Nielsen, CEO, exercises control.

33
FINANCIALS
NOTES TO THE FINANCIAL STATEMENTS 15. Fee to auditors appointed at the general meeting
USD ‘000 2015/16 2015/16
Group
PricewaterhouseCoopersFee for statutory audit 74 92 Assurance assignments 0 2 Tax services 9 6 Non-audit services 326 82
429 182
MooreStephensFee for statutory audit 6 6 Non-audit services 15 16
21 22

34
ACCOUNTING POLICIES AND DEFINITIONS
Basis of PreparationThe Annual Report of Uni-Tankers A/S for 2015/16 has been prepared in accordance with the provisions of the Danish Financial Statements Act applying to large enterprises of reporting class C.
The Parent Company has changed accounting policy for recognition and measurement of investments in subsidiaries from previously using the lower of historical cost and net realisable value to now recognising and measuring investments in subsidiaries under the equity method. The change has affected the Parent Company’s result positively by USD 12.7 million (2014/15: negative USD 30k). The Parent Company’s fixed assets increased by USD 18.8 million (2014/15: USD 5.6 million), and total assets and equity by the same amounts. Cash flows are not affected by the change, and neither are Group results, assets or equity.
Besides the change of accounting policy for the Parent Company’s recognition and measurement of investments in subsidiaries, the accounting policies applied remain unchanged from previous years.
The Annual Report for 2015/16 is presented in USD thousands. At 30 April 2016 the year-end exchange rate for USD/DKK was 6.53. The comparative figures are translated at the historical year-end exchange rate which as of 30 April 2015 was 6.65.
Recognition and measurementThe Financial Statements have been prepared based on the historic cost principle.
Revenues are recognised in the income statement as earned, and all expenses incurred to achieve the earnings for the year are deducted. Expenses include operating expenses, depreciation, amortisation, impairment losses and provisions as well as changes due to changed accounting estimates. Furthermore, value adjustments of financial assets and liabilities measured at fair value are recognised in the income statement. Assets are recognised in the balance sheet when it is probable that future economic benefits attributable to the asset will flow to the Group, and the value of the asset can be measured reliably.
Liabilities are recognised in the balance sheet when it is probable that future economic benefits will flow out of the Group, and the value of the liability can be measured reliably.
Assets and liabilities are initially measured at cost. Subsequently, assets and liabilities are measured as described for each item below.
Recognition and measurement take into account profits, losses and risks occurring before the presentation of the Annual Report which relate to affairs and conditions existing at the balance sheet date.
Certain financial assets and liabilities are measured at amortised cost, which involves the recognition of a constant effective interest rate over the maturity period. Amortised cost is calculated as original cost less any repayments and with addition/deduction of the cumulative amortisation of any difference between cost and the nominal amount. In this way, capital losses and gains are allocated over the maturity period.
USD is used as the measurement currency. All other currencies are regarded as foreign currencies.
Basis of consolidationThe Consolidated Financial Statements comprise the Parent Company, Uni-Tankers A/S, and subsidiaries in which the Parent Company directly or indirectly holds more than 50% of the votes or otherwise exercises control.
On consolidation, items of a uniform nature are combined. Elimination is made of intercompany income and expenses, shareholdings, dividends and accounts as well as of realised and unrealised profits and losses on transactions between the consolidated enterprises.
Newly acquired or newly established enterprises are included in the Consolidated Financial Statements from the time of acquisition. The difference between cost and net asset value of the enterprise acquired is determined at the date of acquisition after fair value adjustment of the individual assets and liabilities (the purchase method). This includes allowing for any restructuring provisions determined in relation to the
FINANCIALS
35
enterprise acquired. Positive differences (goodwill) are recognised in intangible assets in the balance sheet as goodwill, which is amortised in the income statement on a straight-line basis over its estimated useful life; however, not exceeding 20 years.
Changes in the purchase price after takeover result in adjustment of the acquisition value of goodwill. Moreover, goodwill is adjusted where, at the time of takeover, the fair value of the net assets taken over turns out to differ from the value previously assumed. Goodwill is adjusted until the end of the financial year following the year of acquisition.
LeasesLeases in terms of which the Group assumes substantially all the risks and rewards of ownership (finance leases) are recognised in the balance sheet at the lower of the fair value of the leased asset and the net present value of the lease payments computed by applying the interest rate implicit in the lease or an approximated value as the discount rate. Assets acquired under finance leases are depreciated and written down for impairment under the same policy as determined for the other fixed assets of the Group. The remaining lease obligation is capitalised and recognised in the balance sheet under debt, and the interest element on the lease payments is charged over the lease term to the income statement.
All other leases are considered operating leases. Payments relating to operating leases are recognised in
the income statement on a straight line basis over the lease period.
Translation policiesTransactions in foreign currencies are translated during the year at the exchange rates at the dates of transaction. Gains and losses arising due to differences between the transaction date rates and the rates at the dates of payment are recognised in financial income and expenses in the income statement.
Receivables, payables and other monetary items in foreign currencies are translated at the exchange rates at the balance sheet date. Any differences between the exchange rates at the balance sheet date and the transaction date rates are recognised in financial income and expenses in the income statement; however, see the paragraph “Hedge accounting”.
Upon recognition of financial statements of foreign group enterprises and associates, income statement items are translated into Danish kroner at average exchange rates and balance sheet items are translated at the exchange rates at the balance sheet date. Exchange adjustments arising on this translation are recognised directly in equity.
Derivative financial instrumentsDerivative financial instruments are initially recognised in the balance sheet at cost and are subsequently remeasured at their fair values. Positive and negative fair values of derivative financial instruments are recognised
in “Other receivables” and “Other payables”, respectively.Changes in the fair values of derivative financial instruments are recognised in the income statement unless the derivative financial instrument is designated and qualify as hedge accounting, see below.
Hedge accountingFair value hedgesChanges in the fair values of derivative financial instruments that are designated and qualify as fair value hedges of a recognised asset or a recognised liability are recognised in the income statement as are any changes in the fair value of the hedged asset or the hedged liability.
Hedges of future assets or liabilitiesChanges in the fair values of derivative financial instruments that are designated and qualify as hedges of expected future transactions are recognised directly in retained earnings under equity. If the hedged transaction results in an asset or a liability, the amount is transferred from equity to the cost of the asset or the liability, respectively. If the hedged transaction results in an income or an expense, the amount is transferred from equity to the income statement in the period in which the hedged transaction is recognised. The amount is recognised in the same item as the hedged transaction.
FINANCIALS

36
Income StatementRevenueRevenue is recognised in the income statement when the sale has been completed. This is considered the case when:
• delivery has been made before year end;• a binding sales agreement has been made;• the sales price has been determined;• payment has been received or may with reasonable
certainty be expected to be received.
Revenue is recognised exclusive of VAT and duties.
Revenue includes income from shipowning activities, which is cut off and recognised over the duration of the voyages.
Direct expensesDirect expenses include bunkers and other voyage expenses, as well as charter hire expenses.
Other income/other expensesOther income/other expenses includes profit/loss from sales of assets.
Other external expensesOther external expenses include expenses for the repair and maintenance of vessels as well as office expenses etc.
Staff expensesStaff expenses comprise wages and salaries as well as payroll expenses.
Income from investments in subsidiariesThe item “Income from investments in subsidiaries” in the income statement of the Parent Company includesthe proportionate share of net profit for the year less goodwill amortisation.
Financial income and expensesFinancial income and expenses comprise interest, financial expenses in respect of finance leases, realised and unrealised exchange gains and losses and gains and losses on securities, amortisation of loan costs, as well as changes in the fair value of financial instruments.
Tax on profit/loss for the yearTax for the year consists of current tax for the year and adjustment of deferred tax for the year. The tax attributable to the profit for the year is recognised in the income statement, whereas the tax attributable to equity transactions is recognised directly in equity.
The Group’s current tax is computed according to the provisions of the Danish Tonnage Tax Act. On the basis of the Group’s planned shipowning activities, the Tonnage Tax Scheme does not imply recapture of depreciation, and therefore deferred tax for these companies is only disclosed in the note “Deferred tax”.
The Group is jointly taxed with Danish group enterprises. The tax effect of the joint taxation is allocated to enterprises showing profits or losses in proportion to their taxable incomes (full allocation with credit for tax losses). The jointly taxed enterprises have adopted the on-account taxation scheme.
Balance SheetIntangible assetsIntangible assets are measured at cost less accumulated amortisation.
The period of amortisation of goodwill is longest for enterprises acquired for strategic purposes with a strong market position and a long earnings profile.
Amortisation based on cost is calculated on a straight-line basis over the expected useful lives of the assets, which are:
Goodwill ..........................................................10 yearsSoftware ........................................................... 5 years
Property, plant and equipmentProperty, plant and equipment are measured at cost less accumulated depreciation and impairment losses. Cost comprises the cost of acquisition and expenses directly related to the acquisition up until the time when the asset is ready for use.
Interest paid on loans raised for indirect or direct financing or production of property, plant and equipment is recognised in the income statement.
Depreciation based on cost reduced by any residual value is calculated on a straight-line basis over the expected useful lives of the assets:
FINANCIALS

37
Fixtures and fittings, tools and equipment .... 3-10 yearsVessels (newbuilding) .......................................25 yearsShips (not newbuilding) ...........................up to 25 yearsLeasehold improvements ............................. lease term
Scrap values are yearly reassessed.
Vessels and equipment are measured at cost less accumulated depreciation calculated on a straight-line basis over the period until either the end of the expected useful life or the time of expected phasing out. At the establishment of expected useful life, the condition and age of the vessels are considered. At the establishment of the time of expected phasing out, the provisions of the MARPOL convention are considered.
The scrap values of vessels are determined as the vessels’ selling value after 25 years of use as estimated by external shipbroker.
Docking expenses are added to the carrying amounts of the vessels at the time of payment and are expensed on a straight-line basis over the expected useful lives of the improvements, on average 2.5 years.
Gains and losses on sale of property, plant and equipment are recognised in the income statement under other income and other expenses, respectively.
Impairment of fixed assetsThe carrying amounts of intangible assets and property, plant and equipment are reviewed on an annual
basis to determine whether there is any indication of impairment other than that expressed by amortisation and depreciation. If so, an impairment test is carried out to determine whether the recoverable amount is lower than the carrying amount, and the asset is written down to its lower recoverable amount.
The recoverable amount of the asset is calculated as the higher of net selling price and value in use.
The recoverable amount of vessels has been determined on the basis of the value in use as the value in use is considered higher than the fair value.
The value in use is calculated by means of cash flow estimates of the expected useful life of the vessel based on approved budgets for the coming financial year as well as the following estimated development. A discount rate of 8% p.a. after tax and exchange rates at the level of the actual rates of exchange at 30 April 2016 have been applied.
The most material assumptions applied at the calculation of the value in use are as follows:
• Cash flows are based on normal earnings over the remaining life of the vessel based on the vessel’s expected total life, cf accounting policies applied
• Freight rates for the coming years are estimated based on experience, knowledge of the market and input from the Group’s business partners. As from the financial year 2016/17, an annual increase in freight
rates corresponding to the market having reached the expected level in 2018/19 is estimated. Hereafter, an annual increase in freight rates corresponding to 2.5% is estimated
• Operating and administrative expenses are based on experience and expectation of the general development in expenses. As from 2016/17, expen-ses are expected to increase by 2.5% annually
• Docking expenses are estimated based on experi-ence and already planned dockings. Docking expen-ses are expected to increase by 2.5% annually.
Investments in subsidiariesInvestments in subsidiaries are recognised and measured under the equity method.
The item “Investments in subsidiaries” in the balance sheet of the Parent Company includes the proportionate ownership share of the net asset value of the enterprises calculated under the accounting policies of the Parent Company, adjusted for unrealised intercompany profits or losses and with addition or deduction of goodwill.
The total net revaluation of investments in subsidiaries is transferred in the Parent Company upon distribution of profit to “Reserve for net revaluation under the equity method” under equity. The reserve is reduced by dividend distributed to the Parent Company and adjusted for other equity movements in the subsidiaries.
Subsidiaries with a negative net asset value are recognised at USD 0. Any legal or constructive obligation
FINANCIALS

38
of the Parent Company to cover the negative balance of the enterprise is recognised in provisions.
Gains or losses on disposal or liquidation of subsidiaries are calculated as the difference between the sales sum or the liquidation amount and the carrying amount of net assets at the time of sale or liquidation, including unamortised goodwill and expected sales or liquidation expenses. Gains or losses are recognised in the income statement.
InventoriesInventories are measured at cost under the FIFO method. Inventories comprise bunkers and lubrication oil for own use.
The cost of inventories for which the fair values are effectively hedged by a financial transaction is adjusted for changes in the fair value of the hedged risk.
ReceivablesReceivables are measured in the balance sheet at the lower of amortised cost and net realisable value, which corresponds to nominal value less provisions for bad debts. Provisions for bad debts are determined on the basis of an individual assessment of each receivable.
PrepaymentsPrepayments comprise prepaid expenses concerning rent, ensurance premiums, subscriptions and interest.
ProvisionsProvisions are recognised when - in consequence of an event occurred before or on the balance sheet date
– the Group has a legal or constructive obligation and it is probable that economic benefits must be given up to settle the obligation.
Deferred tax assets and liabilitiesDeferred tax is recognised in respect of all temporary differences between the carrying amount and the tax base of assets and liabilities. However, deferred tax is not recognised in respect of temporary differences concerning goodwill not deductible for tax purposes and own vessels under the Tonnage Tax Scheme.
Deferred tax is measured on the basis of the tax rules and tax rates that will be effective under the legislation at the balance sheet date when the deferred tax is expected to crystallise as current tax. In cases where the computation of the tax base may be made according to alternative tax rules, deferred tax is measured on the basis of the intended use of the asset and settlement of the liability, respectively.
Deferred tax assets, including the tax base of tax loss carry-forwards, are measured at the value at which the asset is expected to be realised, either by elimination in tax on future earnings or by set-off against deferred tax liabilities.
Deferred tax assets and liabilities are offset within the same legal tax entity.
Current tax receivables and liabilitiesCurrent tax receivables and liabilities are recognised in the balance sheet at the amount calculated on the
basis of the expected taxable income for the year and adjusted for tax on taxable incomes for prior years. Tax receivables and liabilities are offset and presented as a net item if there is a legally enforceable right of set-off and an intention to settle on a net basis or simultaneously.
Financial debtsFixed-interest loans from credit institutions are recognised initially at the proceeds received net of transaction expenses incurred. Subsequently, the loans are measured at amortised cost; the difference between the proceeds and the nominal value is recognised as an interest expense in the income statement over the loan period.
Other debts are measured at amortised cost, substan-tially corresponding to nominal value.
Deferred incomeDeferred income comprise payments recieved in respect of income in subsequent years.
Cash Flow StatementThe cash flow statement shows the Group’s cash flows for the year broken down by operating, investing and financing activities, changes for the year in cash and cash equivalents as well as the Group’s cash and cash equivalents at the beginning and end of the year.
No cash flow statement has been prepared for the Parent Company as the Parent Company cash flows are included in the Consolidated Cash Flow Statement.
FINANCIALS

39
Cash flows from operating activitiesCash flows from operating activities are calculated as the net profit/loss for the year adjusted for changes in working capital and non-cash operating items such as depreciation, amortisation and impairment losses, and provisions. Working capital comprises current assets less short-term debt excluding items included in cash and cash equivalents.
Cash flows from investing activitiesCash flows from investing activities comprise cash flows from acquisitions and disposals of intangible assets, property, plant and equipment as well as fixed asset investments.
Cash flows from financing activitiesCash flows from financing activities comprise cash flows from the raising and repayment of short- and long-term debt as well as payment of dividend to shareholders.
The cash flow statement cannot be immediately derived from the published financial records.
Definition of financial ratios
Gross margin = Gross profit x 100 Revenue
Profit margin = Profit before financials x 100 Revenue
Return on equity = Net profit for the year x 100 Average equity
Liquidity ratio = Current assets Short-term debt
Solvency ratio = Equity at year end x 100 Total assets

40

41
MANAGEMENT’S STATEMENT
The Board of Directors and the Executive Board have today considered and adopted the Annual Report of Uni-Tankers A/S for the financial year 1 May 2015 – 30 April 2016.
The Annual Report was prepared in accordance with the Danish Financial Statements Act.
In our opinion, the Parent Company Financial Statements and the Consolidated Financial Statements give a true and fair view of the financial position of the Parent Company and the Group at 30 April 2016 and of the results of the Parent Company and Group operations and consolidated cash flows for 2015/16.
In our opinion, Management’s Review includes a true and fair account of the matters addressed in the Review.
We recommend that the Annual Report be adopted at the Annual General Meeting.
Middelfart, 4 July 2016
Signatures
Chairman of the meeting
Torben Andersen
Torben Østergaard-NielsenChairman
Torben Janholt
Klaus NyborgDeputy Chairman
Peter Frederiksen
Michael Keldsen
Nina Østergaard Borris
Morten Hultberg BuchgreitzPeter Korsholm
Executive Board
The Annual Report was presented and adopted at the Annual General Meeting of the Company on 4 July 2016.
Board of Directors

42
INDEPENDENT AUDITOR’S REPORT
To the shareholders of Uni-Tankers A/S
Report on the Financial StatementsWe have audited the Consolidated Financial Statements and the Parent Company Financial Statements of Uni-Tankers A/S for the financial year 1 May 2015 – 30 April 2016, which comprise income statement, balance sheet, statement of changes in equity, cash flow statement, notes and summary of significant accounting policies for both the Group and the Parent Company. The Consolidated Financial Statements and the Parent Company Financial Statements are prepared in accordance with the Danish Financial Statements Act.
Management’s ResponsibilityManagement is responsible for the preparation of Consolidated Financial Statements and Parent Company Financial Statements that give a true and fair view in accordance with the Danish Financial Statements Act, and for such internal control as Management determines is necessary to enable the preparation of Consolidated Financial Statements and Parent Company Financial Statements that are free from material misstatement, whether due to fraud or error.
Auditor’s Responsibility Our responsibility is to express an opinion on the Consolidated Financial Statements and the Parent Company Financial Statements based on our audit. We conducted our audit in accordance with International Standards on Auditing and additional requirements in accordance with Danish audit regulation. This requires that we comply with ethical requirements and plan and perform the audit to obtain reasonable assurance whether the Consolidated Financial Statements and the Parent Company Financial Statements are free from material misstatement.
An audit involves performing audit procedures to obtain audit evidence about the amounts and disclosures in the Consolidated Financial Statements and the Parent Company Financial Statements. The audit procedures selected depend on the auditor’s judgment, including the assessment of the risks of material misstatement of the Consolidated Financial Statements and the Parent Company Financial Statements, whether due to fraud or error. In making those risk assessments, the auditor considers internal control relevant to the Company’s preparation of Consolidated Financial Statements and Parent Company Financial Statements that give a true and fair view in order to design audit procedures that are appropriate in the circumstances, but not for the purpose of expressing an opinion on the effectiveness of the Company’s internal control. An audit also includes evaluating the appropriateness of accounting policies
used and the reasonableness of accounting estimates made by Management, as well as evaluating the overall presentation of the Consolidated Financial Statements and the Parent Company Financial Statements.
We believe that the audit evidence we have obtained is sufficient and appropriate to provide a basis for our audit opinion.
The audit has not resulted in any qualification.
SIGNATURES

43
Jan Bunk Harbo LarsenState Authorised Public Accountant
Carsten DahlState Authorised Public Accountant
INDEPENDENT AUDITOR’S REPORT
Trekantområdet, 4 July 2016PricewaterhouseCoopers
Statsautoriseret RevisionspartnerselskabCompany reg. no.: 33 77 12 31
Opinion In our opinion, the Consolidated Financial Statements and the Parent Company Financial Statements give a true and fair view of the financial position of the Group and the Company at 30 April 2016 and of the results of the Group and Parent Company operations and cash flows for the financial year 1 May 2015 – 30 April 2016 in accordance with the Danish Financial Statements Act.
Statement on Management’s Review We have read Management’s Review in accordance with the Danish Financial Statements Act. We have not performed any procedures additional to the audit of the Financial Statements. On this basis, in our opinion, the information provided in Management’s Review is consistent with the Consolidated Financial Statements and the Parent Company Financial Statements.


45
Group chartGROUP CHART
UNI-TANKERS M/T FALSTRIA SWAN ApS
UNI-TANKERS M/T SELANDIA SWAN ApS
UNI-TANKERS M/T AMAK SWAN ApS
UNI-TANKERS M/T M/T FIONIA SWAN ApS
UNI-TANKERSM/T ALSIA SWAN ApS
UNI-TANKERS M/T ERRIA SWAN ApS
UNI-TANKERS M/T SAMUS SWAN ApS
UNI-TANKERSM/T MONA SWAN ApS
UNI-TANKERSM/T LILLO SWAN ApS
UNI-TANKERS M/T TASING SWAN ApS
UNI-TANKERSM/T FENNO SWAN ApS
UNI-TANKERSM/T BORINGIA SWAN ApS
UNI-TANKERSM/T ENDELO SWAN ApS
UNI-TANKERSM/T LESSOW SWAN ApS
UNI-TANKERSM/T FEO SWAN ApS
UNI-TANKERSM/T ANHOUT SWAN ApS
UNI-TANKERS M/T JUTLANDIA SWAN ApS
Denmark
100% 100% 100% 100% 100%
100% 100% 100% 100% 100%
100% 100% 100% 100% 100%
100% 100% 100% 100%
100%
100%
100%
France
Gibraltar
Turkey
USA

46
Uni-Tankers A/STelephone:Facsimile:E-mail:Company reg. no.:Address:
+45 88 61 88 61 +45 88 61 88 [email protected] 56 07 96Turbinevej 10DK-5500 Middelfart
Uni-Chartering A/STelephone:Facsimile:E-mail:Company reg. no.:Address:
+45 88 61 88 61 +45 88 61 88 [email protected] 58 78 67Turbinevej 10DK-5500 Middelfart
Uni-Chartering A/S (Aalborg)Telephone:E-mail:Address:
+45 88 30 39 [email protected]Østre Havnegade 16DK-9000 Aalborg
Uni-Chartering – USA LLCTelephone:Facsimile:E-mail:Address:
+1 281 833 7271+1 281 833 [email protected] Gessner Road,Houston, TX 77024, USA
Uni-Chartering – TurkeyTelephone:Facsimile:E-mail:Address:
+90 216 302 5900+90 216 302 [email protected] Cad. Gokce Sok.Toksoy Apt.NO: 10/17 - 1834728 Caddebostan, Istanbul, Turkey
Uni-Chartering – FranceTelephone:E-mail:Address:
+33 493 1219 [email protected] ‘La Täne’609 Chemin de Pigranel06250 Mougins, France
Company information

47
COMPANY INFORMATION

Uni-Tankers A/S · Turbinevej 10, 5500 Middelfart, Denmark · Telephone +45 88 61 88 61 · Company reg. no. 12 56 07 96

![ANNUAL REPORT - azcommerce.comannual report • fy 2018 23 table 2 – fiscal year 2018 post-approved active programs summary number of applicants post-approved [1] actual new jobs](https://img.pdfslide.net/doc/110x75/60193fccf258d55e686bd592/annual-report-annual-report-a-fy-2018-23-table-2-a-fiscal-year-2018-post-approved.jpg)


![Annual Report of the University Grants Commission Annual Report 2011... · University Grants Commission [UGC] ... regulation of the administration of HEIs, ... Commission has approved](https://img.pdfslide.net/doc/110x75/5aa535097f8b9a517d8ced68/annual-report-of-the-university-grants-annual-report-2011university-grants-commission.jpg)