Embed Size (px)
Citation preview
MARCH 31, 2016
ANNUAL REPORT
BBIF Tax-Exempt Fund
Not FDIC Insured • May Lose Value • No Bank Guarantee
Table of Contents
Page
Shareholder Letter . . . . . . . . . . . . . . . . . . . . . . . . . . . . . . . . . . . . . . . . . . . . . . . . . . . . . . . . . . . . . . . . . . . . . . . . . . . . . . . . . . . . . . . . . . . . . . . 3Annual Report:Money Market Overview . . . . . . . . . . . . . . . . . . . . . . . . . . . . . . . . . . . . . . . . . . . . . . . . . . . . . . . . . . . . . . . . . . . . . . . . . . . . . . . . . . . . . . . . . . . 4Fund Information . . . . . . . . . . . . . . . . . . . . . . . . . . . . . . . . . . . . . . . . . . . . . . . . . . . . . . . . . . . . . . . . . . . . . . . . . . . . . . . . . . . . . . . . . . . . . . . . 5Disclosure of Expenses . . . . . . . . . . . . . . . . . . . . . . . . . . . . . . . . . . . . . . . . . . . . . . . . . . . . . . . . . . . . . . . . . . . . . . . . . . . . . . . . . . . . . . . . . . . . 5Fund Financial Statements:
Statement of Assets and Liabilities . . . . . . . . . . . . . . . . . . . . . . . . . . . . . . . . . . . . . . . . . . . . . . . . . . . . . . . . . . . . . . . . . . . . . . . . . . . . . . . . . 6Statement of Operations . . . . . . . . . . . . . . . . . . . . . . . . . . . . . . . . . . . . . . . . . . . . . . . . . . . . . . . . . . . . . . . . . . . . . . . . . . . . . . . . . . . . . . . . . 7Statements of Changes in Net Assets . . . . . . . . . . . . . . . . . . . . . . . . . . . . . . . . . . . . . . . . . . . . . . . . . . . . . . . . . . . . . . . . . . . . . . . . . . . . . . . . 8
Fund Financial Highlights . . . . . . . . . . . . . . . . . . . . . . . . . . . . . . . . . . . . . . . . . . . . . . . . . . . . . . . . . . . . . . . . . . . . . . . . . . . . . . . . . . . . . . . . . . 9Fund Notes to Financial Statements . . . . . . . . . . . . . . . . . . . . . . . . . . . . . . . . . . . . . . . . . . . . . . . . . . . . . . . . . . . . . . . . . . . . . . . . . . . . . . . . . . . 13Fund Report of Independent Registered Public Accounting Firm . . . . . . . . . . . . . . . . . . . . . . . . . . . . . . . . . . . . . . . . . . . . . . . . . . . . . . . . . . . . . . . 17Master LLC Portfolio Information . . . . . . . . . . . . . . . . . . . . . . . . . . . . . . . . . . . . . . . . . . . . . . . . . . . . . . . . . . . . . . . . . . . . . . . . . . . . . . . . . . . . . 18Master LLC Financial Statements:
Schedule of Investments . . . . . . . . . . . . . . . . . . . . . . . . . . . . . . . . . . . . . . . . . . . . . . . . . . . . . . . . . . . . . . . . . . . . . . . . . . . . . . . . . . . . . . . . . 19Statement of Assets and Liabilities . . . . . . . . . . . . . . . . . . . . . . . . . . . . . . . . . . . . . . . . . . . . . . . . . . . . . . . . . . . . . . . . . . . . . . . . . . . . . . . . . 28Statement of Operations . . . . . . . . . . . . . . . . . . . . . . . . . . . . . . . . . . . . . . . . . . . . . . . . . . . . . . . . . . . . . . . . . . . . . . . . . . . . . . . . . . . . . . . . . 28Statements of Changes in Net Assets . . . . . . . . . . . . . . . . . . . . . . . . . . . . . . . . . . . . . . . . . . . . . . . . . . . . . . . . . . . . . . . . . . . . . . . . . . . . . . . . 29
Master LLC Financial Highlights . . . . . . . . . . . . . . . . . . . . . . . . . . . . . . . . . . . . . . . . . . . . . . . . . . . . . . . . . . . . . . . . . . . . . . . . . . . . . . . . . . . . . . 29Master LLC Notes to Financial Statements . . . . . . . . . . . . . . . . . . . . . . . . . . . . . . . . . . . . . . . . . . . . . . . . . . . . . . . . . . . . . . . . . . . . . . . . . . . . . . 30Master LLC Report of Independent Registered Public Accounting Firm . . . . . . . . . . . . . . . . . . . . . . . . . . . . . . . . . . . . . . . . . . . . . . . . . . . . . . . . . . . 33Officers and Directors . . . . . . . . . . . . . . . . . . . . . . . . . . . . . . . . . . . . . . . . . . . . . . . . . . . . . . . . . . . . . . . . . . . . . . . . . . . . . . . . . . . . . . . . . . . . . 34Additional Information . . . . . . . . . . . . . . . . . . . . . . . . . . . . . . . . . . . . . . . . . . . . . . . . . . . . . . . . . . . . . . . . . . . . . . . . . . . . . . . . . . . . . . . . . . . . 37
2 BBIF TAX-EXEMPT FUND MARCH 31, 2016
The Markets in Review
Dear Shareholder,
Diverging monetary policies and shifting economic outlooks across regions have been theoverarching themes driving financial markets over the past couple of years. Investors spentmost of 2015 anticipating the end of the Federal Reserve’s (the “Fed”) near-zero interestrate policy as U.S. growth outpaced other developed markets. The Fed ultimately hiked ratesin December, whereas the European Central Bank and the Bank of Japan took additionalsteps to stimulate growth, even introducing negative interest rates. The U.S. dollar hadstrengthened considerably ahead of these developments, causing profit challenges for U.S.companies that generate revenues overseas, and pressuring emerging market currencies andcommodities prices.
Global market volatility increased in the latter part of 2015 and spilled over into early 2016.Oil prices were a key factor behind the instability after collapsing in mid-2015 due to excessglobal supply. China, one of the world’s largest consumers of oil, was another notable sourceof stress for financial markets. Signs of slowing economic growth, a depreciating yuan anddeclining confidence in the country’s policymakers stoked investors’ worries about the poten-tial impact of China’s weakness on the global economy.
Fears of a global recession started to fade toward the end of the first quarter of 2016 andvolatility abated. Central bank stimulus in Europe and Japan, combined with a more tem-pered outlook for rate hikes in the United States, helped bolster financial markets. Asoftening in U.S. dollar strength offered some relief to U.S. exporters and emerging marketeconomies. Oil prices found firmer footing as global supply showed signs of leveling off.
The selloff in risk assets at the turn of the year has resulted in more reasonable valuationsand some appealing entry points for investors today. However, investors continue to face theheadwinds of uncertainty around China’s growth trajectory and currency management, thepotential consequences of negative interest rates and geopolitical risks.
For the 12 months ended March 31, 2016, higher-quality assets such as municipal bonds,U.S. Treasuries and investment grade corporate bonds generated positive returns, whileriskier assets such as non-U.S. and small cap equities broadly declined.
At BlackRock, we believe investors need to think globally, extend their scope across a broadarray of asset classes and be prepared to adjust accordingly as market conditions changeover time. We encourage you to talk with your financial advisor and visit blackrock.com forfurther insight about investing in today’s markets.
Sincerely,
Rob KapitoPresident, BlackRock Advisors, LLC
Rob KapitoPresident, BlackRock Advisors, LLC
Total Returns as of March 31, 2016
6-month 12-month
U.S. large cap equities(S&P 500® Index)
8.49% 1.78%
U.S. small cap equities(Russell 2000® Index)
2.02 (9.76)
International equities(MSCI Europe, Australasia,Far East Index)
1.56 (8.27)
Emerging market equities(MSCI EmergingMarkets Index)
6.41 (12.03)
3-month Treasury bills(BofA Merrill Lynch 3-MonthU.S. Treasury Bill Index)
0.10 0.12
U.S. Treasury securities(BofA Merrill Lynch 10-YearU.S. Treasury Index)
3.27 3.05
U.S. investment gradebonds (BarclaysU.S. Aggregate Bond Index)
2.44 1.96
Tax-exempt municipalbonds (S&P MunicipalBond Index)
3.23 3.95
U.S. high yield bonds(Barclays U.S.Corporate High Yield 2%Issuer Capped Index)
1.23 (3.66)
Past performance is no guarantee of future results. Index performance isshown for illustrative purposes only. You cannot invest directly in an index.
THIS PAGE NOT PART OF YOUR FUND REPORT 3
Money Market Overview
For the 12-Month Period Ended March 31, 2016
The Federal Open Market Committee (the “Committee”) left rates unchanged at the March 16, 2016 meeting, which was not surprising in our opiniongiven low expectations for a rate increase on the heels of market turmoil earlier in the year. Indeed, the Committee continued to highlight concernabout risks associated with global financial and economic developments, and downshifted its expectations for the pace of normalization. The Commit-tee’s present forecast envisions two rate hikes of 25 basis points (0.25%) each during the balance of 2016, down from a projected four increases asof its December 16, 2015 meeting. A stronger-than-expected February employment report combined with recent upward pressure on the CorePersonal Consumption Expenditures Index — the Committee’s preferred measure of inflation — suggest that it may not be overly optimistic to antici-pate that conditions will ultimately line up behind at least one rate hike, possibly as soon as June. While not our base case, a number of Committeemembers even intimated that an increase in rates as soon as April was not out of the question. In our view, the fact that inflation has been runningbehind the Committee’s target for nearly four years reinforces a gradual approach to policy normalization.
While the Committee’s recent statement was generally perceived as “dovish,” anxiety about the prospect of negative interest rates seems to havediminished somewhat. At the post-meeting press conference, Chairwoman Yellen stated that the Committee is “not actively considering negativerates,” supporting our belief that the odds of such a development are relatively narrow.
The slope of the short-dated London Interbank Offered Rate (“LIBOR”) curve steepened in March in response to continued uncertainty about the pathof interest rates and the possible shift of additional assets from prime to government money market funds later in the year. We would anticipate acontinuation of this trend in the months ahead.
Past performance is no guarantee of future results. Index performance is shown for illustrative purposes only. You cannot invest directly in an index.
4 BBIF TAX-EXEMPT FUND MARCH 31, 2016
Fund Information as of March 31, 2016
Investment Objective
BBIF Tax-Exempt Fund’s (the “Fund”) investment objective is to seek current income exempt from federal income tax, preservation of capital and liquidity.
On February 18, 2016, the Board of Trustees of the Fund approved a proposal to close the Fund to purchases and thereafter to liquidate the Fund.Accordingly, effective on July 11, 2016, the Fund will no longer accept purchases orders. On or about July 15, 2016 (the “Liquidation Date”), all ofthe assets of the Fund will be liquidated completely, the shares outstanding on the Liquidation Date will be redeemed at the net asset value per shareand the Fund will then be terminated.
Current Seven-Day Yields
7-DaySEC Yields
7-DayYields
Class 1 . . . . . . . . . . . . . . . . . . . . . . . . . . . . . . . . . . . . . . . 0.00% 0.00%Class 2 . . . . . . . . . . . . . . . . . . . . . . . . . . . . . . . . . . . . . . . 0.00% 0.00%Class 3 . . . . . . . . . . . . . . . . . . . . . . . . . . . . . . . . . . . . . . . 0.00% 0.00%Class 4 . . . . . . . . . . . . . . . . . . . . . . . . . . . . . . . . . . . . . . . 0.00% 0.00%
The 7-Day SEC Yields may differ from the 7-Day Yields shown above due to the fact that the 7-Day SEC Yields exclude distributed capital gains. Past performance is notindicative of future results.
Disclosure of Expenses
Shareholders of the Fund may incur the following charges:(a) transactional expenses such as sales charges; and (b) operatingexpenses, including administration fees, service and distribution fees,including 12b-1 fees, acquired fund fees and expenses, and other Fundexpenses. The expense example shown below (which is based on a hypo-thetical investment of $1,000 invested on October 1, 2015 and heldthrough March 31, 2016) is intended to assist shareholders both in calcu-lating expenses based on an investment in the Fund and in comparingthese expenses with similar costs of investing in other mutual funds.
The expense example provides information about actual account valuesand actual expenses. In order to estimate the expenses a shareholderpaid during the period covered by this report, shareholders can dividetheir account value by $1,000 and then multiply the result by thenumber corresponding to their share class under the heading entitled“Expenses Paid During the Period.”
The expense example also provides information about hypotheticalaccount values and hypothetical expenses based on the Fund’s actualexpense ratio and an assumed rate of return of 5% per year beforeexpenses. In order to assist shareholders in comparing the ongoingexpenses of investing in the Fund and other funds, compare the 5%hypothetical example with the 5% hypothetical examples that appear inshareholder reports of other funds.
The expenses shown in the expense example are intended to highlightshareholders’ ongoing costs only and do not reflect any transactionalexpenses, such as sales charges, if any. Therefore, the hypotheticalexamples are useful in comparing ongoing expenses only, and will nothelp shareholders determine the relative total expenses of owningdifferent funds. If these transactional expenses were included, share-holder expenses would have been higher.
Expense Example
Actual Hypothetical2
AnnualizedExpense Ratio
BeginningAccount Value
October 1, 2015
EndingAccount Value
March 31, 2016Expenses Paid
During the Period1
BeginningAccount Value
October 1, 2015
EndingAccount Value
March 31, 2016Expenses Paid
During the Period1
Class 1 . . . . . . . . . . . . . . . . . . . $1,000.00 $1,000.00 $0.50 $1,000.00 $1,024.50 $0.51 0.10%Class 2 . . . . . . . . . . . . . . . . . . . $1,000.00 $1,000.00 $0.50 $1,000.00 $1,024.50 $0.51 0.10%Class 3 . . . . . . . . . . . . . . . . . . . $1,000.00 $1,000.00 $0.50 $1,000.00 $1,024.50 $0.51 0.10%Class 4 . . . . . . . . . . . . . . . . . . . $1,000.00 $1,000.00 $0.50 $1,000.00 $1,024.50 $0.51 0.10%
1 For each class of the Fund, expenses are equal to the annualized net expense ratio for the class, multiplied by the average account value over the period, multiplied by183/366 (to reflect the one-half year period shown). Because the Fund invests all of its assets in Master Tax-Exempt LLC (the “Master LLC”), the expense examples reflectthe net expenses of both the Fund and the Master LLC in which it invests.
2 Hypothetical 5% annual return before expenses is calculated by prorating the number of days in the most recent fiscal half year divided by 366.
BBIF TAX-EXEMPT FUND MARCH 31, 2016 5
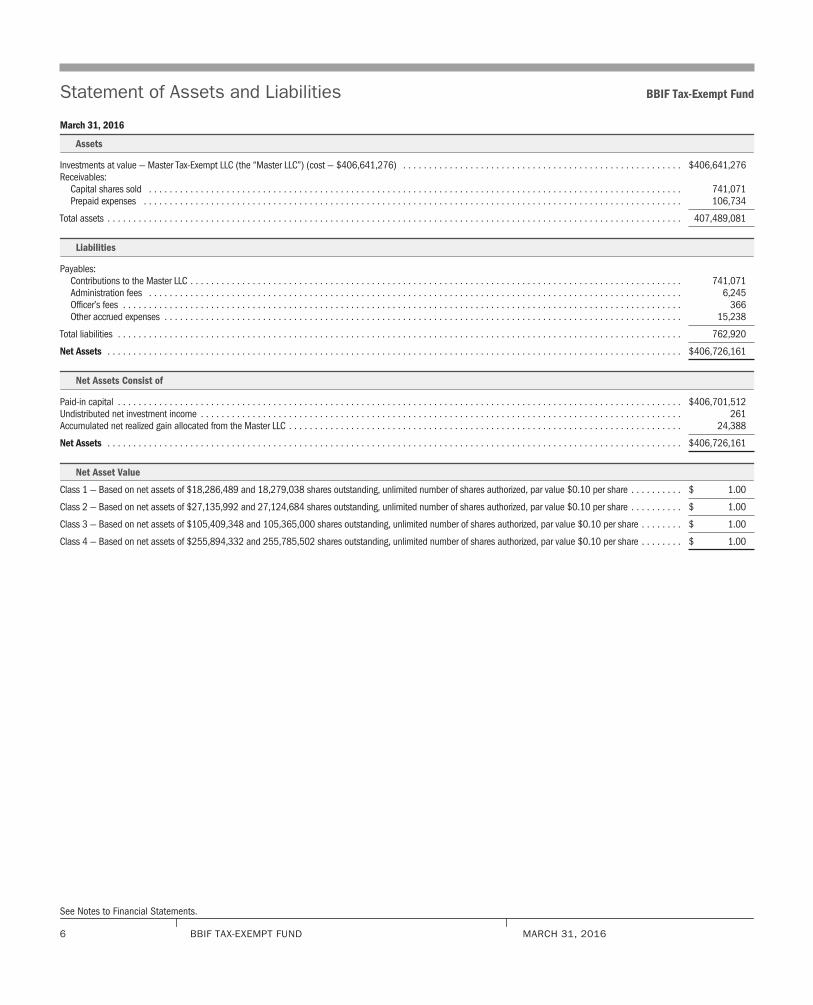
Statement of Assets and Liabilities BBIF Tax-Exempt Fund
March 31, 2016
Assets
Investments at value — Master Tax-Exempt LLC (the “Master LLC”) (cost — $406,641,276) . . . . . . . . . . . . . . . . . . . . . . . . . . . . . . . . . . . . . . . . . . . . . . . . . . . . . . $406,641,276Receivables:
Capital shares sold . . . . . . . . . . . . . . . . . . . . . . . . . . . . . . . . . . . . . . . . . . . . . . . . . . . . . . . . . . . . . . . . . . . . . . . . . . . . . . . . . . . . . . . . . . . . . . . . . . . . . . . 741,071Prepaid expenses . . . . . . . . . . . . . . . . . . . . . . . . . . . . . . . . . . . . . . . . . . . . . . . . . . . . . . . . . . . . . . . . . . . . . . . . . . . . . . . . . . . . . . . . . . . . . . . . . . . . . . . . 106,734
Total assets . . . . . . . . . . . . . . . . . . . . . . . . . . . . . . . . . . . . . . . . . . . . . . . . . . . . . . . . . . . . . . . . . . . . . . . . . . . . . . . . . . . . . . . . . . . . . . . . . . . . . . . . . . . . . . . 407,489,081
Liabilities
Payables:Contributions to the Master LLC . . . . . . . . . . . . . . . . . . . . . . . . . . . . . . . . . . . . . . . . . . . . . . . . . . . . . . . . . . . . . . . . . . . . . . . . . . . . . . . . . . . . . . . . . . . . . . . 741,071Administration fees . . . . . . . . . . . . . . . . . . . . . . . . . . . . . . . . . . . . . . . . . . . . . . . . . . . . . . . . . . . . . . . . . . . . . . . . . . . . . . . . . . . . . . . . . . . . . . . . . . . . . . . 6,245Officer’s fees . . . . . . . . . . . . . . . . . . . . . . . . . . . . . . . . . . . . . . . . . . . . . . . . . . . . . . . . . . . . . . . . . . . . . . . . . . . . . . . . . . . . . . . . . . . . . . . . . . . . . . . . . . . . 366Other accrued expenses . . . . . . . . . . . . . . . . . . . . . . . . . . . . . . . . . . . . . . . . . . . . . . . . . . . . . . . . . . . . . . . . . . . . . . . . . . . . . . . . . . . . . . . . . . . . . . . . . . . . 15,238
Total liabilities . . . . . . . . . . . . . . . . . . . . . . . . . . . . . . . . . . . . . . . . . . . . . . . . . . . . . . . . . . . . . . . . . . . . . . . . . . . . . . . . . . . . . . . . . . . . . . . . . . . . . . . . . . . . . 762,920
Net Assets . . . . . . . . . . . . . . . . . . . . . . . . . . . . . . . . . . . . . . . . . . . . . . . . . . . . . . . . . . . . . . . . . . . . . . . . . . . . . . . . . . . . . . . . . . . . . . . . . . . . . . . . . . . . . . . $406,726,161
Net Assets Consist of
Paid-in capital . . . . . . . . . . . . . . . . . . . . . . . . . . . . . . . . . . . . . . . . . . . . . . . . . . . . . . . . . . . . . . . . . . . . . . . . . . . . . . . . . . . . . . . . . . . . . . . . . . . . . . . . . . . . . $406,701,512Undistributed net investment income . . . . . . . . . . . . . . . . . . . . . . . . . . . . . . . . . . . . . . . . . . . . . . . . . . . . . . . . . . . . . . . . . . . . . . . . . . . . . . . . . . . . . . . . . . . . . 261Accumulated net realized gain allocated from the Master LLC . . . . . . . . . . . . . . . . . . . . . . . . . . . . . . . . . . . . . . . . . . . . . . . . . . . . . . . . . . . . . . . . . . . . . . . . . . . . 24,388
Net Assets . . . . . . . . . . . . . . . . . . . . . . . . . . . . . . . . . . . . . . . . . . . . . . . . . . . . . . . . . . . . . . . . . . . . . . . . . . . . . . . . . . . . . . . . . . . . . . . . . . . . . . . . . . . . . . . $406,726,161
Net Asset Value
Class 1 — Based on net assets of $18,286,489 and 18,279,038 shares outstanding, unlimited number of shares authorized, par value $0.10 per share . . . . . . . . . . $ 1.00
Class 2 — Based on net assets of $27,135,992 and 27,124,684 shares outstanding, unlimited number of shares authorized, par value $0.10 per share . . . . . . . . . . $ 1.00
Class 3 — Based on net assets of $105,409,348 and 105,365,000 shares outstanding, unlimited number of shares authorized, par value $0.10 per share . . . . . . . . $ 1.00
Class 4 — Based on net assets of $255,894,332 and 255,785,502 shares outstanding, unlimited number of shares authorized, par value $0.10 per share . . . . . . . . $ 1.00
See Notes to Financial Statements.
6 BBIF TAX-EXEMPT FUND MARCH 31, 2016
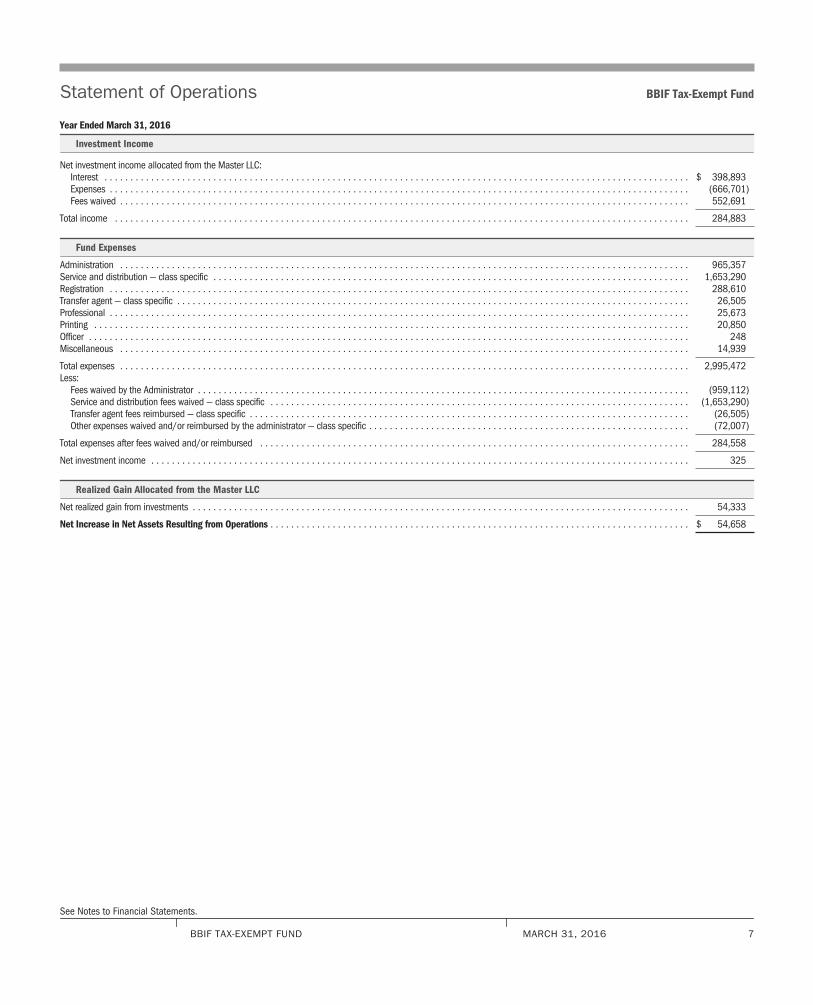
Statement of Operations BBIF Tax-Exempt Fund
Year Ended March 31, 2016
Investment Income
Net investment income allocated from the Master LLC:Interest . . . . . . . . . . . . . . . . . . . . . . . . . . . . . . . . . . . . . . . . . . . . . . . . . . . . . . . . . . . . . . . . . . . . . . . . . . . . . . . . . . . . . . . . . . . . . . . . . . . . . . . . . . . . . . . . . $ 398,893Expenses . . . . . . . . . . . . . . . . . . . . . . . . . . . . . . . . . . . . . . . . . . . . . . . . . . . . . . . . . . . . . . . . . . . . . . . . . . . . . . . . . . . . . . . . . . . . . . . . . . . . . . . . . . . . . . . . (666,701)Fees waived . . . . . . . . . . . . . . . . . . . . . . . . . . . . . . . . . . . . . . . . . . . . . . . . . . . . . . . . . . . . . . . . . . . . . . . . . . . . . . . . . . . . . . . . . . . . . . . . . . . . . . . . . . . . . . 552,691
Total income . . . . . . . . . . . . . . . . . . . . . . . . . . . . . . . . . . . . . . . . . . . . . . . . . . . . . . . . . . . . . . . . . . . . . . . . . . . . . . . . . . . . . . . . . . . . . . . . . . . . . . . . . . . . . . . 284,883
Fund Expenses
Administration . . . . . . . . . . . . . . . . . . . . . . . . . . . . . . . . . . . . . . . . . . . . . . . . . . . . . . . . . . . . . . . . . . . . . . . . . . . . . . . . . . . . . . . . . . . . . . . . . . . . . . . . . . . . . . 965,357Service and distribution — class specific . . . . . . . . . . . . . . . . . . . . . . . . . . . . . . . . . . . . . . . . . . . . . . . . . . . . . . . . . . . . . . . . . . . . . . . . . . . . . . . . . . . . . . . . . . . . 1,653,290Registration . . . . . . . . . . . . . . . . . . . . . . . . . . . . . . . . . . . . . . . . . . . . . . . . . . . . . . . . . . . . . . . . . . . . . . . . . . . . . . . . . . . . . . . . . . . . . . . . . . . . . . . . . . . . . . . . 288,610Transfer agent — class specific . . . . . . . . . . . . . . . . . . . . . . . . . . . . . . . . . . . . . . . . . . . . . . . . . . . . . . . . . . . . . . . . . . . . . . . . . . . . . . . . . . . . . . . . . . . . . . . . . . . 26,505Professional . . . . . . . . . . . . . . . . . . . . . . . . . . . . . . . . . . . . . . . . . . . . . . . . . . . . . . . . . . . . . . . . . . . . . . . . . . . . . . . . . . . . . . . . . . . . . . . . . . . . . . . . . . . . . . . . 25,673Printing . . . . . . . . . . . . . . . . . . . . . . . . . . . . . . . . . . . . . . . . . . . . . . . . . . . . . . . . . . . . . . . . . . . . . . . . . . . . . . . . . . . . . . . . . . . . . . . . . . . . . . . . . . . . . . . . . . . 20,850Officer . . . . . . . . . . . . . . . . . . . . . . . . . . . . . . . . . . . . . . . . . . . . . . . . . . . . . . . . . . . . . . . . . . . . . . . . . . . . . . . . . . . . . . . . . . . . . . . . . . . . . . . . . . . . . . . . . . . . 248Miscellaneous . . . . . . . . . . . . . . . . . . . . . . . . . . . . . . . . . . . . . . . . . . . . . . . . . . . . . . . . . . . . . . . . . . . . . . . . . . . . . . . . . . . . . . . . . . . . . . . . . . . . . . . . . . . . . . 14,939
Total expenses . . . . . . . . . . . . . . . . . . . . . . . . . . . . . . . . . . . . . . . . . . . . . . . . . . . . . . . . . . . . . . . . . . . . . . . . . . . . . . . . . . . . . . . . . . . . . . . . . . . . . . . . . . . . . . 2,995,472Less:
Fees waived by the Administrator . . . . . . . . . . . . . . . . . . . . . . . . . . . . . . . . . . . . . . . . . . . . . . . . . . . . . . . . . . . . . . . . . . . . . . . . . . . . . . . . . . . . . . . . . . . . . . . (959,112)Service and distribution fees waived — class specific . . . . . . . . . . . . . . . . . . . . . . . . . . . . . . . . . . . . . . . . . . . . . . . . . . . . . . . . . . . . . . . . . . . . . . . . . . . . . . . . . (1,653,290)Transfer agent fees reimbursed — class specific . . . . . . . . . . . . . . . . . . . . . . . . . . . . . . . . . . . . . . . . . . . . . . . . . . . . . . . . . . . . . . . . . . . . . . . . . . . . . . . . . . . . . (26,505)Other expenses waived and/or reimbursed by the administrator — class specific . . . . . . . . . . . . . . . . . . . . . . . . . . . . . . . . . . . . . . . . . . . . . . . . . . . . . . . . . . . . . . (72,007)
Total expenses after fees waived and/or reimbursed . . . . . . . . . . . . . . . . . . . . . . . . . . . . . . . . . . . . . . . . . . . . . . . . . . . . . . . . . . . . . . . . . . . . . . . . . . . . . . . . . . . 284,558
Net investment income . . . . . . . . . . . . . . . . . . . . . . . . . . . . . . . . . . . . . . . . . . . . . . . . . . . . . . . . . . . . . . . . . . . . . . . . . . . . . . . . . . . . . . . . . . . . . . . . . . . . . . . . 325
Realized Gain Allocated from the Master LLC
Net realized gain from investments . . . . . . . . . . . . . . . . . . . . . . . . . . . . . . . . . . . . . . . . . . . . . . . . . . . . . . . . . . . . . . . . . . . . . . . . . . . . . . . . . . . . . . . . . . . . . . . . 54,333
Net Increase in Net Assets Resulting from Operations . . . . . . . . . . . . . . . . . . . . . . . . . . . . . . . . . . . . . . . . . . . . . . . . . . . . . . . . . . . . . . . . . . . . . . . . . . . . . . . . . $ 54,658
See Notes to Financial Statements.
BBIF TAX-EXEMPT FUND MARCH 31, 2016 7
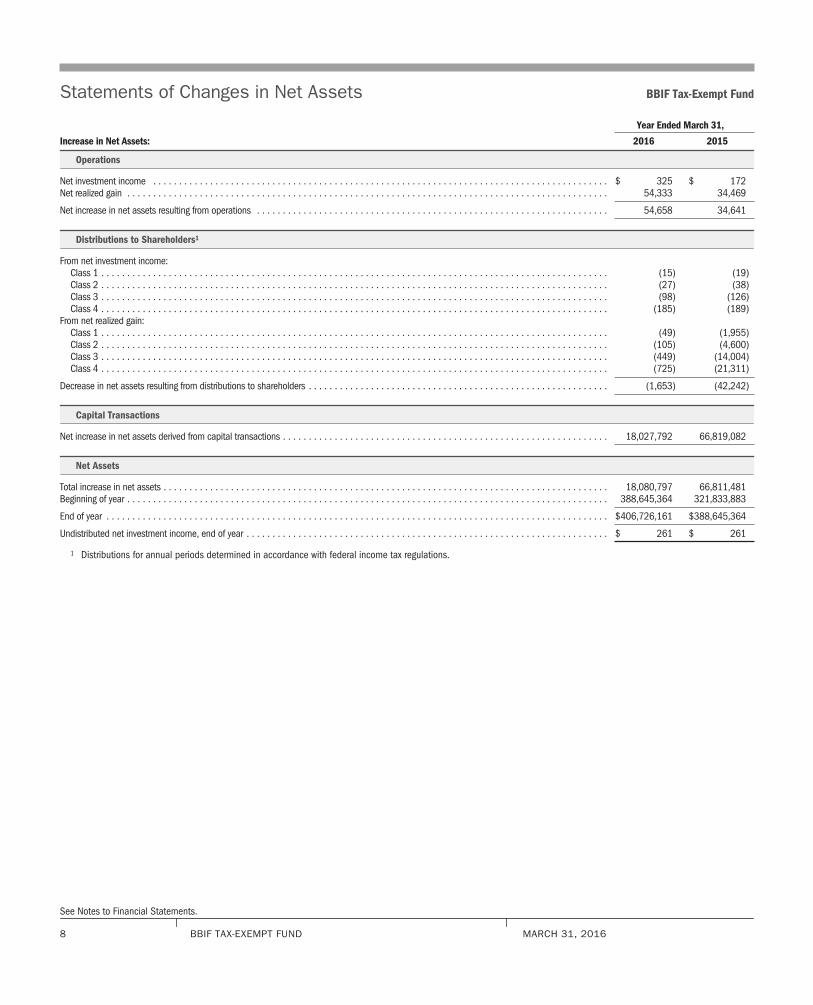
Statements of Changes in Net Assets BBIF Tax-Exempt Fund
Year Ended March 31,
Increase in Net Assets: 2016 2015
Operations
Net investment income . . . . . . . . . . . . . . . . . . . . . . . . . . . . . . . . . . . . . . . . . . . . . . . . . . . . . . . . . . . . . . . . . . . . . . . . . . . . . . . . . . . . . . . . $ 325 $ 172Net realized gain . . . . . . . . . . . . . . . . . . . . . . . . . . . . . . . . . . . . . . . . . . . . . . . . . . . . . . . . . . . . . . . . . . . . . . . . . . . . . . . . . . . . . . . . . . . . . 54,333 34,469
Net increase in net assets resulting from operations . . . . . . . . . . . . . . . . . . . . . . . . . . . . . . . . . . . . . . . . . . . . . . . . . . . . . . . . . . . . . . . . . . . . 54,658 34,641
Distributions to Shareholders1
From net investment income:Class 1 . . . . . . . . . . . . . . . . . . . . . . . . . . . . . . . . . . . . . . . . . . . . . . . . . . . . . . . . . . . . . . . . . . . . . . . . . . . . . . . . . . . . . . . . . . . . . . . . . . (15) (19)Class 2 . . . . . . . . . . . . . . . . . . . . . . . . . . . . . . . . . . . . . . . . . . . . . . . . . . . . . . . . . . . . . . . . . . . . . . . . . . . . . . . . . . . . . . . . . . . . . . . . . . (27) (38)Class 3 . . . . . . . . . . . . . . . . . . . . . . . . . . . . . . . . . . . . . . . . . . . . . . . . . . . . . . . . . . . . . . . . . . . . . . . . . . . . . . . . . . . . . . . . . . . . . . . . . . (98) (126)Class 4 . . . . . . . . . . . . . . . . . . . . . . . . . . . . . . . . . . . . . . . . . . . . . . . . . . . . . . . . . . . . . . . . . . . . . . . . . . . . . . . . . . . . . . . . . . . . . . . . . . (185) (189)
From net realized gain:Class 1 . . . . . . . . . . . . . . . . . . . . . . . . . . . . . . . . . . . . . . . . . . . . . . . . . . . . . . . . . . . . . . . . . . . . . . . . . . . . . . . . . . . . . . . . . . . . . . . . . . (49) (1,955)Class 2 . . . . . . . . . . . . . . . . . . . . . . . . . . . . . . . . . . . . . . . . . . . . . . . . . . . . . . . . . . . . . . . . . . . . . . . . . . . . . . . . . . . . . . . . . . . . . . . . . . (105) (4,600)Class 3 . . . . . . . . . . . . . . . . . . . . . . . . . . . . . . . . . . . . . . . . . . . . . . . . . . . . . . . . . . . . . . . . . . . . . . . . . . . . . . . . . . . . . . . . . . . . . . . . . . (449) (14,004)Class 4 . . . . . . . . . . . . . . . . . . . . . . . . . . . . . . . . . . . . . . . . . . . . . . . . . . . . . . . . . . . . . . . . . . . . . . . . . . . . . . . . . . . . . . . . . . . . . . . . . . (725) (21,311)
Decrease in net assets resulting from distributions to shareholders . . . . . . . . . . . . . . . . . . . . . . . . . . . . . . . . . . . . . . . . . . . . . . . . . . . . . . . . . . (1,653) (42,242)
Capital Transactions
Net increase in net assets derived from capital transactions . . . . . . . . . . . . . . . . . . . . . . . . . . . . . . . . . . . . . . . . . . . . . . . . . . . . . . . . . . . . . . . 18,027,792 66,819,082
Net Assets
Total increase in net assets . . . . . . . . . . . . . . . . . . . . . . . . . . . . . . . . . . . . . . . . . . . . . . . . . . . . . . . . . . . . . . . . . . . . . . . . . . . . . . . . . . . . . . 18,080,797 66,811,481Beginning of year . . . . . . . . . . . . . . . . . . . . . . . . . . . . . . . . . . . . . . . . . . . . . . . . . . . . . . . . . . . . . . . . . . . . . . . . . . . . . . . . . . . . . . . . . . . . . 388,645,364 321,833,883
End of year . . . . . . . . . . . . . . . . . . . . . . . . . . . . . . . . . . . . . . . . . . . . . . . . . . . . . . . . . . . . . . . . . . . . . . . . . . . . . . . . . . . . . . . . . . . . . . . . . $406,726,161 $388,645,364
Undistributed net investment income, end of year . . . . . . . . . . . . . . . . . . . . . . . . . . . . . . . . . . . . . . . . . . . . . . . . . . . . . . . . . . . . . . . . . . . . . . $ 261 $ 261
1 Distributions for annual periods determined in accordance with federal income tax regulations.
See Notes to Financial Statements.
8 BBIF TAX-EXEMPT FUND MARCH 31, 2016
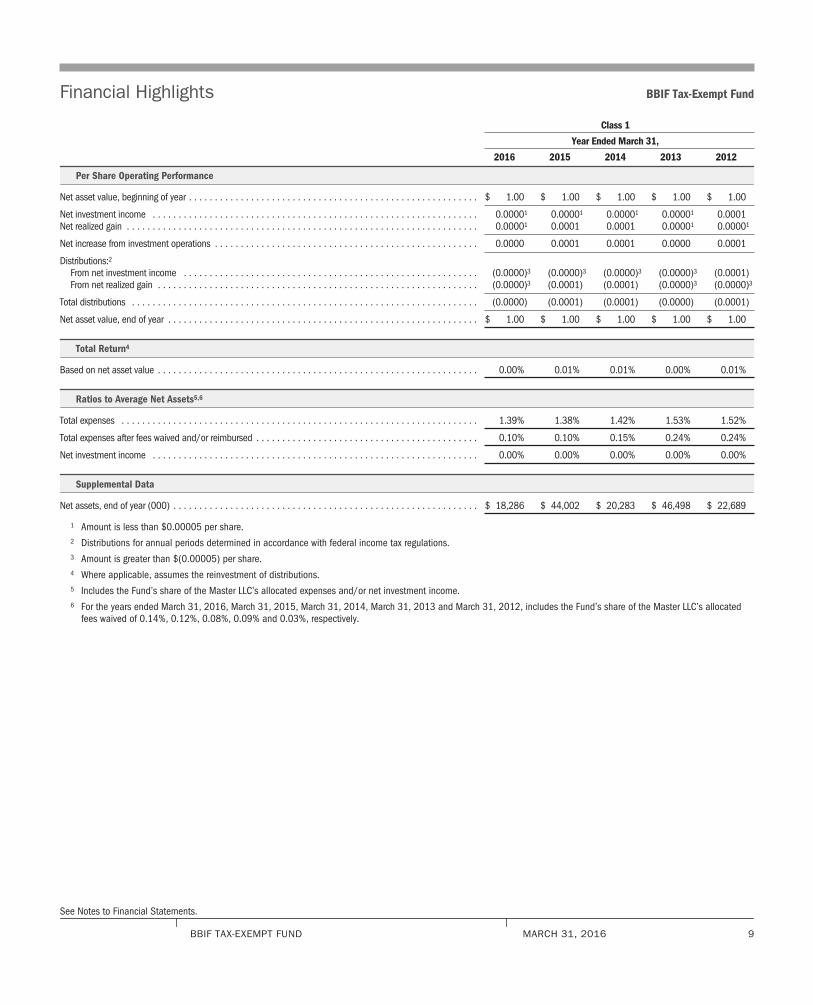
Financial Highlights BBIF Tax-Exempt Fund
Class 1
Year Ended March 31,
2016 2015 2014 2013 2012
Per Share Operating Performance
Net asset value, beginning of year . . . . . . . . . . . . . . . . . . . . . . . . . . . . . . . . . . . . . . . . . . . . . . . . . . . . . . . . $ 1.00 $ 1.00 $ 1.00 $ 1.00 $ 1.00
Net investment income . . . . . . . . . . . . . . . . . . . . . . . . . . . . . . . . . . . . . . . . . . . . . . . . . . . . . . . . . . . . . . . 0.00001 0.00001 0.00001 0.00001 0.0001Net realized gain . . . . . . . . . . . . . . . . . . . . . . . . . . . . . . . . . . . . . . . . . . . . . . . . . . . . . . . . . . . . . . . . . . . . 0.00001 0.0001 0.0001 0.00001 0.00001
Net increase from investment operations . . . . . . . . . . . . . . . . . . . . . . . . . . . . . . . . . . . . . . . . . . . . . . . . . . . 0.0000 0.0001 0.0001 0.0000 0.0001
Distributions:2From net investment income . . . . . . . . . . . . . . . . . . . . . . . . . . . . . . . . . . . . . . . . . . . . . . . . . . . . . . . . . (0.0000)3 (0.0000)3 (0.0000)3 (0.0000)3 (0.0001)From net realized gain . . . . . . . . . . . . . . . . . . . . . . . . . . . . . . . . . . . . . . . . . . . . . . . . . . . . . . . . . . . . . . (0.0000)3 (0.0001) (0.0001) (0.0000)3 (0.0000)3
Total distributions . . . . . . . . . . . . . . . . . . . . . . . . . . . . . . . . . . . . . . . . . . . . . . . . . . . . . . . . . . . . . . . . . . . (0.0000) (0.0001) (0.0001) (0.0000) (0.0001)
Net asset value, end of year . . . . . . . . . . . . . . . . . . . . . . . . . . . . . . . . . . . . . . . . . . . . . . . . . . . . . . . . . . . . $ 1.00 $ 1.00 $ 1.00 $ 1.00 $ 1.00
Total Return4
Based on net asset value . . . . . . . . . . . . . . . . . . . . . . . . . . . . . . . . . . . . . . . . . . . . . . . . . . . . . . . . . . . . . . 0.00% 0.01% 0.01% 0.00% 0.01%
Ratios to Average Net Assets5,6
Total expenses . . . . . . . . . . . . . . . . . . . . . . . . . . . . . . . . . . . . . . . . . . . . . . . . . . . . . . . . . . . . . . . . . . . . . 1.39% 1.38% 1.42% 1.53% 1.52%
Total expenses after fees waived and/or reimbursed . . . . . . . . . . . . . . . . . . . . . . . . . . . . . . . . . . . . . . . . . . . 0.10% 0.10% 0.15% 0.24% 0.24%
Net investment income . . . . . . . . . . . . . . . . . . . . . . . . . . . . . . . . . . . . . . . . . . . . . . . . . . . . . . . . . . . . . . . 0.00% 0.00% 0.00% 0.00% 0.00%
Supplemental Data
Net assets, end of year (000) . . . . . . . . . . . . . . . . . . . . . . . . . . . . . . . . . . . . . . . . . . . . . . . . . . . . . . . . . . . $ 18,286 $ 44,002 $ 20,283 $ 46,498 $ 22,689
1 Amount is less than $0.00005 per share.2 Distributions for annual periods determined in accordance with federal income tax regulations.3 Amount is greater than $(0.00005) per share.4 Where applicable, assumes the reinvestment of distributions.5 Includes the Fund’s share of the Master LLC’s allocated expenses and/or net investment income.6 For the years ended March 31, 2016, March 31, 2015, March 31, 2014, March 31, 2013 and March 31, 2012, includes the Fund’s share of the Master LLC’s allocated
fees waived of 0.14%, 0.12%, 0.08%, 0.09% and 0.03%, respectively.
See Notes to Financial Statements.
BBIF TAX-EXEMPT FUND MARCH 31, 2016 9
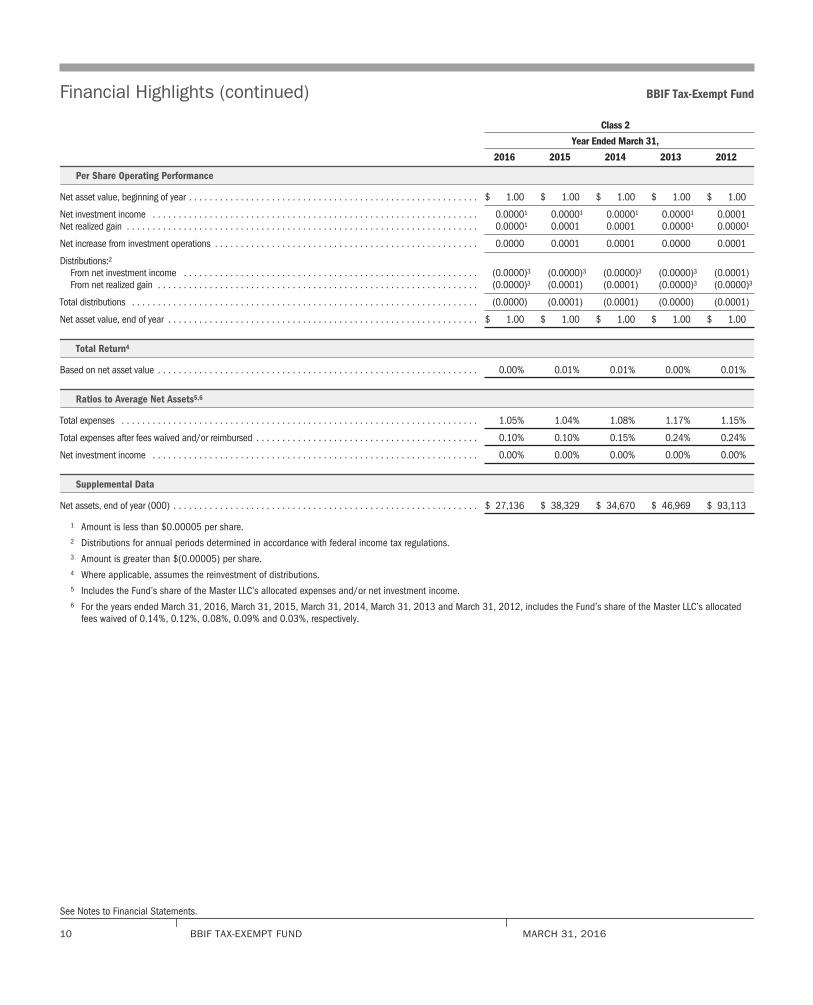
Financial Highlights (continued) BBIF Tax-Exempt Fund
Class 2
Year Ended March 31,
2016 2015 2014 2013 2012
Per Share Operating Performance
Net asset value, beginning of year . . . . . . . . . . . . . . . . . . . . . . . . . . . . . . . . . . . . . . . . . . . . . . . . . . . . . . . . $ 1.00 $ 1.00 $ 1.00 $ 1.00 $ 1.00
Net investment income . . . . . . . . . . . . . . . . . . . . . . . . . . . . . . . . . . . . . . . . . . . . . . . . . . . . . . . . . . . . . . . 0.00001 0.00001 0.00001 0.00001 0.0001Net realized gain . . . . . . . . . . . . . . . . . . . . . . . . . . . . . . . . . . . . . . . . . . . . . . . . . . . . . . . . . . . . . . . . . . . . 0.00001 0.0001 0.0001 0.00001 0.00001
Net increase from investment operations . . . . . . . . . . . . . . . . . . . . . . . . . . . . . . . . . . . . . . . . . . . . . . . . . . . 0.0000 0.0001 0.0001 0.0000 0.0001
Distributions:2From net investment income . . . . . . . . . . . . . . . . . . . . . . . . . . . . . . . . . . . . . . . . . . . . . . . . . . . . . . . . . (0.0000)3 (0.0000)3 (0.0000)3 (0.0000)3 (0.0001)From net realized gain . . . . . . . . . . . . . . . . . . . . . . . . . . . . . . . . . . . . . . . . . . . . . . . . . . . . . . . . . . . . . . (0.0000)3 (0.0001) (0.0001) (0.0000)3 (0.0000)3
Total distributions . . . . . . . . . . . . . . . . . . . . . . . . . . . . . . . . . . . . . . . . . . . . . . . . . . . . . . . . . . . . . . . . . . . (0.0000) (0.0001) (0.0001) (0.0000) (0.0001)
Net asset value, end of year . . . . . . . . . . . . . . . . . . . . . . . . . . . . . . . . . . . . . . . . . . . . . . . . . . . . . . . . . . . . $ 1.00 $ 1.00 $ 1.00 $ 1.00 $ 1.00
Total Return4
Based on net asset value . . . . . . . . . . . . . . . . . . . . . . . . . . . . . . . . . . . . . . . . . . . . . . . . . . . . . . . . . . . . . . 0.00% 0.01% 0.01% 0.00% 0.01%
Ratios to Average Net Assets5,6
Total expenses . . . . . . . . . . . . . . . . . . . . . . . . . . . . . . . . . . . . . . . . . . . . . . . . . . . . . . . . . . . . . . . . . . . . . 1.05% 1.04% 1.08% 1.17% 1.15%
Total expenses after fees waived and/or reimbursed . . . . . . . . . . . . . . . . . . . . . . . . . . . . . . . . . . . . . . . . . . . 0.10% 0.10% 0.15% 0.24% 0.24%
Net investment income . . . . . . . . . . . . . . . . . . . . . . . . . . . . . . . . . . . . . . . . . . . . . . . . . . . . . . . . . . . . . . . 0.00% 0.00% 0.00% 0.00% 0.00%
Supplemental Data
Net assets, end of year (000) . . . . . . . . . . . . . . . . . . . . . . . . . . . . . . . . . . . . . . . . . . . . . . . . . . . . . . . . . . . $ 27,136 $ 38,329 $ 34,670 $ 46,969 $ 93,113
1 Amount is less than $0.00005 per share.2 Distributions for annual periods determined in accordance with federal income tax regulations.3 Amount is greater than $(0.00005) per share.4 Where applicable, assumes the reinvestment of distributions.5 Includes the Fund’s share of the Master LLC’s allocated expenses and/or net investment income.6 For the years ended March 31, 2016, March 31, 2015, March 31, 2014, March 31, 2013 and March 31, 2012, includes the Fund’s share of the Master LLC’s allocated
fees waived of 0.14%, 0.12%, 0.08%, 0.09% and 0.03%, respectively.
See Notes to Financial Statements.
10 BBIF TAX-EXEMPT FUND MARCH 31, 2016

Financial Highlights (continued) BBIF Tax-Exempt Fund
Class 3
Year Ended March 31,
2016 2015 2014 2013 2012
Per Share Operating Performance
Net asset value, beginning of year . . . . . . . . . . . . . . . . . . . . . . . . . . . . . . . . . . . . . . . . . . . . . . . . . . . . . $ 1.00 $ 1.00 $ 1.00 $ 1.00 $ 1.00
Net investment income . . . . . . . . . . . . . . . . . . . . . . . . . . . . . . . . . . . . . . . . . . . . . . . . . . . . . . . . . . . . . 0.00001 0.00001 0.00001 0.00001 0.0001Net realized gain . . . . . . . . . . . . . . . . . . . . . . . . . . . . . . . . . . . . . . . . . . . . . . . . . . . . . . . . . . . . . . . . . . 0.00001 0.0001 0.0001 0.00001 0.00001
Net increase from investment operations . . . . . . . . . . . . . . . . . . . . . . . . . . . . . . . . . . . . . . . . . . . . . . . . 0.0000 0.0001 0.0001 0.0000 0.0001
Distributions:2From net investment income . . . . . . . . . . . . . . . . . . . . . . . . . . . . . . . . . . . . . . . . . . . . . . . . . . . . . . . (0.0000)3 (0.0000)3 (0.0000)3 (0.0000)3 (0.0001)From net realized gain . . . . . . . . . . . . . . . . . . . . . . . . . . . . . . . . . . . . . . . . . . . . . . . . . . . . . . . . . . . . (0.0000)3 (0.0001) (0.0001) (0.0000)3 (0.0000)3
Total distributions . . . . . . . . . . . . . . . . . . . . . . . . . . . . . . . . . . . . . . . . . . . . . . . . . . . . . . . . . . . . . . . . . (0.0000) (0.0001) (0.0001) (0.0000) (0.0001)
Net asset value, end of year . . . . . . . . . . . . . . . . . . . . . . . . . . . . . . . . . . . . . . . . . . . . . . . . . . . . . . . . . $ 1.00 $ 1.00 $ 1.00 $ 1.00 $ 1.00
Total Return4
Based on net asset value . . . . . . . . . . . . . . . . . . . . . . . . . . . . . . . . . . . . . . . . . . . . . . . . . . . . . . . . . . . 0.00% 0.01% 0.01% 0.00% 0.01%
Ratios to Average Net Assets5,6
Total expenses . . . . . . . . . . . . . . . . . . . . . . . . . . . . . . . . . . . . . . . . . . . . . . . . . . . . . . . . . . . . . . . . . . . 0.75% 0.73% 0.77% 0.87% 0.84%
Total expenses after fees waived and/or reimbursed . . . . . . . . . . . . . . . . . . . . . . . . . . . . . . . . . . . . . . . . 0.10% 0.11% 0.15% 0.24% 0.24%
Net investment income . . . . . . . . . . . . . . . . . . . . . . . . . . . . . . . . . . . . . . . . . . . . . . . . . . . . . . . . . . . . . 0.00% 0.00% 0.00% 0.00% 0.00%
Supplemental Data
Net assets, end of year (000) . . . . . . . . . . . . . . . . . . . . . . . . . . . . . . . . . . . . . . . . . . . . . . . . . . . . . . . . $ 105,409 $ 127,273 $ 136,502 $ 139,022 $ 223,118
1 Amount is less than $0.00005 per share.2 Distributions for annual periods determined in accordance with federal income tax regulations.3 Amount is greater than $(0.00005) per share.4 Where applicable, assumes the reinvestment of distributions.5 Includes the Fund’s share of the Master LLC’s allocated expenses and/or net investment income.6 For the years ended March 31, 2016, March 31, 2015, March 31, 2014, March 31, 2013 and March 31, 2012, includes the Fund’s share of the Master LLC’s allocated
fees waived of 0.14%, 0.12%, 0.08%, 0.09% and 0.03%, respectively.
See Notes to Financial Statements.
BBIF TAX-EXEMPT FUND MARCH 31, 2016 11
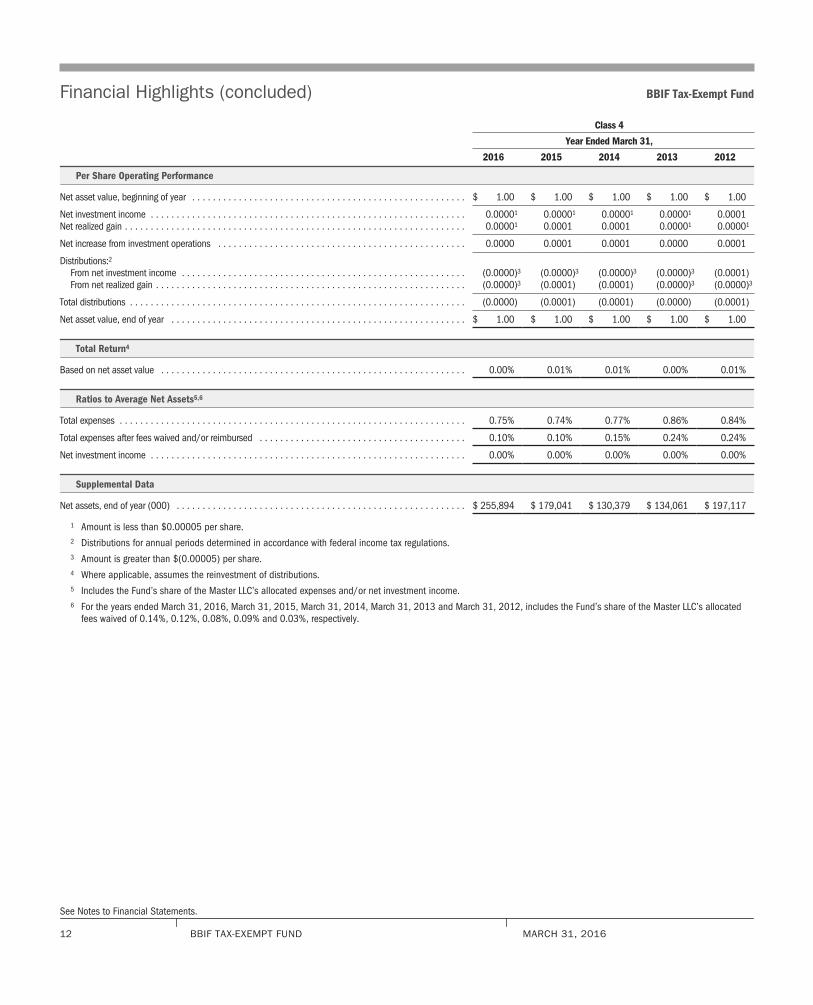
Financial Highlights (concluded) BBIF Tax-Exempt Fund
Class 4
Year Ended March 31,
2016 2015 2014 2013 2012
Per Share Operating Performance
Net asset value, beginning of year . . . . . . . . . . . . . . . . . . . . . . . . . . . . . . . . . . . . . . . . . . . . . . . . . . . . . $ 1.00 $ 1.00 $ 1.00 $ 1.00 $ 1.00
Net investment income . . . . . . . . . . . . . . . . . . . . . . . . . . . . . . . . . . . . . . . . . . . . . . . . . . . . . . . . . . . . . 0.00001 0.00001 0.00001 0.00001 0.0001Net realized gain . . . . . . . . . . . . . . . . . . . . . . . . . . . . . . . . . . . . . . . . . . . . . . . . . . . . . . . . . . . . . . . . . . 0.00001 0.0001 0.0001 0.00001 0.00001
Net increase from investment operations . . . . . . . . . . . . . . . . . . . . . . . . . . . . . . . . . . . . . . . . . . . . . . . . 0.0000 0.0001 0.0001 0.0000 0.0001
Distributions:2From net investment income . . . . . . . . . . . . . . . . . . . . . . . . . . . . . . . . . . . . . . . . . . . . . . . . . . . . . . . (0.0000)3 (0.0000)3 (0.0000)3 (0.0000)3 (0.0001)From net realized gain . . . . . . . . . . . . . . . . . . . . . . . . . . . . . . . . . . . . . . . . . . . . . . . . . . . . . . . . . . . . (0.0000)3 (0.0001) (0.0001) (0.0000)3 (0.0000)3
Total distributions . . . . . . . . . . . . . . . . . . . . . . . . . . . . . . . . . . . . . . . . . . . . . . . . . . . . . . . . . . . . . . . . . (0.0000) (0.0001) (0.0001) (0.0000) (0.0001)
Net asset value, end of year . . . . . . . . . . . . . . . . . . . . . . . . . . . . . . . . . . . . . . . . . . . . . . . . . . . . . . . . . $ 1.00 $ 1.00 $ 1.00 $ 1.00 $ 1.00
Total Return4
Based on net asset value . . . . . . . . . . . . . . . . . . . . . . . . . . . . . . . . . . . . . . . . . . . . . . . . . . . . . . . . . . . 0.00% 0.01% 0.01% 0.00% 0.01%
Ratios to Average Net Assets5,6
Total expenses . . . . . . . . . . . . . . . . . . . . . . . . . . . . . . . . . . . . . . . . . . . . . . . . . . . . . . . . . . . . . . . . . . . 0.75% 0.74% 0.77% 0.86% 0.84%
Total expenses after fees waived and/or reimbursed . . . . . . . . . . . . . . . . . . . . . . . . . . . . . . . . . . . . . . . . 0.10% 0.10% 0.15% 0.24% 0.24%
Net investment income . . . . . . . . . . . . . . . . . . . . . . . . . . . . . . . . . . . . . . . . . . . . . . . . . . . . . . . . . . . . . 0.00% 0.00% 0.00% 0.00% 0.00%
Supplemental Data
Net assets, end of year (000) . . . . . . . . . . . . . . . . . . . . . . . . . . . . . . . . . . . . . . . . . . . . . . . . . . . . . . . . $ 255,894 $ 179,041 $ 130,379 $ 134,061 $ 197,117
1 Amount is less than $0.00005 per share.2 Distributions for annual periods determined in accordance with federal income tax regulations.3 Amount is greater than $(0.00005) per share.4 Where applicable, assumes the reinvestment of distributions.5 Includes the Fund’s share of the Master LLC’s allocated expenses and/or net investment income.6 For the years ended March 31, 2016, March 31, 2015, March 31, 2014, March 31, 2013 and March 31, 2012, includes the Fund’s share of the Master LLC’s allocated
fees waived of 0.14%, 0.12%, 0.08%, 0.09% and 0.03%, respectively.
See Notes to Financial Statements.
12 BBIF TAX-EXEMPT FUND MARCH 31, 2016
Notes to Financial Statements BBIF Tax-Exempt Fund
1. Organization:
BBIF Tax-Exempt Fund (the “Fund”) is registered under the Investment Company Act of 1940, as amended (the “1940 Act”), as a diversified, open-end management investment company. The Fund is organized as a Massachusetts business trust. The Fund seeks to achieve its investment objectiveby investing all of its assets in Master Tax-Exempt LLC (the “Master LLC”), an affiliate of the Fund, which has the same investment objective and strat-egies as the Fund. The value of the Fund’s investment in the Master LLC reflects the Fund’s proportionate interest in the net assets of the Master LLC.The performance of the Fund is directly affected by the performance of the Master LLC. At period end, the percentage of the Master LLC owned by theFund was 13.6%. The financial statements of the Master LLC, including the Schedule of Investments, are included elsewhere in this report and shouldbe read in conjunction with the Fund’s financial statements.
The Fund offers multiple classes of shares. All classes of shares have identical voting, dividend, liquidation and other rights and are subject to thesame terms and conditions, except that each bears certain expenses related to shareholder servicing and expenses related to the distribution of suchshares. Class 1, Class 2, Class 3 and Class 4 Shares are only available through exchanges and distribution reinvestments by current holders and forpurchase by certain employer-sponsored retirement plans. Each class has exclusive voting rights with respect to matters relating to its shareholderservicing and distribution expenditures. The Board of Trustees of the Fund and Board of Directors of the Master LLC are referred to throughout thisreport as the “Board of Directors” or the “Board” and the members are referred to as “Directors.”
On February 18, 2016, the Board approved a proposal to close the Fund to purchases and thereafter to liquidate the Fund. Accordingly, effective onJuly 11, 2016, the Fund will no longer accept purchases orders. On or about July 15, 2016 (the “Liquidation Date”), all of the assets of the Fund willbe liquidated completely, the shares outstanding on the Liquidation Date will be redeemed at the net asset value per share and the Fund will then beterminated.
The Fund, together with certain other registered investment companies advised by BlackRock Advisors, LLC (the “Administrator”) or its affiliates, isincluded in a complex of open-end funds referred to as the Equity-Liquidity Complex.
2. Significant Accounting Policies:
The financial statements are prepared in conformity with accounting principles generally accepted in the United States of America (“U.S. GAAP”),which may require management to make estimates and assumptions that affect the reported amounts of assets and liabilities in the financial state-ments, disclosure of contingent assets and liabilities at the date of the financial statements and the reported amounts of increases and decreases innet assets from operations during the reporting period. Actual results could differ from those estimates. The Fund is considered an investmentcompany under U.S. GAAP and follows the accounting and reporting guidance applicable to investment companies. Below is a summary of significantaccounting policies:
Investment Transactions and Investment Income: For financial reporting purposes, contributions to and withdrawals from the Master LLC areaccounted on a trade date basis. The Fund records daily its proportionate share of the Master LLC’s income, expenses and realized and unrealizedgains and losses. In addition, the Fund accrues its own expenses. Income, expenses and realized and unrealized gains and losses are allocated dailyto each class based on its relative net assets.
Distributions: Distributions from net investment income are declared and reinvested daily. Distributions of capital gains are distributed at least annu-ally and are recorded on the ex-dividend date. The character and timing of distributions are determined in accordance with federal income tax regu-lations, which may differ from U.S. GAAP.
Indemnifications: In the normal course of business, the Fund enters into contracts that contain a variety of representations that provide generalindemnification. The Fund’s maximum exposure under these arrangements is unknown because it involves future potential claims against the Fund,which cannot be predicted with any certainty.
Other: Expenses directly related to the Fund or its classes are charged to the Fund or the applicable class. Other operating expenses shared by sev-eral funds, including other funds managed by the Administrator, are prorated among those funds on the basis of relative net assets or other appro-priate methods. Expenses directly related to the Fund and other shared expenses prorated to the Fund are allocated daily to each class based on itsrelative net assets or other appropriate methods.
The Fund may earn interest on positive cash balances in demand deposit accounts that are maintained by the transfer agent on behalf of the Fund.This amount, if any, is shown as interest income in the Statement of Operations.
BBIF TAX-EXEMPT FUND MARCH 31, 2016 13
Notes to Financial Statements (continued) BBIF Tax-Exempt Fund
3. Investment Valuation and Fair Value Measurements:
Investment Valuation Policies: The Fund’s policy is to fair value its financial instruments at market value. The Fund records its investment in theMaster LLC at fair value based on the Fund’s proportionate interest in the net assets of the Master LLC. Valuation of securities held by the Master LLCis discussed in Note 3 of the Master LLC’s Notes to Financial Statements, which are included elsewhere in this report.
4. Administration Agreement and Other Transactions with Affiliates:
The PNC Financial Services Group, Inc. is the largest stockholder and an affiliate of BlackRock, Inc. (“BlackRock”) for 1940 Act purposes.
Administration
The Fund entered into an Administration Agreement with the Administrator, an indirect, wholly owned subsidiary of BlackRock, to provide admin-istrative services (other than investment advice and related portfolio activities). For such services, the Fund pays the Administrator a monthly fee at anannual rate of 0.25% of the average daily value of the Fund’s net assets. The Fund does not pay an investment advisory fee or investment manage-ment fee.
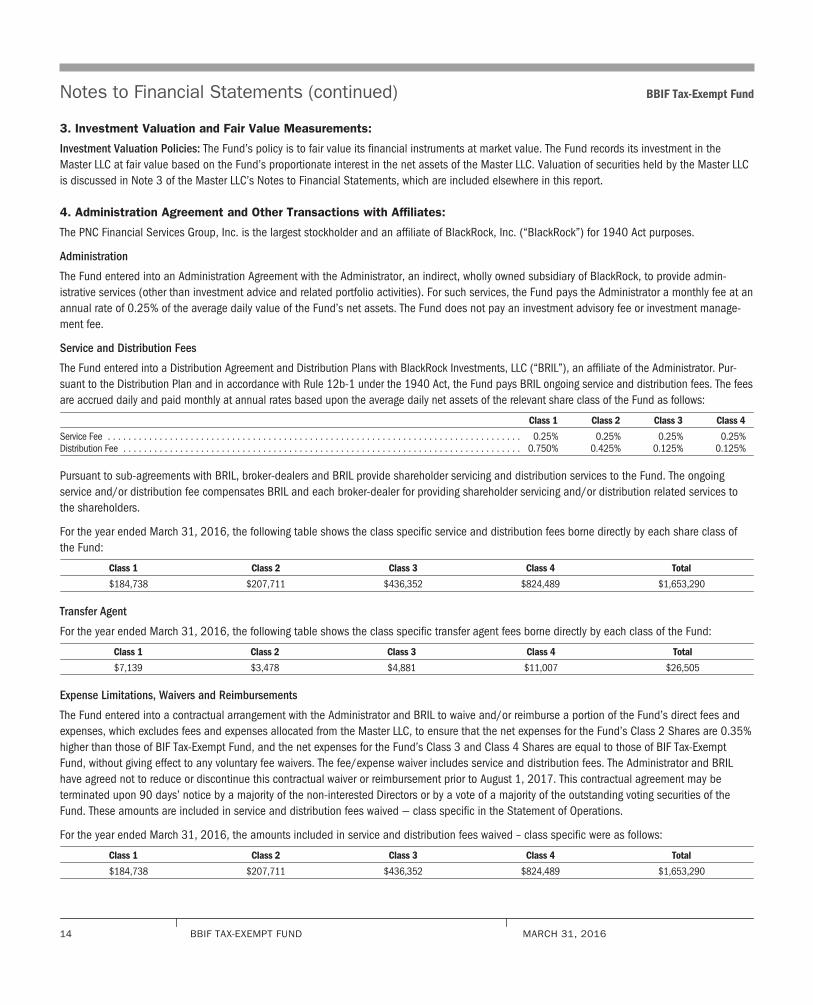
Service and Distribution Fees
The Fund entered into a Distribution Agreement and Distribution Plans with BlackRock Investments, LLC (“BRIL”), an affiliate of the Administrator. Pur-suant to the Distribution Plan and in accordance with Rule 12b-1 under the 1940 Act, the Fund pays BRIL ongoing service and distribution fees. The feesare accrued daily and paid monthly at annual rates based upon the average daily net assets of the relevant share class of the Fund as follows:
Class 1 Class 2 Class 3 Class 4
Service Fee . . . . . . . . . . . . . . . . . . . . . . . . . . . . . . . . . . . . . . . . . . . . . . . . . . . . . . . . . . . . . . . . . . . . . . . . . . . . . . . . 0.25% 0.25% 0.25% 0.25%Distribution Fee . . . . . . . . . . . . . . . . . . . . . . . . . . . . . . . . . . . . . . . . . . . . . . . . . . . . . . . . . . . . . . . . . . . . . . . . . . . . . 0.750% 0.425% 0.125% 0.125%
Pursuant to sub-agreements with BRIL, broker-dealers and BRIL provide shareholder servicing and distribution services to the Fund. The ongoingservice and/or distribution fee compensates BRIL and each broker-dealer for providing shareholder servicing and/or distribution related services tothe shareholders.
For the year ended March 31, 2016, the following table shows the class specific service and distribution fees borne directly by each share class ofthe Fund:
Class 1 Class 2 Class 3 Class 4 Total
$184,738 $207,711 $436,352 $824,489 $1,653,290
Transfer Agent
For the year ended March 31, 2016, the following table shows the class specific transfer agent fees borne directly by each class of the Fund:
Class 1 Class 2 Class 3 Class 4 Total
$7,139 $3,478 $4,881 $11,007 $26,505
Expense Limitations, Waivers and Reimbursements
The Fund entered into a contractual arrangement with the Administrator and BRIL to waive and/or reimburse a portion of the Fund’s direct fees andexpenses, which excludes fees and expenses allocated from the Master LLC, to ensure that the net expenses for the Fund’s Class 2 Shares are 0.35%higher than those of BIF Tax-Exempt Fund, and the net expenses for the Fund’s Class 3 and Class 4 Shares are equal to those of BIF Tax-ExemptFund, without giving effect to any voluntary fee waivers. The fee/expense waiver includes service and distribution fees. The Administrator and BRILhave agreed not to reduce or discontinue this contractual waiver or reimbursement prior to August 1, 2017. This contractual agreement may beterminated upon 90 days’ notice by a majority of the non-interested Directors or by a vote of a majority of the outstanding voting securities of theFund. These amounts are included in service and distribution fees waived — class specific in the Statement of Operations.
For the year ended March 31, 2016, the amounts included in service and distribution fees waived – class specific were as follows:
Class 1 Class 2 Class 3 Class 4 Total
$184,738 $207,711 $436,352 $824,489 $1,653,290
14 BBIF TAX-EXEMPT FUND MARCH 31, 2016
Notes to Financial Statements (continued) BBIF Tax-Exempt Fund
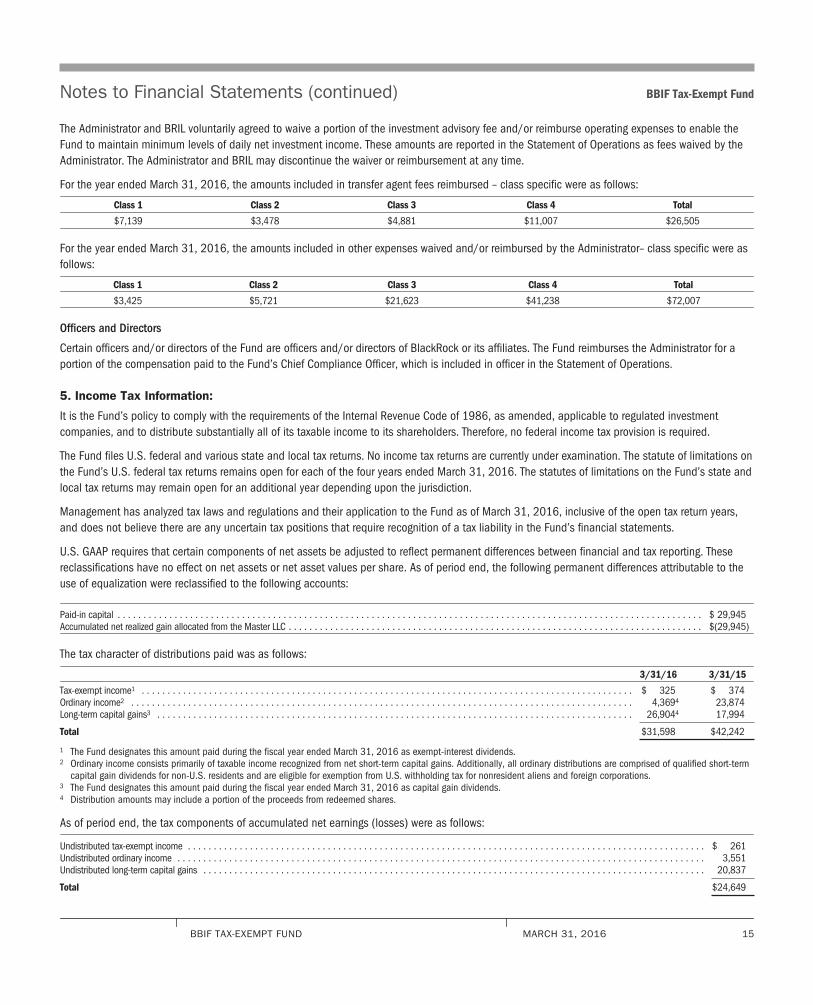
The Administrator and BRIL voluntarily agreed to waive a portion of the investment advisory fee and/or reimburse operating expenses to enable theFund to maintain minimum levels of daily net investment income. These amounts are reported in the Statement of Operations as fees waived by theAdministrator. The Administrator and BRIL may discontinue the waiver or reimbursement at any time.
For the year ended March 31, 2016, the amounts included in transfer agent fees reimbursed – class specific were as follows:
Class 1 Class 2 Class 3 Class 4 Total
$7,139 $3,478 $4,881 $11,007 $26,505
For the year ended March 31, 2016, the amounts included in other expenses waived and/or reimbursed by the Administrator– class specific were asfollows:
Class 1 Class 2 Class 3 Class 4 Total
$3,425 $5,721 $21,623 $41,238 $72,007
Officers and Directors
Certain officers and/or directors of the Fund are officers and/or directors of BlackRock or its affiliates. The Fund reimburses the Administrator for aportion of the compensation paid to the Fund’s Chief Compliance Officer, which is included in officer in the Statement of Operations.
5. Income Tax Information:
It is the Fund’s policy to comply with the requirements of the Internal Revenue Code of 1986, as amended, applicable to regulated investmentcompanies, and to distribute substantially all of its taxable income to its shareholders. Therefore, no federal income tax provision is required.
The Fund files U.S. federal and various state and local tax returns. No income tax returns are currently under examination. The statute of limitations onthe Fund’s U.S. federal tax returns remains open for each of the four years ended March 31, 2016. The statutes of limitations on the Fund’s state andlocal tax returns may remain open for an additional year depending upon the jurisdiction.
Management has analyzed tax laws and regulations and their application to the Fund as of March 31, 2016, inclusive of the open tax return years,and does not believe there are any uncertain tax positions that require recognition of a tax liability in the Fund’s financial statements.
U.S. GAAP requires that certain components of net assets be adjusted to reflect permanent differences between financial and tax reporting. Thesereclassifications have no effect on net assets or net asset values per share. As of period end, the following permanent differences attributable to theuse of equalization were reclassified to the following accounts:
Paid-in capital . . . . . . . . . . . . . . . . . . . . . . . . . . . . . . . . . . . . . . . . . . . . . . . . . . . . . . . . . . . . . . . . . . . . . . . . . . . . . . . . . . . . . . . . . . . . . . . . . . . . . . . . . . . . . . . . . $ 29,945Accumulated net realized gain allocated from the Master LLC . . . . . . . . . . . . . . . . . . . . . . . . . . . . . . . . . . . . . . . . . . . . . . . . . . . . . . . . . . . . . . . . . . . . . . . . . . . . . . . . $(29,945)
The tax character of distributions paid was as follows:
3/31/16 3/31/15
Tax-exempt income1 . . . . . . . . . . . . . . . . . . . . . . . . . . . . . . . . . . . . . . . . . . . . . . . . . . . . . . . . . . . . . . . . . . . . . . . . . . . . . . . . . . . . . . . . . . . . . . . $ 325 $ 374Ordinary income2 . . . . . . . . . . . . . . . . . . . . . . . . . . . . . . . . . . . . . . . . . . . . . . . . . . . . . . . . . . . . . . . . . . . . . . . . . . . . . . . . . . . . . . . . . . . . . . . . . 4,3694 23,874Long-term capital gains3 . . . . . . . . . . . . . . . . . . . . . . . . . . . . . . . . . . . . . . . . . . . . . . . . . . . . . . . . . . . . . . . . . . . . . . . . . . . . . . . . . . . . . . . . . . . . 26,9044 17,994
Total $31,598 $42,242
1 The Fund designates this amount paid during the fiscal year ended March 31, 2016 as exempt-interest dividends.2 Ordinary income consists primarily of taxable income recognized from net short-term capital gains. Additionally, all ordinary distributions are comprised of qualified short-term
capital gain dividends for non-U.S. residents and are eligible for exemption from U.S. withholding tax for nonresident aliens and foreign corporations.3 The Fund designates this amount paid during the fiscal year ended March 31, 2016 as capital gain dividends.4 Distribution amounts may include a portion of the proceeds from redeemed shares.
As of period end, the tax components of accumulated net earnings (losses) were as follows:
Undistributed tax-exempt income . . . . . . . . . . . . . . . . . . . . . . . . . . . . . . . . . . . . . . . . . . . . . . . . . . . . . . . . . . . . . . . . . . . . . . . . . . . . . . . . . . . . . . . . . . . . . . . . . . . . $ 261Undistributed ordinary income . . . . . . . . . . . . . . . . . . . . . . . . . . . . . . . . . . . . . . . . . . . . . . . . . . . . . . . . . . . . . . . . . . . . . . . . . . . . . . . . . . . . . . . . . . . . . . . . . . . . . . 3,551Undistributed long-term capital gains . . . . . . . . . . . . . . . . . . . . . . . . . . . . . . . . . . . . . . . . . . . . . . . . . . . . . . . . . . . . . . . . . . . . . . . . . . . . . . . . . . . . . . . . . . . . . . . . . 20,837
Total $24,649
BBIF TAX-EXEMPT FUND MARCH 31, 2016 15
Notes to Financial Statements (concluded) BBIF Tax-Exempt Fund
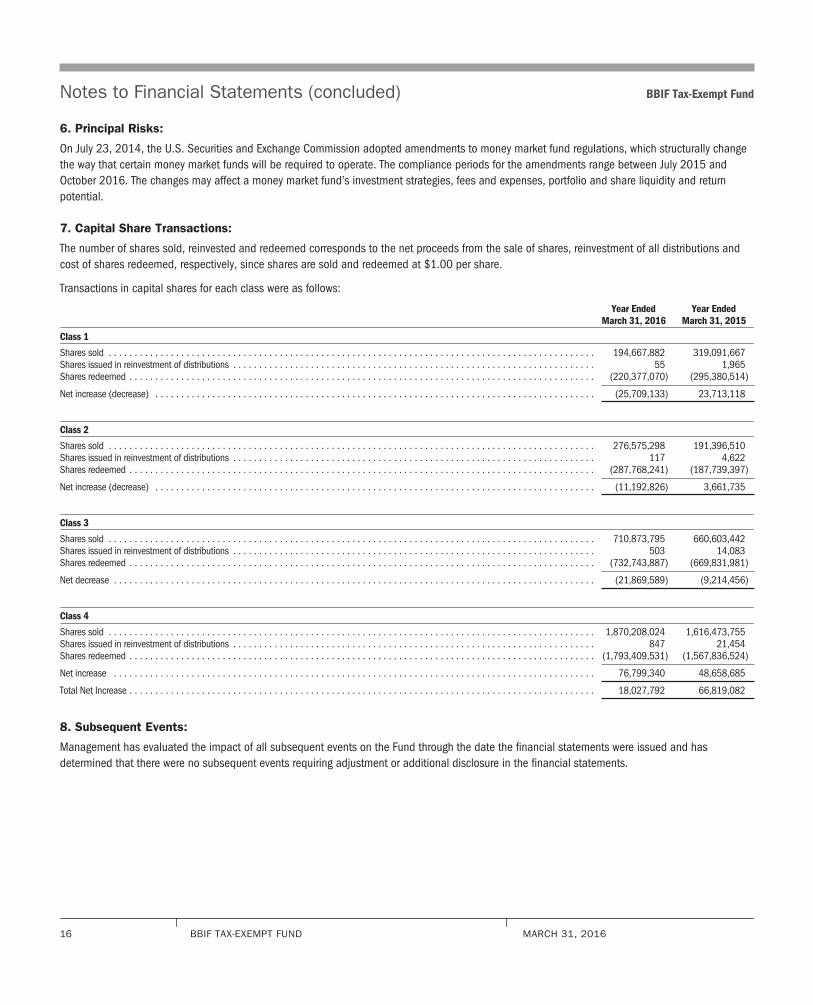
6. Principal Risks:
On July 23, 2014, the U.S. Securities and Exchange Commission adopted amendments to money market fund regulations, which structurally changethe way that certain money market funds will be required to operate. The compliance periods for the amendments range between July 2015 andOctober 2016. The changes may affect a money market fund’s investment strategies, fees and expenses, portfolio and share liquidity and returnpotential.
7. Capital Share Transactions:
The number of shares sold, reinvested and redeemed corresponds to the net proceeds from the sale of shares, reinvestment of all distributions andcost of shares redeemed, respectively, since shares are sold and redeemed at $1.00 per share.
Transactions in capital shares for each class were as follows:
Year EndedMarch 31, 2016
Year EndedMarch 31, 2015
Class 1
Shares sold . . . . . . . . . . . . . . . . . . . . . . . . . . . . . . . . . . . . . . . . . . . . . . . . . . . . . . . . . . . . . . . . . . . . . . . . . . . . . . . . . . . . . . . . . . . . . . 194,667,882 319,091,667Shares issued in reinvestment of distributions . . . . . . . . . . . . . . . . . . . . . . . . . . . . . . . . . . . . . . . . . . . . . . . . . . . . . . . . . . . . . . . . . . . . . . 55 1,965Shares redeemed . . . . . . . . . . . . . . . . . . . . . . . . . . . . . . . . . . . . . . . . . . . . . . . . . . . . . . . . . . . . . . . . . . . . . . . . . . . . . . . . . . . . . . . . . . (220,377,070) (295,380,514)
Net increase (decrease) . . . . . . . . . . . . . . . . . . . . . . . . . . . . . . . . . . . . . . . . . . . . . . . . . . . . . . . . . . . . . . . . . . . . . . . . . . . . . . . . . . . . . (25,709,133) 23,713,118
Class 2
Shares sold . . . . . . . . . . . . . . . . . . . . . . . . . . . . . . . . . . . . . . . . . . . . . . . . . . . . . . . . . . . . . . . . . . . . . . . . . . . . . . . . . . . . . . . . . . . . . . 276,575,298 191,396,510Shares issued in reinvestment of distributions . . . . . . . . . . . . . . . . . . . . . . . . . . . . . . . . . . . . . . . . . . . . . . . . . . . . . . . . . . . . . . . . . . . . . . 117 4,622Shares redeemed . . . . . . . . . . . . . . . . . . . . . . . . . . . . . . . . . . . . . . . . . . . . . . . . . . . . . . . . . . . . . . . . . . . . . . . . . . . . . . . . . . . . . . . . . . (287,768,241) (187,739,397)
Net increase (decrease) . . . . . . . . . . . . . . . . . . . . . . . . . . . . . . . . . . . . . . . . . . . . . . . . . . . . . . . . . . . . . . . . . . . . . . . . . . . . . . . . . . . . . (11,192,826) 3,661,735
Class 3
Shares sold . . . . . . . . . . . . . . . . . . . . . . . . . . . . . . . . . . . . . . . . . . . . . . . . . . . . . . . . . . . . . . . . . . . . . . . . . . . . . . . . . . . . . . . . . . . . . . 710,873,795 660,603,442Shares issued in reinvestment of distributions . . . . . . . . . . . . . . . . . . . . . . . . . . . . . . . . . . . . . . . . . . . . . . . . . . . . . . . . . . . . . . . . . . . . . . 503 14,083Shares redeemed . . . . . . . . . . . . . . . . . . . . . . . . . . . . . . . . . . . . . . . . . . . . . . . . . . . . . . . . . . . . . . . . . . . . . . . . . . . . . . . . . . . . . . . . . . (732,743,887) (669,831,981)
Net decrease . . . . . . . . . . . . . . . . . . . . . . . . . . . . . . . . . . . . . . . . . . . . . . . . . . . . . . . . . . . . . . . . . . . . . . . . . . . . . . . . . . . . . . . . . . . . . (21,869,589) (9,214,456)
Class 4
Shares sold . . . . . . . . . . . . . . . . . . . . . . . . . . . . . . . . . . . . . . . . . . . . . . . . . . . . . . . . . . . . . . . . . . . . . . . . . . . . . . . . . . . . . . . . . . . . . . 1,870,208,024 1,616,473,755Shares issued in reinvestment of distributions . . . . . . . . . . . . . . . . . . . . . . . . . . . . . . . . . . . . . . . . . . . . . . . . . . . . . . . . . . . . . . . . . . . . . . 847 21,454Shares redeemed . . . . . . . . . . . . . . . . . . . . . . . . . . . . . . . . . . . . . . . . . . . . . . . . . . . . . . . . . . . . . . . . . . . . . . . . . . . . . . . . . . . . . . . . . . (1,793,409,531) (1,567,836,524)
Net increase . . . . . . . . . . . . . . . . . . . . . . . . . . . . . . . . . . . . . . . . . . . . . . . . . . . . . . . . . . . . . . . . . . . . . . . . . . . . . . . . . . . . . . . . . . . . . 76,799,340 48,658,685
Total Net Increase . . . . . . . . . . . . . . . . . . . . . . . . . . . . . . . . . . . . . . . . . . . . . . . . . . . . . . . . . . . . . . . . . . . . . . . . . . . . . . . . . . . . . . . . . . 18,027,792 66,819,082
8. Subsequent Events:
Management has evaluated the impact of all subsequent events on the Fund through the date the financial statements were issued and hasdetermined that there were no subsequent events requiring adjustment or additional disclosure in the financial statements.
16 BBIF TAX-EXEMPT FUND MARCH 31, 2016
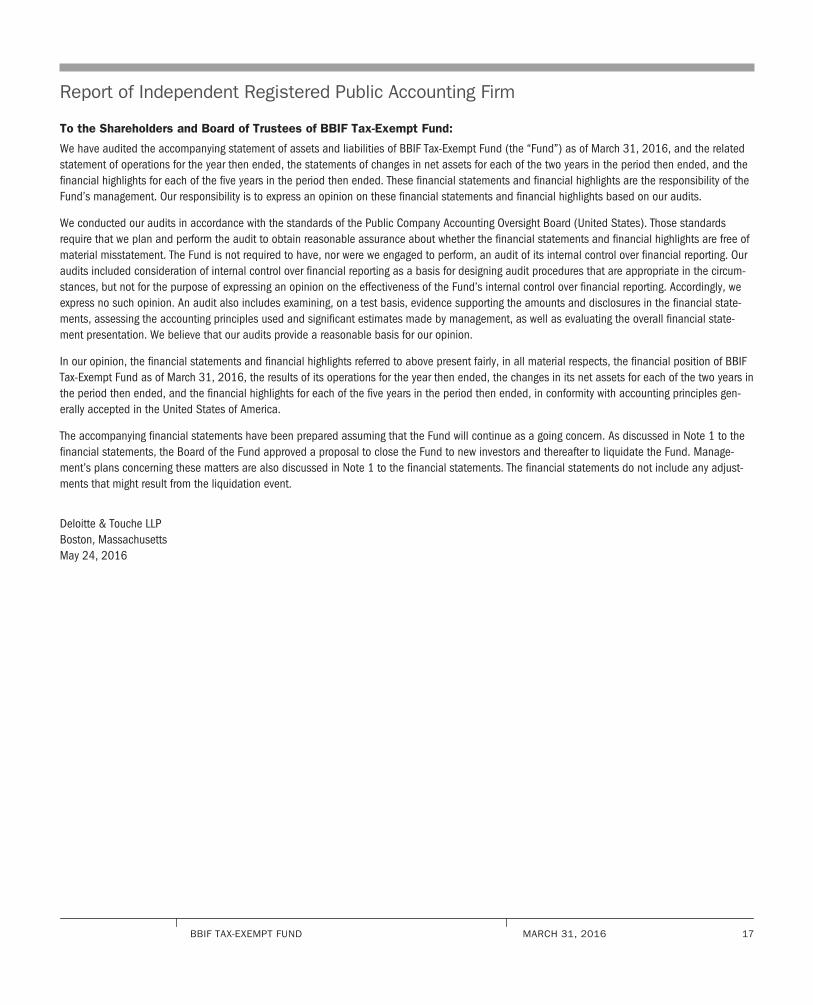
Report of Independent Registered Public Accounting Firm
To the Shareholders and Board of Trustees of BBIF Tax-Exempt Fund:
We have audited the accompanying statement of assets and liabilities of BBIF Tax-Exempt Fund (the “Fund”) as of March 31, 2016, and the relatedstatement of operations for the year then ended, the statements of changes in net assets for each of the two years in the period then ended, and thefinancial highlights for each of the five years in the period then ended. These financial statements and financial highlights are the responsibility of theFund’s management. Our responsibility is to express an opinion on these financial statements and financial highlights based on our audits.
We conducted our audits in accordance with the standards of the Public Company Accounting Oversight Board (United States). Those standardsrequire that we plan and perform the audit to obtain reasonable assurance about whether the financial statements and financial highlights are free ofmaterial misstatement. The Fund is not required to have, nor were we engaged to perform, an audit of its internal control over financial reporting. Ouraudits included consideration of internal control over financial reporting as a basis for designing audit procedures that are appropriate in the circum-stances, but not for the purpose of expressing an opinion on the effectiveness of the Fund’s internal control over financial reporting. Accordingly, weexpress no such opinion. An audit also includes examining, on a test basis, evidence supporting the amounts and disclosures in the financial state-ments, assessing the accounting principles used and significant estimates made by management, as well as evaluating the overall financial state-ment presentation. We believe that our audits provide a reasonable basis for our opinion.
In our opinion, the financial statements and financial highlights referred to above present fairly, in all material respects, the financial position of BBIFTax-Exempt Fund as of March 31, 2016, the results of its operations for the year then ended, the changes in its net assets for each of the two years inthe period then ended, and the financial highlights for each of the five years in the period then ended, in conformity with accounting principles gen-erally accepted in the United States of America.
The accompanying financial statements have been prepared assuming that the Fund will continue as a going concern. As discussed in Note 1 to thefinancial statements, the Board of the Fund approved a proposal to close the Fund to new investors and thereafter to liquidate the Fund. Manage-ment’s plans concerning these matters are also discussed in Note 1 to the financial statements. The financial statements do not include any adjust-ments that might result from the liquidation event.
Deloitte & Touche LLPBoston, MassachusettsMay 24, 2016
BBIF TAX-EXEMPT FUND MARCH 31, 2016 17
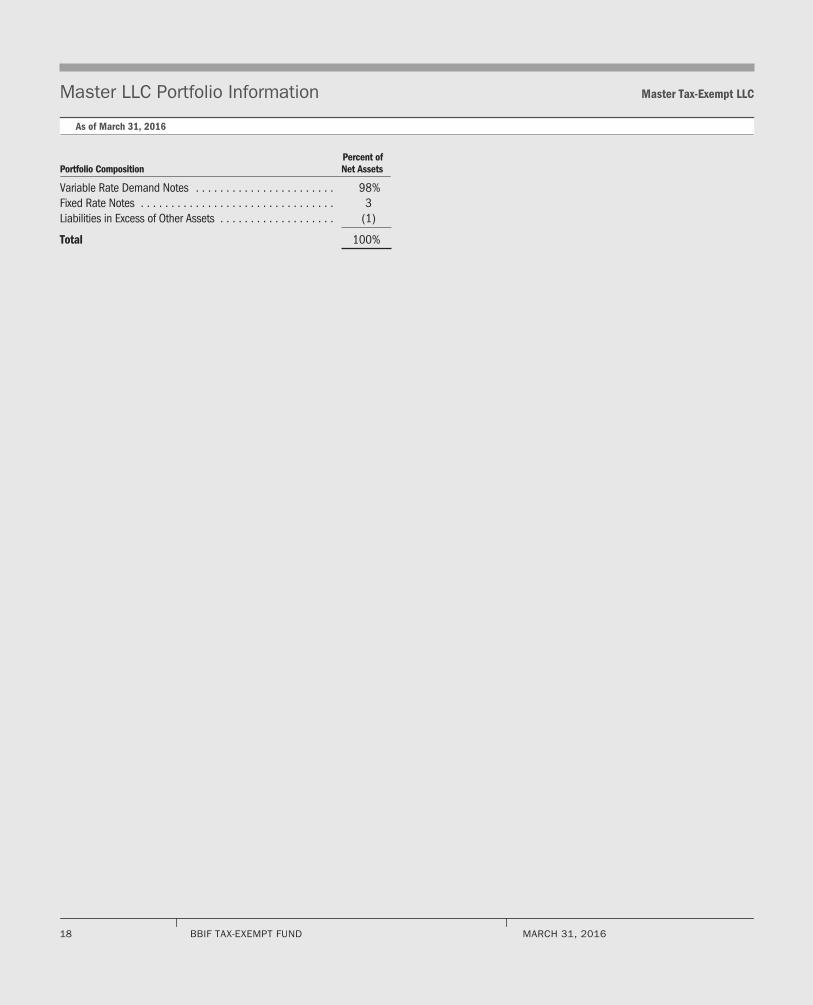
Master LLC Portfolio Information Master Tax-Exempt LLC
As of March 31, 2016
Portfolio CompositionPercent ofNet Assets
Variable Rate Demand Notes . . . . . . . . . . . . . . . . . . . . . . . 98%Fixed Rate Notes . . . . . . . . . . . . . . . . . . . . . . . . . . . . . . . . 3Liabilities in Excess of Other Assets . . . . . . . . . . . . . . . . . . . (1)
Total 100%
18 BBIF TAX-EXEMPT FUND MARCH 31, 2016
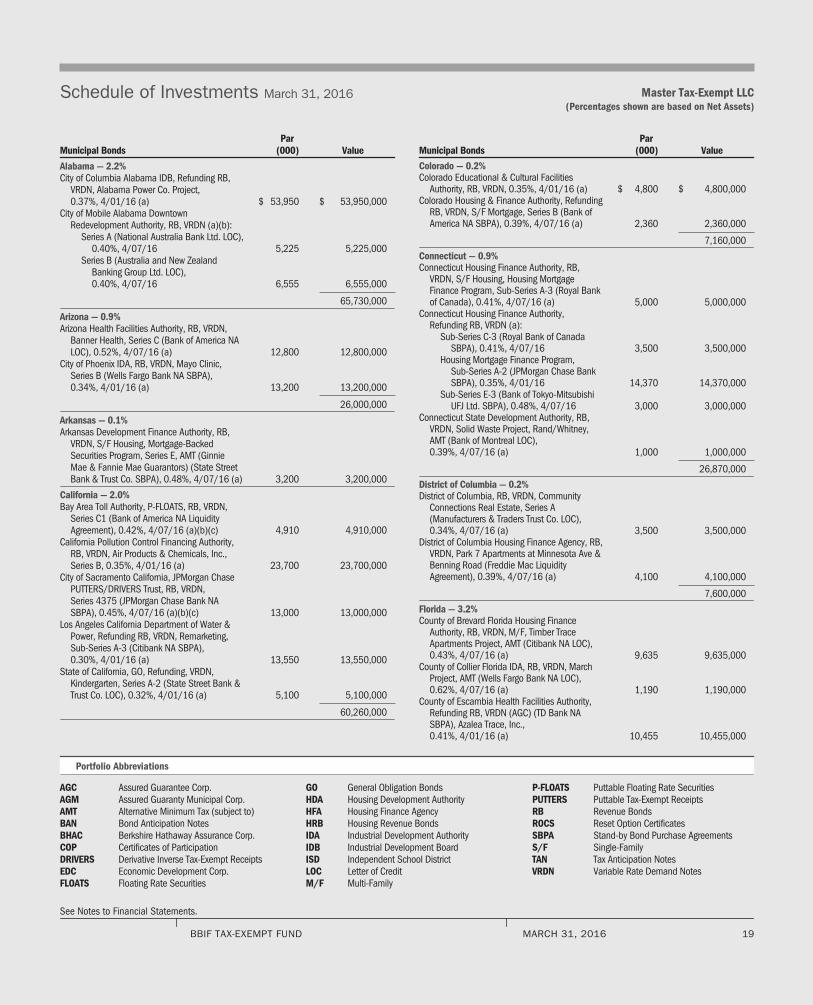
Schedule of Investments March 31, 2016 Master Tax-Exempt LLC(Percentages shown are based on Net Assets)
Municipal BondsPar
(000) Value
Alabama — 2.2%City of Columbia Alabama IDB, Refunding RB,
VRDN, Alabama Power Co. Project,0.37%, 4/01/16 (a) $ 53,950 $ 53,950,000
City of Mobile Alabama DowntownRedevelopment Authority, RB, VRDN (a)(b):
Series A (National Australia Bank Ltd. LOC),0.40%, 4/07/16 5,225 5,225,000
Series B (Australia and New ZealandBanking Group Ltd. LOC),0.40%, 4/07/16 6,555 6,555,000
65,730,000
Arizona — 0.9%Arizona Health Facilities Authority, RB, VRDN,
Banner Health, Series C (Bank of America NALOC), 0.52%, 4/07/16 (a) 12,800 12,800,000
City of Phoenix IDA, RB, VRDN, Mayo Clinic,Series B (Wells Fargo Bank NA SBPA),0.34%, 4/01/16 (a) 13,200 13,200,000
26,000,000
Arkansas — 0.1%Arkansas Development Finance Authority, RB,
VRDN, S/F Housing, Mortgage-BackedSecurities Program, Series E, AMT (GinnieMae & Fannie Mae Guarantors) (State StreetBank & Trust Co. SBPA), 0.48%, 4/07/16 (a) 3,200 3,200,000
California — 2.0%Bay Area Toll Authority, P-FLOATS, RB, VRDN,
Series C1 (Bank of America NA LiquidityAgreement), 0.42%, 4/07/16 (a)(b)(c) 4,910 4,910,000
California Pollution Control Financing Authority,RB, VRDN, Air Products & Chemicals, Inc.,Series B, 0.35%, 4/01/16 (a) 23,700 23,700,000
City of Sacramento California, JPMorgan ChasePUTTERS/DRIVERS Trust, RB, VRDN,Series 4375 (JPMorgan Chase Bank NASBPA), 0.45%, 4/07/16 (a)(b)(c) 13,000 13,000,000
Los Angeles California Department of Water &Power, Refunding RB, VRDN, Remarketing,Sub-Series A-3 (Citibank NA SBPA),0.30%, 4/01/16 (a) 13,550 13,550,000
State of California, GO, Refunding, VRDN,Kindergarten, Series A-2 (State Street Bank &Trust Co. LOC), 0.32%, 4/01/16 (a) 5,100 5,100,000
60,260,000
Municipal BondsPar
(000) Value
Colorado — 0.2%Colorado Educational & Cultural Facilities
Authority, RB, VRDN, 0.35%, 4/01/16 (a) $ 4,800 $ 4,800,000Colorado Housing & Finance Authority, Refunding
RB, VRDN, S/F Mortgage, Series B (Bank ofAmerica NA SBPA), 0.39%, 4/07/16 (a) 2,360 2,360,000
7,160,000
Connecticut — 0.9%Connecticut Housing Finance Authority, RB,
VRDN, S/F Housing, Housing MortgageFinance Program, Sub-Series A-3 (Royal Bankof Canada), 0.41%, 4/07/16 (a) 5,000 5,000,000
Connecticut Housing Finance Authority,Refunding RB, VRDN (a):
Sub-Series C-3 (Royal Bank of CanadaSBPA), 0.41%, 4/07/16 3,500 3,500,000
Housing Mortgage Finance Program,Sub-Series A-2 (JPMorgan Chase BankSBPA), 0.35%, 4/01/16 14,370 14,370,000
Sub-Series E-3 (Bank of Tokyo-MitsubishiUFJ Ltd. SBPA), 0.48%, 4/07/16 3,000 3,000,000
Connecticut State Development Authority, RB,VRDN, Solid Waste Project, Rand/Whitney,AMT (Bank of Montreal LOC),0.39%, 4/07/16 (a) 1,000 1,000,000
26,870,000
District of Columbia — 0.2%District of Columbia, RB, VRDN, Community
Connections Real Estate, Series A(Manufacturers & Traders Trust Co. LOC),0.34%, 4/07/16 (a) 3,500 3,500,000
District of Columbia Housing Finance Agency, RB,VRDN, Park 7 Apartments at Minnesota Ave &Benning Road (Freddie Mac LiquidityAgreement), 0.39%, 4/07/16 (a) 4,100 4,100,000
7,600,000
Florida — 3.2%County of Brevard Florida Housing Finance
Authority, RB, VRDN, M/F, Timber TraceApartments Project, AMT (Citibank NA LOC),0.43%, 4/07/16 (a) 9,635 9,635,000
County of Collier Florida IDA, RB, VRDN, MarchProject, AMT (Wells Fargo Bank NA LOC),0.62%, 4/07/16 (a) 1,190 1,190,000
County of Escambia Health Facilities Authority,Refunding RB, VRDN (AGC) (TD Bank NASBPA), Azalea Trace, Inc.,0.41%, 4/01/16 (a) 10,455 10,455,000
Portfolio Abbreviations
AGC Assured Guarantee Corp. GO General Obligation Bonds P-FLOATS Puttable Floating Rate SecuritiesAGM Assured Guaranty Municipal Corp. HDA Housing Development Authority PUTTERS Puttable Tax-Exempt ReceiptsAMT Alternative Minimum Tax (subject to) HFA Housing Finance Agency RB Revenue BondsBAN Bond Anticipation Notes HRB Housing Revenue Bonds ROCS Reset Option CertificatesBHAC Berkshire Hathaway Assurance Corp. IDA Industrial Development Authority SBPA Stand-by Bond Purchase AgreementsCOP Certificates of Participation IDB Industrial Development Board S/F Single-FamilyDRIVERS Derivative Inverse Tax-Exempt Receipts ISD Independent School District TAN Tax Anticipation NotesEDC Economic Development Corp. LOC Letter of Credit VRDN Variable Rate Demand NotesFLOATS Floating Rate Securities M/F Multi-Family
See Notes to Financial Statements.
BBIF TAX-EXEMPT FUND MARCH 31, 2016 19
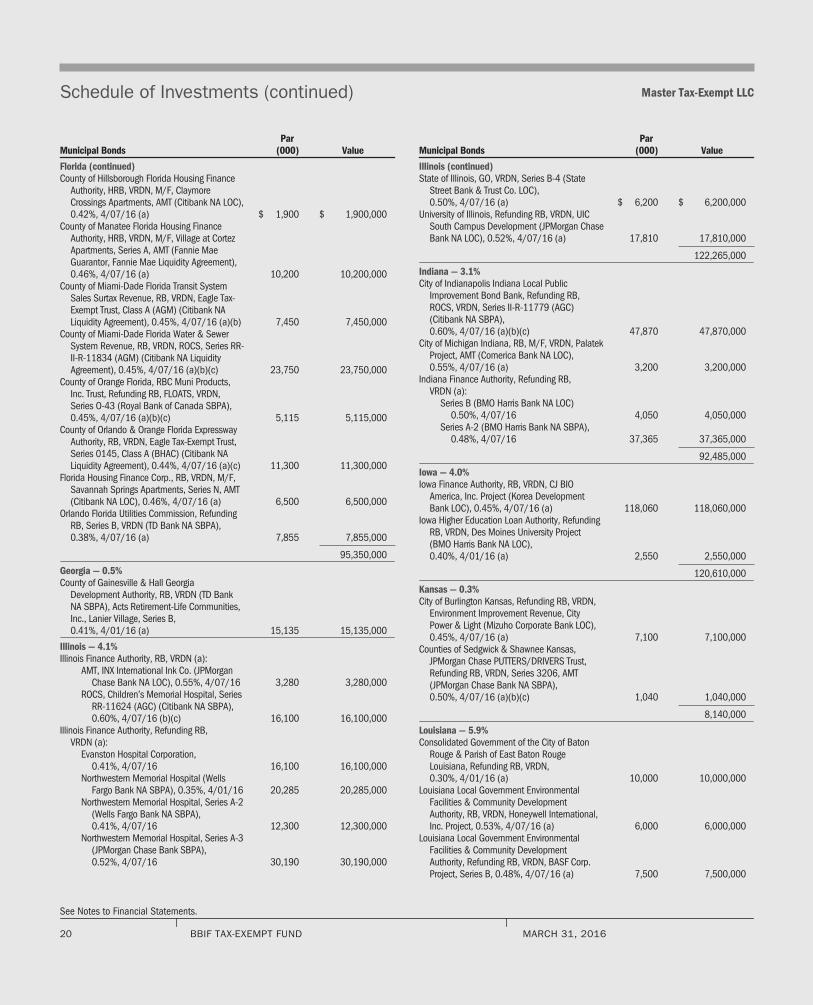
Schedule of Investments (continued) Master Tax-Exempt LLC
Municipal BondsPar
(000) Value
Florida (continued)County of Hillsborough Florida Housing Finance
Authority, HRB, VRDN, M/F, ClaymoreCrossings Apartments, AMT (Citibank NA LOC),0.42%, 4/07/16 (a) $ 1,900 $ 1,900,000
County of Manatee Florida Housing FinanceAuthority, HRB, VRDN, M/F, Village at CortezApartments, Series A, AMT (Fannie MaeGuarantor, Fannie Mae Liquidity Agreement),0.46%, 4/07/16 (a) 10,200 10,200,000
County of Miami-Dade Florida Transit SystemSales Surtax Revenue, RB, VRDN, Eagle Tax-Exempt Trust, Class A (AGM) (Citibank NALiquidity Agreement), 0.45%, 4/07/16 (a)(b) 7,450 7,450,000
County of Miami-Dade Florida Water & SewerSystem Revenue, RB, VRDN, ROCS, Series RR-II-R-11834 (AGM) (Citibank NA LiquidityAgreement), 0.45%, 4/07/16 (a)(b)(c) 23,750 23,750,000
County of Orange Florida, RBC Muni Products,Inc. Trust, Refunding RB, FLOATS, VRDN,Series O-43 (Royal Bank of Canada SBPA),0.45%, 4/07/16 (a)(b)(c) 5,115 5,115,000
County of Orlando & Orange Florida ExpresswayAuthority, RB, VRDN, Eagle Tax-Exempt Trust,Series 0145, Class A (BHAC) (Citibank NALiquidity Agreement), 0.44%, 4/07/16 (a)(c) 11,300 11,300,000
Florida Housing Finance Corp., RB, VRDN, M/F,Savannah Springs Apartments, Series N, AMT(Citibank NA LOC), 0.46%, 4/07/16 (a) 6,500 6,500,000
Orlando Florida Utilities Commission, RefundingRB, Series B, VRDN (TD Bank NA SBPA),0.38%, 4/07/16 (a) 7,855 7,855,000
95,350,000
Georgia — 0.5%County of Gainesville & Hall Georgia
Development Authority, RB, VRDN (TD BankNA SBPA), Acts Retirement-Life Communities,Inc., Lanier Village, Series B,0.41%, 4/01/16 (a) 15,135 15,135,000
Illinois — 4.1%Illinois Finance Authority, RB, VRDN (a):
AMT, INX International Ink Co. (JPMorganChase Bank NA LOC), 0.55%, 4/07/16 3,280 3,280,000
ROCS, Children’s Memorial Hospital, SeriesRR-11624 (AGC) (Citibank NA SBPA),0.60%, 4/07/16 (b)(c) 16,100 16,100,000
Illinois Finance Authority, Refunding RB,VRDN (a):
Evanston Hospital Corporation,0.41%, 4/07/16 16,100 16,100,000
Northwestern Memorial Hospital (WellsFargo Bank NA SBPA), 0.35%, 4/01/16 20,285 20,285,000
Northwestern Memorial Hospital, Series A-2(Wells Fargo Bank NA SBPA),0.41%, 4/07/16 12,300 12,300,000
Northwestern Memorial Hospital, Series A-3(JPMorgan Chase Bank SBPA),0.52%, 4/07/16 30,190 30,190,000
Municipal BondsPar
(000) Value
Illinois (continued)State of Illinois, GO, VRDN, Series B-4 (State
Street Bank & Trust Co. LOC),0.50%, 4/07/16 (a) $ 6,200 $ 6,200,000
University of Illinois, Refunding RB, VRDN, UICSouth Campus Development (JPMorgan ChaseBank NA LOC), 0.52%, 4/07/16 (a) 17,810 17,810,000
122,265,000
Indiana — 3.1%City of Indianapolis Indiana Local Public
Improvement Bond Bank, Refunding RB,ROCS, VRDN, Series II-R-11779 (AGC)(Citibank NA SBPA),0.60%, 4/07/16 (a)(b)(c) 47,870 47,870,000
City of Michigan Indiana, RB, M/F, VRDN, PalatekProject, AMT (Comerica Bank NA LOC),0.55%, 4/07/16 (a) 3,200 3,200,000
Indiana Finance Authority, Refunding RB,VRDN (a):
Series B (BMO Harris Bank NA LOC)0.50%, 4/07/16 4,050 4,050,000
Series A-2 (BMO Harris Bank NA SBPA),0.48%, 4/07/16 37,365 37,365,000
92,485,000
Iowa — 4.0%Iowa Finance Authority, RB, VRDN, CJ BIO
America, Inc. Project (Korea DevelopmentBank LOC), 0.45%, 4/07/16 (a) 118,060 118,060,000
Iowa Higher Education Loan Authority, RefundingRB, VRDN, Des Moines University Project(BMO Harris Bank NA LOC),0.40%, 4/01/16 (a) 2,550 2,550,000
120,610,000
Kansas — 0.3%City of Burlington Kansas, Refunding RB, VRDN,
Environment Improvement Revenue, CityPower & Light (Mizuho Corporate Bank LOC),0.45%, 4/07/16 (a) 7,100 7,100,000
Counties of Sedgwick & Shawnee Kansas,JPMorgan Chase PUTTERS/DRIVERS Trust,Refunding RB, VRDN, Series 3206, AMT(JPMorgan Chase Bank NA SBPA),0.50%, 4/07/16 (a)(b)(c) 1,040 1,040,000
8,140,000
Louisiana — 5.9%Consolidated Government of the City of Baton
Rouge & Parish of East Baton RougeLouisiana, Refunding RB, VRDN,0.30%, 4/01/16 (a) 10,000 10,000,000
Louisiana Local Government EnvironmentalFacilities & Community DevelopmentAuthority, RB, VRDN, Honeywell International,Inc. Project, 0.53%, 4/07/16 (a) 6,000 6,000,000
Louisiana Local Government EnvironmentalFacilities & Community DevelopmentAuthority, Refunding RB, VRDN, BASF Corp.Project, Series B, 0.48%, 4/07/16 (a) 7,500 7,500,000
See Notes to Financial Statements.
20 BBIF TAX-EXEMPT FUND MARCH 31, 2016
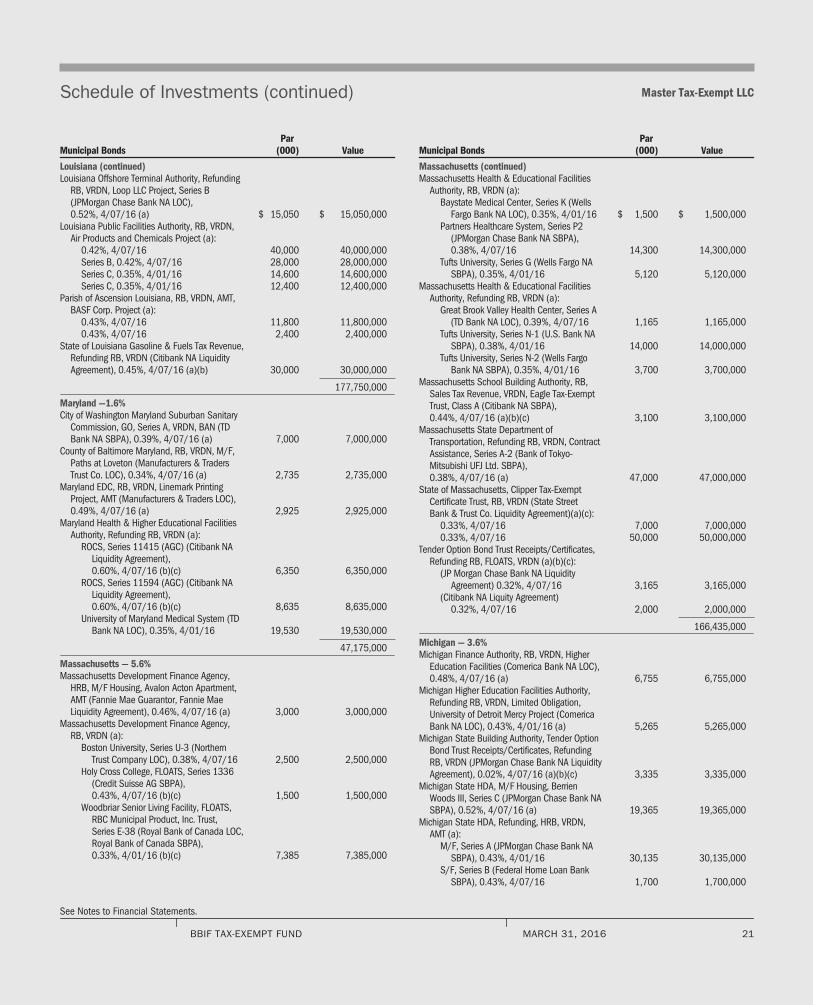
Schedule of Investments (continued) Master Tax-Exempt LLC
Municipal BondsPar
(000) Value
Louisiana (continued)Louisiana Offshore Terminal Authority, Refunding
RB, VRDN, Loop LLC Project, Series B(JPMorgan Chase Bank NA LOC),0.52%, 4/07/16 (a) $ 15,050 $ 15,050,000
Louisiana Public Facilities Authority, RB, VRDN,Air Products and Chemicals Project (a):
0.42%, 4/07/16 40,000 40,000,000Series B, 0.42%, 4/07/16 28,000 28,000,000Series C, 0.35%, 4/01/16 14,600 14,600,000Series C, 0.35%, 4/01/16 12,400 12,400,000
Parish of Ascension Louisiana, RB, VRDN, AMT,BASF Corp. Project (a):
0.43%, 4/07/16 11,800 11,800,0000.43%, 4/07/16 2,400 2,400,000
State of Louisiana Gasoline & Fuels Tax Revenue,Refunding RB, VRDN (Citibank NA LiquidityAgreement), 0.45%, 4/07/16 (a)(b) 30,000 30,000,000
177,750,000
Maryland —1.6%City of Washington Maryland Suburban Sanitary
Commission, GO, Series A, VRDN, BAN (TDBank NA SBPA), 0.39%, 4/07/16 (a) 7,000 7,000,000
County of Baltimore Maryland, RB, VRDN, M/F,Paths at Loveton (Manufacturers & TradersTrust Co. LOC), 0.34%, 4/07/16 (a) 2,735 2,735,000
Maryland EDC, RB, VRDN, Linemark PrintingProject, AMT (Manufacturers & Traders LOC),0.49%, 4/07/16 (a) 2,925 2,925,000
Maryland Health & Higher Educational FacilitiesAuthority, Refunding RB, VRDN (a):
ROCS, Series 11415 (AGC) (Citibank NALiquidity Agreement),0.60%, 4/07/16 (b)(c) 6,350 6,350,000
ROCS, Series 11594 (AGC) (Citibank NALiquidity Agreement),0.60%, 4/07/16 (b)(c) 8,635 8,635,000
University of Maryland Medical System (TDBank NA LOC), 0.35%, 4/01/16 19,530 19,530,000
47,175,000
Massachusetts — 5.6%Massachusetts Development Finance Agency,
HRB, M/F Housing, Avalon Acton Apartment,AMT (Fannie Mae Guarantor, Fannie MaeLiquidity Agreement), 0.46%, 4/07/16 (a) 3,000 3,000,000
Massachusetts Development Finance Agency,RB, VRDN (a):
Boston University, Series U-3 (NorthernTrust Company LOC), 0.38%, 4/07/16 2,500 2,500,000
Holy Cross College, FLOATS, Series 1336(Credit Suisse AG SBPA),0.43%, 4/07/16 (b)(c) 1,500 1,500,000
Woodbriar Senior Living Facility, FLOATS,RBC Municipal Product, Inc. Trust,Series E-38 (Royal Bank of Canada LOC,Royal Bank of Canada SBPA),0.33%, 4/01/16 (b)(c) 7,385 7,385,000
Municipal BondsPar
(000) Value
Massachusetts (continued)Massachusetts Health & Educational Facilities
Authority, RB, VRDN (a):Baystate Medical Center, Series K (Wells
Fargo Bank NA LOC), 0.35%, 4/01/16 $ 1,500 $ 1,500,000Partners Healthcare System, Series P2
(JPMorgan Chase Bank NA SBPA),0.38%, 4/07/16 14,300 14,300,000
Tufts University, Series G (Wells Fargo NASBPA), 0.35%, 4/01/16 5,120 5,120,000
Massachusetts Health & Educational FacilitiesAuthority, Refunding RB, VRDN (a):
Great Brook Valley Health Center, Series A(TD Bank NA LOC), 0.39%, 4/07/16 1,165 1,165,000
Tufts University, Series N-1 (U.S. Bank NASBPA), 0.38%, 4/01/16 14,000 14,000,000
Tufts University, Series N-2 (Wells FargoBank NA SBPA), 0.35%, 4/01/16 3,700 3,700,000
Massachusetts School Building Authority, RB,Sales Tax Revenue, VRDN, Eagle Tax-ExemptTrust, Class A (Citibank NA SBPA),0.44%, 4/07/16 (a)(b)(c) 3,100 3,100,000
Massachusetts State Department ofTransportation, Refunding RB, VRDN, ContractAssistance, Series A-2 (Bank of Tokyo-Mitsubishi UFJ Ltd. SBPA),0.38%, 4/07/16 (a) 47,000 47,000,000
State of Massachusetts, Clipper Tax-ExemptCertificate Trust, RB, VRDN (State StreetBank & Trust Co. Liquidity Agreement)(a)(c):
0.33%, 4/07/16 7,000 7,000,0000.33%, 4/07/16 50,000 50,000,000
Tender Option Bond Trust Receipts/Certificates,Refunding RB, FLOATS, VRDN (a)(b)(c):
(JP Morgan Chase Bank NA LiquidityAgreement) 0.32%, 4/07/16 3,165 3,165,000
(Citibank NA Liquity Agreement)0.32%, 4/07/16 2,000 2,000,000
166,435,000
Michigan — 3.6%Michigan Finance Authority, RB, VRDN, Higher
Education Facilities (Comerica Bank NA LOC),0.48%, 4/07/16 (a) 6,755 6,755,000
Michigan Higher Education Facilities Authority,Refunding RB, VRDN, Limited Obligation,University of Detroit Mercy Project (ComericaBank NA LOC), 0.43%, 4/01/16 (a) 5,265 5,265,000
Michigan State Building Authority, Tender OptionBond Trust Receipts/Certificates, RefundingRB, VRDN (JPMorgan Chase Bank NA LiquidityAgreement), 0.02%, 4/07/16 (a)(b)(c) 3,335 3,335,000
Michigan State HDA, M/F Housing, BerrienWoods III, Series C (JPMorgan Chase Bank NASBPA), 0.52%, 4/07/16 (a) 19,365 19,365,000
Michigan State HDA, Refunding, HRB, VRDN,AMT (a):
M/F, Series A (JPMorgan Chase Bank NASBPA), 0.43%, 4/01/16 30,135 30,135,000
S/F, Series B (Federal Home Loan BankSBPA), 0.43%, 4/07/16 1,700 1,700,000
See Notes to Financial Statements.
BBIF TAX-EXEMPT FUND MARCH 31, 2016 21
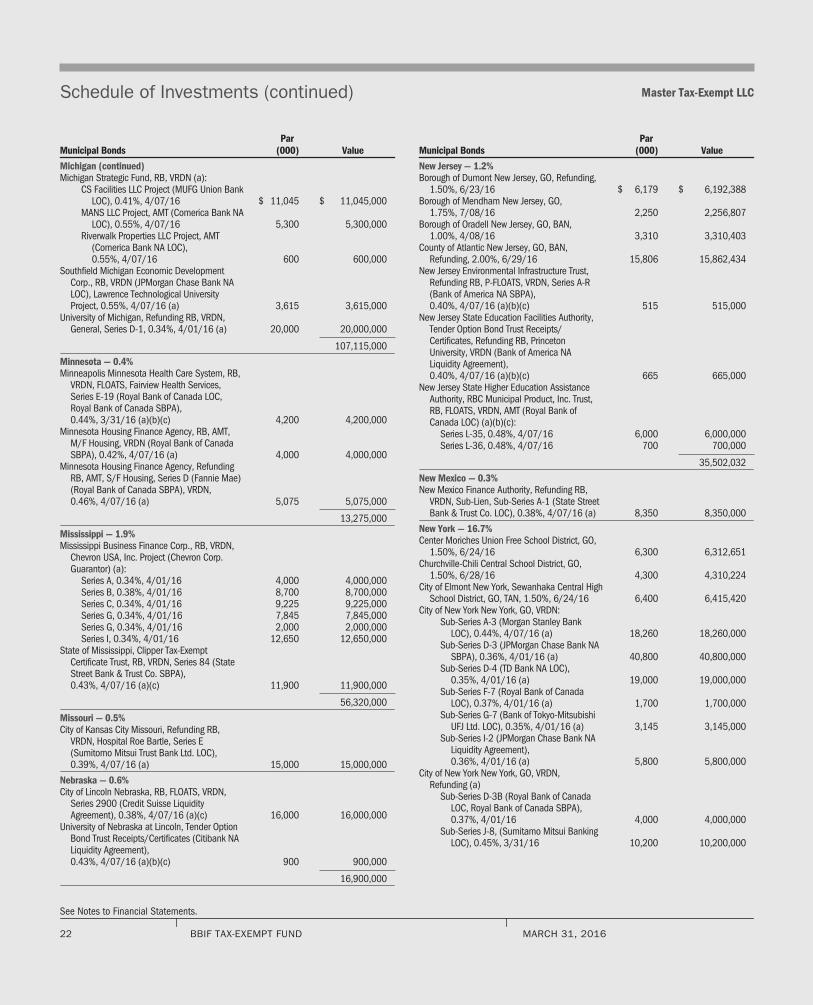
Schedule of Investments (continued) Master Tax-Exempt LLC
Municipal BondsPar
(000) Value
Michigan (continued)Michigan Strategic Fund, RB, VRDN (a):
CS Facilities LLC Project (MUFG Union BankLOC), 0.41%, 4/07/16 $ 11,045 $ 11,045,000
MANS LLC Project, AMT (Comerica Bank NALOC), 0.55%, 4/07/16 5,300 5,300,000
Riverwalk Properties LLC Project, AMT(Comerica Bank NA LOC),0.55%, 4/07/16 600 600,000
Southfield Michigan Economic DevelopmentCorp., RB, VRDN (JPMorgan Chase Bank NALOC), Lawrence Technological UniversityProject, 0.55%, 4/07/16 (a) 3,615 3,615,000
University of Michigan, Refunding RB, VRDN,General, Series D-1, 0.34%, 4/01/16 (a) 20,000 20,000,000
107,115,000
Minnesota — 0.4%Minneapolis Minnesota Health Care System, RB,
VRDN, FLOATS, Fairview Health Services,Series E-19 (Royal Bank of Canada LOC,Royal Bank of Canada SBPA),0.44%, 3/31/16 (a)(b)(c) 4,200 4,200,000
Minnesota Housing Finance Agency, RB, AMT,M/F Housing, VRDN (Royal Bank of CanadaSBPA), 0.42%, 4/07/16 (a) 4,000 4,000,000
Minnesota Housing Finance Agency, RefundingRB, AMT, S/F Housing, Series D (Fannie Mae)(Royal Bank of Canada SBPA), VRDN,0.46%, 4/07/16 (a) 5,075 5,075,000
13,275,000
Mississippi — 1.9%Mississippi Business Finance Corp., RB, VRDN,
Chevron USA, Inc. Project (Chevron Corp.Guarantor) (a):
Series A, 0.34%, 4/01/16 4,000 4,000,000Series B, 0.38%, 4/01/16 8,700 8,700,000Series C, 0.34%, 4/01/16 9,225 9,225,000Series G, 0.34%, 4/01/16 7,845 7,845,000Series G, 0.34%, 4/01/16 2,000 2,000,000Series I, 0.34%, 4/01/16 12,650 12,650,000
State of Mississippi, Clipper Tax-ExemptCertificate Trust, RB, VRDN, Series 84 (StateStreet Bank & Trust Co. SBPA),0.43%, 4/07/16 (a)(c) 11,900 11,900,000
56,320,000
Missouri — 0.5%City of Kansas City Missouri, Refunding RB,
VRDN, Hospital Roe Bartle, Series E(Sumitomo Mitsui Trust Bank Ltd. LOC),0.39%, 4/07/16 (a) 15,000 15,000,000
Nebraska — 0.6%City of Lincoln Nebraska, RB, FLOATS, VRDN,
Series 2900 (Credit Suisse LiquidityAgreement), 0.38%, 4/07/16 (a)(c) 16,000 16,000,000
University of Nebraska at Lincoln, Tender OptionBond Trust Receipts/Certificates (Citibank NALiquidity Agreement),0.43%, 4/07/16 (a)(b)(c) 900 900,000
16,900,000
Municipal BondsPar
(000) Value
New Jersey — 1.2%Borough of Dumont New Jersey, GO, Refunding,
1.50%, 6/23/16 $ 6,179 $ 6,192,388Borough of Mendham New Jersey, GO,
1.75%, 7/08/16 2,250 2,256,807Borough of Oradell New Jersey, GO, BAN,
1.00%, 4/08/16 3,310 3,310,403County of Atlantic New Jersey, GO, BAN,
Refunding, 2.00%, 6/29/16 15,806 15,862,434New Jersey Environmental Infrastructure Trust,
Refunding RB, P-FLOATS, VRDN, Series A-R(Bank of America NA SBPA),0.40%, 4/07/16 (a)(b)(c) 515 515,000
New Jersey State Education Facilities Authority,Tender Option Bond Trust Receipts/Certificates, Refunding RB, PrincetonUniversity, VRDN (Bank of America NALiquidity Agreement),0.40%, 4/07/16 (a)(b)(c) 665 665,000
New Jersey State Higher Education AssistanceAuthority, RBC Municipal Product, Inc. Trust,RB, FLOATS, VRDN, AMT (Royal Bank ofCanada LOC) (a)(b)(c):
Series L-35, 0.48%, 4/07/16 6,000 6,000,000Series L-36, 0.48%, 4/07/16 700 700,000
35,502,032
New Mexico — 0.3%New Mexico Finance Authority, Refunding RB,
VRDN, Sub-Lien, Sub-Series A-1 (State StreetBank & Trust Co. LOC), 0.38%, 4/07/16 (a) 8,350 8,350,000
New York — 16.7%Center Moriches Union Free School District, GO,
1.50%, 6/24/16 6,300 6,312,651Churchville-Chili Central School District, GO,
1.50%, 6/28/16 4,300 4,310,224City of Elmont New York, Sewanhaka Central High
School District, GO, TAN, 1.50%, 6/24/16 6,400 6,415,420City of New York New York, GO, VRDN:
Sub-Series A-3 (Morgan Stanley BankLOC), 0.44%, 4/07/16 (a) 18,260 18,260,000
Sub-Series D-3 (JPMorgan Chase Bank NASBPA), 0.36%, 4/01/16 (a) 40,800 40,800,000
Sub-Series D-4 (TD Bank NA LOC),0.35%, 4/01/16 (a) 19,000 19,000,000
Sub-Series F-7 (Royal Bank of CanadaLOC), 0.37%, 4/01/16 (a) 1,700 1,700,000
Sub-Series G-7 (Bank of Tokyo-MitsubishiUFJ Ltd. LOC), 0.35%, 4/01/16 (a) 3,145 3,145,000
Sub-Series I-2 (JPMorgan Chase Bank NALiquidity Agreement),0.36%, 4/01/16 (a) 5,800 5,800,000
City of New York New York, GO, VRDN,Refunding (a)
Sub-Series D-3B (Royal Bank of CanadaLOC, Royal Bank of Canada SBPA),0.37%, 4/01/16 4,000 4,000,000
Sub-Series J-8, (Sumitamo Mitsui BankingLOC), 0.45%, 3/31/16 10,200 10,200,000
See Notes to Financial Statements.
22 BBIF TAX-EXEMPT FUND MARCH 31, 2016
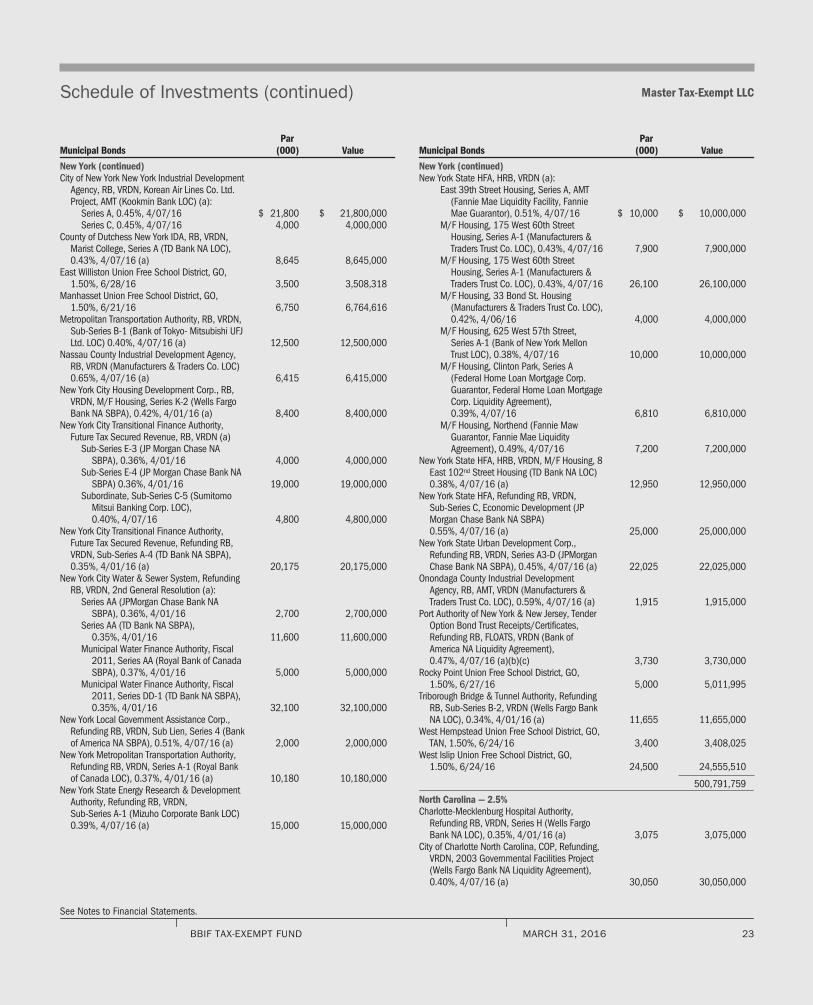
Schedule of Investments (continued) Master Tax-Exempt LLC
Municipal BondsPar
(000) Value
New York (continued)City of New York New York Industrial Development
Agency, RB, VRDN, Korean Air Lines Co. Ltd.Project, AMT (Kookmin Bank LOC) (a):
Series A, 0.45%, 4/07/16 $ 21,800 $ 21,800,000Series C, 0.45%, 4/07/16 4,000 4,000,000
County of Dutchess New York IDA, RB, VRDN,Marist College, Series A (TD Bank NA LOC),0.43%, 4/07/16 (a) 8,645 8,645,000
East Williston Union Free School District, GO,1.50%, 6/28/16 3,500 3,508,318
Manhasset Union Free School District, GO,1.50%, 6/21/16 6,750 6,764,616
Metropolitan Transportation Authority, RB, VRDN,Sub-Series B-1 (Bank of Tokyo- Mitsubishi UFJLtd. LOC) 0.40%, 4/07/16 (a) 12,500 12,500,000
Nassau County Industrial Development Agency,RB, VRDN (Manufacturers & Traders Co. LOC)0.65%, 4/07/16 (a) 6,415 6,415,000
New York City Housing Development Corp., RB,VRDN, M/F Housing, Series K-2 (Wells FargoBank NA SBPA), 0.42%, 4/01/16 (a) 8,400 8,400,000
New York City Transitional Finance Authority,Future Tax Secured Revenue, RB, VRDN (a)
Sub-Series E-3 (JP Morgan Chase NASBPA), 0.36%, 4/01/16 4,000 4,000,000
Sub-Series E-4 (JP Morgan Chase Bank NASBPA) 0.36%, 4/01/16 19,000 19,000,000
Subordinate, Sub-Series C-5 (SumitomoMitsui Banking Corp. LOC),0.40%, 4/07/16 4,800 4,800,000
New York City Transitional Finance Authority,Future Tax Secured Revenue, Refunding RB,VRDN, Sub-Series A-4 (TD Bank NA SBPA),0.35%, 4/01/16 (a) 20,175 20,175,000
New York City Water & Sewer System, RefundingRB, VRDN, 2nd General Resolution (a):
Series AA (JPMorgan Chase Bank NASBPA), 0.36%, 4/01/16 2,700 2,700,000
Series AA (TD Bank NA SBPA),0.35%, 4/01/16 11,600 11,600,000
Municipal Water Finance Authority, Fiscal2011, Series AA (Royal Bank of CanadaSBPA), 0.37%, 4/01/16 5,000 5,000,000
Municipal Water Finance Authority, Fiscal2011, Series DD-1 (TD Bank NA SBPA),0.35%, 4/01/16 32,100 32,100,000
New York Local Government Assistance Corp.,Refunding RB, VRDN, Sub Lien, Series 4 (Bankof America NA SBPA), 0.51%, 4/07/16 (a) 2,000 2,000,000
New York Metropolitan Transportation Authority,Refunding RB, VRDN, Series A-1 (Royal Bankof Canada LOC), 0.37%, 4/01/16 (a) 10,180 10,180,000
New York State Energy Research & DevelopmentAuthority, Refunding RB, VRDN,Sub-Series A-1 (Mizuho Corporate Bank LOC)0.39%, 4/07/16 (a) 15,000 15,000,000
Municipal BondsPar
(000) Value
New York (continued)New York State HFA, HRB, VRDN (a):
East 39th Street Housing, Series A, AMT(Fannie Mae Liquidity Facility, FannieMae Guarantor), 0.51%, 4/07/16 $ 10,000 $ 10,000,000
M/F Housing, 175 West 60th StreetHousing, Series A-1 (Manufacturers &Traders Trust Co. LOC), 0.43%, 4/07/16 7,900 7,900,000
M/F Housing, 175 West 60th StreetHousing, Series A-1 (Manufacturers &Traders Trust Co. LOC), 0.43%, 4/07/16 26,100 26,100,000
M/F Housing, 33 Bond St. Housing(Manufacturers & Traders Trust Co. LOC),0.42%, 4/06/16 4,000 4,000,000
M/F Housing, 625 West 57th Street,Series A-1 (Bank of New York MellonTrust LOC), 0.38%, 4/07/16 10,000 10,000,000
M/F Housing, Clinton Park, Series A(Federal Home Loan Mortgage Corp.Guarantor, Federal Home Loan MortgageCorp. Liquidity Agreement),0.39%, 4/07/16 6,810 6,810,000
M/F Housing, Northend (Fannie MawGuarantor, Fannie Mae LiquidityAgreement), 0.49%, 4/07/16 7,200 7,200,000
New York State HFA, HRB, VRDN, M/F Housing, 8East 102nd Street Housing (TD Bank NA LOC)0.38%, 4/07/16 (a) 12,950 12,950,000
New York State HFA, Refunding RB, VRDN,Sub-Series C, Economic Development (JPMorgan Chase Bank NA SBPA)0.55%, 4/07/16 (a) 25,000 25,000,000
New York State Urban Development Corp.,Refunding RB, VRDN, Series A3-D (JPMorganChase Bank NA SBPA), 0.45%, 4/07/16 (a) 22,025 22,025,000
Onondaga County Industrial DevelopmentAgency, RB, AMT, VRDN (Manufacturers &Traders Trust Co. LOC), 0.59%, 4/07/16 (a) 1,915 1,915,000
Port Authority of New York & New Jersey, TenderOption Bond Trust Receipts/Certificates,Refunding RB, FLOATS, VRDN (Bank ofAmerica NA Liquidity Agreement),0.47%, 4/07/16 (a)(b)(c) 3,730 3,730,000
Rocky Point Union Free School District, GO,1.50%, 6/27/16 5,000 5,011,995
Triborough Bridge & Tunnel Authority, RefundingRB, Sub-Series B-2, VRDN (Wells Fargo BankNA LOC), 0.34%, 4/01/16 (a) 11,655 11,655,000
West Hempstead Union Free School District, GO,TAN, 1.50%, 6/24/16 3,400 3,408,025
West Islip Union Free School District, GO,1.50%, 6/24/16 24,500 24,555,510
500,791,759
North Carolina — 2.5%Charlotte-Mecklenburg Hospital Authority,
Refunding RB, VRDN, Series H (Wells FargoBank NA LOC), 0.35%, 4/01/16 (a) 3,075 3,075,000
City of Charlotte North Carolina, COP, Refunding,VRDN, 2003 Governmental Facilities Project(Wells Fargo Bank NA Liquidity Agreement),0.40%, 4/07/16 (a) 30,050 30,050,000
See Notes to Financial Statements.
BBIF TAX-EXEMPT FUND MARCH 31, 2016 23
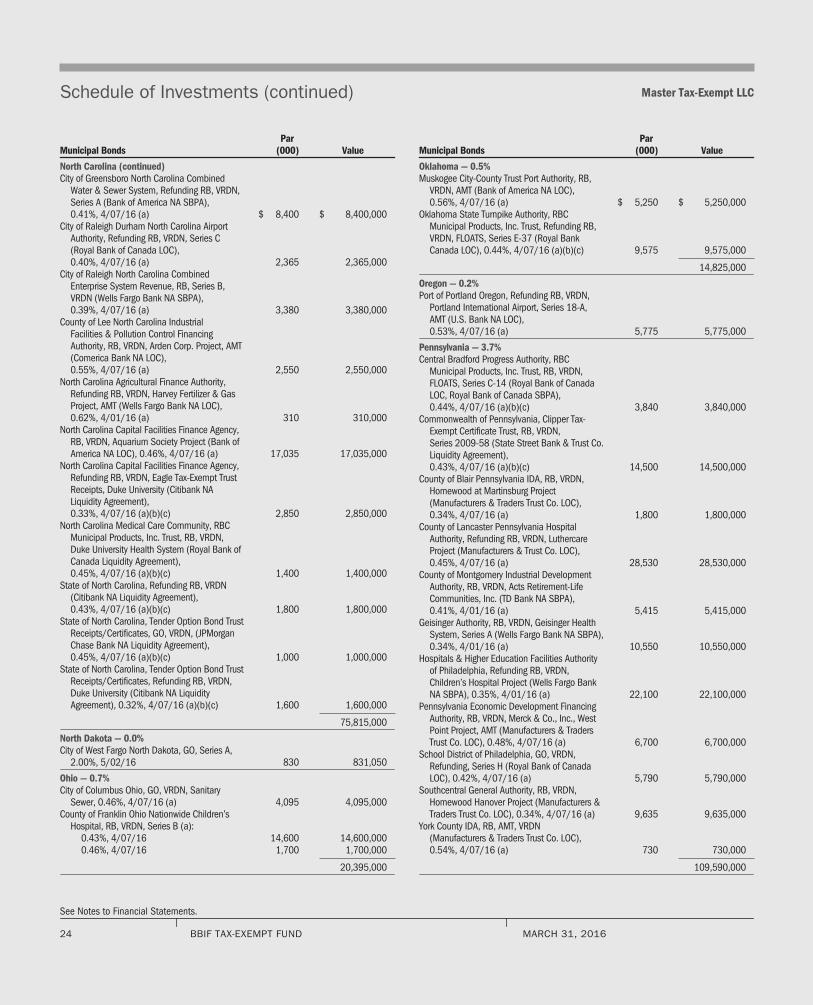
Schedule of Investments (continued) Master Tax-Exempt LLC
Municipal BondsPar
(000) Value
North Carolina (continued)City of Greensboro North Carolina Combined
Water & Sewer System, Refunding RB, VRDN,Series A (Bank of America NA SBPA),0.41%, 4/07/16 (a) $ 8,400 $ 8,400,000
City of Raleigh Durham North Carolina AirportAuthority, Refunding RB, VRDN, Series C(Royal Bank of Canada LOC),0.40%, 4/07/16 (a) 2,365 2,365,000
City of Raleigh North Carolina CombinedEnterprise System Revenue, RB, Series B,VRDN (Wells Fargo Bank NA SBPA),0.39%, 4/07/16 (a) 3,380 3,380,000
County of Lee North Carolina IndustrialFacilities & Pollution Control FinancingAuthority, RB, VRDN, Arden Corp. Project, AMT(Comerica Bank NA LOC),0.55%, 4/07/16 (a) 2,550 2,550,000
North Carolina Agricultural Finance Authority,Refunding RB, VRDN, Harvey Fertilizer & GasProject, AMT (Wells Fargo Bank NA LOC),0.62%, 4/01/16 (a) 310 310,000
North Carolina Capital Facilities Finance Agency,RB, VRDN, Aquarium Society Project (Bank ofAmerica NA LOC), 0.46%, 4/07/16 (a) 17,035 17,035,000
North Carolina Capital Facilities Finance Agency,Refunding RB, VRDN, Eagle Tax-Exempt TrustReceipts, Duke University (Citibank NALiquidity Agreement),0.33%, 4/07/16 (a)(b)(c) 2,850 2,850,000
North Carolina Medical Care Community, RBCMunicipal Products, Inc. Trust, RB, VRDN,Duke University Health System (Royal Bank ofCanada Liquidity Agreement),0.45%, 4/07/16 (a)(b)(c) 1,400 1,400,000
State of North Carolina, Refunding RB, VRDN(Citibank NA Liquidity Agreement),0.43%, 4/07/16 (a)(b)(c) 1,800 1,800,000
State of North Carolina, Tender Option Bond TrustReceipts/Certificates, GO, VRDN, (JPMorganChase Bank NA Liquidity Agreement),0.45%, 4/07/16 (a)(b)(c) 1,000 1,000,000
State of North Carolina, Tender Option Bond TrustReceipts/Certificates, Refunding RB, VRDN,Duke University (Citibank NA LiquidityAgreement), 0.32%, 4/07/16 (a)(b)(c) 1,600 1,600,000
75,815,000
North Dakota — 0.0%City of West Fargo North Dakota, GO, Series A,
2.00%, 5/02/16 830 831,050
Ohio — 0.7%City of Columbus Ohio, GO, VRDN, Sanitary
Sewer, 0.46%, 4/07/16 (a) 4,095 4,095,000County of Franklin Ohio Nationwide Children’s
Hospital, RB, VRDN, Series B (a):0.43%, 4/07/16 14,600 14,600,0000.46%, 4/07/16 1,700 1,700,000
20,395,000
Municipal BondsPar
(000) Value
Oklahoma — 0.5%Muskogee City-County Trust Port Authority, RB,
VRDN, AMT (Bank of America NA LOC),0.56%, 4/07/16 (a) $ 5,250 $ 5,250,000
Oklahoma State Turnpike Authority, RBCMunicipal Products, Inc. Trust, Refunding RB,VRDN, FLOATS, Series E-37 (Royal BankCanada LOC), 0.44%, 4/07/16 (a)(b)(c) 9,575 9,575,000
14,825,000
Oregon — 0.2%Port of Portland Oregon, Refunding RB, VRDN,
Portland International Airport, Series 18-A,AMT (U.S. Bank NA LOC),0.53%, 4/07/16 (a) 5,775 5,775,000
Pennsylvania — 3.7%Central Bradford Progress Authority, RBC
Municipal Products, Inc. Trust, RB, VRDN,FLOATS, Series C-14 (Royal Bank of CanadaLOC, Royal Bank of Canada SBPA),0.44%, 4/07/16 (a)(b)(c) 3,840 3,840,000
Commonwealth of Pennsylvania, Clipper Tax-Exempt Certificate Trust, RB, VRDN,Series 2009-58 (State Street Bank & Trust Co.Liquidity Agreement),0.43%, 4/07/16 (a)(b)(c) 14,500 14,500,000
County of Blair Pennsylvania IDA, RB, VRDN,Homewood at Martinsburg Project(Manufacturers & Traders Trust Co. LOC),0.34%, 4/07/16 (a) 1,800 1,800,000
County of Lancaster Pennsylvania HospitalAuthority, Refunding RB, VRDN, LuthercareProject (Manufacturers & Trust Co. LOC),0.45%, 4/07/16 (a) 28,530 28,530,000
County of Montgomery Industrial DevelopmentAuthority, RB, VRDN, Acts Retirement-LifeCommunities, Inc. (TD Bank NA SBPA),0.41%, 4/01/16 (a) 5,415 5,415,000
Geisinger Authority, RB, VRDN, Geisinger HealthSystem, Series A (Wells Fargo Bank NA SBPA),0.34%, 4/01/16 (a) 10,550 10,550,000
Hospitals & Higher Education Facilities Authorityof Philadelphia, Refunding RB, VRDN,Children’s Hospital Project (Wells Fargo BankNA SBPA), 0.35%, 4/01/16 (a) 22,100 22,100,000
Pennsylvania Economic Development FinancingAuthority, RB, VRDN, Merck & Co., Inc., WestPoint Project, AMT (Manufacturers & TradersTrust Co. LOC), 0.48%, 4/07/16 (a) 6,700 6,700,000
School District of Philadelphia, GO, VRDN,Refunding, Series H (Royal Bank of CanadaLOC), 0.42%, 4/07/16 (a) 5,790 5,790,000
Southcentral General Authority, RB, VRDN,Homewood Hanover Project (Manufacturers &Traders Trust Co. LOC), 0.34%, 4/07/16 (a) 9,635 9,635,000
York County IDA, RB, AMT, VRDN(Manufacturers & Traders Trust Co. LOC),0.54%, 4/07/16 (a) 730 730,000
109,590,000
See Notes to Financial Statements.
24 BBIF TAX-EXEMPT FUND MARCH 31, 2016
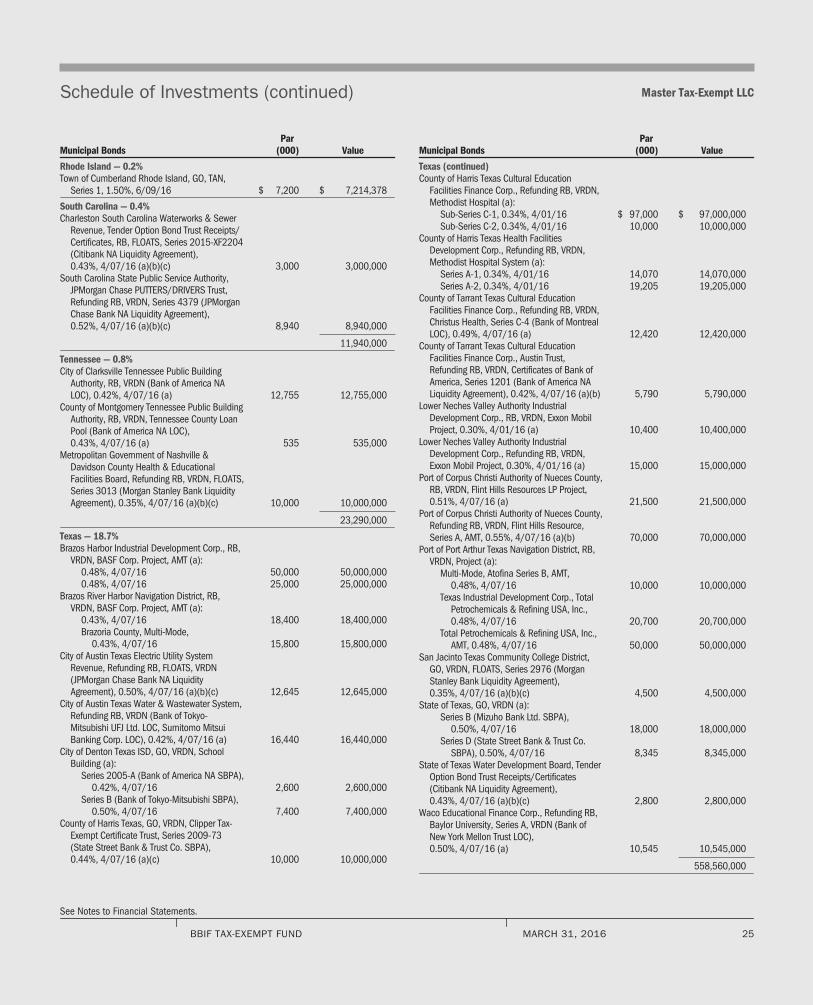
Schedule of Investments (continued) Master Tax-Exempt LLC
Municipal BondsPar
(000) Value
Rhode Island — 0.2%Town of Cumberland Rhode Island, GO, TAN,
Series 1, 1.50%, 6/09/16 $ 7,200 $ 7,214,378
South Carolina — 0.4%Charleston South Carolina Waterworks & Sewer
Revenue, Tender Option Bond Trust Receipts/Certificates, RB, FLOATS, Series 2015-XF2204(Citibank NA Liquidity Agreement),0.43%, 4/07/16 (a)(b)(c) 3,000 3,000,000
South Carolina State Public Service Authority,JPMorgan Chase PUTTERS/DRIVERS Trust,Refunding RB, VRDN, Series 4379 (JPMorganChase Bank NA Liquidity Agreement),0.52%, 4/07/16 (a)(b)(c) 8,940 8,940,000
11,940,000
Tennessee — 0.8%City of Clarksville Tennessee Public Building
Authority, RB, VRDN (Bank of America NALOC), 0.42%, 4/07/16 (a) 12,755 12,755,000
County of Montgomery Tennessee Public BuildingAuthority, RB, VRDN, Tennessee County LoanPool (Bank of America NA LOC),0.43%, 4/07/16 (a) 535 535,000
Metropolitan Government of Nashville &Davidson County Health & EducationalFacilities Board, Refunding RB, VRDN, FLOATS,Series 3013 (Morgan Stanley Bank LiquidityAgreement), 0.35%, 4/07/16 (a)(b)(c) 10,000 10,000,000
23,290,000
Texas — 18.7%Brazos Harbor Industrial Development Corp., RB,
VRDN, BASF Corp. Project, AMT (a):0.48%, 4/07/16 50,000 50,000,0000.48%, 4/07/16 25,000 25,000,000
Brazos River Harbor Navigation District, RB,VRDN, BASF Corp. Project, AMT (a):
0.43%, 4/07/16 18,400 18,400,000Brazoria County, Multi-Mode,
0.43%, 4/07/16 15,800 15,800,000City of Austin Texas Electric Utility System
Revenue, Refunding RB, FLOATS, VRDN(JPMorgan Chase Bank NA LiquidityAgreement), 0.50%, 4/07/16 (a)(b)(c) 12,645 12,645,000
City of Austin Texas Water & Wastewater System,Refunding RB, VRDN (Bank of Tokyo-Mitsubishi UFJ Ltd. LOC, Sumitomo MitsuiBanking Corp. LOC), 0.42%, 4/07/16 (a) 16,440 16,440,000
City of Denton Texas ISD, GO, VRDN, SchoolBuilding (a):
Series 2005-A (Bank of America NA SBPA),0.42%, 4/07/16 2,600 2,600,000
Series B (Bank of Tokyo-Mitsubishi SBPA),0.50%, 4/07/16 7,400 7,400,000
County of Harris Texas, GO, VRDN, Clipper Tax-Exempt Certificate Trust, Series 2009-73(State Street Bank & Trust Co. SBPA),0.44%, 4/07/16 (a)(c) 10,000 10,000,000
Municipal BondsPar
(000) Value
Texas (continued)County of Harris Texas Cultural Education
Facilities Finance Corp., Refunding RB, VRDN,Methodist Hospital (a):
Sub-Series C-1, 0.34%, 4/01/16 $ 97,000 $ 97,000,000Sub-Series C-2, 0.34%, 4/01/16 10,000 10,000,000
County of Harris Texas Health FacilitiesDevelopment Corp., Refunding RB, VRDN,Methodist Hospital System (a):
Series A-1, 0.34%, 4/01/16 14,070 14,070,000Series A-2, 0.34%, 4/01/16 19,205 19,205,000
County of Tarrant Texas Cultural EducationFacilities Finance Corp., Refunding RB, VRDN,Christus Health, Series C-4 (Bank of MontrealLOC), 0.49%, 4/07/16 (a) 12,420 12,420,000
County of Tarrant Texas Cultural EducationFacilities Finance Corp., Austin Trust,Refunding RB, VRDN, Certificates of Bank ofAmerica, Series 1201 (Bank of America NALiquidity Agreement), 0.42%, 4/07/16 (a)(b) 5,790 5,790,000
Lower Neches Valley Authority IndustrialDevelopment Corp., RB, VRDN, Exxon MobilProject, 0.30%, 4/01/16 (a) 10,400 10,400,000
Lower Neches Valley Authority IndustrialDevelopment Corp., Refunding RB, VRDN,Exxon Mobil Project, 0.30%, 4/01/16 (a) 15,000 15,000,000
Port of Corpus Christi Authority of Nueces County,RB, VRDN, Flint Hills Resources LP Project,0.51%, 4/07/16 (a) 21,500 21,500,000
Port of Corpus Christi Authority of Nueces County,Refunding RB, VRDN, Flint Hills Resource,Series A, AMT, 0.55%, 4/07/16 (a)(b) 70,000 70,000,000
Port of Port Arthur Texas Navigation District, RB,VRDN, Project (a):
Multi-Mode, Atofina Series B, AMT,0.48%, 4/07/16 10,000 10,000,000
Texas Industrial Development Corp., TotalPetrochemicals & Refining USA, Inc.,0.48%, 4/07/16 20,700 20,700,000
Total Petrochemicals & Refining USA, Inc.,AMT, 0.48%, 4/07/16 50,000 50,000,000
San Jacinto Texas Community College District,GO, VRDN, FLOATS, Series 2976 (MorganStanley Bank Liquidity Agreement),0.35%, 4/07/16 (a)(b)(c) 4,500 4,500,000
State of Texas, GO, VRDN (a):Series B (Mizuho Bank Ltd. SBPA),
0.50%, 4/07/16 18,000 18,000,000Series D (State Street Bank & Trust Co.
SBPA), 0.50%, 4/07/16 8,345 8,345,000State of Texas Water Development Board, Tender
Option Bond Trust Receipts/Certificates(Citibank NA Liquidity Agreement),0.43%, 4/07/16 (a)(b)(c) 2,800 2,800,000
Waco Educational Finance Corp., Refunding RB,Baylor University, Series A, VRDN (Bank ofNew York Mellon Trust LOC),0.50%, 4/07/16 (a) 10,545 10,545,000
558,560,000
See Notes to Financial Statements.
BBIF TAX-EXEMPT FUND MARCH 31, 2016 25
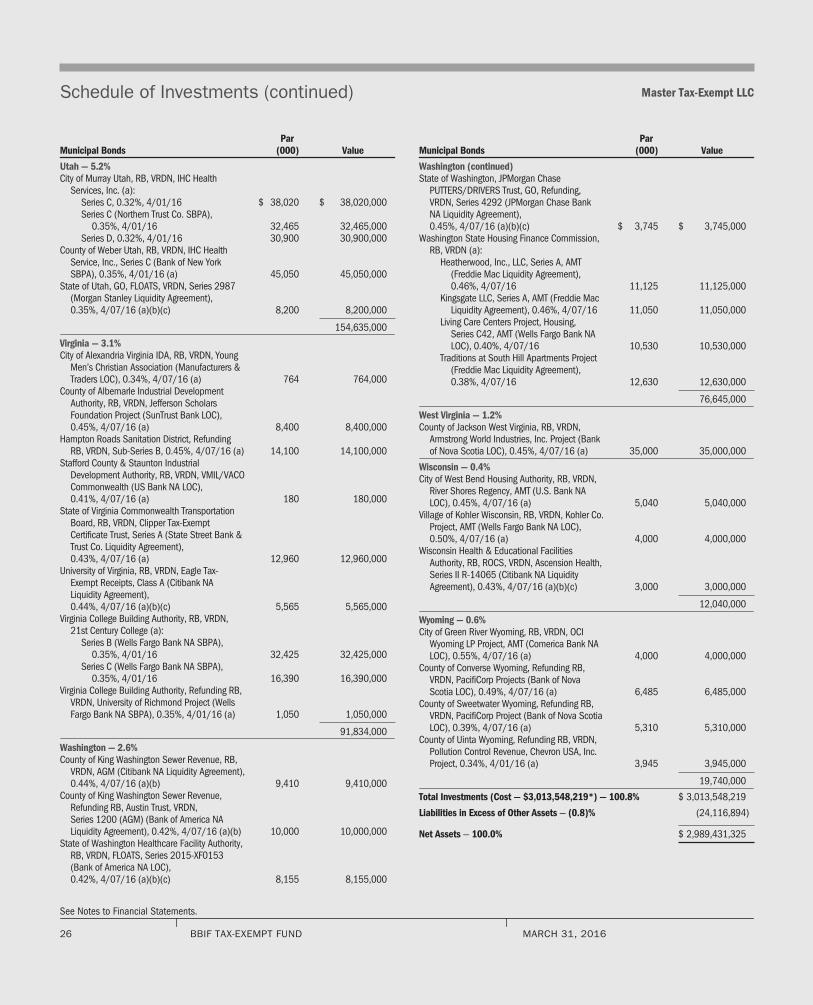
Schedule of Investments (continued) Master Tax-Exempt LLC
Municipal BondsPar
(000) Value
Utah — 5.2%City of Murray Utah, RB, VRDN, IHC Health
Services, Inc. (a):Series C, 0.32%, 4/01/16 $ 38,020 $ 38,020,000Series C (Northern Trust Co. SBPA),
0.35%, 4/01/16 32,465 32,465,000Series D, 0.32%, 4/01/16 30,900 30,900,000
County of Weber Utah, RB, VRDN, IHC HealthService, Inc., Series C (Bank of New YorkSBPA), 0.35%, 4/01/16 (a) 45,050 45,050,000
State of Utah, GO, FLOATS, VRDN, Series 2987(Morgan Stanley Liquidity Agreement),0.35%, 4/07/16 (a)(b)(c) 8,200 8,200,000
154,635,000
Virginia — 3.1%City of Alexandria Virginia IDA, RB, VRDN, Young
Men’s Christian Association (Manufacturers &Traders LOC), 0.34%, 4/07/16 (a) 764 764,000
County of Albemarle Industrial DevelopmentAuthority, RB, VRDN, Jefferson ScholarsFoundation Project (SunTrust Bank LOC),0.45%, 4/07/16 (a) 8,400 8,400,000
Hampton Roads Sanitation District, RefundingRB, VRDN, Sub-Series B, 0.45%, 4/07/16 (a) 14,100 14,100,000
Stafford County & Staunton IndustrialDevelopment Authority, RB, VRDN, VMIL/VACOCommonwealth (US Bank NA LOC),0.41%, 4/07/16 (a) 180 180,000
State of Virginia Commonwealth TransportationBoard, RB, VRDN, Clipper Tax-ExemptCertificate Trust, Series A (State Street Bank &Trust Co. Liquidity Agreement),0.43%, 4/07/16 (a) 12,960 12,960,000
University of Virginia, RB, VRDN, Eagle Tax-Exempt Receipts, Class A (Citibank NALiquidity Agreement),0.44%, 4/07/16 (a)(b)(c) 5,565 5,565,000
Virginia College Building Authority, RB, VRDN,21st Century College (a):
Series B (Wells Fargo Bank NA SBPA),0.35%, 4/01/16 32,425 32,425,000
Series C (Wells Fargo Bank NA SBPA),0.35%, 4/01/16 16,390 16,390,000
Virginia College Building Authority, Refunding RB,VRDN, University of Richmond Project (WellsFargo Bank NA SBPA), 0.35%, 4/01/16 (a) 1,050 1,050,000
91,834,000
Washington — 2.6%County of King Washington Sewer Revenue, RB,
VRDN, AGM (Citibank NA Liquidity Agreement),0.44%, 4/07/16 (a)(b) 9,410 9,410,000
County of King Washington Sewer Revenue,Refunding RB, Austin Trust, VRDN,Series 1200 (AGM) (Bank of America NALiquidity Agreement), 0.42%, 4/07/16 (a)(b) 10,000 10,000,000
State of Washington Healthcare Facility Authority,RB, VRDN, FLOATS, Series 2015-XF0153(Bank of America NA LOC),0.42%, 4/07/16 (a)(b)(c) 8,155 8,155,000
Municipal BondsPar
(000) Value
Washington (continued)State of Washington, JPMorgan Chase
PUTTERS/DRIVERS Trust, GO, Refunding,VRDN, Series 4292 (JPMorgan Chase BankNA Liquidity Agreement),0.45%, 4/07/16 (a)(b)(c) $ 3,745 $ 3,745,000
Washington State Housing Finance Commission,RB, VRDN (a):
Heatherwood, Inc., LLC, Series A, AMT(Freddie Mac Liquidity Agreement),0.46%, 4/07/16 11,125 11,125,000
Kingsgate LLC, Series A, AMT (Freddie MacLiquidity Agreement), 0.46%, 4/07/16 11,050 11,050,000
Living Care Centers Project, Housing,Series C42, AMT (Wells Fargo Bank NALOC), 0.40%, 4/07/16 10,530 10,530,000
Traditions at South Hill Apartments Project(Freddie Mac Liquidity Agreement),0.38%, 4/07/16 12,630 12,630,000
76,645,000
West Virginia — 1.2%County of Jackson West Virginia, RB, VRDN,
Armstrong World Industries, Inc. Project (Bankof Nova Scotia LOC), 0.45%, 4/07/16 (a) 35,000 35,000,000
Wisconsin — 0.4%City of West Bend Housing Authority, RB, VRDN,
River Shores Regency, AMT (U.S. Bank NALOC), 0.45%, 4/07/16 (a) 5,040 5,040,000
Village of Kohler Wisconsin, RB, VRDN, Kohler Co.Project, AMT (Wells Fargo Bank NA LOC),0.50%, 4/07/16 (a) 4,000 4,000,000
Wisconsin Health & Educational FacilitiesAuthority, RB, ROCS, VRDN, Ascension Health,Series II R-14065 (Citibank NA LiquidityAgreement), 0.43%, 4/07/16 (a)(b)(c) 3,000 3,000,000
12,040,000
Wyoming — 0.6%City of Green River Wyoming, RB, VRDN, OCI
Wyoming LP Project, AMT (Comerica Bank NALOC), 0.55%, 4/07/16 (a) 4,000 4,000,000
County of Converse Wyoming, Refunding RB,VRDN, PacifiCorp Projects (Bank of NovaScotia LOC), 0.49%, 4/07/16 (a) 6,485 6,485,000
County of Sweetwater Wyoming, Refunding RB,VRDN, PacifiCorp Project (Bank of Nova ScotiaLOC), 0.39%, 4/07/16 (a) 5,310 5,310,000
County of Uinta Wyoming, Refunding RB, VRDN,Pollution Control Revenue, Chevron USA, Inc.Project, 0.34%, 4/01/16 (a) 3,945 3,945,000
19,740,000
Total Investments (Cost — $3,013,548,219*) — 100.8% $ 3,013,548,219
Liabilities in Excess of Other Assets — (0.8)% (24,116,894)
Net Assets — 100.0% $ 2,989,431,325
See Notes to Financial Statements.
26 BBIF TAX-EXEMPT FUND MARCH 31, 2016
Schedule of Investments (concluded) Master Tax-Exempt LLC
Notes to Schedule of Investments
* Cost for federal income tax purposes
(a) Variable rate security. Rate as of period end and maturity is the date the principal owed can be recovered through demand.
(b) Security exempt from registration pursuant to Rule 144A under the Securities Act of 1933, as amended. These securities may be resold in transactions exempt from registra-tion to qualified institutional investors.
(c) These securities are short-term floating rate certificates issued by tender option bond trusts and are secured by the underlying municipal bond securities.
Fair Value Hierarchy as of Period End
Various inputs are used in determining the fair value of investments. For information about the Master LLC’s policy regarding valuation of investments, refer to the Notes to Finan-cial Statements.
The following table summarizes the Master LLC’s investments categorized in the disclosure hierarchy:
Level 1 Level 2 Level 3 Total
Assets:Investments:
Municipal Bonds 1 . . . . . . . . . . . . . . . . . . . . . . . . . . . . . . . . . . . . . . . . . . . . . . . . . . . . . — $3,013,548,219 — $3,013,548,219
1 See above Schedule of Investments for values in each state or political subdivision.
The Master LLC may hold assets and/or liabilities in which the fair value approximates the carrying amount for financial statement purposes. As of period end, cash of $221,150is categorized as Level 1 within the disclosure hierarchy.
During the year ended March 31, 2016, there were no transfers between levels.
See Notes to Financial Statements.
BBIF TAX-EXEMPT FUND MARCH 31, 2016 27
Statement of Assets and Liabilities
March 31, 2016 Master Tax-Exempt LLC
Assets
Investments at value — unaffiliated (cost — $3,013,548,219) . . . . . . . . . . . . . . . . . . . . . . . . . . . . . . . . . . . . . . . . . . . . . . . . . . . . . . . . . . . . . . . . . . . . . . . . . . $3,013,548,219Cash . . . . . . . . . . . . . . . . . . . . . . . . . . . . . . . . . . . . . . . . . . . . . . . . . . . . . . . . . . . . . . . . . . . . . . . . . . . . . . . . . . . . . . . . . . . . . . . . . . . . . . . . . . . . . . . . . . 221,150Receivables:
Interest . . . . . . . . . . . . . . . . . . . . . . . . . . . . . . . . . . . . . . . . . . . . . . . . . . . . . . . . . . . . . . . . . . . . . . . . . . . . . . . . . . . . . . . . . . . . . . . . . . . . . . . . . . . . . . 1,339,991Investments sold . . . . . . . . . . . . . . . . . . . . . . . . . . . . . . . . . . . . . . . . . . . . . . . . . . . . . . . . . . . . . . . . . . . . . . . . . . . . . . . . . . . . . . . . . . . . . . . . . . . . . . . . 649,000Contributions from investors . . . . . . . . . . . . . . . . . . . . . . . . . . . . . . . . . . . . . . . . . . . . . . . . . . . . . . . . . . . . . . . . . . . . . . . . . . . . . . . . . . . . . . . . . . . . . . . . 741,071
Prepaid expenses . . . . . . . . . . . . . . . . . . . . . . . . . . . . . . . . . . . . . . . . . . . . . . . . . . . . . . . . . . . . . . . . . . . . . . . . . . . . . . . . . . . . . . . . . . . . . . . . . . . . . . . . . 7,458
Total assets . . . . . . . . . . . . . . . . . . . . . . . . . . . . . . . . . . . . . . . . . . . . . . . . . . . . . . . . . . . . . . . . . . . . . . . . . . . . . . . . . . . . . . . . . . . . . . . . . . . . . . . . . . . . . 3,016,506,889
Liabilities
Payables:Investments purchased . . . . . . . . . . . . . . . . . . . . . . . . . . . . . . . . . . . . . . . . . . . . . . . . . . . . . . . . . . . . . . . . . . . . . . . . . . . . . . . . . . . . . . . . . . . . . . . . . . . 26,702,841Investment advisory fees . . . . . . . . . . . . . . . . . . . . . . . . . . . . . . . . . . . . . . . . . . . . . . . . . . . . . . . . . . . . . . . . . . . . . . . . . . . . . . . . . . . . . . . . . . . . . . . . . . 127,358Directors’ fees . . . . . . . . . . . . . . . . . . . . . . . . . . . . . . . . . . . . . . . . . . . . . . . . . . . . . . . . . . . . . . . . . . . . . . . . . . . . . . . . . . . . . . . . . . . . . . . . . . . . . . . . . . 18,318Other affiliates . . . . . . . . . . . . . . . . . . . . . . . . . . . . . . . . . . . . . . . . . . . . . . . . . . . . . . . . . . . . . . . . . . . . . . . . . . . . . . . . . . . . . . . . . . . . . . . . . . . . . . . . . 8,028Other accrued expenses . . . . . . . . . . . . . . . . . . . . . . . . . . . . . . . . . . . . . . . . . . . . . . . . . . . . . . . . . . . . . . . . . . . . . . . . . . . . . . . . . . . . . . . . . . . . . . . . . . 219,019
Total liabilities . . . . . . . . . . . . . . . . . . . . . . . . . . . . . . . . . . . . . . . . . . . . . . . . . . . . . . . . . . . . . . . . . . . . . . . . . . . . . . . . . . . . . . . . . . . . . . . . . . . . . . . . . . . . 27,075,564
Net Assets . . . . . . . . . . . . . . . . . . . . . . . . . . . . . . . . . . . . . . . . . . . . . . . . . . . . . . . . . . . . . . . . . . . . . . . . . . . . . . . . . . . . . . . . . . . . . . . . . . . . . . . . . . . . . . $2,989,431,325
Net Assets Consist of
Investors’ capital . . . . . . . . . . . . . . . . . . . . . . . . . . . . . . . . . . . . . . . . . . . . . . . . . . . . . . . . . . . . . . . . . . . . . . . . . . . . . . . . . . . . . . . . . . . . . . . . . . . . . . . . . . $2,989,431,325
Statement of Operations
Year Ended March 31, 2016 Master Tax-Exempt LLC
Investment Income
Income . . . . . . . . . . . . . . . . . . . . . . . . . . . . . . . . . . . . . . . . . . . . . . . . . . . . . . . . . . . . . . . . . . . . . . . . . . . . . . . . . . . . . . . . . . . . . . . . . . . . . . . . . . . . . . . . . . . . $3,035,165
Expenses
Investment advisory . . . . . . . . . . . . . . . . . . . . . . . . . . . . . . . . . . . . . . . . . . . . . . . . . . . . . . . . . . . . . . . . . . . . . . . . . . . . . . . . . . . . . . . . . . . . . . . . . . . . . . . . . . . 4,552,300Accounting services . . . . . . . . . . . . . . . . . . . . . . . . . . . . . . . . . . . . . . . . . . . . . . . . . . . . . . . . . . . . . . . . . . . . . . . . . . . . . . . . . . . . . . . . . . . . . . . . . . . . . . . . . . . 185,456Custodian . . . . . . . . . . . . . . . . . . . . . . . . . . . . . . . . . . . . . . . . . . . . . . . . . . . . . . . . . . . . . . . . . . . . . . . . . . . . . . . . . . . . . . . . . . . . . . . . . . . . . . . . . . . . . . . . . . 87,060Directors . . . . . . . . . . . . . . . . . . . . . . . . . . . . . . . . . . . . . . . . . . . . . . . . . . . . . . . . . . . . . . . . . . . . . . . . . . . . . . . . . . . . . . . . . . . . . . . . . . . . . . . . . . . . . . . . . . . 76,842Professional . . . . . . . . . . . . . . . . . . . . . . . . . . . . . . . . . . . . . . . . . . . . . . . . . . . . . . . . . . . . . . . . . . . . . . . . . . . . . . . . . . . . . . . . . . . . . . . . . . . . . . . . . . . . . . . . . 76,564Printing . . . . . . . . . . . . . . . . . . . . . . . . . . . . . . . . . . . . . . . . . . . . . . . . . . . . . . . . . . . . . . . . . . . . . . . . . . . . . . . . . . . . . . . . . . . . . . . . . . . . . . . . . . . . . . . . . . . . 3,203Miscellaneous . . . . . . . . . . . . . . . . . . . . . . . . . . . . . . . . . . . . . . . . . . . . . . . . . . . . . . . . . . . . . . . . . . . . . . . . . . . . . . . . . . . . . . . . . . . . . . . . . . . . . . . . . . . . . . . 98,981
Total expenses . . . . . . . . . . . . . . . . . . . . . . . . . . . . . . . . . . . . . . . . . . . . . . . . . . . . . . . . . . . . . . . . . . . . . . . . . . . . . . . . . . . . . . . . . . . . . . . . . . . . . . . . . . . . . . . 5,080,406Less:
Fees waived by the Manager . . . . . . . . . . . . . . . . . . . . . . . . . . . . . . . . . . . . . . . . . . . . . . . . . . . . . . . . . . . . . . . . . . . . . . . . . . . . . . . . . . . . . . . . . . . . . . . . . . . (4,203,318)Fees paid indirectly . . . . . . . . . . . . . . . . . . . . . . . . . . . . . . . . . . . . . . . . . . . . . . . . . . . . . . . . . . . . . . . . . . . . . . . . . . . . . . . . . . . . . . . . . . . . . . . . . . . . . . . . . (12,144)
Total expenses after fees waived and paid indirectly . . . . . . . . . . . . . . . . . . . . . . . . . . . . . . . . . . . . . . . . . . . . . . . . . . . . . . . . . . . . . . . . . . . . . . . . . . . . . . . . . . . . 864,944
Net investment income . . . . . . . . . . . . . . . . . . . . . . . . . . . . . . . . . . . . . . . . . . . . . . . . . . . . . . . . . . . . . . . . . . . . . . . . . . . . . . . . . . . . . . . . . . . . . . . . . . . . . . . . . 2,170,221
Realized Gain
Net realized gain from investments . . . . . . . . . . . . . . . . . . . . . . . . . . . . . . . . . . . . . . . . . . . . . . . . . . . . . . . . . . . . . . . . . . . . . . . . . . . . . . . . . . . . . . . . . . . . . . . . 410,632
Net Increase in Net Assets Resulting from Operations . . . . . . . . . . . . . . . . . . . . . . . . . . . . . . . . . . . . . . . . . . . . . . . . . . . . . . . . . . . . . . . . . . . . . . . . . . . . . . . . . $2,580,853
See Notes to Financial Statements.
28 BBIF TAX-EXEMPT FUND MARCH 31, 2016
Statements of Changes in Net Assets Master Tax-Exempt LLC
Year Ended March 31,
Increase (Decrease) in Net Assets: 2016 2015
Operations
Net investment income . . . . . . . . . . . . . . . . . . . . . . . . . . . . . . . . . . . . . . . . . . . . . . . . . . . . . . . . . . . . . . . . . . . . . . . . . . . . . . . . . . . . $ 2,170,221 $ 1,514,873Net realized gain . . . . . . . . . . . . . . . . . . . . . . . . . . . . . . . . . . . . . . . . . . . . . . . . . . . . . . . . . . . . . . . . . . . . . . . . . . . . . . . . . . . . . . . . . 410,632 272,436
Net increase in net assets resulting from operations . . . . . . . . . . . . . . . . . . . . . . . . . . . . . . . . . . . . . . . . . . . . . . . . . . . . . . . . . . . . . . . . 2,580,853 1,787,309
Capital Transactions
Proceeds from contributions . . . . . . . . . . . . . . . . . . . . . . . . . . . . . . . . . . . . . . . . . . . . . . . . . . . . . . . . . . . . . . . . . . . . . . . . . . . . . . . . . 13,221,531,510 13,552,450,815Value of withdrawals . . . . . . . . . . . . . . . . . . . . . . . . . . . . . . . . . . . . . . . . . . . . . . . . . . . . . . . . . . . . . . . . . . . . . . . . . . . . . . . . . . . . . . (13,269,240,993) (13,346,430,521)
Net increase (decrease) in net assets derived from capital transactions . . . . . . . . . . . . . . . . . . . . . . . . . . . . . . . . . . . . . . . . . . . . . . . . . . (47,709,483) 206,020,294
Net Assets
Total increase (decrease) in net assets . . . . . . . . . . . . . . . . . . . . . . . . . . . . . . . . . . . . . . . . . . . . . . . . . . . . . . . . . . . . . . . . . . . . . . . . . (45,128,630) 207,807,603Beginning of year . . . . . . . . . . . . . . . . . . . . . . . . . . . . . . . . . . . . . . . . . . . . . . . . . . . . . . . . . . . . . . . . . . . . . . . . . . . . . . . . . . . . . . . . . 3,034,559,955 2,826,752,352
End of year . . . . . . . . . . . . . . . . . . . . . . . . . . . . . . . . . . . . . . . . . . . . . . . . . . . . . . . . . . . . . . . . . . . . . . . . . . . . . . . . . . . . . . . . . . . . . $ 2,989,431,325 $ 3,034,559,955
Financial Highlights Master Tax-Exempt LLC
Year Ended March 31,
2016 2015 2014 2013 2012
Total Return
Total return . . . . . . . . . . . . . . . . . . . . . . . . . . . . . . . . . . . . . . . . . . . . . . . . . . . . . . . . . . . . . 0.07% 0.06% 0.07% 0.15% 0.10%
Ratios to Average Net Assets
Total expenses . . . . . . . . . . . . . . . . . . . . . . . . . . . . . . . . . . . . . . . . . . . . . . . . . . . . . . . . . . 0.17% 0.17% 0.17% 0.17% 0.17%
Total expenses after fees waived and paid indirectly . . . . . . . . . . . . . . . . . . . . . . . . . . . . . . . . 0.03% 0.05% 0.08% 0.08% 0.14%
Net investment income . . . . . . . . . . . . . . . . . . . . . . . . . . . . . . . . . . . . . . . . . . . . . . . . . . . . 0.07% 0.05% 0.06% 0.15% 0.12%
Supplemental Data
Net assets, end of year (000) . . . . . . . . . . . . . . . . . . . . . . . . . . . . . . . . . . . . . . . . . . . . . . . . $ 2,989,431 $ 3,034,560 $ 2,826,752 $ 3,073,102 $ 3,629,077
See Notes to Financial Statements.
BBIF TAX-EXEMPT FUND MARCH 31, 2016 29
Notes to Financial Statements Master Tax-Exempt LLC
1. Organization:
Master Tax-Exempt LLC (the “Master LLC”) is registered under the Investment Company Act of 1940, as amended (the “1940 Act”) and is organizedas a Delaware limited liability company. The Master LLC’s Limited Liability Company Agreement permits the Board of Directors of the Master LLC (the“Board”) to issue non-transferable interests in the Master LLC, subject to certain limitations.
The Master LLC, together with certain other registered investment companies advised by BlackRock Advisors, LLC (the “Manager”) or its affiliates, isincluded in a complex of open-end funds referred to as the Equity-Liquidity Complex.
2. Significant Accounting Policies:
The financial statements are prepared in conformity with accounting principles generally accepted in the United States of America (“U.S. GAAP”),which may require management to make estimates and assumptions that affect the reported amounts of assets and liabilities in the financial state-ments, disclosure of contingent assets and liabilities at the date of the financial statements and the reported amounts of increases and decreases innet assets from operations during the reporting period. Actual results could differ from those estimates. The Master LLC is considered an investmentcompany under U.S. GAAP and follows the accounting and reporting guidance applicable to investment companies. Below is a summary of significantaccounting policies:
Investment Transactions and Investment Income: For financial reporting purposes, investment transactions are recorded on the dates the transactionsare entered into (the trade dates). Realized gains and losses on investment transactions are determined on the identified cost basis. Interest income,including amortization and accretion of premiums and discounts on debt securities, is recognized on the accrual basis.
Indemnifications: In the normal course of business, the Master LLC enters into contracts that contain a variety of representations that provide generalindemnification. The Master LLC’s maximum exposure under these arrangements is unknown because it involves future potential claims against theMaster LLC, which cannot be predicted with any certainty.
Other: Expenses directly related to the Master LLC are charged to the Master LLC. Other operating expenses shared by several funds, including otherfunds managed by the Manager, are prorated among those funds on the basis of relative net assets or other appropriate methods.
The Master LLC has an arrangement with its custodian whereby fees may be reduced by credits earned on uninvested cash balances, which, if appli-cable, are shown as fees paid indirectly in the Statement of Operations. The custodian imposes fees on overdrawn cash balances, which can be offsetby accumulated credits earned or may result in additional custody charges. Effective October 2015, the custodian is imposing fees on certain unin-vested cash balances.
3. Investment Valuation and Fair Value Measurements:
Investment Valuation Policies: U.S. GAAP defines fair value as the price the Master LLC would receive to sell an asset or pay to transfer a liability inan orderly transaction between market participants at the measurement date. The Master LLC’s investments are valued under the amortized costmethod which approximates current market value in accordance with Rule 2a-7 under the 1940 Act. Under this method, investments are valued atcost when purchased and, thereafter, a constant proportionate accretion of discounts and amortization of premiums are recorded until the maturity ofthe security. The Master LLC seeks to maintain its net asset value per share at $1.00, although there is no assurance that it will be able to do so on acontinuing basis.
Fair Value Hierarchy: Various inputs are used in determining the fair value of investments. These inputs to valuation techniques are categorized into afair value hierarchy consisting of three broad levels for financial statement purposes as follows:
‰ Level 1 — unadjusted price quotations in active markets/exchanges for identical assets or liabilities that the Master LLC has the ability to access
‰ Level 2 — other observable inputs (including, but not limited to, quoted prices for similar assets or liabilities in markets that are active, quotedprices for identical or similar assets or liabilities in markets that are not active, inputs other than quoted prices that are observable for the assetsor liabilities (such as interest rates, yield curves, volatilities, prepayment speeds, loss severities, credit risks and default rates) or other market–corroborated inputs)
‰ Level 3 — unobservable inputs based on the best information available in the circumstances, to the extent observable inputs are not available(including the Master LLC’s own assumptions used in determining the fair value of investments)
30 BBIF TAX-EXEMPT FUND MARCH 31, 2016
Notes to Financial Statements (continued) Master Tax-Exempt LLC
The hierarchy gives the highest priority to unadjusted quoted prices in active markets for identical assets or liabilities (Level 1 measurements) and thelowest priority to unobservable inputs (Level 3 measurements). Accordingly, the degree of judgment exercised in determining fair value is greatest forinstruments categorized in Level 3. The inputs used to measure fair value may fall into different levels of the fair value hierarchy. In such cases, fordisclosure purposes, the fair value hierarchy classification is determined based on the lowest level input that is significant to the fair value measure-ment in its entirety. The fair value hierarchy for the Master LLC’s investments has been included in the Schedule of Investments.
Changes in valuation techniques may result in transfers into or out of an assigned level within the hierarchy. In accordance with the Master LLC’spolicy, transfers between different levels of the fair value hierarchy are deemed to have occurred as of the beginning of the reporting period. Thecategorization of a value determined for investments is based on the pricing transparency of the investments and is not necessarily an indication ofthe risks associated with investing in those securities.
4. Investment Advisory Agreement and Other Transactions with Affiliates:
The PNC Financial Services Group, Inc. is the largest stockholder and an affiliate of BlackRock, Inc. (“BlackRock”) for 1940 Act purposes.
Investment Advisory
The Master LLC entered into an Investment Advisory Agreement with the Manager, the Master LLC’s investment advisor, an indirect, wholly ownedsubsidiary of BlackRock, to provide investment advisory and administration services. The Manager is responsible for the management of the MasterLLC’s portfolio and provides the personnel, facilities, equipment and certain other services necessary to the operations of the Master LLC. For suchservices, the Master LLC pays the Manager a monthly fee based on a percentage of the Master LLC’s average daily net assets at the following annualrates:
Average Daily Net Assets Investment Advisory Fee
First $500 Million . . . . . . . . . . . . . . . . . . . . . . . . . . . . . . . . . . . . . . . . . . . . . . . . . . . . . . . . . . . . . . . . . . . . . . . . . . . . . . . . . . . . . . . . . . . . . . . . . . . . 0.250%$500 Million — $1 Billion . . . . . . . . . . . . . . . . . . . . . . . . . . . . . . . . . . . . . . . . . . . . . . . . . . . . . . . . . . . . . . . . . . . . . . . . . . . . . . . . . . . . . . . . . . . . . . 0.175%Greater than $1 Billion . . . . . . . . . . . . . . . . . . . . . . . . . . . . . . . . . . . . . . . . . . . . . . . . . . . . . . . . . . . . . . . . . . . . . . . . . . . . . . . . . . . . . . . . . . . . . . . . 0.125%
Waivers and Reimbursements
The Manager voluntarily agreed to waive a portion of the investment advisory fee and/or reimburse operating expenses to enable the feeder fundsthat invest in the Master LLC to maintain minimum levels of daily net investment income. These amounts are reported in the Statement of Operationsas fees waived by the Manager. The Manager may discontinue the waiver and/or reimbursement at any time.
For the year ended March 31, 2016, the Master LLC reimbursed the Manager $31,416 for certain accounting services, which is included inaccounting services in the Statement of Operations.
Officers and Directors
Certain officers and/or directors of the Master LLC are officers and/or directors of BlackRock or its affiliates.
Other Transactions
The Master LLC may purchase securities from, or sell securities to, an affiliated fund provided the affiliation is due solely to having a common invest-ment advisor, common officers, or common directors. For the year ended March 31, 2016, the purchase and sale transactions with an affiliated fundin compliance with Rule 17a-7 under the 1940 Act were $681,001,283 and $456,630,124, respectively.
5. Income Tax Information:
The Master LLC is classified as a partnership for federal income tax purposes. As such, each investor in the Master LLC is treated as the owner of itsproportionate share of net assets, income, expenses and realized and unrealized gains and losses of the Master LLC. Therefore, no federal income taxprovision is required. It is intended that the Master LLC’s assets will be managed so an investor in the Master LLC can satisfy the requirements ofSubchapter M of the Internal Revenue Code of 1986, as amended.
The Master LLC files U.S. federal and various state and local tax returns. No income tax returns are currently under examination. The statute of limi-tations on the Master LLC’s U.S. federal tax returns remains open for each of the four years ended March 31, 2016. The statutes of limitations on theMaster LLC’s state and local tax returns may remain open for an additional year depending upon the jurisdiction.
BBIF TAX-EXEMPT FUND MARCH 31, 2016 31
Notes to Financial Statements (concluded) Master Tax-Exempt LLC
Management has analyzed tax laws and regulations and their application to the Master LLC as of March 31, 2016, inclusive of the open tax returnyears, and does not believe there are any uncertain tax positions that require recognition of a tax liability in the Master LLC’s financial statements.
6. Principal Risks:
In the normal course of business, the Master LLC invests in securities and enters into transactions where risks exist due to fluctuations in the market(market risk) or failure of the issuer to meet all its obligations, including the ability to pay principal and interest when due (issuer credit risk). Thevalue of securities held by the Master LLC may decline in response to certain events, including those directly involving the issuers of securities ownedby the Master LLC. Changes arising from the general economy, the overall market and local, regional or global political and/or social instability, aswell as currency, interest rate and price fluctuations, may also affect the securities’ value.
Certain obligations held by the the Master LLC have a credit enhancement or liquidity feature that may, under certain circumstances, provide forrepayment of principal and interest on the obligation when due. These enhancements, which may include letters of credit, stand-by bond purchaseagreements and/or third party insurance, are issued by financial institutions. The value of the obligations may be affected by changes in creditworthi-ness of the entities that provide the credit enhancements or liquidity features. The Master LLC monitors its exposure by reviewing the creditworthinessof the issuers, as well as the financial institutions issuing the credit enhancements and by limiting the amount of holdings with credit enhancementsfrom one financial institution.
On July 23, 2014, the U.S. Securities and Exchange Commission adopted amendments to money market fund regulations, which structurally changethe way that certain money market funds will be required to operate. The compliance periods for the amendments range between July 2015 andOctober 2016. The changes may affect a money market fund’s investment strategies, fees and expenses, portfolio and share liquidity and returnpotential.
Counterparty Credit Risk: Similar to issuer credit risk, the Master LLC may be exposed to counterparty credit risk, or the risk that an entity may fail toor be unable to perform on its commitments related to unsettled or open transactions. The Master LLC manages counterparty credit risk by enteringinto transactions only with counterparties that the Manager believes have the financial resources to honor their obligations and by monitoring thefinancial stability of those counterparties. Financial assets, which potentially expose the Master LLC to market, issuer and counterparty credit risks,consist principally of financial instruments and receivables due from counterparties. The extent of the Master LLC’s exposure to market, issuer andcounterparty credit risks with respect to these financial assets is approximately their value recorded in the Statement of Assets and Liabilities, less anycollateral held by the Master LLC.
7. Subsequent Events:
Management’s evaluation of the impact of all subsequent events on the Master LLC’s financial statements was completed through the date the finan-cial statements were issued and the following items were noted:
On May 19, 2016, the Board approved a proposal to liquidate the Master LLC. Accordingly, on or about July 15, 2016, (the “Liquidation Date”), all ofthe assets of the Master LLC will be liquidated completely, the interests of any interestholders on the Liquidation Date will be redeemed and theMaster LLC will then be terminated.
32 BBIF TAX-EXEMPT FUND MARCH 31, 2016
Report of Independent Registered Public Accounting Firm Master Tax-Exempt LLC
To the Investors and Board of Directors of Master Tax-Exempt LLC:
We have audited the accompanying statement of assets and liabilities of Master Tax-Exempt LLC (the “Master LLC”), including the schedule ofinvestments, as of March 31, 2016, and the related statement of operations for the year then ended, the statements of changes in net assets foreach of the two years in the period then ended, and the financial highlights for each of the five years in the period then ended. These financial state-ments and financial highlights are the responsibility of the Master LLC’s management. Our responsibility is to express an opinion on these financialstatements and financial highlights based on our audits.
We conducted our audits in accordance with the standards of the Public Company Accounting Oversight Board (United States). Those standardsrequire that we plan and perform the audit to obtain reasonable assurance about whether the financial statements and financial highlights are free ofmaterial misstatement. The Master LLC is not required to have, nor were we engaged to perform, an audit of its internal control over financialreporting. Our audits included consideration of internal control over financial reporting as a basis for designing audit procedures that are appropriatein the circumstances, but not for the purpose of expressing an opinion on the effectiveness of the Master LLC’s internal control over financialreporting. Accordingly, we express no such opinion.
An audit also includes examining, on a test basis, evidence supporting the amounts and disclosures in the financial statements, assessing theaccounting principles used and significant estimates made by management, as well as evaluating the overall financial statement presentation. Ourprocedures included confirmation of securities owned as of March 31, 2016, by correspondence with the custodian and brokers; where replies werenot received from brokers, we performed other auditing procedures. We believe that our audits provide a reasonable basis for our opinion.
In our opinion, the financial statements and financial highlights referred to above present fairly, in all material respects, the financial position ofMaster Tax-Exempt LLC as of March 31, 2016, the results of its operations for the year then ended, the changes in its net assets for each of the twoyears in the period then ended, and the financial highlights for each of the five years in the period then ended, in conformity with accountingprinciples generally accepted in the United States of America.
The accompanying financial statements have been prepared assuming that the Master LLC will continue as a going concern. As discussed in Note 7to the financial statements, the Board of the Master LLC approved a proposal to close the Master LLC to new investors and thereafter to liquidate theMaster LLC. Management’s plans concerning this matter is also discussed in Note 7 to the financial statements. The financial statements do notinclude any adjustments that might result from the liquidation event.
Deloitte & Touche LLPBoston, MassachusettsMay 24, 2016
BBIF TAX-EXEMPT FUND MARCH 31, 2016 33
Officers and Directors
Name, Address1
and Year of Birth
Position(s)Held withthe Fund/Master LLC
Lengthof TimeServed asa Director3 Principal Occupation(s) During Past Five Years
Number of BlackRock-Advised RegisteredInvestment Companies(“RICs”) Consisting ofInvestment Portfolios(“Portfolios”) Overseen
Public Company andInvestment CompanyDirectorships DuringPast Five Years
Independent Directors2
Rodney D. Johnson1941
Chair of theBoard andDirector
Since 2007 President, Fairmount Capital Advisors, Inc. from 1987 to 2013;Member of the Archdiocesan Investment Committee of theArchdiocese of Philadelphia from 2004 to 2012; Director, TheCommittee of Seventy (civic) from 2006 to 2012; Director, FoxChase Cancer Center from 2004 to 2011.
33 RICs consisting of156 Portfolios
None
David O. Beim1940
Director Since 2007 Professor of Professional Practice at the Columbia UniversityGraduate School of Business since 1991; Trustee, Phillips ExeterAcademy from 2002 to 2012; Chairman, Wave Hill, Inc. (publicgarden and cultural center) from 1990 to 2006.
33 RICs consisting of156 Portfolios
None
Susan J. Carter1956
Director Since 2016 Director, Pacific Pension Institute since 2014; Advisory BoardMember, Center for Private Equity and Entrepreneurship atTuck School of Business since 1997; Senior Advisor,Commonfund Capital, Inc. (“CCI”) (investment adviser) in2015; Chief Executive Officer, CCI from 2013 to 2014;President & Chief Executive Officer, CCI from 1997 to 2013;Advisory Board Member, Girls Who Invest since 2015;Advisory Board Member, Bridges Ventures since 2016.
33 RICs consisting of156 Portfolios
None
Collette Chilton1958
Director Since 2015 Chief Investment Officer, Williams College since 2006; ChiefInvestment Officer, Lucent Asset Management Corporation from1998 to 2006.
33 RICs consisting of156 Portfolios
None
Neil A. Cotty1954
Director Since 2016 Bank of America Corporation from 1996 to 2015, serving invarious senior finance leadership roles, including ChiefAccounting Officer, from 2009 to 2015, Chief Financial Officerof Global Banking, Markets and Wealth Management from2008 to 2009, Chief Accounting Officer from 2004 to 2008,Chief Financial Officer of Consumer Bank from 2003 to 2004,Chief Financial Officer of Global Corporate Investment Bankfrom 1999 to 2002.
33 RICs consisting of156 Portfolios
None
Dr. Matina S. Horner1939
Director Since 2007 Executive Vice President, Teachers Insurance and AnnuityAssociation and College Retirement Equities Fund from 1989to 2003.
33 RICs consisting of156 Portfolios
NSTAR (electric and gasutility)
Cynthia A. Montgomery1952
Director Since 2007 Professor, Harvard Business School since 1989; Director,McLean Hospital from 2005 to 2012; Director, HarvardBusiness School Publishing from 2005 to 2010.
33 RICs consisting of156 Portfolios
Newell Rubbermaid, Inc.(manufacturing)
Joseph P. Platt1947
Director Since 2007 Director, Jones and Brown (Canadian insurance broker) since1998; General Partner, Thorn Partners, LP (private investments)since 1998; Director, WQED Multi-Media (public broadcastingnot-for-profit) since 2001; Director, The West Penn AlleghenyHealth System (a not-for-profit health system) from 2008 to2013; Partner, Amarna Corporation, LLC (private investmentcompany) from 2002 to 2008.
33 RICs consisting of156 Portfolios
Greenlight Capital Re, Ltd.(reinsurance company)
Robert C. Robb, Jr.1945
Director Since 2007 Partner, Lewis, Eckert, Robb and Company (management andfinancial consulting firm) since 1981 and Principal since 2010.
33 RICs consisting of156 Portfolios
None
Mark Stalnecker1951
Director Since 2015 Chief Investment Officer, University of Delaware from 1999 to2013; Trustee, Winterthur Museum and Country Estate since2001; Member of the Investment Committee, Delaware PublicEmployees’ Retirement System since 2002; Member of theInvestment Committee, Christiana Care Health System since2009; Member of the Investment Committee, DelawareCommunity Foundation from 2013 to 2014.
33 RICs consisting of156 Portfolios
None
34 BBIF TAX-EXEMPT FUND MARCH 31, 2016
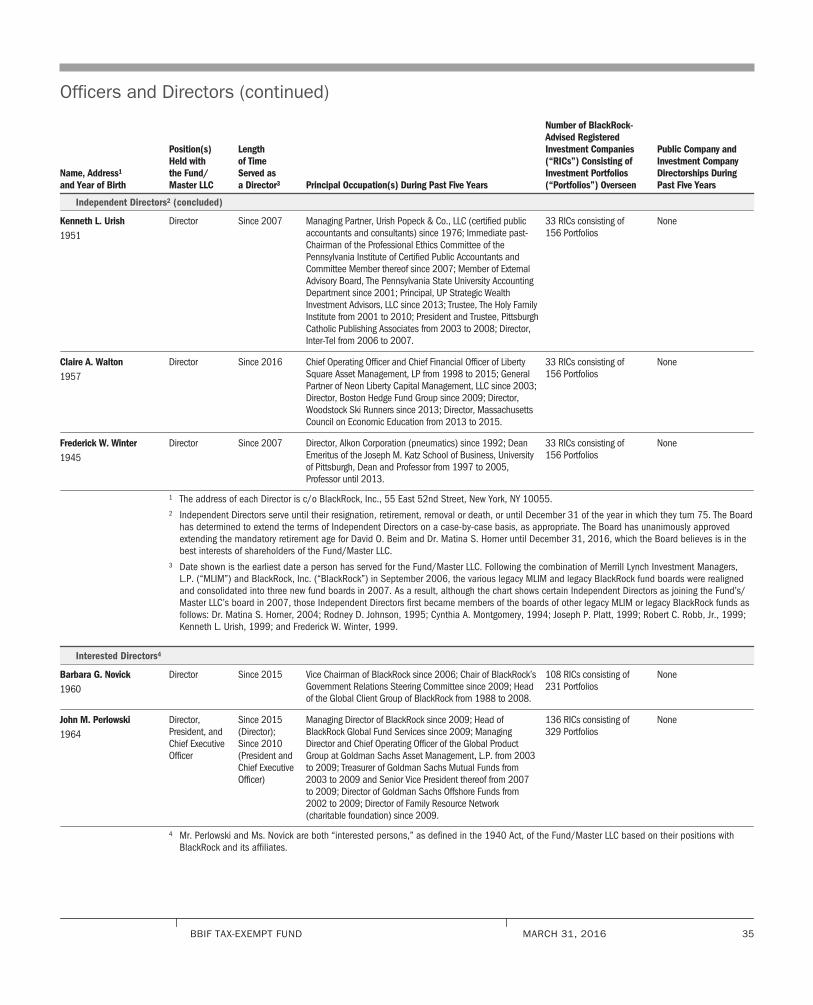
Officers and Directors (continued)
Name, Address1
and Year of Birth
Position(s)Held withthe Fund/Master LLC
Lengthof TimeServed asa Director3 Principal Occupation(s) During Past Five Years
Number of BlackRock-Advised RegisteredInvestment Companies(“RICs”) Consisting ofInvestment Portfolios(“Portfolios”) Overseen
Public Company andInvestment CompanyDirectorships DuringPast Five Years
Independent Directors2 (concluded)
Kenneth L. Urish1951
Director Since 2007 Managing Partner, Urish Popeck & Co., LLC (certified publicaccountants and consultants) since 1976; Immediate past-Chairman of the Professional Ethics Committee of thePennsylvania Institute of Certified Public Accountants andCommittee Member thereof since 2007; Member of ExternalAdvisory Board, The Pennsylvania State University AccountingDepartment since 2001; Principal, UP Strategic WealthInvestment Advisors, LLC since 2013; Trustee, The Holy FamilyInstitute from 2001 to 2010; President and Trustee, PittsburghCatholic Publishing Associates from 2003 to 2008; Director,Inter-Tel from 2006 to 2007.
33 RICs consisting of156 Portfolios
None
Claire A. Walton1957
Director Since 2016 Chief Operating Officer and Chief Financial Officer of LibertySquare Asset Management, LP from 1998 to 2015; GeneralPartner of Neon Liberty Capital Management, LLC since 2003;Director, Boston Hedge Fund Group since 2009; Director,Woodstock Ski Runners since 2013; Director, MassachusettsCouncil on Economic Education from 2013 to 2015.
33 RICs consisting of156 Portfolios
None
Frederick W. Winter1945
Director Since 2007 Director, Alkon Corporation (pneumatics) since 1992; DeanEmeritus of the Joseph M. Katz School of Business, Universityof Pittsburgh, Dean and Professor from 1997 to 2005,Professor until 2013.
33 RICs consisting of156 Portfolios
None
1 The address of each Director is c/o BlackRock, Inc., 55 East 52nd Street, New York, NY 10055.2 Independent Directors serve until their resignation, retirement, removal or death, or until December 31 of the year in which they turn 75. The Board
has determined to extend the terms of Independent Directors on a case-by-case basis, as appropriate. The Board has unanimously approvedextending the mandatory retirement age for David O. Beim and Dr. Matina S. Horner until December 31, 2016, which the Board believes is in thebest interests of shareholders of the Fund/Master LLC.
3 Date shown is the earliest date a person has served for the Fund/Master LLC. Following the combination of Merrill Lynch Investment Managers,L.P. (“MLIM”) and BlackRock, Inc. (“BlackRock”) in September 2006, the various legacy MLIM and legacy BlackRock fund boards were realignedand consolidated into three new fund boards in 2007. As a result, although the chart shows certain Independent Directors as joining the Fund’s/Master LLC’s board in 2007, those Independent Directors first became members of the boards of other legacy MLIM or legacy BlackRock funds asfollows: Dr. Matina S. Horner, 2004; Rodney D. Johnson, 1995; Cynthia A. Montgomery, 1994; Joseph P. Platt, 1999; Robert C. Robb, Jr., 1999;Kenneth L. Urish, 1999; and Frederick W. Winter, 1999.
Interested Directors4
Barbara G. Novick1960
Director Since 2015 Vice Chairman of BlackRock since 2006; Chair of BlackRock’sGovernment Relations Steering Committee since 2009; Headof the Global Client Group of BlackRock from 1988 to 2008.
108 RICs consisting of231 Portfolios
None
John M. Perlowski1964
Director,President, andChief ExecutiveOfficer
Since 2015(Director);Since 2010(President andChief ExecutiveOfficer)
Managing Director of BlackRock since 2009; Head ofBlackRock Global Fund Services since 2009; ManagingDirector and Chief Operating Officer of the Global ProductGroup at Goldman Sachs Asset Management, L.P. from 2003to 2009; Treasurer of Goldman Sachs Mutual Funds from2003 to 2009 and Senior Vice President thereof from 2007to 2009; Director of Goldman Sachs Offshore Funds from2002 to 2009; Director of Family Resource Network(charitable foundation) since 2009.
136 RICs consisting of329 Portfolios
None
4 Mr. Perlowski and Ms. Novick are both “interested persons,” as defined in the 1940 Act, of the Fund/Master LLC based on their positions withBlackRock and its affiliates.
BBIF TAX-EXEMPT FUND MARCH 31, 2016 35
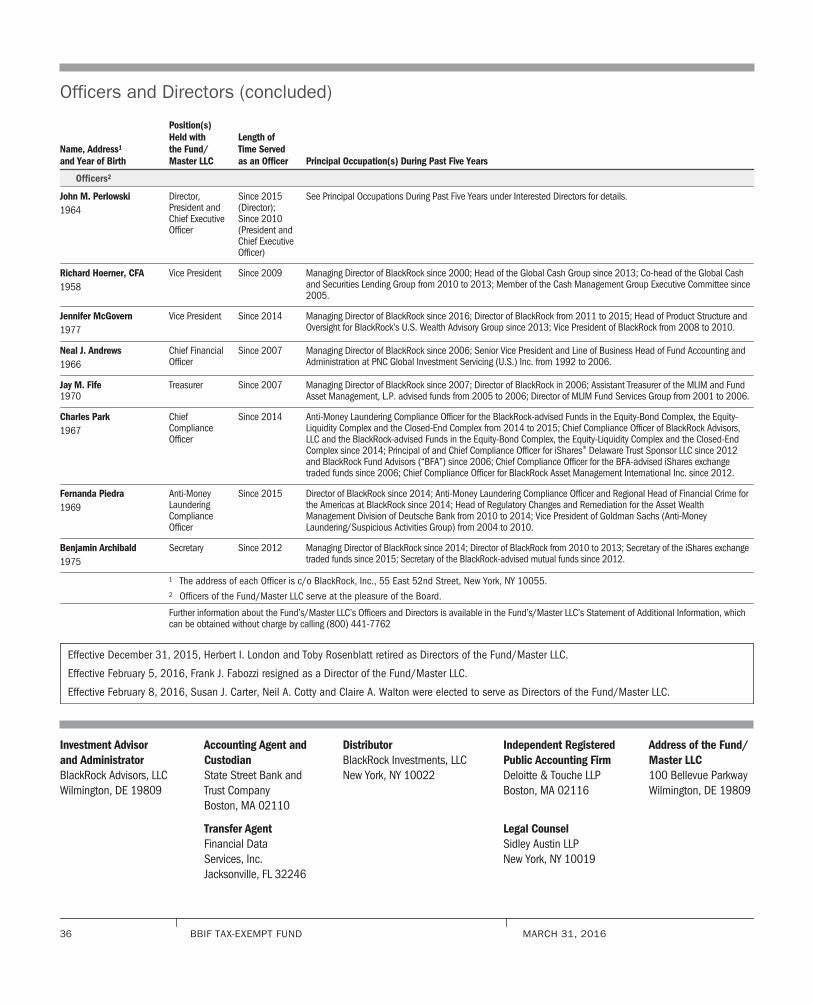
Officers and Directors (concluded)
Name, Address1
and Year of Birth
Position(s)Held withthe Fund/Master LLC
Length ofTime Servedas an Officer Principal Occupation(s) During Past Five Years
Officers2
John M. Perlowski1964
Director,President andChief ExecutiveOfficer
Since 2015(Director);Since 2010(President andChief ExecutiveOfficer)
See Principal Occupations During Past Five Years under Interested Directors for details.
Richard Hoerner, CFA1958
Vice President Since 2009 Managing Director of BlackRock since 2000; Head of the Global Cash Group since 2013; Co-head of the Global Cashand Securities Lending Group from 2010 to 2013; Member of the Cash Management Group Executive Committee since2005.
Jennifer McGovern1977
Vice President Since 2014 Managing Director of BlackRock since 2016; Director of BlackRock from 2011 to 2015; Head of Product Structure andOversight for BlackRock’s U.S. Wealth Advisory Group since 2013; Vice President of BlackRock from 2008 to 2010.
Neal J. Andrews1966
Chief FinancialOfficer
Since 2007 Managing Director of BlackRock since 2006; Senior Vice President and Line of Business Head of Fund Accounting andAdministration at PNC Global Investment Servicing (U.S.) Inc. from 1992 to 2006.
Jay M. Fife1970
Treasurer Since 2007 Managing Director of BlackRock since 2007; Director of BlackRock in 2006; Assistant Treasurer of the MLIM and FundAsset Management, L.P. advised funds from 2005 to 2006; Director of MLIM Fund Services Group from 2001 to 2006.
Charles Park1967
ChiefComplianceOfficer
Since 2014 Anti-Money Laundering Compliance Officer for the BlackRock-advised Funds in the Equity-Bond Complex, the Equity-Liquidity Complex and the Closed-End Complex from 2014 to 2015; Chief Compliance Officer of BlackRock Advisors,LLC and the BlackRock-advised Funds in the Equity-Bond Complex, the Equity-Liquidity Complex and the Closed-EndComplex since 2014; Principal of and Chief Compliance Officer for iShares® Delaware Trust Sponsor LLC since 2012and BlackRock Fund Advisors (“BFA”) since 2006; Chief Compliance Officer for the BFA-advised iShares exchangetraded funds since 2006; Chief Compliance Officer for BlackRock Asset Management International Inc. since 2012.
Fernanda Piedra1969
Anti-MoneyLaunderingComplianceOfficer
Since 2015 Director of BlackRock since 2014; Anti-Money Laundering Compliance Officer and Regional Head of Financial Crime forthe Americas at BlackRock since 2014; Head of Regulatory Changes and Remediation for the Asset WealthManagement Division of Deutsche Bank from 2010 to 2014; Vice President of Goldman Sachs (Anti-MoneyLaundering/Suspicious Activities Group) from 2004 to 2010.
Benjamin Archibald1975
Secretary Since 2012 Managing Director of BlackRock since 2014; Director of BlackRock from 2010 to 2013; Secretary of the iShares exchangetraded funds since 2015; Secretary of the BlackRock-advised mutual funds since 2012.
1 The address of each Officer is c/o BlackRock, Inc., 55 East 52nd Street, New York, NY 10055.2 Officers of the Fund/Master LLC serve at the pleasure of the Board.
Further information about the Fund’s/Master LLC’s Officers and Directors is available in the Fund’s/Master LLC’s Statement of Additional Information, whichcan be obtained without charge by calling (800) 441-7762
Effective December 31, 2015, Herbert I. London and Toby Rosenblatt retired as Directors of the Fund/Master LLC.
Effective February 5, 2016, Frank J. Fabozzi resigned as a Director of the Fund/Master LLC.
Effective February 8, 2016, Susan J. Carter, Neil A. Cotty and Claire A. Walton were elected to serve as Directors of the Fund/Master LLC.
Investment Advisorand AdministratorBlackRock Advisors, LLCWilmington, DE 19809
Accounting Agent andCustodianState Street Bank andTrust CompanyBoston, MA 02110
DistributorBlackRock Investments, LLCNew York, NY 10022
Independent RegisteredPublic Accounting FirmDeloitte & Touche LLPBoston, MA 02116
Address of the Fund/Master LLC100 Bellevue ParkwayWilmington, DE 19809
Transfer AgentFinancial DataServices, Inc.Jacksonville, FL 32246
Legal CounselSidley Austin LLPNew York, NY 10019
36 BBIF TAX-EXEMPT FUND MARCH 31, 2016
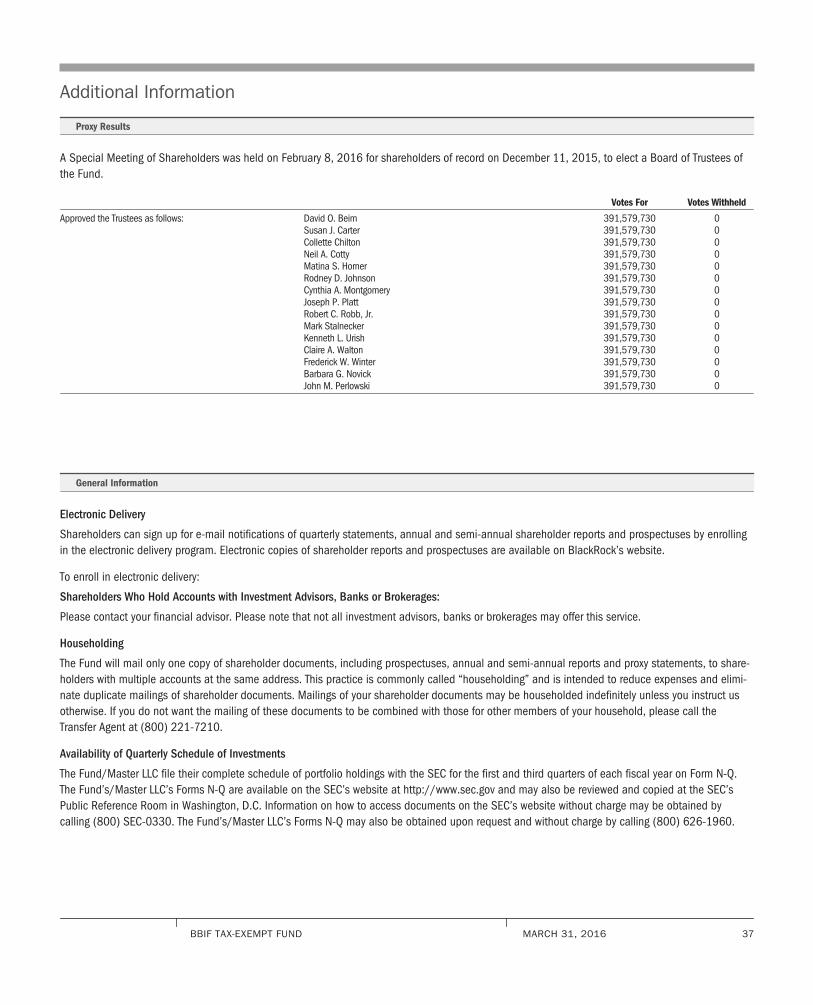
Additional Information
Proxy Results
A Special Meeting of Shareholders was held on February 8, 2016 for shareholders of record on December 11, 2015, to elect a Board of Trustees ofthe Fund.
Votes For Votes Withheld
Approved the Trustees as follows: David O. Beim 391,579,730 0Susan J. Carter 391,579,730 0Collette Chilton 391,579,730 0Neil A. Cotty 391,579,730 0Matina S. Horner 391,579,730 0Rodney D. Johnson 391,579,730 0Cynthia A. Montgomery 391,579,730 0Joseph P. Platt 391,579,730 0Robert C. Robb, Jr. 391,579,730 0Mark Stalnecker 391,579,730 0Kenneth L. Urish 391,579,730 0Claire A. Walton 391,579,730 0Frederick W. Winter 391,579,730 0Barbara G. Novick 391,579,730 0John M. Perlowski 391,579,730 0
General Information
Electronic Delivery
Shareholders can sign up for e-mail notifications of quarterly statements, annual and semi-annual shareholder reports and prospectuses by enrollingin the electronic delivery program. Electronic copies of shareholder reports and prospectuses are available on BlackRock’s website.
To enroll in electronic delivery:
Shareholders Who Hold Accounts with Investment Advisors, Banks or Brokerages:
Please contact your financial advisor. Please note that not all investment advisors, banks or brokerages may offer this service.
Householding
The Fund will mail only one copy of shareholder documents, including prospectuses, annual and semi-annual reports and proxy statements, to share-holders with multiple accounts at the same address. This practice is commonly called “householding” and is intended to reduce expenses and elimi-nate duplicate mailings of shareholder documents. Mailings of your shareholder documents may be householded indefinitely unless you instruct usotherwise. If you do not want the mailing of these documents to be combined with those for other members of your household, please call theTransfer Agent at (800) 221-7210.
Availability of Quarterly Schedule of Investments
The Fund/Master LLC file their complete schedule of portfolio holdings with the SEC for the first and third quarters of each fiscal year on Form N-Q.The Fund’s/Master LLC’s Forms N-Q are available on the SEC’s website at http://www.sec.gov and may also be reviewed and copied at the SEC’sPublic Reference Room in Washington, D.C. Information on how to access documents on the SEC’s website without charge may be obtained bycalling (800) SEC-0330. The Fund’s/Master LLC’s Forms N-Q may also be obtained upon request and without charge by calling (800) 626-1960.
BBIF TAX-EXEMPT FUND MARCH 31, 2016 37
Additional Information (concluded)
General Information (concluded)
Availability of Proxy Voting Policies and Procedures
A description of the policies and procedures that the Fund/Master LLC use to determine how to vote proxies relating to portfolio securities is availableupon request and without charge (1) by calling (800) 626-1960; (2) at http://www.blackrock.com; and (3) on the SEC’s website athttp://www.sec.gov.
Availability of Proxy Voting Record
Information about how the Fund/Master LLC voted proxies relating to securities held in the Fund’s/Master LLC’s portfolio during the most recent12-month period ended June 30 is available upon request and without charge (1) at http://www.blackrock.com or by calling (800) 626-1960 and(2) on the SEC’s website at http://www.sec.gov.
BlackRock Privacy Principles
BlackRock is committed to maintaining the privacy of its current and former fund investors and individual clients (collectively, “Clients”) and to safe-guarding their non-public personal information. The following information is provided to help you understand what personal information BlackRockcollects, how we protect that information and why in certain cases we share such information with select parties.
If you are located in a jurisdiction where specific laws, rules or regulations require BlackRock to provide you with additional or different privacy-relatedrights beyond what is set forth below, then BlackRock will comply with those specific laws, rules or regulations.
BlackRock obtains or verifies personal non-public information from and about you from different sources, including the following: (i) information wereceive from you or, if applicable, your financial intermediary, on applications, forms or other documents; (ii) information about your transactions withus, our affiliates, or others; (iii) information we receive from a consumer reporting agency; and (iv) from visits to our websites.
BlackRock does not sell or disclose to non-affiliated third parties any non-public personal information about its Clients, except as permitted by law oras is necessary to respond to regulatory requests or to service Client accounts. These non-affiliated third parties are required to protect the con-fidentiality and security of this information and to use it only for its intended purpose.
We may share information with our affiliates to service your account or to provide you with information about other BlackRock products or servicesthat may be of interest to you. In addition, BlackRock restricts access to non-public personal information about its Clients to those BlackRockemployees with a legitimate business need for the information. BlackRock maintains physical, electronic and procedural safeguards that are designedto protect the non-public personal information of its Clients, including procedures relating to the proper storage and disposal of such information.
38 BBIF TAX-EXEMPT FUND MARCH 31, 2016

[THIS PAGE INTENTIONALLY LEFT BLANK]
This report is intended for current holders. It is
not authorized for use as an offer of sale or a
solicitation of an offer to buy shares of the Fund
unless preceded or accompanied by the Fund’s
current prospectus. An investment in the Fund is
not insured or guaranteed by the Federal
Deposit Insurance Corporation or any other
government agency. Although the Fund seeks to
preserve the value of your investment at $1.00
per share, it is possible to lose money by
investing in the Fund. Performance data quoted
represents past performance and does not
guarantee future results. Total return information
assumes reinvestment of all distributions.
Current performance may be higher or lower
than the performance data quoted. For current
month-end performance information, call
(800) 626-1960. The Fund’s current 7-day yield
more closely reflects the current earnings of the
Fund than the total returns quoted. Statements
and other information herein are as dated and
are subject to change.
BBIFTE-3/16-AR